| Financial highlights | |||||||||||||||||
| in / end of | % change | in / end of | % change | ||||||||||||||
| 2Q12 | 1Q12 | 2Q11 | QoQ | YoY | 6M12 | 6M11 | YoY | ||||||||||
| Net income (CHF million) | |||||||||||||||||
| Net income attributable to shareholders | 788 | 44 | 768 | – | 3 | 832 | 1,907 | (56) | |||||||||
| Earnings per share (CHF) | |||||||||||||||||
| Basic earnings per share | 0.48 | 0.03 | 0.48 | – | – | 0.52 | 1.43 | (64) | |||||||||
| Diluted earnings per share | 0.46 | 0.03 | 0.48 | – | (4) | 0.50 | 1.42 | (65) | |||||||||
| Return on equity (%, annualized) | |||||||||||||||||
| Return on equity attributable to shareholders | 9.2 | 0.5 | 9.7 | – | – | 4.9 | 11.6 | – | |||||||||
| Core Results (CHF million) 1 | |||||||||||||||||
| Net revenues | 6,241 | 5,878 | 6,326 | 6 | (1) | 12,119 | 14,139 | (14) | |||||||||
| Provision for credit losses | 25 | 34 | 13 | (26) | 92 | 59 | 6 | – | |||||||||
| Total operating expenses | 5,105 | 5,804 | 5,227 | (12) | (2) | 10,909 | 11,422 | (4) | |||||||||
| Income before taxes | 1,111 | 40 | 1,086 | – | 2 | 1,151 | 2,711 | (58) | |||||||||
| Core Results statement of operations metrics (%) 1 | |||||||||||||||||
| Cost/income ratio | 81.8 | 98.7 | 82.6 | – | – | 90.0 | 80.8 | – | |||||||||
| Pre-tax income margin | 17.8 | 0.7 | 17.2 | – | – | 9.5 | 19.2 | – | |||||||||
| Effective tax rate | 28.0 | (40.0) | 25.0 | – | – | 25.6 | 27.1 | – | |||||||||
| Net income margin 2 | 12.6 | 0.7 | 12.1 | – | – | 6.9 | 13.5 | – | |||||||||
| Assets under management and net new assets (CHF billion) | |||||||||||||||||
| Assets under management | 1,213.1 | 1,204.8 | 1,186.3 | 0.7 | 2.3 | 1,213.1 | 1,186.3 | 2.3 | |||||||||
| Net new assets | 4.4 | (5.7) | 14.2 | – | (69.0) | (1.3) | 34.1 | – | |||||||||
| Balance sheet statistics (CHF million) | |||||||||||||||||
| Total assets | 1,043,455 | 1,000,020 | 976,923 | 4 | 7 | 1,043,455 | 976,923 | 7 | |||||||||
| Net loans | 239,164 | 231,696 | 220,030 | 3 | 9 | 239,164 | 220,030 | 9 | |||||||||
| Total shareholders' equity | 34,774 | 33,585 | 31,216 | 4 | 11 | 34,774 | 31,216 | 11 | |||||||||
| Tangible shareholders' equity 3 | 25,831 | 24,992 | 23,027 | 3 | 12 | 25,831 | 23,027 | 12 | |||||||||
| Book value per share outstanding (CHF) | |||||||||||||||||
| Total book value per share | 27.10 | 27.43 | 26.03 | (1) | 4 | 27.10 | 26.03 | 4 | |||||||||
| Tangible book value per share 3 | 20.13 | 20.41 | 19.21 | (1) | 5 | 20.13 | 19.21 | 5 | |||||||||
| Shares outstanding (million) | |||||||||||||||||
| Common shares issued | 1,286.6 | 1,224.5 | 1,202.2 | 5 | 7 | 1,286.6 | 1,202.2 | 7 | |||||||||
| Treasury shares | (3.5) | 0.0 | (3.1) | – | 13 | (3.5) | (3.1) | 13 | |||||||||
| Shares outstanding | 1,283.1 | 1,224.5 | 1,199.1 | 5 | 7 | 1,283.1 | 1,199.1 | 7 | |||||||||
| Market capitalization | |||||||||||||||||
| Market capitalization (CHF million) | 22,207 | 31,507 | 39,312 | (30) | (44) | 22,207 | 39,312 | (44) | |||||||||
| Market capitalization (USD million) | 23,583 | 34,911 | 46,910 | (32) | (50) | 23,583 | 46,910 | (50) | |||||||||
| BIS statistics (Basel II.5) 4 | |||||||||||||||||
| Risk-weighted assets (CHF million) | 233,705 | 234,390 | 238,629 | 0 | (2) | 233,705 | 238,629 | (2) | |||||||||
| Tier 1 ratio (%) | 16.5 | 15.6 | 14.5 | – | – | 16.5 | 14.5 | – | |||||||||
| Core tier 1 ratio (%) | 12.5 | 11.8 | 10.2 | – | – | 12.5 | 10.2 | – | |||||||||
| Number of employees (full-time equivalents) | |||||||||||||||||
| Number of employees | 48,200 | 48,700 | 50,700 | (1) | (5) | 48,200 | 50,700 | (5) | |||||||||
| 1 Refer to "Credit Suisse Reporting structure and Core Results" in I – Credit Suisse results – Credit Suisse for further information on Core Results. 2 Based on amounts attributable to shareholders. 3 A non-GAAP financial measure. Tangible shareholders' equity is calculated by deducting goodwill and other intangible assets from total shareholders' equity. 4 Reported under Basel II.5 since December 31, 2011. Previously reported under Basel II. Prior periods have been adjusted to conform to the current presentation. Refer to "Treasury management" in II – Treasury, risk, balance sheet and off-balance sheet for further information. | |||||||||||||||||

| Brady W. Dougan, Chief Executive Officer (left) and Urs Rohner, Chairman of the Board of Directors. |
Dear shareholders |
| For the second quarter 2012, we reported pre-tax income of CHF 1.1 billion, net income attributable to shareholders of CHF 0.8 billion and return on equity of 9%, evidencing the resilience of our business model. We achieved our year-end 2013 cost-savings target of CHF 2.0 billion 18 months early and have increased the target by an additional CHF 1.0 billion by the end of 2013. Together with our results, we also announced that we are increasing our capital by CHF 15.3 billion through a set of targeted capital measures. These measures will significantly strengthen the Group’s capital base in preparation for the Basel III regulatory framework. Through these measures, we expect to raise our year-end 2012 Look-through Swiss Core Capital Ratio to 9.4%*, compared to the year-end 2018 Swiss requirement of 10%. Even with this significantly strengthened capital base, we are reconfirming our previously announced return on equity target of 15% or above over the cycle. |
Our performance in the second quarter and the first half of 2012 |
| Our result for the second quarter underscores the positive impact of the changes we have made to adapt to the new environment. The first quarter showed that we can produce high returns despite moderate markets, and the second quarter provides evidence that our approach is resilient under more challenging conditions. Improved profitability in Private Banking, resilient results in Investment Banking and solid results in Asset Management demonstrate the balance and strength of the evolved business model. |
| In Private Banking, we reported net revenues of CHF 2,704 million, down CHF 50 million from the second quarter of 2011, reflecting low client activity and low transaction volumes. Wealth Management Clients reported net new assets of CHF 8.9 billion, driven by inflows mainly from its ultra-high-net-worth individual client segment and from emerging markets, before the impact of outflows of CHF 3.4 billion relating to the integration of Clariden Leu. The integration of Clariden Leu is now substantially complete, with a pre-tax income benefit to the Group of CHF 125 million to be realized in 2013. |
| In Investment Banking, we reported net revenues of CHF 2,909 million, up from CHF 2,817 million in the second quarter of 2011. During the second quarter of 2012, we made significant progress in executing our refined strategy, resulting in a more consistent performance and continued market share momentum. Investment Banking further reduced Basel III risk-weighted assets by USD 4 billion to USD 206 billion during the quarter. |
| In Asset Management, we had net revenues of CHF 550 million, down from CHF 654 million in the second quarter of 2011. A partial sale of our investment in Aberdeen Asset Management was completed, leading to a gain of CHF 66 million in the second quarter of 2012. In July 2012, we completed the sale of our residual stake in Aberdeen for a gain of approximately CHF 140 million, which will be recognized in the third quarter. |
| For the first half of 2012, we reported normalized** net income attributable to shareholders of CHF 2.1 billion with a normalized** after-tax return on equity of 12%. Both the second quarter and the first half performance demonstrate that our business model is working and delivering good results, even under challenging conditions. |
Good progress on cost savings and risk reduction |
| Expense reductions and capital discipline also help us ensure the effectiveness of our model going forward. In the first half of 2012, we achieved our CHF 2.0 billion cost reduction target 18 months early, and we have further increased the year-end 2013 target to CHF 3.0 billion. Roughly half of the additional CHF 1.0 billion in cost savings will come from the Shared Services functions. Our significantly reduced cost base provides us with considerable operating flexibility. |
| The progress we have made towards full Basel III compliance – including the reduction of CHF 65 billion in risk-weighted assets from the third quarter of 2011 – positions us favorably in the industry’s inevitable transition to the new environment. This allows us to serve our clients consistently and helps us to generate more stable returns. |
Capital measures to solidify our position as one of the stronger capitalized and funded global banks |
| Capital strength is of paramount importance to the Group. Given the current environment, we decided to accelerate the implementation of our capital plans in a manner, which fully addresses any questions raised by the Swiss National Bank’s (SNB) 2012 Financial Stability Report. |
| A Look-through Swiss Core Capital Ratio of 9.4%* by the end of this year, along with our leading total capital and funding structure, confirms our place among the stronger banks globally. |
| Even before the capital measures we have announced, we were well in excess of the capital requirements by the Swiss regulator, FINMA, with a Basel II.5 tier 1 capital ratio of 16.5%. Our FINMA leverage ratio stood at 4.7% as of the end of the second quarter. |
| Using a methodology broadly comparable to that used in the SNB Financial Stability Report, we expect that our Look-through Swiss Total Capital Ratio will immediately move to 8.5%* and to 10.8*% by year-end, almost double the 5.9% as of the end of the first quarter, as stated in the SNB report. |
| The capital measures include the issuance of CHF 3.8 billion mandatory and contingent convertible securities. Among the strategic investors that have fully underwritten this issuance are some of our existing long-term shareholders, who are extremely important to our broad and well diversified shareholder base, as well as some new high quality investors. Their vote of confidence in our strategy, the Group and this transaction is a very significant statement. |
| The set of measures we announced to further build our common equity is robust and well-balanced. Close to 80% of the measures are non- dilutive to the ownership of existing shareholders subscribing for their rights to the mandatory and contingent convertible securities. Over the years and prior to these measures, our shareholders have incurred minimal dilution. While the Group is strongly capitalized under the existing Swiss regulations, the announced measures accelerate our transition to the new Basel III regulatory requirements. We continue to believe that our business model will generate a best-in-class return on equity, at or above 15% over the cycle, even with the significant strengthening of our capital base due to our cost-saving initiatives. With a business that has demonstrated resilience in a changing economic climate, we are confident that Credit Suisse will further enhance its ability to best serve our clients and provide industry leading returns to our shareholders. |
| Sincerely |
| Urs Rohner Brady W. Dougan |
| July 2012 |
| * The definitions for regulatory capital and respective ratios used refer to the regulations under the Swiss too-big-to-fail regime as determined by FINMA. Ratio calculations based on these capital definitions use projected Basel III year-end 2012 risk-weighted assets. The expected year-end 2012 ratios are based on a pro-forma calculation assuming successful completion of the announced capital actions and using Bloomberg consensus earnings estimates and Credit Suisse Basel III risk-weighted assets estimates. As Basel III will not be implemented before January 1, 2013, our Basel III risk-weighted assets were calculated for purposes of this release in accordance with the currently proposed requirements and our current interpretation of such requirements, including relevant assumptions. Changes in the requirements upon implementation of Basel III would result in different numbers from those used in the release. |
| **Normalized results are non-GAAP financial measures. The table includes a reconciliation of the measures mentioned above. |
in 6M12 | Net income attributable to shareholders | After tax return on equity (%) | |||
| Overview of significant items (CHF million) | |||||
| Reported | 832 | 4.9 | |||
| Fair value losses from movement in credit spreads | 1,092 | – | |||
| Realignment costs | 187 | – | |||
| Gain on sale of stake in Aberdeen Asset Management | (241) | – | |||
| Underlying | 1,870 | 10.8 | |||
| 2011 Partner Asset Facility expense | 369 | – | |||
| Assumed share-based award expense 1 | (122) | – | |||
| Normalized | 2,117 | 12.2 | |||
| 1 Adjusted for the accelerated compensation expense in 6M12 by replacing 2011 Partner Asset Facility (PAF2) expense with assumed share-based awards expense for 6M12. This calculation assumes that share-based awards (with three-year vesting) had been awarded in lieu of PAF2 awards (with accelerated vesting) during 6M12. | |||||

Credit Suisse at a glance
Credit Suisse results
Operating environment
Credit Suisse
Core Results
Private Banking
Wealth Management Clients
Corporate & Institutional Clients
Investment Banking
Asset Management
Assets under management
Treasury, risk, balance sheet and off-balance sheet
Treasury management
Risk management
Balance sheet and off-balance sheet
Condensed consolidated financial statements – unaudited
Report of Independent Registered Public Accounting Firm
Condensed consolidated financial statements – unaudited
Notes to the condensed consolidated financial statements – unaudited
Note 1 Summary of significant accounting policies
Note 2 Recently issued accounting standards
Note 3 Business developments and subsequent events
Note 4 Discontinued operations
Note 5 Segment information
Note 6 Net interest income
Note 7 Commissions and fees
Note 8 Trading revenues
Note 9 Other revenues
Note 10 Provision for credit losses
Note 11 Compensation and benefits
Note 12 General and administrative expenses
Note 13 Earnings per share
Note 14 Trading assets and liabilities
Note 15 Investment securities
Note 16 Loans, allowance for loan losses and credit quality
Note 17 Other assets and other liabilities
Note 18 Long-term debt
Note 19 Accumulated other comprehensive income
Note 20 Tax
Note 21 Employee deferred compensation
Note 22 Pension and other post-retirement benefits
Note 23 Derivatives and hedging activities
Note 24 Guarantees and commitments
Note 25 Transfers of financial assets and variable interest entities
Note 26 Financial instruments
Note 27 Assets pledged or assigned
Note 28 Litigation
Note 29 Subsidiary guarantee information
List of abbreviations
Investor information
Financial calendar and contacts
Cautionary statement regarding forward-looking information
| For purposes of this report, unless the context otherwise requires, the terms “Credit Suisse,” “the Group,” “we,” “us” and “our” mean Credit Suisse Group AG and its consolidated subsidiaries. The business of Credit Suisse AG, the Swiss bank subsidiary of the Group, is substantially similar to the Group, and we use these terms to refer to both when the subject is the same or substantially similar. We use the term “the Bank” when we are only referring to Credit Suisse AG, the Swiss bank subsidiary of the Group, and its consolidated subsidiaries. |
| Abbreviations are explained in the List of abbreviations in the back of this report. |
| Publications referenced in this report, whether via website links or otherwise, are not incorporated into this report. |
| In various tables, use of “–” indicates not meaningful or not applicable. |
Credit Suisse at a glance |
Credit Suisse |
| As one of the world’s leading financial services providers, we are committed to delivering our combined financial experience and expertise to corporate, institutional and government clients and to high-net-worth individuals worldwide, as well as to private clients in Switzerland. Founded in 1856, we have a truly global reach today, with operations in over 50 countries and 48,200 employees from approximately 100 different nations. This worldwide reach enables us to generate a geographically balanced stream of revenues and net new assets and allows us to capture growth opportunities wherever they are. We serve our diverse clients through our three divisions, which cooperate closely to provide holistic financial solutions based on innovative products and specially tailored advice. |
Private Banking |
| Private Banking offers comprehensive advice and a wide range of financial solutions to private, corporate and institutional clients. The Private Banking division comprises the Wealth Management Clients and Corporate & Institutional Clients businesses. In Wealth Management Clients we serve ultra-high-net-worth and high-net-worth individuals around the globe and private clients in Switzerland. Our Corporate & Institutional Clients business serves the needs of corporations and institutional clients, mainly in Switzerland. |
Investment Banking |
| Investment Banking provides a broad range of financial products and services, including global securities sales, trading and execution, prime brokerage and capital raising services, corporate advisory and comprehensive investment research, with a focus on businesses that are client-driven, flow-based and capital-efficient. Clients include corporations, governments, institutional investors, including hedge funds, and private individuals around the world. Credit Suisse delivers its investment banking capabilities via regional and local teams based in major global financial centers. Strongly anchored in Credit Suisse’s integrated model, Investment Banking works closely with the Private Banking and Asset Management divisions to provide clients with customized financial solutions. |
Asset Management |
| Asset Management offers a wide range of investment products and solutions across asset classes, for all investment styles. The division manages global and regional portfolios, separate accounts, mutual funds and other investment vehicles for governments, institutions, corporations and individuals worldwide. Asset Management focuses on becoming a global leader in multi-asset class solutions as well as in alternative investments. To deliver the bank’s best investment performance, Asset Management operates as a global integrated network in close collaboration with the Private Banking and Investment Banking divisions. |
Credit Suisse results |
Operating environment |
Credit Suisse |
Core Results (including Overview of results) |
Private Banking |
Investment Banking |
Asset Management |
Assets under management |
Operating environment |
| Global economic development was strained in 2Q12. The US reported a modest increase in GDP, with growth mixed in Europe and slowing in China. Central banks continued to maintain loose monetary policies. European leaders agreed on further measures to address eurozone issues. Equity markets were mixed and generally closed lower. Major currencies, including the Swiss Franc, weakened against the US dollar, while the Japanese yen strengthened. |
Economic environment |
| Global economic growth slowed in 2Q12, reflecting lower consumer confidence and business sentiment. In Europe, gross domestic product expanded in Germany and Switzerland, was flat in France and declined in the UK, Spain and Italy. Growth was reported for the US, Japan and Australia. Growth slowed in China and India. Inflation in major developed countries continued to decline as energy prices decreased. |
| Central banks around the world maintained loose monetary policies. Australia cut rates by 75 basis points, with China and Brazil also lowering rates. The US Federal Reserve continued to shift its short-term US Treasury holdings towards longer-term securities. |
| The eurozone sovereign debt crisis remained a key theme in 2Q12. Greek elections in May did not result in a parliamentary majority and only renewed elections in June resulted in the formation of a coalition seeking continued participation of the country in the eurozone. In late June, Spain asked for a EUR 100 billion bailout package to recapitalize Spanish banks. European leaders agreed on further proposals to stabilize the eurozone, including a single banking supervisory mechanism run by the European Central Bank and authorizing the European Stability Mechanism to inject funds into banks directly. |
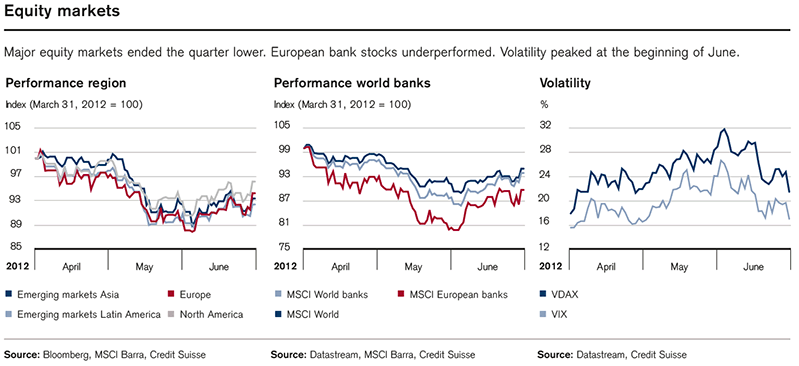
| In 2Q12 global equity markets were down 5%, with losses in April and May partly offset by gains in June. Eurozone sovereign debt issues were the main driver of market volatility. Volatility increased from the low levels of 1Q12 (refer to the charts "Equity markets"). |
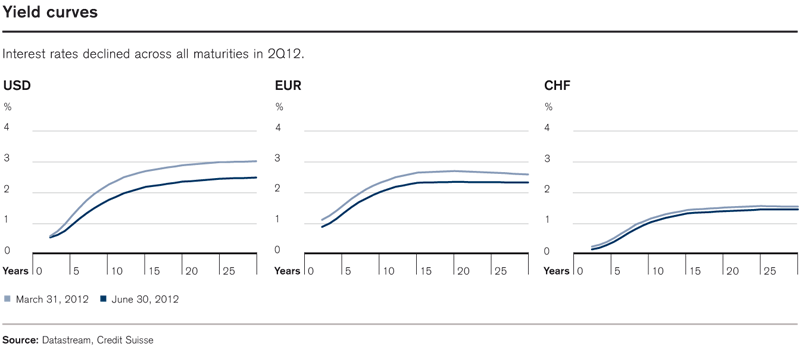
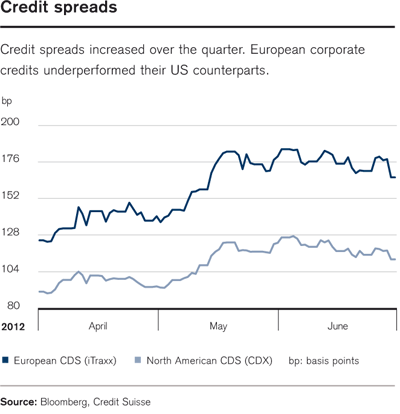
| In fixed income markets, long-dated government bonds from top-rated countries recorded the strongest returns, benefiting from safe-haven flows (refer to charts "Yield curves"). In contrast, sovereign bonds from most troubled eurozone countries posted negative returns in 2Q12. Yields on Spanish government bonds reached record levels, while yields on German, US and UK government bonds further dropped to very low levels. In general, European corporate credits underperformed their US counterparts (refer to chart "Credit spreads"). European sovereign debt concerns particularly weighed on financials and the utility sector in Europe. High yield bond spreads widened during the quarter, with European issuers most negatively affected. Emerging market sovereign spreads were generally more resilient, though more volatile issuers such as Argentina posted negative performance. |
| Tensions in the sovereign debt market in the eurozone and softening growth indicators were drivers in foreign exchange markets. Major currencies, including the euro and the Swiss franc, weakened against the US dollar, except the Japanese yen, which showed the strongest performance of all major currencies. The Swiss franc remained slightly above the minimum exchange rate of CHF 1.20 per euro previously declared by the Swiss National Bank, which intervened in currency markets in 2Q12 to defend the floor. Currencies of commodity rich countries such as Australia weakened as commodity prices fell in the quarter. |
| Commodity markets saw sharp price declines during 2Q12 after significant gains during the quarter. Concerns regarding the global economic slowdown, a stronger US dollar and the ongoing eurozone sovereign debt issues triggered pronounced selling pressure across most markets. Gold prices decreased by 4%, particularly impacted by the stronger US dollar. Oil prices fell to levels last seen in 4Q11. The Credit Suisse Commodity Benchmark lost more than 10%. |
Sector environment |
| European bank stocks reversed their 1Q12 outperformance and were down 10% in 2Q12, while the broader equity market as measured by the MSCI World Index was down 5% (refer to the charts "Equity markets"). Capital market funding for banks remained challenging in 2Q12. Moody’s downgraded the ratings of 15 banks and securities firms with global capital markets operations. Banks took further steps to boost capital and adjust business models to reflect the sector's changing regulatory framework, especially in investment banking. With continued low activity levels, cost pressures remained high in the banking industry, with many institutions continuing to focus on cost-cutting initiatives. |
| The private banking sector continued to be impacted by ongoing client risk aversion, resulting in subdued activity. The sector continued to adapt to industry-specific regulatory changes, including cross-border business activity and investor protection requirements. The Swiss mortgage market saw sustained strong demand, supported by historically low interest rates. Concerns about the real estate market overheating in certain areas of Switzerland remained pronounced. |
| In the investment banking sector, global equity trading volumes declined 9% year on year but increased by 3% quarter on quarter. Global announced mergers and acquisitions (M&A) fell 12%, while global completed M&A declined 26% year on year. Global equity underwriting volumes declined substantially from 1Q12 and 2Q11, particularly in Europe, and were about half of prior year levels, driven primarily by reduced follow-on activity and subdued initial public offering (IPO) volume. Global debt underwriting volumes also declined significantly quarter on quarter and year on year. |
| In the asset management sector, the Dow Jones Credit Suisse Hedge Fund Index lost 1.8% as of the end June 2012. In the uncertain environment, hedge funds further reduced leverage, and their exposure to equities and the energy and precious metals sector. US data for mutual fund flows showed net outflows from equity funds in 2Q12. In contrast, bond funds benefited from risk adverse retail investors. In the private equity industry, the distressed debt cycle continued, with selected opportunities remaining. In Europe, slow growth, refinancing needs and bank deleveraging set the stage for distressed investments. Buyout funds attracted the highest levels of capital during the quarter. |
| Market volumes (growth in %) | |||||||||
| Global | Europe | ||||||||
| end of 2Q12 | QoQ | YoY | QoQ | YoY | |||||
| Equity trading volume 1 | 3 | (9) | 4 | (11) | |||||
| Announced mergers and acquisitions 2 | 11 | (12) | (8) | (30) | |||||
| Completed mergers and acquisitions 2 | 22 | (26) | 18 | (47) | |||||
| Equity underwriting 2 | (21) | (49) | (64) | (83) | |||||
| Debt underwriting 2 | (36) | (21) | (50) | (36) | |||||
| Syndicated lending - investment grade 2, 3 | 15 | (19) | – | – | |||||
| 1 London Stock Exchange, Borsa Italiana, Deutsche Börse, BME and Euronext. Global also includes New York Stock Exchange and NASDAQ. 2 Dealogic 3 6M12 vs 6M11 | |||||||||
Credit Suisse |
| In 2Q12, we recorded net income attributable to shareholders of CHF 788 million. Diluted earnings per share were CHF 0.46. |
| Results | |||||||||||||||||
| in / end of | % change | in / end of | % change | ||||||||||||||
| 2Q12 | 1Q12 | 2Q11 | QoQ | YoY | 6M12 | 6M11 | YoY | ||||||||||
| Statements of operations (CHF million) | |||||||||||||||||
| Net revenues | 6,275 | 6,047 | 6,892 | 4 | (9) | 12,322 | 15,048 | (18) | |||||||||
| Provision for credit losses | 25 | 34 | 13 | (26) | 92 | 59 | 6 | – | |||||||||
| Compensation and benefits | 3,005 | 3,711 | 3,096 | (19) | (3) | 6,716 | 7,125 | (6) | |||||||||
| General and administrative expenses | 1,673 | 1,653 | 1,652 | 1 | 1 | 3,326 | 3,284 | 1 | |||||||||
| Commission expenses | 441 | 451 | 491 | (2) | (10) | 892 | 1,027 | (13) | |||||||||
| Total other operating expenses | 2,114 | 2,104 | 2,143 | 0 | (1) | 4,218 | 4,311 | (2) | |||||||||
| Total operating expenses | 5,119 | 5,815 | 5,239 | (12) | (2) | 10,934 | 11,436 | (4) | |||||||||
| Income before taxes | 1,131 | 198 | 1,640 | 471 | (31) | 1,329 | 3,606 | (63) | |||||||||
| Income tax expense/(benefit) | 311 | (16) | 271 | – | 15 | 295 | 736 | (60) | |||||||||
| Net income | 820 | 214 | 1,369 | 283 | (40) | 1,034 | 2,870 | (64) | |||||||||
| Net income attributable to noncontrolling interests | 32 | 170 | 601 | (81) | (95) | 202 | 963 | (79) | |||||||||
| Net income attributable to shareholders | 788 | 44 | 768 | – | 3 | 832 | 1,907 | (56) | |||||||||
| Earnings per share (CHF) | |||||||||||||||||
| Basic earnings per share | 0.48 | 0.03 | 0.48 | – | 0 | 0.52 | 1.43 | (64) | |||||||||
| Diluted earnings per share | 0.46 | 0.03 | 0.48 | – | (4) | 0.50 | 1.42 | (65) | |||||||||
| Return on equity (%, annualized) | |||||||||||||||||
| Return on equity attributable to shareholders | 9.2 | 0.5 | 9.7 | – | – | 4.9 | 11.6 | – | |||||||||
| Return on tangible equity attributable to shareholders 1 | 12.5 | 0.7 | 13.1 | – | – | 6.6 | 15.7 | – | |||||||||
| Number of employees (full-time equivalents) | |||||||||||||||||
| Number of employees | 48,200 | 48,700 | 50,700 | (1) | (5) | 48,200 | 50,700 | (5) | |||||||||
| 1 Based on tangible shareholders' equity attributable to shareholders, a non-GAAP financial measure, which is calculated by deducting goodwill and other intangible assets from total shareholders' equity attributable to shareholders. Management believes that the return on tangible shareholders' equity attributable to shareholders is meaningful as it allows consistent measurement of the performance of businesses without regard to whether the businesses were acquired. | |||||||||||||||||
| Credit Suisse and Core Results | |||||||||||||||||||
| Core Results | Noncontrolling interests without SEI | Credit Suisse | |||||||||||||||||
| in | 2Q12 | 1Q12 | 2Q11 | 2Q12 | 1Q12 | 2Q11 | 2Q12 | 1Q12 | 2Q11 | ||||||||||
| Statements of operations (CHF million) | |||||||||||||||||||
| Net revenues | 6,241 | 5,878 | 6,326 | 34 | 169 | 566 | 6,275 | 6,047 | 6,892 | ||||||||||
| Provision for credit losses | 25 | 34 | 13 | 0 | 0 | 0 | 25 | 34 | 13 | ||||||||||
| Compensation and benefits | 3,000 | 3,707 | 3,093 | 5 | 4 | 3 | 3,005 | 3,711 | 3,096 | ||||||||||
| General and administrative expenses | 1,664 | 1,646 | 1,643 | 9 | 7 | 9 | 1,673 | 1,653 | 1,652 | ||||||||||
| Commission expenses | 441 | 451 | 491 | 0 | 0 | 0 | 441 | 451 | 491 | ||||||||||
| Total other operating expenses | 2,105 | 2,097 | 2,134 | 9 | 7 | 9 | 2,114 | 2,104 | 2,143 | ||||||||||
| Total operating expenses | 5,105 | 5,804 | 5,227 | 14 | 11 | 12 | 5,119 | 5,815 | 5,239 | ||||||||||
| Income before taxes | 1,111 | 40 | 1,086 | 20 | 158 | 554 | 1,131 | 198 | 1,640 | ||||||||||
| Income tax expense/(benefit) | 311 | (16) | 271 | 0 | 0 | 0 | 311 | (16) | 271 | ||||||||||
| Net income | 800 | 56 | 815 | 20 | 158 | 554 | 820 | 214 | 1,369 | ||||||||||
| Net income attributable to noncontrolling interests | 12 | 12 | 47 | 20 | 158 | 554 | 32 | 170 | 601 | ||||||||||
| Net income attributable to shareholders | 788 | 44 | 768 | – | – | – | 788 | 44 | 768 | ||||||||||
| Statement of operations metrics (%) | |||||||||||||||||||
| Cost/income ratio | 81.8 | 98.7 | 82.6 | – | – | – | 81.6 | 96.2 | 76.0 | ||||||||||
| Pre-tax income margin | 17.8 | 0.7 | 17.2 | – | – | – | 18.0 | 3.3 | 23.8 | ||||||||||
| Effective tax rate | 28.0 | (40.0) | 25.0 | – | – | – | 27.5 | (8.1) | 16.5 | ||||||||||
| Net income margin 1 | 12.6 | 0.7 | 12.1 | – | – | – | 12.6 | 0.7 | 11.1 | ||||||||||
| 1 Based on amounts attributable to shareholders. | |||||||||||||||||||
Core Results |
| In 2Q12, we recorded net income attributable to shareholders of CHF 788 million. Net revenues were CHF 6,241 million and total operating expenses were CHF 5,105 million. |
| Results in 2Q12 included fair value gains of CHF 39 million before tax from movements in credit spreads, compared to fair value losses of CHF 1,554 million in 1Q12. |
| We continue to make progress on the implementation of our strategy, including the integration of Clariden Leu and reflecting a substantially repositioned fixed income business with resilient results in a difficult market environment. In 2Q12, we incurred realignment costs of CHF 183 million in the quarter and losses of CHF 139 million from fixed income businesses we are exiting in Investment Banking. We reduced Basel III risk-weighted assets in Investment Banking by USD 4 billion compared to 1Q12. |
| We recorded net new assets of CHF 4.4 billion, with net new assets of CHF 3.4 billion in Private Banking, mainly driven by inflows in our ultra-high-net-worth individual (UHNWI) client segment and emerging markets, and net asset inflows of CHF 0.4 billion in Asset Management. |
| Our Basel II.5 tier 1 ratio was 16.5% as of the end of 2Q12 compared to 15.6% as of the end of 1Q12. Our core tier 1 ratio improved to 12.5% from 11.8% as of the end of 1Q12. |
| Core Results | |||||||||||||||||
| in / end of | % change | in / end of | % change | ||||||||||||||
| 2Q12 | 1Q12 | 2Q11 | QoQ | YoY | 6M12 | 6M11 | YoY | ||||||||||
| Statements of operations (CHF million) | |||||||||||||||||
| Net interest income | 1,633 | 1,861 | 1,378 | (12) | 19 | 3,494 | 3,110 | 12 | |||||||||
| Commissions and fees | 3,137 | 3,179 | 3,469 | (1) | (10) | 6,316 | 7,148 | (12) | |||||||||
| Trading revenues | 1,147 | 180 | 1,127 | – | 2 | 1,327 | 3,131 | (58) | |||||||||
| Other revenues | 324 | 658 | 352 | (51) | (8) | 982 | 750 | 31 | |||||||||
| Net revenues | 6,241 | 5,878 | 6,326 | 6 | (1) | 12,119 | 14,139 | (14) | |||||||||
| Provision for credit losses | 25 | 34 | 13 | (26) | 92 | 59 | 6 | – | |||||||||
| Compensation and benefits | 3,000 | 3,707 | 3,093 | (19) | (3) | 6,707 | 7,118 | (6) | |||||||||
| General and administrative expenses | 1,664 | 1,646 | 1,643 | 1 | 1 | 3,310 | 3,277 | 1 | |||||||||
| Commission expenses | 441 | 451 | 491 | (2) | (10) | 892 | 1,027 | (13) | |||||||||
| Total other operating expenses | 2,105 | 2,097 | 2,134 | 0 | (1) | 4,202 | 4,304 | (2) | |||||||||
| Total operating expenses | 5,105 | 5,804 | 5,227 | (12) | (2) | 10,909 | 11,422 | (4) | |||||||||
| Income before taxes | 1,111 | 40 | 1,086 | – | 2 | 1,151 | 2,711 | (58) | |||||||||
| Income tax expense/(benefit) | 311 | (16) | 271 | – | 15 | 295 | 736 | (60) | |||||||||
| Net income | 800 | 56 | 815 | – | (2) | 856 | 1,975 | (57) | |||||||||
| Net income attributable to noncontrolling interests | 12 | 12 | 47 | 0 | (74) | 24 | 68 | (65) | |||||||||
| Net income attributable to shareholders | 788 | 44 | 768 | – | 3 | 832 | 1,907 | (56) | |||||||||
| Statement of operations metrics (%) | |||||||||||||||||
| Cost/income ratio | 81.8 | 98.7 | 82.6 | – | – | 90.0 | 80.8 | – | |||||||||
| Pre-tax income margin | 17.8 | 0.7 | 17.2 | – | – | 9.5 | 19.2 | – | |||||||||
| Effective tax rate | 28.0 | (40.0) | 25.0 | – | – | 25.6 | 27.1 | – | |||||||||
| Net income margin 1 | 12.6 | 0.7 | 12.1 | – | – | 6.9 | 13.5 | – | |||||||||
| Number of employees (full-time equivalents) | |||||||||||||||||
| Number of employees | 48,200 | 48,700 | 50,700 | (1) | (5) | 48,200 | 50,700 | (5) | |||||||||
| 1 Based on amounts attributable to shareholders. | |||||||||||||||||
| Core Results reporting by division | |||||||||||||||||
| in | % change | in | % change | ||||||||||||||
| 2Q12 | 1Q12 | 2Q11 | QoQ | YoY | 6M12 | 6M11 | YoY | ||||||||||
| Net revenues (CHF million) | |||||||||||||||||
| Wealth Management Clients | 2,217 | 2,127 | 2,267 | 4 | (2) | 4,344 | 4,627 | (6) | |||||||||
| Corporate & Institutional Clients | 487 | 477 | 487 | 2 | 0 | 964 | 965 | 0 | |||||||||
| Private Banking | 2,704 | 2,604 | 2,754 | 4 | (2) | 5,308 | 5,592 | (5) | |||||||||
| Investment Banking | 2,909 | 4,159 | 2,817 | (30) | 3 | 7,068 | 7,904 | (11) | |||||||||
| Asset Management | 550 | 681 | 654 | (19) | (16) | 1,231 | 1,274 | (3) | |||||||||
| Corporate Center | 78 | (1,566) | 101 | – | (23) | (1,488) | (631) | 136 | |||||||||
| Net revenues | 6,241 | 5,878 | 6,326 | 6 | (1) | 12,119 | 14,139 | (14) | |||||||||
| Provision for credit losses (CHF million) | |||||||||||||||||
| Wealth Management Clients | 28 | 21 | 8 | 33 | 250 | 49 | 20 | 145 | |||||||||
| Corporate & Institutional Clients | 11 | 19 | (10) | (42) | – | 30 | (10) | – | |||||||||
| Private Banking | 39 | 40 | (2) | (3) | – | 79 | 10 | – | |||||||||
| Investment Banking | (14) | (6) | 15 | 133 | – | (20) | (4) | 400 | |||||||||
| Provision for credit losses | 25 | 34 | 13 | (26) | 92 | 59 | 6 | – | |||||||||
| Total operating expenses (CHF million) | |||||||||||||||||
| Wealth Management Clients | 1,638 | 1,720 | 1,682 | (5) | (3) | 3,358 | 3,433 | (2) | |||||||||
| Corporate & Institutional Clients | 252 | 238 | 239 | 6 | 5 | 490 | 481 | 2 | |||||||||
| Private Banking | 1,890 | 1,958 | 1,921 | (3) | (2) | 3,848 | 3,914 | (2) | |||||||||
| Investment Banking | 2,540 | 3,167 | 2,594 | (20) | (2) | 5,707 | 6,217 | (8) | |||||||||
| Asset Management | 417 | 427 | 444 | (2) | (6) | 844 | 881 | (4) | |||||||||
| Corporate Center | 258 | 252 | 268 | 2 | (4) | 510 | 410 | 24 | |||||||||
| Total operating expenses | 5,105 | 5,804 | 5,227 | (12) | (2) | 10,909 | 11,422 | (4) | |||||||||
| Income/(loss) before taxes (CHF million) | |||||||||||||||||
| Wealth Management Clients | 551 | 386 | 577 | 43 | (5) | 937 | 1,174 | (20) | |||||||||
| Corporate & Institutional Clients | 224 | 220 | 258 | 2 | (13) | 444 | 494 | (10) | |||||||||
| Private Banking | 775 | 606 | 835 | 28 | (7) | 1,381 | 1,668 | (17) | |||||||||
| Investment Banking | 383 | 998 | 208 | (62) | 84 | 1,381 | 1,691 | (18) | |||||||||
| Asset Management | 133 | 254 | 210 | (48) | (37) | 387 | 393 | (2) | |||||||||
| Corporate Center | (180) | (1,818) | (167) | (90) | 8 | (1,998) | (1,041) | 92 | |||||||||
| Income before taxes | 1,111 | 40 | 1,086 | – | 2 | 1,151 | 2,711 | (58) | |||||||||
| Core Results reporting by region | |||||||||||||||||
| in | % change | in | % change | ||||||||||||||
| 2Q12 | 1Q12 | 2Q11 | QoQ | YoY | 6M12 | 6M11 | YoY | ||||||||||
| Net revenues (CHF million) | |||||||||||||||||
| Switzerland | 1,933 | 1,928 | 1,983 | 0 | (3) | 3,861 | 4,030 | (4) | |||||||||
| EMEA | 1,705 | 2,031 | 1,696 | (16) | 1 | 3,736 | 3,772 | (1) | |||||||||
| Americas | 2,000 | 2,618 | 1,892 | (24) | 6 | 4,618 | 5,398 | (14) | |||||||||
| Asia Pacific | 525 | 867 | 654 | (39) | (20) | 1,392 | 1,570 | (11) | |||||||||
| Corporate Center | 78 | (1,566) | 101 | – | (23) | (1,488) | (631) | 136 | |||||||||
| Net revenues | 6,241 | 5,878 | 6,326 | 6 | (1) | 12,119 | 14,139 | (14) | |||||||||
| Income/(loss) before taxes (CHF million) | |||||||||||||||||
| Switzerland | 738 | 667 | 726 | 11 | 2 | 1,405 | 1,439 | (2) | |||||||||
| EMEA | 227 | 391 | 97 | (42) | 134 | 618 | 445 | 39 | |||||||||
| Americas | 419 | 619 | 390 | (32) | 7 | 1,038 | 1,640 | (37) | |||||||||
| Asia Pacific | (93) | 181 | 40 | – | – | 88 | 228 | (61) | |||||||||
| Corporate Center | (180) | (1,818) | (167) | (90) | 8 | (1,998) | (1,041) | 92 | |||||||||
| Income before taxes | 1,111 | 40 | 1,086 | – | 2 | 1,151 | 2,711 | (58) | |||||||||
| A significant portion of our business requires inter-regional coordination in order to facilitate the needs of our clients. The methodology for allocating our results by region is dependent on management judgment. For Private Banking, results are allocated based on the management reporting structure of our relationship managers and the region where the transaction is recorded. For Investment Banking, trading results are allocated based on where the risk is primarily managed and fee-based results are allocated where the client is domiciled. For Asset Management, results are allocated based on the location of the investment advisors and sales teams. | |||||||||||||||||
| Impact from movements in credit spreads |
| Our Core Results revenues are impacted by changes in credit spreads on fair-valued Credit Suisse long-term vanilla debt and debit valuation adjustments (DVA) relating to certain structured notes liabilities carried at fair value. For segment reporting purposes through the end of 2011, the cumulative fair value gains of CHF 1.5 billion on Credit Suisse long-term vanilla debt as of the opening 1Q10 balance sheet was charged to the segments on a straight-line amortization basis, and the difference between this amortization and the fair valuation on this Credit Suisse debt from changes in credit spreads was included in the Corporate Center. |
| Beginning in 1Q12, we fully reflect the fair value impact from movements in credit spreads on our long-term vanilla debt and DVA on certain structured notes liabilities in the Corporate Center and discontinued the amortization in the segments of the past fair value gains on long-term vanilla debt. DVA on certain structured notes liabilities was previously recorded in the Investment Banking segment and is now recorded in the Corporate Center in order to aggregate all credit-spread impacts on our funding instruments and to reflect that these impacts are driven by the creditworthiness of the Group rather than our Investment Banking segment or the issuer. Prior periods have been reclassified to conform to the current presentation and such reclassifications had no impact on the Group’s net income/(loss) or total shareholders’ equity. |
| Our Core Results are also impacted by fair valuation gains/(losses) on stand-alone derivatives relating to certain of our funding liabilities. These fair valuation gains/(losses) on the stand-alone derivatives are recorded in the Corporate Center, reflect the volatility of cross-currency swaps and yield curve volatility and, over the life of the derivatives, will result in no net gains/(losses). |
| in | 2Q12 | 1Q12 | 2Q11 | 6M12 | 6M11 | |||||
| Net income/(loss) attributable to shareholders, excluding impact from movements in credit spreads (CHF million) | 770 | 1,154 | 693 | 1,924 | 2,369 | |||||
| Fair value gains/(losses) on own long-term vanilla debt | 109 | (894) | 54 | (785) | (255) | |||||
| Fair value gains/(losses) on debit valuation adjustments on structured notes | (18) | (482) | 63 | (500) | (23) | |||||
| Fair value gains/(losses) on stand-alone derivatives | (52) | (178) | (13) | (230) | (321) | |||||
| Tax expense/(benefit) | 21 | (444) | 29 | (423) | (137) | |||||
| Net income attributable to shareholders | 788 | 44 | 768 | 832 | 1,907 | |||||
| Regulatory capital excludes cumulative fair value gains/(losses) related to own long-term vanilla debt and structured notes, net of tax. Refer to “Treasury management” in II – Treasury, risk, balance sheet and off-balance sheet for further information. | ||||||||||
Results overview |
| Certain reclassifications have been made to prior periods to conform to the current presentation. |
| > Refer to “Changes in reporting” in Information and developments for further information. |
| InPrivate Banking, net revenues of CHF 2,704 million increased CHF 100 million from 1Q12, reflecting slightly higher net interest income and recurring commissions and fees, which included semi-annual performance fees. Transaction-based revenues were negatively impacted by ongoing low client activity, which was more than offset by gains from the integration of Clariden Leu, of which CHF 41 million related to the sale of a non-core business. Compared to 2Q11, which included gains of CHF 72 million from the sale of real estate, net revenues declined 2%. Recurring commissions and fees declined 6% compared to 2Q11 due to lower revenues across most revenue categories, particularly due to lower investment product management fees. Compared to 2Q11, transaction-based revenues were 4% lower, mainly driven by substantially lower brokerage and product issuing fees, reflecting significantly lower client activity and lower transaction volumes across most product lines. Net interest income increased 3%, mainly reflecting higher average deposit and loan volumes, notwithstanding lower deposit margins as a result of the ongoing low interest rate environment, while loan margins increased slightly. |
| InInvestment Banking, net revenues of CHF 2,909 million were up 3% from 2Q11. In 2Q12, consistent with the execution of our refined strategy, we further reduced Basel III risk-weighted assets by USD 4 billion to USD 206 billion. Fixed income sales and trading revenues were resilient and more balanced amid a difficult market environment, reflecting a substantially repositioned business with significantly reduced inventory levels. Relative to 2Q11, revenues increased 96%, led by a marked improvement in securitized products and higher results in corporate lending, global rates, emerging markets and global credit products. Revenues declined from a strong 1Q12, reflecting challenging trading conditions, particularly in global rates, and subdued client flow. Equity sales and trading revenues decreased in 2Q12 compared to 1Q12 and 2Q11, reflecting reduced client volumes across key businesses such as cash equities and derivatives. Prime services results remained strong as solid market share, particularly in Europe, more than offset lower industry activity and lower client balances due to reduced market values. Underwriting and advisory results were lower in the quarter relative to 1Q12 and 2Q11, driven by weak underwriting revenues as global issuance volumes remained subdued. |
| InAsset Management, net revenues of CHF 550 million were down 16% compared to 2Q11. In the quarter, we completed additional partial sales of our investment in Aberdeen Asset Management, recognizing a gain of CHF 66 million and improving our capital position. In 1Q12 we recognized a gain of CHF 178 million from an earlier sale. Excluding the gains from these sales in the first two quarters of 2012, income before taxes was CHF 67 million in 2Q12 and CHF 76 million in 1Q12, compared to CHF 210 million in 2Q11. Investment-related gains of CHF 27 million were significantly lower than the CHF 101 million in 1Q12 and CHF 156 million in 2Q11, mainly due to adverse market conditions. Compared to 2Q11, fee-based revenues of CHF 478 million were down 3%, with higher performance fees, offset by lower equity participations income resulting from the sale of Aberdeen and lower placement fees. Our fee-based margin was 53 basis points compared to 51 basis points in 2Q11. |
| > Refer to “Private Banking”, “Investment Banking” and “Asset Management” for further information. |
| Corporate Center includes parent company operations such as Group financing, expenses for projects sponsored by the Group and certain expenses and revenues that have not been allocated to the segments. In addition, the Corporate Center includes consolidation and elimination adjustments required to eliminate intercompany revenues and expenses. In 2Q12, losses before taxes were CHF 180 million, including fair value gains on our long-term vanilla debt of CHF 109 million, fair value losses on stand-alone derivatives of CHF 52 million and DVA losses on certain structured notes liabilities of CHF 18 million, resulting in overall net gains on such items of CHF 39 million in the quarter. The fair value gains on own vanilla debt reflected the widening of credit spreads on senior and subordinated debt across most currencies. 2Q12 results also included realignment costs of CHF 183 million consisting primarily of severance and other compensation expenses relating to the Group-wide cost efficiency initiatives. |
| > Refer to “Impact from movements in credit spreads” for further information. |
| Provision for credit losses were net provisions of CHF 25 million in 2Q12, with net provisions of CHF 39 million in Private Banking and releases of CHF 14 million in Investment Banking. |
| Total operating expensesof CHF 5,105 million were down 2% compared to 2Q11, primarily reflecting 3% lower compensation and benefits. The decrease in compensation and benefits was mainly due to lower discretionary performance-related compensation expense. The lower operating expenses also reflected our expense reduction initiative. General and administrative expenses were CHF 1,664 million, up 1% compared to 2Q11. Total operating expenses in 6M12, excluding the deferred compensation expense of CHF 534 million related to 2011 Partner Asset Facility (PAF2) awards in 1Q12 and CHF 251 million of business realignment costs in 6M12, were down CHF 1,298 million, or 11%, compared to 6M11. |
| Income tax expense of CHF 311 million in 2Q12 mainly reflected the geographical mix of the results, an increase in valuation allowances against deferred tax assets resulting from current quarter losses in the UK and Asia Pacific, partially offset by the impact of an advanced pricing agreement with tax authorities and a release of contingency reserves for uncertain tax positions. Deferred tax assets on net operating losses increased by CHF 153 million to CHF 3,541 million as of the end of 2Q12. Overall, net deferred tax assets increased by CHF 334 million to CHF 8,625 million during 2Q12. The Core Results effective tax rate was 28.0% in 2Q12, compared to (40.0)% in 1Q12. |
| > Refer to “Note 20 – Tax” in III – Condensed consolidated financial statements – unaudited for further information. |
| Assets under management were CHF 1,213.1 billion, up CHF 8.3 billion, or 0.7% compared to the end of 1Q12, mainly reflecting favorable foreign exchange-related movements and net new assets, partially offset by negative market performance. Private Banking recorded net new assets of CHF 3.4 billion in 2Q12, including CHF 8.9 billion from Wealth Management Clients with inflows in particular from its UHNWI client segment and emerging markets (excluding the impact of outflows of CHF 3.4 billion related to the integration of Clariden Leu). Asset management recorded net asset inflows of CHF 0.4 billion in 2Q12, with inflows in alternative investments, partly offset by outflows in traditional investments. |
| Overview of results | |||||||||||||||||||||||||||||||||||||||||||
| Private Banking | Investment Banking | Asset Management | Corporate Center | Core Results | 1 | Noncontrolling Interests without SEI | Credit Suisse | ||||||||||||||||||||||||||||||||||||
| in / end of period | 2Q12 | 1Q12 | 2Q11 | 2Q12 | 1Q12 | 2Q11 | 2Q12 | 1Q12 | 2Q11 | 2Q12 | 1Q12 | 2Q11 | 2Q12 | 1Q12 | 2Q11 | 2Q12 | 1Q12 | 2Q11 | 2Q12 | 1Q12 | 2Q11 | ||||||||||||||||||||||
| Statements of operations (CHF million) | |||||||||||||||||||||||||||||||||||||||||||
| Net revenues | 2,704 | 2,604 | 2,754 | 2,909 | 4,159 | 2,817 | 550 | 681 | 654 | 78 | (1,566) | 101 | 6,241 | 5,878 | 6,326 | 34 | 169 | 566 | 6,275 | 6,047 | 6,892 | ||||||||||||||||||||||
| Provision for credit losses | 39 | 40 | (2) | (14) | (6) | 15 | 0 | 0 | 0 | 0 | 0 | 0 | 25 | 34 | 13 | 0 | 0 | 0 | 25 | 34 | 13 | ||||||||||||||||||||||
| Compensation and benefits | 1,107 | 1,194 | 1,111 | 1,457 | 2,076 | 1,463 | 256 | 270 | 256 | 180 | 167 | 263 | 3,000 | 3,707 | 3,093 | 5 | 4 | 3 | 3,005 | 3,711 | 3,096 | ||||||||||||||||||||||
| General and administrative expenses | 635 | 619 | 660 | 839 | 839 | 829 | 121 | 121 | 149 | 69 | 67 | 5 | 1,664 | 1,646 | 1,643 | 9 | 7 | 9 | 1,673 | 1,653 | 1,652 | ||||||||||||||||||||||
| Commission expenses | 148 | 145 | 150 | 244 | 252 | 302 | 40 | 36 | 39 | 9 | 18 | 0 | 441 | 451 | 491 | 0 | 0 | 0 | 441 | 451 | 491 | ||||||||||||||||||||||
| Total other operating expenses | 783 | 764 | 810 | 1,083 | 1,091 | 1,131 | 161 | 157 | 188 | 78 | 85 | 5 | 2,105 | 2,097 | 2,134 | 9 | 7 | 9 | 2,114 | 2,104 | 2,143 | ||||||||||||||||||||||
| Total operating expenses | 1,890 | 1,958 | 1,921 | 2,540 | 3,167 | 2,594 | 417 | 427 | 444 | 258 | 252 | 268 | 5,105 | 5,804 | 5,227 | 14 | 11 | 12 | 5,119 | 5,815 | 5,239 | ||||||||||||||||||||||
| Income/(loss) before taxes | 775 | 606 | 835 | 383 | 998 | 208 | 133 | 254 | 210 | (180) | (1,818) | (167) | 1,111 | 40 | 1,086 | 20 | 158 | 554 | 1,131 | 198 | 1,640 | ||||||||||||||||||||||
| Income tax expense/(benefit) | – | – | – | – | – | – | – | – | – | – | – | – | 311 | (16) | 271 | 0 | 0 | 0 | 311 | (16) | 271 | ||||||||||||||||||||||
| Net income | – | – | – | – | – | – | – | – | – | – | – | – | 800 | 56 | 815 | 20 | 158 | 554 | 820 | 214 | 1,369 | ||||||||||||||||||||||
| Net income attributable to noncontrolling interests | – | – | – | – | – | – | – | – | – | – | – | – | 12 | 12 | 47 | 20 | 158 | 554 | 32 | 170 | 601 | ||||||||||||||||||||||
| Net income attributable to shareholders | – | – | – | – | – | – | – | – | – | – | – | – | 788 | 44 | 768 | – | – | – | 788 | 44 | 768 | ||||||||||||||||||||||
| Statement of operations metrics (%) | |||||||||||||||||||||||||||||||||||||||||||
| Cost/income ratio | 69.9 | 75.2 | 69.8 | 87.3 | 76.1 | 92.1 | 75.8 | 62.7 | 67.9 | – | – | – | 81.8 | 98.7 | 82.6 | – | – | – | 81.6 | 96.2 | 76.0 | ||||||||||||||||||||||
| Pre-tax income margin | 28.7 | 23.3 | 30.3 | 13.2 | 24.0 | 7.4 | 24.2 | 37.3 | 32.1 | – | – | – | 17.8 | 0.7 | 17.2 | – | – | – | 18.0 | 3.3 | 23.8 | ||||||||||||||||||||||
| Effective tax rate | – | – | – | – | – | – | – | – | – | – | – | – | 28.0 | (40.0) | 25.0 | – | – | – | 27.5 | (8.1) | 16.5 | ||||||||||||||||||||||
| Net income margin | – | – | – | – | – | – | – | – | – | – | – | – | 12.6 | 0.7 | 12.1 | – | – | – | 12.6 | 0.7 | 11.1 | ||||||||||||||||||||||
| Utilized economic capital and return | |||||||||||||||||||||||||||||||||||||||||||
| Average utilized economic capital (CHF million) | 7,560 | 7,374 | 7,025 | 19,522 | 19,670 | 19,620 | 3,073 | 3,145 | 3,218 | 1,912 | 2 | 1,932 | 2 | 715 | 2 | 32,056 | 32,109 | 30,559 | – | – | – | 32,056 | 32,109 | 30,559 | |||||||||||||||||||
| Pre-tax return on average utilized economic capital (%) 3 | 41.3 | 33.2 | 47.9 | 8.5 | 21.0 | 4.7 | 18.6 | 33.6 | 27.1 | – | – | – | 14.5 | 1.1 | 14.7 | – | – | – | 14.7 | 3.1 | 22.0 | ||||||||||||||||||||||
| Balance sheet statistics (CHF million) | |||||||||||||||||||||||||||||||||||||||||||
| Total assets | 366,609 | 351,064 | 332,474 | 796,613 | 762,648 | 747,901 | 23,647 | 22,549 | 21,976 | (148,006) | 4 | (140,839) | 4 | (131,720) | 4 | 1,038,863 | 995,422 | 970,631 | 4,592 | 4,598 | 6,292 | 1,043,455 | 1,000,020 | 976,923 | |||||||||||||||||||
| Net loans | 202,445 | 197,566 | 186,691 | 36,623 | 34,063 | 33,333 | – | – | – | 96 | 67 | 6 | 239,164 | 231,696 | 220,030 | – | – | – | 239,164 | 231,696 | 220,030 | ||||||||||||||||||||||
| Goodwill | 781 | 735 | 724 | 6,393 | 6,165 | 5,836 | 1,491 | 1,433 | 1,348 | – | – | – | 8,665 | 8,333 | 7,908 | – | – | – | 8,665 | 8,333 | 7,908 | ||||||||||||||||||||||
| Number of employees (full-time equivalents) | |||||||||||||||||||||||||||||||||||||||||||
| Number of employees | 23,800 | 23,700 | 24,900 | 20,600 | 21,200 | 21,900 | 2,900 | 2,900 | 3,000 | 900 | 900 | 900 | 48,200 | 48,700 | 50,700 | – | – | – | 48,200 | 48,700 | 50,700 | ||||||||||||||||||||||
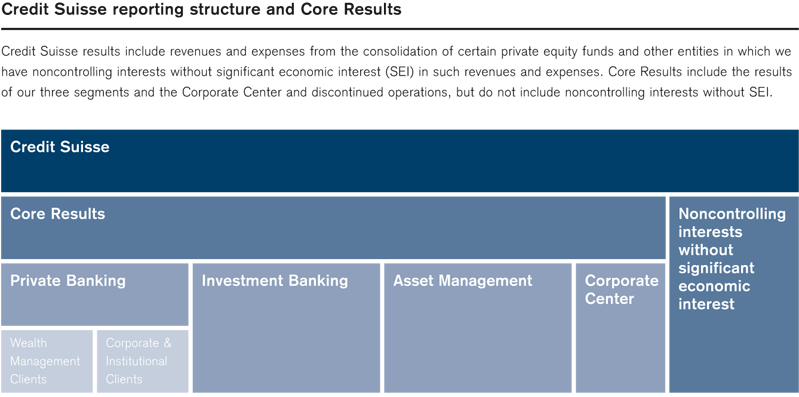
| 1 Core Results include the results of our integrated banking business, excluding revenues and expenses in respect of noncontrolling interests without SEI. 2 Includes diversification benefit. 3 Calculated using a return excluding interest costs for allocated goodwill. 4 Under the central treasury model, Group financing results in intra-Group balances between the segments. The elimination of these assets and liabilities occurs in the Corporate Center. | |||||||||||||||||||||||||||||||||||||||||||
| Key performance indicators |
| Our key performance indicators (KPIs) are targets to be achieved over a three to five year period across market cycles. As such, year-to-date results may be more meaningful than individual quarterly results. Our KPIs are assessed annually as part of our normal planning process. |
| in / end of | Target | 2Q12 | 6M12 | 2011 | 2010 | 2009 | |||||||
| Growth (%) | |||||||||||||
| Collaboration revenues | 18 - 20% of net revenues | 16.8 | 16.6 | 16.8 | 14.4 | 15.5 | |||||||
| Net new asset growth (annualized) | Above 6% | 1.5 | (0.2) | 3.9 | 5.3 | 3.9 | |||||||
| Efficiency and performance (%) | |||||||||||||
| Total shareholder return (Credit Suisse) 1 | Superior return vs. peer group | (30.3) | (18.8) | (39.4) | (23.3) | 80.1 | |||||||
| Total shareholder return of peer group 1, 2 | – | (16.6) | 9.2 | (35.0) | (1.7) | 36.6 | |||||||
| Return on equity attributable to shareholders (annualized) | Above 15% | 9.2 | 4.9 | 6.0 | 14.4 | 18.3 | |||||||
| Core Results pre-tax income margin | Above 28% | 17.8 | 9.5 | 10.8 | 22.2 | 25.5 | |||||||
| Capital (%) | |||||||||||||
| Tier 1 ratio (Basel II.5) | Compliance with Swiss "Too Big to Fail" and Basel III | 16.5 | 16.5 | 15.2 | 14.2 | – | |||||||
| 1 Source: Bloomberg. Total shareholder return is calculated as equal to the appreciation or depreciation of a particular share, plus any dividends, over a given period, expressed as a percentage of the share's value at the beginning of the period. 2 The peer group for this comparison comprises Bank of America, Barclays, BNP Paribas, Citigroup, Deutsche Bank, HSBC, JPMorgan Chase, Société Générale and UBS. The total shareholder return of this peer group is calculated as a simple, unweighted average of the return reported by Bloomberg for each of the members of the peer group. | |||||||||||||
Information and developments |
| In managing the business, revenues are evaluated in the aggregate, including an assessment of trading gains and losses and the related interest income and expense from financing and hedging positions. For this reason, individual revenue categories may not be indicative of performance. |
| The definitions of regulatory capital and capital ratios mentioned below and in II - Treasury refer to the Swiss “Too Big to Fail” legislation adopted in September 2011 as determined by the Swiss Financial Market Supervisory Authority (FINMA). Ratio calculations based on these capital definitions use projected Basel III year-end 2012 risk-weighted assets. The expected year-end 2012 ratios are based on a pro-forma calculation assuming successful completion of the announced capital actions, and using Bloomberg consensus estimates earnings and our Basel III risk-weighted assets estimates. |
| As the Basel Committee on Banking Supervision (BCBS) Basel III framework (Basel III) will not be implemented before January 1, 2013, we have calculated our Basel III risk-weighted assets and capital for purposes of this report in accordance with the currently proposed requirements and our current interpretation of such requirements, including relevant assumptions. Changes in the actual implementation of Basel III would result in different numbers from those shown in this report. |
Capital measures |
| On July 18, 2012, we announced a number of measures described below to accelerate the strengthening of our capital position in light of the current regulatory and market environment by adding an expected CHF 15.3 billion of capital by year-end 2012. An immediate set of actions will be implemented to add CHF 8.7 billion of capital by the end of July 2012. Additional capital actions and earnings-related impacts are expected to add CHF 6.6 billion of capital by year-end 2012. |
| The measures will result in an expected year-end 2012 Look-through Swiss Core Capital ratio of 9.4%, compared to the 2018 requirement of 10%. Look-through Swiss Core Capital includes Basel III common equity tier 1 (CET1) and existing tier 1 participation securities that qualify as part of the Swiss equity requirement in excess of the 8.5% Basel III Global Systemically Important Bank (G-SIB) CET1 ratio. |
| > Refer to “Capital ratio simulations” in II – Treasury, risk, balance sheet and off-balance sheet – Treasury management for further information. |
| Accelerated hybrids exchange |
| In July 2012, we reached an agreement with an investor for the immediate exchange of its existing tier 1 capital notes issued in 2008 (hybrids) into tier 1 buffer capital notes (BCNs), thereby accelerating an exchange initially scheduled for October 2013. The BCNs will qualify for Swiss Total Capital, adding CHF 1.7 billion of such capital. The conversion floor price of the high trigger BCNs delivered in the exchange (as well as the remaining BCNs scheduled to be delivered in 2013) has been adjusted to the conversion price of the mandatory and contingent convertible securities described below. |
| Mandatory and contingent convertible securities |
| In July 2012, we offered CHF 3.8 billion mandatory and contingent convertible securities (MACCS) that are mandatorily convertible into 233.5 million shares at a conversion price of CHF 16.29 per share on March 29, 2013 (subject to early conversion upon certain contingency and viability events). CHF 1.9 billion of MACCS will be purchased directly by strategic and institutional investors, and CHF 1.9 billion MACCS are being offered to shareholders of the Group by way of an offering of preferential subscription rights. Strategic and institutional investors have entered into definitive agreements to purchase any MACCS not taken up by shareholders, thereby ensuring placement of the entire CHF 3.8 billion of MACCS. Among the shares to be issued upon conversion are 33.5 million shares in respect of our 2Q12 purchase of the residual minority stake in Hedging-Griffo Investimentos S.A. (Hedging-Griffo). |
| As of the end of the offering period on July 27, 2012, shareholders and investors had exercised preferential subscription rights for CHF 1,833 million of MACCS, which represented 96.6% of the MAACS offered with such rights. |
| Tier 1 participation securities recognition |
| In 2008 and 2010, the Bank issued tier 1 participation securities to “Claudius”, a third-party special purpose entity which, in turn, issued perpetual, non-cumulative, secured notes to investors, of which USD 1.5 billion bear interest at 8.25% and the other USD 1.5 billion bear interest at 7.875%. FINMA ruled that under the Swiss “Too Big to Fail” regime, the existing USD 3 billion in tier 1 participation securities (with a haircut of 20%) will qualify as part of the Swiss equity requirement in excess of the 8.5% Basel III G-SIB CET1 ratio. Effectively, this contributes an additional CHF 2.3 billion of capital and 0.8% to the Swiss core capital ratio until the earlier of redemption or 2018 on a non-reducing basis. |
| Sale of residual stake in Aberdeen Asset Management |
| We completed the sale of our residual stake in Aberdeen Asset Management on July 2, 2012 for a capital benefit of CHF 0.2 billion. |
| Adjustable Performance Plan awards exchange: voluntary exchange offer to employees |
| We have launched a voluntary exchange offer, under which employees can elect to convert any future cash payments from deferred compensation awards under the Adjustable Performance Plan awards for shares at the same price as the conversion price under the MACCS. Such an exchange would be immediately accretive to Credit Suisse’s capital. Delivery of the shares will be consistent with the Adjustable Performance Plan awards deferred payment schedule, which provides for payments from 2013 to 2015. Adjustable Performance Plan awards is a cash-based deferred compensation plan awarded in respect of 2009 and 2010, where the award value is linked to the financial performance of the employees’ business areas and the Group’s return on equity. Assuming a 2012 year-end obligation of CHF 1.3 billion, the initial exchange offer benefit to capital is targeted to be approximately CHF 0.75 billion (assuming a 58% acceptance level). The actual amount of the capital benefit depends on the acceptance level of the exchange offer and the Group’s financial performance during the second half of 2012. |
| As of the date of this report, the election period for the exchange offer has not closed. |
| Strategic divestments |
| In line with the accelerated implementation of our strategy toward a more liquid alternatives business and given the residual uncertainty regarding the implementation of the “Volcker Rule”, we intend to sell certain illiquid private equity businesses within Asset Management, adding CHF 1.1 billion of capital. The targeted businesses have limited synergies with other businesses of the Group. At the same time, we intend to grow liquid alternative strategies as they are more capital efficient, consistent with regulatory developments and more synergistic with other businesses of the Group. |
| Real estate sales |
| We are also in advanced negotiations for outright sales covering two major real-estate sites and a number of smaller buildings. Additionally, we intend to enter into a sale-and-lease-back transaction agreement relating to an office building we currently own and occupy. These sales are expected to add CHF 0.5 billion of capital. |
| Earnings-related effects |
| In addition, positive earnings for the second half of 2012 are expected to have a positive impact on our capital position. Using, analysts’ consensus net income as published by Bloomberg, adjusted for our actual results in the first half of the year, additional expected business realignment costs, capital plan transaction fees, the capital effect of share-based compensation awards and deferred tax assets on net operating losses, together with the effect of the tender offer described below, we expect these earning-related effects to add CHF 1.95 billion of additional capital. |
| Lower capital deductions |
| As a result of the capital measures described above, regulatory capital deductions are expected to be reduced by CHF 3.0 billion, primarily from lower deferred tax assets and lower regulatory threshold deductions. |
Tender offer to repurchase certain outstanding public capital and senior funding instruments |
| In addition to the capital measures announced July 18, 2012, we announced a tender offer to repurchase certain outstanding public capital and senior funding instruments. The offer targets 11 capital instruments denominated in US dollars, euros and British pounds and five additional senior bonds denominated in US dollars. The offers allow the Group’s bond investors to sell holdings in capital and senior funding securities. This transaction follows a similar transaction completed in April 2012. |
Cost saving measures |
| In 2011, we began implementing a number of cost efficiency initiatives with the goal of achieving CHF 2.0 billion in total cost savings by the end of 2013. We are increasing our year-end 2013 cost savings target to a total of CHF 3.0 billion. The additional cost savings of CHF 1.0 billion include savings of CHF 0.45 billion in Private Banking and CHF 0.55 billion in Investment Banking with approximately 50% of these savings being generated from shared infrastructure and support services across the Group. Remaining realignment costs are expected to be approximately CHF 525 million, of which CHF 225 million are expected to be incurred in the second half of 2012. |
Capital target |
| As part of our capital measures announced on July 18, 2012, we communicated a capital ratio target of 10% based on our estimate of the Look-Through Swiss Core Capital Ratio. |
Changes in reporting |
| The legal merger of Clariden Leu into the Bank was completed on April 2, 2012. While the integration of Clariden Leu did not impact the consolidated Group’s financial condition, results of operations or cash flows, the integration did impact the financial statements of the Bank. While the majority of Clariden Leu’s activities were integrated into our Private Banking division, some activities are now managed as part of our Investment Banking and Asset Management divisions, thereby affecting results of all three divisions and assets under management for both Private Banking and Asset Management. |
| In 2Q12, we also implemented the previously announced integration of our Private Banking and Investment Banking operations into a single function within Shared Services. |
| In addition, our Swiss advisory business and its respective assets under management are now managed as part of our Private Banking division rather than Asset Management. |
| We performed a review of our policies regarding the measurement of assets under management and net new assets. As a result of this review we have adopted a more restrictive definition of these metrics, leading to a decrease in assets under management of CHF 45 billion for the Group. |
| As a result of these matters, prior period results of the Bank and its divisions and assets under management for the Group have been restated to conform to the current presentation in order to show meaningful trends. The restatement for the three divisions had limited impact on their revenues, expenses and pre-tax income. Assets under management from our Swiss advisory business were shifted from Asset Management to Corporate & Institutional Clients within Private Banking and assets from selected Clariden Leu products were shifted from Wealth Management Clients within Private Banking to Asset Management. |
| > Refer to “Capital ratio simulations” in II – Treasury, risk, balance sheet and off-balance sheet – Treasury management for further information. |
Progress on strategy implementation |
| We continued to adapt our client-focused, capital-efficient strategy to optimize our use of capital and improve our cost structure. |
| In Private Banking, we made further progress in implementing the initiatives announced to optimize Private Banking’s business portfolio and enhance profitability. We completed the merger with Clariden Leu on April 2, 2012. |
| In Investment Banking, we further reduced Basel III risk-weighted assets by USD 4 billion to USD 206 billion and lowered our expense base. |
| > Refer to “Strategy” in I – Information on the company in the Credit Suisse Annual Report 2011 for further information. |
Share Issuances |
| In April 2012, the Annual General Meeting approved a distribution against reserves instead of a dividend paid from net income for the year 2011 in the form of shares (scrip dividend) or cash. In May, shareholders made their election and, as a result, 24.2 million new Group shares were issued out of authorized capital, representing approximately 2% of our share capital upon issuance. |
| In 2Q12, we issued 37.9 million new Group shares in connection with the settlement of vested share-based compensation awards, representing approximately 3.0% of our share capital upon issuance. |
Compensation and benefits |
| Compensation and benefits for a given year reflect the strength and breadth of the business results and staffing levels and include fixed components, such as salaries, benefits and the amortization of share-based and other deferred compensation from prior-year awards, and a discretionary variable component. The variable component reflects the performance-based variable compensation for the current year. The portion of the performance-based compensation for the current year deferred through share-based and other awards is expensed in future periods and is subject to vesting and other conditions. |
| > Refer to “Compensation and benefits” in II – Operating and financial review – Core Results in the Credit Suisse Annual Report 2011 for further information. |
Board of Directors and Management changes |
| At our Annual General Meeting in April 2012, shareholders approved the election of two new members to the Board of Directors, Iris Bohnet, Academic Dean and Professor of Public Policy at the Harvard Kennedy School, and Jean-Daniel Gerber, former Director of the Swiss State Secretariat for Economic Affairs (SECO) in the Federal Department of Economic Affairs, and the re-election of Walter B. Kielholz, Andreas N. Koopmann, Urs Rohner, Richard E. Thornburgh and John Tiner. Peter F. Weibel stepped down from the Board of Directors. |
| Effective April 30, 2012, Karl Landert stepped down from the Executive Board and his position as Chief Information Officer. David Mathers, Chief Financial Officer and a member of the Executive Board, assumed responsibility for the IT organization in addition to his current role. |
| Effective May 31, 2012, Antonio Quintella was appointed as Chairman of Hedging-Griffo and stepped down from the Executive Board and his position as Chief Executive Officer Americas. Rob Shafir assumed the role as Chief Executive Officer Americas in addition to his current role as Chief Executive Officer Asset Management. |
Regulatory developments and proposals |
| Government leaders and regulators continued to focus on reform of the financial services industry, including capital, leverage and liquidity requirements, changes in compensation practices and systemic risk. |
| On June 1, 2012, the Swiss Federal Council adopted implementing ordinances under the “Too Big to Fail” legislation and with regard to the implementation of Basel III into Swiss law. Effective immediately is a supplemental countercyclical buffer of up to 2.5% of risk-weighted assets which can be activated during periods of excess credit growth and subsequently deactivated by the Federal Council upon request of the Swiss National Bank after consultation with FINMA. Also effective immediately are increased lending standards for residential mortgage lending. The remaining ordinance requirements are expected to become effective January 1, 2013, with some being phased in through the end of 2018. Requirements particular to systemically relevant banks, including specific capital, leverage and Recovery and Resolution Plan requirements, will require approval by Parliament, which is expected to vote in September 2012. A final, liquidity-related implementing ordinance is expected to be completed in 2013. |
| On June 15, 2012, the Swiss Parliament approved the bilateral tax agreements between Switzerland and Germany, the UK and Austria. The agreements each remain subject to parliamentary approval by the other contracting country to become effective. |
| On June 29, 2012, the Commodities Futures Trading Commission (CFTC) issued proposed guidance on the cross-border application of its derivatives reforms under the US Dodd-Frank Wall Street Reform and Consumer Protection Act (Dodd-Frank) and a proposed exemption delaying the effectiveness of certain CFTC rules promulgated under Dodd-Frank for up to a year. The proposed guidance includes a broad definition of a “US person” and, if adopted, would expand the range of activity by Credit Suisse’s non-US subsidiaries that will be subject to the CFTC rules, particularly with respect to certain counterparties that are collective investment vehicles with US investors. The proposed guidance also includes an interpretation of when a non-US entity may be required to register with the CFTC as a swap dealer or major swap participant, and a policy statement regarding how such an entity would be required to comply with the CFTC rules, including some limits on the scope of transactions subject to the CFTC rules. The final guidance and exemption are expected to become effective later in the year. In addition, on July 9 and 10, 2012, the US Securities and Exchange Commission (SEC) and the CFTC approved final rules defining key terms under Dodd-Frank. Those final rules are expected to become effective later in the year, and their effectiveness will trigger the application of several other CFTC rules, including the requirement that Credit Suisse entities engaged in US swap dealing activity register with the CFTC. We are currently evaluating how the proposed guidance, proposed exemption and final rules may affect our existing plans for implementation of Dodd-Frank. |
| > Refer to “Regulation and supervision” in I – Information on the company in the Credit Suisse Annual Report 2011 for further information. |
Allocations and funding |
| Responsibility for each product is allocated to a segment, which records all related revenues and expenses. Revenue-sharing and service level agreements, which aim to reflect the pricing structure of unrelated third-party transactions, govern the compensation received by one segment for generating revenue or providing services on behalf of another. Corporate services and business support are provided by the Shared Services area and these costs are allocated to the segments and Corporate Center based on their requirements and other relevant measures. |
| We centrally manage our funding activities, with new securities for funding and capital purposes issued primarily by the Bank which lends funds to our operating subsidiaries and affiliates. Capital is distributed to the segments considering factors such as regulatory capital requirements, utilized economic capital and the historic and future potential return on capital. Transfer pricing, using market rates, is used to record net revenues and expenses relating to this funding in each of the segments, and our businesses are also credited to the extent they provide long-term stable funding. |
| > Refer to “Allocations and funding” in II – Operating and financial review – Core Results in the Credit Suisse Annual Report 2011 for further information. |
Fair valuations |
| Fair value can be a relevant measurement for financial instruments when it aligns the accounting for these instruments with how we manage our business. The levels of the fair value hierarchy as defined by the relevant accounting guidance are not a measurement of economic risk, but rather an indication of the observability of prices or valuation inputs. |
| > Refer to “Note 1 – Summary of significant accounting policies” and “Note 26 – Financial instruments” in III – Condensed consolidated financial statements – unaudited for further information. |
| Models were used to value financial instruments for which no prices are available and which have little or no observable inputs (level 3). Models are developed internally and are reviewed by functions independent of the front office to ensure they are appropriate for current market conditions. The models require subjective assessment and varying degrees of judgment depending on liquidity, concentration, pricing assumptions and risks affecting the specific instrument. The models consider observable and unobservable parameters in calculating the value of these products, including certain indices relating to these products. Consideration of these indices is more significant in periods of lower market activity. |
| As of the end of 2Q12, 51% and 40% of our total assets and total liabilities, respectively, were measured at fair value. |
| While the majority of our level 3 assets are recorded in Investment Banking, some are recorded in Asset Management, specifically certain private equity investments. Total assets at fair value recorded as level 3 increased by CHF 1.9 billion during 2Q12, primarily reflecting increases in loans held-for-sale, trading assets and loans. The increase in loans held-for-sale primarily reflected net purchases and the favorable foreign exchange translation impact. The increase in trading assets primarily reflected the favorable foreign exchange translation impact and the increase in loans was primarily due to net issuances. |
| Our level 3 assets, excluding assets attributable to noncontrolling interests and assets of consolidated variable interest entities (VIEs) that are not risk-weighted assets under the Basel framework, were CHF 35.4 billion, compared to CHF 34.0 billion as of the end of 1Q12. As of the end of 2Q12, these assets comprised 4% of total assets and 7% of total assets measured at fair value, both adjusted on the same basis, unchanged from 1Q12. |
| We believe that the range of any valuation uncertainty, in the aggregate, would not be material to our financial condition, however, it may be material to our operating results for any particular period, depending, in part, upon the operating results for such period. |
Personnel |
| Headcount at the end of 2Q12 was 48,200, down 500 from 1Q12 and down 2,500 from 2Q11. The decrease in 2Q12 reflected reductions in headcount in connection with our cost efficiency initiatives, primarily in Investment Banking. |
| Number of employees by division | |||||||||||
| end of | % change | ||||||||||
| 2Q12 | 1Q12 | 2Q11 | QoQ | YoY | |||||||
| Number of employees by division (full-time equivalents) | |||||||||||
| Private Banking | 23,800 | 23,700 | 24,900 | 0 | (4) | ||||||
| Investment Banking | 20,600 | 21,200 | 21,900 | (3) | (6) | ||||||
| Asset Management | 2,900 | 2,900 | 3,000 | 0 | (3) | ||||||
| Corporate Center | 900 | 900 | 900 | 0 | 0 | ||||||
| Number of employees | 48,200 | 1 | 48,700 | 50,700 | (1) | (5) | |||||
| Reflects the integration of Clariden Leu and the integration of Private Banking and Investment Banking operations. Prior periods have been restated to reflect the current presentation. | |||||||||||
| 1 Excludes 1,300 employees in connection with the cost efficiency initiatives. | |||||||||||
Private Banking |
| In 2Q12, we reported income before taxes of CHF 775 million and net revenues of CHF 2,704 million. |
| Net revenues increased CHF 100 million from 1Q12, reflecting slightly higher net interest income and recurring commissions and fees, which included semi-annual performance fees. Transaction-based revenues were negatively impacted by ongoing low client activity, which was more than offset by gains from the integration of Clariden Leu, of which CHF 41 million related to the sale of a non-core business. Compared to 2Q11, which included gains of CHF 72 million from the sale of real estate, net revenues declined 2%. |
| Total operating expenses were slightly lower compared to 1Q12 and 2Q11. Compensation and benefits decreased 7%, or CHF 87 million compared to 1Q12, which included PAF2 awards which were granted and expensed in 1Q12. |
| Provision for credit losses were CHF 39 million on a net loan portfolio of CHF 202 billion. |
| Headcount was 1,100 lower compared to 2Q11, in line with our efficiency measures. |
| In 2Q12, we attracted net new assets of CHF 8.9 billion in Wealth Management Clients excluding outflows of CHF 3.4 billion related to the integration of Clariden Leu. Inflows were mainly driven by our UHNWI client segment and emerging markets. |
| Results | |||||||||||||||||
| in / end of | % change | in / end of | % change | ||||||||||||||
| 2Q12 | 1Q12 | 2Q11 | QoQ | YoY | 6M12 | 6M11 | YoY | ||||||||||
| Statements of operations (CHF million) | |||||||||||||||||
| Net revenues | 2,704 | 2,604 | 2,754 | 4 | (2) | 5,308 | 5,592 | (5) | |||||||||
| Provision for credit losses | 39 | 40 | (2) | (3) | – | 79 | 10 | – | |||||||||
| Compensation and benefits | 1,107 | 1,194 | 1,111 | (7) | 0 | 2,301 | 2,310 | 0 | |||||||||
| General and administrative expenses | 635 | 619 | 660 | 3 | (4) | 1,254 | 1,278 | (2) | |||||||||
| Commission expenses | 148 | 145 | 150 | 2 | (1) | 293 | 326 | (10) | |||||||||
| Total other operating expenses | 783 | 764 | 810 | 2 | (3) | 1,547 | 1,604 | (4) | |||||||||
| Total operating expenses | 1,890 | 1,958 | 1,921 | (3) | (2) | 3,848 | 3,914 | (2) | |||||||||
| Income before taxes | 775 | 606 | 835 | 28 | (7) | 1,381 | 1,668 | (17) | |||||||||
| of which Wealth Management Clients | 551 | 386 | 577 | 43 | (5) | 937 | 1,174 | (20) | |||||||||
| of which Corporate & Institutional Clients | 224 | 220 | 258 | 2 | (13) | 444 | 494 | (10) | |||||||||
| Statement of operations metrics (%) | |||||||||||||||||
| Cost/income ratio | 69.9 | 75.2 | 69.8 | – | – | 72.5 | 70.0 | – | |||||||||
| Pre-tax income margin | 28.7 | 23.3 | 30.3 | – | – | 26.0 | 29.8 | – | |||||||||
| Utilized economic capital and return | |||||||||||||||||
| Average utilized economic capital (CHF million) | 7,560 | 7,374 | 7,025 | 3 | 8 | 7,546 | 6,888 | 10 | |||||||||
| Pre-tax return on average utilized economic capital (%) 1 | 41.3 | 33.2 | 47.9 | – | – | 36.9 | 48.8 | – | |||||||||
| Number of employees (full-time equivalents) | |||||||||||||||||
| Number of employees | 23,800 | 23,700 | 24,900 | 0 | (4) | 23,800 | 24,900 | (4) | |||||||||
| 1 Calculated using a return excluding interest costs for allocated goodwill. | |||||||||||||||||
| Results (continued) | |||||||||||||||||
| in / end of | % change | in / end of | % change | ||||||||||||||
| 2Q12 | 1Q12 | 2Q11 | QoQ | YoY | 6M12 | 6M11 | YoY | ||||||||||
| Net revenue detail (CHF million) | |||||||||||||||||
| Net interest income | 1,165 | 1,126 | 1,128 | 3 | 3 | 2,291 | 2,274 | 1 | |||||||||
| Recurring commissions and fees | 924 | 893 | 986 | 3 | (6) | 1,817 | 1,973 | (8) | |||||||||
| Transaction-based | 615 | 585 | 640 | 5 | (4) | 1,200 | 1,345 | (11) | |||||||||
| Net revenues | 2,704 | 2,604 | 2,754 | 4 | (2) | 5,308 | 5,592 | (5) | |||||||||
| Provision for credit losses (CHF million) | |||||||||||||||||
| New provisions | 68 | 81 | 54 | (16) | 26 | 149 | 95 | 57 | |||||||||
| Releases of provisions | (29) | (41) | (56) | (29) | (48) | (70) | (85) | (18) | |||||||||
| Provision for credit losses | 39 | 40 | (2) | (3) | – | 79 | 10 | – | |||||||||
| Balance sheet statistics (CHF million) | |||||||||||||||||
| Net loans | 202,445 | 197,566 | 186,691 | 2 | 8 | 202,445 | 186,691 | 8 | |||||||||
| of which Wealth Management Clients 1 | 143,559 | 140,321 | 134,160 | 2 | 7 | 143,559 | 134,160 | 7 | |||||||||
| of which Corporate & Institutional Clients | 58,886 | 57,245 | 52,531 | 3 | 12 | 58,886 | 52,531 | 12 | |||||||||
| Deposits | 272,561 | 262,689 | 249,984 | 4 | 9 | 272,561 | 249,984 | 9 | |||||||||
| of which Wealth Management Clients 1 | 212,566 | 203,857 | 193,729 | 4 | 10 | 212,566 | 193,729 | 10 | |||||||||
| of which Corporate & Institutional Clients | 59,995 | 58,832 | 56,255 | 2 | 7 | 59,995 | 56,255 | 7 | |||||||||
| Number of relationship managers | |||||||||||||||||
| Switzerland | 1,630 | 1,560 | 1,780 | 4 | (8) | 1,630 | 1,780 | (8) | |||||||||
| EMEA | 1,340 | 1,380 | 1,390 | (3) | (4) | 1,340 | 1,390 | (4) | |||||||||
| Americas | 600 | 600 | 620 | 0 | (3) | 600 | 620 | (3) | |||||||||
| Asia Pacific | 390 | 390 | 420 | 0 | (7) | 390 | 420 | (7) | |||||||||
| Wealth Management Clients | 3,960 | 3,930 | 4,210 | 1 | (6) | 3,960 | 4,210 | (6) | |||||||||
| Corporate & Institutional Clients (Switzerland) | 550 | 540 | 500 | 2 | 10 | 550 | 500 | 10 | |||||||||
| Number of relationship managers | 4,510 | 4,470 | 4,710 | 1 | (4) | 4,510 | 4,710 | (4) | |||||||||
| 1 Wealth Management Clients covers individual clients, including affluent, high-net-worth and ultra-high-net-worth individual clients. | |||||||||||||||||
Results detail |
| The following provides a comparison of our 2Q12 results versus 2Q11 (YoY) and versus 1Q12 (QoQ) and reflects the changes in reporting as discussed in “Core Results – Information and developments – Changes in reporting”. |
Net revenues |
| Recurring revenues arise from net interest income, recurring commissions and fees, including performance-based fees, related to assets under management and custody assets, as well as fees for general banking products and services. Net interest income includes a term spread credit on stable deposit funding and a term spread charge on loans. Transaction-based revenues arise primarily from brokerage and product issuing fees, foreign exchange income from client transactions and other transaction-based income. |
| YoY: Down 2% from CHF 2,754 million to CHF 2,704 million |
| The decrease in net revenues was driven by lower recurring commissions and fees and lower transaction-based revenues. Recurring commissions and fees declined 6% due to lower revenues across most revenue categories, particularly due to lower investment product management fees. Transaction-based revenues were 4% lower, mainly driven by substantially lower brokerage and product issuing fees, reflecting significantly lower client activity and lower transaction volumes across most product lines. 2Q12 included gains from the integration of Clariden Leu, of which CHF 41 million related to the sale of a non-core business. 2Q11 included gains of CHF 72 million from the sale of real estate. Net interest income increased 3%, mainly reflecting higher average deposit and loan volumes, notwithstanding lower deposit margins as a result of the ongoing low interest rate environment, while loan margins increased slightly. |
| QoQ: Up 4% from CHF 2,604 million to CHF 2,704 million |
| The increase in net revenues was driven by higher net interest income, recurring commissions and fees and transaction-based revenues. Net interest income increased 3%, reflecting slightly higher average loan volumes with slightly higher margins. Recurring commissions and fees were 3% higher, primarily due to semi-annual performance fees. Transaction-based revenues increased 5%, reflecting gains from the integration of Clariden Leu, partially offset by substantially lower brokerage and product issuing fees. |
Provision for credit losses |
| The Wealth Management Clients loan portfolio is substantially comprised of residential mortgages in Switzerland and loans collateralized by securities. Our corporate and institutional loan portfolio has relatively low concentrations and is mainly secured by mortgages, securities and other financial collateral. |
| YoY: Up from CHF (2) million to CHF 39 million |
| Wealth Management Clients recorded net provisions of CHF 28 million and Corporate & Institutional Clients recorded net provisions of CHF 11 million. Provision for credit losses reflected higher new provisions, resulting from isolated cases in both Wealth Management Clients and Corporate & Institutional Clients. |
| QoQ: Down 3% from CHF 40 million to CHF 39 million |
| Provision for credit losses were slightly lower. In 1Q12, Wealth Management Clients recorded net provisions of CHF 21 million and Corporate & Institutional Clients recorded net provisions of CHF 19 million. |
Operating expenses |
| Compensation and benefits |
| YoY: Stable at CHF 1,107 million compared to CHF 1,111 million |
| Compensation and benefits were stable as measures from our cost efficiency initiatives were offset by increased IT personnel investments. Discretionary performance-related compensation accruals decreased, reflecting lower business performance. |
| QoQ: Down 7% from CHF 1,194 million to CHF 1,107 million |
| The decrease primarily reflected deferred compensation expense of CHF 67 million from the PAF2 awards, which were granted and expensed in 1Q12. |
| General and administrative expenses |
| YoY: Down 4% from CHF 66 0 million to CHF 635 million |
| The decrease reflected lower costs across most categories, including travel and entertainment as well as advertising and marketing expenses. |
| QoQ: Up 3% from CHF 619 million to CHF 635 million |
| General and administrative expenses increased slightly due to a seasonal increase in advertising and marketing expenses as well as higher travel and entertainment expenses, partially offset by lower costs in connection with our cost initiatives. |
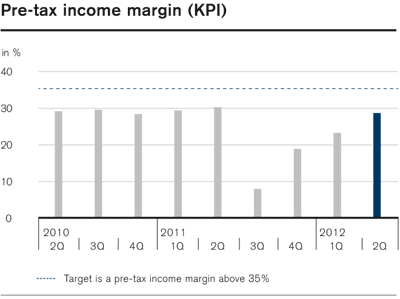
Assets under management |
| Assets under management continued to reflect a risk-averse asset mix, with investments in less complex, lower-margin products, also within managed investment products, and a significant portion of assets in cash and money market products. |
| Assets under management of CHF 987.9 billion were CHF 4.4 billion higher compared to the end of 1Q12, as a favorable foreign exchange impact and net new assets were partially offset by negative market movements. Wealth Management Clients contributed net new assets of CHF 8.9 billion, particularly from our UHNWI client segment and emerging markets excluding outflows of CHF 3.4 billion related to the integration of Clariden Leu. Corporate & Institutional Clients in Switzerland reported outflows of CHF 2.1 billion, driven by a small number of large Swiss institutional clients reducing their asset share by rebalancing their investment strategy. Average assets under management of Wealth Management Clients increased 1.2% compared to 1Q12. |
| Assets under management were CHF 44.9 billion higher compared to the end of 2Q11, driven by a favorable foreign exchange impact and net new assets, partially offset by negative market movements. Average assets under management in Wealth Management Clients increased 1.0% compared to 2Q11. |
| Assets under management - Private Banking | |||||||||||||||||
| in / end of | % change | in / end of | % change | ||||||||||||||
| 2Q12 | 1Q12 | 2Q11 | QoQ | YoY | 6M12 | 6M11 | YoY | ||||||||||
| Assets under management by region (CHF billion) | |||||||||||||||||
| Switzerland | 251.3 | 252.9 | 261.8 | (0.6) | (4.0) | 251.3 | 261.8 | (4.0) | |||||||||
| EMEA | 271.3 | 273.2 | 263.8 | (0.7) | 2.8 | 271.3 | 263.8 | 2.8 | |||||||||
| Americas | 153.9 | 153.1 | 135.0 | 0.5 | 14.0 | 153.9 | 135.0 | 14.0 | |||||||||
| Asia Pacific | 97.6 | 93.0 | 82.9 | 4.9 | 17.7 | 97.6 | 82.9 | 17.7 | |||||||||
| Wealth Management Clients | 774.1 | 772.2 | 743.5 | 0.2 | 4.1 | 774.1 | 743.5 | 4.1 | |||||||||
| Corporate & Institutional Clients (Switzerland) | 213.8 | 211.3 | 199.5 | 1.2 | 7.2 | 213.8 | 199.5 | 7.2 | |||||||||
| Assets under management | 987.9 | 983.5 | 943.0 | 0.4 | 4.8 | 987.9 | 943.0 | 4.8 | |||||||||
| Average assets under management (CHF billion) | |||||||||||||||||
| Average assets under management | 983.9 | 970.3 | 964.7 | 1.4 | 2.0 | 977.1 | 969.5 | 0.8 | |||||||||
| Assets under management by currency (CHF billion) | |||||||||||||||||
| USD | 308.2 | 293.3 | 269.7 | 5.1 | 14.3 | 308.2 | 269.7 | 14.3 | |||||||||
| EUR | 187.9 | 196.7 | 205.0 | (4.5) | (8.3) | 187.9 | 205.0 | (8.3) | |||||||||
| CHF | 350.0 | 354.3 | 340.4 | (1.2) | 2.8 | 350.0 | 340.4 | 2.8 | |||||||||
| Other | 141.8 | 139.2 | 127.9 | 1.9 | 10.9 | 141.8 | 127.9 | 10.9 | |||||||||
| Assets under management | 987.9 | 983.5 | 943.0 | 0.4 | 4.8 | 987.9 | 943.0 | 4.8 | |||||||||
| Net new assets by region (CHF billion) | |||||||||||||||||
| Switzerland | 0.7 | 1.3 | 3.1 | (46.2) | (77.4) | 2.0 | 7.1 | (71.8) | |||||||||
| EMEA | 0.3 | (2.4) | 3.3 | – | (90.9) | (2.1) | 6.3 | – | |||||||||
| Americas | 2.5 | 3.8 | 2.5 | (34.2) | 0.0 | 6.3 | 5.7 | 10.5 | |||||||||
| Asia Pacific | 2.0 | 2.8 | 2.7 | (28.6) | (25.9) | 4.8 | 6.7 | (28.4) | |||||||||
| Wealth Management Clients | 5.5 | 5.5 | 11.6 | 0.0 | (52.6) | 11.0 | 25.8 | (57.4) | |||||||||
| Corporate & Institutional Clients (Switzerland) | (2.1) | 2.4 | 0.3 | – | – | 0.3 | 2.1 | (85.7) | |||||||||
| Net new assets | 3.4 | 7.9 | 11.9 | (57.0) | (71.4) | 11.3 | 27.9 | (59.5) | |||||||||
| Growth in assets under management (CHF billion) | |||||||||||||||||
| Net new assets | 5.5 | 5.5 | 11.6 | – | – | 11.0 | 25.8 | – | |||||||||
| Other effects | (3.6) | 16.5 | (47.3) | – | – | 12.9 | (45.4) | – | |||||||||
| of which market movements | (18.3) | 31.9 | (3.4) | – | – | 13.6 | 0.1 | – | |||||||||
| of which currency | 14.8 | (15.1) | (38.9) | – | – | (0.3) | (38.8) | – | |||||||||
| of which other | (0.1) | (0.3) | (5.0) | – | – | (0.4) | (6.7) | – | |||||||||
| Wealth Management Clients | 1.9 | 22.0 | (35.7) | – | – | 23.9 | (19.6) | – | |||||||||
| Corporate & Institutional Clients | 2.5 | 8.3 | (1.9) | – | – | 10.8 | 3.6 | – | |||||||||
| Growth in assets under management | 4.4 | 30.3 | (37.6) | – | – | 34.7 | (16.0) | – | |||||||||
| Growth in assets under management (annualized) (%) | |||||||||||||||||
| Net new assets | 1.4 | 3.3 | 4.9 | – | – | 2.4 | 5.8 | – | |||||||||
| of which Wealth Management Clients | 2.8 | 2.9 | 6.0 | – | – | 2.9 | 6.8 | – | |||||||||
| of which Corporate & Institutional Clients | (4.0) | 4.7 | 0.6 | – | – | 0.3 | 2.1 | – | |||||||||
| Other effects | 0.4 | 9.4 | (20.2) | – | – | 4.9 | (9.2) | – | |||||||||
| Growth in assets under management | 1.8 | 12.7 | (15.3) | – | – | 7.3 | (3.4) | – | |||||||||
| Growth in assets under management (rolling four-quarter average) (%) | |||||||||||||||||
| Net new assets | 2.8 | 3.5 | 4.9 | – | – | – | – | – | |||||||||
| of which Wealth Management Clients | 3.0 | 3.7 | 5.7 | – | – | – | – | – | |||||||||
| of which Corporate & Institutional Clients | 1.8 | 2.9 | 1.6 | – | – | – | – | – | |||||||||
| Other effects | 2.0 | (3.2) | (5.9) | – | – | – | – | – | |||||||||
| Growth in assets under management (rolling four-quarter average) | 4.8 | 0.3 | (1.0) | – | – | – | – | – | |||||||||
Progress on strategy implementation |
| We made further progress in implementing the initiatives announced in November 2011 to optimize Private Banking’s business portfolio and enhance profitability. |
| We completed the merger with Clariden Leu on April 2, 2012. The integration of Clariden Leu, including its banking platform and systems infrastructure, is well on track and is expected to be completed by the end of 2012. |
| We advanced our international growth strategy with the June 2012 closing of our acquisition of HSBC’s private banking business in Japan, where we are now the second largest foreign wealth manager. |
Wealth Management Clients |
Net revenues |
| Net interest income |
| YoY: Up 3% from CHF 831 million to CHF 86 0 million |
| Higher net interest income reflected higher average loan and deposit volumes notwithstanding slightly lower deposit margins. Higher average deposit volumes reflected a higher average US dollar exchange rate against the Swiss franc and a continued risk-averse client asset mix. |
| QoQ: Up 4% from CHF 828 million to CHF 86 0 million |
| Higher net interest income reflected stable deposit and loan margins on slightly higher average deposit and loan volumes. |
| Recurring commissions and fees |
| YoY: Down 7% from CHF 871 million to CHF 809 million |
| Recurring commissions and fees decreased primarily due to lower investment product management fees, partly reflecting a conservative client asset mix. |
| QoQ: Up 4% from CHF 778 million to CHF 809 million |
| The increase in recurring commissions and fees was driven by semi-annual performance fees and higher investment account and services fees, partly offset by lower banking services fees. |
| Transaction-based |
| YoY: Down 3% from CHF 565 million to CHF 548 million |
| The decline was mainly driven by substantially lower brokerage and product issuing fees, reflecting significantly lower client activity and lower transaction volumes across most product lines. 2Q12 included gains from the integration of Clariden Leu, of which CHF 41 million related to the sale of a non-core business. 2Q11 included gains of CHF 72 million from the sale of real estate. |
| QoQ: Up 5% from CHF 521 million to CHF 548 million |
| The increase was mainly due to gains from the integration of Clariden Leu, partially offset by substantially lower brokerage and product issuing fees, reflecting continued low client activity and lower transaction volumes in equities, bonds and mutual funds. |
Gross margin |
| Our gross margin was 115 basis points in 2Q12, four basis points lower compared to 2Q11. Compared to 1Q12, the gross margin increased four basis points. Excluding the sale of the non-core business, the gross margin was 113 basis points. |
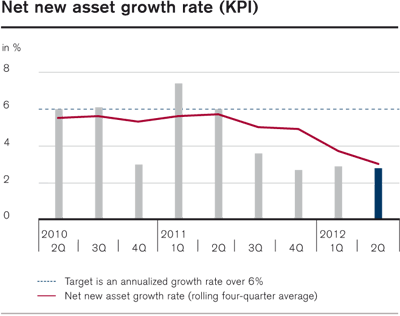
| Results - Wealth Management Clients | |||||||||||||||||
| in / end of | % change | in / end of | % change | ||||||||||||||
| 2Q12 | 1Q12 | 2Q11 | QoQ | YoY | 6M12 | 6M11 | YoY | ||||||||||
| Statements of operations (CHF million) | |||||||||||||||||
| Net revenues | 2,217 | 2,127 | 2,267 | 4 | (2) | 4,344 | 4,627 | (6) | |||||||||
| Provision for credit losses | 28 | 21 | 8 | 33 | 250 | 49 | 20 | 145 | |||||||||
| Total operating expenses | 1,638 | 1,720 | 1,682 | (5) | (3) | 3,358 | 3,433 | (2) | |||||||||
| Income/(loss) before taxes | 551 | 386 | 577 | 43 | (5) | 937 | 1,174 | (20) | |||||||||
| Statement of operations metrics (%) | |||||||||||||||||
| Cost/income ratio | 73.9 | 80.9 | 74.2 | – | – | 77.3 | 74.2 | – | |||||||||
| Pre-tax income margin | 24.9 | 18.1 | 25.5 | – | – | 21.6 | 25.4 | – | |||||||||
| Net revenue detail (CHF million) | |||||||||||||||||
| Net interest income | 860 | 828 | 831 | 4 | 3 | 1,688 | 1,680 | 0 | |||||||||
| Recurring commissions and fees | 809 | 778 | 871 | 4 | (7) | 1,587 | 1,747 | (9) | |||||||||
| Transaction-based | 548 | 521 | 565 | 5 | (3) | 1,069 | 1,200 | (11) | |||||||||
| Net revenues | 2,217 | 2,127 | 2,267 | 4 | (2) | 4,344 | 4,627 | (6) | |||||||||
| Average assets under management (CHF billion) | |||||||||||||||||
| Average assets under management | 772.0 | 763.2 | 764.0 | 1.2 | 1.0 | 767.6 | 769.5 | (0.2) | |||||||||
| Gross margin (annualized) (bp) 1 | |||||||||||||||||
| Net interest income | 45 | 43 | 44 | – | – | 44 | 44 | – | |||||||||
| Recurring commissions and fees | 42 | 41 | 46 | – | – | 41 | 45 | – | |||||||||
| Transaction-based | 28 | 27 | 29 | – | – | 28 | 31 | – | |||||||||
| Gross margin | 115 | 111 | 119 | – | – | 113 | 120 | – | |||||||||
| 1 Net revenues divided by average assets under management. | |||||||||||||||||
Corporate & Institutional Clients |
Net revenues |
| Net interest income |
| YoY: Up 3% from CHF 297 million to CHF 305 million |
| The increase reflected higher loan margins on higher average volumes and lower deposit margins on higher average volumes. |
| QoQ: Up 2% from CHF 298 million to CHF 305 million |
| The increase reflected higher loan margins on slightly higher average volumes and lower deposit margins on stable average volumes. |
| Recurring commissions and fees |
| YoY: Stable at CHF 115 million |
| Recurring commissions and fees remained stable. |
| QoQ: Stable at CHF 115 million |
| Recurring commissions and fees remained stable. |
| Transaction-based |
| YoY: Down 11% from CHF 75 million to CHF 67 million |
| The decrease was mainly driven by lower brokerage and product issuing fees as well as revenues from integrated solutions. |
| QoQ: Up 5% from CHF 64 million to CHF 67 million |
| The increase was mainly driven by lower fair value losses on the Clock Finance transaction of CHF 4 million compared to fair value losses of CHF 16 million in 1Q12, partially offset by lower revenues from integrated solutions and lower brokerage and product issuing fees. |
| Results - Corporate & Institutional Clients | |||||||||||||||||
| in / end of | % change | in / end of | % change | ||||||||||||||
| 2Q12 | 1Q12 | 2Q11 | QoQ | YoY | 6M12 | 6M11 | YoY | ||||||||||
| Statements of operations (CHF million) | |||||||||||||||||
| Net revenues | 487 | 477 | 487 | 2 | 0 | 964 | 965 | 0 | |||||||||
| Provision for credit losses | 11 | 19 | (10) | (42) | – | 30 | (10) | – | |||||||||
| Total operating expenses | 252 | 238 | 239 | 6 | 5 | 490 | 481 | 2 | |||||||||
| Income before taxes | 224 | 220 | 258 | 2 | (13) | 444 | 494 | (10) | |||||||||
| Statement of operations metrics (%) | |||||||||||||||||
| Cost/income ratio | 51.7 | 49.9 | 49.1 | – | – | 50.8 | 49.8 | – | |||||||||
| Pre-tax income margin | 46.0 | 46.1 | 53.0 | – | – | 46.1 | 51.2 | – | |||||||||
| Net revenue detail (CHF million) | |||||||||||||||||
| Net interest income | 305 | 298 | 297 | 2 | 3 | 603 | 594 | 2 | |||||||||
| Recurring commissions and fees | 115 | 115 | 115 | 0 | 0 | 230 | 226 | 2 | |||||||||
| Transaction-based | 67 | 64 | 75 | 5 | (11) | 131 | 145 | (10) | |||||||||
| Net revenues | 487 | 477 | 487 | 2 | 0 | 964 | 965 | 0 | |||||||||
Investment Banking |
| We reported income before taxes of CHF 383 million and net revenues of CHF 2,909 million. |
| In 2Q12, consistent with the execution of our refined strategy, we further reduced Basel III risk-weighted assets by USD 4 billion to USD 206 billion. |
| Fixed income sales and trading revenues were resilient and more balanced amid a difficult market environment, reflecting a substantially repositioned business with significantly reduced inventory levels. Relative to 2Q11, revenues increased 96%, led by a marked improvement in securitized products and higher results in corporate lending, global rates, emerging markets and global credit products. Revenues declined from a strong 1Q12, reflecting challenging trading conditions, particularly in global rates, and subdued client flow. |
| Equity sales and trading revenues decreased compared to 1Q12 and 2Q11, reflecting reduced client volumes across key businesses such as cash equities and derivatives. Prime services results remained strong as solid market share, particularly in Europe, more than offset lower industry activity and lower client balances due to reduced market values. |
| Underwriting and advisory results were also lower in the quarter relative to 1Q12 and 2Q11, driven by weak underwriting revenues as global issuance volumes remained subdued. |
| Compensation and benefits declined from 1Q12, reflecting lower deferred compensation expense, as 1Q12 included CHF 418 million of expense related to the PAF2 awards, and lower discretionary performance-related compensation expense. Total operating expenses in 6M12, excluding the deferred compensation expense of CHF 418 million related to PAF2 in 1Q12, were down CHF 928 million, or 15%, compared 6M11. |
| Results in 2Q12 were impacted by the strengthening of the average rate of the US dollar against the Swiss franc compared to 2Q11, which favorably impacted revenues and adversely affected expenses. In Swiss francs, net revenues increased 3% and total operating expenses declined 2%. In US dollars, net revenues were down 6% and total operating expenses declined 11% from 2Q11. |
| Results | |||||||||||||||||
| in / end of | % change | in / end of | % change | ||||||||||||||
| 2Q12 | 1Q12 | 2Q11 | QoQ | YoY | 6M12 | 6M11 | YoY | ||||||||||
| Statements of operations (CHF million) | |||||||||||||||||
| Net revenues | 2,909 | 4,159 | 2,817 | (30) | 3 | 7,068 | 7,904 | (11) | |||||||||
| Provision for credit losses | (14) | (6) | 15 | 133 | – | (20) | (4) | 400 | |||||||||
| Compensation and benefits | 1,457 | 2,076 | 1,463 | (30) | 0 | 3,533 | 3,888 | (9) | |||||||||
| General and administrative expenses | 839 | 839 | 829 | 0 | 1 | 1,678 | 1,715 | (2) | |||||||||
| Commission expenses | 244 | 252 | 302 | (3) | (19) | 496 | 614 | (19) | |||||||||
| Total other operating expenses | 1,083 | 1,091 | 1,131 | (1) | (4) | 2,174 | 2,329 | (7) | |||||||||
| Total operating expenses | 2,540 | 3,167 | 2,594 | (20) | (2) | 5,707 | 6,217 | (8) | |||||||||
| Income before taxes | 383 | 998 | 208 | (62) | 84 | 1,381 | 1,691 | (18) | |||||||||
| Statement of operations metrics (%) | |||||||||||||||||
| Cost/income ratio | 87.3 | 76.1 | 92.1 | – | – | 80.7 | 78.7 | – | |||||||||
| Pre-tax income margin | 13.2 | 24.0 | 7.4 | – | – | 19.5 | 21.4 | – | |||||||||
| Utilized economic capital and return | |||||||||||||||||
| Average utilized economic capital (CHF million) | 19,522 | 19,670 | 19,620 | (1) | 0 | 19,785 | 19,279 | 3 | |||||||||
| Pre-tax return on average utilized economic capital (%) 1 | 8.5 | 21.0 | 4.7 | – | – | 14.6 | 18.1 | – | |||||||||
| Number of employees (full-time equivalents) | |||||||||||||||||
| Number of employees | 20,600 | 21,200 | 21,900 | (3) | (6) | 20,600 | 21,900 | (6) | |||||||||
| 1 Calculated using a return excluding interest costs for allocated goodwill. | |||||||||||||||||
| Results (continued) | |||||||||||||||||
| in / end of | % change | in / end of | % change | ||||||||||||||
| 2Q12 | 1Q12 | 2Q11 | QoQ | YoY | 6M12 | 6M11 | YoY | ||||||||||
| Net revenue detail (CHF million) | |||||||||||||||||
| Debt underwriting | 312 | 428 | 399 | (27) | (22) | 740 | 900 | (18) | |||||||||
| Equity underwriting | 97 | 120 | 294 | (19) | (67) | 217 | 495 | (56) | |||||||||
| Total underwriting | 409 | 548 | 693 | (25) | (41) | 957 | 1,395 | (31) | |||||||||
| Advisory and other fees | 235 | 213 | 272 | 10 | (14) | 448 | 500 | (10) | |||||||||
| Total underwriting and advisory | 644 | 761 | 965 | (15) | (33) | 1,405 | 1,895 | (26) | |||||||||
| Fixed income sales and trading | 1,190 | 2,033 | 607 | (41) | 96 | 3,223 | 3,175 | 2 | |||||||||
| Equity sales and trading | 1,150 | 1,411 | 1,251 | (18) | (8) | 2,561 | 2,863 | (11) | |||||||||
| Total sales and trading | 2,340 | 3,444 | 1,858 | (32) | 26 | 5,784 | 6,038 | (4) | |||||||||
| Other | (75) | (46) | (6) | 63 | – | (121) | (29) | 317 | |||||||||
| Net revenues | 2,909 | 4,159 | 2,817 | (30) | 3 | 7,068 | 7,904 | (11) | |||||||||
| Average one-day, 98% risk management Value-at-Risk (CHF million) 1 | |||||||||||||||||
| Interest rate & credit spread | 56 | 72 | 66 | (22) | (15) | 64 | 73 | (12) | |||||||||
| Foreign exchange | 18 | 18 | 13 | 0 | 38 | 18 | 13 | 38 | |||||||||
| Commodity | 3 | 4 | 12 | (25) | (75) | 3 | 15 | (80) | |||||||||
| Equity | 20 | 22 | 28 | (9) | (29) | 21 | 25 | (16) | |||||||||
| Diversification benefit | (37) | (48) | (48) | (23) | (23) | (42) | (52) | (19) | |||||||||
| Average one-day, 98% risk management Value-at-Risk | 60 | 68 | 71 | (12) | (15) | 64 | 74 | (14) | |||||||||
| Basel III risk-weighted assets (billion) 2, 3 | |||||||||||||||||
| Risk-weighted assets (CHF) | 195 | 190 | 278 | 3 | (30) | 195 | 278 | (30) | |||||||||
| Risk-weighted assets (USD) | 206 | 210 | 331 | (2) | (38) | 206 | 331 | (38) | |||||||||
| 1 In June 2011, we made significant changes to our VaR methodology. Risk management VaR for periods prior to implementation has been restated in order to show meaningful trends. 2 Refer to "BIS statistics (Basel II.5)" in II – Treasury, risk, balance sheet and off-balance sheet – Treasury management for information on the currently applicable Basel II.5 framework. 3 As Basel III will not be implemented before January 1, 2013, we have calculated our Basel III risk-weighted assets and capital for purposes of this report in accordance with the currently proposed requirements and our current interpretation of such requirements, including relevant assumptions. Changes in the actual implementation of Basel III would result in different numbers from those shown in this report. | |||||||||||||||||
Results detail |
| The following provides a comparison of our 2Q12 results versus 2Q11 (YoY) and versus 1Q12 (QoQ) and reflects the changes in reporting as discussed in “Core Results – Information and developments – Changes in reporting”. |
Net revenues |
| Debt underwriting |
| YoY: Down 22% from CHF 399 million to CHF 312 million |
| The decrease was driven by lower results in investment grade as global issuance volumes remained subdued and lower revenues from structured lending in emerging markets. We also had lower results in leveraged finance, reflecting significantly reduced industry-wide high yield issuance volumes and lower market share. |
| QoQ: Down 27% from CHF 428 million to CHF 312 million |
| The decrease was primarily due to lower results in leveraged finance, reflecting significantly lower industry-wide high yield issuance activity and lower market share. We also had lower results in investment grade as industry-wide global issuance volumes declined. |
| Equity underwriting |
| YoY: Down 67% from CHF 294 million to CHF 97 million |
| The decrease was driven by lower revenues from follow-on offerings and IPOs, reflecting significantly lower levels of industry-wide equity issuance volumes and lower market share. |
| QoQ: Down 19% from CHF 120 million to CHF 97 million |
| The decrease was primarily due to lower revenues from follow-on offerings, reflecting reduced global industry-wide issuance activity and lower market share. |
| Advisory and other fees |
| YoY: Down 14% from CHF 272 million to CHF 235 million |
| The decrease reflected lower M&A and other advisory fees, as a decline in global industry-wide completed M&A activity was only partly offset by an increase in completed M&A market share. |
| QoQ: Up 10% from CHF 213 million to CHF 235 million |
| The increase was due to higher M&A advisory fees, reflecting an improvement in our completed M&A market share and also higher levels of global industry-wide M&A activity relative to 1Q12. |
| Fixed income sales and trading |
| YoY: Up 96% from CHF 607 million to CHF 1,190 million |
| The increase was primarily driven by a substantial improvement in securitized products and higher revenues in corporate lending, global rates, emerging markets and global credit products. These results were achieved following a substantial repositioning of our fixed income franchise, resulting in a more balanced business portfolio with increased revenue diversification and reduced inventory levels. In 2Q11, securitized products were impacted by a steep decline in mortgage bond prices, which led to significant valuation reductions on client flow inventory, losses from sales of inventory as we reduced risk and unfavorable market movements on related hedges. Our global rates and credit results also incurred losses on inventory positions in 2Q11 due to increased volatility and reduced liquidity in the markets. In 2Q12, we incurred losses of CHF 139 million from businesses we are exiting, compared to CHF 126 million in 2Q11. Fixed income Basel III risk-weighted assets totaled USD 139 billion, a reduction of 48% from a year ago, while revenues increased 96%. |
| QoQ: Down 41% from CHF 2,033 million to CHF 1,190 million |
| The decrease was primarily driven by lower results in global rates, reflecting unfavorable trading conditions as macroeconomic concerns persisted and subdued client flows. We also had lower revenues in global credit products and securitized products following a strong 1Q12, driven by more challenging market conditions and subdued client activity resulting from the ongoing economic crisis in Europe. In addition, we had lower results in emerging markets and foreign exchange. In the quarter, we incurred losses of CHF 139 million from businesses we are exiting, compared to losses of CHF 261 million in 1Q12. Fixed income Basel III risk-weighted assets were reduced by 5% from 1Q12. |
| Equity sales and trading |
| YoY: Down 8% from CHF 1,251 million to CHF 1,150 million |
| The decrease was driven by lower revenues in cash equities, reflecting reduced client trading volumes amid continued market uncertainty. We also had lower revenues in fund-linked products. Prime services revenues increased and remained resilient, reflecting continued strong market share. |
| QoQ: Down 18% from CHF 1,411 million to CHF 1,150 million |
| The decrease was primarily driven by weaker results in derivatives, reflecting sustained macroeconomic concerns and our conservative risk positioning, as well as subdued client activity in Asia, offset by stronger client activity in the US. In addition, we had lower revenues in cash equities despite an increase in market share as client trading volumes moderately declined. We also had lower revenues in our fund-linked products, convertibles and global arbitrage trading businesses. These results were partly offset by higher prime services revenues as solid market share, particularly in Europe, more than offset lower industry activity and lower client balances due to reduced market values. |
Provision for credit losses |
| YoY: From CHF 15 million to CHF (14) million |
| The change reflected lower provisions and higher recoveries. |
| QoQ: From CHF (6) million to CHF (14) million |
| The change reflected higher recoveries. |
Operating expenses |
| Compensation and benefits |
| YoY: Stable at CHF 1,457 million |
| Compensation and benefits were stable, reflecting the foreign exchange translation impact. In US dollars, compensation and benefits declined 9% as lower deferred compensation expense from prior year awards was partially offset by higher discretionary performance-related compensation expense, reflecting the higher results. |
| QoQ: Down 30% from CHF 2,076 million to CHF 1,457 million |
| The decrease was primarily driven by lower deferred compensation expense, as 1Q12 included CHF 418 million of expenses related to PAF2 awards, and lower discretionary performance-related compensation expense, reflecting the lower results. |
| General and administrative expenses |
| YoY: Stable at CHF 839 million |
| Expenses were stable, reflecting the foreign exchange translation impact. In US dollars, expenses decreased 8%, driven mainly by lower infrastructure processing costs and legal fees. These were partly offset by a CHF 36 million accrual for the UK bank levy, which was enacted in 3Q11. |
| QoQ: Stable at CHF 839 million |
| Expenses were stable, reflecting the foreign exchange translation impact. In US dollars, expenses decreased 4%, driven by a decrease in litigation expense provisions. |
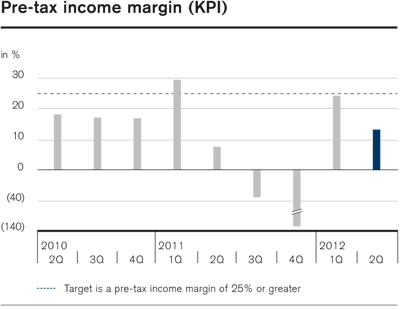
Market share momentum |
| – Credit Suisse retained its #1 rankings in US Equity Trading, US Electronic Trading and US Program Trading for the third consecutive year, according to the latestGreenwich Associatessurvey. |
| – In a recent fixed income trading survey for North America byGreenwich Associates, we increased or maintained market share in several key businesses and significantly improved our market share in investment grade trading. |
Progress on strategy implementation |
| To date, we have made significant progress in executing our refined strategy announced in November 2011. In 2Q12, we further reduced Basel III risk-weighted assets by USD 4 billion to USD 206 billion, bringing the cumulative reduction in Basel III risk-weighted assets to USD 125 billion since 2Q11. This was primarily achieved within our fixed income businesses, including a reduction in trades and positions in our wind-down portfolio and securitized products, and through other mitigation measures. Our Investment Banking Basel III risk-weighted assets target for year-end 2012 is at or below current levels and reflects current foreign exchange rates and estimates for Basel III treatment. |
| In addition, we have increased our operating efficiency through a lower expense base, which we expect will contribute to higher returns on capital. This was driven by a reduction in headcount and a reduction in non-compensation expense, including lower IT and infrastructure processing costs. We now expect to achieve additional cost savings of CHF 0.55 billion by year-end 2013. |
Asset Management |
| In 2Q12, we reported income before taxes of CHF 133 million and net revenues of CHF 550 million. |
| In the quarter, we completed additional partial sales of our investment in Aberdeen Asset Management, recognizing a gain of CHF 66 million and improving our capital position. In 1Q12 we recognized a gain of CHF 178 million from an earlier sale. Excluding the gains from these sales in the first two quarters of 2012, income before taxes was CHF 67 million in 2Q12 and CHF 76 million in 1Q12, compared to CHF 210 million in 2Q11. |
| Investment-related gains of CHF 27 million were significantly lower than the CHF 101 million in 1Q12 and CHF 156 million in 2Q11 mainly due to adverse market conditions. Compared to 2Q11, fee-based revenues of CHF 478 million were down 3%, with higher performance fees, offset by lower equity participations income resulting from the sale of Aberdeen and lower placement fees. Our fee-based margin was 53 basis points compared to 51 basis points in 2Q11. |
| Operating expenses of CHF 417 million were down 2% compared to 1Q12, which included deferred compensation expenses from the PAF2 awards, which were granted and expensed in 1Q12, and were down 6% compared to 2Q11. Total operating expenses in 6M12, excluding the deferred compensation expense of CHF 46 million related to PAF2 awards in 1Q12, were down CHF 83 million, or 9%, compared to 6M11. |
| In 2Q12, assets under management remained stable. We had net asset inflows of CHF 0.4 billion in 2Q12 with inflows in alternative investments offset by outflows in traditional investments. |
| In July 2012, we sold our remaining holding of 7.0% in Aberdeen, resulting in a gain of approximately CHF 140 million to be recognized in 3Q12. |
| Results | |||||||||||||||||
| in / end of | % change | in / end of | % change | ||||||||||||||
| 2Q12 | 1Q12 | 2Q11 | QoQ | YoY | 6M12 | 6M11 | YoY | ||||||||||
| Statements of operations (CHF million) | |||||||||||||||||
| Net revenues | 550 | 681 | 654 | (19) | (16) | 1,231 | 1,274 | (3) | |||||||||
| Provision for credit losses | 0 | 0 | 0 | – | – | 0 | 0 | – | |||||||||
| Compensation and benefits | 256 | 270 | 256 | (5) | 0 | 526 | 524 | 0 | |||||||||
| General and administrative expenses | 121 | 121 | 149 | 0 | (19) | 242 | 278 | (13) | |||||||||
| Commission expenses | 40 | 36 | 39 | 11 | 3 | 76 | 79 | (4) | |||||||||
| Total other operating expenses | 161 | 157 | 188 | 3 | (14) | 318 | 357 | (11) | |||||||||
| Total operating expenses | 417 | 427 | 444 | (2) | (6) | 844 | 881 | (4) | |||||||||
| Income before taxes | 133 | 254 | 210 | (48) | (37) | 387 | 393 | (2) | |||||||||
| Statement of operations metrics (%) | |||||||||||||||||
| Cost/income ratio | 75.8 | 62.7 | 67.9 | – | – | 68.6 | 69.2 | – | |||||||||
| Pre-tax income margin | 24.2 | 37.3 | 32.1 | – | – | 31.4 | 30.8 | – | |||||||||
| Utilized economic capital and return | |||||||||||||||||
| Average utilized economic capital (CHF million) | 3,073 | 3,145 | 3,218 | (2) | (5) | 3,124 | 3,261 | (4) | |||||||||
| Pre-tax return on average utilized economic capital (%) 1 | 18.6 | 33.6 | 27.1 | – | – | 26.1 | 25.1 | – | |||||||||
| Number of employees (full-time equivalents) | |||||||||||||||||
| Number of employees | 2,900 | 2,900 | 3,000 | 0 | (3) | 2,900 | 3,000 | (3) | |||||||||
| 1 Calculated using a return excluding interest costs for allocated goodwill. | |||||||||||||||||
| Results (continued) | |||||||||||||||||
| in | % change | in | % change | ||||||||||||||
| 2Q12 | 1Q12 | 2Q11 | QoQ | YoY | 6M12 | 6M11 | YoY | ||||||||||
| Net revenue detail by type (CHF million) | |||||||||||||||||
| Asset management fees | 326 | 329 | 332 | (1) | (2) | 655 | 681 | (4) | |||||||||
| Placement, transaction and other fees | 51 | 44 | 64 | 16 | (20) | 95 | 122 | (22) | |||||||||
| Performance fees and carried interest | 74 | 34 | 60 | 118 | 23 | 108 | 94 | 15 | |||||||||
| Equity participations income | 27 | 20 | 36 | 35 | (25) | 47 | 68 | (31) | |||||||||
| Fee-based revenues | 478 | 427 | 492 | 12 | (3) | 905 | 965 | (6) | |||||||||
| Investment-related gains/(losses) | 27 | 101 | 156 | (73) | (83) | 128 | 316 | (59) | |||||||||
| Equity participations and other gains/(losses) | 69 | 170 | 0 | (59) | – | 239 | (4) | – | |||||||||
| Other revenues 1 | (24) | (17) | 6 | 41 | – | (41) | (3) | – | |||||||||
| Net revenues | 550 | 681 | 654 | (19) | (16) | 1,231 | 1,274 | (3) | |||||||||
| Net revenue detail by investment strategies (CHF million) | |||||||||||||||||
| Alternative investments | 328 | 264 | 309 | 24 | 6 | 592 | 585 | 1 | |||||||||
| Traditional investments | 123 | 124 | 153 | (1) | (20) | 247 | 307 | (20) | |||||||||
| Diversified investments 2 | 82 | 201 | 39 | (59) | 110 | 283 | 79 | 258 | |||||||||
| Other | (10) | (9) | (3) | 11 | 233 | (19) | (13) | 46 | |||||||||
| Net revenues before investment-related gains/(losses) | 523 | 580 | 498 | (10) | 5 | 1,103 | 958 | 15 | |||||||||
| Investment-related gains/(losses) | 27 | 101 | 156 | (73) | (83) | 128 | 316 | (59) | |||||||||
| Net revenues | 550 | 681 | 654 | (19) | (16) | 1,231 | 1,274 | (3) | |||||||||
| Fee-based margin on assets under management (annualized) (bp) | |||||||||||||||||
| Fee-based margin 3 | 53 | 47 | 51 | – | – | 50 | 50 | – | |||||||||
| 1 Includes allocated funding costs. 2 Includes revenues relating to management of the 2008 Partner Asset Facility and income from our investment in Aberdeen. 3 Fee-based revenues divided by average assets under management. | |||||||||||||||||
Results detail |
| The following provides a comparison of our 2Q12 results versus 2Q11 (YoY) and versus 1Q12 (QoQ) and reflects the changes in reporting as discussed in “Core Results – Information and developments – Changes in reporting”. |
Net revenues |
| Asset management fees |
| YoY: Down 2% from CHF 332 million to CHF 326 million |
| Lower fees in traditional investments were partially offset by higher fees in alternative investments. Lower fees in traditional investments primarily reflected the decrease in average assets under management and outflows of assets from mandates transferred into Asset Management in connection with the integration of Clariden Leu. Higher fees in alternative investments reflected the final closing of a secondary fund in 1Q12 and higher average assets under management in index solutions, partially offset by the closure and restructuring of certain product lines in 2011. Average assets under management decreased 6.3%. |
| QoQ: Stable at CHF 326 million |
| Both alternative investments and traditional investments management fees were stable. |
| Placement, transaction and other fees |
| YoY: Down 20% from CHF 64 million to CHF 51 million |
| The decrease primarily reflected lower private equity placement fees. |
| QoQ: Up 16% from CHF 44 million to CHF 51 million |
| The increase primarily reflected higher private equity placement fees, partially offset by lower transaction fees. |
| Performance fees and carried interest |
| YoY: Up 23% from CHF 60 million to CHF 74 million |
| The increase reflected higher performance fees from Hedging-Griffo and credit strategies, partially offset by lower carried interest from realized private equity gains. |
| QoQ: Up 118% from CHF 34 million to CHF 74 million |
| The increase was mainly due to semi-annual performance fees from Hedging-Griffo, partially offset by lower carried interest from realized private equity gains and lower performance fees in diversified investments relating to the management of the 2008 Partner Asset Facility (PAF). |
| Equity participations income |
| YoY: Down 25% from CHF 36 million to CHF 27 million |
| The decrease was primarily due to lower revenues in diversified investments due to our partial sale of Aberdeen, partially offset by higher equity income from private equity participations. As a result of the partial sale of our investment in Aberdeen in February, we discontinued accounting for this investment under the equity method of accounting and in 1Q12 classified our remaining holdings as available-for-sale securities. This change contributed to lower equity participations income in diversified investments in 2Q12. |
| QoQ: Up 35% from CHF 20 million to CHF 27 million |
| The increase was mainly due to higher equity participations income in emerging markets, private equity and single-manager hedge funds in alternative investments. The increase was partly offset by lower equity participations income in diversified investments resulting from the change in the accounting treatment in 1Q12 for our investment in Aberdeen. |
| Investment-related gains/(losses) |
| YoY: Down 83% from CHF 156 million to CHF 27 million |
| In 2Q12, the gains of CHF 27 million reflected gains in private equity investments mainly in the commodities and financial sectors, offset in part by losses in the energy sector. In 2Q11, the gains of CHF 156 million reflected gains in private equity investments, mainly in the healthcare, energy, retail and commodity sectors, partially offset by losses in the technology sector. |
| QoQ: Down 73% from CHF 101 million to CHF 27 million |
| In 2Q12, the gains of CHF 27 million reflected gains in private equity investments mainly in the commodities and financial sectors, offset in part by losses in the energy sector. In 1Q12, the gains of CHF 101 million reflected gains in hedge fund investments and in the energy and healthcare sectors. |
| Equity participations and other gains/(losses) |
| YoY: Up from zero to CHF 69 million |
| The gain in 2Q12 resulted from the sale of 32.2 million shares of our ownership interest in Aberdeen, reducing our interest in Aberdeen from 9.8% to 7.0%, and a small gain on the partial sale of a joint venture investment. |
| QoQ: Down 59% from CHF 170 million to CHF 69 million |
| The gain in 1Q12 reflected the sale of 113.8 million shares of our ownership interest in Aberdeen, partially offset by an impairment of CHF 8 million on investments held by Asset Management Finance LLC. The gain in 2Q12 primarily resulted from the partial sale of our ownership interest in Aberdeen. |
Operating expenses |
| Compensation and benefits |
| YoY: Stable at CHF 256 million |
| Lower discretionary performance-related compensation in 2Q12 was offset by higher deferred compensation expense and higher social security taxes on share award settlements. |
| QoQ: Down 5% from CHF 270 million to CHF 256 million |
| The decrease was primarily due to lower deferred compensation expense, which in 1Q12 included an expense of CHF 46 million related to the PAF2 awards, which were granted and expensed in 1Q12, partly offset by higher discretionary performance-related compensation expense and higher social security taxes on share award settlements. |
| General and administrative expenses |
| YoY: Down 19% from CHF 149 million to CHF 121 million |
| The decrease mainly reflected lower legal and consulting fees and the release of expense provisions, partly offset by higher occupancy-related expenses and higher outsourced services. |
| QoQ: Stable at CHF 121 million |
| The release of expense provisions offset higher advertising, market data and occupancy-related expenses. |
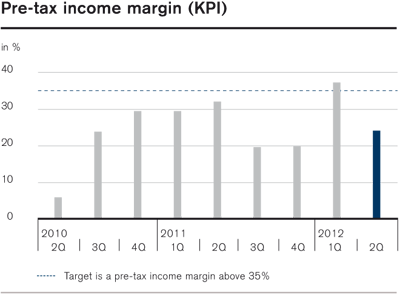
| Assets under management - Asset Management | |||||||||||||||||
| in / end of | % change | in / end of | % change | ||||||||||||||
| 2Q12 | 1Q12 | 2Q11 | QoQ | YoY | 6M12 | 6M11 | YoY | ||||||||||
| Assets under management (CHF billion) | |||||||||||||||||
| Alternative investments | 199.1 | 197.1 | 190.7 | 1.0 | 4.4 | 199.1 | 190.7 | 4.4 | |||||||||
| of which hedge funds | 24.8 | 25.0 | 25.5 | (0.8) | (2.7) | 24.8 | 25.5 | (2.7) | |||||||||
| of which private equity | 28.9 | 27.5 | 28.5 | 5.1 | 1.4 | 28.9 | 28.5 | 1.4 | |||||||||
| of which real estate & commodities | 47.8 | 47.6 | 45.5 | 0.4 | 5.1 | 47.8 | 45.5 | 5.1 | |||||||||
| of which credit | 19.7 | 18.0 | 17.6 | 9.4 | 11.9 | 19.7 | 17.6 | 11.9 | |||||||||
| of which ETF | 15.1 | 15.3 | 15.2 | (1.3) | (0.7) | 15.1 | 15.2 | (0.7) | |||||||||
| of which index strategies | 58.3 | 58.7 | 53.0 | (0.7) | 10.0 | 58.3 | 53.0 | 10.0 | |||||||||
| of which other | 4.5 | 5.0 | 5.4 | (10.0) | (16.7) | 4.5 | 5.4 | (16.7) | |||||||||
| Traditional investments | 160.5 | 162.8 | 187.7 | (1.4) | (14.5) | 160.5 | 187.7 | (14.5) | |||||||||
| of which multi-asset class solutions | 103.0 | 105.1 | 124.1 | (2.0) | (17.0) | 103.0 | 124.1 | (17.0) | |||||||||
| of which fixed income & equities | 57.5 | 57.7 | 63.6 | (0.3) | (9.6) | 57.5 | 63.6 | (9.6) | |||||||||
| Diversified investments | 0.9 | 0.9 | 0.8 | 0.0 | 12.5 | 0.9 | 0.8 | 12.5 | |||||||||
| Assets under management 1 | 360.5 | 360.8 | 379.2 | (0.1) | (4.9) | 360.5 | 379.2 | (4.9) | |||||||||
| Average assets under management (CHF billion) | |||||||||||||||||
| Average assets under management | 361.5 | 366.9 | 385.8 | (1.5) | (6.3) | 364.2 | 387.7 | (6.1) | |||||||||
| Assets under management by currency (CHF billion) | |||||||||||||||||
| USD | 93.5 | 83.5 | 97.4 | 12.0 | (4.0) | 93.5 | 97.4 | (4.0) | |||||||||
| EUR | 47.3 | 44.5 | 59.9 | 6.3 | (21.0) | 47.3 | 59.9 | (21.0) | |||||||||
| CHF | 195.1 | 208.3 | 199.7 | (6.3) | (2.3) | 195.1 | 199.7 | (2.3) | |||||||||
| Other | 24.6 | 24.5 | 22.2 | 0.4 | 10.8 | 24.6 | 22.2 | 10.8 | |||||||||
| Assets under management | 360.5 | 360.8 | 379.2 | (0.1) | (4.9) | 360.5 | 379.2 | (4.9) | |||||||||
| Growth in assets under management (CHF billion) | |||||||||||||||||
| Net new assets 2 | 0.4 | (11.4) | 3.9 | – | – | (11.0) | 10.4 | – | |||||||||
| Other effects | (0.7) | 7.0 | (18.1) | – | – | 6.3 | (13.2) | – | |||||||||
| of which market movements | (1.9) | 13.6 | (3.9) | – | – | 11.7 | 1.8 | – | |||||||||
| of which currency | 3.9 | (5.2) | (14.8) | – | – | (1.3) | (15.1) | – | |||||||||
| of which other | (2.7) | (1.4) | 0.6 | – | – | (4.1) | 0.1 | – | |||||||||
| Growth in assets under management | (0.3) | (4.4) | (14.2) | – | – | (4.7) | (2.8) | – | |||||||||
| Growth in assets under management (annualized) (%) | |||||||||||||||||
| Net new assets | 0.4 | (12.5) | 4.0 | – | – | (6.0) | 5.4 | – | |||||||||
| Other effects | (0.8) | 7.7 | (18.4) | – | – | 3.5 | (6.9) | – | |||||||||
| Growth in assets under management | (0.4) | (4.8) | (14.4) | – | – | (2.5) | (1.5) | – | |||||||||
| Growth in assets under management (rolling four-quarter average) (%) | |||||||||||||||||
| Net new assets | (4.3) | (3.2) | 5.2 | – | – | – | – | – | |||||||||
| Other effects | (0.7) | (5.1) | (5.0) | – | – | – | – | – | |||||||||
| Growth in assets under management (rolling four-quarter average) | (5.0) | (8.3) | 0.2 | – | – | – | – | – | |||||||||
| Principal investments (CHF billion) | |||||||||||||||||
| Principal investments 3 | 3.7 | 3.4 | 3.1 | 8.8 | 19.4 | 3.7 | 3.1 | 19.4 | |||||||||
| 1 Excludes our portion of assets under management from our investment in Aberdeen. 2 Includes outflows for private equity assets reflecting realizations at cost and unfunded commitments on which a fee is no longer earned. 3 Primarily private equity investments. | |||||||||||||||||
Assets under management |
| Assets under management as of the end of 2Q12 were CHF 360.5 billion, stable compared with 1Q12. We had net asset inflows of CHF 0.4 billion in 2Q12 with inflows of CHF 0.9 billion in alternative investments, primarily from emerging markets and credit strategies. Outflows of CHF 0.5 billion in traditional investments reflected outflows in multi-asset class solutions, largely from mandates transferred into Asset Management in connection with the integration of Clariden Leu, partially offset by inflows in fixed income and equity, including inflows into former Clariden Leu funds. Favorable foreign exchange-related movements and the net asset inflows were offset by negative market performance. Average assets under management at CHF 361.5 billion were 1.5% lower than 1Q12. |
| Compared to 2Q11, assets under management were down 4.9%. The decrease primarily reflected net asset outflows partially offset by positive foreign exchange-related movements. Average assets under management decreased 6.3%. |
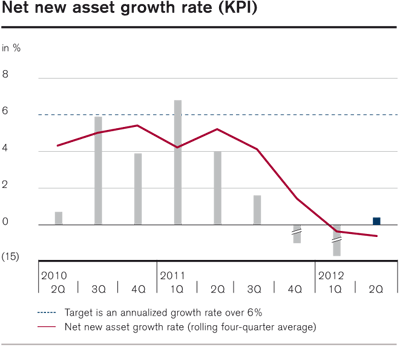
Assets under management |
| We had net asset inflows of CHF 4.4 billion during 2Q12 and assets under management of CHF 1,213.1 billion as of the end of 2Q12. |
Assets under management |
| Assets under management reflect the changes in reporting as discussed in “Core Results – Information and developments – Changes in reporting”. |
| Assets under management comprise assets that are placed with us for investment purposes and include discretionary and advisory counterparty assets. |
| Discretionary assets are assets for which the customer fully transfers the discretionary power to a Credit Suisse entity with a management mandate. Discretionary assets are reported in the segment in which the advice is provided as well as in the segment in which the investment decisions take place. Assets managed by Asset Management for Private Banking clients are reported in both segments and eliminated at Group level. |
| Advisory assets include assets placed with us where the client is provided access to investment advice but retains discretion over investment decisions. |
| Assets under management and net new assets include assets managed by consolidated entities, joint ventures and strategic participations. Assets from joint ventures and participations are counted in proportion to our share in the respective entity. |
| As of the end of 2Q12, assets under management were CHF 1,213.1 billion, up CHF 8.3 billion, or 0.7%, compared to the end of 1Q12, mainly reflecting favorable foreign exchange-related movements and net new assets, partially offset by negative market performance. |
| Compared to the end of 2Q11, assets under management were up CHF 26.8 billion, or 2.3%. Favorable foreign exchange-related movements and net new assets were partly offset by negative market performance. |
| In Private Banking, assets under management were CHF 987.9 billion, up CHF 4.4 billion, or 0.4%, compared to the end of 1Q12, and up CHF 44.9 billion, or 4.8%, compared to the end of 2Q11. In Asset Management, assets under management were CHF 360.5 billion, down CHF 0.3 billion, stable compared to the end of 1Q12, and down CHF 18.7 billion, or 4.9%, compared to the end of 2Q11. |
| > Refer to “Private Banking” and “Asset Management” in I – Credit Suisse results and “Note 36 – Assets under management” in V – Consolidated financial statements – Credit Suisse Group in the Credit Suisse Annual Report 2011 for further information. |
Net new assets |
| Net new assets include individual cash payments, security deliveries and cash flows resulting from loan increases or repayments. Interest and dividend income credited to clients, commissions, interest and fees charged for banking services are not included as they do not reflect success in acquiring assets under management. |
| Furthermore, changes due to foreign exchange-related and market movements as well as asset inflows and outflows due to the acquisition or divestiture of businesses are not part of net new assets. |
| Private Banking recorded net new assets of CHF 3.4 billion in 2Q12, including CHF 5.5 billion from Wealth Management Clients, with inflows particularly from its UHNWI client segment and emerging markets. Asset Management recorded net asset inflows of CHF 0.4 billion in 2Q12, with inflows in alternative investments, partly offset by outflows in traditional investments. |
Client assets |
| Client assets is a broader measure than assets under management as it includes transactional and custody accounts (assets held solely for transaction-related or safekeeping/custody purposes) and assets of corporate clients and public institutions used primarily for cash management or transaction-related purposes. |
| Assets under management and client assets | |||||||||||||||
| end of | % change | ||||||||||||||
| 2Q12 | 1Q12 | 4Q11 | 2Q11 | QoQ | Ytd | YoY | |||||||||
| Assets under management (CHF billion) | |||||||||||||||
| Private Banking | 987.9 | 983.5 | 953.2 | 943.0 | 0.4 | 3.6 | 4.8 | ||||||||
| Asset Management | 360.5 | 360.8 | 365.2 | 379.2 | (0.1) | (1.3) | (4.9) | ||||||||
| Assets managed by Asset Management for Private Banking clients | (135.3) | (139.5) | (133.2) | (135.9) | (3.0) | 1.6 | (0.4) | ||||||||
| Assets under management | 1,213.1 | 1,204.8 | 1,185.2 | 1,186.3 | 0.7 | 2.4 | 2.3 | ||||||||
| of which discretionary assets | 391.6 | 388.1 | 390.2 | 405.4 | 0.9 | 0.4 | (3.4) | ||||||||
| of which advisory assets | 821.5 | 816.7 | 795.0 | 780.9 | 0.6 | 3.3 | 5.2 | ||||||||
| Client assets (CHF billion) | |||||||||||||||
| Private Banking | 1,195.6 | 1,193.6 | 1,159.4 | 1,149.2 | 0.2 | 3.1 | 4.0 | ||||||||
| Asset Management | 360.5 | 360.8 | 365.2 | 379.2 | (0.1) | (1.3) | (4.9) | ||||||||
| Assets managed by Asset Management for Private Banking clients | (135.3) | (139.5) | (133.2) | (135.9) | (3.0) | 1.6 | (0.4) | ||||||||
| Client assets | 1,420.8 | 1,414.9 | 1,391.4 | 1,392.5 | 0.4 | 2.1 | 2.0 | ||||||||
| Growth in assets under management | |||||||||||
| in | 2Q12 | 1Q12 | 2Q11 | 6M12 | 6M11 | ||||||
| Growth in assets under management (CHF billion) | |||||||||||
| Private Banking | 3.4 | 7.9 | 11.9 | 11.3 | 27.9 | ||||||
| Asset Management 1 | 0.4 | (11.4) | 3.9 | (11.0) | 10.4 | ||||||
| Assets managed by Asset Management for Private Banking clients | 0.6 | (2.2) | (1.6) | (1.6) | (4.2) | ||||||
| Net new assets | 4.4 | (5.7) | 14.2 | (1.3) | 34.1 | ||||||
| Private Banking | 1.0 | 22.4 | (49.5) | 23.4 | (43.9) | ||||||
| Asset Management | (0.7) | 7.0 | (18.1) | 6.3 | (13.2) | ||||||
| Assets managed by Asset Management for Private Banking clients | 3.6 | (4.1) | 6.8 | (0.5) | 4.0 | ||||||
| Other effects | 3.9 | 25.3 | (60.8) | 29.2 | (53.1) | ||||||
| Private Banking | 4.4 | 30.3 | (37.6) | 34.7 | (16.0) | ||||||
| Asset Management | (0.3) | (4.4) | (14.2) | (4.7) | (2.8) | ||||||
| Assets managed by Asset Management for Private Banking clients | 4.2 | (6.3) | 5.2 | (2.1) | (0.2) | ||||||
| Total growth in assets under management | 8.3 | 19.6 | (46.6) | 27.9 | (19.0) | ||||||
| Growth in assets under management (annualized) (%) | |||||||||||
| Private Banking | 1.4 | 3.3 | 4.9 | 2.4 | 5.8 | ||||||
| Asset Management | 0.4 | (12.5) | 4.0 | (6.0) | 5.4 | ||||||
| Assets managed by Asset Management for Private Banking clients | (1.7) | 6.6 | 4.5 | 2.4 | 6.2 | ||||||
| Net new assets | 1.5 | (1.9) | 4.6 | (0.2) | 5.7 | ||||||
| Private Banking | 0.4 | 9.4 | (20.2) | 4.9 | (9.2) | ||||||
| Asset Management | (0.8) | 7.7 | (18.4) | 3.5 | (6.9) | ||||||
| Assets managed by Asset Management for Private Banking clients | (10.3) | 12.3 | (19.3) | 0.8 | (5.9) | ||||||
| Other effects | 1.3 | 8.5 | (19.7) | 4.9 | (8.8) | ||||||
| Private Banking | 1.8 | 12.7 | (15.3) | 7.3 | (3.4) | ||||||
| Asset Management | (0.4) | (4.8) | (14.4) | (2.5) | (1.5) | ||||||
| Assets managed by Asset Management for Private Banking clients | (12.0) | 18.9 | (14.8) | 3.2 | 0.3 | ||||||
| Total growth in assets under management | 2.8 | 6.6 | (15.1) | 4.7 | (3.1) | ||||||
| Growth in net new assets (rolling four-quarter average) (%) | |||||||||||
| Private Banking | 2.8 | 3.5 | 4.9 | – | – | ||||||
| Asset Management | (4.3) | (3.2) | 5.2 | – | – | ||||||
| Assets managed by Asset Management for Private Banking clients | (1.0) | 0.6 | 4.0 | – | – | ||||||
| Growth in net new assets | 0.9 | 1.7 | 5.1 | – | – | ||||||
| 1 Includes outflows for private equity assets reflecting realizations at cost and unfunded commitments on which a fee is no longer earned. | |||||||||||
Treasury, risk, balance sheet and off-balance sheet |
Treasury management |
Risk management |
Balance sheet and off-balance sheet |
Treasury management |
| During 2Q12, we continued to maintain a strong liquidity and funding position with an estimated Basel III net stable funding ratio of over 100% as of the end of the quarter. Our proactive approach to capital management resulted in an increase in our Basel II.5 core tier 1 ratio to 12.5% as of the end of 2Q12 compared to 11.8% as of the end of 1Q12. |
Liquidity and funding management |
Overview |
| Securities for funding and capital purposes are issued primarily by the Bank, our principal operating subsidiary and a US registrant. The Bank lends funds to its operating subsidiaries and affiliates on both a senior and subordinated basis, as needed; the latter typically to meet capital requirements, or as desired by management to support business initiatives. |
| Our internal liquidity risk management framework as agreed with FINMA has been subject to review and monitoring by FINMA, other regulators and rating agencies for many years. Moreover, our liquidity risk management principles and framework are in line with the Basel III liquidity framework. |
| > Refer to “Treasury management” in III – Treasury, Risk, Balance sheet and Off-balance sheet in the Credit Suisse Annual Report 2011 for further information on liquidity and funding management. |
Liquidity risk management framework |
| Our liquidity and funding policy is designed to ensure that funding is available to meet all obligations in times of stress, whether caused by market events or issues specific to Credit Suisse. We achieve this through a conservative asset/liability management strategy aimed at maintaining long-term funding, including stable deposits, well in excess of illiquid assets. To address short-term liquidity stress, we maintain a liquidity buffer that covers unexpected outflows in the event of severe market and idiosyncratic stress. The assets included in the liquidity buffer consist primarily of cash placed with central banks and high-quality sovereign bonds obtained through outright purchase or reverse repurchase transactions. Our liquidity risk parameters reflect various liquidity stress assumptions, which we believe are conservative. We manage our liquidity profile at a sufficient level such that, in the event that we are unable to access unsecured funding, we will have sufficient liquidity to sustain operations for an extended period of time in excess of our minimum target. |
| The BCBS has issued the Basel III international framework for liquidity risk measurement, standards and monitoring. The framework includes a liquidity coverage ratio (LCR) and a net stable funding ratio (NSFR). The LCR, which is expected to be introduced January 1, 2015 following an observation period which began in 2011, addresses liquidity risk over a 30-day period. The NSFR, which is expected to be introduced January 1, 2018 following an observation period which began in 2012, establishes criteria for a minimum amount of stable funding based on the liquidity of a bank’s assets and activities over a one-year horizon. The BCBS has stated that it will review the effect of these liquidity standards on financial markets, credit extension and economic growth to address unintended consequences. |
| The LCR aims to ensure that banks have a stock of unencumbered high-quality liquid assets available to meet liquidity needs for a 30-day time horizon under a severe stress scenario. The LCR is comprised of two components: the value of the stock of high quality liquid assets in stressed conditions and the total net cash outflows calculated according to specified scenario parameters. The ratio of liquid assets over net cash outflows should always be at least 100%. |
| The NSFR is intended to ensure banks maintain a structurally sound long-term funding profile beyond one year and is a complementary measure to the LCR. The NSFR is structured to ensure that illiquid assets are funded with an appropriate amount of stable long-term funds. The standard is defined as the ratio of available stable funding over the amount of required stable funding and should always be at least 100%. |
| Although the NSFR is not expected to be introduced until 2018 and is still subject to adjustment by the BCBS and FINMA, we are now using the NSFR as the primary tool (while continuing to also model alternative scenarios) to monitor our structural liquidity position, to plan funding and as the basis for our funds transfer pricing policy. We estimate that our NSFR is over 100% as of the end of 2Q12, which is our target for the end of 2013. Where requirements are unclear or left to be determined by national regulators, we have made our own interpretation to arrive at the current result. |
| > Refer to “Debt issuances and redemptions” for further information on our liability management activities. |
Funding sources and uses |
| We primarily fund our balance sheet through core customer deposits, long-term debt and shareholders’ equity. A substantial portion of our balance sheet is match funded and requires no unsecured funding. Match funded balance sheet items consist of assets and liabilities with close to equal liquidity durations and values so that the liquidity and funding generated or required by the positions are substantially equivalent. Cash and due from banks is highly liquid. A significant part of our assets, principally unencumbered trading assets that support the securities business, is comprised of securities inventories and collateralized receivables, which fluctuate and are generally liquid. These liquid assets are available to settle short-term liabilities. These assets include our buffer of CHF 146 billion of cash, securities accepted under central bank facilities and other highly liquid unencumbered securities, which can be monetized in a time frame consistent with our short-term stress assumptions. During the quarter, we slightly increased our short-term liabilities, which is reflected in an increase of our liquidity buffer, including central bank balances, from CHF 142 billion in 1Q12. Loans, which comprise the largest component of our illiquid assets, are funded by our core customer deposits, with an excess coverage of 22% as of the end of 2Q12, up from 21% in 1Q12. We fund other illiquid assets, including real estate, private equity and other long-term investments and a haircut for the illiquid portion of securities, with long-term debt and equity, where we try to maintain a substantial funding buffer. |
| Our core customer deposits totaled CHF 285 billion as of the end of 2Q12, compared to CHF 275 billion as of the end of 1Q12. The increase reflected both a growth in the customer deposit base and a strengthening of the US dollar against the Swiss franc. Core customer deposits are from clients with whom we have a broad and longstanding relationship. Core customer deposits exclude deposits from banks and certificates of deposits. We place a priority on maintaining and growing customer deposits, as they have proved to be a stable and resilient source of funding even in difficult market conditions. Our core customer deposit funding is supplemented by the issuance of long-term debt. |
| > Refer to the chart “Balance sheet funding structure” for further information. |
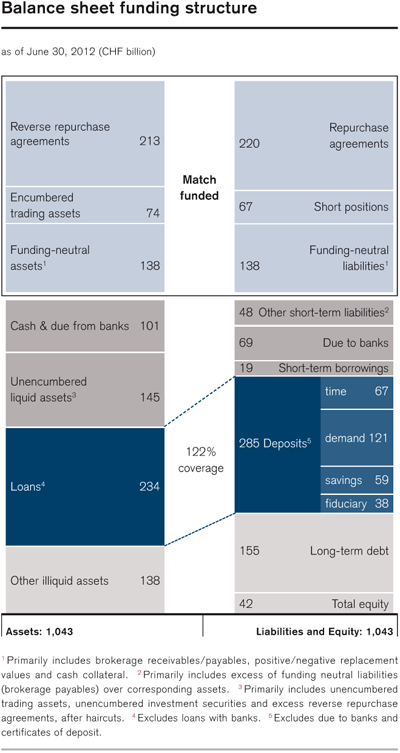 |
Debt issuances and redemptions |
| Our capital markets debt includes senior and subordinated debt issued in US-registered offerings and medium-term note programs, euro market medium-term note programs, Australian dollar domestic medium-term note programs, a Samurai shelf registration statement in Japan and covered bond programs. As a global bank, we have access to multiple markets worldwide and our major funding centers are Zurich, New York, London and Tokyo. |
| We use a wide range of products and currencies to ensure that our funding is efficient and well diversified across markets and investor types. Substantially all of our unsecured senior debt is issued without financial covenants, such as adverse changes in our credit ratings, cash flows, results of operations or financial ratios, which could trigger an increase in our cost of financing or accelerate the maturity of the debt. |
| The percentage of unsecured funding from long-term debt, excluding non-recourse debt associated with the consolidation of variable interest entities (VIEs), was 25% as of the end of 2Q12, compared to 26% as of the end of 1Q12. |
| In 2Q12, the Bank issued CHF 261 million of domestic covered bonds. Senior debt of CHF 3.3 billion and subordinated debt of CHF 100 million and domestic covered bonds of CHF 200 million matured in 2Q12. As of June 30, 2012, we had CHF 14.8 billion of domestic and international covered bonds outstanding. |
| The weighted average maturity of long-term debt was 6.5 years (including certificates of deposits with a maturity of one year or longer, but excluding structured notes, and assuming callable securities are redeemed at final maturity, or in 2030 for instruments without a stated final maturity). |
Credit ratings |
| The maximum impact of a simultaneous one, two or three-notch downgrade by all three major rating agencies in the Bank’s long-term debt ratings would result in additional collateral requirements or assumed termination payments under certain derivative instruments of CHF 1.6 billion, CHF 3.6 billion and CHF 4.2 billion, respectively, as of 2Q12, and would not be material to our liquidity and funding planning. If the downgrade does not involve all three rating agencies, the impact may be smaller. The Moody’s ratings downgrade announced on June 21, 2012 had an impact of less than CHF 100 million on our collateral requirement. |
| As of the end of 2Q12, we were compliant with the requirements related to maintaining a specific credit rating under these derivative instruments. |
| > Refer to “Credit ratings” in III – Treasury, Risk, Balance sheet and Off-balance sheet – Treasury management – Liquidity and funding management in the Credit Suisse Annual Report 2011 for further information. |
Capital management |
Capital management framework |
| Our capital management framework is intended to ensure that there is sufficient capital to support our underlying risks and to achieve management’s regulatory and credit rating objectives. |
| In January 2011, as required by FINMA, Credit Suisse implemented BCBS’s “Revisions to the Basel II market risk framework” (Basel II.5), for FINMA regulatory capital purposes, with some additional requirements for large Swiss banks known as “Swiss Finish”. |
| > Refer to “Capital management” in III – Treasury, Risk, Balance sheet and Off-balance sheet – Treasury management in the Credit Suisse Annual Report 2011 for further information on Credit Suisse’s capital management framework, regulatory capital and risk-weighted assets (RWA). |
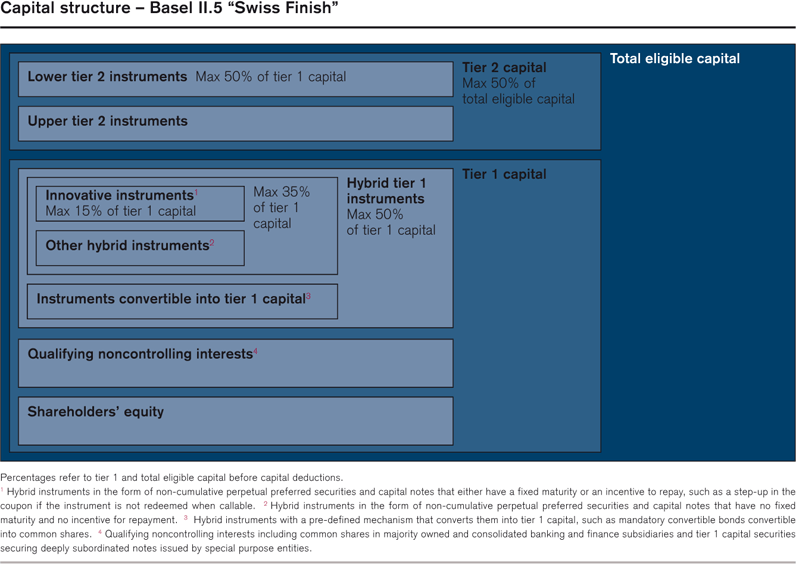 |
Risk-weighted assets |
| Our balance sheet positions and off-balance sheet exposures translate into RWA that are categorized as market, credit, operational and non-counterparty risk RWA. Market risk RWA reflect the capital requirements of potential changes in the fair values of financial instruments in response to market movements inherent in both the balance sheet and the off-balance sheet items. Credit risk RWA reflect the capital requirements for the possibility of a loss being incurred as the result of a borrower or counterparty failing to meet its financial obligations or as a result of a deterioration in the credit quality of the borrower or counterparty. Operational risk RWA reflect the capital requirements for the risk of loss resulting from inadequate or failed internal processes, people and systems or from external events. Non-counterparty-risk RWA primarily reflect the capital requirements for our premises and equipment. It is not the nominal size, but the nature (including risk mitigation such as collateral or hedges) of the balance sheet positions or off-balance sheet positions that determines the RWA. |
Risk measurement models |
| Within the Basel II.5 framework for FINMA regulatory capital purposes, we implemented new risk measurement models, including an incremental risk charge and stressed Value-at-Risk (VaR). The incremental risk charge is a regulatory capital charge for default and migration risk on positions in the trading books and is intended to complement additional standards being applied to the VaR modeling framework, including stressed VaR. Stressed VaR replicates a VaR calculation on the Group’s current portfolio taking into account a one-year observation period relating to significant financial stress and helps reduce the pro-cyclicality of the minimum capital requirements for market risk. |
| FINMA, in line with the Bank for International Settlements (BIS) requirements, uses a multiplier to impose an increase in market risk capital for every regulatory VaR backtesting exception over four in the prior rolling 12-month period. For the purposes of this measurement, backtesting exceptions are calculated using a subset of actual daily trading revenues that includes only the impact of daily movements in financial market variables such as interest rates, equity prices and foreign exchange rates on the previous night’s positions. In 2Q12, the market risk capital multiplier remained at FINMA and BIS minimum levels and we did not experience an increase in market risk capital. |
| > Refer to “Market risk” in Risk management for further information on Credit Suisse’s risk measurement models and backtesting exceptions. |
| Leverage ratios | |||||||||||||||||
| Group | Bank | ||||||||||||||||
end of | 2Q12 | 1Q12 | 4Q11 | % change QoQ | 2Q12 | 1Q12 | 4Q11 | % change QoQ | |||||||||
| Tier 1 capital (CHF billion) | |||||||||||||||||
| Tier 1 capital | 38.5 | 36.7 | 36.8 | 5 | 35.6 | 34.6 | 35.1 | 3 | |||||||||
| Adjusted average assets (CHF billion) 1 | |||||||||||||||||
| Average assets | 1,054 | 1,019 | 1,038 | 3 | 1,039 | 1,005 | 1,024 | 3 | |||||||||
| Adjustments: | |||||||||||||||||
| Assets from Swiss lending activities 2 | (147) | (146) | (145) | 1 | (125) | (124) | (123) | 1 | |||||||||
| Cash and balances with central banks | (77) | (73) | (81) | 5 | (77) | (73) | (81) | 5 | |||||||||
| Other | (12) | (12) | (15) | 0 | (11) | (11) | (14) | 0 | |||||||||
| Adjusted average assets | 818 | 788 | 797 | 4 | 826 | 797 | 806 | 4 | |||||||||
| Leverage ratio (%) | |||||||||||||||||
| Leverage ratio | 4.7 | 4.7 | 4.6 | 0 | 4.3 | 4.3 | 4.4 | 0 | |||||||||
| 1 Calculated as the average of the month-end values for the previous three calendar months. 2 Excludes Swiss interbank lending. | |||||||||||||||||
Leverage ratios |
| Both the Group and the Bank must maintain, for FINMA regulatory capital purposes, a minimum leverage ratio of tier 1 capital to total adjusted average assets (on a non-risk-weighted basis) of 3% at the Group and Bank consolidated level and 4% at the Bank on an unconsolidated basis by 2013. |
| The leverage ratios for the Group and Bank were 4.7% and 4.3%, respectively, as of the end of 2Q12, stable compared to the end of 1Q12. |
| The stable leverage ratios compared to 1Q12 reflected higher tier 1 capital offset by higher adjusted average assets. The adjusted average assets primarily reflected foreign exchange translation impacts. |
Regulatory capital – Group |
| Our tier 1 ratio was 16.5% as of the end of 2Q12 compared to 15.6% as of the end of 1Q12, reflecting stable RWA and increased tier 1 capital. Our core tier 1 ratio was 12.5% as of the end of 2Q12 compared to 11.8% as of the end of 1Q12, reflecting stable RWA and higher core tier 1 capital. Our total capital ratio was 20.2% as of the end of 2Q12 compared to 19.2% as of the end of 1Q12. |
| Tier 1 capital was CHF 38.5 billion as of the end of 2Q12 compared to CHF 36.7 billion as of the end of 1Q12, reflecting a positive foreign exchange translation impact, net income (excluding the impact of fair value gains/(losses) on Credit Suisse debt, net of tax), a release of the 1Q12 dividend accrual due to the assumption of a 100% scrip dividend to be distributed in shares in 2013, a decrease in the capital deductions 50% from tier 1 and tier 2 relating to low rated securitization tranches and the net effect of share-based compensation. These increases were offset by a reduction in qualifying noncontrolling interests due to the purchase of the minority share in Hedging-Griffo. Tier 2 capital was CHF 8.7 billion as of the end of 2Q12 compared to CHF 8.3 billion as of the end of 1Q12, primarily reflecting the positive foreign exchange translation impact and the decrease in the 50% regulatory capital deductions relating to low rated securitization tranches, partially offset by the regulatory amortization of lower tier 2 instruments. Total eligible capital as of the end of 2Q12 was CHF 47.2 billion compared to CHF 45.0 billion as of the end of 1Q12. |
| BIS statistics (Basel II.5) | |||||||||||||||||
| Group | Bank | ||||||||||||||||
end of | 2Q12 | 1Q12 | 4Q11 | % change QoQ | 2Q12 | 1Q12 | 4Q11 | % change QoQ | |||||||||
| Eligible capital (CHF million) | |||||||||||||||||
| Total shareholders' equity | 34,774 | 33,585 | 33,674 | 4 | 29,784 | 29,295 | 29,403 | 2 | |||||||||
| Goodwill and intangible assets | (8,940) | (8,592) | (8,876) | 4 | (8,054) | (7,702) | (7,979) | 5 | |||||||||
| Qualifying noncontrolling interests | 3,245 | 3,417 | 3,365 | (5) | 4,334 | 4,284 | 4,476 | 1 | |||||||||
| Capital deductions 50% from tier 1 | (1,875) | (1,989) | (2,274) | (6) | (1,835) | (1,949) | (2,242) | (6) | |||||||||
| Other adjustments | 1,912 | 1 | 1,201 | 67 | 59 | 1,982 | 1,654 | 552 | 20 | ||||||||
| Core tier 1 capital | 29,116 | 27,622 | 25,956 | 5 | 26,211 | 25,582 | 24,210 | 2 | |||||||||
| Hybrid tier 1 instruments 2 | 9,396 | 3 | 9,046 | 10,888 | 4 | 9,396 | 3 | 9,046 | 10,888 | 4 | |||||||
| Tier 1 capital | 38,512 | 36,668 | 36,844 | 5 | 35,607 | 34,628 | 35,098 | 3 | |||||||||
| Upper tier 2 | 879 | 744 | 1,841 | 18 | 924 | 785 | 1,925 | 18 | |||||||||
| Lower tier 2 | 9,714 | 9,573 | 12,243 | 1 | 10,973 | 11,490 | 13,609 | (4) | |||||||||
| Capital deductions 50% from tier 2 | (1,875) | (1,989) | (2,274) | (6) | (1,835) | (1,949) | (2,242) | (6) | |||||||||
| Tier 2 capital | 8,718 | 8,328 | 11,810 | 5 | 10,062 | 10,326 | 13,292 | (3) | |||||||||
| Total eligible capital | 47,230 | 44,996 | 48,654 | 5 | 45,669 | 44,954 | 48,390 | 2 | |||||||||
| Risk-weighted assets (CHF million)– | |||||||||||||||||
| Credit risk | 147,233 | 144,121 | 157,237 | 2 | 137,929 | 135,090 | 148,378 | 2 | |||||||||
| Market risk | 35,363 | 43,094 | 40,609 | (18) | 35,322 | 43,070 | 40,571 | (18) | |||||||||
| Non-counterparty risk | 7,334 | 7,275 | 7,819 | 1 | 7,086 | 7,028 | 7,564 | 1 | |||||||||
| Operational risk | 43,775 | 39,900 | 36,088 | 10 | 43,775 | 39,900 | 36,088 | 10 | |||||||||
| Risk-weighted assets | 233,705 | 234,390 | 241,753 | 0 | 224,112 | 225,088 | 232,601 | 0 | |||||||||
| Capital ratios (%) | |||||||||||||||||
| Core tier 1 ratio | 12.5 | 11.8 | 10.7 | – | 11.7 | 11.4 | 10.4 | – | |||||||||
| Tier 1 ratio | 16.5 | 15.6 | 15.2 | – | 15.9 | 15.4 | 15.1 | – | |||||||||
| Total capital ratio | 20.2 | 19.2 | 20.1 | – | 20.4 | 20.0 | 20.8 | – | |||||||||
| 1 Includes cumulative fair value adjustments of CHF (1.3) billion on own vanilla debt and structured notes, net of tax and an adjustment for the accounting treatment of pension plans of CHF 2.8 billion. 2 Non-cumulative perpetual preferred securities and capital notes. FINMA has advised that the Group and the Bank may continue to include as tier 1 capital CHF 0.5#nbsp#billion and CHF 3.0 billion, respectively, in 2Q12 (1Q12: CHF 0.4 billion and CHF 2.9 billion, respectively; 4Q11: CHF 0.6 billion and CHF 3.2 billion, respectively) of equity from special purpose entities that are deconsolidated under US GAAP. 3 FINMA has advised that a maximum of 35% of tier 1 capital can be in the form of hybrid capital instruments, which will be phased out under Basel III. Hybrid tier 1 capital represented 23.3% and 25.1% of the Group's and the Bank's adjusted tier 1 capital, respectively, as of the end of 2Q12. | |||||||||||||||||
| Tier 1 capital movement | |||||||
| 2Q12 | 1Q12 | 4Q11 | |||||
| Tier 1 capital (CHF million) | |||||||
| Balance at beginning of period | 36,668 | 36,844 | 34,967 | ||||
| Net income | 788 | 44 | (637) | ||||
| Adjustments for fair value gains/(losses) reversed for regulatory purposes, net of tax | (61) | 1,466 | (261) | ||||
| Foreign exchange impact on tier 1 capital | 851 | (837) | 652 | ||||
| Other 1 | 266 | (849) | 2,123 | ||||
| Balance at end of period | 38,512 | 36,668 | 36,844 | ||||
| 1 Reflects the issuance and redemption of tier 1 capital, a dividend accrual, the effect of share-based compensation and the change in regulatory deductions. | |||||||
| RWA decreased to CHF 233.7 billion as of the end of 2Q12 compared to CHF 234.4 billion as of the end of 1Q12 primarily reflecting a significant decrease in market risk offset by an increase in operational risk and a foreign exchange translation impact, mainly in credit and market risk. The decrease in market risk was primarily driven by reductions in stressed VaR, mainly due to risk reductions within equities and foreign exchange products, and reductions in incremental risk charge, mainly due to risk reductions across emerging markets and credit products businesses. |
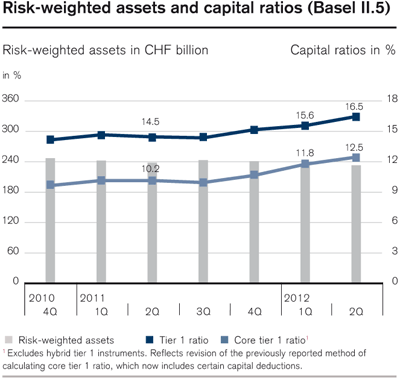 |
| The increase in credit risk was primarily related to the foreign exchange translation impact. This increase was partially offset by a decrease in Investment Banking credit risk, primarily driven by a decrease in counterparty risk. Operational risk increased to reflect anticipated changes to our model. The increase is of a similar size as reflected in 1Q12 and has been agreed with our regulators for capital purposes and represents the second part of a 10% regulatory uplift on operational risk RWA. |
| > Refer to the table “BIS statistics (Basel II.5)” for further information. |
| > Refer to https://www.credit-suisse.com/investors/en/sub_ financials.jsp for further information on capital ratios of certain significant subsidiaries, scheduled to be published as of the end of August 2012. |
| As of the end of 2Q12, we had CHF 3.2 billion of qualifying noncontrolling interests, of which CHF 3.2 billion were core tier 1 capital securities secured by participation securities issued by the Bank. In addition, we had CHF 9.4 billion of hybrid tier 1 instruments, of which CHF 0.8 billion were innovative instruments. The hybrid tier 1 instruments include USD 3.45 billion 11% tier 1 capital notes and CHF 2.5 billion 10% tier 1 capital notes that will be purchased or exchanged for tier 1 BCNs. CHF 1.7 billion tier 1 capital notes will be exchanged in July 2012 with the balance to be exchanged no earlier than October 23, 2013. |
| > Refer to “Capital issuances and redemptions” in III – Treasury, Risk, Balance sheet and Off-balance sheet – Treasury management – Capital management in the Credit Suisse Annual Report 2011 for further information. |
| Risk-weighted assets by division (Basel II.5) | |||||||||||
| end of | 2Q12 | 1Q12 | 4Q11 | QoQ | YoY | ||||||
| Risk-weighted assets by division (CHF million) | |||||||||||
| Private Banking | 75,074 | 72,182 | 71,841 | 4 | 5 | ||||||
| Investment Banking | 132,668 | 137,570 | 145,163 | (4) | (9) | ||||||
| Asset Management | 13,007 | 12,584 | 12,071 | 3 | 8 | ||||||
| Corporate Center | 12,956 | 12,054 | 12,678 | 7 | 2 | ||||||
| Risk-weighted assets | 233,705 | 234,390 | 241,753 | 0 | (3) | ||||||
| For management purposes, the Group allocates to the divisions risk-weighted asset equivalents related to regulatory capital and certain intangible asset deductions from Group tier 1 capital. | |||||||||||
| Capital | |||||||||||||||
| end of | % change | ||||||||||||||
| 2Q12 | 1Q12 | 4Q11 | 2Q11 | QoQ | Ytd | YoY | |||||||||
| Shareholders' equity (CHF million) | |||||||||||||||
| Common shares | 51 | 49 | 49 | 48 | 4 | 4 | 6 | ||||||||
| Additional paid-in capital | 21,930 | 22,262 | 21,796 | 21,107 | (1) | 1 | 4 | ||||||||
| Retained earnings | 27,771 | 27,097 | 27,053 | 27,121 | 2 | 3 | 2 | ||||||||
| Treasury shares, at cost | (66) | 0 | (90) | (111) | – | (27) | (41) | ||||||||
| Accumulated other comprehensive income/(loss) | (14,912) | (15,823) | (15,134) | (16,949) | (6) | (1) | (12) | ||||||||
| Total shareholders' equity | 34,774 | 33,585 | 33,674 | 31,216 | 4 | 3 | 11 | ||||||||
| Goodwill | (8,665) | (8,333) | (8,591) | (7,908) | 4 | 1 | 10 | ||||||||
| Other intangible assets | (278) | (260) | (288) | (281) | 7 | (3) | (1) | ||||||||
| Tangible shareholders' equity 1 | 25,831 | 24,992 | 24,795 | 23,027 | 3 | 4 | 12 | ||||||||
| Shares outstanding (million) | |||||||||||||||
| Common shares issued | 1,286.6 | 1,224.5 | 1,224.3 | 1,202.2 | 5 | 5 | 7 | ||||||||
| Treasury shares | (3.5) | 0.0 | (4.0) | (3.1) | – | (13) | 13 | ||||||||
| Shares outstanding | 1,283.1 | 1,224.5 | 1,220.3 | 1,199.1 | 5 | 5 | 7 | ||||||||
| Par value (CHF) | |||||||||||||||
| Par value | 0.04 | 0.04 | 0.04 | 0.04 | 0 | 0 | 0 | ||||||||
| Book value per share (CHF) | |||||||||||||||
| Total book value per share | 27.10 | 27.43 | 27.59 | 26.03 | (1) | (2) | 4 | ||||||||
| Goodwill per share | (6.75) | (6.81) | (7.04) | (6.59) | (1) | (4) | 2 | ||||||||
| Other intangible assets per share | (0.22) | (0.21) | (0.23) | (0.23) | 5 | (4) | (4) | ||||||||
| Tangible book value per share 1 | 20.13 | 20.41 | 20.32 | 19.21 | (1) | (1) | 5 | ||||||||
| 1 Management believes that tangible shareholders' equity and tangible book value per share, both non-GAAP financial measures, are meaningful as they are measures used and relied upon by industry analysts and investors to assess valuations and capital adequacy. | |||||||||||||||
Total shareholders’ equity |
| Our total shareholders’ equity increased to CHF 34.8 billion as of the end of 2Q12 compared to CHF 33.6 billion as of the end of 1Q12. Total shareholders’ equity was impacted by the issuance of common shares used to settle the scrip dividend and share-based compensation, the impact of foreign exchange-related movements on cumulative translation adjustments and net income. These increases were offset by the dividend payment, the effect of share-based compensation and treasury share purchases and sales. |
| > Refer to the “Consolidated statements of changes in equity (unaudited)” in III – Condensed consolidated financial statements – unaudited for further information on shareholders’ equity. |
Regulatory capital developments and proposals |
| The BCBS issued the Basel III framework, with higher minimum capital requirements and new conservation and countercyclical buffers, revised risk-based capital measures, a leverage ratio and liquidity standards. Prior to its issuance, the proposed BCBS framework was endorsed by the Group of Twenty Finance Ministers and Central Bank Governors (G-20) in November 2010. Each G-20 nation will need to implement the rules, and stricter or different requirements may be adopted by any G-20 nation. The framework was designed to strengthen the resilience of the banking sector. The new capital standards and capital buffers will require banks to hold more capital, mainly in the form of common equity. The new capital standards will be phased in from January 1, 2013 through January 1, 2019. |
| The Swiss “Too Big to Fail” legislation relating to big banks became effective March 1, 2012. The legislation includes capital and liquidity requirements and rules regarding risk diversification and emergency plans designed to maintain systemically important functions even in the event of threatened insolvency. The legislation on capital requirements builds on Basel III, but goes beyond its minimum standards, requiring the Group and the Bank to have common equity of at least 10% of RWA and contingent capital or other qualifying capital of another 9% of RWA by January 1, 2019. |
| On June 1, 2012, the Swiss Federal Council adopted implementing ordinances under the “Too Big to Fail” legislation and with regard to the implementation of Basel III into Swiss law. Effective immediately is a supplemental countercyclical buffer of up to 2.5% of RWA which can be activated during periods of excess credit growth and subsequently deactivated by the Federal Council upon request of the Swiss National Bank after consultation with FINMA. Also effective immediately are increased lending standards for new residential mortgages. The remaining ordinance requirements are expected to become effective January 1, 2013, with some being phased in through the end of 2018. Requirements particular to systemically relevant banks, including specific capital, leverage and Recovery and Resolution Plan requirements, will require approval by Parliament, which is expected to vote in September 2012. A final, liquidity-related implementing ordinance under “Too Big to Fail” is expected to be completed in 2013. |
| Credit Suisse believes that it can meet the new requirements within the prescribed time frames. |
| > Refer to “Regulatory capital developments and proposals” in III – Treasury, Risk, Balance sheet and Off-balance sheet – Treasury management and “Regulation and supervision” in I – Information on the company in the Credit Suisse Annual Report 2011 for further information, including BCBS Basel III phase-in arrangements. |
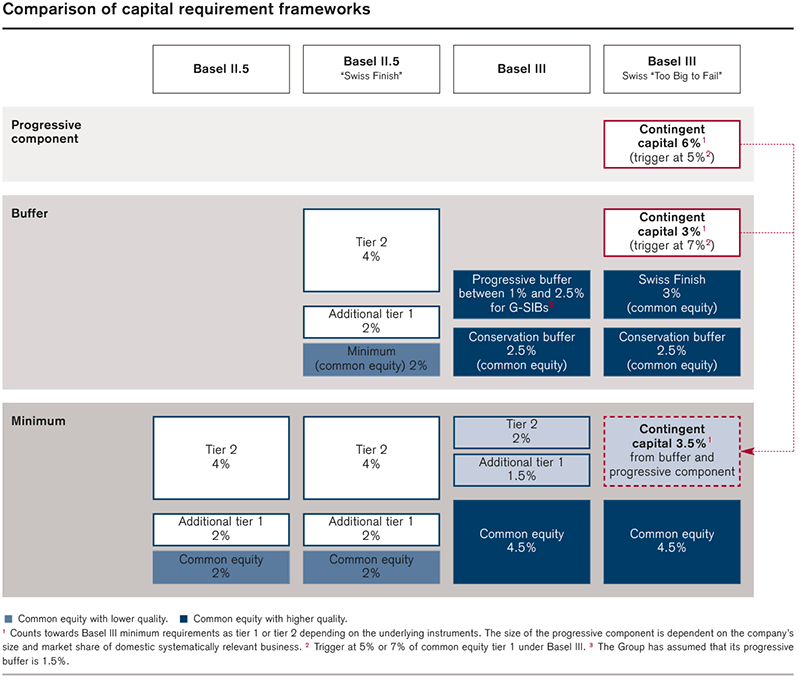 |
Capital ratio simulations |
| The definitions of regulatory capital and capital ratios mentioned below refer to the Swiss “Too Big to Fail” legislation as determined by FINMA. Ratio calculations based on these capital definitions use projected Basel III year-end 2012 RWA. The expected year-end 2012 ratios are based on a pro-forma calculation assuming successful completion of the announced capital measures and using Bloomberg consensus net income estimate and our Basel III RWA estimates. |
| As Basel III will not be implemented before January 1, 2013, we have calculated our Basel III RWA and capital for purposes of this report in accordance with the currently proposed requirements and our current interpretation of such requirements, including relevant assumptions. Changes in the actual implementation of Basel III would result in different numbers from those shown in this report. |
| Accordingly, our calculations are based on our current expectations and forecasts about future events, including our ability to utilize net deferred tax assets on net operating losses, our assumption of successful completion of capital measures, analyst consensus forecasts in the case of earnings, and an assumption that dividends will remain constant from the amount paid in respect of 2011 and that the total amount of the dividend to be paid in respect of 2012 will be paid in shares, as well as our current interpretation of proposed requirements. As a result, information with regard to the simulated capital ratios is subject to uncertainties that could cause our actual capital ratios to differ. |
| > Refer to “Capital measures” in I – Credit Suisse results – Core Results – Information and developments for further information on capital measures and earnings-related effects announced on July 18, 2012. |
Basel III common equity tier 1 (CET1) ratio simulation |
| We updated our earlier simulation to reflect recent developments, including the capital measures announced on July 18, 2012. With regard to Basel III RWA, we increased our earlier guidance for year-end 2012 from CHF 280 billion to CHF 300 billion, which reflects current foreign exchange rates and estimates for Basel III treatment. Compared to Basel II.5 RWA, we now estimate the RWA increase due to Basel III on January 1, 2013 to be CHF 71 billion. We expect substantially all of the Basel III RWA increase to be in the securitized products, global rates, foreign exchange, global credit products and equity derivatives businesses in Investment Banking. We expect to reduce Basel III RWA by January 1, 2013 by approximately CHF 5 billion, primarily in Investment Banking. The RWA reduction reflects our evolving strategy, including the RWA reduction in fixed income. |
| > Refer to “Progress on strategy implementation” in I – Credit Suisse results – Core Results – Information and developments. |
| As of January 1, 2013, we expect a Basel III CET1 ratio of approximately 13.9%, up from approximately 13.1% as per our 1Q12 simulation. The following presentation is consistent with the phase-in requirements of Basel III. |
| CET1 ratio simulation | |||
| Capital development (CHF billion) | |||
| Total shareholders' equity – June 30, 2012 | 34.8 | ||
| Fair value own debt 1 | (1.3) | ||
| CET1 capital – June 30, 2012 | 33.5 | ||
| Consensus net income 2012 2 | 1.6 | ||
| Capital measures 3 | 6.3 | ||
| Share-based compensation and other impacts | 0.4 | ||
| CET1 capital – January 1, 2013 | 41.8 | ||
| Risk-weighted assets (RWA) development (CHF billion) | |||
| RWA (Basel II.5) – June 30, 2012 | 234 | ||
| Estimated Basel III changes | 71 | ||
| RWA (Basel III before reduction) | 305 | ||
| Reduction of RWA | (5) | ||
| RWA (Basel III) – January 1, 2013 4 | 300 | ||
| Capital ratio (%) | |||
| CET1 ratio - January 1, 2013 | 13.9 | ||
| 1 Fair value own debt represents the fair value changes from movements in spreads on our own vanilla debt and structured notes, net of tax. 2 Bloomberg consensus net income estimate for 2012 (adjusted for actual 6M12 net income) is not endorsed or verified and is used solely for illustrative purposes. Actual net income may differ significantly. 3 As announced on July 18, 2012. Includes CHF 3.8 billion of mandatory and contingent convertible securities, CHF 1.1 billion of strategic divestments, CHF 0.75 billion from the exchange of Adjustable Performance Plan awards, CHF 0.5 billion from real estate sales and CHF 0.2 billion from the sale of the residual stake in Aberdeen Asset Management. Based on a pro-forma calculation assuming successful completion of announced capital actions. Actual results may differ. 4 Under our strategic business plan, business growth will require reallocation of capital, because we are targeting no gross increase in risk-weighted assets. Assumed year-end 2012 goal of CHF 300 billion reflects current foreign exchange rates and estimates for Basel III treatment. Includes Basel III risk-weighted assets (in US dollars) in Investment Banking at or below current levels. | |||
| For the years 2014 – 2018, there will be a five-year (20% per annum) phase in of goodwill and other intangibles and other Basel III capital deductions (e.g., deferred tax assets and participations in financial institutions). Considering the impact of the capital measures announced on July 18, 2012 and assuming fully phased-in goodwill and intangible assets and other capital deductions, the CET1 ratio is estimated to be 8.6% as of January 1, 2013. |
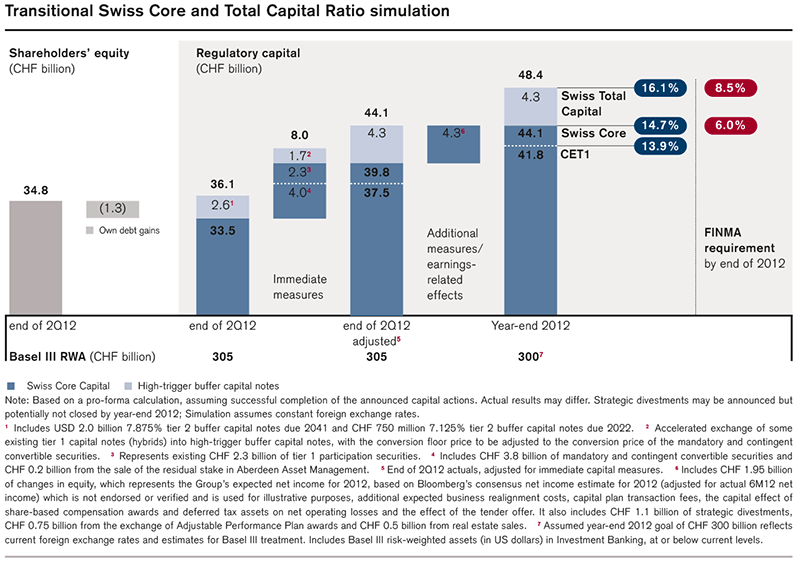 |
Transitional Swiss Core and Total Capital Ratio simulation |
| Swiss Core Capital includes the Basel III CET1 and existing tier 1 participation securities that qualify as part of the Swiss equity requirement in excess of the 8.5% Basel III G-SIB CET1 ratio that will be applicable to us as of January 1, 2013. The announced capital measures and earnings-related effects result in an expected year-end 2012 Swiss Core Capital Ratio of 14.7% and Swiss Total Capital Ratio of 16.1%, compared to 6.0% and 8.5%, respectively, that will be required by FINMA. |
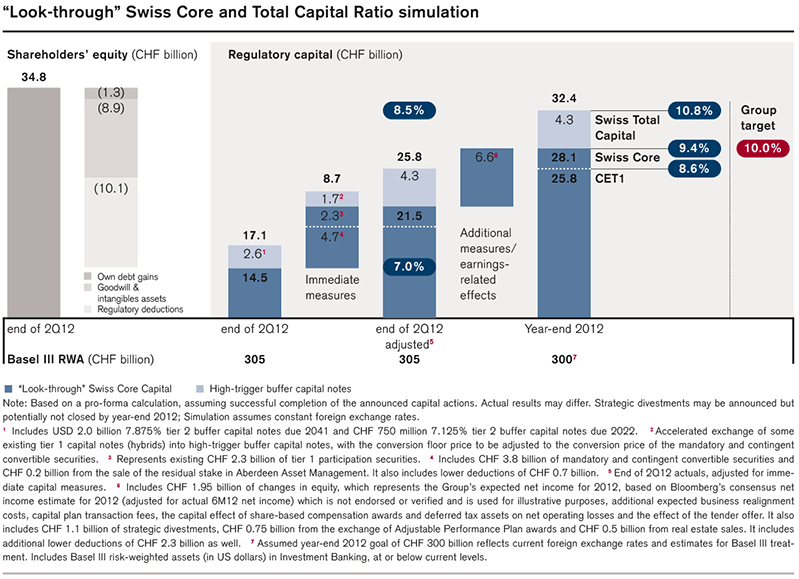 |
Look-through Swiss Core and Total Capital Ratio simulation |
| The Look-through Swiss Core Capital includes Basel III CET1 and existing participation securities that qualify as part of the Swiss equity requirements in excess of the 8.5% Basel III G-SIB CET1 ratio, assuming fully phased-in goodwill and intangible assets and other capital deductions. The announced capital measures and earnings-related effects result in an expected year-end 2012 Look-through Swiss Core Capital Ratio of 9.4%, compared to the 10.0% that will be required by year-end 2018. |
Risk management |
| In 2Q12, our utilized economic capital increased 5%, overall position risk increased 8%, average risk management VaR in US dollars decreased 14% and impaired loans increased slightly to CHF 1.8 billion. |
Economic capital and position risk |
| Economic capital is used as a consistent and comprehensive tool for risk management, capital management and performance measurement. It is our core Group-wide risk management tool for measuring and reporting all quantifiable risks. Economic capital measures risks in terms of economic realities rather than regulatory or accounting rules and is the estimated capital needed to remain solvent and in business, even under extreme market, business and operational conditions, given our target financial strength (our long-term credit rating). |
| We regularly review our economic capital methodology in order to ensure that the model remains relevant as markets and business strategies evolve. In 2Q12, there were no changes to the economic capital methodology. |
| > Refer to “Economic capital and position risk” in III – Treasury, Risk, Balance sheet and Off-balance sheet – Risk management in the Credit Suisse Annual Report 2011 for further information on economic capital and position risk. |
| Position risk |
| end of | % change | ||||||||||||||
| 2Q12 | 1Q12 | 4Q11 | 2Q11 | QoQ | Ytd | YoY | |||||||||
| Position risk (CHF million) | |||||||||||||||
| Fixed income trading 1 | 2,710 | 2,674 | 2,778 | 2,553 | 1 | (2) | 6 | ||||||||
| Equity trading & investments | 2,082 | 2,099 | 2,123 | 2,085 | (1) | (2) | 0 | ||||||||
| Private banking corporate & retail lending | 2,187 | 2,085 | 2,182 | 2,067 | 5 | 0 | 6 | ||||||||
| International lending & counterparty exposures | 4,193 | 3,892 | 4,341 | 4,020 | 8 | (3) | 4 | ||||||||
| Emerging markets country event risk | 1,304 | 928 | 860 | 645 | 41 | 52 | 102 | ||||||||
| Real estate & structured assets 2 | 2,348 | 2,155 | 2,111 | 2,591 | 9 | 11 | (9) | ||||||||
| Simple sum across risk categories | 14,824 | 13,833 | 14,395 | 13,961 | 7 | 3 | 6 | ||||||||
| Diversification benefit 3 | (3,015) | (2,894) | (2,646) | (2,550) | 4 | 14 | 18 | ||||||||
| Position risk (99% confidence level for risk management purposes) | 11,809 | 10,939 | 11,749 | 11,411 | 8 | 1 | 3 | ||||||||
| Prior-period balances have been restated for methodology changes in order to show meaningful trends. | |||||||||||||||
| 1 This category comprises fixed income trading, foreign exchange and commodity exposures. 2 This category comprises commercial and residential real estate (including RMBS and CMBS), ABS exposure, real estate acquired at auction and real estate fund investments. 3 Reflects the net difference between the sum of the position risk categories and the position risk on the total portfolio. | |||||||||||||||
Key position risk trends |
| Position risk for risk management purposes as of the end of 2Q12 increased 8% compared to the end of 1Q12. Excluding the US dollar translation impact, position risk increased 4%, mainly due to increased exposure in Eastern Europe and Asia in emerging markets country event risk, new loans and reduced hedges in Investment Banking in international lending & counterparty exposures and increased mortgage exposures and commercial loans in private banking corporate & retail lending. These increases were partially offset by reduced private equity risk due to asset sales and decreased market value of investments and lower equity derivative exposures in equity trading & investments and lower foreign exchange and credit spread exposures in fixed income trading. |
| Compared to the end of 2Q11, position risk for risk management purposes increased 3%. Excluding the US dollar translation impact, position risk decreased 6%, primarily due to lower residential mortgage-backed securities (RMBS) exposure following sales in real estate & structured assets, lower counterparty risk in Investment Banking in international lending & counterparty exposures, lower private equity and cash equities exposures in equity trading & investments and lower credit spread exposures in fixed income trading. These reductions were partially offset by increased exposures in Latin America and Eastern Europe in emerging markets country event risk and increased mortgage exposures and commercial loans in private banking corporate & retail lending. |
| As part of our overall risk management, we hold a portfolio of hedges. Hedges are impacted by market movements similar to other trading securities and may result in gains or losses which offset losses or gains on the portfolio they were designated to hedge. Due to the varying nature and structure of hedges, these gains or losses may not perfectly offset the losses or gains on the portfolio. |
| Economic capital |
| in / end of | % change | ||||||||||||||
| 2Q12 | 1Q12 | 4Q11 | 2Q11 | QoQ | Ytd | YoY | |||||||||
| Economic capital resources (CHF million) | |||||||||||||||
| Tier 1 capital 1 | 38,512 | 36,668 | 36,844 | 34,592 | 5 | 5 | 11 | ||||||||
| Economic adjustments 2 | 2,378 | 2,521 | 2,417 | 4,408 | (6) | (2) | (46) | ||||||||
| Economic capital resources | 40,890 | 39,189 | 39,261 | 39,000 | 4 | 4 | 5 | ||||||||
| Utilized economic capital (CHF million) | |||||||||||||||
| Position risk (99.97% confidence level) | 21,046 | 19,470 | 20,921 | 20,257 | 8 | 1 | 4 | ||||||||
| Operational risk | 3,836 | 3,754 | 3,754 | 3,470 | 2 | 2 | 11 | ||||||||
| Other risks 3 | 7,986 | 8,019 | 8,300 | 6,005 | 0 | (4) | 33 | ||||||||
| Utilized economic capital | 32,868 | 31,243 | 32,975 | 29,732 | 5 | 0 | 11 | ||||||||
| Utilized economic capital by segment (CHF million) | |||||||||||||||
| Private Banking | 7,891 | 7,229 | 7,519 | 6,971 | 9 | 5 | 13 | ||||||||
| Investment Banking | 20,013 | 19,030 | 20,310 | 19,349 | 5 | (1) | 3 | ||||||||
| Asset Management | 3,081 | 3,065 | 3,224 | 3,107 | 1 | (4) | (1) | ||||||||
| Corporate Center 4 | 1,887 | 1,937 | 1,927 | 322 | (3) | (2) | 486 | ||||||||
| Utilized economic capital - Credit Suisse 5 | 32,868 | 31,243 | 32,975 | 29,732 | 5 | 0 | 11 | ||||||||
| Average utilized economic capital by segment (CHF million) | |||||||||||||||
| Private Banking | 7,560 | 7,374 | 7,365 | 7,025 | 3 | 3 | 8 | ||||||||
| Investment Banking | 19,522 | 19,670 | 19,813 | 19,620 | (1) | (1) | 0 | ||||||||
| Asset Management | 3,073 | 3,145 | 3,207 | 3,218 | (2) | (4) | (5) | ||||||||
| Corporate Center 4 | 1,912 | 1,932 | 1,924 | 715 | (1) | (1) | 167 | ||||||||
| Average utilized economic capital - Credit Suisse 6 | 32,056 | 32,109 | 32,303 | 30,559 | 0 | (1) | 5 | ||||||||
| Prior-period balances have been restated for methodology changes in order to show meaningful trends. | |||||||||||||||
| 1 Reported under Basel II.5 for all periods presented. 2 Primarily includes securitization adjustments, unrealized gains on owned real estate and anticipated cash dividends. Economic adjustments are made to tier 1 capital to enable comparison between capital utilization and resources under the Basel framework. 3 Includes owned real estate risk, expense risk, pension risk, foreign exchange risk between economic capital resources and utilized economic capital, interest rate risk on treasury positions, diversification benefit and an estimate for the impacts of certain methodology changes planned for 2012. 4 Includes primarily expense risk diversification benefits from the divisions and foreign exchange risk between economic capital resources and utilized economic capital. 5 Includes a diversification benefit of CHF 4 million, CHF 18 million, CHF 5 million and CHF 17 million as of the end of 2Q12, 1Q12, 4Q11 and 2Q11, respectively. 6 Includes a diversification benefit of CHF 11 million, CHF 12 million, CHF 6 million and CHF 19 million as of the end of 2Q12, 1Q12, 4Q11 and 2Q11, respectively. | |||||||||||||||
Utilized economic capital trends |
| In 2Q12, our utilized economic capital increased 5%, mainly due to increased position risk. Excluding the US dollar translation impact, utilized economic capital increased 2%. |
| For Private Banking, utilized economic capital increased 9%, mainly due to higher emerging markets country event position risk, higher private banking corporate & retail lending position risk and higher owned real estate risk in other risks reflecting updated real estate valuations. |
| For Investment Banking, utilized economic capital increased 5%. Excluding the US dollar translation impact, utilized economic capital increased 1%, largely due to increased position risk in fixed income trading, emerging markets country event risk and international lending & counterparty exposures. The increase was partially offset by lower interest rate risk on treasury positions in other risks. |
| For Asset Management, utilized economic capital increased 1%. Excluding the US dollar translation impact, utilized economic capital decreased 3%, primarily due to decreased position risk in private equity in equity trading & investments due to asset sales and decreased market value of investments. |
| For Corporate Center, lower utilized economic capital reflected a decrease in foreign exchange risk between utilized economic capital and economic capital resources. |
Market risk |
Trading portfolios |
| We primarily assume market risk through the trading activities in Investment Banking. The other divisions also engage in trading activities, but to a much lesser extent. Trading risks are measured using VaR along with a number of other risk measurement tools. VaR measures the potential loss in fair value of trading positions due to adverse market movements over a defined time horizon at a specified confidence level. VaR relies on historical data and is considered a useful tool for estimating potential loss in normal markets in which there are no abrupt changes in market conditions. We use risk management VaR for internal risk management purposes and regulatory VaR for regulatory capital purposes. For risk management VaR, we use a one-day holding period and a 98% confidence level. This means there is a 1-in-50 chance of incurring a daily mark-to-market trading loss at least as large as the reported VaR. For regulatory VaR, we present one-day, 99% VaR, which is a ten-day VaR adjusted to a one-day holding period. Our VaR methodology is the same for both VaR measures, except for the confidence levels and holding periods. Other tools, including stress testing, are more appropriate for modeling the impact from severe market conditions. |
| We regularly review our VaR model to ensure that it remains appropriate given evolving market conditions and the composition of our trading portfolio. As part of this process, we updated our asset class methodology in May 2012 to better capture complex risks for exotic rate products. |
| For regulatory capital purposes, we operate under the Basel II.5 market risk framework which includes an incremental risk charge and stressed VaR. |
| > Refer to “Market risk” in III – Treasury, Risk, Balance sheet and Off-balance sheet – Risk management in the Credit Suisse Annual Report 2011 for further information. |
| In order to show the aggregate market risk in our trading books, the chart entitled “Daily risk management VaR” shows the trading-related market risk on a consolidated basis. |
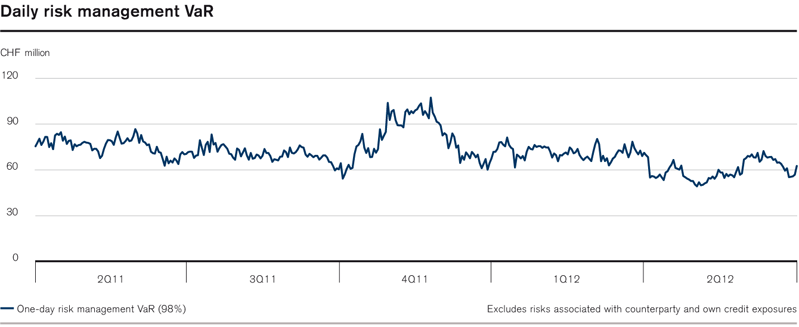 |
| One-day, 98% risk management VaR and one-day, 99% regulatory VaR (CHF) |
| Risk management VaR (98%) | Regulatory VaR (99%) | ||||||||||||||
in / end of | Interest rate & credit spread | Foreign exchange | Commodity | Equity | Diversi- fication benefit | Total | Total | ||||||||
| 2Q12 (CHF million) | |||||||||||||||
| Average | 56 | 18 | 3 | 20 | (37) | 60 | 60 | ||||||||
| Minimum | 49 | 7 | 2 | 14 | – | 1 | 49 | 51 | |||||||
| Maximum | 65 | 34 | 4 | 30 | – | 1 | 72 | 89 | |||||||
| End of period | 60 | 8 | 2 | 19 | (27) | 62 | 60 | ||||||||
| 1Q12 (CHF million) | |||||||||||||||
| Average | 72 | 18 | 4 | 22 | (48) | 68 | 69 | ||||||||
| Minimum | 59 | 9 | 2 | 14 | – | 1 | 53 | 48 | |||||||
| Maximum | 82 | 26 | 7 | 35 | – | 1 | 80 | 89 | |||||||
| End of period | 61 | 26 | 3 | 17 | (46) | 61 | 55 | ||||||||
| 2Q11 (CHF million) | |||||||||||||||
| Average | 66 | 13 | 12 | 27 | (48) | 70 | 111 | ||||||||
| Minimum | 60 | 5 | 8 | 18 | – | 1 | 62 | 52 | |||||||
| Maximum | 77 | 22 | 17 | 40 | – | 1 | 83 | 146 | |||||||
| End of period | 70 | 8 | 13 | 20 | (40) | 71 | 56 | ||||||||
| Excludes risks associated with counterparty and own credit exposures. In June 2011, we made significant changes to our VaR methodology. Risk management VaR for periods prior to implementation was restated in order to show meaningful trends. For regulatory VaR, these methodology changes were reflected from implementation only. | |||||||||||||||
| 1 As the maximum and minimum occur on different days for different risk types, it is not meaningful to calculate a portfolio diversification benefit. | |||||||||||||||
| One-day, 98% risk management VaR and one-day, 99% regulatory VaR (USD) |
| Risk management VaR (98%) | Regulatory VaR (99%) | ||||||||||||||
in / end of | Interest rate & credit spread | Foreign exchange | Commodity | Equity | Diversi- fication benefit | Total | Total | ||||||||
| 2Q12 (USD million) | |||||||||||||||
| Average | 60 | 19 | 3 | 21 | (39) | 64 | 65 | ||||||||
| Minimum | 53 | 7 | 2 | 16 | – | 1 | 53 | 55 | |||||||
| Maximum | 72 | 38 | 5 | 33 | – | 1 | 75 | 93 | |||||||
| End of period | 62 | 8 | 2 | 20 | (28) | 64 | 62 | ||||||||
| 1Q12 (USD million) | |||||||||||||||
| Average | 78 | 20 | 4 | 23 | (51) | 74 | 75 | ||||||||
| Minimum | 64 | 9 | 2 | 15 | – | 1 | 59 | 53 | |||||||
| Maximum | 90 | 29 | 8 | 37 | – | 1 | 88 | 97 | |||||||
| End of period | 68 | 29 | 3 | 19 | (51) | 68 | 60 | ||||||||
| 2Q11 (USD million) | |||||||||||||||
| Average | 76 | 14 | 14 | 31 | (54) | 81 | 126 | ||||||||
| Minimum | 70 | 6 | 10 | 21 | – | 1 | 68 | 63 | |||||||
| Maximum | 83 | 24 | 18 | 48 | – | 1 | 95 | 163 | |||||||
| End of period | 83 | 10 | 16 | 24 | (48) | 85 | 67 | ||||||||
| Excludes risks associated with counterparty and own credit exposures. In June 2011, we made significant changes to our VaR methodology. Risk management VaR for periods prior to implementation was restated in order to show meaningful trends. For regulatory VaR, these methodology changes were reflected from implementation only. | |||||||||||||||
| 1 As the maximum and minimum occur on different days for different risk types, it is not meaningful to calculate a portfolio diversification benefit. | |||||||||||||||
| We measure VaR in US dollars, as substantially all market risk relates to Investment Banking. |
| Average risk management VaR decreased 14% to USD 64 million from 1Q12. The decrease reflected lower risk across fixed income due to lower market volatility and reduced interest rate exposures. Compared to 2Q11, average risk management VaR decreased 21%, primarily reflecting lower risk across fixed income due to lower market volatility and net sales of RMBS client inventory mainly in 3Q11 and 4Q11. |
| Period-end risk management VaR decreased 6% to USD 64 million from 1Q12, mainly reflecting lower market volatility and reduced interest rate exposures. Compared to 2Q11, period-end risk management VaR decreased 25%, also mainly reflecting lower market volatility. |
| Various techniques are used to assess the accuracy of the regulatory VaR model used for trading portfolios, including backtesting. We conduct such backtesting using actual daily trading revenues. Actual daily trading revenues are compared with a regulatory 99% VaR calculated using a one-day holding period. A backtesting exception occurs when a trading loss exceeds the daily VaR estimate. We had no such backtesting exceptions in 2Q12. |
| For capital purposes, FINMA, in line with BIS requirements, uses a multiplier to impose an increase in market risk capital for every regulatory VaR exception over four in the prior rolling 12-month period calculated using a subset of actual daily trading revenues. |
| > Refer to “Capital management” in Treasury management for further information on the use of our regulatory VaR model in the calculation of trading book market risk capital requirements. |
| The histogram entitled “Actual daily trading revenues” compares the actual daily trading revenues for 2Q12 with those for 1Q12 and 2Q11. The dispersion of trading revenues indicates the day-to-day volatility in our trading activities. In 2Q12, we had two days of trading losses, compared to no trading loss days in 1Q12. |
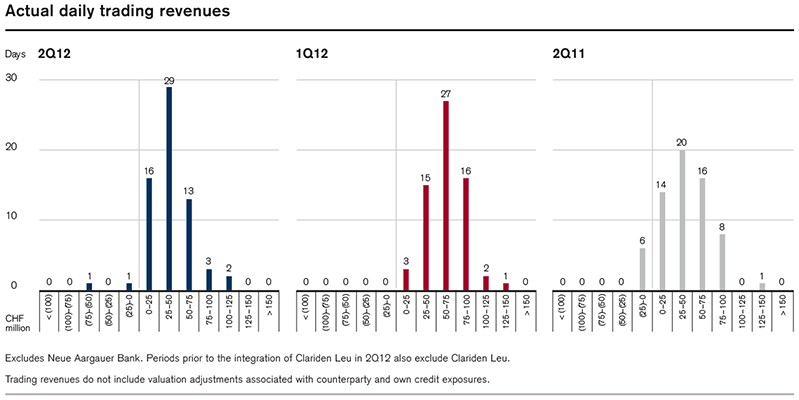 |
Banking portfolios |
| We assume non-trading interest rate risk through interest rate-sensitive positions originated by Private Banking and risk-transferred to Treasury, money market and funding activities by Treasury and the deployment of our consolidated equity as well as other activities, including market making and trading activities involving banking book positions at the divisions, primarily Investment Banking. Savings accounts and many other retail banking products have no contractual maturity date or direct market-linked interest rate and are risk-transferred from Private Banking to Treasury on a pooled basis using replicating portfolios (approximating the re-pricing behavior of the underlying product). Treasury and certain other areas of the Group running interest rate risk positions actively manage the positions within approved limits. |
| The impact of a one basis point parallel increase of the yield curves on the fair value of interest rate-sensitive non-trading book positions would have amounted to a valuation increase of CHF 8.0 million as of the end of 2Q12, compared to a valuation increase of CHF 7.7 million as of the end of 1Q12. |
Credit risk |
| Credit risk is the possibility of a loss being incurred by us as the result of a borrower or counterparty failing to meet its financial obligations or as a result of deterioration in the credit quality of the borrower or counterparty. In the event of a customer default, a bank generally incurs a loss equal to the amount owed by the debtor, less any recoveries from foreclosure, liquidation of collateral, or the restructuring of the debtor company. A change in the credit quality of a counterparty has an impact on the valuation of assets eligible for fair value measurement, with valuation changes recorded in the consolidated statements of operations. |
Sources of credit risk |
| The majority of our credit risk is concentrated in Private Banking and Investment Banking. Credit risk exists within lending products, commitments and letters of credit, and results from counterparty exposure arising from derivatives, foreign exchange and other transactions. |
| Our regular review of the creditworthiness of clients and counterparties does not depend on the accounting treatment of the asset or commitment. Adverse changes in the creditworthiness of counterparties of loans held at fair value are reflected in valuation changes reported directly in revenues, and therefore are not part of the impaired loans balance. |
| > Refer to “Credit risk” in III – Treasury, Risk, Balance sheet and Off-balance sheet – Risk management in the Credit Suisse Annual Report 2011 for further information on credit risk. |
| > Refer to “Note 26 – Financial instruments” in III – Condensed consolidated financial statements – unaudited for further information on counterparty credit risk. |
Selected European credit risk exposures |
| The scope of our disclosure of European credit risk exposure includes all countries of the EU which are rated below AA or its equivalent by at least one of the three major rating agencies and where our gross exposure exceeds our quantitative threshold of EUR 0.5 billion. We believe this external rating is a useful measure in determining the financial ability of countries to meet their financial obligations, including giving an indication of vulnerability to adverse business, financial and economic conditions. |
| The basis for the presentation of the country exposure is our internal risk domicile view. The risk domicile view is based on the domicile of the legal counterparty, i.e., it may include exposure to a legal entity domiciled in the reported country where its parent is located outside of the country. |
| The credit risk exposure in the table is presented on a risk-based view. We present our credit risk exposure and related risk mitigation for the following distinct categories: |
| – Gross credit risk exposure includes the principal amount of loans drawn, letters of credit issued and undrawn portions of committed facilities, the positive replacement value of derivative instruments after consideration of legally enforceable netting agreements, the notional value of investments in money market funds and the market values of securities financing transactions and the debt cash trading portfolio (short-term securities) netted at issuer level. |
| – Risk mitigation includes credit default swaps (CDS) and other hedges, guarantees, insurance and collateral (primarily cash, securities and, to a lesser extent, real estate, mainly for Private Banking exposure to corporates & other). Collateral values applied for the calculation of the net exposure are determined in accordance with our risk management policies and reflect applicable margining considerations. |
| – Net credit risk exposurerepresents gross credit risk exposure net of risk mitigation. |
| – Inventoryrepresents the long inventory positions in trading and non-trading physical debt and synthetic positions, each at market value, all netted at issuer level. Physical debt is non-derivative debt positions (e.g., bonds), and synthetic positions are created through over-the-counter (OTC) contracts (e.g., CDS and total return swaps). |
| Our credit risk exposure to these European countries is managed as part of our risk management process. The Group makes use of country limits and performs scenario analyses on a regular basis, which include analyses on our indirect sovereign credit risk exposures from our exposures to selected European financial institutions. |
| Selected European credit risk exposures |
| Gross credit risk exposure | Risk mitigation | Net credit risk exposure | Inventory | Total credit risk exposure | |||||||||||
| end of 2Q12 | CDS | Other | 1 | Gross | Net | ||||||||||
| Greece (EUR billion) | |||||||||||||||
| Sovereigns | 0.2 | 0.0 | 0.2 | 0.0 | 0.0 | 0.2 | 0.0 | ||||||||
| Financial institutions | 0.1 | 0.0 | 0.1 | 0.0 | 0.0 | 0.1 | 0.0 | ||||||||
| Corporates & other | 0.5 | 0.0 | 0.4 | 0.1 | 0.0 | 0.5 | 0.1 | ||||||||
| Total | 0.8 | 0.0 | 0.7 | 0.1 | 0.0 | 0.8 | 0.1 | ||||||||
| Ireland (EUR billion) | |||||||||||||||
| Sovereigns | 0.0 | 0.0 | 0.0 | 0.0 | 0.0 | 0.0 | 0.0 | ||||||||
| Financial institutions | 1.1 | 0.0 | 0.8 | 0.3 | 0.1 | 1.2 | 0.4 | ||||||||
| Corporates & other | 0.7 | 0.0 | 0.4 | 0.3 | 0.0 | 0.7 | 0.3 | ||||||||
| Total | 1.8 | 0.0 | 1.2 | 0.6 | 0.1 | 1.9 | 0.7 | ||||||||
| Italy (EUR billion) | |||||||||||||||
| Sovereigns | 3.4 | 2.8 | 0.3 | 0.3 | 0.0 | 3.4 | 0.3 | ||||||||
| Financial institutions | 2.2 | 0.0 | 1.6 | 0.6 | 0.5 | 2.7 | 1.1 | ||||||||
| Corporates & other | 2.4 | 0.4 | 1.3 | 0.7 | 0.4 | 2.8 | 1.1 | ||||||||
| Total | 8.0 | 3.2 | 3.2 | 1.6 | 0.9 | 8.9 | 2.5 | ||||||||
| Portugal (EUR billion) | |||||||||||||||
| Sovereigns | 0.2 | 0.2 | 0.0 | 0.0 | 0.0 | 0.2 | 0.0 | ||||||||
| Financial institutions | 0.2 | 0.0 | 0.2 | 0.0 | 0.0 | 0.2 | 0.0 | ||||||||
| Corporates & other | 0.2 | 0.0 | 0.1 | 0.1 | 0.0 | 0.2 | 0.1 | ||||||||
| Total | 0.6 | 0.2 | 0.3 | 0.1 | 0.0 | 0.6 | 0.1 | ||||||||
| Spain (EUR billion) | |||||||||||||||
| Sovereigns | 0.0 | 0.0 | 0.0 | 0.0 | 0.1 | 0.1 | 0.1 | ||||||||
| Financial institutions | 1.6 | 0.0 | 1.4 | 0.2 | 0.6 | 2.2 | 0.8 | ||||||||
| Corporates & other | 1.8 | 0.2 | 0.8 | 0.8 | 0.2 | 2.0 | 1.0 | ||||||||
| Total | 3.4 | 0.2 | 2.2 | 1.0 | 0.9 | 4.3 | 1.9 | ||||||||
| Total (EUR billion) | |||||||||||||||
| Sovereigns | 3.8 | 3.0 | 0.5 | 0.3 | 0.1 | 3.9 | 0.4 | ||||||||
| Financial institutions | 5.2 | 0.0 | 4.1 | 1.1 | 1.2 | 6.4 | 2.3 | ||||||||
| Corporates & other | 5.6 | 0.6 | 3.0 | 2.0 | 0.6 | 6.2 | 2.6 | ||||||||
| Total | 14.6 | 3.6 | 7.6 | 3.4 | 1.9 | 16.5 | 5.3 | ||||||||
| 1 Includes other hedges (derivative instruments), guarantees, insurance and collateral. | |||||||||||||||
| On a gross basis, before taking into account risk mitigation, our risk-based sovereign credit risk exposure to Greece, Ireland, Italy, Portugal and Spain as of the end of 2Q12 was EUR 3.9 billion, down from EUR 4.4 billion as of the end of 1Q12. Our net exposure to these sovereigns was EUR 0.4 billion, down from EUR 1.1 billion as of the end of 1Q12. Our non-sovereign risk-based credit risk exposure in these countries as of the end of 2Q12 included net exposure to financial institutions of EUR 2.3 billion and to corporates and other counterparties of EUR 2.6 billion, up from EUR 2.0 billion and EUR 2.4 billion, respectively, as of the end of 1Q12. A significant majority of the purchased credit protection is transacted with banks outside of the disclosed countries; otherwise such credit risk is reflected in the gross and net exposure to each relevant country. |
| In 2Q12, the long-term sovereign debt ratings of the countries listed in the table were affected as follows: Standard & Poor’s lowered the rating for Spain by two notches to BBB+ from A and for Greece by two notches to CCC from B–. Fitch lowered Greece’s rating to CCC from B– and Spain’s to BBB from A. Moody’s downgraded Spain to Baa3 from A3. The rating changes did not have a significant impact on the Group’s financial condition, result of operations, liquidity or capital resources. |
Credit risk overview |
| The following table represents credit risk from loans, loan commitments and certain other contingent liabilities, loans held-for-sale, traded loans and derivative instruments before consideration of risk mitigation such as cash collateral and marketable securities or credit hedges. Loan commitments include irrevocable credit facilities for Investment Banking and Private Banking and unused credit limits which can be revoked at our sole discretion upon notice to the client in Private Banking. |
| Credit risk |
| end of | % change | ||||||||||||||
| 2Q12 | 1Q12 | 4Q11 | 2Q11 | QoQ | Ytd | YoY | |||||||||
| Balance sheet (CHF million) | |||||||||||||||
| Gross loans | 240,163 | 232,655 | 234,357 | 220,978 | 3 | 2 | 9 | ||||||||
| Loans held-for-sale | 20,115 | 20,147 | 20,457 | 23,816 | 0 | (2) | (16) | ||||||||
| Traded loans | 3,488 | 3,603 | 3,581 | 4,167 | (3) | (3) | (16) | ||||||||
| Derivative instruments 1 | 45,449 | 47,744 | 56,254 | 42,491 | (5) | (19) | 7 | ||||||||
| Total balance sheet | 309,215 | 304,149 | 314,649 | 291,452 | 2 | (2) | 6 | ||||||||
| Off-balance sheet (CHF million) | |||||||||||||||
| Loan commitments 2 | 220,450 | 218,199 | 220,560 | 210,823 | 1 | 0 | 5 | ||||||||
| Credit guarantees and similar instruments | 17,062 | 17,034 | 7,348 | 5,493 | 0 | 132 | 211 | ||||||||
| Irrevocable commitments under documentary credits | 4,573 | 4,747 | 5,687 | 4,848 | (4) | (20) | (6) | ||||||||
| Total off-balance sheet | 242,085 | 239,980 | 233,595 | 221,164 | 1 | 4 | 9 | ||||||||
| Total credit risk | 551,300 | 544,129 | 548,244 | 512,616 | 1 | 1 | 8 | ||||||||
| Before risk mitigation, for example, collateral, credit hedges. | |||||||||||||||
| 1 Positive replacement value after netting agreements. 2 Includes CHF 135 billion, CHF 133 billion, CHF 138 billion and CHF 136 billion of unused credit limits as of the end of 2Q12, 1Q12, 4Q11 and 2Q11, respectively, which were revocable at our sole discretion upon notice to the client. | |||||||||||||||
Loan exposure |
| Compared to the end of 1Q12, gross loans increased CHF 7.5 billion to CHF 240.2 billion. In Private Banking, gross loans were CHF 203.3 billion, slightly up from 1Q12, mainly reflecting increases in commercial and industrial loans, residential mortgages and consumer finance and the US dollar translation impact across the loan portfolio. Gross loans in Investment Banking increased 7% to CHF 36.8 billion, mainly reflecting the US dollar translation impact and increases in loans to financial institutions and governments and public institutions. |
| Gross impaired loans increased slightly to CHF 1.8 billion as of the end of 2Q12, mainly due to an increase in potential problem loans in Private Banking and increases in restructured loans and non-performing loans in Investment Banking. In Private Banking, an increase in non-interest-earning loans was due to reclassifications from non-performing loans. A portion of the impaired loans is economically hedged by insurance and other risk mitigation, including CDS. |
| We recorded a net provision for credit losses of CHF 25 million in 2Q12, compared to a net provision of CHF 34 million in 1Q12, with a net provision of CHF 39 million in Private Banking and a net release of CHF 14 million in Investment Banking. |
| > Refer to “Private Banking” and “Investment Banking” in I – Credit Suisse results for further information. |
| Compared to the end of 2Q11, gross loans increased 9%. An increase in Private Banking was primarily due to higher commercial and industrial loans, residential mortgages and loans to the real estate sector and the US dollar translation impact. In Investment Banking, the increase was mainly related to the US dollar translation impact and increased loans to governments and public institutions, partially offset by a decrease in loans to the real estate sector and lower commercial and industrial loans. Gross impaired loans increased 8%, as increases in potential problem loans and non-performing loans in Private Banking were offset by decreases across most impaired loan categories in Investment Banking. |
| Loans |
| Private Banking | Investment Banking | Credit Suisse | 1 | ||||||||||||||||
| end of | 2Q12 | 1Q12 | 2Q11 | 2Q12 | 1Q12 | 2Q11 | 2Q12 | 1Q12 | 2Q11 | ||||||||||
| Loans (CHF million) | |||||||||||||||||||
| Mortgages | 90,618 | 89,598 | 86,374 | 0 | 0 | 0 | 90,618 | 89,598 | 86,374 | ||||||||||
| Loans collateralized by securities | 26,281 | 25,950 | 25,725 | 0 | 0 | 0 | 26,281 | 25,950 | 25,725 | ||||||||||
| Consumer finance | 6,605 | 5,661 | 5,379 | 486 | 601 | 634 | 7,176 | 6,320 | 6,024 | ||||||||||
| Consumer | 123,504 | 121,209 | 117,478 | 486 | 601 | 634 | 124,075 | 121,868 | 118,123 | ||||||||||
| Real estate | 24,414 | 23,648 | 22,247 | 1,702 | 1,957 | 1,916 | 26,116 | 25,605 | 24,163 | ||||||||||
| Commercial and industrial loans | 47,128 | 45,071 | 39,325 | 14,674 | 14,283 | 13,406 | 61,813 | 59,363 | 52,733 | ||||||||||
| Financial institutions | 6,913 | 7,158 | 7,112 | 18,343 | 16,315 | 16,569 | 25,256 | 23,473 | 23,674 | ||||||||||
| Governments and public institutions | 1,299 | 1,261 | 1,236 | 1,604 | 1,085 | 1,049 | 2,903 | 2,346 | 2,285 | ||||||||||
| Corporate & institutional | 79,754 | 2 | 77,138 | 2 | 69,920 | 2 | 36,323 | 33,640 | 32,940 | 116,088 | 110,787 | 102,855 | |||||||
| Gross loans | 203,258 | 198,347 | 187,398 | 36,809 | 34,241 | 33,574 | 240,163 | 232,655 | 220,978 | ||||||||||
| of which held at fair value | 608 | 448 | 353 | 19,907 | 18,420 | 18,838 | 20,515 | 18,868 | 19,191 | ||||||||||
| Net (unearned income) / deferred expenses | (37) | (26) | (7) | (34) | (25) | (25) | (71) | (51) | (32) | ||||||||||
| Allowance for loan losses 3 | (776) | (755) | (700) | (152) | (153) | (216) | (928) | (908) | (916) | ||||||||||
| Net loans | 202,445 | 197,566 | 186,691 | 36,623 | 34,063 | 33,333 | 239,164 | 231,696 | 220,030 | ||||||||||
| Impaired loans (CHF million) | |||||||||||||||||||
| Non-performing loans | 698 | 781 | 570 | 223 | 212 | 310 | 921 | 993 | 880 | ||||||||||
| Non-interest-earning loans | 272 | 200 | 253 | 26 | 28 | 19 | 298 | 228 | 272 | ||||||||||
| Total non-performing and non-interest-earning loans | 970 | 981 | 823 | 249 | 240 | 329 | 1,219 | 1,221 | 1,152 | ||||||||||
| Restructured loans | 0 | 0 | 5 | 36 | 8 | 41 | 36 | 8 | 46 | ||||||||||
| Potential problem loans | 506 | 476 | 354 | 13 | 21 | 92 | 519 | 497 | 446 | ||||||||||
| Total other impaired loans | 506 | 476 | 359 | 49 | 29 | 133 | 555 | 505 | 492 | ||||||||||
| Gross impaired loans 3 | 1,476 | 1,457 | 1,182 | 298 | 269 | 462 | 1,774 | 1,726 | 1,644 | ||||||||||
| of which loans with a specific allowance | 1,193 | 1,274 | 987 | 197 | 199 | 388 | 1,390 | 1,473 | 1,375 | ||||||||||
| of which loans without a specific allowance | 283 | 183 | 195 | 101 | 70 | 74 | 384 | 253 | 269 | ||||||||||
| Allowance for loan losses (CHF million) | |||||||||||||||||||
| Balance at beginning of period 3 | 755 | 743 | 752 | 153 | 167 | 222 | 908 | 910 | 974 | ||||||||||
| Net movements recognized in statements of operations | 39 | 37 | (4) | (15) | (10) | 7 | 24 | 27 | 3 | ||||||||||
| Gross write-offs | (32) | (41) | (47) | (12) | (2) | 0 | (44) | (43) | (47) | ||||||||||
| Recoveries | 6 | 17 | 13 | 6 | 2 | 2 | 12 | 19 | 15 | ||||||||||
| Net write-offs | (26) | (24) | (34) | (6) | 0 | 2 | (32) | (24) | (32) | ||||||||||
| Provisions for interest | 2 | 6 | 0 | 2 | 2 | 3 | 4 | 8 | 3 | ||||||||||
| Foreign currency translation impact and other adjustments, net | 6 | (7) | (14) | 18 | (6) | (18) | 24 | (13) | (32) | ||||||||||
| Balance at end of period 3 | 776 | 755 | 700 | 152 | 153 | 216 | 928 | 908 | 916 | ||||||||||
| of which individually evaluated for impairment | 574 | 561 | 508 | 108 | 106 | 160 | 682 | 667 | 668 | ||||||||||
| of which collectively evaluated for impairment | 202 | 194 | 192 | 44 | 47 | 56 | 246 | 241 | 248 | ||||||||||
| Loan metrics (%) | |||||||||||||||||||
| Total non-performing and non-interest-earning loans / Gross loans 4 | 0.5 | 0.5 | 0.4 | 1.5 | 1.5 | 2.2 | 0.6 | 0.6 | 0.6 | ||||||||||
| Gross impaired loans / Gross loans 4 | 0.7 | 0.7 | 0.6 | 1.8 | 1.7 | 3.1 | 0.8 | 0.8 | 0.8 | ||||||||||
| Allowance for loan losses / Total non-performing and non-interest-earning loans 3 | 80.0 | 77.0 | 85.1 | 61.0 | 63.8 | 65.7 | 76.1 | 74.4 | 79.5 | ||||||||||
| Allowance for loan losses / Gross impaired loans 3 | 52.6 | 51.8 | 59.2 | 51.0 | 56.9 | 46.8 | 52.3 | 52.6 | 55.7 | ||||||||||
| 1 Includes Asset Management and Corporate Center, in addition to Private Banking and Investment Banking. 2 Includes loans secured by financial collateral and mortgages. The value of financial collateral and mortgages, considered up to the amount of the related loans, was CHF 63,496 million, CHF 61,267 million and CHF 57,224 million as of the end of 2Q12, 1Q12 and 2Q11, respectively. 3 Impaired loans and allowance for loan losses are only based on loans which are not carried at fair value. 4 Excludes loans carried at fair value. | |||||||||||||||||||
Balance sheet and off-balance sheet |
| Total assets were CHF 1,043.5 billion, total liabilities were CHF 1,001.4 billion and total equity was CHF 42.1 billion. Both total assets and total liabilities were up 4% for the quarter, driven in both cases by the foreign exchange translation impact and an increase from operating activities. The majority of our transactions are recorded on our balance sheet, however, we also enter into transactions that give rise to both on and off-balance sheet exposure. |
| Balance sheet summary |
| end of | % change | ||||||||||||||
| 2Q12 | 1Q12 | 4Q11 | 2Q11 | QoQ | Ytd | YoY | |||||||||
| Assets (CHF million) | |||||||||||||||
| Cash and due from banks | 99,038 | 89,449 | 110,573 | 68,073 | 11 | (10) | 45 | ||||||||
| Central bank funds sold, securities purchased under resale agreements and securities borrowing transactions | 226,864 | 192,068 | 236,963 | 200,091 | 18 | (4) | 13 | ||||||||
| Trading assets | 284,058 | 300,597 | 279,553 | 302,626 | (6) | 2 | (6) | ||||||||
| Net loans | 239,164 | 231,696 | 233,413 | 220,030 | 3 | 2 | 9 | ||||||||
| Brokerage receivables | 50,411 | 42,801 | 43,446 | 40,845 | 18 | 16 | 23 | ||||||||
| All other assets | 143,920 | 143,409 | 145,217 | 145,258 | 0 | (1) | (1) | ||||||||
| Total assets | 1,043,455 | 1,000,020 | 1,049,165 | 976,923 | 4 | (1) | 7 | ||||||||
| Liabilities and equity (CHF million) | |||||||||||||||
| Due to banks | 41,325 | 39,035 | 40,147 | 41,987 | 6 | 3 | (2) | ||||||||
| Customer deposits | 312,683 | 304,943 | 313,401 | 286,455 | 3 | 0 | 9 | ||||||||
| Central bank funds purchased, securities sold under repurchase agreements and securities lending transactions | 189,266 | 167,457 | 176,559 | 142,245 | 13 | 7 | 33 | ||||||||
| Trading liabilities | 115,782 | 114,500 | 127,760 | 120,452 | 1 | (9) | (4) | ||||||||
| Long-term debt | 154,838 | 155,631 | 162,655 | 164,159 | (1) | (5) | (6) | ||||||||
| Brokerage payables | 75,822 | 67,569 | 68,034 | 67,315 | 12 | 11 | 13 | ||||||||
| All other liabilities | 111,634 | 110,021 | 119,524 | 114,003 | 1 | (7) | (2) | ||||||||
| Total liabilities | 1,001,350 | 959,156 | 1,008,080 | 936,616 | 4 | (1) | 7 | ||||||||
| Total shareholders' equity | 34,774 | 33,585 | 33,674 | 31,216 | 4 | 3 | 11 | ||||||||
| Noncontrolling interests | 7,331 | 7,279 | 7,411 | 9,091 | 1 | (1) | (19) | ||||||||
| Total equity | 42,105 | 40,864 | 41,085 | 40,307 | 3 | 2 | 4 | ||||||||
| Total liabilities and equity | 1,043,455 | 1,000,020 | 1,049,165 | 976,923 | 4 | (1) | 7 | ||||||||
Balance sheet |
| Total assets were CHF 1,043.5 billion as of the end of 2Q12, up CHF 43.4 billion, or 4%, from the end of 1Q12, driven by the foreign exchange translation impact and an increase from operating activities. Excluding the foreign exchange translation impact, total assets increased CHF 10.6 billion. |
| Compared to the end of 1Q12, central bank funds sold, securities purchased under resale agreements and securities borrowing transactions increased CHF 34.8 billion, or 18%, primarily driven by increases in resale and stock borrowing positions. Cash and due from banks increased CHF 9.6 billion, or 11%, mainly driven by increases in central bank holdings. Brokerage receivables increased CHF 7.6 billion, or 18%, mainly reflecting increased client-flow business and open trades. Net loans increased CHF 7.5 billion, or 3%, primarily from higher commercial and industrial loans and residential mortgages in Private Banking and higher loans to financial institutions in Investment Banking. Trading assets decreased CHF 16.5 billion, or 6%, driven by decreases in equity securities across most businesses. All other assets were stable at CHF 143.9 billion, as an increase in other assets was offset by a decrease in securities received as collateral. |
| Total liabilities were CHF 1,001.4 billion as of the end of 2Q12, up CHF 42.2 billion, or 4%, from the end of 1Q12, driven by the foreign exchange translation impact and an increase from operating activities. Excluding the foreign exchange translation impact, total liabilities increased CHF 9.0 billion. |
| Compared to the end of 1Q12, central bank funds purchased, securities sold under repurchase agreements and securities lending transactions increased CHF 21.8 billion, or 13%, mainly driven by increases in repurchase agreements. Brokerage payables increased CHF 8.3 billion, or 12%, mainly due to increases in margin lending and open trades. Customer deposits increased CHF 7.7 billion, or 3%, primarily due to the foreign exchange translation impact and a growth in the customer deposit base. Due to banks increased CHF 2.3 billion, or 6%, primarily driven by an increase in demand deposits from commercial banks. Trading liabilities increased CHF 1.3 billion, or 1%, primarily due to the foreign exchange translation impact, partially offset by a decrease in short trading positions. Long-term debt decreased CHF 0.8 billion, or 1%, mainly reflecting decreases in senior debt. All other liabilities increased CHF 1.6 billion, or 1%, including increases of CHF 2.9 billion in short-term borrowings and CHF 2.3 billion in other liabilities and a decrease of CHF 3.6 billion in obligations to return securities received as collateral. |
| > Refer to “Funding sources and uses” and “Capital management” in Treasury management for further information, including our funding of the balance sheet and the leverage ratio. |
Off-balance sheet |
| We enter into off-balance sheet arrangements in the normal course of business. Off-balance sheet arrangements are transactions or other contractual arrangements with, or for the benefit of, an entity that is not consolidated. These transactions include derivative instruments, guarantees and similar arrangements, retained or contingent interests in assets transferred to an unconsolidated entity in connection with our involvement with special purpose entities (SPEs), and obligations and liabilities (including contingent obligations and liabilities) under variable interests in unconsolidated entities that provide financing, liquidity, credit and other support. |
| > Refer to “Treasury management” in III – Treasury, Risk, Balance sheet and Off-balance sheet in the Credit Suisse Annual Report 2011 and “Note 24 – Guarantees and commitments” and “Note 28 – Litigation” in III – Condensed consolidated financial statements – unaudited for further information. |
Condensed consolidated financial statements – unaudited |
Report of the Independent Registered Public Accounting Firm |
Condensed consolidated financial statements unaudited |
Notes to the condensed consolidated financial statements unaudited |
Report of Independent Registered Public Accounting Firm |
| to the Board of Directors of |
| Credit Suisse Group AG, Zurich |
| We have reviewed the accompanying condensed consolidated balance sheets of Credit Suisse Group AG and subsidiaries (the “Group”) as of June 30, 2012 and 2011 and the related condensed consolidated statements of operations and comprehensive income for the three and six-month periods ended June 30, 2012 and 2011 and the related condensed consolidated statements of changes in equity and cash flows for the six-month periods ended June 30, 2012 and 2011. These condensed consolidated financial statements are the responsibility of the Group's management. |
| We conducted our reviews in accordance with the standards of the Public Company Accounting Oversight Board (United States). A review of interim financial information consists principally of applying analytical procedures and making inquiries of persons responsible for financial and accounting matters. It is substantially less in scope than an audit conducted in accordance with the standards of the Public Company Accounting Oversight Board (United States), the objective of which is the expression of an opinion regarding the financial statements taken as a whole. Accordingly, we do not express such an opinion. |
| Based on our reviews, we are not aware of any material modifications that should be made to the condensed consolidated financial statements referred to above for them to be in conformity with U.S. generally accepted accounting principles. |
| We have previously audited, in accordance with standards of the Public Company Accounting Oversight Board (United States), the consolidated balance sheet of the Group as of December 31, 2011, and the related consolidated statements of operations, changes in equity, comprehensive income and cash flows for the year then ended (not presented herein); and in our report dated March 23, 2012, we expressed an unqualified opinion on those consolidated financial statements. In our opinion, the information set forth in the accompanying condensed consolidated balance sheet as of December 31, 2011, is fairly stated, in all material respects, in relation to the consolidated balance sheet from which it has been derived. |
| KPMG AG |
| Simon Ryder Anthony Anzevino |
| Licensed Audit Expert Global Lead Partner |
| Zurich, Switzerland |
| August 3, 2012 |
| The accompanying notes to the condensed consolidated financial statements – unaudited are an integral part of these statements. |
Condensed consolidated financial statements – unaudited |
| Consolidated statements of operations (unaudited) |
| in | 2Q12 | 1Q12 | 2Q11 | 6M12 | 6M11 | ||||||
| Consolidated statements of operations (CHF million) | |||||||||||
| Interest and dividend income | 7,044 | 5,295 | 7,082 | 12,339 | 12,534 | ||||||
| Interest expense | (5,430) | (3,411) | (5,705) | (8,841) | (9,404) | ||||||
| Net interest income | 1,614 | 1,884 | 1,377 | 3,498 | 3,130 | ||||||
| Commissions and fees | 3,130 | 3,172 | 3,463 | 6,302 | 7,134 | ||||||
| Trading revenues | 1,156 | 189 | 1,116 | 1,345 | 3,127 | ||||||
| Other revenues | 375 | 802 | 936 | 1,177 | 1,657 | ||||||
| Net revenues | 6,275 | 6,047 | 6,892 | 12,322 | 15,048 | ||||||
| Provision for credit losses | 25 | 34 | 13 | 59 | 6 | ||||||
| Compensation and benefits | 3,005 | 3,711 | 3,096 | 6,716 | 7,125 | ||||||
| General and administrative expenses | 1,673 | 1,653 | 1,652 | 3,326 | 3,284 | ||||||
| Commission expenses | 441 | 451 | 491 | 892 | 1,027 | ||||||
| Total other operating expenses | 2,114 | 2,104 | 2,143 | 4,218 | 4,311 | ||||||
| Total operating expenses | 5,119 | 5,815 | 5,239 | 10,934 | 11,436 | ||||||
| Income before taxes | 1,131 | 198 | 1,640 | 1,329 | 3,606 | ||||||
| Income tax expense/(benefit) | 311 | (16) | 271 | 295 | 736 | ||||||
| Net income | 820 | 214 | 1,369 | 1,034 | 2,870 | ||||||
| Net income attributable to noncontrolling interests | 32 | 170 | 601 | 202 | 963 | ||||||
| Net income attributable to shareholders | 788 | 44 | 768 | 832 | 1,907 | ||||||
| Earnings per share (CHF) | |||||||||||
| Basic earnings per share | 0.48 | 0.03 | 0.48 | 0.52 | 1.43 | ||||||
| Diluted earnings per share | 0.46 | 0.03 | 0.48 | 0.50 | 1.42 | ||||||
| Consolidated statements of comprehensive income (unaudited) |
| in | 2Q12 | 1Q12 | 2Q11 | 6M12 | 6M11 | ||||||
| Comprehensive income (CHF million) | |||||||||||
| Net income | 820 | 214 | 1,369 | 1,034 | 2,870 | ||||||
| Gains/(losses) on cash flow hedges | (4) | 14 | (10) | 10 | (27) | ||||||
| Foreign currency translation | 1,115 | (1,117) | (2,432) | (2) | (3,014) | ||||||
| Unrealized gains/(losses) on securities | (47) | 184 | 2 | 137 | (38) | ||||||
| Actuarial gains/(losses) | 46 | 73 | 26 | 119 | 53 | ||||||
| Net prior service cost | (14) | (22) | 3 | (36) | 6 | ||||||
| Other comprehensive income/(loss), net of tax | 1,096 | (868) | (2,411) | 228 | (3,020) | ||||||
| Comprehensive income/(loss) | 1,916 | (654) | (1,042) | 1,262 | (150) | ||||||
| Comprehensive income/(loss) attributable to noncontrolling interests | 217 | (9) | 128 | 208 | 337 | ||||||
| Comprehensive income/(loss) attributable to shareholders | 1,699 | (645) | (1,170) | 1,054 | (487) | ||||||
| Consolidated balance sheets (unaudited) |
| end of | 2Q12 | 1Q12 | 4Q11 | 2Q11 | |||||
| Assets (CHF million) | |||||||||
| Cash and due from banks | 99,038 | 89,449 | 110,573 | 68,073 | |||||
| of which reported at fair value | 475 | 782 | – | – | |||||
| of which reported from consolidated VIEs | 1,324 | 1,310 | 1,396 | 1,491 | |||||
| Interest-bearing deposits with banks | 2,328 | 2,570 | 2,272 | 1,940 | |||||
| of which reported at fair value | 624 | 579 | 405 | 336 | |||||
| Central bank funds sold, securities purchased under resale agreements and securities borrowing transactions | 226,864 | 192,068 | 236,963 | 200,091 | |||||
| of which reported at fair value | 148,721 | 119,318 | 158,673 | 117,340 | |||||
| of which reported from consolidated VIEs | 118 | 73 | 19 | 0 | |||||
| Securities received as collateral, at fair value | 30,191 | 33,761 | 30,191 | 32,057 | |||||
| of which encumbered | 20,985 | 21,747 | 20,447 | 18,130 | |||||
| Trading assets, at fair value | 284,058 | 300,597 | 279,553 | 302,626 | |||||
| of which encumbered | 74,191 | 78,605 | 73,749 | 85,467 | |||||
| of which reported from consolidated VIEs | 6,053 | 5,738 | 6,399 | 7,479 | |||||
| Investment securities | 5,326 | 5,604 | 5,160 | 5,550 | |||||
| of which reported at fair value | 5,324 | 5,602 | 5,158 | 5,404 | |||||
| of which reported from consolidated VIEs | 34 | 36 | 41 | 45 | |||||
| Other investments | 12,773 | 12,294 | 13,226 | 14,086 | |||||
| of which reported at fair value | 9,710 | 9,340 | 9,751 | 11,147 | |||||
| of which reported from consolidated VIEs | 2,327 | 2,181 | 2,346 | 2,043 | |||||
| Net loans | 239,164 | 231,696 | 233,413 | 220,030 | |||||
| of which reported at fair value | 20,515 | 18,868 | 20,694 | 19,191 | |||||
| of which encumbered | 602 | 552 | 471 | 347 | |||||
| of which reported from consolidated VIEs | 6,611 | 5,373 | 5,940 | 4,036 | |||||
| allowance for loan losses | (928) | (908) | (910) | (916) | |||||
| Premises and equipment | 6,846 | 6,878 | 7,193 | 6,651 | |||||
| of which reported from consolidated VIEs | 609 | 616 | 646 | 91 | |||||
| Goodwill | 8,665 | 8,333 | 8,591 | 7,908 | |||||
| Other intangible assets | 278 | 260 | 288 | 281 | |||||
| of which reported at fair value | 63 | 61 | 70 | 50 | |||||
| Brokerage receivables | 50,411 | 42,801 | 43,446 | 40,845 | |||||
| Other assets | 77,513 | 73,709 | 78,296 | 76,785 | |||||
| of which reported at fair value | 37,002 | 35,233 | 35,765 | 37,887 | |||||
| of which encumbered | 2,120 | 2,302 | 2,255 | 2,510 | |||||
| of which reported from consolidated VIEs | 11,946 | 11,963 | 13,002 | 16,764 | |||||
| Total assets | 1,043,455 | 1,000,020 | 1,049,165 | 976,923 | |||||
| Consolidated balance sheets (unaudited) (continued) |
| end of | 2Q12 | 1Q12 | 4Q11 | 2Q11 | |||||
| Liabilities and equity (CHF million) | |||||||||
| Due to banks | 41,325 | 39,035 | 40,147 | 41,987 | |||||
| of which reported at fair value | 3,324 | 3,301 | 2,721 | 3,477 | |||||
| Customer deposits | 312,683 | 304,943 | 313,401 | 286,455 | |||||
| of which reported at fair value | 4,825 | 4,355 | 4,599 | 3,675 | |||||
| of which reported from consolidated VIEs | 175 | 100 | 221 | 433 | |||||
| Central bank funds purchased, securities sold under repurchase agreements and securities lending transactions | 189,266 | 167,457 | 176,559 | 142,245 | |||||
| of which reported at fair value | 143,714 | 123,483 | 136,483 | 109,282 | |||||
| Obligation to return securities received as collateral, at fair value | 30,191 | 33,761 | 30,191 | 32,057 | |||||
| Trading liabilities, at fair value | 115,782 | 114,500 | 127,760 | 120,452 | |||||
| of which reported from consolidated VIEs | 1,256 | 1,295 | 1,286 | 165 | |||||
| Short-term borrowings | 19,184 | 16,331 | 26,116 | 20,373 | |||||
| of which reported at fair value | 4,456 | 3,870 | 3,547 | 4,046 | |||||
| of which reported from consolidated VIEs | 7,095 | 5,888 | 6,141 | 4,126 | |||||
| Long-term debt | 154,838 | 155,631 | 162,655 | 164,159 | |||||
| of which reported at fair value | 66,952 | 66,347 | 70,366 | 76,844 | |||||
| of which reported from consolidated VIEs | 13,860 | 13,077 | 14,858 | 18,184 | |||||
| Brokerage payables | 75,822 | 67,569 | 68,034 | 67,315 | |||||
| Other liabilities | 62,259 | 59,929 | 63,217 | 61,573 | |||||
| of which reported at fair value | 29,818 | 30,722 | 31,092 | 29,677 | |||||
| of which reported from consolidated VIEs | 681 | 870 | 746 | 820 | |||||
| Total liabilities | 1,001,350 | 959,156 | 1,008,080 | 936,616 | |||||
| Common shares | 51 | 49 | 49 | 48 | |||||
| Additional paid-in capital | 21,930 | 22,262 | 21,796 | 21,107 | |||||
| Retained earnings | 27,771 | 27,097 | 27,053 | 27,121 | |||||
| Treasury shares, at cost | (66) | 0 | (90) | (111) | |||||
| Accumulated other comprehensive income/(loss) | (14,912) | (15,823) | (15,134) | (16,949) | |||||
| Total shareholders' equity | 34,774 | 33,585 | 33,674 | 31,216 | |||||
| Noncontrolling interests | 7,331 | 7,279 | 7,411 | 9,091 | |||||
| Total equity | 42,105 | 40,864 | 41,085 | 40,307 | |||||
| Total liabilities and equity | 1,043,455 | 1,000,020 | 1,049,165 | 976,923 | |||||
| end of | 2Q12 | 1Q12 | 4Q11 | 2Q11 | |||||
| Additional share information | |||||||||
| Par value (CHF) | 0.04 | 0.04 | 0.04 | 0.04 | |||||
| Authorized shares (million) | 2,118.1 | 1,868.1 | 1,868.1 | 1,868.1 | |||||
| Common shares issued (million) | 1,286.6 | 1,224.5 | 1,224.3 | 1,202.2 | |||||
| Treasury shares (million) | (3.5) | 0.0 | (4.0) | (3.1) | |||||
| Shares outstanding (million) | 1,283.1 | 1,224.5 | 1,220.3 | 1,199.1 | |||||
| Consolidated statements of changes in equity (unaudited) |
| Attributable to shareholders | |||||||||||||||||||
Common shares | Additional paid-in capital | Retained earnings | Treasury shares, at cost | Accumu- lated other compre- hensive income | Total share- holders' equity | Non- controlling interests | Total equity | Number of common shares outstanding | |||||||||||
| 2Q12 (CHF million) | |||||||||||||||||||
| Balance at beginning of period | 49 | 22,262 | 27,097 | 0 | (15,823) | 33,585 | 7,279 | 40,864 | 1,224,513,920 | 1 | |||||||||
| Purchase of subsidiary shares from non- controlling interests, changing ownership | – | 44 | – | – | – | 44 | – | 44 | – | ||||||||||
| Purchase of subsidiary shares from non- controlling interests, not changing ownership 2, 3 | – | – | – | – | – | – | (194) | (194) | – | ||||||||||
| Sale of subsidiary shares to noncontrolling interests, not changing ownership 3 | – | – | – | – | – | – | 42 | 42 | – | ||||||||||
| Net income/(loss) | – | – | 788 | – | – | 788 | 32 | 820 | – | ||||||||||
| Total other comprehensive income/(loss), net of tax | – | – | – | – | 911 | 911 | 185 | 1,096 | – | ||||||||||
| Issuance of common shares | 2 | 1,317 | – | – | – | 1,319 | – | 1,319 | 62,085,315 | ||||||||||
| Sale of treasury shares | – | (33) | – | 1,955 | – | 1,922 | – | 1,922 | 93,628,678 | ||||||||||
| Repurchase of treasury shares | – | – | – | (2,128) | – | (2,128) | – | (2,128) | (101,754,767) | ||||||||||
| Share-based compensation, net of tax | – | (594) | 4 | – | 107 | – | (487) | (1) | (488) | 4,614,725 | |||||||||
| Financial instruments indexed to own shares 5 | – | (57) | – | – | – | (57) | – | (57) | – | ||||||||||
| Dividends paid | – | (1,011) | 6 | (114) | – | – | (1,125) | (12) | (1,137) | – | |||||||||
| Changes in redeemable noncontrolling interests | – | 2 | 7 | – | – | – | 2 | – | 2 | – | |||||||||
| Balance at end of period | 51 | 21,930 | 27,771 | (66) | (14,912) | 34,774 | 7,331 | 42,105 | 1,283,087,871 | 8 | |||||||||
| 1 At par value CHF 0.04 each, fully paid. A maximum of 643,620,119 unissued shares (conditional and authorized capital) were available for issuance without further approval of the shareholders. 2 Distributions to owners in funds include the return of original capital invested and any related dividends. 3 Transactions with and without ownership changes related to fund activity are all displayed under "not changing ownership". 4 Includes a net tax charge of CHF 5 million from the excess recognized compensation expense over fair value of shares delivered. 5 The Group had purchased certain call options on its own shares to economically hedge share-based compensation awards. In accordance with US GAAP, these call options were designated as equity instruments and, as such, were initially recognized in shareholders' equity at their fair values and not subsequently remeasured. 6 Paid out of reserves from capital contributions. 7 Represents the accrued portion of the redemption value of redeemable noncontrolling interests in Credit Suisse Hedging-Griffo Investimentos S.A. Refer to "Other commitments" in Note 24 – Guarantees and commitments for further information. 8 At par value CHF 0.04 each, fully paid, net of 3,511,364 treasury shares. In addition to the treasury shares, a maximum of 805,730,391 unissued shares (conditional and authorized capital) were available for issuance without further approval of the shareholders. 449,750,000 of these unissued shares are reserved mainly for a potential conversion of already issued buffer capital notes into shares in the case of a trigger event. As a result of the capital measures announced on July 18, 2012, 732,326,910 unissued shares are reserved for buffer capital notes and mandatory and contingent convertible securities. | |||||||||||||||||||
| Consolidated statements of changes in equity (unaudited) (continued) |
| Attributable to shareholders | |||||||||||||||||||
Common shares | Additional paid-in capital | Retained earnings | Treasury shares, at cost | Accumu- lated other compre- hensive income | Total share- holders' equity | Non- controlling interests | Total equity | Number of common shares outstanding | |||||||||||
| 1Q12 (CHF million) | |||||||||||||||||||
| Balance at beginning of period | 49 | 21,796 | 27,053 | (90) | (15,134) | 33,674 | 7,411 | 41,085 | 1,220,322,988 | ||||||||||
| Purchase of subsidiary shares from non- controlling interests, not changing ownership | – | – | – | – | – | – | (117) | (117) | – | ||||||||||
| Sale of subsidiary shares to noncontrolling interests, not changing ownership | – | – | – | – | – | – | 7 | 7 | – | ||||||||||
| Net income/(loss) | – | – | 44 | – | – | 44 | 170 | 214 | – | ||||||||||
| Total other comprehensive income/(loss), net of tax | – | – | – | – | (689) | (689) | (179) | (868) | – | ||||||||||
| Issuance of common shares | – | 4 | – | – | – | 4 | – | 4 | 180,858 | ||||||||||
| Sale of treasury shares | – | 32 | – | 1,821 | – | 1,853 | – | 1,853 | 74,369,036 | ||||||||||
| Repurchase of treasury shares | – | – | – | (1,734) | – | (1,734) | – | (1,734) | (70,484,278) | ||||||||||
| Share-based compensation, net of tax | – | 397 | – | 3 | – | 400 | – | 400 | 125,316 | ||||||||||
| Financial instruments indexed to own shares | – | 41 | – | – | – | 41 | – | 41 | – | ||||||||||
| Dividends paid | – | – | – | – | – | – | (13) | (13) | – | ||||||||||
| Changes in redeemable noncontrolling interests | – | (8) | – | – | – | (8) | – | (8) | – | ||||||||||
| Balance at end of period | 49 | 22,262 | 27,097 | 0 | (15,823) | 33,585 | 7,279 | 40,864 | 1,224,513,920 | ||||||||||
| Consolidated statements of changes in equity (unaudited) (continued) |
| Attributable to shareholders | |||||||||||||||||||
Common shares | Additional paid-in capital | Retained earnings | Treasury shares, at cost | Accumu- lated other compre- hensive income | Total share- holders' equity | Non- controlling interests | Total equity | Number of common shares outstanding | |||||||||||
| 2Q11 (CHF million) | |||||||||||||||||||
| Balance at beginning of period | 48 | 22,565 | 26,455 | 0 | (15,011) | 34,057 | 9,231 | 43,288 | 1,201,020,793 | ||||||||||
| Purchase of subsidiary shares from non- controlling interests, changing ownership | – | (1) | – | – | – | (1) | (1) | (2) | – | ||||||||||
| Purchase of subsidiary shares from non- controlling interests, not changing ownership | – | – | – | – | – | – | (372) | (372) | – | ||||||||||
| Sale of subsidiary shares to noncontrolling interests, not changing ownership | – | – | – | – | – | – | 153 | 153 | – | ||||||||||
| Net income/(loss) | – | – | 768 | – | – | 768 | 580 | 1,348 | – | ||||||||||
| Total other comprehensive income/(loss), net of tax | – | – | – | – | (1,938) | (1,938) | (473) | (2,411) | – | ||||||||||
| Issuance of common shares | – | 43 | – | – | – | 43 | – | 43 | 1,182,356 | ||||||||||
| Sale of treasury shares | – | (221) | – | 3,166 | – | 2,945 | – | 2,945 | 85,354,994 | ||||||||||
| Repurchase of treasury shares | – | – | – | (3,292) | – | (3,292) | – | (3,292) | (88,801,653) | ||||||||||
| Share-based compensation, net of tax | – | 358 | – | 15 | – | 373 | – | 373 | 343,263 | ||||||||||
| Financial instruments indexed to own shares | – | 217 | – | – | – | 217 | – | 217 | – | ||||||||||
| Dividends paid | – | (1,646) | (102) | – | – | (1,748) | (46) | (1,794) | – | ||||||||||
| Changes in redeemable noncontrolling interests | – | (208) | – | – | – | (208) | – | (208) | – | ||||||||||
| Change in scope of consolidation, net | – | – | – | – | – | – | 19 | 19 | – | ||||||||||
| Balance at end of period | 48 | 21,107 | 27,121 | (111) | (16,949) | 31,216 | 9,091 | 40,307 | 1,199,099,753 | ||||||||||
| Consolidated statements of changes in equity (unaudited) (continued) |
| Attributable to shareholders | |||||||||||||||||||
Common shares | Additional paid-in capital | Retained earnings | Treasury shares, at cost | Accumu- lated other compre- hensive income | Total share- holders' equity | Non- controlling interests | Total equity | Number of common shares outstanding | |||||||||||
| 6M12 (CHF million) | |||||||||||||||||||
| Balance at beginning of period | 49 | 21,796 | 27,053 | (90) | (15,134) | 33,674 | 7,411 | 41,085 | 1,220,322,988 | 1 | |||||||||
| Purchase of subsidiary shares from non- controlling interests, changing ownership | – | 44 | – | – | – | 44 | – | 44 | – | ||||||||||
| Purchase of subsidiary shares from non- controlling interests, not changing ownership 2, 3 | – | – | – | – | – | – | (311) | (311) | – | ||||||||||
| Sale of subsidiary shares to noncontrolling interests, not changing ownership 3 | – | – | – | – | – | – | 49 | 49 | – | ||||||||||
| Net income/(loss) | – | – | 832 | – | – | 832 | 202 | 1,034 | – | ||||||||||
| Total other comprehensive income/(loss), net of tax | – | – | – | – | 222 | 222 | 6 | 228 | – | ||||||||||
| Issuance of common shares | 2 | 1,321 | – | – | – | 1,323 | – | 1,323 | 62,266,173 | ||||||||||
| Sale of treasury shares | – | (1) | – | 3,776 | – | 3,775 | – | 3,775 | 167,997,714 | ||||||||||
| Repurchase of treasury shares | – | – | – | (3,862) | – | (3,862) | – | (3,862) | (172,239,045) | ||||||||||
| Share-based compensation, net of tax | – | (197) | 4 | – | 110 | – | (87) | (1) | (88) | 4,740,041 | |||||||||
| Financial instruments indexed to own shares 5 | – | (16) | – | – | – | (16) | – | (16) | – | ||||||||||
| Dividends paid | – | (1,011) | 6 | (114) | – | – | (1,125) | (25) | (1,150) | – | |||||||||
| Changes in redeemable noncontrolling interests | – | (6) | 7 | – | – | – | (6) | – | (6) | – | |||||||||
| Balance at end of period | 51 | 21,930 | 27,771 | (66) | (14,912) | 34,774 | 7,331 | 42,105 | 1,283,087,871 | 8 | |||||||||
| 1 At par value CHF 0.04 each, fully paid, net of 4,010,074 treasury shares. In addition to the treasury shares, a maximum of 643,807,004 unissued shares (conditional and authorized capital) were available for issuance without further approval of the shareholders. 2 Distributions to owners in funds include the return of original capital invested and any related dividends. 3 Transactions with and without ownership changes related to fund activity are all displayed under "not changing ownership". 4 Includes a net tax benefit of CHF 14 million from the excess fair value of shares delivered over recognized compensation expense. 5 The Group had purchased certain call options on its own shares to economically hedge share-based compensation awards. In accordance with US GAAP, these call options were designated as equity instruments and, as such, were initially recognized in shareholders' equity at their fair values and not subsequently remeasured. 6 Paid out of reserves from capital contributions. 7 Represents the accrued portion of the redemption value of redeemable noncontrolling interests in Credit Suisse Hedging-Griffo Investimentos S.A. Refer to "Other commitments" in Note 24 – Guarantees and commitments for further information. 8 At par value CHF 0.04 each, fully paid, net of 3,511,364 treasury shares. In addition to the treasury shares, a maximum of 805,730,391 unissued shares (conditional and authorized capital) were available for issuance without further approval of the shareholders. 449,750,000 of these unissued shares are reserved mainly for a potential conversion of already issued buffer capital notes into shares in the case of a trigger event. As a result of the capital measures announced on July 18, 2012, 732,326,910 unissued shares are reserved for buffer capital notes and mandatory and contingent convertible securities. | |||||||||||||||||||
| Consolidated statements of changes in equity (unaudited) (continued) |
| Attributable to shareholders | |||||||||||||||||||
Common shares | Additional paid-in capital | Retained earnings | Treasury shares, at cost | Accumu- lated other compre- hensive income | Total share- holders' equity | Non- controlling interests | Total equity | Number of common shares outstanding | |||||||||||
| 6M11 (CHF million) | |||||||||||||||||||
| Balance at beginning of period | 47 | 23,026 | 25,316 | (552) | (14,555) | 33,282 | 9,733 | 43,015 | 1,173,946,065 | ||||||||||
| Purchase of subsidiary shares from non- controlling interests, changing ownership | – | (2) | – | – | – | (2) | (1) | (3) | – | ||||||||||
| Purchase of subsidiary shares from non- controlling interests, not changing ownership | – | – | – | – | – | – | (747) | (747) | – | ||||||||||
| Sale of subsidiary shares to noncontrolling interests, changing ownership | – | (7) | – | – | – | (7) | 7 | – | – | ||||||||||
| Sale of subsidiary shares to noncontrolling interests, not changing ownership | – | – | – | – | – | – | 246 | 246 | – | ||||||||||
| Net income/(loss) | – | – | 1,907 | – | – | 1,907 | 937 | 2,844 | – | ||||||||||
| Total other comprehensive income/(loss), net of tax | – | – | – | – | (2,394) | (2,394) | (626) | (3,020) | – | ||||||||||
| Issuance of common shares | 1 | 665 | – | – | – | 666 | – | 666 | 16,028,707 | ||||||||||
| Sale of treasury shares | – | (83) | – | 7,829 | – | 7,746 | – | 7,746 | 197,154,527 | ||||||||||
| Repurchase of treasury shares | – | – | – | (7,672) | – | (7,672) | – | (7,672) | (194,611,747) | ||||||||||
| Share-based compensation, net of tax | – | (713) | – | 284 | – | (429) | (1) | (430) | 6,582,201 | ||||||||||
| Financial instruments indexed to own shares | – | 202 | – | – | – | 202 | – | 202 | – | ||||||||||
| Dividends paid | – | (1,646) | (102) | – | – | (1,748) | (57) | (1,805) | – | ||||||||||
| Changes in redeemable noncontrolling interests | – | (335) | – | – | – | (335) | (90) | (425) | |||||||||||
| Change in scope of consolidation, net | – | – | – | – | – | – | (310) | (310) | – | ||||||||||
| Balance at end of period | 48 | 21,107 | 27,121 | (111) | (16,949) | 31,216 | 9,091 | 40,307 | 1,199,099,753 | ||||||||||
| Consolidated statements of cash flows (unaudited) |
| in | 6M12 | 6M11 | |||
| Operating activities of continuing operations (CHF million) | |||||
| Net income | 1,034 | 2,870 | |||
| Adjustments to reconcile net income/(loss) to net cash provided by/(used in) operating activities of continuing operations (CHF million) | |||||
| Impairment, depreciation and amortization | 624 | 544 | |||
| Provision for credit losses | 59 | 6 | |||
| Deferred tax provision | (106) | 483 | |||
| Share of net income from equity method investments | 55 | (21) | |||
| Trading assets and liabilities, net | (13,657) | (9,211) | |||
| (Increase)/decrease in other assets | (6,407) | (10,856) | |||
| Increase/(decrease) in other liabilities | 6,340 | 15,889 | |||
| Other, net | 1,636 | 804 | |||
| Total adjustments | (11,456) | (2,362) | |||
| Net cash provided by/(used in) operating activities of continuing operations | (10,422) | 508 | |||
| Investing activities of continuing operations (CHF million) | |||||
| (Increase)/decrease in interest-bearing deposits with banks | (182) | (485) | |||
| (Increase)/decrease in central bank funds sold, securities purchased under resale agreements and securities borrowing transactions | 10,374 | 932 | |||
| Purchase of investment securities | (208) | (1,172) | |||
| Proceeds from sale of investment securities | 339 | 2,096 | |||
| Maturities of investment securities | 167 | 1,372 | |||
| Investments in subsidiaries and other investments | (688) | (870) | |||
| Proceeds from sale of other investments | 1,112 | 2,516 | |||
| (Increase)/decrease in loans | (5,975) | (5,636) | |||
| Proceeds from sales of loans | 522 | 230 | |||
| Capital expenditures for premises and equipment and other intangible assets | (670) | (718) | |||
| Proceeds from sale of premises and equipment and other intangible assets | 8 | 3 | |||
| Other, net | 2,039 | 147 | |||
| Net cash provided by/(used in) investing activities of continuing operations | 6,838 | (1,585) | |||
| Consolidated statements of cash flows (unaudited) (continued) |
| in | 6M12 | 6M11 | |||
| Financing activities of continuing operations (CHF million) | |||||
| Increase/(decrease) in due to banks and customer deposits | (2,035) | 15,703 | |||
| Increase/(decrease) in short-term borrowings | (7,814) | 413 | |||
| Increase/(decrease) in central bank funds purchased, securities sold under repurchase agreements and securities lending transactions | 11,587 | (10,240) | |||
| Issuances of long-term debt | 19,667 | 23,602 | |||
| Repayments of long-term debt | (28,420) | (18,972) | |||
| Issuances of common shares | 1,323 | 666 | |||
| Sale of treasury shares | 3,775 | 7,746 | |||
| Repurchase of treasury shares | (3,862) | (7,672) | |||
| Dividends paid/capital repayments | (1,151) | (1,805) | |||
| Other, net | (780) | 671 | |||
| Net cash provided by/(used in) financing activities of continuing operations | (7,710) | 10,112 | |||
| Effect of exchange rate changes on cash and due from banks (CHF million) | |||||
| Effect of exchange rate changes on cash and due from banks | (241) | (6,454) | |||
| Net cash provided by/(used in) discontinued operations (CHF million) | |||||
| Net cash provided by/(used in) operating activities of discontinued operations | 0 | 25 | |||
| Net increase/(decrease) in cash and due from banks (CHF million) | |||||
| Net increase/(decrease) in cash and due from banks | (11,535) | 2,606 | |||
| Cash and due from banks at beginning of period | 110,573 | 65,467 | |||
| Cash and due from banks at end of period | 99,038 | 68,073 | |||
| Supplemental cash flow information (unaudited) |
| in | 6M12 | 6M11 | |||
| Cash paid for income taxes and interest (CHF million) | |||||
| Cash paid for income taxes | 527 | 675 | |||
| Cash paid for interest | 8,578 | 9,238 | |||
| Assets acquired and liabilities assumed in business acquisitions (CHF million) | |||||
| Fair value of assets acquired | 2,418 | 0 | |||
| Fair value of liabilities assumed | 2,418 | 0 | |||
Notes to the condensed consolidated financial statements – unaudited |
| Note 1 Summary of significant accounting policies |
Basis of presentation |
| The accompanying unaudited condensed consolidated financial statements of Credit Suisse Group AG (the Group) are prepared in accordance with accounting principles generally accepted in the US (US GAAP) and are stated in Swiss francs (CHF). These condensed consolidated financial statements should be read in conjunction with the US GAAP consolidated financial statements and notes thereto for the year ended December 31, 2011, included in the Credit Suisse Annual Report 2011. |
| > Refer to “Note 1 – Summary of significant accounting policies” in V – Consolidated financial statements – Credit Suisse Group in the Credit Suisse Annual Report 2011 for a description of the Group’s significant accounting policies. |
| Certain financial information, which is normally included in annual consolidated financial statements prepared in accordance with US GAAP, but not required for interim reporting purposes, has been condensed or omitted. Certain reclassifications have been made to the prior period’s consolidated financial statements to conform to the current period’s presentation. These condensed consolidated financial statements reflect, in the opinion of management, all adjustments that are necessary for a fair presentation of the condensed consolidated financial statements for the periods presented. The presentation of the 1Q12 consolidated statements of operations and consolidated balance sheet, the 2Q12, 1Q12 and 2Q11 consolidated statements of changes in equity and the 2Q11 consolidated balance sheet have been added for convenience of the reader and are not a required presentation under US GAAP. The results of operations for interim periods are not indicative of results for the entire year. |
| In preparing these condensed consolidated financial statements, management is required to make estimates and assumptions which affect the reported amounts of assets and liabilities and disclosure of contingent assets and liabilities as of the date of the condensed consolidated balance sheets and the reported amounts of revenues and expenses during the reporting period. Actual results could differ from those estimates. |
| Note 2 Recently issued accounting standards |
Recently adopted accounting standards |
| The following provides the most relevant recently adopted accounting standards. |
| > Refer to “Note 2 – Recently issued accounting standards” in V – Consolidated financial statements – Credit Suisse Group in the Credit Suisse Annual Report 2011 for a description of accounting standards adopted in 2011. |
| ASC Topic 220 – Comprehensive Income |
| In December 2011, the Financial Accounting Standards Board (FASB) issued Accounting Standards Update (ASU) 2011-12, “Deferral of the Effective Date for Amendments to the Presentation of Reclassifications of Items Out of Accumulated Other Comprehensive Income in Accounting Standards Update No. 2011-05” (ASU 2011-12), an update to Accounting Standards Codification (ASC) Topic 220 – Comprehensive Income. The amendment delays the effective date of those changes in ASU 2011-05 that relate to the presentation of reclassification adjustments. ASU 2011-12 was effective upon issuance and its adoption did not impact the Group’s financial condition, results of operations or cash flows. |
| In June 2011, the FASB issued ASU 2011-05, “Presentation of Comprehensive Income” (ASU 2011-05), an update to ASC Topic 220 – Comprehensive Income. ASU 2011-05 provides the entity with an option to present total comprehensive income either in a single continuous statement or in two separate but consecutive statements. The adoption of ASU 2011-05 on January 1, 2012 did not impact the Group’s financial position, results of operations or cash flows. |
| ASC Topic 350 – Intangibles – Goodwill and Other |
| In September 2011, the FASB issued ASU 2011-08, “Testing Goodwill for Impairment” (ASU 2011-08), an update to ASC Topic 350 – Intangibles – Goodwill and Other. The amendments in ASU 2011-08 permit an entity to qualitatively assess whether the fair value of the reporting unit is less than the carrying amount. Based on the qualitative assessment, if an entity determines that it is more likely than not that the fair value of the reporting unit is less than the carrying amount, then the entity must perform step one of the goodwill impairment test by calculating the fair value of the reporting unit and comparing the fair value to the carrying amount of the reporting unit. If the carrying amount of the reporting unit exceeds its fair value, then the entity is required to perform the second step of the goodwill impairment test to measure the amount of the impairment loss, if any. The adoption of ASU 2011-08 on January 1, 2012 did not have a material impact on the Group’s financial condition, results of operations or cash flows. |
| ASC Topic 820 – Fair Value Measurement |
| In May 2011, the FASB issued ASU 2011-04, “Amendments to Achieve Common Fair Value Measurement and Disclosure Requirements in U.S. GAAP and IFRSs” (ASU 2011-04), an update to ASC Topic 820 – Fair Value Measurement. The amendments in ASU 2011-04 include clarifications about the application of existing fair value measurement requirements and changes to principles for measuring fair value. ASU 2011-04 also requires additional disclosures about fair value measurements. The adoption of ASU 2011-04 on January 1, 2012 did not have a material impact on the Group’s financial condition, results of operations or cash flows. |
| > Refer to “Note 26 – Financial instruments” for further information. |
| ASC Topic 860 – Transfers and Servicing |
| In April 2011, the FASB issued ASU 2011-03, “Reconsideration of Effective Control for Repurchase Agreements” (ASU 2011-03), an update to ASC Topic 860 – Transfers and Servicing. Current guidance prescribes when an entity may or may not recognize a sale upon the transfer of financial assets subject to repurchase agreements. That determination is based, in part, on whether the entity has maintained effective control over the transferred financial assets. ASU 2011-03 removes from the assessment of effective control the criterion requiring the transferor to have the ability to repurchase or redeem the financial assets. The adoption of ASU 2011-03 on January 1, 2012 did not have a material impact on the Group’s financial condition, results of operations or cash flows. |
Standards to be adopted in future periods |
| ASC Topic 210 – Balance Sheet |
| In December 2011, the FASB issued ASU 2011-11, “Disclosures about Offsetting Assets and Liabilities” (ASU 2011-11), an update to ASC Topic 210 – Balance Sheet. ASU 2011-11 is effective for interim and annual reporting periods beginning on or after January 1, 2013. An entity should provide the required disclosures retrospectively for all comparative periods presented. ASU 2011-11 is an update for presentation and as such will not impact the Group’s financial position, results of operation or cash flows. |
| ASC Topic 360 – Property, Plant and Equipment |
| In December 2011, the FASB issued ASU 2011-10, “Derecognition of in Substance Real Estate – a Scope Clarification, a consensus of the FASB Emerging Issues Task Force” (ASU 2011-10), an update to ASC Topic 360 – Property, Plant and Equipment. ASU 2011-10 is effective for interim and annual reporting periods beginning on or after June 15, 2012. The Group is currently evaluating the impact of the adoption of ASU 2011-10 on the Group’s financial condition, results of operations or cash flows. |
| Note 3 Business developments and subsequent events |
| In June 2012, the Group announced the completion of its acquisition of HSBC’s private banking business in Japan, which includes expanded coverage through additional offices in Osaka and Nagoya. |
| On July 18, 2012, we announced a number of measures to accelerate the strengthening of the Group’s capital position in light of the current regulatory and market environment These measures include the placement of CHF 3.8 billion in Subordinated Mandatory and Contingent Convertible Securities (“MACCS”) due March 29, 2013, issued at a fixed conversion price of CHF 16.29 per share. The MACCS will be accounted for as debt until conversion, when they will be reclassified to equity, utilizing authorized capital. As of the end of the placement period on July 27, 2012, shareholders exercised preferential subscription rights for CHF 1.8 billion of MACCS and strategic investors purchased CHF 64 million of MACCS not taken up by shareholders as well as CHF 1.9 billion of MACCS without preferential rights. |
| Additionally, Credit Suisse and an investor agreed to bring forward to July 31, 2012, the exchange date for CHF 1.7 billion of their holdings of hybrid tier 1 instruments to be exchanged into tier 1 BCNs. This acceleration will not have any impact on reported balance sheet balances, as BCNs have been recognized on the balance sheet since the BCN commitment agreement in February 2011. Also announced on July 18, 2012, the Group launched a voluntary exchange offer, under which employees can elect to convert any future cash payments from the Adjustable Performance Plan awards for shares at a fixed conversion price of CHF 16.29. As of the date of this report, the election period for the exchange offer has not closed. |
| The Group acquired the remaining equity interests in Hedging-Griffo Investimentos S.A. as contemplated under the existing option arrangements previously disclosed. The costs associated with the acquisition will be covered by the issuance of mandatory convertible securities as announced on July 18, 2012. |
| In July 2012, the Group sold its remaining holding of 7.0% in Aberdeen, resulting in an approximate gain of CHF 140 million to be recognized in 3Q12. |
| Note 4 Discontinued operations |
| The Group did not discontinue any material operations in 2Q12. |
| Note 5 Segment information |
Overview |
| The Group is a global financial services company domiciled in Switzerland. The Group’s business consists of three segments: Private Banking, Investment Banking and Asset Management. The three segments are complemented by Shared Services, which provides support in the areas of finance, operations, human resources, legal and compliance, risk management and IT. Corporate Center includes parent company operations such as Group financing, expenses for projects sponsored by the Group and certain expenses that have not been allocated to the segments. In addition, Corporate Center includes consolidation and elimination adjustments required to eliminate intercompany revenues and expenses. |
| Beginning in 1Q12, the Group fully reflects the fair value impact from movements in credit spreads on its long-term vanilla debt and DVA on certain structured notes liabilities in the Corporate Center and discontinued the amortization in the segments of the past fair value gains on long-term vanilla debt, primarily in Investment Banking. DVA on certain structured notes liabilities was previously recorded in the Investment Banking segment and is now recorded in the Corporate Center in order to aggregate all credit-spread impacts on the Group’s funding instruments and to reflect that these impacts are driven by the creditworthiness of the Group rather than the Investment Banking segment or the issuer. Prior periods have been reclassified to conform to the current presentation and such reclassifications had no impact on the Group’s net income/(loss) or total shareholders’ equity. |
| > Refer to “Note 5 – Segment information” in V – Consolidated financial statements – Credit Suisse Group in the Credit Suisse Annual Report 2011 for further information on segment information, revenue sharing and cost allocation, funding and taxes. |
| Net revenues and income before taxes |
| in | 2Q12 | 1Q12 | 2Q11 | 6M12 | 6M11 | ||||||
| Net revenues (CHF million) | |||||||||||
| Private Banking | 2,704 | 2,604 | 2,754 | 5,308 | 5,592 | ||||||
| Investment Banking | 2,909 | 4,159 | 2,817 | 7,068 | 7,904 | ||||||
| Asset Management | 550 | 681 | 654 | 1,231 | 1,274 | ||||||
| Corporate Center | 78 | (1,566) | 101 | (1,488) | (631) | ||||||
| Noncontrolling interests without SEI | 34 | 169 | 566 | 203 | 909 | ||||||
| Net revenues | 6,275 | 6,047 | 6,892 | 12,322 | 15,048 | ||||||
| Income/(loss) before taxes (CHF million) | |||||||||||
| Private Banking | 775 | 606 | 835 | 1,381 | 1,668 | ||||||
| Investment Banking | 383 | 998 | 208 | 1,381 | 1,691 | ||||||
| Asset Management | 133 | 254 | 210 | 387 | 393 | ||||||
| Corporate Center | (180) | (1,818) | (167) | (1,998) | (1,041) | ||||||
| Noncontrolling interests without SEI | 20 | 158 | 554 | 178 | 895 | ||||||
| Income before taxes | 1,131 | 198 | 1,640 | 1,329 | 3,606 | ||||||
| Total assets |
| end of | 2Q12 | 1Q12 | 4Q11 | 2Q11 | |||||
| Total assets (CHF million) | |||||||||
| Private Banking | 366,609 | 351,064 | 347,476 | 332,474 | |||||
| Investment Banking | 796,613 | 762,648 | 811,689 | 747,901 | |||||
| Asset Management | 23,647 | 22,549 | 23,203 | 21,976 | |||||
| Corporate Center 1 | (148,006) | (140,839) | (137,952) | (131,720) | |||||
| Noncontrolling interests without SEI | 4,592 | 4,598 | 4,749 | 6,292 | |||||
| Total assets | 1,043,455 | 1,000,020 | 1,049,165 | 976,923 | |||||
| 1 Under the central treasury model, Group financing results in intra-Group balances between the segments. The elimination of these assets and liabilities occurs in the Corporate Center. | |||||||||
| Note 6 Net interest income |
| in | 2Q12 | 1Q12 | 2Q11 | 6M12 | 6M11 | ||||||
| Net interest income (CHF million) | |||||||||||
| Loans | 1,232 | 1,213 | 1,253 | 2,445 | 2,475 | ||||||
| Investment securities | 26 | 21 | 23 | 47 | 54 | ||||||
| Trading assets | 4,418 | 2,666 | 4,159 | 7,084 | 6,836 | ||||||
| Central bank funds sold, securities purchased under resale agreements and securities borrowing transactions | 786 | 772 | 870 | 1,558 | 1,577 | ||||||
| Other | 582 | 623 | 777 | 1,205 | 1,592 | ||||||
| Interest and dividend income | 7,044 | 5,295 | 7,082 | 12,339 | 12,534 | ||||||
| Deposits | (353) | (388) | (427) | (741) | (831) | ||||||
| Short-term borrowings | (16) | (20) | (14) | (36) | (32) | ||||||
| Trading liabilities | (3,278) | (1,274) | (3,264) | (4,552) | (4,640) | ||||||
| Central bank funds purchased, securities sold under repurchase agreements and securities lending transactions | (527) | (370) | (505) | (897) | (848) | ||||||
| Long-term debt | (1,177) | (1,287) | (1,422) | (2,464) | (2,892) | ||||||
| Other | (79) | (72) | (73) | (151) | (161) | ||||||
| Interest expense | (5,430) | (3,411) | (5,705) | (8,841) | (9,404) | ||||||
| Net interest income | 1,614 | 1,884 | 1,377 | 3,498 | 3,130 | ||||||
| Note 7 Commissions and fees |
| in | 2Q12 | 1Q12 | 2Q11 | 6M12 | 6M11 | ||||||
| Commissions and fees (CHF million) | |||||||||||
| Lending business | 364 | 307 | 349 | 671 | 691 | ||||||
| Investment and portfolio management | 1,033 | 979 | 1,072 | 2,012 | 2,142 | ||||||
| Other securities business | 24 | 21 | 22 | 45 | 37 | ||||||
| Fiduciary business | 1,057 | 1,000 | 1,094 | 2,057 | 2,179 | ||||||
| Underwriting | 311 | 411 | 491 | 722 | 1,033 | ||||||
| Brokerage | 896 | 989 | 989 | 1,885 | 2,197 | ||||||
| Underwriting and brokerage | 1,207 | 1,400 | 1,480 | 2,607 | 3,230 | ||||||
| Other services | 502 | 465 | 540 | 967 | 1,034 | ||||||
| Commissions and fees | 3,130 | 3,172 | 3,463 | 6,302 | 7,134 | ||||||
| Note 8 Trading revenues |
| in | 2Q12 | 1Q12 | 2Q11 | 6M12 | 6M11 | ||||||
| Trading revenues (CHF million) | |||||||||||
| Interest rate products | 636 | (332) | 1,389 | 304 | 2,452 | ||||||
| Foreign exchange products | (554) | 1,037 | (1,562) | 483 | (884) | ||||||
| Equity/index-related products | 757 | 185 | 689 | 942 | 1,202 | ||||||
| Credit products | 162 | (990) | 317 | (828) | (158) | ||||||
| Commodity, emission and energy products | 17 | 71 | 232 | 88 | 306 | ||||||
| Other products | 138 | 218 | 51 | 356 | 209 | ||||||
| Trading revenues | 1,156 | 189 | 1,116 | 1,345 | 3,127 | ||||||
| Represents revenues on a product basis which are not representative of business results within segments, as segment results utilize financial instruments across various product types. | |||||||||||
| > Refer to “Note 8 – Trading revenues” in V – Consolidated financial statements – Credit Suisse Group in the Credit Suisse Annual Report 2011 for further information on trading revenues and managing trading risks. |
| Note 9 Other revenues |
| in | 2Q12 | 1Q12 | 2Q11 | 6M12 | 6M11 | ||||||
| Other revenues (CHF million) | |||||||||||
| Noncontrolling interests without SEI | 50 | 144 | 584 | 194 | 907 | ||||||
| Loans held-for-sale | (9) | (10) | 17 | (19) | 35 | ||||||
| Long-lived assets held-for-sale | (1) | (2) | 65 | (3) | 64 | ||||||
| Equity method investments | 33 | 31 | 52 | 64 | 58 | ||||||
| Other investments | 130 | 232 | 91 | 362 | 340 | ||||||
| Other | 172 | 407 | 127 | 579 | 253 | ||||||
| Other revenues | 375 | 802 | 936 | 1,177 | 1,657 | ||||||
| Note 10 Provision for credit losses |
| in | 2Q12 | 1Q12 | 2Q11 | 6M12 | 6M11 | ||||||
| Provision for credit losses (CHF million) | |||||||||||
| Provision for loan losses | 24 | 27 | 3 | 51 | 15 | ||||||
| Provision for lending-related and other exposures | 1 | 7 | 10 | 8 | (9) | ||||||
| Provision for credit losses | 25 | 34 | 13 | 59 | 6 | ||||||
| Note 11 Compensation and benefits |
| in | 2Q12 | 1Q12 | 2Q11 | 6M12 | 6M11 | ||||||
| Compensation and benefits (CHF million) | |||||||||||
| Salaries and variable compensation | 2,571 | 3,314 | 2,719 | 5,885 | 6,222 | ||||||
| Social security | 247 | 219 | 207 | 466 | 529 | ||||||
| Other 1 | 187 | 178 | 170 | 365 | 374 | ||||||
| Compensation and benefits 2 | 3,005 | 3,711 | 3,096 | 6,716 | 7,125 | ||||||
| 1 Includes pension and other post-retirement expense of CHF 129 million, CHF 112 million, CHF 112 million, CHF 241 million and CHF 246 million in 2Q12, 1Q12, 2Q11, 6M12 and 6M11, respectively. 2 Includes severance and other compensation expense relating to headcount reductions of CHF 123 million, CHF 45 million, CHF 142 million, CHF 168 million and CHF 142 million as of 2Q12, 1Q12, 2Q11, 6M12 and 6M11, respectively. | |||||||||||
| Note 12 General and administrative expenses |
| in | 2Q12 | 1Q12 | 2Q11 | 6M12 | 6M11 | ||||||
| General and administrative expenses (CHF million) | |||||||||||
| Occupancy expenses | 308 | 288 | 269 | 596 | 533 | ||||||
| IT, machinery, etc. | 372 | 343 | 333 | 715 | 660 | ||||||
| Provisions and losses | 13 | 69 | 42 | 82 | 89 | ||||||
| Travel and entertainment | 101 | 90 | 115 | 191 | 219 | ||||||
| Professional services | 473 | 435 | 541 | 908 | 1,026 | ||||||
| Amortization and impairment of other intangible assets | 7 | 14 | 8 | 21 | 15 | ||||||
| Other | 399 | 414 | 344 | 813 | 742 | ||||||
| General and administrative expenses | 1,673 | 1,653 | 1,652 | 3,326 | 3,284 | ||||||
| Note 13 Earnings per share |
| in | 2Q12 | 1Q12 | 2Q11 | 6M12 | 6M11 | ||||||
| Basic net income attributable to shareholders (CHF million) | |||||||||||
| Net income attributable to shareholders | 788 | 44 | 768 | 832 | 1,907 | ||||||
| Preferred securities dividends | (114) | – | (102) | (114) | (102) | ||||||
| Net income attributable to shareholders for basic earnings per share | 674 | 44 | 666 | 718 | 1,805 | ||||||
| Available for common shares | 615 | 41 | 575 | 659 | 1,704 | ||||||
| Available for unvested share-based payment awards | 59 | 3 | 91 | 59 | 101 | ||||||
| Diluted net income attributable to shareholders (CHF million) | |||||||||||
| Net income attributable to shareholders for basic earnings per share | 674 | 44 | 666 | 718 | 1,805 | ||||||
| Income impact of assumed conversion on contracts that may be settled in shares or cash 1 | (13) | (1) | – | (14) | – | ||||||
| Net income attributable to shareholders for diluted earnings per share | 661 | 43 | 666 | 704 | 1,805 | ||||||
| Available for common shares | 602 | 40 | 575 | 645 | 1,704 | ||||||
| Available for unvested share-based payment awards | 59 | 3 | 91 | 59 | 101 | ||||||
| Weighted-average shares outstanding (million) | |||||||||||
| Weighted-average shares outstanding for basic earnings per share available for common shares | 1,282.2 | 1,244.2 | 1,199.3 | 1,263.2 | 1,191.8 | ||||||
| Dilutive contracts that may be settled in shares or cash 2 | 26.4 | 6.9 | – | 16.7 | – | ||||||
| Dilutive share options and warrants | 6.4 | 4.5 | 2.9 | 5.5 | 2.7 | ||||||
| Dilutive share awards | 1.7 | 1.7 | 5.6 | 1.7 | 3.4 | ||||||
| Weighted-average shares outstanding for diluted earnings per share available for common shares 3 | 1,316.7 | 1,257.3 | 1,207.8 | 1,287.1 | 1,197.9 | ||||||
| Weighted-average shares outstanding for basic/diluted earnings per share available for unvested share-based payment awards | 90.1 | 81.0 | 74.6 | 85.6 | 73.4 | ||||||
| Earnings per share available for common shares (CHF) | |||||||||||
| Basic earnings per share available for common shares | 0.48 | 0.03 | 0.48 | 0.52 | 1.43 | ||||||
| Diluted earnings per share available for common shares | 0.46 | 0.03 | 0.48 | 0.50 | 1.42 | ||||||
| 1 Reflects changes in the fair value of the PAF2 units which are reflected in the results of the Group until the awards are finally settled. 2 Reflects weighted-average shares outstanding on PAF2 units. 3 Weighted-average potential common shares relating to instruments that were not dilutive for the respective periods (and therefore not included in the diluted earnings per share calculation above) but could potentially dilute earnings per share in the future were 23.5 million, 28.5 million, 36.4 million, 26.0 million and 40.7 million for 2Q12, 1Q12, 2Q11, 6M12 and 6M11, respectively. | |||||||||||
| Note 14 Trading assets and liabilities |
| end of | 2Q12 | 1Q12 | 4Q11 | 2Q11 | |||||
| Trading assets (CHF million) | |||||||||
| Debt securities | 160,166 | 154,676 | 145,035 | 155,058 | |||||
| Equity securities 1 | 68,829 | 87,340 | 66,904 | 89,077 | |||||
| Derivative instruments 2 | 42,014 | 44,505 | 52,548 | 40,313 | |||||
| Other | 13,049 | 14,076 | 15,066 | 18,178 | |||||
| Trading assets | 284,058 | 300,597 | 279,553 | 302,626 | |||||
| Trading liabilities (CHF million) | |||||||||
| Short positions | 67,239 | 65,696 | 67,639 | 74,137 | |||||
| Derivative instruments 2 | 48,543 | 48,804 | 60,121 | 46,315 | |||||
| Trading liabilities | 115,782 | 114,500 | 127,760 | 120,452 | |||||
| 1 Including convertible bonds. 2 Amounts shown net of cash collateral receivables and payables. | |||||||||
| Cash collateral receivables and payables |
| end of | 2Q12 | 1Q12 | 4Q11 | 2Q11 | |||||
| Cash collateral receivables (CHF million) | |||||||||
| Receivables netted against derivative positions | 37,637 | 32,420 | 36,474 | 25,333 | |||||
| Receivables not netted 1 | 13,221 | 12,317 | 15,809 | 13,739 | |||||
| Total | 50,858 | 44,737 | 52,283 | 39,072 | |||||
| Cash collateral payables (CHF million) | |||||||||
| Payables netted against derivative positions | 39,816 | 34,778 | 37,639 | 27,166 | |||||
| Payables not netted 1 | 12,978 | 10,948 | 11,934 | 14,562 | |||||
| Total | 52,794 | 45,726 | 49,573 | 41,728 | |||||
| 1 Recorded as cash collateral on derivative instruments in Note 17 – Other assets and other liabilities. | |||||||||
| Note 15 Investment securities |
| end of | 2Q12 | 1Q12 | 4Q11 | 2Q11 | |||||
| Investment securities (CHF million) | |||||||||
| Debt securities held-to-maturity | 2 | 2 | 2 | 146 | |||||
| Securities available-for-sale | 5,324 | 5,602 | 5,158 | 5,404 | |||||
| Total investment securities | 5,326 | 5,604 | 5,160 | 5,550 | |||||
| Investment securities by type |
end of | Amortized cost | Gross unrealized gains | Gross unrealized losses | Fair value | |||||
| 2Q12 (CHF million) | |||||||||
| Debt securities issued by foreign governments | 2 | 0 | 0 | 2 | |||||
| Debt securities held-to-maturity | 2 | 0 | 0 | 2 | |||||
| Debt securities issued by the Swiss federal, cantonal or local governmental entities | 460 | 29 | 0 | 489 | |||||
| Debt securities issued by foreign governments | 3,154 | 103 | 5 | 3,252 | |||||
| Corporate debt securities | 678 | 21 | 1 | 698 | |||||
| Collateralized debt obligations | 465 | 22 | 0 | 487 | |||||
| Debt securities available-for-sale | 4,757 | 175 | 6 | 4,926 | |||||
| Banks, trust and insurance companies | 220 | 171 | 0 | 391 | |||||
| Industry and all other | 7 | 0 | 0 | 7 | |||||
| Equity securities available-for-sale | 227 | 171 | 0 | 398 | |||||
| Securities available-for-sale | 4,984 | 346 | 6 | 5,324 | |||||
| 4Q11 (CHF million) | |||||||||
| Debt securities issued by foreign governments | 2 | 0 | 0 | 2 | |||||
| Debt securities held-to-maturity | 2 | 0 | 0 | 2 | |||||
| Debt securities issued by the Swiss federal, cantonal or local governmental entities | 321 | 27 | 0 | 348 | |||||
| Debt securities issued by foreign governments | 3,211 | 121 | 12 | 3,320 | |||||
| Corporate debt securities | 778 | 18 | 5 | 791 | |||||
| Collateralized debt obligations | 587 | 20 | 0 | 607 | |||||
| Debt securities available-for-sale | 4,897 | 186 | 17 | 5,066 | |||||
| Banks, trust and insurance companies | 67 | 9 | 0 | 76 | |||||
| Industry and all other | 15 | 1 | 0 | 16 | |||||
| Equity securities available-for-sale | 82 | 10 | 0 | 92 | |||||
| Securities available-for-sale | 4,979 | 196 | 17 | 5,158 | |||||
| Gross unrealized losses on investment securities and the related fair value |
| Less than 12 months | 12 months or more | Total | |||||||||||
end of | Fair value | Gross unrealized losses | Fair value | Gross unrealized losses | Fair value | Gross unrealized losses | |||||||
| 2Q12 (CHF million) | |||||||||||||
| Debt securities issued by foreign governments | 1,027 | 1 | 48 | 4 | 1,075 | 5 | |||||||
| Corporate debt securities | 10 | 0 | 34 | 1 | 44 | 1 | |||||||
| Debt securities available-for-sale | 1,037 | 1 | 82 | 5 | 1,119 | 6 | |||||||
| 4Q11 (CHF million) | |||||||||||||
| Debt securities issued by foreign governments | 100 | 2 | 40 | 10 | 140 | 12 | |||||||
| Corporate debt securities | 81 | 2 | 17 | 3 | 98 | 5 | |||||||
| Debt securities available-for-sale | 181 | 4 | 57 | 13 | 238 | 17 | |||||||
| Management determined that the unrealized losses on debt securities are primarily attributable to general market interest rate, credit spread or exchange rate movements. No significant impairment charges were recorded as the Group does not intend to sell the investments, nor is it more likely than not that the Group will be required to sell the investments before the recovery of their amortized cost bases, which may be maturity. |
| Proceeds from sales, realized gains and realized losses from available-for-sale securities |
| 6M12 | 6M11 | ||||||||
in | Debt securities | Equity securities | Debt securities | Equity securities | |||||
| Additional information (CHF million) | |||||||||
| Proceeds from sales | 9 | 330 | 2,095 | 1 | |||||
| Realized gains | 1 | 154 | 40 | 0 | |||||
| Realized losses | 0 | 0 | (22) | 0 | |||||
| Amortized cost, fair value and average yield of debt securities |
| Debt securities held-to-maturity | Debt securities available-for-sale | ||||||||||||
end of | Amortized cost | Fair value | Average yield (in %) | Amortized cost | Fair value | Average yield (in %) | |||||||
| 2Q12 (CHF million) | |||||||||||||
| Due within 1 year | 2 | 2 | 4.41 | 1,713 | 1,713 | 3.11 | |||||||
| Due from 1 to 5 years | 0 | 0 | – | 2,396 | 2,529 | 3.10 | |||||||
| Due from 5 to 10 years | 0 | 0 | – | 457 | 483 | 2.03 | |||||||
| Due after 10 years | 0 | 0 | – | 191 | 201 | 2.39 | |||||||
| Total debt securities | 2 | 2 | 4.41 | 4,757 | 4,926 | 2.97 | |||||||
| Note 16 Loans, allowance for loan losses and credit quality |
| Loans are divided in two portfolio segments, “consumer” and “corporate & institutional”. Consumer loans are disaggregated into the classes of mortgages, loans collateralized by securities and consumer finance. Corporate & institutional loans are disaggregated into the classes of real estate, commercial and industrial loans, financial institutions and governments and public institutions. |
| The determination of the loan classes is primarily driven by the customer segmentation in the two business divisions, Private Banking and Investment Banking, that are engaged in credit activities. |
| The Group assigns both counterparty and transaction ratings to its credit exposures. The counterparty rating reflects the probability of default of the counterparty. The transaction rating reflects the expected loss, considering collateral, on a given transaction if the counterparty defaults. Credit risk is assessed and monitored on the single obligor and single obligation level as well as on the credit portfolio level as represented by the classes of loans. Credit limits are used to manage counterparty credit risk. |
| > Refer to “Note 18 – Loans, allowance for loan losses and credit quality” in V – Consolidated financial statements – Credit Suisse Group in the Credit Suisse Annual Report 2011 for further information on loans, allowance for loan losses, credit quality and impaired loans. |
| Loans |
| end of | 2Q12 | 1Q12 | 4Q11 | 2Q11 | |||||
| Loans (CHF million) | |||||||||
| Mortgages | 90,618 | 89,598 | 88,255 | 86,374 | |||||
| Loans collateralized by securities | 26,281 | 25,950 | 26,461 | 25,725 | |||||
| Consumer finance | 7,176 | 6,320 | 6,695 | 6,024 | |||||
| Consumer | 124,075 | 121,868 | 121,411 | 118,123 | |||||
| Real estate | 26,116 | 25,605 | 25,185 | 24,163 | |||||
| Commercial and industrial loans | 61,813 | 59,363 | 59,998 | 52,733 | |||||
| Financial institutions | 25,256 | 23,473 | 25,373 | 23,674 | |||||
| Governments and public institutions | 2,903 | 2,346 | 2,390 | 2,285 | |||||
| Corporate & institutional | 116,088 | 110,787 | 112,946 | 102,855 | |||||
| Gross loans | 240,163 | 232,655 | 234,357 | 220,978 | |||||
| of which held at amortized cost | 219,648 | 213,787 | 213,663 | 201,787 | |||||
| of which held at fair value | 20,515 | 18,868 | 20,694 | 19,191 | |||||
| Net (unearned income)/deferred expenses | (71) | (51) | (34) | (32) | |||||
| Allowance for loan losses | (928) | (908) | (910) | (916) | |||||
| Net loans | 239,164 | 231,696 | 233,413 | 220,030 | |||||
| Gross loans by location (CHF million) | |||||||||
| Switzerland | 149,042 | 148,181 | 146,737 | 142,091 | |||||
| Foreign | 91,121 | 84,474 | 87,620 | 78,887 | |||||
| Gross loans | 240,163 | 232,655 | 234,357 | 220,978 | |||||
| Impaired loan portfolio (CHF million) | |||||||||
| Non-performing loans | 921 | 993 | 758 | 880 | |||||
| Non-interest-earning loans | 298 | 228 | 262 | 272 | |||||
| Total non-performing and non-interest-earning loans | 1,219 | 1,221 | 1,020 | 1,152 | |||||
| Restructured loans | 36 | 8 | 18 | 46 | |||||
| Potential problem loans | 519 | 497 | 680 | 446 | |||||
| Total other impaired loans | 555 | 505 | 698 | 492 | |||||
| Gross impaired loans | 1,774 | 1,726 | 1,718 | 1,644 | |||||
| Allowance for loan losses by loan portfolio |
| 2Q12 | 1Q12 | 2Q11 | |||||||||||||||||
Consumer | Corporate & institutional | Total | Consumer | Corporate & institutional | Total | Consumer | Corporate & institutional | Total | |||||||||||
| Allowance for loan losses (CHF million) | |||||||||||||||||||
| Balance at beginning of period | 295 | 613 | 908 | 289 | 621 | 910 | 281 | 693 | 974 | ||||||||||
| Net movements recognized in statements of operations | 25 | (1) | 24 | 22 | 5 | 27 | 2 | 1 | 3 | ||||||||||
| Gross write-offs | (22) | (22) | (44) | (26) | (17) | (43) | (17) | (30) | (47) | ||||||||||
| Recoveries | 3 | 9 | 12 | 11 | 8 | 19 | 14 | 1 | 15 | ||||||||||
| Net write-offs | (19) | (13) | (32) | (15) | (9) | (24) | (3) | (29) | (32) | ||||||||||
| Provisions for interest | 2 | 2 | 4 | 3 | 5 | 8 | 1 | 2 | 3 | ||||||||||
| Foreign currency translation impact and other adjustments, net | 1 | 23 | 24 | (4) | (9) | (13) | (12) | (20) | (32) | ||||||||||
| Balance at end of period | 304 | 624 | 928 | 295 | 613 | 908 | 269 | 647 | 916 | ||||||||||
| of which individually evaluated for impairment | 239 | 443 | 682 | 230 | 437 | 667 | 198 | 470 | 668 | ||||||||||
| of which collectively evaluated for impairment | 65 | 181 | 246 | 65 | 176 | 241 | 71 | 177 | 248 | ||||||||||
| Gross loans held at amortized cost (CHF million) | |||||||||||||||||||
| Balance at end of period | 124,064 | 95,584 | 219,648 | 121,857 | 91,930 | 213,787 | 118,118 | 83,669 | 201,787 | ||||||||||
| of which individually evaluated for impairment | 558 | 832 | 1,390 | 553 | 920 | 1,473 | 538 | 837 | 1,375 | ||||||||||
| of which collectively evaluated for impairment | 123,506 | 94,752 | 218,258 | 121,304 | 91,010 | 212,314 | 117,580 | 82,832 | 200,412 | ||||||||||
| 6M12 | 6M11 | ||||||||||||
Consumer | Corporate & institutional | Total | Consumer | Corporate & institutional | Total | ||||||||
| Allowance for loan losses (CHF million) | |||||||||||||
| Balance at beginning of period | 289 | 621 | 910 | 279 | 738 | 1,017 | |||||||
| Net movements recognized in statements of operations | 47 | 4 | 51 | 14 | 1 | 15 | |||||||
| Gross write-offs | (48) | (39) | (87) | (41) | (67) | (108) | |||||||
| Recoveries | 14 | 17 | 31 | 20 | 3 | 23 | |||||||
| Net write-offs | (34) | (22) | (56) | (21) | (64) | (85) | |||||||
| Provisions for interest | 5 | 7 | 12 | 2 | 3 | 5 | |||||||
| Foreign currency translation impact and other adjustments, net | (3) | 14 | 11 | (5) | (31) | (36) | |||||||
| Balance at end of period | 304 | 624 | 928 | 269 | 647 | 916 | |||||||
| Purchases, reclassifications and sales |
| 2Q12 | 1Q12 | 2Q11 | |||||||||||||||||
in | Consumer | Corporate & institutional | Total | Consumer | Corporate & institutional | Total | Consumer | Corporate & institutional | Total | ||||||||||
| Loans held at amortized cost (CHF million) | |||||||||||||||||||
| Purchases 1 | 348 | 2,445 | 2,793 | 0 | 916 | 916 | 0 | 541 | 541 | ||||||||||
| Reclassifications from loans held-for-sale 2 | 0 | 85 | 85 | 0 | 0 | 0 | 0 | 0 | 0 | ||||||||||
| Reclassifications to loans held-for-sale 3 | 0 | 341 | 341 | 0 | 475 | 475 | 0 | 286 | 286 | ||||||||||
| Sales 3 | 0 | 264 | 264 | 0 | 443 | 443 | 0 | 113 | 113 | ||||||||||
| 1 Includes drawdowns under purchased loan commitments. 2 Includes loans previously reclassified to held-for-sale that were not sold and were reclassified back to loans held-to-maturity. 3 All loans held at amortized cost which are sold are reclassified to loans held-for-sale on or prior to the date of the sale. | |||||||||||||||||||
| Purchases, reclassifications and sales (continued) |
| 6M12 | 6M11 | ||||||||||||
in | Consumer | Corporate & institutional | Total | Consumer | Corporate & institutional | Total | |||||||
| Loans held at amortized cost (CHF million) | |||||||||||||
| Purchases 1 | 348 | 3,361 | 3,709 | 0 | 2,077 | 2,077 | |||||||
| Reclassifications from loans held-for-sale 2 | 0 | 85 | 85 | 0 | 0 | 0 | |||||||
| Reclassifications to loans held-for-sale 3 | 0 | 816 | 816 | 0 | 656 | 656 | |||||||
| Sales 3 | 0 | 707 | 707 | 0 | 483 | 483 | |||||||
| 1 Includes drawdowns under purchased loan commitments. 2 Includes loans previously reclassified to held-for-sale that were not sold and were reclassified back to loans held-to-maturity. 3 All loans held at amortized cost which are sold are reclassified to loans held-for-sale on or prior to the date of the sale. | |||||||||||||
Credit quality of loans held at amortized cost |
| Management monitors the credit quality of loans through its credit risk management processes, which are structured to assess, quantify, measure, monitor and manage risk on a consistent basis. This process requires careful consideration of proposed extensions of credit, the setting of specific limits, monitoring during the life of the exposure, active use of credit mitigation tools and a disciplined approach to recognizing credit impairment. |
| Management evaluates many factors when assessing the credit quality of loans. These factors include the volatility of default probabilities, rating changes, the magnitude of potential loss, internal risk ratings, and geographic, industry and other economic factors. For the purpose of credit quality disclosures, the Group uses internal risk ratings as credit quality indicators. |
| The Group employs a set of credit ratings for the purpose of internally rating counterparties. Credit ratings are intended to reflect the risk of default of each obligor or counterparty. Ratings are assigned based on internally developed rating models and processes, which are subject to governance and internally independent validation procedures. |
| > Refer to “Credit quality of loans held at amortized cost” in V – Consolidated financial statements – Credit Suisse Group – Note 18 – Loans, allowance for loan losses and credit quality in the Credit Suisse Annual Report 2011 for further information on internal ratings and the scope of the credit quality disclosures. |
| Gross loans held at amortized cost by internal counterparty rating |
| end of | AAA | AA | A | BBB | BB | B | CCC | CC | C | D | Total | ||||||||||||
| 2Q12 (CHF million) | |||||||||||||||||||||||
| Mortgages | 380 | 705 | 11,686 | 57,485 | 19,545 | 572 | 16 | 17 | 0 | 212 | 90,618 | ||||||||||||
| Loans collateralized by securities | 27 | 41 | 515 | 22,682 | 2,814 | 99 | 0 | 33 | 0 | 70 | 26,281 | ||||||||||||
| Consumer finance | 3 | 6 | 72 | 3,257 | 2,589 | 562 | 55 | 4 | 314 | 303 | 7,165 | ||||||||||||
| Consumer | 410 | 752 | 12,273 | 83,424 | 24,948 | 1,233 | 71 | 54 | 314 | 585 | 124,064 | ||||||||||||
| Real estate | 318 | 253 | 1,479 | 13,230 | 10,066 | 393 | 0 | 3 | 0 | 64 | 25,806 | ||||||||||||
| Commercial and industrial loans | 294 | 259 | 1,597 | 22,458 | 21,101 | 3,313 | 146 | 7 | 50 | 753 | 49,978 | ||||||||||||
| Financial institutions | 3,414 | 1,998 | 3,993 | 5,479 | 2,256 | 655 | 2 | 45 | 0 | 158 | 18,000 | ||||||||||||
| Governments and public institutions | 123 | 51 | 331 | 579 | 137 | 100 | 473 | 0 | 0 | 6 | 1,800 | ||||||||||||
| Corporate & institutional | 4,149 | 2,561 | 7,400 | 41,746 | 33,560 | 4,461 | 621 | 55 | 50 | 981 | 95,584 | ||||||||||||
| Gross loans held at amortized cost | 4,559 | 3,313 | 19,673 | 125,170 | 58,508 | 5,694 | 692 | 109 | 364 | 1,566 | 219,648 | ||||||||||||
| Value of collateral 1 | 3,826 | 2,256 | 18,187 | 114,600 | 48,318 | 3,461 | 112 | 96 | 10 | 847 | 191,713 | ||||||||||||
| 4Q11 (CHF million) | |||||||||||||||||||||||
| Mortgages | 166 | 637 | 8,837 | 55,222 | 22,368 | 763 | 18 | 19 | 0 | 225 | 88,255 | ||||||||||||
| Loans collateralized by securities | 1 | 18 | 397 | 24,089 | 1,793 | 88 | 0 | 2 | 0 | 73 | 26,461 | ||||||||||||
| Consumer finance | 1 | 5 | 51 | 3,234 | 2,187 | 524 | 58 | 9 | 316 | 300 | 6,685 | ||||||||||||
| Consumer | 168 | 660 | 9,285 | 82,545 | 26,348 | 1,375 | 76 | 30 | 316 | 598 | 121,401 | ||||||||||||
| Real estate | 341 | 204 | 1,241 | 12,476 | 10,277 | 312 | 0 | 3 | 0 | 60 | 24,914 | ||||||||||||
| Commercial and industrial loans | 409 | 242 | 1,755 | 21,182 | 20,091 | 3,128 | 179 | 27 | 121 | 714 | 47,848 | ||||||||||||
| Financial institutions | 3,906 | 2,098 | 3,333 | 5,549 | 1,890 | 760 | 3 | 43 | 0 | 132 | 17,714 | ||||||||||||
| Governments and public institutions | 119 | 88 | 355 | 484 | 160 | 104 | 470 | 0 | 0 | 6 | 1,786 | ||||||||||||
| Corporate & institutional | 4,775 | 2,632 | 6,684 | 39,691 | 32,418 | 4,304 | 652 | 73 | 121 | 912 | 92,262 | ||||||||||||
| Gross loans held at amortized cost | 4,943 | 3,292 | 15,969 | 122,236 | 58,766 | 5,679 | 728 | 103 | 437 | 1,510 | 213,663 | ||||||||||||
| Value of collateral 1 | 3,938 | 1,751 | 14,176 | 112,505 | 48,100 | 3,171 | 119 | 86 | 9 | 871 | 184,726 | ||||||||||||
| 1 Includes the value of collateral up to the amount of the outstanding related loans. For mortgages, collateral values are generally values at the time of granting the loan. | |||||||||||||||||||||||
| Value of collateral |
| In Private Banking, all collateral values for loans are regularly reviewed according to our risk management policies and directives, with maximum review periods determined by market liquidity, market transparency and appraisal costs. For example, traded securities are revalued on a daily basis and property values are appraised over a period of more than one year considering the characteristics of the borrower, current developments in the relevant real estate market and the current level of credit exposure to the borrower. If the credit exposure to a borrower has changed significantly, in volatile markets or in times of increasing general market risk, collateral values may be appraised more frequently. Management judgment is applied in assessing whether markets are volatile or general market risk has increased to a degree that warrants a more frequent update of collateral values. Movements in monitored risk metrics that are statistically different compared to historical experience are considered in addition to analysis of externally-provided forecasts, scenario techniques and macro-economic research. For impaired loans, the fair value of collateral is determined within 90 days of the date the impairment was identified and thereafter regularly revalued by Group credit risk management within the impairment review process. |
| In Investment Banking, few loans are collateral dependent. The collateral values for these loans are appraised on at least an annual basis, or when a loan-relevant event occurs. |
| Gross loans held at amortized cost – aging analysis |
| Current | Past due | ||||||||||||||
end of | Up to 30 days | 31–60 days | 61–90 days | More than 90 days | Total | Total | |||||||||
| 2Q12 (CHF million) | |||||||||||||||
| Mortgages | 90,281 | 107 | 58 | 8 | 164 | 337 | 90,618 | ||||||||
| Loans collateralized by securities | 26,031 | 216 | 7 | 12 | 15 | 250 | 26,281 | ||||||||
| Consumer finance | 6,351 | 483 | 83 | 75 | 173 | 814 | 7,165 | ||||||||
| Consumer | 122,663 | 806 | 148 | 95 | 352 | 1,401 | 124,064 | ||||||||
| Real estate | 25,686 | 80 | 4 | 9 | 27 | 120 | 25,806 | ||||||||
| Commercial and industrial loans | 49,249 | 399 | 43 | 116 | 171 | 729 | 49,978 | ||||||||
| Financial institutions | 17,733 | 225 | 1 | 15 | 26 | 267 | 18,000 | ||||||||
| Governments and public institutions | 1,770 | 30 | 0 | 0 | 0 | 30 | 1,800 | ||||||||
| Corporate & institutional | 94,438 | 734 | 48 | 140 | 224 | 1,146 | 95,584 | ||||||||
| Gross loans held at amortized cost | 217,101 | 1,540 | 196 | 235 | 576 | 2,547 | 219,648 | ||||||||
| 4Q11 (CHF million) | |||||||||||||||
| Mortgages | 88,016 | 48 | 12 | 6 | 173 | 239 | 88,255 | ||||||||
| Loans collateralized by securities | 26,254 | 180 | 11 | 3 | 13 | 207 | 26,461 | ||||||||
| Consumer finance | 5,886 | 496 | 86 | 50 | 167 | 799 | 6,685 | ||||||||
| Consumer | 120,156 | 724 | 109 | 59 | 353 | 1,245 | 121,401 | ||||||||
| Real estate | 24,840 | 41 | 3 | 1 | 29 | 74 | 24,914 | ||||||||
| Commercial and industrial loans | 47,085 | 454 | 90 | 50 | 169 | 763 | 47,848 | ||||||||
| Financial institutions | 17,550 | 78 | 2 | 48 | 36 | 164 | 17,714 | ||||||||
| Governments and public institutions | 1,785 | 1 | 0 | 0 | 0 | 1 | 1,786 | ||||||||
| Corporate & institutional | 91,260 | 574 | 95 | 99 | 234 | 1,002 | 92,262 | ||||||||
| Gross loans held at amortized cost | 211,416 | 1,298 | 204 | 158 | 587 | 2,247 | 213,663 | ||||||||
Impaired loans |
| > Refer to “Impaired loans” in V – Consolidated financial statements – Credit Suisse Group – Note 18 – Loans, allowance for loan losses and credit quality in the Credit Suisse Annual Report 2011 for further information on impaired loan categories and allowance for specifically identified credit losses on impaired loans. |
| Gross impaired loans by category |
| Non-performing and non-interest-earning loans | Other impaired loans | ||||||||||||||
end of | Non- performing loans | Non- interest- earning loans | Total | Restruc- tured loans | Potential problem loans | Total | Total | ||||||||
| 2Q12 (CHF million) | |||||||||||||||
| Mortgages | 174 | 15 | 189 | 0 | 65 | 65 | 254 | ||||||||
| Loans collateralized by securities | 59 | 11 | 70 | 0 | 0 | 0 | 70 | ||||||||
| Consumer finance | 268 | 28 | 296 | 0 | 15 | 15 | 311 | ||||||||
| Consumer | 501 | 54 | 555 | 0 | 80 | 80 | 635 | ||||||||
| Real estate | 41 | 5 | 46 | 0 | 21 | 21 | 67 | ||||||||
| Commercial and industrial loans | 271 | 171 | 442 | 36 | 360 | 396 | 838 | ||||||||
| Financial institutions | 108 | 62 | 170 | 0 | 58 | 58 | 228 | ||||||||
| Governments and public institutions | 0 | 6 | 6 | 0 | 0 | 0 | 6 | ||||||||
| Corporate & institutional | 420 | 244 | 664 | 36 | 439 | 475 | 1,139 | ||||||||
| Gross impaired loans | 921 | 298 | 1,219 | 36 | 519 | 555 | 1,774 | ||||||||
| 4Q11 (CHF million) | |||||||||||||||
| Mortgages | 176 | 14 | 190 | 1 | 73 | 74 | 264 | ||||||||
| Loans collateralized by securities | 27 | 13 | 40 | 0 | 46 | 46 | 86 | ||||||||
| Consumer finance | 262 | 28 | 290 | 0 | 25 | 25 | 315 | ||||||||
| Consumer | 465 | 55 | 520 | 1 | 144 | 145 | 665 | ||||||||
| Real estate | 29 | 7 | 36 | 0 | 24 | 24 | 60 | ||||||||
| Commercial and industrial loans | 215 | 129 | 344 | 17 | 454 | 471 | 815 | ||||||||
| Financial institutions | 49 | 65 | 114 | 0 | 58 | 58 | 172 | ||||||||
| Governments and public institutions | 0 | 6 | 6 | 0 | 0 | 0 | 6 | ||||||||
| Corporate & institutional | 293 | 207 | 500 | 17 | 536 | 553 | 1,053 | ||||||||
| Gross impaired loans | 758 | 262 | 1,020 | 18 | 680 | 698 | 1,718 | ||||||||
| Gross impaired loan detail |
| 2Q12 | 4Q11 | ||||||||||||
end of | Recorded investment | Unpaid principal balance | Associated specific allowance | Recorded investment | Unpaid principal balance | Associated specific allowance | |||||||
| Gross impaired loan detail (CHF million) | |||||||||||||
| Mortgages | 216 | 205 | 41 | 217 | 206 | 41 | |||||||
| Loans collateralized by securities | 69 | 65 | 57 | 85 | 83 | 50 | |||||||
| Consumer finance | 273 | 258 | 141 | 303 | 288 | 131 | |||||||
| Consumer | 558 | 528 | 239 | 605 | 577 | 222 | |||||||
| Real estate | 53 | 46 | 19 | 46 | 38 | 20 | |||||||
| Commercial and industrial loans | 555 | 523 | 326 | 734 | 709 | 318 | |||||||
| Financial institutions | 218 | 216 | 92 | 156 | 154 | 84 | |||||||
| Governments and public institutions | 6 | 5 | 6 | 6 | 5 | 6 | |||||||
| Corporate & institutional | 832 | 790 | 443 | 942 | 906 | 428 | |||||||
| Gross impaired loans with a specific allowance | 1,390 | 1,318 | 682 | 1,547 | 1,483 | 650 | |||||||
| Mortgages | 38 | 38 | – | 46 | 46 | – | |||||||
| Loans collateralized by securities | 1 | 1 | – | 1 | 1 | – | |||||||
| Consumer finance | 38 | 38 | – | 13 | 13 | – | |||||||
| Consumer | 77 | 77 | – | 60 | 60 | – | |||||||
| Real estate | 14 | 14 | – | 15 | 15 | – | |||||||
| Commercial and industrial loans | 283 | 280 | – | 80 | 80 | – | |||||||
| Financial institutions | 10 | 10 | – | 16 | 16 | – | |||||||
| Corporate & institutional | 307 | 304 | – | 111 | 111 | – | |||||||
| Gross impaired loans without specific allowance | 384 | 381 | – | 171 | 171 | – | |||||||
| Gross impaired loans | 1,774 | 1,699 | 682 | 1,718 | 1,654 | 650 | |||||||
| of which consumer | 635 | 605 | 239 | 665 | 637 | 222 | |||||||
| of which corporate & institutional | 1,139 | 1,094 | 443 | 1,053 | 1,017 | 428 | |||||||
| Gross impaired loan detail (continued) |
| 2Q12 | 1Q12 | 2Q11 | |||||||||||||||||
in | Average recorded investment | Interest income recognized | Interest income recognized on a cash basis | Average recorded investment | Interest income recognized | Interest income recognized on a cash basis | Average recorded investment | Interest income recognized | Interest income recognized on a cash basis | ||||||||||
| Gross impaired loan detail (CHF million) | |||||||||||||||||||
| Mortgages | 218 | 1 | 1 | 214 | 0 | 0 | 237 | 0 | 0 | ||||||||||
| Loans collateralized by securities | 68 | 1 | 0 | 69 | 0 | 0 | 39 | 0 | 0 | ||||||||||
| Consumer finance | 273 | 0 | 0 | 289 | 2 | 2 | 264 | 1 | 0 | ||||||||||
| Consumer | 559 | 2 | 1 | 572 | 2 | 2 | 540 | 1 | 0 | ||||||||||
| Real estate | 53 | 0 | 0 | 58 | 0 | 0 | 59 | 1 | 1 | ||||||||||
| Commercial and industrial loans | 575 | 0 | 0 | 701 | 2 | 1 | 655 | 1 | 1 | ||||||||||
| Financial institutions | 223 | 1 | 1 | 206 | 0 | 0 | 151 | 0 | 0 | ||||||||||
| Governments and public institutions | 6 | 0 | 0 | 6 | 0 | 0 | 6 | 0 | 0 | ||||||||||
| Corporate & institutional | 857 | 1 | 1 | 971 | 2 | 1 | 871 | 2 | 2 | ||||||||||
| Gross impaired loans with a specific allowance | 1,416 | 3 | 2 | 1,543 | 4 | 3 | 1,411 | 3 | 2 | ||||||||||
| Mortgages | 47 | 0 | 0 | 51 | 0 | 0 | 38 | 0 | 0 | ||||||||||
| Loans collateralized by securities | 1 | 0 | 0 | 1 | 0 | 0 | 1 | 0 | 0 | ||||||||||
| Consumer finance | 37 | 0 | 0 | 30 | 0 | 0 | 13 | 0 | 0 | ||||||||||
| Consumer | 85 | 0 | 0 | 82 | 0 | 0 | 52 | 0 | 0 | ||||||||||
| Real estate | 19 | 0 | 0 | 16 | 0 | 0 | 57 | 3 | 3 | ||||||||||
| Commercial and industrial loans | 307 | 2 | 2 | 103 | 0 | 0 | 155 | 0 | 0 | ||||||||||
| Financial institutions | 11 | 0 | 0 | 12 | 0 | 0 | 4 | 0 | 0 | ||||||||||
| Corporate & institutional | 337 | 2 | 2 | 131 | 0 | 0 | 216 | 3 | 3 | ||||||||||
| Gross impaired loans without specific allowance | 422 | 2 | 2 | 213 | 0 | 0 | 268 | 3 | 3 | ||||||||||
| Gross impaired loans | 1,838 | 5 | 4 | 1,756 | 4 | 3 | 1,679 | 6 | 5 | ||||||||||
| of which consumer | 644 | 2 | 1 | 654 | 2 | 2 | 592 | 1 | 0 | ||||||||||
| of which corporate & institutional | 1,194 | 3 | 3 | 1,102 | 2 | 1 | 1,087 | 5 | 5 | ||||||||||
| Gross impaired loan detail (continued) |
| 6M12 | 6M11 | ||||||||||||
in | Average recorded investment | Interest income recognized | Interest income recognized on a cash basis | Average recorded investment | Interest income recognized | Interest income recognized on a cash basis | |||||||
| Gross impaired loan detail (CHF million) | |||||||||||||
| Mortgages | 219 | 1 | 1 | 240 | 1 | 0 | |||||||
| Loans collateralized by securities | 68 | 1 | 0 | 43 | 0 | 0 | |||||||
| Consumer finance | 285 | 2 | 2 | 285 | 1 | 0 | |||||||
| Consumer | 572 | 4 | 3 | 568 | 2 | 0 | |||||||
| Real estate | 54 | 0 | 0 | 60 | 1 | 1 | |||||||
| Commercial and industrial loans | 624 | 2 | 1 | 659 | 3 | 3 | |||||||
| Financial institutions | 215 | 1 | 1 | 167 | 0 | 0 | |||||||
| Governments and public institutions | 6 | 0 | 0 | 6 | 0 | 0 | |||||||
| Corporate & institutional | 899 | 3 | 2 | 892 | 4 | 4 | |||||||
| Gross impaired loans with a specific allowance | 1,471 | 7 | 5 | 1,460 | 6 | 4 | |||||||
| Mortgages | 51 | 0 | 0 | 53 | 0 | 0 | |||||||
| Loans collateralized by securities | 1 | 0 | 0 | 1 | 0 | 0 | |||||||
| Consumer finance | 36 | 0 | 0 | 16 | 0 | 0 | |||||||
| Consumer | 88 | 0 | 0 | 70 | 0 | 0 | |||||||
| Real estate | 18 | 0 | 0 | 61 | 3 | 3 | |||||||
| Commercial and industrial loans | 236 | 2 | 2 | 192 | 0 | 0 | |||||||
| Financial institutions | 11 | 0 | 0 | 4 | 0 | 0 | |||||||
| Corporate & institutional | 265 | 2 | 2 | 257 | 3 | 3 | |||||||
| Gross impaired loans without specific allowance | 353 | 2 | 2 | 327 | 3 | 3 | |||||||
| Gross impaired loans | 1,824 | 9 | 7 | 1,787 | 9 | 7 | |||||||
| of which consumer | 660 | 4 | 3 | 638 | 2 | 0 | |||||||
| of which corporate & institutional | 1,164 | 5 | 4 | 1,149 | 7 | 7 | |||||||
| Note 17 Other assets and other liabilities |
| end of | 2Q12 | 1Q12 | 4Q11 | 2Q11 | |||||
| Other assets (CHF million) | |||||||||
| Cash collateral on derivative instruments | 13,221 | 12,317 | 15,809 | 13,739 | |||||
| Cash collateral on non-derivative transactions | 2,920 | 2,454 | 2,083 | 1,841 | |||||
| Derivative instruments used for hedging | 3,435 | 3,239 | 3,706 | 2,178 | |||||
| Assets held-for-sale | 20,741 | 20,634 | 21,205 | 25,362 | |||||
| of which loans | 20,115 | 20,147 | 20,457 | 23,816 | |||||
| of which real estate | 619 | 459 | 732 | 1,528 | |||||
| Assets held for separate accounts | 14,410 | 14,707 | 14,407 | 14,712 | |||||
| Interest and fees receivable | 6,029 | 5,389 | 6,090 | 5,748 | |||||
| Deferred tax assets | 8,825 | 8,609 | 8,939 | 7,754 | |||||
| Prepaid expenses | 706 | 680 | 601 | 718 | |||||
| Failed purchases | 2,861 | 1,338 | 1,513 | 1,245 | |||||
| Other | 4,365 | 4,342 | 3,943 | 3,488 | |||||
| Other assets | 77,513 | 73,709 | 78,296 | 76,785 | |||||
| Other liabilities (CHF million) | |||||||||
| Cash collateral on derivative instruments | 12,978 | 10,948 | 11,934 | 14,562 | |||||
| Cash collateral on non-derivative transactions | 1,564 | 996 | 1,002 | 52 | |||||
| Derivative instruments used for hedging | 1,682 | 2,181 | 1,998 | 982 | |||||
| Provisions 1 | 1,078 | 1,104 | 1,113 | 1,177 | |||||
| of which off-balance sheet risk | 66 | 65 | 65 | 488 | |||||
| Liabilities held for separate accounts | 14,410 | 14,707 | 14,407 | 14,712 | |||||
| Interest and fees payable | 7,565 | 6,576 | 7,142 | 7,588 | |||||
| Current tax liabilities | 817 | 747 | 767 | 783 | |||||
| Deferred tax liabilities | 200 | 318 | 429 | 354 | |||||
| Failed sales | 5,895 | 6,258 | 6,888 | 6,963 | |||||
| Other | 16,070 | 16,094 | 17,537 | 14,400 | |||||
| Other liabilities | 62,259 | 59,929 | 63,217 | 61,573 | |||||
| 1 Includes provisions for bridge commitments. | |||||||||
| Note 18 Long-term debt |
| end of | 2Q12 | 1Q12 | 4Q11 | 2Q11 | |||||
| Long-term debt (CHF million) | |||||||||
| Senior | 120,627 | 122,792 | 123,632 | 122,668 | |||||
| Subordinated | 20,351 | 19,762 | 24,165 | 23,307 | |||||
| Non-recourse liabilities from consolidated VIEs | 13,860 | 13,077 | 14,858 | 18,184 | |||||
| Long-term debt | 154,838 | 155,631 | 162,655 | 164,159 | |||||
| of which reported at fair value | 66,952 | 66,347 | 70,366 | 76,844 | |||||
| Note 19 Accumulated other comprehensive income |
Gains/ (losses) on cash flow hedges | Cumulative translation adjustments | Unrealized gains/ (losses) on securities | Actuarial gains/ (losses) | Net prior service credit/ (cost) | Accumu- lated other compre- hensive income | ||||||||
| 2Q12 (CHF million) | |||||||||||||
| Balance at beginning of period | (52) | (12,716) | 283 | (3,678) | 340 | (15,823) | |||||||
| Increase/(decrease) | 1 | 930 | (37) | 4 | 0 | 898 | |||||||
| Increase/(decrease) due to equity method investments | (5) | 0 | 0 | 0 | 0 | (5) | |||||||
| Reclassification adjustments, included in net income | 0 | 0 | (10) | 42 | (14) | 18 | |||||||
| Balance at end of period | (56) | (11,786) | 236 | (3,632) | 326 | (14,912) | |||||||
| 1Q12 (CHF million) | |||||||||||||
| Balance at beginning of period | (66) | (11,778) | 99 | (3,751) | 362 | (15,134) | |||||||
| Increase/(decrease) | (1) | (939) | 185 | 31 | 0 | (724) | |||||||
| Increase/(decrease) due to equity method investments | 15 | 0 | 0 | 0 | 0 | 15 | |||||||
| Reclassification adjustments, included in net income | 0 | 1 | (1) | 42 | (22) | 20 | |||||||
| Balance at end of period | (52) | (12,716) | 283 | (3,678) | 340 | (15,823) | |||||||
| 2Q11 (CHF million) | |||||||||||||
| Balance at beginning of period | (50) | (11,899) | 77 | (3,109) | (30) | (15,011) | |||||||
| Increase/(decrease) | 2 | (1,961) | 15 | 0 | 0 | (1,944) | |||||||
| Increase/(decrease) due to equity method investments | 1 | 0 | 0 | 0 | 0 | 1 | |||||||
| Reclassification adjustments, included in net income | (13) | 2 | (13) | 26 | 3 | 5 | |||||||
| Balance at end of period | (60) | (13,858) | 79 | (3,083) | (27) | (16,949) | |||||||
| 6M12 (CHF million) | |||||||||||||
| Balance at beginning of period | (66) | (11,778) | 99 | (3,751) | 362 | (15,134) | |||||||
| Increase/(decrease) | 0 | (9) | 148 | 35 | 0 | 174 | |||||||
| Increase/(decrease) due to equity method investments | 10 | 0 | 0 | 0 | 0 | 10 | |||||||
| Reclassification adjustments, included in net income | 0 | 1 | (11) | 84 | (36) | 38 | |||||||
| Balance at end of period | (56) | (11,786) | 236 | (3,632) | 326 | (14,912) | |||||||
| 6M11 (CHF million) | |||||||||||||
| Balance at beginning of period | (33) | (11,470) | 117 | (3,136) | (33) | (14,555) | |||||||
| Increase/(decrease) | 4 | (2,395) | (14) | 0 | 0 | (2,405) | |||||||
| Increase/(decrease) due to equity method investments | (4) | 0 | 0 | 0 | 0 | (4) | |||||||
| Reclassification adjustments, included in net income | (27) | 7 | (24) | 53 | 6 | 15 | |||||||
| Balance at end of period | (60) | (13,858) | 79 | (3,083) | (27) | (16,949) | |||||||
| Note 20 Tax |
| The tax charge of CHF 311 million recorded in 2Q12 mainly reflected the impact of the geographical mix of results, an increase in valuation allowances against deferred tax assets resulting from current quarter losses in the UK and in Asia Pacific, partially offset by the impact of an advanced pricing agreement with tax authorities and a release of contingency reserves of CHF 16 million for uncertain tax positions, mainly as a result of the expiration of relevant statutes of limitations. |
| Overall, net deferred tax assets increased CHF 334 million to CHF 8,625 million as of the end of 2Q12 compared to 1Q12. The increase in net deferred tax assets primarily related to foreign exchange translation gains of CHF 365 million. |
| The presentation of net deferred tax assets related to net operating losses, net deferred tax assets on temporary differences and net deferred tax liabilities is in accordance with ASC Topic 740 – Income Taxes guidance to interim reporting. Nettable gross deferred tax liabilities are allocated on a pro-rata basis to gross deferred tax assets on net operating losses and gross deferred tax assets on temporary differences. This approach is aligned with the underlying treatment of netting gross deferred tax assets and liabilities under the Basel III framework. Valuation allowances have been allocated against such deferred tax assets on net operating losses first with any remainder allocated to such deferred tax assets on temporary differences. This presentation is considered the most appropriate disclosure given the underlying nature of the gross deferred tax balances. |
| As of June 30, 2012, the Group had accumulated undistributed earnings from foreign subsidiaries of CHF 8.7 billion which are considered indefinitely reinvested. The Group would need to accrue and pay taxes on these undistributed earnings if such earnings were repatriated. No deferred tax liability was recorded in respect of those amounts as these earnings are considered indefinitely reinvested. It is not practicable to estimate the amount of unrecognized deferred tax liabilities for these undistributed foreign earnings. |
| The Group is currently subject to ongoing tax audits and inquiries with the tax authorities in a number of jurisdictions, including the US, the UK and Switzerland. Although the timing of the completion of these audits is uncertain, it is reasonably possible that some of these audits and inquiries will be resolved within 12 months of the reporting date. It is reasonably possible that there will be a decrease between zero and CHF 16 million in unrecognized tax benefits within 12 months of the reporting date. |
| The Group remains open to examination from federal, state, provincial or similar local jurisdictions from the following years onward in these major countries: Switzerland – 2008; the UK – 2006; the US – 2006; Japan – 2005; and the Netherlands – 2005. |
| Effective tax rate |
| in | 2Q12 | 1Q12 | 2Q11 | 6M12 | 6M11 | ||||||
| Effective tax rate (%) | |||||||||||
| Effective tax rate | 27.5 | (8.1) | 16.5 | 22.2 | 20.4 | ||||||
| Net deferred tax assets |
| end of | 2Q12 | 1Q12 | Change | ||||
| Net deferred tax assets (CHF million) | |||||||
| Deferred tax assets | 8,825 | 8,609 | 216 | ||||
| of which net operating losses | 3,541 | 3,388 | 153 | ||||
| of which deductible temporary differences | 5,284 | 5,221 | 63 | ||||
| Deferred tax liabilities | (200) | (318) | 118 | ||||
| Net deferred tax assets | 8,625 | 8,291 | 334 | ||||
| Note 21 Employee deferred compensation |
| The Group’s current and previous deferred compensation plans include share awards, performance share awards, Partner Asset Facilities awards, Adjustable Performance Plan awards, Restricted Cash Awards, Scaled Incentive Share Units (SISUs), Incentive Share Units (ISUs), PAF awards and other cash awards. |
| > Refer to “Note 27 – Employee deferred compensation” in V – Consolidated financial statements – Credit Suisse Group in the Credit Suisse Annual Report 2011 for further information. |
| The following tables show the expense for deferred compensation awards recognized in the consolidated statements of operations, the estimated unrecognized expense for deferred compensation awards granted in 2Q12 and prior periods and the associated remaining requisite service period over which the unrecognized expense will be recognized. The estimated unrecognized deferred compensation expense was based on the fair value of each award on the date of grant and included the current estimated outcome of relevant performance criteria and estimated future forfeitures but no estimate for future mark-to-market adjustments. |
| Deferred compensation expense |
| in | 2Q12 | 1Q12 | 2Q11 | 6M12 | 6M11 | ||||||
| Deferred compensation expense (CHF million) | |||||||||||
| Share awards | 211 | 206 | 223 | 417 | 423 | ||||||
| Performance share awards | 96 | 103 | 0 | 199 | 0 | ||||||
| 2011 Partner Asset Facility awards 1 | (19) | 534 | 0 | 515 | 0 | ||||||
| Adjustable Performance Plan awards | 98 | 108 | 318 | 206 | 688 | ||||||
| Restricted Cash Awards | 45 | 41 | 47 | 86 | 148 | ||||||
| Scaled Incentive Share Units | 32 | 30 | 98 | 62 | 215 | ||||||
| Incentive Share Units | 15 | 19 | 46 | 34 | 82 | ||||||
| 2008 Partner Asset Facility awards 1 | 12 | 49 | 20 | 61 | 73 | ||||||
| Other cash awards | 71 | 90 | 93 | 161 | 205 | ||||||
| Total deferred compensation expense | 561 | 1,180 | 845 | 1,741 | 1,834 | ||||||
| 1 Compensation expense includes the change in underlying fair value of the indexed assets during the period. | |||||||||||
| Estimated unrecognized deferred compensation expense |
| end of | 2Q12 | ||
| Estimated unrecognized deferred compensation expense (CHF million) | |||
| Share awards | 1,112 | ||
| Performance share awards | 335 | ||
| Adjustable Performance Plan awards | 314 | ||
| Restricted Cash Awards | 80 | ||
| Scaled Incentive Share Units | 136 | ||
| Incentive Share Units | 40 | ||
| Other cash awards | 93 | ||
| Total | 2,110 | ||
| Aggregate remaining weighted-average requisite service period (years) | |||
| Aggregate remaining weighted-average requisite service period | 1.3 | ||
2Q12 activity |
| In 2Q12, the Group delivered 29.7 million Group shares across all plans. |
| Adjustable Performance Plan awards |
| In connection with the capital measures announced on July 18, 2012, the Group launched a voluntary exchange offer, under which employees can elect to convert any future cash payments from the Adjustable Performance Plan awards for shares. The conversion price has been fixed at CHF 16.29. |
| Incentive Share Units |
| In 2Q12, ISU leverage units granted in 2009 were settled. In accordance with the terms of the plan, each outstanding ISU leverage unit settled for approximately 0.986 Group shares. |
| 2008 Partner Asset Facility |
| In 2Q12, existing PAF holders were given a voluntary election to make a value-for-value exchange of their existing PAF awards for a new PAF award linked to an expanded portfolio of reference assets. Approximately 41% of employees holding PAF awards elected to exchange their existing PAF awards. There was no impact on compensation expense in 2Q12. |
| Share-based award activity |
| 2Q12 | 6M12 | ||||||||||||||||
Number of awards (in millions) | Share awards | Performance share awards | SISU awards | ISU awards | Share awards | Performance share awards | SISU awards | ISU awards | |||||||||
| Share-based award activities | |||||||||||||||||
| Balance at beginning of period | 70.1 | 23.7 | 14.7 | 13.3 | 48.1 | – | 14.7 | 13.3 | |||||||||
| Granted | 0.9 | 0.0 | 0.0 | 0.0 | 23.3 | 23.7 | 0.0 | 0.0 | |||||||||
| Settled | (12.2) | 0.0 | (4.9) | (8.8) | (12.5) | 0.0 | (4.9) | (8.8) | |||||||||
| Forfeited | (0.4) | 0.0 | (0.1) | (0.3) | (0.5) | 0.0 | (0.1) | (0.3) | |||||||||
| Balance at end of period | 58.4 | 23.7 | 9.7 | 4.2 | 58.4 | 23.7 | 9.7 | 4.2 | |||||||||
| of which vested | 3.0 | 0.1 | 1.2 | 0.4 | 3.0 | 0.1 | 1.2 | 0.4 | |||||||||
| of which unvested | 55.4 | 23.6 | 8.5 | 3.8 | 55.4 | 23.6 | 8.5 | 3.8 | |||||||||
| Note 22 Pension and other post-retirement benefits |
| The Group previously disclosed that it expected to contribute CHF 639 million to the Swiss and international defined benefit plans and other post-retirement defined benefit plans in 2012. As of the end of 2Q12, CHF 404 million of contributions had been made. |
| Components of total pension costs |
| in | 2Q12 | 1Q12 | 2Q11 | 6M12 | 6M11 | ||||||
| Total pension costs (CHF million) | |||||||||||
| Service costs on benefit obligation | 95 | 95 | 89 | 190 | 177 | ||||||
| Interest costs on benefit obligation | 128 | 128 | 136 | 256 | 274 | ||||||
| Expected return on plan assets | (196) | (194) | (206) | (390) | (415) | ||||||
| Amortization of recognized prior service cost/(credit) | (13) | (14) | 3 | (27) | 7 | ||||||
| Amortization of recognized actuarial losses | 58 | 57 | 36 | 115 | 73 | ||||||
| Net periodic pension costs | 72 | 72 | 58 | 144 | 116 | ||||||
| Curtailment losses/(gains) | (4) | (15) | 0 | (19) | 1 | ||||||
| Special termination benefits | 0 | 6 | 0 | 6 | 0 | ||||||
| Total pension costs | 68 | 63 | 58 | 131 | 117 | ||||||
| Note 23 Derivatives and hedging activities |
| > Refer to “Note 30 – Derivatives and hedging activities” in V – Consolidated financial statements – Credit Suisse Group in the Credit Suisse Annual Report 2011 for further information. |
Fair value of derivative instruments |
| The tables below present gross derivative replacement values by type of contract and balance sheet location and whether the derivative is used for trading purposes or in a qualifying hedging relationship. Notional amounts have also been provided as an indication of the volume of derivative activity within the Group. |
| Information on bifurcated embedded derivatives has not been included in these tables. Under US GAAP, the Group elected to account for substantially all financial instruments with an embedded derivative that is not considered clearly and closely related to the host contract at fair value. |
| > Refer to “Note 26 – Financial instruments” for further information. |
| Fair value of derivative instruments |
| Trading | Hedging | 1 | |||||||||||
end of 2Q12 | Notional amount | Positive replacement value (PRV) | Negative replacement value (NRV) | Notional amount | Positive replacement value (PRV) | Negative replacement value (NRV) | |||||||
| Derivative instruments (CHF billion) | |||||||||||||
| Forwards and forward rate agreements | 8,036.9 | 4.1 | 3.6 | 0.0 | 0.0 | 0.0 | |||||||
| Swaps | 28,725.8 | 656.3 | 647.4 | 61.7 | 3.6 | 1.9 | |||||||
| Options bought and sold (OTC) | 3,250.2 | 66.7 | 67.6 | 0.0 | 0.0 | 0.0 | |||||||
| Futures | 3,128.0 | 0.0 | 0.0 | 0.0 | 0.0 | 0.0 | |||||||
| Options bought and sold (exchange-traded) | 1,380.4 | 0.5 | 0.4 | 0.0 | 0.0 | 0.0 | |||||||
| Interest rate products | 44,521.3 | 727.6 | 719.0 | 61.7 | 3.6 | 1.9 | |||||||
| Forwards | 2,371.2 | 21.5 | 22.0 | 21.0 | 0.1 | 0.0 | |||||||
| Swaps | 1,332.8 | 31.9 | 48.5 | 0.0 | 0.0 | 0.0 | |||||||
| Options bought and sold (OTC) | 1,040.7 | 11.2 | 11.5 | 0.0 | 0.0 | 0.0 | |||||||
| Futures | 22.3 | 0.0 | 0.0 | 0.0 | 0.0 | 0.0 | |||||||
| Options bought and sold (exchange-traded) | 4.5 | 0.1 | 0.1 | 0.0 | 0.0 | 0.0 | |||||||
| Foreign exchange products | 4,771.5 | 64.7 | 82.1 | 21.0 | 0.1 | 0.0 | |||||||
| Forwards | 19.1 | 1.0 | 1.1 | 0.0 | 0.0 | 0.0 | |||||||
| Options bought and sold (OTC) | 37.6 | 1.3 | 1.3 | 0.0 | 0.0 | 0.0 | |||||||
| Futures | 0.3 | 0.0 | 0.0 | 0.0 | 0.0 | 0.0 | |||||||
| Precious metals products | 57.0 | 2.3 | 2.4 | 0.0 | 0.0 | 0.0 | |||||||
| Forwards | 4.9 | 0.8 | 0.1 | 0.0 | 0.0 | 0.0 | |||||||
| Swaps | 223.3 | 5.6 | 6.2 | 0.0 | 0.0 | 0.0 | |||||||
| Options bought and sold (OTC) | 239.4 | 13.2 | 13.8 | 0.0 | 0.0 | 0.0 | |||||||
| Futures | 72.2 | 0.0 | 0.0 | 0.0 | 0.0 | 0.0 | |||||||
| Options bought and sold (exchange-traded) | 378.8 | 17.3 | 19.9 | 0.0 | 0.0 | 0.0 | |||||||
| Equity/index-related products | 918.6 | 36.9 | 40.0 | 0.0 | 0.0 | 0.0 | |||||||
| Credit derivatives 2 | 1,952.2 | 47.6 | 45.3 | 0.0 | 0.0 | 0.0 | |||||||
| Forwards | 3.3 | 0.4 | 0.4 | 0.0 | 0.0 | 0.0 | |||||||
| Swaps | 55.7 | 6.8 | 6.0 | 0.0 | 0.0 | 0.0 | |||||||
| Options bought and sold (OTC) | 29.7 | 1.7 | 1.7 | 0.0 | 0.0 | 0.0 | |||||||
| Futures | 177.8 | 0.0 | 0.0 | 0.0 | 0.0 | 0.0 | |||||||
| Options bought and sold (exchange-traded) | 62.3 | 2.9 | 2.8 | 0.0 | 0.0 | 0.0 | |||||||
| Other products 3 | 328.8 | 11.8 | 10.9 | 0.0 | 0.0 | 0.0 | |||||||
| Total derivative instruments | 52,549.4 | 890.9 | 899.7 | 82.7 | 3.7 | 1.9 | |||||||
| The notional amount for derivative instruments (trading and hedging) was CHF 52,632.1 billion as of June 30, 2012. | |||||||||||||
| 1 Relates to derivative contracts that qualify for hedge accounting under US GAAP. 2 Primarily credit default swaps. 3 Primarily commodity, energy and emission products. | |||||||||||||
| Fair value of derivative instruments (continued) |
| Trading | Hedging | 1 | |||||||||||
end of 4Q11 | Notional amount | Positive replacement value (PRV) | Negative replacement value (NRV) | Notional amount | Positive replacement value (PRV) | Negative replacement value (NRV) | |||||||
| Derivative instruments (CHF billion) | |||||||||||||
| Forwards and forward rate agreements | 7,210.5 | 4.5 | 4.2 | 0.0 | 0.0 | 0.0 | |||||||
| Swaps | 28,754.5 | 658.0 | 650.0 | 71.2 | 3.8 | 2.3 | |||||||
| Options bought and sold (OTC) | 2,902.5 | 65.9 | 66.3 | 0.0 | 0.0 | 0.0 | |||||||
| Futures | 2,537.1 | 0.0 | 0.0 | 0.0 | 0.0 | 0.0 | |||||||
| Options bought and sold (exchange-traded) | 962.3 | 0.4 | 0.3 | 0.0 | 0.0 | 0.0 | |||||||
| Interest rate products | 42,366.9 | 728.8 | 720.8 | 71.2 | 3.8 | 2.3 | |||||||
| Forwards | 2,133.0 | 29.7 | 30.7 | 17.4 | 0.1 | 0.0 | |||||||
| Swaps | 1,230.0 | 34.1 | 51.3 | 0.0 | 0.0 | 0.0 | |||||||
| Options bought and sold (OTC) | 831.7 | 12.3 | 12.7 | 0.0 | 0.0 | 0.0 | |||||||
| Futures | 25.6 | 0.0 | 0.0 | 0.0 | 0.0 | 0.0 | |||||||
| Options bought and sold (exchange-traded) | 3.7 | 0.0 | 0.0 | 0.0 | 0.0 | 0.0 | |||||||
| Foreign exchange products | 4,224.0 | 76.1 | 94.7 | 17.4 | 0.1 | 0.0 | |||||||
| Forwards | 16.3 | 1.4 | 1.4 | 0.0 | 0.0 | 0.0 | |||||||
| Options bought and sold (OTC) | 34.7 | 0.9 | 1.0 | 0.0 | 0.0 | 0.0 | |||||||
| Futures | 0.1 | 0.0 | 0.0 | 0.0 | 0.0 | 0.0 | |||||||
| Precious metals products | 51.1 | 2.3 | 2.4 | 0.0 | 0.0 | 0.0 | |||||||
| Forwards | 4.1 | 0.9 | 0.0 | 0.0 | 0.0 | 0.0 | |||||||
| Swaps | 211.4 | 5.8 | 5.7 | 0.0 | 0.0 | 0.0 | |||||||
| Options bought and sold (OTC) | 241.5 | 14.5 | 14.9 | 0.0 | 0.0 | 0.0 | |||||||
| Futures | 57.8 | 0.0 | 0.0 | 0.0 | 0.0 | 0.0 | |||||||
| Options bought and sold (exchange-traded) | 366.0 | 18.2 | 21.2 | 0.0 | 0.0 | 0.0 | |||||||
| Equity/index-related products | 880.8 | 39.4 | 41.8 | 0.0 | 0.0 | 0.0 | |||||||
| Credit derivatives 2 | 2,042.7 | 63.3 | 60.0 | 0.0 | 0.0 | 0.0 | |||||||
| Forwards | 8.7 | 0.9 | 0.8 | 0.0 | 0.0 | 0.0 | |||||||
| Swaps | 63.6 | 8.3 | 7.8 | 0.0 | 0.0 | 0.0 | |||||||
| Options bought and sold (OTC) | 29.9 | 2.2 | 1.7 | 0.0 | 0.0 | 0.0 | |||||||
| Futures | 177.1 | 0.0 | 0.0 | 0.0 | 0.0 | 0.0 | |||||||
| Options bought and sold (exchange-traded) | 63.3 | 3.9 | 3.8 | 0.0 | 0.0 | 0.0 | |||||||
| Other products 3 | 342.6 | 15.3 | 14.1 | 0.0 | 0.0 | 0.0 | |||||||
| Total derivative instruments | 49,908.1 | 925.2 | 933.8 | 88.6 | 3.9 | 2.3 | |||||||
| The notional amount for derivative instruments (trading and hedging) was CHF 49,996.7 billion as of December 31, 2011. | |||||||||||||
| 1 Relates to derivative contracts that qualify for hedge accounting under US GAAP. 2 Primarily credit default swaps. 3 Primarily commodity, energy and emission products. | |||||||||||||
| Fair value of derivative instruments (continued) |
| 2Q12 | 4Q11 | ||||||||
end of | Positive replacement value (PRV) | Negative replacement value (NRV) | Positive replacement value (PRV) | Negative replacement value (NRV) | |||||
| Derivative instruments (CHF billion) | |||||||||
| Replacement values (trading and hedging) before netting agreements | 894.6 | 901.6 | 929.1 | 936.1 | |||||
| Counterparty netting 1 | (811.6) | (811.6) | (836.4) | (836.4) | |||||
| Cash collateral netting 1 | (37.6) | (39.8) | (36.5) | (37.6) | |||||
| Replacement values (trading and hedging) after netting agreements | 45.4 | 50.2 | 56.2 | 62.1 | |||||
| of which recorded in trading assets (PRV) and trading liabilities (NRV) | 42.0 | 48.5 | 52.5 | 60.1 | |||||
| of which recorded in other assets (PRV) and other liabilities (NRV) | 3.4 | 1.7 | 3.7 | 2.0 | |||||
| 1 Netting was based on legally enforceable netting agreements. | |||||||||
| Fair value hedges |
| in | 2Q12 | 1Q12 | 2Q11 | 6M12 | 6M11 | ||||||
| Gains/(losses) recognized in income on derivatives (CHF million) | |||||||||||
| Interest rate products | 385 | 51 | 248 | 436 | (13) | ||||||
| Foreign exchange products | (12) | (1) | 9 | (13) | (2) | ||||||
| Total | 373 | 50 | 257 | 423 | (15) | ||||||
| Gains/(losses) recognized in income on hedged items (CHF million) | |||||||||||
| Interest rate products | (398) | (64) | (273) | (462) | (14) | ||||||
| Foreign exchange products | 10 | 2 | (9) | 12 | 2 | ||||||
| Total | (388) | (62) | (282) | (450) | (12) | ||||||
| Details of fair value hedges (CHF million) | |||||||||||
| Net gains/(losses) on the ineffective portion | (15) | (12) | (25) | (27) | (27) | ||||||
| Represents gains/(losses) recognized in trading revenues. | |||||||||||
| Cash flow hedges |
| in | 2Q12 | 1Q12 | 2Q11 | 6M12 | 6M11 | ||||||
| Gains/(losses) recognized in AOCI on derivatives (CHF million) | |||||||||||
| Interest rate products | 1 | (1) | 0 | 0 | 0 | ||||||
| Foreign exchange products | (5) | 15 | 3 | 10 | 0 | ||||||
| Total | (4) | 14 | 3 | 10 | 0 | ||||||
| Gains/(losses) reclassified from AOCI into income (CHF million) | |||||||||||
| Foreign exchange products 1 | 0 | 0 | 14 | 0 | 31 | ||||||
| Total | 0 | 0 | 14 | 0 | 31 | ||||||
| Represents gains/(losses) on effective portion. | |||||||||||
| 1 Included in commissions and fees. | |||||||||||
| As of the end of 2Q12, the maximum length of time over which the Group hedged its exposure to the variability in future cash flows for forecasted transactions, excluding those forecasted transactions related to the payment of variable interest on existing financial instruments, was 14 months. |
| The net loss associated with cash flow hedges expected to be reclassified from accumulated other comprehensive income (AOCI) within the next 12 months was CHF 9 million. |
| Net investment hedges |
| in | 2Q12 | 1Q12 | 2Q11 | 6M12 | 6M11 | ||||||
| Gains/(losses) recognized in AOCI on derivatives (CHF million) | |||||||||||
| Foreign exchange products | (467) | 266 | 955 | (201) | 1,000 | ||||||
| Total | (467) | 266 | 955 | (201) | 1,000 | ||||||
| Gains/(losses) reclassified from AOCI into income (CHF million) | |||||||||||
| Foreign exchange products 1 | 0 | 77 | 1 | 77 | (2) | ||||||
| Total | 0 | 77 | 1 | 77 | (2) | ||||||
| Represents gains/(losses) on effective portion. | |||||||||||
| 1 Included in other revenues. | |||||||||||
| The Group includes all derivative instruments not included in hedge accounting relationships in its trading activities. |
| > Refer to “Note 8 – Trading revenues” for gains and losses on trading activities by product type. |
Disclosures relating to contingent credit risk |
| Certain of the Group’s derivative instruments contain provisions that require it to maintain a specified credit rating from each of the major credit rating agencies. If the ratings fall below that specified in the contract, the counterparties to the agreements could request payment of additional collateral on those derivative instruments that are in a net liability position. Certain of the derivative contracts also provide for termination of the contract, generally upon a downgrade of either the Group or the counterparty, at the existing mark-to-market replacement value of the derivative contract. |
| The following table provides the Group’s current net exposure from contingent credit risk relating to derivative contracts with bilateral counterparties and SPEs that include credit support agreements, the related collateral posted and the additional collateral required in a one-notch and a two-notch downgrade event, respectively. The table also includes derivative contracts with contingent credit risk features without credit support agreements that have accelerated termination event conditions. The current net exposure for derivative contracts with bilateral counterparties and contracts with accelerated termination event conditions is the aggregate fair value of derivative instruments that were in a net liability position. For SPEs, the current net exposure by contract may include amounts other than or in addition to the NRV of derivative instruments with credit risk-related contingent features. |
| Contingent credit risk |
end of | Bilateral counterparties | Special purpose entities | Accelerated terminations | Total | |||||
| 2Q12 (CHF billion) | |||||||||
| Current net exposure | 17.1 | 1.6 | 0.7 | 19.4 | |||||
| Collateral posted | 16.0 | 1.5 | – | 17.5 | |||||
| Additional collateral required in a one-notch downgrade event | 0.1 | 1.5 | 0.0 | 1.6 | |||||
| Additional collateral required in a two-notch downgrade event | 0.4 | 2.7 | 0.5 | 3.6 | |||||
| 4Q11 (CHF billion) | |||||||||
| Current net exposure | 17.0 | 2.0 | 0.7 | 19.7 | |||||
| Collateral posted | 14.8 | 1.8 | – | 16.6 | |||||
| Additional collateral required in a one-notch downgrade event | 0.2 | 1.6 | 0.0 | 1.8 | |||||
| Additional collateral required in a two-notch downgrade event | 0.4 | 3.0 | 0.5 | 3.9 | |||||
Credit derivatives |
| > Refer to “Note 30 – Derivatives and hedging activities” in V – Consolidated financial statements – Credit Suisse Group in the Credit Suisse Annual Report 2011 for further information on credit derivatives. |
| Credit protection sold/purchased |
| The following tables do not include all credit derivatives and differ from the credit derivatives in the “Fair value of derivative instruments” tables. This is due to the exclusion of certain credit derivative instruments under US GAAP, which defines a credit derivative as a derivative instrument (a) in which one or more of its underlyings are related to the credit risk of a specified entity (or a group of entities) or an index based on the credit risk of a group of entities and (b) that exposes the seller to potential loss from credit risk-related events specified in the contract. |
| Certain cash collateralized debt obligations (CDOs) and other derivative instruments were excluded as they do not fall within the scope of US GAAP rules. Total return swaps (TRS) of CHF 3.8 billion and CHF 4.8 billion as of the end of 2Q12 and 4Q11, respectively, were also excluded because a TRS does not expose the seller to potential loss from credit risk-related events specified in the contract. A TRS only provides protection against a loss in asset value and not against additional amounts as a result of specific credit events. |
| Credit protection sold |
| Credit protection sold is the maximum potential payout, which is based on the notional value of derivatives and represents the amount of future payments that the Group would be required to make as a result of credit risk-related events. |
| Credit protection purchased |
| Credit protection purchased represents those instruments where the underlying reference instrument is identical to the reference instrument of the credit protection sold. |
| Other protection purchased |
| In the normal course of business, the Group purchases protection to offset the risk of credit protection sold that may have similar, but not identical, reference instruments, and may use similar, but not identical, products, which reduces the total credit derivative exposure. Other protection purchased is based on the notional value of the instruments. |
| Fair value of credit protection sold |
| The fair values of the credit protection sold give an indication of the amount of payment risk, as the negative fair values increase when the potential payment under the derivative contracts becomes more probable. |
| Credit protection sold/purchased |
end of 2Q12 | Credit protection sold | Credit protection purchased | 1 | Net credit protection (sold)/ purchased | Other protection purchased | Fair value of credit protection sold | |||||
| Single-name instruments (CHF billion) | |||||||||||
| Investment grade 2 | (465.5) | 441.7 | (23.8) | 66.6 | (7.8) | ||||||
| Non-investment grade | (195.6) | 182.4 | (13.2) | 22.1 | (6.1) | ||||||
| Total single-name instruments | (661.1) | 624.1 | (37.0) | 88.7 | (13.9) | ||||||
| of which sovereigns | (126.1) | 124.2 | (1.9) | 10.3 | (4.3) | ||||||
| of which non-sovereigns | (535.0) | 499.9 | (35.1) | 78.4 | (9.6) | ||||||
| Multi-name instruments (CHF billion) | |||||||||||
| Investment grade 2 | (254.6) | 231.0 | (23.6) | 15.5 | (6.8) | ||||||
| Non-investment grade | (24.8) | 22.5 | 3 | (2.3) | 4.6 | (4.0) | |||||
| Total multi-name instruments | (279.4) | 253.5 | (25.9) | 20.1 | (10.8) | ||||||
| of which sovereigns | (16.5) | 16.2 | (0.3) | 0.5 | (0.7) | ||||||
| of which non-sovereigns | (262.9) | 237.3 | (25.6) | 19.6 | (10.1) | ||||||
| Total instruments (CHF billion) | |||||||||||
| Investment grade 2 | (720.1) | 672.7 | (47.4) | 82.1 | (14.6) | ||||||
| Non-investment grade | (220.4) | 204.9 | (15.5) | 26.7 | (10.1) | ||||||
| Total instruments | (940.5) | 877.6 | (62.9) | 108.8 | (24.7) | ||||||
| of which sovereigns | (142.6) | 140.4 | (2.2) | 10.8 | (5.0) | ||||||
| of which non-sovereigns | (797.9) | 737.2 | (60.7) | 98.0 | (19.7) | ||||||
| 1 Represents credit protection purchased with identical underlyings and recoveries. 2 Based on internal ratings of BBB and above. 3 Includes the Clock Finance transaction. | |||||||||||
| Credit protection sold/purchased (continued) | |||||||||||
end of 4Q11 | Credit protection sold | Credit protection purchased | 1 | Net credit protection (sold)/ purchased | Other protection purchased | Fair value of credit protection sold | |||||
| Single-name instruments (CHF billion) | |||||||||||
| Investment grade 2 | (452.2) | 432.4 | (19.8) | 55.6 | (9.0) | ||||||
| Non-investment grade | (189.1) | 179.4 | (9.7) | 16.7 | (15.3) | ||||||
| Total single-name instruments | (641.3) | 611.8 | (29.5) | 72.3 | (24.3) | ||||||
| of which sovereigns | (134.8) | 132.6 | (2.2) | 10.8 | (8.1) | ||||||
| of which non-sovereigns | (506.5) | 479.2 | (27.3) | 61.5 | (16.2) | ||||||
| Multi-name instruments (CHF billion) | |||||||||||
| Investment grade 2 | (278.2) | 253.1 | (25.1) | 14.5 | (15.5) | ||||||
| Non-investment grade | (71.9) | 64.1 | 3 | (7.8) | 9.0 | (1.7) | |||||
| Total multi-name instruments | (350.1) | 317.2 | (32.9) | 23.5 | (17.2) | ||||||
| of which sovereigns | (18.4) | 17.5 | (0.9) | 0.9 | (1.5) | ||||||
| of which non-sovereigns | (331.7) | 299.7 | (32.0) | 22.6 | (15.7) | ||||||
| Total instruments (CHF billion) | |||||||||||
| Investment grade 2 | (730.4) | 685.5 | (44.9) | 70.1 | (24.5) | ||||||
| Non-investment grade | (261.0) | 243.5 | (17.5) | 25.7 | (17.0) | ||||||
| Total instruments | (991.4) | 929.0 | (62.4) | 95.8 | (41.5) | ||||||
| of which sovereigns | (153.2) | 150.1 | (3.1) | 11.7 | (9.6) | ||||||
| of which non-sovereigns | (838.2) | 778.9 | (59.3) | 84.1 | (31.9) | ||||||
| 1 Represents credit protection purchased with identical underlyings and recoveries. 2 Based on internal ratings of BBB and above. 3 Includes the Clock Finance transaction. | |||||||||||
| The following table reconciles the notional amount of credit derivatives included in the table “Fair value of derivative instruments” to the table “Credit protection sold/purchased”. |
| Credit derivatives |
| end of | 2Q12 | 4Q11 | |||
| Credit derivatives (CHF billion) | |||||
| Credit protection sold | 940.5 | 991.4 | |||
| Credit protection purchased | 877.6 | 929.0 | |||
| Other protection purchased | 108.8 | 95.8 | |||
| Other instruments 1 | 25.3 | 26.5 | |||
| Total credit derivatives | 1,952.2 | 2,042.7 | |||
| 1 Consists of certain cash collateralized debt obligations, total return swaps and other derivative instruments. | |||||
| The segregation of the future payments by maturity range and underlying risk gives an indication of the current status of the potential for performance under the derivative contracts. |
| Maturity of credit protection sold |
end of | Maturity less than 1 year | Maturity between 1 to 5 years | Maturity greater than 5 years | Total | | ||||
| 2Q12 (CHF billion) | |||||||||
| Single-name instruments | 142.8 | 407.9 | 110.4 | 661.1 | |||||
| Multi-name instruments | 37.2 | 137.8 | 104.4 | 279.4 | |||||
| Total instruments | 180.0 | 545.7 | 214.8 | 940.5 | |||||
| 4Q11 (CHF billion) | |||||||||
| Single-name instruments | 134.1 | 394.5 | 112.7 | 641.3 | |||||
| Multi-name instruments | 58.7 | 202.4 | 89.0 | 350.1 | |||||
| Total instruments | 192.8 | 596.9 | 201.7 | 991.4 | |||||
| Note 24 Guarantees and commitments |
Guarantees |
| In the ordinary course of business, guarantees are provided that contingently obligate Credit Suisse to make payments to third parties if the counterparty fails to fulfill its obligation under a borrowing or other contractual arrangement. The total gross amount disclosed within the Guarantees table reflects the maximum potential payment under the guarantees. The carrying value represents the Group’s current best estimate of payments that will be required under existing guarantee arrangements. |
| Guarantees provided by the Group are classified as follows: credit guarantees and similar instruments, performance guarantees and similar instruments, securities lending indemnifications, derivatives and other guarantees. |
| > Refer to “Guarantees” in V – Consolidated financial statements – Credit Suisse Group – Note 31 – Guarantees and commitments in the Credit Suisse Annual Report 2011 for a detailed description of guarantees. |
| Guarantees |
end of | Maturity less than 1 year | Maturity greater than 1 year | Total gross amount | Total net amount | 1 | Carrying value | Collateral received | ||||||
| 2Q12 (CHF million) | |||||||||||||
| Credit guarantees and similar instruments | 3,187 | 13,875 | 17,062 | 16,638 | 134 | 2,243 | |||||||
| Performance guarantees and similar instruments | 5,097 | 4,650 | 9,747 | 8,881 | 69 | 3,344 | |||||||
| Securities lending indemnifications | 14,027 | 0 | 14,027 | 14,027 | 0 | 14,027 | |||||||
| Derivatives 2 | 21,171 | 10,707 | 31,878 | 31,878 | 1,588 | – | 3 | ||||||
| Other guarantees | 4,396 | 1,148 | 5,544 | 5,519 | 3 | 2,967 | |||||||
| Total guarantees | 47,878 | 30,380 | 78,258 | 76,943 | 1,794 | 22,581 | |||||||
| 4Q11 (CHF million) | |||||||||||||
| Credit guarantees and similar instruments | 3,273 | 4,075 | 7,348 | 6,613 | 50 | 2,455 | |||||||
| Performance guarantees and similar instruments | 5,598 | 4,706 | 10,304 | 9,394 | 73 | 3,381 | |||||||
| Securities lending indemnifications | 15,005 | 0 | 15,005 | 15,005 | 0 | 15,005 | |||||||
| Derivatives 2 | 27,593 | 23,800 | 51,393 | 51,393 | 3,650 | – | 3 | ||||||
| Other guarantees | 3,972 | 1,003 | 4,975 | 4,939 | 4 | 2,268 | |||||||
| Total guarantees | 55,441 | 33,584 | 89,025 | 87,344 | 3,777 | 23,109 | |||||||
| 1 Total net amount is computed as the gross amount less any participations. 2 Excludes derivative contracts with certain active commercial and investment banks and certain other counterparties, as such contracts can be cash settled and the Group had no basis to conclude it was probable that the counterparties held, at inception, the underlying instruments. 3 Collateral for derivatives accounted for as guarantees is not significant. | |||||||||||||
| Deposit-taking banks and securities dealers in Switzerland and certain other European countries are required to ensure the payout of privileged deposits in case of specified restrictions or compulsory liquidation of a deposit-taking bank. In Switzerland, deposit-taking banks and securities dealers jointly guarantee an amount of up to CHF 6 billion. Upon occurrence of a payout event triggered by a specified restriction of business imposed by FINMA or by the compulsory liquidation of another deposit-taking bank, the Group’s contribution will be calculated based on its share of privileged deposits in proportion to total privileged deposits. Based on FINMA’s estimate for the Group’s banking subsidiaries in Switzerland, the Group’s share in the deposit insurance guarantee program for the period July 1, 2011 to June 30, 2012 was CHF 0.7 billion. These deposit insurance guarantees were reflected in other guarantees. For the period July 1, 2012 to June 30, 2013, the Group’s share in the deposit insurance guarantee program based on FINMA’s estimate will be stable at CHF 0.7 billion. |
PAF2 transaction |
| The Group’s results are impacted by the risk of counterparty defaults and the potential for changes in counterparty credit spreads related to derivative trading activities of the Group. In 1Q12, the Group entered into the PAF2 transaction to hedge the counterparty credit risk of a referenced portfolio of derivatives and their credit spread volatility. The hedge covers approximately USD 12 billion notional amount of expected positive exposure from counterparties of the Group, and is addressed in three layers: (i) first loss (USD 0.5 billion), (ii) mezzanine (USD 0.8 billion) and (iii) senior (USD 11 billion). The first loss element is retained by the Group and actively managed through normal credit procedures. The mezzanine layer was hedged by transferring the risk of default and counterparty credit spread movements to eligible employees in the form of PAF2 awards, as part of their deferred compensation granted in the annual compensation process. |
| The Group has purchased protection on the senior layer to hedge against the potential for future counterparty credit spread volatility. This was executed through a CDS, accounted for at fair value, with a third-party entity. The Group also has a credit support facility with this entity that requires the Group to provide funding to it in certain circumstances. Under the facility, the Group may be required to fund payments or costs related to amounts due by the entity under the CDS, and any funded amount may be settled by the assignment of the rights and obligations of the CDS to the Group. The credit support facility is accounted for on an accrual basis and is reflected in credit guarantees and similar instruments in the “Guarantees” table. The transaction overall is a four-year transaction, but can be extended to nine years. The Group has the right to terminate the third-party transaction for certain reasons, including certain regulatory developments. |
Representations and warranties on residential mortgage loans sold |
| In connection with Investment Banking’s sale of US residential mortgage loans, the Group has provided certain representations and warranties relating to the loans sold. The Group has provided these representations and warranties relating to sales of loans to: the US government-sponsored enterprises Fannie Mae and Freddie Mac (GSEs); institutional investors, primarily banks; and non-agency, or private label, securitizations. The loans sold are primarily loans that the Group has purchased from other parties. The scope of representations and warranties, if any, depends on the transaction, but can include: ownership of the mortgage loans and legal capacity to sell the loans; loan-to-value ratios and other characteristics of the property, the borrower and the loan; validity of the liens securing the loans and absence of delinquent taxes or related liens; conformity to underwriting standards and completeness of documentation; and origination in compliance with law. If it is determined that representations and warranties were breached, the Group may be required to repurchase the related loans or indemnify the investors to make them whole for losses. Whether the Group will incur a loss in connection with repurchases and make whole payments depends on: the extent to which claims are made; the validity of such claims (including the likelihood and ability to enforce claims); whether the Group can successfully claim against parties that sold loans to the Group and made representations and warranties to the Group; the residential real estate market, including the number of defaults; and whether the obligations of the securitization vehicles were guaranteed or insured by third parties. |
| The following tables present the total amount of residential mortgage loans sold during the period from January 1, 2004 to June 30, 2012 by counterparty type, the development of outstanding repurchase claims and provisions for outstanding repurchase claims in 2Q12, 1Q12 and 6M12, and the realized losses from the repurchase of residential mortgage loans sold. |
| Residential mortgage loans sold |
| Residential mortgage loans sold from January 1, 2004 to June 30, 2012 (USD billion) | |||
| Government-sponsored enterprises | 8.2 | ||
| Private investors 1 | 22.4 | ||
| Non-agency securitizations | 129.7 | 2 | |
| Total | 160.3 | ||
| 1 Primarily banks. 2 The outstanding balance of residential mortgage loans sold was USD 29.6 billion as of the end of 2Q12. The difference of the total balance of mortgage loans sold and the outstanding balance as of the end of 2Q12 is attributable to borrower payments of USD 83.7 billion and losses of USD 16.4 billion due to loan defaults. | |||
| Residential mortgage loans sold – outstanding repurchase claims |
| 2Q12 | 1Q12 | ||||||||||||||||
Government- sponsored enterprises | Private investors | Non- agency securiti- zations | Total | Government- sponsored enterprises | Private investors | Non- agency securiti- zations | Total | ||||||||||
| Outstanding repurchase claims (USD million) | |||||||||||||||||
| Balance at beginning of period | 50 | 437 | 762 | 1,249 | 68 | 432 | 243 | 743 | |||||||||
| New claims | 25 | 14 | 242 | 281 | 11 | 8 | 535 | 554 | |||||||||
| Claims settled through repurchases | (2) | 0 | (3) | (5) | 1 | (1) | 0 | (2) | (3) | 1 | |||||||
| Other settlements | (2) | (1) | (6) | (9) | 2 | (2) | 0 | (2) | (4) | 2 | |||||||
| Total claims settled | (4) | (1) | (9) | (14) | (3) | 0 | (4) | (7) | |||||||||
| Claims rescinded | 0 | (2) | 0 | (2) | (26) | (3) | 0 | (29) | |||||||||
| Transfers to/from arbitration and litigation, net 3 | 0 | 0 | (144) | (144) | 0 | 0 | (12) | (12) | |||||||||
| Balance at end of period | 71 | 448 | 851 | 1,370 | 50 | 437 | 762 | 1,249 | |||||||||
| 1 Settled at a repurchase price of USD 6 million and USD 3 million in 2Q12 and 1Q12, respectively. 2 Settled at USD 7 million and USD 3 million in 2Q12 and 1Q12, respectively. 3 Refer to "Note 28 – Litigation" for repurchase claims that are in arbitration or litigation. | |||||||||||||||||
| Residential mortgage loans sold – outstanding repurchase claims (continued) |
| 6M12 | |||||||||
Government- sponsored enterprises | Private investors | Non- agency securiti- zations | Total | ||||||
| Outstanding repurchase claims (USD million) | |||||||||
| Balance at beginning of period | 68 | 432 | 243 | 743 | |||||
| New claims | 36 | 22 | 777 | 835 | |||||
| Claims settled through repurchases | (3) | 0 | (5) | (8) | 1 | ||||
| Other settlements | (4) | (1) | (8) | (13) | 2 | ||||
| Total claims settled | (7) | (1) | (13) | (21) | |||||
| Claims rescinded | (26) | (5) | 0 | (31) | |||||
| Transfers to/from arbitration and litigation, net 3 | 0 | 0 | (156) | (156) | |||||
| Balance at end of period | 71 | 448 | 851 | 1,370 | |||||
| 1 Settled at a repurchase price of USD 9 million. 2 Settled at USD 10 million. 3 Refer to "Note 28 – Litigation" for repurchase claims that are in arbitration or litigation. | |||||||||
| Provisions for outstanding repurchase claims |
| 2Q12 | 1Q12 | 6M12 | |||||
| Provisions for outstanding repurchase claims (USD million) 1 | |||||||
| Balance at beginning of period | 49 | 59 | 59 | ||||
| Increase/(decrease) in provisions, net | 20 | (4) | 16 | ||||
| Realized losses 2 | (13) | (6) | (19) | ||||
| Balance at end of period 3 | 56 | 49 | 56 | ||||
| 1 Excludes provisions for repurchase claims related to residential mortgage loans sold that are in arbitration or litigation. Refer to "Note 28 – Litigation" for further information. 2 Includes indemnifications paid to resolve loan repurchase claims. 3 Primarily related to government-sponsored enterprises and non-agency securitizations. | |||||||
| Realized losses from repurchase of residential mortgage loans sold |
| in | 2Q12 | 1Q12 | 2Q11 | 6M12 | 6M11 | ||||||
| Realized losses from repurchase of residential mortgage loans sold (USD million) | |||||||||||
| Realized losses | (13) | 1 | (6) | 1 | 0 | (19) | 1 | (3) | 2 | ||
| Includes indemnifications paid to resolve loan repurchase claims. | |||||||||||
| 1 Primarily related to non-agency securitizations and government-sponsored enterprises. 2 Primarily related to government-sponsored enterprises. | |||||||||||
| Representations and warranties relating to residential mortgage loans sold to non-agency securitization vehicles are more limited in scope than those relating to residential mortgage loans sold to GSEs, and it can be more difficult to establish causation and standing in making a repurchase claim for breach of representations and warranties on residential mortgage loans sold in non-agency securitizations. The Group is involved in litigation relating to representations and warranties on residential mortgage loans sold. |
| > Refer to “Note 28 – Litigation” for further information. |
| Repurchase claims on residential mortgage loans sold that are, or become during the reporting period, subject to arbitration or litigation proceedings, are not included in the Guarantees and commitments disclosure of repurchase claims and related loss contingencies and provisions but are addressed in litigation and related loss contingencies and provisions. |
| Repurchase claims relating to residential mortgage loans sold may increase in the future based on the large number of defaults in residential mortgages, including those sold or securitized by the Group. |
Disposal-related contingencies and other indemnifications |
| The Group has certain guarantees for which its maximum contingent liability cannot be quantified. These guarantees include disposal-related contingencies in connection with the sale of assets or businesses, and other indemnifications. These guarantees are not reflected in the “Guarantees” table. |
| > Refer to “Disposal-related contingencies and other indemnifications” in V – Consolidated financial statements – Credit Suisse Group – Note 31 – Guarantees and commitments in the Credit Suisse Annual Report 2011 for a description of these guarantees. |
Other commitments |
| Other commitments of the Group are classified as follows: irrevocable commitments under documentary credits, loan commitments, forward reverse repurchase agreements and other commitments. |
| > Refer to “Guarantees” in V – Consolidated financial statements – Credit Suisse Group – Note 31 – Guarantees and commitments in the Credit Suisse Annual Report 2011 for a detailed description of guarantees. |
| Other commitments |
end of | Maturity less than 1 year | Maturity greater than 1 year | Total gross amount | Total net amount | 1 | Collateral received | |||||
| 2Q12 (CHF million) | |||||||||||
| Irrevocable commitments under documentary credits | 4,536 | 37 | 4,573 | 4,366 | 1,621 | ||||||
| Loan commitments | 155,309 | 65,141 | 220,450 | 2 | 215,446 | 147,108 | |||||
| Forward reverse repurchase agreements | 47,775 | 0 | 47,775 | 47,775 | 47,775 | ||||||
| Other commitments | 1,838 | 1,807 | 3,645 | 3,645 | 253 | ||||||
| Total other commitments | 209,458 | 66,985 | 276,443 | 271,232 | 196,757 | ||||||
| 4Q11 (CHF million) | |||||||||||
| Irrevocable commitments under documentary credits | 5,644 | 43 | 5,687 | 5,207 | 2,372 | ||||||
| Loan commitments | 157,701 | 62,859 | 220,560 | 2 | 215,343 | 144,278 | |||||
| Forward reverse repurchase agreements | 28,885 | 0 | 28,885 | 28,885 | 28,885 | ||||||
| Other commitments | 1,457 | 2,151 | 3,608 | 3,608 | 33 | ||||||
| Total other commitments | 193,687 | 65,053 | 258,740 | 253,043 | 175,568 | ||||||
| 1 Total net amount is computed as the gross amount less any participations. 2 Includes CHF 134,826 million and CHF 138,051 million of unused credit limits as of the end of 2Q12 and 4Q11, respectively, which were revocable at the Group's sole discretion upon notice to the client. | |||||||||||
| In November 2007, Credit Suisse Brazil, a wholly owned subsidiary of Credit Suisse AG, acquired a majority interest (50% plus one share) in Hedging-Griffo and entered into option arrangements in respect of the remaining equity interests in Hedging-Griffo. In 2Q12, the Group acquired the remaining equity interests in Hedging-Griffo as contemplated under the existing option arrangements at a final purchase price of BRL 1,248 million (CHF 584 million), gaining full control and ownership of Hedging-Griffo. |
| > Refer to “Note 3 – Business developments and subsequent events” for further information. |
| Note 25 Transfers of financial assets and variable interest entities |
| In the normal course of business, the Group enters into transactions with, and makes use of, SPEs. An SPE is an entity in the form of a trust or other legal structure designed to fulfill a specific limited need of the company that organized it and are generally structured to isolate the SPE’s assets from creditors of other entities, including the Group. The principal uses of SPEs are to assist the Group and its clients in securitizing financial assets and creating investment products. The Group also uses SPEs for other client-driven activity, such as to facilitate financings, and Group tax or regulatory purposes. |
Transfers of financial assets |
Securitizations |
| The majority of the Group’s securitization activities involve mortgages and mortgage-related securities and are predominantly transacted using SPEs. In a typical securitization, the SPE purchases assets financed by proceeds received from the SPE’s issuance of debt and equity instruments, certificates, commercial paper (CP) and other notes of indebtedness. These assets and liabilities are recorded on the balance sheet of the SPE and not reflected on the Group’s consolidated balance sheet, unless either the Group sold the assets to the entity and the accounting requirements for sale were not met or the Group consolidates the SPE. |
| The Group purchases commercial and residential mortgages for the purpose of securitization and sells these mortgage loans to SPEs. These SPEs issue commercial mortgage-backed securities (CMBS) and RMBS that are collateralized by the assets transferred to the SPE and that pay a return based on the returns on those assets. Investors in these mortgage-backed securities typically have recourse to the assets in the SPEs, unless a third-party guarantee has been received to further enhance the creditworthiness of the assets. The investors and the SPEs have no recourse to the Group’s assets. The Group is typically an underwriter of, and makes a market in, these securities. |
| The Group also transacts in re-securitizations of previously issued RMBS securities. Typically, certificates issued out of an existing securitization vehicle are sold into a newly created and separate securitization vehicle. Often, these re-securitizations are initiated in order to repackage an existing security to give the investor a higher rated tranche. |
| The Group also uses SPEs for other asset-backed financings relating to client-driven activity and for Group tax or regulatory purposes. Types of structures included in this category include CDOs, leveraged finance, repack and other types of transactions, including life insurance structures, emerging market structures set up for financing, loan participation or loan origination purposes, and other alternative structures created for the purpose of investing in venture capital-like investments. CDOs are collateralized by the assets transferred to the CDO vehicle and pay a return based on the returns on those assets. Leveraged finance structures are used to assist in the syndication of certain loans held by the Group, while repack structures are designed to give a client collateralized exposure to specific cash flows or credit risk backed by collateral purchased from the Group. In these asset-backed financing structures investors typically only have recourse to the collateral of the SPE and do not have recourse to the Group’s assets. |
| When the Group transfers assets into an SPE, it must assess whether that transfer is accounted for as a sale of the assets. Transfers of assets may not meet sale requirements if the assets have not been legally isolated from the Group and/or if the Group’s continuing involvement is deemed to give it effective control over the assets. If the transfer is not deemed a sale, it is instead accounted for as a secured borrowing, with the transferred assets as collateral. |
| Gains and losses on securitization transactions depend, in part, on the carrying values of mortgages and CDOs involved in the transfer and are allocated between the assets sold and any beneficial interests retained according to the relative fair values at the date of sale. |
| The Group does not retain material servicing responsibilities from securitization activities. |
| The following table provides the gains or losses and proceeds from the transfer of assets relating to 6M12 and 6M11 securitizations of financial assets that qualify for sale accounting and subsequent derecognition, along with the cash flows between the Group and the SPEs used in any securitizations in which the Group still had continuing involvement, regardless of when the securitization occurred. |
| Securitizations |
| in | 6M12 | 6M11 | |||
| Gains and cash flows (CHF million) | |||||
| CMBS | |||||
| Net gain 1 | 23 | 0 | |||
| Proceeds from transfer of assets | 3,718 | 0 | |||
| Cash received on interests that continue to be held | 35 | 34 | |||
| RMBS | |||||
| Net gain/(loss) 1 | (2) | 36 | |||
| Proceeds from transfer of assets | 8,483 | 19,542 | |||
| Purchases of previously transferred financial assets or its underlying collateral | (11) | 0 | |||
| Servicing fees | 1 | 2 | |||
| Cash received on interests that continue to be held | 246 | 220 | |||
| Other asset-backed financings | |||||
| Net gain 1 | 71 | 11 | |||
| Proceeds from transfer of assets | 279 | 591 | |||
| Purchases of previously transferred financial assets or its underlying collateral 2 | (161) | (185) | |||
| Servicing fees | 0 | 1 | |||
| Cash received on interests that continue to be held | 582 | 378 | |||
| 1 Includes underwriting revenues, deferred origination fees, gains or losses on the sale of collateral to the SPE and gains or losses on the sale of newly issued securities to third parties, but excludes net interest income on assets prior to the securitization. The gains or losses on the sale of the collateral is the difference between the fair value on the day prior to the securitization pricing date and the sale price of the loans. 2 Represents market making activity and voluntary repurchases at fair value where no repurchase obligations were present. | |||||
Continuing involvement in transferred financial assets |
| The Group may have continuing involvement in the financial assets that are transferred to an SPE which may take several forms, including, but not limited to, servicing, recourse and guarantee arrangements, agreements to purchase or redeem transferred assets, derivative instruments, pledges of collateral and beneficial interests in the transferred assets. |
| > Refer to “Transfer of financial assets” in V – Consolidated financial statements – Credit Suisse Group – Note 32 – Transfer of financial assets and variable interest entities in the Credit Suisse Annual Report 2011 for a detailed description of continuing involvement in transferred financial assets. |
| The following table provides the outstanding principal balance of assets to which the Group continued to be exposed after the transfer of the financial assets to any SPE and the total assets of the SPE as of the end of 2Q12 and 4Q11, regardless of when the transfer of assets occurred. |
| Principal amounts outstanding and total assets of SPEs resulting from continuing involvement |
| end of | 2Q12 | 4Q11 | |||
| CHF million | |||||
| CMBS | |||||
| Principal amount outstanding | 35,027 | 35,487 | |||
| Total assets of SPE | 49,655 | 52,536 | |||
| RMBS | |||||
| Principal amount outstanding | 79,484 | 91,242 | |||
| Total assets of SPE | 82,654 | 95,297 | |||
| Other asset-backed financings | |||||
| Principal amount outstanding | 34,984 | 35,233 | |||
| Total assets of SPE | 34,987 | 35,307 | |||
| Principal amount outstanding relates to assets transferred from the Group and does not include principle amounts for assets transferred from third parties. | |||||
Fair value of beneficial interests |
| The fair value measurement of the beneficial interests held at the time of transfer and as of the reporting date that result from any continuing involvement are determined using fair value estimation techniques, such as the present value of estimated future cash flows that incorporate assumptions that market participants customarily use in these valuation techniques. The fair value of the assets or liabilities that result from any continuing involvement does not include any benefits from financial instruments that the Group may utilize to hedge the inherent risks. |
Key economic assumptions at the time of transfer |
| > Refer to “Note 26 – Financial instruments” for information on fair value hierarchy levels. |
| Key economic assumptions used in measuring fair value of beneficial interests at time of transfer |
| 2Q12 | 4Q11 | ||||||||||||||||
| at time of transfer | CMBS | RMBS | CMBS | RMBS | |||||||||||||
| CHF million, except where indicated | |||||||||||||||||
| Fair value of beneficial interests | 572 | 1,154 | 57 | 5,095 | |||||||||||||
| of which level 2 | 461 | 1,116 | 42 | 4,695 | |||||||||||||
| of which level 3 | 111 | 39 | 15 | 399 | |||||||||||||
| Weighted-average life, in years | 9.1 | 1.4 | 7.2 | 5.4 | |||||||||||||
| Prepayment speed assumption (rate per annum), in % 1 | – | 13.0 | - | 31.5 | – | 9.0 | - | 34.9 | |||||||||
| Cash flow discount rate (rate per annum), in % 2 | 1.9 | - | 10.7 | 0.4 | - | 13.7 | 2.9 | - | 10.6 | 0.5 | - | 71.2 | |||||
| Expected credit losses (rate per annum), in % | 0.8 | - | 9.0 | 0.0 | - | 12.7 | 1.2 | - | 9.3 | 0.3 | - | 71.0 | |||||
| Transfers of assets in which the Group does not have beneficial interests are not included in this table. | |||||||||||||||||
| 1 Prepayment speed assumption (PSA) is an industry standard prepayment speed metric used for projecting prepayments over the life of a residential mortgage loan. PSA utilizes the constant prepayment rate (CPR) assumptions. A 100% prepayment assumption assumes a prepayment rate of 0.2% per annum of the outstanding principal balance of mortgage loans in the first month. This increases by 0.2% thereafter during the term of the mortgage loan, leveling off to a CPR of 6% per annum beginning in the 30th month and each month thereafter during the term of the mortgage loan. 100 PSA equals 6 CPR. 2 The rate was based on the weighted-average yield on the beneficial interests. | |||||||||||||||||
Key economic assumptions as of the reporting date |
| The following table provides the sensitivity analysis of key economic assumptions used in measuring the fair value of beneficial interests held in SPEs as of the end of 2Q12 and 4Q11. |
| Key economic assumptions used in measuring fair value of beneficial interests held in SPEs |
| 2Q12 | 4Q11 | ||||||||||||||||||||||||
CMBS | 1 | RMBS | Other asset- backed financing activities | 2 | CMBS | 1 | RMBS | Other asset- backed financing activities | 2 | ||||||||||||||||
| CHF million, except where indicated | |||||||||||||||||||||||||
| Fair value of beneficial interests | 932 | 2,346 | 1,106 | 342 | 2,960 | 1,754 | |||||||||||||||||||
| of which non-investment grade | 114 | 649 | 1,091 | 133 | 688 | 1,513 | |||||||||||||||||||
| Weighted-average life, in years | 7.5 | 5.3 | 3.4 | 4.1 | 5.3 | 2.5 | |||||||||||||||||||
| Prepayment speed assumption (rate per annum), in % 3 | – | 0.0 | - | 44.9 | – | – | 0.1 | - | 30.0 | – | |||||||||||||||
| Impact on fair value from 10% adverse change | – | (35.3) | – | – | (44.2) | – | |||||||||||||||||||
| Impact on fair value from 20% adverse change | – | (69.3) | – | – | (86.6) | – | |||||||||||||||||||
| Cash flow discount rate (rate per annum), in % 4 | 1.5 | - | 47.2 | 0.4 | - | 50.9 | 0.8 | - | 27.6 | 2.3 | - | 50.1 | 0.3 | - | 49.1 | 0.7 | - | 58.7 | |||||||
| Impact on fair value from 10% adverse change | (47.3) | (76.6) | (1.2) | (30.5) | (94.4) | (8.2) | |||||||||||||||||||
| Impact on fair value from 20% adverse change | (65.4) | (116.8) | (2.3) | (36.2) | (151.9) | (15.9) | |||||||||||||||||||
| Expected credit losses (rate per annum), in % | 1.1 | - | 46.5 | 2.5 | - | 49.4 | 2.6 | - | 25.9 | 1.9 | - | 49.0 | 0.9 | - | 48.9 | 5.4 | - | 31.8 | |||||||
| Impact on fair value from 10% adverse change | (39.9) | (68.6) | (1.1) | (29.8) | (83.6) | (6.8) | |||||||||||||||||||
| Impact on fair value from 20% adverse change | (51.0) | (101.4) | (2.1) | (34.8) | (131.5) | (13.2) | |||||||||||||||||||
| 1 To deter prepayment, commercial mortgage loans typically have prepayment protection in the form of prepayment lockouts and yield maintenances. 2 CDO's within this category are generally structured to be protected from prepayment risk. 3 PSA is an industry standard prepayment speed metric used for projecting prepayments over the life of a residential mortgage loan. PSA utilizes the CPR assumptions. A 100% prepayment assumption assumes a prepayment rate of 0.2% per annum of the outstanding principal balance of mortgage loans in the first month. This increases by 0.2% thereafter during the term of the mortgage loan, leveling off to a CPR of 6% per annum beginning in the 30th month and each month thereafter during the term of the mortgage loan. 100 PSA equals 6 CPR. 4 The rate was based on the weighted-average yield on the beneficial interests. | |||||||||||||||||||||||||
| These sensitivities are hypothetical and do not reflect economic hedging activities. Changes in fair value based on a 10% or 20% variation in assumptions generally cannot be extrapolated because the relationship of the change in assumption to the change in fair value may not be linear. Also, the effect of a variation in a particular assumption on the fair value of the beneficial interests is calculated without changing any other assumption. In practice, changes in one assumption may result in changes in other assumptions (for example, increases in market interest rates may result in lower prepayments and increased credit losses), which might magnify or counteract the sensitivities. |
Secured borrowings |
| The following table provides the carrying amounts of transferred financial assets and the related liabilities where sale treatment was not achieved as of the end of 2Q12 and 4Q11. |
| > Refer to “Note 27 – Assets pledged or assigned” for further information. |
| Carrying amounts of transferred financial assets and liabilities where sale treatment was not achieved |
| end of | 2Q12 | 4Q11 | |||
| CHF million | |||||
| CMBS | |||||
| Other assets | 609 | 664 | |||
| Liability to SPE, included in Other liabilities | (609) | (664) | |||
| RMBS | |||||
| Other assets | 12 | 12 | |||
| Liability to SPE, included in Other liabilities | (12) | (12) | |||
| Other asset-backed financings | |||||
| Trading assets | 1,531 | 1,851 | |||
| Other assets | 1,359 | 1,475 | |||
| Liability to SPE, included in Other liabilities | (2,890) | (3,326) | |||
Variable interest entities |
| As a normal part of its business, the Group engages in various transactions that include entities that are considered VIEs and are grouped into three primary categories: CDOs, CP conduits and financial intermediation. |
| > Refer to “Transfer of financial assets” in V – Consolidated financial statements – Credit Suisse Group – Note 32 – Transfer of financial assets and variable interest entities in the Credit Suisse Annual Report 2011 for a detailed description of VIEs, CDOs, CP conduit or financial intermediation. |
Collateralized debt obligations |
| The Group engages in CDO transactions to meet client and investor needs, earn fees and sell financial assets. The Group may act as underwriter, placement agent or asset manager and may warehouse assets prior to the closing of a transaction. |
Commercial paper conduit |
| The Group continues to act as the administrator and provider of liquidity and credit enhancement facilities for one asset-backed CP conduit, Alpine, a client-focused multi-seller conduit vehicle. Alpine publishes portfolio and asset data and submits its portfolio to a rating agency for public ratings based on the cash flows of the portfolio taken as a whole. This CP conduit purchases assets, primarily loans and receivables, from clients and finances such purchases through the issuance of CP backed by these assets. For an asset to qualify for acquisition by the CP conduit, it must be rated at least investment grade after giving effect to the related asset-specific credit enhancement primarily provided by the client seller of the asset. The clients provide credit support to investors of the CP conduit in the form of over-collateralization and other asset-specific enhancements. Further, an unaffiliated investor retains a limited first-loss position in Alpine’s entire portfolio. Alpine is a separate legal entity that is wholly owned by the Group. However, its assets are available to satisfy only the claims of its creditors. In addition, the Group, as administrator and liquidity and credit enhancement facilities provider, has significant exposure to and power over the activities of Alpine. Alpine is considered a VIE for accounting purposes. Effective January 1, 2010, the Group was deemed the primary beneficiary of Alpine and consolidated it in accordance with new guidance. |
| The overall average maturity of the conduit’s outstanding CP was approximately 25 days and 18 days as of 2Q12 and 4Q11, respectively. As of 2Q12 and 4Q11, Alpine had the highest short-term ratings from Moody’s and Dominion Bond Rating Service and was rated A-1 by Standard & Poors and F-1 by Fitch. The majority of Alpine’s purchased assets were highly rated loans or receivables in the consumer sector, including auto loans or leases, student loans and credit card receivables. As of 2Q12 and 4Q11, those assets had an average rating of AA, based on the lowest of each asset’s external or internal rating, and an average maturity of 2.6 years and 2.5 years as of 2Q12 and 4Q11, respectively. |
Financial intermediation |
| The Group has significant involvement with VIEs in its role as a financial intermediary on behalf of clients. |
| Financial intermediation consists of securitizations, funds, loans and other vehicles. |
Consolidated VIEs |
| The Group has significant involvement with VIEs in its role as a financial intermediary on behalf of clients. The Group consolidated all VIEs related to financial intermediation for which it was the primary beneficiary. |
| The consolidated VIEs tables provide the carrying amounts and classifications of the assets and liabilities of consolidated VIEs as of the end of 2Q12 and 4Q11. |
| Consolidated VIEs in which the Group was the primary beneficiary |
| Financial intermediation | |||||||||||||||
end of 2Q12 | CDO | CP Conduit | Securi- tizations | Funds | Loans | Other | Total | ||||||||
| Assets of consolidated VIEs (CHF million) | |||||||||||||||
| Cash and due from banks | 1,047 | 24 | 0 | 161 | 70 | 22 | 1,324 | ||||||||
| Central bank funds sold, securities purchased under resale agreements and securities borrowing transactions | 0 | 118 | 0 | 0 | 0 | 0 | 118 | ||||||||
| Trading assets | 1,206 | 561 | 18 | 2,497 | 526 | 1,245 | 6,053 | ||||||||
| Investment securities | 0 | 34 | 0 | 0 | 0 | 0 | 34 | ||||||||
| Other investments | 0 | 0 | 0 | 0 | 1,811 | 516 | 2,327 | ||||||||
| Net loans | 0 | 5,397 | 821 | 0 | 56 | 337 | 6,611 | ||||||||
| Premises and equipment | 0 | 0 | 0 | 0 | 532 | 77 | 609 | ||||||||
| Loans held-for-sale | 7,520 | 0 | 2,661 | 0 | 3 | 0 | 10,184 | ||||||||
| Other assets | 44 | 1,015 | 0 | 5 | 482 | 216 | 1,762 | ||||||||
| Total assets of consolidated VIEs | 9,817 | 7,149 | 3,500 | 2,663 | 3,480 | 2,413 | 29,022 | ||||||||
| Liabilities of consolidated VIEs (CHF million) | |||||||||||||||
| Customer deposits | 0 | 0 | 0 | 0 | 0 | 175 | 175 | ||||||||
| Trading liabilities | 23 | 0 | 0 | 0 | 3 | 1,230 | 1,256 | ||||||||
| Short-term borrowings | 318 | 6,737 | 0 | 40 | 0 | 0 | 7,095 | ||||||||
| Long-term debt | 9,433 | 21 | 3,595 | 310 | 41 | 460 | 13,860 | ||||||||
| Other liabilities | 55 | 0 | 1 | 3 | 151 | 471 | 681 | ||||||||
| Total liabilities of consolidated VIEs | 9,829 | 6,758 | 3,596 | 353 | 195 | 2,336 | 23,067 | ||||||||
| Consolidated VIEs in which the Group was the primary beneficiary (continued) |
| Financial intermediation | |||||||||||||||
end of 4Q11 | CDO | CP Conduit | Securi- tizations | Funds | Loans | Other | Total | ||||||||
| Assets of consolidated VIEs (CHF million) | |||||||||||||||
| Cash and due from banks | 1,202 | 24 | 0 | 43 | 102 | 25 | 1,396 | ||||||||
| Central bank funds sold, securities purchased under resale agreements and securities borrowing transactions | 0 | 19 | 0 | 0 | 0 | 0 | 19 | ||||||||
| Trading assets | 1,207 | 728 | 18 | 2,681 | 554 | 1,211 | 6,399 | ||||||||
| Investment securities | 0 | 41 | 0 | 0 | 0 | 0 | 41 | ||||||||
| Other investments | 0 | 0 | 0 | 0 | 1,863 | 483 | 2,346 | ||||||||
| Net loans | 0 | 4,720 | 0 | 0 | 62 | 1,158 | 5,940 | ||||||||
| Premises and equipment | 0 | 0 | 0 | 0 | 564 | 82 | 646 | ||||||||
| Loans held-for-sale | 7,231 | 0 | 3,941 | 0 | 2 | 0 | 11,174 | ||||||||
| Other assets | 43 | 751 | 0 | 30 | 741 | 263 | 1,828 | ||||||||
| Total assets of consolidated VIEs | 9,683 | 6,283 | 3,959 | 2,754 | 3,888 | 3,222 | 29,789 | ||||||||
| Liabilities of consolidated VIEs (CHF million) | |||||||||||||||
| Customer deposits | 0 | 0 | 0 | 0 | 0 | 221 | 221 | ||||||||
| Trading liabilities | 30 | 0 | 0 | 0 | 3 | 1,253 | 1,286 | ||||||||
| Short-term borrowings | 0 | 6,141 | 0 | 0 | 0 | 0 | 6,141 | ||||||||
| Long-term debt | 9,383 | 24 | 4,483 | 276 | 227 | 465 | 14,858 | ||||||||
| Other liabilities | 69 | 2 | 0 | 24 | 158 | 493 | 746 | ||||||||
| Total liabilities of consolidated VIEs | 9,482 | 6,167 | 4,483 | 300 | 388 | 2,432 | 23,252 | ||||||||
Non-consolidated VIEs |
| The non-consolidated VIEs tables provide the carrying amounts and classification of the assets and liabilities of variable interests recorded in the Group’s consolidated balance sheets, maximum exposure to loss and total assets of the non-consolidated VIEs. |
| Certain VIEs have not been included in the following table, including VIEs structured by third parties in which the Group’s interest is in the form of securities held in the Group’s inventory, certain single-asset financing vehicles not sponsored by the Group to which the Group provides financing but has very little risk of loss due to over-collateralization and guarantees, failed sales where the Group does not have any other holdings and other entities out of scope. |
| > Refer to “Transfer of financial assets ” in V – Consolidated financial statements – Credit Suisse Group – Note 32 – Non-consolidated VIE’s in the Credit Suisse Annual Report 2011 for further information. |
| Non-consolidated VIEs |
| Financial intermediation | |||||||||||||
end of 2Q12 | CDO | Securi- tizations | Funds | Loans | Other | Total | |||||||
| Variable interest assets (CHF million) | |||||||||||||
| Trading assets | 133 | 3,392 | 1,202 | 664 | 2,437 | 7,828 | |||||||
| Net loans | 9 | 119 | 2,063 | 4,125 | 1,519 | 7,835 | |||||||
| Other assets | 0 | 0 | 71 | 0 | 5 | 76 | |||||||
| Total variable interest assets | 142 | 3,511 | 3,336 | 4,789 | 3,961 | 15,739 | |||||||
| Maximum exposure to loss (CHF million) | |||||||||||||
| Maximum exposure to loss | 155 | 12,997 | 3,838 | 5,247 | 4,651 | 26,888 | |||||||
| Non-consolidated VIE assets (CHF million) | |||||||||||||
| Non-consolidated VIE assets | 9,096 | 113,118 | 63,088 | 24,417 | 17,633 | 227,352 | |||||||
| Financial intermediation | |||||||||||||
end of 4Q11 | CDO | Securi- tizations | Funds | Loans | Other | Total | |||||||
| Variable interest assets (CHF million) | |||||||||||||
| Trading assets | 126 | 5,497 | 1,449 | 834 | 2,395 | 10,301 | |||||||
| Net loans | 0 | 123 | 1,627 | 4,742 | 3,257 | 9,749 | |||||||
| Other assets | 0 | 0 | 32 | 0 | 391 | 423 | |||||||
| Total variable interest assets | 126 | 5,620 | 3,108 | 5,576 | 6,043 | 20,473 | |||||||
| Maximum exposure to loss (CHF million) | |||||||||||||
| Maximum exposure to loss | 153 | 7,056 | 3,505 | 6,051 | 6,413 | 23,178 | |||||||
| Non-consolidated VIE assets (CHF million) | |||||||||||||
| Non-consolidated VIE assets | 7,093 | 113,845 | 58,815 | 23,633 | 20,748 | 224,134 | |||||||
| Note 26 Financial instruments |
| The disclosure of the Group’s financial instruments below includes the following sections: |
| – Concentration of credit risk; |
| – Fair value measurement (including fair value hierarchy, transfers between levels; level 3 reconciliation; qualitative and quantitative disclosures of valuation techniques and nonrecurring fair value changes) |
| – Fair value option; and |
| – Disclosures about fair value of financial instruments. |
Concentrations of credit risk |
| Credit risk concentrations arise when a number of counterparties are engaged in similar business activities, are located in the same geographic region or when there are similar economic features that would cause their ability to meet contractual obligations to be similarly impacted by changes in economic conditions. |
| > Refer to “Note 33 – Financial instruments” in V – Consolidated financial statements – Credit Suisse Group in the Credit Suisse Annual Report 2011 for further information on the Group’s concentrations of credit risk. |
Fair value measurement |
| A significant portion of the Group’s financial instruments are carried at fair value. Deterioration of financial markets could significantly impact the fair value of these financial instruments and the results of operations. |
| The fair value of the majority of the Group’s financial instruments is based on quoted prices in active markets or observable inputs. These instruments include government and agency securities, certain CP, most investment grade corporate debt, certain high yield debt securities, exchange-traded and certain OTC derivative instruments and most listed equity securities. |
| In addition, the Group holds financial instruments for which no prices are available and which have little or no observable inputs. For these instruments, the determination of fair value requires subjective assessment and judgment, depending on liquidity, pricing assumptions, the current economic and competitive environment and the risks affecting the specific instrument. In such circumstances, valuation is determined based on management’s own judgments about the assumptions that market participants would use in pricing the asset or liability, including assumptions about risk. These instruments include certain OTC derivatives, including equity and credit derivatives, certain corporate equity-linked securities, mortgage-related and CDO securities, private equity investments, certain loans and credit products, including leveraged finance, certain syndicated loans and certain high yield bonds, and life finance instruments. |
| The fair value of financial assets and liabilities is impacted by factors such as benchmark interest rates, prices of financial instruments issued by third parties, commodity prices, foreign exchange rates and index prices or rates. In addition, valuation adjustments are an integral part of the valuation process when market prices are not indicative of the credit quality of a counterparty, and are applied to both OTC derivatives and debt instruments. The impact of changes in a counterparty’s credit spreads (known as credit valuation adjustments) is considered when measuring the fair value of assets and the impact of changes in the Group’s own credit spreads (known as DVA) is considered when measuring the fair value of its liabilities. For OTC derivatives, the impact of changes in both the Group’s and the counterparty’s credit standing is considered when measuring their fair value, based on current CDS prices. The adjustments also take into account contractual factors designed to reduce the Group’s credit exposure to a counterparty, such as collateral held and master netting agreements. For hybrid debt instruments with embedded derivative features, the impact of changes in the Group’s credit standing is considered when measuring their fair value, based on current funded debt spreads. |
| Based on the Group’s regular review of observable parameters used in its pricing models, in 2Q12 the Group extended the adoption of overnight indexed swap (OIS) discounting, instead of other reference rates such as LIBOR, to inflation products, which resulted in a loss of CHF 30 million. |
| ASU 2011-04 permits a reporting entity to measure the fair value of a group of financial assets and financial liabilities on the basis of the price that would be received to sell a net long position or paid to transfer a net short position for a particular risk exposure in an orderly transaction between market participants at the measurement date. This change to the fair value measurement guidance is consistent with industry practice. As such, the Group continues to apply bid and offer adjustments to net portfolios of cash securities and/or derivative instruments to adjust the value of the net position from a mid-market price to the appropriate bid or offer level that would be realized under normal market conditions for the net long or net short position for a specific market risk. In addition, the Group reflects the net exposure to credit risk for its derivative instruments where the Group has legally enforceable agreements with its counterparties that mitigate credit risk exposure in the event of default. Valuation adjustments are recorded in a reasonable and consistent manner that results in an allocation to the relevant disclosures in the notes to the financial statements as if the valuation adjustment had been allocated to the individual unit of account. |
Fair value hierarchy |
| The levels of the fair value hierarchy are defined as follows: |
| – Level 1: Quoted prices (unadjusted) in active markets for identical assets or liabilities that the Group has the ability to access. This level of the fair value hierarchy provides the most reliable evidence of fair value and is used to measure fair value whenever available. |
| – Level 2: Inputs other than quoted prices included within level 1 that are observable for the asset or liability, either directly or indirectly. These inputs include: (i) quoted prices for similar assets or liabilities in active markets; (ii) quoted prices for identical or similar assets or liabilities in markets that are not active, that is, markets in which there are few transactions for the asset or liability, the prices are not current or price quotations vary substantially either over time or among market makers, or in which little information is publicly available; (iii) inputs other than quoted prices that are observable for the asset or liability; or (iv) inputs that are derived principally from or corroborated by observable market data by correlation or other means. |
| – Level 3: Inputs that are unobservable for the asset or liability. These inputs reflect the Group’s own assumptions about the assumptions that market participants would use in pricing the asset or liability (including assumptions about risk). These inputs are developed based on the best information available in the circumstances, which include the Group’s own data. The Group’s own data used to develop unobservable inputs is adjusted if information indicates that market participants would use different assumptions. |
| Assets and liabilities measured at fair value on a recurring basis |
end of 2Q12 | Level 1 | Level 2 | Level 3 | Netting impact | 1 | Total | |||||
| Assets (CHF million) | |||||||||||
| Cash and due from banks | 0 | 475 | 0 | 0 | 475 | ||||||
| Interest-bearing deposits with banks | 0 | 624 | 0 | 0 | 624 | ||||||
| Central bank funds sold, securities purchased under resale agreements and securities borrowing transactions | 0 | 147,535 | 1,186 | 0 | 148,721 | ||||||
| Debt | 70 | 391 | 0 | 0 | 461 | ||||||
| of which corporates | 0 | 382 | 0 | 0 | 382 | ||||||
| Equity | 29,717 | 13 | 0 | 0 | 29,730 | ||||||
| Securities received as collateral | 29,787 | 404 | 0 | 0 | 30,191 | ||||||
| Debt | 99,561 | 52,670 | 7,935 | 0 | 160,166 | ||||||
| of which foreign governments | 72,102 | 8,864 | 51 | 0 | 81,017 | ||||||
| of which corporates | 3 | 25,431 | 4,125 | 0 | 29,559 | ||||||
| of which RMBS | 26,732 | 8,340 | 1,253 | 0 | 36,325 | ||||||
| of which CMBS | 0 | 4,730 | 1,364 | 0 | 6,094 | ||||||
| of which CDO | 0 | 5,080 | 654 | 0 | 5,734 | ||||||
| Equity | 59,797 | 8,603 | 429 | 0 | 68,829 | ||||||
| Derivatives | 10,026 | 872,337 | 8,586 | (848,935) | 42,014 | ||||||
| of which interest rate products | 1,914 | 723,498 | 2,195 | – | – | ||||||
| of which foreign exchange products | 1 | 63,700 | 1,045 | – | – | ||||||
| of which equity/index-related products | 7,317 | 27,293 | 2,247 | – | – | ||||||
| of which credit derivatives | 0 | 45,537 | 2,091 | – | – | ||||||
| Other | 8,550 | 2,172 | 2,327 | 0 | 13,049 | ||||||
| Trading assets | 177,934 | 935,782 | 19,277 | (848,935) | 284,058 | ||||||
| Debt | 3,722 | 1,113 | 91 | 0 | 4,926 | ||||||
| of which foreign governments | 3,233 | 0 | 19 | 0 | 3,252 | ||||||
| of which corporates | 0 | 659 | 39 | 0 | 698 | ||||||
| of which CDO | 0 | 454 | 33 | 0 | 487 | ||||||
| Equity | 314 | 83 | 1 | 0 | 398 | ||||||
| Investment securities | 4,036 | 1,196 | 92 | 0 | 5,324 | ||||||
| Private equity | 0 | 0 | 4,443 | 0 | 4,443 | ||||||
| of which equity funds | 0 | 0 | 3,143 | 0 | 3,143 | ||||||
| Hedge funds | 0 | 220 | 274 | 0 | 494 | ||||||
| of which debt funds | 0 | 143 | 178 | 0 | 321 | ||||||
| Other equity investments | 244 | 88 | 2,519 | 0 | 2,851 | ||||||
| of which private | 0 | 46 | 2,519 | 0 | 2,565 | ||||||
| Life finance instruments | 0 | 0 | 1,922 | 0 | 1,922 | ||||||
| Other investments | 244 | 308 | 9,158 | 0 | 9,710 | ||||||
| Loans | 0 | 14,115 | 6,400 | 0 | 20,515 | ||||||
| of which commercial and industrial loans | 0 | 7,856 | 3,978 | 0 | 11,834 | ||||||
| of which financial institutions | 0 | 5,162 | 2,093 | 0 | 7,255 | ||||||
| Other intangible assets (mortgage servicing rights) | 0 | 0 | 63 | 0 | 63 | ||||||
| Other assets | 5,247 | 25,329 | 6,635 | (209) | 37,002 | ||||||
| of which loans held-for-sale | 0 | 13,029 | 6,052 | 0 | 19,081 | ||||||
| Total assets at fair value | 217,248 | 1,125,768 | 42,811 | (849,144) | 536,683 | ||||||
| Less other investments - equity at fair value attributable to noncontrolling interests | (189) | (102) | (3,899) | 0 | (4,190) | ||||||
| Less assets consolidated under ASU 2009-17 2 | 0 | (9,099) | (3,499) | 0 | (12,598) | ||||||
| Assets at fair value excluding noncontrolling interests and assets not risk-weighted under the Basel framework | 217,059 | 1,116,567 | 35,413 | (849,144) | 519,895 | ||||||
| 1 Derivative contracts are reported on a gross basis by level. The impact of netting represents legally enforceable netting agreements. 2 Assets of consolidated VIEs that are not risk-weighted under the Basel framework. | |||||||||||
| Assets and liabilities measured at fair value on a recurring basis (continued) |
end of 2Q12 | Level 1 | Level 2 | Level 3 | Netting impact | 1 | Total | |||||
| Liabilities (CHF million) | |||||||||||
| Due to banks | 0 | 3,324 | 0 | 0 | 3,324 | ||||||
| Customer deposits | 0 | 4,825 | 0 | 0 | 4,825 | ||||||
| Central bank funds purchased, securities sold under repurchase agreements and securities lending transactions | 0 | 143,714 | 0 | 0 | 143,714 | ||||||
| Debt | 70 | 391 | 0 | 0 | 461 | ||||||
| of which corporates | 0 | 382 | 0 | 0 | 382 | ||||||
| Equity | 29,717 | 13 | 0 | 0 | 29,730 | ||||||
| Obligations to return securities received as collateral | 29,787 | 404 | 0 | 0 | 30,191 | ||||||
| Debt | 35,086 | 10,095 | 16 | 0 | 45,197 | ||||||
| of which foreign governments | 34,937 | 1,928 | 10 | 0 | 36,875 | ||||||
| of which corporates | 0 | 7,396 | 6 | 0 | 7,402 | ||||||
| Equity | 21,619 | 391 | 27 | 0 | 22,037 | ||||||
| Derivatives | 10,480 | 883,045 | 6,088 | (851,065) | 48,548 | ||||||
| of which interest rate products | 1,888 | 715,686 | 1,334 | – | – | ||||||
| of which foreign exchange products | 1 | 79,852 | 2,205 | – | – | ||||||
| of which equity/index-related products | 7,749 | 31,376 | 889 | – | – | ||||||
| of which credit derivatives | 0 | 44,049 | 1,256 | – | – | ||||||
| Trading liabilities | 67,185 | 893,531 | 6,131 | (851,065) | 115,782 | ||||||
| Short-term borrowings | 0 | 4,378 | 78 | 0 | 4,456 | ||||||
| Long-term debt | 108 | 55,167 | 11,677 | 0 | 66,952 | ||||||
| of which treasury debt over two years | 0 | 12,108 | 0 | 0 | 12,108 | ||||||
| of which structured notes over two years | 0 | 21,097 | 7,167 | 0 | 28,264 | ||||||
| of which non-recourse liabilities | 108 | 10,156 | 2,821 | 0 | 13,085 | ||||||
| Other liabilities | 0 | 26,518 | 3,558 | (258) | 29,818 | ||||||
| of which failed sales | 0 | 3,222 | 1,671 | 0 | 4,893 | ||||||
| Total liabilities at fair value | 97,080 | 1,131,861 | 21,444 | (851,323) | 399,062 | ||||||
| 1 Derivative contracts are reported on a gross basis by level. The impact of netting represents legally enforceable netting agreements. | |||||||||||
| Assets and liabilities measured at fair value on a recurring basis (continued) |
end of 4Q11 | Level 1 | Level 2 | Level 3 | Netting impact | 1 | Total | |||||
| Assets (CHF million) | |||||||||||
| Interest-bearing deposits with banks | 0 | 405 | 0 | 0 | 405 | ||||||
| Central bank funds sold, securities purchased under resale agreements and securities borrowing transactions | 0 | 157,469 | 1,204 | 0 | 158,673 | ||||||
| Debt | 94 | 3,895 | 112 | 0 | 4,101 | ||||||
| of which corporates | 0 | 3,835 | 112 | 0 | 3,947 | ||||||
| Equity | 25,958 | 51 | 81 | 0 | 26,090 | ||||||
| Securities received as collateral | 26,052 | 3,946 | 193 | 0 | 30,191 | ||||||
| Debt | 82,241 | 52,766 | 10,028 | 0 | 145,035 | ||||||
| of which foreign governments | 61,507 | 8,123 | 358 | 0 | 69,988 | ||||||
| of which corporates | 340 | 27,622 | 5,076 | 0 | 33,038 | ||||||
| of which RMBS | 19,331 | 5,848 | 1,786 | 0 | 26,965 | ||||||
| of which CMBS | 0 | 4,556 | 1,517 | 0 | 6,073 | ||||||
| of which CDO | 0 | 6,570 | 727 | 0 | 7,297 | ||||||
| Equity | 57,398 | 9,039 | 467 | 0 | 66,904 | ||||||
| Derivatives | 6,455 | 909,156 | 9,587 | (872,650) | 52,548 | ||||||
| of which interest rate products | 2,017 | 724,203 | 2,547 | – | – | ||||||
| of which foreign exchange products | 1 | 75,091 | 1,040 | – | – | ||||||
| of which equity/index-related products | 3,929 | 32,734 | 2,732 | – | – | ||||||
| of which credit derivatives | 0 | 61,120 | 2,171 | – | – | ||||||
| Other | 9,235 | 3,635 | 2,196 | 0 | 15,066 | ||||||
| Trading assets | 155,329 | 974,596 | 22,278 | (872,650) | 279,553 | ||||||
| Debt | 3,649 | 1,315 | 102 | 0 | 5,066 | ||||||
| of which foreign governments | 3,302 | 0 | 18 | 0 | 3,320 | ||||||
| of which corporates | 0 | 748 | 43 | 0 | 791 | ||||||
| of which CDO | 0 | 566 | 41 | 0 | 607 | ||||||
| Equity | 9 | 83 | 0 | 0 | 92 | ||||||
| Investment securities | 3,658 | 1,398 | 102 | 0 | 5,158 | ||||||
| Private equity | 0 | 0 | 4,306 | 0 | 4,306 | ||||||
| of which equity funds | 0 | 0 | 3,136 | 0 | 3,136 | ||||||
| Hedge funds | 0 | 232 | 266 | 0 | 498 | ||||||
| of which debt funds | 0 | 154 | 172 | 0 | 326 | ||||||
| Other equity investments | 424 | 50 | 2,504 | 0 | 2,978 | ||||||
| of which private | 0 | 40 | 2,504 | 0 | 2,544 | ||||||
| Life finance instruments | 0 | 0 | 1,969 | 0 | 1,969 | ||||||
| Other investments | 424 | 282 | 9,045 | 0 | 9,751 | ||||||
| Loans | 0 | 13,852 | 6,842 | 0 | 20,694 | ||||||
| of which commercial and industrial loans | 0 | 7,591 | 4,559 | 0 | 12,150 | ||||||
| of which financial institutions | 0 | 5,480 | 2,179 | 0 | 7,659 | ||||||
| Other intangible assets (mortgage servicing rights) | 0 | 0 | 70 | 0 | 70 | ||||||
| Other assets | 5,451 | 23,050 | 7,469 | (205) | 35,765 | ||||||
| of which loans held-for-sale | 0 | 12,104 | 6,901 | 0 | 19,005 | ||||||
| Total assets at fair value | 190,914 | 1,174,998 | 47,203 | (872,855) | 540,260 | ||||||
| Less other investments - equity at fair value attributable to noncontrolling interests | (295) | (99) | (3,944) | 0 | (4,338) | ||||||
| Less assets consolidated under ASU 2009-17 2 | 0 | (9,304) | (4,003) | 0 | (13,307) | ||||||
| Assets at fair value excluding noncontrolling interests and assets not risk-weighted under the Basel framework | 190,619 | 1,165,595 | 39,256 | (872,855) | 522,615 | ||||||
| 1 Derivative contracts are reported on a gross basis by level. The impact of netting represents legally enforceable netting agreements. 2 Assets of consolidated VIEs that are not risk-weighted under the Basel framework. | |||||||||||
| Assets and liabilities measured at fair value on a recurring basis (continued) |
end of 4Q11 | Level 1 | Level 2 | Level 3 | Netting impact | 1 | Total | |||||
| Liabilities (CHF million) | |||||||||||
| Due to banks | 0 | 2,721 | 0 | 0 | 2,721 | ||||||
| Customer deposits | 0 | 4,599 | 0 | 0 | 4,599 | ||||||
| Central bank funds purchased, securities sold under repurchase agreements and securities lending transactions | 0 | 136,483 | 0 | 0 | 136,483 | ||||||
| Debt | 94 | 3,895 | 112 | 0 | 4,101 | ||||||
| of which corporates | 0 | 3,835 | 112 | 0 | 3,947 | ||||||
| Equity | 25,958 | 51 | 81 | 0 | 26,090 | ||||||
| Obligations to return securities received as collateral | 26,052 | 3,946 | 193 | 0 | 30,191 | ||||||
| Debt | 38,681 | 9,301 | 21 | 0 | 48,003 | ||||||
| of which foreign governments | 38,622 | 829 | 0 | 0 | 39,451 | ||||||
| of which corporates | 6 | 7,591 | 13 | 0 | 7,610 | ||||||
| Equity | 19,124 | 461 | 7 | 0 | 19,592 | ||||||
| Derivatives | 6,283 | 920,251 | 7,315 | (873,684) | 60,165 | ||||||
| of which interest rate products | 1,941 | 717,248 | 1,588 | – | – | ||||||
| of which foreign exchange products | 1 | 91,846 | 2,836 | – | – | ||||||
| of which equity/index-related products | 3,809 | 37,018 | 1,022 | – | – | ||||||
| of which credit derivatives | 0 | 58,497 | 1,520 | – | – | ||||||
| Trading liabilities | 64,088 | 930,013 | 7,343 | (873,684) | 127,760 | ||||||
| Short-term borrowings | 0 | 3,311 | 236 | 0 | 3,547 | ||||||
| Long-term debt | 122 | 57,529 | 12,715 | 0 | 70,366 | ||||||
| of which treasury debt over two years | 0 | 14,228 | 0 | 0 | 14,228 | ||||||
| of which structured notes over two years | 0 | 19,692 | 7,576 | 0 | 27,268 | ||||||
| of which non-recourse liabilities | 122 | 10,564 | 3,585 | 0 | 14,271 | ||||||
| Other liabilities | 0 | 27,536 | 3,891 | (335) | 31,092 | ||||||
| of which failed sales | 0 | 3,821 | 1,909 | 0 | 5,730 | ||||||
| Total liabilities at fair value | 90,262 | 1,166,138 | 24,378 | (874,019) | 406,759 | ||||||
| 1 Derivative contracts are reported on a gross basis by level. The impact of netting represents legally enforceable netting agreements. | |||||||||||
Transfers between level 1 and level 2 |
| Effective January 2012, the FASB amended the disclosure requirements for the Group’s reporting of transfers between level 1 and level 2. As this requirement is not retrospective, comparable data is not presented for prior periods. Previously, only significant transfers were required to be disclosed and such transfers between level 1 and level 2 were not significant in 6M11. |
| All transfers between level 1 and level 2 are reported through the last day of the reporting period. |
| In 6M12, transfers to level 1 out of level 2 were from trading assets and trading liabilities. The transfers were primarily in exchange traded derivative instruments as they moved closer to maturity and pricing inputs became more observable. Transfers out of level 1 to level 2 were primarily from trading assets. The transfers were primarily in equity as suitable closing prices were unobtainable as of the end of 6M12. |
| Transfers between level 1 and level 2 |
6M12 | Transfers to level 1 out of level 2 | Transfers out of level 1 to level 2 | |||
| Assets (CHF million) | |||||
| Debt | 47 | 96 | |||
| Equity | 99 | 202 | |||
| Derivatives | 4,374 | 16 | |||
| Trading assets | 4,520 | 314 | |||
| Liabilities (CHF million) | |||||
| Debt | 26 | 32 | |||
| Equity | 43 | 20 | |||
| Derivatives | 5,116 | 66 | |||
| Trading liabilities | 5,185 | 118 | |||
| Assets and liabilities measured at fair value on a recurring basis for level 3 | |||||||||||||||||||||||||||
| Trading revenues | Other revenues | ||||||||||||||||||||||||||
6M12 | Balance at beginning of period | Transfers in | Transfers out | Purchases | Sales | Issuances | Settlements | On transfers in / out | 1 | On all other | On transfers in / out | 1 | On all other | Foreign currency translation impact | Balance at end of period | ||||||||||||
| Assets (CHF million) | |||||||||||||||||||||||||||
| Central bank funds sold, securities purchased under resale agreements and securities borrowing transactions | 1,204 | 0 | 0 | 0 | 0 | 0 | 0 | 0 | (25) | 0 | 0 | 7 | 1,186 | ||||||||||||||
| Securities received as collateral | 193 | 0 | (195) | 0 | 0 | 0 | 0 | 0 | 0 | 0 | 0 | 2 | 0 | ||||||||||||||
| Debt | 10,028 | 1,269 | (1,477) | 3,338 | (5,310) | 0 | 0 | 28 | 34 | 0 | 0 | 25 | 7,935 | ||||||||||||||
| of which corporates | 5,076 | 479 | (665) | 2,268 | (3,323) | 0 | 0 | 35 | 232 | 0 | 0 | 23 | 4,125 | ||||||||||||||
| of which RMBS | 1,786 | 517 | (545) | 477 | (999) | 0 | 0 | (11) | 26 | 0 | 0 | 2 | 1,253 | ||||||||||||||
| of which CMBS | 1,517 | 111 | (154) | 206 | (142) | 0 | 0 | (5) | (170) | 0 | 0 | 1 | 1,364 | ||||||||||||||
| of which CDO | 727 | 136 | (44) | 300 | (485) | 0 | 0 | 1 | 17 | 0 | 0 | 2 | 654 | ||||||||||||||
| Equity | 467 | 287 | (39) | 198 | (446) | 0 | 0 | 16 | (52) | 0 | 0 | (2) | 429 | ||||||||||||||
| Derivatives | 9,587 | 912 | (1,128) | 0 | 0 | 701 | (1,656) | 73 | 55 | 0 | 0 | 42 | 8,586 | ||||||||||||||
| of which interest rate products | 2,547 | 55 | (247) | 0 | 0 | 152 | (369) | 11 | 34 | 0 | 0 | 12 | 2,195 | ||||||||||||||
| of which equity/index-related products | 2,732 | 396 | (459) | 0 | 0 | 259 | (616) | 57 | (129) | 0 | 0 | 7 | 2,247 | ||||||||||||||
| of which credit derivatives | 2,171 | 455 | (328) | 0 | 0 | 145 | (385) | 0 | 22 | 0 | 0 | 11 | 2,091 | ||||||||||||||
| Other | 2,196 | 110 | (115) | 1,239 | (1,128) | 0 | 0 | (2) | 10 | 0 | 0 | 17 | 2,327 | ||||||||||||||
| Trading assets | 22,278 | 2,578 | (2,759) | 4,775 | (6,884) | 701 | (1,656) | 115 | 47 | 0 | 0 | 82 | 19,277 | ||||||||||||||
| Investment securities | 102 | 0 | 0 | 0 | (7) | 0 | 0 | 0 | 0 | 0 | 0 | (3) | 92 | ||||||||||||||
| Equity | 7,076 | 4 | (48) | 420 | (629) | 0 | 0 | 0 | 1 | 0 | 381 | 31 | 7,236 | ||||||||||||||
| Life finance instruments | 1,969 | 0 | 0 | 70 | (154) | 0 | 0 | 0 | 25 | 0 | 0 | 12 | 1,922 | ||||||||||||||
| Other investments | 9,045 | 4 | (48) | 490 | (783) | 0 | 0 | 0 | 26 | 0 | 381 | 43 | 9,158 | ||||||||||||||
| Loans | 6,842 | 220 | (97) | 327 | (712) | 1,779 | (1,803) | 5 | (186) | 0 | 0 | 25 | 6,400 | ||||||||||||||
| of which commercial and industrial loans | 4,559 | 114 | (97) | 92 | (353) | 1,095 | (1,459) | 5 | 12 | 0 | 0 | 10 | 3,978 | ||||||||||||||
| of which financial institutions | 2,179 | 76 | 0 | 227 | (345) | 496 | (329) | 0 | (221) | 0 | 0 | 10 | 2,093 | ||||||||||||||
| Other intangible assets | 70 | 0 | 0 | 2 | 0 | 0 | 0 | 0 | 0 | 0 | (9) | 0 | 63 | ||||||||||||||
| Other assets | 7,469 | 1,180 | (1,593) | 1,513 | (1,744) | 101 | (664) | 54 | 318 | 0 | 0 | 1 | 6,635 | ||||||||||||||
| of which loans held-for-sale 2 | 6,901 | 1,155 | (1,592) | 1,465 | (1,662) | 101 | (665) | 53 | 286 | 0 | 0 | 10 | 6,052 | ||||||||||||||
| Total assets at fair value | 47,203 | 3,982 | (4,692) | 7,107 | (10,130) | 2,581 | (4,123) | 174 | 180 | 0 | 372 | 157 | 42,811 | ||||||||||||||
| Liabilities (CHF million) | |||||||||||||||||||||||||||
| Obligation to return securities received as collateral | 193 | 0 | (195) | 0 | 0 | 0 | 0 | 0 | 0 | 0 | 0 | 2 | 0 | ||||||||||||||
| Trading liabilities | 7,343 | 704 | (980) | 36 | (271) | 465 | (1,282) | 41 | 47 | 0 | 0 | 28 | 6,131 | ||||||||||||||
| of which interest rate derivatives | 1,588 | 79 | (377) | 0 | 0 | 63 | (66) | 23 | 13 | 0 | 0 | 11 | 1,334 | ||||||||||||||
| of which foreign exchange derivatives | 2,836 | 1 | (167) | 0 | 0 | 0 | (496) | 20 | 1 | 0 | 0 | 10 | 2,205 | ||||||||||||||
| of which equity/index-related derivatives | 1,022 | 62 | (109) | 0 | 0 | 236 | (191) | (32) | (99) | 0 | 0 | 0 | 889 | ||||||||||||||
| of which credit derivatives | 1,520 | 520 | (313) | 0 | 0 | 69 | (459) | 30 | (113) | 0 | 0 | 2 | 1,256 | ||||||||||||||
| Short-term borrowings | 236 | 4 | (60) | 0 | 0 | 129 | (233) | (6) | 9 | 0 | 0 | (1) | 78 | ||||||||||||||
| Long-term debt | 12,715 | 1,493 | (1,654) | 0 | 0 | 1,438 | (2,852) | 116 | 351 | 0 | 0 | 70 | 11,677 | ||||||||||||||
| of which structured notes over two years | 7,576 | 657 | (852) | 0 | 0 | 1,039 | (1,517) | 59 | 152 | 0 | 0 | 53 | 7,167 | ||||||||||||||
| of which non-recourse liabilities | 3,585 | 744 | (716) | 0 | 0 | 173 | (1,171) | 53 | 147 | 0 | 0 | 6 | 2,821 | ||||||||||||||
| Other liabilities | 3,891 | 131 | (46) | 273 | (668) | 1 | (219) | (7) | 80 | 0 | 115 | 7 | 3,558 | ||||||||||||||
| of which failed sales | 1,909 | 72 | (19) | 266 | (661) | 0 | (46) | 0 | 144 | 0 | 0 | 6 | 1,671 | ||||||||||||||
| Total liabilities at fair value | 24,378 | 2,332 | (2,935) | 309 | (939) | 2,033 | (4,586) | 144 | 487 | 0 | 115 | 106 | 21,444 | ||||||||||||||
| Net assets/(liabilities) at fair value | 22,825 | 1,650 | (1,757) | 6,798 | (9,191) | 548 | 463 | 30 | (307) | 0 | 257 | 51 | 21,367 | ||||||||||||||
| 1 For all transfers to level 3 or out of level 3, the Group determines and discloses as level 3 events only gains or losses through the last day of the reporting period. 2 Includes unrealized gains recorded in trading revenues of CHF 170 million primarily related to sub-prime exposures in the RMBS business and market movements across the wider loans held-for-sale portfolio. | |||||||||||||||||||||||||||
| Assets and liabilities measured at fair value on a recurring basis for level 3 (continued) | |||||||||||||||||||||||||||
| Trading revenues | Other revenues | ||||||||||||||||||||||||||
6M11 | Balance at beginning of period | Transfers in | Transfers out | Purchases | Sales | Issuances | Settlements | On transfers in / out | 1 | On all other | On transfers in / out | 1 | On all other | Foreign currency translation impact | Balance at end of period | ||||||||||||
| Assets (CHF million) | |||||||||||||||||||||||||||
| Central bank funds sold, securities purchased under resale agreements and securities borrowing transactions | 1,197 | 0 | (9) | 0 | 0 | 56 | (46) | 0 | (9) | 0 | 0 | (123) | 1,066 | ||||||||||||||
| Debt | 11,013 | 1,450 | (1,512) | 5,291 | (6,237) | 0 | 0 | 98 | 442 | 0 | 1 | (1,164) | 9,382 | ||||||||||||||
| of which corporates | 3,803 | 378 | (205) | 2,180 | (1,853) | 0 | 0 | 46 | 33 | 0 | 1 | (547) | 3,836 | ||||||||||||||
| of which RMBS | 3,264 | 792 | (769) | 2,187 | (2,830) | 0 | 0 | 35 | 215 | 0 | 0 | (297) | 2,597 | ||||||||||||||
| of which CMBS | 1,861 | 68 | (159) | 324 | (601) | 0 | 0 | 4 | 64 | 0 | 0 | (121) | 1,440 | ||||||||||||||
| of which CDO | 1,135 | 175 | (343) | 305 | (616) | 0 | 0 | 12 | 134 | 0 | 0 | (103) | 699 | ||||||||||||||
| Equity | 622 | 204 | (355) | 523 | (425) | 0 | 0 | 40 | 32 | 0 | 38 | (65) | 614 | ||||||||||||||
| Derivatives | 8,719 | 1,288 | (1,040) | 0 | 0 | 319 | (805) | (51) | 475 | 0 | 0 | (877) | 8,028 | ||||||||||||||
| of which interest rate products | 2,072 | 60 | (122) | 0 | 0 | 112 | (241) | (9) | (171) | 0 | 0 | (187) | 1,514 | ||||||||||||||
| of which equity/index-related products | 2,300 | 109 | (153) | 0 | 0 | 110 | (13) | 24 | 171 | 0 | 0 | (255) | 2,293 | ||||||||||||||
| of which credit derivatives | 2,725 | 845 | (717) | 0 | 0 | 21 | (382) | (65) | 222 | 0 | 0 | (259) | 2,390 | ||||||||||||||
| Other | 2,018 | 106 | (199) | 1,573 | (1,239) | 0 | (36) | 8 | 19 | 0 | 0 | (228) | 2,022 | ||||||||||||||
| Trading assets | 22,372 | 3,048 | (3,106) | 7,387 | (7,901) | 319 | (841) | 95 | 968 | 0 | 39 | (2,334) | 20,046 | ||||||||||||||
| Investment securities | 79 | 2 | 0 | 50 | (11) | 0 | (4) | 0 | 0 | 0 | 0 | (8) | 108 | ||||||||||||||
| Equity | 9,591 | 23 | (66) | 640 | (1,876) | 0 | 0 | 0 | 35 | 0 | 927 | (876) | 8,398 | ||||||||||||||
| Life finance instruments | 1,844 | 0 | 0 | 59 | (90) | 0 | 0 | 0 | 56 | 0 | 0 | (190) | 1,679 | ||||||||||||||
| Other investments | 11,435 | 23 | (66) | 699 | (1,966) | 0 | 0 | 0 | 91 | 0 | 927 | (1,066) | 10,077 | ||||||||||||||
| Loans | 6,258 | 915 | (935) | 1,050 | (454) | 1,163 | (1,748) | 21 | 190 | 0 | 0 | (657) | 5,803 | ||||||||||||||
| of which commercial and industrial loans | 3,558 | 912 | (564) | 170 | (269) | 975 | (1,192) | 5 | 96 | 0 | 0 | (342) | 3,349 | ||||||||||||||
| of which financial institutions | 2,195 | 3 | (127) | 876 | (80) | 189 | (370) | (1) | 42 | 0 | 0 | (280) | 2,447 | ||||||||||||||
| Other intangible assets | 66 | 0 | 0 | 0 | 0 | 0 | 0 | 0 | 0 | 0 | (10) | (6) | 50 | ||||||||||||||
| Other assets | 9,253 | 2,965 | (4,591) | 3,185 | (2,874) | 1,186 | (839) | 89 | 374 | 0 | (1) | (1,000) | 7,747 | ||||||||||||||
| of which loans held-for-sale | 8,932 | 2,963 | (4,588) | 2,991 | (2,861) | 1,185 | (833) | 89 | 349 | 0 | 0 | (952) | 7,275 | ||||||||||||||
| Total assets at fair value | 50,660 | 6,953 | (8,707) | 12,371 | (13,206) | 2,724 | (3,478) | 205 | 1,614 | 0 | 955 | (5,194) | 44,897 | ||||||||||||||
| Liabilities (CHF million) | |||||||||||||||||||||||||||
| Central bank funds purchased, securities sold under repurchase agreements and securities lending transactions | 507 | 0 | (263) | 0 | 0 | 0 | (204) | (4) | 0 | 0 | 0 | (36) | 0 | ||||||||||||||
| Trading liabilities | 9,200 | 836 | (844) | 134 | (192) | 453 | (1,070) | (29) | 950 | 0 | 0 | (946) | 8,492 | ||||||||||||||
| of which interest rate derivatives | 1,341 | 26 | (10) | 0 | 0 | 11 | (102) | (11) | (146) | 0 | 0 | (118) | 991 | ||||||||||||||
| of which foreign exchange derivatives | 2,941 | 59 | (33) | 0 | 0 | 3 | (324) | (1) | 640 | 0 | 0 | (320) | 2,965 | ||||||||||||||
| of which equity/index-related derivatives | 2,940 | 94 | (232) | 0 | 0 | 185 | (190) | 26 | 252 | 0 | 0 | (319) | 2,756 | ||||||||||||||
| of which credit derivatives | 1,256 | 623 | (507) | 0 | 0 | 123 | (276) | (43) | 203 | 0 | 0 | (129) | 1,250 | ||||||||||||||
| Short-term borrowings | 123 | 43 | (18) | 0 | 0 | 226 | (137) | 1 | 5 | 0 | 0 | (20) | 223 | ||||||||||||||
| Long-term debt | 16,797 | 3,535 | (5,630) | 0 | 0 | 4,005 | (4,963) | 54 | 546 | 0 | 0 | (1,712) | 12,632 | ||||||||||||||
| of which structured notes over two years | 9,488 | 804 | (1,121) | 0 | 0 | 1,759 | (2,282) | (9) | 337 | 0 | 0 | (982) | 7,994 | ||||||||||||||
| of which non-recourse liabilities | 6,825 | 2,577 | (4,398) | 0 | 0 | 2,043 | (2,441) | 57 | 224 | 0 | 0 | (683) | 4,204 | ||||||||||||||
| Other liabilities | 3,734 | 507 | (155) | 157 | (225) | 1 | (211) | (30) | 163 | 0 | 129 | (365) | 3,705 | ||||||||||||||
| of which failed sales | 1,849 | 499 | (131) | 124 | (207) | 0 | (9) | (5) | 159 | 0 | 0 | (194) | 2,085 | ||||||||||||||
| Total liabilities at fair value | 30,361 | 4,921 | (6,910) | 291 | (417) | 4,685 | (6,585) | (8) | 1,664 | 0 | 129 | (3,079) | 25,052 | ||||||||||||||
| Net assets/(liabilities) at fair value | 20,299 | 2,032 | (1,797) | 12,080 | (12,789) | (1,961) | 3,107 | 213 | (50) | 0 | 826 | (2,115) | 19,845 | ||||||||||||||
| 1 For all transfers to level 3 or out of level 3, the Group determines and discloses as level 3 events only gains or losses through the last day of the reporting period. | |||||||||||||||||||||||||||
| Gains and losses on assets and liabilities measured at fair value on a recurring basis using significant unobservable inputs (level 3) |
| 6M12 | 6M11 | ||||||||||||
in | Trading revenues | Other revenues | Total revenues | Trading revenues | Other revenues | Total revenues | |||||||
| Gains and losses on assets and liabilities (CHF million) | |||||||||||||
| Net realized/unrealized gains/(losses) included in net revenues | (277) | 257 | (20) | 1 | 163 | 826 | 989 | 1 | |||||
| Whereof: | |||||||||||||
| Unrealized gains/(losses) relating to assets and liabilities still held as of the reporting date | 113 | 318 | 431 | (2,139) | 801 | (1,338) | |||||||
| 1 Excludes net realized/unrealized gains/(losses) attributable to foreign currency translation impact. | |||||||||||||
| Both observable and unobservable inputs may be used to determine the fair value of positions that have been classified within level 3. As a result, the unrealized gains and losses for assets and liabilities within level 3 presented in the table above may include changes in fair value that were attributable to both observable and unobservable inputs. |
| The Group employs various economic hedging techniques in order to manage risks, including risks in level 3 positions. Such techniques may include the purchase or sale of financial instruments that are classified in levels 1 or 2. The realized and unrealized gains and losses for assets and liabilities in level 3 presented in the table above do not reflect the related realized or unrealized gains and losses arising on economic hedging instruments classified in levels 1 or 2. |
Transfers in and out of level 3 |
| Transfers into level 3 assets during 6M12 were CHF 3,982 million, primarily from trading assets and loans held-for-sale. The transfers were primarily in the equity derivatives, private equity, corporate credit, corporate bank and securitized products (consolidated SPE positions) businesses due to limited observability of pricing data and reduced pricing information from external providers. Transfers out of level 3 assets during 6M12 were CHF 4,692 million, primarily in trading assets and loans held-for-sale. The transfers out of level 3 assets were primarily in the private equity, securitized products (consolidated SPE positions), corporate credit, rates and CMBS businesses due to improved observability of pricing data and increased availability of pricing information from external providers. |
| Transfers into level 3 assets during 2Q12 were CHF 2,311 million, primarily from trading assets and loans held-for-sale. The transfers were primarily in the corporate credit and securitized products (consolidated SPE positions) businesses due to limited observability of pricing data and reduced pricing information from external providers. Transfers out of level 3 assets during 2Q12 were CHF 1,862 million, primarily in trading assets and loans held-for-sale. The transfers out of level 3 assets were primarily in the private equity, corporate credit and CMBS businesses due to improved observability of pricing data and increased availability of pricing information from external providers. |
Qualitative disclosures of valuation techniques |
| Overview |
| The Group has implemented and maintains a valuation control framework, which is supported by policies and procedures that define the principles for controlling the valuation of the Group’s financial instruments. Product Control and Risk Management create, review and approve significant valuation policies and procedures. The framework includes three main internal processes (i) valuation governance; (ii) independent price verification and significant unobservable inputs review; and (iii) a cross-functional pricing model review. Through this framework, the Group determines the reasonableness of the fair value of its financial instruments. |
| On a monthly basis, meetings are held for each business line with senior representatives of the Front Office and Product Control to discuss independent price verification results, valuation adjustments, and other significant valuation issues. On a quarterly basis, a review of significant changes in the fair value of financial instruments is undertaken by Product Control and conclusions are reached regarding the reasonableness of those changes. Additionally, on a quarterly basis, meetings are held for each business line with senior representatives of the Front Office, Product Control, Risk Management, and Financial Accounting to discuss independent price verification results, valuation issues, business and market updates, as well as a review of significant changes in fair value from the prior quarter, significant unobservable inputs and prices used in valuation techniques, and valuation adjustments. |
| The results of these meetings are aggregated for presentation to the Valuation and Risk Management Committee (VARMC) and the Audit Committee. The VARMC, which is comprised of Executive Board members and the heads of the business and control functions, meets to review and ratify valuation review conclusions, and to resolve significant valuation issues for the Group. Oversight of the valuation control framework is through specific and regular reporting on valuation directly to the Group’s Executive Board through the VARMC. |
| One of the key components of the governance process is the segregation of duties between the Front Office and Product Control. The Front Office is responsible for measuring inventory at fair value on a daily basis, while Product Control is responsible for independently reviewing and validating those valuations on a periodic basis. The Front Office values the inventory using, wherever possible, observable market data which may include executed transactions, dealer quotes, or broker quotes for the same or similar instruments. Product Control values this inventory using independently sourced data that also includes executed transactions, dealer quotes, and broker quotes. |
| Product Control utilizes independent pricing service data as part of their review process. Independent pricing service data is analyzed to ensure that it is representative of fair value including confirming that the data corresponds to executed transactions or executable broker quotes, review of contributors to ensure they are active market participants, review of statistical data and utilization of pricing challenges. The analysis also includes understanding the sources of the pricing service data and any models or assumptions used in determining the results. The purpose of the review is to judge the quality and reliability of the data for fair value measurement purposes and its appropriate level of usage within the Product Control independent valuation review. |
| For certain financial instruments the fair value is estimated in full or in part using valuation techniques based on assumptions that are not supported by market observable prices, rates, or other inputs. In addition, there may be uncertainty about a valuation, which results from the choice of valuation technique or model used, the assumptions embedded in those models, the extent to which inputs are not market observable, or as a consequence of other elements affecting the valuation technique or model. Model calibration is performed when significant new market information becomes available or at a minimum on a quarterly basis as part of the business review of significant unobservable inputs for level 3 instruments. For models that have been deemed to be significant to the overall fair value of the financial instrument, model validation is performed as part of the periodic review of the related model. |
| The Group performs a sensitivity analysis of its significant level 3 financial instruments. This sensitivity analysis estimates a fair value range by changing the related significant unobservable inputs value. This sensitivity analysis is an internal mechanism to monitor the impact of reasonable alternative inputs or prices for level 3 financial instruments. Where a model-based technique is used to determine the fair value of the level 3 financial instrument, an alternative input value is utilized to derive an estimated fair value range. Where a price-based technique is used to determine the fair value of the level 3 financial instruments, Front Office professional judgment is used to estimate a fair value range. |
| Except as noted below, there are no material interrelationships between the significant unobservable inputs for the financial instruments. As the significant unobservable inputs move independently, generally an increase or decrease in one significant unobservable input will have no impact on the other significant unobservable inputs. |
| The following information on the various financial instruments should be read in conjunction with the tables “Quantitative information about level 3 assets at fair value�� and “Quantitative information about level 3 liabilities at fair value”. |
| Central bank funds sold, securities purchased under resale agreements and securities borrowing transactions |
| Securities purchased under resale agreements and securities sold under repurchase agreements are measured at fair value using discounted cash flow analysis. Future cash flows are discounted using observable market interest rate repurchase/resale curves for the applicable maturity and underlying collateral of the instruments. As such, the significant majority of both securities purchased under resale agreements and securities sold under repurchase agreements are included in level 2 of the fair value hierarchy. Structured resale and repurchase agreements include embedded derivatives, which are measured using the same techniques as described below for stand-alone derivative contracts held for trading purposes or used in hedge accounting relationships. If the value of the embedded derivative is determined using significant unobservable inputs, those structured resale and repurchase agreements are classified within level 3 of the fair value hierarchy. Significant unobservable input is mean reversion. |
| Securities purchased under resale agreements are usually fully collateralized or over collateralized by government securities, money market instruments, corporate bonds, or other debt instruments. In the event of counterparty default, the collateral service agreement provides the Group with the right to liquidate the collateral held. |
| A substantial increase (decrease) in the significant unobservable input for securities purchased under resale agreements would result in a lower (higher) fair value. |
| Debt securities |
| Foreign governments and corporates |
| Government debt securities typically have quoted prices in active markets and are categorized as level 1 instruments. For debt securities for which market prices are not available, valuations are based on yields reflecting credit rating, historical performance, delinquencies, loss severity, the maturity of the security, recent transactions in the market or other modeling techniques, which may involve judgment. Those securities where the price or model inputs are observable in the market are categorized as level 2 instruments, while those securities where prices are not observable and significant model inputs are unobservable are categorized as level 3 of the fair value hierarchy. |
| Corporate bonds are priced to reflect current market levels either through recent market transactions or broker or dealer quotes. Where a market price for the particular security is not directly available, valuations are obtained based on yields reflected by other instruments in the specific or similar entity’s capital structure and adjusting for differences in seniority and maturity, benchmarking to a comparable security where market data is available (taking into consideration differences in credit, liquidity and maturity), or through the application of cash flow modeling techniques utilizing observable inputs, such as current interest rate curves and observable CDS spreads. Significant unobservable inputs may include price, buyback probability, correlation, gap risk and credit spreads. |
| Substantial increases (decreases) in each of the significant unobservable inputs individually for corporates would result in a higher (lower) fair value, except for the unobservable inputs gap risk and credit spread which would result in a lower (higher) fair value. |
| CMBS, RMBS and CDO securities |
| Fair values of RMBS, CMBS and CDO may be available through quoted prices, which are often based on the prices at which similarly structured and collateralized securities trade between dealers and to and from customers. Fair values of RMBS, CMBS and CDO for which there are no significant observable inputs are valued using price, capitalization rate and internal rate of return. Price may not be observable for fair value measurement purposes for many reasons, such as the length of time since the last executed transaction for the related security, use of a price from a similar instrument, or use of a price from an indicative quote. |
| For most structured debt securities, determination of fair value requires subjective assessment depending on liquidity, ownership concentration, and the current economic and competitive environment. Valuation is determined based on the Front Office’s own assumptions about how market participants would price the asset. Collateralized bond and loan obligations are split into various structured tranches and each tranche is valued based upon its individual rating and the underlying collateral supporting the structure. Valuation models are used to value both cash and synthetic CDOs. |
| A substantial increase (decrease) in the significant unobservable input for RMBS would result in a higher (lower) fair value. Substantial increases (decreases) in each of the significant unobservable inputs individually for CMBS would result in a lower (higher) fair value, except for the unobservable input price which would result in a higher (lower) fair value. A substantial increase (decrease) in the significant unobservable input for CDO would result in a higher (lower) fair value. |
| Equity securities |
| The majority of the Group’s positions in equity securities are traded on public stock exchanges for which quoted prices are readily and regularly available and are therefore categorized as level 1 instrument. Level 2 and level 3 equities include fund-linked products, convertible bonds or equity securities with restrictions that are not traded in active markets. Significant unobservable inputs may include earnings before interest, taxes, depreciation and amortization (EBITDA) multiples and capitalization rate. Substantial increases (decreases) in the significant unobservable inputs individually for equity securities would generally result in a higher (lower) fair value, except for the capitalization rate which would result in a lower (higher) fair value. |
| Derivatives |
| Derivatives held for trading purposes or used in hedge accounting relationships include both OTC and exchange-traded derivatives. The fair values of exchange-traded derivatives measured using observable exchange prices are included in level 1 of the fair value hierarchy. Some observable exchange prices may not be considered executable at the reporting date and may have been adjusted for liquidity concerns. For those instruments where liquidity adjustments have been made to the exchange price, such as long-dated option contracts, the instrument has been included in level 2 of the fair value hierarchy. |
| The fair values of OTC derivatives are determined on the basis of either industry standard models or internally developed proprietary models. Both model types use various observable and unobservable inputs in order to determine fair value. The inputs include those characteristics of the derivative that have a bearing on the economics of the instrument. The determination of the fair value of many derivatives involves only a limited degree of subjectivity because the required inputs are observable in the marketplace, while more complex derivatives may use unobservable inputs that rely on specific proprietary modeling assumptions. Where observable inputs (prices from exchanges, dealers, brokers or market consensus data providers) are not available, attempts are made to infer values from observable prices through model calibration (spot and forward rates, mean reversion, benchmark interest rate curves and volatility inputs for commonly traded option products). For inputs that cannot be derived from other sources, estimates from historical data may be made. OTC derivatives where the majority of the value is derived from market observable inputs are categorized as level 2 instruments, while those where the majority of the value is derived from unobservable inputs are categorized as level 3 of the fair value hierarchy. |
| Interest rate derivatives |
| OTC vanilla interest rate products, such as interest rate swaps, swaptions, and caps and floors are valued by discounting the anticipated future cash flows. The future cash flows and discounting are derived from market standard yield curves and industry standard volatility inputs. Where applicable, exchange-traded prices are also used to value exchange-traded futures and options and can be used in yield curve construction. For more complex products, inputs include, but are not limited to correlation, volatility, prepayment rate, basis spreads and mean reversion. |
| Substantial increases (decreases) in each of the significant unobservable inputs individually for interest rate derivative assets would result in a higher (lower) fair value. The impact of substantial increases (decreases) in each of the significant unobservable inputs individually for interest rate derivative liabilities would result in a lower (higher) fair value, except for the unobservable inputs correlation and prepayment rate which would result in a higher (lower) fair value. |
| Foreign exchange derivatives |
| Foreign exchange derivatives include vanilla products such as spot, forward and option contracts where the anticipated discounted future cash flows are determined from foreign exchange forward curves and industry standard optionality modeling techniques. Where applicable, exchange-traded prices are also used for futures and option prices. For more complex products inputs include, but are not limited to prepayment rate, correlation and basis spreads. |
| Substantial increases (decreases) in each of the significant unobservable inputs individually for foreign exchange derivative assets would result in a higher (lower) fair value, except for the unobservable input correlation which would result in a lower (higher) fair value. Substantial increases (decreases) in each of the significant unobservable inputs individually for foreign exchange derivative liabilities would result in a lower (higher) fair value, except for the unobservable input prepayment rate which would result in a higher (lower) fair value. |
| Equity and index-related derivatives |
| Equity derivatives include vanilla options and swaps in addition to different types of exotic options. Inputs for equity derivatives can include correlation, volatility, skew, buyback probability, gap risk and credit spreads. |
| Substantial increases (decreases) in each of the significant unobservable inputs individually for equity and index-related derivative assets would result in a higher (lower) fair value, except for the unobservable input credit spread which would result in a lower (higher) fair value. Substantial increases (decreases) in each of the significant unobservable inputs individually for equity and index-related derivative liabilities would result in a lower (higher) fair value, except for the unobservable input gap risk which would result in a higher (lower) fair value. Generally, the interrelationship between the volatility, correlation and credit spreads inputs are positively correlated. |
| Credit derivatives |
| Credit derivatives include index and single name CDS in addition to more complex structured credit products. Vanilla products are valued using industry standard models and inputs that are generally market observable including credit spreads and recovery rates. |
| Complex structured credit derivatives are valued using proprietary models requiring unobservable inputs such as recovery rate, credit spreads, correlation and price. These inputs are generally implied from available market observable data. |
| Substantial increases (decreases) in each of the significant unobservable inputs individually for credit derivative assets would result in a lower (higher) fair value, except for the unobservable inputs recovery rate and credit spreads which would result in a higher (lower) fair value. Substantial increases (decreases) in each of the significant unobservable inputs individually for credit derivative liabilities would result in a higher (lower) fair value, except for the unobservable inputs price and recovery rate which would result in a lower (higher) fair value. |
| Other trading assets |
| Other trading assets primarily include RMBS loans and life settlement and premium finance instruments. Life settlement and premium finance instruments are valued using proprietary models with several inputs. The significant unobservable inputs of the fair value for life settlement and premium finance instruments is the estimate of life expectancy, while for RMBS loans it is price. For life settlement and premium finance instruments, individual life expectancy rates are typically obtained by multiplying a base mortality curve for the general insured population provided by a professional actuarial organization together with an individual-specific multiplier. Individual specific multipliers are determined based on data from third-party life expectancy data providers, which examine the insured individual’s medical conditions, family history and other factors to arrive at a life expectancy estimate. |
| Substantial increases (decreases) in each of the significant unobservable inputs individually for other trading assets would result in a higher (lower) fair value, except for the unobservable input life expectancy which would result in a lower (higher) fair value. |
| Other investments |
| Private equity, hedge funds and other equity investments |
| Other equity investments principally includes equity investments in the form of a) direct investments in third-party hedge funds, private equity funds and funds of funds, b) equity-method investments where the Group has the ability to significantly influence the operating and financial policies of the investee, and c) direct investments in non-marketable equity securities. |
| Direct investments in third-party hedge funds, private equity funds and funds of funds are measured at fair value based on their published net asset values (NAVs). Most of these investments are classified as level 3 of the fair value hierarchy, as there are restrictions imposed upon the redemption of the funds at their NAV in the near term. In some cases, NAVs may be adjusted where there is sufficient evidence that the NAV published by the investment manager is not current with observed market movements or there exist other circumstances that would require an adjustment to the published NAV. Although rarely adjusted, significant judgment is involved in making any adjustments to the published NAVs. Substantial increases (decreases) in the NAV for private equity and hedge funds would result in a higher (lower) fair value. |
| Direct investments in non-marketable equity securities consist of both real estate investments and non-real estate investments. Equity-method investments and direct investments in non-marketable equity securities are initially measured at their transaction price, as this is the best estimate of fair value. Thereafter, these investments are individually measured at fair value based upon a number of factors that include any recent rounds of financing involving third-party investors, comparable company transactions, multiple analyses of cash flows or book values, or discounted cash flow analyses. Unobservable inputs may include credit spreads and EBITDA multiples. The availability of information used in these modeling techniques is often limited and involves significant judgment in evaluating these different factors over time. As a result, these investments are included in level 3 of the fair value hierarchy. |
| Substantial increases (decreases) in each of the significant unobservable inputs individually for other equity investments would result in a higher (lower) fair value, except for the unobservable input credit spread which would result in a lower (higher) fair value. |
| Life finance instruments |
| Life finance instruments include Single Premium Immediate Annuities and other premium finance instruments. Life finance instruments are valued in a similar manner as described for life settlement and premium finance instruments under the other trading assets section above. A substantial increase (decrease) in the significant unobservable input for life finance instruments would result in a higher (lower) fair value. |
| Loans |
| The Group’s loan portfolio which is measured at fair value primarily consists of commercial and industrial loans and loans to financial institutions. Within these categories, loans measured at fair value include commercial loans, real estate loans, corporate loans, leverage finance loans and emerging market loans. Fair value is based on recent transactions and quoted prices, where available. Where recent transactions and quoted prices are not available, fair value may be determined by relative value benchmarking (which includes pricing based upon another position in the same capital structure, other comparable loan issues, generic industry credit spreads, implied credit spreads derived from CDS for the specific borrower, and enterprise valuations) or calculated based on the exit price of the collateral, based on current market conditions. |
| Both the funded and unfunded portion of revolving credit lines on the corporate lending portfolio are valued using a CDS pricing model, which requires estimates of significant inputs including credit spreads, recovery rates, credit conversion factors, and weighted average life of the loan. Significant unobservable inputs may include credit spreads and price. |
| The Group’s other assets and liabilities include mortgage loans held in conjunction with securitization activities and assets and liabilities of VIEs and mortgage securitizations that do not meet the criteria for sale treatment under US GAAP. The fair value of mortgage loans held in conjunction with securitization activities is determined on a whole-loan basis. Whole-loan valuations are calculated based on the exit price reflecting the current market conditions. The fair value of assets and liabilities of VIEs and mortgage securitizations that do not meet the criteria for sale treatment under US GAAP are determined based on the quoted prices for securitized bonds, where available, or on cash flow analyses for securitized bonds, when quoted prices are not available. |
| A substantial increase (decrease) in the significant unobservable input for commercial and industrial loans would result in a lower (higher) fair value. A substantial increase (decrease) in the significant unobservable input for loans to financial institutions would result in a lower (higher) fair value. Substantial increases (decreases) in each of the significant unobservable inputs individually for loans held in conjunction with securitization activities would result in a higher (lower) fair value, except for the unobservable input credit spreads which would result in a lower (higher) fair value. |
| Accrual based Private Banking loans, for which an estimated fair value is disclosed in the table “Carrying value and estimated fair values of financial instruments” below, include consumer loans relating to mortgages, loans collateralized by securities or consumer finance, as well as corporate and institutional loans relating to real estate, commercial and industrial loans, and loans to financial institutions, governments and public institutions. Fair values for these loans are determined by using a discounted cash flow model. Future cash flows are discounted using risk-adjusted discount rates which are derived from observable market interest rates for the applicable maturity and currency and from counterparty related credit spreads. |
| Deposits |
| Accrual based deposits with a stated maturity, for which an estimated fair value is disclosed in the table “Carrying value and estimated fair values of financial instruments” below, are generally fair valued by using a discounted cash flow model incorporating the Group’s credit spreads. The estimated fair value of accrual accounted deposits without a stated maturity approximates the carrying amount; however, the value does not include an estimate of the value attributed to the long-term relationships with its customers that in the aggregate adds significant value to the Group’s stable deposit base. |
| Short-term borrowings and long-term debt |
| The Group’s short-term borrowings and long-term debt include structured notes (hybrid financial instruments that are both bifurcatable and non-bifurcatable) and vanilla debt. The fair value of structured notes is based on quoted prices, where available. When quoted prices are not available, fair value is determined by using a discounted cash flow model incorporating the Group’s credit spreads, the value of derivatives embedded in the debt and the residual term of the issuance based on call options. Derivatives structured into the issued debt are valued consistently with the Group’s stand-alone derivative contracts held for trading purposes or used in hedge accounting relationships as discussed above. The fair value of structured debt is heavily influenced by the combined call options and performance of the underlying derivative returns. Significant unobservable inputs for long-term debt include buyback probability, gap risk, correlation, volatility and price. |
| Substantial increases (decreases) in each of the significant unobservable inputs individually for structured notes that mature beyond two years would result in a lower (higher) fair value, except for the unobservable input gap risk which would result in a higher (lower) fair value. Generally, the interrelationship between volatility, skew, correlation, gap risk, and credit spreads inputs are positively correlated. A substantial increase (decrease) in the significant unobservable input for non-recourse liabilities would result in a higher (lower) fair value. |
| Other liabilities |
| Failed sales |
| These liabilities represent the financing of assets that did not achieve sale accounting treatment under US GAAP. Failed sales are valued in a manner consistent with the related underlying financial instruments. Substantial increases (decreases) in each of the significant unobservable inputs individually for failed sales would result in a lower (higher) fair value, except for the unobservable input price which would result in a higher (lower) fair value. |
| Short-term financial instruments |
| Certain short-term financial instruments are not carried at fair value on the balance sheet, but a fair value has been disclosed in the table “Carrying value and estimated fair values of financial instruments” below. These instruments include: cash and due from banks, cash collateral receivables and payables and other receivables and payables arising in the ordinary course of business. For these financial instruments, the carrying value approximates the fair value due to the relatively short period of time between their origination and expected realization, as well as the minimal credit risk inherent in these instruments. |
Quantitative disclosures of valuation techniques |
| The following tables provide the range of minimum and maximum values of each significant unobservable input for level 3 assets and liabilities by the related valuation technique. |
| Quantitative information about level 3 assets at fair value |
end of 2Q12 | Fair value | Valuation technique | Unobservable input | Minimum value | Maximum value | ||||||
| CHF million, except where indicated | |||||||||||
| Central bank funds sold, securities purchased under resale agreements and securities borrowing transactions | 1,186 | Option model | Mean reversion, in % | 1 | 10.0 | 18.0 | |||||
| Debt | 7,935 | ||||||||||
| of which corporates | 4,125 | Option model | Correlation, in % | (85.0) | 98.0 | ||||||
| Option model | Buyback probability, in % | 2 | 50.0 | 100.0 | |||||||
| Option model | Gap risk, in % | 3 | 0.0 | 12.0 | |||||||
| Price | Price, in % | 0.0 | 150.9 | ||||||||
| Discounted cash flow | Credit spread, in bp | 26.0 | 168.0 | ||||||||
| of which RMBS | 1,253 | Price | Price, in % | 0.1 | 138.0 | ||||||
| of which CMBS | 1,364 | Price | Price, in % | 0.1 | 87.5 | ||||||
| Discounted cash flow | Capitalization rate, in % | 5.0 | 12.0 | ||||||||
| Discounted cash flow | Internal rate of return, in % | 9.0 | 15.0 | ||||||||
| of which CDO | 654 | Price | Price, in % | 0.0 | 101.8 | ||||||
| Equity | 429 | Discounted cash flow | EBITDA multiple | 3.0 | 12.0 | ||||||
| Discounted cash flow | Capitalization rate, in % | 6.5 | 7.5 | ||||||||
| Derivatives | 8,586 | ||||||||||
| of which interest rate products | 2,195 | Option model | Correlation, in % | 17.1 | 99.7 | ||||||
| Option model | Prepayment rate, in % | 56.0 | 108.0 | ||||||||
| Option model | Volatility, in % | 0.3 | 31.3 | ||||||||
| of which equity/index-linked products | 2,247 | Option model | Correlation, in % | (85.0) | 98.0 | ||||||
| Option model | Credit spread, in bp | 52.0 | 184.0 | ||||||||
| Option model | Volatility, in % | 3.0 | 125.0 | ||||||||
| of which credit derivatives | 2,091 | Price | Price, in % | 0.1 | 90.0 | ||||||
| Option model | Correlation, in % | 22.2 | 97.0 | ||||||||
| Discounted cash flow | Credit spread, in bp | 3.8 | 8,719.0 | ||||||||
| Discounted cash flow | Recovery rate, in % | 0.0 | 75.0 | ||||||||
| Other | 2,327 | Price | Price, in % | 0.1 | 113.0 | ||||||
| Discounted cash flow | Life expectancy, in years | 3.5 | 20.2 | ||||||||
| Trading assets | 19,277 | ||||||||||
| 1 Management's best estimate of the speed at which interest rates will revert to the long-term average. 2 Estimate of the probability of corporate bonds being called by the issuer at its option over the remaining life of the financial instrument. 3 Risk of unexpected large declines in the underlying values occuring between collateral settlement dates. | |||||||||||
| Quantitative information about level 3 assets at fair value (continued) |
end of 2Q12 | Fair value | Valuation technique | Unobservable input | Minimum value | Maximum value | ||||||
| CHF million, except where indicated | |||||||||||
| Investment securities | 92 | – | – | – | – | ||||||
| Private equity | 4,443 | – | 1 | – | 1 | – | 1 | – | 1 | ||
| Hedge funds | 274 | – | 1 | – | 1 | – | 1 | – | 1 | ||
| Other equity investments | 2,519 | ||||||||||
| of which private | 2,519 | Discounted cash flow | Credit spread, in bp | 1,068.0 | 1,783.0 | ||||||
| Discounted cash flow | EBITDA multiple | 2.4 | 11.3 | ||||||||
| Life finance instruments | 1,922 | Discounted cash flow | Life expectancy, in years | 1.1 | 21.9 | ||||||
| Other investments | 9,158 | ||||||||||
| Loans | 6,400 | ||||||||||
| of which commercial and industrial loans | 3,978 | Discounted cash flow | Credit spread, in bp | 0.0 | 3,773.0 | ||||||
| of which financial institutions | 2,093 | Discounted cash flow | Credit spread, in bp | (162.0) | 1,147.3 | ||||||
| Other intangible assets (mortgage servicing rights) | 63 | – | – | – | |||||||
| Other assets | 6,635 | ||||||||||
| of which loans held-for-sale | 6,052 | Price | Price, in % | 0.0 | 103.3 | ||||||
| Discounted cash flow | Credit spread, in bp | 25.0 | 1,599.0 | ||||||||
| Total level 3 assets at fair value | 42,811 | ||||||||||
| 1 Disclosure not required as balances are carried at unadjusted NAV. Refer to "Fair value measurements of investments in certain entities that calculate NAV per share" for further information. | |||||||||||
| Quantitative information about level 3 liabilities at fair value |
end of 2Q12 | Fair value | Valuation technique | Unobservable input | Minimum value | Maximum value | ||||||
| CHF million, except where indicated | |||||||||||
| Trading liabilities | 6,131 | ||||||||||
| of which interest rate derivatives | 1,334 | Option model | Basis spread, in bp | (54.0) | 1,238.0 | ||||||
| Option model | Correlation, in % | 17.1 | 98.6 | ||||||||
| Option model | Mean reversion, in % | 1 | (32.8) | 5.0 | |||||||
| Option model | Prepayment rate, in % | 45.0 | 108.0 | ||||||||
| of which foreign exchange derivatives | 2,205 | Option model | Correlation, in % | (12.5) | 76.3 | ||||||
| Option model | Prepayment rate, in % | 56.0 | 108.0 | ||||||||
| of which equity/index-related derivatives | 889 | Option model | Correlation, in % | (85.0) | 98.0 | ||||||
| Option model | Skew, in % | 70.0 | 141.0 | ||||||||
| Option model | Volatility, in % | 3.0 | 125.0 | ||||||||
| Option model | Buyback probability, in % | 2 | 50.0 | 100.0 | |||||||
| Option model | Gap risk, in % | 3 | 0.0 | 4.8 | |||||||
| of which credit derivatives | 1,256 | Price | Price, in % | 0.1 | 90.0 | ||||||
| Option model | Correlation, in % | 22.2 | 65.0 | ||||||||
| Discounted cash flow | Credit spread, in bp | 2.0 | 8,719.0 | ||||||||
| Discounted cash flow | Recovery rate, in % | 0.0 | 77.0 | ||||||||
| Short-term borrowings | 78 | – | – | ||||||||
| Long-term debt | 11,677 | ||||||||||
| of which structured notes over two years | 7,167 | Option model | Correlation, in % | (85.0) | 98.0 | ||||||
| Option model | Volatility, in % | 3.0 | 125.0 | ||||||||
| Option model | Buyback probability, in % | 2 | 50.0 | 100.0 | |||||||
| Option model | Gap risk, in % | 3 | 0.0 | 12.0 | |||||||
| of which non-recourse liabilities | 2,821 | Price | Price, in % | 0.0 | 103.0 | ||||||
| Other liabilities | 3,558 | ||||||||||
| of which failed sales | 1,671 | Price | Price, in % | 0.0 | 93.3 | ||||||
| Discounted cash flow | Credit spread, in bp | 0.0 | 681.2 | ||||||||
| Total level 3 liabilities at fair value | 21,444 | ||||||||||
| 1 Management's best estimate of the speed at which interest rates will revert to the long-term average. 2 Estimate of the probability of structured notes being put back to the Group at the option of the investor over the remaining life of the financial instruments. 3 Risk of unexpected large declines in the underlying values occuring between collateral settlement dates. | |||||||||||
Fair value measurements of investments in certain entities that calculate NAV per share |
| Investments in funds held in trading assets and liabilities primarily include positions held in equity funds of funds as an economic hedge for structured notes and derivatives issued to clients that reference the same underlying risk and liquidity terms of the fund. A majority of these funds have limitations imposed on the amount of withdrawals from the fund during the redemption period due to illiquidity of the investments. In other instances, the withdrawal amounts may vary depending on the redemption notice period and are usually larger for the longer redemption notice periods. In addition, penalties may apply if redemption is within a certain time period from initial investment. |
| Investment in funds held in other investments principally invest in private securities and, to a lesser extent, publicly traded securities and fund of funds. Several of these investments have redemption restrictions subject to discretion of the board of directors of the fund and/or redemption is permitted without restriction, but is limited to a certain percentage of total assets or only after a certain date. |
| Furthermore, for those investments held in both trading assets and other investments that are nonredeemable, the underlying assets of such funds are expected to be liquidated over the life of the fund, which is generally up to ten years. |
| The following table pertains to investments in certain entities that calculate NAV per share or its equivalent, primarily private equity and hedge funds. These investments do not have a readily determinable fair value and are measured at fair value using NAV. |
| Fair value, unfunded commitments and term of redemption conditions |
end of 2Q12 | Non- redeemable | Redeemable | Total fair value | Unfunded commit- ments | |||||
| Fair value and unfunded commitments (CHF million) | |||||||||
| Debt funds | 44 | 49 | 93 | 0 | |||||
| Equity funds | 33 | 3,893 | 1 | 3,926 | 0 | ||||
| Equity funds sold short | 0 | (89) | (89) | 0 | |||||
| Total funds held in trading assets and liabilities | 77 | 3,853 | 3,930 | 0 | |||||
| Debt funds | 63 | 258 | 321 | 210 | |||||
| Equity funds | 4 | 45 | 49 | 0 | |||||
| Others | 4 | 120 | 124 | 55 | |||||
| Hedge funds | 71 | 423 | 2 | 494 | 265 | ||||
| Debt funds | 96 | 0 | 96 | 18 | |||||
| Equity funds | 3,143 | 0 | 3,143 | 830 | |||||
| Real estate funds | 374 | 0 | 374 | 156 | |||||
| Others | 830 | 0 | 830 | 237 | |||||
| Private equities | 4,443 | 0 | 4,443 | 1,241 | |||||
| Equity method investments | 390 | 0 | 390 | 0 | |||||
| Total funds held in other investments | 4,904 | 423 | 5,327 | 1,506 | |||||
| Total fair value | 4,981 | 3 | 4,276 | 4 | 9,257 | 1,506 | 5 | ||
| 1 54% of the redeemable fair value amount of equity funds is redeemable on demand with a notice period primarily of less than 30 days, 17% is redeemable on a quarterly basis with a notice period primarily of more than 45 days, 16% is redeemable on an annual basis with a notice period primarily of more than 60 days and 13% is redeemable on a monthly basis with a notice period primarily of less than 30 days. 2 69% of the redeemable fair value amount of hedge funds is redeemable on a quarterly basis with a notice period primarily of more than 60 days, 17% is redeemable on an annual basis with a notice period of more than 60 days and 13% is redeemable on demand with a notice period primarily of less than 30 days. 3 Includes CHF 2,214 million attributable to noncontrolling interests. 4 Includes CHF 79 million attributable to noncontrolling interests. 5 Includes CHF 473 million attributable to noncontrolling interests. | |||||||||
| Fair value, unfunded commitments and term of redemption conditions (continued) |
end of 4Q11 | Non- redeemable | Redeemable | Total fair value | Unfunded commit- ments | |||||
| Fair value and unfunded commitments (CHF million) | |||||||||
| Debt funds | 45 | 61 | 106 | 0 | |||||
| Equity funds | 40 | 4,864 | 1 | 4,904 | 0 | ||||
| Equity funds sold short | 0 | (78) | (78) | 0 | |||||
| Total funds held in trading assets and liabilities | 85 | 4,847 | 4,932 | 0 | |||||
| Debt funds | 58 | 268 | 326 | 219 | |||||
| Equity funds | 4 | 50 | 54 | 0 | |||||
| Others | 5 | 113 | 118 | 55 | |||||
| Hedge funds | 67 | 431 | 2 | 498 | 274 | ||||
| Debt funds | 9 | 0 | 9 | 18 | |||||
| Equity funds | 3,136 | 0 | 3,136 | 954 | |||||
| Real estate funds | 338 | 0 | 338 | 200 | |||||
| Others | 823 | 0 | 823 | 231 | |||||
| Private equities | 4,306 | 0 | 4,306 | 1,403 | |||||
| Equity method investments | 360 | 0 | 360 | 0 | |||||
| Total funds held in other investments | 4,733 | 431 | 5,164 | 1,677 | |||||
| Total fair value | 4,818 | 3 | 5,278 | 4 | 10,096 | 1,677 | 5 | ||
| 1 46% of the redeemable fair value amount of equity funds is redeemable on demand with a notice period of less than 30 days, 19% is redeemable on a quarterly basis with a notice period primarily of more than 45 days, 18% is redeemable on an annual basis with a notice period primarily of more than 60 days and 17% is redeemable on a monthly basis with a notice period primarily of less than 30 days. 2 72% of the redeemable fair value amount of hedge funds is redeemable on a quarterly basis with a notice period primarily of more than 60 days, 17% is redeemable on an annual basis with a notice period of more than 60 days and 10% is redeemable on demand with a notice period primarily of less than 30 days. 3 Includes CHF 2,248 million attributable to noncontrolling interests. 4 Includes CHF 91 million attributable to noncontrolling interests. 5 Includes CHF 540 million attributable to noncontrolling interests. | |||||||||
Nonrecurring fair value changes |
| Certain assets and liabilities are measured at fair value on a nonrecurring basis; that is, they are not measured at fair value on an ongoing basis but are subject to fair value adjustments in certain circumstances, for example, when there is evidence of impairment. The Group typically uses nonfinancial assets measured at fair value on a recurring or nonrecurring basis in a manner that reflects their highest and best use. |
| Nonrecurring fair value changes |
| end of | 2Q12 | 4Q11 | |||
| Assets held-for-sale recorded at fair value on a nonrecurring basis (CHF billion) | |||||
| Assets held-for-sale recorded at fair value on a nonrecurring basis | 0.6 | 0.7 | |||
| of which level 3 | 0.6 | 0.7 | |||
Fair value option |
| The Group has availed itself of the simplification in accounting offered under the fair value option, primarily in the Investment Banking and Asset Management segments. This has been accomplished generally by electing the fair value option, both at initial adoption and for subsequent transactions, on items impacted by the hedge accounting requirements of US GAAP. That is, for instruments for which there was an inability to achieve hedge accounting and for which the Group is economically hedged, the Group has elected the fair value option. Similarly, where the Group manages an activity on a fair value basis but previously has been unable to achieve fair value accounting, the Group has utilized the fair value option to align its risk management reporting to its financial accounting. |
| Difference between the aggregate fair value and the aggregate unpaid principal balances on loans and financial instruments |
| 2Q12 | 4Q11 | ||||||||||||
end of | Aggregate fair value | Aggregate unpaid principal | Difference | Aggregate fair value | Aggregate unpaid principal | Difference | |||||||
| Loans (CHF million) | |||||||||||||
| Non-interest-earning loans | 895 | 3,712 | (2,817) | 807 | 3,277 | (2,470) | |||||||
| Financial instruments (CHF million) | |||||||||||||
| Interest-bearing deposits with banks | 624 | 613 | 11 | 405 | 404 | 1 | |||||||
| Central bank funds sold, securities purchased under resale agreements and securities borrowing transactions | 148,721 | 148,075 | 646 | 158,673 | 157,889 | 784 | |||||||
| Loans | 20,515 | 20,776 | (261) | 20,694 | 21,382 | (688) | |||||||
| Other assets 1 | 21,941 | 30,081 | (8,140) | 20,511 | 30,778 | (10,267) | |||||||
| Due to banks and customer deposits | (729) | (703) | (26) | (610) | (620) | 10 | |||||||
| Central bank funds purchased, securities sold under repurchase agreements and securities lending transactions | (143,714) | (143,617) | (97) | (136,483) | (136,396) | (87) | |||||||
| Short-term borrowings | (4,456) | (4,524) | 68 | (3,547) | (3,681) | 134 | |||||||
| Long-term debt | (66,952) | (71,254) | 4,302 | (70,366) | (79,475) | 9,109 | |||||||
| Other liabilities | (4,892) | (7,476) | 2,584 | (5,730) | (8,210) | 2,480 | |||||||
| 1 Primarily loans held-for-sale. | |||||||||||||
| Gains and losses on financial instruments |
| 6M12 | 6M11 | ||||
in | Net gains/ (losses) | Net gains/ (losses) | |||
| Financial instruments (CHF million) | |||||
| Cash and due from banks | (12) | 2 | – | ||
| of which related to credit risk | (13) | – | |||
| Central bank funds sold, securities purchased under resale agreements and securities borrowing transactions | 628 | 1 | 713 | 1 | |
| Other trading assets | 10 | 2 | (5) | 2 | |
| Other investments | 26 | 2 | 88 | 2 | |
| of which related to credit risk | 10 | (2) | |||
| Loans | 1 | 2 | 1,012 | 2 | |
| of which related to credit risk | 259 | 134 | |||
| Other assets | 1,223 | 1 | 2,110 | 2 | |
| of which related to credit risk | 268 | 269 | |||
| Due to banks and customer deposits | 4 | 2 | (12) | 1 | |
| of which related to credit risk | 16 | 8 | |||
| Central bank funds purchased, securities sold under repurchase agreements and securities lending transactions | 30 | 2 | (81) | 1 | |
| Short-term borrowings | (131) | 2 | (141) | 2 | |
| Long-term debt | (3,005) | 2 | (4,223) | 2 | |
| of which related to credit risk 4 | (1,298) | (301) | |||
| Other liabilities | 265 | 2 | (738) | 2 | |
| of which related to credit risk | 294 | (260) | |||
| 1 Primarily recognized in net interest income. 2 Primarily recognized in trading revenues. 3 Primarily recognized in other revenues. 4 Changes in fair value related to credit risk are due to the change in the Group's own credit spreads. Other changes in fair value are attributable to changes in foreign currency exchange rates and interest rates, as well as movements in the reference price or index for structured notes. Changes in fair value on Credit Suisse vanilla debt related to credit risk were CHF (785) million and CHF (255) million in 6M12 and 6M11, respectively. | |||||
Disclosures about fair value of financial instruments |
| US GAAP requires the disclosure of the fair values of financial instruments for which it is practicable to estimate those values, whether or not they are recognized in the consolidated financial statements, excluding all non-financial instruments such as lease transactions, real estate, premises and equipment, equity method investments and pension and benefit obligations. Beginning in January 2012, US GAAP also requires the disclosure of the fair values of these financial instruments within the fair value hierarchy prospectively. |
| Carrying value and estimated fair values of financial instruments |
| 2Q12 | 4Q11 | ||||||||
end of | Carrying value | Fair value | Carrying value | Fair value | |||||
| Financial assets (CHF million) | |||||||||
| Central bank funds sold, securities purchased under resale agreements and securities borrowing transactions | 226,864 | 226,863 | 236,963 | 236,963 | |||||
| Securities received as collateral | 30,191 | 30,191 | 30,191 | 30,191 | |||||
| Trading assets | 275,361 | 275,361 | 270,315 | 270,315 | |||||
| Investment securities | 5,326 | 5,326 | 5,160 | 5,160 | |||||
| Loans | 235,281 | 240,130 | 229,657 | 233,922 | |||||
| Other financial assets 1 | 226,672 | 226,697 | 232,452 | 232,491 | |||||
| Financial liabilities (CHF million) | |||||||||
| Due to banks and deposits | 354,008 | 353,948 | 353,548 | 353,467 | |||||
| Central bank funds purchased, securities sold under repurchase agreements and securities lending transactions | 189,266 | 189,268 | 176,559 | 176,559 | |||||
| Obligation to return securities received as collateral | 30,191 | 30,191 | 30,191 | 30,191 | |||||
| Trading liabilities | 115,782 | 115,782 | 127,760 | 127,760 | |||||
| Short-term borrowings | 19,184 | 19,187 | 26,116 | 26,117 | |||||
| Long-term debt | 154,838 | 154,175 | 162,655 | 159,538 | |||||
| Other financial liabilities 2 | 132,388 | 132,193 | 127,936 | 127,936 | |||||
| 1 Primarily includes cash and due from banks, interest-bearing deposits with banks, brokerage receivables, loans held-for-sale, cash collateral on derivative instruments, interest and fee receivables and non-marketable equity securities. 2 Primarily includes brokerage payables, cash collateral on derivative instruments and interest and fee payables. | |||||||||
| Assets and liabilities not measured at fair value where a fair value is disclosed |
end of 2Q12 | Level 1 | Level 2 | Level 3 | Total fair value | |||||
| Financial assets (CHF million) | |||||||||
| Central banks funds sold, securities purchased under resale agreements and securities borrowing transactions | 0 | 78,091 | 51 | 78,142 | |||||
| Loans | 0 | 214,175 | 5,440 | 219,615 | |||||
| Other financial assets | 101,833 | 75,305 | 2,162 | 179,300 | |||||
| Financial liabilities (CHF million) | |||||||||
| Due to banks and deposits | 193,996 | 151,787 | 16 | 345,799 | |||||
| Central banks funds purchased, securities purchased under resale agreements and securities lending transactions | 0 | 45,554 | 0 | 45,554 | |||||
| Short-term borrowings | 0 | 14,731 | 0 | 14,731 | |||||
| Long-term debt | 0 | 82,283 | 4,940 | 87,223 | |||||
| Other financial liabilities | 0 | 100,855 | 1,517 | 102,372 | |||||
| 1 Primarily includes cash and due from banks, interest-bearing deposits with banks, brokerage receivables, loans held-for-sale, cash collateral on derivative instruments, interest and fee receivables and non-marketable equity securities. 2 Primarily includes brokerage payables, cash collateral on derivative instruments and interest and fee payables. | |||||||||
| Note 27 Assets pledged or assigned |
| The Group received collateral in connection with resale agreements, securities lending and loans, derivative transactions and margined broker loans. A substantial portion of the collateral received by the Group was sold or repledged in connection with repurchase agreements, securities sold not yet purchased, securities borrowings and loans, pledges to clearing organizations, segregation requirements under securities laws and regulations, derivative transactions and bank loans. |
| Assets pledged or assigned |
| end of | 2Q12 | 4Q11 | |||
| Assets pledged or assigned (CHF million) | |||||
| Book value of assets pledged or assigned as collateral | 173,169 | 157,856 | |||
| of which assets provided with the right to sell or repledge | 97,898 | 96,922 | |||
| Fair value of collateral received with the right to sell or repledge | 382,438 | 373,657 | |||
| of which sold or repledged | 327,532 | 332,718 | |||
| Note 28 Litigation |
| The Group is involved in a number of judicial, regulatory and arbitration proceedings concerning matters arising in connection with the conduct of its businesses. The Group’s material judicial, regulatory and arbitration proceedings, related provisions and estimate of the aggregate range of reasonably possible losses that are not covered by existing provisions are described inNote 37 – Litigation in V – Consolidated financial statements – Credit Suisse Group in the Credit Suisse Annual Report 2011 and updated in quarterly reports and below. Some of these proceedings have been brought on behalf of various classes of claimants and seek damages of material and/or indeterminate amounts. |
| The Group accrues litigation provisions (including fees and expenses of external lawyers and other service providers) in connection with certain judicial, regulatory and arbitration proceedings when losses, additional losses or ranges of loss are probable and reasonably estimable. The Group reviews its judicial, regulatory and arbitration proceedings each quarter to determine the adequacy of its litigation provisions and may increase or release provisions based on management’s judgment and the advice of counsel. Further increases or releases of litigation provisions may be necessary in the future as developments in such litigations, claims or proceedings warrant. |
| It is inherently difficult to determine whether a loss is probable or even reasonably possible or to estimate the amount of any loss or loss range for many of these matters. In presenting the condensed consolidated financial statements, management makes estimates regarding the outcome of these matters, records a provision and takes a charge to income when losses with respect to such matters are probable and can be reasonably estimated. Estimates, by their nature, are based on judgment and currently available information and involve a variety of factors, including, but not limited to, the type and nature of the litigation, claim or proceeding, the progress of the matter, the advice of legal counsel, the Group’s defenses and its experience in similar cases or proceedings, as well as its assessment of matters, including settlements, involving other defendants in similar or related cases or proceedings. Factual and legal determinations must be made before a loss, additional losses or ranges of loss can be reasonably estimated for any proceeding or matter. |
| Most matters pending against the Group seek damages of an indeterminate amount. While certain matters specify the damages claimed, such claimed amount may not represent reasonably possible losses. The Group’s aggregate litigation provisions include estimates of losses, additional losses or ranges of loss for proceedings for which such losses are probable and can be reasonably estimated. The Group does not believe that it can estimate an aggregate range of reasonably possible losses for certain of its proceedings because of the complexity of the proceedings, the novelty of some of the claims, the early stage of the proceedings and limited amount of discovery that has occurred and/or other factors. The Group’s estimate of the aggregate range of reasonably possible losses that are not covered by existing provisions is zero to CHF 2.7 billion. |
| In 2Q12, the Group recorded net litigation provisions of CHF 29 million. After taking into account its litigation provisions, the Group believes, based on currently available information and advice of counsel, that the results of its proceedings, in the aggregate, will not have a material adverse effect on the Group’s financial condition. However, in light of the uncertainties involved in such proceedings, including those proceedings brought by regulators or other governmental authorities, the ultimate resolution of such proceedings may exceed current litigation provisions and any excess may be material to operating results for any particular period, depending, in part, upon the operating results for such period. |
Mortgage-related matters |
| The amounts disclosed below do not reflect actual realized plaintiff losses to date or anticipated future litigation exposure. Rather, these amounts reflect the original unpaid principal balance amounts as alleged in these actions and do not include any reduction in principal amounts since issuance. |
| Class action litigations |
| On June 29, 2012, the US District Court for the Southern District of New York (SDNY) granted plaintiff’s motion for class certification in Tsereteli v. Residential Asset Securitization Trust 2006-A8, in which Credit Suisse Securities (USA) LLC (CSS LLC) is the sole underwriter defendant related to a USD 632 million IndyMac RMBS offering, of which CSS LLC underwrote USD 603 million of certificates. |
| Individual investor actions |
| In actions brought in connection with being an RMBS issuer, underwriter and/or other participant, CSS LLC, and in some instances certain of its affiliates, have been named as defendants, along with other financial institutions in: two actions brought by Landesbank Baden-Württemberg and affiliated entities, on March 8, 2012 and June 11, 2012, in the Supreme Court for the State of New York, New York County (SCNY), in which claims against CSS LLC relate to approximately USD 200 million of RMBS at issue (100% of the total amount at issue against all banks); one action brought by Watertown Savings Bank on April 27, 2012 in the SCNY, in which claims against CSS LLC and its affiliates relate to an unstated amount of RMBS at issue; one action brought by the Federal Deposit Insurance Corporation (FDIC), as receiver for Citizens National Bank and Strategic Capital Bank on May 18, 2012 in the SDNY, in which claims against CSS LLC and its affiliates relate to approximately USD 28 million of RMBS at issue (approximately 20% of the USD 141 million at issue against all banks); and one action brought by Phoenix Light SF Ltd. and affiliated entities on May 22, 2012 in the SCNY, in which claims against CSS LLC and its affiliates relate to approximately USD 466 million of RMBS at issue (approximately 15% of the USD 3.2 billion at issue against all banks). On May 16, 2012 and May 30, 2012, HSH Nordbank AG and affiliated entities and Sealink Funding Limited respectively filed a notice of discontinuance to discontinue their respective claims against CSS LLC and its applicable affiliates and certain other banks. On June 28, 2012, Asset Management Fund and affiliated entities filed a notice of discontinuance to discontinue their claims in one of their two actions against CSS LLC and its affiliates and certain other banks, reducing the RMBS at issue relating to claims against CSS LLC and its affiliates by USD 145 million to approximately USD 93 million. On June 28, 2012, the Federal Housing Finance Agency (FHFA), as conservator for Fannie Mae and Freddie Mac, in an amended complaint to one of its five actions against CSS LLC relating to an aggregate of approximately USD 5.5 billion of RMBS at issue, reduced the RMBS at issue by approximately USD 230 million; the five actions together now relate to approximately USD 5.2 billion. On July 2, 2012, IKB Deutsche Industriebank AG and affiliated entities filed a consolidated complaint relating to their claims against CSS LLC and its affiliates, reducing the RMBS at issue by approximately USD 143 million to approximately USD 97 million. |
| Repurchase litigations |
| On July 3, 2012, the FHFA, as conservator for Freddie Mac, on behalf of the Trustee of Home Equity Asset Trust 2006-5, filed an action against DLJ Mortgage Capital, Inc. (DLJ) in the SCNY. The action alleges that DLJ breached representations and warranties in respect of certain mortgage loans and failed to repurchase such mortgage loans as required under the applicable agreements. No damages amount is alleged. |
LIBOR-related matters |
| Regulatory authorities in a number of jurisdictions, including the US, UK, EU and Switzerland, have for an extended period of time been conducting investigations into the setting of LIBOR and other reference rates with respect to a number of currencies, as well as the pricing of certain related derivatives. These ongoing investigations have included information requests from regulators regarding LIBOR-setting practices and reviews of the activities of various financial institutions, including the Group. The Group, which is a member of three LIBOR rate-setting panels (US Dollar LIBOR, Swiss Franc LIBOR and Euro LIBOR), is cooperating fully with these investigations. |
| In particular, it has been reported that regulators are investigating whether financial institutions engaged in an effort to manipulate LIBOR, either individually or in concert with other institutions, in order to improve market perception of these institutions’ financial health and/or to increase the value of their proprietary trading positions. In response to regulatory inquiries, Credit Suisse commissioned a review of these issues. To date, Credit Suisse has seen no evidence to suggest that it is likely to have any material exposure in connection with these issues. |
| In addition, members of the US Dollar LIBOR panel, including Credit Suisse, have been named in various civil lawsuits filed in the US. |
| Note 29 Subsidiary guarantee information |
| Five wholly-owned finance subsidiaries of the Group, each of which is a Guernsey incorporated non-cellular company limited by shares, may issue contingent convertible securities fully and unconditionally guaranteed by the Group. There are various legal and regulatory requirements, including the satisfaction of a solvency test under Guernsey law, applicable to some of the Group’s subsidiaries that limit their ability to pay dividends or distributions and make loans and advances to the Group. |
| On March 26, 2007, the Group and the Bank issued full, unconditional and several guarantees of Credit Suisse (USA), Inc.’s outstanding SEC-registered debt securities. In accordance with the guarantees, if Credit Suisse (USA), Inc. fails to make any timely payment under the agreements governing such debt securities, the holders of the debt securities may demand payment from either the Group or the Bank, without first proceeding against Credit Suisse (USA), Inc. The guarantee from the Group is subordinated to senior liabilities. Credit Suisse (USA), Inc. is an indirect, wholly owned subsidiary of the Group. |
| Condensed consolidating statements of operations |
in 2Q12 | Credit Suisse (USA), Inc. consolidated | Bank parent company and other subsidiaries | 1 | Bank | Group parent company | Other Group subsidiaries | 1 | Credit Suisse Group | |||||
| Condensed consolidating statements of operations (CHF million) | |||||||||||||
| Interest and dividend income | 1,996 | 4,909 | 6,905 | 21 | 118 | 7,044 | |||||||
| Interest expense | (1,175) | (4,232) | (5,407) | (19) | (4) | (5,430) | |||||||
| Net interest income | 821 | 677 | 1,498 | 2 | 114 | 1,614 | |||||||
| Commissions and fees | 913 | 2,158 | 3,071 | 3 | 56 | 3,130 | |||||||
| Trading revenues | (497) | 1,578 | 1,081 | 0 | 75 | 1,156 | |||||||
| Other revenues | 129 | 232 | 361 | 789 | 2 | (775) | 375 | ||||||
| Net revenues | 1,366 | 4,645 | 6,011 | 794 | (530) | 6,275 | |||||||
| Provision for credit losses | 0 | 10 | 10 | 0 | 15 | 25 | |||||||
| Compensation and benefits | 814 | 2,171 | 2,985 | 23 | (3) | 3,005 | |||||||
| General and administrative expenses | 383 | 1,295 | 1,678 | (24) | 19 | 1,673 | |||||||
| Commission expenses | 58 | 379 | 437 | 1 | 3 | 441 | |||||||
| Total other operating expenses | 441 | 1,674 | 2,115 | (23) | 22 | 2,114 | |||||||
| Total operating expenses | 1,255 | 3,845 | 5,100 | 0 | 19 | 5,119 | |||||||
| Income/(loss) before taxes | 111 | 790 | 901 | 794 | (564) | 1,131 | |||||||
| Income tax expense | 33 | 221 | 254 | 6 | 51 | 311 | |||||||
| Net income/(loss) | 78 | 569 | 647 | 788 | (615) | 820 | |||||||
| Net income/(loss) attributable to noncontrolling interests | 13 | 70 | 83 | 0 | (51) | 32 | |||||||
| Net income/(loss) attributable to shareholders | 65 | 499 | 564 | 788 | (564) | 788 | |||||||
| 1 Includes eliminations and consolidation adjustments. 2 Primarily consists of dividend income from investments in Group companies (CHF 183 million and CHF 22 million from bank and non-bank subsidiaries, respectively) and revenues from investments accounted for under the equity method. | |||||||||||||
| Condensed consolidating statements of comprehensive income |
in 2Q12 | Credit Suisse (USA), Inc. consolidated | Bank parent company and other subsidiaries | 1 | Bank | Group parent company | Other Group subsidiaries | 1 | Credit Suisse Group | |||||
| Comprehensive income (CHF million) | |||||||||||||
| Net income/(loss) | 78 | 569 | 647 | 788 | (615) | 820 | |||||||
| Gains/(losses) on cash flow hedges | 0 | 2 | 2 | (5) | (1) | (4) | |||||||
| Foreign currency translation | 999 | 108 | 1,107 | 0 | 8 | 1,115 | |||||||
| Unrealized gains/(losses) on securities | 0 | (52) | (52) | 0 | 5 | (47) | |||||||
| Actuarial gains/(losses) | 10 | 4 | 14 | 0 | 32 | 46 | |||||||
| Net prior service cost | 0 | 0 | 0 | 0 | (14) | (14) | |||||||
| Other comprehensive income/(loss), net of tax | 1,009 | 62 | 1,071 | (5) | 30 | 1,096 | |||||||
| Comprehensive income/(loss) | 1,087 | 631 | 1,718 | 783 | (585) | 1,916 | |||||||
| Comprehensive income/(loss) attributable to noncontrolling interests | 208 | 262 | 470 | 0 | (253) | 217 | |||||||
| Comprehensive income/(loss) attributable to shareholders | 879 | 369 | 1,248 | 783 | (332) | 1,699 | |||||||
| 1 Includes eliminations and consolidation adjustments. | |||||||||||||
| Condensed consolidating statements of operations |
in 2Q11 | Credit Suisse (USA), Inc. consolidated | Bank parent company and other subsidiaries | 1 | Bank | Group parent company | Other Group subsidiaries | 1 | Credit Suisse Group | |||||
| Condensed consolidating statements of operations (CHF million) | |||||||||||||
| Interest and dividend income | 1,840 | 5,104 | 6,944 | 41 | 97 | 7,082 | |||||||
| Interest expense | (1,212) | (4,456) | (5,668) | (39) | 2 | (5,705) | |||||||
| Net interest income | 628 | 648 | 1,276 | 2 | 99 | 1,377 | |||||||
| Commissions and fees | 937 | 2,453 | 3,390 | 3 | 70 | 3,463 | |||||||
| Trading revenues | (433) | 1,491 | 1,058 | 0 | 58 | 1,116 | |||||||
| Other revenues | 761 | 119 | 880 | 749 | 2 | (693) | 936 | ||||||
| Net revenues | 1,893 | 4,711 | 6,604 | 754 | (466) | 6,892 | |||||||
| Provision for credit losses | 0 | (2) | (2) | 0 | 15 | 13 | |||||||
| Compensation and benefits | 879 | 2,182 | 3,061 | 24 | 11 | 3,096 | |||||||
| General and administrative expenses | 414 | 1,243 | 1,657 | (38) | 33 | 1,652 | |||||||
| Commission expenses | 60 | 424 | 484 | 1 | 6 | 491 | |||||||
| Total other operating expenses | 474 | 1,667 | 2,141 | (37) | 39 | 2,143 | |||||||
| Total operating expenses | 1,353 | 3,849 | 5,202 | (13) | 50 | 5,239 | |||||||
| Income/(loss) before taxes | 540 | 864 | 1,404 | 767 | (531) | 1,640 | |||||||
| Income tax expense | (17) | 259 | 242 | (1) | 30 | 271 | |||||||
| Net income/(loss) | 557 | 605 | 1,162 | 768 | (561) | 1,369 | |||||||
| Net income attributable to noncontrolling interests | 577 | 27 | 604 | 0 | (3) | 601 | |||||||
| Net income/(loss) attributable to shareholders | (20) | 578 | 558 | 768 | (558) | 768 | |||||||
| 1 Includes eliminations and consolidation adjustments. 2 Primarily consists of dividend income from investments in Group companies (CHF 162 million and CHF 11 million from bank and non-bank subsidiaries, respectively) and revenues from investments accounted for under the equity method. | |||||||||||||
| Condensed consolidating statements of comprehensive income |
in 2Q11 | Credit Suisse (USA), Inc. consolidated | Bank parent company and other subsidiaries | 1 | Bank | Group parent company | Other Group subsidiaries | 1 | Credit Suisse Group | |||||
| Comprehensive income (CHF million) | |||||||||||||
| Net income/(loss) | 557 | 605 | 1,162 | 768 | (561) | 1,369 | |||||||
| Gains/(losses) on cash flow hedges | 0 | (10) | (10) | 0 | 0 | (10) | |||||||
| Foreign currency translation | (1,970) | (493) | (2,463) | 0 | 31 | (2,432) | |||||||
| Unrealized gains/(losses) on securities | 0 | 1 | 1 | 0 | 1 | 2 | |||||||
| Actuarial gains/(losses) | 6 | 3 | 9 | 0 | 17 | 26 | |||||||
| Net prior service cost | 0 | 0 | 0 | 0 | 3 | 3 | |||||||
| Other comprehensive income/(loss), net of tax | (1,964) | (499) | (2,463) | 0 | 52 | (2,411) | |||||||
| Comprehensive income/(loss) | (1,407) | 106 | (1,301) | 768 | (509) | (1,042) | |||||||
| Comprehensive income/(loss) attributable to noncontrolling interests | 82 | (329) | (247) | 0 | 375 | 128 | |||||||
| Comprehensive income/(loss) attributable to shareholders | (1,489) | 435 | (1,054) | 768 | (884) | (1,170) | |||||||
| 1 Includes eliminations and consolidation adjustments. | |||||||||||||
| Condensed consolidating statements of operations |
in 6M12 | Credit Suisse (USA), Inc. consolidated | Bank parent company and other subsidiaries | 1 | Bank | Group parent company | Other Group subsidiaries | 1 | Credit Suisse Group | |||||
| Condensed consolidating statements of operations (CHF million) | |||||||||||||
| Interest and dividend income | 3,837 | 8,224 | 12,061 | 52 | 226 | 12,339 | |||||||
| Interest expense | (2,209) | (6,576) | (8,785) | (50) | (6) | (8,841) | |||||||
| Net interest income | 1,628 | 1,648 | 3,276 | 2 | 220 | 3,498 | |||||||
| Commissions and fees | 1,873 | 4,309 | 6,182 | 5 | 115 | 6,302 | |||||||
| Trading revenues | 243 | 1,198 | 1,441 | 0 | (96) | 1,345 | |||||||
| Other revenues | 415 | 747 | 1,162 | 817 | 2 | (802) | 1,177 | ||||||
| Net revenues | 4,159 | 7,902 | 12,061 | 824 | (563) | 12,322 | |||||||
| Provision for credit losses | (4) | 36 | 32 | 0 | 27 | 59 | |||||||
| Compensation and benefits | 1,973 | 4,718 | 6,691 | 35 | (10) | 6,716 | |||||||
| General and administrative expenses | 800 | 2,520 | 3,320 | (53) | 59 | 3,326 | |||||||
| Commission expenses | 114 | 770 | 884 | 1 | 7 | 892 | |||||||
| Total other operating expenses | 914 | 3,290 | 4,204 | (52) | 66 | 4,218 | |||||||
| Total operating expenses | 2,887 | 8,008 | 10,895 | (17) | 56 | 10,934 | |||||||
| Income/(loss) before taxes | 1,276 | (142) | 1,134 | 841 | (646) | 1,329 | |||||||
| Income tax expense/(benefit) | 432 | (155) | 277 | 9 | 9 | 295 | |||||||
| Net income/(loss) | 844 | 13 | 857 | 832 | (655) | 1,034 | |||||||
| Net income/(loss) attributable to noncontrolling interests | 199 | 89 | 288 | 0 | (86) | 202 | |||||||
| Net income/(loss) attributable to shareholders | 645 | (76) | 569 | 832 | (569) | 832 | |||||||
| 1 Includes eliminations and consolidation adjustments. 2 Primarily consists of dividend income from investments in Group companies (CHF 183 million and CHF 29 million from bank and non-bank subsidiaries, respectively) and revenues from investments accounted for under the equity method. | |||||||||||||
| Condensed consolidating statements of comprehensive income |
in 6M12 | Credit Suisse (USA), Inc. consolidated | Bank parent company and other subsidiaries | 1 | Bank | Group parent company | Other Group subsidiaries | 1 | Credit Suisse Group | |||||
| Comprehensive income (CHF million) | |||||||||||||
| Net income/(loss) | 844 | 13 | 857 | 832 | (655) | 1,034 | |||||||
| Gains/(losses) on cash flow hedges | 0 | 1 | 1 | 10 | (1) | 10 | |||||||
| Foreign currency translation | 169 | (282) | (113) | 0 | 111 | (2) | |||||||
| Unrealized gains/(losses) on securities | 0 | 122 | 122 | 0 | 15 | 137 | |||||||
| Actuarial gains/(losses) | 19 | 7 | 26 | 0 | 93 | 119 | |||||||
| Net prior service cost | (1) | 1 | 0 | 0 | (36) | (36) | |||||||
| Other comprehensive income/(loss), net of tax | 187 | (151) | 36 | 10 | 182 | 228 | |||||||
| Comprehensive income/(loss) | 1,031 | (138) | 893 | 842 | (473) | 1,262 | |||||||
| Comprehensive income/(loss) attributable to noncontrolling interests | 229 | 102 | 331 | 0 | (123) | 208 | |||||||
| Comprehensive income/(loss) attributable to shareholders | 802 | (240) | 562 | 842 | (350) | 1,054 | |||||||
| 1 Includes eliminations and consolidation adjustments. | |||||||||||||
| Condensed consolidating statements of operations |
in 6M11 | Credit Suisse (USA), Inc. consolidated | Bank parent company and other subsidiaries | 1 | Bank | Group parent company | Other Group subsidiaries | 1 | Credit Suisse Group | |||||
| Condensed consolidating statements of operations (CHF million) | |||||||||||||
| Interest and dividend income | 3,858 | 8,396 | 12,254 | 85 | 195 | 12,534 | |||||||
| Interest expense | (2,476) | (6,851) | (9,327) | (81) | 4 | (9,404) | |||||||
| Net interest income | 1,382 | 1,545 | 2,927 | 4 | 199 | 3,130 | |||||||
| Commissions and fees | 2,043 | 4,944 | 6,987 | 5 | 142 | 7,134 | |||||||
| Trading revenues | 320 | 2,802 | 3,122 | 0 | 5 | 3,127 | |||||||
| Other revenues | 1,247 | 356 | 1,603 | 1,872 | 2 | (1,818) | 1,657 | ||||||
| Net revenues | 4,992 | 9,647 | 14,639 | 1,881 | (1,472) | 15,048 | |||||||
| Provision for credit losses | 1 | (22) | (21) | 0 | 27 | 6 | |||||||
| Compensation and benefits | 2,065 | 5,004 | 7,069 | 49 | 7 | 7,125 | |||||||
| General and administrative expenses | 857 | 2,458 | 3,315 | (80) | 49 | 3,284 | |||||||
| Commission expenses | 132 | 882 | 1,014 | 1 | 12 | 1,027 | |||||||
| Total other operating expenses | 989 | 3,340 | 4,329 | (79) | 61 | 4,311 | |||||||
| Total operating expenses | 3,054 | 8,344 | 11,398 | (30) | 68 | 11,436 | |||||||
| Income/(loss) before taxes | 1,937 | 1,325 | 3,262 | 1,911 | (1,567) | 3,606 | |||||||
| Income tax expense | 335 | 367 | 702 | 4 | 30 | 736 | |||||||
| Net income/(loss) | 1,602 | 958 | 2,560 | 1,907 | (1,597) | 2,870 | |||||||
| Net income attributable to noncontrolling interests | 947 | 52 | 999 | 0 | (36) | 963 | |||||||
| Net income/(loss) attributable to shareholders | 655 | 906 | 1,561 | 1,907 | (1,561) | 1,907 | |||||||
| 1 Includes eliminations and consolidation adjustments. 2 Primarily consists of dividend income from investments in Group companies (CHF 320 million and CHF 18 million from bank and non-bank subsidiaries, respectively) and revenues from investments accounted for under the equity method. | |||||||||||||
| Condensed consolidating statements of comprehensive income |
in 6M11 | Credit Suisse (USA), Inc. consolidated | Bank parent company and other subsidiaries | 1 | Bank | Group parent company | Other Group subsidiaries | 1 | Credit Suisse Group | |||||
| Comprehensive income (CHF million) | |||||||||||||
| Net income/(loss) | 1,602 | 958 | 2,560 | 1,907 | (1,597) | 2,870 | |||||||
| Gains/(losses) on cash flow hedges | 0 | (22) | (22) | (5) | 0 | (27) | |||||||
| Foreign currency translation | (2,575) | (481) | (3,056) | (56) | 98 | (3,014) | |||||||
| Unrealized gains/(losses) on securities | 0 | (38) | (38) | 0 | 0 | (38) | |||||||
| Actuarial gains/(losses) | 12 | 7 | 19 | 0 | 34 | 53 | |||||||
| Net prior service cost | 0 | (1) | (1) | 0 | 7 | 6 | |||||||
| Other comprehensive income/(loss), net of tax | (2,563) | (535) | (3,098) | (61) | 139 | (3,020) | |||||||
| Comprehensive income/(loss) | (961) | 423 | (538) | 1,846 | (1,458) | (150) | |||||||
| Comprehensive income/(loss) attributable to noncontrolling interests | 299 | (422) | (123) | 0 | 460 | 337 | |||||||
| Comprehensive income/(loss) attributable to shareholders | (1,260) | 845 | (415) | 1,846 | (1,918) | (487) | |||||||
| 1 Includes eliminations and consolidation adjustments. | |||||||||||||
| Condensed consolidating balance sheets |
end of 2Q12 | Credit Suisse (USA), Inc. consolidated | Bank parent company and other subsidiaries | 1 | Bank | Group parent company | Other Group subsidiaries | 1 | Credit Suisse Group | |||||
| Assets (CHF million) | |||||||||||||
| Cash and due from banks | 4,046 | 95,704 | 99,750 | 66 | (778) | 99,038 | |||||||
| Interest-bearing deposits with banks | 88 | 4,170 | 4,258 | 0 | (1,930) | 2,328 | |||||||
| Central bank funds sold, securities purchased under resale agreements and securities borrowing transactions | 160,898 | 65,957 | 226,855 | 0 | 9 | 226,864 | |||||||
| Securities received as collateral | 32,777 | (2,586) | 30,191 | 0 | 0 | 30,191 | |||||||
| Trading assets | 107,575 | 176,667 | 284,242 | 0 | (184) | 284,058 | |||||||
| Investment securities | 0 | 3,674 | 3,674 | 0 | 1,652 | 5,326 | |||||||
| Other investments | 6,641 | 5,829 | 12,470 | 34,694 | (34,391) | 12,773 | |||||||
| Net loans | 22,694 | 201,910 | 224,604 | 4,901 | 9,659 | 239,164 | |||||||
| Premises and equipment | 1,101 | 5,541 | 6,642 | 0 | 204 | 6,846 | |||||||
| Goodwill | 601 | 7,173 | 7,774 | 0 | 891 | 8,665 | |||||||
| Other intangible assets | 101 | 177 | 278 | 0 | 0 | 278 | |||||||
| Brokerage receivables | 18,817 | 31,593 | 50,410 | 0 | 1 | 50,411 | |||||||
| Other assets | 16,598 | 60,776 | 77,374 | 216 | (77) | 77,513 | |||||||
| Total assets | 371,937 | 656,585 | 1,028,522 | 39,877 | (24,944) | 1,043,455 | |||||||
| Liabilities and equity (CHF million) | |||||||||||||
| Due to banks | 308 | 40,717 | 41,025 | 4,194 | (3,894) | 41,325 | |||||||
| Customer deposits | 1 | 302,791 | 302,792 | 0 | 9,891 | 312,683 | |||||||
| Central bank funds purchased, securities sold under repurchase agreements and securities lending transactions | 168,711 | 20,555 | 189,266 | 0 | 0 | 189,266 | |||||||
| Obligation to return securities received as collateral | 32,777 | (2,586) | 30,191 | 0 | 0 | 30,191 | |||||||
| Trading liabilities | 27,850 | 88,002 | 115,852 | 1 | (71) | 115,782 | |||||||
| Short-term borrowings | 17,360 | 1,824 | 19,184 | 0 | 0 | 19,184 | |||||||
| Long-term debt | 36,398 | 117,464 | 153,862 | 799 | 177 | 154,838 | |||||||
| Brokerage payables | 55,137 | 20,685 | 75,822 | 0 | 0 | 75,822 | |||||||
| Other liabilities | 12,721 | 48,936 | 61,657 | 109 | 493 | 62,259 | |||||||
| Total liabilities | 351,263 | 638,388 | 989,651 | 5,103 | 6,596 | 1,001,350 | |||||||
| Total shareholders' equity | 16,173 | 13,611 | 29,784 | 34,774 | (29,784) | 34,774 | |||||||
| Noncontrolling interests | 4,501 | 4,586 | 9,087 | 0 | (1,756) | 7,331 | |||||||
| Total equity | 20,674 | 18,197 | 38,871 | 34,774 | (31,540) | 42,105 | |||||||
| Total liabilities and equity | 371,937 | 656,585 | 1,028,522 | 39,877 | (24,944) | 1,043,455 | |||||||
| 1 Includes eliminations and consolidation adjustments. | |||||||||||||
| Condensed consolidating balance sheets |
end of 4Q11 | Credit Suisse (USA), Inc. consolidated | Bank parent company and other subsidiaries | 1 | Bank | Group parent company | Other Group subsidiaries | 1 | Credit Suisse Group | |||||
| Assets (CHF million) | |||||||||||||
| Cash and due from banks | 3,698 | 107,526 | 111,224 | 13 | (664) | 110,573 | |||||||
| Interest-bearing deposits with banks | 87 | 4,106 | 4,193 | 0 | (1,921) | 2,272 | |||||||
| Central bank funds sold, securities purchased under resale agreements and securities borrowing transactions | 153,625 | 83,310 | 236,935 | 0 | 28 | 236,963 | |||||||
| Securities received as collateral | 34,189 | (3,998) | 30,191 | 0 | 0 | 30,191 | |||||||
| Trading assets | 91,458 | 188,290 | 279,748 | 0 | (195) | 279,553 | |||||||
| Investment securities | 0 | 3,652 | 3,652 | 0 | 1,508 | 5,160 | |||||||
| Other investments | 6,719 | 6,196 | 12,915 | 34,137 | (33,826) | 13,226 | |||||||
| Net loans | 24,658 | 194,776 | 219,434 | 5,603 | 8,376 | 233,413 | |||||||
| Premises and equipment | 1,110 | 5,880 | 6,990 | 0 | 203 | 7,193 | |||||||
| Goodwill | 597 | 7,103 | 7,700 | 0 | 891 | 8,591 | |||||||
| Other intangible assets | 112 | 168 | 280 | 0 | 8 | 288 | |||||||
| Brokerage receivables | 17,951 | 25,494 | 43,445 | 0 | 1 | 43,446 | |||||||
| Other assets | 16,114 | 61,966 | 78,080 | 190 | 26 | 78,296 | |||||||
| Total assets | 350,318 | 684,469 | 1,034,787 | 39,943 | (25,565) | 1,049,165 | |||||||
| Liabilities and equity (CHF million) | |||||||||||||
| Due to banks | 92 | 39,985 | 40,077 | 4,697 | (4,627) | 40,147 | |||||||
| Customer deposits | 0 | 304,130 | 304,130 | 0 | 9,271 | 313,401 | |||||||
| Central bank funds purchased, securities sold under repurchase agreements and securities lending transactions | 151,655 | 24,904 | 176,559 | 0 | 0 | 176,559 | |||||||
| Obligation to return securities received as collateral | 34,189 | (3,998) | 30,191 | 0 | 0 | 30,191 | |||||||
| Trading liabilities | 29,291 | 98,518 | 127,809 | 0 | (49) | 127,760 | |||||||
| Short-term borrowings | 15,881 | 10,235 | 26,116 | 0 | 0 | 26,116 | |||||||
| Long-term debt | 40,029 | 121,324 | 161,353 | 1,444 | (142) | 162,655 | |||||||
| Brokerage payables | 47,847 | 20,187 | 68,034 | 0 | 0 | 68,034 | |||||||
| Other liabilities | 10,124 | 52,043 | 62,167 | 128 | 922 | 63,217 | |||||||
| Total liabilities | 329,108 | 667,328 | 996,436 | 6,269 | 5,375 | 1,008,080 | |||||||
| Total shareholders' equity | 16,979 | 12,424 | 29,403 | 33,674 | (29,403) | 33,674 | |||||||
| Noncontrolling interests | 4,231 | 4,717 | 8,948 | 0 | (1,537) | 7,411 | |||||||
| Total equity | 21,210 | 17,141 | 38,351 | 33,674 | (30,940) | 41,085 | |||||||
| Total liabilities and equity | 350,318 | 684,469 | 1,034,787 | 39,943 | (25,565) | 1,049,165 | |||||||
| 1 Includes eliminations and consolidation adjustments. | |||||||||||||
| Condensed consolidating statements of cash flows |
in 6M12 | Credit Suisse (USA), Inc. consolidated | Bank parent company and other subsidiaries | 1 | Bank | Group parent company | Other Group subsidiaries | 1 | Credit Suisse Group | |||||
| Operating activities of continuing operations (CHF million) | |||||||||||||
| Net cash provided by/(used in) operating activities of continuing operations | (8,011) | (2,032) | (10,043) | 190 | 2 | (569) | (10,422) | ||||||
| Investing activities of continuing operations (CHF million) | |||||||||||||
| (Increase)/decrease in interest-bearing deposits with banks | (1) | (268) | (269) | 0 | 87 | (182) | |||||||
| (Increase)/decrease in central bank funds sold, securities purchased under resale agreements and securities borrowing transactions | (6,167) | 16,522 | 10,355 | 0 | 19 | 10,374 | |||||||
| Purchase of investment securities | 0 | (25) | (25) | 0 | (183) | (208) | |||||||
| Proceeds from sale of investment securities | 0 | 339 | 339 | 0 | 0 | 339 | |||||||
| Maturities of investment securities | 0 | 106 | 106 | 0 | 61 | 167 | |||||||
| Investments in subsidiaries and other investments | (163) | (452) | (615) | (45) | (28) | (688) | |||||||
| Proceeds from sale of other investments | 608 | 448 | 1,056 | 0 | 56 | 1,112 | |||||||
| (Increase)/decrease in loans | 2,084 | (7,469) | (5,385) | 719 | (1,309) | (5,975) | |||||||
| Proceeds from sales of loans | 0 | 522 | 522 | 0 | 0 | 522 | |||||||
| Capital expenditures for premises and equipment and other intangible assets | (170) | (494) | (664) | 0 | (6) | (670) | |||||||
| Proceeds from sale of premises and equipment and other intangible assets | 2 | 6 | 8 | 0 | 0 | 8 | |||||||
| Other, net | 214 | 1,817 | 2,031 | 28 | (20) | 2,039 | |||||||
| Net cash provided by/(used in) investing activities of continuing operations | (3,593) | 11,052 | 7,459 | 702 | (1,323) | 6,838 | |||||||
| Financing activities of continuing operations (CHF million) | |||||||||||||
| Increase/(decrease) in due to banks and customer deposits | 213 | (3,220) | (3,007) | (586) | 1,558 | (2,035) | |||||||
| Increase/(decrease) in short-term borrowings | 678 | (8,492) | (7,814) | 0 | 0 | (7,814) | |||||||
| Increase/(decrease) in central bank funds purchased, securities sold under repurchase agreements and securities lending transactions | 15,780 | (4,193) | 11,587 | 0 | 0 | 11,587 | |||||||
| Issuances of long-term debt | 444 | 18,550 | 18,994 | 5 | 668 | 19,667 | |||||||
| Repayments of long-term debt | (3,727) | (23,712) | (27,439) | (660) | (321) | (28,420) | |||||||
| Issuances of common shares | 0 | 0 | 0 | 1,323 | 0 | 1,323 | |||||||
| Sale of treasury shares | 0 | 0 | 0 | 361 | 3,414 | 3,775 | |||||||
| Repurchase of treasury shares | 0 | 0 | 0 | (472) | (3,390) | (3,862) | |||||||
| Dividends paid/capital repayments | 0 | (176) | (176) | (944) | (31) | (1,151) | |||||||
| Excess tax benefits related to share-based compensation | 0 | 14 | 14 | 0 | (14) | 0 | |||||||
| Other, net | (1,467) | 615 | (852) | 77 | (5) | (780) | |||||||
| Net cash provided by/(used in) financing activities of continuing operations | 11,921 | (20,614) | (8,693) | (896) | 1,879 | (7,710) | |||||||
| Effect of exchange rate changes on cash and due from banks (CHF million) | |||||||||||||
| Effect of exchange rate changes on cash and due from banks | 31 | (228) | (197) | 57 | (101) | (241) | |||||||
| Net increase/(decrease) in cash and due from banks (CHF million) | |||||||||||||
| Net increase/(decrease) in cash and due from banks | 348 | (11,822) | (11,474) | 53 | (114) | (11,535) | |||||||
| Cash and due from banks at beginning of period | 3,698 | 107,526 | 111,224 | 13 | (664) | 110,573 | |||||||
| Cash and due from banks at end of period | 4,046 | 95,704 | 99,750 | 66 | (778) | 99,038 | |||||||
| 1 Includes eliminations and consolidation adjustments. 2 Consists of dividend income from investments in Group companies. | |||||||||||||
| Condensed consolidating statements of cash flows |
in 6M11 | Credit Suisse (USA), Inc. consolidated | Bank parent company and other subsidiaries | 1 | Bank | Group parent company | Other Group subsidiaries | 1 | Credit Suisse Group | |||||
| Operating activities of continuing operations (CHF million) | |||||||||||||
| Net cash provided by/(used in) operating activities of continuing operations | 4,943 | (5,273) | (330) | 475 | 2 | 363 | 508 | ||||||
| Investing activities of continuing operations (CHF million) | |||||||||||||
| (Increase)/decrease in interest-bearing deposits with banks | (1) | (976) | (977) | 0 | 492 | (485) | |||||||
| (Increase)/decrease in central bank funds sold, securities purchased under resale agreements and securities borrowing transactions | (2,444) | 3,511 | 1,067 | 0 | (135) | 932 | |||||||
| Purchase of investment securities | 0 | (1,044) | (1,044) | 0 | (128) | (1,172) | |||||||
| Proceeds from sale of investment securities | 0 | 2,096 | 2,096 | 0 | 0 | 2,096 | |||||||
| Maturities of investment securities | 0 | 1,289 | 1,289 | 0 | 83 | 1,372 | |||||||
| Investments in subsidiaries and other investments | 708 | (1,499) | (791) | (1) | (78) | (870) | |||||||
| Proceeds from sale of other investments | 428 | 2,019 | 2,447 | 0 | 69 | 2,516 | |||||||
| (Increase)/decrease in loans | 2,192 | (6,754) | (4,562) | 74 | (1,148) | (5,636) | |||||||
| Proceeds from sales of loans | 0 | 230 | 230 | 0 | 0 | 230 | |||||||
| Capital expenditures for premises and equipment and other intangible assets | (182) | (529) | (711) | 0 | (7) | (718) | |||||||
| Proceeds from sale of premises and equipment and other intangible assets | 0 | 3 | 3 | 0 | 0 | 3 | |||||||
| Other, net | 9 | 115 | 124 | 0 | 23 | 147 | |||||||
| Net cash provided by/(used in) investing activities of continuing operations | 710 | (1,539) | (829) | 73 | (829) | (1,585) | |||||||
| Financing activities of continuing operations (CHF million) | |||||||||||||
| Increase/(decrease) in due to banks and customer deposits | (16) | 16,901 | 16,885 | (656) | (526) | 15,703 | |||||||
| Increase/(decrease) in short-term borrowings | (12,509) | 12,922 | 413 | 0 | 0 | 413 | |||||||
| Increase/(decrease) in central bank funds purchased, securities sold under repurchase agreements and securities lending transactions | 8,015 | (18,255) | (10,240) | 0 | 0 | (10,240) | |||||||
| Issuances of long-term debt | 2,718 | 20,732 | 23,450 | 5 | 147 | 23,602 | |||||||
| Repayments of long-term debt | (2,649) | (16,089) | (18,738) | 0 | (234) | (18,972) | |||||||
| Issuances of common shares | 0 | 0 | 0 | 666 | 0 | 666 | |||||||
| Sale of treasury shares | 0 | 614 | 614 | 417 | 6,715 | 7,746 | |||||||
| Repurchase of treasury shares | 0 | (612) | (612) | (61) | (6,999) | (7,672) | |||||||
| Dividends paid/capital repayments | 0 | (338) | (338) | (1,560) | 93 | (1,805) | |||||||
| Other, net | 60 | (42) | 18 | 632 | 21 | 671 | |||||||
| Net cash provided by/(used in) financing activities of continuing operations | (4,381) | 15,833 | 11,452 | (557) | (783) | 10,112 | |||||||
| Effect of exchange rate changes on cash and due from banks (CHF million) | |||||||||||||
| Effect of exchange rate changes on cash and due from banks | (615) | (6,159) | (6,774) | 7 | 313 | (6,454) | |||||||
| Net cash provided by/(used in) operating activities of discontinued operations (CHF million) | |||||||||||||
| Net cash provided by/(used in) operating activities of discontinued operations | 0 | 25 | 25 | 0 | 0 | 25 | |||||||
| Net increase/(decrease) in cash and due from banks (CHF million) | |||||||||||||
| Net increase/(decrease) in cash and due from banks | 657 | 2,887 | 3,544 | (2) | (936) | 2,606 | |||||||
| Cash and due from banks at beginning of period | 5,133 | 60,214 | 65,347 | 18 | 102 | 65,467 | |||||||
| Cash and due from banks at end of period | 5,790 | 63,101 | 68,891 | 16 | (834) | 68,073 | |||||||
| 1 Includes eliminations and consolidation adjustments. 2 Consists of dividend income from investments in Group companies. | |||||||||||||
List of abbreviations |
| A | ||
| ADS | American Depositary Share | |
| AOCI | Accumulated Other Comprehensive Income | |
| ASC | Accounting Standards Codification | |
| ASU | Accounting Standards Update | |
| B | ||
| BCBS | Basel Committee on Banking Supervision | |
| BCN | Buffer Capital Note | |
| BIS | Bank for International Settlements | |
| bp | basis point | |
| BRL | Brazilian Real | |
| C | ||
| CDO | Collateralized Debt Obligation | |
| CDS | Credit Default Swap | |
| CET1 | Common Equity Tier 1 | |
| CFTC | Commodities Futures Trading Commission | |
| CMBS | Commercial Mortgage-backed Securities | |
| CP | Commercial Paper | |
| CPR | Constant Prepayment Rate | |
| D | ||
| DVA | Debit Valuation Adjustments | |
| E | ||
| EBITDA | Earnings Before Interest, Taxes, Depreciation and Amortization | |
| EMEA | Europe, Middle East and Africa | |
| ETF | Exchange-Traded Funds | |
| EU | European Union | |
| F | ||
| FASB | Financial Accounting Standards Board | |
| FINMA | Swiss Financial Market Supervisory Authority | |
| G | ||
| G-20 | Group of Twenty Finance Ministers and Central Bank Governors | |
| G-SIB | Global Systemically Important Bank | |
| GSE | Government-Sponsored Enterprise | |
| I | ||
| IFRS | International Financial Reporting Standards | |
| IPO | Initial Public Offering | |
| ISU | Incentive Share Unit | |
| IT | Information Technology | |
| K | ||
| KPI | Key Performance Indicator | |
| L | ||
| LCR | Liquidity Coverage Ratio | |
| LIBOR | London Interbank Offered Rate | |
| M | ||
| M&A | Mergers and Acquisitions | |
| N | ||
| NAV | Net Asset Value | |
| NRV | Negative Replacement Value | |
| NSFR | Net Stable Funding Ratio | |
| O | ||
| OTC | Over-The-Counter | |
| P | ||
| PAF | 2008 Partner Asset Facility | |
| PAF2 | 2011 Partner Asset Facility | |
| PRV | Positive Replacement Value | |
| PSA | Prepayment Speed Assumption | |
| Q | ||
| QoQ | Quarter on Quarter | |
| R | ||
| RMBS | Residential Mortgage-backed Securities | |
| RWA | Risk-Weighted Assets | |
| S | ||
| SEC | US Securities and Exchange Commission | |
| SEI | Significant Economic Interest | |
| SISU | Scaled Incentive Share Unit | |
| SNB | Swiss National Bank | |
| SPE | Special Purpose Entity | |
| T | ||
| TRS | Total Return Swap | |
| U | ||
| UK | United Kingdom | |
| UHNWI | Ultra-High-Net-Worth Individual | |
| US | United States of America | |
| US GAAP | Accounting Principles Generally Accepted in the US | |
| V | ||
| VaR | Value-at-Risk | |
| VARMC | Valuation and Risk Management Committee | |
| VIE | Variable Interest Entity | |
| VIX | Chicago Board Options Exchange Market Volatility Index | |
| Y | ||
| YoY | Year on Year | |
| Ytd | Year to Date | |
Investor information |
| Share data | |||||||||
| in / end of | |||||||||
| 6M12 | 2011 | 2010 | 2009 | ||||||
| Share price (common shares, CHF) | |||||||||
| Average | 22.46 | 31.43 | 45.97 | 45.65 | |||||
| Minimum | 16.58 | 19.65 | 37.04 | 22.48 | |||||
| Maximum | 27.20 | 44.99 | 56.40 | 60.40 | |||||
| End of period | 17.26 | 22.07 | 37.67 | 51.20 | |||||
| Share price (American Depositary Shares, USD) | |||||||||
| Average | 24.20 | 35.36 | 44.16 | 42.61 | |||||
| Minimum | 17.43 | 21.20 | 36.54 | 19.04 | |||||
| Maximum | 29.69 | 47.63 | 54.57 | 59.84 | |||||
| End of period | 18.33 | 23.48 | 40.41 | 49.16 | |||||
| Market capitalization | |||||||||
| Market capitalization (CHF million) | 22,207 | 27,021 | 44,683 | 60,691 | |||||
| Market capitalization (USD million) | 23,583 | 28,747 | 47,933 | 58,273 | |||||
| Dividend per share (CHF) | |||||||||
| Dividend per share | – | 0.75 | 1, 2 | 1.30 | 2 | 2.00 | |||
| 1 The distribution was payable in cash or, subject to any legal restrictions applicable in shareholders’ home jurisdictions, in new shares of Credit Suisse Group at the option of the shareholder. 2 Paid out of reserves from capital contributions. | |||||||||
| Ticker symbols / stock exchange listings | |||||
| Common shares | ADS | 1 | |||
| Ticker symbols | |||||
| Bloomberg | CSGN VX | CS US | |||
| Reuters | CSGN.VX | CS.N | |||
| Telekurs | CSGN,380 | CS,065 | |||
| Stock exchange listings | |||||
| Swiss security number | 1213853 | 570660 | |||
| ISIN number | CH0012138530 | US2254011081 | |||
| CUSIP number | – | 225 401 108 | |||
| 1 One American Depositary Share (ADS) represents one common share. | |||||
| Bond ratings | |||||||
| as of August 2, 2012 | Moody's | Standard & Poor's | Fitch Ratings | ||||
| Credit Suisse Group ratings | |||||||
| Short-term | – | – | F1 | ||||
| Long-term | A2 | A | A | ||||
| Outlook | Stable | Negative | Stable | ||||
| Credit Suisse (the Bank) ratings | |||||||
| Short-term | P-1 | A-1 | F1 | ||||
| Long-term | A1 | A+ | A | ||||
| Outlook | Stable | Negative | Stable | ||||
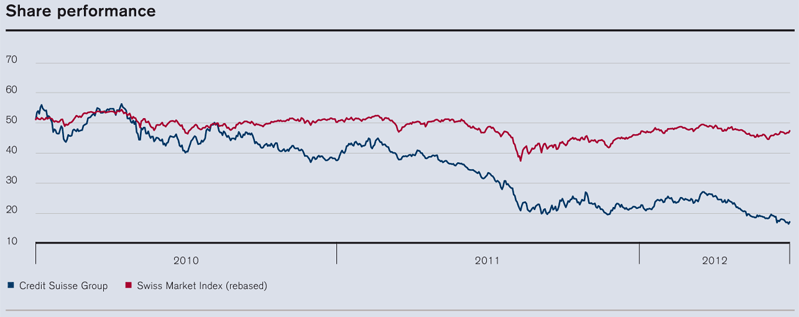
Financial calendar and contacts |
| Financial calendar | |||
| Third quarter 2012 results | Thursday, October 25, 2012 | ||
| Fourth quarter / Full year 2012 results | Thursday, February 7, 2013 | ||
| Investor relations | |||
| Phone | +41 44 333 71 49 | ||
| investor.relations@credit-suisse.com | |||
| Internet | www.credit-suisse.com/investors | ||
| Media relations | |||
| Phone | +41 844 33 88 44 | ||
| media.relations@credit-suisse.com | |||
| Internet | www.credit-suisse.com/news | ||
| Additional information | |||
| Results and financial information | www.credit-suisse.com/results | ||
| Printed copies | Credit Suisse AG | ||
| Publikationenbestellungen/TLSA 221 | |||
| P.O. Box | |||
| 8070 Zurich | |||
| Switzerland | |||
| US share register and transfer agent | |||
| ADS depositary bank | Deutsche Bank Trust Company Americas | ||
| Address | Credit Suisse c/o | ||
| American Stock Transfer & Trust Co. | |||
| Peck Slip Station | |||
| P.O. Box 2050 | |||
| New York, NY 10272-2050 | |||
| United States | |||
| US and Canada phone | +1 800 301 35 17 | ||
| Phone from outside US and Canada | +1 718 921 81 37 | ||
| DB@amstock.com | |||
| Swiss share register and transfer agent | |||
| Address | Credit Suisse Group AG | ||
| Dept. RXS | |||
| 8070 Zurich | |||
| Switzerland | |||
| Phone | +41 44 332 26 60 | ||
| Fax | +41 44 332 98 96 | ||
| Foreign currency translation rates | |||||||||||||||||||
| End of | Average in | Average in | |||||||||||||||||
| 2Q12 | 1Q12 | 4Q11 | 2Q11 | 2Q12 | 1Q12 | 2Q11 | 6M12 | 6M11 | |||||||||||
| 1 USD / 1 CHF | 0.95 | 0.90 | 0.94 | 0.84 | 0.93 | 0.91 | 0.87 | 0.92 | 0.90 | ||||||||||
| 1 EUR / 1 CHF | 1.20 | 1.20 | 1.22 | 1.22 | 1.20 | 1.21 | 1.26 | 1.20 | 1.27 | ||||||||||
| 1 GBP / 1 CHF | 1.48 | 1.44 | 1.45 | 1.35 | 1.48 | 1.45 | 1.42 | 1.46 | 1.46 | ||||||||||
| 100 JPY / 1 CHF | 1.19 | 1.10 | 1.21 | 1.04 | 1.17 | 1.16 | 1.06 | 1.17 | 1.10 | ||||||||||
| Cautionary statement regarding forward-looking information |
| This report contains statements that constitute forward-looking statements within the meaning of the Private Securities Litigation Reform Act of 1995. In addition, in the future we, and others on our behalf, may make statements that constitute forward-looking statements. Such forward-looking statements may include, without limitation, statements relating to the following: |
| – our plans, objectives or goals; |
| – our future economic performance or prospects; |
| – the potential effect on our future performance of certain contingencies; and |
| – assumptions underlying any such statements. |
| Words such as “believes,” “anticipates,” “expects,” “intends” and “plans” and similar expressions are intended to identify forward-looking statements but are not the exclusive means of identifying such statements. We do not intend to update these forward-looking statements except as may be required by applicable securities laws. |
| By their very nature, forward-looking statements involve inherent risks and uncertainties, both general and specific, and risks exist that predictions, forecasts, projections and other outcomes described or implied in forward-looking statements will not be achieved. We caution you that a number of important factors could cause results to differ materially from the plans, objectives, expectations, estimates and intentions expressed in such forward-looking statements. These factors include: |
| – the ability to maintain sufficient liquidity and access capital markets; |
| – market and interest rate fluctuations and interest rate levels; |
| – the strength of the global economy in general and the strength of the economies of the countries in which we conduct our operations, in particular the risk of continued slow economic recovery or downturn in the US or other developed countries in 2012 and beyond; |
| – the direct and indirect impacts of continuing deterioration or slow recovery in residential and commercial real estate markets; |
| – adverse rating actions by credit rating agencies in respect of sovereign issuers, structured credit products or other credit-related exposures; |
| – the ability to achieve our strategic objectives, including improved performance, reduced risks, lower costs and more efficient use of capital; |
| – the ability of counterparties to meet their obligations to us; |
| – the effects of, and changes in, fiscal, monetary, trade and tax policies, and currency fluctuations; |
| – political and social developments, including war, civil unrest or terrorist activity; |
| – the possibility of foreign exchange controls, expropriation, nationalization or confiscation of assets in countries in which we conduct our operations; |
| – operational factors such as systems failure, human error, or the failure to implement procedures properly; |
| – actions taken by regulators with respect to our business and practices in one or more of the countries in which we conduct our operations; |
| – the effects of changes in laws, regulations or accounting policies or practices; |
| – competition in geographic and business areas in which we conduct our operations; |
| – the ability to retain and recruit qualified personnel; |
| – the ability to maintain our reputation and promote our brand; |
| – the ability to increase market share and control expenses; |
| – technological changes; |
| – the timely development and acceptance of our new products and services and the perceived overall value of these products and services by users; |
| – acquisitions, including the ability to integrate acquired businesses successfully, and divestitures, including the ability to sell non-core assets; |
| – the adverse resolution of litigation and other contingencies; |
| – the ability to achieve our cost-efficiency goals and cost targets; and |
| – our success at managing the risks involved in the foregoing. |
| |
| We caution you that the foregoing list of important factors is not exclusive. When evaluating forward-looking statements, you should carefully consider the foregoing factors and other uncertainties and events, as well as the information set forth in “Risk factors” in the Appendix of our Annual Report 2011. |

| Our 2011 annual publication suite consisting of Annual Report, Company Profile and Corporate Responsibility Report is available on our website www.credit-suisse.com/investors |
| Photography: Alberto Venzago |
| Production: Management Digital Data AG |
| Printer: Swissprinters Zürich AG |