
| Key metrics | |||||||||||||||||
| in / end of | % change | in / end of | % change | ||||||||||||||
| 2Q15 | 1Q15 | 2Q14 | QoQ | YoY | 6M15 | 6M14 | YoY | ||||||||||
| Credit Suisse (CHF million, except where indicated) | |||||||||||||||||
| Net income/(loss) attributable to shareholders | 1,051 | 1,054 | (700) | 0 | – | 2,105 | 159 | – | |||||||||
| of which from continuing operations | 1,051 | 1,054 | (691) | 0 | – | 2,105 | 153 | – | |||||||||
| Basic earnings/(loss) per share from continuing operations (CHF) | 0.63 | 0.63 | (0.45) | 0 | – | 1.26 | 0.05 | – | |||||||||
| Diluted earnings/(loss) per share from continuing operations (CHF) | 0.61 | 0.62 | (0.45) | (2) | – | 1.23 | 0.05 | – | |||||||||
| Return on equity attributable to shareholders (%) | 10.0 | 9.9 | (6.7) | – | – | 9.9 | 0.8 | – | |||||||||
| Effective tax rate (%) | 35.6 | 31.6 | (88.7) | – | – | 33.7 | 60.8 | – | |||||||||
| Core Results (CHF million, except where indicated) | |||||||||||||||||
| Net revenues | 6,941 | 6,673 | 6,433 | 4 | 8 | 13,614 | 12,902 | 6 | |||||||||
| Provision for credit losses | 51 | 30 | 18 | 70 | 183 | 81 | 52 | 56 | |||||||||
| Total operating expenses | 5,244 | 5,105 | 6,785 | 3 | (23) | 10,349 | 11,820 | (12) | |||||||||
| Income/(loss) from continuing operations before taxes | 1,646 | 1,538 | (370) | 7 | – | 3,184 | 1,030 | 209 | |||||||||
| Cost/income ratio (%) | 75.6 | 76.5 | 105.5 | – | – | 76.0 | 91.6 | – | |||||||||
| Pre-tax income margin (%) | 23.7 | 23.0 | (5.8) | – | – | 23.4 | 8.0 | – | |||||||||
| Strategic results (CHF million, except where indicated) | |||||||||||||||||
| Net revenues | 6,758 | 6,590 | 6,309 | 3 | 7 | 13,348 | 12,839 | 4 | |||||||||
| Income from continuing operations before taxes | 1,812 | 1,822 | 1,775 | (1) | 2 | 3,634 | 3,719 | (2) | |||||||||
| Cost/income ratio (%) | 72.6 | 72.0 | 71.5 | – | – | 72.3 | 70.7 | – | |||||||||
| Return on equity – strategic results (%) | 13.9 | 12.0 | 13.0 | – | – | 13.0 | 13.5 | – | |||||||||
| Non-strategic results (CHF million) | |||||||||||||||||
| Net revenues | 183 | 83 | 124 | 120 | 48 | 266 | 63 | 322 | |||||||||
| Loss from continuing operations before taxes | (166) | (284) | (2,145) | (42) | (92) | (450) | (2,689) | (83) | |||||||||
| Assets under management and net new assets (CHF billion) | |||||||||||||||||
| Assets under management from continuing operations | 1,355.7 | 1,374.0 | 1,319.6 | (1.3) | 2.7 | 1,355.7 | 1,319.6 | 2.7 | |||||||||
| Net new assets from continuing operations | 14.2 | 17.0 | 10.7 | (16.5) | 32.7 | 31.2 | 25.4 | 22.8 | |||||||||
| Balance sheet statistics (CHF million) | |||||||||||||||||
| Total assets | 879,322 | 904,390 | 891,580 | (3) | (1) | 879,322 | 891,580 | (1) | |||||||||
| Net loans | 270,171 | 270,774 | 254,532 | 0 | 6 | 270,171 | 254,532 | 6 | |||||||||
| Total shareholders' equity | 42,642 | 43,396 | 40,944 | (2) | 4 | 42,642 | 40,944 | 4 | |||||||||
| Tangible shareholders' equity | 34,199 | 34,672 | 32,716 | (1) | 5 | 34,199 | 32,716 | 5 | |||||||||
| Basel III regulatory capital and leverage statistics | |||||||||||||||||
| Risk-weighted assets (CHF million) | 281,886 | 288,514 | 285,421 | (2) | (1) | 281,886 | 285,421 | (1) | |||||||||
| CET1 ratio (%) | 13.9 | 13.8 | 13.8 | – | – | 13.9 | 13.8 | – | |||||||||
| Look-through CET1 ratio (%) | 10.3 | 10.0 | 9.5 | – | – | 10.3 | 9.5 | – | |||||||||
| Look-through CET1 leverage ratio (%) | 2.7 | 2.6 | – | – | – | 2.7 | – | – | |||||||||
| Look-through Tier 1 leverage ratio (%) | 3.7 | 3.6 | – | – | – | 3.7 | – | – | |||||||||
| Share information | |||||||||||||||||
| Shares outstanding (million) | 1,632.4 | 1,563.5 | 1,600.0 | 4 | 2 | 1,632.4 | 1,600.0 | 2 | |||||||||
| of which common shares issued | 1,638.4 | 1,607.2 | 1,607.2 | 2 | 2 | 1,638.4 | 1,607.2 | 2 | |||||||||
| of which treasury shares | (6.0) | (43.7) | (7.2) | (86) | (17) | (6.0) | (7.2) | (17) | |||||||||
| Book value per share (CHF) | 26.12 | 27.76 | 25.59 | (6) | 2 | 26.12 | 25.59 | 2 | |||||||||
| Tangible book value per share (CHF) | 20.95 | 22.18 | 20.45 | (6) | 2 | 20.95 | 20.45 | 2 | |||||||||
| Market capitalization (CHF million) | 42,107 | 42,076 | 40,758 | 0 | 3 | 42,107 | 40,758 | 3 | |||||||||
| Number of employees (full-time equivalents) | |||||||||||||||||
| Number of employees | 46,600 | 46,400 | 45,100 | 0 | 3 | 46,600 | 45,100 | 3 | |||||||||
| See relevant tables for additional information on these metrics. | |||||||||||||||||
2
In the second quarter of 2015, we delivered improved results amidst a number of economic and political developments. The global economy showed signs of stabilization, with the US recovering slightly, oil prices stabilizing and economic data from the eurozone remaining solid, despite financial and political uncertainty relating to the Greek debt negotiations. While “Grexit” may have been averted for now, market volatility is likely to persist.
For Switzerland and many domestic companies, the Swiss National Bank’s decision in January to discontinue the minimum exchange rate of the Swiss franc against the euro and introduce negative short-term interest rates remained a major challenge during the second quarter. Specifically, the private banking sector continued to be affected by difficult market conditions, with clients maintaining a cautious investment stance. Additionally, the changed currency environment has exerted pressure on costs, as the majority of expenses in Swiss private banking are in Swiss francs while a large proportion of revenues are generated in other currencies.
The new market conditions look set to reinforce an existing trend in Swiss private banking towards greater consolidation, as smaller domestic participants look to sell or merge. Similar developments have taken place among foreign banks with Swiss private banking subsidiaries, as such banks refocus on core markets and businesses. We are monitoring matters closely.
Internationally, debate still rages about the relative merits of universal banking, as opposed to stand-alone investment banks and retail and private banks. While the furor over the role of banks during the financial crisis has abated, our sector remains in the political and media spotlight. Rebuilding trust, improving transparency and emphasizing the importance of the financial sector for the broader economy must remain priorities.
Despite domestic and international challenges, we still achieved solid results in the second quarter. To attain consistently good long-term performance, we remain acutely focused on targeted growth initiatives, leveraging our strong position in our Swiss home market and building on our strength in emerging markets.
Improved profits in the second quarter
In the second quarter of 2015, Credit Suisse’s results improved, with reported net income attributable to shareholders of CHF 1.1 billion, compared to a net loss in the second quarter of 2014, which included the CHF 1.6 billion litigation charge related to settlements with US authorities regarding US cross-border matters.
Our Private Banking & Wealth Management division performed well, with a strong contribution from our Wealth Management Clients and Corporate & Institutional Clients businesses, partially offset by lower Asset Management results due to the sale and restructuring measures taken in the fourth quarter of 2014. Wealth Management Clients saw improved profitability, driven by improved net interest income and higher client activity.
Reflecting our strong market position and the continued trust our clients place in us, we saw good client momentum in Private Banking & Wealth Management, attracting strategic net new assets of CHF 15.4 billion. Wealth Management Clients recorded strong inflows from Asia Pacific, and a solid contribution from Switzerland and Europe, Middle East and Africa (EMEA). Overall, we reported total net new assets of CHF 14.2 billion, including outflows from the Corporate & Institutional Clients business in Switzerland, which were due to the low interest rate environment and related pricing changes on cash deposits.
Investment Banking performed well in equities and in advisory. This was, however, offset by lower results in fixed income and an increase in costs primarily due to higher investments in our risk, regulatory and compliance infrastructure. The strong performance in equities was partly due to a very strong quarter in Asia Pacific; as one of the largest equity players in Asia Pacific, we are poised to capture opportunities in this high-growth region. Our strategic businesses generated pre-tax income of CHF 910 million, as higher operating expenses, as explained above, offset higher revenues.
3
We made further progress on winding down our non-strategic unit, bringing us closer to our goal of focusing resources on businesses where we see the greatest potential.
Further leverage reductions
In recent years, there has been a shift in regulatory focus toward an unweighted view of capital in the form of more restrictive leverage requirements. In order to comply with these stricter requirements, we laid out a plan to significantly reduce leverage exposure primarily through reductions in Investment Banking. During the second quarter, we continued to reduce leverage exposure, both for Investment Banking and the Group, and are on track to reach our end-2015 targets.
Separately, our look-through CET1 ratio, another important metric to measure the capital position of banks, and which fully applies the requirements as of 2019, improved to 10.3% from 10.1% as of the end of 2014 and we reported a look-through Swiss total capital ratio of 16.5%.
Progress on our growth initiatives in Private Banking & Wealth Management
We launched Credit Suisse Invest, a new advisory offering focused on improving flexibility and transparency for clients, in Switzerland and other selected markets. This supports our efforts to increase the proportion of mandates in relation to total assets under management in our Wealth Management Clients business. With mandates, our clients can delegate the management of their assets and investment decisions to Credit Suisse so that the assets can be managed securely and transparently for a specific purpose with a clear scope of action.
Our digital capabilities are highly valued by our clients at a time when they are becoming increasingly reliant on real-time mobile banking. We updated our mobile private banking app in the Swiss home market, where we already enjoyed a strong online and mobile banking presence. This followed the launch of the digital client platform in Asia Pacific. The technology gives our clients access to comprehensive portfolio information and market and research insights specific to their investment goals, whenever and wherever they choose. It also facilitates a more direct collaboration between clients and relationship managers, as well as between clients and Credit Suisse’s experts across the globe. We plan to continue to upgrade our digital offering, adding new features in both regions this and next year, and to extend the technology to clients in the Americas and EMEA in 2016.
Key growth regions
Regions enjoying particularly strong economic growth remain a major focus for our expansion. Asia Pacific continues to be a significant driver of our performance in both Private Banking & Wealth Management and Investment Banking. In the first half of 2015, Asia Pacific accounted for 16% of our overall revenues and 27% of our pre-tax income. We foresee further significant opportunities in the years ahead.
Outlook
So far in the third quarter, we have seen continued momentum in Asia Pacific, Wealth Management Clients and equities. However, the weaker trends in the fixed income markets that we saw in June have continued into July, and the third quarter normally sees some seasonal weakness.
Towards a more effective operating infrastructure
Over the last two quarters, we have been implementing the program to amend the Group’s legal entity structure and have completed a number of crucial steps. For example, in Switzerland this quarter, we registered two new legal entities, Credit Suisse (Schweiz) AG and Credit Suisse Services AG. We envisage further progress on additional milestones throughout the remainder of this and next year. The program addresses regulations in Switzerland, the US and the UK with respect to future requirements for global recovery and resolution planning by systemically important banks. We expect the changes will result in a more effective operating structure for the Group.
4
Credit Suisse of the future
Credit Suisse has a solid foundation on which to build and is well placed to develop its strategy. Our ability to harness our private banking and investment banking capabilities for the benefit of our clients remains a powerful differentiator. This is highly attractive to the dynamic client base we serve in Asia Pacific, which includes many entrepreneurs who rely on our support through all phases of their personal and corporate wealth cycle. We are, as a result, increasingly recognized as the Entrepreneurs’ Bank of Asia Pacific, a status we are determined to reinforce in the years to come.
Despite our achievements, we must find ways to provide even better service to our clients, further improve profitability and shareholder returns, and reduce the capital intensity of our business model. In the coming months, we will conduct a thorough assessment of Credit Suisse’s strategy, the results of which we intend to announce before year-end. We expect to build on our strong position in the Swiss market and capitalize on our presence and expertise in the emerging markets. We will strive to formulate a holistic strategy – across all regions and businesses – that aims to achieve sustainable, profitable growth through the cycle.
We would like to express our sincere gratitude to our clients, our shareholders and our employees for their continued support.
Sincerely
Urs Rohner Tidjane Thiam
Chairman of the Chief Executive Officer
Board of Directors
Chairman of the Chief Executive Officer
Board of Directors
July 2015
Ensuring future success
As announced earlier, Tidjane Thiam has taken over as the new CEO of Credit Suisse Group AG effective July 1, 2015. During the coming weeks and months, Tidjane and I will continue to meet and engage with stakeholders, both inside and outside of the bank. In the process, together with the leadership team and the Board of Directors, we will focus on the challenges, our strengths and the growth potential to best position Credit Suisse for the future, to ensure its success in good and challenging times alike. We are committed to making our bank faster, more agile and less operationally complex and to setting Credit Suisse on a clear path towards sustainable, profitable growth.
Urs Rohner
5
For additional information on financial information presented in this Earnings Release, including references to return on equity and return on regulatory capital, refer to the tabular disclosures in the Appendix and other explanatory disclosures regarding capital and leverage metrics in the section titled “Important information” on page 22.
| Core Results highlights | |||||||||||||||||
| in / end of | % change | in / end of | % change | ||||||||||||||
| 2Q15 | 1Q15 | 2Q14 | QoQ | YoY | 6M15 | 6M14 | YoY | ||||||||||
| Reported results (CHF million) | |||||||||||||||||
| Net revenues | 6,941 | 6,673 | 6,433 | 4 | 8 | 13,614 | 12,902 | 6 | |||||||||
| Provision for credit losses | 51 | 30 | 18 | 70 | 183 | 81 | 52 | 56 | |||||||||
| Total operating expenses | 5,244 | 5,105 | 6,785 | 3 | (23) | 10,349 | 11,820 | (12) | |||||||||
| Income/(loss) from continuing operations before taxes | 1,646 | 1,538 | (370) | 7 | – | 3,184 | 1,030 | 209 | |||||||||
| Net income/(loss) attributable to shareholders | 1,051 | 1,054 | (700) | 0 | – | 2,105 | 159 | – | |||||||||
| Metrics (%) | |||||||||||||||||
| Return on regulatory capital | 15.3 | 13.9 | – | – | – | 14.6 | 5.3 | – | |||||||||
| Cost/income ratio | 75.6 | 76.5 | 105.5 | – | – | 76.0 | 91.6 | – | |||||||||
| Strategic results (CHF million) | |||||||||||||||||
| Net revenues | 6,758 | 6,590 | 6,309 | 3 | 7 | 13,348 | 12,839 | 4 | |||||||||
| Provision for credit losses | 38 | 26 | 25 | 46 | 52 | 64 | 43 | 49 | |||||||||
| Total operating expenses | 4,908 | 4,742 | 4,509 | 4 | 9 | 9,650 | 9,077 | 6 | |||||||||
| Income from continuing operations before taxes | 1,812 | 1,822 | 1,775 | (1) | 2 | 3,634 | 3,719 | (2) | |||||||||
| Net income attributable to shareholders | 1,418 | 1,235 | 1,288 | 15 | 10 | 2,653 | 2,692 | (1) | |||||||||
| Metrics (%) | |||||||||||||||||
| Return on regulatory capital | 17.6 | 17.3 | 19.4 | – | – | 17.5 | 20.7 | – | |||||||||
| Cost/income ratio | 72.6 | 72.0 | 71.5 | – | – | 72.3 | 70.7 | – | |||||||||
| Non-strategic results (CHF million) | |||||||||||||||||
| Net revenues | 183 | 83 | 124 | 120 | 48 | 266 | 63 | 322 | |||||||||
| Provision for credit losses | 13 | 4 | (7) | 225 | – | 17 | 9 | 89 | |||||||||
| Total operating expenses | 336 | 363 | 2,276 | (7) | (85) | 699 | 2,743 | (75) | |||||||||
| Loss from continuing operations before taxes | (166) | (284) | (2,145) | (42) | (92) | (450) | (2,689) | (83) | |||||||||
| Net loss attributable to shareholders | (367) | (181) | (1,988) | 103 | (82) | (548) | (2,533) | (78) | |||||||||
| Core Results do not include noncontrolling interests without significant economic interests. | |||||||||||||||||
In 2Q15, net income attributable to shareholders was CHF 1,051 million.
Income before taxes was CHF 1,646 million compared to a loss before taxes of CHF 370 million in 2Q14, primarily reflecting a 23% decrease in total operating expenses. In the strategic businesses, income before taxes of CHF 1,812 million increased 2% compared to 2Q14. Non-strategic businesses reported a loss before taxes of CHF 166 million in 2Q15 compared to a loss before taxes of CHF 2,145 million in 2Q14.
Net revenues of CHF 6,941 million increased 8% compared to 2Q14. In the strategic businesses, net revenues increased 7% to CHF 6,758 million, reflecting higher net revenues in Investment Banking, Private Banking & Wealth Management and Corporate Center. In the non-strategic businesses, net revenues were CHF 183 million in 2Q15 compared to net revenues of CHF 124 million in 2Q14.
Provision for credit losses was CHF 51 million in 2Q15, with net provisions of CHF 44 million in Private Banking & Wealth Management and CHF 7 million in Investment Banking.
6
Total operating expenses of CHF 5,244 million were down 23% compared to 2Q14. In the strategic businesses, total operating expenses of CHF 4,908 million increased 9% compared to 2Q14, primarily reflecting an 18% increase in general and administrative expenses and a 4% increase in compensation and benefits. In the non-strategic businesses, total operating expenses of CHF 336 million decreased 85% compared to 2Q14, primarily due to an 88% decrease in general and administrative expenses, reflecting the charge of CHF 1,618 million relating to the settlements with US authorities regarding US cross-border matters recognized in the non-strategic results of the Private Banking & Wealth Management division in 2Q14. Business realignment costs in 2Q15 were CHF 82 million.
Income tax expense of CHF 590 million recorded in 2Q15 mainly reflected the impact of the geographical mix of results and the effect of a New York City tax law change. This change in tax law required a remeasurement and decrease of existing deferred tax assets arising from timing differences and resulted in an additional tax charge of CHF 189 million. Overall, net deferred tax assets decreased CHF 660 million to CHF 5,034 million, mainly driven by earnings and foreign exchange movements as of the end of 2Q15 compared to 1Q15 and the effect of the New York City tax law change. Deferred tax assets on net operating losses decreased CHF 265 million to CHF 1,119 million during 2Q15. The Core Results effective tax rate was 35.8% in 2Q15, compared to 31.0% in 1Q15.
Range of reasonably possible losses related to certain legal proceedings: The Group’s estimate of the aggregate range of reasonably possible losses that are not covered by existing provisions for certain proceedings for which the Group believes an estimate is possible was zero to CHF 1.8 billion at the end 2Q15.
Diluted earnings per share from continuing operations were CHF 0.61 for 2Q15 compared to a diluted loss per share of CHF 0.45 in 2Q14 and diluted earnings per share of CHF 0.62 in 1Q15.
Benefits of the integrated bank: In 2Q15, Credit Suisse generated CHF 1.0 billion of collaboration revenues from the integrated bank. This corresponds to 14.7% of Core net revenues in 2Q15.
Cost savings: As of the end of 2Q15, Credit Suisse achieved cost savings of approximately CHF 3.5 billion since the start of the expense reduction program in 2011. Further cost savings are expected to be delivered over the balance of the year, reaching approximately CHF 4.0 billion by the end of 2015. However, Credit Suisse expects that risk, compliance and regulatory costs will continue to rise across both divisions.
Management is currently in the process of thoroughly assessing the strategy, the results of which we intend to announce before year-end. When this process is concluded, it is possible that the cost savings plans and targets described above will change.
7
In 2Q15, Private Banking & Wealth Management reported income before taxes of CHF 937 million and net revenues of CHF 3,152 million. In its strategic businesses, Private Banking & Wealth Management reported income before taxes of CHF 1,001 million and net revenues of CHF 3,091 million. Compared to 2Q14, income before taxes increased reflecting higher net interest income, higher transaction- and performance-based revenues, partially offset by lower recurring commissions and fees and slightly higher operating expenses. Compared to 1Q15, income before taxes increased mainly reflecting higher net interest income, partially offset by slightly higher operating expenses. In its non-strategic businesses, Private Banking & Wealth Management reported a loss before taxes of CHF 64 million. In 2Q15, assets under management for the division were CHF 1,355.7 billion and the division attracted net new assets of CHF 14.2 billion.
Capital and leverage metrics: At the end of 2Q15, Private Banking & Wealth Management strategic businesses reported risk-weighted assets of CHF 101.3 billion, a decrease of CHF 3.3 billion compared to the end of 1Q15. The decrease was driven by business reductions and foreign exchange movements, partially offset by methodology changes. Leverage exposure was CHF 376.3 billion, reflecting a decrease of 2.4% compared to the end of 1Q15. At the end of 2Q15, Private Banking & Wealth Management non-strategic businesses reported risk-weighted assets of CHF 4.5 billion, stable compared to the end of 1Q15. Leverage exposure was CHF 3.9 billion, a decrease of CHF 0.3 billion compared to the end of 1Q15.
| Private Banking & Wealth Management | |||||||||||||||||
| in / end of | % change | in / end of | % change | ||||||||||||||
| 2Q15 | 1Q15 | 2Q14 | QoQ | YoY | 6M15 | 6M14 | YoY | ||||||||||
| Reported results (CHF million) | |||||||||||||||||
| Net revenues | 3,152 | 2,972 | 3,046 | 6 | 3 | 6,124 | 6,286 | (3) | |||||||||
| Provision for credit losses | 44 | 29 | 23 | 52 | 91 | 73 | 56 | 30 | |||||||||
| Compensation and benefits | 1,248 | 1,229 | 1,235 | 2 | 1 | 2,477 | 2,525 | (2) | |||||||||
| Total other operating expenses | 923 | 880 | 2,537 | 5 | (64) | 1,803 | 3,442 | (48) | |||||||||
| Total operating expenses | 2,171 | 2,109 | 3,772 | 3 | (42) | 4,280 | 5,967 | (28) | |||||||||
| Income/(loss) before taxes | 937 | 834 | (749) | 12 | – | 1,771 | 263 | – | |||||||||
| Metrics (%) | |||||||||||||||||
| Return on regulatory capital | 23.5 | 21.0 | – | – | – | 22.4 | 4.0 | – | |||||||||
| Cost/income ratio | 68.9 | 71.0 | 123.8 | – | – | 69.9 | 94.9 | – | |||||||||
8
Strategic results
Private Banking & Wealth Management’s strategic results comprise businesses from Wealth Management Clients, Corporate & Institutional Clients and Asset Management.
| Private Banking & Wealth Management – strategic results | |||||||||||||||||
| in / end of | % change | in / end of | % change | ||||||||||||||
| 2Q15 | 1Q15 | 2Q14 | QoQ | YoY | 6M15 | 6M14 | YoY | ||||||||||
| Strategic results (CHF million) | |||||||||||||||||
| Net interest income | 1,096 | 981 | 954 | 12 | 15 | 2,077 | 1,917 | 8 | |||||||||
| Recurring commissions and fees | 1,082 | 1,067 | 1,136 | 1 | (5) | 2,149 | 2,275 | (6) | |||||||||
| Transaction- and performance-based revenues | 925 | 922 | 865 | 0 | 7 | 1,847 | 1,784 | 4 | |||||||||
| Other revenues | (12) | 0 | (23) | – | (48) | (12) | (13) | (8) | |||||||||
| Net revenues | 3,091 | 2,970 | 2,932 | 4 | 5 | 6,061 | 5,963 | 2 | |||||||||
| Provision for credit losses | 31 | 25 | 30 | 24 | 3 | 56 | 47 | 19 | |||||||||
| Total operating expenses | 2,059 | 2,007 | 2,020 | 3 | 2 | 4,066 | 4,069 | 0 | |||||||||
| Income before taxes | 1,001 | 938 | 882 | 7 | 13 | 1,939 | 1,847 | 5 | |||||||||
| Metrics (%) | |||||||||||||||||
| Return on regulatory capital | 25.8 | 24.3 | 28.0 | – | – | 25.2 | 29.8 | – | |||||||||
| Cost/income ratio | 66.6 | 67.6 | 68.9 | – | – | 67.1 | 68.2 | – | |||||||||
In 2Q15, the strategic businesses for Private Banking & Wealth Management reported income before taxes of CHF 1,001 million and net revenues of CHF 3,091 million.
Compared to 2Q14, net revenues increased 5% reflecting higher net interest income, higher transaction- and performance-based revenues and improved other revenues, partially offset by lower recurring commissions and fees. Net interest income increased with significantly higher loan margins on higher average loan volumes, partially offset by significantly lower deposit margins on higher average deposit volumes. Transaction- and performance-based revenues increased reflecting higher sales and trading revenues and higher equity participations income, partially offset by lower performance fees and carried interest and lower corporate advisory fees related to integrated solutions. Improved other revenues mainly reflected a higher fair value loss on the Clock Finance transaction in 2Q14. Recurring commissions and fees decreased reflecting lower asset management fees, banking services fees and security account and custody services fees, partially offset by higher discretionary mandate management fees and higher investment advisory fees.
Compared to 1Q15, net revenues increased 4% with higher net interest income, partially offset by lower other revenues. Net interest income increased reflecting higher loan and deposit margins on stable average loan and deposit volumes. Lower other revenues mainly reflected an equity participation gain related to Asset Management Finance LLC (AMF) in 1Q15. Recurring commissions and fees were stable with higher investment advisory fees and slightly higher asset management fees offset by lower fees from lending activities and lower revenues from wealth structuring solutions. Transaction- and performance-based revenues were stable with higher equity participations income, performance fees and carried interest and placement fees, offset by lower fees from foreign exchange client business.
Provision for credit losses was CHF 31 million, compared to CHF 30 million in 2Q14 and CHF 25 million in 1Q15.
Total operating expenses were slightly higher compared to 2Q14 and 1Q15. Compared to 2Q14, compensation and benefits were higher reflecting higher discretionary compensation expenses and higher salary expenses driven by higher headcount. General and administrative expenses were stable with higher litigation provisions and higher professional services fees offset by lower occupancy expenses. Compared to 1Q15, compensation and benefits
9
were slightly higher reflecting higher discretionary compensation expenses and higher salary expenses, partially offset by lower deferred compensation expenses from prior-year awards. General and administrative expenses increased 4%, reflecting higher litigation provisions and higher professional services fees.
The cost/income ratio for the strategic results was 67% in 2Q15, down two percentage points compared to 2Q14 and down one percentage point compared to 1Q15.
On July 1, 2015, Credit Suisse Group transferred the credit and charge cards issuing business (cards issuing business) to Swisscard AECS GmbH, an entity in which the Group holds a significant equity interest. As a result of the transfer, the cards issuing business will be deconsolidated, including the pre-existing non-controlling interest in the cards issuing business. The aggregate impact of the deconsolidation on the Group’s future net income attributable to shareholders is not expected to be material given that Swisscard AECS GmbH will continue to be an equity method investment of the Group, but financial results for the Wealth Management Clients business within the Private Banking & Wealth Management division will be affected.
| Wealth Management Clients | |||||||||||||||||
| in / end of | % change | in / end of | % change | ||||||||||||||
| 2Q15 | 1Q15 | 2Q14 | QoQ | YoY | 6M15 | 6M14 | YoY | ||||||||||
| Strategic results (CHF million) | |||||||||||||||||
| Net interest income | 821 | 741 | 688 | 11 | 19 | 1,562 | 1,394 | 12 | |||||||||
| Recurring commissions and fees | 717 | 700 | 728 | 2 | (2) | 1,417 | 1,458 | (3) | |||||||||
| Transaction- and performance-based revenues | 659 | 670 | 601 | (2) | 10 | 1,329 | 1,239 | 7 | |||||||||
| Net revenues | 2,197 | 2,111 | 2,017 | 4 | 9 | 4,308 | 4,091 | 5 | |||||||||
| Provision for credit losses | 7 | 17 | 17 | (59) | (59) | 24 | 33 | (27) | |||||||||
| Total operating expenses | 1,521 | 1,458 | 1,431 | 4 | 6 | 2,979 | 2,911 | 2 | |||||||||
| Income before taxes | 669 | 636 | 569 | 5 | 18 | 1,305 | 1,147 | 14 | |||||||||
| Metrics (%) | |||||||||||||||||
| Return on regulatory capital | 29.4 | 28.5 | 30.6 | – | – | 29.1 | 31.5 | – | |||||||||
| Cost/income ratio | 69.2 | 69.1 | 70.9 | – | – | 69.2 | 71.2 | – | |||||||||
The Wealth Management Clients business in 2Q15 reported income before taxes of CHF 669 million and net revenues of CHF 2,197 million. Net revenues increased 9% compared to 2Q14, with higher net interest income and higher transaction- and performance-based revenues, partially offset by slightly lower recurring commissions and fees. Higher net interest income reflected higher loan margins on higher average loan volumes, partially offset by slightly lower deposit margins on higher average deposit volumes. Higher transaction- and performance-based revenues reflected increased sales and trading revenues, performance fees, fees from foreign exchange client business and equity participations income, partially offset by lower corporate advisory fees related to integrated solutions. Recurring commissions and fees were slightly lower with decreased banking services fees, security account and custody services fees and investment product management fees, partially offset by increased discretionary mandate management fees, investment advisory fees and revenues from wealth structuring solutions.
Compared to 1Q15, net revenues increased 4%, driven by higher net interest income and slightly higher recurring commissions and fees, partially offset by slightly lower transaction- and performance-based revenues. Net interest income increased with higher loan and deposit margins on slightly higher average loan and deposit volumes. Recurring commissions and fees were slightly higher reflecting higher investment advisory fees and slightly higher investment product management fees. Transaction- and performance-based revenues were slightly lower with decreased fees from foreign exchange client business, partially offset by higher equity participations income reflecting dividends from the ownership interest in SIX Group AG and higher performance fees.
10
In 2Q15, the gross margin was 102 basis points, three basis points higher compared to 2Q14, mainly reflecting higher net interest income and higher transaction- and performance-based revenues, partially offset by a 4.9% increase in average assets under management. Compared to 1Q15, the gross margin was up two basis points, reflecting higher net interest income and slightly higher recurring commissions and fees, partially offset by a 1.8% increase in average assets under management.
Wealth Management Clients net margin was 31 basis points in 2Q15, three basis points higher compared to 2Q14, reflecting higher net revenues, partially offset by higher operating expenses and a 4.9% increase in average assets under management. Compared to 1Q15, the net margin was up one basis point, reflecting higher net revenues, partially offset by higher operating expenses and a 1.8% increase in average assets under management.
| Corporate & Institutional Clients | |||||||||||||||||
| in / end of | % change | in / end of | % change | ||||||||||||||
| 2Q15 | 1Q15 | 2Q14 | QoQ | YoY | 6M15 | 6M14 | YoY | ||||||||||
| Strategic results (CHF million) | |||||||||||||||||
| Net interest income | 275 | 240 | 266 | 15 | 3 | 515 | 523 | (2) | |||||||||
| Recurring commissions and fees | 115 | 123 | 113 | (7) | 2 | 238 | 235 | 1 | |||||||||
| Transaction- and performance-based revenues | 125 | 126 | 118 | (1) | 6 | 251 | 235 | 7 | |||||||||
| Other revenues | (7) | (5) | (22) | 40 | (68) | (12) | (26) | (54) | |||||||||
| Net revenues | 508 | 484 | 475 | 5 | 7 | 992 | 967 | 3 | |||||||||
| Provision for credit losses | 24 | 8 | 13 | 200 | 85 | 32 | 14 | 129 | |||||||||
| Total operating expenses | 240 | 246 | 251 | (2) | (4) | 486 | 496 | (2) | |||||||||
| Income before taxes | 244 | 230 | 211 | 6 | 16 | 474 | 457 | 4 | |||||||||
| Metrics (%) | |||||||||||||||||
| Return on regulatory capital | 18.8 | 17.6 | 19.5 | – | – | 18.4 | 21.2 | – | |||||||||
| Cost/income ratio | 47.2 | 50.8 | 52.8 | – | – | 49.0 | 51.3 | – | |||||||||
The Corporate & Institutional Clients business in 2Q15 reported income before taxes of CHF 244 million and net revenues of CHF 508 million. Net revenues were 7% higher compared to 2Q14, reflecting improved other revenues, slightly higher net interest income, higher transaction- and performance-based revenues and slightly higher recurring commissions and fees. Improved other revenues mainly reflected a higher fair value loss on the Clock Finance transaction in 2Q14. Net interest income was slightly higher with significantly higher loan margins on higher average loan volumes partially offset by significantly lower deposit margins on higher average deposit volumes. Transaction- and performance-based revenues were higher with higher sales and trading revenues partially offset by lower fees from foreign exchange client business and lower corporate advisory fees related to integrated solutions. Recurring commissions and fees were slightly higher mainly reflecting increased investment product management fees.
Compared to 1Q15, net revenues increased 5%, with higher net interest income partially offset by lower recurring commissions and fees. Higher net interest income reflected higher loan margins on stable average loan volumes partially offset by slightly lower deposit margins on slightly lower average deposit volumes. Lower recurring commissions and fees mainly reflected lower fee income on lending activities. Transaction- and performance-based revenues were stable with lower fees from foreign exchange client business offset by higher corporate advisory fees related to integrated solutions and higher sales and trading revenues.
11
| Asset Management | |||||||||||||||||
| in / end of | % change | in / end of | % change | ||||||||||||||
| 2Q15 | 1Q15 | 2Q14 | QoQ | YoY | 6M15 | 6M14 | YoY | ||||||||||
| Strategic results (CHF million) | |||||||||||||||||
| Recurring commissions and fees | 250 | 244 | 295 | 2 | (15) | 494 | 582 | (15) | |||||||||
| Transaction- and performance-based revenues | 141 | 126 | 146 | 12 | (3) | 267 | 310 | (14) | |||||||||
| Other revenues | (5) | 5 | (1) | – | 400 | 0 | 13 | (100) | |||||||||
| Net revenues | 386 | 375 | 440 | 3 | (12) | 761 | 905 | (16) | |||||||||
| of which fee-based revenues | 372 | 353 | 428 | 5 | (13) | 725 | 866 | (16) | |||||||||
| Provision for credit losses | 0 | 0 | 0 | – | – | 0 | 0 | – | |||||||||
| Total operating expenses | 298 | 303 | 338 | (2) | (12) | 601 | 662 | (9) | |||||||||
| Income before taxes | 88 | 72 | 102 | 22 | (14) | 160 | 243 | (34) | |||||||||
| Metrics (%) | |||||||||||||||||
| Return on regulatory capital | 28.5 | 22.7 | 48.4 | – | – | 25.4 | 61.0 | – | |||||||||
| Cost/income ratio | 77.2 | 80.8 | 76.8 | – | – | 79.0 | 73.1 | – | |||||||||
The Asset Management business reported income before taxes of CHF 88 million in 2Q15, with net revenues of CHF 386 million. Net revenues decreased 12% compared to 2Q14, mainly driven by lower fee-based revenues. Fee-based revenues decreased reflecting lower asset management fees and lower performance fees, partially offset by higher equity participations income and higher transaction fees. The decrease in asset management fees reflected the absence of asset management fees from Hedging-Griffo following the change in fund management from Hedging-Griffo to a new venture in Brazil, Verde Asset Management, in which Credit Suisse has a significant investment.
Net revenues increased 3% compared to 1Q15, primarily due to higher fee-based revenues partially offset by lower equity participations and other gains. Fee-based revenues increased reflecting higher placement fees and higher carried interest on realized private equity gains partially offset by lower performance fees. Lower equity participations and other gains reflected an impairment of CHF 1 million related to AMF recognized in 2Q15 compared to an equity participation gain of CHF 9 million in 1Q15.
The fee-based margin was 38 basis points in 2Q15, compared to 46 basis points in 2Q14 and 37 basis points in 1Q15. The decrease compared to 2Q14 reflected both the lower fee-based revenues and the higher average assets under management, which increased 6.4% compared to 2Q14. The increase compared to 1Q15 reflected the higher fee-based revenues, partially offset by the higher average assets under management, which increased 3.3% compared to 1Q15.
12
Non-strategic results
The non-strategic results for Private Banking & Wealth Management include positions relating to the restructuring of the former Asset Management division, run-off operations relating to the small markets exit initiative and certain legacy cross-border related run-off operations, litigation costs, primarily related to the settlements with US authorities regarding US cross-border matters, other smaller non-strategic positions formerly in the Corporate & Institutional Clients business and the run-off and active reduction of selected products. Furthermore, it comprises certain remaining operations that Credit Suisse continues to wind-down relating to its domestic private banking business booked in Germany, which was sold in 2014.
| Private Banking & Wealth Management – non-strategic results | |||||||||||||||||
| in / end of | % change | in / end of | % change | ||||||||||||||
| 2Q15 | 1Q15 | 2Q14 | QoQ | YoY | 6M15 | 6M14 | YoY | ||||||||||
| Non-strategic results (CHF million) | |||||||||||||||||
| Net revenues | 61 | 2 | 114 | – | (46) | 63 | 323 | (80) | |||||||||
| Provision for credit losses | 13 | 4 | (7) | 225 | – | 17 | 9 | 89 | |||||||||
| Total operating expenses | 112 | 102 | 1,752 | 10 | (94) | 214 | 1,898 | (89) | |||||||||
| Loss before taxes | (64) | (104) | (1,631) | (38) | (96) | (168) | (1,584) | (89) | |||||||||
In 2Q15, the non-strategic businesses reported a loss before taxes of CHF 64 million. Operating expenses were CHF 112 million, primarily reflecting the continued winding-down of operations and costs of CHF 66 million to meet requirements related to the settlements with US authorities regarding US cross-border matters. In 1Q15, Private Banking & Wealth Management’s non-strategic businesses reported a loss before taxes of CHF 104 million.
Assets under management – Private Banking & Wealth Management
Assets under management of CHF 1,355.7 billion decreased CHF 18.3 billion compared to the end of 1Q15, driven by unfavorable foreign exchange-related movements, primarily resulting from the appreciation of the Swiss franc against the US dollar, and unfavorable market movements, partially offset by net new assets.
Net new assets: Private Banking & Wealth Management recorded net new assets of CHF 14.2 billion in 2Q15. In the strategic portfolio, Wealth Management Clients contributed net new assets of CHF 9.0 billion in 2Q15 with continued strong inflows from Asia Pacific and solid contribution from Switzerland and EMEA. Corporate & Institutional Clients in Switzerland reported net asset outflows of CHF 1.6 billion in 2Q15, reflecting pricing changes on cash deposits. Asset Management reported solid net new assets of CHF 8.9 billion in 2Q15, driven by inflows from a joint venture in emerging markets, multi-asset class solutions, credit and real estate products. In the non-strategic portfolio, net asset outflows of CHF 1.2 billion reflected the winding-down of non-strategic operations.
13
| Assets under management – Private Banking & Wealth Management | |||||||||||||||||
| in / end of | % change | in / end of | % change | ||||||||||||||
| 2Q15 | 1Q15 | 2Q14 | QoQ | YoY | 6M15 | 6M14 | YoY | ||||||||||
| Assets under management by business (CHF billion) | |||||||||||||||||
| Wealth Management Clients | 847.7 | 861.2 | 829.7 | (1.6) | 2.2 | 847.7 | 829.7 | 2.2 | |||||||||
| Corporate & Institutional Clients | 277.8 | 286.7 | 261.4 | (3.1) | 6.3 | 277.8 | 261.4 | 6.3 | |||||||||
| Asset Management | 393.9 | 391.7 | 377.1 | 0.6 | 4.5 | 393.9 | 377.1 | 4.5 | |||||||||
| Non-strategic | 9.4 | 9.2 | 25.9 | 2.2 | (63.7) | 9.4 | 25.9 | (63.7) | |||||||||
| Assets managed across businesses | (173.1) | (174.8) | (164.4) | (1.0) | 5.3 | (173.1) | (164.4) | 5.3 | |||||||||
| Assets under management | 1,355.7 | 1,374.0 | 1,329.7 | (1.3) | 2.0 | 1,355.7 | 1,329.7 | 2.0 | |||||||||
| Average assets under management (CHF billion) | |||||||||||||||||
| Average assets under management | 1,370.1 | 1,340.6 | 1,311.6 | 2.2 | 4.5 | 1,355.4 | 1,296.8 | 4.5 | |||||||||
| Net new assets by business (CHF billion) | |||||||||||||||||
| Wealth Management Clients | 9.0 | 7.0 | 7.4 | 28.6 | 21.6 | 16.0 | 18.0 | (11.1) | |||||||||
| Corporate & Institutional Clients | (1.6) | 6.1 | 0.6 | – | – | 4.5 | 1.0 | 350.0 | |||||||||
| Asset Management | 8.9 | 10.2 | 4.1 | (12.7) | 117.1 | 19.1 | 11.0 | 73.6 | |||||||||
| Non-strategic | (1.2) | (1.4) | (1.7) | (14.3) | (29.4) | (2.6) | (4.0) | (35.0) | |||||||||
| Assets managed across businesses | (0.9) | (4.9) | (0.3) | (81.6) | 200.0 | (5.8) | (2.2) | 163.6 | |||||||||
| Net new assets | 14.2 | 17.0 | 10.1 | (16.5) | 40.6 | 31.2 | 23.8 | 31.1 | |||||||||
| Net new asset growth rate (annualized) (%) | |||||||||||||||||
| Net new asset growth rate – Wealth Management Clients | 4.2 | 3.2 | 3.7 | – | – | 3.7 | 4.6 | – | |||||||||
| Net new asset growth rate – Asset Management | 9.1 | 10.5 | 4.5 | – | – | 9.8 | 6.3 | – | |||||||||
14
In 2Q15, Investment Banking reported income before taxes of CHF 615 million and net revenues of CHF 3,381 million. Revenues in the strategic businesses increased compared to 2Q14, led by higher equity sales and trading results in Asia Pacific and improved advisory performance. Compared to 1Q15, which benefited from seasonally stronger trading volumes and client activity in the fixed income and equity sales and trading businesses, strategic revenues were slightly lower. The non-strategic business continued to execute on the wind-down strategy during the quarter, reducing leverage exposure and risk-weighted assets compared to 2Q14 and 1Q15.
Capital and leverage metrics: At the end of 2Q15, Investment Banking strategic businesses reported risk-weighted assets of USD 158.2 billion, an increase of USD 5.1 billion compared to the end of 1Q15. The strategic businesses made continued progress in reducing leverage exposure by USD 13.1 billion from 1Q15, to USD 634.9 billion at the end of 2Q15. Investment Banking made continued progress in winding down its non-strategic businesses. At the end of 2Q15, risk-weighted assets were USD 8.7 billion, down USD 5.7 billion compared to the end of 2Q14 and down USD 0.9 billion compared the end of 1Q15. This compares to a risk-weighted assets target of USD 6 billion by year-end 2015. Leverage exposure was USD 40.4 billion at the end of 2Q15, reflecting a decrease of USD 8.5 billion compared to the end of 1Q15. This compares to a target of USD 24 billion in leverage exposure by year-end 2015.
| Investment Banking | |||||||||||||||||
| in / end of | % change | in / end of | % change | ||||||||||||||
| 2Q15 | 1Q15 | 2Q14 | QoQ | YoY | 6M15 | 6M14 | YoY | ||||||||||
| Reported results (CHF million) | |||||||||||||||||
| Net revenues | 3,381 | 3,583 | 3,342 | (6) | 1 | 6,964 | 6,758 | 3 | |||||||||
| Provision for credit losses | 7 | 1 | (5) | – | – | 8 | (5) | – | |||||||||
| Compensation and benefits | 1,545 | 1,552 | 1,499 | 0 | 3 | 3,097 | 3,020 | 3 | |||||||||
| Total other operating expenses | 1,214 | 1,085 | 1,096 | 12 | 11 | 2,299 | 2,164 | 6 | |||||||||
| Total operating expenses | 2,759 | 2,637 | 2,595 | 5 | 6 | 5,396 | 5,184 | 4 | |||||||||
| Income/(loss) before taxes | 615 | 945 | 752 | (35) | (18) | 1,560 | 1,579 | (1) | |||||||||
| Metrics (%) | |||||||||||||||||
| Return on regulatory capital | 9.9 | 14.7 | 12.3 | – | – | 12.3 | 13.0 | – | |||||||||
| Cost/income ratio | 81.6 | 73.6 | 77.6 | – | – | 77.5 | 76.7 | – | |||||||||
Strategic results
In 2Q15, the strategic businesses reported income before taxes of CHF 910 million and net revenues of CHF 3,549 million. Fixed income sales and trading revenues declined compared to 2Q14 as lower revenues in global credit products and emerging markets offset strength in global macro products and securitized products. Revenues decreased significantly compared to 1Q15, due to seasonally higher client activity across all fixed income businesses in 1Q15. Equity sales and trading results were strong compared to 2Q14, primarily driven by increased activity in Asia Pacific. Revenues were slightly down compared to 1Q15, as lower trading activity in other businesses more than offset strong revenues in prime services. Underwriting and advisory results were stable compared to 2Q14, as higher advisory fees offset lower equity and debt underwriting revenues. Revenues increased significantly compared to 1Q15, reflecting improved activity across mergers and acquisitions (M&A) and debt and equity underwriting. Results in 2Q15 were impacted by the weakening of the average rate of the Swiss franc against the US dollar compared to 2Q14, which positively impacted revenues, but adversely impacted expenses. Compared to 2Q14, revenues increased 5% and total operating expenses increased 12% in Swiss francs, while revenues were stable and total operating expenses increased 6% in US dollars.
15
Fixed income sales and trading: Fixed income trading revenues declined compared to 2Q14, due to weaker June market conditions, resulting in a risk-averse operating environment. In addition, results in 2Q14 were strong, which benefited from increased investor demand for yield products, specifically credit and securitized products, given a low rate environment. Global credit products revenues declined, as a slowdown in leveraged finance underwriting activity resulted in weaker trading performance in the US and EMEA. Revenues in emerging markets were also lower, as weaker trading performance in Asia Pacific and Latin America offset higher results in EMEA. These declines were partially offset by significantly improved global macro products revenues, from subdued levels, reflecting increased client activity across rates and foreign exchange businesses. In addition, revenues in securitized products business were strong, primarily driven by robust growth in the asset finance franchise. Compared to 1Q15, fixed income revenues declined, following a seasonally stronger 1Q15. Global credit products revenues declined, driven by lower leveraged finance and investment grade trading revenues. Revenues in global macro products were lower, as subdued client activity from macroeconomic uncertainty in Greece negatively impacted the foreign exchange and rates businesses. Emerging market revenues decreased, as weak trading results in Asia Pacific and Latin America offset higher financing results. In addition, securitized products revenues declined, as lower non-agency and agency results more than offset significant growth in the asset finance franchise.
Equity sales and trading: Equity sales and trading revenues were strong compared to 2Q14, reflecting increased activity in Asia Pacific and sustained market shares. Derivatives results increased significantly, primarily due to strong revenue growth in Asia Pacific and continued momentum in fee-based products distributed by Private Banking & Wealth Management. Prime services revenues were strong, despite significantly reduced leverage exposure, reflecting continued progress on the client portfolio optimization strategy. Revenues from systematic market making were also higher. Cash equities revenues were stable as commission growth on higher volumes in Asia Pacific and slightly higher revenues in EMEA more than offset difficult trading conditions in Latin America. Equity sales and trading revenues declined slightly compared to 1Q15, reflecting lower systematic market making revenues due to reduced trading activity. Derivatives revenues declined following strong 1Q15 results. These declines were partially offset by higher prime services results, reflecting continued progress on the client optimization strategy and higher revenues as a result of the European and Asian dividend season. Results in cash equities were stable, as commission growth on higher volumes in Asia Pacific and slightly higher revenues in EMEA more than offset difficult trading conditions in Latin America.
Underwriting and advisory: Debt underwriting results decreased compared to 2Q14, primarily driven by lower revenues in the leveraged finance business due to a slow underwriting environment, particularly in the US, and lower revenues in EMEA. These declines were partially offset by higher investment grade revenues, reflecting an increase in share of wallet. Equity underwriting results declined compared to strong 2Q14 results. Revenues from IPOs declined significantly, reflecting a substantial decline in the overall fee pool and a decrease in share of wallet. These declines were partially offset by significantly higher activity from follow-on offerings due to a substantial increase in share of wallet, most notably in Asia Pacific. Advisory revenues improved, reflecting an increase in the overall advisory fee pool, driven by increased industry-wide completed M&A activity, which more than offset the decrease in share of wallet. Debt underwriting results increased significantly compared to 1Q15, due to improved leveraged loans performance in the Americas following weak performance in 1Q15, partially offset by a slowdown in EMEA. Investment grade revenues were slightly higher, due to increased global industry-wide issuance. Equity underwriting results increased significantly from 1Q15, reflecting improved performance across all businesses. Revenues from follow-on offerings were higher, due to an increase in share of wallet, most notably in Asia Pacific. IPO revenues increased, reflecting an increase in both the overall fee pool and share of wallet. Revenues from convertibles were also higher, as an increase in share of wallet offset a decrease in the overall fee pool. Advisory revenues were significantly higher compared to 1Q15, as share of wallet gains more than offset a decline in the overall advisory fee pool. In addition, revenues were positively impacted as certain deal closings moved from 1Q15 into 2Q15.
16
| Investment Banking – strategic results | |||||||||||||||||
| in / end of | % change | in / end of | % change | ||||||||||||||
| 2Q15 | 1Q15 | 2Q14 | QoQ | YoY | 6M15 | 6M14 | YoY | ||||||||||
| Strategic results (CHF million) | |||||||||||||||||
| Debt underwriting | 467 | 332 | 483 | 41 | (3) | 799 | 951 | (16) | |||||||||
| Equity underwriting | 240 | 153 | 268 | 57 | (10) | 393 | 451 | (13) | |||||||||
| Total underwriting | 707 | 485 | 751 | 46 | (6) | 1,192 | 1,402 | (15) | |||||||||
| Advisory and other fees | 207 | 132 | 161 | 57 | 29 | 339 | 341 | (1) | |||||||||
| Total underwriting and advisory | 914 | 617 | 912 | 48 | 0 | 1,531 | 1,743 | (12) | |||||||||
| Fixed income sales and trading | 1,403 | 1,732 | 1,470 | (19) | (5) | 3,135 | 3,056 | 3 | |||||||||
| Equity sales and trading | 1,320 | 1,344 | 1,119 | (2) | 18 | 2,664 | 2,325 | 15 | |||||||||
| Total sales and trading | 2,723 | 3,076 | 2,589 | (11) | 5 | 5,799 | 5,381 | 8 | |||||||||
| Other | (88) | (67) | (121) | 31 | (27) | (155) | (204) | (24) | |||||||||
| Net revenues | 3,549 | 3,626 | 3,380 | (2) | 5 | 7,175 | 6,920 | 4 | |||||||||
| Provision for credit losses | 7 | 1 | (5) | – | – | 8 | (5) | – | |||||||||
| Total operating expenses | 2,632 | 2,510 | 2,343 | 5 | 12 | 5,142 | 4,755 | 8 | |||||||||
| Income before taxes | 910 | 1,115 | 1,042 | (18) | (13) | 2,025 | 2,170 | (7) | |||||||||
| Metrics (%) | |||||||||||||||||
| Return on regulatory capital | 15.6 | 18.6 | 18.7 | – | – | 17.1 | 19.8 | – | |||||||||
| Cost/income ratio | 74.2 | 69.2 | 69.3 | – | – | 71.7 | 68.7 | – | |||||||||
Total operating expenses increased 12% compared to 2Q14, also reflecting the foreign exchange impact of the weakening of the Swiss franc compared to the US dollar. Compensation and benefits expenses in US dollar decreased slightly, primarily due to lower discretionary compensation expenses. An increase in general and administrative expenses in US dollars was driven by increased investments in risk, regulatory and compliance infrastructure, higher litigation, and indirect taxes. Compared to 1Q15, total operating expenses increased 5% in Swiss francs, driven by higher general and administrative expenses due to higher litigation provisions and increased investments in risk, regulatory and compliance infrastructure. Compensation and benefits expenses were stable, as lower discretionary compensation and deferred compensation expenses from prior-year awards partially offset higher salary expenses.
17
Non-strategic results
The non-strategic results for Investment Banking comprise the legacy fixed income portfolio including the legacy rates business, primarily non-exchange-cleared instruments and capital-intensive structured positions, legacy funding costs associated with non-Basel III compliant debt instruments, as well as certain legacy litigation costs and other small non-strategic positions.
| Investment Banking – non-strategic results | |||||||||||||||||
| in / end of | % change | in / end of | % change | ||||||||||||||
| 2Q15 | 1Q15 | 2Q14 | QoQ | YoY | 6M15 | 6M14 | YoY | ||||||||||
| Non-strategic results (CHF million) | |||||||||||||||||
| Net revenues | (168) | (43) | (38) | 291 | 342 | (211) | (162) | 30 | |||||||||
| Provision for credit losses | 0 | 0 | 0 | – | – | 0 | 0 | – | |||||||||
| Total operating expenses | 127 | 127 | 252 | 0 | (50) | 254 | 429 | (41) | |||||||||
| Loss before taxes | (295) | (170) | (290) | 74 | 2 | (465) | (591) | (21) | |||||||||
The non-strategic businesses reported a loss before taxes of CHF 295 million and negative net revenues of CHF 168 million in 2Q15. Negative net revenues were higher compared to 2Q14 and 1Q15, due to increased portfolio and other valuation adjustments and the positive impact on 2Q14 and 1Q15 results from net valuation gains and lower trading losses. Total operating expenses declined compared to 2Q14, reflecting lower litigation provisions. Total operating expenses were stable compared to 1Q15 as lower litigation provisions offset higher UK bank levy expenses.
18
Corporate Center includes parent company operations such as Group financing, expenses for projects sponsored by the Group and certain expenses and revenues that have not been allocated to the segments. It also includes consolidation and elimination adjustments required to eliminate intercompany revenues and expenses.
In 2Q15, the Corporate Center recorded income before taxes of CHF 94 million compared to losses before taxes of CHF 373 million in 2Q14 and CHF 241 million in 1Q15. The Corporate Center recorded a loss before taxes of CHF 99 million in its strategic results. For non-strategic results, it reported income before taxes of CHF 193 million, primarily including fair value gains on own credit spreads of CHF 268 million, partially offset by IT architecture simplification expenses of CHF 71 million and business realignment costs of CHF 67 million.
| Corporate Center | |||||||||||||||||
| in / end of | % change | in / end of | % change | ||||||||||||||
| 2Q15 | 1Q15 | 2Q14 | QoQ | YoY | 6M15 | 6M14 | YoY | ||||||||||
| Reported results (CHF million) | |||||||||||||||||
| Net revenues | 408 | 118 | 45 | 246 | – | 526 | (142) | – | |||||||||
| Provision for credit losses | 0 | 0 | 0 | – | – | 0 | 1 | (100) | |||||||||
| Compensation and benefits | 120 | 194 | 235 | (38) | (49) | 314 | 401 | (22) | |||||||||
| Total other operating expenses | 194 | 165 | 183 | 18 | 6 | 359 | 268 | 34 | |||||||||
| Total operating expenses | 314 | 359 | 418 | (13) | (25) | 673 | 669 | 1 | |||||||||
| Income/(loss) before taxes | 94 | (241) | (373) | – | – | (147) | (812) | (82) | |||||||||
| Non-strategic results (CHF million) | |||||||||||||||||
| Net revenues | 290 | 124 | 48 | 134 | – | 414 | (98) | – | |||||||||
| Provision for credit losses | 0 | 0 | 0 | – | – | 0 | 0 | – | |||||||||
| Total operating expenses | 97 | 134 | 272 | (28) | (64) | 231 | 416 | (44) | |||||||||
| Income/(loss) before taxes | 193 | (10) | (224) | – | – | 183 | (514) | – | |||||||||
19
Balance sheet: As of the end of 2Q15, total assets of CHF 879.3 billion decreased 3% compared to 1Q15, mainly reflecting the foreign exchange translation impact. Excluding the foreign exchange translation impact, total assets decreased CHF 1.6 billion.
Total shareholders’ equity: Credit Suisse’s total shareholders’ equity decreased to CHF 42.6 billion as of the end of 2Q15 compared to CHF 43.4 billion as of the end of 1Q15. Total shareholders’ equity was negatively impacted by foreign exchange-related movements on cumulative translation adjustments, transactions relating to the settlement of share-based compensation awards and dividend payments. These movements were partially offset by net income and an increase in the share-based compensation obligation. As of the end of 2Q15, Credit Suisse had 1,638.4 million shares issued.
BIS regulatory capital and ratios: The common equity tier 1 (CET1) ratio increased slightly to 13.9% as of the end of 2Q15 compared to 13.8% as of the end of 1Q15, reflecting slightly lower risk-weighted assets, largely offset by slightly lower CET1 capital. Credit Suisse’s tier 1 ratio was 16.7% as of the end of 2Q15 compared to 16.5% as of the end of 1Q15. The total capital ratio was 20.1% as of the end of 2Q15 compared to 20.0% as of the end of 1Q15.
CET1 capital was CHF 39.1 billion as of the end of 2Q15 compared to CHF 39.7 billion as of the end of 1Q15, mainly reflecting the net effect of the settlement of share-based compensation awards and a negative foreign exchange impact, partially offset by net income, an increase in the share-based compensation obligation and the impact of the actual 2014 election rate for the scrip dividend.
Total eligible capital was CHF 56.7 billion as of the end of 2Q15 compared to CHF 57.6 billion as of the end of 1Q15, primarily reflecting the 2% decrease in CET1 capital and the 4% decrease in tier 2 capital.
Risk-weighted assets decreased slightly to CHF 281.9 billion as of the end of 2Q15 compared to CHF 288.5 billion as of the end of 1Q15, primarily reflecting movements in risk levels in credit risk and market risk and the foreign exchange impact. This was partially offset by methodology and policy changes, primarily in credit risk.
As of the end of 2Q15, the look-through CET1 ratio was 10.3% compared to 10.0% as of the end of 1Q15.
20
Leverage metrics: Beginning in 1Q15, Credit Suisse adopted the Bank for International Settlements (BIS) leverage ratio framework, as issued by the Basel Committee on Banking Supervision (BCBS) and implemented in Switzerland by FINMA. Under the BIS framework, the leverage ratio measures tier 1 capital against the end of period exposure. Leverage exposure is based on the BIS leverage ratio framework and consists of period-end balance sheet assets and prescribed regulatory adjustments.
The BIS tier 1 leverage ratio was 4.4% as of the end of 2Q15, with a BIS CET1 component of 3.7%. On a look-through basis, the BIS tier 1 leverage ratio was 3.7% as of the end of 2Q15, with a BIS CET1 component of 2.7%.
The Swiss leverage ratio was 5.3% as of the end of 2Q15 versus a requirement of 2.9%. On a look-through basis, the Swiss leverage ratio was 4.3% as of the end of 2Q15 versus the 2019 requirement of 4.1%.
The look-through leverage exposure was CHF 1,061.8 billion as of the end of 2Q15. Credit Suisse targets a leverage exposure of CHF 940–960 billion by the end of 2015, on a foreign exchange adjusted basis.
| Capital and leverage metrics | |||||||||||||
| Phase-in | Look-through | ||||||||||||
| end of | 2Q15 | 1Q15 | 4Q14 | 2Q15 | 1Q15 | 4Q14 | |||||||
| BIS capital ratios (%) | |||||||||||||
| CET1 ratio | 13.9 | 13.8 | 14.9 | 10.3 | 10.0 | 10.1 | |||||||
| Tier 1 ratio | 16.7 | 16.5 | 17.1 | 14.3 | 14.0 | 14.0 | |||||||
| Total capital ratio | 20.1 | 20.0 | 20.8 | 16.6 | 16.4 | 16.5 | |||||||
| Leverage metrics (%, except where indicated) | |||||||||||||
| Leverage exposure (CHF billion) | 1,067.4 | 1,108.6 | 1,157.6 | 1,061.8 | 1,102.7 | 1,149.7 | |||||||
| BIS CET1 leverage ratio | 3.7 | 3.6 | 3.7 | 2.7 | 2.6 | 2.5 | |||||||
| BIS tier 1 leverage ratio | 4.4 | 4.3 | 4.3 | 3.7 | 3.6 | 3.5 | |||||||
| Swiss leverage ratio | 5.3 | 5.2 | 5.2 | 4.3 | 4.2 | 4.1 | |||||||
21
The Group has not finalized its 2Q15 Financial Report and the Group’s independent registered public accounting firm has not completed its review of the condensed consolidated financial statements (unaudited) for the period. Accordingly, the financial information contained in this Earnings Release is subject to completion of quarter-end procedures, which may result in changes to that information. Certain reclassifications have been made to prior periods to conform to the current presentation.
For purposes of this Earnings Release, unless the context otherwise requires, the terms “Credit Suisse” and “the Group” mean Credit Suisse Group AG and its consolidated subsidiaries. The business of Credit Suisse AG, the Swiss bank subsidiary of the Group, is substantially similar to the Group, and these terms are used to refer to both when the subject is the same or substantially similar. The term “the Bank” is used when referring to Credit Suisse AG, the Swiss bank subsidiary of the Group, and its consolidated subsidiaries.
Information referenced in this Earnings Release, whether via website links or otherwise, is not incorporated into this Earnings Release.
As of January 1, 2013, Basel III was implemented in Switzerland along with the Swiss “Too Big to Fail” legislation and regulations thereunder. As of January 1, 2015, the BIS leverage ratio framework, as issued by BCBS, was implemented in Switzerland by FINMA. The related disclosures are in accordance with Credit Suisse’s interpretation of such requirements, including relevant assumptions. Changes in the interpretation of these requirements in Switzerland or in any of Credit Suisse’s assumptions or estimates could result in different numbers from those shown herein.
References to phase-in and look-through included herein refer to Basel III requirements. Phase-in under the Basel III capital framework reflects that for the years 2014 – 2018, there will be a five-year (20% per annum) phase in of goodwill and other intangible assets and other capital deductions (e.g., certain deferred tax assets) and for the years 2013 – 2022, there will be a phase out of certain capital instruments. Look-through assumes the full phase-in of goodwill and other intangible assets and other regulatory adjustments and the full phase out of certain capital instruments.
Unless otherwise noted, leverage exposure is based on the BIS leverage ratio framework and consists of period-end balance sheet assets and prescribed regulatory adjustments. Leverage amounts for 4Q14, which are presented in order to show meaningful comparative information, are based on estimates which are calculated as if the BIS leverage ratio framework had been implemented in Switzerland at such time. Beginning in 2015, the Swiss leverage ratio is calculated as Swiss total eligible capital, divided by period-end leverage exposure. The look-through BIS tier 1 leverage ratio and CET1 leverage ratio are calculated as look-through BIS tier 1 capital and CET1 capital, respectively, divided by end-period leverage exposure. Leverage exposure target assumes constant USD/CHF and EUR/CHF exchange rates equal to those at the end of 2Q15.
Return on equity for strategic results is calculated by dividing annualized strategic net income by average strategic shareholders’ equity (derived by deducting 10% of non-strategic risk-weighted assets from reported shareholders’ equity). Return on regulatory capital is calculated using income after tax and assumes a tax rate of 30% and capital allocated based on the average of 10% of average risk-weighted assets and an average of a certain percentage of leverage exposure (2.4% for periods prior to 2015 and 3% for periods after January 1, 2015).
Adjusted cost run-rates are non-GAAP financial measures. All expense reduction metrics against 6M11 annualized total expenses are measured at constant foreign exchange rates and exclude realignment and other significant expense items and variable compensation expenses. For further information regarding these measures, see the 2Q15 Results Presentation Slides.
The Group’s estimate of the aggregate range of reasonably possible losses that are not covered by existing provisions which is discussed above relates only to those proceedings for which the Group believes an estimate is possible and which are discussed in Note 38 to the Consolidated Financial Statements in the Group’s Annual Report on Form 20-F and updated in its quarterly reports (including the Group’s 2Q15 Financial Report that is scheduled to be released on July 31, 2015). It is inherently difficult to determine whether a loss is probable or even reasonably possible or to estimate the amount of any loss or loss range for many of the Group’s legal proceedings. The Group’s aggregate litigation provisions include estimates of losses, additional losses or ranges of loss for proceedings for which such losses are probable and can be reasonably estimated. The Group does not believe that it can estimate an aggregate range of reasonably possible losses for certain of its proceedings because of their complexity, the novelty of some of the claims, the early stage of the proceedings, the limited amount of discovery that has occurred and/or other factors. For additional details, see Note 38 to the Consolidated Financial Statements in the Group’s Annual Report on Form 20-F and the litigation note in each of its quarterly Financial Reports.
Strategic net new assets are determined based on the assumption that assets managed across businesses relate to strategic businesses only.
Mandates penetration means assets under management related to mandates in Wealth Management Clients divided by total Wealth Management Clients assets under management.
Investors and others should note that we announce material information (including quarterly earnings releases and financial reports) to the investing public using press releases, SEC and Swiss ad hoc filings, our website and public conference calls and webcasts. We intend to also use our Twitter account @creditsuisse (https://twitter.com/creditsuisse) to excerpt key messages from our public disclosures, including earnings releases. We may retweet such messages through certain of our regional Twitter accounts, including @csschweiz (https://twitter.com/csschweiz) and @csapac (https://twitter.com/csapac). Investors and others should take care to consider such abbreviated messages in the context of the disclosures from which they are excerpted. The information we post on these Twitter accounts is not a part of this Earnings Release.
In various tables, use of “–” indicates not meaningful or not applicable.
22
| in / end of | % change | in / end of | % change | ||||||||||||||
| 2Q15 | 1Q15 | 2Q14 | QoQ | YoY | 6M15 | 6M14 | YoY | ||||||||||
| Statements of operations (CHF million) | |||||||||||||||||
| Net revenues | 6,955 | 6,647 | 6,463 | 5 | 8 | 13,602 | 13,292 | 2 | |||||||||
| Provision for credit losses | 51 | 30 | 18 | 70 | 183 | 81 | 52 | 56 | |||||||||
| Compensation and benefits | 2,914 | 2,976 | 2,973 | (2) | (2) | 5,890 | 5,966 | (1) | |||||||||
| General and administrative expenses | 1,928 | 1,738 | 3,441 | 11 | (44) | 3,666 | 5,131 | (29) | |||||||||
| Commission expenses | 406 | 392 | 377 | 4 | 8 | 798 | 746 | 7 | |||||||||
| Total other operating expenses | 2,334 | 2,130 | 3,818 | 10 | (39) | 4,464 | 5,877 | (24) | |||||||||
| Total operating expenses | 5,248 | 5,106 | 6,791 | 3 | (23) | 10,354 | 11,843 | (13) | |||||||||
| Income from continuing operations before taxes | 1,656 | 1,511 | (346) | 10 | – | 3,167 | 1,397 | 127 | |||||||||
| Income tax expense | 590 | 477 | 307 | 24 | 92 | 1,067 | 850 | 26 | |||||||||
| Income/(loss) from continuing operations | 1,066 | 1,034 | (653) | 3 | – | 2,100 | 547 | 284 | |||||||||
| Income/(loss) from discontinued operations | 0 | 0 | (9) | – | 100 | 0 | 6 | (100) | |||||||||
| Net income/(loss) | 1,066 | 1,034 | (662) | 3 | – | 2,100 | 553 | 280 | |||||||||
| Net income/(loss) attributable to noncontrolling interests | 15 | (20) | 38 | – | (61) | (5) | 394 | – | |||||||||
| Net income/(loss) attributable to shareholders | 1,051 | 1,054 | (700) | 0 | – | 2,105 | 159 | – | |||||||||
| of which from continuing operations | 1,051 | 1,054 | (691) | 0 | – | 2,105 | 153 | – | |||||||||
| of which from discontinued operations | 0 | 0 | (9) | – | 100 | 0 | 6 | (100) | |||||||||
| Earnings per share (CHF) | |||||||||||||||||
| Basic earnings/(loss) per share from continuing operations | 0.63 | 0.63 | (0.45) | 0 | – | 1.26 | 0.05 | – | |||||||||
| Basic earnings/(loss) per share | 0.63 | 0.63 | (0.46) | 0 | – | 1.26 | 0.05 | – | |||||||||
| Diluted earnings/(loss) per share from continuing operations | 0.61 | 0.62 | (0.45) | (2) | – | 1.23 | 0.05 | – | |||||||||
| Diluted earnings/(loss) per share | 0.61 | 0.62 | (0.46) | (2) | – | 1.23 | 0.05 | – | |||||||||
| Return on equity (%, annualized) | |||||||||||||||||
| Return on equity attributable to shareholders | 10.0 | 9.9 | (6.7) | – | – | 9.9 | 0.8 | – | |||||||||
| Return on tangible equity attributable to shareholders 1 | 12.5 | 12.4 | (8.3) | – | – | 12.5 | 0.9 | – | |||||||||
| Number of employees (full-time equivalents) | |||||||||||||||||
| Number of employees | 46,600 | 46,400 | 45,100 | 0 | 3 | 46,600 | 45,100 | 3 | |||||||||
1 Based on tangible shareholders' equity attributable to shareholders, a non-GAAP financial measure, which is calculated by deducting goodwill and other intangible assets from total shareholders' equity attributable to shareholders. Management believes that the return on tangible shareholders' equity attributable to shareholders is meaningful as it allows consistent measurement of the performance of businesses without regard to whether the businesses were acquired. | |||||||||||||||||
23
| Credit Suisse and Core Results | |||||||||||||||||||
| Core Results | Noncontrolling interests without SEI | Credit Suisse | |||||||||||||||||
| in | 2Q15 | 1Q15 | 2Q14 | 2Q15 | 1Q15 | 2Q14 | 2Q15 | 1Q15 | 2Q14 | ||||||||||
| Statements of operations (CHF million) | |||||||||||||||||||
| Net revenues | 6,941 | 6,673 | 6,433 | 14 | (26) | 30 | 6,955 | 6,647 | 6,463 | ||||||||||
| Provision for credit losses | 51 | 30 | 18 | 0 | 0 | 0 | 51 | 30 | 18 | ||||||||||
| Compensation and benefits | 2,913 | 2,975 | 2,969 | 1 | 1 | 4 | 2,914 | 2,976 | 2,973 | ||||||||||
| General and administrative expenses | 1,925 | 1,738 | 3,439 | 3 | 0 | 2 | 1,928 | 1,738 | 3,441 | ||||||||||
| Commission expenses | 406 | 392 | 377 | 0 | 0 | 0 | 406 | 392 | 377 | ||||||||||
| Total other operating expenses | 2,331 | 2,130 | 3,816 | 3 | 0 | 2 | 2,334 | 2,130 | 3,818 | ||||||||||
| Total operating expenses | 5,244 | 5,105 | 6,785 | 4 | 1 | 6 | 5,248 | 5,106 | 6,791 | ||||||||||
| Income/(loss) from continuing operations before taxes | 1,646 | 1,538 | (370) | 10 | (27) | 24 | 1,656 | 1,511 | (346) | ||||||||||
| Income tax expense | 590 | 477 | 307 | 0 | 0 | 0 | 590 | 477 | 307 | ||||||||||
| Income/(loss) from continuing operations | 1,056 | 1,061 | (677) | 10 | (27) | 24 | 1,066 | 1,034 | (653) | ||||||||||
| Loss from discontinued operations | 0 | 0 | (9) | 0 | 0 | 0 | 0 | 0 | (9) | ||||||||||
| Net income/(loss) | 1,056 | 1,061 | (686) | 10 | (27) | 24 | 1,066 | 1,034 | (662) | ||||||||||
| Net income/(loss) attributable to noncontrolling interests | 5 | 7 | 14 | 10 | (27) | 24 | 15 | (20) | 38 | ||||||||||
| Net income/(loss) attributable to shareholders | 1,051 | 1,054 | (700) | – | – | – | 1,051 | 1,054 | (700) | ||||||||||
| of which from continuing operations | 1,051 | 1,054 | (691) | – | – | – | 1,051 | 1,054 | (691) | ||||||||||
| of which from discontinued operations | 0 | 0 | (9) | – | – | – | 0 | 0 | (9) | ||||||||||
| Statement of operations metrics (%) | |||||||||||||||||||
| Cost/income ratio | 75.6 | 76.5 | 105.5 | – | – | – | 75.5 | 76.8 | 105.1 | ||||||||||
| Pre-tax income margin | 23.7 | 23.0 | (5.8) | – | – | – | 23.8 | 22.7 | (5.4) | ||||||||||
| Effective tax rate | 35.8 | 31.0 | (83.0) | – | – | – | 35.6 | 31.6 | (88.7) | ||||||||||
| Net income margin 1 | 15.1 | 15.8 | (10.9) | – | – | – | 15.1 | 15.9 | (10.8) | ||||||||||
1 Based on amounts attributable to shareholders. | |||||||||||||||||||
24
| Core Results | |||||||||||||||||
| in / end of | % change | in / end of | % change | ||||||||||||||
| 2Q15 | 1Q15 | 2Q14 | QoQ | YoY | 6M15 | 6M14 | YoY | ||||||||||
| Statements of operations (CHF million) | |||||||||||||||||
| Net interest income | 2,874 | 2,153 | 2,590 | 33 | 11 | 5,027 | 4,773 | 5 | |||||||||
| Commissions and fees | 3,261 | 2,980 | 3,311 | 9 | (2) | 6,241 | 6,587 | (5) | |||||||||
| Trading revenues | 491 | 1,386 | 186 | (65) | 164 | 1,877 | 816 | 130 | |||||||||
| Other revenues | 315 | 154 | 346 | 105 | (9) | 469 | 726 | (35) | |||||||||
| Net revenues | 6,941 | 6,673 | 6,433 | 4 | 8 | 13,614 | 12,902 | 6 | |||||||||
| of which strategic results | 6,758 | 6,590 | 6,309 | 3 | 7 | 13,348 | 12,839 | 4 | |||||||||
| of which non-strategic results | 183 | 83 | 124 | 120 | 48 | 266 | 63 | 322 | |||||||||
| Provision for credit losses | 51 | 30 | 18 | 70 | 183 | 81 | 52 | 56 | |||||||||
| Compensation and benefits | 2,913 | 2,975 | 2,969 | (2) | (2) | 5,888 | 5,946 | (1) | |||||||||
| General and administrative expenses | 1,925 | 1,738 | 3,439 | 11 | (44) | 3,663 | 5,128 | (29) | |||||||||
| Commission expenses | 406 | 392 | 377 | 4 | 8 | 798 | 746 | 7 | |||||||||
| Total other operating expenses | 2,331 | 2,130 | 3,816 | 9 | (39) | 4,461 | 5,874 | (24) | |||||||||
| Total operating expenses | 5,244 | 5,105 | 6,785 | 3 | (23) | 10,349 | 11,820 | (12) | |||||||||
| of which strategic results | 4,908 | 4,742 | 4,509 | 4 | 9 | 9,650 | 9,077 | 6 | |||||||||
| of which non-strategic results | 336 | 363 | 2,276 | (7) | (85) | 699 | 2,743 | (75) | |||||||||
| Income/(loss) from continuing operations before taxes | 1,646 | 1,538 | (370) | 7 | – | 3,184 | 1,030 | 209 | |||||||||
| of which strategic results | 1,812 | 1,822 | 1,775 | (1) | 2 | 3,634 | 3,719 | (2) | |||||||||
| of which non-strategic results | (166) | (284) | (2,145) | (42) | (92) | (450) | (2,689) | (83) | |||||||||
| Income tax expense | 590 | 477 | 307 | 24 | 92 | 1,067 | 850 | 26 | |||||||||
| Income/(loss) from continuing operations | 1,056 | 1,061 | (677) | 0 | – | 2,117 | 180 | – | |||||||||
| Income/(loss) from discontinued operations | 0 | 0 | (9) | – | 100 | 0 | 6 | (100) | |||||||||
| Net income/(loss) | 1,056 | 1,061 | (686) | 0 | – | 2,117 | 186 | – | |||||||||
| Net income attributable to noncontrolling interests | 5 | 7 | 14 | (29) | (64) | 12 | 27 | (56) | |||||||||
| Net income/(loss) attributable to shareholders | 1,051 | 1,054 | (700) | 0 | – | 2,105 | 159 | – | |||||||||
| of which strategic results | 1,418 | 1,235 | 1,288 | 15 | 10 | 2,653 | 2,692 | (1) | |||||||||
| of which non-strategic results | (367) | (181) | (1,988) | 103 | (82) | (548) | (2,533) | (78) | |||||||||
| Statement of operations metrics (%) | |||||||||||||||||
| Return on regulatory capital | 15.3 | 13.9 | – | – | – | 14.6 | 5.3 | – | |||||||||
| Cost/income ratio | 75.6 | 76.5 | 105.5 | – | – | 76.0 | 91.6 | – | |||||||||
| Pre-tax income margin | 23.7 | 23.0 | (5.8) | – | – | 23.4 | 8.0 | – | |||||||||
| Effective tax rate | 35.8 | 31.0 | (83.0) | – | – | 33.5 | 82.5 | – | |||||||||
| Net income margin 1 | 15.1 | 15.8 | (10.9) | – | – | 15.5 | 1.2 | – | |||||||||
| Return on equity (%, annualized) | |||||||||||||||||
| Return on equity – strategic results | 13.9 | 12.0 | 13.0 | – | – | 13.0 | 13.5 | – | |||||||||
| Number of employees (full-time equivalents) | |||||||||||||||||
| Number of employees | 46,600 | 46,400 | 45,100 | 0 | 3 | 46,600 | 45,100 | 3 | |||||||||
1 Based on amounts attributable to shareholders. | |||||||||||||||||
25
| Strategic results | Non-strategic results | Core Results | |||||||||||||||||
| in / end of | 2Q15 | 1Q15 | 2Q14 | 2Q15 | 1Q15 | 2Q14 | 2Q15 | 1Q15 | 2Q14 | ||||||||||
| Statements of operations (CHF million) | |||||||||||||||||||
| Net revenues | 6,758 | 6,590 | 6,309 | 183 | 83 | 124 | 6,941 | 6,673 | 6,433 | ||||||||||
| Provision for credit losses | 38 | 26 | 25 | 13 | 4 | (7) | 51 | 30 | 18 | ||||||||||
| Compensation and benefits | 2,822 | 2,822 | 2,719 | 91 | 153 | 250 | 2,913 | 2,975 | 2,969 | ||||||||||
| Total other operating expenses | 2,086 | 1,920 | 1,790 | 245 | 210 | 2,026 | 2,331 | 2,130 | 3,816 | ||||||||||
| Total operating expenses | 4,908 | 4,742 | 4,509 | 336 | 363 | 2,276 | 5,244 | 5,105 | 6,785 | ||||||||||
| Income/(loss) from continuing operations before taxes | 1,812 | 1,822 | 1,775 | (166) | (284) | (2,145) | 1,646 | 1,538 | (370) | ||||||||||
| Income tax expense/(benefit) | 389 | 580 | 473 | 201 | (103) | (166) | 590 | 477 | 307 | ||||||||||
| Income/(loss) from continuing operations | 1,423 | 1,242 | 1,302 | (367) | (181) | (1,979) | 1,056 | 1,061 | (677) | ||||||||||
| Loss from discontinued operations | 0 | 0 | 0 | 0 | 0 | (9) | 0 | 0 | (9) | ||||||||||
| Net income/(loss) | 1,423 | 1,242 | 1,302 | (367) | (181) | (1,988) | 1,056 | 1,061 | (686) | ||||||||||
| Net income attributable to noncontrolling interests | 5 | 7 | 14 | 0 | 0 | 0 | 5 | 7 | 14 | ||||||||||
| Net income/(loss) attributable to shareholders | 1,418 | 1,235 | 1,288 | (367) | (181) | (1,988) | 1,051 | 1,054 | (700) | ||||||||||
| Balance sheet statistics (CHF million) | |||||||||||||||||||
| Risk-weighted assets 1 | 263,983 | 269,273 | 259,612 | 12,648 | 13,822 | 19,557 | 276,631 | 283,095 | 279,169 | ||||||||||
| Total assets | 855,691 | 875,940 | 849,471 | 22,768 | 27,450 | 40,808 | 878,459 | 903,390 | 890,279 | ||||||||||
| Leverage exposure 1 | 1,020,170 | 1,051,078 | – | 41,655 | 51,650 | – | 1,061,825 | 1,102,728 | – | ||||||||||
1 Disclosed on a fully phased-in look-through basis. | |||||||||||||||||||
| in / end of | % change | in / end of | % change | ||||||||||||||
| 2Q15 | 1Q15 | 2Q14 | QoQ | YoY | 6M15 | 6M14 | YoY | ||||||||||
| Statements of operations (CHF million) | |||||||||||||||||
| Net revenues | 6,758 | 6,590 | 6,309 | 3 | 7 | 13,348 | 12,839 | 4 | |||||||||
| Provision for credit losses | 38 | 26 | 25 | 46 | 52 | 64 | 43 | 49 | |||||||||
| Compensation and benefits | 2,822 | 2,822 | 2,719 | 0 | 4 | 5,644 | 5,501 | 3 | |||||||||
| General and administrative expenses | 1,684 | 1,538 | 1,428 | 9 | 18 | 3,222 | 2,855 | 13 | |||||||||
| Commission expenses | 402 | 382 | 362 | 5 | 11 | 784 | 721 | 9 | |||||||||
| Total other operating expenses | 2,086 | 1,920 | 1,790 | 9 | 17 | 4,006 | 3,576 | 12 | |||||||||
| Total operating expenses | 4,908 | 4,742 | 4,509 | 4 | 9 | 9,650 | 9,077 | 6 | |||||||||
| Income from continuing operations before taxes | 1,812 | 1,822 | 1,775 | (1) | 2 | 3,634 | 3,719 | (2) | |||||||||
| Income tax expense | 389 | 580 | 473 | (33) | (18) | 969 | 1,000 | (3) | |||||||||
| Net income | 1,423 | 1,242 | 1,302 | 15 | 9 | 2,665 | 2,719 | (2) | |||||||||
| Net income attributable to noncontrolling interests | 5 | 7 | 14 | (29) | (64) | 12 | 27 | (56) | |||||||||
| Net income attributable to shareholders | 1,418 | 1,235 | 1,288 | 15 | 10 | 2,653 | 2,692 | (1) | |||||||||
| Statement of operations metrics (%) | |||||||||||||||||
| Return on regulatory capital | 17.6 | 17.3 | 19.4 | – | – | 17.5 | 20.7 | – | |||||||||
| Cost/income ratio | 72.6 | 72.0 | 71.5 | – | – | 72.3 | 70.7 | – | |||||||||
| Pre-tax income margin | 26.8 | 27.6 | 28.1 | – | – | 27.2 | 29.0 | – | |||||||||
26
| in / end of | % change | in / end of | % change | ||||||||||||||
| 2Q15 | 1Q15 | 2Q14 | QoQ | YoY | 6M15 | 6M14 | YoY | ||||||||||
| Statements of operations (CHF million) | |||||||||||||||||
| Net revenues | 183 | 83 | 124 | 120 | 48 | 266 | 63 | 322 | |||||||||
| Provision for credit losses | 13 | 4 | (7) | 225 | – | 17 | 9 | 89 | |||||||||
| Compensation and benefits | 91 | 153 | 250 | (41) | (64) | 244 | 445 | (45) | |||||||||
| General and administrative expenses | 241 | 200 | 2,011 | 21 | (88) | 441 | 2,273 | (81) | |||||||||
| Commission expenses | 4 | 10 | 15 | (60) | (73) | 14 | 25 | (44) | |||||||||
| Total other operating expenses | 245 | 210 | 2,026 | 17 | (88) | 455 | 2,298 | (80) | |||||||||
| Total operating expenses | 336 | 363 | 2,276 | (7) | (85) | 699 | 2,743 | (75) | |||||||||
| Loss from continuing operations before taxes | (166) | (284) | (2,145) | (42) | (92) | (450) | (2,689) | (83) | |||||||||
| Income tax expense/(benefit) | 201 | (103) | (166) | – | – | 98 | (150) | – | |||||||||
| Loss from continuing operations | (367) | (181) | (1,979) | 103 | (81) | (548) | (2,539) | (78) | |||||||||
| Income/(loss) from discontinued operations | 0 | 0 | (9) | – | 100 | 0 | 6 | (100) | |||||||||
| Loss attributable to shareholders | (367) | (181) | (1,988) | 103 | (82) | (548) | (2,533) | (78) | |||||||||
| in | % change | in | % change | ||||||||||||||
| 2Q15 | 1Q15 | 2Q14 | QoQ | YoY | 6M15 | 6M14 | YoY | ||||||||||
| Net revenues (CHF million) | |||||||||||||||||
| Switzerland | 1,778 | 1,714 | 1,669 | 4 | 7 | 3,492 | 3,381 | 3 | |||||||||
| EMEA | 1,365 | 1,498 | 1,540 | (9) | (11) | 2,863 | 3,013 | (5) | |||||||||
| Americas | 2,336 | 2,275 | 2,458 | 3 | (5) | 4,611 | 5,082 | (9) | |||||||||
| Asia Pacific | 1,054 | 1,068 | 721 | (1) | 46 | 2,122 | 1,568 | 35 | |||||||||
| Corporate Center | 408 | 118 | 45 | 246 | – | 526 | (142) | – | |||||||||
| Net revenues | 6,941 | 6,673 | 6,433 | 4 | 8 | 13,614 | 12,902 | 6 | |||||||||
| Income/(loss) from continuing operations before taxes (CHF million) | |||||||||||||||||
| Switzerland | 673 | 640 | 565 | 5 | 19 | 1,313 | 1,171 | 12 | |||||||||
| EMEA | (65) | 161 | 228 | – | – | 96 | 339 | (72) | |||||||||
| Americas | 536 | 513 | (951) | 4 | – | 1,049 | (103) | – | |||||||||
| Asia Pacific | 408 | 465 | 161 | (12) | 153 | 873 | 435 | 101 | |||||||||
| Corporate Center | 94 | (241) | (373) | – | – | (147) | (812) | (82) | |||||||||
| Income/(loss) from continuing operations before taxes | 1,646 | 1,538 | (370) | 7 | – | 3,184 | 1,030 | 209 | |||||||||
| A significant portion of our business requires inter-regional coordination in order to facilitate the needs of our clients. The methodology for allocating our results by region is dependent on management judgment. For Wealth Management Clients and Corporate & Institutional Clients, results are allocated based on the management reporting structure of our relationship managers and the region where the transaction is recorded. For Asset Management, results are allocated based on the location of the investment advisors and sales teams. For Investment Banking, trading results are allocated based on where the risk is primarily managed and fee-based results are allocated where the client is domiciled. | |||||||||||||||||
27
| in / end of | % change | in / end of | % change | ||||||||||||||
| 2Q15 | 1Q15 | 2Q14 | QoQ | YoY | 6M15 | 6M14 | YoY | ||||||||||
| Statements of operations (CHF million) | |||||||||||||||||
| Net revenues | 3,152 | 2,972 | 3,046 | 6 | 3 | 6,124 | 6,286 | (3) | |||||||||
| of which strategic results | 3,091 | 2,970 | 2,932 | 4 | 5 | 6,061 | 5,963 | 2 | |||||||||
| of which non-strategic results | 61 | 2 | 114 | – | (46) | 63 | 323 | (80) | |||||||||
| Provision for credit losses | 44 | 29 | 23 | 52 | 91 | 73 | 56 | 30 | |||||||||
| Compensation and benefits | 1,248 | 1,229 | 1,235 | 2 | 1 | 2,477 | 2,525 | (2) | |||||||||
| General and administrative expenses | 774 | 725 | 2,367 | 7 | (67) | 1,499 | 3,103 | (52) | |||||||||
| Commission expenses | 149 | 155 | 170 | (4) | (12) | 304 | 339 | (10) | |||||||||
| Total other operating expenses | 923 | 880 | 2,537 | 5 | (64) | 1,803 | 3,442 | (48) | |||||||||
| Total operating expenses | 2,171 | 2,109 | 3,772 | 3 | (42) | 4,280 | 5,967 | (28) | |||||||||
| of which strategic results | 2,059 | 2,007 | 2,020 | 3 | 2 | 4,066 | 4,069 | 0 | |||||||||
| of which non-strategic results | 112 | 102 | 1,752 | 10 | (94) | 214 | 1,898 | (89) | |||||||||
| Income/(loss) before taxes | 937 | 834 | (749) | 12 | – | 1,771 | 263 | – | |||||||||
| of which strategic results | 1,001 | 938 | 882 | 7 | 13 | 1,939 | 1,847 | 5 | |||||||||
| of which non-strategic results | (64) | (104) | (1,631) | (38) | (96) | (168) | (1,584) | (89) | |||||||||
| Statement of operations metrics (%) | |||||||||||||||||
| Return on regulatory capital | 23.5 | 21.0 | – | – | – | 22.4 | 4.0 | – | |||||||||
| Cost/income ratio | 68.9 | 71.0 | 123.8 | – | – | 69.9 | 94.9 | – | |||||||||
| Pre-tax income margin | 29.7 | 28.1 | (24.6) | – | – | 28.9 | 4.2 | – | |||||||||
| Assets under management (CHF billion) | |||||||||||||||||
| Assets under management | 1,355.7 | 1,374.0 | 1,329.7 | (1.3) | 2.0 | 1,355.7 | 1,329.7 | 2.0 | |||||||||
| Net new assets | 14.2 | 17.0 | 10.1 | (16.5) | 40.6 | 31.2 | 23.8 | 31.1 | |||||||||
| Number of employees and relationship managers | |||||||||||||||||
| Number of employees (full-time equivalents) | 26,500 | 26,300 | 25,800 | 1 | 3 | 26,500 | 25,800 | 3 | |||||||||
| Number of relationship managers | 4,260 | 4,290 | 4,340 | (1) | (2) | 4,260 | 4,340 | (2) | |||||||||
| in / end of | % change | in / end of | % change | ||||||||||||||
| 2Q15 | 1Q15 | 2Q14 | QoQ | YoY | 6M15 | 6M14 | YoY | ||||||||||
| Net revenue detail (CHF million) | |||||||||||||||||
| Net interest income | 1,106 | 991 | 970 | 12 | 14 | 2,097 | 1,949 | 8 | |||||||||
| Recurring commissions and fees | 1,108 | 1,095 | 1,184 | 1 | (6) | 2,203 | 2,373 | (7) | |||||||||
| Transaction- and performance-based revenues | 939 | 932 | 885 | 1 | 6 | 1,871 | 1,822 | 3 | |||||||||
| Other revenues 1 | (1) | (46) | 7 | (98) | – | (47) | 142 | – | |||||||||
| Net revenues | 3,152 | 2,972 | 3,046 | 6 | 3 | 6,124 | 6,286 | (3) | |||||||||
| Provision for credit losses (CHF million) | |||||||||||||||||
| New provisions | 65 | 48 | 59 | 35 | 10 | 113 | 112 | 1 | |||||||||
| Releases of provisions | (21) | (19) | (36) | 11 | (42) | (40) | (56) | (29) | |||||||||
| Provision for credit losses | 44 | 29 | 23 | 52 | 91 | 73 | 56 | 30 | |||||||||
1 Includes investment-related gains/(losses), equity participations and other gains/(losses) and fair value gains/(losses) on the Clock Finance transaction. | |||||||||||||||||
28
| Strategic results | Non-strategic results | Private Banking & Wealth Management | |||||||||||||||||
| in / end of | 2Q15 | 1Q15 | 2Q14 | 2Q15 | 1Q15 | 2Q14 | 2Q15 | 1Q15 | 2Q14 | ||||||||||
| Statements of operations (CHF million) | |||||||||||||||||||
| Net revenues | 3,091 | 2,970 | 2,932 | 61 | 2 | 114 | 3,152 | 2,972 | 3,046 | ||||||||||
| Provision for credit losses | 31 | 25 | 30 | 13 | 4 | (7) | 44 | 29 | 23 | ||||||||||
| Compensation and benefits | 1,233 | 1,205 | 1,184 | 15 | 24 | 51 | 1,248 | 1,229 | 1,235 | ||||||||||
| Total other operating expenses | 826 | 802 | 836 | 97 | 78 | 1,701 | 923 | 880 | 2,537 | ||||||||||
| Total operating expenses | 2,059 | 2,007 | 2,020 | 112 | 102 | 1,752 | 2,171 | 2,109 | 3,772 | ||||||||||
| Income/(loss) before taxes | 1,001 | 938 | 882 | (64) | (104) | (1,631) | 937 | 834 | (749) | ||||||||||
| Balance sheet statistics (CHF million) | |||||||||||||||||||
| Risk-weighted assets | 101,319 | 104,594 | 96,805 | 4,474 | 4,436 | 6,732 | 105,793 | 109,030 | 103,537 | ||||||||||
| Total assets | 348,074 | 357,648 | 306,919 | 7,983 | 8,743 | 15,750 | 356,057 | 366,391 | 322,669 | ||||||||||
| Leverage exposure | 376,290 | 385,691 | – | 3,867 | 4,118 | – | 380,157 | 389,809 | – | ||||||||||
| in / end of | % change | in / end of | % change | ||||||||||||||
| 2Q15 | 1Q15 | 2Q14 | QoQ | YoY | 6M15 | 6M14 | YoY | ||||||||||
| Statements of operations (CHF million) | |||||||||||||||||
| Net interest income | 1,096 | 981 | 954 | 12 | 15 | 2,077 | 1,917 | 8 | |||||||||
| Recurring commissions and fees | 1,082 | 1,067 | 1,136 | 1 | (5) | 2,149 | 2,275 | (6) | |||||||||
| Transaction- and performance-based revenues | 925 | 922 | 865 | 0 | 7 | 1,847 | 1,784 | 4 | |||||||||
| Other revenues | (12) | 0 | (23) | – | (48) | (12) | (13) | (8) | |||||||||
| Net revenues | 3,091 | 2,970 | 2,932 | 4 | 5 | 6,061 | 5,963 | 2 | |||||||||
| New provisions | 53 | 44 | 49 | 20 | 8 | 97 | 85 | 14 | |||||||||
| Releases of provisions | (22) | (19) | (19) | 16 | 16 | (41) | (38) | 8 | |||||||||
| Provision for credit losses | 31 | 25 | 30 | 24 | 3 | 56 | 47 | 19 | |||||||||
| Compensation and benefits | 1,233 | 1,205 | 1,184 | 2 | 4 | 2,438 | 2,409 | 1 | |||||||||
| General and administrative expenses | 680 | 651 | 672 | 4 | 1 | 1,331 | 1,332 | 0 | |||||||||
| Commission expenses | 146 | 151 | 164 | (3) | (11) | 297 | 328 | (9) | |||||||||
| Total other operating expenses | 826 | 802 | 836 | 3 | (1) | 1,628 | 1,660 | (2) | |||||||||
| Total operating expenses | 2,059 | 2,007 | 2,020 | 3 | 2 | 4,066 | 4,069 | 0 | |||||||||
| Income before taxes | 1,001 | 938 | 882 | 7 | 13 | 1,939 | 1,847 | 5 | |||||||||
| of which Wealth Management Clients | 669 | 636 | 569 | 5 | 18 | 1,305 | 1,147 | 14 | |||||||||
| of which Corporate & Institutional Clients | 244 | 230 | 211 | 6 | 16 | 474 | 457 | 4 | |||||||||
| of which Asset Management | 88 | 72 | 102 | 22 | (14) | 160 | 243 | (34) | |||||||||
| Statement of operations metrics (%) | |||||||||||||||||
| Return on regulatory capital | 25.8 | 24.3 | 28.0 | – | – | 25.2 | 29.8 | – | |||||||||
| Cost/income ratio | 66.6 | 67.6 | 68.9 | – | – | 67.1 | 68.2 | – | |||||||||
| Pre-tax income margin | 32.4 | 31.6 | 30.1 | – | – | 32.0 | 31.0 | – | |||||||||
29
| Wealth Management Clients | |||||||||||||||||
| in / end of | % change | in / end of | % change | ||||||||||||||
| 2Q15 | 1Q15 | 2Q14 | QoQ | YoY | 6M15 | 6M14 | YoY | ||||||||||
| Statements of operations (CHF million) | |||||||||||||||||
| Net revenues | 2,197 | 2,111 | 2,017 | 4 | 9 | 4,308 | 4,091 | 5 | |||||||||
| Provision for credit losses | 7 | 17 | 17 | (59) | (59) | 24 | 33 | (27) | |||||||||
| Total operating expenses | 1,521 | 1,458 | 1,431 | 4 | 6 | 2,979 | 2,911 | 2 | |||||||||
| Income before taxes | 669 | 636 | 569 | 5 | 18 | 1,305 | 1,147 | 14 | |||||||||
| Statement of operations metrics (%) | |||||||||||||||||
| Return on regulatory capital | 29.4 | 28.5 | 30.6 | – | – | 29.1 | 31.5 | – | |||||||||
| Cost/income ratio | 69.2 | 69.1 | 70.9 | – | – | 69.2 | 71.2 | – | |||||||||
| Pre-tax income margin | 30.5 | 30.1 | 28.2 | – | – | 30.3 | 28.0 | – | |||||||||
| Net revenue detail (CHF million) | |||||||||||||||||
| Net interest income | 821 | 741 | 688 | 11 | 19 | 1,562 | 1,394 | 12 | |||||||||
| Recurring commissions and fees | 717 | 700 | 728 | 2 | (2) | 1,417 | 1,458 | (3) | |||||||||
| Transaction- and performance-based revenues | 659 | 670 | 601 | (2) | 10 | 1,329 | 1,239 | 7 | |||||||||
| Net revenues | 2,197 | 2,111 | 2,017 | 4 | 9 | 4,308 | 4,091 | 5 | |||||||||
| Gross and net margin (annualized) (bp) | |||||||||||||||||
| Net interest income | 38 | 35 | 34 | – | – | 37 | 34 | – | |||||||||
| Recurring commissions and fees | 33 | 33 | 36 | – | – | 33 | 36 | – | |||||||||
| Transaction- and performance-based revenues | 31 | 32 | 29 | – | – | 31 | 31 | – | |||||||||
| Gross margin 1 | 102 | 100 | 99 | – | – | 101 | 101 | – | |||||||||
| Net margin 2 | 31 | 30 | 28 | – | – | 31 | 28 | – | |||||||||
| Balance sheet statistics (CHF million) | |||||||||||||||||
| Risk-weighted assets | 53,303 | 53,618 | 51,262 | (1) | 4 | 53,303 | 51,262 | 4 | |||||||||
| Number of relationship managers | |||||||||||||||||
| Switzerland | 1,660 | 1,670 | 1,680 | (1) | (1) | 1,660 | 1,680 | (1) | |||||||||
| EMEA | 1,010 | 1,030 | 1,110 | (2) | (9) | 1,010 | 1,110 | (9) | |||||||||
| Americas | 540 | 540 | 540 | 0 | 0 | 540 | 540 | 0 | |||||||||
| Asia Pacific | 520 | 510 | 470 | 2 | 11 | 520 | 470 | 11 | |||||||||
| Number of relationship managers | 3,730 | 3,750 | 3,800 | (1) | (2) | 3,730 | 3,800 | (2) | |||||||||
1 Net revenues divided by average assets under management. | |||||||||||||||||
2 Income before taxes divided by average assets under management. | |||||||||||||||||
30
| Corporate & Institutional Clients | |||||||||||||||||
| in / end of | % change | in / end of | % change | ||||||||||||||
| 2Q15 | 1Q15 | 2Q14 | QoQ | YoY | 6M15 | 6M14 | YoY | ||||||||||
| Statements of operations (CHF million) | |||||||||||||||||
| Net revenues | 508 | 484 | 475 | 5 | 7 | 992 | 967 | 3 | |||||||||
| Provision for credit losses | 24 | 8 | 13 | 200 | 85 | 32 | 14 | 129 | |||||||||
| Total operating expenses | 240 | 246 | 251 | (2) | (4) | 486 | 496 | (2) | |||||||||
| Income before taxes | 244 | 230 | 211 | 6 | 16 | 474 | 457 | 4 | |||||||||
| Statement of operations metrics (%) | |||||||||||||||||
| Return on regulatory capital | 18.8 | 17.6 | 19.5 | – | – | 18.4 | 21.2 | – | |||||||||
| Cost/income ratio | 47.2 | 50.8 | 52.8 | – | – | 49.0 | 51.3 | – | |||||||||
| Pre-tax income margin | 48.0 | 47.5 | 44.4 | – | – | 47.8 | 47.3 | – | |||||||||
| Net revenue detail (CHF million) | |||||||||||||||||
| Net interest income | 275 | 240 | 266 | 15 | 3 | 515 | 523 | (2) | |||||||||
| Recurring commissions and fees | 115 | 123 | 113 | (7) | 2 | 238 | 235 | 1 | |||||||||
| Transaction- and performance-based revenues | 125 | 126 | 118 | (1) | 6 | 251 | 235 | 7 | |||||||||
| Other revenues 1 | (7) | (5) | (22) | 40 | (68) | (12) | (26) | (54) | |||||||||
| Net revenues | 508 | 484 | 475 | 5 | 7 | 992 | 967 | 3 | |||||||||
| Balance sheet statistics (CHF million) | |||||||||||||||||
| Risk-weighted assets | 36,036 | 38,867 | 34,384 | (7) | 5 | 36,036 | 34,384 | 5 | |||||||||
| Number of relationship managers | |||||||||||||||||
| Number of relationship managers (Switzerland) | 530 | 540 | 540 | (2) | (2) | 530 | 540 | (2) | |||||||||
1 Reflects fair value gains/(losses) on the Clock Finance transaction. | |||||||||||||||||
31
| Asset Management | |||||||||||||||||
| in / end of | % change | in / end of | % change | ||||||||||||||
| 2Q15 | 1Q15 | 2Q14 | QoQ | YoY | 6M15 | 6M14 | YoY | ||||||||||
| Statements of operations (CHF million) | |||||||||||||||||
| Net revenues | 386 | 375 | 440 | 3 | (12) | 761 | 905 | (16) | |||||||||
| Provision for credit losses | 0 | 0 | 0 | – | – | 0 | 0 | – | |||||||||
| Total operating expenses | 298 | 303 | 338 | (2) | (12) | 601 | 662 | (9) | |||||||||
| Income before taxes | 88 | 72 | 102 | 22 | (14) | 160 | 243 | (34) | |||||||||
| Statement of operations metrics (%) | |||||||||||||||||
| Return on regulatory capital | 28.5 | 22.7 | 48.4 | – | – | 25.4 | 61.0 | – | |||||||||
| Cost/income ratio | 77.2 | 80.8 | 76.8 | – | – | 79.0 | 73.1 | – | |||||||||
| Pre-tax income margin | 22.8 | 19.2 | 23.2 | – | – | 21.0 | 26.9 | – | |||||||||
| Net revenue detail (CHF million) | |||||||||||||||||
| Recurring commissions and fees | 250 | 244 | 295 | 2 | (15) | 494 | 582 | (15) | |||||||||
| Transaction- and performance-based revenues | 141 | 126 | 146 | 12 | (3) | 267 | 310 | (14) | |||||||||
| Other revenues | (5) | 5 | (1) | – | 400 | 0 | 13 | (100) | |||||||||
| Net revenues | 386 | 375 | 440 | 3 | (12) | 761 | 905 | (16) | |||||||||
| Net revenue detail by type (CHF million) | |||||||||||||||||
| Asset management fees | 250 | 244 | 295 | 2 | (15) | 494 | 582 | (15) | |||||||||
| Placement, transaction and other fees | 61 | 48 | 59 | 27 | 3 | 109 | 115 | (5) | |||||||||
| Performance fees and carried interest | 32 | 29 | 59 | 10 | (46) | 61 | 139 | (56) | |||||||||
| Equity participations income | 29 | 32 | 15 | (9) | 93 | 61 | 30 | 103 | |||||||||
| Fee-based revenues | 372 | 353 | 428 | 5 | (13) | 725 | 866 | (16) | |||||||||
| Investment-related gains/(losses) | 8 | 11 | 6 | (27) | 33 | 19 | 25 | (24) | |||||||||
| Equity participations and other gains/(losses) | (1) | 9 | 3 | – | – | 8 | 3 | 167 | |||||||||
| Other revenues 1 | 7 | 2 | 3 | 250 | 133 | 9 | 11 | (18) | |||||||||
| Net revenues | 386 | 375 | 440 | 3 | (12) | 761 | 905 | (16) | |||||||||
| Fee-based margin on assets under management (annualized) (bp) | |||||||||||||||||
| Fee-based margin 2 | 38 | 37 | 46 | – | – | 37 | 48 | – | |||||||||
| Balance sheet statistics (CHF million) | |||||||||||||||||
| Risk-weighted assets | 11,980 | 12,109 | 11,159 | (1) | 7 | 11,980 | 11,159 | 7 | |||||||||
1 Includes allocated funding costs. | |||||||||||||||||
2 Fee-based revenues divided by average assets under management. | |||||||||||||||||
| in / end of | % change | in / end of | % change | ||||||||||||||
| 2Q15 | 1Q15 | 2Q14 | QoQ | YoY | 6M15 | 6M14 | YoY | ||||||||||
| Statements of operations (CHF million) | |||||||||||||||||
| Net revenues | 61 | 2 | 114 | – | (46) | 63 | 323 | (80) | |||||||||
| Provision for credit losses | 13 | 4 | (7) | 225 | – | 17 | 9 | 89 | |||||||||
| Compensation and benefits | 15 | 24 | 51 | (38) | (71) | 39 | 116 | (66) | |||||||||
| Total other operating expenses | 97 | 78 | 1,701 | 24 | (94) | 175 | 1,782 | (90) | |||||||||
| Total operating expenses | 112 | 102 | 1,752 | 10 | (94) | 214 | 1,898 | (89) | |||||||||
| Loss before taxes | (64) | (104) | (1,631) | (38) | (96) | (168) | (1,584) | (89) | |||||||||
| Revenue details (CHF million) | |||||||||||||||||
| Restructuring of select onshore businesses | 2 | 1 | 22 | 100 | (91) | 3 | 44 | (93) | |||||||||
| Legacy cross-border business and small markets | 31 | 34 | 41 | (9) | (24) | 65 | 85 | (24) | |||||||||
| Restructuring of former Asset Management division | 15 | (45) | 38 | – | (61) | (30) | 172 | – | |||||||||
| Other | 13 | 12 | 13 | 8 | 0 | 25 | 22 | 14 | |||||||||
| Net revenues | 61 | 2 | 114 | – | (46) | 63 | 323 | (80) | |||||||||
32
| in / end of | % change | in / end of | % change | ||||||||||||||
| 2Q15 | 1Q15 | 2Q14 | QoQ | YoY | 6M15 | 6M14 | YoY | ||||||||||
| Statements of operations (CHF million) | |||||||||||||||||
| Net revenues | 3,381 | 3,583 | 3,342 | (6) | 1 | 6,964 | 6,758 | 3 | |||||||||
| of which strategic results | 3,549 | 3,626 | 3,380 | (2) | 5 | 7,175 | 6,920 | 4 | |||||||||
| of which non-strategic results | (168) | (43) | (38) | 291 | 342 | (211) | (162) | 30 | |||||||||
| Provision for credit losses | 7 | 1 | (5) | – | – | 8 | (5) | – | |||||||||
| Compensation and benefits | 1,545 | 1,552 | 1,499 | 0 | 3 | 3,097 | 3,020 | 3 | |||||||||
| General and administrative expenses | 959 | 853 | 889 | 12 | 8 | 1,812 | 1,745 | 4 | |||||||||
| Commission expenses | 255 | 232 | 207 | 10 | 23 | 487 | 419 | 16 | |||||||||
| Total other operating expenses | 1,214 | 1,085 | 1,096 | 12 | 11 | 2,299 | 2,164 | 6 | |||||||||
| Total operating expenses | 2,759 | 2,637 | 2,595 | 5 | 6 | 5,396 | 5,184 | 4 | |||||||||
| of which strategic results | 2,632 | 2,510 | 2,343 | 5 | 12 | 5,142 | 4,755 | 8 | |||||||||
| of which non-strategic results | 127 | 127 | 252 | 0 | (50) | 254 | 429 | (41) | |||||||||
| Income/(loss) before taxes | 615 | 945 | 752 | (35) | (18) | 1,560 | 1,579 | (1) | |||||||||
| of which strategic results | 910 | 1,115 | 1,042 | (18) | (13) | 2,025 | 2,170 | (7) | |||||||||
| of which non-strategic results | (295) | (170) | (290) | 74 | 2 | (465) | (591) | (21) | |||||||||
| Statement of operations metrics (%) | |||||||||||||||||
| Return on regulatory capital | 9.9 | 14.7 | 12.3 | – | – | 12.3 | 13.0 | – | |||||||||
| Cost/income ratio | 81.6 | 73.6 | 77.6 | – | – | 77.5 | 76.7 | – | |||||||||
| Pre-tax income margin | 18.2 | 26.4 | 22.5 | – | – | 22.4 | 23.4 | – | |||||||||
| Number of employees (full-time equivalents) | |||||||||||||||||
| Number of employees | 19,800 | 19,800 | 19,000 | 0 | 4 | 19,800 | 19,000 | 4 | |||||||||
| in / end of | % change | in / end of | % change | ||||||||||||||
| 2Q15 | 1Q15 | 2Q14 | QoQ | YoY | 6M15 | 6M14 | YoY | ||||||||||
| Net revenue detail (CHF million) | |||||||||||||||||
| Debt underwriting | 467 | 332 | 483 | 41 | (3) | 799 | 951 | (16) | |||||||||
| Equity underwriting | 240 | 153 | 268 | 57 | (10) | 393 | 451 | (13) | |||||||||
| Total underwriting | 707 | 485 | 751 | 46 | (6) | 1,192 | 1,402 | (15) | |||||||||
| Advisory and other fees | 207 | 132 | 161 | 57 | 29 | 339 | 341 | (1) | |||||||||
| Total underwriting and advisory | 914 | 617 | 912 | 48 | 0 | 1,531 | 1,743 | (12) | |||||||||
| Fixed income sales and trading | 1,244 | 1,676 | 1,428 | (26) | (13) | 2,920 | 2,917 | 0 | |||||||||
| Equity sales and trading | 1,322 | 1,376 | 1,134 | (4) | 17 | 2,698 | 2,335 | 16 | |||||||||
| Total sales and trading | 2,566 | 3,052 | 2,562 | (16) | 0 | 5,618 | 5,252 | 7 | |||||||||
| Other | (99) | (86) | (132) | 15 | (25) | (185) | (237) | (22) | |||||||||
| Net revenues | 3,381 | 3,583 | 3,342 | (6) | 1 | 6,964 | 6,758 | (100) | |||||||||
33
| Strategic results | Non-strategic results | Investment Banking | |||||||||||||||||
| in / end of | 2Q15 | 1Q15 | 2Q14 | 2Q15 | 1Q15 | 2Q14 | 2Q15 | 1Q15 | 2Q14 | ||||||||||
| Statements of operations (CHF million) | |||||||||||||||||||
| Net revenues | 3,549 | 3,626 | 3,380 | (168) | (43) | (38) | 3,381 | 3,583 | 3,342 | ||||||||||
| Provision for credit losses | 7 | 1 | (5) | 0 | 0 | 0 | 7 | 1 | (5) | ||||||||||
| Compensation and benefits | 1,507 | 1,514 | 1,465 | 38 | 38 | 34 | 1,545 | 1,552 | 1,499 | ||||||||||
| Total other operating expenses | 1,125 | 996 | 878 | 89 | 89 | 218 | 1,214 | 1,085 | 1,096 | ||||||||||
| Total operating expenses | 2,632 | 2,510 | 2,343 | 127 | 127 | 252 | 2,759 | 2,637 | 2,595 | ||||||||||
| Income/(loss) before taxes | 910 | 1,115 | 1,042 | (295) | (170) | (290) | 615 | 945 | 752 | ||||||||||
| Balance sheet statistics (CHF million, except where indicated) | |||||||||||||||||||
| Risk-weighted assets | 147,829 | 148,716 | 147,374 | 8,174 | 9,386 | 12,825 | 156,003 | 158,102 | 160,199 | ||||||||||
| Risk-weighted assets (USD) | 158,183 | 153,111 | 166,186 | 8,746 | 9,663 | 14,462 | 166,929 | 162,774 | 180,648 | ||||||||||
| Total assets | 445,192 | 470,495 | 500,043 | 14,785 | 18,707 | 25,058 | 459,977 | 489,202 | 525,101 | ||||||||||
| Leverage exposure | 593,330 | 629,380 | – | 37,788 | 47,532 | – | 631,118 | 676,912 | – | ||||||||||
| Leverage exposure (USD) | 634,884 | 647,977 | – | 40,434 | 48,936 | – | 675,318 | 696,913 | – | ||||||||||
| in / end of | % change | in / end of | % change | ||||||||||||||
| 2Q15 | 1Q15 | 2Q14 | QoQ | YoY | 6M15 | 6M14 | YoY | ||||||||||
| Statements of operations (CHF million) | |||||||||||||||||
| Debt underwriting | 467 | 332 | 483 | 41 | (3) | 799 | 951 | (16) | |||||||||
| Equity underwriting | 240 | 153 | 268 | 57 | (10) | 393 | 451 | (13) | |||||||||
| Total underwriting | 707 | 485 | 751 | 46 | (6) | 1,192 | 1,402 | (15) | |||||||||
| Advisory and other fees | 207 | 132 | 161 | 57 | 29 | 339 | 341 | (1) | |||||||||
| Total underwriting and advisory | 914 | 617 | 912 | 48 | 0 | 1,531 | 1,743 | (12) | |||||||||
| Fixed income sales and trading | 1,403 | 1,732 | 1,470 | (19) | (5) | 3,135 | 3,056 | 3 | |||||||||
| Equity sales and trading | 1,320 | 1,344 | 1,119 | (2) | 18 | 2,664 | 2,325 | 15 | |||||||||
| Total sales and trading | 2,723 | 3,076 | 2,589 | (11) | 5 | 5,799 | 5,381 | 8 | |||||||||
| Other | (88) | (67) | (121) | 31 | (27) | (155) | (204) | (24) | |||||||||
| Net revenues | 3,549 | 3,626 | 3,380 | (2) | 5 | 7,175 | 6,920 | 4 | |||||||||
| Provision for credit losses | 7 | 1 | (5) | – | – | 8 | (5) | – | |||||||||
| Compensation and benefits | 1,507 | 1,514 | 1,465 | 0 | 3 | 3,021 | 2,945 | 3 | |||||||||
| General and administrative expenses | 871 | 770 | 680 | 13 | 28 | 1,641 | 1,406 | 17 | |||||||||
| Commission expenses | 254 | 226 | 198 | 12 | 28 | 480 | 404 | 19 | |||||||||
| Total other operating expenses | 1,125 | 996 | 878 | 13 | 28 | 2,121 | 1,810 | 17 | |||||||||
| Total operating expenses | 2,632 | 2,510 | 2,343 | 5 | 12 | 5,142 | 4,755 | 8 | |||||||||
| Income before taxes | 910 | 1,115 | 1,042 | (18) | (13) | 2,025 | 2,170 | (7) | |||||||||
| Statement of operations metrics (%) | |||||||||||||||||
| Return on regulatory capital | 15.6 | 18.6 | 18.7 | – | – | 17.1 | 19.8 | – | |||||||||
| Cost/income ratio | 74.2 | 69.2 | 69.3 | – | – | 71.7 | 68.7 | – | |||||||||
| Pre-tax income margin | 25.6 | 30.8 | 30.8 | – | – | 28.2 | 31.4 | – | |||||||||
34
| in / end of | % change | in / end of | % change | ||||||||||||||
| 2Q15 | 1Q15 | 2Q14 | QoQ | YoY | 6M15 | 6M14 | YoY | ||||||||||
| Statements of operations (CHF million) | |||||||||||||||||
| Net revenues | (168) | (43) | (38) | 291 | 342 | (211) | (162) | 30 | |||||||||
| Provision for credit losses | 0 | 0 | 0 | – | – | 0 | 0 | – | |||||||||
| Compensation and benefits | 38 | 38 | 34 | 0 | 12 | 76 | 75 | 1 | |||||||||
| Total other operating expenses | 89 | 89 | 218 | 0 | (59) | 178 | 354 | (50) | |||||||||
| of which litigation | 30 | 34 | 157 | (12) | (81) | 64 | 223 | (71) | |||||||||
| Total operating expenses | 127 | 127 | 252 | 0 | (50) | 254 | 429 | (41) | |||||||||
| Loss before taxes | (295) | (170) | (290) | 74 | 2 | (465) | (591) | (21) | |||||||||
| Revenue details (CHF million) | |||||||||||||||||
| Legacy fixed income portfolio | (128) | (29) | (38) | 341 | 237 | (157) | (99) | 59 | |||||||||
| Legacy funding costs | (31) | (33) | (34) | (6) | (9) | (64) | (80) | (20) | |||||||||
| Other | (9) | 19 | 34 | – | – | 10 | 17 | (41) | |||||||||
| Net revenues | (168) | (43) | (38) | 291 | 342 | (211) | (162) | 30 | |||||||||
| Corporate Center results | |||||||||||||||||
| in / end of | % change | in / end of | % change | ||||||||||||||
| 2Q15 | 1Q15 | 2Q14 | QoQ | YoY | 6M15 | 6M14 | YoY | ||||||||||
| Statements of operations (CHF million) | |||||||||||||||||
| Net revenues | 408 | 118 | 45 | 246 | – | 526 | (142) | – | |||||||||
| Provision for credit losses | 0 | 0 | 0 | – | – | 0 | 1 | (100) | |||||||||
| Compensation and benefits | 120 | 194 | 235 | (38) | (49) | 314 | 401 | (22) | |||||||||
| General and administrative expenses | 192 | 160 | 183 | 20 | 5 | 352 | 280 | 26 | |||||||||
| Commission expenses | 2 | 5 | 0 | (60) | – | 7 | (12) | – | |||||||||
| Total other operating expenses | 194 | 165 | 183 | 18 | 6 | 359 | 268 | 34 | |||||||||
| Total operating expenses | 314 | 359 | 418 | (13) | (25) | 673 | 669 | 1 | |||||||||
| Income/(loss) before taxes | 94 | (241) | (373) | – | – | (147) | (812) | (82) | |||||||||
| Balance sheet statistics (CHF million) | |||||||||||||||||
| Risk-weighted assets 1 | 14,835 | 15,963 | 15,433 | (7) | (4) | 14,835 | 15,433 | (4) | |||||||||
| Total assets | 62,425 | 47,797 | 42,509 | 31 | 47 | 62,425 | 42,509 | 47 | |||||||||
| Leverage exposure 1 | 50,550 | 36,007 | – | 40 | – | 50,550 | – | – | |||||||||
1 Disclosed on a fully phased-in look-through basis. | |||||||||||||||||
35
| Corporate Center – non-strategic results | |||||||||||||||||
| in / end of | % change | in / end of | % change | ||||||||||||||
| 2Q15 | 1Q15 | 2Q14 | QoQ | YoY | 6M15 | 6M14 | YoY | ||||||||||
| Statements of operations (CHF million) | |||||||||||||||||
| Net revenues | 290 | 124 | 48 | 134 | – | 414 | (98) | – | |||||||||
| Provision for credit losses | 0 | 0 | 0 | – | – | 0 | 0 | – | |||||||||
| Total operating expenses | 97 | 134 | 272 | (28) | (64) | 231 | 416 | (44) | |||||||||
| Income/(loss) before taxes | 193 | (10) | (224) | – | – | 183 | (514) | – | |||||||||
| of which fair value impact from movements in own credit spreads | 268 | 117 | (10) | 129 | – | 385 | (130) | – | |||||||||
| of which realignment costs | (67) | (48) | (136) | 40 | (51) | (115) | (198) | (42) | |||||||||
| of which IT architecture simplification expenses | (71) | (61) | (81) | 16 | (12) | (132) | (142) | (7) | |||||||||
| of which real estate sales | 25 | 1 | 5 | – | 400 | 26 | 39 | (33) | |||||||||
| of which legacy funding costs 1 | (21) | (21) | (22) | – | (5) | (42) | (28) | 50 | |||||||||
| of which reclassifications to discontinued operations 2 | – | – | 10 | – | (100) | – | (46) | 100 | |||||||||
| of which other non-strategic items | 59 | 2 | 10 | – | 490 | 61 | (9) | – | |||||||||
1 Represents legacy funding costs associated with non-Basel III compliant debt instruments. | |||||||||||||||||
2 Includes reclassifications to discontinued operations of revenues and expenses arising from the sale of our Customized Fund Investment Group businesses and the domestic private banking business booked in Germany. | |||||||||||||||||
Impact from movements in own credit spreads
Core Results revenues are impacted by changes in credit spreads on fair-valued Credit Suisse long-term vanilla debt and debit valuation adjustments (DVA) relating to certain structured notes liabilities carried at fair value. Core Results are also impacted by fair value gains/(losses) on stand-alone derivatives relating to certain of our funding liabilities and reflect the volatility of cross-currency swaps and yield curve volatility and, over the life of the derivatives, will result in no net gains/(losses). These fair value gains/(losses) are recorded in the Corporate Center.
| in | 2Q15 | 1Q15 | 2Q14 | 6M15 | 6M14 | |||||
| Impact from movements in own credit spreads (CHF million) | ||||||||||
| Fair value gains/(losses) from movements in own credit spreads | 268 | 117 | (10) | 385 | (130) | |||||
| of which fair value gains/(losses) on own long-term vanilla debt | 52 | (60) | (29) | (8) | (121) | |||||
| of which fair value gains/(losses) from DVA on structured notes | 174 | 127 | 4 | 301 | 0 | |||||
| of which fair value gains/(losses) on stand-alone derivatives | 42 | 50 | 15 | 92 | (9) | |||||
36
| Assets under management – Group | |||||||||||||||
| end of | % change | ||||||||||||||
| 2Q15 | 1Q15 | 4Q14 | 2Q14 | QoQ | Ytd | YoY | |||||||||
| Assets under management (CHF billion) | |||||||||||||||
| Wealth Management Clients | 847.7 | 861.2 | 874.5 | 829.7 | (1.6) | (3.1) | 2.2 | ||||||||
| Corporate & Institutional Clients | 277.8 | 286.7 | 275.9 | 261.4 | (3.1) | 0.7 | 6.3 | ||||||||
| Asset Management | 393.9 | 391.7 | 388.5 | 377.1 | 0.6 | 1.4 | 4.5 | ||||||||
| Non-strategic | 9.4 | 9.2 | 10.8 | 25.9 | 2.2 | (13.0) | (63.7) | ||||||||
| Assets managed across businesses 1 | (173.1) | (174.8) | (172.4) | (164.4) | (1.0) | 0.4 | 5.3 | ||||||||
| Assets under management | 1,355.7 | 1,374.0 | 1,377.3 | 1,329.7 | (1.3) | (1.6) | 2.0 | ||||||||
| of which continuing operations | 1,355.7 | 1,374.0 | 1,377.3 | 1,319.6 | (1.3) | (1.6) | 2.7 | ||||||||
| of which discontinued operations | 0.0 | 0.0 | 0.0 | 10.1 | – | – | (100.0) | ||||||||
| Assets under management from continuing operations | 1,355.7 | 1,374.0 | 1,377.3 | 1,319.6 | (1.3) | (1.6) | 2.7 | ||||||||
| of which discretionary assets | 429.9 | 431.5 | 429.0 | 421.0 | (0.4) | 0.2 | 2.1 | ||||||||
| of which advisory assets | 925.8 | 942.5 | 948.3 | 898.6 | (1.8) | (2.4) | 3.0 | ||||||||
1 Assets managed by Asset Management for Wealth Management Clients, Corporate & Institutional Clients and the non-strategic businesses. | |||||||||||||||
| in | 2Q15 | 1Q15 | 2Q14 | 6M15 | 6M14 | ||||||
| Net new assets (CHF billion) | |||||||||||
| Wealth Management Clients | 9.0 | 7.0 | 7.4 | 16.0 | 18.0 | ||||||
| Corporate & Institutional Clients | (1.6) | 6.1 | 0.6 | 4.5 | 1.0 | ||||||
| Asset Management | 8.9 | 10.2 | 4.1 | 19.1 | 11.0 | ||||||
| Non-strategic | (1.2) | (1.4) | (1.7) | (2.6) | (4.0) | ||||||
| Assets managed across businesses 1 | (0.9) | (4.9) | (0.3) | (5.8) | (2.2) | ||||||
| Net new assets | 14.2 | 17.0 | 10.1 | 31.2 | 23.8 | ||||||
| of which continuing operations | 14.2 | 17.0 | 10.7 | 31.2 | 25.4 | ||||||
| of which discontinued operations | 0.0 | 0.0 | (0.6) | 0.0 | (1.6) | ||||||
1 Assets managed by Asset Management for Wealth Management Clients, Corporate & Institutional Clients and the non-strategic businesses. | |||||||||||
37
| BIS capital metrics – Group | |||||||||||||||||
| Phase-in | Look-through | ||||||||||||||||
| % change | % change | ||||||||||||||||
| end of | 2Q15 | 1Q15 | 4Q14 | QoQ | 2Q15 | 1Q15 | 4Q14 | QoQ | |||||||||
| Capital and risk-weighted assets (CHF million) | |||||||||||||||||
| CET1 capital | 39,117 | 39,746 | 43,322 | (2) | 28,482 | 28,251 | 28,576 | 1 | |||||||||
| Total tier 1 capital | 47,076 | 47,610 | 49,804 | (1) | 39,458 | 39,564 | 39,892 | 0 | |||||||||
| Total eligible capital | 56,661 | 57,603 | 60,751 | (2) | 45,927 | 46,303 | 46,876 | (1) | |||||||||
| Risk-weighted assets | 281,886 | 288,514 | 291,410 | (2) | 276,631 | 283,095 | 284,248 | (2) | |||||||||
| Capital ratios (%) | |||||||||||||||||
| CET1 ratio | 13.9 | 13.8 | 14.9 | – | 10.3 | 10.0 | 10.1 | – | |||||||||
| Tier 1 ratio | 16.7 | 16.5 | 17.1 | – | 14.3 | 14.0 | 14.0 | – | |||||||||
| Total capital ratio | 20.1 | 20.0 | 20.8 | – | 16.6 | 16.4 | 16.5 | – | |||||||||
| Eligible capital – Group | |||||||||||||||||
| Phase-in | Look-through | ||||||||||||||||
| % change | % change | ||||||||||||||||
| end of | 2Q15 | 1Q15 | 4Q14 | QoQ | 2Q15 | 1Q15 | 4Q14 | QoQ | |||||||||
| Eligible capital (CHF million) | |||||||||||||||||
| Total shareholders' equity | 42,642 | 43,396 | 43,959 | (2) | 42,642 | 43,396 | 43,959 | (2) | |||||||||
| Regulatory adjustments 1 | (64) | 304 | (375) | – | (64) | 304 | (375) | – | |||||||||
| Adjustments subject to phase-in | (3,461) | 2 | (3,954) | (262) | (12) | (14,096) | (15,449) | (15,008) | (9) | ||||||||
| CET1 capital | 39,117 | 39,746 | 43,322 | (2) | 28,482 | 28,251 | 28,576 | 1 | |||||||||
| Additional tier 1 instruments | 10,976 | 3 | 11,313 | 11,316 | (3) | 10,976 | 11,313 | 11,316 | (3) | ||||||||
| Additional tier 1 instruments subject to phase-out 4 | 2,392 | 2,470 | 2,473 | (3) | – | – | – | – | |||||||||
| Deductions from additional tier 1 capital | (5,409) | 5 | (5,919) | (7,307) | (9) | – | – | – | – | ||||||||
| Additional tier 1 capital | 7,959 | 7,864 | 6,482 | 1 | 10,976 | 11,313 | 11,316 | (3) | |||||||||
| Total tier 1 capital | 47,076 | 47,610 | 49,804 | (1) | 39,458 | 39,564 | 39,892 | 0 | |||||||||
| Tier 2 instruments | 6,469 | 6 | 6,739 | 6,984 | (4) | 6,469 | 6,739 | 6,984 | (4) | ||||||||
| Tier 2 instruments subject to phase-out | 3,274 | 3,421 | 4,190 | (4) | – | – | – | – | |||||||||
| Deductions from tier 2 capital | (158) | (167) | (227) | (5) | – | – | – | – | |||||||||
| Tier 2 capital | 9,585 | 9,993 | 10,947 | (4) | 6,469 | 6,739 | 6,984 | (4) | |||||||||
| Total eligible capital | 56,661 | 57,603 | 60,751 | (2) | 45,927 | 46,303 | 46,876 | (1) | |||||||||
1 Includes regulatory adjustments not subject to phase-in, including a cumulative dividend accrual. | |||||||||||||||||
2 Reflects 40% phase-in deductions, including goodwill, other intangible assets and certain deferred tax assets, and 60% of an adjustment primarily for the accounting treatment of pension plans pursuant to phase-in requirements. | |||||||||||||||||
3 Consists of high-trigger and low-trigger capital instruments. Of this amount, CHF 6.2 billion consists of capital instruments with a capital ratio write-down trigger of 7% and CHF 4.8 billion consists of capital instruments with a capital ratio write-down trigger of 5.125%. | |||||||||||||||||
4 Includes hybrid capital instruments that are subject to phase-out. | |||||||||||||||||
5 Includes 60% of goodwill and other intangible assets (CHF 5.0 billion) and other capital deductions, including gains/(losses) due to changes in own credit risk on fair valued financial liabilities, that will be deducted from CET1 once Basel III is fully implemented. | |||||||||||||||||
6 Consists of high-trigger and low-trigger capital instruments. Of this amount, CHF 2.6 billion consists of capital instruments with a capital ratio write-down trigger of 7% and CHF 3.9 billion consists of capital instruments with a capital ratio write-down trigger of 5%. | |||||||||||||||||
38
| CET1 Capital movement – Group | |||||
2Q15 | Phase-in | Look- through | |||
| CET1 capital (CHF million) | |||||
| Balance at beginning of period | 39,746 | 28,251 | |||
| Net income | 1,051 | 1,051 | |||
| Foreign exchange impact | (872) | (617) | |||
| Other 1 | (808) | (203) | |||
| Balance at end of period | 39,117 | 28,482 | |||
1 Reflects the net effect of share-based compensation, the impact of a dividend accrual, which includes the assumption that 60% of the proposed dividend is distributed in shares, and a change in other regulatory adjustments. | |||||
| Risk-weighted assets – Group | |||||||||||||||||
| Phase-in | Look-through | ||||||||||||||||
| Private Banking & Wealth Management | Investment Banking | Corporate Center | Group | Private Banking & Wealth Management | Investment Banking | Corporate Center | Group | ||||||||||
| 2Q15 (CHF million) | |||||||||||||||||
| Credit risk | 77,039 | 95,316 | 15,508 | 187,863 | 77,039 | 95,316 | 10,253 | 182,608 | |||||||||
| Market risk | 2,031 | 27,891 | 114 | 30,036 | 2,031 | 27,891 | 114 | 30,036 | |||||||||
| Operational risk | 26,136 | 32,277 | – | 58,413 | 26,136 | 32,277 | – | 58,413 | |||||||||
| Non-counterparty risk | 587 | 519 | 4,468 | 5,574 | 587 | 519 | 4,468 | 5,574 | |||||||||
| Risk-weighted assets | 105,793 | 156,003 | 20,090 | 281,886 | 105,793 | 156,003 | 14,835 | 276,631 | |||||||||
| of which strategic | 101,319 | 147,829 | 20,090 | 269,238 | 101,319 | 147,829 | 14,835 | 263,983 | |||||||||
| of which non-strategic | 4,474 | 8,174 | – | 12,648 | 4,474 | 8,174 | – | 12,648 | |||||||||
| 4Q14 (CHF million) | |||||||||||||||||
| Credit risk | 78,753 | 95,521 | 18,389 | 192,663 | 78,753 | 95,521 | 11,227 | 185,501 | |||||||||
| Market risk | 2,822 | 31,428 | 218 | 34,468 | 2,822 | 31,428 | 218 | 34,468 | |||||||||
| Operational risk | 26,136 | 32,277 | – | 58,413 | 26,136 | 32,277 | – | 58,413 | |||||||||
| Non-counterparty risk | 550 | 589 | 4,727 | 5,866 | 550 | 589 | 4,727 | 5,866 | |||||||||
| Risk-weighted assets | 108,261 | 159,815 | 23,334 | 291,410 | 108,261 | 159,815 | 16,172 | 284,248 | |||||||||
| of which strategic | 102,407 | 149,849 | 23,334 | 275,590 | 102,407 | 149,849 | 16,172 | 268,428 | |||||||||
| of which non-strategic | 5,854 | 9,966 | – | 15,820 | 5,854 | 9,966 | – | 15,820 | |||||||||
| Risk-weighted asset movement by risk type – Group | |||||||||||
Credit risk | Market risk | Operational risk | Non- counterparty risk | Total risk- weighted assets | |||||||
| 2Q15 (CHF million) | |||||||||||
| Balance at beginning of period | 192,858 | 31,464 | 58,413 | 5,779 | 288,514 | ||||||
| Foreign exchange impact | (4,892) | (616) | 0 | 0 | (5,508) | ||||||
| Movements in risk levels | (5,544) | (406) | 0 | (205) | (6,155) | ||||||
| Model and parameter updates 1 | (201) | 75 | 0 | 0 | (126) | ||||||
| Methodology and policy – internal 2 | 2,795 | (481) | 0 | 0 | 2,314 | ||||||
| Methodology and policy – external 3 | 2,847 | 0 | 0 | 0 | 2,847 | ||||||
| Balance at end of period – phase-in | 187,863 | 30,036 | 58,413 | 5,574 | 281,886 | ||||||
| Look-through adjustment 4 | (5,255) | – | – | – | (5,255) | ||||||
| Balance at end of period – look-through | 182,608 | 30,036 | 58,413 | 5,574 | 276,631 | ||||||
1 Represents movements arising from updates to models and recalibrations of parameters. | |||||||||||
2 Represents internal changes impacting how exposures are treated. | |||||||||||
3 Represents externally prescribed regulatory changes impacting how exposures are treated. | |||||||||||
4 The look-through adjustment impacts only credit risk within the Corporate Center. The difference between phase-in and look-through risk-weighted assets relates to transitional arrangements such as the impact from pension assets and deferred tax assets not deducted from CET1 during the phase-in period and the transitional impact from threshold-related risk-weighted assets. | |||||||||||
39
| BIS leverage metrics – Group | |||||||||||||||||
| Phase-in | Look-through | ||||||||||||||||
| % change | % change | ||||||||||||||||
| end of | 2Q15 | 1Q15 | 4Q14 | QoQ | 2Q15 | 1Q15 | 4Q14 | QoQ | |||||||||
| Capital (CHF million) | |||||||||||||||||
| CET1 capital | 39,117 | 39,746 | 43,322 | (2) | 28,482 | 28,251 | 28,576 | 1 | |||||||||
| Tier 1 capital | 47,076 | 47,610 | 49,804 | (1) | 39,458 | 39,564 | 39,892 | 0 | |||||||||
| Leverage exposure (CHF million) | |||||||||||||||||
| Leverage exposure | 1,067,369 | 1,108,649 | 1,157,557 | (4) | 1,061,825 | 1,102,728 | 1,149,656 | (4) | |||||||||
| Leverage ratios (%) | |||||||||||||||||
| CET1 leverage ratio | 3.7 | 3.6 | 3.7 | – | 2.7 | 2.6 | 2.5 | – | |||||||||
| Tier 1 leverage ratio | 4.4 | 4.3 | 4.3 | – | 3.7 | 3.6 | 3.5 | – | |||||||||
| Swiss capital metrics – Group | |||||||||||||||||
| Phase-in | Look-through | ||||||||||||||||
| % change | % change | ||||||||||||||||
| end of | 2Q15 | 1Q15 | 4Q14 | QoQ | 2Q15 | 1Q15 | 4Q14 | QoQ | |||||||||
| Capital development (CHF million) | |||||||||||||||||
| CET1 capital | 39,117 | 39,746 | 43,322 | (2) | 28,482 | 28,251 | 28,576 | 1 | |||||||||
| Swiss regulatory adjustments 1 | (137) | (142) | (133) | (4) | (146) | (151) | (143) | (3) | |||||||||
| Swiss CET1 capital | 38,980 | 39,604 | 43,189 | (2) | 28,336 | 28,100 | 28,433 | 1 | |||||||||
| High-trigger capital instruments | 8,767 | 2 | 8,875 | 8,893 | (1) | 8,767 | 8,875 | 8,893 | (1) | ||||||||
| Low-trigger capital instruments | 8,678 | 3 | 9,177 | 9,406 | (5) | 8,678 | 9,177 | 9,406 | (5) | ||||||||
| Additional tier 1 and tier 2 instruments subject to phase-out | 5,665 | 5,891 | 6,663 | (4) | – | – | – | – | |||||||||
| Deductions from additional tier 1 and tier 2 capital | (5,567) | (6,087) | (7,533) | (9) | – | – | – | – | |||||||||
| Swiss total eligible capital | 56,523 | 57,460 | 60,618 | (2) | 45,781 | 46,152 | 46,732 | (1) | |||||||||
| Risk-weighted assets (CHF million) | |||||||||||||||||
| Risk-weighted assets – Basel III | 281,886 | 288,514 | 291,410 | (2) | 276,631 | 283,095 | 284,248 | (2) | |||||||||
| Swiss regulatory adjustments 4 | 955 | 951 | 1,058 | 0 | 954 | 951 | 1,057 | 0 | |||||||||
| Swiss risk-weighted assets | 282,841 | 289,465 | 292,468 | (2) | 277,585 | 284,046 | 285,305 | (2) | |||||||||
| Swiss capital ratios (%) | |||||||||||||||||
| Swiss CET1 ratio | 13.8 | 13.7 | 14.8 | – | 10.2 | 9.9 | 10.0 | – | |||||||||
| Swiss total capital ratio | 20.0 | 19.9 | 20.7 | – | 16.5 | 16.2 | 16.4 | – | |||||||||
1 Includes adjustments for certain unrealized gains outside the trading book. | |||||||||||||||||
2 Consists of CHF 6.2 billion additional tier 1 instruments and CHF 2.6 billion tier 2 instruments. | |||||||||||||||||
3 Consists of CHF 4.8 billion additional tier 1 instruments and CHF 3.9 billion tier 2 instruments. | |||||||||||||||||
4 Primarily includes differences in the credit risk multiplier. | |||||||||||||||||
| Swiss leverage metrics – Group | |||||||||||||||||
| Phase-in | Look-through | ||||||||||||||||
| % change | % change | ||||||||||||||||
| end of | 2Q15 | 1Q15 | 4Q14 | QoQ | 2Q15 | 1Q15 | 4Q14 | QoQ | |||||||||
| Swiss leverage ratio (CHF million, except where indicated) | |||||||||||||||||
| Swiss total eligible capital | 56,523 | 57,460 | 60,618 | (2) | 45,781 | 46,152 | 46,732 | (1) | |||||||||
| Leverage exposure | 1,067,369 | 1,108,649 | 1,157,557 | (4) | 1,061,825 | 1,102,728 | 1,149,656 | (4) | |||||||||
| Swiss leverage ratio (%) | 5.3 | 5.2 | 5.2 | – | 4.3 | 4.2 | 4.1 | – | |||||||||
40
in / end of | Interest rate | Credit spread | Foreign exchange | Commodity | Equity | Diversi- fication benefit | Total | ||||||||
| 2Q15 (CHF million) | |||||||||||||||
| Average | 19 | 36 | 14 | 2 | 21 | (45) | 47 | ||||||||
| Minimum | 15 | 31 | 5 | 1 | 17 | – | 1 | 38 | |||||||
| Maximum | 28 | 41 | 22 | 4 | 26 | – | 1 | 55 | |||||||
| End of period | 23 | 32 | 11 | 1 | 21 | (43) | 45 | ||||||||
| 1Q15 (CHF million) | |||||||||||||||
| Average | 15 | 36 | 9 | 2 | 20 | (36) | 46 | ||||||||
| Minimum | 6 | 32 | 6 | 1 | 16 | – | 1 | 34 | |||||||
| Maximum | 22 | 40 | 15 | 3 | 24 | – | 1 | 56 | |||||||
| End of period | 17 | 37 | 13 | 1 | 24 | (38) | 54 | ||||||||
| 2Q14 (CHF million) | |||||||||||||||
| Average | 13 | 30 | 8 | 2 | 16 | (29) | 40 | ||||||||
| Minimum | 11 | 28 | 5 | 1 | 13 | – | 1 | 35 | |||||||
| Maximum | 16 | 33 | 12 | 3 | 22 | – | 1 | 46 | |||||||
| End of period | 12 | 32 | 7 | 2 | 20 | (27) | 46 | ||||||||
| Excludes risks associated with counterparty and own credit exposures. | |||||||||||||||
1 As the maximum and minimum occur on different days for different risk types, it is not meaningful to calculate a portfolio diversification benefit. | |||||||||||||||
41
| in | 2Q15 | 1Q15 | 2Q14 | 6M15 | 6M14 | ||||||
| Consolidated statements of operations (CHF million) | |||||||||||
| Interest and dividend income | 5,903 | 4,490 | 5,690 | 10,393 | 10,135 | ||||||
| Interest expense | (3,034) | (2,338) | (3,104) | (5,372) | (5,371) | ||||||
| Net interest income | 2,869 | 2,152 | 2,586 | 5,021 | 4,764 | ||||||
| Commissions and fees | 3,259 | 2,979 | 3,309 | 6,238 | 6,584 | ||||||
| Trading revenues | 498 | 1,390 | 197 | 1,888 | 835 | ||||||
| Other revenues | 329 | 126 | 371 | 455 | 1,109 | ||||||
| Net revenues | 6,955 | 6,647 | 6,463 | 13,602 | 13,292 | ||||||
| Provision for credit losses | 51 | 30 | 18 | 81 | 52 | ||||||
| Compensation and benefits | 2,914 | 2,976 | 2,973 | 5,890 | 5,966 | ||||||
| General and administrative expenses | 1,928 | 1,738 | 3,441 | 3,666 | 5,131 | ||||||
| Commission expenses | 406 | 392 | 377 | 798 | 746 | ||||||
| Total other operating expenses | 2,334 | 2,130 | 3,818 | 4,464 | 5,877 | ||||||
| Total operating expenses | 5,248 | 5,106 | 6,791 | 10,354 | 11,843 | ||||||
| Income/(loss) from continuing operations before taxes | 1,656 | 1,511 | (346) | 3,167 | 1,397 | ||||||
| Income tax expense | 590 | 477 | 307 | 1,067 | 850 | ||||||
| Income/(loss) from continuing operations | 1,066 | 1,034 | (653) | 2,100 | 547 | ||||||
| Income/(loss) from discontinued operations, net of tax | 0 | 0 | (9) | 0 | 6 | ||||||
| Net income/(loss) | 1,066 | 1,034 | (662) | 2,100 | 553 | ||||||
| Net income/(loss) attributable to noncontrolling interests | 15 | (20) | 38 | (5) | 394 | ||||||
| Net income/(loss) attributable to shareholders | 1,051 | 1,054 | (700) | 2,105 | 159 | ||||||
| of which from continuing operations | 1,051 | 1,054 | (691) | 2,105 | 153 | ||||||
| of which from discontinued operations | 0 | 0 | (9) | 0 | 6 | ||||||
| Basic earnings per share (CHF) | |||||||||||
| Basic earnings/(loss) per share from continuing operations | 0.63 | 0.63 | (0.45) | 1.26 | 0.05 | ||||||
| Basic earnings/(loss) per share from discontinued operations | 0.00 | 0.00 | (0.01) | 0.00 | 0.00 | ||||||
| Basic earnings/(loss) per share | 0.63 | 0.63 | (0.46) | 1.26 | 0.05 | ||||||
| Diluted earnings per share (CHF) | |||||||||||
| Diluted earnings/(loss) per share from continuing operations | 0.61 | 0.62 | (0.45) | 1.23 | 0.05 | ||||||
| Diluted earnings/(loss) per share from discontinued operations | 0.00 | 0.00 | (0.01) | 0.00 | 0.00 | ||||||
| Diluted earnings/(loss) per share | 0.61 | 0.62 | (0.46) | 1.23 | 0.05 | ||||||
42
| end of | 2Q15 | 1Q15 | 4Q14 | 2Q14 | |||||
| Assets (CHF million) | |||||||||
| Cash and due from banks | 104,054 | 87,913 | 79,349 | 66,469 | |||||
| Interest-bearing deposits with banks | 928 | 1,117 | 1,244 | 1,749 | |||||
| Central bank funds sold, securities purchased under resale agreements and securities borrowing transactions | 137,834 | 144,859 | 163,208 | 165,744 | |||||
| Securities received as collateral, at fair value | 28,851 | 28,106 | 26,854 | 21,611 | |||||
| Trading assets, at fair value | 205,688 | 235,564 | 241,131 | 235,427 | |||||
| Investment securities | 3,370 | 3,052 | 2,791 | 3,323 | |||||
| Other investments | 7,391 | 7,881 | 8,613 | 7,709 | |||||
| Net loans | 270,171 | 270,774 | 272,551 | 254,532 | |||||
| Premises and equipment | 4,429 | 4,520 | 4,641 | 4,811 | |||||
| Goodwill | 8,238 | 8,504 | 8,644 | 7,983 | |||||
| Other intangible assets | 205 | 220 | 249 | 245 | |||||
| Brokerage receivables | 48,414 | 45,383 | 41,629 | 56,309 | |||||
| Other assets | 59,749 | 66,497 | 70,558 | 64,689 | |||||
| Assets of discontinued operations held-for-sale | 0 | 0 | 0 | 979 | |||||
| Total assets | 879,322 | 904,390 | 921,462 | 891,580 | |||||
| Liabilities and equity (CHF million) | |||||||||
| Due to banks | 30,205 | 27,262 | 26,009 | 26,701 | |||||
| Customer deposits | 356,453 | 365,007 | 369,058 | 346,296 | |||||
| Central bank funds purchased, securities sold under repurchase agreements and securities lending transactions | 58,567 | 66,140 | 70,119 | 88,066 | |||||
| Obligation to return securities received as collateral, at fair value | 28,851 | 28,106 | 26,854 | 21,611 | |||||
| Trading liabilities, at fair value | 59,390 | 69,757 | 72,655 | 75,129 | |||||
| Short-term borrowings | 26,401 | 27,577 | 25,921 | 29,426 | |||||
| Long-term debt | 182,655 | 175,678 | 177,898 | 143,827 | |||||
| Brokerage payables | 48,039 | 55,229 | 56,977 | 68,842 | |||||
| Other liabilities | 45,301 | 45,349 | 50,970 | 48,913 | |||||
| Liabilities of discontinued operations held-for-sale | 0 | 0 | 0 | 742 | |||||
| Total liabilities | 835,862 | 860,105 | 876,461 | 849,553 | |||||
| Common shares | 65 | 64 | 64 | 64 | |||||
| Additional paid-in capital | 25,860 | 27,589 | 27,007 | 26,655 | |||||
| Retained earnings | 34,188 | 33,137 | 32,083 | 30,392 | |||||
| Treasury shares, at cost | (151) | (1,008) | (192) | (190) | |||||
| Accumulated other comprehensive income/(loss) | (17,320) | (16,386) | (15,003) | (15,977) | |||||
| Total shareholders' equity | 42,642 | 43,396 | 43,959 | 40,944 | |||||
| Noncontrolling interests | 818 | 889 | 1,042 | 1,083 | |||||
| Total equity | 43,460 | 44,285 | 45,001 | 42,027 | |||||
| Total liabilities and equity | 879,322 | 904,390 | 921,462 | 891,580 | |||||
43
| Attributable to shareholders | |||||||||||||||||
Common shares | Additional paid-in capital | Retained earnings | Treasury shares, at cost | Accumu- lated other compre- hensive income | Total share- holders' equity | Non- controlling interests | Total equity | ||||||||||
| 2Q15 (CHF million) | |||||||||||||||||
| Balance at beginning of period | 64 | 27,589 | 33,137 | (1,008) | (16,386) | 43,396 | 889 | 44,285 | |||||||||
| Purchase of subsidiary shares from non- controlling interests, not changing ownership 1, 2 | – | – | – | – | – | – | (92) | (92) | |||||||||
| Sale of subsidiary shares to noncontrolling interests, not changing ownership 2 | – | – | – | – | – | – | 30 | 30 | |||||||||
| Net income/(loss) | – | – | 1,051 | – | – | 1,051 | 15 | 1,066 | |||||||||
| Total other comprehensive income/(loss), net of tax | – | – | – | – | (934) | (934) | (30) | (964) | |||||||||
| Issuance of common shares | 1 | 710 | – | – | – | 711 | – | 711 | |||||||||
| Sale of treasury shares | – | 7 | – | 5,605 | – | 5,612 | – | 5,612 | |||||||||
| Repurchase of treasury shares | – | – | – | (5,719) | – | (5,719) | – | (5,719) | |||||||||
| Share-based compensation, net of tax | – | (1,233) | 3 | – | 971 | – | (262) | – | (262) | ||||||||
| Financial instruments indexed to own shares 4 | – | (76) | – | – | – | (76) | – | (76) | |||||||||
| Dividends paid | – | (1,137) | 5 | – | – | – | (1,137) | – | (1,137) | ||||||||
| Changes in scope of consolidation, net | – | – | – | – | – | – | 6 | 6 | |||||||||
| Balance at end of period | 65 | 25,860 | 34,188 | (151) | (17,320) | 42,642 | 818 | 43,460 | |||||||||
| 6M15 (CHF million) | |||||||||||||||||
| Balance at beginning of period | 64 | 27,007 | 32,083 | (192) | (15,003) | 43,959 | 1,042 | 45,001 | |||||||||
| Purchase of subsidiary shares from non- controlling interests, not changing ownership 1, 2 | – | – | – | – | – | – | (214) | (214) | |||||||||
| Sale of subsidiary shares to noncontrolling interests, not changing ownership 2 | – | – | – | – | – | – | 45 | 45 | |||||||||
| Net income/(loss) | – | – | 2,105 | – | – | 2,105 | (5) | 2,100 | |||||||||
| Total other comprehensive income/(loss), net of tax | – | – | – | – | (2,317) | (2,317) | (54) | (2,371) | |||||||||
| Issuance of common shares | 1 | 710 | – | – | – | 711 | – | 711 | |||||||||
| Sale of treasury shares | – | (3) | – | 7,438 | – | 7,435 | – | 7,435 | |||||||||
| Repurchase of treasury shares | – | – | – | (8,385) | – | (8,385) | – | (8,385) | |||||||||
| Share-based compensation, net of tax | – | (857) | 6 | – | 988 | – | 131 | – | 131 | ||||||||
| Financial instruments indexed to own shares 4 | – | 140 | – | – | – | 140 | – | 140 | |||||||||
| Dividends paid | – | (1,137) | 5 | – | – | – | (1,137) | – | (1,137) | ||||||||
| Changes in scope of consolidation, net | – | – | – | – | – | – | 6 | 6 | |||||||||
| Other | – | – | – | – | – | – | (2) | (2) | |||||||||
| Balance at end of period | 65 | 25,860 | 34,188 | (151) | (17,320) | 42,642 | 818 | 43,460 | |||||||||
1 Distributions to owners in funds include the return of original capital invested and any related dividends. | |||||||||||||||||
2 Transactions with and without ownership changes related to fund activity are all displayed under "not changing ownership". | |||||||||||||||||
3 Includes a net tax charge of CHF (14) million from the excess recognized compensation expense over fair value of shares delivered. | |||||||||||||||||
4 The Group had purchased certain call options on its own shares to economically hedge share-based compensation awards. In accordance with US GAAP, these call options were designated as equity instruments and, as such, were initially recognized in shareholders' equity at their fair values and not subsequently remeasured. | |||||||||||||||||
5 Paid out of reserves from capital contributions. | |||||||||||||||||
6 Includes a net tax charge of CHF (12) million from the excess recognized compensation expense over fair value of shares delivered. | |||||||||||||||||
44
| in | 2Q15 | 1Q15 | 2Q14 | 6M15 | 6M14 | ||||||
| Basic net income/(loss) attributable to shareholders (CHF million) | |||||||||||
| Income/(loss) from continuing operations | 1,051 | 1,054 | (691) | 2,105 | 153 | ||||||
| Income/(loss) from discontinued operations, net of tax | 0 | 0 | (9) | 0 | 6 | ||||||
| Net income/(loss) attributable to shareholders | 1,051 | 1,054 | (700) | 2,105 | 159 | ||||||
| Preferred securities dividends | – | – | – | – | (28) | ||||||
| Net income/(loss) attributable to shareholders for basic earnings per share | 1,051 | 1,054 | (700) | 2,105 | 131 | ||||||
| Available for common shares | 1,029 | 1,028 | (752) | 2,059 | 79 | ||||||
| Available for unvested share-based payment awards | 22 | 26 | 52 | 46 | 52 | ||||||
| Diluted net income/(loss) attributable to shareholders (CHF million) | |||||||||||
| Net income/(loss) attributable to shareholders for diluted earnings per share | 1,051 | 1,054 | (700) | 2,105 | 131 | ||||||
| Available for common shares | 1,029 | 1,028 | (752) | 2,060 | 79 | ||||||
| Available for unvested share-based payment awards | 22 | 26 | 52 | 45 | 52 | ||||||
| Weighted-average shares outstanding (million) | |||||||||||
| Weighted-average shares outstanding for basic earnings per share available for common shares | 1,641.0 | 1,621.5 | 1,625.0 | 1,631.3 | 1,623.1 | ||||||
| Dilutive share options and warrants | 0.9 | 1.0 | 0.0 | 0.9 | 0.7 | ||||||
| Dilutive share awards | 44.6 | 30.8 | 0.0 | 37.7 | 2.6 | ||||||
| Weighted-average shares outstanding for diluted earnings per share available for common shares 1 | 1,686.5 | 1,653.3 | 1,625.0 | 2 | 1,669.9 | 1,626.4 | |||||
| Weighted-average shares outstanding for basic/diluted earnings per share available for unvested share-based payment awards | 21.8 | 41.3 | 68.3 | 31.6 | 81.9 | ||||||
| Basic earnings/(loss) per share available for common shares (CHF) | |||||||||||
| Basic earnings/(loss) per share from continuing operations | 0.63 | 0.63 | (0.45) | 1.26 | 0.05 | ||||||
| Basic earnings/(loss) per share from discontinued operations | 0.00 | 0.00 | (0.01) | 0.00 | 0.00 | ||||||
| Basic earnings/(loss) per share available for common shares | 0.63 | 0.63 | (0.46) | 1.26 | 0.05 | ||||||
| Diluted earnings/(loss) per share available for common shares (CHF) | |||||||||||
| Diluted earnings/(loss) per share from continuing operations | 0.61 | 0.62 | (0.45) | 1.23 | 0.05 | ||||||
| Diluted earnings/(loss) per share from discontinued operations | 0.00 | 0.00 | (0.01) | 0.00 | 0.00 | ||||||
| Diluted earnings/(loss) per share available for common shares | 0.61 | 0.62 | (0.46) | 1.23 | 0.05 | ||||||
1 Weighted-average potential common shares relating to instruments that were not dilutive for the respective periods (and therefore not included in the diluted earnings per share calculation above) but could potentially dilute earnings per share in the future were 7.2 million, 9.2 million, 8.8 million, 8.2 million and 8.9 million for 2Q15, 1Q15, 2Q14, 6M15 and 6M14, respectively. | |||||||||||
2 Due to the net loss in 2Q14, 1.3 million weighted-average share options and warrants outstanding and 12.2 million weighted-average share awards outstanding were excluded from the diluted earnings per share calculation, as the effect would be antidilutive. | |||||||||||
45
Relationship between total shareholders’ equity, tangible shareholders’ equity and regulatory capital
Credit Suisse measures firm-wide returns against total shareholders’ equity and tangible shareholders’ equity. In addition, it also measures the efficiency of the firm and its divisions with regards to the usage of capital as determined by the minimum requirements set by regulators. This regulatory capital is calculated as the average of 10% of risk-weighted assets and 3% of the leverage exposure utilized by each division and the firm as a whole. These percentages are used in the calculation in order to reflect the 2019 fully phased in Swiss regulatory minimum requirements for Basel III CET1 capital and leverage ratio.
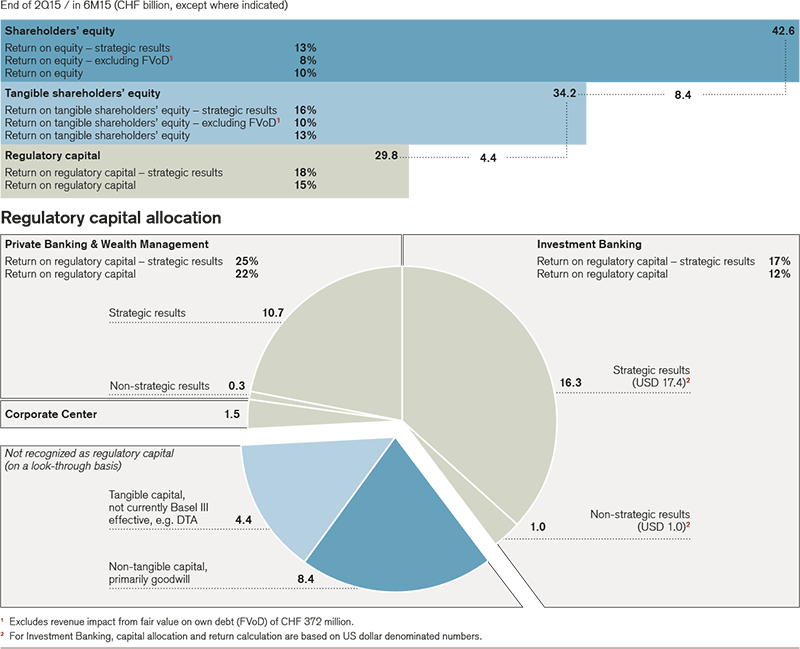
46
Cautionary statement regarding forward-looking information
This earnings release contains statements that constitute forward-looking statements. In addition, in the future we, and others on our behalf, may make statements that constitute forward-looking statements. Such forward-looking statements may include, without limitation, statements relating to the following:
– our plans, objectives or goals;
– our future economic performance or prospects;
– the potential effect on our future performance of certain contingencies; and
– assumptions underlying any such statements.
Words such as “believes,” “anticipates,” “expects,” “intends” and “plans” and similar expressions are intended to identify forward-looking statements but are not the exclusive means of identifying such statements. We do not intend to update these forward-looking statements except as may be required by applicable securities laws.
By their very nature, forward-looking statements involve inherent risks and uncertainties, both general and specific, and risks exist that predictions, forecasts, projections and other outcomes described or implied in forward-looking statements will not be achieved. We caution you that a number of important factors could cause results to differ materially from the plans, objectives, expectations, estimates and intentions expressed in such forward-looking statements. These factors include:
– the ability to maintain sufficient liquidity and access capital markets;
– market volatility and interest rate fluctuations and developments affecting interest rate levels;
– the strength of the global economy in general and the strength of the economies of the countries in which we conduct our operations, in particular the risk of continued slow economic recovery or downturn in the US or other developed countries in 2015 and beyond;
– the direct and indirect impacts of deterioration or slow recovery in residential and commercial real estate markets;
– adverse rating actions by credit rating agencies in respect of us, sovereign issuers, structured credit products or other credit-related exposures;
– the ability to achieve our strategic objectives, including improved performance, reduced risks, lower costs and more efficient use of capital;
– the ability of counterparties to meet their obligations to us;
– the effects of, and changes in, fiscal, monetary, exchange rate, trade and tax policies, as well as currency fluctuations;
– political and social developments, including war, civil unrest or terrorist activity;
– the possibility of foreign exchange controls, expropriation, nationalization or confiscation of assets in countries in which we conduct our operations;
– operational factors such as systems failure, human error, or the failure to implement procedures properly;
– actions taken by regulators with respect to our business and practices and possible resulting changes to our business organization, practices and policies in countries in which we conduct our operations;
– the effects of changes in laws, regulations or accounting policies or practices in countries in which we conduct our operations;
– competition or changes in our competitive position in geographic and business areas in which we conduct our operations;
– the ability to retain and recruit qualified personnel;
– the ability to maintain our reputation and promote our brand;
– the ability to increase market share and control expenses;
– technological changes;
– the timely development and acceptance of our new products and services and the perceived overall value of these products and services by users;
– acquisitions, including the ability to integrate acquired businesses successfully, and divestitures, including the ability to sell non-core assets;
– the adverse resolution of litigation, regulatory proceedings and other contingencies;
– the ability to achieve our cost efficiency goals and cost targets; and
– our success at managing the risks involved in the foregoing.
We caution you that the foregoing list of important factors is not exclusive. When evaluating forward-looking statements, you should carefully consider the foregoing factors and other uncertainties and events, including the information set forth in “Risk factors” in I – Information on the company in our Annual Report 2014.
47