
| Key metrics | |||||||||||||||||
| in / end of | % change | in / end of | % change | ||||||||||||||
| 4Q16 | 3Q16 | 4Q15 | QoQ | YoY | 2016 | 2015 | YoY | ||||||||||
| Credit Suisse (CHF million, except where indicated) | |||||||||||||||||
| Net income/(loss) attributable to shareholders | (2,619) | 41 | (5,828) | – | (55) | (2,710) | (2,944) | (8) | |||||||||
| Basic earnings/(loss) per share (CHF) | (1.25) | 0.02 | (3.28) | – | (62) | (1.32) | (1.73) | (24) | |||||||||
| Diluted earnings/(loss) per share (CHF) | (1.25) | 0.02 | (3.28) | – | (62) | (1.32) | (1.73) | (24) | |||||||||
| Return on equity attributable to shareholders (%) | (23.8) | 0.4 | (51.3) | – | – | (6.1) | (6.8) | – | |||||||||
| Effective tax rate (%) | (18.8) | 83.3 | 9.7 | – | – | (19.5) | (21.6) | – | |||||||||
| Core Results (CHF million, except where indicated) | |||||||||||||||||
| Net revenues | 5,383 | 5,561 | 4,336 | (3) | 24 | 21,594 | 23,286 | (7) | |||||||||
| Provision for credit losses | 47 | 50 | 33 | (6) | 42 | 141 | 187 | (25) | |||||||||
| Total operating expenses | 4,644 | 4,437 | 9,422 | 5 | (51) | 17,960 | 22,869 | (21) | |||||||||
| Income/(loss) before taxes | 692 | 1,074 | (5,119) | (36) | – | 3,493 | 230 | – | |||||||||
| Cost/income ratio (%) | 86.3 | 79.8 | 217.3 | – | – | 83.2 | 98.2 | – | |||||||||
| Assets under management and net new assets (CHF billion) | |||||||||||||||||
| Assets under management | 1,251.1 | 1,254.2 | 1,214.1 | (0.2) | 3.0 | 1,251.1 | 1,214.1 | 3.0 | |||||||||
| Net new assets | (6.7) | 11.6 | 2.1 | – | – | 26.8 | 46.9 | (42.9) | |||||||||
| Balance sheet statistics (CHF million) | |||||||||||||||||
| Total assets | 819,861 | 806,711 | 820,805 | 2 | 0 | 819,861 | 820,805 | 0 | |||||||||
| Net loans | 275,976 | 274,606 | 272,995 | 0 | 1 | 275,976 | 272,995 | 1 | |||||||||
| Total shareholders' equity | 41,897 | 44,276 | 44,382 | (5) | (6) | 41,897 | 44,382 | (6) | |||||||||
| Tangible shareholders' equity | 36,771 | 39,359 | 39,378 | (7) | (7) | 36,771 | 39,378 | (7) | |||||||||
| Basel III regulatory capital and leverage statistics | |||||||||||||||||
| CET1 ratio (%) | 13.5 | 14.1 | 14.3 | – | – | 13.5 | 14.3 | – | |||||||||
| Look-through CET1 ratio (%) | 11.5 | 12.0 | 11.4 | – | – | 11.5 | 11.4 | – | |||||||||
| Look-through CET1 leverage ratio (%) | 3.2 | 3.4 | 3.3 | – | – | 3.2 | 3.3 | – | |||||||||
| Look-through Tier 1 leverage ratio (%) | 4.4 | 4.6 | 4.5 | – | – | 4.4 | 4.5 | – | |||||||||
| Share information | |||||||||||||||||
| Shares outstanding (million) | 2,089.9 | 2,088.3 | 1,951.5 | 0 | 7 | 2,089.9 | 1,951.5 | 7 | |||||||||
| of which common shares issued | 2,089.9 | 2,089.9 | 1,957.4 | 0 | 7 | 2,089.9 | 1,957.4 | 7 | |||||||||
| of which treasury shares | 0.0 | (1.6) | (5.9) | 100 | 100 | 0.0 | (5.9) | 100 | |||||||||
| Book value per share (CHF) | 20.05 | 21.20 | 22.74 | (5) | (12) | 20.05 | 22.74 | (12) | |||||||||
| Tangible book value per share (CHF) | 17.59 | 18.85 | 20.18 | (7) | (13) | 17.59 | 20.18 | (13) | |||||||||
| Market capitalization (CHF million) | 30,533 | 26,563 | 42,456 | 15 | (28) | 30,533 | 42,456 | (28) | |||||||||
| Number of employees (full-time equivalents) | |||||||||||||||||
| Number of employees | 47,170 | 47,690 | 48,210 | (1) | (2) | 47,170 | 48,210 | (2) | |||||||||
| See relevant tables for additional information on these metrics. | |||||||||||||||||
Explanation of revision
As announced on March 24, 2017, we updated our previously reported unaudited financial results for 4Q16 and 2016 to reflect additional after tax charges of CHF 272 million and a BIS look-through CET1 ratio of 11.5%. These charges reflect an increase in the existing litigation provision by CHF 300 million for a settlement in principle to resolve the RMBS matter with the National Credit Union Administration Board (NCUA). In addition, in our Asia Pacific division, the previously reported amounts as of the end of 2016 for total assets under management and net new assets in 2016 have been reduced by CHF 1.4 billion and CHF 1 billion, respectively.
This revised 4Q16 Earnings Release updates those financial results and related information to reflect these charges and changes in assets under management and net new assets and does not update or modify any other information contained in the 4Q16 Earnings Release originally published on February 14, 2017 that does not relate to these charges or changes to assets under management and net new assets.
2
In 4Q16, we recorded a net loss attributable to shareholders of CHF 2,619 million. The diluted loss per share was CHF 1.25 and the return on equity attributable to shareholders was (23.8)%. As of the end of 4Q16, our BIS CET1 ratio was 11.5% on a look-through basis.
| Results | |||||||||||||||||
| in / end of | % change | in / end of | % change | ||||||||||||||
| 4Q16 | 3Q16 | 4Q15 | QoQ | YoY | 2016 | 2015 | YoY | ||||||||||
| Statements of operations (CHF million) | |||||||||||||||||
| Net interest income | 1,622 | 1,930 | 2,194 | (16) | (26) | 7,562 | 9,299 | (19) | |||||||||
| Commissions and fees | 2,941 | 2,680 | 2,914 | 10 | 1 | 11,092 | 12,044 | (8) | |||||||||
| Trading revenues | 258 | 232 | (1,349) | 11 | – | 313 | 1,340 | (77) | |||||||||
| Other revenues | 360 | 554 | 451 | (35) | (20) | 1,356 | 1,114 | 22 | |||||||||
| Net revenues | 5,181 | 5,396 | 4,210 | (4) | 23 | 20,323 | 23,797 | (15) | |||||||||
| Provision for credit losses | 75 | 55 | 133 | 36 | (44) | 252 | 324 | (22) | |||||||||
| Compensation and benefits | 2,682 | 2,674 | 3,149 | 0 | (15) | 10,572 | 11,546 | (8) | |||||||||
| General and administrative expenses | 4,184 | 1,978 | 2,808 | 112 | 49 | 9,770 | 8,574 | 14 | |||||||||
| Commission expenses | 394 | 322 | 409 | 22 | (4) | 1,455 | 1,623 | (10) | |||||||||
| Goodwill impairment | 0 | 0 | 3,797 | – | (100) | 0 | 3,797 | (100) | |||||||||
| Restructuring expenses | 49 | 145 | 355 | (66) | (86) | 540 | 355 | 52 | |||||||||
| Total other operating expenses | 4,627 | 2,445 | 7,369 | 89 | (37) | 11,765 | 14,349 | (18) | |||||||||
| Total operating expenses | 7,309 | 5,119 | 10,518 | 43 | (31) | 22,337 | 25,895 | (14) | |||||||||
| Income/(loss) before taxes | (2,203) | 222 | (6,441) | – | (66) | (2,266) | (2,422) | (6) | |||||||||
| Income tax expense/(benefit) | 414 | 185 | (627) | 124 | – | 441 | 523 | (16) | |||||||||
| Net income/(loss) | (2,617) | 37 | (5,814) | – | (55) | (2,707) | (2,945) | (8) | |||||||||
| Net income/(loss) attributable to noncontrolling interests | 2 | (4) | 14 | – | (86) | 3 | (1) | – | |||||||||
| Net income/(loss) attributable to shareholders | (2,619) | 41 | (5,828) | – | (55) | (2,710) | (2,944) | (8) | |||||||||
| Statement of operations metrics (%) | |||||||||||||||||
| Return on regulatory capital | (18.6) | 1.8 | (50.7) | – | – | (4.7) | (4.5) | – | |||||||||
| Cost/income ratio | 141.1 | 94.9 | 249.8 | – | – | 109.9 | 108.8 | – | |||||||||
| Effective tax rate | (18.8) | 83.3 | 9.7 | – | – | (19.5) | (21.6) | – | |||||||||
| Earnings per share (CHF) | |||||||||||||||||
| Basic earnings/(loss) per share | (1.25) | 0.02 | (3.28) | – | (62) | (1.32) | (1.73) | (24) | |||||||||
| Diluted earnings/(loss) per share | (1.25) | 0.02 | (3.28) | – | (62) | (1.32) | (1.73) | (24) | |||||||||
| Return on equity (%, annualized) | |||||||||||||||||
| Return on equity attributable to shareholders | (23.8) | 0.4 | (51.3) | – | – | (6.1) | (6.8) | – | |||||||||
| Return on tangible equity attributable to shareholders 1 | (26.9) | 0.4 | (62.7) | – | – | (6.9) | (8.4) | – | |||||||||
| Balance sheet statistics (CHF million) | |||||||||||||||||
| Total assets | 819,861 | 806,711 | 820,805 | 2 | 0 | 819,861 | 820,805 | 0 | |||||||||
| Risk-weighted assets 2 | 268,045 | 270,462 | 289,946 | (1) | (8) | 268,045 | 289,946 | (8) | |||||||||
| Leverage exposure 2 | 950,763 | 948,744 | 987,628 | 0 | (4) | 950,763 | 987,628 | (4) | |||||||||
| Number of employees (full-time equivalents) | |||||||||||||||||
| Number of employees | 47,170 | 47,690 | 48,210 | (1) | (2) | 47,170 | 48,210 | (2) | |||||||||
1 Based on tangible shareholders' equity attributable to shareholders, a non-GAAP financial measure, which is calculated by deducting goodwill and other intangible assets from total shareholders' equity attributable to shareholders as presented in our balance sheet. Management believes that the return on tangible shareholders' equity attributable to shareholders is meaningful as it allows consistent measurement of the performance of businesses without regard to whether the businesses were acquired. | |||||||||||||||||
2 Disclosed on a look-through basis. | |||||||||||||||||
3
4Q16 results
In 4Q16, Credit Suisse reported a net loss attributable to shareholders of CHF 2,619 million compared to net income attributable to shareholders of CHF 41 million in 3Q16 and a net loss attributable to shareholders of CHF 5,828 million in 4Q15. The 4Q16 results included net litigation provisions of CHF 2,470 million, primarily relating to the settlement with the US Department of Justice (DOJ) and the NCUA regarding our legacy residential mortgage-backed securities (RMBS) business. Our 4Q15 results included a significant goodwill impairment charge of CHF 3,797 million. In 4Q16, Credit Suisse reported an adjusted income before taxes of CHF 171 million.
2016 results
In 2016, Credit Suisse reported a net loss attributable to shareholders of CHF 2,710 million compared to CHF 2,944 million in 2015. The 2016 results included net litigation provisions of CHF 2,986 million, primarily relating to the RMBS settlements. Our 2015 results included the significant goodwill impairment charge. In 2016, Credit Suisse reported an adjusted income before taxes of CHF 615 million.
> Refer to the Appendix for a reconciliation of our adjusted results to the most directly comparable US GAAP measures.
Net revenues
We reported net revenues of CHF 5,181 million, which decreased 4% compared to 3Q16, primarily reflecting lower net revenues in Swiss Universal Bank and Global Markets, partially offset by higher net revenues in International Wealth Management and Investment Banking & Capital Markets. Net revenues in Swiss Universal Bank decreased mainly due to gains on the sale of real estate of CHF 346 million in 3Q16. The decrease in net revenues in Global Markets reflected a seasonal slowdown in client activity partially offset by improved performance in equities. The increase in net revenues in International Wealth Management was primarily due to significantly higher transaction- and performance-based revenues in both Asset Management and Private Banking and a gain on the sale of real estate of CHF 54 million. The increase in net revenues in Investment Banking & Capital Markets was primarily due to higher revenues from advisory and other fees.
Net revenues increased 23% compared to 4Q15, primarily reflecting higher net revenues in Corporate Center, Investment Banking & Capital Markets and International Wealth Management. Net revenues in Corporate Center increased, primarily driven by fair value losses from movements in own credit spreads in 4Q15, which, beginning in 1Q16, were no longer recorded in the consolidated income statement under US GAAP. Net revenues in Investment Banking & Capital Markets increased primarily driven by higher debt underwriting revenues. Net revenues in International Wealth Management increased primarily due to higher net interest income and the gain on the sale of real estate.
Provision for credit losses
In 4Q16, there was a provision for credit losses of CHF 75 million, primarily related to a net provision for credit losses of CHF 34 million in Swiss Universal Bank and CHF 28 million in the Strategic Resolution Unit.
Total operating expenses
We reported total operating expenses of CHF 7,309 million in 4Q16, an increase of 43% compared to 3Q16, reflecting a 112% increase in general and administrative expenses, including higher net litigation provisions of CHF 2,470 million, primarily related to the RMBS settlements, partially offset by a 66% decrease in restructuring expenses. We incurred CHF 49 million of restructuring expenses in 4Q16, of which CHF 30 million were expenses related to compensation and benefits.
Total operating expenses decreased 31% compared to 4Q15, primarily due to a goodwill impairment charge of CHF 3,797 million in 4Q15. Compensation and benefits decreased 15%, mainly due to lower salaries and variable compensation, and restructuring expenses decreased 86%. These movements were partially offset by a 49% increase in general and administrative expenses, mainly due to higher net litigation provisions, primarily related to the RMBS settlements.
Income tax expense
Income tax expense of CHF 414 million recorded in 4Q16 mainly reflected the impact of the geographical mix of results as well as the impact of tax contingency accruals. Overall, net deferred tax assets decreased CHF 736 million to CHF 5,699 million, mainly driven by earnings and the start of operations of Credit Suisse (Schweiz) AG, partially offset by foreign exchange impacts. Deferred tax assets on net operating losses decreased CHF 758 million to CHF 2,198 million during 4Q16. The Credit Suisse effective tax rate was (18.8)% in 4Q16, compared to 83.3% in 3Q16. The 4Q16 tax rate was mostly impacted by the non-deductible civil monetary penalty relating to the final settlement with the DOJ for the legacy RMBS business.
RMBS settlement
In January 2017, Credit Suisse reached a final settlement with the DOJ related to its legacy RMBS business – a business conducted through 2007. The settlement releases Credit Suisse from potential civil claims by the DOJ related to its securitization, underwriting, issuance and sale of RMBS. Under the terms of the settlement, Credit Suisse will pay to the DOJ a civil monetary penalty of USD 2.48 billion. In addition, Credit Suisse will provide consumer relief totaling USD 2.8 billion within five years post settlement. These consumer relief measures include affordable housing payments and loan forgiveness. The DOJ and Credit Suisse agreed to the appointment of an independent monitor to oversee the completion of the consumer relief requirements of the settlement. In 4Q16, Credit Suisse recorded a litigation provision of USD 1,990 million in the Strategic Resolution Unit in addition to its existing provisions of USD 550 million against this matter which were recorded in prior periods.
4
Subsequent event
In March 2017, we increased our existing litigation provision by CHF 300 million in our Strategic Resolution Unit to reflect a settlement in principle to resolve the RMBS matter with the NCUA. At the Group level, this resulted in an after tax charge of CHF 272 million in respect of our previously reported 2016 financial result and our BIS look-through common equity tier 1 (CET1) ratio is 11.5%.
Investor Day 2016
At the Investor Day on December 7, 2016, we communicated our financial targets for the Group and the divisions.
Financial objectives for the Group:
– reduce our operating cost base on an adjusted basis to below CHF 17.0 billion by year-end 2018;
– increase our net cost savings to more than CHF 4.2 billion by year-end 2018;
– achieve a look-through CET1 ratio (pre-major litigation expenses) of between 12-13% by year-end 2018 and greater than 13% (pre-Basel III reform uplift) and greater than 11% (post-Basel III reform uplift) by year-end 2019; and
– achieve a look-through CET1 leverage ratio of greater than 3.5% by year-end 2018.
Financial objectives for the divisions:
– achieve adjusted income before taxes for Asia Pacific of CHF 1.6 billion in 2018, of which we aim to achieve CHF 0.7 billion from Private Banking and wealth management connected activities;
– achieve adjusted income before taxes in International Wealth Management of CHF 1.8 billion in 2018;
– achieve adjusted income before taxes for the Swiss Universal Bank of CHF 2.3 billion in 2018;
– achieve adjusted return on regulatory capital for Global Markets of between 10-15% by year-end 2018;
– achieve adjusted return on regulatory capital for Investment Banking & Capital Markets of between 15-20% by year-end 2018; and
– reduce adjusted pre-tax loss for the Strategic Resolution Unit to approximately USD 1.4 billion by year-end 2018 and approximately USD 0.8 billion by year-end 2019 and reduce risk-weighted assets to USD 30 billion and leverage exposure to USD 40 billion by year-end 2019.
Capital distribution proposal
Our Board of Directors will propose to the shareholders at the Annual General Meeting on April 28, 2017 a distribution of CHF 0.70 per share out of reserves from capital contributions for the financial year 2016. The distribution will be free of Swiss withholding tax and will not be subject to income tax for Swiss resident individuals holding the shares as a private investment. The distribution will be payable in cash or, subject to any legal restrictions applicable in shareholders’ home jurisdictions, in new shares of Credit Suisse Group at the option of the shareholder.
5
In 4Q16, we reported income before taxes of CHF 382 million and net revenues of CHF 1,399 million. Income before taxes was CHF 376 million lower compared to 3Q16 and CHF 18 million higher compared to 4Q15. For 2016, we reported income before taxes of CHF 2,025 million and net revenues of CHF 5,759 million.
4Q16 results
In 4Q16, we reported income before taxes of CHF 382 million and net revenues of CHF 1,399 million. Compared to 3Q16, net revenues were 16% lower, mainly due to gains on the sale of real estate of CHF 346 million in 3Q16, partially offset by higher transaction-based revenues and slightly higher net interest income. Total operating expenses were 12% higher compared to 3Q16, primarily reflecting higher general and administrative expenses mainly due to higher allocated corporate function costs and higher litigation provisions.
Compared to 4Q15, net revenues were 6% lower, mainly due to gains on the sale of real estate, an extraordinary dividend from our ownership interest in SIX Group AG and a partial sale of an investment in Euroclear in 4Q15. Total operating expenses decreased 10% compared to 4Q15, reflecting lower restructuring expenses, lower compensation and benefits and lower general and administrative expenses.
Adjusted income before taxes of CHF 378 million was 12% lower compared to 3Q16 and 13% higher compared to 4Q15.
2016 results
In 2016, we reported income before taxes of CHF 2,025 million and net revenues of CHF 5,759 million. Compared to 2015, net revenues were stable with higher gains on the sale of real estate and increased net interest income, offset by lower transaction-based revenues and the impact of the deconsolidation of the cards issuing business in 3Q15, primarily reflected in recurring commissions and fees. Net interest income increased 5%, reflecting improved loan margins on stable average loan volumes, partially offset by slightly lower deposit margins on lower average deposit volumes. The decrease in transaction-based revenues primarily reflected lower brokerage and product issuing fees, lower fees from foreign exchange client business and lower sales and trading revenues, partially offset by increased revenues from our Swiss investment banking business. Excluding the net impact from the deconsolidation of the cards issuing business of CHF 115 million, recurring commissions and fees were stable. Provision for credit losses was CHF 79 million in 2016 on a net loan portfolio of CHF 165.7 billion. Total operating expenses decreased 6%, primarily reflecting lower expenses due to the deconsolidation of the cards issuing business and lower allocated corporate function costs, partially offset by higher professional services fees and higher contractor services fees.
Adjusted income before taxes of CHF 1,738 million was 7% higher compared to 2015.
| Divisional results | |||||||||||||||||
| in / end of | % change | in / end of | % change | ||||||||||||||
| 4Q16 | 3Q16 | 4Q15 | QoQ | YoY | 2016 | 2015 | YoY | ||||||||||
| Statements of operations (CHF million) | |||||||||||||||||
| Net revenues | 1,399 | 1,667 | 1,495 | (16) | (6) | 5,759 | 5,721 | 1 | |||||||||
| Provision for credit losses | 34 | 30 | 43 | 13 | (21) | 79 | 138 | (43) | |||||||||
| Compensation and benefits | 497 | 474 | 535 | 5 | (7) | 1,937 | 1,985 | (2) | |||||||||
| General and administrative expenses | 416 | 320 | 438 | 30 | (5) | 1,375 | 1,597 | (14) | |||||||||
| Commission expenses | 73 | 66 | 73 | 11 | 0 | 283 | 284 | 0 | |||||||||
| Restructuring expenses | (3) | 19 | 42 | – | – | 60 | 42 | 43 | |||||||||
| Total other operating expenses | 486 | 405 | 553 | 20 | (12) | 1,718 | 1,923 | (11) | |||||||||
| Total operating expenses | 983 | 879 | 1,088 | 12 | (10) | 3,655 | 3,908 | (6) | |||||||||
| Income before taxes | 382 | 758 | 364 | (50) | 5 | 2,025 | 1,675 | 21 | |||||||||
| Statement of operations metrics (%) | |||||||||||||||||
| Return on regulatory capital | 12.2 | 24.7 | 12.3 | – | – | 16.5 | 13.8 | – | |||||||||
| Cost/income ratio | 70.3 | 52.7 | 72.8 | – | – | 63.5 | 68.3 | – | |||||||||
| Economic risk capital and return | |||||||||||||||||
| Average economic risk capital (CHF million) | 5,763 | 5,649 | 5,123 | 2 | 12 | 5,564 | 5,119 | 9 | |||||||||
| Pre-tax return on average economic risk capital (%) 1 | 26.6 | 53.7 | 28.5 | – | – | 36.5 | 32.8 | – | |||||||||
| Number of employees and relationship managers | |||||||||||||||||
| Number of employees (full-time equivalents) | 13,140 | 13,440 | 13,400 | (2) | (2) | 13,140 | 13,400 | (2) | |||||||||
| Number of relationship managers | 1,970 | 1,980 | 2,060 | (1) | (4) | 1,970 | 2,060 | (4) | |||||||||
1 Calculated using a return excluding interest costs for allocated goodwill. | |||||||||||||||||
6
Capital and leverage metrics
As of the end of 4Q16, our reported risk-weighted assets of CHF 65.7 billion were stable compared to the end of 3Q16. Leverage exposure was CHF 252.9 billion, reflecting an increase of CHF 6.6 billion compared to the end of 3Q16, driven by increased high-quality liquid assets (HQLA) and business growth.
| Divisional results (continued) | |||||||||||||||||
| in / end of | % change | in / end of | % change | ||||||||||||||
| 4Q16 | 3Q16 | 4Q15 | QoQ | YoY | 2016 | 2015 | YoY | ||||||||||
| Net revenue detail (CHF million) | |||||||||||||||||
| Private Banking | 858 | 1,160 | 963 | (26) | (11) | 3,704 | 3,696 | 0 | |||||||||
| Corporate & Institutional Banking | 541 | 507 | 532 | 7 | 2 | 2,055 | 2,025 | 1 | |||||||||
| Net revenues | 1,399 | 1,667 | 1,495 | (16) | (6) | 5,759 | 5,721 | 1 | |||||||||
| Net revenue detail (CHF million) | |||||||||||||||||
| Net interest income | 745 | 724 | 753 | 3 | (1) | 2,884 | 2,757 | 5 | |||||||||
| Recurring commissions and fees | 378 | 361 | 373 | 5 | 1 | 1,446 | 1,569 | (8) | |||||||||
| Transaction-based revenues | 270 | 249 | 287 | 8 | (6) | 1,112 | 1,313 | (15) | |||||||||
| Other revenues | 6 | 333 | 82 | (98) | (93) | 317 | 82 | 287 | |||||||||
| Net revenues | 1,399 | 1,667 | 1,495 | (16) | (6) | 5,759 | 5,721 | 1 | |||||||||
| Provision for credit losses (CHF million) | |||||||||||||||||
| New provisions | 46 | 45 | 60 | 2 | (23) | 150 | 205 | (27) | |||||||||
| Releases of provisions | (12) | (15) | (17) | (20) | (29) | (71) | (67) | 6 | |||||||||
| Provision for credit losses | 34 | 30 | 43 | 13 | (21) | 79 | 138 | (43) | |||||||||
| Balance sheet statistics (CHF million) | |||||||||||||||||
| Total assets | 228,363 | 222,164 | 220,359 | 3 | 4 | 228,363 | 220,359 | 4 | |||||||||
| Net loans | 165,685 | 166,910 | 162,717 | (1) | 2 | 165,685 | 162,717 | 2 | |||||||||
| of which Private Banking | 115,277 | 115,601 | – | 0 | – | 115,277 | – | – | |||||||||
| Risk-weighted assets | 65,669 | 65,571 | 60,352 | 0 | 9 | 65,669 | 60,352 | 9 | |||||||||
| Leverage exposure | 252,889 | 246,254 | 238,180 | 3 | 6 | 252,889 | 238,180 | 6 | |||||||||
| Net interest income includes a term spread credit on stable deposit funding and a term spread charge on loans. Recurring commissions and fees includes investment product management, discretionary mandate and other asset management-related fees, fees for general banking products and services and revenues from wealth structuring solutions. Transaction-based revenues arise primarily from brokerage and product issuing fees, fees from foreign exchange client transactions, trading and sales income, equity participations income and other transaction-based income. Other revenues include fair value gains/(losses) on synthetic securitized loan portfolios and other gains and losses. | |||||||||||||||||
| Reconciliation of adjusted results | |||||||||||||||||||
| Private Banking | Corporate & Institutional Banking | Swiss Universal Bank | |||||||||||||||||
| in | 4Q16 | 3Q16 | 4Q15 | 4Q16 | 3Q16 | 4Q15 | 4Q16 | 3Q16 | 4Q15 | ||||||||||
| Adjusted results (CHF million) | |||||||||||||||||||
| Net revenues | 858 | 1,160 | 963 | 541 | 507 | 532 | 1,399 | 1,667 | 1,495 | ||||||||||
| Real estate gains | (20) | (346) | (72) | 0 | 0 | 0 | (20) | (346) | (72) | ||||||||||
| Gains on business sales | 0 | 0 | (10) | 0 | 0 | (13) | 0 | 0 | (23) | ||||||||||
| Adjusted net revenues | 838 | 814 | 881 | 541 | 507 | 519 | 1,379 | 1,321 | 1,400 | ||||||||||
| Provision for credit losses | 10 | 13 | 14 | 24 | 17 | 29 | 34 | 30 | 43 | ||||||||||
| Total operating expenses | 654 | 603 | 784 | 329 | 276 | 304 | 983 | 879 | 1,088 | ||||||||||
| Restructuring expenses | 3 | (16) | (33) | 0 | (3) | (9) | 3 | (19) | (42) | ||||||||||
| Major litigation provisions | 0 | 0 | (25) | (19) | 0 | 0 | (19) | 0 | (25) | ||||||||||
| Adjusted total operating expenses | 657 | 587 | 726 | 310 | 273 | 295 | 967 | 860 | 1,021 | ||||||||||
| Income before taxes | 194 | 544 | 165 | 188 | 214 | 199 | 382 | 758 | 364 | ||||||||||
| Total adjustments | (23) | (330) | (24) | 19 | 3 | (4) | (4) | (327) | (28) | ||||||||||
| Adjusted income before taxes | 171 | 214 | 141 | 207 | 217 | 195 | 378 | 431 | 336 | ||||||||||
| Adjusted return on regulatory capital (%) | – | – | – | – | – | – | 12.1 | 14.0 | 11.4 | ||||||||||
7
| Reconciliation of adjusted results (continued) | |||||||||||||
Private Banking | Corporate & Institutional Banking | Swiss Universal Bank | |||||||||||
| in | 2016 | 2015 | 2016 | 2015 | 2016 | 2015 | |||||||
| Adjusted results (CHF million) | |||||||||||||
| Net revenues | 3,704 | 3,696 | 2,055 | 2,025 | 5,759 | 5,721 | |||||||
| Real estate gains | (366) | (95) | 0 | 0 | (366) | (95) | |||||||
| Gains on business sales | 0 | (10) | 0 | (13) | 0 | (23) | |||||||
| Adjusted net revenues | 3,338 | 3,591 | 2,055 | 2,012 | 5,393 | 5,603 | |||||||
| Provision for credit losses | 39 | 49 | 40 | 89 | 79 | 138 | |||||||
| Total operating expenses | 2,471 | 2,772 | 1,184 | 1,136 | 3,655 | 3,908 | |||||||
| Restructuring expenses | (51) | (33) | (9) | (9) | (60) | (42) | |||||||
| Major litigation provisions | 0 | (25) | (19) | 0 | (19) | (25) | |||||||
| Adjusted total operating expenses | 2,420 | 2,714 | 1,156 | 1,127 | 3,576 | 3,841 | |||||||
| Income before taxes | 1,194 | 875 | 831 | 800 | 2,025 | 1,675 | |||||||
| Total adjustments | (315) | (47) | 28 | (4) | (287) | (51) | |||||||
| Adjusted income before taxes | 879 | 828 | 859 | 796 | 1,738 | 1,624 | |||||||
| Adjusted return on regulatory capital (%) | – | – | – | – | 14.2 | 13.4 | |||||||
| Adjusted results are non-GAAP financial measures. Refer to "Reconciliation of adjusted results" in the Appendix for further information. | |||||||||||||
Private Banking
In 4Q16, income before taxes of CHF 194 million was CHF 350 million lower compared to 3Q16, reflecting lower net revenues and higher total operating expenses. Compared to 4Q15, income before taxes increased 18%, reflecting lower total operating expenses, partially offset by lower net revenues. Adjusted income before taxes of CHF 171 million decreased 20% compared to 3Q16 and increased 21% compared to 4Q15.
Net revenues
Compared to 3Q16, net revenues of CHF 858 million were 26% lower due to the gains on the sale of real estate of CHF 346 million in 3Q16 reflected in other revenues. Recurring commissions and fees of CHF 253 million increased 4%, primarily driven by higher discretionary mandate management fees, higher investment product management fees and increased revenues from wealth structuring solutions. Net interest income was slightly higher at CHF 454 million with stable loan margins on slightly higher average loan volumes and slightly higher deposit margins on stable average deposit volumes. Transaction-based revenues of CHF 131 million were 5% higher, primarily due to higher brokerage and product issuing fees. Adjusted net revenues of CHF 838 million were slightly higher compared to 3Q16.
Compared to 4Q15, net revenues decreased 11%, driven by the gains on the sale of real estate and the partial sale of an investment in Euroclear in 4Q15 reflected in other revenues. Transaction-based revenues decreased 18%, primarily due to an extraordinary dividend from our ownership interest in SIX Group AG in 4Q15. Net interest income was slightly lower with decreased deposit margins on stable average deposit volumes, partially offset by improved loan margins on slightly higher average loan volumes. Recurring commissions and fees were slightly lower, primarily reflecting lower investment product management fees partially offset by higher investment advisory fees. Adjusted net revenues decreased 5% compared to 4Q15.
Provision for credit losses
The Private Banking loan portfolio is substantially comprised of residential mortgages in Switzerland and loans collateralized by securities and, to a lesser extent, consumer finance loans.
In 4Q16, Private Banking recorded provision for credit losses of CHF 10 million compared to CHF 13 million in 3Q16 and CHF 14 million in 4Q15. The provision was primarily related to our consumer finance business.
8
| Results - Private Banking | |||||||||||||||||
| in / end of | % change | in / end of | % change | ||||||||||||||
| 4Q16 | 3Q16 | 4Q15 | QoQ | YoY | 2016 | 2015 | YoY | ||||||||||
| Statements of operations (CHF million) | |||||||||||||||||
| Net revenues | 858 | 1,160 | 963 | (26) | (11) | 3,704 | 3,696 | 0 | |||||||||
| Provision for credit losses | 10 | 13 | 14 | (23) | (29) | 39 | 49 | (20) | |||||||||
| Compensation and benefits | 324 | 312 | 368 | 4 | (12) | 1,258 | 1,327 | (5) | |||||||||
| General and administrative expenses | 282 | 233 | 335 | 21 | (16) | 975 | 1,221 | (20) | |||||||||
| Commission expenses | 51 | 42 | 48 | 21 | 6 | 187 | 191 | (2) | |||||||||
| Restructuring expenses | (3) | 16 | 33 | – | – | 51 | 33 | 55 | |||||||||
| Total other operating expenses | 330 | 291 | 416 | 13 | (21) | 1,213 | 1,445 | (16) | |||||||||
| Total operating expenses | 654 | 603 | 784 | 8 | (17) | 2,471 | 2,772 | (11) | |||||||||
| Income before taxes | 194 | 544 | 165 | (64) | 18 | 1,194 | 875 | 36 | |||||||||
| Statement of operations metrics (%) | |||||||||||||||||
| Cost/income ratio | 76.2 | 52.0 | 81.4 | – | – | 66.7 | 75.0 | – | |||||||||
| Net revenue detail (CHF million) | |||||||||||||||||
| Net interest income | 454 | 446 | 465 | 2 | (2) | 1,801 | 1,770 | 2 | |||||||||
| Recurring commissions and fees | 253 | 243 | 257 | 4 | (2) | 971 | 1,102 | (12) | |||||||||
| Transaction-based revenues | 131 | 125 | 159 | 5 | (18) | 564 | 720 | (22) | |||||||||
| Other revenues | 20 | 346 | 82 | (94) | (76) | 368 | 104 | 254 | |||||||||
| Net revenues | 858 | 1,160 | 963 | (26) | (11) | 3,704 | 3,696 | 0 | |||||||||
| Margins on assets under management (annualized) (bp) | |||||||||||||||||
| Gross margin 1 | 141 | 191 | 159 | – | – | 154 | 148 | – | |||||||||
| Net margin 2 | 32 | 89 | 27 | – | – | 50 | 35 | – | |||||||||
| Number of relationship managers | |||||||||||||||||
| Number of relationship managers | 1,490 | 1,500 | 1,570 | (1) | (5) | 1,490 | 1,570 | (5) | |||||||||
1 Net revenues divided by average assets under management. | |||||||||||||||||
2 Income before taxes divided by average assets under management. | |||||||||||||||||
Total operating expenses
Compared to 3Q16, total operating expenses of CHF 654 million increased 8%, primarily reflecting higher general and administrative expenses. General and administrative expenses of CHF 282 million increased 21% primarily due to higher allocated corporate function costs and higher professional services fees. Compensation and benefits of CHF 324 million increased 4% compared to 3Q16, primarily reflecting higher discretionary compensation expenses partially offset by lower salary expenses. Adjusted total operating expenses of CHF 657 million were CHF 70 million higher compared to 3Q16.
Compared to 4Q15, total operating expenses were 17% lower, despite investments in regulatory and compliance functions, reflecting decreased general and administrative expenses, lower compensation and benefits and lower restructuring expenses. General and administrative expenses decreased 16%, primarily reflecting decreased allocated corporate function costs and lower litigation provisions. Compensation and benefits were 12% lower, driven by decreased salary expenses mainly due to a recalibration of Swiss holiday accruals in 4Q15. Adjusted total operating expenses were 10% lower compared to 4Q15.
Gross margin
Our gross margin was 141 basis points in 4Q16, 50 basis points lower compared to 3Q16, mainly reflecting the gains on the sale of real estate in 3Q16 on stable average assets under management. Compared to 4Q15, our gross margin was 18 basis points lower, primarily due to the gains on the sale of real estate in 4Q15 and lower transaction-based revenues on stable average assets under management. On the basis of adjusted net revenues, our gross margin was 138 basis points in 4Q16, four basis points higher compared to 3Q16 and seven basis points lower compared to 4Q15.
> Refer to “Assets under management” for further information.
Net margin
Our net margin was 32 basis points in 4Q16, 57 basis points lower compared to 3Q16, mainly due to the gains on the sale of real estate in 3Q16 and higher total operating expenses. Compared to 4Q15, our net margin was five basis points higher, primarily due to lower total operating expenses, partially offset by the gains on the sale of real estate in 4Q15 and lower transaction-based revenues. On the basis of adjusted income before taxes, our net margin was 28 basis points in 4Q16, seven basis points lower compared to 3Q16 and five basis points higher compared to 4Q15.
9
As of the end of 4Q16, assets under management of CHF 242.9 billion were CHF 1.6 billion lower compared to the end of 3Q16, mainly driven by net asset outflows, partially offset by favorable foreign exchange-related and market movements. Net asset outflows of CHF 3.5 billion reflected terminated relationships with certain external asset managers, the regularization of client assets of CHF 0.8 billion and seasonal effects.
As of the end of 2016, assets under management of CHF 242.9 billion were stable compared to the end of 2015. Net asset outflows of CHF 1.7 billion mainly reflected terminated relationships with certain external asset managers, and the regularization of client assets of CHF 2.0 billion.
| Assets under management – Private Banking | |||||||||||||||||
| in / end of | % change | in / end of | % change | ||||||||||||||
| 4Q16 | 3Q16 | 4Q15 | QoQ | YoY | 2016 | 2015 | YoY | ||||||||||
| Assets under management (CHF billion) | |||||||||||||||||
| Assets under management | 242.9 | 244.5 | 241.0 | (0.7) | 0.8 | 242.9 | 241.0 | 0.8 | |||||||||
| Average assets under management | 242.9 | 243.2 | 242.8 | (0.1) | 0.0 | 241.2 | 249.0 | (3.1) | |||||||||
| Assets under management by currency (CHF billion) | |||||||||||||||||
| USD | 41.8 | 41.6 | 40.5 | 0.5 | 3.2 | 41.8 | 40.5 | 3.2 | |||||||||
| EUR | 36.3 | 36.8 | 31.5 | (1.4) | 15.2 | 36.3 | 31.5 | 15.2 | |||||||||
| CHF | 153.3 | 154.6 | 153.0 | (0.8) | 0.2 | 153.3 | 153.0 | 0.2 | |||||||||
| Other | 11.5 | 11.5 | 16.0 | 0.0 | (28.1) | 11.5 | 16.0 | (28.1) | |||||||||
| Assets under management | 242.9 | 244.5 | 241.0 | (0.7) | 0.8 | 242.9 | 241.0 | 0.8 | |||||||||
| Growth in assets under management (CHF billion) | |||||||||||||||||
| Net new assets | (3.5) | 0.2 | (2.9) | – | – | (1.7) | 3.2 | – | |||||||||
| Other effects | 1.9 | 2.9 | 6.8 | – | – | 3.6 | (20.8) | – | |||||||||
| of which market movements | 0.6 | 3.7 | 4.9 | – | – | 3.0 | (2.6) | – | |||||||||
| of which foreign exchange | 1.7 | (0.1) | 0.3 | – | – | 0.4 | (4.0) | – | |||||||||
| of which other | (0.4) | (0.7) | 1.6 | – | – | 0.2 | (14.2) | – | |||||||||
| Growth in assets under management | (1.6) | 3.1 | 3.9 | – | – | 1.9 | (17.6) | – | |||||||||
| Growth in assets under management (annualized) (%) | |||||||||||||||||
| Net new assets | (5.7) | 0.3 | (4.9) | – | – | (0.7) | 1.2 | – | |||||||||
| Other effects | 3.1 | 4.9 | 11.5 | – | – | 1.5 | (8.0) | – | |||||||||
| Growth in assets under management (annualized) | (2.6) | 5.2 | 6.6 | – | – | 0.8 | (6.8) | – | |||||||||
| Growth in assets under management (rolling four-quarter average) (%) | |||||||||||||||||
| Net new assets | (0.7) | (0.5) | 1.2 | – | – | – | – | – | |||||||||
| Other effects | 1.5 | 3.6 | (8.0) | – | – | – | – | – | |||||||||
| Growth in assets under management (rolling four-quarter average) | 0.8 | 3.1 | (6.8) | – | – | – | – | – | |||||||||
Corporate & institutional Banking
In 4Q16, income before taxes of CHF 188 million decreased 12% compared to 3Q16, driven by higher total operating expenses, partially offset by higher net revenues. Compared to 4Q15, income before taxes decreased 6%, reflecting higher total operating expenses, partially offset by slightly higher net revenues. Adjusted income before taxes of CHF 207 million decreased 5% compared to 3Q16 and increased 6% compared to 4Q15.
Net revenues
Compared to 3Q16, net revenues of CHF 541 million increased 7%, mainly driven by higher transaction-based revenues and higher net interest income. Transaction-based revenues of CHF 139 million were 12% higher, primarily reflecting increased revenues from our Swiss investment banking business and fees from foreign exchange client business. Net interest income of CHF 291 million increased 5%, with stable loan margins on slightly higher average loan volumes, partially offset by lower deposit margins on slightly lower average deposit volumes. Recurring commissions and fees of CHF 125 million were 6% higher compared to 3Q16, primarily due to increased banking services and investment product management fees.
Compared to 4Q15, net revenues increased slightly, with higher transaction-based revenues and higher recurring commissions and fees, partially offset by lower other revenues. Transaction-based revenues were 9% higher due to increased revenues from our Swiss investment banking business, partly offset by lower fees from foreign exchange client business. Recurring commissions and fees increased 8% with higher banking services fees and higher fees from lending activities, partly offset by lower investment advisory fees. The decrease in other revenues was driven by the partial sale of an investment in Euroclear in 4Q15.
10
| Results – Corporate & Institutional Banking | |||||||||||||||||
| in / end of | % change | in / end of | % change | ||||||||||||||
| 4Q16 | 3Q16 | 4Q15 | QoQ | YoY | 2016 | 2015 | YoY | ||||||||||
| Statements of operations (CHF million) | |||||||||||||||||
| Net revenues | 541 | 507 | 532 | 7 | 2 | 2,055 | 2,025 | 1 | |||||||||
| Provision for credit losses | 24 | 17 | 29 | 41 | (17) | 40 | 89 | (55) | |||||||||
| Compensation and benefits | 173 | 162 | 167 | 7 | 4 | 679 | 658 | 3 | |||||||||
| General and administrative expenses | 134 | 87 | 103 | 54 | 30 | 400 | 376 | 6 | |||||||||
| Commission expenses | 22 | 24 | 25 | (8) | (12) | 96 | 93 | 3 | |||||||||
| Restructuring expenses | 0 | 3 | 9 | (100) | (100) | 9 | 9 | 0 | |||||||||
| Total other operating expenses | 156 | 114 | 137 | 37 | 14 | 505 | 478 | 6 | |||||||||
| Total operating expenses | 329 | 276 | 304 | 19 | 8 | 1,184 | 1,136 | 4 | |||||||||
| Income before taxes | 188 | 214 | 199 | (12) | (6) | 831 | 800 | 4 | |||||||||
| Statement of operations metrics (%) | |||||||||||||||||
| Cost/income ratio | 60.8 | 54.4 | 57.1 | – | – | 57.6 | 56.1 | – | |||||||||
| Net revenue detail (CHF million) | |||||||||||||||||
| Net interest income | 291 | 278 | 288 | 5 | 1 | 1,083 | 987 | 10 | |||||||||
| Recurring commissions and fees | 125 | 118 | 116 | 6 | 8 | 475 | 467 | 2 | |||||||||
| Transaction-based revenues | 139 | 124 | 128 | 12 | 9 | 548 | 593 | (8) | |||||||||
| Other revenues | (14) | (13) | 0 | 8 | – | (51) | (22) | 132 | |||||||||
| Net revenues | 541 | 507 | 532 | 7 | 2 | 2,055 | 2,025 | 1 | |||||||||
| Number of relationship managers | |||||||||||||||||
| Number of relationship managers | 480 | 480 | 490 | 0 | (2) | 480 | 490 | (2) | |||||||||
Provision for credit losses
The Corporate & Institutional Banking loan portfolio has relatively low concentrations and is mainly secured by mortgages, securities and other financial collateral.
In 4Q16, Corporate & Institutional Banking recorded provision for credit losses of CHF 24 million compared to CHF 17 million in 3Q16 and CHF 29 million in 4Q15. The increase compared to 3Q16 reflected several individual cases.
Total operating expenses
Compared to 3Q16, total operating expenses of CHF 329 million were 19% higher, primarily reflecting higher allocated corporate function costs and litigation provisions. General and administrative expenses of CHF 134 million increased 54% due to higher litigation provisions, allocated corporate function costs and professional services fees. Compensation and benefits of CHF 173 million increased 7%, driven by higher allocated corporate function costs and higher social security costs, partially offset by lower discretionary compensation expenses. Adjusted total operating expenses of CHF 310 million were 14% higher compared to 3Q16.
Compared to 4Q15, total operating expenses increased 8%, with 30% higher general and administrative expenses driven by higher litigation provisions and higher professional services fees, partially offset by lower allocated corporate function costs. Compensation and benefits increased 4% compared to 4Q15 driven by higher discretionary compensation expenses and social security costs, partially offset by lower salary expenses due to the holiday accrual recalibration in 4Q15. Restructuring expenses were CHF 9 million lower compared to 4Q15. Adjusted total operating expenses were 5% higher compared to 4Q15.
As of the end of 4Q16, assets under management of CHF 288.6 billion were CHF 4.0 billion higher compared to the end of 3Q16, driven by net new assets of CHF 2.5 billion and favorable foreign exchange-related movements.
As of the end of 2016, assets under management of CHF 288.6 billion were CHF 12.8 billion higher compared to the end of 2015, driven by favorable market movements and net new assets of CHF 4.3 billion.
11
In 4Q16, we reported income before taxes of CHF 331 million and net revenues of CHF 1,299 million. Income before taxes was CHF 86 million higher compared to 3Q16 and CHF 355 million higher compared to 4Q15. For 2016, we reported income before taxes of CHF 1,121 million and net revenues of CHF 4,698 million.
4Q16 results
In 4Q16, we reported income before taxes of CHF 331 million and net revenues of CHF 1,299 million. Compared to 3Q16, net revenues increased 20% due to significantly higher transaction- and performance-based revenues in both Asset Management and Private Banking, a gain on the sale of real estate of CHF 54 million reflected in other revenues in Private Banking, higher net interest income and higher recurring commissions and fees. Provision for credit losses increased to CHF 6 million in 4Q16 compared to zero in 3Q16. Total operating expenses were 15% higher compared to 3Q16, driven by higher general and administrative expenses and higher compensation and benefits.
Net revenues were 11% higher compared to 4Q15, reflecting higher net interest income and the gain on the sale of real estate. Provision for credit losses was CHF 6 million compared to a net release of CHF 7 million in 4Q15. Total operating expenses were 20% lower with significantly lower general and administrative expenses and significantly lower restructuring expenses partially offset by higher compensation and benefits.
Adjusted income before taxes of CHF 300 million increased 24% and 31% compared to 3Q16 and 4Q15, respectively.
2016 results
In 2016, we reported income before taxes of CHF 1,121 million and net revenues of CHF 4,698 million. Compared to 2015, net revenues increased slightly driven by significantly higher net interest income, investment-related gains in 2016 compared to losses in 2015 and the gain on the sale of real estate in 2016. These increases were partially offset by lower transaction- and performance-based revenues and slightly lower recurring commissions and fees. Higher net interest income reflected higher loan and deposit margins on higher average loan and deposit volumes. The decrease in transaction- and performance-based revenues mainly reflected lower sales and trading revenues, lower equity participations income, lower brokerage and product issuing fees and lower fees from foreign exchange client business, partially offset by higher carried interest reflecting a residual gain from a private equity interest. Recurring commissions and fees were slightly lower, primarily driven by lower security account and custody services fees, lower discretionary mandate management fees and lower banking services fees, partially offset by higher asset management fees. Provision for credit losses was CHF 20 million on a net loan portfolio of CHF 45.0 billion. The decrease in total operating expenses was mainly driven by lower litigation provisions and lower deferred compensation expenses from prior-year awards, partially offset by higher discretionary compensation expenses and an increase in professional services fees.
Adjusted income before taxes of CHF 1,109 million increased 9% compared to 2015.
| Divisional results | |||||||||||||||||
| in / end of | % change | in / end of | % change | ||||||||||||||
| 4Q16 | 3Q16 | 4Q15 | QoQ | YoY | 2016 | 2015 | YoY | ||||||||||
| Statements of operations (CHF million) | |||||||||||||||||
| Net revenues | 1,299 | 1,081 | 1,173 | 20 | 11 | 4,698 | 4,552 | 3 | |||||||||
| Provision for credit losses | 6 | 0 | (7) | – | – | 20 | 5 | 300 | |||||||||
| Compensation and benefits | 565 | 513 | 540 | 10 | 5 | 2,119 | 2,115 | 0 | |||||||||
| General and administrative expenses | 318 | 256 | 568 | 24 | (44) | 1,145 | 1,429 | (20) | |||||||||
| Commission expenses | 63 | 52 | 60 | 21 | 5 | 239 | 244 | (2) | |||||||||
| Restructuring expenses | 16 | 15 | 36 | 7 | (56) | 54 | 36 | 50 | |||||||||
| Total other operating expenses | 397 | 323 | 664 | 23 | (40) | 1,438 | 1,709 | (16) | |||||||||
| Total operating expenses | 962 | 836 | 1,204 | 15 | (20) | 3,557 | 3,824 | (7) | |||||||||
| Income/(loss) before taxes | 331 | 245 | (24) | 35 | – | 1,121 | 723 | 55 | |||||||||
| Statement of operations metrics (%) | |||||||||||||||||
| Return on regulatory capital | 27.0 | 20.5 | (1.9) | – | – | 23.3 | 15.4 | – | |||||||||
| Cost/income ratio | 74.1 | 77.3 | 102.6 | – | – | 75.7 | 84.0 | – | |||||||||
| Economic risk capital and return | |||||||||||||||||
| Average economic risk capital (CHF million) | 3,976 | 3,958 | 3,364 | 0 | 18 | 3,785 | 3,288 | 15 | |||||||||
| Pre-tax return on average economic risk capital (%) 1 | 34.2 | 25.8 | (2.0) | – | – | 30.6 | 22.8 | – | |||||||||
| Number of employees (full-time equivalents) | |||||||||||||||||
| Number of employees | 10,300 | 10,350 | 9,750 | 0 | 6 | 10,300 | 9,750 | 6 | |||||||||
1 Calculated using a return excluding interest costs for allocated goodwill. | |||||||||||||||||
12
Capital and leverage metrics
As of the end of 4Q16, we reported risk-weighted assets of CHF 35.3 billion, an increase of CHF 1.8 billion compared to the end of 3Q16, mainly driven by business growth and foreign exchange-related movements. Leverage exposure was CHF 94.1 billion, reflecting an increase of CHF 5.2 billion compared to the end of 3Q16, driven by increased HQLA balances associated with funding requirements and foreign exchange-related movements.
| Divisional results (continued) | |||||||||||||||||
| in / end of | % change | in / end of | % change | ||||||||||||||
| 4Q16 | 3Q16 | 4Q15 | QoQ | YoY | 2016 | 2015 | YoY | ||||||||||
| Net revenue detail (CHF million) | |||||||||||||||||
| Private Banking | 918 | 789 | 808 | 16 | 14 | 3,371 | 3,224 | 5 | |||||||||
| Asset Management | 381 | 292 | 365 | 30 | 4 | 1,327 | 1,328 | 0 | |||||||||
| Net revenues | 1,299 | 1,081 | 1,173 | 20 | 11 | 4,698 | 4,552 | 3 | |||||||||
| Net revenue detail (CHF million) | |||||||||||||||||
| Net interest income | 353 | 326 | 275 | 8 | 28 | 1,308 | 1,006 | 30 | |||||||||
| Recurring commissions and fees | 489 | 471 | 494 | 4 | (1) | 1,914 | 1,965 | (3) | |||||||||
| Transaction- and performance-based revenues | 402 | 291 | 399 | 38 | 1 | 1,426 | 1,607 | (11) | |||||||||
| Other revenues | 55 | (7) | 5 | – | – | 50 | (26) | – | |||||||||
| Net revenues | 1,299 | 1,081 | 1,173 | 20 | 11 | 4,698 | 4,552 | 3 | |||||||||
| Provision for credit losses (CHF million) | |||||||||||||||||
| New provisions | 20 | 14 | 17 | 43 | 18 | 55 | 37 | 49 | |||||||||
| Releases of provisions | (14) | (14) | (24) | 0 | (42) | (35) | (32) | 9 | |||||||||
| Provision for credit losses | 6 | 0 | (7) | – | – | 20 | 5 | 300 | |||||||||
| Balance sheet statistics (CHF million) | |||||||||||||||||
| Total assets | 91,083 | 86,457 | 96,085 | 5 | (5) | 91,083 | 96,085 | (5) | |||||||||
| Net loans | 44,965 | 42,942 | 40,084 | 5 | 12 | 44,965 | 40,084 | 12 | |||||||||
| of which Private Banking | 44,952 | 42,876 | – | 5 | – | 44,952 | – | – | |||||||||
| Risk-weighted assets | 35,252 | 33,457 | 32,880 | 5 | 7 | 35,252 | 32,880 | 7 | |||||||||
| Leverage exposure | 94,092 | 88,899 | 101,628 | 6 | (7) | 94,092 | 101,628 | (7) | |||||||||
| Reconciliation of adjusted results | |||||||||||||||||||
| Private Banking | Asset Management | International Wealth Management | |||||||||||||||||
| in | 4Q16 | 3Q16 | 4Q15 | 4Q16 | 3Q16 | 4Q15 | 4Q16 | 3Q16 | 4Q15 | ||||||||||
| Adjusted results (CHF million) | |||||||||||||||||||
| Net revenues | 918 | 789 | 808 | 381 | 292 | 365 | 1,299 | 1,081 | 1,173 | ||||||||||
| Real estate gains | (54) | 0 | 0 | 0 | 0 | 0 | (54) | 0 | 0 | ||||||||||
| Gains on business sales | 0 | 0 | (11) | 0 | 0 | 0 | 0 | 0 | (11) | ||||||||||
| Adjusted net revenues | 864 | 789 | 797 | 381 | 292 | 365 | 1,245 | 1,081 | 1,162 | ||||||||||
| Provision for credit losses | 6 | 0 | (7) | 0 | 0 | 0 | 6 | 0 | (7) | ||||||||||
| Total operating expenses | 684 | 593 | 874 | 278 | 243 | 330 | 962 | 836 | 1,204 | ||||||||||
| Restructuring expenses | (11) | (13) | (32) | (5) | (2) | (4) | (16) | (15) | (36) | ||||||||||
| Major litigation provisions | (7) | 19 | (228) | 0 | 0 | 0 | (7) | 19 | (228) | ||||||||||
| Adjusted total operating expenses | 666 | 599 | 614 | 273 | 241 | 326 | 939 | 840 | 940 | ||||||||||
| Income/(loss) before taxes | 228 | 196 | (59) | 103 | 49 | 35 | 331 | 245 | (24) | ||||||||||
| Total adjustments | (36) | (6) | 249 | 5 | 2 | 4 | (31) | (4) | 253 | ||||||||||
| Adjusted income before taxes | 192 | 190 | 190 | 108 | 51 | 39 | 300 | 241 | 229 | ||||||||||
| Adjusted return on regulatory capital (%) | – | – | – | – | – | – | 24.4 | 20.1 | 18.8 | ||||||||||
13
| Reconciliation of adjusted results (continued) | |||||||||||||
| Private Banking | Asset Management | International Wealth Management | |||||||||||
| in | 2016 | 2015 | 2016 | 2015 | 2016 | 2015 | |||||||
| Adjusted results (CHF million) | |||||||||||||
| Net revenues | 3,371 | 3,224 | 1,327 | 1,328 | 4,698 | 4,552 | |||||||
| Real estate gains | (54) | 0 | 0 | 0 | (54) | 0 | |||||||
| Gains on business sales | 0 | (11) | 0 | 0 | 0 | (11) | |||||||
| Adjusted net revenues | 3,317 | 3,213 | 1,327 | 1,328 | 4,644 | 4,541 | |||||||
| Provision for credit losses | 20 | 5 | 0 | 0 | 20 | 5 | |||||||
| Total operating expenses | 2,510 | 2,678 | 1,047 | 1,146 | 3,557 | 3,824 | |||||||
| Restructuring expenses | (47) | (32) | (7) | (4) | (54) | (36) | |||||||
| Major litigation provisions | 12 | (268) | 0 | 0 | 12 | (268) | |||||||
| Adjusted total operating expenses | 2,475 | 2,378 | 1,040 | 1,142 | 3,515 | 3,520 | |||||||
| Income before taxes | 841 | 541 | 280 | 182 | 1,121 | 723 | |||||||
| Total adjustments | (19) | 289 | 7 | 4 | (12) | 293 | |||||||
| Adjusted income before taxes | 822 | 830 | 287 | 186 | 1,109 | 1,016 | |||||||
| Adjusted return on regulatory capital (%) | – | – | – | – | 23.1 | 21.7 | |||||||
| Adjusted results are non-GAAP financial measures. Refer to "Reconciliation of adjusted results" in the Appendix for further information. | |||||||||||||
Private Banking
In 4Q16, income before taxes of CHF 228 million increased 16% compared to 3Q16 reflecting higher net revenues, partially offset by higher total operating expenses. Compared to 4Q15, income before taxes increased CHF 287 million mainly due to lower total operating expenses and higher net revenues. Adjusted income before taxes of CHF 192 million was stable compared to 3Q16 and 4Q15.
Net revenues
Compared to 3Q16, net revenues of CHF 918 million were 16% higher, with an increase in other revenues, higher transaction- and performance-based revenues, higher net interest income and higher recurring commissions and fees. Other revenues increased CHF 54 million, reflecting the gain on the sale of real estate. Transaction- and performance-based revenues of CHF 235 million increased 19%, driven by higher brokerage and product issuing fees, higher performance fees, higher corporate advisory fees related to integrated solutions and higher fees from foreign exchange client business. Net interest income of CHF 353 million increased 8%, reflecting higher loan margins on higher average loan volumes and higher deposit margins on slightly higher average deposit volumes. Recurring commissions and fees increased 4% to CHF 277 million with higher investment product management fees partially offset by lower discretionary mandate management fees.
Compared to 4Q15, net revenues increased 14%, mainly driven by higher net interest income and higher other revenues. Net interest income increased 28%, primarily reflecting higher loan and deposit margins on higher average loan and deposit volumes. Other revenues increased due to the gain on the sale of real estate. Transaction- and performance-based revenues decreased slightly, mainly driven by the absence of equity participations income as 4Q15 included an extraordinary dividend from SIX Group of CHF 23 million, partially offset by an increase in brokerage and product issuing fees. Recurring commissions and fees were slightly lower with lower discretionary mandate management fees.
Adjusted net revenues of CHF 864 million increased 10% and 8% compared to 3Q16 and 4Q15, respectively.
14
| Results – Private Banking | |||||||||||||||||
| in / end of | % change | in / end of | % change | ||||||||||||||
| 4Q16 | 3Q16 | 4Q15 | QoQ | YoY | 2016 | 2015 | YoY | ||||||||||
| Statements of operations (CHF million) | |||||||||||||||||
| Net revenues | 918 | 789 | 808 | 16 | 14 | 3,371 | 3,224 | 5 | |||||||||
| Provision for credit losses | 6 | 0 | (7) | – | – | 20 | 5 | 300 | |||||||||
| Compensation and benefits | 382 | 369 | 341 | 4 | 12 | 1,463 | 1,413 | 4 | |||||||||
| General and administrative expenses | 242 | 173 | 458 | 40 | (47) | 827 | 1,053 | (21) | |||||||||
| Commission expenses | 49 | 38 | 43 | 29 | 14 | 173 | 180 | (4) | |||||||||
| Restructuring expenses | 11 | 13 | 32 | (15) | (66) | 47 | 32 | 47 | |||||||||
| Total other operating expenses | 302 | 224 | 533 | 35 | (43) | 1,047 | 1,265 | (17) | |||||||||
| Total operating expenses | 684 | 593 | 874 | 15 | (22) | 2,510 | 2,678 | (6) | |||||||||
| Income/(loss) before taxes | 228 | 196 | (59) | 16 | – | 841 | 541 | 55 | |||||||||
| Statement of operations metrics (%) | |||||||||||||||||
| Cost/income ratio | 74.5 | 75.2 | 108.2 | – | – | 74.5 | 83.1 | – | |||||||||
| Net revenue detail (CHF million) | |||||||||||||||||
| Net interest income | 353 | 326 | 275 | 8 | 28 | 1,308 | 1,006 | 30 | |||||||||
| Recurring commissions and fees | 277 | 267 | 283 | 4 | (2) | 1,093 | 1,161 | (6) | |||||||||
| Transaction- and performance-based revenues | 235 | 197 | 240 | 19 | (2) | 922 | 1,049 | (12) | |||||||||
| Other revenues | 53 | (1) | 10 | – | 430 | 48 | 8 | 500 | |||||||||
| Net revenues | 918 | 789 | 808 | 16 | 14 | 3,371 | 3,224 | 5 | |||||||||
| Margins on assets under management (annualized) (bp) | |||||||||||||||||
| Gross margin 1 | 116 | 104 | 110 | – | – | 112 | 107 | – | |||||||||
| Net margin 2 | 29 | 26 | (8) | – | – | 28 | 18 | – | |||||||||
| Number of relationship managers | |||||||||||||||||
| Number of relationship managers | 1,140 | 1,160 | 1,180 | (2) | (3) | 1,140 | 1,180 | (3) | |||||||||
| Net interest income includes a term spread credit on stable deposit funding and a term spread charge on loans. Recurring commissions and fees includes investment product management, discretionary mandate and other asset management-related fees, fees for general banking products and services and revenues from wealth structuring solutions. Transaction- and performance-based revenues arise primarily from brokerage and product issuing fees, fees from foreign exchange client transactions, trading and sales income, equity participations income and other transaction- and performance-based income. | |||||||||||||||||
1 Net revenues divided by average assets under management. | |||||||||||||||||
2 Income before taxes divided by average assets under management. | |||||||||||||||||
Provision for credit losses
In 4Q16, provision for credit losses was CHF 6 million, compared to provision for credit losses of zero in 3Q16 and a net release of provision for credit losses of CHF 7 million in 4Q15.
Total operating expenses
Compared to 3Q16, total operating expenses of CHF 684 million increased 15% due to higher general and administrative expenses and higher compensation and benefits. General and administrative expenses of CHF 242 million increased 40%, mainly reflecting litigation provisions in 4Q16, compared to a provision release in 3Q16, and higher professional services fees. Compensation and benefits of CHF 382 million increased 4%, mainly driven by higher discretionary compensation expenses and slightly higher salary expenses. Restructuring expenses of CHF 11 million were lower compared to 3Q16. Adjusted total operating expenses of CHF 666 million increased 11% compared to 3Q16.
Compared to 4Q15, total operating expenses decreased 22%, with lower general and administrative expenses and lower restructuring expenses, partially offset by an increase in compensation and benefits. General and administrative expenses decreased 47%, driven by significantly lower litigation provisions, partially offset by higher professional services fees. Compensation and benefits increased 12%, driven by higher discretionary compensation expenses, partially offset by lower salary expenses mainly due to the holiday accrual recalibration in 4Q15. Adjusted total operating expenses increased 8% compared to 4Q15.
15
Gross margin
Our gross margin was 116 basis points in 4Q16, an increase of twelve basis points compared to 3Q16, mainly reflecting higher other revenues, higher transaction- and performance-based revenues and higher net interest income, partially offset by a 3.9% increase in average assets under management. Our gross margin increased six basis points compared to 4Q15, mainly reflecting an increase in net interest income and other revenues, partially offset by a 7.2% increase in average assets under management. On the basis of adjusted net revenues, our gross margin was 109 basis points in 4Q16, five basis points higher compared to 3Q16 and one basis point higher compared to 4Q15.
> Refer to “Assets under management” for further information.
Net margin
Our net margin was 29 basis points in 4Q16, an increase of three basis points compared to 3Q16, mainly reflecting higher net revenues, partially offset by higher total operating expenses. The significant improvement in our net margin compared to 4Q15 mainly reflected lower total operating expenses due to the litigation provisions in 4Q15 and higher net revenues. On the basis of adjusted income before taxes, our net margin was 24 basis points in 4Q16, one basis point lower compared to 3Q16 and two basis points lower compared to 4Q15 reflecting higher average assets under management.
As of the end of 4Q16, assets under management of CHF 323.2 billion were CHF 11.8 billion higher compared to the end of 3Q16, primarily reflecting favorable foreign exchange-related and market movements. Net new assets of CHF 0.4 billion reflected continued inflows from the Middle East and Europe, partially offset by outflows in connection with the regularization of client assets of CHF 2.2 billion, mostly in Latin America. Other effects included outflows of CHF 1.1 billion relating to certain client accounts with a US nexus which were closed or are in the process of being closed due to the Group’s strategic decision to transition away from this market.
As of the end of 2016, assets under management of CHF 323.2 billion were CHF 33.6 billion higher compared to the end of 2015, reflecting net new assets of CHF 15.6 billion and favorable market and foreign exchange-related movements. The net new assets reflected solid inflows from emerging markets and Europe, partially offset by outflows in connection with the regularization of client assets of CHF 5.7 billion.
| Assets under management – Private Banking | |||||||||||||||||
| in / end of | % change | in / end of | % change | ||||||||||||||
| 4Q16 | 3Q16 | 4Q15 | QoQ | YoY | 2016 | 2015 | YoY | ||||||||||
| Assets under management (CHF billion) | |||||||||||||||||
| Assets under management | 323.2 | 311.4 | 289.6 | 3.8 | 11.6 | 323.2 | 289.6 | 11.6 | |||||||||
| Average assets under management | 315.9 | 304.0 | 294.8 | 3.9 | 7.2 | 300.3 | 301.3 | (0.3) | |||||||||
| Assets under management by currency (CHF billion) | |||||||||||||||||
| USD | 149.0 | 140.1 | 137.6 | 6.4 | 8.3 | 149.0 | 137.6 | 8.3 | |||||||||
| EUR | 93.2 | 92.7 | 92.7 | 0.5 | 0.5 | 93.2 | 92.7 | 0.5 | |||||||||
| CHF | 21.0 | 20.7 | 22.4 | 1.4 | (6.2) | 21.0 | 22.4 | (6.2) | |||||||||
| Other | 60.0 | 57.9 | 36.9 | 3.6 | 62.6 | 60.0 | 36.9 | 62.6 | |||||||||
| Assets under management | 323.2 | 311.4 | 289.6 | 3.8 | 11.6 | 323.2 | 289.6 | 11.6 | |||||||||
| Growth in assets under management (CHF billion) | |||||||||||||||||
| Net new assets | 0.4 | 4.4 | (4.2) | – | – | 15.6 | (3.0) | – | |||||||||
| Other effects | 11.4 | 8.4 | 7.3 | – | – | 18.0 | (31.1) | – | |||||||||
| of which market movements | 3.7 | 8.5 | 6.9 | – | – | 10.1 | 8.3 | – | |||||||||
| of which currency | 7.7 | (1.2) | 1.2 | – | – | 7.8 | (20.5) | – | |||||||||
| of which other | 0.0 | 1.1 | (0.8) | – | – | 0.1 | (18.9) | – | |||||||||
| Growth in assets under management | 11.8 | 12.8 | 3.1 | – | – | 33.6 | (34.1) | – | |||||||||
| Growth in assets under management (annualized) (%) | |||||||||||||||||
| Net new assets | 0.5 | 5.8 | (5.9) | – | – | 5.4 | (0.9) | – | |||||||||
| Other effects | 14.7 | 11.3 | 10.2 | – | – | 6.2 | (9.6) | – | |||||||||
| Growth in assets under management (annualized) | 15.2 | 17.1 | 4.3 | – | – | 11.6 | (10.5) | – | |||||||||
| Growth in assets under management (rolling four-quarter average) (%) | |||||||||||||||||
| Net new assets | 5.4 | 3.8 | (0.9) | – | – | – | – | – | |||||||||
| Other effects | 6.2 | 4.9 | (9.6) | – | – | – | – | – | |||||||||
| Growth in assets under management (rolling four-quarter average) | 11.6 | 8.7 | (10.5) | – | – | – | – | – | |||||||||
16
Asset management
| Results – Asset Management | |||||||||||||||||
| in / end of | % change | in / end of | % change | ||||||||||||||
| 4Q16 | 3Q16 | 4Q15 | QoQ | YoY | 2016 | 2015 | YoY | ||||||||||
| Statements of operations (CHF million) | |||||||||||||||||
| Net revenues | 381 | 292 | 365 | 30 | 4 | 1,327 | 1,328 | 0 | |||||||||
| Provision for credit losses | 0 | 0 | 0 | – | – | 0 | 0 | – | |||||||||
| Compensation and benefits | 183 | 144 | 199 | 27 | (8) | 656 | 702 | (7) | |||||||||
| General and administrative expenses | 76 | 83 | 110 | (8) | (31) | 318 | 376 | (15) | |||||||||
| Commission expenses | 14 | 14 | 17 | 0 | (18) | 66 | 64 | 3 | |||||||||
| Restructuring expenses | 5 | 2 | 4 | 150 | 25 | 7 | 4 | 75 | |||||||||
| Total other operating expenses | 95 | 99 | 131 | (4) | (27) | 391 | 444 | (12) | |||||||||
| Total operating expenses | 278 | 243 | 330 | 14 | (16) | 1,047 | 1,146 | (9) | |||||||||
| Income before taxes | 103 | 49 | 35 | 110 | 194 | 280 | 182 | 54 | |||||||||
| Statement of operations metrics (%) | |||||||||||||||||
| Cost/income ratio | 73.0 | 83.2 | 90.4 | – | – | 78.9 | 86.3 | – | |||||||||
| Net revenue detail (CHF million) | |||||||||||||||||
| Management fees | 228 | 218 | 225 | 5 | 1 | 891 | 873 | 2 | |||||||||
| Performance and placement revenues | 108 | 41 | 56 | 163 | 93 | 208 | 164 | 27 | |||||||||
| Investment and partnership income | 45 | 33 | 84 | 36 | (46) | 228 | 291 | (22) | |||||||||
| Net revenues | 381 | 292 | 365 | 30 | 4 | 1,327 | 1,328 | 0 | |||||||||
| of which recurring commissions and fees | 212 | 204 | 211 | 4 | 0 | 821 | 804 | 2 | |||||||||
| of which transaction- and performance-based revenues | 167 | 94 | 159 | 78 | 5 | 504 | 558 | (10) | |||||||||
| of which other revenues | 2 | (6) | (5) | – | – | 2 | (34) | – | |||||||||
| Management fees include fees on assets under management, asset administration revenues and transaction fees related to the acquisition and disposal of investments in the funds being managed. Performance revenues relate to the performance or return of the funds being managed and includes investment-related gains and losses from proprietary funds. Placement revenues arise from our third-party private equity fundraising activities and secondary private equity market advisory services. Investment and partnership income includes equity participation income from seed capital returns and from minority investments in third-party asset managers, income from strategic partnerships and distribution agreements, and other revenues. | |||||||||||||||||
In 4Q16, income before taxes of CHF 103 million increased CHF 54 million compared to 3Q16, driven by higher net revenues, partially offset by higher total operating expenses. Income before taxes increased CHF 68 million compared to 4Q15, reflecting a decrease in total operating expenses and an increase in net revenues. Adjusted income before taxes of CHF 108 million increased CHF 57 million and CHF 69 million compared to 3Q15 and 4Q15, respectively.
Net revenues
Compared to 3Q16, net revenues of CHF 381 million increased 30%, mainly driven by higher performance and placement revenues and higher investment and partnership income. Performance and placement revenues increased CHF 67 million to CHF 108 million, primarily driven by year-end performance fees and higher placement fees. Investment and partnership income of CHF 45 million increased 36%, mainly due to annual performance revenues from single manager hedge funds and higher income from the real estate sector. Management fees of CHF 228 million increased 5%.
Compared to 4Q15, net revenues were 4% higher, primarily reflecting an increase in performance and placement revenues, partially offset by significantly lower investment and partnership income. Performance and placement revenues increased CHF 52 million, mainly driven by investment-related gains and higher performance fees. Investment and partnership income decreased 46%, mainly due to weaker results from single manager hedge funds. Management fees were stable.
Total operating expenses
Compared to 3Q16, total operating expenses of CHF 278 million increased 14%, mainly reflecting higher compensation and benefits. Compensation and benefits of CHF 183 million increased 27%, reflecting higher discretionary compensation expenses, higher deferred compensation expenses from prior-year awards and higher salary expenses. General and administrative expenses of CHF 76 million decreased 8%.
Compared to 4Q15, total operating expenses decreased 16%, reflecting lower general and administrative expenses and lower compensation and benefits. General and administrative expenses were CHF 34 million lower, mainly due to lower allocated corporate function costs. Compensation and benefits were CHF 16 million lower, mainly reflecting lower discretionary compensation expenses.
17
As of the end of 4Q16, assets under management of CHF 321.6 billion were CHF 2.7 billion lower compared to the end of 3Q16, reflecting net asset outflows of CHF 4.4 billion, partially offset by favorable foreign exchange-related and market movements. Net asset outflows primarily reflected money market outflows from an emerging market joint venture.
As of the end of 2016, assets under management of CHF 321.6 billion were stable compared to the end of 2015, reflecting favorable market movements, net new assets of CHF 5.6 billion and favorable foreign exchange-related movements, offset by structural effects, mainly from an adjustment of assets under management reported for multi-asset class solutions in 1Q16. Net new assets reflected inflows from an emerging market joint venture and from a new product launch, partially offset by an outflow from a single mandate.
| Assets under management – Asset Management | |||||||||||||||||
| in / end of | % change | in / end of | % change | ||||||||||||||
| 4Q16 | 3Q16 | 4Q15 | QoQ | YoY | 2016 | 2015 | YoY | ||||||||||
| Assets under management (CHF billion) | |||||||||||||||||
| Traditional investments | 159.9 | 163.4 | 172.2 | (2.1) | (7.1) | 159.9 | 172.2 | (7.1) | |||||||||
| Alternative investments | 121.3 | 117.7 | 110.4 | 3.1 | 9.9 | 121.3 | 110.4 | 9.9 | |||||||||
| Investments and partnerships | 40.4 | 43.2 | 38.7 | (6.5) | 4.4 | 40.4 | 38.7 | 4.4 | |||||||||
| Assets under management | 321.6 | 324.3 | 321.3 | (0.8) | 0.1 | 321.6 | 321.3 | 0.1 | |||||||||
| Average assets under management | 325.0 | 318.6 | 321.5 | 2.0 | 1.1 | 317.5 | 312.4 | 1.6 | |||||||||
| Assets under management by currency (CHF billion) | |||||||||||||||||
| USD | 95.9 | 90.2 | 88.1 | 6.3 | 8.9 | 95.9 | 88.1 | 8.9 | |||||||||
| EUR | 36.6 | 36.8 | 42.1 | (0.5) | (13.1) | 36.6 | 42.1 | (13.1) | |||||||||
| CHF | 140.7 | 145.9 | 148.9 | (3.6) | (5.5) | 140.7 | 148.9 | (5.5) | |||||||||
| Other | 48.4 | 51.4 | 42.2 | (5.8) | 14.7 | 48.4 | 42.2 | 14.7 | |||||||||
| Assets under management | 321.6 | 324.3 | 321.3 | (0.8) | 0.1 | 321.6 | 321.3 | 0.1 | |||||||||
| Growth in assets under management (CHF billion) | |||||||||||||||||
| Net new assets 1 | (4.4) | 5.0 | 3.6 | – | – | 5.6 | 26.5 | – | |||||||||
| Other effects | 1.7 | 4.4 | 3.1 | – | – | (5.3) | (10.4) | – | |||||||||
| of which market movements | 1.4 | 5.0 | 5.1 | – | – | 7.6 | 0.7 | – | |||||||||
| of which foreign exchange | 5.0 | (0.8) | 0.7 | – | – | 3.9 | (8.0) | – | |||||||||
| of which other | (4.7) | 0.2 | (2.7) | – | – | (16.8) | (3.1) | – | |||||||||
| Growth in assets under management | (2.7) | 9.4 | 6.7 | – | – | 0.3 | 16.1 | – | |||||||||
| Growth in assets under management (annualized) (%) | |||||||||||||||||
| Net new assets | (5.4) | 6.4 | 4.6 | – | – | 1.7 | 8.7 | – | |||||||||
| Other effects | 2.1 | 5.5 | 3.9 | – | – | (1.6) | (3.4) | – | |||||||||
| Growth in assets under management | (3.3) | 11.9 | 8.5 | – | – | 0.1 | 5.3 | – | |||||||||
| Growth in assets under management (rolling four-quarter average) (%) | |||||||||||||||||
| Net new assets | 1.7 | 4.3 | 8.7 | – | – | – | – | – | |||||||||
| Other effects | (1.6) | (1.2) | (3.4) | – | – | – | – | – | |||||||||
| Growth in assets under management (rolling four-quarter average) | 0.1 | 3.1 | 5.3 | – | – | – | – | – | |||||||||
1 Includes outflows for private equity assets reflecting realizations at cost and unfunded commitments on which a fee is no longer earned. | |||||||||||||||||
18
In 4Q16, we reported income before taxes of CHF 103 million and net revenues of CHF 862 million. Income before taxes decreased 32% compared to 3Q16 and increased CHF 720 million compared to a loss before taxes of CHF 617 million reported in 4Q15. For 2016, we reported income before taxes of CHF 725 million and net revenues of CHF 3,597 million.
4Q16 results
In 4Q16, we reported income before taxes of CHF 103 million and net revenues of CHF 862 million. Compared to 3Q16, net revenues decreased 6%, mainly due to lower fixed income sales and trading revenues, partially offset by higher revenues from the ultra-high-net-worth individual and high-net-worth individual client business in Private Banking. Provision for credit losses was CHF 11 million in 4Q16, compared to a provision of CHF 34 million in 3Q16. Total operating expenses of CHF 748 million increased slightly, primarily due to higher compensation and benefits in Private Banking and Investment Banking and higher commission expenses in Investment Banking.
Compared to 4Q15, net revenues increased 4%, driven by higher revenues from Private Banking and underwriting and advisory, partially offset by lower fixed income and equity sales and trading revenues, reflecting subdued market conditions in 4Q16. Total operating expenses decreased 48%, mainly reflecting the absence of the goodwill impairment charge of CHF 756 million in 4Q15, partially offset by higher compensation and benefits, reflecting increases in discretionary compensation and salary expenses driven by growth-related higher headcount.
Adjusted income before taxes of CHF 122 million decreased 30% compared to 3Q16 and 18% compared to 4Q15.
2016 results
In 2016, we reported income before taxes of CHF 725 million and net revenues of CHF 3,597 million. Compared to 2015, income before taxes increased 92%, mainly due to lower total operating expenses, primarily reflecting the absence of the goodwill impairment charge of CHF 756 million in Investment Banking in 4Q15, partially offset by lower net revenues, particularly in equity sales and trading. Lower revenues in equity sales and trading were primarily driven by decreased client activity, particularly in Greater China. Private Banking revenues were higher, primarily reflecting increases in net interest income. Underwriting and advisory revenues improved significantly compared to 2015, with strong client activity in advisory, equity and debt underwriting. Compared to 2015, total operating expenses of CHF 2,846 million decreased 17%, mainly reflecting the absence of the goodwill impairment charge in 2015, partially offset by increased compensation and benefits driven by growth-related higher headcount, higher restructuring expenses and higher general and administrative expenses. Adjusted income before taxes of CHF 778 million decreased 32% compared to 2015.
| Divisional results | |||||||||||||||||
| in / end of | % change | in / end of | % change | ||||||||||||||
| 4Q16 | 3Q16 | 4Q15 | QoQ | YoY | 2016 | 2015 | YoY | ||||||||||
| Statements of operations (CHF million) | |||||||||||||||||
| Net revenues | 862 | 917 | 826 | (6) | 4 | 3,597 | 3,839 | (6) | |||||||||
| Provision for credit losses | 11 | 34 | 3 | (68) | 267 | 26 | 35 | (26) | |||||||||
| Compensation and benefits | 429 | 413 | 390 | 4 | 10 | 1,665 | 1,557 | 7 | |||||||||
| General and administrative expenses | 219 | 224 | 225 | (2) | (3) | 836 | 790 | 6 | |||||||||
| Commission expenses | 81 | 71 | 66 | 14 | 23 | 292 | 321 | (9) | |||||||||
| Goodwill impairment | 0 | 0 | 756 | – | (100) | 0 | 756 | (100) | |||||||||
| Restructuring expenses | 19 | 23 | 3 | (17) | – | 53 | 3 | – | |||||||||
| Total other operating expenses | 319 | 318 | 1,050 | 0 | (70) | 1,181 | 1,870 | (37) | |||||||||
| Total operating expenses | 748 | 731 | 1,440 | 2 | (48) | 2,846 | 3,427 | (17) | |||||||||
| Income/(loss) before taxes | 103 | 152 | (617) | (32) | – | 725 | 377 | 92 | |||||||||
| Statement of operations metrics (%) | |||||||||||||||||
| Return on regulatory capital | 7.6 | 11.3 | (49.7) | – | – | 13.7 | 6.7 | – | |||||||||
| Cost/income ratio | 86.8 | 79.7 | 174.3 | – | – | 79.1 | 89.3 | – | |||||||||
| Economic risk capital and return | |||||||||||||||||
| Average economic risk capital (CHF million) | 4,453 | 4,320 | 3,582 | 3 | 24 | 4,147 | 3,405 | 22 | |||||||||
| Pre-tax return on average economic risk capital (%) 1 | 9.7 | 14.1 | (68.9) | – | – | 17.6 | 11.1 | – | |||||||||
| Number of employees (full-time equivalents) | |||||||||||||||||
| Number of employees | 6,980 | 7,140 | 6,590 | (2) | 6 | 6,980 | 6,590 | 6 | |||||||||
1 Calculated using a return excluding interest costs for allocated goodwill. | |||||||||||||||||
19
| Divisional results (continued) | |||||||||||||||||
| in / end of | % change | in / end of | % change | ||||||||||||||
| 4Q16 | 3Q16 | 4Q15 | QoQ | YoY | 2016 | 2015 | YoY | ||||||||||
| Net revenues (CHF million) | |||||||||||||||||
| Private Banking | 372 | 346 | 271 | 8 | 37 | 1,374 | 1,178 | 17 | |||||||||
| Investment Banking | 490 | 571 | 555 | (14) | (12) | 2,223 | 2,661 | (16) | |||||||||
| Net revenues | 862 | 917 | 826 | (6) | 4 | 3,597 | 3,839 | (6) | |||||||||
| Provision for credit losses (CHF million) | |||||||||||||||||
| New provisions | 14 | 54 | 23 | (74) | (39) | 72 | 74 | (3) | |||||||||
| Releases of provisions | (3) | (20) | (20) | (85) | (85) | (46) | (39) | 18 | |||||||||
| Provision for credit losses | 11 | 34 | 3 | (68) | 267 | 26 | 35 | (26) | |||||||||
| Balance sheet statistics (CHF million) | |||||||||||||||||
| Total assets | 97,221 | 93,079 | 85,929 | 4 | 13 | 97,221 | 85,929 | 13 | |||||||||
| Net loans | 40,134 | 38,669 | 35,905 | 4 | 12 | 40,134 | 35,905 | 12 | |||||||||
| of which Private Banking | 33,405 | 32,859 | – | 2 | – | 33,405 | – | – | |||||||||
| Risk-weighted assets | 34,605 | 32,264 | 26,835 | 7 | 29 | 34,605 | 26,835 | 29 | |||||||||
| Leverage exposure | 108,926 | 108,495 | 98,632 | 0 | 10 | 108,926 | 98,632 | 10 | |||||||||
| Reconciliation of adjusted results | |||||||||||||||||||
| Private Banking | Investment Banking | Asia Pacific | |||||||||||||||||
| in | 4Q16 | 3Q16 | 4Q15 | 4Q16 | 3Q16 | 4Q15 | 4Q16 | 3Q16 | 4Q15 | ||||||||||
| Adjusted results (CHF million) | |||||||||||||||||||
| Net revenues | 372 | 346 | 271 | 490 | 571 | 555 | 862 | 917 | 826 | ||||||||||
| Provision for credit losses | 9 | 38 | (5) | 2 | (4) | 8 | 11 | 34 | 3 | ||||||||||
| Total operating expenses | 267 | 242 | 228 | 481 | 489 | 1,212 | 748 | 731 | 1,440 | ||||||||||
| Goodwill impairment | – | – | – | 0 | 0 | (756) | 0 | 0 | (756) | ||||||||||
| Restructuring expenses | (1) | (3) | (1) | (18) | (20) | (2) | (19) | (23) | (3) | ||||||||||
| Major litigation provisions | 0 | 0 | (6) | 0 | 0 | 0 | 0 | 0 | (6) | ||||||||||
| Adjusted total operating expenses | 266 | 239 | 221 | 463 | 469 | 454 | 729 | 708 | 675 | ||||||||||
| Income/(loss) before taxes | 96 | 66 | 48 | 7 | 86 | (665) | 103 | 152 | (617) | ||||||||||
| Total adjustments | 1 | 3 | 7 | 18 | 20 | 758 | 19 | 23 | 765 | ||||||||||
| Adjusted income before taxes | 97 | 69 | 55 | 25 | 106 | 93 | 122 | 175 | 148 | ||||||||||
| Adjusted return on regulatory capital (%) | – | – | – | – | – | – | 9.0 | 12.9 | 11.7 | ||||||||||
| Private Banking | Investment Banking | Asia Pacific | |||||||||||
| in | 2016 | 2015 | 2016 | 2015 | 2016 | 2015 | |||||||
| Adjusted results (CHF million) | |||||||||||||
| Net revenues | 1,374 | 1,178 | 2,223 | 2,661 | 3,597 | 3,839 | |||||||
| Provision for credit losses | 32 | 18 | (6) | 17 | 26 | 35 | |||||||
| Total operating expenses | 970 | 816 | 1,876 | 2,611 | 2,846 | 3,427 | |||||||
| Goodwill impairment | – | – | 0 | (756) | 0 | (756) | |||||||
| Restructuring expenses | (4) | (1) | (49) | (2) | (53) | (3) | |||||||
| Major litigation provisions | 0 | (6) | 0 | 0 | 0 | (6) | |||||||
| Adjusted total operating expenses | 966 | 809 | 1,827 | 1,853 | 2,793 | 2,662 | |||||||
| Income before taxes | 372 | 344 | 353 | 33 | 725 | 377 | |||||||
| Total adjustments | 4 | 7 | 49 | 758 | 53 | 765 | |||||||
| Adjusted income before taxes | 376 | 351 | 402 | 791 | 778 | 1,142 | |||||||
| Adjusted return on regulatory capital (%) | – | – | – | – | 14.8 | 20.4 | |||||||
| Adjusted results are non-GAAP financial measures. Refer to "Reconciliation of adjusted results" in the Appendix for further information. | |||||||||||||
20
Capital and leverage metrics
As of the end of 4Q16, we reported risk-weighted assets of CHF 34.6 billion, an increase of CHF 2.3 billion compared to the end of 3Q16, mainly reflecting the foreign exchange impact from the strengthening of the US dollar against the Swiss franc, higher risk levels and methodology changes. Leverage exposure was CHF 108.9 billion, reflecting an increase of CHF 0.4 billion compared to the end of 3Q16, primarily driven by an increase in HQLA and the foreign exchange impact, partially offset by lower inventory levels reflecting subdued market conditions and a reduction of positions including the ongoing transfer of the systematic market making business to the Asset Management business of International Wealth Management.
Private Banking
In 4Q16, income before taxes of CHF 96 million increased 45% compared to 3Q16, reflecting lower provision for credit losses and higher net revenues, partially offset by higher total operating expenses. Compared to 4Q15, income before taxes increased 100% due to higher net revenues, partially offset by higher total operating expenses and higher provision for credit losses. Adjusted income before taxes of CHF 97 million increased 41% compared to 3Q16 and 76% compared to 4Q15.
Net revenues
Net revenues of CHF 372 million increased 8% compared to 3Q16, primarily due to increased recurring commissions and fees. Recurring commissions and fees increased 37% to CHF 92 million, mainly due to higher other commissions and fees, partially offset by lower wealth structuring solutions fees. Other commissions and fees for the quarter included the positive impact of an adjustment relating to treasury allocations of CHF 19 million. Net interest income increased 4% to CHF 166 million, reflecting stable deposit and loan margins on slightly higher average deposit and loan volumes. Transaction-based revenues decreased 5% to CHF 114 million, mainly due to lower brokerage and product issuing fees, partially offset by higher fees from foreign exchange client business and higher corporate advisory fees arising from integrated solutions.
Compared to 4Q15, net revenues increased 37%, mainly reflecting increases in net interest income, recurring commissions and fees and transaction-based revenues. Net interest income increased 27%, reflecting significantly higher deposit margins on higher average deposit volumes and higher loan margins on higher average loan volumes. Recurring commissions and fees increased 53%, mainly due to higher other commissions and fees, which included the positive impact of the adjustment relating to treasury allocations, and higher investment product management fees. Transaction-based revenues increased 36%, primarily reflecting higher fees from foreign exchange client business, higher corporate advisory fees arising from integrated solutions and higher brokerage and product issuing fees.
Provision for credit losses
The Private Banking loan portfolio primarily comprises lombard loans, mainly backed by listed securities.
In 4Q16, Private Banking recorded a net provision for credit losses of CHF 9 million, compared to a net provision for credit losses of CHF 38 million in 3Q16 and a net release of provision for credit losses of CHF 5 million in 4Q15. The higher provision for credit losses in 3Q16 was in relation to a small number of share-based loans in Hong Kong which were impaired due to their collateral values abruptly falling below their loan amounts.
Total operating expenses
Total operating expenses of CHF 267 million increased 10% compared to 3Q16, mainly reflecting higher general and administrative expenses and higher compensation and benefits. General and administrative expenses increased 33% to CHF 76 million, reflecting higher expenses for IT infrastructure and product development and support. Compensation and benefits increased 5% to CHF 177 million, primarily driven by higher discretionary compensation and salary expenses. Adjusted total operating expenses of CHF 266 million increased 11% compared to 3Q16.
Compared to 4Q15, total operating expenses increased 17%, mainly reflecting higher compensation and benefits. Compensation and benefits increased 27%, primarily driven by higher salary expenses reflecting growth-related higher headcount, and higher discretionary compensation expenses. General and administrative expenses decreased slightly, mainly due to lower litigation provisions and lower advertising and marketing expenses, partially offset by higher expenses for IT infrastructure, product development and support and risk management. Adjusted total operating expenses increased 20% compared to 4Q15.
21
| Results - Private Banking | |||||||||||||||||
| in / end of | % change | in / end of | % change | ||||||||||||||
| 4Q16 | 3Q16 | 4Q15 | QoQ | YoY | 2016 | 2015 | YoY | ||||||||||
| Statements of operations (CHF million) | |||||||||||||||||
| Net revenues | 372 | 346 | 271 | 8 | 37 | 1,374 | 1,178 | 17 | |||||||||
| Provision for credit losses | 9 | 38 | (5) | (76) | – | 32 | 18 | 78 | |||||||||
| Compensation and benefits | 177 | 169 | 139 | 5 | 27 | 652 | 522 | 25 | |||||||||
| General and administrative expenses | 76 | 57 | 78 | 33 | (3) | 267 | 244 | 9 | |||||||||
| Commission expenses | 13 | 13 | 10 | 0 | 30 | 47 | 49 | (4) | |||||||||
| Restructuring expenses | 1 | 3 | 1 | (67) | 0 | 4 | 1 | 300 | |||||||||
| Total other operating expenses | 90 | 73 | 89 | 23 | 1 | 318 | 294 | 8 | |||||||||
| Total operating expenses | 267 | 242 | 228 | 10 | 17 | 970 | 816 | 19 | |||||||||
| Income before taxes | 96 | 66 | 48 | 45 | 100 | 372 | 344 | 8 | |||||||||
| Statement of operations metrics (%) | |||||||||||||||||
| Cost/income ratio | 71.8 | 69.9 | 84.1 | – | – | 70.6 | 69.3 | – | |||||||||
| Net revenue detail (CHF million) | |||||||||||||||||
| Net interest income | 166 | 159 | 131 | 4 | 27 | 602 | 445 | 35 | |||||||||
| Recurring commissions and fees | 92 | 67 | 60 | 37 | 53 | 302 | 260 | 16 | |||||||||
| Transaction-based revenues | 114 | 120 | 84 | (5) | 36 | 486 | 456 | 7 | |||||||||
| Other revenues | 0 | 0 | (4) | – | 100 | (16) | 17 | – | |||||||||
| Net revenues | 372 | 346 | 271 | 8 | 37 | 1,374 | 1,178 | 17 | |||||||||
| Margins on assets under management (annualized) (bp) | |||||||||||||||||
| Gross margin 1 | 87 | 84 | 72 | – | – | 86 | 79 | – | |||||||||
| Net margin 2 | 23 | 16 | 13 | – | – | 23 | 23 | – | |||||||||
| Number of relationship managers | |||||||||||||||||
| Number of relationship managers | 640 | 650 | 580 | (2) | 10 | 640 | 580 | 10 | |||||||||
1 Net revenues divided by average assets under management. | |||||||||||||||||
2 Income before taxes divided by average assets under management. | |||||||||||||||||
Gross margin
Our gross margin was 87 basis points in 4Q16, three basis points higher compared to 3Q16, mainly reflecting higher net revenues, particularly recurring commissions and fees, partially offset by a 3.7% increase in average assets under management. Compared to 4Q15, our gross margin was 15 basis points higher, mainly reflecting higher net revenues, particularly net interest income, recurring commissions and fees and transaction-based revenues, partially offset by a 12.8% increase in average assets under management.
> Refer to “Assets under management” for further information.
Net margin
Our net margin was 23 basis points in 4Q16, seven basis points higher compared to 3Q16, mainly reflecting lower provision for credit losses and higher net revenues, partially offset by higher operating expenses. Compared to 4Q15, our net margin was ten basis points higher, mainly reflecting higher net revenues, partially offset by higher operating expenses and higher provision for credit losses.
As of the end of 4Q16, assets under management of CHF 166.9 billion were CHF 1.1 billion lower compared to the end of 3Q16, primarily driven by unfavorable market movements. Net new assets of CHF 0.7 billion reflected inflows primarily from Greater China and Australia, partially offset by significant outflows in connection with the regularization of client assets of CHF 1.4 billion, mainly in South East Asia.
As of the end of 2016, assets under management of CHF 166.9 billion were CHF 16.5 billion higher compared to the end of 2015, mainly reflecting net new assets of CHF 13.6 billion and favorable foreign exchange-related and market movements. Net new assets reflected inflows primarily from Greater China, Australia and South East Asia, partially offset by significant outflows in connection with the regularization of client assets of CHF 2.5 billion, mainly in South East Asia.
22
| Assets under management – Private Banking | |||||||||||||||||
| in / end of | % change | in / end of | % change | ||||||||||||||
| 4Q16 | 3Q16 | 4Q15 | QoQ | YoY | 2016 | 2015 | YoY | ||||||||||
| Assets under management (CHF billion) | |||||||||||||||||
| Assets under management | 166.9 | 168.0 | 150.4 | (0.7) | 11.0 | 166.9 | 150.4 | 11.0 | |||||||||
| Average assets under management | 170.6 | 164.5 | 151.3 | 3.7 | 12.8 | 159.5 | 150.0 | 6.3 | |||||||||
| Assets under management by currency (CHF billion) | |||||||||||||||||
| USD | 82.5 | 79.0 | 66.5 | 4.4 | 24.1 | 82.5 | 66.5 | 24.1 | |||||||||
| EUR | 4.6 | 4.5 | 4.7 | 2.2 | (2.1) | 4.6 | 4.7 | (2.1) | |||||||||
| CHF | 2.0 | 1.8 | 2.3 | 11.1 | (13.0) | 2.0 | 2.3 | (13.0) | |||||||||
| Other | 77.8 | 82.7 | 76.9 | (5.9) | 1.2 | 77.8 | 76.9 | 1.2 | |||||||||
| Assets under management | 166.9 | 168.0 | 150.4 | (0.7) | 11.0 | 166.9 | 150.4 | 11.0 | |||||||||
| Growth in assets under management (CHF billion) | |||||||||||||||||
| Net new assets | 0.7 | 4.3 | 3.0 | – | – | 13.6 | 17.8 | – | |||||||||
| Other effects | (1.8) | 6.1 | 8.3 | – | – | 2.9 | (17.9) | – | |||||||||
| of which market movements | (4.2) | 6.9 | 6.1 | – | – | 1.0 | (4.9) | – | |||||||||
| of which foreign exchange | 5.2 | (0.5) | 2.1 | – | – | 4.8 | (3.4) | – | |||||||||
| of which other | (2.8) | (0.3) | 0.1 | – | – | (2.9) | (9.6) | – | |||||||||
| Growth in assets under management | (1.1) | 10.4 | 11.3 | – | – | 16.5 | (0.1) | – | |||||||||
| Growth in assets under management (annualized) (%) | |||||||||||||||||
| Net new assets | 1.7 | 10.9 | 8.6 | – | – | 9.0 | 11.8 | – | |||||||||
| Other effects | (4.3) | 15.5 | 23.9 | – | – | 2.0 | (11.9) | – | |||||||||
| Growth in assets under management (annualized) | (2.6) | 26.4 | 32.5 | – | – | 11.0 | (0.1) | – | |||||||||
| Growth in assets under management (rolling four-quarter average) (%) | |||||||||||||||||
| Net new assets | 9.0 | 11.4 | 11.8 | – | – | – | – | – | |||||||||
| Other effects | 2.0 | 9.4 | (11.9) | – | – | – | – | – | |||||||||
| Growth in assets under management (rolling four-quarter average) | 11.0 | 20.8 | (0.1) | – | – | – | – | – | |||||||||
| 2016 net new assets and total assets under management were updated since February 14, 2017 to reflect a correction. | |||||||||||||||||
Investment Banking
In 4Q16, income before taxes of CHF 7 million decreased 92% compared to 3Q16, mainly due to lower net revenues. Compared to 4Q15, income before taxes increased CHF 672 million, primarily reflecting the absence of the goodwill impairment charge of CHF 756 million in 4Q15, partially offset by lower net revenues and higher restructuring expenses. Adjusted income before taxes of CHF 25 million decreased 76% compared to 3Q16 and 73% compared to 4Q15.
Net revenues
Net revenues decreased 14% to CHF 490 million compared to 3Q16, mainly reflecting lower fixed income sales and trading revenues. Fixed income sales and trading revenues decreased 53% to CHF 70 million, mainly due to lower client activity in emerging markets rates products and the absence of the positive impact of CHF 33 million in 3Q16 resulting from an increase in the funding value of certain structured deposits originated in Asia Pacific, partially offset by higher financing revenues which included a positive net fair value impact of CHF 26 million from an impaired loan portfolio in recovery management. Equity sales and trading revenues of CHF 340 million, which included a positive net fair value impact in derivatives of CHF 49 million from an impaired loan portfolio in recovery management, and underwriting and advisory revenues of CHF 115 million were stable.
Compared to 4Q15, net revenues decreased 12%, mainly due to lower fixed income and equity sales and trading revenues, partially offset by higher underwriting and advisory revenues. Fixed income sales and trading revenues decreased 50%, primarily driven by lower client activity within rates products, partially offset by the positive net fair value impact from an impaired loan portfolio in recovery management and higher revenues from foreign exchange products. Equity sales and trading revenues decreased 10%, primarily due to decreases in systematic market making and prime services and the absence of the positive impact from the release of a trade-related provision in 4Q15, partially offset by higher revenues from derivatives which included the positive net fair value impact from an impaired loan portfolio in recovery management. Underwriting and advisory revenues increased 44%, primarily due to higher equity underwriting and advisory fees resulting from increased market activity and higher share of wallet. Share of wallet refers to our share of the overall fee pool for the respective products.
23
| Results - Investment Banking | |||||||||||||||||
| in / end of | % change | in / end of | % change | ||||||||||||||
| 4Q16 | 3Q16 | 4Q15 | QoQ | YoY | 2016 | 2015 | YoY | ||||||||||
| Statements of operations (CHF million) | |||||||||||||||||
| Net revenues | 490 | 571 | 555 | (14) | (12) | 2,223 | 2,661 | (16) | |||||||||
| Provision for credit losses | 2 | (4) | 8 | – | (75) | (6) | 17 | – | |||||||||
| Compensation and benefits | 252 | 244 | 251 | 3 | 0 | 1,013 | 1,035 | (2) | |||||||||
| General and administrative expenses | 143 | 167 | 147 | (14) | (3) | 569 | 546 | 4 | |||||||||
| Commission expenses | 68 | 58 | 56 | 17 | 21 | 245 | 272 | (10) | |||||||||
| Goodwill impairment | 0 | 0 | 756 | – | (100) | 0 | 756 | (100) | |||||||||
| Restructuring expenses | 18 | 20 | 2 | (10) | – | 49 | 2 | – | |||||||||
| Total other operating expenses | 229 | 245 | 961 | (7) | (76) | 863 | 1,576 | (45) | |||||||||
| Total operating expenses | 481 | 489 | 1,212 | (2) | (60) | 1,876 | 2,611 | (28) | |||||||||
| Income/(loss) before taxes | 7 | 86 | (665) | (92) | – | 353 | 33 | – | |||||||||
| Statement of operations metrics (%) | |||||||||||||||||
| Cost/income ratio | 98.2 | 85.6 | 218.4 | – | – | 84.4 | 98.1 | – | |||||||||
| Net revenue detail (CHF million) | |||||||||||||||||
| Fixed income sales and trading | 70 | 148 | 139 | (53) | (50) | 635 | 608 | 4 | |||||||||
| Equity sales and trading | 340 | 339 | 379 | 0 | (10) | 1,314 | 1,872 | (30) | |||||||||
| Underwriting and advisory | 115 | 115 | 80 | 0 | 44 | 402 | 292 | 38 | |||||||||
| Other revenues | (35) | (31) | (43) | 13 | (19) | (128) | (111) | 15 | |||||||||
| Net revenues | 490 | 571 | 555 | (14) | (12) | 2,223 | 2,661 | (16) | |||||||||
Provision for credit losses
In 4Q16, Investment Banking recorded a net provision for credit losses of CHF 2 million, compared to a net release of provision of CHF 4 million in 3Q16 and a net provision for credit losses of CHF 8 million in 4Q15.
Total operating expenses
Total operating expenses of CHF 481 million decreased slightly compared to 3Q16, reflecting lower general and administrative expenses, offset by higher commission expenses and higher compensation and benefits. General and administrative expenses decreased 14% to CHF 143 million, mainly due to lower allocated corporate function costs. Compensation and benefits increased slightly to CHF 252 million, primarily driven by higher discretionary compensation expenses. Commission expenses increased 17% to CHF 68 million, mainly reflecting an adjustment relating to intercompany commission expenses charged by Global Markets. Adjusted total operating expenses of CHF 463 million were stable compared to 3Q16.
Compared to 4Q15, total operating expenses decreased 60%, mainly reflecting the absence of the goodwill impairment charge of CHF 756 million in 4Q15. General and administrative expenses decreased slightly, mainly due to lower litigation provisions and lower travel and entertainment expenses, partially offset by higher allocated corporate function costs. Compensation and benefits were stable, primarily reflecting lower deferred compensation from prior-year awards, offset by higher discretionary compensation expenses and higher salary expenses reflecting growth-related hires in the advisory, underwriting and financing businesses. Restructuring expenses increased CHF 16 million to CHF 18 million reflecting ongoing cost management initiatives. Adjusted total operating expenses increased slightly compared to 4Q15.
24
In 4Q16, Global Markets reported income before taxes of CHF 5 million and net revenues of CHF 1,265 million. Net revenues decreased 7% compared to 3Q16, reflecting a seasonal slowdown in client activity partially offset by improved performance in equities. For 2016, we reported income before taxes of CHF 48 million and net revenues of CHF 5,497 million.
4Q16 results
In 4Q16, we reported income before taxes of CHF 5 million and net revenues of CHF 1,265 million. Compared to 3Q16, net revenues decreased 7%, reflecting a 25% decline in solutions revenues and a 15% decline in credit revenues, partially offset by a 37% increase in equities revenues. Compared to 4Q15, net revenues increased 8%, primarily due to significant improvement across global credit products and securitized products, albeit from subdued levels, partially offset by lower equities and solutions performance. Revenues from our credit businesses increased 66%, solutions revenues decreased 18% and equities revenues declined 16%.
Total operating expenses of CHF 1,264 million were stable compared to 3Q16, as lower restructuring costs and reduced compensation and benefits were offset by increased commission expenses and higher costs related to our risk, regulatory and compliance infrastructure. Compared to 4Q15, total operating expenses decreased 72%, primarily due to the goodwill impairment charge incurred in 4Q15. Adjusted income before taxes was CHF 20 million in 4Q16, compared to CHF 146 million in 3Q16 and a loss of CHF 505 million in 4Q15.
2016 results
In 2016, we reported income before taxes of CHF 48 million and net revenues of CHF 5,497 million. Compared to 2015, net revenues declined 19%, as challenging trading conditions resulted in low levels of client activity. Equities revenues declined 20%, primarily due to lower systematic market making revenues given low volatility, lower prime services revenues as we resized our business model and reduced equity underwriting revenues. Credit revenues declined 18%, primarily due to a decline in securitized products revenues, reflecting a significant reduction in our risk and capital profile, partially offset by higher global credit products revenues, reflecting improved leveraged finance trading activity due to a significant rebound in US high yield and loan trading. Solutions revenues declined 19%, reflecting reduced equity derivatives performance given lower volatility, lower global macro products revenues given the exit of our European rates business and lower emerging markets revenues due to decreased structured products performance, partially offset by improved Brazil trading activity.
Total operating expenses were CHF 5,452 million, down 38% compared to 2015, reflecting the goodwill impairment of CHF 2,661 million in 2015. Adjusted total operating expenses of CHF 5,228 million decreased 9% compared to 2015, reflecting lower compensation and benefits and decreased costs related to our risk, regulatory and compliance infrastructure. Adjusted income before taxes was CHF 272 million in 2016, compared to CHF 1,057 million in 2015.
| Divisional results | |||||||||||||||||
| in / end of | % change | in / end of | % change | ||||||||||||||
| 4Q16 | 3Q16 | 4Q15 | QoQ | YoY | 2016 | 2015 | YoY | ||||||||||
| Statements of operations (CHF million) | |||||||||||||||||
| Net revenues | 1,265 | 1,357 | 1,170 | (7) | 8 | 5,497 | 6,826 | (19) | |||||||||
| Provision for credit losses | (4) | (5) | (4) | (20) | 0 | (3) | 10 | – | |||||||||
| Compensation and benefits | 634 | 642 | 924 | (1) | (31) | 2,725 | 3,105 | (12) | |||||||||
| General and administrative expenses | 475 | 466 | 667 | 2 | (29) | 2,001 | 2,322 | (14) | |||||||||
| Commission expenses | 140 | 115 | 138 | 22 | 1 | 509 | 563 | (10) | |||||||||
| Goodwill impairment | 0 | 0 | 2,661 | – | (100) | 0 | 2,661 | (100) | |||||||||
| Restructuring expenses | 15 | 52 | 96 | (71) | (84) | 217 | 96 | 126 | |||||||||
| Total other operating expenses | 630 | 633 | 3,562 | 0 | (82) | 2,727 | 5,642 | (52) | |||||||||
| Total operating expenses | 1,264 | 1,275 | 4,486 | (1) | (72) | 5,452 | 8,747 | (38) | |||||||||
| Income/(loss) before taxes | 5 | 87 | (3,312) | (94) | – | 48 | (1,931) | – | |||||||||
| Statement of operations metrics (%) | |||||||||||||||||
| Return on regulatory capital | 0.3 | 2.5 | (90.3) | – | – | 0.4 | (11.2) | – | |||||||||
| Cost/income ratio | 99.9 | 94.0 | 383.4 | – | – | 99.2 | 128.1 | – | |||||||||
| Economic risk capital and return | |||||||||||||||||
| Average economic risk capital (CHF million) | 9,030 | 9,311 | 12,314 | (3) | (27) | 9,928 | 12,372 | (20) | |||||||||
| Pre-tax return on average economic risk capital (%) 1 | 0.5 | 4.2 | (106.8) | – | – | 0.9 | (14.9) | – | |||||||||
| Number of employees (full-time equivalents) | |||||||||||||||||
| Number of employees | 11,530 | 11,680 | 12,000 | (1) | (4) | 11,530 | 12,000 | (4) | |||||||||
1 Calculated using a return excluding interest costs for allocated goodwill. | |||||||||||||||||
25
Capital and leverage metrics
As of the end of 4Q16, we reported risk-weighted assets of USD 50.6 billion, below our end-2016 target of USD 60 billion. Risk weighted assets decreased 4% compared to 3Q16, primarily reflecting business reductions. Leverage exposure of USD 277.8 billion was below our end-2016 target of USD 290 billion. Leverage exposure decreased 6% compared to 3Q16, primarily reflecting business reductions. During 4Q16, certain derivative positions in the Strategic Resolution Unit received regulatory approval to apply updated capital models and as a result were transferred to our Global Markets division.
| Divisional results (continued) | |||||||||||||||||
| in / end of | % change | in / end of | % change | ||||||||||||||
| 4Q16 | 3Q16 | 4Q15 | QoQ | YoY | 2016 | 2015 | YoY | ||||||||||
| Net revenue detail (CHF million) | |||||||||||||||||
| Equities | 445 | 324 | 529 | 37 | (16) | 1,839 | 2,295 | (20) | |||||||||
| Credit | 612 | 719 | 369 | (15) | 66 | 2,463 | 2,996 | (18) | |||||||||
| Solutions | 261 | 349 | 318 | (25) | (18) | 1,364 | 1,686 | (19) | |||||||||
| Other | (53) | (35) | (46) | 51 | 15 | (169) | (151) | 12 | |||||||||
| Net revenues | 1,265 | 1,357 | 1,170 | (7) | 8 | 5,497 | 6,826 | (19) | |||||||||
| Balance sheet statistics (CHF million, except where indicated) | |||||||||||||||||
| Total assets | 239,700 | 245,492 | 234,276 | (2) | 2 | 239,700 | 234,276 | 2 | |||||||||
| Risk-weighted assets | 51,713 | 51,127 | 62,838 | 1 | (18) | 51,713 | 62,838 | (18) | |||||||||
| Risk-weighted assets (USD) | 50,556 | 52,741 | 63,527 | (4) | (20) | 50,556 | 63,527 | (20) | |||||||||
| Leverage exposure | 284,143 | 286,694 | 276,656 | (1) | 3 | 284,143 | 276,656 | 3 | |||||||||
| Leverage exposure (USD) | 277,787 | 295,744 | 279,691 | (6) | (1) | 277,787 | 279,691 | (1) | |||||||||
| Reconciliation of adjusted results | |||||||||||
| Global Markets | |||||||||||
| in | 4Q16 | 3Q16 | 4Q15 | 2016 | 2015 | ||||||
| Adjusted results (CHF million) | |||||||||||
| Net revenues | 1,265 | 1,357 | 1,170 | 5,497 | 6,826 | ||||||
| Provision for credit losses | (4) | (5) | (4) | (3) | 10 | ||||||
| Total operating expenses | 1,264 | 1,275 | 4,486 | 5,452 | 8,747 | ||||||
| Goodwill impairment | 0 | 0 | (2,661) | 0 | (2,661) | ||||||
| Restructuring expenses | (15) | (52) | (96) | (217) | (96) | ||||||
| Major litigation provisions | 0 | (7) | (50) | (7) | (231) | ||||||
| Adjusted total operating expenses | 1,249 | 1,216 | 1,679 | 5,228 | 5,759 | ||||||
| Income/(loss) before taxes | 5 | 87 | (3,312) | 48 | (1,931) | ||||||
| Total adjustments | 15 | 59 | 2,807 | 224 | 2,988 | ||||||
| Adjusted income/(loss) before taxes | 20 | 146 | (505) | 272 | 1,057 | ||||||
| Adjusted return on regulatory capital (%) | 0.7 | 4.1 | (13.7) | 2.0 | 6.7 | ||||||
| Adjusted results are non-GAAP financial measures. Refer to "Reconciliation of adjusted results" in the Appendix for further information. | |||||||||||
Equities
In 4Q16, equities revenues of CHF 445 million increased 37% compared to 3Q16, reflecting improved operating conditions due to a rebound in volatility and increased volumes across regions following the US presidential election. Cash equities revenues increased, reflecting higher underwriting revenues, particularly in the Americas due to higher industry-wide initial public offerings (IPOs) volumes, and improved trading revenues due to higher volumes and client activity. Prime services revenues increased compared to 3Q16, primarily due to higher prime financing client activity. In addition, systematic market making revenues increased, albeit from subdued levels, reflecting improved volatility.
Compared to 4Q15, equities revenues declined 16%, primarily reflecting more challenging operating conditions, specifically a subdued volatility environment which negatively impacted client trading activity. Systematic market making revenues declined significantly, particularly in Europe, Middle East and Africa (EMEA), compared to more favorable market conditions in 4Q15. Prime services revenues decreased due to lower prime brokerage results given our resized business model. Cash equities revenues were lower primarily due to a decline in EMEA trading volumes, partially offset by improved underwriting revenues.
Credit
In 4Q16, credit revenues of CHF 612 million decreased 15%, compared to 3Q16 results, reflecting a seasonal slowdown in client activity across global credit products and securitized products. Global credit products trading revenues decreased, as reduced primary activity resulted in lower secondary revenues. Securitized
26
products revenues decreased, due to a decline in non-agency and agency trading, reflecting a seasonal slowdown in client activity, partially offset by robust asset finance revenues. Underwriting revenues declined, reflecting lower investment grade industry wide issuance activity.
Compared to 4Q15, credit revenues increased 66%, reflecting more favorable market conditions, notably improved credit asset prices and volumes, lower volatility and significantly tightened US high yield spreads, which supported increased client activity. In 4Q15, results reflected reduced levels of client activity related to extreme credit market conditions, including widening in US high yield spreads and low levels of market liquidity, which adversely impacted our securitized products and global credit products franchises. Global credit products trading revenues significantly increased, albeit from subdued levels, primarily reflecting increased leveraged finance trading activity and improved corporate lending results. Underwriting revenues increased, reflecting higher leveraged loans and high yield issuance activity. In addition, securitized products trading revenues increased significantly, compared to subdued 4Q15 results which included the impact of mark-to-market losses in our non-agency and agency businesses.
Solutions
In 4Q16, solutions revenues of CHF 261 million decreased 25% compared to 3Q16, as lower Brazil trading activity in emerging markets and rates revenues were partially offset by improved equity derivatives performance. Emerging markets revenues declined due to lower asset prices following the US presidential election. Global macro products revenues declined, reflecting lower rates options and foreign exchange results due to reduced client activity. These declines were partially offset by improved revenues in equity derivatives, reflecting a resurgence of client activity across structured and flow derivatives and compared to challenging operating conditions in 3Q16.
Compared to 4Q15, solutions revenues decreased 18%, as lower equity derivatives and global macro products performance more than offset improved operating conditions in emerging markets. Equity derivatives revenues declined, reflecting low levels of volatility, which negatively impacted flow and structured derivatives. In addition, global macro products revenues declined, reflecting the exit of our European rates business as we resized the franchise. These declines were partially offset by improved emerging markets revenues, reflecting higher trading activity in Brazil.
Provision for credit losses
Global markets recorded a release of provision for credit losses of CHF 4 million in 4Q16, CHF 5 million in 3Q16 and CHF 4 million in 4Q15.
Total operating expenses
In 4Q16, total operating expenses of CHF 1,264 million were stable compared to 3Q16, as lower restructuring costs and reduced compensation and benefits were offset by higher commission expenses and higher general administrative expenses. The decrease in compensation and benefits was primarily driven by lower discretionary compensation and salary expenses. The increase in general and administrative expenses was primarily driven by increased costs related to our risk, regulatory and compliance infrastructure. 4Q16 included a non-recurring settlement charge of CHF 40 million relating to former employees of the US pension plan.
Compared to 4Q15, total operating expenses decreased 72%, primarily reflecting the goodwill impairment charge of CHF 2,661 million incurred in 4Q15. Adjusted total operating expenses decreased 26%, reflecting decreased compensation and benefits and lower general and administrative expenses. The decrease in compensation and benefits was driven by lower discretionary compensation, reduced deferred compensation from prior-year awards and lower salary expenses. General and administrative expenses declined, primarily due to lower costs related to our risk, regulatory and compliance infrastructure.
27
In 4Q16, Investment Banking & Capital Markets reported income before taxes of CHF 149 million and net revenues of CHF 574 million. Net revenues increased 37% compared to 4Q15, outperforming the industry-wide fee pool which was up 2%. For 2016, we reported income before taxes of CHF 261 million and net revenues of CHF 1,972 million.
4Q16 results
In 4Q16, we reported income before taxes of CHF 149 million, an increase compared to 3Q16, primarily due to higher net revenues. Net revenues of CHF 574 million increased 23%, due to higher revenues from advisory and other fees and equity underwriting, partially offset by lower revenues from debt underwriting. Total operating expenses of CHF 425 million decreased 3%, driven by lower restructuring expenses and general and administrative expenses, partially offset by higher compensation and benefits.
In 4Q16, we reported income before taxes of CHF 149 million compared to a loss of CHF 477 million in 4Q15, which reflected a goodwill impairment charge of CHF 380 million. Net revenues increased 37%, primarily driven by higher debt underwriting revenues, partially offset by lower advisory and other fees and lower equity underwriting revenues. Total operating expenses decreased 53%, primarily reflecting the goodwill impairment charge in 4Q15. Adjusted income before taxes was CHF 143 million in 4Q16, compared to CHF 54 million in 3Q16 and a loss of CHF 75 million in 4Q15.
2016 results
In 2016, we reported income before taxes of CHF 261 million and net revenues of CHF 1,972 million. Net revenues increased 10% compared to 2015. Debt underwriting revenues of CHF 934 million increased 15% on higher leveraged finance and derivatives financing revenues and significant mark-to-market losses related to our underwriting commitments in 2015. Advisory and other fees of CHF 849 million increased 14%, mainly reflecting higher revenues from completed M&A transactions. Equity underwriting revenues of CHF 312 million decreased 17%, reflecting a decrease in the industry-wide fee pool for IPOs and follow-on offerings.
Total operating expenses of CHF 1,691 million decreased 20%, primarily due to the goodwill impairment charge of CHF 380 million incurred in 2015, and lower deferred compensation expense. These decreases were partially offset by a higher discretionary compensation accrual, market-based salary increases and higher restructuring expenses. Adjusted income before taxes was CHF 289 million in 2016, compared to CHF 88 million in 2015.
Capital and leverage metrics
As of the end of 4Q16, we reported risk-weighted assets of USD 17.6 billion, a decrease of USD 1.0 billion compared to the end of 3Q16, mainly driven by a reduction in underwriting activity and reductions in the corporate derivatives portfolio. Leverage exposure was USD 44.6 billion, reflecting a decrease of USD 1.1 billion compared to the end of 3Q16, driven by reduced underwriting exposure.
| Divisional results | |||||||||||||||||
| in / end of | % change | in / end of | % change | ||||||||||||||
| 4Q16 | 3Q16 | 4Q15 | QoQ | YoY | 2016 | 2015 | YoY | ||||||||||
| Statements of operations (CHF million) | |||||||||||||||||
| Net revenues | 574 | 467 | 420 | 23 | 37 | 1,972 | 1,787 | 10 | |||||||||
| Provision for credit losses | 0 | (9) | 0 | 100 | – | 20 | 0 | – | |||||||||
| Compensation and benefits | 329 | 313 | 367 | 5 | (10) | 1,237 | 1,265 | (2) | |||||||||
| General and administrative expenses | 101 | 109 | 128 | (7) | (21) | 424 | 432 | (2) | |||||||||
| Commission expenses | 1 | 0 | 0 | – | – | 2 | 2 | 0 | |||||||||
| Goodwill impairment | 0 | 0 | 380 | – | (100) | 0 | 380 | (100) | |||||||||
| Restructuring expenses | (6) | 15 | 22 | – | – | 28 | 22 | 27 | |||||||||
| Total other operating expenses | 96 | 124 | 530 | (23) | (82) | 454 | 836 | (46) | |||||||||
| Total operating expenses | 425 | 437 | 897 | (3) | (53) | 1,691 | 2,101 | (20) | |||||||||
| Income/(loss) before taxes | 149 | 39 | (477) | 282 | – | 261 | (314) | – | |||||||||
| Statement of operations metrics (%) | |||||||||||||||||
| Return on regulatory capital | 22.9 | 6.1 | (85.4) | – | – | 10.7 | (15.4) | – | |||||||||
| Cost/income ratio | 74.0 | 93.6 | 213.6 | – | – | 85.8 | 117.6 | – | |||||||||
| Economic risk capital and return | |||||||||||||||||
| Average economic risk capital (CHF million) | 5,030 | 4,762 | 4,032 | 6 | 25 | 4,652 | 3,717 | 25 | |||||||||
| Pre-tax return on average economic risk capital (%) 1 | 12.0 | 3.3 | (47.3) | – | – | 5.7 | (8.4) | – | |||||||||
| Number of employees (full-time equivalents) | |||||||||||||||||
| Number of employees | 3,090 | 2,910 | 2,810 | 6 | 10 | 3,090 | 2,810 | 10 | |||||||||
1 Calculated using a return excluding interest costs for allocated goodwill. | |||||||||||||||||
28
| Divisional results (continued) | |||||||||||||||||
| in / end of | % change | in / end of | % change | ||||||||||||||
| 4Q16 | 3Q16 | 4Q15 | QoQ | YoY | 2016 | 2015 | YoY | ||||||||||
| Net revenue detail (CHF million) | |||||||||||||||||
| Advisory and other fees | 268 | 161 | 276 | 66 | (3) | 849 | 748 | 14 | |||||||||
| Debt underwriting | 228 | 239 | 138 | (5) | 65 | 934 | 809 | 15 | |||||||||
| Equity underwriting | 99 | 74 | 102 | 34 | (3) | 312 | 376 | (17) | |||||||||
| Other | (21) | (7) | (96) | 200 | (78) | (123) | (146) | (16) | |||||||||
| Net revenues | 574 | 467 | 420 | 23 | 37 | 1,972 | 1,787 | 10 | |||||||||
| Balance sheet statistics (CHF million, except where indicated) | |||||||||||||||||
| Total assets | 20,784 | 19,931 | 18,712 | 4 | 11 | 20,784 | 18,712 | 11 | |||||||||
| Risk-weighted assets | 18,027 | 18,019 | 16,150 | 0 | 12 | 18,027 | 16,150 | 12 | |||||||||
| Risk-weighted assets (USD) | 17,624 | 18,588 | 16,327 | (5) | 8 | 17,624 | 16,327 | 8 | |||||||||
| Leverage exposure | 45,571 | 44,240 | 40,898 | 3 | 11 | 45,571 | 40,898 | 11 | |||||||||
| Leverage exposure (USD) | 44,552 | 45,636 | 41,347 | (2) | 8 | 44,552 | 41,347 | 8 | |||||||||
| Reconciliation of adjusted results | |||||||||||
| Investment Banking & Capital Markets | |||||||||||
| in | 4Q16 | 3Q16 | 4Q15 | 2016 | 2015 | ||||||
| Adjusted results (CHF million) | |||||||||||
| Net revenues | 574 | 467 | 420 | 1,972 | 1,787 | ||||||
| Provision for credit losses | 0 | (9) | 0 | 20 | 0 | ||||||
| Total operating expenses | 425 | 437 | 897 | 1,691 | 2,101 | ||||||
| Goodwill impairment | 0 | 0 | (380) | 0 | (380) | ||||||
| Restructuring expenses | 6 | (15) | (22) | (28) | (22) | ||||||
| Adjusted total operating expenses | 431 | 422 | 495 | 1,663 | 1,699 | ||||||
| Income/(loss) before taxes | 149 | 39 | (477) | 261 | (314) | ||||||
| Total adjustments | (6) | 15 | 402 | 28 | 402 | ||||||
| Adjusted income/(loss) before taxes | 143 | 54 | (75) | 289 | 88 | ||||||
| Adjusted return on regulatory capital (%) | 22.0 | 8.6 | (13.8) | 11.9 | 4.6 | ||||||
| Adjusted results are non-GAAP financial measures. Refer to "Reconciliation of adjusted results" in the Appendix for further information. | |||||||||||
Advisory and other fees
In 4Q16, revenues from advisory and other fees of CHF 268 million increased 66% compared to 3Q16, as higher revenues from completed M&A transactions and an increase in our share of wallet offset a decrease in the overall fee pool. Share of wallet refers to our share of the industry-wide fee pool for the respective products.
Compared to 4Q15, revenues decreased 3%, in line with the decrease in the industry-wide fee pool.
Debt underwriting
In 4Q16, debt underwriting revenues of CHF 228 million decreased 5% compared to 3Q16, driven by lower leveraged finance and investment grade underwriting revenues, partially offset by higher derivatives financing revenues.
Compared to 4Q15, revenues increased 65%, driven by higher leveraged finance revenues and significant mark-to-market losses in 4Q15 related to our underwriting commitments.
Equity underwriting
In 4Q16, revenues from equity underwriting of CHF 99 million increased 34% compared to 3Q16, primarily driven by higher revenues from IPOs and follow-on offerings.
Compared to 4Q15, revenues decreased 3%, driven by lower revenues from rights offerings, partially offset by higher revenues from IPOs.
Provision for credit losses
In 4Q16 and 4Q15, we did not record a provision for credit losses. In 3Q16, we recorded a release of provision for credit losses of CHF 9 million, reflecting continued stabilization in the energy sector.
29
Total operating expenses
Total operating expenses of CHF 425 million decreased 3% compared to 3Q16, driven by lower restructuring and general and administrative expenses, partially offset by higher compensation and benefits. 4Q16 included a non-recurring settlement charge of CHF 17 million relating to former employees of the US pension plan. General and administrative expenses of CHF 101 million decreased 7%, driven by lower allocated corporate function costs. Compensation and benefits of CHF 329 million increased 5%, reflecting the US pension plan settlement.
Compared to 4Q15, total operating expenses decreased 53%, primarily reflecting the CHF 380 million goodwill impairment charge incurred in 2015. Compensation and benefits decreased 10%, primarily driven by lower deferred compensation expenses from prior year awards and lower discretionary compensation expenses. General and administrative expenses declined 21%, reflecting lower costs across most general and administrative-related expense categories. Total adjusted operating expenses decreased 13% compared to 4Q15.
Global advisory and underwriting revenues
The Group’s global advisory and underwriting business operates across multiple business divisions that work in close collaboration with each other to generate these revenues. In order to reflect the global performance and capabilities of this business and for enhanced comparability versus its peers, the following table aggregates total advisory and underwriting revenues for the Group into a single metric in US dollar terms before cross-divisional revenue sharing agreements.
| in | % change | ||||||||||
| 4Q16 | 3Q16 | 4Q15 | QoQ | YoY | |||||||
| Global advisory and underwriting revenues (USD million) | |||||||||||
| Global advisory and underwriting revenues | 1,042 | 945 | 790 | 10 | 32 | ||||||
| of which advisory and other fees | 310 | 209 | 299 | 48 | 4 | ||||||
| of which debt underwriting | 498 | 552 | 274 | (10) | 82 | ||||||
| of which equity underwriting | 234 | 184 | 217 | 27 | 8 | ||||||
30
In 4Q16, the Strategic Resolution Unit reported a loss before taxes of CHF 2,895 million, including significant litigation provisions of CHF 2,388 million primarily related to the RMBS settlements. The division decreased its risk-weighted assets by USD 10.5 billion and its leverage exposure by USD 15.2 billion. For 2016, we reported a loss before taxes of CHF 5,759 million.
4Q16 results
In 4Q16, we reported a loss before taxes of CHF 2,895 million compared to losses of CHF 852 million in 3Q16 and CHF 1,322 million in 4Q15. In 4Q16, we reported an adjusted loss before taxes of CHF 521 million, compared to adjusted losses of CHF 513 million in 3Q16 and CHF 911 million in 4Q15.
We reported negative net revenues of CHF 202 million in 4Q16, driven by overall funding costs and exit costs, partially offset by revenues from the legacy cross-border and small markets businesses. Total operating expenses of CHF 2,665 million in 4Q16 included significant litigation provisions of CHF 2,388 million primarily related to the settlements with the DOJ and the NCUA regarding our legacy RMBS business.
2016 results
We reported a loss before taxes of CHF 5,759 million, including significant litigation provisions of CHF 2,792 million, primarily related to the RMBS settlements, compared to a loss before taxes of CHF 2,652 million in 2015. In 2016, we reported an adjusted loss before taxes of CHF 2,943 million, compared to an adjusted loss of CHF 2,206 million in 2015.
Negative net revenues of CHF 1,271 million in 2016 were driven by overall funding costs, valuation adjustments and exit costs, partially offset by revenues from the legacy cross-border and small markets businesses. Valuation adjustments in 2016 primarily reflected mark-to-market losses on the legacy investment banking portfolio, including our distressed credit and emerging markets loan portfolio. Net revenues decreased CHF 1,782 million compared to 2015, primarily driven by lower revenues from the restructuring of select onshore businesses and higher funding costs. Provision for credit losses was CHF 111 million in 2016 compared to CHF 137 million in 2015. Total operating expenses were CHF 4,377 million in 2016, including CHF 3,590 million of general and administrative expenses, of which CHF 2,792 million were litigation provisions, primarily relating to the RMBS settlements and CHF 612 million of compensation and benefits. In 2016, we reported adjusted total operating expenses of CHF 1,563 million, compared to CHF 2,580 million in 2015.
| Divisional results | |||||||||||||||||
| in / end of | % change | in / end of | % change | ||||||||||||||
| 4Q16 | 3Q16 | 4Q15 | QoQ | YoY | 2016 | 2015 | YoY | ||||||||||
| Statements of operations (CHF million) | |||||||||||||||||
| Net revenues | (202) | (165) | (126) | 22 | 60 | (1,271) | 511 | – | |||||||||
| of which from noncontrolling interests without significant economic interest | 0 | 11 | 20 | (100) | (100) | 27 | 11 | 145 | |||||||||
| Provision for credit losses | 28 | 5 | 100 | 460 | (72) | 111 | 137 | (19) | |||||||||
| Compensation and benefits | 106 | 134 | 259 | (21) | (59) | 612 | 1,168 | (48) | |||||||||
| General and administrative expenses | 2,554 | 514 | 640 | 397 | 299 | 3,590 | 1,539 | 133 | |||||||||
| of which litigation provisions | 2,388 | 334 | 294 | – | – | 2,792 | 417 | – | |||||||||
| Commission expenses | 4 | 13 | 41 | (69) | (90) | 54 | 163 | (67) | |||||||||
| Restructuring expenses | 1 | 21 | 156 | (95) | (99) | 121 | 156 | (22) | |||||||||
| Total other operating expenses | 2,559 | 548 | 837 | 367 | 206 | 3,765 | 1,858 | 103 | |||||||||
| Total operating expenses | 2,665 | 682 | 1,096 | 291 | 143 | 4,377 | 3,026 | 45 | |||||||||
| of which from noncontrolling interests without significant economic interest | 2 | 7 | 5 | (71) | (60) | 23 | 22 | 5 | |||||||||
| Loss before taxes | (2,895) | (852) | (1,322) | 240 | 119 | (5,759) | (2,652) | 117 | |||||||||
| of which from noncontrolling interests without significant economic interest | (2) | 4 | 15 | – | – | 4 | (11) | – | |||||||||
| Number of employees (full-time equivalents) | |||||||||||||||||
| Number of employees | 1,830 | 1,840 | 3,200 | (1) | (43) | 1,830 | 3,200 | (43) | |||||||||
31
Capital and leverage metrics
As of the end of 4Q16, we reported risk-weighted assets of USD 44.4 billion, a decrease of USD 10.5 billion and USD 28.8 billion compared to the end of 3Q16 and 4Q15, respectively. Leverage exposure was USD 103.4 billion as of the end of 4Q16, reflecting a decrease of USD 15.2 billion and USD 67.0 billion compared to the end of 3Q16 and 4Q15, respectively. In 4Q16, risk-weighted assets and leverage exposure reductions were achieved through a broad range of transactions, including the sale of loan portfolios, and a large number of unwinds and compressions across global macro products and credit derivative products.
In 4Q16, certain derivative positions in the Strategic Resolution Unit received regulatory approval to apply updated capital models and as a result were transferred to our Global Markets division. Additionally, the division completed the sale to an institutional investor of a significant portfolio of senior loans to certain global private equity and asset management companies and the Global Markets division entered into a co-investment agreement with such institutional investor. Pursuant to the terms of this transaction, Global Markets will, among other things, originate new loan facilities and hold a minority interest in the transferred loans and any newly originated facilities. The combined impact on risk-weighted assets and leverage exposure for Global Markets was USD 3 billion and USD 8 billion, respectively.
| Divisional results (continued) | |||||||||||||||||
| in | % change | in | % change | ||||||||||||||
| 4Q16 | 3Q16 | 4Q15 | QoQ | YoY | 2016 | 2015 | YoY | ||||||||||
| Net revenue detail (CHF million) | |||||||||||||||||
| Restructuring of select onshore businesses | 9 | 16 | 178 | (44) | (95) | 154 | 757 | (80) | |||||||||
| Legacy cross-border and small markets businesses | 41 | 46 | 68 | (11) | (40) | 194 | 291 | (33) | |||||||||
| Restructuring of former Asset Management division | (34) | 2 | (64) | – | (47) | (90) | (109) | (17) | |||||||||
| Legacy investment banking portfolio | (154) | (171) | (282) | (10) | (45) | (1,253) | (281) | 346 | |||||||||
| Legacy funding costs | (69) | (75) | (68) | (8) | 1 | (315) | (251) | 25 | |||||||||
| Other | 5 | 6 | 22 | (17) | (77) | 12 | 93 | (87) | |||||||||
| Noncontrolling interests without significant economic interest | 0 | 11 | 20 | (100) | (100) | 27 | 11 | 145 | |||||||||
| Net revenues | (202) | (165) | (126) | 22 | 60 | (1,271) | 511 | – | |||||||||
| Balance sheet statistics (CHF million) | |||||||||||||||||
| Total assets | 80,297 | 77,581 | 100,823 | 4 | (20) | 80,297 | 100,823 | (20) | |||||||||
| Risk-weighted assets | 45,441 | 53,268 | 72,424 | (15) | (37) | 45,441 | 72,424 | (37) | |||||||||
| Risk-weighted assets (USD) | 44,425 | 54,949 | 73,218 | (19) | (39) | 44,425 | 73,218 | (39) | |||||||||
| Leverage exposure | 105,768 | 115,008 | 168,544 | (8) | (37) | 105,768 | 168,544 | (37) | |||||||||
| Leverage exposure (USD) | 103,402 | 118,638 | 170,393 | (13) | (39) | 103,402 | 170,393 | (39) | |||||||||
| Reconciliation of adjusted results | |||||||||||
| Strategic Resolution Unit | |||||||||||
| in | 4Q16 | 3Q16 | 4Q15 | 2016 | 2015 | ||||||
| Adjusted results (CHF million) | |||||||||||
| Net revenues | (202) | (165) | (126) | (1,271) | 511 | ||||||
| Real estate gains | (4) | 0 | 0 | (4) | 0 | ||||||
| Losses on business sales | 2 | 0 | 0 | 6 | 0 | ||||||
| Adjusted net revenues | (204) | (165) | (126) | (1,269) | 511 | ||||||
| Provision for credit losses | 28 | 5 | 100 | 111 | 137 | ||||||
| Total operating expenses | 2,665 | 682 | 1,096 | 4,377 | 3,026 | ||||||
| Restructuring expenses | (1) | (21) | (156) | (121) | (156) | ||||||
| Major litigation provisions | (2,375) | (318) | (255) | (2,693) | (290) | ||||||
| Adjusted total operating expenses | 289 | 343 | 685 | 1,563 | 2,580 | ||||||
| Loss before taxes | (2,895) | (852) | (1,322) | (5,759) | (2,652) | ||||||
| Total adjustments | 2,374 | 339 | 411 | 2,816 | 446 | ||||||
| Adjusted loss before taxes | (521) | (513) | (911) | (2,943) | (2,206) | ||||||
| Adjusted results are non-GAAP financial measures. Refer to "Reconciliation of adjusted results" in the Appendix for further information. | |||||||||||
32
Net revenues
We reported negative net revenues of CHF 202 million in 4Q16 compared to negative net revenues of CHF 165 million in 3Q16 and CHF 126 million in 4Q15. Compared to 3Q16, the movement was primarily driven by lower fees and commissions and exit costs relating to the restructuring of our former Asset Management division. Compared to 4Q15, the movement was primarily driven by lower revenues from the restructuring of select onshore businesses, in particular the transfer of our US private banking business, which was announced in October 2015, and higher overall funding costs, partially offset by lower negative valuation adjustments on the legacy investment banking portfolio. Valuation adjustments in 4Q16 primarily reflected mark-to-market losses on the legacy investment banking portfolio, including our distressed credit and emerging markets loan portfolio.
Provision for credit losses
In 4Q16, there was a provision for credit losses of CHF 28 million, primarily reflecting an increase in provisions relating to ship finance transactions. This compares to a provision for credit losses of CHF 5 million in 3Q16 and a provision for credit losses of CHF 100 million in 4Q15, the latter primarily related to the restructuring of select onshore businesses.
Total operating expenses
Total operating expenses of CHF 2,665 million increased CHF 1,983 million compared to 3Q16, reflecting significant litigation provisions of CHF 2,388 million primarily related to the RMBS settlements, partially offset by lower restructuring and compensation-related expenses as a result of various cost reduction initiatives. Compared to 4Q15, total operating expenses increased CHF 1,569 million, primarily driven by higher litigation provisions reflecting the RMBS settlements, partially offset by lower restructuring expenses and compensation and benefits, primarily due to the transfer of our US private banking business, and the further wind down of our legacy investment banking business. Total operating expenses in 4Q16 included costs of CHF 47 million to meet requirements related to the settlements with US authorities regarding US cross-border matters. Adjusted total operating expenses were CHF 289 million in 4Q16, compared to CHF 343 million in 3Q16 and CHF 685 million in 4Q15, a decline of 16% and 58%, respectively.
33
Corporate Center includes parent company operations such as Group financing, expenses for projects sponsored by the Group and certain expenses and revenues that have not been allocated to the segments. It also includes consolidation and elimination adjustments required to eliminate intercompany revenues and expenses.
| Corporate Center results | |||||||||||||||||
| in / end of | % change | in / end of | % change | ||||||||||||||
| 4Q16 | 3Q16 | 4Q15 | QoQ | YoY | 2016 | 2015 | YoY | ||||||||||
| Statements of operations (CHF million) | |||||||||||||||||
| Treasury results | (75) | 68 | (115) | – | (35) | (160) | 69 | – | |||||||||
| Fair value gains/(losses) from movements in own credit spreads 1 | 0 | 0 | (697) | – | 100 | 0 | 298 | (100) | |||||||||
| Other | 59 | 4 | 64 | – | (8) | 231 | 194 | 19 | |||||||||
| Net revenues | (16) | 72 | (748) | – | (98) | 71 | 561 | (87) | |||||||||
| Provision for credit losses | 0 | 0 | (2) | – | 100 | (1) | (1) | 0 | |||||||||
| Compensation and benefits | 122 | 185 | 134 | (34) | (9) | 277 | 351 | (21) | |||||||||
| General and administrative expenses | 101 | 89 | 142 | 13 | (29) | 399 | 465 | (14) | |||||||||
| Commission expenses | 32 | 5 | 31 | – | 3 | 76 | 46 | 65 | |||||||||
| Restructuring expenses | 7 | 0 | 0 | – | – | 7 | 0 | – | |||||||||
| Total other operating expenses | 140 | 94 | 173 | 49 | (19) | 482 | 511 | (6) | |||||||||
| Total operating expenses | 262 | 279 | 307 | (6) | (15) | 759 | 862 | (12) | |||||||||
| Loss before taxes | (278) | (207) | (1,053) | 34 | (74) | (687) | (300) | 129 | |||||||||
| Expense allocation to divisions (CHF million) | |||||||||||||||||
| Compensation and benefits | 719 | 745 | 742 | (3) | (3) | 2,571 | 2,571 | 0 | |||||||||
| General and administrative expenses | 771 | 706 | 1,017 | 9 | (24) | 2,978 | 3,439 | (13) | |||||||||
| Commission expenses | 32 | 5 | 31 | – | 3 | 76 | 46 | 65 | |||||||||
| Restructuring expenses | 24 | 26 | 106 | (8) | (77) | 166 | 106 | 57 | |||||||||
| Total other operating expenses | 827 | 737 | 1,154 | 12 | (28) | 3,220 | 3,591 | (10) | |||||||||
| Total operating expenses before allocation to divisions | 1,546 | 1,482 | 1,896 | 4 | (18) | 5,791 | 6,162 | (6) | |||||||||
| Net allocation to divisions | 1,284 | 1,203 | 1,589 | 7 | (19) | 5,032 | 5,300 | (5) | |||||||||
| of which Swiss Universal Bank | 279 | 239 | 377 | 17 | (26) | 1,021 | 1,217 | (16) | |||||||||
| of which International Wealth Management | 210 | 195 | 235 | 8 | (11) | 789 | 798 | (1) | |||||||||
| of which Asia Pacific | 161 | 185 | 170 | (13) | (5) | 669 | 648 | 3 | |||||||||
| of which Global Markets | 444 | 397 | 522 | 12 | (15) | 1,732 | 1,698 | 2 | |||||||||
| of which Investment Banking & Capital Markets | 72 | 70 | 85 | 3 | (15) | 279 | 262 | 6 | |||||||||
| of which Strategic Resolution Unit | 118 | 117 | 200 | 1 | (41) | 542 | 677 | (20) | |||||||||
| Total operating expenses | 262 | 279 | 307 | (6) | (15) | 759 | 862 | (12) | |||||||||
| Balance sheet statistics (CHF million) | |||||||||||||||||
| Total assets | 62,413 | 62,007 | 64,621 | 1 | (3) | 62,413 | 64,621 | (3) | |||||||||
| Risk-weighted assets 2 | 17,338 | 16,756 | 18,467 | 3 | (6) | 17,338 | 18,467 | (6) | |||||||||
| Leverage exposure 2 | 59,374 | 59,154 | 63,090 | 0 | (6) | 59,374 | 63,090 | (6) | |||||||||
1 We early adopted certain sections of ASU 2016-01 which require that changes in fair value relating to the instrument-specific credit risk of fair value option-elected financial liabilities be presented separately in accumulated other comprehensive income. Therefore, fair value gains or losses from movements in own credit spreads are no longer recorded in the Corporate Center beginning in 1Q16. | |||||||||||||||||
2 Disclosed on a look-through basis. | |||||||||||||||||
34
Corporate services and business support, including in finance, operations, human resources, legal, compliance, risk management and IT, are provided by corporate functions and the related costs are allocated to the segments and the Corporate Center based on their requirements and other relevant measures. Beginning in 4Q16, responsibility for the management of certain segment-specific IT infrastructure and operations costs was transferred directly to the segments resulting in lower expense allocations from the Corporate Center to the segments. Prior periods for Corporate Center-related expense allocations have been restated to conform to the current presentation.
4Q16 results
In 4Q16, Corporate Center recorded a loss before taxes of CHF 278 million compared to CHF 207 million in 3Q16 and CHF 1,053 million in 4Q15. Compensation and benefits mainly reflected fair value adjustments on certain deferred compensation plans not allocated to the segments and, following their final allocation in 3Q16, certain deferred compensation retention awards relating to Global Markets and Investment Banking & Capital Markets, which are intended to support the restructuring of the Group through the end of 2017. General and administrative expenses primarily reflected costs associated with the evolution of our legal entity structure to meet developing and future regulatory requirements. Other revenues include required elimination adjustments associated with trading in own shares.
2016 results
In 2016, Corporate Center recorded a loss before taxes of CHF 687 million compared to CHF 300 million in 2015. Compensation and benefits mainly reflected fair value adjustments on certain deferred compensation plans not allocated to the segments and certain deferred compensation retention awards relating to Global Markets and Investment Banking & Capital Markets, which are intended to support the restructuring of the Group through the end of 2017. General and administrative expenses primarily reflected costs associated with the evolution of our legal entity structure to meet developing and future regulatory requirements. Other revenues include required elimination adjustments associated with trading in own shares.
35
As of the end of 4Q16, assets under management were CHF 1,251.1 billion, stable compared to the end of 3Q16. As of the end of 2016, assets under management were 3.0% higher compared to the end of 2015, with net asset inflows of CHF 26.8 billion.
| Assets under management | |||||||||||
| end of | % change | ||||||||||
| 4Q16 | 3Q16 | 4Q15 | QoQ | YoY | |||||||
| Assets under management (CHF billion) | |||||||||||
| Swiss Universal Bank - Private Banking | 242.9 | 244.5 | 241.0 | (0.7) | 0.8 | ||||||
| Swiss Universal Bank - Corporate & Institutional Banking | 288.6 | 284.6 | 275.8 | 1.4 | 4.6 | ||||||
| International Wealth Management - Private Banking | 323.2 | 311.4 | 289.6 | 3.8 | 11.6 | ||||||
| International Wealth Management - Asset Management | 321.6 | 324.3 | 321.3 | (0.8) | 0.1 | ||||||
| Asia Pacific - Private Banking | 166.9 | 1 | 168.0 | 150.4 | (0.7) | 11.0 | |||||
| Strategic Resolution Unit | 13.7 | 17.8 | 27.3 | (23.0) | (49.8) | ||||||
| Assets managed across businesses 2 | (105.8) | (96.4) | (91.3) | 9.8 | 15.9 | ||||||
| Assets under management | 1,251.1 | 1,254.2 | 1,214.1 | (0.2) | 3.0 | ||||||
| of which discretionary assets | 404.3 | 410.2 | 410.1 | (1.4) | (1.4) | ||||||
| of which advisory assets | 846.8 | 844.0 | 804.0 | 0.3 | 5.3 | ||||||
1 Updated since February 14, 2017 to reflect a correction. | |||||||||||
2 Represents assets managed by Asset Management within International Wealth Management for the other businesses. | |||||||||||
| Net new assets | |||||||||||
| in | 4Q16 | 3Q16 | 4Q15 | 2016 | 2015 | ||||||
| Net new assets (CHF billion) | |||||||||||
| Swiss Universal Bank – Private Banking | (3.5) | 0.2 | (2.9) | (1.7) | 3.2 | ||||||
| Swiss Universal Bank – Corporate & Institutional Banking | 2.5 | (1.2) | 4.2 | 4.3 | 10.6 | ||||||
| International Wealth Managment – Private Banking | 0.4 | 4.4 | (4.2) | 15.6 | (3.0) | ||||||
| International Wealth Managment – Asset Management 1 | (4.4) | 5.0 | 3.6 | 5.6 | 26.5 | ||||||
| Asia Pacific – Private Banking 2 | 0.7 | 4.3 | 3.0 | 13.6 | 17.8 | ||||||
| Strategic Resolution Unit | (2.9) | (1.9) | (2.3) | (8.5) | (4.0) | ||||||
| Assets managed across businesses 3 | 0.5 | 0.8 | 0.7 | (2.1) | (4.2) | ||||||
| Net new assets | (6.7) | 11.6 | 2.1 | 26.8 | 46.9 | ||||||
1 Includes outflows for private equity assets reflecting realizations at cost and unfunded commitments on which a fee is no longer earned. | |||||||||||
2 Updated since February 14, 2017 to reflect a correction. | |||||||||||
3 Represents assets managed by Asset Management within International Wealth Management for the other businesses. | |||||||||||
4Q16 results
As of the end of 4Q16, we reported assets under management of CHF 1,251.1 billion, a decrease of CHF 3.1 billion compared to the end of 3Q16. The decrease was primarily due to unfavorable market movements and net asset outflows of CHF 6.7 billion, partially offset by favorable foreign exchange-related movements.
Net asset outflows of CHF 6.7 billion in 4Q16 were primarily driven by money market outflows from an emerging market joint venture in the Asset Management business of International Wealth Management, outflows due to terminated relationships with certain external asset managers and the regularization of client assets in the Private Banking business of Swiss Universal Bank and outflows due to the wind-down of operations in the Strategic Resolution Unit.
2016 results
As of the end of 2016, assets under management were CHF 1,251.1 billion, an increase of CHF 37.0 billion compared to the end of 2015. The increase was mainly driven by net new assets of CHF 26.8 billion, favorable foreign exchange-related and market movements, partially offset by structural effects, mainly from an adjustment of assets under management reported for multi-asset class solutions in 1Q16 in the Asset Management business of International Wealth Management and the exit of certain markets in the Strategic Resolution Unit.
Net new assets of CHF 26.8 billion in 2016 were mainly driven by inflows from emerging markets and Europe in the Private Banking business of International Wealth Management and inflows primarily from Greater China and Australia in the Private Banking business of Asia Pacific, partially offset by outflows related to the wind-down of operations in the Strategic Resolution Unit.
> Refer to “Swiss Universal Bank”, “International Wealth Management” and “Asia Pacific”.
36
Balance sheet
As of the end of 4Q16, total assets of CHF 819.9 billion increased 2% compared to 3Q16, reflecting the foreign exchange translation impact, partially offset by a decrease in operating activities. Excluding the foreign exchange translation impact, total assets decreased CHF 13.4 billion.
Range of reasonably possible losses related to certain legal proceedings
The Group’s estimate of the aggregate range of reasonably possible losses that are not covered by existing provisions for certain proceedings for which the Group believes an estimate is possible was zero to CHF 1.1 billion as of the end of 4Q16.
Total shareholders’ equity
Credit Suisse’s total shareholders’ equity decreased from CHF 44.3 billion as of the end of 3Q16 to CHF 41.9 billion as of the end of 4Q16. Total shareholders’ equity was negatively impacted by a net loss attributable to shareholders and losses on fair value elected liabilities relating to credit risk. These movements were partially offset by positive foreign exchange-related movements on cumulative translation adjustments and an increase in the share-based compensation obligation.
Liquidity coverage ratio
Our average liquidity coverage ratio was 202% for 4Q16. The ratio reflects a conservative liquidity position leading up to the final settlement with the DOJ related to our legacy RMBS business and our efforts to ensure that Group entities meet applicable local liquidity requirements.
Capital metrics
The CET1 ratio was 13.5% as of the end of 4Q16 compared to 14.1% as of the end of 3Q16, reflecting lower CET1 capital and slightly lower risk-weighted assets. Credit Suisse’s tier 1 ratio was 18.0% as of the end of 4Q16 compared to 18.3% as of the end of 3Q16. The total capital ratio was 20.5% as of the end of 4Q16 compared to 20.8% as of the end of 3Q16.
CET1 capital was CHF 36.6 billion as of the end of 4Q16 compared to CHF 38.6 billion as of the end of 3Q16, mainly reflecting the net loss attributable to shareholders and a net regulatory impact of losses on fair-valued financial liabilities due to changes in our own credit risk, partially offset by a positive foreign exchange impact and the net effect of share-based compensation.
Total eligible capital was CHF 55.7 billion as of the end of 4Q16 compared to CHF 57.0 billion as of the end of 3Q16, reflecting decreases in CET1 capital and tier 2 capital, partially offset by an increase in additional tier 1 capital.
Risk-weighted assets decreased 1% to CHF 271.4 billion as of the end of 4Q16 compared to CHF 273.8 billion as of the end of 3Q16, primarily driven by movements in risk levels, primarily in credit risk, partially offset by increases resulting from the foreign exchange impact.
As of the end of 4Q16, the look-through CET1 ratio was 11.5% compared to 12.0% as of the end of 3Q16. The RMBS settlement with the DOJ had a negative impact of approximately 90 basis points on our 4Q16 look-through CET1 ratio, reflecting the DOJ litigation provision of approximately USD 2 billion and an increase in operational risk of approximately CHF 0.7 billion, both in 4Q16.
Leverage metrics
The Bank for International Settlements (BIS) tier 1 leverage ratio was 5.1% as of the end of 4Q16, with a BIS CET1 component of 3.8%. On a look-through basis, the BIS tier 1 leverage ratio was 4.4% as of the end of 4Q16, with a BIS CET1 component of 3.2%. The RMBS settlement with the DOJ had a negative impact of approximately 20 basis points on our 4Q16 look-through CET1 leverage ratio, reflecting the DOJ litigation provision of approximately USD 2 billion in 4Q16.
The look-through leverage exposure was CHF 950.8 billion as of the end of 4Q16.
| BIS capital and leverage metrics | |||||||||||||
| Phase-in | Look-through | ||||||||||||
| end of | 4Q16 | 3Q16 | 4Q15 | 4Q16 | 3Q16 | 4Q15 | |||||||
| Capital metrics (%, except where indicated) | |||||||||||||
| Risk-weighted assets (CHF billion) | 271.4 | 273.8 | 295.0 | 268.0 | 270.5 | 289.9 | |||||||
| CET1 ratio | 13.5 | 14.1 | 14.3 | 11.5 | 12.0 | 11.4 | |||||||
| Tier 1 ratio | 18.0 | 18.3 | 18.0 | 15.6 | 16.0 | 15.4 | |||||||
| Total capital ratio | 20.5 | 20.8 | 21.3 | 17.4 | 17.8 | 17.7 | |||||||
| Leverage metrics (%, except where indicated) | |||||||||||||
| Leverage exposure (CHF billion) | 957.1 | 955.0 | 993.5 | 950.8 | 948.7 | 987.6 | |||||||
| CET1 leverage ratio | 3.8 | 4.0 | 4.2 | 3.2 | 3.4 | 3.3 | |||||||
| Tier 1 leverage ratio | 5.1 | 5.2 | 5.3 | 4.4 | 4.6 | 4.5 | |||||||
| Refer to the Appendix for additional information on BIS and Swiss capital and leverage metrics. | |||||||||||||
37
The Group has not finalized its 2016 Annual Report and the Group’s independent registered public accounting firm has not completed its audit of the consolidated financial statements for the period. Accordingly, the financial information contained in this Earnings Release is subject to completion of year-end procedures, which may result in changes to that information. Certain reclassifications have been made to prior periods to conform to the current presentation.
For purposes of this Earnings Release, unless the context otherwise requires, the terms “Credit Suisse” and “the Group” mean Credit Suisse Group AG and its consolidated subsidiaries. The business of Credit Suisse AG, the direct bank subsidiary of the Group, is substantially similar to the Group, and these terms are used to refer to both when the subject is the same or substantially similar. The term “the Bank” is used when referring to Credit Suisse AG and its consolidated subsidiaries.
Information referenced in this Earnings Release, whether via website links or otherwise, is not incorporated into this Earnings Release.
As of January 1, 2013, Basel III was implemented in Switzerland along with the Swiss “Too Big to Fail” legislation and regulations thereunder. As of January 1, 2015, the BIS leverage ratio framework, as issued by BCBS, was implemented in Switzerland by FINMA. The related disclosures are in accordance with Credit Suisse’s interpretation of such requirements, including relevant assumptions. Changes in the interpretation of these requirements in Switzerland or in any of Credit Suisse’s assumptions or estimates could result in different numbers from those shown herein.
References to phase-in and look-through included herein refer to Basel III requirements. Phase-in under the Basel III capital framework reflects that for the years 2014 – 2018, there will be a five-year (20% per annum) phase in of goodwill and other intangible assets and other capital deductions (e.g., certain deferred tax assets) and for the years 2013 – 2022, there will be a phase out of certain capital instruments. Look-through assumes the full phase-in of goodwill and other intangible assets and other regulatory adjustments and the full phase out of certain capital instruments.
Unless otherwise noted, leverage exposure is based on the BIS leverage ratio framework and consists of period-end balance sheet assets and prescribed regulatory adjustments. Beginning in 2015, the Swiss leverage ratio is calculated as Swiss total eligible capital, divided by period-end leverage exposure. The look-through BIS tier 1 leverage ratio and CET1 leverage ratio are calculated as look-through BIS tier 1 capital and CET1 capital, respectively, divided by end-period leverage exposure.
Return on regulatory capital is calculated using income after tax and assumes a tax rate of 30% and capital allocated based on the worst of return on 10% of average risk-weighted assets and return on 3.5% of average leverage exposure. For Global Markets and Investment Banking & Capital Markets, return on regulatory capital is based on US dollar denominated numbers.
Cost reduction program is measured on constant FX rates and based on expense run rate excluding major litigation expenses, restructuring costs and goodwill impairment incurred, but including other costs to achieve savings.
We may not achieve all of the expected benefits of our strategic initiatives. Factors beyond our control, including but not limited to the market and economic conditions, changes in laws, rules or regulations and other challenges discussed in our public filings, could limit our ability to achieve some or all of the expected benefits of these initiatives.
A summary document containing a more detailed description of the option to receive the distribution in new shares will be made available to shareholders of Credit Suisse Group on or around March 24, 2017. The conditions for the exercise of the scrip alternative, including possible restrictions to its availability to some Credit Suisse Group shareholders, will be specified in such summary document. This Earnings Release does not constitute an offer to sell or an invitation to subscribe for, or the solicitation of an offer to buy or subscribe for, securities of Credit Suisse Group nor shall it (or any part of it) or the fact of its distribution form the basis of, or be relied on in connection with, any contract therefor. This Earnings Release does not constitute a prospectus within the meaning of any applicable law. Eligible shareholders should make their decision to receive a cash distribution or to receive new shares of Credit Suisse Group as part of the 2016 distribution solely based on the terms and conditions of the 2016 distribution and the additional information contained in the relevant documents, which will be available upon publication of the invitation to the 2017 Annual General Meeting. This Earnings Release does not constitute a recommendation to shareholders to elect to receive new shares of Credit Suisse Group as part of the 2016 distribution. Eligible shareholders are furthermore advised to consult their bank, tax or financial adviser before making any decision.
The Group’s estimate of the aggregate range of reasonably possible losses that are not covered by existing provisions which is discussed above relates only to those proceedings for which the Group believes an estimate is possible and which are discussed in Note 39 to the Consolidated Financial Statements in the Group’s Annual Report on Form 20-F and updated in its quarterly reports (including the Group’s Annual Report on Form 20-F that is scheduled to be released on March 24, 2017). It is inherently difficult to determine whether a loss is probable or even reasonably possible or to estimate the amount of any loss or loss range for many of the Group’s legal proceedings. The Group’s aggregate litigation provisions include estimates of losses, additional losses or ranges of loss for proceedings for which such losses are probable and can be reasonably estimated. The Group does not believe that it can estimate an aggregate range of reasonably possible losses for certain of its proceedings because of their complexity, the novelty of some of the claims, the early stage of the proceedings, the limited amount of discovery that has occurred and/or other factors. For additional details, see Note 39 to the Consolidated Financial Statements in the Group’s Annual Report on Form 20-F and the litigation note in each of its quarterly Financial Reports.
Investors and others should note that we announce material information (including quarterly earnings releases and financial reports) to the investing public using press releases, SEC and Swiss ad hoc filings, our website and public conference calls and webcasts. We intend to also use our Twitter account @creditsuisse (https://twitter.com/creditsuisse) to excerpt key messages from our public disclosures, including earnings releases. We may retweet such messages through certain of our regional Twitter accounts, including @csschweiz (https://twitter.com/csschweiz) and @csapac (https://twitter.com/csapac). Investors and others should take care to consider such abbreviated messages in the context of the disclosures from which they are excerpted. The information we post on these Twitter accounts is not a part of this Earnings Release.
In various tables, use of “–” indicates not meaningful or not applicable.
38
| Overview of Results | |||||||||||||||||||
in / end of | Swiss Universal Bank | International Wealth Management | Asia Pacific | Global Markets | Investment Banking & Capital Markets | Corporate Center | Core Results | Strategic Resolution Unit | Credit Suisse | ||||||||||
| 4Q16 (CHF million) | |||||||||||||||||||
| Net revenues | 1,399 | 1,299 | 862 | 1,265 | 574 | (16) | 5,383 | (202) | 5,181 | ||||||||||
| Provision for credit losses | 34 | 6 | 11 | (4) | 0 | 0 | 47 | 28 | 75 | ||||||||||
| Compensation and benefits | 497 | 565 | 429 | 634 | 329 | 122 | 2,576 | 106 | 2,682 | ||||||||||
| Total other operating expenses | 486 | 397 | 319 | 630 | 96 | 140 | 2,068 | 2,559 | 4,627 | ||||||||||
| of which general and administrative expenses | 416 | 318 | 219 | 475 | 101 | 101 | 1,630 | 2,554 | 4,184 | ||||||||||
| of which restructuring expenses | (3) | 16 | 19 | 15 | (6) | 7 | 48 | 1 | 49 | ||||||||||
| Total operating expenses | 983 | 962 | 748 | 1,264 | 425 | 262 | 4,644 | 2,665 | 7,309 | ||||||||||
| Income/(loss) before taxes | 382 | 331 | 103 | 5 | 149 | (278) | 692 | (2,895) | (2,203) | ||||||||||
| Return on regulatory capital (%) | 12.2 | 27.0 | 7.6 | 0.3 | 22.9 | – | 6.6 | – | (18.6) | ||||||||||
| Cost/income ratio (%) | 70.3 | 74.1 | 86.8 | 99.9 | 74.0 | – | 86.3 | – | 141.1 | ||||||||||
| Total assets | 228,363 | 91,083 | 97,221 | 239,700 | 20,784 | 62,413 | 739,564 | 80,297 | 819,861 | ||||||||||
| Goodwill | 623 | 1,612 | 1,546 | 476 | 656 | 0 | 4,913 | 0 | 4,913 | ||||||||||
| Risk-weighted assets 1 | 65,669 | 35,252 | 34,605 | 51,713 | 18,027 | 17,338 | 222,604 | 45,441 | 268,045 | ||||||||||
| Leverage exposure 1 | 252,889 | 94,092 | 108,926 | 284,143 | 45,571 | 59,374 | 844,995 | 105,768 | 950,763 | ||||||||||
| 3Q16 (CHF million) | |||||||||||||||||||
| Net revenues | 1,667 | 1,081 | 917 | 1,357 | 467 | 72 | 5,561 | (165) | 5,396 | ||||||||||
| Provision for credit losses | 30 | 0 | 34 | (5) | (9) | 0 | 50 | 5 | 55 | ||||||||||
| Compensation and benefits | 474 | 513 | 413 | 642 | 313 | 185 | 2,540 | 134 | 2,674 | ||||||||||
| Total other operating expenses | 405 | 323 | 318 | 633 | 124 | 94 | 1,897 | 548 | 2,445 | ||||||||||
| of which general and administrative expenses | 320 | 256 | 224 | 466 | 109 | 89 | 1,464 | 514 | 1,978 | ||||||||||
| of which restructuring expenses | 19 | 15 | 23 | 52 | 15 | 0 | 124 | 21 | 145 | ||||||||||
| Total operating expenses | 879 | 836 | 731 | 1,275 | 437 | 279 | 4,437 | 682 | 5,119 | ||||||||||
| Income/(loss) before taxes | 758 | 245 | 152 | 87 | 39 | (207) | 1,074 | (852) | 222 | ||||||||||
| Return on regulatory capital (%) | 24.7 | 20.5 | 11.3 | 2.5 | 6.1 | – | 10.4 | – | 1.8 | ||||||||||
| Cost/income ratio (%) | 52.7 | 77.3 | 79.7 | 94.0 | 93.6 | – | 79.8 | – | 94.9 | ||||||||||
| Total assets | 222,164 | 86,457 | 93,079 | 245,492 | 19,931 | 62,007 | 729,130 | 77,581 | 806,711 | ||||||||||
| Goodwill | 607 | 1,532 | 1,500 | 457 | 629 | 0 | 4,725 | 0 | 4,725 | ||||||||||
| Risk-weighted assets 1 | 65,571 | 33,457 | 32,264 | 51,127 | 18,019 | 16,756 | 217,194 | 53,268 | 270,462 | ||||||||||
| Leverage exposure 1 | 246,254 | 88,899 | 108,495 | 286,694 | 44,240 | 59,154 | 833,736 | 115,008 | 948,744 | ||||||||||
| 4Q15 (CHF million) | |||||||||||||||||||
| Net revenues | 1,495 | 1,173 | 826 | 1,170 | 420 | (748) | 4,336 | (126) | 4,210 | ||||||||||
| Provision for credit losses | 43 | (7) | 3 | (4) | 0 | (2) | 33 | 100 | 133 | ||||||||||
| Compensation and benefits | 535 | 540 | 390 | 924 | 367 | 134 | 2,890 | 259 | 3,149 | ||||||||||
| Total other operating expenses | 553 | 664 | 1,050 | 3,562 | 530 | 173 | 6,532 | 837 | 7,369 | ||||||||||
| of which general and administrative expenses | 438 | 568 | 225 | 667 | 128 | 142 | 2,168 | 640 | 2,808 | ||||||||||
| of which goodwill impairment | 0 | 0 | 756 | 2,661 | 380 | 0 | 3,797 | 0 | 3,797 | ||||||||||
| of which restructuring expenses | 42 | 36 | 3 | 96 | 22 | 0 | 199 | 156 | 355 | ||||||||||
| Total operating expenses | 1,088 | 1,204 | 1,440 | 4,486 | 897 | 307 | 9,422 | 1,096 | 10,518 | ||||||||||
| Income/(loss) before taxes | 364 | (24) | (617) | (3,312) | (477) | (1,053) | (5,119) | (1,322) | (6,441) | ||||||||||
| Return on regulatory capital (%) | 12.3 | (1.9) | (49.7) | (90.3) | (85.4) | – | (49.0) | – | (50.7) | ||||||||||
| Cost/income ratio (%) | 72.8 | 102.6 | 174.3 | 383.4 | 213.6 | – | 217.3 | – | 249.8 | ||||||||||
| Total assets | 220,359 | 96,085 | 85,929 | 234,276 | 18,712 | 64,621 | 719,982 | 100,823 | 820,805 | ||||||||||
| Goodwill | 610 | 1,573 | 1,522 | 464 | 639 | 0 | 4,808 | 0 | 4,808 | ||||||||||
| Risk-weighted assets 1 | 60,352 | 32,880 | 26,835 | 62,838 | 16,150 | 18,467 | 217,522 | 72,424 | 289,946 | ||||||||||
| Leverage exposure 1 | 238,180 | 101,628 | 98,632 | 276,656 | 40,898 | 63,090 | 819,084 | 168,544 | 987,628 | ||||||||||
1 Disclosed on a look-through basis. | |||||||||||||||||||
39
| Overview of Results (continued) | |||||||||||||||||||
in / end of | Swiss Universal Bank | International Wealth Management | Asia Pacific | Global Markets | Investment Banking & Capital Markets | Corporate Center | Core Results | Strategic Resolution Unit | Credit Suisse | ||||||||||
| 2016 (CHF million) | |||||||||||||||||||
| Net revenues | 5,759 | 4,698 | 3,597 | 5,497 | 1,972 | 71 | 21,594 | (1,271) | 20,323 | ||||||||||
| Provision for credit losses | 79 | 20 | 26 | (3) | 20 | (1) | 141 | 111 | 252 | ||||||||||
| Compensation and benefits | 1,937 | 2,119 | 1,665 | 2,725 | 1,237 | 277 | 9,960 | 612 | 10,572 | ||||||||||
| Total other operating expenses | 1,718 | 1,438 | 1,181 | 2,727 | 454 | 482 | 8,000 | 3,765 | 11,765 | ||||||||||
| of which general and administrative expenses | 1,375 | 1,145 | 836 | 2,001 | 424 | 399 | 6,180 | 3,590 | 9,770 | ||||||||||
| of which restructuring expenses | 60 | 54 | 53 | 217 | 28 | 7 | 419 | 121 | 540 | ||||||||||
| Total operating expenses | 3,655 | 3,557 | 2,846 | 5,452 | 1,691 | 759 | 17,960 | 4,377 | 22,337 | ||||||||||
| Income/(loss) before taxes | 2,025 | 1,121 | 725 | 48 | 261 | (687) | 3,493 | (5,759) | (2,266) | ||||||||||
| Return on regulatory capital (%) | 16.5 | 23.3 | 13.7 | 0.4 | 10.7 | – | 8.5 | – | (4.7) | ||||||||||
| Cost/income ratio (%) | 63.5 | 75.7 | 79.1 | 99.2 | 85.8 | – | 83.2 | – | 109.9 | ||||||||||
| 2015 (CHF million) | |||||||||||||||||||
| Net revenues | 5,721 | 4,552 | 3,839 | 6,826 | 1,787 | 561 | 23,286 | 511 | 23,797 | ||||||||||
| Provision for credit losses | 138 | 5 | 35 | 10 | 0 | (1) | 187 | 137 | 324 | ||||||||||
| Compensation and benefits | 1,985 | 2,115 | 1,557 | 3,105 | 1,265 | 351 | 10,378 | 1,168 | 11,546 | ||||||||||
| Total other operating expenses | 1,923 | 1,709 | 1,870 | 5,642 | 836 | 511 | 12,491 | 1,858 | 14,349 | ||||||||||
| of which general and administrative expenses | 1,597 | 1,429 | 790 | 2,322 | 432 | 465 | 7,035 | 1,539 | 8,574 | ||||||||||
| of which goodwill impairment | 0 | 0 | 756 | 2,661 | 380 | 0 | 3,797 | 0 | 3,797 | ||||||||||
| of which restructuring expenses | 42 | 36 | 3 | 96 | 22 | 0 | 199 | 156 | 355 | ||||||||||
| Total operating expenses | 3,908 | 3,824 | 3,427 | 8,747 | 2,101 | 862 | 22,869 | 3,026 | 25,895 | ||||||||||
| Income/(loss) before taxes | 1,675 | 723 | 377 | (1,931) | (314) | (300) | 230 | (2,652) | (2,422) | ||||||||||
| Return on regulatory capital (%) | 13.8 | 15.4 | 6.7 | (11.2) | (15.4) | – | 0.5 | – | (4.5) | ||||||||||
| Cost/income ratio (%) | 68.3 | 84.0 | 89.3 | 128.1 | 117.6 | – | 98.2 | – | 108.8 | ||||||||||
In 4Q16, Core Results net revenues of CHF 5,383 million decreased 3% compared to 3Q16, primarily reflecting lower net revenues in Swiss Universal Bank and Global Markets, partially offset by higher net revenues in International Wealth Management and Investment Banking & Capital Markets. Provision for credit losses was CHF 47 million, primarily related to a net provision for credit losses of CHF 34 million in Swiss Universal Bank. Total operating expenses of CHF 4,644 million increased 5% compared to 3Q16. General and administrative expenses of CHF 1,630 million increased 11%, primarily related to Swiss Universal Bank and International Wealth Management. Compensation and benefits of CHF 2,576 million were stable compared to 3Q16. Restructuring expenses of CHF 48 million decreased 61% compared to 3Q16.
Core Results net revenues increased 24% compared to 4Q15, primarily reflecting higher net revenues in Corporate Center, Investment Banking & Capital Markets and International Wealth Management. Total operating expenses decreased 51% compared to 4Q15, which included a goodwill impairment charge of CHF 3,797 million. Compensation and benefits decreased 11%, primarily related to Global Markets. General and administrative expenses decreased 25%, primarily related to International Wealth Management and Global Markets. Total operating expenses in 4Q16 were also impacted by the restructuring expenses, which decreased 76% compared to 4Q15.
40
Adjusted results referred to in this earnings release are non-GAAP financial measures that exclude goodwill impairment and certain other revenues and expenses included in our reported results. Management believes that adjusted results provide a useful presentation of our operating results for purposes of assessing our Group and divisional performance consistently over time, on a basis that excludes items that management does not consider representative of our underlying performance. Provided below is a reconciliation of our adjusted results to the most directly comparable US GAAP measures.
| Reconciliation of adjusted results | |||||||||||||||||||
in | Swiss Universal Bank | International Wealth Management | Asia Pacific | Global Markets | Investment Banking & Capital Markets | Corporate Center | Core Results | Strategic Resolution Unit | Credit Suisse | ||||||||||
| 4Q16 (CHF million) | |||||||||||||||||||
| Net revenues | 1,399 | 1,299 | 862 | 1,265 | 574 | (16) | 5,383 | (202) | 5,181 | ||||||||||
| Real estate gains | (20) | (54) | 0 | 0 | 0 | 0 | (74) | (4) | (78) | ||||||||||
| Losses on business sales | 0 | 0 | 0 | 0 | 0 | 0 | 0 | 2 | 2 | ||||||||||
| Net revenues adjusted | 1,379 | 1,245 | 862 | 1,265 | 574 | (16) | 5,309 | (204) | 5,105 | ||||||||||
| Provision for credit losses | 34 | 6 | 11 | (4) | 0 | 0 | 47 | 28 | 75 | ||||||||||
| Total operating expenses | 983 | 962 | 748 | 1,264 | 425 | 262 | 4,644 | 2,665 | 7,309 | ||||||||||
| Restructuring expenses | 3 | (16) | (19) | (15) | 6 | (7) | (48) | (1) | (49) | ||||||||||
| Major litigation provisions | (19) | (7) | 0 | 0 | 0 | 0 | (26) | (2,375) | (2,401) | ||||||||||
| Total operating expenses adjusted | 967 | 939 | 729 | 1,249 | 431 | 255 | 4,570 | 289 | 4,859 | ||||||||||
| Income/(loss) before taxes | 382 | 331 | 103 | 5 | 149 | (278) | 692 | (2,895) | (2,203) | ||||||||||
| Total adjustments | (4) | (31) | 19 | 15 | (6) | 7 | 0 | 2,374 | 2,374 | ||||||||||
| Adjusted income/(loss) before taxes | 378 | 300 | 122 | 20 | 143 | (271) | 692 | (521) | 171 | ||||||||||
| Adjusted return on regulatory capital (%) | 12.1 | 24.4 | 9.0 | 0.7 | 22.0 | – | 6.6 | – | 1.4 | ||||||||||
| 3Q16 (CHF million) | |||||||||||||||||||
| Net revenues | 1,667 | 1,081 | 917 | 1,357 | 467 | 72 | 5,561 | (165) | 5,396 | ||||||||||
| Real estate gains | (346) | 0 | 0 | 0 | 0 | 0 | (346) | 0 | (346) | ||||||||||
| Net revenues adjusted | 1,321 | 1,081 | 917 | 1,357 | 467 | 72 | 5,215 | (165) | 5,050 | ||||||||||
| Provision for credit losses | 30 | 0 | 34 | (5) | (9) | 0 | 50 | 5 | 55 | ||||||||||
| Total operating expenses | 879 | 836 | 731 | 1,275 | 437 | 279 | 4,437 | 682 | 5,119 | ||||||||||
| Restructuring expenses | (19) | (15) | (23) | (52) | (15) | 0 | (124) | (21) | (145) | ||||||||||
| Major litigation provisions | 0 | 19 | 0 | (7) | 0 | 0 | 12 | (318) | (306) | ||||||||||
| Total operating expenses adjusted | 860 | 840 | 708 | 1,216 | 422 | 279 | 4,325 | 343 | 4,668 | ||||||||||
| Income/(loss) before taxes | 758 | 245 | 152 | 87 | 39 | (207) | 1,074 | (852) | 222 | ||||||||||
| Total adjustments | (327) | (4) | 23 | 59 | 15 | 0 | (234) | 339 | 105 | ||||||||||
| Adjusted income/(loss) before taxes | 431 | 241 | 175 | 146 | 54 | (207) | 840 | (513) | 327 | ||||||||||
| Adjusted return on regulatory capital (%) | 14.0 | 20.1 | 12.9 | 4.1 | 8.6 | – | 8.1 | – | 2.7 | ||||||||||
| 4Q15 (CHF million) | |||||||||||||||||||
| Net revenues | 1,495 | 1,173 | 826 | 1,170 | 420 | (748) | 4,336 | (126) | 4,210 | ||||||||||
| Fair value on own debt | – | – | – | – | – | 697 | 697 | – | 697 | ||||||||||
| Real estate gains | (72) | 0 | 0 | 0 | 0 | 0 | (72) | 0 | (72) | ||||||||||
| Gains on business sales | (23) | (11) | 0 | 0 | 0 | 0 | (34) | 0 | (34) | ||||||||||
| Net revenues adjusted | 1,400 | 1,162 | 826 | 1,170 | 420 | (51) | 4,927 | (126) | 4,801 | ||||||||||
| Provision for credit losses | 43 | (7) | 3 | (4) | 0 | (2) | 33 | 100 | 133 | ||||||||||
| Total operating expenses | 1,088 | 1,204 | 1,440 | 4,486 | 897 | 307 | 9,422 | 1,096 | 10,518 | ||||||||||
| Goodwill impairment | 0 | 0 | (756) | (2,661) | (380) | 0 | (3,797) | 0 | (3,797) | ||||||||||
| Restructuring expenses | (42) | (36) | (3) | (96) | (22) | 0 | (199) | (156) | (355) | ||||||||||
| Major litigation provisions | (25) | (228) | (6) | (50) | 0 | 0 | (309) | (255) | (564) | ||||||||||
| Total operating expenses adjusted | 1,021 | 940 | 675 | 1,679 | 495 | 307 | 5,117 | 685 | 5,802 | ||||||||||
| Income/(loss) before taxes | 364 | (24) | (617) | (3,312) | (477) | (1,053) | (5,119) | (1,322) | (6,441) | ||||||||||
| Total adjustments | (28) | 253 | 765 | 2,807 | 402 | 697 | 4,896 | 411 | 5,307 | ||||||||||
| Adjusted income/(loss) before taxes | 336 | 229 | 148 | (505) | (75) | (356) | (223) | (911) | (1,134) | ||||||||||
| Adjusted return on regulatory capital (%) | 11.4 | 18.8 | 11.7 | (13.7) | (13.8) | – | (2.1) | – | (8.9) | ||||||||||
| Adjusted return on regulatory capital is calculated using adjusted results, applying the same methodology used to calculate return on regulatory capital. | |||||||||||||||||||
41
| Reconciliation of adjusted results | |||||||||||||||||||
in | Swiss Universal Bank | International Wealth Management | Asia Pacific | Global Markets | Investment Banking & Capital Markets | Corporate Center | Core Results | Strategic Resolution Unit | Credit Suisse | ||||||||||
| 2016 (CHF million) | |||||||||||||||||||
| Net revenues | 5,759 | 4,698 | 3,597 | 5,497 | 1,972 | 71 | 21,594 | (1,271) | 20,323 | ||||||||||
| Real estate gains | (366) | (54) | 0 | 0 | 0 | 0 | (420) | (4) | (424) | ||||||||||
| Losses on business sales | 0 | 0 | 0 | 0 | 0 | 52 | 52 | 6 | 58 | ||||||||||
| Net revenues adjusted | 5,393 | 4,644 | 3,597 | 5,497 | 1,972 | 123 | 21,226 | (1,269) | 19,957 | ||||||||||
| Provision for credit losses | 79 | 20 | 26 | (3) | 20 | (1) | 141 | 111 | 252 | ||||||||||
| Total operating expenses | 3,655 | 3,557 | 2,846 | 5,452 | 1,691 | 759 | 17,960 | 4,377 | 22,337 | ||||||||||
| Restructuring expenses | (60) | (54) | (53) | (217) | (28) | (7) | (419) | (121) | (540) | ||||||||||
| Major litigation provisions | (19) | 12 | 0 | (7) | 0 | 0 | (14) | (2,693) | (2,707) | ||||||||||
| Total operating expenses adjusted | 3,576 | 3,515 | 2,793 | 5,228 | 1,663 | 752 | 17,527 | 1,563 | 19,090 | ||||||||||
| Income/(loss) before taxes | 2,025 | 1,121 | 725 | 48 | 261 | (687) | 3,493 | (5,759) | (2,266) | ||||||||||
| Total adjustments | (287) | (12) | 53 | 224 | 28 | 59 | 65 | 2,816 | 2,881 | ||||||||||
| Adjusted income/(loss) before taxes | 1,738 | 1,109 | 778 | 272 | 289 | (628) | 3,558 | (2,943) | 615 | ||||||||||
| Adjusted return on regulatory capital (%) | 14.2 | 23.1 | 14.8 | 2.0 | 11.9 | – | 8.6 | – | 1.3 | ||||||||||
| 2015 (CHF million) | |||||||||||||||||||
| Net revenues | 5,721 | 4,552 | 3,839 | 6,826 | 1,787 | 561 | 23,286 | 511 | 23,797 | ||||||||||
| Fair value on own debt | – | – | – | – | – | (298) | (298) | – | (298) | ||||||||||
| Real estate gains | (95) | 0 | 0 | 0 | 0 | 0 | (95) | 0 | (95) | ||||||||||
| Gains on business sales | (23) | (11) | 0 | 0 | 0 | 0 | (34) | 0 | (34) | ||||||||||
| Net revenues adjusted | 5,603 | 4,541 | 3,839 | 6,826 | 1,787 | 263 | 22,859 | 511 | 23,370 | ||||||||||
| Provision for credit losses | 138 | 5 | 35 | 10 | 0 | (1) | 187 | 137 | 324 | ||||||||||
| Total operating expenses | 3,908 | 3,824 | 3,427 | 8,747 | 2,101 | 862 | 22,869 | 3,026 | 25,895 | ||||||||||
| Goodwill impairment | 0 | 0 | (756) | (2,661) | (380) | 0 | (3,797) | 0 | (3,797) | ||||||||||
| Restructuring expenses | (42) | (36) | (3) | (96) | (22) | 0 | (199) | (156) | (355) | ||||||||||
| Major litigation provisions | (25) | (268) | (6) | (231) | 0 | 0 | (530) | (290) | (820) | ||||||||||
| Total operating expenses adjusted | 3,841 | 3,520 | 2,662 | 5,759 | 1,699 | 862 | 18,343 | 2,580 | 20,923 | ||||||||||
| Income/(loss) before taxes | 1,675 | 723 | 377 | (1,931) | (314) | (300) | 230 | (2,652) | (2,422) | ||||||||||
| Total adjustments | (51) | 293 | 765 | 2,988 | 402 | (298) | 4,099 | 446 | 4,545 | ||||||||||
| Adjusted income/(loss) before taxes | 1,624 | 1,016 | 1,142 | 1,057 | 88 | (598) | 4,329 | (2,206) | 2,123 | ||||||||||
| Adjusted return on regulatory capital (%) | 13.4 | 21.7 | 20.4 | 6.7 | 4.6 | – | 10.0 | – | 4.0 | ||||||||||
| Adjusted return on regulatory capital is calculated using adjusted results, applying the same methodology used to calculate return on regulatory capital. | |||||||||||||||||||
42
| in | 4Q16 | 3Q16 | 4Q15 | ||||||||||||||||
Swiss Universal Bank | International Wealth Management | Asia Pacific | Global Markets | Investment Banking & Capital Markets | Corporate Center | Core Results | Core Results | Core Results | |||||||||||
| Related to private banking (CHF million) | |||||||||||||||||||
| Net revenues | 858 | 918 | 372 | – | – | – | 2,148 | 2,295 | 2,042 | ||||||||||
| of which net interest income | 454 | 353 | 166 | – | – | – | 973 | 931 | 871 | ||||||||||
| of which recurring | 253 | 277 | 92 | – | – | – | 622 | 577 | 600 | ||||||||||
| of which transaction-based | 131 | 235 | 114 | – | – | – | 480 | 442 | 483 | ||||||||||
| Provision for credit losses | 10 | 6 | 9 | – | – | – | 25 | 51 | 2 | ||||||||||
| Total operating expenses | 654 | 684 | 267 | – | – | – | 1,605 | 1,438 | 1,886 | ||||||||||
| Income before taxes | 194 | 228 | 96 | – | – | – | 518 | 806 | 154 | ||||||||||
| Related to corporate & institutional banking | |||||||||||||||||||
| Net revenues | 541 | – | – | – | – | – | 541 | 507 | 532 | ||||||||||
| of which net interest income | 291 | – | – | – | – | – | 291 | 278 | 288 | ||||||||||
| of which recurring | 125 | – | – | – | – | – | 125 | 118 | 116 | ||||||||||
| of which transaction-based | 139 | – | – | – | – | – | 139 | 124 | 128 | ||||||||||
| Provision for credit losses | 24 | – | – | – | – | – | 24 | 17 | 29 | ||||||||||
| Total operating expenses | 329 | – | – | – | – | – | 329 | 276 | 304 | ||||||||||
| Income before taxes | 188 | – | – | – | – | – | 188 | 214 | 199 | ||||||||||
| Related to investment banking | |||||||||||||||||||
| Net revenues | – | – | 490 | 1,265 | 574 | – | 2,329 | 2,395 | 2,145 | ||||||||||
| of which fixed income sales and trading | – | – | 70 | 567 | – | – | 637 | 902 | 498 | ||||||||||
| of which equity sales and trading | – | – | 340 | 508 | – | – | 848 | 690 | 973 | ||||||||||
| of which underwriting and advisory 1 | – | – | 115 | 243 | 595 | – | 953 | 875 | 859 | ||||||||||
| Provision for credit losses | – | – | 2 | (4) | 0 | – | (2) | (18) | 4 | ||||||||||
| Total operating expenses | – | – | 481 | 1,264 | 425 | – | 2,170 | 2,201 | 6,595 | ||||||||||
| Income/(loss) before taxes | – | – | 7 | 5 | 149 | – | 161 | 212 | (4,454) | ||||||||||
| Related to asset management | |||||||||||||||||||
| Net revenues | – | 381 | – | – | – | – | 381 | 292 | 365 | ||||||||||
| Total operating expenses | – | 278 | – | – | – | – | 278 | 243 | 330 | ||||||||||
| Income before taxes | – | 103 | – | – | – | – | 103 | 49 | 35 | ||||||||||
| Related to corporate center | |||||||||||||||||||
| Net revenues | – | – | – | – | – | (16) | (16) | 72 | (748) | ||||||||||
| Provision for credit losses | – | – | – | – | – | 0 | 0 | 0 | (2) | ||||||||||
| Total operating expenses | – | – | – | – | – | 262 | 262 | 279 | 307 | ||||||||||
| Loss before taxes | – | – | – | – | – | (278) | (278) | (207) | (1,053) | ||||||||||
| Total | |||||||||||||||||||
| Net revenues | 1,399 | 1,299 | 862 | 1,265 | 574 | (16) | 5,383 | 5,561 | 4,336 | ||||||||||
| Provision for credit losses | 34 | 6 | 11 | (4) | 0 | 0 | 47 | 50 | 33 | ||||||||||
| Total operating expenses | 983 | 962 | 748 | 1,264 | 425 | 262 | 4,644 | 4,437 | 9,422 | ||||||||||
| Income/(loss) before taxes | 382 | 331 | 103 | 5 | 149 | (278) | 692 | 1,074 | (5,119) | ||||||||||
1 Certain transaction-based revenues in Swiss Universal Bank and certain fixed income and equity sales and trading revenues in Global Markets relate to the Group’s global advisory and underwriting business. Refer to “Global advisory and underwriting revenues” in Investment Banking & Capital Markets for further information. | |||||||||||||||||||
43
| Core Results by business activity (continued) | |||||||||||||||||
| in | 2016 | 2015 | |||||||||||||||
Swiss Universal Bank | International Wealth Management | Asia Pacific | Global Markets | Investment Banking & Capital Markets | Corporate Center | Core Results | Core Results | ||||||||||
| Related to private banking (CHF million) | |||||||||||||||||
| Net revenues | 3,704 | 3,371 | 1,374 | – | – | – | 8,449 | 8,098 | |||||||||
| of which net interest income | 1,801 | 1,308 | 602 | – | – | – | 3,711 | 3,221 | |||||||||
| of which recurring | 971 | 1,093 | 302 | – | – | – | 2,366 | 2,523 | |||||||||
| of which transaction-based | 564 | 922 | 486 | – | – | – | 1,972 | 2,225 | |||||||||
| Provision for credit losses | 39 | 20 | 32 | – | – | – | 91 | 72 | |||||||||
| Total operating expenses | 2,471 | 2,510 | 970 | – | – | – | 5,951 | 6,266 | |||||||||
| Income before taxes | 1,194 | 841 | 372 | – | – | – | 2,407 | 1,760 | |||||||||
| Related to corporate & institutional banking | |||||||||||||||||
| Net revenues | 2,055 | – | – | – | – | – | 2,055 | 2,025 | |||||||||
| of which net interest income | 1,083 | – | – | – | – | – | 1,083 | 987 | |||||||||
| of which recurring | 475 | – | – | – | – | – | 475 | 467 | |||||||||
| of which transaction-based | 548 | – | – | – | – | – | 548 | 593 | |||||||||
| Provision for credit losses | 40 | – | – | – | – | – | 40 | 89 | |||||||||
| Total operating expenses | 1,184 | – | – | – | – | – | 1,184 | 1,136 | |||||||||
| Income before taxes | 831 | – | – | – | – | – | 831 | 800 | |||||||||
| Related to investment banking | |||||||||||||||||
| Net revenues | – | – | 2,223 | 5,497 | 1,972 | – | 9,692 | 11,274 | |||||||||
| of which fixed income sales and trading | – | – | 635 | 2,516 | – | – | 3,151 | 3,894 | |||||||||
| of which equity sales and trading | – | – | 1,314 | 2,181 | – | – | 3,495 | 4,610 | |||||||||
| of which underwriting and advisory 1 | – | – | 402 | 970 | 2,095 | – | 3,467 | 3,178 | |||||||||
| Provision for credit losses | – | – | (6) | (3) | 20 | – | 11 | 27 | |||||||||
| Total operating expenses | – | – | 1,876 | 5,452 | 1,691 | – | 9,019 | 13,459 | |||||||||
| Income/(loss) before taxes | – | – | 353 | 48 | 261 | – | 662 | (2,212) | |||||||||
| Related to asset management | |||||||||||||||||
| Net revenues | – | 1,327 | – | – | – | – | 1,327 | 1,328 | |||||||||
| Total operating expenses | – | 1,047 | – | – | – | – | 1,047 | 1,146 | |||||||||
| Income before taxes | – | 280 | – | – | – | – | 280 | 182 | |||||||||
| Related to corporate center | |||||||||||||||||
| Net revenues | – | – | – | – | – | 71 | 71 | 561 | |||||||||
| Provision for credit losses | – | – | – | – | – | (1) | (1) | (1) | |||||||||
| Total operating expenses | – | – | – | – | – | 759 | 759 | 862 | |||||||||
| Loss before taxes | – | – | – | – | – | (687) | (687) | (300) | |||||||||
| Total | |||||||||||||||||
| Net revenues | 5,759 | 4,698 | 3,597 | 5,497 | 1,972 | 71 | 21,594 | 23,286 | |||||||||
| Provision for credit losses | 79 | 20 | 26 | (3) | 20 | (1) | 141 | 187 | |||||||||
| Total operating expenses | 3,655 | 3,557 | 2,846 | 5,452 | 1,691 | 759 | 17,960 | 22,869 | |||||||||
| Income/(loss) before taxes | 2,025 | 1,121 | 725 | 48 | 261 | (687) | 3,493 | 230 | |||||||||
1 Certain transaction-based revenues in Swiss Universal Bank and certain fixed income and equity sales and trading revenues in Global Markets relate to the Group’s global advisory and underwriting business. Refer to “Global advisory and underwriting revenues” in Investment Banking & Capital Markets for further information. | |||||||||||||||||
44
| BIS capital metrics – Group | |||||||||||||||||
| Phase-in | Look-through | ||||||||||||||||
| % change | % change | ||||||||||||||||
| end of | 4Q16 | 3Q16 | 4Q15 | QoQ | 4Q16 | 3Q16 | 4Q15 | QoQ | |||||||||
| Capital and risk-weighted assets (CHF million) | |||||||||||||||||
| CET1 capital | 36,576 | 38,646 | 42,072 | (5) | 30,783 | 32,362 | 32,938 | (5) | |||||||||
| Tier 1 capital | 48,865 | 50,001 | 53,063 | (2) | 41,879 | 43,263 | 44,601 | (3) | |||||||||
| Total eligible capital | 55,728 | 57,044 | 62,682 | (2) | 46,758 | 48,205 | 51,425 | (3) | |||||||||
| Risk-weighted assets | 271,372 | 273,779 | 294,950 | (1) | 268,045 | 270,462 | 289,946 | (1) | |||||||||
| Capital ratios (%) | |||||||||||||||||
| CET1 ratio | 13.5 | 14.1 | 14.3 | – | 11.5 | 12.0 | 11.4 | – | |||||||||
| Tier 1 ratio | 18.0 | 18.3 | 18.0 | – | 15.6 | 16.0 | 15.4 | – | |||||||||
| Total capital ratio | 20.5 | 20.8 | 21.3 | – | 17.4 | 17.8 | 17.7 | – | |||||||||
| BIS statistics – Group | |||||||||||||||||
| Phase-in | Look-through | ||||||||||||||||
| % change | % change | ||||||||||||||||
| end of | 4Q16 | 3Q16 | 4Q15 | QoQ | 4Q16 | 3Q16 | 4Q15 | QoQ | |||||||||
| Eligible capital (CHF million) | |||||||||||||||||
| Total shareholders' equity | 41,897 | 44,276 | 44,382 | (5) | 41,897 | 44,276 | 44,382 | (5) | |||||||||
| Regulatory adjustments 1 | (694) | (481) | (459) | 44 | (694) | (481) | (459) | 44 | |||||||||
| Adjustments subject to phase-in | (4,627) | 2 | (5,149) | (1,851) | (10) | (10,420) | (11,433) | (10,985) | (9) | ||||||||
| CET1 capital | 36,576 | 38,646 | 42,072 | (5) | 30,783 | 32,362 | 32,938 | (5) | |||||||||
| Additional tier 1 instruments | 11,096 | 3 | 10,901 | 11,663 | 2 | 11,096 | 10,901 | 11,663 | 2 | ||||||||
| Additional tier 1 instruments subject to phase-out 4 | 2,899 | 2,703 | 2,616 | 7 | – | – | – | – | |||||||||
| Deductions from additional tier 1 capital | (1,706) | 5 | (2,249) | (3,288) | (24) | – | – | – | – | ||||||||
| Additional tier 1 capital | 12,289 | 11,355 | 10,991 | 8 | 11,096 | 10,901 | 11,663 | 2 | |||||||||
| Tier 1 capital | 48,865 | 50,001 | 53,063 | (2) | 41,879 | 43,263 | 44,601 | (3) | |||||||||
| Tier 2 instruments | 4,879 | 6 | 4,942 | 6,824 | (1) | 4,879 | 4,942 | 6,824 | (1) | ||||||||
| Tier 2 instruments subject to phase-out | 2,083 | 2,197 | 2,970 | (5) | – | – | – | – | |||||||||
| Deductions from tier 2 capital | (99) | (96) | (175) | 3 | – | – | – | – | |||||||||
| Tier 2 capital | 6,863 | 7,043 | 9,619 | (3) | 4,879 | 4,942 | 6,824 | (1) | |||||||||
| Total eligible capital | 55,728 | 57,044 | 62,682 | (2) | 46,758 | 48,205 | 51,425 | (3) | |||||||||
1 Includes regulatory adjustments not subject to phase-in, including a cumulative dividend accrual. | |||||||||||||||||
2 Reflects 60% phase-in deductions, including goodwill, other intangible assets and certain deferred tax assets, and 40% of an adjustment primarily for the accounting treatment of pension plans pursuant to phase-in requirements. | |||||||||||||||||
3 Consists of high-trigger and low-trigger capital instruments. Of this amount, CHF 6.0 billion consists of capital instruments with a capital ratio write-down trigger of 7% and CHF 5.1 billion consists of capital instruments with a capital ratio write-down trigger of 5.125%. | |||||||||||||||||
4 Includes hybrid capital instruments that are subject to phase-out. | |||||||||||||||||
5 Includes 40% of goodwill and other intangible assets (CHF 2.0 billion) and other capital deductions, including the regulatory reversal of gains/(losses) due to changes in own credit risk on fair-valued financial liabilities, which will be deducted from CET1 once Basel III is fully implemented. | |||||||||||||||||
6 Consists of high-trigger and low-trigger capital instruments. Of this amount, CHF 0.7 billion consists of capital instruments with a capital ratio write-down trigger of 7% and CHF 4.2 billion consists of capital instruments with a capital ratio write-down trigger of 5%. | |||||||||||||||||
45
| Capital movement – Group | |||||
4Q16 | Phase-in | Look- through | |||
| CET1 capital (CHF million) | |||||
| Balance at beginning of period | 38,646 | 32,362 | |||
| Net loss attributable to shareholders | (2,619) | (2,619) | |||
| Foreign exchange impact | 962 | 1 | 768 | ||
| Other | (413) | 2 | 272 | ||
| Balance at end of period | 36,576 | 30,783 | |||
| Additional tier 1 capital (CHF million) | |||||
| Balance at beginning of period | 11,355 | 10,901 | |||
| Foreign exchange impact | 500 | 428 | |||
| Other | 434 | 3 | (233) | ||
| Balance at end of period | 12,289 | 11,096 | |||
| Tier 2 capital (CHF million) | |||||
| Balance at beginning of period | 7,043 | 4,942 | |||
| Foreign exchange impact | 213 | 129 | |||
| Redemptions | (59) | 0 | |||
| Other | (334) | 4 | (192) | ||
| Balance at end of period | 6,863 | 4,879 | |||
| Eligible capital (CHF million) | |||||
| Balance at end of period | 55,728 | 46,758 | |||
1 Includes US GAAP cumulative translation adjustments and the foreign exchange impact on regulatory CET1 adjustments. | |||||
2 Includes the impact of a dividend accrual, which includes the assumption that 60% of the proposed dividend is distributed in shares, the net effect of share-based compensation and pensions and a change in other regulatory adjustments (e.g., the net regulatory impact of gains/(losses) on fair-valued financial liabilities due to changes in own credit risk, which will be deducted from CET1 once Basel III is fully implemented, and certain deferred tax assets). | |||||
3 Includes the regulatory reversal of net losses due to changes in own credit risk on fair-valued financial liabilities. | |||||
4 Primarily reflects negative fair-value movements of tier 2 capital instruments and the impact of the prescribed amortization requirement as instruments move closer to their maturity date. | |||||
| Risk-weighted assets – Group | |||||||||||||||||
end of | Swiss Universal Bank | International Wealth Management | Asia Pacific | Global Markets | Investment Banking & Capital Markets | Strategic Resolution Unit | Corporate Center | Group | |||||||||
| 4Q16 (CHF million) | |||||||||||||||||
| Credit risk | 52,409 | 21,460 | 19,886 | 29,523 | 15,280 | 22,028 | 16,114 | 176,700 | |||||||||
| Market risk | 888 | 992 | 8,808 | 8,755 | 172 | 3,567 | 66 | 23,248 | |||||||||
| Operational risk | 12,068 | 12,523 | 5,836 | 13,393 | 2,575 | 19,660 | 0 | 66,055 | |||||||||
| Non-counterparty risk | 304 | 277 | 75 | 42 | 0 | 186 | 4,485 | 5,369 | |||||||||
| Risk-weighted assets – phase-in | 65,669 | 35,252 | 34,605 | 51,713 | 18,027 | 45,441 | 20,665 | 271,372 | |||||||||
| Look-through adjustment | – | – | – | – | – | – | (3,327) | (3,327) | |||||||||
| Risk-weighted assets – look-through | 65,669 | 35,252 | 34,605 | 51,713 | 18,027 | 45,441 | 17,338 | 268,045 | |||||||||
| 4Q15 (CHF million) | |||||||||||||||||
| Credit risk | 47,989 | 18,653 | 15,214 | 33,955 | 12,856 | 45,739 | 18,792 | 193,198 | |||||||||
| Market risk | 801 | 858 | 4,744 | 15,986 | 112 | 7,129 | 169 | 29,799 | |||||||||
| Operational risk | 11,240 | 13,115 | 6,812 | 12,839 | 3,182 | 19,250 | 0 | 66,438 | |||||||||
| Non-counterparty risk | 322 | 254 | 65 | 58 | 0 | 306 | 4,510 | 5,515 | |||||||||
| Risk-weighted assets – phase-in | 60,352 | 32,880 | 26,835 | 62,838 | 16,150 | 72,424 | 23,471 | 294,950 | |||||||||
| Look-through adjustment | – | – | – | – | – | – | (5,004) | (5,004) | |||||||||
| Risk-weighted assets – look-through | 60,352 | 32,880 | 26,835 | 62,838 | 16,150 | 72,424 | 18,467 | 289,946 | |||||||||
46
| Risk-weighted asset movement by risk type – Group | |||||||||||||||||
4Q16 (CHF million) | Swiss Universal Bank | International Wealth Management | Asia Pacific | Global Markets | Investment Banking & Capital Markets | Strategic Resolution Unit | Corporate Center | Total | |||||||||
| Credit risk | |||||||||||||||||
| Balance at beginning of period | 52,702 | 20,470 | 18,258 | 28,073 | 15,350 | 29,793 | 15,484 | 180,130 | |||||||||
| Foreign exchange impact | 1,155 | 443 | 663 | 1,030 | 915 | 1,342 | 508 | 6,056 | |||||||||
| Movements in risk levels | (3,051) | 292 | 117 | 530 | (1,077) | (8,864) | (88) | (12,141) | |||||||||
| of which credit risk – book size 1 | (3,614) | (9) | (1,282) | 481 | (1,201) | (9,581) | 55 | (15,151) | |||||||||
| of which credit risk – book quality 2 | 563 | 301 | 1,399 | 49 | 124 | 717 | (143) | 3,010 | |||||||||
| Model and parameter updates 3 | 1,003 | 158 | (19) | 15 | (4) | (352) | 215 | 1,016 | |||||||||
| Methodology and policy changes – internal 4 | 32 | (40) | 37 | (240) | 15 | 72 | 4 | (120) | |||||||||
| Methodology and policy changes – external 5 | 568 | 137 | 830 | 115 | 81 | 37 | (9) | 1,759 | |||||||||
| Balance at end of period – phase-in | 52,409 | 21,460 | 19,886 | 29,523 | 15,280 | 22,028 | 16,114 | 176,700 | |||||||||
| Market risk | |||||||||||||||||
| Balance at beginning of period | 574 | 431 | 8,154 | 9,330 | 123 | 4,236 | 202 | 23,050 | |||||||||
| Foreign exchange impact | 17 | 17 | 228 | 382 | 4 | 123 | 2 | 773 | |||||||||
| Movements in risk levels | 327 | 653 | 755 | (949) | 47 | (426) | (51) | 356 | |||||||||
| Model and parameter updates 3 | (12) | (112) | (272) | 244 | (2) | (61) | (3) | (218) | |||||||||
| Methodology and policy changes – internal 4 | (18) | 3 | (57) | (252) | 0 | (305) | (84) | (713) | |||||||||
| Balance at end of period – phase-in | 888 | 992 | 8,808 | 8,755 | 172 | 3,567 | 66 | 23,248 | |||||||||
| Operational risk | |||||||||||||||||
| Balance at beginning of period | 11,937 | 12,289 | 5,783 | 13,679 | 2,546 | 19,000 | 0 | 65,234 | |||||||||
| Model and parameter updates 3 | 100 | 202 | 40 | (329) | 22 | 660 | 0 | 695 | |||||||||
| Methodology and policy changes – internal 4 | 31 | 32 | 13 | 43 | 7 | 0 | 0 | 126 | |||||||||
| Balance at end of period – phase-in | 12,068 | 12,523 | 5,836 | 13,393 | 2,575 | 19,660 | 0 | 66,055 | |||||||||
| Non-counterparty risk | |||||||||||||||||
| Balance at beginning of period | 358 | 267 | 69 | 45 | 0 | 239 | 4,387 | 5,365 | |||||||||
| Movements in risk levels | (54) | 10 | 6 | (3) | 0 | (53) | 98 | 4 | |||||||||
| Balance at end of period – phase-in | 304 | 277 | 75 | 42 | 0 | 186 | 4,485 | 5,369 | |||||||||
| Total | |||||||||||||||||
| Balance at beginning of period | 65,571 | 33,457 | 32,264 | 51,127 | 18,019 | 53,268 | 20,073 | 273,779 | |||||||||
| Foreign exchange impact | 1,172 | 460 | 891 | 1,412 | 919 | 1,465 | 510 | 6,829 | |||||||||
| Movements in risk levels | (2,778) | 955 | 878 | (422) | (1,030) | (9,343) | (41) | (11,781) | |||||||||
| Model and parameter updates 3 | 1,091 | 248 | (251) | (70) | 16 | 247 | 212 | 1,493 | |||||||||
| Methodology and policy changes – internal 4 | 45 | (5) | (7) | (449) | 22 | (233) | (80) | (707) | |||||||||
| Methodology and policy changes – external 5 | 568 | 137 | 830 | 115 | 81 | 37 | (9) | 1,759 | |||||||||
| Balance at end of period – phase-in | 65,669 | 35,252 | 34,605 | 51,713 | 18,027 | 45,441 | 20,665 | 271,372 | |||||||||
| Look-through adjustment 6 | – | – | – | – | – | – | (3,327) | (3,327) | |||||||||
| Balance at end of period – look-through | 65,669 | 35,252 | 34,605 | 51,713 | 18,027 | 45,441 | 17,338 | 268,045 | |||||||||
1 Represents changes in portfolio size. | |||||||||||||||||
2 Represents changes in average risk weighting across credit risk classes. | |||||||||||||||||
3 Represents movements arising from updates to models and recalibrations of parameters. | |||||||||||||||||
4 Represents internal changes impacting how exposures are treated. | |||||||||||||||||
5 Represents externally prescribed regulatory changes impacting how exposures are treated. | |||||||||||||||||
6 The look-through adjustment impacts only credit risk within the Corporate Center. The difference between phase-in and look-through risk-weighted assets relates to transitional arrangements such as the impact from pension assets and deferred tax assets not deducted from CET1 during the phase-in period and the transitional impact from threshold-related risk-weighted assets. | |||||||||||||||||
47
| BIS leverage metrics – Group | |||||||||||||||||
| Phase-in | Look-through | ||||||||||||||||
| % change | % change | ||||||||||||||||
| end of | 4Q16 | 3Q16 | 4Q15 | QoQ | 4Q16 | 3Q16 | 4Q15 | QoQ | |||||||||
| Capital and leverage exposure (CHF million) | |||||||||||||||||
| CET1 capital | 36,576 | 38,646 | 42,072 | (5) | 30,783 | 32,362 | 32,938 | (5) | |||||||||
| Tier 1 capital | 48,865 | 50,001 | 53,063 | (2) | 41,879 | 43,263 | 44,601 | (3) | |||||||||
| Leverage exposure | 957,067 | 954,980 | 993,506 | 0 | 950,763 | 948,744 | 987,628 | 0 | |||||||||
| Leverage ratios (%) | |||||||||||||||||
| CET1 leverage ratio | 3.8 | 4.0 | 4.2 | – | 3.2 | 3.4 | 3.3 | – | |||||||||
| Tier 1 leverage ratio | 5.1 | 5.2 | 5.3 | – | 4.4 | 4.6 | 4.5 | – | |||||||||
| Swiss capital metrics – Group | |||||||||||||
| Phase-in | Look-through | ||||||||||||
| % change | % change | ||||||||||||
| end of | 4Q16 | 3Q16 | QoQ | 4Q16 | 3Q16 | QoQ | |||||||
| Swiss capital and risk-weighted assets (CHF million) | |||||||||||||
| Swiss CET1 capital | 36,417 | 38,498 | (5) | 30,616 | 32,199 | (5) | |||||||
| Going concern capital | 52,392 | 54,341 | (4) | 42,410 | 43,799 | (3) | |||||||
| Gone concern capital | 26,783 | 26,541 | 1 | 26,340 | 26,915 | (2) | |||||||
| Total loss-absorbing capacity (TLAC) | 79,175 | 80,882 | (2) | 68,750 | 70,714 | (3) | |||||||
| Swiss risk-weighted assets | 272,090 | 274,513 | (1) | 268,762 | 271,159 | (1) | |||||||
| Swiss capital ratios (%) | |||||||||||||
| Swiss CET1 ratio | 13.4 | 14.0 | – | 11.4 | 11.9 | – | |||||||
| Going concern capital ratio | 19.3 | 19.8 | – | 15.8 | 16.2 | – | |||||||
| Gone concern capital ratio | 9.8 | 9.7 | – | 9.8 | 9.9 | – | |||||||
| TLAC ratio | 29.1 | 29.5 | – | 25.6 | 26.1 | – | |||||||
| Swiss capital and risk-weighted assets – Group | |||||||||||||
| Phase-in | Look-through | ||||||||||||
| end of | 4Q16 | 3Q16 | QoQ | 4Q16 | 3Q16 | QoQ | |||||||
| Swiss capital (CHF million) | |||||||||||||
| CET1 capital – BIS | 36,576 | 38,646 | (5) | 30,783 | 32,362 | (5) | |||||||
| Swiss regulatory adjustments 1 | (159) | (148) | 7 | (167) | (163) | 2 | |||||||
| Swiss CET1 capital | 36,417 | 38,498 | (5) | 30,616 | 32,199 | (5) | |||||||
| Additional tier 1 high-trigger capital instruments | 6,000 | 5,793 | 4 | 6,000 | 5,793 | 4 | |||||||
| Grandfathered capital instruments | 9,975 | 10,050 | (1) | 5,794 | 5,807 | 0 | |||||||
| of which additional tier 1 low-trigger capital instruments | 5,096 | 5,108 | 0 | 5,096 | 5,108 | 0 | |||||||
| of which tier 2 high-trigger capital instruments | 698 | 699 | 0 | 698 | 699 | 0 | |||||||
| of which tier 2 low-trigger capital instruments | 4,181 | 4,243 | (1) | – | – | – | |||||||
| Swiss additional tier 1 capital | 15,975 | 15,843 | 1 | 11,794 | 11,600 | 2 | |||||||
| Going concern capital | 52,392 | 54,341 | (4) | 42,410 | 43,799 | (3) | |||||||
| Bail-in debt instruments | 22,159 | 22,672 | (2) | 22,159 | 22,672 | (2) | |||||||
| Additional tier 1 instruments subject to phase-out | 2,899 | 2,703 | 7 | – | – | – | |||||||
| Tier 2 instruments subject to phase-out | 2,083 | 2,197 | (5) | – | – | – | |||||||
| Tier 2 amortization component | 1,448 | 1,314 | 10 | – | – | – | |||||||
| Tier 2 low-trigger capital instruments | – | – | – | 4,181 | 4,243 | (1) | |||||||
| Deductions | (1,806) | (2,345) | (23) | – | – | – | |||||||
| Gone concern capital | 26,783 | 26,541 | 1 | 26,340 | 26,915 | (2) | |||||||
| Total loss-absorbing capacity | 79,175 | 80,882 | (2) | 68,750 | 70,714 | (3) | |||||||
| Risk-weighted assets (CHF million) | |||||||||||||
| Risk-weighted assets – BIS | 271,372 | 273,779 | (1) | 268,045 | 270,462 | (1) | |||||||
| Swiss regulatory adjustments 2 | 718 | 734 | (2) | 717 | 697 | 3 | |||||||
| Swiss risk-weighted assets | 272,090 | 274,513 | (1) | 268,762 | 271,159 | (1) | |||||||
1 Includes adjustments for certain unrealized gains outside the trading book. | |||||||||||||
2 Primarily includes differences in the credit risk multiplier. | |||||||||||||
48
| Swiss leverage metrics – Group | |||||||||||||
| Phase-in | Look-through | ||||||||||||
| % change | % change | ||||||||||||
| end of | 4Q16 | 3Q16 | QoQ | 4Q16 | 3Q16 | QoQ | |||||||
| Swiss capital and leverage exposure (CHF million) | |||||||||||||
| Swiss CET1 capital | 36,417 | 38,498 | (5) | 30,616 | 32,199 | (5) | |||||||
| Going concern capital | 52,392 | 54,341 | (4) | 42,410 | 43,799 | (3) | |||||||
| Gone concern capital | 26,783 | 26,541 | 1 | 26,340 | 26,915 | (2) | |||||||
| Total loss-absorbing capacity | 79,175 | 80,882 | (2) | 68,750 | 70,714 | (3) | |||||||
| Leverage exposure | 957,067 | 954,980 | 0 | 950,763 | 948,744 | 0 | |||||||
| Swiss leverage ratios (%) | |||||||||||||
| Swiss CET1 leverage ratio | 3.8 | 4.0 | – | 3.2 | 3.4 | – | |||||||
| Going concern leverage ratio | 5.5 | 5.7 | – | 4.5 | 4.6 | – | |||||||
| Gone concern leverage ratio | 2.8 | 2.8 | – | 2.8 | 2.8 | – | |||||||
| TLAC leverage ratio | 8.3 | 8.5 | – | 7.2 | 7.5 | – | |||||||
| Rounding differences may occur. | |||||||||||||
in / end of | Interest rate | Credit spread | Foreign exchange | Commodity | Equity | Diversi- fication benefit | Total | ||||||||
| Risk management VaR (CHF million) | |||||||||||||||
| 4Q16 | |||||||||||||||
| Average | 13 | 23 | 6 | 2 | 13 | (30) | 27 | ||||||||
| Minimum | 10 | 21 | 4 | 1 | 10 | – | 1 | 24 | |||||||
| Maximum | 19 | 24 | 9 | 3 | 16 | – | 1 | 31 | |||||||
| End of period | 15 | 21 | 7 | 1 | 13 | (28) | 29 | ||||||||
| 3Q16 | |||||||||||||||
| Average | 13 | 22 | 9 | 2 | 12 | (31) | 27 | ||||||||
| Minimum | 9 | 20 | 6 | 1 | 10 | – | 1 | 24 | |||||||
| Maximum | 16 | 24 | 14 | 3 | 16 | – | 1 | 31 | |||||||
| End of period | 14 | 23 | 7 | 1 | 15 | (29) | 31 | ||||||||
| 4Q15 | |||||||||||||||
| Average | 21 | 35 | 9 | 2 | 25 | (41) | 51 | ||||||||
| Minimum | 13 | 33 | 6 | 1 | 17 | – | 1 | 43 | |||||||
| Maximum | 35 | 42 | 12 | 3 | 35 | – | 1 | 60 | |||||||
| End of period | 17 | 40 | 9 | 1 | 31 | (42) | 56 | ||||||||
| Risk management VaR (USD million) | |||||||||||||||
| 4Q16 | |||||||||||||||
| Average | 13 | 23 | 6 | 2 | 13 | (30) | 27 | ||||||||
| Minimum | 10 | 21 | 3 | 1 | 10 | – | 1 | 23 | |||||||
| Maximum | 19 | 24 | 9 | 3 | 17 | – | 1 | 32 | |||||||
| End of period | 15 | 21 | 6 | 1 | 13 | (28) | 28 | ||||||||
| 3Q16 | |||||||||||||||
| Average | 14 | 22 | 9 | 2 | 12 | (31) | 28 | ||||||||
| Minimum | 9 | 21 | 6 | 1 | 10 | – | 1 | 24 | |||||||
| Maximum | 16 | 25 | 14 | 3 | 17 | – | 1 | 32 | |||||||
| End of period | 14 | 24 | 7 | 1 | 16 | (30) | 32 | ||||||||
| 4Q15 | |||||||||||||||
| Average | 22 | 35 | 9 | 2 | 25 | (42) | 51 | ||||||||
| Minimum | 13 | 32 | 6 | 1 | 18 | – | 1 | 44 | |||||||
| Maximum | 35 | 42 | 12 | 3 | 35 | – | 1 | 61 | |||||||
| End of period | 17 | 40 | 9 | 1 | 32 | (42) | 57 | ||||||||
| Excludes risks associated with counterparty and own credit exposures. | |||||||||||||||
1 As the maximum and minimum occur on different days for different risk types, it is not meaningful to calculate a portfolio diversification benefit. | |||||||||||||||
49
| in | 4Q16 | 3Q16 | 4Q15 | 2016 | 2015 | ||||||
| Consolidated statements of operations (CHF million) | |||||||||||
| Interest and dividend income | 3,810 | 4,222 | 4,526 | 17,374 | 19,341 | ||||||
| Interest expense | (2,188) | (2,292) | (2,332) | (9,812) | (10,042) | ||||||
| Net interest income | 1,622 | 1,930 | 2,194 | 7,562 | 9,299 | ||||||
| Commissions and fees | 2,941 | 2,680 | 2,914 | 11,092 | 12,044 | ||||||
| Trading revenues | 258 | 232 | (1,349) | 313 | 1,340 | ||||||
| Other revenues | 360 | 554 | 451 | 1,356 | 1,114 | ||||||
| Net revenues | 5,181 | 5,396 | 4,210 | 20,323 | 23,797 | ||||||
| Provision for credit losses | 75 | 55 | 133 | 252 | 324 | ||||||
| Compensation and benefits | 2,682 | 2,674 | 3,149 | 10,572 | 11,546 | ||||||
| General and administrative expenses | 4,184 | 1,978 | 2,808 | 9,770 | 8,574 | ||||||
| Commission expenses | 394 | 322 | 409 | 1,455 | 1,623 | ||||||
| Goodwill impairment | 0 | 0 | 3,797 | 0 | 3,797 | ||||||
| Restructuring expenses | 49 | 145 | 355 | 540 | 355 | ||||||
| Total other operating expenses | 4,627 | 2,445 | 7,369 | 11,765 | 14,349 | ||||||
| Total operating expenses | 7,309 | 5,119 | 10,518 | 22,337 | 25,895 | ||||||
| Income/(loss) before taxes | (2,203) | 222 | (6,441) | (2,266) | (2,422) | ||||||
| Income tax expense/(benefit) | 414 | 185 | (627) | 441 | 523 | ||||||
| Net income/(loss) | (2,617) | 37 | (5,814) | (2,707) | (2,945) | ||||||
| Net income/(loss) attributable to noncontrolling interests | 2 | (4) | 14 | 3 | (1) | ||||||
| Net income/(loss) attributable to shareholders | (2,619) | 41 | (5,828) | (2,710) | (2,944) | ||||||
| Earnings/(loss) per share (CHF) | |||||||||||
| Basic earnings/(loss) per share | (1.25) | 0.02 | (3.28) | (1.32) | (1.73) | ||||||
| Diluted earnings/(loss) per share | (1.25) | 0.02 | (3.28) | (1.32) | (1.73) | ||||||
50
| end of | 4Q16 | 3Q16 | 4Q15 | ||||
| Assets (CHF million) | |||||||
| Cash and due from banks | 121,161 | 104,972 | 92,328 | ||||
| Interest-bearing deposits with banks | 772 | 827 | 867 | ||||
| Central bank funds sold, securities purchased under resale agreements and securities borrowing transactions | 134,839 | 114,793 | 123,049 | ||||
| Securities received as collateral, at fair value | 32,564 | 27,707 | 28,511 | ||||
| Trading assets, at fair value | 165,150 | 183,870 | 190,737 | ||||
| Investment securities | 2,489 | 2,377 | 3,090 | ||||
| Other investments | 6,777 | 6,012 | 7,021 | ||||
| Net loans | 275,976 | 274,606 | 272,995 | ||||
| Premises and equipment | 4,711 | 4,640 | 4,644 | ||||
| Goodwill | 4,913 | 4,725 | 4,808 | ||||
| Other intangible assets | 213 | 192 | 196 | ||||
| Brokerage receivables | 33,431 | 39,392 | 34,542 | ||||
| Other assets | 36,865 | 42,598 | 58,017 | ||||
| Total assets | 819,861 | 806,711 | 820,805 | ||||
| Liabilities and equity (CHF million) | |||||||
| Due to banks | 22,800 | 21,964 | 21,054 | ||||
| Customer deposits | 355,833 | 345,148 | 342,705 | ||||
| Central bank funds purchased, securities sold under repurchase agreements and securities lending transactions | 33,016 | 32,261 | 46,598 | ||||
| Obligation to return securities received as collateral, at fair value | 32,564 | 27,707 | 28,511 | ||||
| Trading liabilities, at fair value | 44,930 | 47,893 | 48,971 | ||||
| Short-term borrowings | 15,385 | 11,600 | 8,657 | ||||
| Long-term debt | 193,315 | 195,455 | 197,608 | ||||
| Brokerage payables | 39,852 | 42,188 | 39,452 | ||||
| Other liabilities | 39,855 | 37,738 | 42,231 | ||||
| Total liabilities | 777,550 | 761,954 | 775,787 | ||||
| Common shares | 84 | 84 | 78 | ||||
| Additional paid-in capital | 32,131 | 31,925 | 31,925 | ||||
| Retained earnings | 25,954 | 28,573 | 29,139 | ||||
| Treasury shares, at cost | 0 | (18) | (125) | ||||
| Accumulated other comprehensive income/(loss) | (16,272) | (16,288) | (16,635) | ||||
| Total shareholders' equity | 41,897 | 44,276 | 44,382 | ||||
| Noncontrolling interests | 414 | 481 | 636 | ||||
| Total equity | 42,311 | 44,757 | 45,018 | ||||
| Total liabilities and equity | 819,861 | 806,711 | 820,805 | ||||
51
| Attributable to shareholders | |||||||||||||||||
Common shares | Additional paid-in capital | Retained earnings | Treasury shares, at cost | Accumu- lated other compre- hensive income/ (loss) | Total share- holders' equity | Non- controlling interests | Total equity | ||||||||||
| 4Q16 (CHF million) | |||||||||||||||||
| Balance at beginning of period | 84 | 31,925 | 28,573 | (18) | (16,288) | 44,276 | 481 | 44,757 | |||||||||
| Purchases of subsidiary shares from non- controlling interests, changing ownership | – | (13) | – | – | – | (13) | (6) | (19) | |||||||||
| Purchase of subsidiary shares from non- controlling interests, not changing ownership 1, 2 | – | – | – | – | – | – | (38) | (38) | |||||||||
| Sale of subsidiary shares to noncontrolling interests, not changing ownership 2 | – | – | – | – | – | – | 20 | 20 | |||||||||
| Net income/(loss) | – | – | (2,619) | – | – | (2,619) | 2 | (2,617) | |||||||||
| Total other comprehensive income/(loss), net of tax | – | – | – | – | 16 | 16 | 8 | 24 | |||||||||
| Sale of treasury shares | – | 24 | – | 2,875 | – | 2,899 | – | 2,899 | |||||||||
| Repurchase of treasury shares | – | – | – | (2,865) | – | (2,865) | – | (2,865) | |||||||||
| Share-based compensation, net of tax | – | 220 | 3 | – | 8 | – | 228 | – | 228 | ||||||||
| Financial instruments indexed to own shares 4 | – | (19) | – | – | – | (19) | – | (19) | |||||||||
| Changes in scope of consolidation, net | – | – | – | – | – | – | (53) | (53) | |||||||||
| Other | – | (6) | – | – | – | (6) | – | (6) | |||||||||
| Balance at end of period | 84 | 32,131 | 25,954 | 0 | (16,272) | 41,897 | 414 | 42,311 | |||||||||
| 2016 (CHF million) | |||||||||||||||||
| Balance at beginning of period | 78 | 31,925 | 29,139 | (125) | (16,635) | 44,382 | 636 | 45,018 | |||||||||
| Purchase of subsidiary shares from non- controlling interests, changing ownership | – | (13) | – | – | – | (13) | (6) | (19) | |||||||||
| Purchase of subsidiary shares from non- controlling interests, not changing ownership 1, 2 | – | – | – | – | – | – | (103) | (103) | |||||||||
| Sale of subsidiary shares to noncontrolling interests, not changing ownership 2 | – | – | – | – | – | – | 112 | 112 | |||||||||
| Net income/(loss) | – | – | (2,710) | – | – | (2,710) | 3 | (2,707) | |||||||||
| Cumulative effect of accounting changes, net of tax | – | – | (475) | – | 475 | – | – | – | |||||||||
| Total other comprehensive income/(loss), net of tax | – | – | – | – | (112) | (112) | (5) | (117) | |||||||||
| Issuance of common shares | 6 | 1,661 | – | – | – | 1,667 | – | 1,667 | |||||||||
| Sale of treasury shares | – | 7 | – | 16,160 | – | 16,167 | – | 16,167 | |||||||||
| Repurchase of treasury shares | – | – | – | (16,197) | – | (16,197) | – | (16,197) | |||||||||
| Share-based compensation, net of tax | – | 178 | 5 | – | 162 | – | 340 | – | 340 | ||||||||
| Financial instruments indexed to own shares 4 | – | (164) | – | – | – | (164) | – | (164) | |||||||||
| Dividends paid | – | (1,435) | 6 | – | – | – | (1,435) | – | (1,435) | ||||||||
| Changes in scope of consolidation, net | – | – | – | – | – | – | (194) | (194) | |||||||||
| Other | – | (28) | – | – | – | (28) | (29) | (57) | |||||||||
| Balance at end of period | 84 | 32,131 | 25,954 | 0 | (16,272) | 41,897 | 414 | 42,311 | |||||||||
1 Distributions to owners in funds include the return of original capital invested and any related dividends. | |||||||||||||||||
2 Transactions with and without ownership changes related to fund activity are all displayed under "not changing ownership". | |||||||||||||||||
3 Includes a net tax benefit of CHF 13 million from the excess fair value of shares delivered over recognized compensation expense. | |||||||||||||||||
4 Includes certain call options the Group purchased on its own shares to economically hedge share-based compensation awards. In accordance with US GAAP, these call options were designated as equity instruments and, as such, were initially recognized in shareholders' equity at their fair values and not subsequently remeasured. | |||||||||||||||||
5 Includes a net tax charge of CHF (110) million from the excess recognized compensation expense over fair value of shares delivered. | |||||||||||||||||
6 Paid out of reserves from capital contributions. | |||||||||||||||||
52
| in | 4Q16 | 3Q16 | 4Q15 | 2016 | 2015 | ||||||
| Basic net income/(loss) attributable to shareholders (CHF million) | |||||||||||
| Net income/(loss) attributable to shareholders for basic earnings per share | (2,619) | 41 | (5,828) | (2,710) | (2,944) | ||||||
| Available for common shares | (2,713) | 41 | (5,828) | (2,713) | (2,958) | ||||||
| Available for unvested share-based payment awards | 0 | 0 | 0 | 3 | 14 | ||||||
| Diluted net income/(loss) attributable to shareholders (CHF million) | |||||||||||
| Net income/(loss) attributable to shareholders for diluted earnings per share | (2,619) | 41 | (5,828) | (2,710) | (2,944) | ||||||
| Available for common shares | (2,347) | 41 | (5,828) | (2,713) | (2,958) | ||||||
| Available for unvested share-based payment awards | 0 | 0 | 0 | 3 | 14 | ||||||
| Weighted-average shares outstanding (million) | |||||||||||
| Weighted-average shares outstanding for basic earnings per share available for common shares | 2,102.0 | 2,092.6 | 1,777.2 | 2,048.4 | 1,706.3 | ||||||
| Dilutive share options and warrants | 0.0 | 2.8 | 0.0 | 0.0 | 0.0 | ||||||
| Dilutive share awards | 0.0 | 52.9 | 0.0 | 0.0 | 0.0 | ||||||
| Weighted-average shares outstanding for diluted earnings per share available for common shares 1 | 2,102.0 | 2 | 2,148.3 | 1,777.2 | 2 | 2,048.4 | 2 | 1,706.3 | 2 | ||
| Weighted-average shares outstanding for basic/diluted earnings per share available for unvested share-based payment awards | 0.1 | 0.2 | 19.1 | 3.0 | 25.7 | ||||||
| Earnings/(loss) per share available for common shares (CHF) | |||||||||||
| Basic earnings/(loss) per share available for common shares | (1.25) | 0.02 | (3.28) | (1.32) | (1.73) | ||||||
| Diluted earnings/(loss) per share available for common shares | (1.25) | 0.02 | (3.28) | (1.32) | (1.73) | ||||||
1 Weighted-average potential common shares relating to instruments that were not dilutive for the respective periods (and therefore not included in the diluted earnings per share calculation above) but could potentially dilute earnings per share in the future were 12.1 million, 13.4 million, 7.9 million, 11.3 million and 7.6 million for 4Q16, 3Q16, 4Q15, 2016 and 2015, respectively. | |||||||||||
2 Due to the net losses in 4Q16, 4Q15, 2016 and 2015, 3.7 million, 0.9 million, 3.2 million and 0.9 million, respectively, of weighted-average share options and warrants outstanding and 68.8 million, 61.2 million, 54.6 million and 47.8 million, respectively, of weighted-average share awards outstanding were excluded from the diluted earnings per share calculation, as the effect would be antidilutive. | |||||||||||
53
| in | 4Q16 | 3Q16 | 4Q15 | 2016 | 2015 | ||||||
| Restructuring expenses by segment (CHF million) | |||||||||||
| Swiss Universal Bank | (3) | 19 | 42 | 60 | 42 | ||||||
| International Wealth Management | 16 | 15 | 36 | 54 | 36 | ||||||
| Asia Pacific | 19 | 23 | 3 | 53 | 3 | ||||||
| Global Markets | 15 | 52 | 96 | 217 | 96 | ||||||
| Investment Banking & Capital Markets | (6) | 15 | 22 | 28 | 22 | ||||||
| Strategic Resolution Unit | 1 | 21 | 156 | 121 | 156 | ||||||
| Corporate Center | 7 | 0 | 0 | 7 | 0 | ||||||
| Total restructuring expenses | 49 | 145 | 355 | 540 | 355 | ||||||
| in | 4Q16 | 3Q16 | 4Q15 | 2016 | 2015 | ||||||
| Restructuring expenses by type (CHF million) | |||||||||||
| Compensation and benefits-related expenses | 30 | 123 | 309 | 385 | 309 | ||||||
| of which severance expenses | 37 | 65 | 191 | 218 | 191 | ||||||
| of which accelerated deferred compensation | (1) | 52 | 87 | 140 | 87 | ||||||
| of which pension expenses | (6) | 6 | 31 | 27 | 31 | ||||||
| General and administrative-related expenses | 19 | 22 | 46 | 155 | 46 | ||||||
| Total restructuring expenses | 49 | 145 | 355 | 540 | 355 | ||||||
Return on regulatory capital
Credit Suisse measures firm-wide returns against total shareholders’ equity and tangible shareholders’ equity. In addition, it also measures the efficiency of the firm and its divisions with regard to the usage of capital as determined by the minimum requirements set by regulators. This regulatory capital is calculated as the worst of 10% of risk-weighted assets and 3.5% of the leverage exposure. Return on regulatory capital is calculated using income after tax and assumes a tax rate of 30% and capital allocated based on the worst of 10% of average risk-weighted assets and 3.5% of average leverage exposure. These percentages are used in the calculation in order to reflect the 2019 fully phased in Swiss regulatory minimum requirements for Basel III CET1 capital and leverage ratio. For Global Markets and Investment Banking & Capital Markets, return on regulatory capital is based on US dollar denominated numbers.
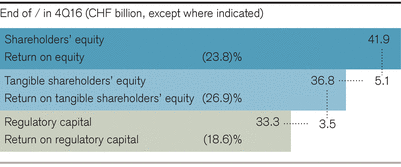
54
Cautionary statement regarding forward-looking information
This earnings release contains statements that constitute forward-looking statements. In addition, in the future we, and others on our behalf, may make statements that constitute forward-looking statements. Such forward-looking statements may include, without limitation, statements relating to the following:
– our plans, objectives or goals;
– our future economic performance or prospects;
– the potential effect on our future performance of certain contingencies; and
– assumptions underlying any such statements.
Words such as “believes,” “anticipates,” “expects,” “intends” and “plans” and similar expressions are intended to identify forward-looking statements but are not the exclusive means of identifying such statements. We do not intend to update these forward-looking statements except as may be required by applicable securities laws.
By their very nature, forward-looking statements involve inherent risks and uncertainties, both general and specific, and risks exist that predictions, forecasts, projections and other outcomes described or implied in forward-looking statements will not be achieved. We caution you that a number of important factors could cause results to differ materially from the plans, objectives, expectations, estimates and intentions expressed in such forward-looking statements. These factors include:
– the ability to maintain sufficient liquidity and access capital markets;
– market volatility and interest rate fluctuations and developments affecting interest rate levels;
– the strength of the global economy in general and the strength of the economies of the countries in which we conduct our operations, in particular the risk of continued slow economic recovery or downturn in the US or other developed countries in 2017 and beyond;
– the direct and indirect impacts of deterioration or slow recovery in residential and commercial real estate markets;
– adverse rating actions by credit rating agencies in respect of us, sovereign issuers, structured credit products or other credit-related exposures;
– the ability to achieve our strategic objectives, including improved performance, reduced risks, lower costs and more efficient use of capital;
– the ability of counterparties to meet their obligations to us;
– the effects of, and changes in, fiscal, monetary, exchange rate, trade and tax policies, as well as currency fluctuations;
– political and social developments, including war, civil unrest or terrorist activity;
– the possibility of foreign exchange controls, expropriation, nationalization or confiscation of assets in countries in which we conduct our operations;
– operational factors such as systems failure, human error, or the failure to implement procedures properly;
– actions taken by regulators with respect to our business and practices and possible resulting changes to our business organization, practices and policies in countries in which we conduct our operations;
– the effects of changes in laws, regulations or accounting policies or practices in countries in which we conduct our operations;
– competition or changes in our competitive position in geographic and business areas in which we conduct our operations;
– the ability to retain and recruit qualified personnel;
– the ability to maintain our reputation and promote our brand;
– the ability to increase our market share and control expenses;
– technological changes;
– the timely development and acceptance of our new products and services and the perceived overall value of these products and services by users;
– acquisitions, including the ability to integrate acquired businesses successfully, and divestitures, including the ability to sell non-core assets;
– the adverse resolution of litigation, regulatory proceedings and other contingencies;
– the ability to achieve our cost efficiency, net new asset, pre-tax income/(loss), capital ratios and return on regulatory capital, leverage exposure threshold, RWA threshold, and other targets and ambitions; and
– other unforeseen or unexpected events and our success at managing these and the risks involved in the foregoing.
We caution you that the foregoing list of important factors is not exclusive. When evaluating forward-looking statements, you should carefully consider the foregoing factors and other uncertainties and events, including the information set forth in “Risk factors” in I – Information on the company in our Annual Report 2015.
55