UNITED STATES
SECURITIES AND EXCHANGE COMMISSION
Washington, D.C. 20549
______________
Form 6-K
______________
REPORT OF FOREIGN PRIVATE ISSUER PURSUANT TO RULE 13a-16 OR 15d-16
UNDER THE SECURITIES EXCHANGE ACT OF 1934
November 30, 2017
Commission File Number 001-15244
CREDIT SUISSE GROUP AG
(Translation of registrant’s name into English)
Paradeplatz 8, 8001 Zurich, Switzerland
(Address of principal executive office)
______________
Commission File Number 001-33434
CREDIT SUISSE AG
(Translation of registrant’s name into English)
Paradeplatz 8, 8001 Zurich, Switzerland
(Address of principal executive office)
______________
Indicate by check mark whether the registrant files or will file annual reports under cover of Form 20-F or Form 40-F.
| Form 20-F ☒ | Form 40-F ☐ |
Indicate by check mark if the registrant is submitting the Form 6-K in paper as permitted by Regulation S-T Rule 101(b)(1):
Note: Regulation S-T Rule 101(b)(1) only permits the submission in paper of a Form 6-K if submitted solely to provide an attached annual report to security holders.
Indicate by check mark if the registrant is submitting the Form 6-K in paper as permitted by Regulation S-T Rule 101(b)(7):
Note: Regulation S-T Rule 101(b)(7) only permits the submission in paper of a Form 6-K if submitted to furnish a report or other document that the registrant foreign private issuer must furnish and make public under the laws of the jurisdiction in which the registrant is incorporated, domiciled or legally organized (the registrant’s “home country”), or under the rules of the home country exchange on which the registrant’s securities are traded, as long as the report or other document is not a press release, is not required to be and has not been distributed to the registrant’s security holders, and, if discussing a material event, has already been the subject of a Form 6-K submission or other Commission filing on EDGAR.
This report includes the slides for the presentation to investors in connection with Investor Day 2017 on November 30, 2017.

Credit Suisse Investor Day 2017Tidjane Thiam, CEO Credit Suisse November 30, 2017
Disclaimer This material does not purport to contain all of the information that you may wish to consider. This material is not to be relied upon as such or used in substitution for the exercise of independent judgment.Cautionary statement regarding forward-looking statementsThis presentation contains forward-looking statements that involve inherent risks and uncertainties, and we might not be able to achieve the predictions, forecasts, projections and other outcomes we describe or imply in forward-looking statements. A number of important factors could cause results to differ materially from the plans, objectives, expectations, estimates and intentions we express in these forward-looking statements, including those we identify in "Risk factors” in our Annual Report on Form 20-F for the fiscal year ended December 31, 2016 and in the “Cautionary statement regarding forward-looking information" in our media release relating to Investor Day, published on November 30, 2017 and filed with the US Securities and Exchange Commission, and in other public filings and press releases. We do not intend to update these forward-looking statements. In particular, the terms “Estimate”, “Illustrative”, “Ambition”, “Objective”, “Outlook” and “Goal” are not intended to be viewed as targets or projections, nor are they considered to be Key Performance Indicators. All such estimates, illustrations, ambitions and goals are subject to a large number of inherent risks, assumptions and uncertainties, many of which are completely outside of our control. These risks, assumptions and uncertainties include, but are not limited to, general market conditions, market volatility, interest rate volatility and levels, global and regional economic conditions, political uncertainty, changes in tax policies, regulatory changes, changes in levels of client activity as a result of any of the foregoing and other factors. Accordingly, this information should not be relied on for any purpose. We do not intend to update these estimates, illustrations, ambitions or goals. We may not achieve the benefits of our strategic initiativesWe may not achieve all of the expected benefits of our strategic initiatives. Factors beyond our control, including but not limited to the market and economic conditions, changes in laws, rules or regulations and other challenges discussed in our public filings, could limit our ability to achieve some or all of the expected benefits of these initiatives. Estimates, assumptions and opinionsIn preparing this presentation, management has made estimates and assumptions that affect the numbers presented. Actual results may differ. Annualized numbers do not take account of variations in operating results, seasonality and other factors and may not be indicative of actual, full-year results. Figures throughout this presentation may also be subject to rounding adjustments. All opinions and views constitute judgments as of the date of writing without regard to the date on which the reader may receive or access the information. This information is subject to change at any time without notice and we do not intend to update this information. Statement regarding non-GAAP financial measuresThis presentation also contains non-GAAP financial measures, including adjusted results. Information needed to reconcile such non-GAAP financial measures to the most directly comparable measures under US GAAP can be found in this presentation in the Appendix, which is available on our website at www.credit-suisse.com. Statement regarding capital, liquidity and leverageAs of January 1, 2013, Basel III was implemented in Switzerland along with the Swiss “Too Big to Fail” legislation and regulations thereunder (in each case, subject to certain phase-in periods). As of January 1, 2015, the Bank for International Settlements (BIS) leverage ratio framework, as issued by the Basel Committee on Banking Supervision (BCBS), was implemented in Switzerland by FINMA. Our related disclosures are in accordance with our interpretation of such requirements, including relevant assumptions. Changes in the interpretation of these requirements in Switzerland or in any of our assumptions or estimates could result in different numbers from those shown in this presentation. Capital and ratio numbers for periods prior to 2013 are based on estimates, which are calculated as if the Basel III framework had been in place in Switzerland during such periods. Unless otherwise noted, leverage exposure is based on the BIS leverage ratio framework and consists of period-end balance sheet assets and prescribed regulatory adjustments. Beginning in 2015, the Swiss leverage ratio is calculated as Swiss total capital, divided by period-end leverage exposure. The look-through BIS tier 1 leverage ratio and CET1 leverage ratio are calculated as look-through BIS tier 1 capital and CET1 capital, respectively, divided by end-period leverage exposure.SourcesCertain material in this presentation has been prepared by Credit Suisse on the basis of publicly available information, internally developed data and other third-party sources believed to be reliable. Credit Suisse has not sought to independently verify information obtained from public and third-party sources and makes no representations or warranties as to accuracy, completeness or reliability of such information.

Program of the day Opening remarks Tidjane Thiam 8.30 am 45 min Webcast Morning break-out sessions 9.25 am No webcast Global Markets Brian Chin, David Miller, Mike Stewart 45 minAPAC Helman Sitohang, Francesco de Ferrari, Carsten Stoehr, Ken Pang 45 minBreak 20 minEfficiency & Productivity Pierre-Olivier Bouée, Paul Turrell 45 minCompliance Lara Warner, Homa Siddiqui 45 min Lunch 12.45 pm 50 min Afternoon break-out sessions 1.35 pm No webcast SUB Thomas Gottstein, Didier Denat, Serge Fehr 45 minIBCM Jim Amine, Malcolm Price, David Hermer 45 minIWM Iqbal Khan, Claudio de Sanctis, Bruno Daher 45 minBreak 25 min Capital,Funding and SRU David Mathers 4.15 pm 45 min Webcast Wrap-up & Q&A 5.00 pm 60 min Webcast Investor Day 2017
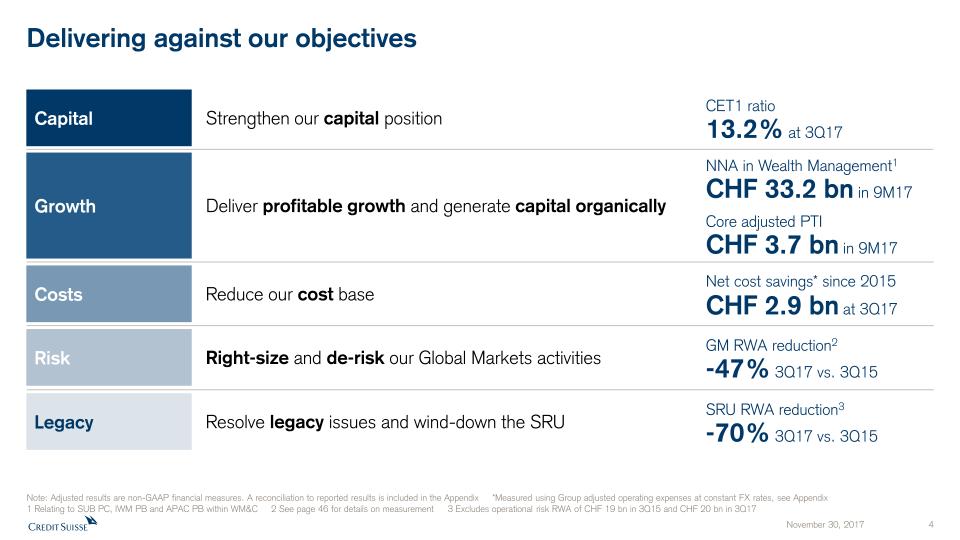
Delivering against our objectives Costs Reduce our cost base Net cost savings* since 2015 CHF 2.9 bn at 3Q17 Risk Right-size and de-risk our Global Markets activities GM RWA reduction2 -47% 3Q17 vs. 3Q15 Legacy Resolve legacy issues and wind-down the SRU SRU RWA reduction3 -70% 3Q17 vs. 3Q15 Capital Strengthen our capital position CET1 ratio 13.2% at 3Q17 Note: Adjusted results are non-GAAP financial measures. A reconciliation to reported results is included in the Appendix *Measured using Group adjusted operating expenses at constant FX rates, see Appendix1 Relating to SUB PC, IWM PB and APAC PB within WM&C 2 See page 46 for details on measurement 3 Excludes operational risk RWA of CHF 19 bn in 3Q15 and CHF 20 bn in 3Q17 Growth Deliver profitable growth and generate capital organically CHF 3.7 bn in 9M17 Core adjusted PTI CHF 33.2 bn in 9M17 NNA in Wealth Management1

The way forward Our strategy and progress The opportunity Agenda
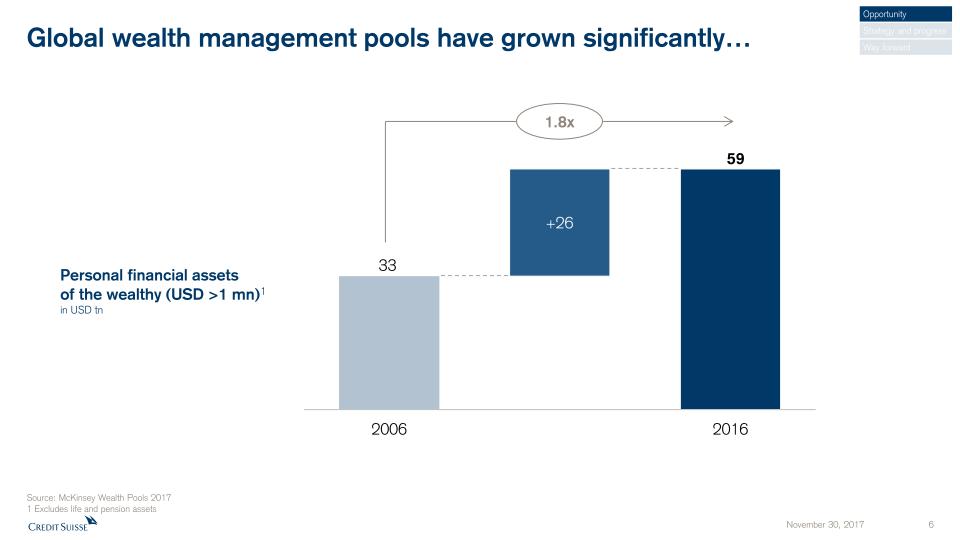
Source: McKinsey Wealth Pools 20171 Excludes life and pension assets Global wealth management pools have grown significantly… 1.8x Personal financial assetsof the wealthy (USD >1 mn)1in USD tn Opportunity Strategy and progress Way forward
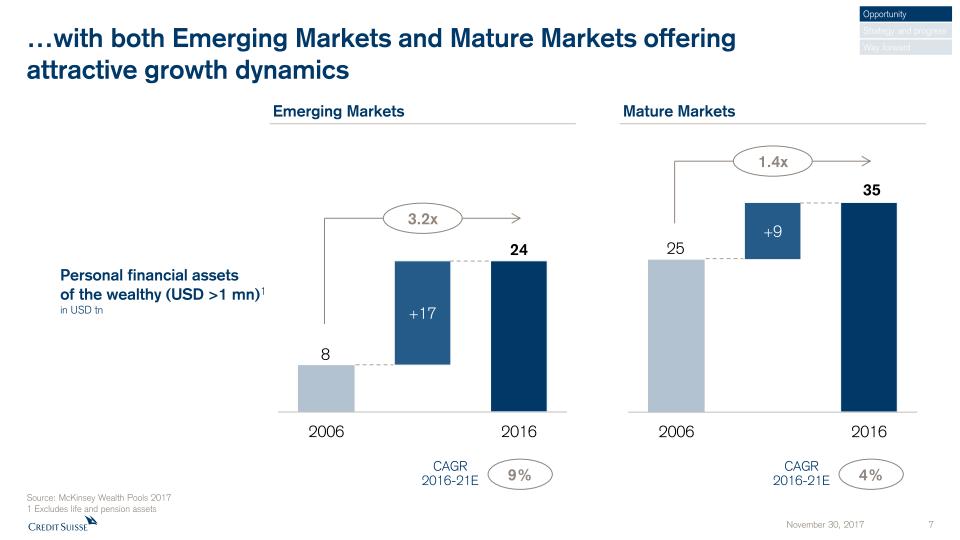
Source: McKinsey Wealth Pools 20171 Excludes life and pension assets …with both Emerging Markets and Mature Markets offeringattractive growth dynamics 1.4x Mature Markets Emerging Markets 3.2x 9% CAGR2016-21E 4% Personal financial assetsof the wealthy (USD >1 mn)1in USD tn CAGR2016-21E Opportunity Strategy and progress Way forward
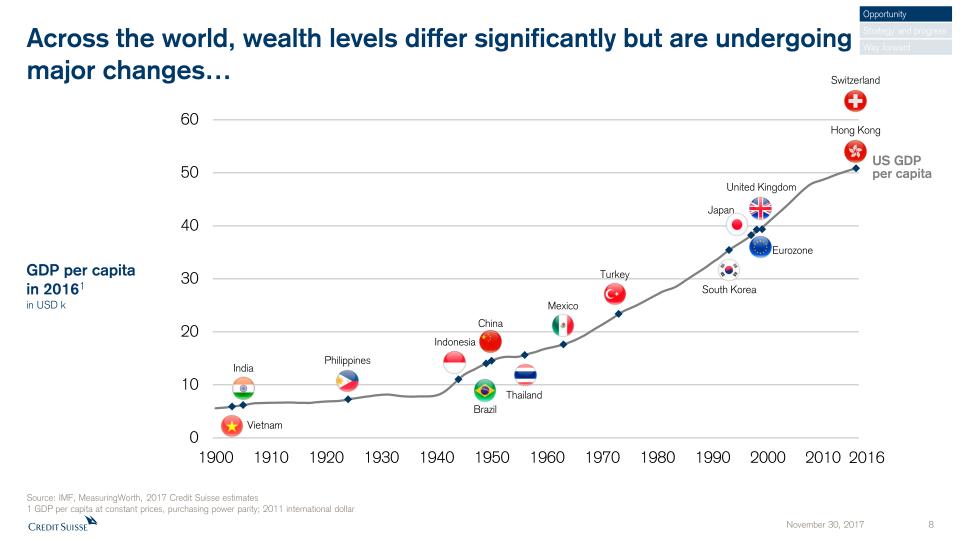
Across the world, wealth levels differ significantly but are undergoingmajor changes… GDP per capitain 20161in USD k Source: IMF, MeasuringWorth, 2017 Credit Suisse estimates1 GDP per capita at constant prices, purchasing power parity; 2011 international dollar Vietnam India Philippines Indonesia Brazil China Thailand Mexico South Korea Hong Kong Japan United Kingdom Eurozone Switzerland 2016 Turkey Opportunity Strategy and progress Way forward US GDP per capita

…China has made rapid progress and still presents hugeopportunities… GDP per capitain 20161in USD k Source: IMF, MeasuringWorth, 2017 Credit Suisse estimates1 GDP per capita at constant prices, purchasing power parity; 2011 international dollar US GDP per capita 2016 1991 2001 2006 2008 2016 Opportunity Strategy and progress Way forward
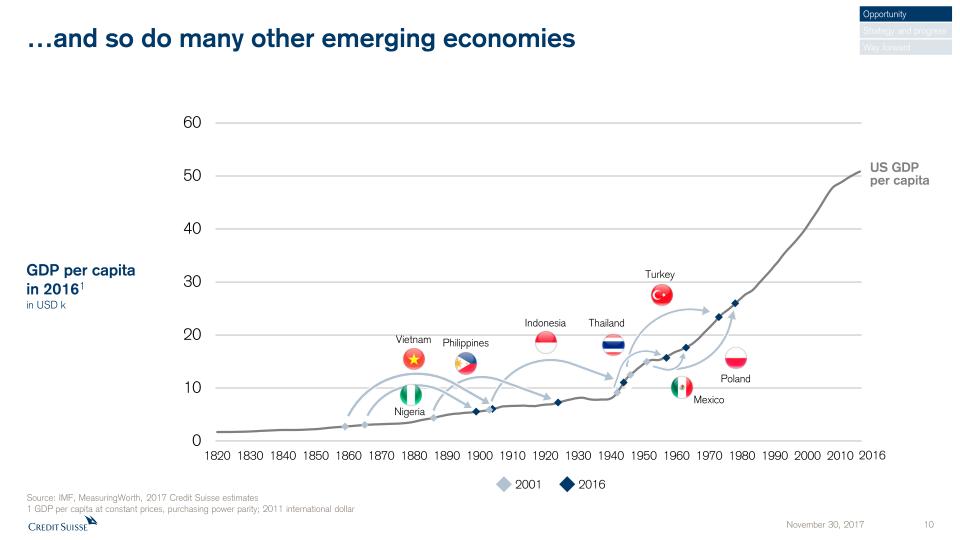
…and so do many other emerging economies GDP per capitain 20161in USD k Source: IMF, MeasuringWorth, 2017 Credit Suisse estimates1 GDP per capita at constant prices, purchasing power parity; 2011 international dollar Vietnam Philippines Thailand 2016 Mexico Nigeria Turkey Poland 2016 2001 Opportunity Strategy and progress Way forward US GDP per capita Indonesia
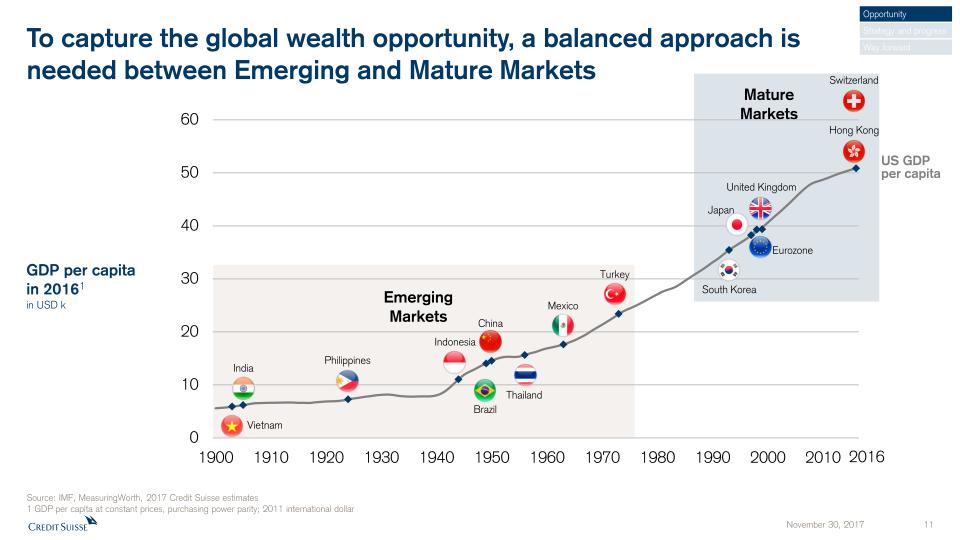
Emerging Markets MatureMarkets To capture the global wealth opportunity, a balanced approach isneeded between Emerging and Mature Markets GDP per capitain 20161in USD k Source: IMF, MeasuringWorth, 2017 Credit Suisse estimates1 GDP per capita at constant prices, purchasing power parity; 2011 international dollar Vietnam India Philippines Indonesia Brazil China Thailand Mexico South Korea Hong Kong Japan United Kingdom Eurozone Switzerland 2016 Turkey Opportunity Strategy and progress Way forward US GDP per capita
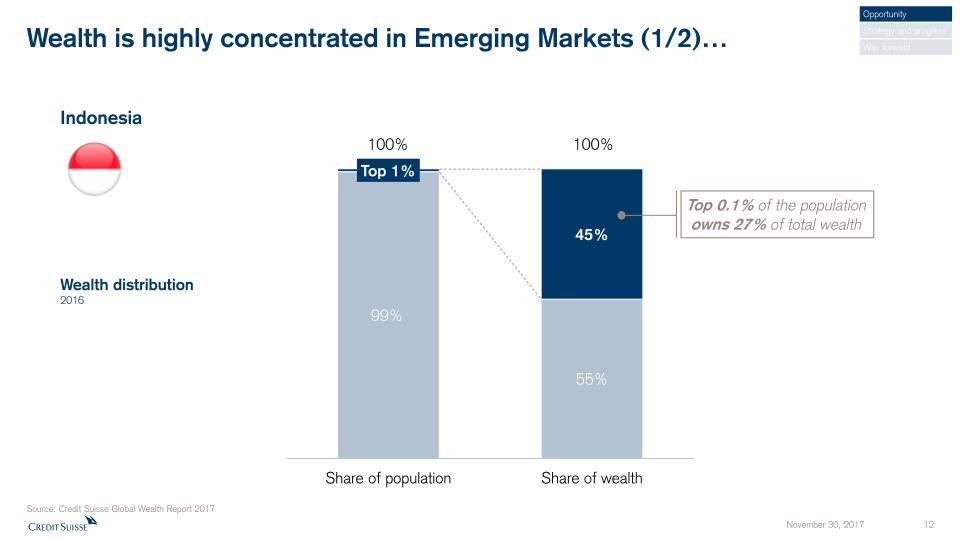
Wealth is highly concentrated in Emerging Markets (1/2)… Source: Credit Suisse Global Wealth Report 2017 Opportunity Strategy and progress Way forward Wealth distribution2016 100% 100% Top 0.1% of the population owns 27% of total wealth Indonesia
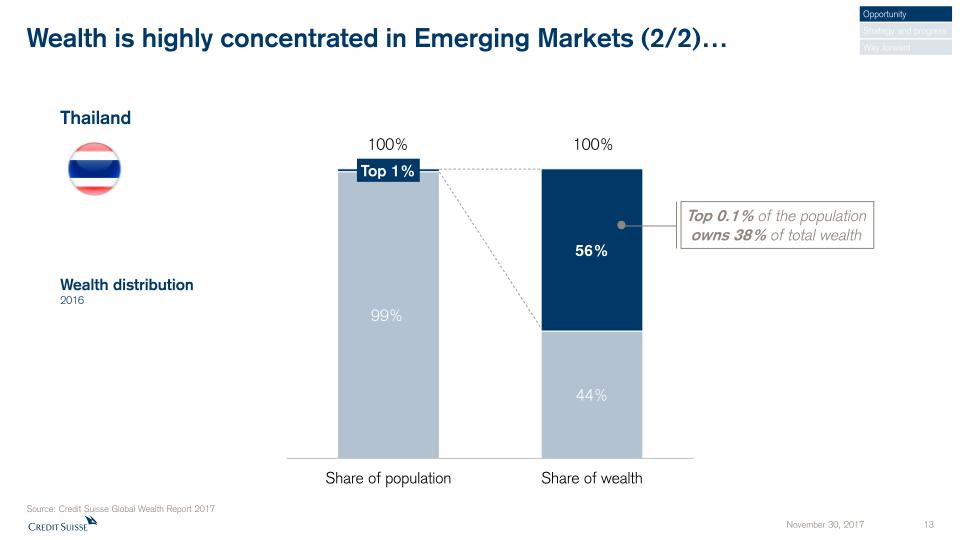
Wealth is highly concentrated in Emerging Markets (2/2)… Thailand Source: Credit Suisse Global Wealth Report 2017 Opportunity Strategy and progress Way forward Wealth distribution2016 100% 100% Top 0.1% of the population owns 38% of total wealth

Astor Ford Gould Vanderbilt Rockefeller Field Carnegie Mellon Weyerhaeuser …as all wealth is created by entrepreneurs Opportunity Strategy and progress Way forward

Wealth creation in Emerging Markets is mostly driven by first andsecond generation entrepreneurs Emerging Markets generational ownership of family-owned companies Source: Credit Suisse Research Institute, “The CS Family 1000” as of September 27, 2017 Opportunity Strategy and progress Way forward
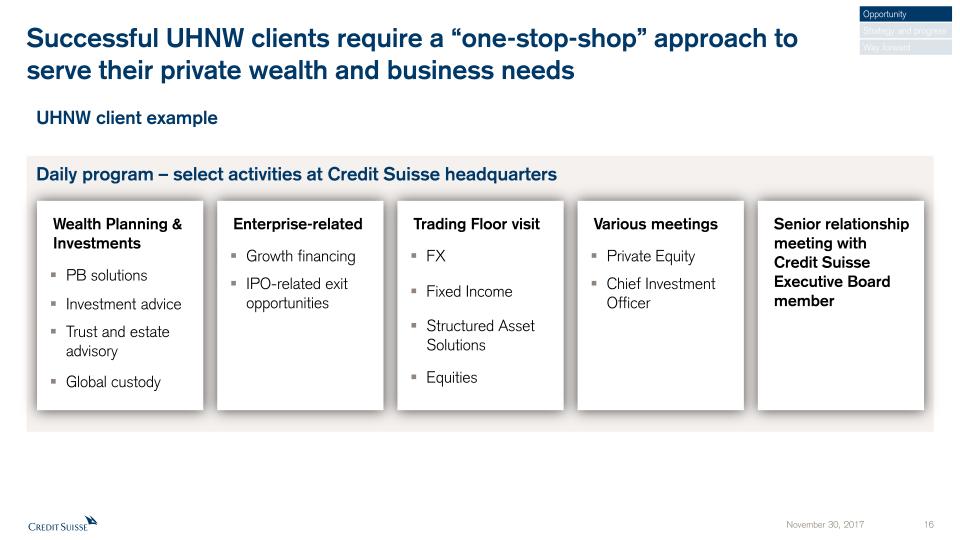
Successful UHNW clients require a “one-stop-shop” approach toserve their private wealth and business needs Daily program – select activities at Credit Suisse headquarters UHNW client example Trading Floor visitFXFixed IncomeStructured Asset SolutionsEquities Senior relationship meeting withCredit Suisse Executive Board member Various meetingsPrivate EquityChief Investment Officer Wealth Planning & InvestmentsPB solutionsInvestment adviceTrust and estate advisoryGlobal custody Enterprise-relatedGrowth financingIPO-related exit opportunities Opportunity Strategy and progress Way forward
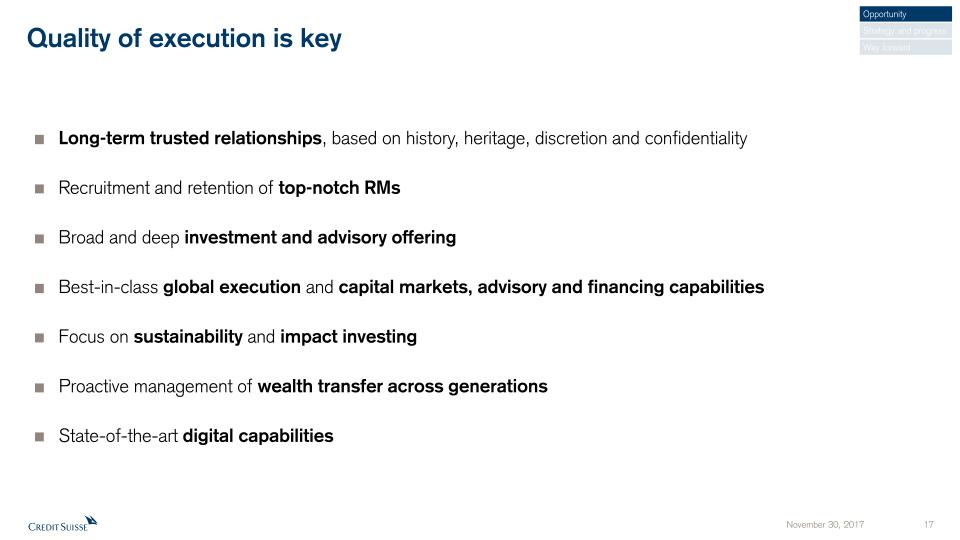
Quality of execution is key Long-term trusted relationships, based on history, heritage, discretion and confidentialityRecruitment and retention of top-notch RMsBroad and deep investment and advisory offeringBest-in-class global execution and capital markets, advisory and financing capabilitiesFocus on sustainability and impact investingProactive management of wealth transfer across generationsState-of-the-art digital capabilities Opportunity Strategy and progress Way forward
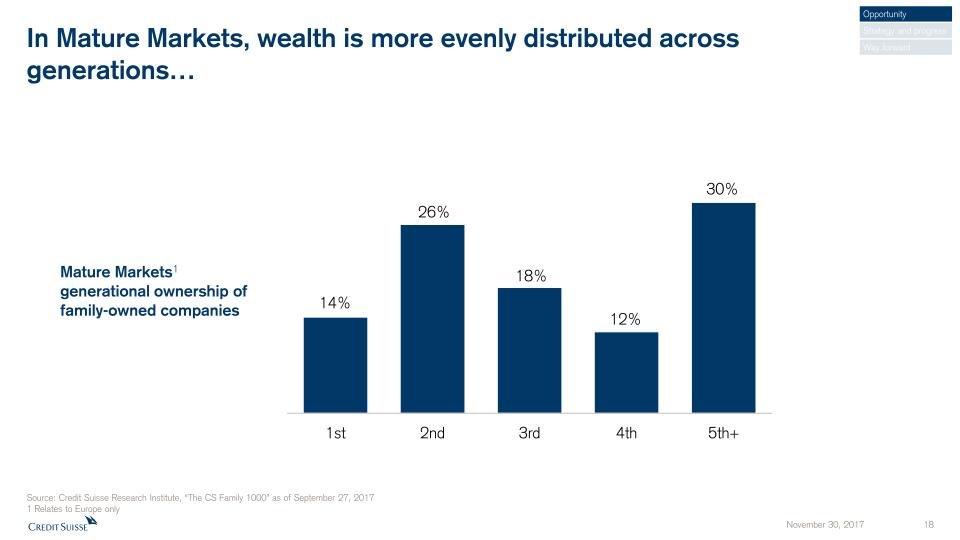
Mature Markets1generational ownership of family-owned companies In Mature Markets, wealth is more evenly distributed acrossgenerations… Source: Credit Suisse Research Institute, “The CS Family 1000” as of September 27, 20171 Relates to Europe only Opportunity Strategy and progress Way forward
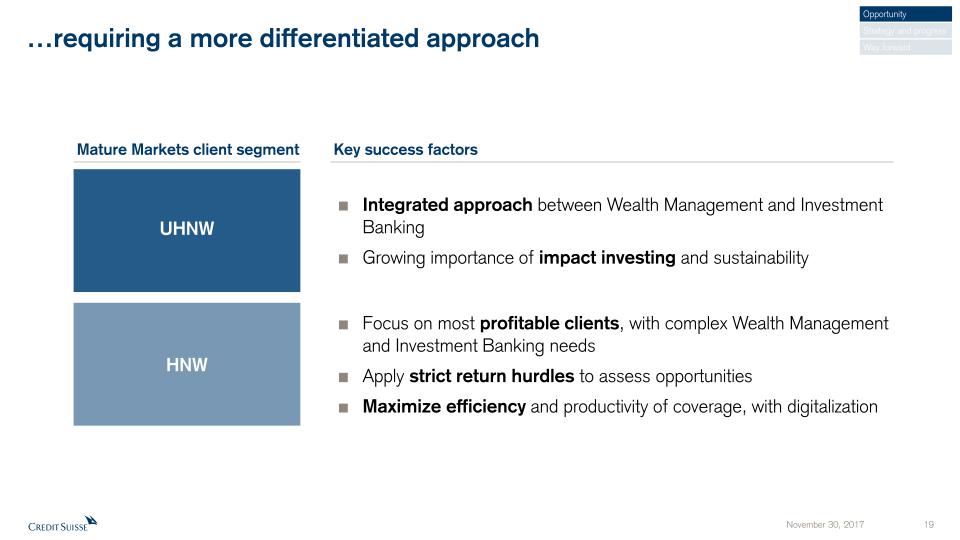
…requiring a more differentiated approach UHNW Integrated approach between Wealth Management and Investment BankingGrowing importance of impact investing and sustainability HNW Mature Markets client segment Key success factors Focus on most profitable clients, with complex Wealth Management and Investment Banking needsApply strict return hurdles to assess opportunitiesMaximize efficiency and productivity of coverage, with digitalization Opportunity Strategy and progress Way forward
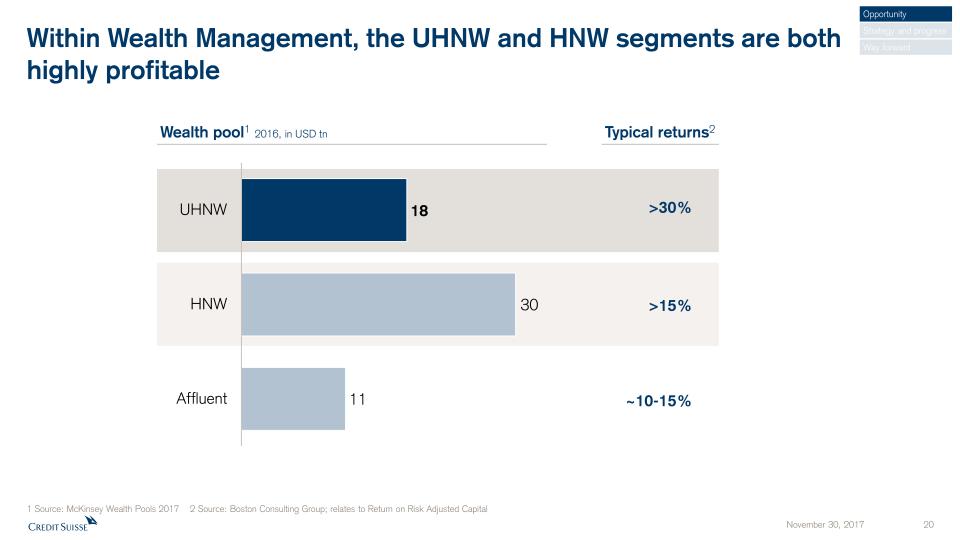
Within Wealth Management, the UHNW and HNW segments are bothhighly profitable 1 Source: McKinsey Wealth Pools 2017 2 Source: Boston Consulting Group; relates to Return on Risk Adjusted Capital ~10-15% >15% Wealth pool1 2016, in USD tn Typical returns2 >30% Opportunity Strategy and progress Way forward
Our strategy A leading Wealth Manager… …with strong Investment Banking capabilities Opportunity Strategy and progress Way forward
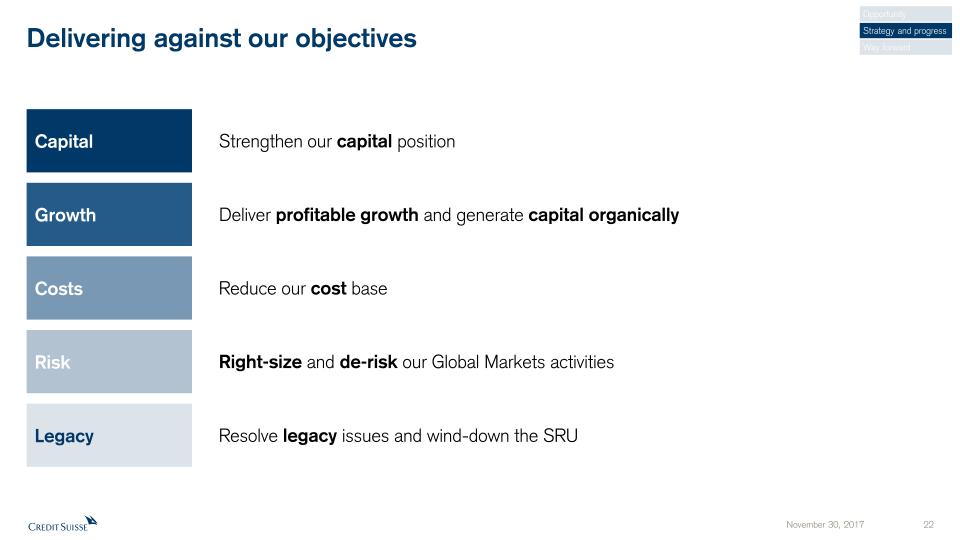
Delivering against our objectives Costs Reduce our cost base Risk Right-size and de-risk our Global Markets activities Capital Strengthen our capital position Legacy Resolve legacy issues and wind-down the SRU Growth Deliver profitable growth and generate capital organically Opportunity Strategy and progress Way forward
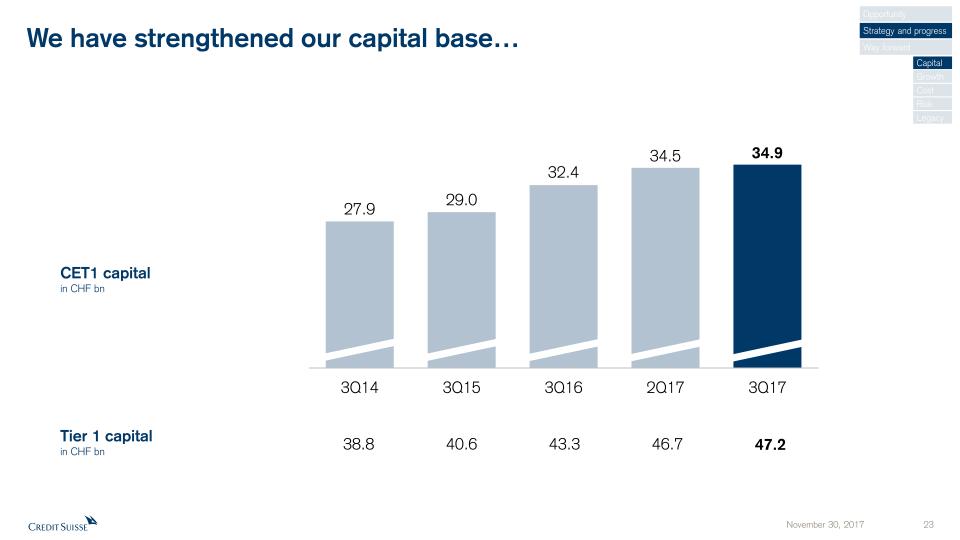
We have strengthened our capital base… CET1 capital in CHF bn 40.6 Tier 1 capitalin CHF bn 43.3 47.2 38.8 46.7 Opportunity Strategy and progress Way forward Capital Growth Cost Risk Legacy
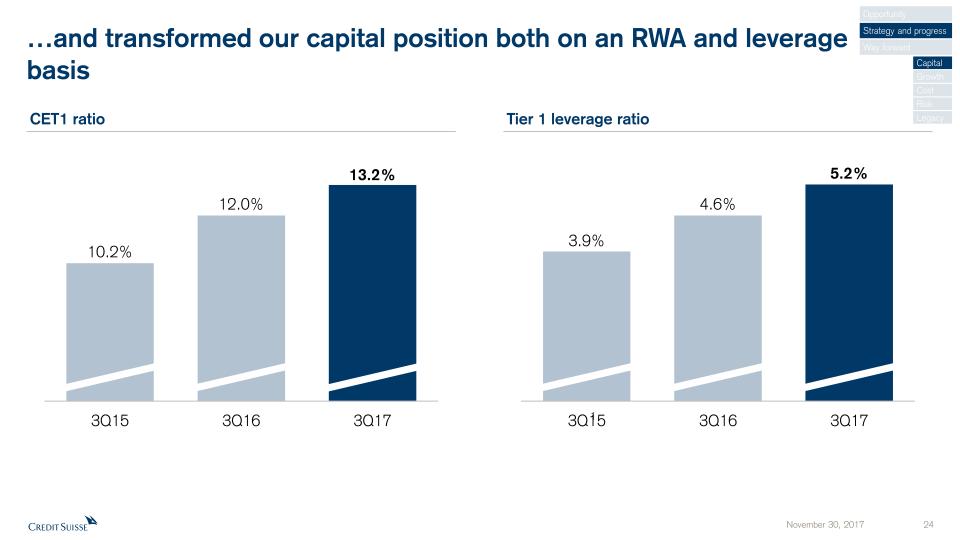
…and transformed our capital position both on an RWA and leveragebasis CET1 ratio Tier 1 leverage ratio 1 Opportunity Strategy and progress Way forward Capital Growth Cost Risk Legacy

We are allocating increasing amounts of capital towards Wealth Management and IBCM as we right-size our Markets activities… 1 Includes Global Markets, APAC Markets and SRU. SRU excludes operational risk RWA of CHF 19 bn in 2Q15 and CHF 20 bn in 3Q17 SUB, IWM, APAC WM&C and IBCM RWA in CHF bn Markets activities RWA1 in CHF bn -33% +20% Opportunity Strategy and progress Way forward Capital Growth Cost Risk Legacy
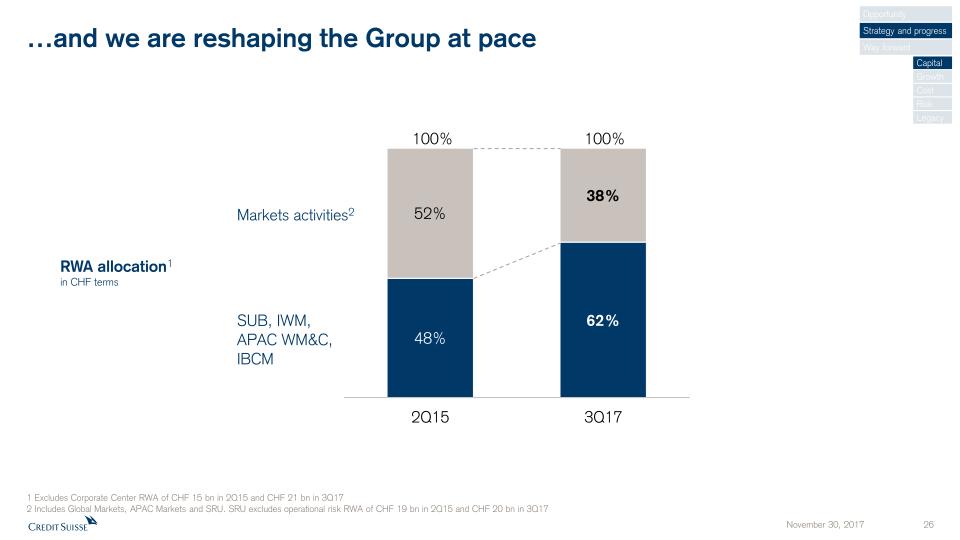
…and we are reshaping the Group at pace 1 Excludes Corporate Center RWA of CHF 15 bn in 2Q15 and CHF 21 bn in 3Q172 Includes Global Markets, APAC Markets and SRU. SRU excludes operational risk RWA of CHF 19 bn in 2Q15 and CHF 20 bn in 3Q17 SUB, IWM, APAC WM&C, IBCM Markets activities2 RWA allocation1in CHF terms 100% 100% Opportunity Strategy and progress Way forward Capital Growth Cost Risk Legacy
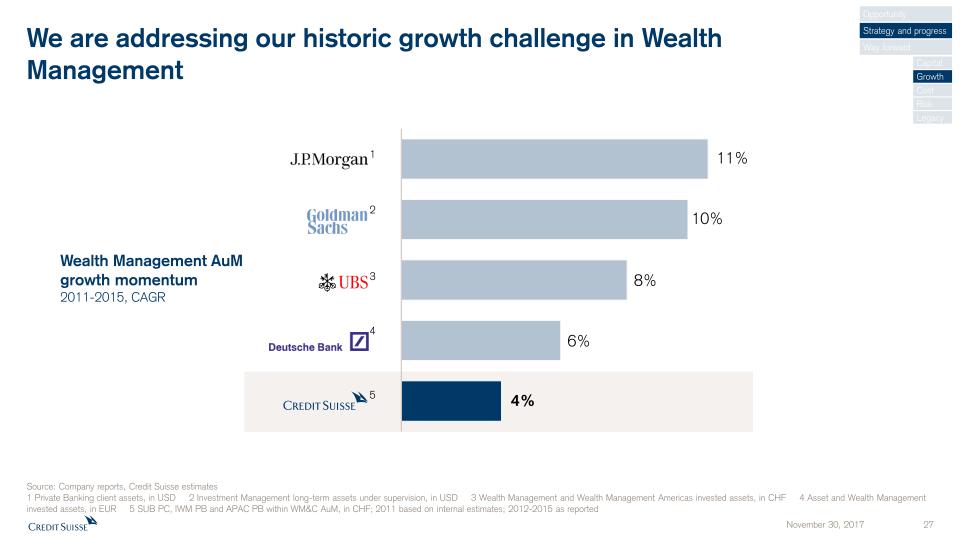
We are addressing our historic growth challenge in WealthManagement Wealth Management AuMgrowth momentum2011-2015, CAGR 1 2 4 3 5 Source: Company reports, Credit Suisse estimates1 Private Banking client assets, in USD 2 Investment Management long-term assets under supervision, in USD 3 Wealth Management and Wealth Management Americas invested assets, in CHF 4 Asset and Wealth Management invested assets, in EUR 5 SUB PC, IWM PB and APAC PB within WM&C AuM, in CHF; 2011 based on internal estimates; 2012-2015 as reported Opportunity Strategy and progress Way forward Capital Growth Cost Risk Legacy
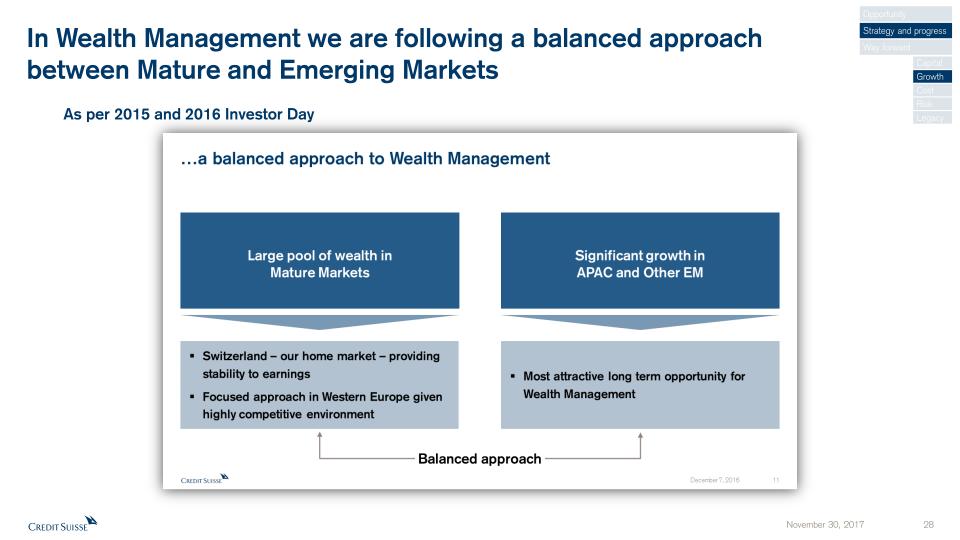
In Wealth Management we are following a balanced approachbetween Mature and Emerging Markets As per 2015 and 2016 Investor Day Opportunity Strategy and progress Way forward Capital Growth Cost Risk Legacy
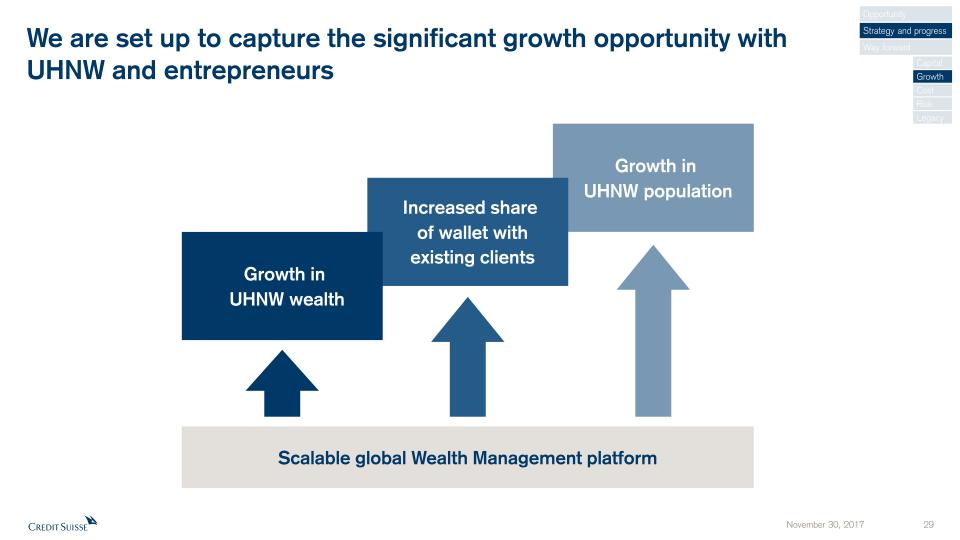
We are set up to capture the significant growth opportunity withUHNW and entrepreneurs Scalable global Wealth Management platform Growth in UHNW population Increased share of wallet withexisting clients Growth in UHNW wealth Opportunity Strategy and progress Way forward Capital Growth Cost Risk Legacy
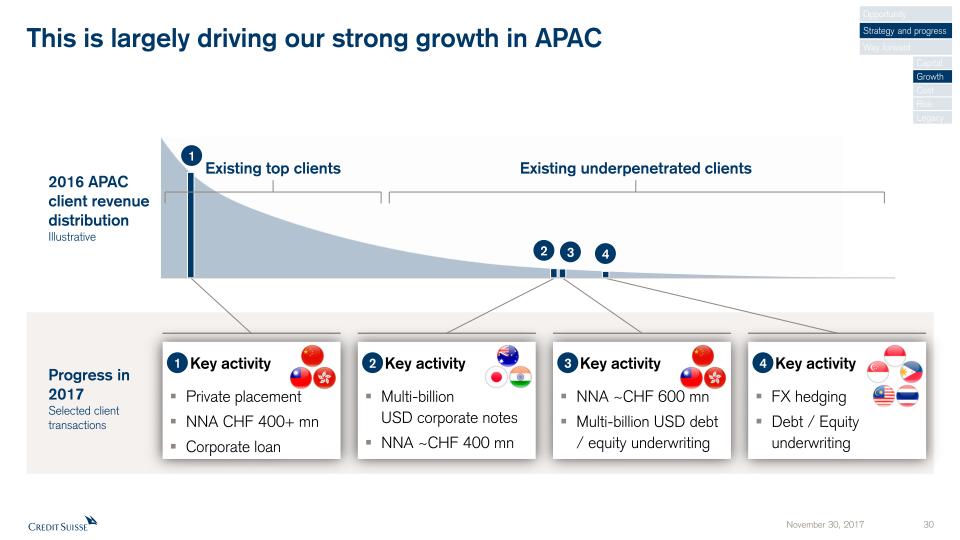
2016 APAC client revenue distributionIllustrative Multi-billionUSD corporate notesNNA ~CHF 400 mn This is largely driving our strong growth in APAC FX hedgingDebt / Equity underwriting NNA ~CHF 600 mnMulti-billion USD debt / equity underwriting Private placementNNA CHF 400+ mnCorporate loan Progress in 2017Selected client transactions Opportunity Strategy and progress Way forward Capital Growth Cost Risk Legacy 2 3 4 Existing underpenetrated clients Existing top clients 1 1 2 3 4 Key activity Key activity Key activity Key activity
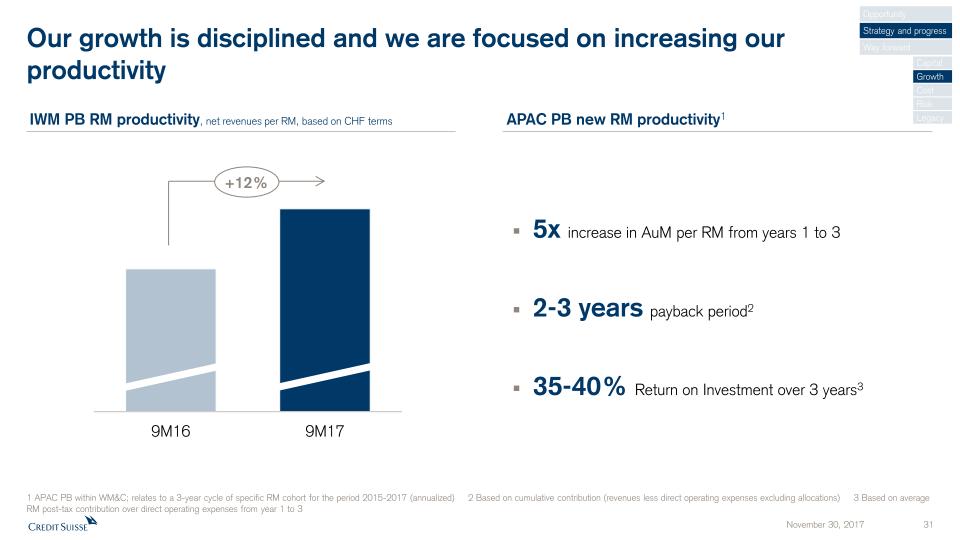
Our growth is disciplined and we are focused on increasing ourproductivity APAC PB new RM productivity1 IWM PB RM productivity, net revenues per RM, based on CHF terms +12% 1 APAC PB within WM&C; relates to a 3-year cycle of specific RM cohort for the period 2015-2017 (annualized) 2 Based on cumulative contribution (revenues less direct operating expenses excluding allocations) 3 Based on average RM post-tax contribution over direct operating expenses from year 1 to 3 5x increase in AuM per RM from years 1 to 32-3 years payback period235-40% Return on Investment over 3 years3 Opportunity Strategy and progress Way forward Capital Growth Cost Risk Legacy
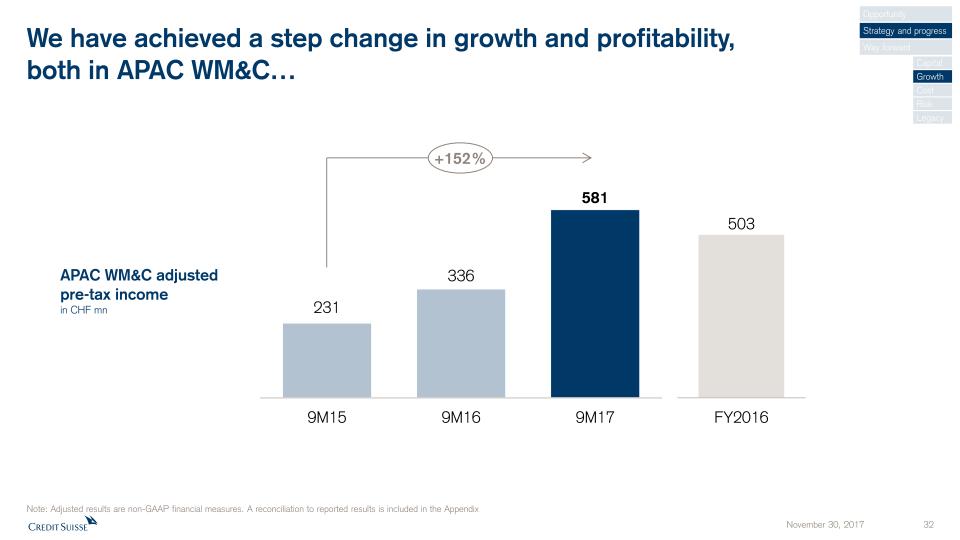
We have achieved a step change in growth and profitability,both in APAC WM&C… Note: Adjusted results are non-GAAP financial measures. A reconciliation to reported results is included in the Appendix +152% APAC WM&C adjustedpre-tax incomein CHF mn Opportunity Strategy and progress Way forward Capital Growth Cost Risk Legacy
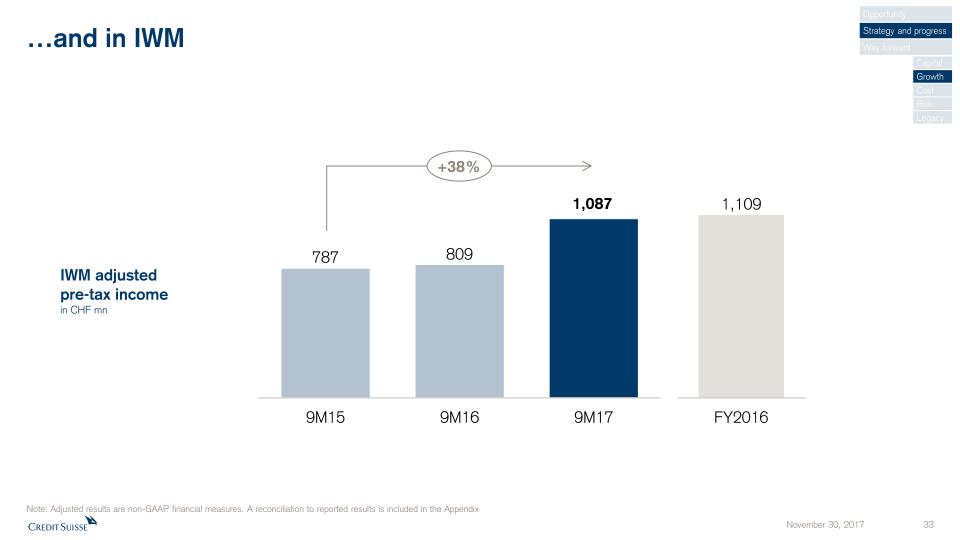
…and in IWM Note: Adjusted results are non-GAAP financial measures. A reconciliation to reported results is included in the Appendix +38% IWM adjustedpre-tax incomein CHF mn Opportunity Strategy and progress Way forward Capital Growth Cost Risk Legacy
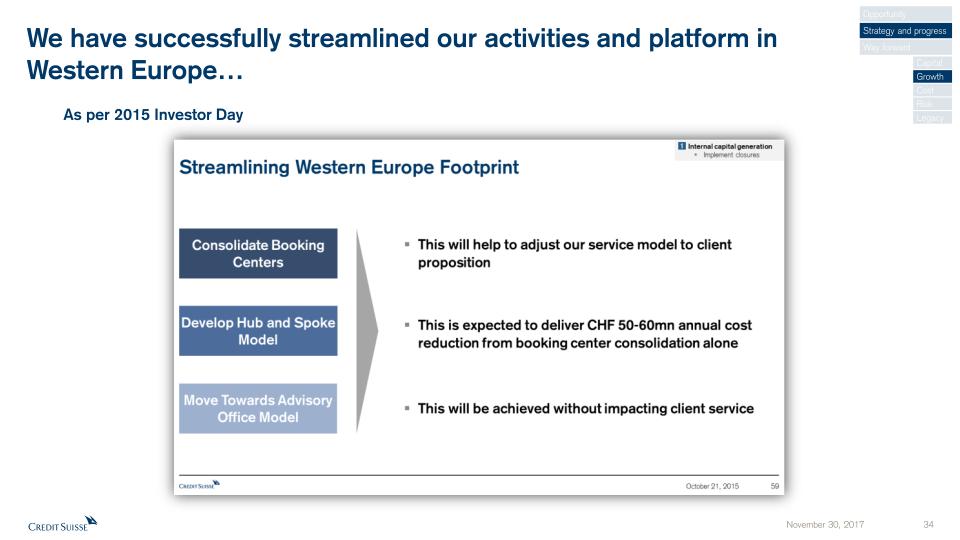
We have successfully streamlined our activities and platform inWestern Europe… Opportunity Strategy and progress Way forward Capital Growth Cost Risk Legacy As per 2015 Investor Day

positive negative …and returned to profitability through positive operating leverage… Revenues Operating expenses Pre-tax income IWM Europepre-tax incomein CHF mn 9M16 9M17 -12% +13% Opportunity Strategy and progress Way forward + >100 mn Capital Growth Cost Risk Legacy
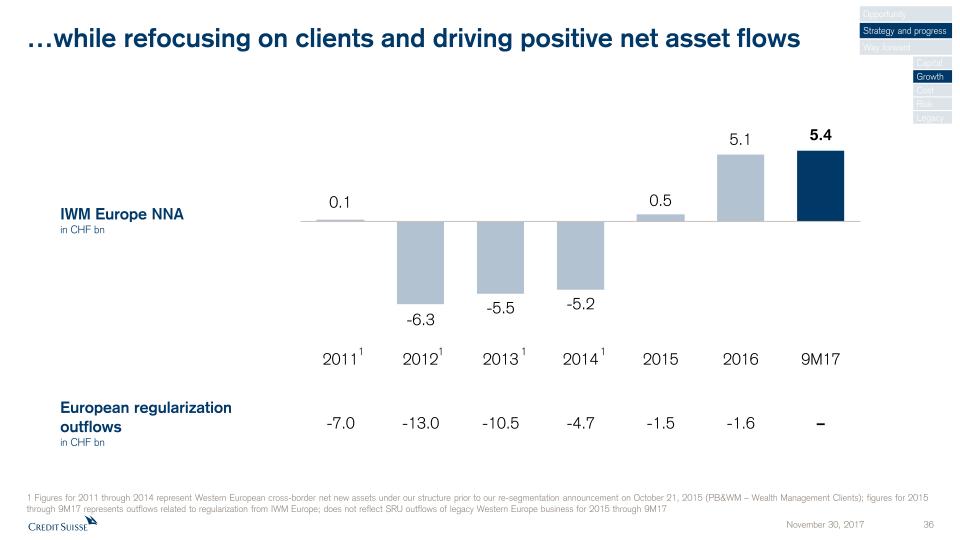
…while refocusing on clients and driving positive net asset flows European regularization outflowsin CHF bn IWM Europe NNAin CHF bn 1 1 1 1 -13.0 -7.0 -10.5 -4.7 -1.5 -1.6 – 1 Figures for 2011 through 2014 represent Western European cross-border net new assets under our structure prior to our re-segmentation announcement on October 21, 2015 (PB&WM – Wealth Management Clients); figures for 2015 through 9M17 represents outflows related to regularization from IWM Europe; does not reflect SRU outflows of legacy Western Europe business for 2015 through 9M17 Opportunity Strategy and progress Way forward Capital Growth Cost Risk Legacy
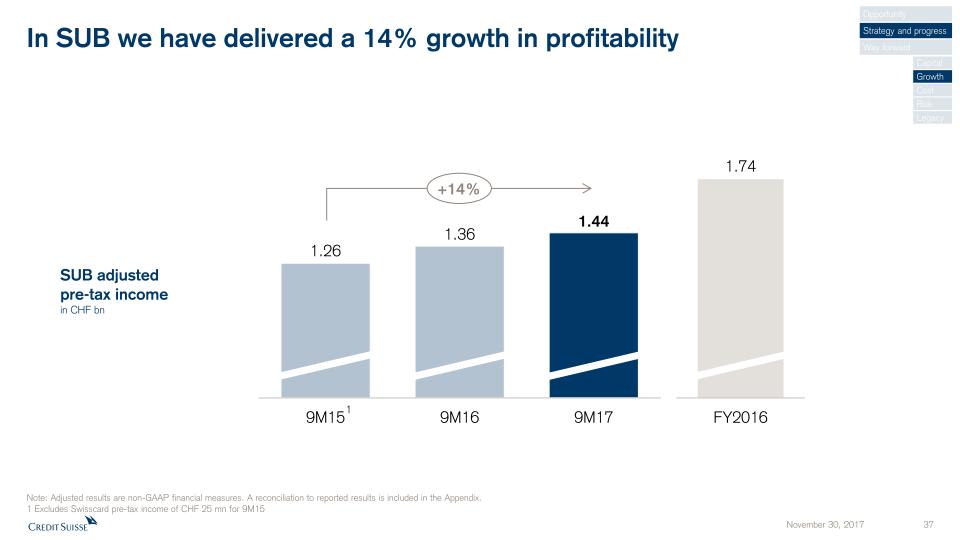
In SUB we have delivered a 14% growth in profitability Note: Adjusted results are non-GAAP financial measures. A reconciliation to reported results is included in the Appendix. 1 Excludes Swisscard pre-tax income of CHF 25 mn for 9M15 1 SUB adjustedpre-tax incomein CHF bn +14% Opportunity Strategy and progress Way forward Capital Growth Cost Risk Legacy
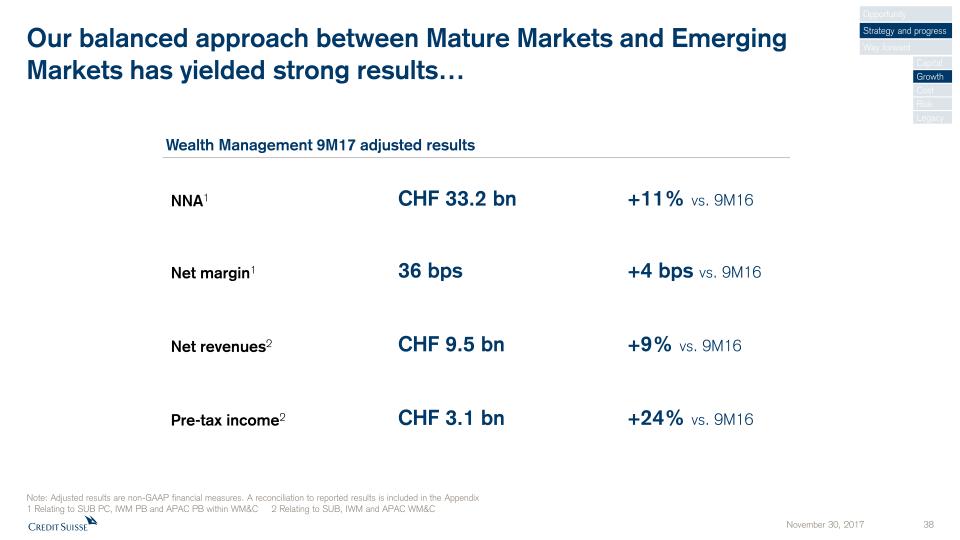
Our balanced approach between Mature Markets and EmergingMarkets has yielded strong results… Net margin1 Net revenues2 NNA1 CHF 33.2 bn 36 bps +9% vs. 9M16 Note: Adjusted results are non-GAAP financial measures. A reconciliation to reported results is included in the Appendix1 Relating to SUB PC, IWM PB and APAC PB within WM&C 2 Relating to SUB, IWM and APAC WM&C CHF 9.5 bn Wealth Management 9M17 adjusted results +4 bps vs. 9M16 +11% vs. 9M16 Pre-tax income2 +24% vs. 9M16 CHF 3.1 bn Opportunity Strategy and progress Way forward Capital Growth Cost Risk Legacy
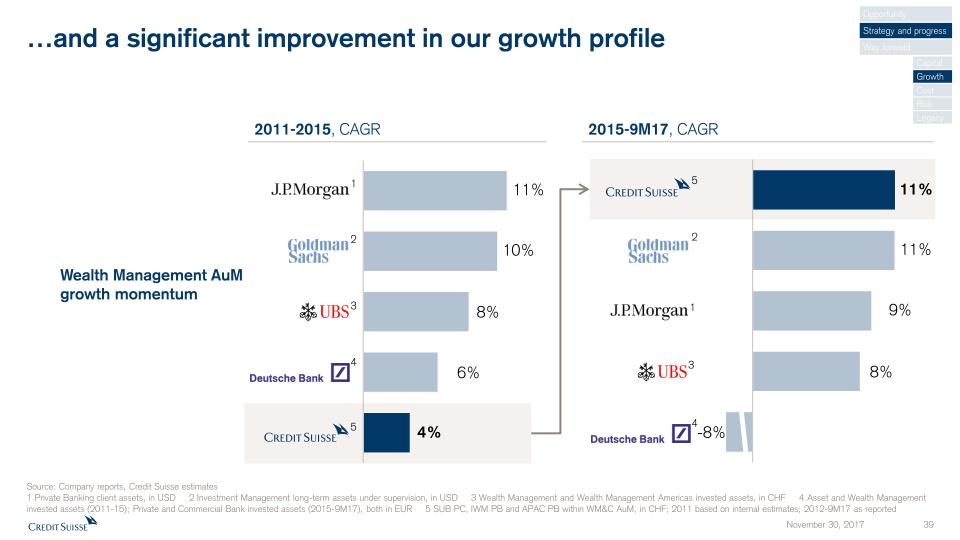
…and a significant improvement in our growth profile Wealth Management AuMgrowth momentum 2011-2015, CAGR 2015-9M17, CAGR 1 2 4 3 5 5 3 2 4 1 Source: Company reports, Credit Suisse estimates1 Private Banking client assets, in USD 2 Investment Management long-term assets under supervision, in USD 3 Wealth Management and Wealth Management Americas invested assets, in CHF 4 Asset and Wealth Management invested assets (2011-15); Private and Commercial Bank invested assets (2015-9M17), both in EUR 5 SUB PC, IWM PB and APAC PB within WM&C AuM, in CHF; 2011 based on internal estimates; 2012-9M17 as reported Opportunity Strategy and progress Way forward Capital Growth Cost Risk Legacy
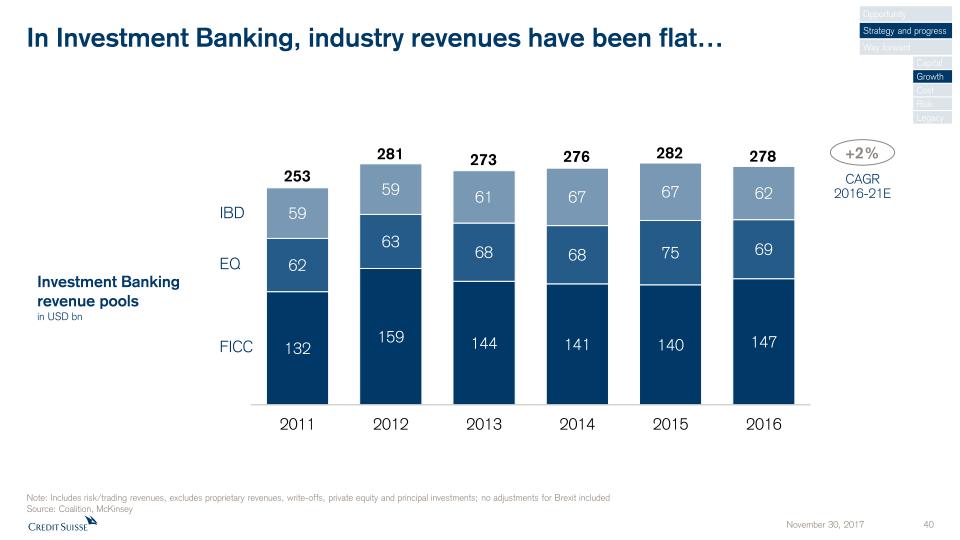
In Investment Banking, industry revenues have been flat… Note: Includes risk/trading revenues, excludes proprietary revenues, write-offs, private equity and principal investments; no adjustments for Brexit includedSource: Coalition, McKinsey Investment Banking revenue poolsin USD bn FICC IBD EQ +2% 253 281 273 276 282 278 CAGR2016-21E Opportunity Strategy and progress Way forward Capital Growth Cost Risk Legacy
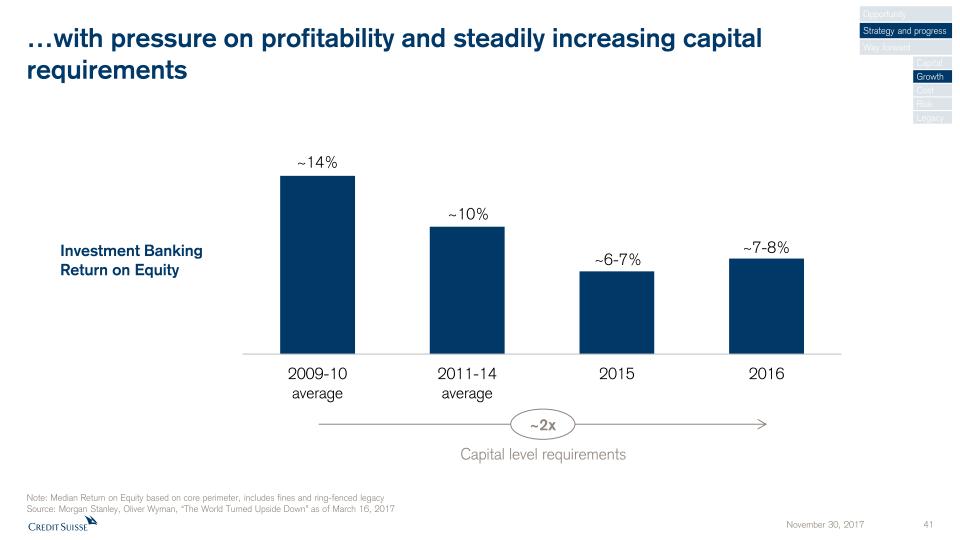
…with pressure on profitability and steadily increasing capitalrequirements Note: Median Return on Equity based on core perimeter, includes fines and ring-fenced legacySource: Morgan Stanley, Oliver Wyman, “The World Turned Upside Down” as of March 16, 2017 Investment BankingReturn on Equity ~2x Capital level requirements Opportunity Strategy and progress Way forward Capital Growth Cost Risk Legacy
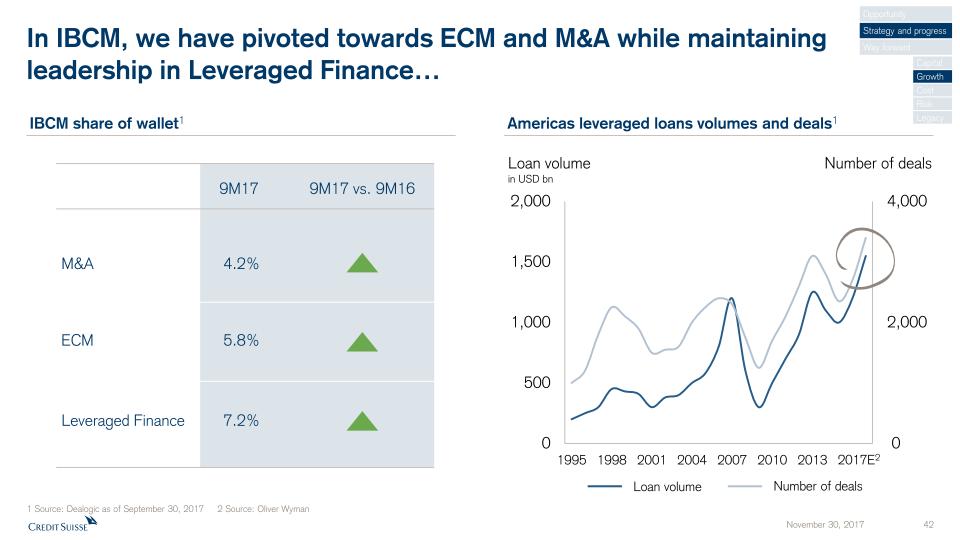
In IBCM, we have pivoted towards ECM and M&A while maintaining leadership in Leveraged Finance… M&A ECM Leveraged Finance 9M17 vs. 9M16 Americas leveraged loans volumes and deals1 IBCM share of wallet1 9M17 4.2% 5.8% 7.2% 1 Source: Dealogic as of September 30, 2017 2 Source: Oliver Wyman Loan volume in USD bn Number of deals Number of deals Loan volume Opportunity Strategy and progress Way forward Capital Growth Cost Risk Legacy 2017E2
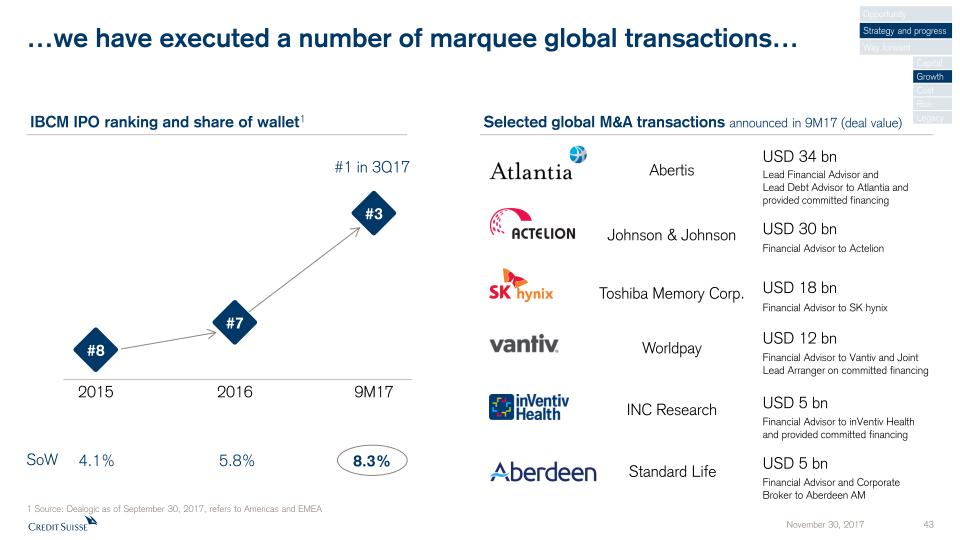
…we have executed a number of marquee global transactions… Selected global M&A transactions announced in 9M17 (deal value) IBCM IPO ranking and share of wallet1 1 Source: Dealogic as of September 30, 2017, refers to Americas and EMEA SoW 8.3% 5.8% 4.1% #1 in 3Q17 Abertis USD 34 bn Lead Financial Advisor and Lead Debt Advisor to Atlantia andprovided committed financing USD 30 bn Financial Advisor to Actelion INC Research USD 5 bn Financial Advisor to inVentiv Health and provided committed financing USD 5 bn Financial Advisor and Corporate Broker to Aberdeen AM Johnson & Johnson Standard Life Worldpay USD 12 bn Financial Advisor to Vantiv and Joint Lead Arranger on committed financing Toshiba Memory Corp. USD 18 bn Financial Advisor to SK hynix Opportunity Strategy and progress Way forward Capital Growth Cost Risk Legacy
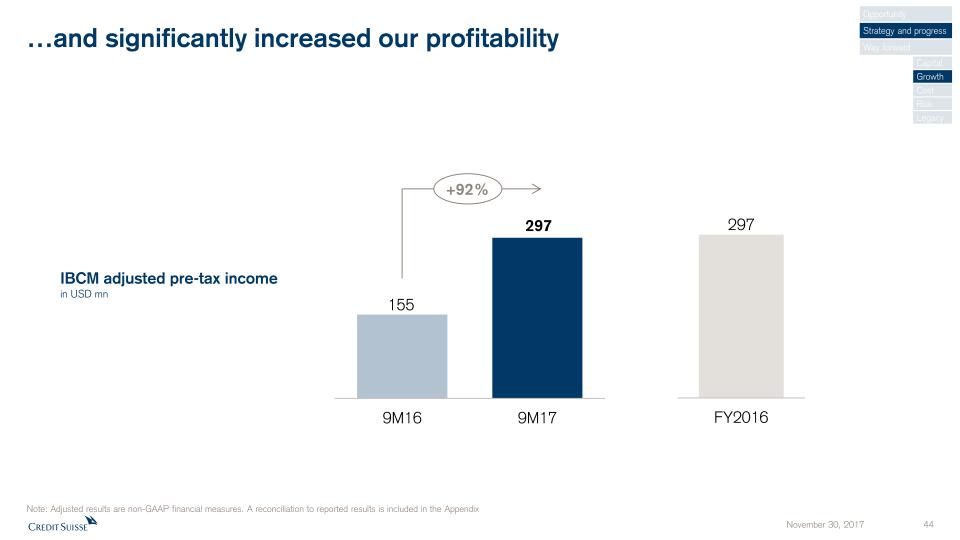
…and significantly increased our profitability IBCM adjusted pre-tax incomein USD mn +92% Note: Adjusted results are non-GAAP financial measures. A reconciliation to reported results is included in the Appendix Opportunity Strategy and progress Way forward Capital Growth Cost Risk Legacy
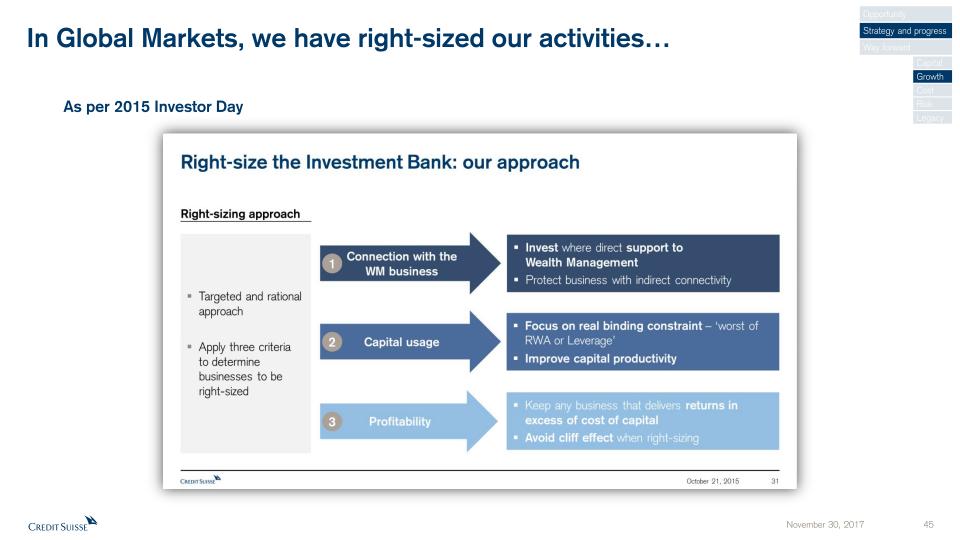
In Global Markets, we have right-sized our activities… As per 2015 Investor Day Opportunity Strategy and progress Way forward Capital Growth Cost Risk Legacy
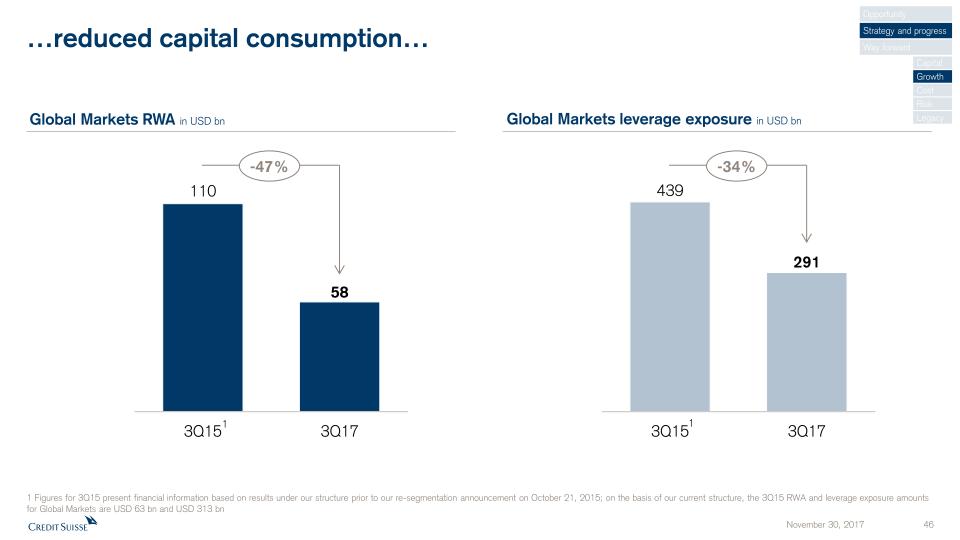
…reduced capital consumption… Global Markets leverage exposure in USD bn 1 Figures for 3Q15 present financial information based on results under our structure prior to our re-segmentation announcement on October 21, 2015; on the basis of our current structure, the 3Q15 RWA and leverage exposure amounts for Global Markets are USD 63 bn and USD 313 bn Global Markets RWA in USD bn -47% 1 -34% 1 Opportunity Strategy and progress Way forward Capital Growth Cost Risk Legacy
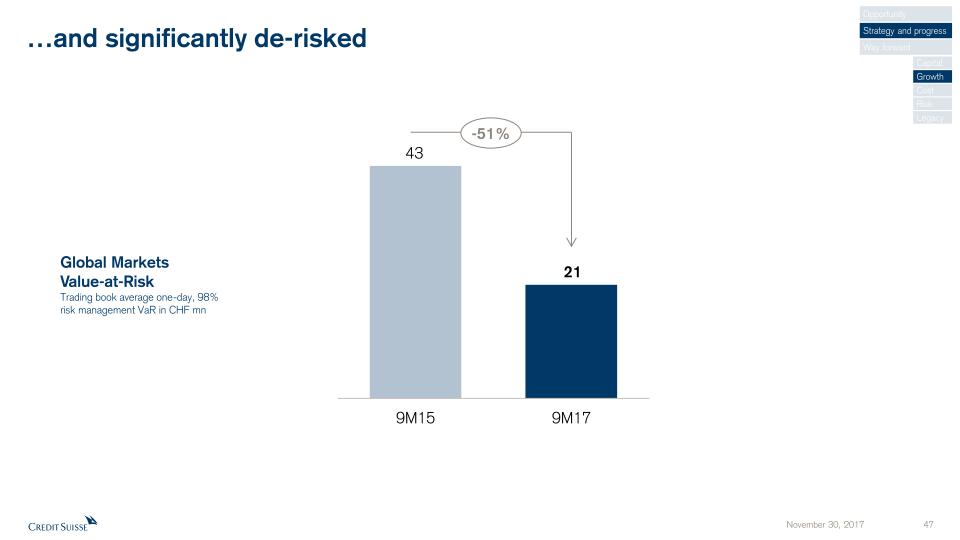
…and significantly de-risked -51% Global MarketsValue-at-RiskTrading book average one-day, 98%risk management VaR in CHF mn Opportunity Strategy and progress Way forward Capital Growth Cost Risk Legacy
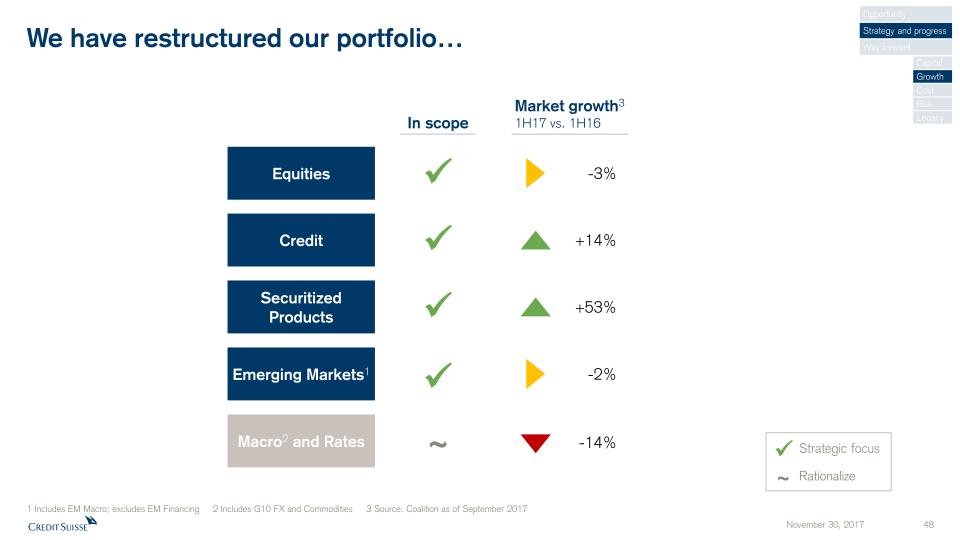
We have restructured our portfolio… Equities Credit Securitized Products In scope Market growth31H17 vs. 1H16 -3% +53% +14% 1 Includes EM Macro; excludes EM Financing 2 Includes G10 FX and Commodities 3 Source: Coalition as of September 2017 Opportunity Strategy and progress Way forward Capital Growth Cost Risk Legacy Strategic focus Rationalize Macro2 and Rates -14% ~ ~ Emerging Markets1 -2%
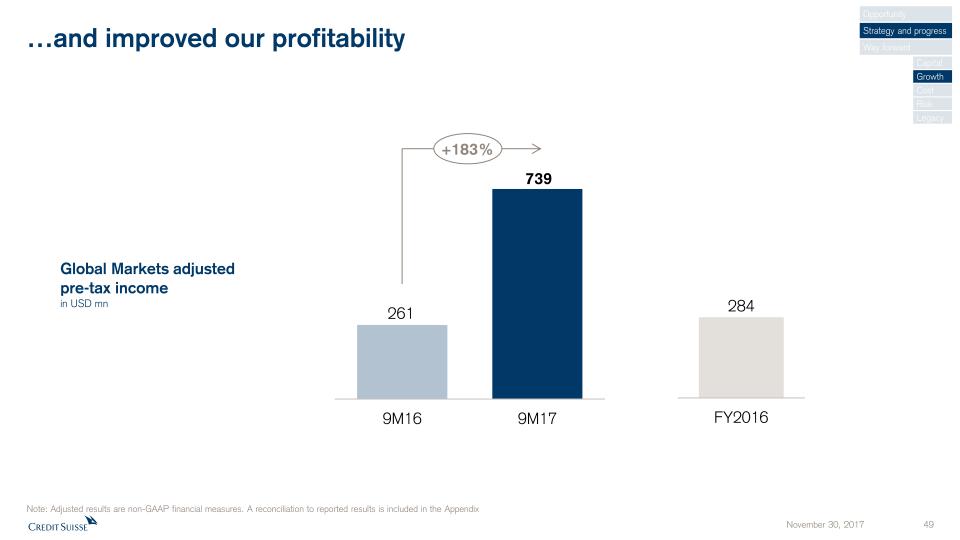
…and improved our profitability Global Markets adjusted pre-tax incomein USD mn Note: Adjusted results are non-GAAP financial measures. A reconciliation to reported results is included in the Appendix +183% Opportunity Strategy and progress Way forward Capital Growth Cost Risk Legacy
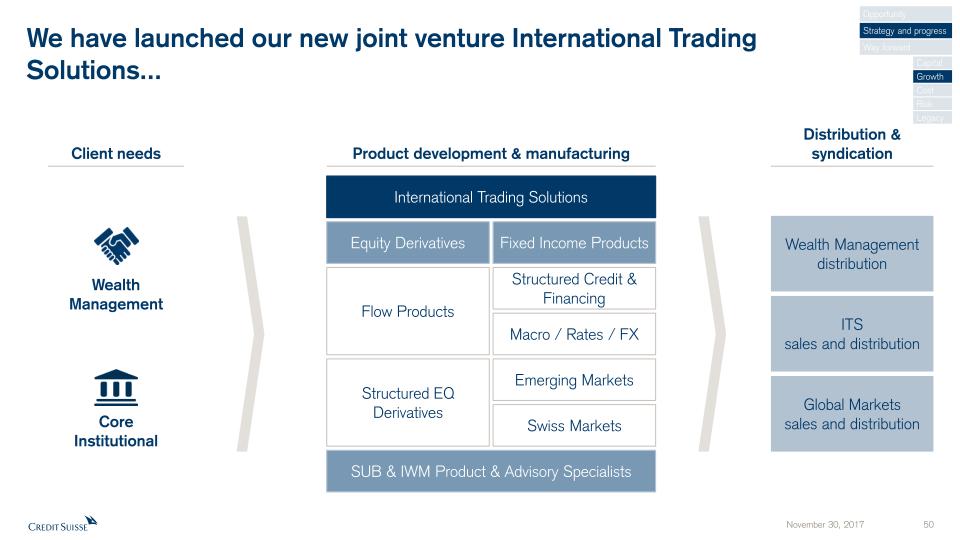
We have launched our new joint venture International TradingSolutions... Product development & manufacturing International Trading Solutions SUB & IWM Product & Advisory Specialists Equity Derivatives Fixed Income Products Flow Products Structured EQ Derivatives Structured Credit & Financing Macro / Rates / FX Emerging Markets Swiss Markets Client needs Distribution & syndication Wealth Management distribution ITSsales and distribution Global Marketssales and distribution Wealth Management Core Institutional Opportunity Strategy and progress Way forward Capital Growth Cost Risk Legacy
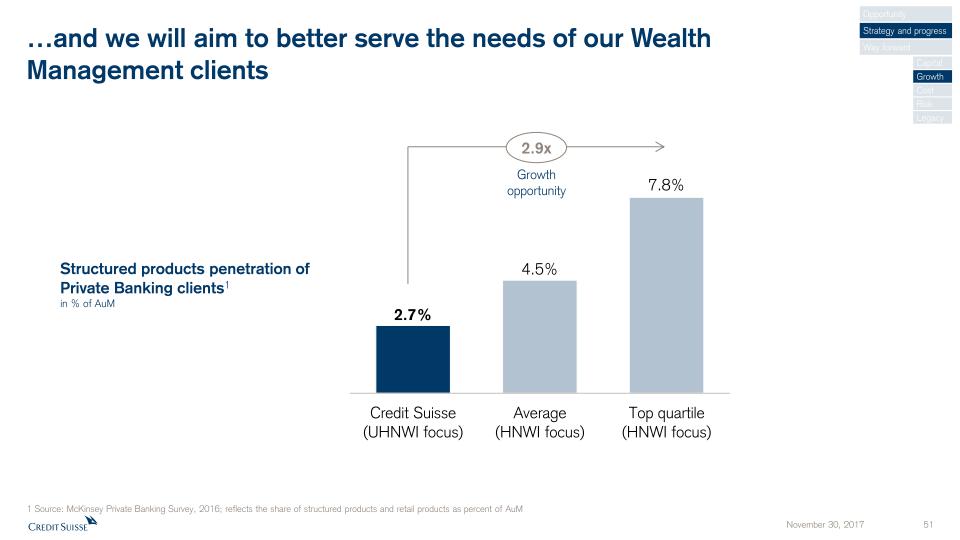
…and we will aim to better serve the needs of our WealthManagement clients 1 Source: McKinsey Private Banking Survey, 2016; reflects the share of structured products and retail products as percent of AuM 2.9x Growth opportunity Structured products penetration of Private Banking clients1in % of AuM Opportunity Strategy and progress Way forward Capital Growth Cost Risk Legacy
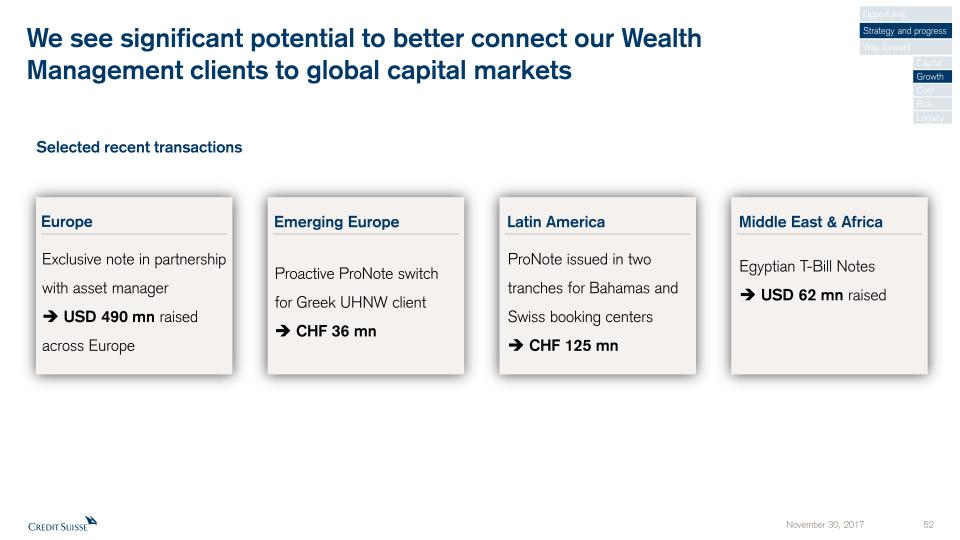
We see significant potential to better connect our WealthManagement clients to global capital markets Europe Exclusive note in partnership with asset manager USD 490 mn raised across Europe Emerging Europe Latin America Middle East & Africa Proactive ProNote switch for Greek UHNW client CHF 36 mn ProNote issued in two tranches for Bahamas and Swiss booking centers CHF 125 mn Egyptian T-Bill Notes USD 62 mn raised Selected recent transactions Opportunity Strategy and progress Way forward Capital Growth Cost Risk Legacy
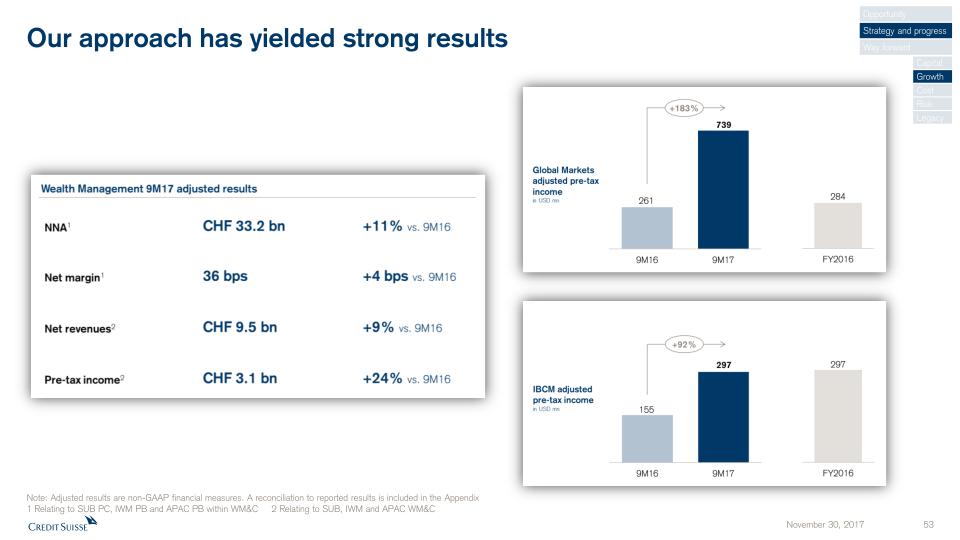
Our approach has yielded strong results Opportunity Strategy and progress Way forward Capital Growth Cost Risk Legacy Note: Adjusted results are non-GAAP financial measures. A reconciliation to reported results is included in the Appendix1 Relating to SUB PC, IWM PB and APAC PB within WM&C 2 Relating to SUB, IWM and APAC WM&C
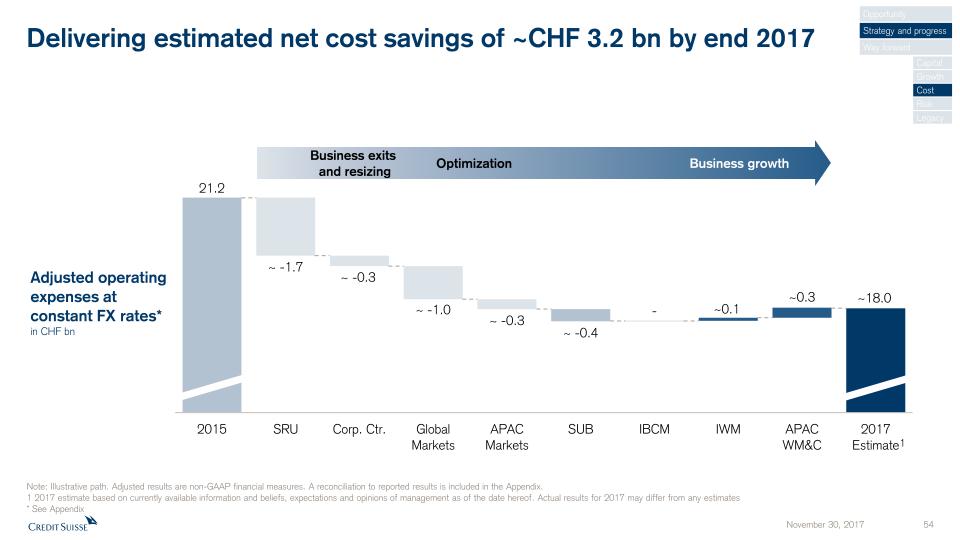
Delivering estimated net cost savings of ~CHF 3.2 bn by end 2017 Adjusted operating expenses at constant FX rates*in CHF bn Business exits and resizing Optimization Business growth Opportunity Strategy and progress Way forward Capital Growth Cost Risk Legacy Note: Illustrative path. Adjusted results are non-GAAP financial measures. A reconciliation to reported results is included in the Appendix.1 2017 estimate based on currently available information and beliefs, expectations and opinions of management as of the date hereof. Actual results for 2017 may differ from any estimates* See Appendix 1
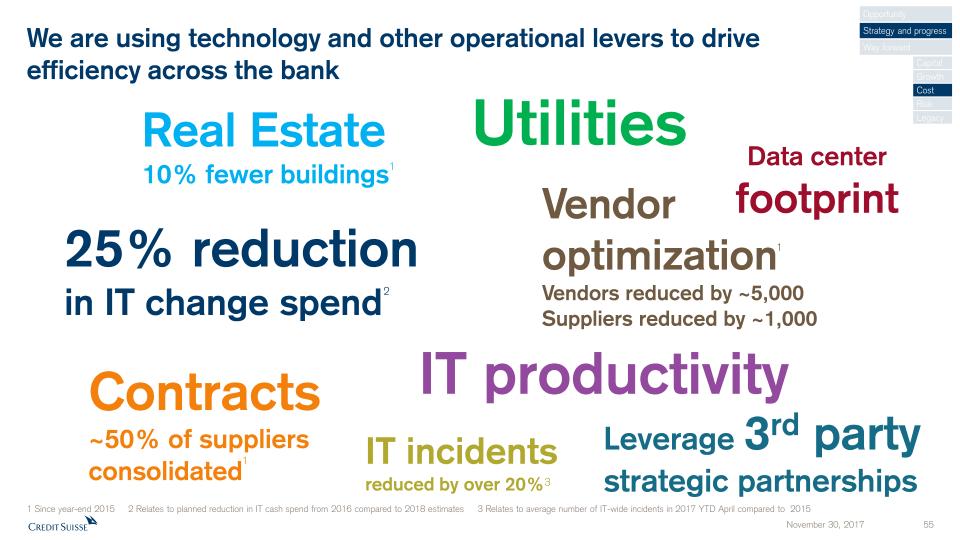
We are using technology and other operational levers to driveefficiency across the bank Real Estate10% fewer buildings IT productivity Vendor optimizationVendors reduced by ~5,000Suppliers reduced by ~1,000 Contracts~50% of suppliers consolidated Leverage 3rd party strategic partnerships Utilities Data centerfootprint 25% reductionin IT change spend IT incidents reduced by over 20%3 Opportunity Strategy and progress Way forward Capital Growth Cost Risk Legacy 1 Since year-end 2015 2 Relates to planned reduction in IT cash spend from 2016 compared to 2018 estimates 3 Relates to average number of IT-wide incidents in 2017 YTD April compared to 2015 2 1 1 1
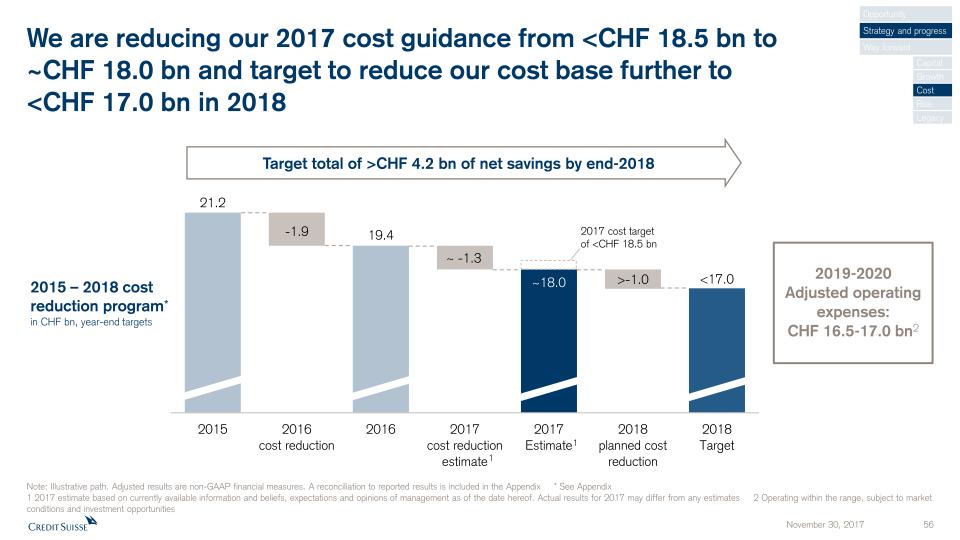
We are reducing our 2017 cost guidance from <CHF 18.5 bn to~CHF 18.0 bn and target to reduce our cost base further to <CHF 17.0 bn in 2018 Target total of >CHF 4.2 bn of net savings by end-2018 Note: Illustrative path. Adjusted results are non-GAAP financial measures. A reconciliation to reported results is included in the Appendix * See Appendix1 2017 estimate based on currently available information and beliefs, expectations and opinions of management as of the date hereof. Actual results for 2017 may differ from any estimates 2 Operating within the range, subject to market conditions and investment opportunities 2017 cost target of <CHF 18.5 bn 2015 – 2018 cost reduction program* in CHF bn, year-end targets Opportunity Strategy and progress Way forward Capital Growth Cost Risk Legacy 1 1 2019-2020Adjusted operating expenses: CHF 16.5-17.0 bn2
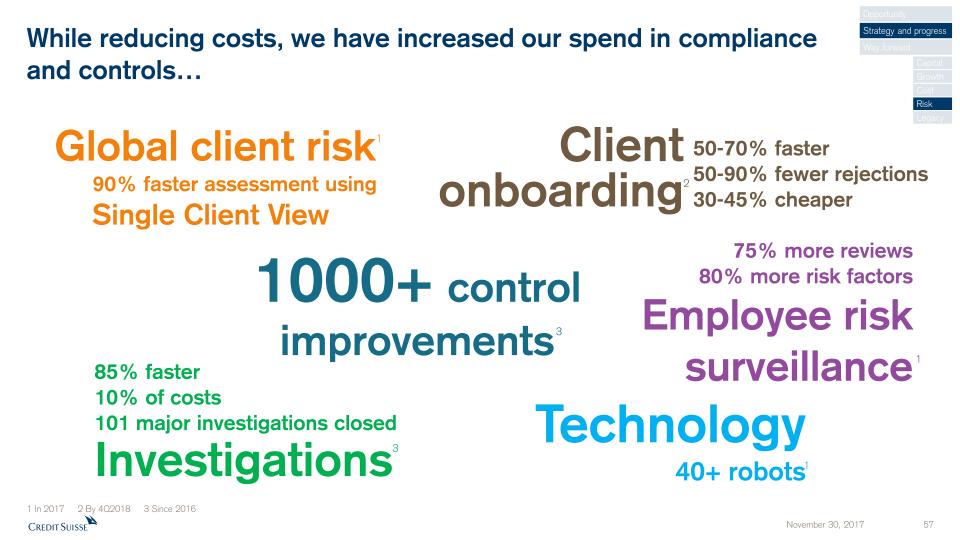
While reducing costs, we have increased our spend in complianceand controls… 1000+ controlimprovements 85% faster10% of costs101 major investigations closedInvestigations Technology40+ robots Clientonboarding Global client risk90% faster assessment using Single Client View 75% more reviews80% more risk factorsEmployee risksurveillance 50-70% faster50-90% fewer rejections30-45% cheaper Opportunity Strategy and progress Way forward Capital Growth Cost Risk Legacy 1 In 2017 2 By 4Q2018 3 Since 2016 1 1 1 2 3 3
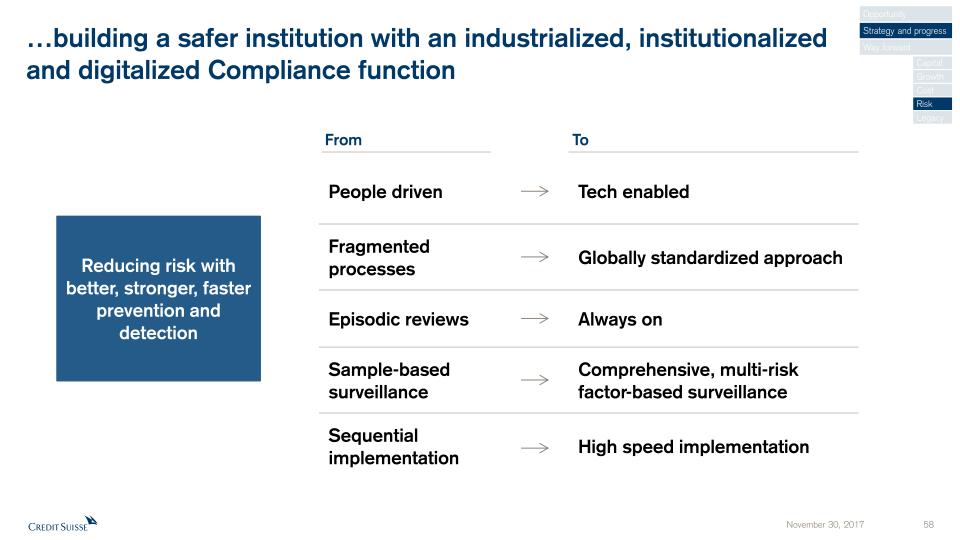
…building a safer institution with an industrialized, institutionalizedand digitalized Compliance function Reducing risk with better, stronger, faster prevention and detection People driven Tech enabled Fragmented processes Globally standardized approach Episodic reviews Always on Sample-based surveillance Comprehensive, multi-risk factor-based surveillance Sequential implementation High speed implementation From To Opportunity Strategy and progress Way forward Capital Growth Cost Risk Legacy
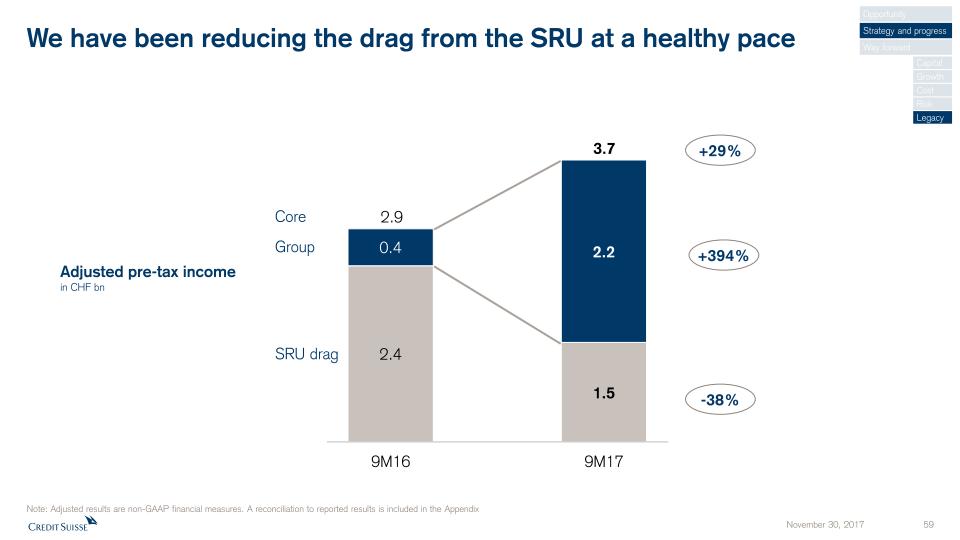
We have been reducing the drag from the SRU at a healthy pace Note: Adjusted results are non-GAAP financial measures. A reconciliation to reported results is included in the Appendix Adjusted pre-tax incomein CHF bn Core SRU drag Group +29% -38% 3.7 2.9 +394% Opportunity Strategy and progress Way forward Capital Growth Cost Risk Legacy
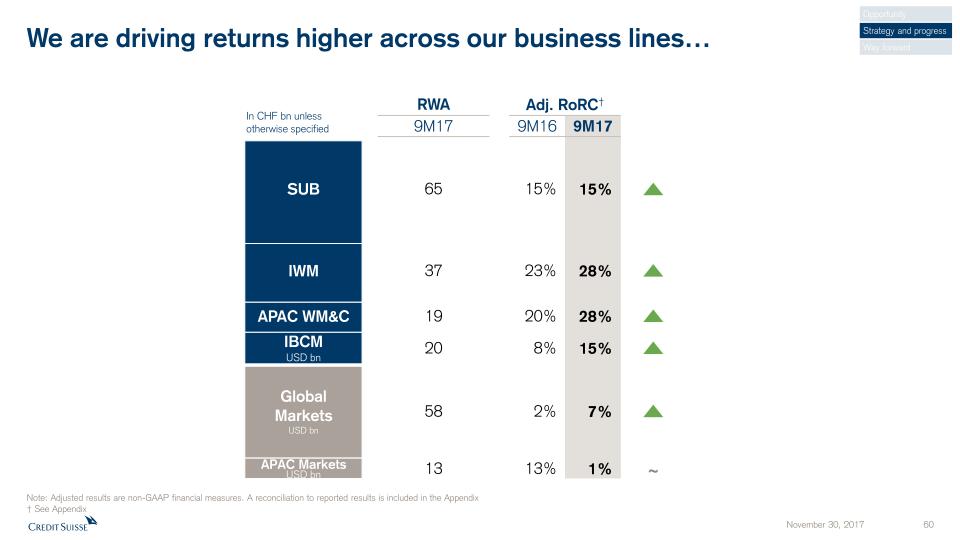
We are driving returns higher across our business lines… Adj. RoRC† RWA 15% 28% 28% 15% 7% 1% Note: Adjusted results are non-GAAP financial measures. A reconciliation to reported results is included in the Appendix† See Appendix In CHF bn unlessotherwise specified 9M17 9M16 15% 23% 20% 8% 2% 13% 9M17 ~ 65 37 19 20 58 SUB IWM APAC WM&C IBCMUSD bn GlobalMarketsUSD bn APAC MarketsUSD bn 13 Opportunity Strategy and progress Way forward
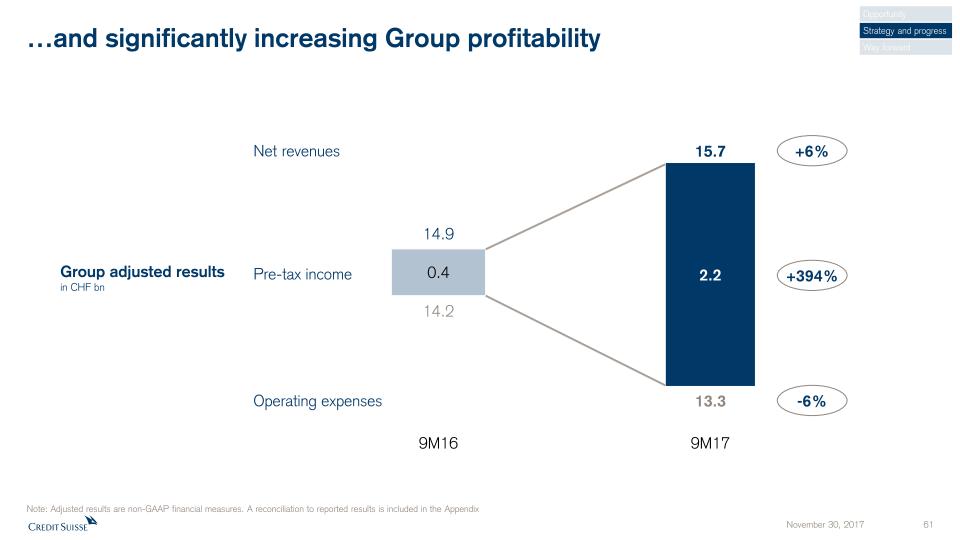
2.2 0.4 …and significantly increasing Group profitability Note: Adjusted results are non-GAAP financial measures. A reconciliation to reported results is included in the Appendix Net revenues Operating expenses Pre-tax income Group adjusted resultsin CHF bn 15.7 14.9 14.2 13.3 9M16 9M17 -6% +6% +394% Opportunity Strategy and progress Way forward
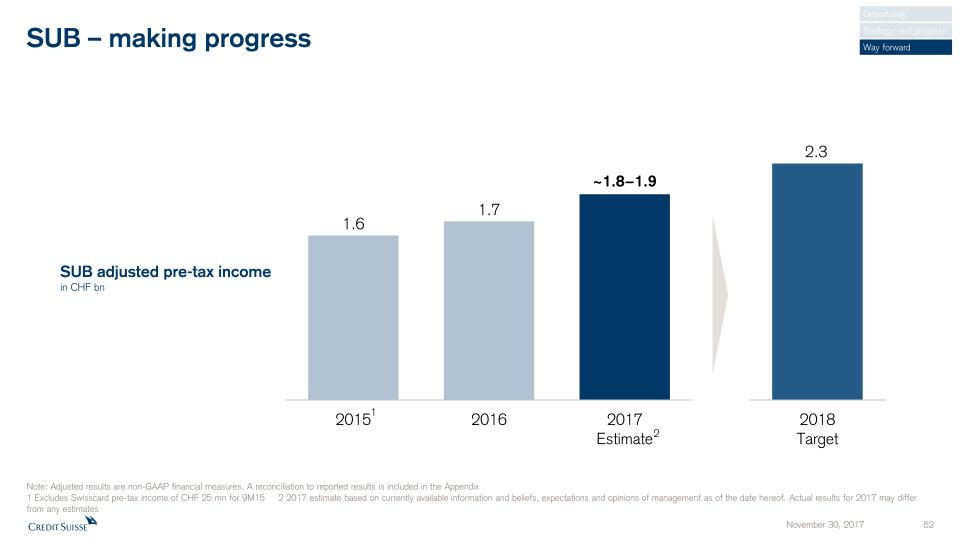
SUB – making progress SUB adjusted pre-tax incomein CHF bn Note: Adjusted results are non-GAAP financial measures. A reconciliation to reported results is included in the Appendix1 Excludes Swisscard pre-tax income of CHF 25 mn for 9M15 2 2017 estimate based on currently available information and beliefs, expectations and opinions of management as of the date hereof. Actual results for 2017 may differ from any estimates 1 Opportunity Strategy and progress Way forward 2
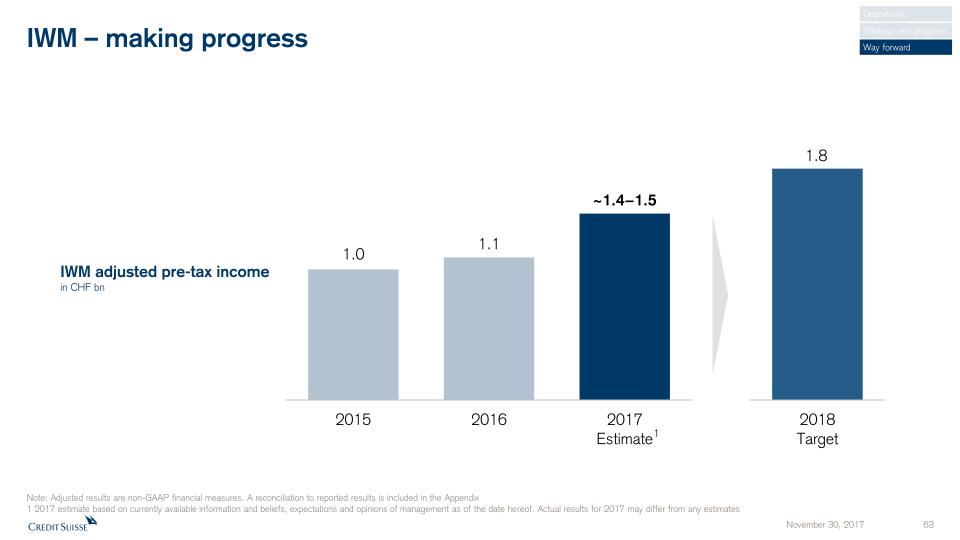
IWM – making progress Opportunity Strategy and progress Way forward 1 Note: Adjusted results are non-GAAP financial measures. A reconciliation to reported results is included in the Appendix1 2017 estimate based on currently available information and beliefs, expectations and opinions of management as of the date hereof. Actual results for 2017 may differ from any estimates IWM adjusted pre-tax incomein CHF bn
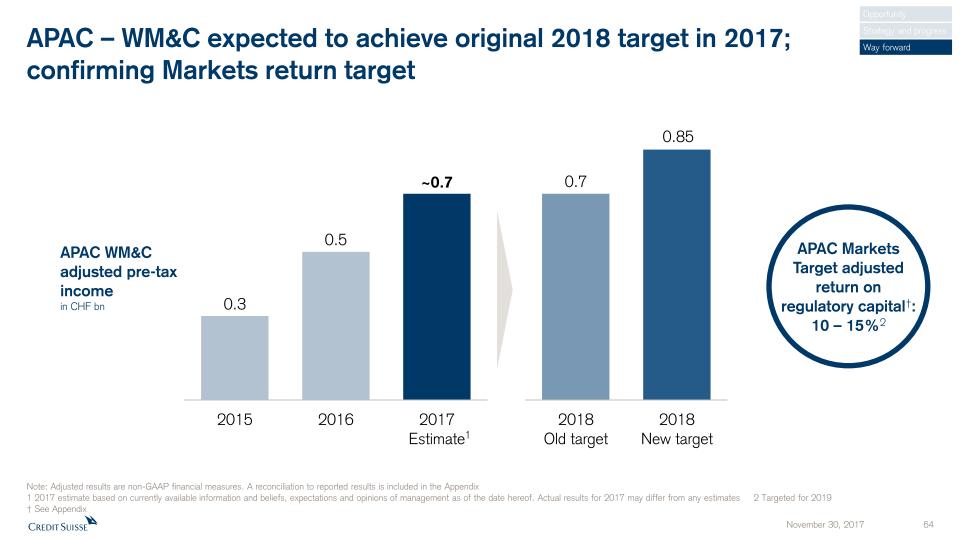
APAC – WM&C expected to achieve original 2018 target in 2017;confirming Markets return target APAC WM&Cadjusted pre-taxincomein CHF bn Note: Adjusted results are non-GAAP financial measures. A reconciliation to reported results is included in the Appendix1 2017 estimate based on currently available information and beliefs, expectations and opinions of management as of the date hereof. Actual results for 2017 may differ from any estimates 2 Targeted for 2019 † See Appendix APAC MarketsTarget adjusted return on regulatory capital†: 10 – 15%2 Opportunity Strategy and progress Way forward 1
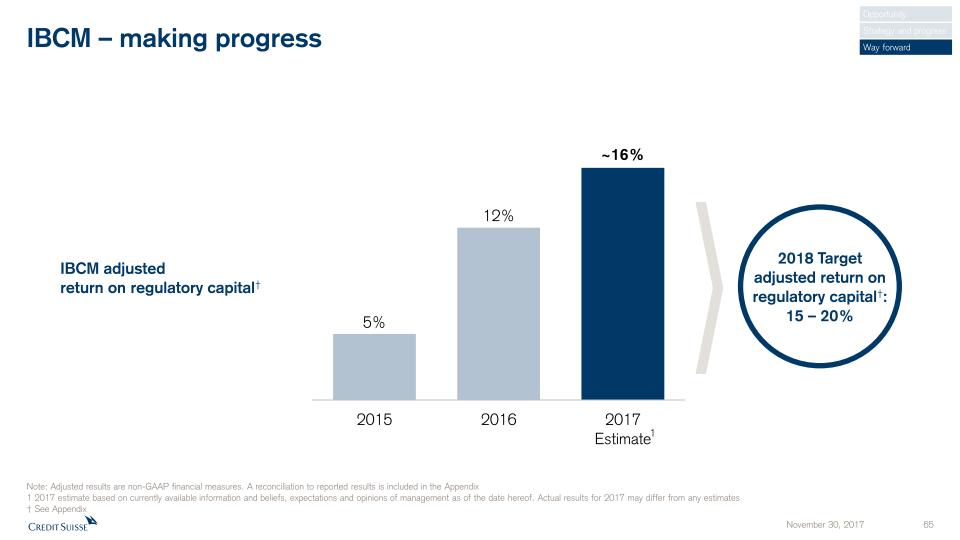
IBCM – making progress IBCM adjustedreturn on regulatory capital† Note: Adjusted results are non-GAAP financial measures. A reconciliation to reported results is included in the Appendix1 2017 estimate based on currently available information and beliefs, expectations and opinions of management as of the date hereof. Actual results for 2017 may differ from any estimates † See Appendix 2018 Targetadjusted return on regulatory capital†: 15 – 20% Opportunity Strategy and progress Way forward 1
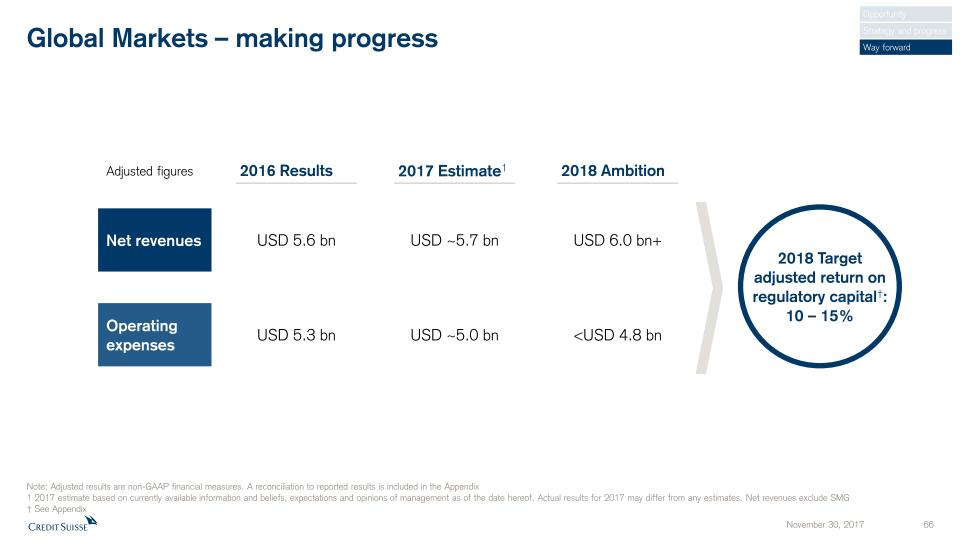
Global Markets – making progress Adjusted figures 2018 Ambition 2016 Results Net revenues USD 6.0 bn+ USD 5.6 bn USD ~5.7 bn 2017 Estimate1 Operating expenses <USD 4.8 bn USD 5.3 bn USD ~5.0 bn Opportunity Strategy and progress Way forward 2018 Targetadjusted return on regulatory capital†: 10 – 15% Note: Adjusted results are non-GAAP financial measures. A reconciliation to reported results is included in the Appendix1 2017 estimate based on currently available information and beliefs, expectations and opinions of management as of the date hereof. Actual results for 2017 may differ from any estimates. Net revenues exclude SMG † See Appendix
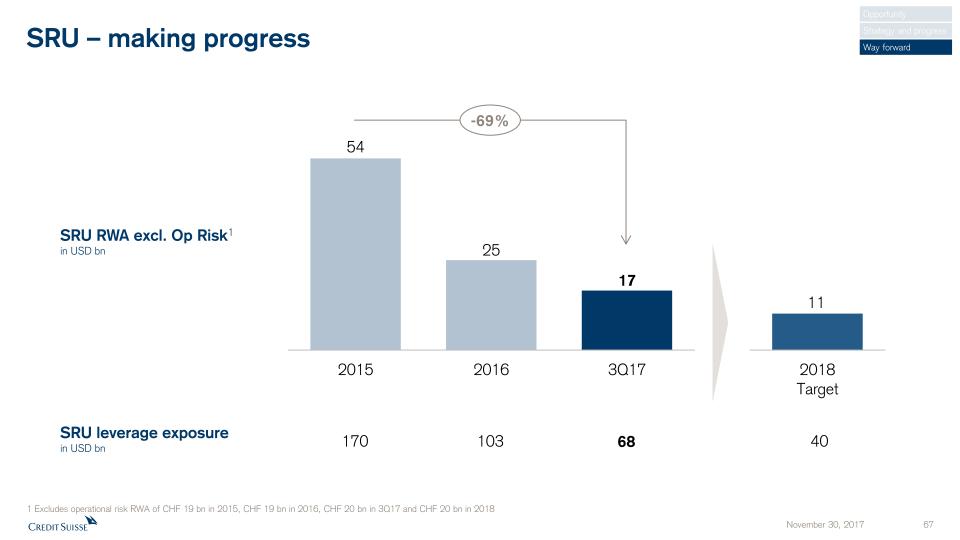
SRU – making progress Opportunity Strategy and progress Way forward 1 Excludes operational risk RWA of CHF 19 bn in 2015, CHF 19 bn in 2016, CHF 20 bn in 3Q17 and CHF 20 bn in 2018 SRU RWA excl. Op Risk1in USD bn SRU leverage exposurein USD bn -69% 170 103 68 40
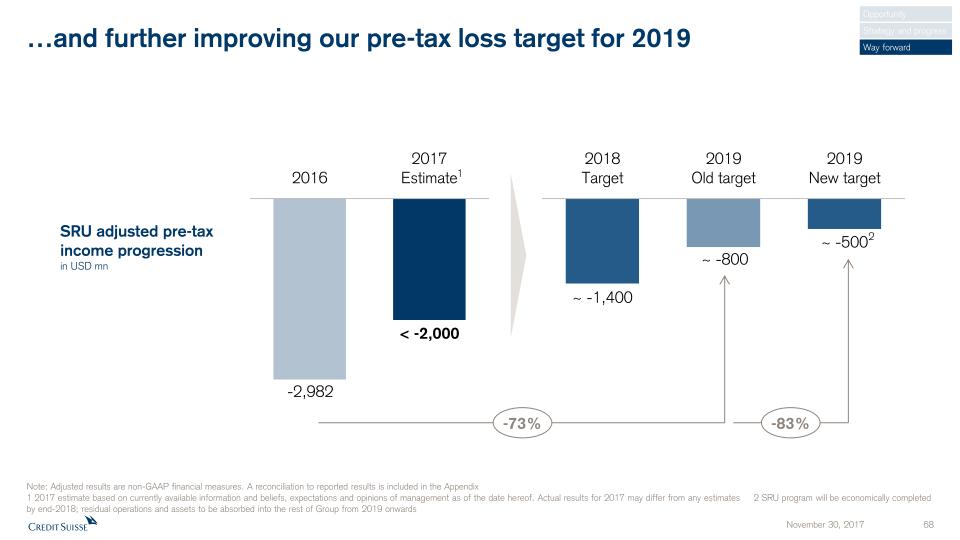
…and further improving our pre-tax loss target for 2019 -83% -73% SRU adjusted pre-tax income progressionin USD mn Note: Adjusted results are non-GAAP financial measures. A reconciliation to reported results is included in the Appendix1 2017 estimate based on currently available information and beliefs, expectations and opinions of management as of the date hereof. Actual results for 2017 may differ from any estimates 2 SRU program will be economically completed by end-2018; residual operations and assets to be absorbed into the rest of Group from 2019 onwards 2 Opportunity Strategy and progress Way forward 1
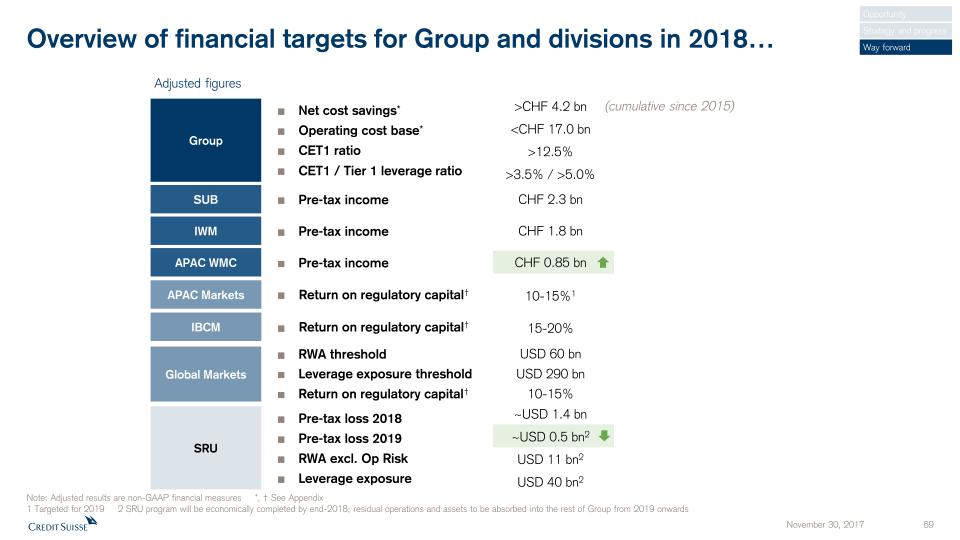
Overview of financial targets for Group and divisions in 2018… Group Net cost savings*Operating cost base*CET1 ratioCET1 / Tier 1 leverage ratio SUB Pre-tax income CHF 2.3 bn IWM Pre-tax income CHF 1.8 bn >CHF 4.2 bn<CHF 17.0 bn>12.5%>3.5% / >5.0% Adjusted figures 10-15%1 APAC Markets Return on regulatory capital† Global Markets RWA thresholdLeverage exposure thresholdReturn on regulatory capital† USD 60 bnUSD 290 bn10-15% APAC WMC Pre-tax income CHF 0.85 bn 15-20% IBCM Return on regulatory capital† SRU Pre-tax loss 2018Pre-tax loss 2019RWA excl. Op RiskLeverage exposure ~USD 1.4 bn~USD 0.5 bn2USD 11 bn2USD 40 bn2 Opportunity Strategy and progress Way forward (cumulative since 2015) Note: Adjusted results are non-GAAP financial measures *, † See Appendix 1 Targeted for 2019 2 SRU program will be economically completed by end-2018; residual operations and assets to be absorbed into the rest of Group from 2019 onwards
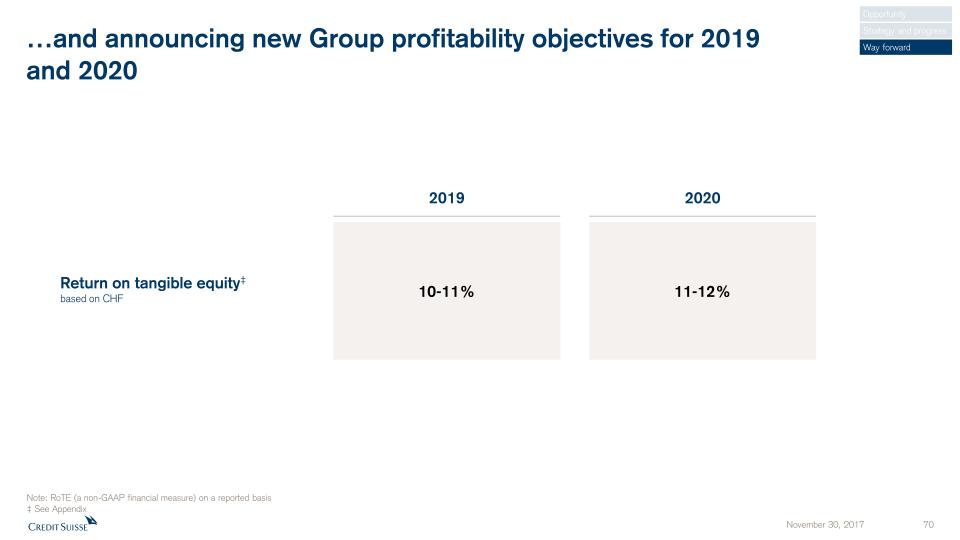
…and announcing new Group profitability objectives for 2019and 2020 Opportunity Strategy and progress Way forward 2020 11-12% 10-11% 2019 Return on tangible equity‡based on CHF Note: RoTE (a non-GAAP financial measure) on a reported basis‡ See Appendix
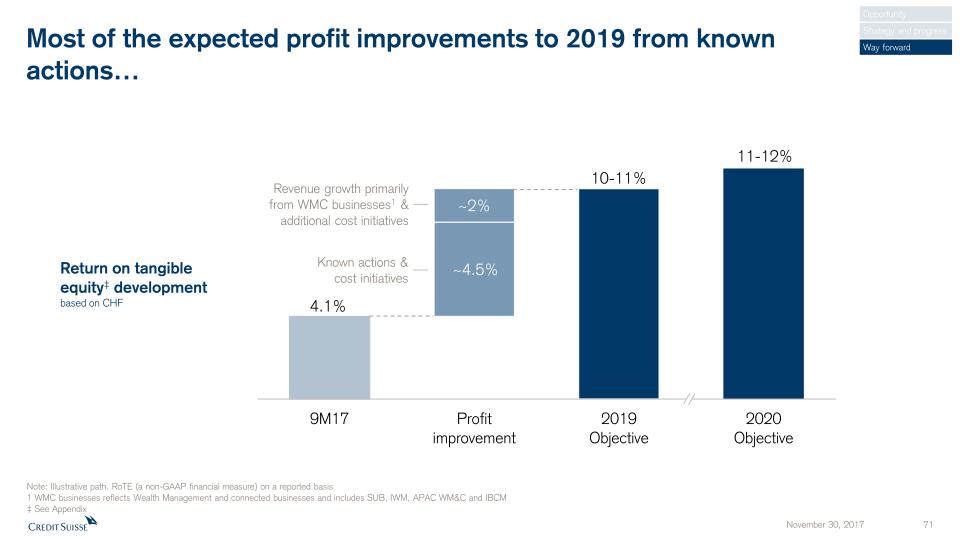
Most of the expected profit improvements to 2019 from knownactions… Return on tangible equity‡ developmentbased on CHF Revenue growth primarily from WMC businesses1 & additional cost initiatives Known actions &cost initiatives Opportunity Strategy and progress Way forward Note: Illustrative path. RoTE (a non-GAAP financial measure) on a reported basis1 WMC businesses reflects Wealth Management and connected businesses and includes SUB, IWM, APAC WM&C and IBCM‡ See Appendix
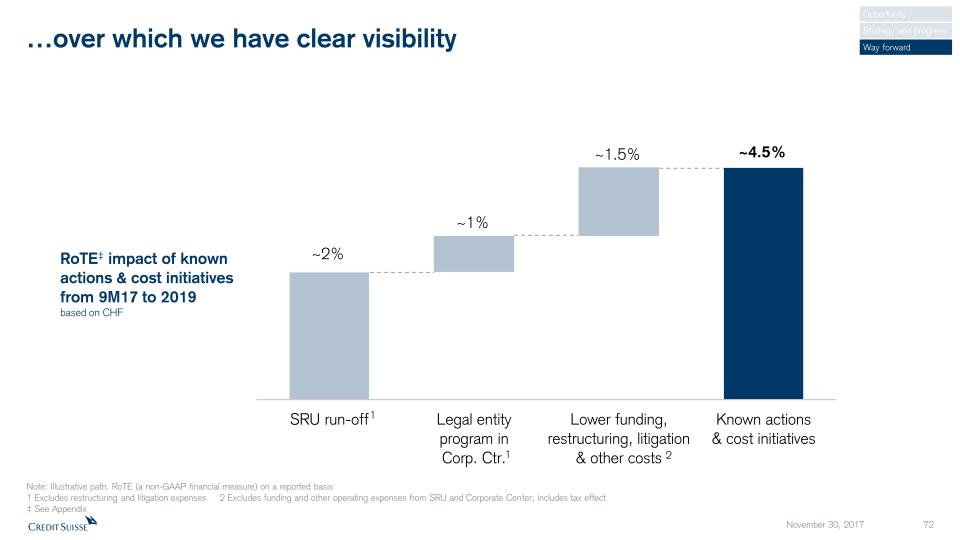
…over which we have clear visibility 2 1 1 Opportunity Strategy and progress Way forward Note: Illustrative path. RoTE (a non-GAAP financial measure) on a reported basis1 Excludes restructuring and litigation expenses 2 Excludes funding and other operating expenses from SRU and Corporate Center; includes tax effect‡ See Appendix RoTE‡ impact of known actions & cost initiativesfrom 9M17 to 2019based on CHF
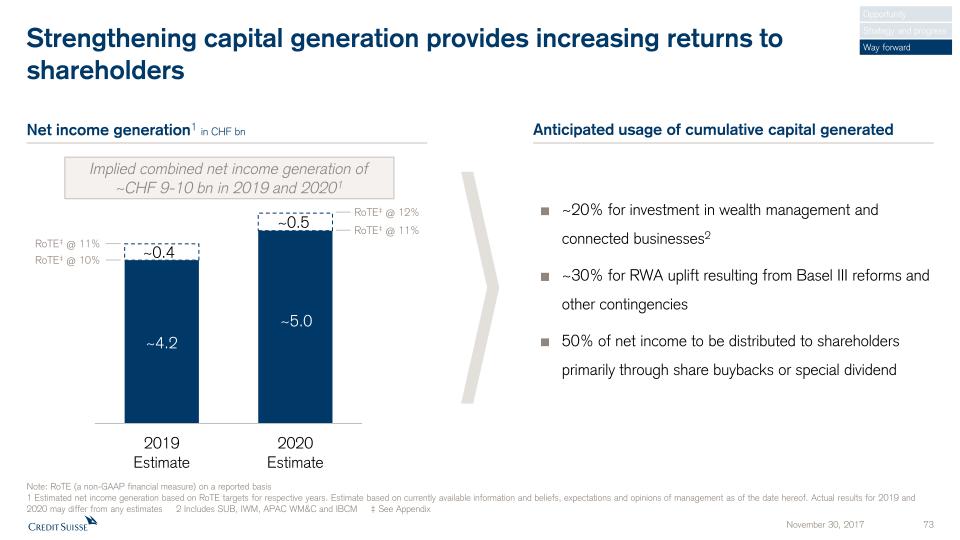
Anticipated usage of cumulative capital generated Strengthening capital generation provides increasing returns to shareholders RoTE‡ @ 11% RoTE‡ @ 10% RoTE‡ @ 12% RoTE‡ @ 11% Implied combined net income generation of~CHF 9-10 bn in 2019 and 20201 Net income generation1 in CHF bn ~20% for investment in wealth management and connected businesses2~30% for RWA uplift resulting from Basel III reforms and other contingencies50% of net income to be distributed to shareholders primarily through share buybacks or special dividend Note: RoTE (a non-GAAP financial measure) on a reported basis1 Estimated net income generation based on RoTE targets for respective years. Estimate based on currently available information and beliefs, expectations and opinions of management as of the date hereof. Actual results for 2019 and 2020 may differ from any estimates 2 Includes SUB, IWM, APAC WM&C and IBCM ‡ See Appendix Opportunity Strategy and progress Way forward

The way forward Our strategy and progress The opportunity Summary

Conclusion Execute with disciplineDeliver value for our shareholders

Program of the day Opening remarks Tidjane Thiam 8.30 am 45 min Webcast Morning break-out sessions 9.25 am No webcast Global Markets Brian Chin, David Miller, Mike Stewart 45 minAPAC Helman Sitohang, Francesco de Ferrari, Carsten Stoehr, Ken Pang 45 minBreak 20 minEfficiency & Productivity Pierre-Olivier Bouée, Paul Turrell 45 minCompliance Lara Warner, Homa Siddiqui 45 min Lunch 12.45 pm 50 min Afternoon break-out sessions 1.35 pm No webcast SUB Thomas Gottstein, Didier Denat, Serge Fehr 45 minIBCM Jim Amine, Malcolm Price, David Hermer 45 minIWM Iqbal Khan, Claudio de Sanctis, Bruno Daher 45 minBreak 25 min Capital,Funding and SRU David Mathers 4.15 pm 45 min Webcast Wrap-up & Q&A 5.00 pm 60 min Webcast Investor Day 2017

Appendix
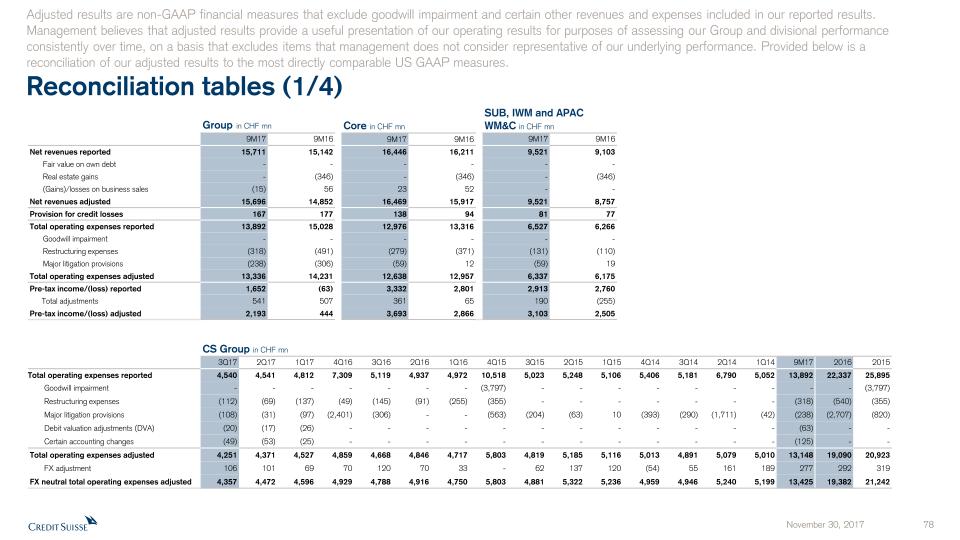
Reconciliation tables (1/4) Adjusted results are non-GAAP financial measures that exclude goodwill impairment and certain other revenues and expenses included in our reported results. Management believes that adjusted results provide a useful presentation of our operating results for purposes of assessing our Group and divisional performance consistently over time, on a basis that excludes items that management does not consider representative of our underlying performance. Provided below is a reconciliation of our adjusted results to the most directly comparable US GAAP measures. Group in CHF mn Core in CHF mn SUB, IWM and APAC WM&C in CHF mn 9M17 9M16 9M17 9M16 9M17 9M16 Net revenues reported 15,711 15,142 16,446 16,211 9,521 9,103 ��Fair value on own debt - - - - - - Real estate gains - (346) - (346) - (346) (Gains)/losses on business sales (15) 56 23 52 - - Net revenues adjusted 15,696 14,852 16,469 15,917 9,521 8,757 Provision for credit losses 167 177 138 94 81 77 Total operating expenses reported 13,892 15,028 12,976 13,316 6,527 6,266 Goodwill impairment - - - - - - Restructuring expenses (318) (491) (279) (371) (131) (110) Major litigation provisions (238) (306) (59) 12 (59) 19 Total operating expenses adjusted 13,336 14,231 12,638 12,957 6,337 6,175 Pre-tax income/(loss) reported 1,652 (63) 3,332 2,801 2,913 2,760 Total adjustments 541 507 361 65 190 (255) Pre-tax income/(loss) adjusted 2,193 444 3,693 2,866 3,103 2,505 CS Group in CHF mn 3Q17 2Q17 1Q17 4Q16 3Q16 2Q16 1Q16 4Q15 3Q15 2Q15 1Q15 4Q14 3Q14 2Q14 1Q14 9M17 2016 2015 Total operating expenses reported 4,540 4,541 4,812 7,309 5,119 4,937 4,972 10,518 5,023 5,248 5,106 5,406 5,181 6,790 5,052 13,892 22,337 25,895 Goodwill impairment - - - - - - - (3,797) - - - - - - - - - (3,797) Restructuring expenses (112) (69) (137) (49) (145) (91) (255) (355) - - - - - - - (318) (540) (355) Major litigation provisions (108) (31) (97) (2,401) (306) - - (563) (204) (63) 10 (393) (290) (1,711) (42) (238) (2,707) (820) Debit valuation adjustments (DVA) (20) (17) (26) - - - - - - - - - - - - (63) - - Certain accounting changes (49) (53) (25) - - - - - - - - - - - - (125) - - Total operating expenses adjusted 4,251 4,371 4,527 4,859 4,668 4,846 4,717 5,803 4,819 5,185 5,116 5,013 4,891 5,079 5,010 13,148 19,090 20,923 FX adjustment 106 101 69 70 120 70 33 - 62 137 120 (54) 55 161 189 277 292 319 FX neutral total operating expenses adjusted 4,357 4,472 4,596 4,929 4,788 4,916 4,750 5,803 4,881 5,322 5,236 4,959 4,946 5,240 5,199 13,425 19,382 21,242

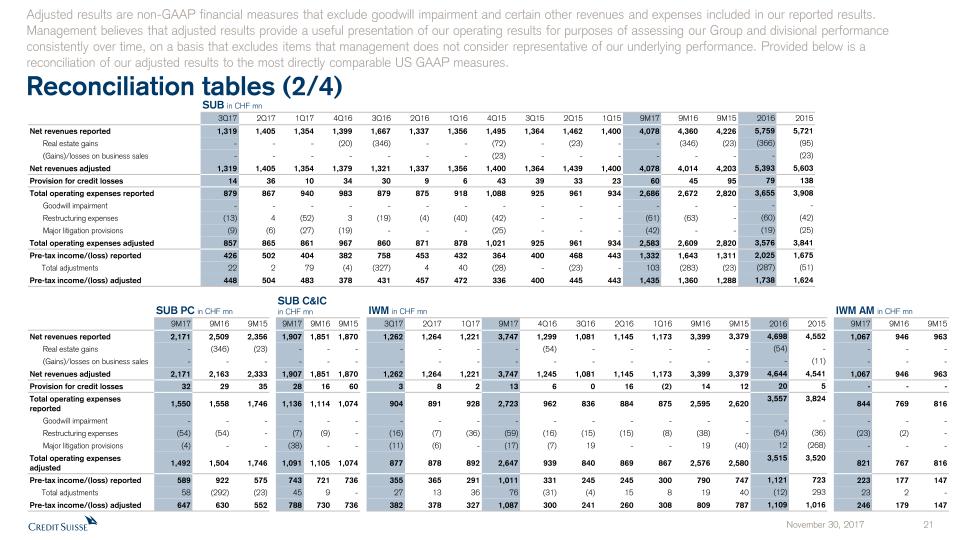
Reconciliation tables (2/4) Adjusted results are non-GAAP financial measures that exclude goodwill impairment and certain other revenues and expenses included in our reported results. Management believes that adjusted results provide a useful presentation of our operating results for purposes of assessing our Group and divisional performance consistently over time, on a basis that excludes items that management does not consider representative of our underlying performance. Provided below is a reconciliation of our adjusted results to the most directly comparable US GAAP measures. SUB in CHF mn 3Q17 2Q17 1Q17 4Q16 3Q16 2Q16 1Q16 4Q15 3Q15 2Q15 1Q15 9M17 9M16 9M15 2016 2015 Net revenues reported 1,319 1,405 1,354 1,399 1,667 1,337 1,356 1,495 1,364 1,462 1,400 4,078 4,360 4,226 5,759 5,721 Real estate gains - - - (20) (346) - - (72) - (23) - - (346) (23) (366) (95) (Gains)/losses on business sales - - - - - - - (23) - - - - - - - (23) Net revenues adjusted 1,319 1,405 1,354 1,379 1,321 1,337 1,356 1,400 1,364 1,439 1,400 4,078 4,014 4,203 5,393 5,603 Provision for credit losses 14 36 10 34 30 9 6 43 39 33 23 60 45 95 79 138 Total operating expenses reported 879 867 940 983 879 875 918 1,088 925 961 934 2,686 2,672 2,820 3,655 3,908 Goodwill impairment - - - - - - - - - - - - - - - - Restructuring expenses (13) 4 (52) 3 (19) (4) (40) (42) - - - (61) (63) - (60) (42) Major litigation provisions (9) (6) (27) (19) - - - (25) - - - (42) - - (19) (25) Total operating expenses adjusted 857 865 861 967 860 871 878 1,021 925 961 934 2,583 2,609 2,820 3,576 3,841 Pre-tax income/(loss) reported 426 502 404 382 758 453 432 364 400 468 443 1,332 1,643 1,311 2,025 1,675 Total adjustments 22 2 79 (4) (327) 4 40 (28) - (23) - 103 (283) (23) (287) (51) Pre-tax income/(loss) adjusted 448 504 483 378 431 457 472 336 400 445 443 1,435 1,360 1,288 1,738 1,624 SUB PC in CHF mn SUB C&ICin CHF mn IWM in CHF mn IWM AM in CHF mn 9M17 9M16 9M15 9M17 9M16 9M15 3Q17 2Q17 1Q17 9M17 4Q16 3Q16 2Q16 1Q16 9M16 9M15 2016 2015 9M17 9M16 9M15 Net revenues reported 2,171 2,509 2,356 1,907 1,851 1,870 1,262 1,264 1,221 3,747 1,299 1,081 1,145 1,173 3,399 3,379 4,698 4,552 1,067 946 963 Real estate gains - (346) (23) - - - - - - - (54) - - - - - (54) - - - - (Gains)/losses on business sales - - - - - - - - - - - - - - - - - (11) - - - Net revenues adjusted 2,171 2,163 2,333 1,907 1,851 1,870 1,262 1,264 1,221 3,747 1,245 1,081 1,145 1,173 3,399 3,379 4,644 4,541 1,067 946 963 Provision for credit losses 32 29 35 28 16 60 3 8 2 13 6 0 16 (2) 14 12 20 5 - - - Total operating expenses reported 1,550 1,558 1,746 1,136 1,114 1,074 904 891 928 2,723 962 836 884 875 2,595 2,620 3,557 3,824 844 769 816 Goodwill impairment - - - - - - - - - - - - - - - - - - - - - Restructuring expenses (54) (54) - (7) (9) - (16) (7) (36) (59) (16) (15) (15) (8) (38) - (54) (36) (23) (2) - Major litigation provisions (4) - - (38) - - (11) (6) - (17) (7) 19 - - 19 (40) 12 (268) - - - Total operating expenses adjusted 1,492 1,504 1,746 1,091 1,105 1,074 877 878 892 2,647 939 840 869 867 2,576 2,580 3,515 3,520 821 767 816 Pre-tax income/(loss) reported 589 922 575 743 721 736 355 365 291 1,011 331 245 245 300 790 747 1,121 723 223 177 147 Total adjustments 58 (292) (23) 45 9 - 27 13 36 76 (31) (4) 15 8 19 40 (12) 293 23 2 - Pre-tax income/(loss) adjusted 647 630 552 788 730 736 382 378 327 1,087 300 241 260 308 809 787 1,109 1,016 246 179 147

Reconciliation tables (3/4) Adjusted results are non-GAAP financial measures that exclude goodwill impairment and certain other revenues and expenses included in our reported results. Management believes that adjusted results provide a useful presentation of our operating results for purposes of assessing our Group and divisional performance consistently over time, on a basis that excludes items that management does not consider representative of our underlying performance. Provided below is a reconciliation of our adjusted results to the most directly comparable US GAAP measures. APAC in CHF mn APAC WM&C in CHF mn APC Mktsin USD mn 9M17 9M16 9M17 9M16 9M15 2016 2015 3Q17 3Q16 Net revenues reported 2,619 2,735 1,696 1,344 1,139 1,904 1,506 354 449 Real estate gains - - - - - - - - - (Gains)/losses on business sales - - - - - - - - - Net revenues adjusted 2,619 2,735 1,696 1,344 1,139 1,904 1,506 354 449 Provision for credit losses 8 15 8 18 32 29 31 - - Total operating expenses reported 2,058 2,098 1,118 999 876 1,386 1,643 308 391 Goodwill impairment - - - - - - (446) - - Restructuring expenses (40) (34) (11) (9) - (14) (1) (6) (16) Major litigation provisions - - - - - - (6) - - Total operating expenses adjusted 2,018 2,064 1,107 990 876 1,372 1,190 302 375 Pre-tax income/(loss) reported 553 622 570 327 231 489 (168) 46 58 Total adjustments 40 34 11 9 - 14 453 6 16 Pre-tax income/(loss) adjusted 593 656 581 336 231 503 285 52 74 IBCM in USD mn GM in USD mn 9M17 9M16 2016 2015 LTM 3Q17 LTM 3Q16 9M17 9M16 LTM 3Q17 2016 2015 Net revenues reported 1,609 1,432 2,001 1,857 2,178 1,850 4,483 4,319 5,739 5,575 7,124 Real estate gains - - - - - - - - - - - (Gains)/losses on business sales - - - - - - - - - - - Net revenues adjusted 1,609 1,432 2,001 1,857 2,178 1,850 4,483 4,319 5,739 5,575 7,124 Provision for credit losses 32 21 20 - 31 21 24 (1) 21 (4) 11 Total operating expenses reported 1,309 1,291 1,713 2,170 1,731 2,193 3,801 4,272 5,051 5,522 9,004 Goodwill impairment - - - (384) - (384) - - - - (2,690) Restructuring expenses (29) (35) (29) (22) (23) (57) (81) (206) (95) (220) (97) Major litigation provisions - - - - - - - (7) - (7) (240) Total operating expenses adjusted 1,280 1,256 1,684 1,764 1,708 1,752 3,720 4,059 4,956 5,295 5,977 Pre-tax income/(loss) reported 268 120 268 (313) 416 (364) 658 48 667 57 (1,891) Total adjustments 29 35 29 406 23 441 81 213 95 227 3,207 Pre-tax income/(loss) adjusted 297 155 297 93 439 77 739 261 762 284 1,136
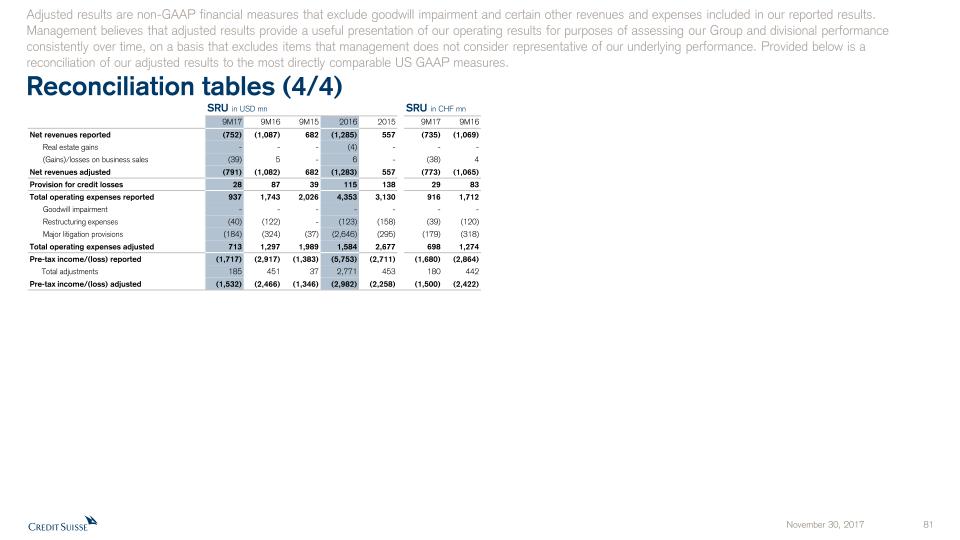
Reconciliation tables (4/4) Adjusted results are non-GAAP financial measures that exclude goodwill impairment and certain other revenues and expenses included in our reported results. Management believes that adjusted results provide a useful presentation of our operating results for purposes of assessing our Group and divisional performance consistently over time, on a basis that excludes items that management does not consider representative of our underlying performance. Provided below is a reconciliation of our adjusted results to the most directly comparable US GAAP measures. SRU in USD mn SRU in CHF mn 9M17 9M16 9M15 2016 2015 9M17 9M16 Net revenues reported (752) (1,087) 682 (1,285) 557 (735) (1,069) Real estate gains - - - (4) - - - (Gains)/losses on business sales (39) 5 - 6 - (38) 4 Net revenues adjusted (791) (1,082) 682 (1,283) 557 (773) (1,065) Provision for credit losses 28 87 39 115 138 29 83 Total operating expenses reported 937 1,743 2,026 4,353 3,130 916 1,712 Goodwill impairment - - - - - - - Restructuring expenses (40) (122) - (123) (158) (39) (120) Major litigation provisions (184) (324) (37) (2,646) (295) (179) (318) Total operating expenses adjusted 713 1,297 1,989 1,584 2,677 698 1,274 Pre-tax income/(loss) reported (1,717) (2,917) (1,383) (5,753) (2,711) (1,680) (2,864) Total adjustments 185 451 37 2,771 453 180 442 Pre-tax income/(loss) adjusted (1,532) (2,466) (1,346) (2,982) (2,258) (1,500) (2,422)

Notes (1/2) For reconciliation of adjusted to reported results, refer to the appendix of this Investor Day 2017 presentation. Throughout the presentation rounding differences may occurUnless otherwise noted, all CET1 ratio, Tier 1 leverage ratio, risk-weighted assets and leverage exposure figures shown in this presentation are as of the end of the respective period and on a “look-through” basisGross and net margins are shown in basis pointsGross margin = adj. net revenues annualized / average AuM; net margin = adj. pre-tax income annualized / average AuMMandates penetration reflects advisory and discretionary mandates as percentage of total AuM General notes Specific notes * Our cost savings program is measured using adjusted operating expenses at constant FX rates. “Adjusted operating expenses at constant FX rates” and “adjusted non-compensation operating expenses at constant FX rates” include adjustments as made in all our disclosures for restructuring expenses, major litigation expenses and a goodwill impairment taken in 4Q15 as well as adjustments for certain accounting changes (which had not been in place at the launch of the cost savings program), debit valuation adjustments (DVA) related volatility and for FX, applying the following main currency exchange rates for1Q15: USD/CHF 0.9465, EUR/CHF 1.0482, GBP/CHF 1.4296, 2Q15: USD/CHF 0.9383, EUR/CHF 1.0418, GBP/CHF 1.4497,3Q15: USD/CHF 0.9684, EUR/CHF 1.0787, GBP/CHF 1.4891, 4Q15: USD/CHF 1.0010, EUR/CHF 1.0851, GBP/CHF 1.5123,1Q16: USD/CHF 0.9928, EUR/CHF 1.0941, GBP/CHF 1.4060, 2Q16: USD/CHF 0.9756, EUR/CHF 1.0956, GBP/CHF 1.3845,3Q16: USD/CHF 0.9728, EUR/CHF 1.0882, GBP/CHF 1.2764, 4Q16: USD/CHF 1.0101, EUR/CHF 1.0798, GBP/CHF 1.2451,1Q17: USD/CHF 0.9963, EUR/CHF 1.0670, GBP/CHF 1.2464, 2Q17: USD/CHF 0.9736, EUR/CHF 1.0881, GBP/CHF 1.2603,3Q17: USD/CHF 0.9645, EUR/CHF 1.1413, GBP/CHF 1.2695.These currency exchange rates are unweighted, i.e. a straight line average of monthly rates. We apply this calculation consistently for the periods under review. Adjusted non-compensation expenses are adjusted operating expenses excluding compensation and benefits. To calculate adjusted non-compensation expenses at constant FX rates, we subtract compensation and benefits (adjusted at constant FX rates in the manner described above) from adjusted operating expenses at constant FX rates.† Regulatory capital is calculated as the worst of 10% of RWA and 3.5% of leverage exposure. Return on regulatory capital is calculated using (adjusted) income after tax and assumes a tax rate of 30% and capital allocated based on the worst of 10% of average RWA and 3.5% of average leverage exposure. For the Markets business within the APAC division and for the Global Markets and Investment Banking & Capital Markets divisions, return on regulatory capital is based on US dollar denominated numbers. Adjusted return on regulatory capital is calculated using adjusted results, applying the same methodology to calculate return on regulatory capital. ‡ Return on tangible equity is based on tangible shareholders’ equity attributable to shareholders, a non-GAAP financial measure, which is calculated by deducting goodwill and other intangible assets from total shareholders’ equity attributable to shareholders as presented in our balance sheet. Management believes that the return on tangible shareholders’ equity attributable to shareholders is meaningful as it allows consistent measurement of the performance of businesses without regard to whether the businesses were acquired.For 3Q17, tangible equity excluded goodwill of CHF 4,715 million and other intangible assets of CHF 219 million from total shareholders’ equity attributable to shareholders of CHF 43,858 million as presented in our balance sheet.

Notes (2/2) Abbreviations Adj. = Adjusted; AI = Artificial Intelligence; AM = Asset Management; AML = Anti-Money Laundering; APAC = Asia Pacific; AT1 = Additional Tier 1; AuM = Assets under Management; BCBS = Basel Committee on Banking Supervision; BIS = Bank for International Settlements; bps = basis points; CAGR = Compound Annual Growth Rate; CCRO = Chief Compliance and Regulatory Affairs Officer; CET1 = Common Equity Tier 1; CIC = Corporate & Institutional Clients; CIF = Customer/Client Information File; Corp. Ctr. = Corporate Center; CVA = Credit Valuation Adjustment; DCM = Debt Capital Markets; EAM = External Asset Manager; ECM = Equity Capital Markets; EM = Emerging Markets; EMEA = Europe, Middle East & Africa; EPS = Earnings Per Share; EQ = Equities; EU = European Union; FICC = Fixed Income, Currencies & Commodities; FINMA = Swiss Financial Market Supervisory Authority; FLP = Fund Linked Products; FRTB = Fundamental Review of the Trading Book; FX = Foreign Exchange; G10 = Group of Ten; GDP = Gross Domestic Product; GM = Global Markets; IBCM = Investment Banking & Capital Markets; IBD = Investment Banking Department; IC = Investment Consultant; IMF = International Monetary Fund; IP = Investor Products; IPO = Initial Public Offering; IRB = Internal Ratings Based; IT = Information Technology; ITS = International Trading Solutions; IWM = International Wealth Management; JV = Joint Venture; LSC = Large Swiss Corporates; M&A = Mergers & Acquisitions; MI = Management Information; Mkts = Markets; NNA = Net new assets; Op Risk = Operational Risk; PB = Private Banking; PC = Private Clients; PEP = Politically Exposed Person; pp = percentage points; PTI = Pre-tax income; PWMC = Private & Wealth Management Clients; RM = Relationship Manager(s); RoRC = Return on Regulatory Capital; RoTE = Return on Tangible Equity; RPA = Robotic Process Automation; RWA = Risk-weighted assets; SA-CCR = Standardized Approach to Counterparty Credit Risk; SME = Small and Medium-Sized Enterprises; SMG = Systematic Market-Making Group; SoW = Share of Wallet; SRU = Strategic Resolution Unit; SUB = Swiss Universal Bank; TBTF = Too Big To Fail; TBVS = Tangible Book Value per Share; (U)HNW(I) = (Ultra) High Net Worth (Individuals); VaR = Value-at-Risk; VIX = Volatility Index; WM = Wealth Management; WM&C = Wealth Management & Connected; YoY = Year over year; YTD = Year to Date

Credit Suisse Investor Day 2017Overview of Capital & FundingDavid Mathers November 30, 2017

Disclaimer This material does not purport to contain all of the information that you may wish to consider. This material is not to be relied upon as such or used in substitution for the exercise of independent judgment.Cautionary statement regarding forward-looking statementsThis presentation contains forward-looking statements that involve inherent risks and uncertainties, and we might not be able to achieve the predictions, forecasts, projections and other outcomes we describe or imply in forward-looking statements. A number of important factors could cause results to differ materially from the plans, objectives, expectations, estimates and intentions we express in these forward-looking statements, including those we identify in "Risk factors” in our Annual Report on Form 20-F for the fiscal year ended December 31, 2016 and in the “Cautionary statement regarding forward-looking information" in our media release relating to Investor Day, published on November 30, 2017 and filed with the US Securities and Exchange Commission, and in other public filings and press releases. We do not intend to update these forward-looking statements. In particular, the terms “Estimate”, “Illustrative”, “Ambition”, “Objective”, “Outlook” and “Goal” are not intended to be viewed as targets or projections, nor are they considered to be Key Performance Indicators. All such estimates, illustrations, ambitions and goals are subject to a large number of inherent risks, assumptions and uncertainties, many of which are completely outside of our control. These risks, assumptions and uncertainties include, but are not limited to, general market conditions, market volatility, interest rate volatility and levels, global and regional economic conditions, political uncertainty, changes in tax policies, regulatory changes, changes in levels of client activity as a result of any of the foregoing and other factors. Accordingly, this information should not be relied on for any purpose. We do not intend to update these estimates, illustrations, ambitions or goals. We may not achieve the benefits of our strategic initiativesWe may not achieve all of the expected benefits of our strategic initiatives. Factors beyond our control, including but not limited to the market and economic conditions, changes in laws, rules or regulations and other challenges discussed in our public filings, could limit our ability to achieve some or all of the expected benefits of these initiatives. Estimates, assumptions and opinionsIn preparing this presentation, management has made estimates and assumptions that affect the numbers presented. Actual results may differ. Annualized numbers do not take account of variations in operating results, seasonality and other factors and may not be indicative of actual, full-year results. Figures throughout this presentation may also be subject to rounding adjustments. All opinions and views constitute judgments as of the date of writing without regard to the date on which the reader may receive or access the information. This information is subject to change at any time without notice and we do not intend to update this information. Statement regarding non-GAAP financial measuresThis presentation also contains non-GAAP financial measures, including adjusted results. Information needed to reconcile such non-GAAP financial measures to the most directly comparable measures under US GAAP can be found in this presentation in the Appendix, which is available on our website at www.credit-suisse.com. Statement regarding capital, liquidity and leverageAs of January 1, 2013, Basel III was implemented in Switzerland along with the Swiss “Too Big to Fail” legislation and regulations thereunder (in each case, subject to certain phase-in periods). As of January 1, 2015, the Bank for International Settlements (BIS) leverage ratio framework, as issued by the Basel Committee on Banking Supervision (BCBS), was implemented in Switzerland by FINMA. Our related disclosures are in accordance with our interpretation of such requirements, including relevant assumptions. Changes in the interpretation of these requirements in Switzerland or in any of our assumptions or estimates could result in different numbers from those shown in this presentation. Capital and ratio numbers for periods prior to 2013 are based on estimates, which are calculated as if the Basel III framework had been in place in Switzerland during such periods. Unless otherwise noted, leverage exposure is based on the BIS leverage ratio framework and consists of period-end balance sheet assets and prescribed regulatory adjustments. Beginning in 2015, the Swiss leverage ratio is calculated as Swiss total capital, divided by period-end leverage exposure. The look-through BIS tier 1 leverage ratio and CET1 leverage ratio are calculated as look-through BIS tier 1 capital and CET1 capital, respectively, divided by end-period leverage exposure.SourcesCertain material in this presentation has been prepared by Credit Suisse on the basis of publicly available information, internally developed data and other third-party sources believed to be reliable. Credit Suisse has not sought to independently verify information obtained from public and third-party sources and makes no representations or warranties as to accuracy, completeness or reliability of such information.
Overview of Capital & Funding Update on cost reduction plans 1 Funding cost update 2 Capital update (including Basel III reforms) 3 RoTE target 4 Capital distribution & dividend plan 5 Financial targets 6
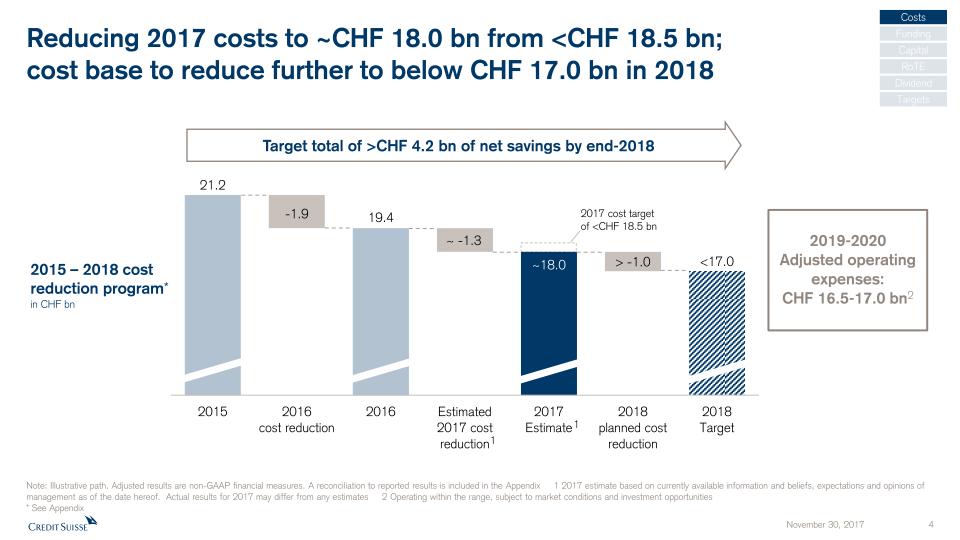
Reducing 2017 costs to ~CHF 18.0 bn from <CHF 18.5 bn;cost base to reduce further to below CHF 17.0 bn in 2018 Note: Illustrative path. Adjusted results are non-GAAP financial measures. A reconciliation to reported results is included in the Appendix 1 2017 estimate based on currently available information and beliefs, expectations and opinions of management as of the date hereof. Actual results for 2017 may differ from any estimates 2 Operating within the range, subject to market conditions and investment opportunities* See Appendix Costs Funding Capital RoTE Dividend Targets Target total of >CHF 4.2 bn of net savings by end-2018 2017 cost target of <CHF 18.5 bn 2015 – 2018 cost reduction program* in CHF bn 1 1 2019-2020Adjusted operating expenses: CHF 16.5-17.0 bn2
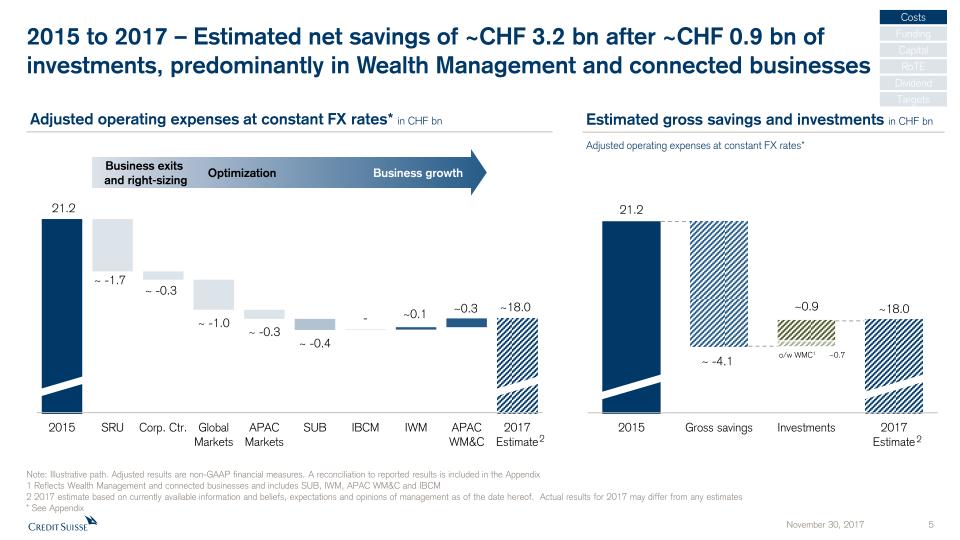
Costs Funding Capital RoTE Dividend Targets Business exits and right-sizing Optimization Business growth Adjusted operating expenses at constant FX rates* in CHF bn Estimated gross savings and investments in CHF bn Adjusted operating expenses at constant FX rates* Note: Illustrative path. Adjusted results are non-GAAP financial measures. A reconciliation to reported results is included in the Appendix1 Reflects Wealth Management and connected businesses and includes SUB, IWM, APAC WM&C and IBCM2 2017 estimate based on currently available information and beliefs, expectations and opinions of management as of the date hereof. Actual results for 2017 may differ from any estimates* See Appendix o/w WMC1 ~0.7 2015 to 2017 – Estimated net savings of ~CHF 3.2 bn after ~CHF 0.9 bn of investments, predominantly in Wealth Management and connected businesses 2 2
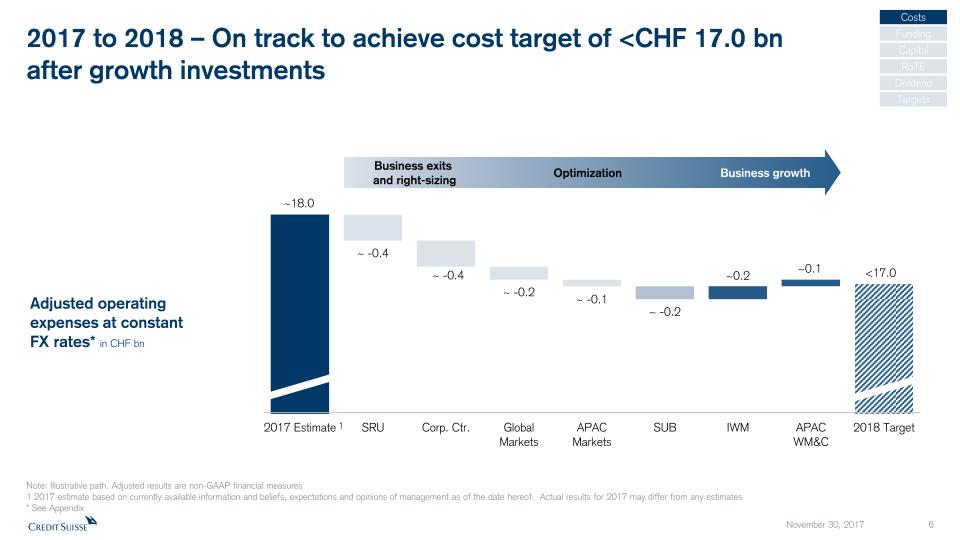
2017 to 2018 – On track to achieve cost target of <CHF 17.0 bnafter growth investments Costs Funding Capital RoTE Dividend Targets Business exits and right-sizing Business growth Adjusted operating expenses at constant FX rates* in CHF bn Note: Illustrative path. Adjusted results are non-GAAP financial measures1 2017 estimate based on currently available information and beliefs, expectations and opinions of management as of the date hereof. Actual results for 2017 may differ from any estimates* See Appendix 1 Optimization
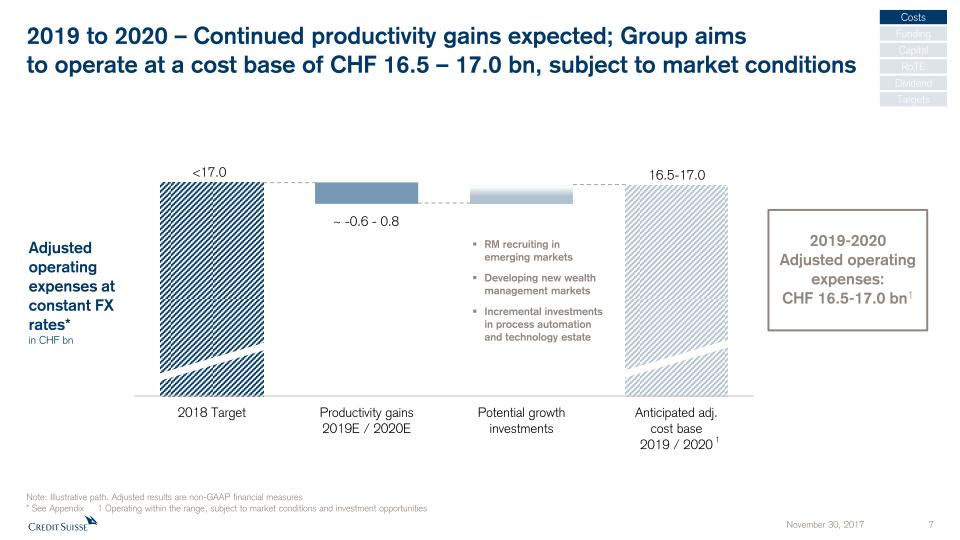
2019 to 2020 – Continued productivity gains expected; Group aims to operate at a cost base of CHF 16.5 – 17.0 bn, subject to market conditions Costs Funding Capital Dividend Targets RM recruiting in emerging marketsDeveloping new wealth management marketsIncremental investments in process automation and technology estate 1 ~ -0.6 - 0.8 16.5-17.0 Adjusted operating expenses at constant FX rates*in CHF bn Note: Illustrative path. Adjusted results are non-GAAP financial measures* See Appendix 1 Operating within the range, subject to market conditions and investment opportunities RoTE 2019-2020Adjusted operating expenses: CHF 16.5-17.0 bn1
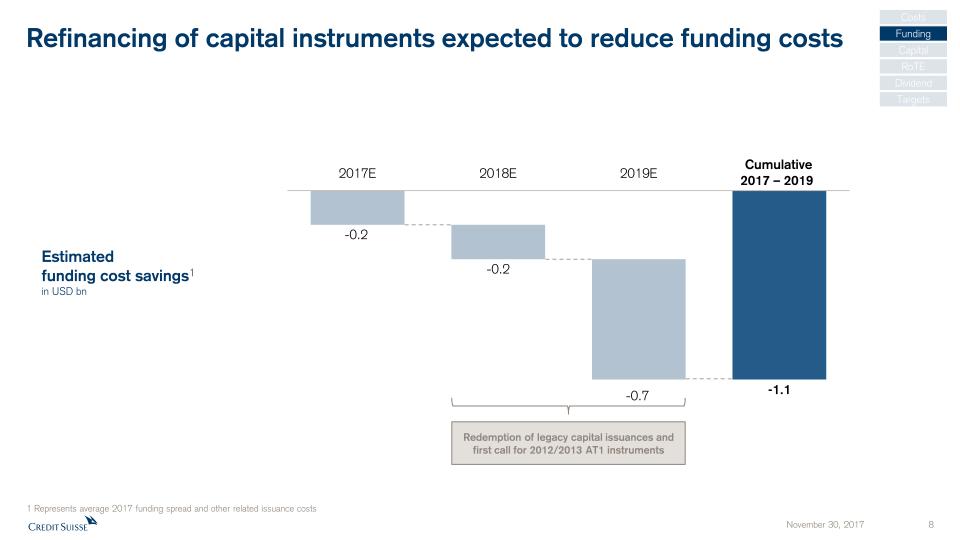
Refinancing of capital instruments expected to reduce funding costs Costs Funding Capital Dividend Targets Estimatedfunding cost savings1in USD bn Cumulative2017 – 2019 Redemption of legacy capital issuances and first call for 2012/2013 AT1 instruments RoTE 1 Represents average 2017 funding spread and other related issuance costs
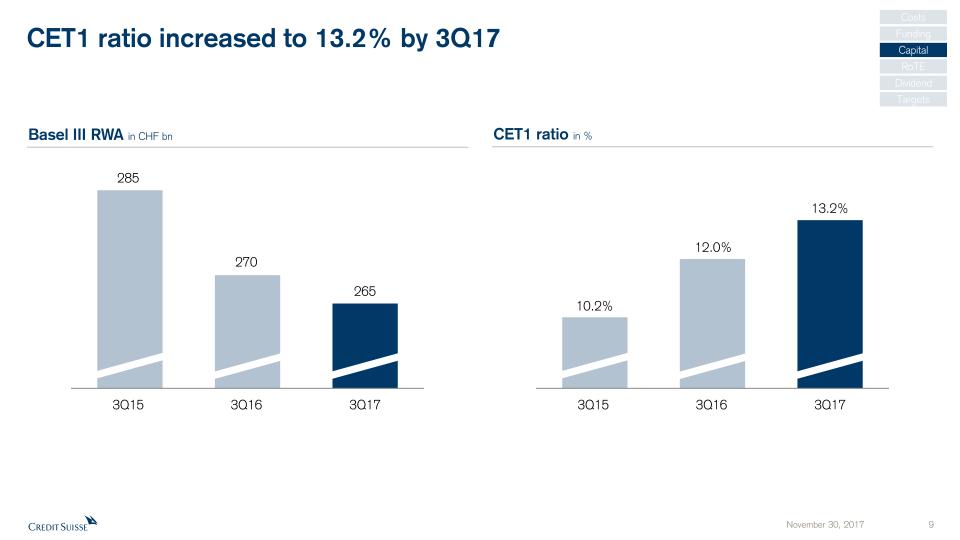
CET1 ratio increased to 13.2% by 3Q17 285 265 10.2% 12.0% 3Q15 3Q16 Basel III RWA in CHF bn CET1 ratio in % 270 3Q17 13.2% 3Q15 3Q16 3Q17 Costs Funding Capital Dividend Targets RoTE
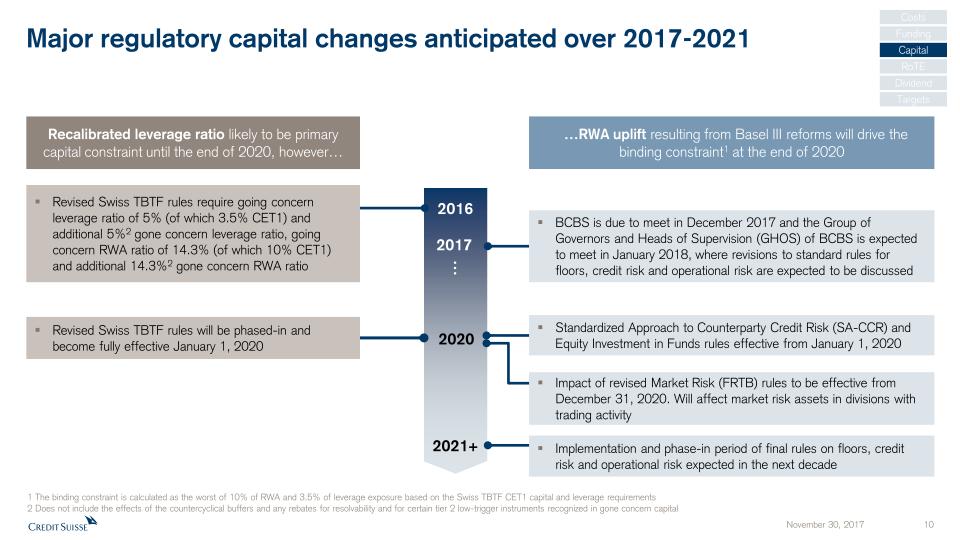
Recalibrated leverage ratio likely to be primary capital constraint until the end of 2020, however… 1 The binding constraint is calculated as the worst of 10% of RWA and 3.5% of leverage exposure based on the Swiss TBTF CET1 capital and leverage requirements2 Does not include the effects of the countercyclical buffers and any rebates for resolvability and for certain tier 2 low-trigger instruments recognized in gone concern capital …RWA uplift resulting from Basel III reforms will drive the binding constraint1 at the end of 2020 2017 Standardized Approach to Counterparty Credit Risk (SA-CCR) and Equity Investment in Funds rules effective from January 1, 2020 2020 2021+ Revised Swiss TBTF rules will be phased-in and become fully effective January 1, 2020 2016 BCBS is due to meet in December 2017 and the Group of Governors and Heads of Supervision (GHOS) of BCBS is expected to meet in January 2018, where revisions to standard rules for floors, credit risk and operational risk are expected to be discussed Revised Swiss TBTF rules require going concern leverage ratio of 5% (of which 3.5% CET1) and additional 5%2 gone concern leverage ratio, going concern RWA ratio of 14.3% (of which 10% CET1) and additional 14.3%2 gone concern RWA ratio Major regulatory capital changes anticipated over 2017-2021 Implementation and phase-in period of final rules on floors, credit risk and operational risk expected in the next decade … Costs Funding Capital Dividend RoTE Impact of revised Market Risk (FRTB) rules to be effective from December 31, 2020. Will affect market risk assets in divisions with trading activity Targets
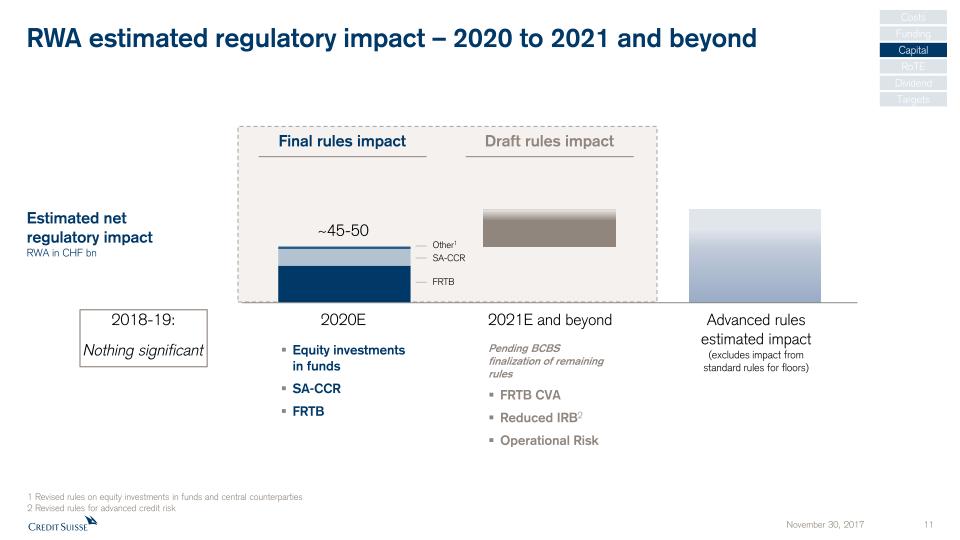
RWA estimated regulatory impact – 2020 to 2021 and beyond 2020E 2021E and beyond Advanced rules estimated impact (excludes impact from standard rules for floors) Equity investments in fundsSA-CCRFRTB Final rules impact Pending BCBS finalization of remaining rulesFRTB CVAReduced IRB2Operational Risk Draft rules impact Estimated netregulatory impactRWA in CHF bn Costs Funding Capital Dividend Targets 1 Revised rules on equity investments in funds and central counterparties2 Revised rules for advanced credit risk FRTB SA-CCR Other1 RoTE 2018-19:Nothing significant
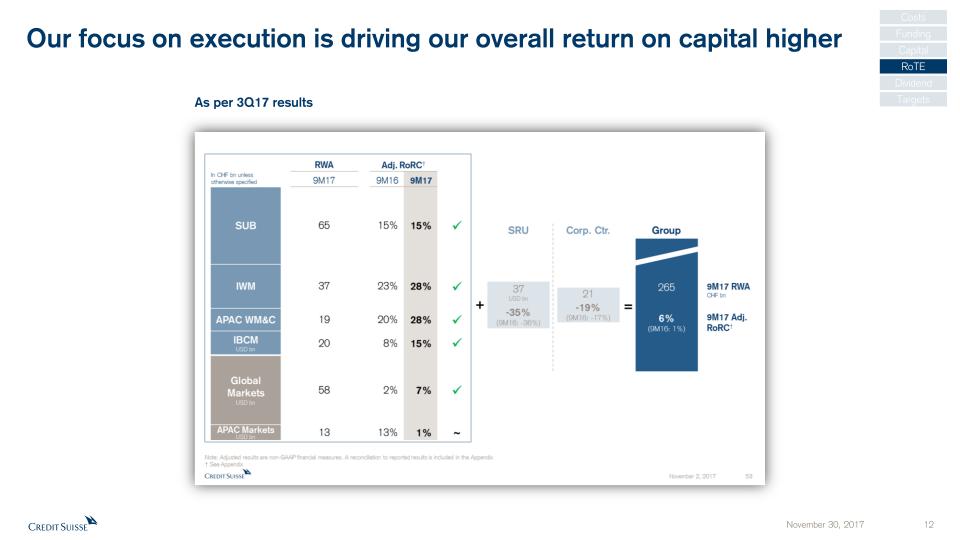
Our focus on execution is driving our overall return on capital higher Costs Funding Capital Dividend Targets RoTE As per 3Q17 results
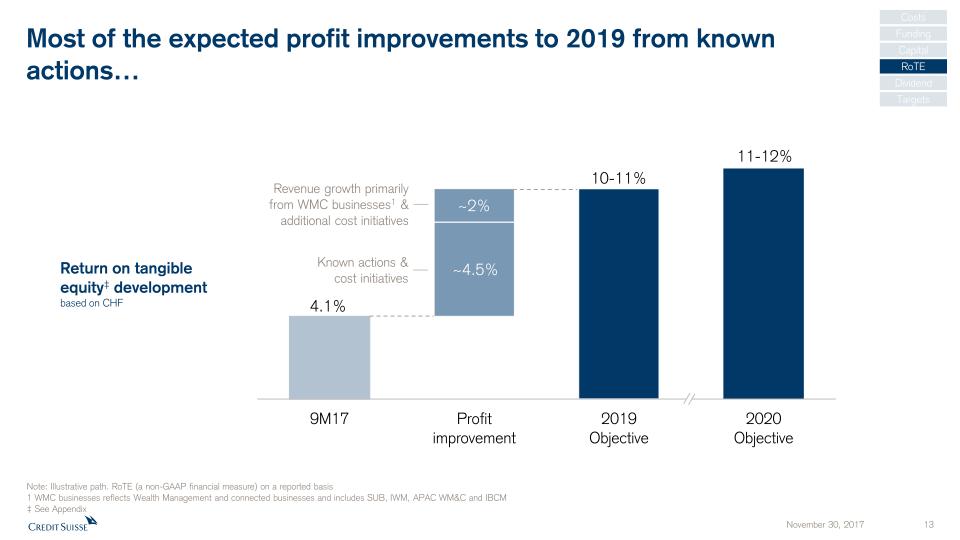
Most of the expected profit improvements to 2019 from knownactions… Return on tangible equity‡ developmentbased on CHF Revenue growth primarily from WMC businesses1 & additional cost initiatives Known actions &cost initiatives Note: Illustrative path. RoTE (a non-GAAP financial measure) on a reported basis1 WMC businesses reflects Wealth Management and connected businesses and includes SUB, IWM, APAC WM&C and IBCM‡ See Appendix Costs Funding Capital Dividend Targets RoTE
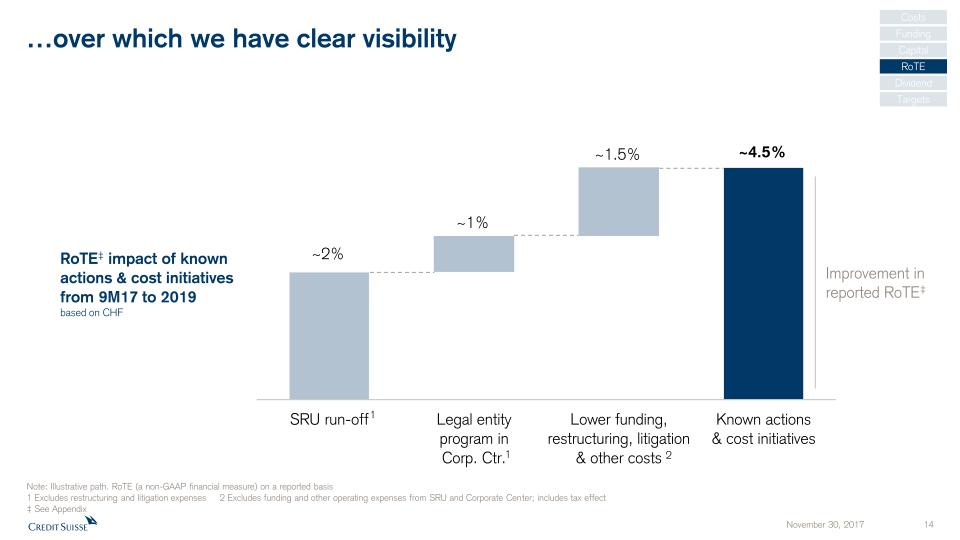
…over which we have clear visibility 2 1 1 Note: Illustrative path. RoTE (a non-GAAP financial measure) on a reported basis1 Excludes restructuring and litigation expenses 2 Excludes funding and other operating expenses from SRU and Corporate Center; includes tax effect‡ See Appendix RoTE‡ impact of known actions & cost initiativesfrom 9M17 to 2019based on CHF Improvement in reported RoTE‡ Costs Funding Capital Dividend Targets RoTE
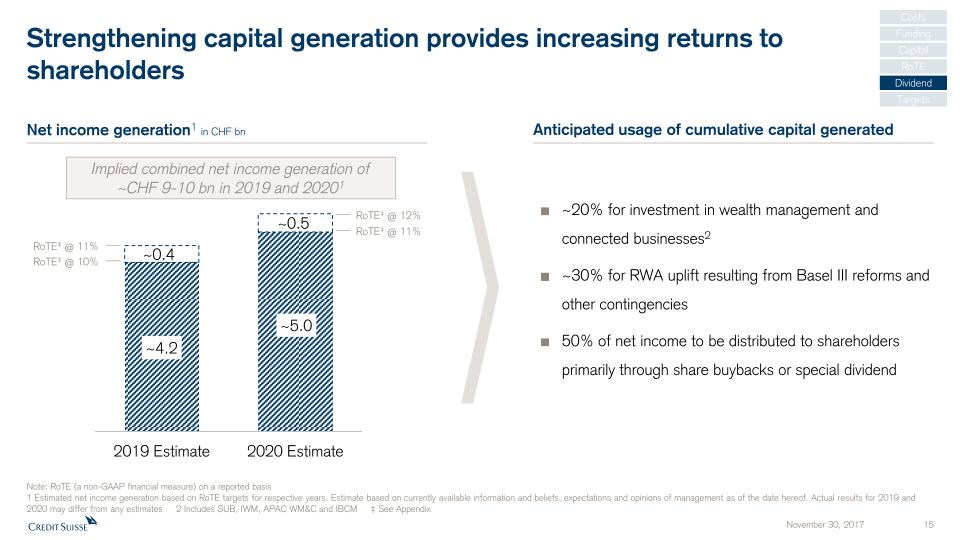
Anticipated usage of cumulative capital generated Strengthening capital generation provides increasing returns to shareholders RoTE‡ @ 11% RoTE‡ @ 10% RoTE‡ @ 12% RoTE‡ @ 11% Implied combined net income generation of~CHF 9-10 bn in 2019 and 20201 Net income generation1 in CHF bn ~20% for investment in wealth management and connected businesses2~30% for RWA uplift resulting from Basel III reforms and other contingencies50% of net income to be distributed to shareholders primarily through share buybacks or special dividend Note: RoTE (a non-GAAP financial measure) on a reported basis1 Estimated net income generation based on RoTE targets for respective years. Estimate based on currently available information and beliefs, expectations and opinions of management as of the date hereof. Actual results for 2019 and 2020 may differ from any estimates 2 Includes SUB, IWM, APAC WM&C and IBCM ‡ See Appendix Costs Funding Capital Dividend Targets RoTE
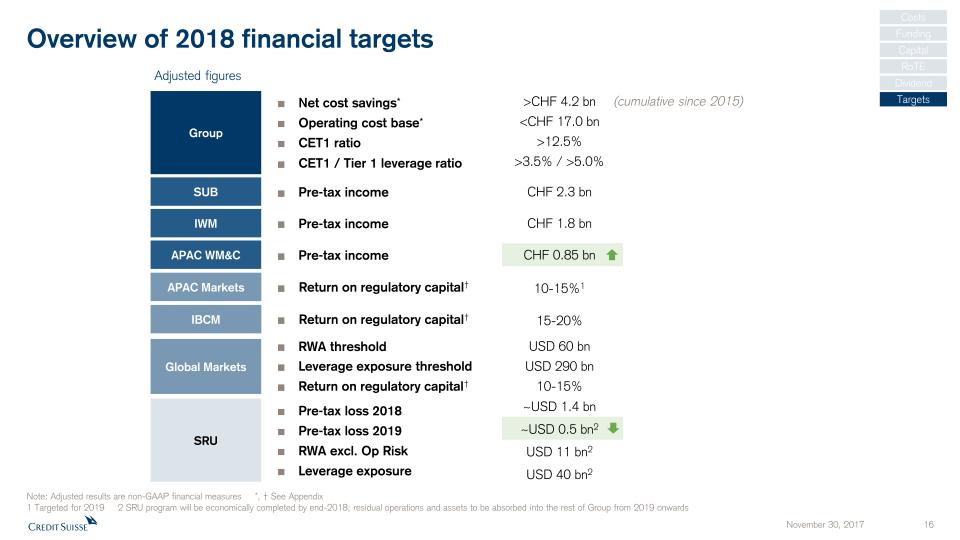
Overview of 2018 financial targets Group Net cost savings*Operating cost base*CET1 ratioCET1 / Tier 1 leverage ratio SUB Pre-tax income CHF 2.3 bn IWM Pre-tax income CHF 1.8 bn >CHF 4.2 bn<CHF 17.0 bn>12.5%>3.5% / >5.0% Adjusted figures 10-15%1 APAC Markets Return on regulatory capital† Global Markets RWA thresholdLeverage exposure thresholdReturn on regulatory capital† USD 60 bnUSD 290 bn10-15% APAC WM&C Pre-tax income CHF 0.85 bn 15-20% IBCM Return on regulatory capital† SRU Pre-tax loss 2018Pre-tax loss 2019RWA excl. Op RiskLeverage exposure ~USD 1.4 bn~USD 0.5 bn2USD 11 bn2USD 40 bn2 (cumulative since 2015) Note: Adjusted results are non-GAAP financial measures *, † See Appendix 1 Targeted for 2019 2 SRU program will be economically completed by end-2018; residual operations and assets to be absorbed into the rest of Group from 2019 onwards Costs Funding Capital RoTE Dividend Targets
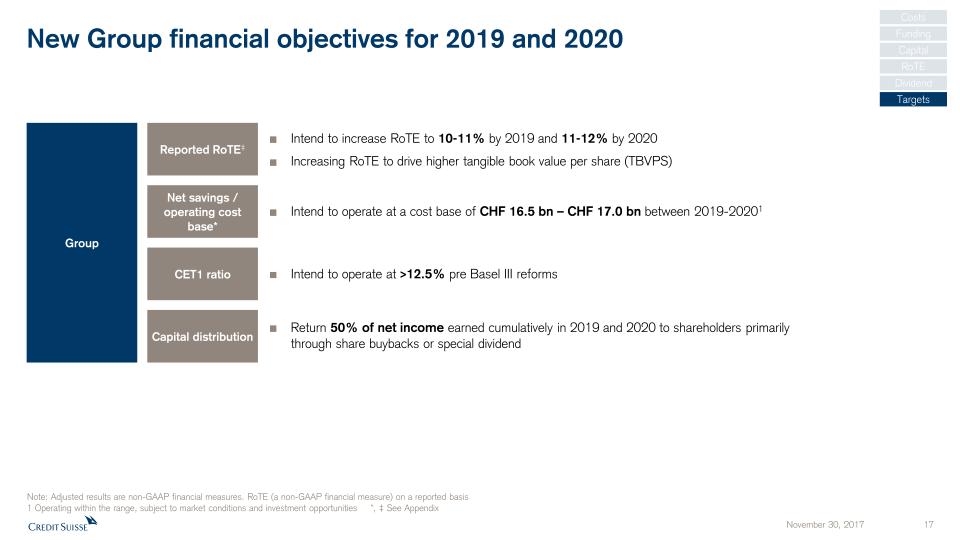
New Group financial objectives for 2019 and 2020 Costs Funding Capital Dividend Targets Group Reported RoTE‡ Net savings / operating cost base* CET1 ratio Intend to increase RoTE to 10-11% by 2019 and 11-12% by 2020Increasing RoTE to drive higher tangible book value per share (TBVPS) Intend to operate at a cost base of CHF 16.5 bn – CHF 17.0 bn between 2019-20201 Intend to operate at >12.5% pre Basel III reforms Note: Adjusted results are non-GAAP financial measures. RoTE (a non-GAAP financial measure) on a reported basis1 Operating within the range, subject to market conditions and investment opportunities *, ‡ See Appendix RoTE Capital distribution Return 50% of net income earned cumulatively in 2019 and 2020 to shareholders primarily through share buybacks or special dividend

Appendix November 30, 2017 18
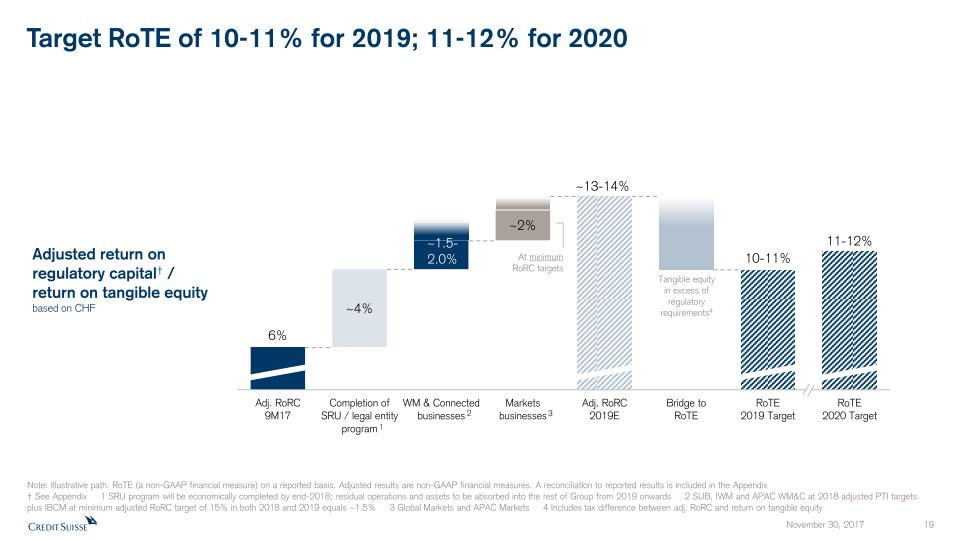
Target RoTE of 10-11% for 2019; 11-12% for 2020 Tangible equity in excess of regulatory requirements4 Adjusted return on regulatory capital† /return on tangible equity based on CHF ~13-14% At minimumRoRC targets Note: Illustrative path. RoTE (a non-GAAP financial measure) on a reported basis. Adjusted results are non-GAAP financial measures. A reconciliation to reported results is included in the Appendix† See Appendix 1 SRU program will be economically completed by end-2018; residual operations and assets to be absorbed into the rest of Group from 2019 onwards 2 SUB, IWM and APAC WM&C at 2018 adjusted PTI targets plus IBCM at minimum adjusted RoRC target of 15% in both 2018 and 2019 equals ~1.5% 3 Global Markets and APAC Markets 4 Includes tax difference between adj. RoRC and return on tangible equity 2 3 1

Reconciliation tables (1/4) Adjusted results are non-GAAP financial measures that exclude goodwill impairment and certain other revenues and expenses included in our reported results. Management believes that adjusted results provide a useful presentation of our operating results for purposes of assessing our Group and divisional performance consistently over time, on a basis that excludes items that management does not consider representative of our underlying performance. Provided below is a reconciliation of our adjusted results to the most directly comparable US GAAP measures. Group in CHF mn Core in CHF mn SUB, IWM and APAC WM&C in CHF mn 9M17 9M16 9M17 9M16 9M17 9M16 Net revenues reported 15,711 15,142 16,446 16,211 9,521 9,103 Fair value on own debt - - - - - - Real estate gains - (346) - (346) - (346) (Gains)/losses on business sales (15) 56 23 52 - - Net revenues adjusted 15,696 14,852 16,469 15,917 9,521 8,757 Provision for credit losses 167 177 138 94 81 77 Total operating expenses reported 13,892 15,028 12,976 13,316 6,527 6,266 Goodwill impairment - - - - - - Restructuring expenses (318) (491) (279) (371) (131) (110) Major litigation provisions (238) (306) (59) 12 (59) 19 Total operating expenses adjusted 13,336 14,231 12,638 12,957 6,337 6,175 Pre-tax income/(loss) reported 1,652 (63) 3,332 2,801 2,913 2,760 Total adjustments 541 507 361 65 190 (255) Pre-tax income/(loss) adjusted 2,193 444 3,693 2,866 3,103 2,505 CS Group in CHF mn 3Q17 2Q17 1Q17 4Q16 3Q16 2Q16 1Q16 4Q15 3Q15 2Q15 1Q15 4Q14 3Q14 2Q14 1Q14 9M17 2016 2015 Total operating expenses reported 4,540 4,541 4,812 7,309 5,119 4,937 4,972 10,518 5,023 5,248 5,106 5,406 5,181 6,790 5,052 13,892 22,337 25,895 Goodwill impairment - - - - - - - (3,797) - - - - - - - - - (3,797) Restructuring expenses (112) (69) (137) (49) (145) (91) (255) (355) - - - - - - - (318) (540) (355) Major litigation provisions (108) (31) (97) (2,401) (306) - - (563) (204) (63) 10 (393) (290) (1,711) (42) (238) (2,707) (820) Debit valuation adjustments (DVA) (20) (17) (26) - - - - - - - - - - - - (63) - - Certain accounting changes (49) (53) (25) - - - - - - - - - - - - (125) - - Total operating expenses adjusted 4,251 4,371 4,527 4,859 4,668 4,846 4,717 5,803 4,819 5,185 5,116 5,013 4,891 5,079 5,010 13,148 19,090 20,923 FX adjustment 106 101 69 70 120 70 33 - 62 137 120 (54) 55 161 189 277 292 319 FX neutral total operating expenses adjusted 4,357 4,472 4,596 4,929 4,788 4,916 4,750 5,803 4,881 5,322 5,236 4,959 4,946 5,240 5,199 13,425 19,382 21,242
Reconciliation tables (2/4) Adjusted results are non-GAAP financial measures that exclude goodwill impairment and certain other revenues and expenses included in our reported results. Management believes that adjusted results provide a useful presentation of our operating results for purposes of assessing our Group and divisional performance consistently over time, on a basis that excludes items that management does not consider representative of our underlying performance. Provided below is a reconciliation of our adjusted results to the most directly comparable US GAAP measures. SUB in CHF mn 3Q17 2Q17 1Q17 4Q16 3Q16 2Q16 1Q16 4Q15 3Q15 2Q15 1Q15 9M17 9M16 9M15 2016 2015 Net revenues reported 1,319 1,405 1,354 1,399 1,667 1,337 1,356 1,495 1,364 1,462 1,400 4,078 4,360 4,226 5,759 5,721 Real estate gains - - - (20) (346) - - (72) - (23) - - (346) (23) (366) (95) (Gains)/losses on business sales - - - - - - - (23) - - - - - - - (23) Net revenues adjusted 1,319 1,405 1,354 1,379 1,321 1,337 1,356 1,400 1,364 1,439 1,400 4,078 4,014 4,203 5,393 5,603 Provision for credit losses 14 36 10 34 30 9 6 43 39 33 23 60 45 95 79 138 Total operating expenses reported 879 867 940 983 879 875 918 1,088 925 961 934 2,686 2,672 2,820 3,655 3,908 Goodwill impairment - - - - - - - - - - - - - - - - Restructuring expenses (13) 4 (52) 3 (19) (4) (40) (42) - - - (61) (63) - (60) (42) Major litigation provisions (9) (6) (27) (19) - - - (25) - - - (42) - - (19) (25) Total operating expenses adjusted 857 865 861 967 860 871 878 1,021 925 961 934 2,583 2,609 2,820 3,576 3,841 Pre-tax income/(loss) reported 426 502 404 382 758 453 432 364 400 468 443 1,332 1,643 1,311 2,025 1,675 Total adjustments 22 2 79 (4) (327) 4 40 (28) - (23) - 103 (283) (23) (287) (51) Pre-tax income/(loss) adjusted 448 504 483 378 431 457 472 336 400 445 443 1,435 1,360 1,288 1,738 1,624 SUB PC in CHF mn SUB C&ICin CHF mn IWM in CHF mn IWM AM in CHF mn 9M17 9M16 9M15 9M17 9M16 9M15 3Q17 2Q17 1Q17 9M17 4Q16 3Q16 2Q16 1Q16 9M16 9M15 2016 2015 9M17 9M16 9M15 Net revenues reported 2,171 2,509 2,356 1,907 1,851 1,870 1,262 1,264 1,221 3,747 1,299 1,081 1,145 1,173 3,399 3,379 4,698 4,552 1,067 946 963 Real estate gains - (346) (23) - - - - - - - (54) - - - - - (54) - - - - (Gains)/losses on business sales - - - - - - - - - - - - - - - - - (11) - - - Net revenues adjusted 2,171 2,163 2,333 1,907 1,851 1,870 1,262 1,264 1,221 3,747 1,245 1,081 1,145 1,173 3,399 3,379 4,644 4,541 1,067 946 963 Provision for credit losses 32 29 35 28 16 60 3 8 2 13 6 0 16 (2) 14 12 20 5 - - - Total operating expenses reported 1,550 1,558 1,746 1,136 1,114 1,074 904 891 928 2,723 962 836 884 875 2,595 2,620 3,557 3,824 844 769 816 Goodwill impairment - - - - - - - - - - - - - - - - - - - - - Restructuring expenses (54) (54) - (7) (9) - (16) (7) (36) (59) (16) (15) (15) (8) (38) - (54) (36) (23) (2) - Major litigation provisions (4) - - (38) - - (11) (6) - (17) (7) 19 - - 19 (40) 12 (268) - - - Total operating expenses adjusted 1,492 1,504 1,746 1,091 1,105 1,074 877 878 892 2,647 939 840 869 867 2,576 2,580 3,515 3,520 821 767 816 Pre-tax income/(loss) reported 589 922 575 743 721 736 355 365 291 1,011 331 245 245 300 790 747 1,121 723 223 177 147 Total adjustments 58 (292) (23) 45 9 - 27 13 36 76 (31) (4) 15 8 19 40 (12) 293 23 2 - Pre-tax income/(loss) adjusted 647 630 552 788 730 736 382 378 327 1,087 300 241 260 308 809 787 1,109 1,016 246 179 147
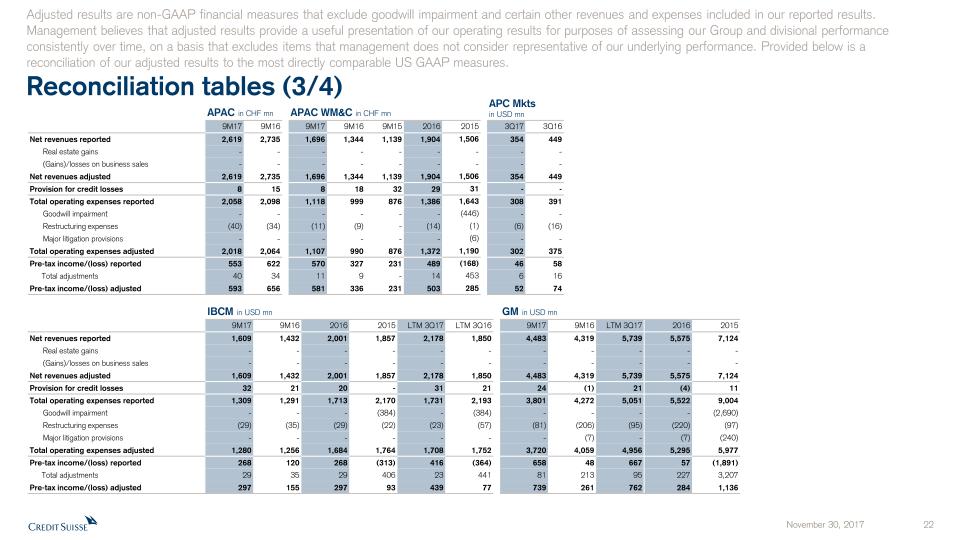
Reconciliation tables (3/4) Adjusted results are non-GAAP financial measures that exclude goodwill impairment and certain other revenues and expenses included in our reported results. Management believes that adjusted results provide a useful presentation of our operating results for purposes of assessing our Group and divisional performance consistently over time, on a basis that excludes items that management does not consider representative of our underlying performance. Provided below is a reconciliation of our adjusted results to the most directly comparable US GAAP measures. APAC in CHF mn APAC WM&C in CHF mn APC Mktsin USD mn 9M17 9M16 9M17 9M16 9M15 2016 2015 3Q17 3Q16 Net revenues reported 2,619 2,735 1,696 1,344 1,139 1,904 1,506 354 449 Real estate gains - - - - - - - - - (Gains)/losses on business sales - - - - - - - - - Net revenues adjusted 2,619 2,735 1,696 1,344 1,139 1,904 1,506 354 449 Provision for credit losses 8 15 8 18 32 29 31 - - Total operating expenses reported 2,058 2,098 1,118 999 876 1,386 1,643 308 391 Goodwill impairment - - - - - - (446) - - Restructuring expenses (40) (34) (11) (9) - (14) (1) (6) (16) Major litigation provisions - - - - - - (6) - - Total operating expenses adjusted 2,018 2,064 1,107 990 876 1,372 1,190 302 375 Pre-tax income/(loss) reported 553 622 570 327 231 489 (168) 46 58 Total adjustments 40 34 11 9 - 14 453 6 16 Pre-tax income/(loss) adjusted 593 656 581 336 231 503 285 52 74 IBCM in USD mn GM in USD mn 9M17 9M16 2016 2015 LTM 3Q17 LTM 3Q16 9M17 9M16 LTM 3Q17 2016 2015 Net revenues reported 1,609 1,432 2,001 1,857 2,178 1,850 4,483 4,319 5,739 5,575 7,124 Real estate gains - - - - - - - - - - - (Gains)/losses on business sales - - - - - - - - - - - Net revenues adjusted 1,609 1,432 2,001 1,857 2,178 1,850 4,483 4,319 5,739 5,575 7,124 Provision for credit losses 32 21 20 - 31 21 24 (1) 21 (4) 11 Total operating expenses reported 1,309 1,291 1,713 2,170 1,731 2,193 3,801 4,272 5,051 5,522 9,004 Goodwill impairment - - - (384) - (384) - - - - (2,690) Restructuring expenses (29) (35) (29) (22) (23) (57) (81) (206) (95) (220) (97) Major litigation provisions - - - - - - - (7) - (7) (240) Total operating expenses adjusted 1,280 1,256 1,684 1,764 1,708 1,752 3,720 4,059 4,956 5,295 5,977 Pre-tax income/(loss) reported 268 120 268 (313) 416 (364) 658 48 667 57 (1,891) Total adjustments 29 35 29 406 23 441 81 213 95 227 3,207 Pre-tax income/(loss) adjusted 297 155 297 93 439 77 739 261 762 284 1,136

Reconciliation tables (4/4) Adjusted results are non-GAAP financial measures that exclude goodwill impairment and certain other revenues and expenses included in our reported results. Management believes that adjusted results provide a useful presentation of our operating results for purposes of assessing our Group and divisional performance consistently over time, on a basis that excludes items that management does not consider representative of our underlying performance. Provided below is a reconciliation of our adjusted results to the most directly comparable US GAAP measures. SRU in USD mn SRU in CHF mn 9M17 9M16 9M15 2016 2015 9M17 9M16 Net revenues reported (752) (1,087) 682 (1,285) 557 (735) (1,069) Real estate gains - - - (4) - - - (Gains)/losses on business sales (39) 5 - 6 - (38) 4 Net revenues adjusted (791) (1,082) 682 (1,283) 557 (773) (1,065) Provision for credit losses 28 87 39 115 138 29 83 Total operating expenses reported 937 1,743 2,026 4,353 3,130 916 1,712 Goodwill impairment - - - - - - - Restructuring expenses (40) (122) - (123) (158) (39) (120) Major litigation provisions (184) (324) (37) (2,646) (295) (179) (318) Total operating expenses adjusted 713 1,297 1,989 1,584 2,677 698 1,274 Pre-tax income/(loss) reported (1,717) (2,917) (1,383) (5,753) (2,711) (1,680) (2,864) Total adjustments 185 451 37 2,771 453 180 442 Pre-tax income/(loss) adjusted (1,532) (2,466) (1,346) (2,982) (2,258) (1,500) (2,422)
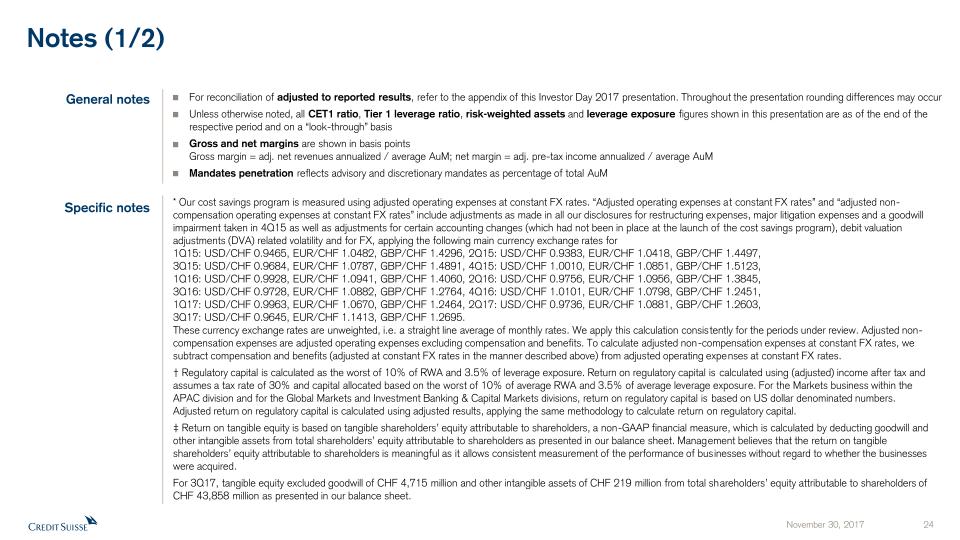
Notes (1/2) For reconciliation of adjusted to reported results, refer to the appendix of this Investor Day 2017 presentation. Throughout the presentation rounding differences may occurUnless otherwise noted, all CET1 ratio, Tier 1 leverage ratio, risk-weighted assets and leverage exposure figures shown in this presentation are as of the end of the respective period and on a “look-through” basisGross and net margins are shown in basis pointsGross margin = adj. net revenues annualized / average AuM; net margin = adj. pre-tax income annualized / average AuMMandates penetration reflects advisory and discretionary mandates as percentage of total AuM General notes Specific notes * Our cost savings program is measured using adjusted operating expenses at constant FX rates. “Adjusted operating expenses at constant FX rates” and “adjusted non-compensation operating expenses at constant FX rates” include adjustments as made in all our disclosures for restructuring expenses, major litigation expenses and a goodwill impairment taken in 4Q15 as well as adjustments for certain accounting changes (which had not been in place at the launch of the cost savings program), debit valuation adjustments (DVA) related volatility and for FX, applying the following main currency exchange rates for1Q15: USD/CHF 0.9465, EUR/CHF 1.0482, GBP/CHF 1.4296, 2Q15: USD/CHF 0.9383, EUR/CHF 1.0418, GBP/CHF 1.4497,3Q15: USD/CHF 0.9684, EUR/CHF 1.0787, GBP/CHF 1.4891, 4Q15: USD/CHF 1.0010, EUR/CHF 1.0851, GBP/CHF 1.5123,1Q16: USD/CHF 0.9928, EUR/CHF 1.0941, GBP/CHF 1.4060, 2Q16: USD/CHF 0.9756, EUR/CHF 1.0956, GBP/CHF 1.3845,3Q16: USD/CHF 0.9728, EUR/CHF 1.0882, GBP/CHF 1.2764, 4Q16: USD/CHF 1.0101, EUR/CHF 1.0798, GBP/CHF 1.2451,1Q17: USD/CHF 0.9963, EUR/CHF 1.0670, GBP/CHF 1.2464, 2Q17: USD/CHF 0.9736, EUR/CHF 1.0881, GBP/CHF 1.2603,3Q17: USD/CHF 0.9645, EUR/CHF 1.1413, GBP/CHF 1.2695.These currency exchange rates are unweighted, i.e. a straight line average of monthly rates. We apply this calculation consistently for the periods under review. Adjusted non-compensation expenses are adjusted operating expenses excluding compensation and benefits. To calculate adjusted non-compensation expenses at constant FX rates, we subtract compensation and benefits (adjusted at constant FX rates in the manner described above) from adjusted operating expenses at constant FX rates.† Regulatory capital is calculated as the worst of 10% of RWA and 3.5% of leverage exposure. Return on regulatory capital is calculated using (adjusted) income after tax and assumes a tax rate of 30% and capital allocated based on the worst of 10% of average RWA and 3.5% of average leverage exposure. For the Markets business within the APAC division and for the Global Markets and Investment Banking & Capital Markets divisions, return on regulatory capital is based on US dollar denominated numbers. Adjusted return on regulatory capital is calculated using adjusted results, applying the same methodology to calculate return on regulatory capital. ‡ Return on tangible equity is based on tangible shareholders’ equity attributable to shareholders, a non-GAAP financial measure, which is calculated by deducting goodwill and other intangible assets from total shareholders’ equity attributable to shareholders as presented in our balance sheet. Management believes that the return on tangible shareholders’ equity attributable to shareholders is meaningful as it allows consistent measurement of the performance of businesses without regard to whether the businesses were acquired.For 3Q17, tangible equity excluded goodwill of CHF 4,715 million and other intangible assets of CHF 219 million from total shareholders’ equity attributable to shareholders of CHF 43,858 million as presented in our balance sheet.

Notes (2/2) Abbreviations Adj. = Adjusted; AI = Artificial Intelligence; AM = Asset Management; AML = Anti-Money Laundering; APAC = Asia Pacific; AT1 = Additional Tier 1; AuM = Assets under Management; BCBS = Basel Committee on Banking Supervision; BIS = Bank for International Settlements; bps = basis points; CAGR = Compound Annual Growth Rate; CCRO = Chief Compliance and Regulatory Affairs Officer; CET1 = Common Equity Tier 1; CIC = Corporate & Institutional Clients; CIF = Customer/Client Information File; Corp. Ctr. = Corporate Center; CVA = Credit Valuation Adjustment; DCM = Debt Capital Markets; EAM = External Asset Manager; ECM = Equity Capital Markets; EM = Emerging Markets; EMEA = Europe, Middle East & Africa; EPS = Earnings Per Share; EQ = Equities; EU = European Union; FICC = Fixed Income, Currencies & Commodities; FINMA = Swiss Financial Market Supervisory Authority; FLP = Fund Linked Products; FRTB = Fundamental Review of the Trading Book; FX = Foreign Exchange; G10 = Group of Ten; GDP = Gross Domestic Product; GM = Global Markets; IBCM = Investment Banking & Capital Markets; IBD = Investment Banking Department; IC = Investment Consultant; IMF = International Monetary Fund; IP = Investor Products; IPO = Initial Public Offering; IRB = Internal Ratings Based; IT = Information Technology; ITS = International Trading Solutions; IWM = International Wealth Management; JV = Joint Venture; LSC = Large Swiss Corporates; M&A = Mergers & Acquisitions; MI = Management Information; Mkts = Markets; NNA = Net new assets; Op Risk = Operational Risk; PB = Private Banking; PC = Private Clients; PEP = Politically Exposed Person; pp = percentage points; PTI = Pre-tax income; PWMC = Private & Wealth Management Clients; RM = Relationship Manager(s); RoRC = Return on Regulatory Capital; RoTE = Return on Tangible Equity; RPA = Robotic Process Automation; RWA = Risk-weighted assets; SA-CCR = Standardized Approach to Counterparty Credit Risk; SME = Small and Medium-Sized Enterprises; SMG = Systematic Market-Making Group; SoW = Share of Wallet; SRU = Strategic Resolution Unit; SUB = Swiss Universal Bank; TBTF = Too Big To Fail; TBVS = Tangible Book Value per Share; (U)HNW(I) = (Ultra) High Net Worth (Individuals); VaR = Value-at-Risk; VIX = Volatility Index; WM = Wealth Management; WM&C = Wealth Management & Connected; YoY = Year over year; YTD = Year to Date


Credit Suisse Investor Day 2017Global MarketsBrian Chin November 30, 2017

Disclaimer This material does not purport to contain all of the information that you may wish to consider. This material is not to be relied upon as such or used in substitution for the exercise of independent judgment.Cautionary statement regarding forward-looking statements This presentation contains forward-looking statements that involve inherent risks and uncertainties, and we might not be able to achieve the predictions, forecasts, projections and other outcomes we describe or imply in forward-looking statements. A number of important factors could cause results to differ materially from the plans, objectives, expectations, estimates and intentions we express in these forward-looking statements, including those we identify in "Risk factors” in our Annual Report on Form 20-F for the fiscal year ended December 31, 2016 and in the “Cautionary statement regarding forward-looking information" in our media release relating to Investor Day, published on November 30, 2017 and filed with the US Securities and Exchange Commission, and in other public filings and press releases. We do not intend to update these forward-looking statements. In particular, the terms “Estimate”, “Illustrative”, “Ambition”, “Objective”, “Outlook” and “Goal” are not intended to be viewed as targets or projections, nor are they considered to be Key Performance Indicators. All such estimates, illustrations, ambitions and goals are subject to a large number of inherent risks, assumptions and uncertainties, many of which are completely outside of our control. These risks, assumptions and uncertainties include, but are not limited to, general market conditions, market volatility, interest rate volatility and levels, global and regional economic conditions, political uncertainty, changes in tax policies, regulatory changes, changes in levels of client activity as a result of any of the foregoing and other factors. Accordingly, this information should not be relied on for any purpose. We do not intend to update these estimates, illustrations, ambitions or goals. We may not achieve the benefits of our strategic initiatives We may not achieve all of the expected benefits of our strategic initiatives. Factors beyond our control, including but not limited to the market and economic conditions, changes in laws, rules or regulations and other challenges discussed in our public filings, could limit our ability to achieve some or all of the expected benefits of these initiatives. Estimates, assumptions and opinionsIn preparing this presentation, management has made estimates and assumptions that affect the numbers presented. Actual results may differ. Annualized numbers do not take account of variations in operating results, seasonality and other factors and may not be indicative of actual, full-year results. Figures throughout this presentation may also be subject to rounding adjustments. All opinions and views constitute judgments as of the date of writing without regard to the date on which the reader may receive or access the information. This information is subject to change at any time without notice and we do not intend to update this information. Statement regarding non-GAAP financial measures This presentation also contains non-GAAP financial measures, including adjusted results. Information needed to reconcile such non-GAAP financial measures to the most directly comparable measures under US GAAP can be found in the Appendix of the CEO and CFO Investor Day presentations, published on November 30, 2017. All Investor Day presentations are available on our website at www.credit-suisse.com. Statement regarding capital, liquidity and leverage As of January 1, 2013, Basel III was implemented in Switzerland along with the Swiss “Too Big to Fail” legislation and regulations thereunder (in each case, subject to certain phase-in periods). As of January 1, 2015, the Bank for International Settlements (BIS) leverage ratio framework, as issued by the Basel Committee on Banking Supervision (BCBS), was implemented in Switzerland by FINMA. Our related disclosures are in accordance with our interpretation of such requirements, including relevant assumptions. Changes in the interpretation of these requirements in Switzerland or in any of our assumptions or estimates could result in different numbers from those shown in this presentation. Capital and ratio numbers for periods prior to 2013 are based on estimates, which are calculated as if the Basel III framework had been in place in Switzerland during such periods. Unless otherwise noted, leverage exposure is based on the BIS leverage ratio framework and consists of period-end balance sheet assets and prescribed regulatory adjustments. Beginning in 2015, the Swiss leverage ratio is calculated as Swiss total capital, divided by period-end leverage exposure. The look-through BIS tier 1 leverage ratio and CET1 leverage ratio are calculated as look-through BIS tier 1 capital and CET1 capital, respectively, divided by end-period leverage exposure.SourcesCertain material in this presentation has been prepared by Credit Suisse on the basis of publicly available information, internally developed data and other third-party sources believed to be reliable. Credit Suisse has not sought to independently verify information obtained from public and third-party sources and makes no representations or warranties as to accuracy, completeness or reliability of such information.
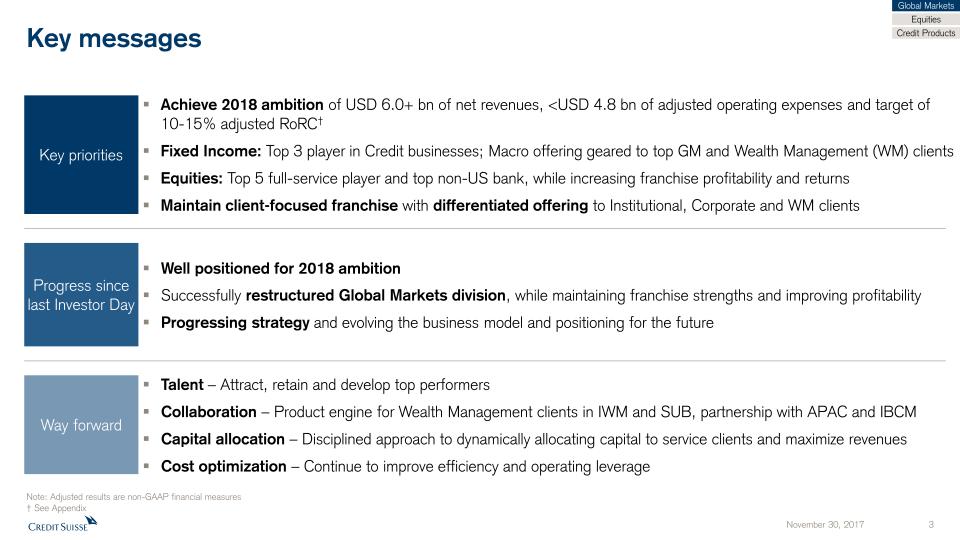
Key messages Achieve 2018 ambition of USD 6.0+ bn of net revenues, <USD 4.8 bn of adjusted operating expenses and target of 10-15% adjusted RoRC†Fixed Income: Top 3 player in Credit businesses; Macro offering geared to top GM and Wealth Management (WM) clientsEquities: Top 5 full-service player and top non-US bank, while increasing franchise profitability and returnsMaintain client-focused franchise with differentiated offering to Institutional, Corporate and WM clients Key priorities Talent – Attract, retain and develop top performersCollaboration – Product engine for Wealth Management clients in IWM and SUB, partnership with APAC and IBCMCapital allocation – Disciplined approach to dynamically allocating capital to service clients and maximize revenuesCost optimization – Continue to improve efficiency and operating leverage Way forward Well positioned for 2018 ambitionSuccessfully restructured Global Markets division, while maintaining franchise strengths and improving profitabilityProgressing strategy and evolving the business model and positioning for the future Progress since last Investor Day Global Markets Equities Credit Products Note: Adjusted results are non-GAAP financial measures† See Appendix
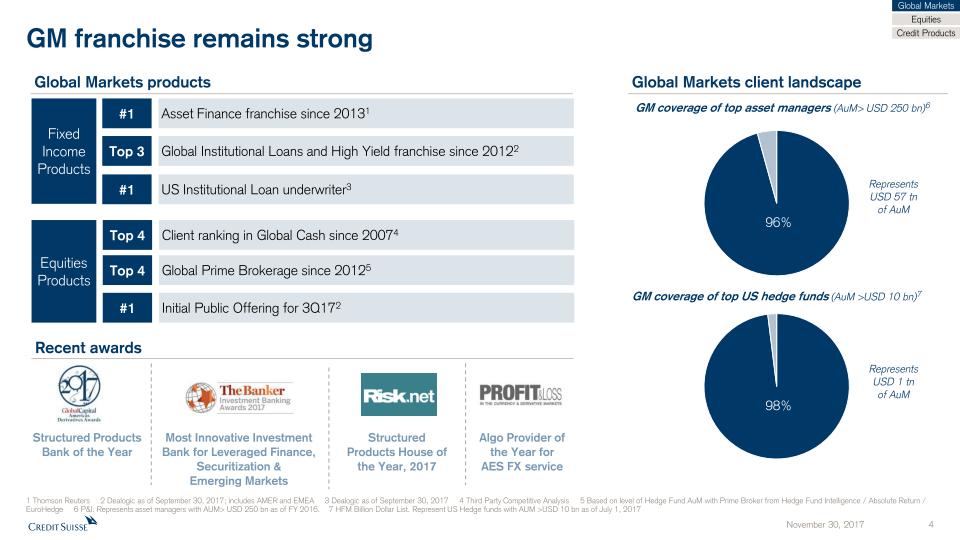
GM franchise remains strong Structured Products Bank of the Year Most Innovative Investment Bank for Leveraged Finance, Securitization & Emerging Markets Recent awards Client ranking in Global Cash since 20074 Global Prime Brokerage since 20125 Initial Public Offering for 3Q172 Top 4 Top 4 #1 Asset Finance franchise since 20131 Global Institutional Loans and High Yield franchise since 20122 US Institutional Loan underwriter3 #1 Top 3 #1 Structured Products House of the Year, 2017 Algo Provider of the Year for AES FX service Global Markets Equities Credit Products 1 Thomson Reuters 2 Dealogic as of September 30, 2017; includes AMER and EMEA 3 Dealogic as of September 30, 2017 4 Third Party Competitive Analysis 5 Based on level of Hedge Fund AuM with Prime Broker from Hedge Fund Intelligence / Absolute Return / EuroHedge 6 P&I. Represents asset managers with AUM> USD 250 bn as of FY 2016. 7 HFM Billion Dollar List. Represent US Hedge funds with AUM >USD 10 bn as of July 1, 2017 Fixed Income Products EquitiesProducts Global Markets client landscape GM coverage of top asset managers (AuM> USD 250 bn)6 Represents USD 57 tn of AuM GM coverage of top US hedge funds (AuM >USD 10 bn)7 Represents USD 1 tn of AuM Global Markets products
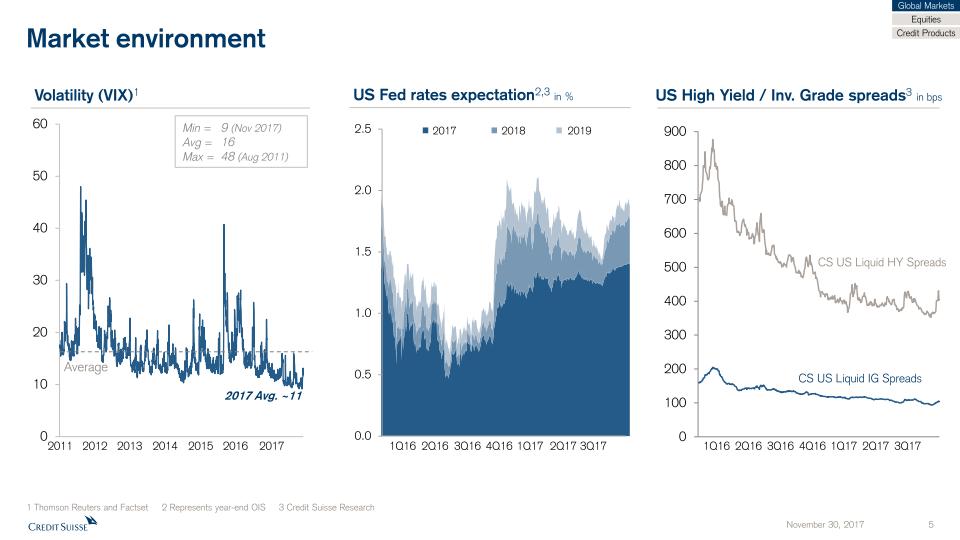
Market environment Volatility (VIX)1 1 Thomson Reuters and Factset 2 Represents year-end OIS 3 Credit Suisse Research Average US Fed rates expectation2,3 in % US High Yield / Inv. Grade spreads3 in bps Global Markets Equities Credit Products CS US Liquid IG Spreads CS US Liquid HY Spreads Min =Avg =Max = 9 (Nov 2017)1648 (Aug 2011) 2011 2012 2013 2014 2015 2016 2017 1Q16 2Q16 3Q16 4Q16 1Q17 2Q17 3Q17 3Q17 1Q16 2Q16 2Q17 1Q17 4Q16 3Q16 2017 2018 2019 2017 Avg. ~11
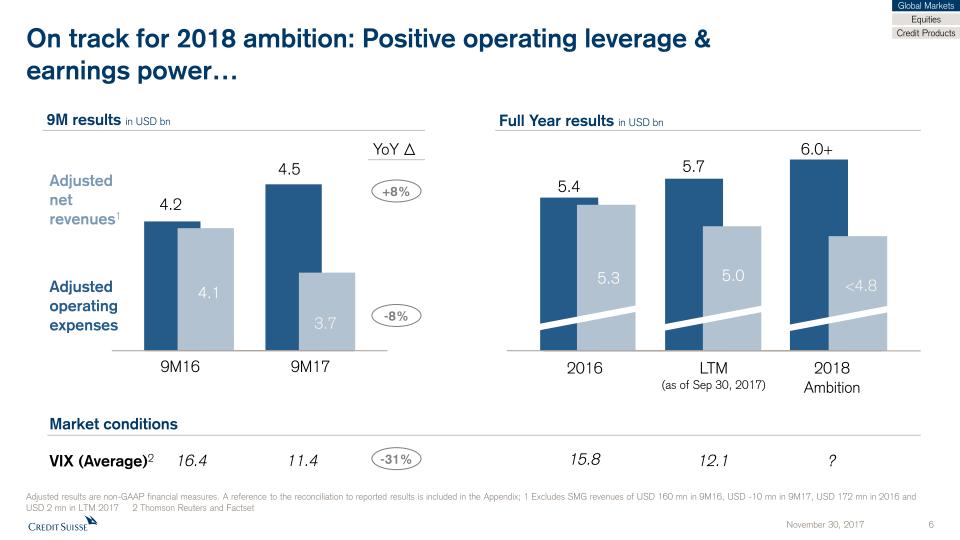
On track for 2018 ambition: Positive operating leverage &earnings power… Global Markets Equities Credit Products Full Year results in USD bn Adjusted net revenues1 Adjusted results are non-GAAP financial measures. A reference to the reconciliation to reported results is included in the Appendix; 1 Excludes SMG revenues of USD 160 mn in 9M16, USD -10 mn in 9M17, USD 172 mn in 2016 and USD 2 mn in LTM 2017 2 Thomson Reuters and Factset LTM(as of Sep 30, 2017) 2018 Ambition 4.2 4.5 4.1 3.7 -8% Adjusted operating expenses 9M16 9M17 +8% 9M results in USD bn 6.0+ YoY -31% Market conditions <4.8 2016 VIX (Average)2 16.4 11.4 12.1 15.8 ?
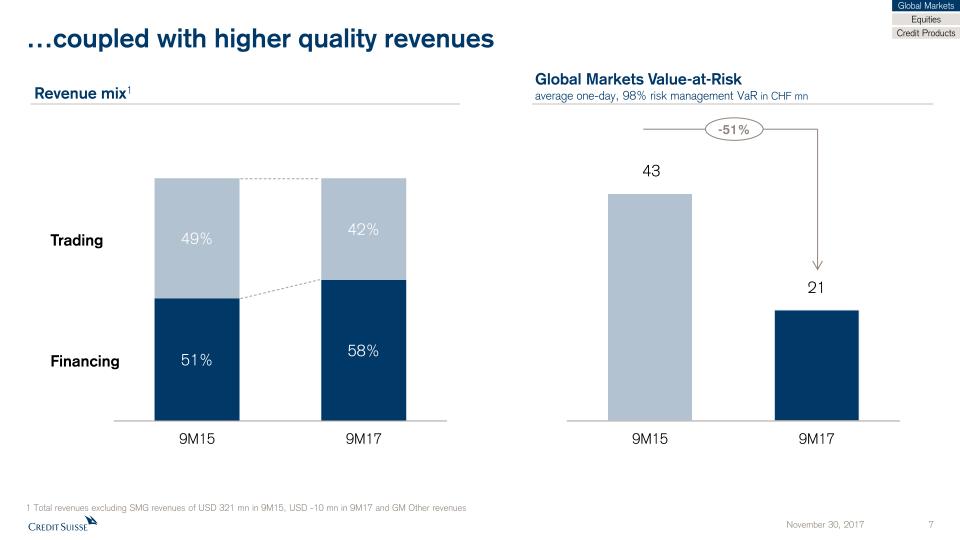
…coupled with higher quality revenues 1 Total revenues excluding SMG revenues of USD 321 mn in 9M15, USD -10 mn in 9M17 and GM Other revenues Global Markets Value-at-Risk average one-day, 98% risk management VaR in CHF mn Revenue mix1 Global Markets Equities Credit Products -51% Financing Trading
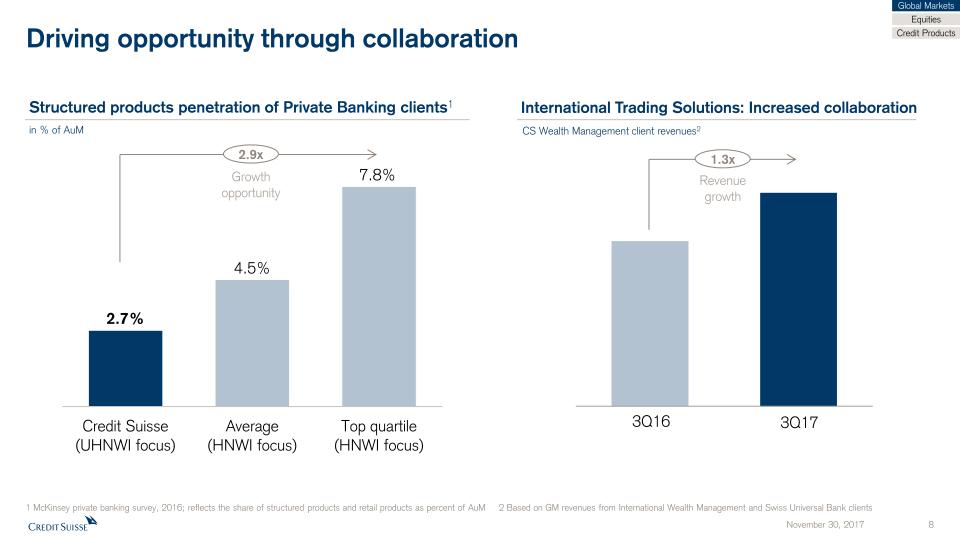
Driving opportunity through collaboration Structured products penetration of Private Banking clients1 International Trading Solutions: Increased collaboration 1 McKinsey private banking survey, 2016; reflects the share of structured products and retail products as percent of AuM 2 Based on GM revenues from International Wealth Management and Swiss Universal Bank clients Global Markets Equities Credit Products Growth opportunity in % of AuM 2.9x 3Q16 3Q17 CS Wealth Management client revenues2 Revenue growth 1.3x

Credit Suisse Investor Day 2017Global MarketsMike Stewart, Head of Equities
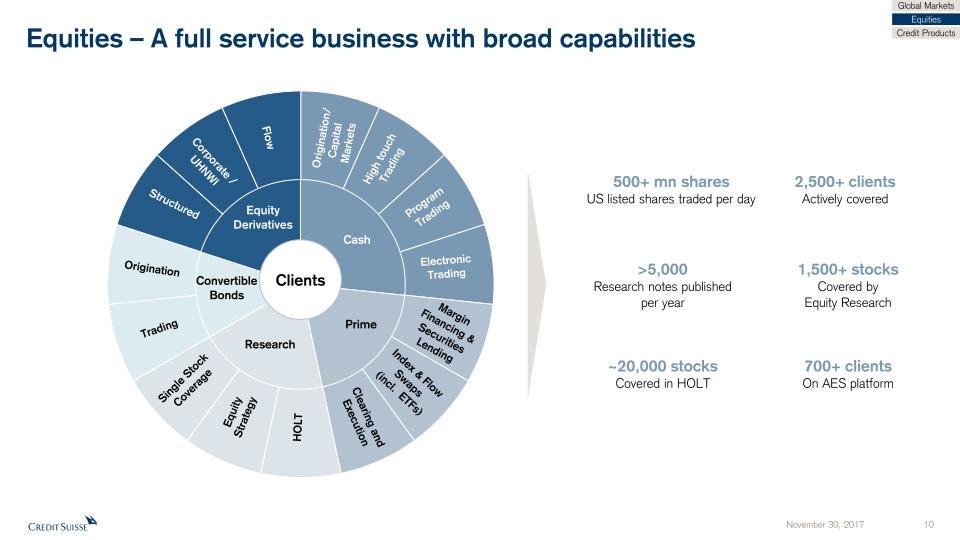
Equities – A full service business with broad capabilities 500+ mn sharesUS listed shares traded per day 2,500+ clientsActively covered 1,500+ stocksCovered by Equity Research >5,000Research notes published per year Cash Convertible Bonds Equity Strategy Origination/ Capital Markets Electronic Trading Corporate / UHNWI Origination EquityDerivatives Clients 700+ clientsOn AES platform ~20,000 stocksCovered in HOLT Prime Research High touch Trading Program Trading Clearing and Execution Index & Flow Swaps (incl. ETFs) Margin Financing & Securities Lending Flow Trading HOLT Single Stock Coverage Global Markets Equities Credit Products Structured
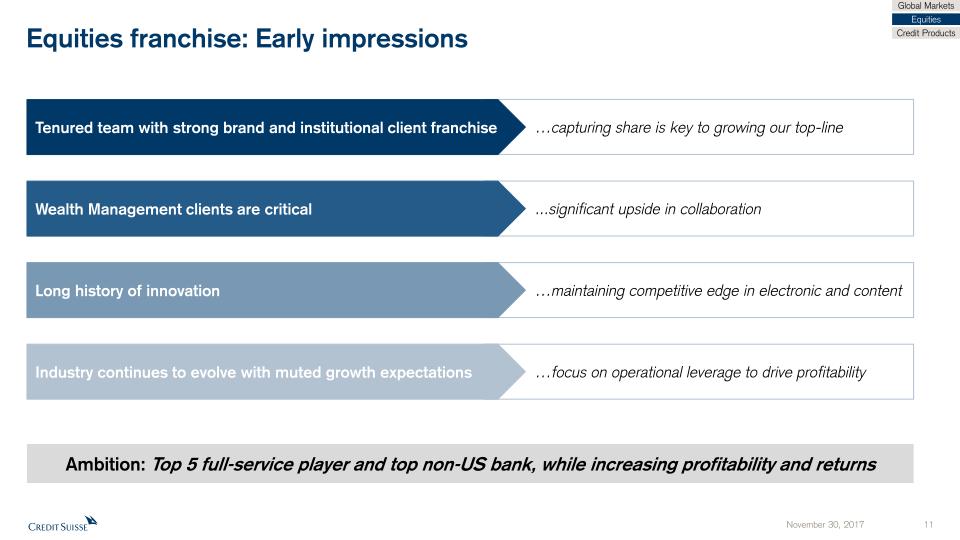
Equities franchise: Early impressions Global Markets Equities Credit Products Ambition: Top 5 full-service player and top non-US bank, while increasing profitability and returns …capturing share is key to growing our top-line ...significant upside in collaboration …maintaining competitive edge in electronic and content …focus on operational leverage to drive profitability Tenured team with strong brand and institutional client franchise Wealth Management clients are critical Long history of innovation Industry continues to evolve with muted growth expectations
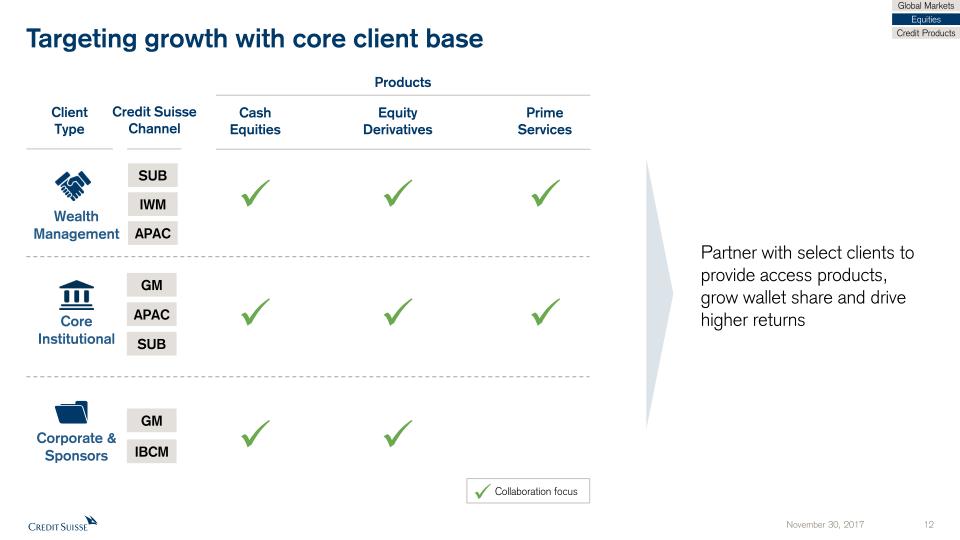
Targeting growth with core client base Wealth Management Core Institutional Corporate & Sponsors Cash Equities Equity Derivatives Prime Services Global Markets Equities Credit Products Partner with select clients to provide access products, grow wallet share and drive higher returns SUB IWM APAC GM IBCM Client Type Credit SuisseChannel Products Collaboration focus GM APAC SUB
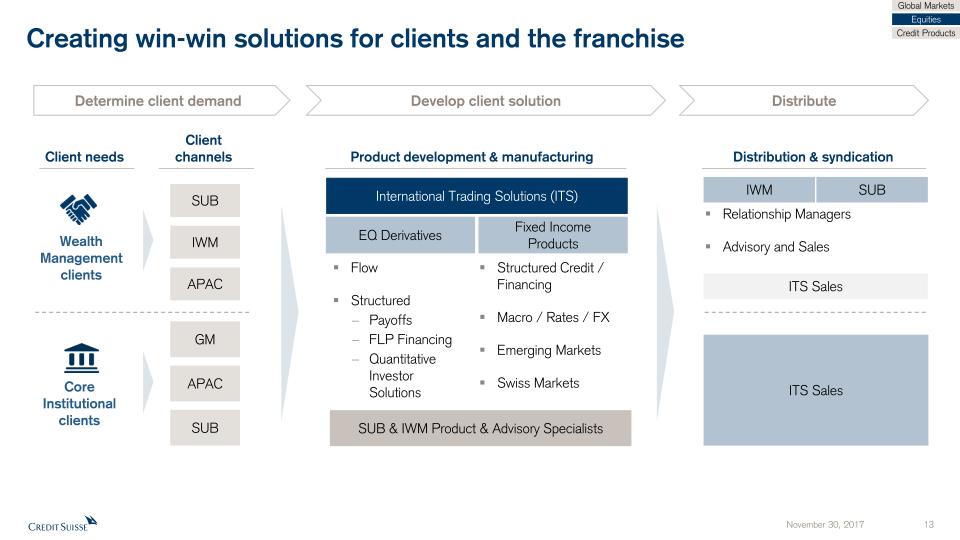
Creating win-win solutions for clients and the franchise Global Markets Equities Credit Products Product development & manufacturing International Trading Solutions (ITS) SUB & IWM Product & Advisory Specialists EQ Derivatives Fixed Income Products Wealth Managementclients Core Institutionalclients Client channels Client needs SUB GM IWM Distribution & syndication IWM ITS Sales ITS Sales APAC APAC Flow StructuredPayoffsFLP FinancingQuantitative Investor Solutions Structured Credit / FinancingMacro / Rates / FXEmerging MarketsSwiss Markets SUB Relationship ManagersAdvisory and Sales Determine client demand Develop client solution Distribute SUB

Credit Suisse Investor Day 2017Global MarketsDavid Miller, Head of Credit
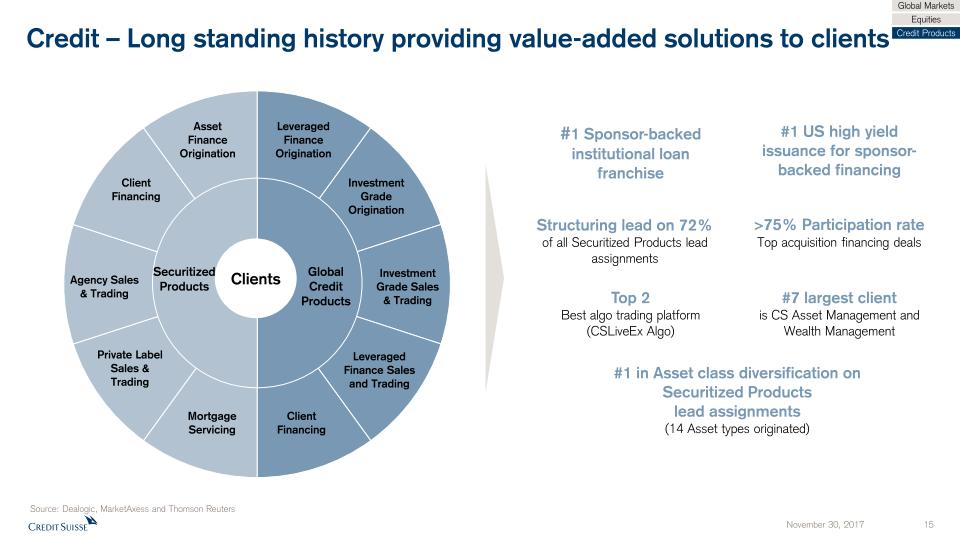
Credit – Long standing history providing value-added solutions to clients Global Markets Equities Credit Products Investment Grade Sales & Trading Investment Grade Origination Mortgage Servicing Asset Finance Origination Clients Global Credit Products Securitized Products Leveraged Finance Sales and Trading ClientFinancing Agency Sales & Trading #1 Sponsor-backed institutional loan franchise #1 US high yield issuance for sponsor-backed financing Top 2 Best algo trading platform(CSLiveEx Algo) >75% Participation rateTop acquisition financing deals Structuring lead on 72% of all Securitized Products lead assignments #7 largest clientis CS Asset Management and Wealth Management Source: Dealogic, MarketAxess and Thomson Reuters Leveraged Finance Origination ClientFinancing Private Label Sales & Trading #1 in Asset class diversification on Securitized Products lead assignments (14 Asset types originated)
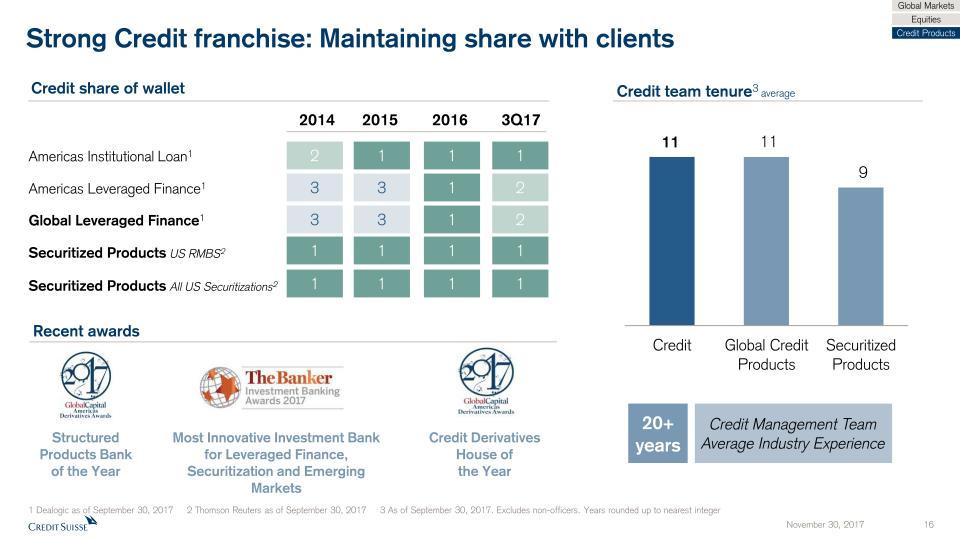
Strong Credit franchise: Maintaining share with clients Recent awards Structured Products Bank of the Year Most Innovative Investment Bank for Leveraged Finance, Securitization and Emerging Markets Credit Derivatives House of the Year Credit share of wallet Global Markets Equities Credit Products 1 Dealogic as of September 30, 2017 2 Thomson Reuters as of September 30, 2017 3 As of September 30, 2017. Excludes non-officers. Years rounded up to nearest integer Credit team tenure3 average 1 1 1 2 1 1 1 1 1 2 3 3 Americas Institutional Loan1 Americas Leveraged Finance1 Global Leveraged Finance1 Securitized Products All US Securitizations2 2014 2015 2016 3Q17 1 2 3 3 Securitized Products US RMBS2 1 1 1 1 Credit Management Team Average Industry Experience 20+years
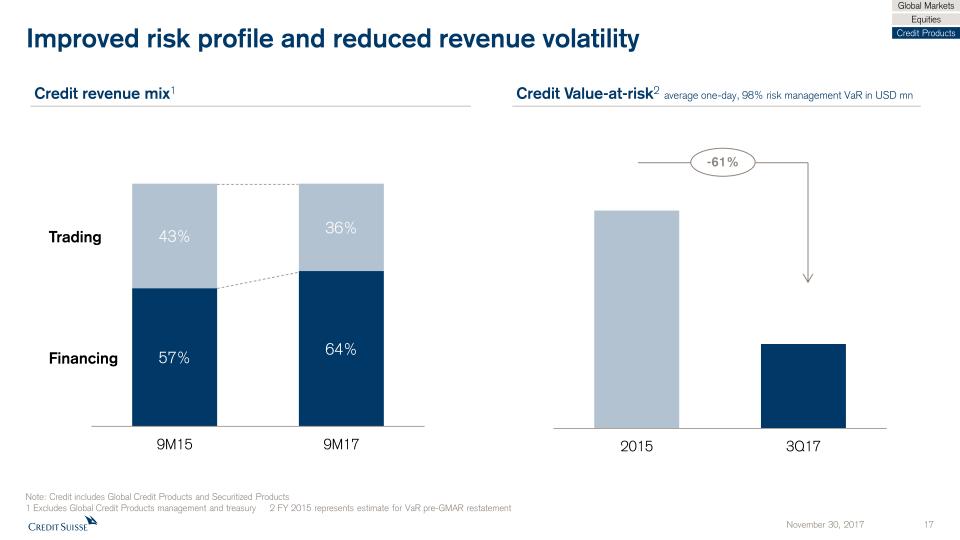
Improved risk profile and reduced revenue volatility Credit Value-at-risk2 average one-day, 98% risk management VaR in USD mn Note: Credit includes Global Credit Products and Securitized Products 1 Excludes Global Credit Products management and treasury 2 FY 2015 represents estimate for VaR pre-GMAR restatement Credit revenue mix1 Global Markets Equities Credit Products Financing Trading -61%
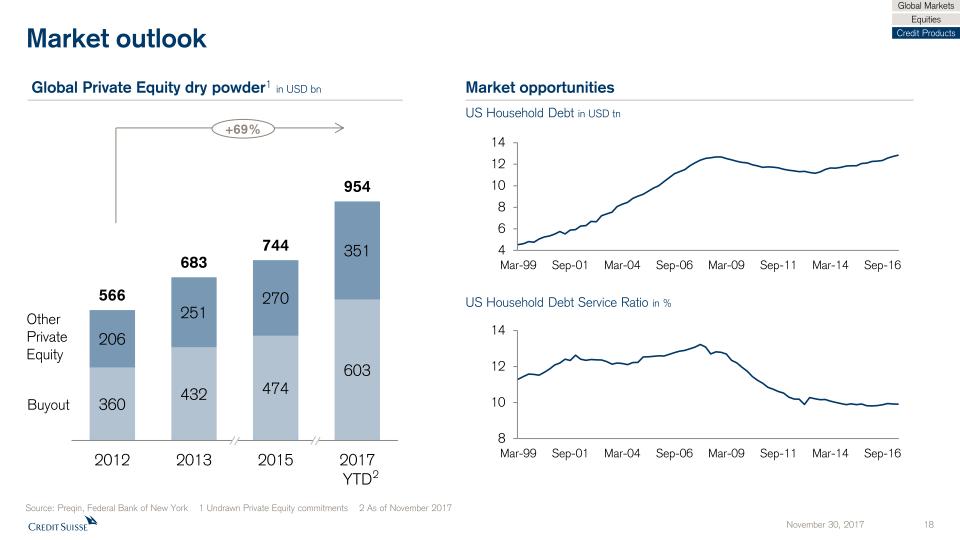
Market outlook Global Private Equity dry powder1 in USD bn Market opportunities Source: Preqin, Federal Bank of New York 1 Undrawn Private Equity commitments 2 As of November 2017 Global Markets Equities Credit Products US Household Debt in USD tn US Household Debt Service Ratio in % +69% Buyout Other Private Equity 2
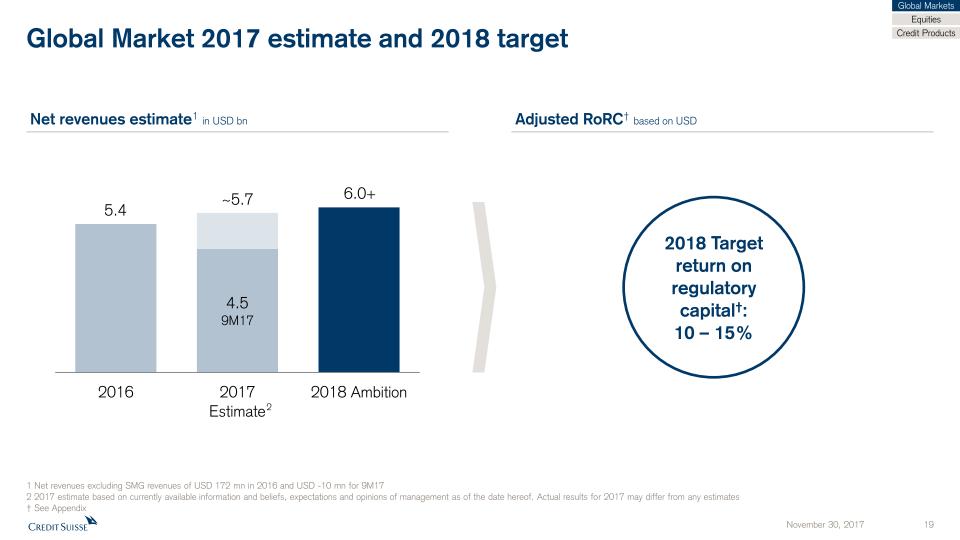
Global Market 2017 estimate and 2018 target 1 Net revenues excluding SMG revenues of USD 172 mn in 2016 and USD -10 mn for 9M172 2017 estimate based on currently available information and beliefs, expectations and opinions of management as of the date hereof. Actual results for 2017 may differ from any estimates† See Appendix ~5.7 Net revenues estimate1 in USD bn Adjusted RoRC† based on USD 2018 Target return on regulatory capital†: 10 – 15% Global Markets Equities Credit Products 2 5.4 6.0+

Appendix November 30, 2017 20

Notes (1/2) General notes Specific notes * Our cost savings program is measured using adjusted operating expenses at constant FX rates. “Adjusted operating expenses at constant FX rates” and “adjusted non-compensation operating expenses at constant FX rates” include adjustments as made in all our disclosures for restructuring expenses, major litigation expenses and a goodwill impairment taken in 4Q15 as well as adjustments for certain accounting changes (which had not been in place at the launch of the cost savings program), debit valuation adjustments (DVA) related volatility and for FX, applying the following main currency exchange rates for1Q15: USD/CHF 0.9465, EUR/CHF 1.0482, GBP/CHF 1.4296, 2Q15: USD/CHF 0.9383, EUR/CHF 1.0418, GBP/CHF 1.4497,3Q15: USD/CHF 0.9684, EUR/CHF 1.0787, GBP/CHF 1.4891, 4Q15: USD/CHF 1.0010, EUR/CHF 1.0851, GBP/CHF 1.5123,1Q16: USD/CHF 0.9928, EUR/CHF 1.0941, GBP/CHF 1.4060, 2Q16: USD/CHF 0.9756, EUR/CHF 1.0956, GBP/CHF 1.3845,3Q16: USD/CHF 0.9728, EUR/CHF 1.0882, GBP/CHF 1.2764, 4Q16: USD/CHF 1.0101, EUR/CHF 1.0798, GBP/CHF 1.2451,1Q17: USD/CHF 0.9963, EUR/CHF 1.0670, GBP/CHF 1.2464, 2Q17: USD/CHF 0.9736, EUR/CHF 1.0881, GBP/CHF 1.2603,3Q17: USD/CHF 0.9645, EUR/CHF 1.1413, GBP/CHF 1.2695.These currency exchange rates are unweighted, i.e. a straight line average of monthly rates. We apply this calculation consistently for the periods under review. Adjusted non-compensation expenses are adjusted operating expenses excluding compensation and benefits. To calculate adjusted non-compensation expenses at constant FX rates, we subtract compensation and benefits (adjusted at constant FX rates in the manner described above) from adjusted operating expenses at constant FX rates.† Regulatory capital is calculated as the worst of 10% of RWA and 3.5% of leverage exposure. Return on regulatory capital is calculated using (adjusted) income after tax and assumes a tax rate of 30% and capital allocated based on the worst of 10% of average RWA and 3.5% of average leverage exposure. For the Markets business within the APAC division and for the Global Markets and Investment Banking & Capital Markets divisions, return on regulatory capital is based on US dollar denominated numbers. Adjusted return on regulatory capital is calculated using adjusted results, applying the same methodology to calculate return on regulatory capital. For reconciliation of adjusted to reported results, refer to the Appendix of either the CEO or CFO Investor Day 2017 presentation. Throughout the presentation rounding differences may occurUnless otherwise noted, all CET1 ratio, Tier 1 leverage ratio, risk-weighted assets and leverage exposure figures shown in this presentation are as of the end of the respective period and on a “look-through” basisGross and net margins are shown in basis pointsGross margin = adj. net revenues annualized / average AuM; net margin = adj. pre-tax income annualized / average AuMMandates penetration reflects advisory and discretionary mandates as percentage of total AuM

Notes (2/2) Abbreviations Adj. = Adjusted; AI = Artificial Intelligence; AM = Asset Management; AML = Anti-Money Laundering; APAC = Asia Pacific; AT1 = Additional Tier 1; AuM = Assets under Management; BCBS = Basel Committee on Banking Supervision; BIS = Bank for International Settlements; bps = basis points; CAGR = Compound Annual Growth Rate; CCRO = Chief Compliance and Regulatory Affairs Officer; CET1 = Common Equity Tier 1; CIC = Corporate & Institutional Clients; CIF = Customer/Client Information File; Corp. Ctr. = Corporate Center; CVA = Credit Valuation Adjustment; DCM = Debt Capital Markets; EAM = External Asset Manager; ECM = Equity Capital Markets; EM = Emerging Markets; EMEA = Europe, Middle East & Africa; EPS = Earnings Per Share; EQ = Equities; EU = European Union; FICC = Fixed Income, Currencies & Commodities; FINMA = Swiss Financial Market Supervisory Authority; FLP = Fund Linked Products; FRTB = Fundamental Review of the Trading Book; FX = Foreign Exchange; G10 = Group of Ten; GDP = Gross Domestic Product; GM = Global Markets; IBCM = Investment Banking & Capital Markets; IBD = Investment Banking Department; IC = Investment Consultant; IMF = International Monetary Fund; IP = Investor Products; IPO = Initial Public Offering; IRB = Internal Ratings Based; IT = Information Technology; ITS = International Trading Solutions; IWM = International Wealth Management; JV = Joint Venture; LSC = Large Swiss Corporates; M&A = Mergers & Acquisitions; MI = Management Information; Mkts = Markets; NNA = Net new assets; Op Risk = Operational Risk; PB = Private Banking; PC = Private Clients; PEP = Politically Exposed Person; pp = percentage points; PTI = Pre-tax income; PWMC = Private & Wealth Management Clients; RM = Relationship Manager(s); RoRC = Return on Regulatory Capital; RoTE = Return on Tangible Equity; RPA = Robotic Process Automation; RWA = Risk-weighted assets; SA-CCR = Standardized Approach to Counterparty Credit Risk; SME = Small and Medium-Sized Enterprises; SMG = Systematic Market-Making Group; SoW = Share of Wallet; SRU = Strategic Resolution Unit; SUB = Swiss Universal Bank; TBTF = Too Big To Fail; TBVS = Tangible Book Value per Share; (U)HNW(I) = (Ultra) High Net Worth (Individuals); VaR = Value-at-Risk; VIX = Volatility Index; WM = Wealth Management; WM&C = Wealth Management & Connected; YoY = Year over year; YTD = Year to Date

Credit Suisse Investor Day 2017Asia PacificHelman Sitohang November 30, 2017

Disclaimer This material does not purport to contain all of the information that you may wish to consider. This material is not to be relied upon as such or used in substitution for the exercise of independent judgment.Cautionary statement regarding forward-looking statements This presentation contains forward-looking statements that involve inherent risks and uncertainties, and we might not be able to achieve the predictions, forecasts, projections and other outcomes we describe or imply in forward-looking statements. A number of important factors could cause results to differ materially from the plans, objectives, expectations, estimates and intentions we express in these forward-looking statements, including those we identify in "Risk factors” in our Annual Report on Form 20-F for the fiscal year ended December 31, 2016 and in the “Cautionary statement regarding forward-looking information" in our media release relating to Investor Day, published on November 30, 2017 and filed with the US Securities and Exchange Commission, and in other public filings and press releases. We do not intend to update these forward-looking statements. In particular, the terms “Estimate”, “Illustrative”, “Ambition”, “Objective”, “Outlook” and “Goal” are not intended to be viewed as targets or projections, nor are they considered to be Key Performance Indicators. All such estimates, illustrations, ambitions and goals are subject to a large number of inherent risks, assumptions and uncertainties, many of which are completely outside of our control. These risks, assumptions and uncertainties include, but are not limited to, general market conditions, market volatility, interest rate volatility and levels, global and regional economic conditions, political uncertainty, changes in tax policies, regulatory changes, changes in levels of client activity as a result of any of the foregoing and other factors. Accordingly, this information should not be relied on for any purpose. We do not intend to update these estimates, illustrations, ambitions or goals. We may not achieve the benefits of our strategic initiatives We may not achieve all of the expected benefits of our strategic initiatives. Factors beyond our control, including but not limited to the market and economic conditions, changes in laws, rules or regulations and other challenges discussed in our public filings, could limit our ability to achieve some or all of the expected benefits of these initiatives. Estimates, assumptions and opinionsIn preparing this presentation, management has made estimates and assumptions that affect the numbers presented. Actual results may differ. Annualized numbers do not take account of variations in operating results, seasonality and other factors and may not be indicative of actual, full-year results. Figures throughout this presentation may also be subject to rounding adjustments. All opinions and views constitute judgments as of the date of writing without regard to the date on which the reader may receive or access the information. This information is subject to change at any time without notice and we do not intend to update this information. Statement regarding non-GAAP financial measures This presentation also contains non-GAAP financial measures, including adjusted results. Information needed to reconcile such non-GAAP financial measures to the most directly comparable measures under US GAAP can be found in the Appendix of the CEO and CFO Investor Day presentations, published on November 30, 2017. All Investor Day presentations are available on our website at www.credit-suisse.com. Statement regarding capital, liquidity and leverage As of January 1, 2013, Basel III was implemented in Switzerland along with the Swiss “Too Big to Fail” legislation and regulations thereunder (in each case, subject to certain phase-in periods). As of January 1, 2015, the Bank for International Settlements (BIS) leverage ratio framework, as issued by the Basel Committee on Banking Supervision (BCBS), was implemented in Switzerland by FINMA. Our related disclosures are in accordance with our interpretation of such requirements, including relevant assumptions. Changes in the interpretation of these requirements in Switzerland or in any of our assumptions or estimates could result in different numbers from those shown in this presentation. Capital and ratio numbers for periods prior to 2013 are based on estimates, which are calculated as if the Basel III framework had been in place in Switzerland during such periods. Unless otherwise noted, leverage exposure is based on the BIS leverage ratio framework and consists of period-end balance sheet assets and prescribed regulatory adjustments. Beginning in 2015, the Swiss leverage ratio is calculated as Swiss total capital, divided by period-end leverage exposure. The look-through BIS tier 1 leverage ratio and CET1 leverage ratio are calculated as look-through BIS tier 1 capital and CET1 capital, respectively, divided by end-period leverage exposure.SourcesCertain material in this presentation has been prepared by Credit Suisse on the basis of publicly available information, internally developed data and other third-party sources believed to be reliable. Credit Suisse has not sought to independently verify information obtained from public and third-party sources and makes no representations or warranties as to accuracy, completeness or reliability of such information.
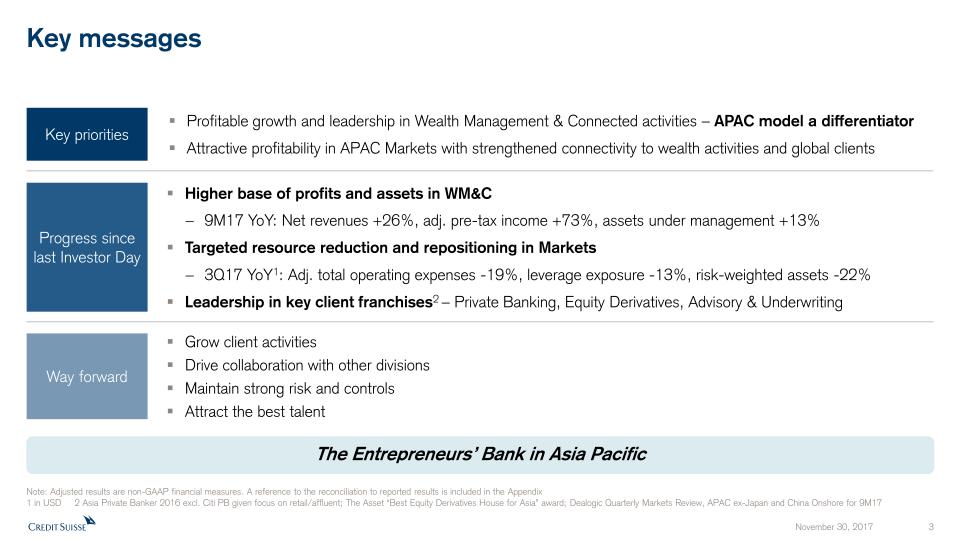
Key messages Key priorities Way forward Progress since last Investor Day Profitable growth and leadership in Wealth Management & Connected activities – APAC model a differentiatorAttractive profitability in APAC Markets with strengthened connectivity to wealth activities and global clients Higher base of profits and assets in WM&C 9M17 YoY: Net revenues +26%, adj. pre-tax income +73%, assets under management +13% Targeted resource reduction and repositioning in Markets 3Q17 YoY1: Adj. total operating expenses -19%, leverage exposure -13%, risk-weighted assets -22%Leadership in key client franchises2 – Private Banking, Equity Derivatives, Advisory & Underwriting Grow client activitiesDrive collaboration with other divisionsMaintain strong risk and controlsAttract the best talent Note: Adjusted results are non-GAAP financial measures. A reference to the reconciliation to reported results is included in the Appendix1 in USD 2 Asia Private Banker 2016 excl. Citi PB given focus on retail/affluent; The Asset “Best Equity Derivatives House for Asia” award; Dealogic Quarterly Markets Review, APAC ex-Japan and China Onshore for 9M17 The Entrepreneurs’ Bank in Asia Pacific
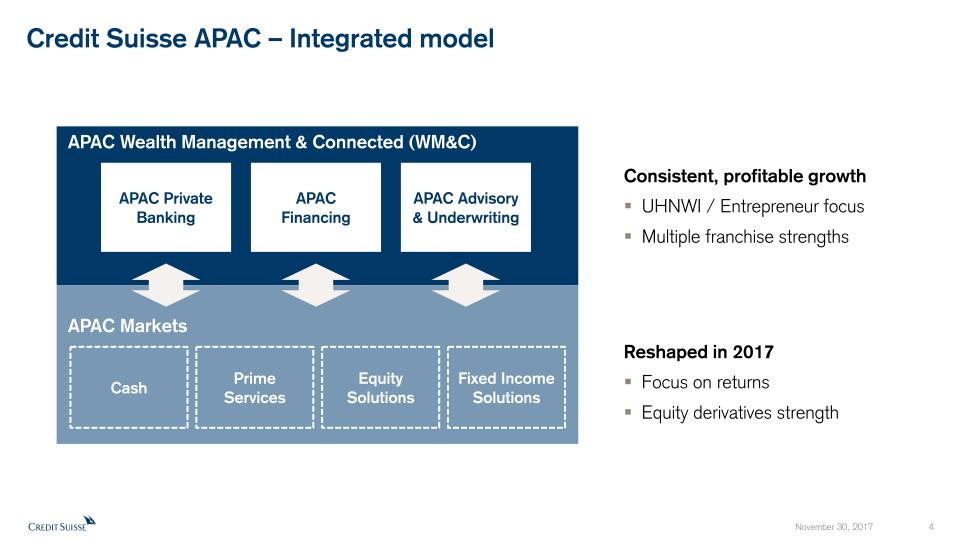
APAC Wealth Management & Connected (WM&C) APAC Private Banking Credit Suisse APAC – Integrated model APAC Financing APAC Advisory & Underwriting APAC Markets Cash Equity Solutions Consistent, profitable growthUHNWI / Entrepreneur focusMultiple franchise strengths Reshaped in 2017Focus on returnsEquity derivatives strength Fixed Income Solutions Prime Services
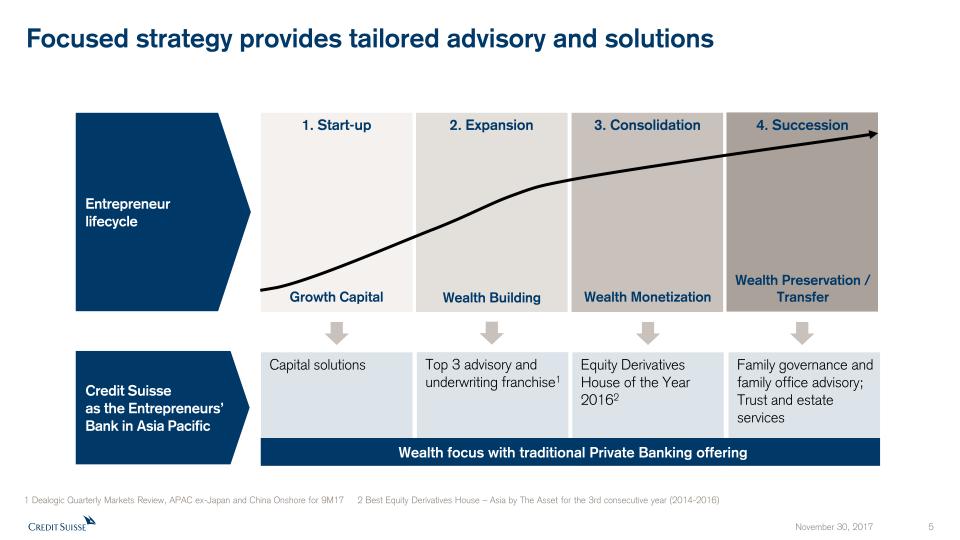
Capital solutions Top 3 advisory and underwriting franchise1 Equity Derivatives House of the Year 20162 Family governance and family office advisory; Trust and estate services Growth Capital Wealth Preservation / Transfer 2. Expansion 3. Consolidation 4. Succession Entrepreneurlifecycle 1. Start-up Wealth Building Wealth Monetization Credit Suisse as the Entrepreneurs’ Bank in Asia Pacific Wealth focus with traditional Private Banking offering 1 Dealogic Quarterly Markets Review, APAC ex-Japan and China Onshore for 9M17 2 Best Equity Derivatives House – Asia by The Asset for the 3rd consecutive year (2014-2016) Focused strategy provides tailored advisory and solutions
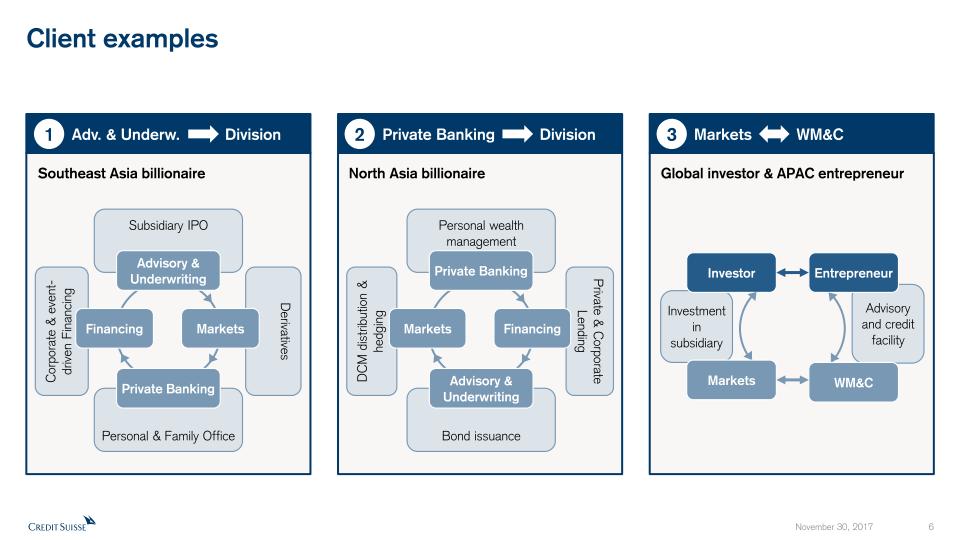
Advisory and credit facility Investment in subsidiary Derivatives Personal & Family Office Subsidiary IPO Client examples 1 Southeast Asia billionaire Advisory & Underwriting Private Banking Markets 2 North Asia billionaire Corporate & event-driven Financing Financing Private & Corporate Lending Bond issuance Personal wealth management Private Banking Advisory & Underwriting Financing DCM distribution & hedging Markets 3 Global investor & APAC entrepreneur Entrepreneur Investor WM&C Markets Adv. & Underw. Division Private Banking Division Markets WM&C

WM&C expected to achieve original 2018 target in 2017;confirming Markets return target APAC WM&C adjusted pre-tax income in CHF bn APAC Markets adjusted RoRC† in USD Adjusted results are non-GAAP financial measures. A reference to the reconciliation to reported results is included in the Appendix1 2017 estimate based on currently available information and beliefs, expectations and opinions of management as of the date hereof. Actual results for 2017 may differ from any estimates 2 Targeted for 2019† See Appendix Target adjusted return on regulatory capital†: 10 – 15%2 Net revenues estimate 20171 in USD bn 1.17 – 1.20 confirmed revised 1 Adjusted pre-tax loss for 4Q171 estimated to be broadly in line with the adjusted pre-tax loss in 4Q16 581(9M17) ~0.7 0.6(9M17)
Appendix
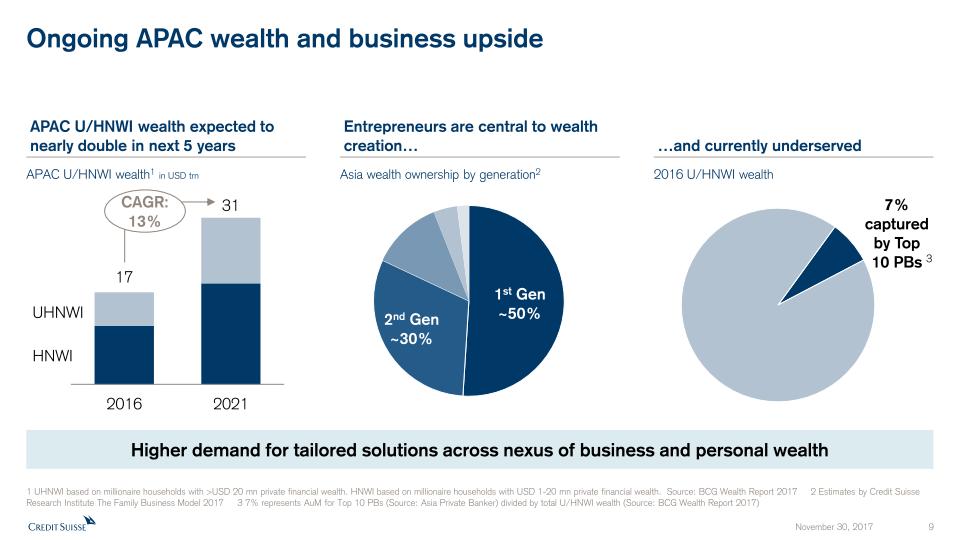
Ongoing APAC wealth and business upside 1 UHNWI based on millionaire households with >USD 20 mn private financial wealth. HNWI based on millionaire households with USD 1-20 mn private financial wealth. Source: BCG Wealth Report 2017 2 Estimates by Credit Suisse Research Institute The Family Business Model 2017 3 7% represents AuM for Top 10 PBs (Source: Asia Private Banker) divided by total U/HNWI wealth (Source: BCG Wealth Report 2017) APAC U/HNWI wealth1 in USD trn 2016 U/HNWI wealth Asia wealth ownership by generation2 UHNWI HNWI Higher demand for tailored solutions across nexus of business and personal wealth APAC U/HNWI wealth expected to nearly double in next 5 years Entrepreneurs are central to wealth creation… …and currently underserved CAGR: 13% 3
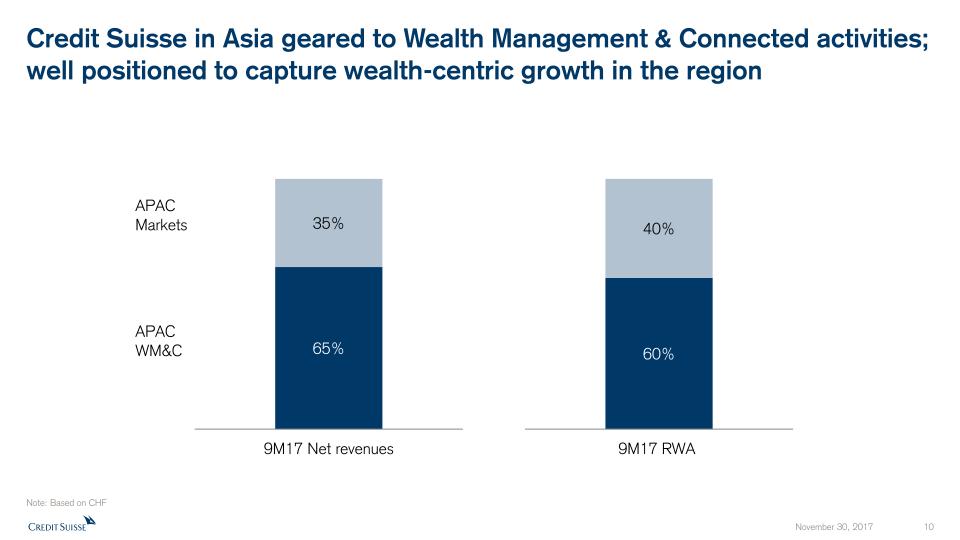
Credit Suisse in Asia geared to Wealth Management & Connected activities; well positioned to capture wealth-centric growth in the region APACWM&C APACMarkets Note: Based on CHF

Multiple leading franchises that our clients value 1 Source: Dealogic Quarterly Markets Review for 9M17 Best Bank for Financing, AsiaBest Bank for Wealth Management, AsiaBest Investment Bank in Indonesia, Singapore, South Korea, Vietnam Best Private Bank – Asia Top 3 Advisory & Underwriting1(APAC ex-Japan and China Onshore) 2017: #1 All-Asia Sales Team Survey2017: #1 All-Asia Trading Team Survey Best Equity Derivatives House – AsiaBest Equity House – Asia ex-Japan Quant House of the Year
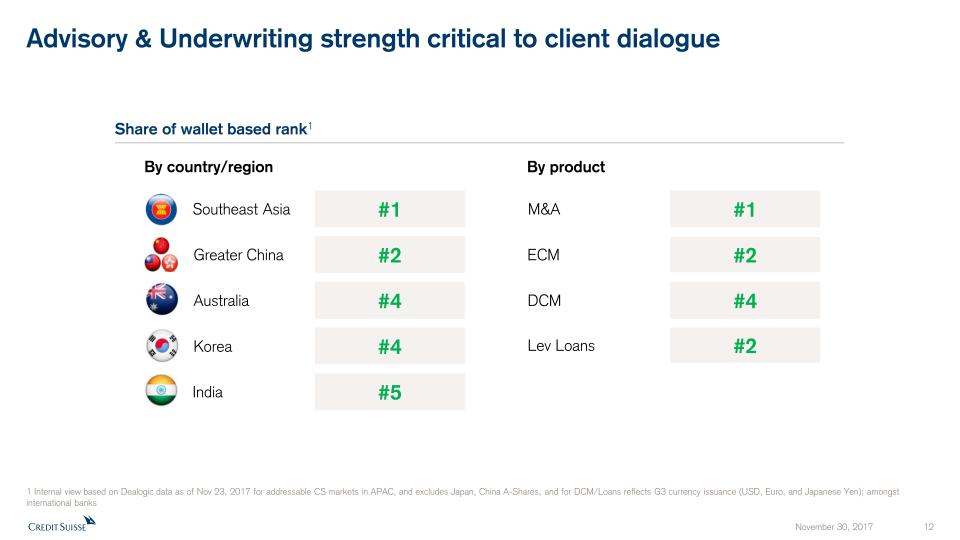
Advisory & Underwriting strength critical to client dialogue Share of wallet based rank1 #1 #2 #4 #4 #5 M&A #1 ECM #2 DCM #4 Lev Loans #2 India Southeast Asia Korea Australia Greater China By country/region By product 1 Internal view based on Dealogic data as of Nov 23, 2017 for addressable CS markets in APAC, and excludes Japan, China A-Shares, and for DCM/Loans reflects G3 currency issuance (USD, Euro, and Japanese Yen); amongst international banks
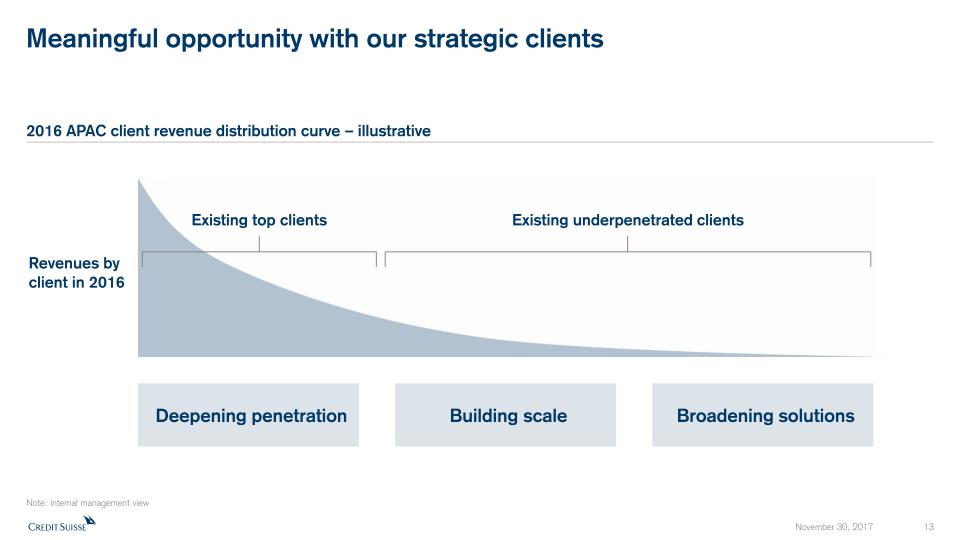
Meaningful opportunity with our strategic clients Note: Internal management view Deepening penetration 2016 APAC client revenue distribution curve – illustrative Building scale Broadening solutions Revenues by client in 2016 Existing underpenetrated clients Existing top clients
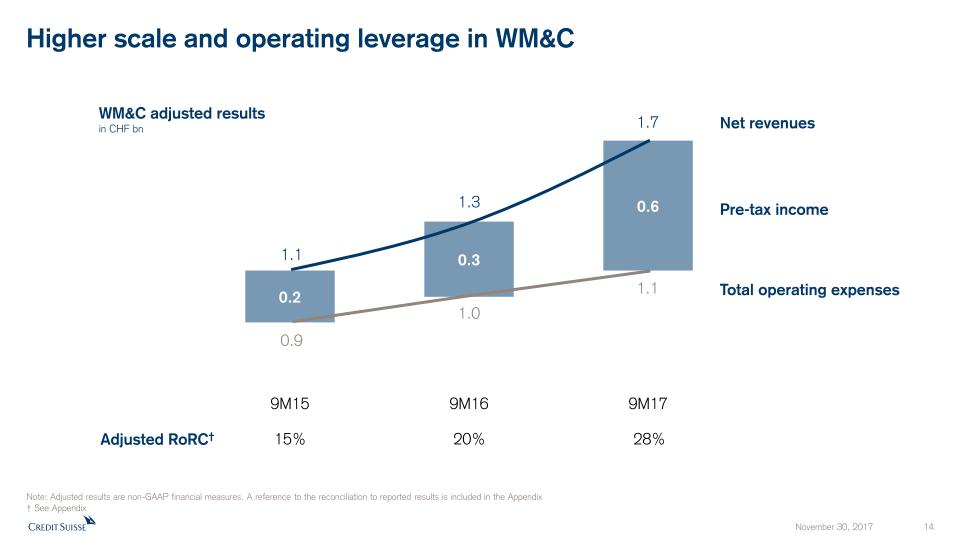
Note: Adjusted results are non-GAAP financial measures. A reference to the reconciliation to reported results is included in the Appendix† See Appendix Higher scale and operating leverage in WM&C 0.9 1.0 1.1 1.1 1.3 1.7 WM&C adjusted results in CHF bn Net revenues Pre-tax income Total operating expenses Adjusted RoRC† 15% 20% 28%
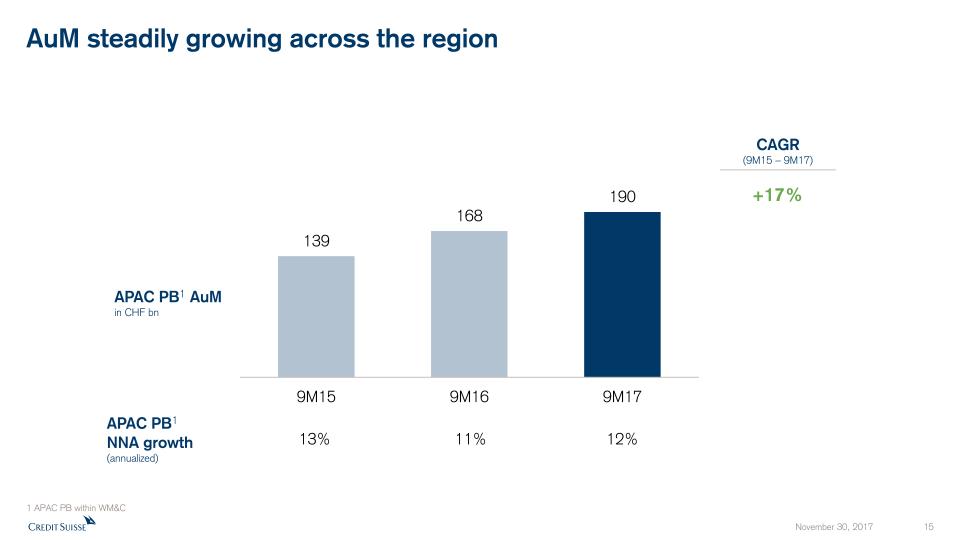
AuM steadily growing across the region APAC PB1 AuMin CHF bn APAC PB1NNA growth (annualized) 13% 11% 12% 1 APAC PB within WM&C CAGR (9M15 – 9M17) +17%
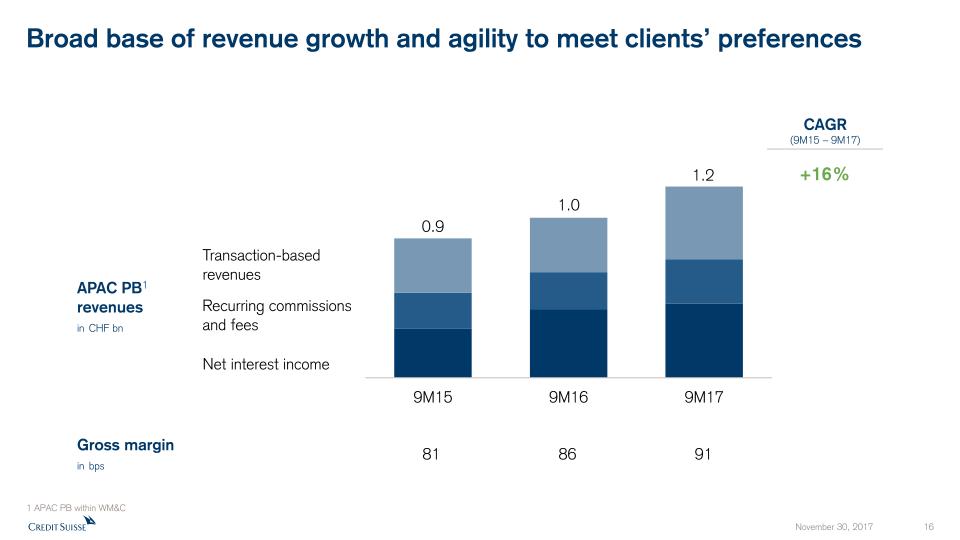
Broad base of revenue growth and agility to meet clients’ preferences Net interest income Recurring commissions and fees Transaction-based revenues CAGR (9M15 – 9M17) APAC PB1 revenuesin CHF bn +16% Gross marginin bps 81 86 91 1 APAC PB within WM&C
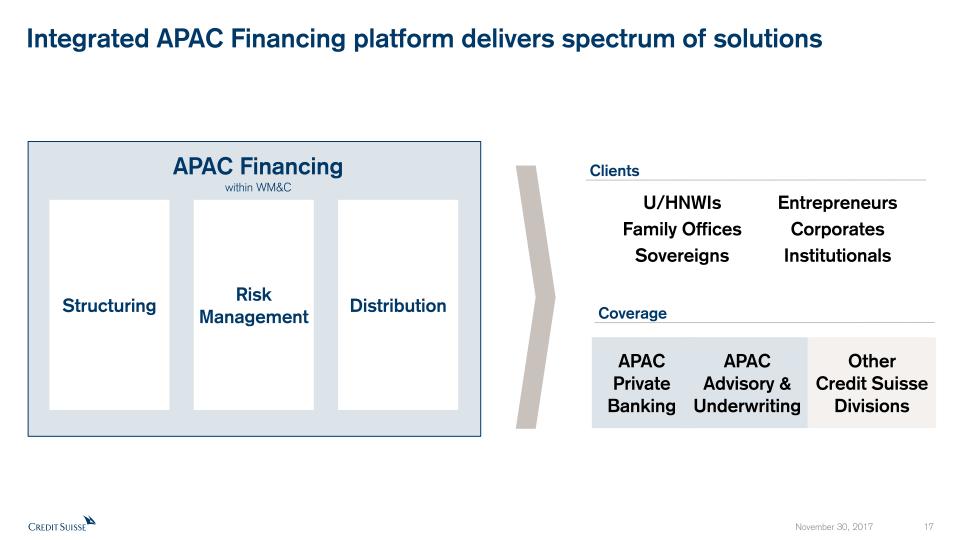
Integrated APAC Financing platform delivers spectrum of solutions APAC Financingwithin WM&C Structuring Risk Management Distribution APAC Private Banking APAC Advisory & Underwriting Other Credit Suisse Divisions U/HNWIsFamily OfficesSovereigns EntrepreneursCorporatesInstitutionals Clients Coverage
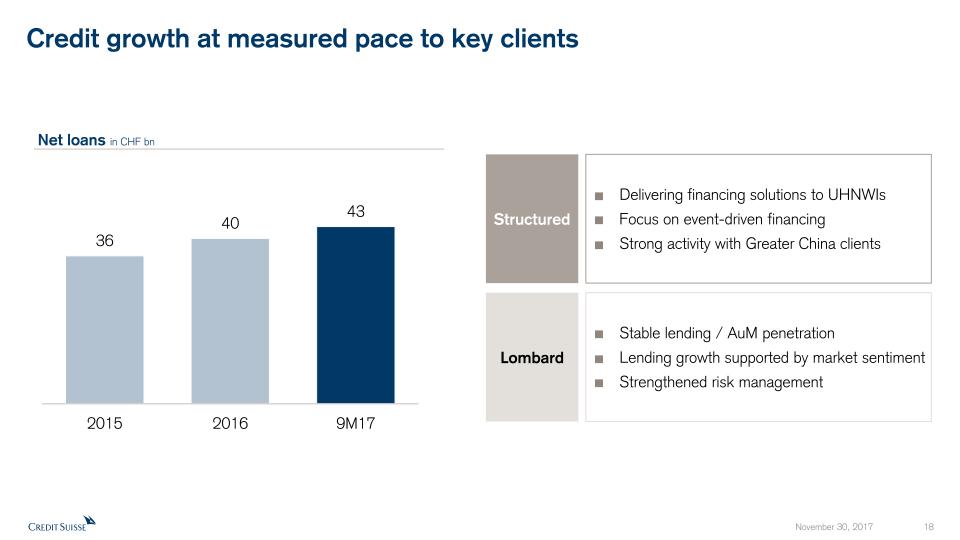
Credit growth at measured pace to key clients Net loans in CHF bn Structured Delivering financing solutions to UHNWIsFocus on event-driven financingStrong activity with Greater China clients Lombard Stable lending / AuM penetrationLending growth supported by market sentimentStrengthened risk management
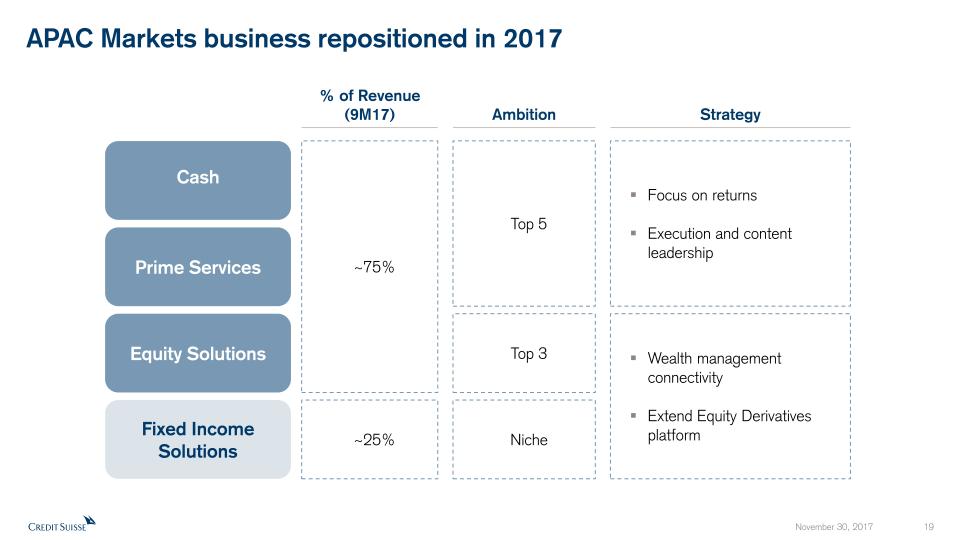
APAC Markets business repositioned in 2017 % of Revenue (9M17) Cash Prime Services Equity Solutions Fixed Income Solutions ~75% ~25% Ambition Strategy Top 5 Niche Top 3 Focus on returnsExecution and content leadership Wealth management connectivityExtend Equity Derivatives platform
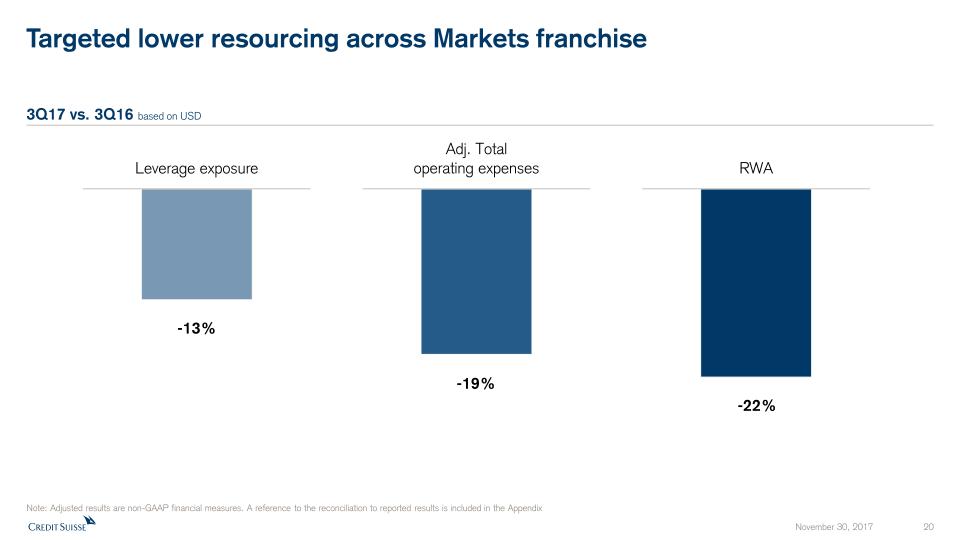
Note: Adjusted results are non-GAAP financial measures. A reference to the reconciliation to reported results is included in the Appendix Targeted lower resourcing across Markets franchise -19% -22% -13% 3Q17 vs. 3Q16 based on USD
Notes (1/2) General notes Specific notes * Our cost savings program is measured using adjusted operating expenses at constant FX rates. “Adjusted operating expenses at constant FX rates” and “adjusted non-compensation operating expenses at constant FX rates” include adjustments as made in all our disclosures for restructuring expenses, major litigation expenses and a goodwill impairment taken in 4Q15 as well as adjustments for certain accounting changes (which had not been in place at the launch of the cost savings program), debit valuation adjustments (DVA) related volatility and for FX, applying the following main currency exchange rates for1Q15: USD/CHF 0.9465, EUR/CHF 1.0482, GBP/CHF 1.4296, 2Q15: USD/CHF 0.9383, EUR/CHF 1.0418, GBP/CHF 1.4497,3Q15: USD/CHF 0.9684, EUR/CHF 1.0787, GBP/CHF 1.4891, 4Q15: USD/CHF 1.0010, EUR/CHF 1.0851, GBP/CHF 1.5123,1Q16: USD/CHF 0.9928, EUR/CHF 1.0941, GBP/CHF 1.4060, 2Q16: USD/CHF 0.9756, EUR/CHF 1.0956, GBP/CHF 1.3845,3Q16: USD/CHF 0.9728, EUR/CHF 1.0882, GBP/CHF 1.2764, 4Q16: USD/CHF 1.0101, EUR/CHF 1.0798, GBP/CHF 1.2451,1Q17: USD/CHF 0.9963, EUR/CHF 1.0670, GBP/CHF 1.2464, 2Q17: USD/CHF 0.9736, EUR/CHF 1.0881, GBP/CHF 1.2603,3Q17: USD/CHF 0.9645, EUR/CHF 1.1413, GBP/CHF 1.2695.These currency exchange rates are unweighted, i.e. a straight line average of monthly rates. We apply this calculation consistently for the periods under review. Adjusted non-compensation expenses are adjusted operating expenses excluding compensation and benefits. To calculate adjusted non-compensation expenses at constant FX rates, we subtract compensation and benefits (adjusted at constant FX rates in the manner described above) from adjusted operating expenses at constant FX rates.† Regulatory capital is calculated as the worst of 10% of RWA and 3.5% of leverage exposure. Return on regulatory capital is calculated using (adjusted) income after tax and assumes a tax rate of 30% and capital allocated based on the worst of 10% of average RWA and 3.5% of average leverage exposure. For the Markets business within the APAC division and for the Global Markets and Investment Banking & Capital Markets divisions, return on regulatory capital is based on US dollar denominated numbers. Adjusted return on regulatory capital is calculated using adjusted results, applying the same methodology to calculate return on regulatory capital. For reconciliation of adjusted to reported results, refer to the Appendix of either the CEO or CFO Investor Day 2017 presentation. Throughout the presentation rounding differences may occurUnless otherwise noted, all CET1 ratio, Tier 1 leverage ratio, risk-weighted assets and leverage exposure figures shown in this presentation are as of the end of the respective period and on a “look-through” basisGross and net margins are shown in basis pointsGross margin = adj. net revenues annualized / average AuM; net margin = adj. pre-tax income annualized / average AuMMandates penetration reflects advisory and discretionary mandates as percentage of total AuM

Notes (2/2) Abbreviations Adj. = Adjusted; AI = Artificial Intelligence; AM = Asset Management; AML = Anti-Money Laundering; APAC = Asia Pacific; AT1 = Additional Tier 1; AuM = Assets under Management; BCBS = Basel Committee on Banking Supervision; BIS = Bank for International Settlements; bps = basis points; CAGR = Compound Annual Growth Rate; CCRO = Chief Compliance and Regulatory Affairs Officer; CET1 = Common Equity Tier 1; CIC = Corporate & Institutional Clients; CIF = Customer/Client Information File; Corp. Ctr. = Corporate Center; CVA = Credit Valuation Adjustment; DCM = Debt Capital Markets; EAM = External Asset Manager; ECM = Equity Capital Markets; EM = Emerging Markets; EMEA = Europe, Middle East & Africa; EPS = Earnings Per Share; EQ = Equities; EU = European Union; FICC = Fixed Income, Currencies & Commodities; FINMA = Swiss Financial Market Supervisory Authority; FLP = Fund Linked Products; FRTB = Fundamental Review of the Trading Book; FX = Foreign Exchange; G10 = Group of Ten; GDP = Gross Domestic Product; GM = Global Markets; IBCM = Investment Banking & Capital Markets; IBD = Investment Banking Department; IC = Investment Consultant; IMF = International Monetary Fund; IP = Investor Products; IPO = Initial Public Offering; IRB = Internal Ratings Based; IT = Information Technology; ITS = International Trading Solutions; IWM = International Wealth Management; JV = Joint Venture; LSC = Large Swiss Corporates; M&A = Mergers & Acquisitions; MI = Management Information; Mkts = Markets; NNA = Net new assets; Op Risk = Operational Risk; PB = Private Banking; PC = Private Clients; PEP = Politically Exposed Person; pp = percentage points; PTI = Pre-tax income; PWMC = Private & Wealth Management Clients; RM = Relationship Manager(s); RoRC = Return on Regulatory Capital; RoTE = Return on Tangible Equity; RPA = Robotic Process Automation; RWA = Risk-weighted assets; SA-CCR = Standardized Approach to Counterparty Credit Risk; SME = Small and Medium-Sized Enterprises; SMG = Systematic Market-Making Group; SoW = Share of Wallet; SRU = Strategic Resolution Unit; SUB = Swiss Universal Bank; TBTF = Too Big To Fail; TBVS = Tangible Book Value per Share; (U)HNW(I) = (Ultra) High Net Worth (Individuals); VaR = Value-at-Risk; VIX = Volatility Index; WM = Wealth Management; WM&C = Wealth Management & Connected; YoY = Year over year; YTD = Year to Date


Credit Suisse Investor Day 2017Efficiency & ProductivityPierre-Olivier Bouée, Paul Turrell November 30, 2017

Disclaimer This material does not purport to contain all of the information that you may wish to consider. This material is not to be relied upon as such or used in substitution for the exercise of independent judgment.Cautionary statement regarding forward-looking statements This presentation contains forward-looking statements that involve inherent risks and uncertainties, and we might not be able to achieve the predictions, forecasts, projections and other outcomes we describe or imply in forward-looking statements. A number of important factors could cause results to differ materially from the plans, objectives, expectations, estimates and intentions we express in these forward-looking statements, including those we identify in "Risk factors” in our Annual Report on Form 20-F for the fiscal year ended December 31, 2016 and in the “Cautionary statement regarding forward-looking information" in our media release relating to Investor Day, published on November 30, 2017 and filed with the US Securities and Exchange Commission, and in other public filings and press releases. We do not intend to update these forward-looking statements. In particular, the terms “Estimate”, “Illustrative”, “Ambition”, “Objective”, “Outlook” and “Goal” are not intended to be viewed as targets or projections, nor are they considered to be Key Performance Indicators. All such estimates, illustrations, ambitions and goals are subject to a large number of inherent risks, assumptions and uncertainties, many of which are completely outside of our control. These risks, assumptions and uncertainties include, but are not limited to, general market conditions, market volatility, interest rate volatility and levels, global and regional economic conditions, political uncertainty, changes in tax policies, regulatory changes, changes in levels of client activity as a result of any of the foregoing and other factors. Accordingly, this information should not be relied on for any purpose. We do not intend to update these estimates, illustrations, ambitions or goals. We may not achieve the benefits of our strategic initiatives We may not achieve all of the expected benefits of our strategic initiatives. Factors beyond our control, including but not limited to the market and economic conditions, changes in laws, rules or regulations and other challenges discussed in our public filings, could limit our ability to achieve some or all of the expected benefits of these initiatives. Estimates, assumptions and opinionsIn preparing this presentation, management has made estimates and assumptions that affect the numbers presented. Actual results may differ. Annualized numbers do not take account of variations in operating results, seasonality and other factors and may not be indicative of actual, full-year results. Figures throughout this presentation may also be subject to rounding adjustments. All opinions and views constitute judgments as of the date of writing without regard to the date on which the reader may receive or access the information. This information is subject to change at any time without notice and we do not intend to update this information. Statement regarding non-GAAP financial measures This presentation also contains non-GAAP financial measures, including adjusted results. Information needed to reconcile such non-GAAP financial measures to the most directly comparable measures under US GAAP can be found in the Appendix of the CEO and CFO Investor Day presentations, published on November 30, 2017. All Investor Day presentations are available on our website at www.credit-suisse.com. Statement regarding capital, liquidity and leverage As of January 1, 2013, Basel III was implemented in Switzerland along with the Swiss “Too Big to Fail” legislation and regulations thereunder (in each case, subject to certain phase-in periods). As of January 1, 2015, the Bank for International Settlements (BIS) leverage ratio framework, as issued by the Basel Committee on Banking Supervision (BCBS), was implemented in Switzerland by FINMA. Our related disclosures are in accordance with our interpretation of such requirements, including relevant assumptions. Changes in the interpretation of these requirements in Switzerland or in any of our assumptions or estimates could result in different numbers from those shown in this presentation. Capital and ratio numbers for periods prior to 2013 are based on estimates, which are calculated as if the Basel III framework had been in place in Switzerland during such periods. Unless otherwise noted, leverage exposure is based on the BIS leverage ratio framework and consists of period-end balance sheet assets and prescribed regulatory adjustments. Beginning in 2015, the Swiss leverage ratio is calculated as Swiss total capital, divided by period-end leverage exposure. The look-through BIS tier 1 leverage ratio and CET1 leverage ratio are calculated as look-through BIS tier 1 capital and CET1 capital, respectively, divided by end-period leverage exposure.SourcesCertain material in this presentation has been prepared by Credit Suisse on the basis of publicly available information, internally developed data and other third-party sources believed to be reliable. Credit Suisse has not sought to independently verify information obtained from public and third-party sources and makes no representations or warranties as to accuracy, completeness or reliability of such information.
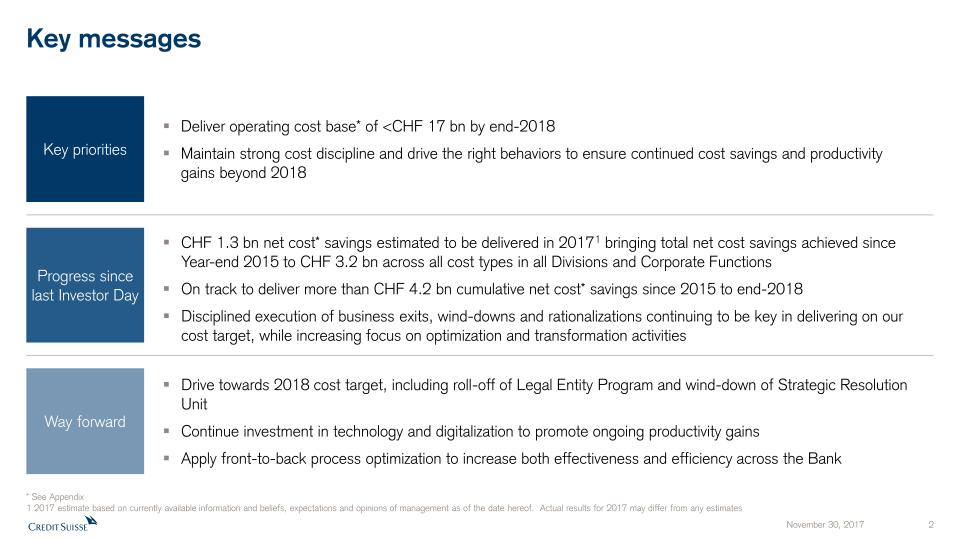
Deliver operating cost base* of <CHF 17 bn by end-2018Maintain strong cost discipline and drive the right behaviors to ensure continued cost savings and productivity gains beyond 2018 Key priorities Drive towards 2018 cost target, including roll-off of Legal Entity Program and wind-down of Strategic Resolution UnitContinue investment in technology and digitalization to promote ongoing productivity gainsApply front-to-back process optimization to increase both effectiveness and efficiency across the Bank Way forward CHF 1.3 bn net cost* savings estimated to be delivered in 20171 bringing total net cost savings achieved since Year-end 2015 to CHF 3.2 bn across all cost types in all Divisions and Corporate FunctionsOn track to deliver more than CHF 4.2 bn cumulative net cost* savings since 2015 to end-2018Disciplined execution of business exits, wind-downs and rationalizations continuing to be key in delivering on our cost target, while increasing focus on optimization and transformation activities Progress since last Investor Day * See Appendix1 2017 estimate based on currently available information and beliefs, expectations and opinions of management as of the date hereof. Actual results for 2017 may differ from any estimates Key messages
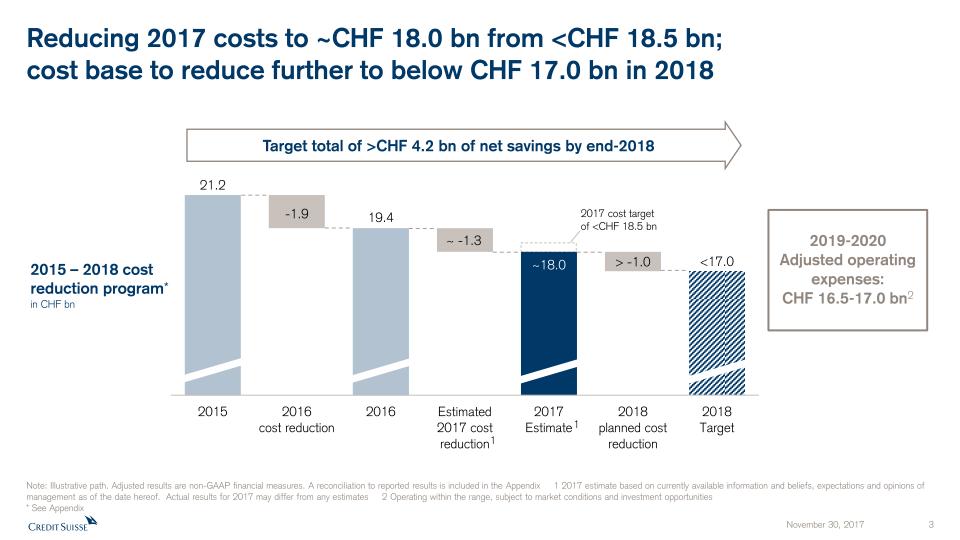
Reducing 2017 costs to ~CHF 18.0 bn from <CHF 18.5 bn;cost base to reduce further to below CHF 17.0 bn in 2018 Note: Illustrative path. Adjusted results are non-GAAP financial measures. A reconciliation to reported results is included in the Appendix 1 2017 estimate based on currently available information and beliefs, expectations and opinions of management as of the date hereof. Actual results for 2017 may differ from any estimates 2 Operating within the range, subject to market conditions and investment opportunities* See Appendix Target total of >CHF 4.2 bn of net savings by end-2018 2017 cost target of <CHF 18.5 bn 2015 – 2018 cost reduction program* in CHF bn 1 1 2019-2020Adjusted operating expenses: CHF 16.5-17.0 bn2
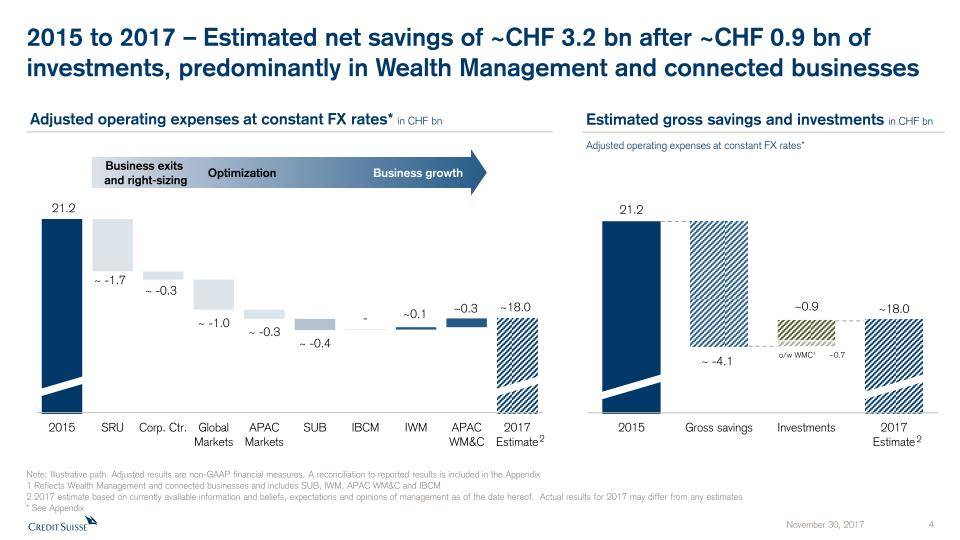
Business exits and right-sizing Optimization Business growth Adjusted operating expenses at constant FX rates* in CHF bn Estimated gross savings and investments in CHF bn Adjusted operating expenses at constant FX rates* Note: Illustrative path. Adjusted results are non-GAAP financial measures. A reconciliation to reported results is included in the Appendix1 Reflects Wealth Management and connected businesses and includes SUB, IWM, APAC WM&C and IBCM2 2017 estimate based on currently available information and beliefs, expectations and opinions of management as of the date hereof. Actual results for 2017 may differ from any estimates* See Appendix o/w WMC1 ~0.7 2015 to 2017 – Estimated net savings of ~CHF 3.2 bn after ~CHF 0.9 bn of investments, predominantly in Wealth Management and connected businesses 2 2
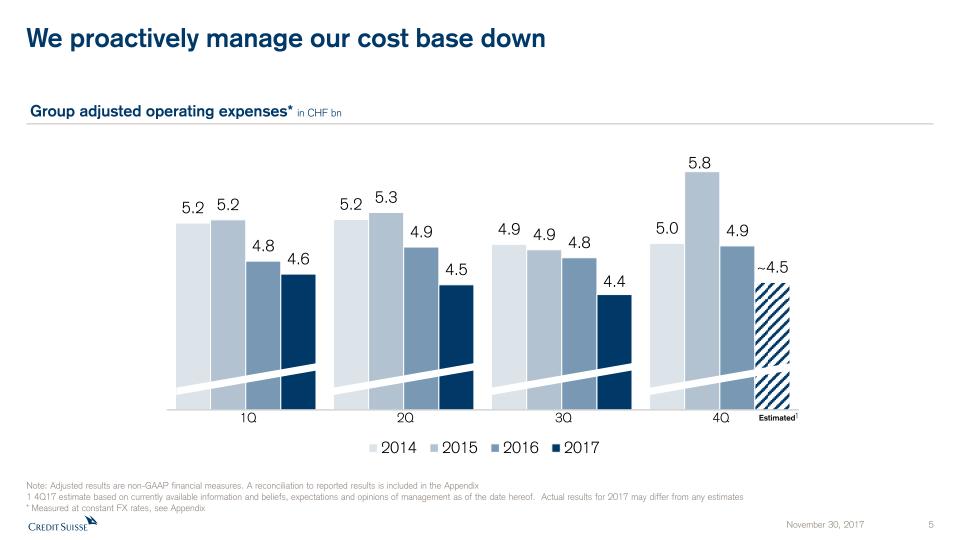
We proactively manage our cost base down Note: Adjusted results are non-GAAP financial measures. A reconciliation to reported results is included in the Appendix 1 4Q17 estimate based on currently available information and beliefs, expectations and opinions of management as of the date hereof. Actual results for 2017 may differ from any estimates* Measured at constant FX rates, see Appendix Group adjusted operating expenses* in CHF bn 1Q 2Q 3Q 4Q Estimated 1
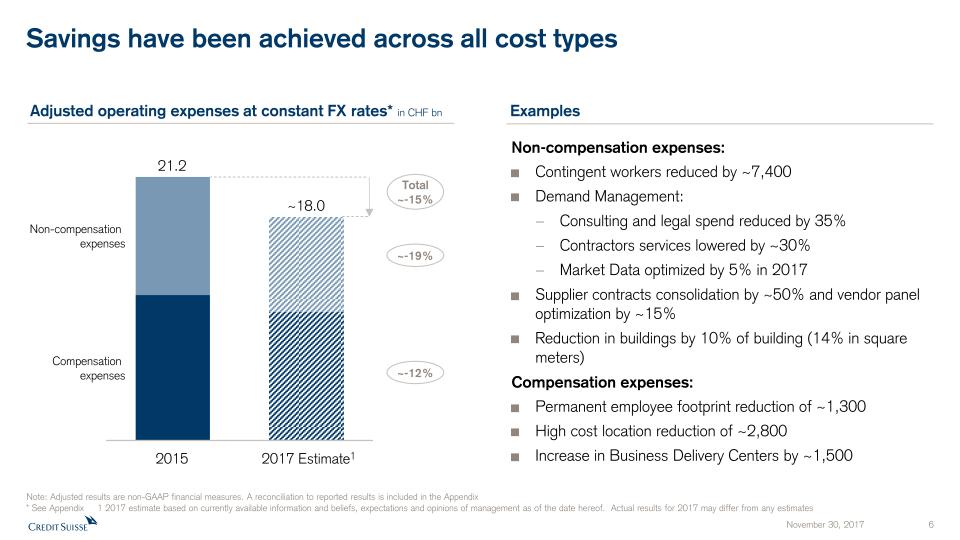
Savings have been achieved across all cost types Adjusted operating expenses at constant FX rates* in CHF bn Examples 1 Note: Adjusted results are non-GAAP financial measures. A reconciliation to reported results is included in the Appendix* See Appendix 1 2017 estimate based on currently available information and beliefs, expectations and opinions of management as of the date hereof. Actual results for 2017 may differ from any estimates 2017 Estimate 2015 Non-compensation expenses Compensation expenses ~18.0 21.2 ~-19% Total~-15% Non-compensation expenses: Contingent workers reduced by ~7,400Demand Management: Consulting and legal spend reduced by 35%Contractors services lowered by ~30%Market Data optimized by 5% in 2017Supplier contracts consolidation by ~50% and vendor panel optimization by ~15% Reduction in buildings by 10% of building (14% in square meters)Compensation expenses: Permanent employee footprint reduction of ~1,300High cost location reduction of ~2,800Increase in Business Delivery Centers by ~1,500 ~-12%
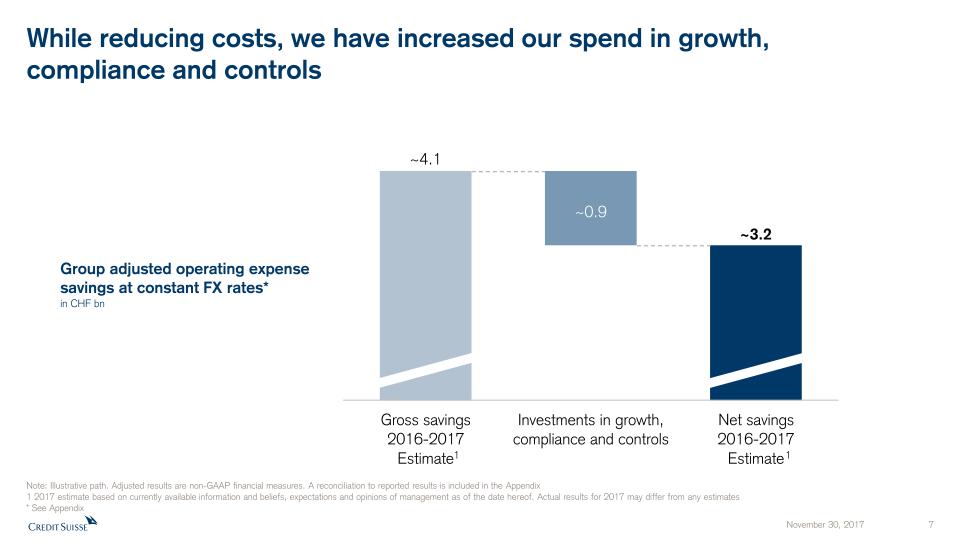
While reducing costs, we have increased our spend in growth, compliance and controls Note: Illustrative path. Adjusted results are non-GAAP financial measures. A reconciliation to reported results is included in the Appendix1 2017 estimate based on currently available information and beliefs, expectations and opinions of management as of the date hereof. Actual results for 2017 may differ from any estimates* See Appendix Group adjusted operating expense savings at constant FX rates*in CHF bn 1 1
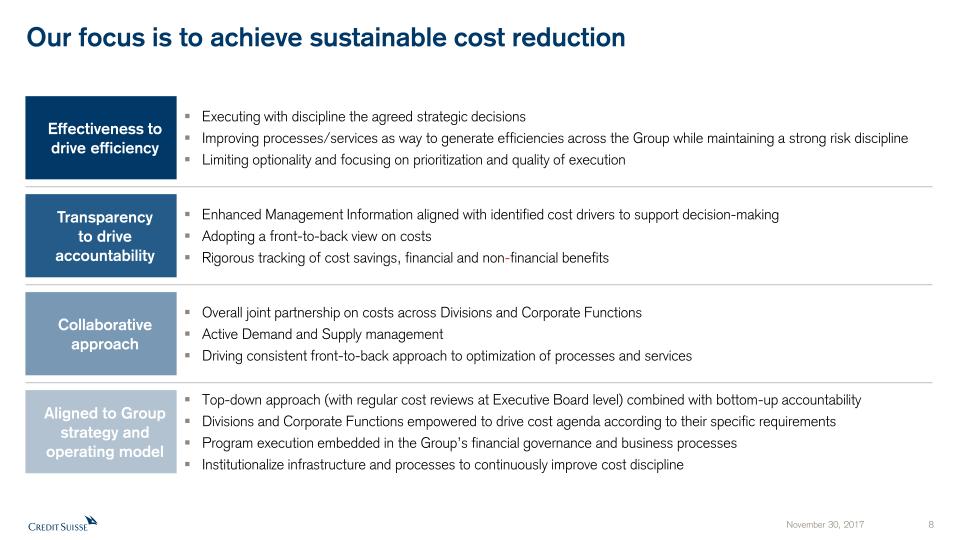
Our focus is to achieve sustainable cost reduction Executing with discipline the agreed strategic decisionsImproving processes/services as way to generate efficiencies across the Group while maintaining a strong risk disciplineLimiting optionality and focusing on prioritization and quality of execution Enhanced Management Information aligned with identified cost drivers to support decision-makingAdopting a front-to-back view on costs Rigorous tracking of cost savings, financial and non-financial benefits Overall joint partnership on costs across Divisions and Corporate FunctionsActive Demand and Supply management Driving consistent front-to-back approach to optimization of processes and services Top-down approach (with regular cost reviews at Executive Board level) combined with bottom-up accountability Divisions and Corporate Functions empowered to drive cost agenda according to their specific requirementsProgram execution embedded in the Group’s financial governance and business processesInstitutionalize infrastructure and processes to continuously improve cost discipline Effectiveness to drive efficiency Transparency to drive accountability Collaborative approach Aligned to Group strategy and operating model
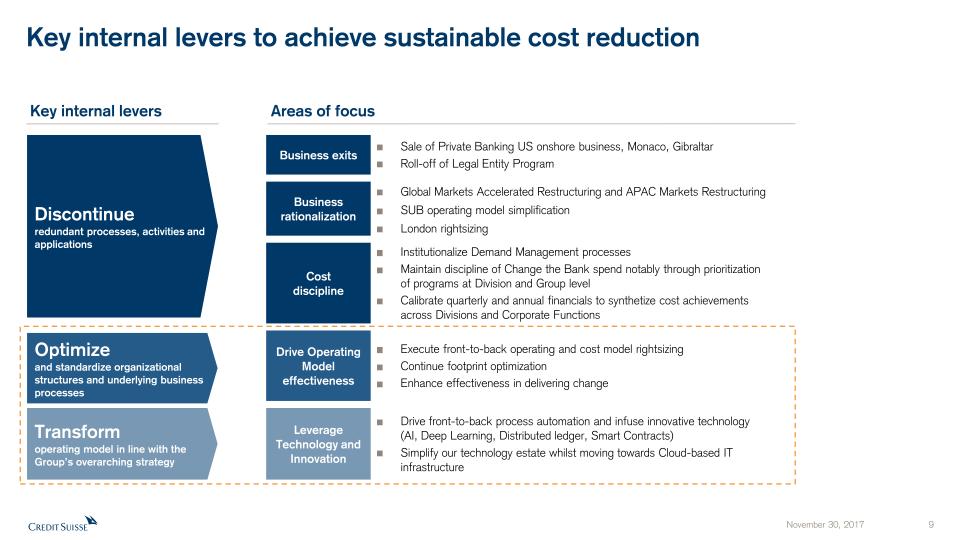
Key internal levers to achieve sustainable cost reduction Business exits Business rationalization Costdiscipline Sale of Private Banking US onshore business, Monaco, GibraltarRoll-off of Legal Entity Program Global Markets Accelerated Restructuring and APAC Markets RestructuringSUB operating model simplificationLondon rightsizing Institutionalize Demand Management processesMaintain discipline of Change the Bank spend notably through prioritization of programs at Division and Group levelCalibrate quarterly and annual financials to synthetize cost achievements across Divisions and Corporate Functions Drive Operating Model effectiveness Leverage Technology and Innovation Execute front-to-back operating and cost model rightsizingContinue footprint optimizationEnhance effectiveness in delivering change Drive front-to-back process automation and infuse innovative technology (AI, Deep Learning, Distributed ledger, Smart Contracts)Simplify our technology estate whilst moving towards Cloud-based IT infrastructure Transformoperating model in line with the Group’s overarching strategy Optimizeand standardize organizational structures and underlying business processes Discontinueredundant processes, activities and applications Areas of focus Key internal levers
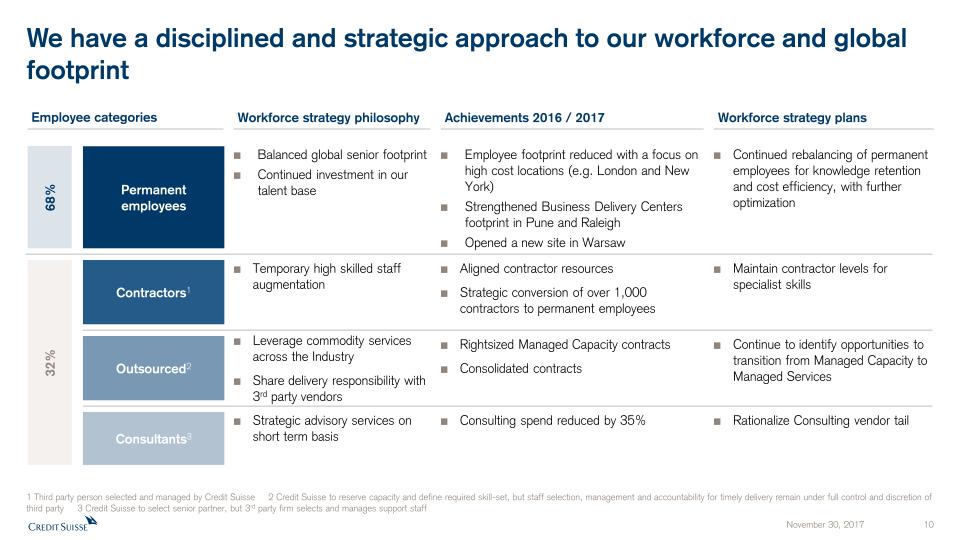
We have a disciplined and strategic approach to our workforce and global footprint Permanentemployees Contractors1 Outsourced2 Consultants3 Balanced global senior footprintContinued investment in our talent base Temporary high skilled staff augmentation Leverage commodity services across the IndustryShare delivery responsibility with 3rd party vendors Strategic advisory services on short term basis Employee footprint reduced with a focus on high cost locations (e.g. London and New York)Strengthened Business Delivery Centers footprint in Pune and RaleighOpened a new site in Warsaw Aligned contractor resources Strategic conversion of over 1,000 contractors to permanent employees Rightsized Managed Capacity contractsConsolidated contracts Consulting spend reduced by 35% Achievements 2016 / 2017 Workforce strategy philosophy Employee categories Workforce strategy plans Continued rebalancing of permanent employees for knowledge retention and cost efficiency, with further optimization Maintain contractor levels for specialist skills Continue to identify opportunities to transition from Managed Capacity to Managed Services Rationalize Consulting vendor tail 1 Third party person selected and managed by Credit Suisse 2 Credit Suisse to reserve capacity and define required skill-set, but staff selection, management and accountability for timely delivery remain under full control and discretion of third party 3 Credit Suisse to select senior partner, but 3rd party firm selects and manages support staff 32% 68%
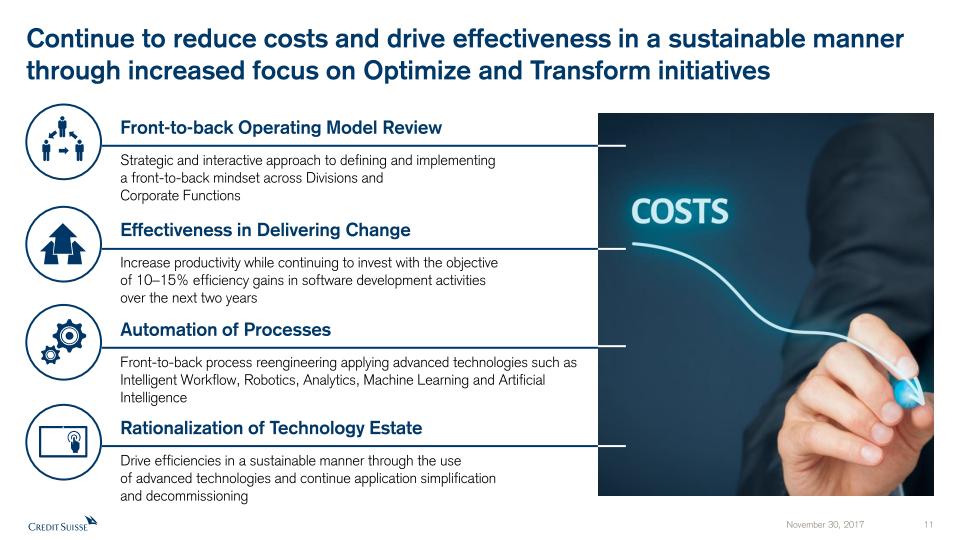
Continue to reduce costs and drive effectiveness in a sustainable manner through increased focus on Optimize and Transform initiatives Strategic and interactive approach to defining and implementing a front-to-back mindset across Divisions and Corporate Functions Front-to-back Operating Model Review Increase productivity while continuing to invest with the objective of 10–15% efficiency gains in software development activities over the next two years Effectiveness in Delivering Change Drive efficiencies in a sustainable manner through the use of advanced technologies and continue application simplification and decommissioning Rationalization of Technology Estate Front-to-back process reengineering applying advanced technologies such as Intelligent Workflow, Robotics, Analytics, Machine Learning and Artificial Intelligence Automation of Processes
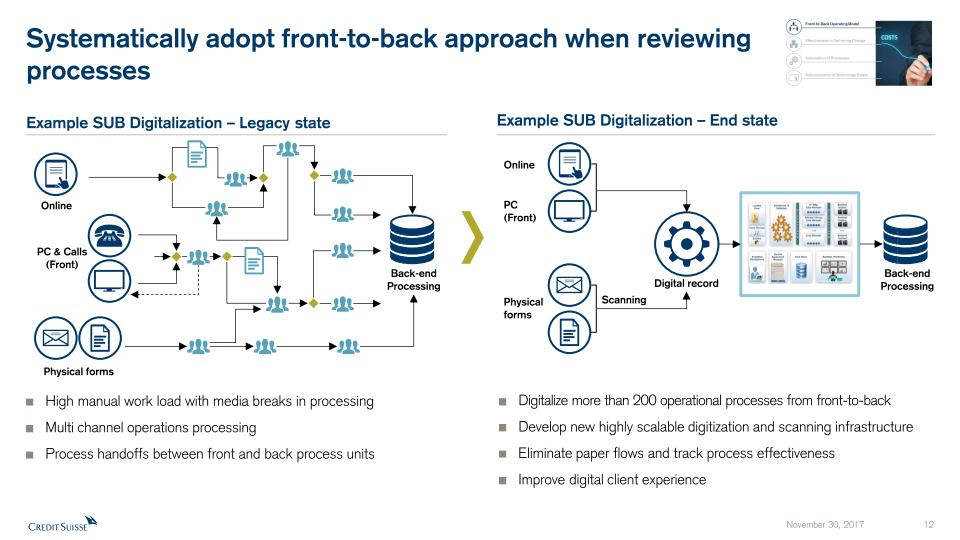
Systematically adopt front-to-back approach when reviewingprocesses Example SUB Digitalization – Legacy state Example SUB Digitalization – End state High manual work load with media breaks in processing Multi channel operations processing Process handoffs between front and back process units Digitalize more than 200 operational processes from front-to-back Develop new highly scalable digitization and scanning infrastructureEliminate paper flows and track process effectivenessImprove digital client experience Back-end Processing Physical forms PC & Calls (Front) Online Scanning Digital record Physical forms PC (Front) Online Back-end Processing
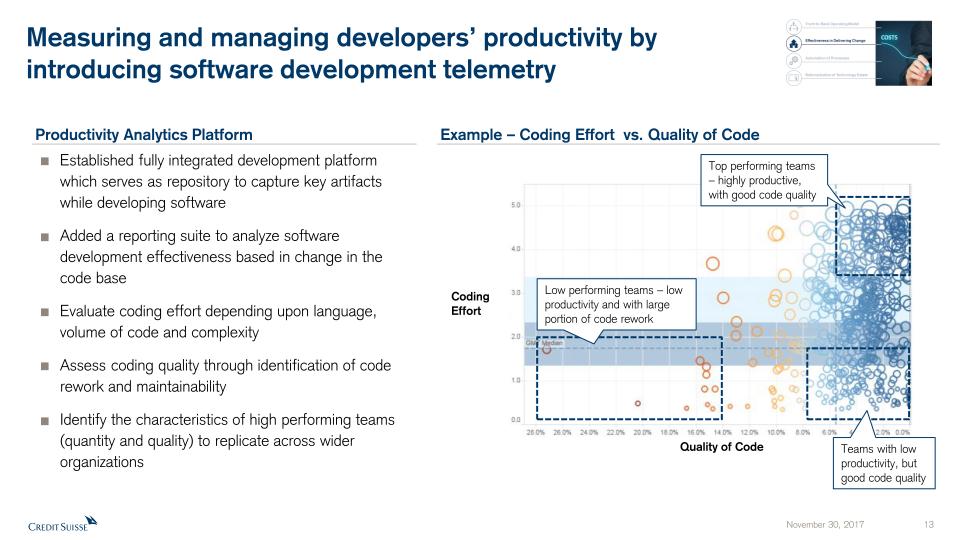
Measuring and managing developers’ productivity by introducing software development telemetry Established fully integrated development platform which serves as repository to capture key artifacts while developing software Added a reporting suite to analyze software development effectiveness based in change in the code base Evaluate coding effort depending upon language, volume of code and complexityAssess coding quality through identification of code rework and maintainabilityIdentify the characteristics of high performing teams (quantity and quality) to replicate across wider organizations Quality of Code Coding Effort Low performing teams – low productivity and with large portion of code rework Teams with low productivity, but good code quality Top performing teams – highly productive, with good code quality Example – Coding Effort vs. Quality of Code Productivity Analytics Platform

We automate re-engineered processes using state-of-the-art technology Example – Pre-matching settlement Open Exceptions Open Exceptions Open Exceptions CS user emails counterparty exception details and updates narrative Counterparty emails response CS user reads and acts upon response and updates narrative For limited exception types a robot handles interaction with certain counterparties exception details and updates narrative CS user reads and acts upon free-format responses and updates narrative For all exception types a robot emails all counterparty exception details and updates narrative Counterparty emails response A.I. natural language processing reads the email and a robot acts upon response including auto-routing exception to department best placed to resolve prioritised using data analytics Re-engineeredManual Process Robot handlesinteraction(2017) Expect to enhance with AI(2018+) Robot responds with standard template and updates narrative Cleansed the data sources providing exception data Standardized email template for consistent communication across clients, markets and products 10 x faster Increased coverage from 3 to over 9,000 Broker/ Clients in 2017 Response rates increased from 10% to 40% Provided clients a standardized response template to enable efficiency for both parties Standardized narration providing improved MI Counterparty emails response

Applying “Big Data” in Group Financial Accounting Example – Big Data Capital Calculation Infrastructure Challenge Millions of trade records daily applying up to 50,000 rules on more than 200 servers supporting development test and production of infrastructure Increased complexity, operations and change cost of calculations framework Considerable growth of data storage costs of legacy infrastructure Faster processing and aggregation reducing calculation time1:Americas from 90 to 18 minutesEMEA from 120 to 27 minutesAPAC from 20 to 12 minutesGreater scalability, simplicity, flexibility and re-usability to meet future regulatory demandsData storage compression tools reducing storage costs by 90% Reduced Total Cost of Ownership Data Processed in Parallel MAP TextCSVBinaryXMLLogData REDUCE In-memory calculation engine using “Big Data” based on open source software, with separate rules engine logic 1 As of implementation in January 2017
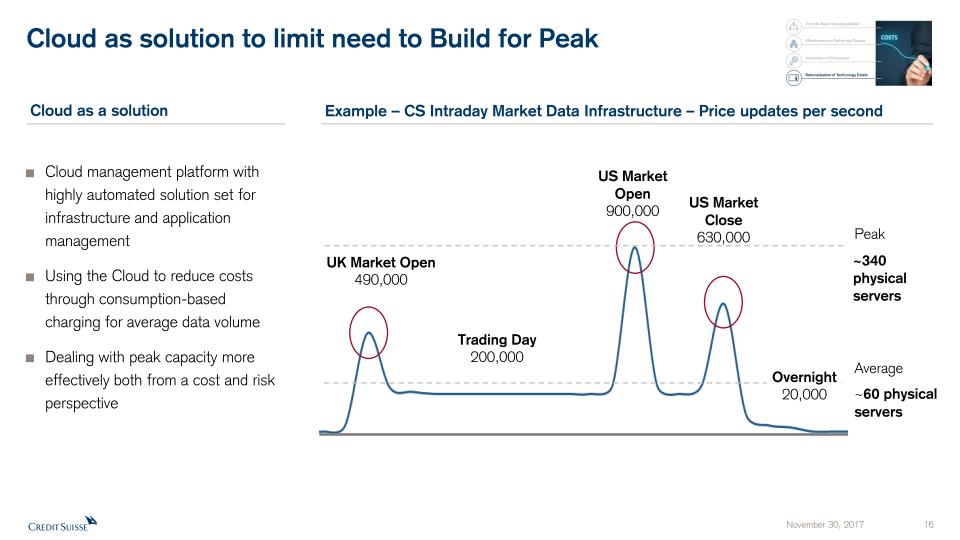
Cloud as solution to limit need to Build for Peak ~60 physical servers Peak Average UK Market Open490,000 Trading Day200,000 US Market Close630,000 Overnight20,000 US Market Open900,000 ~340 physical servers Cloud management platform with highly automated solution set for infrastructure and application managementUsing the Cloud to reduce costs through consumption-based charging for average data volumeDealing with peak capacity more effectively both from a cost and risk perspective Cloud as a solution Example – CS Intraday Market Data Infrastructure – Price updates per second
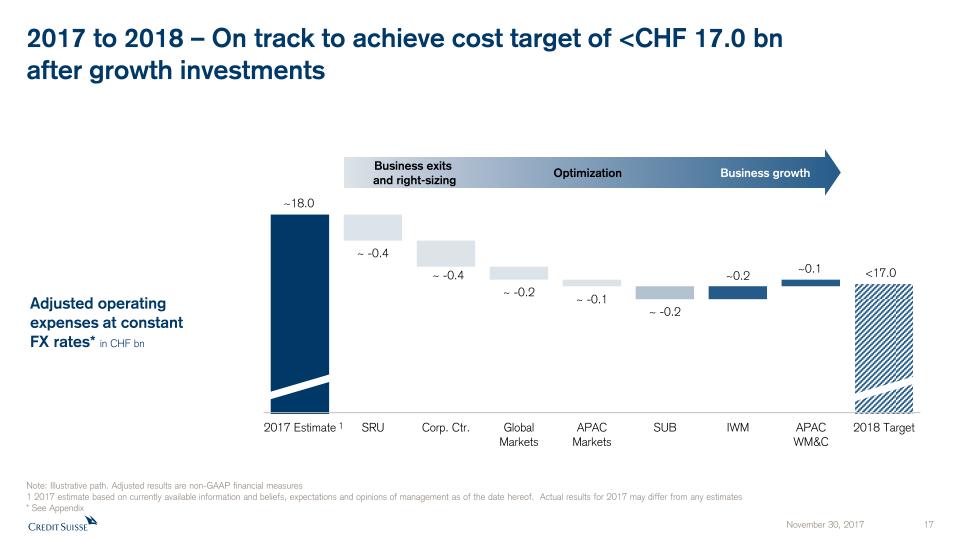
2017 to 2018 – On track to achieve cost target of <CHF 17.0 bnafter growth investments Business exits and right-sizing Business growth Adjusted operating expenses at constant FX rates* in CHF bn Note: Illustrative path. Adjusted results are non-GAAP financial measures1 2017 estimate based on currently available information and beliefs, expectations and opinions of management as of the date hereof. Actual results for 2017 may differ from any estimates* See Appendix 1 Optimization
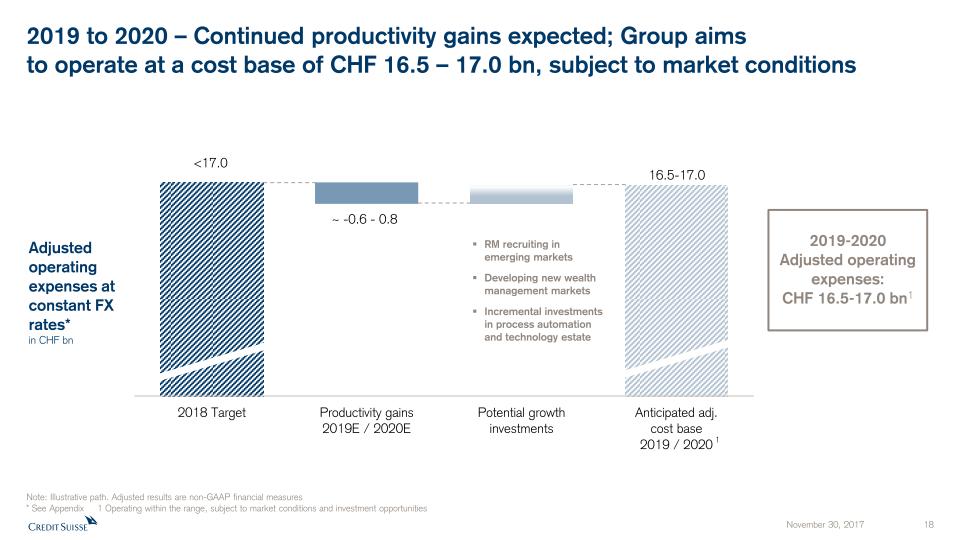
2019 to 2020 – Continued productivity gains expected; Group aims to operate at a cost base of CHF 16.5 – 17.0 bn, subject to market conditions RM recruiting in emerging marketsDeveloping new wealth management marketsIncremental investments in process automation and technology estate 1 ~ -0.6 - 0.8 16.5-17.0 Adjusted operating expenses at constant FX rates*in CHF bn Note: Illustrative path. Adjusted results are non-GAAP financial measures* See Appendix 1 Operating within the range, subject to market conditions and investment opportunities 2019-2020Adjusted operating expenses: CHF 16.5-17.0 bn1
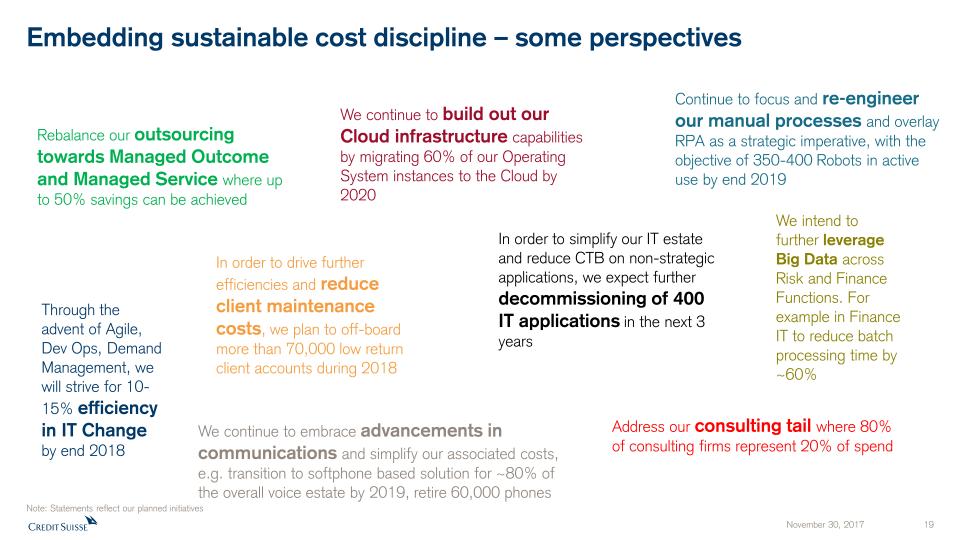
Embedding sustainable cost discipline – some perspectives In order to simplify our IT estate and reduce CTB on non-strategic applications, we expect further decommissioning of 400 IT applications in the next 3 years Continue to focus and re-engineer our manual processes and overlay RPA as a strategic imperative, with the objective of 350-400 Robots in active use by end 2019 Address our consulting tail where 80% of consulting firms represent 20% of spend We continue to build out our Cloud infrastructure capabilities by migrating 60% of our Operating System instances to the Cloud by 2020 In order to drive further efficiencies and reduce client maintenance costs, we plan to off-board more than 70,000 low return client accounts during 2018 Rebalance our outsourcing towards Managed Outcome and Managed Service where up to 50% savings can be achieved Through the advent of Agile, Dev Ops, Demand Management, we will strive for 10-15% efficiency in IT Change by end 2018 We continue to embrace advancements in communications and simplify our associated costs, e.g. transition to softphone based solution for ~80% of the overall voice estate by 2019, retire 60,000 phones We intend to further leverage Big Data across Risk and Finance Functions. For example in Finance IT to reduce batch processing time by ~60% Note: Statements reflect our planned initiatives

Appendix November 30, 2017 20

Notes (1/2) General notes Specific notes * Our cost savings program is measured using adjusted operating expenses at constant FX rates. “Adjusted operating expenses at constant FX rates” and “adjusted non-compensation operating expenses at constant FX rates” include adjustments as made in all our disclosures for restructuring expenses, major litigation expenses and a goodwill impairment taken in 4Q15 as well as adjustments for certain accounting changes (which had not been in place at the launch of the cost savings program), debit valuation adjustments (DVA) related volatility and for FX, applying the following main currency exchange rates for1Q15: USD/CHF 0.9465, EUR/CHF 1.0482, GBP/CHF 1.4296, 2Q15: USD/CHF 0.9383, EUR/CHF 1.0418, GBP/CHF 1.4497,3Q15: USD/CHF 0.9684, EUR/CHF 1.0787, GBP/CHF 1.4891, 4Q15: USD/CHF 1.0010, EUR/CHF 1.0851, GBP/CHF 1.5123,1Q16: USD/CHF 0.9928, EUR/CHF 1.0941, GBP/CHF 1.4060, 2Q16: USD/CHF 0.9756, EUR/CHF 1.0956, GBP/CHF 1.3845,3Q16: USD/CHF 0.9728, EUR/CHF 1.0882, GBP/CHF 1.2764, 4Q16: USD/CHF 1.0101, EUR/CHF 1.0798, GBP/CHF 1.2451,1Q17: USD/CHF 0.9963, EUR/CHF 1.0670, GBP/CHF 1.2464, 2Q17: USD/CHF 0.9736, EUR/CHF 1.0881, GBP/CHF 1.2603,3Q17: USD/CHF 0.9645, EUR/CHF 1.1413, GBP/CHF 1.2695.These currency exchange rates are unweighted, i.e. a straight line average of monthly rates. We apply this calculation consistently for the periods under review. Adjusted non-compensation expenses are adjusted operating expenses excluding compensation and benefits. To calculate adjusted non-compensation expenses at constant FX rates, we subtract compensation and benefits (adjusted at constant FX rates in the manner described above) from adjusted operating expenses at constant FX rates.† Regulatory capital is calculated as the worst of 10% of RWA and 3.5% of leverage exposure. Return on regulatory capital is calculated using (adjusted) income after tax and assumes a tax rate of 30% and capital allocated based on the worst of 10% of average RWA and 3.5% of average leverage exposure. For the Markets business within the APAC division and for the Global Markets and Investment Banking & Capital Markets divisions, return on regulatory capital is based on US dollar denominated numbers. Adjusted return on regulatory capital is calculated using adjusted results, applying the same methodology to calculate return on regulatory capital. For reconciliation of adjusted to reported results, refer to the Appendix of either the CEO or CFO Investor Day 2017 presentation. Throughout the presentation rounding differences may occurUnless otherwise noted, all CET1 ratio, Tier 1 leverage ratio, risk-weighted assets and leverage exposure figures shown in this presentation are as of the end of the respective period and on a “look-through” basisGross and net margins are shown in basis pointsGross margin = adj. net revenues annualized / average AuM; net margin = adj. pre-tax income annualized / average AuMMandates penetration reflects advisory and discretionary mandates as percentage of total AuM
Notes (2/2) Abbreviations Adj. = Adjusted; AI = Artificial Intelligence; AM = Asset Management; AML = Anti-Money Laundering; APAC = Asia Pacific; AT1 = Additional Tier 1; AuM = Assets under Management; BCBS = Basel Committee on Banking Supervision; BIS = Bank for International Settlements; bps = basis points; CAGR = Compound Annual Growth Rate; CCRO = Chief Compliance and Regulatory Affairs Officer; CET1 = Common Equity Tier 1; CIC = Corporate & Institutional Clients; CIF = Customer/Client Information File; Corp. Ctr. = Corporate Center; CVA = Credit Valuation Adjustment; DCM = Debt Capital Markets; EAM = External Asset Manager; ECM = Equity Capital Markets; EM = Emerging Markets; EMEA = Europe, Middle East & Africa; EPS = Earnings Per Share; EQ = Equities; EU = European Union; FICC = Fixed Income, Currencies & Commodities; FINMA = Swiss Financial Market Supervisory Authority; FLP = Fund Linked Products; FRTB = Fundamental Review of the Trading Book; FX = Foreign Exchange; G10 = Group of Ten; GDP = Gross Domestic Product; GM = Global Markets; IBCM = Investment Banking & Capital Markets; IBD = Investment Banking Department; IC = Investment Consultant; IMF = International Monetary Fund; IP = Investor Products; IPO = Initial Public Offering; IRB = Internal Ratings Based; IT = Information Technology; ITS = International Trading Solutions; IWM = International Wealth Management; JV = Joint Venture; LSC = Large Swiss Corporates; M&A = Mergers & Acquisitions; MI = Management Information; Mkts = Markets; NNA = Net new assets; Op Risk = Operational Risk; PB = Private Banking; PC = Private Clients; PEP = Politically Exposed Person; pp = percentage points; PTI = Pre-tax income; PWMC = Private & Wealth Management Clients; RM = Relationship Manager(s); RoRC = Return on Regulatory Capital; RoTE = Return on Tangible Equity; RPA = Robotic Process Automation; RWA = Risk-weighted assets; SA-CCR = Standardized Approach to Counterparty Credit Risk; SME = Small and Medium-Sized Enterprises; SMG = Systematic Market-Making Group; SoW = Share of Wallet; SRU = Strategic Resolution Unit; SUB = Swiss Universal Bank; TBTF = Too Big To Fail; TBVS = Tangible Book Value per Share; (U)HNW(I) = (Ultra) High Net Worth (Individuals); VaR = Value-at-Risk; VIX = Volatility Index; WM = Wealth Management; WM&C = Wealth Management & Connected; YoY = Year over year; YTD = Year to Date


Credit Suisse Investor Day 2017Compliance & Regulatory AffairsLara Warner November 30, 2017

Disclaimer This material does not purport to contain all of the information that you may wish to consider. This material is not to be relied upon as such or used in substitution for the exercise of independent judgment.Cautionary statement regarding forward-looking statements This presentation contains forward-looking statements that involve inherent risks and uncertainties, and we might not be able to achieve the predictions, forecasts, projections and other outcomes we describe or imply in forward-looking statements. A number of important factors could cause results to differ materially from the plans, objectives, expectations, estimates and intentions we express in these forward-looking statements, including those we identify in "Risk factors” in our Annual Report on Form 20-F for the fiscal year ended December 31, 2016 and in the “Cautionary statement regarding forward-looking information" in our media release relating to Investor Day, published on November 30, 2017 and filed with the US Securities and Exchange Commission, and in other public filings and press releases. We do not intend to update these forward-looking statements. In particular, the terms “Estimate”, “Illustrative”, “Ambition”, “Objective”, “Outlook” and “Goal” are not intended to be viewed as targets or projections, nor are they considered to be Key Performance Indicators. All such estimates, illustrations, ambitions and goals are subject to a large number of inherent risks, assumptions and uncertainties, many of which are completely outside of our control. These risks, assumptions and uncertainties include, but are not limited to, general market conditions, market volatility, interest rate volatility and levels, global and regional economic conditions, political uncertainty, changes in tax policies, regulatory changes, changes in levels of client activity as a result of any of the foregoing and other factors. Accordingly, this information should not be relied on for any purpose. We do not intend to update these estimates, illustrations, ambitions or goals. We may not achieve the benefits of our strategic initiatives We may not achieve all of the expected benefits of our strategic initiatives. Factors beyond our control, including but not limited to the market and economic conditions, changes in laws, rules or regulations and other challenges discussed in our public filings, could limit our ability to achieve some or all of the expected benefits of these initiatives. Estimates, assumptions and opinionsIn preparing this presentation, management has made estimates and assumptions that affect the numbers presented. Actual results may differ. Annualized numbers do not take account of variations in operating results, seasonality and other factors and may not be indicative of actual, full-year results. Figures throughout this presentation may also be subject to rounding adjustments. All opinions and views constitute judgments as of the date of writing without regard to the date on which the reader may receive or access the information. This information is subject to change at any time without notice and we do not intend to update this information. Statement regarding non-GAAP financial measures This presentation also contains non-GAAP financial measures, including adjusted results. Information needed to reconcile such non-GAAP financial measures to the most directly comparable measures under US GAAP can be found in the Appendix of the CEO and CFO Investor Day presentations, published on November 30, 2017. All Investor Day presentations are available on our website at www.credit-suisse.com. Statement regarding capital, liquidity and leverage As of January 1, 2013, Basel III was implemented in Switzerland along with the Swiss “Too Big to Fail” legislation and regulations thereunder (in each case, subject to certain phase-in periods). As of January 1, 2015, the Bank for International Settlements (BIS) leverage ratio framework, as issued by the Basel Committee on Banking Supervision (BCBS), was implemented in Switzerland by FINMA. Our related disclosures are in accordance with our interpretation of such requirements, including relevant assumptions. Changes in the interpretation of these requirements in Switzerland or in any of our assumptions or estimates could result in different numbers from those shown in this presentation. Capital and ratio numbers for periods prior to 2013 are based on estimates, which are calculated as if the Basel III framework had been in place in Switzerland during such periods. Unless otherwise noted, leverage exposure is based on the BIS leverage ratio framework and consists of period-end balance sheet assets and prescribed regulatory adjustments. Beginning in 2015, the Swiss leverage ratio is calculated as Swiss total capital, divided by period-end leverage exposure. The look-through BIS tier 1 leverage ratio and CET1 leverage ratio are calculated as look-through BIS tier 1 capital and CET1 capital, respectively, divided by end-period leverage exposure.SourcesCertain material in this presentation has been prepared by Credit Suisse on the basis of publicly available information, internally developed data and other third-party sources believed to be reliable. Credit Suisse has not sought to independently verify information obtained from public and third-party sources and makes no representations or warranties as to accuracy, completeness or reliability of such information.
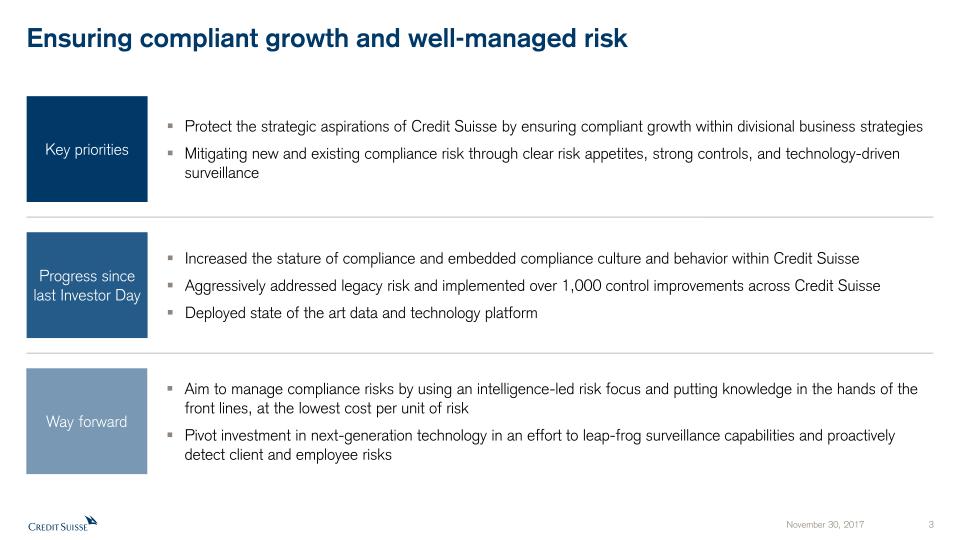
Ensuring compliant growth and well-managed risk Protect the strategic aspirations of Credit Suisse by ensuring compliant growth within divisional business strategiesMitigating new and existing compliance risk through clear risk appetites, strong controls, and technology-driven surveillance Key priorities Aim to manage compliance risks by using an intelligence-led risk focus and putting knowledge in the hands of the front lines, at the lowest cost per unit of riskPivot investment in next-generation technology in an effort to leap-frog surveillance capabilities and proactively detect client and employee risks Way forward Increased the stature of compliance and embedded compliance culture and behavior within Credit Suisse Aggressively addressed legacy risk and implemented over 1,000 control improvements across Credit Suisse Deployed state of the art data and technology platform Progress since last Investor Day
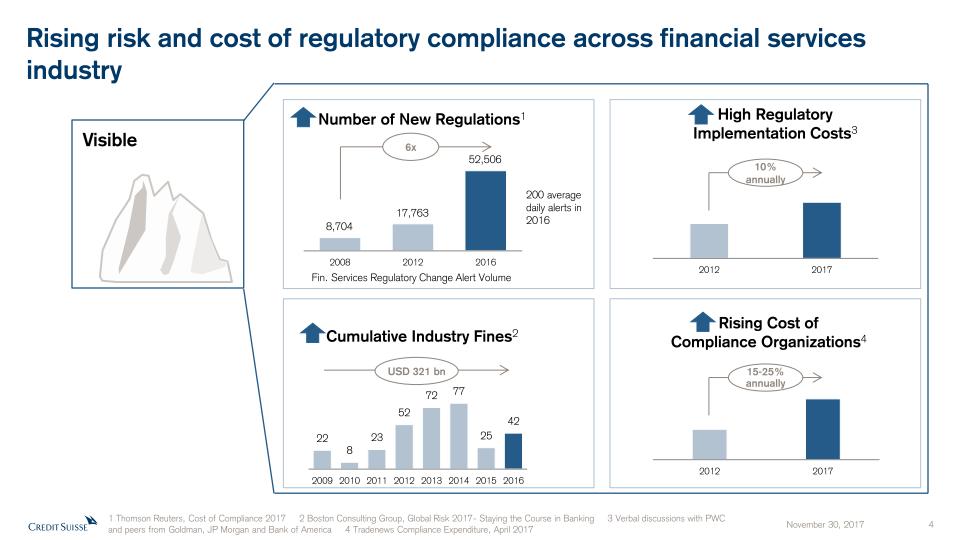
Rising risk and cost of regulatory compliance across financial services industry Visible Number of New Regulations1 Cumulative Industry Fines2 Rising Cost of Compliance Organizations4 200 average daily alerts in 2016 52,506 8,704 17,763 Fin. Services Regulatory Change Alert Volume 1 Thomson Reuters, Cost of Compliance 2017 2 Boston Consulting Group, Global Risk 2017- Staying the Course in Banking 3 Verbal discussions with PWC and peers from Goldman, JP Morgan and Bank of America 4 Tradenews Compliance Expenditure, April 2017 USD 321 bn High Regulatory Implementation Costs3 6x 10% annually 15-25%annually
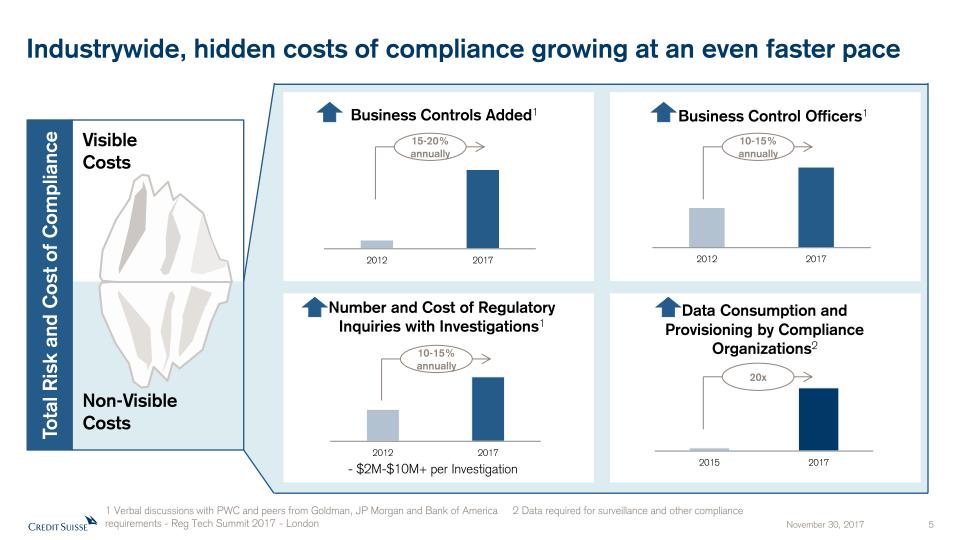
Industrywide, hidden costs of compliance growing at an even faster pace VisibleCosts Non-VisibleCosts Business Controls Added1 Business Control Officers1 Data Consumption and Provisioning by Compliance Organizations2 Number and Cost of Regulatory Inquiries with Investigations1 - $2M-$10M+ per Investigation Total Risk and Cost of Compliance 1 Verbal discussions with PWC and peers from Goldman, JP Morgan and Bank of America 2 Data required for surveillance and other compliance requirements - Reg Tech Summit 2017 - London 15-20%annually 10-15%annually 20x 10-15%annually
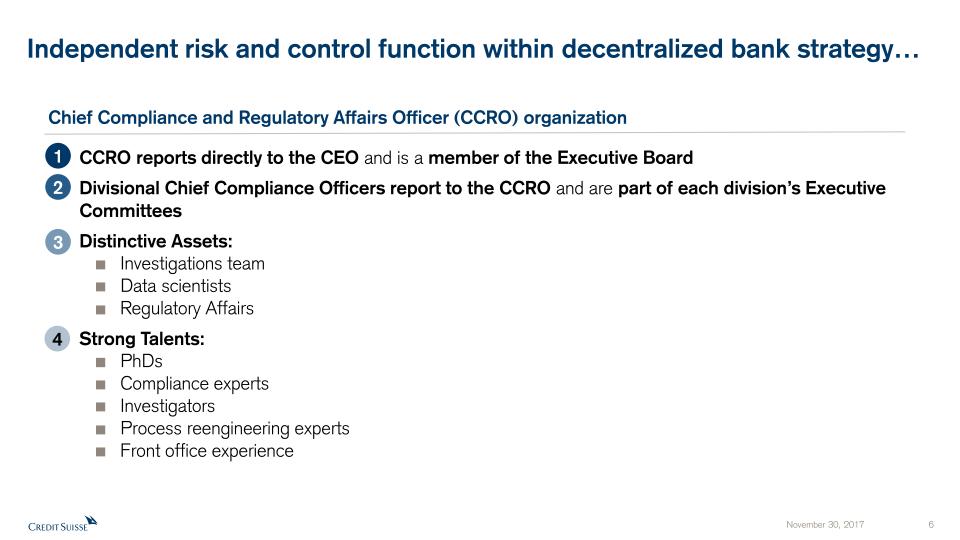
Independent risk and control function within decentralized bank strategy… CCRO reports directly to the CEO and is a member of the Executive Board Divisional Chief Compliance Officers report to the CCRO and are part of each division’s Executive CommitteesDistinctive Assets:Investigations teamData scientistsRegulatory AffairsStrong Talents:PhDsCompliance expertsInvestigatorsProcess reengineering expertsFront office experience Chief Compliance and Regulatory Affairs Officer (CCRO) organization 1 2 3 4
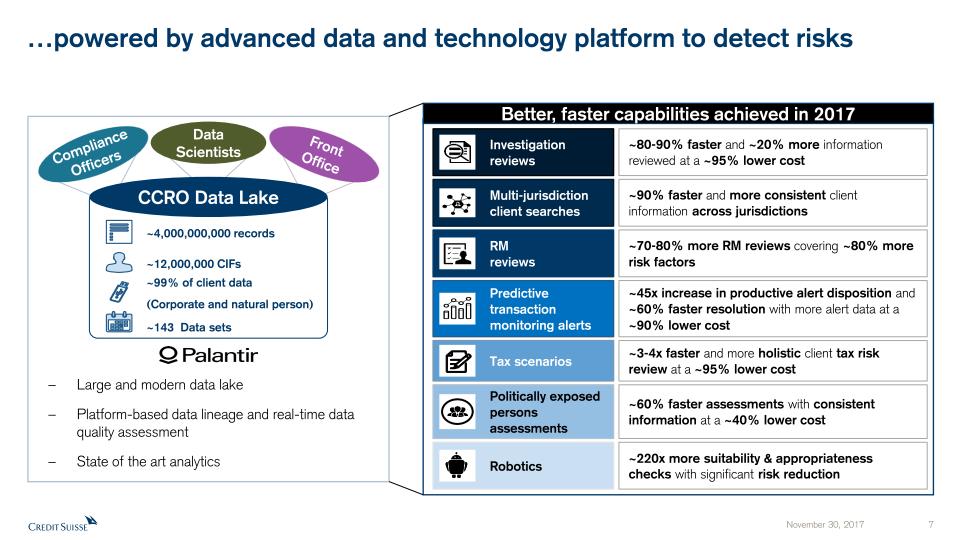
…powered by advanced data and technology platform to detect risks Compliance Officers DataScientists FrontOffice ~4,000,000,000 records ~143 Data sets ~12,000,000 CIFs ~99% of client data (Corporate and natural person) CCRO Data Lake Better, faster capabilities achieved in 2017 Robotics ~220x more suitability & appropriateness checks with significant risk reduction Investigationreviews Politically exposed persons assessments RM reviews Multi-jurisdictionclient searches Predictive transaction monitoring alerts Tax scenarios ~80-90% faster and ~20% more information reviewed at a ~95% lower cost ~60% faster assessments with consistent information at a ~40% lower cost ~70-80% more RM reviews covering ~80% more risk factors ~90% faster and more consistent client information across jurisdictions ~45x increase in productive alert disposition and ~60% faster resolution with more alert data at a ~90% lower cost ~3-4x faster and more holistic client tax risk review at a ~95% lower cost Large and modern data lakePlatform-based data lineage and real-time data quality assessmentState of the art analytics
From periodic, human-led to “always on,” tech-led controls driving earlier prevention & detection
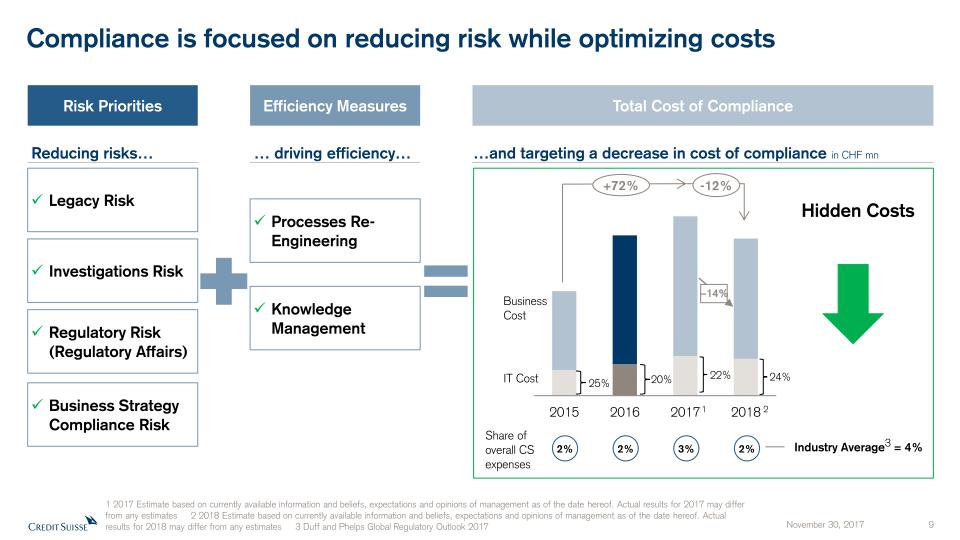
Compliance is focused on reducing risk while optimizing costs Risk Priorities -12% 2% 3% 2% Share of overall CS expenses Hidden Costs −14% 20% 22% 24% IT Cost Business Cost Legacy Risk Regulatory Risk (Regulatory Affairs) Business Strategy Compliance Risk Total Cost of Compliance …and targeting a decrease in cost of compliance in CHF mn +72% Industry Average3 = 4% Investigations Risk 25% 2% Reducing risks… Efficiency Measures Processes Re-Engineering Knowledge Management … driving efficiency… 1 2 1 2017 Estimate based on currently available information and beliefs, expectations and opinions of management as of the date hereof. Actual results for 2017 may differ from any estimates 2 2018 Estimate based on currently available information and beliefs, expectations and opinions of management as of the date hereof. Actual results for 2018 may differ from any estimates 3 Duff and Phelps Global Regulatory Outlook 2017
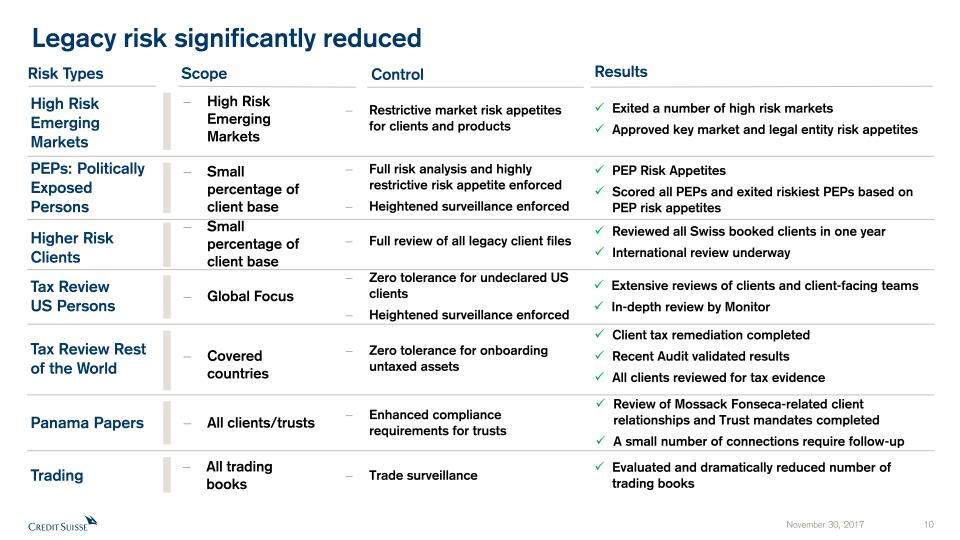
Legacy risk significantly reduced Higher Risk Clients PEPs: Politically Exposed Persons Tax Review US Persons Tax Review Rest of the World Panama Papers Scope Results PEP Risk Appetites Scored all PEPs and exited riskiest PEPs based on PEP risk appetites Small percentage of client base Small percentage of client base Global Focus Covered countries All clients/trusts Risk Types Reviewed all Swiss booked clients in one yearInternational review underway Extensive reviews of clients and client-facing teamsIn-depth review by Monitor Client tax remediation completedRecent Audit validated resultsAll clients reviewed for tax evidence Review of Mossack Fonseca-related client relationships and Trust mandates completed A small number of connections require follow-up High Risk Emerging Markets High Risk Emerging Markets Exited a number of high risk marketsApproved key market and legal entity risk appetites Trading All trading books Evaluated and dramatically reduced number of trading books Control Restrictive market risk appetites for clients and products Full risk analysis and highly restrictive risk appetite enforcedHeightened surveillance enforced Zero tolerance for undeclared US clientsHeightened surveillance enforced Zero tolerance for onboarding untaxed assets Enhanced compliance requirements for trusts Full review of all legacy client files Trade surveillance
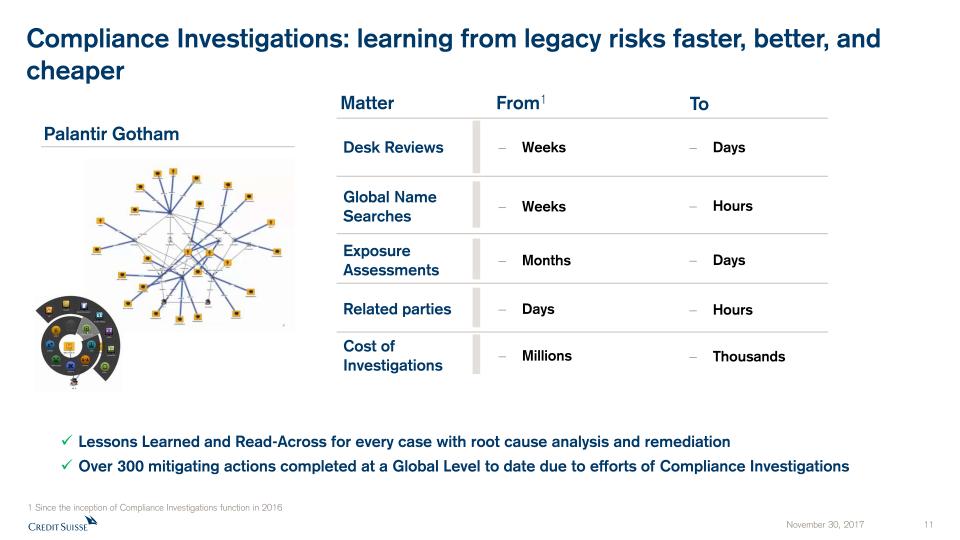
Compliance Investigations: learning from legacy risks faster, better, and cheaper Lessons Learned and Read-Across for every case with root cause analysis and remediationOver 300 mitigating actions completed at a Global Level to date due to efforts of Compliance Investigations From1 Weeks Months Days Weeks To Days Hours Hours Days Exposure Assessments Global Name Searches Related parties Matter Desk Reviews Millions Thousands Cost of Investigations Palantir Gotham 1 Since the inception of Compliance Investigations function in 2016
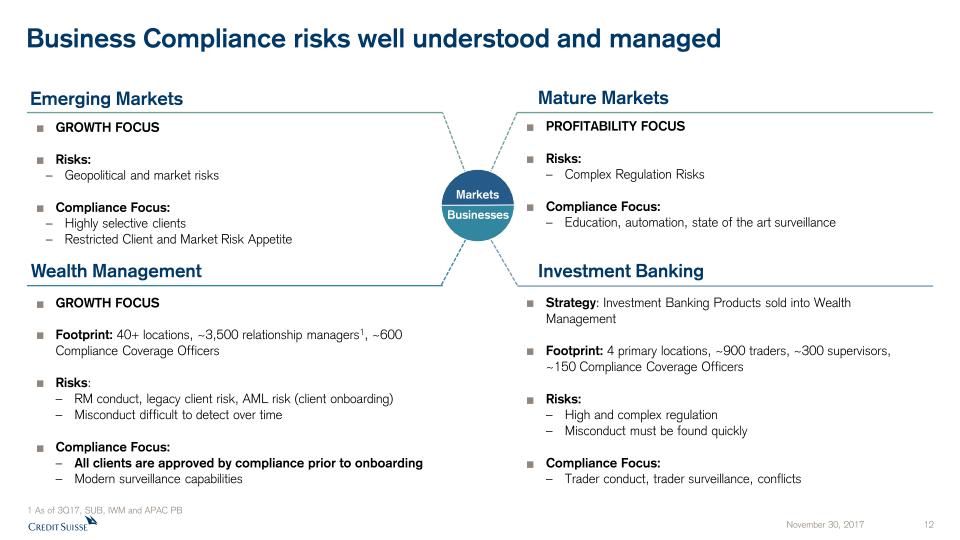
Investment Banking Emerging Markets GROWTH FOCUSRisks:Geopolitical and market risksCompliance Focus:Highly selective clientsRestricted Client and Market Risk Appetite Strategy: Investment Banking Products sold into Wealth ManagementFootprint: 4 primary locations, ~900 traders, ~300 supervisors, ~150 Compliance Coverage OfficersRisks:High and complex regulationMisconduct must be found quicklyCompliance Focus:Trader conduct, trader surveillance, conflicts Wealth Management GROWTH FOCUSFootprint: 40+ locations, ~3,500 relationship managers1, ~600 Compliance Coverage OfficersRisks:RM conduct, legacy client risk, AML risk (client onboarding)Misconduct difficult to detect over timeCompliance Focus:All clients are approved by compliance prior to onboardingModern surveillance capabilities Mature Markets PROFITABILITY FOCUSRisks:Complex Regulation RisksCompliance Focus:Education, automation, state of the art surveillance Markets Businesses 1 As of 3Q17, SUB, IWM and APAC PB Business Compliance risks well understood and managed
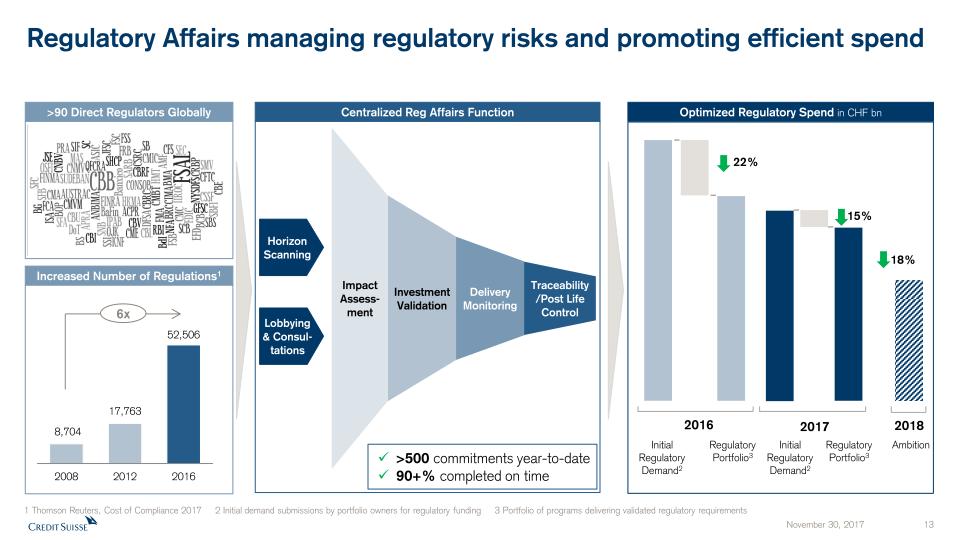
18% Regulatory Affairs managing regulatory risks and promoting efficient spend >90 Direct Regulators Globally Increased Number of Regulations1 Centralized Reg Affairs Function Optimized Regulatory Spend in CHF bn Traceability/Post Life Control Investment Validation Horizon Scanning 2016 2017 22% 15% Delivery Monitoring Lobbying & Consul-tations >500 commitments year-to-date90+% completed on time Impact Assess-ment 2018 Regulatory Portfolio3 Regulatory Portfolio3 Initial Regulatory Demand2 Ambition 6x 1 Thomson Reuters, Cost of Compliance 2017 2 Initial demand submissions by portfolio owners for regulatory funding 3 Portfolio of programs delivering validated regulatory requirements Initial Regulatory Demand2
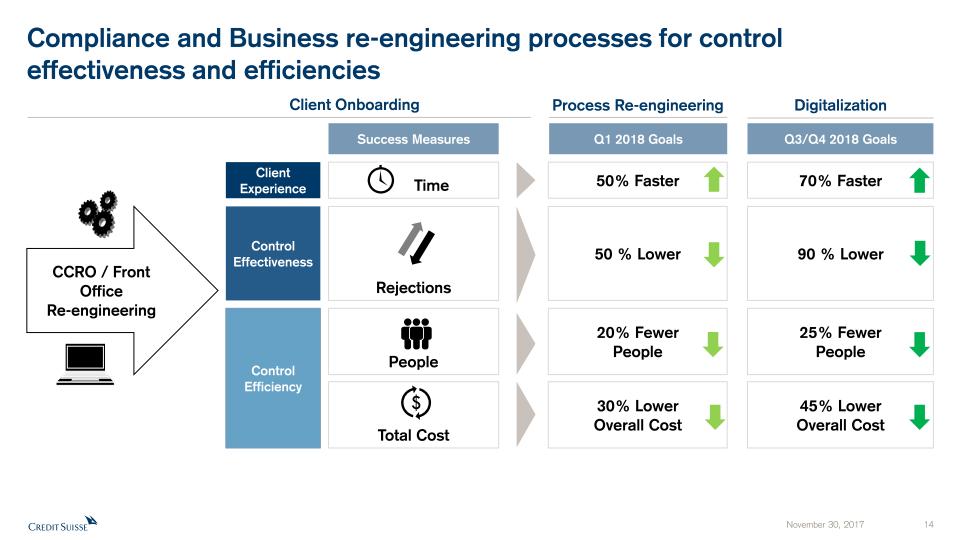
CCRO / Front OfficeRe-engineering Compliance and Business re-engineering processes for control effectiveness and efficiencies Client Onboarding Client Experience Control Effectiveness Control Efficiency Time Rejections People Total Cost Process Re-engineering Digitalization 50% Faster 50 % Lower 20% FewerPeople 30% LowerOverall Cost Q1 2018 Goals Q3/Q4 2018 Goals 70% Faster 90 % Lower 25% FewerPeople 45% LowerOverall Cost Success Measures
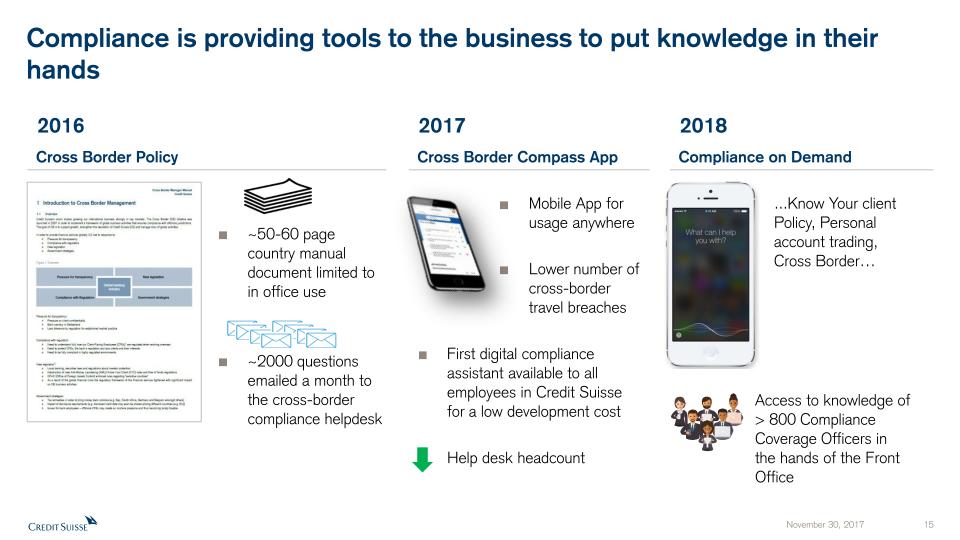
Compliance is providing tools to the business to put knowledge in their hands ~50-60 page country manual document limited to in office use~2000 questions emailed a month to the cross-border compliance helpdesk Mobile App for usage anywhereLower number of cross-border travel breachesFirst digital compliance assistant available to all employees in Credit Suisse for a low development costHelp desk headcount Cross Border Policy Cross Border Compass App Compliance on Demand ...Know Your client Policy, Personal account trading, Cross Border…Access to knowledge of > 800 Compliance Coverage Officers in the hands of the Front Office 2018 2016 2017
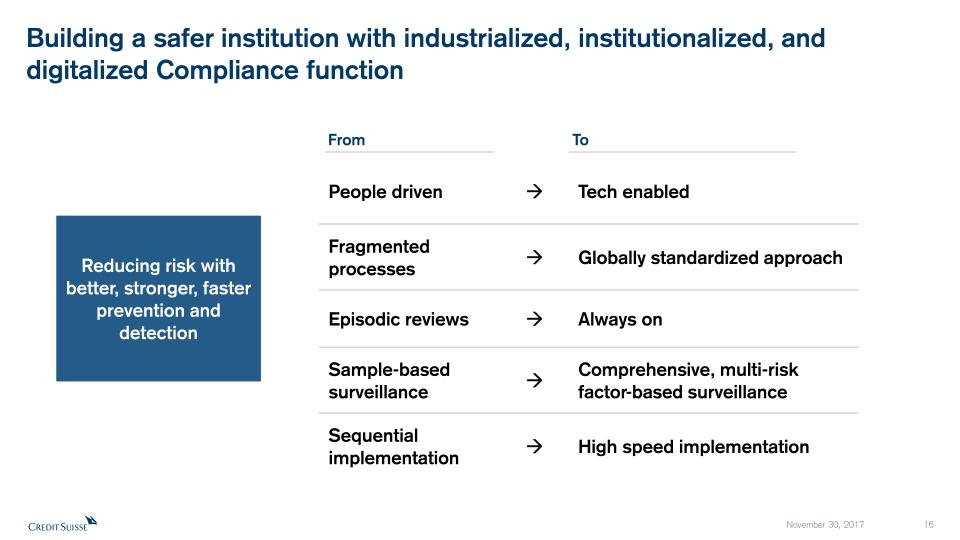
Building a safer institution with industrialized, institutionalized, and digitalized Compliance function Reducing risk with better, stronger, faster prevention and detection People driven Tech enabled Fragmented processes Globally standardized approach Episodic reviews Always on Sample-based surveillance Comprehensive, multi-risk factor-based surveillance Sequential implementation High speed implementation From To

Appendix November 30, 2017 17

Notes (1/2) General notes Specific notes * Our cost savings program is measured using adjusted operating expenses at constant FX rates. “Adjusted operating expenses at constant FX rates” and “adjusted non-compensation operating expenses at constant FX rates” include adjustments as made in all our disclosures for restructuring expenses, major litigation expenses and a goodwill impairment taken in 4Q15 as well as adjustments for certain accounting changes (which had not been in place at the launch of the cost savings program), debit valuation adjustments (DVA) related volatility and for FX, applying the following main currency exchange rates for1Q15: USD/CHF 0.9465, EUR/CHF 1.0482, GBP/CHF 1.4296, 2Q15: USD/CHF 0.9383, EUR/CHF 1.0418, GBP/CHF 1.4497,3Q15: USD/CHF 0.9684, EUR/CHF 1.0787, GBP/CHF 1.4891, 4Q15: USD/CHF 1.0010, EUR/CHF 1.0851, GBP/CHF 1.5123,1Q16: USD/CHF 0.9928, EUR/CHF 1.0941, GBP/CHF 1.4060, 2Q16: USD/CHF 0.9756, EUR/CHF 1.0956, GBP/CHF 1.3845,3Q16: USD/CHF 0.9728, EUR/CHF 1.0882, GBP/CHF 1.2764, 4Q16: USD/CHF 1.0101, EUR/CHF 1.0798, GBP/CHF 1.2451,1Q17: USD/CHF 0.9963, EUR/CHF 1.0670, GBP/CHF 1.2464, 2Q17: USD/CHF 0.9736, EUR/CHF 1.0881, GBP/CHF 1.2603,3Q17: USD/CHF 0.9645, EUR/CHF 1.1413, GBP/CHF 1.2695.These currency exchange rates are unweighted, i.e. a straight line average of monthly rates. We apply this calculation consistently for the periods under review. Adjusted non-compensation expenses are adjusted operating expenses excluding compensation and benefits. To calculate adjusted non-compensation expenses at constant FX rates, we subtract compensation and benefits (adjusted at constant FX rates in the manner described above) from adjusted operating expenses at constant FX rates.† Regulatory capital is calculated as the worst of 10% of RWA and 3.5% of leverage exposure. Return on regulatory capital is calculated using (adjusted) income after tax and assumes a tax rate of 30% and capital allocated based on the worst of 10% of average RWA and 3.5% of average leverage exposure. For the Markets business within the APAC division and for the Global Markets and Investment Banking & Capital Markets divisions, return on regulatory capital is based on US dollar denominated numbers. Adjusted return on regulatory capital is calculated using adjusted results, applying the same methodology to calculate return on regulatory capital. For reconciliation of adjusted to reported results, refer to the Appendix of either the CEO or CFO Investor Day 2017 presentation. Throughout the presentation rounding differences may occurUnless otherwise noted, all CET1 ratio, Tier 1 leverage ratio, risk-weighted assets and leverage exposure figures shown in this presentation are as of the end of the respective period and on a “look-through” basisGross and net margins are shown in basis pointsGross margin = adj. net revenues annualized / average AuM; net margin = adj. pre-tax income annualized / average AuMMandates penetration reflects advisory and discretionary mandates as percentage of total AuM

Notes (2/2) Abbreviations Adj. = Adjusted; AI = Artificial Intelligence; AM = Asset Management; AML = Anti-Money Laundering; APAC = Asia Pacific; AT1 = Additional Tier 1; AuM = Assets under Management; BCBS = Basel Committee on Banking Supervision; BIS = Bank for International Settlements; bps = basis points; CAGR = Compound Annual Growth Rate; CCRO = Chief Compliance and Regulatory Affairs Officer; CET1 = Common Equity Tier 1; CIC = Corporate & Institutional Clients; CIF = Customer/Client Information File; Corp. Ctr. = Corporate Center; CVA = Credit Valuation Adjustment; DCM = Debt Capital Markets; EAM = External Asset Manager; ECM = Equity Capital Markets; EM = Emerging Markets; EMEA = Europe, Middle East & Africa; EPS = Earnings Per Share; EQ = Equities; EU = European Union; FICC = Fixed Income, Currencies & Commodities; FINMA = Swiss Financial Market Supervisory Authority; FLP = Fund Linked Products; FRTB = Fundamental Review of the Trading Book; FX = Foreign Exchange; G10 = Group of Ten; GDP = Gross Domestic Product; GM = Global Markets; IBCM = Investment Banking & Capital Markets; IBD = Investment Banking Department; IC = Investment Consultant; IMF = International Monetary Fund; IP = Investor Products; IPO = Initial Public Offering; IRB = Internal Ratings Based; IT = Information Technology; ITS = International Trading Solutions; IWM = International Wealth Management; JV = Joint Venture; LSC = Large Swiss Corporates; M&A = Mergers & Acquisitions; MI = Management Information; Mkts = Markets; NNA = Net new assets; Op Risk = Operational Risk; PB = Private Banking; PC = Private Clients; PEP = Politically Exposed Person; pp = percentage points; PTI = Pre-tax income; PWMC = Private & Wealth Management Clients; RM = Relationship Manager(s); RoRC = Return on Regulatory Capital; RoTE = Return on Tangible Equity; RPA = Robotic Process Automation; RWA = Risk-weighted assets; SA-CCR = Standardized Approach to Counterparty Credit Risk; SME = Small and Medium-Sized Enterprises; SMG = Systematic Market-Making Group; SoW = Share of Wallet; SRU = Strategic Resolution Unit; SUB = Swiss Universal Bank; TBTF = Too Big To Fail; TBVS = Tangible Book Value per Share; (U)HNW(I) = (Ultra) High Net Worth (Individuals); VaR = Value-at-Risk; VIX = Volatility Index; WM = Wealth Management; WM&C = Wealth Management & Connected; YoY = Year over year; YTD = Year to Date

Credit Suisse Investor Day 2017Swiss Universal BankThomas Gottstein November 30, 2017
Disclaimer This material does not purport to contain all of the information that you may wish to consider. This material is not to be relied upon as such or used in substitution for the exercise of independent judgment.Cautionary statement regarding forward-looking statements This presentation contains forward-looking statements that involve inherent risks and uncertainties, and we might not be able to achieve the predictions, forecasts, projections and other outcomes we describe or imply in forward-looking statements. A number of important factors could cause results to differ materially from the plans, objectives, expectations, estimates and intentions we express in these forward-looking statements, including those we identify in "Risk factors” in our Annual Report on Form 20-F for the fiscal year ended December 31, 2016 and in the “Cautionary statement regarding forward-looking information" in our media release relating to Investor Day, published on November 30, 2017 and filed with the US Securities and Exchange Commission, and in other public filings and press releases. We do not intend to update these forward-looking statements. In particular, the terms “Estimate”, “Illustrative”, “Ambition”, “Objective”, “Outlook” and “Goal” are not intended to be viewed as targets or projections, nor are they considered to be Key Performance Indicators. All such estimates, illustrations, ambitions and goals are subject to a large number of inherent risks, assumptions and uncertainties, many of which are completely outside of our control. These risks, assumptions and uncertainties include, but are not limited to, general market conditions, market volatility, interest rate volatility and levels, global and regional economic conditions, political uncertainty, changes in tax policies, regulatory changes, changes in levels of client activity as a result of any of the foregoing and other factors. Accordingly, this information should not be relied on for any purpose. We do not intend to update these estimates, illustrations, ambitions or goals. We may not achieve the benefits of our strategic initiatives We may not achieve all of the expected benefits of our strategic initiatives. Factors beyond our control, including but not limited to the market and economic conditions, changes in laws, rules or regulations and other challenges discussed in our public filings, could limit our ability to achieve some or all of the expected benefits of these initiatives. Estimates, assumptions and opinionsIn preparing this presentation, management has made estimates and assumptions that affect the numbers presented. Actual results may differ. Annualized numbers do not take account of variations in operating results, seasonality and other factors and may not be indicative of actual, full-year results. Figures throughout this presentation may also be subject to rounding adjustments. All opinions and views constitute judgments as of the date of writing without regard to the date on which the reader may receive or access the information. This information is subject to change at any time without notice and we do not intend to update this information. Statement regarding non-GAAP financial measures This presentation also contains non-GAAP financial measures, including adjusted results. Information needed to reconcile such non-GAAP financial measures to the most directly comparable measures under US GAAP can be found in the Appendix of the CEO and CFO Investor Day presentations, published on November 30, 2017. All Investor Day presentations are available on our website at www.credit-suisse.com. Statement regarding capital, liquidity and leverage As of January 1, 2013, Basel III was implemented in Switzerland along with the Swiss “Too Big to Fail” legislation and regulations thereunder (in each case, subject to certain phase-in periods). As of January 1, 2015, the Bank for International Settlements (BIS) leverage ratio framework, as issued by the Basel Committee on Banking Supervision (BCBS), was implemented in Switzerland by FINMA. Our related disclosures are in accordance with our interpretation of such requirements, including relevant assumptions. Changes in the interpretation of these requirements in Switzerland or in any of our assumptions or estimates could result in different numbers from those shown in this presentation. Capital and ratio numbers for periods prior to 2013 are based on estimates, which are calculated as if the Basel III framework had been in place in Switzerland during such periods. Unless otherwise noted, leverage exposure is based on the BIS leverage ratio framework and consists of period-end balance sheet assets and prescribed regulatory adjustments. Beginning in 2015, the Swiss leverage ratio is calculated as Swiss total capital, divided by period-end leverage exposure. The look-through BIS tier 1 leverage ratio and CET1 leverage ratio are calculated as look-through BIS tier 1 capital and CET1 capital, respectively, divided by end-period leverage exposure.SourcesCertain material in this presentation has been prepared by Credit Suisse on the basis of publicly available information, internally developed data and other third-party sources believed to be reliable. Credit Suisse has not sought to independently verify information obtained from public and third-party sources and makes no representations or warranties as to accuracy, completeness or reliability of such information.
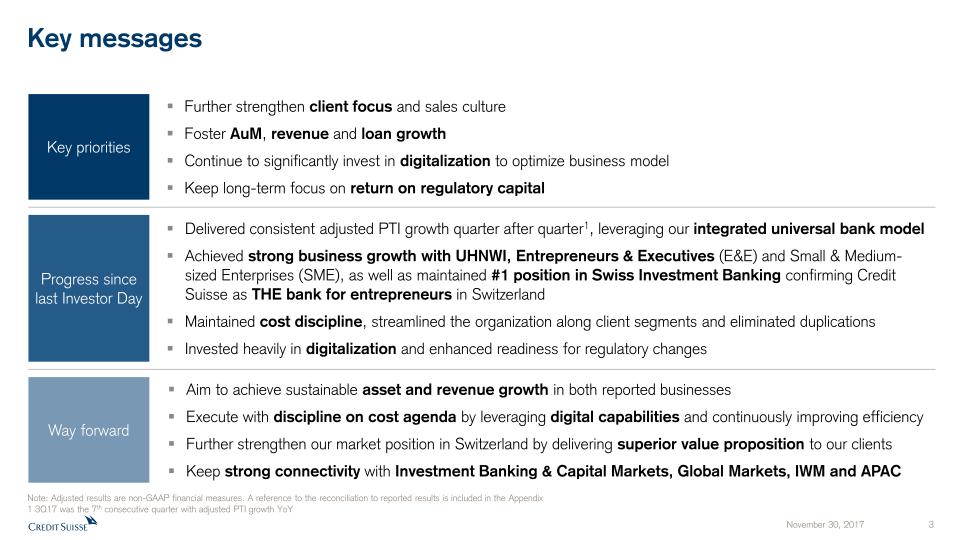
Key messages Further strengthen client focus and sales cultureFoster AuM, revenue and loan growthContinue to significantly invest in digitalization to optimize business model Keep long-term focus on return on regulatory capital Key priorities Aim to achieve sustainable asset and revenue growth in both reported businessesExecute with discipline on cost agenda by leveraging digital capabilities and continuously improving efficiencyFurther strengthen our market position in Switzerland by delivering superior value proposition to our clientsKeep strong connectivity with Investment Banking & Capital Markets, Global Markets, IWM and APAC Delivered consistent adjusted PTI growth quarter after quarter1, leveraging our integrated universal bank modelAchieved strong business growth with UHNWI, Entrepreneurs & Executives (E&E) and Small & Medium-sized Enterprises (SME), as well as maintained #1 position in Swiss Investment Banking confirming Credit Suisse as THE bank for entrepreneurs in Switzerland Maintained cost discipline, streamlined the organization along client segments and eliminated duplications Invested heavily in digitalization and enhanced readiness for regulatory changes Progress since last Investor Day Note: Adjusted results are non-GAAP financial measures. A reference to the reconciliation to reported results is included in the Appendix1 3Q17 was the 7th consecutive quarter with adjusted PTI growth YoY Way forward
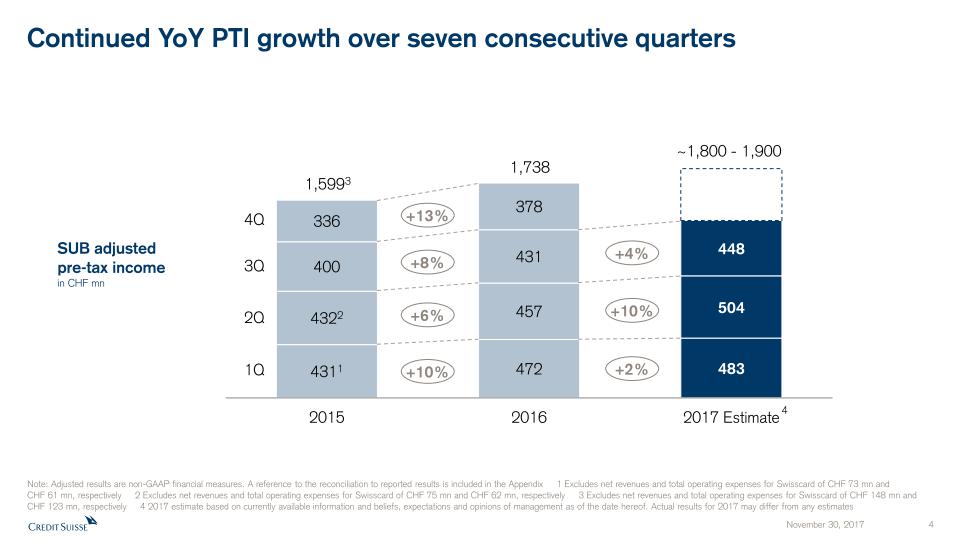
1Q 2Q 3Q SUB adjustedpre-tax incomein CHF mn +4% 4Q +6% +8% +2% +10% +13% +10% Continued YoY PTI growth over seven consecutive quarters 4 1,5993 1,738 ~1,800 - 1,900 Note: Adjusted results are non-GAAP financial measures. A reference to the reconciliation to reported results is included in the Appendix 1 Excludes net revenues and total operating expenses for Swisscard of CHF 73 mn andCHF 61 mn, respectively 2 Excludes net revenues and total operating expenses for Swisscard of CHF 75 mn and CHF 62 mn, respectively 3 Excludes net revenues and total operating expenses for Swisscard of CHF 148 mn and CHF 123 mn, respectively 4 2017 estimate based on currently available information and beliefs, expectations and opinions of management as of the date hereof. Actual results for 2017 may differ from any estimates
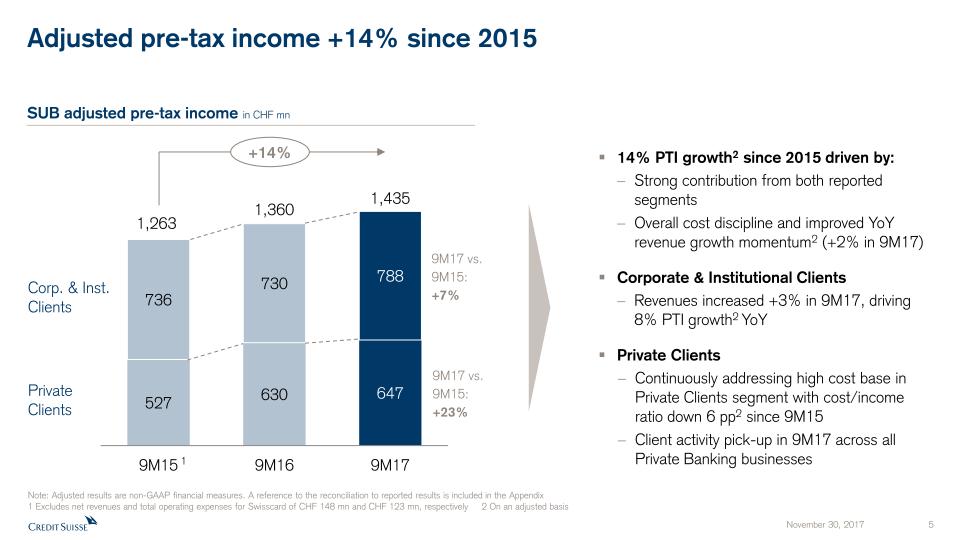
Adjusted pre-tax income +14% since 2015 14% PTI growth2 since 2015 driven by:Strong contribution from both reported segmentsOverall cost discipline and improved YoY revenue growth momentum2 (+2% in 9M17)Corporate & Institutional ClientsRevenues increased +3% in 9M17, driving 8% PTI growth2 YoYPrivate ClientsContinuously addressing high cost base in Private Clients segment with cost/income ratio down 6 pp2 since 9M15Client activity pick-up in 9M17 across all Private Banking businesses 1 SUB adjusted pre-tax income in CHF mn Private Clients Corp. & Inst.Clients 1,263 1,360 1,435 9M17 vs. 9M15: +7% 9M17 vs. 9M15: +23% +14% Note: Adjusted results are non-GAAP financial measures. A reference to the reconciliation to reported results is included in the Appendix 1 Excludes net revenues and total operating expenses for Swisscard of CHF 148 mn and CHF 123 mn, respectively 2 On an adjusted basis
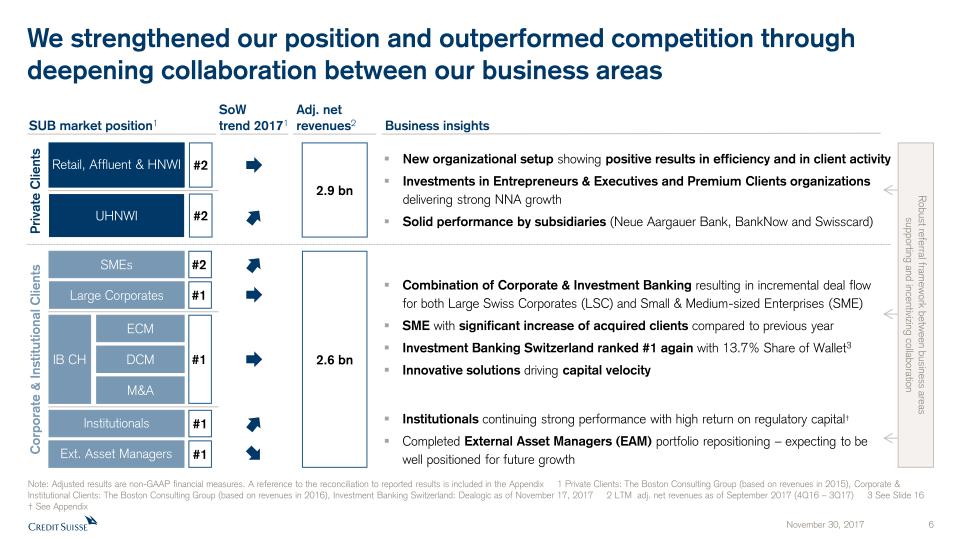
Robust referral framework between business areassupporting and incentivizing collaboration SoW trend 20171 We strengthened our position and outperformed competition through deepening collaboration between our business areas SUB market position1 Private Clients Retail, Affluent & HNWI #2 UHNWI #2 Corporate & Institutional Clients Business insights Large Corporates #1 ECM DCM M&A IB CH #1 Institutionals #1 Ext. Asset Managers #1 SMEs #2 New organizational setup showing positive results in efficiency and in client activityInvestments in Entrepreneurs & Executives and Premium Clients organizations delivering strong NNA growthSolid performance by subsidiaries (Neue Aargauer Bank, BankNow and Swisscard) Combination of Corporate & Investment Banking resulting in incremental deal flow for both Large Swiss Corporates (LSC) and Small & Medium-sized Enterprises (SME)SME with significant increase of acquired clients compared to previous yearInvestment Banking Switzerland ranked #1 again with 13.7% Share of Wallet3Innovative solutions driving capital velocity 2.9 bn 2.6 bn Note: Adjusted results are non-GAAP financial measures. A reference to the reconciliation to reported results is included in the Appendix 1 Private Clients: The Boston Consulting Group (based on revenues in 2015), Corporate & Institutional Clients: The Boston Consulting Group (based on revenues in 2016), Investment Banking Switzerland: Dealogic as of November 17, 2017 2 LTM adj. net revenues as of September 2017 (4Q16 – 3Q17) 3 See Slide 16 † See Appendix Institutionals continuing strong performance with high return on regulatory capital†Completed External Asset Managers (EAM) portfolio repositioning – expecting to be well positioned for future growth Adj. net revenues2
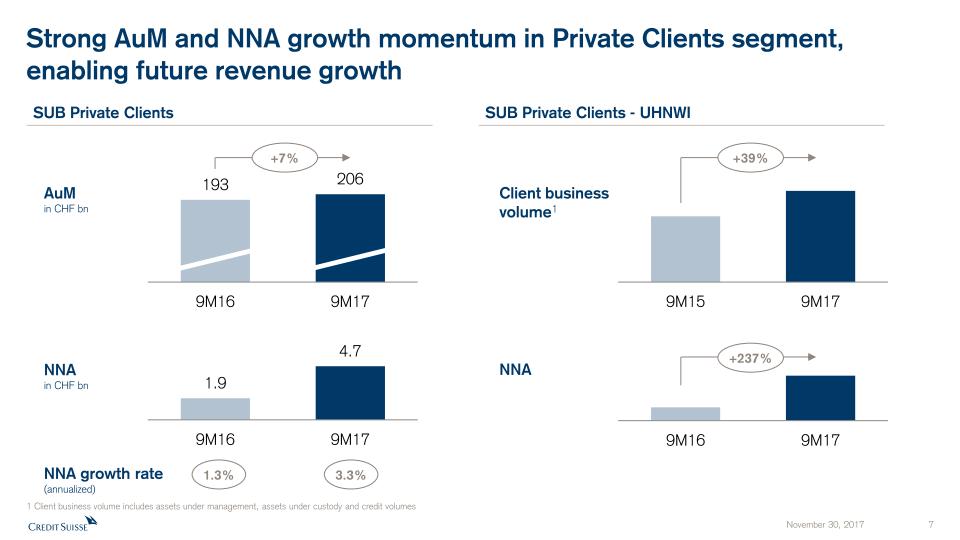
Strong AuM and NNA growth momentum in Private Clients segment, enabling future revenue growth 1 Client business volume includes assets under management, assets under custody and credit volumes +39% SUB Private Clients AuMin CHF bn NNAin CHF bn SUB Private Clients - UHNWI Client business volume1 NNA +237% +7% NNA growth rate(annualized) 1.3% 3.3%
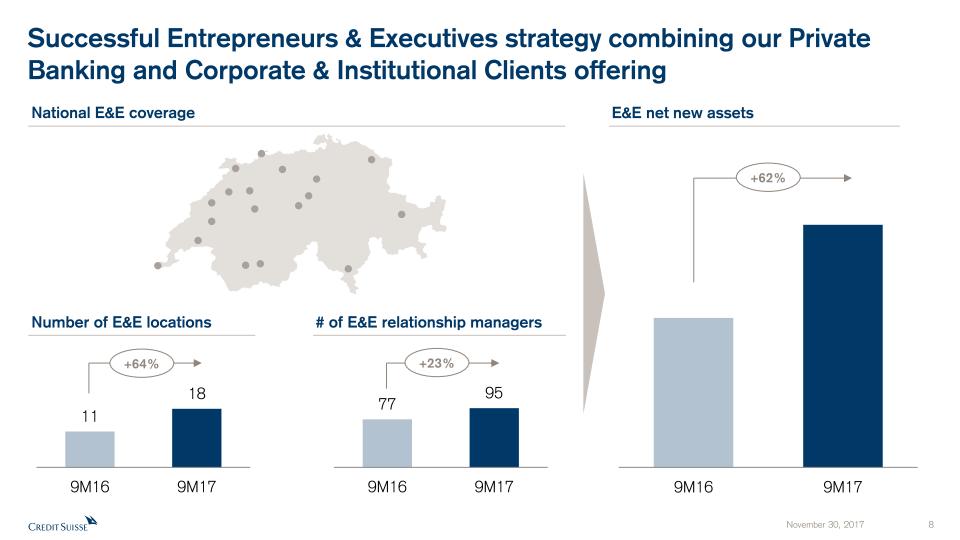
Successful Entrepreneurs & Executives strategy combining our Private Banking and Corporate & Institutional Clients offering E&E net new assets Number of E&E locations # of E&E relationship managers National E&E coverage +64% +23% +62%

Continuous improvement of the cost structure while investing in robust infrastructure AdjustedC/I ratio 68% 66% ~64% Adjusted total operating expenses in CHF bn Outlook 20182Cost reduction of 5-6%3 driven by:Continued optimization of our front office footprint including further centralizationCompletion of automatization program in Operations and further improvements in IT delivery efficiencyReduced allocations from Corporate Functions in line with overall Group cost reduction programCost / income ratio aimed below 60%3 1 -4% ~-3% 2 Note: Adjusted results are non-GAAP financial measures. A reference to the reconciliation to reported results is included in the Appendix 1 Excludes total operating expenses for Swisscard of CHF 123 mn2 2017 estimate and 2018 outlook based on currently available information and beliefs, expectations and opinions of management as of the date hereof. Actual results for 2017 and 2018 may differ from any estimates3 On an adjusted basis
Credit Suisse Investor Day 2017Swiss Universal BankSerge Fehr, Head Private & Wealth Management Clients
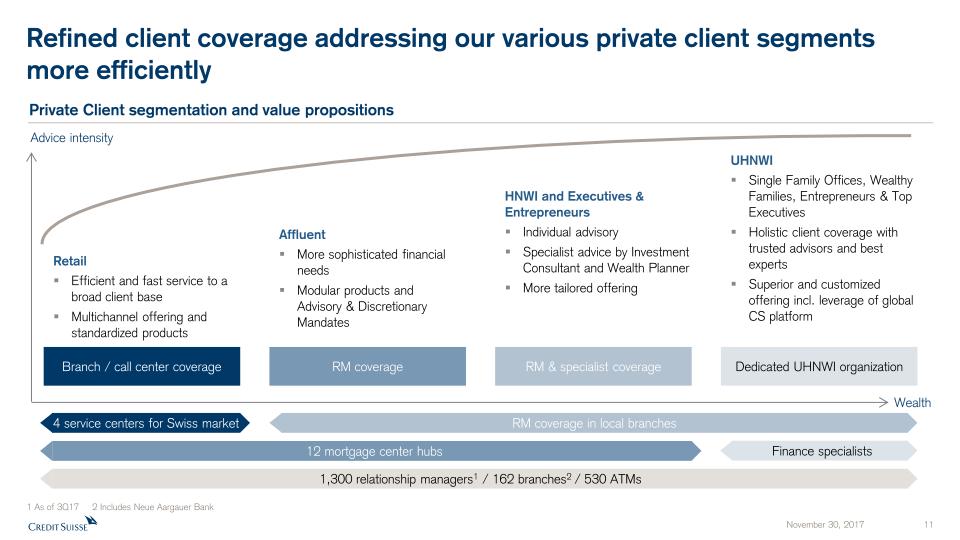
Refined client coverage addressing our various private client segments more efficiently Wealth Advice intensity RetailEfficient and fast service to a broad client baseMultichannel offering and standardized products AffluentMore sophisticated financial needsModular products and Advisory & Discretionary Mandates HNWI and Executives & EntrepreneursIndividual advisorySpecialist advice by Investment Consultant and Wealth PlannerMore tailored offering UHNWISingle Family Offices, Wealthy Families, Entrepreneurs & Top Executives Holistic client coverage with trusted advisors and best expertsSuperior and customized offering incl. leverage of global CS platform Branch / call center coverage RM coverage RM & specialist coverage Dedicated UHNWI organization Private Client segmentation and value propositions 1 As of 3Q17 2 Includes Neue Aargauer Bank 1,300 relationship managers1 / 162 branches2 / 530 ATMs 4 service centers for Swiss market 12 mortgage center hubs Finance specialists RM coverage in local branches
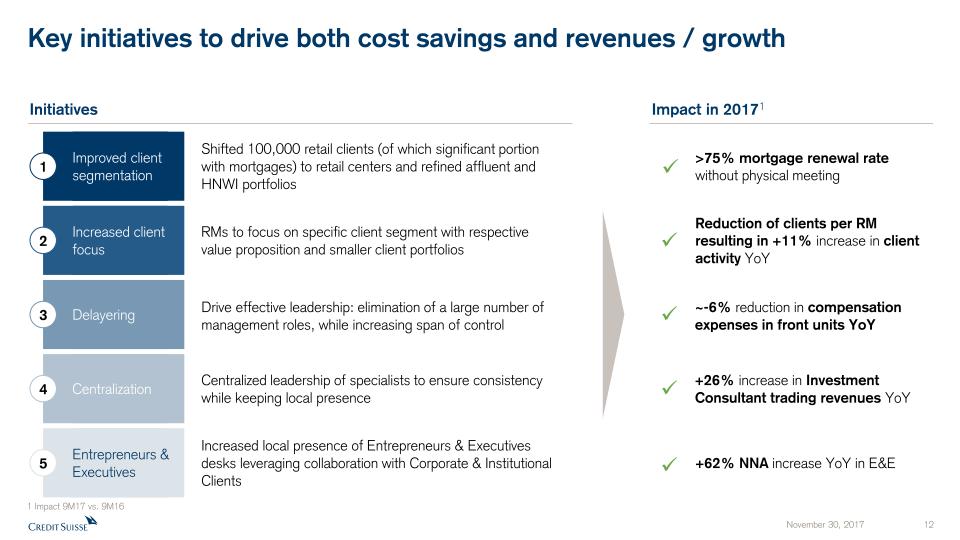
Key initiatives to drive both cost savings and revenues / growth +26% increase in Investment Consultant trading revenues YoY Reduction of clients per RM resulting in +11% increase in client activity YoY +62% NNA increase YoY in E&E >75% mortgage renewal rate without physical meeting ~-6% reduction in compensation expenses in front units YoY Impact in 20171 Initiatives 3 Delayering 4 Centralization 5 Entrepreneurs & Executives 1 Improved client segmentation Increased client focus 2 Increased local presence of Entrepreneurs & Executives desks leveraging collaboration with Corporate & Institutional Clients Centralized leadership of specialists to ensure consistency while keeping local presence RMs to focus on specific client segment with respective value proposition and smaller client portfolios Drive effective leadership: elimination of a large number of management roles, while increasing span of control Shifted 100,000 retail clients (of which significant portion with mortgages) to retail centers and refined affluent and HNWI portfolios 1 Impact 9M17 vs. 9M16
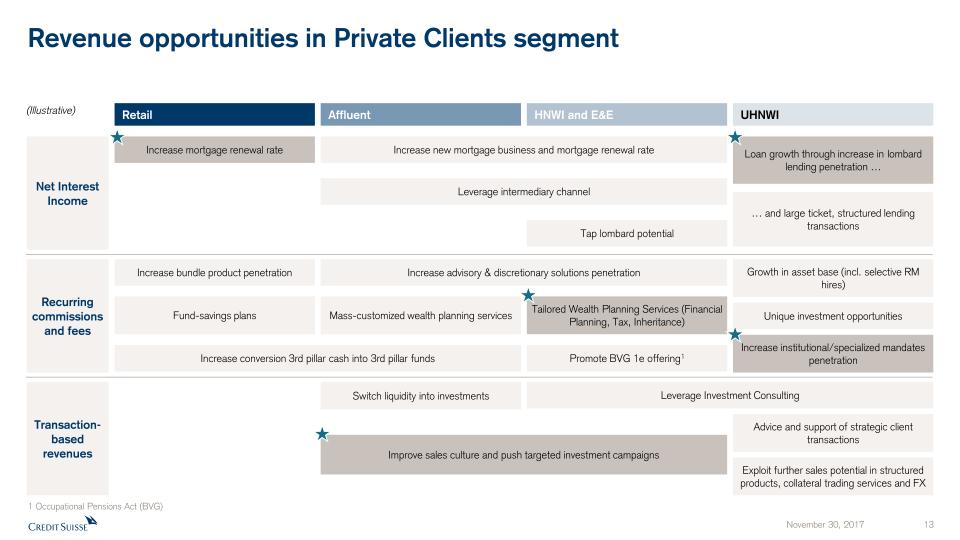
Revenue opportunities in Private Clients segment Net Interest Income Increase mortgage renewal rate Increase new mortgage business and mortgage renewal rate Recurring commissions and fees Transaction-based revenues Retail Affluent HNWI and E&E UHNWI Leverage intermediary channel Tap lombard potential Increase bundle product penetration Fund-savings plans Increase conversion 3rd pillar cash into 3rd pillar funds Increase advisory & discretionary solutions penetration Mass-customized wealth planning services Tailored Wealth Planning Services (Financial Planning, Tax, Inheritance) Promote BVG 1e offering1 Switch liquidity into investments Leverage Investment Consulting Improve sales culture and push targeted investment campaigns Loan growth through increase in lombard lending penetration … … and large ticket, structured lending transactions Growth in asset base (incl. selective RM hires) Unique investment opportunities Increase institutional/specialized mandates penetration Advice and support of strategic client transactions Exploit further sales potential in structured products, collateral trading services and FX (Illustrative) 1 Occupational Pensions Act (BVG)

Credit Suisse Investor Day 2017Swiss Universal BankDidier Denat, Head Corporate & Investment Banking
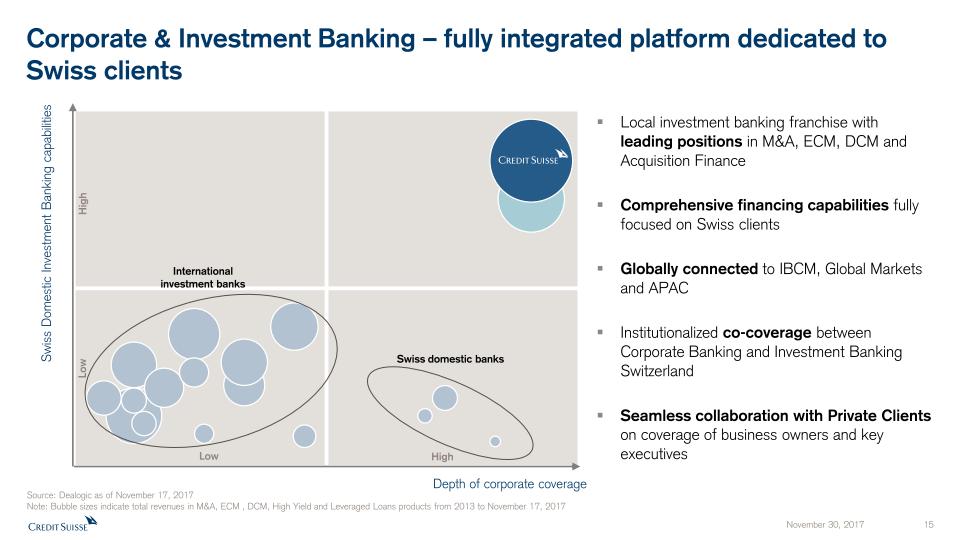
Corporate & Investment Banking – fully integrated platform dedicated to Swiss clients Local investment banking franchise with leading positions in M&A, ECM, DCM and Acquisition FinanceComprehensive financing capabilities fully focused on Swiss clientsGlobally connected to IBCM, Global Markets and APACInstitutionalized co-coverage between Corporate Banking and Investment Banking SwitzerlandSeamless collaboration with Private Clients on coverage of business owners and key executives Source: Dealogic as of November 17, 2017Note: Bubble sizes indicate total revenues in M&A, ECM , DCM, High Yield and Leveraged Loans products from 2013 to November 17, 2017 Depth of corporate coverage Swiss Domestic Investment Banking capabilities High Low Low High International investment banks Swiss domestic banks
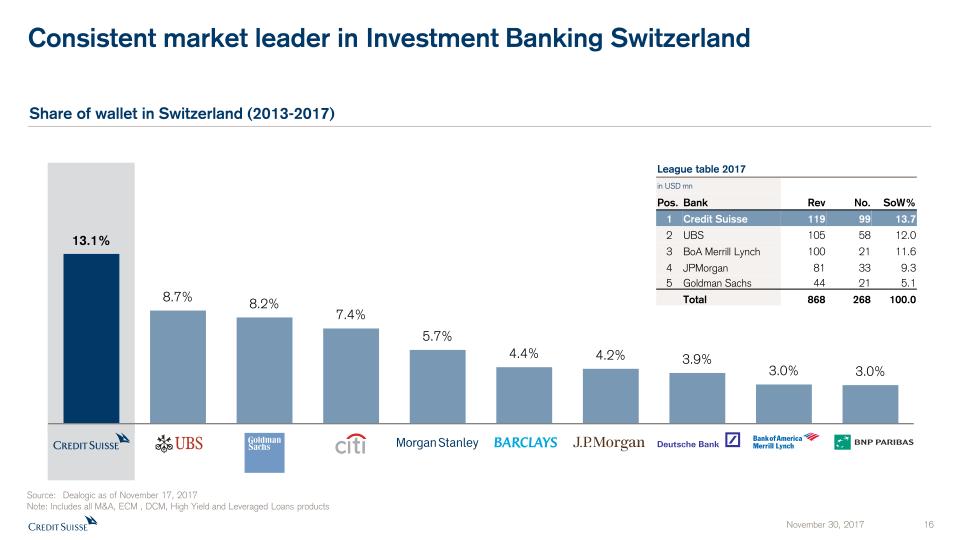
Source: Dealogic as of November 17, 2017Note: Includes all M&A, ECM , DCM, High Yield and Leveraged Loans products Consistent market leader in Investment Banking Switzerland Share of wallet in Switzerland (2013-2017) League table 2017 in USD mn Pos. Bank Rev No. SoW% 1 Credit Suisse 119 99 13.7 2 UBS 105 58 12.0 3 BoA Merrill Lynch 100 21 11.6 4 JPMorgan 81 33 9.3 5 Goldman Sachs 44 21 5.1 Total 868 268 100.0
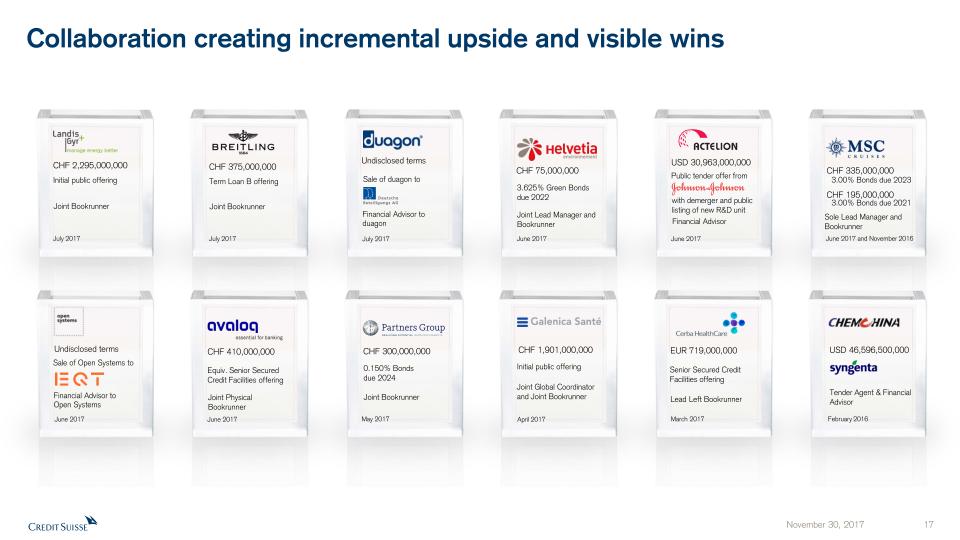
Collaboration creating incremental upside and visible wins Term Loan B offering Joint Bookrunner CHF 375,000,000 July 2017 Public tender offer from Financial Advisor USD 30,963,000,000 June 2017 with demerger and public listing of new R&D unit Equiv. Senior Secured Credit Facilities offering Joint Physical Bookrunner CHF 410,000,000 June 2017 3.00% Bonds due 2023 Sole Lead Manager and Bookrunner CHF 335,000,000 June 2017 and November 2016 CHF 195,000,000 3.00% Bonds due 2021 3.625% Green Bonds due 2022 Joint Lead Manager and Bookrunner CHF 75,000,000 June 2017 Initial public offering Joint Global Coordinator and Joint Bookrunner CHF 1,901,000,000 April 2017 USD 46,596,500,000 Tender Agent & Financial Advisor February 2016 Sale of duagon to Financial Advisor to duagon Undisclosed terms July 2017 Joint Bookrunner 0.150% Bonds due 2024 May 2017 CHF 300,000,000 Sale of Open Systems to Financial Advisor toOpen Systems Undisclosed terms June 2017 Initial public offering Joint Bookrunner CHF 2,295,000,000 July 2017 Lead Left Bookrunner Senior Secured Credit Facilities offering March 2017 EUR 719,000,000
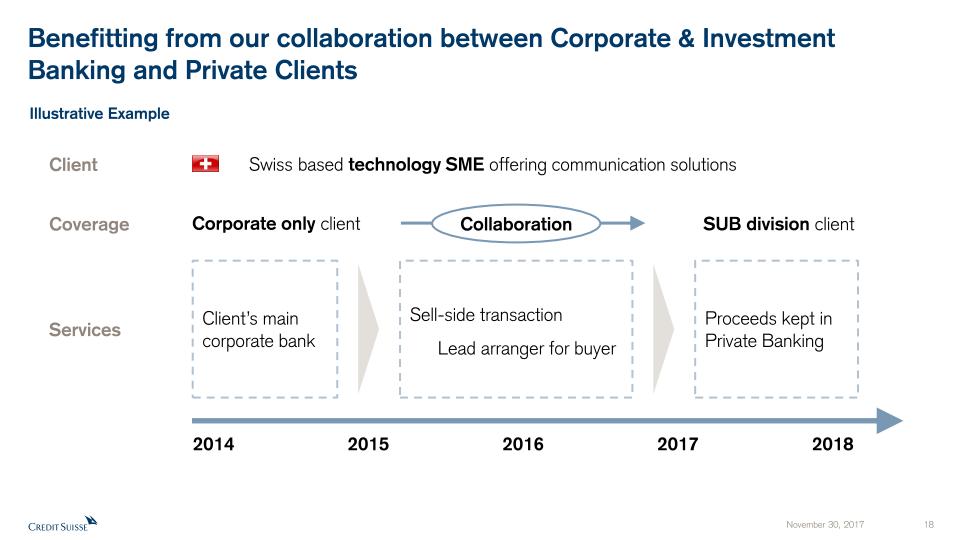
Benefitting from our collaboration between Corporate & Investment Banking and Private Clients Swiss based technology SME offering communication solutions Services 2014 2017 2015 2016 Client’s main corporate bank Client Coverage Corporate only client SUB division client Sell-side transaction Lead arranger for buyer Collaboration 2018 Proceeds kept in Private Banking Illustrative Example
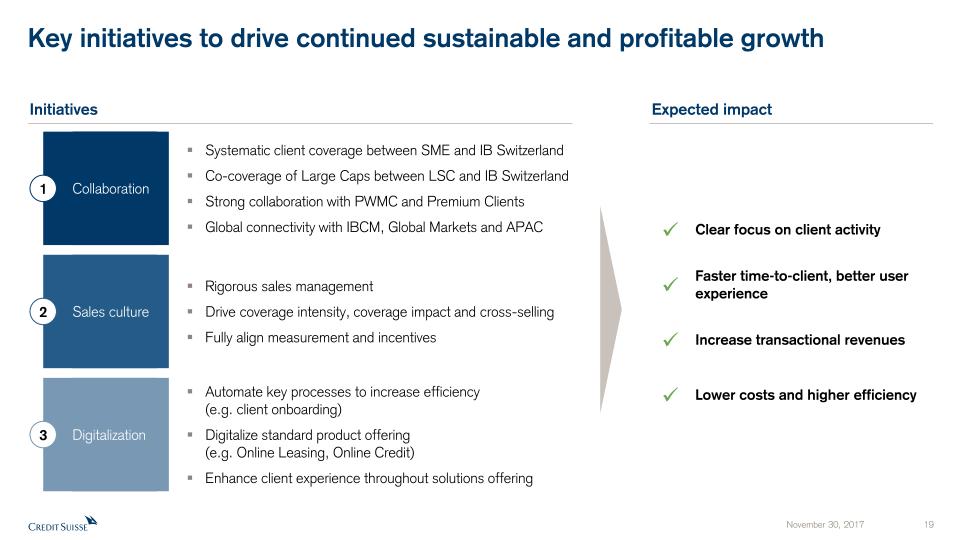
Collaboration Digitalization Key initiatives to drive continued sustainable and profitable growth Sales culture Systematic client coverage between SME and IB SwitzerlandCo-coverage of Large Caps between LSC and IB SwitzerlandStrong collaboration with PWMC and Premium ClientsGlobal connectivity with IBCM, Global Markets and APAC Rigorous sales management Drive coverage intensity, coverage impact and cross-sellingFully align measurement and incentives Automate key processes to increase efficiency (e.g. client onboarding)Digitalize standard product offering (e.g. Online Leasing, Online Credit)Enhance client experience throughout solutions offering Expected impact Initiatives Clear focus on client activity Faster time-to-client, better user experience Increase transactional revenues Lower costs and higher efficiency 3 1 2
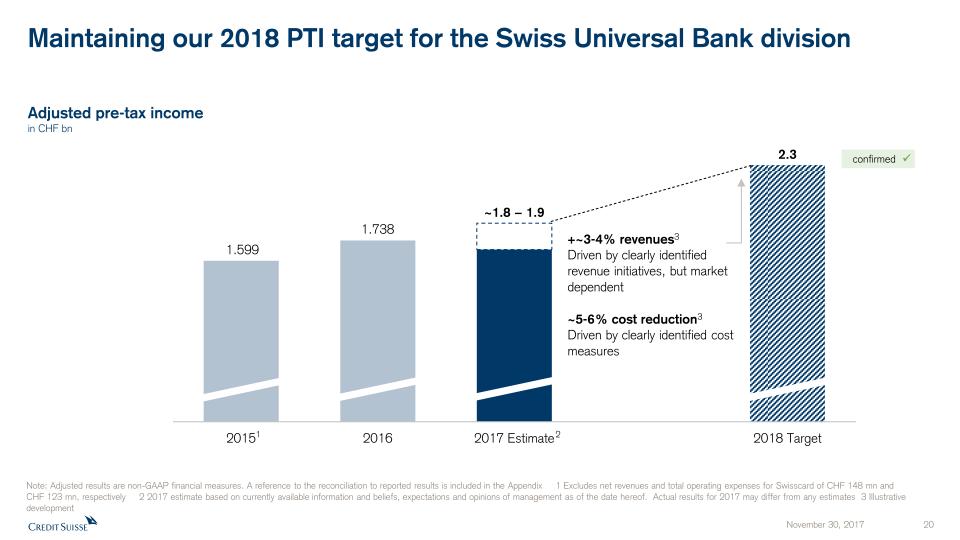
Maintaining our 2018 PTI target for the Swiss Universal Bank division Adjusted pre-tax incomein CHF bn Note: Adjusted results are non-GAAP financial measures. A reference to the reconciliation to reported results is included in the Appendix 1 Excludes net revenues and total operating expenses for Swisscard of CHF 148 mn and CHF 123 mn, respectively 2 2017 estimate based on currently available information and beliefs, expectations and opinions of management as of the date hereof. Actual results for 2017 may differ from any estimates 3 Illustrative development +~3-4% revenues3Driven by clearly identified revenue initiatives, but market dependent~5-6% cost reduction3Driven by clearly identified cost measures confirmed 1 2

Appendix November 30, 2017 21

Organization - Swiss Universal Bank Division Chief Operating OfficerDagmar M. Kamber Borens General CounselThomas Grotzer Human ResourcesClaude Täschler Corporate & Investment BankingDidier Denat Institutional ClientsAndré Helfenstein Chief Executive OfficerThomas Gottstein Chief Financial OfficerAntoine Boublil Chief Risk OfficerPhilippe Clémençon Chief Compliance OfficerErwin Grob Business Areas Products Support Functions Subsidiaries Asset Management SwitzerlandMichel Degen 1 Dual solid reporting line into T. Gottstein and Y.-A. Sommerhalder (ITS Head of Fixed Income and WM Products) Private Clients Corporate & Institutional Clients International Trading Solutions SwitzerlandUrs Beeler1 Products & Investment ServicesFlorence Schnydrig Moser Premium ClientsFelix Baumgartner Private & WealthManagement Clients (PWMC)Serge Fehr SwisscardMarcel Bührer BANK-NowErich Wild Neue Aargauer BankRoland Herrmann
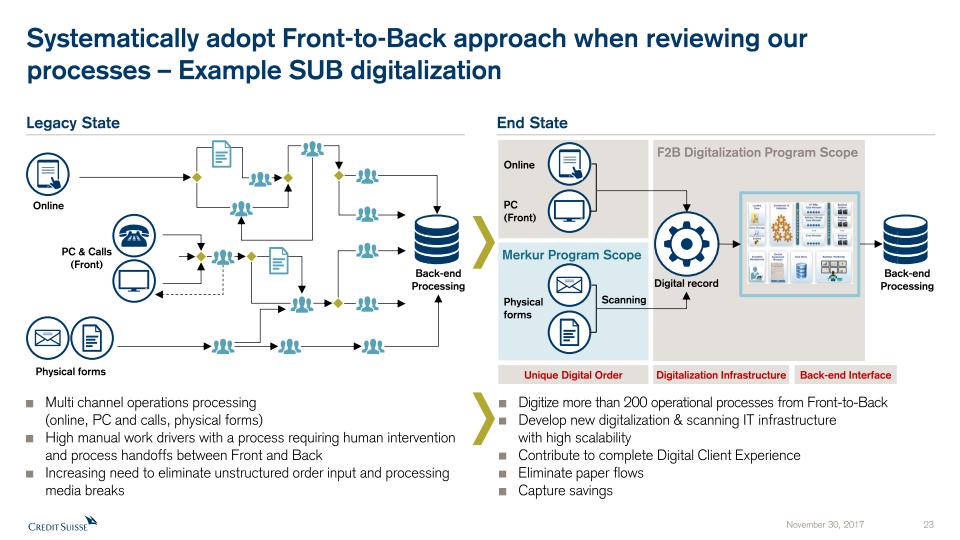
Systematically adopt Front-to-Back approach when reviewing our processes – Example SUB digitalization F2B Digitalization Program Scope Merkur Program Scope Legacy State End State Multi channel operations processing (online, PC and calls, physical forms) High manual work drivers with a process requiring human intervention and process handoffs between Front and BackIncreasing need to eliminate unstructured order input and processing media breaks Digitize more than 200 operational processes from Front-to-Back Develop new digitalization & scanning IT infrastructure with high scalabilityContribute to complete Digital Client ExperienceEliminate paper flows Capture savings Back-end Processing Physical forms PC & Calls (Front) Online Scanning Digital record Physical forms PC (Front) Online Unique Digital Order Digitalization Infrastructure Back-end Interface Back-end Processing
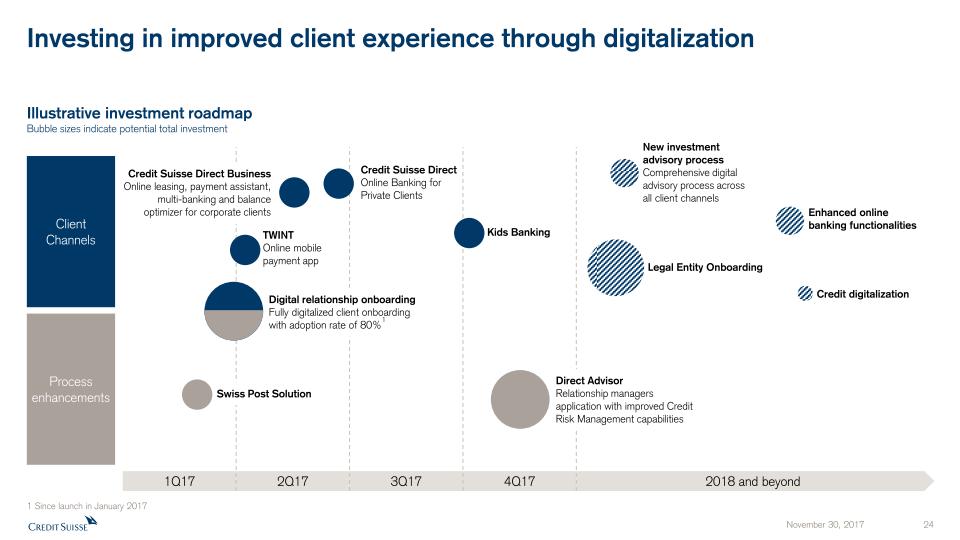
Investing in improved client experience through digitalization Process enhancements Illustrative investment roadmapBubble sizes indicate potential total investment 2018 and beyond 1Q17 2Q17 3Q17 4Q17 Legal Entity Onboarding New investment advisory processComprehensive digital advisory process across all client channels Swiss Post Solution Direct AdvisorRelationship managers application with improved Credit Risk Management capabilities Credit digitalization Credit Suisse DirectOnline Banking forPrivate Clients Kids Banking TWINTOnline mobile payment app Credit Suisse Direct BusinessOnline leasing, payment assistant, multi-banking and balance optimizer for corporate clients Enhanced online banking functionalities Digital relationship onboardingFully digitalized client onboarding with adoption rate of 80%1 Client Channels 1 Since launch in January 2017
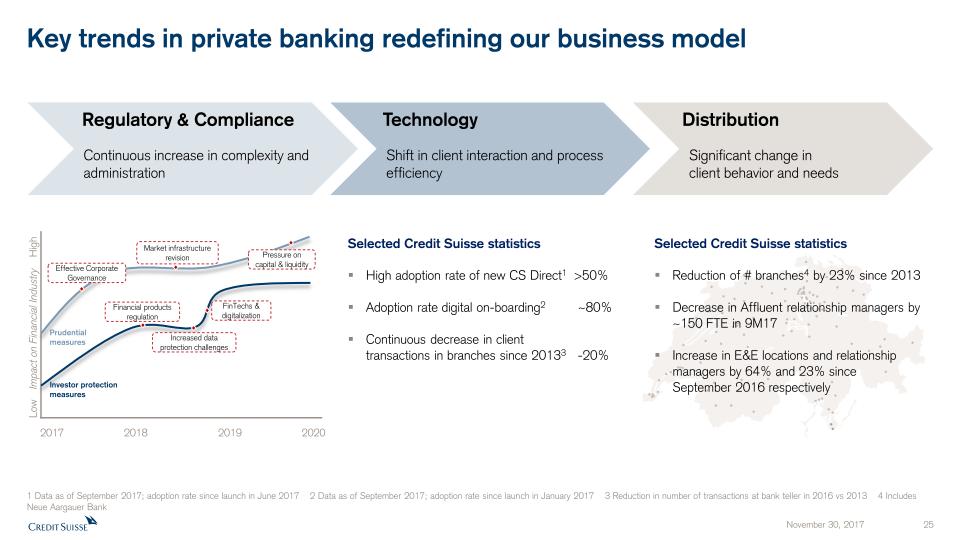
Key trends in private banking redefining our business model Continuous increase in complexity and administration Shift in client interaction and process efficiency Significant change in client behavior and needs Selected Credit Suisse statisticsHigh adoption rate of new CS Direct1 >50%Adoption rate digital on-boarding2 ~80%Continuous decrease in client transactions in branches since 20133 -20% High Effective Corporate Governance Pressure on capital & liquidity Market infrastructure revision Financial products regulation Prudential measures Investor protection measures Increased data protection challenges FinTechs & digitalization Low 2017 2018 2019 2020 1 Data as of September 2017; adoption rate since launch in June 2017 2 Data as of September 2017; adoption rate since launch in January 2017 3 Reduction in number of transactions at bank teller in 2016 vs 2013 4 Includes Neue Aargauer Bank Regulatory & Compliance Technology Distribution Selected Credit Suisse statisticsReduction of # branches4 by 23% since 2013Decrease in Affluent relationship managers by ~150 FTE in 9M17Increase in E&E locations and relationship managers by 64% and 23% since September 2016 respectively Impact on Financial Industry

Notes (1/2) General notes Specific notes * Our cost savings program is measured using adjusted operating expenses at constant FX rates. “Adjusted operating expenses at constant FX rates” and “adjusted non-compensation operating expenses at constant FX rates” include adjustments as made in all our disclosures for restructuring expenses, major litigation expenses and a goodwill impairment taken in 4Q15 as well as adjustments for certain accounting changes (which had not been in place at the launch of the cost savings program), debit valuation adjustments (DVA) related volatility and for FX, applying the following main currency exchange rates for1Q15: USD/CHF 0.9465, EUR/CHF 1.0482, GBP/CHF 1.4296, 2Q15: USD/CHF 0.9383, EUR/CHF 1.0418, GBP/CHF 1.4497,3Q15: USD/CHF 0.9684, EUR/CHF 1.0787, GBP/CHF 1.4891, 4Q15: USD/CHF 1.0010, EUR/CHF 1.0851, GBP/CHF 1.5123,1Q16: USD/CHF 0.9928, EUR/CHF 1.0941, GBP/CHF 1.4060, 2Q16: USD/CHF 0.9756, EUR/CHF 1.0956, GBP/CHF 1.3845,3Q16: USD/CHF 0.9728, EUR/CHF 1.0882, GBP/CHF 1.2764, 4Q16: USD/CHF 1.0101, EUR/CHF 1.0798, GBP/CHF 1.2451,1Q17: USD/CHF 0.9963, EUR/CHF 1.0670, GBP/CHF 1.2464, 2Q17: USD/CHF 0.9736, EUR/CHF 1.0881, GBP/CHF 1.2603,3Q17: USD/CHF 0.9645, EUR/CHF 1.1413, GBP/CHF 1.2695.These currency exchange rates are unweighted, i.e. a straight line average of monthly rates. We apply this calculation consistently for the periods under review. Adjusted non-compensation expenses are adjusted operating expenses excluding compensation and benefits. To calculate adjusted non-compensation expenses at constant FX rates, we subtract compensation and benefits (adjusted at constant FX rates in the manner described above) from adjusted operating expenses at constant FX rates.† Regulatory capital is calculated as the worst of 10% of RWA and 3.5% of leverage exposure. Return on regulatory capital is calculated using (adjusted) income after tax and assumes a tax rate of 30% and capital allocated based on the worst of 10% of average RWA and 3.5% of average leverage exposure. For the Markets business within the APAC division and for the Global Markets and Investment Banking & Capital Markets divisions, return on regulatory capital is based on US dollar denominated numbers. Adjusted return on regulatory capital is calculated using adjusted results, applying the same methodology to calculate return on regulatory capital. For reconciliation of adjusted to reported results, refer to the Appendix of either the CEO or CFO Investor Day 2017 presentation. Throughout the presentation rounding differences may occurUnless otherwise noted, all CET1 ratio, Tier 1 leverage ratio, risk-weighted assets and leverage exposure figures shown in this presentation are as of the end of the respective period and on a “look-through” basisGross and net margins are shown in basis pointsGross margin = adj. net revenues annualized / average AuM; net margin = adj. pre-tax income annualized / average AuMMandates penetration reflects advisory and discretionary mandates as percentage of total AuM

Notes (2/2) Abbreviations Adj. = Adjusted; AI = Artificial Intelligence; AM = Asset Management; AML = Anti-Money Laundering; APAC = Asia Pacific; AT1 = Additional Tier 1; AuM = Assets under Management; BCBS = Basel Committee on Banking Supervision; BIS = Bank for International Settlements; bps = basis points; CAGR = Compound Annual Growth Rate; CCRO = Chief Compliance and Regulatory Affairs Officer; CET1 = Common Equity Tier 1; CIC = Corporate & Institutional Clients; CIF = Customer/Client Information File; Corp. Ctr. = Corporate Center; CVA = Credit Valuation Adjustment; DCM = Debt Capital Markets; EAM = External Asset Manager; ECM = Equity Capital Markets; EM = Emerging Markets; EMEA = Europe, Middle East & Africa; EPS = Earnings Per Share; EQ = Equities; EU = European Union; FICC = Fixed Income, Currencies & Commodities; FINMA = Swiss Financial Market Supervisory Authority; FLP = Fund Linked Products; FRTB = Fundamental Review of the Trading Book; FX = Foreign Exchange; G10 = Group of Ten; GDP = Gross Domestic Product; GM = Global Markets; IBCM = Investment Banking & Capital Markets; IBD = Investment Banking Department; IC = Investment Consultant; IMF = International Monetary Fund; IP = Investor Products; IPO = Initial Public Offering; IRB = Internal Ratings Based; IT = Information Technology; ITS = International Trading Solutions; IWM = International Wealth Management; JV = Joint Venture; LSC = Large Swiss Corporates; M&A = Mergers & Acquisitions; MI = Management Information; Mkts = Markets; NNA = Net new assets; Op Risk = Operational Risk; PB = Private Banking; PC = Private Clients; PEP = Politically Exposed Person; pp = percentage points; PTI = Pre-tax income; PWMC = Private & Wealth Management Clients; RM = Relationship Manager(s); RoRC = Return on Regulatory Capital; RoTE = Return on Tangible Equity; RPA = Robotic Process Automation; RWA = Risk-weighted assets; SA-CCR = Standardized Approach to Counterparty Credit Risk; SME = Small and Medium-Sized Enterprises; SMG = Systematic Market-Making Group; SoW = Share of Wallet; SRU = Strategic Resolution Unit; SUB = Swiss Universal Bank; TBTF = Too Big To Fail; TBVS = Tangible Book Value per Share; (U)HNW(I) = (Ultra) High Net Worth (Individuals); VaR = Value-at-Risk; VIX = Volatility Index; WM = Wealth Management; WM&C = Wealth Management & Connected; YoY = Year over year; YTD = Year to Date


Credit Suisse Investor Day 2017Investment Banking and Capital Markets James L. Amine November 30, 2017

Disclaimer This material does not purport to contain all of the information that you may wish to consider. This material is not to be relied upon as such or used in substitution for the exercise of independent judgment.Cautionary statement regarding forward-looking statements This presentation contains forward-looking statements that involve inherent risks and uncertainties, and we might not be able to achieve the predictions, forecasts, projections and other outcomes we describe or imply in forward-looking statements. A number of important factors could cause results to differ materially from the plans, objectives, expectations, estimates and intentions we express in these forward-looking statements, including those we identify in "Risk factors” in our Annual Report on Form 20-F for the fiscal year ended December 31, 2016 and in the “Cautionary statement regarding forward-looking information" in our media release relating to Investor Day, published on November 30, 2017 and filed with the US Securities and Exchange Commission, and in other public filings and press releases. We do not intend to update these forward-looking statements. In particular, the terms “Estimate”, “Illustrative”, “Ambition”, “Objective”, “Outlook” and “Goal” are not intended to be viewed as targets or projections, nor are they considered to be Key Performance Indicators. All such estimates, illustrations, ambitions and goals are subject to a large number of inherent risks, assumptions and uncertainties, many of which are completely outside of our control. These risks, assumptions and uncertainties include, but are not limited to, general market conditions, market volatility, interest rate volatility and levels, global and regional economic conditions, political uncertainty, changes in tax policies, regulatory changes, changes in levels of client activity as a result of any of the foregoing and other factors. Accordingly, this information should not be relied on for any purpose. We do not intend to update these estimates, illustrations, ambitions or goals. We may not achieve the benefits of our strategic initiatives We may not achieve all of the expected benefits of our strategic initiatives. Factors beyond our control, including but not limited to the market and economic conditions, changes in laws, rules or regulations and other challenges discussed in our public filings, could limit our ability to achieve some or all of the expected benefits of these initiatives. Estimates, assumptions and opinionsIn preparing this presentation, management has made estimates and assumptions that affect the numbers presented. Actual results may differ. Annualized numbers do not take account of variations in operating results, seasonality and other factors and may not be indicative of actual, full-year results. Figures throughout this presentation may also be subject to rounding adjustments. All opinions and views constitute judgments as of the date of writing without regard to the date on which the reader may receive or access the information. This information is subject to change at any time without notice and we do not intend to update this information. Statement regarding non-GAAP financial measures This presentation also contains non-GAAP financial measures, including adjusted results. Information needed to reconcile such non-GAAP financial measures to the most directly comparable measures under US GAAP can be found in the Appendix of the CEO and CFO Investor Day presentations, published on November 30, 2017. All Investor Day presentations are available on our website at www.credit-suisse.com. Statement regarding capital, liquidity and leverage As of January 1, 2013, Basel III was implemented in Switzerland along with the Swiss “Too Big to Fail” legislation and regulations thereunder (in each case, subject to certain phase-in periods). As of January 1, 2015, the Bank for International Settlements (BIS) leverage ratio framework, as issued by the Basel Committee on Banking Supervision (BCBS), was implemented in Switzerland by FINMA. Our related disclosures are in accordance with our interpretation of such requirements, including relevant assumptions. Changes in the interpretation of these requirements in Switzerland or in any of our assumptions or estimates could result in different numbers from those shown in this presentation. Capital and ratio numbers for periods prior to 2013 are based on estimates, which are calculated as if the Basel III framework had been in place in Switzerland during such periods. Unless otherwise noted, leverage exposure is based on the BIS leverage ratio framework and consists of period-end balance sheet assets and prescribed regulatory adjustments. Beginning in 2015, the Swiss leverage ratio is calculated as Swiss total capital, divided by period-end leverage exposure. The look-through BIS tier 1 leverage ratio and CET1 leverage ratio are calculated as look-through BIS tier 1 capital and CET1 capital, respectively, divided by end-period leverage exposure.SourcesCertain material in this presentation has been prepared by Credit Suisse on the basis of publicly available information, internally developed data and other third-party sources believed to be reliable. Credit Suisse has not sought to independently verify information obtained from public and third-party sources and makes no representations or warranties as to accuracy, completeness or reliability of such information.
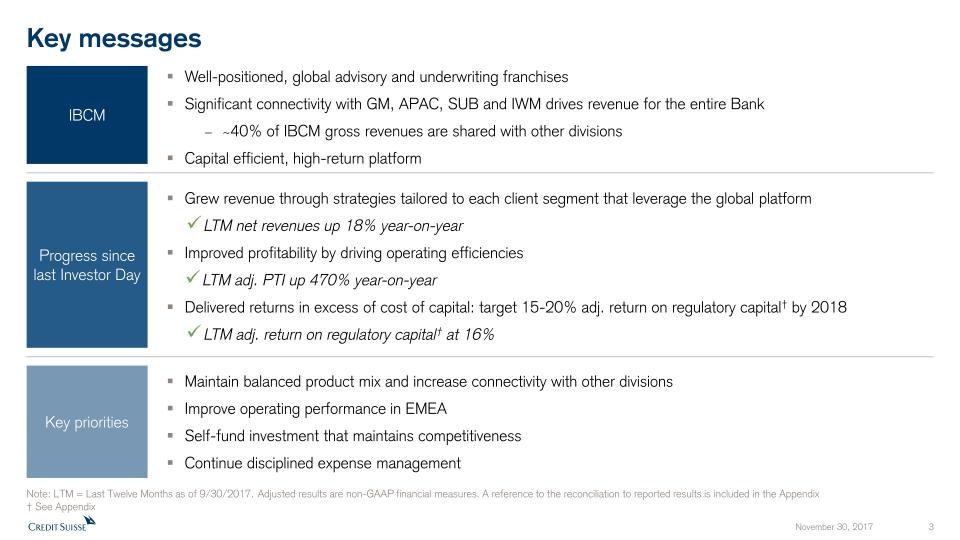
Key messages Well-positioned, global advisory and underwriting franchisesSignificant connectivity with GM, APAC, SUB and IWM drives revenue for the entire Bank~40% of IBCM gross revenues are shared with other divisions Capital efficient, high-return platform IBCM Maintain balanced product mix and increase connectivity with other divisionsImprove operating performance in EMEASelf-fund investment that maintains competitivenessContinue disciplined expense management Key priorities Grew revenue through strategies tailored to each client segment that leverage the global platformLTM net revenues up 18% year-on-yearImproved profitability by driving operating efficienciesLTM adj. PTI up 470% year-on-yearDelivered returns in excess of cost of capital: target 15-20% adj. return on regulatory capital† by 2018LTM adj. return on regulatory capital† at 16% Progress since last Investor Day Note: LTM = Last Twelve Months as of 9/30/2017. Adjusted results are non-GAAP financial measures. A reference to the reconciliation to reported results is included in the Appendix † See Appendix
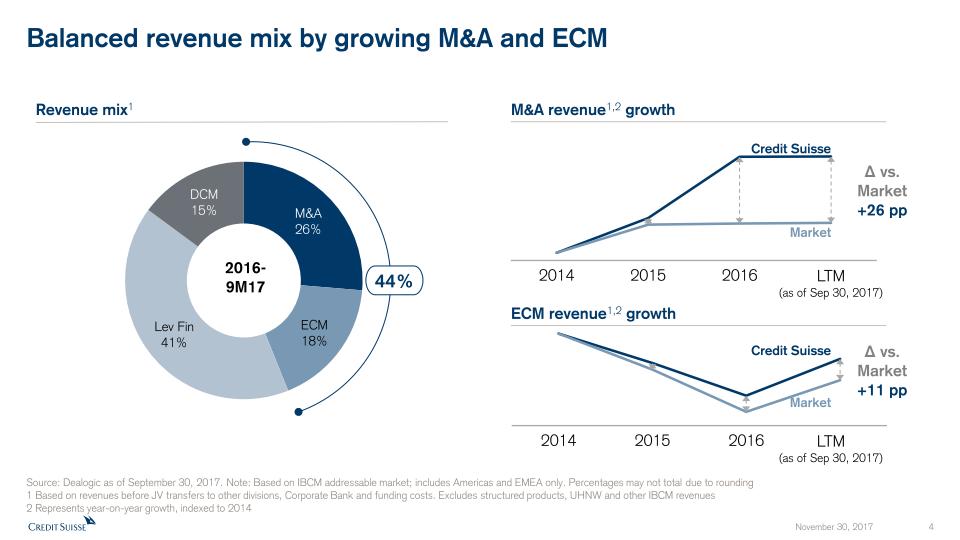
Revenue mix1 M&A revenue1,2 growth Balanced revenue mix by growing M&A and ECM ECM revenue1,2 growth Credit Suisse Market Δ vs. Market+11 pp Δ vs. Market+26 pp 2016-9M17 44% Credit Suisse Market Source: Dealogic as of September 30, 2017. Note: Based on IBCM addressable market; includes Americas and EMEA only. Percentages may not total due to rounding 1 Based on revenues before JV transfers to other divisions, Corporate Bank and funding costs. Excludes structured products, UHNW and other IBCM revenues 2 Represents year-on-year growth, indexed to 2014 LTM(as of Sep 30, 2017) LTM(as of Sep 30, 2017)
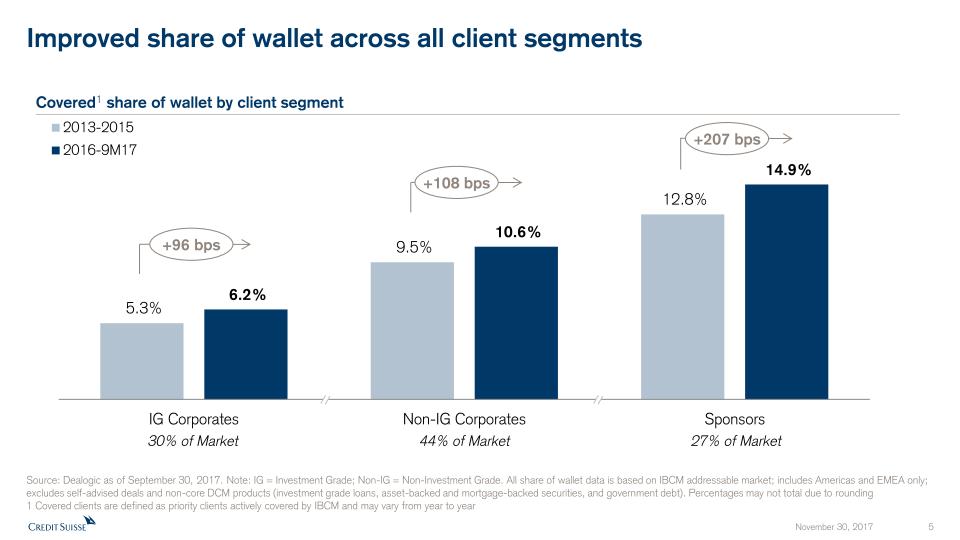
Covered1 share of wallet by client segment Improved share of wallet across all client segments Source: Dealogic as of September 30, 2017. Note: IG = Investment Grade; Non-IG = Non-Investment Grade. All share of wallet data is based on IBCM addressable market; includes Americas and EMEA only; excludes self-advised deals and non-core DCM products (investment grade loans, asset-backed and mortgage-backed securities, and government debt). Percentages may not total due to rounding1 Covered clients are defined as priority clients actively covered by IBCM and may vary from year to year 30% of Market 44% of Market 27% of Market +108 bps +207 bps +96 bps
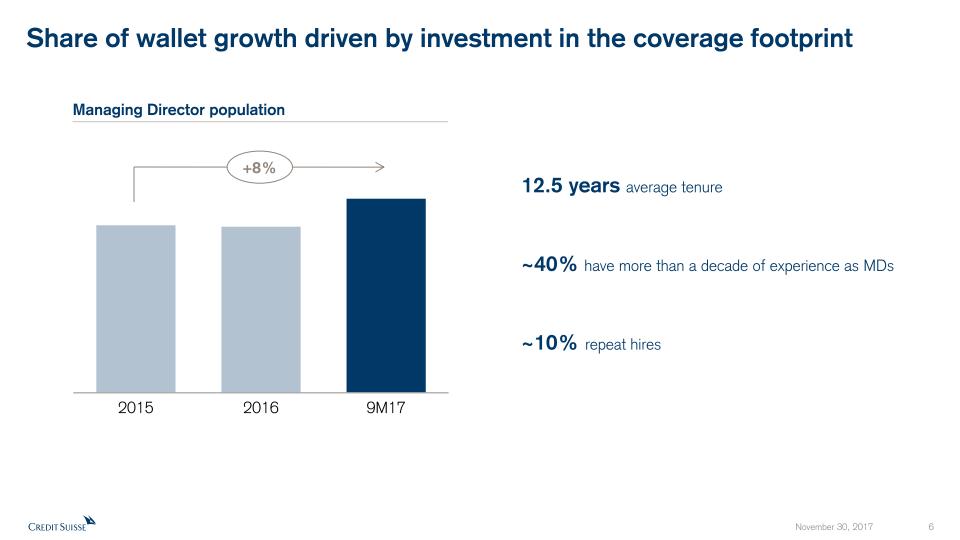
Share of wallet growth driven by investment in the coverage footprint Managing Director population ~40% have more than a decade of experience as MDs ~10% repeat hires 12.5 years average tenure Want to break the scale to better visualize the increase?Changed to be more pronounced +8%
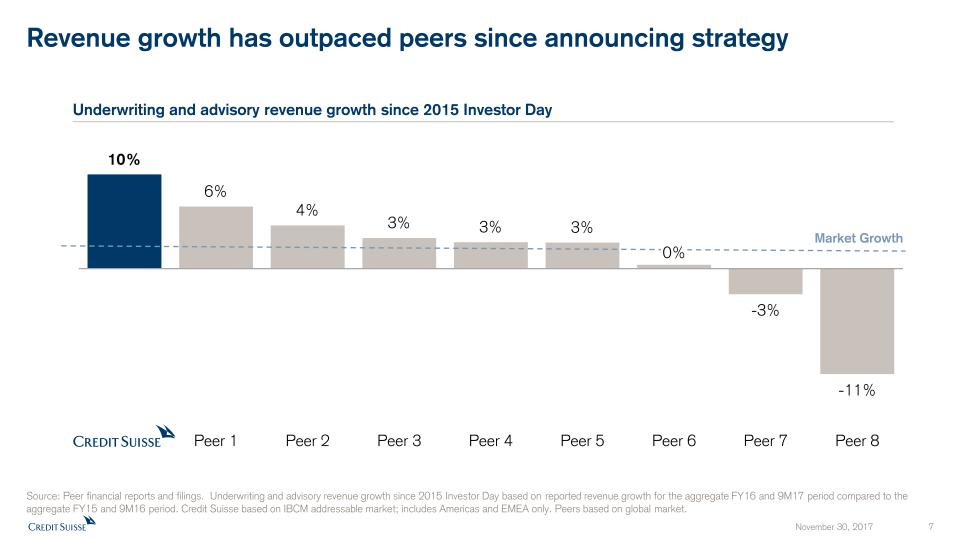
Revenue growth has outpaced peers since announcing strategy Underwriting and advisory revenue growth since 2015 Investor Day Market Growth Source: Peer financial reports and filings. Underwriting and advisory revenue growth since 2015 Investor Day based on reported revenue growth for the aggregate FY16 and 9M17 period compared to the aggregate FY15 and 9M16 period. Credit Suisse based on IBCM addressable market; includes Americas and EMEA only. Peers based on global market. 0%
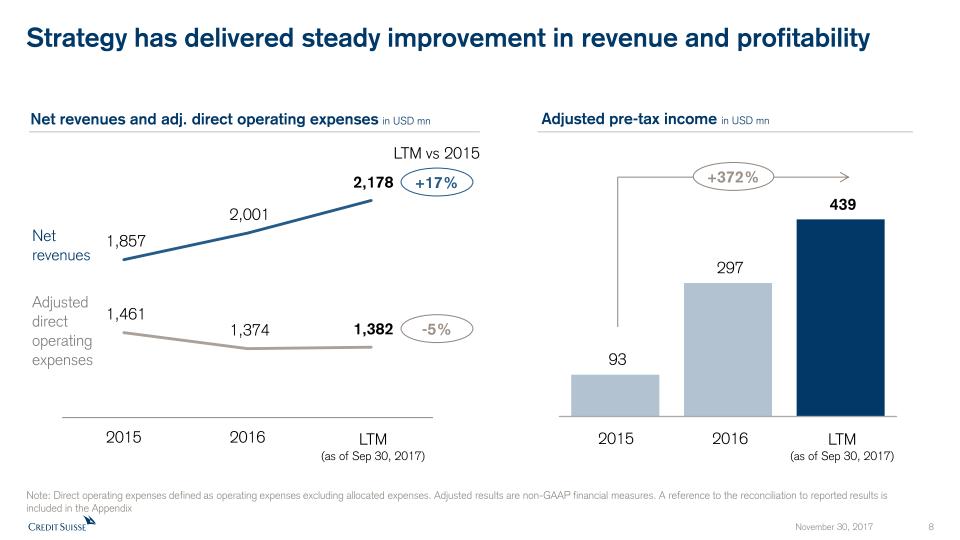
Strategy has delivered steady improvement in revenue and profitability Net revenues and adj. direct operating expenses in USD mn Adjusted pre-tax income in USD mn Note: Direct operating expenses defined as operating expenses excluding allocated expenses. Adjusted results are non-GAAP financial measures. A reference to the reconciliation to reported results is included in the Appendix +372% Net revenues Adjusted direct operating expenses +17% -5% LTM(as of Sep 30, 2017) LTM(as of Sep 30, 2017) 2015 2016 LTM vs 2015
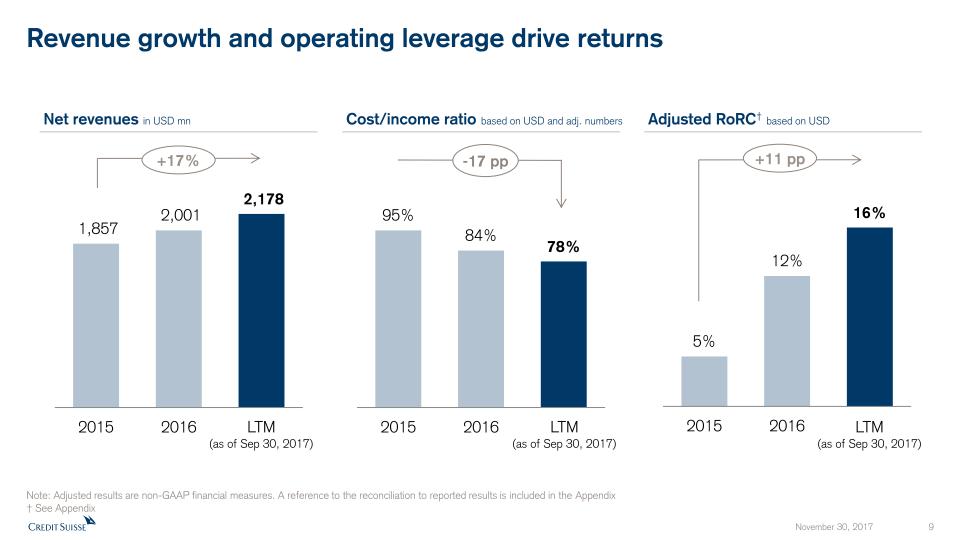
Revenue growth and operating leverage drive returns Net revenues in USD mn Cost/income ratio based on USD and adj. numbers Adjusted RoRC† based on USD Note: Adjusted results are non-GAAP financial measures. A reference to the reconciliation to reported results is included in the Appendix† See Appendix +17% -17 pp +11 pp LTM(as of Sep 30, 2017) LTM(as of Sep 30, 2017) LTM(as of Sep 30, 2017)
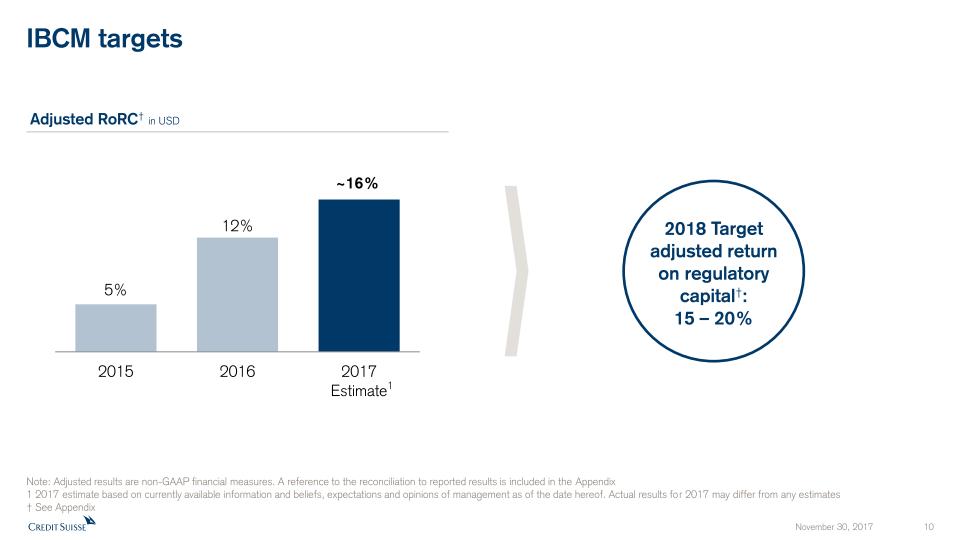
IBCM targets Note: Adjusted results are non-GAAP financial measures. A reference to the reconciliation to reported results is included in the Appendix1 2017 estimate based on currently available information and beliefs, expectations and opinions of management as of the date hereof. Actual results for 2017 may differ from any estimates† See Appendix Adjusted RoRC† in USD 2018 Target adjusted return on regulatory capital†: 15 – 20% 1
Credit Suisse Investor Day 2017Investment Banking and Capital Markets David Hermer, Head of Equity Capital Markets

ECM overview IPO activity IPO fee pool by region Credit Suisse IPO share of wallet Backdrop Source: Dealogic as of September 30, 2017Note: All market and share of wallet data are based on IBCM addressable market; includes Americas and EMEA only Power alleys activeIncreasing momentum for Credit Suisse Healthier volumes in 2017Significantly improved breadth of issuance +440 bps US/Canada EMEA LatAm LTM(as of Sep 30, 2017)
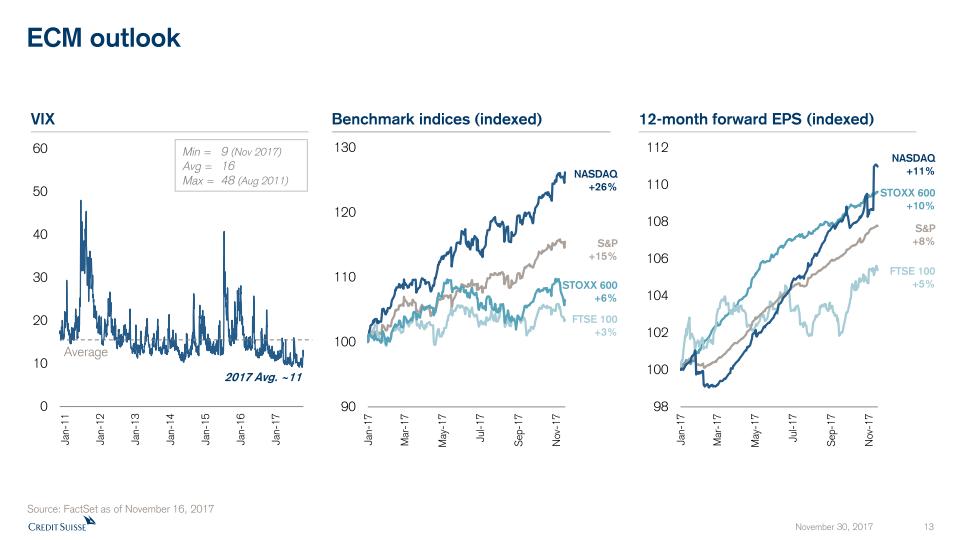
ECM outlook Source: FactSet as of November 16, 2017 12-month forward EPS (indexed) VIX Benchmark indices (indexed) FTSE 100 +3% S&P +15% NASDAQ +26% STOXX 600+6% STOXX 600+10% S&P +8% FTSE 100 +5% NASDAQ +11% Average Min =Avg =Max = 9 (Nov 2017)1648 (Aug 2011) Jan-11 Jan-12 Jan-13 Jan-14 Jan-15 Jan-16 Jan-17 2017 Avg. ~11

Credit Suisse Investor Day 2017Investment Banking and Capital Markets Malcolm Price, Head of Financial Sponsors
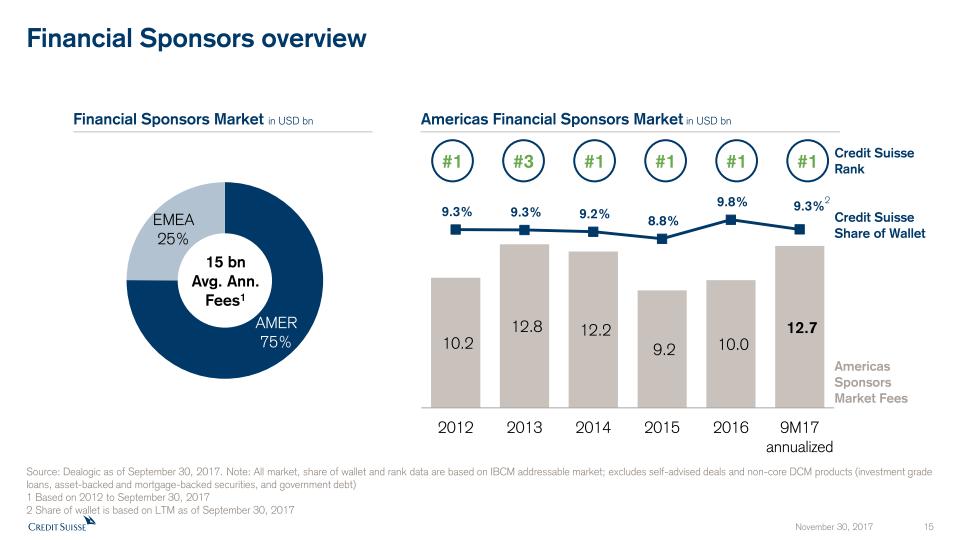
Financial Sponsors overview Source: Dealogic as of September 30, 2017. Note: All market, share of wallet and rank data are based on IBCM addressable market; excludes self-advised deals and non-core DCM products (investment grade loans, asset-backed and mortgage-backed securities, and government debt) 1 Based on 2012 to September 30, 2017 2 Share of wallet is based on LTM as of September 30, 2017 #1 #3 #1 #1 #1 #1 Financial Sponsors Market in USD bn 15 bn Avg. Ann. Fees1 Americas Financial Sponsors Market in USD bn Credit Suisse Rank Credit Suisse Share of Wallet AmericasSponsors Market Fees 2
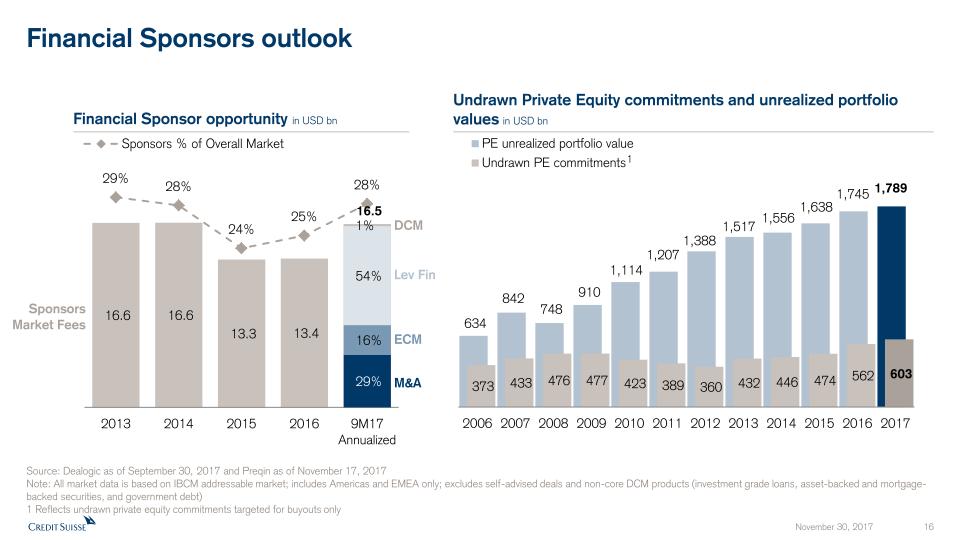
Financial Sponsors outlook Financial Sponsor opportunity in USD bn Undrawn Private Equity commitments and unrealized portfolio values in USD bn Source: Dealogic as of September 30, 2017 and Preqin as of November 17, 2017Note: All market data is based on IBCM addressable market; includes Americas and EMEA only; excludes self-advised deals and non-core DCM products (investment grade loans, asset-backed and mortgage-backed securities, and government debt)1 Reflects undrawn private equity commitments targeted for buyouts only M&A ECM Lev Fin DCM SponsorsMarket Fees 1

Appendix November 30, 2017 17

Notes (1/2) General notes Specific notes * Our cost savings program is measured using adjusted operating expenses at constant FX rates. “Adjusted operating expenses at constant FX rates” and “adjusted non-compensation operating expenses at constant FX rates” include adjustments as made in all our disclosures for restructuring expenses, major litigation expenses and a goodwill impairment taken in 4Q15 as well as adjustments for certain accounting changes (which had not been in place at the launch of the cost savings program), debit valuation adjustments (DVA) related volatility and for FX, applying the following main currency exchange rates for1Q15: USD/CHF 0.9465, EUR/CHF 1.0482, GBP/CHF 1.4296, 2Q15: USD/CHF 0.9383, EUR/CHF 1.0418, GBP/CHF 1.4497,3Q15: USD/CHF 0.9684, EUR/CHF 1.0787, GBP/CHF 1.4891, 4Q15: USD/CHF 1.0010, EUR/CHF 1.0851, GBP/CHF 1.5123,1Q16: USD/CHF 0.9928, EUR/CHF 1.0941, GBP/CHF 1.4060, 2Q16: USD/CHF 0.9756, EUR/CHF 1.0956, GBP/CHF 1.3845,3Q16: USD/CHF 0.9728, EUR/CHF 1.0882, GBP/CHF 1.2764, 4Q16: USD/CHF 1.0101, EUR/CHF 1.0798, GBP/CHF 1.2451,1Q17: USD/CHF 0.9963, EUR/CHF 1.0670, GBP/CHF 1.2464, 2Q17: USD/CHF 0.9736, EUR/CHF 1.0881, GBP/CHF 1.2603,3Q17: USD/CHF 0.9645, EUR/CHF 1.1413, GBP/CHF 1.2695.These currency exchange rates are unweighted, i.e. a straight line average of monthly rates. We apply this calculation consistently for the periods under review. Adjusted non-compensation expenses are adjusted operating expenses excluding compensation and benefits. To calculate adjusted non-compensation expenses at constant FX rates, we subtract compensation and benefits (adjusted at constant FX rates in the manner described above) from adjusted operating expenses at constant FX rates.† Regulatory capital is calculated as the worst of 10% of RWA and 3.5% of leverage exposure. Return on regulatory capital is calculated using (adjusted) income after tax and assumes a tax rate of 30% and capital allocated based on the worst of 10% of average RWA and 3.5% of average leverage exposure. For the Markets business within the APAC division and for the Global Markets and Investment Banking & Capital Markets divisions, return on regulatory capital is based on US dollar denominated numbers. Adjusted return on regulatory capital is calculated using adjusted results, applying the same methodology to calculate return on regulatory capital. For reconciliation of adjusted to reported results, refer to the Appendix of either the CEO or CFO Investor Day 2017 presentation. Throughout the presentation rounding differences may occurUnless otherwise noted, all CET1 ratio, Tier 1 leverage ratio, risk-weighted assets and leverage exposure figures shown in this presentation are as of the end of the respective period and on a “look-through” basisGross and net margins are shown in basis pointsGross margin = adj. net revenues annualized / average AuM; net margin = adj. pre-tax income annualized / average AuMMandates penetration reflects advisory and discretionary mandates as percentage of total AuM

Notes (2/2) Abbreviations Adj. = Adjusted; AI = Artificial Intelligence; AM = Asset Management; AML = Anti-Money Laundering; APAC = Asia Pacific; AT1 = Additional Tier 1; AuM = Assets under Management; BCBS = Basel Committee on Banking Supervision; BIS = Bank for International Settlements; bps = basis points; CAGR = Compound Annual Growth Rate; CCRO = Chief Compliance and Regulatory Affairs Officer; CET1 = Common Equity Tier 1; CIC = Corporate & Institutional Clients; CIF = Customer/Client Information File; Corp. Ctr. = Corporate Center; CVA = Credit Valuation Adjustment; DCM = Debt Capital Markets; EAM = External Asset Manager; ECM = Equity Capital Markets; EM = Emerging Markets; EMEA = Europe, Middle East & Africa; EPS = Earnings Per Share; EQ = Equities; EU = European Union; FICC = Fixed Income, Currencies & Commodities; FINMA = Swiss Financial Market Supervisory Authority; FLP = Fund Linked Products; FRTB = Fundamental Review of the Trading Book; FX = Foreign Exchange; G10 = Group of Ten; GDP = Gross Domestic Product; GM = Global Markets; IBCM = Investment Banking & Capital Markets; IBD = Investment Banking Department; IC = Investment Consultant; IMF = International Monetary Fund; IP = Investor Products; IPO = Initial Public Offering; IRB = Internal Ratings Based; IT = Information Technology; ITS = International Trading Solutions; IWM = International Wealth Management; JV = Joint Venture; LSC = Large Swiss Corporates; M&A = Mergers & Acquisitions; MI = Management Information; Mkts = Markets; NNA = Net new assets; Op Risk = Operational Risk; PB = Private Banking; PC = Private Clients; PEP = Politically Exposed Person; pp = percentage points; PTI = Pre-tax income; PWMC = Private & Wealth Management Clients; RM = Relationship Manager(s); RoRC = Return on Regulatory Capital; RoTE = Return on Tangible Equity; RPA = Robotic Process Automation; RWA = Risk-weighted assets; SA-CCR = Standardized Approach to Counterparty Credit Risk; SME = Small and Medium-Sized Enterprises; SMG = Systematic Market-Making Group; SoW = Share of Wallet; SRU = Strategic Resolution Unit; SUB = Swiss Universal Bank; TBTF = Too Big To Fail; TBVS = Tangible Book Value per Share; (U)HNW(I) = (Ultra) High Net Worth (Individuals); VaR = Value-at-Risk; VIX = Volatility Index; WM = Wealth Management; WM&C = Wealth Management & Connected; YoY = Year over year; YTD = Year to Date


Credit Suisse Investor Day 2017International Wealth ManagementIqbal Khan, Bruno Daher, Claudio de Sanctis November 30, 2017

Disclaimer This material does not purport to contain all of the information that you may wish to consider. This material is not to be relied upon as such or used in substitution for the exercise of independent judgment.Cautionary statement regarding forward-looking statements This presentation contains forward-looking statements that involve inherent risks and uncertainties, and we might not be able to achieve the predictions, forecasts, projections and other outcomes we describe or imply in forward-looking statements. A number of important factors could cause results to differ materially from the plans, objectives, expectations, estimates and intentions we express in these forward-looking statements, including those we identify in "Risk factors” in our Annual Report on Form 20-F for the fiscal year ended December 31, 2016 and in the “Cautionary statement regarding forward-looking information" in our media release relating to Investor Day, published on November 30, 2017 and filed with the US Securities and Exchange Commission, and in other public filings and press releases. We do not intend to update these forward-looking statements. In particular, the terms “Estimate”, “Illustrative”, “Ambition”, “Objective”, “Outlook” and “Goal” are not intended to be viewed as targets or projections, nor are they considered to be Key Performance Indicators. All such estimates, illustrations, ambitions and goals are subject to a large number of inherent risks, assumptions and uncertainties, many of which are completely outside of our control. These risks, assumptions and uncertainties include, but are not limited to, general market conditions, market volatility, interest rate volatility and levels, global and regional economic conditions, political uncertainty, changes in tax policies, regulatory changes, changes in levels of client activity as a result of any of the foregoing and other factors. Accordingly, this information should not be relied on for any purpose. We do not intend to update these estimates, illustrations, ambitions or goals. We may not achieve the benefits of our strategic initiatives We may not achieve all of the expected benefits of our strategic initiatives. Factors beyond our control, including but not limited to the market and economic conditions, changes in laws, rules or regulations and other challenges discussed in our public filings, could limit our ability to achieve some or all of the expected benefits of these initiatives. Estimates, assumptions and opinionsIn preparing this presentation, management has made estimates and assumptions that affect the numbers presented. Actual results may differ. Annualized numbers do not take account of variations in operating results, seasonality and other factors and may not be indicative of actual, full-year results. Figures throughout this presentation may also be subject to rounding adjustments. All opinions and views constitute judgments as of the date of writing without regard to the date on which the reader may receive or access the information. This information is subject to change at any time without notice and we do not intend to update this information. Statement regarding non-GAAP financial measures This presentation also contains non-GAAP financial measures, including adjusted results. Information needed to reconcile such non-GAAP financial measures to the most directly comparable measures under US GAAP can be found in the Appendix of the CEO and CFO Investor Day presentations, published on November 30, 2017. All Investor Day presentations are available on our website at www.credit-suisse.com. Statement regarding capital, liquidity and leverage As of January 1, 2013, Basel III was implemented in Switzerland along with the Swiss “Too Big to Fail” legislation and regulations thereunder (in each case, subject to certain phase-in periods). As of January 1, 2015, the Bank for International Settlements (BIS) leverage ratio framework, as issued by the Basel Committee on Banking Supervision (BCBS), was implemented in Switzerland by FINMA. Our related disclosures are in accordance with our interpretation of such requirements, including relevant assumptions. Changes in the interpretation of these requirements in Switzerland or in any of our assumptions or estimates could result in different numbers from those shown in this presentation. Capital and ratio numbers for periods prior to 2013 are based on estimates, which are calculated as if the Basel III framework had been in place in Switzerland during such periods. Unless otherwise noted, leverage exposure is based on the BIS leverage ratio framework and consists of period-end balance sheet assets and prescribed regulatory adjustments. Beginning in 2015, the Swiss leverage ratio is calculated as Swiss total capital, divided by period-end leverage exposure. The look-through BIS tier 1 leverage ratio and CET1 leverage ratio are calculated as look-through BIS tier 1 capital and CET1 capital, respectively, divided by end-period leverage exposure.SourcesCertain material in this presentation has been prepared by Credit Suisse on the basis of publicly available information, internally developed data and other third-party sources believed to be reliable. Credit Suisse has not sought to independently verify information obtained from public and third-party sources and makes no representations or warranties as to accuracy, completeness or reliability of such information.
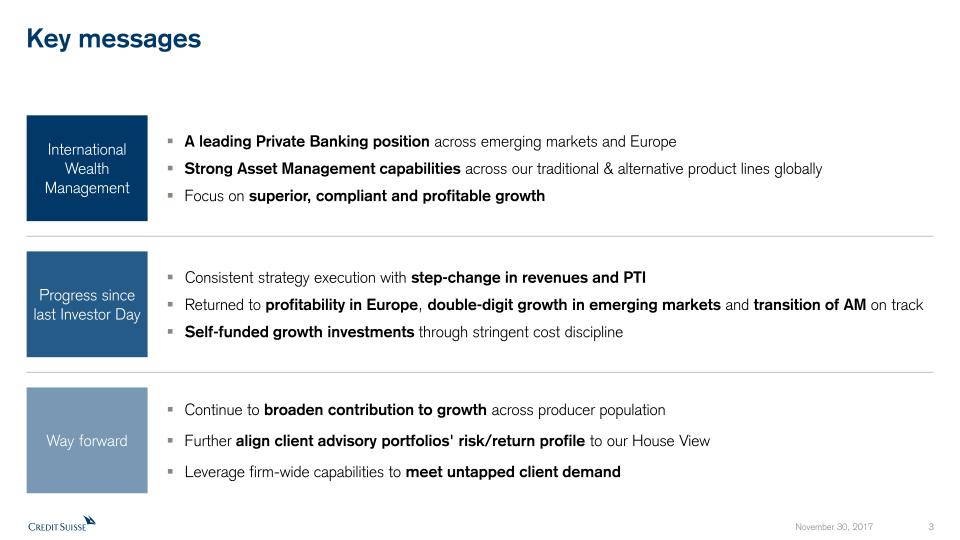
Key messages A leading Private Banking position across emerging markets and EuropeStrong Asset Management capabilities across our traditional & alternative product lines globallyFocus on superior, compliant and profitable growth InternationalWealthManagement Continue to broaden contribution to growth across producer populationFurther align client advisory portfolios' risk/return profile to our House ViewLeverage firm-wide capabilities to meet untapped client demand Way forward Consistent strategy execution with step-change in revenues and PTIReturned to profitability in Europe, double-digit growth in emerging markets and transition of AM on trackSelf-funded growth investments through stringent cost discipline Progress since last Investor Day
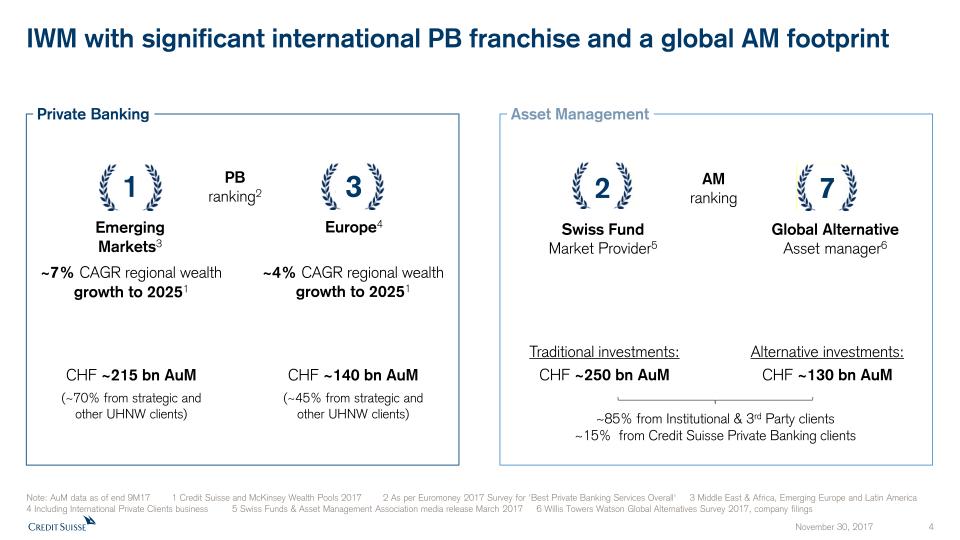
Private Banking Asset Management IWM with significant international PB franchise and a global AM footprint 1 3 2 Swiss FundMarket Provider5 7 Global AlternativeAsset manager6 PBranking2 Emerging Markets3 Europe4 CHF ~215 bn AuM(~70% from strategic andother UHNW clients) CHF ~140 bn AuM(~45% from strategic andother UHNW clients) Traditional investments:CHF ~250 bn AuM Alternative investments:CHF ~130 bn AuM AMranking Note: AuM data as of end 9M17 1 Credit Suisse and McKinsey Wealth Pools 2017 2 As per Euromoney 2017 Survey for 'Best Private Banking Services Overall‘ 3 Middle East & Africa, Emerging Europe and Latin America 4 Including International Private Clients business 5 Swiss Funds & Asset Management Association media release March 2017 6 Willis Towers Watson Global Alternatives Survey 2017, company filings ~85% from Institutional & 3rd Party clients~15% from Credit Suisse Private Banking clients ~7% CAGR regional wealthgrowth to 20251 ~4% CAGR regional wealthgrowth to 20251

Achieved step change in profitability: 9M17 already in line with FY16 level 1.1 bn 0.8 bn 0.8 bn +22% +39% +55% FY 2016 +38% vs. 9M15 1.1 bn 300 mn 241 mn 260 mn 308 mn IWM adjusted PTI in CHF 1Q 2Q 3Q 382 mn 378 mn 327 mn Note: Adjusted results are non-GAAP financial measures. A reference to the reconciliation to reported results is included in the Appendix
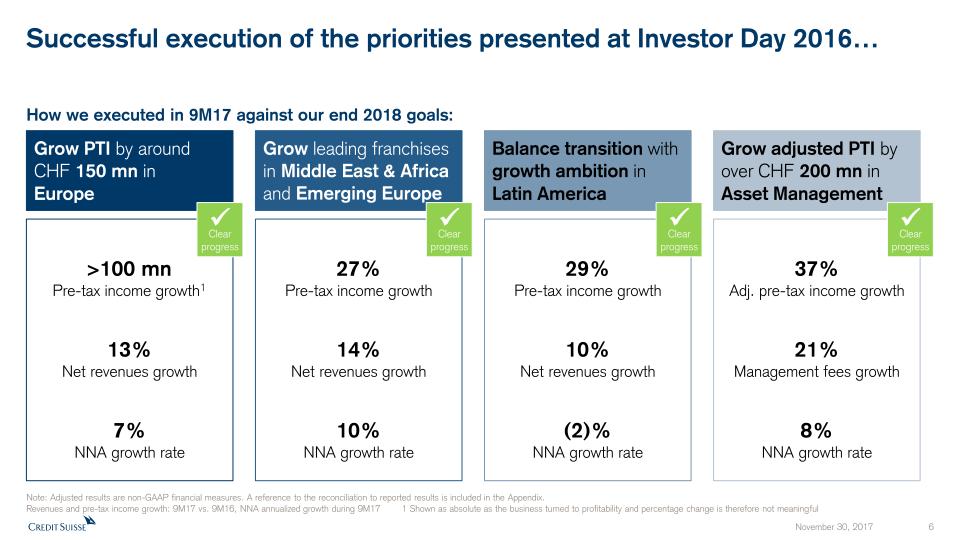
Successful execution of the priorities presented at Investor Day 2016… Grow PTI by around CHF 150 mn in Europe Grow leading franchises in Middle East & Africa and Emerging Europe Balance transition with growth ambition in Latin America Note: Adjusted results are non-GAAP financial measures. A reference to the reconciliation to reported results is included in the Appendix.Revenues and pre-tax income growth: 9M17 vs. 9M16, NNA annualized growth during 9M17 1 Shown as absolute as the business turned to profitability and percentage change is therefore not meaningful Grow adjusted PTI by over CHF 200 mn inAsset Management 13%Net revenues growth 14%Net revenues growth 10%Net revenues growth 21%Management fees growth 7%NNA growth rate 10%NNA growth rate (2)%NNA growth rate 8%NNA growth rate Clearprogress Clearprogress Clearprogress Clearprogress 27%Pre-tax income growth 29%Pre-tax income growth 37%Adj. pre-tax income growth >100 mnPre-tax income growth1 How we executed in 9M17 against our end 2018 goals:
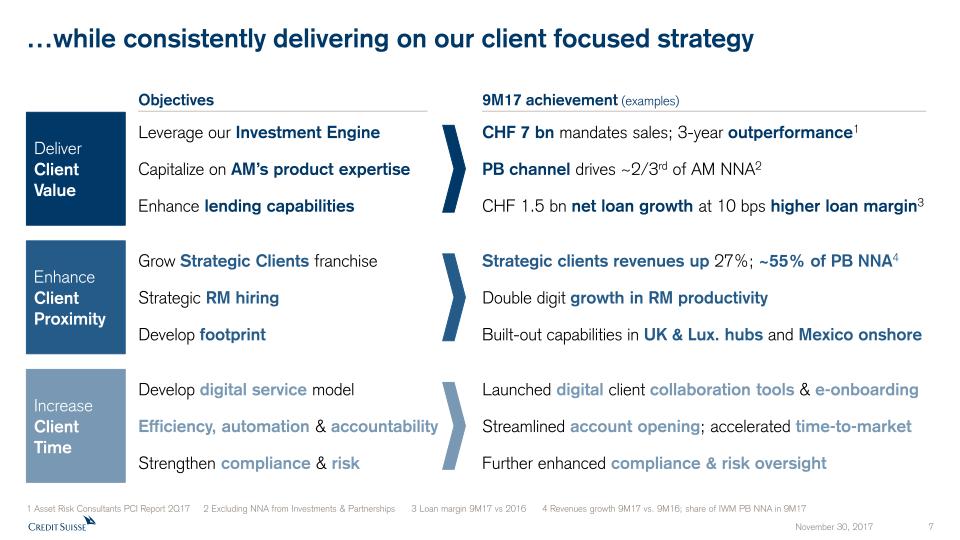
Leverage our Investment EngineCapitalize on AM’s product expertiseEnhance lending capabilities Grow Strategic Clients franchiseStrategic RM hiringDevelop footprint Develop digital service modelEfficiency, automation & accountabilityStrengthen compliance & risk …while consistently delivering on our client focused strategy DeliverClient Value EnhanceClient Proximity IncreaseClient Time CHF 7 bn mandates sales; 3-year outperformance1PB channel drives ~2/3rd of AM NNA2CHF 1.5 bn net loan growth at 10 bps higher loan margin3 Strategic clients revenues up 27%; ~55% of PB NNA4Double digit growth in RM productivityBuilt-out capabilities in UK & Lux. hubs and Mexico onshore Launched digital client collaboration tools & e-onboardingStreamlined account opening; accelerated time-to-marketFurther enhanced compliance & risk oversight 9M17 achievement (examples) 1 Asset Risk Consultants PCI Report 2Q17 2 Excluding NNA from Investments & Partnerships 3 Loan margin 9M17 vs 2016 4 Revenues growth 9M17 vs. 9M16; share of IWM PB NNA in 9M17 Objectives
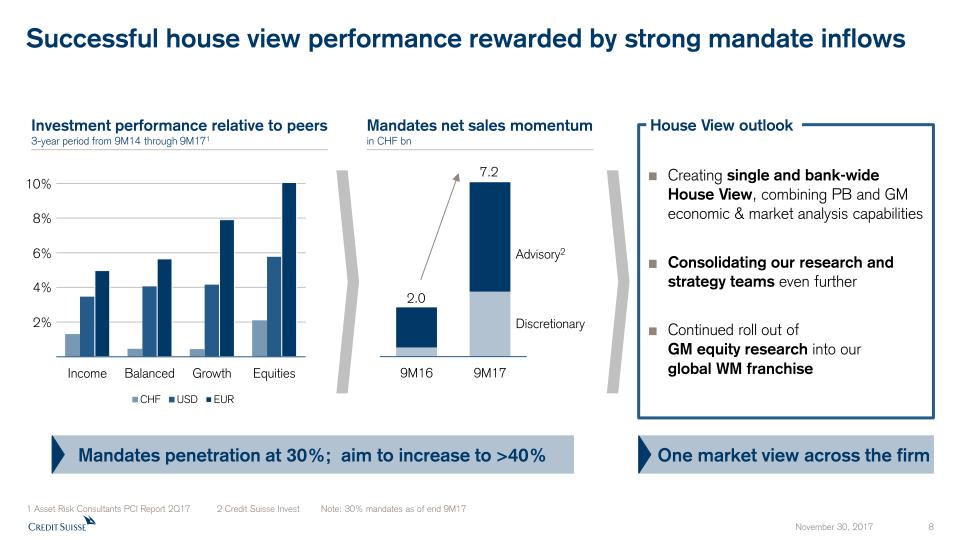
1 Asset Risk Consultants PCI Report 2Q17 2 Credit Suisse Invest Note: 30% mandates as of end 9M17 Investment performance relative to peers3-year period from 9M14 through 9M171 Mandates net sales momentumin CHF bn Advisory2 Discretionary House View outlook Mandates penetration at 30%; aim to increase to >40% 7.2 2.0 2% 4% 6% 8% 10% Successful house view performance rewarded by strong mandate inflows One market view across the firm Creating single and bank-wide House View, combining PB and GM economic & market analysis capabilities Consolidating our research and strategy teams even furtherContinued roll out ofGM equity research into ourglobal WM franchise
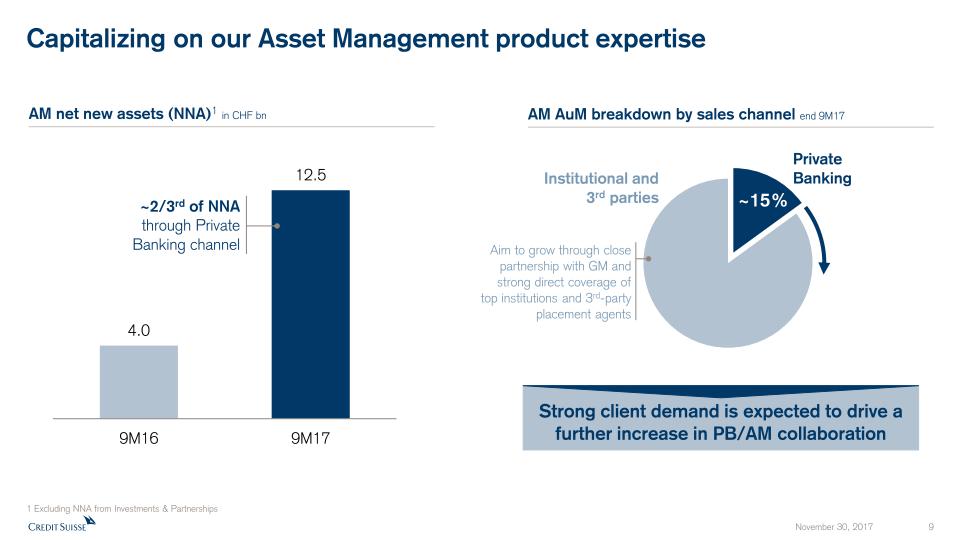
Capitalizing on our Asset Management product expertise 1 Excluding NNA from Investments & Partnerships ~2/3rd of NNAthrough Private Banking channel PrivateBanking Institutional and 3rd parties Strong client demand is expected to drive a further increase in PB/AM collaboration AM net new assets (NNA)1 in CHF bn AM AuM breakdown by sales channel end 9M17 ~15% Aim to grow through close partnership with GM and strong direct coverage of top institutions and 3rd-party placement agents
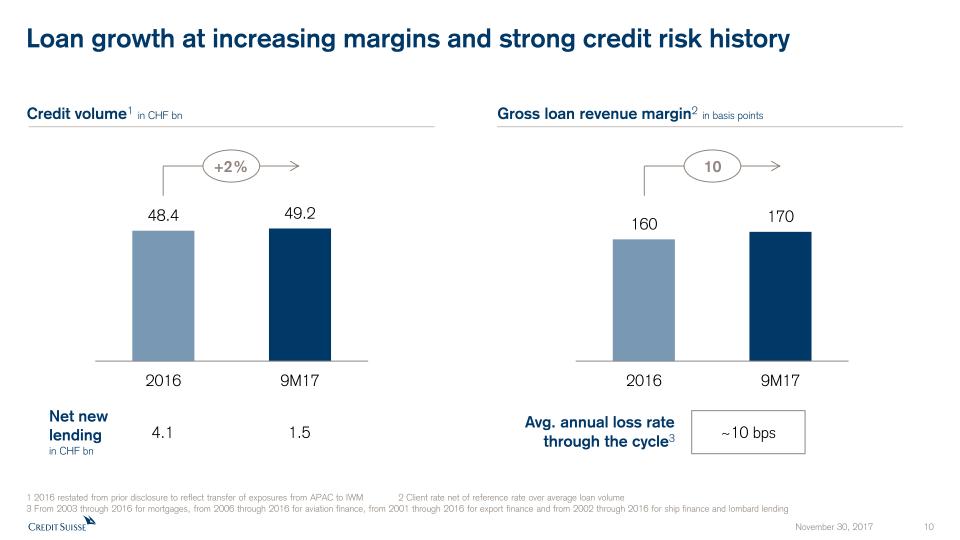
Loan growth at increasing margins and strong credit risk history Credit volume1 in CHF bn Gross loan revenue margin2 in basis points 1 2016 restated from prior disclosure to reflect transfer of exposures from APAC to IWM 2 Client rate net of reference rate over average loan volume3 From 2003 through 2016 for mortgages, from 2006 through 2016 for aviation finance, from 2001 through 2016 for export finance and from 2002 through 2016 for ship finance and lombard lending Avg. annual loss rate through the cycle3 ~10 bps Net new lendingin CHF bn 1.5 4.1 +2% 10
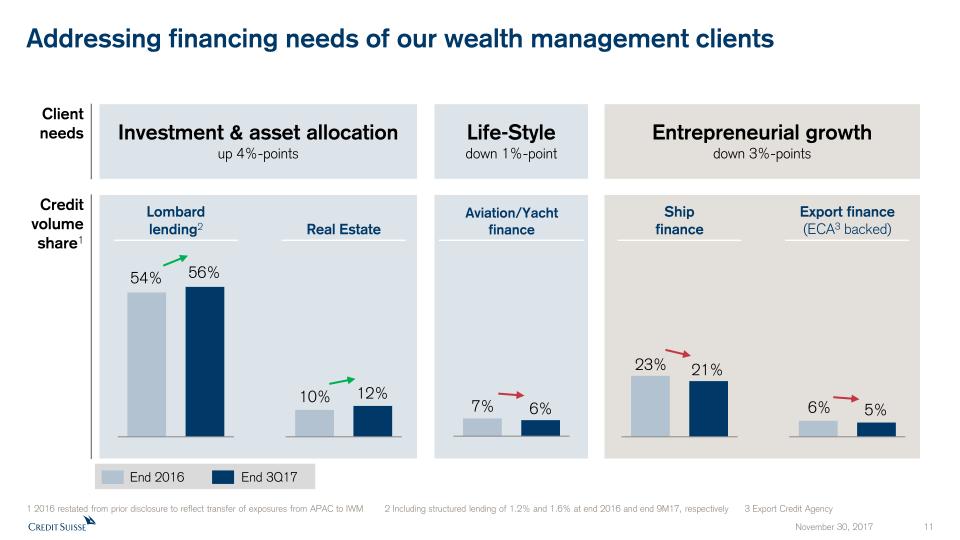
Addressing financing needs of our wealth management clients 1 2016 restated from prior disclosure to reflect transfer of exposures from APAC to IWM 2 Including structured lending of 1.2% and 1.6% at end 2016 and end 9M17, respectively 3 Export Credit Agency Entrepreneurial growthdown 3%-points Investment & asset allocationup 4%-points Life-Styledown 1%-point Lombardlending2 Real Estate Aviation/Yachtfinance Shipfinance Export finance(ECA3 backed) Client needs 54% 56% 10% 12% 7% 6% 23% 21% 6% 5% Credit volume share1 End 2016 End 3Q17
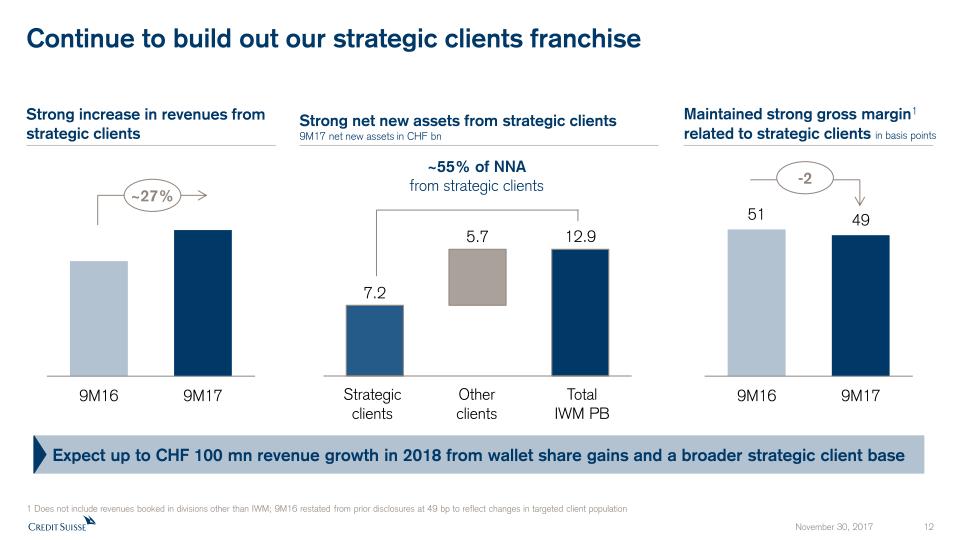
Continue to build out our strategic clients franchise TotalIWM PB Otherclients Strategicclients Expect up to CHF 100 mn revenue growth in 2018 from wallet share gains and a broader strategic client base Strong increase in revenues from strategic clients Maintained strong gross margin1 related to strategic clients in basis points Strong net new assets from strategic clients 9M17 net new assets in CHF bn ~55% of NNAfrom strategic clients 1 Does not include revenues booked in divisions other than IWM; 9M16 restated from prior disclosures at 49 bp to reflect changes in targeted client population ~27% -2
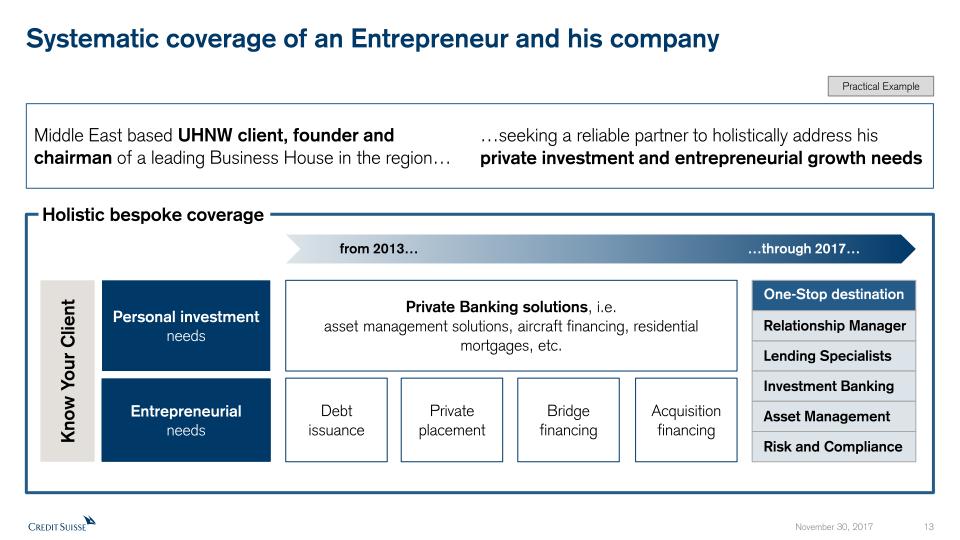
Systematic coverage of an Entrepreneur and his company Middle East based UHNW client, founder and chairman of a leading Business House in the region… Holistic bespoke coverage …seeking a reliable partner to holistically address his private investment and entrepreneurial growth needs from 2013… …through 2017… Privateplacement Debtissuance Bridgefinancing Acquisition financing Entrepreneurialneeds Private Banking solutions, i.e.asset management solutions, aircraft financing, residential mortgages, etc. Personal investmentneeds Lending Specialists Investment Banking Asset Management Risk and Compliance Relationship Manager One-Stop destination Know Your Client Practical Example
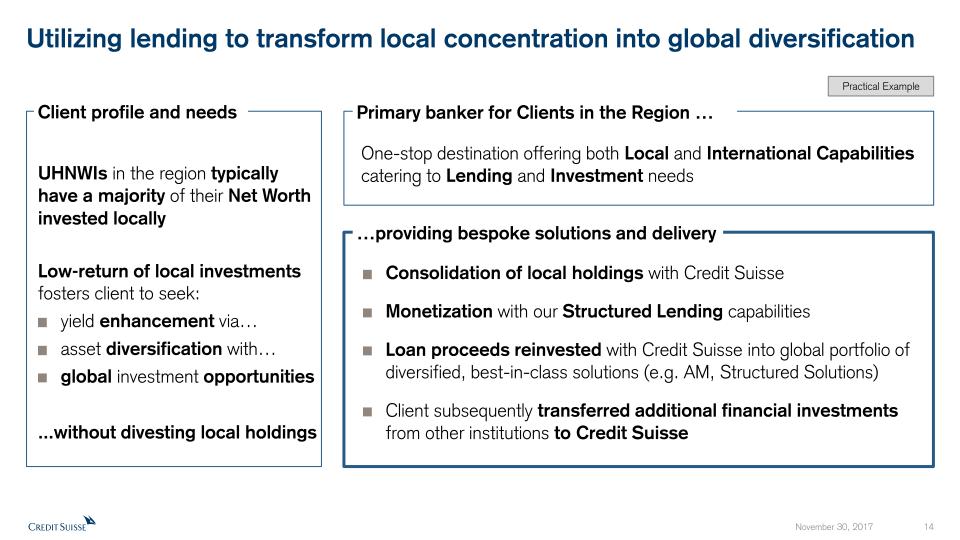
Utilizing lending to transform local concentration into global diversification Client profile and needs UHNWIs in the region typically have a majority of their Net Worth invested locallyLow-return of local investments fosters client to seek:yield enhancement via…asset diversification with…global investment opportunities...without divesting local holdings Primary banker for Clients in the Region … …providing bespoke solutions and delivery Consolidation of local holdings with Credit SuisseMonetization with our Structured Lending capabilitiesLoan proceeds reinvested with Credit Suisse into global portfolio of diversified, best-in-class solutions (e.g. AM, Structured Solutions)Client subsequently transferred additional financial investments from other institutions to Credit Suisse One-stop destination offering both Local and International Capabilities catering to Lending and Investment needs Practical Example
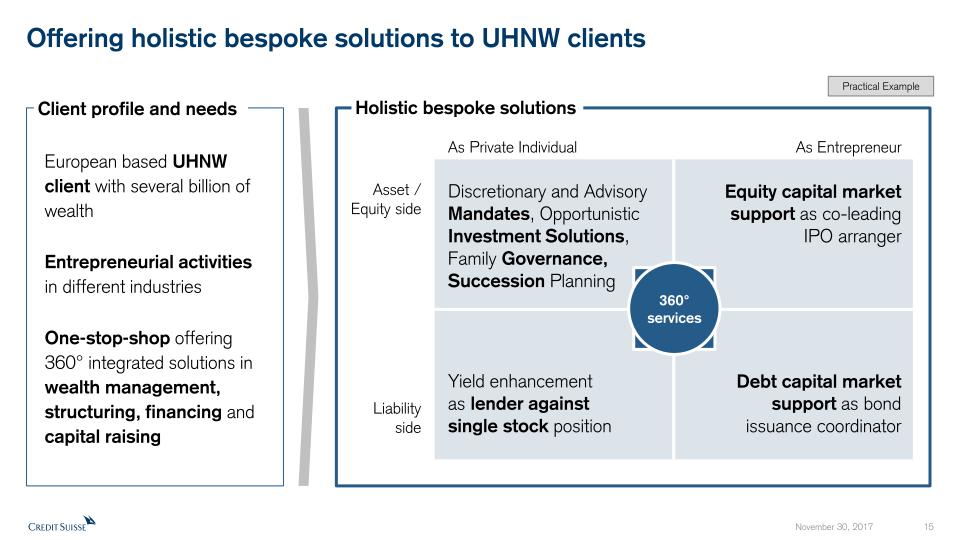
Offering holistic bespoke solutions to UHNW clients Yield enhancementas lender againstsingle stock position Discretionary and Advisory Mandates, Opportunistic Investment Solutions, Family Governance, Succession Planning Debt capital market support as bondissuance coordinator Equity capital market support as co-leading IPO arranger As Private Individual As Entrepreneur Asset / Equity side Liabilityside Holistic bespoke solutions Client profile and needs European based UHNW client with several billion of wealthEntrepreneurial activities in different industriesOne-stop-shop offering 360° integrated solutions in wealth management, structuring, financing and capital raising 360°services Practical Example
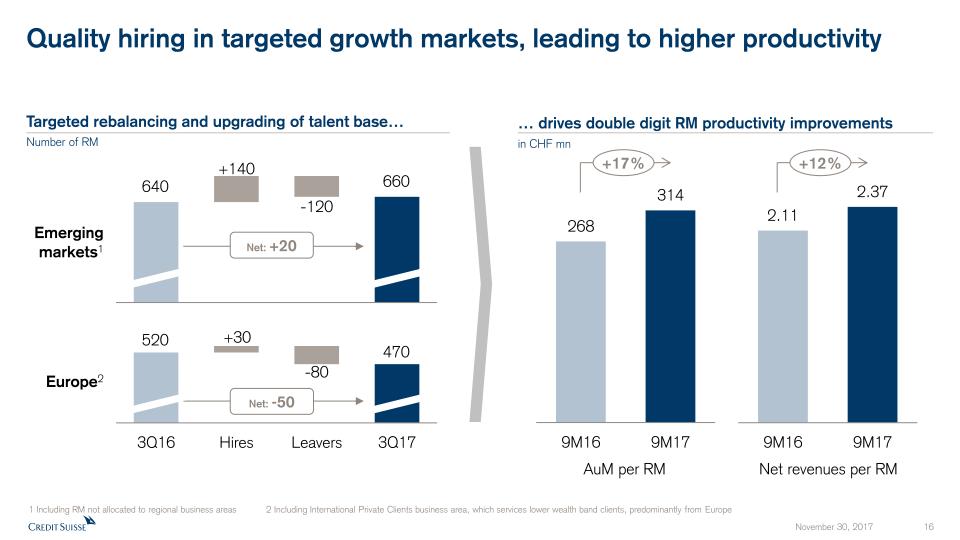
Quality hiring in targeted growth markets, leading to higher productivity AuM per RM Net revenues per RM Europe2 Emerging markets1 1 Including RM not allocated to regional business areas 2 Including International Private Clients business area, which services lower wealth band clients, predominantly from Europe Targeted rebalancing and upgrading of talent base…Number of RM … drives double digit RM productivity improvementsin CHF mn 520 470 640 660 Net: -50 Net: +20 +140 -120 +30 -80 +17% +12%
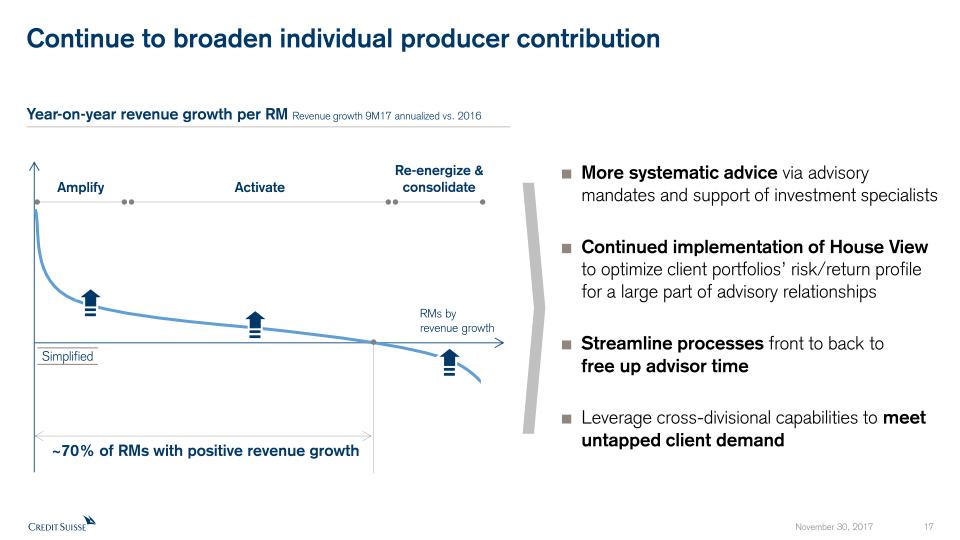
Continue to broaden individual producer contribution Year-on-year revenue growth per RM Revenue growth 9M17 annualized vs. 2016 ~70% of RMs with positive revenue growth RMs byrevenue growth More systematic advice via advisory mandates and support of investment specialistsContinued implementation of House View to optimize client portfolios’ risk/return profile for a large part of advisory relationshipsStreamline processes front to back tofree up advisor timeLeverage cross-divisional capabilities to meet untapped client demand Simplified Amplify Activate Re-energize & consolidate
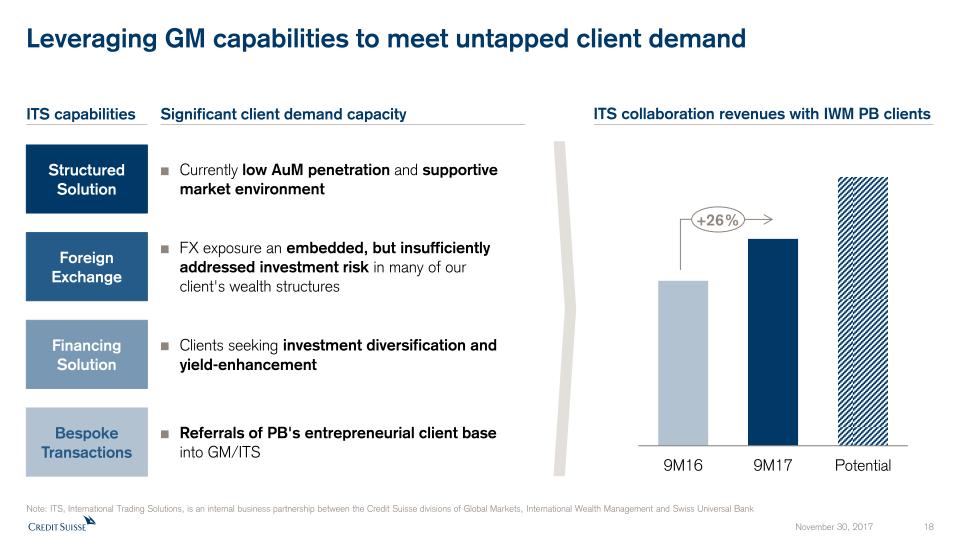
Leveraging GM capabilities to meet untapped client demand Currently low AuM penetration and supportive market environment FX exposure an embedded, but insufficiently addressed investment risk in many of our client's wealth structures Clients seeking investment diversification and yield-enhancement Referrals of PB's entrepreneurial client base into GM/ITS Significant client demand capacity ITS collaboration revenues with IWM PB clients ITS capabilities Note: ITS, International Trading Solutions, is an internal business partnership between the Credit Suisse divisions of Global Markets, International Wealth Management and Swiss Universal Bank Structured Solution ForeignExchange FinancingSolution Bespoke Transactions +26%
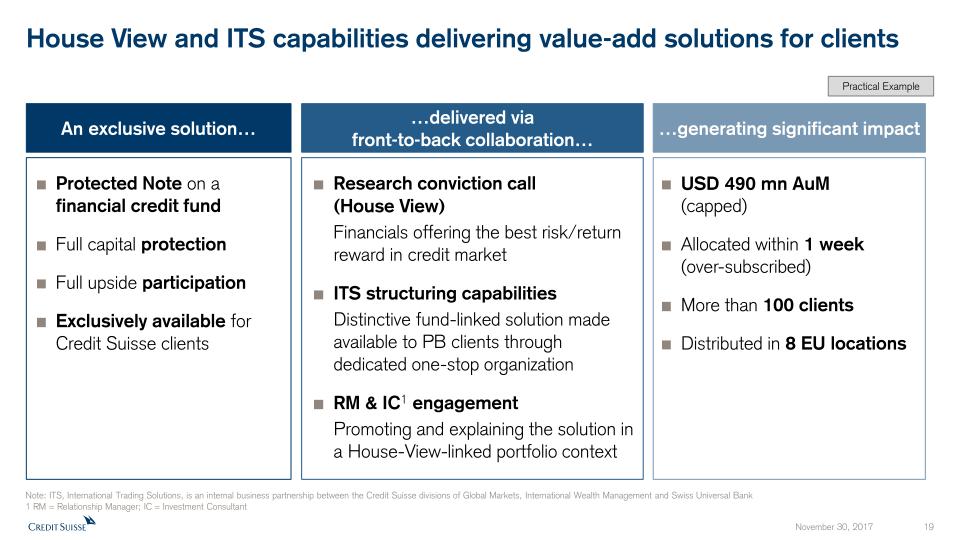
House View and ITS capabilities delivering value-add solutions for clients An exclusive solution… Protected Note on a financial credit fundFull capital protectionFull upside participationExclusively available for Credit Suisse clients Research conviction call(House View)Financials offering the best risk/return reward in credit marketITS structuring capabilitiesDistinctive fund-linked solution made available to PB clients through dedicated one-stop organizationRM & IC1 engagementPromoting and explaining the solution in a House-View-linked portfolio context USD 490 mn AuM(capped)Allocated within 1 week(over-subscribed)More than 100 clients Distributed in 8 EU locations …delivered viafront-to-back collaboration… …generating significant impact Note: ITS, International Trading Solutions, is an internal business partnership between the Credit Suisse divisions of Global Markets, International Wealth Management and Swiss Universal Bank1 RM = Relationship Manager; IC = Investment Consultant Practical Example
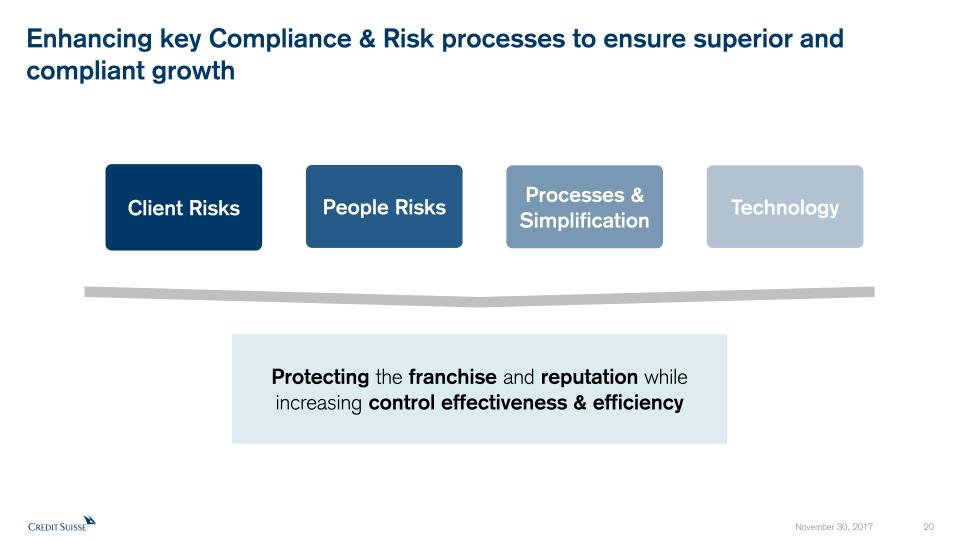
Protecting the franchise and reputation while increasing control effectiveness & efficiency Client Risks Processes & Simplification Technology People Risks Enhancing key Compliance & Risk processes to ensure superior and compliant growth
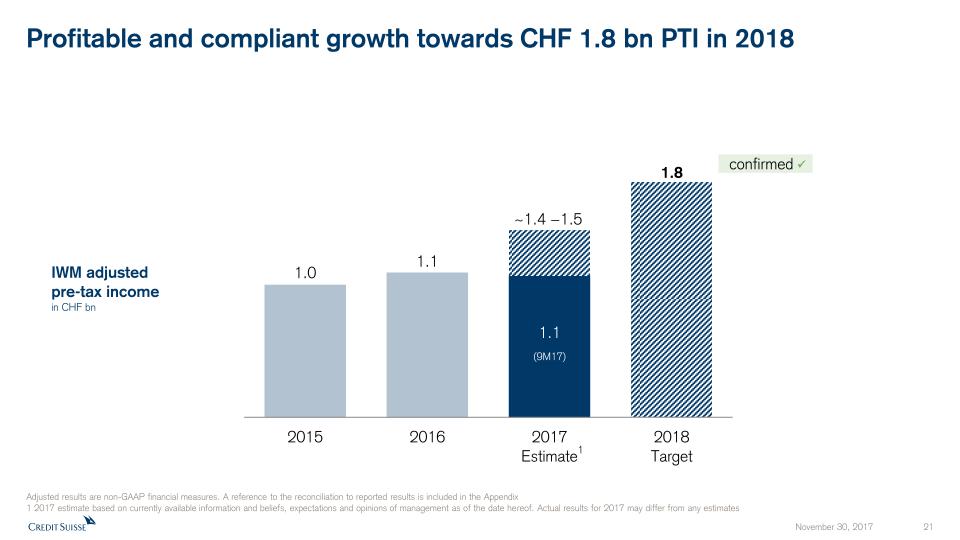
Profitable and compliant growth towards CHF 1.8 bn PTI in 2018 Adjusted results are non-GAAP financial measures. A reference to the reconciliation to reported results is included in the Appendix 1 2017 estimate based on currently available information and beliefs, expectations and opinions of management as of the date hereof. Actual results for 2017 may differ from any estimates ~1.4 −1.5 1.1(9M17) 1.8 confirmed IWM adjusted pre-tax income in CHF bn 1

Appendix November 30, 2017 22
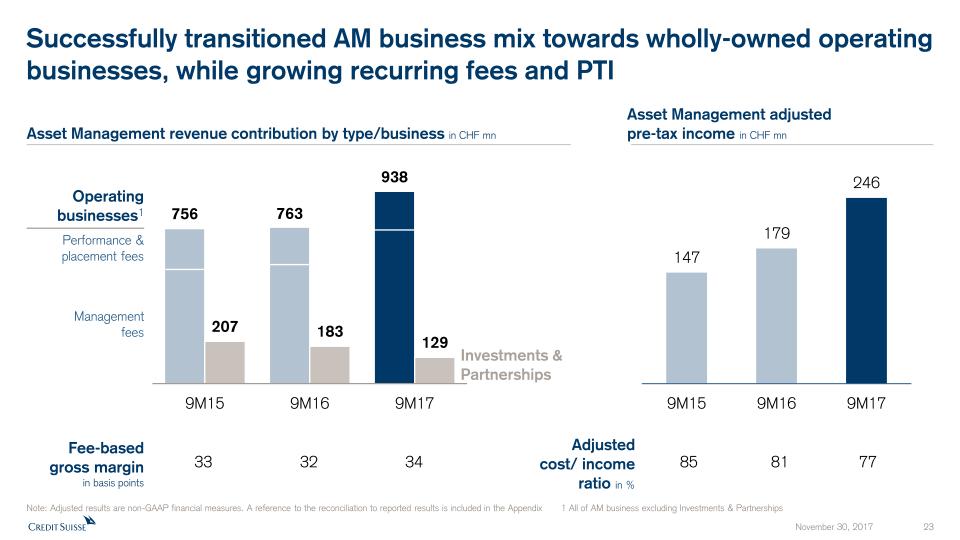
Investments & Partnerships Managementfees Performance & placement fees Operating businesses1 Asset Management revenue contribution by type/business in CHF mn Asset Management adjustedpre-tax income in CHF mn Successfully transitioned AM business mix towards wholly-owned operating businesses, while growing recurring fees and PTI Fee-based gross marginin basis points Adjusted cost/ income ratio in % 85 77 81 33 34 32 Note: Adjusted results are non-GAAP financial measures. A reference to the reconciliation to reported results is included in the Appendix 1 All of AM business excluding Investments & Partnerships
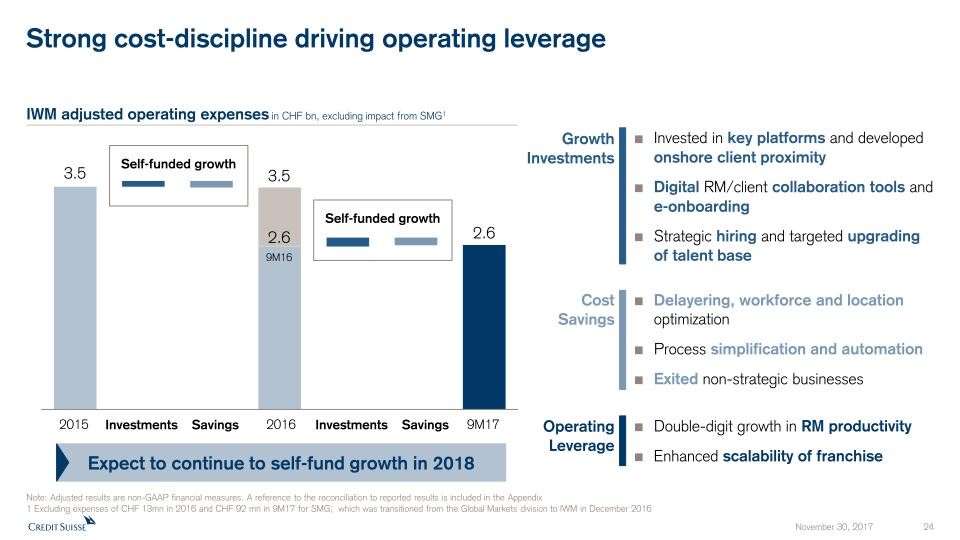
Strong cost-discipline driving operating leverage IWM adjusted operating expenses in CHF bn, excluding impact from SMG1 Savings Investments Note: Adjusted results are non-GAAP financial measures. A reference to the reconciliation to reported results is included in the Appendix 1 Excluding expenses of CHF 13mn in 2016 and CHF 92 mn in 9M17 for SMG, which was transitioned from the Global Markets division to IWM in December 2016 Expect to continue to self-fund growth in 2018 2015 2016 9M17 2.69M16 3.5 Self-funded growth Self-funded growth Savings Investments Invested in key platforms and developed onshore client proximityDigital RM/client collaboration tools and e-onboardingStrategic hiring and targeted upgrading of talent base Growth Investments Delayering, workforce and location optimizationProcess simplification and automationExited non-strategic businesses CostSavings Operating Leverage Double-digit growth in RM productivityEnhanced scalability of franchise

Notes (1/2) General notes Specific notes * Our cost savings program is measured using adjusted operating expenses at constant FX rates. “Adjusted operating expenses at constant FX rates” and “adjusted non-compensation operating expenses at constant FX rates” include adjustments as made in all our disclosures for restructuring expenses, major litigation expenses and a goodwill impairment taken in 4Q15 as well as adjustments for certain accounting changes (which had not been in place at the launch of the cost savings program), debit valuation adjustments (DVA) related volatility and for FX, applying the following main currency exchange rates for1Q15: USD/CHF 0.9465, EUR/CHF 1.0482, GBP/CHF 1.4296, 2Q15: USD/CHF 0.9383, EUR/CHF 1.0418, GBP/CHF 1.4497,3Q15: USD/CHF 0.9684, EUR/CHF 1.0787, GBP/CHF 1.4891, 4Q15: USD/CHF 1.0010, EUR/CHF 1.0851, GBP/CHF 1.5123,1Q16: USD/CHF 0.9928, EUR/CHF 1.0941, GBP/CHF 1.4060, 2Q16: USD/CHF 0.9756, EUR/CHF 1.0956, GBP/CHF 1.3845,3Q16: USD/CHF 0.9728, EUR/CHF 1.0882, GBP/CHF 1.2764, 4Q16: USD/CHF 1.0101, EUR/CHF 1.0798, GBP/CHF 1.2451,1Q17: USD/CHF 0.9963, EUR/CHF 1.0670, GBP/CHF 1.2464, 2Q17: USD/CHF 0.9736, EUR/CHF 1.0881, GBP/CHF 1.2603,3Q17: USD/CHF 0.9645, EUR/CHF 1.1413, GBP/CHF 1.2695.These currency exchange rates are unweighted, i.e. a straight line average of monthly rates. We apply this calculation consistently for the periods under review. Adjusted non-compensation expenses are adjusted operating expenses excluding compensation and benefits. To calculate adjusted non-compensation expenses at constant FX rates, we subtract compensation and benefits (adjusted at constant FX rates in the manner described above) from adjusted operating expenses at constant FX rates.† Regulatory capital is calculated as the worst of 10% of RWA and 3.5% of leverage exposure. Return on regulatory capital is calculated using (adjusted) income after tax and assumes a tax rate of 30% and capital allocated based on the worst of 10% of average RWA and 3.5% of average leverage exposure. For the Markets business within the APAC division and for the Global Markets and Investment Banking & Capital Markets divisions, return on regulatory capital is based on US dollar denominated numbers. Adjusted return on regulatory capital is calculated using adjusted results, applying the same methodology to calculate return on regulatory capital. For reconciliation of adjusted to reported results, refer to the Appendix of either the CEO or CFO Investor Day 2017 presentation. Throughout the presentation rounding differences may occurUnless otherwise noted, all CET1 ratio, Tier 1 leverage ratio, risk-weighted assets and leverage exposure figures shown in this presentation are as of the end of the respective period and on a “look-through” basisGross and net margins are shown in basis pointsGross margin = adj. net revenues annualized / average AuM; net margin = adj. pre-tax income annualized / average AuMMandates penetration reflects advisory and discretionary mandates as percentage of total AuM

Notes (2/2) Abbreviations Adj. = Adjusted; AI = Artificial Intelligence; AM = Asset Management; AML = Anti-Money Laundering; APAC = Asia Pacific; AT1 = Additional Tier 1; AuM = Assets under Management; BCBS = Basel Committee on Banking Supervision; BIS = Bank for International Settlements; bps = basis points; CAGR = Compound Annual Growth Rate; CCRO = Chief Compliance and Regulatory Affairs Officer; CET1 = Common Equity Tier 1; CIC = Corporate & Institutional Clients; CIF = Customer/Client Information File; Corp. Ctr. = Corporate Center; CVA = Credit Valuation Adjustment; DCM = Debt Capital Markets; EAM = External Asset Manager; ECM = Equity Capital Markets; EM = Emerging Markets; EMEA = Europe, Middle East & Africa; EPS = Earnings Per Share; EQ = Equities; EU = European Union; FICC = Fixed Income, Currencies & Commodities; FINMA = Swiss Financial Market Supervisory Authority; FLP = Fund Linked Products; FRTB = Fundamental Review of the Trading Book; FX = Foreign Exchange; G10 = Group of Ten; GDP = Gross Domestic Product; GM = Global Markets; IBCM = Investment Banking & Capital Markets; IBD = Investment Banking Department; IC = Investment Consultant; IMF = International Monetary Fund; IP = Investor Products; IPO = Initial Public Offering; IRB = Internal Ratings Based; IT = Information Technology; ITS = International Trading Solutions; IWM = International Wealth Management; JV = Joint Venture; LSC = Large Swiss Corporates; M&A = Mergers & Acquisitions; MI = Management Information; Mkts = Markets; NNA = Net new assets; Op Risk = Operational Risk; PB = Private Banking; PC = Private Clients; PEP = Politically Exposed Person; pp = percentage points; PTI = Pre-tax income; PWMC = Private & Wealth Management Clients; RM = Relationship Manager(s); RoRC = Return on Regulatory Capital; RoTE = Return on Tangible Equity; RPA = Robotic Process Automation; RWA = Risk-weighted assets; SA-CCR = Standardized Approach to Counterparty Credit Risk; SME = Small and Medium-Sized Enterprises; SMG = Systematic Market-Making Group; SoW = Share of Wallet; SRU = Strategic Resolution Unit; SUB = Swiss Universal Bank; TBTF = Too Big To Fail; TBVS = Tangible Book Value per Share; (U)HNW(I) = (Ultra) High Net Worth (Individuals); VaR = Value-at-Risk; VIX = Volatility Index; WM = Wealth Management; WM&C = Wealth Management & Connected; YoY = Year over year; YTD = Year to Date


Credit Suisse Investor Day 2017Strategic Resolution UnitDavid Mathers November 30, 2017

Disclaimer This material does not purport to contain all of the information that you may wish to consider. This material is not to be relied upon as such or used in substitution for the exercise of independent judgment.Cautionary statement regarding forward-looking statements This presentation contains forward-looking statements that involve inherent risks and uncertainties, and we might not be able to achieve the predictions, forecasts, projections and other outcomes we describe or imply in forward-looking statements. A number of important factors could cause results to differ materially from the plans, objectives, expectations, estimates and intentions we express in these forward-looking statements, including those we identify in "Risk factors” in our Annual Report on Form 20-F for the fiscal year ended December 31, 2016 and in the “Cautionary statement regarding forward-looking information" in our media release relating to Investor Day, published on November 30, 2017 and filed with the US Securities and Exchange Commission, and in other public filings and press releases. We do not intend to update these forward-looking statements. In particular, the terms “Estimate”, “Illustrative”, “Ambition”, “Objective”, “Outlook” and “Goal” are not intended to be viewed as targets or projections, nor are they considered to be Key Performance Indicators. All such estimates, illustrations, ambitions and goals are subject to a large number of inherent risks, assumptions and uncertainties, many of which are completely outside of our control. These risks, assumptions and uncertainties include, but are not limited to, general market conditions, market volatility, interest rate volatility and levels, global and regional economic conditions, political uncertainty, changes in tax policies, regulatory changes, changes in levels of client activity as a result of any of the foregoing and other factors. Accordingly, this information should not be relied on for any purpose. We do not intend to update these estimates, illustrations, ambitions or goals. We may not achieve the benefits of our strategic initiatives We may not achieve all of the expected benefits of our strategic initiatives. Factors beyond our control, including but not limited to the market and economic conditions, changes in laws, rules or regulations and other challenges discussed in our public filings, could limit our ability to achieve some or all of the expected benefits of these initiatives. Estimates, assumptions and opinionsIn preparing this presentation, management has made estimates and assumptions that affect the numbers presented. Actual results may differ. Annualized numbers do not take account of variations in operating results, seasonality and other factors and may not be indicative of actual, full-year results. Figures throughout this presentation may also be subject to rounding adjustments. All opinions and views constitute judgments as of the date of writing without regard to the date on which the reader may receive or access the information. This information is subject to change at any time without notice and we do not intend to update this information. Statement regarding non-GAAP financial measures This presentation also contains non-GAAP financial measures, including adjusted results. Information needed to reconcile such non-GAAP financial measures to the most directly comparable measures under US GAAP can be found in the Appendix of the CEO and CFO Investor Day presentations, published on November 30, 2017. All Investor Day presentations are available on our website at www.credit-suisse.com. Statement regarding capital, liquidity and leverage As of January 1, 2013, Basel III was implemented in Switzerland along with the Swiss “Too Big to Fail” legislation and regulations thereunder (in each case, subject to certain phase-in periods). As of January 1, 2015, the Bank for International Settlements (BIS) leverage ratio framework, as issued by the Basel Committee on Banking Supervision (BCBS), was implemented in Switzerland by FINMA. Our related disclosures are in accordance with our interpretation of such requirements, including relevant assumptions. Changes in the interpretation of these requirements in Switzerland or in any of our assumptions or estimates could result in different numbers from those shown in this presentation. Capital and ratio numbers for periods prior to 2013 are based on estimates, which are calculated as if the Basel III framework had been in place in Switzerland during such periods. Unless otherwise noted, leverage exposure is based on the BIS leverage ratio framework and consists of period-end balance sheet assets and prescribed regulatory adjustments. Beginning in 2015, the Swiss leverage ratio is calculated as Swiss total capital, divided by period-end leverage exposure. The look-through BIS tier 1 leverage ratio and CET1 leverage ratio are calculated as look-through BIS tier 1 capital and CET1 capital, respectively, divided by end-period leverage exposure.SourcesCertain material in this presentation has been prepared by Credit Suisse on the basis of publicly available information, internally developed data and other third-party sources believed to be reliable. Credit Suisse has not sought to independently verify information obtained from public and third-party sources and makes no representations or warranties as to accuracy, completeness or reliability of such information.
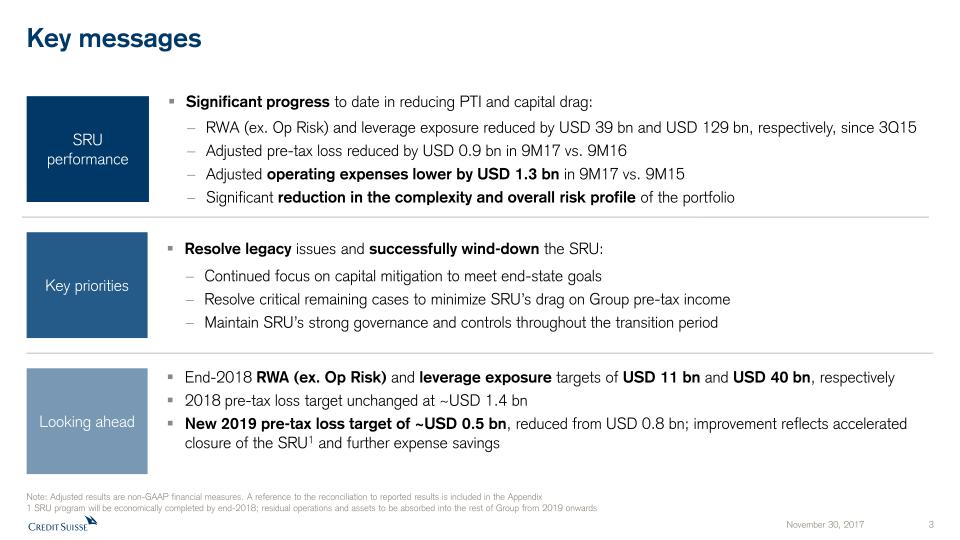
Key messages Significant progress to date in reducing PTI and capital drag:RWA (ex. Op Risk) and leverage exposure reduced by USD 39 bn and USD 129 bn, respectively, since 3Q15Adjusted pre-tax loss reduced by USD 0.9 bn in 9M17 vs. 9M16 Adjusted operating expenses lower by USD 1.3 bn in 9M17 vs. 9M15Significant reduction in the complexity and overall risk profile of the portfolio SRU performance End-2018 RWA (ex. Op Risk) and leverage exposure targets of USD 11 bn and USD 40 bn, respectively2018 pre-tax loss target unchanged at ~USD 1.4 bnNew 2019 pre-tax loss target of ~USD 0.5 bn, reduced from USD 0.8 bn; improvement reflects accelerated closure of the SRU1 and further expense savings Looking ahead Resolve legacy issues and successfully wind-down the SRU:Continued focus on capital mitigation to meet end-state goalsResolve critical remaining cases to minimize SRU’s drag on Group pre-tax incomeMaintain SRU’s strong governance and controls throughout the transition period Key priorities Note: Adjusted results are non-GAAP financial measures. A reference to the reconciliation to reported results is included in the Appendix1 SRU program will be economically completed by end-2018; residual operations and assets to be absorbed into the rest of Group from 2019 onwards

SRU continues to reduce its pre-tax income drag on Group results… Pre-tax income Net revenues Operating expenses -1.1 1.3 -0.8 0.7 -2.5 -1.5 9M16 9M17 +27% +38% -45% SRU adjusted resultsin USD bn Adjusted results are non-GAAP financial measures. A reference to the reconciliation to reported results is included in the Appendix.
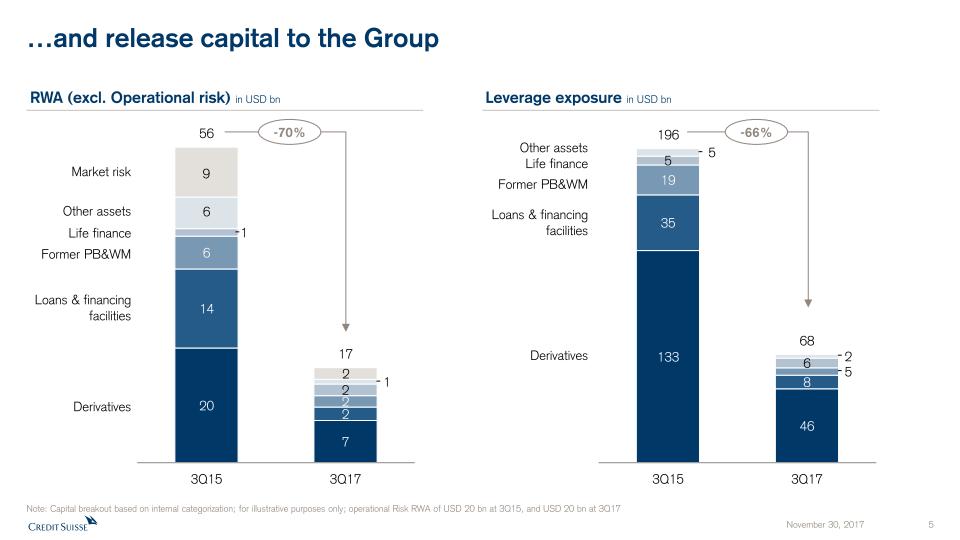
Derivatives RWA (excl. Operational risk) in USD bn Leverage exposure in USD bn Loans & financing facilities Other assets Former PB&WM Market risk Life finance Derivatives Loans & financing facilities Other assets Former PB&WM Life finance -70% -66% Note: Capital breakout based on internal categorization; for illustrative purposes only; operational Risk RWA of USD 20 bn at 3Q15, and USD 20 bn at 3Q17 …and release capital to the Group
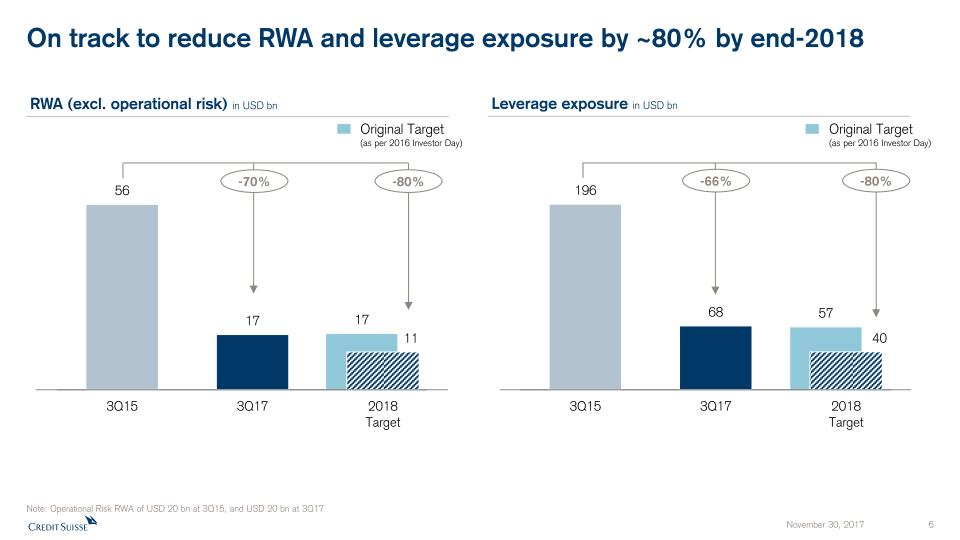
On track to reduce RWA and leverage exposure by ~80% by end-2018 -70% RWA (excl. operational risk) in USD bn Leverage exposure in USD bn -80% Original Target(as per 2016 Investor Day) -66% -80% Note: Operational Risk RWA of USD 20 bn at 3Q15, and USD 20 bn at 3Q17 Original Target(as per 2016 Investor Day)
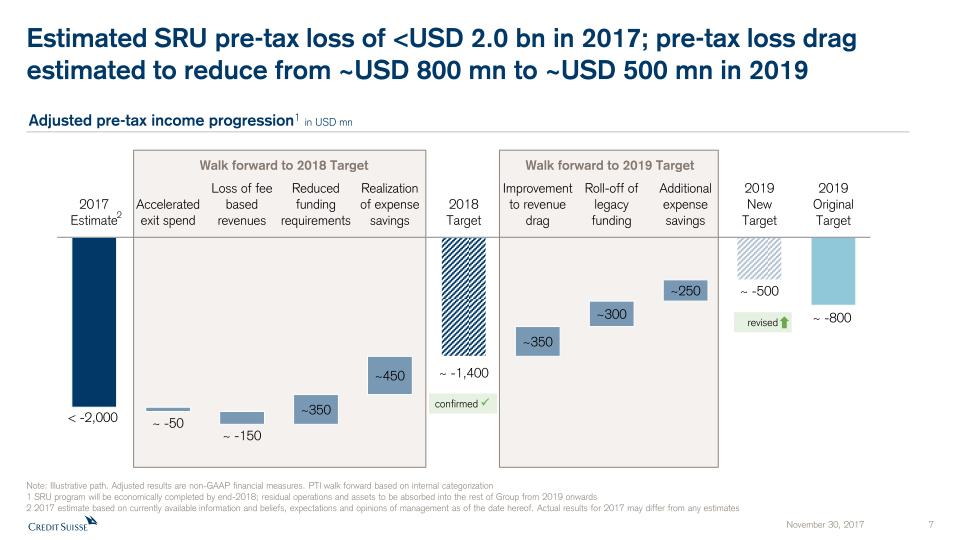
Walk forward to 2019 Target Walk forward to 2018 Target Estimated SRU pre-tax loss of <USD 2.0 bn in 2017; pre-tax loss drag estimated to reduce from ~USD 800 mn to ~USD 500 mn in 2019 Adjusted pre-tax income progression1 in USD mn Note: Illustrative path. Adjusted results are non-GAAP financial measures. PTI walk forward based on internal categorization1 SRU program will be economically completed by end-2018; residual operations and assets to be absorbed into the rest of Group from 2019 onwards2 2017 estimate based on currently available information and beliefs, expectations and opinions of management as of the date hereof. Actual results for 2017 may differ from any estimates confirmed revised 2
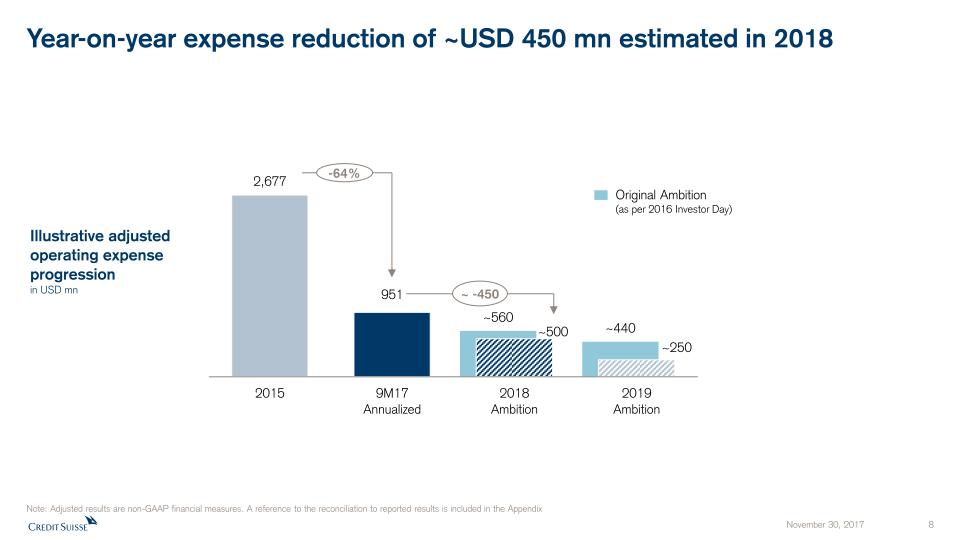
Year-on-year expense reduction of ~USD 450 mn estimated in 2018 Illustrative adjusted operating expense progression in USD mn Original Ambition(as per 2016 Investor Day) Note: Adjusted results are non-GAAP financial measures. A reference to the reconciliation to reported results is included in the Appendix -64% ~ -450
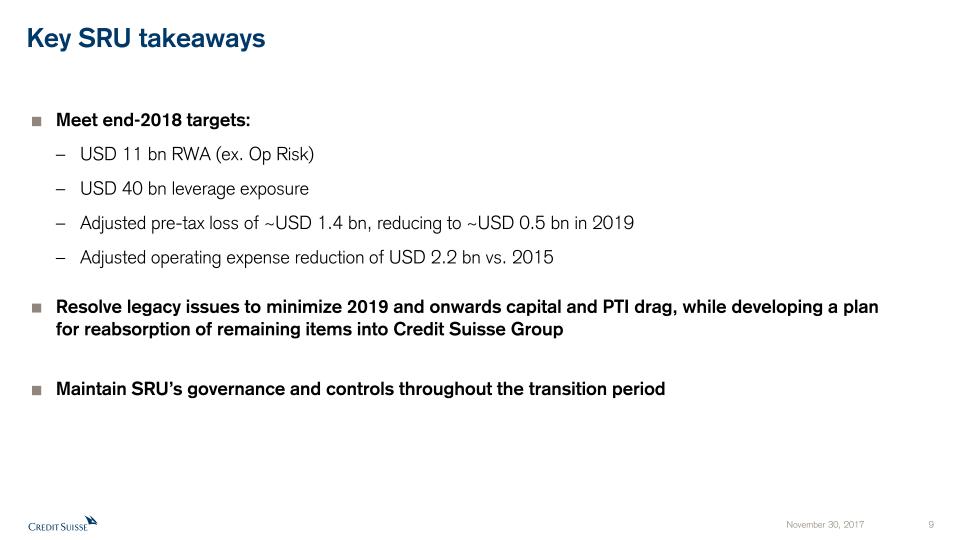
Key SRU takeaways Meet end-2018 targets:USD 11 bn RWA (ex. Op Risk)USD 40 bn leverage exposureAdjusted pre-tax loss of ~USD 1.4 bn, reducing to ~USD 0.5 bn in 2019Adjusted operating expense reduction of USD 2.2 bn vs. 2015Resolve legacy issues to minimize 2019 and onwards capital and PTI drag, while developing a plan for reabsorption of remaining items into Credit Suisse GroupMaintain SRU’s governance and controls throughout the transition period

Appendix November 30, 2017 10
Notes (1/2) General notes Specific notes * Our cost savings program is measured using adjusted operating expenses at constant FX rates. “Adjusted operating expenses at constant FX rates” and “adjusted non-compensation operating expenses at constant FX rates” include adjustments as made in all our disclosures for restructuring expenses, major litigation expenses and a goodwill impairment taken in 4Q15 as well as adjustments for certain accounting changes (which had not been in place at the launch of the cost savings program), debit valuation adjustments (DVA) related volatility and for FX, applying the following main currency exchange rates for1Q15: USD/CHF 0.9465, EUR/CHF 1.0482, GBP/CHF 1.4296, 2Q15: USD/CHF 0.9383, EUR/CHF 1.0418, GBP/CHF 1.4497,3Q15: USD/CHF 0.9684, EUR/CHF 1.0787, GBP/CHF 1.4891, 4Q15: USD/CHF 1.0010, EUR/CHF 1.0851, GBP/CHF 1.5123,1Q16: USD/CHF 0.9928, EUR/CHF 1.0941, GBP/CHF 1.4060, 2Q16: USD/CHF 0.9756, EUR/CHF 1.0956, GBP/CHF 1.3845,3Q16: USD/CHF 0.9728, EUR/CHF 1.0882, GBP/CHF 1.2764, 4Q16: USD/CHF 1.0101, EUR/CHF 1.0798, GBP/CHF 1.2451,1Q17: USD/CHF 0.9963, EUR/CHF 1.0670, GBP/CHF 1.2464, 2Q17: USD/CHF 0.9736, EUR/CHF 1.0881, GBP/CHF 1.2603,3Q17: USD/CHF 0.9645, EUR/CHF 1.1413, GBP/CHF 1.2695.These currency exchange rates are unweighted, i.e. a straight line average of monthly rates. We apply this calculation consistently for the periods under review. Adjusted non-compensation expenses are adjusted operating expenses excluding compensation and benefits. To calculate adjusted non-compensation expenses at constant FX rates, we subtract compensation and benefits (adjusted at constant FX rates in the manner described above) from adjusted operating expenses at constant FX rates.† Regulatory capital is calculated as the worst of 10% of RWA and 3.5% of leverage exposure. Return on regulatory capital is calculated using (adjusted) income after tax and assumes a tax rate of 30% and capital allocated based on the worst of 10% of average RWA and 3.5% of average leverage exposure. For the Markets business within the APAC division and for the Global Markets and Investment Banking & Capital Markets divisions, return on regulatory capital is based on US dollar denominated numbers. Adjusted return on regulatory capital is calculated using adjusted results, applying the same methodology to calculate return on regulatory capital. For reconciliation of adjusted to reported results, refer to the Appendix of either the CEO or CFO Investor Day 2017 presentation. Throughout the presentation rounding differences may occurUnless otherwise noted, all CET1 ratio, Tier 1 leverage ratio, risk-weighted assets and leverage exposure figures shown in this presentation are as of the end of the respective period and on a “look-through” basisGross and net margins are shown in basis pointsGross margin = adj. net revenues annualized / average AuM; net margin = adj. pre-tax income annualized / average AuMMandates penetration reflects advisory and discretionary mandates as percentage of total AuM

Notes (2/2) Abbreviations Adj. = Adjusted; AI = Artificial Intelligence; AM = Asset Management; AML = Anti-Money Laundering; APAC = Asia Pacific; AT1 = Additional Tier 1; AuM = Assets under Management; BCBS = Basel Committee on Banking Supervision; BIS = Bank for International Settlements; bps = basis points; CAGR = Compound Annual Growth Rate; CCRO = Chief Compliance and Regulatory Affairs Officer; CET1 = Common Equity Tier 1; CIC = Corporate & Institutional Clients; CIF = Customer/Client Information File; Corp. Ctr. = Corporate Center; CVA = Credit Valuation Adjustment; DCM = Debt Capital Markets; EAM = External Asset Manager; ECM = Equity Capital Markets; EM = Emerging Markets; EMEA = Europe, Middle East & Africa; EPS = Earnings Per Share; EQ = Equities; EU = European Union; FICC = Fixed Income, Currencies & Commodities; FINMA = Swiss Financial Market Supervisory Authority; FLP = Fund Linked Products; FRTB = Fundamental Review of the Trading Book; FX = Foreign Exchange; G10 = Group of Ten; GDP = Gross Domestic Product; GM = Global Markets; IBCM = Investment Banking & Capital Markets; IBD = Investment Banking Department; IC = Investment Consultant; IMF = International Monetary Fund; IP = Investor Products; IPO = Initial Public Offering; IRB = Internal Ratings Based; IT = Information Technology; ITS = International Trading Solutions; IWM = International Wealth Management; JV = Joint Venture; LSC = Large Swiss Corporates; M&A = Mergers & Acquisitions; MI = Management Information; Mkts = Markets; NNA = Net new assets; Op Risk = Operational Risk; PB = Private Banking; PC = Private Clients; PEP = Politically Exposed Person; pp = percentage points; PTI = Pre-tax income; PWMC = Private & Wealth Management Clients; RM = Relationship Manager(s); RoRC = Return on Regulatory Capital; RoTE = Return on Tangible Equity; RPA = Robotic Process Automation; RWA = Risk-weighted assets; SA-CCR = Standardized Approach to Counterparty Credit Risk; SME = Small and Medium-Sized Enterprises; SMG = Systematic Market-Making Group; SoW = Share of Wallet; SRU = Strategic Resolution Unit; SUB = Swiss Universal Bank; TBTF = Too Big To Fail; TBVS = Tangible Book Value per Share; (U)HNW(I) = (Ultra) High Net Worth (Individuals); VaR = Value-at-Risk; VIX = Volatility Index; WM = Wealth Management; WM&C = Wealth Management & Connected; YoY = Year over year; YTD = Year to Date

SIGNATURES
Pursuant to the requirements of the Securities Exchange Act of 1934, the registrants have duly caused this report to be signed on their behalf by the undersigned, thereunto duly authorized.
| CREDIT SUISSE GROUP AG and CREDIT SUISSE AG | ||
| (Registrants) | ||
| By: | /s/ Christian Schmid | |
| Christian Schmid | ||
| Managing Director | ||
| /s/ Claude Jehle | ||
| Claude Jehle | ||
| Date: November 30, 2017 | Director |