
| Key metrics | |||||||||||
| in / end of | % change | ||||||||||
| 1Q18 | 4Q17 | 1Q17 | QoQ | YoY | |||||||
| Credit Suisse (CHF million, except where indicated) | |||||||||||
| Net income/(loss) attributable to shareholders | 694 | (2,126) | 596 | – | 16 | ||||||
| Basic earnings/(loss) per share (CHF) | 0.27 | (0.83) | 0.27 | – | 0 | ||||||
| Diluted earnings/(loss) per share (CHF) | 0.26 | (0.83) | 0.26 | – | 0 | ||||||
| Return on equity attributable to shareholders (%) | 6.7 | (19.5) | 5.7 | – | – | ||||||
| Effective tax rate (%) | 34.3 | – | 11.6 | – | – | ||||||
| Core Results (CHF million, except where indicated) | |||||||||||
| Net revenues | 5,839 | 5,340 | 5,740 | 9 | 2 | ||||||
| Provision for credit losses | 48 | 40 | 29 | 20 | 66 | ||||||
| Total operating expenses | 4,328 | 4,704 | 4,502 | (8) | (4) | ||||||
| Income before taxes | 1,463 | 596 | 1,209 | 145 | 21 | ||||||
| Cost/income ratio (%) | 74.1 | 88.1 | 78.4 | – | – | ||||||
| Assets under management and net new assets (CHF billion) | |||||||||||
| Assets under management | 1,379.9 | 1,376.1 | 1,304.2 | 0.3 | 5.8 | ||||||
| Net new assets | 25.1 | 3.1 | 24.4 | – | 2.9 | ||||||
| Balance sheet statistics (CHF million) | |||||||||||
| Total assets | 809,052 | 796,289 | 811,979 | 2 | 0 | ||||||
| Net loans | 283,854 | 279,149 | 276,370 | 2 | 3 | ||||||
| Total shareholders' equity | 42,540 | 41,902 | 41,702 | 2 | 2 | ||||||
| Tangible shareholders' equity | 37,661 | 36,937 | 36,669 | 2 | 3 | ||||||
| Basel III regulatory capital and leverage statistics | |||||||||||
| CET1 ratio (%) | 12.9 | 13.5 | 12.7 | – | – | ||||||
| Look-through CET1 ratio (%) | 12.9 | 12.8 | 11.7 | – | – | ||||||
| Look-through CET1 leverage ratio (%) | 3.8 | 3.8 | 3.3 | – | – | ||||||
| Look-through tier 1 leverage ratio (%) | 5.1 | 5.2 | 4.6 | – | – | ||||||
| Share information | |||||||||||
| Shares outstanding (million) | 2,539.6 | 2,550.3 | 2,083.6 | 0 | 22 | ||||||
| of which common shares issued | 2,556.0 | 2,556.0 | 2,089.9 | 0 | 22 | ||||||
| of which treasury shares | (16.4) | (5.7) | (6.3) | 188 | 160 | ||||||
| Book value per share (CHF) | 16.75 | 16.43 | 20.01 | 2 | (16) | ||||||
| Tangible book value per share (CHF) | 14.83 | 14.48 | 17.60 | 2 | (16) | ||||||
| Market capitalization (CHF million) | 40,871 | 44,475 | 31,139 | (8) | 31 | ||||||
| Number of employees (full-time equivalents) | |||||||||||
| Number of employees | 46,370 | 46,840 | 46,640 | (1) | (1) | ||||||
| See relevant tables for additional information on these metrics. | |||||||||||
2
In 1Q18, we recorded net income attributable to shareholders of CHF 694 million. Diluted earnings per share were CHF 0.26 and return on equity attributable to shareholders was 6.7%. As of the end of 1Q18, our BIS CET1 ratio was 12.9% on a look-through basis.
| Results | |||||||||||
| in / end of | % change | ||||||||||
| 1Q18 | 4Q17 | 1Q17 | QoQ | YoY | |||||||
| Statements of operations (CHF million) | |||||||||||
| Net interest income | 1,585 | 1,565 | 1,633 | 1 | (3) | ||||||
| Commissions and fees | 3,046 | 3,104 | 3,046 | (2) | 0 | ||||||
| Trading revenues | 578 | 186 | 574 | 211 | 1 | ||||||
| Other revenues | 427 | 334 | 281 | 28 | 52 | ||||||
| Net revenues | 5,636 | 5,189 | 5,534 | 9 | 2 | ||||||
| Provision for credit losses | 48 | 43 | 53 | 12 | (9) | ||||||
| Compensation and benefits | 2,538 | 2,568 | 2,705 | (1) | (6) | ||||||
| General and administrative expenses | 1,508 | 1,935 | 1,601 | (22) | (6) | ||||||
| Commission expenses | 344 | 365 | 368 | (6) | (7) | ||||||
| Restructuring expenses | 144 | 137 | 137 | 5 | 5 | ||||||
| Total other operating expenses | 1,996 | 2,437 | 2,106 | (18) | (5) | ||||||
| Total operating expenses | 4,534 | 5,005 | 4,811 | (9) | (6) | ||||||
| Income before taxes | 1,054 | 141 | 670 | – | 57 | ||||||
| Income tax expense | 362 | 2,234 | 78 | (84) | 364 | ||||||
| Net income/(loss) | 692 | (2,093) | 592 | – | 17 | ||||||
| Net income/(loss) attributable to noncontrolling interests | (2) | 33 | (4) | – | (50) | ||||||
| Net income/(loss) attributable to shareholders | 694 | (2,126) | 596 | – | 16 | ||||||
| Statement of operations metrics (%) | |||||||||||
| Return on regulatory capital | 9.1 | 1.2 | 5.7 | – | – | ||||||
| Cost/income ratio | 80.4 | 96.5 | 86.9 | – | – | ||||||
| Effective tax rate | 34.3 | – | 11.6 | – | – | ||||||
| Earnings per share (CHF) | |||||||||||
| Basic earnings/(loss) per share | 0.27 | (0.83) | 0.27 | – | 0 | ||||||
| Diluted earnings/(loss) per share | 0.26 | (0.83) | 0.26 | – | 0 | ||||||
| Return on equity (%, annualized) | |||||||||||
| Return on equity attributable to shareholders | 6.7 | (19.5) | 5.7 | – | – | ||||||
| Return on tangible equity attributable to shareholders 1 | 7.6 | (22.0) | 6.5 | – | – | ||||||
| Balance sheet statistics (CHF million) | |||||||||||
| Total assets | 809,052 | 796,289 | 811,979 | 2 | 0 | ||||||
| Risk-weighted assets 2 | 271,015 | 271,680 | 263,737 | 0 | 3 | ||||||
| Leverage exposure 2 | 932,071 | 916,525 | 935,911 | 2 | 0 | ||||||
| Number of employees (full-time equivalents) | |||||||||||
| Number of employees | 46,370 | 46,840 | 46,640 | (1) | (1) | ||||||
1 Based on tangible equity attributable to shareholders, a non-GAAP financial measure, which is calculated by deducting goodwill and other intangible assets from total equity attributable to shareholders as presented in our balance sheet. Management believes that the return on tangible equity attributable to shareholders is meaningful as it allows consistent measurement of the performance of businesses without regard to whether the businesses were acquired. | |||||||||||
2 Disclosed on a look-through basis. | |||||||||||
3
In 1Q18, Credit Suisse reported net income attributable to shareholders of CHF 694 million compared to a net loss attributable to shareholders of CHF 2,126 million in 4Q17 and net income attributable to shareholders of CHF 596 million in 1Q17.
Net revenues of CHF 5,636 million increased 9% compared to 4Q17, primarily reflecting higher net revenues in Global Markets, Swiss Universal Bank and Asia Pacific, partially offset by lower net revenues in Corporate Center. The increase in Global Markets was driven by growth across most businesses, particularly in its International Trading Solutions (ITS) franchise. The increase in Swiss Universal Bank was mainly due to significantly higher transaction-based revenues and a gain on the sale of its investment in Euroclear. The increase in Asia Pacific was driven by higher revenues in its Markets business across all revenue categories and higher revenues in its Wealth Management & Connected business, reflecting higher Private Banking revenues, partially offset by lower advisory, underwriting and financing revenues. The decrease in the Corporate Center primarily reflected negative treasury results, partially offset by higher other revenues.
Net revenues increased 2% compared to 1Q17, primarily reflecting increased net revenues in International Wealth Management, Asia Pacific and Swiss Universal Bank, partially offset by lower net revenues in Corporate Center, Investment Banking & Capital Markets and Global Markets. The increase in International Wealth Management reflected higher revenues across all revenue categories. The increase in Asia Pacific was driven by higher revenues in its Wealth Management & Connected business, reflecting higher Private Banking revenues and higher advisory, underwriting and financing revenues, and higher revenues in its Markets business across all revenue categories. The increase in Swiss Universal Bank was mainly driven by the gain on the sale of its investment in Euroclear, higher transaction-based revenues and higher recurring commissions and fees. The decrease in the Corporate Center primarily reflected movements in treasury results. The decrease in Investment Banking & Capital Markets was due to lower revenues from advisory and other fees and debt underwriting activity. The decrease in Global Markets was due to a decline in underwriting and fixed income sales and trading.
Provision for credit losses in 1Q18 was CHF 48 million, primarily related to net provisions of CHF 34 million in Swiss Universal Bank and CHF 10 million in Asia Pacific.
Total operating expenses of CHF 4,534 million decreased 9% compared to 4Q17, mainly reflecting a 22% decrease in general and administrative expenses, primarily due to lower professional services fees and lower litigation provisions.
Total operating expenses decreased 6% compared to 1Q17, primarily reflecting a 6% decrease in compensation and benefits, mainly relating to lower deferred compensation expenses from prior-year awards and lower discretionary compensation expenses, and a 6% decrease in general and administrative expenses, mainly relating to lower professional services fees.
In 1Q18, we incurred CHF 144 million of restructuring expenses in connection with the implementation of our strategy, of which CHF 103 million were compensation and benefits-related expenses.
Income tax expense of CHF 362 million recorded in 1Q18 mainly reflected the impact of the geographical mix of results and the impact of a re-assessment of deferred tax assets in Switzerland, partially offset by the impact of tax benefits on the resolution of a tax litigation matter. Overall, net deferred tax assets decreased CHF 361 million to CHF 4,767 million during 1Q18, mainly driven by earnings, a foreign exchange impact and the re-assessment of deferred tax assets in Switzerland. Deferred tax assets on net operating losses decreased CHF 167 million to CHF 2,046 million during 1Q18. The Credit Suisse effective tax rate was 34.3% in 1Q18.
4
| Overview of Results | |||||||||||||||||||
in / end of | Swiss Universal Bank | International Wealth Management | Asia Pacific | Global Markets | Investment Banking & Capital Markets | Corporate Center | Core Results | Strategic Resolution Unit | Credit Suisse | ||||||||||
| 1Q18 (CHF million) | |||||||||||||||||||
| Net revenues | 1,431 | 1,403 | 991 | 1,546 | 528 | (60) | 5,839 | (203) | 5,636 | ||||||||||
| Provision for credit losses | 34 | (1) | 10 | 4 | 1 | 0 | 48 | 0 | 48 | ||||||||||
| Compensation and benefits | 487 | 587 | 411 | 617 | 316 | 55 | 2,473 | 65 | 2,538 | ||||||||||
| Total other operating expenses | 347 | 333 | 336 | 630 | 152 | 57 | 1,855 | 141 | 1,996 | ||||||||||
| of which general and administrative expenses | 258 | 254 | 259 | 453 | 121 | 37 | 1,382 | 126 | 1,508 | ||||||||||
| of which restructuring expenses | 28 | 26 | 6 | 42 | 30 | 1 | 133 | 11 | 144 | ||||||||||
| Total operating expenses | 834 | 920 | 747 | 1,247 | 468 | 112 | 4,328 | 206 | 4,534 | ||||||||||
| Income/(loss) before taxes | 563 | 484 | 234 | 295 | 59 | (172) | 1,463 | (409) | 1,054 | ||||||||||
| Return on regulatory capital (%) | 17.9 | 35.7 | 16.9 | 8.5 | 8.1 | – | 13.4 | – | 9.1 | ||||||||||
| Cost/income ratio (%) | 58.3 | 65.6 | 75.4 | 80.7 | 88.6 | – | 74.1 | – | 80.4 | ||||||||||
| Total assets | 217,179 | 89,313 | 107,851 | 239,432 | 15,380 | 109,734 | 778,889 | 30,163 | 809,052 | ||||||||||
| Goodwill | 603 | 1,518 | 1,473 | 451 | 622 | 0 | 4,667 | 0 | 4,667 | ||||||||||
| Risk-weighted assets 1 | 70,558 | 37,580 | 33,647 | 57,990 | 20,866 | 28,135 | 248,776 | 22,239 | 271,015 | ||||||||||
| Leverage exposure 1 | 246,997 | 93,921 | 115,709 | 282,778 | 38,731 | 110,767 | 888,903 | 43,168 | 932,071 | ||||||||||
| 4Q17 (CHF million) | |||||||||||||||||||
| Net revenues | 1,318 | 1,364 | 885 | 1,163 | 565 | 45 | 5,340 | (151) | 5,189 | ||||||||||
| Provision for credit losses | 15 | 14 | 7 | 8 | (1) | (3) | 40 | 3 | 43 | ||||||||||
| Compensation and benefits | 484 | 575 | 394 | 645 | 324 | 81 | 2,503 | 65 | 2,568 | ||||||||||
| Total other operating expenses | 386 | 435 | 308 | 705 | 135 | 232 | 2,201 | 236 | 2,437 | ||||||||||
| of which general and administrative expenses | 321 | 357 | 217 | 490 | 119 | 222 | 1,726 | 209 | 1,935 | ||||||||||
| of which restructuring expenses | (2) | 11 | 23 | 71 | 14 | 2 | 119 | 18 | 137 | ||||||||||
| Total operating expenses | 870 | 1,010 | 702 | 1,350 | 459 | 313 | 4,704 | 301 | 5,005 | ||||||||||
| Income/(loss) before taxes | 433 | 340 | 176 | (195) | 107 | (265) | 596 | (455) | 141 | ||||||||||
| Return on regulatory capital (%) | 13.5 | 25.2 | 13.3 | (5.5) | 15.0 | – | 5.6 | – | 1.2 | ||||||||||
| Cost/income ratio (%) | 66.0 | 74.0 | 79.3 | 116.1 | 81.2 | – | 88.1 | – | 96.5 | ||||||||||
| Total assets | 228,857 | 94,753 | 96,497 | 242,159 | 20,803 | 67,591 | 750,660 | 45,629 | 796,289 | ||||||||||
| Goodwill | 610 | 1,544 | 1,496 | 459 | 633 | 0 | 4,742 | 0 | 4,742 | ||||||||||
| Risk-weighted assets 1 | 65,572 | 38,256 | 31,474 | 58,858 | 20,058 | 23,849 | 238,067 | 33,613 | 271,680 | ||||||||||
| Leverage exposure 1 | 257,054 | 99,267 | 105,585 | 283,809 | 43,842 | 67,034 | 856,591 | 59,934 | 916,525 | ||||||||||
| 1Q17 (CHF million) | |||||||||||||||||||
| Net revenues | 1,354 | 1,221 | 881 | 1,609 | 606 | 69 | 5,740 | (206) | 5,534 | ||||||||||
| Provision for credit losses | 10 | 2 | 4 | 5 | 6 | 2 | 29 | 24 | 53 | ||||||||||
| Compensation and benefits | 483 | 571 | 424 | 690 | 348 | 101 | 2,617 | 88 | 2,705 | ||||||||||
| Total other operating expenses | 457 | 357 | 306 | 597 | 103 | 65 | 1,885 | 221 | 2,106 | ||||||||||
| of which general and administrative expenses | 325 | 267 | 220 | 438 | 101 | 43 | 1,394 | 207 | 1,601 | ||||||||||
| of which restructuring expenses | 52 | 36 | 19 | 20 | 2 | 1 | 130 | 7 | 137 | ||||||||||
| Total operating expenses | 940 | 928 | 730 | 1,287 | 451 | 166 | 4,502 | 309 | 4,811 | ||||||||||
| Income/(loss) before taxes | 404 | 291 | 147 | 317 | 149 | (99) | 1,209 | (539) | 670 | ||||||||||
| Return on regulatory capital (%) | 12.7 | 23.0 | 10.9 | 9.0 | 23.1 | – | 11.4 | – | 5.7 | ||||||||||
| Cost/income ratio (%) | 69.4 | 76.0 | 82.9 | 80.0 | 74.4 | – | 78.4 | – | 86.9 | ||||||||||
| Total assets | 232,334 | 89,927 | 96,291 | 242,745 | 19,997 | 69,045 | 750,339 | 61,640 | 811,979 | ||||||||||
| Goodwill | 616 | 1,580 | 1,522 | 468 | 645 | 0 | 4,831 | 0 | 4,831 | ||||||||||
| Risk-weighted assets 1 | 65,639 | 35,794 | 33,077 | 52,061 | 18,602 | 17,180 | 222,353 | 41,384 | 263,737 | ||||||||||
| Leverage exposure 1 | 257,397 | 93,629 | 106,474 | 287,456 | 44,018 | 64,219 | 853,193 | 82,718 | 935,911 | ||||||||||
1 Disclosed on a look-through basis. | |||||||||||||||||||
5
US tax reform – Tax Cuts and Jobs Act
The US tax reform enacted on December 22, 2017 resulted in a reduction of the federal corporate income tax rate from 35% to 21%, effective as of January 1, 2018.
The reform also introduced the base erosion and anti-abuse tax (BEAT), effective as of January 1, 2018. It is broadly levied on tax deductions created by certain payments, e.g. for interest and services, to affiliated group companies outside the US, in the case where the calculated tax based on a modified taxable income exceeds the amount of ordinary federal corporate income taxes paid. The tax rates applicable for banks are 6% for 2018, 11% for 2019 until 2025 and 13.5% from 2026 onward. On the basis of the current analysis of the BEAT tax regime, we continue to regard it as more likely than not that the Group will not be subject to this regime in 2018. However, there are significant uncertainties in the application of BEAT and this interpretation will be subject to review once further guidance has been issued by the US Department of Treasury.
As of the end of 1Q18, our Bank for International Settlements (BIS) common equity tier 1 (CET1) ratio was 12.9% and our risk-weighted assets were CHF 271.0 billion, both on a look-through basis.
As previously disclosed, the Swiss Financial Market Supervisory Authority FINMA (FINMA) imposed regulatory changes in 1Q18, primarily in respect of credit multipliers and banking book securitizations, which resulted in additional risk-weighted assets relating to credit risk of CHF 2.0 billion.
As a result of the significant reduction in the size of the Strategic Resolution Unit over the last two years, in 1Q18 we agreed with FINMA on a change to the methodology for the allocation of risk-weighted assets relating to operational risk to our businesses to reflect the changed portfolio in the Strategic Resolution Unit. Such risk-weighted assets relating to operational risk were reduced in the Strategic Resolution Unit by CHF 8.9 billion and allocated primarily to the Corporate Center, Global Markets, Investment Banking & Capital Markets and Asia Pacific.
As previously disclosed, Credit Suisse approached FINMA with a request to review the appropriateness of the level of the risk-weighted assets relating to operational risk in the Strategic Resolution Unit, given the progress in exiting businesses and reducing the size of the division over the last two years, with the aim of aligning reductions to the accelerated closure of the Strategic Resolution Unit by the end of 2018. In 1Q18, we concluded discussions with FINMA and reduced the level of risk-weighted assets relating to operational risk by CHF 2.5 billion, primarily in connection with the external transfer of our US private banking business, which was reflected in the Corporate Center.
With respect to leverage exposure, in 1Q18 we increased our centrally held balance of high-quality liquid assets (HQLA) by CHF 7.6 billion, which are allocated to the Corporate Center. In addition, in 1Q18 we have realigned the allocation of HQLA to the divisions to match their actual business usage in line with our internal risk management guidelines. Any excess HQLA held by legal entities above those levels for local regulatory purposes or economic requirements are allocated to the Corporate Center. HQLA allocated to the Corporate Center and Asia Pacific increased CHF 43.2 billion and CHF 5.0 billion, respectively, as a result of these measures and decreased CHF 13.8 billion, CHF 12.6 billion, CHF 6.7 billion, CHF 6.2 billion and CHF 1.2 billion in Swiss Universal Bank, Strategic Resolution Unit, International Wealth Management, Investment Banking & Capital Management and Global Markets, respectively.
> Refer to “Capital management” in II – Treasury, risk, balance sheet and off-balance sheet for further information.
In 1Q18, the Group adopted Accounting Standard Update 2014-09 “Revenue from Contracts with Customers”, a new US GAAP standard pertaining to revenue recognition, which was implemented using the modified retrospective approach with a transition adjustment reducing retained earnings by CHF 44 million, net of tax, without restating comparative periods. The new revenue recognition criteria require a change in the gross and net presentation of certain revenues and expenses, including in relation to certain underwriting and brokerage transactions, with most of the impact reflected in our Investment Banking & Capital Markets, Global Markets and Asia Pacific divisions. Both revenues and expenses increased CHF 15 million in Investment Banking & Capital Markets and CHF 8 million in Global Markets and decreased CHF 7 million in Asia Pacific.
In 1Q18, the Group also adopted a new US GAAP standard pertaining to the presentation of net periodic benefit costs of pension and other post-retirement costs, which was implemented retrospectively by restating comparative periods. The new presentation criteria require the service cost component of the net periodic benefit cost to be presented as a compensation expense while other components are to be presented as non-compensation expenses.
In 1Q18, Core Results net revenues of CHF 5,839 million increased 9% compared to 4Q17, primarily reflecting higher net revenues in Global Markets, Asia Pacific and Swiss Universal Bank, partially offset by lower net revenues in Corporate Center. Provision for credit losses was CHF 48 million, primarily related to a net provision for credit losses of CHF 34 million in Swiss Universal Bank and CHF 10 million in Asia Pacific. Total operating expenses of CHF 4,328 million decreased 8% compared to 4Q17, mainly reflecting a 20% decrease in general and administrative expenses. The decrease in general and administrative expenses was primarily related to the Corporate Center, International Wealth Management and Swiss Universal Bank.
Core Results net revenues increased 2% compared to 1Q17, primarily reflecting increased net revenues in International Wealth Management, Asia Pacific and Swiss Universal Bank, partially offset by lower net revenues in Corporate Center, Investment Banking & Capital Markets and Global Markets. Total operating expenses decreased 4% compared to 1Q17, primarily reflecting a 6% decrease in compensation and benefits. The decrease in compensation and benefits primarily related to Global Markets, the Corporate Center and Investment Banking & Capital Markets.
6
Reconciliation of adjusted results
Adjusted results referred to in this earnings release are non-GAAP financial measures that exclude goodwill impairment and certain other revenues and expenses included in our reported results. Management believes that adjusted results provide a useful presentation of our operating results for purposes of assessing our Group and divisional performance consistently over time, on a basis that excludes items that management does not consider representative of our underlying performance. Provided below is a reconciliation of our adjusted results to the most directly comparable US GAAP measures.
in | Swiss Universal Bank | International Wealth Management | Asia Pacific | Global Markets | Investment Banking & Capital Markets | Corporate Center | Core Results | Strategic Resolution Unit | Credit Suisse | ||||||||||
| 1Q18 (CHF million) | |||||||||||||||||||
| Net revenues | 1,431 | 1,403 | 991 | 1,546 | 528 | (60) | 5,839 | (203) | 5,636 | ||||||||||
| Real estate gains | 0 | 0 | 0 | 0 | 0 | 0 | 0 | (1) | (1) | ||||||||||
| (Gains)/losses on business sales | (37) | (36) | 0 | 0 | 0 | 0 | (73) | 0 | (73) | ||||||||||
| Net revenues adjusted | 1,394 | 1,367 | 991 | 1,546 | 528 | (60) | 5,766 | (204) | 5,562 | ||||||||||
| Provision for credit losses | 34 | (1) | 10 | 4 | 1 | 0 | 48 | 0 | 48 | ||||||||||
| Total operating expenses | 834 | 920 | 747 | 1,247 | 468 | 112 | 4,328 | 206 | 4,534 | ||||||||||
| Restructuring expenses | (28) | (26) | (6) | (42) | (30) | (1) | (133) | (11) | (144) | ||||||||||
| Major litigation provisions | 0 | 0 | (48) | 0 | 0 | 0 | (48) | (37) | (85) | ||||||||||
| Total operating expenses adjusted | 806 | 894 | 693 | 1,205 | 438 | 111 | 4,147 | 158 | 4,305 | ||||||||||
| Income/(loss) before taxes | 563 | 484 | 234 | 295 | 59 | (172) | 1,463 | (409) | 1,054 | ||||||||||
| Total adjustments | (9) | (10) | 54 | 42 | 30 | 1 | 108 | 47 | 155 | ||||||||||
| Adjusted income/(loss) before taxes | 554 | 474 | 288 | 337 | 89 | (171) | 1,571 | (362) | 1,209 | ||||||||||
| Adjusted return on regulatory capital (%) | 17.6 | 34.9 | 20.8 | 9.8 | 12.4 | – | 14.4 | – | 10.5 | ||||||||||
| 4Q17 (CHF million) | |||||||||||||||||||
| Net revenues | 1,318 | 1,364 | 885 | 1,163 | 565 | 45 | 5,340 | (151) | 5,189 | ||||||||||
| (Gains)/losses on business sales | 0 | 28 | 0 | 0 | 0 | 0 | 28 | 0 | 28 | ||||||||||
| Net revenues adjusted | 1,318 | 1,392 | 885 | 1,163 | 565 | 45 | 5,368 | (151) | 5,217 | ||||||||||
| Provision for credit losses | 15 | 14 | 7 | 8 | (1) | (3) | 40 | 3 | 43 | ||||||||||
| Total operating expenses | 870 | 1,010 | 702 | 1,350 | 459 | 313 | 4,704 | 301 | 5,005 | ||||||||||
| Restructuring expenses | 2 | (11) | (23) | (71) | (14) | (2) | (119) | (18) | (137) | ||||||||||
| Major litigation provisions | (7) | (31) | 0 | 0 | 0 | (127) | (165) | (90) | (255) | ||||||||||
| Expenses related to business sales | 0 | 0 | 0 | (8) | 0 | 0 | (8) | 0 | (8) | ||||||||||
| Total operating expenses adjusted | 865 | 968 | 679 | 1,271 | 445 | 184 | 4,412 | 193 | 4,605 | ||||||||||
| Income/(loss) before taxes | 433 | 340 | 176 | (195) | 107 | (265) | 596 | (455) | 141 | ||||||||||
| Total adjustments | 5 | 70 | 23 | 79 | 14 | 129 | 320 | 108 | 428 | ||||||||||
| Adjusted income/(loss) before taxes | 438 | 410 | 199 | (116) | 121 | (136) | 916 | (347) | 569 | ||||||||||
| Adjusted return on regulatory capital (%) | 13.7 | 30.5 | 15.0 | (3.3) | 16.9 | – | 8.6 | – | 5.0 | ||||||||||
| 1Q17 (CHF million) | |||||||||||||||||||
| Net revenues | 1,354 | 1,221 | 881 | 1,609 | 606 | 69 | 5,740 | (206) | 5,534 | ||||||||||
| (Gains)/losses on business sales | 0 | 0 | 0 | 0 | 0 | 23 | 23 | (38) | (15) | ||||||||||
| Net revenues adjusted | 1,354 | 1,221 | 881 | 1,609 | 606 | 92 | 5,763 | (244) | 5,519 | ||||||||||
| Provision for credit losses | 10 | 2 | 4 | 5 | 6 | 2 | 29 | 24 | 53 | ||||||||||
| Total operating expenses | 940 | 928 | 730 | 1,287 | 451 | 166 | 4,502 | 309 | 4,811 | ||||||||||
| Restructuring expenses | (52) | (36) | (19) | (20) | (2) | (1) | (130) | (7) | (137) | ||||||||||
| Major litigation provisions | (27) | 0 | 0 | 0 | 0 | 0 | (27) | (70) | (97) | ||||||||||
| Total operating expenses adjusted | 861 | 892 | 711 | 1,267 | 449 | 165 | 4,345 | 232 | 4,577 | ||||||||||
| Income/(loss) before taxes | 404 | 291 | 147 | 317 | 149 | (99) | 1,209 | (539) | 670 | ||||||||||
| Total adjustments | 79 | 36 | 19 | 20 | 2 | 24 | 180 | 39 | 219 | ||||||||||
| Adjusted income/(loss) before taxes | 483 | 327 | 166 | 337 | 151 | (75) | 1,389 | (500) | 889 | ||||||||||
| Adjusted return on regulatory capital (%) | 15.1 | 25.8 | 12.3 | 9.6 | 23.4 | – | 13.1 | – | 7.5 | ||||||||||
7
In 1Q18, we reported income before taxes of CHF 563 million and net revenues of CHF 1,431 million. Income before taxes was 30% and 39% higher compared to 4Q17 and 1Q17, respectively. Adjusted income before taxes increased 26% and 15% compared to 4Q17 and 1Q17, respectively.
1Q18 results
In 1Q18, we reported income before taxes of CHF 563 million and net revenues of CHF 1,431 million. Compared to 4Q17, net revenues were 9% higher, mainly due to significantly higher transaction-based revenues and a gain of CHF 37 million on the sale of our investment in Euroclear reflected in other revenues. Provision for credit losses was CHF 34 million compared to CHF 15 million in 4Q17. Total operating expenses were 4% lower compared to 4Q17, primarily reflecting significantly lower general and administrative expenses, partially offset by higher restructuring expenses.
Compared to 1Q17, net revenues were 6% higher, mainly driven by the gain on the sale of our investment in Euroclear reflected in other revenues, higher transaction-based revenues and higher recurring commissions and fees. Provision for credit losses was CHF 34 million compared to CHF 10 million in 1Q17. Total operating expenses were 11% lower compared to 1Q17, primarily reflecting significantly lower general and administrative expenses, significantly lower restructuring expenses and lower commission expenses.
Adjusted income before taxes of CHF 554 million was 26% and 15% higher compared to 4Q17 and 1Q17, respectively.
Capital and leverage metrics
As of the end of 1Q18, we reported risk-weighted assets of CHF 70.6 billion, an increase of CHF 5.0 billion compared to the end of 4Q17, driven by changes in certain synthetic loan portfolio securitizations, methodology and policy changes mainly reflecting the phase-in of the Swiss mortgage multipliers and business growth. Leverage exposure was CHF 247.0 billion, reflecting a decrease of CHF 10.1 billion compared to the end of 4Q17, driven by the realignment of our HQLA allocations, partially offset by business growth.
| Divisional results | |||||||||||
| in / end of | % change | ||||||||||
| 1Q18 | 4Q17 | 1Q17 | QoQ | YoY | |||||||
| Statements of operations (CHF million) | |||||||||||
| Net revenues | 1,431 | 1,318 | 1,354 | 9 | 6 | ||||||
| Provision for credit losses | 34 | 15 | 10 | 127 | 240 | ||||||
| Compensation and benefits | 487 | 484 | 483 | 1 | 1 | ||||||
| General and administrative expenses | 258 | 321 | 325 | (20) | (21) | ||||||
| Commission expenses | 61 | 67 | 80 | (9) | (24) | ||||||
| Restructuring expenses | 28 | (2) | 52 | – | (46) | ||||||
| Total other operating expenses | 347 | 386 | 457 | (10) | (24) | ||||||
| Total operating expenses | 834 | 870 | 940 | (4) | (11) | ||||||
| Income before taxes | 563 | 433 | 404 | 30 | 39 | ||||||
| Statement of operations metrics (%) | |||||||||||
| Return on regulatory capital | 17.9 | 13.5 | 12.7 | – | – | ||||||
| Cost/income ratio | 58.3 | 66.0 | 69.4 | – | – | ||||||
| Number of employees and relationship managers | |||||||||||
| Number of employees (full-time equivalents) | 12,420 | 12,600 | 12,740 | (1) | (3) | ||||||
| Number of relationship managers | 1,850 | 1,840 | 1,870 | 1 | (1) | ||||||
8
| Divisional results (continued) | |||||||||||
| in / end of | % change | ||||||||||
| 1Q18 | 4Q17 | 1Q17 | QoQ | YoY | |||||||
| Net revenue detail (CHF million) | |||||||||||
| Private Clients | 762 | 726 | 711 | 5 | 7 | ||||||
| Corporate & Institutional Clients | 669 | 592 | 643 | 13 | 4 | ||||||
| Net revenues | 1,431 | 1,318 | 1,354 | 9 | 6 | ||||||
| Net revenue detail (CHF million) | |||||||||||
| Net interest income | 731 | 729 | 726 | 0 | 1 | ||||||
| Recurring commissions and fees | 380 | 367 | 362 | 4 | 5 | ||||||
| Transaction-based revenues | 299 | 235 | 280 | 27 | 7 | ||||||
| Other revenues | 21 | (13) | (14) | – | – | ||||||
| Net revenues | 1,431 | 1,318 | 1,354 | 9 | 6 | ||||||
| Provision for credit losses (CHF million) | |||||||||||
| New provisions | 47 | 32 | 38 | 47 | 24 | ||||||
| Releases of provisions | (13) | (17) | (28) | (24) | (54) | ||||||
| Provision for credit losses | 34 | 15 | 10 | 127 | 240 | ||||||
| Balance sheet statistics (CHF million) | |||||||||||
| Total assets | 217,179 | 228,857 | 232,334 | (5) | (7) | ||||||
| Net loans | 166,537 | 165,041 | 166,078 | 1 | 0 | ||||||
| of which Private Clients | 112,033 | 111,222 | 110,190 | 1 | 2 | ||||||
| Risk-weighted assets | 70,558 | 65,572 | 65,639 | 8 | 7 | ||||||
| Leverage exposure | 246,997 | 257,054 | 257,397 | (4) | (4) | ||||||
| Net interest income includes a term spread credit on stable deposit funding and a term spread charge on loans. Recurring commissions and fees includes investment product management, discretionary mandate and other asset management-related fees, fees for general banking products and services and revenues from wealth structuring solutions. Transaction-based revenues arise primarily from brokerage and product issuing fees, fees from foreign exchange client transactions, trading and sales income, equity participations income and other transaction-based income. Other revenues include fair value gains/(losses) on synthetic securitized loan portfolios and other gains and losses. | |||||||||||
| Reconciliation of adjusted results | |||||||||||||||||||
| Private Clients | Corporate & Institutional Clients | Swiss Universal Bank | |||||||||||||||||
| in | 1Q18 | 4Q17 | 1Q17 | 1Q18 | 4Q17 | 1Q17 | 1Q18 | 4Q17 | 1Q17 | ||||||||||
| Adjusted results (CHF million) | |||||||||||||||||||
| Net revenues | 762 | 726 | 711 | 669 | 592 | 643 | 1,431 | 1,318 | 1,354 | ||||||||||
| Gains on business sales | (19) | 0 | 0 | (18) | 0 | 0 | (37) | 0 | 0 | ||||||||||
| Adjusted net revenues | 743 | 726 | 711 | 651 | 592 | 643 | 1,394 | 1,318 | 1,354 | ||||||||||
| Provision for credit losses | 10 | 10 | 12 | 24 | 5 | (2) | 34 | 15 | 10 | ||||||||||
| Total operating expenses | 487 | 504 | 538 | 347 | 366 | 402 | 834 | 870 | 940 | ||||||||||
| Restructuring expenses | (22) | 1 | (47) | (6) | 1 | (5) | (28) | 2 | (52) | ||||||||||
| Major litigation provisions | 0 | (2) | 0 | 0 | (5) | (27) | 0 | (7) | (27) | ||||||||||
| Adjusted total operating expenses | 465 | 503 | 491 | 341 | 362 | 370 | 806 | 865 | 861 | ||||||||||
| Income before taxes | 265 | 212 | 161 | 298 | 221 | 243 | 563 | 433 | 404 | ||||||||||
| Total adjustments | 3 | 1 | 47 | (12) | 4 | 32 | (9) | 5 | 79 | ||||||||||
| Adjusted income before taxes | 268 | 213 | 208 | 286 | 225 | 275 | 554 | 438 | 483 | ||||||||||
| Adjusted return on regulatory capital (%) | – | – | – | – | – | – | 17.6 | 13.7 | 15.1 | ||||||||||
| Adjusted results are non-GAAP financial measures. Refer to "Reconciliation of adjusted results" in Credit Suisse for further information. | |||||||||||||||||||
9
Private clients
In 1Q18, income before taxes of CHF 265 million was 25% higher compared to 4Q17, with higher net revenues and lower total operating expenses. Compared to 1Q17, income before taxes increased 65%, primarily reflecting higher net revenues and lower total operating expenses. Adjusted income before taxes of CHF 268 million increased 26% and 29% compared to 4Q17 and 1Q17, respectively.
Net revenues
Compared to 4Q17, net revenues of CHF 762 million were 5% higher, mainly driven by significantly higher transaction-based revenues and a gain of CHF 19 million on the sale of our investment in Euroclear reflected in other revenues. Transaction-based revenues of CHF 109 million were 22% higher, mainly due to significantly increased revenues from ITS and significantly higher brokerage and product issuing fees. Net interest income of CHF 428 million was stable with stable loan margins and higher deposit margins on stable average loan and deposit volumes. Recurring commissions and fees of CHF 206 million were stable. Adjusted net revenues of CHF 743 million were slightly higher compared to 4Q17.
Compared to 1Q17, net revenues increased 7% reflecting higher revenues across all revenue categories, including the gain on the sale of our investment in Euroclear. Net interest income was 4% higher with slightly higher loan margins on slightly higher average loan volumes and higher deposit margins on higher average deposit volumes. Recurring commissions and fees increased 5%, primarily due to increased investment advisory fees, higher discretionary mandate management fees and slightly higher security account and custody services fees. Transaction-based revenues were 9% higher, mainly driven by higher fees from foreign exchange client business and higher brokerage and product issuing fees. Adjusted net revenues were 5% higher compared to 1Q17.
Provision for credit losses
The Private Clients loan portfolio is substantially comprised of residential mortgages in Switzerland and loans collateralized by securities and, to a lesser extent, consumer finance loans.
In 1Q18, Private Clients recorded provision for credit losses of CHF 10 million compared to CHF 10 million in 4Q17 and CHF 12 million in 1Q17. The provisions were primarily related to our consumer finance business.
| Results - Private Clients | |||||||||||
| in / end of | % change | ||||||||||
| 1Q18 | 4Q17 | 1Q17 | QoQ | YoY | |||||||
| Statements of operations (CHF million) | |||||||||||
| Net revenues | 762 | 726 | 711 | 5 | 7 | ||||||
| Provision for credit losses | 10 | 10 | 12 | 0 | (17) | ||||||
| Compensation and benefits | 277 | 275 | 264 | 1 | 5 | ||||||
| General and administrative expenses | 162 | 200 | 181 | (19) | (10) | ||||||
| Commission expenses | 26 | 30 | 46 | (13) | (43) | ||||||
| Restructuring expenses | 22 | (1) | 47 | – | (53) | ||||||
| Total other operating expenses | 210 | 229 | 274 | (8) | (23) | ||||||
| Total operating expenses | 487 | 504 | 538 | (3) | (9) | ||||||
| Income before taxes | 265 | 212 | 161 | 25 | 65 | ||||||
| Statement of operations metrics (%) | |||||||||||
| Cost/income ratio | 63.9 | 69.4 | 75.7 | – | – | ||||||
| Net revenue detail (CHF million) | |||||||||||
| Net interest income | 428 | 428 | 413 | 0 | 4 | ||||||
| Recurring commissions and fees | 206 | 208 | 197 | (1) | 5 | ||||||
| Transaction-based revenues | 109 | 89 | 100 | 22 | 9 | ||||||
| Other revenues | 19 | 1 | 1 | – | – | ||||||
| Net revenues | 762 | 726 | 711 | 5 | 7 | ||||||
| Margins on assets under management (annualized) (bp) | |||||||||||
| Gross margin 1 | 147 | 140 | 146 | – | – | ||||||
| Net margin 2 | 51 | 41 | 33 | – | – | ||||||
| Number of relationship managers | |||||||||||
| Number of relationship managers | 1,310 | 1,300 | 1,330 | 1 | (2) | ||||||
1 Net revenues divided by average assets under management. | |||||||||||
2 Income before taxes divided by average assets under management. | |||||||||||
10
Total operating expenses
Compared to 4Q17, total operating expenses of CHF 487 million were slightly lower mainly reflecting significantly lower general and administrative expenses, partially offset by higher restructuring expenses. General and administrative expenses of CHF 162 million were 19% lower, primarily due to lower advertising and marketing expenses and lower professional and contractor services fees. Restructuring expenses increased CHF 23 million to CHF 22 million. Compensation and benefits of CHF 277 million were stable with higher deferred compensation expenses from prior-year awards and higher discretionary compensation expenses, offset by lower allocated corporate function costs and lower salary expenses. Adjusted total operating expenses of CHF 465 million decreased 8% compared to 4Q17.
Compared to 1Q17, total operating expenses decreased 9%, reflecting significantly lower restructuring expenses, lower commission expenses and lower general and administrative expenses, partially offset by higher compensation and benefits. General and administrative expenses were 10% lower, primarily due to decreased allocated corporate function costs and lower professional and contractor services fees. Compensation and benefits were 5% higher, primarily reflecting higher deferred compensation expenses from prior-year awards and a lower release of Swiss holiday accruals in 1Q18. Adjusted total operating expenses decreased 5% compared to 1Q17.
Gross margin
Our gross margin was 147 basis points in 1Q18, seven basis points higher compared to 4Q17, mainly driven by higher transaction-based revenues and the gain on the sale of our investment in Euroclear on stable average assets under management. Compared to 1Q17, our gross margin increased one basis point, with higher revenues across all revenue categories mostly offset by a 6.5% increase in average assets under management. On the basis of adjusted net revenues, our gross margin was 143 basis points in 1Q18, three basis points higher compared to 4Q17 and three basis points lower compared to 1Q17.
> Refer to “Assets under management” for further information.
Net margin
Our net margin was 51 basis points in 1Q18, ten basis points higher compared to 4Q17, reflecting higher net revenues and lower total operating expenses on stable average assets under management. Compared to 1Q17, our net margin was 18 basis points higher, primarily due to higher net revenues and lower total operating expenses, partially offset by the 6.5% higher average assets under management. On the basis of adjusted income before taxes, our net margin was 52 basis points in 1Q18, eleven basis points higher compared to 4Q17 and nine basis points higher compared to 1Q17.
As of the end of 1Q18, assets under management of CHF 206.7 billion were CHF 1.6 billion lower compared to the end of 4Q17, mainly driven by unfavorable market movements, partially offset by net new assets of CHF 2.7 billion. Net new assets reflected positive contributions from all businesses.
11
| Assets under management – Private Clients | |||||||||||
| in / end of | % change | ||||||||||
| 1Q18 | 4Q17 | 1Q17 | QoQ | YoY | |||||||
| Assets under management (CHF billion) | |||||||||||
| Assets under management | 206.7 | 208.3 | 198.2 | (0.8) | 4.3 | ||||||
| Average assets under management | 207.8 | 208.0 | 195.2 | (0.1) | 6.5 | ||||||
| Assets under management by currency (CHF billion) | |||||||||||
| USD | 30.3 | 30.5 | 29.8 | (0.7) | 1.7 | ||||||
| EUR | 23.1 | 22.9 | 19.5 | 0.9 | 18.5 | ||||||
| CHF | 143.2 | 145.0 | 140.4 | (1.2) | 2.0 | ||||||
| Other | 10.1 | 9.9 | 8.5 | 2.0 | 18.8 | ||||||
| Assets under management | 206.7 | 208.3 | 198.2 | (0.8) | 4.3 | ||||||
| Growth in assets under management (CHF billion) | |||||||||||
| Net new assets | 2.7 | 0.0 | 2.0 | – | – | ||||||
| Other effects | (4.3) | 2.2 | 4.0 | – | – | ||||||
| of which market movements | (3.6) | 2.5 | 4.8 | – | – | ||||||
| of which foreign exchange | (0.4) | 0.8 | (0.6) | – | – | ||||||
| of which other | (0.3) | (1.1) | (0.2) | – | – | ||||||
| Growth in assets under management | (1.6) | 2.2 | 6.0 | – | – | ||||||
| Growth in assets under management (annualized) (%) | |||||||||||
| Net new assets | 5.2 | 0.0 | 4.2 | – | – | ||||||
| Other effects | (8.3) | 4.3 | 8.3 | – | – | ||||||
| Growth in assets under management (annualized) | (3.1) | 4.3 | 12.5 | – | – | ||||||
| Growth in assets under management (rolling four-quarter average) (%) | |||||||||||
| Net new assets | 2.7 | 2.4 | 1.0 | – | – | ||||||
| Other effects | 1.6 | 6.0 | 5.7 | – | – | ||||||
| Growth in assets under management (rolling four-quarter average) | 4.3 | 8.4 | 6.7 | – | – | ||||||
Corporate & institutional clients
In 1Q18, income before taxes of CHF 298 million was 35% higher compared to 4Q17, reflecting higher net revenues and lower total operating expenses, partially offset by higher provision for credit losses. Compared to 1Q17, income before taxes increased 23%, primarily due to lower total operating expenses and higher net revenues, partially offset by higher provision for credit losses. Adjusted income before taxes of CHF 286 million increased 27% and 4% compared to 4Q17 and 1Q17, respectively.
Net revenues
Compared to 4Q17, net revenues of CHF 669 million were 13% higher with higher revenues across all revenue categories. Transaction-based revenues of CHF 190 million were 30% higher, primarily due to increased revenues from ITS, higher revenues from our Swiss investment banking business and increased client activity. The increase in other revenues reflected a gain of CHF 18 million on the sale of our investment in Euroclear. Recurring commissions and fees of CHF 174 million were 9% higher, mainly due to increased wealth structuring solution fees and higher fees from lending activities. Net interest income of CHF 303 million was stable, with stable loan margins on stable average loan volumes and higher deposit margins on lower average deposit volumes. Adjusted net revenues of CHF 651 million increased 10% compared to 4Q17.
Compared to 1Q17, net revenues were 4% higher, reflecting the gain on the sale of our investment in Euroclear reflected in other revenues, higher transaction-based revenues and higher recurring commissions and fees, partially offset by slightly lower net interest income. Transaction-based revenues increased 6%, mainly due to higher fees from foreign exchange client business. Recurring commissions and fees increased 5%, primarily reflecting increased wealth structuring solution fees and higher investment product management fees, partially offset by lower fees from lending activities. Net interest income decreased slightly with slightly higher loan margins on slightly lower average loan volumes, partially offset by higher deposit margins on lower average deposit volumes. Adjusted net revenues were stable compared to 1Q17.
12
| Results – Corporate & Institutional Clients | |||||||||||
| in / end of | % change | ||||||||||
| 1Q18 | 4Q17 | 1Q17 | QoQ | YoY | |||||||
| Statements of operations (CHF million) | |||||||||||
| Net revenues | 669 | 592 | 643 | 13 | 4 | ||||||
| Provision for credit losses | 24 | 5 | (2) | 380 | – | ||||||
| Compensation and benefits | 210 | 209 | 219 | 0 | (4) | ||||||
| General and administrative expenses | 96 | 121 | 144 | (21) | (33) | ||||||
| Commission expenses | 35 | 37 | 34 | (5) | 3 | ||||||
| Restructuring expenses | 6 | (1) | 5 | – | 20 | ||||||
| Total other operating expenses | 137 | 157 | 183 | (13) | (25) | ||||||
| Total operating expenses | 347 | 366 | 402 | (5) | (14) | ||||||
| Income before taxes | 298 | 221 | 243 | 35 | 23 | ||||||
| Statement of operations metrics (%) | |||||||||||
| Cost/income ratio | 51.9 | 61.8 | 62.5 | – | – | ||||||
| Net revenue detail (CHF million) | |||||||||||
| Net interest income | 303 | 301 | 313 | 1 | (3) | ||||||
| Recurring commissions and fees | 174 | 159 | 165 | 9 | 5 | ||||||
| Transaction-based revenues | 190 | 146 | 180 | 30 | 6 | ||||||
| Other revenues | 2 | (14) | (15) | – | – | ||||||
| Net revenues | 669 | 592 | 643 | 13 | 4 | ||||||
| Number of relationship managers | |||||||||||
| Number of relationship managers | 540 | 540 | 540 | 0 | 0 | ||||||
Provision for credit losses
The Corporate & Institutional Clients loan portfolio has relatively low concentrations and is mainly secured by real estate, securities and other financial collateral.
In 1Q18, Corporate & Institutional Clients recorded provision for credit losses of CHF 24 million compared to CHF 5 million in 4Q17 and a release of provision for credit losses of CHF 2 million in 1Q17. The increase compared to 4Q17 and 1Q17 reflected higher new provisions mainly related to two individual cases as well as a recovery case of CHF 8 million in 4Q17 and a release of provision for credit losses in 1Q17.
Total operating expenses
Compared to 4Q17, total operating expenses of CHF 347 million were 5% lower, with significantly lower general and administrative expenses, partially offset by higher restructuring expenses. General and administrative expenses of CHF 96 million decreased 21%, mainly reflecting lower allocated corporate function costs, lower professional services fees and lower litigation provisions. Compensation and benefits of CHF 210 million were stable with higher discretionary compensation expenses and higher deferred compensation expenses from prior-year awards, offset by lower salary expenses and lower social security expenses.
Compared to 1Q17, total operating expenses decreased 14%, primarily due to significantly lower general and administrative expenses and lower compensation and benefits. General and administrative expenses decreased 33% mainly due to the litigation provisions in 1Q17. Compensation and benefits decreased 4%, primarily driven by lower allocated corporate function costs and lower salary expenses. Adjusted total operating expenses of CHF 341 million decreased 8% compared to 1Q17.
As of the end of 1Q18, assets under management of CHF 352.0 billion were CHF 2.7 billion lower compared to the end of 4Q17, mainly driven by unfavorable market movements, partially offset by net new assets of CHF 3.8 billion.
13
In 1Q18, we reported income before taxes of CHF 484 million and net revenues of CHF 1,403 million. Income before taxes was 42% and 66% higher compared to 4Q17 and 1Q17, respectively. Adjusted income before taxes increased 16% and 45% compared to 4Q17 and 1Q17, respectively.
1Q18 results
In 1Q18, we reported income before taxes of CHF 484 million and net revenues of CHF 1,403 million. Compared to 4Q17, net revenues increased slightly, primarily driven by higher other revenues partially offset by lower transaction- and performance-based revenues, mainly as 4Q17 included year-end performance and placement fees. In 1Q18, a release of provision for credit losses of CHF 1 million was recorded compared to provision for credit losses of CHF 14 million in 4Q17. Total operating expenses were 9% lower compared to 4Q17, mainly driven by significantly lower general and administrative expenses.
Compared to 1Q17, net revenues increased 15%, reflecting higher revenues across all revenue categories. In 1Q18, a release of provision for credit losses of CHF 1 million was recorded compared to provision for credit losses of CHF 2 million in 1Q17. Total operating expenses were stable with lower general and administrative expenses and lower restructuring expenses offset by slightly higher compensation and benefits.
Adjusted income before taxes of CHF 474 million increased 16% and 45% compared to 4Q17 and 1Q17, respectively.
Capital and leverage metrics
As of the end of 1Q18, we reported risk-weighted assets of CHF 37.6 billion, slightly lower compared to the end of 4Q17, primarily driven by the new operational risk allocation key and foreign exchange-related movements. This decrease was partially offset by business growth. Leverage exposure of CHF 93.9 billion was 5% lower compared to the end of 4Q17, mainly driven by the realignment of our HQLA allocations, partially offset by business growth.
| Divisional results | |||||||||||
| in / end of | % change | ||||||||||
| 1Q18 | 4Q17 | 1Q17 | QoQ | YoY | |||||||
| Statements of operations (CHF million) | |||||||||||
| Net revenues | 1,403 | 1,364 | 1,221 | 3 | 15 | ||||||
| Provision for credit losses | (1) | 14 | 2 | – | – | ||||||
| Compensation and benefits | 587 | 575 | 571 | 2 | 3 | ||||||
| General and administrative expenses | 254 | 357 | 267 | (29) | (5) | ||||||
| Commission expenses | 53 | 67 | 54 | (21) | (2) | ||||||
| Restructuring expenses | 26 | 11 | 36 | 136 | (28) | ||||||
| Total other operating expenses | 333 | 435 | 357 | (23) | (7) | ||||||
| Total operating expenses | 920 | 1,010 | 928 | (9) | (1) | ||||||
| Income before taxes | 484 | 340 | 291 | 42 | 66 | ||||||
| Statement of operations metrics (%) | |||||||||||
| Return on regulatory capital | 35.7 | 25.2 | 23.0 | – | – | ||||||
| Cost/income ratio | 65.6 | 74.0 | 76.0 | – | – | ||||||
| Number of employees (full-time equivalents) | |||||||||||
| Number of employees | 10,170 | 10,250 | 10,010 | (1) | 2 | ||||||
14
| Divisional results (continued) | |||||||||||
| in / end of | % change | ||||||||||
| 1Q18 | 4Q17 | 1Q17 | QoQ | YoY | |||||||
| Net revenue detail (CHF million) | |||||||||||
| Private Banking | 1,043 | 923 | 883 | 13 | 18 | ||||||
| Asset Management | 360 | 441 | 338 | (18) | 7 | ||||||
| Net revenues | 1,403 | 1,364 | 1,221 | 3 | 15 | ||||||
| Net revenue detail (CHF million) | |||||||||||
| Net interest income | 388 | 380 | 342 | 2 | 13 | ||||||
| Recurring commissions and fees | 547 | 553 | 513 | (1) | 7 | ||||||
| Transaction- and performance-based revenues | 433 | 521 | 366 | (17) | 18 | ||||||
| Other revenues | 35 | (90) | 0 | – | – | ||||||
| Net revenues | 1,403 | 1,364 | 1,221 | 3 | 15 | ||||||
| Provision for credit losses (CHF million) | |||||||||||
| New provisions | 5 | 22 | 6 | (77) | (17) | ||||||
| Releases of provisions | (6) | (8) | (4) | (25) | 50 | ||||||
| Provision for credit losses | (1) | 14 | 2 | – | – | ||||||
| Balance sheet statistics (CHF million) | |||||||||||
| Total assets | 89,313 | 94,753 | 89,927 | (6) | (1) | ||||||
| Net loans | 51,454 | 50,474 | 46,097 | 2 | 12 | ||||||
| of which Private Banking | 51,448 | 50,429 | 45,780 | 2 | 12 | ||||||
| Risk-weighted assets | 37,580 | 38,256 | 35,794 | (2) | 5 | ||||||
| Leverage exposure | 93,921 | 99,267 | 93,629 | (5) | 0 | ||||||
| Reconciliation of adjusted results | |||||||||||||||||||
| Private Banking | Asset Management | International Wealth Management | |||||||||||||||||
| in | 1Q18 | 4Q17 | 1Q17 | 1Q18 | 4Q17 | 1Q17 | 1Q18 | 4Q17 | 1Q17 | ||||||||||
| Adjusted results (CHF million) | |||||||||||||||||||
| Net revenues | 1,043 | 923 | 883 | 360 | 441 | 338 | 1,403 | 1,364 | 1,221 | ||||||||||
| (Gains)/losses on business sales | (37) | 0 | 0 | 1 | 28 | 0 | (36) | 28 | 0 | ||||||||||
| Adjusted net revenues | 1,006 | 923 | 883 | 361 | 469 | 338 | 1,367 | 1,392 | 1,221 | ||||||||||
| Provision for credit losses | (1) | 14 | 2 | 0 | 0 | 0 | (1) | 14 | 2 | ||||||||||
| Total operating expenses | 643 | 673 | 642 | 277 | 337 | 286 | 920 | 1,010 | 928 | ||||||||||
| Restructuring expenses | (18) | (8) | (23) | (8) | (3) | (13) | (26) | (11) | (36) | ||||||||||
| Major litigation provisions | 0 | (31) | 0 | 0 | 0 | 0 | 0 | (31) | 0 | ||||||||||
| Adjusted total operating expenses | 625 | 634 | 619 | 269 | 334 | 273 | 894 | 968 | 892 | ||||||||||
| Income before taxes | 401 | 236 | 239 | 83 | 104 | 52 | 484 | 340 | 291 | ||||||||||
| Total adjustments | (19) | 39 | 23 | 9 | 31 | 13 | (10) | 70 | 36 | ||||||||||
| Adjusted income before taxes | 382 | 275 | 262 | 92 | 135 | 65 | 474 | 410 | 327 | ||||||||||
| Adjusted return on regulatory capital (%) | – | – | – | – | – | – | 34.9 | 30.5 | 25.8 | ||||||||||
| Adjusted results are non-GAAP financial measures. Refer to "Reconciliation of adjusted results" in Credit Suisse for further information. | |||||||||||||||||||
15
Private Banking
In 1Q18, income before taxes of CHF 401 million increased 70% compared to 4Q17, reflecting higher net revenues, lower total operating expenses and lower provision for credit losses. Compared to 1Q17, income before taxes increased 68%, mainly driven by higher net revenues. Adjusted income before taxes of CHF 382 million increased 39% and 46% compared to 4Q17 and 1Q17, respectively.
Net revenues
Compared to 4Q17, net revenues of CHF 1,043 million were 13% higher, driven by significantly higher transaction- and performance-based revenues and higher other revenues. Transaction- and performance-based revenues of CHF 311 million increased 32%, driven by higher revenues from ITS, significantly higher brokerage and product issuing fees including high levels of structured product issuances, and higher fees from foreign exchange client business. Higher client activity was supported by the capabilities of ITS in providing proactive advice in a more volatile environment. These increases were partially offset by the absence of performance fees recorded in 4Q17. Other revenues increased due to the gain on the sale of our investment in Euroclear of CHF 37 million in 1Q18. Net interest income of CHF 388 million increased slightly, reflecting higher deposit margins on slightly lower average deposit volumes, partially offset by lower loan margins on stable average loan volumes. Recurring commissions and fees of CHF 307 million were stable. Adjusted net revenues of CHF 1,006 million increased 9% compared to 4Q17.
Compared to 1Q17, net revenues increased 18%, reflecting higher revenues across all revenue categories. Transaction- and performance-based revenues increased 24%, mainly reflecting significantly higher brokerage and product issuing fees including the high levels of structured product issuances. Higher client activity was supported by the capabilities of ITS in providing proactive advice in a more volatile environment. Net interest income increased 13%, reflecting higher deposit margins and lower loan margins on higher average deposit and loan volumes. Other revenues increased due to the gain on the sale of our investment in Euroclear. Recurring commissions and fees increased 6% mainly from higher investment product management fees. Adjusted net revenues increased 14% compared to 1Q17.
| Results – Private Banking | |||||||||||
| in / end of | % change | ||||||||||
| 1Q18 | 4Q17 | 1Q17 | QoQ | YoY | |||||||
| Statements of operations (CHF million) | |||||||||||
| Net revenues | 1,043 | 923 | 883 | 13 | 18 | ||||||
| Provision for credit losses | (1) | 14 | 2 | – | – | ||||||
| Compensation and benefits | 411 | 357 | 393 | 15 | 5 | ||||||
| General and administrative expenses | 176 | 255 | 185 | (31) | (5) | ||||||
| Commission expenses | 38 | 53 | 41 | (28) | (7) | ||||||
| Restructuring expenses | 18 | 8 | 23 | 125 | (22) | ||||||
| Total other operating expenses | 232 | 316 | 249 | (27) | (7) | ||||||
| Total operating expenses | 643 | 673 | 642 | (4) | 0 | ||||||
| Income before taxes | 401 | 236 | 239 | 70 | 68 | ||||||
| Statement of operations metrics (%) | |||||||||||
| Cost/income ratio | 61.6 | 72.9 | 72.7 | – | – | ||||||
| Net revenue detail (CHF million) | |||||||||||
| Net interest income | 388 | 380 | 342 | 2 | 13 | ||||||
| Recurring commissions and fees | 307 | 308 | 290 | 0 | 6 | ||||||
| Transaction- and performance-based revenues | 311 | 235 | 250 | 32 | 24 | ||||||
| Other revenues | 37 | 0 | 1 | – | – | ||||||
| Net revenues | 1,043 | 923 | 883 | 13 | 18 | ||||||
| Margins on assets under management (annualized) (bp) | |||||||||||
| Gross margin 1 | 114 | 101 | 108 | – | – | ||||||
| Net margin 2 | 44 | 26 | 29 | – | – | ||||||
| Number of relationship managers | |||||||||||
| Number of relationship managers | 1,130 | 1,130 | 1,120 | 0 | 1 | ||||||
| Net interest income includes a term spread credit on stable deposit funding and a term spread charge on loans. Recurring commissions and fees includes investment product management, discretionary mandate and other asset management-related fees, fees for general banking products and services and revenues from wealth structuring solutions. Transaction- and performance-based revenues arise primarily from brokerage and product issuing fees, fees from foreign exchange client transactions, trading and sales income, equity participations income and other transaction- and performance-based income. | |||||||||||
1 Net revenues divided by average assets under management. | |||||||||||
2 Income before taxes divided by average assets under management. | |||||||||||
16
Provision for credit losses
In 1Q18, a release of provision for credit losses of CHF 1 million was recorded, compared to provision for credit losses of CHF 14 million in 4Q17 and CHF 2 million in 1Q17.
Total operating expenses
Compared to 4Q17, total operating expenses of CHF 643 million were 4% lower, mainly due to significantly lower general and administrative expenses, partially offset by higher compensation and benefits. General and administrative expenses of CHF 176 million decreased 31%, mainly reflecting significantly lower litigation provisions, lower allocated corporate function costs and lower professional services fees. Compensation and benefits of CHF 411 million increased 15%, mainly due to higher discretionary compensation expenses and higher deferred compensation expenses from prior-year awards. Adjusted total operating expenses of CHF 625 million were stable compared to 4Q17.
Compared to 1Q17, total operating expenses were stable, reflecting higher compensation and benefits, offset by lower general and administrative expenses and lower restructuring expenses. Compensation and benefits increased 5%, mainly reflecting higher discretionary compensation expenses and higher deferred compensation expenses from prior-year awards, partially offset by lower salary expenses. General and administrative expenses decreased 5%, mainly reflecting lower contractor and professional services fees.
Gross margin
Our gross margin was 114 basis points in 1Q18, an increase of 13 basis points compared to 4Q17, primarily driven by significantly higher transaction- and performance-based revenues and the gain on the sale of our investment in Euroclear on stable average assets under management. Our gross margin was six basis points higher compared to 1Q17, mainly reflecting higher revenues across all revenue categories, partially offset by a 12.1% increase in average assets under management. On the basis of adjusted net revenues, our gross margin was 110 basis points in 1Q18, nine basis points higher compared to 4Q17 and two basis points higher compared to 1Q17.
> Refer to “Assets under management” for further information.
Net margin
Our net margin was 44 basis points in 1Q18, 18 basis points higher compared to 4Q17, mainly reflecting higher net revenues and lower total operating expenses on stable average assets under management. Our net margin was 15 basis points higher compared to 1Q17, mainly reflecting higher net revenues, partially offset by the 12.1% increase in average assets under management. On the basis of adjusted income before taxes, our net margin was 42 basis points in 1Q18, twelve basis points higher compared to 4Q17 and ten basis points higher compared to 1Q17.
17
As of the end of 1Q18, assets under management of CHF 370.0 billion were CHF 3.1 billion higher compared to the end of 4Q17, reflecting net new assets of CHF 5.5 billion, partially offset by unfavorable foreign exchange-related movements. Net new assets mainly reflected inflows from emerging markets and Europe.
| Assets under management – Private Banking | |||||||||||
| in / end of | % change | ||||||||||
| 1Q18 | 4Q17 | 1Q17 | QoQ | YoY | |||||||
| Assets under management (CHF billion) | |||||||||||
| Assets under management | 370.0 | 366.9 | 336.2 | 0.8 | 10.1 | ||||||
| Average assets under management | 366.3 | 365.2 | 326.9 | 0.3 | 12.1 | ||||||
| Assets under management by currency (CHF billion) | |||||||||||
| USD | 164.5 | 162.9 | 153.7 | 1.0 | 7.0 | ||||||
| EUR | 116.3 | 114.1 | 97.4 | 1.9 | 19.4 | ||||||
| CHF | 22.4 | 23.0 | 21.4 | (2.6) | 4.7 | ||||||
| Other | 66.8 | 66.9 | 63.7 | (0.1) | 4.9 | ||||||
| Assets under management | 370.0 | 366.9 | 336.2 | 0.8 | 10.1 | ||||||
| Growth in assets under management (CHF billion) | |||||||||||
| Net new assets | 5.5 | 2.7 | 4.7 | – | – | ||||||
| Other effects | (2.4) | 8.9 | 8.3 | – | – | ||||||
| of which market movements | (0.4) | 5.5 | 9.2 | – | – | ||||||
| of which foreign exchange | (3.1) | 2.7 | (3.1) | – | – | ||||||
| of which other | 1.1 | 0.7 | 2.2 | – | – | ||||||
| Growth in assets under management | 3.1 | 11.6 | 13.0 | – | – | ||||||
| Growth in assets under management (annualized) (%) | |||||||||||
| Net new assets | 6.0 | 3.0 | 5.8 | – | – | ||||||
| Other effects | (2.6) | 10.1 | 10.3 | – | – | ||||||
| Growth in assets under management (annualized) | 3.4 | 13.1 | 16.1 | – | – | ||||||
| Growth in assets under management (rolling four-quarter average) (%) | |||||||||||
| Net new assets | 4.9 | 4.8 | 5.2 | – | – | ||||||
| Other effects | 5.2 | 8.7 | 11.9 | – | – | ||||||
| Growth in assets under management (rolling four-quarter average) | 10.1 | 13.5 | 17.1 | – | – | ||||||
18
Asset management
| Results – Asset Management | |||||||||||
| in / end of | % change | ||||||||||
| 1Q18 | 4Q17 | 1Q17 | QoQ | YoY | |||||||
| Statements of operations (CHF million) | |||||||||||
| Net revenues | 360 | 441 | 338 | (18) | 7 | ||||||
| Provision for credit losses | 0 | 0 | 0 | – | – | ||||||
| Compensation and benefits | 176 | 218 | 178 | (19) | (1) | ||||||
| General and administrative expenses | 78 | 102 | 82 | (24) | (5) | ||||||
| Commission expenses | 15 | 14 | 13 | 7 | 15 | ||||||
| Restructuring expenses | 8 | 3 | 13 | 167 | (38) | ||||||
| Total other operating expenses | 101 | 119 | 108 | (15) | (6) | ||||||
| Total operating expenses | 277 | 337 | 286 | (18) | (3) | ||||||
| Income before taxes | 83 | 104 | 52 | (20) | 60 | ||||||
| Statement of operations metrics (%) | |||||||||||
| Cost/income ratio | 76.9 | 76.4 | 84.6 | – | – | ||||||
| Net revenue detail (CHF million) 1 | |||||||||||
| Management fees | 267 | 263 | 243 | 2 | 10 | ||||||
| Performance and placement revenues | 27 | 159 | 40 | (83) | (33) | ||||||
| Investment and partnership income | 66 | 19 | 55 | 247 | 20 | ||||||
| Net revenues | 360 | 441 | 338 | (18) | 7 | ||||||
| of which recurring commissions and fees | 240 | 245 | 223 | (2) | 8 | ||||||
| of which transaction- and performance-based revenues | 122 | 286 | 116 | (57) | 5 | ||||||
| of which other revenues | (2) | (90) | (1) | (98) | 100 | ||||||
| Management fees include fees on assets under management, asset administration revenues and transaction fees related to the acquisition and disposal of investments in the funds being managed. Performance revenues relate to the performance or return of the funds being managed and includes investment-related gains and losses from proprietary funds. Placement revenues arise from our third-party private equity fundraising activities and secondary private equity market advisory services. Investment and partnership income includes equity participation income from seed capital returns and from minority investments in third-party asset managers, income from strategic partnerships and distribution agreements, and other revenues. | |||||||||||
1 Prior periods have been reclassified to conform to the current presentation. | |||||||||||
Income before taxes of CHF 83 million decreased 20% compared to 4Q17, with lower net revenues partially offset by lower total operating expenses. Income before taxes increased 60% compared to 1Q17, reflecting higher net revenues and slightly lower total operating expenses. Adjusted income before taxes of CHF 92 million decreased 32% compared to 4Q17 and increased 42% compared to 1Q17.
We completed the spin-off of a management company for a quantitative fund relating to our systematic market making business while retaining an economic interest in the management company and the fund. Revenues from this interest are recognized as investment and partnership income rather than management fees and performance and placement revenues as previously reported. Prior periods have been reclassified to conform to the current presentation.
Net revenues
Compared to 4Q17, net revenues of CHF 360 million decreased 18%, mainly driven by lower performance and placement revenues, partially offset by higher investment and partnership income. Performance and placement revenues decreased CHF 132 million to CHF 27 million, mainly due to year-end performance fees and higher placement fees in 4Q17. Investment and partnership income increased CHF 47 million to CHF 66 million, mainly due to the investment loss of CHF 43 million from Asset Management Finance LLC in 4Q17 and higher income from the real estate sector, partially offset by lower revenues from a single manager hedge fund as 4Q17 included annual performance revenues. Management fees of CHF 267 million were slightly higher.
Compared to 1Q17, net revenues increased 7%, driven by higher management fees and higher investment and partnership income, partially offset by lower performance and placement revenues. Management fees increased 10%, reflecting higher average assets under management. Investment and partnership income increased 20% mainly driven by higher private equity income. Performance and placement revenues decreased 33%, mainly reflecting lower placement fees.
19
Total operating expenses
Compared to 4Q17, total operating expenses of CHF 277 million decreased 18%, mainly due to lower compensation and benefits and significantly lower general and administrative expenses. Compensation and benefits of CHF 176 million decreased 19%, mainly due to lower salary expenses, lower discretionary compensation expenses and lower deferred compensation expenses from prior-year awards. General and administrative expenses of CHF 78 million decreased 24%, mainly reflecting lower professional services fees. Adjusted total operating expenses of CHF 269 million decreased 19% compared to 4Q17.
Compared to 1Q17, total operating expenses decreased slightly, mainly reflecting lower restructuring expenses and lower general and administrative expenses. General and administrative expenses decreased 5%, mainly reflecting lower allocated corporate function costs. Compensation and benefits were stable. Adjusted total operating expenses were stable compared to 1Q17.
As of the end of 1Q18, assets under management of CHF 391.2 billion were CHF 5.6 billion higher compared to the end of 4Q17, reflecting net new assets of CHF 9.0 billion, partially offset by unfavorable market and foreign exchange-related movements. Net new assets reflected inflows from traditional and alternative investments and from emerging market joint ventures.
| Assets under management – Asset Management | |||||||||||
| in / end of | % change | ||||||||||
| 1Q18 | 4Q17 | 1Q17 | QoQ | YoY | |||||||
| Assets under management (CHF billion) 1 | |||||||||||
| Traditional investments | 218.4 | 217.6 | 199.2 | 0.4 | 9.6 | ||||||
| Alternative investments | 123.6 | 121.5 | 118.6 | 1.7 | 4.2 | ||||||
| Investments and partnerships | 49.2 | 46.5 | 49.3 | 5.8 | (0.2) | ||||||
| Assets under management | 391.2 | 385.6 | 367.1 | 1.5 | 6.6 | ||||||
| Average assets under management | 386.6 | 384.1 | 348.4 | 0.7 | 11.0 | ||||||
| Assets under management by currency (CHF billion) | |||||||||||
| USD | 102.6 | 100.1 | 95.2 | 2.5 | 7.8 | ||||||
| EUR | 50.1 | 48.2 | 41.8 | 3.9 | 19.9 | ||||||
| CHF | 181.5 | 182.6 | 173.0 | (0.6) | 4.9 | ||||||
| Other | 57.0 | 54.7 | 57.1 | 4.2 | (0.2) | ||||||
| Assets under management | 391.2 | 385.6 | 367.1 | 1.5 | 6.6 | ||||||
| Growth in assets under management (CHF billion) | |||||||||||
| Net new assets 2 | 9.0 | 1.4 | 15.0 | – | – | ||||||
| Other effects | (3.4) | 7.9 | 30.5 | – | – | ||||||
| of which market movements | (2.1) | 5.7 | 7.5 | – | – | ||||||
| of which foreign exchange | (1.2) | 2.8 | (2.5) | – | – | ||||||
| of which other | (0.1) | (0.6) | 25.5 | – | – | ||||||
| Growth in assets under management | 5.6 | 9.3 | 45.5 | – | – | ||||||
| Growth in assets under management (annualized) (%) | |||||||||||
| Net new assets | 9.3 | 1.5 | 18.7 | – | – | ||||||
| Other effects | (3.5) | 8.4 | 37.9 | – | – | ||||||
| Growth in assets under management | 5.8 | 9.9 | 56.6 | – | – | ||||||
| Growth in assets under management (rolling four-quarter average) (%) | |||||||||||
| Net new assets | 3.9 | 6.3 | 6.3 | – | – | ||||||
| Other effects | 2.7 | 13.6 | 15.5 | – | – | ||||||
| Growth in assets under management (rolling four-quarter average) | 6.6 | 19.9 | 21.8 | – | – | ||||||
1 Prior periods have been reclassified to conform to the current presentation. | |||||||||||
2 Includes outflows for private equity assets reflecting realizations at cost and unfunded commitments on which a fee is no longer earned. | |||||||||||
20
In 1Q18, we reported income before taxes of CHF 234 million and net revenues of CHF 991 million. Income before taxes increased 33% compared to 4Q17 and 59% compared to 1Q17. Adjusted income before taxes increased 45% compared to 4Q17 and increased 73% compared to 1Q17.
1Q18 results
In 1Q18, we reported income before taxes of CHF 234 million and net revenues of CHF 991 million. In 1Q18, the US GAAP accounting standard pertaining to revenue recognition was adopted. As a result, 1Q18 net revenues and operating expenses in Asia Pacific both decreased by CHF 7 million.
Compared to 4Q17, net revenues increased 12%, driven by higher revenues in our Markets business across all revenue categories and higher revenues in our Wealth Management & Connected business, reflecting higher Private Banking revenues, partially offset by lower advisory, underwriting and financing revenues. Total operating expenses of CHF 747 million increased 6%, mainly due to higher litigation provisions and higher compensation and benefits, partially offset by significantly lower restructuring expenses.
Compared to 1Q17, net revenues increased 12%, driven by higher revenues in our Wealth Management & Connected business, reflecting higher Private Banking revenues and higher advisory, underwriting and financing revenues, and higher revenues in our Markets business across all revenue categories. Total operating expenses increased slightly, primarily due to higher litigation provisions, largely offset by significantly lower restructuring expenses and lower compensation and benefits.
Adjusted income before taxes of CHF 288 million increased 45% compared to 4Q17 and 73% compared to 1Q17.
Capital and leverage metrics
As of the end of 1Q18, we reported risk-weighted assets of CHF 33.6 billion, an increase of CHF 2.2 billion compared to the end of 4Q17, mainly driven by the new operational risk allocation key, an enhancement of certain loss given default models and business growth, partially offset by foreign exchange-related movements. Leverage exposure was CHF 115.7 billion, an increase of CHF 10.1 billion compared to the end of 4Q17, primarily reflecting business growth and the realignment of the HQLA allocations.
| Divisional results | |||||||||||
| in / end of | % change | ||||||||||
| 1Q18 | 4Q17 | 1Q17 | QoQ | YoY | |||||||
| Statements of operations (CHF million) | |||||||||||
| Net revenues | 991 | 885 | 881 | 12 | 12 | ||||||
| Provision for credit losses | 10 | 7 | 4 | 43 | 150 | ||||||
| Compensation and benefits | 411 | 394 | 424 | 4 | (3) | ||||||
| General and administrative expenses | 259 | 217 | 220 | 19 | 18 | ||||||
| Commission expenses | 71 | 68 | 67 | 4 | 6 | ||||||
| Restructuring expenses | 6 | 23 | 19 | (74) | (68) | ||||||
| Total other operating expenses | 336 | 308 | 306 | 9 | 10 | ||||||
| Total operating expenses | 747 | 702 | 730 | 6 | 2 | ||||||
| Income before taxes | 234 | 176 | 147 | 33 | 59 | ||||||
| Statement of operations metrics (%) | |||||||||||
| Return on regulatory capital | 16.9 | 13.3 | 10.9 | – | – | ||||||
| Cost/income ratio | 75.4 | 79.3 | 82.9 | – | – | ||||||
| Number of employees (full-time equivalents) | |||||||||||
| Number of employees | 7,270 | 7,230 | 7,080 | 1 | 3 | ||||||
21
| Divisional results (continued) | |||||||||||
| in / end of | % change | ||||||||||
| 1Q18 | 4Q17 | 1Q17 | QoQ | YoY | |||||||
| Net revenues (CHF million) | |||||||||||
| Wealth Management & Connected | 663 | 626 | 589 | 6 | 13 | ||||||
| Markets | 328 | 259 | 292 | 27 | 12 | ||||||
| Net revenues | 991 | 885 | 881 | 12 | 12 | ||||||
| Provision for credit losses (CHF million) | |||||||||||
| New provisions | 11 | 9 | 6 | 22 | 83 | ||||||
| Releases of provisions | (1) | (2) | (2) | (50) | (50) | ||||||
| Provision for credit losses | 10 | 7 | 4 | 43 | 150 | ||||||
| Balance sheet statistics (CHF million) | |||||||||||
| Total assets | 107,851 | 96,497 | 96,291 | 12 | 12 | ||||||
| Net loans | 44,940 | 43,080 | 40,805 | 4 | 10 | ||||||
| of which Private Banking | 36,680 | 35,331 | 33,429 | 4 | 10 | ||||||
| Risk-weighted assets | 33,647 | 31,474 | 33,077 | 7 | 2 | ||||||
| Leverage exposure | 115,709 | 105,585 | 106,474 | 10 | 9 | ||||||
| Reconciliation of adjusted results | |||||||||||||||||||
| Wealth Management & Connected | Markets | Asia Pacific | |||||||||||||||||
| in | 1Q18 | 4Q17 | 1Q17 | 1Q18 | 4Q17 | 1Q17 | 1Q18 | 4Q17 | 1Q17 | ||||||||||
| Adjusted results (CHF million) | |||||||||||||||||||
| Net revenues | 663 | 626 | 589 | 328 | 259 | 292 | 991 | 885 | 881 | ||||||||||
| Provision for credit losses | 9 | 7 | 4 | 1 | 0 | 0 | 10 | 7 | 4 | ||||||||||
| Total operating expenses | 449 | 390 | 384 | 298 | 312 | 346 | 747 | 702 | 730 | ||||||||||
| Restructuring expenses | (3) | (10) | (4) | (3) | (13) | (15) | (6) | (23) | (19) | ||||||||||
| Major litigation provisions | (48) | 0 | 0 | 0 | 0 | 0 | (48) | 0 | 0 | ||||||||||
| Adjusted total operating expenses | 398 | 380 | 380 | 295 | 299 | 331 | 693 | 679 | 711 | ||||||||||
| Income/(loss) before taxes | 205 | 229 | 201 | 29 | (53) | (54) | 234 | 176 | 147 | ||||||||||
| Total adjustments | 51 | 10 | 4 | 3 | 13 | 15 | 54 | 23 | 19 | ||||||||||
| Adjusted income/(loss) before taxes | 256 | 239 | 205 | 32 | (40) | (39) | 288 | 199 | 166 | ||||||||||
| Adjusted return on regulatory capital (%) | – | – | – | – | – | – | 20.8 | 15.0 | 12.3 | ||||||||||
| Adjusted results are non-GAAP financial measures. Refer to "Reconciliation of adjusted results" in Credit Suisse for further information. | |||||||||||||||||||
22
wealth Management & connected
Income before taxes of CHF 205 million decreased 10% compared to 4Q17, mainly reflecting higher total operating expenses, partially offset by higher net revenues. Compared to 1Q17, income before taxes increased slightly, reflecting higher net revenues, largely offset by higher total operating expenses. Adjusted income before taxes of CHF 256 million increased 7% compared to 4Q17 and 25% compared to 1Q17.
Net revenues
Net revenues of CHF 663 million increased 6% compared to 4Q17, reflecting increased transaction-based revenues, higher net interest income and higher recurring commissions and fees, partially offset by lower advisory, underwriting and financing revenues. Transaction-based revenues increased 28% to CHF 185 million, primarily reflecting higher brokerage and product issuing fees and higher fees from foreign exchange client business, partially offset by lower corporate advisory fees arising from integrated solutions. Net interest income increased 8% to CHF 159 million, mainly driven by higher treasury revenues. Recurring commissions and fees increased 11% to CHF 111 million, primarily due to higher wealth structuring solutions fees. Advisory, underwriting and financing revenues decreased 11% to CHF 208 million, primarily due to lower financing and equity underwriting revenues, partially offset by higher fees from M&A transactions. Financing revenues in 1Q18 included a negative net fair value impact of CHF 4 million from an impaired loan portfolio in recovery management compared to 4Q17, which included a gain of CHF 64 million from a pre-IPO financing and a positive net fair value impact of CHF 50 million from an impaired loan portfolio in recovery management.
| Results - Wealth Management & Connected | |||||||||||
| in / end of | % change | ||||||||||
| 1Q18 | 4Q17 | 1Q17 | QoQ | YoY | |||||||
| Statements of operations (CHF million) | |||||||||||
| Net revenues | 663 | 626 | 589 | 6 | 13 | ||||||
| Provision for credit losses | 9 | 7 | 4 | 29 | 125 | ||||||
| Compensation and benefits | 270 | 241 | 267 | 12 | 1 | ||||||
| General and administrative expenses | 160 | 121 | 99 | 32 | 62 | ||||||
| Commission expenses | 16 | 18 | 14 | (11) | 14 | ||||||
| Restructuring expenses | 3 | 10 | 4 | (70) | (25) | ||||||
| Total other operating expenses | 179 | 149 | 117 | 20 | 53 | ||||||
| Total operating expenses | 449 | 390 | 384 | 15 | 17 | ||||||
| Income before taxes | 205 | 229 | 201 | (10) | 2 | ||||||
| of which Private Banking | 170 | 113 | 139 | 50 | 22 | ||||||
| Statement of operations metrics (%) | |||||||||||
| Cost/income ratio | 67.7 | 62.3 | 65.2 | – | – | ||||||
| Net revenue detail (CHF million) | |||||||||||
| Private Banking | 455 | 391 | 411 | 16 | 11 | ||||||
| of which net interest income | 159 | 147 | 168 | 8 | (5) | ||||||
| of which recurring commissions and fees�� | 111 | 100 | 90 | 11 | 23 | ||||||
| of which transaction-based revenues | 185 | 144 | 154 | 28 | 20 | ||||||
| of which other revenues | 0 | 0 | (1) | – | 100 | ||||||
| Advisory, underwriting and financing | 208 | 235 | 178 | (11) | 17 | ||||||
| Net revenues | 663 | 626 | 589 | 6 | 13 | ||||||
| Private Banking margins on assets under management (annualized) (bp) | |||||||||||
| Gross margin 1 | 92 | 80 | 96 | – | – | ||||||
| Net margin 2 | 34 | 23 | 33 | – | – | ||||||
| Number of relationship managers | |||||||||||
| Number of relationship managers | 600 | 590 | 620 | 2 | (3) | ||||||
| Net interest income includes a term spread credit on stable deposit funding and a term spread charge on loans. Recurring commissions and fees includes investment product management, discretionary mandate and other asset management-related fees, fees for general banking products and services and revenues from wealth structuring solutions. Transaction-based revenues arise primarily from brokerage and product issuing fees, fees from foreign exchange client transactions, trading and sales income, equity participations income and other transaction-based income. | |||||||||||
1 Net revenues divided by average assets under management. | |||||||||||
2 Income before taxes divided by average assets under management. | |||||||||||
23
Compared to 1Q17, net revenues increased 13%, mainly driven by increased transaction-based revenues, higher advisory, underwriting and financing revenues, and higher recurring commission and fees, partially offset by lower net interest income. Transaction-based revenues increased 20%, primarily reflecting higher brokerage and product issuing fees. Advisory, underwriting and financing revenues increased 17%, mainly due to higher financing and equity underwriting revenues. Recurring commissions and fees increased 23%, mainly due to higher investment product management, wealth structuring solutions and discretionary mandate management fees. Net interest income decreased 5%, mainly due to lower treasury revenues, partially offset by higher loan margins on higher average loans volumes.
Provision for credit losses
The Wealth Management & Connected loan portfolio primarily comprises Private Banking lombard loans, mainly backed by listed securities, and secured and unsecured loans to corporates.
In 1Q18, Wealth Management & Connected recorded a provision for credit losses of CHF 9 million, compared to a provision for credit losses of CHF 7 million in 4Q17 and a provision for credit losses of CHF 4 million in 1Q17.
Total operating expenses
Total operating expenses of CHF 449 million increased 15% compared to 4Q17, mainly reflecting higher general and administrative expenses and higher compensation and benefits, partially offset by lower restructuring expenses. General and administrative expenses increased 32% to CHF 160 million, mainly due to higher litigation provisions, partially offset by lower professional services fees. Compensation and benefits increased 12% to CHF 270 million, primarily driven by higher discretionary compensation expenses and higher deferred compensation expenses from prior-year awards. Adjusted total operating expenses of CHF 398 million increased 5% compared to 4Q17.
Compared to 1Q17, total operating expenses increased 17%, primarily reflecting higher general and administrative expenses. General and administrative expenses increased 62%, mainly due to higher litigation provisions and higher IT infrastructure expenses. Compensation and benefits were stable. Adjusted total operating expenses increased 5% compared to 1Q17.
Margin calculations are aligned with the performance metrics of our Private Banking business and its related assets under management within the Wealth Management & Connected business.
Gross margin
Our Private Banking gross margin was 92 basis points in 1Q18, twelve basis points higher compared to 4Q17, mainly reflecting higher transaction-based revenues, higher net interest income and higher recurring commissions and fees. Compared to 1Q17, our gross margin was four basis points lower, mainly reflecting a 15.8% increase in average assets under management, partially offset by higher transaction-based revenues and higher recurring commissions and fees.
> Refer to “Assets under management” for further information.
Net margin
Our Private Banking net margin was 34 basis points in 1Q18, eleven basis points higher compared to 4Q17, mainly reflecting higher net revenues. Compared to 1Q17, our net margin was one basis points higher, reflecting higher net revenues, largely offset by the increase in average assets under management and higher total operating expenses.
Assets under management and net new assets relate to our Private Banking business within the Wealth Management & Connected business. As of the end of 1Q18, assets under management of CHF 199.1 billion were CHF 2.3 billion higher compared to the end of 4Q17, reflecting net new assets of CHF 6.2 billion and the transfer of CHF 1.1 billion of assets from the Strategic Resolution Unit. This increase in assets under management was largely offset by unfavorable foreign exchange-related and market movements. Net new assets primarily reflected inflows from Greater China, Japan and South East Asia, including certain major client inflows.
> Refer to “Strategic Resolution Unit” for further information.
24
| Assets under management – Private Banking | |||||||||||
| in / end of | % change | ||||||||||
| 1Q18 | 4Q17 | 1Q17 | QoQ | YoY | |||||||
| Assets under management (CHF billion) | |||||||||||
| Assets under management | 199.1 | 196.8 | 177.4 | 1.2 | 12.2 | ||||||
| Average assets under management | 197.6 | 196.1 | 170.7 | 0.8 | 15.8 | ||||||
| Assets under management by currency (CHF billion) | |||||||||||
| USD | 104.4 | 98.2 | 88.6 | 6.3 | 17.8 | ||||||
| EUR | 6.7 | 6.7 | 4.6 | 0.0 | 45.7 | ||||||
| CHF | 2.0 | 2.5 | 2.0 | (20.0) | 0.0 | ||||||
| Other | 86.0 | 89.4 | 82.2 | (3.8) | 4.6 | ||||||
| Assets under management | 199.1 | 196.8 | 177.4 | 1.2 | 12.2 | ||||||
| Growth in assets under management (CHF billion) | |||||||||||
| Net new assets | 6.2 | 1.3 | 5.3 | – | – | ||||||
| Other effects | (3.9) | 5.5 | 5.2 | – | – | ||||||
| of which market movements | (1.9) | 3.4 | 6.8 | – | – | ||||||
| of which foreign exchange | (3.2) | 1.9 | (1.6) | – | – | ||||||
| of which other | 1.2 | 0.2 | 0.0 | – | – | ||||||
| Growth in assets under management | 2.3 | 6.8 | 10.5 | – | – | ||||||
| Growth in assets under management (annualized) (%) | |||||||||||
| Net new assets | 12.6 | 2.7 | 12.7 | – | – | ||||||
| Other effects | (7.9) | 11.6 | 12.5 | – | – | ||||||
| Growth in assets under management (annualized) | 4.7 | 14.3 | 25.2 | – | – | ||||||
| Growth in assets under management (rolling four-quarter average) (%) | |||||||||||
| Net new assets | 10.0 | 10.1 | 10.0 | – | – | ||||||
| Other effects | 2.2 | 7.8 | 8.8 | – | – | ||||||
| Growth in assets under management (rolling four-quarter average) | 12.2 | 17.9 | 18.8 | – | – | ||||||
markets
Income before taxes was CHF 29 million in 1Q18 compared to a loss before taxes of CHF 53 million in 4Q17. The related increase of CHF 82 million primarily reflected higher net revenues and lower total operating expenses. Compared to the loss before taxes of CHF 54 million in 1Q17, the related increase of CHF 83 million primarily reflected lower total operating expenses and higher net revenues. Adjusted income before taxes of CHF 32 million in 1Q18 compared to an adjusted loss before taxes of CHF 40 million in 4Q17 and an adjusted loss before taxes of CHF 39 million in 1Q17.
Net revenues
Net revenues of CHF 328 million increased 27% compared to 4Q17, reflecting higher fixed income and equity sales and trading revenues. Fixed income sales and trading revenues increased 270% to CHF 85 million, mainly from higher revenues in structured products, higher credit products revenues, primarily from increased client activity, and higher trading revenues from emerging markets rates products. Equity sales and trading revenues increased slightly to CHF 243 million, mainly from higher prime services revenues, reflecting increased client activity, partially offset by lower revenues from cash equities, driven by lower equity underwriting revenues, and lower revenues from equity derivatives. Equity derivatives revenues in 4Q17 also included a gain of CHF 27 million resulting from the exercise of a call option on a structured note liability.
Compared to 1Q17, net revenues increased 12%, reflecting higher fixed income and equity sales and trading revenues. Fixed income sales and trading revenues increased 47%, mainly driven by higher structured products revenues and higher foreign exchange products revenues, partially offset by lower trading revenues from emerging markets rates products. Equity sales and trading revenues increased 4%, reflecting higher revenues from prime services and cash equities, primarily from increased client activity, partially offset by lower equity derivatives revenues.
25
| Results - Markets | |||||||||||
| in / end of | % change | ||||||||||
| 1Q18 | 4Q17 | 1Q17 | QoQ | YoY | |||||||
| Statements of operations (CHF million) | |||||||||||
| Net revenues | 328 | 259 | 292 | 27 | 12 | ||||||
| Provision for credit losses | 1 | 0 | 0 | – | – | ||||||
| Compensation and benefits | 141 | 153 | 157 | (8) | (10) | ||||||
| General and administrative expenses | 99 | 96 | 121 | 3 | (18) | ||||||
| Commission expenses | 55 | 50 | 53 | 10 | 4 | ||||||
| Restructuring expenses | 3 | 13 | 15 | (77) | (80) | ||||||
| Total other operating expenses | 157 | 159 | 189 | (1) | (17) | ||||||
| Total operating expenses | 298 | 312 | 346 | (4) | (14) | ||||||
| Income/(loss) before taxes | 29 | (53) | (54) | – | – | ||||||
| Statement of operations metrics (%) | |||||||||||
| Cost/income ratio | 90.9 | 120.5 | 118.5 | – | – | ||||||
| Net revenue detail (CHF million) | |||||||||||
| Equity sales and trading | 243 | 236 | 234 | 3 | 4 | ||||||
| Fixed income sales and trading | 85 | 23 | 58 | 270 | 47 | ||||||
| Net revenues | 328 | 259 | 292 | 27 | 12 | ||||||
Total operating expenses
Total operating expenses of CHF 298 million decreased 4% compared to 4Q17, mainly due to lower compensation and benefits and significantly lower restructuring expenses, partially offset by higher commission expenses. Compensation and benefits decreased 8% to CHF 141 million, primarily driven by lower allocated corporate function costs. General and administrative expenses increased slightly, mainly due to higher IT infrastructure expenses, partly offset by lower professional services fees. Adjusted total operating expenses of CHF 295 million were stable compared to 4Q17.
Compared to 1Q17, total operating expenses decreased 14%, reflecting lower general and administrative expenses, lower compensation and benefits and significantly lower restructuring expenses. General and administrative expenses decreased 18%, mainly due to lower professional services fees. Compensation and benefits decreased 10%, primarily driven by lower salary expenses and lower deferred compensation expenses from prior-year awards following our restructuring efforts. Adjusted total operating expenses decreased 11% compared to 1Q17.
26
In 1Q18, we reported income before taxes of CHF 295 million and net revenues of CHF 1,546 million. Net revenues increased 33% compared to 4Q17, driven by a seasonal increase in client trading activity and higher market volatility and volumes, partially offset by lower underwriting activity.
1Q18 results
In 1Q18, we reported income before taxes of CHF 295 million and net revenues of CHF 1,546 million. Compared to 4Q17, net revenues increased 33%, driven by growth across most businesses, particularly in our ITS franchise. Net revenues decreased 4% compared to a strong 1Q17, primarily due to lower underwriting activity.
Total operating expenses of CHF 1,247 million decreased 8% compared to 4Q17, reflecting lower restructuring costs, general and administrative expenses and compensation and benefits. Compared to 1Q17, total operating expenses decreased 3%, primarily due to lower compensation and benefits. Adjusted income before taxes was CHF 337 million in 1Q18, compared to adjusted loss before taxes of CHF 116 million in 4Q17 and adjusted income before taxes of CHF 337 million in 1Q17.
Results in 1Q18 were impacted by the weakening of the average rate of the US dollar against the Swiss franc, which adversely impacted revenues, but favorably impacted expenses.
Capital and leverage metrics
As of the end of 1Q18, we reported risk-weighted assets of USD 60.7 billion, an increase of USD 0.5 billion compared to the end of 4Q17, primarily driven by the new operational risk allocation key, mostly offset by reduced risk levels. Leverage exposure was USD 296.1 billion, an increase of USD 5.7 billion compared to the end of 4Q17, driven by business growth and foreign exchange-related movements, partially offset by the realignment of our HQLA allocations.
| Divisional results | |||||||||||
| in / end of | % change | ||||||||||
| 1Q18 | 4Q17 | 1Q17 | QoQ | YoY | |||||||
| Statements of operations (CHF million) | |||||||||||
| Net revenues | 1,546 | 1,163 | 1,609 | 33 | (4) | ||||||
| Provision for credit losses | 4 | 8 | 5 | (50) | (20) | ||||||
| Compensation and benefits | 617 | 645 | 690 | (4) | (11) | ||||||
| General and administrative expenses | 453 | 490 | 438 | (8) | 3 | ||||||
| Commission expenses | 135 | 144 | 139 | (6) | (3) | ||||||
| Restructuring expenses | 42 | 71 | 20 | (41) | 110 | ||||||
| Total other operating expenses | 630 | 705 | 597 | (11) | 6 | ||||||
| Total operating expenses | 1,247 | 1,350 | 1,287 | (8) | (3) | ||||||
| Income/(loss) before taxes | 295 | (195) | 317 | – | (7) | ||||||
| Statement of operations metrics (%) | |||||||||||
| Return on regulatory capital | 8.5 | (5.5) | 9.0 | – | – | ||||||
| Cost/income ratio | 80.7 | 116.1 | 80.0 | – | – | ||||||
| Number of employees (full-time equivalents) | |||||||||||
| Number of employees | 11,610 | 11,740 | 11,600 | (1) | 0 | ||||||
27
| Divisional results (continued) | |||||||||||
| in / end of | % change | ||||||||||
| 1Q18 | 4Q17 | 1Q17 | QoQ | YoY | |||||||
| Net revenue detail (CHF million) | |||||||||||
| Fixed income sales and trading | 860 | 547 | 866 | 57 | (1) | ||||||
| Equity sales and trading | 490 | 378 | 488 | 30 | 0 | ||||||
| Underwriting | 288 | 314 | 312 | (8) | (8) | ||||||
| Other | (92) | (76) | (57) | 21 | 61 | ||||||
| Net revenues | 1,546 | 1,163 | 1,609 | 33 | (4) | ||||||
| Balance sheet statistics (CHF million, except where indicated) | |||||||||||
| Total assets | 239,432 | 242,159 | 242,745 | (1) | (1) | ||||||
| Risk-weighted assets | 57,990 | 58,858 | 52,061 | (1) | 11 | ||||||
| Risk-weighted assets (USD) | 60,732 | 60,237 | 52,012 | 1 | 17 | ||||||
| Leverage exposure | 282,778 | 283,809 | 287,456 | 0 | (2) | ||||||
| Leverage exposure (USD) | 296,149 | 290,461 | 287,183 | 2 | 3 | ||||||
| Reconciliation of adjusted results | |||||||
| Global Markets | |||||||
| in | 1Q18 | 4Q17 | 1Q17 | ||||
| Adjusted results (CHF million) | |||||||
| Net revenues | 1,546 | 1,163 | 1,609 | ||||
| Provision for credit losses | 4 | 8 | 5 | ||||
| Total operating expenses | 1,247 | 1,350 | 1,287 | ||||
| Restructuring expenses | (42) | (71) | (20) | ||||
| Expenses related to business sales | 0 | (8) | 0 | ||||
| Adjusted total operating expenses | 1,205 | 1,271 | 1,267 | ||||
| Income/(loss) before taxes | 295 | (195) | 317 | ||||
| Total adjustments | 42 | 79 | 20 | ||||
| Adjusted income/(loss) before taxes | 337 | (116) | 337 | ||||
| Adjusted return on regulatory capital (%) | 9.8 | (3.3) | 9.6 | ||||
| Adjusted results are non-GAAP financial measures. Refer to "Reconciliation of adjusted results" in Credit Suisse for further information. | |||||||
28
In 1Q18, the US GAAP accounting standard pertaining to revenue recognition was adopted. As a result, 1Q18 net revenues and operating expenses in Global Markets both increased by CHF 8 million.
Fixed income sales and trading
In 1Q18, fixed income sales and trading revenues of CHF 860 million increased 57% compared to 4Q17, reflecting growth across all products, due to a seasonal increase in client activity and higher market volatility. Securitized products revenues increased significantly driven by higher non-agency and agency trading activity, reflecting continued investor demand for yield products. Global credit products revenues also increased significantly, reflecting higher leveraged finance and investment grade trading activity. Macro products revenues increased reflecting higher client activity in our foreign exchange and US rates businesses given higher market volatility. This was partially offset by lower emerging markets revenues reflecting reduced financing activity and lower structured credit revenues in EMEA.
Fixed income sales and trading revenues decreased 1% in Swiss francs compared to a strong 1Q17, while revenues increased 5% in US dollars. Emerging markets revenues decreased primarily due to lower trading and financing activity, reflecting challenging market conditions and compared to a strong prior year. In addition, global credit products revenues declined, primarily due to lower leveraged finance trading activity, partially offset by higher investment grade trading revenues. Securitized products revenues were stable in Swiss francs. In US dollars, securitized products revenues increased compared to a strong 1Q17, reflecting continued strength in our asset finance business. Macro products revenues were stable as higher foreign exchange client activity, which benefited from improved market volatility, was offset by lower rates revenues in EMEA.
Equity sales and trading
In 1Q18, equity sales and trading revenues of CHF 490 million increased 30% compared to 4Q17, due to more favorable trading conditions, particularly higher levels of volatility which benefited our derivatives business. We had substantially higher revenues across flow and structured equity derivatives driven by these more favorable market conditions and increased collaboration revenues from our ITS platform. Cash equities revenues increased due to higher secondary trading volumes, particularly in the Americas. In addition, prime services revenues increased reflecting higher client financing activity.
Equity sales and trading revenues were stable in Swiss francs compared to 1Q17, but increased 6% in US dollars, reflecting the more favorable trading conditions. Equity derivatives revenues increased significantly, albeit from subdued levels, reflecting higher revenues across flow and structured equity derivatives due to increased collaboration revenues from our ITS platform and higher market volatility. These increases were mostly offset by lower cash equities revenues, reflecting a decline in secondary trading activity in Latin America. Prime services revenues declined in Swiss francs. In US dollars, prime services revenues increased slightly reflecting higher commissions in listed derivatives.
Underwriting
In 1Q18, underwriting revenues of CHF 288 million decreased 8% compared to 4Q17, reflecting higher levels of volatility which negatively impacted primary issuance activity. Debt underwriting revenues declined, reflecting lower leveraged finance issuance activity, partially offset by higher investment grade revenues. Equity underwriting revenues also decreased.
Underwriting revenues decreased 8% compared to 1Q17, reflecting a decrease in issuance activity. Debt underwriting revenues declined, primarily due to lower investment grade issuance activity. Equity underwriting revenues increased, consistent with higher IPO issuance activity.
Provision for credit losses
Global markets recorded a provision for credit losses of CHF 4 million in 1Q18. This compares to a provision for credit losses of CHF 8 million in 4Q17 and CHF 5 million in 1Q17.
Total operating expenses
In 1Q18, total operating expenses of CHF 1,247 million decreased 8% compared to 4Q17, reflecting lower restructuring costs, general and administrative expenses and compensation and benefits. Compensation and benefits decreased, reflecting lower deferred compensation expenses from prior-year awards, partially offset by higher discretionary compensation expenses. During 1Q18, we incurred restructuring costs of CHF 42 million. General and administrative expenses declined, reflecting lower allocated corporate function costs.
Compared to 1Q17, total operating expenses decreased 3%, primarily due to lower compensation and benefits. Compensation and benefits decreased reflecting lower discretionary compensation and deferred compensation expenses from prior-year awards. General and administrative expenses increased reflecting higher costs due to the adoption of the new revenue recognition accounting standard and higher allocated corporate function costs.
29
In 1Q18, we reported income before taxes of CHF 59 million and net revenues of CHF 528 million. Net revenues decreased 13% compared to 1Q17, reflecting lower client activity.
1Q18 results
In 1Q18, we reported income before taxes of CHF 59 million, a decrease of 45% compared to 4Q17, driven by lower net revenues and higher operating expenses. Net revenues of CHF 528 million decreased 7% compared to 4Q17 due to lower revenues from advisory and other fees and equity underwriting, partially offset by higher revenues from debt underwriting. Compared to 4Q17, revenues from advisory and other fees decreased 17% and revenues from equity underwriting decreased 9%, while debt underwriting revenues increased 3%. Total operating expenses of CHF 468 million increased 2%, driven by higher restructuring costs, partially offset by lower compensation and benefits.
Compared to 1Q17, our reported income before taxes decreased 60% in 1Q18, driven by lower revenues and higher operating expenses. Net revenues decreased 13%, due to lower revenues from advisory and other fees and debt underwriting activity. Revenues from advisory and other fees decreased 21%, and revenues from debt underwriting decreased 12%, while equity underwriting revenues were stable. Total operating expenses increased 4%, primarily driven by higher restructuring costs and general and administrative expenses, partially offset by lower compensation and benefits. Adjusted income before taxes was CHF 89 million in 1Q18, compared to CHF 121 million in 4Q17 and CHF 151 million in 1Q17.
Results in 1Q18 were impacted by the weakening of the average rate of the US dollar against the Swiss franc, which adversely impacted revenues but favorably impacted expenses.
Capital and leverage metrics
As of the end of 1Q18, risk-weighted assets were USD 21.9 billion, an increase of USD 1.3 billion compared to the end of 4Q17, primarily driven by the new operational risk allocation key. Leverage exposure was USD 40.6 billion, a decrease of USD 4.3 billion compared to the end of 4Q17, primarily driven by the realignment of our HQLA allocations.
| Divisional results | |||||||||||
| in / end of | % change | ||||||||||
| 1Q18 | 4Q17 | 1Q17 | QoQ | YoY | |||||||
| Statements of operations (CHF million) | |||||||||||
| Net revenues | 528 | 565 | 606 | (7) | (13) | ||||||
| Provision for credit losses | 1 | (1) | 6 | – | (83) | ||||||
| Compensation and benefits | 316 | 324 | 348 | (2) | (9) | ||||||
| General and administrative expenses | 121 | 119 | 101 | 2 | 20 | ||||||
| Commission expenses | 1 | 2 | 0 | (50) | – | ||||||
| Restructuring expenses | 30 | 14 | 2 | 114 | – | ||||||
| Total other operating expenses | 152 | 135 | 103 | 13 | 48 | ||||||
| Total operating expenses | 468 | 459 | 451 | 2 | 4 | ||||||
| Income before taxes | 59 | 107 | 149 | (45) | (60) | ||||||
| Statement of operations metrics (%) | |||||||||||
| Return on regulatory capital | 8.1 | 15.0 | 23.1 | – | – | ||||||
| Cost/income ratio | 88.6 | 81.2 | 74.4 | – | – | ||||||
| Number of employees (full-time equivalents) | |||||||||||
| Number of employees | 3,120 | 3,190 | 3,210 | (2) | (3) | ||||||
30
| Divisional results (continued) | |||||||||||
| in / end of | % change | ||||||||||
| 1Q18 | 4Q17 | 1Q17 | QoQ | YoY | |||||||
| Net revenue detail (CHF million) | |||||||||||
| Advisory and other fees | 172 | 206 | 218 | (17) | (21) | ||||||
| Debt underwriting | 256 | 249 | 291 | 3 | (12) | ||||||
| Equity underwriting | 103 | 113 | 103 | (9) | 0 | ||||||
| Other | (3) | (3) | (6) | 0 | (50) | ||||||
| Net revenues | 528 | 565 | 606 | (7) | (13) | ||||||
| Balance sheet statistics (CHF million, except where indicated) | |||||||||||
| Total assets | 15,380 | 20,803 | 19,997 | (26) | (23) | ||||||
| Risk-weighted assets | 20,866 | 20,058 | 18,602 | 4 | 12 | ||||||
| Risk-weighted assets (USD) | 21,853 | 20,528 | 18,584 | 6 | 18 | ||||||
| Leverage exposure | 38,731 | 43,842 | 44,018 | (12) | (12) | ||||||
| Leverage exposure (USD) | 40,562 | 44,870 | 43,976 | (10) | (8) | ||||||
| Reconciliation of adjusted results | |||||||
| Investment Banking & Capital Markets | |||||||
| in | 1Q18 | 4Q17 | 1Q17 | ||||
| Adjusted results (CHF million) | |||||||
| Net revenues | 528 | 565 | 606 | ||||
| Provision for credit losses | 1 | (1) | 6 | ||||
| Total operating expenses | 468 | 459 | 451 | ||||
| Restructuring expenses | (30) | (14) | (2) | ||||
| Adjusted total operating expenses | 438 | 445 | 449 | ||||
| Income before taxes | 59 | 107 | 149 | ||||
| Total adjustments | 30 | 14 | 2 | ||||
| Adjusted income before taxes | 89 | 121 | 151 | ||||
| Adjusted return on regulatory capital (%) | 12.4 | 16.9 | 23.4 | ||||
| Adjusted results are non-GAAP financial measures. Refer to "Reconciliation of adjusted results" in Credit Suisse for further information. | |||||||
In 1Q18, the US GAAP accounting standard pertaining to revenue recognition was adopted. As a result, 1Q18 net revenues and operating expenses in Investment Banking & Capital Markets both increased by CHF 15 million.
Advisory and other fees
In 1Q18, revenues from advisory and other fees of CHF 172 million decreased 17% compared to 4Q17, reflecting lower revenues mainly due to fewer completed M&A transactions.
Compared to 1Q17, revenues decreased 21%, reflecting lower revenues mainly due to fewer completed M&A transactions.
Debt underwriting
In 1Q18, debt underwriting revenues of CHF 256 million increased 3% compared to 4Q17, primarily driven by higher revenues from leveraged finance activity.
Compared to 1Q17, revenues decreased 12%, driven by lower leveraged finance and investment grade revenues, partially offset by higher derivatives financing revenues.
Equity underwriting
In 1Q18, revenues from equity underwriting of CHF 103 million decreased 9% compared to 4Q17 primarily due to lower revenues from follow-on and rights offerings, partially offset by higher revenues from IPO issuances.
Compared to 1Q17, revenues were stable, as increases in revenues from IPO issuances and equity derivatives were mostly offset by reductions in revenues from follow-on and rights offerings.
Provision for credit losses
In 1Q18, we recorded a provision of credit losses of CHF 1 million compared to a release of provision for credit losses of CHF 1 million in 4Q17. In 1Q17, we recorded provision for credit losses of CHF 6 million.
31
Total operating expenses
Total operating expenses of CHF 468 million increased 2% compared to 4Q17, primarily driven by higher restructuring costs, partially offset by lower compensation and benefits. During 1Q18, we incurred restructuring costs of CHF 30 million. Compensation and benefits of CHF 316 million decreased 2%, mainly driven by lower discretionary compensation accrual, partially offset by higher deferred compensation. General and administrative expenses were stable. Adjusted total operating expenses decreased 2% compared to 4Q17.
Compared to 1Q17, total operating expenses increased 4%, driven by higher restructuring expenses and general and administrative expenses, partially offset by lower compensation and benefits. General and administrative expenses increased 20%, primarily driven by higher costs due to the adoption of the new revenue recognition accounting standard. Compensation and benefits of CHF 316 million decreased 9%, reflecting lower discretionary compensation accrual. Adjusted total operating expenses decreased 2% compared to 1Q17.
Global advisory and underwriting revenues
The Group’s global advisory and underwriting business operates across multiple business divisions that work in close collaboration with each other to generate these revenues. In order to reflect the global performance and capabilities of this business and for enhanced comparability versus its peers, the following table aggregates total advisory and underwriting revenues for the Group into a single metric in US dollar terms before cross-divisional revenue sharing agreements.
| in | % change | ||||||||||
| 1Q18 | 4Q17 | 1Q17 | QoQ | YoY | |||||||
| Global advisory and underwriting revenues (USD million) | |||||||||||
| Global advisory and underwriting revenues | 1,106 | 1,034 | 1,133 | 7 | (2) | ||||||
| of which advisory and other fees | 251 | 228 | 278 | 10 | (10) | ||||||
| of which debt underwriting | 616 | 519 | 647 | 19 | (5) | ||||||
| of which equity underwriting | 239 | 287 | 208 | (17) | 15 | ||||||
32
In 1Q18, we reported a loss before taxes of CHF 409 million and decreased our risk-weighted assets by USD 11.1 billion and our leverage exposure by USD 16.1 billion compared to 4Q17.
1Q18 results
In 1Q18, we reported a loss before taxes of CHF 409 million compared to losses of CHF 455 million in 4Q17 and CHF 539 million in 1Q17. In 1Q18, we reported an adjusted loss before taxes of CHF 362 million, compared to adjusted losses of CHF 347 million in 4Q17 and CHF 500 million in 1Q17.
We reported negative net revenues of CHF 203 million in 1Q18, primarily driven by overall funding costs and valuation adjustments. Valuation adjustments in 1Q18 primarily reflected mark-to-market losses on our legacy investment banking portfolio. Total operating expenses in 1Q18 were CHF 206 million, including CHF 126 million of general and administrative expenses, of which CHF 47 million were litigation provisions, and CHF 65 million of compensation and benefits.
In 1Q18, we reported adjusted total operating expenses of CHF 158 million, compared to CHF 193 million in 4Q17 and CHF 232 million in 1Q17.
Capital and leverage metrics
As of the end of 1Q18, we reported risk-weighted assets of USD 23.3 billion, a decrease of USD 11.1 billion compared to the end of 4Q17. The decrease was primarily driven by the new operational risk allocation key and through multiple transactions executed in the quarter, including the continued reduction of derivatives exposures.
Leverage exposure was USD 45.2 billion as of the end of 1Q18, a decrease of USD 16.1 billion compared to the end of 4Q17. The decrease was primarily driven by our realignment of the HQLA allocations and through derivatives compression initiatives and the sale of emerging markets loans and residual illiquid asset management exposures.
| Divisional results | |||||||||||
| in / end of | % change | ||||||||||
| 1Q18 | 4Q17 | 1Q17 | QoQ | YoY | |||||||
| Statements of operations (CHF million) | |||||||||||
| Net revenues | (203) | (151) | (206) | 34 | (1) | ||||||
| of which from noncontrolling interests without significant economic interest | (2) | 29 | 1 | – | – | ||||||
| Provision for credit losses | 0 | 3 | 24 | (100) | (100) | ||||||
| Compensation and benefits | 65 | 65 | 88 | 0 | (26) | ||||||
| General and administrative expenses | 126 | 209 | 207 | (40) | (39) | ||||||
| of which litigation provisions | 47 | 91 | 81 | (48) | (42) | ||||||
| Commission expenses | 4 | 9 | 7 | (56) | (43) | ||||||
| Restructuring expenses | 11 | 18 | 7 | (39) | 57 | ||||||
| Total other operating expenses | 141 | 236 | 221 | (40) | (36) | ||||||
| Total operating expenses | 206 | 301 | 309 | (32) | (33) | ||||||
| of which from noncontrolling interests without significant economic interest | 1 | 2 | 4 | (50) | (75) | ||||||
| Income/(loss) before taxes | (409) | (455) | (539) | (10) | (24) | ||||||
| of which from noncontrolling interests without significant economic interest | (3) | 27 | (3) | – | 0 | ||||||
| Number of employees (full-time equivalents) | |||||||||||
| Number of employees | 1,480 | 1,530 | 1,690 | (3) | (12) | ||||||
33
| Divisional results (continued) | |||||||||||
| in / end of | % change | ||||||||||
| 1Q18 | 4Q17 | 1Q17 | QoQ | YoY | |||||||
| Net revenue detail (CHF million) | |||||||||||
| Restructuring of select onshore businesses | (4) | 0 | 35 | – | – | ||||||
| Legacy cross-border and small markets businesses | 16 | 24 | 37 | (33) | (57) | ||||||
| Legacy asset management positions | 0 | (12) | (4) | 100 | 100 | ||||||
| Legacy investment banking portfolio | (119) | (121) | (214) | (2) | (44) | ||||||
| Legacy funding costs | (83) | (90) | (65) | (8) | 28 | ||||||
| Other | (11) | 19 | 4 | – | – | ||||||
| Noncontrolling interests without significant economic interest | (2) | 29 | 1 | – | – | ||||||
| Net revenues | (203) | (151) | (206) | 34 | (1) | ||||||
| Balance sheet statistics (CHF million, except where indicated) | |||||||||||
| Total assets | 30,163 | 45,629 | 61,640 | (34) | (51) | ||||||
| Risk-weighted assets | 22,239 | 33,613 | 41,384 | (34) | (46) | ||||||
| Risk-weighted assets (USD) | 23,291 | 34,401 | 41,345 | (32) | (44) | ||||||
| Leverage exposure | 43,168 | 59,934 | 82,718 | (28) | (48) | ||||||
| Leverage exposure (USD) | 45,209 | 61,339 | 82,639 | (26) | (45) | ||||||
| Reconciliation of adjusted results | |||||||
| Strategic Resolution Unit | |||||||
| in | 1Q18 | 4Q17 | 1Q17 | ||||
| Adjusted results (CHF million) | |||||||
| Net revenues | (203) | (151) | (206) | ||||
| Real estate gains | (1) | 0 | 0 | ||||
| (Gains)/losses on business sales | 0 | 0 | (38) | ||||
| Adjusted net revenues | (204) | (151) | (244) | ||||
| Provision for credit losses | 0 | 3 | 24 | ||||
| Total operating expenses | 206 | 301 | 309 | ||||
| Restructuring expenses | (11) | (18) | (7) | ||||
| Major litigation provisions | (37) | (90) | (70) | ||||
| Adjusted total operating expenses | 158 | 193 | 232 | ||||
| Income/(loss) before taxes | (409) | (455) | (539) | ||||
| Total adjustments | 47 | 108 | 39 | ||||
| Adjusted income/(loss) before taxes | (362) | (347) | (500) | ||||
| Adjusted results are non-GAAP financial measures. Refer to "Reconciliation of adjusted results" in Credit Suisse for further information. | |||||||
Net revenues
We reported negative net revenues of CHF 203 million in 1Q18 compared to negative net revenues of CHF 151 million in 4Q17 and CHF 206 million in 1Q17. Compared to 4Q17, the movement was mainly driven by exit-related gains of CHF 51 million from the sale and restructuring of loan financing and real estate exposures in 4Q17.
Compared to 1Q17, the improvement was primarily driven by lower overall funding costs, partially offset by higher negative valuation adjustments on our legacy investment banking portfolio and a reduction in fee-based revenues as a result of accelerated business exits in 1Q18.
Provision for credit losses
In 1Q18, we had no provision for credit losses compared to CHF 3 million in 4Q17 and CHF 24 million in 1Q17. The provision for credit losses in 1Q17 was primarily related to corporate loans and the disposal of a portfolio of senior financing on US middle market loans in 1Q17.
Total operating expenses
Total operating expenses of CHF 206 million decreased 32% compared to 4Q17, primarily reflecting lower general and administrative expenses. General and administrative expenses of CHF 126 million decreased 40%, including a decrease of CHF 44 million in litigation provisions, mainly in connection with mortgage-related matters. Total operating expenses in 1Q18 included costs of CHF 28 million to meet requirements related to the settlements with US authorities regarding US cross-border matters, some of which relates to the work performed by the New York State Department of Financial Services (DFS) monitor. Adjusted total operating expenses decreased 18% compared to 4Q17.
Compared to 1Q17, total operating expenses decreased 33% as a result of lower general and administrative expenses and lower compensation and benefits. General and administrative expenses decreased 39%, including a decrease of CHF 34 million in litigation provisions mainly in connection with mortgage-related matters. Compensation and benefits decreased 26%, primarily as a result of various cost reduction initiatives, including the impact of the transfer of our US private banking business.
34
Development of the Strategic Resolution Unit
As previously disclosed, on occasion the reduction of exposures in the Strategic Resolution Unit involve the maturation of lending facilities or other transactions that wholly or partially may be renewed or extended by our strategic business divisions, such as Global Markets or International Wealth Management. Similarly, there may be occasions where strategic business divisions will enter into new transactions with counterparties resulting in exposures that may have similar characteristics to those recorded in the Strategic Resolution Unit. This is aligned with the Group’s risk appetite and that of the relevant strategic divisions.
We previously amended and enhanced our risk appetite framework in an effort to provide additional governance and controls to ensure all new business activities are scrutinized to distinguish between those types of business exposures held in the Strategic Resolution Unit that will be allowed for execution in our strategic divisions and those that will be prohibited or for which we have limited risk appetite.
After a business reassessment, the Executive Board and the Audit Committee approved the transfer of twelve counterparty relationships and associated financing transactions from the Strategic Resolution Unit to the Global Markets and Investment Banking & Capital Markets divisions. The execution of these transfers occurred in 1Q18. The impact of these transfers on risk-weighted assets and leverage exposure for the Strategic Resolution Unit was a decline of approximately USD 0.8 billion and USD 1.3 billion, respectively. Risk-weighted assets of USD 0.7 billion and leverage exposure of USD 1.2 billion were transferred to Global Markets and risk-weighted assets of USD 0.1 billion and leverage exposure of USD 0.1 billion were transferred to Investment Banking & Capital Markets.
In addition, a reassessment in 1Q18 of certain assets under management and assets under custody recorded in the Strategic Resolution Unit resulted in a change in the estimate of the expected outflows in connection with the tax regularization of client assets. The estimate of the expected outflows declined by approximately CHF 1.9 billion for assets under management, and CHF 1.1 billion, CHF 0.6 billion and CHF 0.2 billion of such assets under management were transferred to Asia Pacific, International Wealth Management and Swiss Universal Bank, respectively. In addition, CHF 0.6 billion of assets under custody were transferred to International Wealth Management. The transfers are in line with the original transfer of such assets to the Strategic Resolution Unit and as such are reflected as a structural effect in our asset under management disclosures, with no impact to net new assets.
35
In 1Q18, we recorded a loss before taxes of CHF 172 million compared to a loss of CHF 265 million in 4Q17 and a loss of CHF 99 million in 1Q17.
Corporate Center includes parent company operations such as Group financing, expenses for projects sponsored by the Group, including costs associated with the evolution of our legal entity structure to meet developing and future regulatory requirements, and certain other expenses and revenues that have not been allocated to the segments. Corporate Center also includes consolidation and elimination adjustments required to eliminate intercompany revenues and expenses.
Treasury results include the impact of volatility in the valuations of certain central funding transactions such as structured notes issuances and swap transactions. Since 2Q17, treasury results also include additional interest charges from transfer pricing to align funding costs to assets held in the Corporate Center.
Other revenues include required elimination adjustments associated with trading in own shares and treasury commissions charged to divisions and, beginning in 3Q17, the cost of certain hedging transactions executed in connection with the Group’s risk-weighted assets.
Compensation and benefits include fair value adjustments on certain deferred compensation plans not allocated to the segments and certain deferred compensation retention awards intended to support the restructuring of the Group, mainly relating to Asia Pacific predominantly through the end of 2018.
1Q18 results
In 1Q18, we recorded a loss before taxes of CHF 172 million compared to CHF 265 million in 4Q17. The decreased loss before taxes in 1Q18 was primarily driven by lower total operating expenses, partially offset by lower net revenues.
Negative net revenues of CHF 60 million decreased CHF 105 million compared to 4Q17, reflecting negative treasury results, partially offset by higher other revenues. Negative treasury results of CHF 109 million in 1Q18 reflected losses of CHF 134 million relating to funding activities, partially offset by revenues with respect to structured notes volatility of CHF 35 million. In 4Q17, positive treasury results of CHF 72 million reflected revenues with respect to structured notes volatility of CHF 237 million, partially offset by negative revenues of CHF 104 million relating to hedging volatility and CHF 51 million relating to funding activities. The 4Q17 structured notes volatility was substantially comprised of the positive impact of CHF 236 million from an enhancement to the valuation methodology relating to the instrument-specific credit risk on fair value option elected structured notes, of which CHF 162 million was reallocated between accumulated other comprehensive income and net income. We migrated certain sub-portfolios of our structured notes portfolio to a new target operating model that allows for a more granular and precise valuation of the individual notes. This migration became sufficiently advanced during the second half of 2017 with respect to the rates sub-portfolio to allow for this change in estimate. Other revenues of CHF 49 million increased CHF 76 million compared to 4Q17, mainly reflecting reduced costs relating to hedging transactions executed in connection with the Group’s risk-weighted assets and the elimination of losses from trading in own shares.
| Corporate Center results | |||||||||||
| in / end of | % change | ||||||||||
| 1Q18 | 4Q17 | 1Q17 | QoQ | YoY | |||||||
| Statements of operations (CHF million) | |||||||||||
| Treasury results | (109) | 72 | 30 | – | – | ||||||
| Other | 49 | (27) | 39 | – | 26 | ||||||
| Net revenues | (60) | 45 | 69 | – | – | ||||||
| Provision for credit losses | 0 | (3) | 2 | 100 | (100) | ||||||
| Compensation and benefits | 55 | 81 | 101 | (32) | (46) | ||||||
| General and administrative expenses | 37 | 222 | 43 | (83) | (14) | ||||||
| Commission expenses | 19 | 8 | 21 | 138 | (10) | ||||||
| Restructuring expenses | 1 | 2 | 1 | (50) | 0 | ||||||
| Total other operating expenses | 57 | 232 | 65 | (75) | (12) | ||||||
| Total operating expenses | 112 | 313 | 166 | (64) | (33) | ||||||
| Loss before taxes | (172) | (265) | (99) | (35) | 74 | ||||||
| Balance sheet statistics (CHF million) | |||||||||||
| Total assets | 109,734 | 67,591 | 69,045 | 62 | 59 | ||||||
| Risk-weighted assets 1 | 28,135 | 23,849 | 17,180 | 18 | 64 | ||||||
| Leverage exposure 1 | 110,767 | 67,034 | 64,219 | 65 | 72 | ||||||
1 Disclosed on a look-through basis. | |||||||||||
36
Total operating expenses of CHF 112 million decreased 64% compared to 4Q17, mainly reflecting an 83% decrease in general and administrative expenses, primarily due to the litigation settlement with the DFS relating to certain areas of our foreign exchange trading business and the provision for indirect taxes in 4Q17, and a 32% decrease in compensation and benefits, mainly relating to lower deferred compensation expenses from prior-year awards and lower retention award expenses. In 1Q18, we recorded expenses of CHF 49 million, compared to CHF 58 million in 4Q17, with respect to the continuing evolution of our legal entity structure, primarily relating to Credit Suisse (Holdings), Inc. and our recovery and resolution plan framework.
Capital metrics
As of the end of 1Q18, we reported risk-weighted assets of CHF 28.1 billion, reflecting an increase of CHF 4.3 billion compared to the end of 4Q17. The increase was primarily driven by the new operational risk allocation key which increased risk-weighted assets by CHF 5.9 billion, partially offset by the reduced level of risk-weighted assets relating to operational risk of CHF 2.5 billion, reflecting the progress in exiting businesses and reducing the size of the Strategic Resolution Unit over the last two years. The increase of risk-weighted assets relating to operational risk also included the impact of a model and parameter update of CHF 0.6 billion reflecting the annual recalibration of the advanced measurement approach model.
Leverage exposure was CHF 110.8 billion as of the end of 1Q18, reflecting an increase of CHF 43.7 billion compared to the end of 4Q17. The increase mainly reflected a CHF 35.6 billion impact from the realignment of our HQLA allocations and the CHF 7.6 billion increase in our centrally held balance of HQLA.
| Expense allocation to divisions | |||||||||||
| in | % change | ||||||||||
| 1Q18 | 4Q17 | 1Q17 | QoQ | YoY | |||||||
| Expense allocation to divisions (CHF million) | |||||||||||
| Compensation and benefits | 703 | 763 | 776 | (8) | (9) | ||||||
| General and administrative expenses | 554 | 835 | 573 | (34) | (3) | ||||||
| Commission expenses | 19 | 8 | 21 | 138 | (10) | ||||||
| Restructuring expenses | 34 | 73 | 31 | (53) | 10 | ||||||
| Total other operating expenses | 607 | 916 | 625 | (34) | (3) | ||||||
| Total operating expenses before allocation to divisions | 1,310 | 1,679 | 1,401 | (22) | (6) | ||||||
| Net allocation to divisions | 1,198 | 1,366 | 1,235 | (12) | (3) | ||||||
| of which Swiss Universal Bank | 253 | 281 | 271 | (10) | (7) | ||||||
| of which International Wealth Management | 210 | 246 | 216 | (15) | (3) | ||||||
| of which Asia Pacific | 197 | 193 | 188 | 2 | 5 | ||||||
| of which Global Markets | 399 | 456 | 398 | (13) | 0 | ||||||
| of which Investment Banking & Capital Markets | 81 | 103 | 83 | (21) | (2) | ||||||
| of which Strategic Resolution Unit | 58 | 87 | 79 | (33) | (27) | ||||||
| Total operating expenses | 112 | 313 | 166 | (64) | (33) | ||||||
| Corporate services and business support, including in finance, operations, human resources, legal, compliance, risk management and IT, are provided by corporate functions, and the related costs are allocated to the segments and the Corporate Center based on their requirements and other relevant measures. | |||||||||||
| Beginning in 1Q18, certain variable compensation expenses relating to corporate function employees were transferred to the Corporate Center resulting in higher allocations to the divisions. Prior periods for Corporate Center-related expense allocations have been restated to conform to the current presentation. | |||||||||||
37
As of the end of 1Q18, assets under management were CHF 1,379.9 billion, an increase of CHF 3.8 billion compared to the end of 4Q17, with net new assets of CHF 25.1 billion in 1Q18.
| Assets under management | |||||||
| end of | % change | ||||||
| 1Q18 | 4Q17 | QoQ | |||||
| Assets under management (CHF billion) | |||||||
| Swiss Universal Bank - Private Clients | 206.7 | 208.3 | (0.8) | ||||
| Swiss Universal Bank - Corporate & Institutional Clients | 352.0 | 354.7 | (0.8) | ||||
| International Wealth Management - Private Banking | 370.0 | 366.9 | 0.8 | ||||
| International Wealth Management - Asset Management | 391.2 | 385.6 | 1.5 | ||||
| Asia Pacific - Private Banking | 199.1 | 196.8 | 1.2 | ||||
| Strategic Resolution Unit | 2.6 | 5.0 | (48.0) | ||||
| Assets managed across businesses 1 | (141.7) | (141.2) | 0.4 | ||||
| Assets under management | 1,379.9 | 1,376.1 | 0.3 | ||||
| of which discretionary assets | 455.2 | 452.5 | 0.6 | ||||
| of which advisory assets | 924.7 | 923.6 | 0.1 | ||||
1 Represents assets managed by Asset Management within International Wealth Management for the other businesses. | |||||||
| Net new assets | |||||||
| in | 1Q18 | 4Q17 | 1Q17 | ||||
| Net new assets (CHF billion) | |||||||
| Swiss Universal Bank – Private Clients | 2.7 | 0.0 | 2.0 | ||||
| Swiss Universal Bank – Corporate & Institutional Clients | 3.8 | (0.2) | 0.0 | ||||
| International Wealth Managment – Private Banking | 5.5 | 2.7 | 4.7 | ||||
| International Wealth Managment – Asset Management 1 | 9.0 | 1.4 | 15.0 | ||||
| Asia Pacific – Private Banking | 6.2 | 1.3 | 5.3 | ||||
| Strategic Resolution Unit | (0.1) | (0.5) | (1.0) | ||||
| Assets managed across businesses 2 | (2.0) | (1.6) | (1.6) | ||||
| Net new assets | 25.1 | 3.1 | 24.4 | ||||
1 Includes outflows for private equity assets reflecting realizations at cost and unfunded commitments on which a fee is no longer earned. | |||||||
2 Represents assets managed by Asset Management within International Wealth Management for the other businesses. | |||||||
1Q18 results
As of the end of 1Q18, assets under management of CHF 1,379.9 billion increased CHF 3.8 billion compared to the end of 4Q17. The increase was driven by net new assets of CHF 25.1 billion, partially offset by unfavorable market and foreign exchange-related movements.
Net new assets of CHF 25.1 billion in 1Q18 mainly reflected net new assets in the Asset Management business of International Wealth Management, reflecting inflows from traditional and alternative investments and from emerging market joint ventures, net new assets in the Private Banking business of Asia Pacific, primarily reflecting inflows from Greater China, Japan and South East Asia, including certain major client inflows, and net new assets in the Private Banking business of International Wealth Management, mainly reflecting inflows from emerging markets and Europe.
> Refer to “Swiss Universal Bank”, “International Wealth Management”, “Asia Pacific” and “Strategic Resolution Unit” for further information.
> Refer to “Note 37 – Assets under management” in VI – Consolidated financial statements – Credit Suisse Group in the Credit Suisse Annual Report 2017 for further information.
38
Balance sheet
As of the end of 1Q18, total assets of CHF 809.1 billion increased 2% compared to 4Q17, reflecting an increase in operating activities, partially offset by the foreign exchange translation impact. Excluding the foreign exchange translation impact, total assets increased CHF 23.0 billion.
Range of reasonably possible losses related to certain legal proceedings
The Group’s estimate of the aggregate range of reasonably possible losses that are not covered by existing provisions for certain proceedings for which the Group believes an estimate is possible was zero to CHF 1.4 billion as of the end of 1Q18.
Total shareholders’ equity
Credit Suisse’s total shareholders’ equity increased to CHF 42.5 billion as of the end of 1Q18 from CHF 41.9 billion as of the end of 4Q17. Total shareholders’ equity was positively impacted by net income attributable to shareholders, gains on fair value elected liabilities relating to credit risk and an increase in the share-based compensation obligation, partially offset by foreign exchange-related movements on cumulative translation adjustments and transactions relating to the settlement of share-based compensation awards.
Liquidity coverage ratio
Our average liquidity coverage ratio was 208% as of the end of 1Q18 compared to 185% as of the end of 4Q17. The ratio reflects a conservative liquidity position, including ensuring that the Group’s branches and subsidiaries meet applicable local liquidity requirements.
Capital metrics
The CET1 ratio was 12.9% as of the end of 1Q18 compared to 13.5% as of the end of 4Q17, reflecting a decrease in CET1 capital and slightly lower risk-weighted assets. Credit Suisse’s tier 1 ratio was 18.4% as of the end of 1Q18 compared to 18.9% as of the end of 4Q17. The total capital ratio was 20.2% as of the end of 1Q18 compared to 20.8% as of the end of 4Q17.
CET1 capital was CHF 35.0 billion as of the end of 1Q18, a decrease compared to CHF 36.7 billion as of the end of 4Q17, mainly reflecting an additional annual 20% phase-in of regulatory deductions from CET1 (from 80% to 100%), including goodwill, other intangible assets and certain deferred tax assets and an additional annual 20% decrease in the adjustment for the accounting treatment of pension plans (from 20% to 0%), pursuant to phase-in requirements, as well as a negative foreign exchange impact. These decreases were partially offset by net income attributable to shareholders.
Total eligible capital was CHF 54.8 billion as of the end of 1Q18, a decrease compared to CHF 56.7 billion as of the end of 4Q17, primarily reflecting decreases in CET1 capital and tier 2 capital.
Risk-weighted assets decreased 1% to CHF 271.0 billion as of the end of 1Q18 compared to CHF 272.8 billion as of the end of 4Q17, mainly driven by a negative foreign exchange impact and a reduction in methodology and policy changes in operational risk. These decreases were partially offset by increases in methodology and policy changes in credit risk and movements in risk levels, mainly in market risk.
As of the end of 1Q18, the look-through CET1 ratio was 12.9% compared to 12.8% as of the end of 4Q17, reflecting slightly higher CET1 capital and stable risk-weighted assets.
Leverage metrics
The BIS tier 1 leverage ratio was 5.4% as of the end of 1Q18, with a BIS CET1 component of 3.8%. On a look-through basis, the BIS tier 1 leverage ratio was 5.1% as of the end of 1Q18, with a BIS CET1 component of 3.8%.
The look-through leverage exposure was CHF 932.1 billion as of the end of 1Q18, a slight increase compared to CHF 916.5 billion as of the end of 4Q17.
| BIS capital and leverage metrics | |||||||||
| Phase-in | Look-through | ||||||||
| end of | 1Q18 | 4Q17 | 1Q18 | 4Q17 | |||||
| Capital metrics (%, except where indicated) | |||||||||
| Risk-weighted assets (CHF billion) | 271.0 | 272.8 | 271.0 | 271.7 | |||||
| CET1 ratio | 12.9 | 13.5 | 12.9 | 12.8 | |||||
| Tier 1 ratio | 18.4 | 18.9 | 17.4 | 17.4 | |||||
| Total capital ratio | 20.2 | 20.8 | 18.9 | 18.9 | |||||
| Leverage metrics (%, except where indicated) | |||||||||
| Leverage exposure (CHF billion) | 932.1 | 919.1 | 932.1 | 916.5 | |||||
| CET1 leverage ratio | 3.8 | 4.0 | 3.8 | 3.8 | |||||
| Tier 1 leverage ratio | 5.4 | 5.6 | 5.1 | 5.2 | |||||
| Refer to the Appendix for additional information on BIS and Swiss capital and leverage metrics. | |||||||||
39
The Group has not finalized its 1Q18 Financial Report and the Group’s independent registered public accounting firm has not completed its review of the condensed consolidated financial statements (unaudited) for the period. Accordingly, the financial information contained in this Earnings Release is subject to completion of quarter-end procedures, which may result in changes to that information. Certain reclassifications have been made to prior periods to conform to the current presentation.
For purposes of this Earnings Release, unless the context otherwise requires, the terms “Credit Suisse”, “the Group”, “we”, “us” and “our” mean Credit Suisse Group AG and its consolidated subsidiaries. The business of Credit Suisse AG, the direct bank subsidiary of the Group, is substantially similar to the Group, and these terms are used to refer to both when the subject is the same or substantially similar. The term “the Bank” is used when referring to Credit Suisse AG and its consolidated subsidiaries.
Information referenced in this Earnings Release, whether via website links or otherwise, is not incorporated into this Earnings Release.
As of January 1, 2013, Basel III was implemented in Switzerland along with the Swiss “Too Big to Fail” legislation and regulations thereunder (Swiss Requirements) (in each case, subject to certain phase-in periods). As of January 1, 2015, the BIS leverage ratio framework, as issued by BCBS, was implemented in Switzerland by FINMA. Our related disclosures are in accordance with Credit Suisse’s interpretation of such requirements, including relevant assumptions. Changes in the interpretation of these requirements in Switzerland or in any of Credit Suisse’s assumptions or estimates could result in different numbers from those shown herein.
References to phase-in and look-through included herein refer to Basel III requirements and Swiss Requirements. Phase-in reflects that for the years 2014 – 2018, there will be a five-year (20% per annum) phase in of goodwill, other intangible assets and other capital deductions (e.g., certain deferred tax assets) and the phase-out of an adjustment for the accounting treatment of pension plans and, for the years 2013 – 2022, there will be a phase out of certain capital instruments. Look-through assumes the full phase-in of goodwill and other intangible assets and other regulatory adjustments and the phase out of certain capital instruments.
Unless otherwise noted, leverage exposure is based on the BIS leverage ratio framework and consists of period-end balance sheet assets and prescribed regulatory adjustments. The look-through tier 1 leverage ratio and CET1 leverage ratio are calculated as look-through BIS tier 1 capital and CET1 capital, respectively, divided by period-end leverage exposure. Swiss leverage ratios are measured on the same period-end basis as the leverage exposure for the BIS leverage ratio.
Return on regulatory capital is calculated using income/(loss) after tax and assumes a tax rate of 30% and capital allocated based on the worst of 10% of average risk-weighted assets and 3.5% of average leverage exposure. For Global Markets and Investment Banking & Capital Markets, return on regulatory capital is based on US dollar denominated numbers. Adjusted return on regulatory capital is calculated using adjusted results, applying the same methodology to calculate return on regulatory capital.
We may not achieve all of the expected benefits of our strategic initiatives. Factors beyond our control, including but not limited to the market and economic conditions, changes in laws, rules or regulations and other challenges discussed in our public filings, could limit our ability to achieve some or all of the expected benefits of these initiatives.
The Group’s estimate of the aggregate range of reasonably possible losses that are not covered by existing provisions which is discussed above relates only to those proceedings for which the Group believes an estimate is possible and which are discussed in the litigation note to the Consolidated Financial Statements in the Group’s Annual Report on Form 20-F and updated in its quarterly reports (including the Group’s 1Q18 Financial Report that is scheduled to be released on May 3, 2018). It is inherently difficult to determine whether a loss is probable or even reasonably possible or to estimate the amount of any loss or loss range for many of the Group’s legal proceedings. The Group’s aggregate litigation provisions include estimates of losses, additional losses or ranges of loss for proceedings for which such losses are probable and can be reasonably estimated. The Group does not believe that it can estimate an aggregate range of reasonably possible losses for certain of its proceedings because of their complexity, the novelty of some of the claims, the early stage of the proceedings, the limited amount of discovery that has occurred and/or other factors. For additional details, see the litigation note to the Consolidated Financial Statements in the Group’s Annual Report on Form 20-F and in each of its quarterly Financial Reports.
Investors and others should note that we announce material information (including quarterly earnings releases and financial reports) to the investing public using press releases, SEC and Swiss ad hoc filings, our website and public conference calls and webcasts. We intend to also use our Twitter account @creditsuisse (https://twitter.com/creditsuisse) to excerpt key messages from our public disclosures, including earnings releases. We may retweet such messages through certain of our regional Twitter accounts, including @csschweiz (https://twitter.com/csschweiz) and @csapac (https://twitter.com/csapac). Investors and others should take care to consider such abbreviated messages in the context of the disclosures from which they are excerpted. The information we post on these Twitter accounts is not a part of this Earnings Release.
In various tables, use of “–” indicates not meaningful or not applicable.
40
| Core Results by business activity | |||||||||||||||||||
| in | 1Q18 | 4Q17 | 1Q17 | ||||||||||||||||
Swiss Universal Bank | International Wealth Management | Asia Pacific | Global Markets | Investment Banking & Capital Markets | Corporate Center | Core Results | Core Results | Core Results | |||||||||||
| Related to private banking (CHF million) | |||||||||||||||||||
| Net revenues | 762 | 1,043 | 455 | – | – | – | 2,260 | 2,040 | 2,005 | ||||||||||
| of which net interest income | 428 | 388 | 159 | – | – | – | 975 | 955 | 923 | ||||||||||
| of which recurring | 206 | 307 | 111 | – | – | – | 624 | 616 | 577 | ||||||||||
| of which transaction-based | 109 | 311 | 185 | – | – | – | 605 | 468 | 504 | ||||||||||
| Provision for credit losses | 10 | (1) | 4 | – | – | – | 13 | 31 | 18 | ||||||||||
| Total operating expenses | 487 | 643 | 281 | – | – | – | 1,411 | 1,448 | 1,448 | ||||||||||
| Income before taxes | 265 | 401 | 170 | – | – | – | 836 | 561 | 539 | ||||||||||
| Related to corporate & institutional banking | |||||||||||||||||||
| Net revenues | 669 | – | – | – | – | – | 669 | 592 | 643 | ||||||||||
| of which net interest income | 303 | – | – | – | – | – | 303 | 301 | 313 | ||||||||||
| of which recurring | 174 | – | – | – | – | – | 174 | 159 | 165 | ||||||||||
| of which transaction-based | 190 | – | – | – | – | – | 190 | 146 | 180 | ||||||||||
| Provision for credit losses | 24 | – | – | – | – | – | 24 | 5 | (2) | ||||||||||
| Total operating expenses | 347 | – | – | – | – | – | 347 | 366 | 402 | ||||||||||
| Income before taxes | 298 | – | – | – | – | – | 298 | 221 | 243 | ||||||||||
| Related to investment banking | |||||||||||||||||||
| Net revenues | – | – | 536 | 1,546 | 528 | – | 2,610 | 2,222 | 2,685 | ||||||||||
| of which fixed income sales and trading | – | – | 85 | 860 | – | – | 945 | 570 | 924 | ||||||||||
| of which equity sales and trading | – | – | 243 | 490 | – | – | 733 | 614 | 722 | ||||||||||
| of which underwriting and advisory | – | – | 208 | 1 | 288 | 531 | – | 1,027 | 1,117 | 1,102 | |||||||||
| Provision for credit losses | – | – | 6 | 4 | 1 | – | 11 | 7 | 11 | ||||||||||
| Total operating expenses | – | – | 466 | 1,247 | 468 | – | 2,181 | 2,240 | 2,200 | ||||||||||
| Income/(loss) before taxes | – | – | 64 | 295 | 59 | – | 418 | (25) | 474 | ||||||||||
| Related to asset management | |||||||||||||||||||
| Net revenues | – | 360 | – | – | – | – | 360 | 441 | 338 | ||||||||||
| Total operating expenses | – | 277 | – | – | – | – | 277 | 337 | 286 | ||||||||||
| Income before taxes | – | 83 | – | – | – | – | 83 | 104 | 52 | ||||||||||
| Related to corporate center | |||||||||||||||||||
| Net revenues | – | – | – | – | – | (60) | (60) | 45 | 69 | ||||||||||
| Provision for credit losses | – | – | – | – | – | 0 | 0 | (3) | 2 | ||||||||||
| Total operating expenses | – | – | – | – | – | 112 | 112 | 313 | 166 | ||||||||||
| Loss before taxes | – | – | – | – | – | (172) | (172) | (265) | (99) | ||||||||||
| Total | |||||||||||||||||||
| Net revenues | 1,431 | 1,403 | 991 | 1,546 | 528 | (60) | 5,839 | 5,340 | 5,740 | ||||||||||
| Provision for credit losses | 34 | (1) | 10 | 4 | 1 | 0 | 48 | 40 | 29 | ||||||||||
| Total operating expenses | 834 | 920 | 747 | 1,247 | 468 | 112 | 4,328 | 4,704 | 4,502 | ||||||||||
| Income/(loss) before taxes | 563 | 484 | 234 | 295 | 59 | (172) | 1,463 | 596 | 1,209 | ||||||||||
| Certain transaction-based revenues in Swiss Universal Bank and certain fixed income and equity sales and trading revenues in Asia Pacific and Global Markets relate to the Group’s global advisory and underwriting business. Refer to “Global advisory and underwriting revenues” in Investment Banking & Capital Markets for further information. | |||||||||||||||||||
1 Reflects certain financing revenues in Asia Pacific that are not included in the Group’s global advisory and underwriting revenues. | |||||||||||||||||||
41
| BIS capital metrics – Group | |||||||||||||
| Phase-in | Look-through | ||||||||||||
| % change | % change | ||||||||||||
| end of | 1Q18 | 4Q17 | QoQ | 1Q18 | 4Q17 | QoQ | |||||||
| Capital and risk-weighted assets (CHF million) | |||||||||||||
| CET1 capital | 35,020 | 36,711 | (5) | 35,020 | 34,824 | 1 | |||||||
| Tier 1 capital | 49,973 | 51,482 | (3) | 47,214 | 47,262 | 0 | |||||||
| Total eligible capital | 54,769 | 56,696 | (3) | 51,229 | 51,389 | 0 | |||||||
| Risk-weighted assets | 271,015 | 272,815 | (1) | 271,015 | 271,680 | 0 | |||||||
| Capital ratios (%) | |||||||||||||
| CET1 ratio | 12.9 | 13.5 | – | 12.9 | 12.8 | – | |||||||
| Tier 1 ratio | 18.4 | 18.9 | – | 17.4 | 17.4 | – | |||||||
| Total capital ratio | 20.2 | 20.8 | – | 18.9 | 18.9 | – | |||||||
| Eligible capital – Group | |||||||||||||
| Phase-in | Look-through | ||||||||||||
| % change | % change | ||||||||||||
| end of | 1Q18 | 4Q17 | QoQ | 1Q18 | 4Q17 | QoQ | |||||||
| Eligible capital (CHF million) | |||||||||||||
| Total shareholders' equity | 42,540 | 41,902 | 2 | 42,540 | 41,902 | 2 | |||||||
| Regulatory adjustments 1 | (560) | (576) | (3) | (560) | (576) | (3) | |||||||
| Adjustments subject to phase-in | (6,960) | 2 | (4,615) | 51 | (6,960) | (6,502) | 7 | ||||||
| CET1 capital | 35,020 | 36,711 | (5) | 35,020 | 34,824 | 1 | |||||||
| Additional tier 1 instruments | 12,194 | 3 | 12,438 | (2) | 12,194 | 12,438 | (2) | ||||||
| Additional tier 1 instruments subject to phase-out 4 | 2,759 | 2,778 | (1) | – | – | – | |||||||
| Deductions from additional tier 1 capital | 0 | (445) | 100 | – | – | – | |||||||
| Additional tier 1 capital | 14,953 | 14,771 | 1 | 12,194 | 12,438 | (2) | |||||||
| Tier 1 capital | 49,973 | 51,482 | (3) | 47,214 | 47,262 | 0 | |||||||
| Tier 2 instruments | 4,015 | 5 | 4,127 | (3) | 4,015 | 4,127 | (3) | ||||||
| Tier 2 instruments subject to phase-out | 781 | 1,138 | (31) | – | – | – | |||||||
| Deductions from tier 2 capital | 0 | (51) | 100 | – | – | – | |||||||
| Tier 2 capital | 4,796 | 5,214 | (8) | 4,015 | 4,127 | (3) | |||||||
| Total eligible capital | 54,769 | 56,696 | (3) | 51,229 | 51,389 | 0 | |||||||
1 Includes regulatory adjustments not subject to phase-in, including a cumulative dividend accrual. | |||||||||||||
2 Reflects 100% phase-in deductions, including goodwill, other intangible assets and certain deferred tax assets. | |||||||||||||
3 Consists of high-trigger and low-trigger capital instruments. Of this amount, CHF 7.5 billion consists of capital instruments with a capital ratio write-down trigger of 7% and CHF 4.7 billion consists of capital instruments with a capital ratio write-down trigger of 5.125%. | |||||||||||||
4 Includes hybrid capital instruments that are subject to phase-out. | |||||||||||||
5 Consists of low-trigger capital instruments with a capital ratio write-down trigger of 5%. | |||||||||||||
42
| Capital movement – Group | |||||
1Q18 | Phase-in | Look- through | |||
| CET1 capital (CHF million) | |||||
| Balance at beginning of period | 36,711 | 34,824 | |||
| Net income attributable to shareholders | 694 | 694 | |||
| Foreign exchange impact 1 | (445) | (403) | |||
| Impact of deductions relating to phase-in requirements | (1,843) | – | |||
| Other | (97) | 2 | (95) | ||
| Balance at end of period | 35,020 | 35,020 | |||
| Additional tier 1 capital (CHF million) | |||||
| Balance at beginning of period | 14,771 | 12,438 | |||
| Foreign exchange impact | (275) | (212) | |||
| Impact of deductions relating to phase-in requirements | 445 | – | |||
| Other | 12 | (32) | |||
| Balance at end of period | 14,953 | 12,194 | |||
| Tier 2 capital (CHF million) | |||||
| Balance at beginning of period | 5,214 | 4,127 | |||
| Foreign exchange impact | (74) | (49) | |||
| Impact of deductions relating to phase-in requirements | 50 | – | |||
| Other | (394) | 3 | (63) | ||
| Balance at end of period | 4,796 | 4,015 | |||
| Eligible capital (CHF million) | |||||
| Balance at end of period | 54,769 | 51,229 | |||
1 Includes US GAAP cumulative translation adjustments and the foreign exchange impact on regulatory CET1 adjustments. | |||||
2 Includes the net effect of share-based compensation and pensions, a change in other regulatory adjustments (e.g., the net regulatory impact of gains/(losses) on fair-valued financial liabilities due to changes in own credit risk) and the impact of a dividend accrual. | |||||
3 Primarily reflects the impact of the prescribed amortization requirement as instruments move closer to their maturity date. | |||||
| Risk-weighted assets – Group | |||||||||||||||||
end of | Swiss Universal Bank | International Wealth Management | Asia Pacific | Global Markets | Investment Banking & Capital Markets | Strategic Resolution Unit | Corporate Center | Group | |||||||||
| 1Q18 (CHF million) | |||||||||||||||||
| Credit risk | 57,842 | 24,622 | 21,444 | 32,010 | 17,093 | 9,449 | 13,803 | 176,263 | |||||||||
| Market risk | 842 | 1,121 | 5,362 | 10,839 | 125 | 2,003 | 1,347 | 21,639 | |||||||||
| Operational risk | 11,874 | 11,837 | 6,841 | 15,141 | 3,648 | 10,787 | 12,985 | 73,113 | |||||||||
| Risk-weighted assets – phase-in | 70,558 | 37,580 | 33,647 | 57,990 | 20,866 | 22,239 | 28,135 | 271,015 | |||||||||
| Risk-weighted assets – look-through | 70,558 | 37,580 | 33,647 | 57,990 | 20,866 | 22,239 | 28,135 | 271,015 | |||||||||
| 4Q17 (CHF million) | |||||||||||||||||
| Credit risk | 52,776 | 24,641 | 20,510 | 34,185 | 17,362 | 12,078 | 14,960 | 176,512 | |||||||||
| Market risk | 737 | 1,101 | 5,128 | 11,334 | 121 | 1,875 | 994 | 21,290 | |||||||||
| Operational risk | 12,059 | 12,514 | 5,836 | 13,339 | 2,575 | 19,660 | 9,030 | 75,013 | |||||||||
| Risk-weighted assets – phase-in | 65,572 | 38,256 | 31,474 | 58,858 | 20,058 | 33,613 | 24,984 | 272,815 | |||||||||
| Look-through adjustment | – | – | – | – | – | – | (1,135) | (1,135) | |||||||||
| Risk-weighted assets – look-through | 65,572 | 38,256 | 31,474 | 58,858 | 20,058 | 33,613 | 23,849 | 271,680 | |||||||||
43
| Risk-weighted asset movement by risk type – Group | |||||||||||||||||
1Q18 (CHF million) | Swiss Universal Bank | International Wealth Management | Asia Pacific | Global Markets | Investment Banking & Capital Markets | Strategic Resolution Unit | Corporate Center | Total | |||||||||
| Credit risk | |||||||||||||||||
| Balance at beginning of period | 52,776 | 24,641 | 20,510 | 34,185 | 17,362 | 12,078 | 14,960 | 176,512 | |||||||||
| Foreign exchange impact | (159) | (264) | (341) | (405) | (344) | (248) | (47) | (1,808) | |||||||||
| Movements in risk levels | 4,071 | 355 | (75) | (1,050) | 125 | (2,607) | (956) | (137) | |||||||||
| Model and parameter updates 1 | 76 | (195) | 1,109 | (895) | (365) | 155 | (154) | (269) | |||||||||
| Methodology and policy changes 2 | 1,078 | 85 | 241 | 175 | 315 | 71 | 0 | 1,965 | |||||||||
| Balance at end of period – phase-in | 57,842 | 24,622 | 21,444 | 32,010 | 17,093 | 9,449 | 13,803 | 176,263 | |||||||||
| Market risk | |||||||||||||||||
| Balance at beginning of period | 737 | 1,101 | 5,128 | 11,334 | 121 | 1,875 | 994 | 21,290 | |||||||||
| Foreign exchange impact | (6) | (10) | (46) | (93) | (1) | (19) | (7) | (182) | |||||||||
| Movements in risk levels | 112 | (56) | 556 | (231) | 10 | 222 | 422 | 1,035 | |||||||||
| Model and parameter updates 1 | (1) | 89 | (261) | (147) | (5) | (70) | (58) | (453) | |||||||||
| Methodology and policy changes 2 | 0 | (3) | (15) | (24) | 0 | (5) | (4) | (51) | |||||||||
| Balance at end of period – phase-in | 842 | 1,121 | 5,362 | 10,839 | 125 | 2,003 | 1,347 | 21,639 | |||||||||
| Operational risk | |||||||||||||||||
| Balance at beginning of period | 12,059 | 12,514 | 5,836 | 13,339 | 2,575 | 19,660 | 9,030 | 75,013 | |||||||||
| Movements in risk levels | 0 | 0 | 1 | 1 | (1) | 0 | 1 | 2 | |||||||||
| Model and parameter updates 1 | 0 | 0 | 0 | 0 | 0 | 0 | 577 | 577 | |||||||||
| Methodology and policy changes 2 | (185) | (677) | 1,004 | 1,801 | 1,074 | (8,873) | 3,377 | (2,479) | |||||||||
| Balance at end of period – phase-in | 11,874 | 11,837 | 6,841 | 15,141 | 3,648 | 10,787 | 12,985 | 73,113 | |||||||||
| Total | |||||||||||||||||
| Balance at beginning of period | 65,572 | 38,256 | 31,474 | 58,858 | 20,058 | 33,613 | 24,984 | 272,815 | |||||||||
| Foreign exchange impact | (165) | (274) | (387) | (498) | (345) | (267) | (54) | (1,990) | |||||||||
| Movements in risk levels | 4,183 | 299 | 482 | (1,280) | 134 | (2,385) | (533) | 900 | |||||||||
| Model and parameter updates 1 | 75 | (106) | 848 | (1,042) | (370) | 85 | 365 | (145) | |||||||||
| Methodology and policy changes 2 | 893 | (595) | 1,230 | 1,952 | 1,389 | (8,807) | 3,373 | (565) | |||||||||
| Balance at end of period – phase-in | 70,558 | 37,580 | 33,647 | 57,990 | 20,866 | 22,239 | 28,135 | 271,015 | |||||||||
| Balance at end of period – look-through | 70,558 | 37,580 | 33,647 | 57,990 | 20,866 | 22,239 | 28,135 | 271,015 | |||||||||
1 Represents movements arising from updates to models and recalibrations of parameters and internal changes impacting how exposures are treated. | |||||||||||||||||
2 Represents externally prescribed regulatory changes impacting how exposures are treated. | |||||||||||||||||
| BIS leverage metrics – Group | |||||||||||||
| Phase-in | Look-through | ||||||||||||
| % change | % change | ||||||||||||
| end of | 1Q18 | 4Q17 | QoQ | 1Q18 | 4Q17 | QoQ | |||||||
| Capital and leverage exposure (CHF million) | |||||||||||||
| CET1 capital | 35,020 | 36,711 | (5) | 35,020 | 34,824 | 1 | |||||||
| Tier 1 capital | 49,973 | 51,482 | (3) | 47,214 | 47,262 | 0 | |||||||
| Leverage exposure | 932,071 | 919,053 | 1 | 932,071 | 916,525 | 2 | |||||||
| Leverage ratios (%) | |||||||||||||
| CET1 leverage ratio | 3.8 | 4.0 | – | 3.8 | 3.8 | – | |||||||
| Tier 1 leverage ratio | 5.4 | 5.6 | – | 5.1 | 5.2 | – | |||||||
44
| Swiss capital metrics – Group | |||||||||||||
| Phase-in | Look-through | ||||||||||||
| % change | % change | ||||||||||||
| end of | 1Q18 | 4Q17 | QoQ | 1Q18 | 4Q17 | QoQ | |||||||
| Swiss capital and risk-weighted assets (CHF million) | |||||||||||||
| Swiss CET1 capital | 34,907 | 36,567 | (5) | 34,907 | 34,665 | 1 | |||||||
| Going concern capital | 51,116 | 53,131 | (4) | 47,101 | 47,102 | 0 | |||||||
| Gone concern capital | 36,218 | 35,712 | 1 | 35,974 | 35,226 | 2 | |||||||
| Total loss-absorbing capacity (TLAC) | 87,334 | 88,843 | (2) | 83,075 | 82,328 | 1 | |||||||
| Swiss risk-weighted assets | 271,584 | 273,436 | (1) | 271,584 | 272,265 | 0 | |||||||
| Swiss capital ratios (%) | |||||||||||||
| Swiss CET1 ratio | 12.9 | 13.4 | – | 12.9 | 12.7 | – | |||||||
| Going concern capital ratio | 18.8 | 19.4 | – | 17.3 | 17.3 | – | |||||||
| Gone concern capital ratio | 13.3 | 13.1 | – | 13.2 | 12.9 | – | |||||||
| TLAC ratio | 32.2 | 32.5 | – | 30.6 | 30.2 | – | |||||||
| Swiss capital and risk-weighted assets – Group | |||||||||||||
| Phase-in | Look-through | ||||||||||||
| % change | % change | ||||||||||||
| end of | 1Q18 | 4Q17 | QoQ | 1Q18 | 4Q17 | QoQ | |||||||
| Swiss capital (CHF million) | |||||||||||||
| CET1 capital – BIS | 35,020 | 36,711 | (5) | 35,020 | 34,824 | 1 | |||||||
| Swiss regulatory adjustments 1 | (113) | (144) | (22) | (113) | (159) | (29) | |||||||
| Swiss CET1 capital | 34,907 | 36,567 | (5) | 34,907 | 34,665 | 1 | |||||||
| Additional tier 1 high-trigger capital instruments | 7,530 | 7,574 | (1) | 7,530 | 7,574 | (1) | |||||||
| Grandfathered capital instruments | 8,679 | 8,990 | (3) | 4,664 | 4,863 | (4) | |||||||
| of which additional tier 1 low-trigger capital instruments | 4,664 | 4,863 | (4) | 4,664 | 4,863 | (4) | |||||||
| of which tier 2 low-trigger capital instruments | 4,015 | 4,127 | (3) | – | – | – | |||||||
| Swiss additional tier 1 capital | 16,209 | 16,564 | (2) | 12,194 | 12,437 | (2) | |||||||
| Going concern capital | 51,116 | 53,131 | (4) | 47,101 | 47,102 | 0 | |||||||
| Bail-in debt instruments | 31,959 | 31,099 | 3 | 31,959 | 31,099 | 3 | |||||||
| Additional tier 1 instruments subject to phase-out | 2,759 | 2,778 | (1) | – | – | – | |||||||
| Tier 2 instruments subject to phase-out | 782 | 1,138 | (31) | – | – | – | |||||||
| Tier 2 amortization component | 718 | 1,193 | (40) | – | – | – | |||||||
| Tier 2 low-trigger capital instruments | – | – | – | 4,015 | 4,127 | (3) | |||||||
| Deductions | 0 | (496) | 100 | – | – | – | |||||||
| Gone concern capital | 36,218 | 35,712 | 1 | 35,974 | 35,226 | 2 | |||||||
| Total loss-absorbing capacity | 87,334 | 88,843 | (2) | 83,075 | 82,328 | 1 | |||||||
| Risk-weighted assets (CHF million) | |||||||||||||
| Risk-weighted assets – BIS | 271,015 | 272,815 | (1) | 271,015 | 271,680 | 0 | |||||||
| Swiss regulatory adjustments 2 | 569 | 621 | (8) | 569 | 585 | (3) | |||||||
| Swiss risk-weighted assets | 271,584 | 273,436 | (1) | 271,584 | 272,265 | 0 | |||||||
1 Includes adjustments for certain unrealized gains outside the trading book. | |||||||||||||
2 Primarily includes differences in the credit risk multiplier. | |||||||||||||
45
| Swiss leverage metrics – Group | |||||||||||||
| Phase-in | Look-through | ||||||||||||
| % change | % change | ||||||||||||
| end of | 1Q18 | 4Q17 | QoQ | 1Q18 | 4Q17 | QoQ | |||||||
| Swiss capital and leverage exposure (CHF million) | |||||||||||||
| Swiss CET1 capital | 34,907 | 36,567 | (5) | 34,907 | 34,665 | 1 | |||||||
| Going concern capital | 51,116 | 53,131 | (4) | 47,101 | 47,102 | 0 | |||||||
| Gone concern capital | 36,218 | 35,712 | 1 | 35,974 | 35,226 | 2 | |||||||
| Total loss-absorbing capacity | 87,334 | 88,843 | (2) | 83,075 | 82,328 | 1 | |||||||
| Leverage exposure | 932,071 | 919,053 | 1 | 932,071 | 916,525 | 2 | |||||||
| Swiss leverage ratios (%) | |||||||||||||
| Swiss CET1 leverage ratio | 3.7 | 4.0 | – | 3.7 | 3.8 | – | |||||||
| Going concern leverage ratio | 5.5 | 5.8 | – | 5.1 | 5.1 | – | |||||||
| Gone concern leverage ratio | 3.9 | 3.9 | – | 3.9 | 3.8 | – | |||||||
| TLAC leverage ratio | 9.4 | 9.7 | – | 8.9 | 9.0 | – | |||||||
| Rounding differences may occur. | |||||||||||||
in / end of | Interest rate | Credit spread | Foreign exchange | Commodity | Equity | Diversi- fication benefit | Total | ||||||||
| Risk management VaR (CHF million) | |||||||||||||||
| 1Q18 | |||||||||||||||
| Average | 16 | 20 | 5 | 2 | 11 | (25) | 29 | ||||||||
| Minimum | 13 | 17 | 4 | 1 | 8 | – | 1 | 26 | |||||||
| Maximum | 21 | 23 | 9 | 2 | 15 | – | 1 | 34 | |||||||
| End of period | 19 | 20 | 4 | 1 | 14 | (29) | 29 | ||||||||
| 4Q17 | |||||||||||||||
| Average | 14 | 19 | 5 | 2 | 10 | (24) | 26 | ||||||||
| Minimum | 12 | 17 | 4 | 1 | 8 | – | 1 | 22 | |||||||
| Maximum | 16 | 21 | 7 | 3 | 12 | – | 1 | 29 | |||||||
| End of period | 15 | 19 | 5 | 1 | 10 | (22) | 28 | ||||||||
| Risk management VaR (USD million) | |||||||||||||||
| 1Q18 | |||||||||||||||
| Average | 17 | 21 | 5 | 2 | 11 | (25) | 31 | ||||||||
| Minimum | 14 | 17 | 4 | 1 | 9 | – | 1 | 27 | |||||||
| Maximum | 23 | 24 | 10 | 3 | 15 | – | 1 | 36 | |||||||
| End of period | 20 | 21 | 4 | 1 | 15 | (31) | 30 | ||||||||
| 4Q17 | |||||||||||||||
| Average | 14 | 19 | 5 | 2 | 10 | (24) | 26 | ||||||||
| Minimum | 12 | 17 | 4 | 1 | 8 | – | 1 | 22 | |||||||
| Maximum | 17 | 21 | 7 | 3 | 12 | – | 1 | 30 | |||||||
| End of period | 15 | 19 | 5 | 1 | 10 | (21) | 29 | ||||||||
| Excludes risks associated with counterparty and own credit exposures. | |||||||||||||||
1 As the maximum and minimum occur on different days for different risk types, it is not meaningful to calculate a portfolio diversification benefit. | |||||||||||||||
46
| in | 1Q18 | 4Q17 | 1Q17 | ||||
| Consolidated statements of operations (CHF million) | |||||||
| Interest and dividend income | 4,451 | 4,140 | 4,042 | ||||
| Interest expense | (2,866) | (2,575) | (2,409) | ||||
| Net interest income | 1,585 | 1,565 | 1,633 | ||||
| Commissions and fees | 3,046 | 3,104 | 3,046 | ||||
| Trading revenues | 578 | 186 | 574 | ||||
| Other revenues | 427 | 334 | 281 | ||||
| Net revenues | 5,636 | 5,189 | 5,534 | ||||
| Provision for credit losses | 48 | 43 | 53 | ||||
| Compensation and benefits | 2,538 | 2,568 | 2,705 | ||||
| General and administrative expenses | 1,508 | 1,935 | 1,601 | ||||
| Commission expenses | 344 | 365 | 368 | ||||
| Restructuring expenses | 144 | 137 | 137 | ||||
| Total other operating expenses | 1,996 | 2,437 | 2,106 | ||||
| Total operating expenses | 4,534 | 5,005 | 4,811 | ||||
| Income/(loss) before taxes | 1,054 | 141 | 670 | ||||
| Income tax expense | 362 | 2,234 | 78 | ||||
| Net income/(loss) | 692 | (2,093) | 592 | ||||
| Net income/(loss) attributable to noncontrolling interests | (2) | 33 | (4) | ||||
| Net income/(loss) attributable to shareholders | 694 | (2,126) | 596 | ||||
| Earnings/(loss) per share (CHF) | |||||||
| Basic earnings/(loss) per share | 0.27 | (0.83) | 0.27 | ||||
| Diluted earnings/(loss) per share | 0.26 | (0.83) | 0.26 | ||||
47
| end of | 1Q18 | 4Q17 | |||
| Assets (CHF million) | |||||
| Cash and due from banks | 118,164 | 109,815 | |||
| Interest-bearing deposits with banks | 730 | 726 | |||
| Central bank funds sold, securities purchased under resale agreements and securities borrowing transactions | 121,170 | 115,346 | |||
| Securities received as collateral, at fair value | 41,227 | 38,074 | |||
| Trading assets, at fair value | 140,201 | 156,334 | |||
| Investment securities | 2,146 | 2,191 | |||
| Other investments | 5,487 | 5,964 | |||
| Net loans | 283,854 | 279,149 | |||
| Premises and equipment | 4,677 | 4,686 | |||
| Goodwill | 4,667 | 4,742 | |||
| Other intangible assets | 212 | 223 | |||
| Brokerage receivables | 52,739 | 46,968 | |||
| Other assets | 33,778 | 32,071 | |||
| Total assets | 809,052 | 796,289 | |||
| Liabilities and equity (CHF million) | |||||
| Due to banks | 18,858 | 15,413 | |||
| Customer deposits | 368,382 | 361,162 | |||
| Central bank funds purchased, securities sold under repurchase agreements and securities lending transactions | 27,579 | 26,496 | |||
| Obligation to return securities received as collateral, at fair value | 41,227 | 38,074 | |||
| Trading liabilities, at fair value | 44,755 | 39,119 | |||
| Short-term borrowings | 31,872 | 25,889 | |||
| Long-term debt | 166,166 | 173,032 | |||
| Brokerage payables | 37,838 | 43,303 | |||
| Other liabilities | 29,678 | 31,612 | |||
| Total liabilities | 766,355 | 754,100 | |||
| Common shares | 102 | 102 | |||
| Additional paid-in capital | 35,933 | 35,668 | |||
| Retained earnings | 25,643 | 24,973 | |||
| Treasury shares, at cost | (287) | (103) | |||
| Accumulated other comprehensive income/(loss) | (18,851) | (18,738) | |||
| Total shareholders' equity | 42,540 | 41,902 | |||
| Noncontrolling interests | 157 | 287 | |||
| Total equity | 42,697 | 42,189 | |||
| Total liabilities and equity | 809,052 | 796,289 | |||
48
| Attributable to shareholders | |||||||||||||||||
Common shares | Additional paid-in capital | Retained earnings | Treasury shares, at cost | Accumu- lated other compre- hensive income/ (loss) | Total share- holders' equity | Non- controlling interests | Total equity | ||||||||||
| 1Q18 (CHF million) | |||||||||||||||||
| Balance at beginning of period | 102 | 35,668 | 24,973 | (103) | (18,738) | 41,902 | 287 | 42,189 | |||||||||
| Purchase of subsidiary shares from non- controlling interests, not changing ownership 1, 2 | – | – | – | – | – | – | (21) | (21) | |||||||||
| Sale of subsidiary shares to noncontrolling interests, not changing ownership 2 | – | – | – | – | – | – | 9 | 9 | |||||||||
| Net income/(loss) | – | – | 694 | – | – | 694 | (2) | 692 | |||||||||
| Cumulative effect of accounting changes, net of tax | – | – | (24) | – | (21) | (45) | – | (45) | |||||||||
| Total other comprehensive income/(loss), net of tax | – | – | – | – | (92) | (92) | (9) | (101) | |||||||||
| Sale of treasury shares | – | (10) | – | 3,443 | – | 3,433 | – | 3,433 | |||||||||
| Repurchase of treasury shares | – | – | – | (3,655) | – | (3,655) | – | (3,655) | |||||||||
| Share-based compensation, net of tax | – | 275 | – | 28 | – | 303 | – | 303 | |||||||||
| Dividends paid | – | – | – | – | – | – | (3) | (3) | |||||||||
| Changes in scope of consolidation, net | – | – | – | – | – | – | (104) | (104) | |||||||||
| Balance at end of period | 102 | 35,933 | 25,643 | (287) | (18,851) | 42,540 | 157 | 42,697 | |||||||||
1 Distributions to owners in funds include the return of original capital invested and any related dividends. | |||||||||||||||||
2 Transactions with and without ownership changes related to fund activity are all displayed under "not changing ownership". | |||||||||||||||||
| in | 1Q18 | 4Q17 | 1Q17 | ||||
| Basic net income/(loss) attributable to shareholders (CHF million) | |||||||
| Net income/(loss) attributable to shareholders for basic earnings per share | 694 | (2,126) | 596 | ||||
| Diluted net income/(loss) attributable to shareholders (CHF million) | |||||||
| Net income/(loss) attributable to shareholders for diluted earnings per share | 694 | (2,126) | 596 | ||||
| Weighted-average shares outstanding (million) | |||||||
| Weighted-average shares outstanding for basic earnings per share available for common shares | 2,586.4 | 2,565.7 | 2,214.2 | ||||
| Dilutive share options and warrants | 2.2 | 0.0 | 3.8 | ||||
| Dilutive share awards | 65.1 | 0.0 | 55.1 | ||||
| Weighted-average shares outstanding for diluted earnings per share available for common shares 1 | 2,653.7 | 2,565.7 | 2 | 2,273.1 | |||
| Earnings/(loss) per share available for common shares (CHF) | |||||||
| Basic earnings/(loss) per share available for common shares | 0.27 | (0.83) | 0.27 | ||||
| Diluted earnings/(loss) per share available for common shares | 0.26 | (0.83) | 0.26 | ||||
1 Weighted-average potential common shares relating to instruments that were not dilutive for the respective periods (and therefore not included in the diluted earnings per share calculation above) but could potentially dilute earnings per share in the future were 11.6 million, 10.4 million and 7.8 million for 1Q18, 4Q17 and 1Q17, respectively. | |||||||
2 Due to the net loss in 4Q17, 1.9 million of weighted-average share options and warrants outstanding and 76.6 million of weighted-average share awards outstanding were excluded from the diluted earnings per share calculation, as the effect would be antidilutive. | |||||||
49
| in | 1Q18 | 4Q17 | 1Q17 | ||||
| Restructuring expenses by segment (CHF million) | |||||||
| Swiss Universal Bank | 28 | (2) | 52 | ||||
| International Wealth Management | 26 | 11 | 36 | ||||
| Asia Pacific | 6 | 23 | 19 | ||||
| Global Markets | 42 | 71 | 20 | ||||
| Investment Banking & Capital Markets | 30 | 14 | 2 | ||||
| Strategic Resolution Unit | 11 | 18 | 7 | ||||
| Corporate Center | 1 | 2 | 1 | ||||
| Total restructuring expenses | 144 | 137 | 137 | ||||
| in | 1Q18 | 4Q17 | 1Q17 | ||||
| Restructuring expenses by type (CHF million) | |||||||
| Compensation and benefits-related expenses | 103 | 79 | 87 | ||||
| of which severance expenses | 69 | 47 | 62 | ||||
| of which accelerated deferred compensation | 34 | 32 | 25 | ||||
| General and administrative-related expenses | 41 | 58 | 50 | ||||
| of which pension expenses | 27 | (14) | 42 | ||||
| Total restructuring expenses | 144 | 137 | 137 | ||||
Return on regulatory capital
Credit Suisse measures firm-wide returns against total shareholders’ equity and tangible shareholders’ equity. In addition, it also measures the efficiency of the firm and its divisions with regard to the usage of capital as determined by the minimum requirements set by regulators. This regulatory capital is calculated as the worst of 10% of risk-weighted assets and 3.5% of leverage exposure. Return on regulatory capital is calculated using income/(loss) after tax and assumes a tax rate of 30% and capital allocated based on the worst of 10% of average risk-weighted assets and 3.5% of average leverage exposure. These percentages are used in the calculation in order to reflect the 2019 fully phased in Swiss regulatory minimum requirements for Basel III CET1 capital and leverage ratio. For Global Markets and Investment Banking & Capital Markets, return on regulatory capital is based on US dollar denominated numbers. Adjusted return on regulatory capital is calculated using adjusted results, applying the same methodology used to calculate return on regulatory capital.
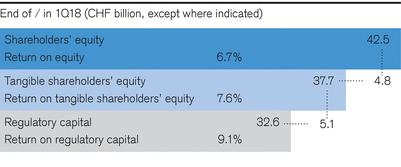
50
This document contains statements that constitute forward-looking statements. In addition, in the future we, and others on our behalf, may make statements that constitute forward-looking statements. Such forward-looking statements may include, without limitation, statements relating to the following:
– our plans, objectives, ambitions, targets or goals;
– our future economic performance or prospects;
– the potential effect on our future performance of certain contingencies; and
– assumptions underlying any such statements.
Words such as “believes,” “anticipates,” “expects,” “intends” and “plans” and similar expressions are intended to identify forward-looking statements but are not the exclusive means of identifying such statements. We do not intend to update these forward-looking statements.
By their very nature, forward-looking statements involve inherent risks and uncertainties, both general and specific, and risks exist that predictions, forecasts, projections and other outcomes described or implied in forward-looking statements will not be achieved. We caution you that a number of important factors could cause results to differ materially from the plans, objectives, ambitions, targets, expectations, estimates and intentions expressed in such forward-looking statements. These factors include:
– the ability to maintain sufficient liquidity and access capital markets;
– market volatility and interest rate fluctuations and developments affecting interest rate levels;
– the strength of the global economy in general and the strength of the economies of the countries in which we conduct our operations, in particular the risk of continued slow economic recovery or downturn in the US or other developed countries or in emerging markets in 2018 and beyond;
– the direct and indirect impacts of deterioration or slow recovery in residential and commercial real estate markets;
– adverse rating actions by credit rating agencies in respect of us, sovereign issuers, structured credit products or other credit-related exposures;
– the ability to achieve our strategic goals, including those related to cost efficiency, income/(loss) before taxes, capital ratios and return on regulatory capital, leverage exposure threshold, risk-weighted assets threshold, return on tangible equity and other targets, objectives and ambitions;
– the ability of counterparties to meet their obligations to us;
– the effects of, and changes in, fiscal, monetary, exchange rate, trade and tax policies, as well as currency fluctuations;
– political and social developments, including war, civil unrest or terrorist activity;
– the possibility of foreign exchange controls, expropriation, nationalization or confiscation of assets in countries in which we conduct our operations;
– operational factors such as systems failure, human error, or the failure to implement procedures properly;
– the risk of cyber attacks on our business or operations;
– actions taken by regulators with respect to our business and practices and possible resulting changes to our business organization, practices and policies in countries in which we conduct our operations;
– the effects of changes in laws, regulations or accounting or tax standards, policies or practices in countries in which we conduct our operations;
– the potential effects of proposed changes in our legal entity structure;
– competition or changes in our competitive position in geographic and business areas in which we conduct our operations;
– the ability to retain and recruit qualified personnel;
– the ability to maintain our reputation and promote our brand;
– the ability to increase market share and control expenses;
– technological changes;
– the timely development and acceptance of our new products and services and the perceived overall value of these products and services by users;
– acquisitions, including the ability to integrate acquired businesses successfully, and divestitures, including the ability to sell non-core assets;
– the adverse resolution of litigation, regulatory proceedings and other contingencies; and
– other unforeseen or unexpected events and our success at managing these and the risks involved in the foregoing.
We caution you that the foregoing list of important factors is not exclusive. When evaluating forward-looking statements, you should carefully consider the foregoing factors and other uncertainties and events, including the information set forth in “Risk factors” in I – Information on the company in our Annual Report 2017.
51