UNITED STATES
SECURITIES AND EXCHANGE COMMISSION
SECURITIES AND EXCHANGE COMMISSION
Washington, D.C. 20549
Form 6-K
REPORT OF FOREIGN PRIVATE ISSUER PURSUANT TO RULE 13a-16 OR 15d-16
UNDER THE SECURITIES EXCHANGE ACT OF 1934
UNDER THE SECURITIES EXCHANGE ACT OF 1934
July 31, 2019
Commission File Number 001-15244
CREDIT SUISSE GROUP AG
(Translation of registrant’s name into English)
Paradeplatz 8, CH 8001 Zurich, Switzerland
(Address of principal executive office)
(Address of principal executive office)
Commission File Number 001-33434
CREDIT SUISSE AG
(Translation of registrant’s name into English)
Paradeplatz 8, CH 8001 Zurich, Switzerland
(Address of principal executive office)
(Address of principal executive office)
Indicate by check mark whether the registrant files or will file annual reports under cover of Form 20-F or
Form 40-F.
Form 40-F.
Form 20-F  Form 40-F
Form 40-F Indicate by check mark if the registrant is submitting the Form 6-K in paper as permitted by Regulation S-T Rule 101(b)(1):
Note: Regulation S-T Rule 101(b)(1) only permits the submission in paper of a Form 6-K if submitted solely to provide an attached annual report to security holders.
Indicate by check mark if the registrant is submitting the Form 6-K in paper as permitted by Regulation S-T Rule 101(b)(7):
Note: Regulation S-T Rule 101(b)(7) only permits the submission in paper of a Form 6-K if submitted to furnish a report or other document that the registrant foreign private issuer must furnish and make public under the laws of the jurisdiction in which the registrant is incorporated, domiciled or legally organized (the registrant’s “home country”), or under the rules of the home country exchange on which the registrant’s securities are traded, as long as the report or other document is not a press release, is not required to be and has not been distributed to the registrant’s security holders, and, if discussing a material event, has already been the subject of a Form 6-K submission or other Commission filing on EDGAR.
This report includes the media release and the slides for the presentation to investors in connection with the 2Q19 results.
Media Release Zurich, July 31, 2019 |  |
2Q19 financial results
Continued improvement in operating performance with net income of CHF 937 million, up 45% year on year, and increased RoTE at 10%
Highlights
| ■ | Group Return on Tangible Equity (RoTE)1 significantly higher year on year at 10%, versus 8% for 1Q19 and 7% for 2Q18 |
| ■ | Returned CHF 1.3 billion of capital to shareholders, including CHF 570 million worth of shares repurchased year to date and payment of 2018 dividend of CHF 695 million |
| ■ | Group net income attributable to shareholders of CHF 937 million, up 45% year on year, and Group pre-tax income (PTI) of CHF 1.3 billion, up 24% year on year |
| ■ | CHF 9.5 billion of Wealth Management Net New Assets (NNA) added in 2Q19 after CHF 9.6 billion in 1Q19, and record Assets under Management (AuM) of CHF 797 billion |
| ■ | Increased Group AuM by CHF 113 billion in the first six months of 2019 to reach CHF 1.5 trillion, with NNA of CHF 59 billion for 1H19 |
| ■ | Global Markets revenues up 8% year on year with Fixed Income sales and trading up 11% and Equity sales and trading up 3%; restructured GM platform achieved PTI of USD 359 million, up 141% year on year, with a return on regulatory capital of 11% |
| ■ | 11th consecutive quarter of year on year positive operating leverage, with operating expenses of CHF 4.3 billion, down 5% year on year |
| ■ | Maintained strong capital position, with CET1 ratio of 12.5% and Tier 1 leverage ratio of 5.3% |
Tidjane Thiam, Chief Executive Officer of Credit Suisse, commented:
“In the second quarter, we continued to deliver a strong operating performance through the disciplined execution of our strategy, with higher profits, both year on year and sequentially. We achieved an RoTE of 10% for the first time since we launched our restructuring in 4Q15. We have been explicit that we wanted to be a leading wealth manager with strong investment banking capabilities, and we have continued to make progress on both of these fronts.
“These results, delivered in a challenging environment, indicate that our bank has emerged from three years of restructuring with a strong franchise and an efficient platform, allowing us to support our clients and generate growing returns for our shareholders, with CHF 1.3 billion of capital returned to investors year to date. The results demonstrate the continued value of our regional, client-focused operating model, allowing us to fully leverage our leading wealth management and investment banking capabilities as we support our clients and help them protect and grow their wealth.”
1
Media Release Zurich, July 31, 2019 | |
Outlook
Following the headwinds we saw in 1Q19, the latter half of 2Q19 provided a more supportive revenue environment as a result of growing expectations around a Sino-US trade agreement and dovish central bank statements improving investor sentiment and leading to higher activity levels among clients sequentially. We have seen a broad sequential improvement in our performance with net revenues and pre-tax income up 4% and 23%, respectively, from 1Q19 to 2Q19.
We have experienced healthy levels of client engagement to date in 3Q19; whether this translates into activity remains dependent on prevailing market conditions. We must also underline that we expect the usual seasonal slowdown in revenues as a result of the holiday season in many parts of the world.
We expect global GDP to show continued positive growth for the balance of the year, albeit at lower levels than previously expected, with market sentiment continuing to be impacted by geopolitical uncertainty and punctuated by periods of lower client activity.
Key metrics
| In CHF millions | 2Q19 | 1Q19 | 2Q18 | Δ 1Q19 | Δ 2Q18 | |
| Pre-tax income | 1,302 | 1,062 | 1,052 | 23% | 24% | |
| Net income attributable to shareholders | 937 | 749 | 647 | 25% | 45% | |
| Return on Tangible Equity | 10% | 8% | 7% | 2pp | 3pp |
2
Media Release Zurich, July 31, 2019 | |
Detailed divisional summaries
Swiss Universal Bank (SUB) had a strong second quarter in 2019, generating a record second quarter pre-tax income of CHF 654 million, up 18% year on year and resulting in a return on regulatory capital of 20%. Net revenues were solid, up 4% year on year, reflecting the positive impact of real estate gains as part of our ongoing sale and lease back programme and higher transaction-based revenues. The negative interest rate environment has continued to impact our income but provides us with opportunities to monetise real assets, which can mitigate the loss of income linked to negative interest rates.
In this unsupportive environment, we have remained disciplined on costs, with operating expenses down 2% year on year. This reduction comes from continued efficiency gains realised through further investment in the digitalisation and automation of our client offering. We extended our integrated offering with fintech collaborations and increased the adoption rate of online and mobile banking, supported by the new version of our mobile banking app. As a result, we reached an industry leading2 cost/income ratio of 55% in the second quarter of 2019.
Private Clients generated pre-tax income of CHF 356 million in the second quarter of 2019, an increase of 33% year on year. Over the same period, net revenues of CHF 828 million increased 9%, while costs were down by 3%. Our NNA over the quarter were CHF 1.2 billion, reflecting contributions from across our Private Clients’ businesses, and confirming the strength of our franchise.
Corporate & Institutional Clients reported pre-tax income of CHF 298 million in the second quarter of 2019, up 5% year on year. AuM of CHF 411 billion increased by 4% from CHF 396 billion at the end of the first quarter 2019. NNA in the second quarter were CHF 8.9 billion, mainly driven by the positive momentum in our pension fund business.
We were named Switzerland’s Best Bank and Switzerland’s Best Investment Bank for the second consecutive year.3
International Wealth Management (IWM) delivered robust results in the second quarter with stronger asset gathering after the slowdown experienced in the first quarter of the year. Pre-tax income for the quarter increased 3% year on year to CHF 444 million, reflecting a 2% increase in net revenues and a 1% increase in operating expenses. NNA significantly improved to CHF 14.1 billion after a slow start in 1Q19. Pre-tax income for the first half of 2019 rose 5% year on year to CHF 967 million as a result of a 1% increase in revenues and a 1% reduction in operating expenses. Return on regulatory capital was 29% for the second quarter of 2019.
Private Banking’s pre-tax income was down 2% year on year at CHF 340 million. Net revenues were stable at CHF 989 million in a challenging environment, where higher transaction revenues, including a higher SIX dividend, were offset by lower net interest income and fewer large idiosyncratic transactions. Operating expenses were stable at CHF 642 million in the quarter and were down by 3% overall in 1H19 versus 1H18. After a period in which we reduced our total number of relationship managers every year and improved the quality of our advisory team, we have made targeted investments in our client coverage, hiring 70 high-quality relationship managers since the fourth quarter of 2018 to capture opportunities in our preferred growth markets. NNA were strong at CHF 5.5 billion for the quarter, an annualised growth rate of 6%, primarily driven by ultra-high-net-worth clients, with inflows across emerging markets and Europe.
3
Media Release Zurich, July 31, 2019 | |
Asset Management’s pre-tax income in the second quarter increased 21% year on year to CHF 104 million, with an 8% increase in net revenues and a 3% increase in operating expenses. We saw continued year on year growth in management fees, which were up 5%, at a stable recurring fee margin of 31 basis points. NNA were strong at CHF 8.6 billion across traditional and alternative investments, bringing AuM to CHF 414 billion at quarter-end.
We were named Best Bank for Wealth Management in Latin America for the second consecutive year and in the Middle East for the third consecutive year.3
Asia Pacific (APAC) delivered pre-tax income of CHF 237 million in the second quarter of 2019, up 9% year on year, with growth in revenues and AuM in our Wealth Management & Connected (WM&C) activities. Net revenues in the quarter were largely flat year on year but increased 7% sequentially, driven by stronger performance in our WM&C activities. The return on regulatory capital improved to 17% for the second quarter.
WM&C reported pre-tax income of CHF 216 million in the second quarter of 2019, up 29% year on year. Revenues were up 9% and the return on regulatory capital remained stable at 22%, as client sentiment and activity levels continued to recover. Private Banking revenues were our second-highest on record as a result of higher transaction-based revenues and net interest income. Advisory, underwriting, and financing revenues for the quarter were up 16% year on year, reflecting an increase in financing activities and debt underwriting, and our completed deal activities were amongst the highest in the last two years. In the first half of the year, APAC IBCM was ranked number 14 in terms of share of wallet, a first for our franchise in the region. Additionally, this was the 11th consecutive quarter of revenues5 above CHF 200 million for APAC advisory, underwriting and the APAC financing group.
Our Markets activities were profitable with pre-tax income of USD 21 million in the second quarter of 2019, contributing to first half pre-tax income of USD 34 million. Net revenues were down 16% year on year on a quarterly and half-yearly basis, but up 2% sequentially as demanding market conditions continue to have an impact on client activity levels. Our focus on generating additional cost efficiencies drove operating expenses down 7% year on year. In the second quarter, we also established Asia Pacific Trading Solutions, modelled on our successful ITS construct, to provide opportunities to increase revenues while supplying solutions to meet the complex needs of our clients.
We were named Asia’s Best Bank for Wealth Management for the second time and received country-specific awards for Pakistan, Papua New Guinea and Vietnam.3
Investment Banking & Capital Markets (IBCM) net revenues were up 27% in US dollar terms in the second quarter compared to the first quarter of 2019, a positive result in the context of sequentially flat Street fees6. Our performance across equity and debt underwriting versus the Street6 is a testament to the strength of the division as we continue to deepen the collaboration between IBCM and our Wealth Management businesses.
The division’s net revenues for the quarter were down 30% year on year, driven by lower client activity as investor concerns lingered over global trade negotiations and slowing GDP growth. IBCM reported pre-tax income of USD 8 million for the second quarter, compared to pre-tax income of USD 110 million in the second quarter of 2018. Our continued focus on cost efficiency led to lower operating expenses, down 15% year on year, largely driven by lower variable compensation costs and the completion of our restructuring programme.
4
Media Release Zurich, July 31, 2019 | |
Our total global advisory and underwriting revenues7 for the second quarter of 2019 were USD 924 million, down 20% year on year due to lower client activity, and up 20% compared to the first quarter of 2019.
Within IBCM, equity underwriting revenues for the second quarter outperformed the Street6 year on year, increasing by 5% year on year to USD 111 million. Furthermore, revenues were up 91% compared to the first quarter of 2019, largely driven by higher IPO issuance activity. We maintained our top-five ranking in IPOs globally8 during the first half of 2019.
Debt underwriting revenues for the second quarter outperformed the Street6 both year on year and sequentially. At USD 211 million, they were down 24% year on year, but up 13% compared to the first quarter of 2019. We also maintained our top-five ranking in global leveraged finance8.
Advisory revenues for the second quarter were down compared to the Street6 year on year. At USD 159 million, they were down 41% year on year, reflecting lower revenues from completed M&A transactions across Americas and EMEA. However, revenues were up 14% compared to the first quarter of 2019, outperforming the Street6.
We were named Western Europe’s Best Bank for Advisory.3
Global Markets (GM) delivered pre-tax income of USD 359 million in the second quarter, up 141% year on year, and a return on regulatory capital of 11%. Despite tougher market conditions, we saw positive operating leverage in the quarter, highlighting the strength of our diversified client franchise and our continued focus on disciplined resource management.
Net revenues for the quarter increased by 8% compared to the second quarter of 2018, primarily due to strong results in our market-leading credit franchise9 with no benefit from Tradeweb, where a gain was booked in 4Q18.
Fixed income sales and trading revenues of USD 901 million increased 11% year on year, with particular outperformance versus peers in securitised products10 and higher revenues in global credit products.
Equities sales and trading revenues of USD 510 million increased 3% year on year, also outperforming peers, as a result of higher prime services and cash trading results, partially offset by reduced derivatives results.
Additionally, performance in our ITS business was resilient.
Total operating expenses declined 7% year on year as a result of ongoing efficiency initiatives. Leverage exposure of USD 260 billion declined year on year, while risk-weighted assets of USD 60 billion remained broadly stable.
For the first half of 2019, the division achieved pre-tax income of USD 642 million, up 39% year on year, driven by a continued effective execution of our strategy.
5
Media Release Zurich, July 31, 2019 | |
Impact Advisory and Finance
The second quarter marked an important milestone in the development of the impact investing market: the launch of the nine Impact Management Principles, in April, under the auspices of the International Finance Corporation (IFC), part of the World Bank. These principles are designed to bring greater transparency, comparability and rigour to the market. Credit Suisse has supported the initiative from the outset and was part of the small working group brought together to advise on the creation of these principles, underscoring our expertise in a market that the IFC believes could be worth over USD 25 trillion if brought further into the mainstream.
In June, we issued the inaugural Credit Suisse green Yankee Certificates of Deposit of USD 200 million. This was an important development for the sustainability finance sector, being the first green issuance to feature a coupon with a portion linked to SOFR - an alternative reference rate, as the industry transitions away from LIBOR.
Sustainability and Corporate Citizenship
In the second quarter, the International Monetary Fund backed the work done by the Institute of International Finance on its Principles for Debt Transparency. The principles were discussed and accepted at the G20 meeting in Tokyo in late June. Credit Suisse began to develop the framework that has evolved into these principles in 2017 in the belief that increased transparency is the key to better access to capital markets in the developing world. We are proud to have incubated this idea, and we remain at the forefront of banks and leading civil organisations that are seeking to implement the principles and to apply them to future transactions.
As a global financial institution, Credit Suisse is expanding the role it can play in its own operations and in supporting our clients in their transition to a low-carbon economy with investment products and advisory services. To this end, we recently joined the United Nations Environment Programme – Finance Initiative’s Task Force on Climate-related Disclosures Banking Pilot Phase II to further develop approaches and tools for climate risk management in the banking sector. In our internal operations, we have joined the Early Adopter programme for the Green Power Pass of one of the bank’s key providers of data center services, ensuring that 100% of the power used comes from renewable resources.
6
Media Release Zurich, July 31, 2019 | |
Contact details
Adam Gishen, Investor Relations, Credit Suisse Tel: +41 44 333 71 49 Email: investor.relations@credit-suisse.com |
James Quinn, Corporate Communications, Credit Suisse Tel: +41 844 33 88 44 E-mail: media.relations@credit-suisse.com |
The Financial Report and Presentation Slides for the second quarter 2019 are available to download from 7:00 CEST today at: https://www.credit-suisse.com/results |
Presentation of 2Q19 results – Wednesday, July 31, 2019
| Event | Analyst Call | Media Call |
| Time | 08:15 Zurich 07:15 London 02:15 New York | 10:15 Zurich 09:15 London 04:15 New York |
| Language | English | English |
| Access | Switzerland: +41 44 580 48 67 Europe: +44 203 057 6528 US: +1 866 276 89 33 Reference: Credit Suisse analyst call Conference ID: 9262128 Please dial in 10 minutes before the start of the call | Switzerland: +41 44 580 48 67 Europe: +44 203 057 6528 US: +1 866 276 89 33 Reference: Credit Suisse media call Conference ID: 7388713 Please dial in 10 minutes before the start of the call |
| Q&A Session | Following the presentation, you will have the opportunity to ask the speakers questions | Following the presentation, you will have the opportunity to ask the speakers questions |
| Playback | Replay available approximately one hour after the event Switzerland: +41 44 580 40 26 Europe: +44 333 300 9785 US: +1 917 677 7532 Conference ID: 9262128 | Replay available approximately one hour after the event Switzerland: +41 44 580 40 26 Europe: +44 333 300 9785 US: +1 917 677 7532 Conference ID: 7388713 |
7
Media Release Zurich, July 31, 2019 | |
Footnotes
1 RoTE figures are rounded up or down to the nearest whole number
2 Compared to other listed Swiss private banks on the SIX Swiss Exchange
3 Source: Euromoney Awards for Excellence, July 10, 2019
4 Source: Dealogic (APAC excluding Japan and excluding onshore China) for the period ending June 30, 2019
5 After deduction of funding costs, but pre revenue sharing agreements with APAC Markets and APAC PB within WM&C; information derived from management accounts and has not been reviewed by our independent registered public accounting firm
6 Source: Dealogic for the period ending June 30, 2019 (Americas and EMEA only)
7 Gross global revenues from advisory, debt and equity underwriting generated across all divisions
8 Source: Dealogic for the period ending June 30, 2019 (Global)
9 Ranked #1 for Asset Finance for 1H19; source: Thomson Reuters, ranked #3 for Leveraged Finance Capital Markets for 1H19, source: Dealogic
10 Source: Thomson Reuters for the period ending June 30, 2019
Abbreviations
APAC – Asia Pacific; AuM – assets under management; CHF – Swiss francs; CET1 – common equity tier 1; EMEA – Europe, Middle East and Africa; FINMA – Swiss Financial Market Supervisory Authority; GAAP – Generally accepted accounting principles; GDP – gross domestic product; GM – Global Markets; IBCM – Investment Banking & Capital Markets; IFC – International Finance Corporation; IPO – initial public offering; ITS – International Trading Solutions; IWM – International Wealth Management; LIBOR – London Inter-bank Offered Rate; M&A – mergers and acquisitions; NNA – net new assets; o/w – of which; PTI – Pre-tax income; PB – Private Banking; PC – Private Clients; RoRC – Return on Regulatory Capital; RoTE – Return on Tangible Equity; RWA – risk-weighted assets; SOFR – Secured Overnight Financing Rate; SUB – Swiss Universal Bank; USD – US dollar; WM&C – Wealth Management & Connected
Important information
This document contains select information from the full 2Q19 Financial Report and 2Q19 Results Presentation slides that Credit Suisse believes is of particular interest to media professionals. The complete 2Q19 Financial Report and 2Q19 Results Presentation slides, which have been distributed simultaneously, contain more comprehensive information about our results and operations for the reporting quarter, as well as important information about our reporting methodology and some of the terms used in these documents. The complete 2Q19 Financial Report and 2Q19 Results Presentation slides are not incorporated by reference into this document.
We may not achieve all of the expected benefits of our strategic initiatives. Factors beyond our control, including but not limited to the market and economic conditions, changes in laws, rules or regulations and other challenges discussed in our public filings, could limit our ability to achieve some or all of the expected benefits of these initiatives.
In particular, the terms “Estimate”, “Illustrative”, “Ambition”, “Objective”, “Outlook” and “Goal” are not intended to be viewed as targets or projections, nor are they considered to be Key Performance Indicators. All such estimates, illustrations, ambitions, objectives, outlooks and goals are subject to a large number of inherent risks, assumptions and uncertainties, many of which are completely outside of our control. These risks, assumptions and uncertainties include, but are not limited to, general market conditions, market volatility, interest rate volatility and levels, global and regional economic conditions, political uncertainty, changes in tax policies, regulatory changes, changes in levels of client activity as a result of any of the foregoing and other factors. Accordingly, this information should not be relied on for any purpose. We do not intend to update these estimates, illustrations, ambitions, objectives, outlooks or goals.
In preparing this document, management has made estimates and assumptions that affect the numbers presented. Actual results may differ. Annualised numbers do not take into account variations in operating results, seasonality and other factors and may not be indicative of actual, full-year results. Figures throughout this document may also be subject to rounding adjustments. All opinions and views constitute judgments as of the date of writing without regard to the date on which the reader may receive or access the information. This information is subject to change at any time without notice and we do not intend to update this information.
Return on tangible equity is based on tangible shareholders’ equity, a non-GAAP financial measure, which is calculated by deducting goodwill and other intangible assets from total shareholders’ equity as presented in our balance sheet. Management believes that return on tangible equity is meaningful as it is a measure used and relied upon by industry analysts and investors to assess valuations and capital adequacy. For end-2Q19, tangible equity excluded goodwill of CHF 4,731 million and other intangible assets of CHF 216 million from total shareholders’ equity of CHF 43,673 million as presented in our balance sheet. For end-1Q19, tangible equity excluded goodwill of CHF 4,807 million and other intangible assets of CHF 224 million from total shareholders’ equity of CHF 43,825 million as presented in our balance sheet. For end-2Q18, tangible equity excluded goodwill of CHF 4,797 million and other intangible assets of CHF 212 million from total shareholders’ equity of CHF 43,470 million as presented in our balance sheet.
Regulatory capital is calculated as the worst of 10% of RWA and 3.5% of leverage exposure. Return on regulatory capital is calculated using income / (loss) after tax and assumes a tax rate of 30% and capital allocated based on the worst of 10% of average RWA and
8
Media Release Zurich, July 31, 2019 | |
3.5% of average leverage exposure. For the Markets business within the APAC division and for the Global Markets and Investment Banking & Capital Markets divisions, return on regulatory capital is based on US dollar denominated numbers. Adjusted return on regulatory capital is calculated using adjusted results, applying the same methodology to calculate return on regulatory capital.
Credit Suisse is subject to the Basel III framework, as implemented in Switzerland, as well as Swiss legislation and regulations for systemically important banks, which include capital, liquidity, leverage and large exposure requirements and rules for emergency plans designed to maintain systemically relevant functions in the event of threatened insolvency. Credit Suisse has adopted the Bank for International Settlements (BIS) leverage ratio framework, as issued by the Basel Committee on Banking Supervision (BCBS) and implemented in Switzerland by the Swiss Financial Market Supervisory Authority FINMA (FINMA).
Unless otherwise noted, leverage exposure is based on the BIS leverage ratio framework and consists of period-end balance sheet assets and prescribed regulatory adjustments. The tier 1 leverage ratio and CET1 leverage ratio are calculated as BIS tier 1 capital and CET1 capital, respectively, divided by period end leverage exposure. Swiss leverage ratios are measured on the same period-end basis as the leverage exposure for the BIS leverage ratio.
References to Wealth Management mean SUB PC, IWM PB and APAC PB within WM&C or their combined results. References to global advisory and underwriting include global revenues from advisory, debt and equity underwriting generated across all divisions.
Investors and others should note that we announce material information (including quarterly earnings releases and financial reports) to the investing public using press releases, SEC and Swiss ad hoc filings, our website and public conference calls and webcasts. We intend to also use our Twitter account @creditsuisse (https://twitter.com/creditsuisse) to excerpt key messages from our public disclosures, including earnings releases. We may retweet such messages through certain of our regional Twitter accounts, including @csschweiz (https://twitter.com/csschweiz) and @csapac (https://twitter.com/csapac). Investors and others should take care to consider such abbreviated messages in the context of the disclosures from which they are excerpted. The information we post on these Twitter accounts is not a part of this document.
Information referenced in this document, whether via website links or otherwise, is not incorporated into this document.
Certain material in this document has been prepared by Credit Suisse on the basis of publicly available information, internally developed data and other third-party sources believed to be reliable. Credit Suisse has not sought to independently verify information obtained from public and third-party sources and makes no representations or warranties as to accuracy, completeness or reliability of such information.
In various tables, use of “–” indicates not meaningful or not applicable.
9
| Key metrics | |||||||||||||||||
| in / end of | % change | in / end of | % change | ||||||||||||||
| 2Q19 | 1Q19 | 2Q18 | QoQ | YoY | 6M19 | 6M18 | YoY | ||||||||||
| Credit Suisse Group results (CHF million) | |||||||||||||||||
| Net revenues | 5,581 | 5,387 | 5,595 | 4 | 0 | 10,968 | 11,231 | (2) | |||||||||
| Provision for credit losses | 25 | 81 | 73 | (69) | (66) | 106 | 121 | (12) | |||||||||
| Compensation and benefits | 2,545 | 2,518 | 2,547 | 1 | 0 | 5,063 | 5,085 | 0 | |||||||||
| General and administrative expenses | 1,395 | 1,413 | 1,420 | (1) | (2) | 2,808 | 2,928 | (4) | |||||||||
| Commission expenses | 314 | 313 | 328 | 0 | (4) | 627 | 672 | (7) | |||||||||
| Restructuring expenses | – | – | 175 | – | – | – | 319 | – | |||||||||
| Total other operating expenses | 1,709 | 1,726 | 1,923 | (1) | (11) | 3,435 | 3,919 | (12) | |||||||||
| Total operating expenses | 4,254 | 4,244 | 4,470 | 0 | (5) | 8,498 | 9,004 | (6) | |||||||||
| Income before taxes | 1,302 | 1,062 | 1,052 | 23 | 24 | 2,364 | 2,106 | 12 | |||||||||
| Net income attributable to shareholders | 937 | 749 | 647 | 25 | 45 | 1,686 | 1,341 | 26 | |||||||||
| Statement of operations metrics (%) | |||||||||||||||||
| Return on regulatory capital | 11.6 | 9.5 | 9.1 | – | – | 10.6 | 9.1 | – | |||||||||
| Balance sheet statistics (CHF million) | |||||||||||||||||
| Total assets | 784,216 | 793,636 | 798,158 | (1) | (2) | 784,216 | 798,158 | (2) | |||||||||
| Risk-weighted assets | 290,798 | 290,098 | 277,125 | 0 | 5 | 290,798 | 277,125 | 5 | |||||||||
| Leverage exposure | 897,916 | 901,814 | 920,002 | 0 | (2) | 897,916 | 920,002 | (2) | |||||||||
| Assets under management and net new assets (CHF billion) | |||||||||||||||||
| Assets under management | 1,459.9 | 1,431.3 | 1,398.7 | 2.0 | 4.4 | 1,459.9 | 1,398.7 | 4.4 | |||||||||
| Net new assets | 23.2 | 35.8 | 15.3 | (35.2) | 51.6 | 59.0 | 40.3 | 46.4 | |||||||||
| Basel III regulatory capital and leverage statistics (%) | |||||||||||||||||
| CET1 ratio | 12.5 | 12.6 | 12.8 | – | – | 12.5 | 12.8 | – | |||||||||
| CET1 leverage ratio | 4.1 | 4.1 | 3.9 | – | – | 4.1 | 3.9 | – | |||||||||
| Look-through tier 1 leverage ratio | 5.3 | 5.2 | 5.2 | – | – | 5.3 | 5.2 | – | |||||||||
A-1
| Swiss Universal Bank | |||||||||||||||||
| in / end of | % change | in / end of | % change | ||||||||||||||
| 2Q19 | 1Q19 | 2Q18 | QoQ | YoY | 6M19 | 6M18 | YoY | ||||||||||
| Results (CHF million) | |||||||||||||||||
| Net revenues | 1,476 | 1,379 | 1,419 | 7 | 4 | 2,855 | 2,850 | 0 | |||||||||
| of which Private Clients | 828 | 742 | 757 | 12 | 9 | 1,570 | 1,519 | 3 | |||||||||
| of which Corporate & Institutional Clients | 648 | 637 | 662 | 2 | (2) | 1,285 | 1,331 | (3) | |||||||||
| Provision for credit losses | 10 | 29 | 35 | (66) | (71) | 39 | 69 | (43) | |||||||||
| Total operating expenses | 812 | 800 | 831 | 2 | (2) | 1,612 | 1,665 | (3) | |||||||||
| Income before taxes | 654 | 550 | 553 | 19 | 18 | 1,204 | 1,116 | 8 | |||||||||
| of which Private Clients | 356 | 273 | 268 | 30 | 33 | 629 | 533 | 18 | |||||||||
| of which Corporate & Institutional Clients | 298 | 277 | 285 | 8 | 5 | 575 | 583 | (1) | |||||||||
| Metrics (%) | |||||||||||||||||
| Return on regulatory capital | 20.1 | 17.1 | 17.7 | – | – | 18.6 | 17.7 | – | |||||||||
| Cost/income ratio | 55.0 | 58.0 | 58.6 | – | – | 56.5 | 58.4 | – | |||||||||
| Private Clients | |||||||||||||||||
| Assets under management (CHF billion) | 214.7 | 210.7 | 207.9 | 1.9 | 3.3 | 214.7 | 207.9 | 3.3 | |||||||||
| Net new assets (CHF billion) | 1.2 | 3.3 | 0.5 | – | – | 4.5 | 3.2 | – | |||||||||
| Gross margin (annualized) (bp) | 156 | 143 | 145 | – | – | 150 | 146 | – | |||||||||
| Net margin (annualized) (bp) | 67 | 53 | 51 | – | – | 60 | 51 | – | |||||||||
| Corporate & Institutional Clients | |||||||||||||||||
| Assets under management (CHF billion) | 410.7 | 395.9 | 355.8 | 3.7 | 15.4 | 410.7 | 355.8 | 15.4 | |||||||||
| Net new assets (CHF billion) | 8.9 | 27.6 | 0.9 | – | – | 36.5 | 4.7 | – | |||||||||
| International Wealth Management | |||||||||||||||||
| in / end of | % change | in / end of | % change | ||||||||||||||
| 2Q19 | 1Q19 | 2Q18 | QoQ | YoY | 6M19 | 6M18 | YoY | ||||||||||
| Results (CHF million) | |||||||||||||||||
| Net revenues | 1,369 | 1,417 | 1,344 | (3) | 2 | 2,786 | 2,747 | 1 | |||||||||
| of which Private Banking | 989 | 1,019 | 992 | (3) | 0 | 2,008 | 2,035 | (1) | |||||||||
| of which Asset Management | 380 | 398 | 352 | (5) | 8 | 778 | 712 | 9 | |||||||||
| Provision for credit losses | 9 | 10 | 5 | (10) | 80 | 19 | 4 | 375 | |||||||||
| Total operating expenses | 916 | 884 | 906 | 4 | 1 | 1,800 | 1,826 | (1) | |||||||||
| Income before taxes | 444 | 523 | 433 | (15) | 3 | 967 | 917 | 5 | |||||||||
| of which Private Banking | 340 | 402 | 347 | (15) | (2) | 742 | 748 | (1) | |||||||||
| of which Asset Management | 104 | 121 | 86 | (14) | 21 | 225 | 169 | 33 | |||||||||
| Metrics (%) | |||||||||||||||||
| Return on regulatory capital | 28.9 | 35.4 | 31.8 | – | – | 32.2 | 33.6 | – | |||||||||
| Cost/income ratio | 66.9 | 62.4 | 67.4 | – | – | 64.6 | 66.5 | – | |||||||||
| Private Banking | |||||||||||||||||
| Assets under management (CHF billion) | 363.1 | 356.4 | 370.7 | 1.9 | (2.1) | 363.1 | 370.7 | (2.1) | |||||||||
| Net new assets (CHF billion) | 5.5 | 1.3 | 5.2 | – | – | 6.8 | 10.7 | – | |||||||||
| Gross margin (annualized) (bp) | 109 | 113 | 107 | – | – | 111 | 110 | – | |||||||||
| Net margin (annualized) (bp) | 37 | 45 | 37 | – | – | 41 | 41 | – | |||||||||
| Asset Management | |||||||||||||||||
| Assets under management (CHF billion) | 414.0 | 404.5 | 401.4 | 2.3 | 3.1 | 414.0 | 401.4 | 3.1 | |||||||||
| Net new assets (CHF billion) | 8.6 | (0.5) | 8.0 | – | – | 8.1 | 17.0 | – | |||||||||
A-2
| Asia Pacific | |||||||||||||||||
| in / end of | % change | in / end of | % change | ||||||||||||||
| 2Q19 | 1Q19 | 2Q18 | QoQ | YoY | 6M19 | 6M18 | YoY | ||||||||||
| Results (CHF million) | |||||||||||||||||
| Net revenues | 913 | 854 | 914 | 7 | 0 | 1,767 | 1,905 | (7) | |||||||||
| of which Wealth Management & Connected | 614 | 565 | 564 | 9 | 9 | 1,179 | 1,227 | (4) | |||||||||
| of which Markets | 299 | 289 | 350 | 3 | (15) | 588 | 678 | (13) | |||||||||
| Provision for credit losses | (1) | 17 | 7 | – | – | 16 | 17 | (6) | |||||||||
| Total operating expenses | 677 | 654 | 690 | 4 | (2) | 1,331 | 1,437 | (7) | |||||||||
| Income before taxes | 237 | 183 | 217 | 30 | 9 | 420 | 451 | (7) | |||||||||
| of which Wealth Management & Connected | 216 | 170 | 168 | 27 | 29 | 386 | 373 | 3 | |||||||||
| of which Markets | 21 | 13 | 49 | 62 | (57) | 34 | 78 | (56) | |||||||||
| Metrics (%) | |||||||||||||||||
| Return on regulatory capital | 17.0 | 13.5 | 14.8 | – | – | 15.3 | 15.9 | – | |||||||||
| Cost/income ratio | 74.2 | 76.6 | 75.5 | – | – | 75.3 | 75.4 | – | |||||||||
| Wealth Management & Connected – Private Banking | |||||||||||||||||
| Assets under management (CHF billion) | 218.7 | 219.0 | 205.6 | (0.1) | 6.4 | 218.7 | 205.6 | 6.4 | |||||||||
| Net new assets (CHF billion) | 2.8 | 5.0 | 3.4 | – | – | 7.8 | 9.6 | – | |||||||||
| Gross margin (annualized) (bp) | 79 | 75 | 80 | – | – | 77 | 86 | – | |||||||||
| Net margin (annualized) (bp) | 30 | 25 | 29 | – | – | 27 | 32 | – | |||||||||
A-3
| Global Markets | |||||||||||||||||
| in / end of | % change | in / end of | % change | ||||||||||||||
| 2Q19 | 1Q19 | 2Q18 | QoQ | YoY | 6M19 | 6M18 | YoY | ||||||||||
| Results (CHF million) | |||||||||||||||||
| Net revenues | 1,553 | 1,472 | 1,426 | 6 | 9 | 3,025 | 2,972 | 2 | |||||||||
| Provision for credit losses | 2 | 11 | 12 | (82) | (83) | 13 | 16 | (19) | |||||||||
| Total operating expenses | 1,194 | 1,179 | 1,266 | 1 | (6) | 2,373 | 2,513 | (6) | |||||||||
| Income before taxes | 357 | 282 | 148 | 27 | 141 | 639 | 443 | 44 | |||||||||
| Metrics (%) | |||||||||||||||||
| Return on regulatory capital | 11.0 | 8.9 | 4.2 | – | – | 10.0 | 6.5 | – | |||||||||
| Cost/income ratio | 76.9 | 80.1 | 88.8 | – | – | 78.4 | 84.6 | – | |||||||||
| Investment Banking & Capital Markets | |||||||||||||||||
| in / end of | % change | in / end of | % change | ||||||||||||||
| 2Q19 | 1Q19 | 2Q18 | QoQ | YoY | 6M19 | 6M18 | YoY | ||||||||||
| Results (CHF million) | |||||||||||||||||
| Net revenues | 454 | 356 | 644 | 28 | (30) | 810 | 1,172 | (31) | |||||||||
| Provision for credit losses | 1 | 8 | 15 | (88) | (93) | 9 | 16 | (44) | |||||||||
| Total operating expenses | 447 | 441 | 519 | 1 | (14) | 888 | 987 | (10) | |||||||||
| Income/(loss) before taxes | 6 | (93) | 110 | – | (95) | (87) | 169 | – | |||||||||
| Metrics (%) | |||||||||||||||||
| Return on regulatory capital | 0.8 | (10.6) | 13.9 | – | – | (4.7) | 11.1 | – | |||||||||
| Cost/income ratio | 98.5 | 123.9 | 80.6 | – | – | 109.6 | 84.2 | – | |||||||||
| Global advisory and underwriting revenues | |||||||||||||||||
| in | % change | in | % change | ||||||||||||||
| 2Q19 | 1Q19 | 2Q18 | QoQ | YoY | 6M19 | 6M18 | YoY | ||||||||||
| Global advisory and underwriting revenues (USD million) | |||||||||||||||||
| Global advisory and underwriting revenues | 924 | 769 | 1,156 | 20 | (20) | 1,693 | 2,262 | (25) | |||||||||
| of which advisory and other fees | 208 | 171 | 313 | 22 | (34) | 379 | 564 | (33) | |||||||||
| of which debt underwriting | 463 | 460 | 568 | 1 | (18) | 923 | 1,184 | (22) | |||||||||
| of which equity underwriting | 253 | 138 | 275 | 83 | (8) | 391 | 514 | (24) | |||||||||
A-4
Cautionary statement regarding forward-looking information
This document contains statements that constitute forward-looking statements. In addition, in the future we, and others on our behalf, may make statements that constitute forward-looking statements. Such forward-looking statements may include, without limitation, statements relating to the following:
■ our plans, targets or goals;
■ our future economic performance or prospects;
■ the potential effect on our future performance of certain contingencies; and
■ assumptions underlying any such statements.
Words such as “believes,” “anticipates,” “expects,” “intends” and “plans” and similar expressions are intended to identify forward-looking statements but are not the exclusive means of identifying such statements. We do not intend to update these forward-looking statements.
By their very nature, forward-looking statements involve inherent risks and uncertainties, both general and specific, and risks exist that predictions, forecasts, projections and other outcomes described or implied in forward-looking statements will not be achieved. We caution you that a number of important factors could cause results to differ materially from the plans, targets, goals, expectations, estimates and intentions expressed in such forward-looking statements. These factors include:
■ the ability to maintain sufficient liquidity and access capital markets;
■ market volatility and interest rate fluctuations and developments affecting interest rate levels;
■ the strength of the global economy in general and the strength of the economies of the countries in which we conduct our operations, in particular the risk of continued slow economic recovery or downturn in the EU, the US or other developed countries or in emerging markets in 2019 and beyond;
■ the direct and indirect impacts of deterioration or slow recovery in residential and commercial real estate markets;
■ adverse rating actions by credit rating agencies in respect of us, sovereign issuers, structured credit products or other credit-related exposures;
■ the ability to achieve our strategic goals, including those related to our targets and financial goals;
■ the ability of counterparties to meet their obligations to us;
■ the effects of, and changes in, fiscal, monetary, exchange rate, trade and tax policies, as well as currency fluctuations;
■ political and social developments, including war, civil unrest or terrorist activity;
■ the possibility of foreign exchange controls, expropriation, nationalization or confiscation of assets in countries in which we conduct our operations;
■ operational factors such as systems failure, human error, or the failure to implement procedures properly;
■ the risk of cyber attacks, information or security breaches or technology failures on our business or operations;
■ the adverse resolution of litigation, regulatory proceedings and other contingencies;
■ actions taken by regulators with respect to our business and practices and possible resulting changes to our business organization, practices and policies in countries in which we conduct our operations;
■ the effects of changes in laws, regulations or accounting or tax standards, policies or practices in countries in which we conduct our operations;
■ the potential effects of changes in our legal entity structure;
■ competition or changes in our competitive position in geographic and business areas in which we conduct our operations;
■ the ability to retain and recruit qualified personnel;
■ the ability to maintain our reputation and promote our brand;
■ the ability to increase market share and control expenses;
■ technological changes;
■ the timely development and acceptance of our new products and services and the perceived overall value of these products and services by users;
■ acquisitions, including the ability to integrate acquired businesses successfully, and divestitures, including the ability to sell non-core assets; and
■ other unforeseen or unexpected events and our success at managing these and the risks involved in the foregoing.
We caution you that the foregoing list of important factors is not exclusive. When evaluating forward-looking statements, you should carefully consider the foregoing factors and other uncertainties and events, including the information set forth in “Risk factors” in I – Information on the company in our Annual Report 2018.
A-5

Tidjane Thiam, Chief Executive OfficerDavid Mathers, Chief Financial OfficerJuly 31, 2019 Credit SuisseSecond Quarter 2019 Results
Disclaimer 2 July 31, 2019 This material does not purport to contain all of the information that you may wish to consider. This material is not to be relied upon as such or used in substitution for the exercise of independent judgment.Cautionary statement regarding forward-looking statements This presentation contains forward-looking statements that involve inherent risks and uncertainties, and we might not be able to achieve the predictions, forecasts, projections and other outcomes we describe or imply in forward-looking statements. A number of important factors could cause results to differ materially from the plans, objectives, expectations, estimates and intentions we express in these forward-looking statements, including those we identify in "Risk factors” in our Annual Report on Form 20-F for the fiscal year ended December 31, 2018 and in the “Cautionary statement regarding forward-looking information" in our 2Q19 Financial Report published on July 31, 2019 and filed with the US Securities and Exchange Commission, and in other public filings and press releases. We do not intend to update these forward-looking statements. In particular, the terms “Estimate”, “Illustrative”, “Ambition”, “Objective”, “Outlook” and “Goal” are not intended to be viewed as targets or projections, nor are they considered to be Key Performance Indicators. All such estimates, illustrations, ambitions, objectives, outlooks and goals are subject to a large number of inherent risks, assumptions and uncertainties, many of which are completely outside of our control. These risks, assumptions and uncertainties include, but are not limited to, general market conditions, market volatility, interest rate volatility and levels, global and regional economic conditions, political uncertainty, changes in tax policies, regulatory changes, changes in levels of client activity as a result of any of the foregoing and other factors. Accordingly, this information should not be relied on for any purpose. We do not intend to update these estimates, illustrations, ambitions, objectives, outlooks or goals. We may not achieve the benefits of our strategic initiativesWe may not achieve all of the expected benefits of our strategic initiatives. Factors beyond our control, including but not limited to the market and economic conditions, changes in laws, rules or regulations and other challenges discussed in our public filings, could limit our ability to achieve some or all of the expected benefits of these initiatives. Estimates and assumptionsIn preparing this presentation, management has made estimates and assumptions that affect the numbers presented. Actual results may differ. Annualized numbers do not take account of variations in operating results, seasonality and other factors and may not be indicative of actual, full-year results. Figures throughout this presentation may also be subject to rounding adjustments. All opinions and views constitute judgments as of the date of writing without regard to the date on which the reader may receive or access the information. This information is subject to change at any time without notice and we do not intend to update this information.Statement regarding non-GAAP financial measuresThis presentation also contains non-GAAP financial measures, including adjusted results. Information needed to reconcile such non-GAAP financial measures to the most directly comparable measures under US GAAP can be found in this presentation in the Appendix as well as in the 2Q19 Financial Report, which are both available on our website at www.credit-suisse.com.Our estimates, ambitions, objectives and targets often include metrics that are non-GAAP financial measures and are unaudited. A reconciliation of the estimates, ambitions, objectives and targets to the nearest GAAP measures is unavailable without unreasonable efforts. Adjusted results exclude goodwill impairment, major litigation charges, real estate gains and other revenue and expense items included in our reported results, all of which are unavailable on a prospective basis. Return on Tangible Equity is based on tangible shareholders' equity, a non-GAAP financial measure, which is calculated by deducting goodwill and other intangible assets from total shareholders' equity as presented in our balance sheet, both of which are unavailable on a prospective basis. Such estimates, ambitions, objectives and targets are calculated in a manner that is consistent with the accounting policies applied by us in preparing our financial statements.Statement regarding capital, liquidity and leverageCredit Suisse is subject to the Basel III framework, as implemented in Switzerland, as well as Swiss legislation and regulations for systemically important banks, which include capital, liquidity, leverage and large exposure requirements and rules for emergency plans designed to maintain systemically relevant functions in the event of threatened insolvency. Credit Suisse has adopted the Bank for International Settlements (BIS) leverage ratio framework, as issued by the Basel Committee on Banking Supervision (BCBS) and implemented in Switzerland by FINMA.Unless otherwise noted, leverage exposure is based on the BIS leverage ratio framework and consists of period-end balance sheet assets and prescribed regulatory adjustments. The tier 1 leverage ratio and CET1 leverage ratio are calculated as BIS tier 1 capital and CET1 capital, respectively, divided by period-end leverage exposure. Swiss leverage ratios are measured on the same period-end basis as the leverage exposure for the BIS leverage ratio.SourcesCertain material in this presentation has been prepared by Credit Suisse on the basis of publicly available information, internally developed data and other third-party sources believed to be reliable. Credit Suisse has not sought to independently verify information obtained from public and third-party sources and makes no representations or warranties as to accuracy, completeness or reliability of such information.

Earnings Review 3 July 31, 2019
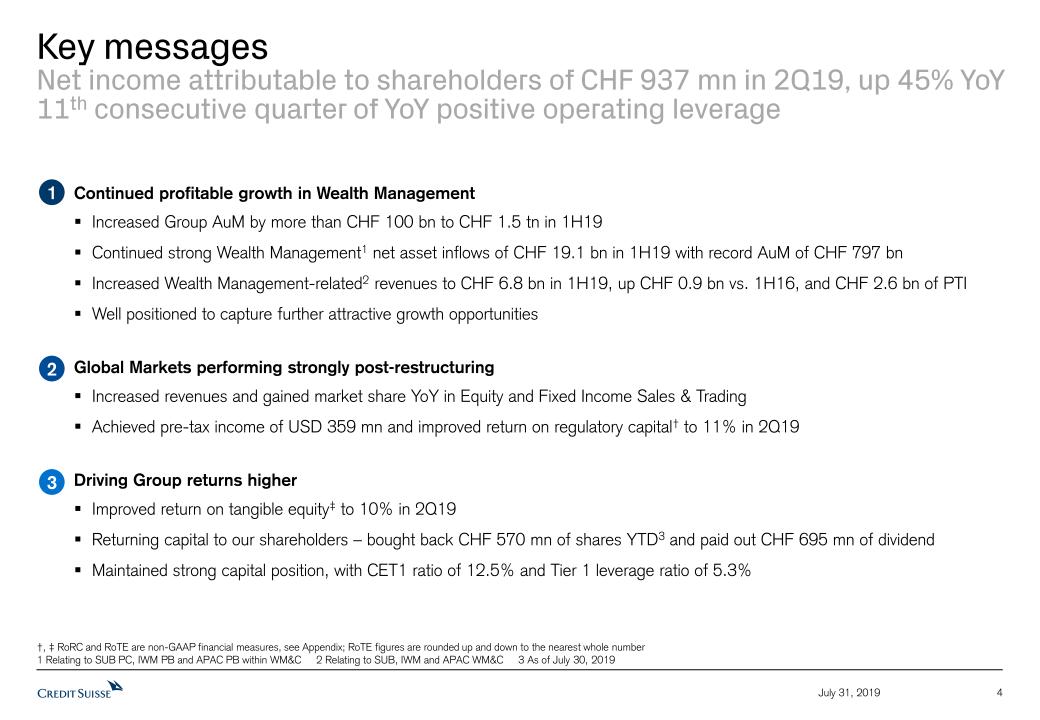
Key messagesNet income attributable to shareholders of CHF 937 mn in 2Q19, up 45% YoY11th consecutive quarter of YoY positive operating leverage 4 July 31, 2019 Continued profitable growth in Wealth ManagementIncreased Group AuM by more than CHF 100 bn to CHF 1.5 tn in 1H19Continued strong Wealth Management1 net asset inflows of CHF 19.1 bn in 1H19 with record AuM of CHF 797 bn Increased Wealth Management-related2 revenues to CHF 6.8 bn in 1H19, up CHF 0.9 bn vs. 1H16, and CHF 2.6 bn of PTIWell positioned to capture further attractive growth opportunitiesGlobal Markets performing strongly post-restructuring Increased revenues and gained market share YoY in Equity and Fixed Income Sales & TradingAchieved pre-tax income of USD 359 mn and improved return on regulatory capital† to 11% in 2Q19Driving Group returns higherImproved return on tangible equity‡ to 10% in 2Q19Returning capital to our shareholders – bought back CHF 570 mn of shares YTD3 and paid out CHF 695 mn of dividendMaintained strong capital position, with CET1 ratio of 12.5% and Tier 1 leverage ratio of 5.3% 1 2 3 †, ‡ RoRC and RoTE are non-GAAP financial measures, see Appendix; RoTE figures are rounded up and down to the nearest whole number1 Relating to SUB PC, IWM PB and APAC PB within WM&C 2 Relating to SUB, IWM and APAC WM&C 3 As of July 30, 2019
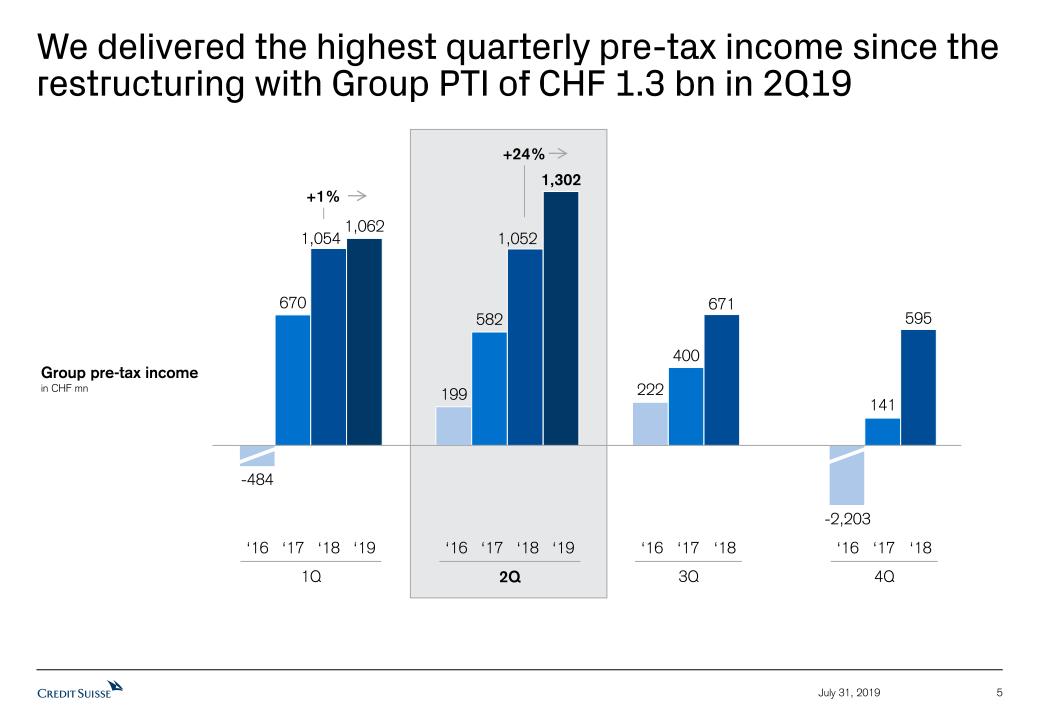
We delivered the highest quarterly pre-tax income since the restructuring with Group PTI of CHF 1.3 bn in 2Q19 5 July 31, 2019 Group pre-tax incomein CHF mn 3Q ‘16 ‘17 ‘18 1Q ‘16 ‘17 ‘18 ‘19 -484 4Q ‘16 ‘17 ‘18 -2,203 2Q ‘16 ‘17 ‘18 ‘19 +24% +1%
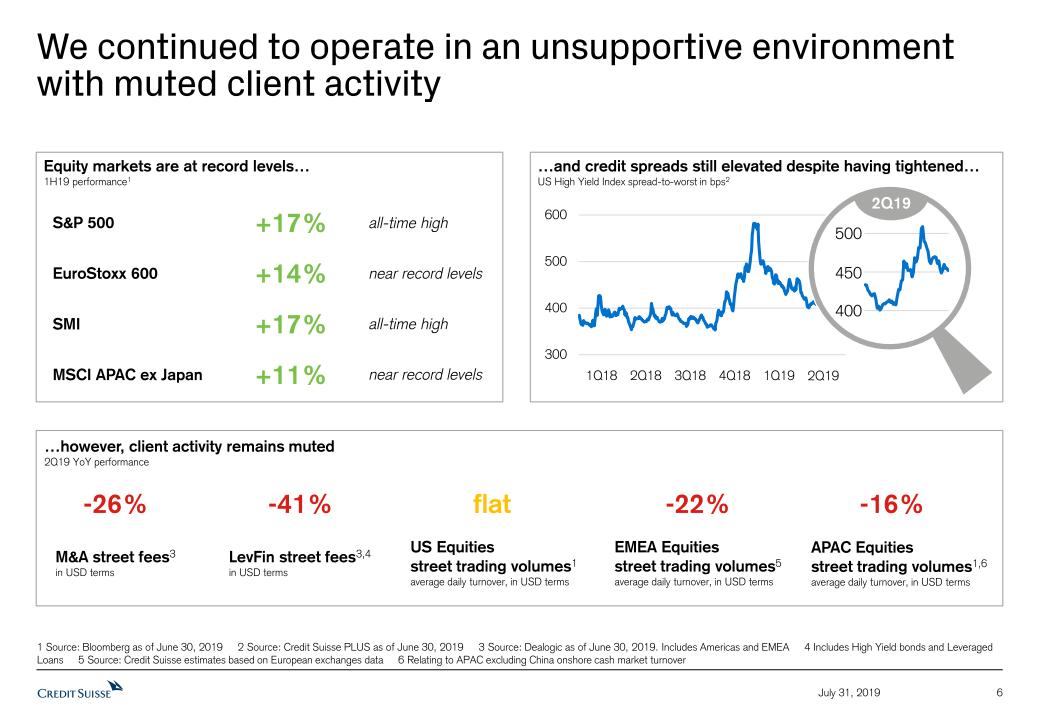
We continued to operate in an unsupportive environment with muted client activity 6 July 31, 2019 Equity markets are at record levels…1H19 performance1 …however, client activity remains muted2Q19 YoY performance M&A street fees3in USD terms LevFin street fees3,4in USD terms APAC Equities street trading volumes1,6 average daily turnover, in USD terms EMEA Equities street trading volumes5average daily turnover, in USD terms -16% -22% -41% -26% US Equities street trading volumes1average daily turnover, in USD terms flat S&P 500 EuroStoxx 600 SMI MSCI APAC ex Japan +17% +14% +17% +11% 1 Source: Bloomberg as of June 30, 2019 2 Source: Credit Suisse PLUS as of June 30, 2019 3 Source: Dealogic as of June 30, 2019. Includes Americas and EMEA 4 Includes High Yield bonds and Leveraged Loans 5 Source: Credit Suisse estimates based on European exchanges data 6 Relating to APAC excluding China onshore cash market turnover all-time high all-time high near record levels near record levels …and credit spreads still elevated despite having tightened…US High Yield Index spread-to-worst in bps2 1Q18 2Q18 3Q18 1Q19 4Q18 2Q19 500 400 450 2Q19
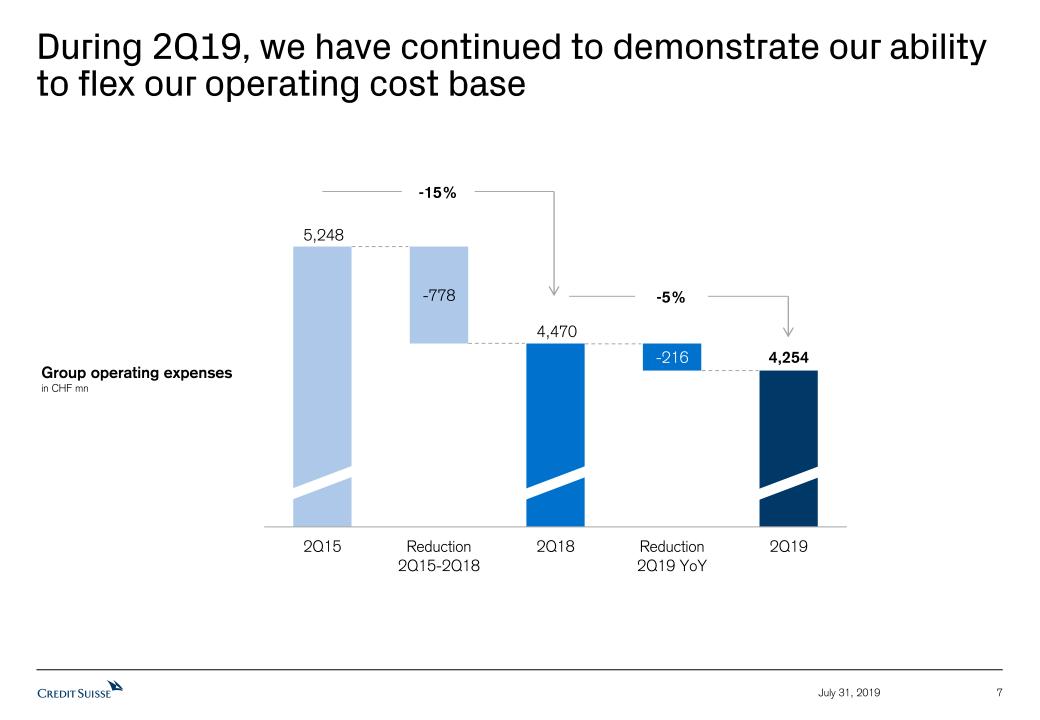
7 July 31, 2019 During 2Q19, we have continued to demonstrate our ability to flex our operating cost base Group operating expensesin CHF mn -15% -5%
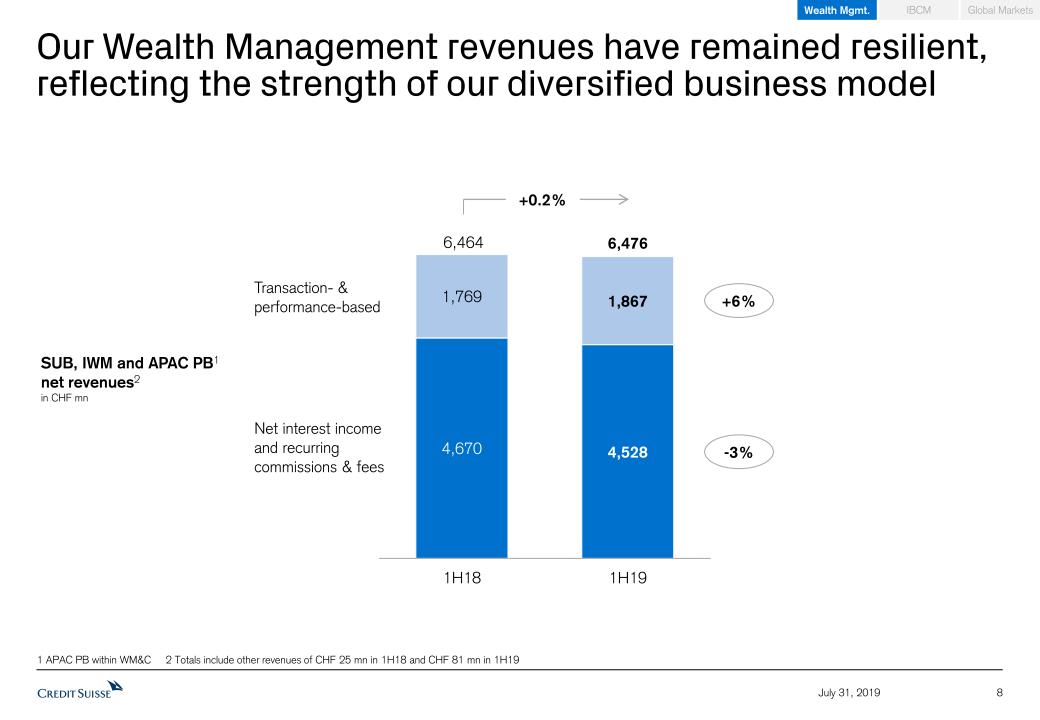
Our Wealth Management revenues have remained resilient, reflecting the strength of our diversified business model 8 July 31, 2019 SUB, IWM and APAC PB1net revenues2in CHF mn Net interest income and recurring commissions & fees Transaction- & performance-based 6,464 +6% -3% 6,476 +0.2% 1 APAC PB within WM&C 2 Totals include other revenues of CHF 25 mn in 1H18 and CHF 81 mn in 1H19 IBCM Wealth Mgmt. Global Markets
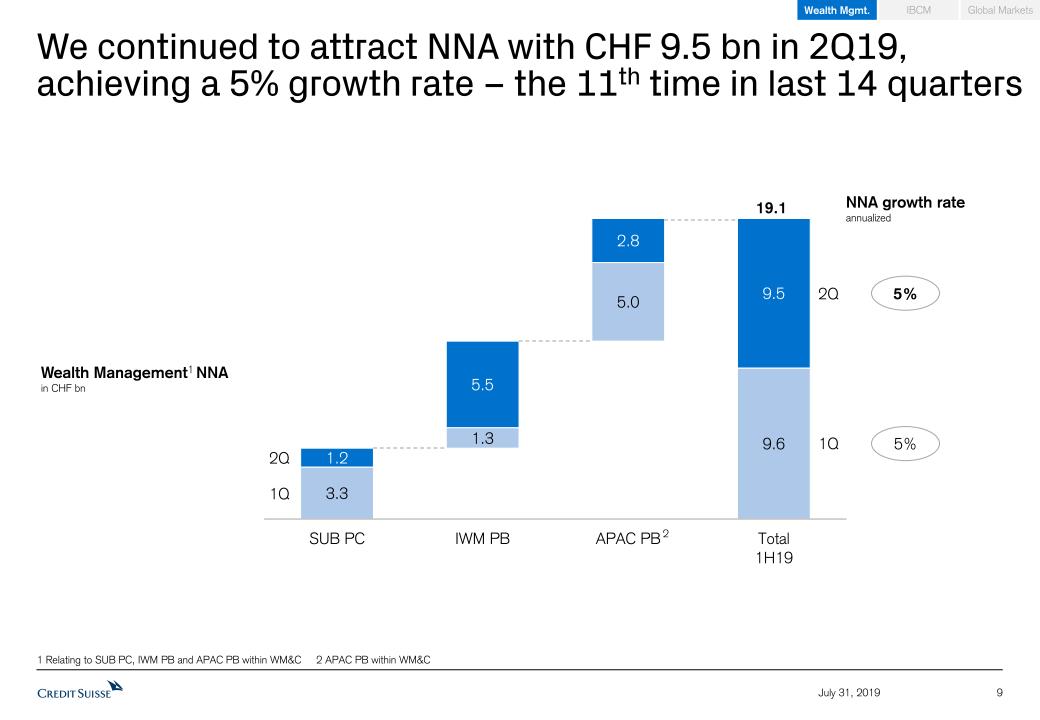
9 July 31, 2019 We continued to attract NNA with CHF 9.5 bn in 2Q19, achieving a 5% growth rate – the 11th time in last 14 quarters Wealth Management1 NNAin CHF bn 2 NNA growth rateannualized 5% 1 Relating to SUB PC, IWM PB and APAC PB within WM&C 2 APAC PB within WM&C 19.1 1Q 2Q 1Q 2Q 5% IBCM Wealth Mgmt. Global Markets
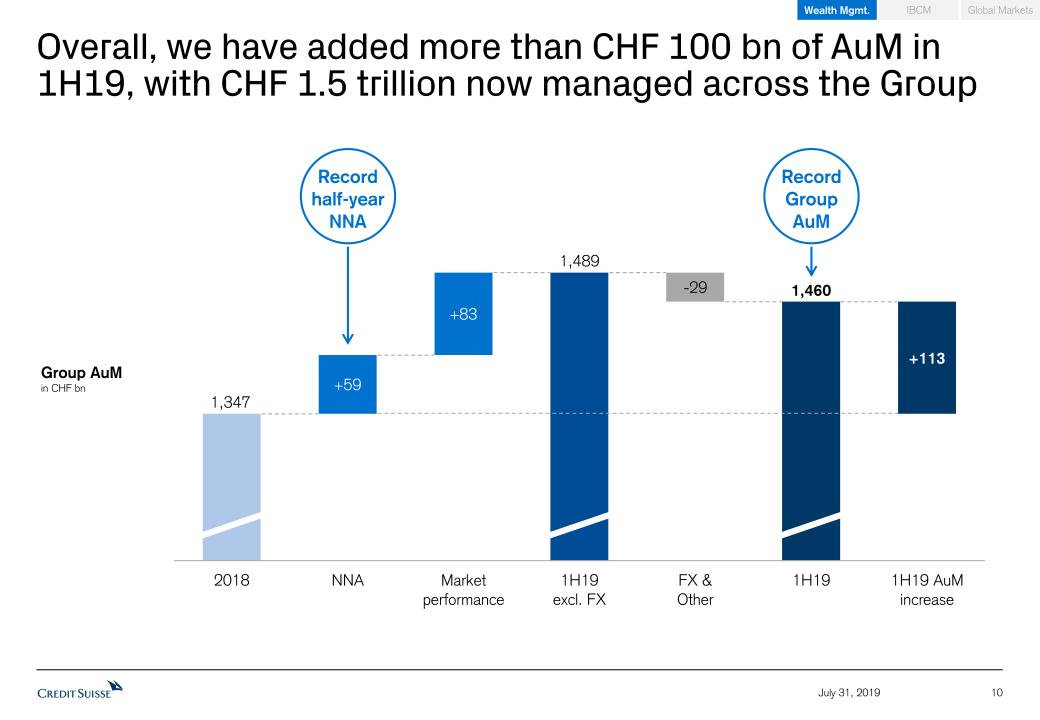
Overall, we have added more than CHF 100 bn of AuM in 1H19, with CHF 1.5 trillion now managed across the Group 10 July 31, 2019 Group AuMin CHF bn Record Group AuM Record half-year NNA IBCM Wealth Mgmt. Global Markets
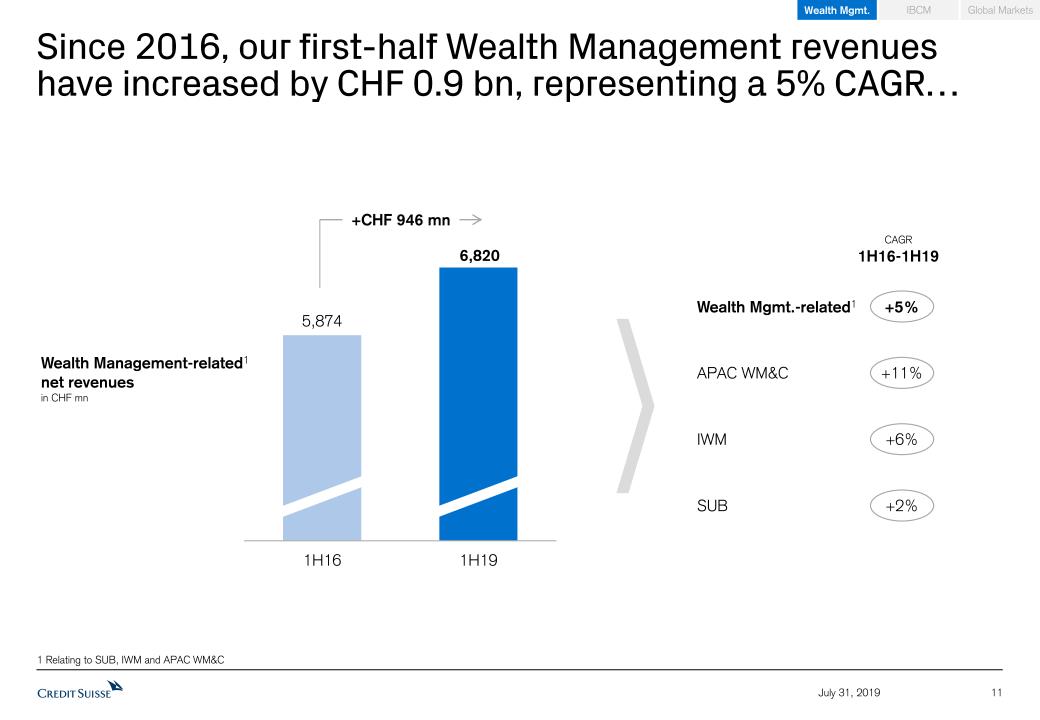
11 July 31, 2019 Since 2016, our first-half Wealth Management revenues have increased by CHF 0.9 bn, representing a 5% CAGR… Wealth Management-related1net revenuesin CHF mn 1 Relating to SUB, IWM and APAC WM&C CAGR1H16-1H19 +11% +2% +6% +5% Wealth Mgmt.-related1 APAC WM&C IWM SUB IBCM Wealth Mgmt. Global Markets +CHF 946 mn
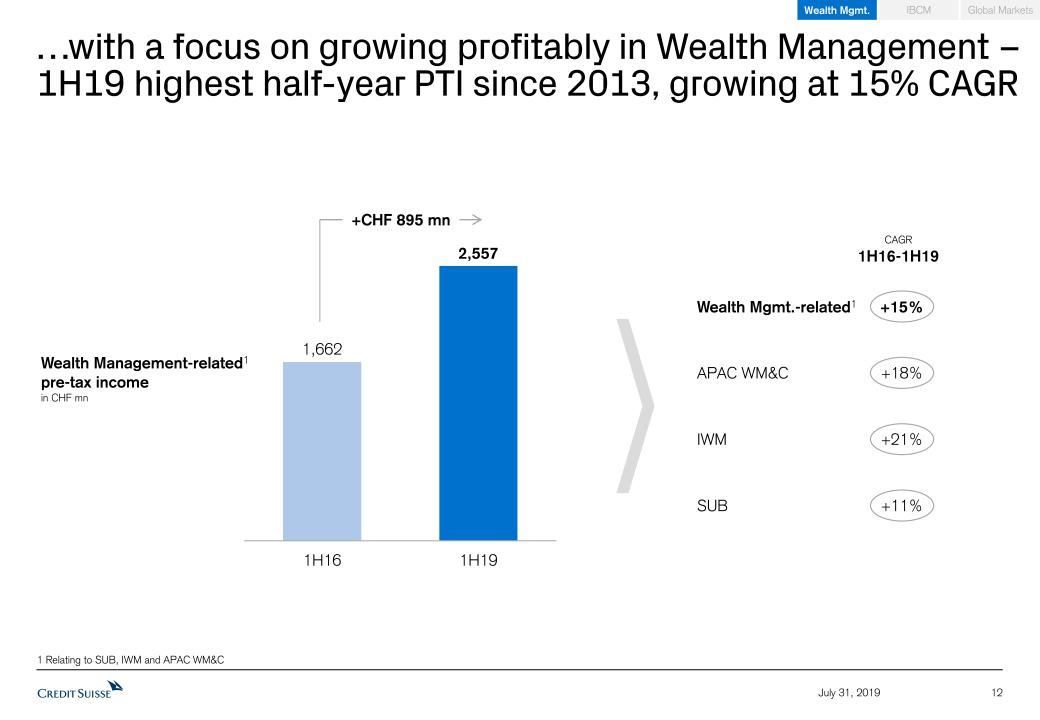
12 July 31, 2019 …with a focus on growing profitably in Wealth Management – 1H19 highest half-year PTI since 2013, growing at 15% CAGR CAGR1H16-1H19 +18% +11% +21% +15% Wealth Mgmt.-related1 APAC WM&C IWM SUB Wealth Management-related1 pre-tax incomein CHF mn 1 Relating to SUB, IWM and APAC WM&C IBCM Wealth Mgmt. Global Markets +CHF 895 mn
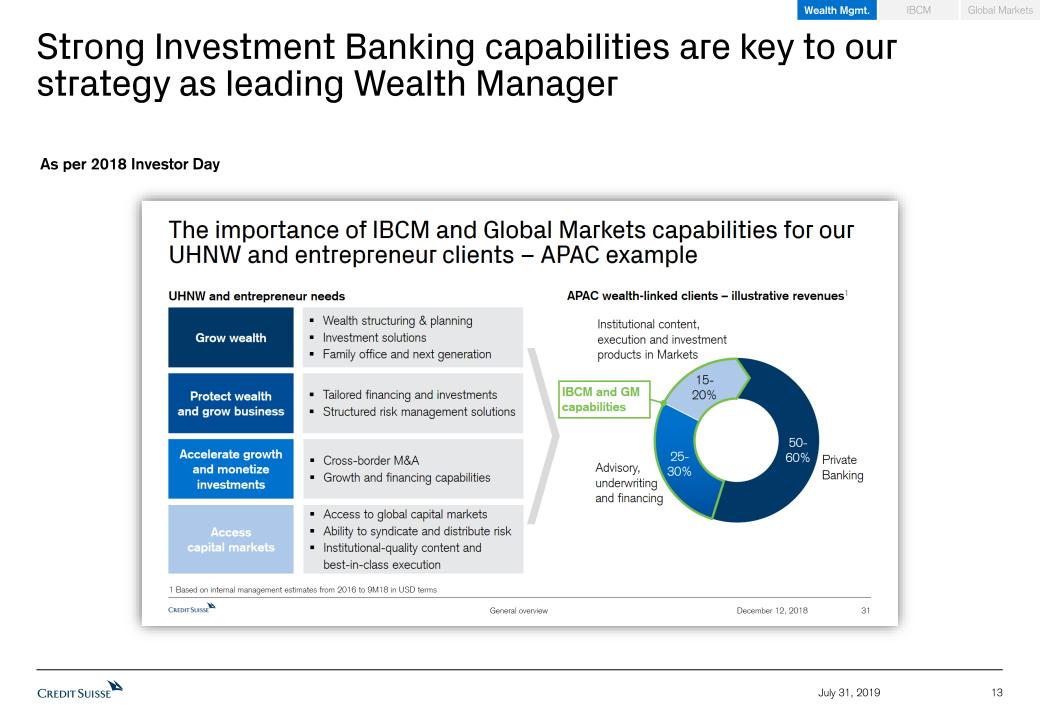
Strong Investment Banking capabilities are key to our strategy as leading Wealth Manager 13 July 31, 2019 IBCM Wealth Mgmt. Global Markets As per 2018 Investor Day
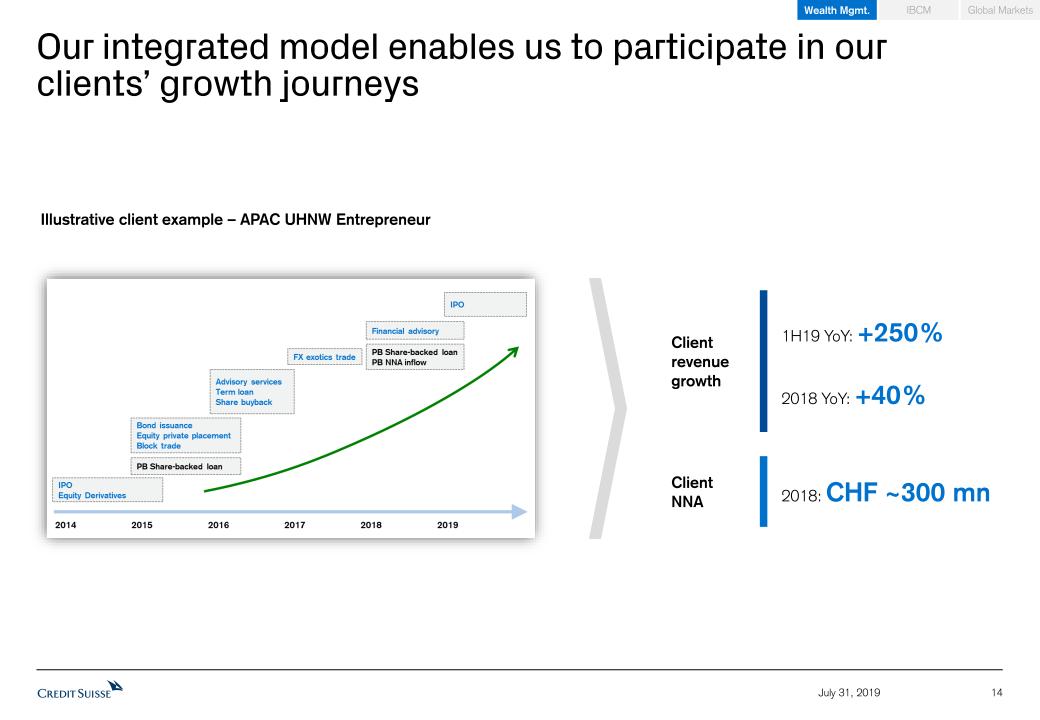
Our integrated model enables us to participate in our clients’ growth journeys 14 July 31, 2019 Illustrative client example – APAC UHNW Entrepreneur Client revenue growth 1H19 YoY: +250% 2018 YoY: +40% Client NNA 2018: CHF ~300 mn IBCM Wealth Mgmt. Global Markets
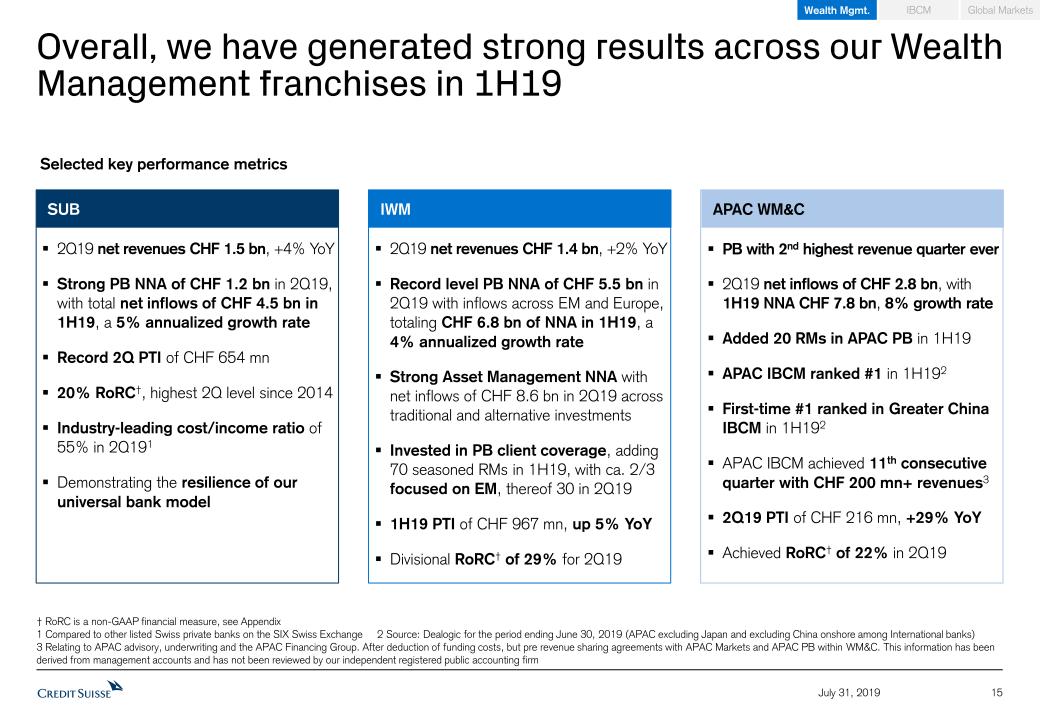
Overall, we have generated strong results across our Wealth Management franchises in 1H19 15 July 31, 2019 IBCM Wealth Mgmt. Global Markets SUB IWM APAC WM&C 2Q19 net revenues CHF 1.5 bn, +4% YoYStrong PB NNA of CHF 1.2 bn in 2Q19, with total net inflows of CHF 4.5 bn in 1H19, a 5% annualized growth rateRecord 2Q PTI of CHF 654 mn20% RoRC†, highest 2Q level since 2014Industry-leading cost/income ratio of 55% in 2Q191Demonstrating the resilience of our universal bank model 2Q19 net revenues CHF 1.4 bn, +2% YoYRecord level PB NNA of CHF 5.5 bn in 2Q19 with inflows across EM and Europe, totaling CHF 6.8 bn of NNA in 1H19, a 4% annualized growth rateStrong Asset Management NNA with net inflows of CHF 8.6 bn in 2Q19 across traditional and alternative investmentsInvested in PB client coverage, adding 70 seasoned RMs in 1H19, with ca. 2/3 focused on EM, thereof 30 in 2Q191H19 PTI of CHF 967 mn, up 5% YoYDivisional RoRC† of 29% for 2Q19 PB with 2nd highest revenue quarter ever2Q19 net inflows of CHF 2.8 bn, with 1H19 NNA CHF 7.8 bn, 8% growth rateAdded 20 RMs in APAC PB in 1H19APAC IBCM ranked #1 in 1H192First-time #1 ranked in Greater China IBCM in 1H192APAC IBCM achieved 11th consecutive quarter with CHF 200 mn+ revenues32Q19 PTI of CHF 216 mn, +29% YoYAchieved RoRC† of 22% in 2Q19 † RoRC is a non-GAAP financial measure, see Appendix1 Compared to other listed Swiss private banks on the SIX Swiss Exchange 2 Source: Dealogic for the period ending June 30, 2019 (APAC excluding Japan and excluding China onshore among International banks) 3 Relating to APAC advisory, underwriting and the APAC Financing Group. After deduction of funding costs, but pre revenue sharing agreements with APAC Markets and APAC PB within WM&C. This information has been derived from management accounts and has not been reviewed by our independent registered public accounting firm Selected key performance metrics
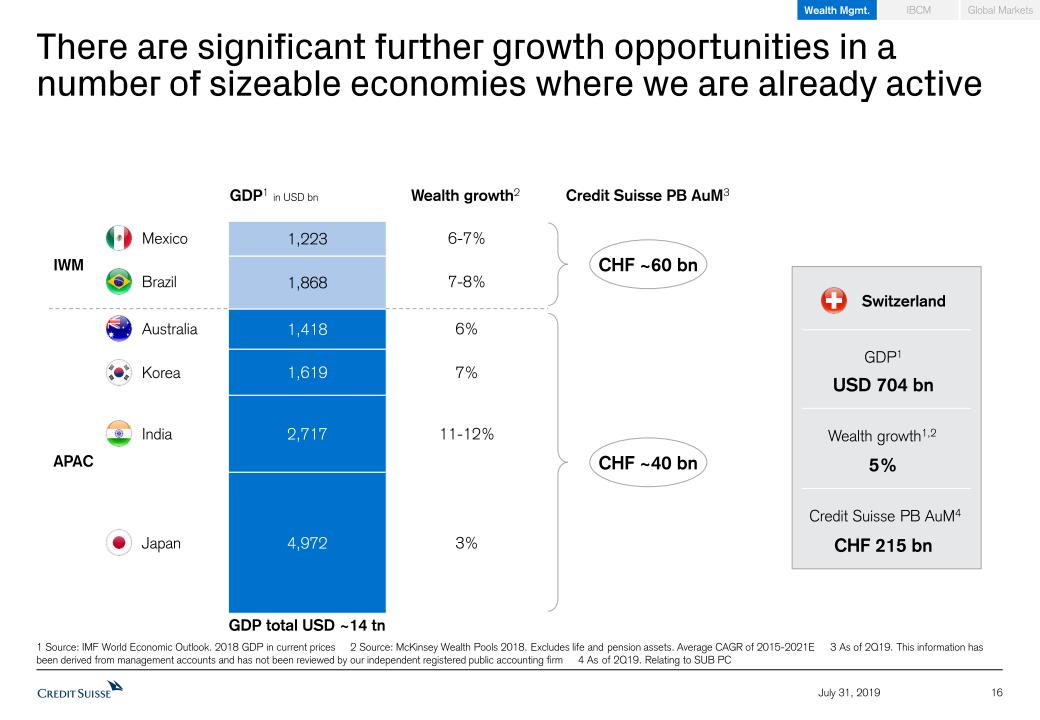
16 July 31, 2019 There are significant further growth opportunities in a number of sizeable economies where we are already active IWM APAC GDP1 in USD bn Mexico 6-7% Brazil 7-8% Australia 6% Korea 7% Japan 3% India 11-12% Wealth growth2 Credit Suisse PB AuM3 CHF ~60 bn CHF ~40 bn Switzerland Wealth growth1,2 5% GDP1 USD 704 bn Credit Suisse PB AuM4 CHF 215 bn IBCM Wealth Mgmt. Global Markets GDP total USD ~14 tn 1 Source: IMF World Economic Outlook. 2018 GDP in current prices 2 Source: McKinsey Wealth Pools 2018. Excludes life and pension assets. Average CAGR of 2015-2021E 3 As of 2Q19. This information has been derived from management accounts and has not been reviewed by our independent registered public accounting firm 4 As of 2Q19. Relating to SUB PC
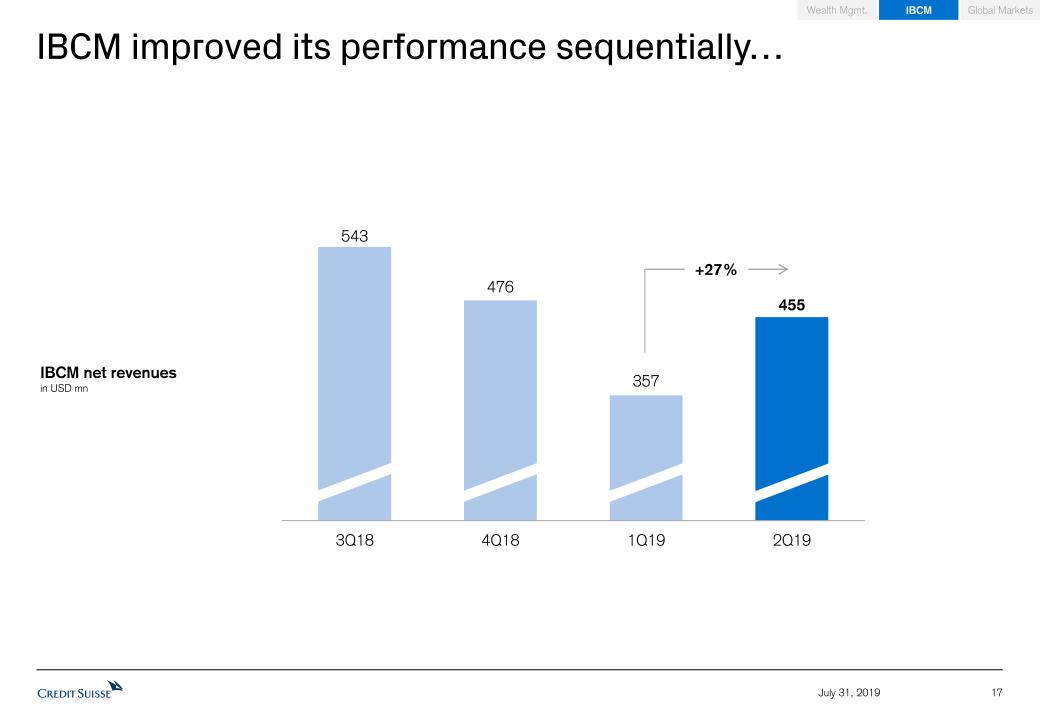
IBCM improved its performance sequentially… 17 July 31, 2019 IBCM net revenuesin USD mn +27% IBCM Wealth Mgmt. Global Markets
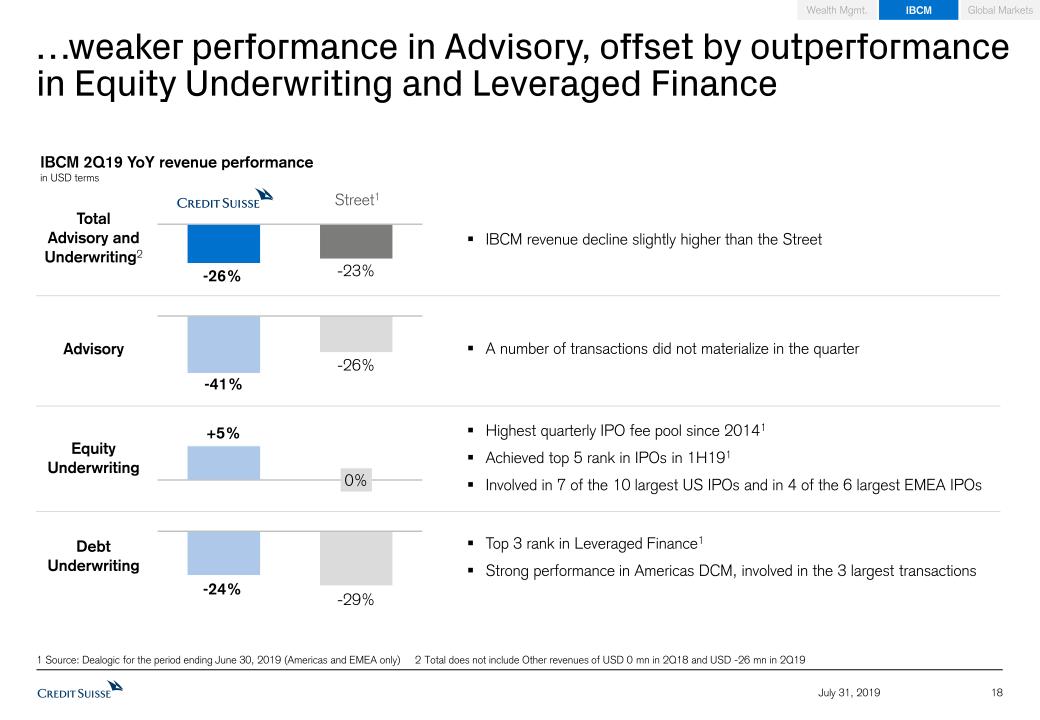
…weaker performance in Advisory, offset by outperformance in Equity Underwriting and Leveraged Finance 18 July 31, 2019 IBCM 2Q19 YoY revenue performancein USD terms IBCM Wealth Mgmt. Global Markets TotalAdvisory and Underwriting2 Advisory Equity Underwriting Debt Underwriting 1 Source: Dealogic for the period ending June 30, 2019 (Americas and EMEA only) 2 Total does not include Other revenues of USD 0 mn in 2Q18 and USD -26 mn in 2Q19 Highest quarterly IPO fee pool since 20141Achieved top 5 rank in IPOs in 1H191Involved in 7 of the 10 largest US IPOs and in 4 of the 6 largest EMEA IPOs Top 3 rank in Leveraged Finance1Strong performance in Americas DCM, involved in the 3 largest transactions A number of transactions did not materialize in the quarter IBCM revenue decline slightly higher than the Street Street1
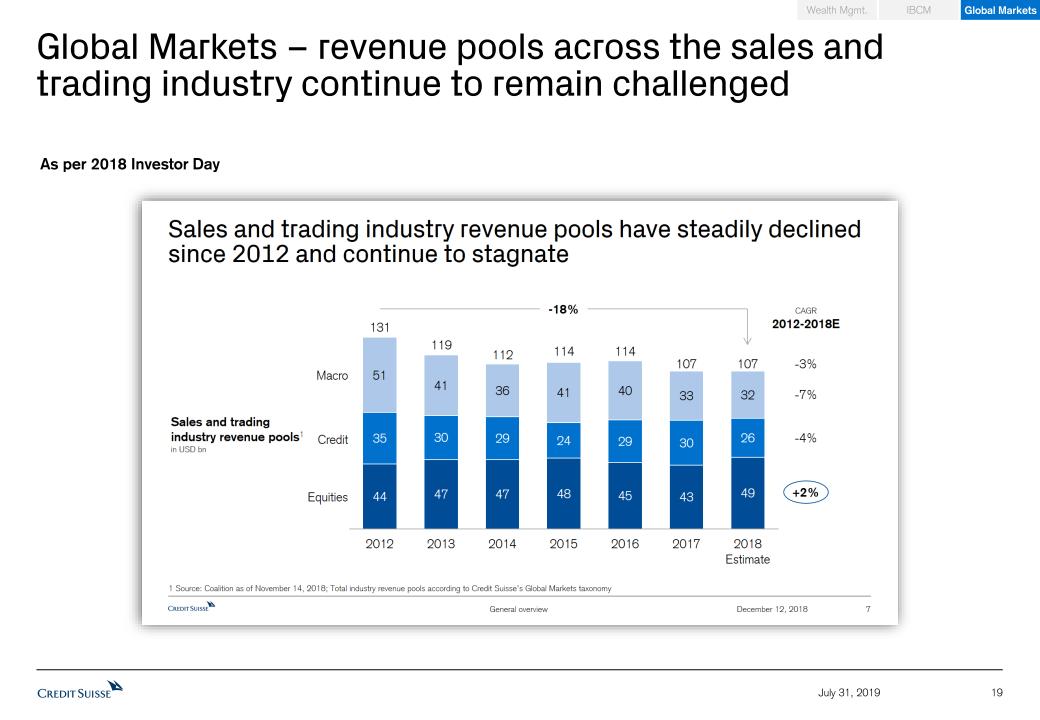
Global Markets – revenue pools across the sales and trading industry continue to remain challenged 19 July 31, 2019 As per 2018 Investor Day IBCM Wealth Mgmt. Global Markets
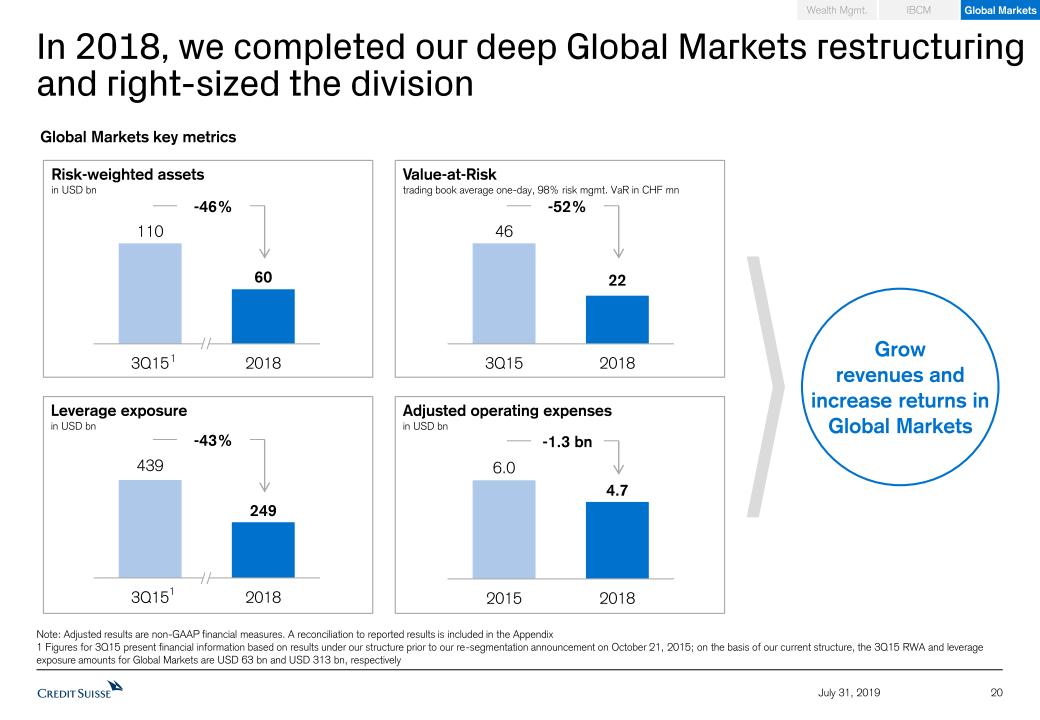
-52% In 2018, we completed our deep Global Markets restructuring and right-sized the division 20 July 31, 2019 Leverage exposurein USD bn 1 Risk-weighted assets in USD bn 1 -46% Global Markets key metrics Value-at-Risktrading book average one-day, 98% risk mgmt. VaR in CHF mn Adjusted operating expensesin USD bn -43% Grow revenues and increase returns in Global Markets -1.3 bn IBCM Wealth Mgmt. Global Markets Note: Adjusted results are non-GAAP financial measures. A reconciliation to reported results is included in the Appendix1 Figures for 3Q15 present financial information based on results under our structure prior to our re-segmentation announcement on October 21, 2015; on the basis of our current structure, the 3Q15 RWA and leverage exposure amounts for Global Markets are USD 63 bn and USD 313 bn, respectively
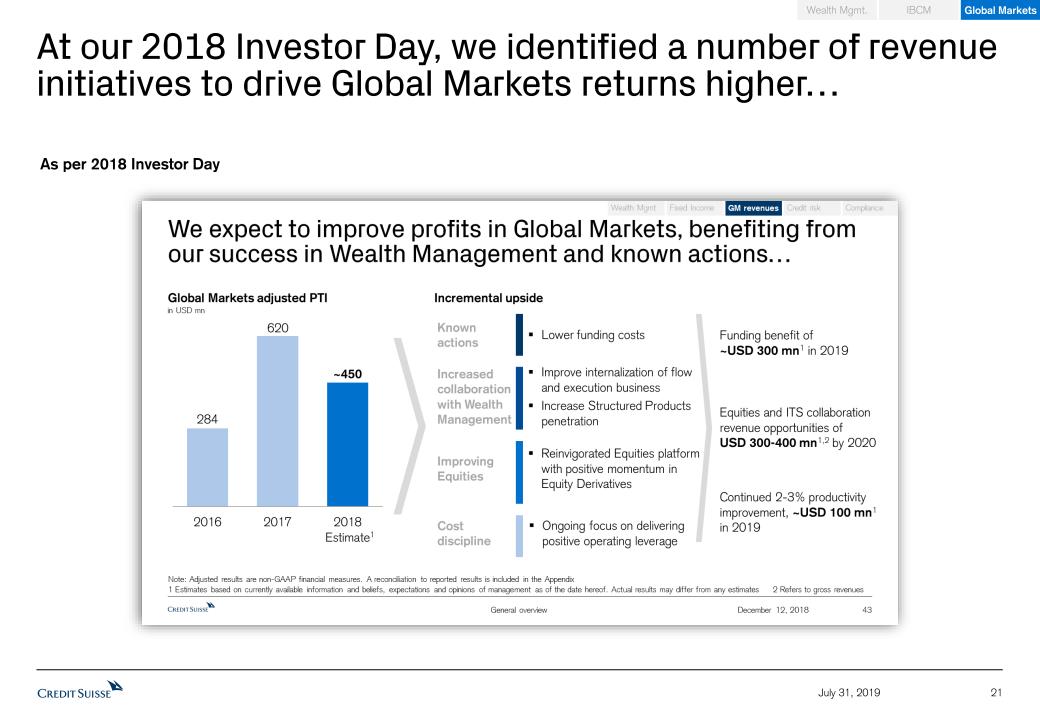
21 July 31, 2019 At our 2018 Investor Day, we identified a number of revenue initiatives to drive Global Markets returns higher… As per 2018 Investor Day IBCM Wealth Mgmt. Global Markets
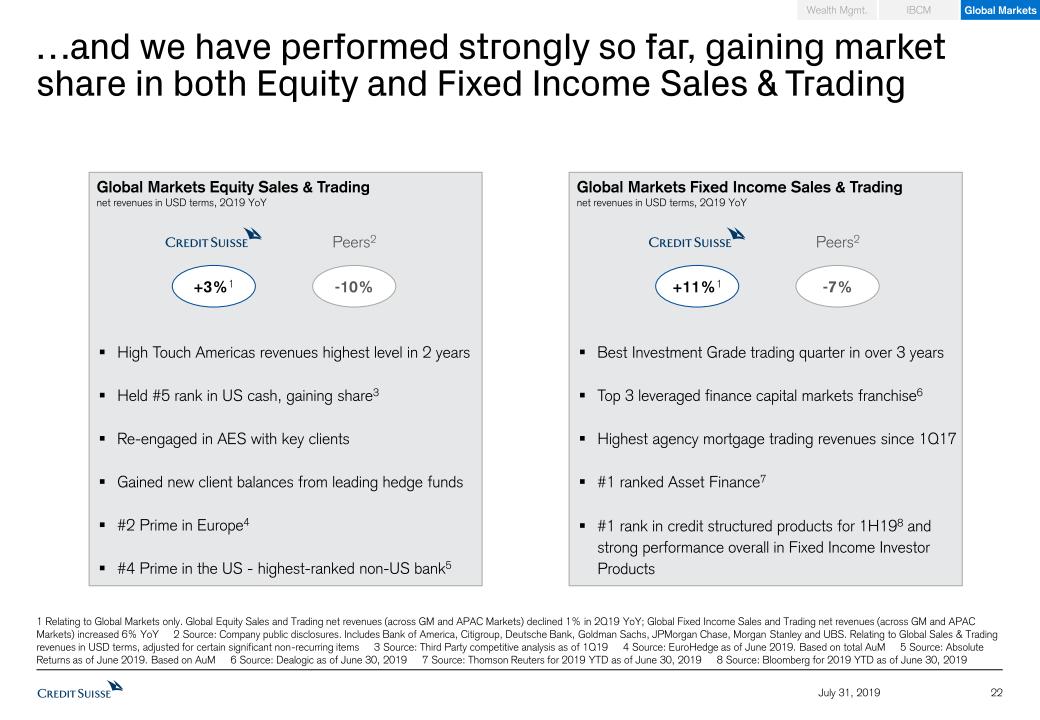
…and we have performed strongly so far, gaining market share in both Equity and Fixed Income Sales & Trading 22 July 31, 2019 1 Relating to Global Markets only. Global Equity Sales and Trading net revenues (across GM and APAC Markets) declined 1% in 2Q19 YoY; Global Fixed Income Sales and Trading net revenues (across GM and APAC Markets) increased 6% YoY 2 Source: Company public disclosures. Includes Bank of America, Citigroup, Deutsche Bank, Goldman Sachs, JPMorgan Chase, Morgan Stanley and UBS. Relating to Global Sales & Trading revenues in USD terms, adjusted for certain significant non-recurring items 3 Source: Third Party competitive analysis as of 1Q19 4 Source: EuroHedge as of June 2019. Based on total AuM 5 Source: Absolute Returns as of June 2019. Based on AuM 6 Source: Dealogic as of June 30, 2019 7 Source: Thomson Reuters for 2019 YTD as of June 30, 2019 8 Source: Bloomberg for 2019 YTD as of June 30, 2019 IBCM Wealth Mgmt. Global Markets Best Investment Grade trading quarter in over 3 yearsTop 3 leveraged finance capital markets franchise6Highest agency mortgage trading revenues since 1Q17#1 ranked Asset Finance7#1 rank in credit structured products for 1H198 and strong performance overall in Fixed Income Investor Products Global Markets Fixed Income Sales & Tradingnet revenues in USD terms, 2Q19 YoY +11%1 Peers2 -7% High Touch Americas revenues highest level in 2 yearsHeld #5 rank in US cash, gaining share3Re-engaged in AES with key clientsGained new client balances from leading hedge funds#2 Prime in Europe4#4 Prime in the US - highest-ranked non-US bank5 Global Markets Equity Sales & Tradingnet revenues in USD terms, 2Q19 YoY +3%1 Peers2 -10%
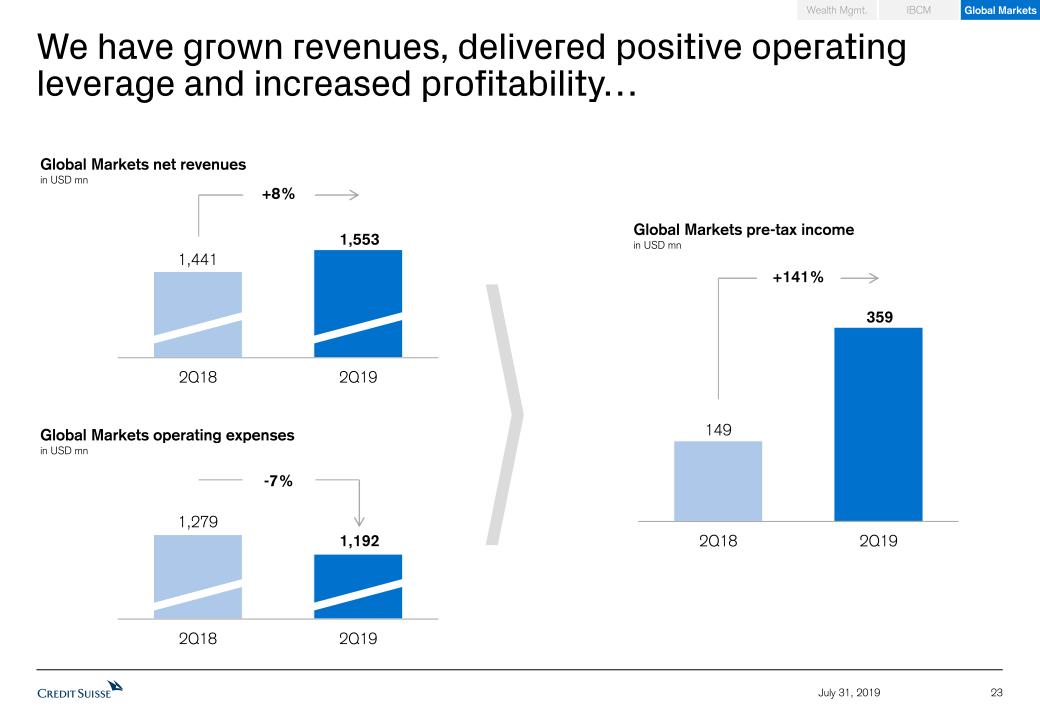
We have grown revenues, delivered positive operating leverage and increased profitability… 23 July 31, 2019 Global Markets net revenuesin USD mn Global Markets operating expensesin USD mn -7% +8% Global Markets pre-tax incomein USD mn +141% IBCM Wealth Mgmt. Global Markets
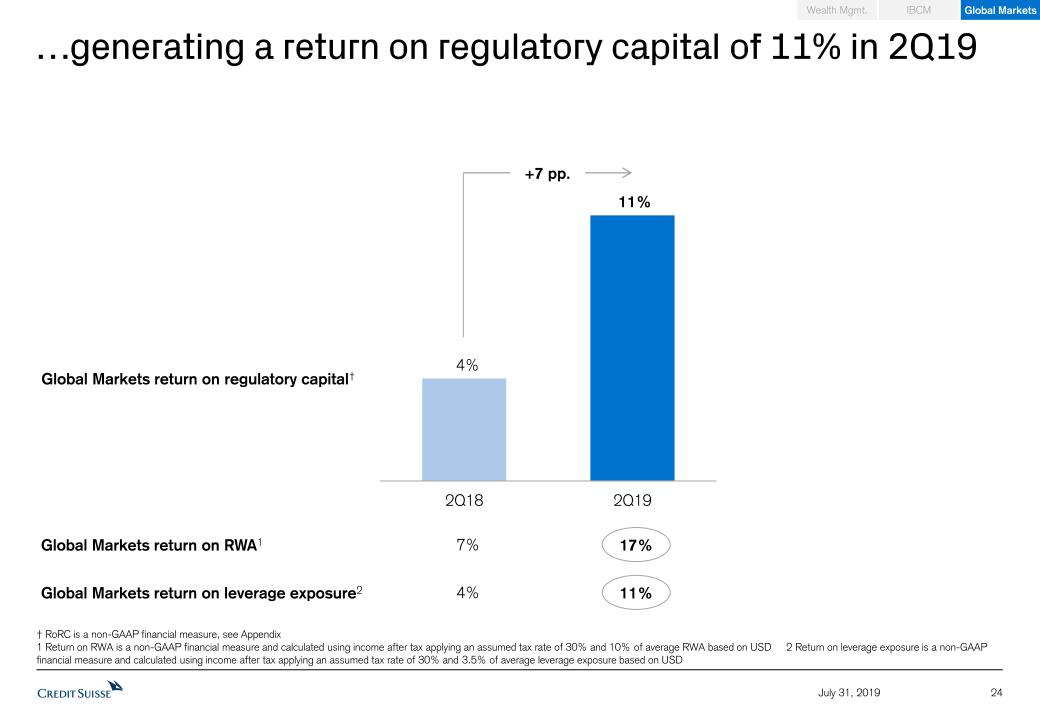
24 July 31, 2019 …generating a return on regulatory capital of 11% in 2Q19 † RoRC is a non-GAAP financial measure, see Appendix1 Return on RWA is a non-GAAP financial measure and calculated using income after tax applying an assumed tax rate of 30% and 10% of average RWA based on USD 2 Return on leverage exposure is a non-GAAP financial measure and calculated using income after tax applying an assumed tax rate of 30% and 3.5% of average leverage exposure based on USD Global Markets return on RWA1 17% 7% +7 pp. Global Markets return on regulatory capital† Global Markets return on leverage exposure2 11% 4% IBCM Wealth Mgmt. Global Markets
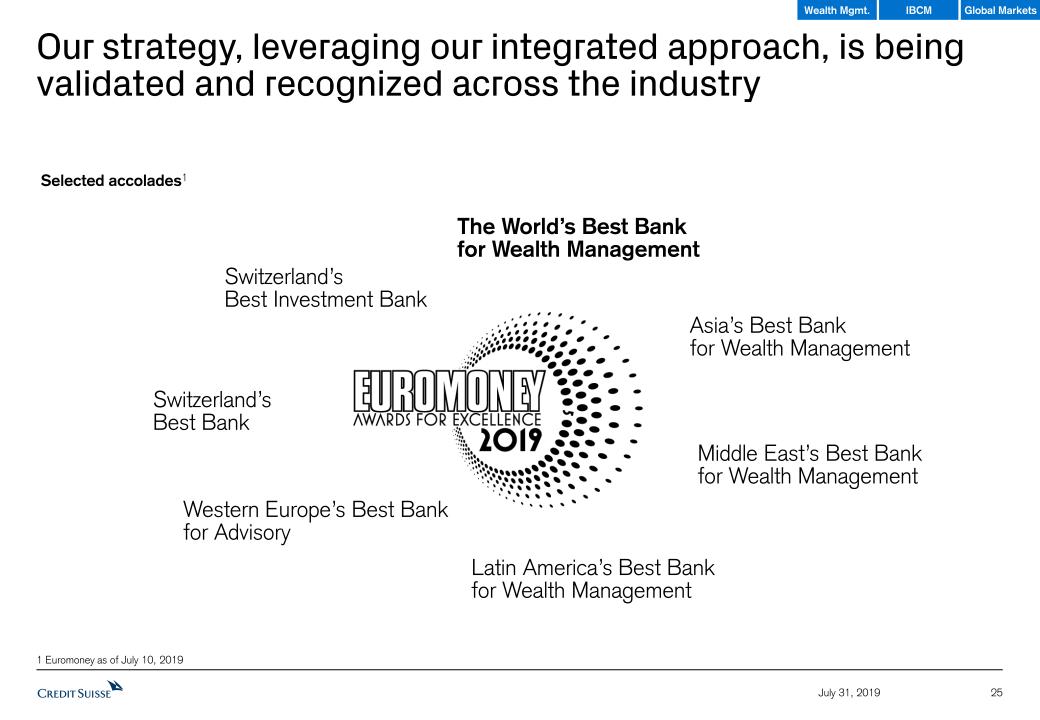
25 July 31, 2019 Our strategy, leveraging our integrated approach, is being validated and recognized across the industry Selected accolades1 1 Euromoney as of July 10, 2019 The World’s Best Bank for Wealth Management Asia’s Best Bankfor Wealth Management Middle East’s Best Bankfor Wealth Management Latin America’s Best Bankfor Wealth Management Western Europe’s Best Bank for Advisory Switzerland’s Best Bank Switzerland’sBest Investment Bank IBCM Wealth Mgmt. Global Markets
Summary 26 July 31, 2019 Continued profitable growth in Wealth ManagementGlobal Markets performing strongly post-restructuringDriving Group returns higher
Detailed Financials 27 July 31, 2019
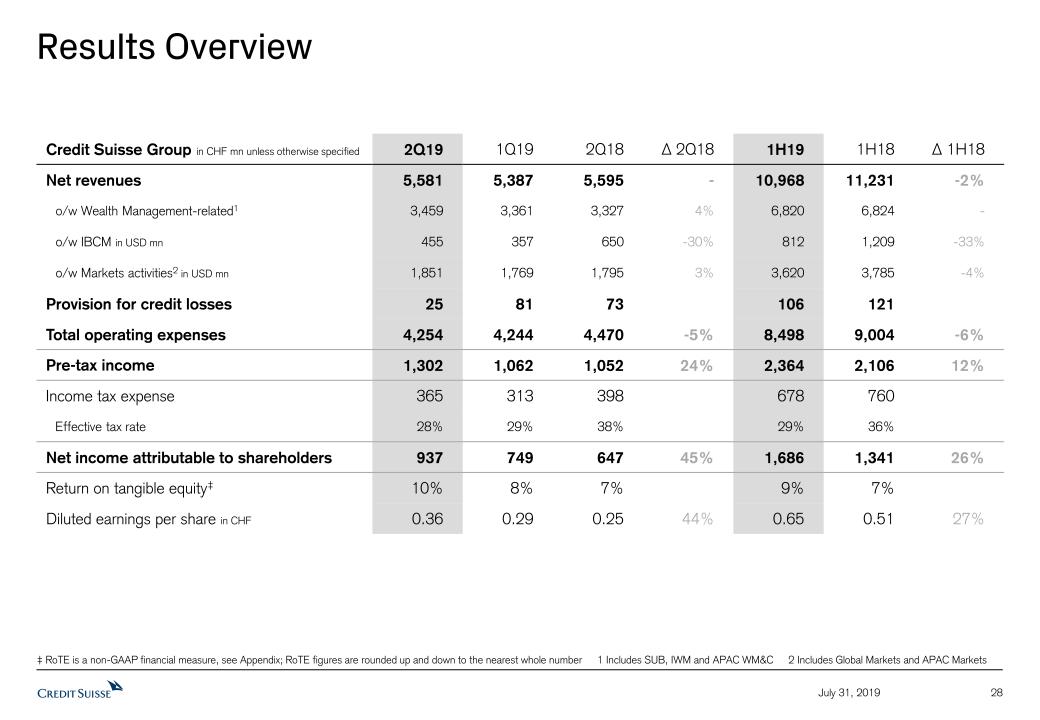
Results Overview ‡ RoTE is a non-GAAP financial measure, see Appendix; RoTE figures are rounded up and down to the nearest whole number 1 Includes SUB, IWM and APAC WM&C 2 Includes Global Markets and APAC Markets 28 July 31, 2019 Credit Suisse Group in CHF mn unless otherwise specified 2Q19 1Q19 2Q18 Δ 2Q18 1H19 1H18 Δ 1H18 Net revenues 5,581 5,387 5,595 - 10,968 11,231 -2% o/w Wealth Management-related1 3,459 3,361 3,327 4% 6,820 6,824 - o/w IBCM in USD mn 455 357 650 -30% 812 1,209 -33% o/w Markets activities2 in USD mn 1,851 1,769 1,795 3% 3,620 3,785 -4% Provision for credit losses 25 81 73 106 121 Total operating expenses 4,254 4,244 4,470 -5% 8,498 9,004 -6% Pre-tax income 1,302 1,062 1,052 24% 2,364 2,106 12% Income tax expense 365 313 398 678 760 Effective tax rate 28% 29% 38% 29% 36% Net income attributable to shareholders 937 749 647 45% 1,686 1,341 26% Return on tangible equity‡ 10% 8% 7% 9% 7% Diluted earnings per share in CHF 0.36 0.29 0.25 44% 0.65 0.51 27%
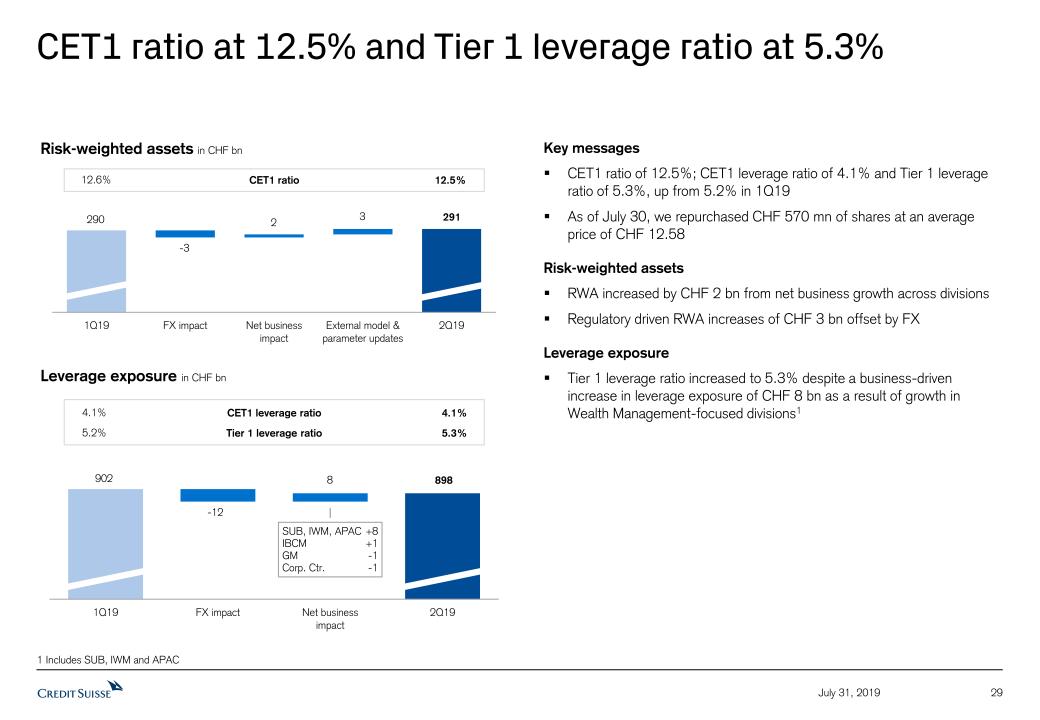
CET1 ratio at 12.5% and Tier 1 leverage ratio at 5.3% 29 July 31, 2019 1 Includes SUB, IWM and APAC Risk-weighted assets in CHF bn 290 -3 2 3 291 Leverage exposure in CHF bn 902 -12 898 12.6% 12.5% CET1 ratio 4.1% 4.1% CET1 leverage ratio 5.2% 5.3% Tier 1 leverage ratio Key messagesCET1 ratio of 12.5%; CET1 leverage ratio of 4.1% and Tier 1 leverage ratio of 5.3%, up from 5.2% in 1Q19As of July 30, we repurchased CHF 570 mn of shares at an average price of CHF 12.58Risk-weighted assetsRWA increased by CHF 2 bn from net business growth across divisionsRegulatory driven RWA increases of CHF 3 bn offset by FXLeverage exposureTier 1 leverage ratio increased to 5.3% despite a business-driven increase in leverage exposure of CHF 8 bn as a result of growth in Wealth Management-focused divisions1 8 SUB, IWM, APAC +8IBCM +1GM -1Corp. Ctr. -1
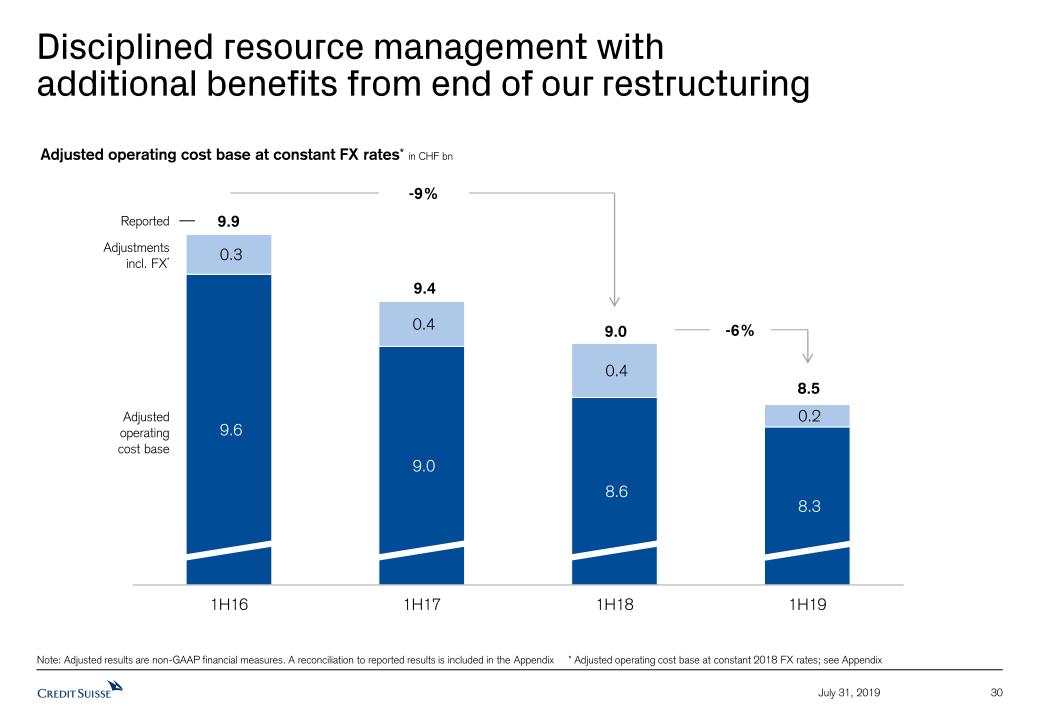
30 July 31, 2019 Disciplined resource management with additional benefits from end of our restructuring Note: Adjusted results are non-GAAP financial measures. A reconciliation to reported results is included in the Appendix * Adjusted operating cost base at constant 2018 FX rates; see Appendix Adjusted operating cost base at constant FX rates* in CHF bn 9.9 9.4 9.0 8.5 Adjusted operatingcost base Adjustmentsincl. FX* Reported -9% -6%
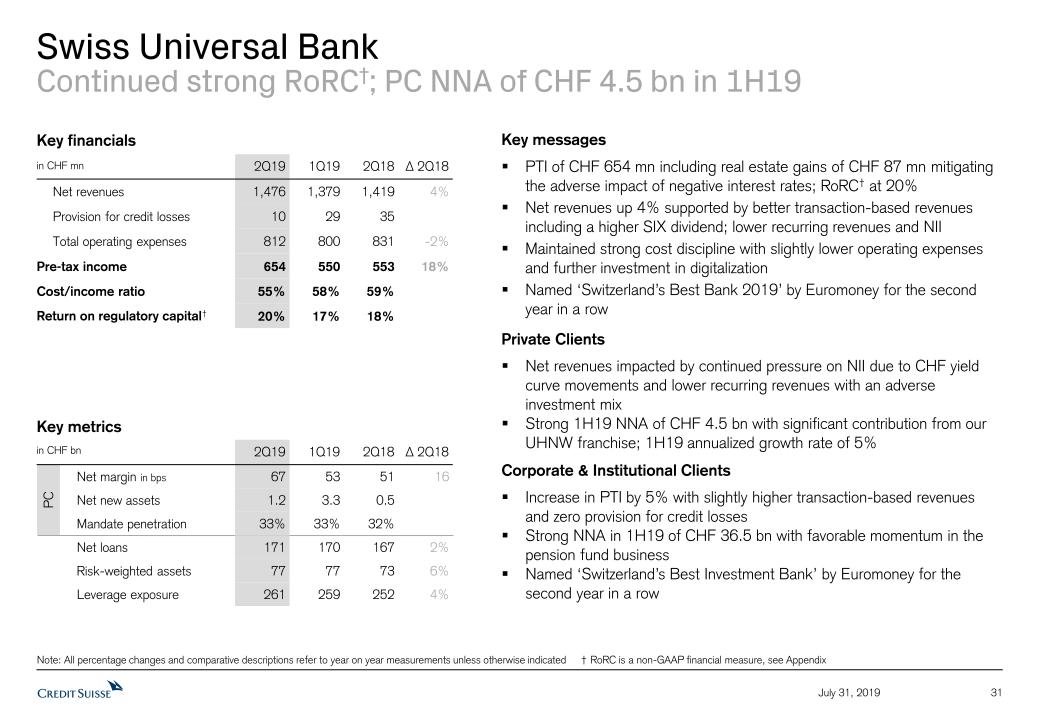
Swiss Universal Bank Continued strong RoRC†; PC NNA of CHF 4.5 bn in 1H19 Note: All percentage changes and comparative descriptions refer to year on year measurements unless otherwise indicated † RoRC is a non-GAAP financial measure, see Appendix PC Key financials in CHF mn 2Q19 1Q19 2Q18 Δ 2Q18 Net revenues 1,476 1,379 1,419 4% Provision for credit losses 10 29 35 Total operating expenses 812 800 831 -2% Pre-tax income 654 550 553 18% Cost/income ratio 55% 58% 59% Return on regulatory capital† 20% 17% 18% 31 July 31, 2019 Key metrics in CHF bn 2Q19 1Q19 2Q18 Δ 2Q18 Net margin in bps 67 53 51 16 Net new assets 1.2 3.3 0.5 Mandate penetration 33% 33% 32% Net loans 171 170 167 2% Risk-weighted assets 77 77 73 6% Leverage exposure 261 259 252 4% Key messagesPTI of CHF 654 mn including real estate gains of CHF 87 mn mitigating the adverse impact of negative interest rates; RoRC† at 20%Net revenues up 4% supported by better transaction-based revenues including a higher SIX dividend; lower recurring revenues and NIIMaintained strong cost discipline with slightly lower operating expenses and further investment in digitalizationNamed ‘Switzerland’s Best Bank 2019’ by Euromoney for the second year in a rowPrivate ClientsNet revenues impacted by continued pressure on NII due to CHF yield curve movements and lower recurring revenues with an adverse investment mix Strong 1H19 NNA of CHF 4.5 bn with significant contribution from our UHNW franchise; 1H19 annualized growth rate of 5%Corporate & Institutional ClientsIncrease in PTI by 5% with slightly higher transaction-based revenues and zero provision for credit lossesStrong NNA in 1H19 of CHF 36.5 bn with favorable momentum in the pension fund business Named ‘Switzerland’s Best Investment Bank’ by Euromoney for the second year in a row
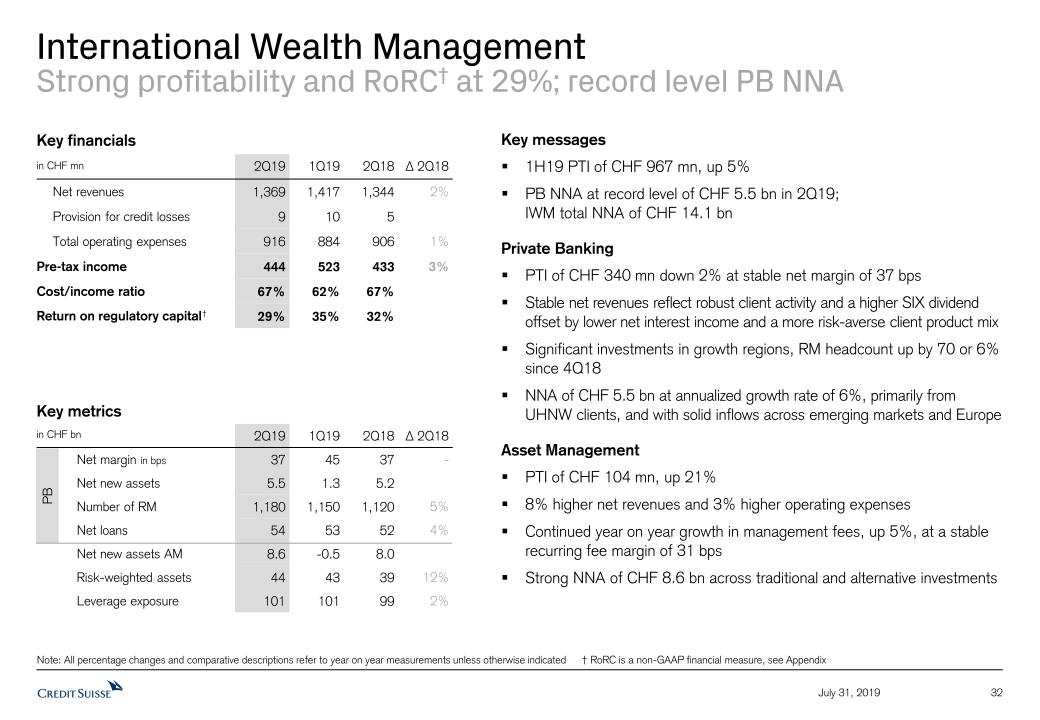
Key metrics in CHF bn 2Q19 1Q19 2Q18 Δ 2Q18 Net margin in bps 37 45 37 - Net new assets 5.5 1.3 5.2 Number of RM 1,180 1,150 1,120 5% Net loans 54 53 52 4% Net new assets AM 8.6 -0.5 8.0 Risk-weighted assets 44 43 39 12% Leverage exposure 101 101 99 2% International Wealth ManagementStrong profitability and RoRC† at 29%; record level PB NNA PB Key financials in CHF mn 2Q19 1Q19 2Q18 Δ 2Q18 Net revenues 1,369 1,417 1,344 2% Provision for credit losses 9 10 5 Total operating expenses 916 884 906 1% Pre-tax income 444 523 433 3% Cost/income ratio 67% 62% 67% Return on regulatory capital† 29% 35% 32% 32 July 31, 2019 Key messages1H19 PTI of CHF 967 mn, up 5%PB NNA at record level of CHF 5.5 bn in 2Q19; IWM total NNA of CHF 14.1 bnPrivate BankingPTI of CHF 340 mn down 2% at stable net margin of 37 bpsStable net revenues reflect robust client activity and a higher SIX dividend offset by lower net interest income and a more risk-averse client product mixSignificant investments in growth regions, RM headcount up by 70 or 6% since 4Q18NNA of CHF 5.5 bn at annualized growth rate of 6%, primarily from UHNW clients, and with solid inflows across emerging markets and EuropeAsset ManagementPTI of CHF 104 mn, up 21%8% higher net revenues and 3% higher operating expensesContinued year on year growth in management fees, up 5%, at a stable recurring fee margin of 31 bpsStrong NNA of CHF 8.6 bn across traditional and alternative investments Note: All percentage changes and comparative descriptions refer to year on year measurements unless otherwise indicated † RoRC is a non-GAAP financial measure, see Appendix

Asia PacificIncreased profitability and positive momentum in WM&C with resilient asset inflows PB1 Key financials in CHF mn 2Q19 1Q19 2Q18 Δ 2Q18 Net revenues 913 854 914 - Provision for credit losses -1 17 7 Total operating expenses 677 654 690 -2% Pre-tax income 237 183 217 9% Cost/income ratio 74% 77% 75% Return on regulatory capital† 17% 13% 15% 33 July 31, 2019 Key messagesAPAC pre-tax income of CHF 237 mn, up 9%Further strong progress in WM&C driven by Private Banking and Financing activitiesMitigated the impact of lower client activity in both Equities and Fixed IncomeWealth Management & Connected (WM&C)PB transaction-based revenues up 15% reflecting improved client activity; higher NII offsetting lower recurring commissions and fees Higher Advisory, Underwriting and Financing revenues reflecting higher financing volumes; APAC IBCM ranked #1 in 1H193Continued positive NNA generation of CHF 2.8 bn in the quarter taking 1H19 NNA to CHF 7.8 bnMarkets2Equity sales and trading revenues down 9%, adversely affected by continued weakness in trading volumes across Asian markets which declined 16%4Fixed Income sales and trading revenues reduced by 29%, reflecting lower levels of transactions and less favorable market conditions in emerging markets rates partly offset by stronger performance in CreditContinued disciplined resource management with expenses down;RWA down 13% and leverage exposure down 14% Key metrics in CHF bn 2Q19 1Q19 2Q18 Δ 2Q18 Net margin in bps 30 25 29 1 Net new assets 2.8 5.0 3.4 Number of RM 600 600 610 -2% Assets under management 219 219 206 6% Net loans 45 45 44 2% Risk-weighted assets 37 38 34 10% Leverage exposure 112 111 118 -5% Note: All percentage changes and comparative descriptions refer to year on year measurements unless otherwise indicated † RoRC is a non-GAAP financial measure, see Appendix 1 APAC PB within WM&C 2 All references under key messages for Markets are based on USD 3 Source: Dealogic for the period ending June 30, 2019 (APAC excluding Japan and China onshore among International banks) 4 Source: Bloomberg as of June 30, 2019 (APAC excluding China onshore cash market turnover)
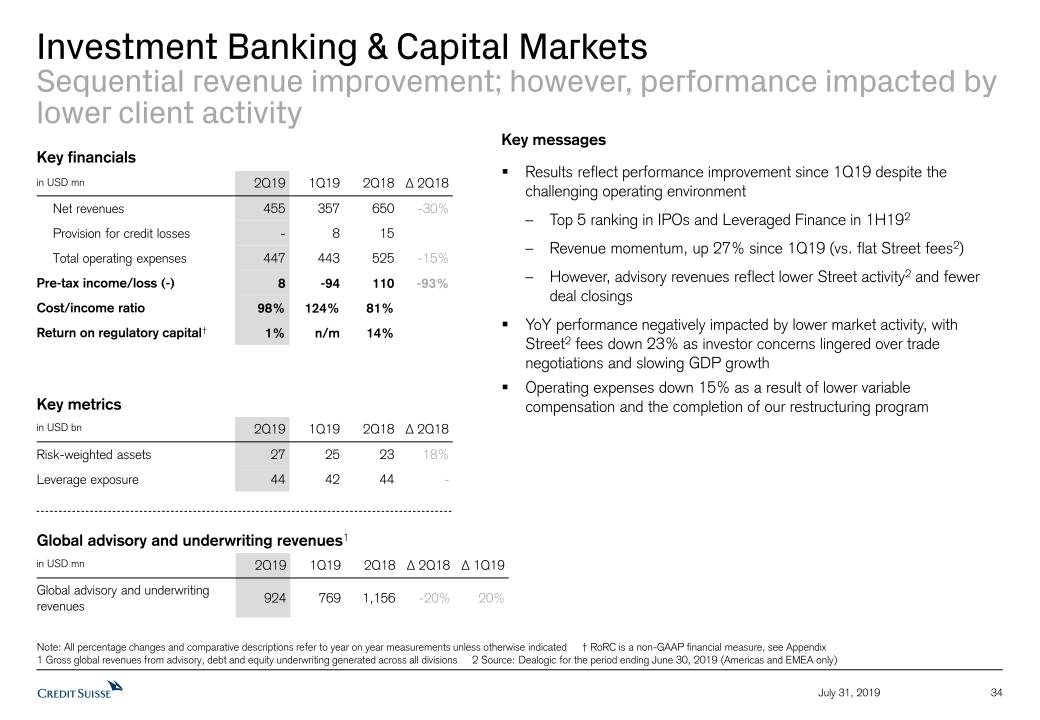
Investment Banking & Capital Markets Sequential revenue improvement; however, performance impacted by lower client activity Key metrics in USD bn 2Q19 1Q19 2Q18 Δ 2Q18 Risk-weighted assets 27 25 23 18% Leverage exposure 44 42 44 - Key financials in USD mn 2Q19 1Q19 2Q18 Δ 2Q18 Net revenues 455 357 650 -30% Provision for credit losses - 8 15 Total operating expenses 447 443 525 -15% Pre-tax income/loss (-) 8 -94 110 -93% Cost/income ratio 98% 124% 81% Return on regulatory capital† 1% n/m 14% Global advisory and underwriting revenues1 in USD mn 2Q19 1Q19 2Q18 Δ 2Q18 Δ 1Q19 Global advisory and underwriting revenues 924 769 1,156 -20% 20% 34 July 31, 2019 Note: All percentage changes and comparative descriptions refer to year on year measurements unless otherwise indicated † RoRC is a non-GAAP financial measure, see Appendix 1 Gross global revenues from advisory, debt and equity underwriting generated across all divisions 2 Source: Dealogic for the period ending June 30, 2019 (Americas and EMEA only) Key messagesResults reflect performance improvement since 1Q19 despite the challenging operating environment Top 5 ranking in IPOs and Leveraged Finance in 1H192Revenue momentum, up 27% since 1Q19 (vs. flat Street fees2) However, advisory revenues reflect lower Street activity2 and fewer deal closings YoY performance negatively impacted by lower market activity, with Street2 fees down 23% as investor concerns lingered over trade negotiations and slowing GDP growthOperating expenses down 15% as a result of lower variable compensation and the completion of our restructuring program
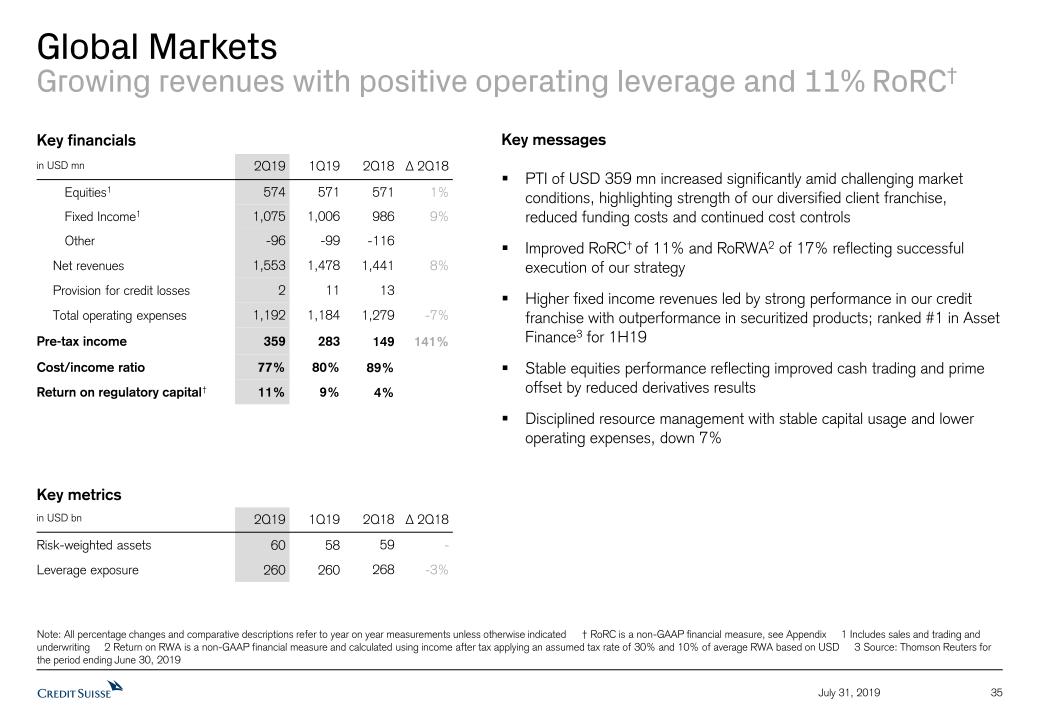
Global MarketsGrowing revenues with positive operating leverage and 11% RoRC† Note: All percentage changes and comparative descriptions refer to year on year measurements unless otherwise indicated † RoRC is a non-GAAP financial measure, see Appendix 1 Includes sales and trading and underwriting 2 Return on RWA is a non-GAAP financial measure and calculated using income after tax applying an assumed tax rate of 30% and 10% of average RWA based on USD 3 Source: Thomson Reuters for the period ending June 30, 2019 Key metrics in USD bn 2Q19 1Q19 2Q18 Δ 2Q18 Risk-weighted assets 60 58 59 - Leverage exposure 260 260 268 -3% Key financials in USD mn 2Q19 1Q19 2Q18 Δ 2Q18 Equities1 574 571 571 1% Fixed Income1 1,075 1,006 986 9% Other -96 -99 -116 Net revenues 1,553 1,478 1,441 8% Provision for credit losses 2 11 13 Total operating expenses 1,192 1,184 1,279 -7% Pre-tax income 359 283 149 141% Cost/income ratio 77% 80% 89% Return on regulatory capital† 11% 9% 4% 35 July 31, 2019 Key messagesPTI of USD 359 mn increased significantly amid challenging market conditions, highlighting strength of our diversified client franchise, reduced funding costs and continued cost controlsImproved RoRC† of 11% and RoRWA2 of 17% reflecting successful execution of our strategyHigher fixed income revenues led by strong performance in our credit franchise with outperformance in securitized products; ranked #1 in Asset Finance3 for 1H19Stable equities performance reflecting improved cash trading and prime offset by reduced derivatives resultsDisciplined resource management with stable capital usage and lower operating expenses, down 7%

Summary 36 July 31, 2019
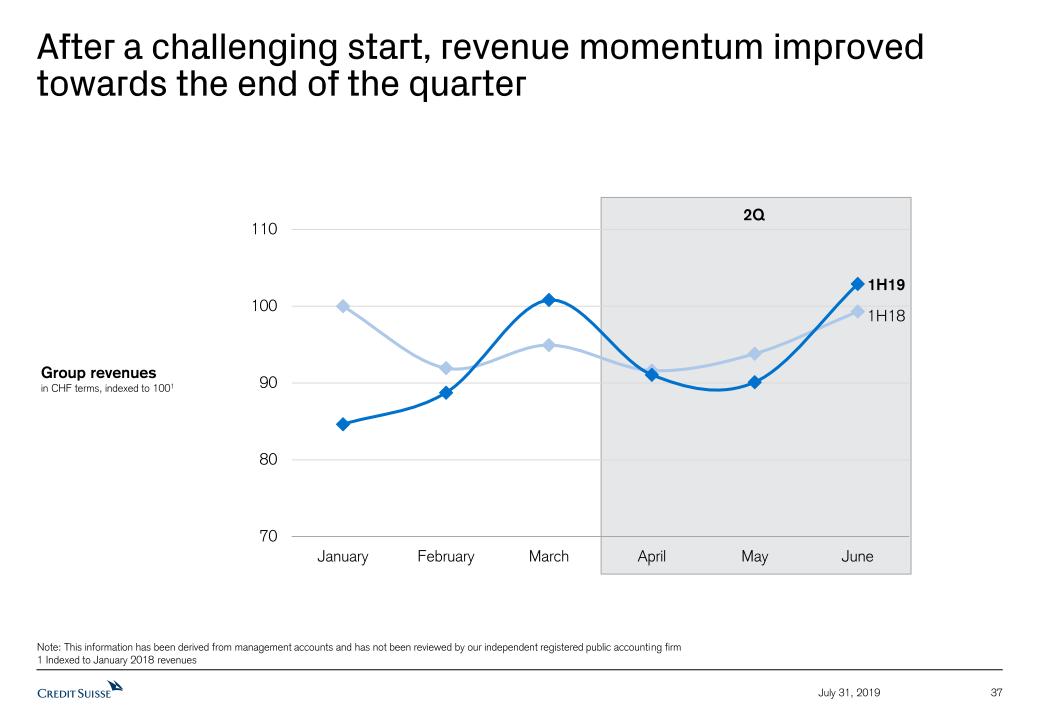
After a challenging start, revenue momentum improved towards the end of the quarter 37 July 31, 2019 Group revenuesin CHF terms, indexed to 1001 Note: This information has been derived from management accounts and has not been reviewed by our independent registered public accounting firm1 Indexed to January 2018 revenues 2Q
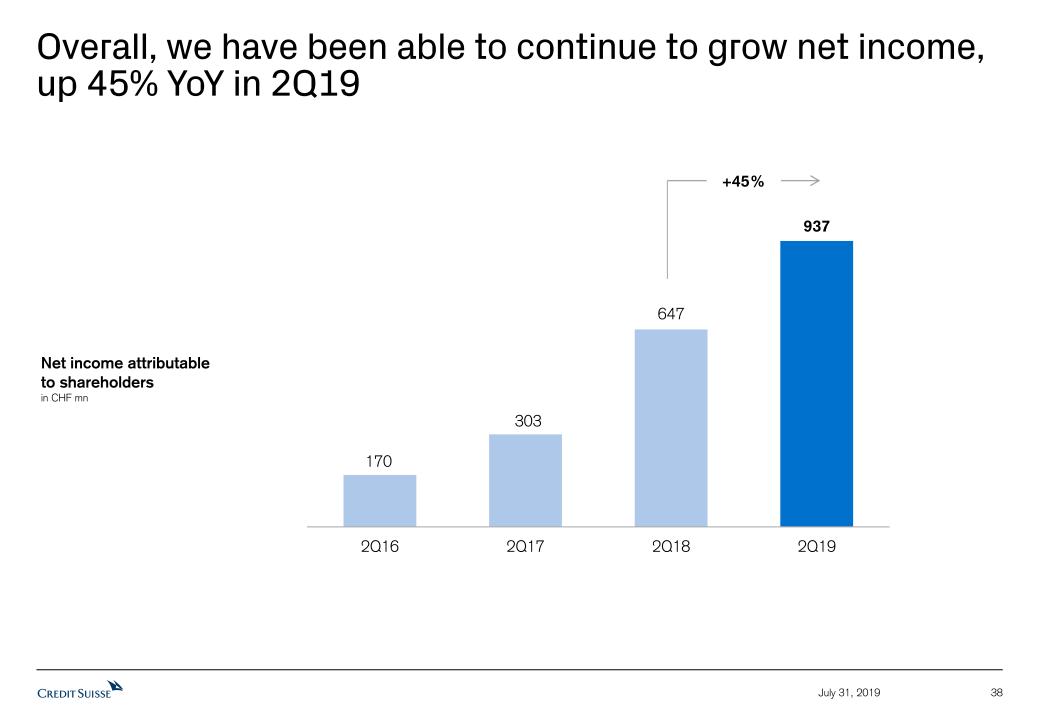
Overall, we have been able to continue to grow net income, up 45% YoY in 2Q19 38 July 31, 2019 Net income attributable to shareholdersin CHF mn +45%
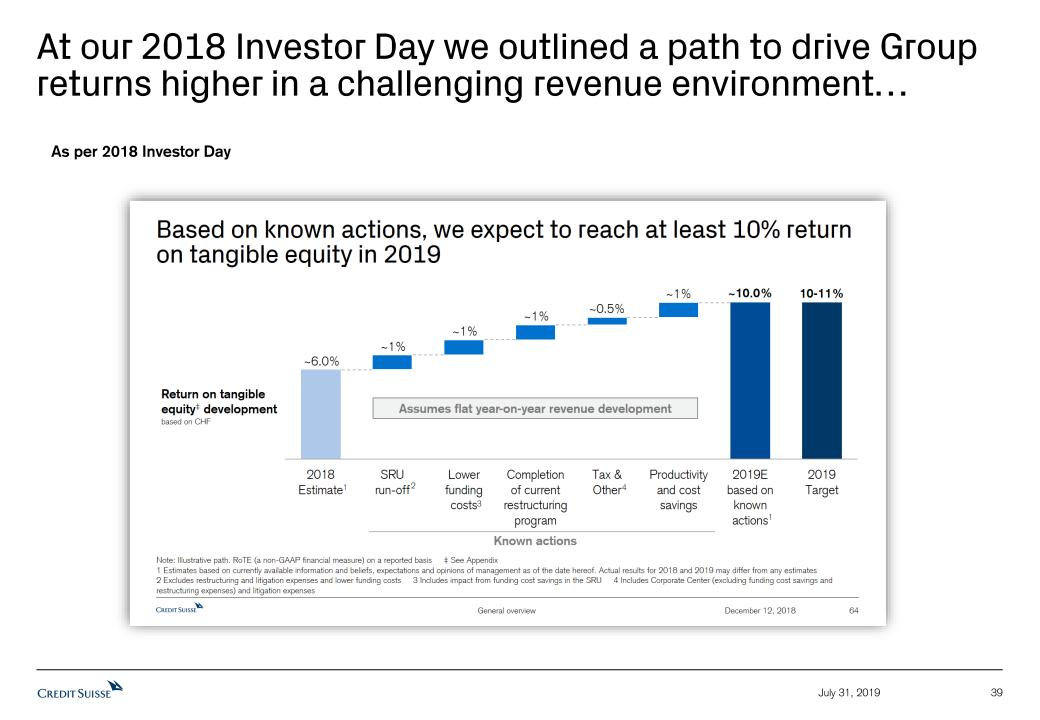
At our 2018 Investor Day we outlined a path to drive Group returns higher in a challenging revenue environment… 39 July 31, 2019 As per 2018 Investor Day
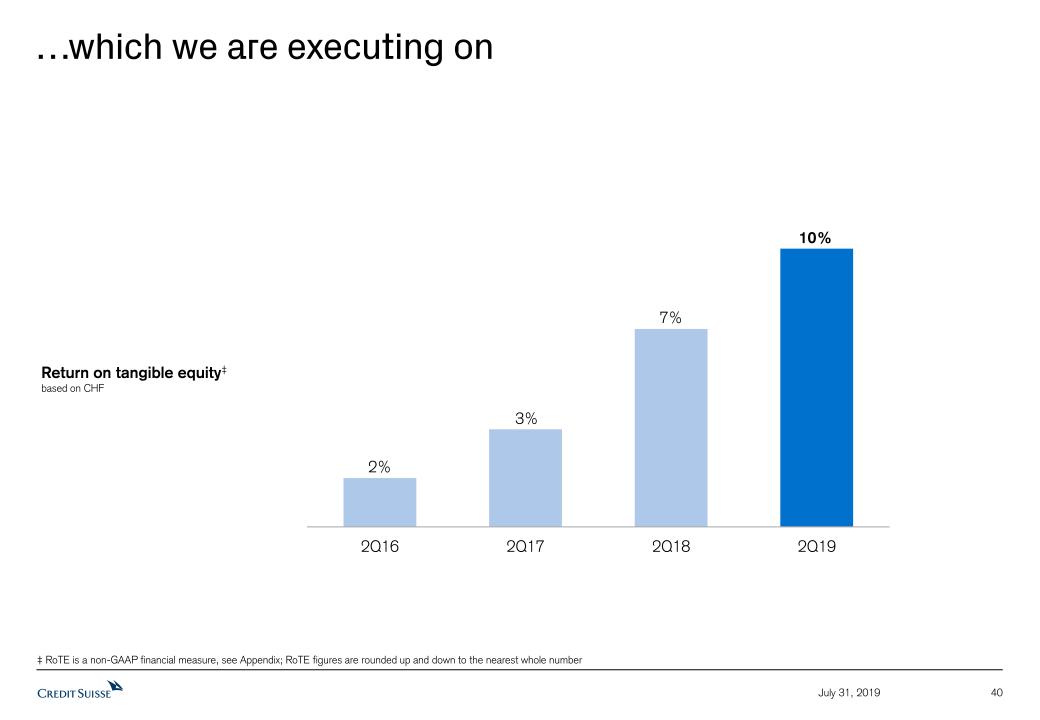
…which we are executing on 40 July 31, 2019 Return on tangible equity‡based on CHF ‡ RoTE is a non-GAAP financial measure, see Appendix; RoTE figures are rounded up and down to the nearest whole number
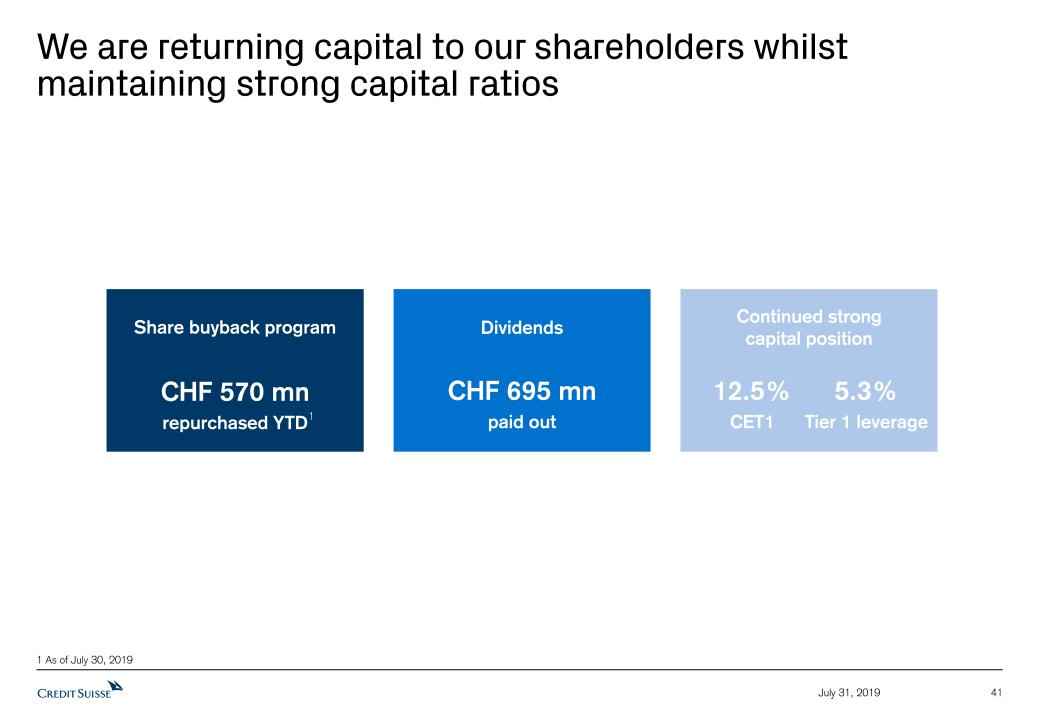
41 July 31, 2019 We are returning capital to our shareholders whilst maintaining strong capital ratios 1 As of July 30, 2019 Continued strongcapital position 5.3%Tier 1 leverage 12.5%CET1 Dividends CHF 695 mnpaid out Share buyback program CHF 570 mnrepurchased YTD 1
Outlook 42 July 31, 2019 Healthy levels of client engagement in 3Q19 to date; whether this translates into activity remains dependent on prevailing market conditionsExpecting the usual seasonal slowdown in revenues in 3Q19 as a result of the holiday season in many parts of the worldExpecting global GDP to show continued positive growth for the balance of the year, albeit at lower levels than previously expectedExpecting market sentiment to continue to be impacted by geopolitical uncertainty and punctuated by periods of lower client activity
Appendix 43 July 31, 2019
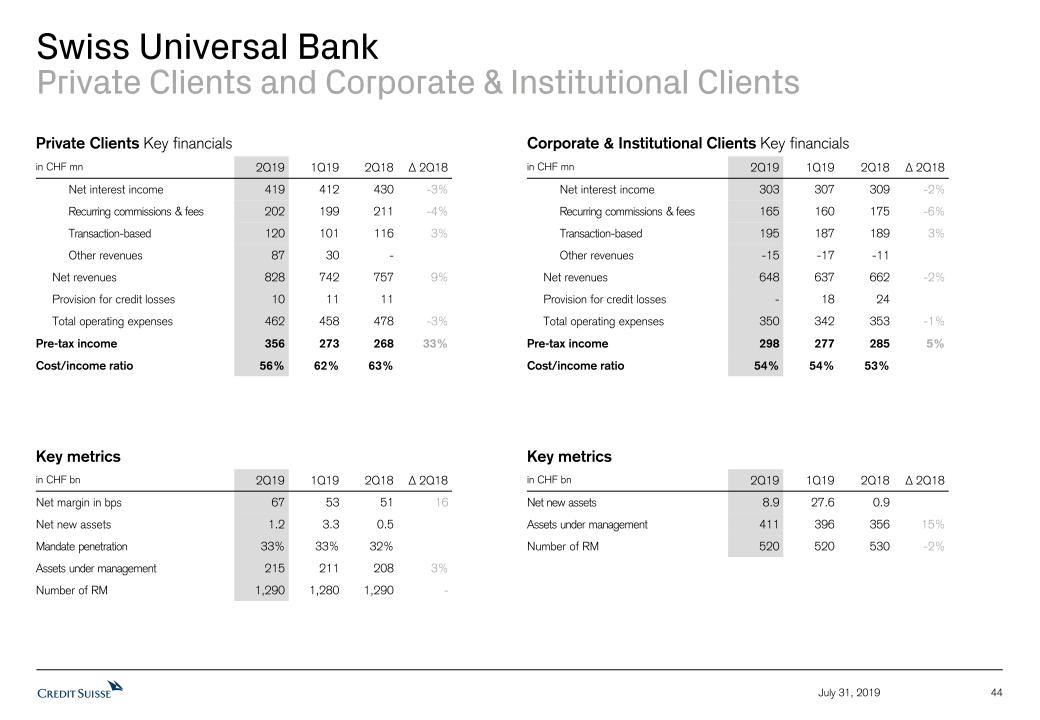
Swiss Universal BankPrivate Clients and Corporate & Institutional Clients Corporate & Institutional Clients Key financials in CHF mn 2Q19 1Q19 2Q18 Δ 2Q18 Net interest income 303 307 309 -2% Recurring commissions & fees 165 160 175 -6% Transaction-based 195 187 189 3% Other revenues -15 -17 -11 Net revenues 648 637 662 -2% Provision for credit losses - 18 24 Total operating expenses 350 342 353 -1% Pre-tax income 298 277 285 5% Cost/income ratio 54% 54% 53% Key metrics in CHF bn 2Q19 1Q19 2Q18 Δ 2Q18 Net margin in bps 67 53 51 16 Net new assets 1.2 3.3 0.5 Mandate penetration 33% 33% 32% Assets under management 215 211 208 3% Number of RM 1,290 1,280 1,290 - Key metrics in CHF bn 2Q19 1Q19 2Q18 Δ 2Q18 Net new assets 8.9 27.6 0.9 Assets under management 411 396 356 15% Number of RM 520 520 530 -2% Private Clients Key financials in CHF mn 2Q19 1Q19 2Q18 Δ 2Q18 Net interest income 419 412 430 -3% Recurring commissions & fees 202 199 211 -4% Transaction-based 120 101 116 3% Other revenues 87 30 - Net revenues 828 742 757 9% Provision for credit losses 10 11 11 Total operating expenses 462 458 478 -3% Pre-tax income 356 273 268 33% Cost/income ratio 56% 62% 63% 44 July 31, 2019
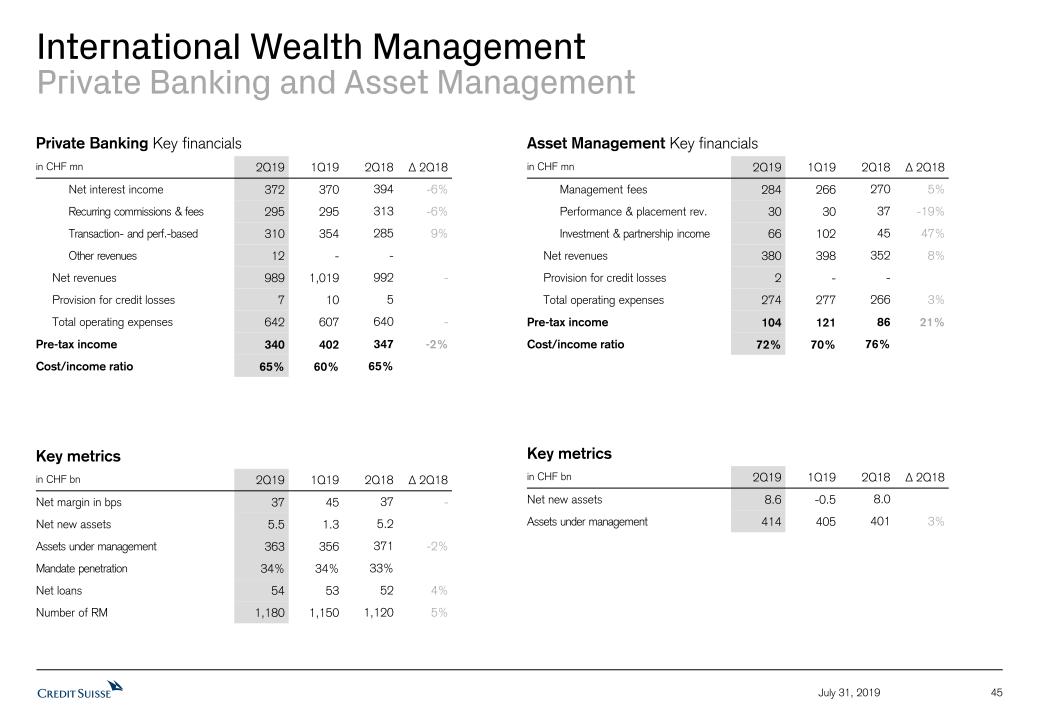
International Wealth ManagementPrivate Banking and Asset Management Private Banking Key financials in CHF mn 2Q19 1Q19 2Q18 Δ 2Q18 Net interest income 372 370 394 -6% Recurring commissions & fees 295 295 313 -6% Transaction- and perf.-based 310 354 285 9% Other revenues 12 - - Net revenues 989 1,019 992 - Provision for credit losses 7 10 5 Total operating expenses 642 607 640 - Pre-tax income 340 402 347 -2% Cost/income ratio 65% 60% 65% Key metrics in CHF bn 2Q19 1Q19 2Q18 Δ 2Q18 Net margin in bps 37 45 37 - Net new assets 5.5 1.3 5.2 Assets under management 363 356 371 -2% Mandate penetration 34% 34% 33% Net loans 54 53 52 4% Number of RM 1,180 1,150 1,120 5% Asset Management Key financials in CHF mn 2Q19 1Q19 2Q18 Δ 2Q18 Management fees 284 266 270 5% Performance & placement rev. 30 30 37 -19% Investment & partnership income 66 102 45 47% Net revenues 380 398 352 8% Provision for credit losses 2 - - Total operating expenses 274 277 266 3% Pre-tax income 104 121 86 21% Cost/income ratio 72% 70% 76% Key metrics in CHF bn 2Q19 1Q19 2Q18 Δ 2Q18 Net new assets 8.6 -0.5 8.0 Assets under management 414 405 401 3% 45 July 31, 2019
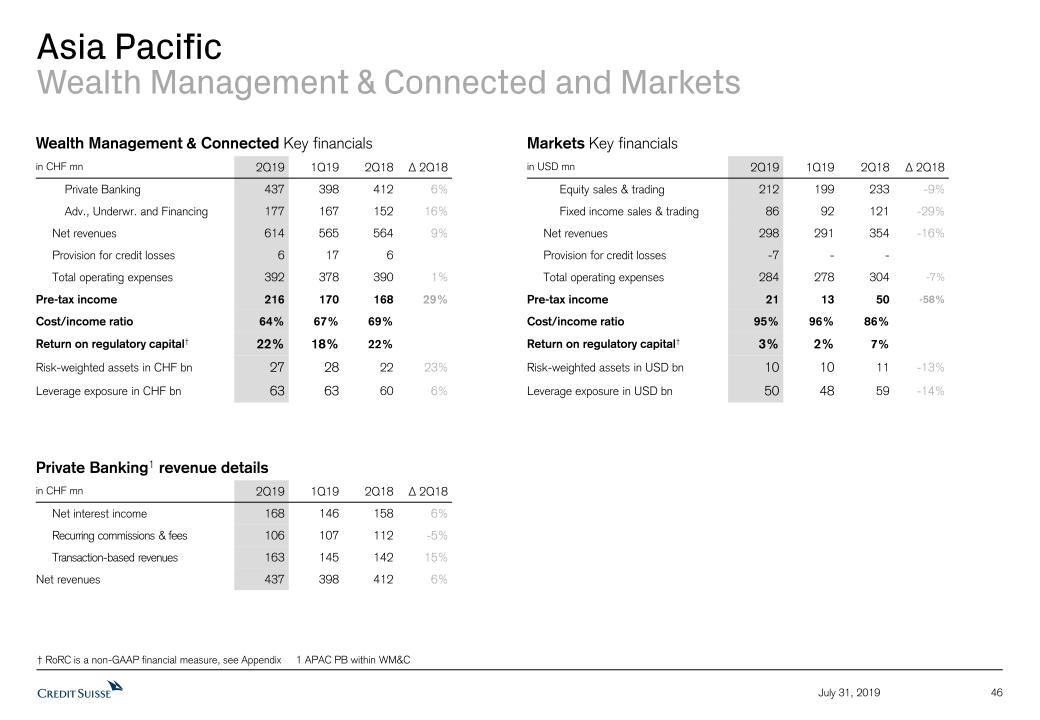
Asia PacificWealth Management & Connected and Markets † RoRC is a non-GAAP financial measure, see Appendix 1 APAC PB within WM&C Wealth Management & Connected Key financials in CHF mn 2Q19 1Q19 2Q18 Δ 2Q18 Private Banking 437 398 412 6% Adv., Underwr. and Financing 177 167 152 16% Net revenues 614 565 564 9% Provision for credit losses 6 17 6 Total operating expenses 392 378 390 1% Pre-tax income 216 170 168 29% Cost/income ratio 64% 67% 69% Return on regulatory capital† 22% 18% 22% Risk-weighted assets in CHF bn 27 28 22 23% Leverage exposure in CHF bn 63 63 60 6% Markets Key financials in USD mn 2Q19 1Q19 2Q18 Δ 2Q18 Equity sales & trading 212 199 233 -9% Fixed income sales & trading 86 92 121 -29% Net revenues 298 291 354 -16% Provision for credit losses -7 - - Total operating expenses 284 278 304 -7% Pre-tax income 21 13 50 -58% Cost/income ratio 95% 96% 86% Return on regulatory capital† 3% 2% 7% Risk-weighted assets in USD bn 10 10 11 -13% Leverage exposure in USD bn 50 48 59 -14% Private Banking1 revenue details in CHF mn 2Q19 1Q19 2Q18 Δ 2Q18 Net interest income 168 146 158 6% Recurring commissions & fees 106 107 112 -5% Transaction-based revenues 163 145 142 15% Net revenues 437 398 412 6% 46 July 31, 2019
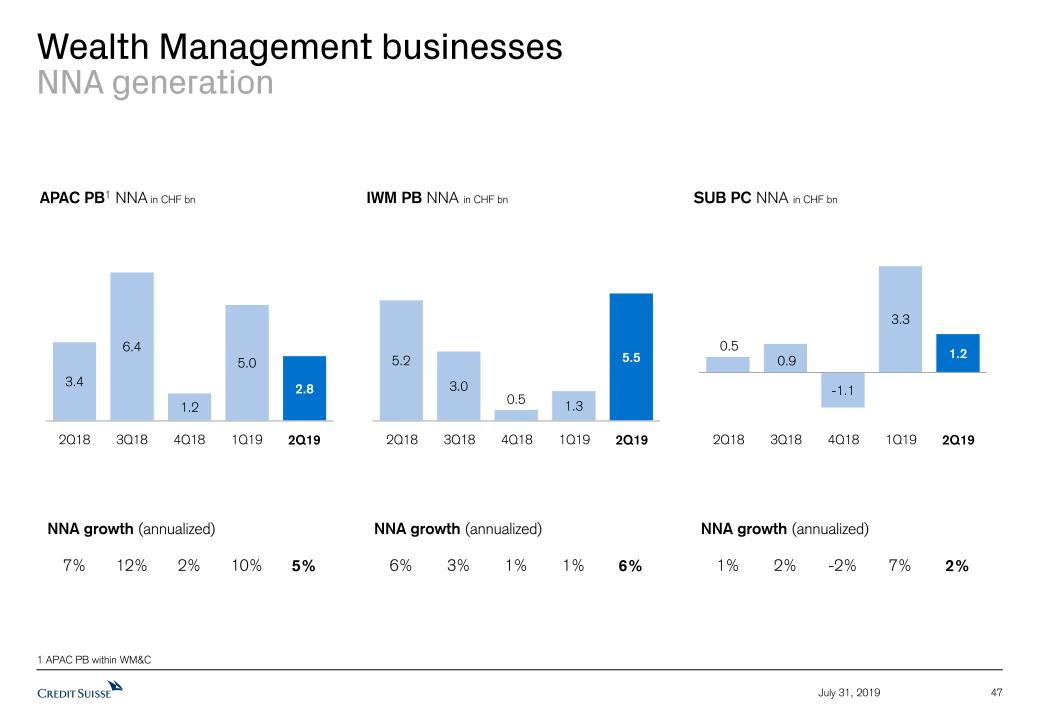
Wealth Management businessesNNA generation IWM PB NNA in CHF bn NNA growth (annualized) 6% 6% 3% 1% 1% SUB PC NNA in CHF bn NNA growth (annualized) 1% 2% 2% 7% -2% 1 APAC PB within WM&C 2Q18 2Q19 3Q18 4Q18 1Q19 2Q18 2Q19 3Q18 4Q18 1Q19 NNA growth (annualized) 2Q18 7% 5% 12% 10% APAC PB1 NNA in CHF bn 2Q19 3Q18 4Q18 1Q19 2% 47 July 31, 2019
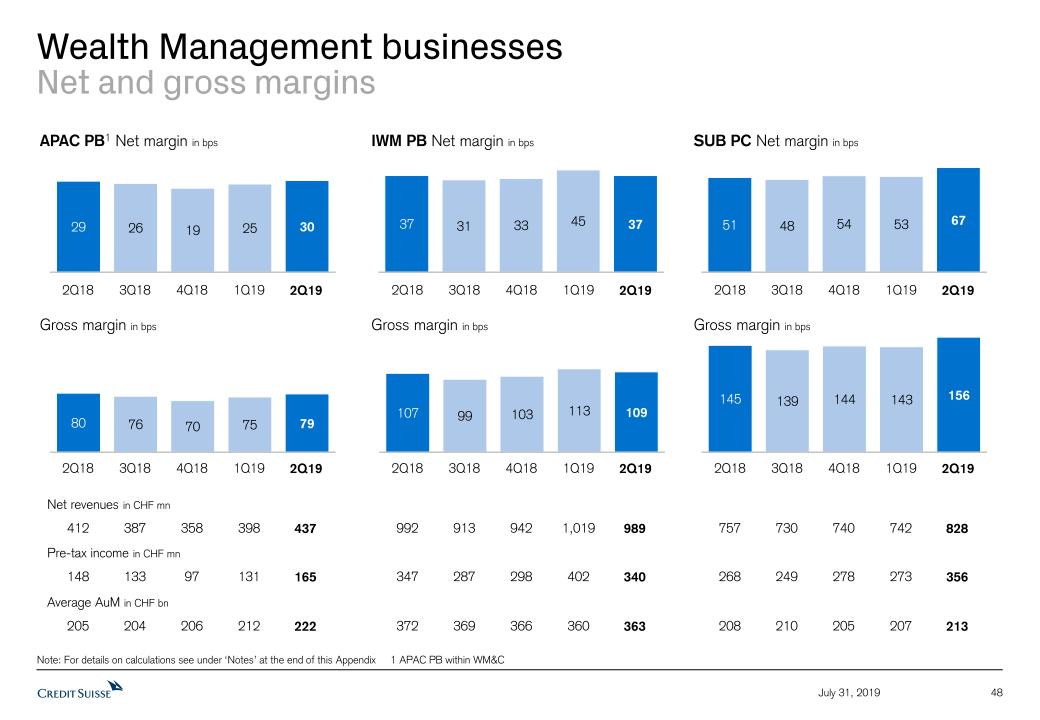
Wealth Management businessesNet and gross margins Note: For details on calculations see under ‘Notes’ at the end of this Appendix 1 APAC PB within WM&C IWM PB Net margin in bps Gross margin in bps SUB PC Net margin in bps Gross margin in bps 372 363 360 369 366 208 213 207 210 205 347 340 402 287 298 268 356 273 249 278 992 989 1,019 913 942 757 828 742 730 740 2Q18 2Q19 4Q18 3Q18 1Q19 2Q18 2Q19 4Q18 3Q18 1Q19 2Q18 2Q19 4Q18 3Q18 1Q19 2Q18 2Q19 4Q18 3Q18 1Q19 APAC PB1 Net margin in bps 2Q18 2Q19 4Q18 Gross margin in bps 3Q18 1Q19 205 222 212 Average AuM in CHF bn 204 206 148 165 131 Pre-tax income in CHF mn 133 97 412 437 398 Net revenues in CHF mn 387 358 2Q18 2Q19 4Q18 3Q18 1Q19 48 July 31, 2019
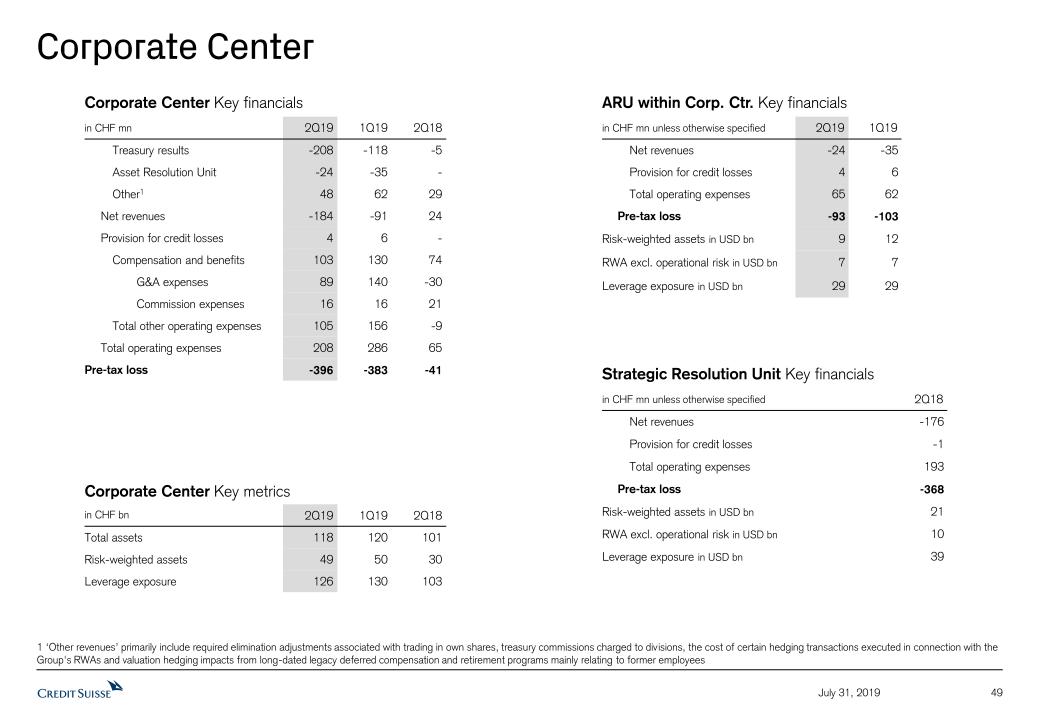
Corporate Center 49 July 31, 2019 1 ‘Other revenues’ primarily include required elimination adjustments associated with trading in own shares, treasury commissions charged to divisions, the cost of certain hedging transactions executed in connection with the Group's RWAs and valuation hedging impacts from long-dated legacy deferred compensation and retirement programs mainly relating to former employees ARU within Corp. Ctr. Key financials in CHF mn unless otherwise specified 2Q19 1Q19 Net revenues -24 -35 Provision for credit losses 4 6 Total operating expenses 65 62 Pre-tax loss -93 -103 Risk-weighted assets in USD bn 9 12 RWA excl. operational risk in USD bn 7 7 Leverage exposure in USD bn 29 29 Corporate Center Key metrics in CHF bn 2Q19 1Q19 2Q18 Total assets 118 120 101 Risk-weighted assets 49 50 30 Leverage exposure 126 130 103 Corporate Center Key financials in CHF mn 2Q19 1Q19 2Q18 Treasury results -208 -118 -5 Asset Resolution Unit -24 -35 - Other1 48 62 29 Net revenues -184 -91 24 Provision for credit losses 4 6 - Compensation and benefits 103 130 74 G&A expenses 89 140 -30 Commission expenses 16 16 21 Total other operating expenses 105 156 -9 Total operating expenses 208 286 65 Pre-tax loss -396 -383 -41 Strategic Resolution Unit Key financials in CHF mn unless otherwise specified 2Q18 Net revenues -176 Provision for credit losses -1 Total operating expenses 193 Pre-tax loss -368 Risk-weighted assets in USD bn 21 RWA excl. operational risk in USD bn 10 Leverage exposure in USD bn 39

50 Continuous delivery on structural measures drivingRoTE improvement despite adverse revenues during 1H19 July 31, 2019 ‡ RoTE is a non-GAAP financial measure, see Appendix; RoTE figures are rounded up and down to the nearest whole number 1 Excludes restructuring and litigation expenses and lower funding costs 2 Includes impact from funding cost savings in the ARU and from funding instruments volatility 3 Includes expenses related to real estate disposals 4 Includes provision for credit losses, fair value gains / losses from debit valuation adjustments (DVA) on deferred compensation and impact from higher average tangible shareholders’ equity 5 Excludes impact from ARU run-off on revenues before funding costs Return on tangible equity‡ development – 2Q18 to 2Q19based on CHF o/w +1.3%tax benefit Return on tangible equity‡ development – 1H18 to 1H19 based on CHF o/w +0.9%tax benefit ARU run-off 1 Lower funding costs 2 Restructuringexpenses 3 Tax, litigation &Other 4 1H19 before cost measures & lower revenues Revenue decline netof productivity & costsavings 5 2Q19 before costmeasures & lowerrevenues
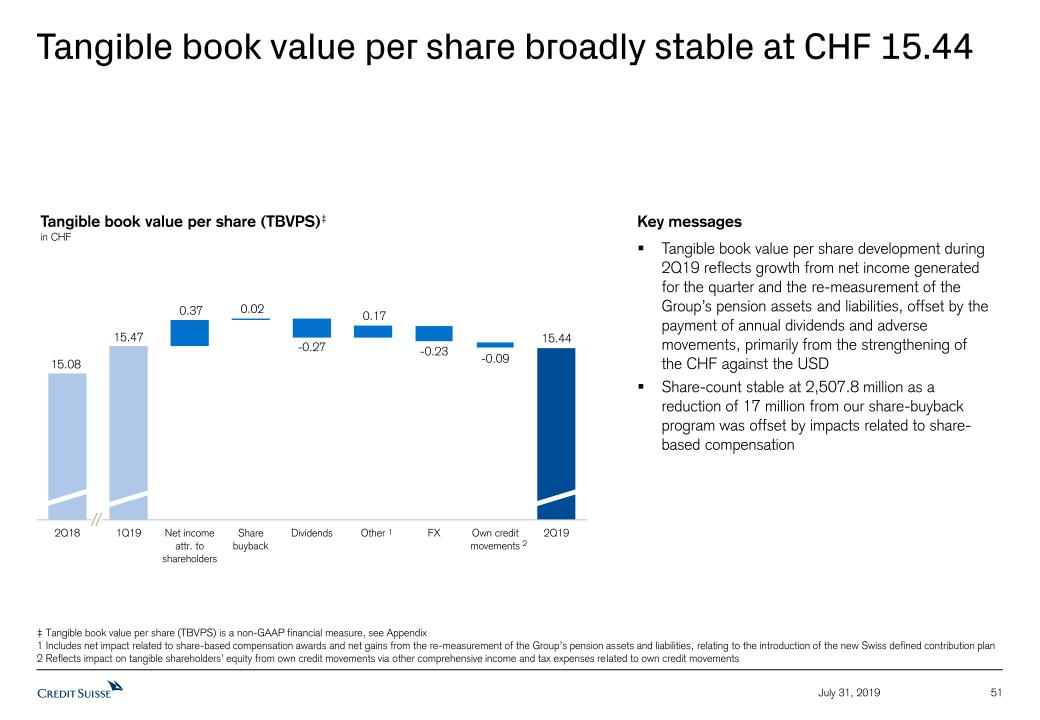
51 Tangible book value per share broadly stable at CHF 15.44 July 31, 2019 Tangible book value per share (TBVPS)‡in CHF Key messagesTangible book value per share development during 2Q19 reflects growth from net income generated for the quarter and the re-measurement of the Group’s pension assets and liabilities, offset by the payment of annual dividends and adverse movements, primarily from the strengthening of the CHF against the USDShare-count stable at 2,507.8 million as a reduction of 17 million from our share-buyback program was offset by impacts related to share-based compensation ‡ Tangible book value per share (TBVPS) is a non-GAAP financial measure, see Appendix1 Includes net impact related to share-based compensation awards and net gains from the re-measurement of the Group’s pension assets and liabilities, relating to the introduction of the new Swiss defined contribution plan2 Reflects impact on tangible shareholders’ equity from own credit movements via other comprehensive income and tax expenses related to own credit movements 2 1
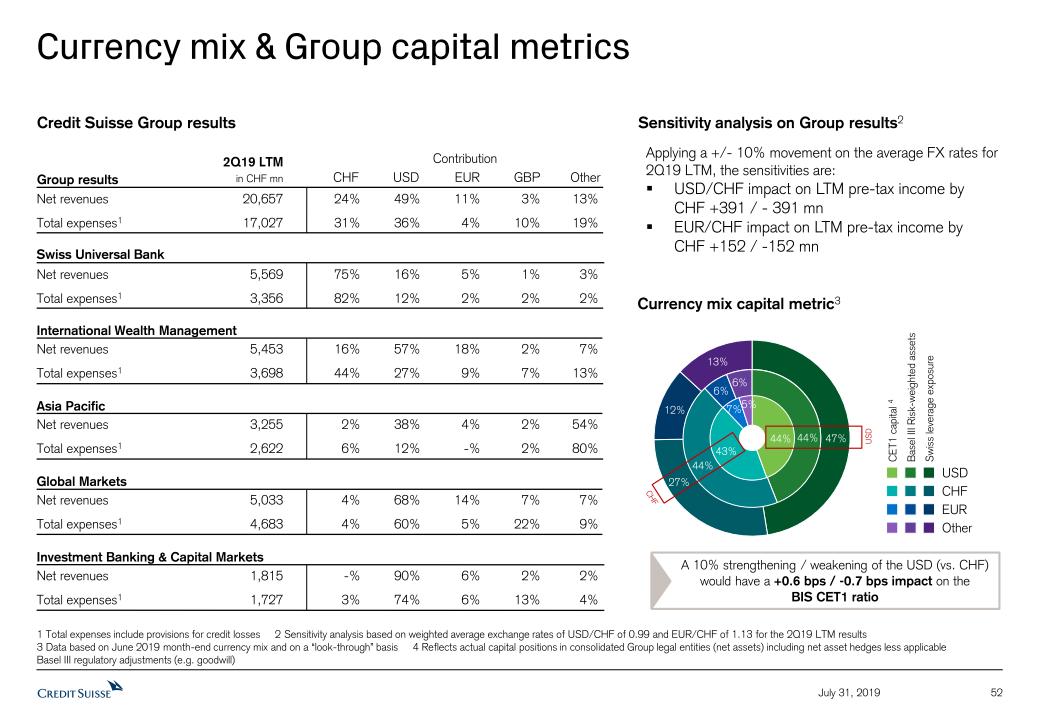
Currency mix & Group capital metrics 52 July 31, 2019 1 Total expenses include provisions for credit losses 2 Sensitivity analysis based on weighted average exchange rates of USD/CHF of 0.99 and EUR/CHF of 1.13 for the 2Q19 LTM results 3 Data based on June 2019 month-end currency mix and on a “look-through” basis 4 Reflects actual capital positions in consolidated Group legal entities (net assets) including net asset hedges less applicable Basel III regulatory adjustments (e.g. goodwill) Credit Suisse Group results 2Q19 LTMin CHF mn Applying a +/- 10% movement on the average FX rates for 2Q19 LTM, the sensitivities are:USD/CHF impact on LTM pre-tax income by CHF +391 / - 391 mnEUR/CHF impact on LTM pre-tax income by CHF +152 / -152 mn Sensitivity analysis on Group results2 Contribution Swiss Universal Bank International Wealth Management Asia Pacific Global Markets Investment Banking & Capital Markets Group results CHF USD EUR GBP Other Currency mix capital metric3 A 10% strengthening / weakening of the USD (vs. CHF) would have a +0.6 bps / -0.7 bps impact on theBIS CET1 ratio Basel III Risk-weighted assets Swiss leverage exposure CHF EUR Other USD USD CET1 capital 4 CHF Net revenues 20,657 24% 49% 11% 3% 13%Total expenses1 17,027 31% 36% 4% 10% 19% Net revenues 5,569 75% 16% 5% 1% 3%Total expenses1 3,356 82% 12% 2% 2% 2% Net revenues 5,453 16% 57% 18% 2% 7%Total expenses1 3,698 44% 27% 9% 7% 13% Net revenues 3,255 2% 38% 4% 2% 54%Total expenses1 2,622 6% 12% -% 2% 80% Net revenues 5,033 4% 68% 14% 7% 7%Total expenses1 4,683 4% 60% 5% 22% 9% Net revenues 1,815 -% 90% 6% 2% 2%Total expenses1 1,727 3% 74% 6% 13% 4%
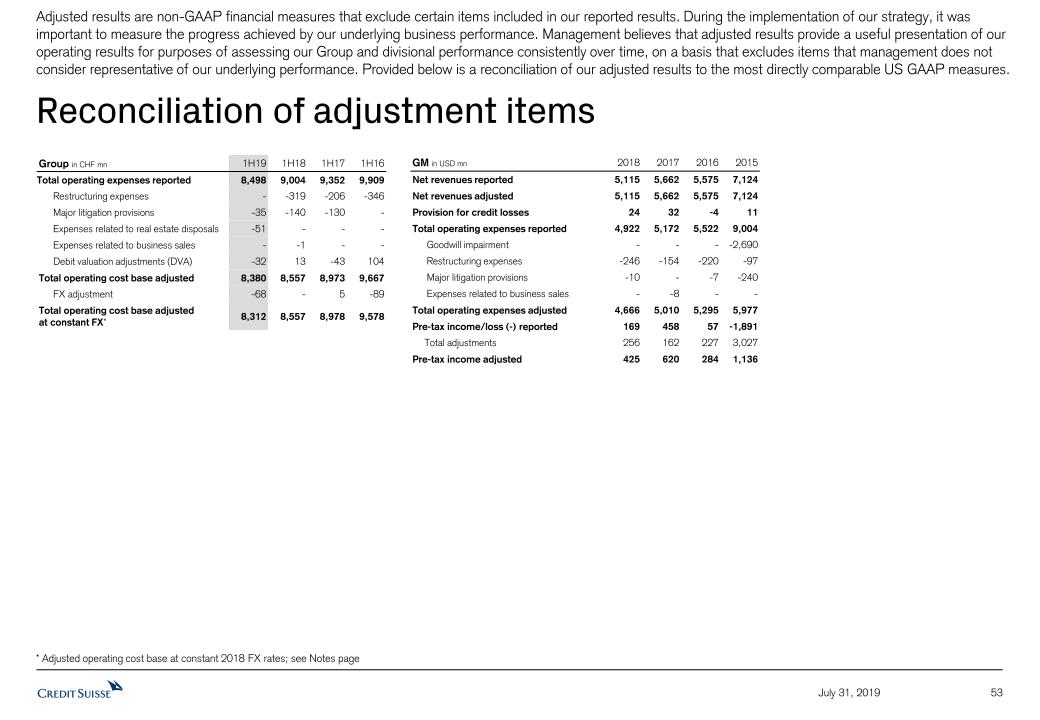
53 July 31, 2019 Reconciliation of adjustment items Adjusted results are non-GAAP financial measures that exclude certain items included in our reported results. During the implementation of our strategy, it was important to measure the progress achieved by our underlying business performance. Management believes that adjusted results provide a useful presentation of our operating results for purposes of assessing our Group and divisional performance consistently over time, on a basis that excludes items that management does not consider representative of our underlying performance. Provided below is a reconciliation of our adjusted results to the most directly comparable US GAAP measures. * Adjusted operating cost base at constant 2018 FX rates; see Notes page Group in CHF mn 1H19 1H18 1H17 1H16 Total operating expenses reported 8,498 9,004 9,352 9,909 Restructuring expenses - -319 -206 -346 Major litigation provisions -35 -140 -130 - Expenses related to real estate disposals -51 - - - Expenses related to business sales - -1 - - Debit valuation adjustments (DVA) -32 13 -43 104 Total operating cost base adjusted 8,380 8,557 8,973 9,667 FX adjustment -68 - 5 -89 Total operating cost base adjusted at constant FX* 8,312 8,557 8,978 9,578 GM in USD mn 2018 2017 2016 2015 Net revenues reported 5,115 5,662 5,575 7,124 Net revenues adjusted 5,115 5,662 5,575 7,124 Provision for credit losses 24 32 -4 11 Total operating expenses reported 4,922 5,172 5,522 9,004 Goodwill impairment - - - -2,690 Restructuring expenses -246 -154 -220 -97 Major litigation provisions -10 - -7 -240 Expenses related to business sales - -8 - - Total operating expenses adjusted 4,666 5,010 5,295 5,977 Pre-tax income/loss (-) reported 169 458 57 -1,891 Total adjustments 256 162 227 3,027 Pre-tax income adjusted 425 620 284 1,136
Notes 54 July 31, 2019 General notesThroughout the presentation rounding differences may occurUnless otherwise noted, all CET1 ratio, Tier 1 leverage ratio, risk-weighted assets and leverage exposure figures shown in this presentation are as of the end of the respective period and on a “look-through” basisGross and net margins are shown in basis pointsGross margin = net revenues annualized / average AuM; net margin = pre-tax income annualized / average AuMMandate penetration reflects advisory and discretionary mandate volumes as a percentage of AuM, excluding those from the external asset manager businessSpecific notes* Following the successful completion of our restructuring program in 2018, we updated our calculation approach for adjusted operating cost base at constant FX rates. Beginning in 1Q19, adjusted operating cost base at constant FX rates includes adjustments for major litigation provisions, expenses related to real estate disposals and business sales as well as for debit valuation adjustments (DVA) related volatility and FX, but not for restructuring expenses and certain accounting changes. Adjustments for FX apply unweighted 2018 currency exchange rates, i.e., a straight line average of monthly rates, consistently for the periods under review. Under the current presentation, adjusted operating cost base at constant FX rates for periods prior to 1Q19 still include adjustments for restructuring expenses and a goodwill impairment taken in 4Q15, but no longer include an adjustment for certain accounting changes.† Regulatory capital is calculated as the worst of 10% of RWA and 3.5% of leverage exposure. Return on regulatory capital is calculated using income / (loss) after tax and assumes a tax rate of 30% and capital allocated based on the worst of 10% of average RWA and 3.5% of average leverage exposure. For the Markets business within the APAC division and for the Global Markets and Investment Banking & Capital Markets divisions, return on regulatory capital is based on US dollar denominated numbers. ‡ Return on tangible equity is based on tangible shareholders’ equity, a non-GAAP financial measure, which is calculated by deducting goodwill and other intangible assets from total shareholders’ equity as presented in our balance sheet. Tangible book value, a non-GAAP financial measure, is equal to tangible shareholders’ equity. Tangible book value per share is a non-GAAP financial measure, which is calculated by dividing tangible shareholders' equity by total number of shares outstanding. Management believes that tangible shareholders’ equity/tangible book value, return on tangible equity and tangible book value per share are meaningful as they are measures used and relied upon by industry analysts and investors to assess valuations and capital adequacy. For end-2Q16, tangible equity excluded goodwill of CHF 4,745 mn and other intangible assets of CHF 191 mn from total shareholders’ equity of CHF 44,962 mn as presented in our balance sheet. For end-2Q17, tangible equity excluded goodwill of CHF 4,673 mn and other intangible assets of CHF 195 mn from total shareholders’ equity of CHF 43,493 mn as presented in our balance sheet. For end-2Q18, tangible equity excluded goodwill of CHF 4,797 mn and other intangible assets of CHF 212 mn from total shareholders’ equity of CHF 43,470 mn as presented in our balance sheet. For end-4Q18, tangible equity excluded goodwill of CHF 4,766 mn and other intangible assets of CHF 219 mn from total shareholders’ equity of CHF 43,922 mn as presented in our balance sheet. For end-1Q19, tangible equity excluded goodwill of CHF 4,807 mn and other intangible assets of CHF 224 mn from total shareholders’ equity of CHF 43,825 mn as presented in our balance sheet. For end-2Q19, tangible equity excluded goodwill of CHF 4,731 mn and other intangible assets of CHF 216 mn from total shareholders’ equity of CHF 43,673 mn as presented in our balance sheet. Shares outstanding were 2,550.0 mn at end-2Q18, 2,507.8 mn at end-1Q19 and 2,507.8 mn at end-2Q19.AbbreviationsAdv. = Advisory; AES = Advanced Execution Services; AM = Asset Management; APAC = Asia Pacific; ARU = Asset Resolution Unit; attr. = attributable; AuM = Assets under Management; BCBS = Basel Committee on Banking Supervision; BIS = Bank for International Settlements; bps = basis points; CAGR = Compound Annual Growth Rate; CET1 = Common Equity Tier 1; Corp. = Corporate(s); Corp. Ctr. = Corporate Center; DVA = Debit Valuation Adjustments; E = Estimate; e.g. = for example; EMEA = Europe, Middle East & Africa; excl. = excluding; FINMA = Swiss Financial Market Supervisory Authority; FX = Foreign Exchange; G&A = General & Administrative; GAAP = Generally Accepted Accounting Principles; GDP = Gross Domestic Product; GM = Global Markets; IBCM = Investment Banking & Capital Markets; IMF = International Monetary Fund; IPO = Initial Public Offering; ITS = International Trading Solutions; IWM = International Wealth Management; LevFin = Leveraged Finance; LTM = Last Twelve Months; M&A = Mergers & Acquisitions; Mgmt. = Management; n/m = not meaningful; NII = Net interest income; NNA = Net New Assets; o/w = of which; PB = Private Banking; PC = Private Clients; perf. = performance; pp. = percentage point; PTI = Pre-tax income; QoQ = Quarter on quarter; rev. = revenues; RM = Relationship Manager; RoRC = Return on Regulatory Capital; RoTE = Return on Tangible Equity; RWA = Risk-weighted assets; SMI = Swiss Market Index; SRU = Strategic Resolution Unit; SUB = Swiss Universal Bank; TBVPS = Tangible Book Value Per Share; (U)HNW = (Ultra) High Net Worth; Underwr. = Underwriting; VaR = Value at Risk; WM&C = Wealth Management & Connected; YoY = Year on year; YTD = Year to Date

Pursuant to the requirements of the Securities Exchange Act of 1934, the registrants have duly caused this report to be signed on their behalf by the undersigned, thereunto duly authorized.
CREDIT SUISSE GROUP AG and CREDIT SUISSE AG
(Registrants)
Date: July 31, 2019
By:
/s/ Tidjane Thiam
Tidjane Thiam
Chief Executive Officer
By:
/s/ David R. Mathers
David R. Mathers
Chief Financial Officer