UNITED STATES
SECURITIES AND EXCHANGE COMMISSION
Washington, D.C. 20549
______________
Form 6-K
______________
REPORT OF FOREIGN PRIVATE ISSUER PURSUANT TO RULE 13a-16 OR 15d-16
UNDER THE SECURITIES EXCHANGE ACT OF 1934
December 11, 2019
Commission File Number 001-15244
CREDIT SUISSE GROUP AG
(Translation of registrant’s name into English)
Paradeplatz 8, 8001 Zurich, Switzerland
(Address of principal executive office)
______________
Commission File Number 001-33434
CREDIT SUISSE AG
(Translation of registrant’s name into English)
Paradeplatz 8, 8001 Zurich, Switzerland
(Address of principal executive office)
______________
Indicate by check mark whether the registrant files or will file annual reports under cover of Form 20-F or Form 40-F.
| Form 20-F ☒ | Form 40-F ☐ |
Indicate by check mark if the registrant is submitting the Form 6-K in paper as permitted by Regulation S-T Rule 101(b)(1):
Note: Regulation S-T Rule 101(b)(1) only permits the submission in paper of a Form 6-K if submitted solely to provide an attached annual report to security holders.
Indicate by check mark if the registrant is submitting the Form 6-K in paper as permitted by Regulation S-T Rule 101(b)(7):
Note: Regulation S-T Rule 101(b)(7) only permits the submission in paper of a Form 6-K if submitted to furnish a report or other document that the registrant foreign private issuer must furnish and make public under the laws of the jurisdiction in which the registrant is incorporated, domiciled or legally organized (the registrant’s “home country”), or under the rules of the home country exchange on which the registrant’s securities are traded, as long as the report or other document is not a press release, is not required to be and has not been distributed to the registrant’s security holders, and, if discussing a material event, has already been the subject of a Form 6-K submission or other Commission filing on EDGAR.
This report includes the media release and the slides for the presentation to investors in connection with Investor Day 2019 held on December 11, 2019.
Media Release Zurich, December 11, 2019 |
Update:
An earlier version of the media release stated, under ‘Driving TBVPS higher’, that “…we have identified up to 50 basis points of additional cost measures…” It has now been corrected to read 40 basis points.
Investor Day 2019
Highlights
| § | We will continue to grow by offering bespoke solutions to our clients, fully leveraging our wealth management and investment banking capabilities. Our regionalised approach allows us to stay close to our clients whilst capturing global synergies, when relevant. |
| § | Aim to deliver in 2020: |
| § | approximately 175 basis points of Return on Tangible Equity (RoTE) uplift, with additional upside in a constructive market environment |
| § | approximately 10% RoTE |
| § | Continued discipline on costs to drive positive operating leverage |
| § | At least 50% of net income expected to be paid out in 2020 through dividends and share buybacks |
| § | Approved buyback of Credit Suisse Group AG ordinary shares of up to CHF 1.5 billion for 2020, with at least CHF 1.0 billion expected in 20201 |
| § | Plan to continue to increase ordinary dividend by at least 5% per annum |
| § | Medium term ambition of 12%+ RoTE |
| § | ESG policy update: commitment to no longer provide any form of financing specifically related to the development of new coal-fired power plants |
Zurich, December 11, 2019 – We will today update investors and analysts on the progress we have made in 2019, the first year since the completion of our three-year restructuring programme.
We will outline how we intend to continue to increase our returns in 2020 and beyond, support our clients across our franchises, deliver industry leading performance in our chosen markets, and return capital to our shareholders.
Continued momentum in 2019
We have achieved strong growth across key metrics:
| § | Pre-tax income was up 26%, Return on Equity increased by 220 basis points and RoTE improved by 250 basis points for the first nine months of 2019 versus the same period for 2018 |
| § | Book value per share grew by a compound annual growth rate (CAGR) of 8% and shareholder value creation grew by a CAGR of 11%2 in the first nine months of 2019 |
| § | Supported by our wealth management businesses, Net New Asset (NNA) growth across the Group was 28% higher at 9M19 than at 9M18 and we achieved a record NNA of CHF 72 billion at 9M19, driving our Assets under Management to a record CHF 1.5 trillion, winning prestigious industry awards over the course of the year |
We will address today how we intend to maintain our momentum in 2020.
Page 1
Media Release Zurich, December 11, 2019 |
Growing revenues in wealth management
Over the past few years, thanks to the disciplined execution of our strategy - ‘A leading wealth manager with strong investment banking capabilities’ - we have been able to grow faster than our chosen markets, even when the environment was not supportive, as in 2019. Our regionalised structure, aligned to client needs, drives agile decision-making, greater accountability and an effective control framework, with a particular focus on compliance and risk management.
Between the end of 2015 and the end of 3Q19, we had attracted CHF 193 billion of NNA across the Group as a whole. We also achieved a CAGR of 7% for our Wealth Management AuM over those four years. We have delivered consistent asset inflows by being a trusted adviser. Thanks to the strong collaboration among our wealth management, markets and investment banking teams, we provide institutional quality solutions and capabilities to our ultra-high-net-worth (UHNW) and entrepreneur clients. As we continue to further scale our record Wealth Management AuM of CHF 802 billion, we are compounding the growth of our more stable and recurring revenue streams.
Over time this growth in quality, stable, capital efficient revenue should drive significant upside to our Group RoTE.
Growing revenues in our markets businesses
We successfully completed the restructuring of Global Markets (GM) at the end of 2018. We have right-sized and de-risked our platform and increased its connectivity with our wealth management franchise. Global Markets delivered a strong performance in the first nine months of 2019, outperforming our peers across Fixed Income sales and trading and Equity sales and trading3. During that period, Global Markets achieved a pre-tax income of USD 914 million driven by significant revenue growth and continued cost discipline, achieving a return on regulatory capital of 9%, more than double its return on regulatory capital year on year.
We are uniquely positioned to leverage our markets activities across our wealth management businesses, and we are successfully delivering solutions to our wealth management clients through our ITS platform. With our ATS platform in APAC, we are starting to see early tangible benefits in 4Q19 of working closer together with Global Markets, across Prime and Equity Derivatives, as well as the potential to streamline support and control functions, capturing global synergies when and where relevant in due course.
Investment banking key to our success
Investment Banking and Capital Market’s (IBCM) leading client franchise is core to our integrated approach. We also have top tier investment banking franchises in Switzerland and in APAC4. Ahead of an expected loss for IBCM in 2019, including restructuring measures, we have put in place new leadership for our activities in New York and London. Looking ahead to 2020, we are working on actions that will reinvigorate the division, building on a strongly improving pipeline, which we expect will put us in a more advantageous position compared to 2019.
Maintaining cost discipline
As we have invested in the business and continued to seek opportunities for top-line growth, we have also maintained our cost discipline, consistently creating positive operating leverage during our restructuring and in 2019. We are focused on delivering continued productivity improvements through disciplined expense and investment management and are driving further structural savings initiatives. We
Page 2
Media Release Zurich, December 11, 2019 |
aim to realise further efficiencies across the bank, driving operating leverage further through embedded cost management practices including transparency, productivity improvements and a consistent front-to-back approach across the bank.
Continuing to optimise our operating model
Continuing to invest in our control functions is key to our success as we grow our businesses. To this end, we have strengthened our Risk management function over the last four years, with a focus on Credit Risk management to ensure we are well equipped to navigate the cycle. We have maintained conservative underwriting and lending standards, while increasing hedging against potential tail events, minimising Group Value-at-Risk5, leverage exposure and level 3 assets as we have de-risked the Group over the last four years.
We continue to invest in effective Compliance and Controls, supporting growth through enhanced compliance capabilities. Our Compliance teams continue to utilise smart systems and processes throughout the entire client lifecycle – from onboarding to offboarding – delivering continued shareholder value.
Swiss regulatory capital rebalancing substantially complete
Since 2015, we have absorbed more than CHF 64 billion of methodology-driven RWA inflation. During the same period, we have de-risked our bank and significantly strengthened our capital base, with CET1 capital of CHF 37.4 billion at 3Q19. As a result, we expect to operate with a risk density6 of 34% in 1Q20, and believe that our Swiss regulatory capital metrics are substantially rebalanced. Subsequently, we expect additional RWA inflation to be minimal over the next three years, after the RWA increase expected in 1Q20 from the Basel III reforms.
Driving TBVPS higher
We are generating capital to drive growth investments and reward shareholders. We have added 250 basis points to our RoTE for the nine months ending September 30, 2019 year on year and we aim to deliver approximately 175 basis points of further RoTE uplift in 2020 compared to 2019, taking us to approximately 10% by year-end 2020, driving Tangible Book Value per Share higher. We believe we can achieve this primarily by implementing measures we have already identified.
If markets are constructive and support revenue growth, we would expect our year-end 2020 RoTE to be approximately 11%. Conversely, should markets remain challenging in 2020, we have identified up to 40 basis points of additional cost measures in order to protect our RoTE ambition of approximately 10%.
Distributing capital to shareholders
As a result of our Swiss regulatory capital metrics rebalancing, we anticipate capital requirements as a percentage of Group net income to decrease in 2020. Our expected RoTE improvement would increase our headroom to further invest in our businesses and distribute capital to shareholders in 2020.
We expect to distribute at least 50% of net income to shareholders through a combination of both a sustainable ordinary dividend, which we expect to increase by at least 5% per annum, and a similar share buyback programme to 2019, with a buyback of up to CHF 1.5 billion approved by the Board of Directors for 2020, from which we expect a buyback of at least CHF 1 billion, subject to market and economic conditions. By delivering on our ambitions over the coming quarters and years, we aim to earn
Page 3
Media Release Zurich, December 11, 2019 |
the right to invest more to grow our business as we demonstrate to investors our ability to generate above cost of capital returns.
Credit Suisse’s climate commitment: ESG policy update
As we recognise our share of responsibilities in addressing the challenges of climate change, Credit Suisse continues to expand its own role in supporting the transition to a low-carbon and climate-resilient economy. In 3Q19, we introduced a Group-wide Climate Risk Strategy, one important element of which is working with our clients to support the respective transition of their business models, and further integrating climate change into our risk management models.
As part of this effort, Credit Suisse is today announcing a significant policy change. The bank has decided to no longer provide any form of financing specifically related to the development of new coal-fired power plants. This is in addition to the bank’s existing policy of not providing any form of financing that is specifically related to the development of new greenfield thermal coal mines. This commitment also applies to cases where the majority of the use of proceeds is intended for the development of a new coal-fired power plant or a new greenfield thermal coal mine, respectively.
The bank continues to review its relevant policies and guidelines on an ongoing basis.
Outlook
At our third quarter results on October 30, we said we expected to see the usual seasonal slowdown as a result of the holiday season in many parts of the world, as well as headwinds from the ongoing challenging geopolitical environment. So far in 4Q19, our business performance has improved against 4Q18.
Examining the Reported PTI trends of our businesses in more detail for the fourth quarter to date:
| § | In SUB, we are seeing ongoing pressures from the negative interest rate environment, which we expect to substantially mitigate in 2020. In the meantime, we have identified opportunities to offset these pressures through real estate sales, at least one of which we expect to close in the fourth quarter |
| § | We are seeing a stable performance in IWM |
| § | APAC and GM are showing significantly better performances compared to 4Q18, which was particularly challenging |
| § | While we expect IBCM to be loss-making for 2019, our pipeline of announced deals has been building strongly in the fourth quarter, a marked improvement year on year |
We expect to achieve a Reported RoTE of greater than 8% for the full year 2019.
Ends
Page 4
Media Release Zurich, December 11, 2019 |
Contact details
Adam Gishen, Investor Relations Tel: +41 44 333 71 49 Email: investor.relations@credit-suisse.com |
James Quinn, Corporate Communications Tel: +41 844 33 88 44 E-mail: media.relations@credit-suisse.com |
The Investor Day media release and all presentation slides will be available to download from 7:00 CET today at: https://www.credit-suisse.com/investorday |
Note: Our estimates, ambitions, objectives and targets often include metrics that are non-GAAP financial measures and are unaudited. A reconciliation of the estimates, ambitions, objectives and targets to the nearest GAAP measures is unavailable without unreasonable efforts. Return on tangible equity is based on tangible shareholders' equity (also known as tangible book value), a non-GAAP financial measure, which is calculated by deducting goodwill and other intangible assets from total shareholders’ equity as presented in our balance sheet, both of which are unavailable on a prospective basis. Such estimates, ambitions, objectives and targets are calculated in a manner that is consistent with the accounting policies applied by us in preparing our financial statements.
Webcast details
| Date | Wednesday, December 11, 2019 |
| Time | 08:30 GMT / 09:30 CET |
| Webcast | https://www.credit-suisse.com/investorday |
| Telephone | Switzerland: +41 445 807 121 Europe: +44 2071 928 522 US: +1 917 677 75 38 Conference passcode: 1504800 # |
| Note | Due to the large volume of callers expected we strongly recommend that you dial in approximately 20 minutes before the start of the presentation. Please enter the Direct Event Passcode when prompted. You will be joined automatically to the conference. Due to regional restrictions some participants may receive operator assistance when joining this conference call and will not be automatically connected. |
Page 5
Media Release Zurich, December 11, 2019 |
| Documents | All documentation will be available on https://www.credit-suisse.com/investorday |
| Playbacks | A replay of the telephone conference will be available approximately four hours after the event. |
Footnotes
1 Subject to market and economic conditions
2 Book value per share was CHF 18.25 at 9M19 compared to CHF 17.22 at 4Q18.Shareholder value creation is measured as 9M19 tangible book value per share of CHF 16.24 plus the dividend of CHF 0.26 per share paid in 2019 compared to 4Q18 tangible book value per share of CHF 15.27
3 Credit Suisse analysis based on company public disclosures. Includes Bank of America, Barclays, Citigroup, Deutsche Bank, Goldman Sachs, JPMorgan Chase, Morgan Stanley and UBS. For Equity Sales & Trading, does not include Deutsche Bank, who exited Equity Sales & Trading as part of its strategic transformation as announced on July 7, 2019. Analysis relates to Global Sales & Trading revenues in USD terms
4 Ranked number #1 in Switzerland and in APAC, excluding Japan and China onshore; Source: Dealogic as of September 30, 2019
5 Average one day, 98% trading book risk management Value-at-Risk
6 Rate of RWA to leverage exposure
Abbreviations
APAC – Asia Pacific; ATS – Asia Pacific Trading Solutions; AuM – assets under management; BCBS – Basel Committee on Banking Supervision; BIS – Bank for International Settlements; CAGR – Compound Annual Growth Rate; CHF – Swiss francs; CET1 – common equity tier 1; FINMA – Swiss Financial Market Supervisory Authority; GAAP – Generally accepted accounting principles; GM – Global Markets; IBCM – Investment Banking & Capital Markets; ITS – International Trading Solutions; IWM – International Wealth Management; M&A – mergers and acquisitions; NNA – net new assets; PB – Private Banking; PC – Private Clients; RoTE – Return on Tangible Equity; RWA – risk weighted assets; SEC – US Securities and Exchange Commission; SUB – Swiss Universal Bank; TBVPS – tangible book value per share; UHNW – ultra-high-net-worth; USD – US dollar; WM&C – Wealth Management & Connected
Important information about this media release
In preparing this media release, management has made estimates and assumptions that affect the numbers presented. Estimates and assumptions are based on currently available information and beliefs, expectations and opinions of management and include all known facts and decisions as of the date hereof. Actual results may differ. Annualised numbers do not take into account variations in operating results, seasonality and other factors and may not be indicative of actual, full-year results. Figures throughout this media release may also be subject to rounding adjustments. All opinions and views constitute judgments as of the date of writing without regard to the date on which the reader may receive or access the information. This information is subject to change at any time without notice and we do not intend to update this information.
We may not achieve all of the expected benefits of our strategic initiatives. Factors beyond our control, including but not limited to the market and economic conditions, changes in laws, rules or regulations and other challenges discussed in our public filings, could limit our ability to achieve some or all of the expected benefits of these initiatives.
In particular, the terms “Estimate”, “Illustrative”, “Ambition”, “Objective”, “Outlook” and “Goal” are not intended to be viewed as targets or projections, nor are they considered to be Key Performance Indicators. All such estimates, illustrations, ambitions, objectives, outlooks and goals are subject to a large number of inherent risks, assumptions and uncertainties, many of which are completely outside of our control. These risks, assumptions and uncertainties include, but are not limited to, general market conditions, market volatility, interest rate volatility and levels, global and regional economic conditions, political uncertainty, changes in tax policies, regulatory changes, changes in levels of client activity as a result of any of the foregoing and other factors. Accordingly, this information should not be relied on for any purpose. We do not intend to update these estimates, illustrations, ambitions, objectives, outlooks or goals.
Return on tangible equity is based on tangible shareholders’ equity, a non-GAAP financial measure, which is calculated by deducting goodwill and other intangible assets from total shareholders’ equity as presented in our balance sheet. Tangible book value per share is a non-GAAP financial measure, which is calculated by dividing tangible shareholders' equity by total number of shares outstanding. Management believes that return on tangible equity and tangible book value per share are meaningful as they are measures used and relied upon by industry analysts and investors to assess valuations and capital adequacy. For end-3Q18, tangible shareholders’ equity excluded goodwill of CHF 4,736 million and other intangible assets of CHF 214 million from total shareholders’ equity of CHF 42,734 million as presented in our balance sheet. For end-4Q18, tangible shareholders’ equity excluded goodwill of CHF 4,766 million and other intangible assets of CHF 219 million from total shareholders’ equity of CHF 43,922 million as presented in our
Page 6
Media Release Zurich, December 11, 2019 |
balance sheet. For end-3Q19, tangible shareholders’ equity excluded goodwill of CHF 4,760 million and other intangible assets of CHF 219 million from total shareholders’ equity of CHF 45,150 million as presented in our balance sheet. Shares outstanding were 2,552.4 million at end-3Q18, 2,550.6 million at end-4Q18 and 2,473.8 million at end-3Q19.
Regulatory capital is calculated as the worst of 10% of RWA and 3.5% of leverage exposure. Return on regulatory capital (a non-GAAP financial measure) is calculated using income / (loss) after tax and assumes a tax rate of 30% and capital allocated based on the worst of 10% of average RWA and 3.5% of average leverage exposure. For the Markets business within the APAC division and for the Global Markets and Investment Banking & Capital Markets divisions, return on regulatory capital is based on US dollar denominated numbers. Adjusted return on regulatory capital is calculated using adjusted results, applying the same methodology to calculate return on regulatory capital.
Credit Suisse is subject to the Basel III framework, as implemented in Switzerland, as well as Swiss legislation and regulations for systemically important banks, which include capital, liquidity, leverage and large exposure requirements and rules for emergency plans designed to maintain systemically relevant functions in the event of threatened insolvency. Credit Suisse has adopted the Bank for International Settlements (BIS) leverage ratio framework, as issued by the Basel Committee on Banking Supervision (BCBS) and implemented in Switzerland by the Swiss Financial Market Supervisory Authority FINMA (FINMA).
References to Wealth Management net new assets and assets under management refer to the combined results of SUB PC, IWM PB and APAC PB within WM&C.
Information referenced in this media release, whether via website links or otherwise, is not incorporated into this media release.
Investors and others should note that we announce material information (including quarterly earnings releases and financial reports) to the investing public using press releases, SEC and Swiss ad hoc filings, our website and public conference calls and webcasts.
We intend to also use our Twitter account @creditsuisse (https://twitter.com/creditsuisse) to excerpt key messages from our public disclosures, including earnings releases. We may retweet such messages through certain of our regional Twitter accounts, including @csschweiz (https://twitter.com/csschweiz) and @csapac (https://twitter.com/csapac). Investors and others should take care to consider such abbreviated messages in the context of the disclosures from which they are excerpted. The information we post on these Twitter accounts is not a part of this media release.
Cautionary statement regarding forward-looking information
This document contains statements that constitute forward-looking statements. In addition, in the future we, and others on our behalf, may make statements that constitute forward-looking statements. Such forward-looking statements may include, without limitation, statements relating to the following:
| § | our plans, targets or goals; |
| § | our future economic performance or prospects; |
| § | the potential effect on our future performance of certain contingencies; and |
| § | assumptions underlying any such statements. |
Words such as “believes,” “anticipates,” “expects,” “intends” and “plans” and similar expressions are intended to identify forward-looking statements but are not the exclusive means of identifying such statements. We do not intend to update these forward-looking statements.
By their very nature, forward-looking statements involve inherent risks and uncertainties, both general and specific, and risks exist that predictions, forecasts, projections and other outcomes described or implied in forward-looking statements will not be achieved. We caution you that a number of important factors could cause results to differ materially from the plans, targets, goals expectations, estimates and intentions expressed in such forward-looking statements. These factors include:
| § | the ability to maintain sufficient liquidity and access capital markets; |
| § | market volatility and interest rate fluctuations and developments affecting interest rate levels; |
| § | the strength of the global economy in general and the strength of the economies of the countries in which we conduct our operations, in particular the risk of continued slow economic recovery or downturn in the US or other developed countries or in emerging markets in 2019 and beyond; |
| § | the direct and indirect impacts of deterioration or slow recovery in residential and commercial real estate markets; |
| § | adverse rating actions by credit rating agencies in respect of us, sovereign issuers, structured credit products or other credit-related exposures; |
| § | the ability to achieve our strategic goals, including those related to our targets and financial goals; |
| § | the ability of counterparties to meet their obligations to us; |
| § | the effects of, and changes in, fiscal, monetary, exchange rate, trade and tax policies, as well as currency fluctuations; |
| § | political and social developments, including war, civil unrest or terrorist activity; |
| § | the possibility of foreign exchange controls, expropriation, nationalisation or confiscation of assets in countries in which we conduct our operations; |
| § | operational factors such as systems failure, human error, or the failure to implement procedures properly; |
| § | the risk of cyber attacks, information or security breaches or technology failure on our business or operations; |
| § | the adverse resolution of litigation, regulatory proceedings and other contingencies; |
Page 7
Media Release Zurich, December 11, 2019 |
| § | actions taken by regulators with respect to our business and practices and possible resulting changes to our business organisation, practices and policies in countries in which we conduct our operations; |
| § | the effects of changes in laws, regulations or accounting or tax standards, policies or practices in countries in which we conduct our operations; |
| § | the potential effects of proposed changes in our legal entity structure; |
| § | competition or changes in our competitive position in geographic and business areas in which we conduct our operations; |
| § | the ability to retain and recruit qualified personnel; |
| § | the ability to maintain our reputation and promote our brand; |
| § | the ability to increase market share and control expenses; |
| § | technological changes; |
| § | the timely development and acceptance of our new products and services and the perceived overall value of these products and services by users; |
| § | acquisitions, including the ability to integrate acquired businesses successfully, and divestitures, including the ability to sell non-core assets; and |
| § | other unforeseen or unexpected events and our success at managing these and the risks involved in the foregoing. |
We caution you that the foregoing list of important factors is not exclusive. When evaluating forward-looking statements, you should carefully consider the foregoing factors and other uncertainties and events, including the information set forth in “Risk factors” in I – Information on the company in our Annual Report 2018.
Page 8
Credit Suisse Investor Day 2019General overview Tidjane Thiam, Chief Executive OfficerDecember 11, 2019

Disclaimer 2 December 11, 2019 This material does not purport to contain all of the information that you may wish to consider. This material is not to be relied upon as such or used in substitution for the exercise of independent judgment.Cautionary statement regarding forward-looking statementsThis presentation contains forward-looking statements that involve inherent risks and uncertainties, and we might not be able to achieve the predictions, forecasts, projections and other outcomes we describe or imply in forward-looking statements. A number of important factors could cause results to differ materially from the plans, targets, goals, expectations, estimates and intentions we express in these forward-looking statements, including those we identify in "Risk factors” in our Annual Report on Form 20-F for the fiscal year ended December 31, 2018 and in the “Cautionary statement regarding forward-looking information" in our media release relating to Investor Day, published on December 11, 2019 and filed with the US Securities and Exchange Commission, and in other public filings and press releases. We do not intend to update these forward-looking statements. In particular, the terms “Estimate”, “Illustrative”, “Ambition”, “Objective”, “Outlook” and “Goal” are not intended to be viewed as targets or projections, nor are they considered to be Key Performance Indicators. All such estimates, illustrations, ambitions, objectives, outlooks and goals are subject to a large number of inherent risks, assumptions and uncertainties, many of which are completely outside of our control. These risks, assumptions and uncertainties include, but are not limited to, general market conditions, market volatility, interest rate volatility and levels, global and regional economic conditions, political uncertainty, changes in tax policies, regulatory changes, changes in levels of client activity as a result of any of the foregoing and other factors. Accordingly, this information should not be relied on for any purpose. We do not intend to update these estimates, illustrations, ambitions, objectives, outlooks or goals. We may not achieve the benefits of our strategic initiativesWe may not achieve all of the expected benefits of our strategic initiatives. Factors beyond our control, including but not limited to the market and economic conditions, changes in laws, rules or regulations and other challenges discussed in our public filings, could limit our ability to achieve some or all of the expected benefits of these initiatives. Estimates and assumptionsIn preparing this presentation, management has made estimates and assumptions that affect the numbers presented. Actual results may differ. Annualized numbers do not take into account variations in operating results, seasonality and other factors and may not be indicative of actual, full-year results. Figures throughout this presentation may also be subject to rounding adjustments. All opinions and views constitute judgments as of the date of writing without regard to the date on which the reader may receive or access the information. This information is subject to change at any time without notice and we do not intend to update this information. Cautionary statements relating to interim financial informationThis presentation contains certain unaudited interim financial information for the fourth quarter of 2019. This information has been derived from management accounts, is preliminary in nature, does not reflect the complete results of the fourth quarter of 2019 or the full year 2019 and is subject to change, including as a result of any normal quarterly adjustments in relation to the financial statements for the full year 2019. This information has not been subject to any review by our independent registered public accounting firm. There can be no assurance that the final results for these periods will not differ from these preliminary results, and any such differences could be material. Quarterly financial results for the fourth quarter of 2019 and full year results will be included in our 4Q19 Earnings Release and our 2019 Annual Report. Statement regarding non-GAAP financial measuresThis presentation also contains non-GAAP financial measures, including adjusted results as well as return on regulatory capital, return on tangible equity and tangible book value per share (which are based on tangible shareholders’ equity). Information needed to reconcile such non-GAAP financial measures to the most directly comparable measures under US GAAP can be found in this presentation in the Appendix, which is available on our website at www.credit-suisse.com.Our estimates, ambitions, objectives and targets often include metrics that are non-GAAP financial measures and are unaudited. A reconciliation of the estimates, ambitions, objectives and targets to the nearest GAAP measures is unavailable without unreasonable efforts. Adjusted results exclude goodwill impairment, major litigation provisions, real estate gains and other revenue and expense items included in our reported results, all of which are unavailable on a prospective basis. Return on Tangible Equity is based on tangible shareholders' equity (also known as tangible book value), a non-GAAP financial measure, which is calculated by deducting goodwill and other intangible assets from total shareholders' equity as presented in our balance sheet, both of which are unavailable on a prospective basis. Tangible book value per share excludes the impact of any dividends paid during the performance period, share buybacks, own credit movements, foreign exchange rate movements and pension-related impacts, all of which are unavailable on a prospective basis. Such estimates, ambitions, objectives and targets are calculated in a manner that is consistent with the accounting policies applied by us in preparing our financial statements.Statement regarding capital, liquidity and leverageCredit Suisse is subject to the Basel III framework, as implemented in Switzerland, as well as Swiss legislation and regulations for systemically important banks (Swiss Requirements), which include capital, liquidity, leverage and large exposure requirements and rules for emergency plans designed to maintain systemically relevant functions in the event of threatened insolvency. Credit Suisse has adopted the Bank for International Settlements (BIS) leverage ratio framework, as issued by the Basel Committee on Banking Supervision (BCBS) and implemented in Switzerland by the Swiss Financial Market Supervisory Authority FINMA. References to phase-in and look-through included herein refer to Basel III capital requirements and Swiss Requirements. Phase-in reflects that, for the years 2014-2018, there was a five-year (20% per annum) phase-in of goodwill, other intangible assets and other capital deductions (e.g., certain deferred tax assets) and a phase-out of an adjustment for the accounting treatment of pension plans. For the years 2013-2022, there is a phase-out of certain capital instruments. Look-through assumes the full phase-in of goodwill and other intangible assets and other regulatory adjustments and the phase-out of certain capital instruments.Unless otherwise noted, leverage exposure is based on the BIS leverage ratio framework and consists of period-end balance sheet assets and prescribed regulatory adjustments. The look-through tier 1 leverage ratio and CET1 leverage ratio are calculated as look-through BIS tier 1 capital and CET1 capital, respectively, divided by period-end leverage exposure. Swiss leverage ratios are measured on the same period-end basis as the leverage exposure for the BIS leverage ratio.SourcesThis presentation contains certain material prepared by Credit Suisse on the basis of publicly available information, internally developed data and other third-party sources believed to be reliable. Credit Suisse has not sought to independently verify information obtained from public and third-party sources and makes no representations or warranties as to accuracy, completeness or reliability of such information. Certain information has been derived from internal management accounts.

3 December 11, 2019 Programme of the day Q&A & wrap-up Webcast 3:45 pm Investor Day 2019 Lunch break 12:00 pm 60 min Coffee break 3:30 pm 15 min General overview Webcast 8:30 am Thiam 40 min Coffee break 10:30 am 15 min Key financials Webcast 9:10 am 20 min Mathers Growth in Wealth Management Webcast 9:30 am Gottstein, Wehle, Sitohang 30 min Break-out sessions (rounds 2 & 3) 1:00 pm 75 min each Wehle, Sitohang, Gottstein Driving revenue growth in Wealth Management Chin, Miller Increasing profitability across our Markets activities Warner, Hudson, Walker Facilitating growth through an effective and efficient operating model 10:45 am 75 min Delivering profitable growth in a low interest rate environmentBreak-out sessions (round 1) An effective approach: 3 case studies Webcast 10:00 am Varvel, Drew, Low/Hung 30 min
Resilient business model - delivering profitable, compliant growth 2 Continued momentum in 2019 1 Agenda 4 December 11, 2019 Capital 3
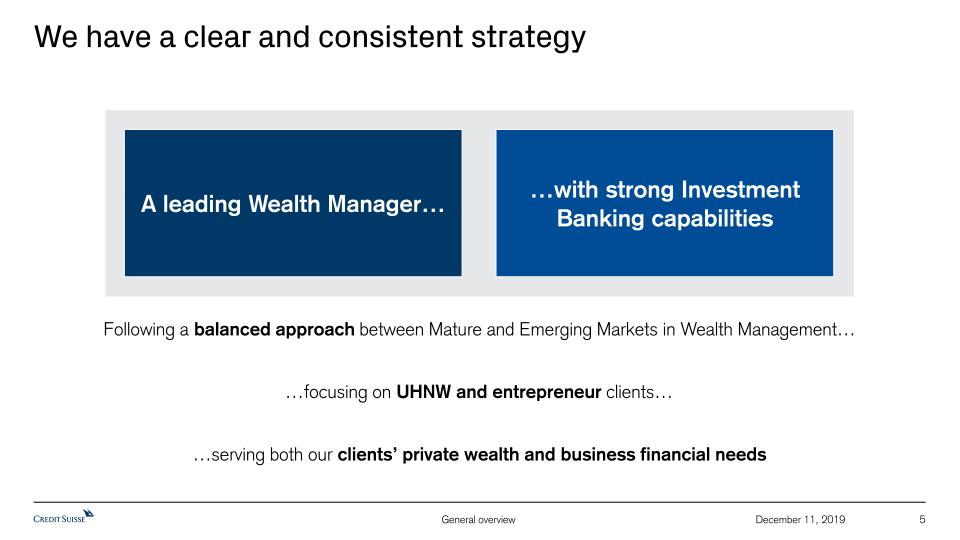
We have a clear and consistent strategy 5 December 11, 2019 A leading Wealth Manager… Following a balanced approach between Mature and Emerging Markets in Wealth Management… …with strong Investment Banking capabilities …focusing on UHNW and entrepreneur clients… …serving both our clients’ private wealth and business financial needs
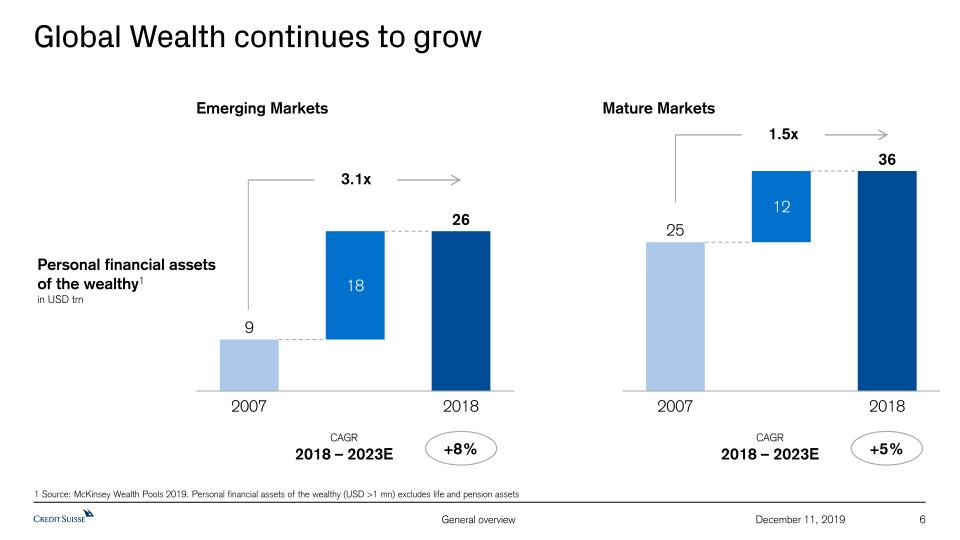
Global Wealth continues to grow 6 December 11, 2019 Emerging Markets Mature Markets 2007 2018 18 9 26 3.1x 12 25 2007 2018 36 1.5x CAGR2018 – 2023E +8% CAGR2018 – 2023E +5% 1 Source: McKinsey Wealth Pools 2019. Personal financial assets of the wealthy (USD >1 mn) excludes life and pension assets Personal financial assets of the wealthy1in USD trn
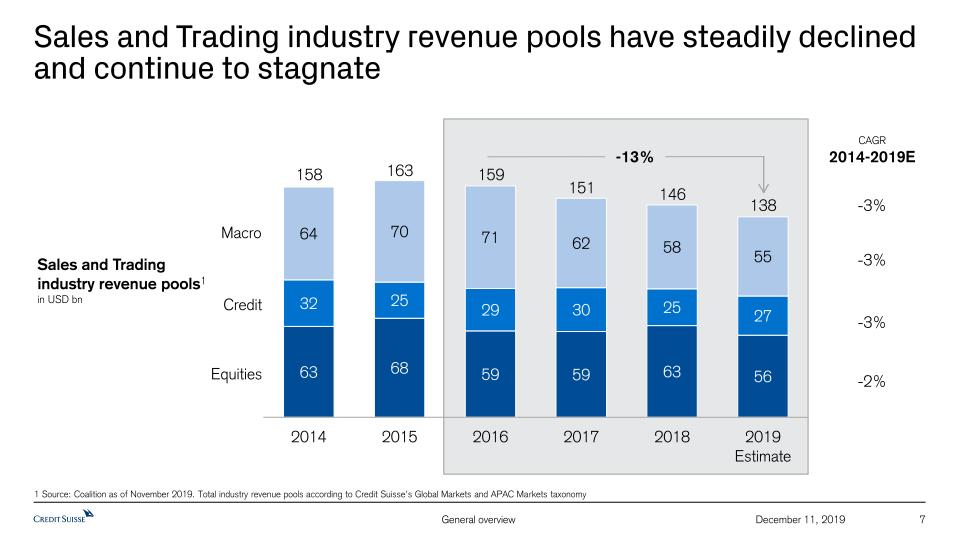
Sales and Trading industry revenue pools have steadily declined and continue to stagnate 7 December 11, 2019 1 Source: Coalition as of November 2019. Total industry revenue pools according to Credit Suisse’s Global Markets and APAC Markets taxonomy -3% -13% -3% Macro Credit Equities 158 163 138 159 146 151 -2% CAGR2014-2019E -3% Sales and Trading industry revenue pools1in USD bn
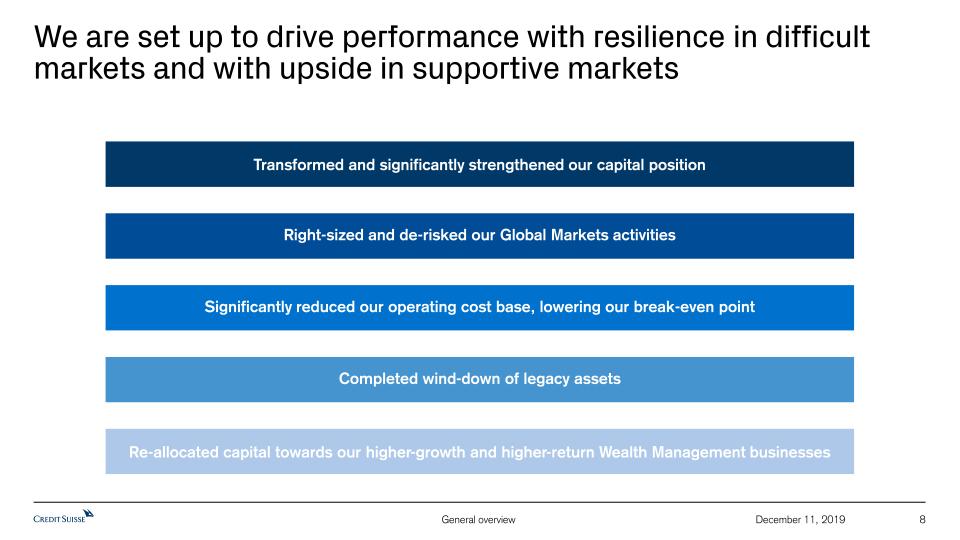
We are set up to drive performance with resilience in difficult markets and with upside in supportive markets 8 December 11, 2019 Transformed and significantly strengthened our capital position Significantly reduced our operating cost base, lowering our break-even point Completed wind-down of legacy assets Right-sized and de-risked our Global Markets activities Re-allocated capital towards our higher-growth and higher-return Wealth Management businesses
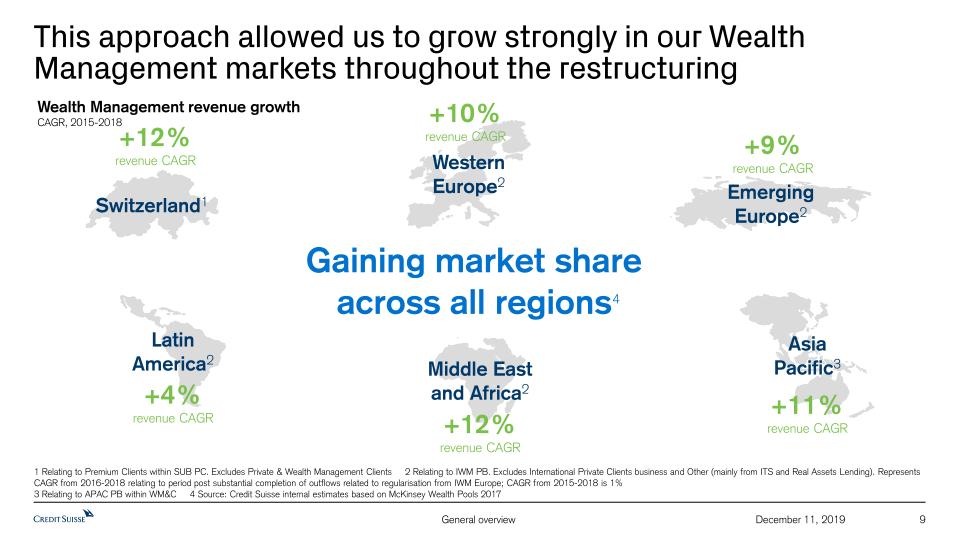
This approach allowed us to grow strongly in our Wealth Management markets throughout the restructuring 9 December 11, 2019 Western Europe2 Switzerland1 Latin America2 Middle East and Africa2 Emerging Europe2 Asia Pacific3 Gaining market share across all regions +12%revenue CAGR +10%revenue CAGR +9%revenue CAGR +4%revenue CAGR +12%revenue CAGR +11%revenue CAGR 1 Relating to Premium Clients within SUB PC. Excludes Private & Wealth Management Clients 2 Relating to IWM PB. Excludes International Private Clients business and Other (mainly from ITS and Real Assets Lending). Represents CAGR from 2016-2018 relating to period post substantial completion of outflows related to regularisation from IWM Europe; CAGR from 2015-2018 is 1% 3 Relating to APAC PB within WM&C 4 Source: Credit Suisse internal estimates based on McKinsey Wealth Pools 2017 Wealth Management revenue growthCAGR, 2015-2018 4
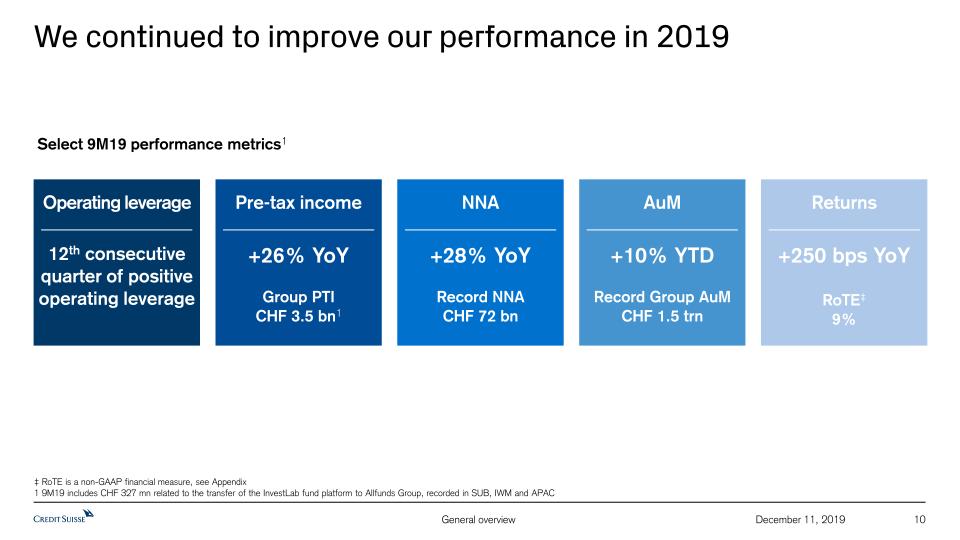
10 December 11, 2019 We continued to improve our performance in 2019 Operating leverage12th consecutivequarter of positive operating leverage Pre-tax income+26% YoY Group PTI CHF 3.5 bn1 NNA+28% YoYRecord NNA CHF 72 bn AuM+10% YTDRecord Group AuMCHF 1.5 trn Returns+250 bps YoY RoTE‡9% ‡ RoTE is a non-GAAP financial measure, see Appendix1 9M19 includes CHF 327 mn related to the transfer of the InvestLab fund platform to Allfunds Group, recorded in SUB, IWM and APAC Select 9M19 performance metrics1
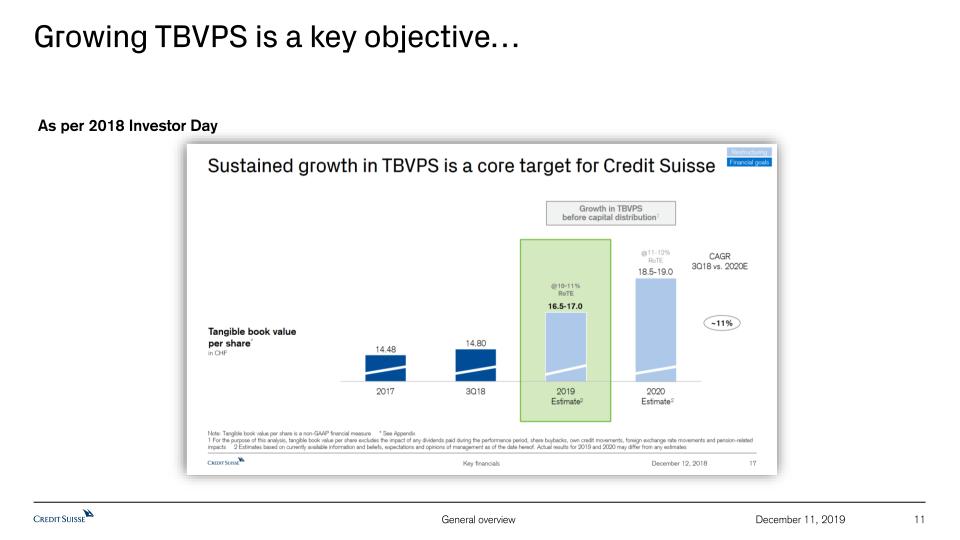
Growing TBVPS is a key objective… 11 December 11, 2019 As per 2018 Investor Day
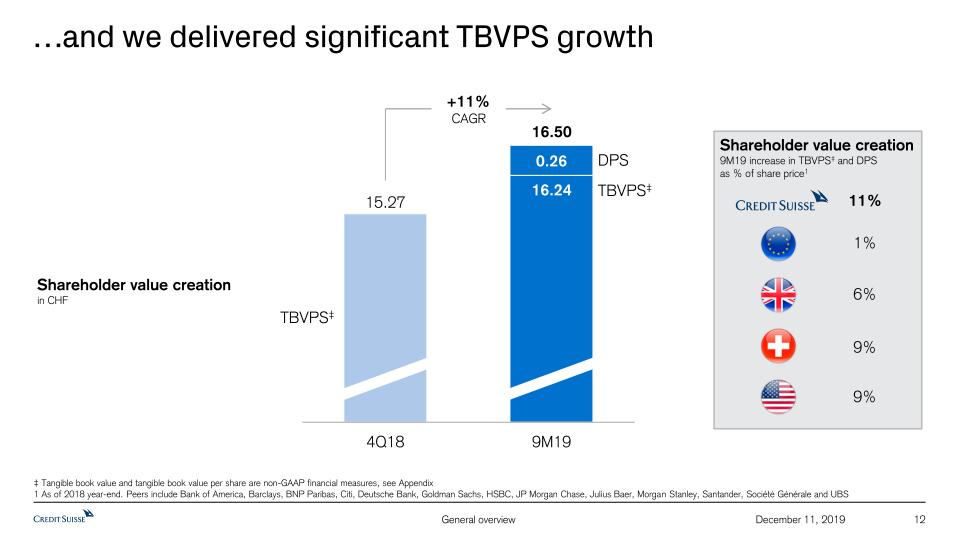
…and we delivered significant TBVPS growth 12 December 11, 2019 Shareholder value creationin CHF +11% CAGR 16.50 DPS 6% Shareholder value creation 9M19 increase in TBVPS‡ and DPSas % of share price1 1% 9% 11% 9% ‡ Tangible book value and tangible book value per share are non-GAAP financial measures, see Appendix 1 As of 2018 year-end. Peers include Bank of America, Barclays, BNP Paribas, Citi, Deutsche Bank, Goldman Sachs, HSBC, JP Morgan Chase, Julius Baer, Morgan Stanley, Santander, Société Générale and UBS TBVPS‡ TBVPS‡
Resilient business model - delivering profitable, compliant growth 2 Continued momentum in 2019 1 Agenda 13 December 11, 2019 Capital 3
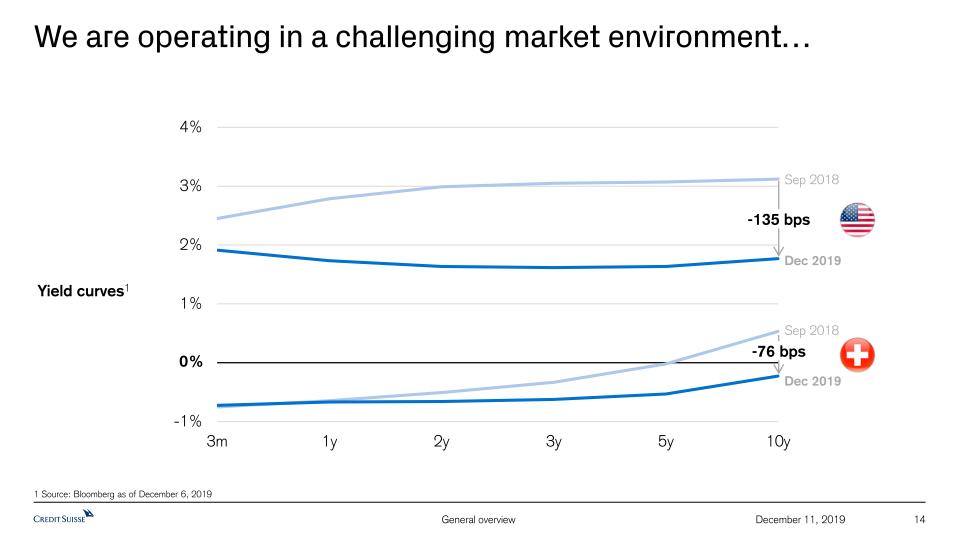
We are operating in a challenging market environment… 14 December 11, 2019 Dec 2019 Sep 2018 -135 bps -76 bps Dec 2019 Sep 2018 1 Source: Bloomberg as of December 6, 2019 Yield curves1 0%
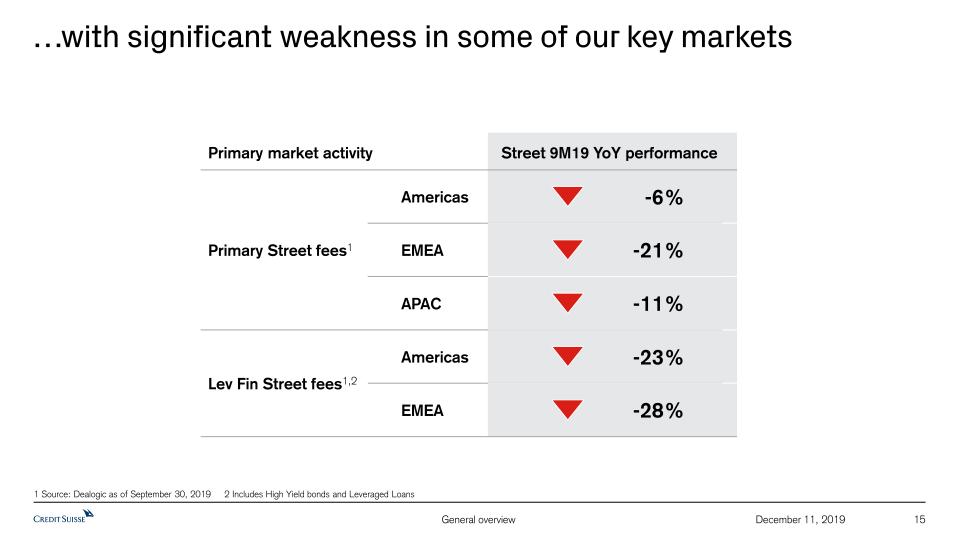
…with significant weakness in some of our key markets 15 December 11, 2019 1 Source: Dealogic as of September 30, 2019 2 Includes High Yield bonds and Leveraged Loans Americas -6% -21% EMEA APAC -11% Primary market activity Street 9M19 YoY performance Primary Street fees1 Lev Fin Street fees1,2 -23% Americas -28% EMEA
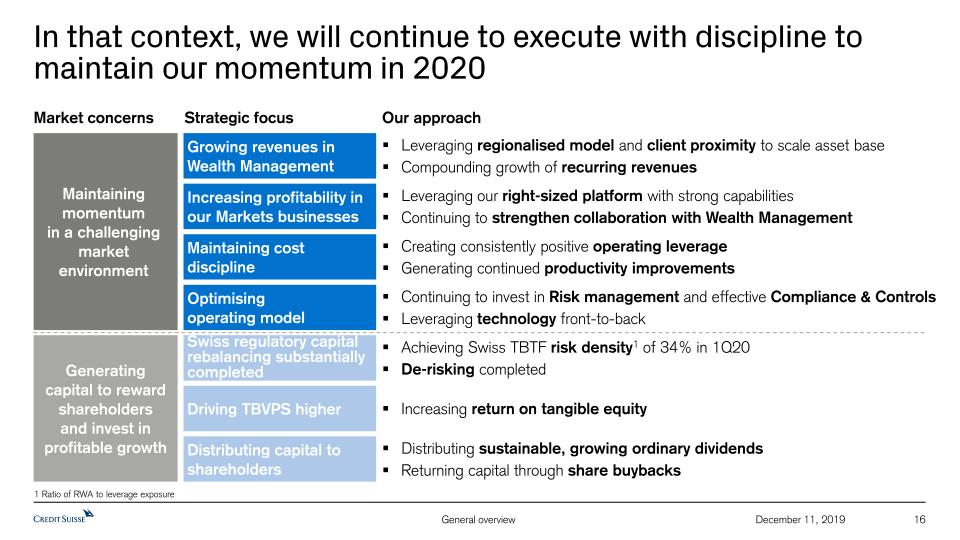
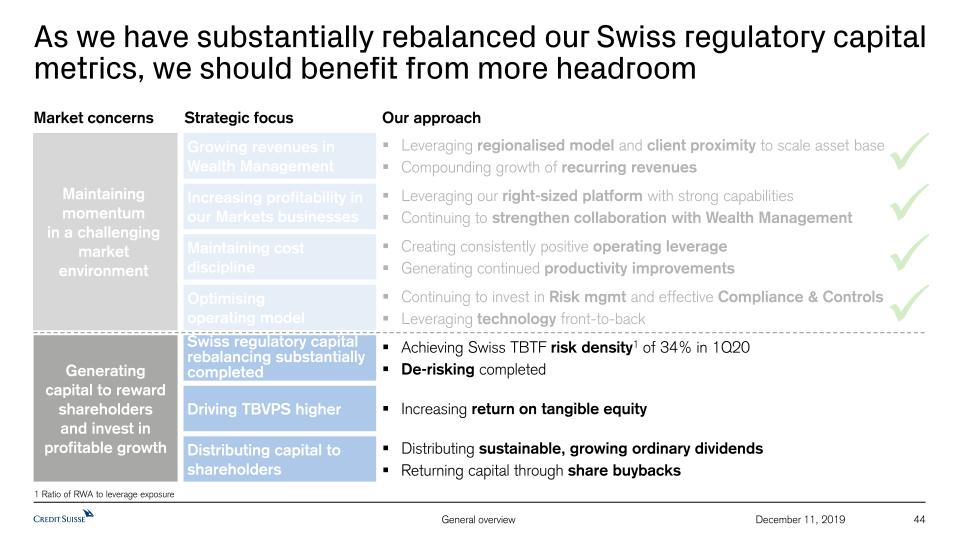
In that context, we will continue to execute with discipline to maintain our momentum in 2020 16 December 11, 2019 Maintaining momentumin a challenging market environment Market concerns Generating capital to reward shareholders and invest in profitable growth Strategic focus Creating consistently positive operating leverageGenerating continued productivity improvements Maintaining cost discipline Optimising operating model Swiss regulatory capital rebalancing substantially completed Continuing to invest in Risk management and effective Compliance & ControlsLeveraging technology front-to-back Driving TBVPS higher Achieving Swiss TBTF risk density1 of 34% in 1Q20De-risking completed Increasing return on tangible equity Our approach Leveraging our right-sized platform with strong capabilitiesContinuing to strengthen collaboration with Wealth Management Increasing profitability inour Markets businesses Growing revenues in Wealth Management Leveraging regionalised model and client proximity to scale asset base Compounding growth of recurring revenues Distributing capital to shareholders Distributing sustainable, growing ordinary dividendsReturning capital through share buybacks 1 Ratio of RWA to leverage exposure
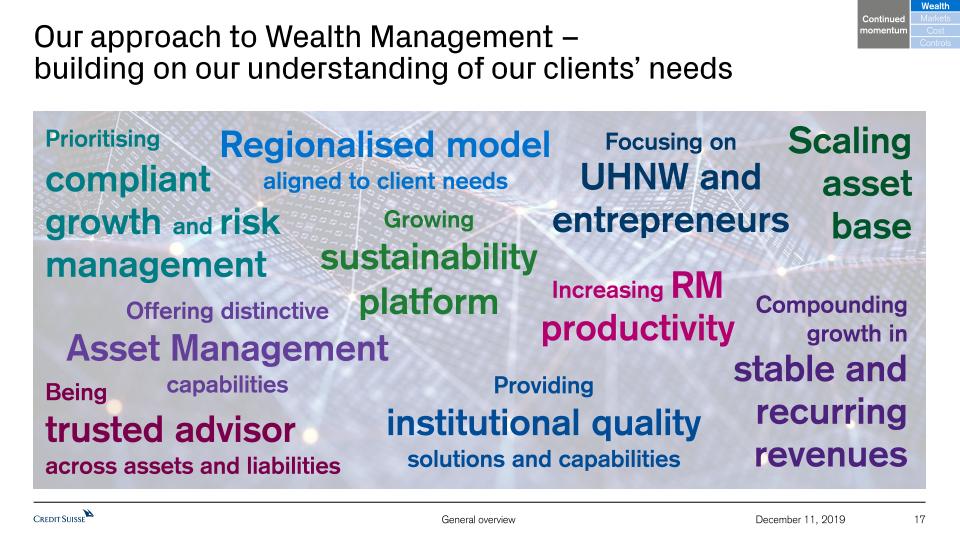
Our approach to Wealth Management – building on our understanding of our clients’ needs 17 December 11, 2019 Scalingasset base Compoundinggrowth instable andrecurring revenues Providing institutional qualitysolutions and capabilities Focusing onUHNW and entrepreneurs Beingtrusted advisoracross assets and liabilities Regionalised model aligned to client needs Continued momentum Markets Wealth Cost Controls Prioritising compliantgrowth and riskmanagement Increasing RM productivity Growingsustainabilityplatform Offering distinctiveAsset Management capabilities
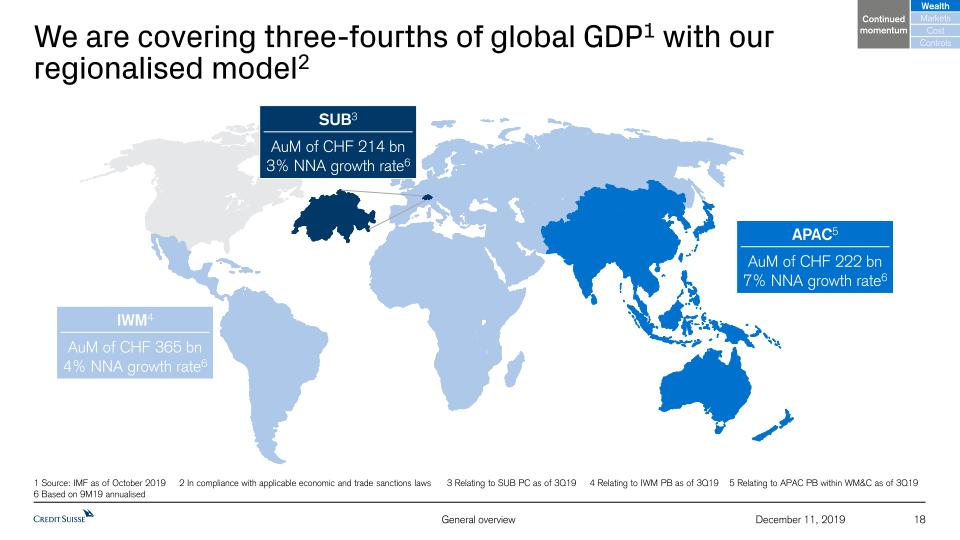
We are covering three-fourths of global GDP1 with our regionalised model2 18 December 11, 2019 Continued momentum Markets Wealth Cost Controls IWM4AuM of CHF 365 bn4% NNA growth rate6 APAC5AuM of CHF 222 bn7% NNA growth rate6 SUB3AuM of CHF 214 bn3% NNA growth rate6 1 Source: IMF as of October 2019 2 In compliance with applicable economic and trade sanctions laws 3 Relating to SUB PC as of 3Q19 4 Relating to IWM PB as of 3Q19 5 Relating to APAC PB within WM&C as of 3Q19 6 Based on 9M19 annualised
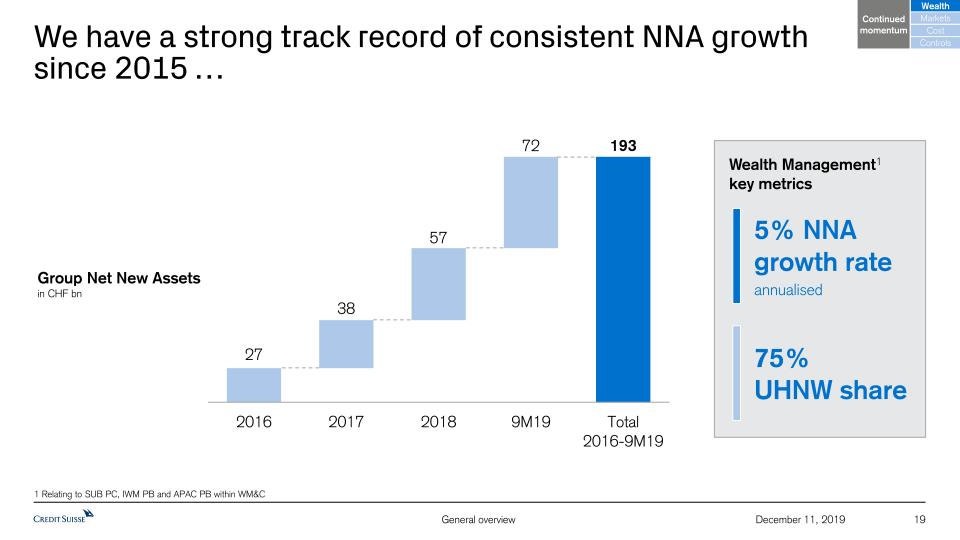
We have a strong track record of consistent NNA growthsince 2015 … 19 December 11, 2019 1 Relating to SUB PC, IWM PB and APAC PB within WM&C Group Net New Assetsin CHF bn 5% NNAgrowth rateannualised 75%UHNW share Continued momentum Markets Wealth Cost Controls Wealth Management1 key metrics
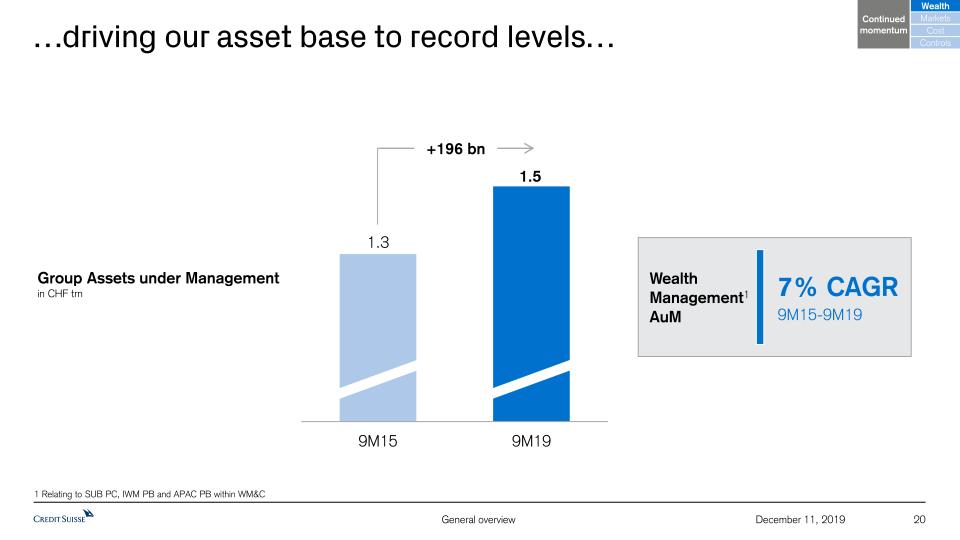
…driving our asset base to record levels… 20 December 11, 2019 1 Relating to SUB PC, IWM PB and APAC PB within WM&C Group Assets under Managementin CHF trn +196 bn Continued momentum Markets Wealth Cost Controls 7% CAGR9M15-9M19 Wealth Management1AuM
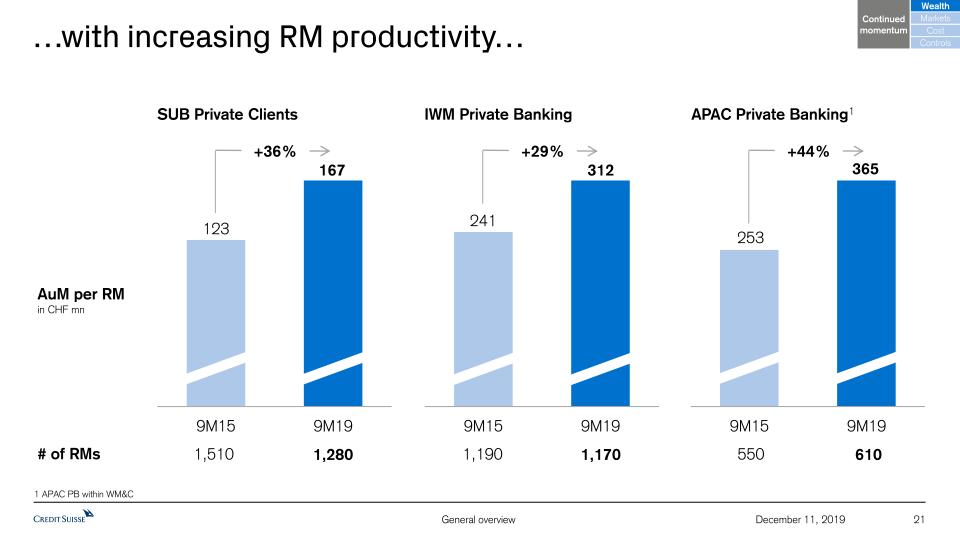
…with increasing RM productivity… 21 December 11, 2019 AuM per RMin CHF mn +36% Continued momentum Markets Wealth Cost Controls # of RMs SUB Private Clients IWM Private Banking APAC Private Banking1 1,510 1,280 1,190 1,170 550 610 +29% +44% 1 APAC PB within WM&C
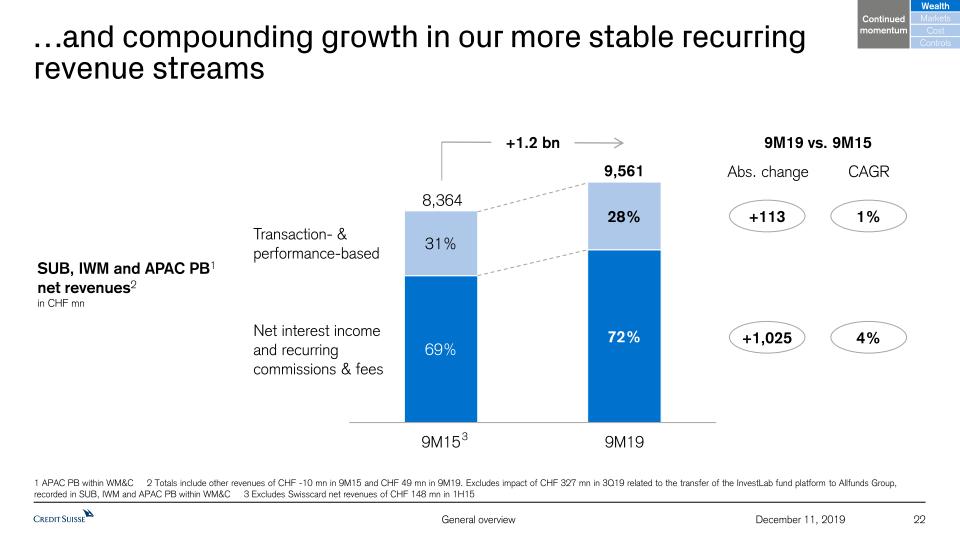
…and compounding growth in our more stable recurring revenue streams 22 December 11, 2019 Net interest income and recurring commissions & fees Transaction- & performance-based +1.2 bn 8,364 9,561 +1,025 +113 Abs. change 3 9M19 vs. 9M15 CAGR 4% 1% 1 APAC PB within WM&C 2 Totals include other revenues of CHF -10 mn in 9M15 and CHF 49 mn in 9M19. Excludes impact of CHF 327 mn in 3Q19 related to the transfer of the InvestLab fund platform to Allfunds Group, recorded in SUB, IWM and APAC PB within WM&C 3 Excludes Swisscard net revenues of CHF 148 mn in 1H15 SUB, IWM and APAC PB1net revenues2in CHF mn Continued momentum Markets Wealth Cost Controls
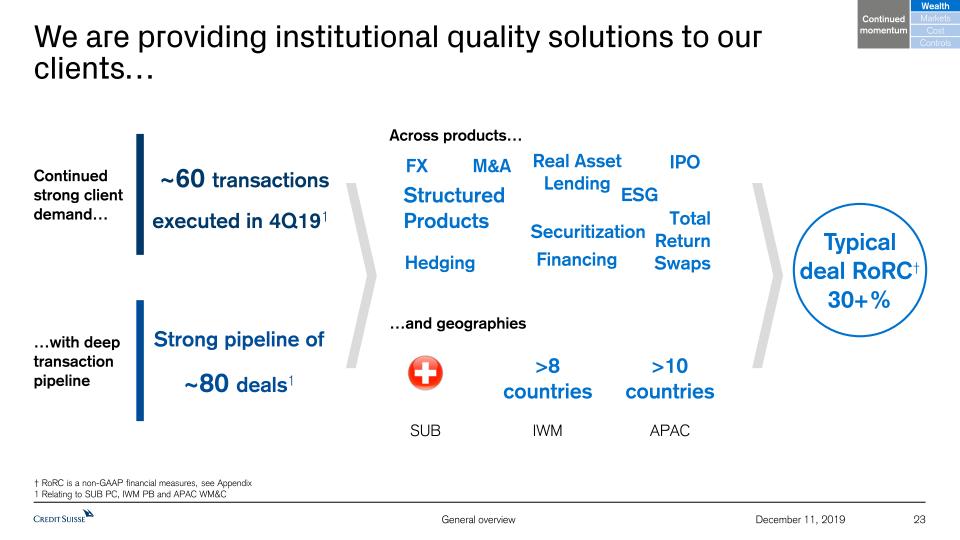
We are providing institutional quality solutions to our clients… 23 December 11, 2019 Continued momentum Markets Wealth Cost Controls ~60 transactions executed in 4Q191 Continued strong client demand… Strong pipeline of~80 deals1 † RoRC is a non-GAAP financial measures, see Appendix1 Relating to SUB PC, IWM PB and APAC WM&C Across products… Financing M&A Structured Products FX …and geographies …with deep transaction pipeline Real Asset Lending Total Return Swaps Hedging IPO Securitization SUB IWM APAC >8 countries >10 countries Typicaldeal RoRC† 30+% ESG
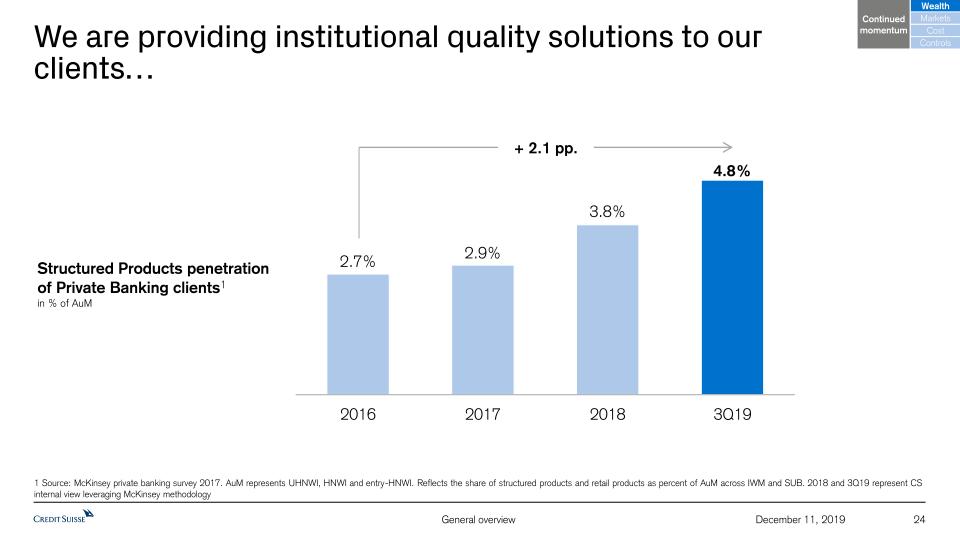
We are providing institutional quality solutions to our clients… 24 December 11, 2019 + 2.1 pp. 1 Source: McKinsey private banking survey 2017. AuM represents UHNWI, HNWI and entry-HNWI. Reflects the share of structured products and retail products as percent of AuM across IWM and SUB. 2018 and 3Q19 represent CS internal view leveraging McKinsey methodology Continued momentum Markets Wealth Cost Controls Structured Products penetration of Private Banking clients1in % of AuM
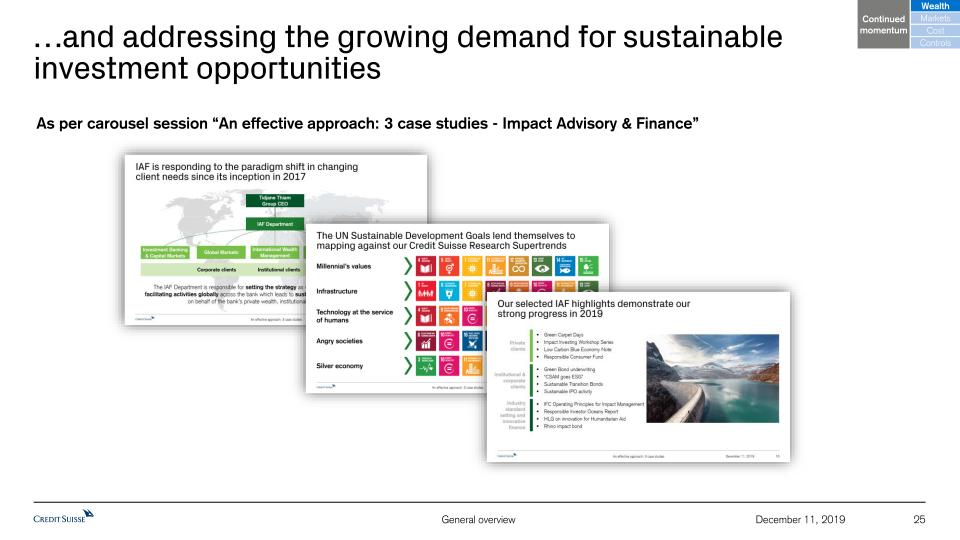
…and addressing the growing demand for sustainable investment opportunities 25 December 11, 2019 Continued momentum Markets Wealth Cost Controls As per carousel session “An effective approach: 3 case studies - Impact Advisory & Finance”
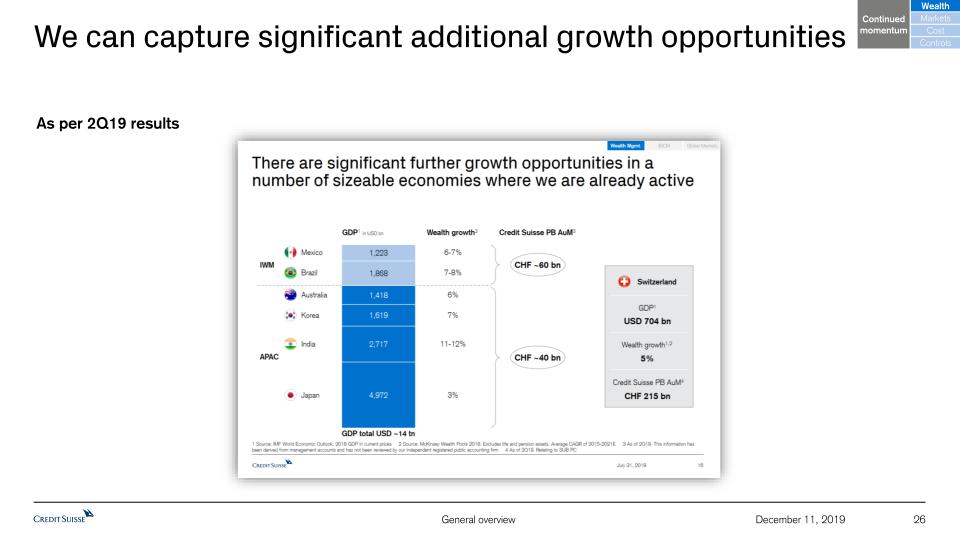
We can capture significant additional growth opportunities 26 December 11, 2019 As per 2Q19 results Continued momentum Markets Wealth Cost Controls
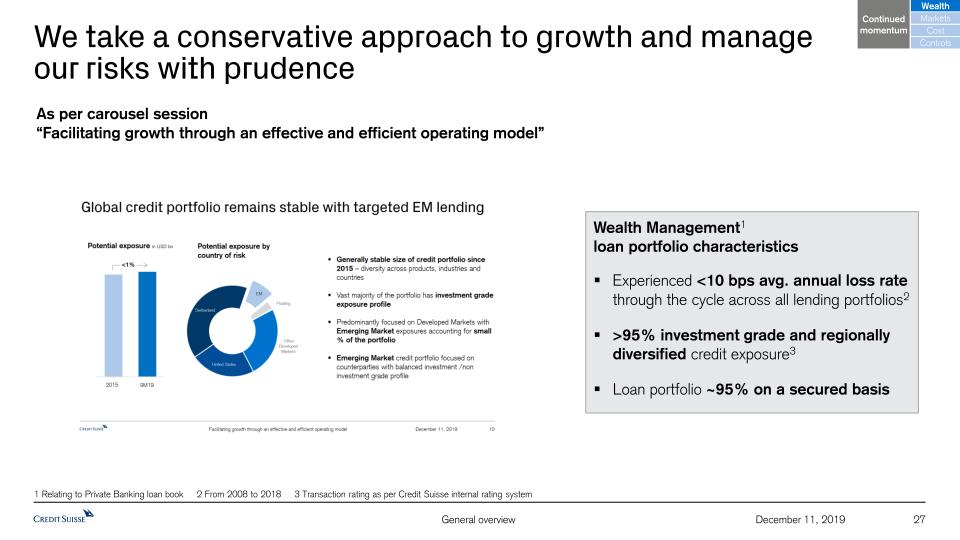
We take a conservative approach to growth and manage our risks with prudence 27 December 11, 2019 Continued momentum Markets Wealth Cost Controls As per carousel session “Facilitating growth through an effective and efficient operating model” Experienced <10 bps avg. annual loss rate through the cycle across all lending portfolios2>95% investment grade and regionally diversified credit exposure3Loan portfolio ~95% on a secured basis Wealth Management1 loan portfolio characteristics 1 Relating to Private Banking loan book 2 From 2008 to 2018 3 Transaction rating as per Credit Suisse internal rating system
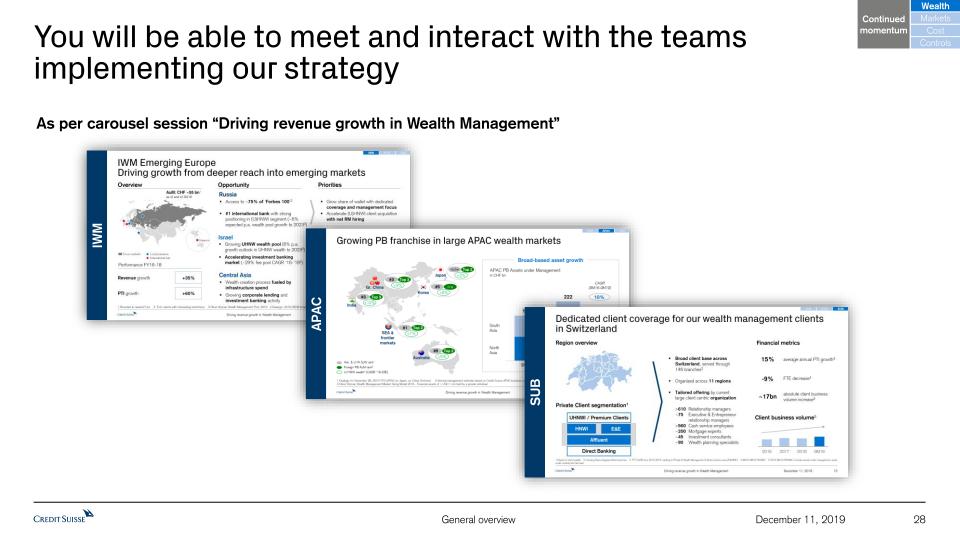
You will be able to meet and interact with the teams implementing our strategy 28 December 11, 2019 As per carousel session “Driving revenue growth in Wealth Management” Continued momentum Markets Wealth Cost Controls IWM IWM APAC APAC SUB SUB
We are continuing to drive profitable, compliant growth 29 December 11, 2019 1 Ratio of RWA to leverage exposure Maintaining momentumin a challenging market environment Market concerns Generating capital to reward shareholders and invest in profitable growth Strategic focus Creating consistently positive operating leverageGenerating continued productivity improvements Maintaining cost discipline Optimising operating model Swiss regulatory capital rebalancing substantially completed Continuing to invest in Risk management and effective Compliance & ControlsLeveraging technology front-to-back Driving TBVPS higher Achieving Swiss TBTF risk density1 of 34% in 1Q20De-risking completed Increasing return on tangible equity Our approach Leveraging our right-sized platform with strong capabilitiesContinuing to strengthen collaboration with Wealth Management Increasing profitability inour Markets businesses Growing revenues in Wealth Management Leveraging regionalised model and client proximity to scale asset base Compounding growth of recurring revenues Distributing capital to shareholders Distributing sustainable, growing ordinary dividendsReturning capital through share buybacks
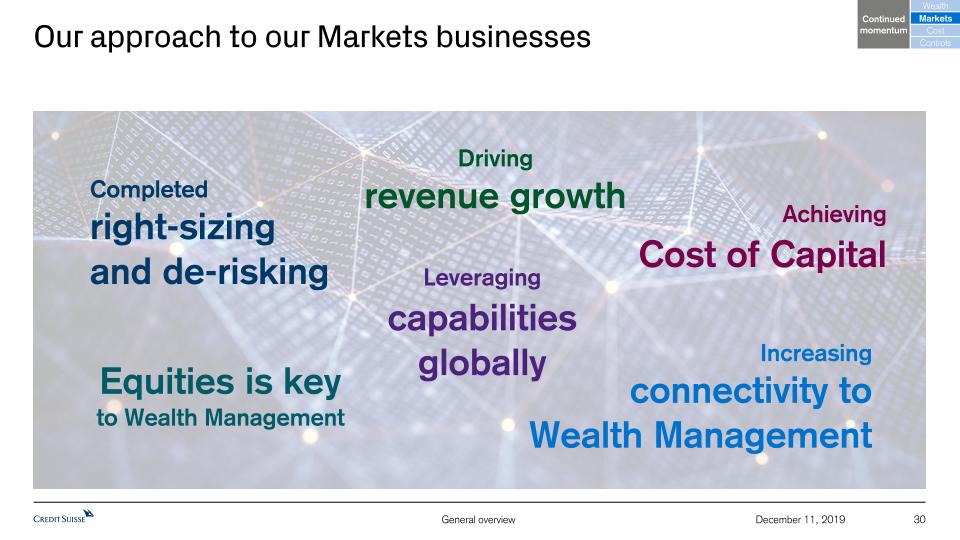
Our approach to our Markets businesses 30 December 11, 2019 Increasingconnectivity to Wealth Management Equities is keyto Wealth Management Drivingrevenue growth Completedright-sizingand de-risking Leveraging capabilitiesglobally Achieving Cost of Capital Continued momentum Markets Wealth Cost Controls
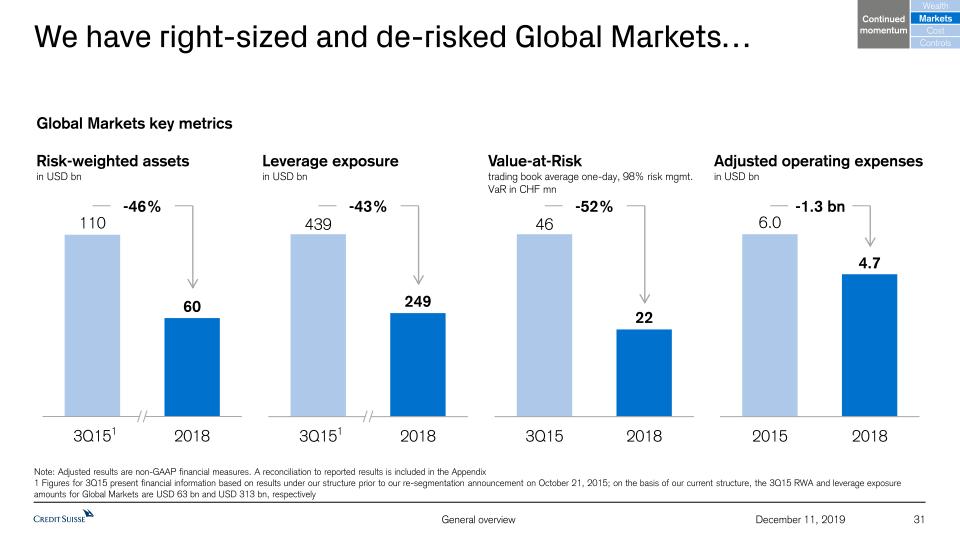
Risk-weighted assetsin USD bn We have right-sized and de-risked Global Markets… 31 December 11, 2019 -46% Note: Adjusted results are non-GAAP financial measures. A reconciliation to reported results is included in the Appendix1 Figures for 3Q15 present financial information based on results under our structure prior to our re-segmentation announcement on October 21, 2015; on the basis of our current structure, the 3Q15 RWA and leverage exposure amounts for Global Markets are USD 63 bn and USD 313 bn, respectively Global Markets key metrics Leverage exposurein USD bn Value-at-Risktrading book average one-day, 98% risk mgmt. VaR in CHF mn Adjusted operating expensesin USD bn 1 -43% 1 -52% -1.3 bn Continued momentum Markets Wealth Cost Controls
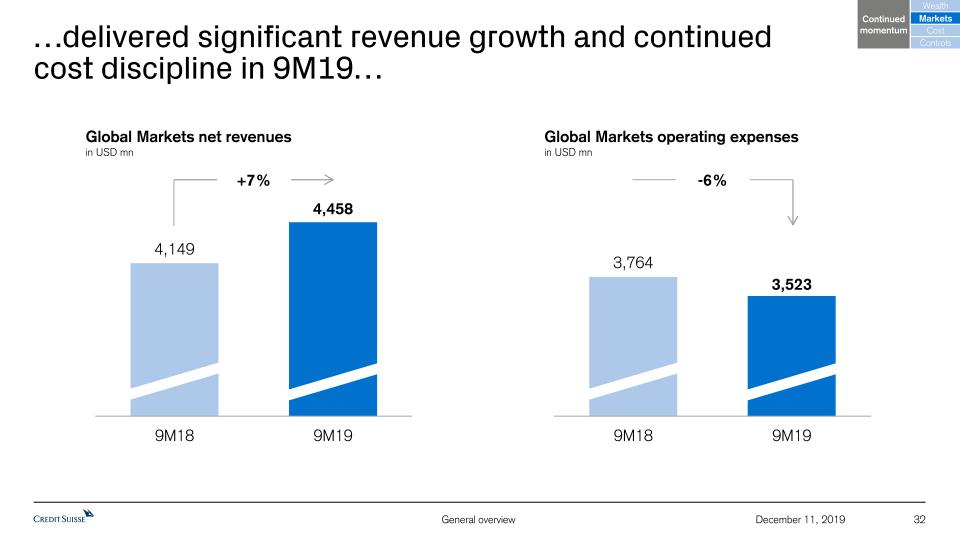
…delivered significant revenue growth and continuedcost discipline in 9M19… 32 December 11, 2019 Global Markets net revenuesin USD mn +7% Global Markets operating expensesin USD mn -6% Continued momentum Markets Wealth Cost Controls
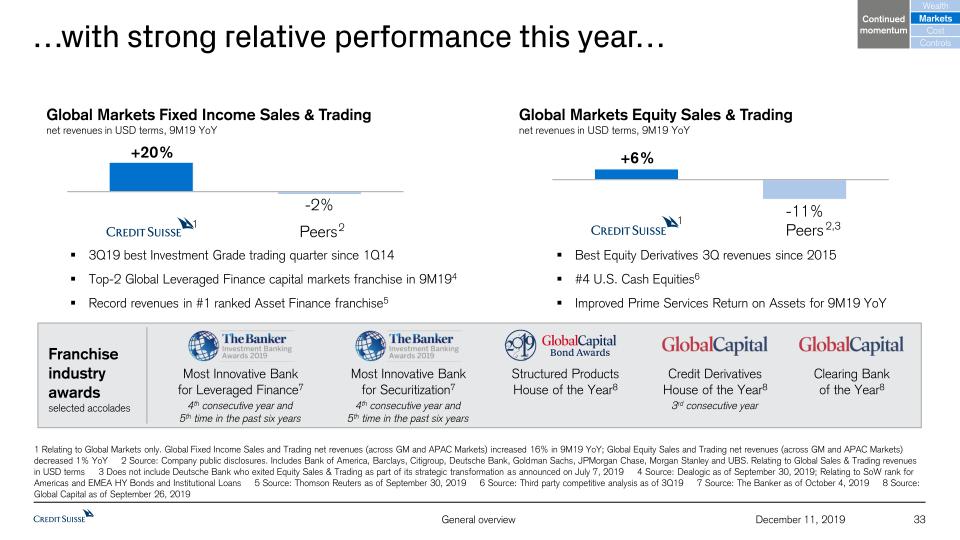
…with strong relative performance this year… 33 December 11, 2019 1 Relating to Global Markets only. Global Fixed Income Sales and Trading net revenues (across GM and APAC Markets) increased 16% in 9M19 YoY; Global Equity Sales and Trading net revenues (across GM and APAC Markets) decreased 1% YoY 2 Source: Company public disclosures. Includes Bank of America, Barclays, Citigroup, Deutsche Bank, Goldman Sachs, JPMorgan Chase, Morgan Stanley and UBS. Relating to Global Sales & Trading revenues in USD terms 3 Does not include Deutsche Bank who exited Equity Sales & Trading as part of its strategic transformation as announced on July 7, 2019 4 Source: Dealogic as of September 30, 2019; Relating to SoW rank for Americas and EMEA HY Bonds and Institutional Loans 5 Source: Thomson Reuters as of September 30, 2019 6 Source: Third party competitive analysis as of 3Q19 7 Source: The Banker as of October 4, 2019 8 Source: Global Capital as of September 26, 2019 3Q19 best Investment Grade trading quarter since 1Q14Top-2 Global Leveraged Finance capital markets franchise in 9M194Record revenues in #1 ranked Asset Finance franchise5 Best Equity Derivatives 3Q revenues since 2015#4 U.S. Cash Equities6Improved Prime Services Return on Assets for 9M19 YoY Global Markets Equity Sales & Tradingnet revenues in USD terms, 9M19 YoY 2 Global Markets Fixed Income Sales & Tradingnet revenues in USD terms, 9M19 YoY 2,3 1 1 Franchise industry awardsselected accolades Clearing Bankof the Year8 Structured ProductsHouse of the Year8 Most Innovative Bankfor Leveraged Finance7 4th consecutive year and5th time in the past six years Most Innovative Bankfor Securitization7 4th consecutive year and5th time in the past six years Credit DerivativesHouse of the Year8 3rd consecutive year Peers Peers Continued momentum Markets Wealth Cost Controls
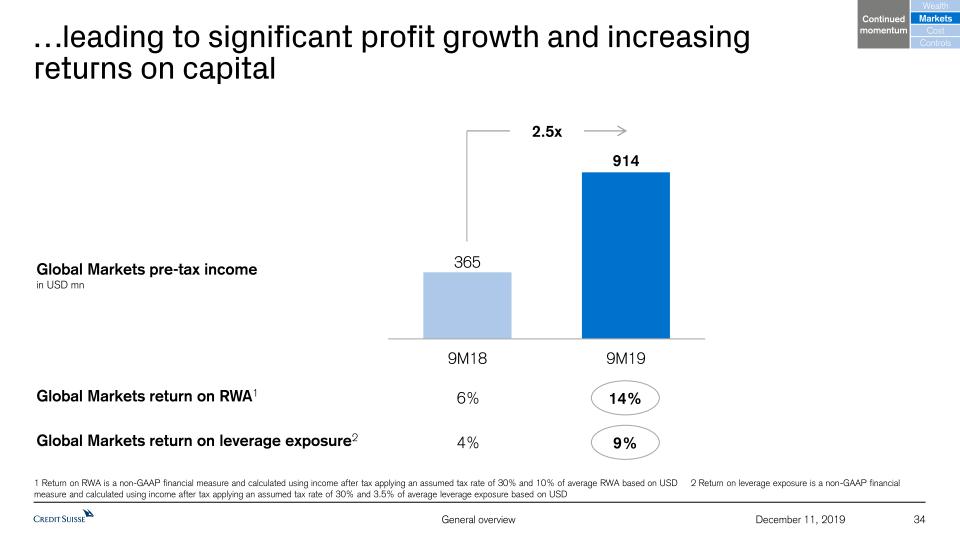
…leading to significant profit growth and increasing returns on capital 34 December 11, 2019 Global Markets pre-tax incomein USD mn 2.5x Global Markets return on RWA1 14% 6% Global Markets return on leverage exposure2 9% 4% 1 Return on RWA is a non-GAAP financial measure and calculated using income after tax applying an assumed tax rate of 30% and 10% of average RWA based on USD 2 Return on leverage exposure is a non-GAAP financial measure and calculated using income after tax applying an assumed tax rate of 30% and 3.5% of average leverage exposure based on USD Continued momentum Markets Wealth Cost Controls
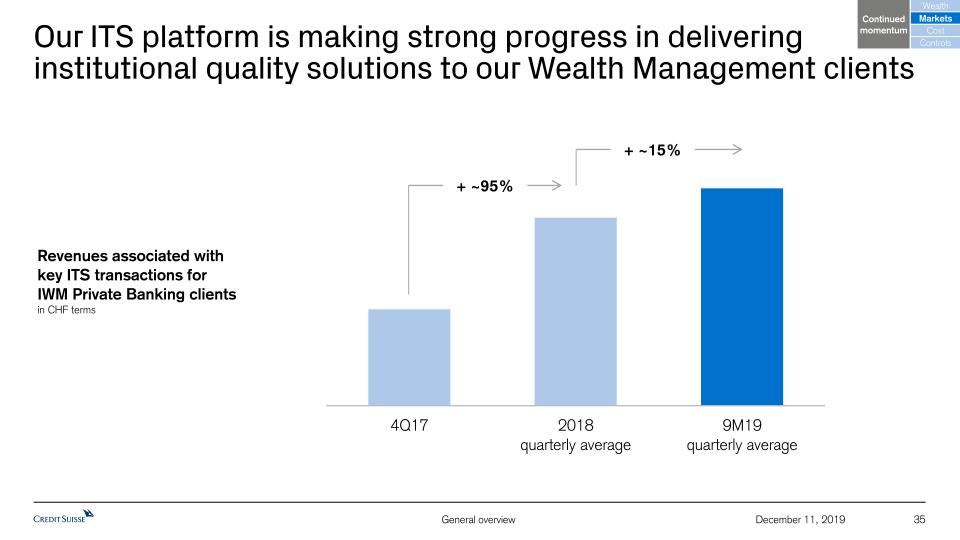
Our ITS platform is making strong progress in delivering institutional quality solutions to our Wealth Management clients 35 December 11, 2019 + ~95% + ~15% Continued momentum Markets Wealth Cost Controls Revenues associated withkey ITS transactions forIWM Private Banking clientsin CHF terms
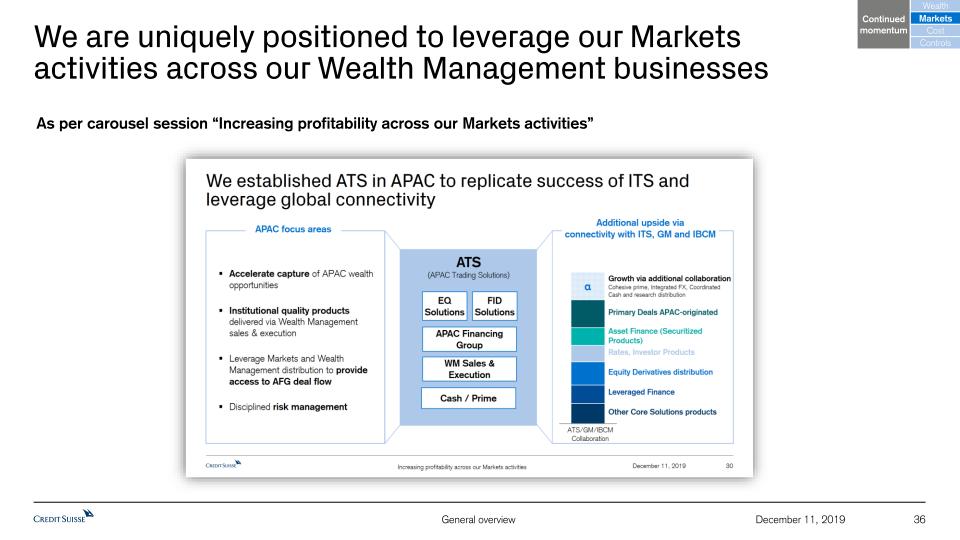
We are uniquely positioned to leverage our Markets activities across our Wealth Management businesses 36 December 11, 2019 As per carousel session “Increasing profitability across our Markets activities” Continued momentum Markets Wealth Cost Controls
Advisory and Underwriting is core to our strategy 37 December 11, 2019 Continued momentum Markets Wealth Cost Controls We have delivered 3 years of strong results since the announcement of our strategy in 2015 and we maintain leading market positions in ECM and Leveraged FinanceOur integrated approach to Wealth Management and Investment Banking has proven successful: #1 ranked in APAC1 and Switzerland in 20192New management under the leadership of David MillerWe will continue to invest in our IBCM franchise across the US and EMEAWe are implementing a number of M&A focused strategic initiatives expected to drive incrementalrevenues for 2020-2022 and our pipeline of announced deals has been improving strongly in 4Q19Expecting pre-tax loss for 2019 including early restructuring measures 1 Source: Dealogic for the period ending September 30, 2019. Relating to APAC ex-Japan and excluding China onshore. Includes USD, EUR and JPY currencies in DCM and Loans and excludes A shares in ECM 2 Source: Dealogic as of September 30, 2019
We are continuing to drive profitable, compliant growth 38 December 11, 2019 1 Ratio of RWA to leverage exposure Maintaining momentumin a challenging market environment Market concerns Generating capital to reward shareholders and invest in profitable growth Strategic focus Creating consistently positive operating leverageGenerating continued productivity improvements Maintaining cost discipline Optimising operating model Swiss regulatory capital rebalancing substantially completed Continuing to invest in Risk management and effective Compliance & ControlsLeveraging technology front-to-back Driving TBVPS higher Achieving Swiss TBTF risk density1 of 34% in 1Q20De-risking completed Increasing return on tangible equity Our approach Leveraging our right-sized platform with strong capabilitiesContinuing to strengthen collaboration with Wealth Management Increasing profitability inour Markets businesses Growing revenues in Wealth Management Leveraging regionalised model and client proximity to scale asset base Compounding growth of recurring revenues Distributing capital to shareholders Distributing sustainable, growing ordinary dividendsReturning capital through share buybacks
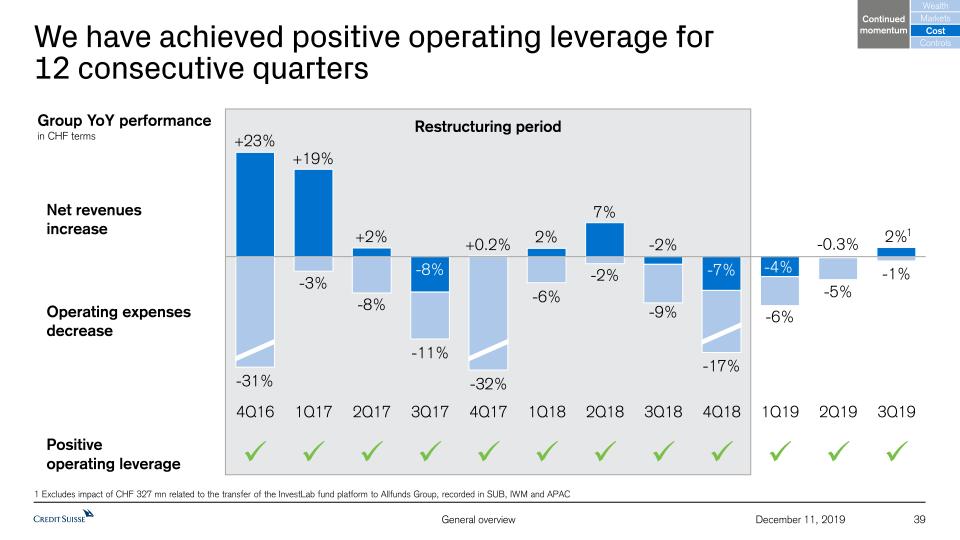
We have achieved positive operating leverage for 12 consecutive quarters 39 December 11, 2019 -31% -32% Positiveoperating leverage Group YoY performancein CHF terms Net revenuesincrease Operating expenses decrease -17% 1 Excludes impact of CHF 327 mn related to the transfer of the InvestLab fund platform to Allfunds Group, recorded in SUB, IWM and APAC 1 Restructuring period -11% Continued momentum Markets Wealth Cost Controls
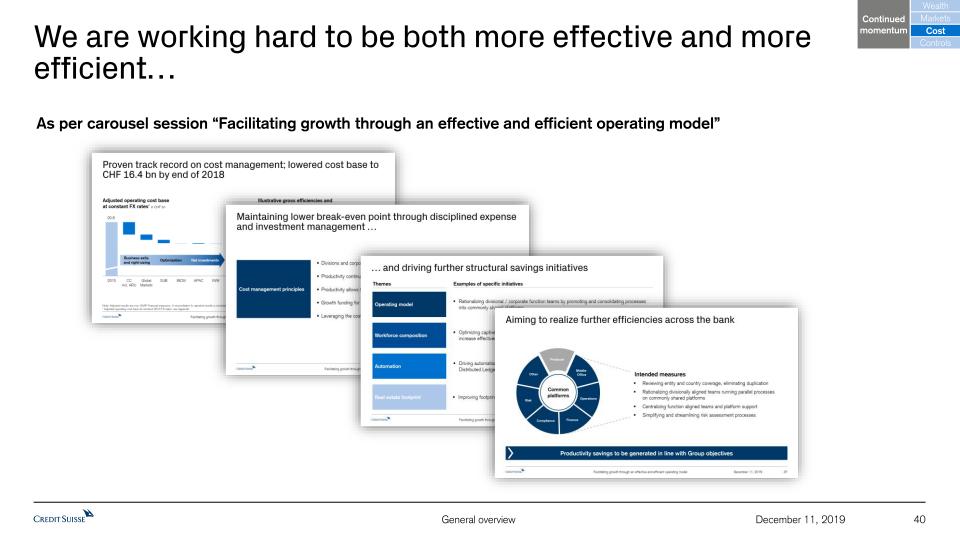
We are working hard to be both more effective and more efficient… 40 December 11, 2019 As per carousel session “Facilitating growth through an effective and efficient operating model” Continued momentum Markets Wealth Cost Controls
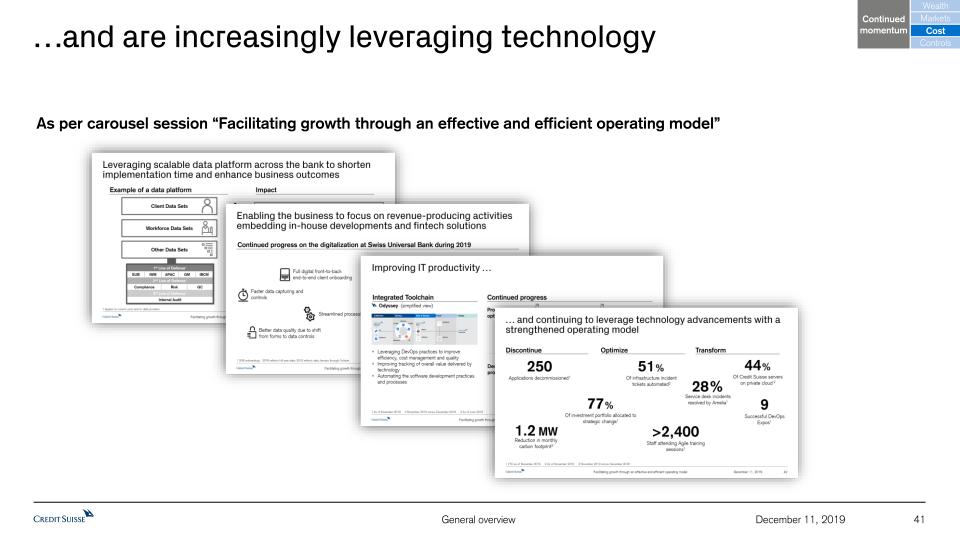
…and are increasingly leveraging technology 41 December 11, 2019 As per carousel session “Facilitating growth through an effective and efficient operating model” Continued momentum Markets Wealth Cost Controls
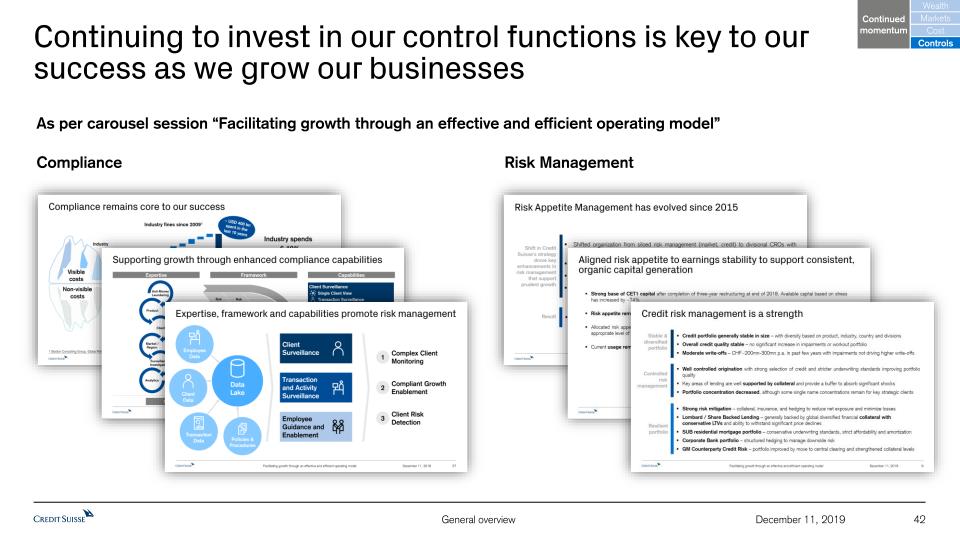
Continuing to invest in our control functions is key to our success as we grow our businesses 42 December 11, 2019 As per carousel session “Facilitating growth through an effective and efficient operating model” Compliance Risk Management Continued momentum Markets Wealth Cost Controls
Resilient business model - delivering profitable, compliant growth 2 Continued momentum in 2019 1 Agenda 43 December 11, 2019 Capital 3
As we have substantially rebalanced our Swiss regulatory capital metrics, we should benefit from more headroom 44 December 11, 2019 1 Ratio of RWA to leverage exposure Maintaining momentumin a challenging market environment Market concerns Generating capital to reward shareholders and invest in profitable growth Strategic focus Creating consistently positive operating leverageGenerating continued productivity improvements Maintaining cost discipline Optimising operating model Swiss regulatory capital rebalancing substantially completed Continuing to invest in Risk mgmt and effective Compliance & ControlsLeveraging technology front-to-back Driving TBVPS higher Achieving Swiss TBTF risk density1 of 34% in 1Q20De-risking completed Increasing return on tangible equity Our approach Leveraging our right-sized platform with strong capabilitiesContinuing to strengthen collaboration with Wealth Management Increasing profitability inour Markets businesses Growing revenues in Wealth Management Leveraging regionalised model and client proximity to scale asset base Compounding growth of recurring revenues Distributing capital to shareholders Distributing sustainable, growing ordinary dividendsReturning capital through share buybacks
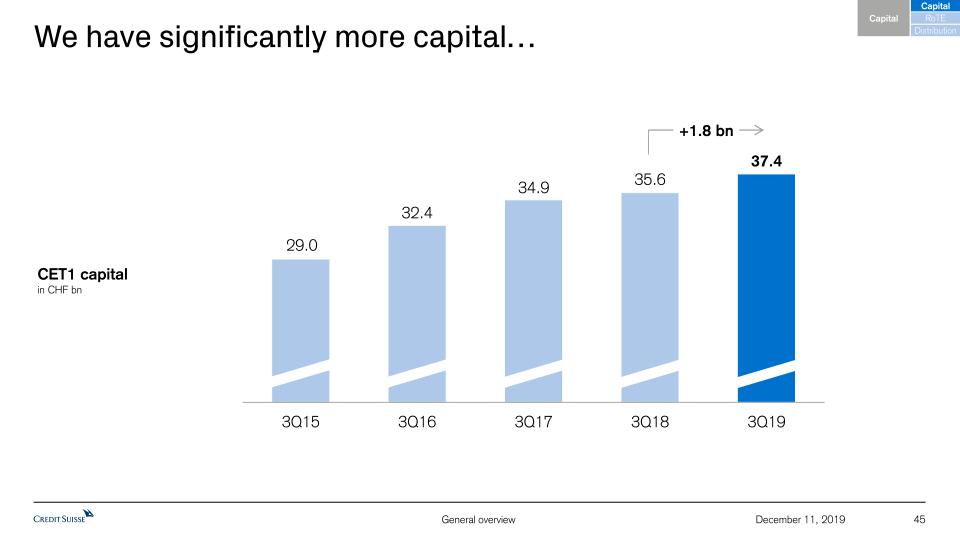
We have significantly more capital… 45 December 11, 2019 CET1 capitalin CHF bn +1.8 bn Capital RoTE Capital Distribution
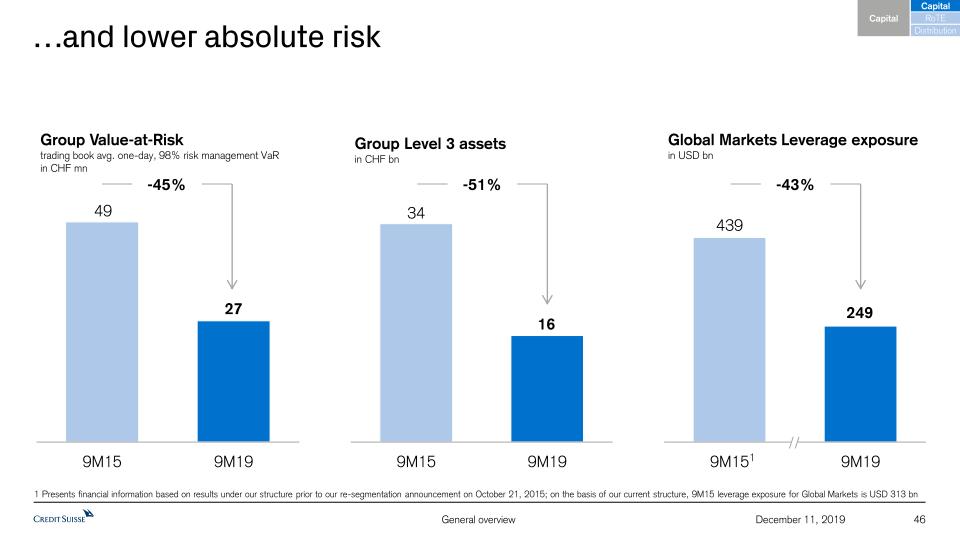
…and lower absolute risk 46 December 11, 2019 Group Value-at-Risktrading book avg. one-day, 98% risk management VaRin CHF mn -45% Group Level 3 assetsin CHF bn -51% Global Markets Leverage exposurein USD bn -43% Capital RoTE Capital Distribution 1 Presents financial information based on results under our structure prior to our re-segmentation announcement on October 21, 2015; on the basis of our current structure, 9M15 leverage exposure for Global Markets is USD 313 bn 1
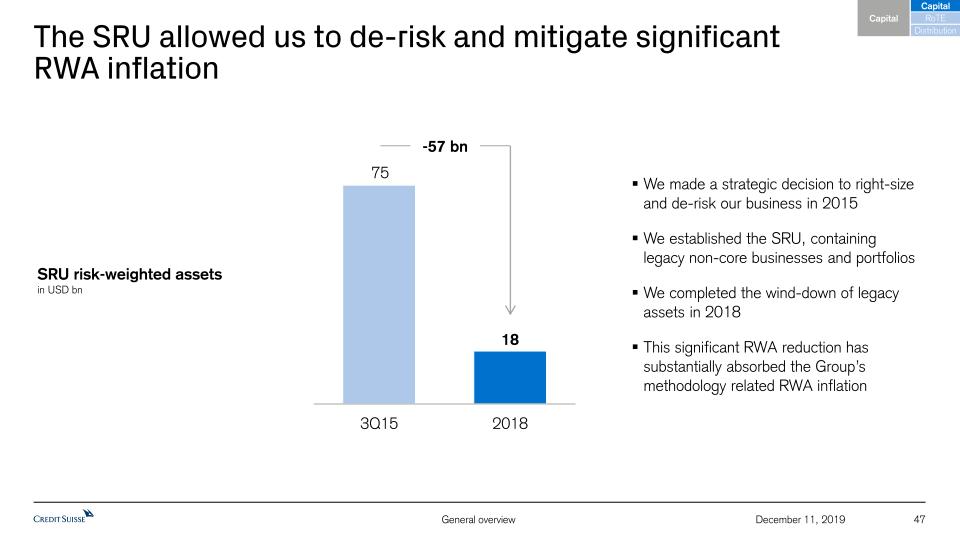
The SRU allowed us to de-risk and mitigate significant RWA inflation 47 December 11, 2019 SRU risk-weighted assetsin USD bn Capital RoTE Capital Distribution -57 bn 75 We made a strategic decision to right-size and de-risk our business in 2015We established the SRU, containinglegacy non-core businesses and portfoliosWe completed the wind-down of legacy assets in 2018This significant RWA reduction has substantially absorbed the Group’s methodology related RWA inflation
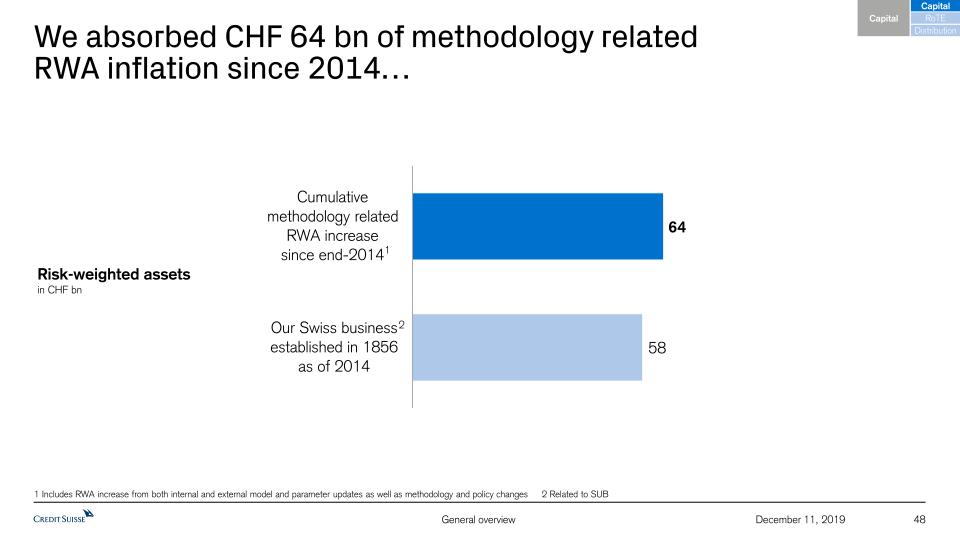
We absorbed CHF 64 bn of methodology relatedRWA inflation since 2014… 48 December 11, 2019 Risk-weighted assetsin CHF bn 1 Includes RWA increase from both internal and external model and parameter updates as well as methodology and policy changes 2 Related to SUB 2 Capital RoTE Capital Distribution 1
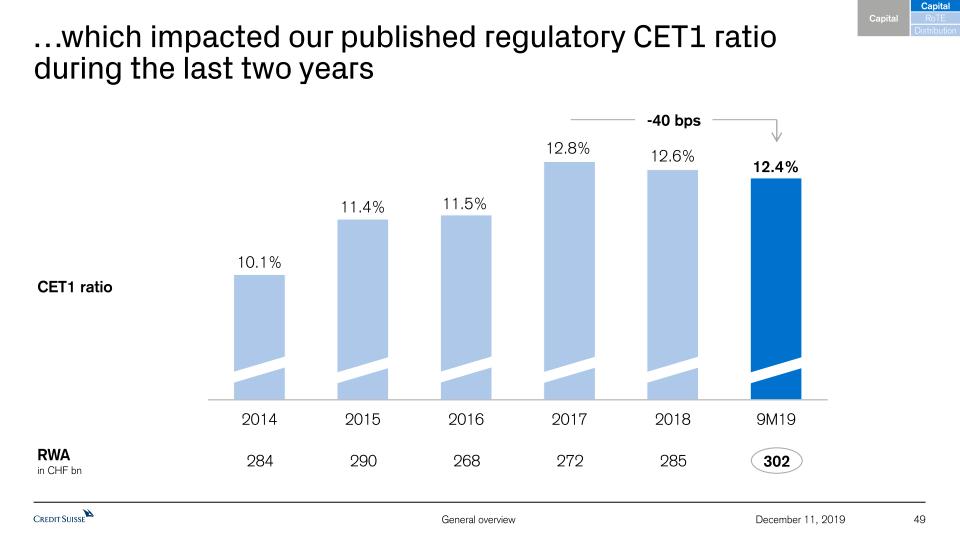
…which impacted our published regulatory CET1 ratio during the last two years 49 December 11, 2019 CET1 ratio -40 bps RWA in CHF bn 302 290 268 272 285 284 Capital RoTE Capital Distribution
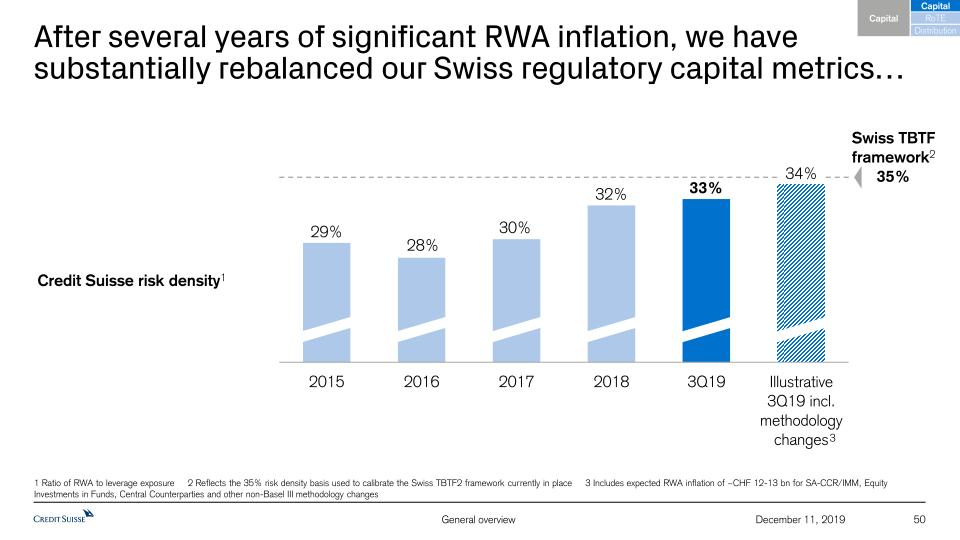
After several years of significant RWA inflation, we have substantially rebalanced our Swiss regulatory capital metrics… 50 December 11, 2019 1 Ratio of RWA to leverage exposure 2 Reflects the 35% risk density basis used to calibrate the Swiss TBTF2 framework currently in place 3 Includes expected RWA inflation of ~CHF 12-13 bn for SA-CCR/IMM, Equity Investments in Funds, Central Counterparties and other non-Basel III methodology changes Capital RoTE Capital Distribution Swiss TBTF framework235% Credit Suisse risk density1 3 34%
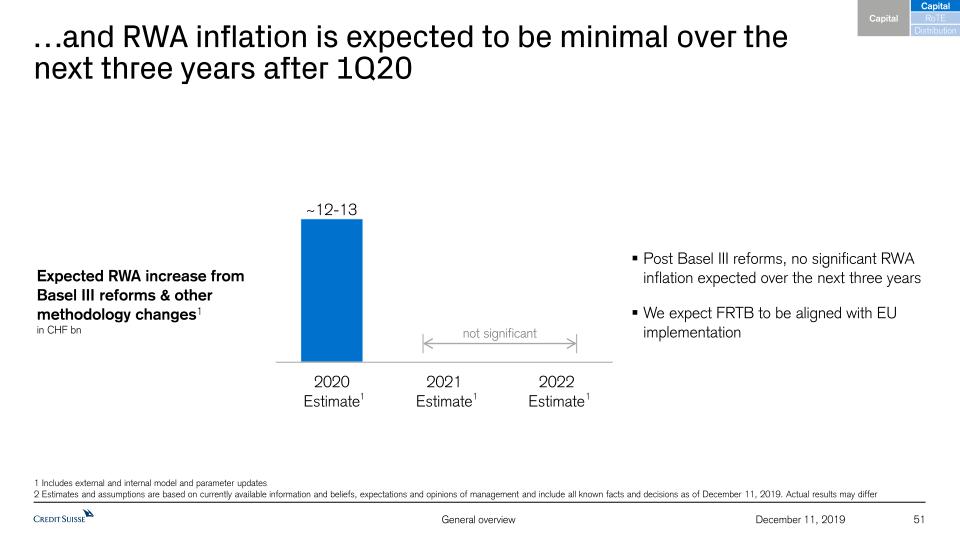
…and RWA inflation is expected to be minimal over the next three years after 1Q20 51 December 11, 2019 1 Includes external and internal model and parameter updates2 Estimates and assumptions are based on currently available information and beliefs, expectations and opinions of management and include all known facts and decisions as of December 11, 2019. Actual results may differ Expected RWA increase fromBasel III reforms & other methodology changes1in CHF bn Post Basel III reforms, no significant RWA inflation expected over the next three yearsWe expect FRTB to be aligned with EU implementation ~12-13 1 1 1 Capital RoTE Capital Distribution not significant
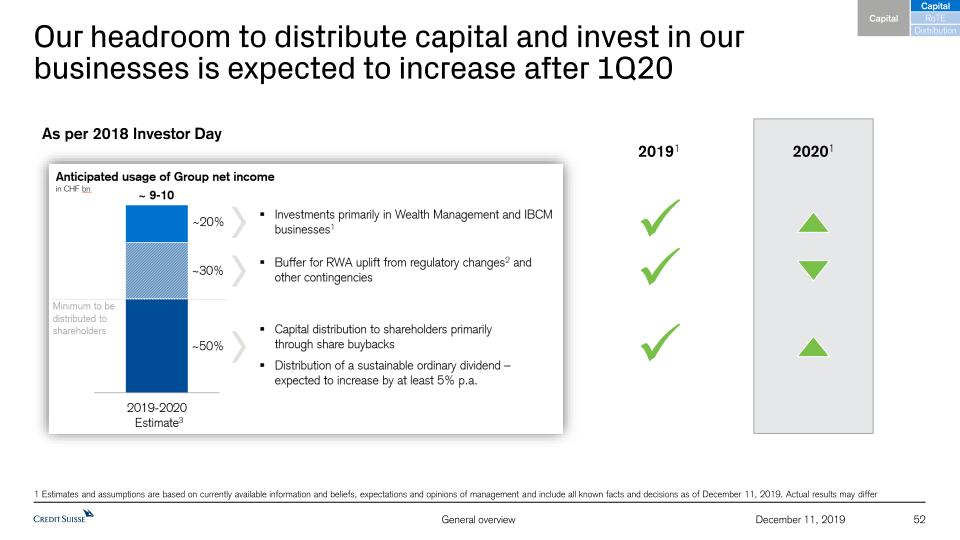
Our headroom to distribute capital and invest in our businesses is expected to increase after 1Q20 52 December 11, 2019 1 Estimates and assumptions are based on currently available information and beliefs, expectations and opinions of management and include all known facts and decisions as of December 11, 2019. Actual results may differ Capital RoTE Capital Distribution As per 2018 Investor Day 20191 20201
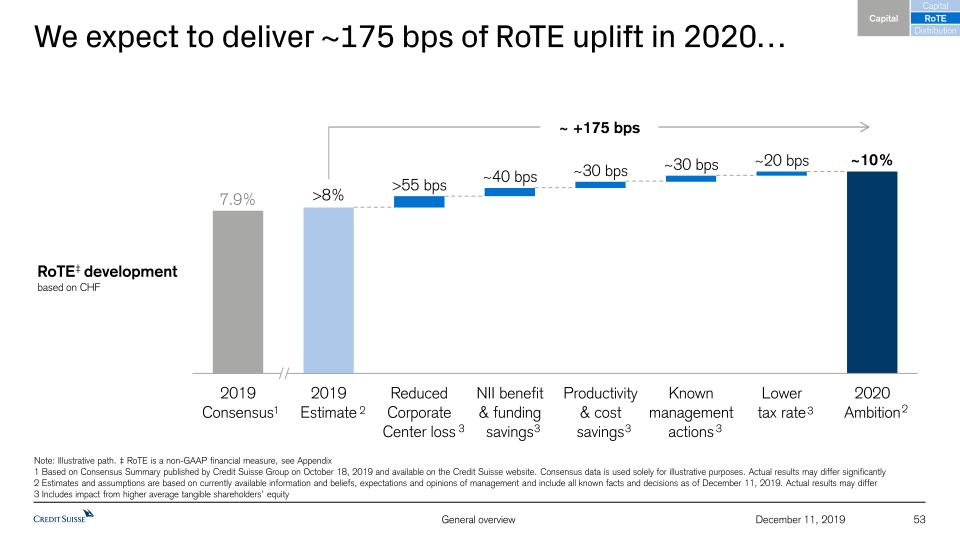
We expect to deliver ~175 bps of RoTE uplift in 2020… 53 December 11, 2019 Note: Illustrative path. ‡ RoTE is a non-GAAP financial measure, see Appendix1 Based on Consensus Summary published by Credit Suisse Group on October 18, 2019 and available on the Credit Suisse website. Consensus data is used solely for illustrative purposes. Actual results may differ significantly 2 Estimates and assumptions are based on currently available information and beliefs, expectations and opinions of management and include all known facts and decisions as of December 11, 2019. Actual results may differ 3 Includes impact from higher average tangible shareholders’ equity ~ +175 bps 1 3 2 3 2 3 Capital RoTE Capital Distribution RoTE‡ developmentbased on CHF 3 3
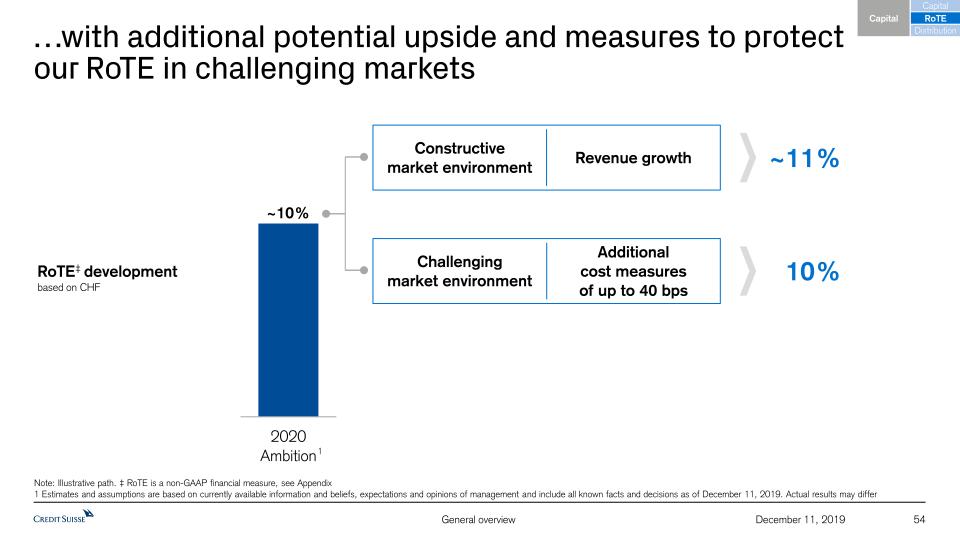
…with additional potential upside and measures to protect our RoTE in challenging markets 54 December 11, 2019 Constructive market environment Challenging market environment ~11% 10% Revenue growth Additional cost measuresof up to 40 bps Note: Illustrative path. ‡ RoTE is a non-GAAP financial measure, see Appendix1 Estimates and assumptions are based on currently available information and beliefs, expectations and opinions of management and include all known facts and decisions as of December 11, 2019. Actual results may differ ~10% RoTE‡ developmentbased on CHF 1 Capital RoTE Capital Distribution
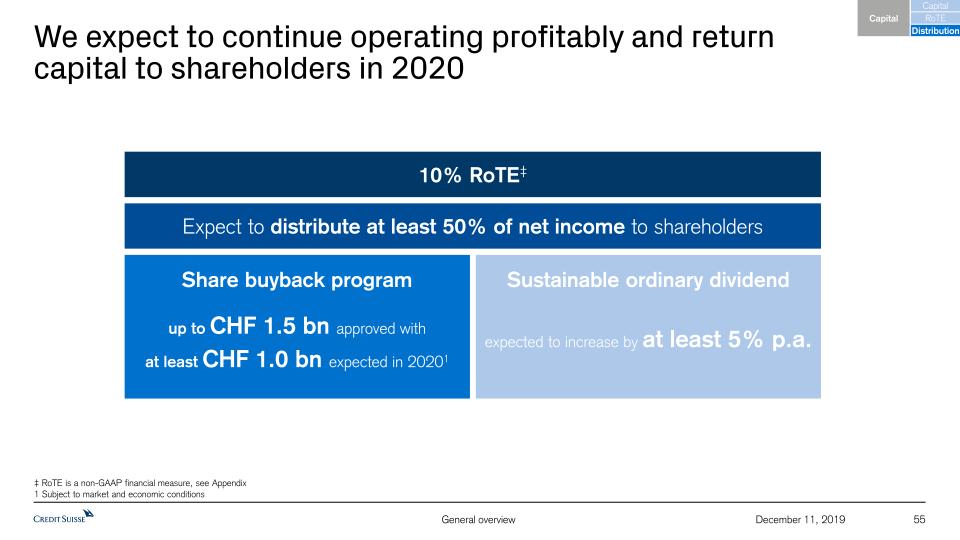
We expect to continue operating profitably and return capital to shareholders in 2020 55 December 11, 2019 Share buyback programup to CHF 1.5 bn approved withat least CHF 1.0 bn expected in 20201 Sustainable ordinary dividendexpected to increase by at least 5% p.a. ‡ RoTE is a non-GAAP financial measure, see Appendix1 Subject to market and economic conditions Capital RoTE Capital Distribution 10% RoTE‡ Expect to distribute at least 50% of net income to shareholders
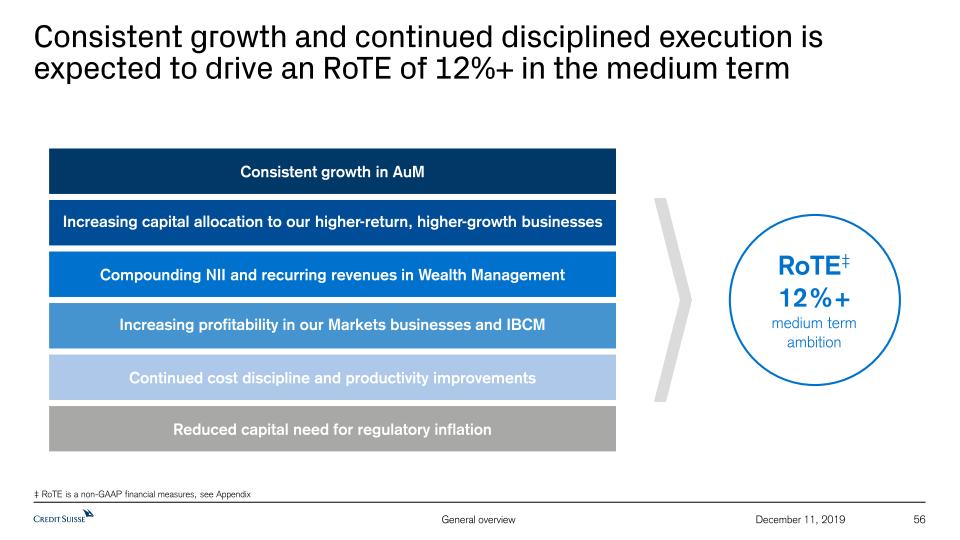
Consistent growth and continued disciplined execution is expected to drive an RoTE of 12%+ in the medium term 56 December 11, 2019 RoTE‡12%+medium term ambition Consistent growth in AuM Compounding NII and recurring revenues in Wealth Management Increasing profitability in our Markets businesses and IBCM Continued cost discipline and productivity improvements Reduced capital need for regulatory inflation ‡ RoTE is a non-GAAP financial measures, see Appendix Increasing capital allocation to our higher-return, higher-growth businesses
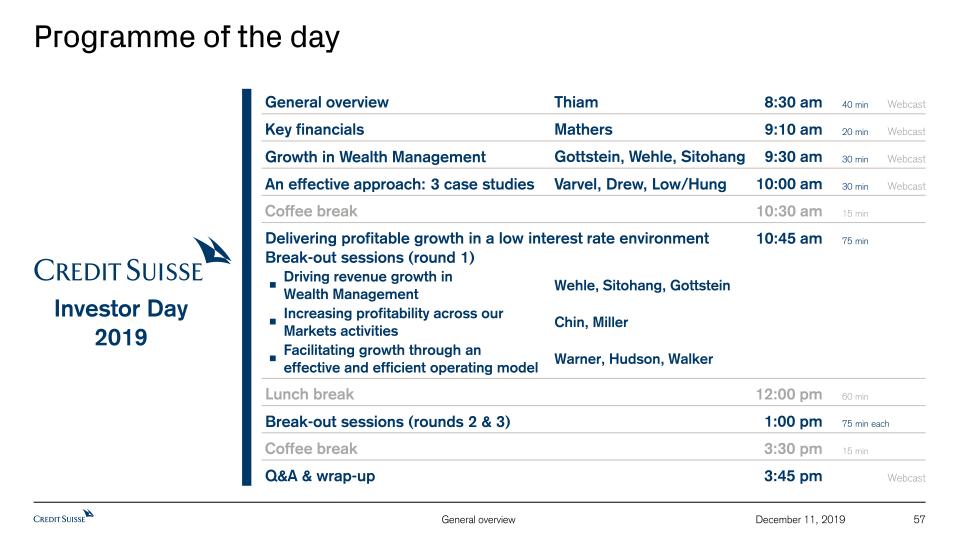
57 December 11, 2019 Programme of the day Q&A & wrap-up Webcast 3:45 pm Investor Day 2019 Lunch break 12:00 pm 60 min Coffee break 3:30 pm 15 min General overview Webcast 8:30 am Thiam 40 min Coffee break 10:30 am 15 min Key financials Webcast 9:10 am 20 min Mathers Growth in Wealth Management Webcast 9:30 am Gottstein, Wehle, Sitohang 30 min Break-out sessions (rounds 2 & 3) 1:00 pm 75 min each Wehle, Sitohang, Gottstein Driving revenue growth in Wealth Management Chin, Miller Increasing profitability across our Markets activities Warner, Hudson, Walker Facilitating growth through an effective and efficient operating model 10:45 am 75 min Delivering profitable growth in a low interest rate environmentBreak-out sessions (round 1) An effective approach: 3 case studies Webcast 10:00 am Varvel, Drew, Low/Hung 30 min

Appendix 58 December 11, 2019
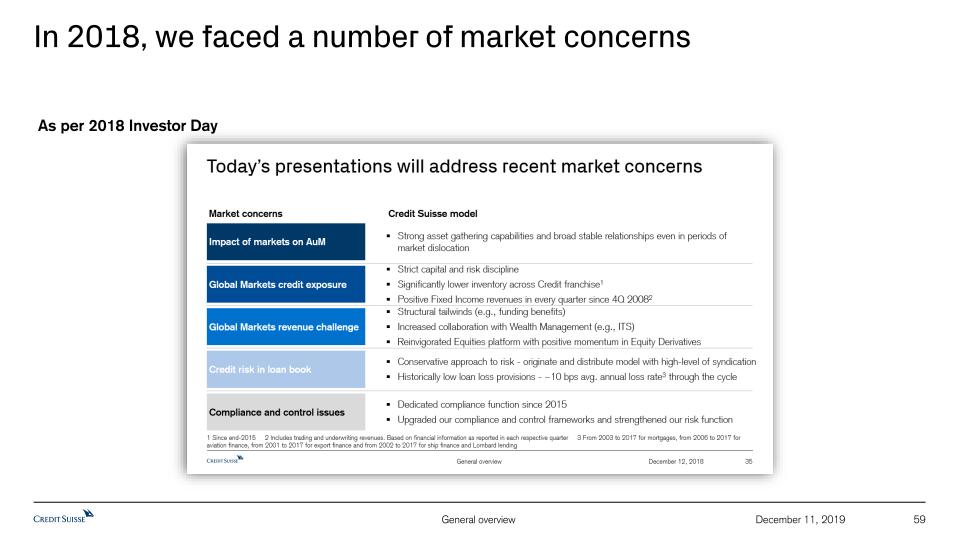
In 2018, we faced a number of market concerns 59 December 11, 2019 As per 2018 Investor Day

Reconciliation of adjustment items (1/2) 60 December 11, 2019 Adjusted results are non-GAAP financial measures that exclude certain items included in our reported results. During the implementation of our strategy, it was important to measure the progress achieved by our underlying business performance. Management believes that adjusted results provide a useful presentation of our operating results for purposes of assessing our Group and divisional performance consistently over time, on a basis that excludes items that management does not consider representative of our underlying performance. Provided below is a reconciliation of our adjusted results to the most directly comparable US GAAP measures. Group in CHF mn 9M19 9M18 9M17 9M16 2018 2015 Total operating expenses reported 12,610 13,156 13,892 15,028 17,303 25,895 Goodwill impairment - - - - - -3,797 Restructuring expenses - -490 -318 -491 -626 -355 Major litigation provisions -63 -162 -238 -306 -244 -820 Expenses related to real estate disposals -51 - - - -51 - Expenses related to business sales - -3 - - - - Debit valuation adjustments (DVA) -21 14 -63 46 45 -33 Total operating cost base adjusted 12,475 12,515 13,273 14,277 16,427 20,890 FX adjustment -42 - 27 -68 - -135 Total operating cost base adjusted at constant 2018 FX 12,433 12,515 13,300 14,209 16,427 20,755

Reconciliation of adjustment items (2/2) 61 December 11, 2019 Adjusted results are non-GAAP financial measures that exclude certain items included in our reported results. During the implementation of our strategy, it was important to measure the progress achieved by our underlying business performance. Management believes that adjusted results provide a useful presentation of our operating results for purposes of assessing our Group and divisional performance consistently over time, on a basis that excludes items that management does not consider representative of our underlying performance. Provided below is a reconciliation of our adjusted results to the most directly comparable US GAAP measures. GM in USD mn 2018 2015 5,115 7,124 - - - - 5,115 7,124 24 11 4,922 9,004 - -2,690 -246 -97 -10 -240 - - 4,666 5,977 169 -1,891 256 3,027 425 1,136 SUB in CHF mn 9M19 9M18 2018 2017 2016 20151 Net revenues reported 4,272 4,191 5,564 5,396 5,759 5,573 Real estate gains -117 -15 -21 - -366 -95 Gains (-)/losses on business sales - -37 -37 - - -23 Net revenues adjusted 4,155 4,139 5,506 5,396 5,393 5,455 Provision for credit losses 67 100 126 75 79 138 Total operating expenses reported 2,394 2,464 3,313 3,556 3,655 3,785 Goodwill impairment - - - - - - Restructuring expenses - -80 -101 -59 -60 -42 Major litigation provisions -3 -2 -37 -49 -19 -25 Expenses related to real estate disposals -10 - - - - - Total operating expenses adjusted 2,381 2,382 3,175 3,448 3,576 3,718 Pre-tax income/loss (-) reported 1,811 1,627 2,125 1,765 2,025 1,650 Total adjustments -104 30 80 108 -287 -51 Pre-tax income/loss (-) adjusted 1,707 1,657 2,205 1,873 1,738 1,599 1 Excludes net revenues and total operating expenses for Swisscard of CHF 148 mn and CHF 123 mn, respectively

62 December 11, 2019 Notes (1/2) For reconciliation of adjusted to reported results, refer to the Appendix of this Investor Day 2019 presentationThroughout the presentation rounding differences may occurUnless otherwise noted, all CET1 capital, CET1 ratio, Tier 1 leverage ratio, risk-weighted assets and leverage exposure figures shown in this presentation for periods prior to 2019 are as of the end of the respective period and on a “look-through” basisGross and net margins are shown in basis pointsGross margin = net revenues annualized / average AuM; net margin = pre-tax income annualized / average AuMMandate penetration reflects advisory and discretionary mandate volumes as a percentage of AuM, excluding those from the external asset manager business General notes Specific notes * Following the successful completion of our restructuring program in 2018, we updated our calculation approach for adjusted operating cost base at constant FX rates. Beginning in 1Q19, adjusted operating cost base at constant FX rates includes adjustments for major litigation provisions, expenses related to real estate disposals and business sales as well as for debit valuation adjustments (DVA) related volatility and FX, but not for restructuring expenses and certain accounting changes. Adjustments for FX apply unweighted 2018 currency exchange rates, i.e., a straight line average of monthly rates, consistently for the periods under review. Under the current presentation, adjusted operating cost base at constant FX rates for periods prior to 1Q19 still include adjustments for restructuring expenses and a goodwill impairment taken in 4Q15, but no longer include an adjustment for certain accounting changes. Beginning in 1Q20, adjustments for FX will apply unweighted 2019 currency exchange rates.† Regulatory capital is calculated as the worst of 10% of RWA and 3.5% of leverage exposure. Return on regulatory capital (a non-GAAP financial measure) is calculated using income/(loss) after tax and assumes a tax rate of 30% and capital allocated based on the worst of 10% of average RWA and 3.5% of average leverage exposure. For the Markets business within the APAC division and for the Global Markets and Investment Banking & Capital Markets divisions, return on regulatory capital is based on US dollar denominated numbers. Adjusted return on regulatory capital is calculated using adjusted results, applying the same methodology to calculate return on regulatory capital. ‡ Return on tangible equity is based on tangible shareholders’ equity, a non-GAAP financial measure, which is calculated by deducting goodwill and other intangible assets from total shareholders’ equity as presented in our balance sheet. Tangible book value, a non-GAAP financial measure, is equal to tangible shareholders’ equity. Tangible book value per share is a non-GAAP financial measure, which is calculated by dividing tangible shareholders’ equity by total number of shares outstanding. Management believes that tangible shareholders’ equity/tangible book value, return on tangible equity and tangible book value per share are meaningful as they are measures used and relied upon by industry analysts and investors to assess valuations and capital adequacy. For end-4Q17, tangible shareholders’ equity excluded goodwill of CHF 4,742 mn and other intangible assets of CHF 223 mn from total shareholders’ equity of CHF 41,902 mn as presented in our balance sheet. For end-1Q18, tangible shareholders’ equity excluded goodwill of CHF 4,667 mn and other intangible assets of CHF 212 mn from total shareholders’ equity of CHF 42,540 mn as presented in our balance sheet. For end-2Q18, tangible shareholders’ equity excluded goodwill of CHF 4,797 mn and other intangible assets of CHF 212 mn from total shareholders’ equity of CHF 43,470 mn as presented in our balance sheet. For end-3Q18, tangible shareholders’ equity excluded goodwill of CHF 4,736 mn and other intangible assets of CHF 214 mn from total shareholders’ equity of CHF 42,734 mn as presented in our balance sheet. For end-4Q18, tangible shareholders’ equity excluded goodwill of CHF 4,766 mn and other intangible assets of CHF 219 mn from total shareholders’ equity of CHF 43,922 mn as presented in our balance sheet. For end-1Q19, tangible shareholders’ equity excluded goodwill of CHF 4,807 mn and other intangible assets of CHF 224 mn from total shareholders’ equity of CHF 43,825 mn as presented in our balance sheet. For end-2Q19, tangible shareholders’ equity excluded goodwill of CHF 4,731 mn and other intangible assets of CHF 216 mn from total shareholders’ equity of CHF 43,673 mn as presented in our balance sheet. For end-3Q19, tangible shareholders’ equity excluded goodwill of CHF 4,760 mn and other intangible assets ofCHF 219 mn from total shareholders’ equity of CHF 45,150 mn as presented in our balance sheet. Shares outstanding were 2,550.3 mn at end-4Q17, 2,552.4 mn at end-3Q18, 2,550.6 mn at end-4Q18 and 2,473.8 mn at end-3Q19.

Notes (2/2) 63 December 11, 2019 Abbreviations ABL = Asset Based Lending; Abs. = Absolute; Adj. = Adjusted; AFG = Asia Pacific Financing Group; AM = Asset Management; Ann. = Annualized;APAC = Asia Pacific; Approx. = Approximately; ARC = Asset Risk Consultants; ARU = Asset Resolution Unit; ATS = APAC Trading Solutions; AuM = Assets under Management; Avg.= Average; BCBS = Basel Committee on Banking Supervision; BEAT = Base Erosion and Anti-Abuse Tax; BfE = Bank for Entrepreneurs; BHC = Bank Holding Company; BIS = Bank for International Settlements; bps = basis points; CAGR = Compound Annual Growth Rate; CBG = Corporate Bank Group; CC = Corporate Center; CCO = Chief Compliance Officer; CCRO = Chief Compliance and Regulatory Affairs Officer; CET1 = Common Equity Tier 1;CH = Switzerland; C/I = Cost/Income; C&IC = Corporate and Institutional Clients; CIC = Corporate & Institutional Clients; CLO = Collateralized Loan Obligation; CRO = Chief Risk Officer; CSAM = Credit Suisse Asset Management; DCM = Debt Capital Markets; DevOps = Development-to-Operations; DPS = Dividend Per Share; E = Estimate; EAM = External Asset Manager; ECA = Export Credit Agency; ECM = Equity Capital Markets; E&E = Entrepreneurs & Executives;EMEA = Europe, Middle East & Africa; ESG = Environmental Social and Governance; Est. = Estimate; EU = European Union; Excl. = Exclude; FID = Fixed Income Department; FI&WM = Fixed Income Wealth Management; FRTB = Fundamental Review of the Trading Book; FX = Foreign Exchange; FY = Full Year; GC = General Counsel; GCP = Global Credit Products; GM = Global Markets; GMV = Gross Market Value; GYB = Global Yield Balanced; HLG = High Level Group; HR = Human Resources; HY = High Yield; IAF = Impact Advisory & Finance; IB = Investment Banking; IBCM = Investment Banking & Capital Markets; IBOR = Interbank Offer Rate; IFC = International Finance Corporation; IG = Investment Grade; ILS = Insurance-Linked Strategies; IMM = Internal Model Method;incl. = including; IPO = Initial Public Offering; IRB = Internal Ratings-Based Approach; IT = Information Technology; ITS = International Trading Solutions;IWM = International Wealth Management; LDI = Liability-driven investments; Lev Fin = Leveraged Finance; LTD = Long-term debt; LTM = Last Twelve Months; LTV = Loan to Value; M&A = Mergers & Acquisitions; MREL = Minimum Requirement for own funds and Eligible Liabilities; NIG = Non investment grade;NNA = Net new assets; NRI = Non-resident Indians; Op Risk = Operational Risk; OTC = Over the Counter; p.a. = per annum; PB = Private Banking;PB&WM = Private Banking & Wealth Management; PC = Private Clients; PD = probability of default; p.p. = percentage points; PTI = Pre-tax income;QIS = Quantitative Investment Strategies; QoQ = Quarter over Quarter; QT = Quantitative Trading; RBL = Reserve Based Lending; RM = Relationship Manager(s); RoRC = Return on Regulatory Capital; RoTE= Return on Tangible Equity; RSA = Revenue Sharing Agreement; RWA = Risk-weighted assets;SA-CCR = Standardized Approach to Counterparty Credit Risk; SBL = Share Backed Lending; SCP = Strategic Client Partner; SEA = South East Asia;SME = Small and Medium-Sized Enterprises; SNB = Swiss National Bank; SoW = Share of Wallet; SP = Securitized Products; STBs = Sustainable Transition Bonds; SUB = Swiss Universal Bank; TBVPS = Tangible book value per share; TLAC = Total Loss-Absorbing Capacity; TLOF = Total Liabilities and Own Funds; TMT = Technology, Media and Telecommunications; (U)HNW(I) = (Ultra) High Net Worth (Individuals); U/W = Underwriting; US GAAP = United States Generally Accepted Accounting Principles; WM&C = Wealth Management & Connected; YoY = Year over year; YTD = Year to Date

December 11, 2019 64
Credit Suisse Investor Day 2019Key Financials David Mathers, Chief Financial OfficerDecember 11, 2019
Disclaimer 2 December 11, 2019 This material does not purport to contain all of the information that you may wish to consider. This material is not to be relied upon as such or used in substitution for the exercise of independent judgment.Cautionary statement regarding forward-looking statementsThis presentation contains forward-looking statements that involve inherent risks and uncertainties, and we might not be able to achieve the predictions, forecasts, projections and other outcomes we describe or imply in forward-looking statements. A number of important factors could cause results to differ materially from the plans, targets, goals, expectations, estimates and intentions we express in these forward-looking statements, including those we identify in "Risk factors” in our Annual Report on Form 20-F for the fiscal year ended December 31, 2018 and in the “Cautionary statement regarding forward-looking information" in our media release relating to Investor Day, published on December 11, 2019 and filed with the US Securities and Exchange Commission, and in other public filings and press releases. We do not intend to update these forward-looking statements. In particular, the terms “Estimate”, “Illustrative”, “Ambition”, “Objective”, “Outlook” and “Goal” are not intended to be viewed as targets or projections, nor are they considered to be Key Performance Indicators. All such estimates, illustrations, ambitions, objectives, outlooks and goals are subject to a large number of inherent risks, assumptions and uncertainties, many of which are completely outside of our control. These risks, assumptions and uncertainties include, but are not limited to, general market conditions, market volatility, interest rate volatility and levels, global and regional economic conditions, political uncertainty, changes in tax policies, regulatory changes, changes in levels of client activity as a result of any of the foregoing and other factors. Accordingly, this information should not be relied on for any purpose. We do not intend to update these estimates, illustrations, ambitions, objectives, outlooks or goals. We may not achieve the benefits of our strategic initiativesWe may not achieve all of the expected benefits of our strategic initiatives. Factors beyond our control, including but not limited to the market and economic conditions, changes in laws, rules or regulations and other challenges discussed in our public filings, could limit our ability to achieve some or all of the expected benefits of these initiatives. Estimates and assumptionsIn preparing this presentation, management has made estimates and assumptions that affect the numbers presented. Actual results may differ. Annualized numbers do not take into account variations in operating results, seasonality and other factors and may not be indicative of actual, full-year results. Figures throughout this presentation may also be subject to rounding adjustments. All opinions and views constitute judgments as of the date of writing without regard to the date on which the reader may receive or access the information. This information is subject to change at any time without notice and we do not intend to update this information. Cautionary statements relating to interim financial informationThis presentation contains certain unaudited interim financial information for the fourth quarter of 2019. This information has been derived from management accounts, is preliminary in nature, does not reflect the complete results of the fourth quarter of 2019 or the full year 2019 and is subject to change, including as a result of any normal quarterly adjustments in relation to the financial statements for the full year 2019. This information has not been subject to any review by our independent registered public accounting firm. There can be no assurance that the final results for these periods will not differ from these preliminary results, and any such differences could be material. Quarterly financial results for the fourth quarter of 2019 and full year results will be included in our 4Q19 Earnings Release and our 2019 Annual Report. Statement regarding non-GAAP financial measuresThis presentation also contains non-GAAP financial measures, including adjusted results as well as return on regulatory capital, return on tangible equity and tangible book value per share (which are based on tangible shareholders’ equity). Information needed to reconcile such non-GAAP financial measures to the most directly comparable measures under US GAAP can be found in this presentation in the Appendix, which is available on our website at www.credit-suisse.com.Our estimates, ambitions, objectives and targets often include metrics that are non-GAAP financial measures and are unaudited. A reconciliation of the estimates, ambitions, objectives and targets to the nearest GAAP measures is unavailable without unreasonable efforts. Adjusted results exclude goodwill impairment, major litigation provisions, real estate gains and other revenue and expense items included in our reported results, all of which are unavailable on a prospective basis. Return on Tangible Equity is based on tangible shareholders' equity (also known as tangible book value), a non-GAAP financial measure, which is calculated by deducting goodwill and other intangible assets from total shareholders' equity as presented in our balance sheet, both of which are unavailable on a prospective basis. Tangible book value per share excludes the impact of any dividends paid during the performance period, share buybacks, own credit movements, foreign exchange rate movements and pension-related impacts, all of which are unavailable on a prospective basis. Such estimates, ambitions, objectives and targets are calculated in a manner that is consistent with the accounting policies applied by us in preparing our financial statements.Statement regarding capital, liquidity and leverageCredit Suisse is subject to the Basel III framework, as implemented in Switzerland, as well as Swiss legislation and regulations for systemically important banks (Swiss Requirements), which include capital, liquidity, leverage and large exposure requirements and rules for emergency plans designed to maintain systemically relevant functions in the event of threatened insolvency. Credit Suisse has adopted the Bank for International Settlements (BIS) leverage ratio framework, as issued by the Basel Committee on Banking Supervision (BCBS) and implemented in Switzerland by the Swiss Financial Market Supervisory Authority FINMA. References to phase-in and look-through included herein refer to Basel III capital requirements and Swiss Requirements. Phase-in reflects that, for the years 2014-2018, there was a five-year (20% per annum) phase-in of goodwill, other intangible assets and other capital deductions (e.g., certain deferred tax assets) and a phase-out of an adjustment for the accounting treatment of pension plans. For the years 2013-2022, there is a phase-out of certain capital instruments. Look-through assumes the full phase-in of goodwill and other intangible assets and other regulatory adjustments and the phase-out of certain capital instruments.Unless otherwise noted, leverage exposure is based on the BIS leverage ratio framework and consists of period-end balance sheet assets and prescribed regulatory adjustments. The look-through tier 1 leverage ratio and CET1 leverage ratio are calculated as look-through BIS tier 1 capital and CET1 capital, respectively, divided by period-end leverage exposure. Swiss leverage ratios are measured on the same period-end basis as the leverage exposure for the BIS leverage ratio.SourcesThis presentation contains certain material prepared by Credit Suisse on the basis of publicly available information, internally developed data and other third-party sources believed to be reliable. Credit Suisse has not sought to independently verify information obtained from public and third-party sources and makes no representations or warranties as to accuracy, completeness or reliability of such information. Certain information has been derived from internal management accounts.
Update on Financials 3 December 11, 2019 Capital ratios & distribution Review of progress during 2019 2 1 Financial ambitions in 2020 and beyond 3
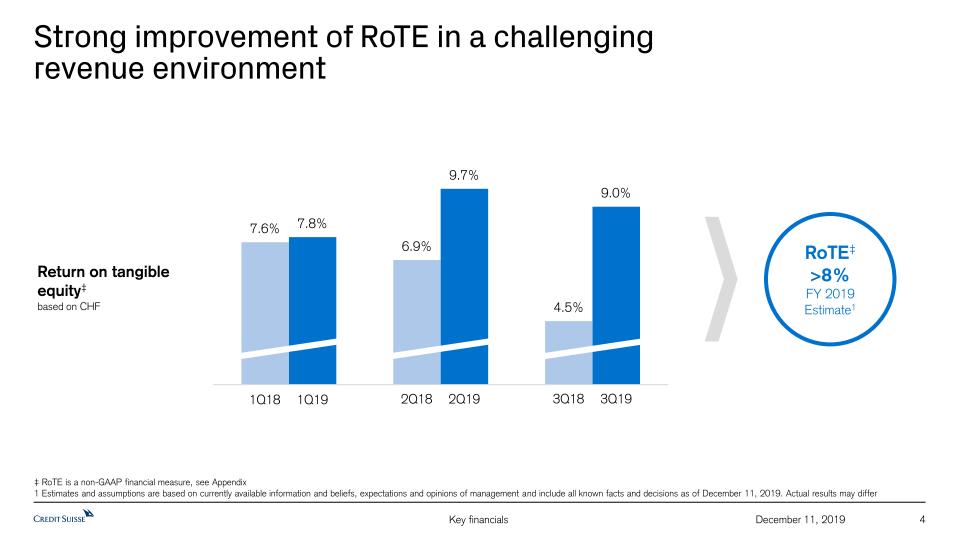
Strong improvement of RoTE in a challengingrevenue environment 4 December 11, 2019 Return on tangibleequity‡based on CHF ‡ RoTE is a non-GAAP financial measure, see Appendix1 Estimates and assumptions are based on currently available information and beliefs, expectations and opinions of management and include all known facts and decisions as of December 11, 2019. Actual results may differ RoTE‡>8%FY 2019 Estimate1 1Q19 1Q18 2Q19 2Q18 3Q19 3Q18
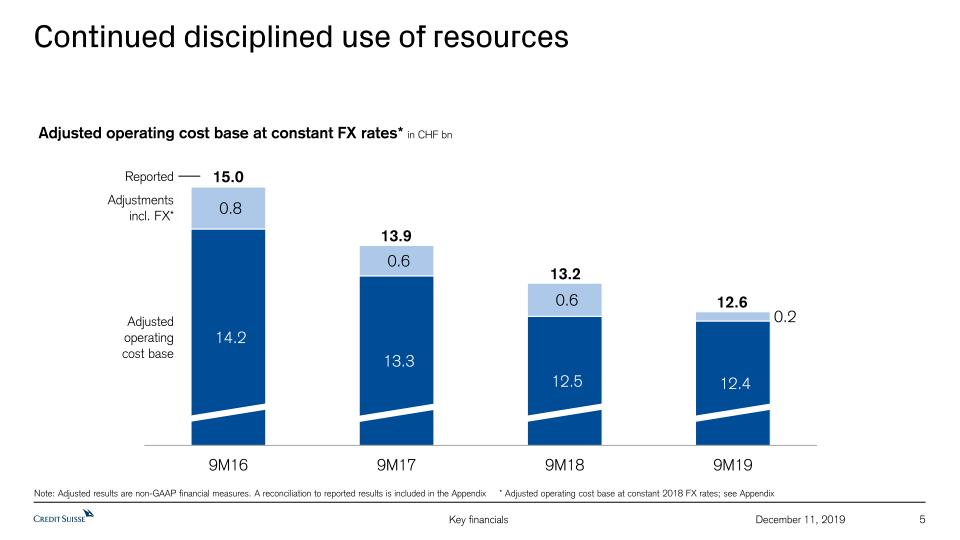
Continued disciplined use of resources 5 December 11, 2019 Adjusted operating cost base at constant FX rates* in CHF bn Note: Adjusted results are non-GAAP financial measures. A reconciliation to reported results is included in the Appendix * Adjusted operating cost base at constant 2018 FX rates; see Appendix 15.0 13.9 13.2 12.6 Adjusted operatingcost base Adjustmentsincl. FX* Reported
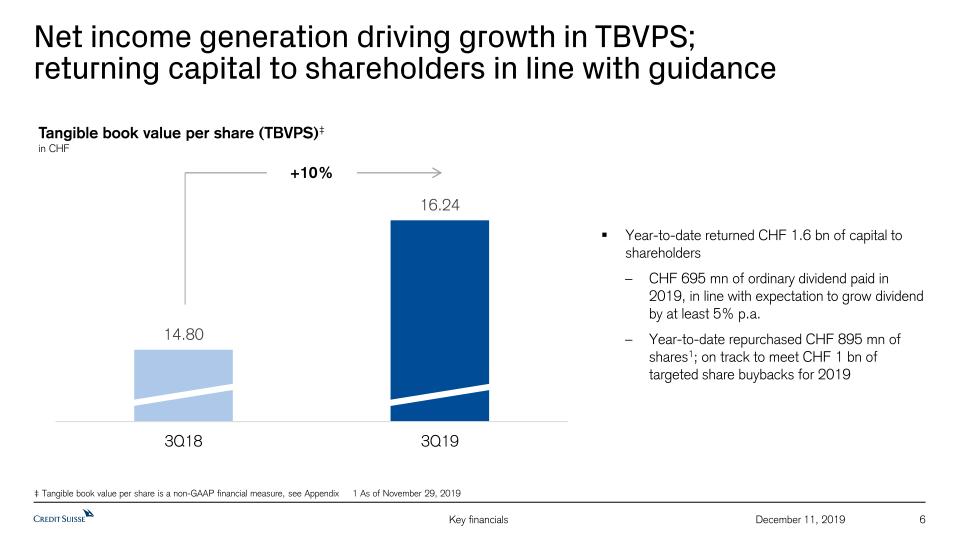
Net income generation driving growth in TBVPS;returning capital to shareholders in line with guidance 6 December 11, 2019 ‡ Tangible book value per share is a non-GAAP financial measure, see Appendix 1 As of November 29, 2019 Tangible book value per share (TBVPS)‡in CHF Year-to-date returned CHF 1.6 bn of capital to shareholdersCHF 695 mn of ordinary dividend paid in 2019, in line with expectation to grow dividend by at least 5% p.a.Year-to-date repurchased CHF 895 mn of shares1; on track to meet CHF 1 bn of targeted share buybacks for 2019 +10%

Fourth quarter outlook 7 December 11, 2019 At our third quarter results on October 30, 2019, we said we expected to see the usual seasonal slowdown as a result of the holiday season in many parts of the world, as well as headwinds from the ongoing challenging geopolitical environment. So far in 4Q19, our business performance has improved against 4Q18Examining the reported pre-tax income trends of our businesses in more detail for the fourth quarter to date: In SUB, we are seeing ongoing pressures from the negative interest rate environment, which we expect to substantially mitigate in 2020. In the meantime, we have identified opportunities to offset these pressures through real estate sales, at least one of which we expect to close in the fourth quarterWe are seeing a stable performance in IWMAPAC and GM are showing significantly better performances compared to 4Q18, which was particularly challengingWhile we expect IBCM to be loss-making for 2019, our pipeline of announced deals has been building strongly in the fourth quarter, a marked improvement year over yearWe expect to achieve a reported RoTE‡ of greater than 8% for the full year 2019 ‡ RoTE is a non-GAAP financial measure, see AppendixNote: Estimates and assumptions are based on currently available information and beliefs, expectations and opinions of management and include all known facts and decisions as of December 11, 2019. Actual results may differ
Update on Financials 8 December 11, 2019 Capital ratios & distribution Review of progress during 2019 2 1 Financial ambitions in 2020 and beyond 3
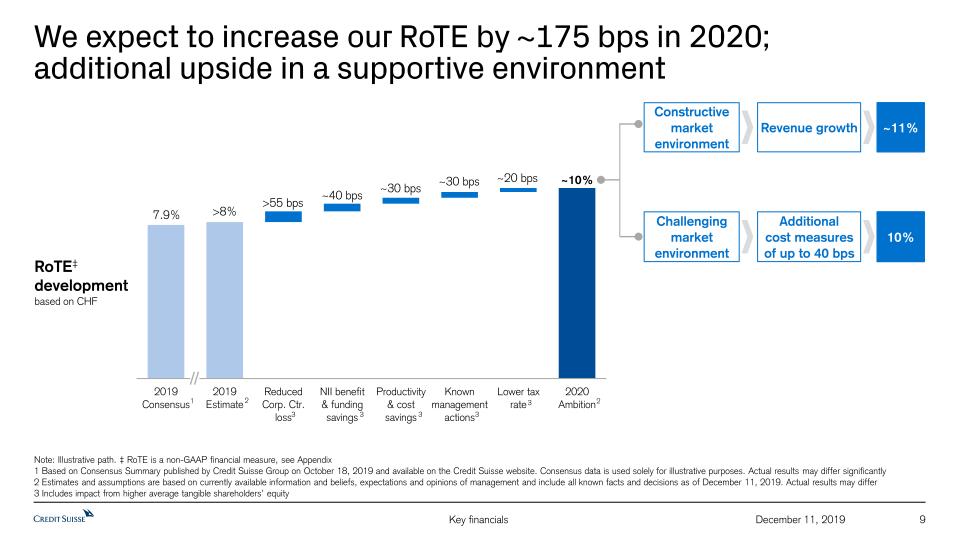
We expect to increase our RoTE by ~175 bps in 2020;additional upside in a supportive environment 9 December 11, 2019 RoTE‡developmentbased on CHF 2 Constructive market environment Challenging market environment ~11% 10% Revenue growth Additionalcost measuresof up to 40 bps Note: Illustrative path. ‡ RoTE is a non-GAAP financial measure, see Appendix1 Based on Consensus Summary published by Credit Suisse Group on October 18, 2019 and available on the Credit Suisse website. Consensus data is used solely for illustrative purposes. Actual results may differ significantly2 Estimates and assumptions are based on currently available information and beliefs, expectations and opinions of management and include all known facts and decisions as of December 11, 2019. Actual results may differ 3 Includes impact from higher average tangible shareholders’ equity >55 bps ~40 bps ~30 bps ~30 bps ~10% 3 2 3 7.9% 1 3 3 ~20 bps 3
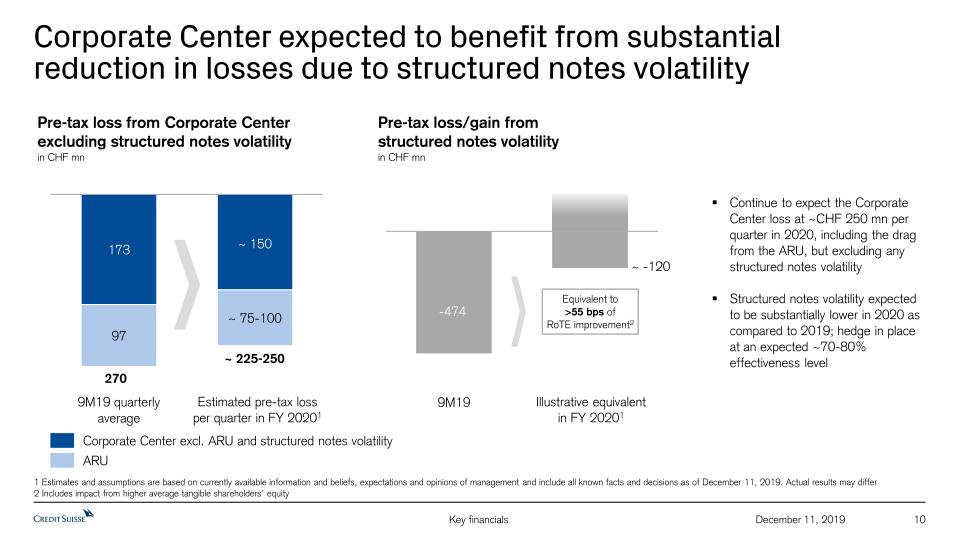
Corporate Center expected to benefit from substantialreduction in losses due to structured notes volatility 10 December 11, 2019 270 ARU Estimated pre-tax lossper quarter in FY 20201 1 Estimates and assumptions are based on currently available information and beliefs, expectations and opinions of management and include all known facts and decisions as of December 11, 2019. Actual results may differ2 Includes impact from higher average tangible shareholders’ equity ~ 225-250 Corporate Center excl. ARU and structured notes volatility Pre-tax loss from Corporate Centerexcluding structured notes volatilityin CHF mn Illustrative equivalentin FY 20201 Pre-tax loss/gain fromstructured notes volatilityin CHF mn Continue to expect the Corporate Center loss at ~CHF 250 mn per quarter in 2020, including the drag from the ARU, but excluding any structured notes volatilityStructured notes volatility expected to be substantially lower in 2020 as compared to 2019; hedge in place at an expected ~70-80% effectiveness level Equivalent to>55 bps ofRoTE improvement2 ~ -120
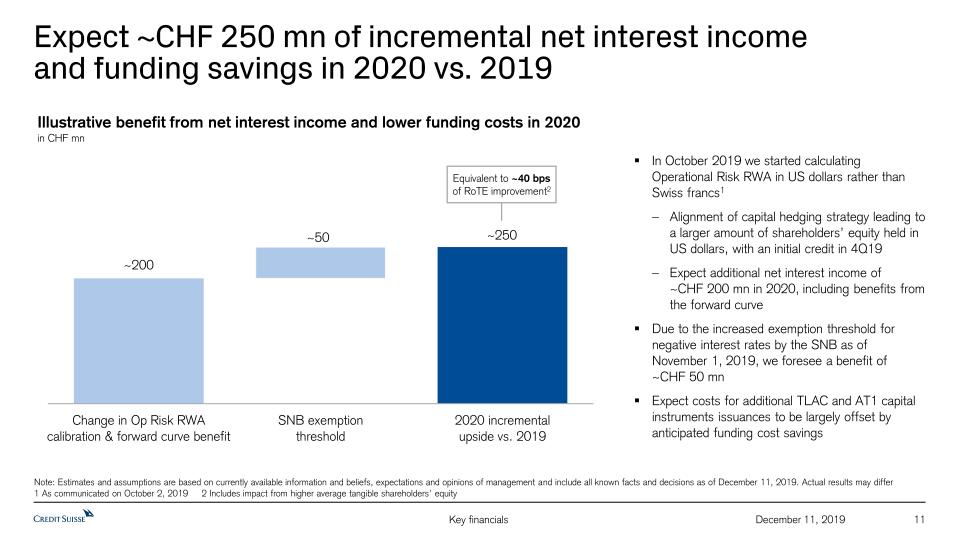
Expect ~CHF 250 mn of incremental net interest incomeand funding savings in 2020 vs. 2019 11 December 11, 2019 In October 2019 we started calculating Operational Risk RWA in US dollars rather than Swiss francs1Alignment of capital hedging strategy leading to a larger amount of shareholders’ equity held in US dollars, with an initial credit in 4Q19Expect additional net interest income of ~CHF 200 mn in 2020, including benefits from the forward curveDue to the increased exemption threshold for negative interest rates by the SNB as of November 1, 2019, we foresee a benefit of~CHF 50 mnExpect costs for additional TLAC and AT1 capital instruments issuances to be largely offset by anticipated funding cost savings Illustrative benefit from net interest income and lower funding costs in 2020in CHF mn Note: Estimates and assumptions are based on currently available information and beliefs, expectations and opinions of management and include all known facts and decisions as of December 11, 2019. Actual results may differ1 As communicated on October 2, 2019 2 Includes impact from higher average tangible shareholders’ equity Equivalent to ~40 bps of RoTE improvement2 ~250
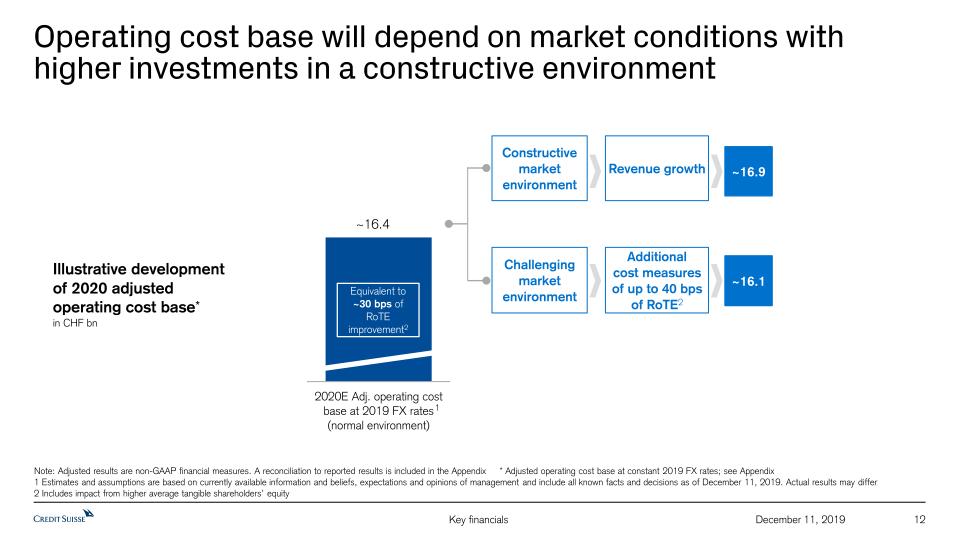
Operating cost base will depend on market conditions with higher investments in a constructive environment 12 December 11, 2019 1 Illustrative development of 2020 adjusted operating cost base*in CHF bn Equivalent to~30 bps of RoTE improvement2 ~16.4 Constructive market environment Challenging market environment ~16.9 ~16.1 Revenue growth Additionalcost measuresof up to 40 bps of RoTE2 Note: Adjusted results are non-GAAP financial measures. A reconciliation to reported results is included in the Appendix * Adjusted operating cost base at constant 2019 FX rates; see Appendix1 Estimates and assumptions are based on currently available information and beliefs, expectations and opinions of management and include all known facts and decisions as of December 11, 2019. Actual results may differ2 Includes impact from higher average tangible shareholders’ equity
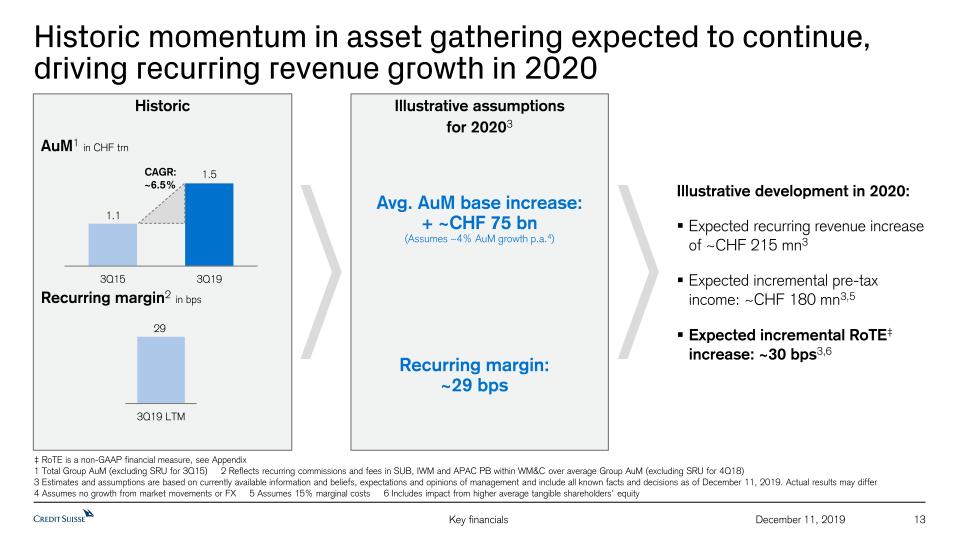
Historic momentum in asset gathering expected to continue,driving recurring revenue growth in 2020 13 December 11, 2019 ‡ RoTE is a non-GAAP financial measure, see Appendix1 Total Group AuM (excluding SRU for 3Q15) 2 Reflects recurring commissions and fees in SUB, IWM and APAC PB within WM&C over average Group AuM (excluding SRU for 4Q18)3 Estimates and assumptions are based on currently available information and beliefs, expectations and opinions of management and include all known facts and decisions as of December 11, 2019. Actual results may differ4 Assumes no growth from market movements or FX 5 Assumes 15% marginal costs 6 Includes impact from higher average tangible shareholders’ equity Historic Illustrative assumptionsfor 20203 AuM1 in CHF trn Avg. AuM base increase:+ ~CHF 75 bn(Assumes ~4% AuM growth p.a.4) Recurring margin2 in bps Recurring margin:~29 bps Illustrative development in 2020:Expected recurring revenue increaseof ~CHF 215 mn3Expected incremental pre-tax income: ~CHF 180 mn3,5Expected incremental RoTE‡ increase: ~30 bps3,6 1.1 1.5 CAGR:~6.5% 29
Update on Financials 14 December 11, 2019 Capital ratios & distribution Review of progress during 2019 2 1 Financial ambitions in 2020 and beyond 3
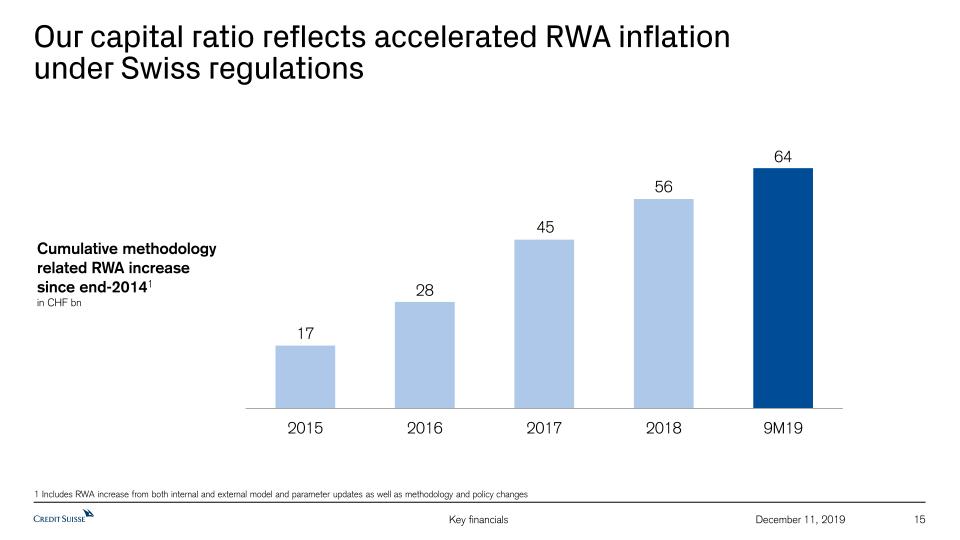
Our capital ratio reflects accelerated RWA inflationunder Swiss regulations 15 December 11, 2019 Cumulative methodology related RWA increasesince end-20141in CHF bn 1 Includes RWA increase from both internal and external model and parameter updates as well as methodology and policy changes
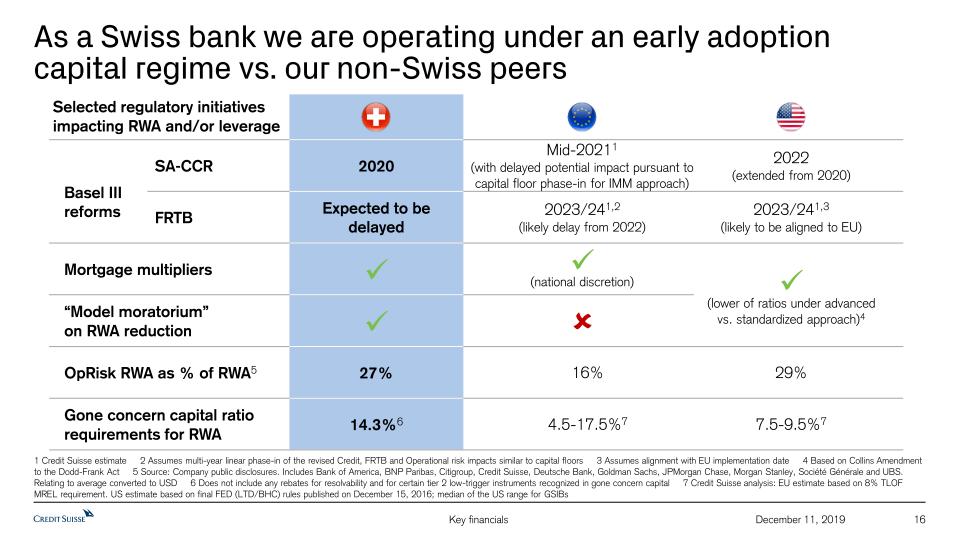
As a Swiss bank we are operating under an early adoption capital regime vs. our non-Swiss peers 16 December 11, 2019 Basel IIIreforms Selected regulatory initiatives impacting RWA and/or leverage Mortgage multipliers “Model moratorium” on RWA reduction SA-CCR 2020 2022(extended from 2020) Mid-20211(with delayed potential impact pursuant tocapital floor phase-in for IMM approach) FRTB Expected to be delayed 2023/241,2(likely delay from 2022) 2023/241,3(likely to be aligned to EU) Gone concern capital ratio requirements for RWA 14.3%6 4.5-17.5%7 7.5-9.5%7 1 Credit Suisse estimate 2 Assumes multi-year linear phase-in of the revised Credit, FRTB and Operational risk impacts similar to capital floors 3 Assumes alignment with EU implementation date 4 Based on Collins Amendment to the Dodd-Frank Act 5 Source: Company public disclosures. Includes Bank of America, BNP Paribas, Citigroup, Credit Suisse, Deutsche Bank, Goldman Sachs, JPMorgan Chase, Morgan Stanley, Société Générale and UBS. Relating to average converted to USD 6 Does not include any rebates for resolvability and for certain tier 2 low-trigger instruments recognized in gone concern capital 7 Credit Suisse analysis: EU estimate based on 8% TLOF MREL requirement. US estimate based on final FED (LTD/BHC) rules published on December 15, 2016; median of the US range for GSIBs (national discretion) OpRisk RWA as % of RWA5 27% 16% 29% (lower of ratios under advancedvs. standardized approach)4
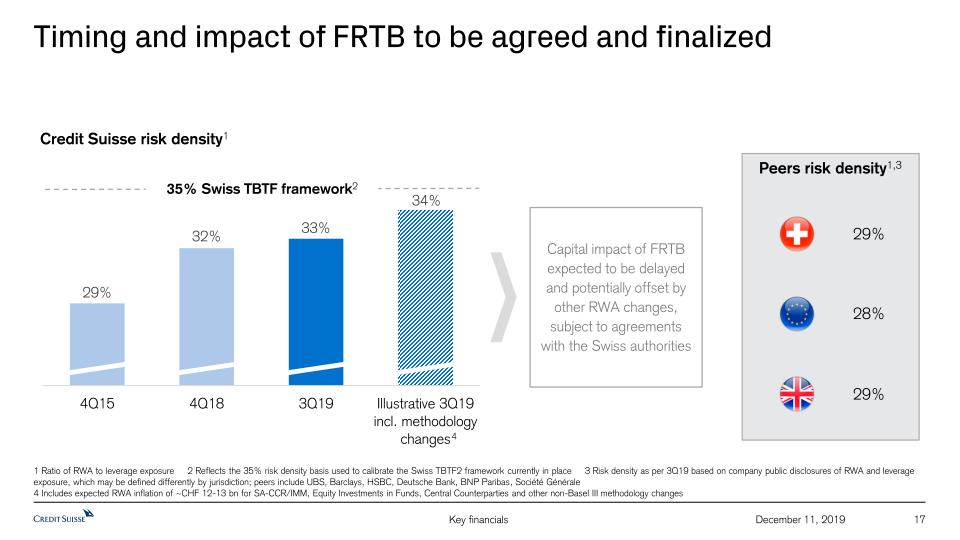
Timing and impact of FRTB to be agreed and finalized 17 December 11, 2019 1 Ratio of RWA to leverage exposure 2 Reflects the 35% risk density basis used to calibrate the Swiss TBTF2 framework currently in place 3 Risk density as per 3Q19 based on company public disclosures of RWA and leverage exposure, which may be defined differently by jurisdiction; peers include UBS, Barclays, HSBC, Deutsche Bank, BNP Paribas, Société Générale 4 Includes expected RWA inflation of ~CHF 12-13 bn for SA-CCR/IMM, Equity Investments in Funds, Central Counterparties and other non-Basel III methodology changes 29% Credit Suisse risk density1 Peers risk density1,3 28% 29% 4 Capital impact of FRTB expected to be delayed and potentially offset by other RWA changes, subject to agreements with the Swiss authorities 35% Swiss TBTF framework2
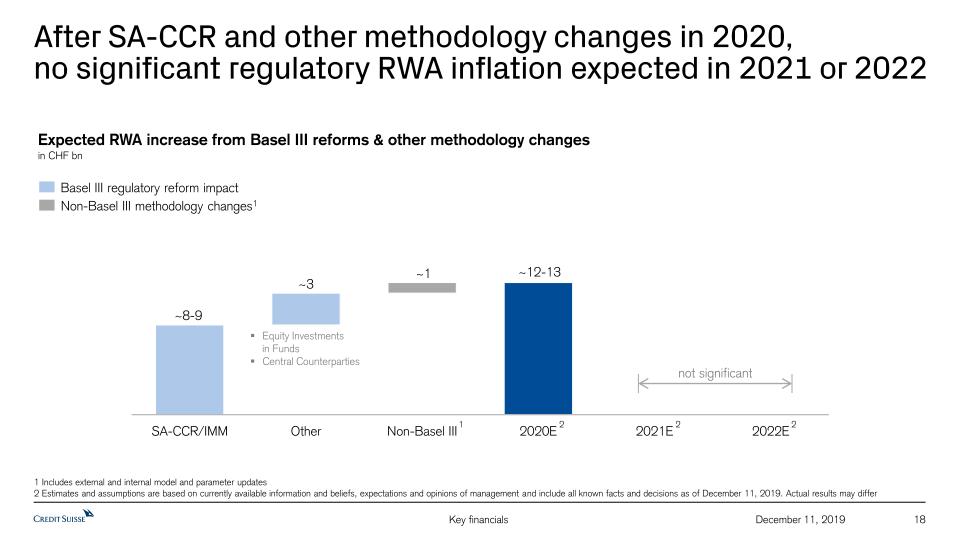
After SA-CCR and other methodology changes in 2020,no significant regulatory RWA inflation expected in 2021 or 2022 18 December 11, 2019 1 Includes external and internal model and parameter updates2 Estimates and assumptions are based on currently available information and beliefs, expectations and opinions of management and include all known facts and decisions as of December 11, 2019. Actual results may differ Expected RWA increase from Basel III reforms & other methodology changesin CHF bn Equity Investmentsin FundsCentral Counterparties 2 2 2 1 Non-Basel III methodology changes1 Basel III regulatory reform impact not significant
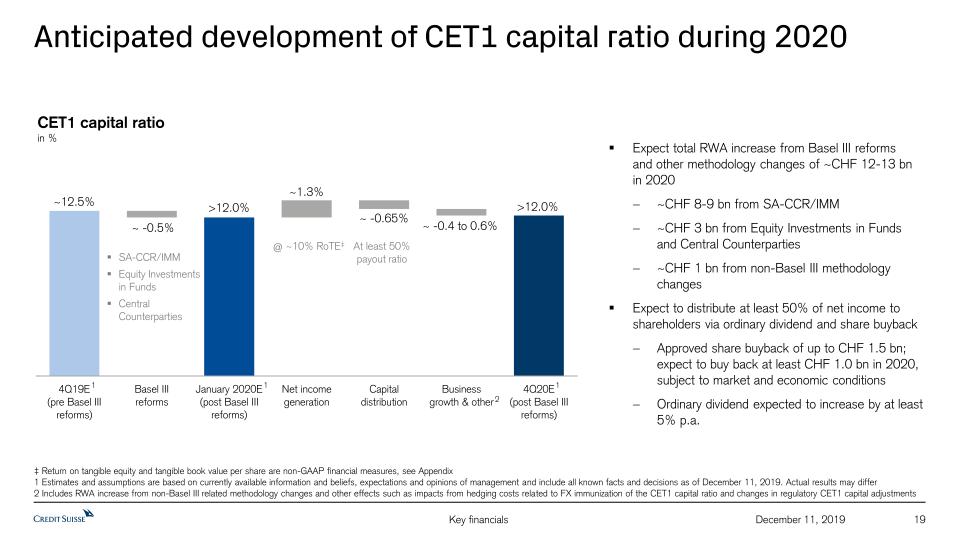
Anticipated development of CET1 capital ratio during 2020 19 December 11, 2019 CET1 capital ratioin % ‡ Return on tangible equity and tangible book value per share are non-GAAP financial measures, see Appendix1 Estimates and assumptions are based on currently available information and beliefs, expectations and opinions of management and include all known facts and decisions as of December 11, 2019. Actual results may differ2 Includes RWA increase from non-Basel III related methodology changes and other effects such as impacts from hedging costs related to FX immunization of the CET1 capital ratio and changes in regulatory CET1 capital adjustments Expect total RWA increase from Basel III reformsand other methodology changes of ~CHF 12-13 bn in 2020~CHF 8-9 bn from SA-CCR/IMM~CHF 3 bn from Equity Investments in Funds and Central Counterparties~CHF 1 bn from non-Basel III methodology changesExpect to distribute at least 50% of net income to shareholders via ordinary dividend and share buybackApproved share buyback of up to CHF 1.5 bn; expect to buy back at least CHF 1.0 bn in 2020, subject to market and economic conditionsOrdinary dividend expected to increase by at least 5% p.a. 1 1 1 SA-CCR/IMMEquity Investments in FundsCentral Counterparties At least 50%payout ratio 2 @ ~10% RoTE‡
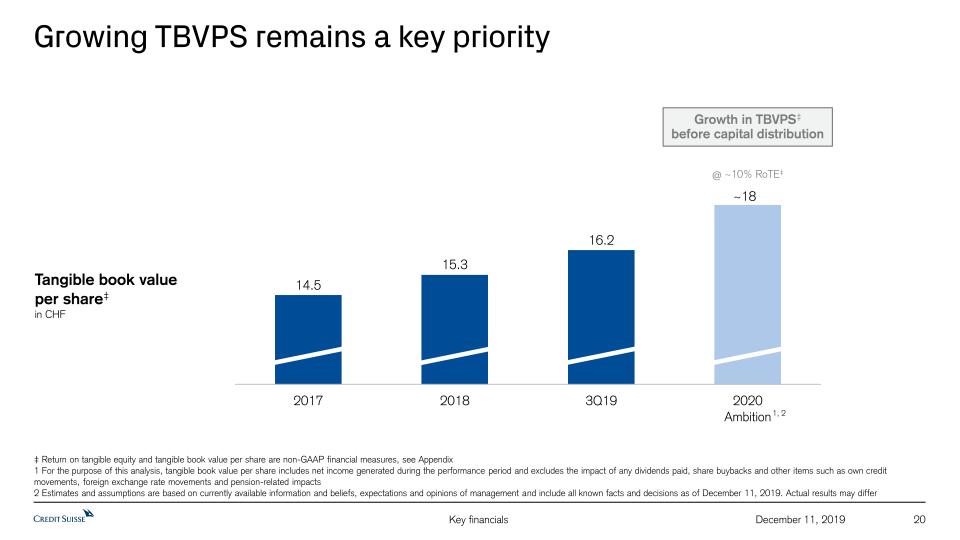
Growing TBVPS remains a key priority 20 December 11, 2019 Tangible book valueper share‡in CHF @ ~10% RoTE‡ Growth in TBVPS‡before capital distribution ‡ Return on tangible equity and tangible book value per share are non-GAAP financial measures, see Appendix1 For the purpose of this analysis, tangible book value per share includes net income generated during the performance period and excludes the impact of any dividends paid, share buybacks and other items such as own credit movements, foreign exchange rate movements and pension-related impacts2 Estimates and assumptions are based on currently available information and beliefs, expectations and opinions of management and include all known facts and decisions as of December 11, 2019. Actual results may differ ~18 1, 2
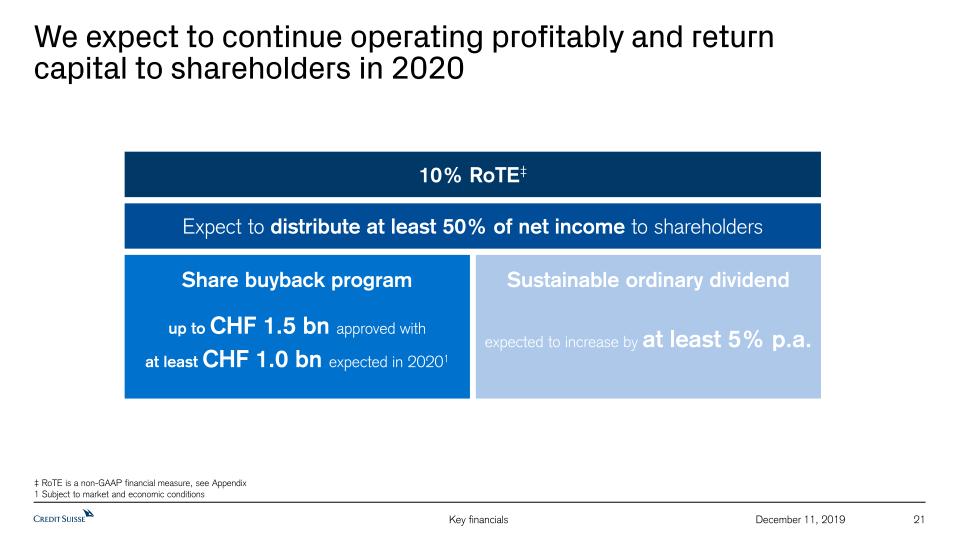
We expect to continue operating profitably and return capital to shareholders in 2020 21 December 11, 2019 Share buyback programup to CHF 1.5 bn approved withat least CHF 1.0 bn expected in 20201 Sustainable ordinary dividendexpected to increase by at least 5% p.a. ‡ RoTE is a non-GAAP financial measure, see Appendix1 Subject to market and economic conditions 10% RoTE‡ Expect to distribute at least 50% of net income to shareholders

Appendix 22 December 11, 2019
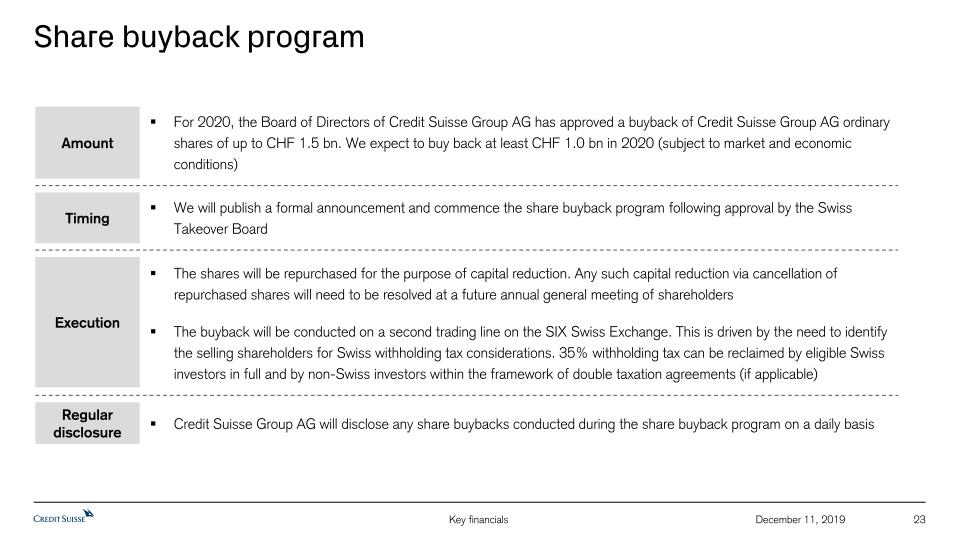
Share buyback program 23 December 11, 2019 For 2020, the Board of Directors of Credit Suisse Group AG has approved a buyback of Credit Suisse Group AG ordinary shares of up to CHF 1.5 bn. We expect to buy back at least CHF 1.0 bn in 2020 (subject to market and economic conditions) Amount Timing Execution We will publish a formal announcement and commence the share buyback program following approval by the Swiss Takeover Board The shares will be repurchased for the purpose of capital reduction. Any such capital reduction via cancellation of repurchased shares will need to be resolved at a future annual general meeting of shareholdersThe buyback will be conducted on a second trading line on the SIX Swiss Exchange. This is driven by the need to identify the selling shareholders for Swiss withholding tax considerations. 35% withholding tax can be reclaimed by eligible Swiss investors in full and by non-Swiss investors within the framework of double taxation agreements (if applicable) Credit Suisse Group AG will disclose any share buybacks conducted during the share buyback program on a daily basis Regular disclosure
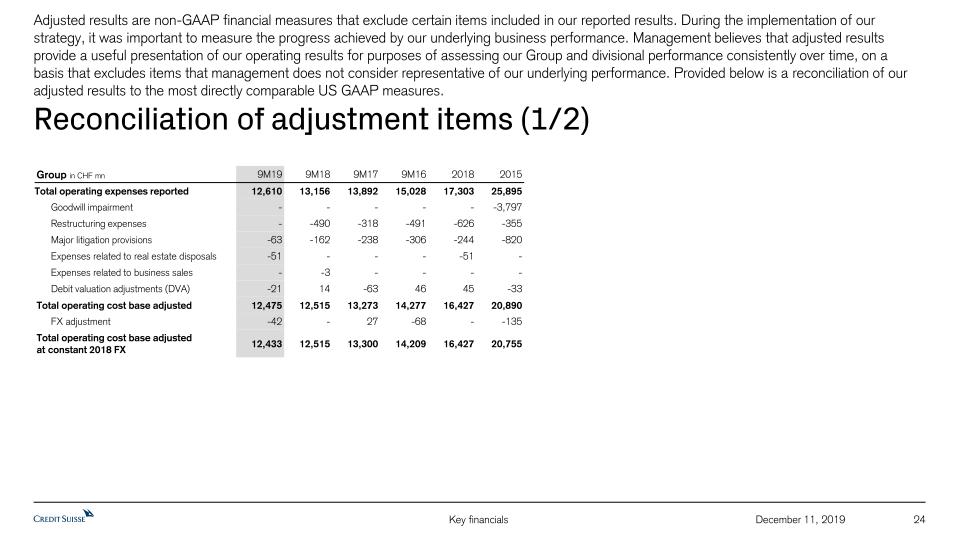
Reconciliation of adjustment items (1/2) 24 December 11, 2019 Adjusted results are non-GAAP financial measures that exclude certain items included in our reported results. During the implementation of our strategy, it was important to measure the progress achieved by our underlying business performance. Management believes that adjusted results provide a useful presentation of our operating results for purposes of assessing our Group and divisional performance consistently over time, on a basis that excludes items that management does not consider representative of our underlying performance. Provided below is a reconciliation of our adjusted results to the most directly comparable US GAAP measures. Group in CHF mn 9M19 9M18 9M17 9M16 2018 2015 Total operating expenses reported 12,610 13,156 13,892 15,028 17,303 25,895 Goodwill impairment - - - - - -3,797 Restructuring expenses - -490 -318 -491 -626 -355 Major litigation provisions -63 -162 -238 -306 -244 -820 Expenses related to real estate disposals -51 - - - -51 - Expenses related to business sales - -3 - - - - Debit valuation adjustments (DVA) -21 14 -63 46 45 -33 Total operating cost base adjusted 12,475 12,515 13,273 14,277 16,427 20,890 FX adjustment -42 - 27 -68 - -135 Total operating cost base adjusted at constant 2018 FX 12,433 12,515 13,300 14,209 16,427 20,755
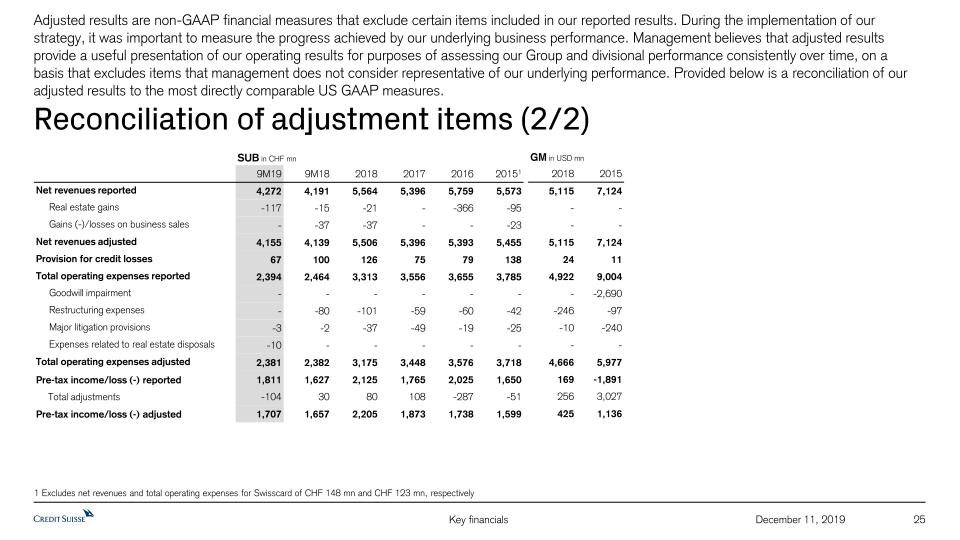
Reconciliation of adjustment items (2/2) 25 December 11, 2019 Adjusted results are non-GAAP financial measures that exclude certain items included in our reported results. During the implementation of our strategy, it was important to measure the progress achieved by our underlying business performance. Management believes that adjusted results provide a useful presentation of our operating results for purposes of assessing our Group and divisional performance consistently over time, on a basis that excludes items that management does not consider representative of our underlying performance. Provided below is a reconciliation of our adjusted results to the most directly comparable US GAAP measures. GM in USD mn 2018 2015 5,115 7,124 - - - - 5,115 7,124 24 11 4,922 9,004 - -2,690 -246 -97 -10 -240 - - 4,666 5,977 169 -1,891 256 3,027 425 1,136 SUB in CHF mn 9M19 9M18 2018 2017 2016 20151 Net revenues reported 4,272 4,191 5,564 5,396 5,759 5,573 Real estate gains -117 -15 -21 - -366 -95 Gains (-)/losses on business sales - -37 -37 - - -23 Net revenues adjusted 4,155 4,139 5,506 5,396 5,393 5,455 Provision for credit losses 67 100 126 75 79 138 Total operating expenses reported 2,394 2,464 3,313 3,556 3,655 3,785 Goodwill impairment - - - - - - Restructuring expenses - -80 -101 -59 -60 -42 Major litigation provisions -3 -2 -37 -49 -19 -25 Expenses related to real estate disposals -10 - - - - - Total operating expenses adjusted 2,381 2,382 3,175 3,448 3,576 3,718 Pre-tax income/loss (-) reported 1,811 1,627 2,125 1,765 2,025 1,650 Total adjustments -104 30 80 108 -287 -51 Pre-tax income/loss (-) adjusted 1,707 1,657 2,205 1,873 1,738 1,599 1 Excludes net revenues and total operating expenses for Swisscard of CHF 148 mn and CHF 123 mn, respectively
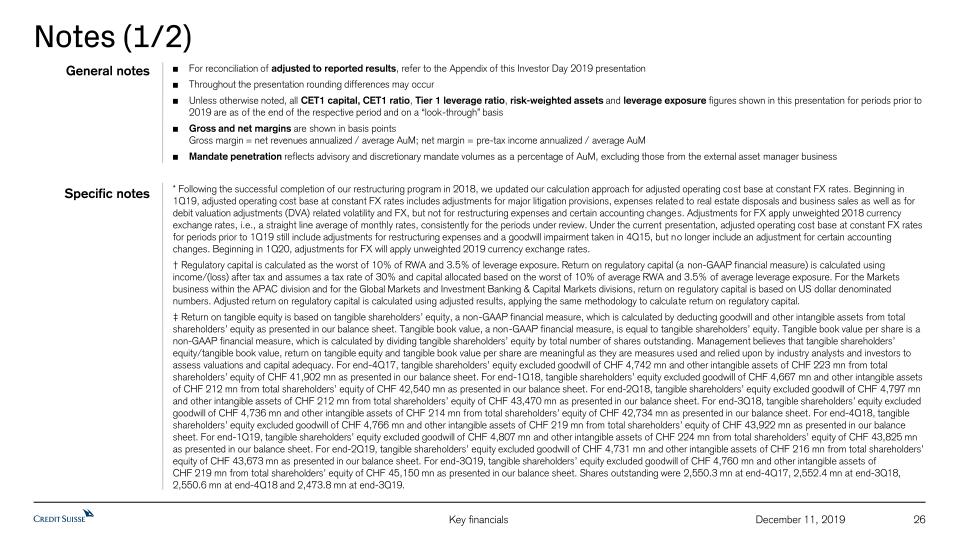
26 December 11, 2019 For reconciliation of adjusted to reported results, refer to the Appendix of this Investor Day 2019 presentationThroughout the presentation rounding differences may occurUnless otherwise noted, all CET1 capital, CET1 ratio, Tier 1 leverage ratio, risk-weighted assets and leverage exposure figures shown in this presentation for periods prior to 2019 are as of the end of the respective period and on a “look-through” basisGross and net margins are shown in basis pointsGross margin = net revenues annualized / average AuM; net margin = pre-tax income annualized / average AuMMandate penetration reflects advisory and discretionary mandate volumes as a percentage of AuM, excluding those from the external asset manager business General notes Specific notes Notes (1/2) * Following the successful completion of our restructuring program in 2018, we updated our calculation approach for adjusted operating cost base at constant FX rates. Beginning in 1Q19, adjusted operating cost base at constant FX rates includes adjustments for major litigation provisions, expenses related to real estate disposals and business sales as well as for debit valuation adjustments (DVA) related volatility and FX, but not for restructuring expenses and certain accounting changes. Adjustments for FX apply unweighted 2018 currency exchange rates, i.e., a straight line average of monthly rates, consistently for the periods under review. Under the current presentation, adjusted operating cost base at constant FX rates for periods prior to 1Q19 still include adjustments for restructuring expenses and a goodwill impairment taken in 4Q15, but no longer include an adjustment for certain accounting changes. Beginning in 1Q20, adjustments for FX will apply unweighted 2019 currency exchange rates.† Regulatory capital is calculated as the worst of 10% of RWA and 3.5% of leverage exposure. Return on regulatory capital (a non-GAAP financial measure) is calculated using income/(loss) after tax and assumes a tax rate of 30% and capital allocated based on the worst of 10% of average RWA and 3.5% of average leverage exposure. For the Markets business within the APAC division and for the Global Markets and Investment Banking & Capital Markets divisions, return on regulatory capital is based on US dollar denominated numbers. Adjusted return on regulatory capital is calculated using adjusted results, applying the same methodology to calculate return on regulatory capital. ‡ Return on tangible equity is based on tangible shareholders’ equity, a non-GAAP financial measure, which is calculated by deducting goodwill and other intangible assets from total shareholders’ equity as presented in our balance sheet. Tangible book value, a non-GAAP financial measure, is equal to tangible shareholders’ equity. Tangible book value per share is a non-GAAP financial measure, which is calculated by dividing tangible shareholders’ equity by total number of shares outstanding. Management believes that tangible shareholders’ equity/tangible book value, return on tangible equity and tangible book value per share are meaningful as they are measures used and relied upon by industry analysts and investors to assess valuations and capital adequacy. For end-4Q17, tangible shareholders’ equity excluded goodwill of CHF 4,742 mn and other intangible assets of CHF 223 mn from total shareholders’ equity of CHF 41,902 mn as presented in our balance sheet. For end-1Q18, tangible shareholders’ equity excluded goodwill of CHF 4,667 mn and other intangible assets of CHF 212 mn from total shareholders’ equity of CHF 42,540 mn as presented in our balance sheet. For end-2Q18, tangible shareholders’ equity excluded goodwill of CHF 4,797 mn and other intangible assets of CHF 212 mn from total shareholders’ equity of CHF 43,470 mn as presented in our balance sheet. For end-3Q18, tangible shareholders’ equity excluded goodwill of CHF 4,736 mn and other intangible assets of CHF 214 mn from total shareholders’ equity of CHF 42,734 mn as presented in our balance sheet. For end-4Q18, tangible shareholders’ equity excluded goodwill of CHF 4,766 mn and other intangible assets of CHF 219 mn from total shareholders’ equity of CHF 43,922 mn as presented in our balance sheet. For end-1Q19, tangible shareholders’ equity excluded goodwill of CHF 4,807 mn and other intangible assets of CHF 224 mn from total shareholders’ equity of CHF 43,825 mn as presented in our balance sheet. For end-2Q19, tangible shareholders’ equity excluded goodwill of CHF 4,731 mn and other intangible assets of CHF 216 mn from total shareholders’ equity of CHF 43,673 mn as presented in our balance sheet. For end-3Q19, tangible shareholders’ equity excluded goodwill of CHF 4,760 mn and other intangible assets ofCHF 219 mn from total shareholders’ equity of CHF 45,150 mn as presented in our balance sheet. Shares outstanding were 2,550.3 mn at end-4Q17, 2,552.4 mn at end-3Q18, 2,550.6 mn at end-4Q18 and 2,473.8 mn at end-3Q19.
Notes (2/2) 27 December 11, 2019 Abbreviations ABL = Asset Based Lending; Abs. = Absolute; Adj. = Adjusted; AFG = Asia Pacific Financing Group; AM = Asset Management; Ann. = Annualized;APAC = Asia Pacific; Approx. = Approximately; ARC = Asset Risk Consultants; ARU = Asset Resolution Unit; ATS = APAC Trading Solutions; AuM = Assets under Management; Avg.= Average; BCBS = Basel Committee on Banking Supervision; BEAT = Base Erosion and Anti-Abuse Tax; BfE = Bank for Entrepreneurs; BHC = Bank Holding Company; BIS = Bank for International Settlements; bps = basis points; CAGR = Compound Annual Growth Rate; CBG = Corporate Bank Group; CC = Corporate Center; CCO = Chief Compliance Officer; CCRO = Chief Compliance and Regulatory Affairs Officer; CET1 = Common Equity Tier 1;CH = Switzerland; C/I = Cost/Income; C&IC = Corporate and Institutional Clients; CIC = Corporate & Institutional Clients; CLO = Collateralized Loan Obligation; CRO = Chief Risk Officer; CSAM = Credit Suisse Asset Management; DCM = Debt Capital Markets; DevOps = Development-to-Operations; DPS = Dividend Per Share; E = Estimate; EAM = External Asset Manager; ECA = Export Credit Agency; ECM = Equity Capital Markets; E&E = Entrepreneurs & Executives;EMEA = Europe, Middle East & Africa; ESG = Environmental Social and Governance; Est. = Estimate; EU = European Union; Excl. = Exclude; FID = Fixed Income Department; FI&WM = Fixed Income Wealth Management; FRTB = Fundamental Review of the Trading Book; FX = Foreign Exchange; FY = Full Year; GC = General Counsel; GCP = Global Credit Products; GM = Global Markets; GMV = Gross Market Value; GYB = Global Yield Balanced; HLG = High Level Group; HR = Human Resources; HY = High Yield; IAF = Impact Advisory & Finance; IB = Investment Banking; IBCM = Investment Banking & Capital Markets; IBOR = Interbank Offer Rate; IFC = International Finance Corporation; IG = Investment Grade; ILS = Insurance-Linked Strategies; IMM = Internal Model Method;incl. = including; IPO = Initial Public Offering; IRB = Internal Ratings-Based Approach; IT = Information Technology; ITS = International Trading Solutions;IWM = International Wealth Management; LDI = Liability-driven investments; Lev Fin = Leveraged Finance; LTD = Long-term debt; LTM = Last Twelve Months; LTV = Loan to Value; M&A = Mergers & Acquisitions; MREL = Minimum Requirement for own funds and Eligible Liabilities; NIG = Non investment grade;NNA = Net new assets; NRI = Non-resident Indians; Op Risk = Operational Risk; OTC = Over the Counter; p.a. = per annum; PB = Private Banking;PB&WM = Private Banking & Wealth Management; PC = Private Clients; PD = probability of default; p.p. = percentage points; PTI = Pre-tax income;QIS = Quantitative Investment Strategies; QoQ = Quarter over Quarter; QT = Quantitative Trading; RBL = Reserve Based Lending; RM = Relationship Manager(s); RoRC = Return on Regulatory Capital; RoTE= Return on Tangible Equity; RSA = Revenue Sharing Agreement; RWA = Risk-weighted assets;SA-CCR = Standardized Approach to Counterparty Credit Risk; SBL = Share Backed Lending; SCP = Strategic Client Partner; SEA = South East Asia;SME = Small and Medium-Sized Enterprises; SNB = Swiss National Bank; SoW = Share of Wallet; SP = Securitized Products; STBs = Sustainable Transition Bonds; SUB = Swiss Universal Bank; TBVPS = Tangible book value per share; TLAC = Total Loss-Absorbing Capacity; TLOF = Total Liabilities and Own Funds; TMT = Technology, Media and Telecommunications; (U)HNW(I) = (Ultra) High Net Worth (Individuals); U/W = Underwriting; US GAAP = United States Generally Accepted Accounting Principles; WM&C = Wealth Management & Connected; YoY = Year over year; YTD = Year to Date
Credit Suisse Investor Day 2019Growth in Wealth Management Thomas Gottstein, CEO Swiss Universal BankPhilipp Wehle, CEO International Wealth ManagementHelman Sitohang, CEO Asia PacificDecember 11, 2019
2 December 11, 2019 Disclaimer This material does not purport to contain all of the information that you may wish to consider. This material is not to be relied upon as such or used in substitution for the exercise of independent judgment.Cautionary statement regarding forward-looking statementsThis presentation contains forward-looking statements that involve inherent risks and uncertainties, and we might not be able to achieve the predictions, forecasts, projections and other outcomes we describe or imply in forward-looking statements. A number of important factors could cause results to differ materially from the plans, targets, goals, expectations, estimates and intentions we express in these forward-looking statements, including those we identify in "Risk factors” in our Annual Report on Form 20-F for the fiscal year ended December 31, 2018 and in the “Cautionary statement regarding forward-looking information" in our media release relating to Investor Day, published on December 11, 2019 and filed with the US Securities and Exchange Commission, and in other public filings and press releases. We do not intend to update these forward-looking statements. In particular, the terms “Estimate”, “Illustrative”, “Ambition”, “Objective”, “Outlook” and “Goal” are not intended to be viewed as targets or projections, nor are they considered to be Key Performance Indicators. All such estimates, illustrations, ambitions, objectives, outlooks and goals are subject to a large number of inherent risks, assumptions and uncertainties, many of which are completely outside of our control. These risks, assumptions and uncertainties include, but are not limited to, general market conditions, market volatility, interest rate volatility and levels, global and regional economic conditions, political uncertainty, changes in tax policies, regulatory changes, changes in levels of client activity as a result of any of the foregoing and other factors. Accordingly, this information should not be relied on for any purpose. We do not intend to update these estimates, illustrations, ambitions, objectives, outlooks or goals. We may not achieve the benefits of our strategic initiativesWe may not achieve all of the expected benefits of our strategic initiatives. Factors beyond our control, including but not limited to the market and economic conditions, changes in laws, rules or regulations and other challenges discussed in our public filings, could limit our ability to achieve some or all of the expected benefits of these initiatives. Estimates and assumptionsIn preparing this presentation, management has made estimates and assumptions that affect the numbers presented. Actual results may differ. Annualized numbers do not take into account variations in operating results, seasonality and other factors and may not be indicative of actual, full-year results. Figures throughout this presentation may also be subject to rounding adjustments. All opinions and views constitute judgments as of the date of writing without regard to the date on which the reader may receive or access the information. This information is subject to change at any time without notice and we do not intend to update this information. Cautionary statements relating to interim financial informationThis presentation contains certain unaudited interim financial information for the fourth quarter of 2019. This information has been derived from management accounts, is preliminary in nature, does not reflect the complete results of the fourth quarter of 2019 or the full year 2019 and is subject to change, including as a result of any normal quarterly adjustments in relation to the financial statements for the full year 2019. This information has not been subject to any review by our independent registered public accounting firm. There can be no assurance that the final results for these periods will not differ from these preliminary results, and any such differences could be material. Quarterly financial results for the fourth quarter of 2019 and full year results will be included in our 4Q19 Earnings Release and our 2019 Annual Report. Statement regarding non-GAAP financial measuresThis presentation also contains non-GAAP financial measures, including adjusted results as well as return on regulatory capital, return on tangible equity and tangible book value per share (which are based on tangible shareholders’ equity). Information needed to reconcile such non-GAAP financial measures to the most directly comparable measures under US GAAP can be found in the Appendix of the CEO and CFO Investor Day presentations, published on December 11, 2019. All Investor Day presentations are available on our website at www.credit-suisse.com.Our estimates, ambitions, objectives and targets often include metrics that are non-GAAP financial measures and are unaudited. A reconciliation of the estimates, ambitions, objectives and targets to the nearest GAAP measures is unavailable without unreasonable efforts. Adjusted results exclude goodwill impairment, major litigation provisions, real estate gains and other revenue and expense items included in our reported results, all of which are unavailable on a prospective basis. Return on Tangible Equity is based on tangible shareholders' equity (also known as tangible book value), a non-GAAP financial measure, which is calculated by deducting goodwill and other intangible assets from total shareholders' equity as presented in our balance sheet, both of which are unavailable on a prospective basis. Tangible book value per share excludes the impact of any dividends paid during the performance period, share buybacks, own credit movements, foreign exchange rate movements and pension-related impacts, all of which are unavailable on a prospective basis. Such estimates, ambitions, objectives and targets are calculated in a manner that is consistent with the accounting policies applied by us in preparing our financial statements.Statement regarding capital, liquidity and leverageCredit Suisse is subject to the Basel III framework, as implemented in Switzerland, as well as Swiss legislation and regulations for systemically important banks (Swiss Requirements), which include capital, liquidity, leverage and large exposure requirements and rules for emergency plans designed to maintain systemically relevant functions in the event of threatened insolvency. Credit Suisse has adopted the Bank for International Settlements (BIS) leverage ratio framework, as issued by the Basel Committee on Banking Supervision (BCBS) and implemented in Switzerland by the Swiss Financial Market Supervisory Authority FINMA. References to phase-in and look-through included herein refer to Basel III capital requirements and Swiss Requirements. Phase-in reflects that, for the years 2014-2018, there was a five-year (20% per annum) phase-in of goodwill, other intangible assets and other capital deductions (e.g., certain deferred tax assets) and a phase-out of an adjustment for the accounting treatment of pension plans. For the years 2013-2022, there is a phase-out of certain capital instruments. Look-through assumes the full phase-in of goodwill and other intangible assets and other regulatory adjustments and the phase-out of certain capital instruments.Unless otherwise noted, leverage exposure is based on the BIS leverage ratio framework and consists of period-end balance sheet assets and prescribed regulatory adjustments. The look-through tier 1 leverage ratio and CET1 leverage ratio are calculated as look-through BIS tier 1 capital and CET1 capital, respectively, divided by period-end leverage exposure. Swiss leverage ratios are measured on the same period-end basis as the leverage exposure for the BIS leverage ratio.SourcesThis presentation contains certain material prepared by Credit Suisse on the basis of publicly available information, internally developed data and other third-party sources believed to be reliable. Credit Suisse has not sought to independently verify information obtained from public and third-party sources and makes no representations or warranties as to accuracy, completeness or reliability of such information. Certain information has been derived from internal management accounts.

Credit Suisse Investor Day 2019Swiss Universal Bank Thomas Gottstein, CEO Swiss Universal BankDecember 11, 2019
Continued improvements of financial metrics (PTI, cost/income ratio, RoRC) and strong client business volume growth driven by significant AuM growth in institutional clients (pension funds) and continued positive momentum in private clients (U/HNWI)Successful Bank for Entrepreneurs (BfE) implementation:Solid momentum in Corporate Banking, U/HNWI and E&E clientsMaintained strong #1 position in our Swiss investment banking business1Further strengthened BfE offering suite, notably in private equity and in technologyAccelerated rollout of new digital offerings across private, corporate and institutional clients, driving digital adoption rate and automationCreated Direct Banking, demonstrating strong commitment to high-tech development of retail and small commercial clientsFor the second year running, won both Euromoney awards (2018, 2019): Best Bank and Best Investment Bank in Switzerland SUB highlights 2019 4 December 11, 2019 1 Dealogic for the period January 1 to November 27, 2019. Ranked #1 across M&A, ECM and DCM in Switzerland Swiss Universal Bank
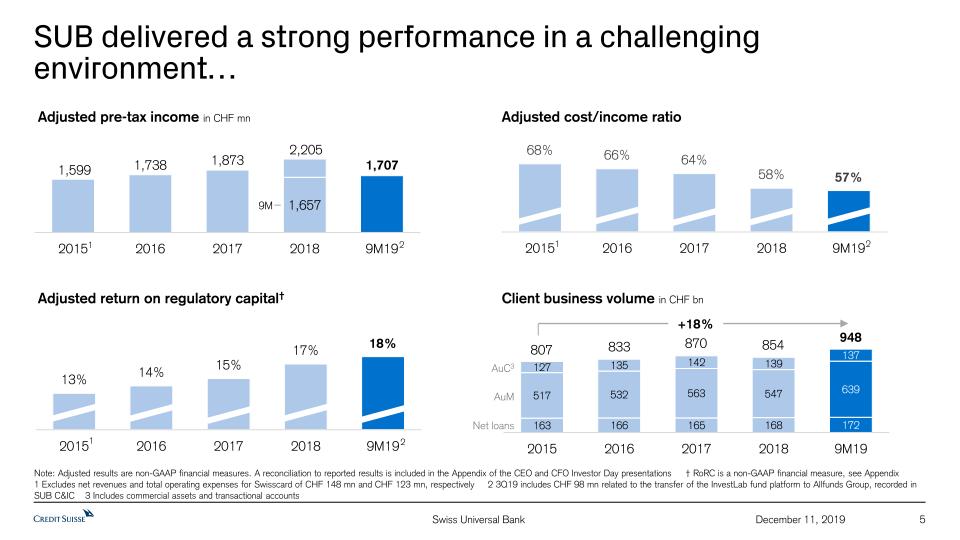
SUB delivered a strong performance in a challenging environment… 5 December 11, 2019 Adjusted pre-tax income in CHF mn Adjusted return on regulatory capital† Adjusted cost/income ratio Client business volume in CHF bn Note: Adjusted results are non-GAAP financial measures. A reconciliation to reported results is included in the Appendix of the CEO and CFO Investor Day presentations † RoRC is a non-GAAP financial measure, see Appendix 1 Excludes net revenues and total operating expenses for Swisscard of CHF 148 mn and CHF 123 mn, respectively 2 3Q19 includes CHF 98 mn related to the transfer of the InvestLab fund platform to Allfunds Group, recorded in SUB C&IC 3 Includes commercial assets and transactional accounts 1,707 1 1 1 AuM AuC3 Net loans 807 833 870 854 948 +18% 9M 2 2 2 Swiss Universal Bank
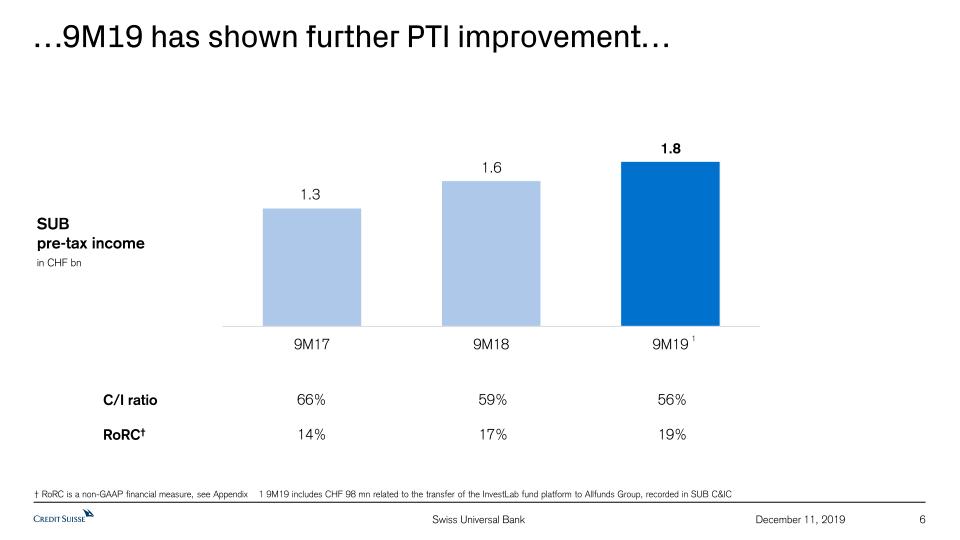
6 December 11, 2019 …9M19 has shown further PTI improvement… SUBpre-tax incomein CHF bn 1 † RoRC is a non-GAAP financial measure, see Appendix 1 9M19 includes CHF 98 mn related to the transfer of the InvestLab fund platform to Allfunds Group, recorded in SUB C&IC C/I ratio RoRC† 1.6 1.3 66% 59% 56% 14% 17% 19% Swiss Universal Bank 1.8

7 December 11, 2019 …and we continue to be a leading Swiss bank in terms of efficiency Source: Company public disclosures and The Boston Consulting Group Benchmarking 2019 1 Swiss Universal Bank; excludes net revenues and total operating expenses for Swisscard of CHF 148 mn and CHF 123 mn, respectively Cost/income ratio 1H19Compared to domestic peer group Cost/income ratio 2015Compared to domestic peer group SUB1 SUB Bank 1 Bank 1 Bank 2 Bank 3 Bank 4 Bank 5 Bank 6 Bank 7 Bank 8 Bank 1 Bank 1 Bank 2 Bank 3 Bank 4 Bank 5 Bank 6 Bank 7 Bank 8 -12pps Swiss Universal Bank
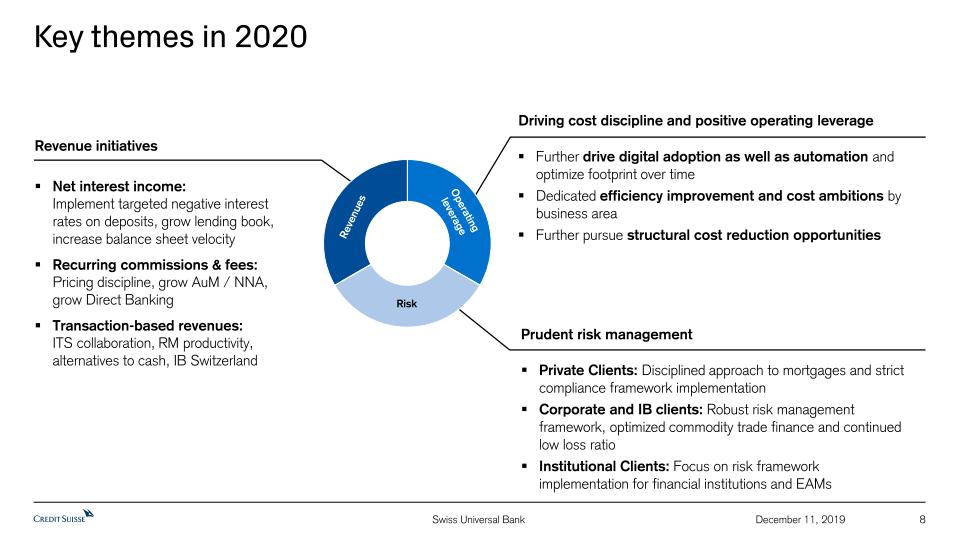
8 December 11, 2019 Key themes in 2020 Revenue initiatives Net interest income:Implement targeted negative interest rates on deposits, grow lending book, increase balance sheet velocityRecurring commissions & fees:Pricing discipline, grow AuM / NNA, grow Direct BankingTransaction-based revenues:ITS collaboration, RM productivity, alternatives to cash, IB Switzerland Further drive digital adoption as well as automation and optimize footprint over timeDedicated efficiency improvement and cost ambitions by business areaFurther pursue structural cost reduction opportunities Driving cost discipline and positive operating leverage Private Clients: Disciplined approach to mortgages and strict compliance framework implementationCorporate and IB clients: Robust risk management framework, optimized commodity trade finance and continued low loss ratioInstitutional Clients: Focus on risk framework implementation for financial institutions and EAMs Prudent risk management Revenues Operating leverage Risk Swiss Universal Bank
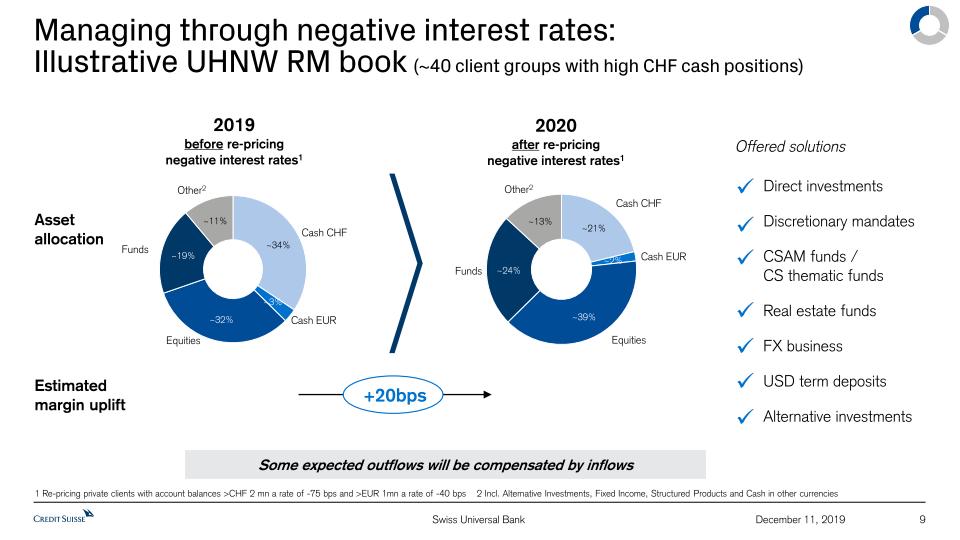
Managing through negative interest rates:Illustrative UHNW RM book (~40 client groups with high CHF cash positions) 2019before re-pricingnegative interest rates1 2020after re-pricingnegative interest rates1 Asset allocation Estimatedmargin uplift +20bps Cash CHF Equities Other2 Funds Cash EUR Direct investmentsDiscretionary mandatesCSAM funds / CS thematic fundsReal estate fundsFX businessUSD term depositsAlternative investments Cash CHF Equities Other2 Funds Cash EUR Funds 1 Re-pricing private clients with account balances >CHF 2 mn a rate of -75 bps and >EUR 1mn a rate of -40 bps 2 Incl. Alternative Investments, Fixed Income, Structured Products and Cash in other currencies Offered solutions December 11, 2019 9 Some expected outflows will be compensated by inflows Swiss Universal Bank
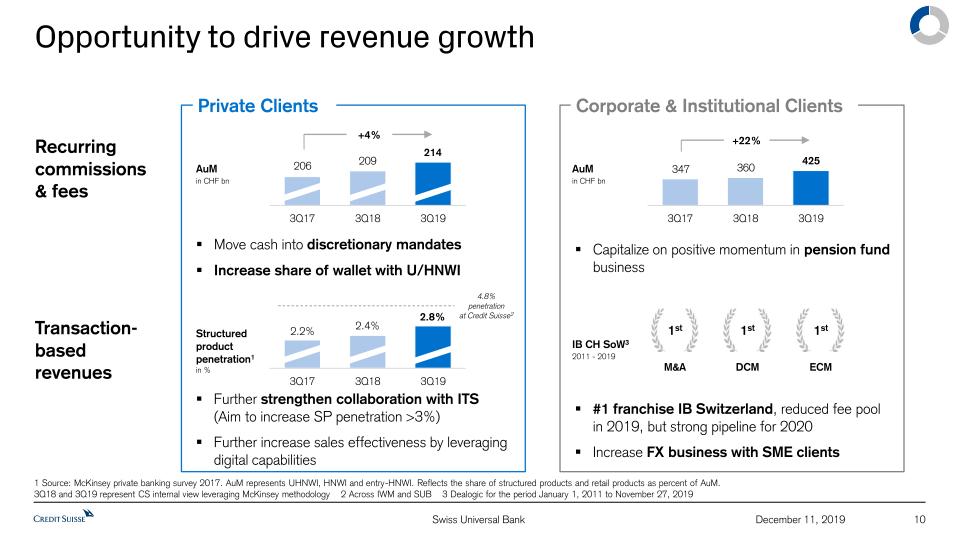
10 December 11, 2019 Opportunity to drive revenue growth Recurringcommissions & fees Move cash into discretionary mandatesIncrease share of wallet with U/HNWI Capitalize on positive momentum in pension fund business Transaction-based revenues Further strengthen collaboration with ITS (Aim to increase SP penetration >3%)Further increase sales effectiveness by leveraging digital capabilities #1 franchise IB Switzerland, reduced fee pool in 2019, but strong pipeline for 2020 Increase FX business with SME clients Private Clients Corporate & Institutional Clients AuM in CHF bn AuM in CHF bn Structured productpenetration1 in % IB CH SoW3 2011 - 2019 1st 1st 1st M&A DCM ECM 4.8% penetration at Credit Suisse2 1 Source: McKinsey private banking survey 2017. AuM represents UHNWI, HNWI and entry-HNWI. Reflects the share of structured products and retail products as percent of AuM.3Q18 and 3Q19 represent CS internal view leveraging McKinsey methodology 2 Across IWM and SUB 3 Dealogic for the period January 1, 2011 to November 27, 2019 206 209 214 2.2% 2.4% 2.8% 347 360 425 +22% +4% Swiss Universal Bank
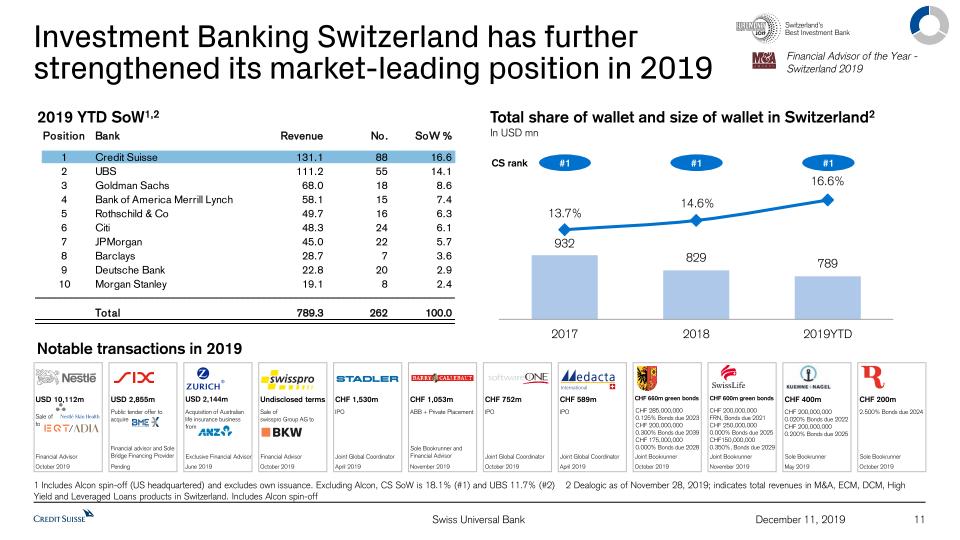
Investment Banking Switzerland has further strengthened its market-leading position in 2019 Total share of wallet and size of wallet in Switzerland2In USD mn 1 Includes Alcon spin-off (US headquartered) and excludes own issuance. Excluding Alcon, CS SoW is 18.1% (#1) and UBS 11.7% (#2) 2 Dealogic as of November 28, 2019; indicates total revenues in M&A, ECM, DCM, High Yield and Leveraged Loans products in Switzerland. Includes Alcon spin-off CS rank #1 #1 #1 Financial Advisor of the Year - Switzerland 2019 2019 YTD SoW1,2 Notable transactions in 2019 Public tender offer to acquire Financial advisor and Sole Bridge Financing Provider USD 2,855m Pending IPO Joint Global Coordinator CHF 752m October 2019 CHF 200,000,0000.020% Bonds due 2022CHF 200,000,0000.200% Bonds due 2025 Sole Bookrunner CHF 400m May 2019 2.500% Bonds due 2024 Sole Bookrunner CHF 200m October 2019 CHF 200,000,000FRN, Bonds due 2021CHF 250,000,0000.000% Bonds due 2025CHF150,000,0000.350%, Bonds due 2029 Joint Bookrunner CHF 600m green bonds November 2019 IPO Joint Global Coordinator CHF 1,530m April 2019 Sale of to Financial Advisor USD 10,112m October 2019 / IPO Joint Global Coordinator CHF 589m April 2019 Sale of swisspro Group AG to Financial Advisor Undisclosed terms October 2019 ABB + Private Placement Sole Bookrunner and Financial Advisor CHF 1,053m November 2019 Acquisition of Australian life insurance business from Exclusive Financial Advisor USD 2,144m June 2019 Joint Bookrunner CHF 660m green bonds October 2019 CHF 285,000,0000.125% Bonds due 2023CHF 200,000,0000.300% Bonds due 2039CHF 175,000,0000.000% Bonds due 2028 11 December 11, 2019 Swiss Universal Bank
12 December 11, 2019 Direct Banking to drive digital offering for high-tech clients About Direct Banking Achievements & way-forward Focus on four key areas to increase market share in retail and small commercial clients segments:Launch of new product offeringsFurther digitalization of current products and processesBest-in-class client service by investing in technology and extending servicing hoursStrong focus on highest security standards Covering > 1 mn retail client accounts and ~60 k small commercial clients...with ~500 employees in 4 contact centers offering basic products such as accounts, cards, saving solutions including pension products, standard mortgages and simple investment offerings increase in mobile banking usage since January 2019 ~10pp of legal entities and private clients are digitally onboarded > 90% ‘Best digital corporate bank’Institute of Financial Services Zug (IFZ) and e-foresight Swiss Universal Bank
13 December 11, 2019 Substantially reduced operating expenses in the last few years Total operating expenses in CHF bn 1 1 Estimates and assumptions are based on currently available information and beliefs, expectations and opinions of management and include all known facts and decisions as of December 11, 2019. Actual results may differ 2 9M19 figure 9M19 66% 60% 56% C/Iratio 2 Mobile banking penetration Local footprint ~+14 pp 214 146 68 branches closed increase in digital RM workbench usage in 2019 ~50pp more eDoc subscriptions since 2017 ~3x Strong track record in terms of efficiency and effectiveness over the last 3 years Continuously driving productivity agenda with clear focus on utilization and front-to-back digitalization decrease in # of teller transactions since 2017 ~20% sales leads generated applying advanced analytics >400k Swiss Universal Bank ~15 pp
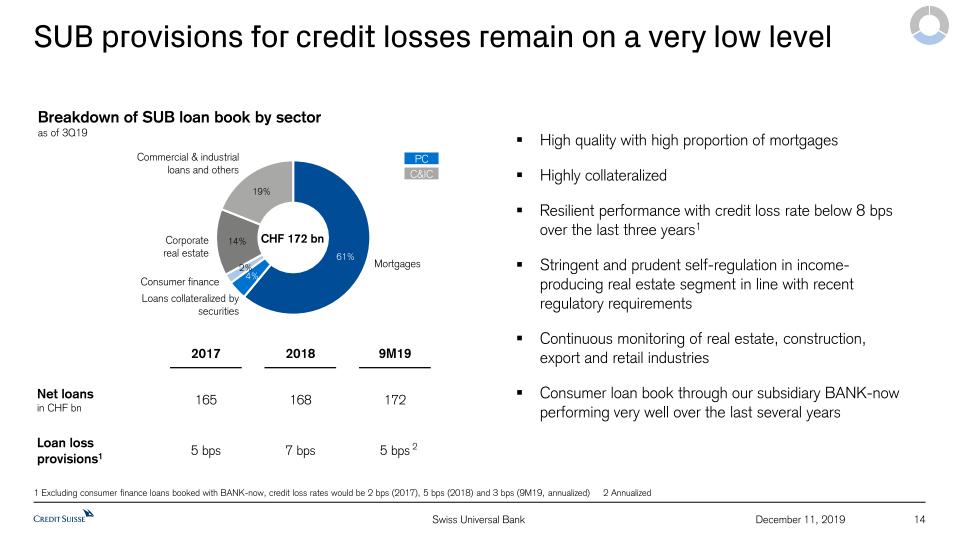
14 December 11, 2019 SUB provisions for credit losses remain on a very low level PC C&IC 1 Excluding consumer finance loans booked with BANK-now, credit loss rates would be 2 bps (2017), 5 bps (2018) and 3 bps (9M19, annualized) 2 Annualized High quality with high proportion of mortgagesHighly collateralizedResilient performance with credit loss rate below 8 bps over the last three years1Stringent and prudent self-regulation in income-producing real estate segment in line with recent regulatory requirementsContinuous monitoring of real estate, construction, export and retail industriesConsumer loan book through our subsidiary BANK-now performing very well over the last several years Breakdown of SUB loan book by sectoras of 3Q19 Loan loss provisions1 9M19 Net loansin CHF bn 5 bps 165 2017 7 bps 168 2018 5 bps 172 9M19 2 Commercial & industrial loans and others Corporate real estate Consumer finance Loans collateralized by securities Mortgages CHF 172 bn Swiss Universal Bank
15 December 11, 2019 Summary Resilient performance in 2019 despite market headwindsContinued leadership as The Bank for Entrepreneurs and in other ‘high-touch’ areas (e.g. UHNWI, IB, IC)Successfully launched Direct Banking to focus on ‘high-tech’ needs of retail and small commercial clientsKey measures introduced in 4Q19 to address negative interest rate environmentContinued focus on multiple growth opportunities as well as on cost discipline and further efficiency improvements Summary Above market growthin revenues & client business volumeIndustry leadingcost/income ratioStrong return on regulatory capital Ambition Swiss Universal Bank

Appendix 16 December 11, 2019
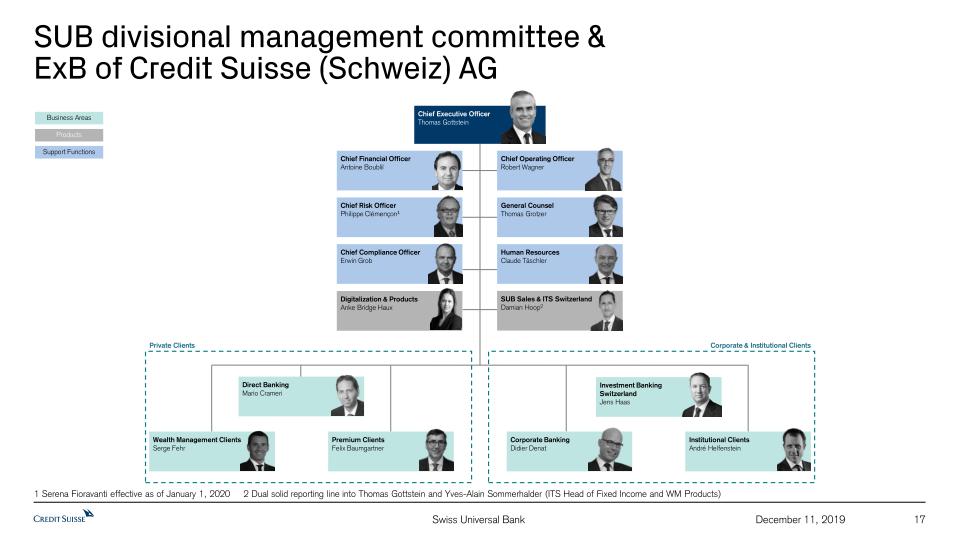
Investment BankingSwitzerlandJens Haas SUB divisional management committee & ExB of Credit Suisse (Schweiz) AG 17 December 11, 2019 Business Areas Products Support Functions General CounselThomas Grotzer Human ResourcesClaude Täschler Chief Executive OfficerThomas Gottstein Chief Financial OfficerAntoine Boublil Chief Risk OfficerPhilippe Clémençon1 Chief Compliance OfficerErwin Grob SUB Sales & ITS SwitzerlandDamian Hoop2 Corporate BankingDidier Denat Institutional ClientsAndré Helfenstein Private Clients Corporate & Institutional Clients Premium ClientsFelix Baumgartner Wealth Management ClientsSerge Fehr Chief Operating OfficerRobert Wagner Digitalization & ProductsAnke Bridge Haux Direct BankingMario Crameri 1 Serena Fioravanti effective as of January 1, 2020 2 Dual solid reporting line into Thomas Gottstein and Yves-Alain Sommerhalder (ITS Head of Fixed Income and WM Products) Swiss Universal Bank
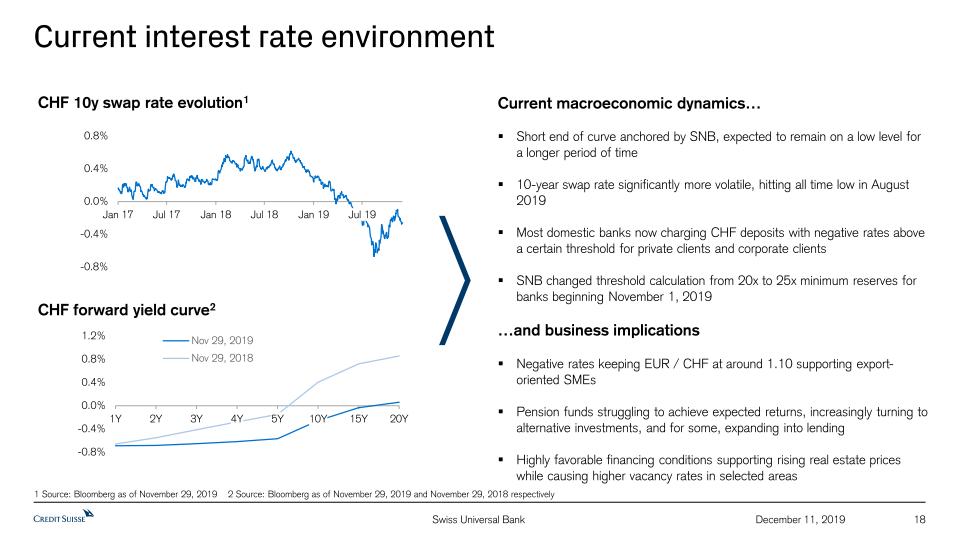
18 December 11, 2019 Current interest rate environment 1 Source: Bloomberg as of November 29, 2019 2 Source: Bloomberg as of November 29, 2019 and November 29, 2018 respectively CHF 10y swap rate evolution1 CHF forward yield curve2 Current macroeconomic dynamics…Short end of curve anchored by SNB, expected to remain on a low level for a longer period of time10-year swap rate significantly more volatile, hitting all time low in August 2019Most domestic banks now charging CHF deposits with negative rates above a certain threshold for private clients and corporate clientsSNB changed threshold calculation from 20x to 25x minimum reserves for banks beginning November 1, 2019 …and business implicationsNegative rates keeping EUR / CHF at around 1.10 supporting export-oriented SMEsPension funds struggling to achieve expected returns, increasingly turning to alternative investments, and for some, expanding into lendingHighly favorable financing conditions supporting rising real estate prices while causing higher vacancy rates in selected areas Swiss Universal Bank
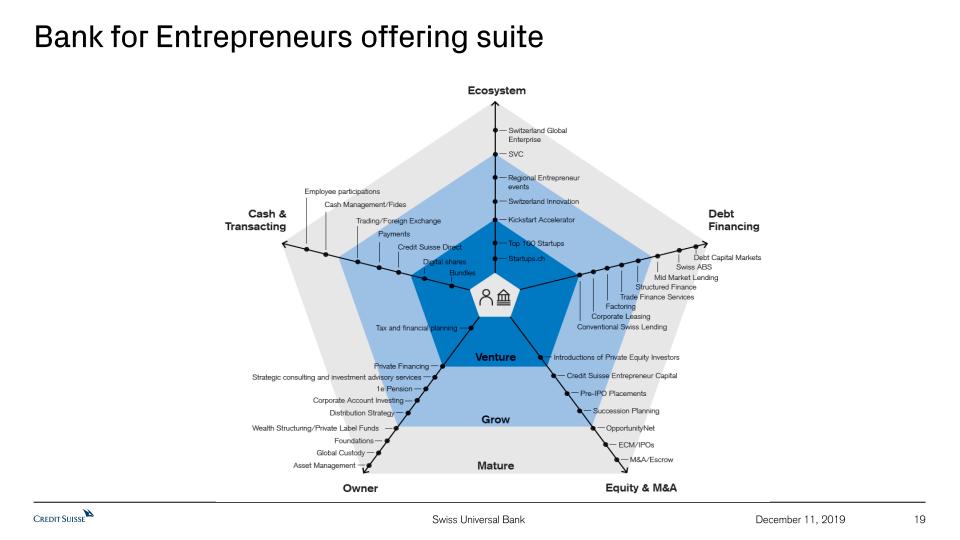
Bank for Entrepreneurs offering suite 19 December 11, 2019 Swiss Universal Bank
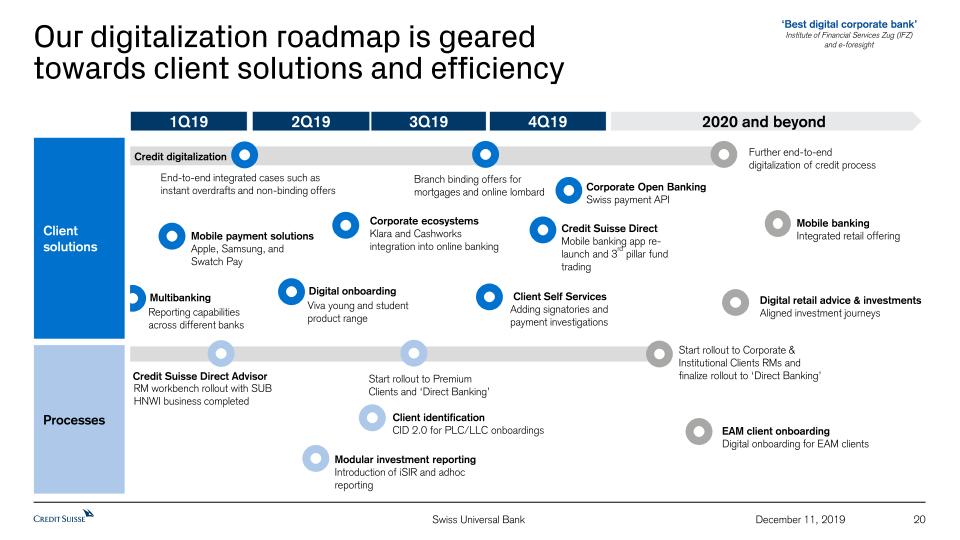
20 December 11, 2019 Our digitalization roadmap is geared towards client solutions and efficiency 2020 and beyond 1Q19 2Q19 3Q19 4Q19 Processes Client solutions Viva young and student product range Credit Suisse Direct Advisor Client Self Services Adding signatories and payment investigations Start rollout to Corporate & Institutional Clients RMs and finalize rollout to ‘Direct Banking’ EAM client onboardingDigital onboarding for EAM clients Credit Suisse DirectMobile banking app re-launch and 3rd pillar fund trading Mobile payment solutionsApple, Samsung, and Swatch Pay End-to-end integrated cases such as instant overdrafts and non-binding offers Corporate ecosystemsKlara and Cashworks integration into online banking Mobile bankingIntegrated retail offering Further end-to-end digitalization of credit process Credit digitalization Digital onboarding RM workbench rollout with SUB HNWI business completed Branch binding offers for mortgages and online lombard Corporate Open BankingSwiss payment API Start rollout to Premium Clients and ‘Direct Banking’ Client identificationCID 2.0 for PLC/LLC onboardings Modular investment reportingIntroduction of iSIR and adhoc reporting Digital retail advice & investmentsAligned investment journeys Reporting capabilities across different banks Multibanking ‘Best digital corporate bank’Institute of Financial Services Zug (IFZ)and e-foresight Swiss Universal Bank

Credit Suisse Investor Day 2019International Wealth Management Philipp Wehle, CEO International Wealth ManagementDecember 11, 2019

IWM – an attractive wealth and asset management franchise 22 December 11, 2019 Private Banking Asset Management We operate in highly relevant markets… Note: 9M19 includes CHF 131 mn related to the transfer of the InvestLab fund platform to Allfunds Group, recorded in IWM PB 1 Credit Suisse Global Wealth Report 2019 2 Credit Suisse and Oliver Wyman Wealth Pools 2019 3 Beginning of 2016 through end 3Q19 4 9M19 vs. 9M16 5 BCG Global AM Database 2019 6 Active specialty, solutions/liability-driven investments/balanced in BCG Global AM Database PTI1.5 22% 78% 28% 72% Net revenues4.2 9M19 in CHF bn AuM791 54% 46% Population1 ~40%GDP1 ~40%Wealth2 ~35% IWMcover 2023E 2018 2015 ~5% ~4% CAGR in CHF tr …with a long-term industry growth… Multiple awards since 2015, reflecting our integrated deliveryCHF 56 bn NNA3 and 6% AuM CAGR3 since 2016PTI up 91%4 since 2016 Top-tier player in our segment geared towards alternatives / alternatives-lite solutions (~2/3rd of AuM)CHF 62 bn NNA3 and 7% revenue CAGR4 since 2016PTI up 90%4 since 2016 …with tangible success 16% 5%32% 4%32% 0%20% 3% 2015 2018 2023E ~7% ~5% CAGR in CHF tr AuM share 20185 Fee pool CAGR 2018-23E5 IndustryAM AuM5 AlternativesAlternatives-lite6Active corePassive IndustryPB AuM2 International Wealth Management
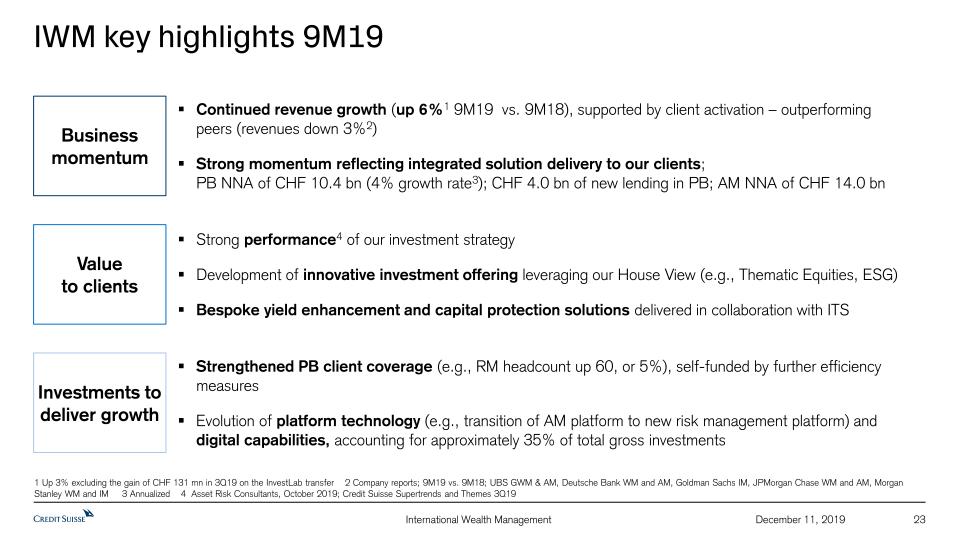
IWM key highlights 9M19 23 December 11, 2019 Continued revenue growth (up 6%1 9M19 vs. 9M18), supported by client activation – outperformingpeers (revenues down 3%2)Strong momentum reflecting integrated solution delivery to our clients; PB NNA of CHF 10.4 bn (4% growth rate3); CHF 4.0 bn of new lending in PB; AM NNA of CHF 14.0 bn Business momentum 1 Up 3% excluding the gain of CHF 131 mn in 3Q19 on the InvestLab transfer 2 Company reports; 9M19 vs. 9M18; UBS GWM & AM, Deutsche Bank WM and AM, Goldman Sachs IM, JPMorgan Chase WM and AM, Morgan Stanley WM and IM 3 Annualized 4 Asset Risk Consultants, October 2019; Credit Suisse Supertrends and Themes 3Q19 Strong performance4 of our investment strategyDevelopment of innovative investment offering leveraging our House View (e.g., Thematic Equities, ESG)Bespoke yield enhancement and capital protection solutions delivered in collaboration with ITS Valueto clients Strengthened PB client coverage (e.g., RM headcount up 60, or 5%), self-funded by further efficiency measuresEvolution of platform technology (e.g., transition of AM platform to new risk management platform) and digital capabilities, accounting for approximately 35% of total gross investments Investments to deliver growth International Wealth Management
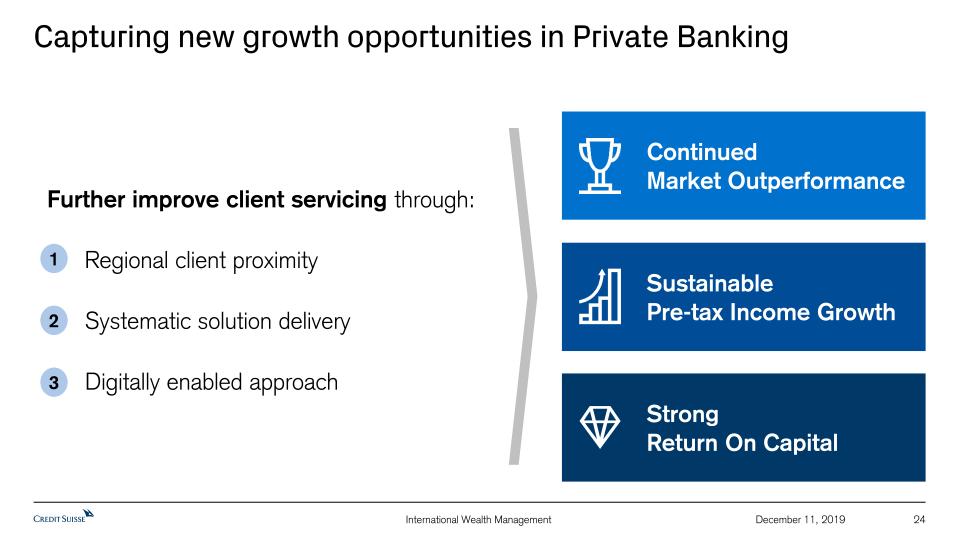
Capturing new growth opportunities in Private Banking 24 December 11, 2019 SustainablePre-tax Income Growth StrongReturn On Capital ContinuedMarket Outperformance Further improve client servicing through:Regional client proximitySystematic solution deliveryDigitally enabled approach 1 2 3 International Wealth Management
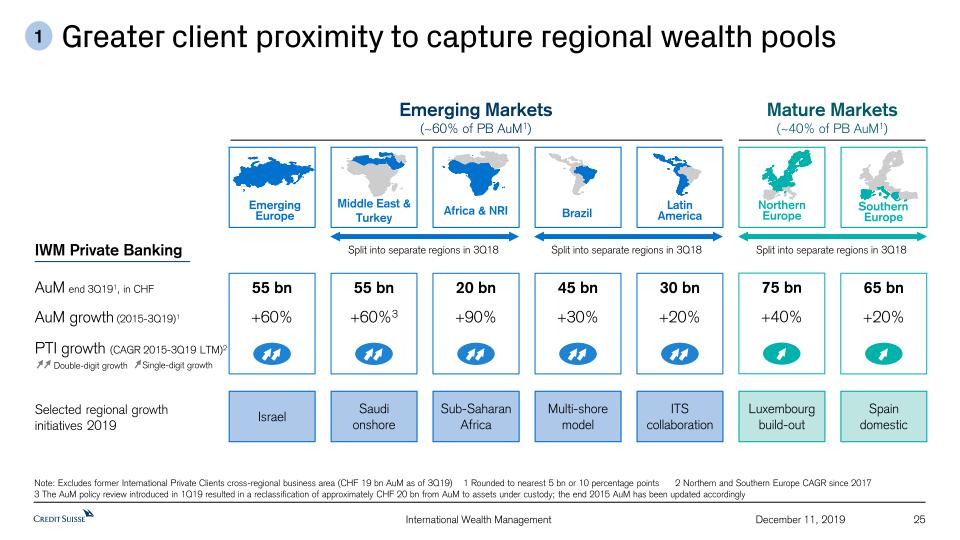
Greater client proximity to capture regional wealth pools 25 December 11, 2019 1 Note: Excludes former International Private Clients cross-regional business area (CHF 19 bn AuM as of 3Q19) 1 Rounded to nearest 5 bn or 10 percentage points 2 Northern and Southern Europe CAGR since 2017 3 The AuM policy review introduced in 1Q19 resulted in a reclassification of approximately CHF 20 bn from AuM to assets under custody; the end 2015 AuM has been updated accordingly IWM Private Banking AuM end 3Q191, in CHF AuM growth (2015-3Q19)1 PTI growth (CAGR 2015-3Q19 LTM)2 Double-digit growth Single-digit growth Mature Markets(~40% of PB AuM1) 75 bn 65 bn Northern Europe SouthernEurope 30 bn Latin America 55 bn Emerging Europe 20 bn Africa & NRI 55 bn Middle East & Turkey 45 bn Brazil Split into separate regions in 3Q18 Split into separate regions in 3Q18 Split into separate regions in 3Q18 Selected regional growth initiatives 2019 Emerging Markets(~60% of PB AuM1) +20% +60% +90% +60%3 +30% +40% +20% Israel Saudionshore Sub-Saharan Africa Multi-shore model ITS collaboration Luxembourg build-out Spaindomestic International Wealth Management
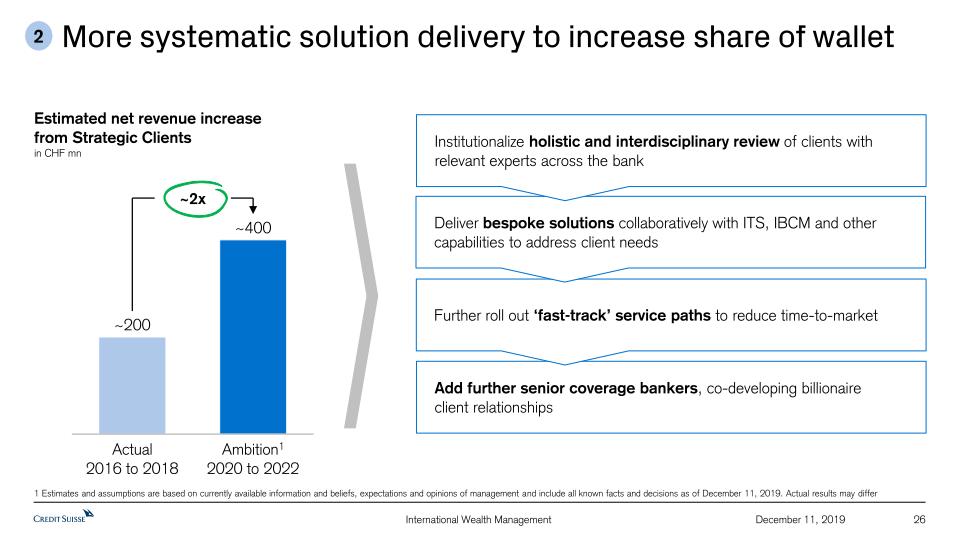
More systematic solution delivery to increase share of wallet 26 December 11, 2019 ~400 Ambition12020 to 2022 Actual2016 to 2018 ~200 ~2x Estimated net revenue increasefrom Strategic Clientsin CHF mn 2 Add further senior coverage bankers, co-developing billionaire client relationships Further roll out ‘fast-track’ service paths to reduce time-to-market Deliver bespoke solutions collaboratively with ITS, IBCM and other capabilities to address client needs Institutionalize holistic and interdisciplinary review of clients with relevant experts across the bank 1 Estimates and assumptions are based on currently available information and beliefs, expectations and opinions of management and include all known facts and decisions as of December 11, 2019. Actual results may differ International Wealth Management
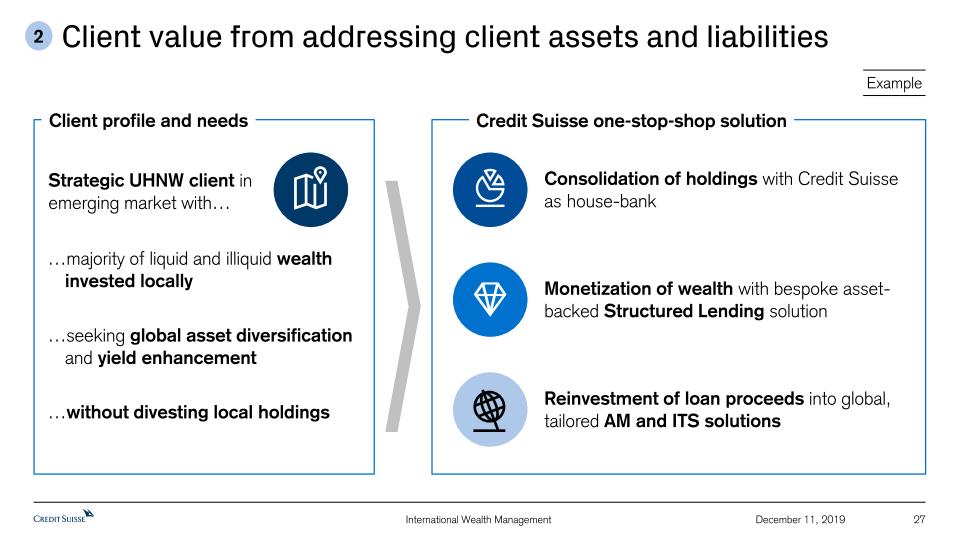
Client value from addressing client assets and liabilities 27 December 11, 2019 …majority of liquid and illiquid wealth invested locally…seeking global asset diversification and yield enhancement…without divesting local holdings Consolidation of holdings with Credit Suisse as house-bank Strategic UHNW client in emerging market with… Client profile and needs Credit Suisse one-stop-shop solution 2 Example Monetization of wealth with bespoke asset-backed Structured Lending solution Reinvestment of loan proceeds into global, tailored AM and ITS solutions International Wealth Management
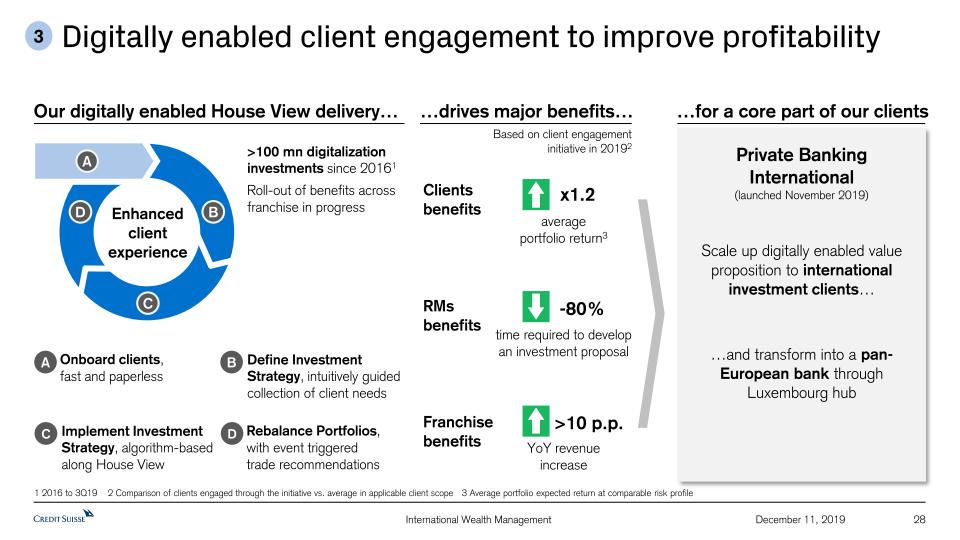
Digitally enabled client engagement to improve profitability 28 December 11, 2019 Onboard clients,fast and paperless A Define Investment Strategy, intuitively guided collection of client needs Implement InvestmentStrategy, algorithm-based along House View Rebalance Portfolios,with event triggered trade recommendations B C D Our digitally enabled House View delivery… Enhancedclient experience A B C D average portfolio return3 …drives major benefits… Clientsbenefits time required to develop an investment proposal Private Banking International(launched November 2019)Scale up digitally enabled value proposition to international investment clients… …and transform into a pan-European bank through Luxembourg hub RMsbenefits YoY revenue increase Franchisebenefits Based on client engagement initiative in 20192 1 2016 to 3Q19 2 Comparison of clients engaged through the initiative vs. average in applicable client scope 3 Average portfolio expected return at comparable risk profile x1.2 -80% >10 p.p. …for a core part of our clients >100 mn digitalization investments since 20161Roll-out of benefits across franchise in progress 3 International Wealth Management
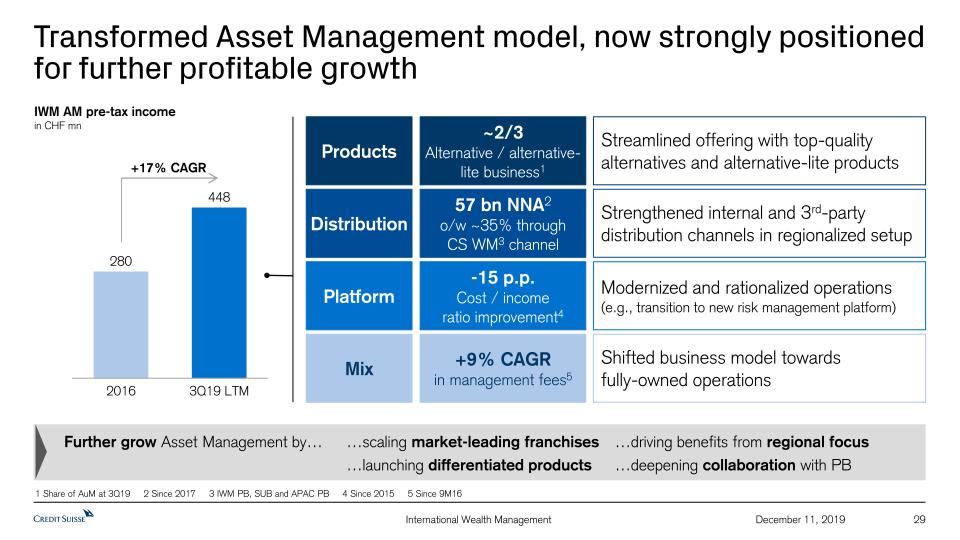
Transformed Asset Management model, now strongly positioned for further profitable growth 29 December 11, 2019 2016 3Q19 LTM IWM AM pre-tax incomein CHF mn +17% CAGR Products Streamlined offering with top-quality alternatives and alternative-lite products ~2/3 Alternative / alternative-lite business1 Distribution Strengthened internal and 3rd-party distribution channels in regionalized setup 57 bn NNA2o/w ~35% throughCS WM3 channel Mix Shifted business model towardsfully-owned operations +9% CAGRin management fees5 Platform Modernized and rationalized operations(e.g., transition to new risk management platform) -15 p.p.Cost / income ratio improvement4 1 Share of AuM at 3Q19 2 Since 2017 3 IWM PB, SUB and APAC PB 4 Since 2015 5 Since 9M16 …scaling market-leading franchises…launching differentiated products Further grow Asset Management by… …driving benefits from regional focus…deepening collaboration with PB International Wealth Management
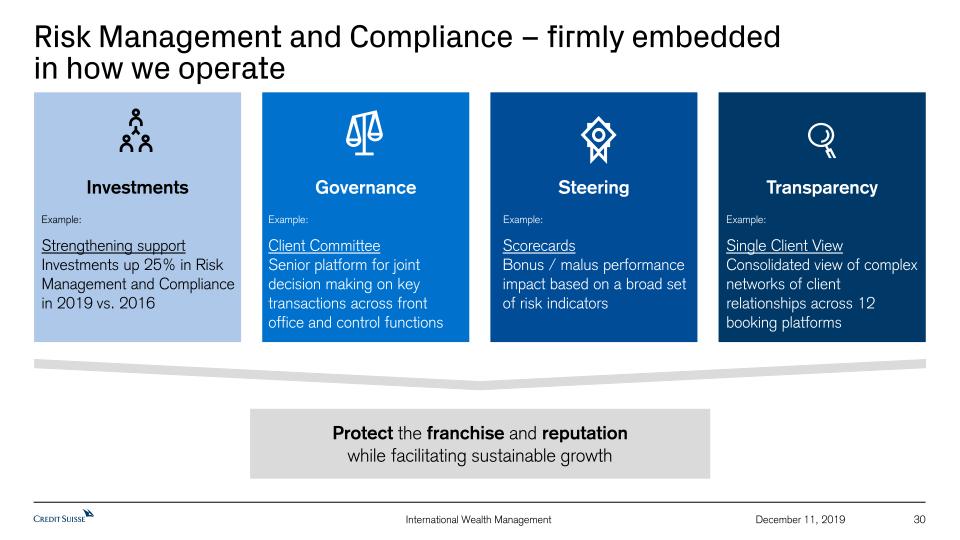
Risk Management and Compliance – firmly embeddedin how we operate 30 December 11, 2019 International Wealth Management 30 December 11, 2019 Protect the franchise and reputationwhile facilitating sustainable growth Investments Example: Strengthening supportInvestments up 25% in Risk Management and Compliance in 2019 vs. 2016 Governance Example: Client CommitteeSenior platform for joint decision making on key transactions across front office and control functions Steering ScorecardsBonus / malus performance impact based on a broad set of risk indicators Example: Transparency Single Client ViewConsolidated view of complex networks of client relationships across 12 booking platforms Example:
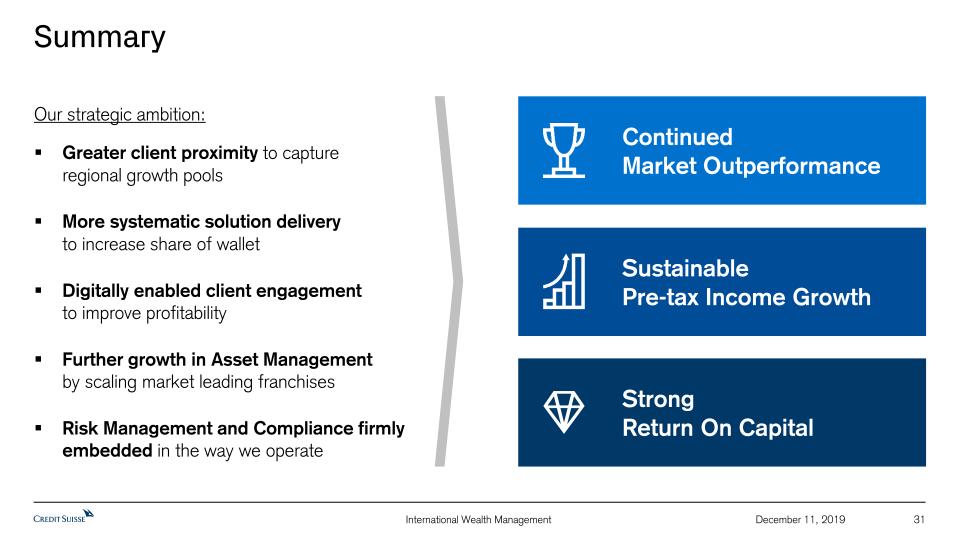
Summary 31 December 11, 2019 Low-margin product with strong client demand(Index Solutions) SustainablePre-tax Income Growth StrongReturn On Capital ContinuedMarket Outperformance Our strategic ambition:Greater client proximity to capture regional growth poolsMore systematic solution delivery to increase share of walletDigitally enabled client engagement to improve profitabilityFurther growth in Asset Management by scaling market leading franchisesRisk Management and Compliance firmly embedded in the way we operate International Wealth Management

Appendix 32 December 11, 2019
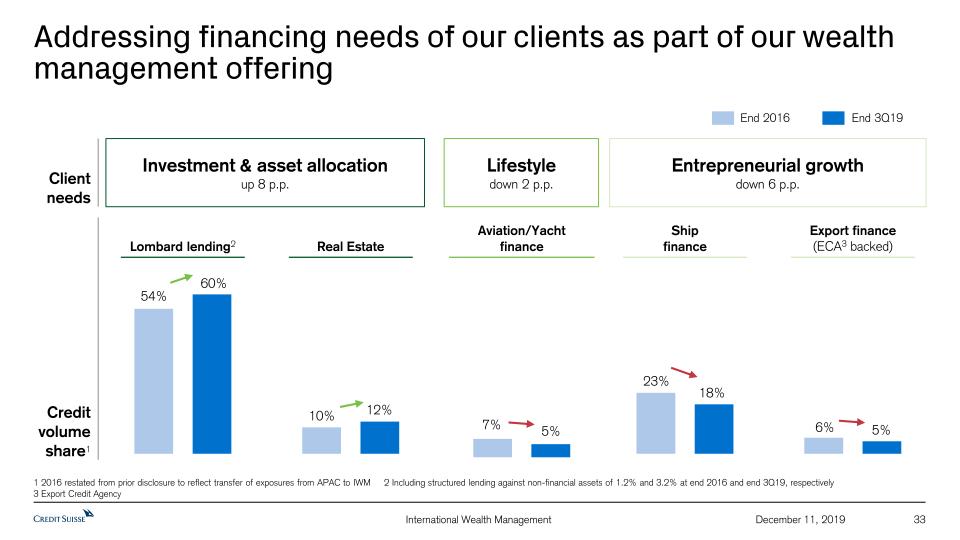
Addressing financing needs of our clients as part of our wealth management offering 33 December 11, 2019 Entrepreneurial growthdown 6 p.p. Investment & asset allocationup 8 p.p. Lifestyledown 2 p.p. Lombard lending2 Real Estate Aviation/Yachtfinance Shipfinance Export finance(ECA3 backed) Client needs 54% 60% 10% 12% 7% 5% 23% 18% 6% 5% Credit volume share1 End 2016 End 3Q19 1 2016 restated from prior disclosure to reflect transfer of exposures from APAC to IWM 2 Including structured lending against non-financial assets of 1.2% and 3.2% at end 2016 and end 3Q19, respectively 3 Export Credit Agency International Wealth Management
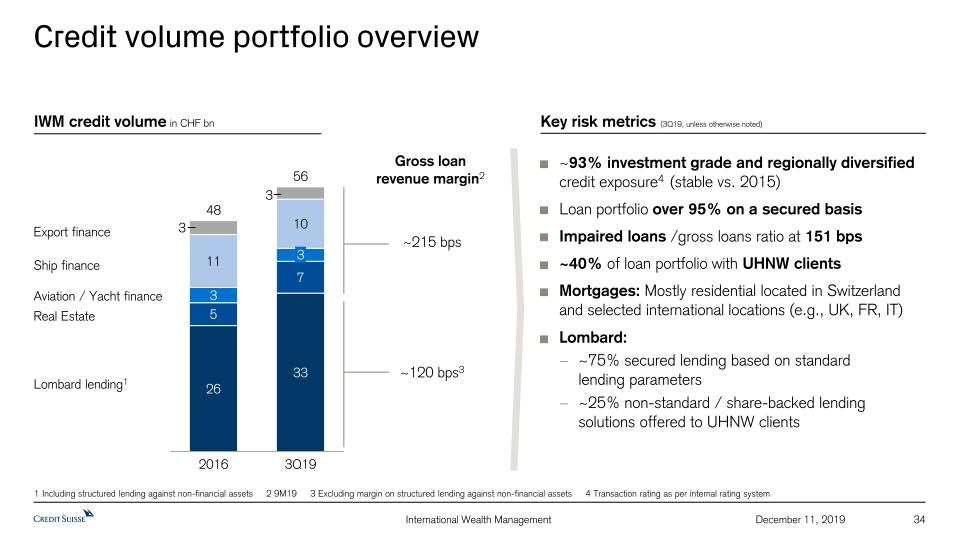
Credit volume portfolio overview 34 December 11, 2019 ~93% investment grade and regionally diversified credit exposure4 (stable vs. 2015)Loan portfolio over 95% on a secured basisImpaired loans /gross loans ratio at 151 bps ~40% of loan portfolio with UHNW clientsMortgages: Mostly residential located in Switzerlandand selected international locations (e.g., UK, FR, IT)Lombard:~75% secured lending based on standardlending parameters~25% non-standard / share-backed lending solutions offered to UHNW clients ~120 bps3 ~215 bps Gross loan revenue margin2 IWM credit volume in CHF bn Key risk metrics (3Q19, unless otherwise noted) 3Q19 56 3 2016 48 Lombard lending1 Ship finance Real Estate Aviation / Yacht finance Export finance 1 Including structured lending against non-financial assets 2 9M19 3 Excluding margin on structured lending against non-financial assets 4 Transaction rating as per internal rating system International Wealth Management
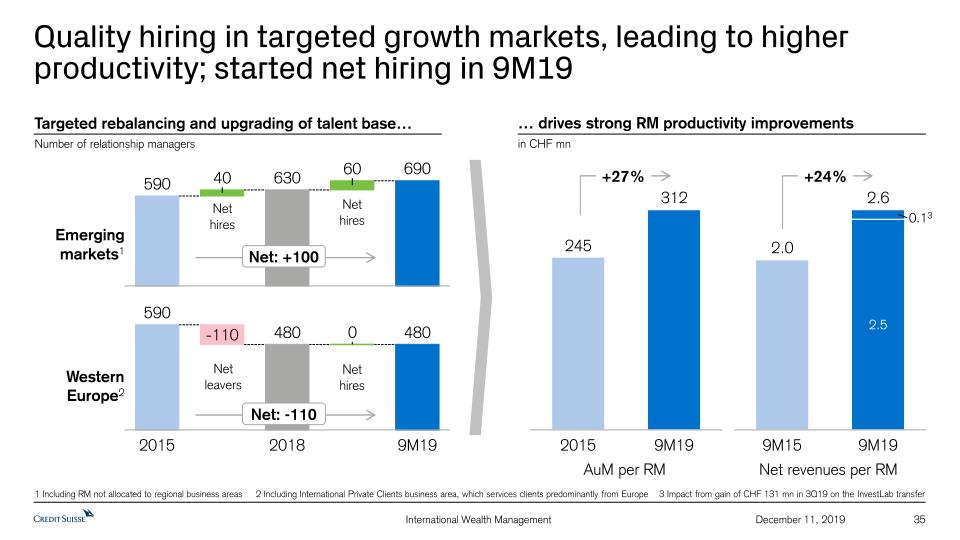
2015 -110 9M19 2018 0 0.13 9M15 9M19 2.6 2015 9M19 Quality hiring in targeted growth markets, leading to higher productivity; started net hiring in 9M19 35 December 11, 2019 AuM per RM Net revenues per RM Western Europe2 Emerging markets1 1 Including RM not allocated to regional business areas 2 Including International Private Clients business area, which services clients predominantly from Europe 3 Impact from gain of CHF 131 mn in 3Q19 on the InvestLab transfer Targeted rebalancing and upgrading of talent base…Number of relationship managers … drives strong RM productivity improvementsin CHF mn +27% +24% Net: -110 Net: +100 Net hires Net hires Net leavers Net hires International Wealth Management

Credit Suisse Investor Day 2019Asia Pacific Helman Sitohang, CEO Asia PacificDecember 11, 2019
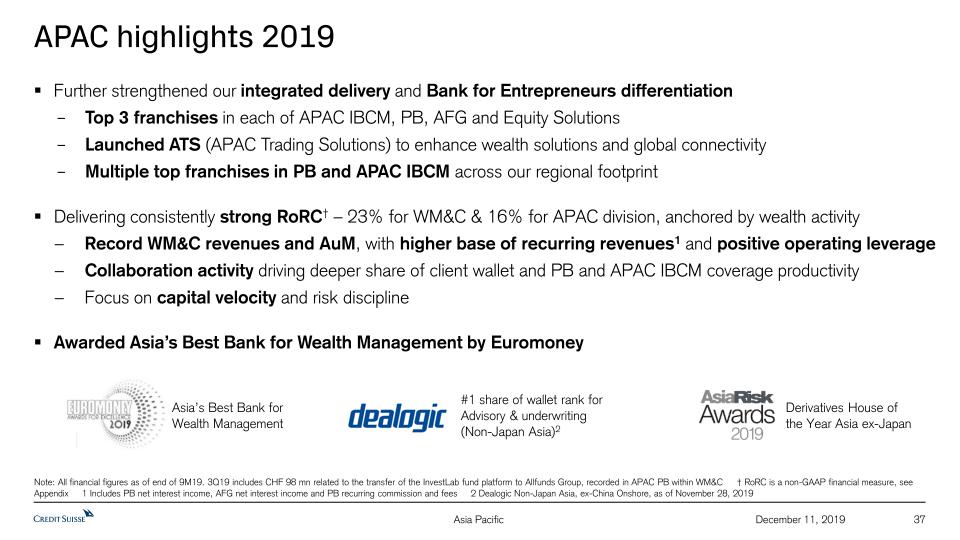
APAC highlights 2019 37 December 11, 2019 Note: All financial figures as of end of 9M19. 3Q19 includes CHF 98 mn related to the transfer of the InvestLab fund platform to Allfunds Group, recorded in APAC PB within WM&C † RoRC is a non-GAAP financial measure, see Appendix 1 Includes PB net interest income, AFG net interest income and PB recurring commission and fees 2 Dealogic Non-Japan Asia, ex-China Onshore, as of November 28, 2019 Asia’s Best Bank for Wealth Management Derivatives House of the Year Asia ex-Japan #1 share of wallet rank for Advisory & underwriting (Non-Japan Asia)2 Further strengthened our integrated delivery and Bank for Entrepreneurs differentiationTop 3 franchises in each of APAC IBCM, PB, AFG and Equity SolutionsLaunched ATS (APAC Trading Solutions) to enhance wealth solutions and global connectivityMultiple top franchises in PB and APAC IBCM across our regional footprintDelivering consistently strong RoRC† – 23% for WM&C & 16% for APAC division, anchored by wealth activityRecord WM&C revenues and AuM, with higher base of recurring revenues1 and positive operating leverageCollaboration activity driving deeper share of client wallet and PB and APAC IBCM coverage productivity Focus on capital velocity and risk disciplineAwarded Asia’s Best Bank for Wealth Management by Euromoney Asia Pacific
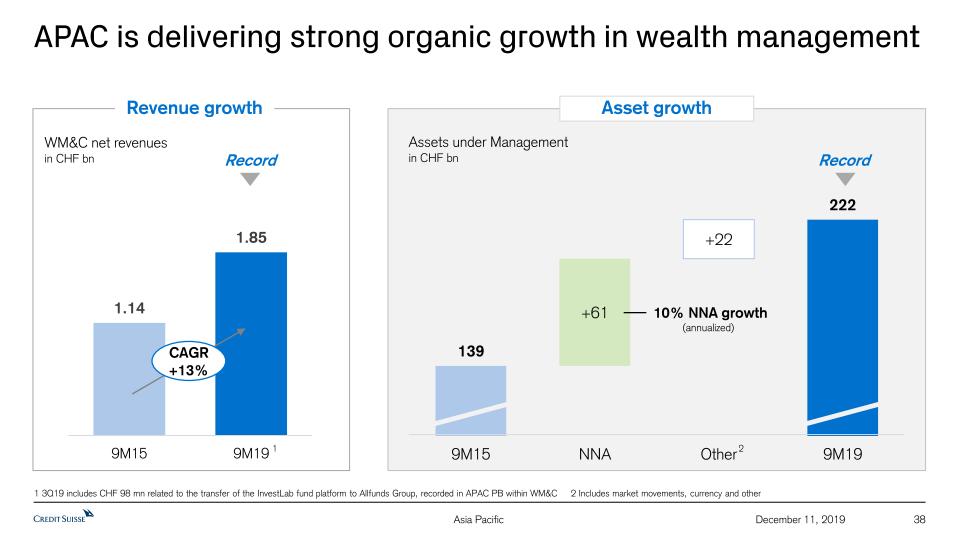
APAC is delivering strong organic growth in wealth management 38 December 11, 2019 WM&C net revenuesin CHF bn CAGR+13% Record Assets under Managementin CHF bn Record Asset growth 10% NNA growth (annualized) Revenue growth 2 1 3Q19 includes CHF 98 mn related to the transfer of the InvestLab fund platform to Allfunds Group, recorded in APAC PB within WM&C 2 Includes market movements, currency and other 1 Asia Pacific
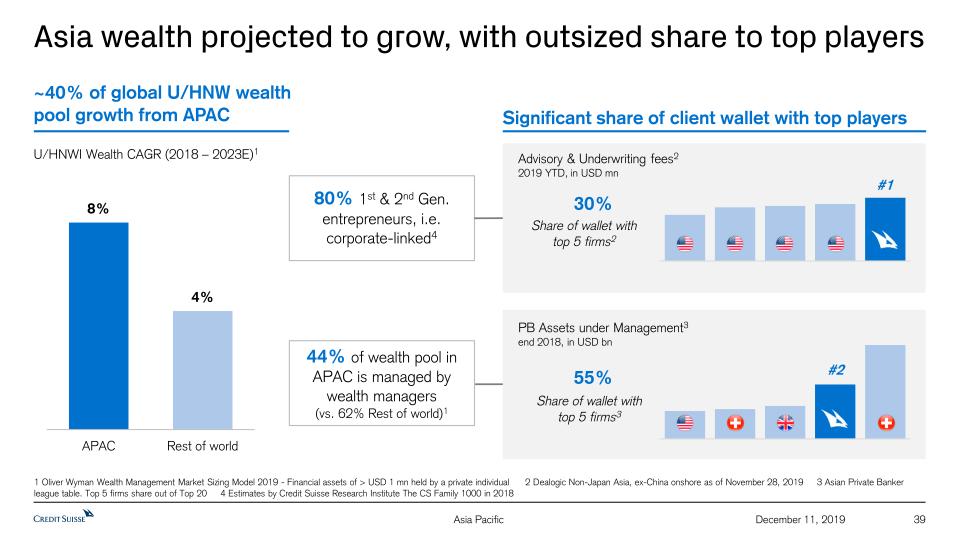
Asia wealth projected to grow, with outsized share to top players 39 December 11, 2019 Significant share of client wallet with top players Share of wallet with top 5 firms2 30% 55% #2 ~40% of global U/HNW wealth pool growth from APAC 80% 1st & 2nd Gen. entrepreneurs, i.e. corporate-linked4 44% of wealth pool in APAC is managed by wealth managers (vs. 62% Rest of world)1 U/HNWI Wealth CAGR (2018 – 2023E)1 #1 1 Oliver Wyman Wealth Management Market Sizing Model 2019 - Financial assets of > USD 1 mn held by a private individual 2 Dealogic Non-Japan Asia, ex-China onshore as of November 28, 2019 3 Asian Private Banker league table. Top 5 firms share out of Top 20 4 Estimates by Credit Suisse Research Institute The CS Family 1000 in 2018 Share of wallet with top 5 firms3 Advisory & Underwriting fees22019 YTD, in USD mn PB Assets under Management3end 2018, in USD bn Asia Pacific
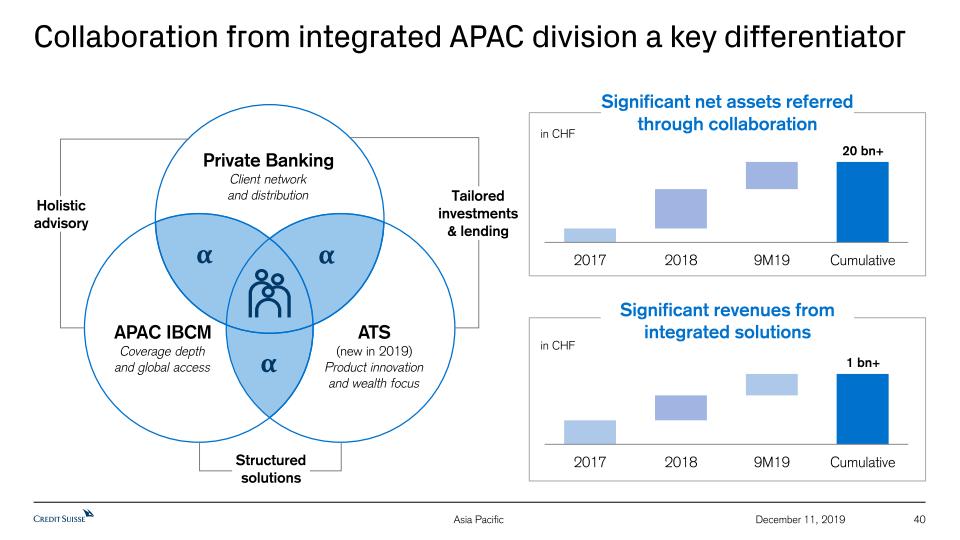
Collaboration from integrated APAC division a key differentiator 40 Significant net assets referred through collaboration Significant revenues from integrated solutions APAC IBCMCoverage depth and global access ATS(new in 2019) Product innovation and wealth focus December 11, 2019 α α α Holistic advisory Tailored investments & lending Structured solutions Private BankingClient networkand distribution 20 bn+ 1 bn+ in CHF in CHF Asia Pacific
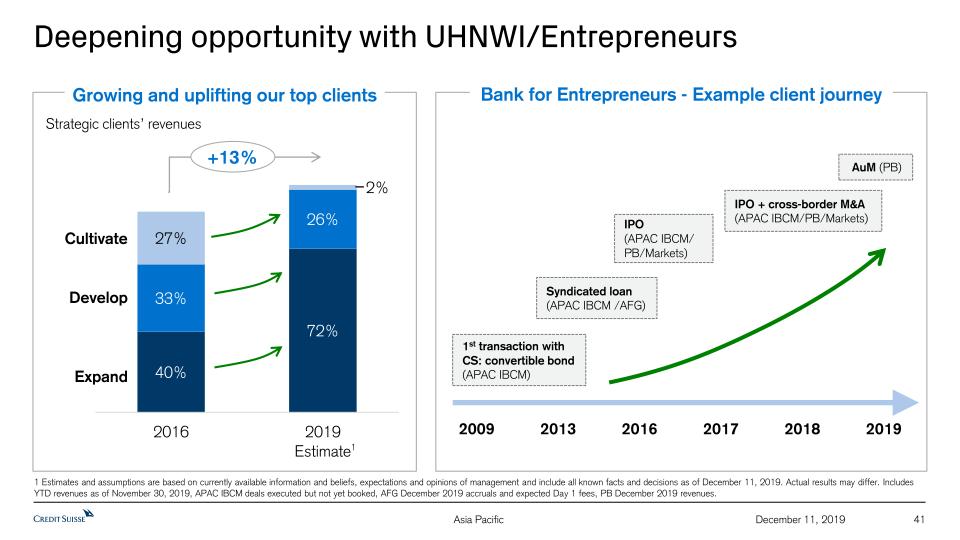
41 December 11, 2019 Deepening opportunity with UHNWI/Entrepreneurs Bank for Entrepreneurs - Example client journey Growing and uplifting our top clients Strategic clients’ revenues Develop Expand Cultivate +13% 2009 2013 2016 2017 2018 2019 1st transaction with CS: convertible bond (APAC IBCM) Syndicated loan (APAC IBCM /AFG) IPO (APAC IBCM/ PB/Markets) IPO + cross-border M&A (APAC IBCM/PB/Markets) AuM (PB) 1 Estimates and assumptions are based on currently available information and beliefs, expectations and opinions of management and include all known facts and decisions as of December 11, 2019. Actual results may differ. Includes YTD revenues as of November 30, 2019, APAC IBCM deals executed but not yet booked, AFG December 2019 accruals and expected Day 1 fees, PB December 2019 revenues. 1 Asia Pacific
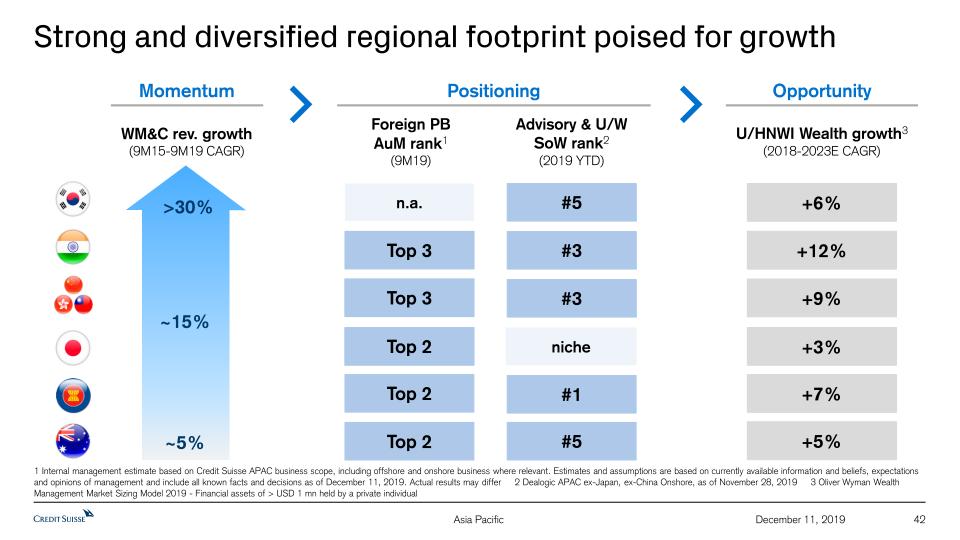
Strong and diversified regional footprint poised for growth 42 December 11, 2019 Momentum Opportunity WM&C rev. growth(9M15-9M19 CAGR) U/HNWI Wealth growth3(2018-2023E CAGR) +12% Positioning Advisory & U/W SoW rank2(2019 YTD) #3 Foreign PB AuM rank1(9M19) Top 3 +6% #5 n.a. +7% #1 Top 2 +5% #5 Top 2 +9% #3 Top 3 +3% niche ~5% >30% ~15% Top 2 1 Internal management estimate based on Credit Suisse APAC business scope, including offshore and onshore business where relevant. Estimates and assumptions are based on currently available information and beliefs, expectations and opinions of management and include all known facts and decisions as of December 11, 2019. Actual results may differ 2 Dealogic APAC ex-Japan, ex-China Onshore, as of November 28, 2019 3 Oliver Wyman Wealth Management Market Sizing Model 2019 - Financial assets of > USD 1 mn held by a private individual Asia Pacific
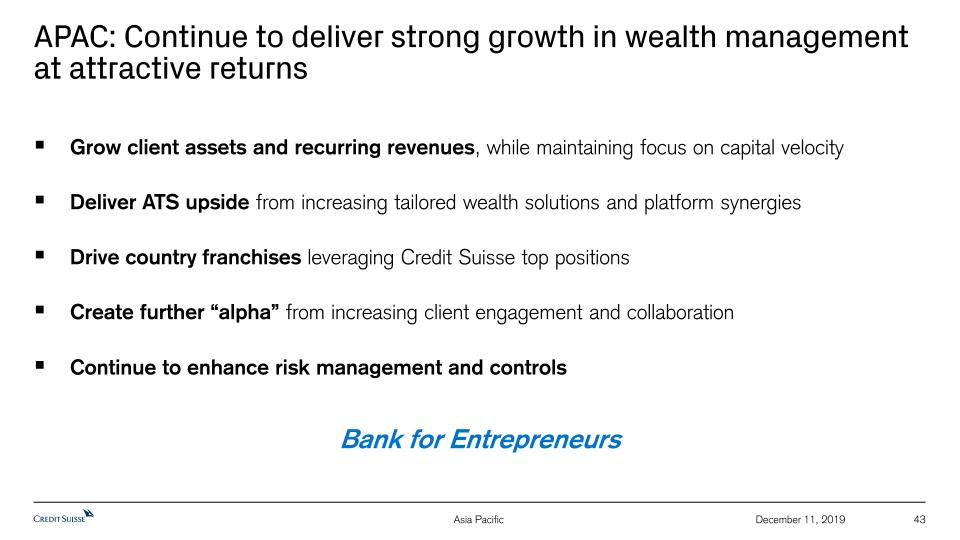
APAC: Continue to deliver strong growth in wealth management at attractive returns 43 December 11, 2019 Grow client assets and recurring revenues, while maintaining focus on capital velocity Deliver ATS upside from increasing tailored wealth solutions and platform synergiesDrive country franchises leveraging Credit Suisse top positionsCreate further “alpha” from increasing client engagement and collaborationContinue to enhance risk management and controls Bank for Entrepreneurs Asia Pacific

Appendix 44 December 11, 2019
45 December 11, 2019 For reconciliation of adjusted to reported results, refer to the Appendix of the CEO and CFO Investor Day 2019 presentations, published on December 11, 2019Throughout the presentation rounding differences may occurUnless otherwise noted, all CET1 capital, CET1 ratio, Tier 1 leverage ratio, risk-weighted assets and leverage exposure figures shown in this presentation for periods prior to 2019 are as of the end of the respective period and on a “look-through” basisGross and net margins are shown in basis pointsGross margin = net revenues annualized / average AuM; net margin = pre-tax income annualized / average AuMMandate penetration reflects advisory and discretionary mandate volumes as a percentage of AuM, excluding those from the external asset manager business General notes Specific notes Notes (1/2) * Following the successful completion of our restructuring program in 2018, we updated our calculation approach for adjusted operating cost base at constant FX rates. Beginning in 1Q19, adjusted operating cost base at constant FX rates includes adjustments for major litigation provisions, expenses related to real estate disposals and business sales as well as for debit valuation adjustments (DVA) related volatility and FX, but not for restructuring expenses and certain accounting changes. Adjustments for FX apply unweighted 2018 currency exchange rates, i.e., a straight line average of monthly rates, consistently for the periods under review. Under the current presentation, adjusted operating cost base at constant FX rates for periods prior to 1Q19 still include adjustments for restructuring expenses and a goodwill impairment taken in 4Q15, but no longer include an adjustment for certain accounting changes. Beginning in 1Q20, adjustments for FX will apply unweighted 2019 currency exchange rates.† Regulatory capital is calculated as the worst of 10% of RWA and 3.5% of leverage exposure. Return on regulatory capital (a non-GAAP financial measure) is calculated using income/(loss) after tax and assumes a tax rate of 30% and capital allocated based on the worst of 10% of average RWA and 3.5% of average leverage exposure. For the Markets business within the APAC division and for the Global Markets and Investment Banking & Capital Markets divisions, return on regulatory capital is based on US dollar denominated numbers. Adjusted return on regulatory capital is calculated using adjusted results, applying the same methodology to calculate return on regulatory capital. ‡ Return on tangible equity is based on tangible shareholders’ equity, a non-GAAP financial measure, which is calculated by deducting goodwill and other intangible assets from total shareholders’ equity as presented in our balance sheet. Tangible book value, a non-GAAP financial measure, is equal to tangible shareholders’ equity. Tangible book value per share is a non-GAAP financial measure, which is calculated by dividing tangible shareholders’ equity by total number of shares outstanding. Management believes that tangible shareholders’ equity/tangible book value, return on tangible equity and tangible book value per share are meaningful as they are measures used and relied upon by industry analysts and investors to assess valuations and capital adequacy. For end-4Q17, tangible shareholders’ equity excluded goodwill of CHF 4,742 mn and other intangible assets of CHF 223 mn from total shareholders’ equity of CHF 41,902 mn as presented in our balance sheet. For end-1Q18, tangible shareholders’ equity excluded goodwill of CHF 4,667 mn and other intangible assets of CHF 212 mn from total shareholders’ equity of CHF 42,540 mn as presented in our balance sheet. For end-2Q18, tangible shareholders’ equity excluded goodwill of CHF 4,797 mn and other intangible assets of CHF 212 mn from total shareholders’ equity of CHF 43,470 mn as presented in our balance sheet. For end-3Q18, tangible shareholders’ equity excluded goodwill of CHF 4,736 mn and other intangible assets of CHF 214 mn from total shareholders’ equity of CHF 42,734 mn as presented in our balance sheet. For end-4Q18, tangible shareholders’ equity excluded goodwill of CHF 4,766 mn and other intangible assets of CHF 219 mn from total shareholders’ equity of CHF 43,922 mn as presented in our balance sheet. For end-1Q19, tangible shareholders’ equity excluded goodwill of CHF 4,807 mn and other intangible assets of CHF 224 mn from total shareholders’ equity of CHF 43,825 mn as presented in our balance sheet. For end-2Q19, tangible shareholders’ equity excluded goodwill of CHF 4,731 mn and other intangible assets of CHF 216 mn from total shareholders’ equity of CHF 43,673 mn as presented in our balance sheet. For end-3Q19, tangible shareholders’ equity excluded goodwill of CHF 4,760 mn and other intangible assets ofCHF 219 mn from total shareholders’ equity of CHF 45,150 mn as presented in our balance sheet. Shares outstanding were 2,550.3 mn at end-4Q17, 2,552.4 mn at end-3Q18, 2,550.6 mn at end-4Q18 and 2,473.8 mn at end-3Q19.
46 December 11, 2019 Notes (2/2) Abbreviations ABL = Asset Based Lending; Abs. = Absolute; Adj. = Adjusted; AFG = Asia Pacific Financing Group; AM = Asset Management; Ann. = Annualized;APAC = Asia Pacific; Approx. = Approximately; ARC = Asset Risk Consultants; ARU = Asset Resolution Unit; ATS = APAC Trading Solutions; AuM = Assets under Management; Avg.= Average; BCBS = Basel Committee on Banking Supervision; BEAT = Base Erosion and Anti-Abuse Tax; BfE = Bank for Entrepreneurs; BHC = Bank Holding Company; BIS = Bank for International Settlements; bps = basis points; CAGR = Compound Annual Growth Rate; CBG = Corporate Bank Group; CC = Corporate Center; CCO = Chief Compliance Officer; CCRO = Chief Compliance and Regulatory Affairs Officer; CET1 = Common Equity Tier 1;CH = Switzerland; C/I = Cost/Income; C&IC = Corporate and Institutional Clients; CIC = Corporate & Institutional Clients; CLO = Collateralized Loan Obligation; CRO = Chief Risk Officer; CSAM = Credit Suisse Asset Management; DCM = Debt Capital Markets; DevOps = Development-to-Operations; DPS = Dividend Per Share; E = Estimate; EAM = External Asset Manager; ECA = Export Credit Agency; ECM = Equity Capital Markets; E&E = Entrepreneurs & Executives;EMEA = Europe, Middle East & Africa; ESG = Environmental Social and Governance; Est. = Estimate; EU = European Union; Excl. = Exclude; FID = Fixed Income Department; FI&WM = Fixed Income Wealth Management; FRTB = Fundamental Review of the Trading Book; FX = Foreign Exchange; FY = Full Year; GC = General Counsel; GCP = Global Credit Products; GM = Global Markets; GMV = Gross Market Value; GYB = Global Yield Balanced; HLG = High Level Group; HR = Human Resources; HY = High Yield; IAF = Impact Advisory & Finance; IB = Investment Banking; IBCM = Investment Banking & Capital Markets; IBOR = Interbank Offer Rate; IFC = International Finance Corporation; IG = Investment Grade; ILS = Insurance-Linked Strategies; IMM = Internal Model Method;incl. = including; IPO = Initial Public Offering; IRB = Internal Ratings-Based Approach; IT = Information Technology; ITS = International Trading Solutions;IWM = International Wealth Management; LDI = Liability-driven investments; Lev Fin = Leveraged Finance; LTD = Long-term debt; LTM = Last Twelve Months; LTV = Loan to Value; M&A = Mergers & Acquisitions; MREL = Minimum Requirement for own funds and Eligible Liabilities; NIG = Non investment grade;NNA = Net new assets; NRI = Non-resident Indians; Op Risk = Operational Risk; OTC = Over the Counter; p.a. = per annum; PB = Private Banking;PB&WM = Private Banking & Wealth Management; PC = Private Clients; PD = probability of default; p.p. = percentage points; PTI = Pre-tax income;QIS = Quantitative Investment Strategies; QoQ = Quarter over Quarter; QT = Quantitative Trading; RBL = Reserve Based Lending; RM = Relationship Manager(s); RoRC = Return on Regulatory Capital; RoTE= Return on Tangible Equity; RSA = Revenue Sharing Agreement; RWA = Risk-weighted assets;SA-CCR = Standardized Approach to Counterparty Credit Risk; SBL = Share Backed Lending; SCP = Strategic Client Partner; SEA = South East Asia;SME = Small and Medium-Sized Enterprises; SNB = Swiss National Bank; SoW = Share of Wallet; SP = Securitized Products; STBs = Sustainable Transition Bonds; SUB = Swiss Universal Bank; TBVPS = Tangible book value per share; TLAC = Total Loss-Absorbing Capacity; TLOF = Total Liabilities and Own Funds; TMT = Technology, Media and Telecommunications; (U)HNW(I) = (Ultra) High Net Worth (Individuals); U/W = Underwriting; US GAAP = United States Generally Accepted Accounting Principles; WM&C = Wealth Management & Connected; YoY = Year over year; YTD = Year to Date
December 11, 2019 47
Credit Suisse Investor Day 2019An effective approach: 3 case studies Eric Varvel, Global Head of Asset ManagementMarisa Drew, CEO Impact & Advisory FinanceEdwin Low and Zeth Hung, Co-Heads APAC IBCMDecember 11, 2019
Disclaimer 2 December 11, 2019 This material does not purport to contain all of the information that you may wish to consider. This material is not to be relied upon as such or used in substitution for the exercise of independent judgment.Cautionary statement regarding forward-looking statementsThis presentation contains forward-looking statements that involve inherent risks and uncertainties, and we might not be able to achieve the predictions, forecasts, projections and other outcomes we describe or imply in forward-looking statements. A number of important factors could cause results to differ materially from the plans, targets, goals, expectations, estimates and intentions we express in these forward-looking statements, including those we identify in "Risk factors” in our Annual Report on Form 20-F for the fiscal year ended December 31, 2018 and in the “Cautionary statement regarding forward-looking information" in our media release relating to Investor Day, published on December 11, 2019 and filed with the US Securities and Exchange Commission, and in other public filings and press releases. We do not intend to update these forward-looking statements. In particular, the terms “Estimate”, “Illustrative”, “Ambition”, “Objective”, “Outlook” and “Goal” are not intended to be viewed as targets or projections, nor are they considered to be Key Performance Indicators. All such estimates, illustrations, ambitions, objectives, outlooks and goals are subject to a large number of inherent risks, assumptions and uncertainties, many of which are completely outside of our control. These risks, assumptions and uncertainties include, but are not limited to, general market conditions, market volatility, interest rate volatility and levels, global and regional economic conditions, political uncertainty, changes in tax policies, regulatory changes, changes in levels of client activity as a result of any of the foregoing and other factors. Accordingly, this information should not be relied on for any purpose. We do not intend to update these estimates, illustrations, ambitions, objectives, outlooks or goals. We may not achieve the benefits of our strategic initiativesWe may not achieve all of the expected benefits of our strategic initiatives. Factors beyond our control, including but not limited to the market and economic conditions, changes in laws, rules or regulations and other challenges discussed in our public filings, could limit our ability to achieve some or all of the expected benefits of these initiatives. Estimates and assumptionsIn preparing this presentation, management has made estimates and assumptions that affect the numbers presented. Actual results may differ. Annualized numbers do not take into account variations in operating results, seasonality and other factors and may not be indicative of actual, full-year results. Figures throughout this presentation may also be subject to rounding adjustments. All opinions and views constitute judgments as of the date of writing without regard to the date on which the reader may receive or access the information. This information is subject to change at any time without notice and we do not intend to update this information. Cautionary statements relating to interim financial informationThis presentation contains certain unaudited interim financial information for the fourth quarter of 2019. This information has been derived from management accounts, is preliminary in nature, does not reflect the complete results of the fourth quarter of 2019 or the full year 2019 and is subject to change, including as a result of any normal quarterly adjustments in relation to the financial statements for the full year 2019. This information has not been subject to any review by our independent registered public accounting firm. There can be no assurance that the final results for these periods will not differ from these preliminary results, and any such differences could be material. Quarterly financial results for the fourth quarter of 2019 and full year results will be included in our 4Q19 Earnings Release and our 2019 Annual Report. Statement regarding non-GAAP financial measuresThis presentation also contains non-GAAP financial measures, including adjusted results as well as return on regulatory capital, return on tangible equity and tangible book value per share (which are based on tangible shareholders’ equity). Information needed to reconcile such non-GAAP financial measures to the most directly comparable measures under US GAAP can be found in the Appendix of the CEO and CFO Investor Day presentations, published on December 11, 2019. All Investor Day presentations are available on our website at www.credit-suisse.com.Our estimates, ambitions, objectives and targets often include metrics that are non-GAAP financial measures and are unaudited. A reconciliation of the estimates, ambitions, objectives and targets to the nearest GAAP measures is unavailable without unreasonable efforts. Adjusted results exclude goodwill impairment, major litigation provisions, real estate gains and other revenue and expense items included in our reported results, all of which are unavailable on a prospective basis. Return on Tangible Equity is based on tangible shareholders' equity (also known as tangible book value), a non-GAAP financial measure, which is calculated by deducting goodwill and other intangible assets from total shareholders' equity as presented in our balance sheet, both of which are unavailable on a prospective basis. Tangible book value per share excludes the impact of any dividends paid during the performance period, share buybacks, own credit movements, foreign exchange rate movements and pension-related impacts, all of which are unavailable on a prospective basis. Such estimates, ambitions, objectives and targets are calculated in a manner that is consistent with the accounting policies applied by us in preparing our financial statements.Statement regarding capital, liquidity and leverageCredit Suisse is subject to the Basel III framework, as implemented in Switzerland, as well as Swiss legislation and regulations for systemically important banks (Swiss Requirements), which include capital, liquidity, leverage and large exposure requirements and rules for emergency plans designed to maintain systemically relevant functions in the event of threatened insolvency. Credit Suisse has adopted the Bank for International Settlements (BIS) leverage ratio framework, as issued by the Basel Committee on Banking Supervision (BCBS) and implemented in Switzerland by the Swiss Financial Market Supervisory Authority FINMA. References to phase-in and look-through included herein refer to Basel III capital requirements and Swiss Requirements. Phase-in reflects that, for the years 2014-2018, there was a five-year (20% per annum) phase-in of goodwill, other intangible assets and other capital deductions (e.g., certain deferred tax assets) and a phase-out of an adjustment for the accounting treatment of pension plans. For the years 2013-2022, there is a phase-out of certain capital instruments. Look-through assumes the full phase-in of goodwill and other intangible assets and other regulatory adjustments and the phase-out of certain capital instruments.Unless otherwise noted, leverage exposure is based on the BIS leverage ratio framework and consists of period-end balance sheet assets and prescribed regulatory adjustments. The look-through tier 1 leverage ratio and CET1 leverage ratio are calculated as look-through BIS tier 1 capital and CET1 capital, respectively, divided by period-end leverage exposure. Swiss leverage ratios are measured on the same period-end basis as the leverage exposure for the BIS leverage ratio.SourcesThis presentation contains certain material prepared by Credit Suisse on the basis of publicly available information, internally developed data and other third-party sources believed to be reliable. Credit Suisse has not sought to independently verify information obtained from public and third-party sources and makes no representations or warranties as to accuracy, completeness or reliability of such information. Certain information has been derived from internal management accounts.

Asset Management 3 December 11, 2019
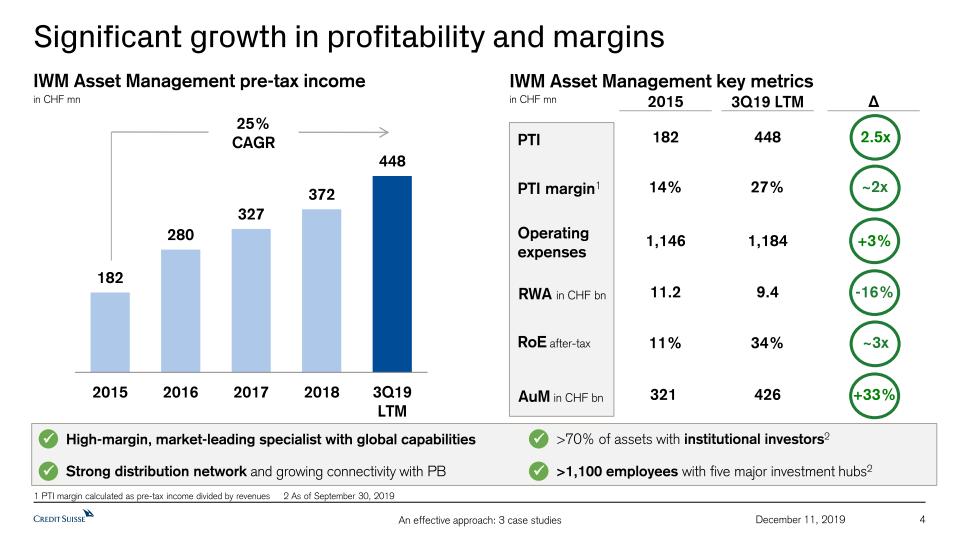
Significant growth in profitability and margins IWM Asset Management pre-tax income 2015 3Q19 LTM ∆ 182 448 PTI 2.5x 11% 34% RoE after-tax ~3x 1,184 Operating expenses +3% 1,146 11.2 9.4 RWA in CHF bn -16% 321 426 AuM in CHF bn +33% 14% 27% PTI margin1 ~2x IWM Asset Management key metrics in CHF mn High-margin, market-leading specialist with global capabilities Strong distribution network and growing connectivity with PB >70% of assets with institutional investors2 >1,100 employees with five major investment hubs2 in CHF mn 25% CAGR 1 PTI margin calculated as pre-tax income divided by revenues 2 As of September 30, 2019 4 December 11, 2019
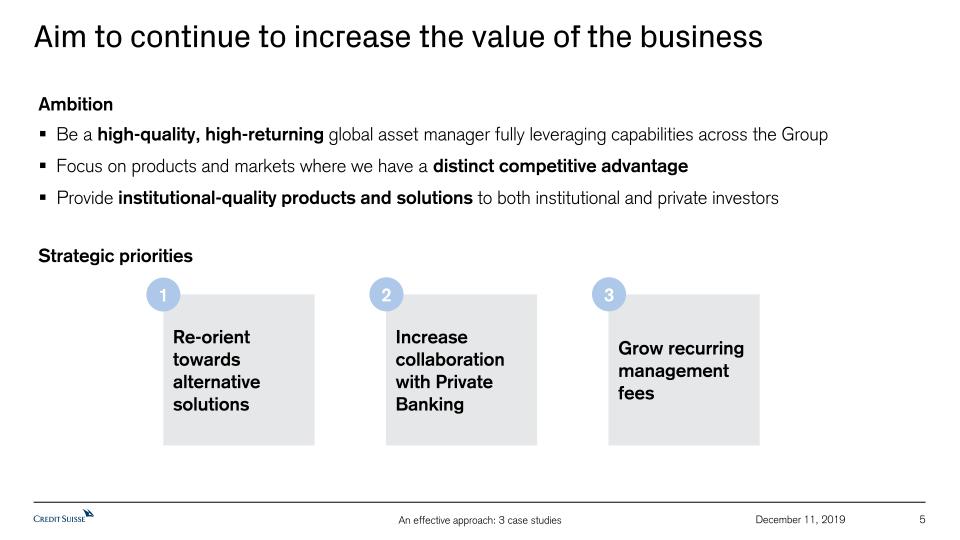
Re-orient towards alternative solutions 1 Grow recurring management fees 3 Increase collaboration with Private Banking 2 Be a high-quality, high-returning global asset manager fully leveraging capabilities across the GroupFocus on products and markets where we have a distinct competitive advantage Provide institutional-quality products and solutions to both institutional and private investors Ambition Strategic priorities Aim to continue to increase the value of the business 5 December 11, 2019
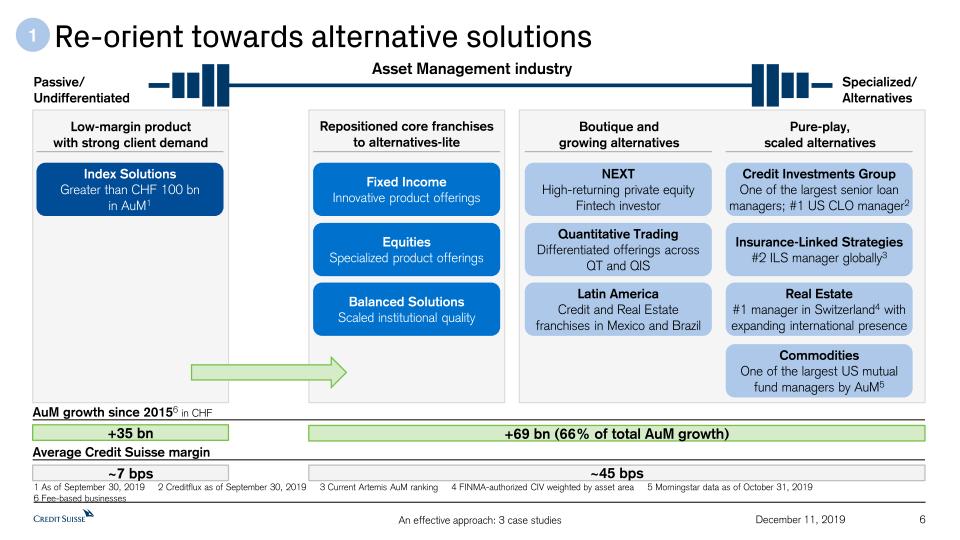
Re-orient towards alternative solutions Repositioned core franchisesto alternatives-lite Boutique and growing alternatives Pure-play, scaled alternatives Insurance-Linked Strategies#2 ILS manager globally3 NEXTHigh-returning private equity Fintech investor Quantitative TradingDifferentiated offerings across QT and QIS Latin AmericaCredit and Real Estate franchises in Mexico and Brazil Balanced SolutionsScaled institutional quality Low-margin product with strong client demand Index SolutionsGreater than CHF 100 bnin AuM1 +35 bn +69 bn (66% of total AuM growth) Asset Management industry Passive/Undifferentiated Specialized/Alternatives AuM growth since 20156 in CHF 1 Average Credit Suisse margin ~7 bps ~45 bps 6 Credit Investments GroupOne of the largest senior loan managers; #1 US CLO manager2 Fixed IncomeInnovative product offerings EquitiesSpecialized product offerings Real Estate#1 manager in Switzerland4 with expanding international presence 1 As of September 30, 2019 2 Creditflux as of September 30, 2019 3 Current Artemis AuM ranking 4 FINMA-authorized CIV weighted by asset area 5 Morningstar data as of October 31, 2019 6 Fee-based businesses December 11, 2019 CommoditiesOne of the largest US mutual fund managers by AuM5
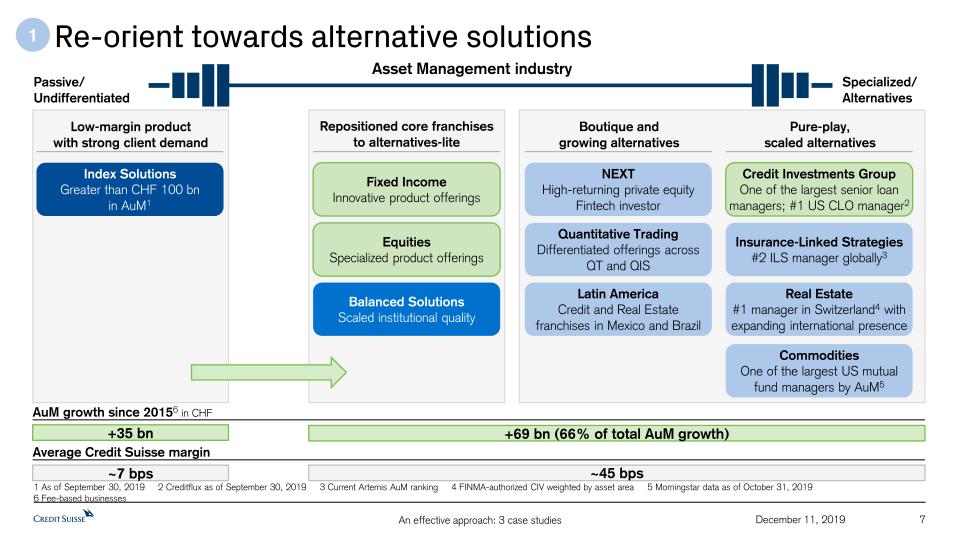
Re-orient towards alternative solutions Repositioned core franchisesto alternatives-lite Boutique and growing alternatives Pure-play, scaled alternatives Insurance-Linked Strategies#2 ILS manager globally3 NEXTHigh-returning private equity Fintech investor Quantitative TradingDifferentiated offerings across QT and QIS Latin AmericaCredit and Real Estate franchises in Mexico and Brazil Balanced SolutionsScaled institutional quality Low-margin product with strong client demand Index SolutionsGreater than CHF 100 bnin AuM1 Asset Management industry Passive/Undifferentiated Specialized/Alternatives 1 7 Credit Investments GroupOne of the largest senior loan managers; #1 US CLO manager2 Fixed IncomeInnovative product offerings EquitiesSpecialized product offerings Real Estate#1 manager in Switzerland4 with expanding international presence December 11, 2019 +35 bn +69 bn (66% of total AuM growth) AuM growth since 20156 in CHF Average Credit Suisse margin ~7 bps ~45 bps CommoditiesOne of the largest US mutual fund managers by AuM5 1 As of September 30, 2019 2 Creditflux as of September 30, 2019 3 Current Artemis AuM ranking 4 FINMA-authorized CIV weighted by asset area 5 Morningstar data as of October 31, 2019 6 Fee-based businesses
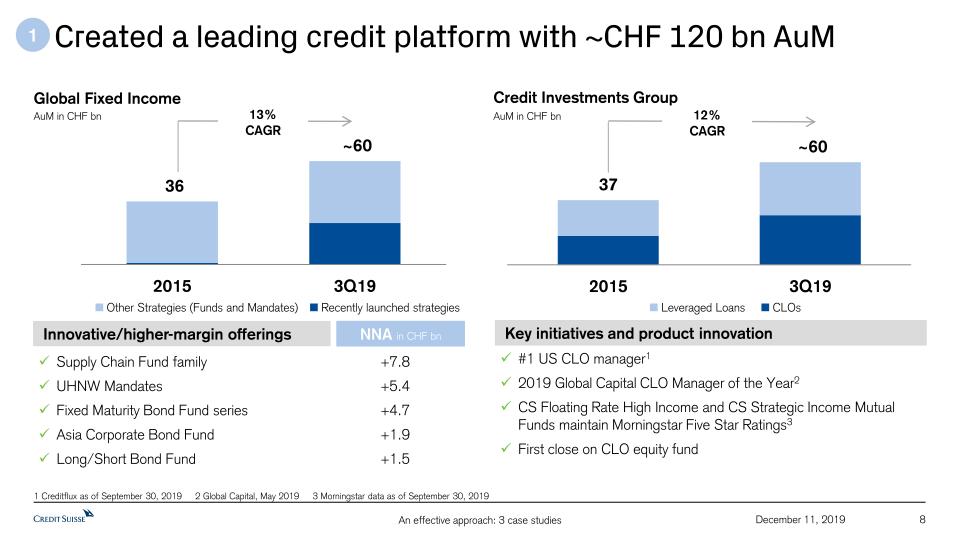
Credit Investments Group Key initiatives and product innovation #1 US CLO manager12019 Global Capital CLO Manager of the Year2CS Floating Rate High Income and CS Strategic Income Mutual Funds maintain Morningstar Five Star Ratings3First close on CLO equity fund AuM in CHF bn CLOs Leveraged Loans Global Fixed Income Supply Chain Fund family UHNW MandatesFixed Maturity Bond Fund seriesAsia Corporate Bond FundLong/Short Bond Fund +7.8+5.4+4.7+1.9+1.5 NNA in CHF bn Innovative/higher-margin offerings Recently launched strategies Other Strategies (Funds and Mandates) AuM in CHF bn 1 Created a leading credit platform with ~CHF 120 bn AuM 13% CAGR 12% CAGR 8 1 Creditflux as of September 30, 2019 2 Global Capital, May 2019 3 Morningstar data as of September 30, 2019 December 11, 2019
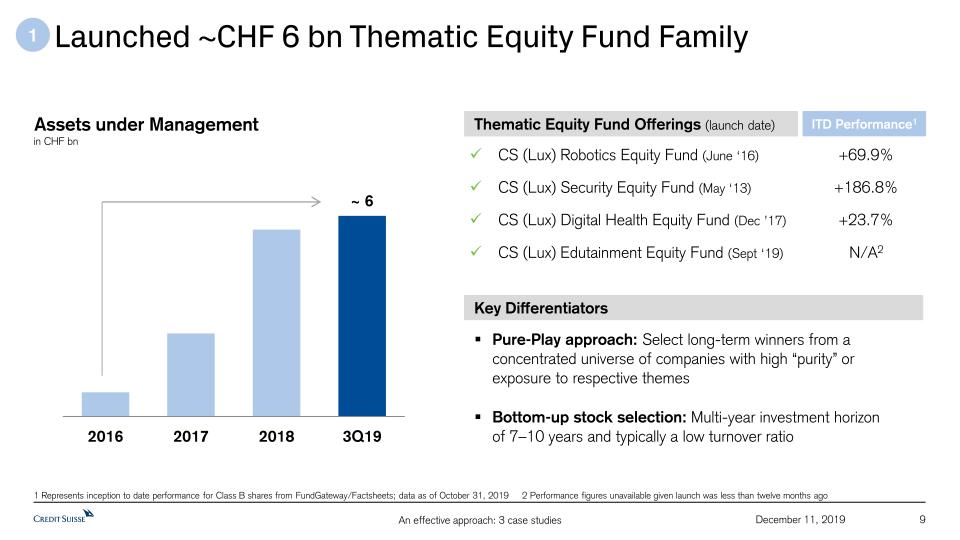
CS (Lux) Robotics Equity Fund (June ‘16)CS (Lux) Security Equity Fund (May ‘13)CS (Lux) Digital Health Equity Fund (Dec ’17)CS (Lux) Edutainment Equity Fund (Sept ‘19) Assets under Management Pure-Play approach: Select long-term winners from a concentrated universe of companies with high “purity” or exposure to respective themesBottom-up stock selection: Multi-year investment horizon of 7–10 years and typically a low turnover ratio Key Differentiators 1 Launched ~CHF 6 bn Thematic Equity Fund Family 9 in CHF bn +69.9% +186.8%+23.7%N/A2 ITD Performance1 1 Represents inception to date performance for Class B shares from FundGateway/Factsheets; data as of October 31, 2019 2 Performance figures unavailable given launch was less than twelve months ago Thematic Equity Fund Offerings (launch date) December 11, 2019
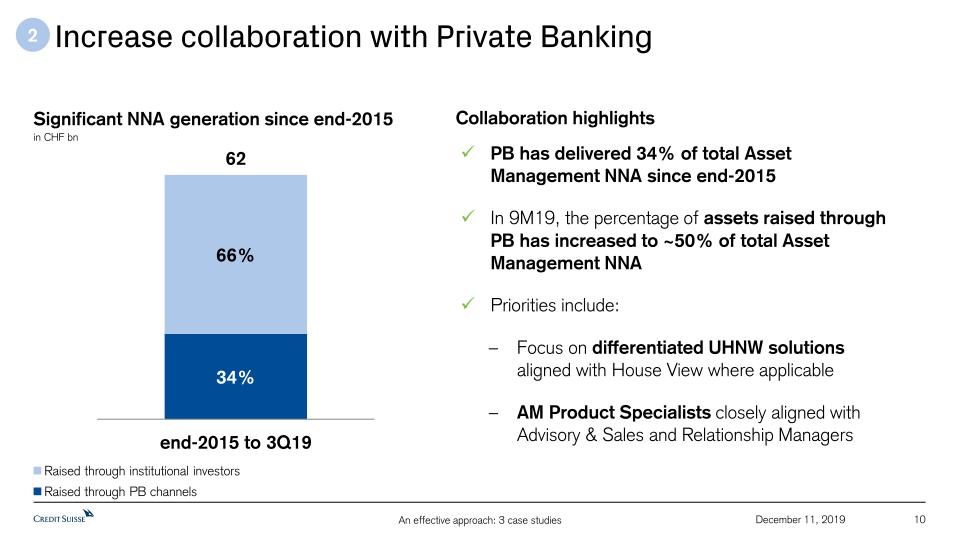
Collaboration highlights PB has delivered 34% of total Asset Management NNA since end-2015In 9M19, the percentage of assets raised through PB has increased to ~50% of total Asset Management NNAPriorities include:Focus on differentiated UHNW solutions aligned with House View where applicableAM Product Specialists closely aligned with Advisory & Sales and Relationship Managers in CHF bn Significant NNA generation since end-2015 Raised through PB channels Raised through institutional investors 2 Increase collaboration with Private Banking 10 December 11, 2019
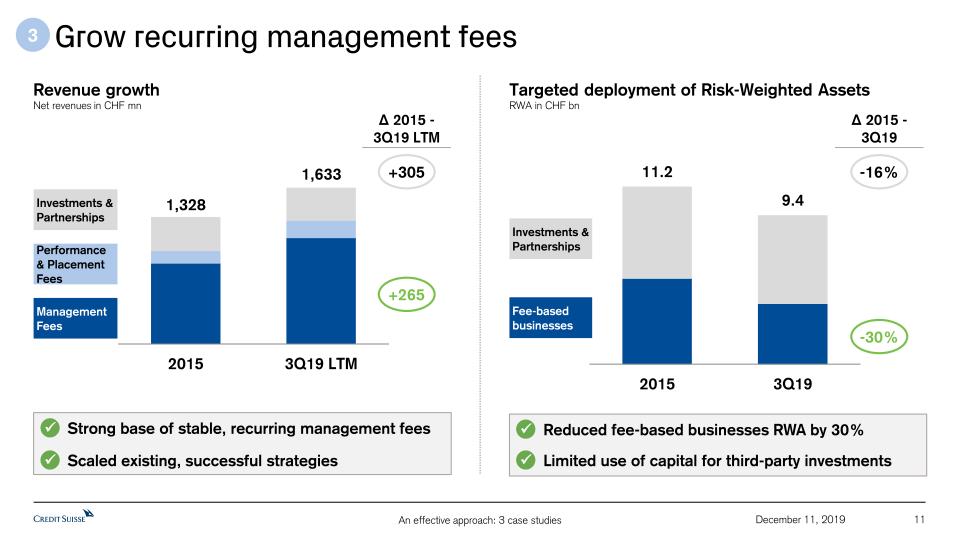
Revenue growth +265 ∆ 2015 -3Q19 LTM +305 Management Fees Performance & PlacementFees Investments & Partnerships Net revenues in CHF mn 3 Grow recurring management fees Targeted deployment of Risk-Weighted Assets -16% -30% Fee-based businesses Investments & Partnerships ∆ 2015 -3Q19 Strong base of stable, recurring management fees Scaled existing, successful strategies Reduced fee-based businesses RWA by 30% Limited use of capital for third-party investments RWA in CHF bn 1,328 1,633 11 December 11, 2019
Performance Innovation, product adjacencies and ESG Distribution Management of resources Scale Management philosophy going forward Management matters 12 December 11, 2019

Impact Advisory & Finance (IAF) 13 December 11, 2019
IAF is responding to the paradigm shift in changingclient needs since its inception in 2017 14 Tidjane ThiamGroup CEO Global Markets Investment Banking & Capital Markets IAF Department The IAF Department is responsible for setting the strategy as well as directing, coordinating and facilitating activities globally across the bank which leads to sustainable finance and impact investing on behalf of the bank’s private wealth, institutional and corporate clients. Corporate clients Institutional clients Private clients International Wealth Management Swiss Universal Bank APAC December 11, 2019
The UN Sustainable Development Goals lend themselves to mapping against our Credit Suisse Research Supertrends 15 Technology at the service of humans Silver economy Millennial’s values Angry societies Infrastructure December 11, 2019
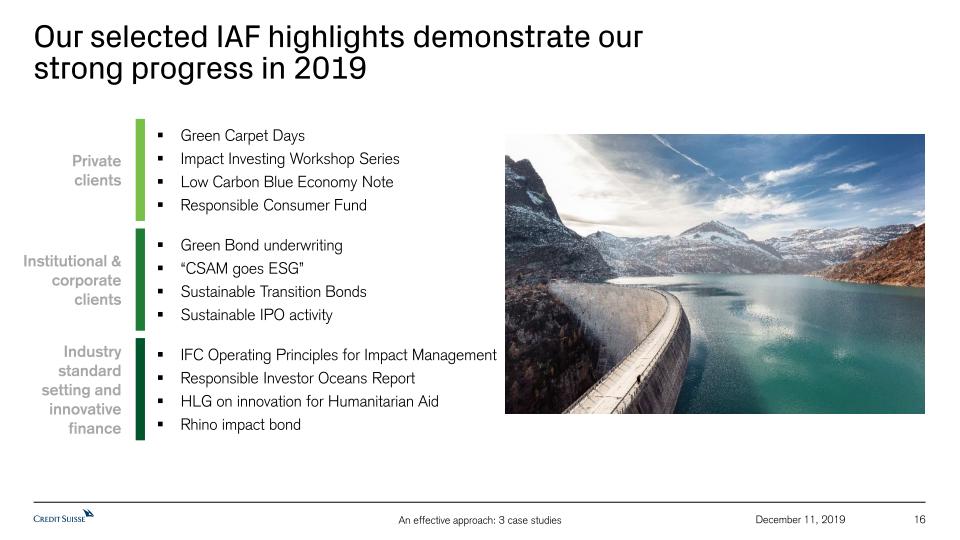
Our selected IAF highlights demonstrate ourstrong progress in 2019 16 Private clients Institutional & corporate clients Industry standard setting and innovative finance Green Carpet Days Impact Investing Workshop Series Low Carbon Blue Economy NoteResponsible Consumer Fund Green Bond underwriting “CSAM goes ESG”Sustainable Transition BondsSustainable IPO activity IFC Operating Principles for Impact Management Responsible Investor Oceans ReportHLG on innovation for Humanitarian Aid Rhino impact bond December 11, 2019
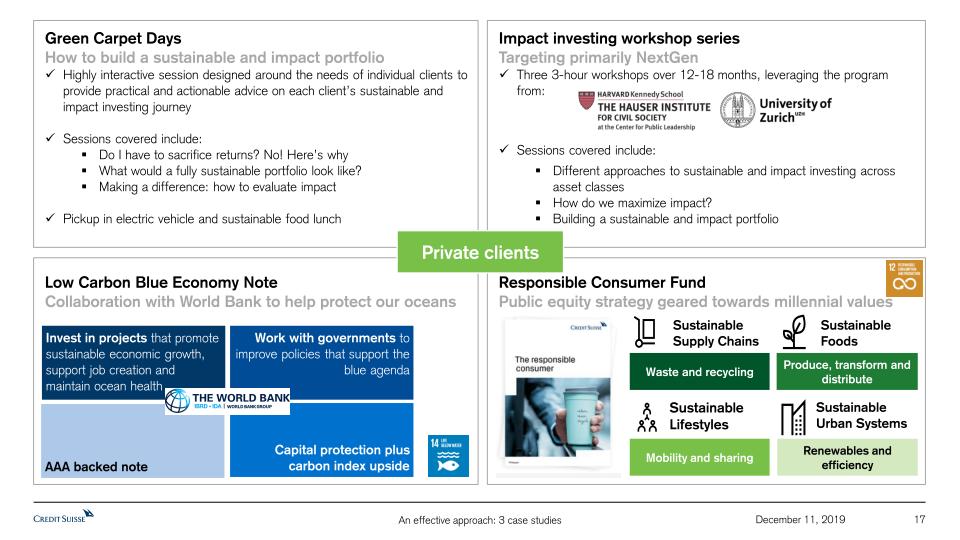
17 Green Carpet DaysHow to build a sustainable and impact portfolioHighly interactive session designed around the needs of individual clients to provide practical and actionable advice on each client’s sustainable and impact investing journey Sessions covered include:Do I have to sacrifice returns? No! Here’s whyWhat would a fully sustainable portfolio look like? Making a difference: how to evaluate impact Pickup in electric vehicle and sustainable food lunch Impact investing workshop series Targeting primarily NextGenThree 3-hour workshops over 12-18 months, leveraging the program from: Sessions covered include:Different approaches to sustainable and impact investing across asset classesHow do we maximize impact? Building a sustainable and impact portfolio Low Carbon Blue Economy Note Collaboration with World Bank to help protect our oceans Invest in projects that promote sustainable economic growth, support job creation and maintain ocean health Work with governments to improve policies that support the blue agenda Capital protection plus carbon index upside AAA backed note Responsible Consumer FundPublic equity strategy geared towards millennial values Clients Waste and recycling Sustainable Supply Chains Produce, transform and distribute Sustainable Foods Renewables and efficiency Sustainable Urban Systems Mobility and sharing Sustainable Lifestyles Private clients December 11, 2019
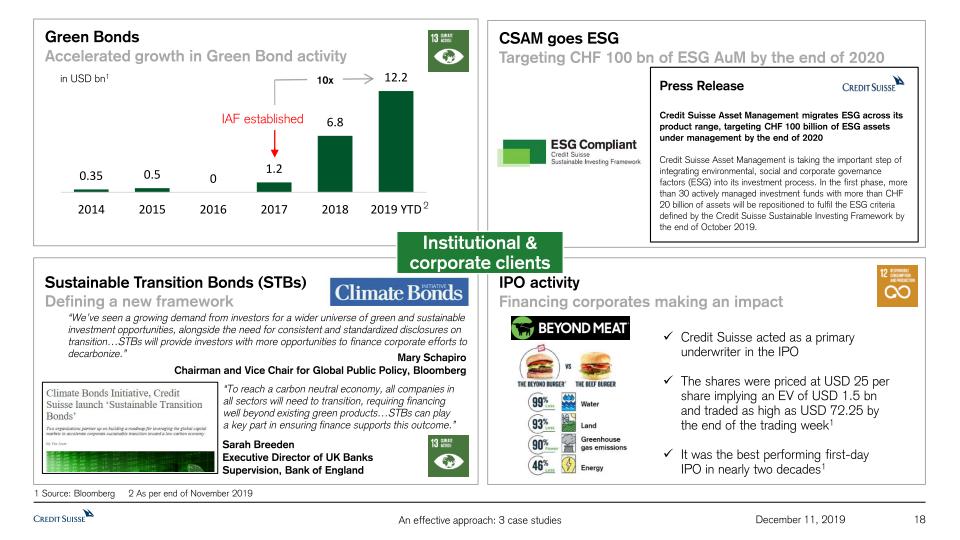
18 Green BondsAccelerated growth in Green Bond activity Sustainable Transition Bonds (STBs)Defining a new framework CSAM goes ESG Targeting CHF 100 bn of ESG AuM by the end of 2020 IPO activityFinancing corporates making an impact “We’ve seen a growing demand from investors for a wider universe of green and sustainable investment opportunities, alongside the need for consistent and standardized disclosures on transition…STBs will provide investors with more opportunities to finance corporate efforts to decarbonize.” Sarah BreedenExecutive Director of UK Banks Supervision, Bank of England “To reach a carbon neutral economy, all companies in all sectors will need to transition, requiring financing well beyond existing green products…STBs can play a key part in ensuring finance supports this outcome.” Credit Suisse acted as a primary underwriter in the IPOThe shares were priced at USD 25 per share implying an EV of USD 1.5 bn and traded as high as USD 72.25 by the end of the trading week1 It was the best performing first-day IPO in nearly two decades1 in USD bn1 Press ReleaseCredit Suisse Asset Management migrates ESG across its product range, targeting CHF 100 billion of ESG assets under management by the end of 2020 Credit Suisse Asset Management is taking the important step of integrating environmental, social and corporate governance factors (ESG) into its investment process. In the first phase, more than 30 actively managed investment funds with more than CHF 20 billion of assets will be repositioned to fulfil the ESG criteria defined by the Credit Suisse Sustainable Investing Framework by the end of October 2019. 1 Source: Bloomberg 2 As per end of November 2019 IAF established Institutional &corporate clients Mary SchapiroChairman and Vice Chair for Global Public Policy, Bloomberg 2 10x December 11, 2019

APAC IBCM 19 December 11, 2019
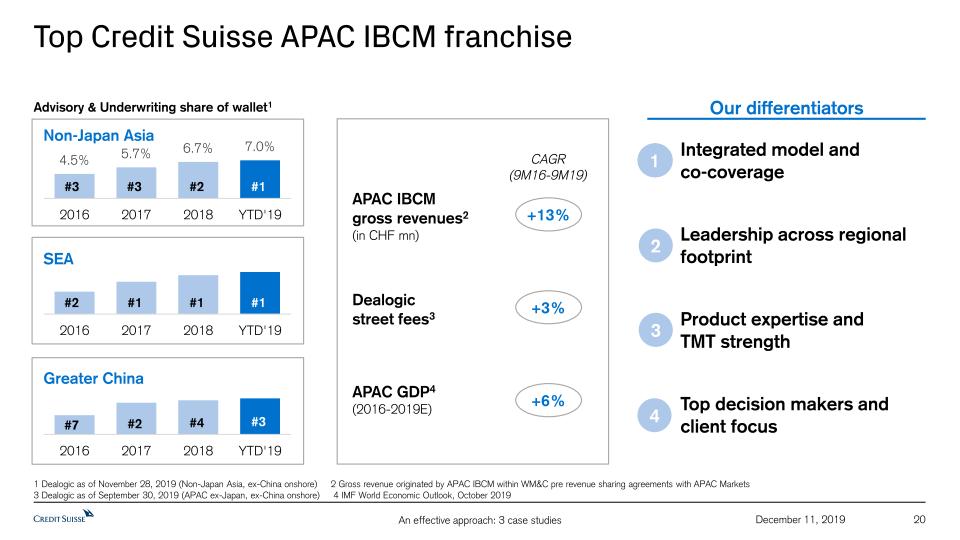
Top Credit Suisse APAC IBCM franchise 20 1 Dealogic as of November 28, 2019 (Non-Japan Asia, ex-China onshore) 2 Gross revenue originated by APAC IBCM within WM&C pre revenue sharing agreements with APAC Markets 3 Dealogic as of September 30, 2019 (APAC ex-Japan, ex-China onshore) 4 IMF World Economic Outlook, October 2019 APAC IBCM gross revenues2(in CHF mn) +13% CAGR(9M16-9M19) Dealogic street fees3 +3% APAC GDP4(2016-2019E) +6% Advisory & Underwriting share of wallet1 #1 #3 #3 #2 Non-Japan Asia #1 #2 #1 #1 SEA #3 #7 #2 #4 Greater China Integrated model and co-coverageLeadership across regional footprintProduct expertise and TMT strengthTop decision makers and client focus Our differentiators 1 2 3 1 4 December 11, 2019
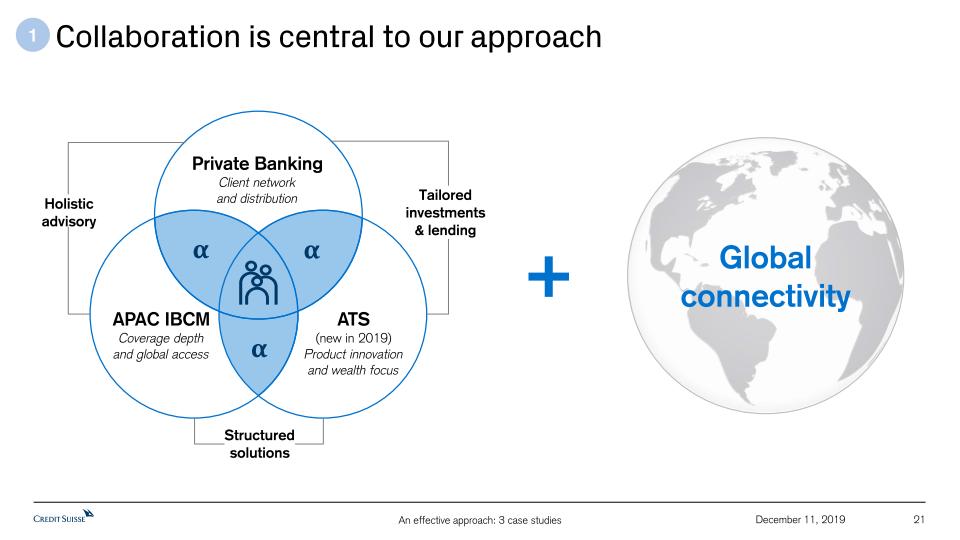
Collaboration is central to our approach 21 APAC IBCMCoverage depth and global access ATS(new in 2019) Product innovation and wealth focus α α α Holistic advisory Tailored investments & lending Structured solutions Private BankingClient networkand distribution + Global connectivity 1 December 11, 2019
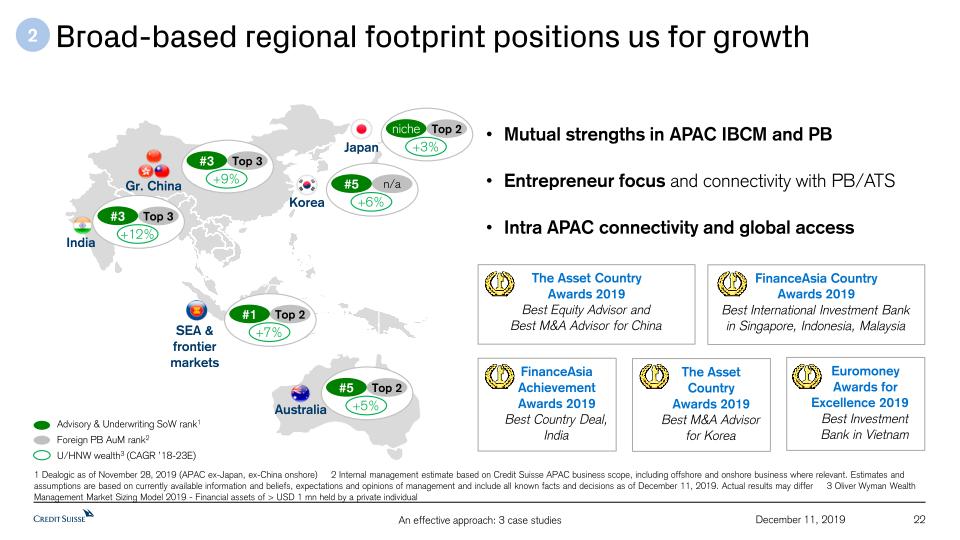
Broad-based regional footprint positions us for growth 22 1 Dealogic as of November 28, 2019 (APAC ex-Japan, ex-China onshore) 2 Internal management estimate based on Credit Suisse APAC business scope, including offshore and onshore business where relevant. Estimates and assumptions are based on currently available information and beliefs, expectations and opinions of management and include all known facts and decisions as of December 11, 2019. Actual results may differ 3 Oliver Wyman Wealth Management Market Sizing Model 2019 - Financial assets of > USD 1 mn held by a private individual U/HNW wealth3 (CAGR ’18-23E) Foreign PB AuM rank2 Gr. China SEA & frontier markets India Japan Australia Advisory & Underwriting SoW rank1 Top 3 +12% #3 Top 3 +9% #3 Top 2 +3% niche Top 2 +7% #1 Top 2 +5% #5 2 Korea n/a +6% #5 Mutual strengths in APAC IBCM and PBEntrepreneur focus and connectivity with PB/ATSIntra APAC connectivity and global access The Asset Country Awards 2019 Best Equity Advisor and Best M&A Advisor for China The Asset Country Awards 2019 Best M&A Advisor for Korea FinanceAsia Country Awards 2019 Best International Investment Bank in Singapore, Indonesia, Malaysia Euromoney Awards for Excellence 2019 Best Investment Bank in Vietnam FinanceAsia Achievement Awards 2019 Best Country Deal, India December 11, 2019
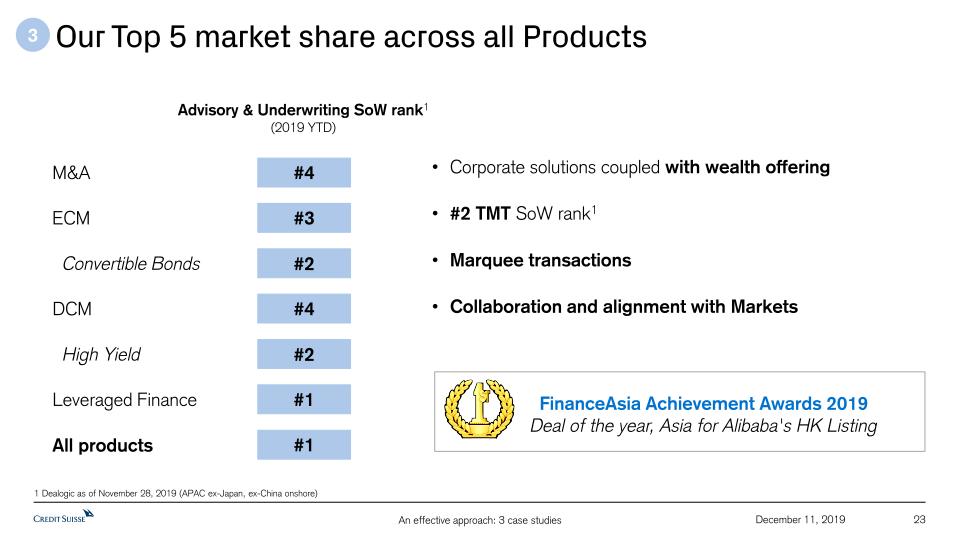
Our Top 5 market share across all Products 23 1 Dealogic as of November 28, 2019 (APAC ex-Japan, ex-China onshore) #3 #4 #4 Advisory & Underwriting SoW rank1(2019 YTD) #1 ECM M&A DCM Leveraged Finance #1 All products 3 #2 Convertible Bonds #2 High Yield Corporate solutions coupled with wealth offering#2 TMT SoW rank1Marquee transactionsCollaboration and alignment with Markets FinanceAsia Achievement Awards 2019Deal of the year, Asia for Alibaba's HK Listing December 11, 2019
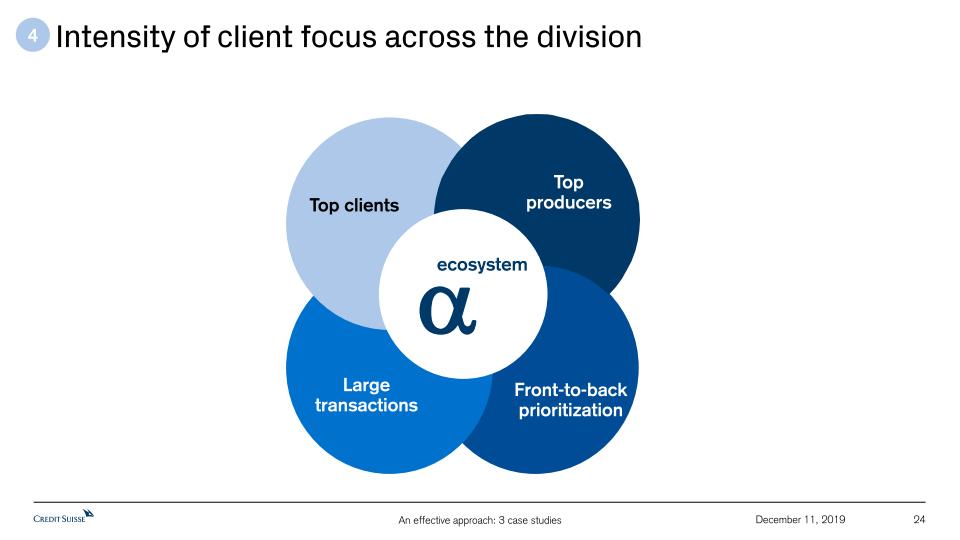
Intensity of client focus across the division 24 Top clients Top producers Front-to-back prioritization Large transactions ecosystem 4 December 11, 2019

Appendix 25 December 11, 2019

26 December 11, 2019 For reconciliation of adjusted to reported results, refer to the Appendix of the CEO and CFO Investor Day 2019 presentations, published on December 11, 2019Throughout the presentation rounding differences may occurUnless otherwise noted, all CET1 capital, CET1 ratio, Tier 1 leverage ratio, risk-weighted assets and leverage exposure figures shown in this presentation for periods prior to 2019 are as of the end of the respective period and on a “look-through” basisGross and net margins are shown in basis pointsGross margin = net revenues annualized / average AuM; net margin = pre-tax income annualized / average AuMMandate penetration reflects advisory and discretionary mandate volumes as a percentage of AuM, excluding those from the external asset manager business General notes Specific notes Notes (1/2) * Following the successful completion of our restructuring program in 2018, we updated our calculation approach for adjusted operating cost base at constant FX rates. Beginning in 1Q19, adjusted operating cost base at constant FX rates includes adjustments for major litigation provisions, expenses related to real estate disposals and business sales as well as for debit valuation adjustments (DVA) related volatility and FX, but not for restructuring expenses and certain accounting changes. Adjustments for FX apply unweighted 2018 currency exchange rates, i.e., a straight line average of monthly rates, consistently for the periods under review. Under the current presentation, adjusted operating cost base at constant FX rates for periods prior to 1Q19 still include adjustments for restructuring expenses and a goodwill impairment taken in 4Q15, but no longer include an adjustment for certain accounting changes. Beginning in 1Q20, adjustments for FX will apply unweighted 2019 currency exchange rates.† Regulatory capital is calculated as the worst of 10% of RWA and 3.5% of leverage exposure. Return on regulatory capital (a non-GAAP financial measure) is calculated using income/(loss) after tax and assumes a tax rate of 30% and capital allocated based on the worst of 10% of average RWA and 3.5% of average leverage exposure. For the Markets business within the APAC division and for the Global Markets and Investment Banking & Capital Markets divisions, return on regulatory capital is based on US dollar denominated numbers. Adjusted return on regulatory capital is calculated using adjusted results, applying the same methodology to calculate return on regulatory capital. ‡ Return on tangible equity is based on tangible shareholders’ equity, a non-GAAP financial measure, which is calculated by deducting goodwill and other intangible assets from total shareholders’ equity as presented in our balance sheet. Tangible book value, a non-GAAP financial measure, is equal to tangible shareholders’ equity. Tangible book value per share is a non-GAAP financial measure, which is calculated by dividing tangible shareholders’ equity by total number of shares outstanding. Management believes that tangible shareholders’ equity/tangible book value, return on tangible equity and tangible book value per share are meaningful as they are measures used and relied upon by industry analysts and investors to assess valuations and capital adequacy. For end-4Q17, tangible shareholders’ equity excluded goodwill of CHF 4,742 mn and other intangible assets of CHF 223 mn from total shareholders’ equity of CHF 41,902 mn as presented in our balance sheet. For end-1Q18, tangible shareholders’ equity excluded goodwill of CHF 4,667 mn and other intangible assets of CHF 212 mn from total shareholders’ equity of CHF 42,540 mn as presented in our balance sheet. For end-2Q18, tangible shareholders’ equity excluded goodwill of CHF 4,797 mn and other intangible assets of CHF 212 mn from total shareholders’ equity of CHF 43,470 mn as presented in our balance sheet. For end-3Q18, tangible shareholders’ equity excluded goodwill of CHF 4,736 mn and other intangible assets of CHF 214 mn from total shareholders’ equity of CHF 42,734 mn as presented in our balance sheet. For end-4Q18, tangible shareholders’ equity excluded goodwill of CHF 4,766 mn and other intangible assets of CHF 219 mn from total shareholders’ equity of CHF 43,922 mn as presented in our balance sheet. For end-1Q19, tangible shareholders’ equity excluded goodwill of CHF 4,807 mn and other intangible assets of CHF 224 mn from total shareholders’ equity of CHF 43,825 mn as presented in our balance sheet. For end-2Q19, tangible shareholders’ equity excluded goodwill of CHF 4,731 mn and other intangible assets of CHF 216 mn from total shareholders’ equity of CHF 43,673 mn as presented in our balance sheet. For end-3Q19, tangible shareholders’ equity excluded goodwill of CHF 4,760 mn and other intangible assets ofCHF 219 mn from total shareholders’ equity of CHF 45,150 mn as presented in our balance sheet. Shares outstanding were 2,550.3 mn at end-4Q17, 2,552.4 mn at end-3Q18, 2,550.6 mn at end-4Q18 and 2,473.8 mn at end-3Q19.

27 December 11, 2019 Notes (2/2) Abbreviations ABL = Asset Based Lending; Abs. = Absolute; Adj. = Adjusted; AFG = Asia Pacific Financing Group; AM = Asset Management; Ann. = Annualized;APAC = Asia Pacific; Approx. = Approximately; ARC = Asset Risk Consultants; ARU = Asset Resolution Unit; ATS = APAC Trading Solutions; AuM = Assets under Management; Avg.= Average; BCBS = Basel Committee on Banking Supervision; BEAT = Base Erosion and Anti-Abuse Tax; BfE = Bank for Entrepreneurs; BHC = Bank Holding Company; BIS = Bank for International Settlements; bps = basis points; CAGR = Compound Annual Growth Rate; CBG = Corporate Bank Group; CC = Corporate Center; CCO = Chief Compliance Officer; CCRO = Chief Compliance and Regulatory Affairs Officer; CET1 = Common Equity Tier 1;CH = Switzerland; C/I = Cost/Income; C&IC = Corporate and Institutional Clients; CIC = Corporate & Institutional Clients; CLO = Collateralized Loan Obligation; CRO = Chief Risk Officer; CSAM = Credit Suisse Asset Management; DCM = Debt Capital Markets; DevOps = Development-to-Operations; DPS = Dividend Per Share; E = Estimate; EAM = External Asset Manager; ECA = Export Credit Agency; ECM = Equity Capital Markets; E&E = Entrepreneurs & Executives;EMEA = Europe, Middle East & Africa; ESG = Environmental Social and Governance; Est. = Estimate; EU = European Union; Excl. = Exclude; FID = Fixed Income Department; FI&WM = Fixed Income Wealth Management; FRTB = Fundamental Review of the Trading Book; FX = Foreign Exchange; FY = Full Year; GC = General Counsel; GCP = Global Credit Products; GM = Global Markets; GMV = Gross Market Value; GYB = Global Yield Balanced; HLG = High Level Group; HR = Human Resources; HY = High Yield; IAF = Impact Advisory & Finance; IB = Investment Banking; IBCM = Investment Banking & Capital Markets; IBOR = Interbank Offer Rate; IFC = International Finance Corporation; IG = Investment Grade; ILS = Insurance-Linked Strategies; IMM = Internal Model Method;incl. = including; IPO = Initial Public Offering; IRB = Internal Ratings-Based Approach; IT = Information Technology; ITS = International Trading Solutions;IWM = International Wealth Management; LDI = Liability-driven investments; Lev Fin = Leveraged Finance; LTD = Long-term debt; LTM = Last Twelve Months; LTV = Loan to Value; M&A = Mergers & Acquisitions; MREL = Minimum Requirement for own funds and Eligible Liabilities; NIG = Non investment grade;NNA = Net new assets; NRI = Non-resident Indians; Op Risk = Operational Risk; OTC = Over the Counter; p.a. = per annum; PB = Private Banking;PB&WM = Private Banking & Wealth Management; PC = Private Clients; PD = probability of default; p.p. = percentage points; PTI = Pre-tax income;QIS = Quantitative Investment Strategies; QoQ = Quarter over Quarter; QT = Quantitative Trading; RBL = Reserve Based Lending; RM = Relationship Manager(s); RoRC = Return on Regulatory Capital; RoTE= Return on Tangible Equity; RSA = Revenue Sharing Agreement; RWA = Risk-weighted assets;SA-CCR = Standardized Approach to Counterparty Credit Risk; SBL = Share Backed Lending; SCP = Strategic Client Partner; SEA = South East Asia;SME = Small and Medium-Sized Enterprises; SNB = Swiss National Bank; SoW = Share of Wallet; SP = Securitized Products; STBs = Sustainable Transition Bonds; SUB = Swiss Universal Bank; TBVPS = Tangible book value per share; TLAC = Total Loss-Absorbing Capacity; TLOF = Total Liabilities and Own Funds; TMT = Technology, Media and Telecommunications; (U)HNW(I) = (Ultra) High Net Worth (Individuals); U/W = Underwriting; US GAAP = United States Generally Accepted Accounting Principles; WM&C = Wealth Management & Connected; YoY = Year over year; YTD = Year to Date
Credit Suisse Investor Day 2019Driving revenue growth in Wealth Management Philipp Wehle, CEO International Wealth ManagementHelman Sitohang, CEO Asia PacificThomas Gottstein, CEO Swiss Universal BankDecember 11, 2019
2 December 11, 2019 This material does not purport to contain all of the information that you may wish to consider. This material is not to be relied upon as such or used in substitution for the exercise of independent judgment.Cautionary statement regarding forward-looking statementsThis presentation contains forward-looking statements that involve inherent risks and uncertainties, and we might not be able to achieve the predictions, forecasts, projections and other outcomes we describe or imply in forward-looking statements. A number of important factors could cause results to differ materially from the plans, targets, goals, expectations, estimates and intentions we express in these forward-looking statements, including those we identify in "Risk factors” in our Annual Report on Form 20-F for the fiscal year ended December 31, 2018 and in the “Cautionary statement regarding forward-looking information" in our media release relating to Investor Day, published on December 11, 2019 and filed with the US Securities and Exchange Commission, and in other public filings and press releases. We do not intend to update these forward-looking statements. In particular, the terms “Estimate”, “Illustrative”, “Ambition”, “Objective”, “Outlook” and “Goal” are not intended to be viewed as targets or projections, nor are they considered to be Key Performance Indicators. All such estimates, illustrations, ambitions, objectives, outlooks and goals are subject to a large number of inherent risks, assumptions and uncertainties, many of which are completely outside of our control. These risks, assumptions and uncertainties include, but are not limited to, general market conditions, market volatility, interest rate volatility and levels, global and regional economic conditions, political uncertainty, changes in tax policies, regulatory changes, changes in levels of client activity as a result of any of the foregoing and other factors. Accordingly, this information should not be relied on for any purpose. We do not intend to update these estimates, illustrations, ambitions, objectives, outlooks or goals. We may not achieve the benefits of our strategic initiativesWe may not achieve all of the expected benefits of our strategic initiatives. Factors beyond our control, including but not limited to the market and economic conditions, changes in laws, rules or regulations and other challenges discussed in our public filings, could limit our ability to achieve some or all of the expected benefits of these initiatives. Estimates and assumptionsIn preparing this presentation, management has made estimates and assumptions that affect the numbers presented. Actual results may differ. Annualized numbers do not take into account variations in operating results, seasonality and other factors and may not be indicative of actual, full-year results. Figures throughout this presentation may also be subject to rounding adjustments. All opinions and views constitute judgments as of the date of writing without regard to the date on which the reader may receive or access the information. This information is subject to change at any time without notice and we do not intend to update this information. Cautionary statements relating to interim financial informationThis presentation contains certain unaudited interim financial information for the fourth quarter of 2019. This information has been derived from management accounts, is preliminary in nature, does not reflect the complete results of the fourth quarter of 2019 or the full year 2019 and is subject to change, including as a result of any normal quarterly adjustments in relation to the financial statements for the full year 2019. This information has not been subject to any review by our independent registered public accounting firm. There can be no assurance that the final results for these periods will not differ from these preliminary results, and any such differences could be material. Quarterly financial results for the fourth quarter of 2019 and full year results will be included in our 4Q19 Earnings Release and our 2019 Annual Report. Statement regarding non-GAAP financial measuresThis presentation also contains non-GAAP financial measures, including adjusted results as well as return on regulatory capital, return on tangible equity and tangible book value per share (which are based on tangible shareholders’ equity). Information needed to reconcile such non-GAAP financial measures to the most directly comparable measures under US GAAP can be found in the Appendix of the CEO and CFO Investor Day presentations, published on December 11, 2019. All Investor Day presentations are available on our website at www.credit-suisse.com.Our estimates, ambitions, objectives and targets often include metrics that are non-GAAP financial measures and are unaudited. A reconciliation of the estimates, ambitions, objectives and targets to the nearest GAAP measures is unavailable without unreasonable efforts. Adjusted results exclude goodwill impairment, major litigation provisions, real estate gains and other revenue and expense items included in our reported results, all of which are unavailable on a prospective basis. Return on Tangible Equity is based on tangible shareholders' equity (also known as tangible book value), a non-GAAP financial measure, which is calculated by deducting goodwill and other intangible assets from total shareholders' equity as presented in our balance sheet, both of which are unavailable on a prospective basis. Tangible book value per share excludes the impact of any dividends paid during the performance period, share buybacks, own credit movements, foreign exchange rate movements and pension-related impacts, all of which are unavailable on a prospective basis. Such estimates, ambitions, objectives and targets are calculated in a manner that is consistent with the accounting policies applied by us in preparing our financial statements.Statement regarding capital, liquidity and leverageCredit Suisse is subject to the Basel III framework, as implemented in Switzerland, as well as Swiss legislation and regulations for systemically important banks (Swiss Requirements), which include capital, liquidity, leverage and large exposure requirements and rules for emergency plans designed to maintain systemically relevant functions in the event of threatened insolvency. Credit Suisse has adopted the Bank for International Settlements (BIS) leverage ratio framework, as issued by the Basel Committee on Banking Supervision (BCBS) and implemented in Switzerland by the Swiss Financial Market Supervisory Authority FINMA. References to phase-in and look-through included herein refer to Basel III capital requirements and Swiss Requirements. Phase-in reflects that, for the years 2014-2018, there was a five-year (20% per annum) phase-in of goodwill, other intangible assets and other capital deductions (e.g., certain deferred tax assets) and a phase-out of an adjustment for the accounting treatment of pension plans. For the years 2013-2022, there is a phase-out of certain capital instruments. Look-through assumes the full phase-in of goodwill and other intangible assets and other regulatory adjustments and the phase-out of certain capital instruments.Unless otherwise noted, leverage exposure is based on the BIS leverage ratio framework and consists of period-end balance sheet assets and prescribed regulatory adjustments. The look-through tier 1 leverage ratio and CET1 leverage ratio are calculated as look-through BIS tier 1 capital and CET1 capital, respectively, divided by period-end leverage exposure. Swiss leverage ratios are measured on the same period-end basis as the leverage exposure for the BIS leverage ratio.SourcesThis presentation contains certain material prepared by Credit Suisse on the basis of publicly available information, internally developed data and other third-party sources believed to be reliable. Credit Suisse has not sought to independently verify information obtained from public and third-party sources and makes no representations or warranties as to accuracy, completeness or reliability of such information. Certain information has been derived from internal management accounts. Disclaimer
International Wealth Management 3 December 11, 2019
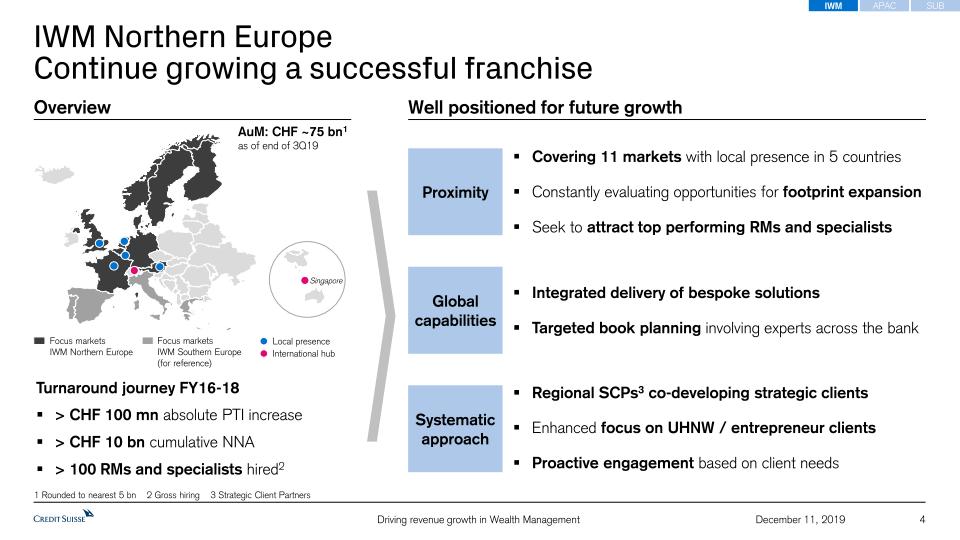
IWM Northern EuropeContinue growing a successful franchise 4 December 11, 2019 IWM SUB APAC 1 Rounded to nearest 5 bn 2 Gross hiring 3 Strategic Client Partners Overview Turnaround journey FY16-18> CHF 100 mn absolute PTI increase> CHF 10 bn cumulative NNA> 100 RMs and specialists hired2 AuM: CHF ~75 bn1as of end of 3Q19 Focus marketsIWM Southern Europe(for reference) Focus marketsIWM Northern Europe Singapore Local presence International hub Well positioned for future growth Integrated delivery of bespoke solutionsTargeted book planning involving experts across the bank Global capabilities Proximity Systematic approach Covering 11 markets with local presence in 5 countriesConstantly evaluating opportunities for footprint expansionSeek to attract top performing RMs and specialists Regional SCPs3 co-developing strategic clientsEnhanced focus on UHNW / entrepreneur clientsProactive engagement based on client needs
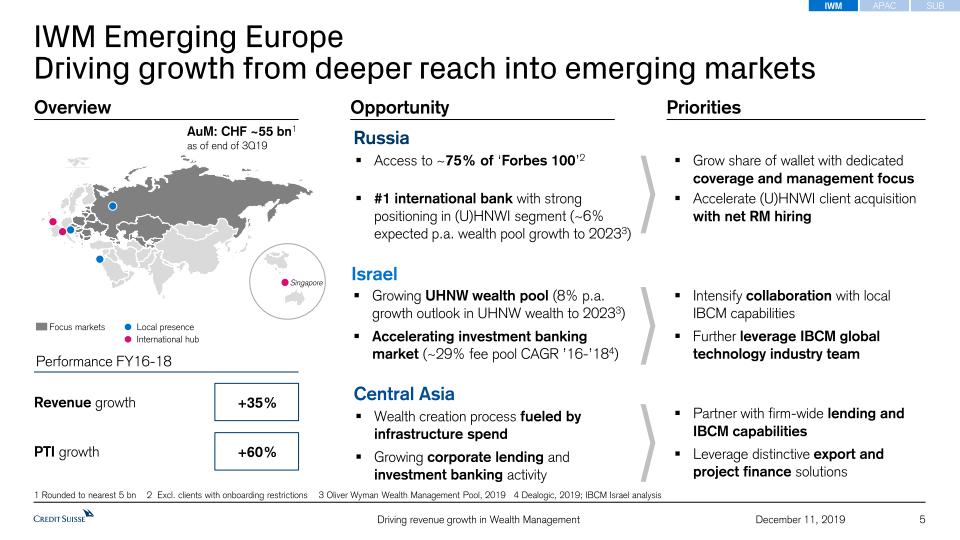
IWM Emerging EuropeDriving growth from deeper reach into emerging markets 5 December 11, 2019 Opportunity Priorities 1 Rounded to nearest 5 bn 2 Excl. clients with onboarding restrictions 3 Oliver Wyman Wealth Management Pool, 2019 4 Dealogic, 2019; IBCM Israel analysis Intensify collaboration with local IBCM capabilitiesFurther leverage IBCM global technology industry team Israel Growing UHNW wealth pool (8% p.a. growth outlook in UHNW wealth to 20233) Accelerating investment banking market (~29% fee pool CAGR ’16-’184) Partner with firm-wide lending and IBCM capabilitiesLeverage distinctive export and project finance solutions Central Asia Wealth creation process fueled by infrastructure spendGrowing corporate lending and investment banking activity Grow share of wallet with dedicated coverage and management focusAccelerate (U)HNWI client acquisition with net RM hiring Russia Access to ~75% of ‘Forbes 100’2#1 international bank with strong positioning in (U)HNWI segment (~6% expected p.a. wealth pool growth to 20233) AuM: CHF ~55 bn1as of end of 3Q19 Overview Performance FY16-18 Revenue growth +35% PTI growth +60% Local presence Focus markets International hub Singapore IWM SUB APAC
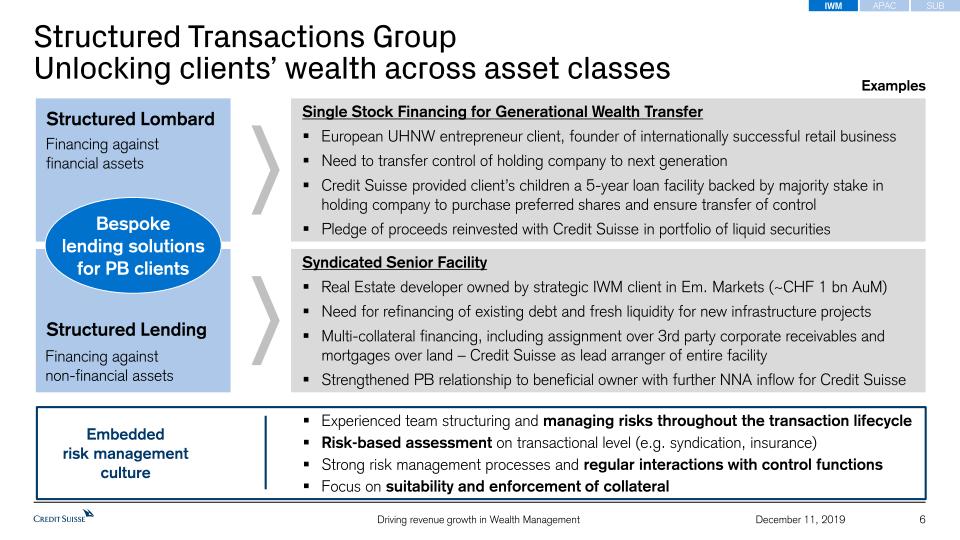
Structured Transactions GroupUnlocking clients’ wealth across asset classes 6 December 11, 2019 Examples Single Stock Financing for Generational Wealth TransferEuropean UHNW entrepreneur client, founder of internationally successful retail businessNeed to transfer control of holding company to next generationCredit Suisse provided client’s children a 5-year loan facility backed by majority stake in holding company to purchase preferred shares and ensure transfer of controlPledge of proceeds reinvested with Credit Suisse in portfolio of liquid securities Syndicated Senior FacilityReal Estate developer owned by strategic IWM client in Em. Markets (~CHF 1 bn AuM) Need for refinancing of existing debt and fresh liquidity for new infrastructure projectsMulti-collateral financing, including assignment over 3rd party corporate receivables and mortgages over land – Credit Suisse as lead arranger of entire facilityStrengthened PB relationship to beneficial owner with further NNA inflow for Credit Suisse Structured Lombard Structured Lending Bespokelending solutionsfor PB clients Financing against financial assets Financing againstnon-financial assets Experienced team structuring and managing risks throughout the transaction lifecycleRisk-based assessment on transactional level (e.g. syndication, insurance)Strong risk management processes and regular interactions with control functionsFocus on suitability and enforcement of collateral Embeddedrisk management culture IWM SUB APAC

Asia Pacific 7 December 11, 2019

Growing PB franchise in large APAC wealth markets 8 December 11, 2019 North Asia South Asia APAC PB Assets under Managementin CHF bn 10% ~8% ~10% Broad-based asset growth CAGR (9M16-9M19) 1 Dealogic for November 28, 2019 YTD (APAC ex-Japan, ex-China Onshore) 2 Internal management estimate based on Credit Suisse APAC business scope, including offshore and onshore business where relevant. 3 Oliver Wyman Wealth Management Market Sizing Model 2019 - Financial assets of > USD 1 mn held by a private individual U/HNW wealth3 (CAGR ’18-23E) Foreign PB AuM rank2 Gr. China SEA & frontier markets India Australia Adv. & U/W SoW rank1 Top 3 +12% #3 Top 3 +9% #3 Top 2 +7% #1 Top 2 +5% #5 Japan Top 2 +3% niche Korea n/a +6% #5 IWM SUB APAC
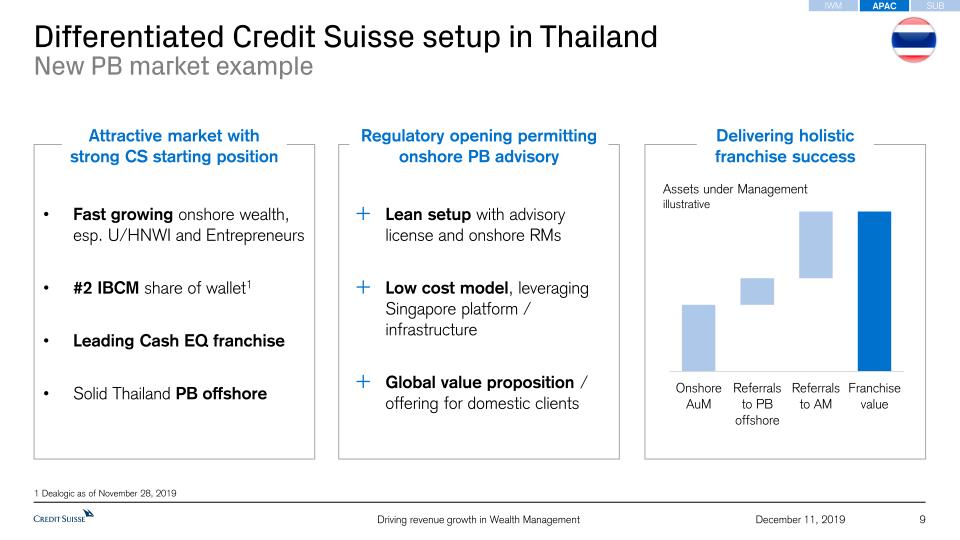
Differentiated Credit Suisse setup in ThailandNew PB market example 9 December 11, 2019 Attractive market with strong CS starting position Regulatory opening permitting onshore PB advisory Delivering holistic franchise success Fast growing onshore wealth, esp. U/HNWI and Entrepreneurs#2 IBCM share of wallet1Leading Cash EQ franchiseSolid Thailand PB offshore Lean setup with advisory license and onshore RMsLow cost model, leveraging Singapore platform / infrastructureGlobal value proposition / offering for domestic clients Assets under Managementillustrative 1 Dealogic as of November 28, 2019 IWM SUB APAC
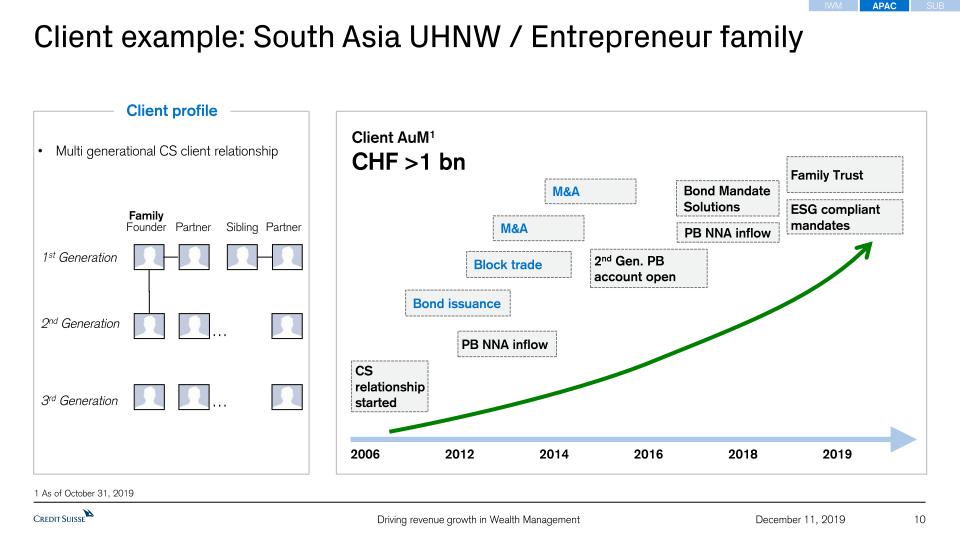
Client example: South Asia UHNW / Entrepreneur family 10 December 11, 2019 2006 2012 2014 2016 2018 2019 Family Trust PB NNA inflow 2nd Gen. PB account open ESG compliant mandates PB NNA inflow Multi generational CS client relationship Client profile Family Founder 1st Generation 2nd Generation Partner CS relationship started M&A Bond Mandate Solutions Bond issuance Sibling Wife … 3rd Generation … Block trade M&A Client AuM1CHF >1 bn 1 As of October 31, 2019 Partner IWM SUB APAC
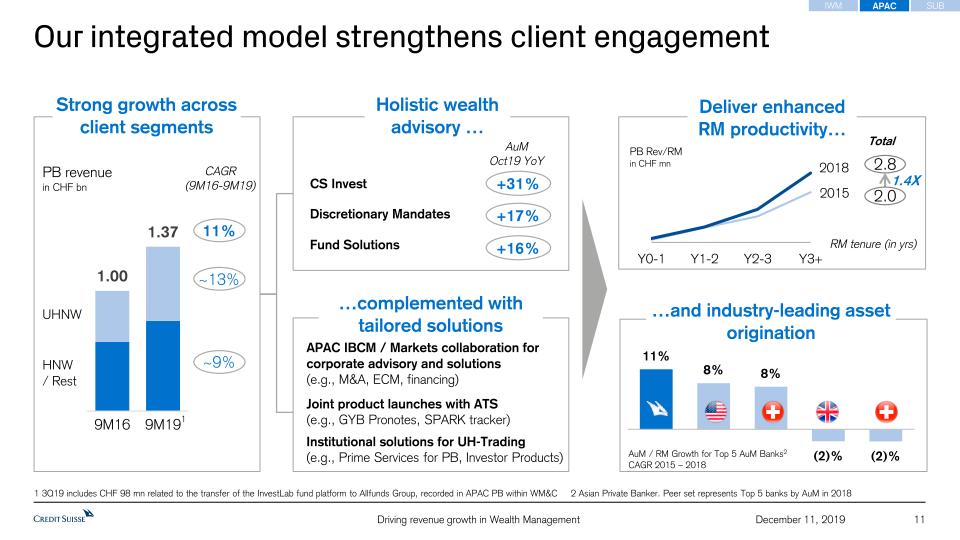
Our integrated model strengthens client engagement Strong growth across client segments PB Rev/RMin CHF mn AuM / RM Growth for Top 5 AuM Banks2CAGR 2015 – 2018 PB revenuein CHF bn CAGR(9M16-9M19) 11% ~9% HNW / Rest UHNW RM tenure (in yrs) 1.4X 2.8 2.0 Total CS Invest +31% AuMOct19 YoY Discretionary Mandates +17% Fund Solutions +16% Holistic wealth advisory … …complemented with tailored solutions APAC IBCM / Markets collaboration for corporate advisory and solutions(e.g., M&A, ECM, financing) Joint product launches with ATS (e.g., GYB Pronotes, SPARK tracker) December 11, 2019 Deliver enhanced RM productivity… Institutional solutions for UH-Trading(e.g., Prime Services for PB, Investor Products) …and industry-leading asset origination 11 1 3Q19 includes CHF 98 mn related to the transfer of the InvestLab fund platform to Allfunds Group, recorded in APAC PB within WM&C 2 Asian Private Banker. Peer set represents Top 5 banks by AuM in 2018 1 ~13% IWM SUB APAC
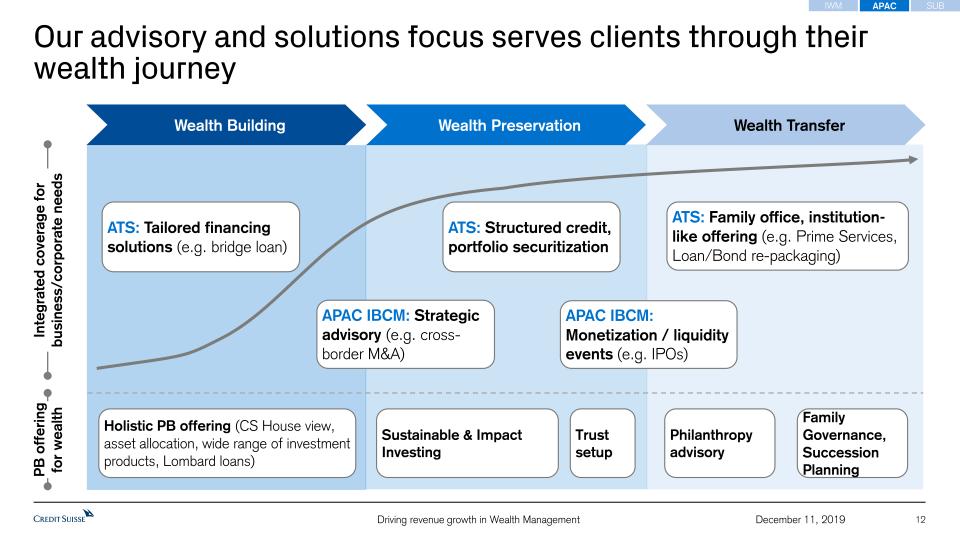
Our advisory and solutions focus serves clients through their wealth journey 12 Wealth Building Wealth Preservation Wealth Transfer ATS: Tailored financing solutions (e.g. bridge loan) APAC IBCM: Strategic advisory (e.g. cross-border M&A) APAC IBCM: Monetization / liquidity events (e.g. IPOs) ATS: Family office, institution-like offering (e.g. Prime Services, Loan/Bond re-packaging) Integrated coverage for business/corporate needs PB offering for wealth ATS: Structured credit, portfolio securitization Holistic PB offering (CS House view, asset allocation, wide range of investment products, Lombard loans) Trust setup Sustainable & Impact Investing Philanthropy advisory Family Governance, Succession Planning December 11, 2019 IWM SUB APAC
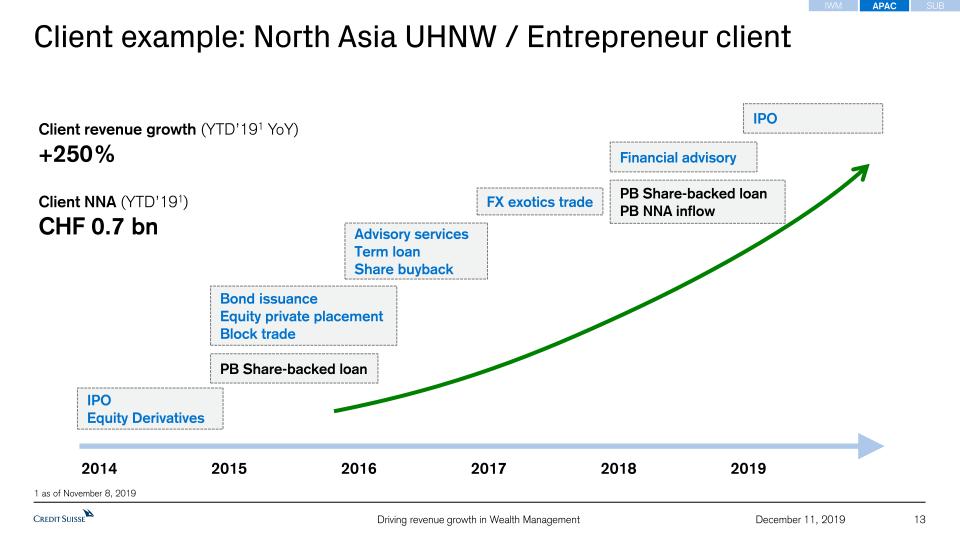
Client example: North Asia UHNW / Entrepreneur client 13 December 11, 2019 Client revenue growth (YTD’191 YoY) +250% 2014 2015 2016 2017 2018 2019 IPOEquity Derivatives Bond issuanceEquity private placementBlock trade Advisory services Term loanShare buyback FX exotics trade Financial advisory IPO PB Share-backed loanPB NNA inflow PB Share-backed loan Client NNA (YTD’191) CHF 0.7 bn 1 as of November 8, 2019 IWM SUB APAC
Swiss Universal Bank 14 December 11, 2019
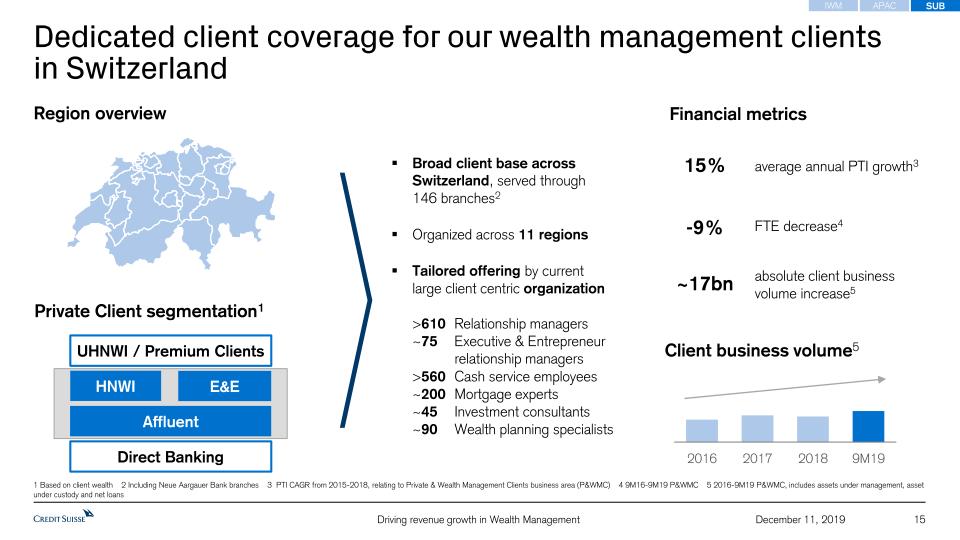
Dedicated client coverage for our wealth management clients in Switzerland December 11, 2019 15 UHNWI / Premium Clients HNWI Affluent Direct Banking E&E Private Client segmentation1 Financial metrics Region overview average annual PTI growth3 15% FTE decrease4 -9% absolute client business volume increase5 ~17bn Client business volume5 Broad client base across Switzerland, served through 146 branches2Organized across 11 regionsTailored offering by currentlarge client centric organization>610 Relationship managers~75 Executive & Entrepreneur relationship managers>560 Cash service employees~200 Mortgage experts ~45 Investment consultants ~90 Wealth planning specialists 1 Based on client wealth 2 Including Neue Aargauer Bank branches 3 PTI CAGR from 2015-2018, relating to Private & Wealth Management Clients business area (P&WMC) 4 9M16-9M19 P&WMC 5 2016-9M19 P&WMC, includes assets under management, asset under custody and net loans IWM SUB APAC
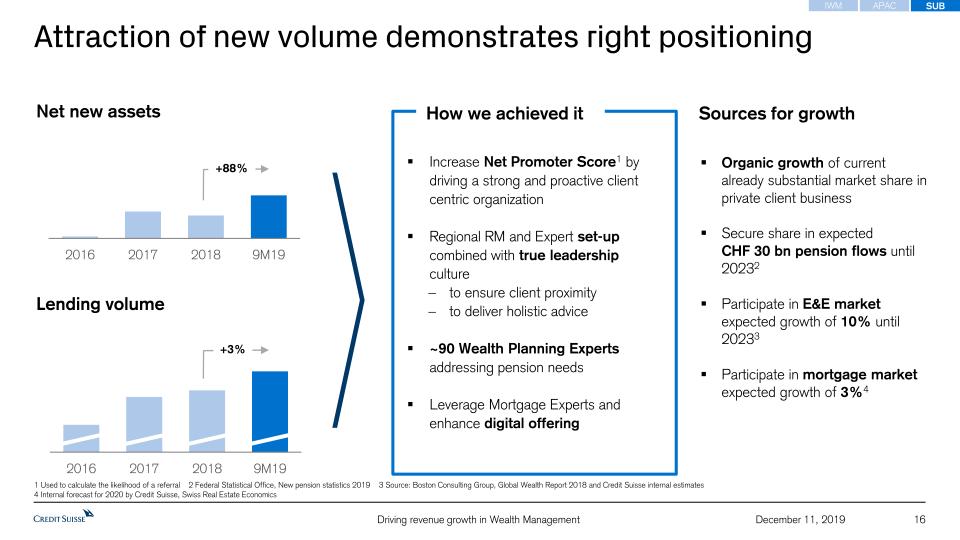
16 Attraction of new volume demonstrates right positioning Increase Net Promoter Score1 by driving a strong and proactive client centric organizationRegional RM and Expert set-up combined with true leadership cultureto ensure client proximity to deliver holistic advice~90 Wealth Planning Experts addressing pension needsLeverage Mortgage Experts and enhance digital offering How we achieved it Net new assets Sources for growth Organic growth of current already substantial market share in private client businessSecure share in expected CHF 30 bn pension flows until 20232Participate in E&E market expected growth of 10% until 20233Participate in mortgage market expected growth of 3%4 Lending volume December 11, 2019 1 Used to calculate the likelihood of a referral 2 Federal Statistical Office, New pension statistics 2019 3 Source: Boston Consulting Group, Global Wealth Report 2018 and Credit Suisse internal estimates4 Internal forecast for 2020 by Credit Suisse, Swiss Real Estate Economics +88% +3% IWM SUB APAC
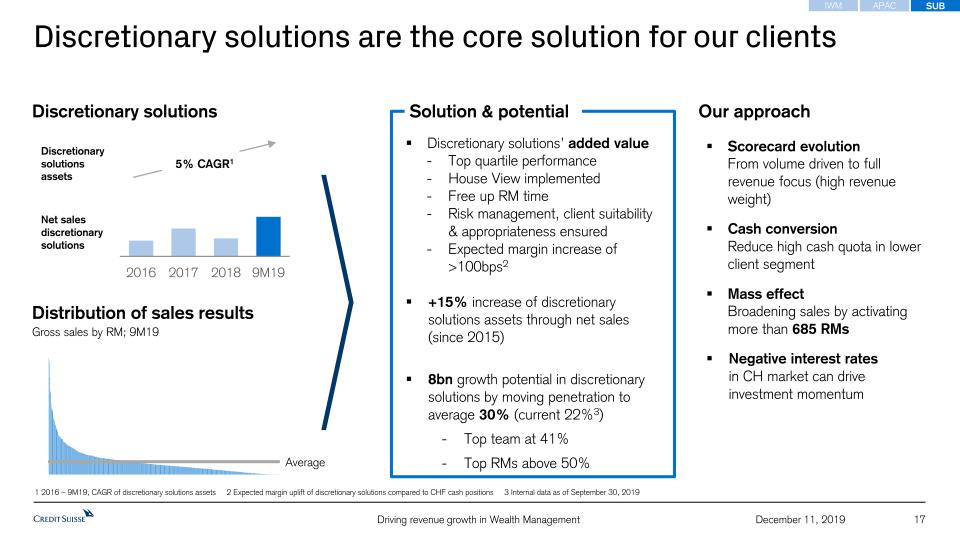
17 Discretionary solutions are the core solution for our clients Discretionary solutions’ added valueTop quartile performanceHouse View implementedFree up RM timeRisk management, client suitability & appropriateness ensuredExpected margin increase of >100bps2+15% increase of discretionary solutions assets through net sales (since 2015)8bn growth potential in discretionary solutions by moving penetration to average 30% (current 22%3)Top team at 41%Top RMs above 50% Scorecard evolution From volume driven to full revenue focus (high revenue weight)Cash conversionReduce high cash quota in lower client segmentMass effectBroadening sales by activating more than 685 RMsNegative interest ratesin CH market can drive investment momentum Discretionary solutions Our approach Solution & potential December 11, 2019 1 2016 – 9M19, CAGR of discretionary solutions assets 2 Expected margin uplift of discretionary solutions compared to CHF cash positions 3 Internal data as of September 30, 2019 Gross sales by RM; 9M19 Distribution of sales results Average Net sales discretionary solutions Discretionary solutionsassets 5% CAGR1 IWM SUB APAC
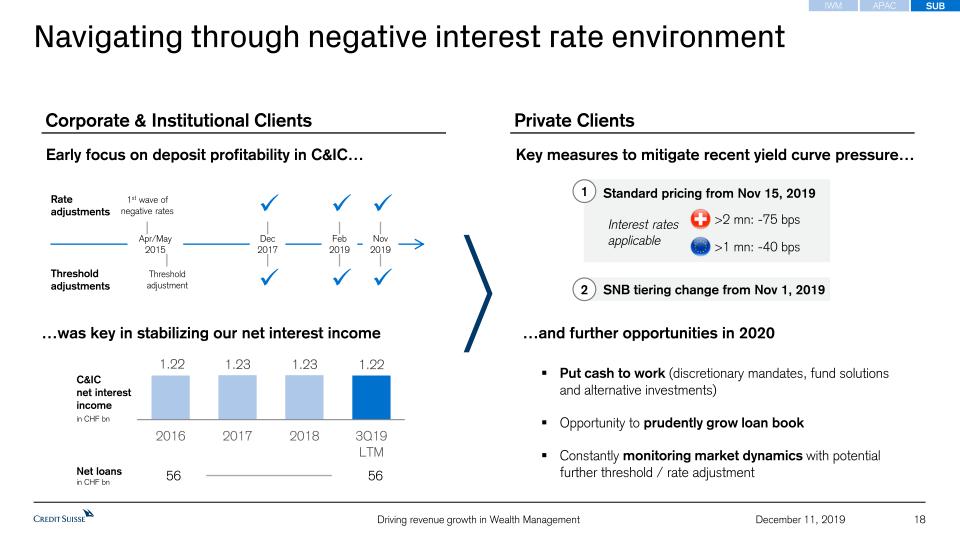
18 December 11, 2019 Navigating through negative interest rate environment Early focus on deposit profitability in C&IC… C&IC net interest income in CHF bn Key measures to mitigate recent yield curve pressure… Interest rates applicable >2 mn: -75 bps >1 mn: -40 bps 56 Net loans in CHF bn …was key in stabilizing our net interest income …and further opportunities in 2020 Put cash to work (discretionary mandates, fund solutions and alternative investments)Opportunity to prudently grow loan bookConstantly monitoring market dynamics with potential further threshold / rate adjustment Rate adjustments Threshold adjustments Apr/May 2015 1st wave of negative rates Threshold adjustment Dec 2017 Feb 2019 Nov 2019 56 Corporate & Institutional Clients Private Clients Standard pricing from Nov 15, 2019 SNB tiering change from Nov 1, 2019 2 1 IWM SUB APAC

Appendix 19 December 11, 2019

20 December 11, 2019 For reconciliation of adjusted to reported results, refer to the Appendix of the CEO and CFO Investor Day 2019 presentations, published on December 11, 2019Throughout the presentation rounding differences may occurUnless otherwise noted, all CET1 capital, CET1 ratio, Tier 1 leverage ratio, risk-weighted assets and leverage exposure figures shown in this presentation for periods prior to 2019 are as of the end of the respective period and on a “look-through” basisGross and net margins are shown in basis pointsGross margin = net revenues annualized / average AuM; net margin = pre-tax income annualized / average AuMMandate penetration reflects advisory and discretionary mandate volumes as a percentage of AuM, excluding those from the external asset manager business General notes Specific notes Notes (1/2) * Following the successful completion of our restructuring program in 2018, we updated our calculation approach for adjusted operating cost base at constant FX rates. Beginning in 1Q19, adjusted operating cost base at constant FX rates includes adjustments for major litigation provisions, expenses related to real estate disposals and business sales as well as for debit valuation adjustments (DVA) related volatility and FX, but not for restructuring expenses and certain accounting changes. Adjustments for FX apply unweighted 2018 currency exchange rates, i.e., a straight line average of monthly rates, consistently for the periods under review. Under the current presentation, adjusted operating cost base at constant FX rates for periods prior to 1Q19 still include adjustments for restructuring expenses and a goodwill impairment taken in 4Q15, but no longer include an adjustment for certain accounting changes. Beginning in 1Q20, adjustments for FX will apply unweighted 2019 currency exchange rates.† Regulatory capital is calculated as the worst of 10% of RWA and 3.5% of leverage exposure. Return on regulatory capital (a non-GAAP financial measure) is calculated using income/(loss) after tax and assumes a tax rate of 30% and capital allocated based on the worst of 10% of average RWA and 3.5% of average leverage exposure. For the Markets business within the APAC division and for the Global Markets and Investment Banking & Capital Markets divisions, return on regulatory capital is based on US dollar denominated numbers. Adjusted return on regulatory capital is calculated using adjusted results, applying the same methodology to calculate return on regulatory capital. ‡ Return on tangible equity is based on tangible shareholders’ equity, a non-GAAP financial measure, which is calculated by deducting goodwill and other intangible assets from total shareholders’ equity as presented in our balance sheet. Tangible book value, a non-GAAP financial measure, is equal to tangible shareholders’ equity. Tangible book value per share is a non-GAAP financial measure, which is calculated by dividing tangible shareholders’ equity by total number of shares outstanding. Management believes that tangible shareholders’ equity/tangible book value, return on tangible equity and tangible book value per share are meaningful as they are measures used and relied upon by industry analysts and investors to assess valuations and capital adequacy. For end-4Q17, tangible shareholders’ equity excluded goodwill of CHF 4,742 mn and other intangible assets of CHF 223 mn from total shareholders’ equity of CHF 41,902 mn as presented in our balance sheet. For end-1Q18, tangible shareholders’ equity excluded goodwill of CHF 4,667 mn and other intangible assets of CHF 212 mn from total shareholders’ equity of CHF 42,540 mn as presented in our balance sheet. For end-2Q18, tangible shareholders’ equity excluded goodwill of CHF 4,797 mn and other intangible assets of CHF 212 mn from total shareholders’ equity of CHF 43,470 mn as presented in our balance sheet. For end-3Q18, tangible shareholders’ equity excluded goodwill of CHF 4,736 mn and other intangible assets of CHF 214 mn from total shareholders’ equity of CHF 42,734 mn as presented in our balance sheet. For end-4Q18, tangible shareholders’ equity excluded goodwill of CHF 4,766 mn and other intangible assets of CHF 219 mn from total shareholders’ equity of CHF 43,922 mn as presented in our balance sheet. For end-1Q19, tangible shareholders’ equity excluded goodwill of CHF 4,807 mn and other intangible assets of CHF 224 mn from total shareholders’ equity of CHF 43,825 mn as presented in our balance sheet. For end-2Q19, tangible shareholders’ equity excluded goodwill of CHF 4,731 mn and other intangible assets of CHF 216 mn from total shareholders’ equity of CHF 43,673 mn as presented in our balance sheet. For end-3Q19, tangible shareholders’ equity excluded goodwill of CHF 4,760 mn and other intangible assets ofCHF 219 mn from total shareholders’ equity of CHF 45,150 mn as presented in our balance sheet. Shares outstanding were 2,550.3 mn at end-4Q17, 2,552.4 mn at end-3Q18, 2,550.6 mn at end-4Q18 and 2,473.8 mn at end-3Q19.

21 December 11, 2019 Notes (2/2) Abbreviations ABL = Asset Based Lending; Abs. = Absolute; Adj. = Adjusted; AFG = Asia Pacific Financing Group; AM = Asset Management; Ann. = Annualized;APAC = Asia Pacific; Approx. = Approximately; ARC = Asset Risk Consultants; ARU = Asset Resolution Unit; ATS = APAC Trading Solutions; AuM = Assets under Management; Avg.= Average; BCBS = Basel Committee on Banking Supervision; BEAT = Base Erosion and Anti-Abuse Tax; BfE = Bank for Entrepreneurs; BHC = Bank Holding Company; BIS = Bank for International Settlements; bps = basis points; CAGR = Compound Annual Growth Rate; CBG = Corporate Bank Group; CC = Corporate Center; CCO = Chief Compliance Officer; CCRO = Chief Compliance and Regulatory Affairs Officer; CET1 = Common Equity Tier 1;CH = Switzerland; C/I = Cost/Income; C&IC = Corporate and Institutional Clients; CIC = Corporate & Institutional Clients; CLO = Collateralized Loan Obligation; CRO = Chief Risk Officer; CSAM = Credit Suisse Asset Management; DCM = Debt Capital Markets; DevOps = Development-to-Operations; DPS = Dividend Per Share; E = Estimate; EAM = External Asset Manager; ECA = Export Credit Agency; ECM = Equity Capital Markets; E&E = Entrepreneurs & Executives;EMEA = Europe, Middle East & Africa; ESG = Environmental Social and Governance; Est. = Estimate; EU = European Union; Excl. = Exclude; FID = Fixed Income Department; FI&WM = Fixed Income Wealth Management; FRTB = Fundamental Review of the Trading Book; FX = Foreign Exchange; FY = Full Year; GC = General Counsel; GCP = Global Credit Products; GM = Global Markets; GMV = Gross Market Value; GYB = Global Yield Balanced; HLG = High Level Group; HR = Human Resources; HY = High Yield; IAF = Impact Advisory & Finance; IB = Investment Banking; IBCM = Investment Banking & Capital Markets; IBOR = Interbank Offer Rate; IFC = International Finance Corporation; IG = Investment Grade; ILS = Insurance-Linked Strategies; IMM = Internal Model Method;incl. = including; IPO = Initial Public Offering; IRB = Internal Ratings-Based Approach; IT = Information Technology; ITS = International Trading Solutions;IWM = International Wealth Management; LDI = Liability-driven investments; Lev Fin = Leveraged Finance; LTD = Long-term debt; LTM = Last Twelve Months; LTV = Loan to Value; M&A = Mergers & Acquisitions; MREL = Minimum Requirement for own funds and Eligible Liabilities; NIG = Non investment grade;NNA = Net new assets; NRI = Non-resident Indians; Op Risk = Operational Risk; OTC = Over the Counter; p.a. = per annum; PB = Private Banking;PB&WM = Private Banking & Wealth Management; PC = Private Clients; PD = probability of default; p.p. = percentage points; PTI = Pre-tax income;QIS = Quantitative Investment Strategies; QoQ = Quarter over Quarter; QT = Quantitative Trading; RBL = Reserve Based Lending; RM = Relationship Manager(s); RoRC = Return on Regulatory Capital; RoTE= Return on Tangible Equity; RSA = Revenue Sharing Agreement; RWA = Risk-weighted assets;SA-CCR = Standardized Approach to Counterparty Credit Risk; SBL = Share Backed Lending; SCP = Strategic Client Partner; SEA = South East Asia;SME = Small and Medium-Sized Enterprises; SNB = Swiss National Bank; SoW = Share of Wallet; SP = Securitized Products; STBs = Sustainable Transition Bonds; SUB = Swiss Universal Bank; TBVPS = Tangible book value per share; TLAC = Total Loss-Absorbing Capacity; TLOF = Total Liabilities and Own Funds; TMT = Technology, Media and Telecommunications; (U)HNW(I) = (Ultra) High Net Worth (Individuals); U/W = Underwriting; US GAAP = United States Generally Accepted Accounting Principles; WM&C = Wealth Management & Connected; YoY = Year over year; YTD = Year to Date

Credit Suisse Investor Day 2019Increasing profitability across ourMarkets activities Brian Chin, CEO Global MarketsDavid Miller, CEO Investment Banking & Capital Markets December 11, 2019
Disclaimer 2 December 11, 2019 This material does not purport to contain all of the information that you may wish to consider. This material is not to be relied upon as such or used in substitution for the exercise of independent judgment.Cautionary statement regarding forward-looking statementsThis presentation contains forward-looking statements that involve inherent risks and uncertainties, and we might not be able to achieve the predictions, forecasts, projections and other outcomes we describe or imply in forward-looking statements. A number of important factors could cause results to differ materially from the plans, targets, goals, expectations, estimates and intentions we express in these forward-looking statements, including those we identify in "Risk factors” in our Annual Report on Form 20-F for the fiscal year ended December 31, 2018 and in the “Cautionary statement regarding forward-looking information" in our media release relating to Investor Day, published on December 11, 2019 and filed with the US Securities and Exchange Commission, and in other public filings and press releases. We do not intend to update these forward-looking statements. In particular, the terms “Estimate”, “Illustrative”, “Ambition”, “Objective”, “Outlook” and “Goal” are not intended to be viewed as targets or projections, nor are they considered to be Key Performance Indicators. All such estimates, illustrations, ambitions, objectives, outlooks and goals are subject to a large number of inherent risks, assumptions and uncertainties, many of which are completely outside of our control. These risks, assumptions and uncertainties include, but are not limited to, general market conditions, market volatility, interest rate volatility and levels, global and regional economic conditions, political uncertainty, changes in tax policies, regulatory changes, changes in levels of client activity as a result of any of the foregoing and other factors. Accordingly, this information should not be relied on for any purpose. We do not intend to update these estimates, illustrations, ambitions, objectives, outlooks or goals. We may not achieve the benefits of our strategic initiativesWe may not achieve all of the expected benefits of our strategic initiatives. Factors beyond our control, including but not limited to the market and economic conditions, changes in laws, rules or regulations and other challenges discussed in our public filings, could limit our ability to achieve some or all of the expected benefits of these initiatives. Estimates and assumptionsIn preparing this presentation, management has made estimates and assumptions that affect the numbers presented. Actual results may differ. Annualized numbers do not take into account variations in operating results, seasonality and other factors and may not be indicative of actual, full-year results. Figures throughout this presentation may also be subject to rounding adjustments. All opinions and views constitute judgments as of the date of writing without regard to the date on which the reader may receive or access the information. This information is subject to change at any time without notice and we do not intend to update this information. Cautionary statements relating to interim financial informationThis presentation contains certain unaudited interim financial information for the fourth quarter of 2019. This information has been derived from management accounts, is preliminary in nature, does not reflect the complete results of the fourth quarter of 2019 or the full year 2019 and is subject to change, including as a result of any normal quarterly adjustments in relation to the financial statements for the full year 2019. This information has not been subject to any review by our independent registered public accounting firm. There can be no assurance that the final results for these periods will not differ from these preliminary results, and any such differences could be material. Quarterly financial results for the fourth quarter of 2019 and full year results will be included in our 4Q19 Earnings Release and our 2019 Annual Report. Statement regarding non-GAAP financial measuresThis presentation also contains non-GAAP financial measures, including adjusted results as well as return on regulatory capital, return on tangible equity and tangible book value per share (which are based on tangible shareholders’ equity). Information needed to reconcile such non-GAAP financial measures to the most directly comparable measures under US GAAP can be found in the Appendix of the CEO and CFO Investor Day presentations, published on December 11, 2019. All Investor Day presentations are available on our website at www.credit-suisse.com.Our estimates, ambitions, objectives and targets often include metrics that are non-GAAP financial measures and are unaudited. A reconciliation of the estimates, ambitions, objectives and targets to the nearest GAAP measures is unavailable without unreasonable efforts. Adjusted results exclude goodwill impairment, major litigation provisions, real estate gains and other revenue and expense items included in our reported results, all of which are unavailable on a prospective basis. Return on Tangible Equity is based on tangible shareholders' equity (also known as tangible book value), a non-GAAP financial measure, which is calculated by deducting goodwill and other intangible assets from total shareholders' equity as presented in our balance sheet, both of which are unavailable on a prospective basis. Tangible book value per share excludes the impact of any dividends paid during the performance period, share buybacks, own credit movements, foreign exchange rate movements and pension-related impacts, all of which are unavailable on a prospective basis. Such estimates, ambitions, objectives and targets are calculated in a manner that is consistent with the accounting policies applied by us in preparing our financial statements.Statement regarding capital, liquidity and leverageCredit Suisse is subject to the Basel III framework, as implemented in Switzerland, as well as Swiss legislation and regulations for systemically important banks (Swiss Requirements), which include capital, liquidity, leverage and large exposure requirements and rules for emergency plans designed to maintain systemically relevant functions in the event of threatened insolvency. Credit Suisse has adopted the Bank for International Settlements (BIS) leverage ratio framework, as issued by the Basel Committee on Banking Supervision (BCBS) and implemented in Switzerland by the Swiss Financial Market Supervisory Authority FINMA. References to phase-in and look-through included herein refer to Basel III capital requirements and Swiss Requirements. Phase-in reflects that, for the years 2014-2018, there was a five-year (20% per annum) phase-in of goodwill, other intangible assets and other capital deductions (e.g., certain deferred tax assets) and a phase-out of an adjustment for the accounting treatment of pension plans. For the years 2013-2022, there is a phase-out of certain capital instruments. Look-through assumes the full phase-in of goodwill and other intangible assets and other regulatory adjustments and the phase-out of certain capital instruments.Unless otherwise noted, leverage exposure is based on the BIS leverage ratio framework and consists of period-end balance sheet assets and prescribed regulatory adjustments. The look-through tier 1 leverage ratio and CET1 leverage ratio are calculated as look-through BIS tier 1 capital and CET1 capital, respectively, divided by period-end leverage exposure. Swiss leverage ratios are measured on the same period-end basis as the leverage exposure for the BIS leverage ratio.SourcesThis presentation contains certain material prepared by Credit Suisse on the basis of publicly available information, internally developed data and other third-party sources believed to be reliable. Credit Suisse has not sought to independently verify information obtained from public and third-party sources and makes no representations or warranties as to accuracy, completeness or reliability of such information. Certain information has been derived from internal management accounts.
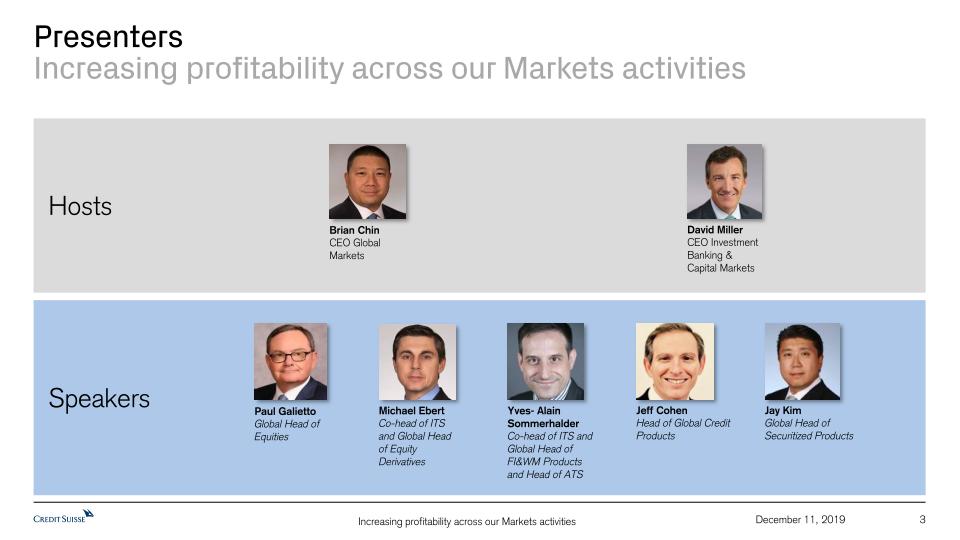
Speakers Hosts 3 December 11, 2019 Presenters Increasing profitability across our Markets activities David MillerCEO Investment Banking & Capital Markets Brian ChinCEO Global Markets Paul GaliettoGlobal Head of Equities Michael EbertCo-head of ITS and Global Head of Equity Derivatives Yves- AlainSommerhalderCo-head of ITS and Global Head of FI&WM Products and Head of ATS Jay KimGlobal Head of Securitized Products Jeff CohenHead of Global Credit Products
Increasing profitability across our Markets activities 4 December 11, 2019 Agenda Global Markets Brian Chin Paul Galietto Michael Ebert & Yves-Alain Sommerhalder APAC Trading Solutions Yves-Alain Sommerhalder Investment Banking & Capital Markets David Miller Q&A All
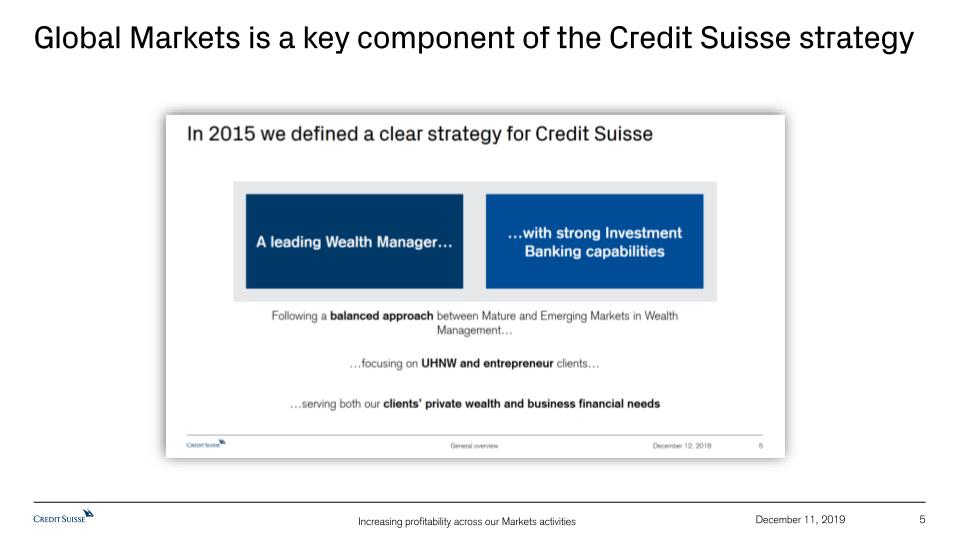
5 December 11, 2019 Global Markets is a key component of the Credit Suisse strategy
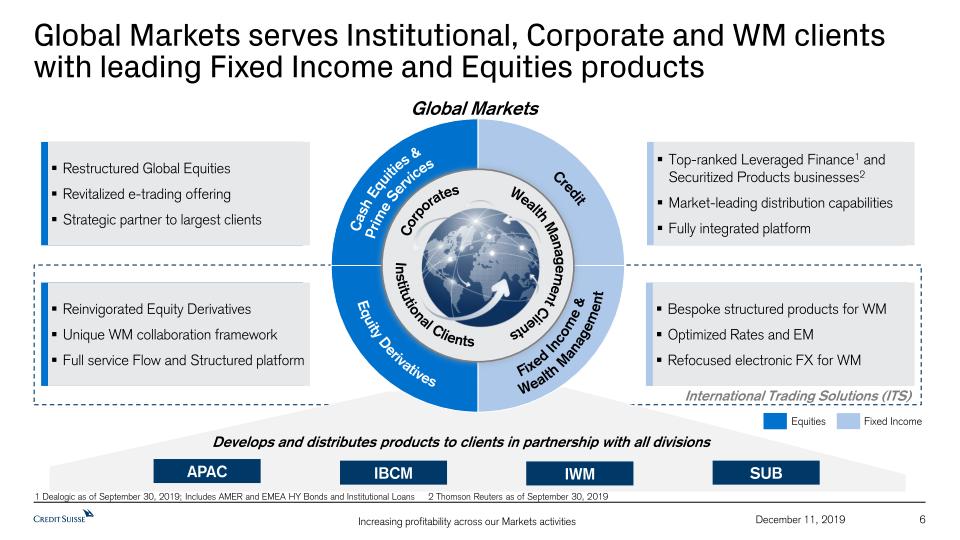
Reinvigorated Equity DerivativesUnique WM collaboration frameworkFull service Flow and Structured platform 6 December 11, 2019 Global Markets serves Institutional, Corporate and WM clients with leading Fixed Income and Equities products Bespoke structured products for WMOptimized Rates and EM Refocused electronic FX for WM Top-ranked Leveraged Finance1 and Securitized Products businesses2Market-leading distribution capabilitiesFully integrated platform Global Markets Develops and distributes products to clients in partnership with all divisions APAC IBCM IWM SUB Equity Derivatives Credit Fixed Income & Wealth Management Cash Equities & Prime Services Corporates Institutional Clients Wealth Management Clients Restructured Global EquitiesRevitalized e-trading offering Strategic partner to largest clients International Trading Solutions (ITS) Equities Fixed Income 1 Dealogic as of September 30, 2019; Includes AMER and EMEA HY Bonds and Institutional Loans 2 Thomson Reuters as of September 30, 2019
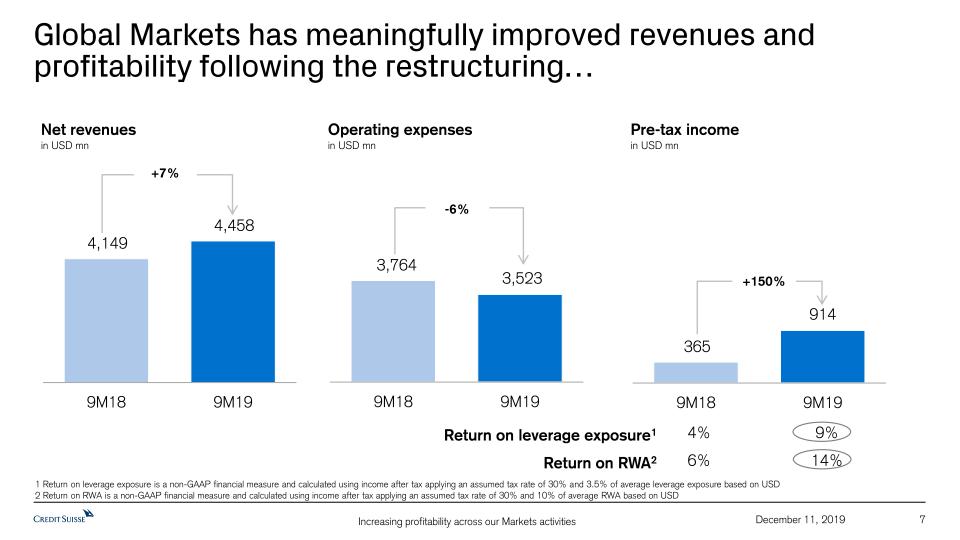
7 December 11, 2019 Global Markets has meaningfully improved revenues and profitability following the restructuring… Net revenues in USD mn 1 Return on leverage exposure is a non-GAAP financial measure and calculated using income after tax applying an assumed tax rate of 30% and 3.5% of average leverage exposure based on USD 2 Return on RWA is a non-GAAP financial measure and calculated using income after tax applying an assumed tax rate of 30% and 10% of average RWA based on USD Return on leverage exposure1 Return on RWA2 6% 4% 14% 9% Operating expenses in USD mn Pre-tax income in USD mn -6% +150% +7%
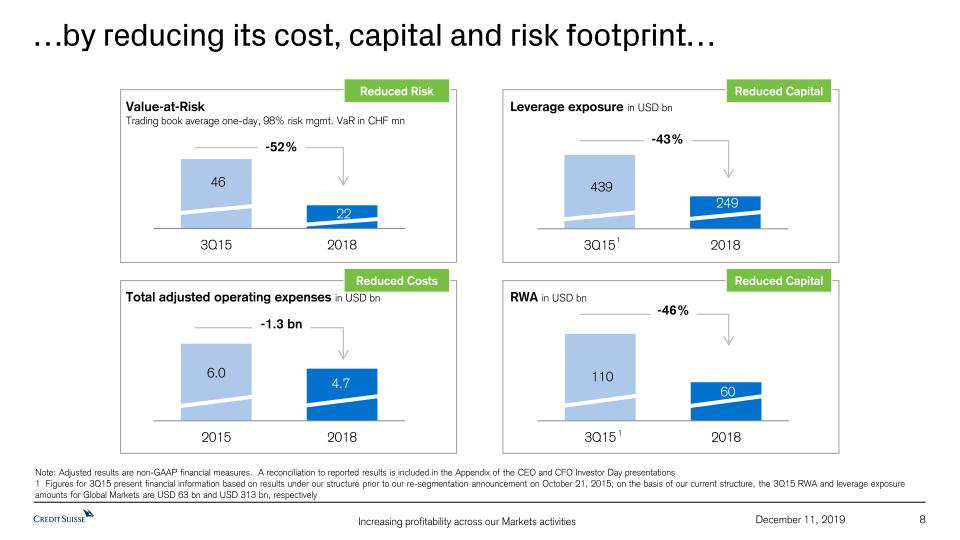
…by reducing its cost, capital and risk footprint… Leverage exposure in USD bn 8 December 11, 2019 Total adjusted operating expenses in USD bn -46% RWA in USD bn Value-at-Risk Trading book average one-day, 98% risk mgmt. VaR in CHF mn -43% -52% -1.3 bn Reduced Risk Reduced Costs Reduced Capital Note: Adjusted results are non-GAAP financial measures. A reconciliation to reported results is included in the Appendix of the CEO and CFO Investor Day presentations1 Figures for 3Q15 present financial information based on results under our structure prior to our re-segmentation announcement on October 21, 2015; on the basis of our current structure, the 3Q15 RWA and leverage exposure amounts for Global Markets are USD 63 bn and USD 313 bn, respectively Reduced Capital 1 1
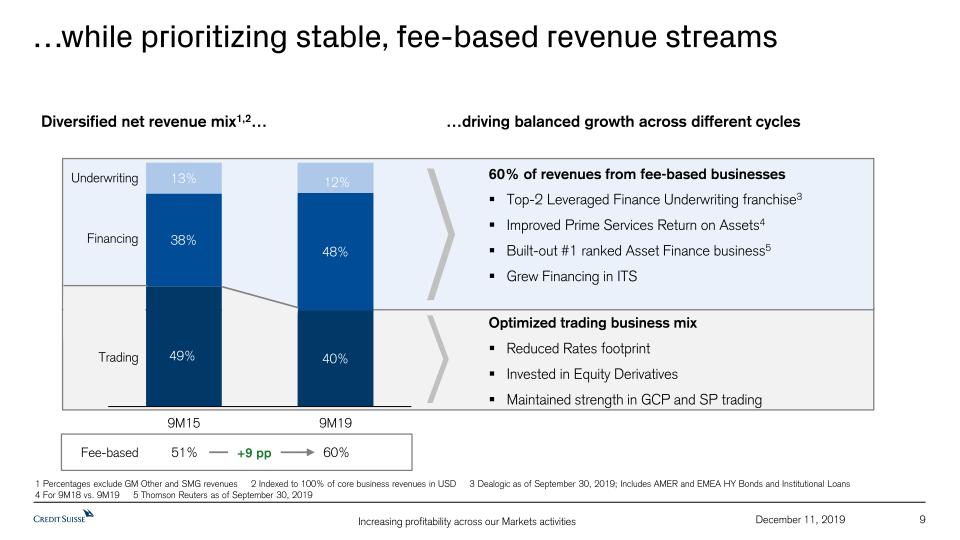
December 11, 2019 Financing Underwriting Trading 1 Percentages exclude GM Other and SMG revenues 2 Indexed to 100% of core business revenues in USD 3 Dealogic as of September 30, 2019; Includes AMER and EMEA HY Bonds and Institutional Loans 4 For 9M18 vs. 9M19 5 Thomson Reuters as of September 30, 2019 51% 60% Fee-based 60% of revenues from fee-based businessesTop-2 Leveraged Finance Underwriting franchise3Improved Prime Services Return on Assets4 Built-out #1 ranked Asset Finance business5Grew Financing in ITS +9 pp 9 …while prioritizing stable, fee-based revenue streams Optimized trading business mixReduced Rates footprintInvested in Equity Derivatives Maintained strength in GCP and SP trading Diversified net revenue mix1,2… …driving balanced growth across different cycles
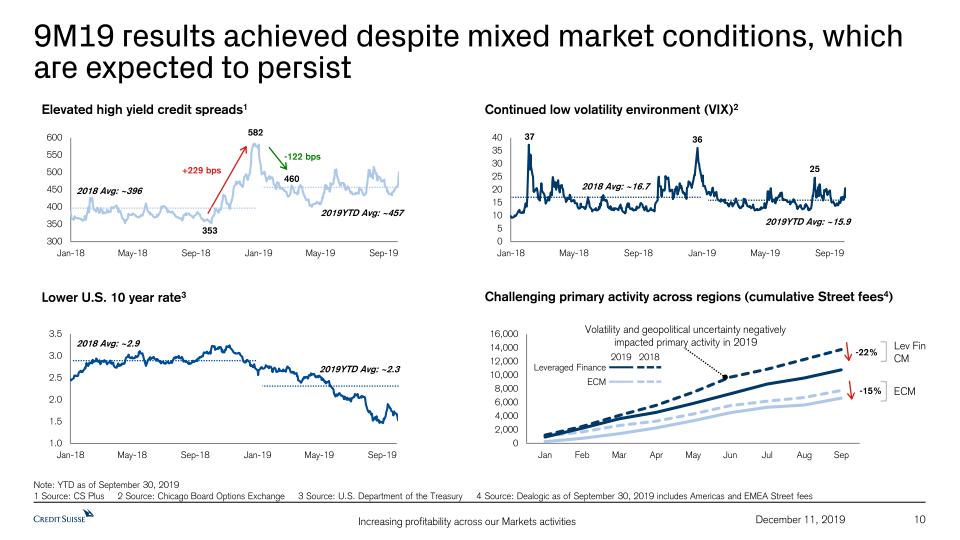
10 December 11, 2019 353 582 460 2018 Avg: ~396 +229 bps -122 bps Elevated high yield credit spreads1 Lower U.S. 10 year rate3 Challenging primary activity across regions (cumulative Street fees4) 9M19 results achieved despite mixed market conditions, which are expected to persist -22% -15% Leveraged Finance 2019 ECM 2018 Volatility and geopolitical uncertainty negatively impacted primary activity in 2019 Note: YTD as of September 30, 2019 1 Source: CS Plus 2 Source: Chicago Board Options Exchange 3 Source: U.S. Department of the Treasury 4 Source: Dealogic as of September 30, 2019 includes Americas and EMEA Street fees Lev FinCM ECM 2019YTD Avg: ~457 2018 Avg: ~2.9 2019YTD Avg: ~2.3 Continued low volatility environment (VIX)2 2018 Avg: ~16.7 36 25 37 2019YTD Avg: ~15.9
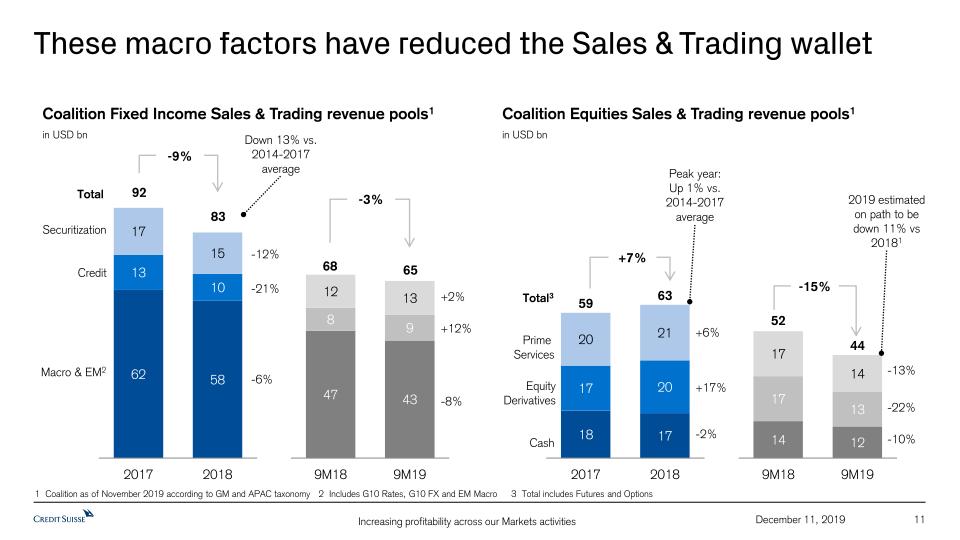
These macro factors have reduced the Sales & Trading wallet 11 December 11, 2019 Macro & EM2 Credit Securitization Coalition Fixed Income Sales & Trading revenue pools1in USD bn Coalition Equities Sales & Trading revenue pools1in USD bn Total 1 Coalition as of November 2019 according to GM and APAC taxonomy 2 Includes G10 Rates, G10 FX and EM Macro 3 Total includes Futures and Options Cash Equity Derivatives Prime Services Total3 -8% -6% +12% -21% +2% -12% -10% -2% -22% +17% -13% +6% Down 13% vs. 2014-2017 average -9% -3% +7% -15% 2019 estimated on path to be down 11% vs 20181 Peak year: Up 1% vs. 2014-2017 average
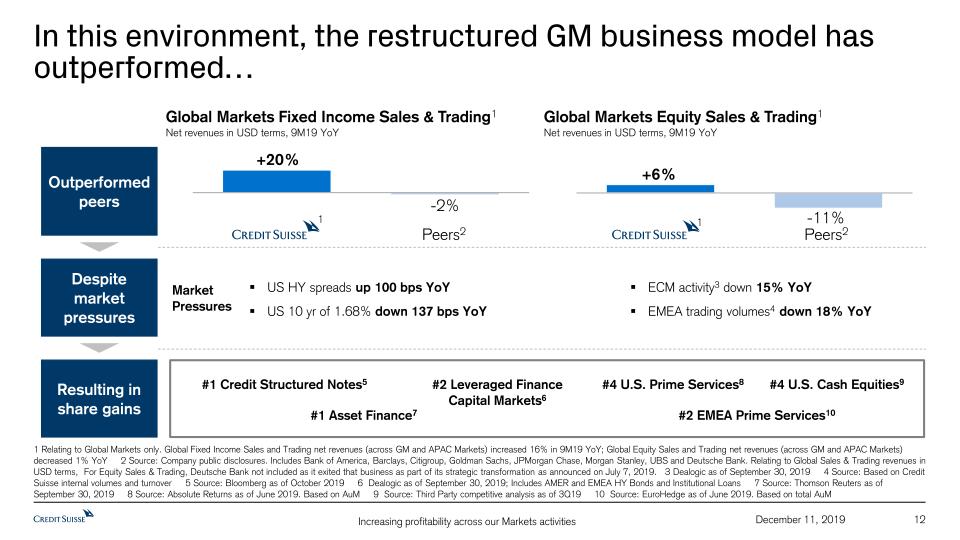
12 December 11, 2019 1 Relating to Global Markets only. Global Fixed Income Sales and Trading net revenues (across GM and APAC Markets) increased 16% in 9M19 YoY; Global Equity Sales and Trading net revenues (across GM and APAC Markets) decreased 1% YoY 2 Source: Company public disclosures. Includes Bank of America, Barclays, Citigroup, Goldman Sachs, JPMorgan Chase, Morgan Stanley, UBS and Deutsche Bank. Relating to Global Sales & Trading revenues in USD terms, For Equity Sales & Trading, Deutsche Bank not included as it exited that business as part of its strategic transformation as announced on July 7, 2019. 3 Dealogic as of September 30, 2019 4 Source: Based on Credit Suisse internal volumes and turnover 5 Source: Bloomberg as of October 2019 6 Dealogic as of September 30, 2019; Includes AMER and EMEA HY Bonds and Institutional Loans 7 Source: Thomson Reuters as of September 30, 2019 8 Source: Absolute Returns as of June 2019. Based on AuM 9 Source: Third Party competitive analysis as of 3Q19 10 Source: EuroHedge as of June 2019. Based on total AuM 1 1 US HY spreads up 100 bps YoY US 10 yr of 1.68% down 137 bps YoY ECM activity3 down 15% YoY EMEA trading volumes4 down 18% YoY Peers2 Peers2 Market Pressures #1 Asset Finance7 #1 Credit Structured Notes5 #2 Leveraged FinanceCapital Markets6 #4 U.S. Prime Services8 #4 U.S. Cash Equities9 #2 EMEA Prime Services10 Global Markets Fixed Income Sales & Trading1 Net revenues in USD terms, 9M19 YoY Global Markets Equity Sales & Trading1 Net revenues in USD terms, 9M19 YoY Outperformed peers Despite market pressures Resulting in share gains In this environment, the restructured GM business model has outperformed…
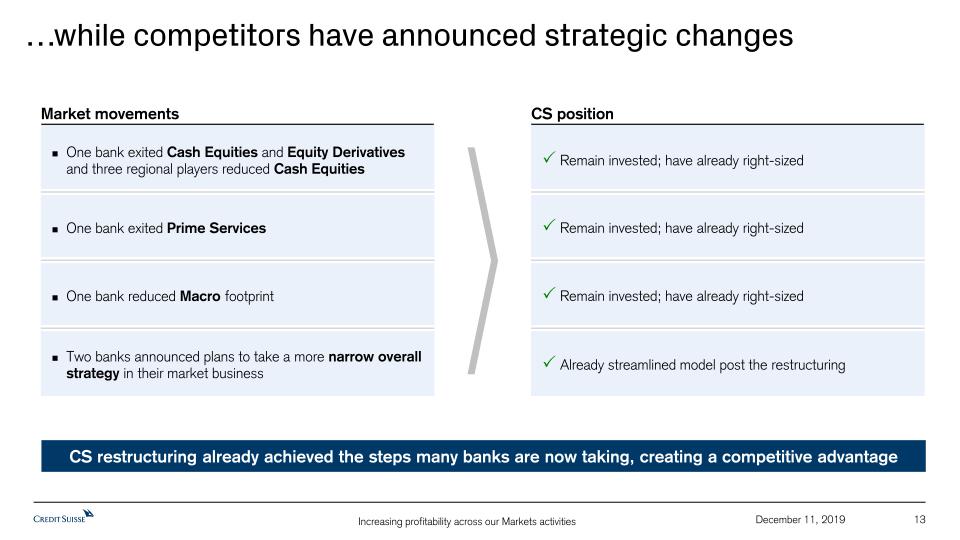
13 December 11, 2019 …while competitors have announced strategic changes One bank exited Cash Equities and Equity Derivatives and three regional players reduced Cash Equities One bank exited Prime Services One bank reduced Macro footprint Two banks announced plans to take a more narrow overall strategy in their market business Remain invested; have already right-sized Remain invested; have already right-sized Remain invested; have already right-sized Already streamlined model post the restructuring CS restructuring already achieved the steps many banks are now taking, creating a competitive advantage Market movements CS position
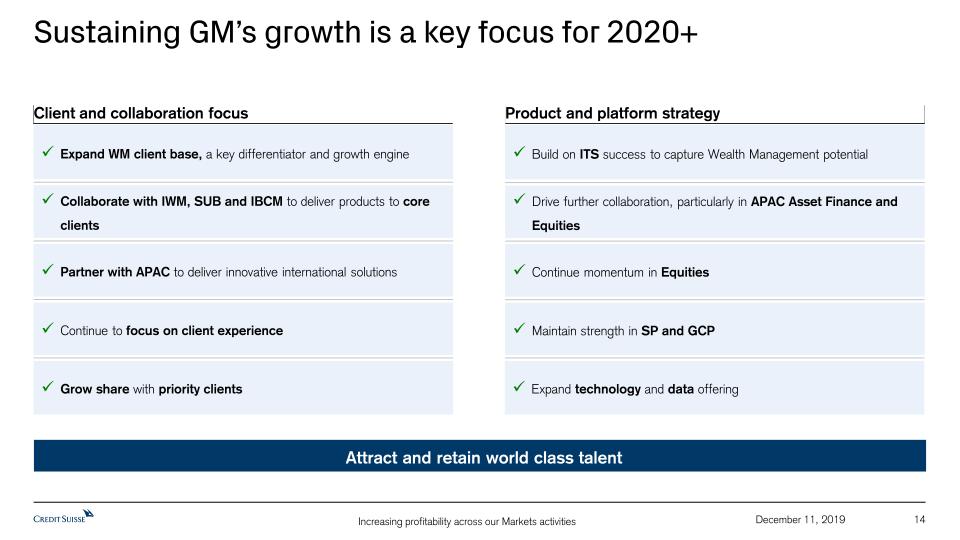
Attract and retain world class talent 14 December 11, 2019 Sustaining GM’s growth is a key focus for 2020+ Continue momentum in Equities Maintain strength in SP and GCP Build on ITS success to capture Wealth Management potential Drive further collaboration, particularly in APAC Asset Finance and Equities Product and platform strategy Expand technology and data offering Partner with APAC to deliver innovative international solutions Expand WM client base, a key differentiator and growth engine Continue to focus on client experience Collaborate with IWM, SUB and IBCM to deliver products to core clients Client and collaboration focus Grow share with priority clients

Credit 15 December 11, 2019
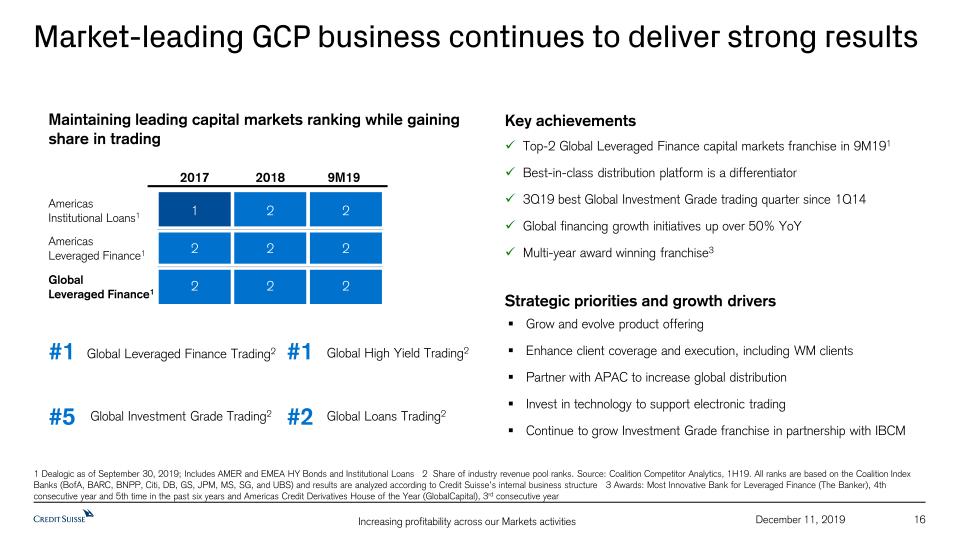
Market-leading GCP business continues to deliver strong results 1 Dealogic as of September 30, 2019; Includes AMER and EMEA HY Bonds and Institutional Loans 2 Share of industry revenue pool ranks. Source: Coalition Competitor Analytics, 1H19. All ranks are based on the Coalition Index Banks (BofA, BARC, BNPP, Citi, DB, GS, JPM, MS, SG, and UBS) and results are analyzed according to Credit Suisse’s internal business structure 3 Awards: Most Innovative Bank for Leveraged Finance (The Banker), 4th consecutive year and 5th time in the past six years and Americas Credit Derivatives House of the Year (GlobalCapital), 3rd consecutive year 16 December 11, 2019 Top-2 Global Leveraged Finance capital markets franchise in 9M191Best-in-class distribution platform is a differentiator3Q19 best Global Investment Grade trading quarter since 1Q14Global financing growth initiatives up over 50% YoYMulti-year award winning franchise3 Strategic priorities and growth drivers Grow and evolve product offering Enhance client coverage and execution, including WM clientsPartner with APAC to increase global distribution Invest in technology to support electronic trading Continue to grow Investment Grade franchise in partnership with IBCM Key achievements Americas Institutional Loans1 Americas Leveraged Finance1 Global Leveraged Finance1 2018 2 2 2 2017 1 2 2 9M19 2 2 2 Maintaining leading capital markets ranking while gaining share in trading #1 Global Leveraged Finance Trading2 #1 Global High Yield Trading2 #2 Global Loans Trading2 #5 Global Investment Grade Trading2
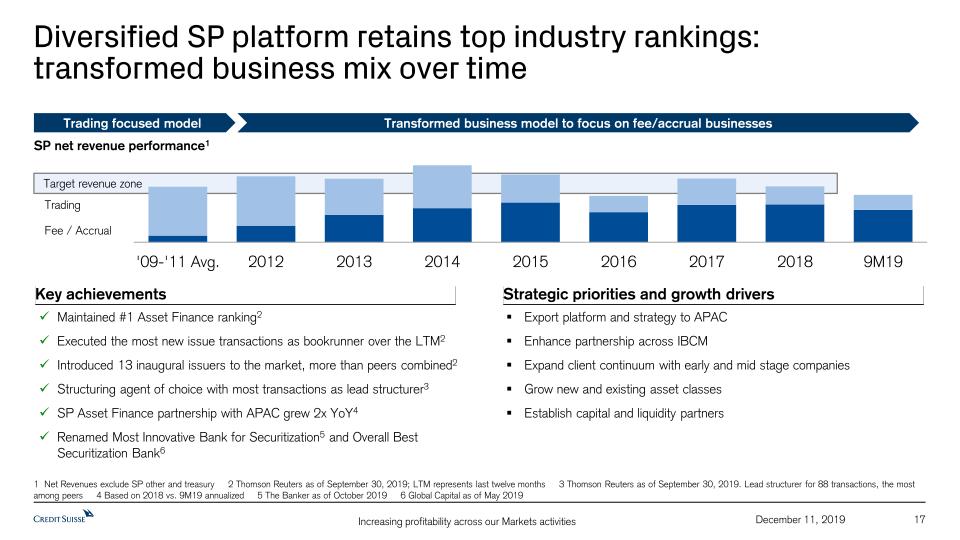
Maintained #1 Asset Finance ranking2 Executed the most new issue transactions as bookrunner over the LTM2Introduced 13 inaugural issuers to the market, more than peers combined2Structuring agent of choice with most transactions as lead structurer3SP Asset Finance partnership with APAC grew 2x YoY4Renamed Most Innovative Bank for Securitization5 and Overall Best Securitization Bank6 Diversified SP platform retains top industry rankings: transformed business mix over time 1 Net Revenues exclude SP other and treasury 2 Thomson Reuters as of September 30, 2019; LTM represents last twelve months 3 Thomson Reuters as of September 30, 2019. Lead structurer for 88 transactions, the most among peers 4 Based on 2018 vs. 9M19 annualized 5 The Banker as of October 2019 6 Global Capital as of May 2019 17 December 11, 2019 Key achievements Strategic priorities and growth drivers Export platform and strategy to APACEnhance partnership across IBCMExpand client continuum with early and mid stage companiesGrow new and existing asset classesEstablish capital and liquidity partners Target revenue zone Trading Transformed business model to focus on fee/accrual businesses Fee / Accrual SP net revenue performance1 Trading focused model

Equities 18 December 11, 2019
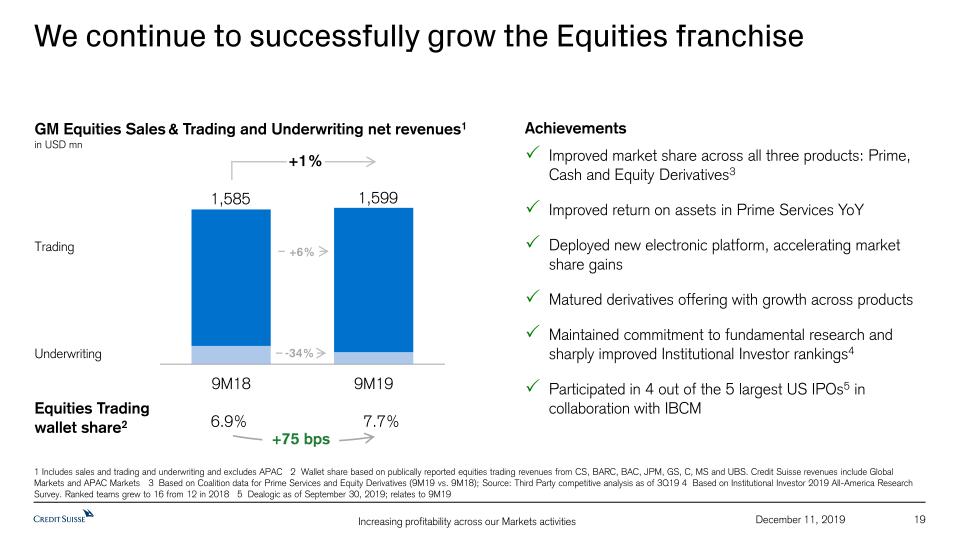
We continue to successfully grow the Equities franchise 19 December 11, 2019 GM Equities Sales & Trading and Underwriting net revenues1in USD mn +1% 7.7% 6.9% Equities Trading wallet share2 1 Includes sales and trading and underwriting and excludes APAC 2 Wallet share based on publically reported equities trading revenues from CS, BARC, BAC, JPM, GS, C, MS and UBS. Credit Suisse revenues include Global Markets and APAC Markets 3 Based on Coalition data for Prime Services and Equity Derivatives (9M19 vs. 9M18); Source: Third Party competitive analysis as of 3Q19 4 Based on Institutional Investor 2019 All-America Research Survey. Ranked teams grew to 16 from 12 in 2018 5 Dealogic as of September 30, 2019; relates to 9M19 AchievementsImproved market share across all three products: Prime, Cash and Equity Derivatives3 Improved return on assets in Prime Services YoYDeployed new electronic platform, accelerating market share gainsMatured derivatives offering with growth across productsMaintained commitment to fundamental research and sharply improved Institutional Investor rankings4Participated in 4 out of the 5 largest US IPOs5 in collaboration with IBCM +75 bps 1,585 1,599 Underwriting Trading +6% -34%
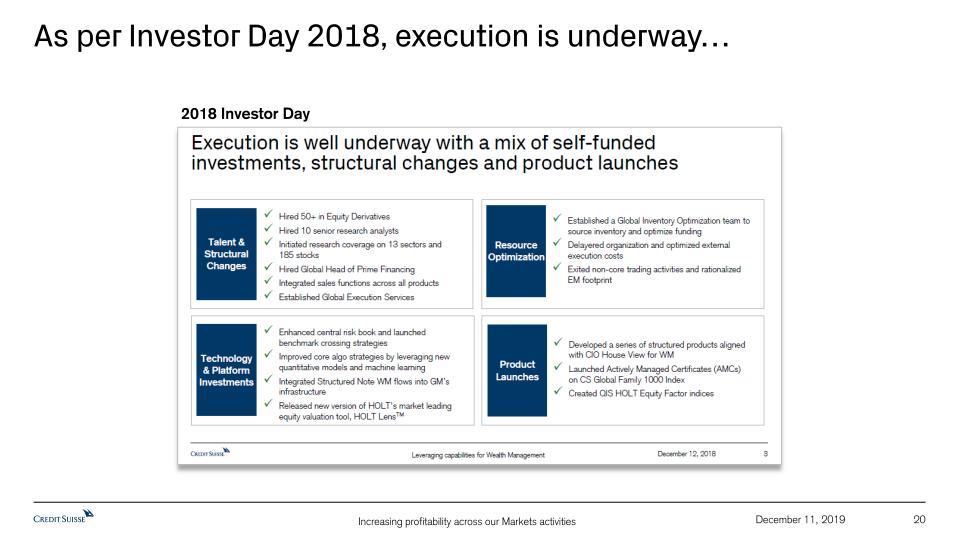
20 December 11, 2019 As per Investor Day 2018, execution is underway… 2018 Investor Day
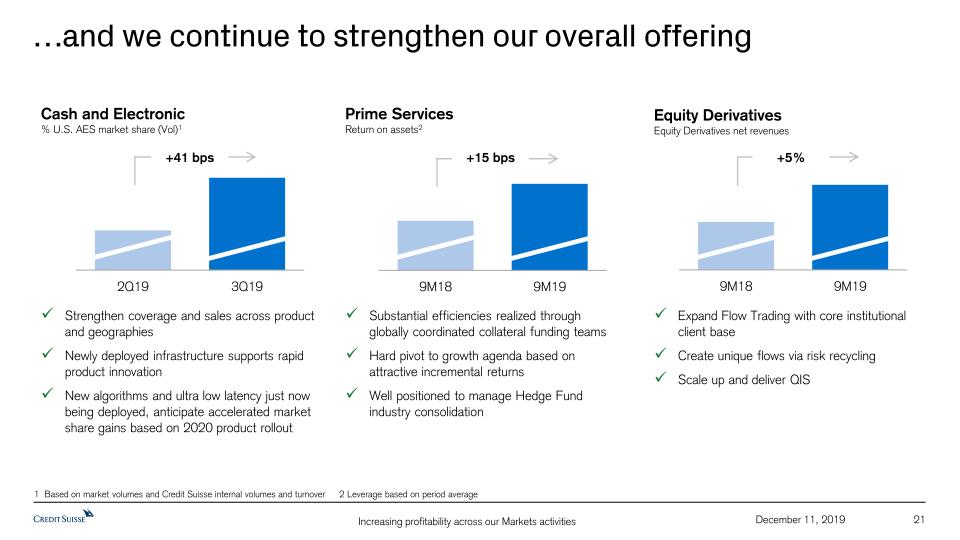
…and we continue to strengthen our overall offering 21 December 11, 2019 Cash and Electronic% U.S. AES market share (Vol)1 Prime ServicesReturn on assets2 Equity DerivativesEquity Derivatives net revenues 1 Based on market volumes and Credit Suisse internal volumes and turnover 2 Leverage based on period average Substantial efficiencies realized through globally coordinated collateral funding teamsHard pivot to growth agenda based on attractive incremental returnsWell positioned to manage Hedge Fund industry consolidation Expand Flow Trading with core institutional client baseCreate unique flows via risk recyclingScale up and deliver QIS Strengthen coverage and sales across product and geographiesNewly deployed infrastructure supports rapid product innovationNew algorithms and ultra low latency just now being deployed, anticipate accelerated market share gains based on 2020 product rollout +41 bps +15 bps +5%
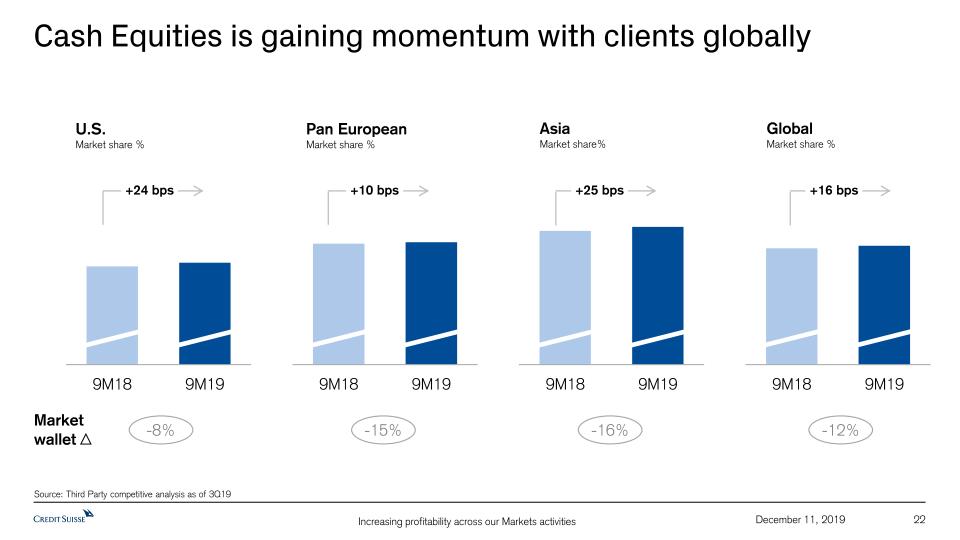
Cash Equities is gaining momentum with clients globally 22 December 11, 2019 U.S.Market share % +24 bps Source: Third Party competitive analysis as of 3Q19 +16 bps Pan EuropeanMarket share % +10 bps +25 bps AsiaMarket share% GlobalMarket share % -8% -15% -16% -12% Market wallet

Stronger international collaboration is a key growth driver with Institutional, Wealth Management and Corporate clients 1 Represents 9M19 client revenues. Calculated as total client revenues from overlapping clients (across GM Equities and APAC Equities) divided by total Global Equities client revenues (GM Equities and APAC Equities) 23 December 11, 2019 Global Equities client revenues Global Markets / APAC Markets execution underway to grow pre tax incomeEstablished global inventory optimization processIntegrating technology plans and systems, while reducing duplicative platformsDriving global client planning and prioritizationEnhancing global advisory delivery GM Equities APACEquities 80%1overlap

ITS 24 December 11, 2019
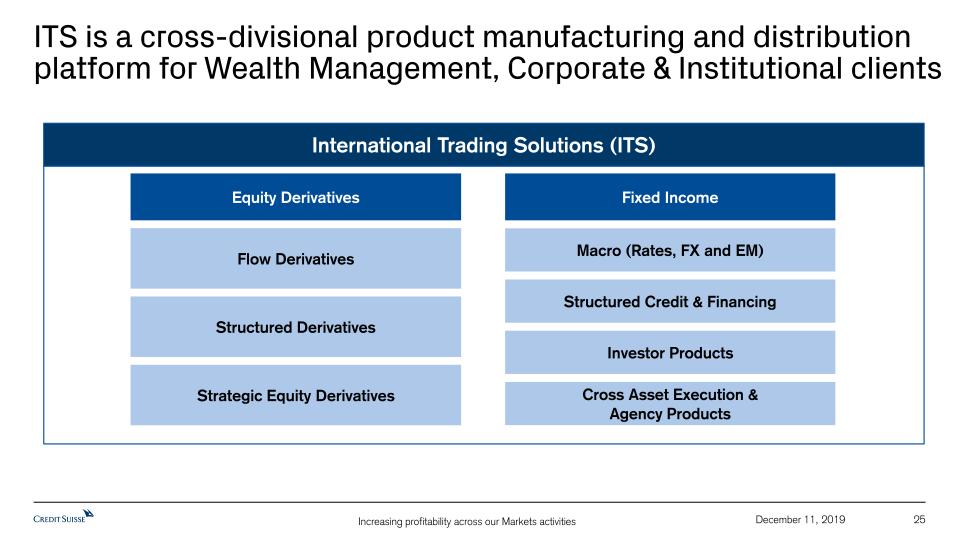
ITS is a cross-divisional product manufacturing and distribution platform for Wealth Management, Corporate & Institutional clients 25 December 11, 2019 International Trading Solutions (ITS) Equity Derivatives Fixed Income Flow Derivatives Structured Derivatives Strategic Equity Derivatives Macro (Rates, FX and EM) Structured Credit & Financing Investor Products Cross Asset Execution & Agency Products
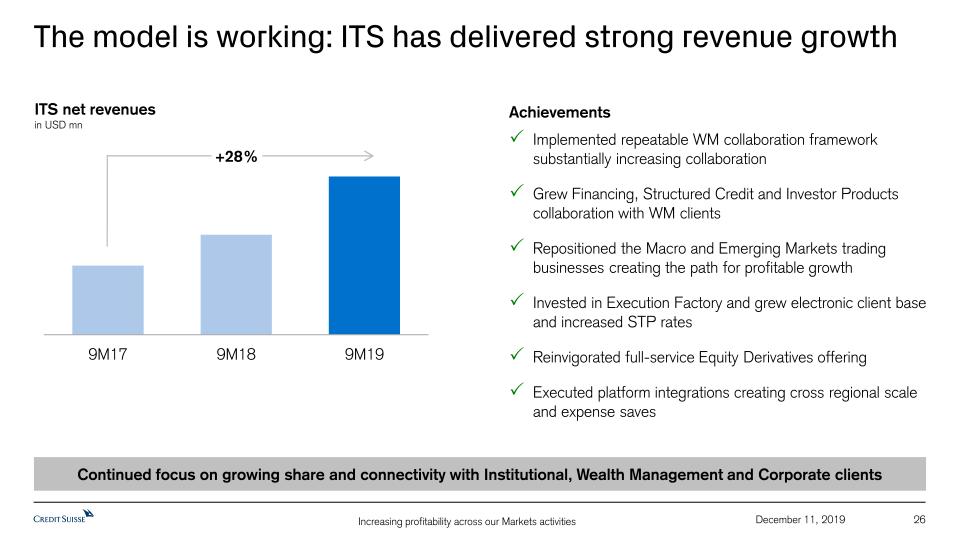
The model is working: ITS has delivered strong revenue growth 26 December 11, 2019 ITS net revenuesin USD mn +28% AchievementsImplemented repeatable WM collaboration framework substantially increasing collaborationGrew Financing, Structured Credit and Investor Products collaboration with WM clients Repositioned the Macro and Emerging Markets trading businesses creating the path for profitable growthInvested in Execution Factory and grew electronic client base and increased STP ratesReinvigorated full-service Equity Derivatives offering Executed platform integrations creating cross regional scale and expense saves Continued focus on growing share and connectivity with Institutional, Wealth Management and Corporate clients
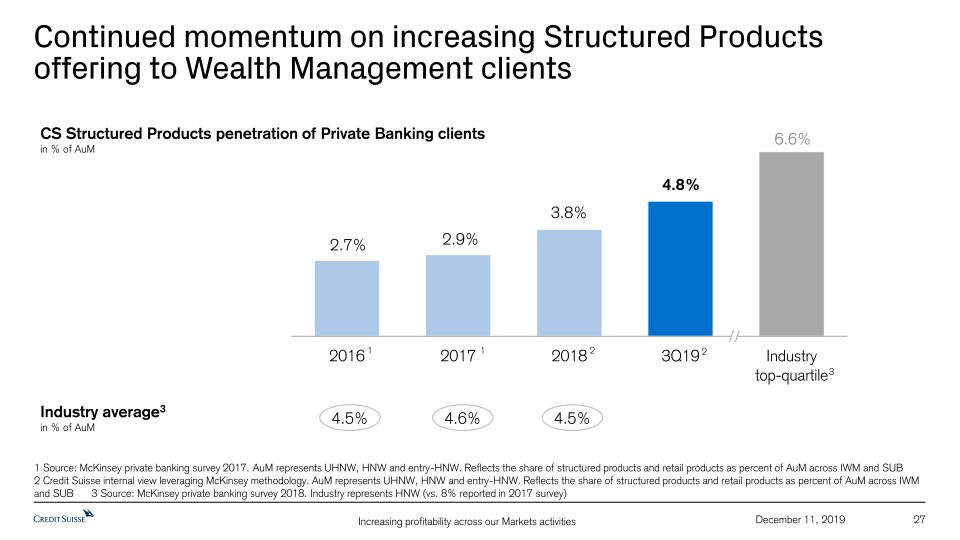
Continued momentum on increasing Structured Products offering to Wealth Management clients 27 December 11, 2019 1 Source: McKinsey private banking survey 2017. AuM represents UHNW, HNW and entry-HNW. Reflects the share of structured products and retail products as percent of AuM across IWM and SUB2 Credit Suisse internal view leveraging McKinsey methodology. AuM represents UHNW, HNW and entry-HNW. Reflects the share of structured products and retail products as percent of AuM across IWM and SUB 3 Source: McKinsey private banking survey 2018. Industry represents HNW (vs. 8% reported in 2017 survey) CS Structured Products penetration of Private Banking clientsin % of AuM 3 1 1 2 Industry average3 in % of AuM 4.5% 4.6% 4.5% 2
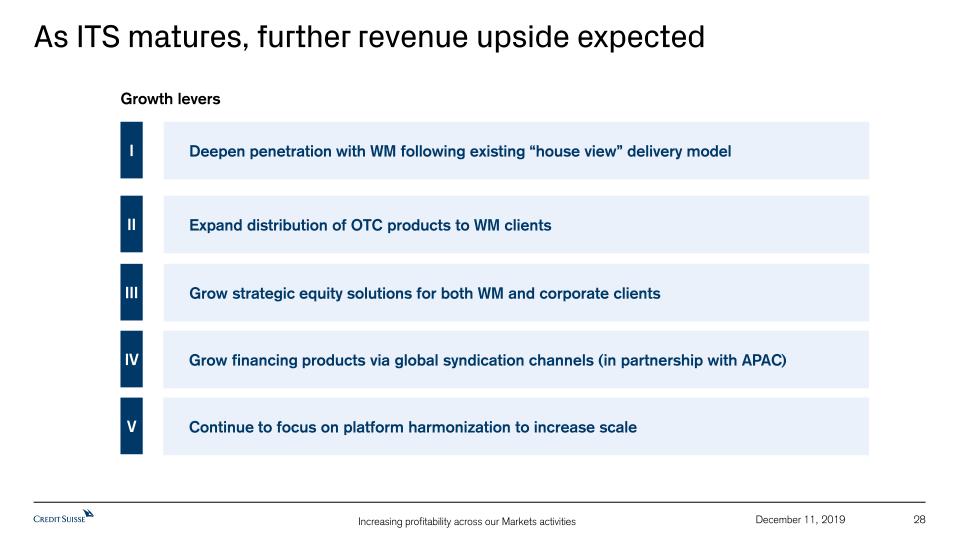
As ITS matures, further revenue upside expected 28 December 11, 2019 Deepen penetration with WM following existing “house view” delivery model Expand distribution of OTC products to WM clients Grow strategic equity solutions for both WM and corporate clients Grow financing products via global syndication channels (in partnership with APAC) Continue to focus on platform harmonization to increase scale II III IV I V Growth levers
ATS 29 December 11, 2019
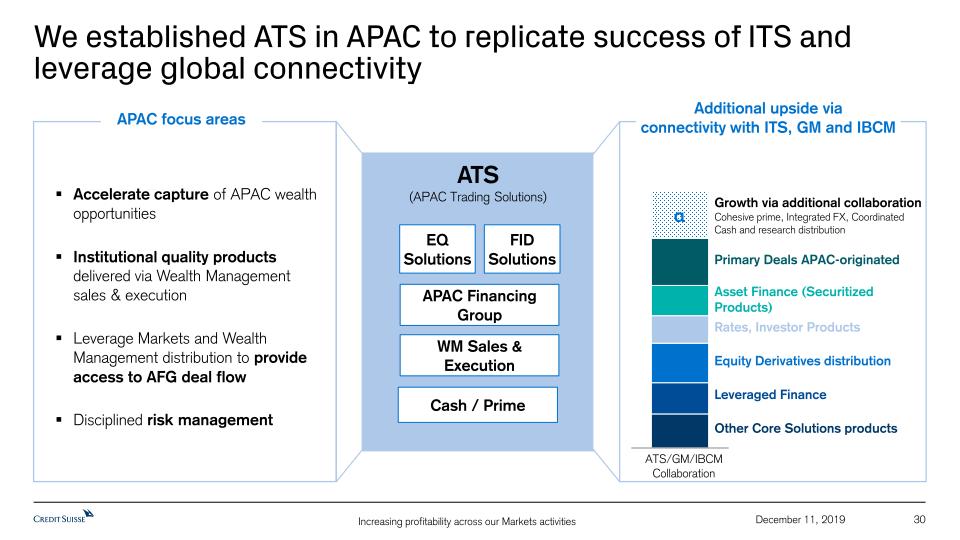
We established ATS in APAC to replicate success of ITS and leverage global connectivity 30 December 11, 2019 Additional upside via connectivity with ITS, GM and IBCM Primary Deals APAC-originated Asset Finance (Securitized Products) Rates, Investor Products Equity Derivatives distribution Leveraged Finance Other Core Solutions products Growth via additional collaborationCohesive prime, Integrated FX, Coordinated Cash and research distribution ATS(APAC Trading Solutions) Cash / Prime EQ Solutions APAC Financing Group WM Sales & Execution APAC focus areas Accelerate capture of APAC wealth opportunities Institutional quality products delivered via Wealth Management sales & executionLeverage Markets and Wealth Management distribution to provide access to AFG deal flow Disciplined risk management FID Solutions ATS/GM/IBCMCollaboration
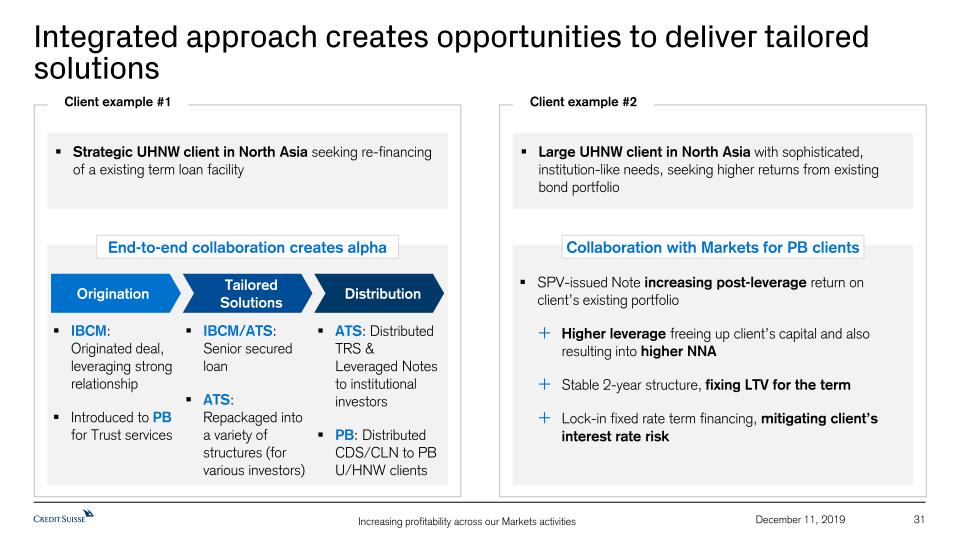
Integrated approach creates opportunities to deliver tailored solutions 31 December 11, 2019 Strategic UHNW client in North Asia seeking re-financing of a existing term loan facility End-to-end collaboration creates alpha Origination Tailored Solutions Distribution IBCM: Originated deal, leveraging strong relationshipIntroduced to PB for Trust services IBCM/ATS: Senior secured loan ATS: Repackaged into a variety of structures (for various investors) ATS: Distributed TRS & Leveraged Notes to institutional investorsPB: Distributed CDS/CLN to PB U/HNW clients Client example #1 Large UHNW client in North Asia with sophisticated, institution-like needs, seeking higher returns from existing bond portfolio Collaboration with Markets for PB clients Client example #2 SPV-issued Note increasing post-leverage return on client’s existing portfolioHigher leverage freeing up client’s capital and also resulting into higher NNAStable 2-year structure, fixing LTV for the termLock-in fixed rate term financing, mitigating client’s interest rate risk
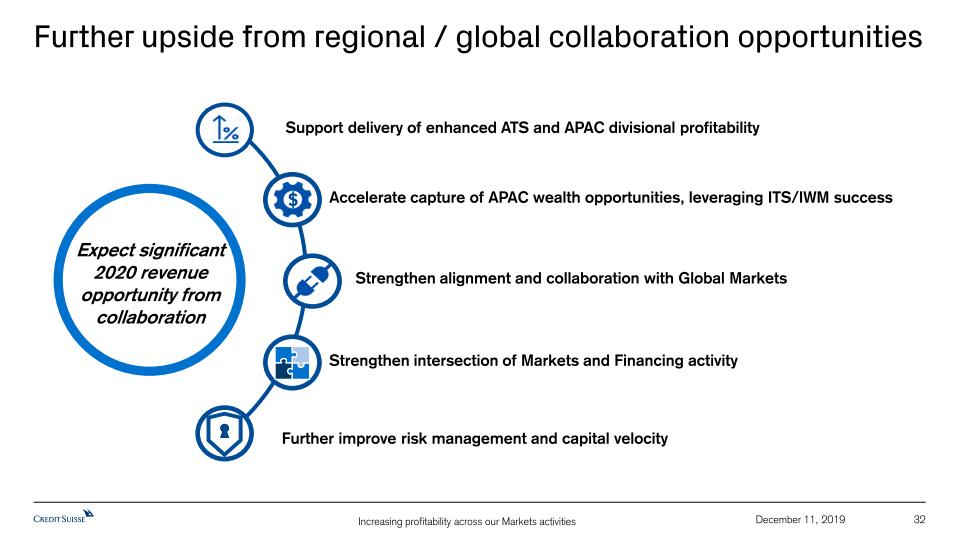
Further upside from regional / global collaboration opportunities Support delivery of enhanced ATS and APAC divisional profitability Accelerate capture of APAC wealth opportunities, leveraging ITS/IWM success Strengthen intersection of Markets and Financing activity Strengthen alignment and collaboration with Global Markets Further improve risk management and capital velocity $ Expect significant 2020 revenue opportunity from collaboration 32 December 11, 2019

IBCM 33 December 11, 2019
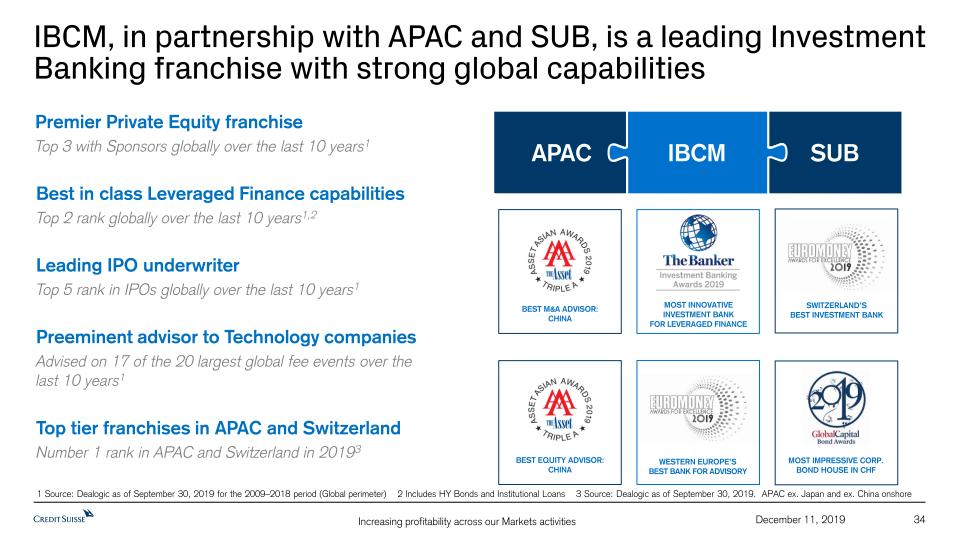
IBCM, in partnership with APAC and SUB, is a leading Investment Banking franchise with strong global capabilities Best in class Leveraged Finance capabilitiesTop 2 rank globally over the last 10 years1,2 Premier Private Equity franchiseTop 3 with Sponsors globally over the last 10 years1 Leading IPO underwriterTop 5 rank in IPOs globally over the last 10 years1 Preeminent advisor to Technology companiesAdvised on 17 of the 20 largest global fee events over the last 10 years1 1 Source: Dealogic as of September 30, 2019 for the 2009–2018 period (Global perimeter) 2 Includes HY Bonds and Institutional Loans 3 Source: Dealogic as of September 30, 2019. APAC ex. Japan and ex. China onshore Top tier franchises in APAC and SwitzerlandNumber 1 rank in APAC and Switzerland in 20193 December 11, 2019 MOST INNOVATIVE INVESTMENT BANK FOR LEVERAGED FINANCE WESTERN EUROPE’SBEST BANK FOR ADVISORY SWITZERLAND’S BEST INVESTMENT BANK BEST M&A ADVISOR:CHINA BEST EQUITY ADVISOR:CHINA MOST IMPRESSIVE CORP.BOND HOUSE IN CHF 34 IBCM APAC SUB
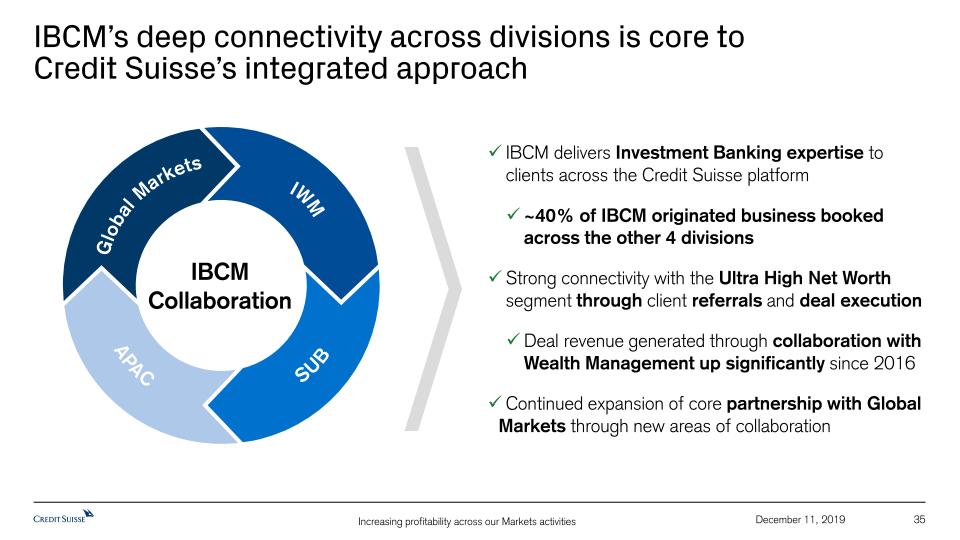
IBCM’s deep connectivity across divisions is core to Credit Suisse’s integrated approach 35 IBCM delivers Investment Banking expertise to clients across the Credit Suisse platform~40% of IBCM originated business booked across the other 4 divisionsStrong connectivity with the Ultra High Net Worth segment through client referrals and deal executionDeal revenue generated through collaboration with Wealth Management up significantly since 2016Continued expansion of core partnership with Global Markets through new areas of collaboration IBCM Collaboration Global Markets SUB IWM APAC December 11, 2019
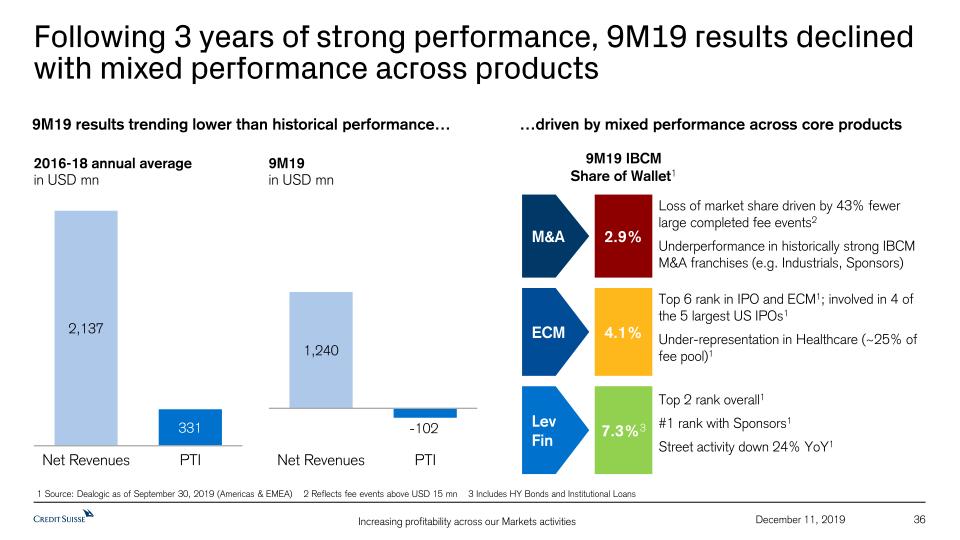
Following 3 years of strong performance, 9M19 results declined with mixed performance across products 36 2016-18 annual averagein USD mn 9M19 in USD mn December 11, 2019 M&A Lev Fin ECM 2.9% 7.3%3 4.1% 9M19 IBCM Share of Wallet1 9M19 results trending lower than historical performance… …driven by mixed performance across core products Top 2 rank overall1#1 rank with Sponsors1Street activity down 24% YoY1 Top 6 rank in IPO and ECM1; involved in 4 of the 5 largest US IPOs1Under-representation in Healthcare (~25% of fee pool)1 Loss of market share driven by 43% fewer large completed fee events2Underperformance in historically strong IBCM M&A franchises (e.g. Industrials, Sponsors) 1 Source: Dealogic as of September 30, 2019 (Americas & EMEA) 2 Reflects fee events above USD 15 mn 3 Includes HY Bonds and Institutional Loans
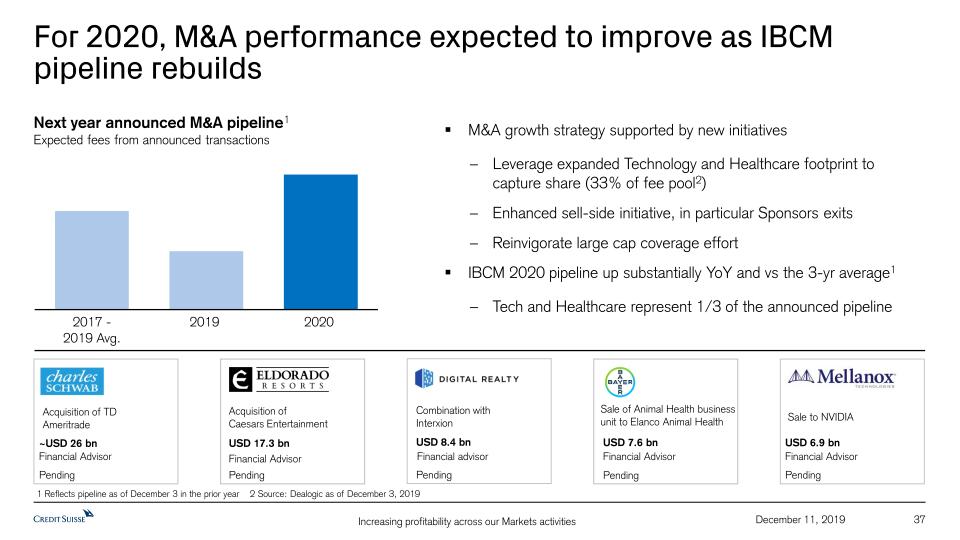
For 2020, M&A performance expected to improve as IBCM pipeline rebuilds M&A growth strategy supported by new initiatives Leverage expanded Technology and Healthcare footprint to capture share (33% of fee pool2)Enhanced sell-side initiative, in particular Sponsors exitsReinvigorate large cap coverage effort IBCM 2020 pipeline up substantially YoY and vs the 3-yr average1Tech and Healthcare represent 1/3 of the announced pipeline Next year announced M&A pipeline1Expected fees from announced transactions USD 7.6 bn Sale of Animal Health business unit to Elanco Animal Health Financial Advisor Pending Financial advisor Pending USD 8.4 bn Combination with Interxion Financial Advisor Pending ~USD 26 bn Acquisition of TD Ameritrade USD 17.3 bn Acquisition ofCaesars Entertainment Financial Advisor Pending Financial Advisor Pending USD 6.9 bn Sale to NVIDIA 37 December 11, 2019 1 Reflects pipeline as of December 3 in the prior year 2 Source: Dealogic as of December 3, 2019
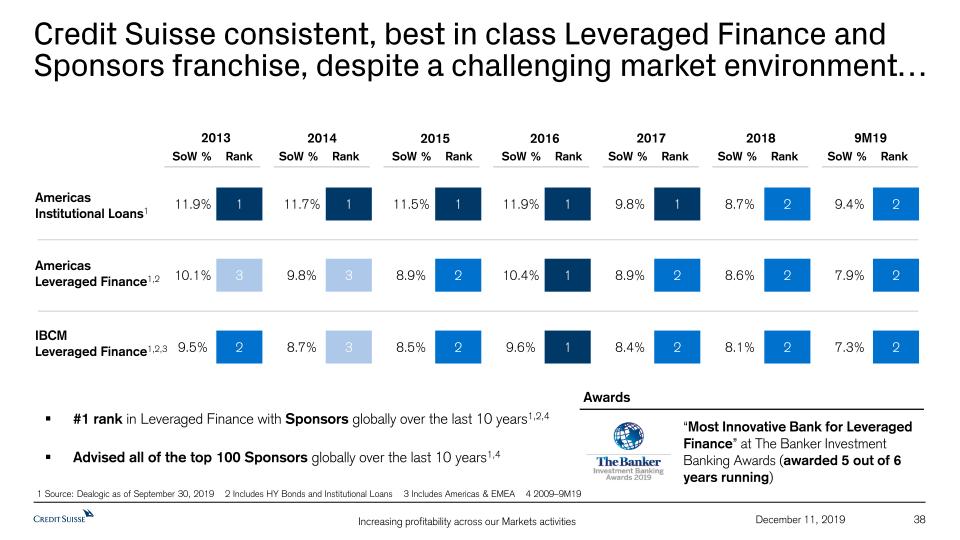
Credit Suisse consistent, best in class Leveraged Finance and Sponsors franchise, despite a challenging market environment… 2013 Americas Institutional Loans1 Americas Leveraged Finance1,2 IBCM Leveraged Finance1,2,3 SoW % Rank 1 11.7% 1 11.9% 2 8.7% 3 9.5% 9.8% 3 10.1% 3 1 11.9% 1 11.5% 2 9.6% 1 8.5% 10.4% 1 8.9% 2 9.8% 1 8.4% 2 8.9% 2 8.7% 2 8.1% 2 8.6% 2 9.4% 2 7.3% 2 7.9% 2 #1 rank in Leveraged Finance with Sponsors globally over the last 10 years1,2,4 Advised all of the top 100 Sponsors globally over the last 10 years1,4 “Most Innovative Bank for Leveraged Finance” at The Banker Investment Banking Awards (awarded 5 out of 6 years running) Awards 38 December 11, 2019 2014 SoW % Rank 2015 SoW % Rank 2016 SoW % Rank 2017 SoW % Rank 2018 SoW % Rank 9M19 SoW % Rank 1 Source: Dealogic as of September 30, 2019 2 Includes HY Bonds and Institutional Loans 3 Includes Americas & EMEA 4 2009–9M19
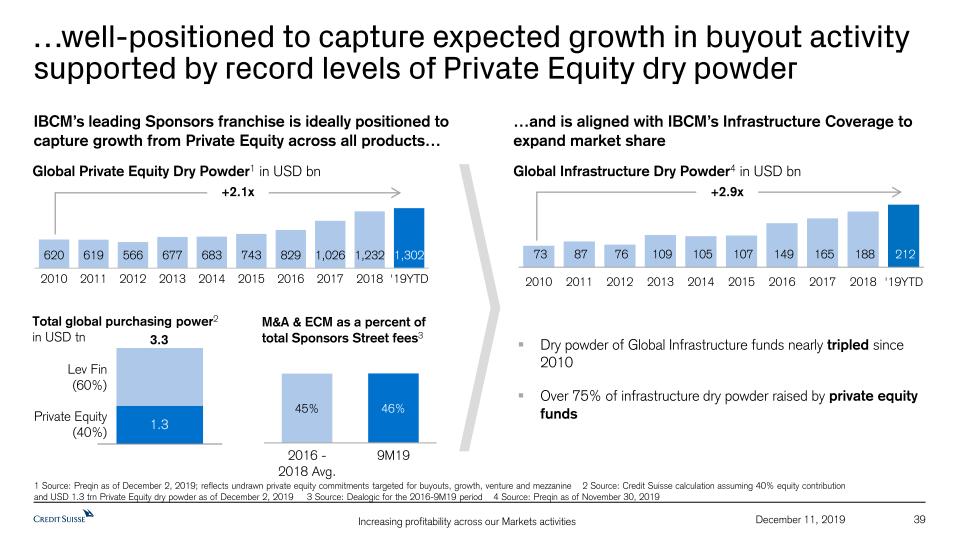
…well-positioned to capture expected growth in buyout activity supported by record levels of Private Equity dry powder 39 December 11, 2019 IBCM’s leading Sponsors franchise is ideally positioned to capture growth from Private Equity across all products… …and is aligned with IBCM’s Infrastructure Coverage to expand market share Global Infrastructure Dry Powder4 in USD bn +2.9x Global Private Equity Dry Powder1 in USD bn +2.1x Dry powder of Global Infrastructure funds nearly tripled since 2010Over 75% of infrastructure dry powder raised by private equity funds 1 Source: Preqin as of December 2, 2019; reflects undrawn private equity commitments targeted for buyouts, growth, venture and mezzanine 2 Source: Credit Suisse calculation assuming 40% equity contribution and USD 1.3 trn Private Equity dry powder as of December 2, 2019 3 Source: Dealogic for the 2016-9M19 period 4 Source: Preqin as of November 30, 2019 M&A & ECM as a percent of total Sponsors Street fees3 Total global purchasing power2 in USD tn Lev Fin (60%) 3.3 1.3 Private Equity (40%) M&A/ECM Exit Street fees3Annual average in USD bn +16%
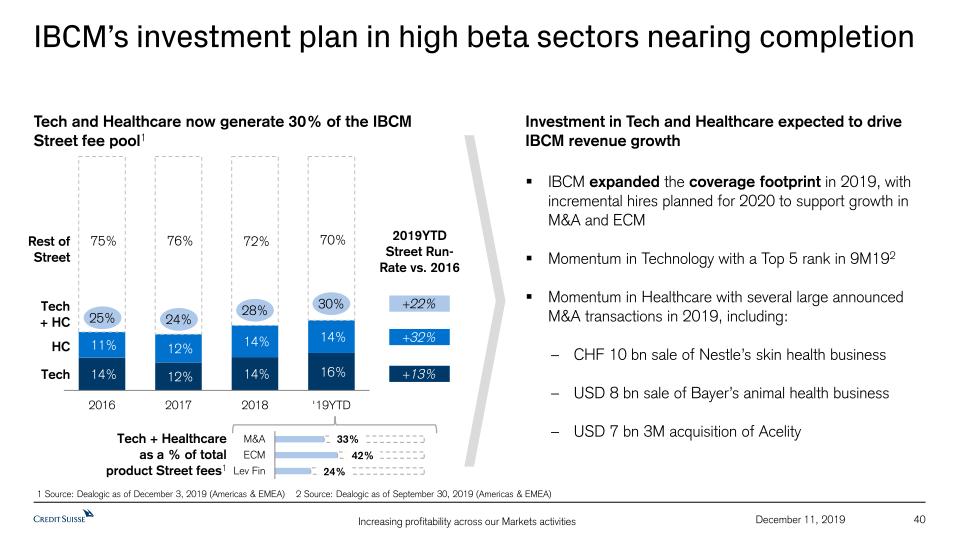
IBCM’s investment plan in high beta sectors nearing completion Investment in Tech and Healthcare expected to drive IBCM revenue growth IBCM expanded the coverage footprint in 2019, with incremental hires planned for 2020 to support growth in M&A and ECM Momentum in Technology with a Top 5 rank in 9M192Momentum in Healthcare with several large announced M&A transactions in 2019, including: CHF 10 bn sale of Nestle’s skin health businessUSD 8 bn sale of Bayer’s animal health businessUSD 7 bn 3M acquisition of Acelity 40 December 11, 2019 1 Source: Dealogic as of December 3, 2019 (Americas & EMEA) 2 Source: Dealogic as of September 30, 2019 (Americas & EMEA) Tech and Healthcare now generate 30% of the IBCM Street fee pool1 25% 24% 28% 30% Tech HC Rest of Street 2019YTDStreet Run-Rate vs. 2016 +32% +13% +22% Tech + HC % of 9M19 fee pool33% of M&A 43% of ECM43% of Lev Fin Tech + Healthcare as a % of total product Street fees1 24% 42% 33%
Key takeaways 41 December 11, 2019 IBCM franchise is core to Credit Suisse’s strategy, with ~40% of IBCM originated business booked across the other 4 divisionsFollowing 3 years of strong performance, 9M19 performance is mixed in the context of a challenging market environment Going into 2020, IBCM ambition is to reinvigorate revenue generation to deliver profitable growth through the cycle Key areas of focus are:Grow M&A: early read of the pipeline suggests meaningful improvement in 2020Replicate Sponsors’ success in Leveraged Finance in M&A and ECM Gain share in high beta Tech and Healthcare sectors from recent investments
Appendix 42 December 11, 2019
43 December 11, 2019 Notes (1/2) For reconciliation of adjusted to reported results, refer to the Appendix of the CEO and CFO Investor Day 2019 presentations, published on December 11, 2019Throughout the presentation rounding differences may occurUnless otherwise noted, all CET1 capital, CET1 ratio, Tier 1 leverage ratio, risk-weighted assets and leverage exposure figures shown in this presentation for periods prior to 2019 are as of the end of the respective period and on a “look-through” basisGross and net margins are shown in basis pointsGross margin = net revenues annualized / average AuM; net margin = pre-tax income annualized / average AuMMandate penetration reflects advisory and discretionary mandate volumes as a percentage of AuM, excluding those from the external asset manager business General notes Specific notes * Following the successful completion of our restructuring program in 2018, we updated our calculation approach for adjusted operating cost base at constant FX rates. Beginning in 1Q19, adjusted operating cost base at constant FX rates includes adjustments for major litigation provisions, expenses related to real estate disposals and business sales as well as for debit valuation adjustments (DVA) related volatility and FX, but not for restructuring expenses and certain accounting changes. Adjustments for FX apply unweighted 2018 currency exchange rates, i.e., a straight line average of monthly rates, consistently for the periods under review. Under the current presentation, adjusted operating cost base at constant FX rates for periods prior to 1Q19 still include adjustments for restructuring expenses and a goodwill impairment taken in 4Q15, but no longer include an adjustment for certain accounting changes. Beginning in 1Q20, adjustments for FX will apply unweighted 2019 currency exchange rates.† Regulatory capital is calculated as the worst of 10% of RWA and 3.5% of leverage exposure. Return on regulatory capital (a non-GAAP financial measure) is calculated using income/(loss) after tax and assumes a tax rate of 30% and capital allocated based on the worst of 10% of average RWA and 3.5% of average leverage exposure. For the Markets business within the APAC division and for the Global Markets and Investment Banking & Capital Markets divisions, return on regulatory capital is based on US dollar denominated numbers. Adjusted return on regulatory capital is calculated using adjusted results, applying the same methodology to calculate return on regulatory capital. ‡ Return on tangible equity is based on tangible shareholders’ equity, a non-GAAP financial measure, which is calculated by deducting goodwill and other intangible assets from total shareholders’ equity as presented in our balance sheet. Tangible book value, a non-GAAP financial measure, is equal to tangible shareholders’ equity. Tangible book value per share is a non-GAAP financial measure, which is calculated by dividing tangible shareholders’ equity by total number of shares outstanding. Management believes that tangible shareholders’ equity/tangible book value, return on tangible equity and tangible book value per share are meaningful as they are measures used and relied upon by industry analysts and investors to assess valuations and capital adequacy. For end-4Q17, tangible shareholders’ equity excluded goodwill of CHF 4,742 mn and other intangible assets of CHF 223 mn from total shareholders’ equity of CHF 41,902 mn as presented in our balance sheet. For end-1Q18, tangible shareholders’ equity excluded goodwill of CHF 4,667 mn and other intangible assets of CHF 212 mn from total shareholders’ equity of CHF 42,540 mn as presented in our balance sheet. For end-2Q18, tangible shareholders’ equity excluded goodwill of CHF 4,797 mn and other intangible assets of CHF 212 mn from total shareholders’ equity of CHF 43,470 mn as presented in our balance sheet. For end-3Q18, tangible shareholders’ equity excluded goodwill of CHF 4,736 mn and other intangible assets of CHF 214 mn from total shareholders’ equity of CHF 42,734 mn as presented in our balance sheet. For end-4Q18, tangible shareholders’ equity excluded goodwill of CHF 4,766 mn and other intangible assets of CHF 219 mn from total shareholders’ equity of CHF 43,922 mn as presented in our balance sheet. For end-1Q19, tangible shareholders’ equity excluded goodwill of CHF 4,807 mn and other intangible assets of CHF 224 mn from total shareholders’ equity of CHF 43,825 mn as presented in our balance sheet. For end-2Q19, tangible shareholders’ equity excluded goodwill of CHF 4,731 mn and other intangible assets of CHF 216 mn from total shareholders’ equity of CHF 43,673 mn as presented in our balance sheet. For end-3Q19, tangible shareholders’ equity excluded goodwill of CHF 4,760 mn and other intangible assets ofCHF 219 mn from total shareholders’ equity of CHF 45,150 mn as presented in our balance sheet. Shares outstanding were 2,550.3 mn at end-4Q17, 2,552.4 mn at end-3Q18, 2,550.6 mn at end-4Q18 and 2,473.8 mn at end-3Q19.

Notes (2/2) 44 December 11, 2019 Abbreviations ABL = Asset Based Lending; Abs. = Absolute; Adj. = Adjusted; AFG = Asia Pacific Financing Group; AM = Asset Management; Ann. = Annualized;APAC = Asia Pacific; Approx. = Approximately; ARC = Asset Risk Consultants; ARU = Asset Resolution Unit; ATS = APAC Trading Solutions; AuM = Assets under Management; Avg.= Average; BCBS = Basel Committee on Banking Supervision; BEAT = Base Erosion and Anti-Abuse Tax; BfE = Bank for Entrepreneurs; BHC = Bank Holding Company; BIS = Bank for International Settlements; bps = basis points; CAGR = Compound Annual Growth Rate; CBG = Corporate Bank Group; CC = Corporate Center; CCO = Chief Compliance Officer; CCRO = Chief Compliance and Regulatory Affairs Officer; CET1 = Common Equity Tier 1;CH = Switzerland; C/I = Cost/Income; C&IC = Corporate and Institutional Clients; CIC = Corporate & Institutional Clients; CLO = Collateralized Loan Obligation; CRO = Chief Risk Officer; CSAM = Credit Suisse Asset Management; DCM = Debt Capital Markets; DevOps = Development-to-Operations; DPS = Dividend Per Share; E = Estimate; EAM = External Asset Manager; ECA = Export Credit Agency; ECM = Equity Capital Markets; E&E = Entrepreneurs & Executives;EMEA = Europe, Middle East & Africa; ESG = Environmental Social and Governance; Est. = Estimate; EU = European Union; Excl. = Exclude; FID = Fixed Income Department; FI&WM = Fixed Income Wealth Management; FRTB = Fundamental Review of the Trading Book; FX = Foreign Exchange; FY = Full Year; GC = General Counsel; GCP = Global Credit Products; GM = Global Markets; GMV = Gross Market Value; GYB = Global Yield Balanced; HLG = High Level Group; HR = Human Resources; HY = High Yield; IAF = Impact Advisory & Finance; IB = Investment Banking; IBCM = Investment Banking & Capital Markets; IBOR = Interbank Offer Rate; IFC = International Finance Corporation; IG = Investment Grade; ILS = Insurance-Linked Strategies; IMM = Internal Model Method;incl. = including; IPO = Initial Public Offering; IRB = Internal Ratings-Based Approach; IT = Information Technology; ITS = International Trading Solutions;IWM = International Wealth Management; LDI = Liability-driven investments; Lev Fin = Leveraged Finance; LTD = Long-term debt; LTM = Last Twelve Months; LTV = Loan to Value; M&A = Mergers & Acquisitions; MREL = Minimum Requirement for own funds and Eligible Liabilities; NIG = Non investment grade;NNA = Net new assets; NRI = Non-resident Indians; Op Risk = Operational Risk; OTC = Over the Counter; p.a. = per annum; PB = Private Banking;PB&WM = Private Banking & Wealth Management; PC = Private Clients; PD = probability of default; p.p. = percentage points; PTI = Pre-tax income;QIS = Quantitative Investment Strategies; QoQ = Quarter over Quarter; QT = Quantitative Trading; RBL = Reserve Based Lending; RM = Relationship Manager(s); RoRC = Return on Regulatory Capital; RoTE= Return on Tangible Equity; RSA = Revenue Sharing Agreement; RWA = Risk-weighted assets;SA-CCR = Standardized Approach to Counterparty Credit Risk; SBL = Share Backed Lending; SCP = Strategic Client Partner; SEA = South East Asia;SME = Small and Medium-Sized Enterprises; SNB = Swiss National Bank; SoW = Share of Wallet; SP = Securitized Products; STBs = Sustainable Transition Bonds; SUB = Swiss Universal Bank; TBVPS = Tangible book value per share; TLAC = Total Loss-Absorbing Capacity; TLOF = Total Liabilities and Own Funds; TMT = Technology, Media and Telecommunications; (U)HNW(I) = (Ultra) High Net Worth (Individuals); U/W = Underwriting; US GAAP = United States Generally Accepted Accounting Principles; WM&C = Wealth Management & Connected; YoY = Year over year; YTD = Year to Date

Credit Suisse Investor Day 2019Facilitating growth through an effective and efficient operating model Lara Warner, Chief Risk OfficerLydie Hudson, Chief Compliance OfficerJames Walker, Chief Operating OfficerDecember 11, 2019
Disclaimer 2 December 11, 2019 This material does not purport to contain all of the information that you may wish to consider. This material is not to be relied upon as such or used in substitution for the exercise of independent judgment.Cautionary statement regarding forward-looking statementsThis presentation contains forward-looking statements that involve inherent risks and uncertainties, and we might not be able to achieve the predictions, forecasts, projections and other outcomes we describe or imply in forward-looking statements. A number of important factors could cause results to differ materially from the plans, targets, goals, expectations, estimates and intentions we express in these forward-looking statements, including those we identify in "Risk factors” in our Annual Report on Form 20-F for the fiscal year ended December 31, 2018 and in the “Cautionary statement regarding forward-looking information" in our media release relating to Investor Day, published on December 11, 2019 and filed with the US Securities and Exchange Commission, and in other public filings and press releases. We do not intend to update these forward-looking statements. In particular, the terms “Estimate”, “Illustrative”, “Ambition”, “Objective”, “Outlook” and “Goal” are not intended to be viewed as targets or projections, nor are they considered to be Key Performance Indicators. All such estimates, illustrations, ambitions, objectives, outlooks and goals are subject to a large number of inherent risks, assumptions and uncertainties, many of which are completely outside of our control. These risks, assumptions and uncertainties include, but are not limited to, general market conditions, market volatility, interest rate volatility and levels, global and regional economic conditions, political uncertainty, changes in tax policies, regulatory changes, changes in levels of client activity as a result of any of the foregoing and other factors. Accordingly, this information should not be relied on for any purpose. We do not intend to update these estimates, illustrations, ambitions, objectives, outlooks or goals. We may not achieve the benefits of our strategic initiativesWe may not achieve all of the expected benefits of our strategic initiatives. Factors beyond our control, including but not limited to the market and economic conditions, changes in laws, rules or regulations and other challenges discussed in our public filings, could limit our ability to achieve some or all of the expected benefits of these initiatives. Estimates and assumptionsIn preparing this presentation, management has made estimates and assumptions that affect the numbers presented. Actual results may differ. Annualized numbers do not take into account variations in operating results, seasonality and other factors and may not be indicative of actual, full-year results. Figures throughout this presentation may also be subject to rounding adjustments. All opinions and views constitute judgments as of the date of writing without regard to the date on which the reader may receive or access the information. This information is subject to change at any time without notice and we do not intend to update this information. Cautionary statements relating to interim financial informationThis presentation contains certain unaudited interim financial information for the fourth quarter of 2019. This information has been derived from management accounts, is preliminary in nature, does not reflect the complete results of the fourth quarter of 2019 or the full year 2019 and is subject to change, including as a result of any normal quarterly adjustments in relation to the financial statements for the full year 2019. This information has not been subject to any review by our independent registered public accounting firm. There can be no assurance that the final results for these periods will not differ from these preliminary results, and any such differences could be material. Quarterly financial results for the fourth quarter of 2019 and full year results will be included in our 4Q19 Earnings Release and our 2019 Annual Report. Statement regarding non-GAAP financial measuresThis presentation also contains non-GAAP financial measures, including adjusted results as well as return on regulatory capital, return on tangible equity and tangible book value per share (which are based on tangible shareholders’ equity). Information needed to reconcile such non-GAAP financial measures to the most directly comparable measures under US GAAP can be found in the Appendix of the CEO and CFO Investor Day presentations, published on December 11, 2019. All Investor Day presentations are available on our website at www.credit-suisse.com.Our estimates, ambitions, objectives and targets often include metrics that are non-GAAP financial measures and are unaudited. A reconciliation of the estimates, ambitions, objectives and targets to the nearest GAAP measures is unavailable without unreasonable efforts. Adjusted results exclude goodwill impairment, major litigation provisions, real estate gains and other revenue and expense items included in our reported results, all of which are unavailable on a prospective basis. Return on Tangible Equity is based on tangible shareholders' equity (also known as tangible book value), a non-GAAP financial measure, which is calculated by deducting goodwill and other intangible assets from total shareholders' equity as presented in our balance sheet, both of which are unavailable on a prospective basis. Tangible book value per share excludes the impact of any dividends paid during the performance period, share buybacks, own credit movements, foreign exchange rate movements and pension-related impacts, all of which are unavailable on a prospective basis. Such estimates, ambitions, objectives and targets are calculated in a manner that is consistent with the accounting policies applied by us in preparing our financial statements.Statement regarding capital, liquidity and leverageCredit Suisse is subject to the Basel III framework, as implemented in Switzerland, as well as Swiss legislation and regulations for systemically important banks (Swiss Requirements), which include capital, liquidity, leverage and large exposure requirements and rules for emergency plans designed to maintain systemically relevant functions in the event of threatened insolvency. Credit Suisse has adopted the Bank for International Settlements (BIS) leverage ratio framework, as issued by the Basel Committee on Banking Supervision (BCBS) and implemented in Switzerland by the Swiss Financial Market Supervisory Authority FINMA. References to phase-in and look-through included herein refer to Basel III capital requirements and Swiss Requirements. Phase-in reflects that, for the years 2014-2018, there was a five-year (20% per annum) phase-in of goodwill, other intangible assets and other capital deductions (e.g., certain deferred tax assets) and a phase-out of an adjustment for the accounting treatment of pension plans. For the years 2013-2022, there is a phase-out of certain capital instruments. Look-through assumes the full phase-in of goodwill and other intangible assets and other regulatory adjustments and the phase-out of certain capital instruments.Unless otherwise noted, leverage exposure is based on the BIS leverage ratio framework and consists of period-end balance sheet assets and prescribed regulatory adjustments. The look-through tier 1 leverage ratio and CET1 leverage ratio are calculated as look-through BIS tier 1 capital and CET1 capital, respectively, divided by period-end leverage exposure. Swiss leverage ratios are measured on the same period-end basis as the leverage exposure for the BIS leverage ratio.SourcesThis presentation contains certain material prepared by Credit Suisse on the basis of publicly available information, internally developed data and other third-party sources believed to be reliable. Credit Suisse has not sought to independently verify information obtained from public and third-party sources and makes no representations or warranties as to accuracy, completeness or reliability of such information. Certain information has been derived from internal management accounts.
Speakers Hosts 3 December 11, 2019 Presenters Facilitating growth through an efficient and effective operating model Laura BarrowmanChief Information Officer James WalkerChief Operating Officer Lara WarnerChief Risk Officer Lydie HudsonChief Compliance Officer

Credit Suisse Investor Day 2019Facilitating growth through an effective and efficient operating model Lara Warner, Chief Risk OfficerDecember 11, 2019
5 December 11, 2019 Risk Appetite Management has evolved since 2015 Shift in Credit Suisse’s strategy drove key enhancements in risk management that support prudent growth Shifted organization from siloed risk management (market, credit) to divisional CROs with proximity to clients, business and marketsAligned risk appetite to earnings stability to support consistent, organic capital generationIncreased focus on both sides of client balance sheet as well as UHNW clientsIncreased velocity of capital and distribution efforts resulting in lower and more liquid inventory Result Credit Suisse’s well positioned for prudent growth through the cycle
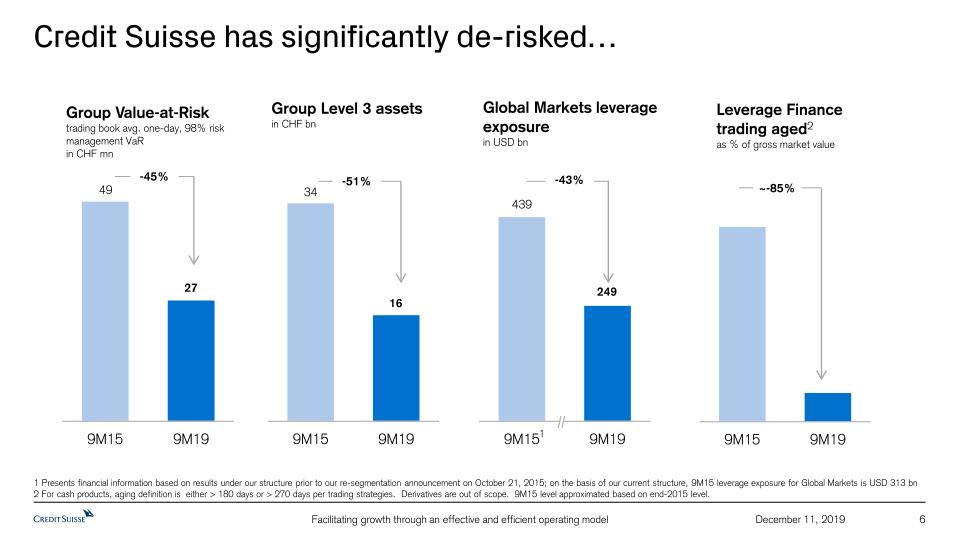
Credit Suisse has significantly de-risked… 6 December 11, 2019 Leverage Finance trading aged2as % of gross market value Group Value-at-Risktrading book avg. one-day, 98% risk management VaRin CHF mn Group Level 3 assetsin CHF bn Global Markets leverage exposurein USD bn 1 -45% -51% -43% ~-85% 1 Presents financial information based on results under our structure prior to our re-segmentation announcement on October 21, 2015; on the basis of our current structure, 9M15 leverage exposure for Global Markets is USD 313 bn 2 For cash products, aging definition is either > 180 days or > 270 days per trading strategies. Derivatives are out of scope. 9M15 level approximated based on end-2015 level.
7 December 11, 2019 Aligned risk appetite to earnings stability to support consistent, organic capital generation Strong base of CET1 capital after completion of three-year restructuring at end of 2018. Available capital based on stress has increased by ~74%Risk appetite remained constant despite increased stress capacityAllocated risk appetite sized to support maintenance of Tangible Book Value Per Share (TBVPS) ambitions via an appropriate level of earnings stabilityCurrent usage remains below appetite given muted markets
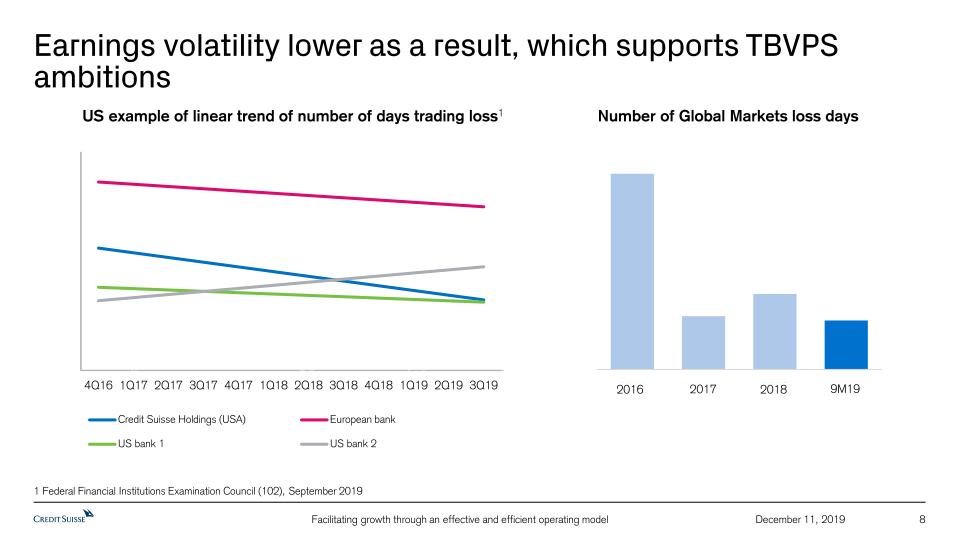
8 December 11, 2019 Earnings volatility lower as a result, which supports TBVPS ambitions Number of Global Markets loss days 1 Federal Financial Institutions Examination Council (102), September 2019 US example of linear trend of number of days trading loss1 Credit Suisse Holdings (USA) US bank 1 US bank 2 European bank 2016 2017 2018 9M19
9 Credit risk management is a strength December 11, 2019 Stable & diversified portfolio Resilient portfolio Credit portfolio generally stable in size – with diversity based on product, industry, country and divisionsOverall credit quality stable – no significant increase in impairments or workout portfolioModerate write-offs – CHF~200mn-300mn p.a. in past few years with impairments not driving higher write-offs Controlledrisk management Well controlled origination with strong selection of credit and stricter underwriting standards improving portfolio qualityKey areas of lending are well supported by collateral and provide a buffer to absorb significant shocksPortfolio concentration decreased, although some single name concentrations remain for key strategic clients Strong risk mitigation – collateral, insurance, and hedging to reduce net exposure and minimize losses Lombard / Share Backed Lending – generally backed by global diversified financial collateral with conservative LTVs and ability to withstand significant price declinesSUB residential mortgage portfolio – conservative underwriting standards, strict affordability and amortizationCorporate Bank portfolio – structured hedging to manage downside risk GM Counterparty Credit Risk – portfolio improved by move to central clearing and strengthened collateral levels
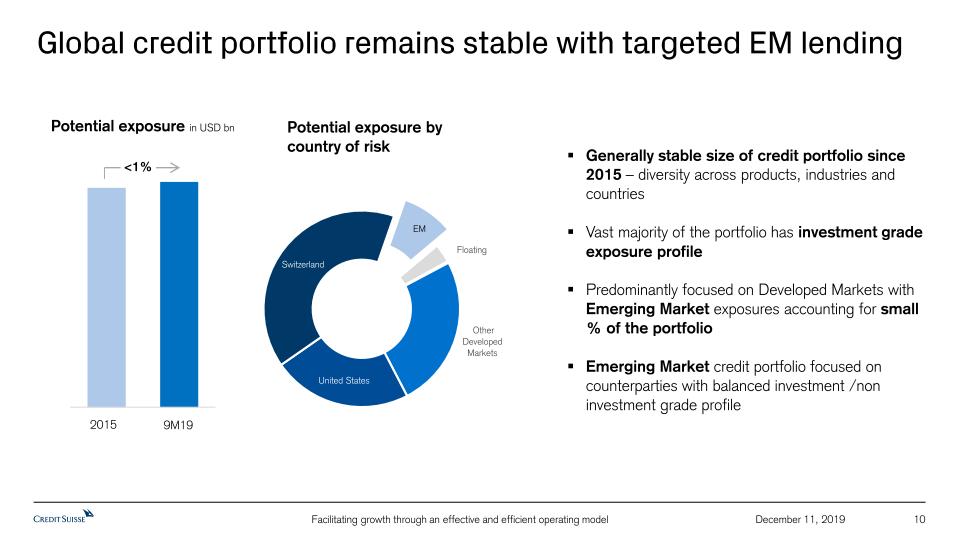
10 Global credit portfolio remains stable with targeted EM lending Potential exposure by country of risk December 11, 2019 Potential exposure in USD bn <1% Generally stable size of credit portfolio since 2015 – diversity across products, industries and countriesVast majority of the portfolio has investment grade exposure profilePredominantly focused on Developed Markets with Emerging Market exposures accounting for small % of the portfolio Emerging Market credit portfolio focused on counterparties with balanced investment /non investment grade profile 9M19 2015
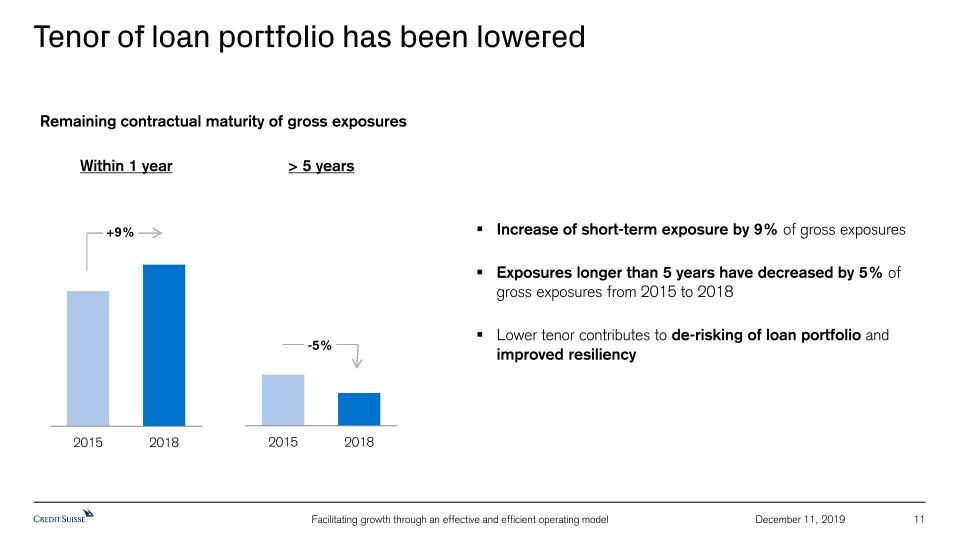
11 December 11, 2019 Tenor of loan portfolio has been lowered Increase of short-term exposure by 9% of gross exposures Exposures longer than 5 years have decreased by 5% of gross exposures from 2015 to 2018 Lower tenor contributes to de-risking of loan portfolio and improved resiliency Remaining contractual maturity of gross exposures +9% Within 1 year > 5 years -5%
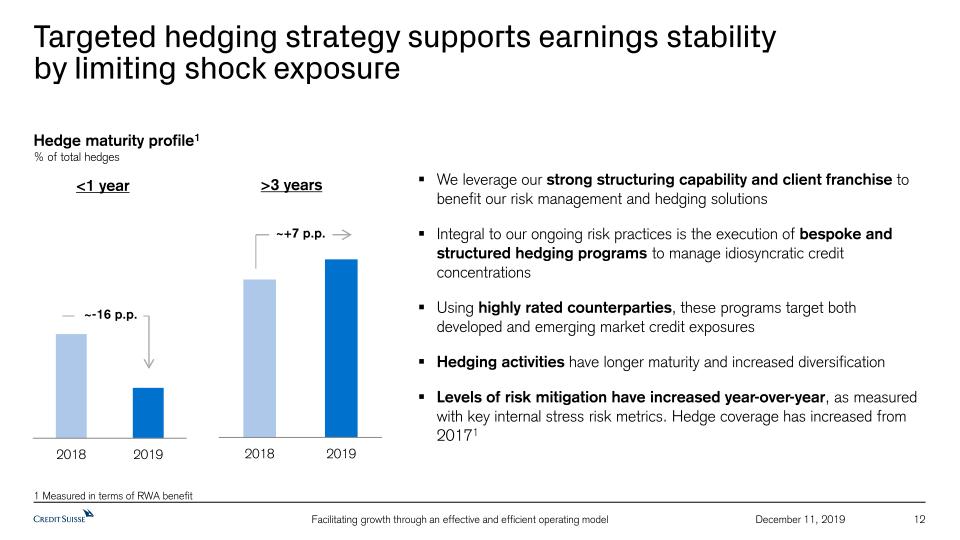
12 December 11, 2019 Targeted hedging strategy supports earnings stability by limiting shock exposure We leverage our strong structuring capability and client franchise to benefit our risk management and hedging solutionsIntegral to our ongoing risk practices is the execution of bespoke and structured hedging programs to manage idiosyncratic credit concentrations Using highly rated counterparties, these programs target both developed and emerging market credit exposuresHedging activities have longer maturity and increased diversification Levels of risk mitigation have increased year-over-year, as measured with key internal stress risk metrics. Hedge coverage has increased from 20171 Hedge maturity profile1 % of total hedges 1 Measured in terms of RWA benefit ~+7 p.p. ~-16 p.p.
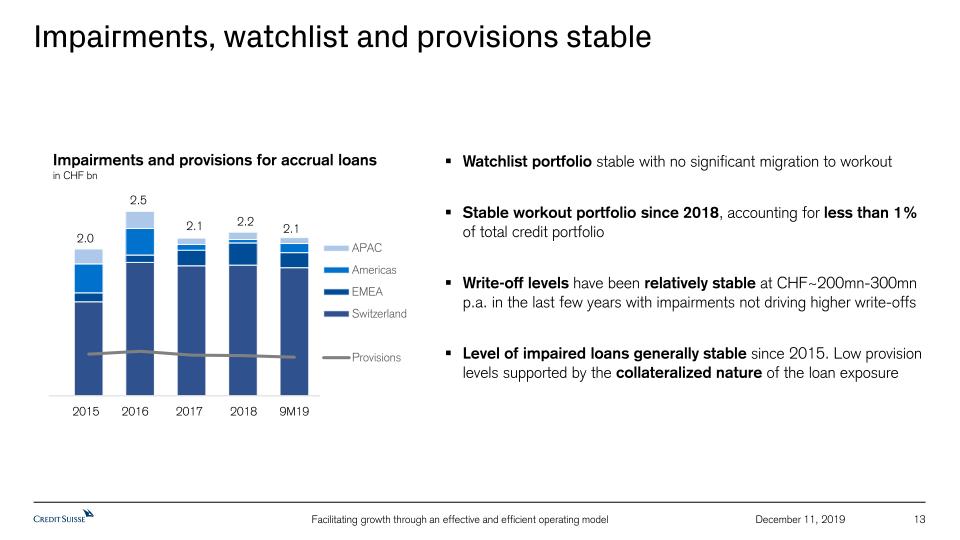
13 Impairments, watchlist and provisions stable Impairments and provisions for accrual loans in CHF bn Watchlist portfolio stable with no significant migration to workoutStable workout portfolio since 2018, accounting for less than 1% of total credit portfolioWrite-off levels have been relatively stable at CHF~200mn-300mn p.a. in the last few years with impairments not driving higher write-offsLevel of impaired loans generally stable since 2015. Low provision levels supported by the collateralized nature of the loan exposure December 11, 2019 9M19 2015 2016 2017 2018 2.1 2.0 2.5 2.1 2.2
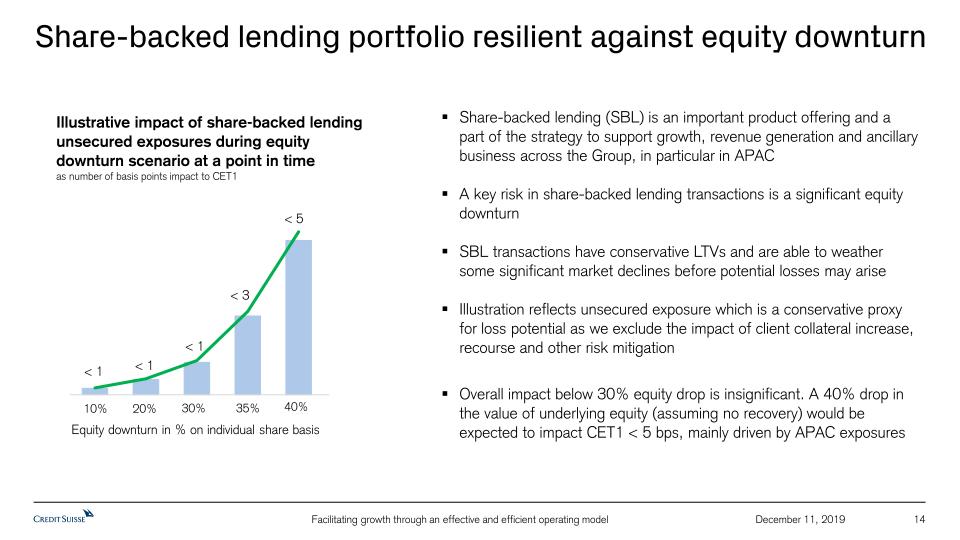
Share-backed lending portfolio resilient against equity downturn Illustrative impact of share-backed lending unsecured exposures during equity downturn scenario at a point in time as number of basis points impact to CET1 December 11, 2019 14 Equity downturn in % on individual share basis < 5 < 3 < 1 < 1 < 1 Share-backed lending (SBL) is an important product offering and a part of the strategy to support growth, revenue generation and ancillary business across the Group, in particular in APACA key risk in share-backed lending transactions is a significant equity downturnSBL transactions have conservative LTVs and are able to weather some significant market declines before potential losses may ariseIllustration reflects unsecured exposure which is a conservative proxy for loss potential as we exclude the impact of client collateral increase, recourse and other risk mitigationOverall impact below 30% equity drop is insignificant. A 40% drop in the value of underlying equity (assuming no recovery) would be expected to impact CET1 < 5 bps, mainly driven by APAC exposures 40% 10% 20% 30% 35%
15 December 11, 2019 Despite de-risking and asset quality improvement, credit risk RWA increased driven by methodology and policy changes Credit risk RWA under IRB1 in CHF bn Net impact 2016 to 3Q19 in CHF bn +15% 1 Credit risk RWA (excluding counterparty credit risk) not including RWA under standardized approach of CHF 11 bn for 2016 and CHF 25 bn for 3Q19 Average portfolio asset quality improved as SRU offloaded higher-risk portfolios: SRU CR RWA significantly decreased from 2015 to 2018; associated risk weights dropped by more than halfResulting in a de-risking of Group average RWAIncreased RWA primarily driven by FINMA credit risk discretionary measures to e.g.:Income and Non-Income Producing Real estate Low rated corporates Lombard Annual Credit Provision ModelIncrease in RWA > 2.5% probability of default (PD) is mainly driven by regulatory measures:Various multipliers on Swiss Real EstateMultiplier on IB corporate applicable to corporate counterparties rated ‘B and worse’ (was phased in over years to the current value of 1.6x) Portfolio quality improvement
16 Credit Suisse already navigating shocks globally December 11, 2019 Markets are volatile Risk management framework built for our strategy Examples and risk focus We are vigilantly operating in a mild to medium stress environment in a number of areas Our Risk Management Framework is designed to: Protect against instantaneous shocks – granular risk appetite controls at risk factor and single name levelsProtect against through-the-cycle shocks – through myriad macro / earnings scenario analysesFacilitate prudent underwriting and rapid risk distribution Market shocks drive temporary and permanent adaptations in risk management and certain specific actions:Restructured high profile corporate positions without significant lossesTurned down more Leverage Finance transactions and took smaller positions Hong Kong stocks experienced high idiosyncratic volatility over the last 6 months: proactive management of lending values Argentine dollar debt has fallen ~50 points through 2019: early exited number of repurchase agreement positionsTurkey market volatility: reduced risk appetite US / China trade tensions: make use of a supply chain analytical tool to understand second order impacts
Spotlight Leveraged Finance: Conditions stable despite market stress 17 December 11, 2019 Flex rate cushion2 (bps) Underwriting exposure1 -74% +164% Underwriting duration3 1 Reflects peak Non-Investment Grade notional exposure for Leveraged Finance Capital Markets 2 Month-end weighted average(s) of remaining flex across loan and bridge commitments, averaged over the time period. A Flex provision allows the arranger to change spreads during syndication to adjust pricing 3 Reflects average days to de-risk, for Single B Rated loan and bridge commitments signed within each quarter Active dialogue and challenge between CRO and investment banking businesses has increased significantly over the past year as the risk to end of the credit cycle has increased:A significant reduction in our commitments to B- credits in 3Q19 given the current environmentCredit Suisse Capital Markets business has actively either turned down or taken a significantly reduced participationMore Capital Markets turndowns in 3Q19 versus 2Q19; mainly driven by perceived difficulty of syndication and aggressive leverage proposals from the sponsorBuilt upon our high underwriting standards and the level of diligence, with additional scrutiny around add-backs and leverageable EBITDA
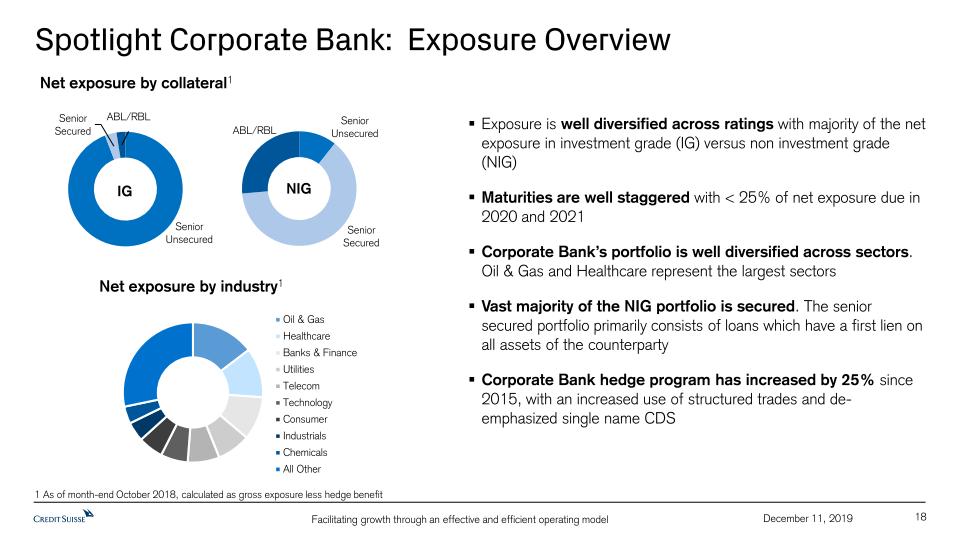
Spotlight Corporate Bank: Exposure Overview 18 December 11, 2019 Exposure is well diversified across ratings with majority of the net exposure in investment grade (IG) versus non investment grade (NIG)Maturities are well staggered with < 25% of net exposure due in 2020 and 2021Corporate Bank’s portfolio is well diversified across sectors. Oil & Gas and Healthcare represent the largest sectors Vast majority of the NIG portfolio is secured. The senior secured portfolio primarily consists of loans which have a first lien on all assets of the counterpartyCorporate Bank hedge program has increased by 25% since 2015, with an increased use of structured trades and de-emphasized single name CDS IG NIG Net exposure by collateral1 Net exposure by industry1 1 As of month-end October 2018, calculated as gross exposure less hedge benefit
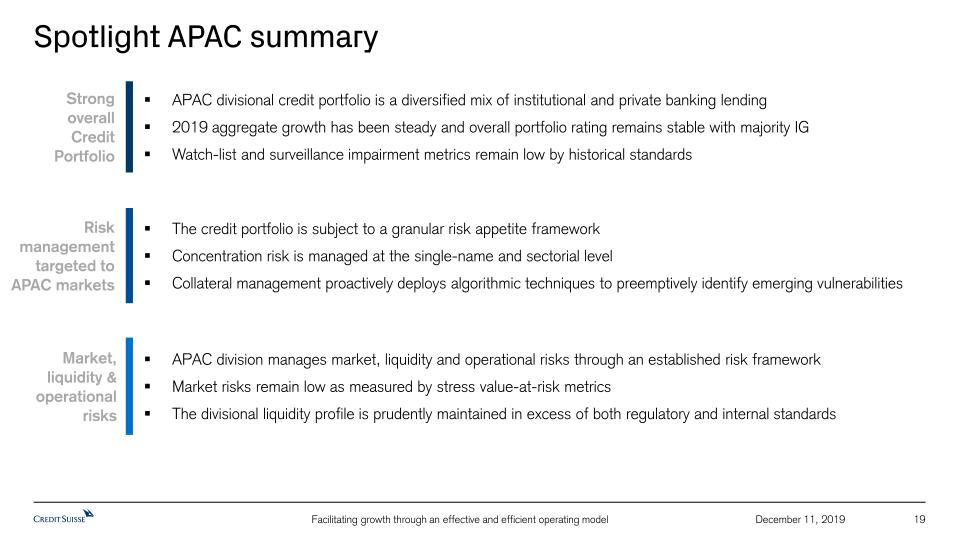
Spotlight APAC summary 19 December 11, 2019 Strong overall Credit Portfolio Market, liquidity & operational risks The credit portfolio is subject to a granular risk appetite frameworkConcentration risk is managed at the single-name and sectorial levelCollateral management proactively deploys algorithmic techniques to preemptively identify emerging vulnerabilities APAC division manages market, liquidity and operational risks through an established risk frameworkMarket risks remain low as measured by stress value-at-risk metricsThe divisional liquidity profile is prudently maintained in excess of both regulatory and internal standards Risk management targeted to APAC markets APAC divisional credit portfolio is a diversified mix of institutional and private banking lending2019 aggregate growth has been steady and overall portfolio rating remains stable with majority IGWatch-list and surveillance impairment metrics remain low by historical standards
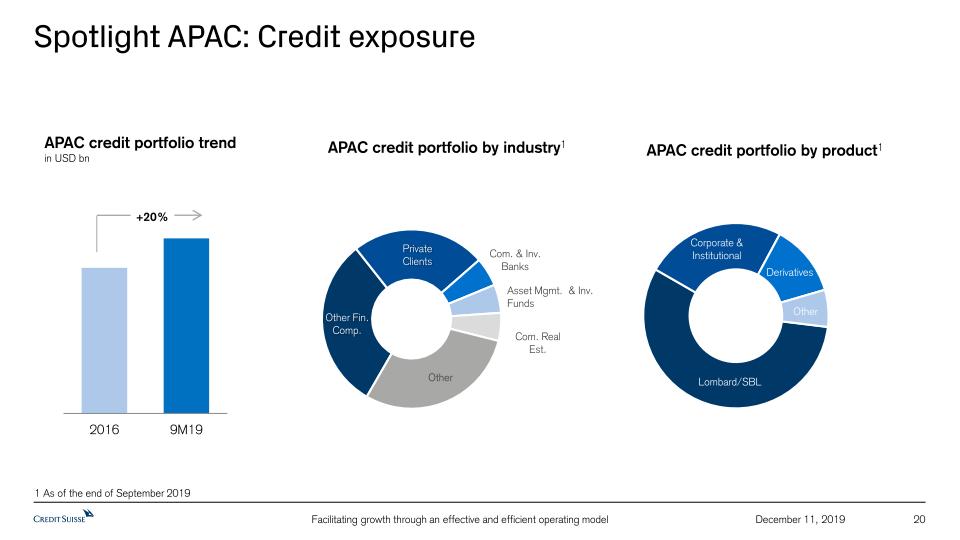
20 Spotlight APAC: Credit exposure December 11, 2019 APAC credit portfolio trend in USD bn APAC credit portfolio by industry1 APAC credit portfolio by product1 +20% 1 As of the end of September 2019 Asset Mgmt. & Inv. Funds
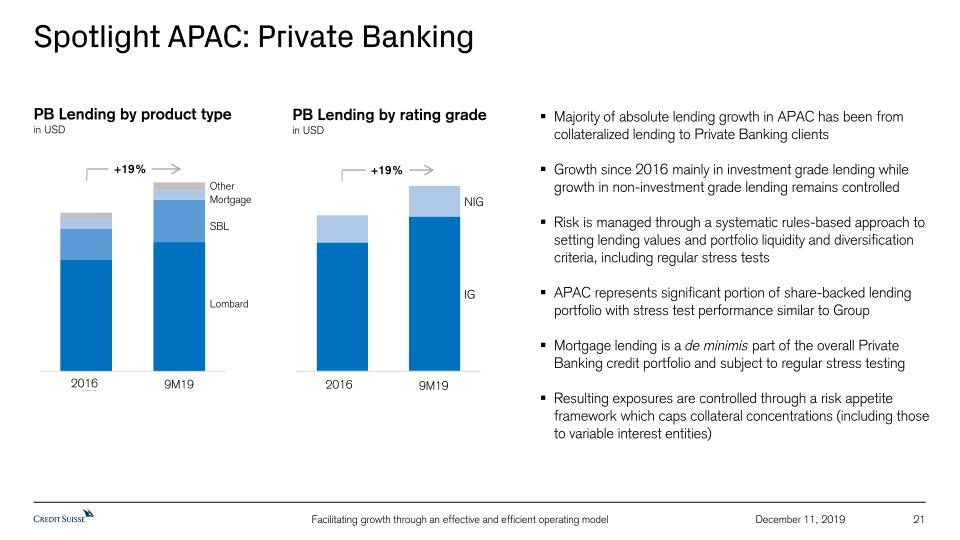
Spotlight APAC: Private Banking 21 December 11, 2019 Majority of absolute lending growth in APAC has been from collateralized lending to Private Banking clients Growth since 2016 mainly in investment grade lending while growth in non-investment grade lending remains controlledRisk is managed through a systematic rules-based approach to setting lending values and portfolio liquidity and diversification criteria, including regular stress testsAPAC represents significant portion of share-backed lending portfolio with stress test performance similar to GroupMortgage lending is a de minimis part of the overall Private Banking credit portfolio and subject to regular stress testing Resulting exposures are controlled through a risk appetite framework which caps collateral concentrations (including those to variable interest entities) PB Lending by product typein USD PB Lending by rating gradein USD IG NIG +19% +19% Lombard SBL Mortgage Other 2016 9M19 2016 9M19
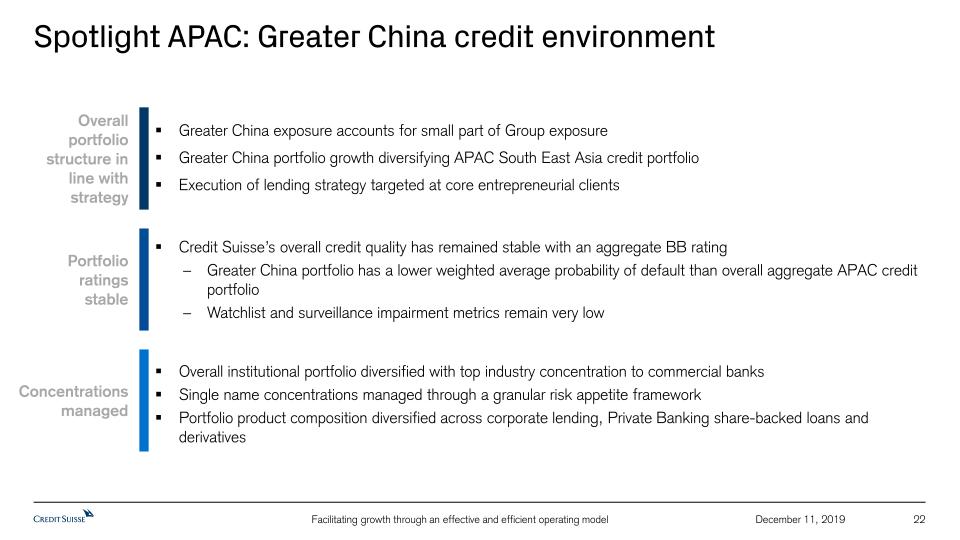
22 Spotlight APAC: Greater China credit environment Greater China exposure accounts for small part of Group exposureGreater China portfolio growth diversifying APAC South East Asia credit portfolioExecution of lending strategy targeted at core entrepreneurial clients Credit Suisse’s overall credit quality has remained stable with an aggregate BB ratingGreater China portfolio has a lower weighted average probability of default than overall aggregate APAC credit portfolio Watchlist and surveillance impairment metrics remain very low Overall institutional portfolio diversified with top industry concentration to commercial banksSingle name concentrations managed through a granular risk appetite frameworkPortfolio product composition diversified across corporate lending, Private Banking share-backed loans and derivatives December 11, 2019 Overall portfolio structure in line with strategy Portfolio ratings stable Concentrations managed
Credit Suisse Investor Day 2019Facilitating growth through an effective and efficient operating model Lydie Hudson, Chief Compliance OfficerDecember 11, 2019
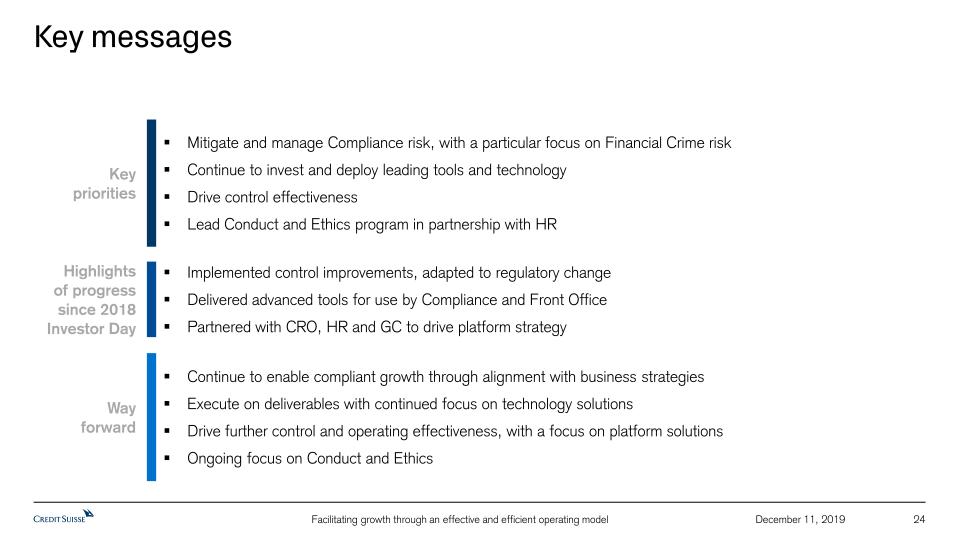
Key messages 24 December 11, 2019 Key priorities Mitigate and manage Compliance risk, with a particular focus on Financial Crime riskContinue to invest and deploy leading tools and technologyDrive control effectivenessLead Conduct and Ethics program in partnership with HR Highlights of progress since 2018 Investor Day Implemented control improvements, adapted to regulatory changeDelivered advanced tools for use by Compliance and Front OfficePartnered with CRO, HR and GC to drive platform strategy Wayforward Continue to enable compliant growth through alignment with business strategies Execute on deliverables with continued focus on technology solutionsDrive further control and operating effectiveness, with a focus on platform solutionsOngoing focus on Conduct and Ethics
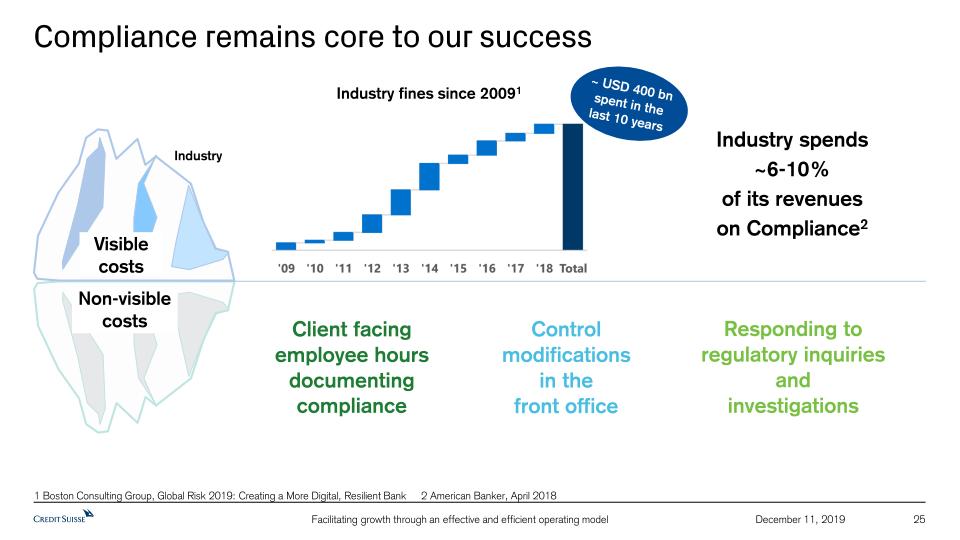
Compliance remains core to our success 25 December 11, 2019 1 Boston Consulting Group, Global Risk 2019: Creating a More Digital, Resilient Bank 2 American Banker, April 2018 Non-visiblecosts Visiblecosts Industry fines since 20091 Industry spends ~6-10% of its revenues on Compliance2 Client facing employee hours documenting compliance Control modifications in the front office Responding to regulatory inquiries and investigations Industry ~ USD 400 bn spent in the last 10 years
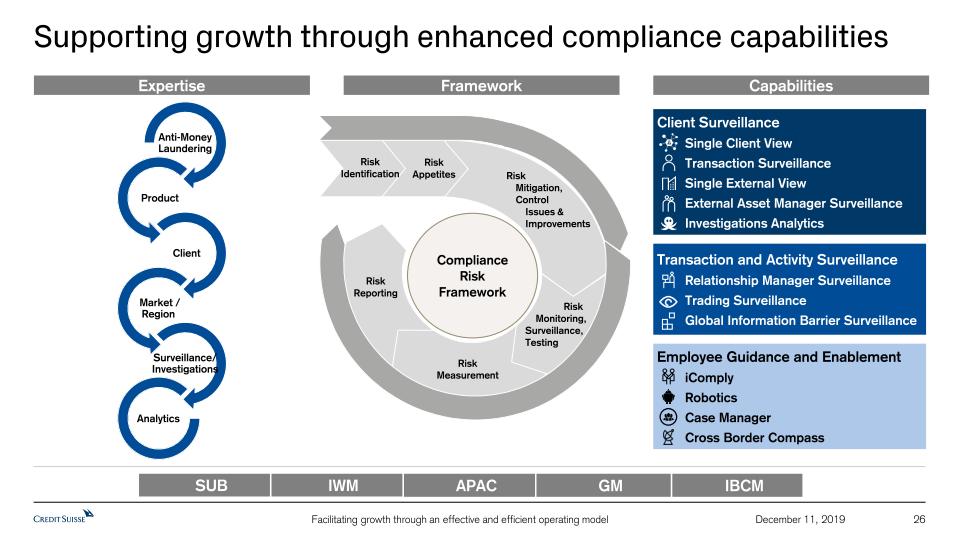
Supporting growth through enhanced compliance capabilities 26 December 11, 2019 Capabilities Expertise Framework GM APAC IBCM IWM SUB Client SurveillanceSingle Client ViewTransaction SurveillanceSingle External ViewExternal Asset Manager SurveillanceInvestigations Analytics Transaction and Activity SurveillanceRelationship Manager SurveillanceTrading SurveillanceGlobal Information Barrier Surveillance Employee Guidance and EnablementiComply RoboticsCase ManagerCross Border Compass Compliance Risk Framework Risk Monitoring, Surveillance,Testing Risk Measurement Risk Reporting RiskMitigation,Control Issues & Improvements Risk Appetites Risk Identification
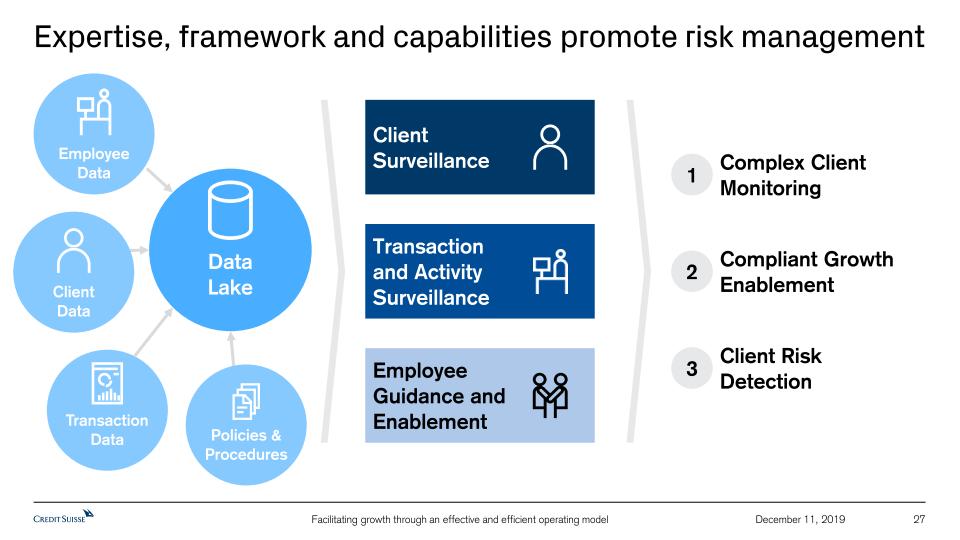
Expertise, framework and capabilities promote risk management 27 December 11, 2019 Transaction Data Employee Data Transaction and Activity Surveillance Employee Guidance and Enablement DataLake Client Data Client Surveillance 1 Complex Client Monitoring 2 Compliant Growth Enablement 3 Client Risk Detection Policies & Procedures
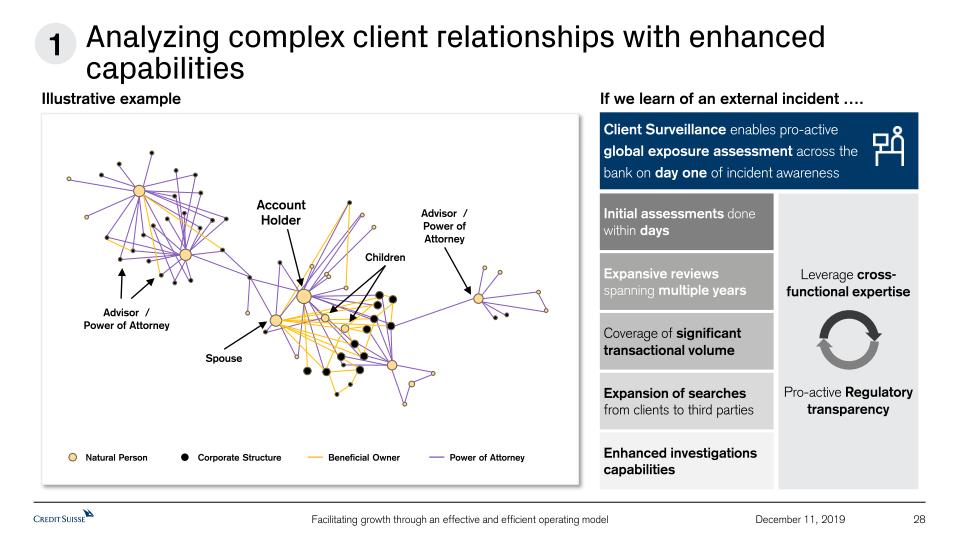
Analyzing complex client relationships with enhanced capabilities 28 December 11, 2019 1 Client Surveillance enables pro-active global exposure assessment across the bank on day one of incident awareness Initial assessments done within days Expansive reviews spanning multiple years Coverage of significant transactional volume Expansion of searches from clients to third parties Enhanced investigations capabilities If we learn of an external incident …. Leverage cross-functional expertisePro-active Regulatory transparency Illustrative example Power of Attorney Beneficial Owner Corporate Structure Natural Person Advisor / Power of Attorney Advisor / Power of Attorney Holder Account Spouse Children
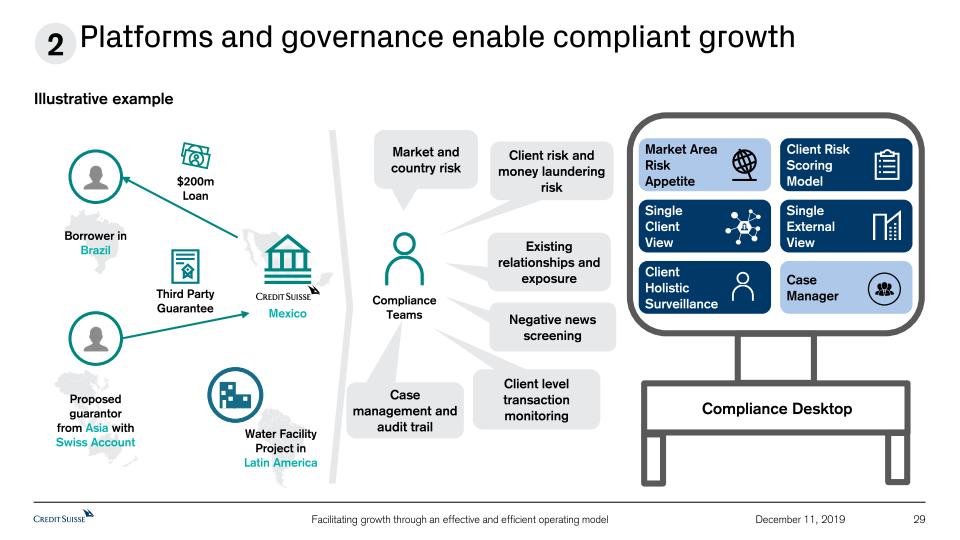
Platforms and governance enable compliant growth 29 December 11, 2019 2 Illustrative example ComplianceTeams Market and country risk Client risk and money laundering risk Existing relationships and exposure Negative news screening Client level transaction monitoring Case management and audit trail Single Client View Single External View Market AreaRisk Appetite Client Risk Scoring Model Case Manager Client HolisticSurveillance Compliance Desktop Borrower in Brazil Proposed guarantor from Asia with Swiss Account $200m Loan Mexico Water Facility Project in Latin America Third Party Guarantee
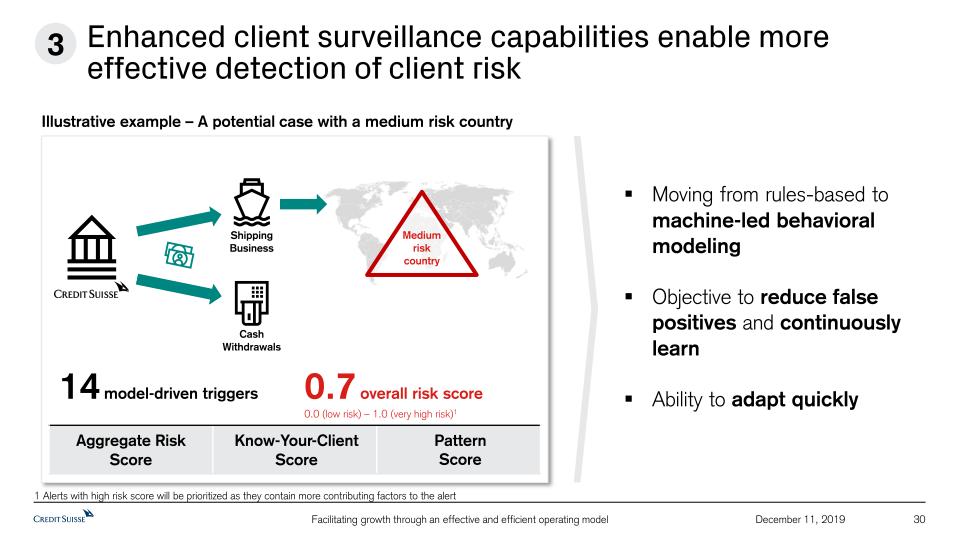
Enhanced client surveillance capabilities enable more effective detection of client risk 30 December 11, 2019 1 Alerts with high risk score will be prioritized as they contain more contributing factors to the alert 3 Medium risk country 14 model-driven triggers 0.7 overall risk score0.0 (low risk) – 1.0 (very high risk)1 Aggregate RiskScore Know-Your-Client Score Pattern Score Cash Withdrawals Shipping Business Illustrative example – A potential case with a medium risk country Moving from rules-based to machine-led behavioral modelingObjective to reduce false positives and continuously learnAbility to adapt quickly
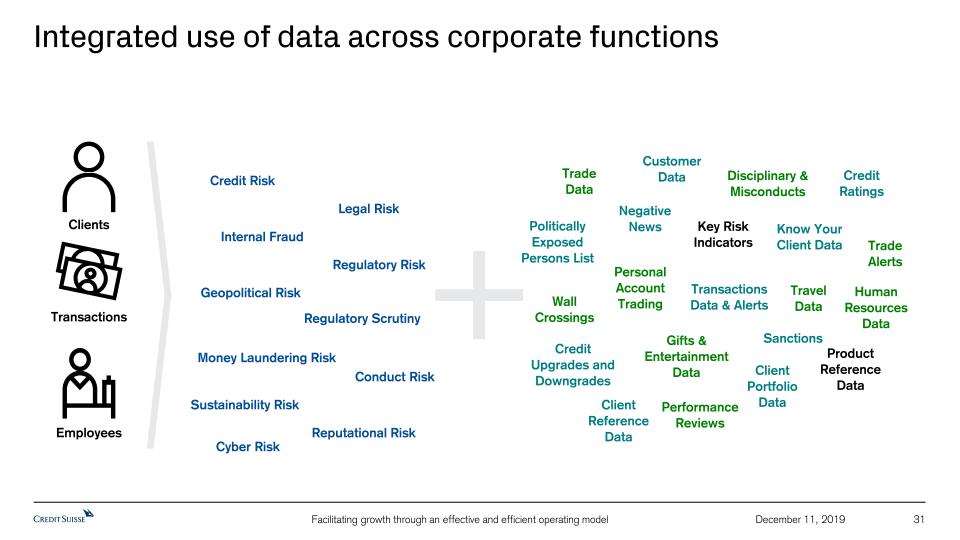
Integrated use of data across corporate functions 31 December 11, 2019 Employees Clients Transactions Client Portfolio Data Customer Data Negative News Know Your Client Data Sanctions Politically Exposed Persons List Transactions Data & Alerts Client Reference Data Product Reference Data Key Risk Indicators Trade Data HumanResources Data Disciplinary &Misconducts Personal Account Trading Wall Crossings Gifts & Entertainment Data Travel Data Trade Alerts Performance Reviews Credit Ratings Credit Upgrades and Downgrades Regulatory Scrutiny Money Laundering Risk Regulatory Risk Geopolitical Risk Conduct Risk Internal Fraud Legal Risk Sustainability Risk Credit Risk Reputational Risk Cyber Risk
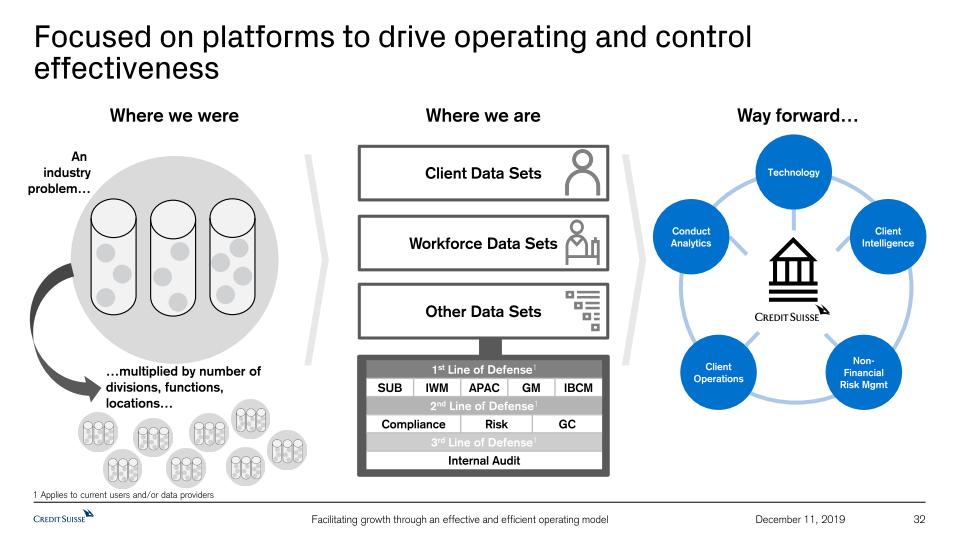
Focused on platforms to drive operating and control effectiveness 32 December 11, 2019 Where we are Other Data Sets Workforce Data Sets Client Data Sets An industry problem… Way forward… Where we were …multiplied by number of divisions, functions, locations… 1st Line of Defense1 SUB IWM APAC GM IBCM 2nd Line of Defense1 Compliance Risk GC 3rd Line of Defense1 Internal Audit Client Intelligence Technology ConductAnalytics Client Operations Non-Financial Risk Mgmt 1 Applies to current users and/or data providers

Credit Suisse Investor Day 2019Facilitating growth through an effective and efficient operating model James Walker, Chief Operating OfficerDecember 11, 2019
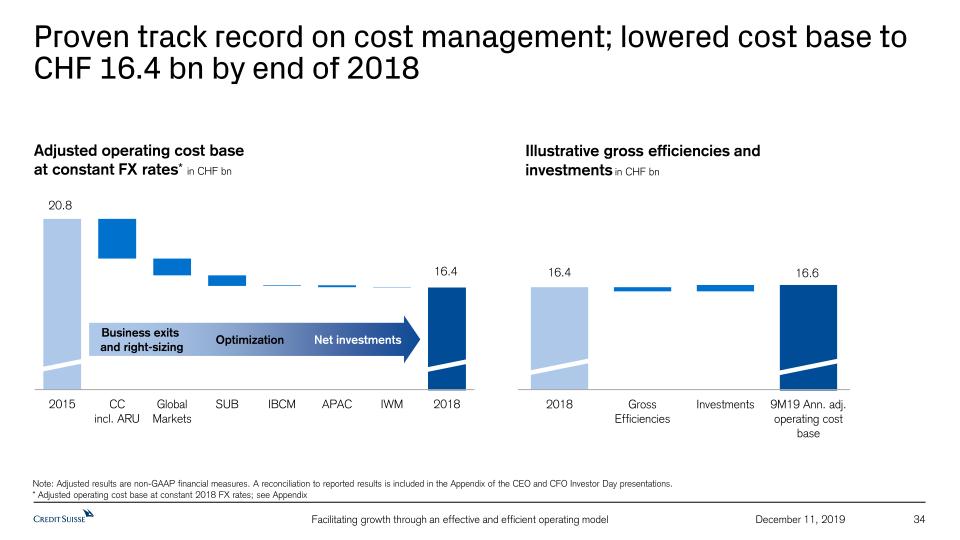
34 December 11, 2019 Proven track record on cost management; lowered cost base to CHF 16.4 bn by end of 2018 Business exits and right-sizing Optimization Net investments Adjusted operating cost baseat constant FX rates* in CHF bn Illustrative gross efficiencies and investments in CHF bn Note: Adjusted results are non-GAAP financial measures. A reconciliation to reported results is included in the Appendix of the CEO and CFO Investor Day presentations.* Adjusted operating cost base at constant 2018 FX rates; see Appendix
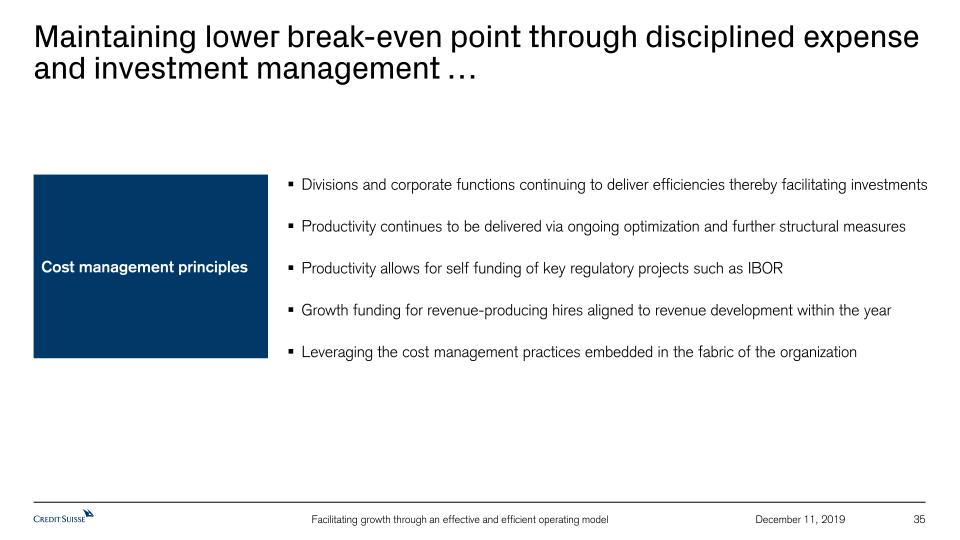
35 December 11, 2019 Maintaining lower break-even point through disciplined expense and investment management … Divisions and corporate functions continuing to deliver efficiencies thereby facilitating investmentsProductivity continues to be delivered via ongoing optimization and further structural measuresProductivity allows for self funding of key regulatory projects such as IBORGrowth funding for revenue-producing hires aligned to revenue development within the yearLeveraging the cost management practices embedded in the fabric of the organization Cost management principles

36 December 11, 2019 … and driving further structural savings initiatives Improving footprint and reducing occupancy in high cost locations Examples of specific initiatives Themes Rationalizing divisional / corporate function teams by promoting and consolidating processes into commonly shared platforms Operating model Optimizing captive vs outsourced vendor footprint mix in India, Poland and other locations to increase effectiveness and institutionalize knowledge retention Workforce composition Real estate footprint Driving automation and data driven insights through leveraging innovative solutions such as Distributed Ledger Technology and machine learning Automation
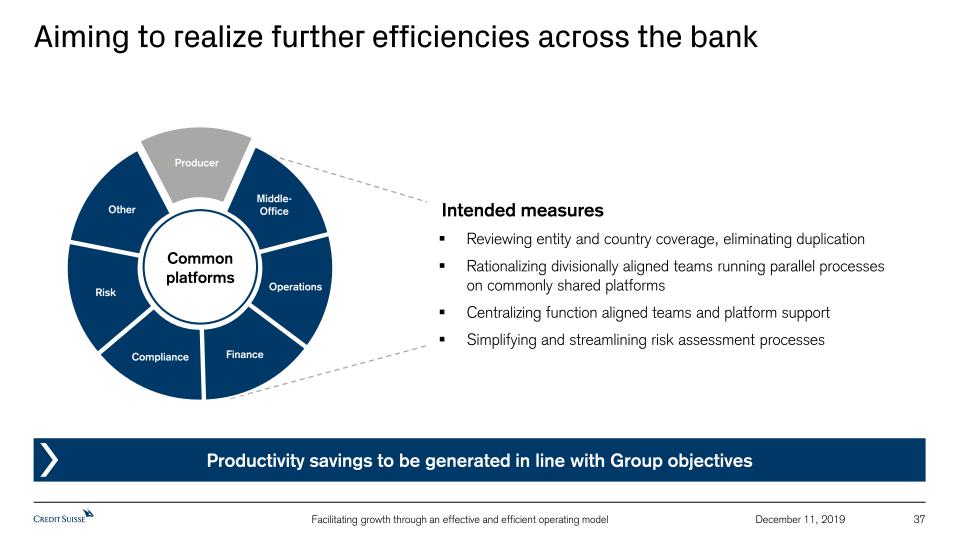
Aiming to realize further efficiencies across the bank 37 December 11, 2019 Productivity savings to be generated in line with Group objectives Reviewing entity and country coverage, eliminating duplicationRationalizing divisionally aligned teams running parallel processes on commonly shared platforms Centralizing function aligned teams and platform supportSimplifying and streamlining risk assessment processes Intended measures Common platforms
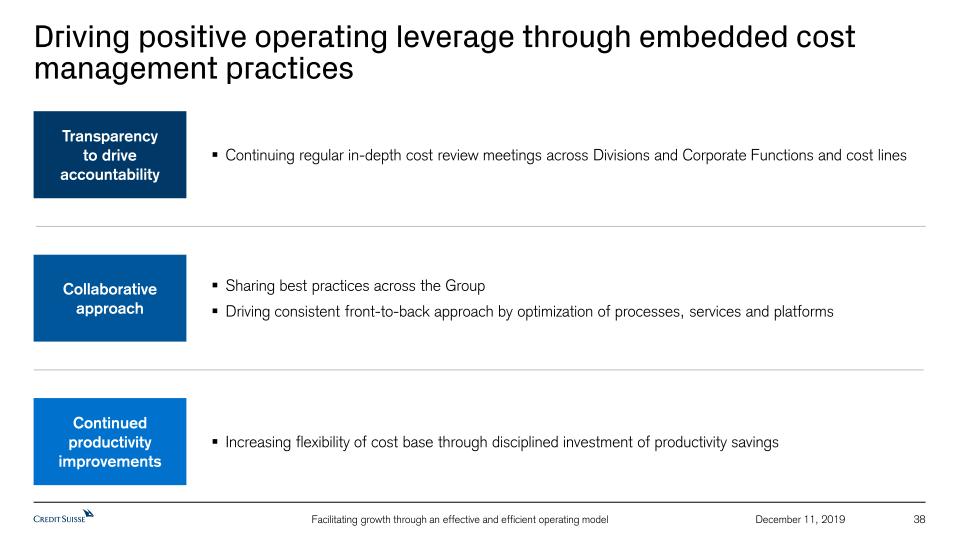
38 December 11, 2019 Driving positive operating leverage through embedded cost management practices Continued productivity improvements Increasing flexibility of cost base through disciplined investment of productivity savings Transparency to drive accountability Continuing regular in-depth cost review meetings across Divisions and Corporate Functions and cost lines Collaborative approach Sharing best practices across the GroupDriving consistent front-to-back approach by optimization of processes, services and platforms
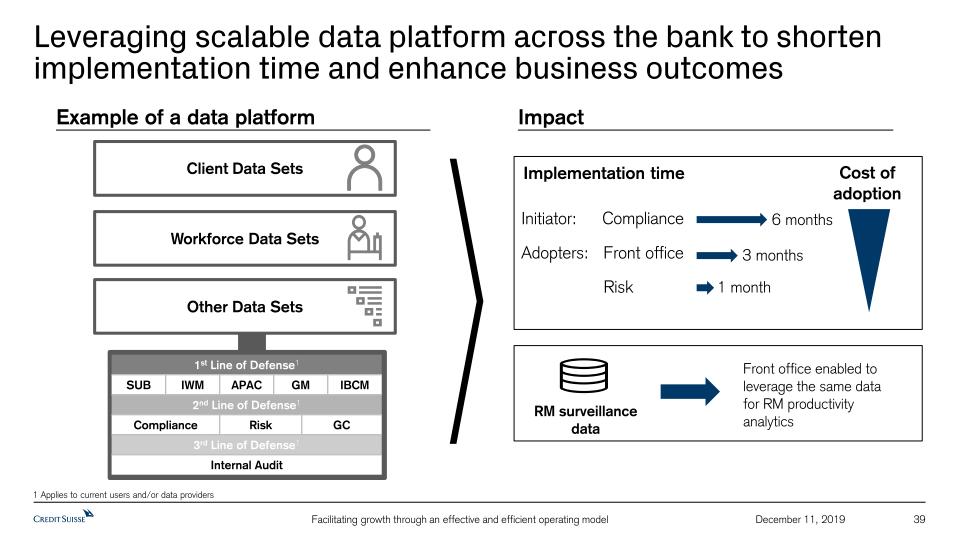
39 December 11, 2019 Leveraging scalable data platform across the bank to shorten implementation time and enhance business outcomes RM surveillance data Front office enabled to leverage the same data for RM productivity analytics Example of a data platform Impact Implementation time Initiator: Adopters: Compliance 6 months Front office 3 months Risk 1 month Cost of adoption Other Data Sets Workforce Data Sets Client Data Sets 1 Applies to current users and/or data providers 1st Line of Defense1 SUB IWM APAC GM IBCM 2nd Line of Defense1 Compliance Risk GC 3rd Line of Defense1 Internal Audit
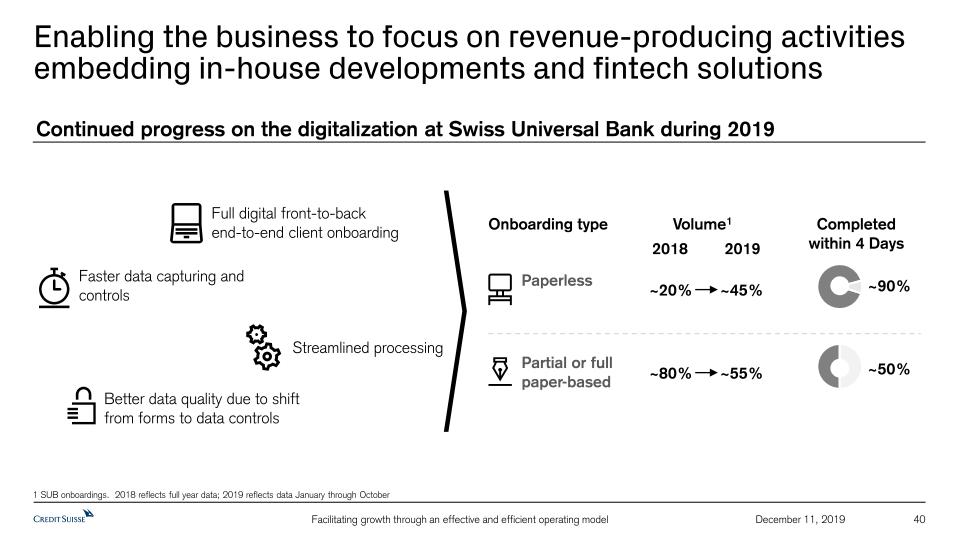
40 December 11, 2019 Enabling the business to focus on revenue-producing activities embedding in-house developments and fintech solutions ~80% Onboarding type Partial or full paper-based Paperless Volume1 ~20% ~55% ~45% 2018 2019 Full digital front-to-back end-to-end client onboarding Faster data capturing and controls Streamlined processing Better data quality due to shift from forms to data controls Continued progress on the digitalization at Swiss Universal Bank during 2019 Completed within 4 Days ~50% ~90% 1 SUB onboardings. 2018 reflects full year data; 2019 reflects data January through October
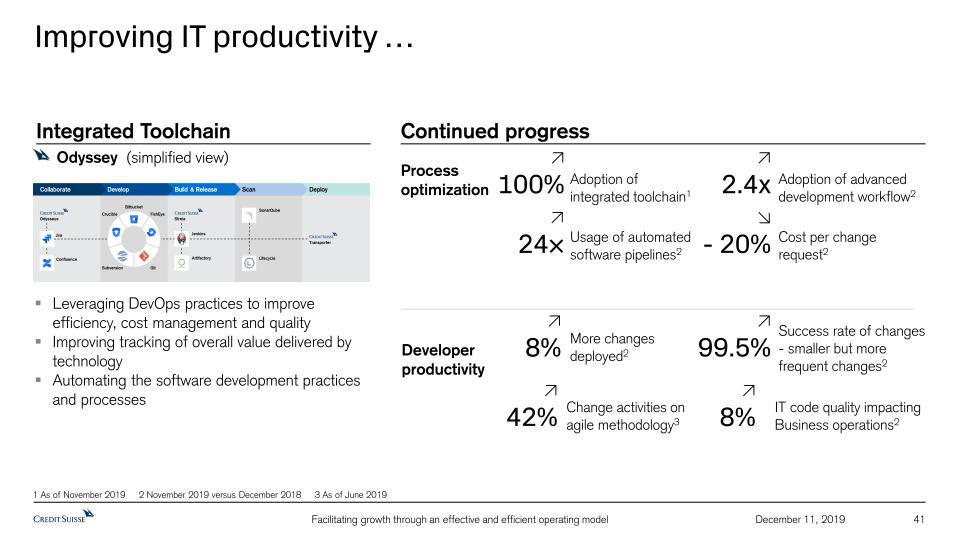
Improving IT productivity … Leveraging DevOps practices to improve efficiency, cost management and qualityImproving tracking of overall value delivered by technology Automating the software development practices and processes Integrated Toolchain Continued progress 24× 2.4x Usage of automated software pipelines2 Adoption of advanced development workflow2 - 20% Cost per change request2 Adoption of integrated toolchain1 100% More changes deployed2 Success rate of changes - smaller but more frequent changes2 99.5% 8% Change activities on agile methodology3 IT code quality impacting Business operations2 8% 42% Process optimization Developer productivity 41 December 11, 2019 Odyssey (simplified view) 1 As of November 2019 2 November 2019 versus December 2018 3 As of June 2019
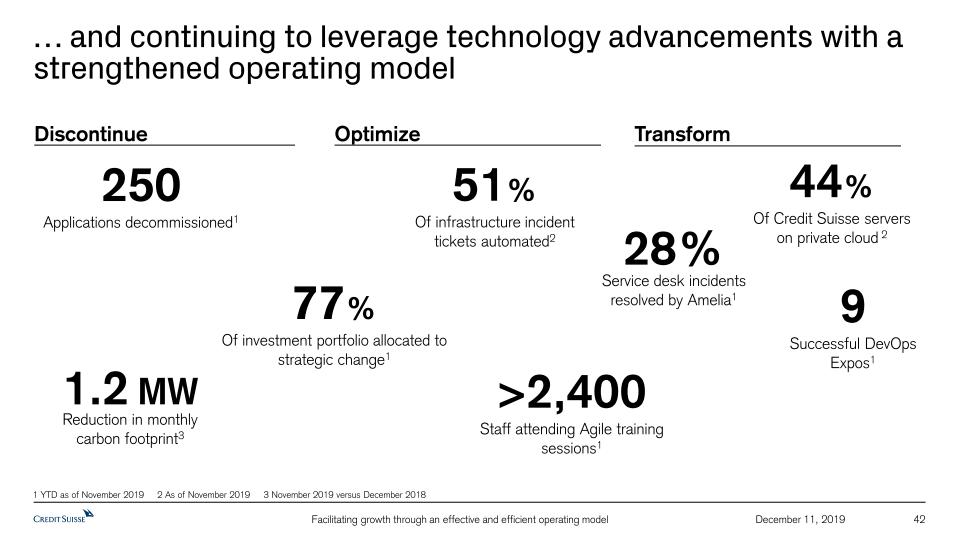
42 December 11, 2019 … and continuing to leverage technology advancements with a strengthened operating model Of infrastructure incident tickets automated2 51% Of Credit Suisse servers on private cloud 2 44% Of investment portfolio allocated to strategic change1 77% Applications decommissioned1 250 1.2 MW Reduction in monthly carbon footprint3 Service desk incidents resolved by Amelia1 28% Discontinue Optimize Transform Successful DevOps Expos1 9 Staff attending Agile training sessions1 >2,400 1 YTD as of November 2019 2 As of November 2019 3 November 2019 versus December 2018

Appendix 43 December 11, 2019
44 December 11, 2019 Notes (1/2) For reconciliation of adjusted to reported results, refer to the Appendix of the CEO and CFO Investor Day 2019 presentations, published on December 11, 2019Throughout the presentation rounding differences may occurUnless otherwise noted, all CET1 capital, CET1 ratio, Tier 1 leverage ratio, risk-weighted assets and leverage exposure figures shown in this presentation for periods prior to 2019 are as of the end of the respective period and on a “look-through” basisGross and net margins are shown in basis pointsGross margin = net revenues annualized / average AuM; net margin = pre-tax income annualized / average AuMMandate penetration reflects advisory and discretionary mandate volumes as a percentage of AuM, excluding those from the external asset manager business * Following the successful completion of our restructuring program in 2018, we updated our calculation approach for adjusted operating cost base at constant FX rates. Beginning in 1Q19, adjusted operating cost base at constant FX rates includes adjustments for major litigation provisions, expenses related to real estate disposals and business sales as well as for debit valuation adjustments (DVA) related volatility and FX, but not for restructuring expenses and certain accounting changes. Adjustments for FX apply unweighted 2018 currency exchange rates, i.e., a straight line average of monthly rates, consistently for the periods under review. Under the current presentation, adjusted operating cost base at constant FX rates for periods prior to 1Q19 still include adjustments for restructuring expenses and a goodwill impairment taken in 4Q15, but no longer include an adjustment for certain accounting changes. Beginning in 1Q20, adjustments for FX will apply unweighted 2019 currency exchange rates.† Regulatory capital is calculated as the worst of 10% of RWA and 3.5% of leverage exposure. Return on regulatory capital (a non-GAAP financial measure) is calculated using income/(loss) after tax and assumes a tax rate of 30% and capital allocated based on the worst of 10% of average RWA and 3.5% of average leverage exposure. For the Markets business within the APAC division and for the Global Markets and Investment Banking & Capital Markets divisions, return on regulatory capital is based on US dollar denominated numbers. Adjusted return on regulatory capital is calculated using adjusted results, applying the same methodology to calculate return on regulatory capital. ‡ Return on tangible equity is based on tangible shareholders’ equity, a non-GAAP financial measure, which is calculated by deducting goodwill and other intangible assets from total shareholders’ equity as presented in our balance sheet. Tangible book value, a non-GAAP financial measure, is equal to tangible shareholders’ equity. Tangible book value per share is a non-GAAP financial measure, which is calculated by dividing tangible shareholders’ equity by total number of shares outstanding. Management believes that tangible shareholders’ equity/tangible book value, return on tangible equity and tangible book value per share are meaningful as they are measures used and relied upon by industry analysts and investors to assess valuations and capital adequacy. For end-4Q17, tangible shareholders’ equity excluded goodwill of CHF 4,742 mn and other intangible assets of CHF 223 mn from total shareholders’ equity of CHF 41,902 mn as presented in our balance sheet. For end-1Q18, tangible shareholders’ equity excluded goodwill of CHF 4,667 mn and other intangible assets of CHF 212 mn from total shareholders’ equity of CHF 42,540 mn as presented in our balance sheet. For end-2Q18, tangible shareholders’ equity excluded goodwill of CHF 4,797 mn and other intangible assets of CHF 212 mn from total shareholders’ equity of CHF 43,470 mn as presented in our balance sheet. For end-3Q18, tangible shareholders’ equity excluded goodwill of CHF 4,736 mn and other intangible assets of CHF 214 mn from total shareholders’ equity of CHF 42,734 mn as presented in our balance sheet. For end-4Q18, tangible shareholders’ equity excluded goodwill of CHF 4,766 mn and other intangible assets of CHF 219 mn from total shareholders’ equity of CHF 43,922 mn as presented in our balance sheet. For end-1Q19, tangible shareholders’ equity excluded goodwill of CHF 4,807 mn and other intangible assets of CHF 224 mn from total shareholders’ equity of CHF 43,825 mn as presented in our balance sheet. For end-2Q19, tangible shareholders’ equity excluded goodwill of CHF 4,731 mn and other intangible assets of CHF 216 mn from total shareholders’ equity of CHF 43,673 mn as presented in our balance sheet. For end-3Q19, tangible shareholders’ equity excluded goodwill of CHF 4,760 mn and other intangible assets ofCHF 219 mn from total shareholders’ equity of CHF 45,150 mn as presented in our balance sheet. Shares outstanding were 2,550.3 mn at end-4Q17, 2,552.4 mn at end-3Q18, 2,550.6 mn at end-4Q18 and 2,473.8 mn at end-3Q19. General notes Specific notes

Notes (2/2) 45 December 11, 2019 Abbreviations ABL = Asset Based Lending; Abs. = Absolute; Adj. = Adjusted; AFG = Asia Pacific Financing Group; AM = Asset Management; Ann. = Annualized;APAC = Asia Pacific; Approx. = Approximately; ARC = Asset Risk Consultants; ARU = Asset Resolution Unit; ATS = APAC Trading Solutions; AuM = Assets under Management; Avg.= Average; BCBS = Basel Committee on Banking Supervision; BEAT = Base Erosion and Anti-Abuse Tax; BfE = Bank for Entrepreneurs; BHC = Bank Holding Company; BIS = Bank for International Settlements; bps = basis points; CAGR = Compound Annual Growth Rate; CBG = Corporate Bank Group; CC = Corporate Center; CCO = Chief Compliance Officer; CCRO = Chief Compliance and Regulatory Affairs Officer; CET1 = Common Equity Tier 1;CH = Switzerland; C/I = Cost/Income; C&IC = Corporate and Institutional Clients; CIC = Corporate & Institutional Clients; CLO = Collateralized Loan Obligation; CRO = Chief Risk Officer; CSAM = Credit Suisse Asset Management; DCM = Debt Capital Markets; DevOps = Development-to-Operations; DPS = Dividend Per Share; E = Estimate; EAM = External Asset Manager; ECA = Export Credit Agency; ECM = Equity Capital Markets; E&E = Entrepreneurs & Executives;EMEA = Europe, Middle East & Africa; ESG = Environmental Social and Governance; Est. = Estimate; EU = European Union; Excl. = Exclude; FID = Fixed Income Department; FI&WM = Fixed Income Wealth Management; FRTB = Fundamental Review of the Trading Book; FX = Foreign Exchange; FY = Full Year; GC = General Counsel; GCP = Global Credit Products; GM = Global Markets; GMV = Gross Market Value; GYB = Global Yield Balanced; HLG = High Level Group; HR = Human Resources; HY = High Yield; IAF = Impact Advisory & Finance; IB = Investment Banking; IBCM = Investment Banking & Capital Markets; IBOR = Interbank Offer Rate; IFC = International Finance Corporation; IG = Investment Grade; ILS = Insurance-Linked Strategies; IMM = Internal Model Method;incl. = including; IPO = Initial Public Offering; IRB = Internal Ratings-Based Approach; IT = Information Technology; ITS = International Trading Solutions;IWM = International Wealth Management; LDI = Liability-driven investments; Lev Fin = Leveraged Finance; LTD = Long-term debt; LTM = Last Twelve Months; LTV = Loan to Value; M&A = Mergers & Acquisitions; MREL = Minimum Requirement for own funds and Eligible Liabilities; NIG = Non investment grade;NNA = Net new assets; NRI = Non-resident Indians; Op Risk = Operational Risk; OTC = Over the Counter; p.a. = per annum; PB = Private Banking;PB&WM = Private Banking & Wealth Management; PC = Private Clients; PD = probability of default; p.p. = percentage points; PTI = Pre-tax income;QIS = Quantitative Investment Strategies; QoQ = Quarter over Quarter; QT = Quantitative Trading; RBL = Reserve Based Lending; RM = Relationship Manager(s); RoRC = Return on Regulatory Capital; RoTE= Return on Tangible Equity; RSA = Revenue Sharing Agreement; RWA = Risk-weighted assets;SA-CCR = Standardized Approach to Counterparty Credit Risk; SBL = Share Backed Lending; SCP = Strategic Client Partner; SEA = South East Asia;SME = Small and Medium-Sized Enterprises; SNB = Swiss National Bank; SoW = Share of Wallet; SP = Securitized Products; STBs = Sustainable Transition Bonds; SUB = Swiss Universal Bank; TBVPS = Tangible book value per share; TLAC = Total Loss-Absorbing Capacity; TLOF = Total Liabilities and Own Funds; TMT = Technology, Media and Telecommunications; (U)HNW(I) = (Ultra) High Net Worth (Individuals); U/W = Underwriting; US GAAP = United States Generally Accepted Accounting Principles; WM&C = Wealth Management & Connected; YoY = Year over year; YTD = Year to Date
SIGNATURES
Pursuant to the requirements of the Securities Exchange Act of 1934, the registrants have duly caused this report to be signed on their behalf by the undersigned, thereunto duly authorized.
| CREDIT SUISSE GROUP AG and CREDIT SUISSE AG | ||
| (Registrants) | ||
| By: | /s/ Tidjane Thiam | |
| Tidjane Thiam | ||
| Chief Executive Officer | ||
| /s/ David R. Mathers | ||
| David R. Mathers | ||
| Date: December 11, 2019 | Chief Financial Officer |