UNITED STATES SECURITIES AND EXCHANGE COMMISSION
Washington, D.C. 20549
Form 6-K
REPORT OF FOREIGN PRIVATE ISSUER PURSUANT TO RULE 13a-16 OR 15d-16 UNDER THE SECURITIES EXCHANGE ACT OF 1934
December 15, 2020
Commission File Number 001-15244
CREDIT SUISSE GROUP AG
(Translation of registrant’s name into English)
Paradeplatz 8, 8001 Zurich, Switzerland
(Address of principal executive office)
Commission File Number 001-33434
CREDIT SUISSE AG
(Translation of registrant’s name into English)
Paradeplatz 8, 8001 Zurich, Switzerland
(Address of principal executive office)
Indicate by check mark whether the registrant files or will file annual reports under cover of Form 20-F or Form 40-F.
Form 20-F  Form 40-F
Form 40-F Indicate by check mark if the registrant is submitting the Form 6-K in paper as permitted by Regulation S-T Rule 101(b)(1):
Note: Regulation S-T Rule 101(b)(1) only permits the submission in paper of a Form 6-K if submitted solely to provide an attached annual report to security holders.
Indicate by check mark if the registrant is submitting the Form 6-K in paper as permitted by Regulation S-T Rule 101(b)(7):
Note: Regulation S-T Rule 101(b)(7) only permits the submission in paper of a Form 6-K if submitted to furnish a report or other document that the registrant foreign private issuer must furnish and make public under the laws of the jurisdiction in which the registrant is incorporated, domiciled or legally organized (the registrant’s “home country”), or under the rules of the home country exchange on which the registrant’s securities are traded, as long as the report or other document is not a press release, is not required to be and has not been distributed to the registrant’s security holders, and, if discussing a material event, has already been the subject of a Form 6-K submission or other Commission filing on EDGAR.
This report includes the media release and the slides for the presentation to investors in connection with Investor Update 2020 held on December 15, 2020.
Media Release Zurich, December 15, 2020 |
2020 Investor Update
Accelerating growth in strategic business areas, continuing to deliver for our stakeholders
HIGHLIGHTS
| - | Planning significant investments to deliver on our growth ambitions: |
| o | Investment priorities for Wealth Management-related businesses: expand coverage base, enhance client offering, drive business growth |
| o | Investment priorities for global investment banking businesses: drive Global Trading Solutions (GTS), expand Investment Bank offering, invest in M&A |
| o | Infrastructure investments: enhance IT platforms, invest in cloud and automation, drive regulatory agenda |
| - | Sustainability ambitions: |
| o | Establish new Sustainability Advisory Committee at the Board of Directors level |
| o | Commit to develop Science Based Targets within the next 24 months, including our commitment to align our operations and financing to net zero emissions over the coming decades |
| o | Align our financing with the Paris Agreement objective of limiting global warming to 1.5° C |
| o | Reposition our portfolio to mobilize capital towards our clients’ transitions |
| - | Financial ambitions: |
| o | Increase Wealth Management-related pre-tax income from CHF 4.0 billion in 9M20 LTM, on an adjusted basis and excluding significant items*, to CHF 5.0 billion to CHF 5.5 billion in 2023 |
| o | Reconfirm medium-term ambition of a Return on Tangible Equity (RoTE) of 10% to 12% |
| o | Operate with a CET1 ratio of at least 12.5% for at least the first half of 2021 given the ongoing COVID-19 pandemic |
| o | Continue to accrue for at least 5% dividend growth per annum, including with respect to the planned 2020 dividend compared to CHF 0.2776 per share paid this year |
| o | Intend to restart share buybacks in January 2021 of up to CHF 1.5 billion, with at least CHF 1.0 billion, for the full year, subject to market and economic conditions |
Thomas Gottstein, Chief Executive Officer of Credit Suisse Group AG, commented: “Today, we are outlining our ambitious and achievable growth agenda for 2021 and beyond, including broad-based investment initiatives to accelerate growth in our Wealth Management-related businesses and our Investment Bank, with a commitment to placing Sustainability and our new SRI function at the heart of our strategy. We continue to believe wealth management is one of the most attractive segments in financial services, notably in Asia Pacific, and we also expect to further expand the connectivity between our Investment Bank and the Wealth Management-related divisions. Together, these initiatives should allow us to deliver on our medium-term ambition of an RoTE of 10% to 12% in a normalized environment, subject to market and economic conditions, while maintaining a strong balance sheet.” |
Page 1
Media Release Zurich, December 15, 2020 |
Zurich, December 15, 2020 – We will today update investors and analysts on the progress we have made in 2020, and outline how we intend to drive and accelerate growth across key strategic business areas in 2021 and beyond. We will also detail how we intend to continue supporting our clients by striving for excellence through our leading franchises, across all geographies, and how we expect to continue to deliver value for our shareholders.
SUMMARY – 2020 ACHIEVEMENTS
In 9M20, our strategy as a leading Wealth Manager with strong global Investment Banking capabilities enabled us to deliver resilient results. In Wealth Management, we continued to apply a balanced approach between Mature and Emerging Markets, amplifying our position as the ‘Bank for Entrepreneurs’ focusing on the UHNWI segment, as a core strength, and building out our regional Wealth Management model with continued proximity to our clients. In the Investment Bank, we built on the strong momentum of our newly integrated global division, which is more diversified, more balanced and less volatile, and further strengthened our connectivity to Wealth Management.
Despite absorbing provision for credit losses of CHF 958 million and significant foreign exchange headwinds, we recorded pre-tax income of CHF 3.6 billion in 9M20, up 1% year on year, and net income attributable to shareholders of CHF 3.0 billion, up 18%, with continued underlying momentum in our Wealth Management businesses, as well as a strong performance in our global investment banking businesses. Net revenues were CHF 17.2 billion, up 5% year on year, while total operating expenses of CHF 12.7 billion remained flat, reinvigorating operating leverage. On an adjusted basis, excluding significant items*, pre-tax income was CHF 3.5 billion, up 10% year on year, driven by higher adjusted net revenues, excluding significant items*, of CHF 16.8 billion, up 6%, and lower adjusted* total operating expenses of CHF 12.3 billion, down 2%.
Our RoTE for 9M20 was 9.8% and our capital position at the end of 3Q20 remained strong, with a CET1 ratio of 13.0% compared to 12.5% at the end of 2Q20. Our Tier 1 leverage ratio was 6.3%1 at the end of 3Q20, up from 6.2%2 at the end of 2Q20.
With regard to 4Q20, we would note that business performance so far has followed similar year-on-year trends as we saw in 3Q20. In our Wealth Management businesses, stronger year-on-year transactional activity, particularly in Asia, is partly offsetting the adverse FX translational impact resulting from the strengthening of the Swiss Franc and some pressure on net interest income. Our Investment Bank continues to perform well, with revenues ahead of 4Q19, in both USD and CHF terms. Results for the current quarter will also be impacted by the expected impairment relating to York Capital Management and the updated assessment of RMBS-related provisions as we have previously disclosed.
In a year that has been significantly impacted by the global COVID-19 pandemic, we have managed our businesses carefully with the aim of continuing to deliver value for all of our stakeholders. Our key achievements in 9M20 include, but are not limited to:
Page 2
Media Release Zurich, December 15, 2020 |
| - | More than 90% of employees feel well-supported and informed by management’s response to the COVID-19 pandemic3, which included free antibody testing to employees and extended paid family leave in locations with closed schools |
| - | Leadership in the design and execution of the COVID-19 program sponsored by the Swiss government that ultimately provided CHF 17 billion in financing to Swiss SMEs until its expiration end-July 2020 |
| - | Market share gains across various private banking and investment banking products |
| - | Leveraged technology for client engagement, supporting clients’ increasing financing needs and developing innovative Private Markets and Sustainability products |
| - | Successful execution of key strategic initiatives with expected gross savings of approximately CHF 400 million to CHF 450 million from 2022 onwards |
| - | Managed leadership transition and announced Chairman designate, António Horta-Osório, to be proposed for election at the next Annual General Meeting on April 30, 2021 |
| - | Paid full 2019 dividend, accruing for 2020 dividend and confirming our 2021 dividend and share buyback plan |
Building on our foundation of success, we today announce a clear growth agenda over the medium-term:
ACCELERATING GROWTH IN WEALTH MANAGEMENT-RELATED BUSINESSES
As we expect global wealth to grow faster than GDP by 20244, we continue to believe wealth management is one of the most attractive segments in financial services. As the award-winning5 ‘Bank for Entrepreneurs’, we intend to further invest in our leading wealth management franchises; to build out our market position in growth areas such as Emerging Markets, where wealth is expected to grow by 11% per annum6; to continue to focus on UHNWIs, as they are the most profitable and fastest growing wealth segment7; and to further deepen collaboration between our Wealth Management-related businesses and our global Investment Bank.
Building on our 9M20 performance, with total Wealth Management net revenues of CHF 7.4 billion, flat year on year, and adjusted net revenues excluding significant items, at constant foreign exchange rates*, of CHF 7.6 billion, up 6% year on year, we intend to grow our overall Wealth Management-related pre-tax income to between CHF 5.0 billion and CHF 5.5 billion in 2023, which would represent a compound annual growth rate (CAGR) of approximately 10%. Specifically, in Wealth Management, we aim to capture growth opportunities by growing client business volume8; attracting NNA9; extending lending10; deepening mandate penetration; growing Private Markets; accelerating digital transformation; and strengthening collaboration with the Investment Bank. In Asset Management, we expect a significant turnaround in 2021 and will focus on our strategic priorities, by continuing to scale market-leading franchises; expanding Alternatives, Alternatives-lite and Private Market offerings; accelerating the focus on ESG; and leveraging Wealth Management for distribution.
We intend to achieve this through targeted growth investments and focused execution, while delivering on our medium-term ambition of a Return on Regulatory Capital (RoRC) of 20% to 25% in our Wealth Management-related businesses, and, within that, greater than 40% for Asset Management, specifically.
Page 3
Media Release Zurich, December 15, 2020 |
Key investment priorities for Wealth Management-related businesses include:
| - | Expand coverage base |
| o | Pursue selective strategic relationship manager hires and team lift-outs |
| o | Expand product specialists to drive client activation |
| o | Strengthen EMEA mid-market advisory coverage |
| - | Enhance client offering |
| o | Invest in integrated lending solution delivery |
| o | Deepen UHNW offering focused on sustainable solutions and Private Markets |
| o | Build on recently launched CSX digital banking offering |
| - | Drive business growth |
| o | Deepen onshore footprint in faster growing markets |
| o | Accelerate onshore China build-out |
| o | Deliver Wealth Management platform transformation |
| o | Scale existing business, e.g. Asset Management |
The initiatives are estimated to have a 2021 incremental cost impact of CHF 100 million to CHF 150 million.
DRIVING SUSTAINABLE INVESTMENT BANKING RETURNS
Building on our 9M20 performance, with total global investment banking revenues of USD 7.8 billion, up 20% year on year, and a strong position in the market, with a number 1 rank in IPOs11 and a top 5 rank in announced M&A12, we intend to focus on enhancing our existing diversified model by continuing to drive integration and search for growth opportunities by expanding our global Investment Bank offering.
In July 2020, we announced the establishment of a global Investment Bank division, bringing together the former Investment Banking and Capital Markets (IBCM) and Global Markets (GM) divisions as well as Asia Pacific (APAC) Markets. Driven by a diversified franchise that continues to focus on generating returns – with more than 75% of revenues in our global Investment Bank being generated by our top 6 franchises – we also intend to further drive efficiency and effectively manage risk.
For the post COVID-19 market environment, we believe we are well positioned across our M&A and Capital Markets franchises, our Equity and Credit sales & trading businesses, and our more tailored offering in Macro products. Additionally, we also intend to continue driving connectivity to our Wealth Management-related businesses, particularly through GTS and the newly established mid-market M&A and advisory team in International Wealth Management (IWM). Finally, we intend to continue investing in our market-leading businesses across Equities, Fixed Income and Banking.
By focusing on the execution of these strategic priorities, we intend to deliver on our medium-term RoRC ambition of 10% to 15% for the global Investment Bank.
Page 4
Media Release Zurich, December 15, 2020 |
Key investment priorities for the Investment Bank include:
| - | Drive GTS |
| o | Expand financing and structured credit solutions in select markets |
| o | Capitalize on a streamlined, unified platform to enhance delivery of institutional-style solutions to Wealth Management clients |
| o | Expand Investment Bank Markets offering for sophisticated UHNW clients |
| - | Expand Investment Bank offering |
| o | Grow Asset Finance and private credit financing |
| o | Build on our proprietary cross-asset electronic execution capabilities |
| o | Invest in onshore China platform |
| - | Invest in M&A |
| o | Deliver ESG advisory focused on energy transition |
| o | Expand industry coverage to grow share including focus on Technology and Healthcare |
| o | Grow sponsor led M&A share and Private Markets opportunity |
The initiatives are estimated to have a 2021 incremental cost impact of approximately CHF 50 million.
ADDING INCREMENTAL INFRASTRUCTURE ENHANCEMENT INVESTMENTS
In addition to the planned investments in our Wealth Management-related businesses and the Investment Bank as described above, we intend to make significant incremental investments in our infrastructure.
Key investment priorities for infrastructure include:
| - | Enhance IT platforms |
| o | Enhance IT platforms across international locations |
| o | Drive further standardization across core platforms |
| o | Build-out data analytics |
| - | Invest in cloud and automation |
| o | Build-out cloud and cyber security |
| o | Drive digitalization and automation to improve productivity |
| o | Enhance digital front-to-back and end-to-end client onboarding |
| - | Drive regulatory agenda |
| o | Invest in climate risk platform |
| o | Deliver Basel IV requirements |
| o | Leverage scalable data platform across Chief Risk and Compliance Officer (CRCO) function |
These initiatives are estimated to have a 2021 incremental cost impact of CHF 150 million to CHF 200 million.
Page 5
Media Release Zurich, December 15, 2020 |
DELIVERING ON SUSTAINABILITY ASPIRATIONS
Building on our progress in the last few years, in July 2020 we announced the creation of our unique Executive Board-level function, Sustainability, Research & Investment Solutions (SRI), under the leadership of Lydie Hudson, to express our commitment to becoming a leader in Sustainability in the financial industry, across our Wealth Management-related and Investment Bank franchises. Going forward, this should allow us to drive a cohesive approach and to meet the evolving needs of our clients, investors, employees and society in general. Furthermore, we established a dedicated Board of Directors mandate by naming Iris Bohnet as the Board of Directors Sustainability Leader on the Group Board of Directors in order to enable the integration of the bank’s Sustainability agenda. Furthermore, by naming Sustainability leaders in each division and function, we have created a mechanism to implement our Sustainability strategy across our firm.
Today, we further detail our Sustainability ambitions, intending to integrate Sustainability in how we work with clients and across our operations. Our plans include launching new, innovative ESG products, services and advisory capabilities for clients, as well as taking action with and aiding our clients with their transition journey, which became even more critical given the COVID-19 disruption. Additionally, we aim to become a leading voice in ESG Research, and be a standard setter through partnerships with industry groups and NGOs in the fragmented ESG ecosystem. Finally, we will strive to establish best-in-class governance and disclosures for maximum transparency.
Explicitly, we intend to:
| - | Drive our own transition |
| o | Commitment to develop Science Based Targets within the next 24 months, including our commitment to achieve net zero emissions from our financing no later than 2050, with intermediate emissions goals for 2030 |
| o | Align our financing with the Paris Agreement objective of limiting global warming to 1.5° C |
| - | Adapt our culture |
| o | Establish a new Board of Directors’ Sustainability Advisory Committee, including external experts in the field, to cover our ESG strategy and execution |
| o | Reflect our overall Sustainability ambitions across our conduct and culture efforts, including a refined Diversity & Inclusion strategy |
| - | Deliver sustainable investment solutions |
| o | Aim for sustainable investment solutions to be at the core of our offering to wealth management and institutional clients |
| o | Reposition our portfolio to mobilize capital towards our clients’ transitions |
Page 6
Media Release Zurich, December 15, 2020 |
SUMMARY OF FINANCIAL AMBITIONS OUTLINED AT THE 2020 INVESTOR UPDATE
|
CONTACT DETAILS
Kinner Lakhani, Investor Relations, Credit Suisse
Tel: +41 44 333 71 49
Email: investor.relations@credit-suisse.com
James Quinn, Corporate Communications, Credit Suisse
Tel: +41 844 33 88 44
Email: media.relations@credit-suisse.com
The 2020 Investor Update media release and the CEO and CFO presentations are available to download from 07:00 CET / 06:00 GMT / 01:00 EST today at: https://www.credit-suisse.com/about-us/en/events/investor-day-2020.html. Additional presentations will be available to download at 12:30 CET / 11:30 GMT / 06:30 EST today.
Page 7
Media Release Zurich, December 15, 2020 |
Dial in details | |
| Time | 13:00 CET / 12:00 GMT / 07:00 EST |
Follow all presentations and the Q&A | You can follow the 2020 Investor Update either through webcast or telephone, from 13:00 CET / 12:00 GMT / 07:00 EST to 17:45 CET / 16:45 GMT / 11:45 EST. |
Asking questions in the Q&A | Questions can be asked by investors and analysts only, and solely through telephone. Those who are dialed in through both, webcast and telephone, please mute your webcast when asking a question on the telephone. |
| Access | The webcast will be accessible through this link. For the telephone, please use: Standard International +44 2030 576 528 Switzerland Local Call +41 44 580 48 67 Switzerland Free Call +41 800 00 00 86 UK Free Call +44 800 279 67 97 USA Free Call +1 866 276 89 33 When dialing in please ask for the “Credit Suisse Investor Update”. Conference ID: 1789159 |
| Note | Due to the large volume of calls expected, we strongly recommend that you dial in 15 minutes before the start of the Q&A session. All presentations will be given in English. |
| Replay | Telephone replay available approximately 2 hours after the event, until Friday, December 25, 2020, 22:00 CET / 21:00 GMT / 16:00 EST. International Dial in: +44 3333 00 97 85 Switzerland Local: +41 44 580 40 26 UK Free Call Dial In: +44 808 238 06 67 UK Local Dial In: +44 844 571 89 51 USA Local Dial In: +1 917 677 75 32 Replay ID: 1789159 |
Page 8
Media Release Zurich, December 15, 2020 |
* Refers to adjusted results, results excluding significant items and results on a constant foreign exchange rate basis as applicable. Results excluding items included in our reported results are non-GAAP financial measures. For further details and a reconciliation to the most directly comparable US GAAP measures, see the Appendix of this Media Release.
Footnotes
1 For 3Q20 and 2Q20, leverage exposure excludes CHF 110 billion and CHF 104 billion, respectively, of central bank reserves, after adjusting for the dividends paid in 2020 as required by FINMA. Including cash held at central banks, our Tier 1 leverage ratio would have been 5.6% for 3Q20 and 5.5% for 2Q20.
2 For 3Q20 and 2Q20, leverage exposure excludes CHF 110 billion and CHF 104 billion, respectively, of central bank reserves, after adjusting for the dividends paid in 2020 as required by FINMA. Including cash held at central banks, our Tier 1 leverage ratio would have been 5.6% for 3Q20 and 5.5% for 2Q20.
3 Internal pulse survey completed in June 2020
4 IMF, GDP at current prices based on PPP; and Oliver Wyman; UHNWI defined as individuals with personal financial assets above USD 100 million
5 PWM and The Banker magazine, Best Private Bank for Entrepreneurs award 2020
6 Oliver Wyman; CAGR 2020 to 2024; total financial wealth of households with >USD 1 million wealth
7 Oliver Wyman; UHNWI defined as individuals with personal financial assets above USD 100 million
8 Excluding estimated cumulative FX impact
9 Excluding estimated cumulative FX impact
10 Excluding estimated cumulative FX impact
11 Refers to global investment banking results from the Investment Bank, APAC advisory and underwriting as well as M&A, DCM and ECM in SUB C&IC. Dealogic 2020 YTD as of December 11, 2020 (Global); IPOs and M&A based on volume
12 Refers to global investment banking results from the Investment Bank, APAC advisory and underwriting as well as M&A, DCM and ECM in SUB C&IC. Dealogic 2020 YTD as of December 11, 2020 (Global); IPOs and M&A based on volume
Abbreviations
APAC – Asia Pacific; BCBS – Basel Committee on Banking Supervision; BIS – Bank for International Settlements; CAGR – compound annual growth rate; CEO – Chief Executive Officer; CET1 – common equity tier 1; CFO – Chief Financial Officer; CHF – Swiss francs; C&IC – Corporate & Institutional Clients; CRCO – Chief Risk and Compliance Officer; DCM – Debt Capital Markets; ECM – Equity Capital Markets; EMEA – Europe, Middle East, Africa; ESG – environmental, social and corporate Governance; FINMA – Swiss Financial Market Supervisory Authority FINMA; FX – foreign exchange; GAAP – generally accepted accounting principles; GDP – gross domestic product; GTS – Global Trading Solutions; GM – Global Markets; IBCM – Investment Banking & Capital Markets; IPO – Initial Public Offering; IT – information technology; ITS – International Trading Solutions; IWM – International Wealth Management; LTM – last twelve months; M&A – Mergers & Acquisitions; NNA – net new assets; NGO – non-governmental organization; PB – Private Banking; PC – Private Clients; PPP – Purchasing Power Parity; RoRC – Return on Regulatory Capital; RoTE – Return on Tangible Equity; RWA – risk weighted assets; SME – Small and Medium Enterprises; SRI – Sustainability, Research & Investment Solutions; SUB – Swiss Universal Bank; YTD – year-to-date; UHNW(I) – ultra high-net-worth individual; US – United States; USD – US dollar.
Important information
We may not achieve all of the expected benefits of our strategic initiatives. Factors beyond our control, including but not limited to the market and economic conditions (including macroeconomic and other challenges and uncertainties, for example, resulting from the COVID-19 pandemic), changes in laws, rules or regulations and other challenges discussed in our public filings, could limit our ability to achieve some or all of the expected benefits of these initiatives.
In particular, the terms “Estimate”, “Illustrative”, “Ambition”, “Objective”, “Outlook” and “Goal” are not intended to be viewed as targets or projections, nor are they considered to be Key Performance Indicators. All such estimates, illustrations, ambitions, objectives, outlooks and goals are subject to a large number of inherent risks, assumptions and uncertainties, many of which are completely outside of our control. These risks, assumptions and uncertainties include, but are not limited to, general market conditions, market volatility, interest rate volatility and levels, global and regional economic conditions, challenges and uncertainties resulting from the COVID-19 pandemic, political uncertainty, changes in tax policies, regulatory changes, changes in levels of client activity as a result of any of the foregoing and other factors. Accordingly, this information should not be relied on for any purpose. We do not intend to update these estimates, illustrations, ambitions, objectives, outlooks or goals.
In preparing this document, management has made estimates and assumptions that affect the numbers presented. Actual results may differ. Annualized numbers do not take into account variations in operating results, seasonality and other factors and may not be indicative of actual, full-year results. Figures throughout this document may also be subject to rounding adjustments. All opinions and views constitute judgments as of the date of writing without regard to the date on which the reader may receive or access the information. This information is subject to change at any time without notice and we do not intend to update this information.
Page 9
Media Release Zurich, December 15, 2020 |
Our estimates, ambitions, objectives and targets often include metrics that are non-GAAP financial measures and are unaudited. A reconciliation of the estimates, ambitions, objectives and targets to the nearest GAAP measures is unavailable without unreasonable efforts. Results excluding certain items included in our reported results do not include items such as goodwill impairment, major litigation provisions, real estate gains, impacts from foreign exchange and other items included in our reported results, all of which are unavailable on a prospective basis. Return on tangible equity is based on tangible shareholders' equity (also known as tangible book value), a non-GAAP financial measure, which is calculated by deducting goodwill and other intangible assets from total shareholders' equity as presented in our balance sheet, both of which are unavailable on a prospective basis. Return on regulatory capital (a non-GAAP financial measure) is calculated using income / (loss) after tax and assumes a tax rate of 25% and capital allocated based on the average of 10% of average risk-weighted assets and 3.5% of average leverage exposure; the essential components of this calculation are unavailable on a prospective basis. Such estimates, ambitions, objectives and targets are calculated in a manner that is consistent with the accounting policies applied by us in preparing our financial statements.
Return on tangible equity (a non-GAAP financial measure) is calculated as annualized net income attributable to shareholders divided by average tangible shareholders’ equity. Tangible shareholder’s equity (a non-GAAP financial measure) is calculated by deducting goodwill and other intangible assets from total shareholders’ equity as presented in our balance sheet. Management believes that return on tangible equity is meaningful as it is a measure used and relied upon by industry analysts and investors to assess valuations and capital adequacy. For end-3Q20, tangible shareholders’ equity excluded goodwill of CHF 4,577 million and other intangible assets of CHF 256 million from total shareholders’ equity of CHF 45,740 million as presented in our balance sheet.
Prior to 3Q20, regulatory capital was calculated as the worst of 10% of RWA and 3.5% of leverage exposure, and return on regulatory capital (a non-GAAP financial measure) was calculated using income/(loss) after tax and assumed a tax rate of 30%. In 3Q20, we updated our calculation approach, following which regulatory capital is calculated as the average of 10% of RWA and 3.5% of leverage exposure, and return on regulatory capital (a non-GAAP financial measure) is calculated using income/(loss) after tax and assumes a tax rate of 30% for periods prior to 2020 and 25% from 2020 onward. For periods in 2020, for purposes of calculating Group return on regulatory capital, leverage exposure excludes cash held at central banks, after adjusting for the dividends paid in 2020. For the Investment Bank division, return on regulatory capital is based on US dollar denominated numbers. Adjusted return on regulatory capital is calculated using adjusted results, applying the same methodology to calculate return on regulatory capital.
Foreign exchange impact is calculated by converting the CHF amount of net revenues, provision for credit losses and operating expenses for 2020 back to the original currency on a monthly basis at the respective spot foreign exchange rate. The respective amounts are then converted back to CHF applying the average 2019 foreign exchange rate from the period against which the foreign exchange impact is measured. Average foreign exchange rates apply a straight line average of monthly foreign exchange rates for major currencies.
Client business volume is a broader measure than assets under management as it includes custody assets and net loans.
Credit Suisse is subject to the Basel III framework, as implemented in Switzerland, as well as Swiss legislation and regulations for systemically important banks, which include capital, liquidity, leverage and large exposure requirements and rules for emergency plans designed to maintain systemically relevant functions in the event of threatened insolvency. Credit Suisse has adopted the Bank for International Settlements (BIS) leverage ratio framework, as issued by the Basel Committee on Banking Supervision (BCBS) and implemented in Switzerland by the Swiss Financial Market Supervisory Authority FINMA (FINMA).
Unless otherwise noted, all CET1 capital, CET1 ratio, Tier-1 leverage ratio, risk-weighted assets and leverage exposure figures in this document are as of the end of the respective period and, for periods prior to 2019, on a “look-through” basis.
Unless otherwise noted, leverage exposure is based on the BIS leverage ratio framework and consists of period-end balance sheet assets and prescribed regulatory adjustments. The tier 1 leverage ratio and CET1 leverage ratio are calculated as BIS tier 1 capital and CET1 capital, respectively, divided by period end leverage exposure. Swiss leverage ratios are measured on the same period-end basis as the leverage exposure for the BIS leverage ratio. Unless otherwise noted, for periods in 2020, leverage exposure excludes cash held at central banks, after adjusting for the dividends paid in 2020.
Mandate penetration reflects advisory and discretionary mandate volumes as a percentage of assets under management, excluding those from the external asset manager business.
Generic references to profit and costs in this document refer to pre-tax income and operating expenses, respectively. References to Wealth Management mean SUB PC, IWM PB and APAC or their combined results. References to Wealth Management-related mean SUB, IWM and APAC or their combined results. References to global investment banking mean the Investment Bank, APAC advisory and underwriting as well as M&A, DCM and ECM in SUB C&IC. References to Global Trading Solutions, prior to 3Q20, mean the combination of ITS and APAC Solutions.
Page 10
Media Release Zurich, December 15, 2020 |
Investors and others should note that we announce material information (including quarterly earnings releases and financial reports) to the investing public using press releases, SEC and Swiss ad hoc filings, our website and public conference calls and webcasts. We intend to also use our Twitter account @creditsuisse (https://twitter.com/creditsuisse) to excerpt key messages from our public disclosures, including earnings releases. We may retweet such messages through certain of our regional Twitter accounts, including @csschweiz (https://twitter.com/csschweiz) and @csapac (https://twitter.com/csapac). Investors and others should take care to consider such abbreviated messages in the context of the disclosures from which they are excerpted. The information we post on these Twitter accounts is not a part of this document.
Information referenced in this document, whether via website links or otherwise, is not incorporated into this document.
Certain material in this document has been prepared by Credit Suisse on the basis of publicly available information, internally developed data and other third-party sources believed to be reliable. Credit Suisse has not sought to independently verify information obtained from public and third-party sources and makes no representations or warranties as to accuracy, completeness or reliability of such information.
In various tables, use of “–” indicates not meaningful or not applicable.
The English language version of this document is the controlling version.
Page 11
| Appendix |
Results excluding items included in our reported results are non-GAAP financial measures. During the implementation of our strategy, we will measure the progress achieved by our underlying business performance. Management believes that such results provide a useful presentation of our operating results for purposes of assessing our Group and divisional performance consistently over time, on a basis that excludes items that management does not consider representative of our underlying performance. Provided below is a reconciliation to the most directly comparable US GAAP measures.
| Reconciliation of adjustment items | |||||||||||||
| Group | |||||||||||||
| in | 9M20 | 9M19 | |||||||||||
| Adjusted results excluding signficant items (CHF million) | |||||||||||||
| Net revenues | 17,168 | 16,294 | |||||||||||
| Real estate gains | 0 | (105) | |||||||||||
| Adjusted net revenues | 17,168 | 16,189 | |||||||||||
| of which gain related to InvestLab transfer | 268 | 327 | |||||||||||
| of which Pfandbriefbank gain | 134 | 0 | |||||||||||
| Adjusted net revenues excluding significant items | 16,766 | 15,862 | |||||||||||
| Provision for credit losses | 958 | 178 | |||||||||||
| Total operating expenses | 12,655 | 12,610 | |||||||||||
| Restructuring expenses | (107) | – | |||||||||||
| Major litigation provisions | (231) | (63) | |||||||||||
| Expenses related to real estate disposals | (23) | (51) | |||||||||||
| Adjusted total operating expenses | 12,294 | 12,496 | |||||||||||
| Income before taxes | 3,555 | 3,506 | |||||||||||
| Total adjustments and significant items | (41) | (318) | |||||||||||
| Adjusted income before taxes excluding significant items | 3,514 | 3,188 | |||||||||||
Page A-1
| Appendix |
| Reconciliation of adjustment items | |||||
| Wealth Management- related | |||||
in | 9M20 LTM | ||||
| Adjusted results excluding significant items (CHF million) | |||||
| Net revenues | 14,598 | ||||
| Real estate gains | (138) | ||||
| Adjusted net revenues | 14,460 | ||||
| of which gain related to InvestLab transfer | 268 | ||||
| of which related to SIX revaluation | 498 | ||||
| of which Pfandbrief gain | 134 | ||||
| Adjusted net revenues excluding significant items | 13,560 | ||||
| Provision for credit losses | 593 | ||||
| Total operating expenses | 9,035 | ||||
| Restructuring expenses | (72) | ||||
| Major litigation provisions | 14 | ||||
| Expenses related to real estate disposals | (14) | ||||
| Adjusted total operating expenses | 8,963 | ||||
| Income before taxes | 4,970 | ||||
| Total adjustments and significant items | (966) | ||||
| Adjusted income before taxes excluding significant items | 4,004 | ||||
| Reconciliation of adjustment items | |||||||
| Wealth Management | |||||||
| in | 9M20 | 9M19 | |||||
| Adjusted net revenues excluding significant items and FX impact (CHF million) | |||||||
| Net revenues | 7,449 | 7,492 | |||||
| of which real estate gains | 0 | 130 | |||||
| of which gain related to InvestLab transfer | 40 | 229 | |||||
| of which Pfandbriefbank gain | 134 | 0 | |||||
| of which FX impact | (315) | 0 | |||||
| Adjusted net revenues excluding significant items and FX impact | 7,590 | 7,133 | |||||
Page A-2
| Appendix |
Cautionary statement regarding forward-looking information
This document contains statements that constitute forward-looking statements. In addition, in the future we, and others on our behalf, may make statements that constitute forward-looking statements. Such forward-looking statements may include, without limitation, statements relating to the following:
■ our plans, targets or goals;
■ our future economic performance or prospects;
■ the potential effect on our future performance of certain contingencies; and
■ assumptions underlying any such statements.
Words such as “believes,” “anticipates,” “expects,” “intends” and “plans” and similar expressions are intended to identify forward-looking statements but are not the exclusive means of identifying such statements. We do not intend to update these forward-looking statements.
By their very nature, forward-looking statements involve inherent risks and uncertainties, both general and specific, and risks exist that predictions, forecasts, projections and other outcomes described or implied in forward-looking statements will not be achieved. We caution you that a number of important factors could cause results to differ materially from the plans, targets, goals, expectations, estimates and intentions expressed in such forward-looking statements. These factors include:
■ the ability to maintain sufficient liquidity and access capital markets;
■ market volatility and interest rate fluctuations and developments affecting interest rate levels, including the persistence of a low or negative interest rate environment;
■ the strength of the global economy in general and the strength of the economies of the countries in which we conduct our operations, in particular the risk of negative impacts of COVID-19 on the global economy and financial markets and the risk of continued slow economic recovery or downturn in the EU, the US or other developed countries or in emerging markets in 2020 and beyond;
■ the emergence of widespread health emergencies, infectious diseases or pandemics, such as COVID-19, and the actions that may be taken by governmental authorities to contain the outbreak or to counter its impact on our business;
■ potential risks and uncertainties relating to the severity of impacts from COVID-19 and the duration of the pandemic, including potential material adverse effects on our business, financial condition and results of operations;
■ the direct and indirect impacts of deterioration or slow recovery in residential and commercial real estate markets;
■ adverse rating actions by credit rating agencies in respect of us, sovereign issuers, structured credit products or other credit-related exposures;
■ the ability to achieve our strategic goals, including those related to our targets, ambitions and financial goals;
■ the ability of counterparties to meet their obligations to us and the adequacy of our allowance for credit losses;
■ the effects of, and changes in, fiscal, monetary, exchange rate, trade and tax policies, as well as currency fluctuations;
■ political, social and environmental developments, including war, civil unrest or terrorist activity and climate change;
■ the ability to appropriately address social, environmental and sustainability concerns that may arise from our business activities;
■ the effects of, and the uncertainty arising from, the UK’s withdrawal from the EU;
■ the possibility of foreign exchange controls, expropriation, nationalization or confiscation of assets in countries in which we conduct our operations;
■ operational factors such as systems failure, human error, or the failure to implement procedures properly;
■ the risk of cyber attacks, information or security breaches or technology failures on our business or operations;
■ the adverse resolution of litigation, regulatory proceedings and other contingencies;
■ actions taken by regulators with respect to our business and practices and possible resulting changes to our business organization, practices and policies in countries in which we conduct our operations;
■ the effects of changes in laws, regulations or accounting or tax standards, policies or practices in countries in which we conduct our operations;
■ the expected discontinuation of LIBOR and other interbank offered rates and the transition to alternative reference rates;
■ the potential effects of changes in our legal entity structure;
■ competition or changes in our competitive position in geographic and business areas in which we conduct our operations;
■ the ability to retain and recruit qualified personnel;
■ the ability to maintain our reputation and promote our brand;
■ the ability to increase market share and control expenses;
■ technological changes instituted by us, our counterparties or competitors;
■ the timely development and acceptance of our new products and services and the perceived overall value of these products and services by users;
■ acquisitions, including the ability to integrate acquired businesses successfully, and divestitures, including the ability to sell non-core assets; and
■ other unforeseen or unexpected events and our success at managing these and the risks involved in the foregoing.
We caution you that the foregoing list of important factors is not exclusive. When evaluating forward-looking statements, you should carefully consider the foregoing factors and other uncertainties and events, including the information set forth in “Risk factors” in I – Information on the company in our Annual Report 2019 and in “Risk factor” in I – Credit Suisse in our 1Q20 Financial Report.
Page A-3

Thomas Gottstein, Chief Executive OfficerDecember 15, 2020 Credit Suisse Investor Update 2020Strategic perspectives

Disclaimer 2 December 15, 2020 This material does not purport to contain all of the information that you may wish to consider. This material is not to be relied upon as such or used in substitution for the exercise of independent judgment.Cautionary statement regarding forward-looking statementsThis presentation contains forward-looking statements that involve inherent risks and uncertainties, and we might not be able to achieve the predictions, forecasts, projections and other outcomes we describe or imply in forward-looking statements. A number of important factors could cause results to differ materially from the plans, targets, goals, expectations, estimates and intentions we express in these forward-looking statements, including those we identify in "Risk factors” in our Annual Report on Form 20-F for the fiscal year ended December 31, 2019, in “Credit Suisse – Risk factor” in our 1Q20 Financial Report published on May 7, 2020 and in the “Cautionary statement regarding forward-looking information" in our media release relating to the Investor Update published on December 15, 2020 and filed with the US Securities and Exchange Commission, and in other public filings and press releases. We do not intend to update these forward-looking statements. In particular, the terms “Estimate”, “Illustrative”, “Ambition”, “Objective”, “Outlook” and “Goal” are not intended to be viewed as targets or projections, nor are they considered to be Key Performance Indicators. All such estimates, illustrations, ambitions, objectives, outlooks and goals are subject to a large number of inherent risks, assumptions and uncertainties, many of which are completely outside of our control. These risks, assumptions and uncertainties include, but are not limited to, general market conditions, market volatility, interest rate volatility and levels, global and regional economic conditions, challenges and uncertainties resulting from the COVID-19 pandemic, political uncertainty, changes in tax policies, regulatory changes, changes in levels of client activity as a result of any of the foregoing and other factors. Accordingly, this information should not be relied on for any purpose. We do not intend to update these estimates, illustrations, ambitions, objectives, outlooks or goals. We may not achieve the benefits of our strategic initiativesWe may not achieve all of the expected benefits of our strategic initiatives. Factors beyond our control, including but not limited to the market and economic conditions (including macroeconomic and other challenges and uncertainties, for example, resulting from the COVID-19 pandemic), changes in laws, rules or regulations and other challenges discussed in our public filings, could limit our ability to achieve some or all of the expected benefits of these initiatives. Estimates and assumptionsIn preparing this presentation, management has made estimates and assumptions that affect the numbers presented. Actual results may differ. Annualized numbers do not take into account variations in operating results, seasonality and other factors and may not be indicative of actual, full-year results. Figures throughout this presentation may also be subject to rounding adjustments. All opinions and views constitute judgments as of the date of writing without regard to the date on which the reader may receive or access the information. This information is subject to change at any time without notice and we do not intend to update this information. RestatementAs of 3Q20, financial information reflects the new divisional reporting structure and management responsibilities announced on July 30, 2020 and updates to certain calculations and allocations. Prior periods have been restated to conform to the current presentation. In light of the restructuring announced July 30, 2020 and several significant items impacting results in prior periods, we intend to focus on adjusted numbers, excluding significant items in our discussion of results until the restructuring is completed.Cautionary statements relating to interim financial informationThis presentation contains certain unaudited interim financial information. This information has been derived from management accounts, is preliminary in nature, does not reflect the complete results of the fourth quarter of 2020 or the full year 2020 and is subject to change, including as a result of any normal quarterly or yearly adjustments in relation to the financial statements. This information has not been subject to any review by our independent registered public accounting firm. There can be no assurance that the final results for these periods will not differ from these preliminary results, and any such differences could be material. Quarterly financial results for the fourth quarter of 2020 and full year 2020 will be included in our 4Q20 Earnings Release and our 2020 Annual Report. These interim results of operations are not necessarily indicative of the results to be achieved for the remainder of 2020. Statement regarding non-GAAP financial measuresThis presentation also contains non-GAAP financial measures, including results excluding certain items included in our reported results, return on regulatory capital and return on tangible equity and tangible book value per share (which are both based on tangible shareholders’ equity). Further details and information needed to reconcile such non-GAAP financial measures to the most directly comparable measures under US GAAP can be found in the Appendix of the CEO and CFO Investor Update presentations, published on December 15, 2020, which are both available on our website at www.credit-suisse.com.Our estimates, ambitions, objectives and targets often include metrics that are non-GAAP financial measures and are unaudited. A reconciliation of the estimates, ambitions, objectives and targets to the nearest GAAP measures is unavailable without unreasonable efforts. Results excluding certain items included in our reported results do not include items such as goodwill impairment, major litigation provisions, real estate gains, impacts from foreign exchange and other items included in our reported results, all of which are unavailable on a prospective basis. Return on Tangible Equity is based on tangible shareholders' equity, a non-GAAP financial measure also known as tangible book value, which is calculated by deducting goodwill and other intangible assets from total shareholders' equity as presented in our balance sheet, both of which are unavailable on a prospective basis. Tangible book value per share excludes the impact of any dividends paid during the performance period, share buybacks, own credit movements, foreign exchange rate movements and pension-related impacts, all of which are unavailable on a prospective basis. Return on regulatory capital (a non-GAAP financial measure) is calculated using income/(loss) after tax and assumes a tax rate of 25% and capital allocated based on the average of 10% of average risk-weighted assets and 3.5% of average leverage exposure; the essential components of this calculation are unavailable on a prospective basis. Such estimates, ambitions, objectives and targets are calculated in a manner that is consistent with the accounting policies applied by us in preparing our financial statements.Statement regarding capital, liquidity and leverageCredit Suisse is subject to the Basel III framework, as implemented in Switzerland, as well as Swiss legislation and regulations for systemically important banks (Swiss Requirements), which include capital, liquidity, leverage and large exposure requirements and rules for emergency plans designed to maintain systemically relevant functions in the event of threatened insolvency. Credit Suisse has adopted the Bank for International Settlements (BIS) leverage ratio framework, as issued by the Basel Committee on Banking Supervision (BCBS) and implemented in Switzerland by the Swiss Financial Market Supervisory Authority FINMA. References to phase-in and look-through included herein refer to Basel III capital requirements and Swiss Requirements. Phase-in reflects that, for the years 2014-2018, there was a five-year (20% per annum) phase-in of goodwill, other intangible assets and other capital deductions (e.g., certain deferred tax assets) and a phase-out of an adjustment for the accounting treatment of pension plans. For the years 2013-2022, there is a phase-out of certain capital instruments. Look-through assumes the full phase-in of goodwill and other intangible assets and other regulatory adjustments and the phase-out of certain capital instruments.Unless otherwise noted, leverage exposure is based on the BIS leverage ratio framework and consists of period-end balance sheet assets and prescribed regulatory adjustments. The tier 1 leverage ratio and CET1 leverage ratio are calculated as BIS tier 1 capital and CET1 capital, respectively, divided by period-end leverage exposure. Swiss leverage ratios are measured on the same period-end basis as the leverage exposure for the BIS leverage ratio. Unless otherwise noted, for periods in 2020, leverage exposure excludes cash held at central banks, after adjusting for the dividends paid in 2020.SourcesCertain material in this presentation has been prepared by Credit Suisse on the basis of publicly available information, internally developed data and other third-party sources believed to be reliable. Credit Suisse has not sought to independently verify information obtained from public and third-party sources and makes no representations or warranties as to accuracy, completeness or reliability of such information.
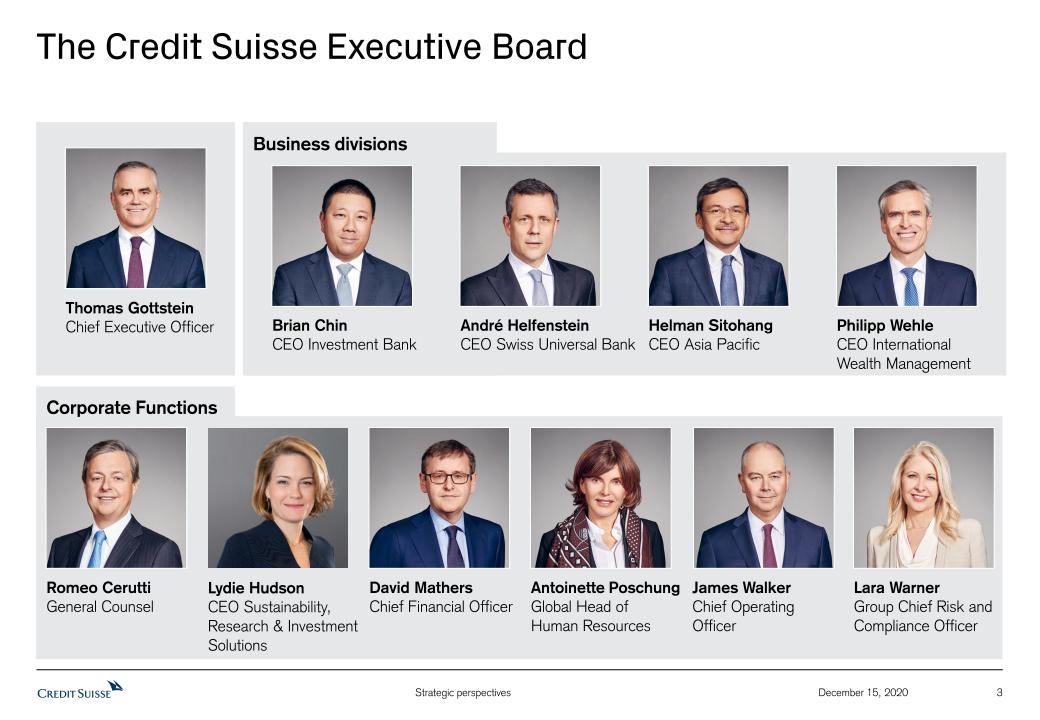
3 December 15, 2020 The Credit Suisse Executive Board Corporate Functions Business divisions Thomas GottsteinChief Executive Officer Brian ChinCEO Investment Bank André HelfensteinCEO Swiss Universal Bank Romeo CeruttiGeneral Counsel David MathersChief Financial Officer Philipp WehleCEO International Wealth Management Helman SitohangCEO Asia Pacific Lydie HudsonCEO Sustainability, Research & Investment Solutions Antoinette PoschungGlobal Head ofHuman Resources James WalkerChief Operating Officer Lara WarnerGroup Chief Risk and Compliance Officer
4 December 15, 2020 Agenda 2021 and beyond: A new era for Credit Suisse with a clear growth agenda 4 Credit Suisse achievements in 2020 3 The year 2020 and COVID-19: A macro and banking sector perspective 2 Our strategic vision and our financial ambitions 1

5 December 15, 2020 My core beliefs Credit Suisse has a rich history, a strong brand and a powerful, entrepreneurial culture……with a defined purpose and a clear strategy, which in combination with our global talent pool, positions us well for the futureDelivering best-in-class client service is the key to long-term successI strongly believe in partnership, inclusion and diversityWe are fully determined to invest in growth and in technology across all our divisions……without losing sight of strong governance, compliance as well as cost and risk disciplineMistakes can and will always happen but we have no tolerance for unprofessional behaviorMy management team and I want to be transparent and to proactively address legacy issues, thereby avoiding surprisesI want Credit Suisse to become a sustainability leaderMy primary objective is to deliver shareholder value and deliver an RoTE in excess of our Cost of Capital
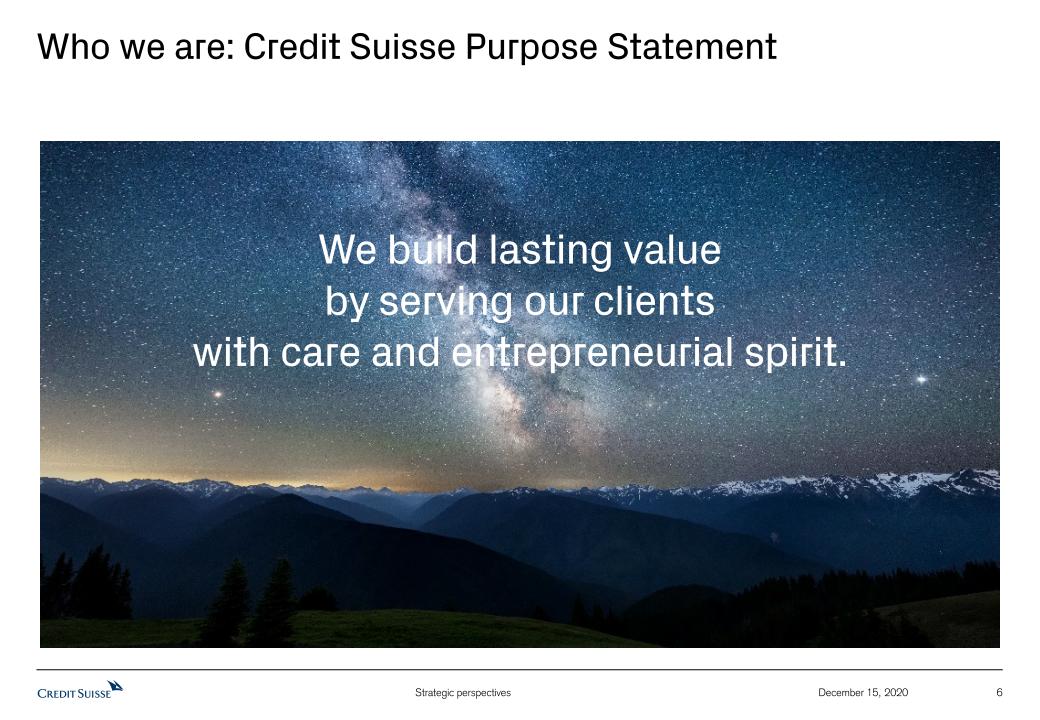
6 We build lasting valueby serving our clients with care and entrepreneurial spirit. December 15, 2020 Who we are: Credit Suisse Purpose Statement
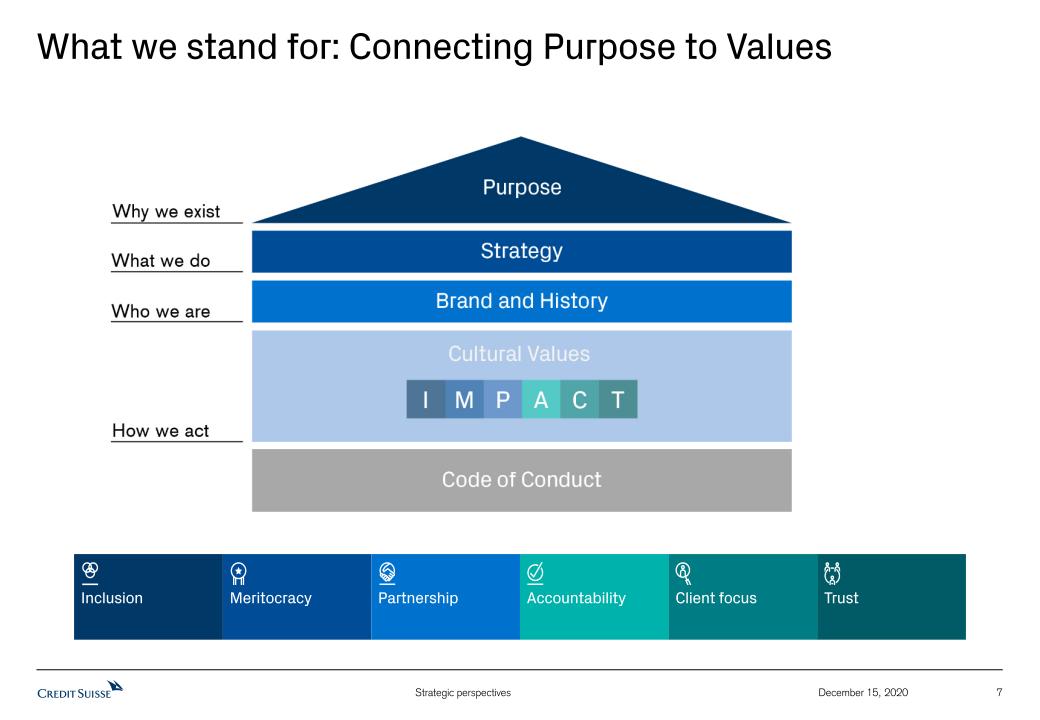
7 December 15, 2020 What we stand for: Connecting Purpose to Values Inclusion Meritocracy Partnership Accountability Client focus Trust
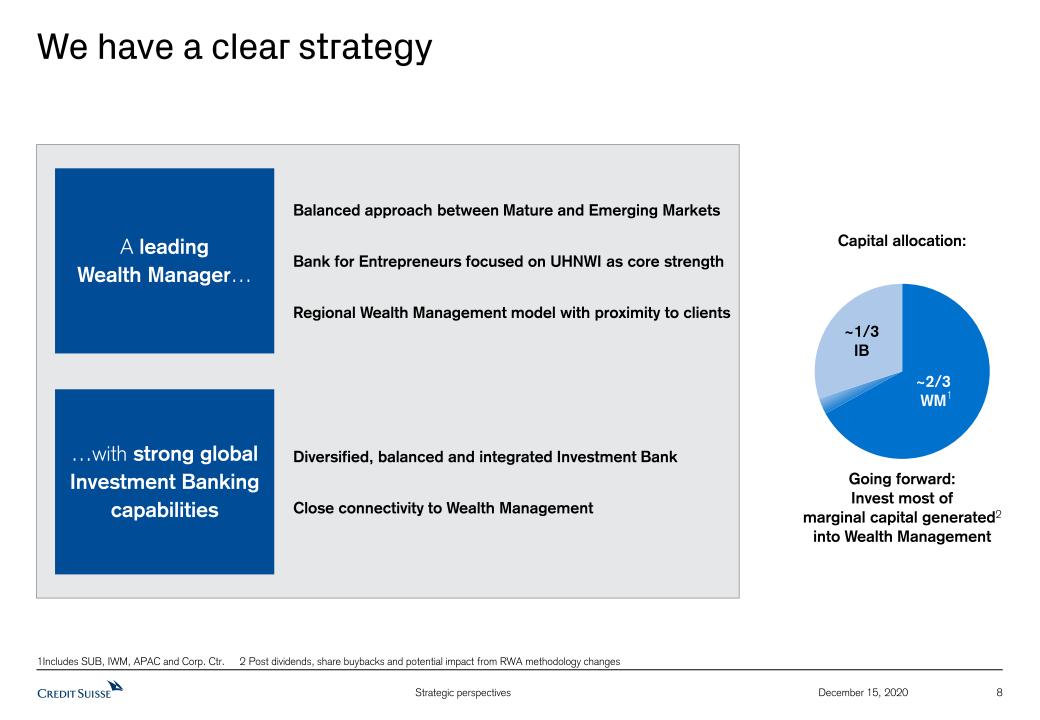
8 December 15, 2020 We have a clear strategy Balanced approach between Mature and Emerging MarketsBank for Entrepreneurs focused on UHNWI as core strengthRegional Wealth Management model with proximity to clients A leading Wealth Manager… …with strong global Investment Banking capabilities Diversified, balanced and integrated Investment BankClose connectivity to Wealth Management Going forward:Invest most of marginal capital generated2 into Wealth Management 1 Capital allocation: 1Includes SUB, IWM, APAC and Corp. Ctr. 2 Post dividends, share buybacks and potential impact from RWA methodology changes

9 December 15, 2020 The strategic journey of Credit Suisse Restructuringphase Restructuring and de-risking of Global MarketsExit from sub-scale US PB brokerage modelTwo capital raises totaling ~CHF 10 bn1Addressed several legacy issuesSignificant regulatory RWA inflation2 of CHF 31 bn Leadership transitionManagement actions / structural refinementsFurther progress with legacy issuesIncremental CHF 22 bn of regulatory RWA inflation2,3 Accelerate growth in WMSustainable, profitable growth in the IBBecoming an ESG leaderProactively invest in growthDelayed implementation ofBasel III reforms Post-restructuring phase Growth phase Improvement in adjusted pre-provision profitin CHF bn, excluding significant items RoTE ambition 10-12%5 COVID-19 Note: Results excluding items included in our reported results are non-GAAP financial measures. For further details and reconciliation information, see Appendix1 Net of fees and taxes 2 Includes RWA increase from external model and parameter updates as well as external methodology and policy changes 3 Includes expected ~CHF 3 bn of RWA inflation in 4Q20 due to external methodology changes (mainly from the phase-in of SA-CCR) 4 Based on Consensus Summary published by Credit Suisse Group on October 21, 2020 and available on the Credit Suisse website. Calculated by deducting real estate (gains)/losses and total operating expenses (excluding restructuring expenses and litigation provisions) from net revenues, all as shown in the published Consensus Summary, and further deducting gains of CHF 134 million related to the equity investment revaluation of Pfandbriefbank and CHF 268 million related to the transfer of InvestLab. Consensus data is used solely for illustrative purposes. Actual results may differ significantly. Does not reflect expected post-tax impact from the York impairment in 4Q20 and still to be determined RMBS-related provisions 5 Reported Return on Tangible Equity 4

10 December 15, 2020 Our strategy can deliver 10-12% medium-term RoTE ambition Illustrative RoTE‡ developmentbased on CHF Note: Estimates and assumptions are based on currently available information and beliefs, expectations and opinions of management and include all known facts and decisions as of December 15, 2020. Actual results may differ ‡ RoTE is a non-GAAP financial measure, see Appendix 1 Based on Consensus Summary published by Credit Suisse Group on October 21, 2020 and available on the Credit Suisse website. Consensus data is used solely for illustrative purposes. Actual results may differ significantly. Does not reflect expected post-tax impact from the York impairment in 4Q20 and still to be determined RMBS-related provisions 2 Includes PTI impact of CHF 268 mn from the gain related to the second tranche of the InvestLab transfer and CHF 134 mn from the gain related to Pfandbriefbank in 2020 3 Normalized tax rate assumption for 2021 of 25% 4 Assumes normalized provision for credit losses based on average annual provision for credit losses from 2015-2019 vs. 2020 consensus 5 Includes gross cost savings, certain reinvestments and other cost adjustments Before York impairment and an updated assessment of RMBS-related provisions 2, 3 1 5 4 Wealth Management-related PTI of CHF 5.0-5.5 bn in 2023 10-12% ~100 bps Macroeconomic uncertainty, primarily credit provisions ~50 bps
11 December 15, 2020 Agenda 2021 and beyond: A new era for Credit Suisse with a clear growth agenda 4 Credit Suisse achievements in 2020 3 The year 2020 and COVID-19: A macro and banking sector perspective 2 Our strategic vision and our financial ambitions 1
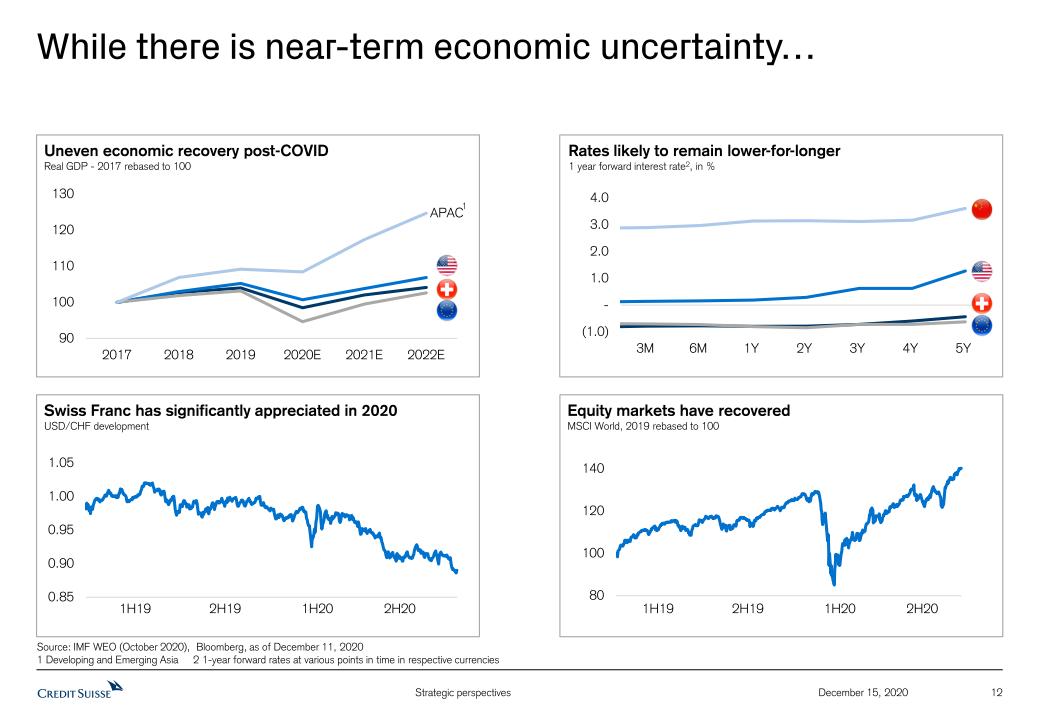
While there is near-term economic uncertainty… 12 December 15, 2020 Source: IMF WEO (October 2020), Bloomberg, as of December 11, 20201 Developing and Emerging Asia 2 1-year forward rates at various points in time in respective currencies Uneven economic recovery post-COVIDReal GDP - 2017 rebased to 100 Rates likely to remain lower-for-longer1 year forward interest rate2, in % Equity markets have recoveredMSCI World, 2019 rebased to 100 1 Swiss Franc has significantly appreciated in 2020USD/CHF development APAC 1H19 2H19 1H20 2H20 1H19 2H19 1H20 2H20
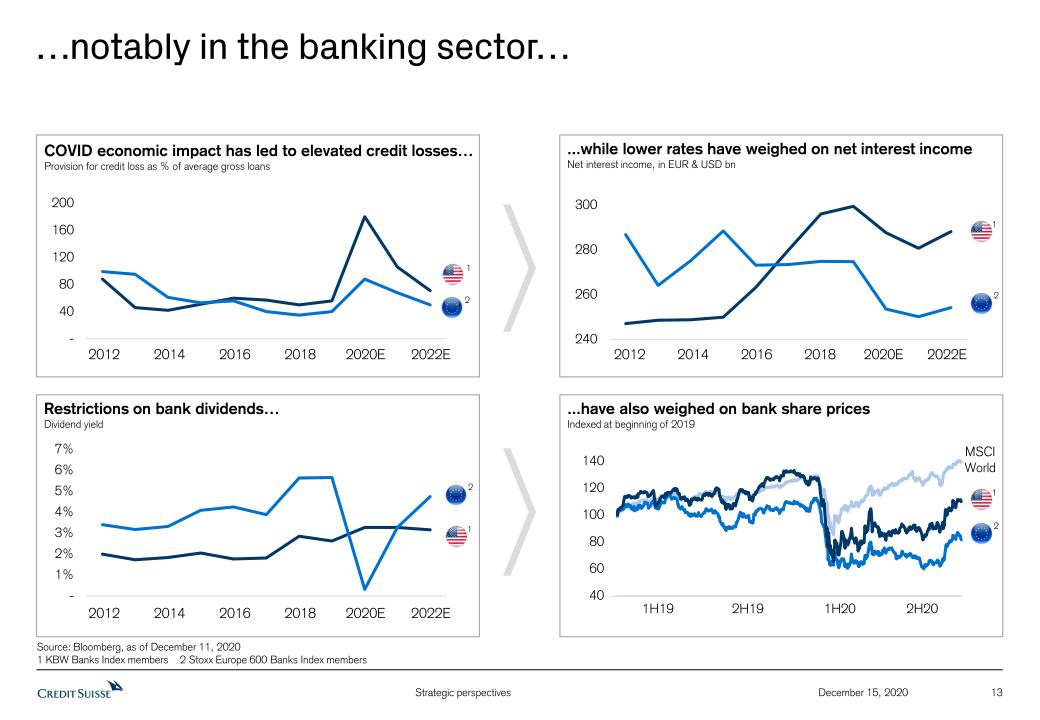
…notably in the banking sector… 13 December 15, 2020 Source: Bloomberg, as of December 11, 20201 KBW Banks Index members 2 Stoxx Europe 600 Banks Index members COVID economic impact has led to elevated credit losses…Provision for credit loss as % of average gross loans 1 2 ...while lower rates have weighed on net interest incomeNet interest income, in EUR & USD bn ...have also weighed on bank share prices Indexed at beginning of 2019 Restrictions on bank dividends…Dividend yield 1 2 1 2 2012 2014 2016 2018 2020E 2022E 2012 2014 2016 2018 2020E 2022E 2012 2014 2016 2018 2020E 2022E 1 2 MSCI World 1H19 2H19 1H20 2H20
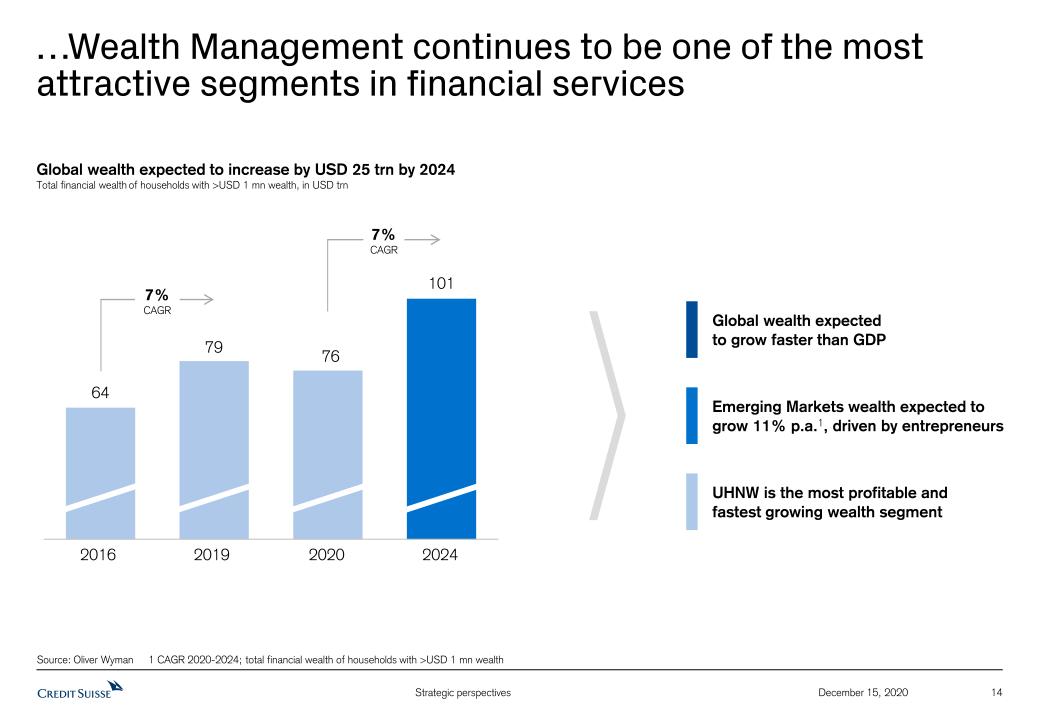
14 December 15, 2020 …Wealth Management continues to be one of the most attractive segments in financial services Source: Oliver Wyman 1 CAGR 2020-2024; total financial wealth of households with >USD 1 mn wealth Global wealth expected to increase by USD 25 trn by 2024Total financial wealth of households with >USD 1 mn wealth, in USD trn Global wealth expected to grow faster than GDP Emerging Markets wealth expected to grow 11% p.a.1, driven by entrepreneurs UHNW is the most profitable and fastest growing wealth segment 7%CAGR 7%CAGR 2020 2024 2019 2016
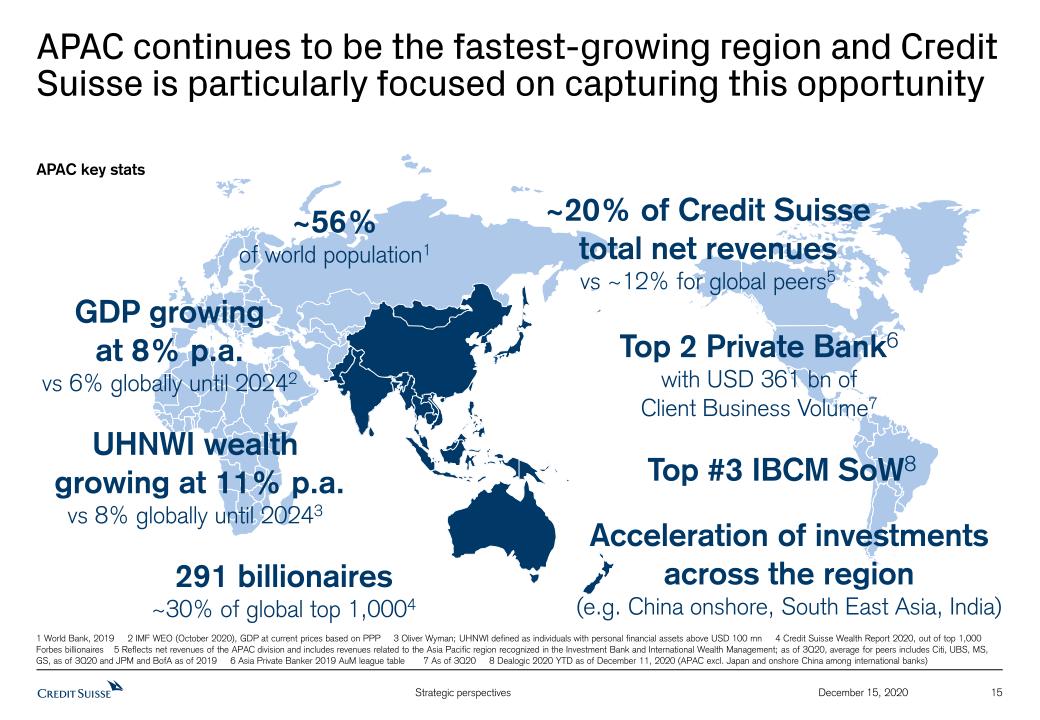
15 December 15, 2020 APAC continues to be the fastest-growing region and Credit Suisse is particularly focused on capturing this opportunity UHNWI wealth growing at 11% p.a. vs 8% globally until 20243 ~56% of world population1 291 billionaires~30% of global top 1,0004 ~20% of Credit Suisse total net revenuesvs ~12% for global peers5 GDP growing at 8% p.a. vs 6% globally until 20242 Top #3 IBCM SoW8 Top 2 Private Bank6 with USD 361 bn of Client Business Volume7 APAC key stats Acceleration of investments across the region(e.g. China onshore, South East Asia, India) 1 World Bank, 2019 2 IMF WEO (October 2020), GDP at current prices based on PPP 3 Oliver Wyman; UHNWI defined as individuals with personal financial assets above USD 100 mn 4 Credit Suisse Wealth Report 2020, out of top 1,000 Forbes billionaires 5 Reflects net revenues of the APAC division and includes revenues related to the Asia Pacific region recognized in the Investment Bank and International Wealth Management; as of 3Q20, average for peers includes Citi, UBS, MS, GS, as of 3Q20 and JPM and BofA as of 2019 6 Asia Private Banker 2019 AuM league table 7 As of 3Q20 8 Dealogic 2020 YTD as of December 11, 2020 (APAC excl. Japan and onshore China among international banks)
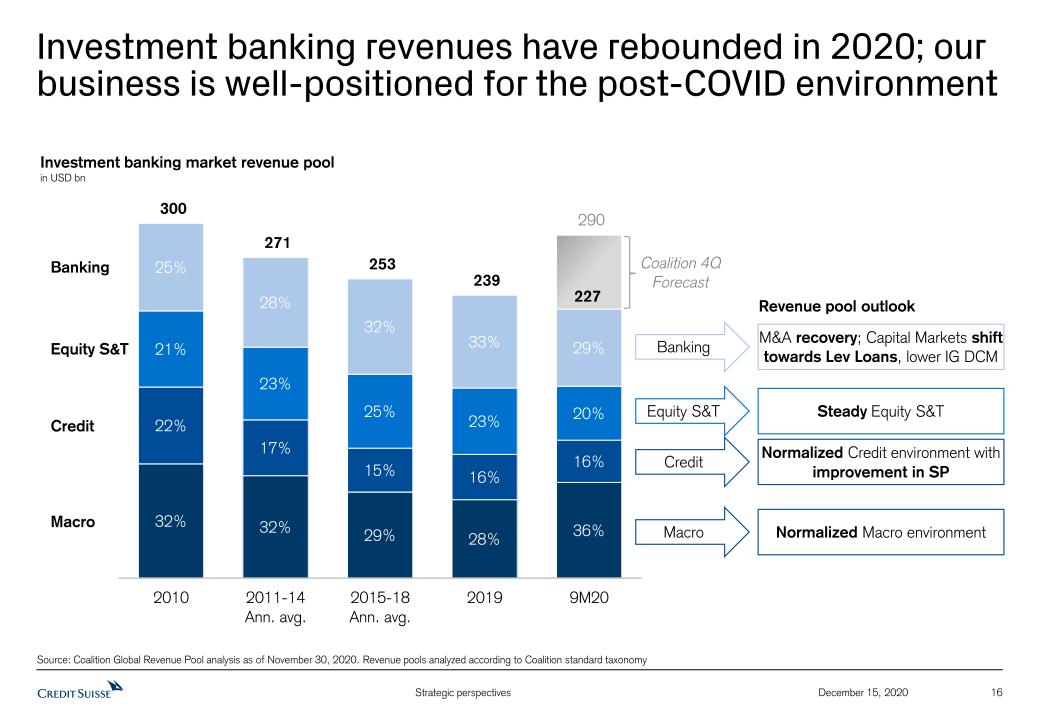
16 December 15, 2020 Investment banking revenues have rebounded in 2020; our business is well-positioned for the post-COVID environment Investment banking market revenue pool in USD bn Banking Equity S&T 227 Coalition 4Q Forecast Credit Macro Revenue pool outlook Source: Coalition Global Revenue Pool analysis as of November 30, 2020. Revenue pools analyzed according to Coalition standard taxonomy Banking Equity S&T Credit Macro M&A recovery; Capital Markets shift towards Lev Loans, lower IG DCM Steady Equity S&T Normalized Credit environment with improvement in SP Normalized Macro environment

17 December 15, 2020 Agenda 2021 and beyond: A new era for Credit Suisse with a clear growth agenda 4 Credit Suisse achievements in 2020 3 The year 2020 and COVID-19: A macro and banking sector perspective 2 Our strategic vision and our financial ambitions 1
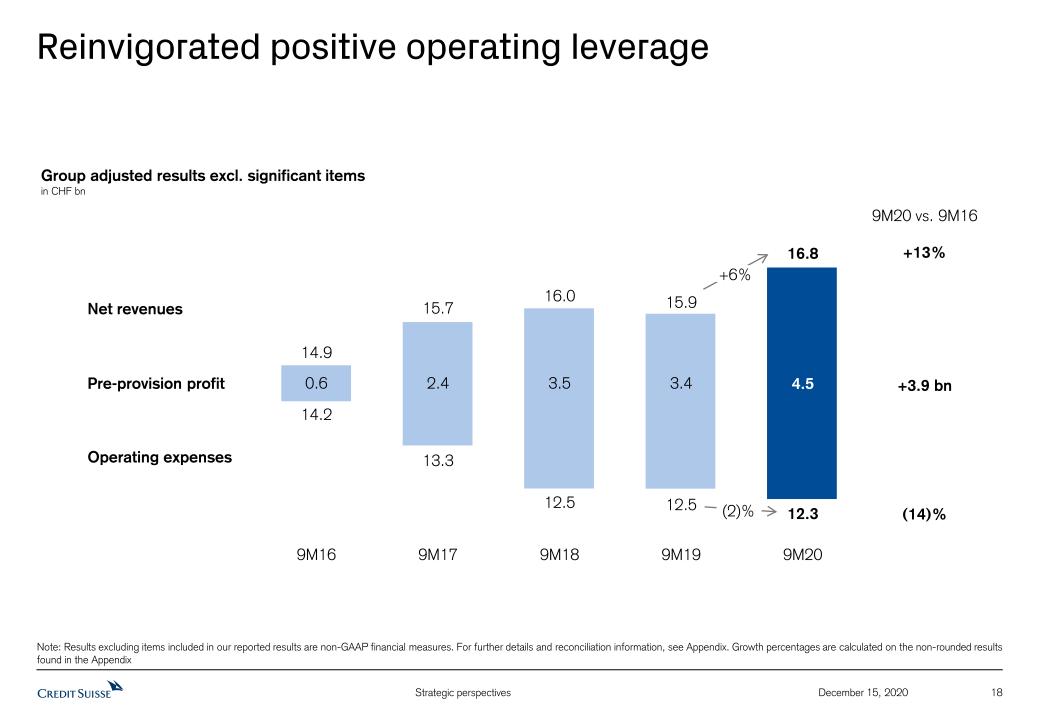
18 December 15, 2020 Reinvigorated positive operating leverage Note: Results excluding items included in our reported results are non-GAAP financial measures. For further details and reconciliation information, see Appendix. Growth percentages are calculated on the non-rounded results found in the Appendix Pre-provision profit Operating expenses Net revenues 9M17 9M18 9M19 9M20 13.3 12.5 12.5 12.3 15.7 16.0 15.9 16.8 2.4 3.5 3.4 4.5 Group adjusted results excl. significant itemsin CHF bn +6% (2)% 9M20 vs. 9M16 (14)% +3.9 bn +13% 0.6 9M16 14.2 14.9

19 December 15, 2020 Increasing RoTE despite high credit provisions ‡ RoTE is a non-GAAP financial measure, see Appendix1 Provision for credit losses related to loans held at amortized cost (annualized) as % of average gross loans held at amortized cost 2 For the period 2010-9M20 Return on tangible equity‡based on CHF Provision for credit lossesin CHF mn 252 210 245 324 1,104 2016 2017 2018 2019 9M20LTM 258 Average ~4x PCL ratio1in bps 10 7 7 10 41 Through-the-cycle <10 bps2
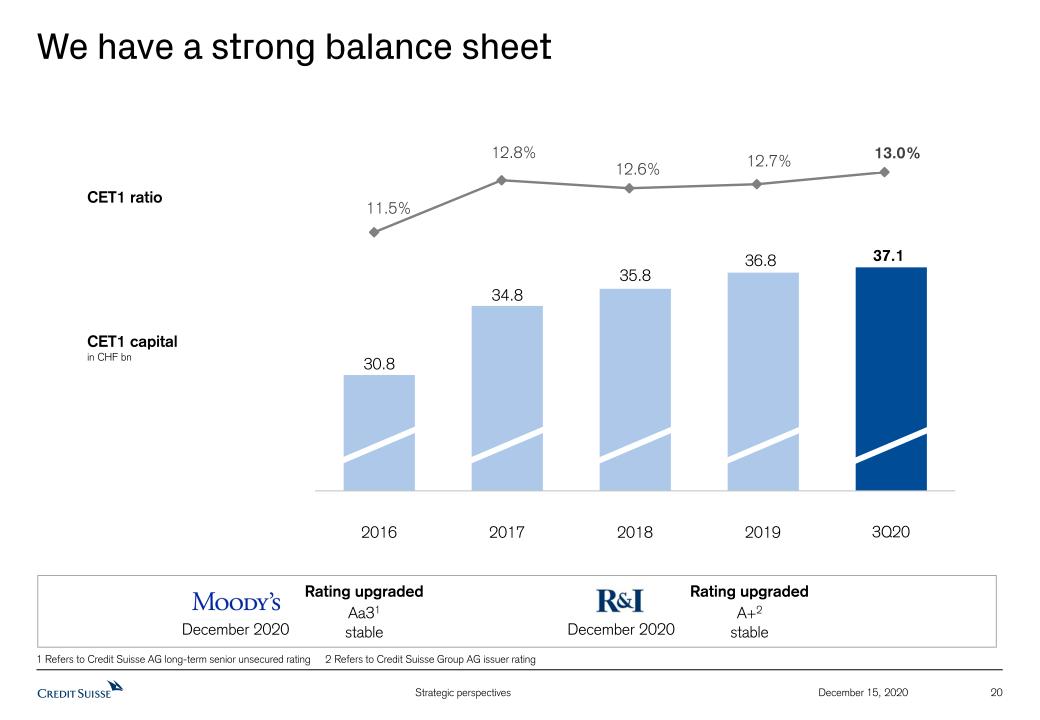
20 December 15, 2020 We have a strong balance sheet Rating upgraded Aa31stable December 2020 December 2020 Rating upgraded A+2stable CET1 capitalin CHF bn CET1 ratio 2016 2017 2018 2019 3Q20 1 Refers to Credit Suisse AG long-term senior unsecured rating 2 Refers to Credit Suisse Group AG issuer rating
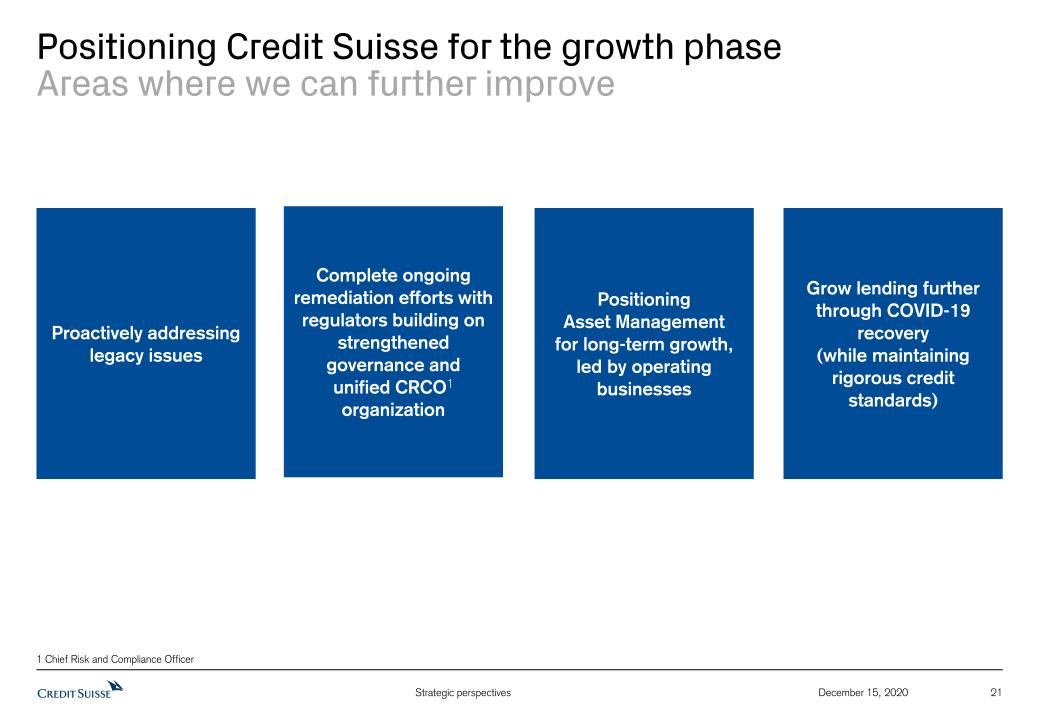
21 December 15, 2020 Positioning Credit Suisse for the growth phaseAreas where we can further improve Proactively addressing legacy issues Positioning Asset Management for long-term growth, led by operating businesses Grow lending further through COVID-19 recovery (while maintaining rigorous credit standards) Complete ongoing remediation efforts with regulators building on strengthened governance and unified CRCO1 organization 1 Chief Risk and Compliance Officer
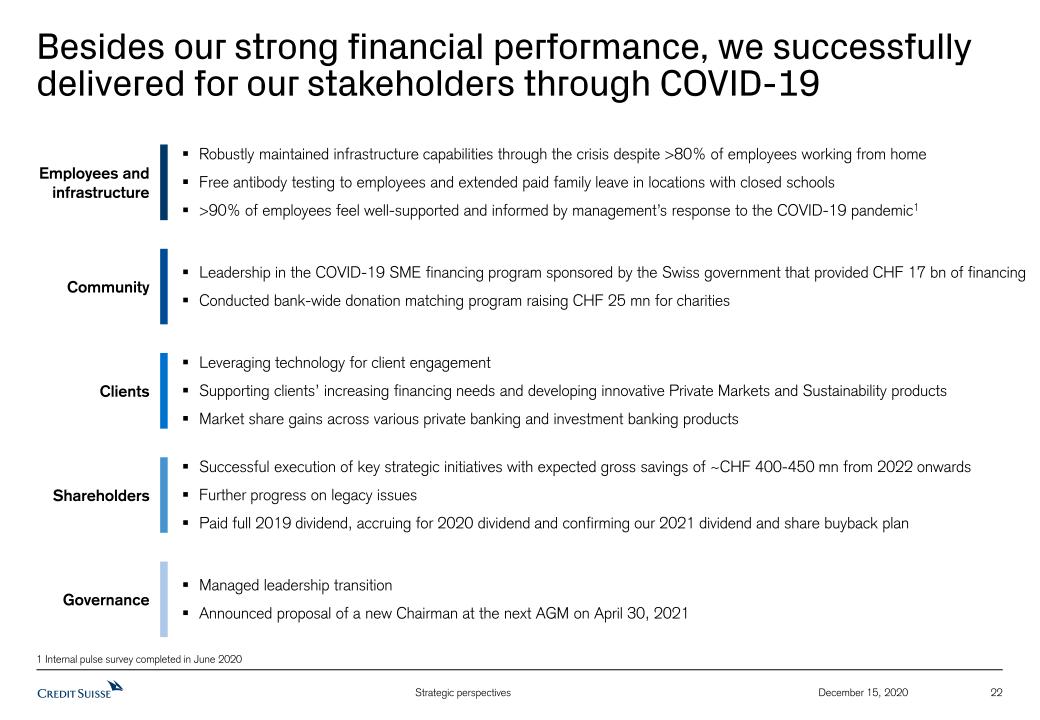
22 December 15, 2020 Besides our strong financial performance, we successfully delivered for our stakeholders through COVID-19 Clients Community Governance Employees and infrastructure Robustly maintained infrastructure capabilities through the crisis despite >80% of employees working from homeFree antibody testing to employees and extended paid family leave in locations with closed schools>90% of employees feel well-supported and informed by management’s response to the COVID-19 pandemic1 Leadership in the COVID-19 SME financing program sponsored by the Swiss government that provided CHF 17 bn of financingConducted bank-wide donation matching program raising CHF 25 mn for charities Leveraging technology for client engagementSupporting clients’ increasing financing needs and developing innovative Private Markets and Sustainability productsMarket share gains across various private banking and investment banking products Managed leadership transition Announced proposal of a new Chairman at the next AGM on April 30, 2021 Shareholders Successful execution of key strategic initiatives with expected gross savings of ~CHF 400-450 mn from 2022 onwardsFurther progress on legacy issuesPaid full 2019 dividend, accruing for 2020 dividend and confirming our 2021 dividend and share buyback plan 1 Internal pulse survey completed in June 2020
23 December 15, 2020 Agenda 2021 and beyond: A new era for Credit Suisse with a clear growth agenda 4 Credit Suisse achievements in 2020 3 The year 2020 and COVID-19: A macro and banking sector perspective 2 Our strategic vision and our financial ambitions 1

24 December 15, 2020 A new era for Credit Suisse with a clear growth agenda Improving Return on Tangible Equity‡…Based on CHF Deliver medium-term RoTE‡ ambition of 10-12% Accelerate Wealth Management growth Generate sustainable Investment Bank returns Be a leader in Sustainability Drive digitalization and operating leverage …towards our 10-12% RoTE‡ ambition 2017 2018 2019 9M20LTM ‡ RoTE is a non-GAAP financial measure, see Appendix
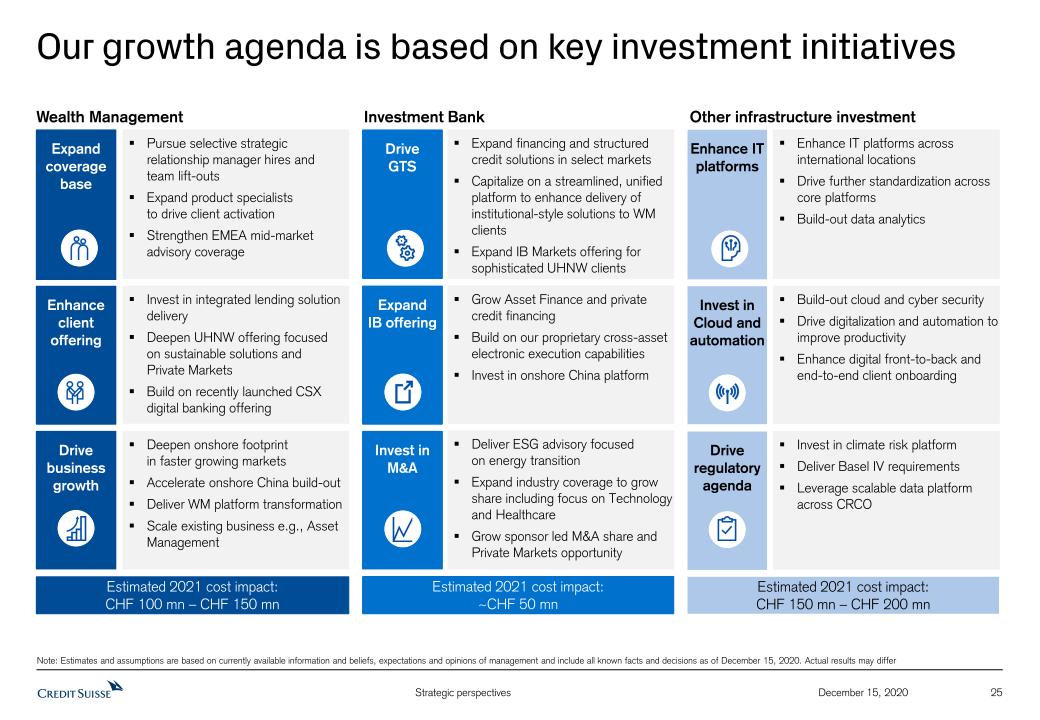
25 December 15, 2020 Our growth agenda is based on key investment initiatives Wealth Management Investment Bank Other infrastructure investment Note: Estimates and assumptions are based on currently available information and beliefs, expectations and opinions of management and include all known facts and decisions as of December 15, 2020. Actual results may differ Expand coverage base Pursue selective strategic relationship manager hires and team lift-outs Expand product specialists to drive client activationStrengthen EMEA mid-market advisory coverage Estimated 2021 cost impact: CHF 100 mn – CHF 150 mn Enhance client offering Invest in integrated lending solution deliveryDeepen UHNW offering focused on sustainable solutions and Private MarketsBuild on recently launched CSX digital banking offering Drive business growth Deepen onshore footprint in faster growing marketsAccelerate onshore China build-outDeliver WM platform transformationScale existing business e.g., Asset Management Drive GTS Expand financing and structured credit solutions in select marketsCapitalize on a streamlined, unified platform to enhance delivery of institutional-style solutions to WM clientsExpand IB Markets offering for sophisticated UHNW clients Estimated 2021 cost impact: ~CHF 50 mn Expand IB offering Grow Asset Finance and private credit financingBuild on our proprietary cross-asset electronic execution capabilitiesInvest in onshore China platform Invest in M&A Deliver ESG advisory focused on energy transitionExpand industry coverage to grow share including focus on Technology and HealthcareGrow sponsor led M&A share and Private Markets opportunity Enhance IT platforms Enhance IT platforms across international locationsDrive further standardization across core platformsBuild-out data analytics Estimated 2021 cost impact: CHF 150 mn – CHF 200 mn Invest in Cloud and automation Build-out cloud and cyber securityDrive digitalization and automation to improve productivityEnhance digital front-to-back and end-to-end client onboarding Driveregulatoryagenda Invest in climate risk platformDeliver Basel IV requirementsLeverage scalable data platform across CRCO
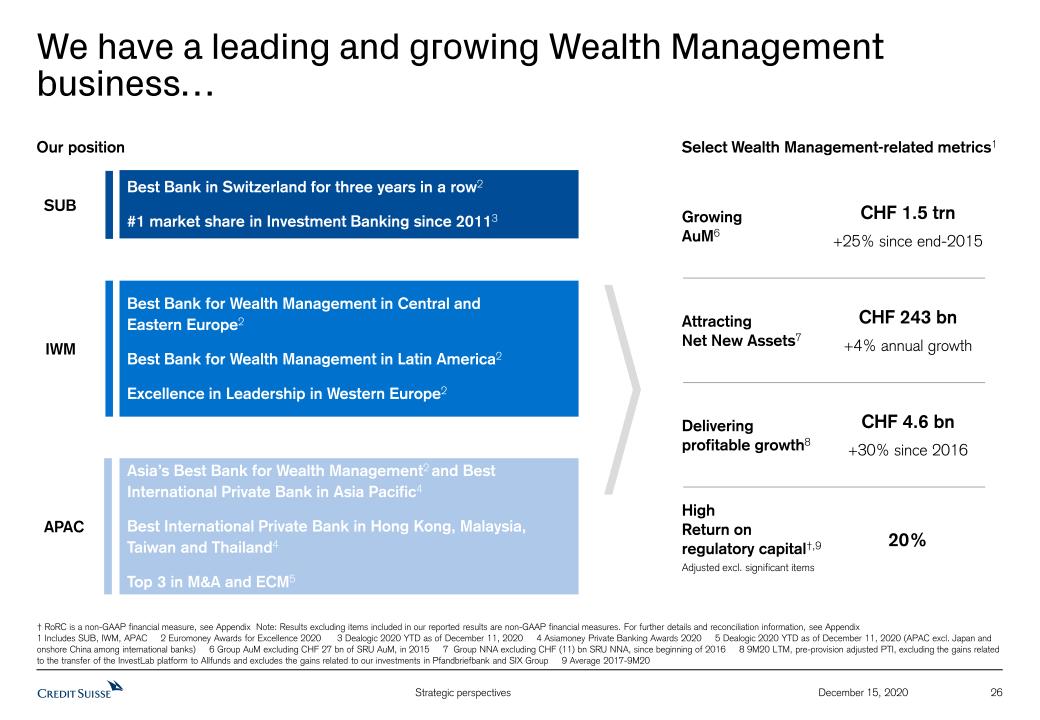
Asia’s Best Bank for Wealth Management2 and Best International Private Bank in Asia Pacific4Best International Private Bank in Hong Kong, Malaysia, Taiwan and Thailand4Top 3 in M&A and ECM5 Best Bank for Wealth Management in Central and Eastern Europe2Best Bank for Wealth Management in Latin America2Excellence in Leadership in Western Europe2 Best Bank in Switzerland for three years in a row2#1 market share in Investment Banking since 20113 26 December 15, 2020 We have a leading and growing Wealth Management business… † RoRC is a non-GAAP financial measure, see Appendix Note: Results excluding items included in our reported results are non-GAAP financial measures. For further details and reconciliation information, see Appendix1 Includes SUB, IWM, APAC 2 Euromoney Awards for Excellence 2020 3 Dealogic 2020 YTD as of December 11, 2020 4 Asiamoney Private Banking Awards 2020 5 Dealogic 2020 YTD as of December 11, 2020 (APAC excl. Japan and onshore China among international banks) 6 Group AuM excluding CHF 27 bn of SRU AuM, in 2015 7 Group NNA excluding CHF (11) bn SRU NNA, since beginning of 2016 8 9M20 LTM, pre-provision adjusted PTI, excluding the gains related to the transfer of the InvestLab platform to Allfunds and excludes the gains related to our investments in Pfandbriefbank and SIX Group 9 Average 2017-9M20 IWM SUB APAC Our position Growing AuM6 Attracting Net New Assets7 Delivering profitable growth8 HighReturn on regulatory capital†,9Adjusted excl. significant items CHF 1.5 trn+25% since end-2015 CHF 243 bn+4% annual growth CHF 4.6 bn+30% since 2016 20% Select Wealth Management-related metrics1

27 December 15, 2020 …with best-in-class net margins Source: Company filings, in reporting currencyNote: Results excluding items included in our reported results are non-GAAP financial measures. For further details and reconciliation information, see Appendix; Credit Suisse includes SUB PC, IWM PB and APAC; Peers include Bank of America GWIM, JP Morgan WM, Julius Baer, Morgan Stanley WM and UBS GWM; Julius Baer; JP Morgan WM cost-to-income ratio not available, derived from pre-tax margin instead 1 Based on adjusted revenues and expenses where available; Credit Suisse also excludes the gains related to the transfer of the InvestLab fund platform to Allfunds Group in 1Q20 and to the equity investment revaluation of Pfandbriefbank in 2Q20 Wealth management – Net margin1 vs. improvement in cost/income ratio1 Net margin – 9M201 in bps Cost/income ratio improvement – 9M20 vs. 2016 Lower C/I ratio Higher C/I ratio
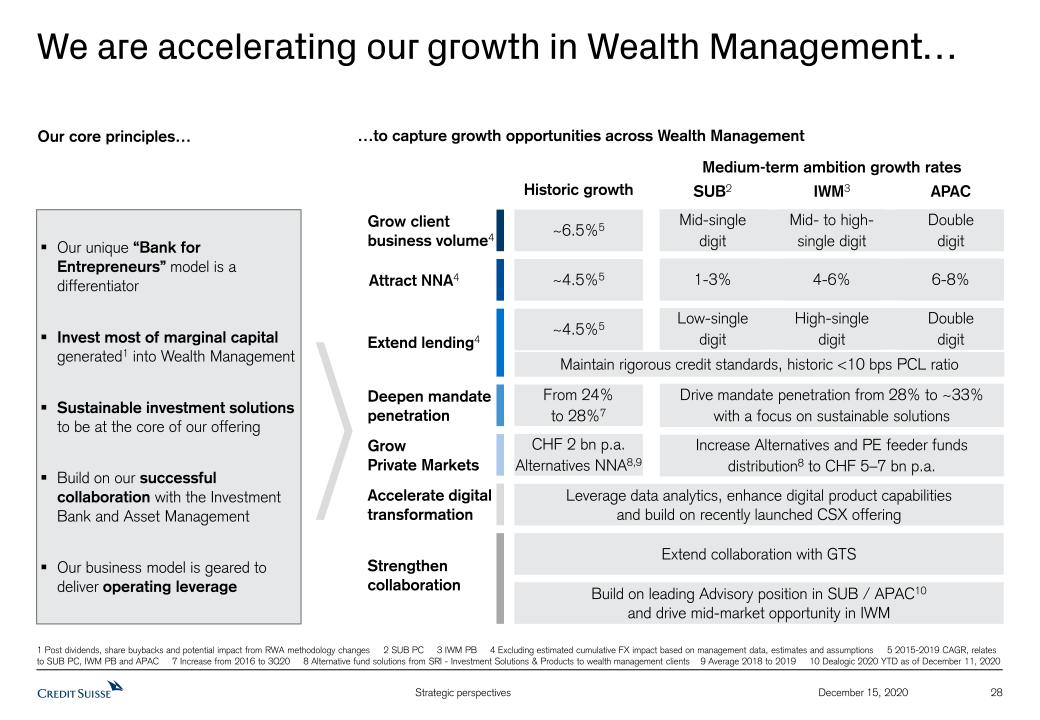
28 December 15, 2020 We are accelerating our growth in Wealth Management… Our unique “Bank for Entrepreneurs” model is a differentiator Invest most of marginal capital generated1 into Wealth Management Sustainable investment solutions to be at the core of our offering Build on our successful collaboration with the Investment Bank and Asset ManagementOur business model is geared to deliver operating leverage Our core principles… …to capture growth opportunities across Wealth Management 1 Post dividends, share buybacks and potential impact from RWA methodology changes 2 SUB PC 3 IWM PB 4 Excluding estimated cumulative FX impact based on management data, estimates and assumptions 5 2015-2019 CAGR, relates to SUB PC, IWM PB and APAC 7 Increase from 2016 to 3Q20 8 Alternative fund solutions from SRI - Investment Solutions & Products to wealth management clients 9 Average 2018 to 2019 10 Dealogic 2020 YTD as of December 11, 2020 Grow client business volume4 Attract NNA4 Extend lending4 Strengthen collaboration Deepen mandate penetration Extend collaboration with GTS Build on leading Advisory position in SUB / APAC10 and drive mid-market opportunity in IWM GrowPrivate Markets Leverage data analytics, enhance digital product capabilities and build on recently launched CSX offering Accelerate digital transformation SUB2 IWM3 APAC Medium-term ambition growth rates Drive mandate penetration from 28% to ~33% with a focus on sustainable solutions Mid-singledigit Mid- to high-single digit Double digit Low-singledigit High-singledigit Double digit 1-3% 4-6% 6-8% Increase Alternatives and PE feeder funds distribution8 to CHF 5–7 bn p.a. Maintain rigorous credit standards, historic <10 bps PCL ratio CHF 2 bn p.a. Alternatives NNA8,9 ~6.5%5 ~4.5%5 Historic growth From 24% to 28%7 ~4.5%5

Growth trajectory 29 December 15, 2020 …and are expecting a rebound in our Asset Management performance… Continue to scale market-leading franchises Expand alternatives, alternatives-lite and private market offerings Accelerate focus on ESG Leverage Wealth Management for distribution Our strategic priorities… …to capture Asset Management growth potentialPre-tax income, in CHF mn † RoRC is a non-GAAP financial measure, see Appendix Note: Results excluding items included in our reported results are non-GAAP financial measures. Excluding ~USD 450 mn impairment of interest in York Capital Management Medium-term RoRC† ambition >40%
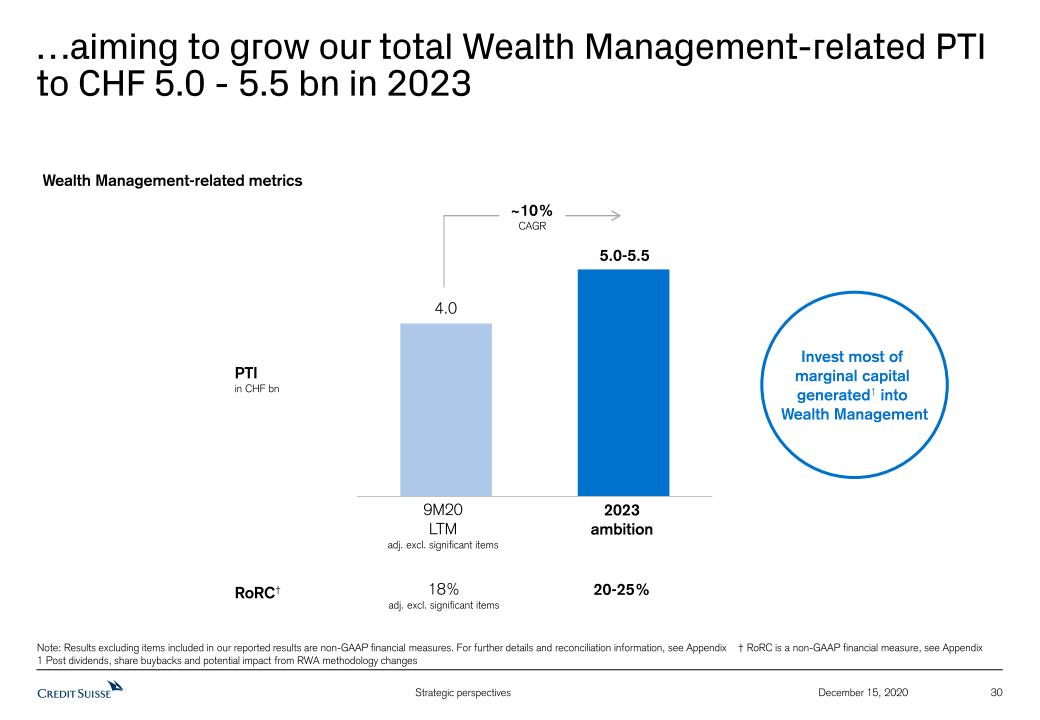
30 December 15, 2020 …aiming to grow our total Wealth Management-related PTI to CHF 5.0 - 5.5 bn in 2023 Note: Results excluding items included in our reported results are non-GAAP financial measures. For further details and reconciliation information, see Appendix † RoRC is a non-GAAP financial measure, see Appendix 1 Post dividends, share buybacks and potential impact from RWA methodology changes 18%adj. excl. significant items 20-25% Invest most of marginal capital generated1 into Wealth Management Wealth Management-related metrics ~10%CAGR PTIin CHF bn RoRC† 2023ambition 5.0-5.5 9M20LTMadj. excl. significant items
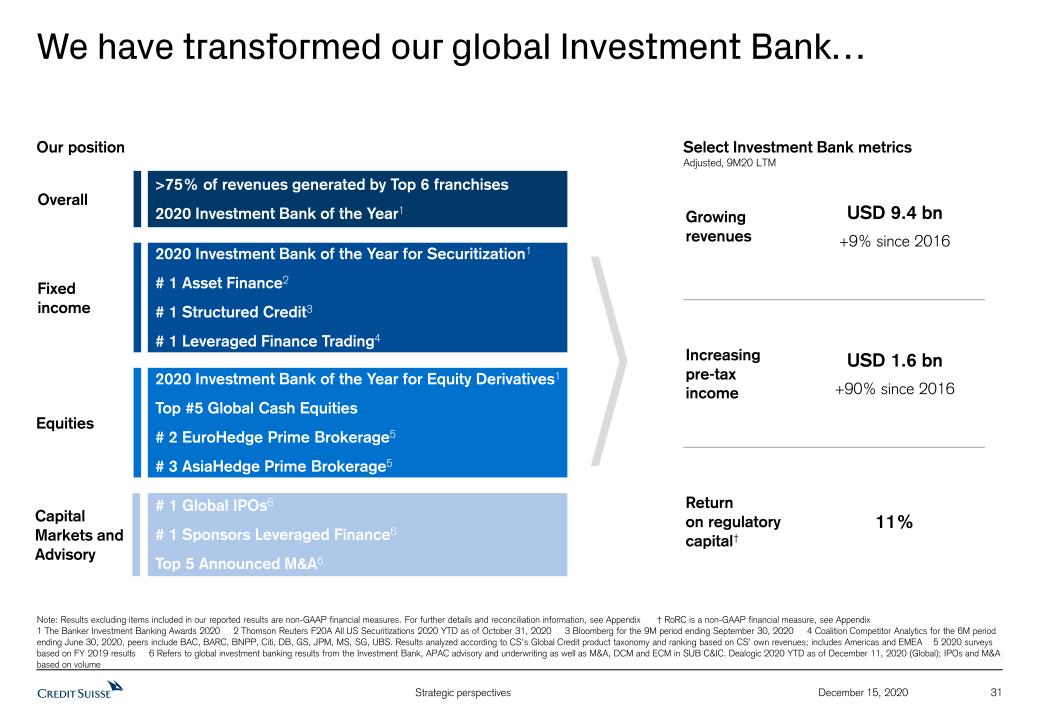
# 1 Global IPOs6# 1 Sponsors Leveraged Finance6Top 5 Announced M&A6 2020 Investment Bank of the Year for Equity Derivatives1Top #5 Global Cash Equities# 2 EuroHedge Prime Brokerage5# 3 AsiaHedge Prime Brokerage5 2020 Investment Bank of the Year for Securitization1 # 1 Asset Finance2# 1 Structured Credit3# 1 Leveraged Finance Trading4 >75% of revenues generated by Top 6 franchises2020 Investment Bank of the Year1 31 December 15, 2020 We have transformed our global Investment Bank… Our position Note: Results excluding items included in our reported results are non-GAAP financial measures. For further details and reconciliation information, see Appendix † RoRC is a non-GAAP financial measure, see Appendix 1 The Banker Investment Banking Awards 2020 2 Thomson Reuters F20A All US Securitizations 2020 YTD as of October 31, 2020 3 Bloomberg for the 9M period ending September 30, 2020 4 Coalition Competitor Analytics for the 6M period ending June 30, 2020, peers include BAC, BARC, BNPP, Citi, DB, GS, JPM, MS, SG, UBS. Results analyzed according to CS’s Global Credit product taxonomy and ranking based on CS’ own revenues; includes Americas and EMEA 5 2020 surveys based on FY 2019 results 6 Refers to global investment banking results from the Investment Bank, APAC advisory and underwriting as well as M&A, DCM and ECM in SUB C&IC. Dealogic 2020 YTD as of December 11, 2020 (Global); IPOs and M&A based on volume Capital Markets and Advisory Equities Fixed income Overall Growing revenues Increasing pre-tax income Return on regulatory capital† USD 9.4 bn+9% since 2016 USD 1.6 bn+90% since 2016 11% Select Investment Bank metricsAdjusted, 9M20 LTM

32 December 15, 2020 …focused on driving sustainable returns Building on a diversified, balanced and integrated Investment BankReduced revenue and earnings volatility Growing connectivity to Wealth Management through GTSDelivering institutional-style solution to Wealth Management clients Investing in our market-leading businesses across Equities, Fixed Income and BankingDisciplined investment in people, capital and technology focused on revenue growth …to deliver our medium-term RoRC† ambition Focused execution… Note: Results excluding items included in our reported results are non-GAAP financial measures. For further details and reconciliation information, see Appendix † RoRC is a non-GAAP financial measure, see Appendix; RoRC based on USD 2019adjusted Medium-term ambition 9M20 LTMadjusted Business mix well positioned forpost-COVID market environmentExpected recovery in M&A and Asset Finance; capital markets activity driven Leveraged Finance; more tailored offering in Macro;expect normalized credit loss provisions
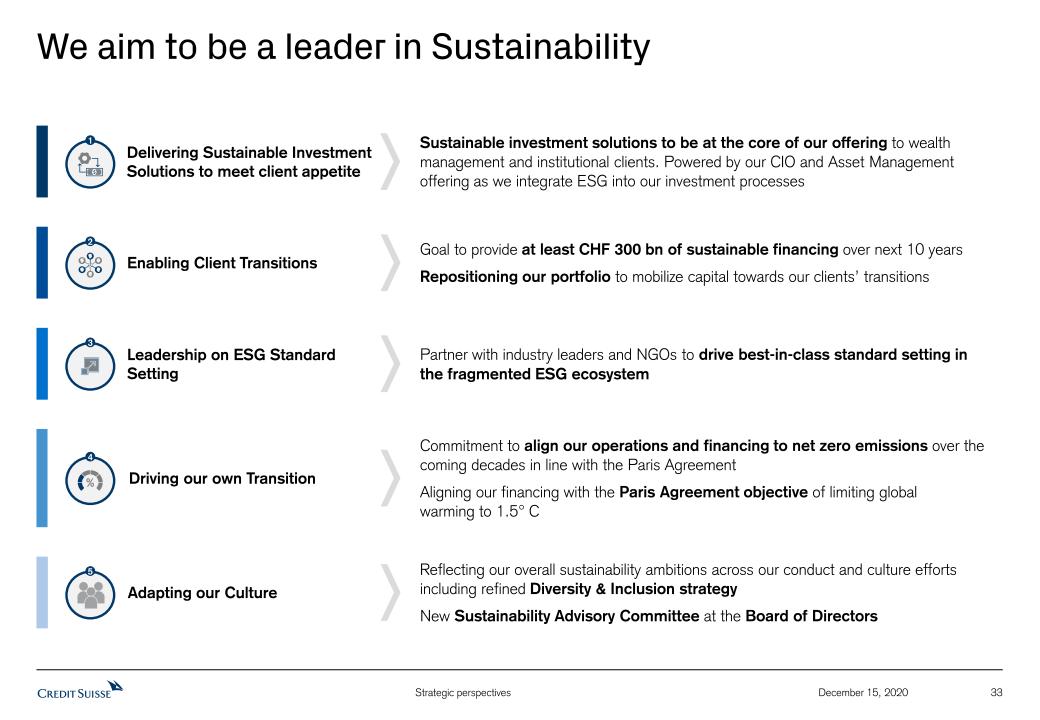
33 December 15, 2020 We aim to be a leader in Sustainability Delivering Sustainable Investment Solutions to meet client appetite Sustainable investment solutions to be at the core of our offering to wealth management and institutional clients. Powered by our CIO and Asset Management offering as we integrate ESG into our investment processes 1 Driving our own Transition Commitment to align our operations and financing to net zero emissions over the coming decades in line with the Paris Agreement Aligning our financing with the Paris Agreement objective of limiting global warming to 1.5° C 4 Enabling Client Transitions Goal to provide at least CHF 300 bn of sustainable financing over next 10 years Repositioning our portfolio to mobilize capital towards our clients’ transitions 2 Adapting our Culture Reflecting our overall sustainability ambitions across our conduct and culture efforts including refined Diversity & Inclusion strategy New Sustainability Advisory Committee at the Board of Directors Leadership on ESG Standard Setting Partner with industry leaders and NGOs to drive best-in-class standard setting in the fragmented ESG ecosystem 3 5

34 December 15, 2020 In summary, we are focused on delivering attractive shareholder value Continued innovation in digitalization and automation, driving positive operating leverage Deliver RoRC† of 20-25%2 Deliver PTI of CHF 5.0-5.5 bn2 in 2023 Accelerate Wealth Management growth Deliver RoRC† of 10-15% Drive sustainable Investment Bank returns Be a leader in sustainability Invest most of marginal capital generated1 into Wealth Management Grow TBVPS‡ and provide attractive capital returns through dividends and share buybacks Deliver medium-term RoTE‡ of 10-12% † RoRC is a non-GAAP financial measure, see Appendix ‡ RoTE and TBVPS are non-GAAP financial measures, see Appendix 1 Post dividends, share buybacks and potential impact from RWA methodology changes 2 Includes SUB, IWM and APAC
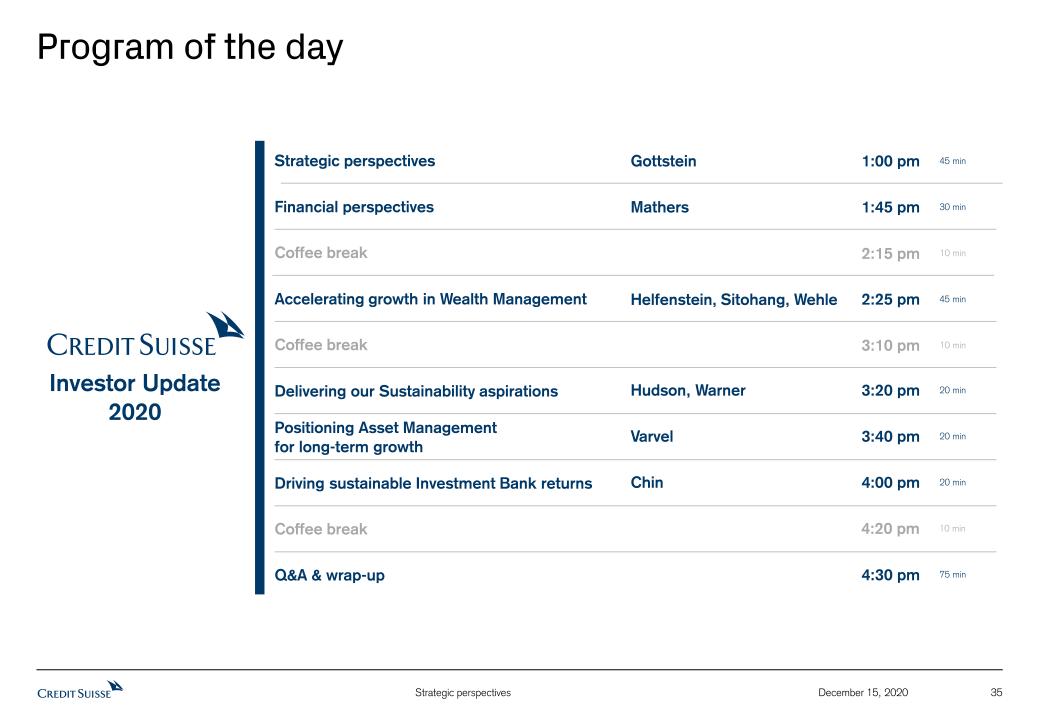
35 December 15, 2020 Program of the day Investor Update 2020 Coffee break 4:20 pm 10 min Strategic perspectives 1:00 pm Gottstein 45 min Coffee break 3:10 pm 10 min Financial perspectives 1:45 pm 30 min Mathers Coffee break 2:15 pm 10 min Accelerating growth in Wealth Management 2:25 pm Helfenstein, Sitohang, Wehle 45 min Delivering our Sustainability aspirations 3:20 pm Hudson, Warner 20 min Positioning Asset Management for long-term growth 3:40 pm 20 min Varvel Driving sustainable Investment Bank returns 4:00 pm 20 min Chin Q&A & wrap-up 4:30 pm 75 min
Appendix 36 December 15, 2020
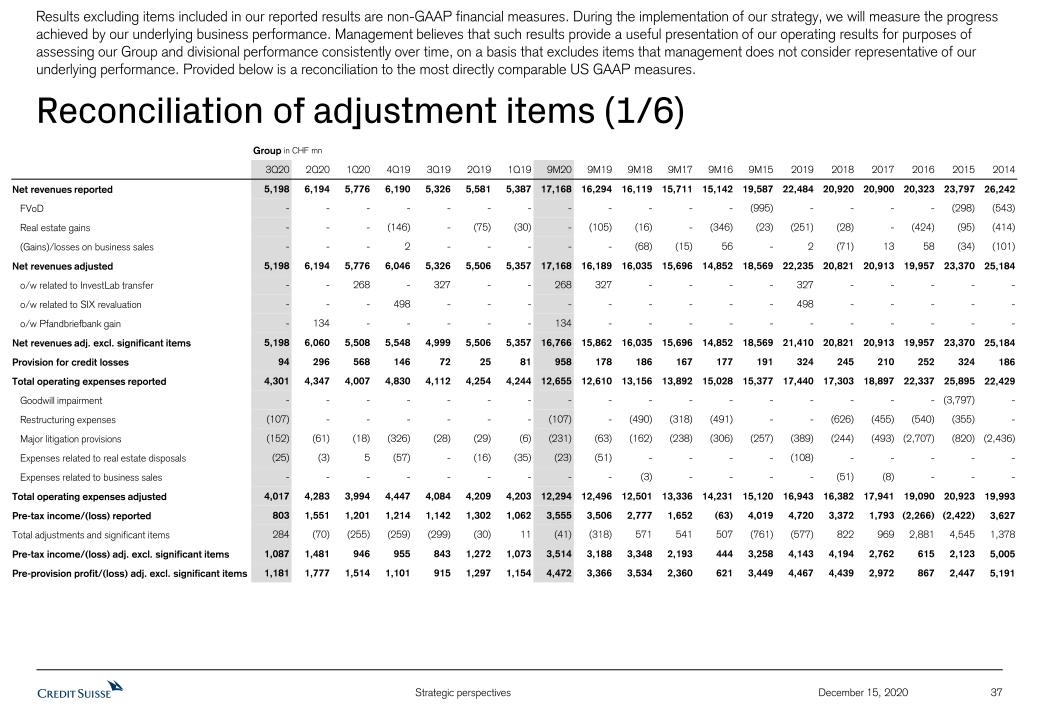
37 Reconciliation of adjustment items (1/6) Results excluding items included in our reported results are non-GAAP financial measures. During the implementation of our strategy, we will measure the progress achieved by our underlying business performance. Management believes that such results provide a useful presentation of our operating results for purposes of assessing our Group and divisional performance consistently over time, on a basis that excludes items that management does not consider representative of our underlying performance. Provided below is a reconciliation to the most directly comparable US GAAP measures. December 15, 2020 Group in CHF mn 3Q20 2Q20 1Q20 4Q19 3Q19 2Q19 1Q19 9M20 9M19 9M18 9M17 9M16 9M15 2019 2018 2017 2016 2015 2014 Net revenues reported 5,198 6,194 5,776 6,190 5,326 5,581 5,387 17,168 16,294 16,119 15,711 15,142 19,587 22,484 20,920 20,900 20,323 23,797 26,242 FVoD - - - - - - - - - - - - (995) - - - - (298) (543) Real estate gains - - - (146) - (75) (30) - (105) (16) - (346) (23) (251) (28) - (424) (95) (414) (Gains)/losses on business sales - - - 2 - - - - - (68) (15) 56 - 2 (71) 13 58 (34) (101) Net revenues adjusted 5,198 6,194 5,776 6,046 5,326 5,506 5,357 17,168 16,189 16,035 15,696 14,852 18,569 22,235 20,821 20,913 19,957 23,370 25,184 o/w related to InvestLab transfer - - 268 - 327 - - 268 327 - - - - 327 - - - - - o/w related to SIX revaluation - - - 498 - - - - - - - - - 498 - - - - - o/w Pfandbriefbank gain - 134 - - - - - 134 - - - - - - - - - - - Net revenues adj. excl. significant items 5,198 6,060 5,508 5,548 4,999 5,506 5,357 16,766 15,862 16,035 15,696 14,852 18,569 21,410 20,821 20,913 19,957 23,370 25,184 Provision for credit losses 94 296 568 146 72 25 81 958 178 186 167 177 191 324 245 210 252 324 186 Total operating expenses reported 4,301 4,347 4,007 4,830 4,112 4,254 4,244 12,655 12,610 13,156 13,892 15,028 15,377 17,440 17,303 18,897 22,337 25,895 22,429 Goodwill impairment - - - - - - - - - - - - - - - - - (3,797) - Restructuring expenses (107) - - - - - - (107) - (490) (318) (491) - - (626) (455) (540) (355) - Major litigation provisions (152) (61) (18) (326) (28) (29) (6) (231) (63) (162) (238) (306) (257) (389) (244) (493) (2,707) (820) (2,436) Expenses related to real estate disposals (25) (3) 5 (57) - (16) (35) (23) (51) - - - - (108) - - - - - Expenses related to business sales - - - - - - - - - (3) - - - - (51) (8) - - - Total operating expenses adjusted 4,017 4,283 3,994 4,447 4,084 4,209 4,203 12,294 12,496 12,501 13,336 14,231 15,120 16,943 16,382 17,941 19,090 20,923 19,993 Pre-tax income/(loss) reported 803 1,551 1,201 1,214 1,142 1,302 1,062 3,555 3,506 2,777 1,652 (63) 4,019 4,720 3,372 1,793 (2,266) (2,422) 3,627 Total adjustments and significant items 284 (70) (255) (259) (299) (30) 11 (41) (318) 571 541 507 (761) (577) 822 969 2,881 4,545 1,378 Pre-tax income/(loss) adj. excl. significant items 1,087 1,481 946 955 843 1,272 1,073 3,514 3,188 3,348 2,193 444 3,258 4,143 4,194 2,762 615 2,123 5,005 Pre-provision profit/(loss) adj. excl. significant items 1,181 1,777 1,514 1,101 915 1,297 1,154 4,472 3,366 3,534 2,360 621 3,449 4,467 4,439 2,972 867 2,447 5,191

38 Reconciliation of adjustment items (2/6) December 15, 2020 SUB in CHF mn SUB PC in CHF mn SUB C&IC in CHF mn IWM in CHF mn IWM PB in CHF mn IWM AM in CHF mn LTM1 9M20 9M19 LTM1 9M20 9M19 LTM1 9M20 9M19 LTM1 9M20 9M19 LTM1 9M20 9M19 LTM1 9M20 9M19 Net revenues reported 5,956 4,222 4,171 3,273 2,305 2,218 2,683 1,917 1,953 5,521 3,885 4,180 3,959 2,773 2,995 1,562 1,112 1,185 Real estate gains (106) - (117) (104) - (117) (2) - - (32) - (13) (32) - (13) - - - (Gains)/losses on business sales - - - - - - - - - - - - - - - - - - Net revenues adjusted 5,850 4,222 4,054 3,169 2,305 2,101 2,681 1,917 1,953 5,489 3,885 4,167 3,927 2,773 2,982 1,562 1,112 1,185 o/w related to InvestLab transfer 25 25 98 - - - 25 25 98 218 218 131 15 15 131 203 203 - o/w related to SIX revaluation 306 - - 149 - - 157 - - 192 - - 192 - - - - - o/w Pfandbriefbank gain 134 134 - 134 134 - - - - - - - - - - - - - Net revenues adj. excl. significant items 5,385 4,063 3,956 2,886 2,171 2,101 2,499 1,892 1,855 5,079 3,667 4,036 3,720 2,758 2,851 1,359 909 1,185 Provision for credit losses 247 204 66 56 45 35 191 159 31 102 85 32 96 79 31 6 6 1 Total operating expenses reported 3,225 2,401 2,399 1,920 1,437 1,375 1,305 964 1,024 3,725 2,736 2,713 2,574 1,896 1,869 1,151 840 844 Restructuring expenses (41) (41) - (36) (36) - (5) (5) - (29) (29) - (16) (16) - (13) (13) - Major litigation provisions (1) (1) (3) - - - (1) (1) (3) 15 12 27 15 12 27 - - - Expenses related to real estate disposals (2) - (10) (1) - (7) (1) - (3) (12) (3) (12) (9) (2) (10) (3) (1) (2) Expenses related to business sales - - - - - - - - - - - - - - - - - - Total operating expenses adjusted 3,181 2,359 2,386 1,883 1,401 1,368 1,298 958 1,018 3,699 2,716 2,728 2,564 1,890 1,886 1,135 826 842 Pre-tax income/(loss) reported 2,484 1,617 1,706 1,297 823 808 1,187 794 898 1,694 1,064 1,435 1,289 798 1,095 405 266 340 Total adjustments and significant items (527) (117) (202) (350) (98) (110) (177) (19) (92) (416) (198) (159) (229) (9) (161) (187) (189) 2 Pre-tax income/(loss) adj. excl. significant items 1,957 1,500 1,504 947 725 698 1,010 775 806 1,278 866 1,276 1,060 789 934 218 77 342 Pre-provision profit/(loss) adj. excl. significant items 2,204 1,704 1,570 1,003 770 733 1,201 934 837 1,380 951 1,308 1,156 868 965 224 83 343 1 9M20 LTM Results excluding items included in our reported results are non-GAAP financial measures. During the implementation of our strategy, we will measure the progress achieved by our underlying business performance. Management believes that such results provide a useful presentation of our operating results for purposes of assessing our Group and divisional performance consistently over time, on a basis that excludes items that management does not consider representative of our underlying performance. Provided below is a reconciliation to the most directly comparable US GAAP measures.

39 Reconciliation of adjustment items (3/6) December 15, 2020 APAC in CHF mn Total WM2 in CHF mn WM-related3 in CHF mn IB in USD mn LTM1 9M20 9M19 LTM1 9M20 9M19 LTM1 9M20 9M19 LTM1 9M20 9M19 2019 2018 2017 2016 Net revenues reported 3,121 2,371 2,279 10,353 7,449 7,492 14,598 10,478 10,630 9,358 7,381 6,239 8,216 8,215 8,688 8,572 Real estate gains - - - (136) - (130) (138) - (130) (7) - - (7) - - - (Gains)/losses on business sales - - - - - - - - - - - - - - - - Net revenues adjusted 3,121 2,371 2,279 10,217 7,449 7,362 14,460 10,478 10,500 9,351 7,381 6,239 8,209 8,215 8,688 8,572 o/w related to InvestLab transfer 25 25 98 40 40 229 268 268 327 - - - - o/w related to SIX revaluation - - - 341 - - 498 - - - - - - - - - o/w Pfandbriefbank gain - - - 134 134 - 134 134 - - - - - - - - Net revenues adj. excl. significant items 3,096 2,346 2,181 9,702 7,275 7,133 13,560 10,076 10,173 9,351 7,381 6,239 8,209 8,215 8,688 8,572 Provision for credit losses 244 230 41 396 354 107 593 519 139 516 447 36 105 52 61 15 Total operating expenses reported 2,085 1,550 1,517 6,579 4,883 4,761 9,035 6,687 6,629 7,343 5,492 5,227 7,078 7,313 7,573 7,998 Restructuring expenses (2) (2) - (54) (54) - (72) (72) - (36) (36) - - (360) (235) (288) Major litigation provisions - - - 15 12 27 14 11 24 (25) (25) - - (12) - (7) Expenses related to real estate disposals - - - (10) (2) (17) (14) (3) (22) (69) (22) (31) (78) - - - Expenses related to business sales - - - - - - - - - - - - - - (8) - Total operating expenses adjusted 2,083 1,548 1,517 6,530 4,839 4,771 8,963 6,623 6,631 7,213 5,409 5,196 7,000 6,941 7,330 7,703 Pre-tax income/(loss) reported 792 591 721 3,378 2,212 2,624 4,970 3,272 3,862 1,499 1,442 976 1,033 850 1,054 559 Total adjustments and significant items (23) (23) (98) (602) (130) (369) (966) (338) (459) 123 83 31 71 372 243 295 Pre-tax income/(loss) adj. excl. significant items 769 568 623 2,776 2,082 2,255 4,004 2,934 3,403 1,622 1,525 1,007 1,104 1,222 1,297 854 Pre-provision profit/(loss) adj. excl. significant items 1,013 798 664 3,172 2,436 2,362 4,597 3,453 3,542 2,138 1,972 1,043 1,209 1,274 1,358 869 1 9M20 LTM 2 SUB PC, IWM PB and APAC 3 SUB, IWM and APAC Results excluding items included in our reported results are non-GAAP financial measures. During the implementation of our strategy, we will measure the progress achieved by our underlying business performance. Management believes that such results provide a useful presentation of our operating results for purposes of assessing our Group and divisional performance consistently over time, on a basis that excludes items that management does not consider representative of our underlying performance. Provided below is a reconciliation to the most directly comparable US GAAP measures.

40 Reconciliation of adjustment items (4/6) December 15, 2020 Note: Figures at FXC are at constant average 9M19 FX rates 1 SUB PC, IWM PB and APAC Total WM1 in CHF mn 9M20 9M19 Net revenues reported 7,449 7,492 o/w FX impact (315) - Net revenues reported at FXC 7,764 7,492 o/w Real estate gains - 130 o/w related to InvestLab transfer 40 229 o/w Pfandbriefbank gain 134 - Net revenues adj. excl. significant items at FXC 7,590 7,133 Net interest income 3,002 3,005 o/w FX impact (92) - Net interest income at FXC 3,094 3,005 Recurring commissions & fees 1,680 1,784 o/w FX impact (83) - Recurring commissions & fees at FXC 1,763 1,784 Transaction-based revenues 2,599 2,346 o/w FX impact (137) - Transaction-based revenues at FXC 2,736 2,346 Group in CHF mn 9M20 9M19 Net revenues adj. excl. significant items 16,766 15,862 o/w FX impact (763) - Net revenues adj. excl. significant items at FXC 17,529 15,862 Provision for credit losses 958 178 o/w FX impact (29) - Provision for credit losses at FXC 987 178 Total operating expenses adjusted 12,294 12,496 o/w FX impact (557) - Total operating expenses adjusted at FXC 12,851 12,496 Pre-tax income/(loss) adj. excl. significant items 3,514 3,188 o/w FX impact (177) - Pre-tax income/(loss) adj. excl. significant items at FXC 3,691 3,188 Pre-provision profit/(loss) adj. excl. significant items at FXC 4,678 3,366 Results excluding items included in our reported results are non-GAAP financial measures. During the implementation of our strategy, we will measure the progress achieved by our underlying business performance. Management believes that such results provide a useful presentation of our operating results for purposes of assessing our Group and divisional performance consistently over time, on a basis that excludes items that management does not consider representative of our underlying performance. Provided below is a reconciliation to the most directly comparable US GAAP measures.

41 Reconciliation of adjustment items (5/6) December 15, 2020 SUB in CHF mn IWM in CHF mn APAC in CHF mn WM-related1 in CHF mn 2019 2018 2017 2016 2019 2018 2017 2016 2019 2018 2017 2016 2019 2018 2017 2016 Net revenues reported 5,905 5,443 5,314 5,720 5,816 5,320 5,055 4,721 3,029 2,759 2,814 2,658 14,750 13,522 13,183 13,099 Real estate gains (223) (21) - (366) (45) (2) - (54) - - - - (268) (23) - (420) (Gains)/losses on business sales - (37) - - - (55) 28 - - - - - - (92) 28 - Net revenues adjusted 5,682 5,385 5,314 5,354 5,771 5,263 5,083 4,667 3,029 2,759 2,814 2,658 14,482 13,407 13,211 12,679 o/w related to InvestLab transfer 98 - - - 131 - - - 98 - - - 327 - - - o/w related to SIX revaluation 306 - - - 192 - - - - - - - 498 - - - o/w Pfandbriefbank gain - - - - - - - - - - - - - - - - Net revenues adj. excl. significant items 5,278 5,385 5,314 5,354 5,448 5,263 5,083 4,667 2,931 2,759 2,814 2,658 13,657 13,407 13,211 12,679 Provision for credit losses 109 127 75 79 49 37 28 20 55 28 16 27 213 192 119 126 Total operating expenses reported 3,223 3,325 3,576 3,619 3,702 3,673 3,745 3,612 2,052 2,099 2,064 2,041 8,977 9,097 9,385 9,272 Restructuring expenses - (101) (59) (60) - (115) (70) (54) - (37) (25) (17) - (253) (154) (131) Major litigation provisions (3) (37) (49) (19) 30 - (48) 12 - (79) - - 27 (116) (97) (7) Expenses related to real estate disposals (12) - - - (21) - - - - - - - (33) - - - Expenses related to business sales - - - - - (47) - - - - - - - (47) - - Total operating expenses adjusted 3,208 3,187 3,468 3,540 3,711 3,511 3,627 3,570 2,052 1,983 2,039 2,024 8,971 8,681 9,134 9,134 Pre-tax income/(loss) reported 2,573 1,991 1,663 2,022 2,065 1,610 1,282 1,089 922 632 734 590 5,560 4,233 3,679 3,701 Total adjustments and significant items (612) 80 108 (287) (377) 105 146 (12) (98) 116 25 17 (1,087) 301 279 (282) Pre-tax income/(loss) adj. excl. significant items 1,961 2,071 1,771 1,735 1,688 1,715 1,428 1,077 824 748 759 607 4,473 4,534 3,958 3,419 Pre-provision profit/(loss) adj. excl. significant items 2,070 2,198 1,846 1,814 1,737 1,752 1,456 1,097 879 776 775 634 4,686 4,726 4,077 3,545 1 SUB, IWM and APAC Results excluding items included in our reported results are non-GAAP financial measures. During the implementation of our strategy, we will measure the progress achieved by our underlying business performance. Management believes that such results provide a useful presentation of our operating results for purposes of assessing our Group and divisional performance consistently over time, on a basis that excludes items that management does not consider representative of our underlying performance. Provided below is a reconciliation to the most directly comparable US GAAP measures.
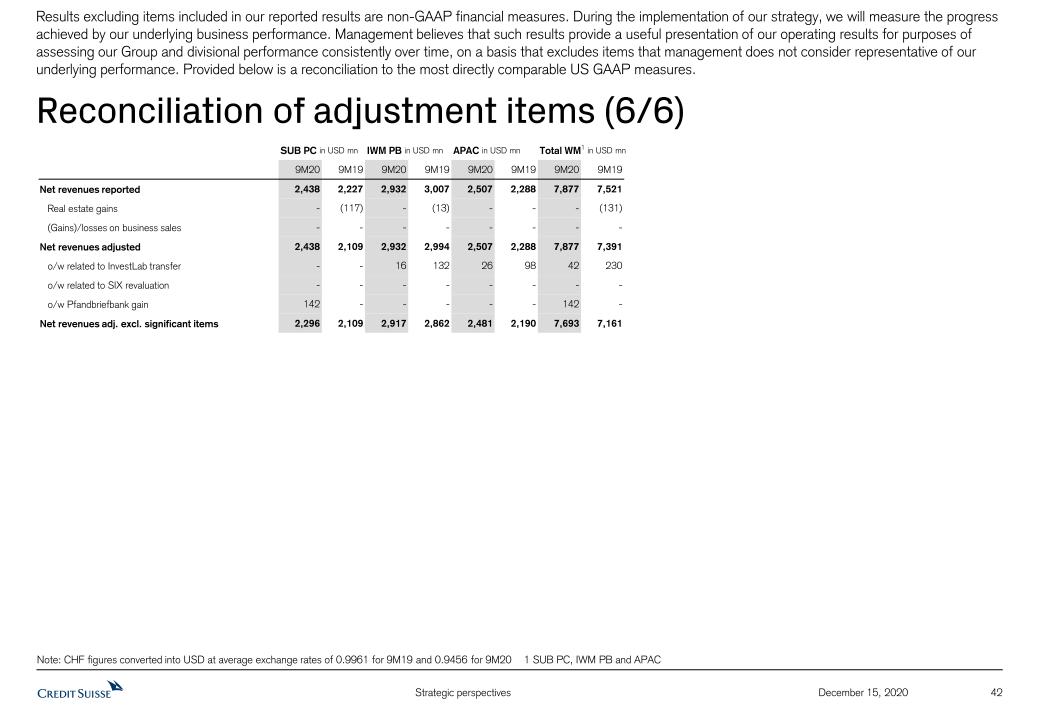
42 Reconciliation of adjustment items (6/6) December 15, 2020 Note: CHF figures converted into USD at average exchange rates of 0.9961 for 9M19 and 0.9456 for 9M20 1 SUB PC, IWM PB and APAC Results excluding items included in our reported results are non-GAAP financial measures. During the implementation of our strategy, we will measure the progress achieved by our underlying business performance. Management believes that such results provide a useful presentation of our operating results for purposes of assessing our Group and divisional performance consistently over time, on a basis that excludes items that management does not consider representative of our underlying performance. Provided below is a reconciliation to the most directly comparable US GAAP measures. SUB PC in USD mn IWM PB in USD mn APAC in USD mn Total WM1 in USD mn 9M20 9M19 9M20 9M19 9M20 9M19 9M20 9M19 Net revenues reported 2,438 2,227 2,932 3,007 2,507 2,288 7,877 7,521 Real estate gains - (117) - (13) - - - (131) (Gains)/losses on business sales - - - - - - - - Net revenues adjusted 2,438 2,109 2,932 2,994 2,507 2,288 7,877 7,391 o/w related to InvestLab transfer - - 16 132 26 98 42 230 o/w related to SIX revaluation - - - - - - - - o/w Pfandbriefbank gain 142 - - - - - 142 - Net revenues adj. excl. significant items 2,296 2,109 2,917 2,862 2,481 2,190 7,693 7,161

Notes (1/2) 43 December 15, 2020 General notesThroughout the presentation rounding differences may occurUnless otherwise noted, all CET1 capital, CET1 ratio, Tier 1 leverage ratio, risk-weighted assets and leverage exposure figures shown in this presentation are as of the end of the respective period and, for periods prior to 2019, on a “look-through” basisGross and net margins are shown in basis pointsGross margin = net revenues annualized / average AuM; net margin = pre-tax income annualized / average AuM. Net margin excluding certain significant items, as disclosed herein, is calculated excluding those items applying the same methodologyPTI margin = pre-tax income / net revenuesMandate penetration reflects advisory and discretionary mandate volumes as a percentage of AuM, excluding those from the external asset manager businessFX impact, unless otherwise noted, is calculated by converting the CHF amount of net revenues, provision for credit losses and operating expenses for 2020 back to the original currency on a monthly basis at the respective spot FX rate. The respective amounts are then converted back to CHF applying the average 2019 FX rate from the period against which the FX impact is measured. Average FX rates apply a straight line average of monthly FX rates for major currenciesWealth Management businesses include SUB PC, IWM PB and APAC and related figures refer to their combined resultsWealth Management-related businesses include SUB, IWM and APAC and related figures refer to their combined resultsPre-provision profit refers to pre-tax income excluding provision for credit losses Client Business Volume includes assets under management, custody assets and net loansBanking for the Investment Bank is defined as its capital markets and advisory franchisesSpecific notes† Prior to 3Q20, regulatory capital was calculated as the worst of 10% of RWA and 3.5% of leverage exposure and return on regulatory capital (a non-GAAP financial measure) was calculated using income / (loss) after tax and assumed a tax rate of 30%. In 3Q20, we updated our calculation approach, following which regulatory capital is calculated as the average of 10% of RWA and 3.5% of leverage exposure and return on regulatory capital (a non-GAAP financial measure) is calculated using income / (loss) after tax and assumes a tax rate of 30% for periods prior to 2020 and 25% from 2020 onwards. For periods in 2020, for purposes of calculating Group return on regulatory capital, leverage exposure excludes cash held at central banks, after adjusting for the dividend paid in 2Q20 and the planned dividend in 4Q20. For the Investment Bank division, return on regulatory capital is based on US dollar denominated numbers. Adjusted return on regulatory capital is calculated using adjusted results, applying the same methodology to calculate return on regulatory capital.‡ Return on tangible equity, a non-GAAP financial measure, is calculated as annualized net income attributable to shareholders divided by average tangible shareholders’ equity. Tangible shareholders’ equity, a non-GAAP financial measure, is calculated by deducting goodwill and other intangible assets from total shareholders’ equity as presented in our balance sheet. Tangible book value, a non-GAAP financial measure, is equal to tangible shareholders’ equity. Tangible book value per share, a non-GAAP financial measure, is calculated by dividing tangible shareholders' equity by total number of shares outstanding. Management believes that tangible shareholders’ equity/tangible book value, return on tangible equity and tangible book value per share are meaningful as they are measures used and relied upon by industry analysts and investors to assess valuations and capital adequacy.For end-4Q15, tangible shareholders’ equity excluded goodwill of CHF 4,808 mn and other intangible assets of CHF 196 mn from total shareholders’ equity of CHF 44,382 mn as presented in our balance sheet.For end-1Q16, tangible shareholders’ equity excluded goodwill of CHF 4,688 mn and other intangible assets of CHF 186 mn from total shareholders’ equity of CHF 44,997 mn as presented in our balance sheet.For end-2Q16, tangible shareholders’ equity excluded goodwill of CHF 4,745 mn and other intangible assets of CHF 191 mn from total shareholders’ equity of CHF 44,962 mn as presented in our balance sheet.For end-3Q16, tangible shareholders’ equity excluded goodwill of CHF 4,725 mn and other intangible assets of CHF 192 mn from total shareholders’ equity of CHF 44,276 mn as presented in our balance sheet.For end-4Q16, tangible shareholders’ equity excluded goodwill of CHF 4,913 mn and other intangible assets of CHF 213 mn from total shareholders’ equity of CHF 41,897 mn as presented in our balance sheet.For end-1Q17, tangible shareholders’ equity excluded goodwill of CHF 4,831 mn and other intangible assets of CHF 202 mn from total shareholders’ equity of CHF 41,702 mn as presented in our balance sheet.For end-2Q17, tangible shareholders’ equity excluded goodwill of CHF 4,673 mn and other intangible assets of CHF 195 mn from total shareholders’ equity of CHF 43,493 mn as presented in our balance sheet.For end-3Q17, tangible shareholders’ equity excluded goodwill of CHF 4,715 mn and other intangible assets of CHF 219 mn from total shareholders’ equity of CHF 43,858 mn as presented in our balance sheet.For end-4Q17, tangible shareholders’ equity excluded goodwill of CHF 4,742 mn and other intangible assets of CHF 223 mn from total shareholders’ equity of CHF 41,902 mn as presented in our balance sheet.For end-1Q18, tangible shareholders’ equity excluded goodwill of CHF 4,667 mn and other intangible assets of CHF 212 mn from total shareholders’ equity of CHF 42,540 mn as presented in our balance sheet.For end-2Q18, tangible shareholders’ equity excluded goodwill of CHF 4,797 mn and other intangible assets of CHF 212 mn from total shareholders’ equity of CHF 43,470 mn as presented in our balance sheet.For end-3Q18, tangible shareholders’ equity excluded goodwill of CHF 4,736 mn and other intangible assets of CHF 214 mn from total shareholders’ equity of CHF 42,734 mn as presented in our balance sheet.For end-4Q18, tangible shareholders’ equity excluded goodwill of CHF 4,766 mn and other intangible assets of CHF 219 mn from total shareholders’ equity of CHF 43,922 mn as presented in our balance sheet.For end-1Q19, tangible shareholders’ equity excluded goodwill of CHF 4,807 mn and other intangible assets of CHF 224 mn from total shareholders’ equity of CHF 43,825 mn as presented in our balance sheet. For end-2Q19, tangible shareholders’ equity excluded goodwill of CHF 4,731 mn and other intangible assets of CHF 216 mn from total shareholders’ equity of CHF 43,673 mn as presented in our balance sheet.For end-3Q19, tangible shareholders’ equity excluded goodwill of CHF 4,760 mn and other intangible assets of CHF 219 mn from total shareholders’ equity of CHF 45,150 mn as presented in our balance sheet.For end-4Q19, tangible shareholders’ equity excluded goodwill of CHF 4,663 mn and other intangible assets of CHF 291 mn from total shareholders’ equity of CHF 43,644 mn as presented in our balance sheet.

Notes (2/2) 44 December 15, 2020 For end-1Q20, tangible shareholders’ equity excluded goodwill of CHF 4,604 mn and other intangible assets of CHF 279 mn from total shareholders’ equity of CHF 48,675 mn as presented in our balance sheet. For end-2Q20, tangible shareholders’ equity excluded goodwill of CHF 4,676 mn and other intangible assets of CHF 273 mn from total shareholders’ equity of CHF 46,535 mn as presented in our balance sheet.For end-3Q20, tangible shareholders’ equity excluded goodwill of CHF 4,577 mn and other intangible assets of CHF 256 mn from total shareholders’ equity of CHF 45,740 mn as presented in our balance sheet. AbbreviationsABS = Asset Backed Securities; ACL = Allowance for credit losses; Adj. = Adjusted; AGM = Annual General Meeting; AI = Artificial Intelligence; AM = Asset Management; Ann. = Annualized; APAC = Asia Pacific; AuM = Assets under Management; Avg. = Average; BIS = Bank for International Settlements; BoD = Board of Directors; bps = basis points; CAGR = Compound Annual Growth Rate; CARMC = Capital Allocation & Risk Management Committee; C&IC = Corporate & Institutional Clients; CBV = Client Business Volume; CDS = Credit Default Swap; CECL = Current Expected Credit Losses; CET1 = Common Equity Tier 1; C&IC = Corporate and Institutional Clients; C/I = Cost/Income; CIG = Credit Investments Group; CIO = Chief Investment Officer; CLO = Collateralized Loan Obligation; Corp. Ctr. = Corporate Center; COVID-19 = Coronavirus disease 2019; CRCO = Chief Risk and Compliance Officer; CSO = Chief Sustainability Officer; CSR = Corporate Social Responsibility; CSX = Credit Suisse X; CVA = Credit Valuation Adjustment; DCM = Debt Capital Markets; DPB = Digital Private Banking; ECM = Equity Capital Markets; EM Credit = Emerging Market Credit; EMEA = Europe, Middle East & Africa; ESG = Environmental Social and Governance; ExB = Executive Board of Directors; Excl. = Excluding; FINMA = Swiss Financial Market Supervisory Authority; FRTB = Fundamental Review of the Trading Book; FVoD = Fair Value on own Debt; FX = Foreign Exchange; FXC = FX Constant; GAAP = Generally Accepted Accounting Principles; GDP = Gross Domestic Product; GRESB = Global ESG Benchmark for Real Assets; GTS = Global Trading Solutions; HY = High Yield; I&P = Investments & Partnerships; IB = Investment Bank; IBCM = Investment Banking & Capital Markets; ICBCCS = ICBC Credit Suisse Asset Management; IG = Investment Grade; ILS = Insurance-Linked Strategies; IMF = International Monetary Fund; IPO = Initial Public Offering; IS&P = Investment Solutions & Products; ITS = International Trading Solutions; IWM = International Wealth Management; L/S = Long/Short; Lev Fin = Leveraged Finance; LGBT = Lesbian, Gay, Bisexual, and Transgender; LTM = Last Twelve Months; M&A = Mergers & Acquisitions; MSCI = Morgan Stanley Capital International; NAB = Neue Aargauer Bank; NGO = Non-governmental organization; NII = Net interest income; NNA = Net new assets; NPA = Non-performing assets; o/w = of which; OpRisk = Operational Risk; p.a. = per annum; PACTA = Paris Agreement Capital Transition Assessment; PB = Private Banking; PC = Private Clients; PCL = Provision for credit losses; PCO = Private Credit Opportunities; PCR = Position & Client Risk; PE = Private Equity; PPP = Purchasing Power Parity; PTI = Pre-tax income; RE = Real Estate; RM = Relationship Manager(s); RMBS = Residential Mortgage-Backed Security; RoRC = Return on Regulatory Capital; RoTE = Return on Tangible Equity; RWA = Risk-weighted assets; SA-CCR = Standardized Approach to Counterparty Credit Risk; SASB = Sustainability Accounting Standards Board; S&T = Sales and Trading; SIX = Swiss Infrastructure and Exchange; SME = Small and Medium-Sized Enterprises; SoW = Share of Wallet; SP = Securitized Products; SRI = Sustainability, Research & Investment Solutions; SRU = Strategic Resolution Unit; SUB = Swiss Universal Bank; TBTF = Too big to fail; TBVPS = Tangible Book Value Per Share; TFCD = Task Force on Climate-related Financial Disclosures; (U)HNW = (Ultra) High Net Worth; (U)HNWI = (Ultra) High Net Worth Individuals; UN SDG = United Nations Sustainable Development Goals; VCs = Venture Capitalists; YoY = Year over year; YTD = Year to Date

David Mathers, Chief Financial OfficerDecember 15, 2020 Credit Suisse Investor Update 2020Financial perspectives

Disclaimer 2 December 15, 2020 This material does not purport to contain all of the information that you may wish to consider. This material is not to be relied upon as such or used in substitution for the exercise of independent judgment.Cautionary statement regarding forward-looking statementsThis presentation contains forward-looking statements that involve inherent risks and uncertainties, and we might not be able to achieve the predictions, forecasts, projections and other outcomes we describe or imply in forward-looking statements. A number of important factors could cause results to differ materially from the plans, targets, goals, expectations, estimates and intentions we express in these forward-looking statements, including those we identify in "Risk factors” in our Annual Report on Form 20-F for the fiscal year ended December 31, 2019, in “Credit Suisse – Risk factor” in our 1Q20 Financial Report published on May 7, 2020 and in the “Cautionary statement regarding forward-looking information" in our media release relating to the Investor Update published on December 15, 2020 and filed with the US Securities and Exchange Commission, and in other public filings and press releases. We do not intend to update these forward-looking statements. In particular, the terms “Estimate”, “Illustrative”, “Ambition”, “Objective”, “Outlook” and “Goal” are not intended to be viewed as targets or projections, nor are they considered to be Key Performance Indicators. All such estimates, illustrations, ambitions, objectives, outlooks and goals are subject to a large number of inherent risks, assumptions and uncertainties, many of which are completely outside of our control. These risks, assumptions and uncertainties include, but are not limited to, general market conditions, market volatility, interest rate volatility and levels, global and regional economic conditions, challenges and uncertainties resulting from the COVID-19 pandemic, political uncertainty, changes in tax policies, regulatory changes, changes in levels of client activity as a result of any of the foregoing and other factors. Accordingly, this information should not be relied on for any purpose. We do not intend to update these estimates, illustrations, ambitions, objectives, outlooks or goals. We may not achieve the benefits of our strategic initiativesWe may not achieve all of the expected benefits of our strategic initiatives. Factors beyond our control, including but not limited to the market and economic conditions (including macroeconomic and other challenges and uncertainties, for example, resulting from the COVID-19 pandemic), changes in laws, rules or regulations and other challenges discussed in our public filings, could limit our ability to achieve some or all of the expected benefits of these initiatives. Estimates and assumptionsIn preparing this presentation, management has made estimates and assumptions that affect the numbers presented. Actual results may differ. Annualized numbers do not take into account variations in operating results, seasonality and other factors and may not be indicative of actual, full-year results. Figures throughout this presentation may also be subject to rounding adjustments. All opinions and views constitute judgments as of the date of writing without regard to the date on which the reader may receive or access the information. This information is subject to change at any time without notice and we do not intend to update this information. RestatementAs of 3Q20, financial information reflects the new divisional reporting structure and management responsibilities announced on July 30, 2020 and updates to certain calculations and allocations. Prior periods have been restated to conform to the current presentation. In light of the restructuring announced July 30, 2020 and several significant items impacting results in prior periods, we intend to focus on adjusted numbers, excluding significant items in our discussion of results until the restructuring is completed.Cautionary statements relating to interim financial informationThis presentation contains certain unaudited interim financial information. This information has been derived from management accounts, is preliminary in nature, does not reflect the complete results of the fourth quarter of 2020 or the full year 2020 and is subject to change, including as a result of any normal quarterly or yearly adjustments in relation to the financial statements. This information has not been subject to any review by our independent registered public accounting firm. There can be no assurance that the final results for these periods will not differ from these preliminary results, and any such differences could be material. Quarterly financial results for the fourth quarter of 2020 and full year 2020 will be included in our 4Q20 Earnings Release and our 2020 Annual Report. These interim results of operations are not necessarily indicative of the results to be achieved for the remainder of 2020. Statement regarding non-GAAP financial measuresThis presentation also contains non-GAAP financial measures, including results excluding certain items included in our reported results, return on regulatory capital and return on tangible equity and tangible book value per share (which are both based on tangible shareholders’ equity). Further details and information needed to reconcile such non-GAAP financial measures to the most directly comparable measures under US GAAP can be found in the Appendix of the CEO and CFO Investor Update presentations, published on December 15, 2020, which are both available on our website at www.credit-suisse.com.Our estimates, ambitions, objectives and targets often include metrics that are non-GAAP financial measures and are unaudited. A reconciliation of the estimates, ambitions, objectives and targets to the nearest GAAP measures is unavailable without unreasonable efforts. Results excluding certain items included in our reported results do not include items such as goodwill impairment, major litigation provisions, real estate gains, impacts from foreign exchange and other items included in our reported results, all of which are unavailable on a prospective basis. Return on Tangible Equity is based on tangible shareholders' equity, a non-GAAP financial measure also known as tangible book value, which is calculated by deducting goodwill and other intangible assets from total shareholders' equity as presented in our balance sheet, both of which are unavailable on a prospective basis. Tangible book value per share excludes the impact of any dividends paid during the performance period, share buybacks, own credit movements, foreign exchange rate movements and pension-related impacts, all of which are unavailable on a prospective basis. Return on regulatory capital (a non-GAAP financial measure) is calculated using income/(loss) after tax and assumes a tax rate of 25% and capital allocated based on the average of 10% of average risk-weighted assets and 3.5% of average leverage exposure; the essential components of this calculation are unavailable on a prospective basis. Such estimates, ambitions, objectives and targets are calculated in a manner that is consistent with the accounting policies applied by us in preparing our financial statements.Statement regarding capital, liquidity and leverageCredit Suisse is subject to the Basel III framework, as implemented in Switzerland, as well as Swiss legislation and regulations for systemically important banks (Swiss Requirements), which include capital, liquidity, leverage and large exposure requirements and rules for emergency plans designed to maintain systemically relevant functions in the event of threatened insolvency. Credit Suisse has adopted the Bank for International Settlements (BIS) leverage ratio framework, as issued by the Basel Committee on Banking Supervision (BCBS) and implemented in Switzerland by the Swiss Financial Market Supervisory Authority FINMA. References to phase-in and look-through included herein refer to Basel III capital requirements and Swiss Requirements. Phase-in reflects that, for the years 2014-2018, there was a five-year (20% per annum) phase-in of goodwill, other intangible assets and other capital deductions (e.g., certain deferred tax assets) and a phase-out of an adjustment for the accounting treatment of pension plans. For the years 2013-2022, there is a phase-out of certain capital instruments. Look-through assumes the full phase-in of goodwill and other intangible assets and other regulatory adjustments and the phase-out of certain capital instruments.Unless otherwise noted, leverage exposure is based on the BIS leverage ratio framework and consists of period-end balance sheet assets and prescribed regulatory adjustments. The tier 1 leverage ratio and CET1 leverage ratio are calculated as BIS tier 1 capital and CET1 capital, respectively, divided by period-end leverage exposure. Swiss leverage ratios are measured on the same period-end basis as the leverage exposure for the BIS leverage ratio. Unless otherwise noted, for periods in 2020, leverage exposure excludes cash held at central banks, after adjusting for the dividends paid in 2020.SourcesCertain material in this presentation has been prepared by Credit Suisse on the basis of publicly available information, internally developed data and other third-party sources believed to be reliable. Credit Suisse has not sought to independently verify information obtained from public and third-party sources and makes no representations or warranties as to accuracy, completeness or reliability of such information.
3 December 15, 2020 Update on Financials Capital distribution Review of progress during 2020 2 1 Our financial ambitions in 2021 and beyond 3

4 December 15, 2020 Strong YoY development of underlying results in 9M20 RoTE‡~10%9M20 Adjusted pre-tax income excl. significant items; in CHF mn 1Q20 1Q19 2Q20 2Q19 3Q20 3Q19 Note: Results excluding items included in our reported results are non-GAAP financial measures. For further details and reconciliation information, see Appendix ‡ RoTE is a non-GAAP financial measure, see Appendix (12)% +16% +29% Provision for credit lossesin CHF mn
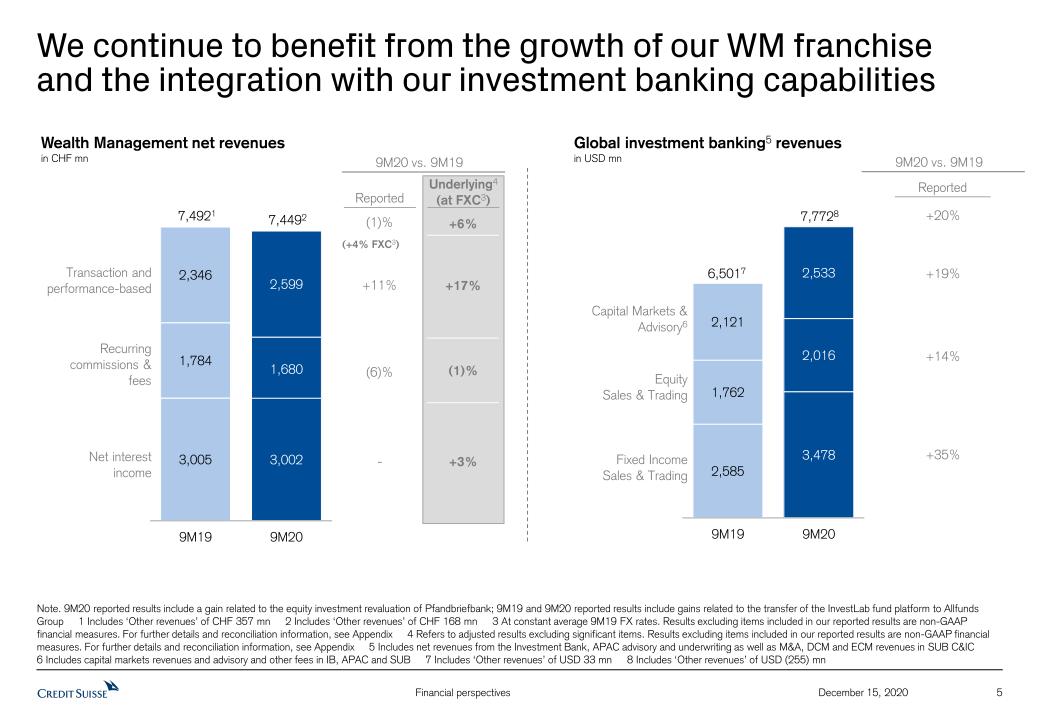
5 December 15, 2020 We continue to benefit from the growth of our WM franchise and the integration with our investment banking capabilities Note. 9M20 reported results include a gain related to the equity investment revaluation of Pfandbriefbank; 9M19 and 9M20 reported results include gains related to the transfer of the InvestLab fund platform to Allfunds Group 1 Includes ‘Other revenues’ of CHF 357 mn 2 Includes ‘Other revenues’ of CHF 168 mn 3 At constant average 9M19 FX rates. Results excluding items included in our reported results are non-GAAP financial measures. For further details and reconciliation information, see Appendix 4 Refers to adjusted results excluding significant items. Results excluding items included in our reported results are non-GAAP financial measures. For further details and reconciliation information, see Appendix 5 Includes net revenues from the Investment Bank, APAC advisory and underwriting as well as M&A, DCM and ECM revenues in SUB C&IC 6 Includes capital markets revenues and advisory and other fees in IB, APAC and SUB 7 Includes ‘Other revenues’ of USD 33 mn 8 Includes ‘Other revenues’ of USD (255) mn 7,4921 Net interestincome Recurring commissions & fees Transaction and performance-based 7,4492 9M20 vs. 9M19 - (6)% +11% (1)% +3% (1)% +17% Underlying4(at FXC3) Reported +6% (+4% FXC3) Wealth Management net revenuesin CHF mn 6,5017 Fixed IncomeSales & Trading EquitySales & Trading Capital Markets & Advisory6 7,7728 Global investment banking5 revenuesin USD mn +35% +14% +19% +20% 9M20 vs. 9M19 Reported
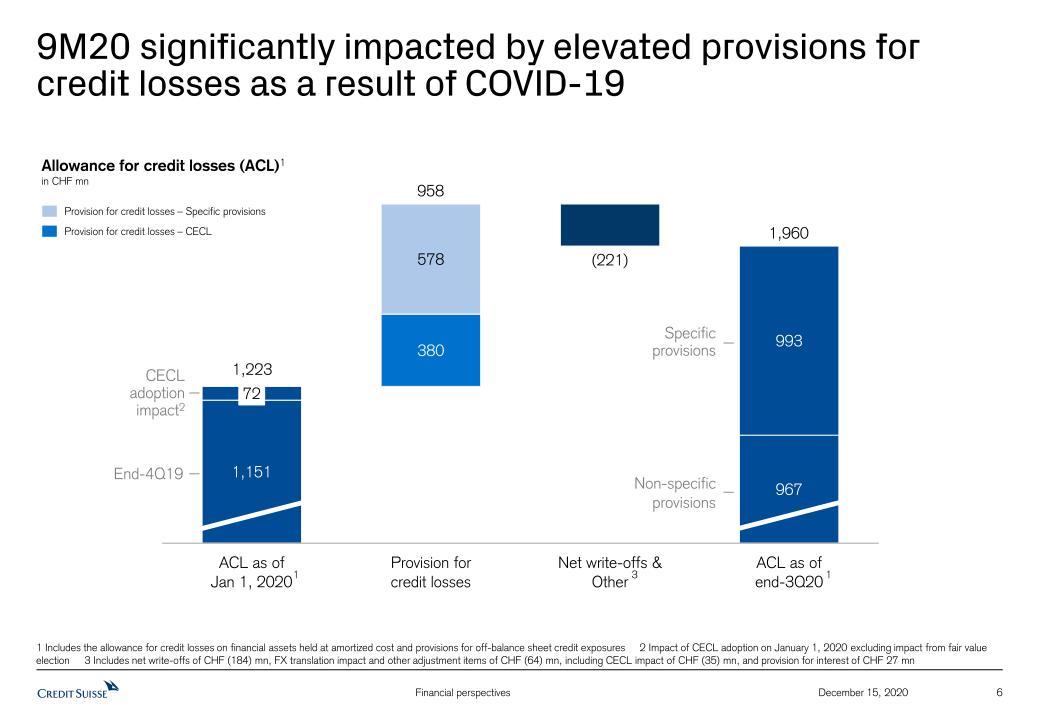
6 December 15, 2020 9M20 significantly impacted by elevated provisions forcredit losses as a result of COVID-19 Allowance for credit losses (ACL)1in CHF mn 1 Includes the allowance for credit losses on financial assets held at amortized cost and provisions for off-balance sheet credit exposures 2 Impact of CECL adoption on January 1, 2020 excluding impact from fair value election 3 Includes net write-offs of CHF (184) mn, FX translation impact and other adjustment items of CHF (64) mn, including CECL impact of CHF (35) mn, and provision for interest of CHF 27 mn 1 1,223 Non-specificprovisions Specificprovisions CECL adoption impact2 End-4Q19 Provision for credit losses – Specific provisions Provision for credit losses – CECL 958 1,960 3 1
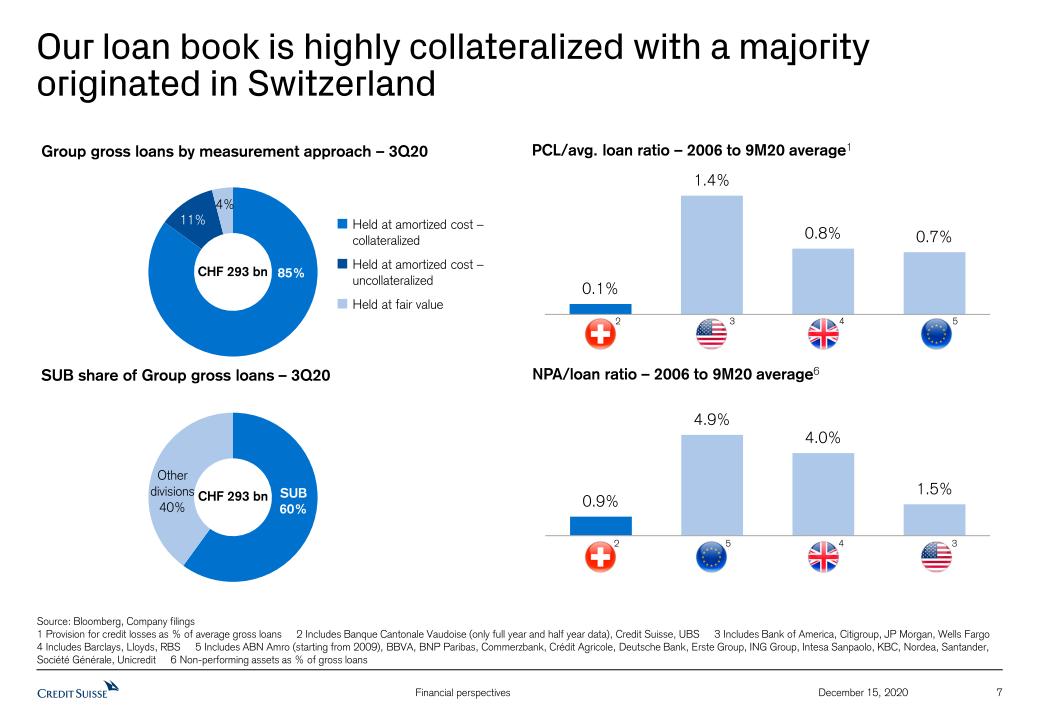
7 December 15, 2020 Our loan book is highly collateralized with a majorityoriginated in Switzerland CHF 293 bn Group gross loans by measurement approach – 3Q20 SUB share of Group gross loans – 3Q20 CHF 293 bn Held at amortized cost – collateralizedHeld at amortized cost – uncollateralizedHeld at fair value PCL/avg. loan ratio – 2006 to 9M20 average1 NPA/loan ratio – 2006 to 9M20 average6 2 5 4 3 2 5 4 3 Source: Bloomberg, Company filings1 Provision for credit losses as % of average gross loans 2 Includes Banque Cantonale Vaudoise (only full year and half year data), Credit Suisse, UBS 3 Includes Bank of America, Citigroup, JP Morgan, Wells Fargo 4 Includes Barclays, Lloyds, RBS 5 Includes ABN Amro (starting from 2009), BBVA, BNP Paribas, Commerzbank, Crédit Agricole, Deutsche Bank, Erste Group, ING Group, Intesa Sanpaolo, KBC, Nordea, Santander, Société Générale, Unicredit 6 Non-performing assets as % of gross loans

8 December 15, 2020 Credit Suisse’s comparative reserves against wholesale exposures of international peers Source: Company filings Note: Ratios based on local currency 1 Includes specific and portfolio based allowances for credit losses as % of gross loans for wholesale businesses. CS includes the Investment Bank. Peers include Bank of America, Barclays, Citigroup, Goldman Sachs and JP Morgan. Bank of America includes Commercial, Barclays includes Wholesale International, Citigroup includes Corporate, Goldman Sachs includes all excl. Consumer & Wealth Management and JP Morgan includes Wholesale Wholesale – Allowance for loan losses as % of loans1 (excluding fair value and held-for-sale loans)
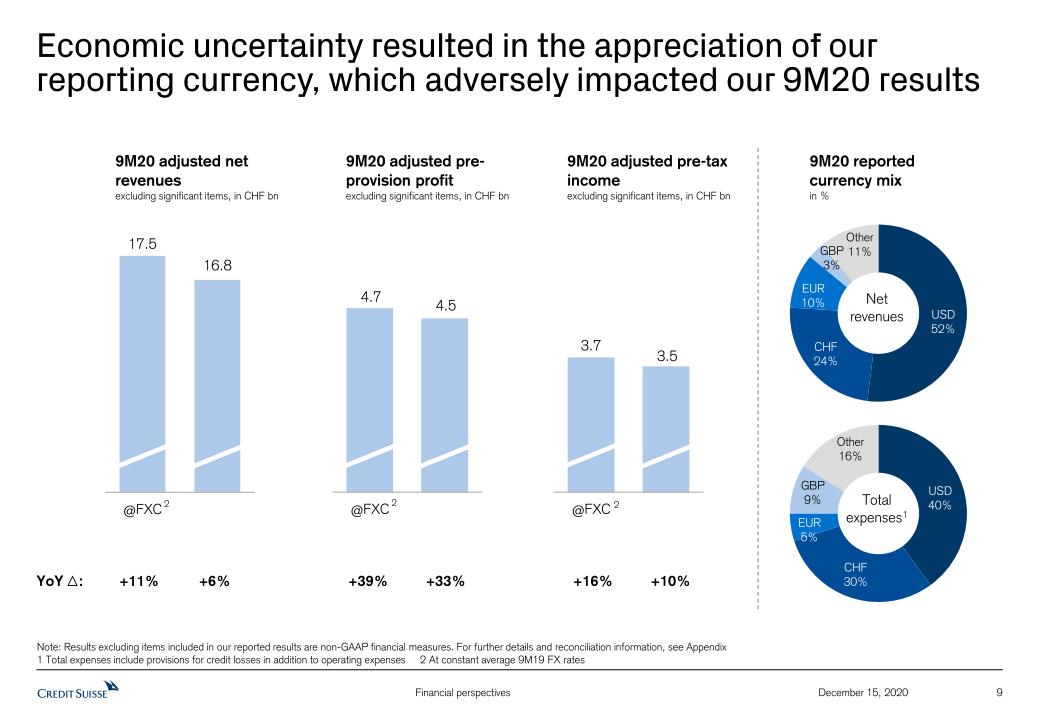
9 December 15, 2020 Economic uncertainty resulted in the appreciation of our reporting currency, which adversely impacted our 9M20 results Note: Results excluding items included in our reported results are non-GAAP financial measures. For further details and reconciliation information, see Appendix 1 Total expenses include provisions for credit losses in addition to operating expenses 2 At constant average 9M19 FX rates 9M20 adjusted net revenuesexcluding significant items, in CHF bn Net revenues Total expenses1 9M20 reported currency mixin % 9M20 adjusted pre-provision profitexcluding significant items, in CHF bn 2 2 9M20 adjusted pre-tax incomeexcluding significant items, in CHF bn 2 YoY : +11% +6% +39% +33% +16% +10%
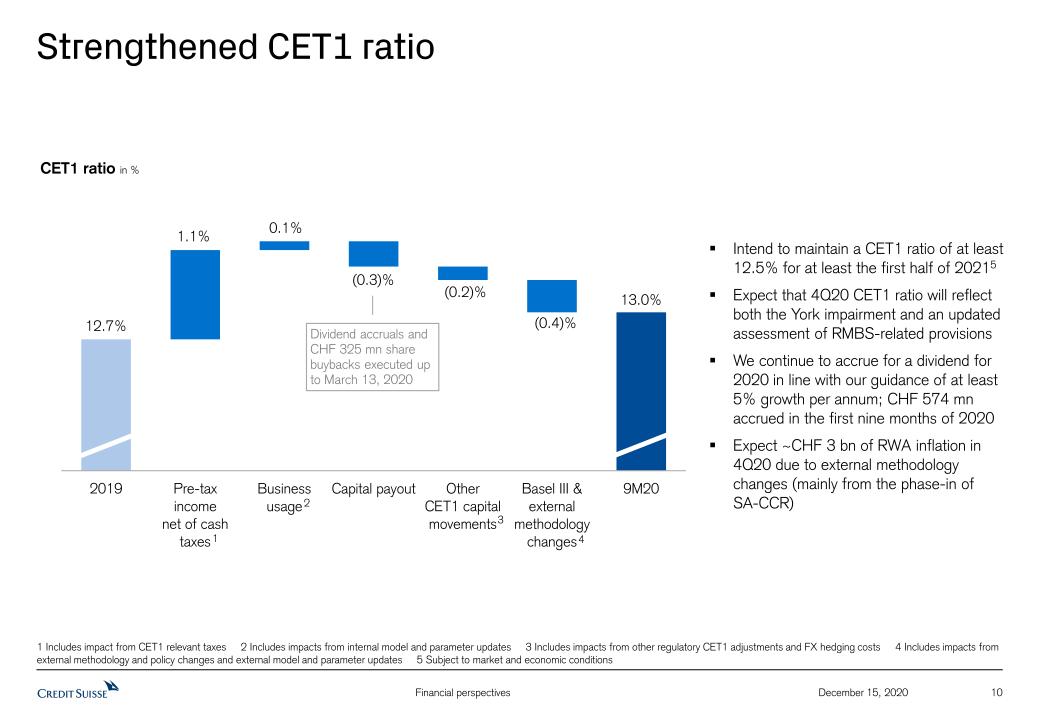
10 December 15, 2020 Strengthened CET1 ratio CET1 ratio in % 1 4 1 Includes impact from CET1 relevant taxes 2 Includes impacts from internal model and parameter updates 3 Includes impacts from other regulatory CET1 adjustments and FX hedging costs 4 Includes impacts from external methodology and policy changes and external model and parameter updates 5 Subject to market and economic conditions Dividend accruals and CHF 325 mn share buybacks executed up to March 13, 2020 Intend to maintain a CET1 ratio of at least 12.5% for at least the first half of 20215Expect that 4Q20 CET1 ratio will reflect both the York impairment and an updated assessment of RMBS-related provisionsWe continue to accrue for a dividend for 2020 in line with our guidance of at least 5% growth per annum; CHF 574 mn accrued in the first nine months of 2020Expect ~CHF 3 bn of RWA inflation in 4Q20 due to external methodology changes (mainly from the phase-in of SA-CCR) 2 3
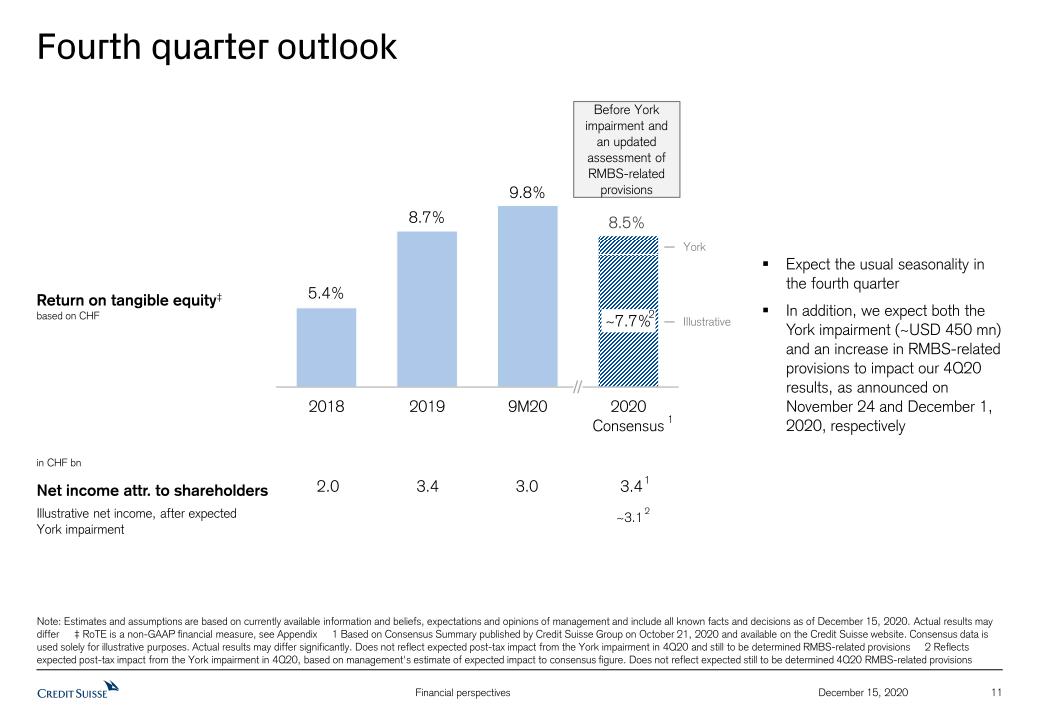
11 December 15, 2020 Fourth quarter outlook Return on tangible equity‡based on CHF Expect the usual seasonality in the fourth quarterIn addition, we expect both the York impairment (~USD 450 mn) and an increase in RMBS-related provisions to impact our 4Q20 results, as announced on November 24 and December 1, 2020, respectively Note: Estimates and assumptions are based on currently available information and beliefs, expectations and opinions of management and include all known facts and decisions as of December 15, 2020. Actual results may differ ‡ RoTE is a non-GAAP financial measure, see Appendix 1 Based on Consensus Summary published by Credit Suisse Group on October 21, 2020 and available on the Credit Suisse website. Consensus data is used solely for illustrative purposes. Actual results may differ significantly. Does not reflect expected post-tax impact from the York impairment in 4Q20 and still to be determined RMBS-related provisions 2 Reflects expected post-tax impact from the York impairment in 4Q20, based on management's estimate of expected impact to consensus figure. Does not reflect expected still to be determined 4Q20 RMBS-related provisions Net income attr. to shareholders 2.0 3.4 3.0 3.4 in CHF bn Illustrative net income, after expected York impairment ~3.1 1 2 Before York impairment and an updated assessment of RMBS-related provisions 1 York 2 Illustrative
12 December 15, 2020 Update on Financials Capital distribution Review of progress during 2020 2 1 Our financial ambitions in 2021 and beyond 3
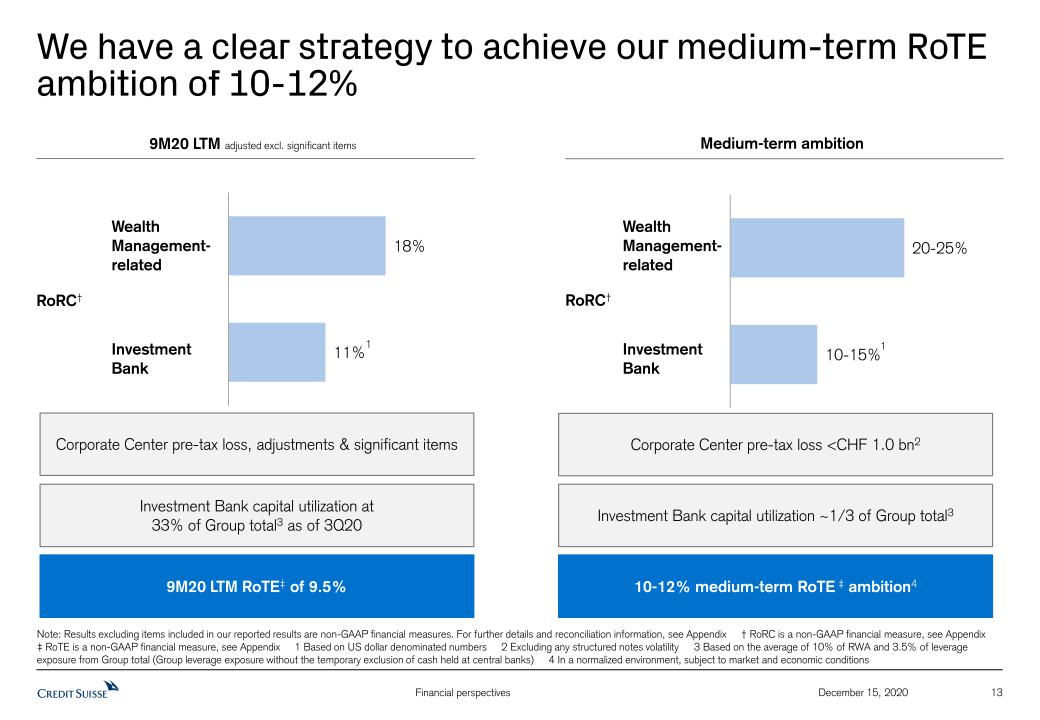
13 December 15, 2020 We have a clear strategy to achieve our medium-term RoTE ambition of 10-12% Note: Results excluding items included in our reported results are non-GAAP financial measures. For further details and reconciliation information, see Appendix † RoRC is a non-GAAP financial measure, see Appendix ‡ RoTE is a non-GAAP financial measure, see Appendix 1 Based on US dollar denominated numbers 2 Excluding any structured notes volatility 3 Based on the average of 10% of RWA and 3.5% of leverage exposure from Group total (Group leverage exposure without the temporary exclusion of cash held at central banks) 4 In a normalized environment, subject to market and economic conditions 9M20 LTM adjusted excl. significant items Medium-term ambition Investment Bank capital utilization at33% of Group total3 as of 3Q20 9M20 LTM RoTE‡ of 9.5% Investment Bank capital utilization ~1/3 of Group total3 10-12% medium-term RoTE ‡ ambition4 RoRC† RoRC† Wealth Management-related Wealth Management-related Investment Bank Investment Bank Corporate Center pre-tax loss <CHF 1.0 bn2 Corporate Center pre-tax loss, adjustments & significant items 1 1
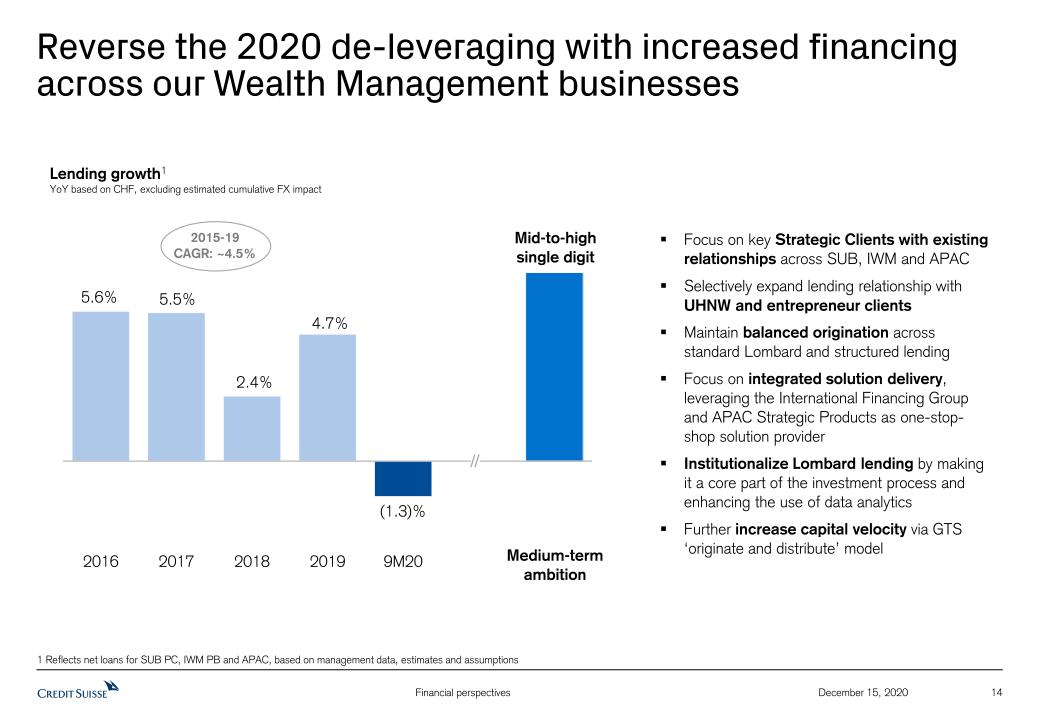
14 December 15, 2020 Reverse the 2020 de-leveraging with increased financing across our Wealth Management businesses Lending growth1YoY based on CHF, excluding estimated cumulative FX impact Mid-to-highsingle digit Focus on key Strategic Clients with existing relationships across SUB, IWM and APACSelectively expand lending relationship with UHNW and entrepreneur clientsMaintain balanced origination across standard Lombard and structured lending Focus on integrated solution delivery, leveraging the International Financing Group and APAC Strategic Products as one-stop-shop solution providerInstitutionalize Lombard lending by making it a core part of the investment process and enhancing the use of data analyticsFurther increase capital velocity via GTS ‘originate and distribute’ model 1 Reflects net loans for SUB PC, IWM PB and APAC, based on management data, estimates and assumptions 2015-19 CAGR: ~4.5% Medium-termambition

15 December 15, 2020 Build our bank for entrepreneurs, growing lending, assets under management and custody assets Client Business Volume growth(AuM, custody assets and net loans)CAGR, excluding estimated cumulative FX impact Mid-to-highsingle digit Deepen share of wallet with key Strategic Clients based on integrated advisory and institutional-style solutionsSelectively extend Strategic Clients listBroaden onshore footprint to tap into fast growing markets, notably ChinaBuild scale by offering an analytics driven multi-channel advisory offering Build on recent strategic hires and team lift-outs across Brazil, LatAm, Russia, India and Greater ChinaSelectively add further senior relationship managers and bankers to our platform Note: Relates to SUB PC, IWM PB and APAC, based on management data, estimates and assumptions ~6.5% Medium-termambition
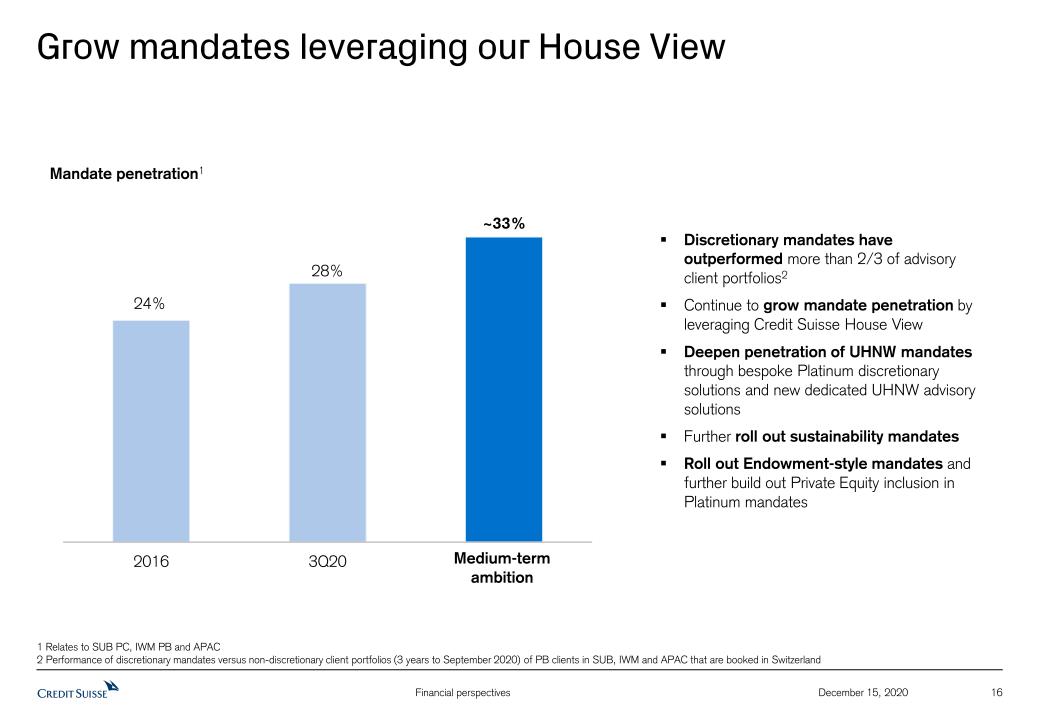
16 December 15, 2020 Grow mandates leveraging our House View Mandate penetration1 ~33% Discretionary mandates have outperformed more than 2/3 of advisory client portfolios2Continue to grow mandate penetration by leveraging Credit Suisse House ViewDeepen penetration of UHNW mandates through bespoke Platinum discretionary solutions and new dedicated UHNW advisory solutionsFurther roll out sustainability mandatesRoll out Endowment-style mandates and further build out Private Equity inclusion in Platinum mandates 1 Relates to SUB PC, IWM PB and APAC 2 Performance of discretionary mandates versus non-discretionary client portfolios (3 years to September 2020) of PB clients in SUB, IWM and APAC that are booked in Switzerland Medium-termambition
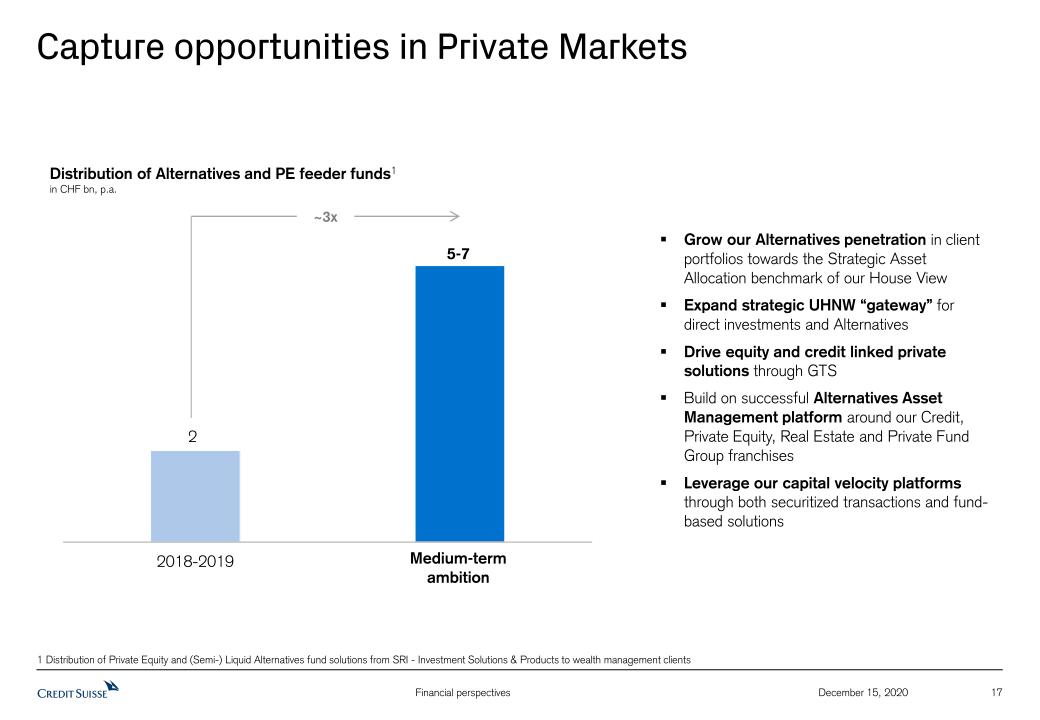
17 December 15, 2020 Capture opportunities in Private Markets Distribution of Alternatives and PE feeder funds1in CHF bn, p.a. 5-7 ~3x Grow our Alternatives penetration in client portfolios towards the Strategic Asset Allocation benchmark of our House ViewExpand strategic UHNW “gateway” for direct investments and AlternativesDrive equity and credit linked private solutions through GTSBuild on successful Alternatives Asset Management platform around our Credit, Private Equity, Real Estate and Private Fund Group franchisesLeverage our capital velocity platforms through both securitized transactions and fund- based solutions 1 Distribution of Private Equity and (Semi-) Liquid Alternatives fund solutions from SRI - Investment Solutions & Products to wealth management clients Medium-termambition
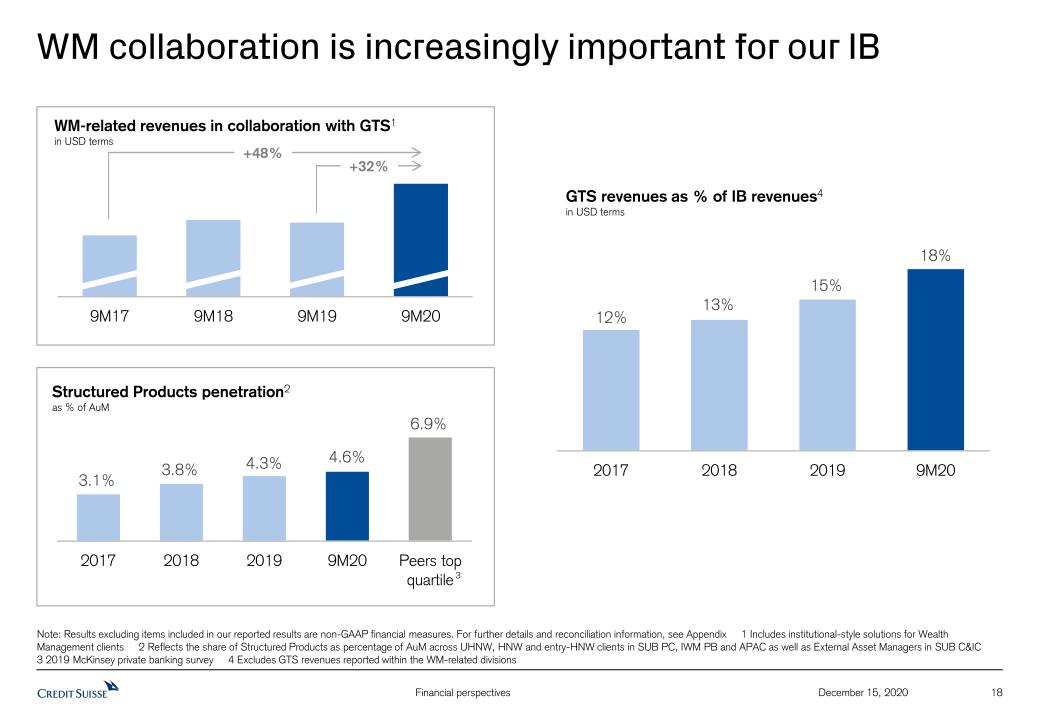
18 December 15, 2020 WM collaboration is increasingly important for our IB GTS revenues as % of IB revenues4 in USD terms Structured Products penetration2 as % of AuM 3 Note: Results excluding items included in our reported results are non-GAAP financial measures. For further details and reconciliation information, see Appendix 1 Includes institutional-style solutions for Wealth Management clients 2 Reflects the share of Structured Products as percentage of AuM across UHNW, HNW and entry-HNW clients in SUB PC, IWM PB and APAC as well as External Asset Managers in SUB C&IC 3 2019 McKinsey private banking survey 4 Excludes GTS revenues reported within the WM-related divisions WM-related revenues in collaboration with GTS1in USD terms +32% +48%
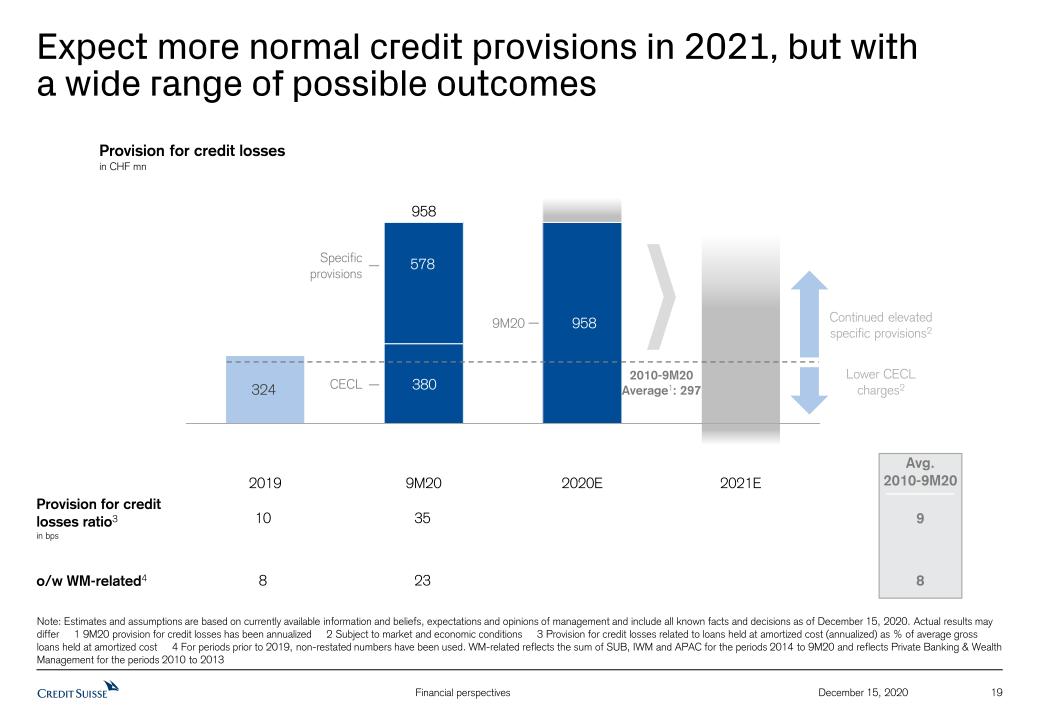
19 December 15, 2020 Expect more normal credit provisions in 2021, but with a wide range of possible outcomes CECL 2010-9M20 Average1: 297 Provision for credit lossesin CHF mn Specific provisions 578 958 Continued elevated specific provisions2 Lower CECL charges2 9M20 Note: Estimates and assumptions are based on currently available information and beliefs, expectations and opinions of management and include all known facts and decisions as of December 15, 2020. Actual results may differ 1 9M20 provision for credit losses has been annualized 2 Subject to market and economic conditions 3 Provision for credit losses related to loans held at amortized cost (annualized) as % of average gross loans held at amortized cost 4 For periods prior to 2019, non-restated numbers have been used. WM-related reflects the sum of SUB, IWM and APAC for the periods 2014 to 9M20 and reflects Private Banking & Wealth Management for the periods 2010 to 2013 Provision for credit losses ratio3in bps o/w WM-related4 8 23 10 35 Avg.2010-9M20 8 9

20 December 15, 2020 Reinvigorated positive operating leverage Note: Results excluding items included in our reported results are non-GAAP financial measures. For further details and reconciliation information, see Appendix. Growth percentages are calculated on the non-rounded results found in the Appendix Pre-provision profit Operating expenses Net revenues 9M17 9M18 9M19 9M20 13.3 12.5 12.5 12.3 15.7 16.0 15.9 16.8 2.4 3.5 3.4 4.5 Group adjusted results excl. significant itemsin CHF bn +2% (1)% +6% (6)% 0% (2)% 9M20 vs. 9M16 (14)% +3.9 bn +13% 0.6 9M16 14.2 14.9 +6% (6)%

21 December 15, 2020 Continued focus on efficiency, including the savings from the 2020 restructuring Illustrative developmentof 2021 adjusted operating expensesin CHF bn ~16.5 ~(0.25) ~15.9 Note: Results excluding items included in our reported results are non-GAAP financial measures. Estimates and assumptions are based on currently available information and beliefs, expectations and opinions of management and include all known facts and decisions as of December 15, 2020. Actual results may differ 1 Positive FX impact assuming no change in FX rates compared to current FX rates as of November 30, 2020 ~(0.1) ~(0.2) ~0.3 – 0.6 ~16.2 – 16.5 1
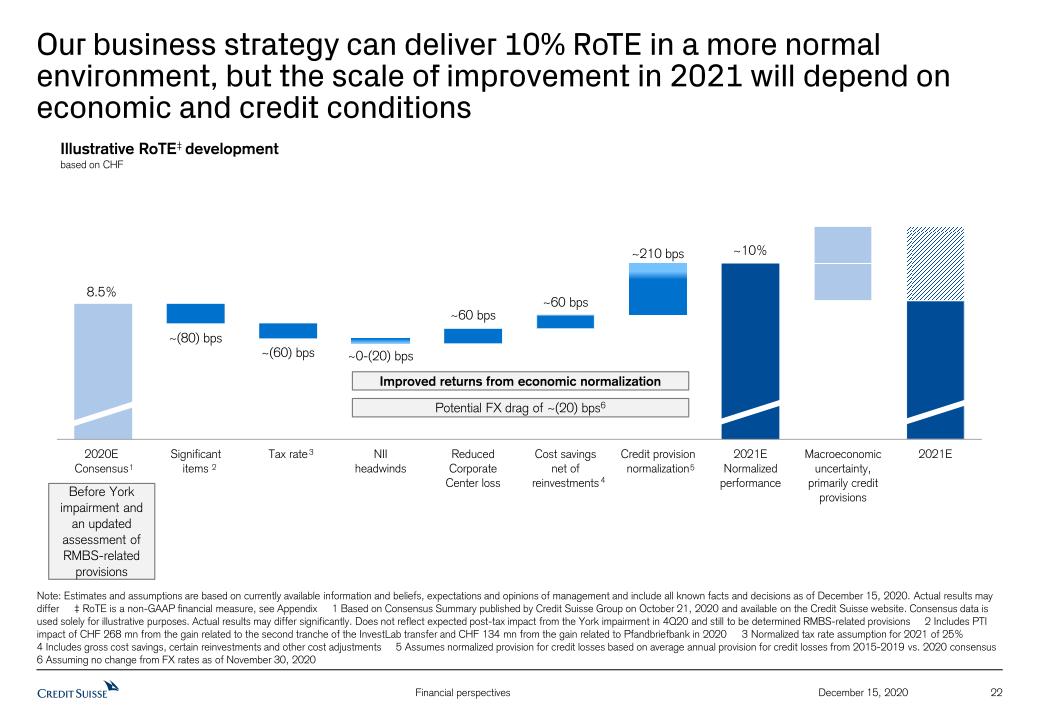
22 December 15, 2020 Our business strategy can deliver 10% RoTE in a more normal environment, but the scale of improvement in 2021 will depend on economic and credit conditions Illustrative RoTE‡ developmentbased on CHF 2 3 ~210 bps 1 5 Improved returns from economic normalization 4 Potential FX drag of ~(20) bps6 Before York impairment and an updated assessment of RMBS-related provisions Note: Estimates and assumptions are based on currently available information and beliefs, expectations and opinions of management and include all known facts and decisions as of December 15, 2020. Actual results may differ ‡ RoTE is a non-GAAP financial measure, see Appendix 1 Based on Consensus Summary published by Credit Suisse Group on October 21, 2020 and available on the Credit Suisse website. Consensus data is used solely for illustrative purposes. Actual results may differ significantly. Does not reflect expected post-tax impact from the York impairment in 4Q20 and still to be determined RMBS-related provisions 2 Includes PTI impact of CHF 268 mn from the gain related to the second tranche of the InvestLab transfer and CHF 134 mn from the gain related to Pfandbriefbank in 2020 3 Normalized tax rate assumption for 2021 of 25% 4 Includes gross cost savings, certain reinvestments and other cost adjustments 5 Assumes normalized provision for credit losses based on average annual provision for credit losses from 2015-2019 vs. 2020 consensus 6 Assuming no change from FX rates as of November 30, 2020
23 December 15, 2020 Update on Financials Capital distribution Review of progress during 2020 2 1 Our financial ambitions in 2021 and beyond 3

24 December 15, 2020 Expected impact of regulatory RWA inflation in 2020 and beyond 1 Includes impacts from the phase-in of Basel III reforms, external methodology and policy changes and external model and parameter updates 2 Estimates and assumptions are based on currently available information and beliefs, expectations and opinions of management and include all known facts and decisions as of December 15, 2020. Actual results may differ SA-CCR/IMMEquity Investmentsin FundsCentral Counterparties 1 not significant Implementation of FRTB expected to be aligned to the EU timetable, implying a start on January 1, 2024Future RWA uplift estimated to be ~CHF 15-20 bn from FRTB and ~CHF 10 bn from FRTB CVATwo other regulatory changes are also to be expected at this time:Adoption of reduced IRB by FINMA, reducing the use of advanced models and/or including input floors; estimated impact <CHF 5 bnRemoval of advanced models for OpRisk and replacement with a standardized approach; estimated impact <CHF 5 bnThe estimated split across all of these changes totals ~CHF 15 bn for the IB, ~CHF 15 bn for the three WM-related divisions and less than CHF 10 bn for the Corporate CenterExpect CET1 ratio post Basel III reforms in 2024 of 11-12%, subject to risk and stress scenarios at that time Expected RWA increase from Basel III reforms & other external methodology changes2in CHF bn ~15-20 FRTB FRTB CVA ~10 ~25-30
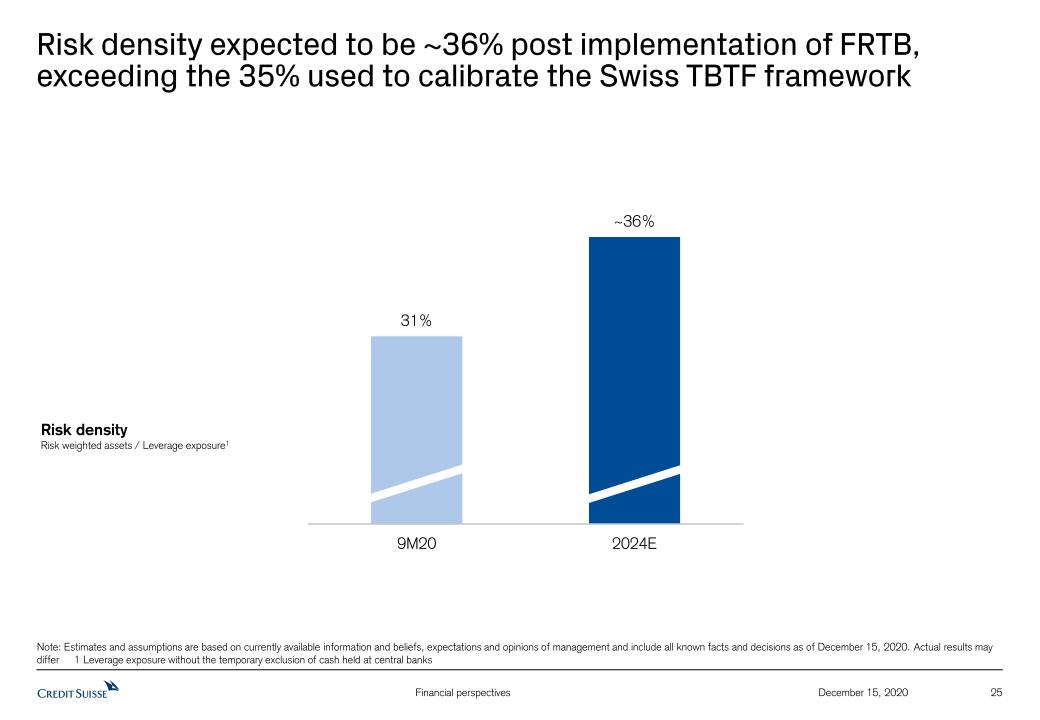
25 December 15, 2020 Risk density expected to be ~36% post implementation of FRTB, exceeding the 35% used to calibrate the Swiss TBTF framework Note: Estimates and assumptions are based on currently available information and beliefs, expectations and opinions of management and include all known facts and decisions as of December 15, 2020. Actual results may differ 1 Leverage exposure without the temporary exclusion of cash held at central banks Risk densityRisk weighted assets / Leverage exposure1
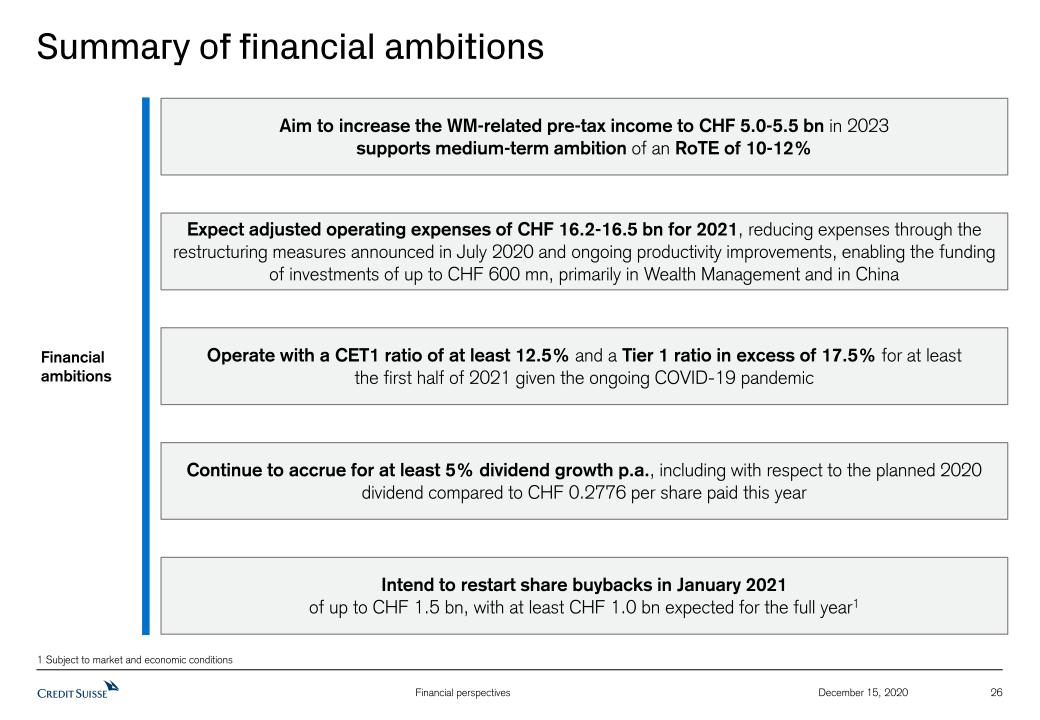
26 December 15, 2020 Summary of financial ambitions 1 Subject to market and economic conditions Financial ambitions Expect adjusted operating expenses of CHF 16.2-16.5 bn for 2021, reducing expenses through the restructuring measures announced in July 2020 and ongoing productivity improvements, enabling the funding of investments of up to CHF 600 mn, primarily in Wealth Management and in China Operate with a CET1 ratio of at least 12.5% and a Tier 1 ratio in excess of 17.5% for at least the first half of 2021 given the ongoing COVID-19 pandemic Continue to accrue for at least 5% dividend growth p.a., including with respect to the planned 2020 dividend compared to CHF 0.2776 per share paid this year Intend to restart share buybacks in January 2021 of up to CHF 1.5 bn, with at least CHF 1.0 bn expected for the full year1 Aim to increase the WM-related pre-tax income to CHF 5.0-5.5 bn in 2023 supports medium-term ambition of an RoTE of 10-12%

Appendix 27 December 15, 2020
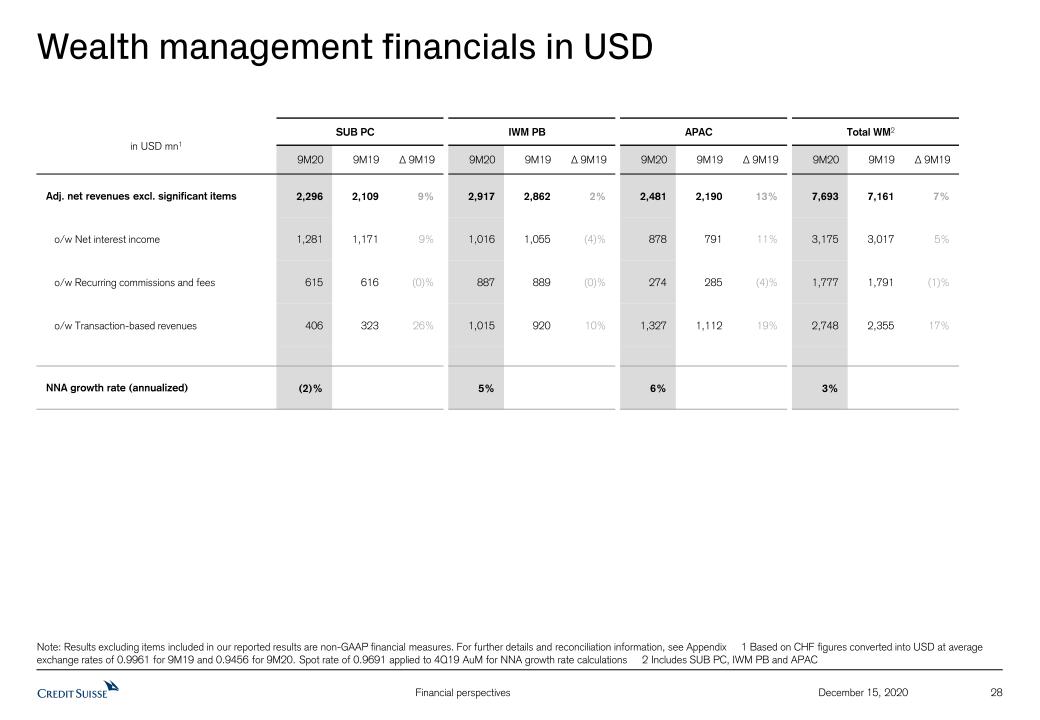
28 December 15, 2020 Wealth management financials in USD Note: Results excluding items included in our reported results are non-GAAP financial measures. For further details and reconciliation information, see Appendix 1 Based on CHF figures converted into USD at average exchange rates of 0.9961 for 9M19 and 0.9456 for 9M20. Spot rate of 0.9691 applied to 4Q19 AuM for NNA growth rate calculations 2 Includes SUB PC, IWM PB and APAC in USD mn1 SUB PC IWM PB APAC Total WM2 9M20 9M19 Δ 9M19 9M20 9M19 Δ 9M19 9M20 9M19 Δ 9M19 9M20 9M19 Δ 9M19 Adj. net revenues excl. significant items 2,296 2,109 9% 2,917 2,862 2% 2,481 2,190 13% 7,693 7,161 7% o/w Net interest income 1,281 1,171 9% 1,016 1,055 (4)% 878 791 11% 3,175 3,017 5% o/w Recurring commissions and fees 615 616 (0)% 887 889 (0)% 274 285 (4)% 1,777 1,791 (1)% o/w Transaction-based revenues 406 323 26% 1,015 920 10% 1,327 1,112 19% 2,748 2,355 17% NNA growth rate (annualized) (2)% 5% 6% 3%

29 Reconciliation of adjustment items (1/6) Results excluding items included in our reported results are non-GAAP financial measures. During the implementation of our strategy, we will measure the progress achieved by our underlying business performance. Management believes that such results provide a useful presentation of our operating results for purposes of assessing our Group and divisional performance consistently over time, on a basis that excludes items that management does not consider representative of our underlying performance. Provided below is a reconciliation to the most directly comparable US GAAP measures. December 15, 2020 Group in CHF mn 3Q20 2Q20 1Q20 4Q19 3Q19 2Q19 1Q19 9M20 9M19 9M18 9M17 9M16 9M15 2019 2018 2017 2016 2015 2014 Net revenues reported 5,198 6,194 5,776 6,190 5,326 5,581 5,387 17,168 16,294 16,119 15,711 15,142 19,587 22,484 20,920 20,900 20,323 23,797 26,242 FVoD - - - - - - - - - - - - (995) - - - - (298) (543) Real estate gains - - - (146) - (75) (30) - (105) (16) - (346) (23) (251) (28) - (424) (95) (414) (Gains)/losses on business sales - - - 2 - - - - - (68) (15) 56 - 2 (71) 13 58 (34) (101) Net revenues adjusted 5,198 6,194 5,776 6,046 5,326 5,506 5,357 17,168 16,189 16,035 15,696 14,852 18,569 22,235 20,821 20,913 19,957 23,370 25,184 o/w related to InvestLab transfer - - 268 - 327 - - 268 327 - - - - 327 - - - - - o/w related to SIX revaluation - - - 498 - - - - - - - - - 498 - - - - - o/w Pfandbriefbank gain - 134 - - - - - 134 - - - - - - - - - - - Net revenues adj. excl. significant items 5,198 6,060 5,508 5,548 4,999 5,506 5,357 16,766 15,862 16,035 15,696 14,852 18,569 21,410 20,821 20,913 19,957 23,370 25,184 Provision for credit losses 94 296 568 146 72 25 81 958 178 186 167 177 191 324 245 210 252 324 186 Total operating expenses reported 4,301 4,347 4,007 4,830 4,112 4,254 4,244 12,655 12,610 13,156 13,892 15,028 15,377 17,440 17,303 18,897 22,337 25,895 22,429 Goodwill impairment - - - - - - - - - - - - - - - - - (3,797) - Restructuring expenses (107) - - - - - - (107) - (490) (318) (491) - - (626) (455) (540) (355) - Major litigation provisions (152) (61) (18) (326) (28) (29) (6) (231) (63) (162) (238) (306) (257) (389) (244) (493) (2,707) (820) (2,436) Expenses related to real estate disposals (25) (3) 5 (57) - (16) (35) (23) (51) - - - - (108) - - - - - Expenses related to business sales - - - - - - - - - (3) - - - - (51) (8) - - - Total operating expenses adjusted 4,017 4,283 3,994 4,447 4,084 4,209 4,203 12,294 12,496 12,501 13,336 14,231 15,120 16,943 16,382 17,941 19,090 20,923 19,993 Pre-tax income/(loss) reported 803 1,551 1,201 1,214 1,142 1,302 1,062 3,555 3,506 2,777 1,652 (63) 4,019 4,720 3,372 1,793 (2,266) (2,422) 3,627 Total adjustments and significant items 284 (70) (255) (259) (299) (30) 11 (41) (318) 571 541 507 (761) (577) 822 969 2,881 4,545 1,378 Pre-tax income/(loss) adj. excl. significant items 1,087 1,481 946 955 843 1,272 1,073 3,514 3,188 3,348 2,193 444 3,258 4,143 4,194 2,762 615 2,123 5,005 Pre-provision profit/(loss) adj. excl. significant items 1,181 1,777 1,514 1,101 915 1,297 1,154 4,472 3,366 3,534 2,360 621 3,449 4,467 4,439 2,972 867 2,447 5,191
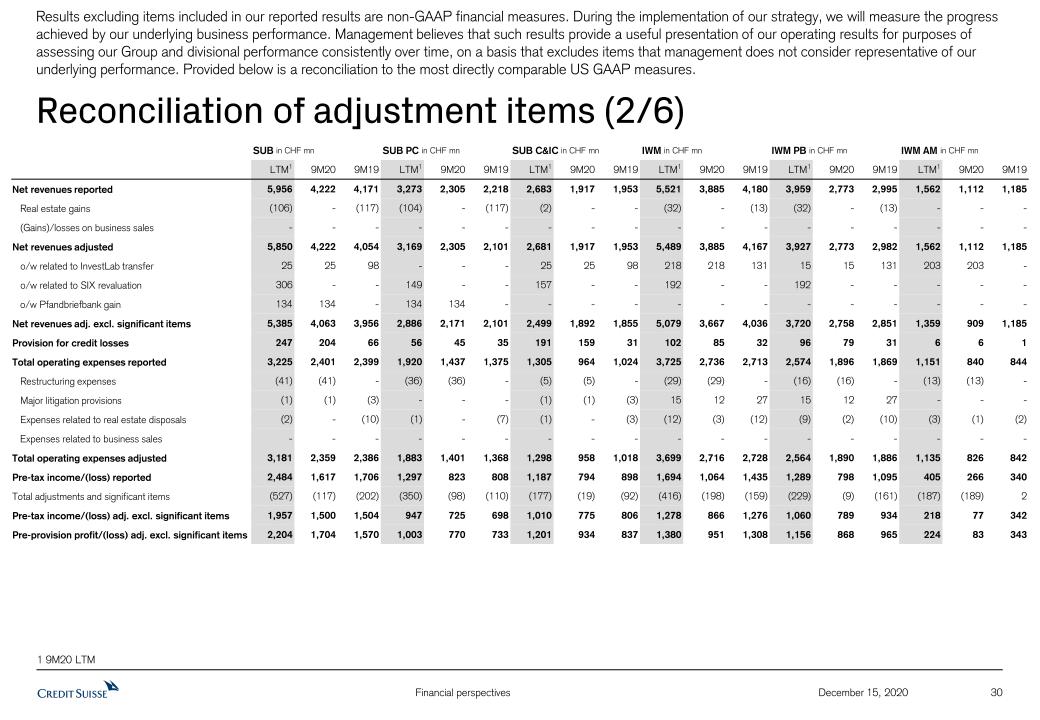
30 Reconciliation of adjustment items (2/6) December 15, 2020 SUB in CHF mn SUB PC in CHF mn SUB C&IC in CHF mn IWM in CHF mn IWM PB in CHF mn IWM AM in CHF mn LTM1 9M20 9M19 LTM1 9M20 9M19 LTM1 9M20 9M19 LTM1 9M20 9M19 LTM1 9M20 9M19 LTM1 9M20 9M19 Net revenues reported 5,956 4,222 4,171 3,273 2,305 2,218 2,683 1,917 1,953 5,521 3,885 4,180 3,959 2,773 2,995 1,562 1,112 1,185 Real estate gains (106) - (117) (104) - (117) (2) - - (32) - (13) (32) - (13) - - - (Gains)/losses on business sales - - - - - - - - - - - - - - - - - - Net revenues adjusted 5,850 4,222 4,054 3,169 2,305 2,101 2,681 1,917 1,953 5,489 3,885 4,167 3,927 2,773 2,982 1,562 1,112 1,185 o/w related to InvestLab transfer 25 25 98 - - - 25 25 98 218 218 131 15 15 131 203 203 - o/w related to SIX revaluation 306 - - 149 - - 157 - - 192 - - 192 - - - - - o/w Pfandbriefbank gain 134 134 - 134 134 - - - - - - - - - - - - - Net revenues adj. excl. significant items 5,385 4,063 3,956 2,886 2,171 2,101 2,499 1,892 1,855 5,079 3,667 4,036 3,720 2,758 2,851 1,359 909 1,185 Provision for credit losses 247 204 66 56 45 35 191 159 31 102 85 32 96 79 31 6 6 1 Total operating expenses reported 3,225 2,401 2,399 1,920 1,437 1,375 1,305 964 1,024 3,725 2,736 2,713 2,574 1,896 1,869 1,151 840 844 Restructuring expenses (41) (41) - (36) (36) - (5) (5) - (29) (29) - (16) (16) - (13) (13) - Major litigation provisions (1) (1) (3) - - - (1) (1) (3) 15 12 27 15 12 27 - - - Expenses related to real estate disposals (2) - (10) (1) - (7) (1) - (3) (12) (3) (12) (9) (2) (10) (3) (1) (2) Expenses related to business sales - - - - - - - - - - - - - - - - - - Total operating expenses adjusted 3,181 2,359 2,386 1,883 1,401 1,368 1,298 958 1,018 3,699 2,716 2,728 2,564 1,890 1,886 1,135 826 842 Pre-tax income/(loss) reported 2,484 1,617 1,706 1,297 823 808 1,187 794 898 1,694 1,064 1,435 1,289 798 1,095 405 266 340 Total adjustments and significant items (527) (117) (202) (350) (98) (110) (177) (19) (92) (416) (198) (159) (229) (9) (161) (187) (189) 2 Pre-tax income/(loss) adj. excl. significant items 1,957 1,500 1,504 947 725 698 1,010 775 806 1,278 866 1,276 1,060 789 934 218 77 342 Pre-provision profit/(loss) adj. excl. significant items 2,204 1,704 1,570 1,003 770 733 1,201 934 837 1,380 951 1,308 1,156 868 965 224 83 343 1 9M20 LTM Results excluding items included in our reported results are non-GAAP financial measures. During the implementation of our strategy, we will measure the progress achieved by our underlying business performance. Management believes that such results provide a useful presentation of our operating results for purposes of assessing our Group and divisional performance consistently over time, on a basis that excludes items that management does not consider representative of our underlying performance. Provided below is a reconciliation to the most directly comparable US GAAP measures.

31 Reconciliation of adjustment items (3/6) December 15, 2020 APAC in CHF mn Total WM2 in CHF mn WM-related3 in CHF mn IB in USD mn LTM1 9M20 9M19 LTM1 9M20 9M19 LTM1 9M20 9M19 LTM1 9M20 9M19 2019 2018 2017 2016 Net revenues reported 3,121 2,371 2,279 10,353 7,449 7,492 14,598 10,478 10,630 9,358 7,381 6,239 8,216 8,215 8,688 8,572 Real estate gains - - - (136) - (130) (138) - (130) (7) - - (7) - - - (Gains)/losses on business sales - - - - - - - - - - - - - - - - Net revenues adjusted 3,121 2,371 2,279 10,217 7,449 7,362 14,460 10,478 10,500 9,351 7,381 6,239 8,209 8,215 8,688 8,572 o/w related to InvestLab transfer 25 25 98 40 40 229 268 268 327 - - - - o/w related to SIX revaluation - - - 341 - - 498 - - - - - - - - - o/w Pfandbriefbank gain - - - 134 134 - 134 134 - - - - - - - - Net revenues adj. excl. significant items 3,096 2,346 2,181 9,702 7,275 7,133 13,560 10,076 10,173 9,351 7,381 6,239 8,209 8,215 8,688 8,572 Provision for credit losses 244 230 41 396 354 107 593 519 139 516 447 36 105 52 61 15 Total operating expenses reported 2,085 1,550 1,517 6,579 4,883 4,761 9,035 6,687 6,629 7,343 5,492 5,227 7,078 7,313 7,573 7,998 Restructuring expenses (2) (2) - (54) (54) - (72) (72) - (36) (36) - - (360) (235) (288) Major litigation provisions - - - 15 12 27 14 11 24 (25) (25) - - (12) - (7) Expenses related to real estate disposals - - - (10) (2) (17) (14) (3) (22) (69) (22) (31) (78) - - - Expenses related to business sales - - - - - - - - - - - - - - (8) - Total operating expenses adjusted 2,083 1,548 1,517 6,530 4,839 4,771 8,963 6,623 6,631 7,213 5,409 5,196 7,000 6,941 7,330 7,703 Pre-tax income/(loss) reported 792 591 721 3,378 2,212 2,624 4,970 3,272 3,862 1,499 1,442 976 1,033 850 1,054 559 Total adjustments and significant items (23) (23) (98) (602) (130) (369) (966) (338) (459) 123 83 31 71 372 243 295 Pre-tax income/(loss) adj. excl. significant items 769 568 623 2,776 2,082 2,255 4,004 2,934 3,403 1,622 1,525 1,007 1,104 1,222 1,297 854 Pre-provision profit/(loss) adj. excl. significant items 1,013 798 664 3,172 2,436 2,362 4,597 3,453 3,542 2,138 1,972 1,043 1,209 1,274 1,358 869 1 9M20 LTM 2 SUB PC, IWM PB and APAC 3 SUB, IWM and APAC Results excluding items included in our reported results are non-GAAP financial measures. During the implementation of our strategy, we will measure the progress achieved by our underlying business performance. Management believes that such results provide a useful presentation of our operating results for purposes of assessing our Group and divisional performance consistently over time, on a basis that excludes items that management does not consider representative of our underlying performance. Provided below is a reconciliation to the most directly comparable US GAAP measures.
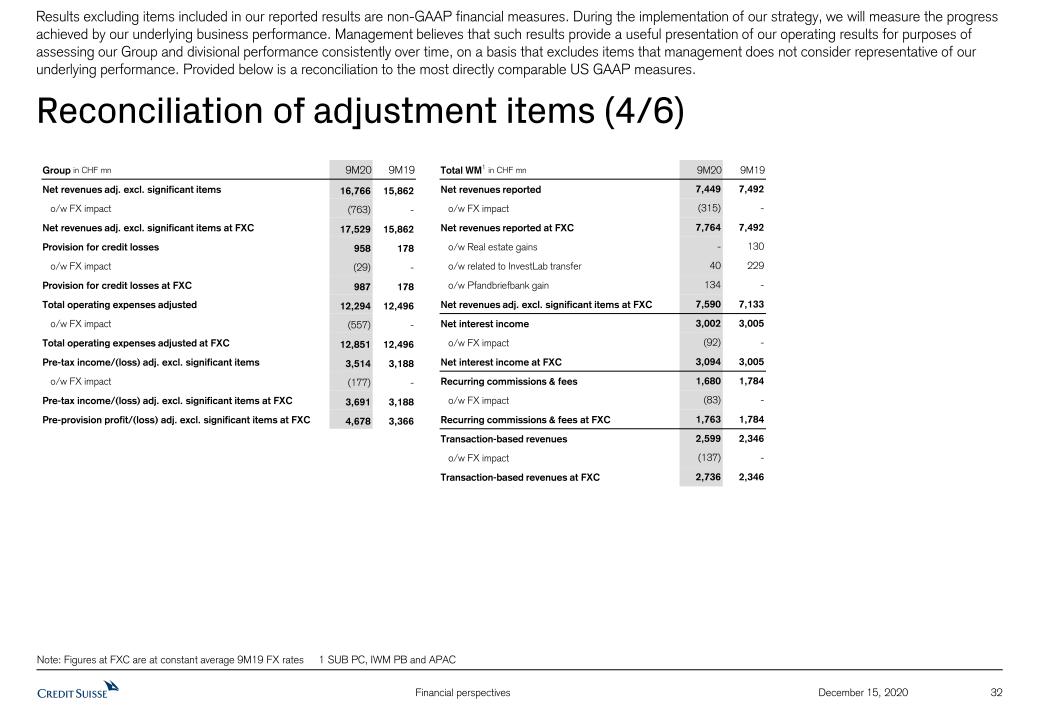
32 Reconciliation of adjustment items (4/6) December 15, 2020 Note: Figures at FXC are at constant average 9M19 FX rates 1 SUB PC, IWM PB and APAC Total WM1 in CHF mn 9M20 9M19 Net revenues reported 7,449 7,492 o/w FX impact (315) - Net revenues reported at FXC 7,764 7,492 o/w Real estate gains - 130 o/w related to InvestLab transfer 40 229 o/w Pfandbriefbank gain 134 - Net revenues adj. excl. significant items at FXC 7,590 7,133 Net interest income 3,002 3,005 o/w FX impact (92) - Net interest income at FXC 3,094 3,005 Recurring commissions & fees 1,680 1,784 o/w FX impact (83) - Recurring commissions & fees at FXC 1,763 1,784 Transaction-based revenues 2,599 2,346 o/w FX impact (137) - Transaction-based revenues at FXC 2,736 2,346 Group in CHF mn 9M20 9M19 Net revenues adj. excl. significant items 16,766 15,862 o/w FX impact (763) - Net revenues adj. excl. significant items at FXC 17,529 15,862 Provision for credit losses 958 178 o/w FX impact (29) - Provision for credit losses at FXC 987 178 Total operating expenses adjusted 12,294 12,496 o/w FX impact (557) - Total operating expenses adjusted at FXC 12,851 12,496 Pre-tax income/(loss) adj. excl. significant items 3,514 3,188 o/w FX impact (177) - Pre-tax income/(loss) adj. excl. significant items at FXC 3,691 3,188 Pre-provision profit/(loss) adj. excl. significant items at FXC 4,678 3,366 Results excluding items included in our reported results are non-GAAP financial measures. During the implementation of our strategy, we will measure the progress achieved by our underlying business performance. Management believes that such results provide a useful presentation of our operating results for purposes of assessing our Group and divisional performance consistently over time, on a basis that excludes items that management does not consider representative of our underlying performance. Provided below is a reconciliation to the most directly comparable US GAAP measures.
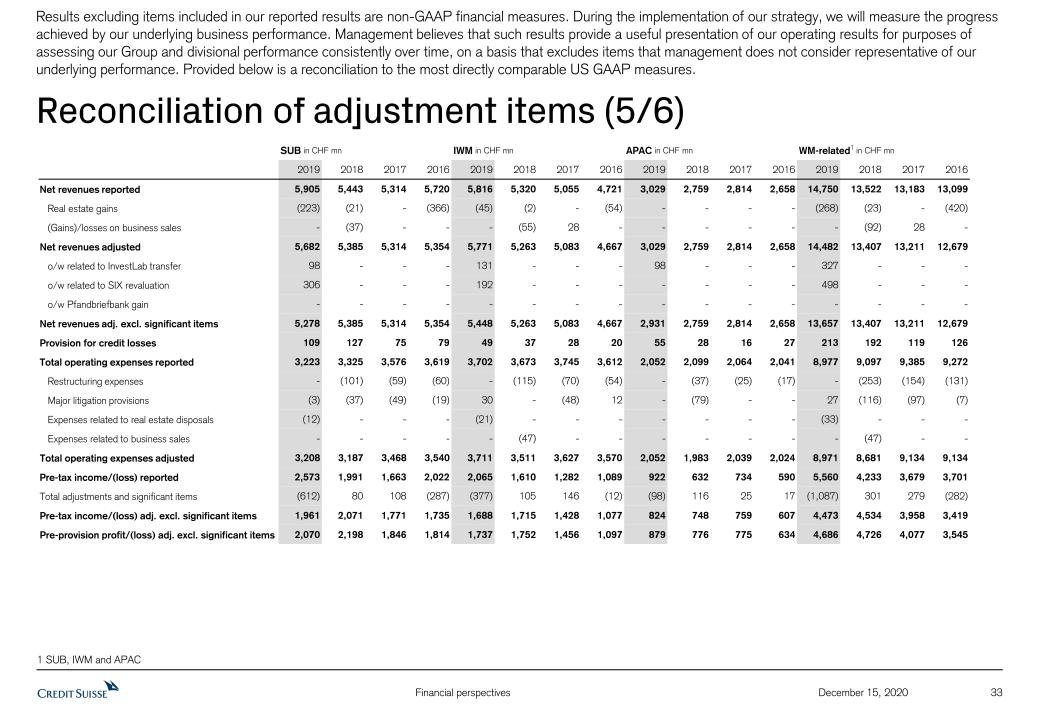
33 Reconciliation of adjustment items (5/6) December 15, 2020 SUB in CHF mn IWM in CHF mn APAC in CHF mn WM-related1 in CHF mn 2019 2018 2017 2016 2019 2018 2017 2016 2019 2018 2017 2016 2019 2018 2017 2016 Net revenues reported 5,905 5,443 5,314 5,720 5,816 5,320 5,055 4,721 3,029 2,759 2,814 2,658 14,750 13,522 13,183 13,099 Real estate gains (223) (21) - (366) (45) (2) - (54) - - - - (268) (23) - (420) (Gains)/losses on business sales - (37) - - - (55) 28 - - - - - - (92) 28 - Net revenues adjusted 5,682 5,385 5,314 5,354 5,771 5,263 5,083 4,667 3,029 2,759 2,814 2,658 14,482 13,407 13,211 12,679 o/w related to InvestLab transfer 98 - - - 131 - - - 98 - - - 327 - - - o/w related to SIX revaluation 306 - - - 192 - - - - - - - 498 - - - o/w Pfandbriefbank gain - - - - - - - - - - - - - - - - Net revenues adj. excl. significant items 5,278 5,385 5,314 5,354 5,448 5,263 5,083 4,667 2,931 2,759 2,814 2,658 13,657 13,407 13,211 12,679 Provision for credit losses 109 127 75 79 49 37 28 20 55 28 16 27 213 192 119 126 Total operating expenses reported 3,223 3,325 3,576 3,619 3,702 3,673 3,745 3,612 2,052 2,099 2,064 2,041 8,977 9,097 9,385 9,272 Restructuring expenses - (101) (59) (60) - (115) (70) (54) - (37) (25) (17) - (253) (154) (131) Major litigation provisions (3) (37) (49) (19) 30 - (48) 12 - (79) - - 27 (116) (97) (7) Expenses related to real estate disposals (12) - - - (21) - - - - - - - (33) - - - Expenses related to business sales - - - - - (47) - - - - - - - (47) - - Total operating expenses adjusted 3,208 3,187 3,468 3,540 3,711 3,511 3,627 3,570 2,052 1,983 2,039 2,024 8,971 8,681 9,134 9,134 Pre-tax income/(loss) reported 2,573 1,991 1,663 2,022 2,065 1,610 1,282 1,089 922 632 734 590 5,560 4,233 3,679 3,701 Total adjustments and significant items (612) 80 108 (287) (377) 105 146 (12) (98) 116 25 17 (1,087) 301 279 (282) Pre-tax income/(loss) adj. excl. significant items 1,961 2,071 1,771 1,735 1,688 1,715 1,428 1,077 824 748 759 607 4,473 4,534 3,958 3,419 Pre-provision profit/(loss) adj. excl. significant items 2,070 2,198 1,846 1,814 1,737 1,752 1,456 1,097 879 776 775 634 4,686 4,726 4,077 3,545 1 SUB, IWM and APAC Results excluding items included in our reported results are non-GAAP financial measures. During the implementation of our strategy, we will measure the progress achieved by our underlying business performance. Management believes that such results provide a useful presentation of our operating results for purposes of assessing our Group and divisional performance consistently over time, on a basis that excludes items that management does not consider representative of our underlying performance. Provided below is a reconciliation to the most directly comparable US GAAP measures.

34 Reconciliation of adjustment items (6/6) December 15, 2020 Note: CHF figures converted into USD at average exchange rates of 0.9961 for 9M19 and 0.9456 for 9M20 1 SUB PC, IWM PB and APAC Results excluding items included in our reported results are non-GAAP financial measures. During the implementation of our strategy, we will measure the progress achieved by our underlying business performance. Management believes that such results provide a useful presentation of our operating results for purposes of assessing our Group and divisional performance consistently over time, on a basis that excludes items that management does not consider representative of our underlying performance. Provided below is a reconciliation to the most directly comparable US GAAP measures. SUB PC in USD mn IWM PB in USD mn APAC in USD mn Total WM1 in USD mn 9M20 9M19 9M20 9M19 9M20 9M19 9M20 9M19 Net revenues reported 2,438 2,227 2,932 3,007 2,507 2,288 7,877 7,521 Real estate gains - (117) - (13) - - - (131) (Gains)/losses on business sales - - - - - - - - Net revenues adjusted 2,438 2,109 2,932 2,994 2,507 2,288 7,877 7,391 o/w related to InvestLab transfer - - 16 132 26 98 42 230 o/w related to SIX revaluation - - - - - - - - o/w Pfandbriefbank gain 142 - - - - - 142 - Net revenues adj. excl. significant items 2,296 2,109 2,917 2,862 2,481 2,190 7,693 7,161
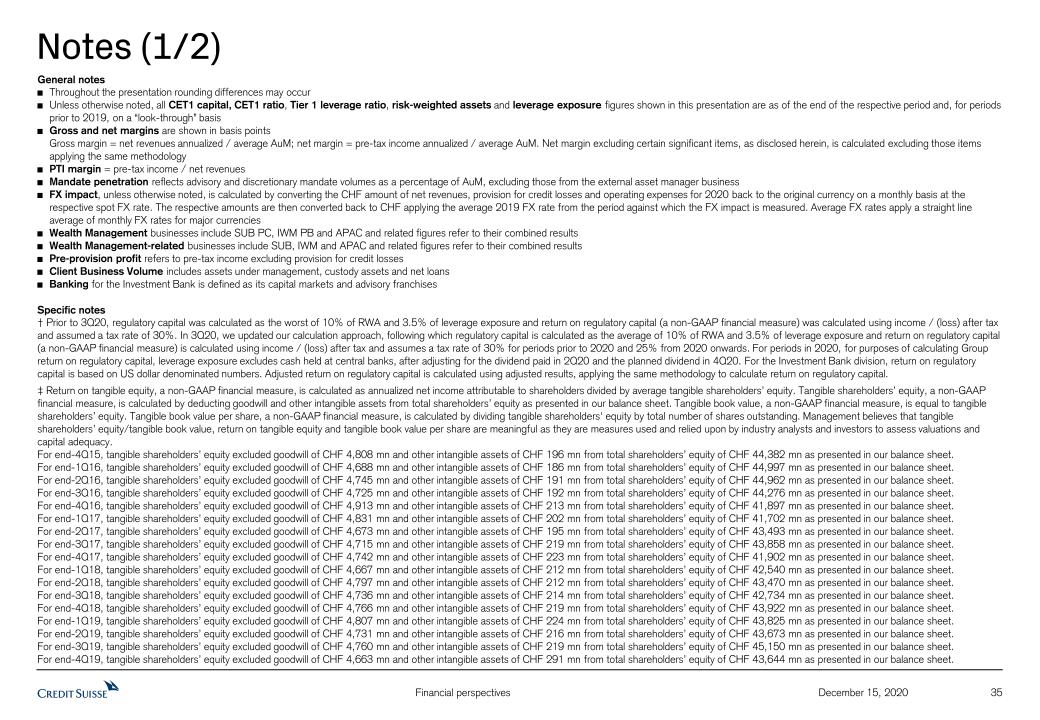
Notes (1/2) 35 December 15, 2020 General notesThroughout the presentation rounding differences may occurUnless otherwise noted, all CET1 capital, CET1 ratio, Tier 1 leverage ratio, risk-weighted assets and leverage exposure figures shown in this presentation are as of the end of the respective period and, for periods prior to 2019, on a “look-through” basisGross and net margins are shown in basis pointsGross margin = net revenues annualized / average AuM; net margin = pre-tax income annualized / average AuM. Net margin excluding certain significant items, as disclosed herein, is calculated excluding those items applying the same methodologyPTI margin = pre-tax income / net revenuesMandate penetration reflects advisory and discretionary mandate volumes as a percentage of AuM, excluding those from the external asset manager businessFX impact, unless otherwise noted, is calculated by converting the CHF amount of net revenues, provision for credit losses and operating expenses for 2020 back to the original currency on a monthly basis at the respective spot FX rate. The respective amounts are then converted back to CHF applying the average 2019 FX rate from the period against which the FX impact is measured. Average FX rates apply a straight line average of monthly FX rates for major currenciesWealth Management businesses include SUB PC, IWM PB and APAC and related figures refer to their combined resultsWealth Management-related businesses include SUB, IWM and APAC and related figures refer to their combined resultsPre-provision profit refers to pre-tax income excluding provision for credit losses Client Business Volume includes assets under management, custody assets and net loansBanking for the Investment Bank is defined as its capital markets and advisory franchisesSpecific notes† Prior to 3Q20, regulatory capital was calculated as the worst of 10% of RWA and 3.5% of leverage exposure and return on regulatory capital (a non-GAAP financial measure) was calculated using income / (loss) after tax and assumed a tax rate of 30%. In 3Q20, we updated our calculation approach, following which regulatory capital is calculated as the average of 10% of RWA and 3.5% of leverage exposure and return on regulatory capital (a non-GAAP financial measure) is calculated using income / (loss) after tax and assumes a tax rate of 30% for periods prior to 2020 and 25% from 2020 onwards. For periods in 2020, for purposes of calculating Group return on regulatory capital, leverage exposure excludes cash held at central banks, after adjusting for the dividend paid in 2Q20 and the planned dividend in 4Q20. For the Investment Bank division, return on regulatory capital is based on US dollar denominated numbers. Adjusted return on regulatory capital is calculated using adjusted results, applying the same methodology to calculate return on regulatory capital.‡ Return on tangible equity, a non-GAAP financial measure, is calculated as annualized net income attributable to shareholders divided by average tangible shareholders’ equity. Tangible shareholders’ equity, a non-GAAP financial measure, is calculated by deducting goodwill and other intangible assets from total shareholders’ equity as presented in our balance sheet. Tangible book value, a non-GAAP financial measure, is equal to tangible shareholders’ equity. Tangible book value per share, a non-GAAP financial measure, is calculated by dividing tangible shareholders' equity by total number of shares outstanding. Management believes that tangible shareholders’ equity/tangible book value, return on tangible equity and tangible book value per share are meaningful as they are measures used and relied upon by industry analysts and investors to assess valuations and capital adequacy.For end-4Q15, tangible shareholders’ equity excluded goodwill of CHF 4,808 mn and other intangible assets of CHF 196 mn from total shareholders’ equity of CHF 44,382 mn as presented in our balance sheet.For end-1Q16, tangible shareholders’ equity excluded goodwill of CHF 4,688 mn and other intangible assets of CHF 186 mn from total shareholders’ equity of CHF 44,997 mn as presented in our balance sheet.For end-2Q16, tangible shareholders’ equity excluded goodwill of CHF 4,745 mn and other intangible assets of CHF 191 mn from total shareholders’ equity of CHF 44,962 mn as presented in our balance sheet.For end-3Q16, tangible shareholders’ equity excluded goodwill of CHF 4,725 mn and other intangible assets of CHF 192 mn from total shareholders’ equity of CHF 44,276 mn as presented in our balance sheet.For end-4Q16, tangible shareholders’ equity excluded goodwill of CHF 4,913 mn and other intangible assets of CHF 213 mn from total shareholders’ equity of CHF 41,897 mn as presented in our balance sheet.For end-1Q17, tangible shareholders’ equity excluded goodwill of CHF 4,831 mn and other intangible assets of CHF 202 mn from total shareholders’ equity of CHF 41,702 mn as presented in our balance sheet.For end-2Q17, tangible shareholders’ equity excluded goodwill of CHF 4,673 mn and other intangible assets of CHF 195 mn from total shareholders’ equity of CHF 43,493 mn as presented in our balance sheet.For end-3Q17, tangible shareholders’ equity excluded goodwill of CHF 4,715 mn and other intangible assets of CHF 219 mn from total shareholders’ equity of CHF 43,858 mn as presented in our balance sheet.For end-4Q17, tangible shareholders’ equity excluded goodwill of CHF 4,742 mn and other intangible assets of CHF 223 mn from total shareholders’ equity of CHF 41,902 mn as presented in our balance sheet.For end-1Q18, tangible shareholders’ equity excluded goodwill of CHF 4,667 mn and other intangible assets of CHF 212 mn from total shareholders’ equity of CHF 42,540 mn as presented in our balance sheet.For end-2Q18, tangible shareholders’ equity excluded goodwill of CHF 4,797 mn and other intangible assets of CHF 212 mn from total shareholders’ equity of CHF 43,470 mn as presented in our balance sheet.For end-3Q18, tangible shareholders’ equity excluded goodwill of CHF 4,736 mn and other intangible assets of CHF 214 mn from total shareholders’ equity of CHF 42,734 mn as presented in our balance sheet.For end-4Q18, tangible shareholders’ equity excluded goodwill of CHF 4,766 mn and other intangible assets of CHF 219 mn from total shareholders’ equity of CHF 43,922 mn as presented in our balance sheet.For end-1Q19, tangible shareholders’ equity excluded goodwill of CHF 4,807 mn and other intangible assets of CHF 224 mn from total shareholders’ equity of CHF 43,825 mn as presented in our balance sheet. For end-2Q19, tangible shareholders’ equity excluded goodwill of CHF 4,731 mn and other intangible assets of CHF 216 mn from total shareholders’ equity of CHF 43,673 mn as presented in our balance sheet.For end-3Q19, tangible shareholders’ equity excluded goodwill of CHF 4,760 mn and other intangible assets of CHF 219 mn from total shareholders’ equity of CHF 45,150 mn as presented in our balance sheet.For end-4Q19, tangible shareholders’ equity excluded goodwill of CHF 4,663 mn and other intangible assets of CHF 291 mn from total shareholders’ equity of CHF 43,644 mn as presented in our balance sheet.

Notes (2/2) 36 December 15, 2020 For end-1Q20, tangible shareholders’ equity excluded goodwill of CHF 4,604 mn and other intangible assets of CHF 279 mn from total shareholders’ equity of CHF 48,675 mn as presented in our balance sheet. For end-2Q20, tangible shareholders’ equity excluded goodwill of CHF 4,676 mn and other intangible assets of CHF 273 mn from total shareholders’ equity of CHF 46,535 mn as presented in our balance sheet.For end-3Q20, tangible shareholders’ equity excluded goodwill of CHF 4,577 mn and other intangible assets of CHF 256 mn from total shareholders’ equity of CHF 45,740 mn as presented in our balance sheet. AbbreviationsABS = Asset Backed Securities; ACL = Allowance for credit losses; Adj. = Adjusted; AGM = Annual General Meeting; AI = Artificial Intelligence; AM = Asset Management; Ann. = Annualized; APAC = Asia Pacific; AuM = Assets under Management; Avg. = Average; BIS = Bank for International Settlements; BoD = Board of Directors; bps = basis points; CAGR = Compound Annual Growth Rate; CARMC = Capital Allocation & Risk Management Committee; C&IC = Corporate & Institutional Clients; CBV = Client Business Volume; CDS = Credit Default Swap; CECL = Current Expected Credit Losses; CET1 = Common Equity Tier 1; C&IC = Corporate and Institutional Clients; C/I = Cost/Income; CIG = Credit Investments Group; CIO = Chief Investment Officer; CLO = Collateralized Loan Obligation; Corp. Ctr. = Corporate Center; COVID-19 = Coronavirus disease 2019; CRCO = Chief Risk and Compliance Officer; CSO = Chief Sustainability Officer; CSR = Corporate Social Responsibility; CSX = Credit Suisse X; CVA = Credit Valuation Adjustment; DCM = Debt Capital Markets; DPB = Digital Private Banking; ECM = Equity Capital Markets; EM Credit = Emerging Market Credit; EMEA = Europe, Middle East & Africa; ESG = Environmental Social and Governance; ExB = Executive Board of Directors; Excl. = Excluding; FINMA = Swiss Financial Market Supervisory Authority; FRTB = Fundamental Review of the Trading Book; FVoD = Fair Value on own Debt; FX = Foreign Exchange; FXC = FX Constant; GAAP = Generally Accepted Accounting Principles; GDP = Gross Domestic Product; GRESB = Global ESG Benchmark for Real Assets; GTS = Global Trading Solutions; HY = High Yield; I&P = Investments & Partnerships; IB = Investment Bank; IBCM = Investment Banking & Capital Markets; ICBCCS = ICBC Credit Suisse Asset Management; IG = Investment Grade; ILS = Insurance-Linked Strategies; IMF = International Monetary Fund; IPO = Initial Public Offering; IS&P = Investment Solutions & Products; ITS = International Trading Solutions; IWM = International Wealth Management; L/S = Long/Short; Lev Fin = Leveraged Finance; LGBT = Lesbian, Gay, Bisexual, and Transgender; LTM = Last Twelve Months; M&A = Mergers & Acquisitions; MSCI = Morgan Stanley Capital International; NAB = Neue Aargauer Bank; NGO = Non-governmental organization; NII = Net interest income; NNA = Net new assets; NPA = Non-performing assets; o/w = of which; OpRisk = Operational Risk; p.a. = per annum; PACTA = Paris Agreement Capital Transition Assessment; PB = Private Banking; PC = Private Clients; PCL = Provision for credit losses; PCO = Private Credit Opportunities; PCR = Position & Client Risk; PE = Private Equity; PPP = Purchasing Power Parity; PTI = Pre-tax income; RE = Real Estate; RM = Relationship Manager(s); RMBS = Residential Mortgage-Backed Security; RoRC = Return on Regulatory Capital; RoTE = Return on Tangible Equity; RWA = Risk-weighted assets; SA-CCR = Standardized Approach to Counterparty Credit Risk; SASB = Sustainability Accounting Standards Board; S&T = Sales and Trading; SIX = Swiss Infrastructure and Exchange; SME = Small and Medium-Sized Enterprises; SoW = Share of Wallet; SP = Securitized Products; SRI = Sustainability, Research & Investment Solutions; SRU = Strategic Resolution Unit; SUB = Swiss Universal Bank; TBTF = Too big to fail; TBVPS = Tangible Book Value Per Share; TFCD = Task Force on Climate-related Financial Disclosures; (U)HNW = (Ultra) High Net Worth; (U)HNWI = (Ultra) High Net Worth Individuals; UN SDG = United Nations Sustainable Development Goals; VCs = Venture Capitalists; YoY = Year over year; YTD = Year to Date
December 15, 2020 37
Andre Helfenstein, CEO Swiss Universal BankHelman Sitohang, CEO Asia PacificPhilipp Wehle, CEO International Wealth ManagementDecember 15, 2020 Credit Suisse Investor Update 2020Accelerating growth in Wealth Management

Disclaimer 2 December 15, 2020 This material does not purport to contain all of the information that you may wish to consider. This material is not to be relied upon as such or used in substitution for the exercise of independent judgment.Cautionary statement regarding forward-looking statementsThis presentation contains forward-looking statements that involve inherent risks and uncertainties, and we might not be able to achieve the predictions, forecasts, projections and other outcomes we describe or imply in forward-looking statements. A number of important factors could cause results to differ materially from the plans, targets, goals, expectations, estimates and intentions we express in these forward-looking statements, including those we identify in "Risk factors” in our Annual Report on Form 20-F for the fiscal year ended December 31, 2019, in “Credit Suisse – Risk factor” in our 1Q20 Financial Report published on May 7, 2020 and in the “Cautionary statement regarding forward-looking information" in our media release relating to the Investor Update published on December 15, 2020 and filed with the US Securities and Exchange Commission, and in other public filings and press releases. We do not intend to update these forward-looking statements. In particular, the terms “Estimate”, “Illustrative”, “Ambition”, “Objective”, “Outlook” and “Goal” are not intended to be viewed as targets or projections, nor are they considered to be Key Performance Indicators. All such estimates, illustrations, ambitions, objectives, outlooks and goals are subject to a large number of inherent risks, assumptions and uncertainties, many of which are completely outside of our control. These risks, assumptions and uncertainties include, but are not limited to, general market conditions, market volatility, interest rate volatility and levels, global and regional economic conditions, challenges and uncertainties resulting from the COVID-19 pandemic, political uncertainty, changes in tax policies, regulatory changes, changes in levels of client activity as a result of any of the foregoing and other factors. Accordingly, this information should not be relied on for any purpose. We do not intend to update these estimates, illustrations, ambitions, objectives, outlooks or goals. We may not achieve the benefits of our strategic initiativesWe may not achieve all of the expected benefits of our strategic initiatives. Factors beyond our control, including but not limited to the market and economic conditions (including macroeconomic and other challenges and uncertainties, for example, resulting from the COVID-19 pandemic), changes in laws, rules or regulations and other challenges discussed in our public filings, could limit our ability to achieve some or all of the expected benefits of these initiatives. Estimates and assumptionsIn preparing this presentation, management has made estimates and assumptions that affect the numbers presented. Actual results may differ. Annualized numbers do not take into account variations in operating results, seasonality and other factors and may not be indicative of actual, full-year results. Figures throughout this presentation may also be subject to rounding adjustments. All opinions and views constitute judgments as of the date of writing without regard to the date on which the reader may receive or access the information. This information is subject to change at any time without notice and we do not intend to update this information. RestatementAs of 3Q20, financial information reflects the new divisional reporting structure and management responsibilities announced on July 30, 2020 and updates to certain calculations and allocations. Prior periods have been restated to conform to the current presentation. In light of the restructuring announced July 30, 2020 and several significant items impacting results in prior periods, we intend to focus on adjusted numbers, excluding significant items in our discussion of results until the restructuring is completed.Cautionary statements relating to interim financial informationThis presentation contains certain unaudited interim financial information. This information has been derived from management accounts, is preliminary in nature, does not reflect the complete results of the fourth quarter of 2020 or the full year 2020 and is subject to change, including as a result of any normal quarterly or yearly adjustments in relation to the financial statements. This information has not been subject to any review by our independent registered public accounting firm. There can be no assurance that the final results for these periods will not differ from these preliminary results, and any such differences could be material. Quarterly financial results for the fourth quarter of 2020 and full year 2020 will be included in our 4Q20 Earnings Release and our 2020 Annual Report. These interim results of operations are not necessarily indicative of the results to be achieved for the remainder of 2020. Statement regarding non-GAAP financial measuresThis presentation also contains non-GAAP financial measures, including results excluding certain items included in our reported results, return on regulatory capital and return on tangible equity and tangible book value per share (which are both based on tangible shareholders’ equity). Further details and information needed to reconcile such non-GAAP financial measures to the most directly comparable measures under US GAAP can be found in the Appendix of the CEO and CFO Investor Update presentations, published on December 15, 2020, which are both available on our website at www.credit-suisse.com.Our estimates, ambitions, objectives and targets often include metrics that are non-GAAP financial measures and are unaudited. A reconciliation of the estimates, ambitions, objectives and targets to the nearest GAAP measures is unavailable without unreasonable efforts. Results excluding certain items included in our reported results do not include items such as goodwill impairment, major litigation provisions, real estate gains, impacts from foreign exchange and other items included in our reported results, all of which are unavailable on a prospective basis. Return on Tangible Equity is based on tangible shareholders' equity, a non-GAAP financial measure also known as tangible book value, which is calculated by deducting goodwill and other intangible assets from total shareholders' equity as presented in our balance sheet, both of which are unavailable on a prospective basis. Tangible book value per share excludes the impact of any dividends paid during the performance period, share buybacks, own credit movements, foreign exchange rate movements and pension-related impacts, all of which are unavailable on a prospective basis. Return on regulatory capital (a non-GAAP financial measure) is calculated using income/(loss) after tax and assumes a tax rate of 25% and capital allocated based on the average of 10% of average risk-weighted assets and 3.5% of average leverage exposure; the essential components of this calculation are unavailable on a prospective basis. Such estimates, ambitions, objectives and targets are calculated in a manner that is consistent with the accounting policies applied by us in preparing our financial statements.Statement regarding capital, liquidity and leverageCredit Suisse is subject to the Basel III framework, as implemented in Switzerland, as well as Swiss legislation and regulations for systemically important banks (Swiss Requirements), which include capital, liquidity, leverage and large exposure requirements and rules for emergency plans designed to maintain systemically relevant functions in the event of threatened insolvency. Credit Suisse has adopted the Bank for International Settlements (BIS) leverage ratio framework, as issued by the Basel Committee on Banking Supervision (BCBS) and implemented in Switzerland by the Swiss Financial Market Supervisory Authority FINMA. References to phase-in and look-through included herein refer to Basel III capital requirements and Swiss Requirements. Phase-in reflects that, for the years 2014-2018, there was a five-year (20% per annum) phase-in of goodwill, other intangible assets and other capital deductions (e.g., certain deferred tax assets) and a phase-out of an adjustment for the accounting treatment of pension plans. For the years 2013-2022, there is a phase-out of certain capital instruments. Look-through assumes the full phase-in of goodwill and other intangible assets and other regulatory adjustments and the phase-out of certain capital instruments.Unless otherwise noted, leverage exposure is based on the BIS leverage ratio framework and consists of period-end balance sheet assets and prescribed regulatory adjustments. The tier 1 leverage ratio and CET1 leverage ratio are calculated as BIS tier 1 capital and CET1 capital, respectively, divided by period-end leverage exposure. Swiss leverage ratios are measured on the same period-end basis as the leverage exposure for the BIS leverage ratio. Unless otherwise noted, for periods in 2020, leverage exposure excludes cash held at central banks, after adjusting for the dividends paid in 2020.SourcesCertain material in this presentation has been prepared by Credit Suisse on the basis of publicly available information, internally developed data and other third-party sources believed to be reliable. Credit Suisse has not sought to independently verify information obtained from public and third-party sources and makes no representations or warranties as to accuracy, completeness or reliability of such information.
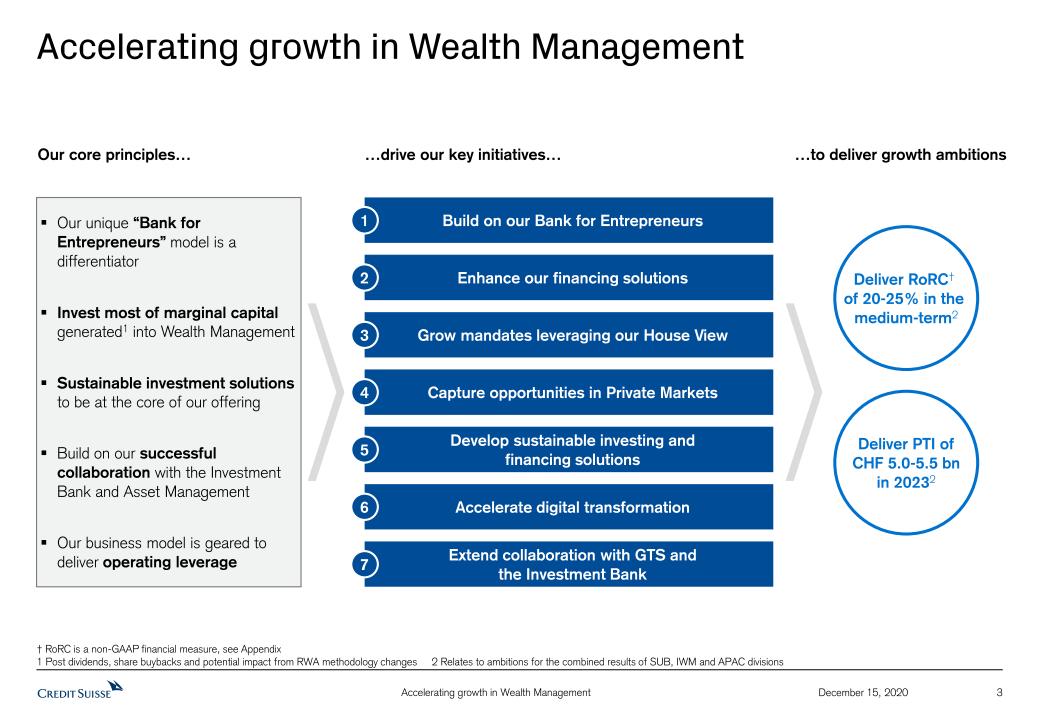
3 December 15, 2020 Accelerating growth in Wealth Management † RoRC is a non-GAAP financial measure, see Appendix 1 Post dividends, share buybacks and potential impact from RWA methodology changes 2 Relates to ambitions for the combined results of SUB, IWM and APAC divisions Our unique “Bank for Entrepreneurs” model is a differentiator Invest most of marginal capital generated1 into Wealth Management Sustainable investment solutions to be at the core of our offering Build on our successful collaboration with the Investment Bank and Asset ManagementOur business model is geared to deliver operating leverage …drive our key initiatives… Our core principles… Deliver RoRC† of 20-25% in the medium-term2 …to deliver growth ambitions Build on our Bank for Entrepreneurs Enhance our financing solutions Grow mandates leveraging our House View Develop sustainable investing and financing solutions 1 2 3 5 Capture opportunities in Private Markets 4 Accelerate digital transformation 6 Extend collaboration with GTS and the Investment Bank 7 Deliver PTI of CHF 5.0-5.5 bn in 20232

4 December 15, 2020 SUB - Strategic Priorities ‘High-tech’:Accelerate digitalization and streamline business model Position as digital leader in retail and affluent business with newly launched digital offering CSXIntegration of NAB on track resulting in unified coverage, processes and offeringOptimize branch footprint while rolling out innovative new branch concept ‘High-touch’: Drive business momentum and growth Build on our leading positions in the ‘high-touch’ segment to outgrow the market with U/HNW, institutional and large corporate clientsDeliver the universal bank experience leveraging our Investment Bank and Asset Management capabilities and strong connectivity to GTSSelected RM hires and further build-out of competitive institutional platformDrive sustainability and Private Markets opportunities Switzerland’s Best Bank(third consecutive year) Switzerland's Best Investment Bank Investment Bankingin Switzerland YTD3 #1 1 Part of the expected ~CHF 400-450 mn gross savings per annum from our restructuring program 2 SUB PC 3 Dealogic 2020 YTD as of December 11, 2020 CBV NNA Lending Mid-single digit SelectedAccolades Medium-term ambition growth rates (p.a.)2 Grow above market in both ‘high-touch’ and ‘high-tech’ segmentsExpect to generate gross cost savings of ~CHF 100 mn per annum from 2022 onwards1Goal to further reduce cost/income ratio Ambition 1-3% Low-single digit Switzerland’s Bank of the Year
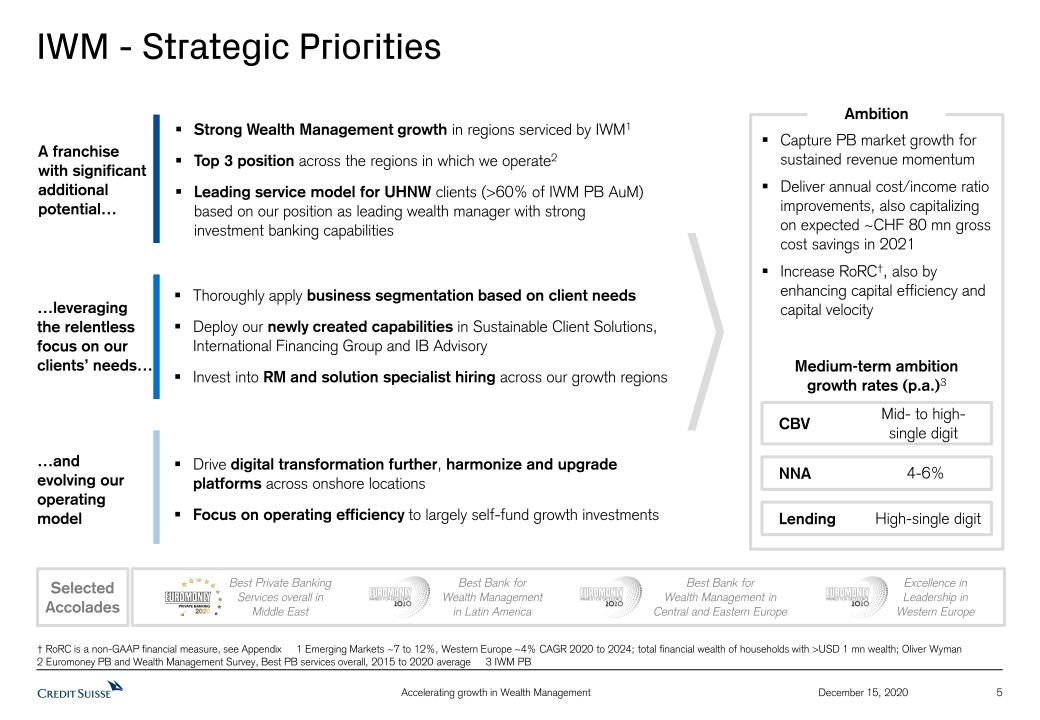
5 December 15, 2020 IWM - Strategic Priorities † RoRC is a non-GAAP financial measure, see Appendix 1 Emerging Markets ~7 to 12%, Western Europe ~4% CAGR 2020 to 2024; total financial wealth of households with >USD 1 mn wealth; Oliver Wyman2 Euromoney PB and Wealth Management Survey, Best PB services overall, 2015 to 2020 average 3 IWM PB Best Bank for Wealth Management in Latin America Excellence in Leadership in Western Europe Best Bank for Wealth Management in Central and Eastern Europe Best Private Banking Services overall in Middle East A franchise with significant additional potential… Strong Wealth Management growth in regions serviced by IWM1 Top 3 position across the regions in which we operate2Leading service model for UHNW clients (>60% of IWM PB AuM) based on our position as leading wealth manager with strong investment banking capabilities …leveraging the relentless focus on our clients’ needs… Thoroughly apply business segmentation based on client needsDeploy our newly created capabilities in Sustainable Client Solutions, International Financing Group and IB AdvisoryInvest into RM and solution specialist hiring across our growth regions …andevolving our operating model Drive digital transformation further, harmonize and upgrade platforms across onshore locationsFocus on operating efficiency to largely self-fund growth investments SelectedAccolades Ambition Capture PB market growth for sustained revenue momentumDeliver annual cost/income ratio improvements, also capitalizing on expected ~CHF 80 mn gross cost savings in 2021Increase RoRC†, also by enhancing capital efficiency and capital velocity CBV NNA Lending Mid- to high- single digit Medium-term ambition growth rates (p.a.)3 4-6% High-single digit

6 December 15, 2020 APAC - Strategic Priorities Invest in our leading country franchises to capture alpha, and continue long-term build out of China onshore capabilitiesGrow wealth-linked strategic solutions and distribution, including with GTS, SRI and Asset Management Drive diversified growth and collaboration upside Seek operational excellence Improve our client experience with digitalization, data management and automationContinue to enhance our risk and controls to support our ambitions Leverage our differentiated integrated model Selectively broaden UHNW and Entrepreneur focus clients with strategic hires across the regionDeepen tailored product offering for growth in financings, managed solutions and Private Markets activities 1 Reflects net revenues of the APAC division and includes revenues related to the Asia Pacific region recognized in the Investment Bank and International Wealth Management 2 Dealogic 2020 YTD as of December 11, 2020 (APAC excl. Japan and onshore China among international banks) Double digit 6-8% Double digit CBV NNA Lending Grow APAC regional revenue contribution to Group from current ~20%1Benefit from higher capital deployment in wealth managementTop 3 rankings in wealth management and IBCM businesses Ambition Asia’s Best Bank for Wealth Management (3rd time in 5 years) IBCM SoW for APeJ YTD2 Asia’s Best Bank for Investment Solutions #3 Equity DerivativesHouse of the Year Medium-term ambition growth rates (p.a.) SelectedAccolades

7 December 15, 2020 Build on our Bank for Entrepreneurs Business Volume 1 Lending growth 2 Mandate penetration 3 Private Markets 4 Sustainable solutions 5 Digital transformation 6 Our ambition 1 CAGR 2020 to 2024; total financial wealth of households with >USD 1 mn wealth; Oliver Wyman 2 Relates to SUB PC, IWM PB and APAC based on management data, estimates and assumptions 3 Relates to SUB PC, IWM PB and APAC Client Business Volume growth2CAGR, excluding estimated cumulative FX impact Key strategic actions Build on recent strategic hires and team lift-outs across Brazil, LatAm, Russia, India and Greater ChinaSelectively add further senior relationship managers and bankers to our platform Deepen share of wallet with key Strategic Clients based on integrated advisory and institutional-style solutionsSelectively extend Strategic Clients list Strategic Clients Relationship Managers Broaden onshore footprint to tap into fast growing markets, notably China (U)HNW clients Build scale by offering an analytics driven multi-channel advisory offering HNW / Affluent clients Key theme: Global wealth pools are expected to continue to grow; +6% in Developed Markets and +11% in Emerging Markets per annum1 GTS and IB 7 2015 - 2019 Mid- to high- single digit ~6.5% Medium-term ambition NNA growth3 ~4.5% Mid-singledigit
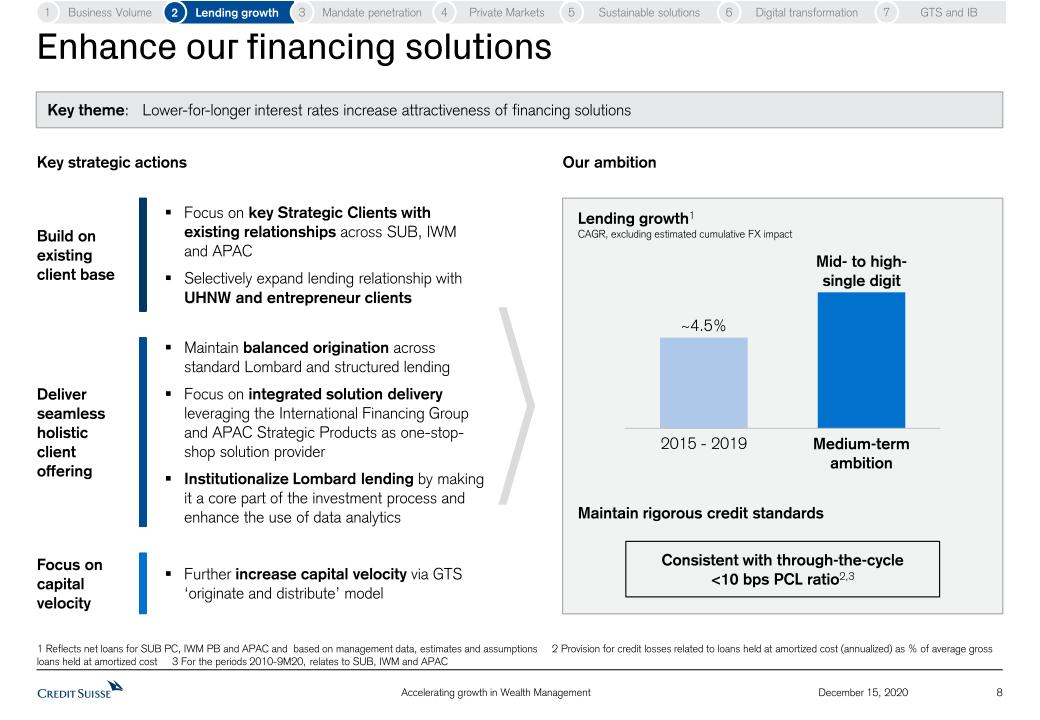
8 December 15, 2020 Enhance our financing solutions Business Volume 1 Lending growth 2 Mandate penetration 3 Private Markets 4 1 Reflects net loans for SUB PC, IWM PB and APAC and based on management data, estimates and assumptions 2 Provision for credit losses related to loans held at amortized cost (annualized) as % of average gross loans held at amortized cost 3 For the periods 2010-9M20, relates to SUB, IWM and APAC Maintain balanced origination across standard Lombard and structured lendingFocus on integrated solution delivery leveraging the International Financing Group and APAC Strategic Products as one-stop-shop solution providerInstitutionalize Lombard lending by making it a core part of the investment process and enhance the use of data analytics Focus on key Strategic Clients with existing relationships across SUB, IWM and APACSelectively expand lending relationship with UHNW and entrepreneur clients Build on existing client base Deliver seamless holistic client offering Focus on capital velocity Further increase capital velocity via GTS ‘originate and distribute’ model Lending growth1CAGR, excluding estimated cumulative FX impact Maintain rigorous credit standards Our ambition Key strategic actions Key theme: Lower-for-longer interest rates increase attractiveness of financing solutions Consistent with through-the-cycle <10 bps PCL ratio2,3 Sustainable solutions 5 Digital transformation 6 GTS and IB 7 ~4.5% 2015 - 2019 Medium-termambition Mid- to high-single digit

9 December 15, 2020 Grow mandates leveraging our House View Business Volume 1 Lending growth 2 Mandate penetration 3 Private Markets 4 Further roll out sustainability mandatesRoll out Endowment-style mandates and further build out Private Equity inclusion in Platinum mandates Discretionary mandates have outperformed around 2/3 of advisory client portfolios1Continue to grow mandate penetration by leveraging Credit Suisse House View Deepen penetration of UHNW mandates through bespoke Platinum discretionary solutions and new dedicated UHNW advisory solutions Grow UHNW mandates Innovate product suite Promote House View Key theme: Investors search for yield and alpha generating solutions Our ambition Key strategic actions 1 Performance of discretionary mandates versus non-discretionary client portfolios (3 years to September 2020) of PB clients in SUB, IWM and APAC that are booked in Switzerland 2 Relates to SUB PC, IWM PB and APAC Mandate penetration2 Sustainable solutions 5 Digital transformation 6 GTS and IB 7 28% 3Q20 Medium-term ambition 2016 24% ~33%
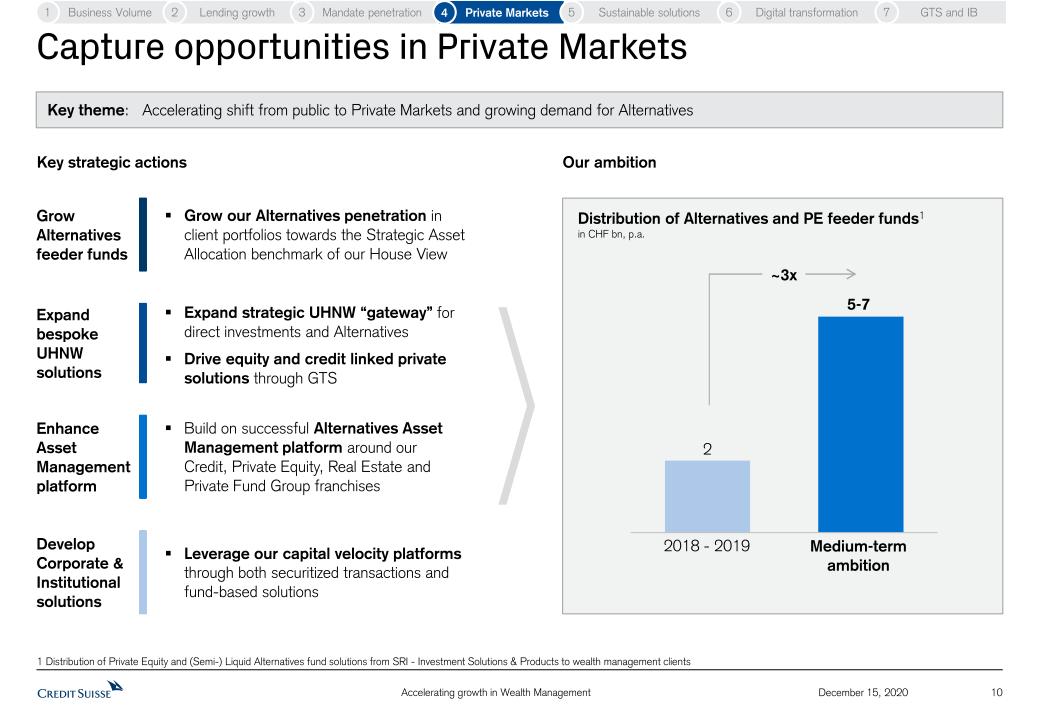
10 December 15, 2020 Capture opportunities in Private Markets Business Volume 1 Lending growth 2 Mandate penetration 3 Private Markets 4 Distribution of Alternatives and PE feeder funds1in CHF bn, p.a. Grow Alternativesfeeder funds Expand bespoke UHNW solutions EnhanceAsset Managementplatform DevelopCorporate & Institutional solutions Key theme: Accelerating shift from public to Private Markets and growing demand for Alternatives Our ambition Key strategic actions Grow our Alternatives penetration in client portfolios towards the Strategic Asset Allocation benchmark of our House View Expand strategic UHNW “gateway” for direct investments and AlternativesDrive equity and credit linked private solutions through GTS Build on successful Alternatives Asset Management platform around our Credit, Private Equity, Real Estate and Private Fund Group franchises Leverage our capital velocity platforms through both securitized transactions and fund-based solutions Sustainable solutions 5 Digital transformation 6 GTS and IB 7 2018 - 2019 5-7 Medium-termambition 1 Distribution of Private Equity and (Semi-) Liquid Alternatives fund solutions from SRI - Investment Solutions & Products to wealth management clients ~3x

11 December 15, 2020 Develop sustainable investing and financing solutions Business Volume 1 Lending growth 2 Mandate penetration 3 Private Markets 4 Key theme: Game-changer in the importance of sustainability Accelerate sustainable financing and support client transitionActive contribution in industry initiatives and standards Grow sustainable mandates and investment productsIntegration of ESG factors in client portfolio reporting Develop PrivateClient solutions Innovate products and industry standards Examples of sustainable solutions & partnerships Key strategic actions Sustainable solutions 5 Digital transformation 6 GTS and IB 7 Scale up ESG integration, active ownership and proxy votingRecently announced partnership with Equilibrium Capital to develop sustainable infrastructure and resource management solutions Accelerate Asset Management shift to sustainability A powerhouse in Swiss, European and Global Real Estate products – named global sector leader by GRESB Covers five climate-related themes: water and the ocean; green energy; smart cities; food and agriculture; and health and inclusion GTS structured notes with green use of issuance proceeds Signatory of key industry standards for banking and investment products IS&P Climate Focus Mandate
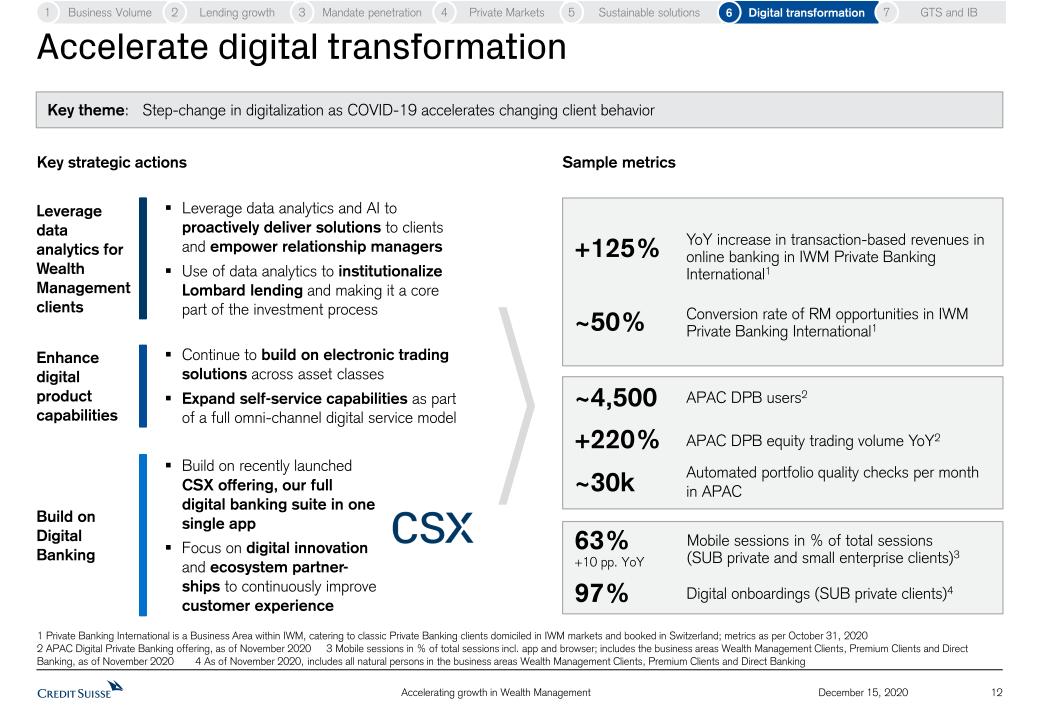
12 December 15, 2020 Accelerate digital transformation Business Volume 1 Lending growth 2 Mandate penetration 3 Private Markets 4 Build on recently launched CSX offering, our full digital banking suite in one single app Focus on digital innovation and ecosystem partner-ships to continuously improve customer experience 97% +220% ~4,500 Continue to build on electronic trading solutions across asset classesExpand self-service capabilities as part of a full omni-channel digital service model Leverage data analytics and AI to proactively deliver solutions to clients and empower relationship managersUse of data analytics to institutionalize Lombard lending and making it a core part of the investment process Leverage data analytics for Wealth Management clients Enhance digital product capabilities Build on Digital Banking ~50% +125% Key theme: Step-change in digitalization as COVID-19 accelerates changing client behavior Sample metrics Key strategic actions ~30k 1 Private Banking International is a Business Area within IWM, catering to classic Private Banking clients domiciled in IWM markets and booked in Switzerland; metrics as per October 31, 2020 2 APAC Digital Private Banking offering, as of November 2020 3 Mobile sessions in % of total sessions incl. app and browser; includes the business areas Wealth Management Clients, Premium Clients and Direct Banking, as of November 2020 4 As of November 2020, includes all natural persons in the business areas Wealth Management Clients, Premium Clients and Direct Banking Conversion rate of RM opportunities in IWM Private Banking International1 YoY increase in transaction-based revenues in online banking in IWM Private Banking International1 Digital onboardings (SUB private clients)4 APAC DPB users2 APAC DPB equity trading volume YoY2 Automated portfolio quality checks per month in APAC 63%+10 pp. YoY Mobile sessions in % of total sessions (SUB private and small enterprise clients)3 Sustainable solutions 5 Digital transformation 6 GTS and IB 7
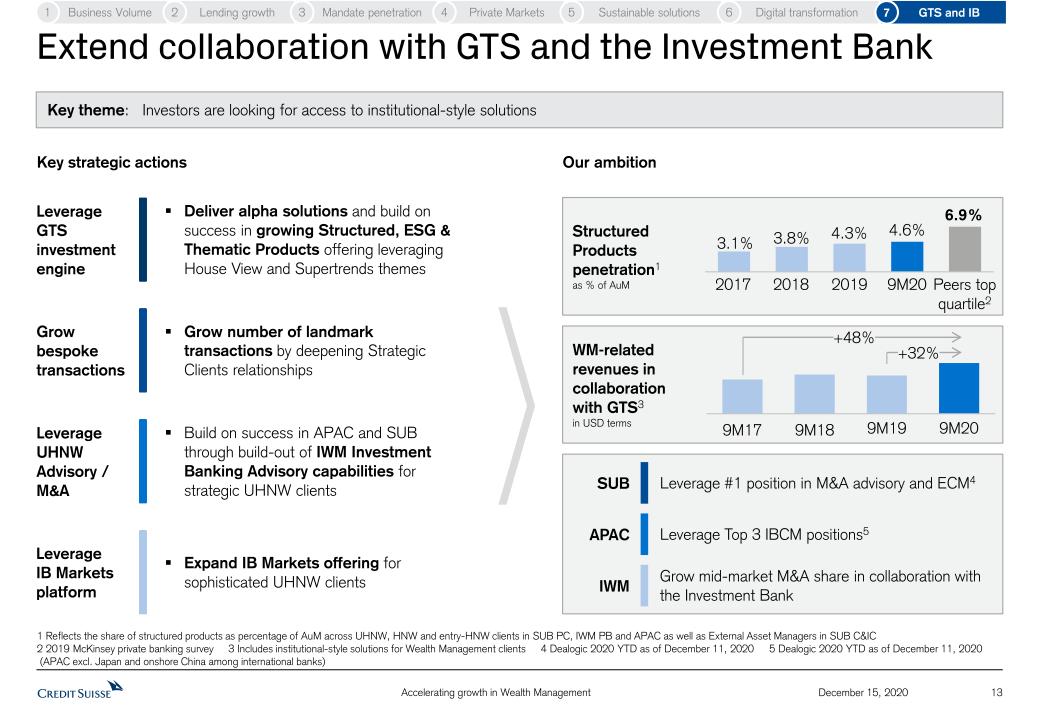
13 December 15, 2020 Extend collaboration with GTS and the Investment Bank Business Volume 1 Lending growth 2 Mandate penetration 3 Private Markets 4 Key theme: Investors are looking for access to institutional-style solutions Our ambition Key strategic actions Structured Products penetration1as % of AuM Leverage #1 position in M&A advisory and ECM4 SUB APAC Leverage Top 3 IBCM positions5 IWM Grow mid-market M&A share in collaboration with the Investment Bank Sustainable solutions 5 Digital transformation 6 GTS and IB 7 Leverage GTS investment engine Grow bespoke transactions Leverage UHNWAdvisory / M&A Leverage IB Markets platform Deliver alpha solutions and build on success in growing Structured, ESG & Thematic Products offering leveraging House View and Supertrends themes Grow number of landmark transactions by deepening Strategic Clients relationships Build on success in APAC and SUB through build-out of IWM Investment Banking Advisory capabilities for strategic UHNW clients Expand IB Markets offering for sophisticated UHNW clients WM-related revenues in collaboration with GTS3in USD terms 9M19 9M17 9M18 9M20 2019 2017 2018 9M20 Peers topquartile2 1 Reflects the share of structured products as percentage of AuM across UHNW, HNW and entry-HNW clients in SUB PC, IWM PB and APAC as well as External Asset Managers in SUB C&IC 2 2019 McKinsey private banking survey 3 Includes institutional-style solutions for Wealth Management clients 4 Dealogic 2020 YTD as of December 11, 2020 5 Dealogic 2020 YTD as of December 11, 2020 (APAC excl. Japan and onshore China among international banks) 6.9% +48% +32%
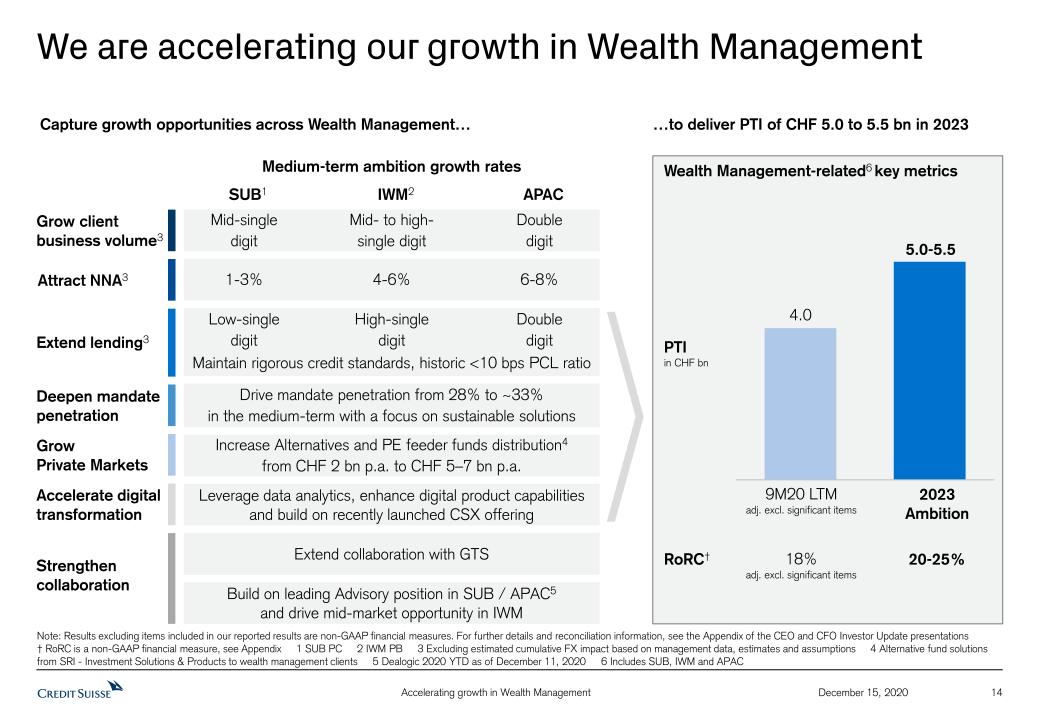
14 December 15, 2020 We are accelerating our growth in Wealth Management …to deliver PTI of CHF 5.0 to 5.5 bn in 2023 PTIin CHF bn Note: Results excluding items included in our reported results are non-GAAP financial measures. For further details and reconciliation information, see the Appendix of the CEO and CFO Investor Update presentations † RoRC is a non-GAAP financial measure, see Appendix 1 SUB PC 2 IWM PB 3 Excluding estimated cumulative FX impact based on management data, estimates and assumptions 4 Alternative fund solutions from SRI - Investment Solutions & Products to wealth management clients 5 Dealogic 2020 YTD as of December 11, 2020 6 Includes SUB, IWM and APAC Capture growth opportunities across Wealth Management… RoRC† 18%adj. excl. significant items 20-25% 9M20 LTMadj. excl. significant items 5.0-5.5 2023 Ambition Wealth Management-related6 key metrics Medium-term ambition growth rates Drive mandate penetration from 28% to ~33% in the medium-term with a focus on sustainable solutions Grow client business volume3 Attract NNA3 Extend lending3 Strengthen collaboration Mid-singledigit Mid- to high-single digit Double digit Low-singledigit High-singledigit Double digit Deepen mandate penetration 1-3% 4-6% 6-8% Increase Alternatives and PE feeder funds distribution4 from CHF 2 bn p.a. to CHF 5–7 bn p.a. Extend collaboration with GTS Build on leading Advisory position in SUB / APAC5 and drive mid-market opportunity in IWM GrowPrivate Markets Leverage data analytics, enhance digital product capabilities and build on recently launched CSX offering Accelerate digital transformation Maintain rigorous credit standards, historic <10 bps PCL ratio SUB1 IWM2 APAC

Appendix 15 December 15, 2020

Notes (1/2) 16 December 15, 2020 General notesThroughout the presentation rounding differences may occurUnless otherwise noted, all CET1 capital, CET1 ratio, Tier 1 leverage ratio, risk-weighted assets and leverage exposure figures shown in this presentation are as of the end of the respective period and, for periods prior to 2019, on a “look-through” basisGross and net margins are shown in basis pointsGross margin = net revenues annualized / average AuM; net margin = pre-tax income annualized / average AuM. Net margin excluding certain significant items, as disclosed herein, is calculated excluding those items applying the same methodologyPTI margin = pre-tax income / net revenuesMandate penetration reflects advisory and discretionary mandate volumes as a percentage of AuM, excluding those from the external asset manager businessFX impact, unless otherwise noted, is calculated by converting the CHF amount of net revenues, provision for credit losses and operating expenses for 2020 back to the original currency on a monthly basis at the respective spot FX rate. The respective amounts are then converted back to CHF applying the average 2019 FX rate from the period against which the FX impact is measured. Average FX rates apply a straight line average of monthly FX rates for major currenciesWealth Management businesses include SUB PC, IWM PB and APAC and related figures refer to their combined resultsWealth Management-related businesses include SUB, IWM and APAC and related figures refer to their combined resultsPre-provision profit refers to pre-tax income excluding provision for credit losses Client Business Volume includes assets under management, custody assets and net loansBanking for the Investment Bank is defined as its capital markets and advisory franchisesSpecific notes† Prior to 3Q20, regulatory capital was calculated as the worst of 10% of RWA and 3.5% of leverage exposure and return on regulatory capital (a non-GAAP financial measure) was calculated using income / (loss) after tax and assumed a tax rate of 30%. In 3Q20, we updated our calculation approach, following which regulatory capital is calculated as the average of 10% of RWA and 3.5% of leverage exposure and return on regulatory capital (a non-GAAP financial measure) is calculated using income / (loss) after tax and assumes a tax rate of 30% for periods prior to 2020 and 25% from 2020 onwards. For periods in 2020, for purposes of calculating Group return on regulatory capital, leverage exposure excludes cash held at central banks, after adjusting for the dividend paid in 2Q20 and the planned dividend in 4Q20. For the Investment Bank division, return on regulatory capital is based on US dollar denominated numbers. Adjusted return on regulatory capital is calculated using adjusted results, applying the same methodology to calculate return on regulatory capital.‡ Return on tangible equity, a non-GAAP financial measure, is calculated as annualized net income attributable to shareholders divided by average tangible shareholders’ equity. Tangible shareholders’ equity, a non-GAAP financial measure, is calculated by deducting goodwill and other intangible assets from total shareholders’ equity as presented in our balance sheet. Tangible book value, a non-GAAP financial measure, is equal to tangible shareholders’ equity. Tangible book value per share, a non-GAAP financial measure, is calculated by dividing tangible shareholders' equity by total number of shares outstanding. Management believes that tangible shareholders’ equity/tangible book value, return on tangible equity and tangible book value per share are meaningful as they are measures used and relied upon by industry analysts and investors to assess valuations and capital adequacy.For end-4Q15, tangible shareholders’ equity excluded goodwill of CHF 4,808 mn and other intangible assets of CHF 196 mn from total shareholders’ equity of CHF 44,382 mn as presented in our balance sheet.For end-1Q16, tangible shareholders’ equity excluded goodwill of CHF 4,688 mn and other intangible assets of CHF 186 mn from total shareholders’ equity of CHF 44,997 mn as presented in our balance sheet.For end-2Q16, tangible shareholders’ equity excluded goodwill of CHF 4,745 mn and other intangible assets of CHF 191 mn from total shareholders’ equity of CHF 44,962 mn as presented in our balance sheet.For end-3Q16, tangible shareholders’ equity excluded goodwill of CHF 4,725 mn and other intangible assets of CHF 192 mn from total shareholders’ equity of CHF 44,276 mn as presented in our balance sheet.For end-4Q16, tangible shareholders’ equity excluded goodwill of CHF 4,913 mn and other intangible assets of CHF 213 mn from total shareholders’ equity of CHF 41,897 mn as presented in our balance sheet.For end-1Q17, tangible shareholders’ equity excluded goodwill of CHF 4,831 mn and other intangible assets of CHF 202 mn from total shareholders’ equity of CHF 41,702 mn as presented in our balance sheet.For end-2Q17, tangible shareholders’ equity excluded goodwill of CHF 4,673 mn and other intangible assets of CHF 195 mn from total shareholders’ equity of CHF 43,493 mn as presented in our balance sheet.For end-3Q17, tangible shareholders’ equity excluded goodwill of CHF 4,715 mn and other intangible assets of CHF 219 mn from total shareholders’ equity of CHF 43,858 mn as presented in our balance sheet.For end-4Q17, tangible shareholders’ equity excluded goodwill of CHF 4,742 mn and other intangible assets of CHF 223 mn from total shareholders’ equity of CHF 41,902 mn as presented in our balance sheet.For end-1Q18, tangible shareholders’ equity excluded goodwill of CHF 4,667 mn and other intangible assets of CHF 212 mn from total shareholders’ equity of CHF 42,540 mn as presented in our balance sheet.For end-2Q18, tangible shareholders’ equity excluded goodwill of CHF 4,797 mn and other intangible assets of CHF 212 mn from total shareholders’ equity of CHF 43,470 mn as presented in our balance sheet.For end-3Q18, tangible shareholders’ equity excluded goodwill of CHF 4,736 mn and other intangible assets of CHF 214 mn from total shareholders’ equity of CHF 42,734 mn as presented in our balance sheet.For end-4Q18, tangible shareholders’ equity excluded goodwill of CHF 4,766 mn and other intangible assets of CHF 219 mn from total shareholders’ equity of CHF 43,922 mn as presented in our balance sheet.For end-1Q19, tangible shareholders’ equity excluded goodwill of CHF 4,807 mn and other intangible assets of CHF 224 mn from total shareholders’ equity of CHF 43,825 mn as presented in our balance sheet. For end-2Q19, tangible shareholders’ equity excluded goodwill of CHF 4,731 mn and other intangible assets of CHF 216 mn from total shareholders’ equity of CHF 43,673 mn as presented in our balance sheet.For end-3Q19, tangible shareholders’ equity excluded goodwill of CHF 4,760 mn and other intangible assets of CHF 219 mn from total shareholders’ equity of CHF 45,150 mn as presented in our balance sheet.For end-4Q19, tangible shareholders’ equity excluded goodwill of CHF 4,663 mn and other intangible assets of CHF 291 mn from total shareholders’ equity of CHF 43,644 mn as presented in our balance sheet.

Notes (2/2) 17 December 15, 2020 For end-1Q20, tangible shareholders’ equity excluded goodwill of CHF 4,604 mn and other intangible assets of CHF 279 mn from total shareholders’ equity of CHF 48,675 mn as presented in our balance sheet. For end-2Q20, tangible shareholders’ equity excluded goodwill of CHF 4,676 mn and other intangible assets of CHF 273 mn from total shareholders’ equity of CHF 46,535 mn as presented in our balance sheet.For end-3Q20, tangible shareholders’ equity excluded goodwill of CHF 4,577 mn and other intangible assets of CHF 256 mn from total shareholders’ equity of CHF 45,740 mn as presented in our balance sheet. AbbreviationsABS = Asset Backed Securities; ACL = Allowance for credit losses; Adj. = Adjusted; AGM = Annual General Meeting; AI = Artificial Intelligence; AM = Asset Management; Ann. = Annualized; APAC = Asia Pacific; AuM = Assets under Management; Avg. = Average; BIS = Bank for International Settlements; BoD = Board of Directors; bps = basis points; CAGR = Compound Annual Growth Rate; CARMC = Capital Allocation & Risk Management Committee; C&IC = Corporate & Institutional Clients; CBV = Client Business Volume; CDS = Credit Default Swap; CECL = Current Expected Credit Losses; CET1 = Common Equity Tier 1; C&IC = Corporate and Institutional Clients; C/I = Cost/Income; CIG = Credit Investments Group; CIO = Chief Investment Officer; CLO = Collateralized Loan Obligation; Corp. Ctr. = Corporate Center; COVID-19 = Coronavirus disease 2019; CRCO = Chief Risk and Compliance Officer; CSO = Chief Sustainability Officer; CSR = Corporate Social Responsibility; CSX = Credit Suisse X; CVA = Credit Valuation Adjustment; DCM = Debt Capital Markets; DPB = Digital Private Banking; ECM = Equity Capital Markets; EM Credit = Emerging Market Credit; EMEA = Europe, Middle East & Africa; ESG = Environmental Social and Governance; ExB = Executive Board of Directors; Excl. = Excluding; FINMA = Swiss Financial Market Supervisory Authority; FRTB = Fundamental Review of the Trading Book; FVoD = Fair Value on own Debt; FX = Foreign Exchange; FXC = FX Constant; GAAP = Generally Accepted Accounting Principles; GDP = Gross Domestic Product; GRESB = Global ESG Benchmark for Real Assets; GTS = Global Trading Solutions; HY = High Yield; I&P = Investments & Partnerships; IB = Investment Bank; IBCM = Investment Banking & Capital Markets; ICBCCS = ICBC Credit Suisse Asset Management; IG = Investment Grade; ILS = Insurance-Linked Strategies; IMF = International Monetary Fund; IPO = Initial Public Offering; IS&P = Investment Solutions & Products; ITS = International Trading Solutions; IWM = International Wealth Management; L/S = Long/Short; Lev Fin = Leveraged Finance; LGBT = Lesbian, Gay, Bisexual, and Transgender; LTM = Last Twelve Months; M&A = Mergers & Acquisitions; MSCI = Morgan Stanley Capital International; NAB = Neue Aargauer Bank; NGO = Non-governmental organization; NII = Net interest income; NNA = Net new assets; NPA = Non-performing assets; o/w = of which; OpRisk = Operational Risk; p.a. = per annum; PACTA = Paris Agreement Capital Transition Assessment; PB = Private Banking; PC = Private Clients; PCL = Provision for credit losses; PCO = Private Credit Opportunities; PCR = Position & Client Risk; PE = Private Equity; PPP = Purchasing Power Parity; PTI = Pre-tax income; RE = Real Estate; RM = Relationship Manager(s); RMBS = Residential Mortgage-Backed Security; RoRC = Return on Regulatory Capital; RoTE = Return on Tangible Equity; RWA = Risk-weighted assets; SA-CCR = Standardized Approach to Counterparty Credit Risk; SASB = Sustainability Accounting Standards Board; S&T = Sales and Trading; SIX = Swiss Infrastructure and Exchange; SME = Small and Medium-Sized Enterprises; SoW = Share of Wallet; SP = Securitized Products; SRI = Sustainability, Research & Investment Solutions; SRU = Strategic Resolution Unit; SUB = Swiss Universal Bank; TBTF = Too big to fail; TBVPS = Tangible Book Value Per Share; TFCD = Task Force on Climate-related Financial Disclosures; (U)HNW = (Ultra) High Net Worth; (U)HNWI = (Ultra) High Net Worth Individuals; UN SDG = United Nations Sustainable Development Goals; VCs = Venture Capitalists; YoY = Year over year; YTD = Year to Date
Lydie Hudson, CEO Sustainability, Research & Investment SolutionsLara Warner, Chief Risk and Compliance Officer December 15, 2020 Credit Suisse Investor Update 2020Delivering our Sustainability aspirations
Disclaimer 2 December 15, 2020 This material does not purport to contain all of the information that you may wish to consider. This material is not to be relied upon as such or used in substitution for the exercise of independent judgment.Cautionary statement regarding forward-looking statementsThis presentation contains forward-looking statements that involve inherent risks and uncertainties, and we might not be able to achieve the predictions, forecasts, projections and other outcomes we describe or imply in forward-looking statements. A number of important factors could cause results to differ materially from the plans, targets, goals, expectations, estimates and intentions we express in these forward-looking statements, including those we identify in "Risk factors” in our Annual Report on Form 20-F for the fiscal year ended December 31, 2019, in “Credit Suisse – Risk factor” in our 1Q20 Financial Report published on May 7, 2020 and in the “Cautionary statement regarding forward-looking information" in our media release relating to the Investor Update published on December 15, 2020 and filed with the US Securities and Exchange Commission, and in other public filings and press releases. We do not intend to update these forward-looking statements. In particular, the terms “Estimate”, “Illustrative”, “Ambition”, “Objective”, “Outlook” and “Goal” are not intended to be viewed as targets or projections, nor are they considered to be Key Performance Indicators. All such estimates, illustrations, ambitions, objectives, outlooks and goals are subject to a large number of inherent risks, assumptions and uncertainties, many of which are completely outside of our control. These risks, assumptions and uncertainties include, but are not limited to, general market conditions, market volatility, interest rate volatility and levels, global and regional economic conditions, challenges and uncertainties resulting from the COVID-19 pandemic, political uncertainty, changes in tax policies, regulatory changes, changes in levels of client activity as a result of any of the foregoing and other factors. Accordingly, this information should not be relied on for any purpose. We do not intend to update these estimates, illustrations, ambitions, objectives, outlooks or goals. We may not achieve the benefits of our strategic initiativesWe may not achieve all of the expected benefits of our strategic initiatives. Factors beyond our control, including but not limited to the market and economic conditions (including macroeconomic and other challenges and uncertainties, for example, resulting from the COVID-19 pandemic), changes in laws, rules or regulations and other challenges discussed in our public filings, could limit our ability to achieve some or all of the expected benefits of these initiatives. Estimates and assumptionsIn preparing this presentation, management has made estimates and assumptions that affect the numbers presented. Actual results may differ. Annualized numbers do not take into account variations in operating results, seasonality and other factors and may not be indicative of actual, full-year results. Figures throughout this presentation may also be subject to rounding adjustments. All opinions and views constitute judgments as of the date of writing without regard to the date on which the reader may receive or access the information. This information is subject to change at any time without notice and we do not intend to update this information. RestatementAs of 3Q20, financial information reflects the new divisional reporting structure and management responsibilities announced on July 30, 2020 and updates to certain calculations and allocations. Prior periods have been restated to conform to the current presentation. In light of the restructuring announced July 30, 2020 and several significant items impacting results in prior periods, we intend to focus on adjusted numbers, excluding significant items in our discussion of results until the restructuring is completed.Cautionary statements relating to interim financial informationThis presentation contains certain unaudited interim financial information. This information has been derived from management accounts, is preliminary in nature, does not reflect the complete results of the fourth quarter of 2020 or the full year 2020 and is subject to change, including as a result of any normal quarterly or yearly adjustments in relation to the financial statements. This information has not been subject to any review by our independent registered public accounting firm. There can be no assurance that the final results for these periods will not differ from these preliminary results, and any such differences could be material. Quarterly financial results for the fourth quarter of 2020 and full year 2020 will be included in our 4Q20 Earnings Release and our 2020 Annual Report. These interim results of operations are not necessarily indicative of the results to be achieved for the remainder of 2020. Statement regarding non-GAAP financial measuresThis presentation also contains non-GAAP financial measures, including results excluding certain items included in our reported results, return on regulatory capital and return on tangible equity and tangible book value per share (which are both based on tangible shareholders’ equity). Further details and information needed to reconcile such non-GAAP financial measures to the most directly comparable measures under US GAAP can be found in the Appendix of the CEO and CFO Investor Update presentations, published on December 15, 2020, which are both available on our website at www.credit-suisse.com.Our estimates, ambitions, objectives and targets often include metrics that are non-GAAP financial measures and are unaudited. A reconciliation of the estimates, ambitions, objectives and targets to the nearest GAAP measures is unavailable without unreasonable efforts. Results excluding certain items included in our reported results do not include items such as goodwill impairment, major litigation provisions, real estate gains, impacts from foreign exchange and other items included in our reported results, all of which are unavailable on a prospective basis. Return on Tangible Equity is based on tangible shareholders' equity, a non-GAAP financial measure also known as tangible book value, which is calculated by deducting goodwill and other intangible assets from total shareholders' equity as presented in our balance sheet, both of which are unavailable on a prospective basis. Tangible book value per share excludes the impact of any dividends paid during the performance period, share buybacks, own credit movements, foreign exchange rate movements and pension-related impacts, all of which are unavailable on a prospective basis. Return on regulatory capital (a non-GAAP financial measure) is calculated using income/(loss) after tax and assumes a tax rate of 25% and capital allocated based on the average of 10% of average risk-weighted assets and 3.5% of average leverage exposure; the essential components of this calculation are unavailable on a prospective basis. Such estimates, ambitions, objectives and targets are calculated in a manner that is consistent with the accounting policies applied by us in preparing our financial statements.Statement regarding capital, liquidity and leverageCredit Suisse is subject to the Basel III framework, as implemented in Switzerland, as well as Swiss legislation and regulations for systemically important banks (Swiss Requirements), which include capital, liquidity, leverage and large exposure requirements and rules for emergency plans designed to maintain systemically relevant functions in the event of threatened insolvency. Credit Suisse has adopted the Bank for International Settlements (BIS) leverage ratio framework, as issued by the Basel Committee on Banking Supervision (BCBS) and implemented in Switzerland by the Swiss Financial Market Supervisory Authority FINMA. References to phase-in and look-through included herein refer to Basel III capital requirements and Swiss Requirements. Phase-in reflects that, for the years 2014-2018, there was a five-year (20% per annum) phase-in of goodwill, other intangible assets and other capital deductions (e.g., certain deferred tax assets) and a phase-out of an adjustment for the accounting treatment of pension plans. For the years 2013-2022, there is a phase-out of certain capital instruments. Look-through assumes the full phase-in of goodwill and other intangible assets and other regulatory adjustments and the phase-out of certain capital instruments.Unless otherwise noted, leverage exposure is based on the BIS leverage ratio framework and consists of period-end balance sheet assets and prescribed regulatory adjustments. The tier 1 leverage ratio and CET1 leverage ratio are calculated as BIS tier 1 capital and CET1 capital, respectively, divided by period-end leverage exposure. Swiss leverage ratios are measured on the same period-end basis as the leverage exposure for the BIS leverage ratio. Unless otherwise noted, for periods in 2020, leverage exposure excludes cash held at central banks, after adjusting for the dividends paid in 2020.SourcesCertain material in this presentation has been prepared by Credit Suisse on the basis of publicly available information, internally developed data and other third-party sources believed to be reliable. Credit Suisse has not sought to independently verify information obtained from public and third-party sources and makes no representations or warranties as to accuracy, completeness or reliability of such information.

Agenda The Power of SRIDelivering Sustainable SolutionsEnabling Client TransitionsLeadership on Standard SettingDriving our own TransitionAdapting our Culture New commitments announced today Strategy Propelling our ambition to be a leader in Sustainability 3 December 15, 2020

The power of SRI – Sustainability and Insight CreationGlobally Under one Roof Corporates Institutions Wealth clients Our business Our employees Society SRI at Credit Suisse Sustainability Strategy, Advisory & Finance Led by the Chief Sustainability Officer, drives the group Sustainability strategy at Credit SuisseSustainable investing and financing frameworks and client advisoryThought leadership Industry partnerships and initiatives Sustainable disruption Climate transition Sustainable land, food, and water systems Protect what is precious today Support disruptors in making step changes Enable clients to transition current operations and business models Focus themes 4 Marketing CS investors Investment Solutions & Products Led by the Chief Investment Officer, provides economic and thematic views and sustainable investment solutionsHouse ViewContent creationMandatesAlternatives & private markets 15+ bnAlternative Investments1 500+Global investment specialists1 CHF ~140 bnDiscretionary and Advisory Mandates1 80+Economists and Research Analysts1 170+Product specialists1 Led by the Global Head of Securities Research and powered by ~260 analysts covering ~3,000 securitiesThematic research across public and private marketsData & analyticsESG integration Sectors coverage by market cap 5% Energy & Utilties Tech Consumer Materials Health Care Financials Industrials 3% Telecom 1% Other 1 IS&P data points as of September 2020 Securities Research Cover major securities globally December 15, 2020
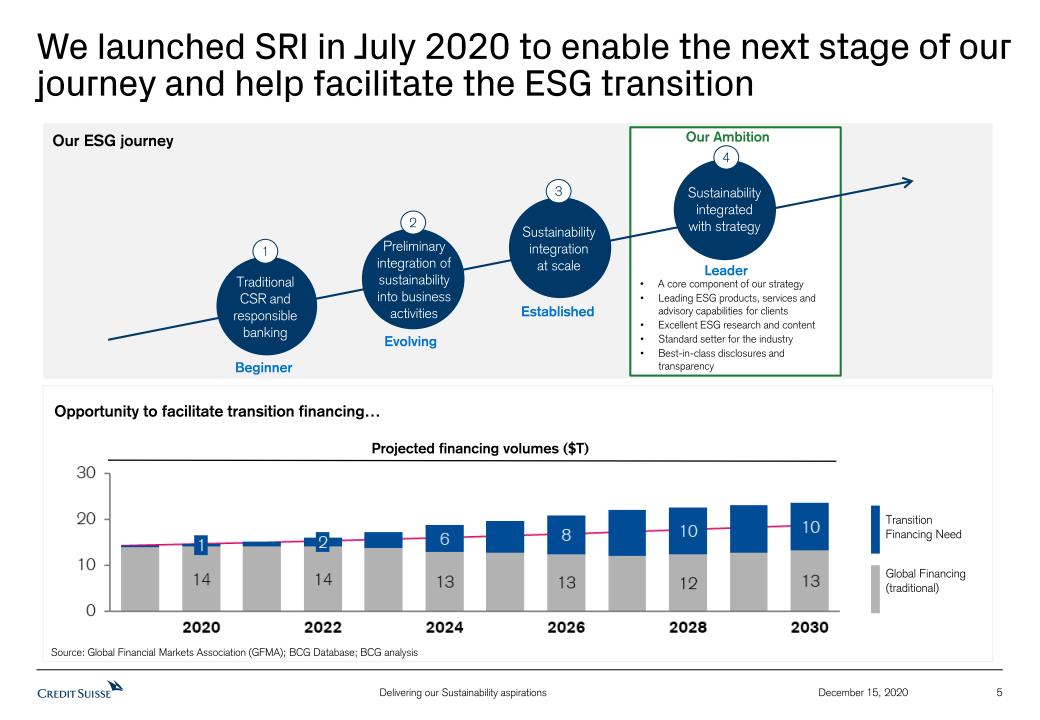
Our ESG journey We launched SRI in July 2020 to enable the next stage of our journey and help facilitate the ESG transition Beginner Established Evolving Leader Our Ambition A core component of our strategy Leading ESG products, services and advisory capabilities for clientsExcellent ESG research and contentStandard setter for the industry Best-in-class disclosures and transparency Preliminary integration of sustainability into business activities 2 Sustainability integrationat scale 3 Sustainability integrated with strategy 4 TraditionalCSR andresponsiblebanking 1 Source: Global Financial Markets Association (GFMA); BCG Database; BCG analysis Projected financing volumes ($T) Global Financing (traditional) Transition Financing Need Opportunity to facilitate transition financing… December 15, 2020 5

…established with clear governance underpinned by commitments Grow & EnhanceGoal to provide at least CHF 300 bn of sustainable financing over the next 10 yearsEnhanced consideration of biodiversity in lending and capital market transactionsTransitionReposition corporate oil & gas business by reducing exposure to traditional business Utilize our broader Energy Transition Frameworks to guide engagement with high carbon-emitting industriesRestrictNo lending or capital markets underwriting to any company deriving more than 25% of their revenue from thermal coal extraction1,2 or coal power1,3No financing related to offshore and onshore oil & gas projects in the Arctic region Executive BoardLydie Hudson SRI CEO Board of DirectorsIris BohnetSustainability Leader Commitments to propel our progress as announced on July 30 Leadership and Governance as announced on July 30 Sustainability Leadership CommitteeSenior representatives from each division and control function to drive & execute strategy 1 Direct lending 2 Unless such transaction is to help the company specifically transition and the use of proceeds are tied to such transition strategies aligned with the Paris Agreement; for greater certainty, these exclusions do not apply to metallurgical coal 3 Unless company can demonstrate decreasing share of coal in generation portfolio consistent with our Energy Transition Framework or such transaction is to help the company specifically transition and the use of proceeds are tied to such transition strategies (and will continue our policy of not financing the development of new coal-fired power plants) December 15, 2020 6
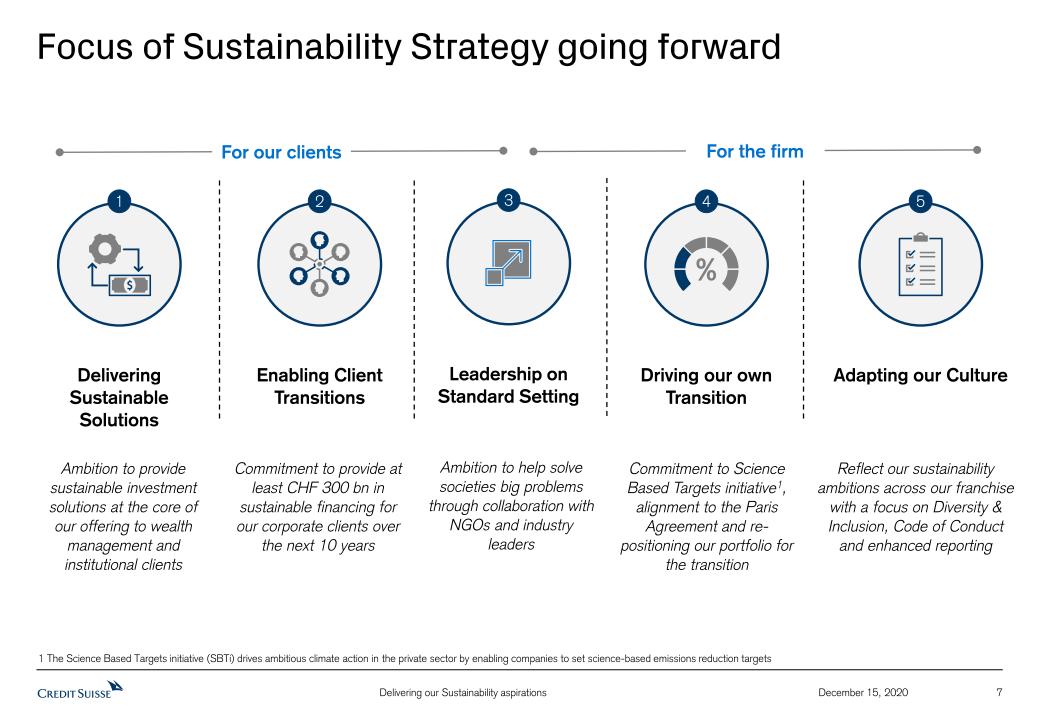
Delivering Sustainable Solutions 1 Driving our own Transition 4 Enabling Client Transitions 2 Adapting our Culture 5 Ambition to provide sustainable investment solutions at the core of our offering to wealth management and institutional clients Commitment to provide at least CHF 300 bn in sustainable financing for our corporate clients over the next 10 years Commitment to Science Based Targets initiative1, alignment to the Paris Agreement and re-positioning our portfolio for the transition Reflect our sustainability ambitions across our franchise with a focus on Diversity & Inclusion, Code of Conduct and enhanced reporting Leadership on Standard Setting 3 Ambition to help solve societies big problems through collaboration with NGOs and industry leaders 7 For our clients Focus of Sustainability Strategy going forward For the firm 1 The Science Based Targets initiative (SBTi) drives ambitious climate action in the private sector by enabling companies to set science-based emissions reduction targets December 15, 2020

As the Bank for Entrepreneurs, we innovate to provide Sustainable Solutions Enhancing product and solutions offering with ESG integration at the CoreExtending breadth and depth of ESG investable products to meet client appetite Tailoring ESG financing framework to enable wealth management clients’ access to transition lendingEssential will be the scaling-up of active ownership and proxy voting activitiesEducating RMs and product specialists on ESG offering and finance framework Delivering Sustainable Solutions Enabling Client Transitions Leadership on Standard Setting Driving our own Transition Adapting our Culture CS Sustainability Framework Traditional Investments Exclusion ESG Integration Thematic & impact investing Impact investing Philanthropy Thematic & impact aligned Ambition: Sustainable investment solutions will be at the core of our offering to wealth management and institutional clients IS&P Climate Focus Mandate: Sustainability offeringWith this actively-managed discretionary solution, our clients can get exposure to companies that contribute to efforts to adapt to and/or mitigate climate change Examples of sustainable solutions and partnerships Asset Management & Equilibrium sustainable joint venture Partnership to jointly develop and manage a platform that provides investors with access to sustainable infrastructure and resource management projects GTS structured notes offering: Green use of issuance proceedsStructured notes incorporate an impact-aligned use of proceeds with exposure to the ‘MSCI ESG Rating Select Indices’ on either US or Eurozone equities Global Real Estate products focus on ESG integration Over the last 15 months, we intensified ESG integration for all CS AM Real Estate funds, capturing over CHF 30 bn AuM and 14 funds Announced today 8 December 15, 2020

Mobilizing capital to facilitate our clients’ transitions NRG’s landmark Sustainability-Linked Bond offering Selectionof KPIs Calibration of SPTs2 Bond features Reporting Verification Goal to provide at least CHF 300 bn of sustainable financing to support transition strategies (renewables, Green/Blue/Transition bonds, low-carbon energy solutions and UN SDG aligned financings) over the next 10 years Providing strategies and solutions to transition operations, predominately focused on high carbon emitting industriesIntending to align IB footprint to support the objectives of the Paris Agreement by increasing lending to support energy transitionGlobal Trading Solutions is intended to bridge the requirements of our Wealth Management clients with investment banking capabilities (e.g., structured notes) 1 Oil & Gas net lending exposure in Corporate Bank 2 SPTs: Sustainability performance targets Oil & Gas exposure1 trending down allowing for increased lending to support energy transitionin USD bn (24)% Transition is a material topic for our corporate and institutional clients USD 900 mn 2.450% Sustainability-Linked Bond (SLB) due 2027The transaction is a landmark issuance with NRG pioneering the first SLB from a North American company and first in its industry outside EuropeCS served as active bookrunner on the offeringFramework has been prepared in accordance with the SLB Principles and alignment verified by Vigeo Eiris Delivering Sustainable Solutions Enabling Client Transitions Leadership on Standard Setting Driving our own Transition Adapting our Culture 9 December 15, 2020

We are signatory to critical industry initiatives and actively participate in sustainability networks globally… We are focused on partnering with industry leaders and NGOs to drive best-in-class standard setting Sustainable Transition Bonds – partnered with the Climate Bonds Initiative in a landmark initiative to help create a framework for transition finance Participated in voluntary Swiss climate-alignments test based on PACTA methodology to create greater transparency regarding the climate compatibility of financial flowsJoined global RE100 initiative, with a public commitment to source 100% renewable electricity across our entire global operations by 2025Ongoing inclusion in leading sustainability indices such as Dow Jones Sustainability Index (DJSI) Selected highlights Delivering Sustainable Solutions Enabling Client Transitions Leadership on Standard Setting Driving our own Transition Adapting our Culture The ThunGroup of Banks December 15, 2020 10
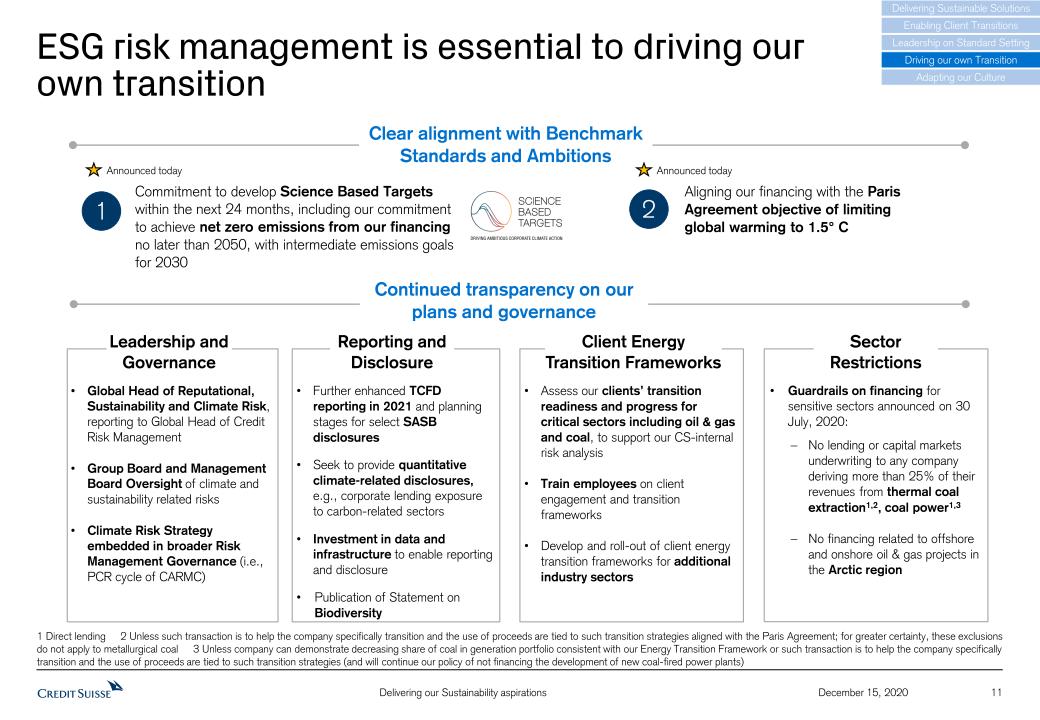
ESG risk management is essential to driving our own transition Client Energy Transition Frameworks Assess our clients’ transition readiness and progress for critical sectors including oil & gas and coal, to support our CS-internal risk analysis Train employees on client engagement and transition frameworksDevelop and roll-out of client energy transition frameworks for additional industry sectors Global Head of Reputational, Sustainability and Climate Risk, reporting to Global Head of Credit Risk ManagementGroup Board and Management Board Oversight of climate and sustainability related risksClimate Risk Strategy embedded in broader Risk Management Governance (i.e., PCR cycle of CARMC) Leadership and Governance Reporting and Disclosure Further enhanced TCFD reporting in 2021 and planning stages for select SASB disclosuresSeek to provide quantitative climate-related disclosures, e.g., corporate lending exposure to carbon-related sectorsInvestment in data and infrastructure to enable reporting and disclosurePublication of Statement on Biodiversity Guardrails on financing for sensitive sectors announced on 30 July, 2020:No lending or capital markets underwriting to any company deriving more than 25% of their revenues from thermal coal extraction1,2, coal power1,3No financing related to offshore and onshore oil & gas projects in the Arctic region Sector Restrictions Continued transparency on our plans and governance Delivering Sustainable Solutions Enabling Client Transitions Leadership on Standard Setting Driving our own Transition Adapting our Culture 11 Clear alignment with Benchmark Standards and Ambitions Commitment to develop Science Based Targets within the next 24 months, including our commitment to achieve net zero emissions from our financing no later than 2050, with intermediate emissions goals for 2030 Aligning our financing with the Paris Agreement objective of limiting global warming to 1.5° C 1 2 Announced today Announced today 1 Direct lending 2 Unless such transaction is to help the company specifically transition and the use of proceeds are tied to such transition strategies aligned with the Paris Agreement; for greater certainty, these exclusions do not apply to metallurgical coal 3 Unless company can demonstrate decreasing share of coal in generation portfolio consistent with our Energy Transition Framework or such transaction is to help the company specifically transition and the use of proceeds are tied to such transition strategies (and will continue our policy of not financing the development of new coal-fired power plants) December 15, 2020

Spotlight on Client Energy Transition Frameworks The Client Energy Transition Frameworks (CETFs)1 consist of the identification of priority sectors / industries and a methodology to classify clients that operate in these sectors according to their energy transition readiness. Lending to “Unaware” clients is phased out. GreenFully or predominantly climate-friendly business StrategicTransition strategy in place AlignedOverall business is aligned to the Paris Agreement AwareIdentifies and manages risks UnawareLittle to no evidence of steps towards transition Credible disclosure of ESG information Minimum social and environmental standards 1 Internal definitions and classification apply, for instance on a revenue-based approach, to determine in-scope clients Phase 1 Roll-out (live: as of Dec 2020): Oil & Gas, Coal Mining and Utilities / Power GenerationPhase 2 Roll-out (internal target: Q1 2021) to cover: Shipping, Aviation and Commodities Trade FinancePhase 3 Roll-out (internal target: end of 2021) to cover: Manufacturing, Construction / Real Estate, Agriculture & Forestry Delivering Sustainable Solutions Enabling Client Transitions Leadership on Standard Setting Driving our own Transition Adapting our Culture December 15, 2020 12
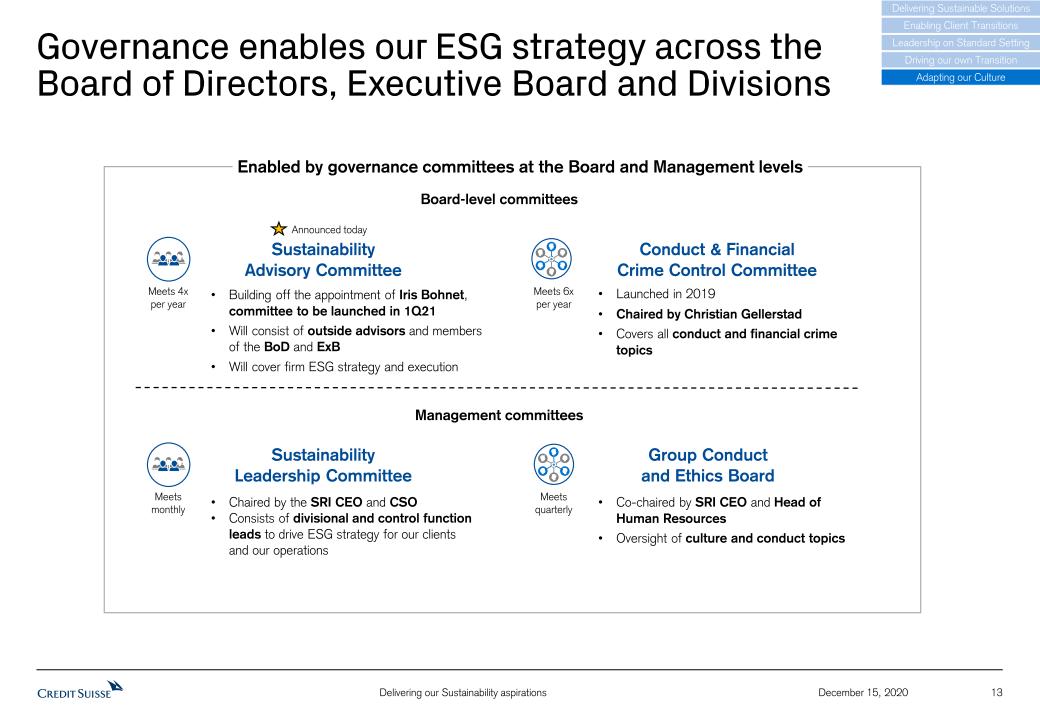
Governance enables our ESG strategy across the Board of Directors, Executive Board and Divisions Sustainability Leadership Committee Sustainability Advisory Committee Conduct & Financial Crime Control Committee Enabled by governance committees at the Board and Management levels Launched in 2019Chaired by Christian GellerstadCovers all conduct and financial crime topics Building off the appointment of Iris Bohnet, committee to be launched in 1Q21 Will consist of outside advisors and members of the BoD and ExBWill cover firm ESG strategy and execution Meets 4x per year Meets monthly Meets 6x per year Board-level committees Management committees Chaired by the SRI CEO and CSOConsists of divisional and control function leads to drive ESG strategy for our clients and our operations Group Conduct and Ethics Board Co-chaired by SRI CEO and Head of Human ResourcesOversight of culture and conduct topics Meets quarterly Delivering Sustainable Solutions Enabling Client Transitions Leadership on Standard Setting Driving our own Transition Adapting our Culture 13 Announced today December 15, 2020
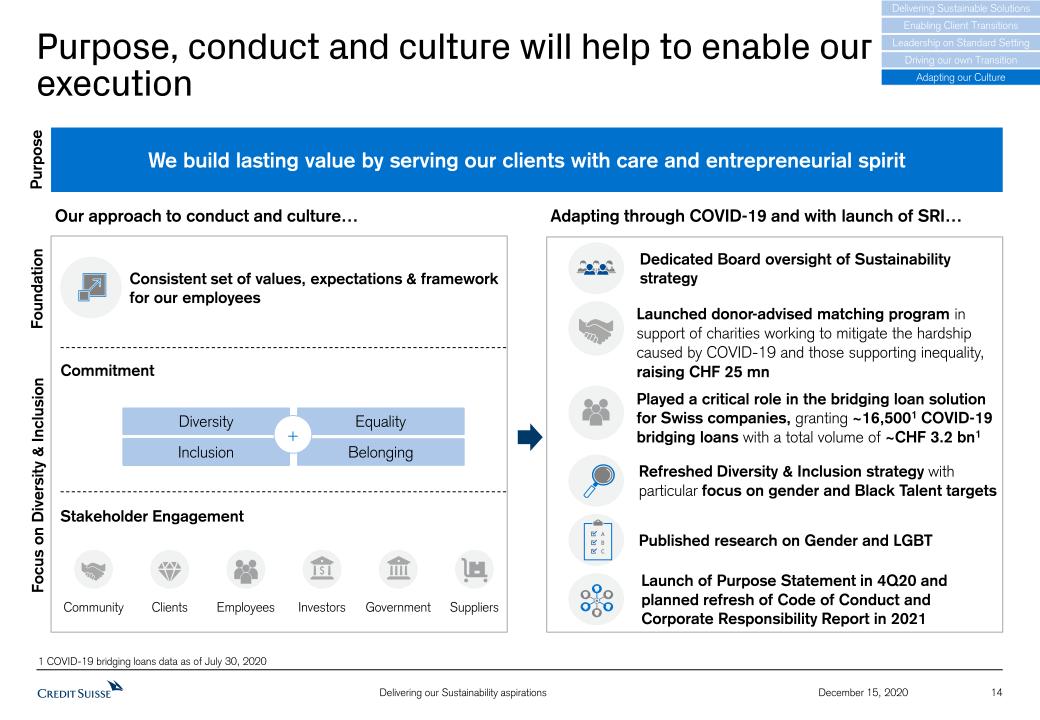
Purpose, conduct and culture will help to enable our execution Adapting through COVID-19 and with launch of SRI… Launch of Purpose Statement in 4Q20 and planned refresh of Code of Conduct and Corporate Responsibility Report in 2021 Commitment Stakeholder Engagement Community Clients Employees Investors Government Suppliers Diversity Equality Inclusion Belonging + Focus on Diversity & Inclusion Our approach to conduct and culture… Consistent set of values, expectations & framework for our employees Foundation Refreshed Diversity & Inclusion strategy with particular focus on gender and Black Talent targets Dedicated Board oversight of Sustainability strategy Delivering Sustainable Solutions Enabling Client Transitions Leadership on Standard Setting Driving our own Transition Adapting our Culture Published research on Gender and LGBT Launched donor-advised matching program in support of charities working to mitigate the hardship caused by COVID-19 and those supporting inequality, raising CHF 25 mnPlayed a critical role in the bridging loan solution for Swiss companies, granting ~16,5001 COVID-19 bridging loans with a total volume of ~CHF 3.2 bn1 1 COVID-19 bridging loans data as of July 30, 2020 We build lasting value by serving our clients with care and entrepreneurial spirit Purpose December 15, 2020 14

Integrating Sustainability in how we work with clients and across our operations, we continue to focus on:Innovative ESG products, services and advisory capabilities for clientsTaking action with our clients in their transition journey, made more critical given COVID-19 disruption Being a leading voice in ESG researchBeing a standard setter through partnership with industry groups and NGOs in the fragmented ESG ecosystemBest-in-class governance and disclosures powered by a purpose driven cultureRecap of today’s announcements… Ambition to lead in Sustainability Commitment to develop Science Based Targets within the next 24 months, including our commitment to achieve net zero emissions from our financing no later than 2050, with intermediate emissions goals for 2030 Aligning our financing with the Paris Agreement objective of limiting global warming to 1.5° C 1 2 Mobilizing capital to facilitate our clients’ transitions New Sustainability Advisory Committee focused on ESG at the Board of Directors Aiming for Sustainable investment solutions to be at the core of our offering to wealth management and institutional clients 3 4 5 December 15, 2020 15

Appendix December 15, 2020 16

Notes (1/2) 17 December 15, 2020 General notesThroughout the presentation rounding differences may occurUnless otherwise noted, all CET1 capital, CET1 ratio, Tier 1 leverage ratio, risk-weighted assets and leverage exposure figures shown in this presentation are as of the end of the respective period and, for periods prior to 2019, on a “look-through” basisGross and net margins are shown in basis pointsGross margin = net revenues annualized / average AuM; net margin = pre-tax income annualized / average AuM. Net margin excluding certain significant items, as disclosed herein, is calculated excluding those items applying the same methodologyPTI margin = pre-tax income / net revenuesMandate penetration reflects advisory and discretionary mandate volumes as a percentage of AuM, excluding those from the external asset manager businessFX impact, unless otherwise noted, is calculated by converting the CHF amount of net revenues, provision for credit losses and operating expenses for 2020 back to the original currency on a monthly basis at the respective spot FX rate. The respective amounts are then converted back to CHF applying the average 2019 FX rate from the period against which the FX impact is measured. Average FX rates apply a straight line average of monthly FX rates for major currenciesWealth Management businesses include SUB PC, IWM PB and APAC and related figures refer to their combined resultsWealth Management-related businesses include SUB, IWM and APAC and related figures refer to their combined resultsPre-provision profit refers to pre-tax income excluding provision for credit losses Client Business Volume includes assets under management, custody assets and net loansBanking for the Investment Bank is defined as its capital markets and advisory franchisesSpecific notes† Prior to 3Q20, regulatory capital was calculated as the worst of 10% of RWA and 3.5% of leverage exposure and return on regulatory capital (a non-GAAP financial measure) was calculated using income / (loss) after tax and assumed a tax rate of 30%. In 3Q20, we updated our calculation approach, following which regulatory capital is calculated as the average of 10% of RWA and 3.5% of leverage exposure and return on regulatory capital (a non-GAAP financial measure) is calculated using income / (loss) after tax and assumes a tax rate of 30% for periods prior to 2020 and 25% from 2020 onwards. For periods in 2020, for purposes of calculating Group return on regulatory capital, leverage exposure excludes cash held at central banks, after adjusting for the dividend paid in 2Q20 and the planned dividend in 4Q20. For the Investment Bank division, return on regulatory capital is based on US dollar denominated numbers. Adjusted return on regulatory capital is calculated using adjusted results, applying the same methodology to calculate return on regulatory capital.‡ Return on tangible equity, a non-GAAP financial measure, is calculated as annualized net income attributable to shareholders divided by average tangible shareholders’ equity. Tangible shareholders’ equity, a non-GAAP financial measure, is calculated by deducting goodwill and other intangible assets from total shareholders’ equity as presented in our balance sheet. Tangible book value, a non-GAAP financial measure, is equal to tangible shareholders’ equity. Tangible book value per share, a non-GAAP financial measure, is calculated by dividing tangible shareholders' equity by total number of shares outstanding. Management believes that tangible shareholders’ equity/tangible book value, return on tangible equity and tangible book value per share are meaningful as they are measures used and relied upon by industry analysts and investors to assess valuations and capital adequacy.For end-4Q15, tangible shareholders’ equity excluded goodwill of CHF 4,808 mn and other intangible assets of CHF 196 mn from total shareholders’ equity of CHF 44,382 mn as presented in our balance sheet.For end-1Q16, tangible shareholders’ equity excluded goodwill of CHF 4,688 mn and other intangible assets of CHF 186 mn from total shareholders’ equity of CHF 44,997 mn as presented in our balance sheet.For end-2Q16, tangible shareholders’ equity excluded goodwill of CHF 4,745 mn and other intangible assets of CHF 191 mn from total shareholders’ equity of CHF 44,962 mn as presented in our balance sheet.For end-3Q16, tangible shareholders’ equity excluded goodwill of CHF 4,725 mn and other intangible assets of CHF 192 mn from total shareholders’ equity of CHF 44,276 mn as presented in our balance sheet.For end-4Q16, tangible shareholders’ equity excluded goodwill of CHF 4,913 mn and other intangible assets of CHF 213 mn from total shareholders’ equity of CHF 41,897 mn as presented in our balance sheet.For end-1Q17, tangible shareholders’ equity excluded goodwill of CHF 4,831 mn and other intangible assets of CHF 202 mn from total shareholders’ equity of CHF 41,702 mn as presented in our balance sheet.For end-2Q17, tangible shareholders’ equity excluded goodwill of CHF 4,673 mn and other intangible assets of CHF 195 mn from total shareholders’ equity of CHF 43,493 mn as presented in our balance sheet.For end-3Q17, tangible shareholders’ equity excluded goodwill of CHF 4,715 mn and other intangible assets of CHF 219 mn from total shareholders’ equity of CHF 43,858 mn as presented in our balance sheet.For end-4Q17, tangible shareholders’ equity excluded goodwill of CHF 4,742 mn and other intangible assets of CHF 223 mn from total shareholders’ equity of CHF 41,902 mn as presented in our balance sheet.For end-1Q18, tangible shareholders’ equity excluded goodwill of CHF 4,667 mn and other intangible assets of CHF 212 mn from total shareholders’ equity of CHF 42,540 mn as presented in our balance sheet.For end-2Q18, tangible shareholders’ equity excluded goodwill of CHF 4,797 mn and other intangible assets of CHF 212 mn from total shareholders’ equity of CHF 43,470 mn as presented in our balance sheet.For end-3Q18, tangible shareholders’ equity excluded goodwill of CHF 4,736 mn and other intangible assets of CHF 214 mn from total shareholders’ equity of CHF 42,734 mn as presented in our balance sheet.For end-4Q18, tangible shareholders’ equity excluded goodwill of CHF 4,766 mn and other intangible assets of CHF 219 mn from total shareholders’ equity of CHF 43,922 mn as presented in our balance sheet.For end-1Q19, tangible shareholders’ equity excluded goodwill of CHF 4,807 mn and other intangible assets of CHF 224 mn from total shareholders’ equity of CHF 43,825 mn as presented in our balance sheet. For end-2Q19, tangible shareholders’ equity excluded goodwill of CHF 4,731 mn and other intangible assets of CHF 216 mn from total shareholders’ equity of CHF 43,673 mn as presented in our balance sheet.For end-3Q19, tangible shareholders’ equity excluded goodwill of CHF 4,760 mn and other intangible assets of CHF 219 mn from total shareholders’ equity of CHF 45,150 mn as presented in our balance sheet.For end-4Q19, tangible shareholders’ equity excluded goodwill of CHF 4,663 mn and other intangible assets of CHF 291 mn from total shareholders’ equity of CHF 43,644 mn as presented in our balance sheet.

Notes (2/2) 18 December 15, 2020 For end-1Q20, tangible shareholders’ equity excluded goodwill of CHF 4,604 mn and other intangible assets of CHF 279 mn from total shareholders’ equity of CHF 48,675 mn as presented in our balance sheet. For end-2Q20, tangible shareholders’ equity excluded goodwill of CHF 4,676 mn and other intangible assets of CHF 273 mn from total shareholders’ equity of CHF 46,535 mn as presented in our balance sheet.For end-3Q20, tangible shareholders’ equity excluded goodwill of CHF 4,577 mn and other intangible assets of CHF 256 mn from total shareholders’ equity of CHF 45,740 mn as presented in our balance sheet. AbbreviationsABS = Asset Backed Securities; ACL = Allowance for credit losses; Adj. = Adjusted; AGM = Annual General Meeting; AI = Artificial Intelligence; AM = Asset Management; Ann. = Annualized; APAC = Asia Pacific; AuM = Assets under Management; Avg. = Average; BIS = Bank for International Settlements; BoD = Board of Directors; bps = basis points; CAGR = Compound Annual Growth Rate; CARMC = Capital Allocation & Risk Management Committee; C&IC = Corporate & Institutional Clients; CBV = Client Business Volume; CDS = Credit Default Swap; CECL = Current Expected Credit Losses; CET1 = Common Equity Tier 1; C&IC = Corporate and Institutional Clients; C/I = Cost/Income; CIG = Credit Investments Group; CIO = Chief Investment Officer; CLO = Collateralized Loan Obligation; Corp. Ctr. = Corporate Center; COVID-19 = Coronavirus disease 2019; CRCO = Chief Risk and Compliance Officer; CSO = Chief Sustainability Officer; CSR = Corporate Social Responsibility; CSX = Credit Suisse X; CVA = Credit Valuation Adjustment; DCM = Debt Capital Markets; DPB = Digital Private Banking; ECM = Equity Capital Markets; EM Credit = Emerging Market Credit; EMEA = Europe, Middle East & Africa; ESG = Environmental Social and Governance; ExB = Executive Board of Directors; Excl. = Excluding; FINMA = Swiss Financial Market Supervisory Authority; FRTB = Fundamental Review of the Trading Book; FVoD = Fair Value on own Debt; FX = Foreign Exchange; FXC = FX Constant; GAAP = Generally Accepted Accounting Principles; GDP = Gross Domestic Product; GRESB = Global ESG Benchmark for Real Assets; GTS = Global Trading Solutions; HY = High Yield; I&P = Investments & Partnerships; IB = Investment Bank; IBCM = Investment Banking & Capital Markets; ICBCCS = ICBC Credit Suisse Asset Management; IG = Investment Grade; ILS = Insurance-Linked Strategies; IMF = International Monetary Fund; IPO = Initial Public Offering; IS&P = Investment Solutions & Products; ITS = International Trading Solutions; IWM = International Wealth Management; L/S = Long/Short; Lev Fin = Leveraged Finance; LGBT = Lesbian, Gay, Bisexual, and Transgender; LTM = Last Twelve Months; M&A = Mergers & Acquisitions; MSCI = Morgan Stanley Capital International; NAB = Neue Aargauer Bank; NGO = Non-governmental organization; NII = Net interest income; NNA = Net new assets; NPA = Non-performing assets; o/w = of which; OpRisk = Operational Risk; p.a. = per annum; PACTA = Paris Agreement Capital Transition Assessment; PB = Private Banking; PC = Private Clients; PCL = Provision for credit losses; PCO = Private Credit Opportunities; PCR = Position & Client Risk; PE = Private Equity; PPP = Purchasing Power Parity; PTI = Pre-tax income; RE = Real Estate; RM = Relationship Manager(s); RMBS = Residential Mortgage-Backed Security; RoRC = Return on Regulatory Capital; RoTE = Return on Tangible Equity; RWA = Risk-weighted assets; SA-CCR = Standardized Approach to Counterparty Credit Risk; SASB = Sustainability Accounting Standards Board; S&T = Sales and Trading; SIX = Swiss Infrastructure and Exchange; SME = Small and Medium-Sized Enterprises; SoW = Share of Wallet; SP = Securitized Products; SRI = Sustainability, Research & Investment Solutions; SRU = Strategic Resolution Unit; SUB = Swiss Universal Bank; TBTF = Too big to fail; TBVPS = Tangible Book Value Per Share; TFCD = Task Force on Climate-related Financial Disclosures; (U)HNW = (Ultra) High Net Worth; (U)HNWI = (Ultra) High Net Worth Individuals; UN SDG = United Nations Sustainable Development Goals; VCs = Venture Capitalists; YoY = Year over year; YTD = Year to Date

Eric Varvel, Head of Asset ManagementDecember 15, 2020 Credit Suisse Investor Update 2020Positioning Asset Managementfor long-term growth

Disclaimer 2 December 15, 2020 This material does not purport to contain all of the information that you may wish to consider. This material is not to be relied upon as such or used in substitution for the exercise of independent judgment.Cautionary statement regarding forward-looking statementsThis presentation contains forward-looking statements that involve inherent risks and uncertainties, and we might not be able to achieve the predictions, forecasts, projections and other outcomes we describe or imply in forward-looking statements. A number of important factors could cause results to differ materially from the plans, targets, goals, expectations, estimates and intentions we express in these forward-looking statements, including those we identify in "Risk factors” in our Annual Report on Form 20-F for the fiscal year ended December 31, 2019, in “Credit Suisse – Risk factor” in our 1Q20 Financial Report published on May 7, 2020 and in the “Cautionary statement regarding forward-looking information" in our media release relating to the Investor Update published on December 15, 2020 and filed with the US Securities and Exchange Commission, and in other public filings and press releases. We do not intend to update these forward-looking statements. In particular, the terms “Estimate”, “Illustrative”, “Ambition”, “Objective”, “Outlook” and “Goal” are not intended to be viewed as targets or projections, nor are they considered to be Key Performance Indicators. All such estimates, illustrations, ambitions, objectives, outlooks and goals are subject to a large number of inherent risks, assumptions and uncertainties, many of which are completely outside of our control. These risks, assumptions and uncertainties include, but are not limited to, general market conditions, market volatility, interest rate volatility and levels, global and regional economic conditions, challenges and uncertainties resulting from the COVID-19 pandemic, political uncertainty, changes in tax policies, regulatory changes, changes in levels of client activity as a result of any of the foregoing and other factors. Accordingly, this information should not be relied on for any purpose. We do not intend to update these estimates, illustrations, ambitions, objectives, outlooks or goals. We may not achieve the benefits of our strategic initiativesWe may not achieve all of the expected benefits of our strategic initiatives. Factors beyond our control, including but not limited to the market and economic conditions (including macroeconomic and other challenges and uncertainties, for example, resulting from the COVID-19 pandemic), changes in laws, rules or regulations and other challenges discussed in our public filings, could limit our ability to achieve some or all of the expected benefits of these initiatives. Estimates and assumptionsIn preparing this presentation, management has made estimates and assumptions that affect the numbers presented. Actual results may differ. Annualized numbers do not take into account variations in operating results, seasonality and other factors and may not be indicative of actual, full-year results. Figures throughout this presentation may also be subject to rounding adjustments. All opinions and views constitute judgments as of the date of writing without regard to the date on which the reader may receive or access the information. This information is subject to change at any time without notice and we do not intend to update this information. RestatementAs of 3Q20, financial information reflects the new divisional reporting structure and management responsibilities announced on July 30, 2020 and updates to certain calculations and allocations. Prior periods have been restated to conform to the current presentation. In light of the restructuring announced July 30, 2020 and several significant items impacting results in prior periods, we intend to focus on adjusted numbers, excluding significant items in our discussion of results until the restructuring is completed.Cautionary statements relating to interim financial informationThis presentation contains certain unaudited interim financial information. This information has been derived from management accounts, is preliminary in nature, does not reflect the complete results of the fourth quarter of 2020 or the full year 2020 and is subject to change, including as a result of any normal quarterly or yearly adjustments in relation to the financial statements. This information has not been subject to any review by our independent registered public accounting firm. There can be no assurance that the final results for these periods will not differ from these preliminary results, and any such differences could be material. Quarterly financial results for the fourth quarter of 2020 and full year 2020 will be included in our 4Q20 Earnings Release and our 2020 Annual Report. These interim results of operations are not necessarily indicative of the results to be achieved for the remainder of 2020. Statement regarding non-GAAP financial measuresThis presentation also contains non-GAAP financial measures, including results excluding certain items included in our reported results, return on regulatory capital and return on tangible equity and tangible book value per share (which are both based on tangible shareholders’ equity). Further details and information needed to reconcile such non-GAAP financial measures to the most directly comparable measures under US GAAP can be found in the Appendix of the CEO and CFO Investor Update presentations, published on December 15, 2020, which are both available on our website at www.credit-suisse.com.Our estimates, ambitions, objectives and targets often include metrics that are non-GAAP financial measures and are unaudited. A reconciliation of the estimates, ambitions, objectives and targets to the nearest GAAP measures is unavailable without unreasonable efforts. Results excluding certain items included in our reported results do not include items such as goodwill impairment, major litigation provisions, real estate gains, impacts from foreign exchange and other items included in our reported results, all of which are unavailable on a prospective basis. Return on Tangible Equity is based on tangible shareholders' equity, a non-GAAP financial measure also known as tangible book value, which is calculated by deducting goodwill and other intangible assets from total shareholders' equity as presented in our balance sheet, both of which are unavailable on a prospective basis. Tangible book value per share excludes the impact of any dividends paid during the performance period, share buybacks, own credit movements, foreign exchange rate movements and pension-related impacts, all of which are unavailable on a prospective basis. Return on regulatory capital (a non-GAAP financial measure) is calculated using income/(loss) after tax and assumes a tax rate of 25% and capital allocated based on the average of 10% of average risk-weighted assets and 3.5% of average leverage exposure; the essential components of this calculation are unavailable on a prospective basis. Such estimates, ambitions, objectives and targets are calculated in a manner that is consistent with the accounting policies applied by us in preparing our financial statements.Statement regarding capital, liquidity and leverageCredit Suisse is subject to the Basel III framework, as implemented in Switzerland, as well as Swiss legislation and regulations for systemically important banks (Swiss Requirements), which include capital, liquidity, leverage and large exposure requirements and rules for emergency plans designed to maintain systemically relevant functions in the event of threatened insolvency. Credit Suisse has adopted the Bank for International Settlements (BIS) leverage ratio framework, as issued by the Basel Committee on Banking Supervision (BCBS) and implemented in Switzerland by the Swiss Financial Market Supervisory Authority FINMA. References to phase-in and look-through included herein refer to Basel III capital requirements and Swiss Requirements. Phase-in reflects that, for the years 2014-2018, there was a five-year (20% per annum) phase-in of goodwill, other intangible assets and other capital deductions (e.g., certain deferred tax assets) and a phase-out of an adjustment for the accounting treatment of pension plans. For the years 2013-2022, there is a phase-out of certain capital instruments. Look-through assumes the full phase-in of goodwill and other intangible assets and other regulatory adjustments and the phase-out of certain capital instruments.Unless otherwise noted, leverage exposure is based on the BIS leverage ratio framework and consists of period-end balance sheet assets and prescribed regulatory adjustments. The tier 1 leverage ratio and CET1 leverage ratio are calculated as BIS tier 1 capital and CET1 capital, respectively, divided by period-end leverage exposure. Swiss leverage ratios are measured on the same period-end basis as the leverage exposure for the BIS leverage ratio. Unless otherwise noted, for periods in 2020, leverage exposure excludes cash held at central banks, after adjusting for the dividends paid in 2020.SourcesCertain material in this presentation has been prepared by Credit Suisse on the basis of publicly available information, internally developed data and other third-party sources believed to be reliable. Credit Suisse has not sought to independently verify information obtained from public and third-party sources and makes no representations or warranties as to accuracy, completeness or reliability of such information.

3 December 15, 2020 Agenda and business overview Progress since 20152020 updateMarket trendsStrategic priorities going forward Agenda Business overview CHF 438 bn of AuM at 3Q20 across a broad range of strategiesMarket-leading specialist with global capabilitiesStrong distribution network and growing connectivity with Wealth Management>70% of assets with institutional investors~1,100 employees with five major investment hubs
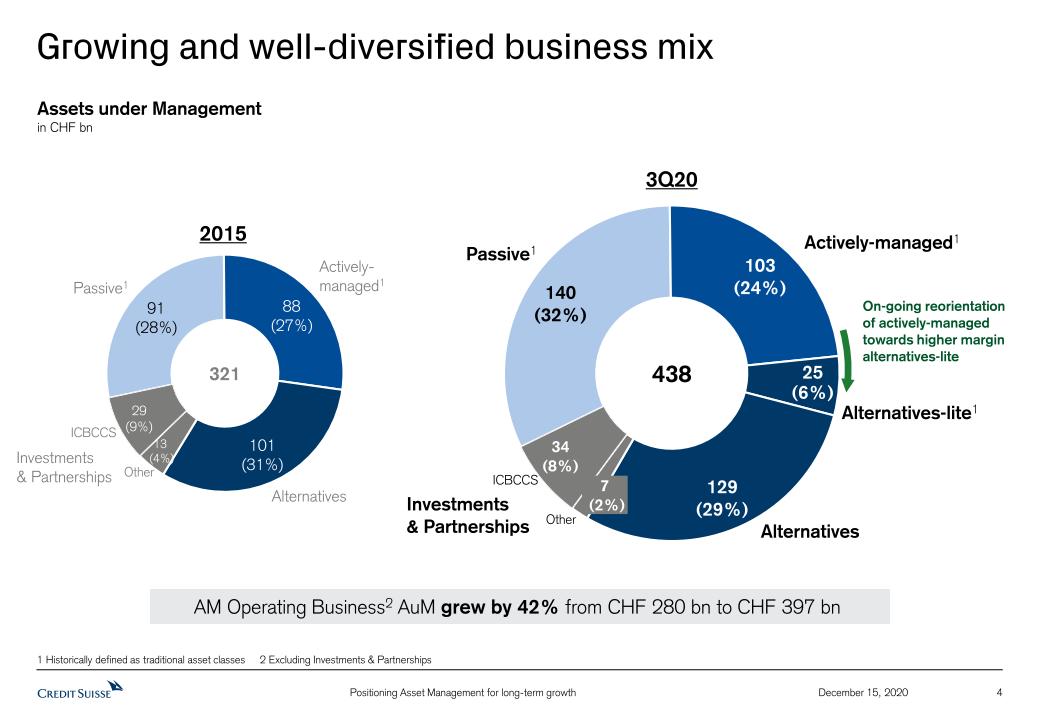
4 December 15, 2020 Growing and well-diversified business mix Assets under Managementin CHF bn 3Q20 2015 AM Operating Business2 AuM grew by 42% from CHF 280 bn to CHF 397 bn 1 Historically defined as traditional asset classes 2 Excluding Investments & Partnerships 29(9%) 91(28%) Passive1 ICBCCS 88(27%) Actively-managed1 101(31%) Alternatives 321 140(32%) 103(24%) 129(29%) Alternatives-lite1 Alternatives 34(8%) 438 On-going reorientation of actively-managed towards higher margin alternatives-lite Actively-managed1 Investments& Partnerships Passive1 25(6%) Other 13 (4%) Investments& Partnerships 7 (2%) ICBCCS Other

5 December 15, 2020 Growing and well-diversified business mix 140(32%) 321 438 Passive1 Assets under Managementin CHF bn 3Q20 2015 +55% 91(28%) includingIndex Solutions Passive1 1 Historically defined as traditional asset classes
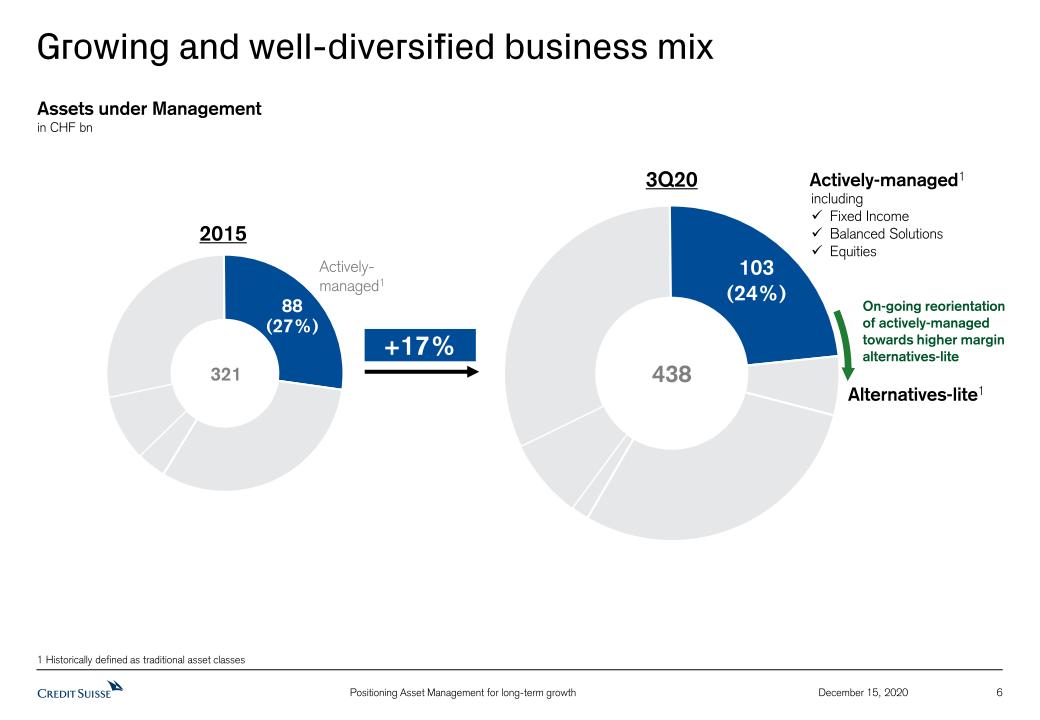
6 December 15, 2020 Growing and well-diversified business mix Alternatives-lite1 103(24%) 321 438 Actively-managed1 Assets under Managementin CHF bn 3Q20 2015 +17% 88(27%) On-going reorientation of actively-managed towards higher margin alternatives-lite Actively-managed1 includingFixed Income Balanced Solutions Equities 1 Historically defined as traditional asset classes
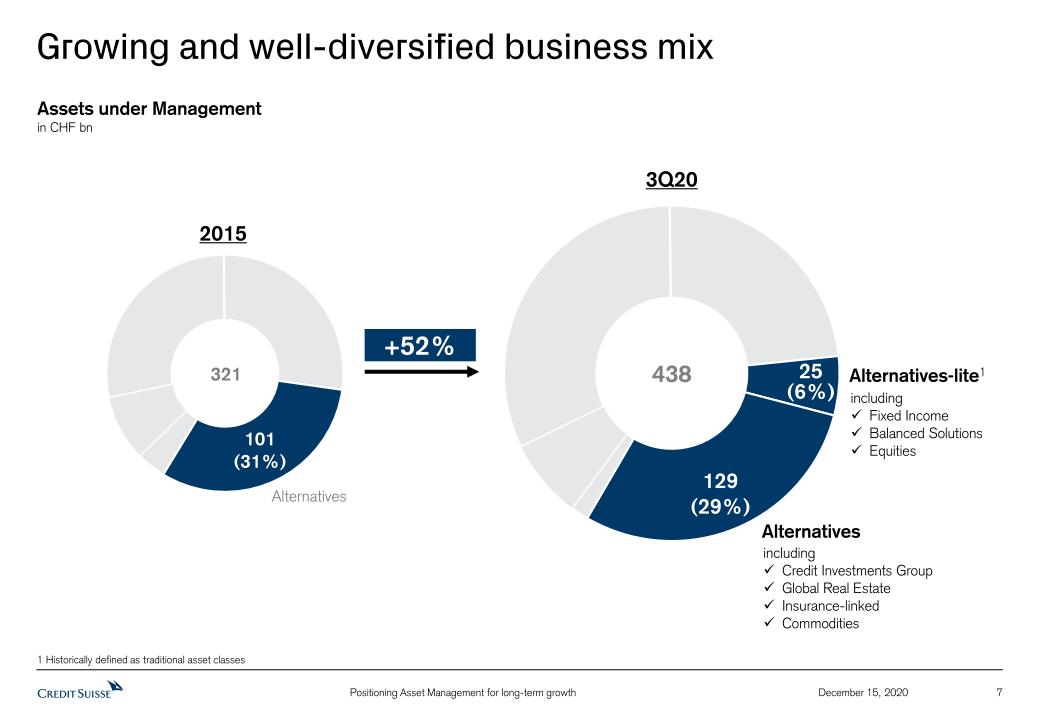
7 December 15, 2020 Growing and well-diversified business mix Alternatives Alternatives-lite1 129(29%) 321 438 101(31%) Alternatives Assets under Managementin CHF bn 3Q20 2015 +52% includingCredit Investments Group Global Real Estate Insurance-linked Commodities includingFixed Income Balanced Solutions Equities 25(6%) 1 Historically defined as traditional asset classes

8 December 15, 2020 Growing and well-diversified business mix Assets under Managementin CHF bn (1)% 29(9%) ICBCCS 34(8%) Investments& Partnerships Other 13 (4%) 7 (2%) ICBCCS Other Other includes York Capital Verde 321 438 Investments& Partnerships 3Q20 2015
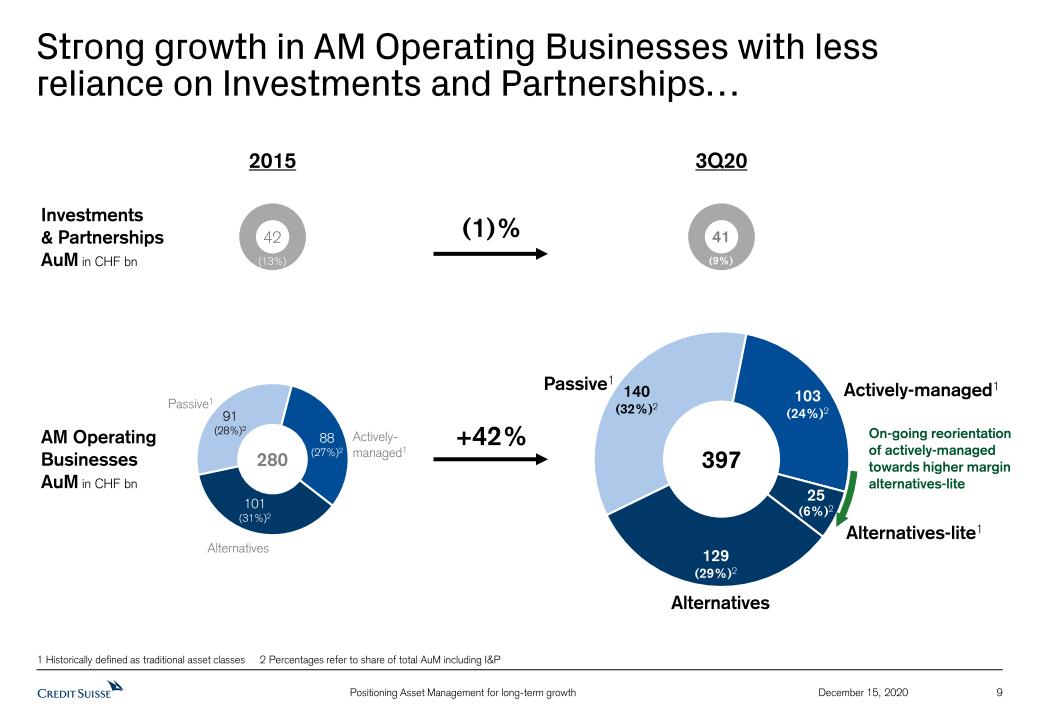
9 December 15, 2020 Strong growth in AM Operating Businesses with less reliance on Investments and Partnerships… 1 Historically defined as traditional asset classes 2 Percentages refer to share of total AuM including I&P 3Q20 2015 Investments& PartnershipsAuM in CHF bn 42 41 280 397 +42% (1)% AM Operating BusinessesAuM in CHF bn Alternatives-lite1 Alternatives On-going reorientation of actively-managed towards higher margin alternatives-lite Actively-managed1 Passive1 140(32%)2 103(24%)2 129(29%)2 25(6%)2 88(27%)2 101(31%)2 91(28%)2 Actively-managed1 Passive1 Alternatives (13%) (9%)
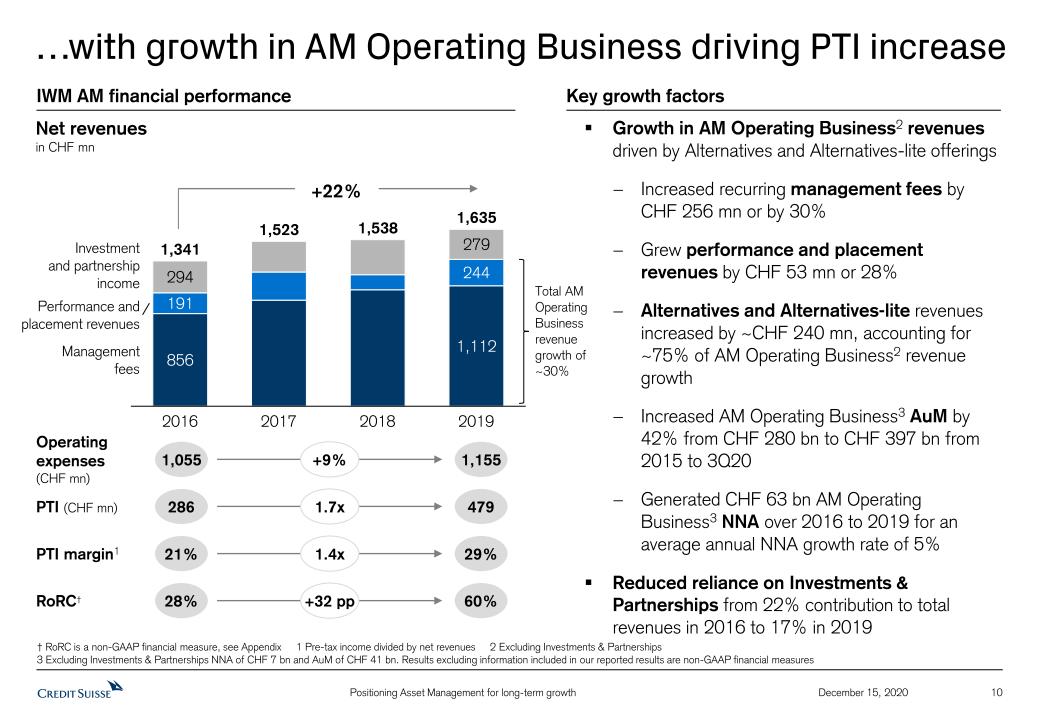
10 December 15, 2020 …with growth in AM Operating Business driving PTI increase IWM AM financial performance Net revenuesin CHF mn Investmentand partnershipincome 2019 1,112 2016 2017 2018 Performance andplacement revenues Managementfees 1,341 1,523 1,538 1,635 +22% Key growth factors Growth in AM Operating Business2 revenues driven by Alternatives and Alternatives-lite offeringsIncreased recurring management fees byCHF 256 mn or by 30%Grew performance and placement revenues by CHF 53 mn or 28%Alternatives and Alternatives-lite revenues increased by ~CHF 240 mn, accounting for ~75% of AM Operating Business2 revenue growthIncreased AM Operating Business3 AuM by 42% from CHF 280 bn to CHF 397 bn from 2015 to 3Q20Generated CHF 63 bn AM Operating Business3 NNA over 2016 to 2019 for an average annual NNA growth rate of 5%Reduced reliance on Investments & Partnerships from 22% contribution to total revenues in 2016 to 17% in 2019 1,055 1,155 Operatingexpenses (CHF mn) +9% Total AM Operating Business revenue growth of ~30% 286 479 PTI (CHF mn) 1.7x 28% 60% RoRC† +32 pp PTI margin1 21% 29% 1.4x † RoRC is a non-GAAP financial measure, see Appendix 1 Pre-tax income divided by net revenues 2 Excluding Investments & Partnerships3 Excluding Investments & Partnerships NNA of CHF 7 bn and AuM of CHF 41 bn. Results excluding information included in our reported results are non-GAAP financial measures
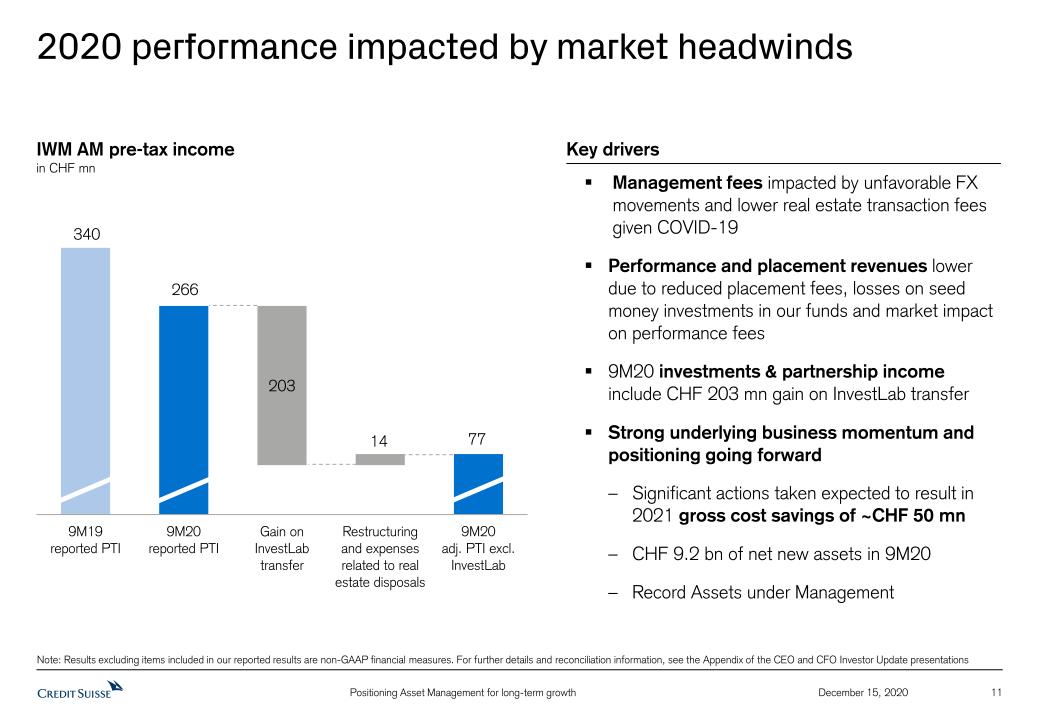
11 December 15, 2020 2020 performance impacted by market headwinds IWM AM pre-tax incomein CHF mn Key drivers Management fees impacted by unfavorable FX movements and lower real estate transaction fees given COVID-19Performance and placement revenues lower due to reduced placement fees, losses on seed money investments in our funds and market impact on performance fees9M20 investments & partnership income include CHF 203 mn gain on InvestLab transferStrong underlying business momentum and positioning going forwardSignificant actions taken expected to result in 2021 gross cost savings of ~CHF 50 mnCHF 9.2 bn of net new assets in 9M20Record Assets under Management Note: Results excluding items included in our reported results are non-GAAP financial measures. For further details and reconciliation information, see the Appendix of the CEO and CFO Investor Update presentations

12 December 15, 2020 Investments & Partnerships York Capital Management (AM AuM of CHF 5 bn)Change in York strategy to wind down its European hedge funds business, primarily manage internal capital in its Multi Strategy fund and expected spin out of APAC (Credit Suisse intends to have continued interest); expecting impairment of~USD 450 mn in 4Q20ICBCCS (AM AuM of CHF 34 bn)Profitable and scaled asset management joint venture in China; AuM of RMB 1.25 tn (CHF 168 bn)Verde Asset Management (AM AuM of CHF 2 bn)Brazilian hedge fund focused on Brazil Macro, Equities Long-Only and Global MacroReal Estate Capital PartnersLP investment in third-party real estate private equity fund family spun-off from Credit Suisse in 2010; fund losses in 2020 primarily due to COVID-19 impacts Summary of significant investments Investments & Partnerships1 – as of 3Q20 York ICBCCS Other CHF 0.8 bn Note: AuM figures as of 3Q20 1 Includes management company investments (post expected York impairment of ~USD 450 mn in 4Q20)
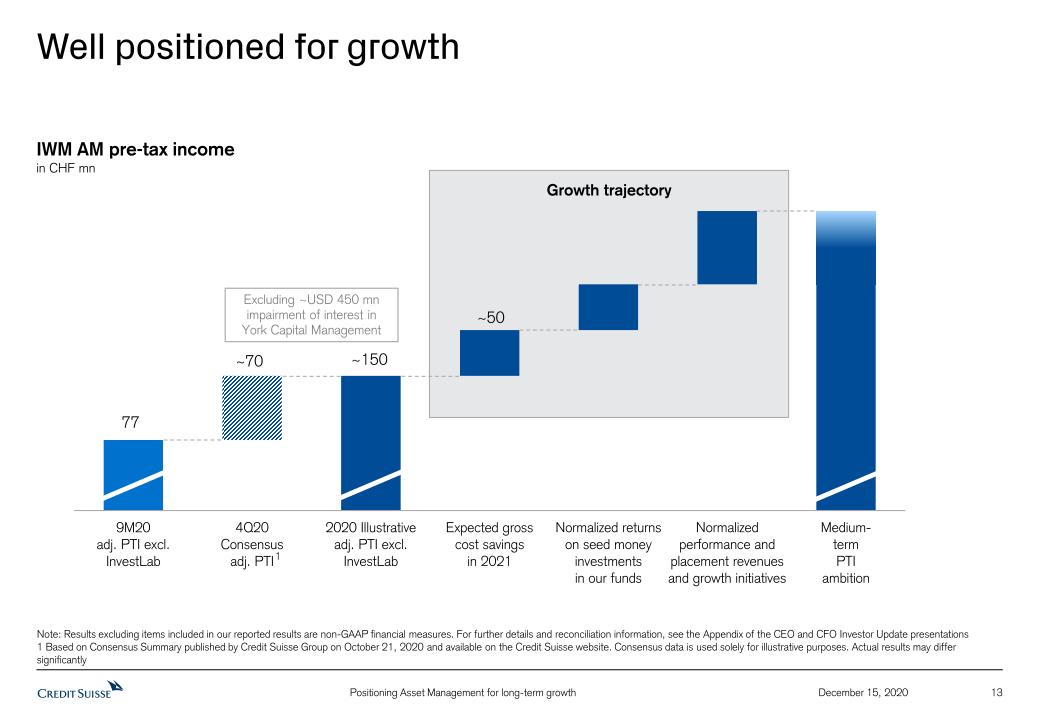
13 December 15, 2020 Well positioned for growth Note: Results excluding items included in our reported results are non-GAAP financial measures. For further details and reconciliation information, see the Appendix of the CEO and CFO Investor Update presentations1 Based on Consensus Summary published by Credit Suisse Group on October 21, 2020 and available on the Credit Suisse website. Consensus data is used solely for illustrative purposes. Actual results may differ significantly Growth trajectory 1 Excluding ~USD 450 mn impairment of interest in York Capital Management IWM AM pre-tax incomein CHF mn
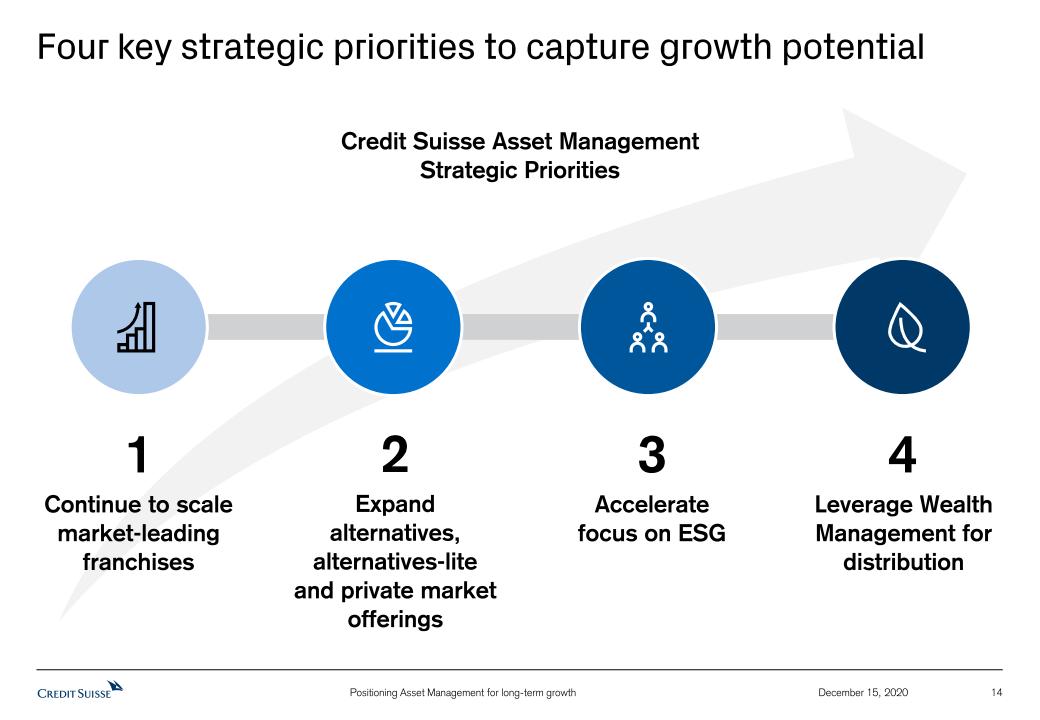
14 December 15, 2020 Four key strategic priorities to capture growth potential Continue to scalemarket-leading franchises Expand alternatives, alternatives-lite and private market offerings Acceleratefocus on ESG Leverage Wealth Management for distribution 1 2 3 4 Credit Suisse Asset ManagementStrategic Priorities
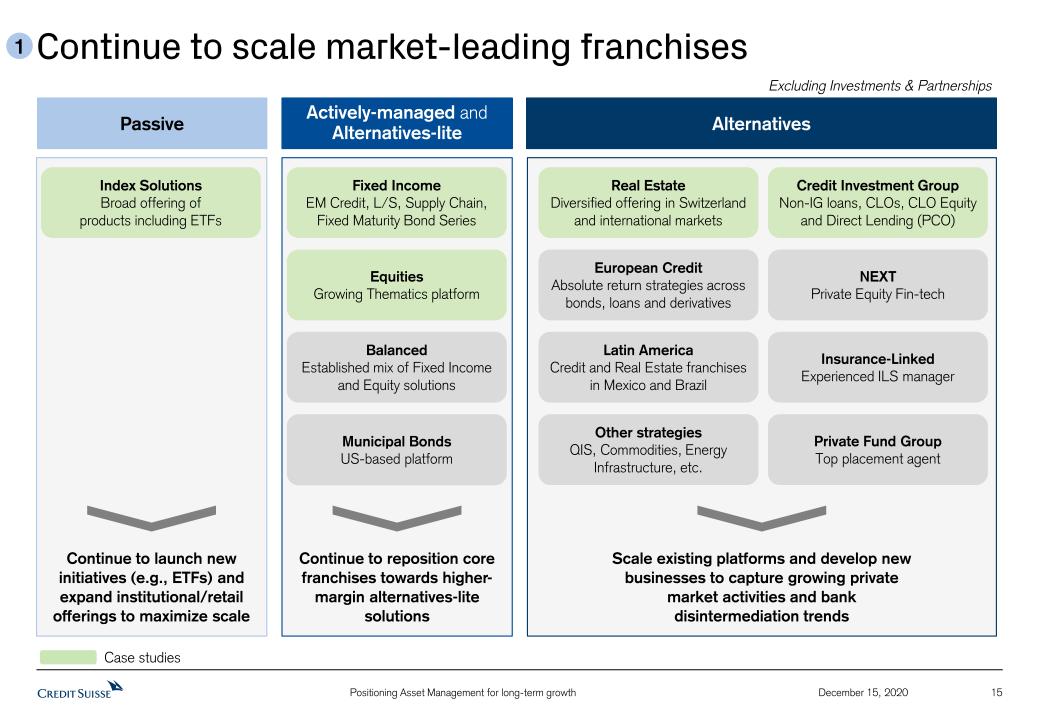
15 Excluding Investments & Partnerships Continue to scale market-leading franchises 1 Passive Actively-managed and Alternatives-lite Alternatives Credit Investment GroupNon-IG loans, CLOs, CLO Equity and Direct Lending (PCO) Insurance-LinkedExperienced ILS manager Real EstateDiversified offering in Switzerlandand international markets NEXTPrivate Equity Fin-tech Latin AmericaCredit and Real Estate franchisesin Mexico and Brazil Fixed IncomeEM Credit, L/S, Supply Chain, Fixed Maturity Bond Series EquitiesGrowing Thematics platform BalancedEstablished mix of Fixed Income and Equity solutions Index SolutionsBroad offering ofproducts including ETFs Other strategiesQIS, Commodities, Energy Infrastructure, etc. Private Fund GroupTop placement agent European CreditAbsolute return strategies across bonds, loans and derivatives December 15, 2020 Case studies Continue to launch new initiatives (e.g., ETFs) and expand institutional/retail offerings to maximize scale Continue to reposition core franchises towards higher-margin alternatives-lite solutions Scale existing platforms and develop new businesses to capture growing private market activities and bank disintermediation trends Municipal BondsUS-based platform

Focus on products and markets where we have a distinct competitive advantage 16 December 15, 2020 1 AuM in CHF bn 57 21 Index Solutions: Key initiatives and product innovationFourth largest provider of ETFs/index funds in Europe3Growing European and Asia mandates PassiveMaximize scale of Index businesses Actively-managed and Alternatives-liteContinue to reposition towards Alternatives-lite Fixed Income: Innovative/higher-margin offeringsGrowing Alternatives-lite offerings include Fixed Maturity Bond series,Supply Chain Finance funds, Long/Short and Credit Opportunities Launch of new CS Investment Partners Convertible bond businessEquities: Thematic Equity Fund Offerings (ITD performance2)CS (Lux) Security Equity Fund (May ‘13) +219%CS (Lux) Robotics Equity Fund (June ‘16) +112%CS (Lux) Digital Health Equity Fund (Dec ‘17) +106%CS (Lux) Edutainment Equity Fund (Sept ‘19) +29% AlternativesScale market-leading businesses Credit Investments Group: Award-winning credit platformDeep relationships with PE, financial intermediaries, 800+ corporates2020 GlobalCapital Broadly Syndicated CLO Manager of the YearGlobal Real Estate: Market-leading real estate franchiseLargest provider of real estate investments in Switzerland4th largest provider of Europe RE investments and Top 10 globally1 1 Source: ANREV/INREV/NCREIF Fund Manager Survey 2020 2 Represents inception to date performance net of fees for Class B shares. Source: FundGateway/Factsheets as of October 20203 Source: Morningstar as of August 31, 2020 4 Source: CSAM Investment Performance Reporting as of October 31, 2020. Refers to performance relative to benchmark gross of fees for funds only(except for CIG which also includes mandates). Benchmarked against its individual benchmarks as set out in the fund IMA or prospectus 5 Refers to Swiss Real Estate funds only 84% 71% 61%5 83% 1 year 5 year 95% 78% 52%5 91% Percentage of weighted AuMreturning above benchmark4 +55% +58% +50% +26% +57% Alts-lite Alts-lite Not applicable
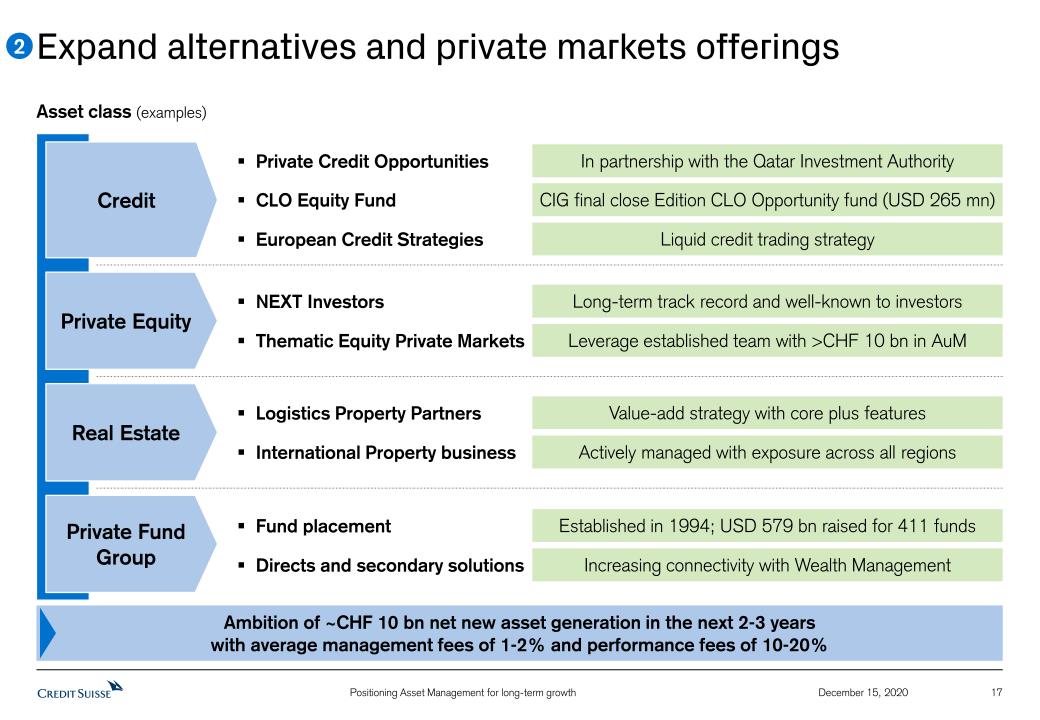
17 December 15, 2020 Expand alternatives and private markets offerings Asset class (examples) 2 Credit Private Equity Real Estate Private Fund Group Ambition of ~CHF 10 bn net new asset generation in the next 2-3 yearswith average management fees of 1-2% and performance fees of 10-20% Long-term track record and well-known to investors Leverage established team with >CHF 10 bn in AuM NEXT Investors Thematic Equity Private Markets Value-add strategy with core plus features Actively managed with exposure across all regions Logistics Property Partners International Property business CIG final close Edition CLO Opportunity fund (USD 265 mn) Liquid credit trading strategy In partnership with the Qatar Investment Authority CLO Equity Fund European Credit Strategies Private Credit Opportunities Established in 1994; USD 579 bn raised for 411 funds Increasing connectivity with Wealth Management Fund placement Directs and secondary solutions
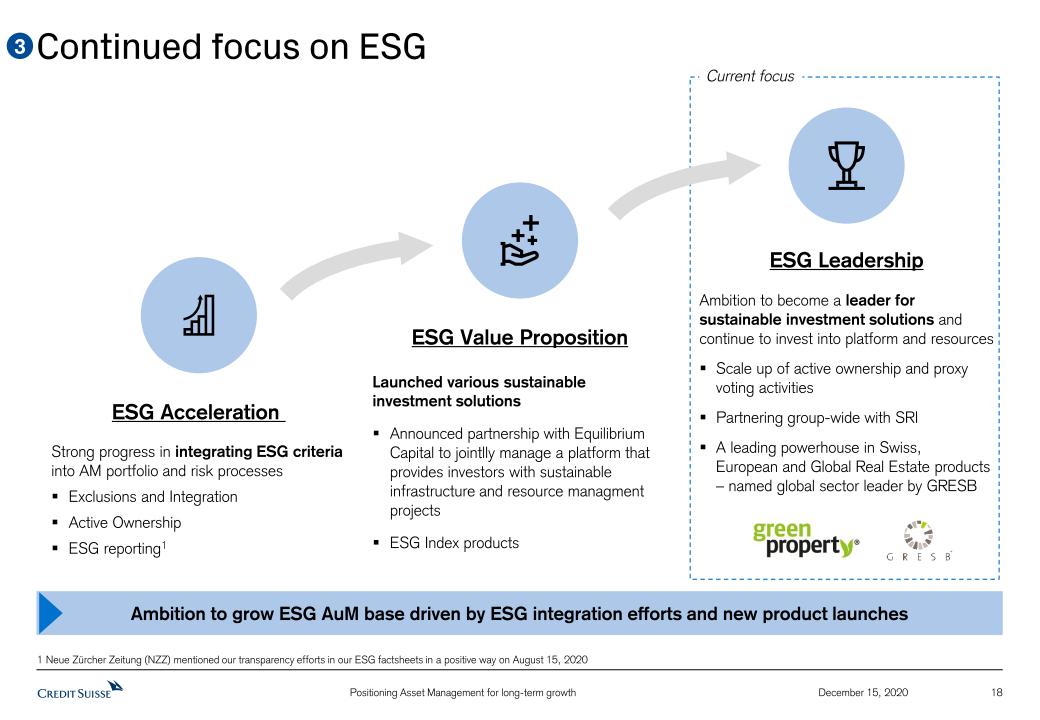
Ambition to grow ESG AuM base driven by ESG integration efforts and new product launches 18 December 15, 2020 Continued focus on ESG ESG Acceleration ESG Leadership Strong progress in integrating ESG criteria into AM portfolio and risk processesExclusions and Integration Active OwnershipESG reporting1 Ambition to become a leader for sustainable investment solutions and continue to invest into platform and resourcesScale up of active ownership and proxy voting activitiesPartnering group-wide with SRIA leading powerhouse in Swiss, European and Global Real Estate products – named global sector leader by GRESB ESG Value Proposition Launched various sustainable investment solutionsAnnounced partnership with Equilibrium Capital to jointlly manage a platform that provides investors with sustainable infrastructure and resource managment projectsESG Index products 3 Current focus 1 Neue Zürcher Zeitung (NZZ) mentioned our transparency efforts in our ESG factsheets in a positive way on August 15, 2020

19 December 15, 2020 Leverage Wealth Management for distribution Increase AM/WM collaboration across alternative and private market offerings(ambition of >CHF 1 bn NNA per year) 4 AM Operating Business1 AuM sourced through WM channelsin CHF bn Significant AuM growth from WM since 2016 Collaboration priorities Growth in AuM sourced through WM channels since the end of 2016 of 63% exceeded overall growth in AM Operating Business1 Expand focus on alternatives and private market products, e.g. NEXT Fintech Private EquityContinue efforts on both Index and actively-managed portfolio offeringsIn partnership with IS&P, continue engagement to align demand for House View solutions with AM product suite AM Product Specialists closely aligned with advisory & sales and RMs +63% 1 Excluding Investments & Partnerships
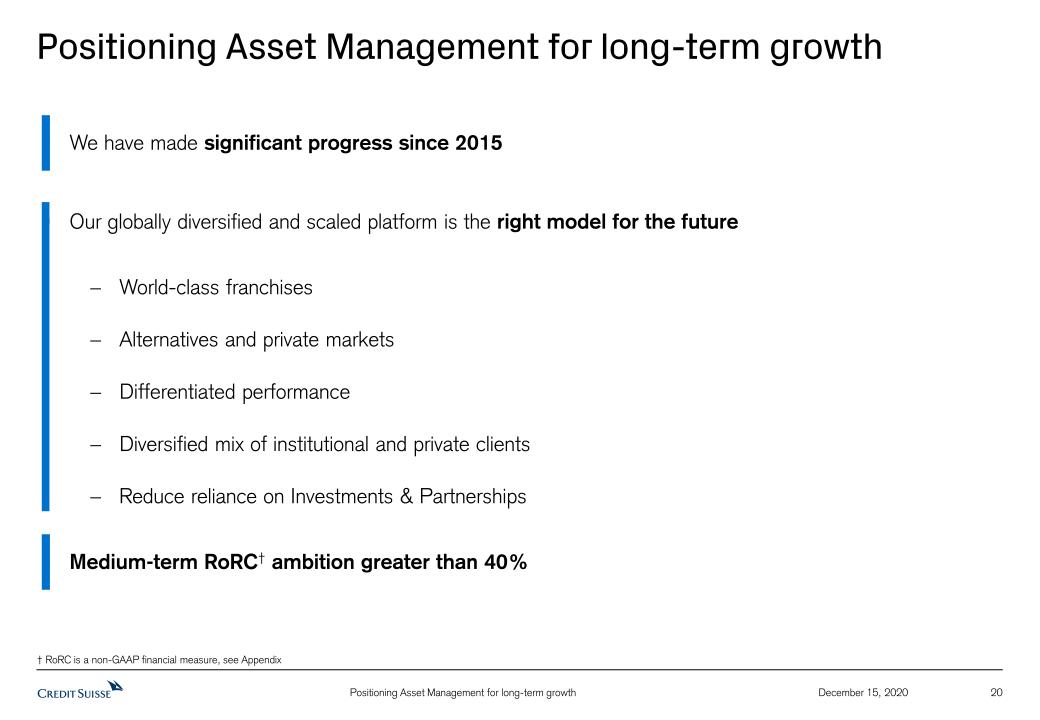
20 December 15, 2020 Positioning Asset Management for long-term growth We have made significant progress since 2015Our globally diversified and scaled platform is the right model for the futureWorld-class franchisesAlternatives and private marketsDifferentiated performanceDiversified mix of institutional and private clientsReduce reliance on Investments & PartnershipsMedium-term RoRC† ambition greater than 40% † RoRC is a non-GAAP financial measure, see Appendix

Appendix 21 December 15, 2020
Notes (1/2) 22 December 15, 2020 General notesThroughout the presentation rounding differences may occurUnless otherwise noted, all CET1 capital, CET1 ratio, Tier 1 leverage ratio, risk-weighted assets and leverage exposure figures shown in this presentation are as of the end of the respective period and, for periods prior to 2019, on a “look-through” basisGross and net margins are shown in basis pointsGross margin = net revenues annualized / average AuM; net margin = pre-tax income annualized / average AuM. Net margin excluding certain significant items, as disclosed herein, is calculated excluding those items applying the same methodologyPTI margin = pre-tax income / net revenuesMandate penetration reflects advisory and discretionary mandate volumes as a percentage of AuM, excluding those from the external asset manager businessFX impact, unless otherwise noted, is calculated by converting the CHF amount of net revenues, provision for credit losses and operating expenses for 2020 back to the original currency on a monthly basis at the respective spot FX rate. The respective amounts are then converted back to CHF applying the average 2019 FX rate from the period against which the FX impact is measured. Average FX rates apply a straight line average of monthly FX rates for major currenciesWealth Management businesses include SUB PC, IWM PB and APAC and related figures refer to their combined resultsWealth Management-related businesses include SUB, IWM and APAC and related figures refer to their combined resultsPre-provision profit refers to pre-tax income excluding provision for credit losses Client Business Volume includes assets under management, custody assets and net loansBanking for the Investment Bank is defined as its capital markets and advisory franchisesSpecific notes† Prior to 3Q20, regulatory capital was calculated as the worst of 10% of RWA and 3.5% of leverage exposure and return on regulatory capital (a non-GAAP financial measure) was calculated using income / (loss) after tax and assumed a tax rate of 30%. In 3Q20, we updated our calculation approach, following which regulatory capital is calculated as the average of 10% of RWA and 3.5% of leverage exposure and return on regulatory capital (a non-GAAP financial measure) is calculated using income / (loss) after tax and assumes a tax rate of 30% for periods prior to 2020 and 25% from 2020 onwards. For periods in 2020, for purposes of calculating Group return on regulatory capital, leverage exposure excludes cash held at central banks, after adjusting for the dividend paid in 2Q20 and the planned dividend in 4Q20. For the Investment Bank division, return on regulatory capital is based on US dollar denominated numbers. Adjusted return on regulatory capital is calculated using adjusted results, applying the same methodology to calculate return on regulatory capital.‡ Return on tangible equity, a non-GAAP financial measure, is calculated as annualized net income attributable to shareholders divided by average tangible shareholders’ equity. Tangible shareholders’ equity, a non-GAAP financial measure, is calculated by deducting goodwill and other intangible assets from total shareholders’ equity as presented in our balance sheet. Tangible book value, a non-GAAP financial measure, is equal to tangible shareholders’ equity. Tangible book value per share, a non-GAAP financial measure, is calculated by dividing tangible shareholders' equity by total number of shares outstanding. Management believes that tangible shareholders’ equity/tangible book value, return on tangible equity and tangible book value per share are meaningful as they are measures used and relied upon by industry analysts and investors to assess valuations and capital adequacy.For end-4Q15, tangible shareholders’ equity excluded goodwill of CHF 4,808 mn and other intangible assets of CHF 196 mn from total shareholders’ equity of CHF 44,382 mn as presented in our balance sheet.For end-1Q16, tangible shareholders’ equity excluded goodwill of CHF 4,688 mn and other intangible assets of CHF 186 mn from total shareholders’ equity of CHF 44,997 mn as presented in our balance sheet.For end-2Q16, tangible shareholders’ equity excluded goodwill of CHF 4,745 mn and other intangible assets of CHF 191 mn from total shareholders’ equity of CHF 44,962 mn as presented in our balance sheet.For end-3Q16, tangible shareholders’ equity excluded goodwill of CHF 4,725 mn and other intangible assets of CHF 192 mn from total shareholders’ equity of CHF 44,276 mn as presented in our balance sheet.For end-4Q16, tangible shareholders’ equity excluded goodwill of CHF 4,913 mn and other intangible assets of CHF 213 mn from total shareholders’ equity of CHF 41,897 mn as presented in our balance sheet.For end-1Q17, tangible shareholders’ equity excluded goodwill of CHF 4,831 mn and other intangible assets of CHF 202 mn from total shareholders’ equity of CHF 41,702 mn as presented in our balance sheet.For end-2Q17, tangible shareholders’ equity excluded goodwill of CHF 4,673 mn and other intangible assets of CHF 195 mn from total shareholders’ equity of CHF 43,493 mn as presented in our balance sheet.For end-3Q17, tangible shareholders’ equity excluded goodwill of CHF 4,715 mn and other intangible assets of CHF 219 mn from total shareholders’ equity of CHF 43,858 mn as presented in our balance sheet.For end-4Q17, tangible shareholders’ equity excluded goodwill of CHF 4,742 mn and other intangible assets of CHF 223 mn from total shareholders’ equity of CHF 41,902 mn as presented in our balance sheet.For end-1Q18, tangible shareholders’ equity excluded goodwill of CHF 4,667 mn and other intangible assets of CHF 212 mn from total shareholders’ equity of CHF 42,540 mn as presented in our balance sheet.For end-2Q18, tangible shareholders’ equity excluded goodwill of CHF 4,797 mn and other intangible assets of CHF 212 mn from total shareholders’ equity of CHF 43,470 mn as presented in our balance sheet.For end-3Q18, tangible shareholders’ equity excluded goodwill of CHF 4,736 mn and other intangible assets of CHF 214 mn from total shareholders’ equity of CHF 42,734 mn as presented in our balance sheet.For end-4Q18, tangible shareholders’ equity excluded goodwill of CHF 4,766 mn and other intangible assets of CHF 219 mn from total shareholders’ equity of CHF 43,922 mn as presented in our balance sheet.For end-1Q19, tangible shareholders’ equity excluded goodwill of CHF 4,807 mn and other intangible assets of CHF 224 mn from total shareholders’ equity of CHF 43,825 mn as presented in our balance sheet. For end-2Q19, tangible shareholders’ equity excluded goodwill of CHF 4,731 mn and other intangible assets of CHF 216 mn from total shareholders’ equity of CHF 43,673 mn as presented in our balance sheet.For end-3Q19, tangible shareholders’ equity excluded goodwill of CHF 4,760 mn and other intangible assets of CHF 219 mn from total shareholders’ equity of CHF 45,150 mn as presented in our balance sheet.For end-4Q19, tangible shareholders’ equity excluded goodwill of CHF 4,663 mn and other intangible assets of CHF 291 mn from total shareholders’ equity of CHF 43,644 mn as presented in our balance sheet.

Notes (2/2) 23 December 15, 2020 For end-1Q20, tangible shareholders’ equity excluded goodwill of CHF 4,604 mn and other intangible assets of CHF 279 mn from total shareholders’ equity of CHF 48,675 mn as presented in our balance sheet. For end-2Q20, tangible shareholders’ equity excluded goodwill of CHF 4,676 mn and other intangible assets of CHF 273 mn from total shareholders’ equity of CHF 46,535 mn as presented in our balance sheet.For end-3Q20, tangible shareholders’ equity excluded goodwill of CHF 4,577 mn and other intangible assets of CHF 256 mn from total shareholders’ equity of CHF 45,740 mn as presented in our balance sheet. AbbreviationsABS = Asset Backed Securities; ACL = Allowance for credit losses; Adj. = Adjusted; AGM = Annual General Meeting; AI = Artificial Intelligence; AM = Asset Management; Ann. = Annualized; APAC = Asia Pacific; AuM = Assets under Management; Avg. = Average; BIS = Bank for International Settlements; BoD = Board of Directors; bps = basis points; CAGR = Compound Annual Growth Rate; CARMC = Capital Allocation & Risk Management Committee; C&IC = Corporate & Institutional Clients; CBV = Client Business Volume; CDS = Credit Default Swap; CECL = Current Expected Credit Losses; CET1 = Common Equity Tier 1; C&IC = Corporate and Institutional Clients; C/I = Cost/Income; CIG = Credit Investments Group; CIO = Chief Investment Officer; CLO = Collateralized Loan Obligation; Corp. Ctr. = Corporate Center; COVID-19 = Coronavirus disease 2019; CRCO = Chief Risk and Compliance Officer; CSO = Chief Sustainability Officer; CSR = Corporate Social Responsibility; CSX = Credit Suisse X; CVA = Credit Valuation Adjustment; DCM = Debt Capital Markets; DPB = Digital Private Banking; ECM = Equity Capital Markets; EM Credit = Emerging Market Credit; EMEA = Europe, Middle East & Africa; ESG = Environmental Social and Governance; ExB = Executive Board of Directors; Excl. = Excluding; FINMA = Swiss Financial Market Supervisory Authority; FRTB = Fundamental Review of the Trading Book; FVoD = Fair Value on own Debt; FX = Foreign Exchange; FXC = FX Constant; GAAP = Generally Accepted Accounting Principles; GDP = Gross Domestic Product; GRESB = Global ESG Benchmark for Real Assets; GTS = Global Trading Solutions; HY = High Yield; I&P = Investments & Partnerships; IB = Investment Bank; IBCM = Investment Banking & Capital Markets; ICBCCS = ICBC Credit Suisse Asset Management; IG = Investment Grade; ILS = Insurance-Linked Strategies; IMF = International Monetary Fund; IPO = Initial Public Offering; IS&P = Investment Solutions & Products; ITS = International Trading Solutions; IWM = International Wealth Management; L/S = Long/Short; Lev Fin = Leveraged Finance; LGBT = Lesbian, Gay, Bisexual, and Transgender; LTM = Last Twelve Months; M&A = Mergers & Acquisitions; MSCI = Morgan Stanley Capital International; NAB = Neue Aargauer Bank; NGO = Non-governmental organization; NII = Net interest income; NNA = Net new assets; NPA = Non-performing assets; o/w = of which; OpRisk = Operational Risk; p.a. = per annum; PACTA = Paris Agreement Capital Transition Assessment; PB = Private Banking; PC = Private Clients; PCL = Provision for credit losses; PCO = Private Credit Opportunities; PCR = Position & Client Risk; PE = Private Equity; PPP = Purchasing Power Parity; PTI = Pre-tax income; RE = Real Estate; RM = Relationship Manager(s); RMBS = Residential Mortgage-Backed Security; RoRC = Return on Regulatory Capital; RoTE = Return on Tangible Equity; RWA = Risk-weighted assets; SA-CCR = Standardized Approach to Counterparty Credit Risk; SASB = Sustainability Accounting Standards Board; S&T = Sales and Trading; SIX = Swiss Infrastructure and Exchange; SME = Small and Medium-Sized Enterprises; SoW = Share of Wallet; SP = Securitized Products; SRI = Sustainability, Research & Investment Solutions; SRU = Strategic Resolution Unit; SUB = Swiss Universal Bank; TBTF = Too big to fail; TBVPS = Tangible Book Value Per Share; TFCD = Task Force on Climate-related Financial Disclosures; (U)HNW = (Ultra) High Net Worth; (U)HNWI = (Ultra) High Net Worth Individuals; UN SDG = United Nations Sustainable Development Goals; VCs = Venture Capitalists; YoY = Year over year; YTD = Year to Date
Brian Chin, CEO Investment BankDecember 15, 2020 Credit Suisse Investor Update 2020Driving sustainable Investment Bank returns
Disclaimer 2 December 15, 2020 This material does not purport to contain all of the information that you may wish to consider. This material is not to be relied upon as such or used in substitution for the exercise of independent judgment.Cautionary statement regarding forward-looking statementsThis presentation contains forward-looking statements that involve inherent risks and uncertainties, and we might not be able to achieve the predictions, forecasts, projections and other outcomes we describe or imply in forward-looking statements. A number of important factors could cause results to differ materially from the plans, targets, goals, expectations, estimates and intentions we express in these forward-looking statements, including those we identify in "Risk factors” in our Annual Report on Form 20-F for the fiscal year ended December 31, 2019, in “Credit Suisse – Risk factor” in our 1Q20 Financial Report published on May 7, 2020 and in the “Cautionary statement regarding forward-looking information" in our media release relating to the Investor Update published on December 15, 2020 and filed with the US Securities and Exchange Commission, and in other public filings and press releases. We do not intend to update these forward-looking statements. In particular, the terms “Estimate”, “Illustrative”, “Ambition”, “Objective”, “Outlook” and “Goal” are not intended to be viewed as targets or projections, nor are they considered to be Key Performance Indicators. All such estimates, illustrations, ambitions, objectives, outlooks and goals are subject to a large number of inherent risks, assumptions and uncertainties, many of which are completely outside of our control. These risks, assumptions and uncertainties include, but are not limited to, general market conditions, market volatility, interest rate volatility and levels, global and regional economic conditions, challenges and uncertainties resulting from the COVID-19 pandemic, political uncertainty, changes in tax policies, regulatory changes, changes in levels of client activity as a result of any of the foregoing and other factors. Accordingly, this information should not be relied on for any purpose. We do not intend to update these estimates, illustrations, ambitions, objectives, outlooks or goals. We may not achieve the benefits of our strategic initiativesWe may not achieve all of the expected benefits of our strategic initiatives. Factors beyond our control, including but not limited to the market and economic conditions (including macroeconomic and other challenges and uncertainties, for example, resulting from the COVID-19 pandemic), changes in laws, rules or regulations and other challenges discussed in our public filings, could limit our ability to achieve some or all of the expected benefits of these initiatives. Estimates and assumptionsIn preparing this presentation, management has made estimates and assumptions that affect the numbers presented. Actual results may differ. Annualized numbers do not take into account variations in operating results, seasonality and other factors and may not be indicative of actual, full-year results. Figures throughout this presentation may also be subject to rounding adjustments. All opinions and views constitute judgments as of the date of writing without regard to the date on which the reader may receive or access the information. This information is subject to change at any time without notice and we do not intend to update this information. RestatementAs of 3Q20, financial information reflects the new divisional reporting structure and management responsibilities announced on July 30, 2020 and updates to certain calculations and allocations. Prior periods have been restated to conform to the current presentation. In light of the restructuring announced July 30, 2020 and several significant items impacting results in prior periods, we intend to focus on adjusted numbers, excluding significant items in our discussion of results until the restructuring is completed.Cautionary statements relating to interim financial informationThis presentation contains certain unaudited interim financial information. This information has been derived from management accounts, is preliminary in nature, does not reflect the complete results of the fourth quarter of 2020 or the full year 2020 and is subject to change, including as a result of any normal quarterly or yearly adjustments in relation to the financial statements. This information has not been subject to any review by our independent registered public accounting firm. There can be no assurance that the final results for these periods will not differ from these preliminary results, and any such differences could be material. Quarterly financial results for the fourth quarter of 2020 and full year 2020 will be included in our 4Q20 Earnings Release and our 2020 Annual Report. These interim results of operations are not necessarily indicative of the results to be achieved for the remainder of 2020. Statement regarding non-GAAP financial measuresThis presentation also contains non-GAAP financial measures, including results excluding certain items included in our reported results, return on regulatory capital and return on tangible equity and tangible book value per share (which are both based on tangible shareholders’ equity). Further details and information needed to reconcile such non-GAAP financial measures to the most directly comparable measures under US GAAP can be found in the Appendix of the CEO and CFO Investor Update presentations, published on December 15, 2020, which are both available on our website at www.credit-suisse.com.Our estimates, ambitions, objectives and targets often include metrics that are non-GAAP financial measures and are unaudited. A reconciliation of the estimates, ambitions, objectives and targets to the nearest GAAP measures is unavailable without unreasonable efforts. Results excluding certain items included in our reported results do not include items such as goodwill impairment, major litigation provisions, real estate gains, impacts from foreign exchange and other items included in our reported results, all of which are unavailable on a prospective basis. Return on Tangible Equity is based on tangible shareholders' equity, a non-GAAP financial measure also known as tangible book value, which is calculated by deducting goodwill and other intangible assets from total shareholders' equity as presented in our balance sheet, both of which are unavailable on a prospective basis. Tangible book value per share excludes the impact of any dividends paid during the performance period, share buybacks, own credit movements, foreign exchange rate movements and pension-related impacts, all of which are unavailable on a prospective basis. Return on regulatory capital (a non-GAAP financial measure) is calculated using income/(loss) after tax and assumes a tax rate of 25% and capital allocated based on the average of 10% of average risk-weighted assets and 3.5% of average leverage exposure; the essential components of this calculation are unavailable on a prospective basis. Such estimates, ambitions, objectives and targets are calculated in a manner that is consistent with the accounting policies applied by us in preparing our financial statements.Statement regarding capital, liquidity and leverageCredit Suisse is subject to the Basel III framework, as implemented in Switzerland, as well as Swiss legislation and regulations for systemically important banks (Swiss Requirements), which include capital, liquidity, leverage and large exposure requirements and rules for emergency plans designed to maintain systemically relevant functions in the event of threatened insolvency. Credit Suisse has adopted the Bank for International Settlements (BIS) leverage ratio framework, as issued by the Basel Committee on Banking Supervision (BCBS) and implemented in Switzerland by the Swiss Financial Market Supervisory Authority FINMA. References to phase-in and look-through included herein refer to Basel III capital requirements and Swiss Requirements. Phase-in reflects that, for the years 2014-2018, there was a five-year (20% per annum) phase-in of goodwill, other intangible assets and other capital deductions (e.g., certain deferred tax assets) and a phase-out of an adjustment for the accounting treatment of pension plans. For the years 2013-2022, there is a phase-out of certain capital instruments. Look-through assumes the full phase-in of goodwill and other intangible assets and other regulatory adjustments and the phase-out of certain capital instruments.Unless otherwise noted, leverage exposure is based on the BIS leverage ratio framework and consists of period-end balance sheet assets and prescribed regulatory adjustments. The tier 1 leverage ratio and CET1 leverage ratio are calculated as BIS tier 1 capital and CET1 capital, respectively, divided by period-end leverage exposure. Swiss leverage ratios are measured on the same period-end basis as the leverage exposure for the BIS leverage ratio. Unless otherwise noted, for periods in 2020, leverage exposure excludes cash held at central banks, after adjusting for the dividends paid in 2020.SourcesCertain material in this presentation has been prepared by Credit Suisse on the basis of publicly available information, internally developed data and other third-party sources believed to be reliable. Credit Suisse has not sought to independently verify information obtained from public and third-party sources and makes no representations or warranties as to accuracy, completeness or reliability of such information.
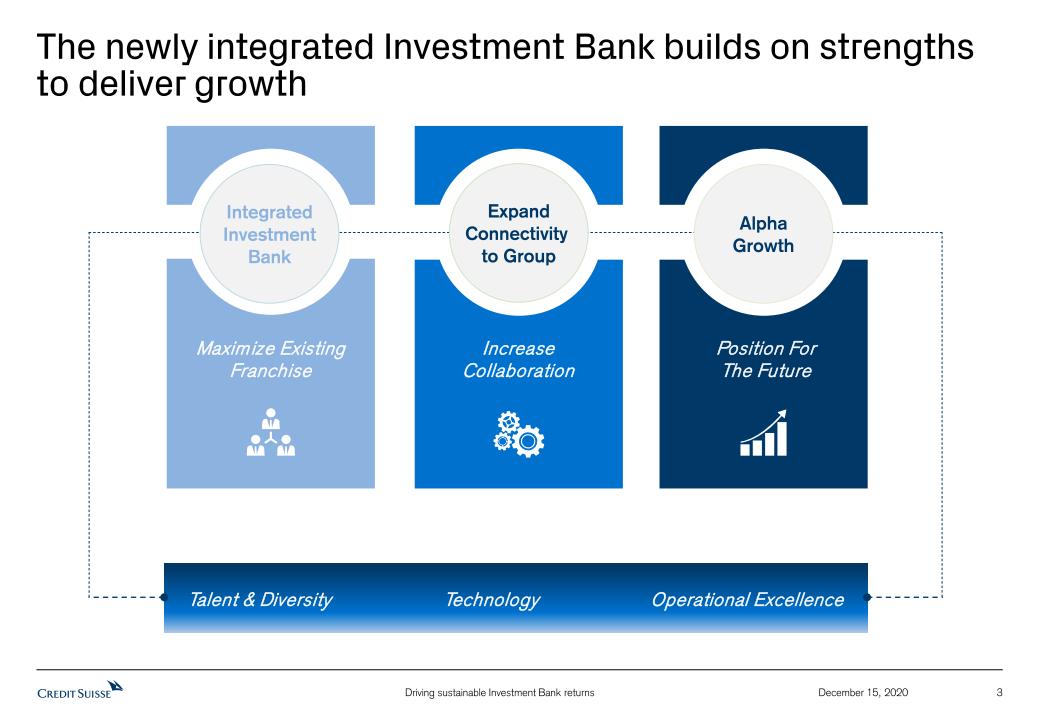
3 December 15, 2020 The newly integrated Investment Bank builds on strengths to deliver growth AlphaGrowth Position For The Future ExpandConnectivity to Group Increase Collaboration Integrated Investment Bank Maximize Existing Franchise Technology Operational Excellence Talent & Diversity
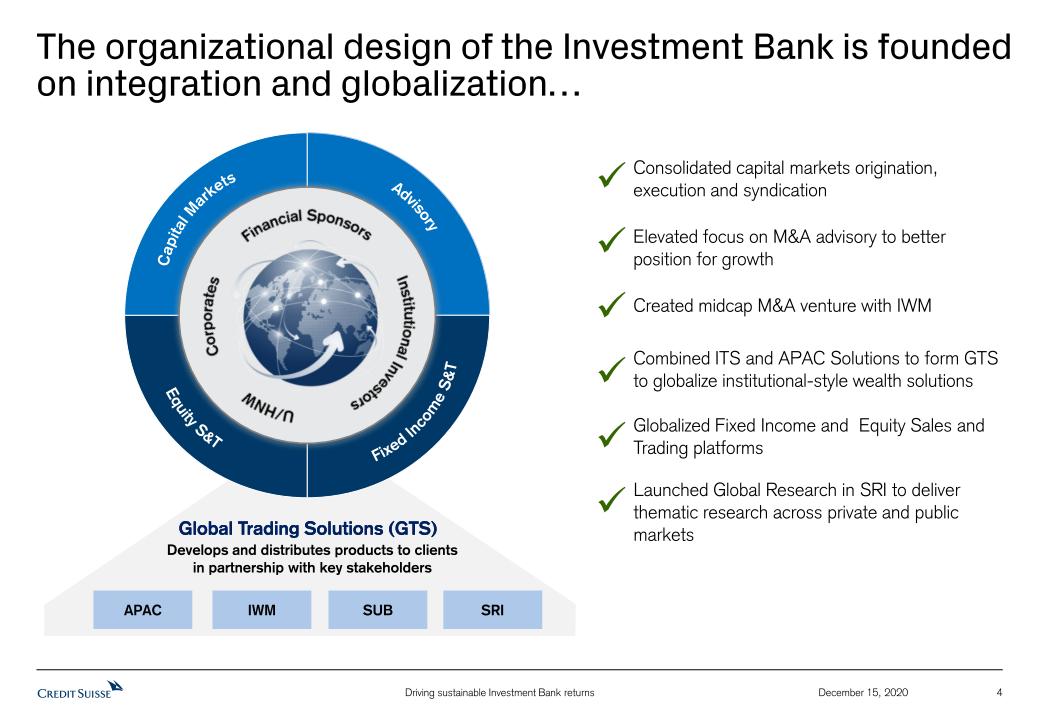
4 December 15, 2020 The organizational design of the Investment Bank is founded on integration and globalization… Develops and distributes products to clients in partnership with key stakeholders APAC IWM SUB Global Trading Solutions (GTS) SRI Consolidated capital markets origination, execution and syndication Created midcap M&A venture with IWM Elevated focus on M&A advisory to better position for growth Combined ITS and APAC Solutions to form GTS to globalize institutional-style wealth solutions Globalized Fixed Income and Equity Sales and Trading platforms Launched Global Research in SRI to deliver thematic research across private and public markets Global Trading Solutions (GTS) Equity S&T Advisory Fixed Income S&T Capital Markets

5 December 15, 2020 …with >75% of revenues generated by Top 6 ranked businesses and market leading franchises across the platform #1 Global IPOs1 Banking Investment Bank of the Year for Securitization Investment Bank of the Year Investment Bank of the Year for Equity Derivatives Share up ~90bps vs. 20191 #1 Sponsors Leveraged Finance1 #2 Institutional Loans1 Top 5 Announced M&A1 Equities #2 EuroHedge Prime Brokerage8 Share up 75bps YoYGlobal Cash Equities7 #3 AsiaHedge Prime Brokerage8 #4US Prime Brokerage8,9 Top 5Global Cash Equities7 Fixed Income #1 Structured Credit3 #1 Asset Finance2 #1 Leveraged Finance Trading4 #1 Pass-Through Trading5 #1 IG and HY CDS Trading6 1 Refers to global investment banking results from the Investment Bank, APAC advisory and underwriting as well as M&A, DCM and ECM in SUB C&IC. Dealogic 2020 YTD as of December 11, 2020 (Global); IPOs and M&A based on volume 2 Thomson Reuters F20A All US Securitizations 2020 YTD as of October 31, 2020 3 Bloomberg for the 9M period ending September 30, 2020 4 Coalition Competitor Analytics for the 6M period ending June 30, 2020, peers include Bank of America, Barclays, BNP Paribas, Citigroup, Deutsche Bank, Goldman Sachs, JP Morgan, Morgan Stanley, Société Générale and UBS. Results analyzed according to CS’s Global Credit product taxonomy and ranking based on CS’ own revenues; includes Americas and EMEA 5 Tradeweb for the 9M period ending September 30, 2020 (US) 6 Bloomberg for the 9M period ending September 30, 2020 (US) 7 Third Party competitive analysis for the 6M period ending June 30, 2020 8 2020 surveys based on FY 2019 results 9 Absolute Return

6 December 15, 2020 The integrated Investment Bank’s diversified business mix has led to reduced revenue volatility Diversified revenue streams… By Product ByType Revenue, 2018-9M20, in USD terms …leading to significantly reduced volatility of revenue Total investment banking revenues1,2 volatility Quarterly revenue (2018 – 9M20) coefficient of standard variation Source: Company financials from 1Q18 to 3Q20, converted to USD using average exchange rates; Industry includes Bank of America, Barclays, BNP Paribas, Citigroup, Credit Suisse, Deutsche Bank, HSBC, JP Morgan, Morgan Stanley, Société Générale and UBS; Goldman Sachs excluded given no quarterly disclosures pre-4Q18 1 Include Fixed Income Sales and Trading, Equity Sales and Trading and Advisory and Underwriting revenues; no Equity Sales and Trading revenues for Deutsche Bank; no Advisory and Underwriting revenues for HSBC, BNP Paribas and Société Générale 2 Credit Suisse and UBS exclude mark-to-market impacts in 1Q-3Q and 1Q-2Q, respectively
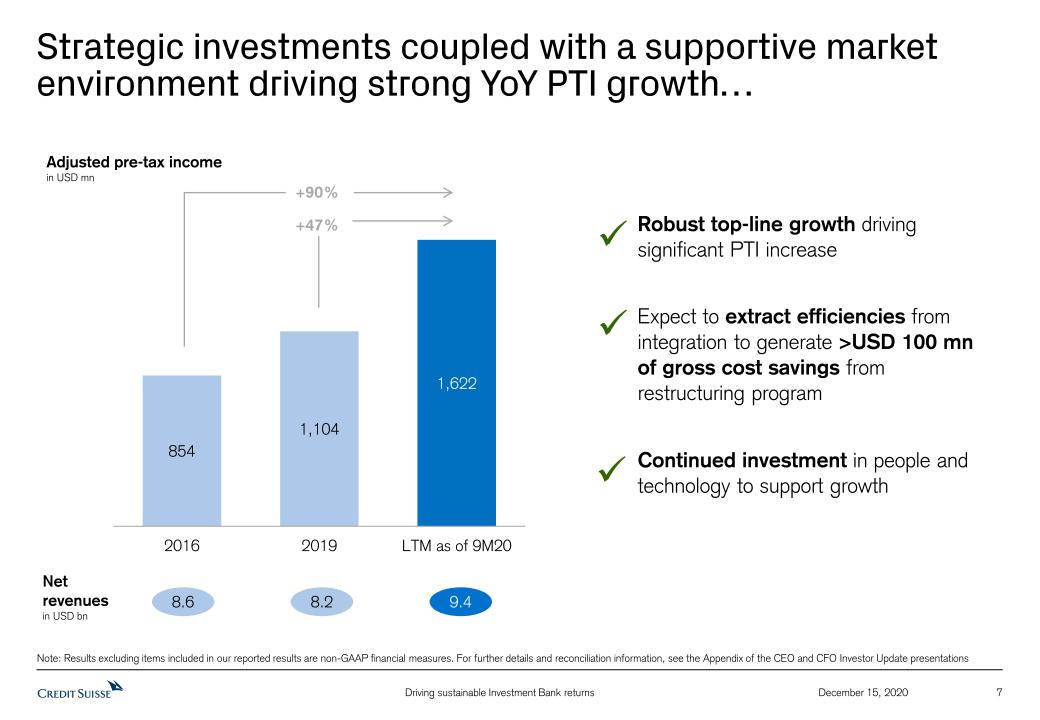
7 December 15, 2020 Strategic investments coupled with a supportive market environment driving strong YoY PTI growth… Expect to extract efficiencies from integration to generate >USD 100 mn of gross cost savings from restructuring program Continued investment in people and technology to support growth Note: Results excluding items included in our reported results are non-GAAP financial measures. For further details and reconciliation information, see the Appendix of the CEO and CFO Investor Update presentations Robust top-line growth driving significant PTI increase Adjusted pre-tax income in USD mn +90% 8.6 8.2 9.4 Net revenuesin USD bn +47%
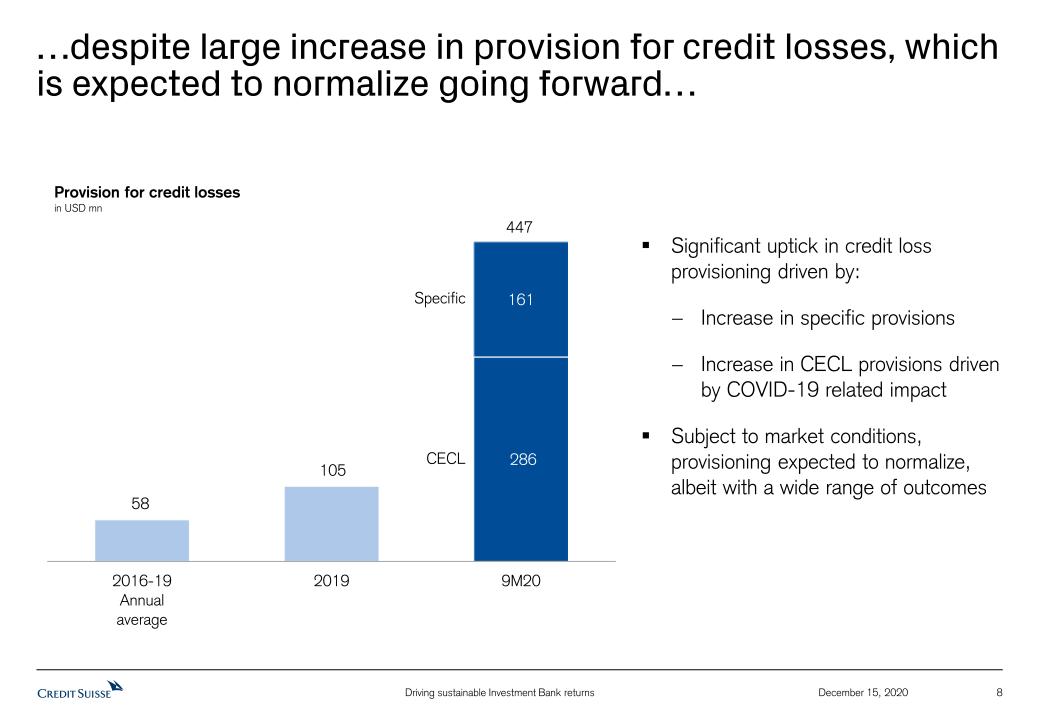
8 December 15, 2020 …despite large increase in provision for credit losses, which is expected to normalize going forward… Provision for credit lossesin USD mn 447 CECL Specific Significant uptick in credit loss provisioning driven by: Increase in specific provisionsIncrease in CECL provisions driven by COVID-19 related impactSubject to market conditions, provisioning expected to normalize, albeit with a wide range of outcomes

9 December 15, 2020 …and while leveraging the consolidated capital base to enhance efficiency and returns Transformation of Investment Bank capital consumption brings the business in-line with medium-term Group ambition ~1/3 of Group capital allocation ambition ensures capital discipline The consolidated, integrated IB capital pool enables:Greater velocity of capitalDynamic allocation of capital towards emerging opportunitiesBetter alignment of capital with long-term strategic objectives 3Q20 Credit Suisse Group Average Capital2 Investment Bank Rest of Group 1 For the purposes of this 3Q15 chart, includes GM, IBCM, APAC Markets and SRU 2 Based on the average of 10% of RWA and 3.5% of leverage exposure from Group total (Group leverage exposure without the temporary exclusion of cash held at central banks) Investment Bank1 Rest of Group 3Q15 Credit Suisse Group Average Capital2
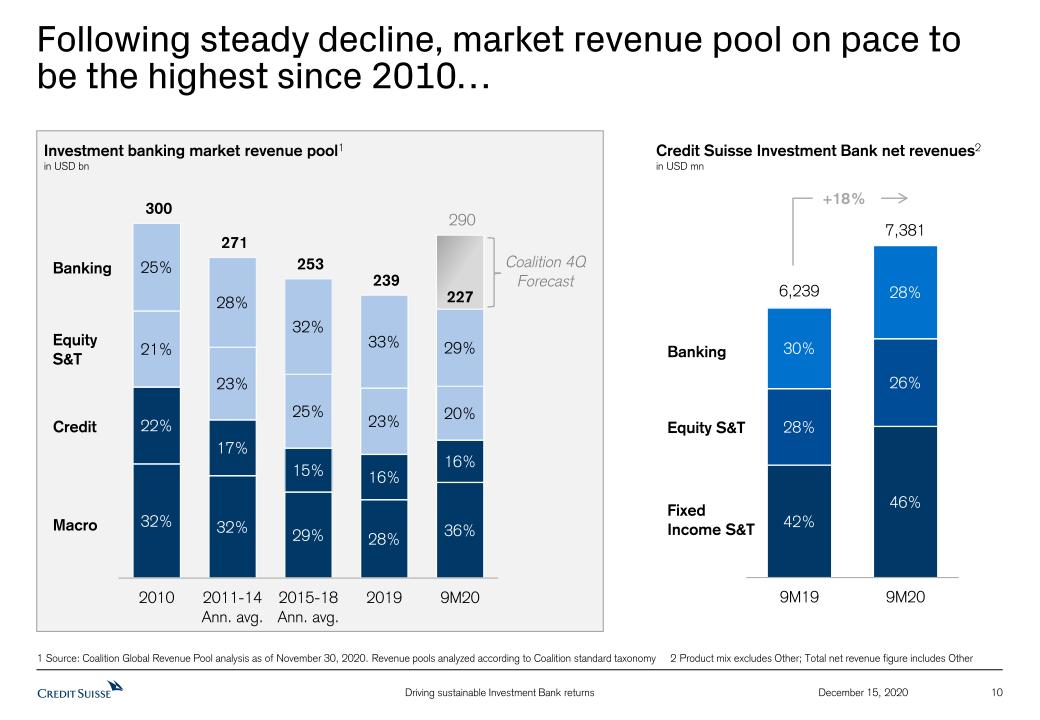
Banking EquityS&T Investment banking market revenue pool1in USD bn 227 Coalition 4Q Forecast Credit Macro 10 December 15, 2020 Following steady decline, market revenue pool on pace to be the highest since 2010… Credit Suisse Investment Bank net revenues2in USD mn FixedIncome S&T Equity S&T +18% Banking 1 Source: Coalition Global Revenue Pool analysis as of November 30, 2020. Revenue pools analyzed according to Coalition standard taxonomy 2 Product mix excludes Other; Total net revenue figure includes Other

11 December 15, 2020 …and while market growth has been geared towards Macro, CS business mix is well positioned to perform in post-COVID-19 market environment… Macro Banking Credit Equity S&T Investment banking market revenue pool1in USD bn Competitive position/business strategy Revenue pool outlook1 1 Source: Coalition Global Revenue Pool analysis as of November 30, 2020. Revenue pools analyzed according to Coalition standard taxonomy 2 Dealogic 2020 YTD as of December 11, 2020 (Global); M&A based on volume 3 Third Party competitive analysis for the 6M period ending June 30, 2020 4 Thomson Reuters F20A All US Securitizations 2020 YTD as of October 31, 2020 5 Coalition Competitor Analytics for the 6M period ending June 30, 2020, peers include Bank of America, Barclays, BNP Paribas, Citigroup, Deutsche Bank, Goldman Sachs, JP Morgan, Morgan Stanley, Société Générale and UBS. Results analyzed according to CS’s Global Credit product taxonomy and ranking based on CS’ own revenues; includes Americas and EMEA Niche Macro offering tailored to WM clients and supporting Institutional clients Top 5 Announced M&A2#2 Institutional Loans2 Top 5 Global Cash Equities3 #1 Asset Finance4#1 Lev Fin Trading5 M&A recovery; Capital Markets shift towards Lev Loans, lower IG DCM Steady Equity S&T Normalized Credit environment with improvement in SP Normalized Macro environment +61% YoY % +19% +4% +14% 67% of increase from Macro Banking Equity S&T Credit Macro +25%
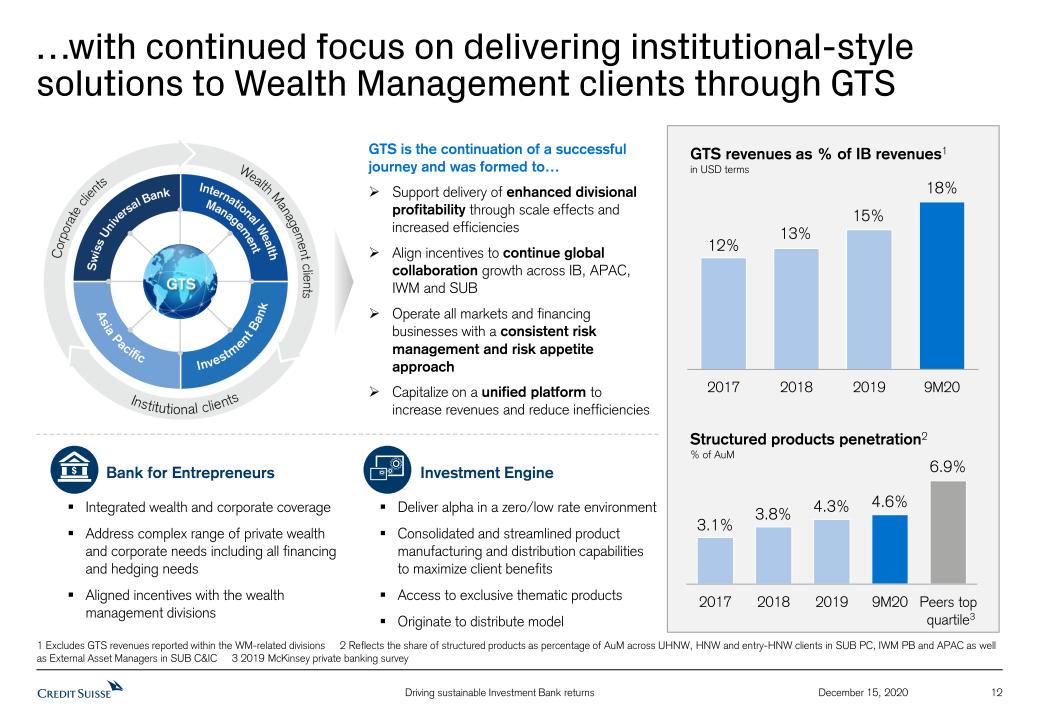
12 December 15, 2020 …with continued focus on delivering institutional-style solutions to Wealth Management clients through GTS GTS is the continuation of a successful journey and was formed to…Support delivery of enhanced divisional profitability through scale effects and increased efficienciesAlign incentives to continue global collaboration growth across IB, APAC, IWM and SUBOperate all markets and financing businesses with a consistent risk management and risk appetite approach Capitalize on a unified platform to increase revenues and reduce inefficiencies Integrated wealth and corporate coverageAddress complex range of private wealth and corporate needs including all financing and hedging needsAligned incentives with the wealth management divisions Investment Engine Deliver alpha in a zero/low rate environment Consolidated and streamlined product manufacturing and distribution capabilities to maximize client benefitsAccess to exclusive thematic products Originate to distribute model GTS revenues as % of IB revenues1 in USD terms Structured products penetration2 % of AuM Bank for Entrepreneurs 1 Excludes GTS revenues reported within the WM-related divisions 2 Reflects the share of structured products as percentage of AuM across UHNW, HNW and entry-HNW clients in SUB PC, IWM PB and APAC as well as External Asset Managers in SUB C&IC 3 2019 McKinsey private banking survey 3

13 December 15, 2020 The Investment Bank’s client-centric strategy positions the franchise ahead of trends to capture market growth… Transition from public to private markets Market trends Investment Bank strategy Focus on ESG for Corporates and Investors Rapid growth in Tech/Healthcare banking fee pools Onshore China expansion opportunity Increased prominence of electronic trading across asset classes Untapped credit markets opportunity Expand MD coverage footprint and increase connectivity with VCs and founders Expand coverage of private issuers and leverage access to private capital across UHNW investor base Support energy transition by creating distinctive service offering targeting infrastructure and renewable growth Invest to build out new product distribution and trading capabilities Deliver cross-asset electronic trading in targeted products leveraging Equities solutions and Fintech partnerships Enter new markets and expand Asset Finance to new asset classes
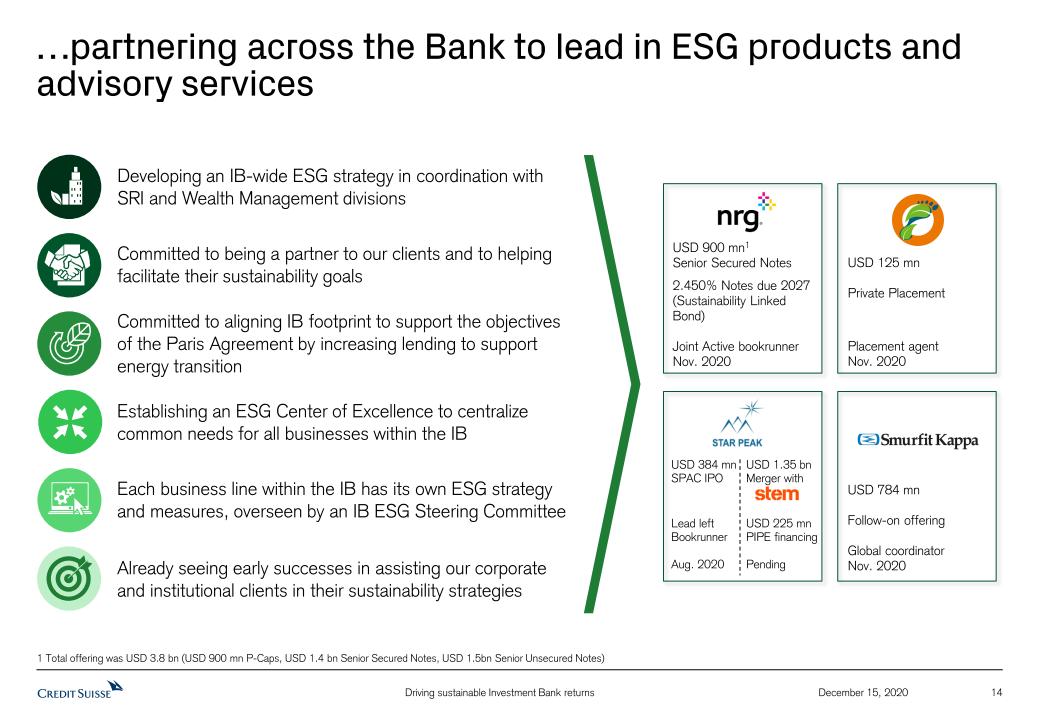
14 December 15, 2020 …partnering across the Bank to lead in ESG products and advisory services Already seeing early successes in assisting our corporate and institutional clients in their sustainability strategies Developing an IB-wide ESG strategy in coordination with SRI and Wealth Management divisions Committed to being a partner to our clients and to helping facilitate their sustainability goals Establishing an ESG Center of Excellence to centralize common needs for all businesses within the IB Each business line within the IB has its own ESG strategy and measures, overseen by an IB ESG Steering Committee 1 Total offering was USD 3.8 bn (USD 900 mn P-Caps, USD 1.4 bn Senior Secured Notes, USD 1.5bn Senior Unsecured Notes) USD 784 mnFollow-on offeringGlobal coordinatorNov. 2020 USD 900 mn1Senior Secured Notes 2.450% Notes due 2027 (Sustainability Linked Bond)Joint Active bookrunnerNov. 2020 USD 125 mnPrivate PlacementPlacement agentNov. 2020 USD 384 mnSPAC IPOLead left BookrunnerAug. 2020 USD 1.35 bnMerger with USD 225 mnPIPE financingPending Committed to aligning IB footprint to support the objectives of the Paris Agreement by increasing lending to support energy transition

15 December 15, 2020 Investing in relationships, people and culture to enhance operational excellence Winning culture Operational excellence Aspire to operational excellence across the Investment Bank Prioritize automation, preventative controls, data integrity and supervision Require principled and ethical behavior with a full awareness of controls, policies and procedures Monitor risks through effective partnership between business and control functions Employees focus on building trust with clients1 Employees operate with full ownership and accountability1 88% 85% 1 Internal pulse survey completed in June 2020; analytics provided by Karian and Box; industry benchmark reflects data from 12 Financial Services organizations +13pp +13pp
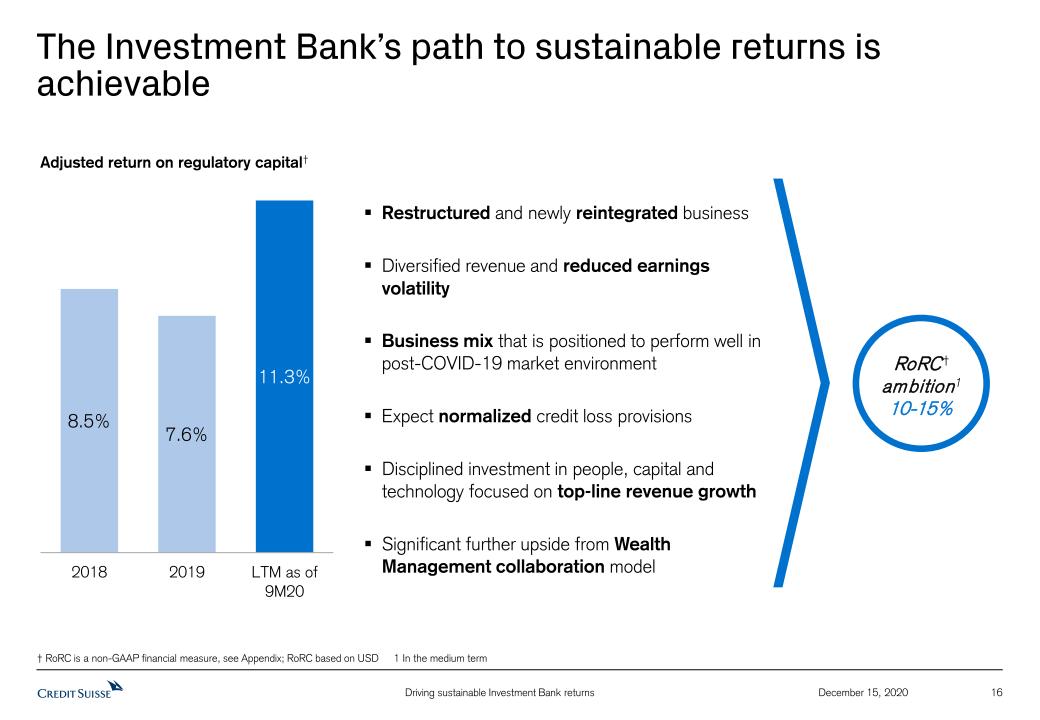
16 December 15, 2020 The Investment Bank’s path to sustainable returns is achievable † RoRC is a non-GAAP financial measure, see Appendix; RoRC based on USD 1 In the medium term Adjusted return on regulatory capital† RoRC † ambition110-15% Restructured and newly reintegrated businessDiversified revenue and reduced earnings volatilityBusiness mix that is positioned to perform well in post-COVID-19 market environmentExpect normalized credit loss provisionsDisciplined investment in people, capital and technology focused on top-line revenue growthSignificant further upside from Wealth Management collaboration model

17 December 15, 2020 Appendix

Notes (1/2) 18 December 15, 2020 General notesThroughout the presentation rounding differences may occurUnless otherwise noted, all CET1 capital, CET1 ratio, Tier 1 leverage ratio, risk-weighted assets and leverage exposure figures shown in this presentation are as of the end of the respective period and, for periods prior to 2019, on a “look-through” basisGross and net margins are shown in basis pointsGross margin = net revenues annualized / average AuM; net margin = pre-tax income annualized / average AuM. Net margin excluding certain significant items, as disclosed herein, is calculated excluding those items applying the same methodologyPTI margin = pre-tax income / net revenuesMandate penetration reflects advisory and discretionary mandate volumes as a percentage of AuM, excluding those from the external asset manager businessFX impact, unless otherwise noted, is calculated by converting the CHF amount of net revenues, provision for credit losses and operating expenses for 2020 back to the original currency on a monthly basis at the respective spot FX rate. The respective amounts are then converted back to CHF applying the average 2019 FX rate from the period against which the FX impact is measured. Average FX rates apply a straight line average of monthly FX rates for major currenciesWealth Management businesses include SUB PC, IWM PB and APAC and related figures refer to their combined resultsWealth Management-related businesses include SUB, IWM and APAC and related figures refer to their combined resultsPre-provision profit refers to pre-tax income excluding provision for credit losses Client Business Volume includes assets under management, custody assets and net loansBanking for the Investment Bank is defined as its capital markets and advisory franchisesSpecific notes† Prior to 3Q20, regulatory capital was calculated as the worst of 10% of RWA and 3.5% of leverage exposure and return on regulatory capital (a non-GAAP financial measure) was calculated using income / (loss) after tax and assumed a tax rate of 30%. In 3Q20, we updated our calculation approach, following which regulatory capital is calculated as the average of 10% of RWA and 3.5% of leverage exposure and return on regulatory capital (a non-GAAP financial measure) is calculated using income / (loss) after tax and assumes a tax rate of 30% for periods prior to 2020 and 25% from 2020 onwards. For periods in 2020, for purposes of calculating Group return on regulatory capital, leverage exposure excludes cash held at central banks, after adjusting for the dividend paid in 2Q20 and the planned dividend in 4Q20. For the Investment Bank division, return on regulatory capital is based on US dollar denominated numbers. Adjusted return on regulatory capital is calculated using adjusted results, applying the same methodology to calculate return on regulatory capital.‡ Return on tangible equity, a non-GAAP financial measure, is calculated as annualized net income attributable to shareholders divided by average tangible shareholders’ equity. Tangible shareholders’ equity, a non-GAAP financial measure, is calculated by deducting goodwill and other intangible assets from total shareholders’ equity as presented in our balance sheet. Tangible book value, a non-GAAP financial measure, is equal to tangible shareholders’ equity. Tangible book value per share, a non-GAAP financial measure, is calculated by dividing tangible shareholders' equity by total number of shares outstanding. Management believes that tangible shareholders’ equity/tangible book value, return on tangible equity and tangible book value per share are meaningful as they are measures used and relied upon by industry analysts and investors to assess valuations and capital adequacy.For end-4Q15, tangible shareholders’ equity excluded goodwill of CHF 4,808 mn and other intangible assets of CHF 196 mn from total shareholders’ equity of CHF 44,382 mn as presented in our balance sheet.For end-1Q16, tangible shareholders’ equity excluded goodwill of CHF 4,688 mn and other intangible assets of CHF 186 mn from total shareholders’ equity of CHF 44,997 mn as presented in our balance sheet.For end-2Q16, tangible shareholders’ equity excluded goodwill of CHF 4,745 mn and other intangible assets of CHF 191 mn from total shareholders’ equity of CHF 44,962 mn as presented in our balance sheet.For end-3Q16, tangible shareholders’ equity excluded goodwill of CHF 4,725 mn and other intangible assets of CHF 192 mn from total shareholders’ equity of CHF 44,276 mn as presented in our balance sheet.For end-4Q16, tangible shareholders’ equity excluded goodwill of CHF 4,913 mn and other intangible assets of CHF 213 mn from total shareholders’ equity of CHF 41,897 mn as presented in our balance sheet.For end-1Q17, tangible shareholders’ equity excluded goodwill of CHF 4,831 mn and other intangible assets of CHF 202 mn from total shareholders’ equity of CHF 41,702 mn as presented in our balance sheet.For end-2Q17, tangible shareholders’ equity excluded goodwill of CHF 4,673 mn and other intangible assets of CHF 195 mn from total shareholders’ equity of CHF 43,493 mn as presented in our balance sheet.For end-3Q17, tangible shareholders’ equity excluded goodwill of CHF 4,715 mn and other intangible assets of CHF 219 mn from total shareholders’ equity of CHF 43,858 mn as presented in our balance sheet.For end-4Q17, tangible shareholders’ equity excluded goodwill of CHF 4,742 mn and other intangible assets of CHF 223 mn from total shareholders’ equity of CHF 41,902 mn as presented in our balance sheet.For end-1Q18, tangible shareholders’ equity excluded goodwill of CHF 4,667 mn and other intangible assets of CHF 212 mn from total shareholders’ equity of CHF 42,540 mn as presented in our balance sheet.For end-2Q18, tangible shareholders’ equity excluded goodwill of CHF 4,797 mn and other intangible assets of CHF 212 mn from total shareholders’ equity of CHF 43,470 mn as presented in our balance sheet.For end-3Q18, tangible shareholders’ equity excluded goodwill of CHF 4,736 mn and other intangible assets of CHF 214 mn from total shareholders’ equity of CHF 42,734 mn as presented in our balance sheet.For end-4Q18, tangible shareholders’ equity excluded goodwill of CHF 4,766 mn and other intangible assets of CHF 219 mn from total shareholders’ equity of CHF 43,922 mn as presented in our balance sheet.For end-1Q19, tangible shareholders’ equity excluded goodwill of CHF 4,807 mn and other intangible assets of CHF 224 mn from total shareholders’ equity of CHF 43,825 mn as presented in our balance sheet. For end-2Q19, tangible shareholders’ equity excluded goodwill of CHF 4,731 mn and other intangible assets of CHF 216 mn from total shareholders’ equity of CHF 43,673 mn as presented in our balance sheet.For end-3Q19, tangible shareholders’ equity excluded goodwill of CHF 4,760 mn and other intangible assets of CHF 219 mn from total shareholders’ equity of CHF 45,150 mn as presented in our balance sheet.For end-4Q19, tangible shareholders’ equity excluded goodwill of CHF 4,663 mn and other intangible assets of CHF 291 mn from total shareholders’ equity of CHF 43,644 mn as presented in our balance sheet.
Notes (2/2) 19 December 15, 2020 For end-1Q20, tangible shareholders’ equity excluded goodwill of CHF 4,604 mn and other intangible assets of CHF 279 mn from total shareholders’ equity of CHF 48,675 mn as presented in our balance sheet. For end-2Q20, tangible shareholders’ equity excluded goodwill of CHF 4,676 mn and other intangible assets of CHF 273 mn from total shareholders’ equity of CHF 46,535 mn as presented in our balance sheet.For end-3Q20, tangible shareholders’ equity excluded goodwill of CHF 4,577 mn and other intangible assets of CHF 256 mn from total shareholders’ equity of CHF 45,740 mn as presented in our balance sheet. AbbreviationsABS = Asset Backed Securities; ACL = Allowance for credit losses; Adj. = Adjusted; AGM = Annual General Meeting; AI = Artificial Intelligence; AM = Asset Management; Ann. = Annualized; APAC = Asia Pacific; AuM = Assets under Management; Avg. = Average; BIS = Bank for International Settlements; BoD = Board of Directors; bps = basis points; CAGR = Compound Annual Growth Rate; CARMC = Capital Allocation & Risk Management Committee; C&IC = Corporate & Institutional Clients; CBV = Client Business Volume; CDS = Credit Default Swap; CECL = Current Expected Credit Losses; CET1 = Common Equity Tier 1; C&IC = Corporate and Institutional Clients; C/I = Cost/Income; CIG = Credit Investments Group; CIO = Chief Investment Officer; CLO = Collateralized Loan Obligation; Corp. Ctr. = Corporate Center; COVID-19 = Coronavirus disease 2019; CRCO = Chief Risk and Compliance Officer; CSO = Chief Sustainability Officer; CSR = Corporate Social Responsibility; CSX = Credit Suisse X; CVA = Credit Valuation Adjustment; DCM = Debt Capital Markets; DPB = Digital Private Banking; ECM = Equity Capital Markets; EM Credit = Emerging Market Credit; EMEA = Europe, Middle East & Africa; ESG = Environmental Social and Governance; ExB = Executive Board of Directors; Excl. = Excluding; FINMA = Swiss Financial Market Supervisory Authority; FRTB = Fundamental Review of the Trading Book; FVoD = Fair Value on own Debt; FX = Foreign Exchange; FXC = FX Constant; GAAP = Generally Accepted Accounting Principles; GDP = Gross Domestic Product; GRESB = Global ESG Benchmark for Real Assets; GTS = Global Trading Solutions; HY = High Yield; I&P = Investments & Partnerships; IB = Investment Bank; IBCM = Investment Banking & Capital Markets; ICBCCS = ICBC Credit Suisse Asset Management; IG = Investment Grade; ILS = Insurance-Linked Strategies; IMF = International Monetary Fund; IPO = Initial Public Offering; IS&P = Investment Solutions & Products; ITS = International Trading Solutions; IWM = International Wealth Management; L/S = Long/Short; Lev Fin = Leveraged Finance; LGBT = Lesbian, Gay, Bisexual, and Transgender; LTM = Last Twelve Months; M&A = Mergers & Acquisitions; MSCI = Morgan Stanley Capital International; NAB = Neue Aargauer Bank; NGO = Non-governmental organization; NII = Net interest income; NNA = Net new assets; NPA = Non-performing assets; o/w = of which; OpRisk = Operational Risk; p.a. = per annum; PACTA = Paris Agreement Capital Transition Assessment; PB = Private Banking; PC = Private Clients; PCL = Provision for credit losses; PCO = Private Credit Opportunities; PCR = Position & Client Risk; PE = Private Equity; PPP = Purchasing Power Parity; PTI = Pre-tax income; RE = Real Estate; RM = Relationship Manager(s); RMBS = Residential Mortgage-Backed Security; RoRC = Return on Regulatory Capital; RoTE = Return on Tangible Equity; RWA = Risk-weighted assets; SA-CCR = Standardized Approach to Counterparty Credit Risk; SASB = Sustainability Accounting Standards Board; S&T = Sales and Trading; SIX = Swiss Infrastructure and Exchange; SME = Small and Medium-Sized Enterprises; SoW = Share of Wallet; SP = Securitized Products; SRI = Sustainability, Research & Investment Solutions; SRU = Strategic Resolution Unit; SUB = Swiss Universal Bank; TBTF = Too big to fail; TBVPS = Tangible Book Value Per Share; TFCD = Task Force on Climate-related Financial Disclosures; (U)HNW = (Ultra) High Net Worth; (U)HNWI = (Ultra) High Net Worth Individuals; UN SDG = United Nations Sustainable Development Goals; VCs = Venture Capitalists; YoY = Year over year; YTD = Year to Date
Signatures
Pursuant to the requirements of the Securities Exchange Act of 1934, the registrants have duly caused this report to be signed on their behalf by the undersigned, thereunto duly authorized.
CREDIT SUISSE GROUP AG and CREDIT SUISSE AG
(Registrants)
Date: December 15, 2020
By:
/s/ Flavio Lardelli
Flavio Lardelli
Director
By:
/s/ Annina Müller
Annina Müller
Vice President