UNITED STATES SECURITIES AND EXCHANGE COMMISSION
Washington, D.C. 20549
Form 6-K
REPORT OF FOREIGN PRIVATE ISSUER PURSUANT TO RULE 13a-16 OR 15d-16 UNDER THE SECURITIES EXCHANGE ACT OF 1934
April 22, 2021
Commission File Number 001-15244
Credit Suisse Group AG
(Translation of registrant’s name into English)
Paradeplatz 8, 8001 Zurich, Switzerland
(Address of principal executive office)
Commission File Number 001-33434
Credit Suisse AG
(Translation of registrant’s name into English)
Paradeplatz 8, 8001 Zurich, Switzerland
(Address of principal executive office)
Indicate by check mark whether the registrant files or will file annual reports under cover of Form 20-F or Form 40-F.
Form 20-F  Form 40-F
Form 40-F Indicate by check mark if the registrant is submitting the Form 6-K in paper as permitted by Regulation S-T Rule 101(b)(1):
Note: Regulation S-T Rule 101(b)(1) only permits the submission in paper of a Form 6-K if submitted solely to provide an attached annual report to security holders.
Indicate by check mark if the registrant is submitting the Form 6-K in paper as permitted by Regulation S-T Rule 101(b)(7):
Note: Regulation S-T Rule 101(b)(7) only permits the submission in paper of a Form 6-K if submitted to furnish a report or other document that the registrant foreign private issuer must furnish and make public under the laws of the jurisdiction in which the registrant is incorporated, domiciled or legally organized (the registrant’s “home country”), or under the rules of the home country exchange on which the registrant’s securities are traded, as long as the report or other document is not a press release, is not required to be and has not been distributed to the registrant’s security holders, and, if discussing a material event, has already been the subject of a Form 6-K submission or other Commission filing on EDGAR.
This report includes the media release and the slides for the presentation to investors in connection with the 1Q21 results.
Media Release Zurich, April 22, 2021 |
First quarter 2021 financial results
Net loss of CHF 252 mn in 1Q21, reflecting significant charge with respect to the US-based hedge fund matter in 1Q21, offsetting positive performance across wealth management and investment banking; capital position with CET1 ratio of 12.2% to be further strengthened by successful placement of 203 mn shares via two series of Mandatory Convertible Notes
Credit Suisse Group Reported Results (CHF mn, unless otherwise specified) | 1Q21 | 1Q20 | ∆1Q20 | |
| Net revenues | 7,574 | 5,776 | 31% | |
| o/w Wealth Management-related | 3,882 | 3,766 | 3% | |
| o/w Investment Bank in USD mn | 3,888 | 2,155 | 80% | |
| Provision for credit losses | 4,394 | 568 | - | |
| Total operating expenses | 3,937 | 4,007 | (2)% | |
| Pre-tax income / (loss) | (757) | 1,201 | - | |
| Net income / (loss) attributable to shareholders | (252) | 1,314 | - | |
| Return on tangible equity attributable to shareholders | (2.6)% | 13.1% | - | |
| CET1 ratio | 12.2% | 12.1% | - | |
Tier 1 leverage ratio1 | 5.5% | 5.3% | - | |
| Adjusted excluding significant items and the US-based hedge-fund matter* (CHF mn) | 1Q21 | 1Q20 | ∆1Q20 | |
| Net revenues | 7,430 | 5,508 | 35% | |
| Pre-tax income | 3,596 | 946 | 280% | |
Thomas Gottstein, Chief Executive Officer of Credit Suisse Group AG, commented: “Our results for the first quarter of 2021 have been significantly impacted by a CHF 4.4 bn charge related to a US-based hedge fund. The loss we report this quarter, because of this matter, is unacceptable. Together with the Board of Directors, we have taken significant steps to address this situation as well as the supply chain finance funds matter. Among other decisive actions, we have made changes in our senior business and control functions; we have enhanced our risk review across the bank; we have launched independent investigations into these matters by external advisors, supervised by a special committee of the Board; and we have taken several capital-related actions. We will work to ensure Credit Suisse emerges stronger. However, it is also important to recognize that our underlying 1Q21 financial performance2, across all divisions, was strong, supported by solid results in Switzerland, and strong growth in APAC and investment banking. We expect that our successful MCN placement today will further strengthen our balance sheet and enable us to support the momentum in our core franchises. Our underlying result is a testament to the earnings power of Credit Suisse and to the commitment of our employees. And it makes it all the more important that we quickly and decisively resolve the issues we are currently dealing with.” | ||||
Financial highlights - Strong revenue generation across Wealth Management-related businesses and the Investment Bank; reported net revenues up 31% year on year - Strong 1Q21 Net New Assets (NNA) for the Group of CHF 28.4 bn, of which WM NNA of CHF 14.4 bn, equal to a 7% annualized growth rate with positive contributions across all three WM businesses - CET1 ratio of 12.2% and CET1 leverage ratio of 3.8% at the end of 1Q21, with intention to achieve approx. 13% CET1 ratio and a minimum of 4.0% CET1 leverage ratio - Successfully placed 203 mn shares via two series of MCNs, leading to an estimated uplift of ~55-60 bps to the CET1 ratio3 | Business highlights for 1Q21 - Continued momentum in Wealth Management (WM)-related businesses with pre-tax income growth, on an adjusted basis, excluding significant items*, of 59% year on year and an adjusted RoRC, excluding significant items*, of 29% - Strong growth in Asia Pacific (APAC) with pre-tax income growth, on an adjusted basis and excluding significant items*, of 164% year on year and an adjusted RoRC, excluding significant items*, of 52%, on a USD basis - Investment Bank (IB) results significantly impacted by US-based hedge fund charge of CHF 4.4 bn; net revenues grew by 80% year on year; reported pre-tax loss of USD 2.6 bn - Group-wide AuM of CHF 1.6 trn at end of 1Q21, up 6% vs 4Q20; WM AuM of CHF 841 bn, up 6% vs 4Q20; WM Client Business Volume of CHF 1.3 trn, up 7% vs 4Q20 - Supply Chain Finance (SCF) Funds matter: returning cash to investors in the four supply SCF funds remains CSAM’s priority; to date, total cash distributions to investors of USD 4.8 bn; progress updates to be provided over the coming months | |||
Page 1
Media Release Zurich, April 22, 2021 |
SUMMARY
1Q21 Results
As per our trading updates in March and April, we absorbed several items during the quarter that had a considerable impact on the reported results. We recorded a pre-tax loss of CHF 757 mn in 1Q21 and a net loss attributable to shareholders of CHF 252 mn, including a pre-tax charge of CHF 4.4 bn relating to the US-based hedge fund matter.4 The underlying business results5 have been strong with adjusted net revenues excluding significant items and the US-based hedge-fund matter* were CHF 7.4 bn, up 35% year on year, and higher adjusted pre-tax income, excluding significant items and the US-based hedge-fund matter*, of CHF 3.6 bn, up 280%. As per close of business on April 21, 2021, we have now exited 97% of the related positions and expect to take an additional loss in 2Q21 of approximately CHF 0.6 bn in connection with the US-based hedge fund matter.
In our Wealth Management-related businesses, we delivered strong growth across our franchise and reported net revenues of CHF 3.9 bn, up 3% year on year, with transaction-based revenues up 18%, recurring commissions & fees up 3% and lower net interest income, down 9%. Adjusted total Wealth-Management-related net revenues, excluding significant items*, of CHF 3.7 bn were up 7% year on year.
Our Investment Bank continued to demonstrate momentum as revenues increased to USD 3.9 bn, up 80% year on year, benefitting from a strong performance across all products: Fixed Income Sales & Trading was up 29% year on year, Equity Sales & Trading was up 23%, and Capital Markets & Advisory6 was up significantly. Global Trading Solutions (GTS), our collaboration between the IB and our wealth management businesses, also recorded increased net revenues, up 10% year on year, underlining the strength of our strategy as we continue to drive collaboration across divisions and business areas.
Operating expenses for the Group of CHF 3.9 bn decreased by 2% year on year, mainly reflecting lower compensation expenses; on an adjusted* basis, operating expenses decreased by 3%. Provision for credit losses in 1Q21 increased significantly year on year, and quarter on quarter, due to the US-based hedge fund matter. We recorded CHF 4.4 bn of provision for credit losses, compared to CHF 568 mn in 1Q20 and CHF 138 mn in 4Q20. The vast majority of the quarter’s provisions are reflected in the IB and relate to this specific matter.
The Group recorded NNA of CHF 28.4 bn in 1Q21, this compares to CHF 5.8 bn in 1Q20 and CHF 8.4 bn in 4Q20. Strong asset gathering across our wealth management businesses with Swiss Universal Bank (SUB) Private Clients recording CHF 2.2 bn, International Wealth Management (IWM) Private Banking recording CHF 7.2 bn and APAC recording USD 5.4 bn. Group Assets under Management (AuM) totaled CHF 1.6 trn at the end of 1Q21, up from CHF 1.5 trn at the end of 4Q20.
As of the end of 1Q21, our CET1 ratio was 12.2%. For 1Q21, CHF 5.8 bn in risk-weighted assets were related to our remaining exposure in the US-based hedge fund matter, and a Pillar 2 capital add-on of CHF 1.9 bn relating to the supply chain finance funds matter was required by FINMA. During 2Q21, as we exit the hedge fund-related positions, the amount of the associated risk-weighted assets will be reduced accordingly. We would expect the required risk-weighted assets to be reduced to zero during 2Q21.
On April 22, 2021, we announced an offering of two series of mandatory convertible notes (MCNs), Series A MCNs and Series B MCNs, which will be convertible into 100 million shares and 103 million shares of Credit Suisse Group AG, respectively. The offering is expected to further strengthen our capital position and to close on or around May 12, 2021.
The shares of Credit Suisse Group AG underlying the Series A MCNs will be issued from Credit Suisse Group AG’s current conditional capital. The shares of Credit Suisse Group AG underlying the Series B MCNs will be issued from Credit Suisse Group AG's current authorized capital. As the full amount of the current authorized capital is expected to be utilized for such issuance, the Board has decided to withdraw, at the Annual General Meeting (AGM) 2021, its proposal for a moderate increase and the extension of the authorized capital.
Page 2
Media Release Zurich, April 22, 2021 |
CAPITAL RETURNS TO SHAREHOLDERS
As previously announced on April 6, 2021, the Board of Directors amended its dividend proposal to shareholders at the AGM on April 30, 2021. It is proposing to distribute an ordinary total dividend of CHF 0.10 gross per registered share, half from retained earnings and half out of the capital contribution reserves. This proposal will help to preserve our strong capital positon. Following the completion of share buybacks in 1Q21 of CHF 305 mn of shares, we have suspended the share buyback program. Subject to 2021 financial performance, the Board of Directors would intend to restore the dividend in 2021 before any resumption of share buybacks.
OUTLOOK Overall, we would expect market volumes to return to lower, and more normal, levels in the coming quarters. We expect a residual impact of approximately CHF 0.6 bn from the US-based hedge fund matter in 2Q21, as we have now exited 97% of the related positions. In Wealth Management, we anticipate broadly stable net interest income and improving recurring commissions and fees benefiting from higher levels of AuM. For the Investment Bank, we would expect the second quarter to reflect a slowdown in market activity, as well as the adverse impact from the US-based hedge fund matter, particularly from the resizing of our Prime Services business. Signs of recovery in the global economy could allow us to progressively release part of our allowance for credit losses under the CECL accounting methodology that was built in the early months of the COVID-19 crisis last year. Additionally, we expect the effective tax rate to remain significantly elevated for the remainder of the year. Including the benefit of the MCN-related capital raise as well as other proactive capital actions, we intend to achieve a CET1 ratio of approximately 13% and a minimum 4% CET1 leverage ratio. |
DECISIVE ACTIONS TAKEN FOLLOWING RECENT EVENTS
As previously announced in trading updates in March and April, the Credit Suisse Board of Directors and the Executive Board have taken action to address the supply chain finance funds and US-based hedge fund matters directly. FINMA and other regulators were kept informed. These include:
Senior management changes:
| - | Replacing Brian Chin, CEO Investment Bank, and Lara Warner, Chief Risk and Compliance Officer |
| - | Christian Meissner appointed CEO of the Investment Bank and member of the Executive Board, effective May 1, 2021 |
| - | Joachim Oechslin appointed Chief Risk Officer and member of the Executive Board, in each case on an ad-interim basis, effective April 6, 2021 |
| - | Thomas Grotzer appointed interim Global Head of Compliance, reporting to the Group CEO, effective April 6, 2021 |
| - | Ulrich Körner appointed CEO of Asset Management and member of the Executive Board, effective April 1, 2021 |
| - | And a number of other executive changes in the Investment Bank and the CRCO function |
Enhanced review of risk across the bank:
| - | Extensive review across our Prime Services business focused on underlying risk positions, as well as related counterparties |
| - | Enhanced due diligence across Asset Management following supply chain finance funds matter |
| - | Group-wide review of risk positions and of business and risk processes in close cooperation with Board of Directors and external advisors |
| - | Applying lessons learned from recent matters across the bank |
Launched independent investigations into supply chain finance funds matter and US-based hedge fund matter
| - | The Board of Directors has launched two independent investigations, carried out by external advisors, into the supply chain finance funds matter and the significant US-based hedge fund matter |
Page 3
Media Release Zurich, April 22, 2021 |
| - | These investigations are being supervised by a special committee of the Board of Directors and will not only focus on the direct issues arising from those matters, but also reflect on the broader consequences and lessons learned |
Capital related actions:
| - | Suspension of share buyback program |
| - | Reduction of ordinary total dividend proposal to CHF 0.10 gross per registered share |
| - | Successful placement of two series of MCNs |
| - | Close engagement with FINMA and all relevant regulators; FINMA has initiated two enforcement proceedings (with regards to the US-based hedge fund and supply chain finance funds matters) |
UPDATE ON LITIGATION
On April 19, 2021, Credit Suisse entered into a settlement with U.S. Bank as trustee in two legacy legal actions in New York state court relating to residential mortgage-backed securities from 2006 for the aggregate amount of USD 500 mn on claims of over USD 1.3 bn. Credit Suisse is fully reserved and no further charge will be incurred. The settlement remains subject to approval through a separate court proceeding to be brought by the trustee. This resolution also removes two of the largest exposures remaining on Credit Suisse’s legacy RMBS docket.
Page 4
Media Release Zurich, April 22, 2021 |
DETAILED DIVISIONAL SUMMARIES
| Swiss Universal Bank (SUB) | |||
| Reported results (in CHF mn) | 1Q21 | 1Q20 | ∆1Q20 |
| Net revenues | 1,449 | 1,454 | (0)% |
| Provision for credit losses | 26 | 124 | - |
| Total operating expenses | 758 | 799 | (5)% |
| Pre-tax income | 665 | 531 | 25% |
| Cost/income ratio (%) | 52% | 55% | - |
| Net New Assets | 6.1 | 0.6 | - |
| o/w Private Clients | 2.2 | (4.2) | - |
| Adjusted results, excluding significant items* (in CHF mn) | 1Q21 | 1Q20 | ∆1Q20 |
| Net revenues | 1,406 | 1,429 | (2)% |
| Total operating expenses | 749 | 798 | (6)% |
| Pre-tax income | 631 | 507 | 24% |
| Cost/income ratio (%) | 53% | 56% | - |
1Q21 Results
| - | Strong pre-tax income for SUB in 1Q21, reflecting stable net revenues; continued positive momentum compared to 4Q20 with resilient performance across all major revenue categories, including net interest income |
| - | Record quarterly adjusted pre-tax income, excluding significant items*, of CHF 631 mn, up 24% year on year, with limited CECL-related provision for credit losses as well as a decreased adjusted* operating expenses, down 6% year on year, driven by ongoing cost discipline |
| - | Resilient adjusted net revenues, excluding significant items*, up 13% compared to 4Q20; down 2% compared to 1Q20, driven by lower deposit income, partially offset by higher recurring commissions & fees |
| - | Strong NNA flows of CHF 6.1 bn with positive contributions from Private Clients and Corporate & Institutional Clients |
| - | SUB recorded higher client business volumes of CHF 1.0 trn, up 5% compared to 4Q20 |
| - | Private Clients adjusted pre-tax income, excluding significant items*, of CHF 286 mn, up 3% year on year, driven by decreased adjusted* operating expenses, down 7%, and lower provision for credit losses; adjusted net revenues, excluding significant items*, down 4%, driven by lower transaction-based revenues, down 10%, from decreased client activity, decreased net interest income, down 3%, from lower deposit income, and lower recurring commissions & fees, down 2%, mainly from our investment in Swisscard |
| - | Corporate & Institutional Clients adjusted pre-tax income, excluding significant items*, of CHF 345 mn, up 51% year on year, driven by lower provision for credit losses, decreased adjusted* operating expenses, down 5%, as well as increased adjusted net revenues, excluding significant items*, up 1%, driven by higher recurring commissions & fees, up 7%, due to higher fees from lending activities, with stable net interest income and slightly lower transaction-based revenues, down 1%, compared to 1Q20 |
Page 5
Media Release Zurich, April 22, 2021 |
| International Wealth Management (IWM) – Private Banking | |||
| Reported results (in CHF mn) | 1Q21 | 1Q20 | ∆1Q20 |
| Net revenues | 987 | 1,032 | (4)% |
| Provision for credit losses | 0 | 39 | - |
| Total operating expenses | 579 | 648 | (11)% |
| Pre-tax income | 408 | 345 | 18% |
| Cost/income ratio (%) | 59% | 63% | - |
| Net New Assets | 7.2 | 3.7 | - |
| Adjusted results, excluding significant items* (in CHF mn) | 1Q21 | 1Q20 | ∆1Q20 |
| Net revenues | 929 | 1,017 | (9)% |
| Total operating expenses | 585 | 649 | (10)% |
| Pre-tax income | 344 | 329 | 5% |
| Cost/income ratio (%) | 63% | 64% | - |
1Q21 Results
| - | Adjusted pre-tax income, excluding significant items*, was CHF 344 mn, up 5% year on year, driven by lower costs, with adjusted* operating expenses down 10% and lower provision for credit losses, offset in part by lower net revenues |
| - | Adjusted net revenues, excluding significant items*, down 9% year on year, with 18% lower net interest income primarily due to lower USD interest rates, offsetting positive impacts from strong deposit and loan growth; recurring commissions & fees, up 1%, and lower transaction-based revenues, down 8% with lower brokerage and product issuing fees and lower FX commissions, compared to high activity in 1Q20. Compared to 4Q20, there was a rebound in net revenues |
| - | Adverse FX impact compared to 1Q20 of CHF 30 mn on revenues and CHF 13 mn on adjusted pre-tax income, excluding significant items* |
| - | Strong NNA of CHF 7.2 bn from across Emerging Markets and Western Europe |
| - | IWM recorded higher client business volumes of CHF 555 bn, up 7% compared to 4Q20 |
Page 6
Media Release Zurich, April 22, 2021 |
| International Wealth Management (IWM) – Asset Management | |||
| Reported results (in CHF m) | 1Q21 | 1Q20 | ∆1Q20 |
| Net revenues | 386 | 445 | (13)% |
| Provision for credit losses | 0 | 0 | - |
| Total operating expenses | 271 | 281 | (4)% |
| Pre-tax income | 115 | 164 | (30)% |
| Cost/income ratio (%) | 70% | 63% | - |
| Net New Assets | 10.3 | 0.1 | - |
| Adjusted results, excluding significant items* (in CHF m) | 1Q21 | 1Q20 | ∆1Q20 |
| Net revenues | 386 | 242 | 60% |
| Total operating expenses | 269 | 281 | (4)% |
| Pre-tax income / (loss) | 117 | (39) | - |
| Cost/income ratio (%) | 70% | 116% | - |
1Q21 Results
| - | It remains Credit Suisse Asset Management’s priority to return cash to investors in the supply chain finance funds; as of April 9, 2021, redemption payments totaling USD 4.8 bn have been made; intend to provide a further update on the progress made by the end of April 2021 |
| - | Adjusted pre-tax income, excluding significant items*, was CHF 117 mn, up significantly year on year, driven by higher adjusted net revenues, excluding significant items*, and lower adjusted* operating expenses, down 4% |
| - | Adjusted net revenues, excluding significant items*, were CHF 386 mn, up 60% year on year, driven by significantly higher investment-related gains, and higher management fees, up 6%, on higher AuM and strong NNA inflows |
| - | Strong NNA of CHF 10.3 bn driven by Equities and Index Solutions |
Page 7
Media Release Zurich, April 22, 2021 |
| Asia Pacific (APAC) | |||
| Reported results (in USD mn) | 1Q21 | 1Q20 | ∆1Q20 |
| Net revenues | 1,166 | 866 | 35% |
| Provision for credit losses | 30 | 102 | - |
| Total operating expenses | 559 | 537 | 4% |
| Pre-tax income | 577 | 227 | 154% |
| Cost/income ratio (%) | 48% | 62% | - |
| Net New Assets | 5.4 | 3.2 | - |
| Adjusted results, excluding significant items* (in USD mn) | 1Q21 | 1Q20 | ∆1Q20 |
| Net revenues | 1,119 | 840 | 33% |
| Total operating expenses | 558 | 537 | 4% |
| Pre-tax income | 531 | 201 | 164% |
| Cost/income ratio (%) | 50% | 64% | - |
1Q21 Results
| - | Adjusted pre-tax income, excluding significant items*, was USD 531 mn, up significantly year on year, driven by higher adjusted net revenues, excluding significant items*, offset partly by adjusted* operating expenses up 4%, due in part to China-related investments; provision for credit losses was significantly lower |
| - | Adjusted net revenues, excluding significant items*, up 33% year on year, reflected significantly higher transaction-based revenues, up 74%, mainly from significantly lower mark-to-market losses, elevated private client activity levels, higher M&A and ECM activities and higher revenues from GTS, as well as higher recurring commissions & fees up 11%, reflecting strong fund and mandates volumes. These were offset in part by lower net interest income down 12%, driven by lower deposit and lower loan margins |
| - | Asia Pacific regional net revenues7, excluding significant items*8, were up 30% year on year and represented 19% of the bank’s net revenues, on a CHF basis |
| - | Strong NNA inflows of USD 5.4 bn, mainly driven by inflows from Greater China |
| - | Higher client business volumes of USD 419 bn, up 4% compared to 4Q20 |
Page 8
Media Release Zurich, April 22, 2021 |
| Investment Bank (IB) | |||
| Reported results (in USD mn) | 1Q21 | 1Q20 | ∆1Q20 |
| Net revenues | 3,888 | 2,155 | 80% |
| Provision for credit losses | 4,618 | 315 | - |
| Total operating expenses | 1,830 | 1,754 | 4% |
| Pre-tax income/loss | (2,560) | 86 | - |
| Cost/income ratio (%) | 47% | 81% | - |
| Return on Regulatory Capital | (70)% | 2% | - |
| Adjusted results, excluding the US-based hedge fund matter* (in USD mn) | 1Q21 | 1Q20 | ∆1Q20 |
| Net revenues | 3,888 | 2,155 | 80% |
| Total operating expenses | 1,778 | 1,758 | 1% |
| Pre-tax income | 2,199 | 82 | - |
| Cost/income ratio (%) | 46% | 82% | - |
| Return on Regulatory Capital | 60% | 2% | - |
1Q21 Results
| - | Provision for credit losses of USD 4.6 bn includes the charge related to the US-based hedge fund matter, as announced on April 6, 2021; this led to a reported pre-tax loss of USD 2.6 bn |
| - | Strategic review underway focused on resizing and de-risking Prime Brokerage and Prime Financing businesses, with a primary focus on continuing to serve our most important franchise clients. By the end of 2021, we plan to reduce IB leverage exposure by at least USD 35 bn and align IB RWA to no more than end-2020 levels |
| - | Adjusted pre-tax income, excluding the US-based hedge fund matter*, of USD 2.2 bn, up significantly year on year, driven by strong revenue performance across the diversified franchise with net revenues up 80% |
| - | Fixed Income Sales and Trading revenues of USD 1.6 bn, up 29% year on year, reflecting continued strength in our leading9 credit franchise with particular strength in Securitized Products and higher Emerging Markets Trading and Financing revenues |
| - | Equity Sales and Trading revenues of USD 988 mn, up 23% year on year, reflected strength in Equity Derivatives and higher Cash Equities Trading activity, partially offset by lower Prime Services revenues |
| - | Capital Markets revenues of USD 1.2 bn, up significantly year on year, driven by outperformance in equity capital markets resulting in market share gains10 and rebound in leveraged finance issuance |
| - | Advisory revenues of USD 214 mn, up 49% year on year, driven by increased M&A deal completions |
| - | Global investment banking Capital Markets and Advisory share of wallet11 of 4.9% increased 110 basis points year on year to the highest level since 4Q17 |
| - | We continue to see strong momentum in Global Trading Solutions reflecting increased collaboration and continued momentum with our wealth management, institutional and corporate clients |
Page 9
Media Release Zurich, April 22, 2021 |
ONGOING COMMITMENT TO SUSTAINABILITY AND PROGRESS UPDATE ON SRI
Credit Suisse continued to work on its ambition to become a leading provider of sustainable solutions in financial services and our dedicated Sustainability, Research & Investment Solutions (SRI) function continued to sharpen its value proposition in 1Q21:
| - | As of end of 1Q21, Credit Suisse’s assets managed according to sustainability criteria (Sustainable AuM) were CHF 118 bn, up from CHF 108 bn at the end of 4Q20 |
| - | Credit Suisse enhanced its scope of reporting and launched its Sustainability Report in March 2021, as part of the 2020 annual reporting suite. The Sustainability Report includes new disclosures pursuant to the Sustainability Accounting Standards Board (SASB) standards, for the first time, as well as enhanced Task Force on Climate-related Financial Disclosures (TCFD) disclosures |
| - | Published a number of key publications such as ‘The Decarbonizing Portfolio’ report and the ‘Double Delta of Impact Investing’ report; we also sponsored the ‘Little Book of Investing in Nature’, a guide to taking action on biodiversity |
| - | SRI additionally drives Credit Suisse’s commitment to Diversity & Inclusion; in January 2021, we announced further steps toward our commitment in this area by joining ‘The Valuable 500’, a global movement to put disability on the business agenda |
| - | Credit Suisse has been included in the Bloomberg Gender-Equality Index (GEI) for the second consecutive year in 2021, underscoring our commitment to transparency in gender-data reporting |
| - | In January 2021, we also celebrated our 16th consecutive year of achieving a score of 100% on the Human Rights Campaign Corporate Equality Index, which highlights our ongoing efforts to promote LGBT+ equality in the workplace |
Page 10
Media Release Zurich, April 22, 2021 |
CONTACT DETAILS
Kinner Lakhani, Investor Relations, Credit Suisse Tel: +41 44 333 71 49 Email: investor.relations@credit-suisse.com |
Katrin Schaad, Corporate Communications, Credit Suisse Tel: +41 844 33 88 44 Email: media.relations@credit-suisse.com |
The Earnings Release and Presentation Slides for 1Q21 are available to download from 06:45 CEST today at: https://www.credit-suisse.com/results |
PRESENTATION OF 1Q21 RESULTS – THURSDAY, APRIL 22, 2021
| Event | Analyst Call | Media Call |
| Time | 08:15 Zurich 07:15 London 02:15 New York | 10:30 Zurich 09:30 London 04:30 New York |
| Language | English | English |
| Access | Switzerland: +41 44 580 48 67 Europe: +44 203 057 6528 US: +1 866 276 8933 Reference: Credit Suisse Analysts and Investors Call Conference ID: 8485515 Please dial in 10 minutes before the start of the call Webcast link here. | Switzerland: +41 44 580 48 67 Europe: +44 203 057 6528 US: +1 866 276 8933 Reference: Credit Suisse Media Call Conference ID: 6849056 Please dial in 10 minutes before the start of the call Webcast link here. |
| Q&A Session | Following the presentation, you will have the opportunity to ask the speakers questions | Following the presentation, you will have the opportunity to ask the speakers questions |
| Playback | Replay available approximately two hours after the event Switzerland: +41 44 580 40 26 Europe: +44 333 300 9785 US: +1 917 677 7532 Conference ID: 8485515 | Replay available approximately two hours after the event Switzerland: +41 44 580 40 26 Europe: +44 333 300 9785 US: +1 917 677 7532 Conference ID: 6849056 |
Page 11
Media Release Zurich, April 22, 2021 |
* Refers to adjusted results, adjusted results excluding significant items, and adjusted results excluding significant items and the US-based hedge fund matter, as applicable. Results excluding items included in our reported results are non-GAAP financial measures. For a reconciliation to the most directly comparable US GAAP measures, see the Appendix of this Media Release. Significant items include the gain related to the transfer of the InvestLab fund platform to Allfunds Group in 1Q20, the gain related to the equity investment revaluation of Allfunds Group in 4Q20, the gain related to the equity investment revaluation of SIX in 4Q20, the impairment to the valuation of our non-controlling interest in York Capital Management in 4Q20 and the gain related to the equity investment revaluation of Allfunds Group in 1Q21. Reported results in 1Q21 include a charge of CHF 4,430 million in respect of the failure by a US-based hedge fund to meet its margin commitments.
Footnotes
Abbreviations
AGM – Annual General Meeting; APAC – Asia Pacific; AuM – assets under management; BCBS – Basel Committee on Banking Supervision; BIS – Bank for International Settlements; bn – billion; CECL – US GAAP accounting standard for current expected credit losses; CET1 – common equity tier 1; CHF – Swiss francs; C&IC – Corporate & Institutional Clients; CRCO – Chief Risk and Compliance Officer; CSAM – Credit Suisse Asset Management; DCM – Debt Capital Markets; ECM – Equity Capital Markets; EMEA – Europe, Middle East, Africa; ExB – Executive Board; FINMA – Swiss Financial Market Supervisory Authority FINMA; FX – Foreign Exchange; FXC – Foreign Exchange Constant; GAAP – Generally accepted accounting principles; GTS – Global Trading Solutions; IB – Investment Bank; IPO – Initial Public Offering; ITS – International Trading Solutions; IWM – International Wealth Management; NAB– Neue Aargauer Bank; mn – million; M&A – Mergers & Acquisitions; NNA – net new assets; PB – Private Banking; PC – Private Clients; PTI – Pre-Tax Income; RM – Relationship Manager; RMBS – Residential Mortgage Backed Securities; RoRC – Return on Regulatory Capital; RoTE – Return on Tangible Equity; RWA – risk weighted assets; SEC – U.S. Securities and Exchange Commission; SME – Small and Medium Enterprises; SRI – Sustainability, Research & Investment Solutions; SUB – Swiss Universal Bank; SCF – Supply Chain Finance; trn – trillion; US – United States; USD – US dollar; WM – Wealth Management.
Mandatory Convertible Notes
These materials are not for release, publication or distribution (directly or indirectly) in or to Australia, Canada, Hong Kong, Japan or any other jurisdiction in which such distribution would be prohibited by applicable law.
These materials are not an offer of securities for sale in the United States or to U.S. persons (“U.S. persons”) as defined in Regulation S under the U.S. Securities Act of 1933, as amended (the “U.S. Securities Act”). The mandatory convertible notes described in these materials and the shares of Credit Suisse Group AG issuable on their conversion have not been and will not be registered under the U.S. Securities Act and may not be offered or sold in the United States or to, or for the account or benefit of, U.S. persons, absent registration or an applicable exemption from registration under the U.S. Securities Act.
Important information
This document contains select information from the full 1Q21 Earnings Release and 1Q21 Results Presentation slides that Credit Suisse believes is of particular interest to media professionals. The complete 1Q21 Earnings Release and 1Q21 Results
Page 12
Media Release Zurich, April 22, 2021 |
Presentation slides, which have been distributed simultaneously, contain more comprehensive information about our results and operations for the reporting quarter, as well as important information about our reporting methodology and some of the terms used in these documents. The complete 1Q21 Earnings Release and 1Q21 Results Presentation slides are not incorporated by reference into this document.
Credit Suisse has not finalized its 1Q21 Financial Report and Credit Suisse’s independent registered public accounting firm has not completed its review of the condensed consolidated financial statements (unaudited) for the period. Accordingly, the financial information contained in this document is subject to completion of quarter-end procedures, which may result in changes to that information.
We may not achieve all of the expected benefits of our strategic initiatives. Factors beyond our control, including but not limited to the market and economic conditions (including macroeconomic and other challenges and uncertainties, for example, resulting from the COVID-19 pandemic), changes in laws, rules or regulations and other challenges discussed in our public filings, could limit our ability to achieve some or all of the expected benefits of these initiatives.
In particular, the terms “Estimate”, “Illustrative”, “Ambition”, “Objective”, “Outlook” and “Goal” are not intended to be viewed as targets or projections, nor are they considered to be Key Performance Indicators. All such estimates, illustrations, ambitions, objectives, outlooks and goals are subject to a large number of inherent risks, assumptions and uncertainties, many of which are completely outside of our control. These risks, assumptions and uncertainties include, but are not limited to, general market conditions, market volatility, interest rate volatility and levels, global and regional economic conditions, challenges and uncertainties resulting from the COVID-19 pandemic, political uncertainty, changes in tax policies, regulatory changes, changes in levels of client activity as a result of any of the foregoing and other factors. Accordingly, this information should not be relied on for any purpose. We do not intend to update these estimates, illustrations, ambitions, objectives, outlooks or goals.
In preparing this document, management has made estimates and assumptions that affect the numbers presented. Actual results may differ. Annualized numbers do not take into account variations in operating results, seasonality and other factors and may not be indicative of actual, full-year results. Figures throughout this document may also be subject to rounding adjustments. All opinions and views constitute judgments as of the date of writing without regard to the date on which the reader may receive or access the information. This information is subject to change at any time without notice and we do not intend to update this information.
Return on tangible equity, a non-GAAP financial measure, is calculated as annualized net income attributable to shareholders divided by average tangible shareholders’ equity. Tangible shareholders’ equity, a non-GAAP financial measure, is calculated by deducting goodwill and other intangible assets from total shareholders’ equity as presented in our balance sheet. Management believes that return on tangible equity is meaningful as it is a measure used and relied upon by industry analysts and investors to assess valuations and capital adequacy. For end-1Q21, tangible shareholders’ equity excluded goodwill of CHF 4,644 mn and other intangible assets of CHF 239 mn from total shareholders’ equity of CHF 44,590 mn as presented in our balance sheet. For end-1Q20, tangible shareholders’ equity excluded goodwill of CHF 4,604 mn and other intangible assets of CHF 279 mn from total shareholders’ equity of CHF 48,675 mn as presented in our balance sheet.
Prior to 3Q20, regulatory capital was calculated as the worst of 10% of RWA and 3.5% of leverage exposure, and return on regulatory capital (a non-GAAP financial measure) was calculated using income / (loss) after tax and assumed a tax rate of 30%. In 3Q20, we updated our calculation approach, following which regulatory capital is calculated as the average of 10% of RWA and 3.5% of leverage exposure, and return on regulatory capital (a non-GAAP financial measure) is calculated using income / (loss) after tax and assumes a tax rate of 30% for periods prior to 2020 and 25% from 2020 onward. For periods in 2020, for purposes of calculating Group return on regulatory capital, leverage exposure excludes cash held at central banks, after adjusting for the dividend paid in 2020. For the Investment Bank division, return on regulatory capital is based on US dollar denominated numbers. Adjusted return on regulatory capital is calculated using adjusted results, applying the same methodology to calculate return on regulatory capital.
Foreign exchange impact is calculated by converting the CHF amount of net revenues, provision for credit losses and operating expenses for 2021 back to the original currency on a monthly basis at the respective spot foreign exchange rate. The respective amounts are then converted back to CHF applying the average 2020 foreign exchange rate from the period against which the foreign exchange impact is measured. Average foreign exchange rates apply a straight line average of monthly foreign exchange rates for major currencies.
Client business volume includes assets under management, custody assets and net loans.
Credit Suisse is subject to the Basel III framework, as implemented in Switzerland, as well as Swiss legislation and regulations for systemically important banks, which include capital, liquidity, leverage and large exposure requirements and rules for emergency plans designed to maintain systemically relevant functions in the event of threatened insolvency. Credit Suisse has adopted the Bank for International Settlements (BIS) leverage ratio framework, as issued by the Basel Committee on Banking Supervision (BCBS) and implemented in Switzerland by the Swiss Financial Market Supervisory Authority FINMA (FINMA).
Page 13
Media Release Zurich, April 22, 2021 |
Unless otherwise noted, all CET1 capital, CET1 ratio, Tier-1 leverage ratio, risk-weighted assets and leverage exposure figures in this document are as of the end of the respective period and, for periods prior to 2019, on a “look-through” basis.
Unless otherwise noted, leverage exposure is based on the BIS leverage ratio framework and consists of period-end balance sheet assets and prescribed regulatory adjustments. The tier 1 leverage ratio and CET1 leverage ratio are calculated as BIS tier 1 capital and CET1 capital, respectively, divided by period end leverage exposure. Swiss leverage ratios are measured on the same period-end basis as the leverage exposure for the BIS leverage ratio. Unless otherwise noted, for periods in 2020, leverage exposure excludes cash held at central banks, after adjusting for the dividend paid in 2020.
References to Wealth Management-related mean SUB, IWM and APAC or their combined results. References to global investment banking mean the Investment Bank, APAC advisory and underwriting as well as M&A, DCM and ECM in SUB C&IC. References to Global Trading Solutions, prior to 3Q20, mean the combination of ITS and APAC Solutions.
Investors and others should note that we announce important company information (including quarterly earnings releases and financial reports as well as our annual sustainability report) to the investing public using press releases, SEC and Swiss ad hoc filings, our website and public conference calls and webcasts. We also routinely use our Twitter account @creditsuisse (https://twitter.com/creditsuisse), our LinkedIn account (https://www.linkedin.com/company/credit-suisse/), our Instagram accounts (https://www.instagram.com/creditsuisse_careers/ and https://www.instagram.com/creditsuisse_ch/), our Facebook account (https://www.facebook.com/creditsuisse/) and other social media channels as additional means to disclose public information, including to excerpt key messages from our public disclosures. We may share or retweet such messages through certain of our regional accounts, including through Twitter at @csschweiz (https://twitter.com/csschweiz) and @csapac (https://twitter.com/csapac). Investors and others should take care to consider such abbreviated messages in the context of the disclosures from which they are excerpted. The information we post on these social media accounts is not a part of this document.
Information referenced in this document, whether via website links or otherwise, is not incorporated into this document.
Certain material in this document has been prepared by Credit Suisse on the basis of publicly available information, internally developed data and other third-party sources believed to be reliable. Credit Suisse has not sought to independently verify information obtained from public and third-party sources and makes no representations or warranties as to accuracy, completeness or reliability of such information.
In various tables, use of “–” indicates not meaningful or not applicable.
The English language version of this document is the controlling version.
Page 14
| Appendix |
| Key metrics | |||||||||||
| in / end of | % change | ||||||||||
| 1Q21 | 4Q20 | 1Q20 | QoQ | YoY | |||||||
| Credit Suisse Group results (CHF million) | |||||||||||
| Net revenues | 7,574 | 5,221 | 5,776 | 45 | 31 | ||||||
| Provision for credit losses | 4,394 | 138 | 568 | – | �� | ||||||
| Compensation and benefits | 2,207 | 2,539 | 2,316 | (13) | (5) | ||||||
| General and administrative expenses | 1,376 | 2,279 | 1,346 | (40) | 2 | ||||||
| Commission expenses | 329 | 303 | 345 | 9 | (5) | ||||||
| Restructuring expenses | 25 | 50 | – | (50) | – | ||||||
| Total other operating expenses | 1,730 | 2,632 | 1,691 | (34) | 2 | ||||||
| Total operating expenses | 3,937 | 5,171 | 4,007 | (24) | (2) | ||||||
| Income/(loss) before taxes | (757) | (88) | 1,201 | – | – | ||||||
| Net income/(loss) attributable to shareholders | (252) | (353) | 1,314 | (29) | – | ||||||
| Statement of operations metrics (%) | |||||||||||
| Return on regulatory capital | (7.6) | (0.9) | 11.9 | – | – | ||||||
| Balance sheet statistics (CHF million) | |||||||||||
| Total assets | 851,395 | 805,822 | 832,166 | 6 | 2 | ||||||
| Risk-weighted assets | 302,869 | 275,084 | 300,580 | 10 | 1 | ||||||
| Leverage exposure | 967,798 | 799,853 | 869,706 | 21 | 11 | ||||||
| Assets under management and net new assets (CHF billion) | |||||||||||
| Assets under management | 1,596.0 | 1,511.9 | 1,370.5 | 5.6 | 16.5 | ||||||
| Net new assets | 28.4 | 8.4 | 5.8 | 238.1 | 389.7 | ||||||
| Basel III regulatory capital and leverage statistics (%) | |||||||||||
| CET1 ratio | 12.2 | 12.9 | 12.1 | – | – | ||||||
| CET1 leverage ratio | 3.8 | 4.4 | 4.2 | – | – | ||||||
| Tier 1 leverage ratio | 5.5 | 6.4 | 5.8 | – | – | ||||||
Page A-1
| Appendix |
Results excluding certain items included in our reported results are non-GAAP financial measures. Management believes that such results provide a useful presentation of our operating results for purposes of assessing our Group and divisional performance consistently over time, on a basis that excludes items that management does not consider representative of our underlying performance. Provided below is a reconciliation of our adjusted results, our adjusted results excluding significant items and our adjusted results excluding significant items and the US-based hedge fund matter to the most directly comparable US GAAP measures.
| Reconciliation of adjustment items | |||||
| Group | |||||
| in | 1Q21 | 1Q20 | |||
| Credit Suisse (CHF million) | |||||
| Net revenues | 7,574 | 5,776 | |||
| Significant items | |||||
| Gain related to InvestLab transfer | 0 | (268) | |||
| Gain on equity investment in Allfunds Group | (144) | 0 | |||
| Adjusted net revenues excluding significant items | 7,430 | 5,508 | |||
| Provision for credit losses | 4,394 | 568 | |||
| US-based hedge fund matter | (4,430) | 0 | |||
| Provision for credit losses excluding the US-based hedge fund matter | (36) | 568 | |||
| Total operating expenses | 3,937 | 4,007 | |||
| Restructuring expenses | (25) | – | |||
| Major litigation provisions | (4) | (18) | |||
| Expenses related to real estate disposals | (38) | 5 | |||
| Adjusted total operating expenses | 3,870 | 3,994 | |||
| Income before taxes | (757) | 1,201 | |||
| Adjusted income/(loss) before taxes | (690) | 1,214 | |||
| Adjusted income before taxes excluding significant items | (834) | 946 | |||
| Adjusted income before taxes excluding significant items and the US-based hedge fund matter | 3,596 | 946 | |||
| Reconciliation of adjustment items excluding FX impact | |||||
| Group | |||||
| in | 1Q21 | 1Q20 | |||
| Adjusted results excluding significant items and FX impact (CHF million) | |||||
| Adjusted net revenues | 7,574 | 5,776 | |||
| Significant items | |||||
| Gain related to InvestLab transfer | 0 | (268) | |||
| Gain on equity investment in Allfunds Group | (144) | 0 | |||
| Adjusted net revenues excluding significant items | 7,430 | 6,044 | |||
| FX impact | 243 | – | |||
| Adjusted net revenues excluding FX impact | 7,673 | 6,044 | |||
| Provision for credit losses | 4,394 | 568 | |||
| US-based hedge fund matter | (4,430) | – | |||
| Provision for credit losses excluding the US-based hedge fund matter | (36) | 568 | |||
| FX impact | (5) | – | |||
| Provision for credit losses excluding the US-based hedge fund matter and excluding FX impact | (41) | 568 | |||
| Adjusted operating expenses | 3,870 | 3,994 | |||
| FX impact | 113 | – | |||
| Adjusted operating expenses excluding FX impact | 3,983 | 3,994 | |||
| Adjusted income before taxes | 3,596 | 946 | |||
| FX impact | 135 | – | |||
| Adjusted income before taxes excluding significant items, the US-based hedge fund matter and FX impact | 3,731 | 946 | |||
Page A-2
| Appendix |
| Swiss Universal Bank | |||||||||||
| in / end of | % change | ||||||||||
| 1Q21 | 4Q20 | 1Q20 | QoQ | YoY | |||||||
| Results (CHF million) | |||||||||||
| Net revenues | 1,449 | 1,393 | 1,454 | 4 | 0 | ||||||
| of which Private Clients | 737 | 750 | 769 | (2) | (4) | ||||||
| of which Corporate & Institutional Clients | 712 | 643 | 685 | 11 | 4 | ||||||
| Provision for credit losses | 26 | 66 | 124 | (61) | (79) | ||||||
| Total operating expenses | 758 | 840 | 799 | (10) | (5) | ||||||
| Income before taxes | 665 | 487 | 531 | 37 | 25 | ||||||
| of which Private Clients | 281 | 257 | 279 | 9 | 1 | ||||||
| of which Corporate & Institutional Clients | 384 | 230 | 252 | 67 | 52 | ||||||
| Metrics (%) | |||||||||||
| Return on regulatory capital | 21.2 | 15.8 | 17.5 | – | – | ||||||
| Cost/income ratio | 52.3 | 60.3 | 55.0 | – | – | ||||||
| Private Clients | |||||||||||
| Assets under management (CHF billion) | 213.1 | 208.6 | 194.8 | 2.2 | 9.4 | ||||||
| Net new assets (CHF billion) | 2.2 | (2.1) | (4.2) | – | – | ||||||
| Gross margin (annualized) (bp) | 142 | 146 | 146 | – | – | ||||||
| Net margin (annualized) (bp) | 54 | 50 | 53 | – | – | ||||||
| Corporate & Institutional Clients | |||||||||||
| Assets under management (CHF billion) | 487.0 | 462.6 | 405.3 | 5.3 | 20.2 | ||||||
| Net new assets (CHF billion) | 3.9 | 3.8 | 4.8 | – | – | ||||||
| Reconciliation of adjustment items | |||||
| Swiss Universal Bank | |||||
| in | 1Q21 | 1Q20 | |||
| Adjusted results excluding significant items (CHF million) | |||||
| Net revenues | 1,449 | 1,454 | |||
| Significant items | |||||
| Gain related to InvestLab transfer | 0 | (25) | |||
| Gain on equity investment in Allfunds Group | (43) | 0 | |||
| Adjusted net revenues excluding significant items | 1,406 | 1,429 | |||
| Provision for credit losses | 26 | 124 | |||
| Total operating expenses | 758 | 799 | |||
| Restructuring expenses | (9) | – | |||
| Major litigation provisions | 0 | (1) | |||
| Adjusted total operating expenses | 749 | 798 | |||
| Income before taxes | 665 | 531 | |||
| Adjusted income before taxes | 674 | 532 | |||
| Adjusted income before taxes excluding significant items | 631 | 507 | |||
Page A-3
| Appendix |
| Reconciliation of adjustment items | |||||
| Swiss Universal Bank – Private Clients | |||||
| in | 1Q21 | 1Q20 | |||
| Adjusted results excluding significant items (CHF million) | |||||
| Net revenues | 737 | 769 | |||
| Provision for credit losses | 5 | 12 | |||
| Total operating expenses | 451 | 478 | |||
| Restructuring expenses | (5) | – | |||
| Adjusted total operating expenses | 446 | 478 | |||
| Income before taxes | 281 | 279 | |||
| Adjusted income before taxes | 286 | 279 | |||
| Adjusted income before taxes excluding significant items | 286 | 279 | |||
| Reconciliation of adjustment items | |||||
| Swiss Universal Bank – Corporate & Institutional Clients | |||||
| in | 1Q21 | 1Q20 | |||
| Adjusted results excluding significant items (CHF million) | |||||
| Net revenues | 712 | 685 | |||
| Significant items | |||||
| Gain related to InvestLab transfer | 0 | (25) | |||
| Gain on equity investment in Allfunds Group | (43) | 0 | |||
| Adjusted net revenues excluding significant items | 669 | 660 | |||
| Provision for credit losses | 21 | 112 | |||
| Total operating expenses | 307 | 321 | |||
| Restructuring expenses | (4) | – | |||
| Major litigation provisions | 0 | (1) | |||
| Adjusted total operating expenses | 303 | 320 | |||
| Income before taxes | 384 | 252 | |||
| Adjusted income before taxes | 388 | 253 | |||
| Adjusted income before taxes excluding significant items | 345 | 228 | |||
Page A-4
| Appendix |
| International Wealth Management | |||||||||||
| in / end of | % change | ||||||||||
| 1Q21 | 4Q20 | 1Q20 | QoQ | YoY | |||||||
| Results (CHF million) | |||||||||||
| Net revenues | 1,373 | 952 | 1,477 | 44 | (7) | ||||||
| of which Private Banking | 987 | 974 | 1,032 | 1 | (4) | ||||||
| of which Asset Management | 386 | (22) | 445 | – | (13) | ||||||
| Provision for credit losses | 0 | 25 | 39 | (100) | (100) | ||||||
| Total operating expenses | 850 | 939 | 929 | (9) | (9) | ||||||
| Income/(loss) before taxes | 523 | (12) | 509 | – | 3 | ||||||
| of which Private Banking | 408 | 293 | 345 | 39 | 18 | ||||||
| of which Asset Management | 115 | (305) | 164 | – | (30) | ||||||
| Metrics (%) | |||||||||||
| Return on regulatory capital | 38.6 | (0.9) | 38.7 | – | – | ||||||
| Cost/income ratio | 61.9 | 98.6 | 62.9 | – | – | ||||||
| Private Banking | |||||||||||
| Assets under management (CHF billion) | 386.2 | 365.4 | 327.7 | 5.7 | 17.9 | ||||||
| Net new assets (CHF billion) | 7.2 | 4.3 | 3.7 | – | – | ||||||
| Gross margin (annualized) (bp) | 105 | 109 | 115 | – | – | ||||||
| Net margin (annualized) (bp) | 44 | 33 | 39 | – | – | ||||||
| Asset Management | |||||||||||
| Assets under management (CHF billion) | 458.0 | 440.3 | 409.6 | 4.0 | 11.8 | ||||||
| Net new assets (CHF billion) | 10.3 | 6.3 | 0.1 | – | – | ||||||
| Reconciliation of adjustment items | |||||
| International Wealth Management | |||||
| in | 1Q21 | 1Q20 | |||
| Adjusted results excluding significant items (CHF million) | |||||
| Net revenues | 1,373 | 1,477 | |||
| Significant items | |||||
| Gain related to InvestLab transfer | 0 | (218) | |||
| Gain on equity investment in Allfunds Group | (58) | 0 | |||
| Adjusted net revenues excluding significant items | 1,315 | 1,259 | |||
| Provision for credit losses | 0 | 39 | |||
| Total operating expenses | 850 | 929 | |||
| Restructuring expenses | (1) | – | |||
| Major litigation provisions | 11 | 0 | |||
| Expenses related to real estate disposals | (6) | 1 | |||
| Adjusted total operating expenses | 854 | 930 | |||
| Income/(loss) before taxes | 523 | 509 | |||
| Adjusted income before taxes | 519 | 508 | |||
| Adjusted income before taxes income excluding significant items | 461 | 290 | |||
Page A-5
| Appendix |
| Reconciliation of adjustment items | |||||
| International Wealth Management – Private Banking | |||||
| in | 1Q21 | 1Q20 | |||
| Adjusted results excluding significant items (CHF million) | |||||
| Net revenues | 987 | 1,032 | |||
| Significant items | |||||
| Gain related to InvestLab transfer | 0 | (15) | |||
| Gain on equity investment in Allfunds Group | (58) | 0 | |||
| Adjusted net revenues excluding significant items | 929 | 1,017 | |||
| Provision for credit losses | 0 | 39 | |||
| Total operating expenses | 579 | 648 | |||
| Major litigation provisions | 11 | 0 | |||
| Expenses related to real estate disposals | (5) | 1 | |||
| Adjusted total operating expenses | 585 | 649 | |||
| Income before taxes | 408 | 345 | |||
| Adjusted income before taxes | 402 | 344 | |||
| Adjusted income before taxes income excluding significant items | 344 | 329 | |||
| Reconciliation of adjustment items | |||||
| International Wealth Management – Asset Management | |||||
| in | 1Q21 | 1Q20 | |||
| Adjusted results excluding significant items (CHF million) | |||||
| Net revenues | 386 | 445 | |||
| Significant items | |||||
| Gain related to InvestLab transfer | 0 | (203) | |||
| Adjusted net revenues excluding significant items | 386 | 242 | |||
| Provision for credit losses | 0 | 0 | |||
| Total operating expenses | 271 | 281 | |||
| Restructuring expenses | (1) | – | |||
| Expenses related to real estate disposals | (1) | 0 | |||
| Adjusted total operating expenses | 269 | 281 | |||
| Income/(loss) before taxes | 115 | 164 | |||
| Adjusted income before taxes | 117 | 164 | |||
| Adjusted income/(loss) before taxes income excluding significant items | 117 | (39) | |||
Page A-6
| Appendix |
| Asia Pacific | |||||||||||
| in / end of | % change | ||||||||||
| 1Q21 | 4Q20 | 1Q20 | QoQ | YoY | |||||||
| Results (CHF million) | |||||||||||
| Net revenues | 1,060 | 784 | 835 | 35 | 27 | ||||||
| Provision for credit losses | 27 | 6 | 99 | 350 | (73) | ||||||
| Total operating expenses | 509 | 541 | 518 | (6) | (2) | ||||||
| Income before taxes | 524 | 237 | 218 | 121 | 140 | ||||||
| Metrics (%) | |||||||||||
| Return on regulatory capital | 56.3 | 27.0 | 21.7 | – | – | ||||||
| Cost/income ratio | 48.0 | 69.0 | 62.0 | – | – | ||||||
| Assets under management (CHF billion) | 241.9 | 221.3 | 197.0 | 9.3 | 22.8 | ||||||
| Net new assets (CHF billion) | 5.0 | (1.1) | 3.0 | – | – | ||||||
| Gross margin (annualized) (bp) | 184 | 141 | 156 | – | – | ||||||
| Net margin (annualized) (bp) | 91 | 43 | 41 | – | – | ||||||
| Asia Pacific | |||||||||||
| in / end of | % change | ||||||||||
| 1Q21 | 4Q20 | 1Q20 | QoQ | YoY | |||||||
| Results (USD million) | |||||||||||
| Net revenues | 1,166 | 871 | 866 | 34 | 35 | ||||||
| Provision for credit losses | 30 | 7 | 102 | 329 | (71) | ||||||
| Total operating expenses | 559 | 600 | 537 | (7) | 4 | ||||||
| Income before taxes | 577 | 264 | 227 | 119 | 154 | ||||||
| Reconciliation of adjustment items | |||||
| Asia Pacific | |||||
| in | 1Q21 | 1Q20 | |||
| Adjusted results excluding significant items (USD million) | |||||
| Net revenues | 1,166 | 866 | |||
| Significant items | |||||
| Gain related to InvestLab transfer | 0 | (26) | |||
| Gain on equity investment in Allfunds Groups | (47) | 0 | |||
| Adjusted net revenues excluding significant items | 1,119 | 840 | |||
| Provision for credit losses | 30 | 102 | |||
| Total operating expenses | 559 | 537 | |||
| Restructuring expenses | (1) | – | |||
| Adjusted total operating expenses | 558 | 537 | |||
| Income before taxes | 577 | 227 | |||
| Adjusted income before taxes | 578 | 227 | |||
| Adjusted income before taxes excluding significant items | 531 | 201 | |||
Page A-7
| Appendix |
| Reconciliation of adjustment items | |||||
| Wealth Management- related | |||||
| in | 1Q21 | 1Q20 | |||
| Adjusted results excluding significant items (CHF million) | |||||
| Net revenues | 3,882 | 3,766 | |||
| Significant items | |||||
| Gain related to InvestLab transfer | 0 | (268) | |||
| Gain on equity investment in Allfunds Group | (144) | 0 | |||
| Adjusted net revenues excluding significant items | 3,738 | 3,498 | |||
| Provision for credit losses | 53 | 262 | |||
| Total operating expenses | 2,117 | 2,246 | |||
| Restructuring expenses | (11) | – | |||
| Major litigation provisions | 11 | (1) | |||
| Expenses related to real estate disposals | (6) | 1 | |||
| Adjusted total operating expenses | 2,111 | 2,246 | |||
| Income before taxes | 1,712 | 1,258 | |||
| Adjusted income before taxes | 1,718 | 1,258 | |||
| Adjusted income before taxes excluding significant items | 1,574 | 990 | |||
Page A-8
| Appendix |
| Investment Bank | |||||||||||
| in / end of | % change | ||||||||||
| 1Q21 | 4Q20 | 1Q20 | QoQ | YoY | |||||||
| Results (CHF million) | |||||||||||
| Net revenues | 3,543 | 2,109 | 2,080 | 68 | 70 | ||||||
| Provision for credit losses | 4,350 | 38 | 304 | – | – | ||||||
| Total operating expenses | 1,660 | 1,781 | 1,693 | (7) | (2) | ||||||
| Income/(loss) before taxes | (2,467) | 290 | 83 | – | – | ||||||
| Metrics (%) | |||||||||||
| Return on regulatory capital | (69.2) | 8.8 | 2.3 | – | – | ||||||
| Cost/income ratio | 46.9 | 84.4 | 81.4 | – | – | ||||||
| Results (USD million) | |||||||||||
| Net revenues | 3,888 | 2,337 | 2,155 | 66 | 80 | ||||||
| Provision for credit losses | 4,618 | 42 | 315 | – | – | ||||||
| Total operating expenses | 1,830 | 1,977 | 1,754 | (7) | 4 | ||||||
| Income/(loss) before taxes | (2,560) | 318 | 86 | – | – | ||||||
| Reconciliation of adjustment items | |||||
| Investment Bank | |||||
| in | 1Q21 | 1Q20 | |||
| Adjusted results (USD million) | |||||
| Net revenues | 3,888 | 2,155 | |||
| Provision for credit losses | 4,618 | 315 | |||
| US-based hedge fund matter | (4,707) | 0 | |||
| Provision for credit losses excluding the US-based hedge fund matter | (89) | 315 | |||
| Total operating expenses | 1,830 | 1,754 | |||
| Restructuring expenses | (18) | – | |||
| Expenses related to real estate disposals | (34) | 4 | |||
| Adjusted total operating expenses | 1,778 | 1,758 | |||
| Income before taxes | (2,560) | 86 | |||
| Adjusted income before taxes | (2,508) | 82 | |||
| Adjusted income before taxes excluding the US-based hedge fund matter | 2,199 | 82 | |||
| Net revenue detail | |||||
| in | 1Q21 | 1Q20 | |||
| Net revenue detail (USD million) | |||||
| Fixed income sales and trading | 1,569 | 1,220 | |||
| Equity sales and trading | 988 | 805 | |||
| Capital markets | 1,189 | 63 | |||
| Advisory and other fees | 214 | 144 | |||
| Other revenues | (72) | (77) | |||
| Net revenues | 3,888 | 2,155 | |||
Page A-9
| Appendix |
| Global investment banking revenues | |||||
| in | 1Q21 | 1Q20 | |||
| Global investment banking revenues (USD million) | |||||
| Fixed income sales and trading | 1,569 | 1,220 | |||
| Equity sales and trading | 988 | 805 | |||
| Capital markets | 1,295 | 127 | |||
| Advisory and other fees | 267 | 177 | |||
| Other revenues | (72) | (77) | |||
| Global investment banking revenues | 4,047 | 2,252 | |||
Page A-10
| Appendix |
Cautionary statement regarding forward-looking information
This document contains statements that constitute forward-looking statements. In addition, in the future we, and others on our behalf, may make statements that constitute forward-looking statements. Such forward-looking statements may include, without limitation, statements relating to the following:
■ our plans, targets or goals;
■ our future economic performance or prospects;
■ the potential effect on our future performance of certain contingencies; and
■ assumptions underlying any such statements.
Words such as “believes,” “anticipates,” “expects,” “intends” and “plans” and similar expressions are intended to identify forward-looking statements but are not the exclusive means of identifying such statements. We do not intend to update these forward-looking statements.
By their very nature, forward-looking statements involve inherent risks and uncertainties, both general and specific, and risks exist that predictions, forecasts, projections and other outcomes described or implied in forward-looking statements will not be achieved. We caution you that a number of important factors could cause results to differ materially from the plans, targets, goals, expectations, estimates and intentions expressed in such forward-looking statements and that the COVID-19 pandemic creates significantly greater uncertainty about forward-looking statements in addition to the factors that generally affect our business. These factors include:
■ the ability to maintain sufficient liquidity and access capital markets;
■ market volatility and interest rate fluctuations and developments affecting interest rate levels, including the persistence of a low or negative interest rate environment;
■ the strength of the global economy in general and the strength of the economies of the countries in which we conduct our operations, in particular the risk of negative impacts of COVID-19 on the global economy and financial markets and the risk of continued slow economic recovery or downturn in the EU, the US or other developed countries or in emerging markets in 2021 and beyond;
■ the emergence of widespread health emergencies, infectious diseases or pandemics, such as COVID-19, and the actions that may be taken by governmental authorities to contain the outbreak or to counter its impact;
■ potential risks and uncertainties relating to the severity of impacts from COVID-19 and the duration of the pandemic, including potential material adverse effects on our business, financial condition and results of operations;
■ the direct and indirect impacts of deterioration or slow recovery in residential and commercial real estate markets;
■ adverse rating actions by credit rating agencies in respect of us, sovereign issuers, structured credit products or other credit-related exposures;
■ the ability to achieve our strategic goals, including those related to our targets, ambitions and financial goals;
■ the ability of counterparties to meet their obligations to us and the adequacy of our allowance for credit losses;
■ the effects of, and changes in, fiscal, monetary, exchange rate, trade and tax policies;
■ the effects of currency fluctuations, including the related impact on our business, financial condition and results of operations due to moves in foreign exchange rates;
■ political, social and environmental developments, including war, civil unrest or terrorist activity and climate change;
■ the ability to appropriately address social, environmental and sustainability concerns that may arise from our business activities;
■ the effects of, and the uncertainty arising from, the UK’s withdrawal from the EU;
■ the possibility of foreign exchange controls, expropriation, nationalization or confiscation of assets in countries in which we conduct our operations;
■ operational factors such as systems failure, human error, or the failure to implement procedures properly;
■ the risk of cyber attacks, information or security breaches or technology failures on our reputation, business or operations, the risk of which is increased while large portions of our employees work remotely;
■ the adverse resolution of litigation, regulatory proceedings and other contingencies;
■ actions taken by regulators with respect to our business and practices and possible resulting changes to our business organization, practices and policies in countries in which we conduct our operations;
■ the effects of changes in laws, regulations or accounting or tax standards, policies or practices in countries in which we conduct our operations;
■ the expected discontinuation of LIBOR and other interbank offered rates and the transition to alternative reference rates;
■ the potential effects of changes in our legal entity structure;
■ competition or changes in our competitive position in geographic and business areas in which we conduct our operations;
■ the ability to retain and recruit qualified personnel;
■ the ability to maintain our reputation and promote our brand;
■ the ability to increase market share and control expenses;
■ technological changes instituted by us, our counterparties or competitors;
■ the timely development and acceptance of our new products and services and the perceived overall value of these products and services by users;
■ acquisitions, including the ability to integrate acquired businesses successfully, and divestitures, including the ability to sell non-core assets; and
■ other unforeseen or unexpected events and our success at managing these and the risks involved in the foregoing.
We caution you that the foregoing list of important factors is not exclusive. When evaluating forward-looking statements, you should carefully consider the foregoing factors and other uncertainties and events, including the information set forth in “Risk factors” in I – Information on the company in our Annual Report 2020 and in “Risk factor” in Credit Suisse in our 1Q21 Earnings Release.
Page A-11

Thomas Gottstein, Chief Executive OfficerDavid Mathers, Chief Financial OfficerApril 22, 2021 Credit SuisseFirst Quarter 2021 ResultsAnalyst and Investor Call
Disclaimer (1/2) 2 April 22, 2021 Credit Suisse has not finalized its 1Q21 Financial Report and Credit Suisse's independent registered public accounting firm has not completed its review of the condensed consolidated financial statements for the period. Accordingly, the financial information contained in this presentation is subject to completion of quarter-end procedures, which may result in changes to that information.This material does not purport to contain all of the information that you may wish to consider. This material is not to be relied upon as such or used in substitution for the exercise of independent judgment. Cautionary statement regarding forward-looking statements This presentation contains forward-looking statements that involve inherent risks and uncertainties, and we might not be able to achieve the predictions, forecasts, projections and other outcomes we describe or imply in forward-looking statements. A number of important factors could cause results to differ materially from the plans, targets, goals, expectations, estimates and intentions we express in these forward-looking statements, including those we identify in "Risk factors” in our Annual Report on Form 20-F for the fiscal year ended December 31, 2020 and “Credit Suisse – Risk factor” and the “Cautionary statement regarding forward-looking information" in our 1Q21 Earnings Release published on April 22, 2021 and filed with the US Securities and Exchange Commission, and in other public filings and press releases. We do not intend to update these forward-looking statements. In particular, the terms “Estimate”, “Illustrative”, “Ambition”, “Objective”, “Outlook” and “Goal” are not intended to be viewed as targets or projections, nor are they considered to be Key Performance Indicators. All such estimates, illustrations, ambitions, objectives, outlooks and goals are subject to a large number of inherent risks, assumptions and uncertainties, many of which are completely outside of our control. These risks, assumptions and uncertainties include, but are not limited to, general market conditions, market volatility, interest rate volatility and levels, global and regional economic conditions, challenges and uncertainties resulting from the COVID-19 pandemic, political uncertainty, changes in tax policies, regulatory changes, changes in levels of client activity as a result of any of the foregoing and other factors. Accordingly, this information should not be relied on for any purpose. We do not intend to update these estimates, illustrations, ambitions, objectives, outlooks or goals. We may not achieve the benefits of our strategic initiativesWe may not achieve all of the expected benefits of our strategic initiatives. Factors beyond our control, including but not limited to the market and economic conditions (including macroeconomic and other challenges and uncertainties, for example, resulting from the COVID-19 pandemic), changes in laws, rules or regulations and other challenges discussed in our public filings, could limit our ability to achieve some or all of the expected benefits of these initiatives. Estimates and assumptionsIn preparing this presentation, management has made estimates and assumptions that affect the numbers presented. Actual results may differ. Annualized numbers do not take into account variations in operating results, seasonality and other factors and may not be indicative of actual, full-year results. Figures throughout this presentation may also be subject to rounding adjustments. All opinions and views constitute judgments as of the date of writing without regard to the date on which the reader may receive or access the information. This information is subject to change at any time without notice and we do not intend to update this information.RestatementAs of 3Q20, financial information reflects the new divisional reporting structure and management responsibilities announced on July 30, 2020 and updates to certain calculations and allocations. Prior periods have been restated to conform to the current presentation. In light of the restructuring announced on July 30, 2020 and several significant items impacting results in prior periods, we intend to focus on adjusted numbers, excluding significant items in our discussion of results until the restructuring is completed.

Disclaimer (2/2) 3 April 22, 2021 Statement regarding non-GAAP financial measuresThis presentation contains non-GAAP financial measures, including results excluding certain items included in our reported results as well as return on regulatory capital and return on tangible equity and tangible book value per share (which are both based on tangible shareholders’ equity). Further details and information needed to reconcile such non-GAAP financial measures to the most directly comparable measures under US GAAP can be found in this presentation in the Appendix, which is available on our website at www.credit-suisse.com.Our estimates, ambitions, objectives and targets often include metrics that are non-GAAP financial measures and are unaudited. A reconciliation of the estimates, ambitions, objectives and targets to the nearest GAAP measures is unavailable without unreasonable efforts. Results excluding certain items included in our reported results do not include items such as goodwill impairment, major litigation provisions, real estate gains, impacts from foreign exchange and other revenue and expense items included in our reported results, all of which are unavailable on a prospective basis. Return on tangible equity is based on tangible shareholders’ equity, a non-GAAP financial measure also known as tangible book value, which is calculated by deducting goodwill and other intangible assets from total shareholders’ equity as presented in our balance sheet, both of which are unavailable on a prospective basis. Return on regulatory capital (a non-GAAP financial measure) is calculated using income / (loss) after tax and assumes a tax rate of 25% and capital allocated based on the average of 10% of RWA and 3.5% of leverage exposure; the essential components of this calculation are unavailable on a prospective basis. Such estimates, ambitions, objectives and targets are calculated in a manner that is consistent with the accounting policies applied by us in preparing our financial statements.Statement regarding capital, liquidity and leverageCredit Suisse is subject to the Basel III framework, as implemented in Switzerland, as well as Swiss legislation and regulations for systemically important banks, which include capital, liquidity, leverage and large exposure requirements and rules for emergency plans designed to maintain systemically relevant functions in the event of threatened insolvency. Credit Suisse has adopted the Bank for International Settlements (BIS) leverage ratio framework, as issued by the Basel Committee on Banking Supervision (BCBS) and implemented in Switzerland by the Swiss Financial Market Supervisory Authority FINMA.Unless otherwise noted, leverage exposure is based on the BIS leverage ratio framework and consists of period-end balance sheet assets and prescribed regulatory adjustments. The tier 1 leverage ratio and CET1 leverage ratio are calculated as BIS tier 1 capital and CET1 capital, respectively, divided by period-end leverage exposure. Swiss leverage ratios are measured on the same period-end basis as the leverage exposure for the BIS leverage ratio.SourcesCertain material in this presentation has been prepared by Credit Suisse on the basis of publicly available information, internally developed data and other third-party sources believed to be reliable. Credit Suisse has not sought to independently verify information obtained from public and third-party sources and makes no representations or warranties as to accuracy, completeness or reliability of such information.Mandatory Convertible NotesThese materials are not an offer to sell securities or the solicitation of any offer to buy securities, nor shall there be any offer of securities, in any jurisdiction in which such offer or sale would be unlawful.These materials are not an offer of securities for sale in the United States or to U.S. persons (“U.S. persons”) as defined in Regulation S under the U.S. Securities Act of 1933, as amended (the “U.S. Securities Act”). The mandatory convertible notes described in these materials and the shares of Credit Suisse Group AG issuable on their conversion have not been and will not be registered under the U.S. Securities Act and may not be offered or sold in the United States or to, or for the account or benefit of, U.S. persons, absent registration or an applicable exemption from registration under the U.S. Securities Act.
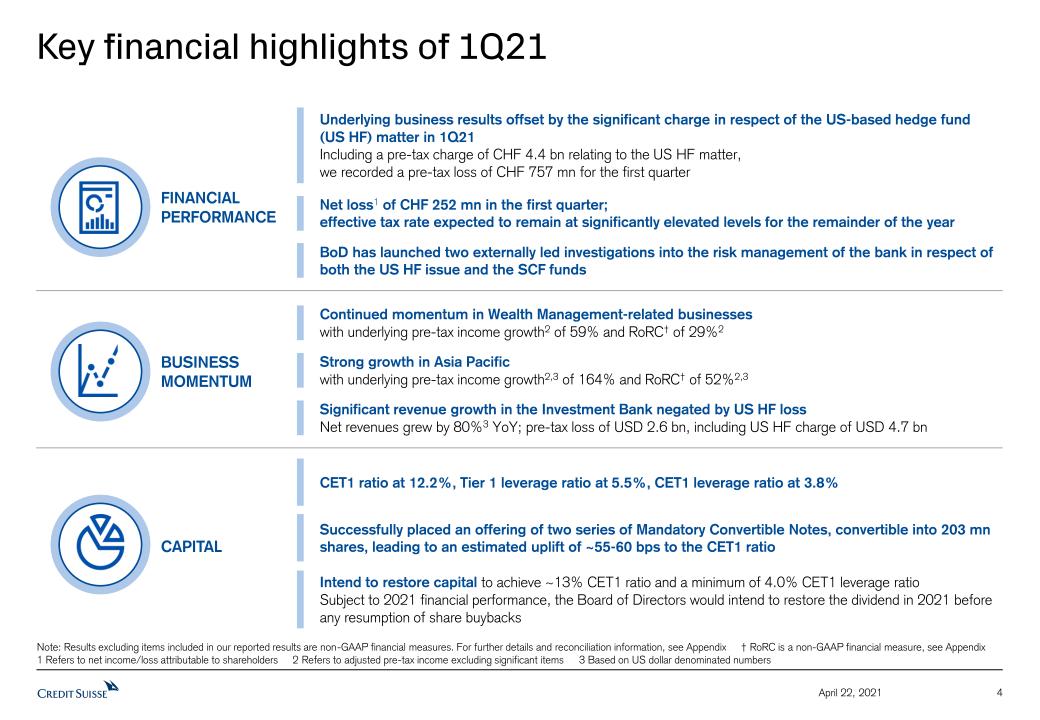
Key financial highlights of 1Q21 4 April 22, 2021 Note: Results excluding items included in our reported results are non-GAAP financial measures. For further details and reconciliation information, see Appendix † RoRC is a non-GAAP financial measure, see Appendix1 Refers to net income/loss attributable to shareholders 2 Refers to adjusted pre-tax income excluding significant items 3 Based on US dollar denominated numbers FINANCIAL PERFORMANCE BUSINESS MOMENTUM BoD has launched two externally led investigations into the risk management of the bank in respect of both the US HF issue and the SCF funds Continued momentum in Wealth Management-related businesseswith underlying pre-tax income growth2 of 59% and RoRC† of 29%2 Strong growth in Asia Pacificwith underlying pre-tax income growth2,3 of 164% and RoRC† of 52%2,3 Significant revenue growth in the Investment Bank negated by US HF lossNet revenues grew by 80%3 YoY; pre-tax loss of USD 2.6 bn, including US HF charge of USD 4.7 bn Net loss1 of CHF 252 mn in the first quarter; effective tax rate expected to remain at significantly elevated levels for the remainder of the year Underlying business results offset by the significant charge in respect of the US-based hedge fund (US HF) matter in 1Q21Including a pre-tax charge of CHF 4.4 bn relating to the US HF matter, we recorded a pre-tax loss of CHF 757 mn for the first quarter CAPITAL CET1 ratio at 12.2%, Tier 1 leverage ratio at 5.5%, CET1 leverage ratio at 3.8% Successfully placed an offering of two series of Mandatory Convertible Notes, convertible into 203 mn shares, leading to an estimated uplift of ~55-60 bps to the CET1 ratio Intend to restore capital to achieve ~13% CET1 ratio and a minimum of 4.0% CET1 leverage ratioSubject to 2021 financial performance, the Board of Directors would intend to restore the dividend in 2021 before any resumption of share buybacks
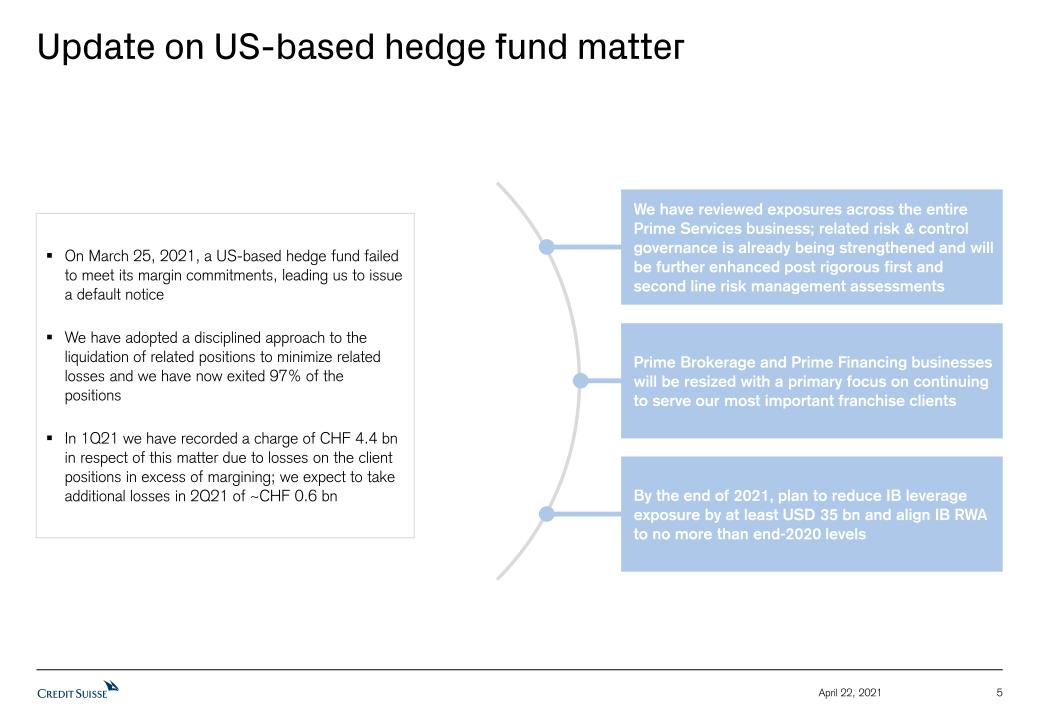
Update on US-based hedge fund matter 5 April 22, 2021 On March 25, 2021, a US-based hedge fund failed to meet its margin commitments, leading us to issue a default noticeWe have adopted a disciplined approach to the liquidation of related positions to minimize related losses and we have now exited 97% of the positionsIn 1Q21 we have recorded a charge of CHF 4.4 bn in respect of this matter due to losses on the client positions in excess of margining; we expect to take additional losses in 2Q21 of ~CHF 0.6 bn Prime Brokerage and Prime Financing businesses will be resized with a primary focus on continuing to serve our most important franchise clients By the end of 2021, plan to reduce IB leverage exposure by at least USD 35 bn and align IB RWA to no more than end-2020 levels We have reviewed exposures across the entire Prime Services business; related risk & control governance is already being strengthened and will be further enhanced post rigorous first and second line risk management assessments

Update on supply chain finance funds matter 6 April 22, 2021 Returning cash to investors in the four supply chain finance funds (NAV of ~USD 10 bn in the aggregate in late February 2021) remains Credit Suisse Asset Management (CSAM)’s priorityTo date, total cash collected in the funds amounts to USD 5.4 bn1, more than half of the total AuM at the time that the funds were suspended, of which USD 4.8 bn has been returned to fund investors in two cash distributionsProgress updates to be provided over the coming monthsCSAM is in active dialogue with the administrators of Greensill and other parties to identify and progress options to facilitate further recoveryCSAM will take all necessary steps to collect outstanding amounts from debtors and insurers, but can give no assurance as to the final amount that may be recovered for the supply chain finance funds under such notes. The amount of loss of the investors therefore is currently unknownOf our collateralized bridge loan of USD 140 mn to Greensill, USD 50 mn has been repaid by Greensill’s administrators, reducing the outstanding fair value loan to USD 90 mn, which we have marked down by USD 30 mn in 1Q21We have noted that it is reasonably possible that Credit Suisse will incur a loss in respect of these matters, though it is not yet possible to estimate the size of such a reasonably possible loss Effective April 1, 2021, established Asset Management as a separate division under the leadership of Ulrich Körner, reporting directly to the Group CEO 1 Includes cash position in the funds at the time of suspension
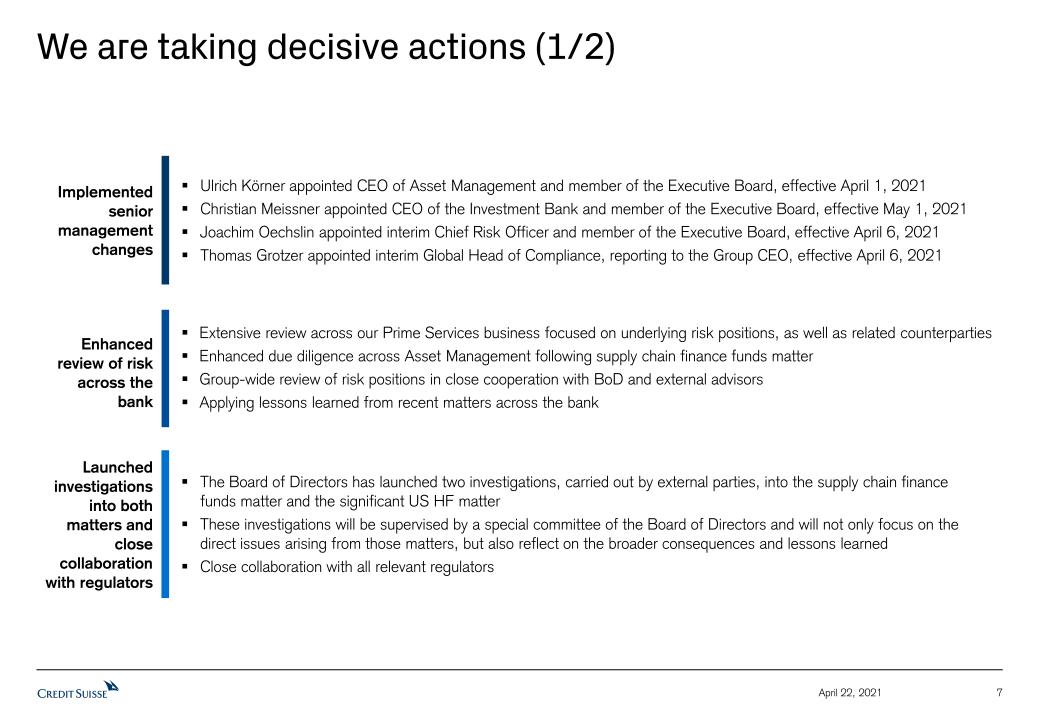
We are taking decisive actions (1/2) 7 April 22, 2021 Launched investigations into both matters and close collaboration with regulators The Board of Directors has launched two investigations, carried out by external parties, into the supply chain finance funds matter and the significant US HF matter These investigations will be supervised by a special committee of the Board of Directors and will not only focus on the direct issues arising from those matters, but also reflect on the broader consequences and lessons learned Close collaboration with all relevant regulators Implemented senior management changes Ulrich Körner appointed CEO of Asset Management and member of the Executive Board, effective April 1, 2021Christian Meissner appointed CEO of the Investment Bank and member of the Executive Board, effective May 1, 2021Joachim Oechslin appointed interim Chief Risk Officer and member of the Executive Board, effective April 6, 2021Thomas Grotzer appointed interim Global Head of Compliance, reporting to the Group CEO, effective April 6, 2021 Enhanced review of risk across the bank Extensive review across our Prime Services business focused on underlying risk positions, as well as related counterpartiesEnhanced due diligence across Asset Management following supply chain finance funds matterGroup-wide review of risk positions in close cooperation with BoD and external advisors Applying lessons learned from recent matters across the bank
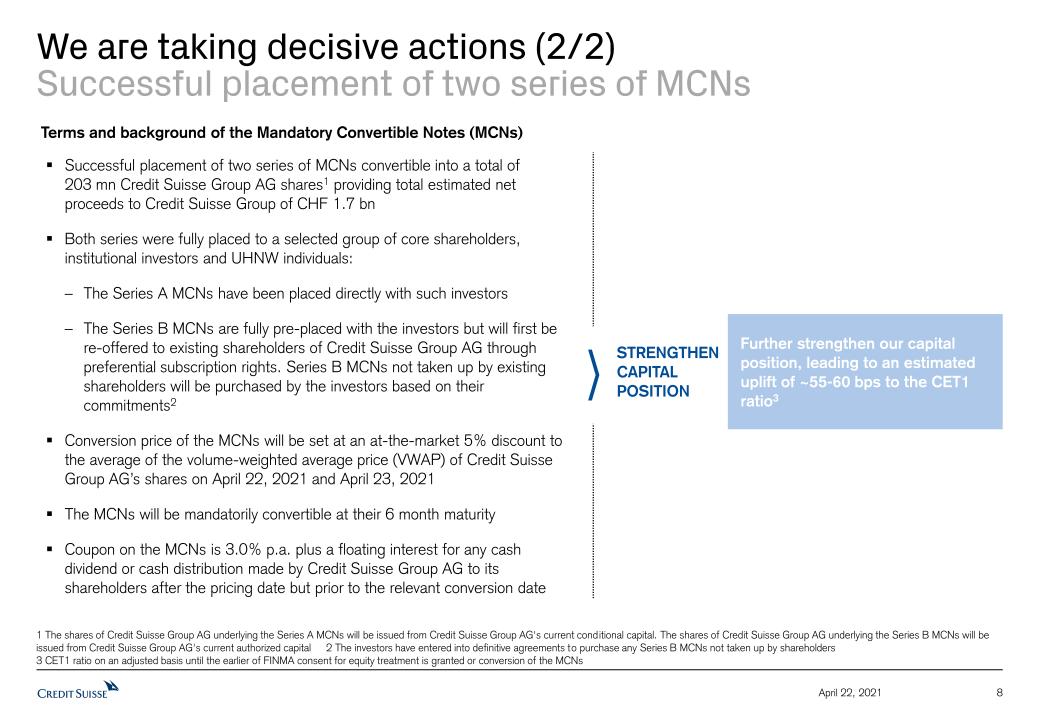
We are taking decisive actions (2/2)Successful placement of two series of MCNs 8 April 22, 2021 Successful placement of two series of MCNs convertible into a total of 203 mn Credit Suisse Group AG shares1 providing total estimated net proceeds to Credit Suisse Group of CHF 1.7 bnBoth series were fully placed to a selected group of core shareholders, institutional investors and UHNW individuals:The Series A MCNs have been placed directly with such investorsThe Series B MCNs are fully pre-placed with the investors but will first be re-offered to existing shareholders of Credit Suisse Group AG through preferential subscription rights. Series B MCNs not taken up by existing shareholders will be purchased by the investors based on their commitments2Conversion price of the MCNs will be set at an at-the-market 5% discount to the average of the volume-weighted average price (VWAP) of Credit Suisse Group AG’s shares on April 22, 2021 and April 23, 2021The MCNs will be mandatorily convertible at their 6 month maturity Coupon on the MCNs is 3.0% p.a. plus a floating interest for any cash dividend or cash distribution made by Credit Suisse Group AG to its shareholders after the pricing date but prior to the relevant conversion date Further strengthen our capital position, leading to an estimated uplift of ~55-60 bps to the CET1 ratio3 Terms and background of the Mandatory Convertible Notes (MCNs) STRENGTHEN CAPITAL POSITION 1 The shares of Credit Suisse Group AG underlying the Series A MCNs will be issued from Credit Suisse Group AG's current conditional capital. The shares of Credit Suisse Group AG underlying the Series B MCNs will be issued from Credit Suisse Group AG's current authorized capital 2 The investors have entered into definitive agreements to purchase any Series B MCNs not taken up by shareholders 3 CET1 ratio on an adjusted basis until the earlier of FINMA consent for equity treatment is granted or conversion of the MCNs

We continue to benefit from the growth of our WM franchise and the integration with our Investment Bank 9 April 22, 2021 WM-related1 revenuesAdjusted excluding significant items, in CHF mn Note: Results excluding items included in our reported results are non-GAAP financial measures. For further details and reconciliation information, see Appendix1 Relates to SUB, IWM and APAC 2 Includes Other revenues of CHF (102) mn 3 Includes Other revenues of CHF (50) mn 4 Includes Other revenues of CHF 6 mn 5 Includes capital markets revenues and advisory and other fees 6 Includes Other revenues of USD (77) mn 7 Includes Other revenues of USD (48) mn 8 Includes Other revenues of USD (72) mn Investment Bank revenuesin USD mn +29% +23% >+500% +80% 3,4982 Net interestincome Recurring commissions & fees Transaction and performance-based 3,2433 (9)% +3% +18% +7% QoQ YoY 2,1556 Fixed IncomeSales & Trading EquitySales & Trading CM&A5 3,7384 +2% +4% +34% +15% QoQ YoY 2,3377 3,8888 +99% +78% +35% +66%

10 April 22, 2021 AuM grew by 16% YoY with an NNA growth rate of 5% 1 Includes SUB C&IC, IWM AM and adjustment for assets managed by Asset Management within International Wealth Management for the other businesses 2 YTD, annualized Group Assets under Managementin CHF bn Wealth Management Institutional (AM, C&IC)1 1,371 1,596 +16%YoY +17% 1,512 1,596 +6%QoQ +6% NNA growth5% NNA growth27%

11 April 22, 2021 Client Business Volume with strong growth across our Wealth Management franchise SUB PCClient Business Volume (CBV) in CHF bn 1Q21 3Q20 1Q20 2Q20 4Q20 APACClient Business Volume (CBV) in USD bn3 1Q21 3Q20 1Q20 2Q20 4Q20 IWM PBClient Business Volume (CBV) in CHF bn1 1Q21 3Q20 1Q20 2Q20 4Q20 1 Adjusted for CHF 13 bn structural NAB shift to SUB C&IC in January 2021, of which CHF 6 bn in net loans, CHF 4 bn in AuM and CHF 3 bn in AuC/commercial assets 2 Excluding estimated cumulative FX impact based on management data, estimates and assumptions 3 Where CHF is converted to USD, a USD/CHF year-end spot exchange rate has been applied +10% Mid-single digit Mid- to high-single digit Double digit CBV growthambition2 +24% +41% +13% ex-FX impact1 +22% ex-FX impact +38% ex-FX impact Net new assets (4.2) (1.6) 2.0 (2.1) 2.2 3.7 1.8 6.9 4.3 7.2 3.2 4.7 2.3 (1.3) 5.4
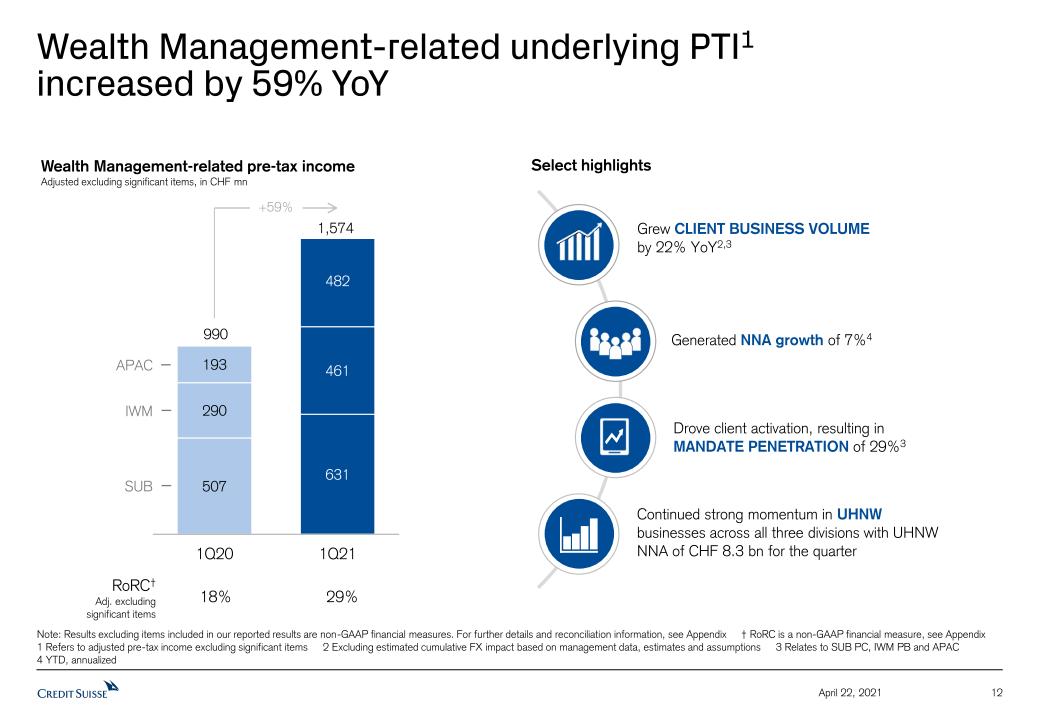
Wealth Management-related underlying PTI1 increased by 59% YoY 12 April 22, 2021 Wealth Management-related pre-tax incomeAdjusted excluding significant items, in CHF mn Select highlights 990 1,574 Grew CLIENT BUSINESS VOLUME by 22% YoY2,3 Drove client activation, resulting in MANDATE PENETRATION of 29%3 Generated NNA growth of 7%4 SUB IWM APAC +59% RoRC†Adj. excluding significant items 18% 29% Continued strong momentum in UHNW businesses across all three divisions with UHNW NNA of CHF 8.3 bn for the quarter Note: Results excluding items included in our reported results are non-GAAP financial measures. For further details and reconciliation information, see Appendix † RoRC is a non-GAAP financial measure, see Appendix 1 Refers to adjusted pre-tax income excluding significant items 2 Excluding estimated cumulative FX impact based on management data, estimates and assumptions 3 Relates to SUB PC, IWM PB and APAC 4 YTD, annualized
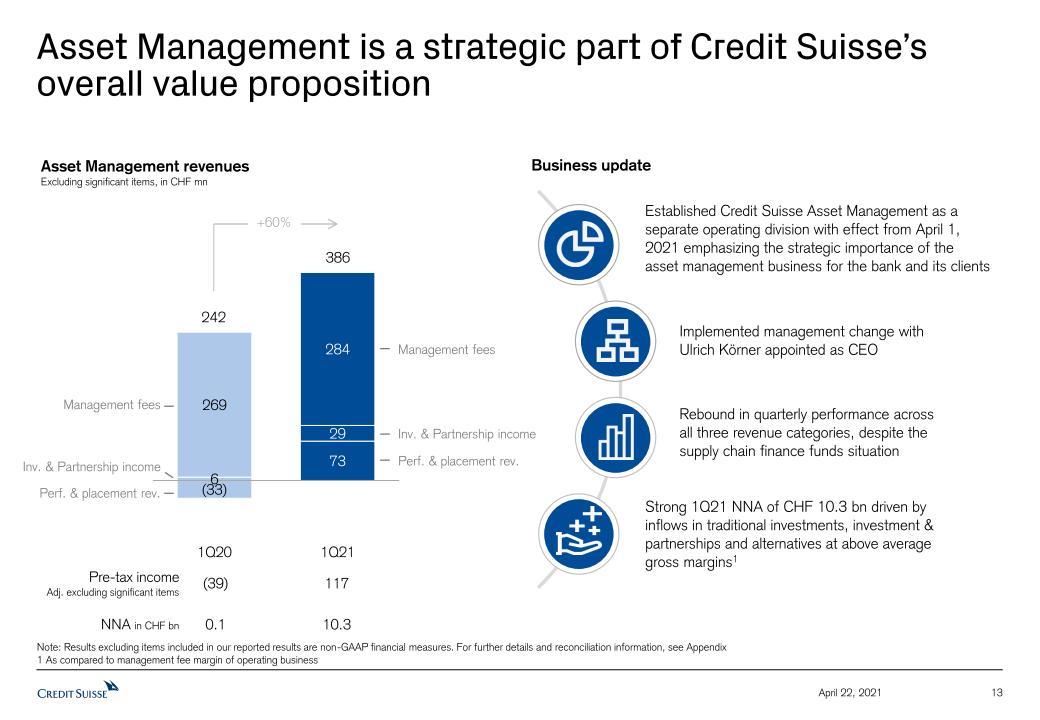
Asset Management is a strategic part of Credit Suisse’s overall value proposition 13 April 22, 2021 Asset Management revenuesExcluding significant items, in CHF mn 242 386 +60% Pre-tax income Adj. excluding significant items (39) 117 Perf. & placement rev. Management fees Inv. & Partnership income Perf. & placement rev. Management fees Inv. & Partnership income NNA in CHF bn 0.1 10.3 Business update Established Credit Suisse Asset Management as a separate operating division with effect from April 1, 2021 emphasizing the strategic importance of the asset management business for the bank and its clients Rebound in quarterly performance across all three revenue categories, despite the supply chain finance funds situation Implemented management change with Ulrich Körner appointed as CEO Strong 1Q21 NNA of CHF 10.3 bn driven by inflows in traditional investments, investment &partnerships and alternatives at above average gross margins1 Note: Results excluding items included in our reported results are non-GAAP financial measures. For further details and reconciliation information, see Appendix 1 As compared to management fee margin of operating business

14 April 22, 2021 Continued momentum in our capital markets and advisory franchise 1.0 Fees3USD bn 1.7 0.7 2.2 3.0 1.3 2.0 Top 10 Global Investment Banks: Capital markets and advisory fees growth1Q21 – YoY1,2 Credit Suisse’s capital markets and advisory share of wallet2 1 Includes Bank of America, Barclays, Citibank, Deutsche Bank, Goldman Sachs, Jefferies, JP Morgan, Morgan Stanley and UBS 2 Dealogic as of March 31, 2021; based on global fees (for 1Q20 and 1Q21) 3 Dealogic as of March 31, 2021 (for 1Q21) 2.3 3.2 1.0

15 April 22, 2021 SRI delivering continued value to clients and stakeholders, nine months since launch Select highlights Enabling Client Transitions Delivering Sustainable Solutions Driving our own Transition Leadership on Standard Setting Adapting our Culture Priced 25 deals including sustainable bonds globally totaling USD 17.3 bn CHF 118 bn of Sustainable AuM1 in 1Q21, up from CHF 108 bn in 4Q20; 1Q21 net sales of ~CHF 7 bn Phase 2 roll-out of Climate Energy Transition Frameworks (CETF) underway with a focus on Shipping, Aviation and Commodities Trade Finance Published Sustainability Report with enhanced TCFD (Task Force on Climate-related Financial Disclosures) climate disclosures and SASB (Sustainability Accounting Standards Board) disclosures for the first time 1 Refers to Credit Suisse’s assets managed according to sustainability criteria (Sustainable AuM)

Detailed Financials 16 April 22, 2021

Results Overview 17 Note: Results excluding items included in our reported results are non-GAAP financial measures. For further details and reconciliation information, see Appendix. 1Q20 reported results include a gain related to the completed transfer of the InvestLab fund platform to Allfunds Group. 4Q20 reported results include a gain related to the equity investment revaluation of SIX and Allfunds and a York impairment. 1Q21 reported results include a gain related to the equity investment revaluation of Allfunds and a charge related to a US-based hedge fund ‡ RoTE is a non-GAAP financial measure, see Appendix 1 Includes SUB, IWM and APAC April 22, 2021 Credit Suisse Group in CHF mn unless otherwise specified 1Q21 4Q20 1Q20 Δ 4Q20 Δ 1Q20 Net revenues 7,574 5,221 5,776 45% 31% o/w Wealth Management-related1 3,882 3,129 3,766 24% 3% o/w Investment Bank in USD mn 3,888 2,337 2,155 66% 80% Provision for credit losses 4,394 138 568 o/w US HF charge 4,430 o/w CECL-related (59) 32 305 Total operating expenses 3,937 5,171 4,007 (24)% (2)% Pre-tax income (757) (88) 1,201 n/m n/m Income tax expense (526) 262 (110) Effective tax rate 69% n/m (9)% Net income attributable to shareholders (252) (353) 1,314 n/m n/m Return on tangible equity‡ (2.6)% (3.5)% 13.1% Cost/income ratio 52% 99% 69% Diluted earnings per share in CHF (0.10) (0.15) 0.52 n/m nm Adjusted excluding significant items and the US HF charge in CHF mn Net revenues 7,430 5,335 5,508 39% 35% o/w Wealth Management-related1 3,738 3,243 3,498 15% 7% Pre-tax income 3,596 861 946 318% 280%

18 April 22, 2021 US-based hedge fund charge negates underlying pre-tax income Group pre-tax income in CHF mn Reported Note: Results excluding items included in our reported results are non-GAAP financial measures. For further details and reconciliation information, see Appendix 1 Reflects net release +280% Adjusted excluding significant items and US HF charge Reported pre-tax income includes in CHF mn 1Q20 1Q21 InvestLab/Allfunds gains 268 144 Restructuring & real estate disposal expenses 51 (63) Major litigation provisions (18) (4) US HF charge - (4,430) Total adjustments, significant items and US HF charge 255 (4,353) CECL-related PCL 305 (59) Comp & benefits 2,316 2,207
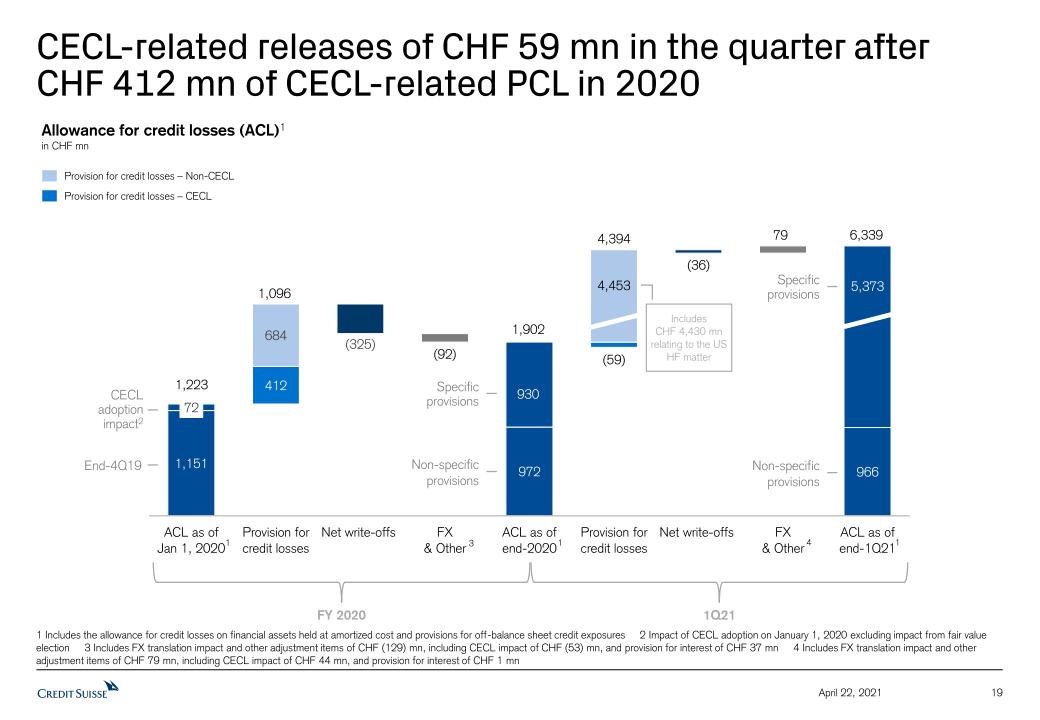
19 April 22, 2021 CECL-related releases of CHF 59 mn in the quarter after CHF 412 mn of CECL-related PCL in 2020 Allowance for credit losses (ACL)1in CHF mn 1 Includes the allowance for credit losses on financial assets held at amortized cost and provisions for off-balance sheet credit exposures 2 Impact of CECL adoption on January 1, 2020 excluding impact from fair value election 3 Includes FX translation impact and other adjustment items of CHF (129) mn, including CECL impact of CHF (53) mn, and provision for interest of CHF 37 mn 4 Includes FX translation impact and other adjustment items of CHF 79 mn, including CECL impact of CHF 44 mn, and provision for interest of CHF 1 mn 1 1,223 Non-specificprovisions Specificprovisions CECL adoption impact2 End-4Q19 Provision for credit losses – Non-CECL Provision for credit losses – CECL 1,096 6,339 1 Non-specificprovisions Specificprovisions 1,902 4,394 1 3 4 FY 2020 1Q21 Includes CHF 4,430 mn relating to the US HF matter
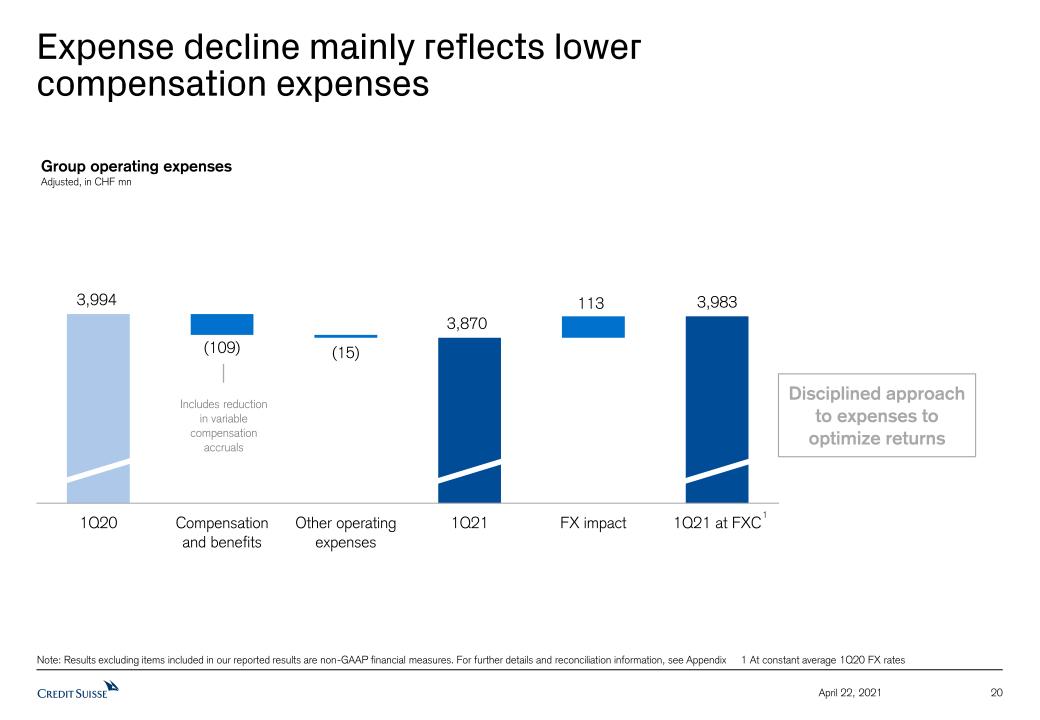
Expense decline mainly reflects lowercompensation expenses 20 April 22, 2021 Group operating expensesAdjusted, in CHF mn Note: Results excluding items included in our reported results are non-GAAP financial measures. For further details and reconciliation information, see Appendix 1 At constant average 1Q20 FX rates Includes reduction in variable compensation accruals 1 Disciplined approach to expenses to optimize returns

21 April 22, 2021 Higher RWA and leverage exposure driven by increased business usage and FX impact 911 SUB, IWM, APAC +14IB +11Corp. Ctr. - Key messagesRWA and leverage exposure growth mainly driven by FX impact and higher business usage in both the Investment Bank and the WM-related businessesTemporary regulatory RWA add-on of CHF 6 bn relating to the US HF positions, expected to be reduced to zero during 2Q21FX impact mainly driven by strengthening of USD vs. CHF Leverage exposure in CHF bn 1 Includes impacts from internal model & parameter updates 2 Leverage exposure without the temporary exclusion of central bank reserves permitted by FINMA in 2020 (3) 968 Risk-weighted assets in CHF bn 275 303 IB +4SUB, IWM, APAC +3Corp. Ctr. +1 1 8 14 6 2

22 April 22, 2021 Intend to restore capital to achieve a ~13% CET1 ratio and a minimum of 4.0% CET1 leverage ratio Illustrative CET1 ratio development Illustrative CET1 leverage ratio development FY 2021 effective tax rate expected to remain at significantly elevated levels for the remainder of the year due to only partial recognition of the US HF loss in our tax charge FY 2021 effective tax rate expected to remain at significantly elevated levels for the remainder of the year due to only partial recognition of the US HF loss in our tax charge 1 Note: Estimates and assumptions are based on currently available information and beliefs, expectations and opinions of management and include all known facts and decisions as of April 22, 2021. Actual results may differ1 We expect an increase in OpRisk RWA as a result of the provisions we took in 4Q20 in connection with mortgage-related matters
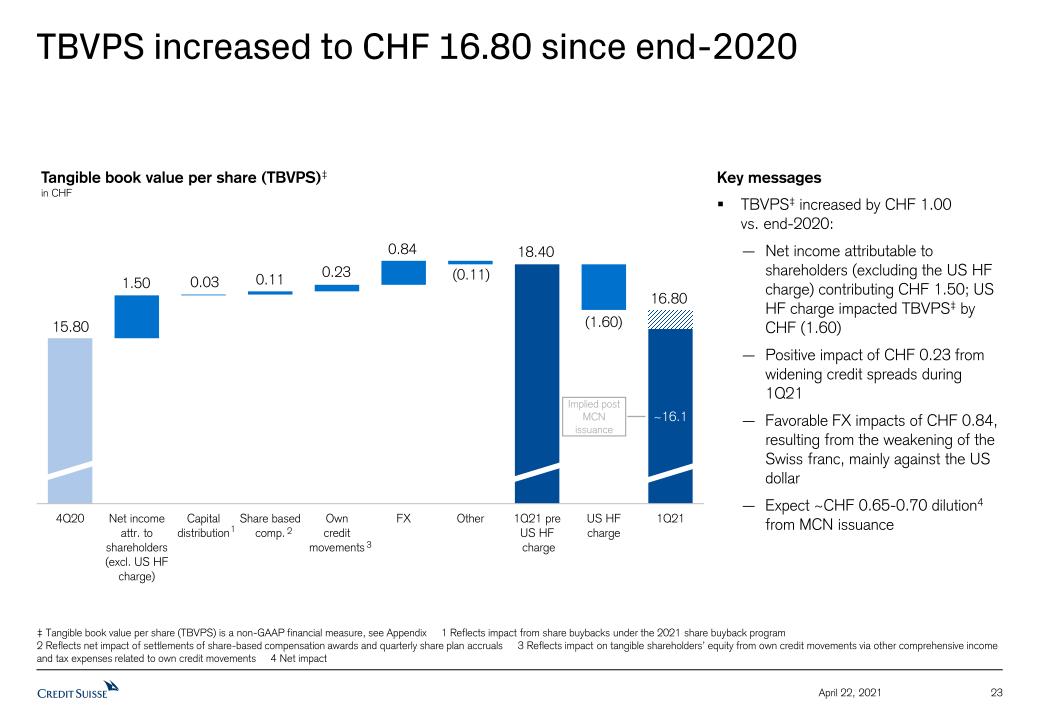
23 April 22, 2021 TBVPS increased to CHF 16.80 since end-2020 ‡ Tangible book value per share (TBVPS) is a non-GAAP financial measure, see Appendix 1 Reflects impact from share buybacks under the 2021 share buyback program2 Reflects net impact of settlements of share-based compensation awards and quarterly share plan accruals 3 Reflects impact on tangible shareholders’ equity from own credit movements via other comprehensive income and tax expenses related to own credit movements 4 Net impact 3 1 2 Tangible book value per share (TBVPS)‡in CHF 1.50 0.03 0.11 0.23 0.84 (0.11) (1.60) Key messagesTBVPS‡ increased by CHF 1.00 vs. end-2020:Net income attributable to shareholders (excluding the US HF charge) contributing CHF 1.50; US HF charge impacted TBVPS‡ by CHF (1.60)Positive impact of CHF 0.23 from widening credit spreads during 1Q21Favorable FX impacts of CHF 0.84, resulting from the weakening of the Swiss franc, mainly against the US dollarExpect ~CHF 0.65-0.70 dilution4 from MCN issuance 15.80 18.40 16.80 Implied post MCN issuance

Transaction-based revenues significantly increased in 1Q21, particularly in APAC 24 WM revenues benefitted from sequential stability in recurring income1 and high levels of transaction activity April 22, 2021 Net interest income Wealth Management, in CHF mn Recurring commissions & fees Wealth Management, in CHF mn Transaction-based revenues Wealth Management, in CHF mn Net interest income broadly stabilized in 1Q21, compared to 4Q20 Recurring commissions & fees continued to increase in 1Q21, benefitting from AuM growth Pre-COVID Pre-COVID Pre-COVID Note: Wealth Management includes SUB PC, IWM PB and APAC 1 Recurring income includes net interest income and recurring commissions & fees
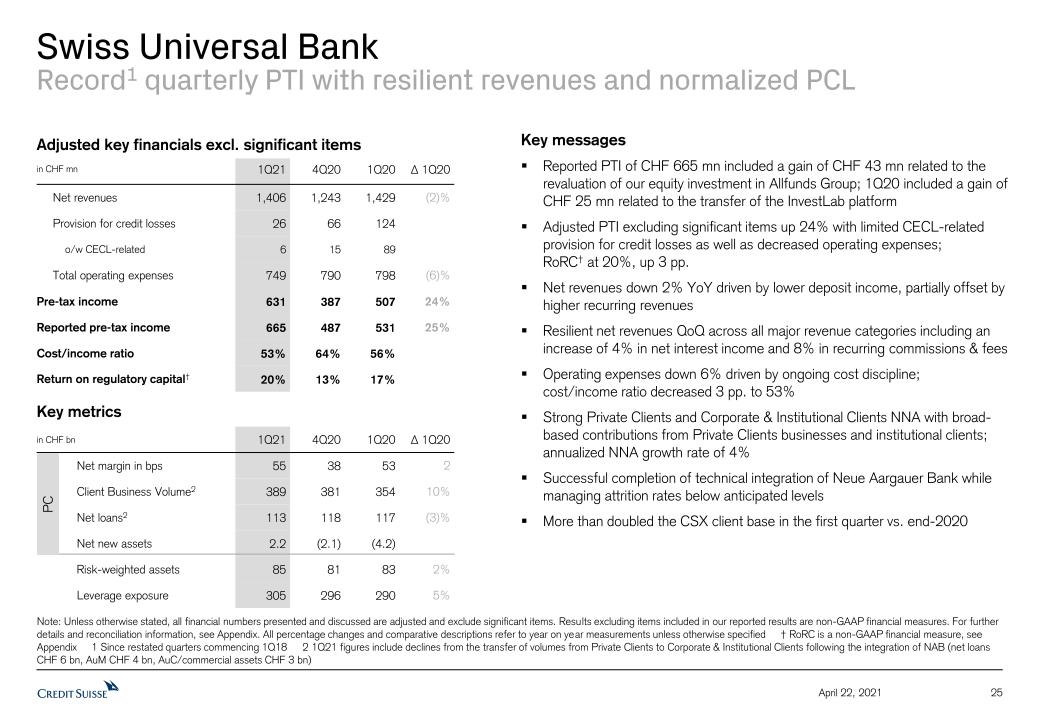
Swiss Universal BankRecord1 quarterly PTI with resilient revenues and normalized PCL 25 Note: Unless otherwise stated, all financial numbers presented and discussed are adjusted and exclude significant items. Results excluding items included in our reported results are non-GAAP financial measures. For further details and reconciliation information, see Appendix. All percentage changes and comparative descriptions refer to year on year measurements unless otherwise specified † RoRC is a non-GAAP financial measure, see Appendix 1 Since restated quarters commencing 1Q18 2 1Q21 figures include declines from the transfer of volumes from Private Clients to Corporate & Institutional Clients following the integration of NAB (net loans CHF 6 bn, AuM CHF 4 bn, AuC/commercial assets CHF 3 bn) April 22, 2021 Key metrics in CHF bn 1Q21 4Q20 1Q20 Δ 1Q20 Net margin in bps 55 38 53 2 Client Business Volume2 389 381 354 10% Net loans2 113 118 117 (3)% Net new assets 2.2 (2.1) (4.2) Risk-weighted assets 85 81 83 2% Leverage exposure 305 296 290 5% Adjusted key financials excl. significant items in CHF mn 1Q21 4Q20 1Q20 Δ 1Q20 Net revenues 1,406 1,243 1,429 (2)% Provision for credit losses 26 66 124 o/w CECL-related 6 15 89 Total operating expenses 749 790 798 (6)% Pre-tax income 631 387 507 24% Reported pre-tax income 665 487 531 25% Cost/income ratio 53% 64% 56% Return on regulatory capital† 20% 13% 17% PC Key messagesReported PTI of CHF 665 mn included a gain of CHF 43 mn related to the revaluation of our equity investment in Allfunds Group; 1Q20 included a gain of CHF 25 mn related to the transfer of the InvestLab platformAdjusted PTI excluding significant items up 24% with limited CECL-related provision for credit losses as well as decreased operating expenses; RoRC† at 20%, up 3 pp.Net revenues down 2% YoY driven by lower deposit income, partially offset by higher recurring revenuesResilient net revenues QoQ across all major revenue categories including an increase of 4% in net interest income and 8% in recurring commissions & feesOperating expenses down 6% driven by ongoing cost discipline; cost/income ratio decreased 3 pp. to 53%Strong Private Clients and Corporate & Institutional Clients NNA with broad-based contributions from Private Clients businesses and institutional clients; annualized NNA growth rate of 4% Successful completion of technical integration of Neue Aargauer Bank while managing attrition rates below anticipated levelsMore than doubled the CSX client base in the first quarter vs. end-2020

Swiss Universal BankLast 4 first quarters – Adjusted results excluding significant items 26 April 22, 2021 Net revenues in CHF mn 1Q21 1Q20 1Q19 1Q21 1Q20 1Q19 1Q21 1Q20 1Q19 1Q21 1Q20 1Q19 Note: Unless otherwise stated, all financial numbers presented and discussed are adjusted and exclude significant items. Results excluding items included in our reported results are non-GAAP financial measures. For furtherdetails and reconciliation information, see Appendix † RoRC is a non-GAAP financial measure, see Appendix 1Q18 1Q18 1Q18 1Q18 1Q21 1Q20 1Q19 1Q18 1Q21 1Q20 1Q19 1Q18 Pre-tax income in CHF mn Return on regulatory capital† SUB PC net margin in bps Client Business Volume in CHF bn Cost/income ratio
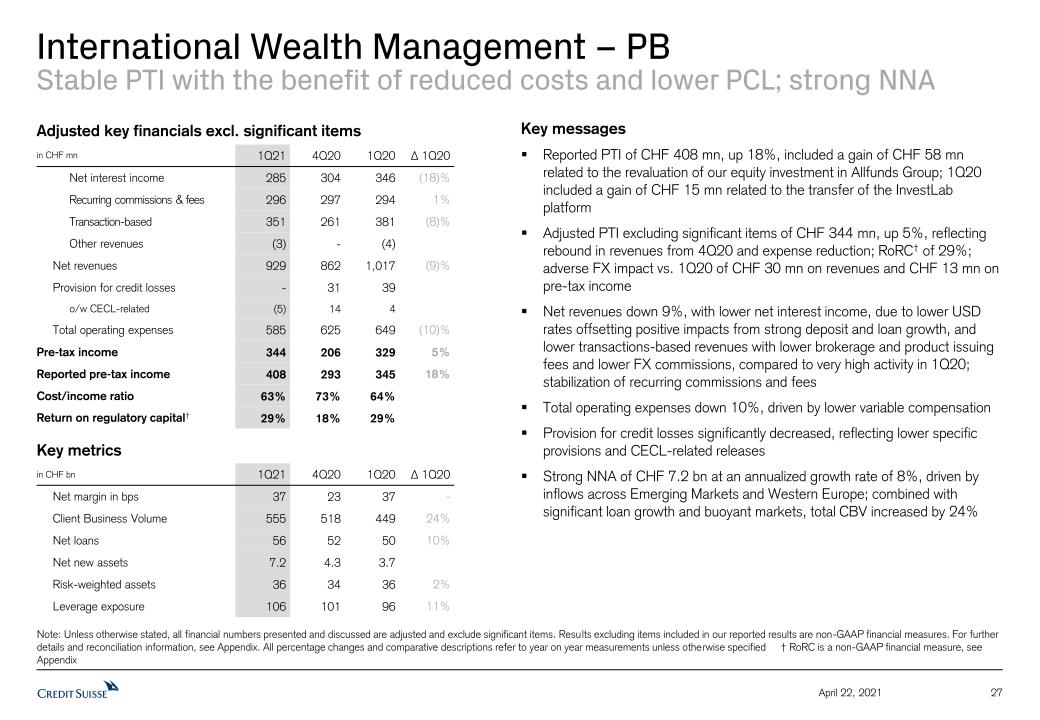
International Wealth Management – PBStable PTI with the benefit of reduced costs and lower PCL; strong NNA 27 April 22, 2021 Note: Unless otherwise stated, all financial numbers presented and discussed are adjusted and exclude significant items. Results excluding items included in our reported results are non-GAAP financial measures. For further details and reconciliation information, see Appendix. All percentage changes and comparative descriptions refer to year on year measurements unless otherwise specified † RoRC is a non-GAAP financial measure, see Appendix Adjusted key financials excl. significant items in CHF mn 1Q21 4Q20 1Q20 Δ 1Q20 Net interest income 285 304 346 (18)% Recurring commissions & fees 296 297 294 1% Transaction-based 351 261 381 (8)% Other revenues (3) - (4) Net revenues 929 862 1,017 (9)% Provision for credit losses - 31 39 o/w CECL-related (5) 14 4 Total operating expenses 585 625 649 (10)% Pre-tax income 344 206 329 5% Reported pre-tax income 408 293 345 18% Cost/income ratio 63% 73% 64% Return on regulatory capital† 29% 18% 29% Key metrics in CHF bn 1Q21 4Q20 1Q20 Δ 1Q20 Net margin in bps 37 23 37 - Client Business Volume 555 518 449 24% Net loans 56 52 50 10% Net new assets 7.2 4.3 3.7 Risk-weighted assets 36 34 36 2% Leverage exposure 106 101 96 11% Key messagesReported PTI of CHF 408 mn, up 18%, included a gain of CHF 58 mn related to the revaluation of our equity investment in Allfunds Group; 1Q20 included a gain of CHF 15 mn related to the transfer of the InvestLab platformAdjusted PTI excluding significant items of CHF 344 mn, up 5%, reflecting rebound in revenues from 4Q20 and expense reduction; RoRC† of 29%; adverse FX impact vs. 1Q20 of CHF 30 mn on revenues and CHF 13 mn on pre-tax incomeNet revenues down 9%, with lower net interest income, due to lower USD rates offsetting positive impacts from strong deposit and loan growth, and lower transactions-based revenues with lower brokerage and product issuing fees and lower FX commissions, compared to very high activity in 1Q20; stabilization of recurring commissions and fees Total operating expenses down 10%, driven by lower variable compensationProvision for credit losses significantly decreased, reflecting lower specific provisions and CECL-related releasesStrong NNA of CHF 7.2 bn at an annualized growth rate of 8%, driven by inflows across Emerging Markets and Western Europe; combined with significant loan growth and buoyant markets, total CBV increased by 24%

International Wealth Management – PBLast 4 first quarters – Adjusted results excluding significant items 28 April 22, 2021 Net revenues in CHF mn Net margin in bps Note: Unless otherwise stated, all financial numbers presented and discussed are adjusted and exclude significant items. Results excluding items included in our reported results are non-GAAP financial measures. For furtherdetails and reconciliation information, see Appendix † RoRC is a non-GAAP financial measure, see Appendix 1Q21 1Q20 1Q19 1Q18 1Q21 1Q20 1Q19 1Q18 Pre-tax income in CHF mn 1Q21 1Q20 1Q19 1Q21 1Q20 1Q19 1Q18 1Q18 Client Business Volume in CHF bn Cost/income ratio Return on regulatory capital† 1Q21 1Q20 1Q19 1Q18 1Q21 1Q20 1Q19 1Q18

International Wealth Management – AMStabilization of PTI on higher management fees; strong NNA 29 April 22, 2021 Note: Unless otherwise stated, all financial numbers presented and discussed are adjusted and exclude significant items. Results excluding items included in our reported results are non-GAAP financial measures. For further details and reconciliation information, see Appendix. All percentage changes and comparative descriptions refer to year on year measurements unless otherwise specified † RoRC is a non-GAAP financial measure, see Appendix Adjusted key financials excl. significant items in CHF mn 1Q21 4Q20 1Q20 Δ 1Q20 Management fees 284 269 269 6% Performance & placement rev. 73 115 (33) n/m Investment & partnership income 29 8 6 383% Net revenues 386 392 242 60% Provision for credit losses - (6) - o/w CECL-related - (5) - Total operating expenses 269 283 281 (4)% Pre-tax income 117 115 (39) n/m Reported pre-tax income 115 (305) 164 (30)% Cost/income ratio 70% 72% 116% Return on regulatory capital† 69% 63% n/m Key metrics in CHF bn 1Q21 4Q20 1Q20 Δ 1Q20 Assets under management 458 440 410 12% Net new assets 10.3 6.3 0.1 Risk-weighted assets 9 9 9 - Leverage exposure 3 3 3 (9)% Key messagesIt remains CSAM's top priority to return cash to investors in the supply chain finance funds; we intend to provide a further update on the progress made by the end of April 2021Reported PTI of CHF 115 mn, down from 1Q20, which included a gain of CHF 203 mn related to the transfer of the InvestLab platform and seed money losses in our fundsAdjusted PTI excluding significant items of CHF 117 mn reflecting continuation of strong performance seen in 4Q20; RoRC† of 69%Net revenues up 60%, with higher management fees on higher AuM and strong NNA inflows, and higher performance & placement revenues due to investment-related gains compared to losses in 1Q20Total operating expenses down 4% driven by lower variable compensation and lower professional feesStrong NNA of CHF 10.3 bn, driven by Equities, Index Solutions and our emerging market joint venturesAuM up 4% from 4Q20 with benefit from strong NNA and FX impacts;1Q21 AuM also included an adverse structural effect related to the exit of our supply chain finance funds business
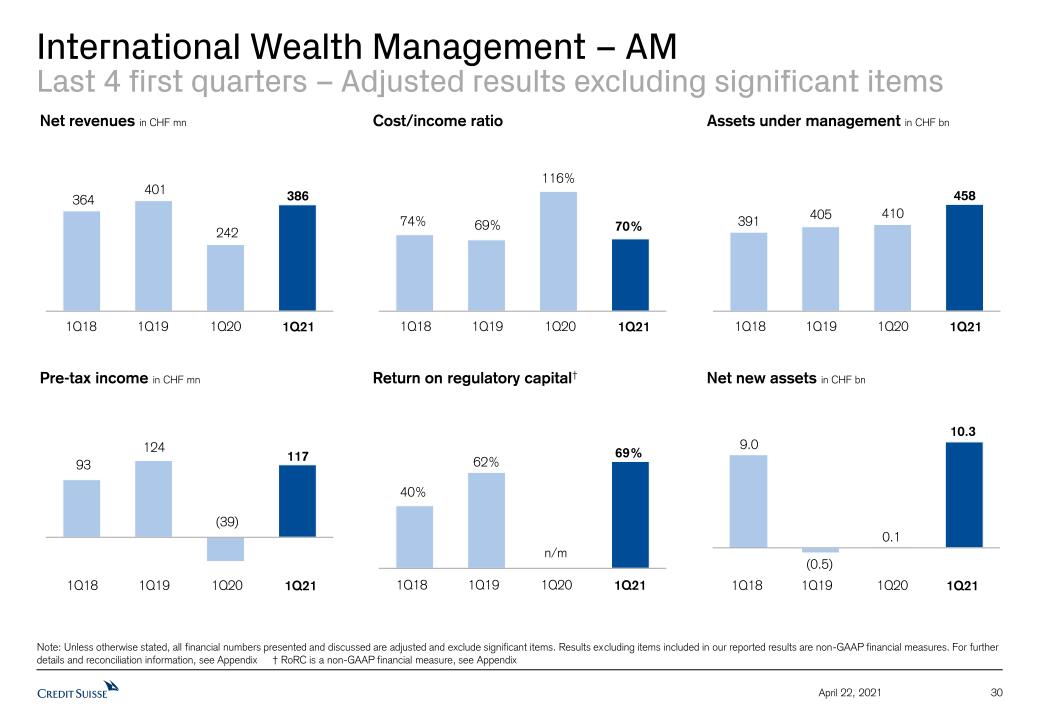
International Wealth Management – AMLast 4 first quarters – Adjusted results excluding significant items 30 April 22, 2021 Note: Unless otherwise stated, all financial numbers presented and discussed are adjusted and exclude significant items. Results excluding items included in our reported results are non-GAAP financial measures. For furtherdetails and reconciliation information, see Appendix † RoRC is a non-GAAP financial measure, see Appendix Net revenues in CHF mn Net new assets in CHF bn 1Q21 1Q20 1Q19 Pre-tax income in CHF mn 1Q21 1Q20 1Q19 1Q18 1Q21 1Q20 1Q19 1Q18 1Q18 1Q21 1Q20 1Q19 1Q21 1Q20 1Q19 1Q18 1Q18 Cost/income ratio Return on regulatory capital† 1Q21 1Q20 1Q19 1Q18 Assets under management in CHF bn
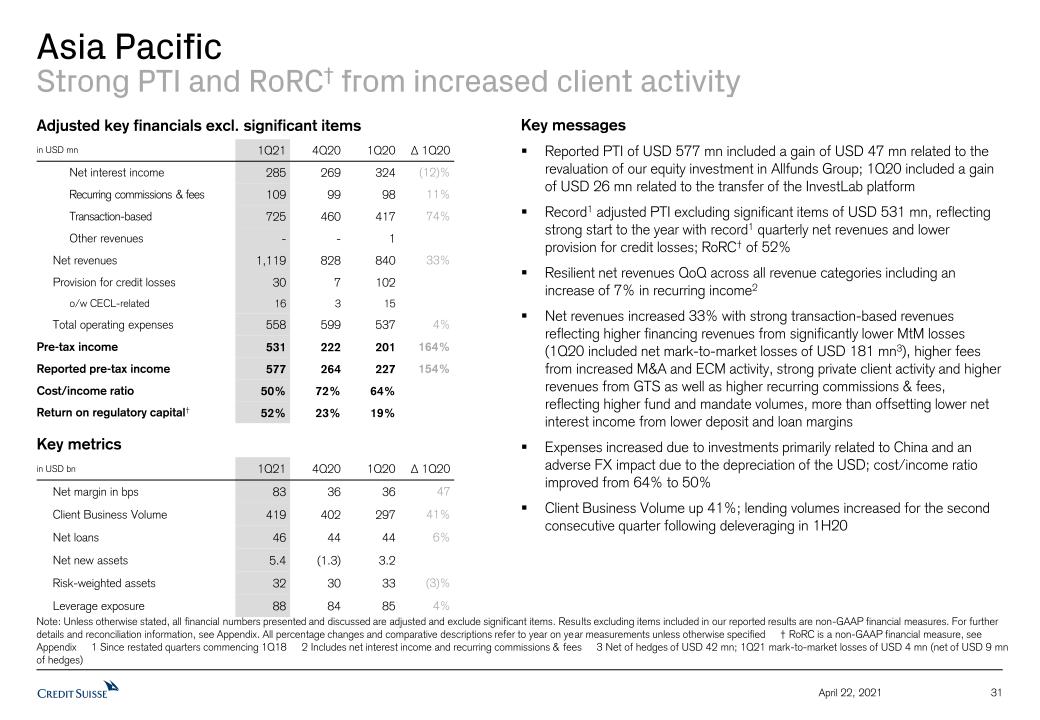
Asia PacificStrong PTI and RoRC† from increased client activity 31 April 22, 2021 Note: Unless otherwise stated, all financial numbers presented and discussed are adjusted and exclude significant items. Results excluding items included in our reported results are non-GAAP financial measures. For further details and reconciliation information, see Appendix. All percentage changes and comparative descriptions refer to year on year measurements unless otherwise specified † RoRC is a non-GAAP financial measure, see Appendix 1 Since restated quarters commencing 1Q18 2 Includes net interest income and recurring commissions & fees 3 Net of hedges of USD 42 mn; 1Q21 mark-to-market losses of USD 4 mn (net of USD 9 mn of hedges) Adjusted key financials excl. significant items in USD mn 1Q21 4Q20 1Q20 Δ 1Q20 Net interest income 285 269 324 (12)% Recurring commissions & fees 109 99 98 11% Transaction-based 725 460 417 74% Other revenues - - 1 Net revenues 1,119 828 840 33% Provision for credit losses 30 7 102 o/w CECL-related 16 3 15 Total operating expenses 558 599 537 4% Pre-tax income 531 222 201 164% Reported pre-tax income 577 264 227 154% Cost/income ratio 50% 72% 64% Return on regulatory capital† 52% 23% 19% Key metrics in USD bn 1Q21 4Q20 1Q20 Δ 1Q20 Net margin in bps 83 36 36 47 Client Business Volume 419 402 297 41% Net loans 46 44 44 6% Net new assets 5.4 (1.3) 3.2 Risk-weighted assets 32 30 33 (3)% Leverage exposure 88 84 85 4% Key messagesReported PTI of USD 577 mn included a gain of USD 47 mn related to the revaluation of our equity investment in Allfunds Group; 1Q20 included a gain of USD 26 mn related to the transfer of the InvestLab platformRecord1 adjusted PTI excluding significant items of USD 531 mn, reflecting strong start to the year with record1 quarterly net revenues and lower provision for credit losses; RoRC† of 52%Resilient net revenues QoQ across all revenue categories including an increase of 7% in recurring income2Net revenues increased 33% with strong transaction-based revenues reflecting higher financing revenues from significantly lower MtM losses (1Q20 included net mark-to-market losses of USD 181 mn3), higher fees from increased M&A and ECM activity, strong private client activity and higher revenues from GTS as well as higher recurring commissions & fees, reflecting higher fund and mandate volumes, more than offsetting lower net interest income from lower deposit and loan marginsExpenses increased due to investments primarily related to China and an adverse FX impact due to the depreciation of the USD; cost/income ratio improved from 64% to 50%Client Business Volume up 41%; lending volumes increased for the second consecutive quarter following deleveraging in 1H20

Asia PacificLast 4 first quarters – Adjusted results excluding significant items 32 April 22, 2021 Note: Unless otherwise stated, all financial numbers presented and discussed are adjusted and exclude significant items. Results excluding items included in our reported results are non-GAAP financial measures. For furtherdetails and reconciliation information, see Appendix † RoRC is a non-GAAP financial measure, see Appendix Net revenues in USD mn Net margin in bps 1Q21 1Q20 1Q19 Pre-tax income in USD mn 1Q21 1Q20 1Q19 1Q18 1Q21 1Q20 1Q19 1Q18 1Q18 1Q21 1Q20 1Q19 1Q21 1Q20 1Q19 1Q18 1Q18 Cost/income ratio Return on regulatory capital† 1Q21 1Q20 1Q19 1Q18 Client Business Volume in USD bn

Investment BankUS-based hedge fund loss offsets significantly higher revenues 33 April 22, 2021 Key messagesRecord adjusted PTI, excluding the US HF charge of USD 2.2 bn, reflecting broad-based revenue growth across products and regions; RoRC† of 59%, up 57 pp.Outperformance in Capital Markets reflecting share of wallet gains4,5 in ECM, rebound in #2 ranked4,5 Leveraged Finance business and higher M&A deal completions; global Banking share of wallet of 4.9%5, increased 110 bps YoY, highest since 4Q17Record GTS performance compared to a strong prior year with robust results in equity derivatives and emerging markets reflecting continued collaboration Continued momentum in Credit franchise driven by outperformance in Securitized Products; maintained #1 rank6 in our fee-based Asset Finance businessProvision for credit losses increased significantly due to a charge of USD 4.7 bn related to the US HF matter; excluding this charge, provision for credit losses decreased reflecting CECL-related releases from an improved macroeconomic outlook; expect to take additional losses in 2Q21 of ~USD 0.6 bn in connection with the US HF matterStrategic review underway focused on resizing and de-risking Prime Brokerage and Prime Financing businesses, with a primary focus on continuing to serve our most important franchise clients Note: Unless otherwise stated, all financial numbers presented and discussed are adjusted and exclude significant items and the charge related to a US-based hedge fund. Results excluding items included in our reported results are non-GAAP financial measures. For further details and reconciliation information, see Appendix. All percentage changes and comparative descriptions refer to year on year measurements unless otherwise specified † RoRC is a non-GAAP financial measure, see Appendix 1 Includes DCM and ECM 2 Other revenues include treasury funding costs and changes in the carrying value of certain investments 3 Includes restructuring, real estate disposals and major litigation 4 Dealogic as of March 31, 2021 (Americas and EMEA) 5 Dealogic as of March 31, 2021; based on global fees (for 1Q20 and 1Q21) 6 Based on Thomson Reuters as of March 31, 2021 Key metrics in USD bn 1Q21 4Q20 1Q20 Δ 1Q20 Risk-weighted assets 99 88 101 (2)% Leverage exposure 371 363 376 (1)% Adjusted key financials excl. the US HF charge in USD mn 1Q21 4Q20 1Q20 Δ 1Q20 Fixed income S&T 1,569 788 1,220 29% Equity S&T 988 555 805 23% Capital markets1 1,189 843 63 >500% Advisory and other fees 214 199 144 49% Other2 (72) (48) (77) Net revenues 3,888 2,337 2,155 80% Provision for credit losses (89) 42 315 o/w CECL-related (73) 3 201 Total operating expenses 1,778 1,938 1,758 1% Pre-tax income 2,199 357 82 >500% US HF charge 4,707 - - Other adjustments3 52 39 (4) Reported pre-tax income (2,560) 318 86 n/m Cost/income ratio4 46% 83% 82% Return on regulatory capital† 59% 10% 2%

Investment BankLast 4 first quarters – Adjusted results excluding the US HF charge 34 April 22, 2021 Fixed income Sales & Trading in USD mn Capital markets1 in USD mn Equity Sales & Trading in USD mn Advisory and other fees in USD mn Pre-tax income in USD mn Return on regulatory capital† 1Q21 1Q20 1Q19 1Q21 1Q20 1Q19 1Q21 1Q20 1Q19 1Q21 1Q20 1Q19 1Q21 1Q20 1Q19 Note: Unless otherwise stated, all financial numbers presented and discussed are adjusted and exclude significant items and a charge related to a US-based hedge fund. Results excluding items included in our reported results are non-GAAP financial measures. For further details and reconciliation information, see Appendix † RoRC is a non-GAAP financial measure, see Appendix 1Q18 1Q21 1Q20 1Q19 1Q18 1Q18 1Q18 1Q18 1Q18

Appendix 35 April 22, 2021
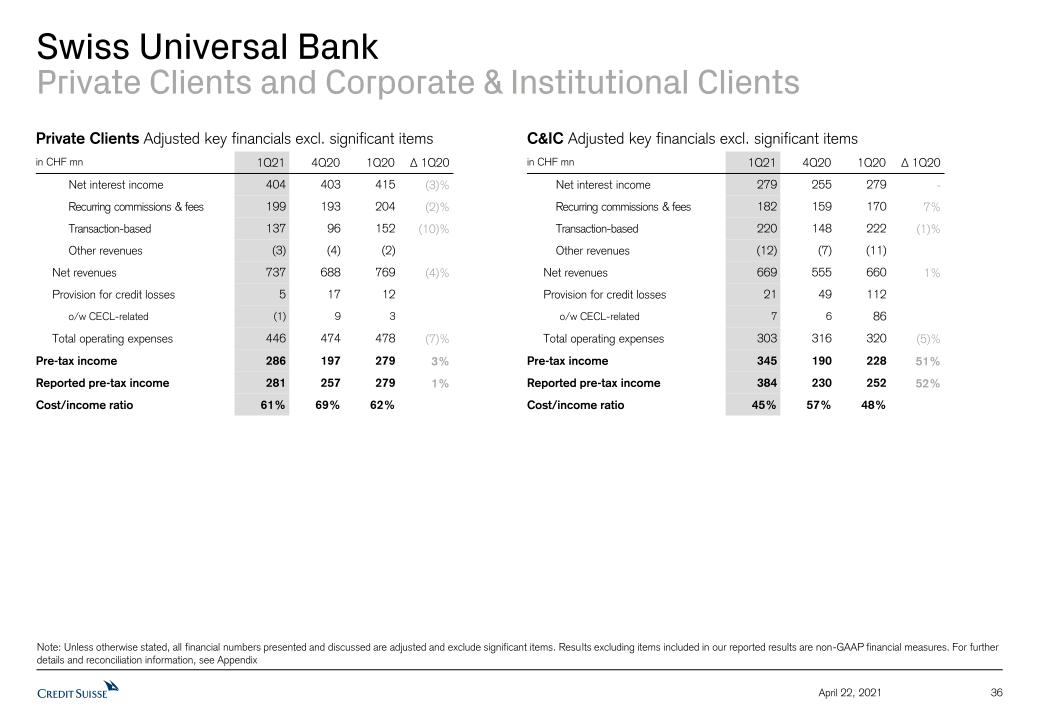
Swiss Universal BankPrivate Clients and Corporate & Institutional Clients 36 April 22, 2021 Note: Unless otherwise stated, all financial numbers presented and discussed are adjusted and exclude significant items. Results excluding items included in our reported results are non-GAAP financial measures. For furtherdetails and reconciliation information, see Appendix C&IC Adjusted key financials excl. significant items in CHF mn 1Q21 4Q20 1Q20 Δ 1Q20 Net interest income 279 255 279 - Recurring commissions & fees 182 159 170 7% Transaction-based 220 148 222 (1)% Other revenues (12) (7) (11) Net revenues 669 555 660 1% Provision for credit losses 21 49 112 o/w CECL-related 7 6 86 Total operating expenses 303 316 320 (5)% Pre-tax income 345 190 228 51% Reported pre-tax income 384 230 252 52% Cost/income ratio 45% 57% 48% Private Clients Adjusted key financials excl. significant items in CHF mn 1Q21 4Q20 1Q20 Δ 1Q20 Net interest income 404 403 415 (3)% Recurring commissions & fees 199 193 204 (2)% Transaction-based 137 96 152 (10)% Other revenues (3) (4) (2) Net revenues 737 688 769 (4)% Provision for credit losses 5 17 12 o/w CECL-related (1) 9 3 Total operating expenses 446 474 478 (7)% Pre-tax income 286 197 279 3% Reported pre-tax income 281 257 279 1% Cost/income ratio 61% 69% 62%
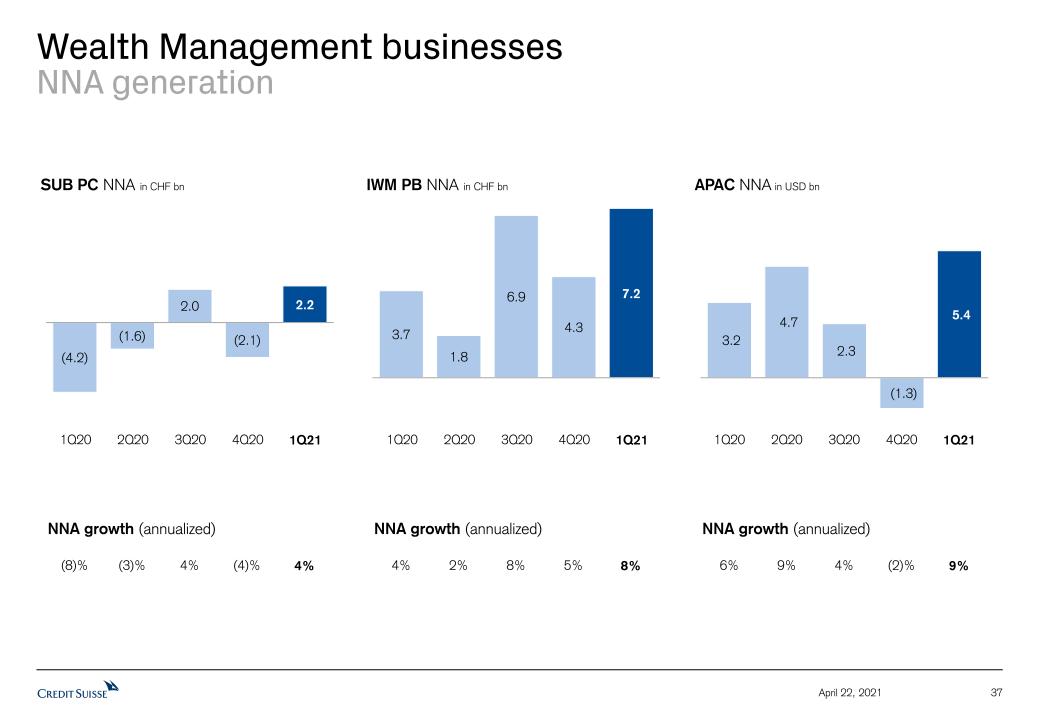
Wealth Management businessesNNA generation 37 IWM PB NNA in CHF bn NNA growth (annualized) 8% SUB PC NNA in CHF bn NNA growth (annualized) 4% 1Q21 1Q21 5% 4% 8% 2% (4)% (8)% 4% (3)% 4Q20 1Q20 2Q20 3Q20 4Q20 1Q20 2Q20 3Q20 April 22, 2021 NNA growth (annualized) 9% APAC NNA in USD bn 1Q21 (2)% 6% 4% 9% 4Q20 1Q20 2Q20 3Q20

38 April 22, 2021 Wealth Management businessesNet and gross margins Note: For details on calculations see under ‘Notes’ at the end of this Appendix. Unless otherwise stated, all financial numbers presented and discussed are adjusted and exclude significant items. Results excluding items included in our reported results are non-GAAP financial measures. For further details and reconciliation information, see Appendix 347 204 236 236 836 700 Average AuM in CHF bn, unless specified Adjusted pre-tax income excl. significant items in CHF mn, unless specified Adjusted net revenues excl. significant items in CHF mn, unless specified 905 1,017 862 929 224 329 206 344 338 358 356 375 702 769 688 737 210 279 197 286 200 211 206 208 IWM PB Adj. net margin excl. sign. items in bps Adj. gross margin excl. sign. items in bps 1Q21 4Q20 2Q20 1Q20 3Q20 1Q21 4Q20 2Q20 1Q20 3Q20 SUB PC Adj. net margin excl. sign. items in bps Adj. gross margin excl. sign. items in bps 1Q21 4Q20 2Q20 1Q20 3Q20 1Q21 4Q20 2Q20 1Q20 3Q20 197 800 841 840 828 1,119 204 201 222 531 236 217 221 245 256 APAC Adj. net margin excl. sign. items in bps Adj. gross margin excl. sign. items in bps 1Q21 4Q20 2Q20 1Q20 3Q20 1Q21 4Q20 2Q20 1Q20 3Q20 Average AuM in USD bn Adjusted pre-tax income excl. significant items in USD mn Adjusted net revenues excl. significant items in USD mn
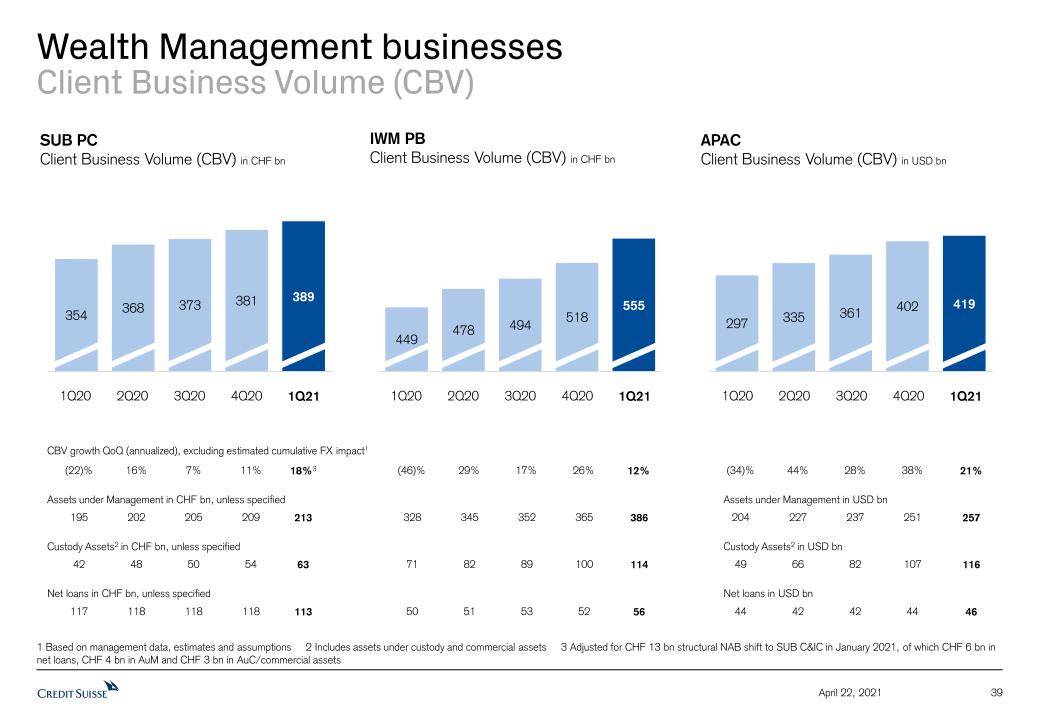
39 April 22, 2021 Wealth Management businessesClient Business Volume (CBV) SUB PCClient Business Volume (CBV) in CHF bn 1Q21 3Q20 1Q20 2Q20 4Q20 CBV growth QoQ (annualized), excluding estimated cumulative FX impact1 18%3 (22)% 16% 7% 11% APACClient Business Volume (CBV) in USD bn IWM PBClient Business Volume (CBV) in CHF bn 1Q21 3Q20 1Q20 2Q20 4Q20 1Q21 3Q20 1Q20 2Q20 4Q20 Assets under Management in CHF bn, unless specified 213 195 202 205 209 Custody Assets2 in CHF bn, unless specified 63 42 48 50 54 Net loans in CHF bn, unless specified 113 117 118 118 118 386 328 345 352 365 114 71 82 89 100 56 50 51 53 52 257 204 227 237 251 116 49 66 82 107 46 44 42 42 44 12% (46)% 29% 17% 26% 21% (34)% 44% 28% 38% 1 Based on management data, estimates and assumptions 2 Includes assets under custody and commercial assets 3 Adjusted for CHF 13 bn structural NAB shift to SUB C&IC in January 2021, of which CHF 6 bn in net loans, CHF 4 bn in AuM and CHF 3 bn in AuC/commercial assets Assets under Management in USD bn Custody Assets2 in USD bn Net loans in USD bn

40 Corporate Center Note: Unless otherwise stated, all financial numbers presented and discussed are adjusted. Results excluding items included in our reported results are non-GAAP financial measures. For further details and reconciliation information, see Appendix 1 ‘Other revenues’ primarily include required elimination adjustments associated with trading in own shares, treasury commissions charged to divisions, the cost of certain hedging transactions executed in connection with the Group's RWAs and valuation hedging impacts from long-dated legacy deferred compensation and retirement programs mainly relating to former employees 3 Leverage exposure without the temporary exclusion of central bank reserves permitted by FINMA in 2020 ARU within Corp. Ctr. Adjusted key financials in CHF mn unless otherwise specified 1Q21 4Q20 1Q20 Net revenues (33) (50) (57) Provision for credit losses (1) - - Total operating expenses 36 50 37 Pre-tax income / (loss) (68) (100) (94) Risk-weighted assets in USD bn 9 10 9 RWA excl. operational risk in USD bn 8 9 7 Leverage exposure in USD bn 18 21 22 Corporate Center Key metrics in CHF bn 1Q21 4Q20 1Q20 Total assets 120 111 118 Risk-weighted assets 50 46 44 Leverage exposure 122 1173 1243 Corporate Center Adjusted key financials in CHF mn 1Q21 4Q20 1Q20 Treasury results 104 (32) (43) o/w Structured Notes Volatility 70 22 (279) Asset Resolution Unit (33) (50) (57) Other1 78 65 30 Net revenues 149 (17) (70) Provision for credit losses (9) 3 2 Compensation and benefits 39 140 (52) G&A expenses 90 196 78 Commission expenses 19 17 25 Total other operating expenses 109 213 103 Total operating expenses 148 353 51 Pre-tax income / (loss) 10 (373) (123) Reported pre-tax income / (loss) (2) (1,090) (140) April 22, 2021
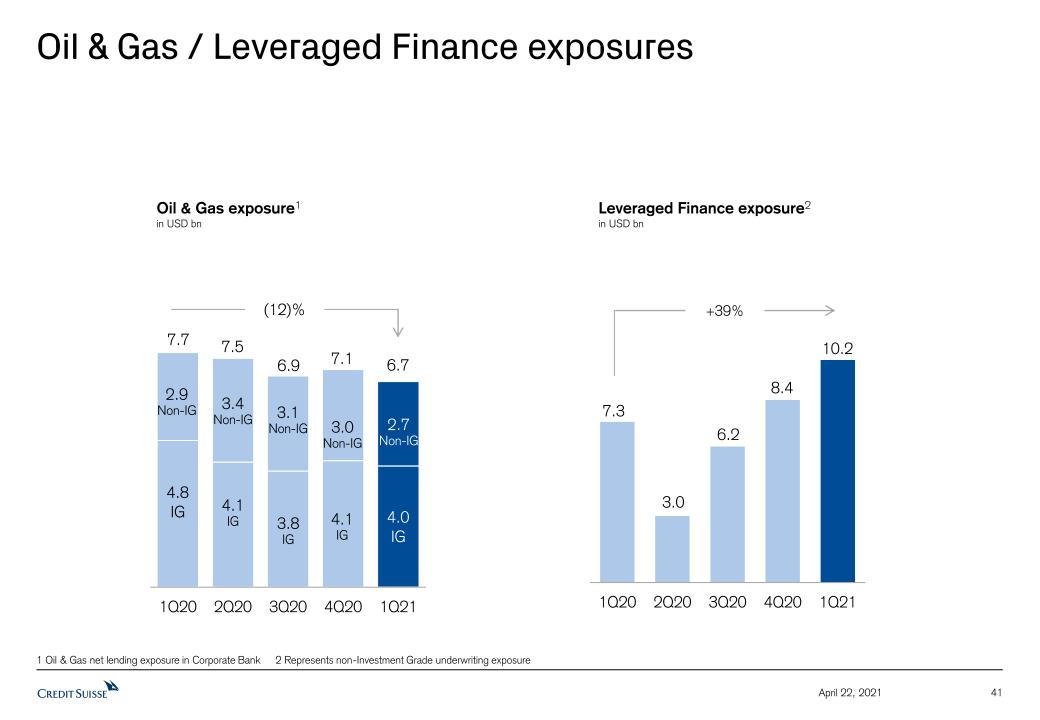
41 April 22, 2021 Oil & Gas / Leveraged Finance exposures Oil & Gas exposure1in USD bn Leveraged Finance exposure2in USD bn (12)% 1 Oil & Gas net lending exposure in Corporate Bank 2 Represents non-Investment Grade underwriting exposure 7.3 3.0 7.5 3.4Non-IG 4.1IG 6.2 6.9 3.1Non-IG 3.0Non-IG 3.8IG 7.1 4.1IG 8.4 2.7Non-IG 2.9Non-IG 7.7 10.2 6.7 +39%

42 April 22, 2021 Currency mix & Group capital metrics Currency mix capital metric3 A 10% strengthening / weakening of the USD (vs. CHF) would have a (3.8) bps / +4.4 bps impact on theBIS CET1 ratio Basel III Risk-weighted assets Swiss leverage exposure CHF EUR Other USD USD CET1 capital 4 CHF Credit Suisse Group results 1Q21 LTMin CHF mn Contribution Swiss Universal Bank International Wealth Management Asia Pacific Investment Bank Group results CHF USD EUR GBP Other Net revenues 24,187 25% 50% 11% 3% 11%Total expenses1 22,678 25% 51% 4% 8% 12% Net revenues 5,610 79% 12% 5% 1% 3%Total expenses1 3,372 81% 13% 3% 1% 2% Net revenues 4,733 22% 45% 22% 3% 8%Total expenses1 3,667 42% 28% 9% 9% 12% Net revenues 3,380 5% 61% 5% 2% 27%Total expenses1 2,246 13% 25% -% 1% 61% Net revenues 10,561 2% 69% 11% 5% 13%Total expenses1 11,456 3% 72% 3% 11% 11% Applying a +/- 10% movement on the average FX rates for 1Q21 LTM, the sensitivities are:USD/CHF impact on 1Q21 LTM pre-tax income by CHF +51 / (51) mnEUR/CHF impact on 1Q21 LTM pre-tax income by CHF +179 / (179) mn Sensitivity analysis on Group results2 1 Total expenses include provisions for credit losses 2 Sensitivity analysis based on weighted average exchange rates of USD/CHF of 0.83 and EUR/CHF of 1.08 for the 1Q21 LTM results 3 Data based on March 2021 month-end currency mix 4 Reflects actual capital positions in consolidated Group legal entities (net assets) including net asset hedges less applicable Basel III regulatory adjustments (e.g. goodwill)
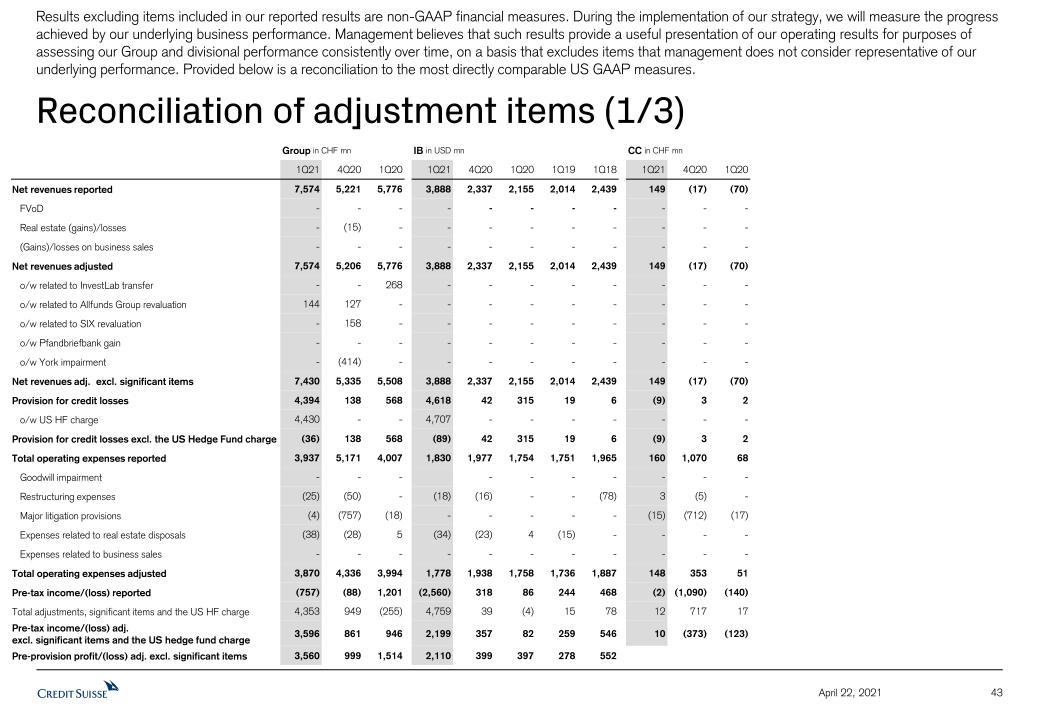
43 Reconciliation of adjustment items (1/3) Results excluding items included in our reported results are non-GAAP financial measures. During the implementation of our strategy, we will measure the progress achieved by our underlying business performance. Management believes that such results provide a useful presentation of our operating results for purposes of assessing our Group and divisional performance consistently over time, on a basis that excludes items that management does not consider representative of our underlying performance. Provided below is a reconciliation to the most directly comparable US GAAP measures. April 22, 2021 Group in CHF mn IB in USD mn CC in CHF mn 1Q21 4Q20 1Q20 1Q21 4Q20 1Q20 1Q19 1Q18 1Q21 4Q20 1Q20 Net revenues reported 7,574 5,221 5,776 3,888 2,337 2,155 2,014 2,439 149 (17) (70) FVoD - - - - - - - - - - - Real estate (gains)/losses - (15) - - - - - - - - - (Gains)/losses on business sales - - - - - - - - - - - Net revenues adjusted 7,574 5,206 5,776 3,888 2,337 2,155 2,014 2,439 149 (17) (70) o/w related to InvestLab transfer - - 268 - - - - - - - - o/w related to Allfunds Group revaluation 144 127 - - - - - - - - - o/w related to SIX revaluation - 158 - - - - - - - - - o/w Pfandbriefbank gain - - - - - - - - - - - o/w York impairment - (414) - - - - - - - - - Net revenues adj. excl. significant items 7,430 5,335 5,508 3,888 2,337 2,155 2,014 2,439 149 (17) (70) Provision for credit losses 4,394 138 568 4,618 42 315 19 6 (9) 3 2 o/w US HF charge 4,430 - - 4,707 - - - - - - - Provision for credit losses excl. the US Hedge Fund charge (36) 138 568 (89) 42 315 19 6 (9) 3 2 Total operating expenses reported 3,937 5,171 4,007 1,830 1,977 1,754 1,751 1,965 160 1,070 68 Goodwill impairment - - - - - - - - - - Restructuring expenses (25) (50) - (18) (16) - - (78) 3 (5) - Major litigation provisions (4) (757) (18) - - - - - (15) (712) (17) Expenses related to real estate disposals (38) (28) 5 (34) (23) 4 (15) - - - - Expenses related to business sales - - - - - - - - - - - Total operating expenses adjusted 3,870 4,336 3,994 1,778 1,938 1,758 1,736 1,887 148 353 51 Pre-tax income/(loss) reported (757) (88) 1,201 (2,560) 318 86 244 468 (2) (1,090) (140) Total adjustments, significant items and the US HF charge 4,353 949 (255) 4,759 39 (4) 15 78 12 717 17 Pre-tax income/(loss) adj. excl. significant items and the US hedge fund charge 3,596 861 946 2,199 357 82 259 546 10 (373) (123) Pre-provision profit/(loss) adj. excl. significant items 3,560 999 1,514 2,110 399 397 278 552
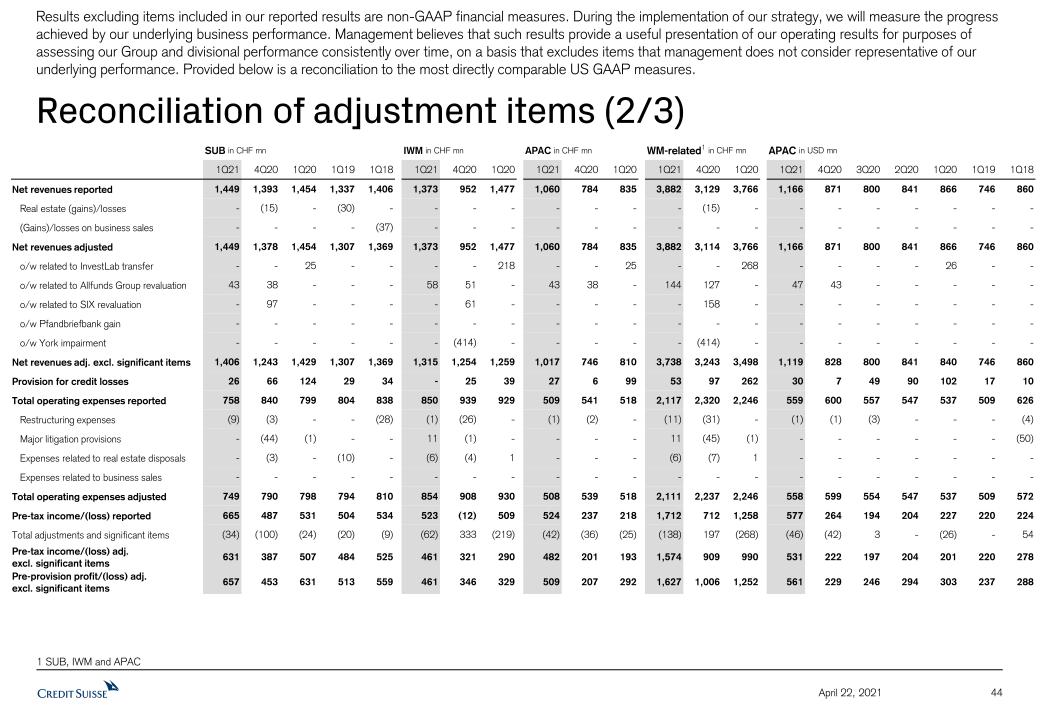
44 Reconciliation of adjustment items (2/3) Results excluding items included in our reported results are non-GAAP financial measures. During the implementation of our strategy, we will measure the progress achieved by our underlying business performance. Management believes that such results provide a useful presentation of our operating results for purposes of assessing our Group and divisional performance consistently over time, on a basis that excludes items that management does not consider representative of our underlying performance. Provided below is a reconciliation to the most directly comparable US GAAP measures. April 22, 2021 SUB in CHF mn IWM in CHF mn APAC in CHF mn WM-related1 in CHF mn APAC in USD mn 1Q21 4Q20 1Q20 1Q19 1Q18 1Q21 4Q20 1Q20 1Q21 4Q20 1Q20 1Q21 4Q20 1Q20 1Q21 4Q20 3Q20 2Q20 1Q20 1Q19 1Q18 Net revenues reported 1,449 1,393 1,454 1,337 1,406 1,373 952 1,477 1,060 784 835 3,882 3,129 3,766 1,166 871 800 841 866 746 860 Real estate (gains)/losses - (15) - (30) - - - - - - - - (15) - - - - - - - - (Gains)/losses on business sales - - - - (37) - - - - - - - - - - - - - - - - Net revenues adjusted 1,449 1,378 1,454 1,307 1,369 1,373 952 1,477 1,060 784 835 3,882 3,114 3,766 1,166 871 800 841 866 746 860 o/w related to InvestLab transfer - - 25 - - - - 218 - - 25 - - 268 - - - - 26 - - o/w related to Allfunds Group revaluation 43 38 - - - 58 51 - 43 38 - 144 127 - 47 43 - - - - - o/w related to SIX revaluation - 97 - - - - 61 - - - - - 158 - - - - - - - - o/w Pfandbriefbank gain - - - - - - - - - - - - - - - - - - - - - o/w York impairment - - - - - - (414) - - - - - (414) - - - - - - - - Net revenues adj. excl. significant items 1,406 1,243 1,429 1,307 1,369 1,315 1,254 1,259 1,017 746 810 3,738 3,243 3,498 1,119 828 800 841 840 746 860 Provision for credit losses 26 66 124 29 34 - 25 39 27 6 99 53 97 262 30 7 49 90 102 17 10 Total operating expenses reported 758 840 799 804 838 850 939 929 509 541 518 2,117 2,320 2,246 559 600 557 547 537 509 626 Restructuring expenses (9) (3) - - (28) (1) (26) - (1) (2) - (11) (31) - (1) (1) (3) - - - (4) Major litigation provisions - (44) (1) - - 11 (1) - - - - 11 (45) (1) - - - - - - (50) Expenses related to real estate disposals - (3) - (10) - (6) (4) 1 - - - (6) (7) 1 - - - - - - - Expenses related to business sales - - - - - - - - - - - - - - - - - - - - - Total operating expenses adjusted 749 790 798 794 810 854 908 930 508 539 518 2,111 2,237 2,246 558 599 554 547 537 509 572 Pre-tax income/(loss) reported 665 487 531 504 534 523 (12) 509 524 237 218 1,712 712 1,258 577 264 194 204 227 220 224 Total adjustments and significant items (34) (100) (24) (20) (9) (62) 333 (219) (42) (36) (25) (138) 197 (268) (46) (42) 3 - (26) - 54 Pre-tax income/(loss) adj. excl. significant items 631 387 507 484 525 461 321 290 482 201 193 1,574 909 990 531 222 197 204 201 220 278 Pre-provision profit/(loss) adj.excl. significant items 657 453 631 513 559 461 346 329 509 207 292 1,627 1,006 1,252 561 229 246 294 303 237 288 1 SUB, IWM and APAC

45 Reconciliation of adjustment items (3/3) Results excluding items included in our reported results are non-GAAP financial measures. During the implementation of our strategy, we will measure the progress achieved by our underlying business performance. Management believes that such results provide a useful presentation of our operating results for purposes of assessing our Group and divisional performance consistently over time, on a basis that excludes items that management does not consider representative of our underlying performance. Provided below is a reconciliation to the most directly comparable US GAAP measures. April 22, 2021 SUB PC in CHF mn SUB C&IC in CHF mn IWM PB in CHF mn IWM AM in CHF mn 1Q21 4Q20 3Q20 2Q20 1Q20 1Q21 4Q20 1Q20 1Q21 4Q20 3Q20 2Q20 1Q20 1Q19 1Q18 1Q21 4Q20 1Q20 1Q19 1Q18 Net revenues reported 737 750 700 836 769 712 643 685 987 974 836 905 1,032 989 1,022 386 (22) 445 401 363 Real estate (gains)/losses - (15) - - - - - - - - - - - - - - - - - - (Gains)/losses on business sales - - - - - - - - - - - - - - (37) - - - - 1 Net revenues adjusted 737 735 700 836 769 712 643 685 987 974 836 905 1,032 989 985 386 (22) 445 401 364 o/w related to InvestLab transfer - - - - - - - 25 - - - - 15 - - - - 203 - - o/w related to Allfunds Group revaluation - - - - - 43 38 - 58 51 - - - - - - - - - - o/w related to SIX revaluation - 47 - - - - 50 - - 61 - - - - - - - - - - o/w Pfandbriefbank gain - - - 134 - - - - - - - - - - - - - - - - o/w York impairment - - - - - - - - - - - - - - - - (414) - - - Net revenues adj. excl. significant items 737 688 700 702 769 669 555 660 929 862 836 905 1,017 989 985 386 392 242 401 364 Provision for credit losses 5 17 5 28 12 21 49 112 - 31 8 32 39 10 - - (6) - - - Total operating expenses reported 451 476 495 464 478 307 364 321 579 650 631 617 648 609 643 271 289 281 279 279 Restructuring expenses (5) 1 (36) - - (4) (4) - - (21) (16) - - - (18) (1) (5) - - (8) Major litigation provisions - - - - - - (44) (1) 11 (1) (20) 32 - 27 - - - - - - Expenses related to real estate disposals - (3) - - - - - - (5) (3) (3) - 1 (8) - (1) (1) - (2) - Expenses related to business sales - - - - - - - - - - - - - - - - - - - - Total operating expenses adjusted 446 474 459 464 478 303 316 320 585 625 592 649 649 628 625 269 283 281 277 271 Pre-tax income/(loss) reported 281 257 200 344 279 384 230 252 408 293 197 256 345 370 379 115 (305) 164 122 84 Total adjustments and significant items 5 (60) 36 (134) - (39) (40) (24) (64) (87) 39 (32) (16) (19) (19) 2 420 (203) 2 9 Pre-tax income/(loss) adj.excl. significant items 286 197 236 210 279 345 190 228 344 206 236 224 329 351 360 117 115 (39) 124 93 Pre-provision profit/(loss) adj.excl. significant items 291 214 241 238 291 366 239 340 344 237 244 256 368 361 360 117 109 (39) 124 93
Notes 46 April 22, 2021 General notesThroughout the presentation rounding differences may occurUnless otherwise noted, all CET1 capital, CET1 ratio, Tier 1 leverage ratio, risk-weighted assets and leverage exposure figures shown in this presentation are as of the end of the respective period and, for periods prior to 2019, on a “look-through” basisBanking means capital markets & advisoryGross and net margins are shown in basis pointsGross margin = net revenues annualized / average AuM; net margin = pre-tax income annualized / average AuM. Net margin excluding certain significant items, as disclosed herein, is calculated excluding those items applying the same methodologyMandate penetration reflects advisory and discretionary mandate volumes as a percentage of AuM, excluding those from the external asset manager businessUnless otherwise noted, FX impact is calculated by converting the CHF amount of net revenues, provision for credit losses and operating expenses for 2021 back to the original currency on a monthly basis at the respective spot FX rate. The respective amounts are then converted back to CHF applying the average 2020 FX rate from the period against which the FX impact is measured. Average FX rates apply a straight line average of monthly FX rates for major currenciesWealth Management businesses include SUB PC, IWM PB and APAC and related figures refer to their combined resultsWealth Management-related businesses include SUB, IWM and APAC and related figures refer to their combined resultsPre-provision profit refers to pre-tax income excluding provision for credit lossesClient Business Volume includes assets under management, custody assets and net loansGreensill refers to Greensill Capital (UK) Ltd. or one of its affiliates Specific notes† Prior to 3Q20, regulatory capital was calculated as the worst of 10% of RWA and 3.5% of leverage exposure and return on regulatory capital (a non-GAAP financial measure) was calculated using income / (loss) after tax and assumed a tax rate of 30%. In 3Q20, we updated our calculation approach, following which regulatory capital is calculated as the average of 10% of RWA and 3.5% of leverage exposure and return on regulatory capital (a non-GAAP financial measure) is calculated using income / (loss) after tax and assumes a tax rate of 30% for periods prior to 2020 and 25% from 2020 onwards. For periods in 2020, for purposes of calculating Group return on regulatory capital, leverage exposure excludes cash held at central banks, after adjusting for the dividend paid in 2020. For the Investment Bank division, return on regulatory capital is based on US dollar denominated numbers. Adjusted return on regulatory capital is calculated using adjusted results, applying the same methodology to calculate return on regulatory capital.‡ Return on tangible equity, a non-GAAP financial measure, is calculated as annualized net income attributable to shareholders divided by average tangible shareholders’ equity. Tangible shareholders’ equity, a non-GAAP financial measure, is calculated by deducting goodwill and other intangible assets from total shareholders’ equity as presented in our balance sheet. Tangible book value, a non-GAAP financial measure, is equal to tangible shareholders’ equity. Tangible book value per share, a non-GAAP financial measure, is calculated by dividing tangible shareholders' equity by total number of shares outstanding. Management believes that tangible shareholders’ equity/tangible book value, return on tangible equity and tangible book value per share are meaningful as they are measures used and relied upon by industry analysts and investors to assess valuations and capital adequacy.For end-1Q20, tangible shareholders’ equity excluded goodwill of CHF 4,604 mn and other intangible assets of CHF 279 mn from total shareholders’ equity of CHF 48,675 mn as presented in our balance sheet. For end-4Q20, tangible shareholders’ equity excluded goodwill of CHF 4,426 mn and other intangible assets of CHF 237 mn from total shareholders’ equity of CHF 42,677 mn as presented in our balance sheet.For end-1Q21, tangible shareholders’ equity excluded goodwill of CHF 4,644 mn and other intangible assets of CHF 239 mn from total shareholders’ equity of CHF 44,590 mn as presented in our balance sheet.Shares outstanding were 2,406.1 mn at end-4Q20 and 2,364.0 mn at end-1Q21.
47 April 22, 2021 AbbreviationsAdj. = Adjusted; AM = Asset Management; APAC = Asia Pacific; AuC = Assets under Custody; AuM = Assets under Management; BCBS = Basel Committee on Banking Supervision; BIS = Bank for International Settlements; BoD = Board of Directors; bps = basis point; C&IC = Corporate & Institutional Clients; CBV = Client Business Volume; CECL = Current Expected Credit Losses; CEO = Chef Executive Officer; CET1 = Common Equity Tier 1; CM&A = Capital Markets & Advisory and other fees; Comm. assets = Commercial assets; Comp = Compensation; Corp. = Corporate; COVID-19 = Coronavirus disease 2019; CSAM = Credit Suisse Asset Management; Ctr. = Center; ex- = excluding; excl. = excluding; FINMA = Swiss Financial Market Supervisory Authority; FX = Foreign Exchange; GAAP = Generally Accepted Accounting Principles; HF = Hedge Fund; IB = Investment Bank; Inv. = Investment; IPO = Initial Public Offering; IWM = International Wealth Management; M&A = Mergers & Acquisitions; MCN = Mandatory Convertible Note; NAB = Neue Aargauer Bank; NAV = Net asset value; NNA = Net New Assets; OpRisk = Operational risk; PB = Private Banking; PC = Private Clients; PCL = Provision for credit losses; Perf. = performance; pp. = percentage points; PTI = Pre-tax income; QoQ = Quarter on Quarter; rev. = revenues; RoRC = Return on Regulatory Capital; RWA = Risk-weighted assets; SCF = Supply Chain Finance; sign. = significant; SUB = Swiss Universal Bank; TBVPS = Tangible Book Value Per Share; U/HNW = (Ultra) High Net Worth; US HF = US-based hedge fund; vs. = versus; VWAP = Volume-Weighted Average Price WM = Wealth Management; YoY = Year on year

April 22, 2021 48
Signatures
Pursuant to the requirements of the Securities Exchange Act of 1934, the registrants have duly caused this report to be signed on their behalf by the undersigned, thereunto duly authorized.
CREDIT SUISSE GROUP AG and CREDIT SUISSE AG
(Registrants)
Date: April 22, 2021
By:
/s/ Thomas Gottstein /s/ David R. Mathers
Thomas Gottstein David R. Mathers
Chief Executive Officer Chief Financial Officer