This report includes the media release and the slides for the presentation to investors in connection with the 2Q21 results.
Ad hoc announcement pursuant to article 53 LR
Credit Suisse posts CET1 ratio of 13.7% and pre-tax income of CHF 813 mn in 2Q21
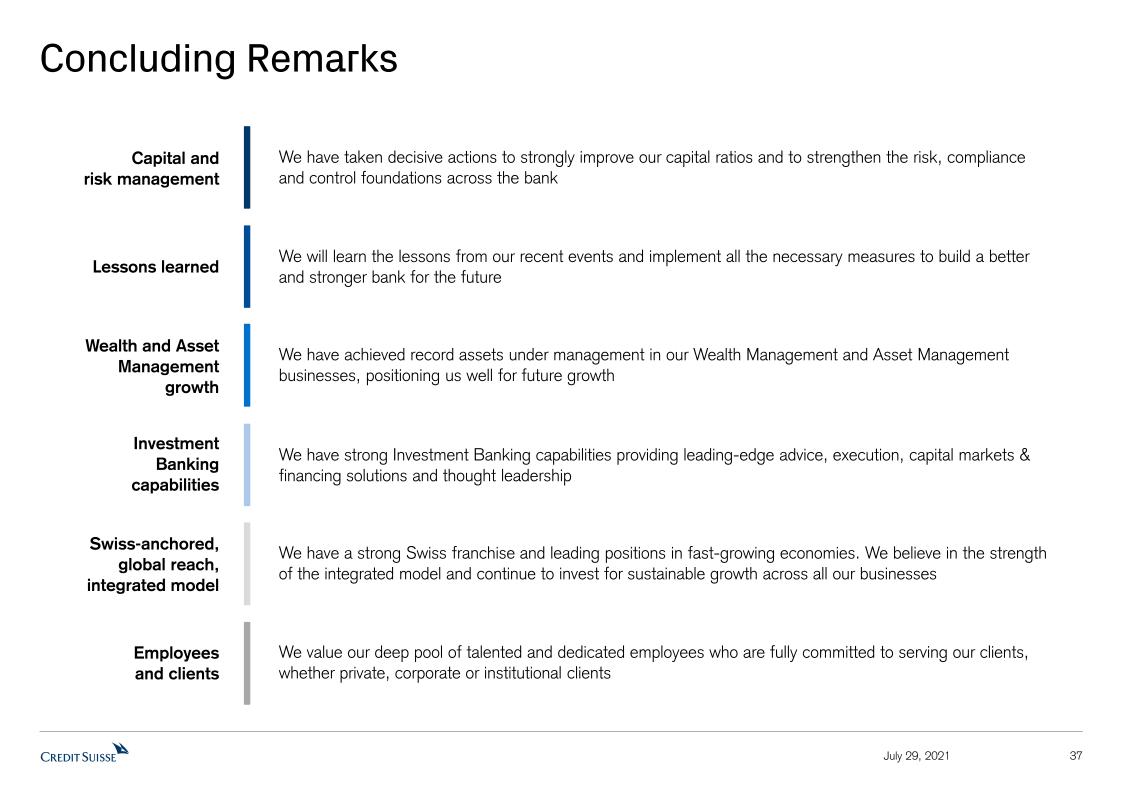
“Credit Suisse delivered resilient underlying second quarter results and strong capital ratios as we are benefitting from having taken decisive actions to address the challenges raised by the Archegos and Supply Chain Finance Funds matters. We take these two events very seriously and we are determined to learn all the right lessons. We have significantly reduced our RWA and leverage exposure and improved the risk profile of our Prime Services business in the Investment Bank, as well as strengthened the overall risk capabilities across the bank. Our underlying business performance remains solid with a record level of assets under management in our Wealth Management and Asset Management businesses, supporting strong growth in recurring commissions and fees. Together with our more conservative approach to risk and a less favorable trading environment compared to the second quarter of 2020, we delivered a resilient underlying performance in the Investment Bank. We continue to invest in people and technology across Wealth Management, notably in APAC, as well as Asset Management and the Investment Bank. Over the coming months, we will continue to develop our long-term vision for the bank that will serve as our compass for the years ahead. Our objectives are clear: whilst we aim to further strengthen our risk culture, we remain committed to serving all our private, corporate and institutional clients with best-in-class service and advice and to creating value for our shareholders.” Thomas Gottstein, Chief Executive Officer of Credit Suisse Group AG |
Credit Suisse Group Reported Results (CHF mn, unless otherwise specified) | 2Q21 | 1Q21 | 2Q20 | ∆2Q20 | | 1H21 | 1H20 | ∆1H20 |
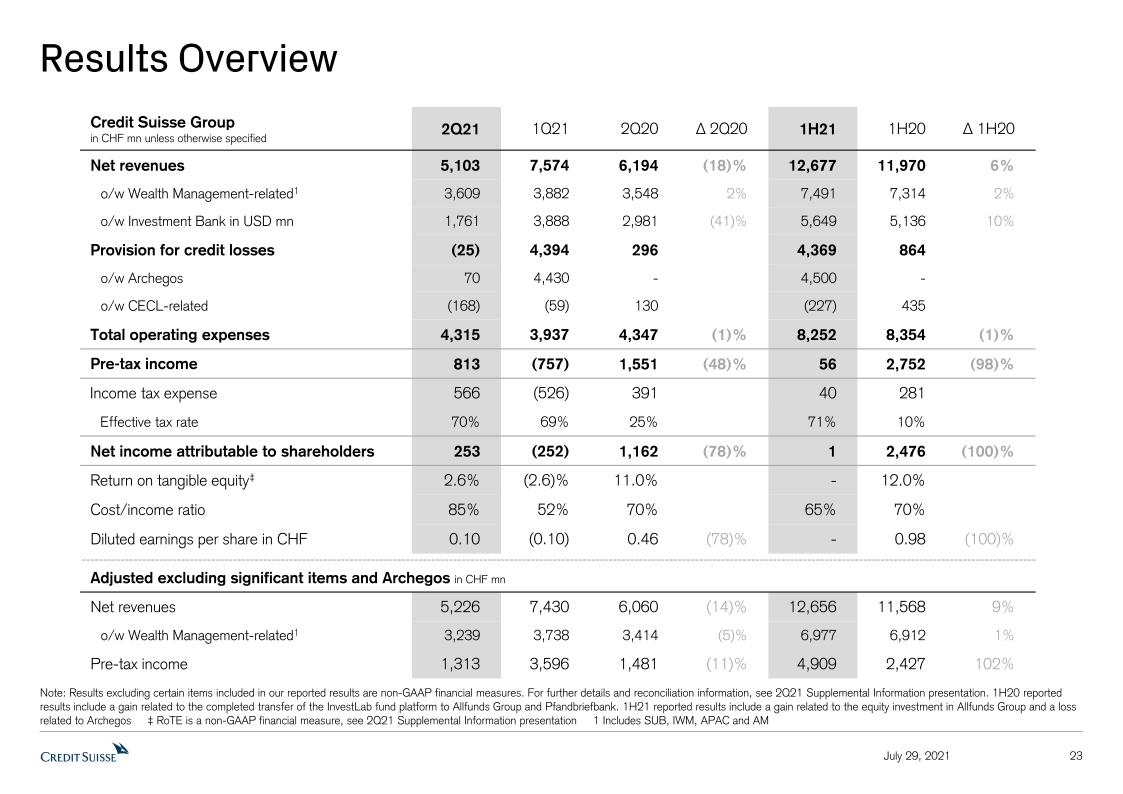
| Net revenues | 5,103 | 7,574 | 6,194 | (18)% | 12,677 | 11,970 | 6% |
| o/w Wealth Management-related | 3,609 | 3,882 | 3,548 | 2% | 7,491 | 7,314 | 2% |
| o/w Investment Bank in USD mn | 1,761 | 3,888 | 2,981 | (41)% | 5,649 | 5,136 | 10% |
| Provision for credit losses | (25) | 4,394 | 296 | - | 4,369 | 864 | - |
| Total operating expenses | 4,315 | 3,937 | 4,347 | (1)% | 8,252 | 8,354 | (1)% |
| Pre-tax income / (loss) | 813 | (757) | 1,551 | (48)% | 56 | 2,752 | (98)% |
| Net income / (loss) attributable to shareholders | 253 | (252) | 1,162 | (78)% | 1 | 2,476 | (100)% |
| Return on tangible equity attributable to shareholders | 2.6% | (2.6)% | 11.0% | - | 0.0% | 12.0% | - |
| CET1 ratio | 13.7% | 12.2% | 12.5% | - | 13.7% | 12.5% | - |
Tier 1 leverage ratio1 | 6.0% | 5.5% | 6.2% | - | 6.0% | 6.2% | - |
| Adjusted excluding significant items and Archegos* (CHF mn) | 2Q21 | 1Q21 | 2Q20 | ∆2Q20 | 1H21 | 1H20 | ∆1H20 |
| Net revenues | 5,226 | 7,430 | 6,060 | (14)% | 12,656 | 11,568 | 9% |
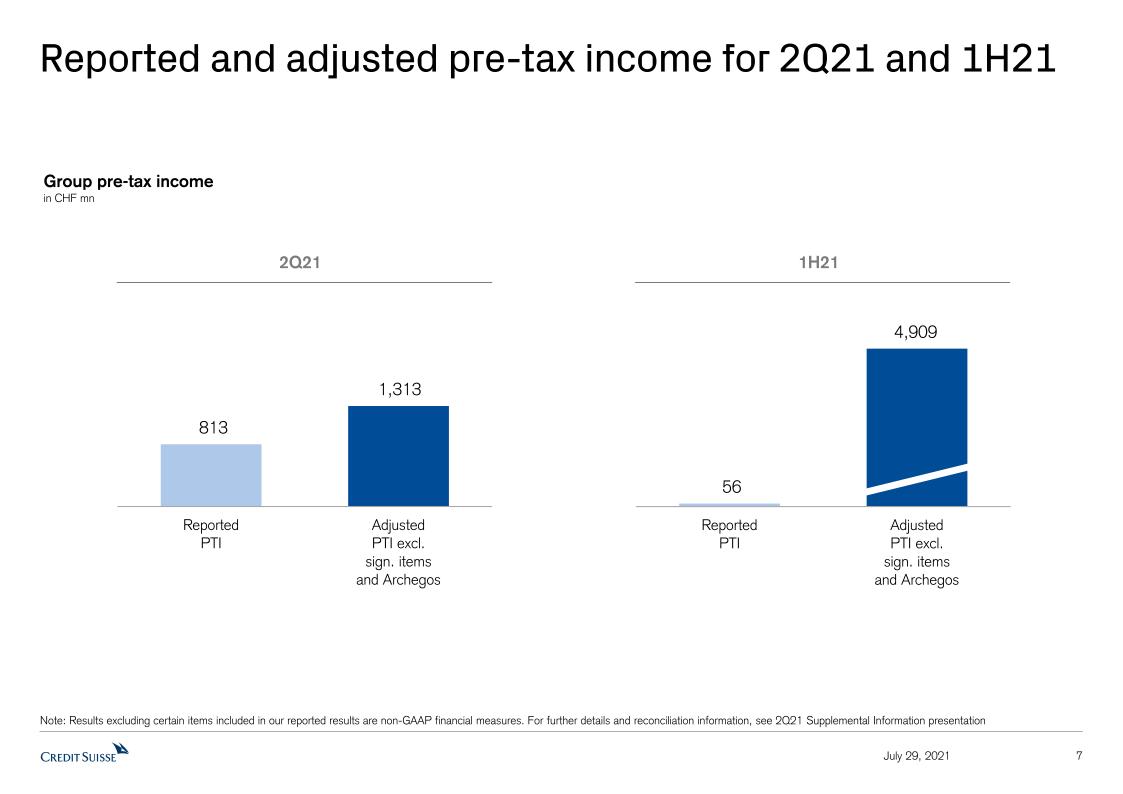
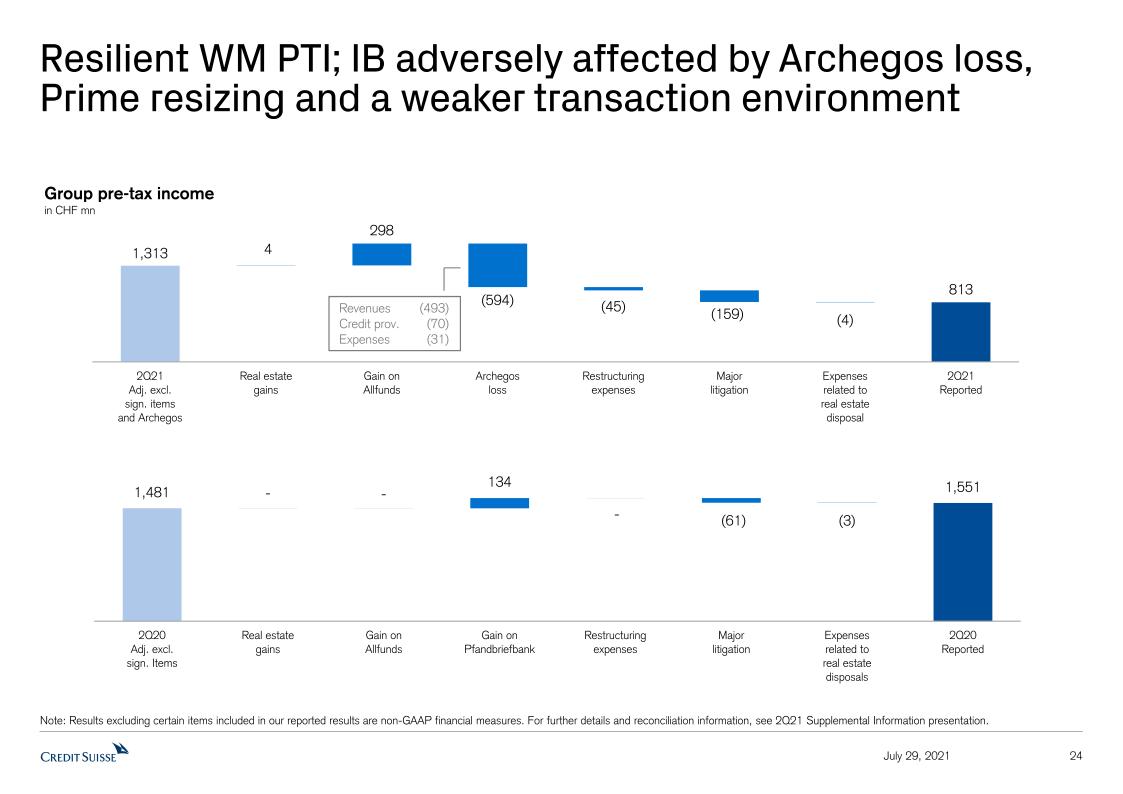
| Pre-tax income | 1,313 | 3,596 | 1,481 | (11)% | 4,909 | 2,427 | 102% |
Highlights for the second quarter 2021
Resilient financial performance despite more conservative risk appetite and weaker environment for transactions vs 2Q20
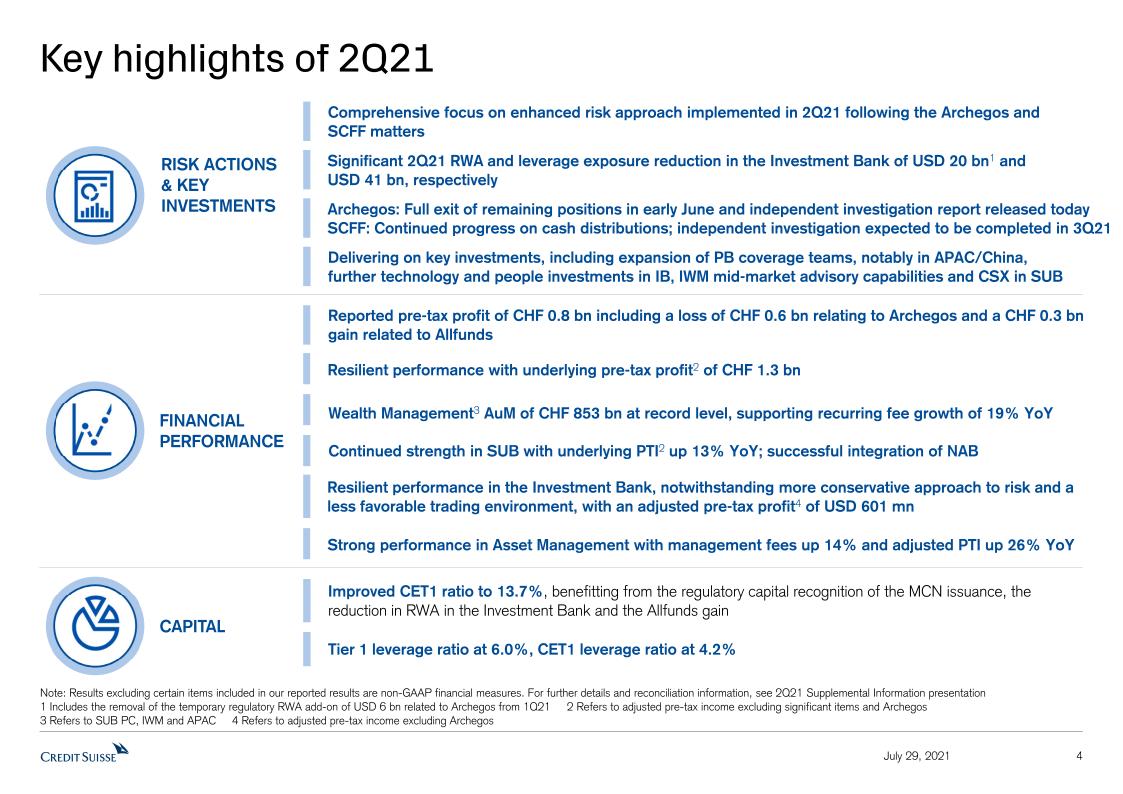
| - | Reported net income attributable to shareholders of CHF 253 mn and reported pre-tax income of CHF 813 mn. Adjusted pre-tax income, excluding significant items and Archegos*, of CHF 1.3 bn, 11% lower than 2Q20 |
| - | Adjusted net revenues, excluding significant items and Archegos*, down 14% year on year as higher AM revenues and stable SUB revenues, were offset by lower APAC, IWM and IB revenues |
| - | Adjusted operating expenses, excluding significant items and Archegos*, down 6% year on year, mainly driven by lower variable compensation |
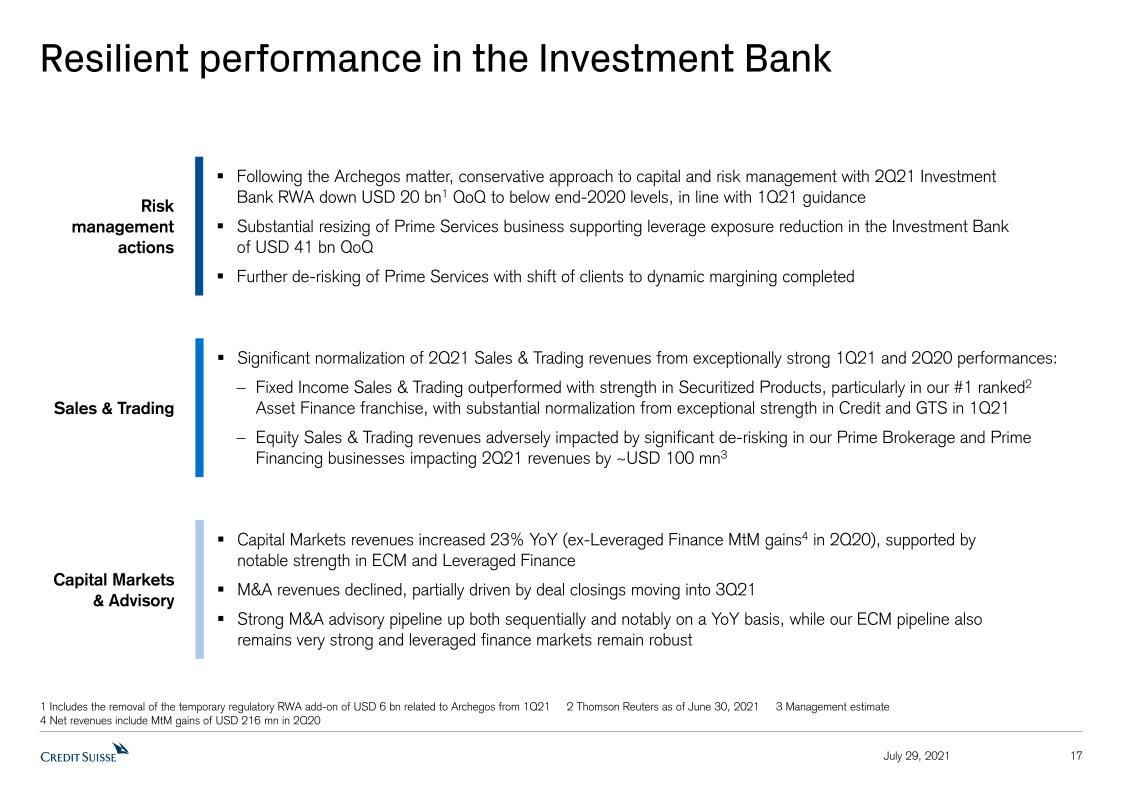
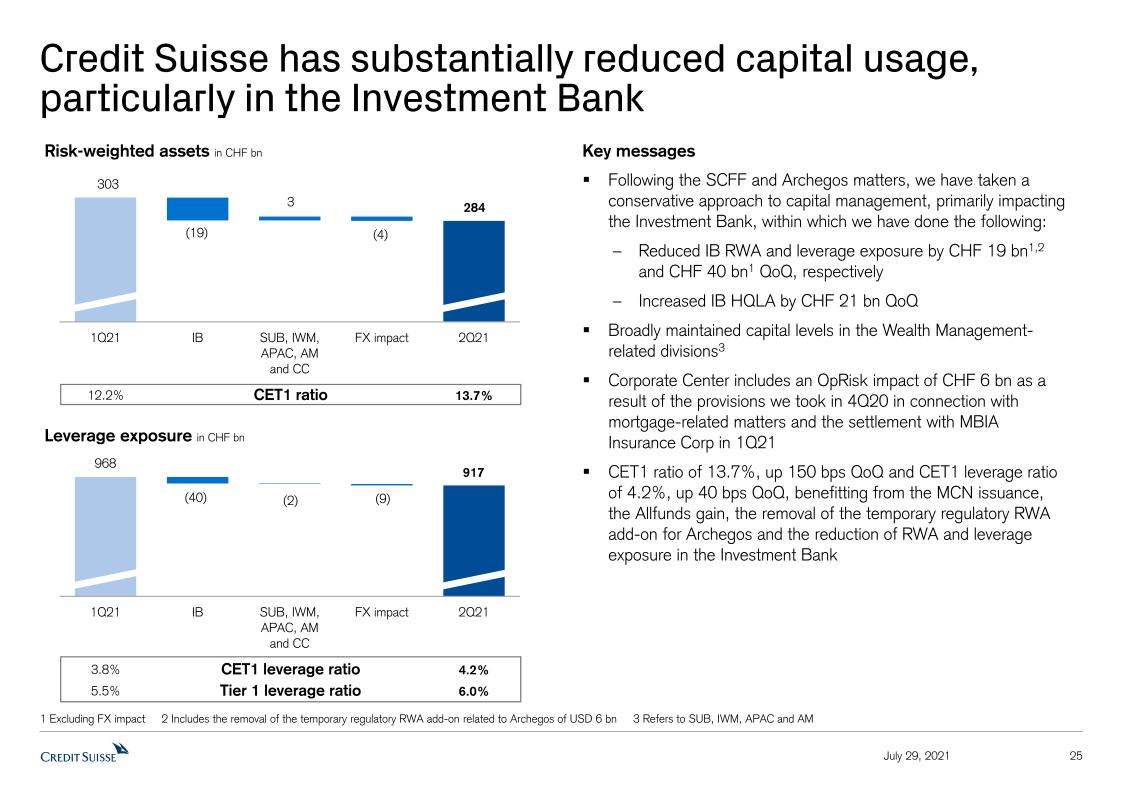
| - | Comprehensive focus on enhanced risk approach implemented in 2Q21 following the Archegos and supply chain finance funds (SCFF) matters and substantial reduction in RWA and leverage exposure in the Investment Bank by USD 20 bn and USD 41 bn, respectively, compared to end of 1Q21 levels |
| - | Additional pre-tax losses of USD 653 mn (CHF 594 mn) relating to Archegos; publication of an independent external investigation report commissioned by the Board of Directors (see separate media release) |
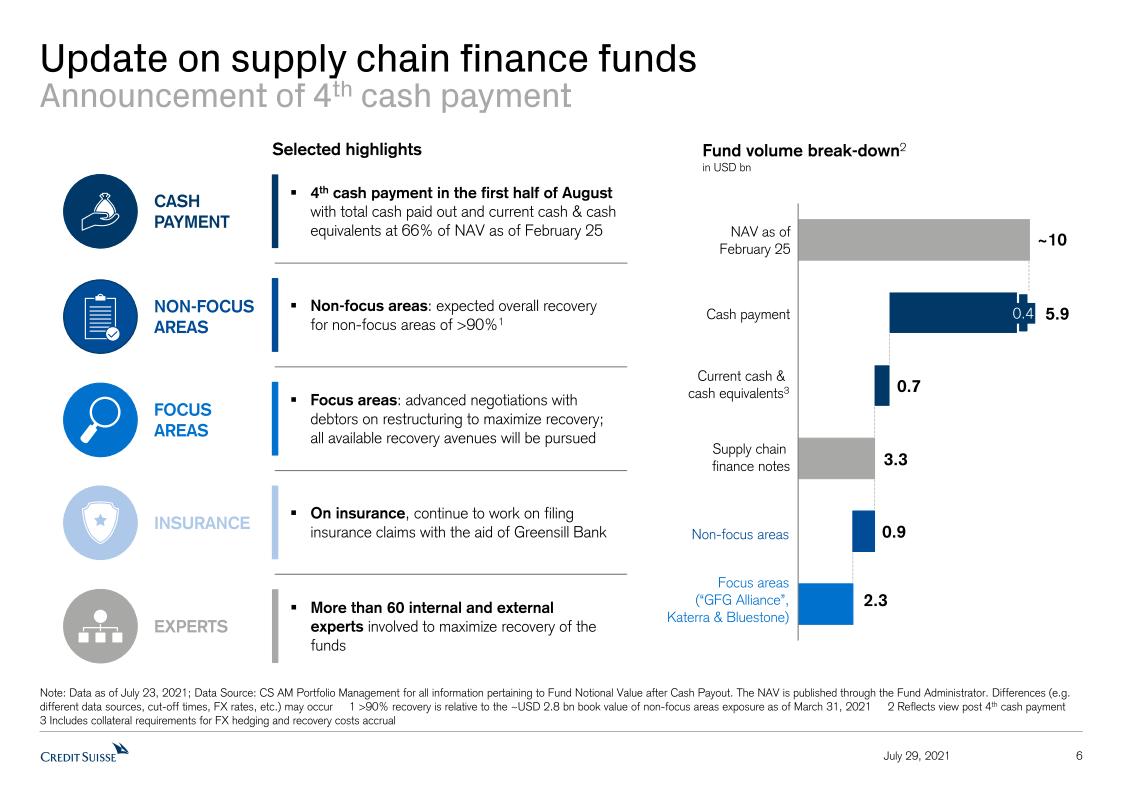
| - | Focus on returning cash to investors in the SCFF with investors receiving a total of approximately USD 5.9 bn following the upcoming fourth payment of liquidation proceeds planned for the first half of August 2021 |
Page 1
Media Release Zurich, July 29, 2021 | |
Strong capital position and higher Assets under Management (AuM)
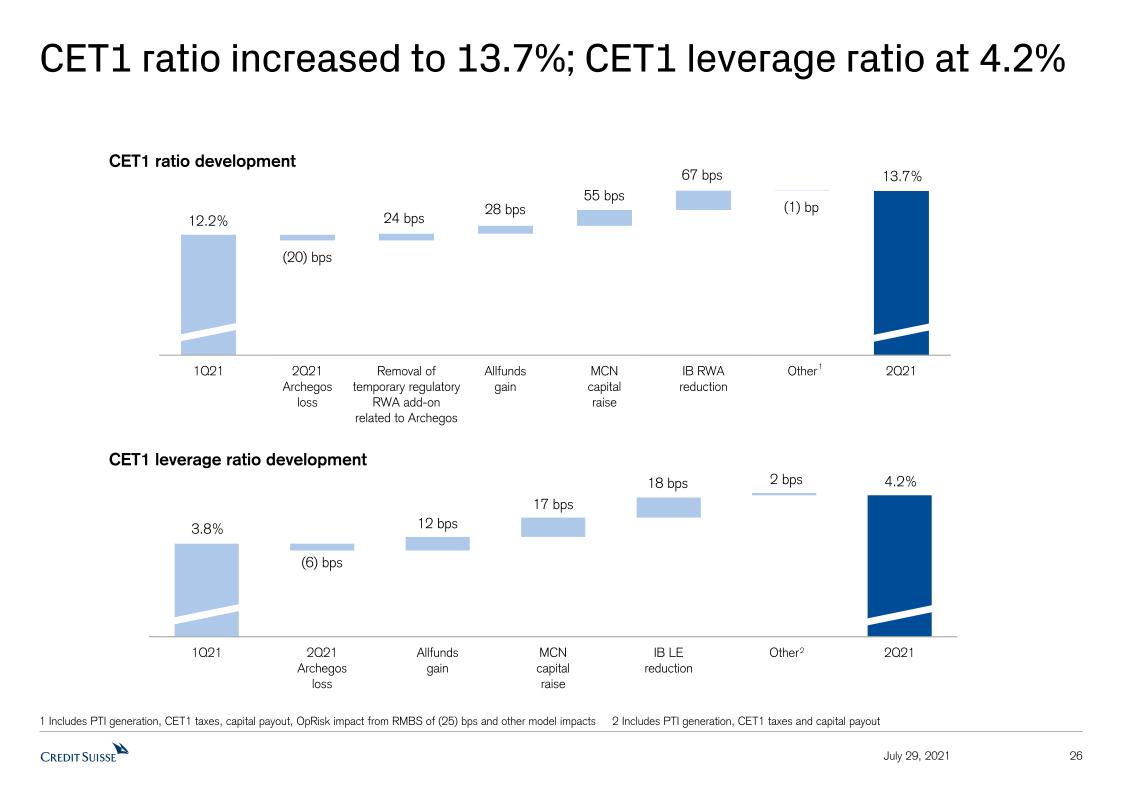
| - | Strong capital base, with CET1 ratio at 13.7%, benefitting from Mandatory Convertible Notes (MCN) issuance, the impact from the Allfunds Group IPO combined with the reduction in our investment to less than 10%, a proactive reduction in RWA in the IB and the removal of the temporary RWA add-on related to Archegos; Tier 1 leverage ratio has risen to 6.0%; CET1 leverage ratio stands at 4.2% |
| - | Joint Board of Directors and Executive Board long-term vision and mid-term plan expected to be finalized by the end of the year |
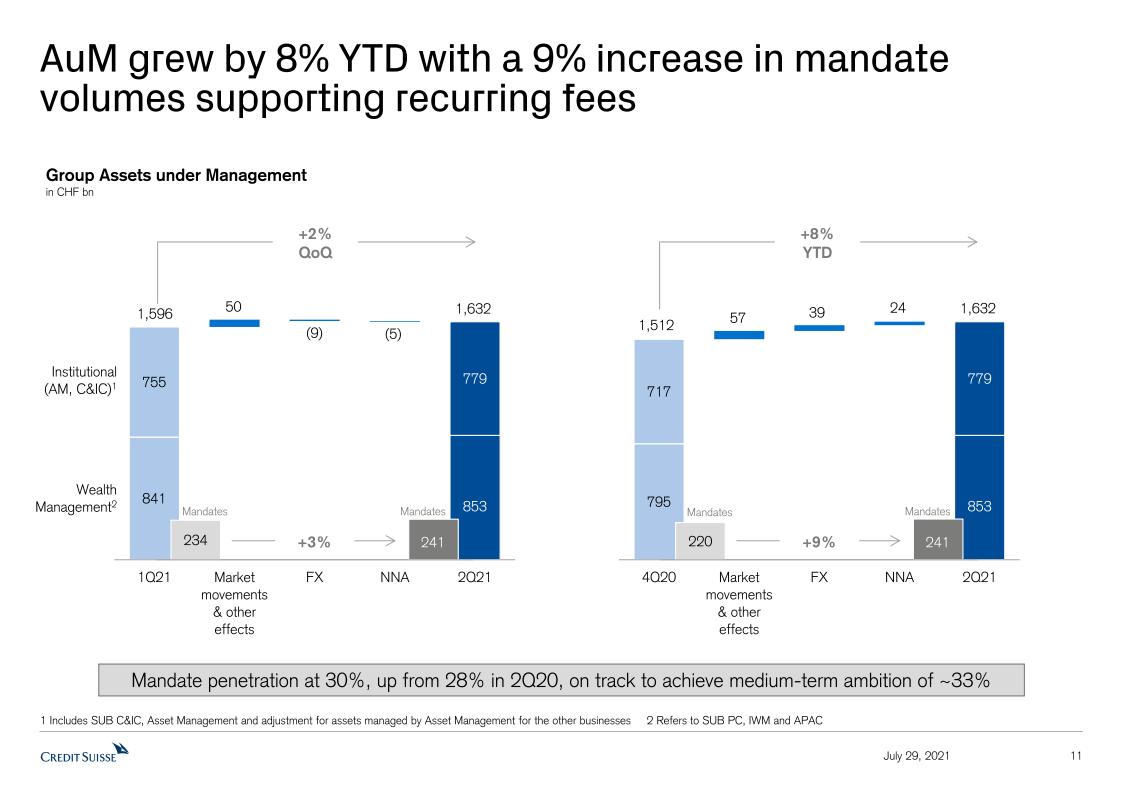
| - | Record Group Assets under Management (AuM) of over CHF 1.6 trn at the end of 2Q21; net asset outflows of CHF 4.7 bn with net new assets in SUB and AM more than offset by net asset outflows in APAC, mainly driven by proactive de-risking, and a small net asset outflow in IWM |
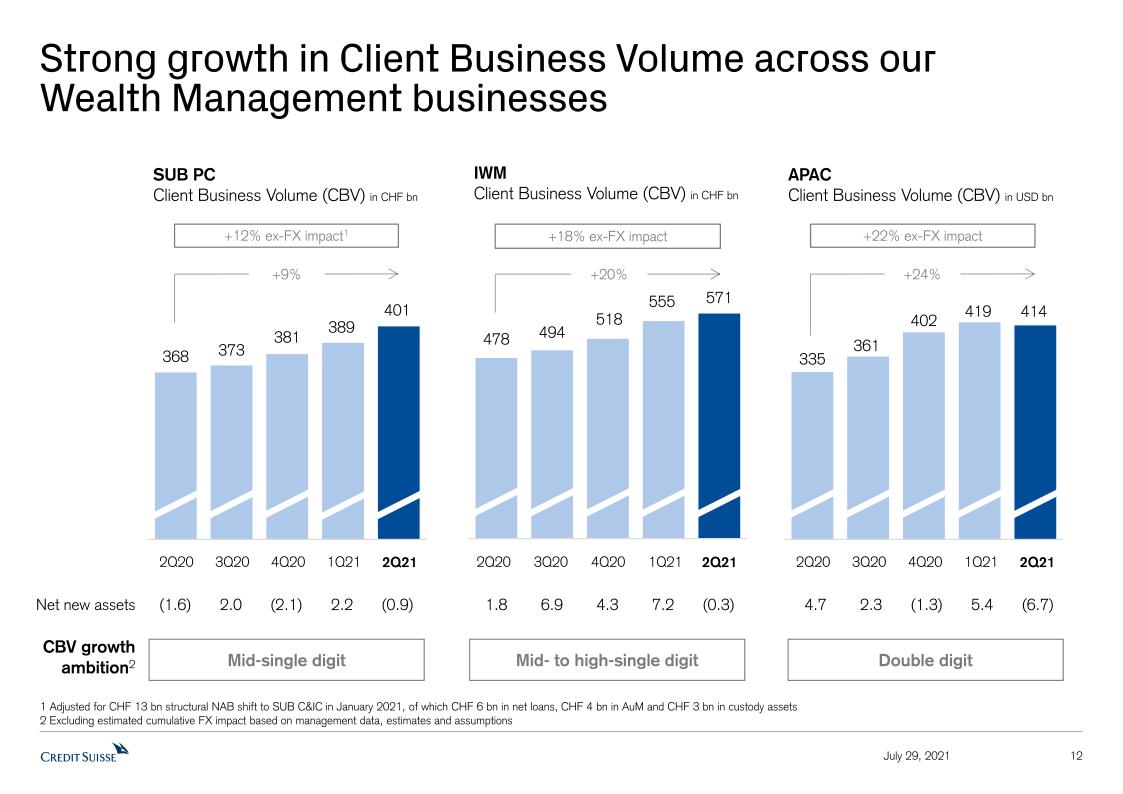
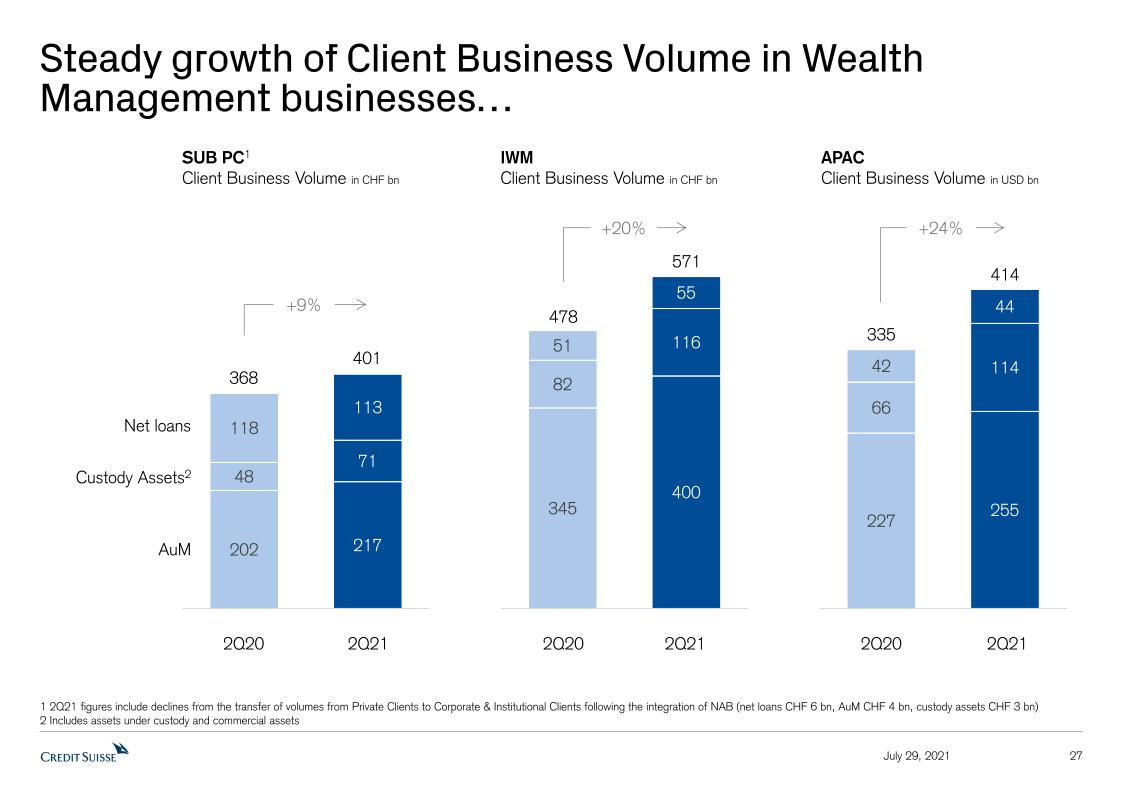
| - | Record Wealth Management AuM at CHF 853 bn, supporting recurring commissions and fees’ growth of 19% year on year; client business volumes at higher levels |
Highlights for the first half 2021
- | Despite the challenging first half, a total Archegos-related loss of CHF 5.0 bn and our more conservative approach to risk, we concluded the period with a positive pre-tax income of CHF 56 mn; this demonstrates the underlying resilience of our franchise |
- | Adjusted pre-tax income, excluding significant items and Archegos*, doubled year on year to CHF 4.9 bn, driven by growth in adjusted pre-tax income, excluding significant items and Archegos*, across all divisions; a net release of CHF 227 mn in CECL-related provision for credit losses; as well as lower adjusted operating expenses, excluding significant items and Archegos*, down 5% |
- | Adjusted net revenues, excluding significant items and Archegos*, up 9% year on year, at CHF 12.7 bn, driven by underlying2 growth in APAC, IB and AM |
- | NNA of CHF 23.7 bn compared to CHF 15.6 bn in 1H20 across the Group; NNA of CHF 7.1 bn across Wealth Management businesses in 1H21, compared to CHF 7.2 bn in 1H20 |
Outlook
Overall, we continue to expect more normal levels of market volumes in the coming quarters of 2021 compared to the elevated levels seen in 2020. Furthermore, for the course of the ongoing review of the Group’s business strategy, we expect to continue to adopt a more conservative approach to risk.
In Wealth Management, we expect recurring commissions and fees to continue to benefit from higher levels of AuM as well as increased levels of mandate penetration, together with broadly stable net interest income. For the Investment Bank, we would expect the third quarter to reflect the usual seasonal slowdown in market activity, as well as some further impact from the resizing of our Prime Services business. We have a strong M&A advisory pipeline up both sequentially and notably on a year on year basis and our pipelines across ECM and leveraged finance are also robust.
The ongoing recovery in the global economy could allow us to continue to release part of our allowance for credit losses, which was built in the early months of the COVID-19 crisis last year, under the CECL accounting methodology. As we noted at the end of the first quarter, we would, though, expect the effective tax rate to remain significantly elevated for the remainder of the year. Following significant strengthening of our capital ratios in 2Q21, we continue to intend to operate with a CET1 ratio of at least 13% and a CET1 leverage ratio of at least 4%.
ARCHEGOS AND SUPPLY CHAIN FINANCE FUNDS UPDATE
The Board of Directors commissioned two externally led investigations into the Archegos and supply chain finance funds matters, both of which were supervised by a special committee. The investigation into the supply chain finance funds matter is still ongoing and is expected to be completed in 3Q21. Today we announced the outcome of the independent investigation into the Archegos matter and published the full externally-led report commissioned by the Board of Directors’ special committee. A summary of the findings can be found in the separate media release published at 06.45 CEST on July 29, 2021.
Select key findings from the independent investigation into Archegos include failure to:
| - | Effectively manage risk in our Prime Services business by both first and second lines of defense |
| - | Escalate risks and to control limit excesses across first and second lines of defense |
| - | Discharge supervisory responsibilities across first and second lines of defense |
Page 2
Media Release Zurich, July 29, 2021 | |
| - | Prioritize risk mitigation and enhancement measures (including dynamic margining) |
However, the investigation also found that, this was not a situation where the business and risk personnel engaged in fraudulent or illegal conduct or acted with ill intent. Nor was it one where the architecture of risk controls and processes was lacking, or the existing risk systems failed to operate sufficiently to identify critical risks and related concerns.
Of the selected key recommendations presented by the independent authors of the report, we have completed or are in progress of completing the following:
| - | Change leadership in the Investment Bank, including Prime Services, and Risk |
| - | Invest in additional resources to improve risk management |
| - | Clearly define roles, responsibilities and accountability |
| - | Strengthen existing processes to protect Credit Suisse from risk |
| - | Re-examine counterparty risk appetite and controls |
| - | Improve quality of risk information and access |
| - | Conduct a read-across and further improve risk culture |
All of the remaining long and short positions in Archegos were exited in early June and Credit Suisse took appropriate HR-related actions, including terminations and monetary penalties. The financial impact of Archegos on Credit Suisse’s pre-tax income was CHF 594 mn (USD 653 mn) in 2Q21 and CHF 5.0 bn in 1H21. Moreover, Credit Suisse reserves its right to pursue claims against various third parties.
On the SCFF matter, returning cash to investors and maximizing recoveries remain CSAM’s top priority. Taking into account the upcoming fourth distribution, planned for the first half of August, of approximately USD 0.4 bn, the total cash distribution to investors will stand at approximately USD 5.9 bn. Together with the cash distributed to date and cash remaining in the funds, the cash position is equivalent to approximately USD 6.6 bn, or 66%, of the funds’ net asset value at the time of their suspension. With regard to the three ‘focus’ areas3, where we expect recovery to be more complex and take more time, we are in advanced negotiations with certain debtors on restructuring to maximize recovery, and we have set up dedicated teams of more than 60 internal and external experts as part of our efforts to maximize and expedite asset recovery. In respect of our non-focus areas, we expect overall recovery of more than 90%4. Finally, on insurance, we continue to work on filing insurance claims with the aid of Greensill Bank.
2Q21 Results – Review of Performance
We posted a pre-tax income of CHF 813 mn in 2Q21 and a net income attributable to shareholders of CHF 253 mn, impacted by a significantly elevated effective tax rate. We expect the tax rate to remain at a significantly elevated level for the remainder of the year due to only a partial tax recognition of the Archegos loss. We also recorded a release in provision for credit losses of CHF 25 mn, including CHF 168 mn of CECL-related releases primarily reflecting the continued improved macroeconomic outlook. Our reported results include pre-tax losses of USD 653 mn (CHF 594 mn) relating to Archegos as well as a pre-tax gain related to our equity investment in Allfunds Group of CHF 298 mn. The underlying business results5 were solid, given a strong comparable in 2Q20 and our more conservative approach to risk. Our adjusted net revenues, excluding significant items and Archegos*, of CHF 5.2 bn, were down 14% year on year, and our adjusted pre-tax income, excluding significant items and Archegos*, of CHF 1.3 bn, was down 11%.
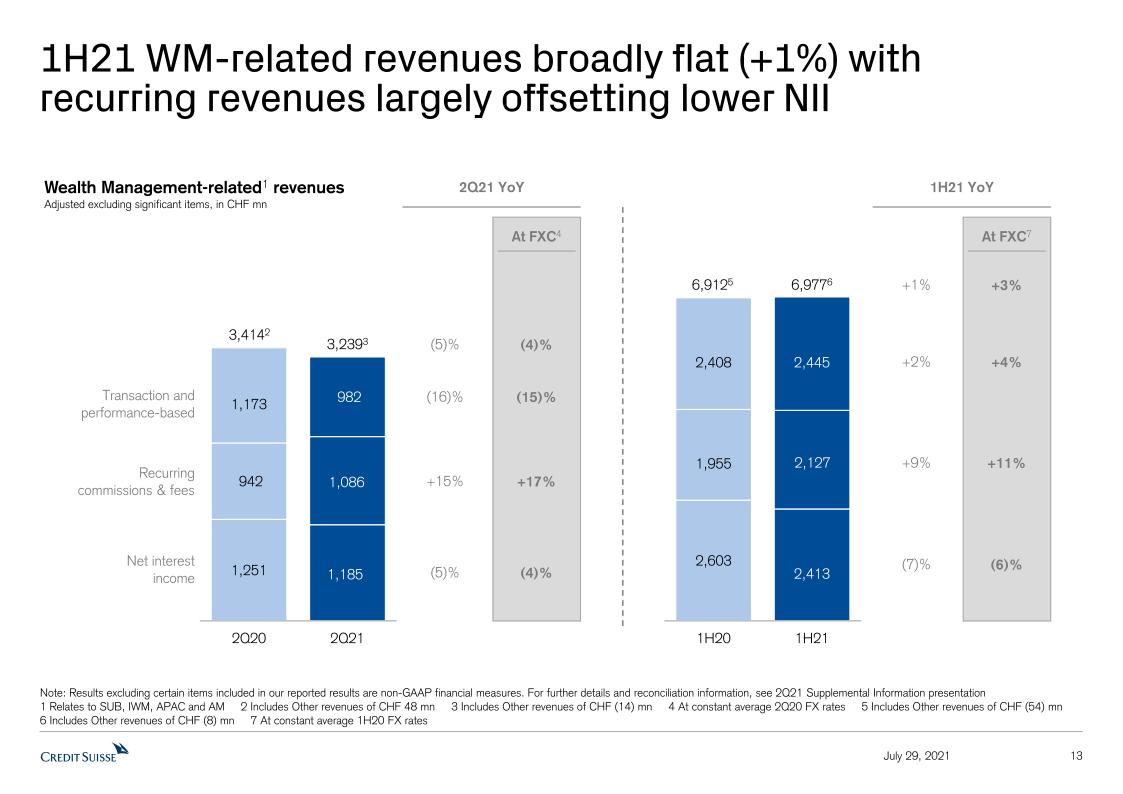
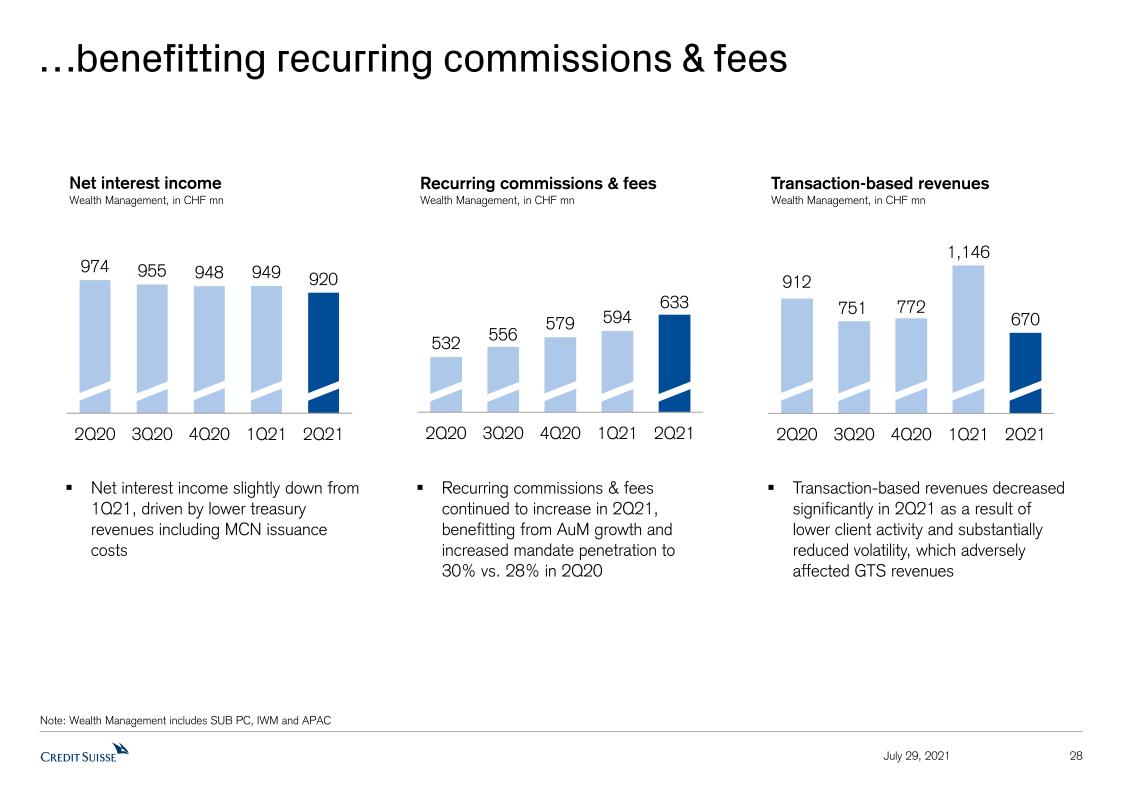
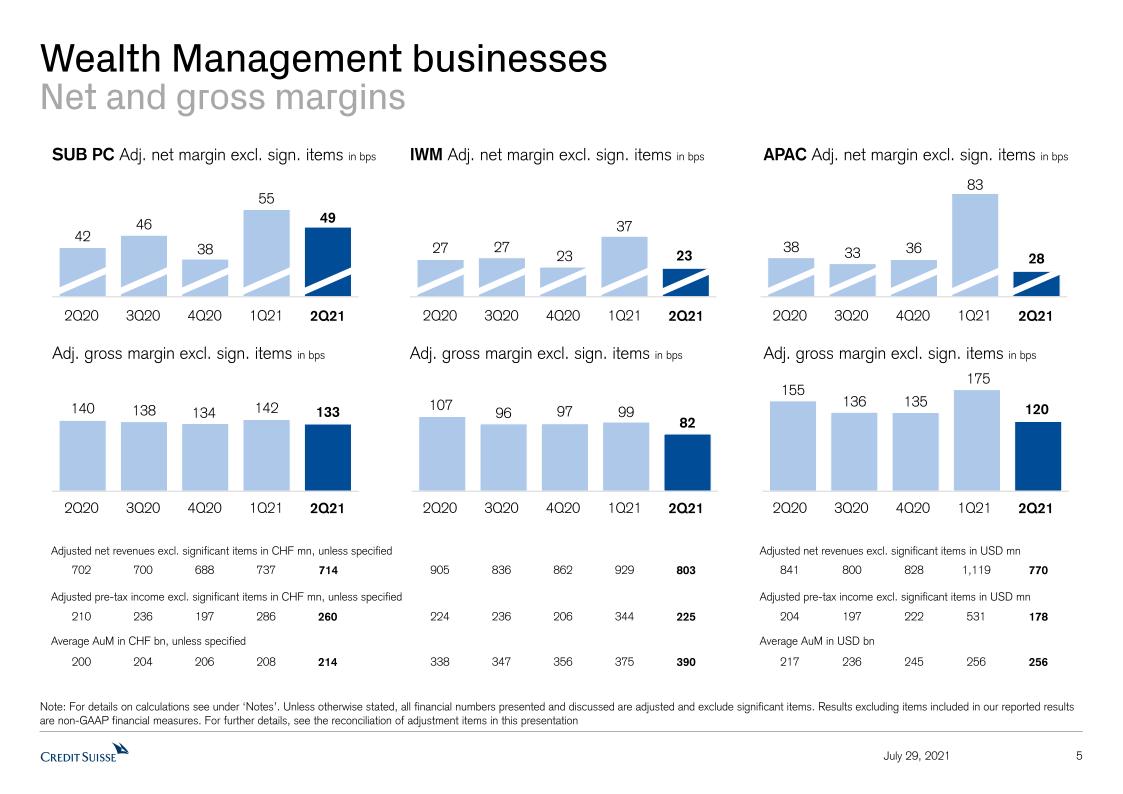
Our Wealth Management-related businesses reported net revenues of CHF 3.6 bn, up 2% year on year. On an adjusted basis, excluding significant items*, revenues were down 5%. We saw strong momentum in recurring commissions and fees, up 15%, benefitting from AuM and Client Business Volume growth and an increased mandate penetration at 30%, up from 28% in 2Q20, offset by lower transaction and performance-based revenues, down 16%, due to lower client activity compared to 2Q20 and lower revenues in Global Trading Solutions (GTS). We also recorded lower net interest income, down 5% year on year, impacted by flat-to-negative net new loans in the quarter and the MCN issuance costs and lower USD interest rates. Asset Management had a particularly strong net revenue performance, up 12% year on year, driven mainly by higher management fees.
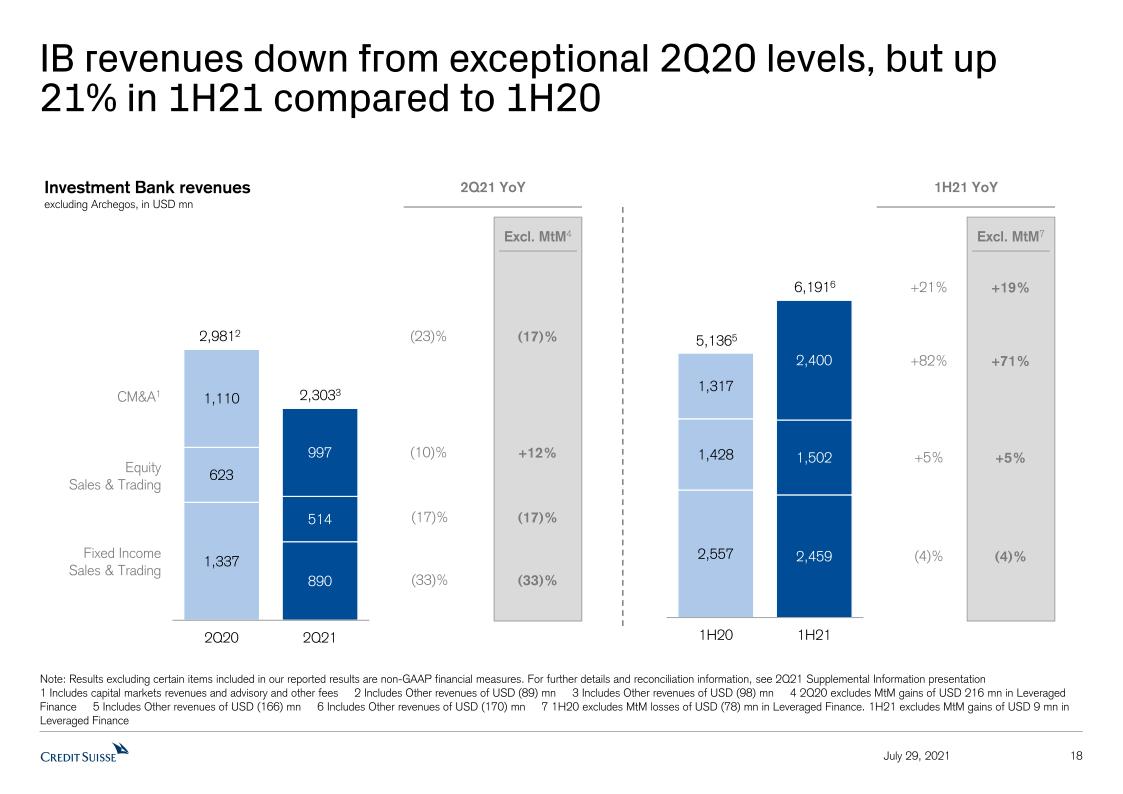
Our Investment Bank delivered a resilient underlying performance6 notwithstanding a weaker trading environment, compared to an exceptional 2Q20, a slowdown in client activity and the deliberate actions taken with regard to reductions to RWA and leverage exposure, reflecting our more conservative approach to risk and capital management. Net revenues of USD 1.8 bn were down 41% year on year. IB results included pre-tax losses of USD 653 mn (CHF 594 mn) relating to Archegos. Adjusted net revenues, excluding Archegos*, were down 23%, though the effect on our adjusted pre-tax income, excluding Archegos*, was partially offset by releases of provision for credit losses. Fixed Income Sales & Trading revenues were down 33% year on year; Equity Sales & Trading revenues, excluding Archegos*, were down 17%7; Capital Markets revenues were down 6%, or increased 23% excluding the Leveraged Finance mark-to-market gains in 2Q208; and Advisory revenues were down 34%. Revenues in GTS, our collaboration between the IB and our wealth management businesses, declined, in part due to our more conservative risk appetite in the IB as well as an exceptional
Page 3
comparable in 2Q20. In terms of outlook, we have a strong M&A advisory pipeline up both sequentially and notably on a year on year basis and our pipelines across ECM and leveraged finance are also robust.
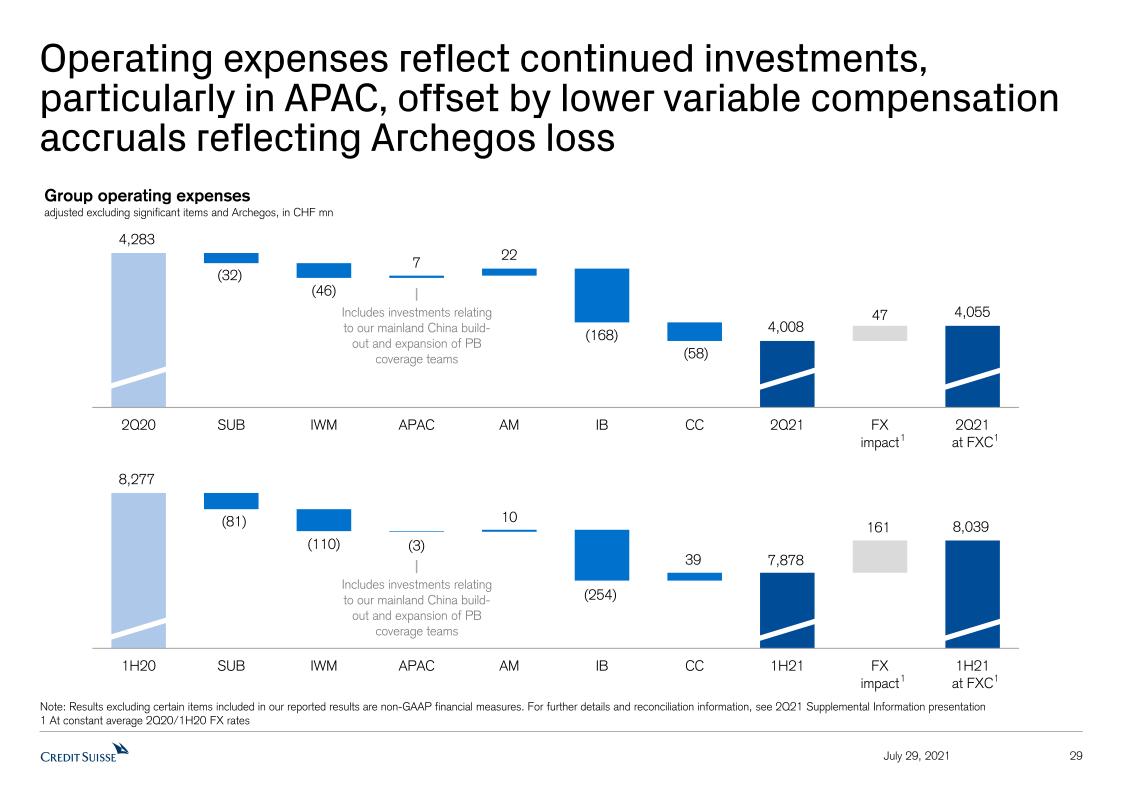
Operating expenses for the Group of CHF 4.3 bn decreased by 1% year on year, reflecting lower variable compensation accruals due to the impact of the Archegos loss; adjusted operating expenses, excluding significant items and Archegos*, decreased by 6%.
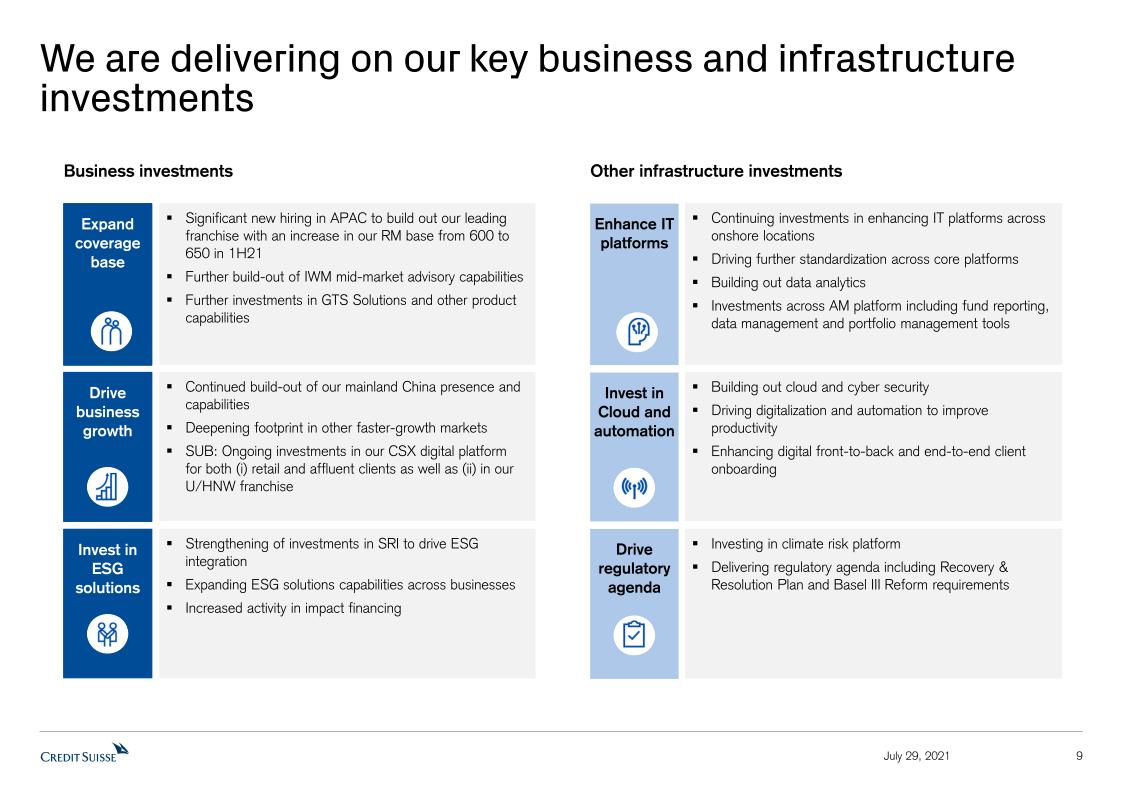
We continued to deliver on key business investments in wealth management, including building out our mainland China franchise and expanding our Private Banking coverage teams, most notably in APAC. We continue to invest in technology and people in the Investment Bank, and have also further built out the IWM mid-market advisory capabilities and continue to invest in deepening our wealth management footprint in fast growing markets like Brazil, India, Russia and the Middle East. Furthermore, we have ongoing investments in CSX, our SUB digital platform for retail and affluent clients as well as in our ultra-high-net-worth (UHNW) and high-net-worth (HNW) franchises. This is in addition to investing in enhanced IT platforms, building out our cloud technology and strengthening our cyber security as well as driving digitalization and automation.
The Group reported a higher level of AuM totaling CHF 1.63 trn at the end of 2Q21, up 2% quarter on quarter, with mandate penetration at 30%, up from 28% in 2Q20, supporting our recurring commissions and fees. We saw net asset outflows of CHF 4.7 bn in 2Q21, compared to NNA of CHF 9.8 bn in 2Q20 and CHF 28.4 bn in 1Q21. We have seen outflows in a number of individual cases across our wealth management businesses; additionally, some of the outflows can be attributed to our de-risking efforts, especially in APAC.
We delivered a substantial improvement in our capital ratios with a CET1 ratio of 13.7% at the end of 2Q21, compared to 12.2% at the end of 1Q21, and a CET1 leverage ratio of 4.2% at the end of 2Q21, compared to 3.8% at the end of 1Q21. Our CET1 and CET1 leverage ratios benefitted from the MCN issuance, the impact from the Allfunds Group IPO combined with the reduction in our investment to less than 10%, the removal of the temporary RWA add-on related to Archegos and the proactive reduction of RWA and leverage exposure in the Investment Bank; with IB RWA reduction of USD 20 bn and IB leverage exposure reduction of USD 41 bn in 2Q21.
1H21 Results – Review of Performance
Despite the significant losses related to the Archegos matter of CHF 5.0 bn, our resilient underlying performance in both quarters allowed us to achieve a small net income attributable to shareholders of CHF 1 mn for 1H21. This illustrates the underlying resilience of our franchise even when taking into consideration our significant de-risking approach, particularly in the Investment Bank. Our provision for credit losses for 1H21 was CHF 4.4 bn, which included losses related to Archegos and a net release in CECL-related provision for credit losses of CHF 227 mn, mainly due to CECL-related adjustments reflecting the continued improved macroeconomic outlook.
Our 1H21 adjusted net revenues, excluding significant items and Archegos*, were up 9% year on year, at CHF 12.7 bn, driven by revenue growth in APAC, IB and AM, with stable revenues in SUB and lower revenues in IWM.
In 1H21, our adjusted pre-tax income, excluding significant items and Archegos*, doubled year on year, to CHF 4.9 bn, driven by growth in adjusted pre-tax income, excluding significant items and Archegos*, across all divisions, and also reflecting the net release in CECL-related provision for credit losses and lower adjusted operating expenses, excluding significant items and Archegos*, down 5%, mainly reflecting lower variable compensation accruals.
Our Wealth Management-related businesses reported net revenues of CHF 7.5 bn, up 2% year on year. On an adjusted basis, excluding significant items*, revenues were up 1%, driven by higher recurring commissions and fees, up 9% year on year, and higher transaction and performance-based revenues, up 2%, partly offset by lower net interest income, down 7%.
Our Investment Bank reported net revenues of USD 5.6 bn, up 10% year on year. Our adjusted net revenues, excluding Archegos*, were up 21%. Fixed Income Sales & Trading revenues were down 4% year on year; Equity Sales & Trading revenues, excluding Archegos*, were up 5%9; Capital Markets revenues were up 109%, or 93% excluding Leveraged Finance mark-to-market gains in 1H21 and Leveraged Finance mark-to-market losses in 1H2010; and Advisory revenues were up 2%.
NNA for 1H21 were CHF 23.7 bn, up compared to CHF 15.6 bn in 1H20 with contributions from SUB of CHF 6.7 bn, IWM of CHF 6.9 bn, and AM of CHF 11.6 bn, slightly offset by net asset outflows in APAC of CHF 1.1 bn.
Page 4
Detailed Divisional Summaries
| Swiss Universal Bank (SUB) |
| Reported results (in CHF mn) | 2Q21 | 1Q21 | 2Q20 | ∆2Q20 | | 1H21 | 1H20 | ∆1H20 |
| Net revenues | 1,477 | 1,449 | 1,474 | - | 2,926 | 2,928 | - |
| Provision for credit losses | (21) | 26 | 28 | - | 5 | 152 | (97)% |
| Operating expenses | 773 | 758 | 790 | (2)% | 1,531 | 1,589 | (4)% |
| Pre-tax income | 725 | 665 | 656 | 11% | 1,390 | 1,187 | 17% |
| Cost/income ratio (%) | 52% | 52% | 54% | - | 52% | 54% | - |
| Net New Assets (bn) | 0.6 | 6.1 | 0.0 | - | 6.7 | 0.6 | - |
| o/w Private Clients (bn) | (0.9) | 2.2 | (1.6) | - | 1.3 | (5.8) | - |
Adjusted results, excluding significant items* (in CHF mn) | 2Q21 | 1Q21 | 2Q20 | ∆2Q20 | 1H21 | 1H20 | ∆1H20 |
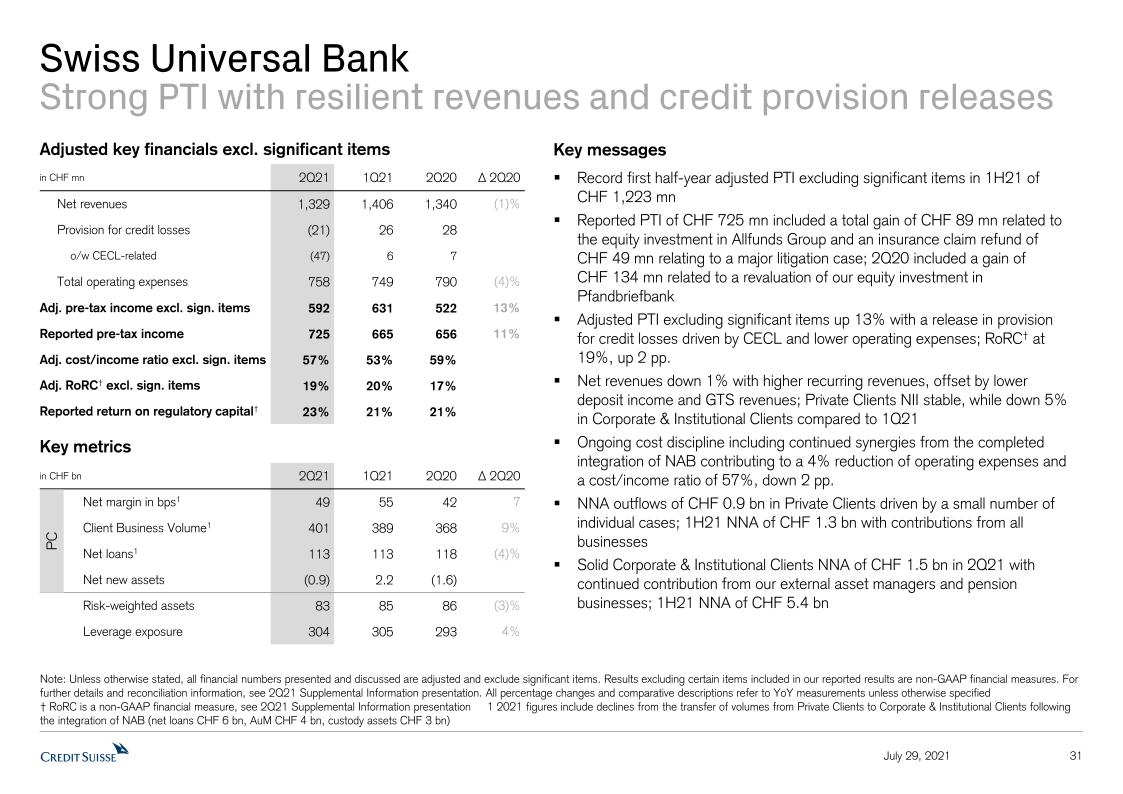
| Net revenues | 1,329 | 1,406 | 1,340 | (1)% | 2,735 | 2,769 | (1)% |
| Operating expenses | 758 | 749 | 790 | (4)% | 1,507 | 1,588 | (5)% |
| Pre-tax income | 592 | 631 | 522 | 13% | 1,223 | 1,029 | 19% |
| Cost/income ratio (%) | 57% | 53% | 59% | - | 55% | 57% | - |
2Q21
1H21
| International Wealth Management (IWM) |
| Reported results (in CHF mn) | 2Q21 | 1Q21 | 2Q20 | ∆2Q20 | | 1H21 | 1H20 | ∆1H20 |
| Net revenues | 930 | 987 | 905 | 3% | 1,917 | 1,937 | (1)% |
| Provision for credit losses | (25) | 0 | 32 | - | (25) | 71 | - |
| Operating expenses | 615 | 579 | 617 | - | 1,194 | 1,265 | (6)% |
| Pre-tax income | 340 | 408 | 256 | 33% | 748 | 601 | 24% |
| Cost/income ratio (%) | 66% | 59% | 68% | - | 62% | 65% | - |
| Net New Assets (bn) | (0.3) | 7.2 | 1.8 | - | 6.9 | 5.5 | - |
Adjusted results, excluding significant items* (in CHF mn) | 2Q21 | 1Q21 | 2Q20 | ∆2Q20 | 1H21 | 1H20 | ∆1H20 |
Page 5
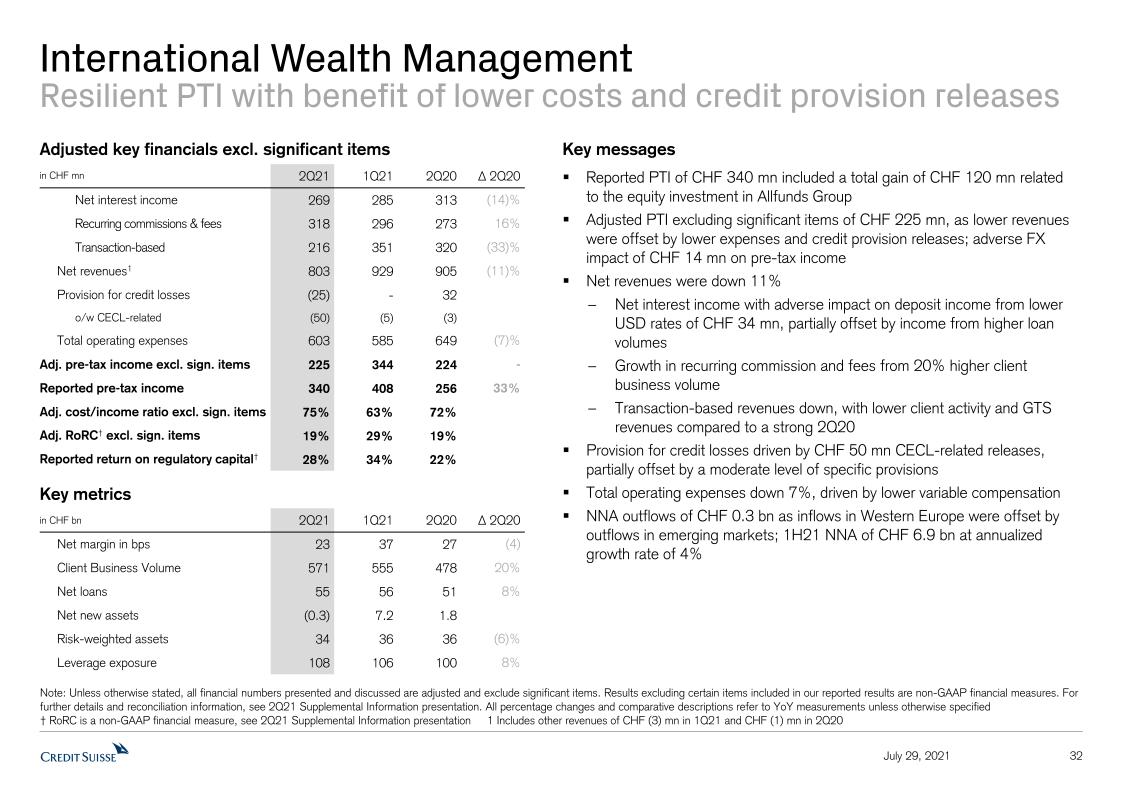
| Net revenues | 803 | 929 | 905 | (11)% | | 1,732 | 1,922 | (10)% |
| Operating expenses | 603 | 585 | 649 | (7)% | 1,188 | 1,298 | (8)% |
| Pre-tax income | 225 | 344 | 224 | - | 569 | 553 | 3% |
| Cost/income ratio (%) | 75% | 63% | 72% | - | 69% | 68% | - |
2Q21
| - | Adjusted pre-tax income, excluding significant items*, of CHF 225 mn, stable year on year, driven by lower adjusted net revenues, excluding significant items*, which were mostly offset by lower costs, with adjusted operating expenses, excluding significant items*, down 7%, and a net release of provision for credit losses of CHF 25 mn |
1H21
| - | Solid adjusted pre-tax income, excluding significant items*, of CHF 569 mn, up 3% year on year, driven largely by continued cost discipline with adjusted operating expenses, excluding significant items*, down 8% and a net release of provision for credit losses of CHF 25 mn |
| - | Stable reported net revenue performance compared to 1H20; adjusted net revenues, excluding significant items*, of CHF 1.7 bn, down 10% year on year, driven by lower net interest income, in part due to lower USD rates, and lower transaction and performance-based revenues in less volatile markets, partly offset by higher recurring commissions and fees with higher client business volumes |
| - | NNA of CHF 6.9 bn, reflecting an annualized growth rate of 4% |
| Asia Pacific (APAC) |
| Reported results (in USD mn) | 2Q21 | 1Q21 | 2Q20 | ∆2Q20 | | 1H21 | 1H20 | ∆1H20 |
| Net revenues | 874 | 1,166 | 841 | 4% | 2,040 | 1,707 | 20% |
| Provision for credit losses | 6 | 30 | 90 | (93)% | 36 | 192 | (81)% |
| Operating expenses | 595 | 559 | 547 | 9% | 1,154 | 1,084 | 6% |
| Pre-tax income | 273 | 577 | 204 | 34% | 850 | 431 | 97% |
| Cost/income ratio (%) | 68% | 48% | 65% | - | 57% | 64% | - |
| Net New Assets (bn) | (6.7) | 5.4 | 4.7 | - | (1.3) | 7.9 | - |
Adjusted results, excluding significant items* (in USD mn) | 2Q21 | 1Q21 | 2Q20 | ∆2Q20 | 1H21 | 1H20 | ∆1H20 |
| Net revenues | 770 | 1,119 | 841 | (8)% | 1,889 | 1,681 | 12% |
| Operating expenses | 586 | 558 | 547 | 7% | 1,144 | 1,084 | 6% |
| Pre-tax income | 178 | 531 | 204 | (13)% | 709 | 405 | 75% |
| Cost/income ratio (%) | 76% | 50% | 65% | - | 61% | 64% | - |
2Q21
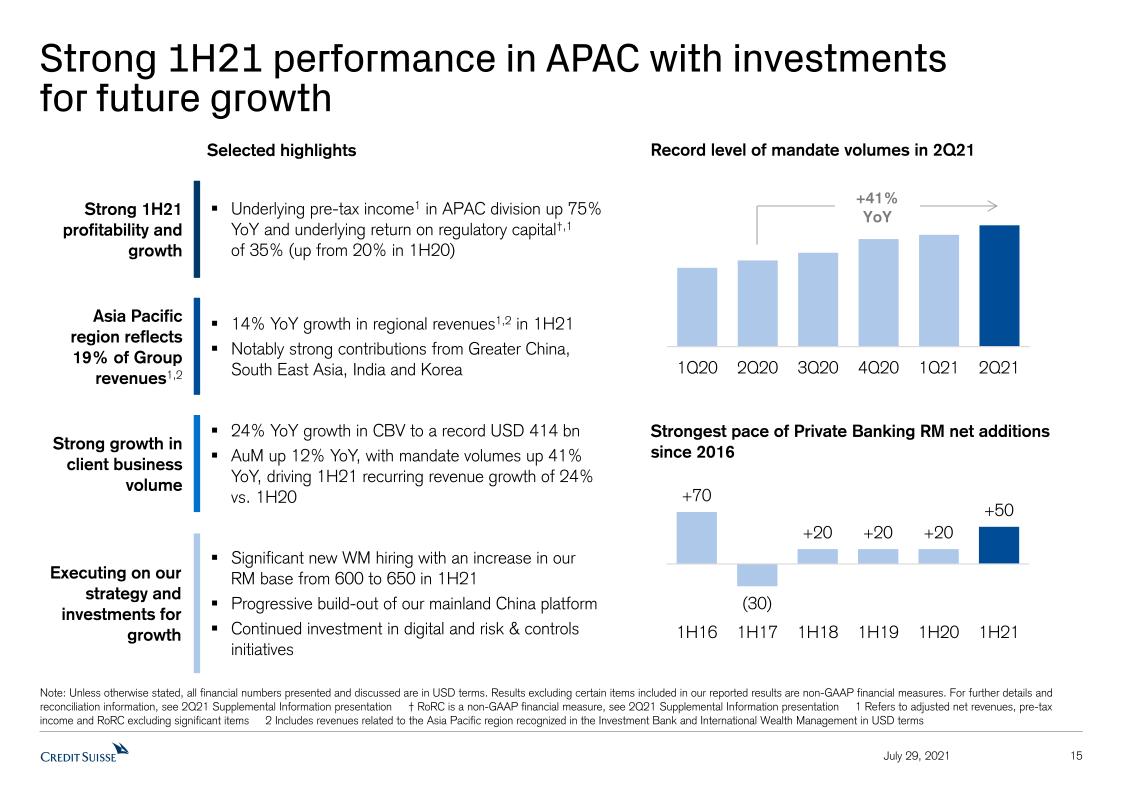
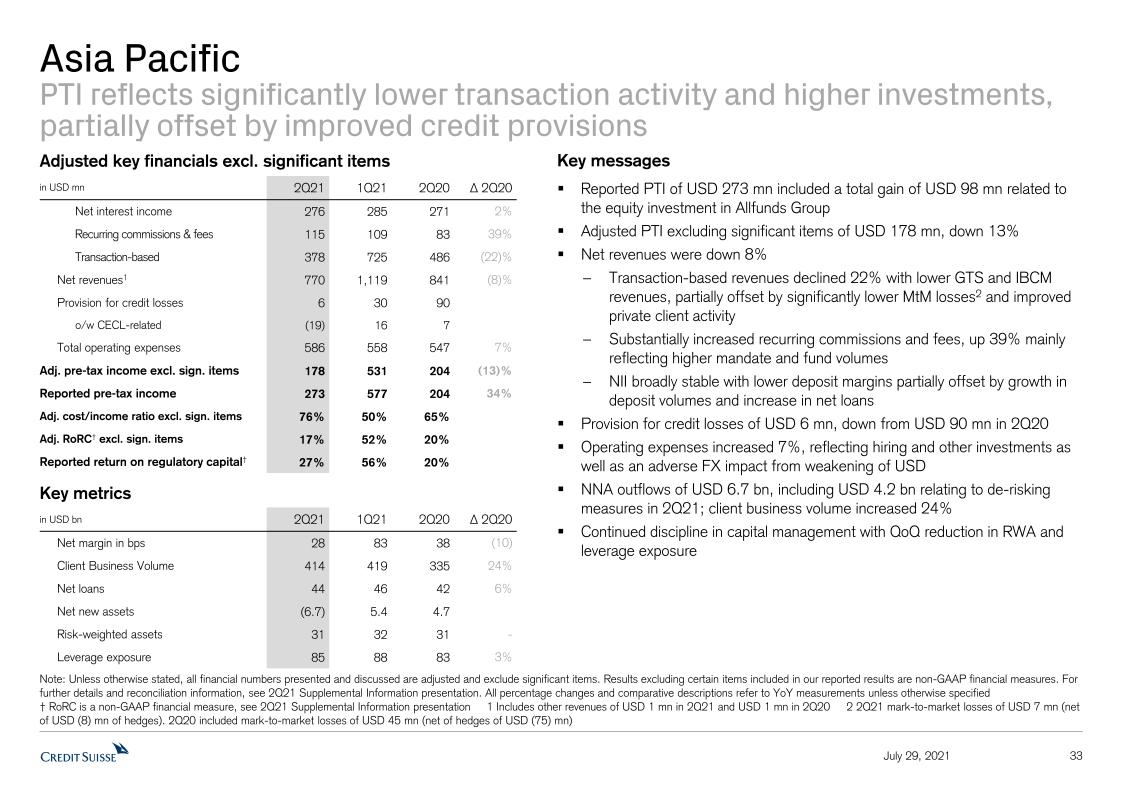
| - | Adjusted pre-tax income, excluding significant items*, of USD 178 mn, down 13% year on year, resulting from lower adjusted net revenues, excluding significant items*, as well as higher adjusted operating expenses, excluding significant items*. Adjusted operating expenses, excluding significant items*, were up in part due to our continued investment and growth in the region, including in China and continued relationship manager hiring |
| - | Reported net revenues of USD 874 mn, up 4% year on year, this includes a gain on the equity investment in Allfunds Group of USD 104 mn. Excluding significant items*, adjusted net revenues were down 8% at USD 770 mn, due to lower transaction-based revenues, down 22%, driven by lower revenues from GTS, and lower fees from IBCM-related activities. This was partly offset by substantially increased recurring commissions and fees, up 39%, mainly reflecting higher mandate and fund volumes. Net interest income was up 2% year on year with lower deposit margins partially offset by growth in deposit volumes and an increase in net loans |
Page 6
| - | Net asset outflows of USD 6.7 bn mainly from Southeast Asia, Japan and China, including USD 4.2 bn relating to de-risking measures in 2Q21 |
| - | Client business volumes of USD 414 bn, up 24% year on year |
1H21
| - | Significantly higher adjusted pre-tax income, excluding significant items* of USD 709 mn, up 75% year on year, driven by higher adjusted net revenues, excluding significant items*, and lower provision for credit losses |
| - | Strong net revenue performance compared to 1H20; excluding significant items*; adjusted net revenues of USD 1.9 bn, up 12% year on year, driven by higher transaction based revenues, up 22%, mainly due to significantly lower mark-to market losses and higher brokerage and product issuing fees as well as higher recurring commissions and fees, up 24%. These were partly offset by lower net interest income, down 6%, driven by lower deposit and loan margins |
| - | Net asset outflows of USD 1.3 bn due, in part, to de-risking measures implemented in 2Q21 |
| Asset Management (AM) |
| Reported results (in CHF m) | 2Q21 | 1Q21 | 2Q20 | ∆2Q20 | | 1H21 | 1H20 | ∆1H20 |
| Net revenues | 404 | 386 | 361 | 12% | 790 | 806 | (2)% |
| Provision for credit losses | 1 | 0 | 2 | - | 1 | 2 | - |
| Operating expenses | 299 | 271 | 275 | 9% | 570 | 556 | 3% |
| Pre-tax income | 104 | 115 | 84 | 24% | 219 | 248 | (12)% |
| Cost/income ratio (%) | 74% | 70% | 76% | - | 72% | 69% | - |
| Net New Assets (bn) | 1.3 | 10.3 | 4.1 | - | 11.6 | 4.2 | - |
Adjusted results, excluding significant items* (in CHF m) | 2Q21 | 1Q21 | 2Q20 | ∆2Q20 | 1H21 | 1H20 | ∆1H20 |
| Net revenues | 404 | 386 | 361 | 12% | 790 | 603 | 31% |
| Operating expenses | 297 | 269 | 275 | 8% | 566 | 556 | 2% |
| Pre-tax income / (loss) | 106 | 117 | 84 | 26% | 223 | 45 | - |
| Cost/income ratio (%) | 74% | 70% | 76% | - | 72% | 92% | - |
2Q21
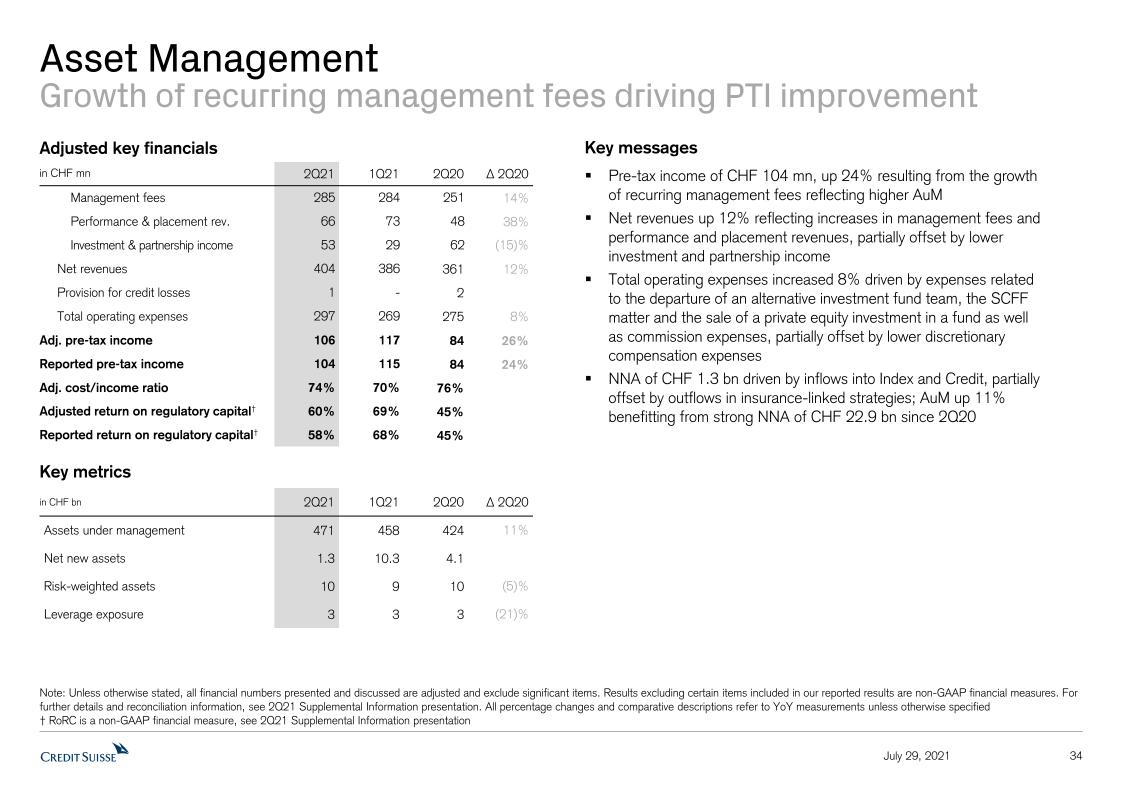
| - | Adjusted pre-tax income, excluding significant items*, of CHF 106 mn, up 26% year on year, driven by higher net revenues, partially offset by higher adjusted operating expenses, excluding significant items*, including expenses related to the departure of an alternative investment fund team, the SCFF matter and the sale of a private equity investment in a fund as well as commission expenses, partially offset by lower discretionary compensation expenses |
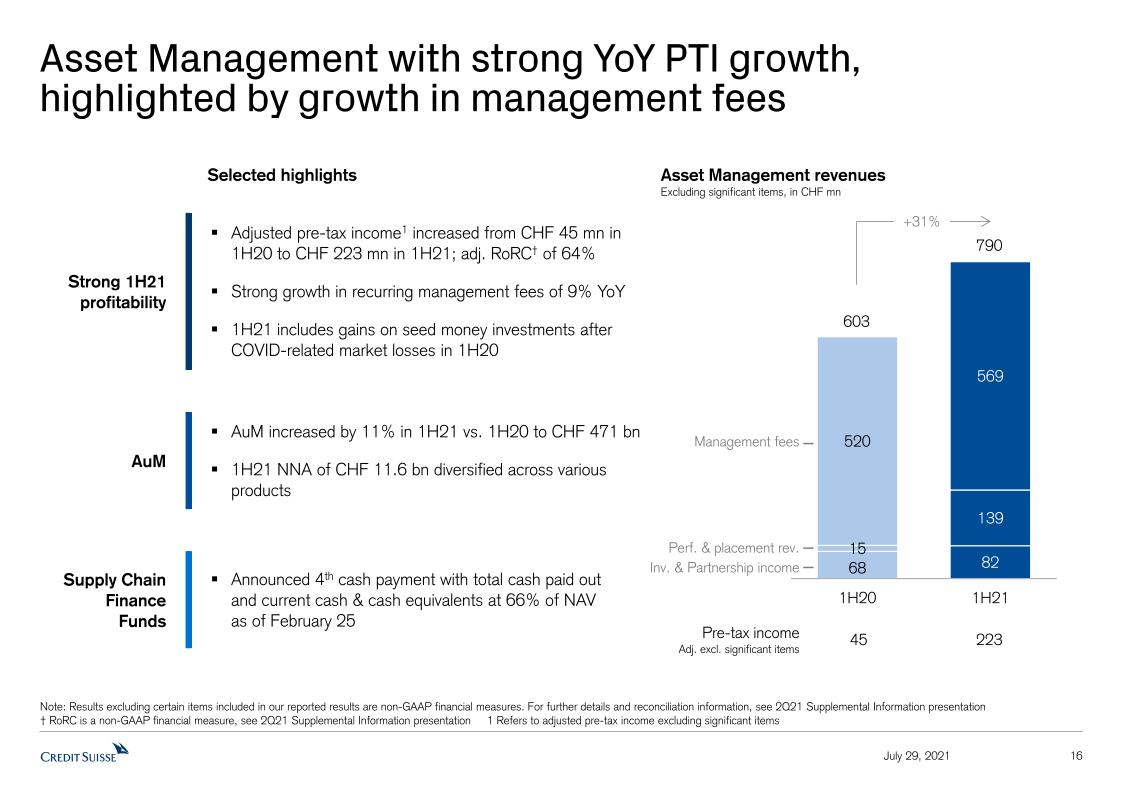
| - | Strong net revenues reported by AM of CHF 404 mn, up 12% year on year, driven by management fees, up 14%, on stronger asset base, as well as performance and placement revenues, up 38%, mainly due to an increase in performance fees and carried interest and higher placement fees, partly offset by lower investment and partnership income, down 15% |
| - | Positive NNA of CHF 1.3 bn, driven by inflows from traditional and alternative Investments, partially offset by outflows in investments & partnerships bringing AuM to CHF 471 bn |
1H21
| - | Significantly higher adjusted pre-tax income, excluding significant items* of CHF 223 mn compared to CHF 45 mn in 1H20, driven by higher adjusted net revenues, excluding significant items*, partially offset by higher adjusted operating expenses, excluding significant items* |
| - | Reported net revenues of CHF 790 mn, down 2% year on year, mainly due to the 1H20 gain related to the transfer of the InvestLab fund platform of CHF 203 million; strong adjusted net revenue, excluding significant items*, up 31% year on year, driven by higher management fees, up 9%, on stronger asset base along with a significant increase in performance and placement revenues due to positive investment-related gains compared to losses in 1H20, higher performance fees and carried interest and higher placement fees |
| - | NNA of CHF 11.6 bn at annualized growth rate of 5% |
Page 7
| Investment Bank (IB) |
| Reported results (in USD mn) | 2Q21 | 1Q21 | 2Q20 | ∆2Q20 | | 1H21 | 1H20 | ∆1H20 |
| Net revenues | 1,761 | 3,888 | 2,981 | (41)% | 5,649 | 5,136 | 10% |
| Provision for credit losses | 16 | 4,618 | 148 | - | 4,634 | 463 | - |
| Operating expenses | 1,831 | 1,830 | 1,882 | (3)% | 3,661 | 3,636 | 1% |
| Pre-tax income/loss | (86) | (2,560) | 951 | - | (2,646) | 1,037 | - |
| Cost/income ratio (%) | 104% | 47% | 63% | - | 65% | 71% | - |
| Return on Regulatory Capital (%) | (2)% | (69)% | 26% | - | (37)% | 14% | - |
| Adjusted results, excluding Archegos* (in USD mn) | 2Q21 | 1Q21 | 2Q20 | ∆2Q20 | 1H21 | 1H20 | ∆1H20 |
| Net revenues | 2,303 | 3,888 | 2,981 | (23)% | 6,191 | 5,136 | 21% |
| Operating expenses | 1,763 | 1,778 | 1,854 | (5)% | 3,541 | 3,612 | (2)% |
| Pre-tax income | 601 | 2,199 | 979 | (39)% | 2,800 | 1,061 | 164% |
| Cost/income ratio (%) | 77% | 46% | 62% | - | 57% | 70% | - |
| Return on Regulatory Capital (%) | 17% | 59% | 27% | - | 40% | 15% | - |
2Q21
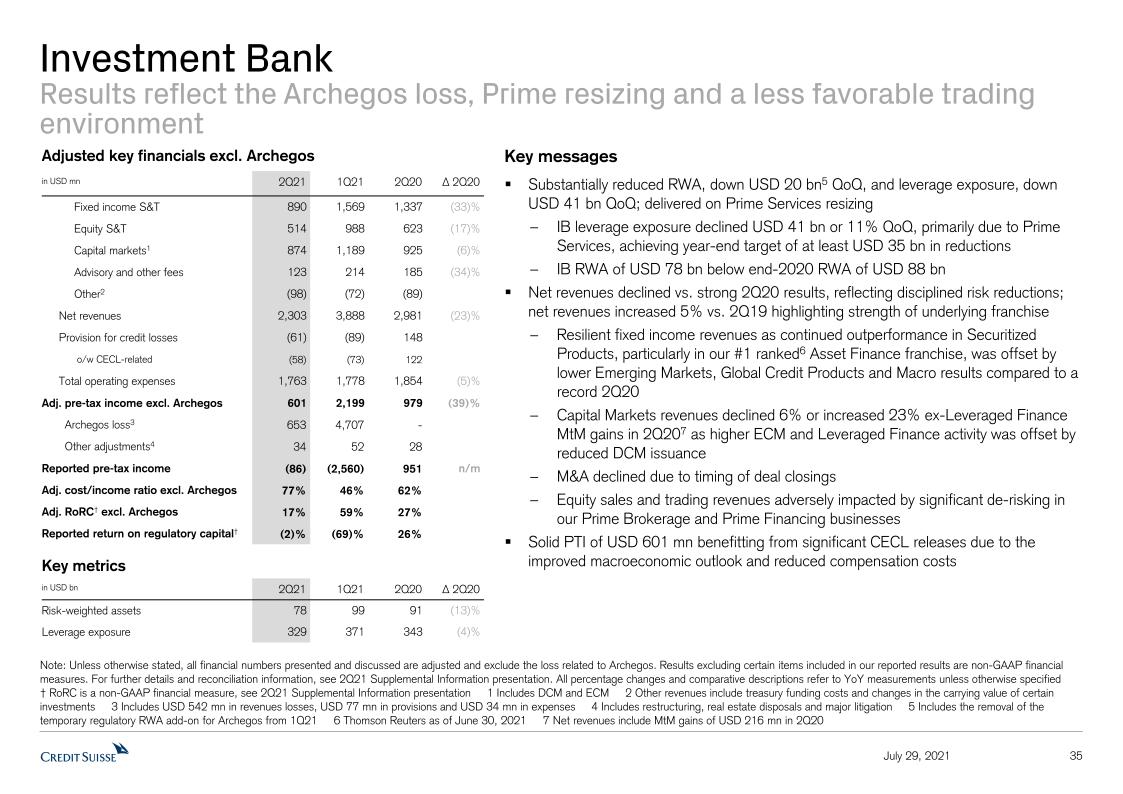
| - | Adjusted pre-tax income, excluding Archegos*, of USD 601 mn, down 39% year on year, with an adjusted return on regulatory capital, excluding Archegos*, of 17% driven by the strength of the underlying franchise, improved provision for credit losses as well as reduced variable compensation accruals |
| - | Reported net revenues of USD 1.8 bn, down 41% year on year; adjusted net revenues, excluding Archegos*, of USD 2.3 bn, declined 23% compared to a strong 2Q20, which benefitted from high levels of volatility and client activity, and reflecting the costs of disciplined risk reductions |
| - | Revenues in our Fixed Income Sales & Trading business were down 33%, albeit resilient when compared to a strong performance in 2Q20, benefitting from outperformance in securitized products revenues, but offset by significantly lower Emerging Markets, Global Credit Products and Macro results. Equity Sales & Trading revenues, excluding Archegos*, declined by 17% year on year in light of significant de-risking in Prime Services; on an adjusted basis, excluding Archegos*, revenues were down 17%. Our Capital Markets revenues were down 6%, or increased 23% excluding leveraged finance mark-to-market gains in 2Q2011, as higher ECM and leverage finance revenues were offset by lower DCM issuance; finally Advisory revenues decreased by 34% due to timing of deal closings |
| - | The bank incurred pre-tax losses of USD 653 mn in 2Q21 related to Archegos. As a result of the Archegos matter, we substantially reduced RWA and reduced leverage exposure to USD 78 bn and USD 329 bn, respectively, in line with our previous guidance, driven by the resizing of our Prime Services business |
1H21
| - | Significantly higher adjusted pre-tax income, excluding Archegos*, of USD 2.8 bn year on year, resulted in an adjusted return on regulatory capital, excluding Archegos*, of 40%. The reported pre-tax loss of USD 2.6 bn included losses from Archegos of approximately USD 5.4 bn |
| - | Adjusted net revenues, excluding Archegos*, of USD 6.2 bn, up 21% year on year, resulting in a strong 1H performance with a notable performance in capital markets and securitized products, while adjusted operating expenses, excluding Archegos*, were down 2% |
ONGOING COMMITMENT TO SUSTAINABILITY AND PROGRESS UPDATE ON SRI
Credit Suisse continued to work on its ambition to become a leading provider of sustainable solutions in financial services in 2Q21:
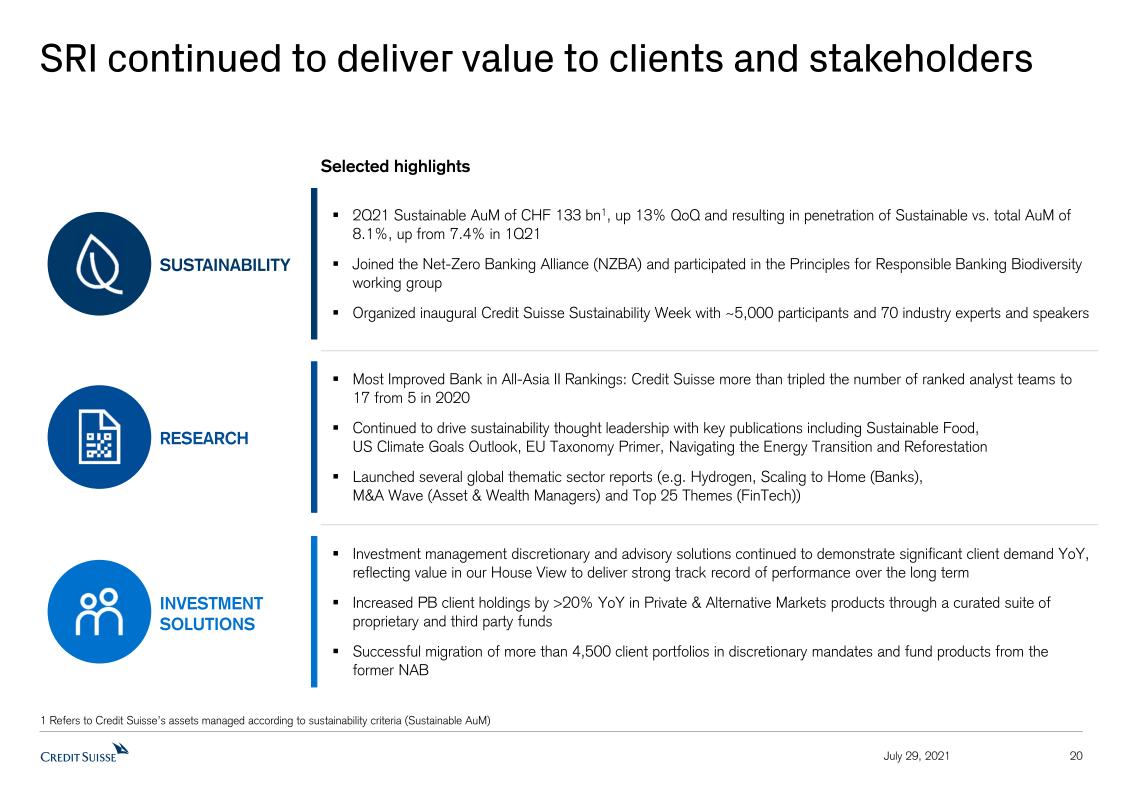
| - | As of the end of 2Q21, Credit Suisse’s assets managed according to sustainability criteria (Sustainable AuM) were CHF 133 bn, up from CHF 118 bn at the end of 1Q21 |
| - | Organized inaugural Credit Suisse Sustainability Week with ~ 5,000 participants and 70 industry experts and speakers |
| - | Joined the Net Zero Banking Alliance (NZBA) and participated in the Principles for Responsible Banking Biodiversity working group which developed the biodiversity target-setting guidance which was launched in June 2021 |
Page 8
CONTACT DETAILS
Kinner Lakhani, Investor Relations, Credit Suisse Tel: +41 44 333 71 49 Email: investor.relations@credit-suisse.com |
Dominik von Arx, Corporate Communications, Credit Suisse Tel: +41 844 33 88 44 Email: media.relations@credit-suisse.com |
The Financial Report and Presentation Slides for 2Q21 are available to download from 06:45 CEST today at: https://www.credit-suisse.com/results
PRESENTATION OF 2Q21 RESULTS – THURSDAY, JULY 29, 2021
| Event | Analyst Call | Media Call |
| Time | 08:15 Zurich 07:15 London 02:15 New York | 10:30 Zurich 09:30 London 04:30 New York |
| Language | English | English |
| Access | Switzerland: +41 44 580 48 67 Europe: +44 203 057 6528 US: +1 866 276 8933 Reference: Credit Suisse Analysts and Investors Call Conference ID: 1434865 Please dial in 10 minutes before the start of the call Webcast link here. | Switzerland: +41 44 580 48 67 Europe: +44 203 057 6528 US: +1 866 276 8933 Reference: Credit Suisse Media Call Conference ID: 7094618 Please dial in 10 minutes before the start of the call Webcast link here. |
| Q&A Session | Following the presentation, you will have the opportunity to ask the speakers questions | Following the presentation, you will have the opportunity to ask the speakers questions |
| Playback | Replay available approximately two hours after the event Switzerland: +41 44 580 40 26 Europe: +44 333 300 9785 US: +1 917 677 7532 Conference ID: 1434865 | Replay available approximately two hours after the event Switzerland: +41 44 580 40 26 Europe: +44 333 300 9785 US: +1 917 677 7532 Conference ID: 7094618 |
Page 9
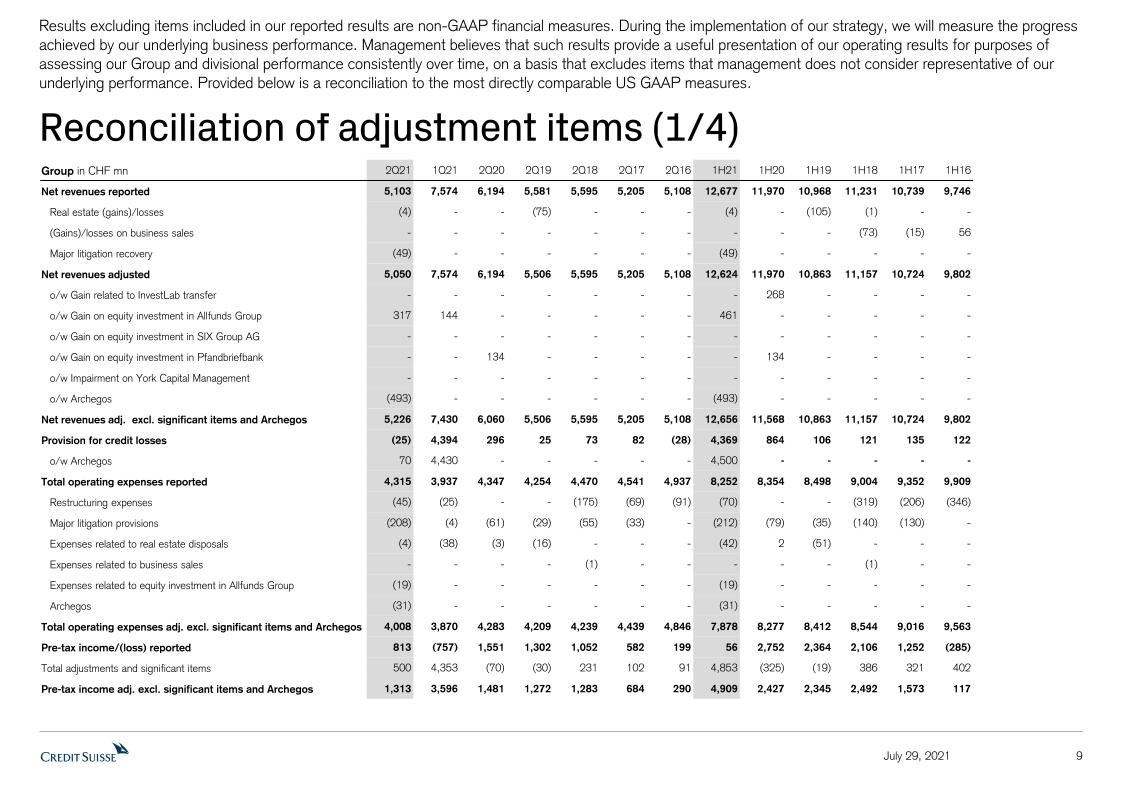
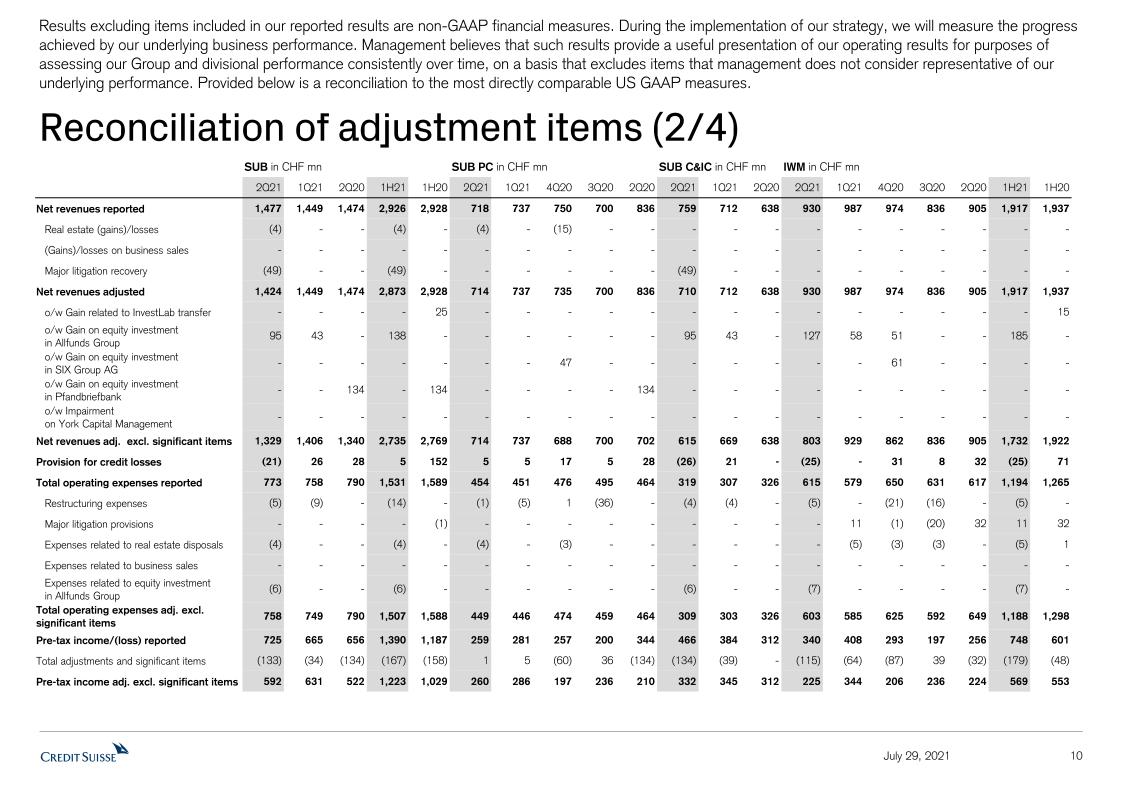
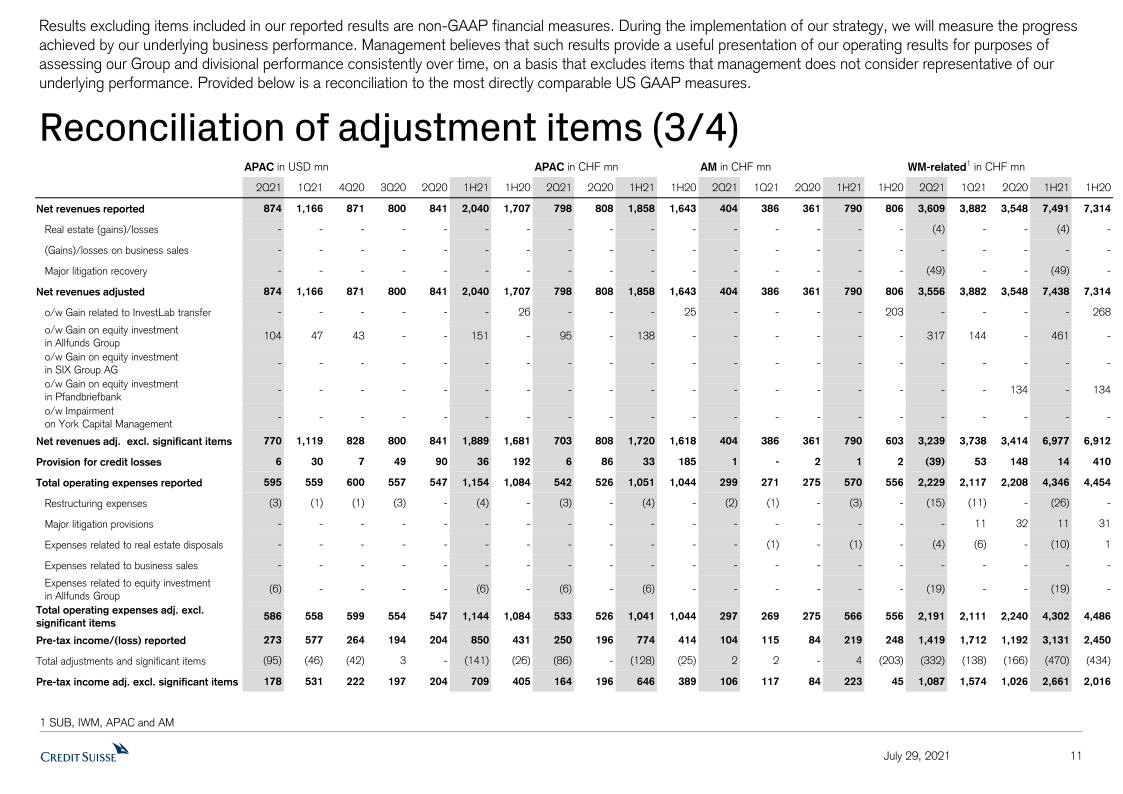
* Refers to adjusted results, adjusted results excluding significant items, and adjusted results excluding significant items and Archegos, as applicable. Results excluding certain items included in our reported results are non-GAAP financial measures. For a reconciliation to the most directly comparable US GAAP measures, see the Appendix of this Media Release.
Footnotes
1 2Q20 and 1H20 Tier 1 leverage ratio without temporary exclusion of CHF 103,614 mn for cash held at central banks as permitted by FINMA in 2020
2 References to underlying results or performance mean adjusted pre-tax income, excluding significant items and Archegos*
3 “GFG Alliance”, Bluestone, Katerra: ~ USD 2.3 bn exposure
4 More than 90% recovery is relative to the ~USD 2.8 bn book value of non-focus areas exposure as of March 31, 2021
5 References to underlying results or performance mean adjusted pre-tax income, excluding significant items and Archegos*
6 References to underlying results or performance mean adjusted pre-tax income, excluding Archegos*
7 Excludes Archegos loss of USD 542 mn from Equity Sales & Trading revenues in 2Q21
8 Excludes mark-to-market gains of USD 216 mn in 2Q20
9 Excludes Archegos loss of USD 542 mn from Equity Sales & Trading revenues in 1H21
10 Excludes mark-to-market losses of USD 78 mn in Leveraged Finance in 1H20 and mark-to-market gains of USD 9 mn in Leveraged Finance in 1H21
11 Excludes mark-to-market gains of USD 216 mn in 2Q20
Abbreviations
AM – Asset Management; APAC – Asia Pacific; AuM – assets under management; BCBS – Basel Committee on Banking Supervision; BIS – Bank for International Settlements; bn – billion; CECL – US GAAP accounting standard for current expected credit losses; CET1 – common equity tier 1; CHF – Swiss francs; CSAM – Credit Suisse Asset Management (Schweiz) AG; DCM – Debt Capital Markets; ECM – Equity Capital Markets; FINMA – Swiss Financial Market Supervisory Authority FINMA; FX – Foreign Exchange; GAAP – Generally accepted accounting principles; GTS – Global Trading Solutions; HNW – high-net-worth; HR – Human Resources; IB – Investment Bank; IBCM – Investment Bank and Capital Markets; ITS – International Trading Solutions; IWM – International Wealth Management; mn – million; MCN – Mandatory Convertible Notes; M&A – Mergers & Acquisitions; NNA – net new assets; PB – Private Banking; PC – Private Clients; PTI – Pre-Tax Income; RM – Relationship Manager; RoRC – Return on Regulatory Capital; RoTE – Return on Tangible Equity; RWA – risk weighted assets; SEC – US Securities and Exchange Commission; SRI – Sustainability, Research & Investment Solutions; SUB – Swiss Universal Bank; SCFF – Supply Chain Finance Funds; trn – trillion; UHNW – ultra-high-net-worth; US – United States; USD – US dollar; WM – Wealth Management.
Mandatory Convertible Notes
These materials are not for release, publication or distribution (directly or indirectly) in or to Australia, Canada, Hong Kong, Japan or any other jurisdiction in which such distribution would be prohibited by applicable law.
These materials are not an offer of securities for sale in the United States or to U.S. persons (“U.S. persons”) as defined in Regulation S under the U.S. Securities Act of 1933, as amended (the “U.S. Securities Act”). The mandatory convertible notes described in these materials and the shares of Credit Suisse Group AG issuable on their conversion have not been and will not be registered under the U.S. Securities Act and may not be offered or sold in the United States or to, or for the account or benefit of, U.S. persons, absent registration or an applicable exemption from registration under the U.S. Securities Act.
Important information
This document contains select information from the full 2Q21 Financial Report and 2Q21 Results Presentation slides that Credit Suisse believes is of particular interest to media professionals. The complete 2Q21 Financial Report and 2Q21 Results Presentation slides, which have been distributed simultaneously, contain more comprehensive information about our results and operations for the reporting quarter, as well as important information about our reporting methodology and some of the terms used in these documents. The complete 2Q21 Financial Report and 2Q21 Results Presentation slides are not incorporated by reference into this document.
We may not achieve all of the expected benefits of our strategic initiatives. Factors beyond our control, including but not limited to the market and economic conditions (including macroeconomic and other challenges and uncertainties, for example, resulting from the COVID-19 pandemic), changes in laws, rules or regulations and other challenges discussed in our public filings, could limit our ability to achieve some or all of the expected benefits of these initiatives.
In particular, the terms “Estimate”, “Illustrative”, “Ambition”, “Objective”, “Outlook” and “Goal” are not intended to be viewed as targets or projections, nor are they considered to be Key Performance Indicators. All such estimates, illustrations, ambitions,
Page 10
objectives, outlooks and goals are subject to a large number of inherent risks, assumptions and uncertainties, many of which are completely outside of our control. These risks, assumptions and uncertainties include, but are not limited to, general market conditions, market volatility, interest rate volatility and levels, global and regional economic conditions, challenges and uncertainties resulting from the COVID-19 pandemic, political uncertainty, changes in tax policies, regulatory changes, changes in levels of client activity as a result of any of the foregoing and other factors. Accordingly, this information should not be relied on for any purpose. We do not intend to update these estimates, illustrations, ambitions, objectives, outlooks or goals.
In preparing this document, management has made estimates and assumptions that affect the numbers presented. Actual results may differ. Annualized numbers do not take into account variations in operating results, seasonality and other factors and may not be indicative of actual, full-year results. Figures throughout this document may also be subject to rounding adjustments. All opinions and views constitute judgments as of the date of writing without regard to the date on which the reader may receive or access the information. This information is subject to change at any time without notice and we do not intend to update this information.
Return on tangible equity, a non-GAAP financial measure, is calculated as annualized net income attributable to shareholders divided by average tangible shareholders’ equity. Tangible shareholders’ equity, a non-GAAP financial measure, is calculated by deducting goodwill and other intangible assets from total shareholders’ equity as presented in our balance sheet. Management believes that return on tangible equity is meaningful as it is a measure used and relied upon by industry analysts and investors to assess valuations and capital adequacy. For end-2Q21, tangible shareholders’ equity excluded goodwill of CHF 4,588 million and other intangible assets of CHF 245 million from total shareholders’ equity of CHF 43,580 million as presented in our balance sheet. For end-1Q21, tangible shareholders’ equity excluded goodwill of CHF 4,644 million and other intangible assets of CHF 239 million from total shareholders’ equity of CHF 44,590 million as presented in our balance sheet. For end-2Q20, tangible shareholders’ equity excluded goodwill of CHF 4,676 million and other intangible assets of CHF 273 million from total shareholders’ equity of CHF 46,535 million as presented in our balance sheet.
Prior to 3Q20, regulatory capital was calculated as the worst of 10% of RWA and 3.5% of leverage exposure, and return on regulatory capital (a non-GAAP financial measure) was calculated using income / (loss) after tax and assumed a tax rate of 30%. In 3Q20, we updated our calculation approach, following which regulatory capital is calculated as the average of 10% of RWA and 3.5% of leverage exposure, and return on regulatory capital (a non-GAAP financial measure) is calculated using income / (loss) after tax and assumes a tax rate of 30% for periods prior to 2020 and 25% from 2020 onward. For the Investment Bank division, return on regulatory capital is based on US dollar denominated numbers. Return on regulatory capital excluding certain items included in our reported results is calculated using results excluding such items, applying the same methodology.
Client business volume includes assets under management, custody assets (including assets under custody and commercial assets) and net loans.
Credit Suisse is subject to the Basel III framework, as implemented in Switzerland, as well as Swiss legislation and regulations for systemically important banks, which include capital, liquidity, leverage and large exposure requirements and rules for emergency plans designed to maintain systemically relevant functions in the event of threatened insolvency. Credit Suisse has adopted the Bank for International Settlements (BIS) leverage ratio framework, as issued by the Basel Committee on Banking Supervision (BCBS) and implemented in Switzerland by the Swiss Financial Market Supervisory Authority FINMA (FINMA).
Unless otherwise noted, all CET1 ratio, Tier-1 leverage ratio, risk-weighted assets and leverage exposure figures in this document are as of the end of the respective period and on a “look-through” basis.
Unless otherwise noted, leverage exposure is based on the BIS leverage ratio framework and consists of period-end balance sheet assets and prescribed regulatory adjustments. The tier 1 leverage ratio and CET1 leverage ratio are calculated as BIS tier 1 capital and CET1 capital, respectively, divided by period end leverage exposure. Swiss leverage ratios are measured on the same period-end basis as the leverage exposure for the BIS leverage ratio.
Mandate penetration reflects advisory and discretionary mandates volumes as a percentage of assets under management, excluding those from the external asset manager business.
References to Wealth Management mean SUB PC, IWM and APAC or their combined results. References to Wealth Management-related mean SUB, IWM, APAC and AM or their combined results. References to Global Trading Solutions, prior to 3Q20, mean the combination of ITS and APAC Solutions.
Investors and others should note that we announce important company information (including quarterly earnings releases and financial reports as well as our annual sustainability report) to the investing public using press releases, SEC and Swiss ad hoc filings, our website and public conference calls and webcasts. We also routinely use our Twitter account @creditsuisse (https://twitter.com/creditsuisse), our LinkedIn account (https://www.linkedin.com/company/credit-suisse/), our Instagram accounts (https://www.instagram.com/creditsuisse_careers/ and https://www.instagram.com/creditsuisse_ch/), our Facebook account (https://www.facebook.com/creditsuisse/) and other social media channels as additional means to disclose public information, including to excerpt key messages from our public disclosures. We may share or retweet such messages through certain of our regional accounts, including through Twitter at @csschweiz (https://twitter.com/csschweiz) and @csapac (https://twitter.com/csapac). Investors and others should take care to consider such abbreviated messages in the context of the
Page 11
disclosures from which they are excerpted. The information we post on these social media accounts is not a part of this document.
Information referenced in this document, whether via website links or otherwise, is not incorporated into this document.
Certain material in this document has been prepared by Credit Suisse on the basis of publicly available information, internally developed data and other third-party sources believed to be reliable. Credit Suisse has not sought to independently verify information obtained from public and third-party sources and makes no representations or warranties as to accuracy, completeness or reliability of such information. In various tables, use of “–” indicates not meaningful or not applicable.
The English language version of this document is the controlling version.
Page 12
Results excluding certain items included in our reported results are non-GAAP financial measures. Management believes that such results provide a useful presentation of our operating results for purposes of assessing our Group and divisional performance consistently over time, on a basis that excludes items that management does not consider representative of our underlying performance. Provided below is a reconciliation of our adjusted results, our adjusted results excluding significant items and our adjusted results excluding significant items and the Archegos matter to the most directly comparable US GAAP measures. Restructuring charges are excluded in the presentation of these metrics.
This document contains statements that constitute forward-looking statements. In addition, in the future we, and others on our behalf, may make statements that constitute forward-looking statements. Such forward-looking statements may include, without limitation, statements relating to the following:
Words such as “believes,” “anticipates,” “expects,” “intends” and “plans” and similar expressions are intended to identify forward-looking statements but are not the exclusive means of identifying such statements. We do not intend to update these forward-looking statements.
By their very nature, forward-looking statements involve inherent risks and uncertainties, both general and specific, and risks exist that predictions, forecasts, projections and other outcomes described or implied in forward-looking statements will not be achieved. We caution you that a number of important factors could cause results to differ materially from the plans, targets, goals, expectations, estimates and intentions expressed in such forward-looking statements and that the COVID-19 pandemic creates significantly greater uncertainty about forward-looking statements in addition to the factors that generally affect our business. These factors include:
Pursuant to the requirements of the Securities Exchange Act of 1934, the registrants have duly caused this report to be signed on their behalf by the undersigned, thereunto duly authorized.
/s/ Thomas Gottstein /s/ David R. Mathers
Thomas Gottstein David R. Mathers
Chief Executive Officer Chief Financial Officer
 Form 40-F