UNITED STATES
SECURITIES AND EXCHANGE COMMISSION
Washington, D.C. 20549
______________
Form 6-K
______________
REPORT OF FOREIGN PRIVATE ISSUER PURSUANT TO RULE 13a-16 OR 15d-16
UNDER THE SECURITIES EXCHANGE ACT OF 1934
November 4, 2021
Commission File Number 001-15244
CREDIT SUISSE GROUP AG
(Translation of registrant’s name into English)
Paradeplatz 8, 8001 Zurich, Switzerland
(Address of principal executive office)
______________
Commission File Number 001-33434
CREDIT SUISSE AG
(Translation of registrant’s name into English)
Paradeplatz 8, 8001 Zurich, Switzerland
(Address of principal executive office)
______________
Indicate by check mark whether the registrant files or will file annual reports under cover of Form 20-F or Form 40-F.
| Form 20-F ☒ | Form 40-F ☐ |
Indicate by check mark if the registrant is submitting the Form 6-K in paper as permitted by Regulation S-T Rule 101(b)(1):
Note: Regulation S-T Rule 101(b)(1) only permits the submission in paper of a Form 6-K if submitted solely to provide an attached annual report to security holders.
Indicate by check mark if the registrant is submitting the Form 6-K in paper as permitted by Regulation S-T Rule 101(b)(7):
Note: Regulation S-T Rule 101(b)(7) only permits the submission in paper of a Form 6-K if submitted to furnish a report or other document that the registrant foreign private issuer must furnish and make public under the laws of the jurisdiction in which the registrant is incorporated, domiciled or legally organized (the registrant’s “home country”), or under the rules of the home country exchange on which the registrant’s securities are traded, as long as the report or other document is not a press release, is not required to be and has not been distributed to the registrant’s security holders, and, if discussing a material event, has already been the subject of a Form 6-K submission or other Commission filing on EDGAR.
This report includes the media release and the slides for the presentation to investors in connection with Investor Day 2021 held on November 4, 2021.
Media release Zurich, November 4, 2021 | ||
Ad hoc announcement pursuant to article 53 LR
| Credit Suisse announces its Group strategy with a clear focus on strengthening, simplifying and investing for growth |
Zurich, November 4, 2021– Credit Suisse announces its Group strategy with a clear focus on strengthening and simplifying its integrated model and investing in sustainable growth, while placing risk management at the very core of the bank.
Following a comprehensive assessment of its strategy, the Credit Suisse Group Board of Directors (BoD) has unanimously agreed on a long-term strategic direction for the Group. The strategy is based on a long-term vision and reemphasizes the integrated model, with a well-defined three-year plan, investing in sustainable growth across Credit Suisse’s businesses, while placing risk management and a culture that reinforces the importance of accountability and responsibility at its core. It has also approved the introduction of a global business and regional structure to align the organization with the strategy review and to reinforce cross-divisional collaboration and management oversight.
Work in this direction has already begun as we strengthened our risk management and capitalization, and de-risked the bank while increasing the investment in our core businesses.
Over the next three years, the bank aims to drive sustainable growth and economic profit driven by three key pillars:
| · | Strengthening its core by deploying CHF ~3 billion of capital to the Wealth Management division by 2024 and increasing the ratio of capital allocated to Wealth Management, the Swiss Bank and Asset Management versus the Investment Bank from ~1.5x in 2020 to ~2.0x in 2022. |
| · | Simplifying its operating model with a clear matrix organization of global businesses and regions, and a unified, global Wealth Management division, a global Investment Bank, and a central Technology and Operations function, which, together with other measures, is expected to generate structural cost savings to invest for growth. |
| · | Investing for growth with incremental investments progressively increasing from 2022 to 2024 to approximately CHF 1 – 1.5 billion p.a. in all four divisions, namely in our leading global Wealth Management business; global Investment Bank focused on advisory and solutions; leading Swiss universal banking franchise; as well as multi-specialist Asset Manager. |
António Horta-Osório, Chairman of the Board of Directors, said: “Over the past months, the Board of Directors and the Executive Board have been working together relentlessly on shaping the strategy that will serve as our compass going forward. The measures announced today provide the framework for a much stronger, more client-centric bank with leading businesses and regional franchises. Risk management will be at the core of our actions, helping to foster a culture that reinforces the importance of accountability and responsibility. We will invest to grow our topline by shifting approximately CHF 3 billion of capital to our wealth management business and through additional technology and other investments amounting to around CHF 1 to 1.5 billion per year by 2024, funded by expected BAU cost savings. This should enable us to achieve sustainable growth together with substantially lower risk and to deliver lasting value for all our key stakeholders – clients, investors, colleagues and society. With our 165-year heritage of superior client service and integrated approach, Credit Suisse is well positioned to build on the strengths of its great people and operating businesses.”
Media release Zurich, November 4, 2021 | ||
Thomas Gottstein, Group CEO, said: “With this strategic review, we have determined a clear and compelling way forward, building on existing strengths and accelerating growth in key strategic business areas. We will become a more streamlined bank, with expected lower volatility of earnings and with a sharper focus on the markets we operate in. We have the ambition to further strengthen our position as a global leader in wealth management and we will make further investments in areas where we have competitive advantages within our more focused and more capital-light Investment Bank, our leading and client-centric bank in Switzerland as well as our multi-specialist Asset Manager. I am confident that with the measures we announced today, we will be better positioned to leverage our strengths, control our risks and further build connectivity with the Wealth Management division, bringing the whole of our bank to all our private, corporate and institutional clients around the world.”
ACCELERATING GROWTH
Starting from January 2022, the Group will be reorganized into four divisions – Wealth Management, Investment Bank, Swiss Bank and Asset Management -- and four geographic regions – Switzerland, Europe, Middle East and Africa (EMEA), Asia-Pacific (APAC) and Americas -- reinforcing the integrated model with global businesses and strong regional client and regulatory accountability. The new leadership structure will be announced nearer to the implementation date.
The Group is making clear choices across all four divisions to strengthen the bank and accelerate growth:
| · | The globally unified Wealth Management division is expected to accelerate growth with an increase of about 25% in allocated capital by 2024, while aligning client segmentation, product offerings, platforms and technology, and leveraging global capabilities through a best-in-class integrated model across all regions. The division plans to expand its market leading UHNW and Upper HNW franchises and accelerate Core HNW growth in selected scale markets. We plan to exit approximately 10 non-core markets. The division expects to hire approximately 500 Relationship Managers over the next three years, which represents an increase of about 15% from 2021 to 2024. Investments in technology are expected to increase by approximately 60% in 2024 versus 2021. It has an objective of approximately CHF 1.1 trillion in assets under management by 2024, an increase of CHF 200 billion from current levels. This growth strategy is expected to deliver incremental recurring revenues of at least CHF 1 billion by 2024 combined with growth in transaction-based revenues. The 2024 ambition is to exceed a return on regulatory capital of 18% on an adjusted basis, excluding significant items, and grow net new assets by a mid-single digit p.a. |
| · | The Investment Bank creates a single global franchise across all four regions by integrating APAC and Swiss IBCM (Investment Banking & Capital Markets) with the existing Investment Bank. It intends to further pivot to capital-light Capital Markets & Advisory businesses, and continue to leverage its market-leading Credit, Securitized Products & Leverage Finance businesses, while further growing Global Trading Solutions (GTS) connectivity with Wealth Management. The division plans to exit Prime Services (with the exception of Index Access and APAC Delta One), optimize the Corporate Banking exposure and reduce the long-duration structured derivatives book, while exiting approximately 10 non-core GTS markets without Wealth Management nexus, helping drive an expected capital reduction of about 25% from 2020 levels by 2022. This will enable the investment banking businesses to be an even stronger strategic partner to the bank’s core corporate, entrepreneurial, UHNW, institutional and financial sponsor clients. With these measures, a return on regulatory capital of over 12% on an adjusted basis excluding significant items, is being pursued for 2024. |
Media release Zurich, November 4, 2021 | ||
| · | The Swiss Bank will include the domestic retail, corporate and institutional client segments as a business. The Swiss Bank will also continue to invest in further growth and build its leading position, by bringing the fully integrated services of the bank to its clients together with the global business divisions. Our 2024 ambition is to exceed a return on regulatory capital of 12% on an adjusted basis excluding significant items and grow client business volumes at low- to mid-single digit over 2022 to 2024. |
| · | In Asset Management, the focus will be on investing in core product capabilities, on expanding distribution in select European and APAC markets, and building a strong connectivity to our Wealth Management division. The division plans to exit non-core investments & partnerships, which is expected to result in an approximate 40% RWA reduction in investments & partnerships over 2021-2022. Our 2024 ambition is to exceed a return on regulatory capital of 45% on an adjusted basis excluding significant items and net new asset growth of over 4% p.a. |
The global divisions will be complemented by four strong regions namely, Switzerland, EMEA, APAC and Americas, to drive cross-divisional collaboration and strengthen legal entity management oversight and regulatory relationships at a regionally-aligned level.
In the APAC region, the bank has a unique opportunity to capture growth from our leading position there. This includes investing in its Mainland China franchise, centered around the Bank for Entrepreneurs model, building on our leading Singapore and Hong Kong hubs and further leveraging investment, financing, advisory and capital markets solutions.
In connection with the reorganization, we expect operating expenses to be impacted by approximately CHF 400 million of restructuring expenses relating to business exits, compensation normalization and Archegos remediation activities between the fourth quarter 2021 and 2022. As the implementation of the reorganization progresses, restructuring costs relating to asset impairments and liability valuations may arise in connection with business activities we are planning to exit and their related infrastructure.
Our Sustainability, Research & Investment Solutions function will continue to lead the bank and our clients into a sustainable future. The bank will build on its provision of sustainable investment solutions to clients through its distinctive ESG product offering, partnering with corporate clients to finance their sustainable transition through innovative and collaborative solutions and publish high-impact research and thought-leadership content. It will also continue to adapt its culture and governance to reflect sustainability across its franchise, with a focus on diversity and inclusion.
In addition, the bank’s corporate functions will continue to partner with the divisions and regions, providing effective collaboration, management and control oversight. The simplification of the business model and IT infrastructure is key to improving effectiveness as well as to defining clear accountability and ownership. Credit Suisse is centralizing IT and Operations under the new Chief Technology and Operations Officer. Furthermore, centralized teams covering procurement and enterprise architecture have been established under the Chief Financial Officer to drive the overall cost management program.
The Group has clear financial goals for each of the new divisions for 2022 to 2024 and will deliver on its strategy with disciplined and relentless execution.
Media release Zurich, November 4, 2021 | ||
FINANCIAL OBJECTIVES:
| - | Reshape the Investment Bank by reducing more than USD 3 billion, or ~25%, of capital by exiting Prime Services (with the exception of Index Access and APAC Delta One) over 2021 to 2022, while investing in the businesses where there are clear competitive advantages as well as those that are capital-light advisory-driven and/or have connectivity to Wealth Management. |
| - | Redeploy additional capital of approximately CHF 3 billion to the Wealth Management division by 2024, a 25% increase, with an ambition to grow client business volume to about CHF 1.6 trillion and assets under management to about CHF 1.1 trillion, to deliver incremental recurring revenues of >CHF 1 billion by 2024; this will be supported by growth investments including ~500 new Relationship Managers and ~60% step-up in technology investments by 2024. |
| - | Increase capital allocated to Wealth Management, Swiss Bank and Asset Management versus the Investment Bank to about 2.0x in 2022 and beyond from about 1.5x in 2020. |
| - | Invest capital for growth in the Investment Bank from 2023, while remaining at 50% capital of Wealth Management, Swiss Bank and Asset Management, collectively. |
| - | Aim to achieve a Group return on tangible equity of >10% by 2024; cost income ratio of ~70% on an adjusted basis, excluding significant items, with additional investments of CHF ~1 to 1.5 billion p.a. by 2024 funded by structural cost savings. |
| - | Objective by 2024 of a CET1 ratio of more than 14% pre-Basel 3 reform and a CET1 leverage ratio of approximately 4.5%. |
| - | Aim for net income distribution of ~25% in 2022, based on net income attributable to shareholders, subject to market and economic conditions. |
PROGRESS TO DATE
Work on the implementation of this new phase of growth for the Group has already begun:
| · | Strengthened capital position, achieving a CET1 ratio of 14.4% in the third quarter of 2021, supported by a significant reduction in RWA. |
| · | Established Asset Management as a separate operating division, emphasized the strategic importance of the business for the bank and clients. |
| · | Reinforced leadership with key, experienced appointments both at the Board of Directors and the Executive Board. |
| · | Completing a full-scale risk review across the entire bank, recalibrating the risk appetite at both Group and divisional levels and strengthening the risk management leadership and oversight at the BoD level. |
| · | Published the detailed findings of the Archegos Report, while the independent investigation into the Supply Chain Finance Funds matter continues to be a focus for the bank, with work ongoing. |
PRIORITIZING RISK MANAGEMENT
As part of the outcomes of the strategic review, the bank will continue to focus on risk culture, putting risk management at the heart of all its actions, with investments in data, infrastructure, reporting capabilities, as well as in compliance.
Media release Zurich, November 4, 2021 | ||
The following initiatives have already been completed or are underway:
| · | Fundamental risk review, examining how risks are being assessed, managed and controlled across the Group. |
| · | Clear definition of roles, responsibilities and accountabilities across all divisions, as Credit Suisse continues to implement remediation efforts that were initiated earlier in the year. |
| · | Development of tools and processes to improve business accountability and ownership as the first line of defense for risk and controls. |
| · | Revision of compensation process and structure, incorporating risk-sensitive performance and non-financial objectives into the enhanced performance scorecards. |
| · | Fostering a culture that reinforces the importance of personal accountability and responsibility. |
DELIVERING ON THE GROUP’S STRATEGIC VISION
In summary, the comprehensive measures communicated today set Credit Suisse on a positive new trajectory and will support the bank in delivering its long-term purpose: to build lasting value by serving its clients with care and entrepreneurial spirit.
The Group’s strategy is based on three themes: strengthening the core, simplifying its operating model and investing for growth. Based on this new strategy and the consequential organizational changes, the bank has made clear choices around the clients it serves, the markets it operates in and the capabilities in which it will further invest.
The Credit Suisse Executive Board is fully committed to relentlessly execute this strategic plan in order to deliver sustainable value for all stakeholders.
CONTACT DETAILS
Kinner Lakhani, Investor Relations, Credit Suisse Tel: +41 44 333 71 49 Email: investor.relations@credit-suisse.com |
Dominik von Arx, Corporate Communications, Credit Suisse Tel: +41 844 33 88 44 Email: media.relations@credit-suisse.com |
Media release Zurich, November 4, 2021 | ||
INVESTOR UPDATE
The 2021 Investor Update media release and the CEO and CFO presentations are available to download from 06:45 CET / 05:45 GMT / 01:45 EST today on www.credit-suisse.com/results.
Investor Update dial in details
Time: 09:45 CET / 08:45 GMT / 04:45 EST
Access: The webcast will be accessible through this link. For telephone, please use:
Telephone Standard International +44 2071 928338
Switzerland Free Call +41 80 000 0367
USA Free Call +1 877 870 9135
Conference ID: 7583203
Participant instructions:
1. In the 10 minutes prior to call start time, call the appropriate Participant Dial-In Number.
2. Enter the Event Passcode and leave any information requested after the tone. You will be joined automatically to the conference.
Q&A session. You will have the opportunity to ask questions during the telephone conference following the presentation.
Playbacks
A replay of the webcast will be available the day after the event at: www.credit-suisse.com/investorday
Important information
Credit Suisse has not finalized restated historical information according to its intended future divisional structure and Credit Suisse’s independent registered public accounting firm has not reviewed such information. Accordingly, the preliminary financial information contained in this document is subject to completion of ongoing procedures, which may result in changes to that information, and you should not place undue reliance on this preliminary information.
This material does not purport to contain all of the information that you may wish to consider. This material is not to be relied upon as such or used in substitution for the exercise of independent judgment.
We may not achieve all of the expected benefits of our strategic initiatives. Factors beyond our control, including but not limited to the market and economic conditions (including macroeconomic and other challenges and uncertainties, for example, resulting from the COVID-19 pandemic), changes in laws, rules or regulations and other challenges discussed in our public filings, could limit our ability to achieve some or all of the expected benefits of these initiatives.
In particular, the terms “Estimate”, “Illustrative”, “Expectation”, “Ambition”, “Objective”, “Outlook”, “Goal”, “Commitment” and “Aspiration” are not intended to be viewed as targets or projections, nor are they considered to be Key Performance Indicators. All such estimates, illustrations, expectations, ambitions, objectives, outlooks, goals, commitments and aspirations are subject to a large number of inherent risks, assumptions and uncertainties, many of which are completely outside of our control. These risks, assumptions and uncertainties include, but are not limited to, general market conditions, market volatility, increased inflation, interest rate volatility and levels, global and regional economic conditions, challenges and uncertainties resulting from the COVID-19 pandemic, political uncertainty, changes in tax policies, regulatory changes, changes in levels of client activity as a result of any of the foregoing and other factors. Accordingly, this information should not be relied on for any purpose. We do not intend to update these estimates, illustrations, expectations, ambitions, objectives, outlooks, goals, commitments or aspirations.
Unless otherwise noted, all such estimates, illustrations, expectations, ambitions, objectives, outlooks, goals, commitments and aspirations are for the full year indicated or as of the end of the year indicated, as applicable.
In preparing this document, management has made estimates and assumptions that affect the numbers presented. Actual results may differ. Annualized numbers do not take into account variations in operating results, seasonality and other factors and may not be indicative of actual, full-year results. Figures throughout this document may also be subject to rounding adjustments. All opinions and views constitute judgments as of the date of writing without regard to the date on which the
Media release Zurich, November 4, 2021 | ||
reader may receive or access the information. This information is subject to change at any time without notice and we do not intend to update this information.
This presentation contains certain preliminary information for the historical periods according to the future intended divisional structure of the Group. This information has been derived from management accounts, is preliminary in nature, does not reflect the complete restated results and is subject to change. Our independent registered public accounting firm has not audited, reviewed or performed any procedures with respect to this preliminary information and, accordingly, does not express an opinion or any other form of assurance with respect to this data. There can be no assurance that the final results for these periods will not differ from these preliminary results, and any such differences could be material. Accordingly, you should not place undue reliance on this preliminary information.
Our estimates, ambitions, objectives and targets often include metrics that are non-GAAP financial measures and are unaudited. A reconciliation of the estimates, ambitions, objectives and targets to the nearest GAAP measures is unavailable without unreasonable efforts. Adjusted results exclude goodwill impairment, major litigation provisions, real estate gains and other revenue and expense items included in our reported results, all of which are unavailable on a prospective basis. Return on tangible equity is based on tangible shareholders' equity (also known as tangible book value), a non-GAAP financial measure, which is calculated by deducting goodwill and other intangible assets from total shareholders' equity as presented in our balance sheet, both of which are unavailable on a prospective basis. Return on regulatory capital (a non-GAAP financial measure) is calculated using income / (loss) after tax and assumes a tax rate of 25% and capital allocated based on the average of 13.5% of average risk-weighted assets and 4.25% of average leverage exposure; the essential components of this calculation are unavailable on a prospective basis. Such estimates, ambitions, objectives and targets are calculated in a manner that is consistent with the accounting policies applied by us in preparing our financial statements.
Capital allocation ambitions are calculated based on the average of 13.5% of risk-weighted assets (RWA) and 4.25% of leverage exposure. Cost savings ambitions are calculated using adjusted operating expenses excluding significant items at constant 2021 foreign exchange rates.
Credit Suisse is subject to the Basel III framework, as implemented in Switzerland, as well as Swiss legislation and regulations for systemically important banks, which include capital, liquidity, leverage and large exposure requirements and rules for emergency plans designed to maintain systemically relevant functions in the event of threatened insolvency. Credit Suisse has adopted the Bank for International Settlements (BIS) leverage ratio framework, as issued by the Basel Committee on Banking Supervision (BCBS) and implemented in Switzerland by the Swiss Financial Market Supervisory Authority FINMA (FINMA).
Unless otherwise noted, all CET1 ratio, Tier-1 leverage ratio, risk-weighted assets and leverage exposure figures in this document are as of the end of the respective period.
Unless otherwise noted, leverage exposure is based on the BIS leverage ratio framework and consists of period-end balance sheet assets and prescribed regulatory adjustments. The tier 1 leverage ratio and CET1 leverage ratio are calculated as BIS tier 1 capital and CET1 capital, respectively, divided by period end leverage exposure.
Client business volume includes assets under management, custody assets (including assets under custody and commercial assets) and net loans.
Investors and others should note that we announce important company information (including quarterly earnings releases and financial reports as well as our annual sustainability report) to the investing public using press releases, SEC and Swiss ad hoc filings, our website and public conference calls and webcasts. We also routinely use our Twitter account @creditsuisse (https://twitter.com/creditsuisse), our LinkedIn account (https://www.linkedin.com/company/credit-suisse/), our Instagram accounts (https://www.instagram.com/creditsuisse_careers/ and https://www.instagram.com/creditsuisse_ch/), our Facebook account (https://www.facebook.com/creditsuisse/) and other social media channels as additional means to disclose public information, including to excerpt key messages from our public disclosures. We may share or retweet such messages through certain of our regional accounts, including through Twitter at @csschweiz (https://twitter.com/csschweiz) and @csapac (https://twitter.com/csapac). Investors and others should take care to consider such abbreviated messages in the context of the disclosures from which they are excerpted. The information we post on these social media accounts is not a part of this document.
Information referenced in this document, whether via website links or otherwise, is not incorporated into this document.
In various tables, use of “–” indicates not meaningful or not applicable.
The English language version of this document is the controlling version.
Media release Zurich, November 4, 2021 | ||
Reconciliation of adjustment items
Results excluding certain items included in our reported results are non-GAAP financial measures. Management believes that such results provide a useful presentation of our operating results for purposes of assessing our Group and divisional performance consistently over time, on a basis that excludes items that management does not consider representative of our underlying performance. Provided below is a reconciliation to the most directly comparable US GAAP measures. Historical information presented according to the new divisional structure is a preliminary estimate based on management accounts and subject to change.
| 2020 in CHF bn | Wealth Management | Swiss Bank | Investment Bank | Asset Management |
| Net revenues reported | 9.0 | 3.0 | 9.6 | 1.1 |
| Real estate (gains)/losses | - | (0.0) | - | - |
| (Gains)/losses on business sales | - | - | - | - |
| Major litigation recovery | - | - | - | - |
| Valuation adjustment related to a major litigation | - | - | - | - |
| Gain related to InvestLab transfer | (0.0) | (0.0) | - | (0.2) |
| Gain on equity investment in Allfunds Group | (0.1) | (0.0) | - | - |
| Gain on equity investment in SIX Group AG | (0.1) | (0.1) | - | - |
| Gain on equity investment in Pfandbriefbank | - | (0.1) | - | - |
| Impairment on York Capital Management | - | - | - | 0.4 |
| Archegos | - | - | - | - |
| Net revenues adj. excl. sign. items and Archegos | 8.9 | 2.7 | 9.6 | 1.3 |
| Provision for credit losses | 0.3 | 0.3 | 0.6 | - |
| o/w Archegos | - | - | - | - |
| Total operating expenses reported | 6.1 | 1.6 | 7.1 | 1.1 |
| Restructuring expenses | (0.0) | (0.0) | (0.0) | (0.0) |
| Major litigation provisions | 0.0 | (0.0) | (0.0) | - |
| Expenses related to real estate disposals | (0.0) | (0.0) | (0.0) | (0.0) |
| Expenses related to business sales | - | - | - | - |
| Expenses related to equity investment in Allfunds Group | - | - | - | - |
| Archegos | - | - | - | - |
| Total operating expenses adj. excl. sign. items and Archegos | 6.1 | 1.5 | 7.0 | 1.1 |
| Pre-tax income/(loss) reported | 2.7 | 1.1 | 1.9 | (0.0) |
| Total adjustments, significant items and Archegos | (0.2) | (0.2) | 0.1 | 0.2 |
| Pre-tax income/(loss) adj. excl. sign. items and Archegos | 2.5 | 0.9 | 2.0 | 0.2 |
Reported return on regulatory capital† | 17% | 12% | 11% | (4)% |
Adjusted RoRC† excluding significant items and Archegos | 16% | 10% | 11% | 19% |
Credit Suisse
Credit Suisse is one of the world's leading financial services providers. Our strategy builds on Credit Suisse's core strengths: its position as a leading wealth manager, its specialist investment banking capabilities and its strong presence in our home market of Switzerland. We seek to follow a balanced approach to wealth management, aiming to capitalize on both the large pool of wealth within mature markets as well as the significant growth in wealth in Asia Pacific and other emerging markets, while also serving key developed markets with an emphasis on Switzerland. Credit Suisse employs approximately 49,950 people. The registered shares (CSGN) of Credit Suisse Group AG, are listed in Switzerland and, in the form of American Depositary Shares (CS), in New York. Further information about Credit Suisse can be found at www.credit-suisse.com.
Cautionary statement regarding forward-looking information
This document contains statements that constitute forward-looking statements. In addition, in the future we, and others on our behalf, may make statements that constitute forward-looking statements. Such forward-looking statements may include, without limitation, statements relating to the following:
| § | our plans, targets or goals; |
| § | our future economic performance or prospects; |
| § | the potential effect on our future performance of certain contingencies; and |
| § | assumptions underlying any such statements. |
Media release Zurich, November 4, 2021 | ||
Words such as “believes,” “anticipates,” “expects,” “intends” and “plans” and similar expressions are intended to identify forward-looking statements but are not the exclusive means of identifying such statements. We do not intend to update these forward-looking statements.
By their very nature, forward-looking statements involve inherent risks and uncertainties, both general and specific, and risks exist that predictions, forecasts, projections and other outcomes described or implied in forward-looking statements will not be achieved. We caution you that a number of important factors could cause results to differ materially from the plans, targets, goals, expectations, estimates and intentions expressed in such forward-looking statements and that the COVID-19 pandemic creates significantly greater uncertainty about forward-looking statements in addition to the factors that generally affect our business. These factors include:
| § | the ability to maintain sufficient liquidity and access capital markets; |
| § | market volatility, increases in inflation and interest rate fluctuations or developments affecting interest rate levels, including the persistence of a low or negative interest rate environment; |
| § | the strength of the global economy in general and the strength of the economies of the countries in which we conduct our operations, in particular the risk of negative impacts of COVID-19 on the global economy and financial markets and the risk of continued slow economic recovery or downturn in the EU, the US or other developed countries or in emerging markets in 2021 and beyond; |
| § | the emergence of widespread health emergencies, infectious diseases or pandemics, such as COVID-19, and the actions that may be taken by governmental authorities to contain the outbreak or to counter its impact; |
| § | potential risks and uncertainties relating to the severity of impacts from COVID-19 and the duration of the pandemic, including potential material adverse effects on our business, financial condition and results of operations; |
| § | the direct and indirect impacts of deterioration or slow recovery in residential and commercial real estate markets; |
| § | adverse rating actions by credit rating agencies in respect of us, sovereign issuers, structured credit products or other credit-related exposures; |
| § | the ability to achieve our strategic goals, including those related to our targets, ambitions and financial goals; |
| § | the ability of counterparties to meet their obligations to us and the adequacy of our allowance for credit losses; |
| § | the effects of, and changes in, fiscal, monetary, exchange rate, trade and tax policies; |
| § | the effects of currency fluctuations, including the related impact on our business, financial condition and results of operations due to moves in foreign exchange rates; |
| § | political, social and environmental developments, including war, civil unrest or terrorist activity and climate change; |
| § | the ability to appropriately address social, environmental and sustainability concerns that may arise from our business activities; |
| § | the effects of, and the uncertainty arising from, the UK’s withdrawal from the EU; |
| § | the possibility of foreign exchange controls, expropriation, nationalization or confiscation of assets in countries in which we conduct our operations; |
| § | operational factors such as systems failure, human error, or the failure to implement procedures properly; |
| § | the risk of cyber attacks, information or security breaches or technology failures on our reputation, business or operations, the risk of which is increased while large portions of our employees work remotely; |
| § | the adverse resolution of litigation, regulatory proceedings and other contingencies; |
| § | actions taken by regulators with respect to our business and practices and possible resulting changes to our business organization, practices and policies in countries in which we conduct our operations; |
| § | the effects of changes in laws, regulations or accounting or tax standards, policies or practices in countries in which we conduct our operations; |
| § | the expected discontinuation of LIBOR and other interbank offered rates and the transition to alternative reference rates; |
| § | the potential effects of changes in our legal entity structure; |
| § | competition or changes in our competitive position in geographic and business areas in which we conduct our operations; |
| § | the ability to retain and recruit qualified personnel; |
| § | the ability to maintain our reputation and promote our brand; |
| § | the ability to increase market share and control expenses; |
| § | technological changes instituted by us, our counterparties or competitors; |
| § | the timely development and acceptance of our new products and services and the perceived overall value of these products and services by users; |
| § | acquisitions, including the ability to integrate acquired businesses successfully, and divestitures, including the ability to sell non-core assets; and |
| § | other unforeseen or unexpected events and our success at managing these and the risks involved in the foregoing. |
We caution you that the foregoing list of important factors is not exclusive. When evaluating forward-looking statements, you should carefully consider the foregoing factors and other uncertainties and events, including the information set forth in “Risk factors” in I – Information on the company in our Annual Report 2020 and in “Risk factor” in I – Credit Suisse results – Credit Suisse in our 1Q21 Financial Report.
Copyright © 2021 Credit Suisse Group AG and/or its affiliates. All rights reserved.
Page 9/9

Credit Suisse 2021 Investor Day November 4, 2021
Disclaimer (1/2) 2 November 4, 2021 Credit Suisse has not finalized restated historical information according to its intended future divisional structure and Credit Suisse’s independent registered public accounting firm has not reviewed such information. Accordingly, the preliminary information contained in this presentation is subject to completion of ongoing procedures, which may result in changes to that information, and you should not place undue reliance on this preliminary information.This material does not purport to contain all of the information that you may wish to consider. This material is not to be relied upon as such or used in substitution for the exercise of independent judgment. Cautionary statement regarding forward-looking statements This presentation contains forward-looking statements that involve inherent risks and uncertainties, and we might not be able to achieve the predictions, forecasts, projections and other outcomes we describe or imply in forward-looking statements. A number of important factors could cause results to differ materially from the plans, targets, goals, expectations, estimates and intentions we express in these forward-looking statements, including those we identify in "Risk factors” in our Annual Report on Form 20-F for the fiscal year ended December 31, 2020, in “Credit Suisse – Risk factor” in our 1Q21 Financial Report published on May 6, 2021 and in the “Cautionary statement regarding forward-looking information" in our media release relating to the 2021 Investor Day published on November 4, 2021 and filed with the US Securities and Exchange Commission, and in other public filings and press releases. We do not intend to update these forward-looking statements. In particular, the terms “Estimate”, “Illustrative”, “Expectation”, “Ambition”, “Objective”, “Outlook”, “Goal”, “Commitment” and “Aspiration” are not intended to be viewed as targets or projections, nor are they considered to be Key Performance Indicators. All such estimates, illustrations, expectations, ambitions, objectives, outlooks, goals, commitments and aspirations are subject to a large number of inherent risks, assumptions and uncertainties, many of which are completely outside of our control. These risks, assumptions and uncertainties include, but are not limited to, general market conditions, market volatility, inflation increases, interest rate volatility and levels, global and regional economic conditions, challenges and uncertainties resulting from the COVID-19 pandemic, political uncertainty, changes in tax policies, regulatory changes, changes in levels of client activity as a result of any of the foregoing and other factors. Accordingly, this information should not be relied on for any purpose. We do not intend to update these estimates, illustrations, expectations, ambitions, objectives, outlooks, goals, commitments or aspirations. Unless otherwise noted, all such estimates, illustrations, expectations, ambitions, objectives, outlooks, goals, commitments and aspirations are for the full year indicated or as of the end of the year indicated, as applicable.We may not achieve the benefits of our strategic initiativesWe may not achieve all of the expected benefits of our strategic initiatives. Factors beyond our control, including but not limited to the market and economic conditions (including macroeconomic and other challenges and uncertainties, for example, resulting from the COVID-19 pandemic), changes in laws, rules or regulations and other challenges discussed in our public filings, could limit our ability to achieve some or all of the expected benefits of these initiatives. Estimates and assumptionsIn preparing this presentation, management has made estimates and assumptions that affect the numbers presented. Actual results may differ. Annualized numbers do not take into account variations in operating results, seasonality and other factors and may not be indicative of actual, full-year results. Figures throughout this presentation may also be subject to rounding adjustments. All opinions and views constitute judgments as of the date of writing without regard to the date on which the reader may receive or access the information. This information is subject to change at any time without notice and we do not intend to update this information. 2021 Investor Day
Disclaimer (2/2) 3 November 4, 2021 Cautionary statements relating to certain preliminary financial informationThis presentation contains certain preliminary financial information for the historical periods according to the future intended divisional structure of the Group. This information has been derived from management accounts, is preliminary in nature, does not reflect the complete restated results and is subject to change. Our independent registered public accounting firm has not audited, reviewed or performed any procedures with respect to this preliminary information and, accordingly, does not express an opinion or any other form of assurance with respect to this data. There can be no assurance that the final results for these periods will not differ from these preliminary results, and any such differences could be material. Accordingly, you should not place undue reliance on this preliminary information.Statement regarding non-GAAP financial measuresThis presentation contains non-GAAP financial measures, including results excluding certain items included in our reported results as well as return on regulatory capital and return on tangible equity (which is based on tangible shareholders’ equity). Further details and information needed to reconcile such non-GAAP financial measures to the most directly comparable measures under US GAAP can be found in the Appendix, which is available on our website at www.credit-suisse.com. Our estimates, ambitions, objectives, aspirations and targets often include metrics that are non-GAAP financial measures and are unaudited. A reconciliation of these measures to the nearest GAAP measures is unavailable without unreasonable efforts. Results excluding certain items included in our reported results do not include items such as goodwill impairment, major litigation provisions, real estate gains, impacts from foreign exchange and other revenue and expense items included in our reported results, all of which are unavailable on a prospective basis. Return on tangible equity is based on tangible shareholders' equity, a non-GAAP financial measure also known as tangible book value, which is calculated by deducting goodwill and other intangible assets from total shareholders' equity as presented in our balance sheet, both of which are unavailable on a prospective basis. Return on regulatory capital (a non-GAAP financial measure) is calculated using income/(loss) after tax and assumes a tax rate of 25% and capital allocated based on the average of 13.5% of risk-weighted assets and 4.25% of leverage exposure; the essential components of this calculation are unavailable on a prospective basis. Such estimates, ambitions, objectives and targets are calculated in a manner that is consistent with the accounting policies applied by us in preparing our financial statements. Statement regarding capital, liquidity and leverageCredit Suisse is subject to the Basel III framework, as implemented in Switzerland, as well as Swiss legislation and regulations for systemically important banks, which include capital, liquidity, leverage and large exposure requirements and rules for emergency plans designed to maintain systemically relevant functions in the event of threatened insolvency. Credit Suisse has adopted the Bank for International Settlements (BIS) leverage ratio framework, as issued by the Basel Committee on Banking Supervision (BCBS) and implemented in Switzerland by the Swiss Financial Market Supervisory Authority FINMA.Unless otherwise noted, leverage exposure is based on the BIS leverage ratio framework and consists of period-end balance sheet assets and prescribed regulatory adjustments. The tier 1 leverage ratio and CET1 leverage ratio are calculated as BIS tier 1 capital and CET1 capital, respectively, divided by period-end leverage exposure. Swiss leverage ratios are measured on the same period-end basis as the leverage exposure for the BIS leverage ratio. Unless otherwise noted, for periods in 2020, leverage exposure excludes cash held at central banks, after adjusting for the dividend paid in 2020.SourcesCertain material in this presentation has been prepared by Credit Suisse on the basis of publicly available information, internally developed data and other third-party sources believed to be reliable. Credit Suisse has not sought to independently verify information obtained from public and third-party sources and makes no representations or warranties as to accuracy, completeness or reliability of such information.Mandatory Convertible NotesThese materials are not an offer to sell securities or the solicitation of any offer to buy securities, nor shall there be any offer of securities, in any jurisdiction in which such offer or sale would be unlawful.These materials are not an offer of securities for sale in the United States or to U.S. persons (“U.S. persons”) as defined in Regulation S under the U.S. Securities Act of 1933, as amended (the “U.S. Securities Act”). The mandatory convertible notes described in these materials and the shares of Credit Suisse Group AG issuable on their conversion have not been and will not be registered under the U.S. Securities Act and may not be offered or sold in the United States or to, or for the account or benefit of, U.S. persons, absent registration or an applicable exemption from registration under the U.S. Securities Act. 2021 Investor Day

Credit Suisse 2021 Investor DayAgenda Time (GMT) Theme Presenter Duration 08:45 am Welcome and agenda Kinner Lakhani, Head of Group Strategy and Investor Relations 5’ 08:50 am Chairman’s Perspective – Our Vision António Horta-Osório, Chairman of the Board of Directors 15’ 09:05 am Strategic Perspectives Thomas Gottstein, Chief Executive Officer 30’ 09:35 am Financial Perspectives David Mathers, Chief Financial Officer 30’ 10:05 am Wealth Management Philipp Wehle, CEO International Wealth Management 20’ 10:25 am Investment Bank Christian Meissner, CEO Investment Bank 20’ 10:45 am Swiss Bank André Helfenstein, CEO Swiss Universal Bank 15’ 11:00 am Asset Management Ulrich Körner, CEO Asset Management 15’ 11:15 am Asia Pacific – Growth Aspirations Helman Sitohang, CEO APAC 15’ 11:30 am A Transformed Bank Thomas Gottstein, Chief Executive Officer 5’ 11:35 am Q&A 70’ 12:45 pm Close 2021 Investor Day 4 November 4, 2021

5 November 4, 2021 A Transformed Bank 6 Financial Perspectives 5 Asia Pacific Growth Aspirations 4 Divisional Perspectives 3 Strategic Perspectives 2 Our Vision 1 Agenda 2021 Investor Day

António Horta-Osório, Chairman of the Board of Directors November 4, 2021 Our VisionCredit Suisse 2021 Investor Day
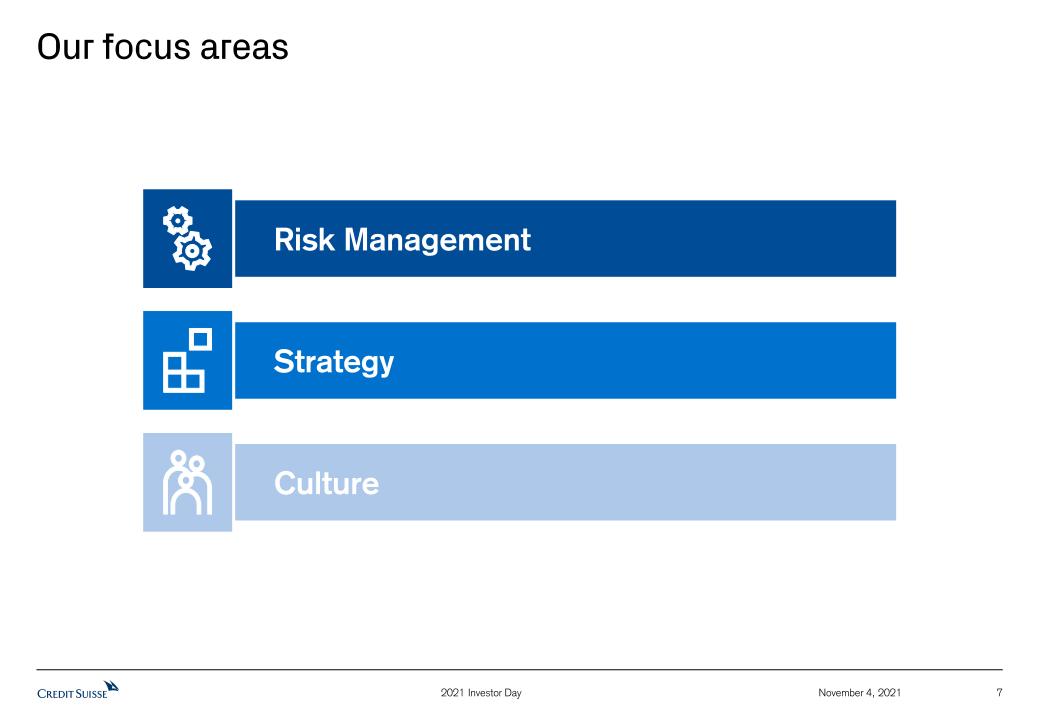
7 November 4, 2021 Our focus areas 2021 Investor Day Risk Management Strategy Culture
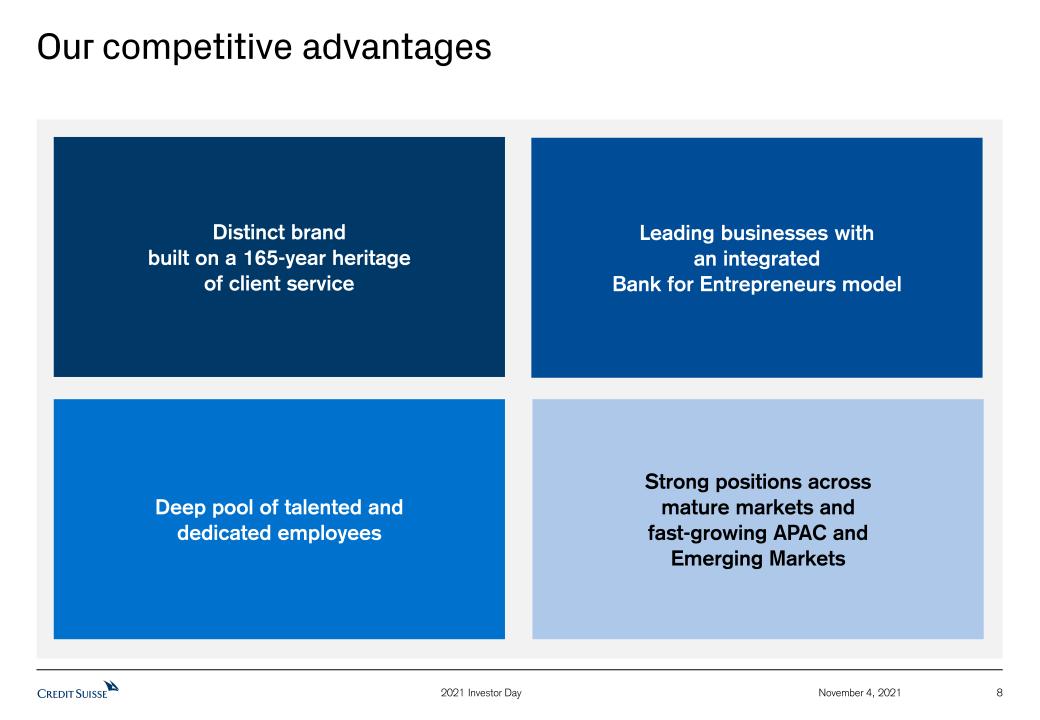
8 November 4, 2021 Our competitive advantages Distinct brand built on a 165-year heritage of client service Leading businesses with an integrated Bank for Entrepreneurs model Deep pool of talented and dedicated employees Strong positions across mature markets and fast-growing APAC and Emerging Markets 2021 Investor Day

Our purpose is the foundation of our strategic vision We build lasting value by serving our clients with care and entrepreneurial spirit November 4, 2021 9 2021 Investor Day

November 4, 2021 The Board of Directors has comprehensively assessed and concluded on our strategic options 10 2021 Investor Day Our key considerations… …are driving clear choices around clients, businesses and markets Pillars of our strategy Strengthen Simplify Invest for growth Connectivity and nexus to Wealth Management Sustainable competitive advantage Core clients with deep relationships Markets and capabilities with scale Through-the-cycle risk-return economics 1 2 3 4 Reinforce our integrated model, creating a matrix of global businesses and strong regional client accountability Invest in our leading Wealth Management business to accelerate growth, under a unified global division Reshape our global Investment Bank for connectivity, capital-light and competitive advantage Retain and grow our core Asset Management business Build on our leading position in our Swiss home market Strengthen our risk and control foundation Pivot to faster-growth APAC and Emerging Markets 5 6 7 Shift capital allocation across the portfolio, aiming to direct CHF ~3 bn of capital1 to Wealth Management, increasing capital allocation to Wealth Management, Swiss Bank and Asset Management vs. Investment Bank from ~1.5x in 2020 to ~2.0x in 2022 and beyond 9 Increase investment in talent, technology and digital transformation 8 1 Based on average of 13.5% RWA and 4.25% Leverage Exposure

The pillars of our strategy November 4, 2021 11 2021 Investor Day Invest in clients, businesses, talent and technology where we have sustainable competitive advantage Shift capital to value-creating businesses and strengthen our balance sheet and organization Place risk management at the core of the Bank Foster a diverse and inclusive culture that reinforces the importance of personal accountability and responsibility with our entrepreneurial spirit Deliver on our strategy with disciplined, relentless execution Drive structural cost discipline to fund strategic investments and generate operational leverage Strengthen Simplify Invest for growth Lead the Bank and our clients into a sustainable future
12 November 4, 2021 A Transformed Bank 6 Financial Perspectives 5 Asia Pacific Growth Aspirations 4 Divisional Perspectives 3 Strategic Perspectives 2 Our Vision 1 Agenda 2021 Investor Day
Strategic PerspectivesCredit Suisse 2021 Investor Day Thomas Gottstein, Chief Executive OfficerNovember 4, 2021

November 4, 2021 We will execute on our strategic vision 14 2021 Investor Day Strengthen Simplify Invest forgrowth Global Investment Bank focused on advice and solutions Leading universal bankin Switzerland Multi-specialist Asset Manager Strong risk management foundation and technology capabilities Global leader in Wealth Management Balanced approach between mature and emerging markets with a pivot to APAC Leading the Bank and our clients into a sustainable future Empowered regional organization driving cross-divisional collaboration

We have taken decisive actions to strengthen our Bank… Reinforced our leadership with key ExB appointments:Ulrich Körner as CEO Asset ManagementChristian Meissner as CEO Investment BankDavid Wildermuth as Chief Risk Officer Strengthened our capital position through MCN issuance of CHF 1.7 bn in 2Q21 and reductions in RWA and Leverage Exposure Largely completed fundamental risk review across the bankRecalibration of risk appetite at Group and divisional levelStrengthened Risk Management leadership Completed Board investigations into the Archegos matterSCFF: Total cash position1 of USD 7.0 bn; continued focus on returning cash to our clients; the independent investigation continues to be a focus for the Bank, with work ongoing Established Asset Management as a separate operating division, emphasizing the strategic importance of the business for the Bank and our clients November 4, 2021 15 2021 Investor Day Invest for Growth Simplify Strengthen Joanne Hannaford as Chief Technology & Operations OfficerRafael Lopez Lorenzo as Chief Compliance Officer Christine Graeff as Global Head of Human Resources Leadership Capital Risk Management Asset Management Archegos and Supply Chain Finance Funds Legacy matters Settlement with US, UK and Swiss regulators of legacy matters related to loan financing for Mozambique state enterprises and related securities transactions that took place between 2013 and 2016Concluded enforcement proceedings with Swiss regulator related to past observation activities 1 Includes cash already distributed to investors and cash & cash equivalent remaining in the funds

...and are investing in our Risk and Controls foundation to support our growth November 4, 2021 16 2021 Investor Day Strengthen our risk culture Align risk appetite to the strategic direction of Credit Suisse Strengthen risk management leadership Invest in risk, compliance and controls foundation across the Bank Aligncompensation process and structure to reinforce culture shift Actions in progress Invest for Growth Simplify Strengthen Launched “Everyone is a risk manager” as a core principle across the bankStrengthen business accountability and ownership as the first line of defense for risk and controls Appointed new Chief Risk Officer and Chief Compliance OfficerAppointments of experienced senior risk officers across divisions More clearly defined roles, responsibilities and accountability Comprehensive remediation post recent incidentsInvestments in compliance, data, infrastructure, reporting capabilities and risk management processes Recalibration of risk appetite across the portfolio with continued regular multi-dimensional reviews going forward Align compensation process to reinforce both Risk & Control objectives and collaboration
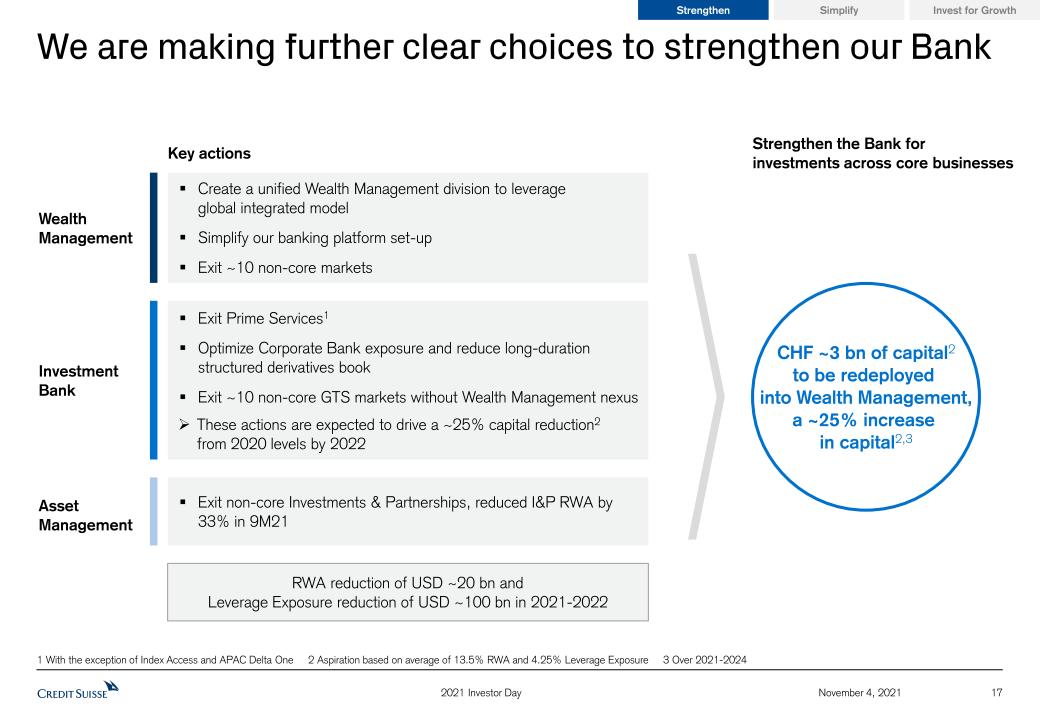
We are making further clear choices to strengthen our Bank November 4, 2021 17 2021 Investor Day WealthManagement Investment Bank Asset Management Invest for Growth Simplify Strengthen CHF ~3 bn of capital2to be redeployed into Wealth Management,a ~25% increase in capital2,3 1 With the exception of Index Access and APAC Delta One 2 Aspiration based on average of 13.5% RWA and 4.25% Leverage Exposure 3 Over 2021-2024 RWA reduction of USD ~20 bn and Leverage Exposure reduction of USD ~100 bn in 2021-2022 Create a unified Wealth Management division to leverage global integrated modelSimplify our banking platform set-upExit ~10 non-core markets Exit non-core Investments & Partnerships, reduced I&P RWA by 33% in 9M21 Exit Prime Services1Optimize Corporate Bank exposure and reduce long-duration structured derivatives bookExit ~10 non-core GTS markets without Wealth Management nexus These actions are expected to drive a ~25% capital reduction2 from 2020 levels by 2022 Key actions Strengthen the Bank for investments across core businesses
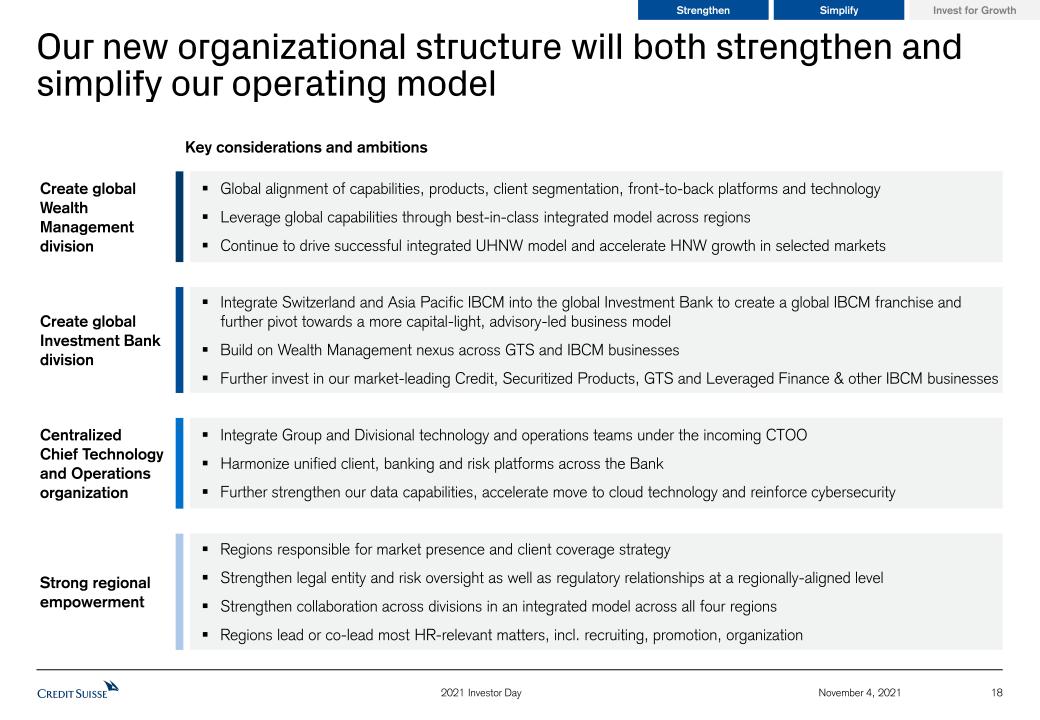
Our new organizational structure will both strengthen and simplify our operating model November 4, 2021 18 2021 Investor Day Invest for Growth Simplify Strengthen Key considerations and ambitions Create global Wealth Management division Create global Investment Bank division Centralized Chief Technology and Operations organization Strong regional empowerment Global alignment of capabilities, products, client segmentation, front-to-back platforms and technologyLeverage global capabilities through best-in-class integrated model across regionsContinue to drive successful integrated UHNW model and accelerate HNW growth in selected markets Integrate Switzerland and Asia Pacific IBCM into the global Investment Bank to create a global IBCM franchise and further pivot towards a more capital-light, advisory-led business modelBuild on Wealth Management nexus across GTS and IBCM businessesFurther invest in our market-leading Credit, Securitized Products, GTS and Leveraged Finance & other IBCM businesses Integrate Group and Divisional technology and operations teams under the incoming CTOOHarmonize unified client, banking and risk platforms across the BankFurther strengthen our data capabilities, accelerate move to cloud technology and reinforce cybersecurity Regions responsible for market presence and client coverage strategyStrengthen legal entity and risk oversight as well as regulatory relationships at a regionally-aligned levelStrengthen collaboration across divisions in an integrated model across all four regionsRegions lead or co-lead most HR-relevant matters, incl. recruiting, promotion, organization

Our new organizational structure with 4 divisions and 4 regions will support our strategy November 4, 2021 19 2021 Investor Day Invest for Growth Simplify Strengthen Primary external reporting divisions Switzerland EMEA APAC Americas Wealth Managementdivision Investment Bankdivision Swiss Bankdivision Asset Managementdivision Global Capabilities andRegional Business Units Digital Corporate Institutional Investment Banking & Capital Markets Credit GTS Equities Global Capabilities andRegional Business Units SRI – Sustainability, Research and Investment Solutions

November 4, 2021 20 2021 Investor Day Invest for Growth Simplify Strengthen CHF ~1.0-1.5 bn of annual structural cost savings1 by 2024 to invest for growth Simplify Creating global Wealth Management division Creating global Investment Bank division Streamline Automate Digitalizing front-to-back operating model Delivering CSX in Swiss Bank Centralizing technology and operations functions to deliver shared platform Rationalizing legal entity and banking platform set-up Optimizing our organizational structure Centralizing Procurement We aim to deliver CHF ~1.0-1.5 bn of efficiency savings by 2024 to fund growth investments 1 Aspiration measured using adjusted operating expenses, excluding significant items, at constant 2021 FX rates, progressively increasing from 2022-2024; does not include cost reductions from exited businesses
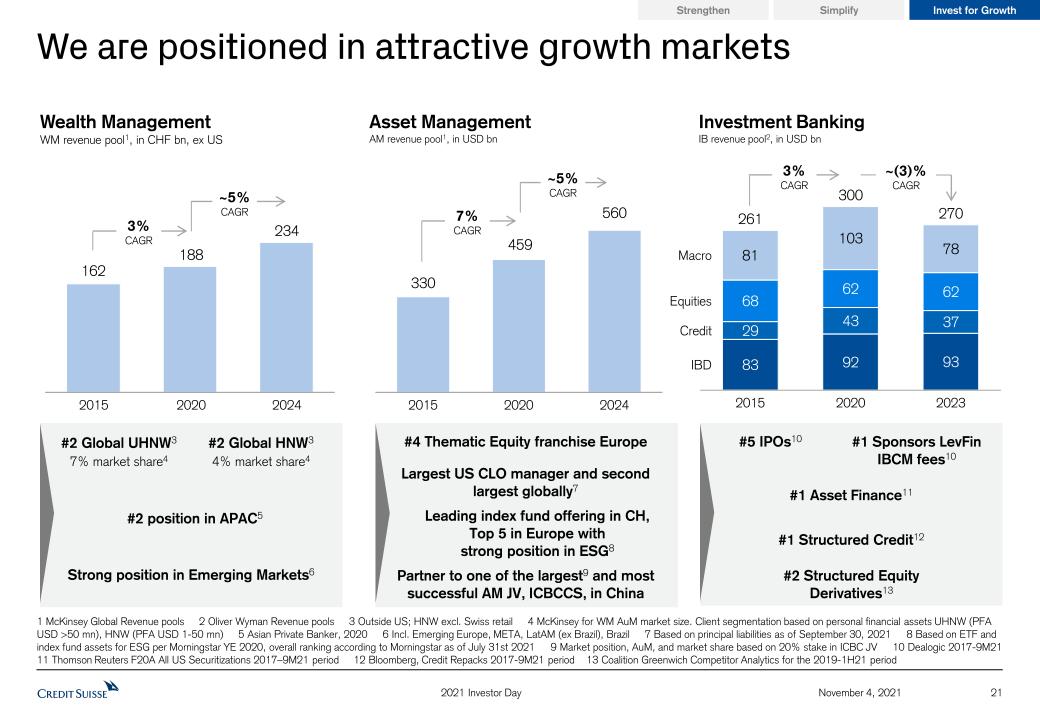
21 November 4, 2021 2021 Investor Day We are positioned in attractive growth markets Invest for Growth Simplify Strengthen 2020 2015 2024 162 188 234 Wealth ManagementWM revenue pool1, in CHF bn, ex US Investment BankingIB revenue pool2, in USD bn 3%CAGR ~5%CAGR Asset ManagementAM revenue pool1, in USD bn 2015 2020 2024 7%CAGR ~5%CAGR 3%CAGR ~(3)%CAGR #4 Thematic Equity franchise Europe Largest US CLO manager and second largest globally7 Leading index fund offering in CH,Top 5 in Europe with strong position in ESG8 #1 Structured Credit12 #5 IPOs10 #2 Structured Equity Derivatives13 #1 Asset Finance11 #1 Sponsors LevFin IBCM fees10 #2 Global UHNW3 7% market share4 #2 position in APAC5 Strong position in Emerging Markets6 #2 Global HNW3 4% market share4 IBD Credit 2020 2015 2023 Macro Equities 261 300 270 1 McKinsey Global Revenue pools 2 Oliver Wyman Revenue pools 3 Outside US; HNW excl. Swiss retail 4 McKinsey for WM AuM market size. Client segmentation based on personal financial assets UHNW (PFA USD >50 mn), HNW (PFA USD 1-50 mn) 5 Asian Private Banker, 2020 6 Incl. Emerging Europe, META, LatAM (ex Brazil), Brazil 7 Based on principal liabilities as of September 30, 2021 8 Based on ETF and index fund assets for ESG per Morningstar YE 2020, overall ranking according to Morningstar as of July 31st 2021 9 Market position, AuM, and market share based on 20% stake in ICBC JV 10 Dealogic 2017-9M21 11 Thomson Reuters F20A All US Securitizations 2017–9M21 period 12 Bloomberg, Credit Repacks 2017-9M21 period 13 Coalition Greenwich Competitor Analytics for the 2019-1H21 period Partner to one of the largest9 and most successful AM JV, ICBCCS, in China
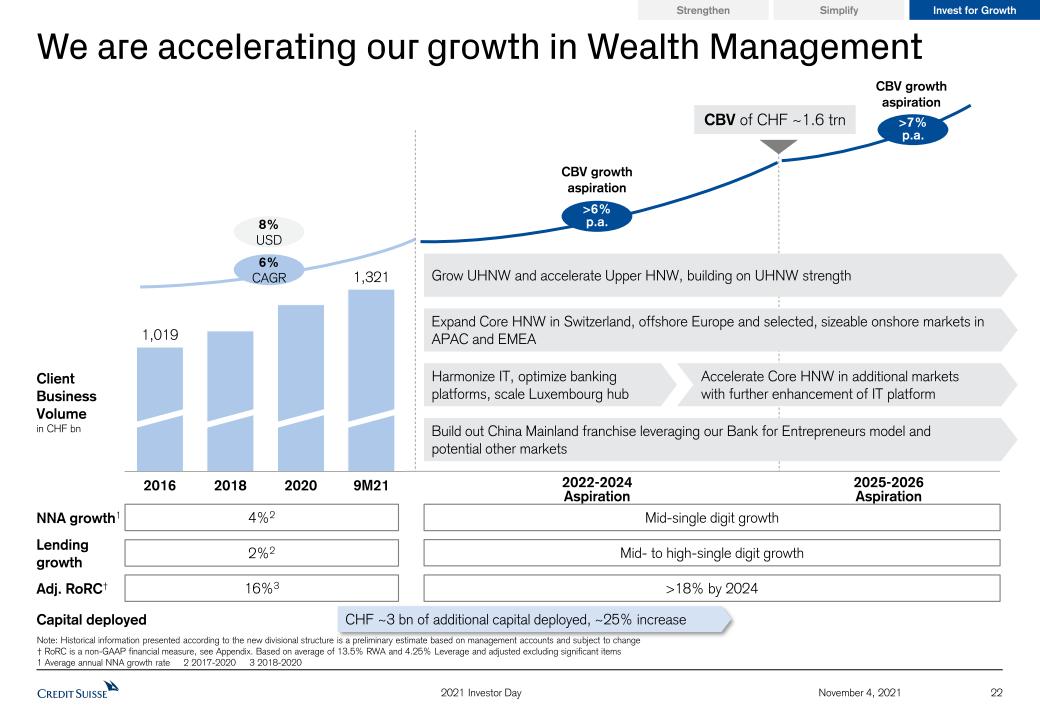
22 November 4, 2021 We are accelerating our growth in Wealth Management 2021 Investor Day Client Business Volume in CHF bn 9M21 2020 2016 2018 1,019 1,321 8%USD 4%2 NNA growth1 Adj. RoRC† Capital deployed 16%3 >6% p.a. Mid-single digit growth CBV growth aspiration CBV growth aspiration 6%CAGR >7% p.a. Expand Core HNW in Switzerland, offshore Europe and selected, sizeable onshore markets in APAC and EMEA Harmonize IT, optimize banking platforms, scale Luxembourg hub 2022-2024 Aspiration 2025-2026Aspiration Build out China Mainland franchise leveraging our Bank for Entrepreneurs model and potential other markets Grow UHNW and accelerate Upper HNW, building on UHNW strength Accelerate Core HNW in additional markets with further enhancement of IT platform 2%2 Lending growth Mid- to high-single digit growth CHF ~3 bn of additional capital deployed, ~25% increase Invest for Growth Simplify Strengthen >18% by 2024 CBV of CHF ~1.6 trn Note: Historical information presented according to the new divisional structure is a preliminary estimate based on management accounts and subject to change† RoRC is a non-GAAP financial measure, see Appendix. Based on average of 13.5% RWA and 4.25% Leverage and adjusted excluding significant items1 Average annual NNA growth rate 2 2017-2020 3 2018-2020

23 November 4, 2021 2021 Investor Day Our Wealth Management growth strategy is expected to deliver incremental recurring revenues of CHF >1 bn by 2024 Invest for Growth Simplify Strengthen …and deliver significant revenue upside by 2024 …to support higher AuM and CBV growth… We are investing for growth… CHF ~3 bn capital1 redeployed to Wealth Management over 2021-2024RWA increase CHF ~20 bnLE increase by CHF ~70 bn ~500 increase in Relationship Managers~15% increase over 2021-2024 +~60%IT spend2 in 2024 vs. 2021E Step-up in technology investments AuM CHF ~1.1 trnby 2024from CHF 0.9 trn in 3Q21;mid-single digit NNA CAGR CBV CHF ~1.6 trnby 2024from CHF 1.3 trn in 3Q21; mid- to high-single digit CAGR Incremental commissions and fees of CHF ~0.5 bn vs. 2021 Incremental net interest income of CHF ~0.7 bn vs. 2021 Our integrated model is expected to drive higher transaction-based revenues Incremental recurring revenues of CHF >1 bn 1 Based on average of 13.5% RWA and 4.25% Leverage Exposure 2 Wealth Management total technology cash spend Medium-term Aspirations

24 November 4, 2021 2021 Investor Day Invest for Growth Simplify Strengthen The Investment Bank has significantly reduced capital and improved underlying returns but performance remains volatile …with improved underlying performanceadjusted RoRC† unless otherwise stated, in % Impact of adjustments and ArchegosUSD ~(5.1) bn related to Archegos 8% 11% (12)% 26% 12%Cost of capital 2019 2020 9M21reported 9M21adj. excl. Archegos Note: Historical information presented according to the new divisional structure is a preliminary estimate based on management accounts and subject to change† RoRC is a non-GAAP financial measure, see Appendix. Based on average of 13.5% RWA and 4.25% Leverage 1 Incl. GM, IBCM, APAC Markets and SRU 2 Based on average of 13.5% RWA and 4.25% Leverage Exposure Capital2 Capital reduction in the Investment Bank…in USD bn RWA Leverage 2020 3Q151 3Q21 (51)% (42)% (46)%

25 November 4, 2021 Our global Investment Bank is core to our integrated strategy 2021 Investor Day Be a strategic partner to our core corporate, entrepreneurial, institutional and UHNW clients IBCM Equities Credit GTS Leading Equity Capital Markets and Leveraged Finance franchises; invest in Advisory solutions and coverage Focused, asset-light with strong high-touch execution capabilities, equity derivatives, ECM distribution and research & content Pre-eminent Securitized Products business joined with leading IG/HY offering Wealth Management centric franchise with best-in-class cross-asset, Structured Products and trading execution Our Aspiration Invest for Growth Simplify Strengthen † RoRC is a non-GAAP financial measure, see Appendix. Based on average of 13.5% RWA and 4.25% Leverage 1 Based on average of 13.5% RWA and 4.25% Leverage 2 On an adjusted excluding significant items basis RoRC†,2>12% in 2024 Capital released1 USD >3 bn over 2021-2022, a ~25% reduction Invest for growthFrom 2023, invest capital for growth while remaining at 50% capital1 of WM, SB, AM Capital-light Invest in capital-light Investment Banking & Capital Markets businesses Competitive advantage Drive market-leading Securitized Products and Credit solutions Connectivity Deliver differentiated cross-asset structured products and capital markets & advisory solutions to Wealth Management clients Capital velocity Leverage 3rd-party capital to grow Credit Create global Investment Bank

26 November 4, 2021 The Swiss Bank will serve corporate, institutional and digital banking clients as part of our Swiss universal bank model 2021 Investor Day Pillars of success Invest for Growth Simplify Strengthen Key metric for Swiss Bank Key levers Client Business Volumein CHF bn 7%CAGR 601 2019 2020 9M21 675 635 “High-touch” Corporate & Institutional Capitalize on leading position and global connectivity leveraging our IB, GTS and AM businessesContinue to drive capital velocity leveraging our distinct fund-based modelContinued disciplined risk management “High-tech” Private clients & SME Drive CSX: grow private clients and target smaller SME clientsFurther invest in digital client engagement and marketingSimplify and digitalize front-to-back processes to drive operating leverage RoRC†,1>12% CIR1Low 50s CBVLow- to mid-single digit CAGRCAGR over 2022-2024 Institutional Banking for pension funds and banks Corporate Banking for multi-national Swiss corporates and SMEs Digital Banking for broader private client base and small businesses Consumer Finance with BANK-now and our participation in Swisscard 2024Aspiration Note: Historical information presented according to the new divisional structure is a preliminary estimate based on management accounts and subject to change† RoRC is a non-GAAP financial measure, see Appendix. Based on average of 13.5% RWA and 4.25% Leverage 1 On an adjusted basis excluding significant items basis

27 November 4, 2021 We expect to grow our multi-specialist Asset Management division with a refocus on our core product capabilities 2021 Investor Day Invest for Growth Simplify Strengthen Key metric for Asset Management Key levers AuMin CHF bn 5%CAGR 438 2020 2019 9M21 440 475 DistributionExpand footprint in selected European and Asian marketsStrengthen sales support teams on regional and global level ProductsEnhance innovative alpha solutions (private markets, thematic equities, ESG)Strengthen breadth and quality of institutional-grade yield products (fixed income and Real Estate) RoRC†,1>45% CIR1~75% NNA>4% 2024Aspiration Note: Historical information presented according to the new divisional structure is a preliminary estimate based on management accounts and subject to change† RoRC is a non-GAAP financial measure, see Appendix. Based on average of 13.5% RWA and 4.25% Leverage 1 On an adjusted excluding significant items basis Growing our core operating businesses; exit non-core Investments & Partnerships Strong connectivity to Wealth Management and Swiss Bank Leading Alternatives and Alternatives-lite offerings Pillars of success
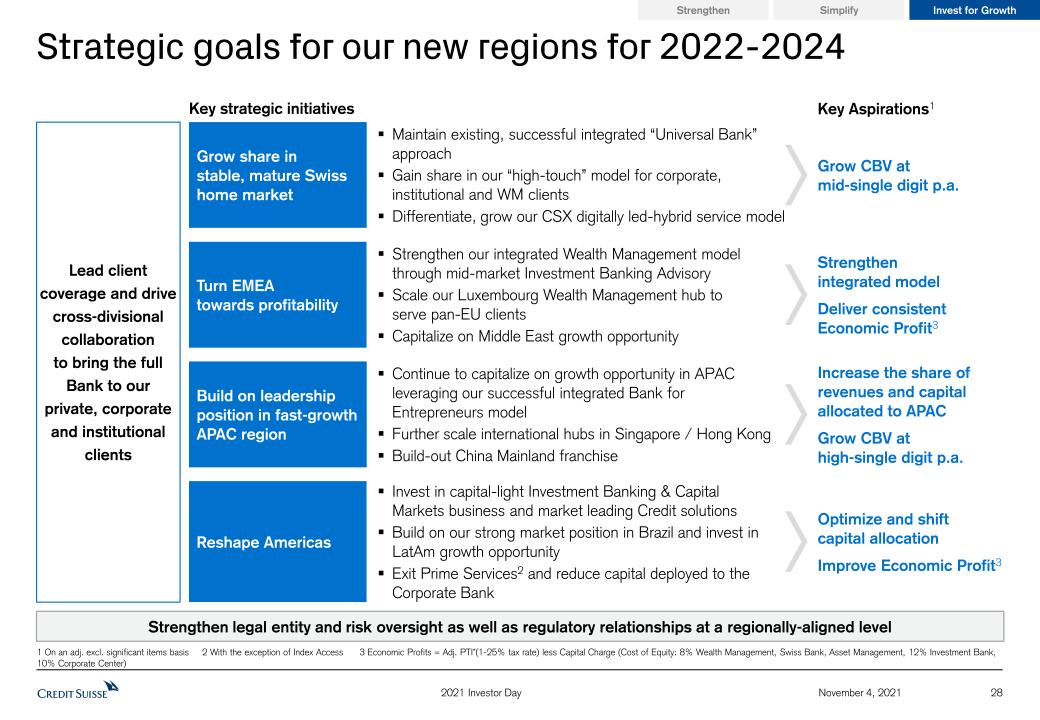
Strategic goals for our new regions for 2022-2024 2021 Investor Day November 4, 2021 28 Grow share in stable, mature Swiss home market Grow CBV at mid-single digit p.a. Maintain existing, successful integrated “Universal Bank” approachGain share in our “high-touch” model for corporate, institutional and WM clients Differentiate, grow our CSX digitally led-hybrid service model Lead client coverage and drive cross-divisional collaborationto bring the full Bank to our private, corporate and institutional clients Build on leadership position in fast-growth APAC region Continue to capitalize on growth opportunity in APAC leveraging our successful integrated Bank for Entrepreneurs modelFurther scale international hubs in Singapore / Hong Kong Build-out China Mainland franchise Increase the share of revenues and capital allocated to APACGrow CBV at high-single digit p.a. Turn EMEA towards profitability Strengthen our integrated Wealth Management model through mid-market Investment Banking AdvisoryScale our Luxembourg Wealth Management hub to serve pan-EU clientsCapitalize on Middle East growth opportunity Strengthenintegrated modelDeliver consistent Economic Profit3 Key Aspirations1 Key strategic initiatives Strengthen legal entity and risk oversight as well as regulatory relationships at a regionally-aligned level Invest for Growth Simplify Strengthen 1 On an adj. excl. significant items basis 2 With the exception of Index Access 3 Economic Profits = Adj. PTI*(1-25% tax rate) less Capital Charge (Cost of Equity: 8% Wealth Management, Swiss Bank, Asset Management, 12% Investment Bank, 10% Corporate Center) Reshape Americas Invest in capital-light Investment Banking & Capital Markets business and market leading Credit solutionsBuild on our strong market position in Brazil and invest in LatAm growth opportunityExit Prime Services2 and reduce capital deployed to the Corporate Bank Optimize and shiftcapital allocationImprove Economic Profit3
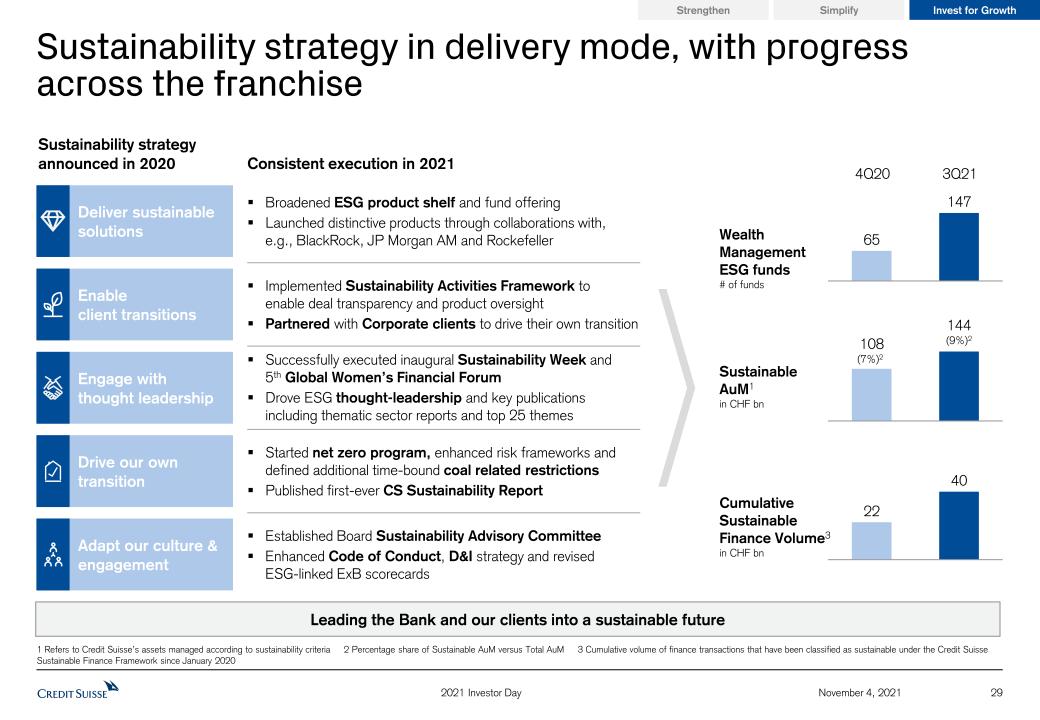
Leading the Bank and our clients into a sustainable future 29 November 4, 2021 Sustainability strategy in delivery mode, with progress across the franchise 2021 Investor Day Sustainability strategyannounced in 2020 Consistent execution in 2021 Deliver sustainable solutions Enableclient transitions Engage with thought leadership Drive our owntransition Adapt our culture & engagement Broadened ESG product shelf and fund offering Launched distinctive products through collaborations with, e.g., BlackRock, JP Morgan AM and Rockefeller Successfully executed inaugural Sustainability Week and 5th Global Women’s Financial ForumDrove ESG thought-leadership and key publications including thematic sector reports and top 25 themes Started net zero program, enhanced risk frameworks and defined additional time-bound coal related restrictionsPublished first-ever CS Sustainability Report Established Board Sustainability Advisory Committee Enhanced Code of Conduct, D&I strategy and revised ESG-linked ExB scorecards 1 Refers to Credit Suisse’s assets managed according to sustainability criteria 2 Percentage share of Sustainable AuM versus Total AuM 3 Cumulative volume of finance transactions that have been classified as sustainable under the Credit Suisse Sustainable Finance Framework since January 2020 Implemented Sustainability Activities Framework to enable deal transparency and product oversight Partnered with Corporate clients to drive their own transition Invest for Growth Simplify Strengthen 4Q20 3Q21 Wealth ManagementESG funds# of funds SustainableAuM1in CHF bn Cumulative SustainableFinance Volume3in CHF bn 108(7%)2 144(9%)2
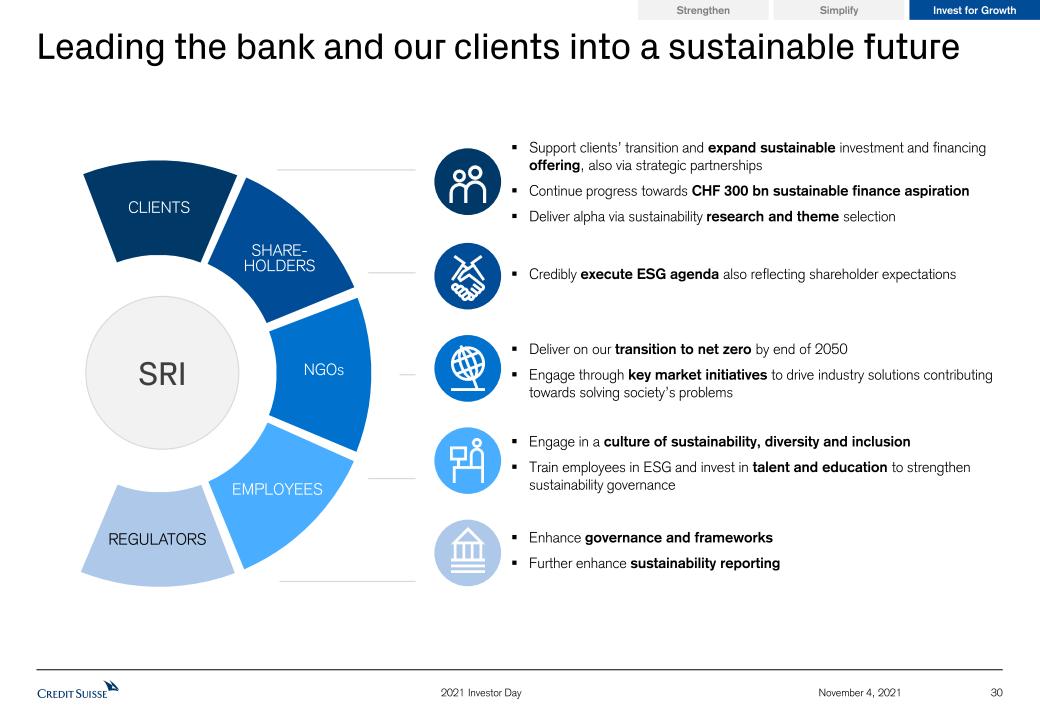
30 November 4, 2021 Leading the bank and our clients into a sustainable future 2021 Investor Day Support clients’ transition and expand sustainable investment and financing offering, also via strategic partnershipsContinue progress towards CHF 300 bn sustainable finance aspirationDeliver alpha via sustainability research and theme selection Credibly execute ESG agenda also reflecting shareholder expectations Enhance governance and frameworksFurther enhance sustainability reporting CLIENTS SHARE-HOLDERS NGOs EMPLOYEES REGULATORS SRI Deliver on our transition to net zero by end of 2050Engage through key market initiatives to drive industry solutions contributing towards solving society’s problems Engage in a culture of sustainability, diversity and inclusionTrain employees in ESG and invest in talent and education to strengthen sustainability governance Invest for Growth Simplify Strengthen

31 November 4, 2021 We are continuing our transformation 2021 Investor Day Invest for Growth Simplify Strengthen Capital3 IB CC WM, SB & AM to IB capital allocation ratio WM, SB & AM Capital reallocation through exit of Prime Services4, targeted reductions in the Corporate Bank and in GTS; redeploy CHF ~3 bn of capital3 into Wealth Management ~2.0x 2020 IB1,2 CC1 WM& AM1,2 1.5x IB CC WM, SB& AM IB CC WM, SB& AM ~2.0x 0.6x 2015 2024assuming B3R implementation on 1/1/24 2022 Note: Historical information presented according to the new divisional structure is a preliminary estimate based on management accounts and subject to change 1 As of 3Q15 2 IB incl. GM, IBCM, APAC Markets and SRU; WM incl. SUB, IWM, APAC WM&C 3 Based on avg of 13.5% RWA and 4.25% Leverage 4 With the exception of Index Access and APAC Delta One

Our 2024 financial aspirations 2021 Investor Day November 4, 2021 32 CIR adj. excl. sign. items~70% Reported Group RoTE‡>10% Corp Center adj. pre-tax loss CHF ~0.5 bn CIR adj. excl. sign. items~80% Reported Group RoTE‡~7% Corp Center and SRU adj. pre-tax loss CHF 1.4 bn Adj. RoRC† excl. sign. items Strategic Plan 2024 Aspirations 9% Asset Management Wealth Management 16% Swiss Bank Investment Bank 12% 35% Investment Bank >12% Wealth Management Swiss Bank Asset Management >18% >12% >45% Average 2018-2020 Release USD >3 bn of Investment Bank capital1 over 2021-2022 ~(25)%;targeted investments from 2023 Invest incrementalCHF ~1.0-1.5 bn p.a. into growth investments by 2024, progressively increasing from 2022, funded by structural cost savings Increase capital1 allocated to WM, SB, AM vs. the IB to ~2.0x in 2022 and beyond Invest CHF ~3 bn of capital1 into Wealth Managementover 2021-2024 +25% Adj. RoRC† excl. sign. items CET1 ratio>14% pre-B3R Leverage ratio~4.5% Note: Historical information presented according to the new divisional structure is a preliminary estimate based on management accounts and subject to change. Results excluding certain items included in our reported results are non-GAAP financial measures. For further details and reconciliation information, see the Appendix† RoRC is a non-GAAP financial measure, see Appendix. Based on average of 13.5% RWA and 4.25% Leverage ‡ Return on tangible equity, a non-GAAP financial measure, is calculated as annualized net income attributable to shareholders divided by average tangible shareholders’ equity1 Based on average of 13.5% RWA and 4.25% Leverage CET1 ratio 12-13% Leverage ratio4.0-4.5%

33 November 4, 2021 A Transformed Bank 6 Financial Perspectives 5 Asia Pacific Growth Aspirations 4 Divisional Perspectives 3 Strategic Perspectives 2 Our Vision 1 Agenda 2021 Investor Day

Financial PerspectivesCredit Suisse 2021 Investor Day David Mathers, Chief Financial OfficerNovember 4, 2021

Accelerate growth in Wealth Management Financial goals for our new divisions for 2022-2024 2021 Investor Day November 4, 2021 35 Deliver Group productivity cost savings to release investment resources 1 5 Grow core Asset Management 4 Invest CHF ~3 bn of capital3 over 2021-2024, a ~25% capital increase CHF ~1.1 trn AuMby 2024 CHF ~1.6 trn CBVby 2024 Release USD >3 bn of capital3 over 2021-2022,a ~25% capital reduction; from 2023 invest capital for growth RoRC† >12%in 2024 Continue to develop the Swiss Bank 3 RoRC† >12%in 2024 CIR in low 50sin 2024 Reshape the Investment Bank Deliver CHF ~1.0-1.5 bn of annual structural cost savings4 to invest for growthby 2024 † RoRC is a non-GAAP financial measure, see Appendix. Based on the average of 13.5% of RWA and 4.25% of Leverage1 With the exception of Index Access and APAC Delta One 2 On an adj. excl. significant items basis 3 Based on the avg. of 13.5% of RWA and 4.25% of Leverage Exposure 4 Aspiration measured using adj. operating expenses, excl. significant items, at constant 2021 FX rates, progressively increasing from 2022-2024 2 Streamline with new organizational structureUnify IT and Operations functions across the bankEnhance focus on centralized procurement and organizational structure incl. spans & layers Expand core operating businesses Invest in distribution capabilitiesReduce I&P RWA portfolio by ~40% Drive digital model for retail and SME clientsStrengthen collaboration with IB, GTS and AM for corporate and institutional clients Exit Prime Services1, optimize Corporate Bank and reduce GTS businesses without strong WM-nexusInvest in capital-light Advisory and leading Credit businessContinue to differentiate GTS to support WM Expand UHNW and Upper HNW; accelerate growth in Core HNWInvest and further scale ~20 priority markets; exit ~10 non-core marketsLeverage investment, financing, advisory and capital markets solutions Key financial goals2 Key strategic initiatives RoRC† >45%in 2024 CIR ~75%in 2024

We are simplifying our divisional structure around three global divisions and our core Swiss Bank… 2021 Investor Day November 4, 2021 36 Current Credit Suisse Divisional structure9M21, adjusted excl. significant items and Archegos (unless otherwise stated), in CHF bn (unless otherwise stated) SUB PB (UHNW, HNW, EAM) APAC IBCM IB AM CC SUB IBCM SUB Digital BankingSUB Corp. & Institutional APAC PB IWM Net revenues PTI (adj./rep.) AuM Allocated capital1 RoRC† (adj./rep.) Econ. profit2 (adj./rep.) Net revenues PTI (adj./rep.) AuM Allocated capital1 RoRC† (adj./rep.) Econ. profit2 (adj./rep.) Net revenues PTI (adj./rep.) AuM Allocated capital1 RoRC† (ajd./rep.) Econ. profit2 (adj./rep.) Swiss Universal Bank Net revenues PTI (adj./rep.) AuM Allocated capital1 RoRC† (ajd./rep.) Econ. profit2 (adj./rep.) 4.11.8/2.072412.015%/17%0.6/0.8 InternationalWealth Management 2.5 0.7/0.9 396 4.6 16%/21%0.3/0.4 Asia Pacific 2.5 0.8/1.0 230 3.5 23%/28%0.4/0.5 InvestmentBankin USD bn Net revenues PTI (adj./rep.) Allocated capital1 RoRC† (adj./rep.) Econ. profit2 (adj./rep.) 8.6 3.4/(1.8) 12.2 26%/(14)%1.4/(2.5) Asset Management 1.2 0.3/0.2 475 0.6 50%/33%0.2/0.1 CorporateCenter Net revenuesPTI (adj./rep.) Allocated capital1 RoRC† (adj./rep.) Econ. profit2 (adj./rep.) 0.0(0.6)/(1.3) 6.3 (9)%/(22)% (0.9)/(1.5) Asset Management Net revenues PTI (adj./rep.) AuM Allocated capital1 RoRC† (adj./rep.) Econ. prof.2 (adj./rep.) 1.2 0.3/0.2 475 0.6 50%/33%0.2/0.1 Corporate Center Net revenuesPTI (adj./rep.) Allocated capital1 RoRC† (adj./rep.) Econ. profit2 (adj./rep.) 0.0(0.6)/(1.3) 6.3 (9)%/(22)% (0.9)/(1.5) Wealth Management Net revenues PTI (adj./rep.) AuM Allocated capital1 RoRC† (adj./rep.) Econ.profit2 (adj./rep.) 6.62.2/2.687712.119%/22% 1.0/1.2 Investment Bankin USD bn Net revenues PTI (adj./rep.) Allocated capital1 RoRC† (adj./rep.) Econ.profit2 (adj./rep.) 9.03.6/(1.6)13.026%/(12)%1.5/(2.4) Swiss Bank Net revenues PTI (adj./rep.) AuM Allocated capital1 RoRC† (adj./rep.) Econ. profit2 (adj./rep.) 2.11.0/1.24727.214%/16% 0.3/0.5 Note: Historical information presented according to the new divisional structure is a preliminary estimate based on management accounts and subject to change; Results excluding certain items included in our reported results are non-GAAP financial measures. For further details and reconciliation information, see the Appendix; Divisional AuM shown are gross of AuM managed across Businesses † RoRC is a non-GAAP financial measure, see Appendix. Based on average of 13.5% RWA and 4.25% Leverage 1 Based on average of 13.5% RWA and 4.25% Leverage 2 Economic Profits = Adj. PTI*(1-25% tax rate) less Capital Charge (Cost of Equity: 8% Wealth Management, Swiss Bank, Asset Management, 12% Investment Bank, 10% Corporate Center) From January 1, 2022
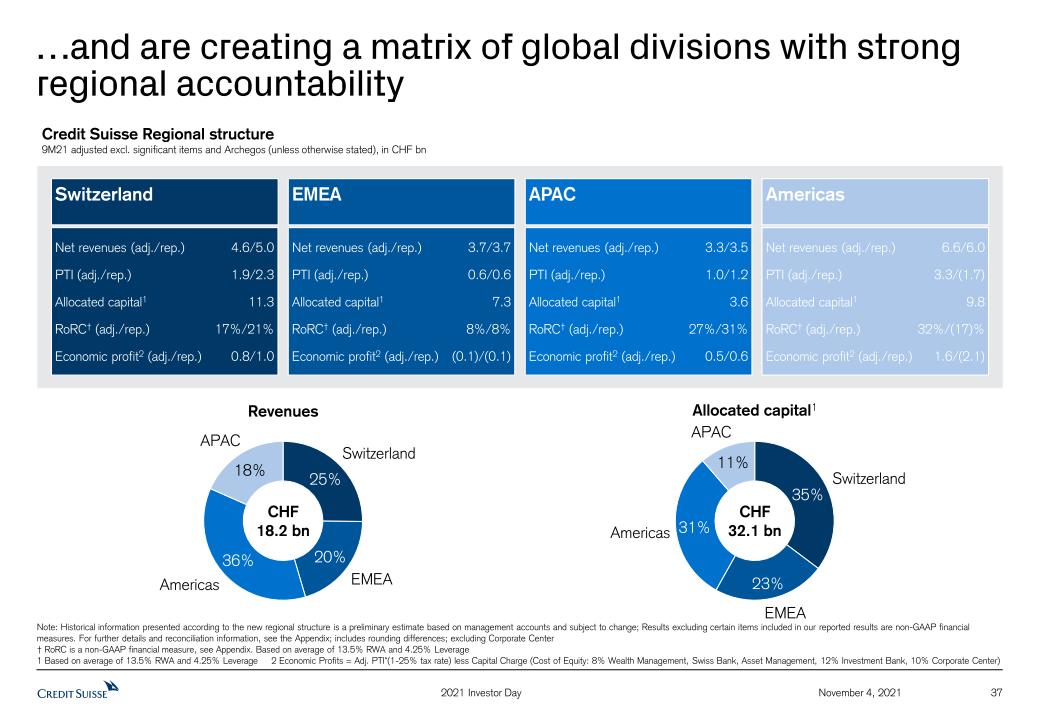
…and are creating a matrix of global divisions with strong regional accountability 2021 Investor Day November 4, 2021 37 Credit Suisse Regional structure9M21 adjusted excl. significant items and Archegos (unless otherwise stated), in CHF bn Switzerland Net revenues (adj./rep.) PTI (adj./rep.) Allocated capital1 RoRC† (adj./rep.) Economic profit2 (adj./rep.) 4.6/5.01.9/2.311.317%/21% 0.8/1.0 APAC Net revenues (adj./rep.) PTI (adj./rep.) Allocated capital1 RoRC† (adj./rep.) Economic profit2 (adj./rep.) 3.3/3.5 1.0/1.2 3.6 27%/31%0.5/0.6 EMEA Net revenues (adj./rep.) PTI (adj./rep.) Allocated capital1 RoRC† (adj./rep.) Economic profit2 (adj./rep.) 3.7/3.70.6/0.67.38%/8%(0.1)/(0.1) Switzerland APAC EMEA Americas EMEA Switzerland Americas APAC Revenues Allocated capital1 CHF 32.1 bn CHF 18.2 bn Note: Historical information presented according to the new regional structure is a preliminary estimate based on management accounts and subject to change; Results excluding certain items included in our reported results are non-GAAP financial measures. For further details and reconciliation information, see the Appendix; includes rounding differences; excluding Corporate Center† RoRC is a non-GAAP financial measure, see Appendix. Based on average of 13.5% RWA and 4.25% Leverage 1 Based on average of 13.5% RWA and 4.25% Leverage 2 Economic Profits = Adj. PTI*(1-25% tax rate) less Capital Charge (Cost of Equity: 8% Wealth Management, Swiss Bank, Asset Management, 12% Investment Bank, 10% Corporate Center) Americas Net revenues (adj./rep.) PTI (adj./rep.) Allocated capital1RoRC† (adj./rep.) Economic profit2 (adj./rep.) 6.6/6.03.3/(1.7)9.832%/(17)% 1.6/(2.1)
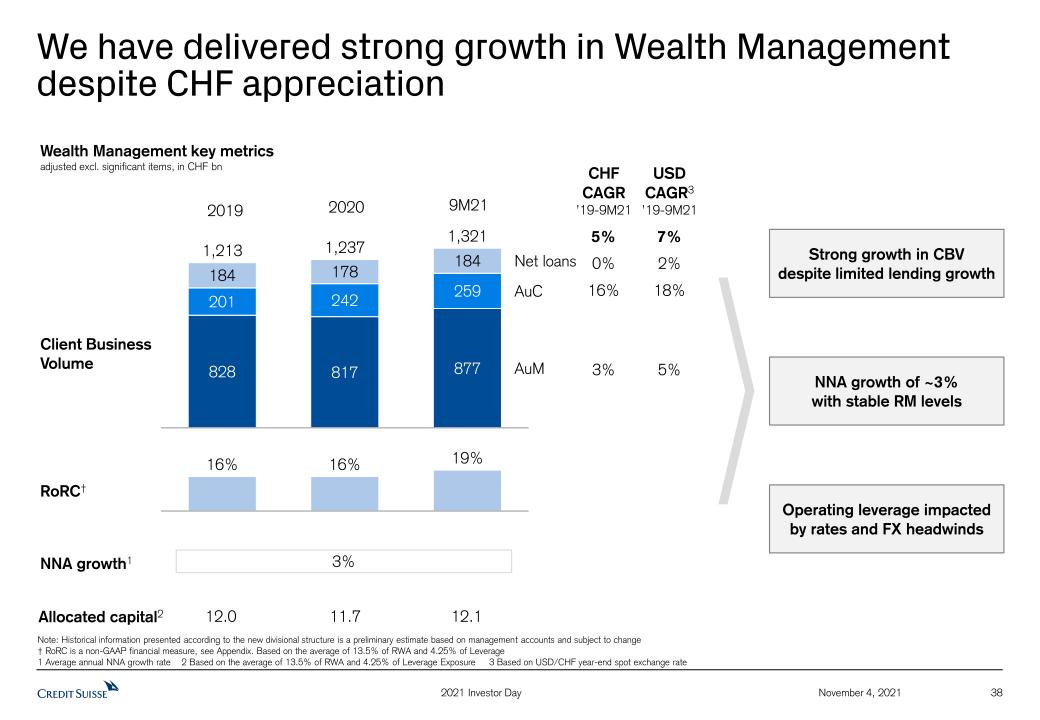
We have delivered strong growth in Wealth Managementdespite CHF appreciation November 4, 2021 38 2021 Investor Day Note: Historical information presented according to the new divisional structure is a preliminary estimate based on management accounts and subject to change † RoRC is a non-GAAP financial measure, see Appendix. Based on the average of 13.5% of RWA and 4.25% of Leverage1 Average annual NNA growth rate 2 Based on the average of 13.5% of RWA and 4.25% of Leverage Exposure 3 Based on USD/CHF year-end spot exchange rate Client Business Volume Wealth Management key metricsadjusted excl. significant items, in CHF bn 828 AuC 817 184 201 242 1,237 259 178 184 877 Net loans AuM 1,213 1,321 0% 16% 3% 5% 2% 18% 5% 7% NNA growth1 Allocated capital2 RoRC† 3% 12.0 11.7 12.1 Strong growth in CBV despite limited lending growth NNA growth of ~3% with stable RM levels Operating leverage impacted by rates and FX headwinds CHFCAGR’19-9M21 USDCAGR3’19-9M21 19% 16% 16% 2019 2020 9M21

Our Wealth Management growth strategy is expected to deliver incremental recurring revenues of CHF >1 bn by 2024 November 4, 2021 39 2021 Investor Day …and deliver significant revenue upside by 2024 …to support higher AuM and CBV growth… We are investing for growth… CHF ~3 bn capital1 redeployed to Wealth Management over 2021-2024RWA increase CHF ~20 bnLE increase by CHF ~70 bn ~500 increase in Relationship Managers~15% increase over 2021-2024 +~60%IT spend2 in 2024 vs. 2021E Step-up in technology investments AuM CHF ~1.1 trnby 2024from CHF 0.9 trn in 3Q21;mid-single digit NNA CAGR CBV CHF ~1.6 trnby 2024from CHF 1.3 trn in 3Q21; mid- to high-single digit CAGR Incremental commissions and fees of CHF ~0.5 bn vs. 2021 Incremental net interest income of CHF ~0.7 bn vs. 2021 Our integrated model is expected to drive higher transaction-based revenues Incremental recurring revenues of CHF >1 bn 1 Based on average of 13.5% RWA and 4.25% Leverage Exposure 2 Wealth Management total technology cash spend Medium-term Aspirations

Reduce Investment Bank capital by ~25% by 2022; invest in Advisory, Capital Markets, Credit and GTS November 4, 2021 40 2021 Investor Day Allocated capital2in USD bn …fund growth initiatives Invest and build share in capital-light Investment Banking & Capital Markets businesses Drive market-leading Securitized Products and Credit solutions Deliver differentiated cross-asset structured products solutions via a Wealth Management focused GTS Support Wealth Management and ECM with a focused, capital-light Cash Equities platform ~(25)% RoRC†,4>12%Remain at 50% capital2 of WM, SB, AM IB reshaping estimated impact 2022 vs. 2021 Key actions… Exit Prime Services1 Optimize Corporate Bank exposure to align our risk appetite to our strategic focus areas Reduce GTS businesses without a strong Wealth Management nexus …to release USD >3 bn of capital2 over 2021-2022… 13.0 3Q21 2020 2024Aspiration 2022Aspiration 14.6 ~11 USD >3 bn of capital release2 Write-down of CHF ~1.6 bn of Investment Bank goodwill in 4Q21 Prime Services exit Lower OpExUSD ~(0.4) bn Lower revenues USD ~(0.6) bn Note: Historical information presented according to the new divisional structure is a preliminary estimate based on management accounts and subject to change † RoRC is a non-GAAP financial measure, see Appendix. Based on average of 13.5% RWA and 4.25% Leverage1 With the exception of Index Access and APAC Delta One 2 Based on the avg. of 13.5% of RWA and 4.25% of Leverage Exposure 3 Assumes impact of Basel 3 reforms of USD 1.0-1.5 bn on 1/1/24 4 On an adj. excl. significant items basis ~13.0-13.53

Swiss Bank expected to deliver positive operating leverage November 4, 2021 41 2021 Investor Day Client Business Volume CIR Allocated capital1 Our 2024 Aspiration 7.1 7.0 7.2 675 601 635 56% 54% 53% Swiss Bank key metricsadjusted, excl. significant items, in CHF bn Low- to mid-single digitCAGR over 2022-2024 CIR in low 50sin 20242 RoRC† >12%in 20242 2019 2020 9M21 13% 10% 14% RoRC† Note: Historical information presented according to the new divisional structure is a preliminary estimate based on management accounts and subject to change; Results excluding certain items included in our reported results are non-GAAP financial measures. For further details and reconciliation information, see the Appendix † RoRC is a non-GAAP financial measure, see Appendix. Based on average of 13.5% RWA and 4.25% Leverage1 Based on the average of 13.5% of RWA and 4.25% of Leverage Exposure 2 On an adj. excl. significant items basis 7%CAGR
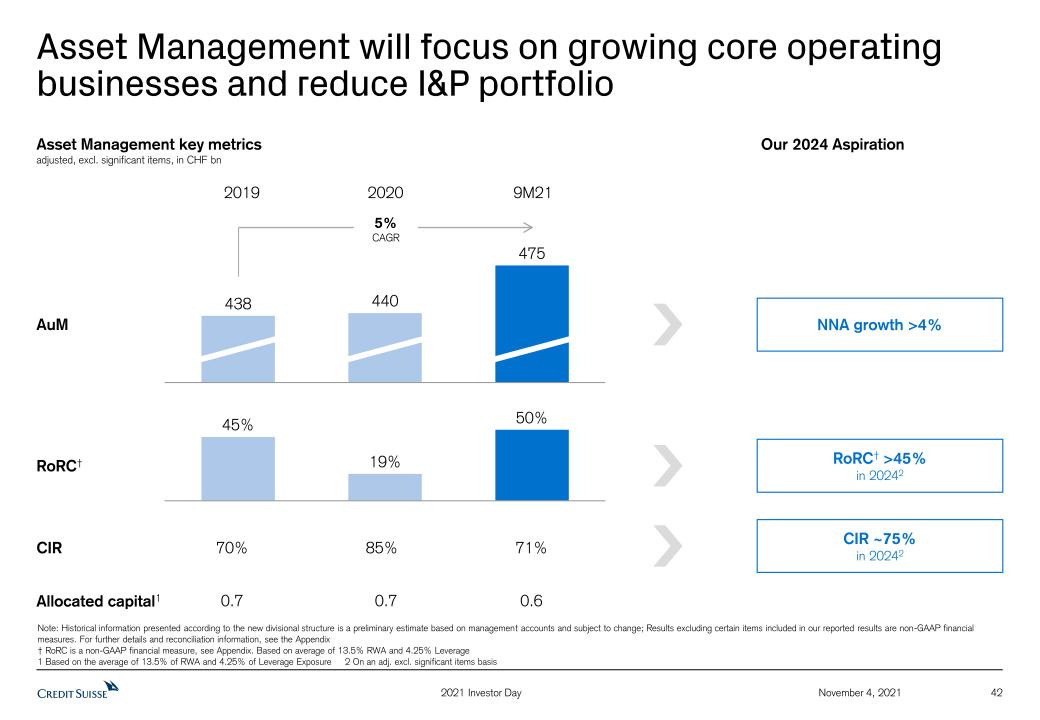
Asset Management will focus on growing core operating businesses and reduce I&P portfolio November 4, 2021 42 2021 Investor Day Our 2024 Aspiration RoRC† >45%in 20242 Asset Management key metricsadjusted, excl. significant items, in CHF bn CIR ~75%in 20242 AuM CIR 440 438 475 19% 45% 50% 2019 2020 9M21 85% 70% 71% 0.7 0.7 0.6 NNA growth >4% RoRC† Allocated capital1 5%CAGR Note: Historical information presented according to the new divisional structure is a preliminary estimate based on management accounts and subject to change; Results excluding certain items included in our reported results are non-GAAP financial measures. For further details and reconciliation information, see the Appendix † RoRC is a non-GAAP financial measure, see Appendix. Based on average of 13.5% RWA and 4.25% Leverage1 Based on the average of 13.5% of RWA and 4.25% of Leverage Exposure 2 On an adj. excl. significant items basis

43 November 4, 2021 We expect to maintain a ratio of at least twice as much capital in WM, SB & AM activities as in IB 2021 Investor Day Capital3 IB CC WM, SB & AM to IB capital allocation ratio WM, SB & AM Capital reallocation through exit of Prime Services4, targeted reductions in the Corporate Bank and in GTS; redeploy CHF ~3 bn of capital3 into Wealth Management ~2.0x 2020 IB1,2 CC1 WM& AM1,2 1.5x IB CC WM, SB& AM IB CC WM, SB& AM ~2.0x 0.6x 2015 2024assuming B3R implementation on 1/1/24 2022 Note: Historical information presented according to the new divisional structure is a preliminary estimate based on management accounts and subject to change 1 As of 3Q15 2 IB incl. GM, IBCM, APAC Markets and SRU; WM incl. SUB, IWM, APAC WM&C 3 Based on avg of 13.5% RWA and 4.25% Leverage 4 With the exception of Index Access and APAC Delta One

We expect to continue to increase our investment spend November 4, 2021 44 2021 Investor Day Capital expenditure1in CHF bn 2021Estimate 2018-2020average 2.8 2016 2024Aspiration ~3.0 2.7 2.2 ~(20)% +35% Future investment focus Build out China Mainland leveraging Bank for Entrepreneurs model Scale Wealth Management, with a focuson ~20 priority markets Continue digitalizing Wealth Management and Swiss Bank through client and RM tools Invest in Investment Banking & Capital Markets and drive leading Credit solutions Drive data analytics and automation; cloud and cybersecurity Enhance Asset Management distribution and product suite Strengthen Risk and Control foundation 1 At constant 2021 FX rates 2 Estimates and assumptions are based on currently available information and beliefs, expectations and opinions of management and include all known facts and decisions as of November 4, 2021. Actual results may differ 2

November 4, 2021 45 2021 Investor Day We aim to deliver CHF ~1.0-1.5 bn of efficiency savings by 2024 to fund growth investments CHF ~1.0-1.5 bn of annual structural cost savings1 by 2024 to invest for growth Simplify Creating global Wealth Management division Creating global Investment Bank division Streamline Automate Digitalizing front-to-back operating model Delivering CSX in Swiss Bank Centralizing technology and operations functions to deliver shared platform Rationalizing legal entity and banking platform set-up Optimizing our organizational structure Centralizing Procurement 1 Aspiration measured using adjusted operating expenses, excluding significant items, at constant 2021 FX rates, progressively increasing from 2022-2024; does not include cost reductions from exited businesses

We expect adjusted operating expenses to be between CHF 16.5-17.0 bn in 2022 to 2024 November 4, 2021 46 2021 Investor Day We expect adjusted operating expenses to be between CHF 16.5-17.0 bn in 2022 to 20241;In addition, we expected CHF ~400 mn of restructuring expenses between 4Q21 and 2022 ~40% 2021Estimate2 Structural cost savings Businessexits Variable compensationnormalization ~60% Investfor growth 2022-2024Aspiration ~16.2-16.5 1.5 16.5-17.0 ~(0.4) ~0.5 Increasing to ~(1.0)-(1.5)by 2024 Increasing to ~1.0-1.5by 2024 Yr1 Yr2 Yr3 Yr3 Yr2 Yr1 Illustrative development of adjusted operating expenses excl. significant items1in CHF bn, FXC Amortization of investments in infrastructure to support growth Operating cost increases as part of the growth plan (e.g. RM hires) 1 At constant 2021 FX rates2 Estimates and assumptions are based on currently available information and beliefs, expectations and opinions of management and include all known facts and decisions as of November 4, 2021. Actual results may differ
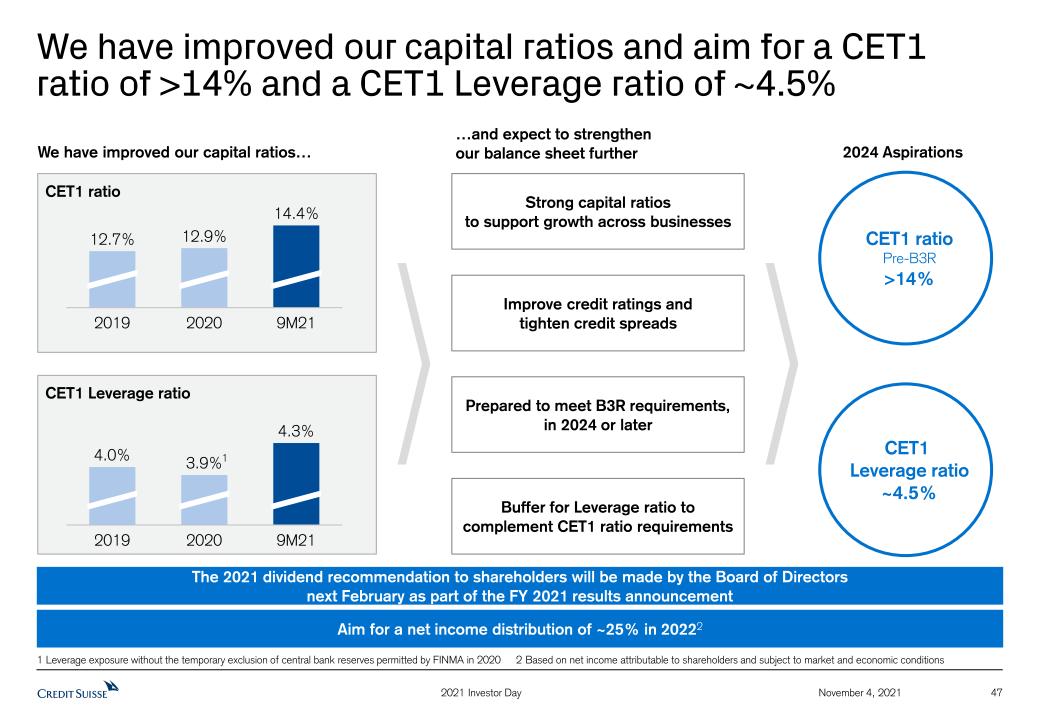
We have improved our capital ratios and aim for a CET1 ratio of >14% and a CET1 Leverage ratio of ~4.5% 47 November 4, 2021 2021 Investor Day 12.9% 14.4% 2019 2020 12.7% 9M21 4.0% 4.3% 2020 9M21 2019 3.9% CET1 ratio CET1 Leverage ratio Aim for a net income distribution of ~25% in 20222 The 2021 dividend recommendation to shareholders will be made by the Board of Directors next February as part of the FY 2021 results announcement We have improved our capital ratios… Strong capital ratios to support growth across businesses Prepared to meet B3R requirements, in 2024 or later Improve credit ratings and tighten credit spreads Buffer for Leverage ratio to complement CET1 ratio requirements CET1 ratioPre-B3R>14% CET1 Leverage ratio~4.5% 2024 Aspirations …and expect to strengthen our balance sheet further 1 Leverage exposure without the temporary exclusion of central bank reserves permitted by FINMA in 2020 2 Based on net income attributable to shareholders and subject to market and economic conditions 1

Our 2024 financial aspirations 2021 Investor Day November 4, 2021 48 CIR adj. excl. sign. items~70% Reported Group RoTE‡>10% Corp Center adj. pre-tax loss CHF ~0.5 bn CIR adj. excl. sign. items~80% Reported Group RoTE‡~7% Corp Center and SRU adj. pre-tax loss CHF 1.4 bn Adj. RoRC† excl. sign. items Strategic Plan 2024 Aspirations Swiss Bank Investment Bank Wealth Management 9% Asset Management 16% 12% 35% Asset Management Swiss Bank Investment Bank Wealth Management >18% >12% >12% >45% Average 2018-2020 Release USD >3 bn of Investment Bank capital1 over 2021-2022 ~(25)%;targeted investments from 2023 Invest incrementalCHF ~1.0-1.5 bn p.a. into growth investments by 2024, progressively increasing from 2022, funded by structural cost savings Increase capital1 allocated to WM, SB, AM vs. the IB to ~2.0x in 2022 and beyond Invest CHF ~3 bn of capital1 into Wealth Managementover 2021-2024 +25% Adj. RoRC† excl. sign. items CET1 ratio>14% pre-B3R Leverage ratio~4.5% Note: Historical information presented according to the new divisional structure is a preliminary estimate based on management accounts and subject to change. Results excluding certain items included in our reported results are non-GAAP financial measures. For further details and reconciliation information, see the Appendix† RoRC is a non-GAAP financial measure, see Appendix. Based on average of 13.5% RWA and 4.25% Leverage ‡ Return on tangible equity, a non-GAAP financial measure, is calculated as annualized net income attributable to shareholders divided by average tangible shareholders’ equity1 Based on average of 13.5% RWA and 4.25% Leverage CET1 ratio 12-13% Leverage ratio4.0-4.5%
49 November 4, 2021 A Transformed Bank 6 Financial Perspectives 5 Asia Pacific Growth Aspirations 4 Divisional Perspectives 3 Strategic Perspectives 2 Our Vision 1 Agenda 2021 Investor Day
Global leader in Wealth ManagementCredit Suisse 2021 Investor Day Philipp Wehle, CEO International Wealth ManagementNovember 4, 2021
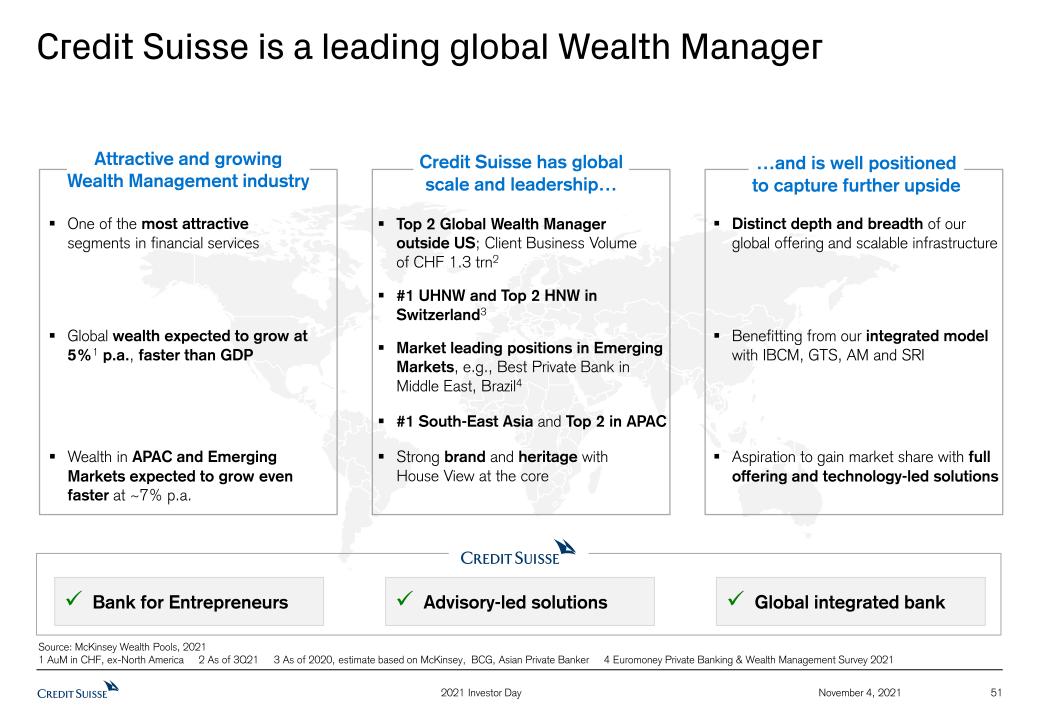
51 November 4, 2021 Credit Suisse is a leading global Wealth Manager One of the most attractive segments in financial services Global wealth expected to grow at 5%1 p.a., faster than GDP Aspiration to gain market share with full offering and technology-led solutions Distinct depth and breadth of our global offering and scalable infrastructure Wealth in APAC and Emerging Markets expected to grow even faster at ~7% p.a. Benefitting from our integrated model with IBCM, GTS, AM and SRI Bank for Entrepreneurs Advisory-led solutions Global integrated bank Source: McKinsey Wealth Pools, 20211 AuM in CHF, ex-North America 2 As of 3Q21 3 As of 2020, estimate based on McKinsey, BCG, Asian Private Banker 4 Euromoney Private Banking & Wealth Management Survey 2021 …and is well positioned to capture further upside Credit Suisse has global scale and leadership… Attractive and growing Wealth Management industry Top 2 Global Wealth Manager outside US; Client Business Volume of CHF 1.3 trn2 #1 UHNW and Top 2 HNW in Switzerland3 Strong brand and heritage with House View at the core 2021 Investor Day #1 South-East Asia and Top 2 in APAC Market leading positions in Emerging Markets, e.g., Best Private Bank in Middle East, Brazil4

52 November 4, 2021 Strong track record of growth in Wealth Management Best Private Bank for Ultra High Net Worth Clients Best Private Bank for High Net Worth Clients in Asia Pacific Best Private Bank in the Middle East Strong asset originationNNA growth of 4% p.a.1 Upside from further asset activation+~6 pp. increase in mandate penetration2 RoRC†,3 of 16%4 Client Business Volumein CHF bn 2021 Investor Day 6%CAGR 8%USD Note: Historical information presented according to the new divisional structure is a preliminary estimate based on management accounts and subject to change† RoRC is a non-GAAP financial measure, see Appendix. Based on average of 13.5% RWA and 4.25% Leverage 1 2017-2020 2 2016-3Q21 3 On an adjusted excluding significant items basis 4 2018-2020 average 1,321 9M21 2018 2016 1,096 2020 1,019 1,237

Expand market-leading UHNW & Upper HNW franchises and accelerate growth of Core HNW Invest in Relationship Managers for added scale in priority markets and build in China Mainland Invest in technology-enabled client experience Simplify operating model and front-to-back processes Leverage our integrated model with investment solutions, financing, advisory and capital markets 53 Levers to accelerate our Wealth Management growth November 4, 2021 2021 Investor Day CHF ~3 bn of capital1redeployed to Wealth Management over 2021-2024, a ~25% increase ~500 increase (~15%) in Relationship Managers over 2021-2024 to further scale up our franchise Step change in technology and platforms investments with +~60% IT spend2in 2024 vs. 2021E 1 2 3 4 5 Focus on strong risk management and controls foundation Strengthen, simplify and invest to leverage the integrated global Wealth Management division 1 Based on average of 13.5% RWA and 4.25% Leverage Exposure 2 Wealth Management total technology cash spend Strong regional empowerment driving cross-division collaboration and market presence
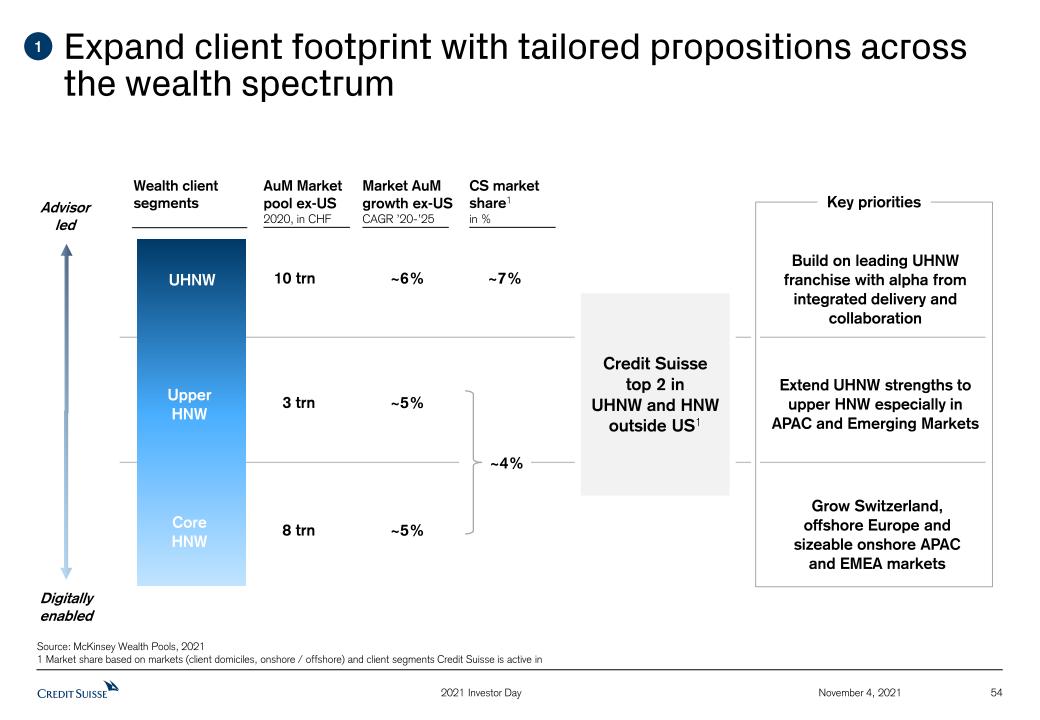
Expand client footprint with tailored propositions across the wealth spectrum 54 Build on leading UHNWfranchise with alpha from integrated delivery and collaboration Grow Switzerland, offshore Europe and sizeable onshore APAC and EMEA markets ~7% Key priorities Advisor led Digitally enabled Extend UHNW strengths to upper HNW especially in APAC and Emerging Markets Wealth client segments 3 trn 8 trn ~6% ~5% Credit Suisse top 2 in UHNW and HNW outside US1 ~4% UHNW Upper HNW Core HNW November 4, 2021 2021 Investor Day 1 CS market share1in % Market AuMgrowth ex-USCAGR ’20-’25 AuM Market pool ex-US 2020, in CHF 10 trn ~5% Source: McKinsey Wealth Pools, 20211 Market share based on markets (client domiciles, onshore / offshore) and client segments Credit Suisse is active in

Our integrated offering has been a key driver of success and differentiator for UHNW and Entrepreneur clients 55 November 4, 2021 2021 Investor Day 1 Grow UHNW and accelerate Upper HNW, build on UHNW strength Strong growth in UHNW segment Empowered regional organization driving cross-divisional collaboration Global WM Global IB SRI + + Global AM + Note: Historical information presented according to the new divisional structure is a preliminary estimate based on management accounts and subject to change 1 Based on McKinsey Wealth Pools Wealth building & monetization Wealth acceleration & preservation Wealth succession & transfer Comprehensive, integrated financing capabilties Global corporate advisory & capital market execution Sustainability, impact investing and ESG advisory Bespoke GTS structured investment solutions and research content Specialist investment consultants, and private & alternatives offering Philanthropy and family office advisory; Next Gen and succession planning One-stop-shop value proposition across clients’ lifecycle UHNWAuM growthCAGR ’16-’20 Market1 Credit Suisse ~2x

Focused HNW coverage matters and has been successful in driving growth and scale 56 November 4, 2021 2021 Investor Day 1 Expand Core HNW in Switzerland, offshore Europe and selected, sizeable onshore markets in APAC and EMEA Personalized and timely offering, driven by advanced data analytics Wealth planning and House View led advisory at the core Superior client experience and value proposition Omni-channel engagement, with hybrid service model Swiss Private Banking#2 market position1 EMEA Private Banking InternationalSizeable offshore business +2 pp. +2 pp. 4Q19 4Q20 3Q21 +3 pp. +2 pp. Penetration in mandate solutionsas % of AuM Examples of HNW focused units~35% of our Global HNW AuM Larger scale with client activation & conversionClient Business Volume growth of ~10% in Swiss PB and EMEA PBICost efficiency Decreasing CIR in Swiss PB at mid-60s and <50% CIR for EMEA PBI Over 2019-9M21: Focused coverage model driving strong business performance Note: Historical information presented according to the new divisional structure is a preliminary estimate based on management accounts and subject to change1 Estimate based on McKinsey and BCG

Increase scale in priority markets with RM growth 57 Number of Relationship Managers 2016-9M21 2022-2024 Aspiration Mid-single digit 4% Annualized NNA growth rate as % of AuM 9M21 2016 2020 2022 2023 o/w APAC 2024Aspiration ~2,950 ~3,300 ~2,800 ~2,810 +12%vs. 2020 November 4, 2021 2021 Investor Day 2 ~15% ~(5)% Note: Historical information presented according to the new divisional structure is a preliminary estimate based on management accounts and subject to change

Deepen share with advisory and investment solutions 58 November 4, 2021 Mandate penetrationin % of AuM 2016 2018 2020 9M21 2024Aspiration 24% 26% 29% 30% 33-35% Alternatives and PE feeder funds AuMin CHF bn 2021 Investor Day Consistently grow discretionary and advisory mandatesEmbed Sustainability, ESG in thematic solutions and advisory processConvert Supertrends views to deepen strength in Thematic equitiesContinue to grow our Private Markets and Alternatives offeringGrow differentiated, cross-asset structured investment solutions House View Mandates Our priorities Our systematic House View is the core of our value proposition GTS SRI Investment Solutions Asset Management Structured Products Private & AlternativeMarkets Funds 3 2016 2018 2020 9M21 2024Aspiration 2x Note: Historical information presented according to the new divisional structure is a preliminary estimate based on management accounts and subject to change

PCL ratio2in bps Drive lending and advisory solutions in collaboration with the Investment Bank 59 November 4, 2021 Note: Historical information presented according to the new divisional structure is a preliminary estimate based on management accounts and subject to change 1 Including mortgages 2 Provision for credit losses as % of average loans 3 Client assets referred by APAC IBCM bankers to APAC WM 2022 2017 2020 2016 2018 2023 2019 9M21 2024 Net loans1in CHF bn Build on extensive front-to-back capabilities and act as “one-stop-shop” for Wealth Management clientsBalanced increase in lending across regions and lending types, including standard Lombard, real assets and structured financingMaintain strong risk discipline and rigorous lending standards mid to high single digit ~3% CAGR 2021 Investor Day 3 3 5 13 2 USD >30 bnclient assets from collaboration32018-9M21 APAC success as Bank for Entrepreneurs with integrated model delivers full spectrum of advisory & financing solutions to Wealth Management and IBCM clients ~40%of APAC IBCM MDs with asset referrals2018-9M21 Integrated APAC financing platform with bespoke solutions and balanced portfolio across geographies Clients Lending Risk Focus U/HNWIsEntrepreneursSponsorsCorporates LombardStructuredReal AssetShare-backed` StructuringPortfolio managementSyndicationHedging 3 3 Aspiration

60 November 4, 2021 Deliver superior client experience with targeted technology spend 1 Wealth Management total technology cash spend 2 For EMEA PBI 3 Within APAC division 4 In SUB CSX 2021 Investor Day Direct-to-client investment ideas Personalized offering, driven by analytics 4 Priorities Investments Sample achievements Omni channel client experience for better conversion +35%client investment proposals29M21 vs. 9M20 ~2Xclients on CS Chat39M21 vs. 9M20 Strong uptake in new clients >50% are younger than 35 years4 Risk &compliance Products & platform Front office& other Bespoke direct to client advice and communication channel (launched in 2019) End-to-end digital advisory - customized advice at broad scale CSX digital banking offering leadingtransition to digital Wealth Management total IT spend1in %, medium-term aspiration ~30% ~30% ~40% IT spend1 ~+60% in 2024 (Aspiration) vs. 2021E

Simplify the operating model and front-to-back processes Invest in digitalization and automation of operating modelConsolidate and leverage technology assets across geographiesEnhance risk management and controls in global processes Streamline onboarding journey with fewer steps and faster turnaround 5 2xshare of fully digital onboardings Higher front office productivity with more time for client advisoryCost efficiency enabled by a scalable, global technology platformStrong risk management and controls enabling sustained quality growthBetter client experience right from the start 75%of workflows1 tobe digitalized Example medium-term aspirations Priorities Target state 61 November 4, 2021 1 Volume-weighted 2021 Investor Day

62 November 4, 2021 Our Wealth Management growth strategy is expected to deliver incremental recurring revenues of CHF >1 bn by 2024 2021 Investor Day …and deliver significant revenue upside by 2024 …to support higher AuM and CBV growth… We are investing for growth… CHF ~3 bn capital1 redeployed to Wealth Management over 2021-2024RWA increase CHF ~20 bnLE increase by CHF ~70 bn ~500 increase in Relationship Managers~15% increase over 2021-2024 +~60%IT spend2 in 2024 vs. 2021E Step-up in technology investments AuM CHF ~1.1 trnby 2024from CHF 0.9 trn in 3Q21;mid-single digit NNA CAGR CBV CHF ~1.6 trnby 2024from CHF 1.3 trn in 3Q21; mid- to high-single digit CAGR Incremental commissions and fees of CHF ~0.5 bn vs. 2021 Incremental net interest income of CHF ~0.7 bn vs. 2021 Our integrated model is expected to drive higher transaction-based revenues Incremental recurring revenues of CHF >1 bn 1 Based on average of 13.5% RWA and 4.25% Leverage Exposure 2 Wealth Management total technology cash spend Medium-term Aspirations

63 November 4, 2021 We are accelerating our growth in Wealth Management 2021 Investor Day Client Business Volume in CHF bn 9M21 2020 2016 2018 1,019 1,321 8%USD 4%2 NNA growth1 Adj. RoRC† Capital deployed 16%3 >6% p.a. Mid-single digit growth CBV growth aspiration CBV growth aspiration 6%CAGR >7% p.a. Expand Core HNW in Switzerland, offshore Europe and selected, sizeable onshore markets in APAC and EMEA Harmonize IT, optimize banking platforms, scale Luxembourg hub 2022-2024 Aspiration 2025-2026Aspiration Build out China Mainland franchise leveraging our Bank for Entrepreneurs model and potential other markets Grow UHNW and accelerate Upper HNW, building on UHNW strength Accelerate Core HNW in additional markets with further enhancement of IT platform 2%2 Lending growth Mid- to high-single digit growth CHF ~3 bn of additional capital deployed, ~25% increase >18% by 2024 CBV of CHF ~1.6 trn Note: Historical information presented according to the new divisional structure is a preliminary estimate based on management accounts and subject to change† RoRC is a non-GAAP financial measure, see Appendix. Based on average of 13.5% RWA and 4.25% Leverage and adjusted excluding significant items1 Average annual NNA growth rate 2 2017-2020 3 2018-2020
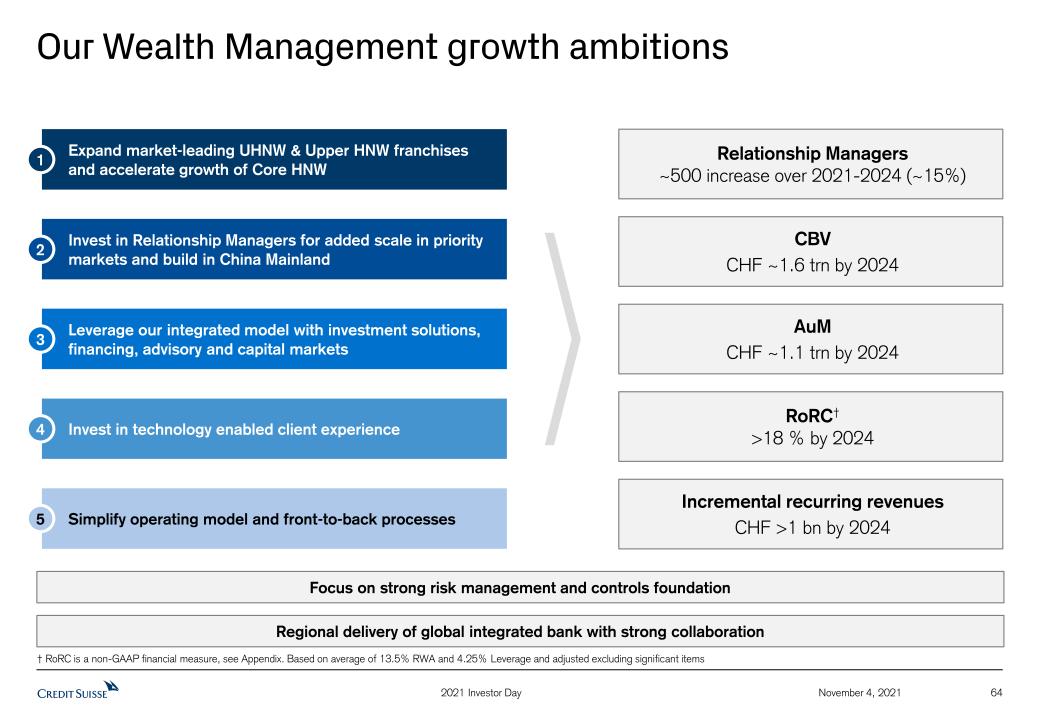
64 November 4, 2021 2021 Investor Day Our Wealth Management growth ambitions Expand market-leading UHNW & Upper HNW franchises and accelerate growth of Core HNW Invest in Relationship Managers for added scale in priority markets and build in China Mainland Invest in technology enabled client experience Leverage our integrated model with investment solutions, financing, advisory and capital markets RoRC†>18 % by 2024 AuM CHF ~1.1 trn by 2024 CBV CHF ~1.6 trn by 2024 Relationship Managers~500 increase over 2021-2024 (~15%) Incremental recurring revenuesCHF >1 bn by 2024 Regional delivery of global integrated bank with strong collaboration Simplify operating model and front-to-back processes 1 2 3 4 5 Focus on strong risk management and controls foundation † RoRC is a non-GAAP financial measure, see Appendix. Based on average of 13.5% RWA and 4.25% Leverage and adjusted excluding significant items
Global Investment Bank focused on advice and solutionsCredit Suisse 2021 Investor Day Christian Meissner, CEO Investment BankNovember 4, 2021

The global Investment Bank is core to Credit Suisse 66 IBCM Equities Credit GTS Leading Equity Capital Markets and Leveraged Finance franchises with investments in Advisory solutions and coverage Focused, asset-light business with strong high-touch execution capabilities, equity derivatives, ECM distribution and research & content Pre-eminent Securitized Products business joined with leading IG/HY trading capabilities Wealth Management centric franchise with best-in-class cross-asset, Structured Products and trading execution InvestmentBank GlobalTradingSolutions Investment Banking Advisory PrivateCapital Wealth Management Strategic partner to our core corporate, entrepreneurial, institutional and UHNW clients Strategy focuses on core areas of competitive advantage, capital efficiency and connectivity to Wealth Management Strong connectivity to our Bank for Entrepreneurs model November 4, 2021 2021 Investor Day

Reshaping our Investment Bank drives investments that will grow Advisory, Capital Markets, Credit and GTS 67 Exit of Prime Services1 Drive market-leading Securitized Products business and leverage 3rd party capital in Credit Invest in capital-light Investment Banking & Capital Markets business November 4, 2021 2021 Investor Day Exit Grow Grow Near-term strategic actions … …expected to result in a ~25% capital2 reduction through 2022 with expected subsequent growth to fund investments Note: Historical information presented according to the new divisional structure is a preliminary estimate based on management accounts and subject to change1 With the exception of Index Access and APAC Delta One 2 Based on average of 13.5% RWA and 4.25% Leverage 3 Assumes impact of Basel 3 reforms of USD 1.0-1.5 bn on 1/1/24 4 2024 capital includes the impact of FRTB Optimize Corporate Bank exposure and reduce GTS businesses without strong Wealth Management nexus Reposition Capital2 in USD bn 4 USD ~20 bn RWA reductionUSD ~100 bn LE reduction From 2023, invest capital for growth ~(25)% 2024Aspiration 2022Aspiration 2020 3Q21 14.6 13.0 ~11 ~13.0-13.53

Prime Services exit enables Cash Equities to focus on collaboration with IBCM and Wealth Management and on its strength in electronic trading 2021 Investor Day 1 Third party competitive analysis for the 2017-1H21 period 2 Institutional Investor 2021 All-Asia Trading and Sales Team surveys 3 With the exception of Index Access and APAC Delta One Build uponkey strengths… …to deliver a clear value proposition Support Wealth Management and Equity Capital Markets with a focused Cash Equities trading and execution platform, leveraging the market-leading AES and alternative data platforms #2Pan-Asia Trading2 #4Americas High Touch1 Top 6Global Cash1 Top 5Global Low Touch1 Exit Prime Services3 to reduce the Investment Bank’s capital footprint and overall risk profile Maintain APAC Delta One and Index Access business to support EQD and enable access to Asia markets for key franchise clients Reshape Cash Equities, strengthening alignment with ECM and Wealth Management in partnership with Equity Research franchise Expand market-leading AES electronic platform supported by industry-leading research and content Capitalize on alternative data monetization program Expand China franchise to grow Advisory, ECM and Cash Trading with hedge funds, SWFs and brokers 68 November 4, 2021 …throughtargeted strategic actions…

GTS will build on its strong track record of driving WM collaboration with expanded products across asset classes 2021 Investor Day 1 Bloomberg, Credit Repacks for the 2017-9M21 period 2 Coalition Greenwich Competitor Analytics for the 2019-1H21 period Build uponkey strengths… …throughtargeted strategic actions… …to deliver a clear value proposition Deliver differentiated institutional quality cross-asset solutions focused on Wealth Management clients addressing hedging, financing and investment needs leveraging technology and data Expand Investor Products, Asset Backed Loans and FX for Wealth Management Expand Wealth Management collaboration in Brazil; further penetrate Asia Wealth Management and entrepreneurs client segments Expand share in corporate Equity Derivatives in collaboration with IBCM coverage teams Simplify GTS operating and booking platforms Reduce long-duration structured derivatives book Reduce EM lending by exiting ~10 non-core GTS markets without Wealth Management nexus 69 November 4, 2021 #1Structured Credit1 #1Single Stock Exotics2 #2Structured Equity Derivatives2
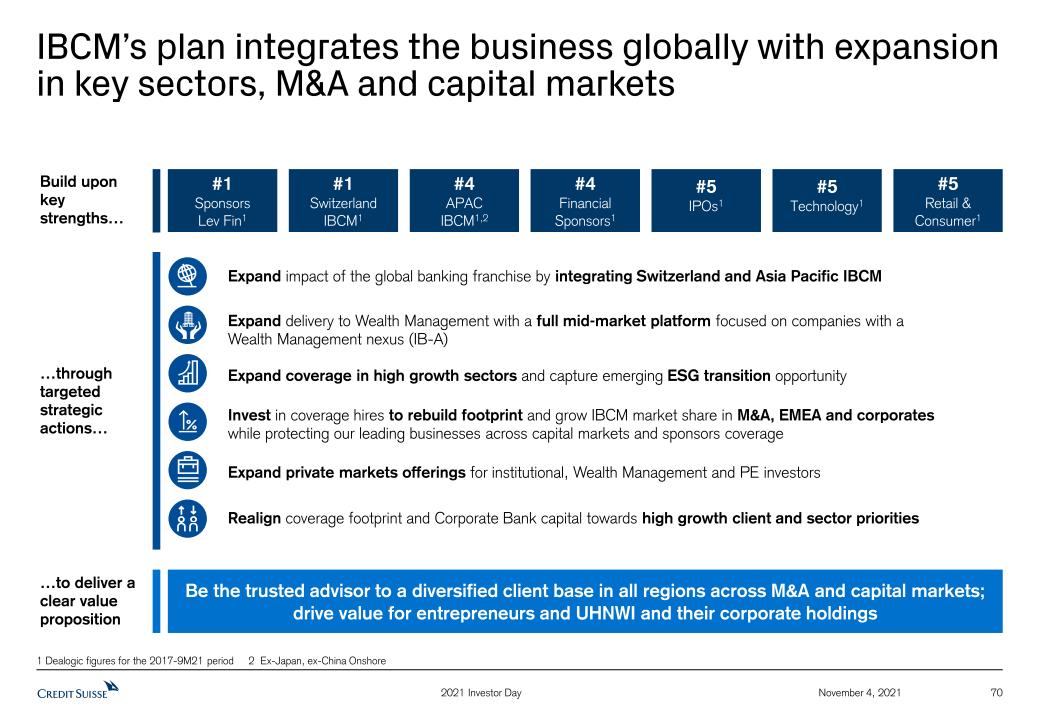
IBCM’s plan integrates the business globally with expansion in key sectors, M&A and capital markets 2021 Investor Day 1 Dealogic figures for the 2017-9M21 period 2 Ex-Japan, ex-China Onshore Expand impact of the global banking franchise by integrating Switzerland and Asia Pacific IBCM Expand delivery to Wealth Management with a full mid-market platform focused on companies with a Wealth Management nexus (IB-A) Expand coverage in high growth sectors and capture emerging ESG transition opportunity Invest in coverage hires to rebuild footprint and grow IBCM market share in M&A, EMEA and corporates while protecting our leading businesses across capital markets and sponsors coverage Expand private markets offerings for institutional, Wealth Management and PE investors Realign coverage footprint and Corporate Bank capital towards high growth client and sector priorities #1Sponsors Lev Fin1 #5IPOs1 #1Switzerland IBCM1 #4APAC IBCM1,2 #4Financial Sponsors1 #5Technology1 #5Retail & Consumer1 70 November 4, 2021 Be the trusted advisor to a diversified client base in all regions across M&A and capital markets; drive value for entrepreneurs and UHNWI and their corporate holdings Build uponkey strengths… …throughtargeted strategic actions… …to deliver a clear value proposition
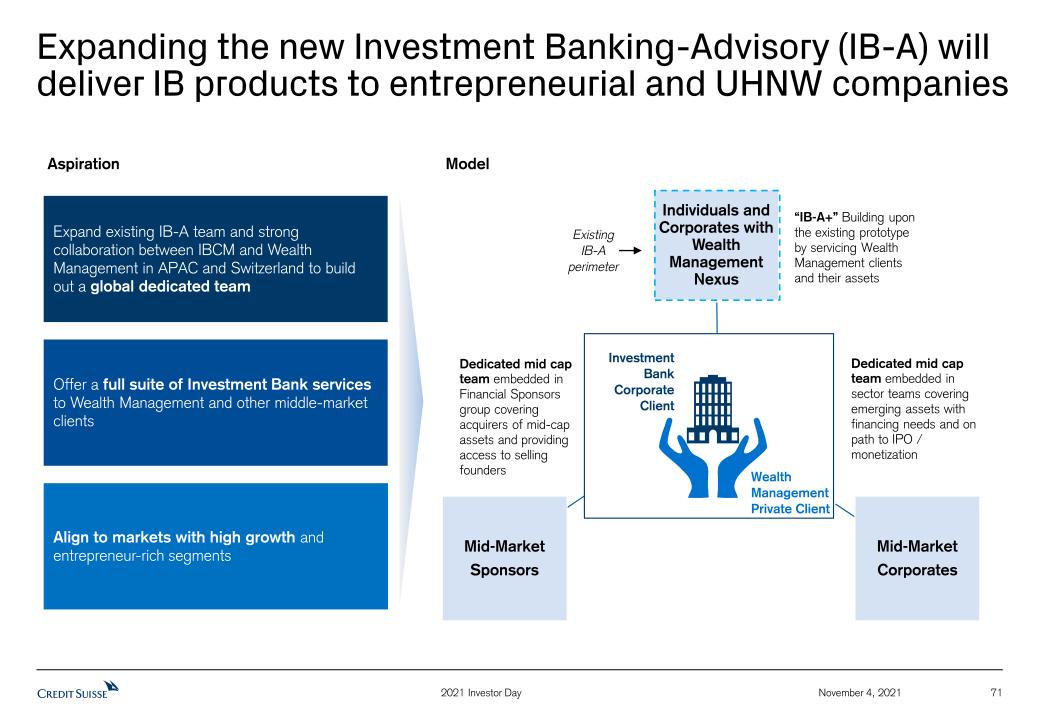
Expanding the new Investment Banking-Advisory (IB-A) will deliver IB products to entrepreneurial and UHNW companies 2021 Investor Day Expand existing IB-A team and strong collaboration between IBCM and Wealth Management in APAC and Switzerland to build out a global dedicated team Offer a full suite of Investment Bank services to Wealth Management and other middle-market clients Align to markets with high growth and entrepreneur-rich segments Individuals and Corporates with Wealth Management Nexus Mid-Market Corporates Mid-Market Sponsors Wealth Management Private Client Investment Bank Corporate Client “IB-A+” Building upon the existing prototype by servicing Wealth Management clients and their assets Dedicated mid cap team embedded in sector teams covering emerging assets with financing needs and on path to IPO / monetization Dedicated mid cap team embedded in Financial Sponsors group covering acquirers of mid-cap assets and providing access to selling founders Existing IB-A perimeter 71 November 4, 2021 Aspiration Model

Our market-leading Credit business will evolve to harness third party capital while driving more value to UHNWI 2021 Investor Day 1 Thomson Reuters F20A All US Securitizations for the 2017-9M21 period 2 Coalition Greenwich Competitor Analytics for the 2018 – 1H21 period (Americas) 3 TradeWeb for the 2017 – 9M21 period 4 CMBS Alert for the 2017 – 9M21 period 5 Thomson Reuters F13b US RMBS for the 2017-9M21 period Build uponkey strengths… …throughtargeted strategic actions… Expand market-leading Securitized Products and Global Credit Products businesses to drive growth and increase competitive advantage by leveraging third party capital #1AssetFinance1 Top 2Pass Through Trading3 Top 2Agency CMBS4 #2Lev Fin Trading2 #2Credit Derivatives Trading2 Top 2RMBS5 Expand Credit business by building credit merchant banking capabilities, leveraging third party capital Expand Wealth Management product offerings Expand our Credit Financing capabilities, leveraging the strength of our SP Finance business by building a full spectrum direct middle market lending platform that will serve corporates and UHNW Expand Credit globally with a focus on Asia, leveraging local distribution capabilities to capture growth Expand financing of companies active in ESG and create ESG investable products Expand collaboration with broader Investment Bank on private, mid-market opportunities attractive to investors and issuers 72 November 4, 2021 …to deliver a clear value proposition
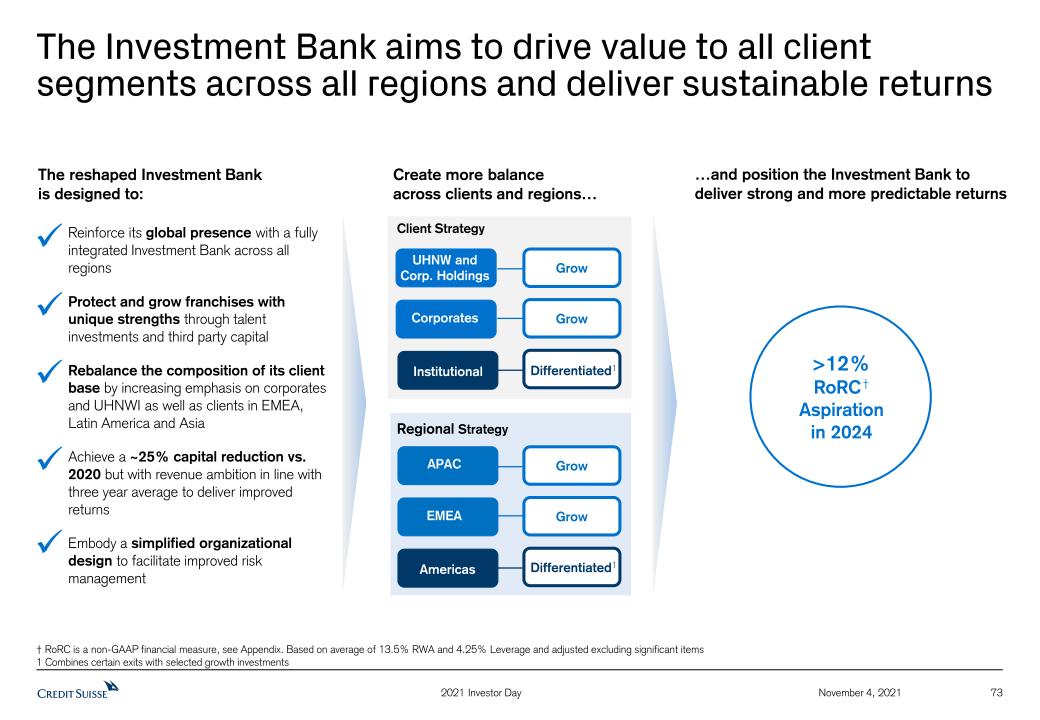
The Investment Bank aims to drive value to all client segments across all regions and deliver sustainable returns 2021 Investor Day …and position the Investment Bank to deliver strong and more predictable returns Reinforce its global presence with a fully integrated Investment Bank across all regionsProtect and grow franchises with unique strengths through talent investments and third party capital Rebalance the composition of its client base by increasing emphasis on corporates and UHNWI as well as clients in EMEA, Latin America and Asia Achieve a ~25% capital reduction vs. 2020 but with revenue ambition in line with three year average to deliver improved returns Embody a simplified organizational design to facilitate improved risk management † RoRC is a non-GAAP financial measure, see Appendix. Based on average of 13.5% RWA and 4.25% Leverage and adjusted excluding significant items1 Combines certain exits with selected growth investments The reshaped Investment Bankis designed to: Client Strategy Regional Strategy UHNW and Corp. Holdings Corporates Institutional Create more balance across clients and regions… Differentiated1 Grow Grow APAC EMEA Americas Grow Grow Differentiated1 >12%RoRC † Aspirationin 2024 73 November 4, 2021
Leading universal bank in SwitzerlandCredit Suisse 2021 Investor Day André Helfenstein, CEO Swiss Universal BankNovember 4, 2021
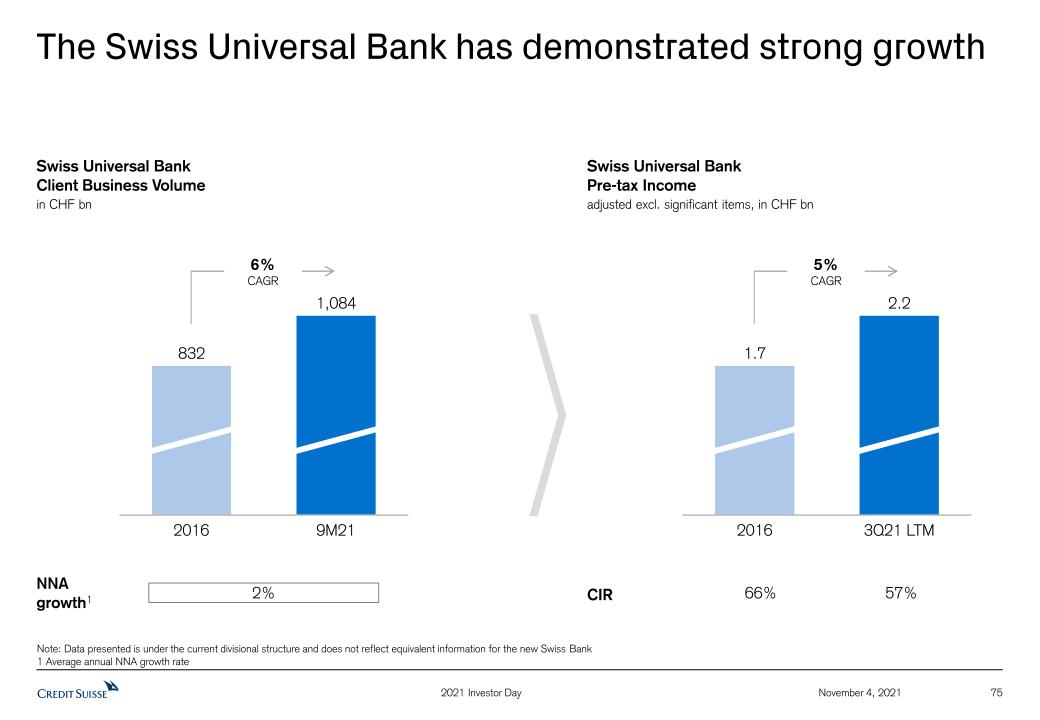
75 November 4, 2021 The Swiss Universal Bank has demonstrated strong growth 2021 Investor Day Swiss Universal BankClient Business Volume in CHF bn 6%CAGR 1,084 2016 9M21 832 2016 3Q21 LTM 1.7 2.2 Swiss Universal BankPre-tax Income adjusted excl. significant items, in CHF bn NNA growth1 CIR 5%CAGR 66% 57% 2% Note: Data presented is under the current divisional structure and does not reflect equivalent information for the new Swiss Bank1 Average annual NNA growth rate

We have leading positions and a track record of delivery November 4, 2021 76 2021 Investor Day Key achievements in Swiss Region Source: BCG, McKinsey, Pensionskassen - Caisses de Pensions Switzerland, Dealogic, FINMA, SIX, Swiss Fund Data, Morningstar Swiss Fund data per YE 20201 From Pension Funds & Corporate Investors and External Asset Managers; Jan 2018-Jun 2021 2 With exception of 2015 when CS IB CH ranked #2 3 Listed companies in Switzerland #1 Institutional BankingUniquely positioned and set up CHF 74 bn NNA over 3.5 years1 Serving 48 out of top 50 pension funds in Switzerland #1 Investment Bankingsince decades #1 over last 13 years2 12% share of wallet in investment banking #2 Wealth ManagementSuccessful coverage along client segments Increased HNW mandate penetration +4 pp. over 2019-9M21 Reduced CIR by 9 pp. over 2019-9M21 Top 2 Corporate BankingCore to Bank for Entrepreneurs CHF >10 bn p.a. Client Referral Volume transferred into other CS businesses Serving 87 of top 100 largest companies3 – 40% market share Top 2 Consumer FinancePremium offering and partnership Resilient consumer credit & strong auto leasing captive franchises (Porsche, Volvo, Ford, Tesla) Leading premium card provider – Swisscard JV with Amex, strong SWISS partnership #4 Retail BankingLeading transition to digital banking Successfully integrated retail subsidiary in 7 months during COVID-19 Launched digital offering CSX with large share of young clients #2 Asset Managerwith strong institutional DNA #1 Real Estate Asset Manager in Switzerland 17% market share in Swiss mutual funds market
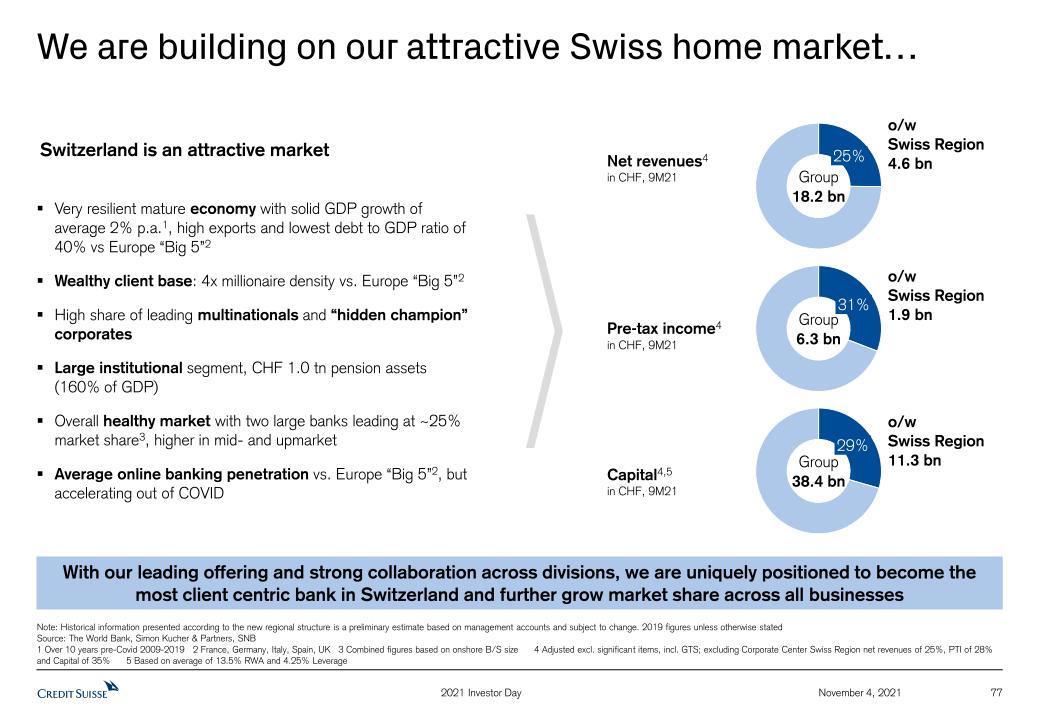
31% 25% 29% Net revenues4 in CHF, 9M21 o/w Swiss Region4.6 bn Group18.2 bn o/w Swiss Region1.9 bn Group6.3 bn Pre-tax income4 in CHF, 9M21 77 November 4, 2021 We are building on our attractive Swiss home market… 2021 Investor Day Very resilient mature economy with solid GDP growth of average 2% p.a.1, high exports and lowest debt to GDP ratio of 40% vs Europe “Big 5”2Wealthy client base: 4x millionaire density vs. Europe “Big 5”2High share of leading multinationals and “hidden champion” corporatesLarge institutional segment, CHF 1.0 tn pension assets (160% of GDP)Overall healthy market with two large banks leading at ~25% market share3, higher in mid- and upmarketAverage online banking penetration vs. Europe “Big 5”2, but accelerating out of COVID Note: Historical information presented according to the new regional structure is a preliminary estimate based on management accounts and subject to change. 2019 figures unless otherwise statedSource: The World Bank, Simon Kucher & Partners, SNB1 Over 10 years pre-Covid 2009-2019 2 France, Germany, Italy, Spain, UK 3 Combined figures based on onshore B/S size 4 Adjusted excl. significant items, incl. GTS; excluding Corporate Center Swiss Region net revenues of 25%, PTI of 28% and Capital of 35% 5 Based on average of 13.5% RWA and 4.25% Leverage Switzerland is an attractive market With our leading offering and strong collaboration across divisions, we are uniquely positioned to become the most client centric bank in Switzerland and further grow market share across all businesses Capital4,5 in CHF, 9M21 Group38.4 bn o/wSwiss Region11.3 bn

… and we aim to further capitalize on this opportunity with a clear positioning and strategy Our business model and key initiatives Our positioning Our Aspiration November 4, 2021 78 2021 Investor Day Gain market share building on leading position with clients consolidating to full offering provider Innovate with tech-centric approach to win new clients and improve profitability Bank for Switzerland with global expertise Bank for Entrepreneurs Bank for holistic solutions Bank for the digital generation “High-touch” businessTailor-made solutions for corporate, institutional and private clients with sophisticated needsStrengthen global connectivity with integrated bank - IB/AM/GTS/SRIInvest in RM/specialist hires, competitive platform and data analyticsInvest in products: sustainability, mandates, lending, private marketsDrive capital velocity by redirecting capital and creating fund-based offeringsContinued disciplined risk management “High-tech” / Broader businessIncreasingly digitally-led hybrid service model for clients with less complex needs and preference for digital channelsSimplify and digitize Front-to-back operating modelDrive CSX: grow private clients, expand offering, target smaller SME clientsFurther invest in digital client engagement and marketing

Going forward we will report on both the Swiss Region and the Swiss Bank Segment 79 November 4, 2021 2021 Investor Day 1 Excluding External Asset Managers (EAM) Reporting Scopes Retail Retail Premium Clients (UHNW)Private BankingExternal Asset ManagersSUB IBCM GTS SwitzerlandAsset Management Switzerland Swiss Bankdivision SUB Swiss Region CorporateInstitutional1DigitalConsumer No longer separately reported Credit Suisse (Schweiz) AG will continue to operate with the same remit as today and our clients will continue to contract with Credit Suisse (Schweiz) AG The CEO of the Swiss Region will be the CEO of Credit Suisse (Schweiz) AG and of the Swiss Bankto ensure continued alignment

80 November 4, 2021 The new Swiss Bank division will serve corporate, institutional and digital banking clients 2021 Investor Day Note: Historical information presented according to the new divisional structure is a preliminary estimate based on management accounts and subject to change† RoRC is a non-GAAP financial measure, see Appendix. Based on average of 13.5% RWA and 4.25% Leverage 1 On an adjusted excluding significant items basis Institutional Banking for pension funds and banks Corporate Banking for multi-national Swiss corporates and SMEs Digital Banking for broader private client base and small businesses Consumer Finance with BANK-now and our participation in Swisscard Our businesses 7%CAGR Key metrics for Swiss Bankin CHF bn RoRC†,1>12% CIR1Low 50s CBVLow- to mid-single digit CAGR over 2022-2024 2024Aspiration 601 635 9M21 2019 2020 675 CIR1 56% 54% 53% Client BusinessVolume RoRC†,1 10% 13% 14%

81 November 4, 2021 Focus and growth levers in the Swiss Bank 2021 Investor Day Note: Historical information presented according to the new divisional structure is a preliminary estimate based on management accounts and subject to change1 Excluding EAM 2 McKinsey and BCG Institutional Banking1 Corporate Banking Retail Banking Business Asset advisory, asset servicing, asset management out of AM, trading, cash clearing and transaction banking for pension funds and banks Strategic advice, lending, FX and cash/working capital solutions to large/medium-sized corporates & entrepreneur-owned companies Digital and basic banking services to broader market private clients and small enterprises; consumer credit / auto leasing; credit cards Growth levers Full breadth offering for mid-/ upmarket clients, consolidating providers and introducing state-of-the-art platform Mid- and upmarket IB, structured lending and Bank for Entrepreneurs value proposition with PB, capital velocity solutions Comprehensive digital offering for payments, accounts, investments and mortgages; partnerships in consumer credit and auto leasing; premium credit card offering Examples +9% p.a. growth in AuM19M19-9M21 +3% p.a. growth in credit volume 9M19-9M21 Attracting new clients incl. high share of clients younger than 35 Market position2 #1 Top 2depending on sub-segment #4in retail banking Top 2in consumer finance
Multi-specialist Asset ManagerCredit Suisse 2021 Investor Day Ulrich Körner, CEO Asset ManagementNovember 4, 2021

Asset Management at a glance Switzerland(61%) EMEA (12%) APAC (13%) Americas (14%) Institutionalclients (70%) Third-Party Wholesale (13%) WealthManagement (17%) Equities (6%) IndexSolutions (36%) Fixed Income (10%) Balanced Solutions (11%) ICBCCS JV (10%) Credit InvestmentsGroup (14%) Global Real Estate (8%) By geography By client segment1 By capability Business mix 3Q21, in % of AuM 1 Operating businesses only, excludes AuM from Investments & Partnerships 2 Includes 1% Investment & Partnerships and 4% of other operating businesses 3 Based on principal liabilities as of September 30, 2021 from CreditFlux 4 Based on AuM according to Morningstar, global thematic fund landscape, May 2021 5 Based on ETF and index fund assets for ESG per Morningstar YE 2020, overall ranking according to Morningstar as of July 31, 2021 6 Mutual fund assets only per YE 2019 per wind.com CS Asset Management Asset manager with CHF 475 bn in AuM Focused franchise, built around strong institutional grade investment capabilities Other2 (5%) 83 November 4, 2021 #4 Thematic Equities franchise in Europe4 Leading market position in Switzerland with access to large in-house distribution Partner to one of the largest6 and most successful AM JV, ICBCCS, in China Largest US CLO manager and second largest globally3 Leading index fund provider in CH, top 5 in Europe with strong position in ESG5 Key strengths to build on Leading positions in specialist products / capabilities: 2021 Investor Day

Decisive actions taken since April 2021 84 Reviewed risk appetite and aligned new business initiativesReviewed Investments & Partnerships portfolio and balance sheet exposureConducted strategic review for Asset Management November 4, 2021 1 Recovery considered as total cash paid out and current cash & cash equivalents. Recovery amount stated based on the funds’ Net Asset Value as of February 25th 2021 Organization & Governance Supply Chain Finance Funds (SCFF) Strategic & Business Reviews Established Asset Management as a separating operating divisionStrengthened senior leadership with dedicated Asset Management and risk experts; 8 new members out of 11 total in the current AM Management CommitteeStrengthened divisional governance and decision making processesStrengthened product approval governance Made significant progress in SCFF remediation, recovering ~70% of the funds value to date1 2021 Investor Day

Significant value creation by Asset Management Value to our clients Access to distinctive investment capabilitiesAttractive offering based on strong institutional DNABroad range of tailored solutions / products and access to exclusive deals 75% of actively managed assets outperforming benchmark1 Value to our shareholders Strong growth potential in high-margin industryLow capital intensity and superior shareholder returns2Stable profit contribution from operating businesses with low volatility 35% Avg. RoRC† 2018-2020 Value to our Group Group’s center of investment managementInvestment credibility, reputation and track recordEnhanced value capture across the entire value chain >70 bn of AuM managed for CS WM clients at 3Q21 (in CHF) † RoRC is a non-GAAP financial measure, see Appendix. Based on average of 13.5% RWA and 4.25% Leverage and adjusted excluding significant items1 Weighted average of actively managed assets across Equities, Fixed Income, Credit Investment Group, Balanced Solutions, Real Estate, Commodities, Insurance Linked Strategies, Quantitative Investment Strategies performing above benchmark per August 2021 on a 3 year annualized basis only; does not include Index Solutions 2 Measured by total return to shareholders (14.0% p.a. of 39 Asset Managers from Europe and Americas vs. 5.3% p.a. of 100 banks globally) weighted by market capitalization over 15-year period (2005-2020) based on Capital IQ data 85 November 4, 2021 2021 Investor Day

Our strategic priorities Key strategic priorities to deliver our vision Simplify Strengthen Invest for growth Expand footprint in selected European and Asian marketsDevelop meaningful third-party Wholesale distribution franchiseBuild focused Private Markets offering Enhance coverage model for Institutional clients and our Wealth Management Establish global product managementBuild out existing investment capabilities Divest non-core Investments & Partnerships portfolioImplement one global operating platformStreamline management structure and governanceOptimize legal entity structure Technology & Talent as key differentiators Ourvision Talent- and technology-led multi-specialist asset manager of choice in public and private markets for global Institutional clients, our Wealth Management and third-party Wholesale distributors Strengthen Risk & Controls November 4, 2021 86 2021 Investor Day

Simplify: Divesting non-core Investments & Partnerships portfolio and streamlining our future platform Exiting non-core Investments & Partnership (I&P) portfolio... Reduction in RWA usage, in CHF bn1 2020 2024 Aspiration Decisive action to reduce portfolio over 2021Achieved 33% or CHF 1.6 bn RWA reduction2 by 3Q21 vs. 2020Aiming for a reduction of ~40% vs. 2020 until 2024Accelerating shift towards operating businesses ...and implementing one global operating platform for Asset Management Global standards Global functions End-to-end processes Technology-enabled Scalable platform Cost Efficiency 6 core principles for future operating platform Build scalable platform that delivers digital- and operational alpha and reduces operational risk Streamline processes and decision-making (33)% as of 3Q21 4.9 ~(40)% 87 1 Includes FX effects. Reduction partially offset by re-valuation of single investment leading to an increased RWA as well as off-setting FX effects of CHF 0.3 bn in 1Q 21 2 Includes 3Q21 impairment of York Capital Management investment November 4, 2021 2021 Investor Day

Strengthen: Strategic pillars to strengthen the franchise 88 Key highlights Build on core investment strengths Introduce global product managementScale blockbuster funds, attractive niche offeringsContinuous product innovation Products &Capabilities Globally aligned coverage model Strengthen sales support teams Dedicated in-house coverage for Wealth ManagementLeverage data to drive sales excellence Distribution Operational model & Technology Global operating platformHarmonize and standardize to create scalabilityTechnology as key differentiator Risk & Controls Increase organizational clarity & accountabilityStrengthen 3 Lines of Defense modelPromote a stronger risk cultureEnhance global reporting & transparency Governance &legal entity set-up Streamline management structure Enhance governance processesImprove legal entity governance November 4, 2021 Strengthen Governance and legal entity set-up Products &Capabilities Operational model& Technology Risk & Controls Distribution 2021 Investor Day

Technology as differentiator vs. competitors...Create unique digital client experienceGenerate superior data-driven insightsDigitalize end-to-end processes...and foundation for creating a scalable, global operating platform toDeliver superior returnsCreate value for clientsAttract and retain top talent 2020 2024 Aspiration Invest: Laying the foundation for future success Geographies Build meaningful distribution footprint in core EMEA marketsInvest into on-shore presence in key fast-growing APAC markets Products / Capabilities Build focused Private Markets offering Further grow / diversify existing high-alpha franchises 2020 2024 Aspiration Share of APAC and EMEA in total NNA, % Share of (quasi-)alternative products1 in total NNA, % ~2x +~30% Client segments Build strong franchise in high-margin third party Wholesale segmentEnhance collaboration with our Wealth Management 2024 Aspiration 2020 Share of third-party Wholesale, Wealth Management in total NNA, % +~50% Technology & talent 1 Includes Global Real Estate, Credit Investment Group and Multi-Manager Offerings November 4, 2021 89 2021 Investor Day

90 November 4, 2021 Our financial aspirations Management fee margin1, in bps Cost-Income-Ratio2, in % Adjusted RoRC†, in % Ambitious organic strategic plan to deliver value for shareholdersStrong net new asset growth ambitionImproved profitabilityOptimized capital usage and strong capital returns for shareholders † RoRC is a non-GAAP financial measure, see Appendix. Based on average of 13.5% RWA and 4.25% Leverage and adjusted excluding significant items1 Management fee margin of operating business 2 Based on adjusted results excluding significant items 15.5 >20 2024 Aspiration 2021 Investor Day >4 2020 2022-2024Aspiration ~75 2020 2024Aspiration >45 2020 2024Aspiration 2020 2024Aspiration Stable Net New Assets, in CHF bn, in % of AuM

91 November 4, 2021 A Transformed Bank 6 Financial Perspectives 5 Asia Pacific Growth Aspirations 4 Divisional Perspectives 3 Strategic Perspectives 2 Our Vision 1 Agenda 2021 Investor Day

Asia Pacific Growth AspirationsCredit Suisse 2021 Investor Day Helman Sitohang, CEO APACNovember 4, 2021

93 November 4, 2021 Our integrated Bank for Entrepreneurs in APAC hasdelivered significantly higher client volume and profitability 2021 Investor Day APAC DivisionClient Business Volume in USD bn 10%CAGR 2016 9M21 1.1 3Q21 LTM 2016 0.6 APAC DivisionPre-tax Income adjusted excl. significant items, in USD bn NNA growth1 CIR 14%CAGR 76% 66% 6% Note: Data presented is under the current divisional structure and does not reflect equivalent information for the new APAC region1 Average annual NNA growth rate

Focus on capturing further upside with regional clients 94 Attractive structural factors 1 Source: McKinsey Wealth Pools, 2021 2 Credit Suisse Wealth Report 2021 - includes PB AuM held by individuals with >USD 1mn financial assets 3 World Federation of Exchanges, September 2021 Our strategic priorities APAC AuM pool1in CHF trn 2025 2020 Number of UHNW and HNWI expected to double over next 5 years with faster growth in onshore markets2 1st & 2nd generation Entrepreneurs driving wealth growth Deeper financial markets, with >1/3rd of global market capitalization in APAC3 Increasing access for foreign players to China Mainland November 4, 2021 2021 Investor Day 6 - 7% CAGR 1.5x 1.3x 1.1x 1.3x 1.3x 1.4x 2020 -2025AuM pool growth Expand client focus with our strengths in UHNW & Entrepreneurs, and accelerate HNW growth 1 Increase scale in largest APAC wealth markets and build out China Mainland franchise 2 Grow wealth & financing solutions and invest in digitalization 3 Drive regional excellence and leadership with integrated global bank 4

Our leading franchise provides a solid foundation for growth 95 Note: Historical information presented according to the new regional structure is a preliminary estimate based on management accounts and subject to change Source: Annual reports and company disclosures1 CS reflects client assets (AuM + AuC); others as per Asian Private Banker, 2020 2 Dealogic share of wallet rank for APAC ex-Japan and China onshore, average 2018-2020 APAC regional revenue as % of Group revenue Credit Suisse vs peers, average 2018-2020 Differentiated strategic focus on wealth management Leading market positions in APAC with integrated global bank Wealth Management Assets1 Credit Suisse vs. peers, 2020 Advisory & Underwriting fees2 (SoW %)Credit Suisse vs. peers, average 2018-2020 18% #2 #3 November 4, 2021 2021 Investor Day

Strengthen client value propositions to capture upside 96 UHNWBespoke advisory & financing solutions CorporatesAdvisory & global solutions HNWHouse View and investment solutions Institutional InvestorsContent & cross-asset solutions Entrepreneurs Our tailored approach and offering enabled by our global integrated bank… …is delivering strong revenue growth with wealth management related clients Broaden UHNW franchise and accelerate growth with HNW Focus on new economy sectors for corporate coverage Differentiate content & access for institutional investors Key priorities 1 Represents APAC Private Banking and APAC IBCM 1 November 4, 2021 2021 Investor Day 2016 3Q21 LTM Revenues form UHNW, HNW, Entrepreneur & Corporate clients1 9%CAGR
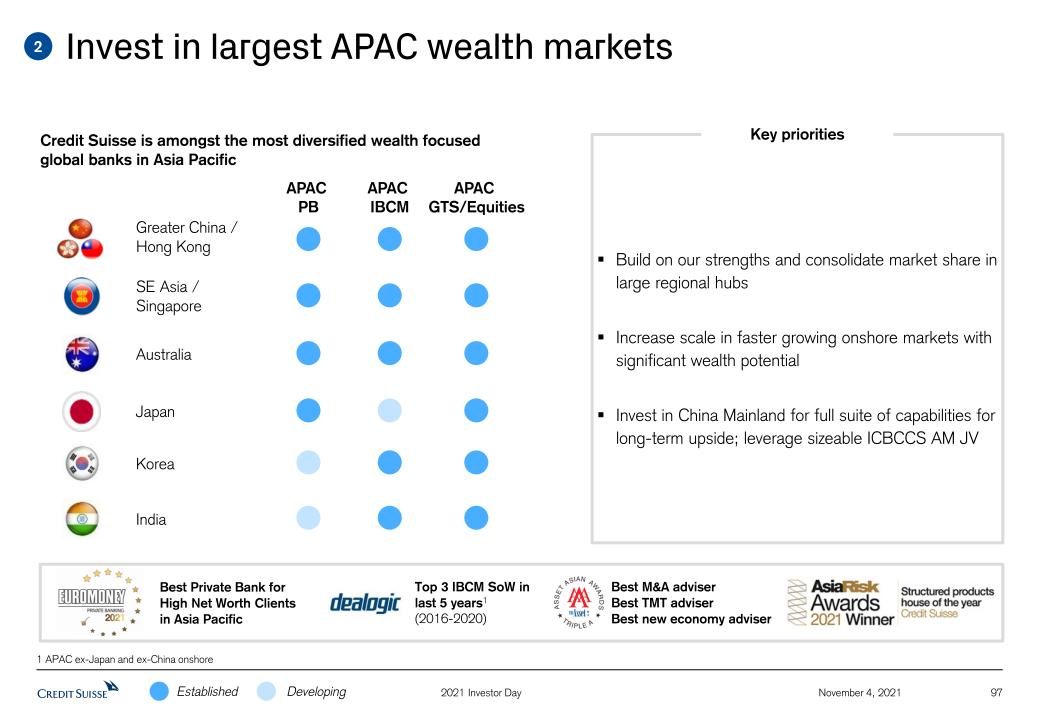
Invest in largest APAC wealth markets 97 Greater China / Hong Kong SE Asia / Singapore Korea Japan India APAC PB APAC IBCM APAC GTS/Equities Australia Build on our strengths and consolidate market share in large regional hubsIncrease scale in faster growing onshore markets with significant wealth potentialInvest in China Mainland for full suite of capabilities for long-term upside; leverage sizeable ICBCCS AM JV Top 3 IBCM SoW in last 5 years1(2016-2020) Best Private Bank for High Net Worth Clients in Asia Pacific Best M&A adviser Best TMT adviser Best new economy adviser Credit Suisse is amongst the most diversified wealth focused global banks in Asia Pacific Key priorities 2 November 4, 2021 2021 Investor Day 1 APAC ex-Japan and ex-China onshore Developing Established

Scale our franchise with comprehensive solutions and expanded client coverage 98 Note: Historical information presented according to the new regional structure is a preliminary estimate based on management accounts and subject to change1 Mandates and Funds 2 Client assets referred by APAC IBCM bankers to APAC WM Grow recurring revenue activities Invest in coverage hires Leverage digital focus Drive collaboration alpha RMs+ IBCM Coverage 2018 2020 9M21 Managed Solutions1 volume Net loans Direct to client approach and business simplification Entrepreneur-led activity via holistic advisory & solutions 2018 2020 9M21 +70 PB RMs in 9M21 to deliver future upside ~40%of APAC IBCM MDs with asset referrals2018-9M21 USD >30 bnclient assets from integrated approach22018-9M21 > 80%of APAC PB clients are on Digital Private Bank ~2xclients on CS Chat 9M21 vs. 9M20(2019 launch) 3 November 4, 2021 2021 Investor Day +30% +15%

Drive regional excellence and leadership with integrated global bank 99 Concerted and aligned focus to capture APAC wealth opportunity, leveraging global Wealth Management Leveraging our integrated Bank for Entrepreneurs model via IBCM, GTS, Asset Management and SRI On-the-ground proximity to clients and market insights with strong risk management Best-in-class collaboration culture and a differentiated platform for talent 2024 Aspiration Grow share of revenue contributionto Group from Asia Pacific Increase share of capital allocated to Asia Pacific High-single digit growth in Client Business Volume 4 November 4, 2021 2021 Investor Day

100 November 4, 2021 A Transformed Bank 6 Financial Perspectives 5 Asia Pacific Growth Aspirations 4 Divisional Perspectives 3 Strategic Perspectives 2 Our Vision 1 Agenda 2021 Investor Day
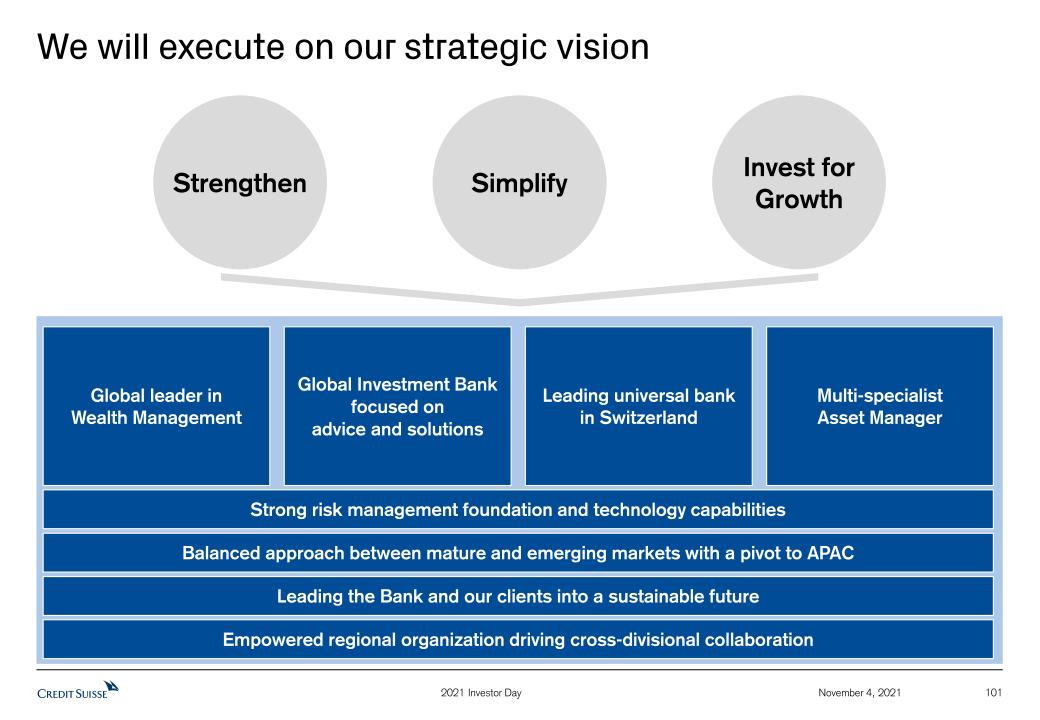
November 4, 2021 We will execute on our strategic vision 101 2021 Investor Day Strengthen Simplify Invest forGrowth Global Investment Bank focused on advice and solutions Leading universal bankin Switzerland Multi-specialist Asset Manager Strong risk management foundation and technology capabilities Global leader in Wealth Management Balanced approach between mature and emerging markets with a pivot to APAC Leading the Bank and our clients into a sustainable future Empowered regional organization driving cross-divisional collaboration

Our 2024 financial aspirations 2021 Investor Day November 4, 2021 102 CIR adj. excl. sign. items~70% Reported Group RoTE‡>10% Corp Center adj. pre-tax loss CHF ~0.5 bn CIR adj. excl. sign. items~80% Reported Group RoTE‡~7% Corp Center and SRU adj. pre-tax loss CHF 1.4 bn Adj. RoRC† excl. sign. items Strategic Plan 2024 Aspirations 12% 9% Swiss Bank Wealth Management Investment Bank Asset Management 16% 35% >45% >12% >18% Wealth Management Investment Bank Asset Management Swiss Bank >12% Average 2018-2020 Release USD >3 bn of Investment Bank capital1 over 2021-2022 ~(25)%;targeted investments from 2023 Invest incrementalCHF ~1.0-1.5 bn p.a. into growth investments by 2024, progressively increasing from 2022, funded by structural cost savings Increase capital1 allocated to WM, SB, AM vs. the IB to ~2.0x in 2022 and beyond Invest CHF ~3 bn of capital1 into Wealth Managementover 2021-2024 +25% Adj. RoRC† excl. sign. items CET1 ratio>14% pre-B3R Leverage ratio~4.5% Note: Historical information presented according to the new divisional structure is a preliminary estimate based on management accounts and subject to change. Results excluding certain items included in our reported results are non-GAAP financial measures. For further details and reconciliation information, see the Appendix† RoRC is a non-GAAP financial measure, see Appendix. Based on average of 13.5% RWA and 4.25% Leverage ‡ Return on tangible equity, a non-GAAP financial measure, is calculated as annualized net income attributable to shareholders divided by average tangible shareholders’ equity1 Based on average of 13.5% RWA and 4.25% Leverage CET1 ratio 12-13% Leverage ratio4.0-4.5%
Appendix 2021 Investor Day November 4, 2021 103

November 4, 2021 104 2021 Investor Day 1 Divisional structure from January 1, 2022 Reconciliation of adjustment items (1/3) Results excluding items included in our reported results are non-GAAP financial measures. During the implementation of our strategy, we will measure the progress achieved by our underlying business performance. Management believes that such results provide a useful presentation of our operating results for purposes of assessing our Group and divisional performance consistently over time, on a basis that excludes items that management does not consider representative of our underlying performance. Provided below is a reconciliation to the most directly comparable US GAAP measures. Wealth Management1 Swiss Bank1 Investment Bank1 (USD) Asset Management in CHF bn 9M21 2020 2019 2018 9M21 2020 2019 2018 9M21 2020 2019 2018 9M21 2020 2019 2018 Net revenues reported 7.0 9.0 9.3 8.6 2.3 3.0 3.4 3.0 8.5 10.2 8.6 8.7 1.1 1.1 1.6 1.5 Real estate (gains)/losses - - (0.1) (0.0) (0.0) (0.0) (0.2) (0.0) - - (0.0) - - - - - (Gains)/losses on business sales 0.0 - - (0.0) 0.0 - - (0.0) - - - - - - - (0.0) Major litigation recovery - - - - (0.0) - - - - - - - - - - - Valuation adjustment related to major litigation - - - - - - - - - - - - - - - - Gain related to InvestLab transfer - (0.0) (0.2) - - (0.0) (0.1) - - - - - - (0.2) - - Gain on equity investment in Allfunds Group (0.4) (0.1) - - (0.2) (0.0) - - - - - - - - - - Gain on equity investment in SIX Group AG - (0.1) (0.2) - - (0.1) (0.3) - - - - - - - - - Gain on equity investment in Pfandbriefbank - - - - - (0.1) - - - - - - - - - - Impairment on York Capital Management - - - - - - - - - - - - 0.1 0.4 - - Archegos - - - - - - - - 0.5 - - - - - - - Net revenues adj. excl. sign. items and Archegos 6.6 8.9 8.8 8.5 2.1 2.7 2.8 2.9 9.0 10.2 8.6 8.7 1.2 1.3 1.6 1.5 Provision for credit losses 0.0 0.3 0.1 0.1 0.0 0.3 0.1 0.1 4.5 0.6 0.1 0.1 0.0 - 0.0 - Archegos - - - - - - - - (4.6) - - - - - - - Total operating expenses reported 4.4 6.1 6.2 6.2 1.1 1.6 1.5 1.6 5.6 7.6 7.2 7.5 0.8 1.1 1.2 1.2 Restructuring expenses (0.0) (0.0) - (0.1) (0.0) (0.0) - (0.1) (0.1) (0.1) - (0.4) (0.0) (0.0) - (0.0) Major litigation provisions 0.0 0.0 0.0 (0.0) - (0.0) (0.0) (0.0) - (0.0) - (0.0) - - - - Expenses related to real estate disposals (0.0) (0.0) (0.0) - (0.0) (0.0) (0.0) - (0.0) (0.0) (0.1) - (0.0) (0.0) (0.0) - Expenses related to business sales - - - - - - - - - - - - - - - (0.0) Expenses related to equity investment in Allfunds Group (0.0) - - - (0.0) - - - - - - - - - - - Archegos - - - - - - - - (0.0) - - - - - - - Total operating expenses adj. excl. sign. items and Archegos 4.4 6.1 6.2 6.0 1.1 1.5 1.5 1.5 5.6 7.5 7.1 7.1 0.8 1.1 1.2 1.1 Pre-tax income/(loss) reported 2.6 2.7 3.1 2.4 1.2 1.1 1.8 1.2 (1.6) 2.0 1.3 1.1 0.2 (0.0) 0.5 0.4 Total adjustments, significant items and Archegos (0.4) (0.2) (0.5) 0.1 (0.2) (0.2) (0.6) 0.1 5.2 0.1 0.1 0.4 0.1 0.2 0.0 0.1 Pre-tax income/(loss) adj. excl. sign. items and Archegos 2.2 2.5 2.6 2.5 1.0 0.9 1.2 1.3 3.6 2.1 1.4 1.5 0.3 0.2 0.5 0.4
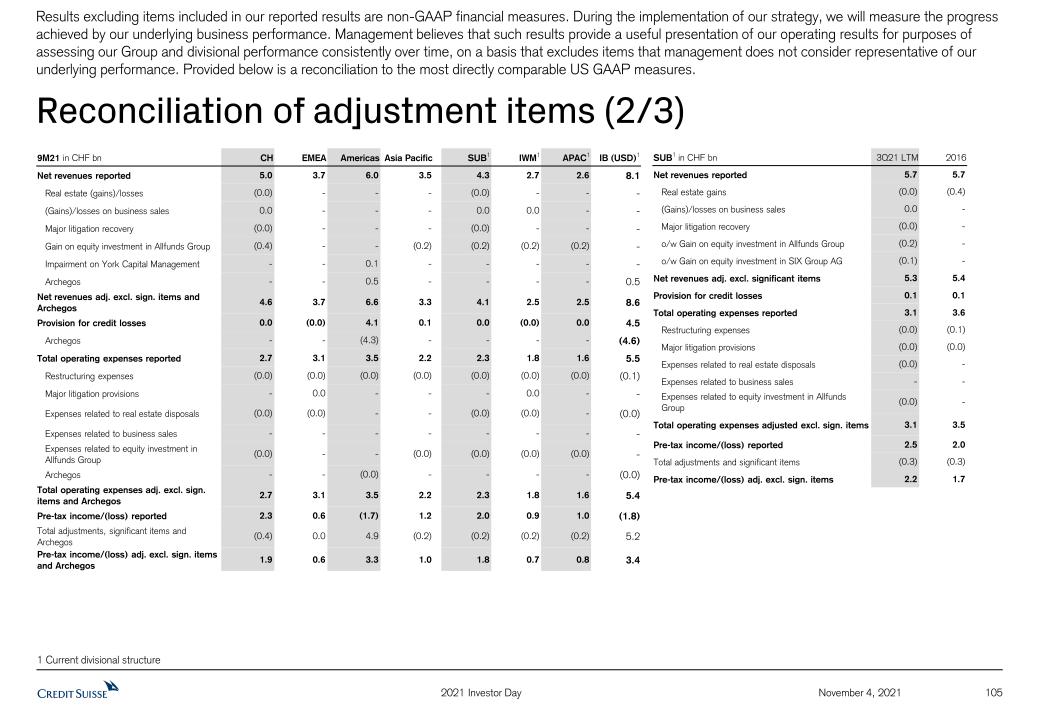
November 4, 2021 105 2021 Investor Day 1 Current divisional structure Reconciliation of adjustment items (2/3) Results excluding items included in our reported results are non-GAAP financial measures. During the implementation of our strategy, we will measure the progress achieved by our underlying business performance. Management believes that such results provide a useful presentation of our operating results for purposes of assessing our Group and divisional performance consistently over time, on a basis that excludes items that management does not consider representative of our underlying performance. Provided below is a reconciliation to the most directly comparable US GAAP measures. 9M21 in CHF bn CH EMEA Americas Asia Pacific SUB1 IWM1 APAC1 IB (USD)1 Net revenues reported 5.0 3.7 6.0 3.5 4.3 2.7 2.6 8.1 Real estate (gains)/losses (0.0) - - - (0.0) - - - (Gains)/losses on business sales 0.0 - - - 0.0 0.0 - - Major litigation recovery (0.0) - - - (0.0) - - - Gain on equity investment in Allfunds Group (0.4) - - (0.2) (0.2) (0.2) (0.2) - Impairment on York Capital Management - - 0.1 - - - - - Archegos - - 0.5 - - - - 0.5 Net revenues adj. excl. sign. items and Archegos 4.6 3.7 6.6 3.3 4.1 2.5 2.5 8.6 Provision for credit losses 0.0 (0.0) 4.1 0.1 0.0 (0.0) 0.0 4.5 Archegos - - (4.3) - - - - (4.6) Total operating expenses reported 2.7 3.1 3.5 2.2 2.3 1.8 1.6 5.5 Restructuring expenses (0.0) (0.0) (0.0) (0.0) (0.0) (0.0) (0.0) (0.1) Major litigation provisions - 0.0 - - - 0.0 - - Expenses related to real estate disposals (0.0) (0.0) - - (0.0) (0.0) - (0.0) Expenses related to business sales - - - - - - - - Expenses related to equity investment in Allfunds Group (0.0) - - (0.0) (0.0) (0.0) (0.0) - Archegos - - (0.0) - - - - (0.0) Total operating expenses adj. excl. sign. items and Archegos 2.7 3.1 3.5 2.2 2.3 1.8 1.6 5.4 Pre-tax income/(loss) reported 2.3 0.6 (1.7) 1.2 2.0 0.9 1.0 (1.8) Total adjustments, significant items and Archegos (0.4) 0.0 4.9 (0.2) (0.2) (0.2) (0.2) 5.2 Pre-tax income/(loss) adj. excl. sign. items and Archegos 1.9 0.6 3.3 1.0 1.8 0.7 0.8 3.4 SUB1 in CHF bn 3Q21 LTM 2016 Net revenues reported 5.7 5.7 Real estate gains (0.0) (0.4) (Gains)/losses on business sales 0.0 - Major litigation recovery (0.0) - o/w Gain on equity investment in Allfunds Group (0.2) - o/w Gain on equity investment in SIX Group AG (0.1) - Net revenues adj. excl. significant items 5.3 5.4 Provision for credit losses 0.1 0.1 Total operating expenses reported 3.1 3.6 Restructuring expenses (0.0) (0.1) Major litigation provisions (0.0) (0.0) Expenses related to real estate disposals (0.0) - Expenses related to business sales - - Expenses related to equity investment in Allfunds Group (0.0) - Total operating expenses adjusted excl. sign. items 3.1 3.5 Pre-tax income/(loss) reported 2.5 2.0 Total adjustments and significant items (0.3) (0.3) Pre-tax income/(loss) adj. excl. sign. items 2.2 1.7
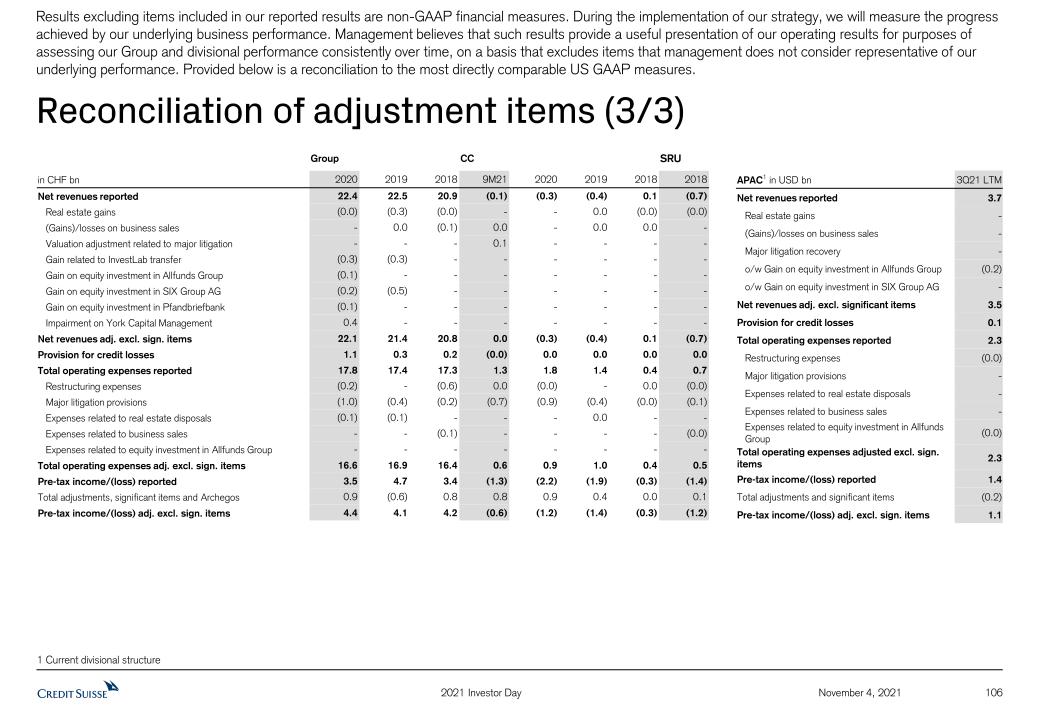
November 4, 2021 106 2021 Investor Day Reconciliation of adjustment items (3/3) Results excluding items included in our reported results are non-GAAP financial measures. During the implementation of our strategy, we will measure the progress achieved by our underlying business performance. Management believes that such results provide a useful presentation of our operating results for purposes of assessing our Group and divisional performance consistently over time, on a basis that excludes items that management does not consider representative of our underlying performance. Provided below is a reconciliation to the most directly comparable US GAAP measures. Group CC SRU in CHF bn 2020 2019 2018 9M21 2020 2019 2018 2018 Net revenues reported 22.4 22.5 20.9 (0.1) (0.3) (0.4) 0.1 (0.7) Real estate gains (0.0) (0.3) (0.0) - - 0.0 (0.0) (0.0) (Gains)/losses on business sales - 0.0 (0.1) 0.0 - 0.0 0.0 - Valuation adjustment related to major litigation - - - 0.1 - - - - Gain related to InvestLab transfer (0.3) (0.3) - - - - - - Gain on equity investment in Allfunds Group (0.1) - - - - - - - Gain on equity investment in SIX Group AG (0.2) (0.5) - - - - - - Gain on equity investment in Pfandbriefbank (0.1) - - - - - - - Impairment on York Capital Management 0.4 - - - - - - - Net revenues adj. excl. sign. items 22.1 21.4 20.8 0.0 (0.3) (0.4) 0.1 (0.7) Provision for credit losses 1.1 0.3 0.2 (0.0) 0.0 0.0 0.0 0.0 Total operating expenses reported 17.8 17.4 17.3 1.3 1.8 1.4 0.4 0.7 Restructuring expenses (0.2) - (0.6) 0.0 (0.0) - 0.0 (0.0) Major litigation provisions (1.0) (0.4) (0.2) (0.7) (0.9) (0.4) (0.0) (0.1) Expenses related to real estate disposals (0.1) (0.1) - - - 0.0 - - Expenses related to business sales - - (0.1) - - - - (0.0) Expenses related to equity investment in Allfunds Group - - - - - - - - Total operating expenses adj. excl. sign. items 16.6 16.9 16.4 0.6 0.9 1.0 0.4 0.5 Pre-tax income/(loss) reported 3.5 4.7 3.4 (1.3) (2.2) (1.9) (0.3) (1.4) Total adjustments, significant items and Archegos 0.9 (0.6) 0.8 0.8 0.9 0.4 0.0 0.1 Pre-tax income/(loss) adj. excl. sign. items 4.4 4.1 4.2 (0.6) (1.2) (1.4) (0.3) (1.2) APAC1 in USD bn 3Q21 LTM Net revenues reported 3.7 Real estate gains - (Gains)/losses on business sales - Major litigation recovery - o/w Gain on equity investment in Allfunds Group (0.2) o/w Gain on equity investment in SIX Group AG - Net revenues adj. excl. significant items 3.5 Provision for credit losses 0.1 Total operating expenses reported 2.3 Restructuring expenses (0.0) Major litigation provisions - Expenses related to real estate disposals - Expenses related to business sales - Expenses related to equity investment in Allfunds Group (0.0) Total operating expenses adjusted excl. sign. items 2.3 Pre-tax income/(loss) reported 1.4 Total adjustments and significant items (0.2) Pre-tax income/(loss) adj. excl. sign. items 1.1 1 Current divisional structure

November 4, 2021 107 2021 Investor Day Notes General notesThroughout this presentation rounding differences may occurUnless otherwise noted, all CET1 capital, CET1 ratio, Tier 1 leverage ratio, risk-weighted assets and leverage exposure figures shown in these presentations are as of the end of the respective period and, for periods prior to 2019, on a “look-through” basisGross and net margins are shown in basis pointsGross margin = net revenues annualized / average AuM; net margin = pre-tax income annualized / average AuM. Net margin excluding certain significant items, as disclosed herein, is calculated excluding those items applying the same methodologyMandates reflect advisory and discretionary mandate volumesMandate penetration reflects advisory and discretionary mandate volumes as a percentage of AuM, excluding those from the external asset manager businessClient Business Volume includes assets under management, custody assets and net loansCustody assets includes assets under custody and commercial assetsUHNW client segmentation is based on personal financial assets of USD >50 mnHNW client segmentation is based on personal financial assets of USD 1-50 mnSpecific notes† Regulatory capital is calculated as the average of 13.5% of RWA and 4.25% of leverage exposure and return on regulatory capital, a non-GAAP financial measure, is calculated using income/(loss) after tax and assumes a tax rate of 25%. For the Investment Bank, return on regulatory capital is based on US dollar denominated numbers. Return on regulatory capital excluding certain items included in our reported results is calculated using results excluding such items, applying the same methodology.‡ Return on tangible equity, a non-GAAP financial measure, is calculated as annualized net income attributable to shareholders divided by average tangible shareholders’ equity. Tangible shareholders’ equity, a non-GAAP financial measure, is calculated by deducting goodwill and other intangible assets from total shareholders’ equity as presented in our balance sheet.For end-2018, tangible shareholders’ equity excluded goodwill of CHF 4,766 mn and other intangible assets of CHF 219 mn from total shareholders’ equity of CHF 43,922 mn as presented in our balance sheet.For end-2019, tangible shareholders’ equity excluded goodwill of CHF 4,663 mn and other intangible assets of CHF 291 mn from total shareholders’ equity of CHF 43,644 mn as presented in our balance sheet.For end-2020, tangible shareholders’ equity excluded goodwill of CHF 4,426 mn and other intangible assets of CHF 237 mn from total shareholders’ equity of CHF 42,677 mn as presented in our balance sheet.AbbreviationsA = Advisory; Adj. = Adjusted; AM = Asset Management; APAC = Asia Pacific; ARU = Asset Resolution Unit; AuM = Assets under Management; Avg. = Average; B3R = Basel III Reform; BCBS = Basel Committee on Banking Supervision; BIS = Bank for International Settlements; bps = basis points; c. = circa; C&IC = Corporate & Institutional Clients; CAGR = Compound Annual Growth Rate; CC = Corporate Center; CECL = Current Expected Credit Losses; CET1 = Common Equity Tier 1; CIR = Cost/Income Ratio; CLO = Collateralized Loan Obligation; CM = Capital Markets; CMBS = Residential Mortgage-Backed Security; Corp. = Corporate; COVID-19 = Coronavirus disease 2019; CSX = Credit Suisse X; CTOO = Chief Technology and Operations Officer; Ctr. = Center; D&I = Diversity and Inclusion; EAM = External Asset Managers; ECM = Equity Capital Markets; econ. = Economic; EM = Emerging Markets; EMEA = Europe, Middle East & Africa; EQD = Equity Derivatives; ESG = Environmental, Social and Governance; ETF = Exchange-traded funds; ex- = excluding; ExB = Executive Board; excl. = excluding; FINMA = Swiss Financial Market Supervisory Authority; FRTB = Fundamental Review of the Trading Book; FX = Foreign Exchange; GAAP = Generally Accepted Accounting Principles; GDP = Gross Domestic Product; Gen. = Generation; GM = Global Markets; GTS = Global Trading Solutions; HQLA = High Quality Liquid Assets; HR = Human Resources; HY = High Yield; I&P = Investments and Partnerships; IG = Investment Grade; incl. = including IPO = Initial Public Offering; IWM = International Wealth Management; JV = Joint venture; LatAM = Latin America; LE = Leverage exposure; LevFin = Leveraged Finance; LTM = Last twelve months; M&A = Mergers & Acquisitions; MCN = Mandatory Convertible Note; MD = Managing Director; META = Middle East, Turkey & Africa; NAB = Neue Aargauer Bank; NAV = Net asset value; NGO = Non-governmental organization; NNA = Net New Assets; p.a. = per annum; PB = Private Banking; PBI = Private Banking International; PC = Private Clients; PCL = Provision for credit losses; PE = Private Equity; pp. = percentage points; prov. = provisions; PTI = Pre-tax income; QoQ = Quarter on Quarter; rev. = revenues; RM = Relationship Manager; RMBS = Residential Mortgage-Backed Security; RoRC = Return on Regulatory Capital; RWA = Risk-weighted assets; SCFF = Supply Chain Finance Funds; sign. = significant; SME = Small and Medium-Sized Enterprises; SRI = Sustainability, Research & Investment Solutions; SRU = Strategic Resolution Unit; SUB = Swiss Universal Bank; U/HNW = (Ultra) High Net Worth; vs. = versus; WM&C = Wealth Management and Connected; YoY = Year on year; Yr = Year
November 4, 2021 2021 Investor Day 108
SIGNATURES
Pursuant to the requirements of the Securities Exchange Act of 1934, the registrants have duly caused this report to be signed on their behalf by the undersigned, thereunto duly authorized.
| CREDIT SUISSE GROUP AG and CREDIT SUISSE AG | ||
| (Registrants) | ||
| By: | /s/ Thomas Gottstein | |
| Thomas Gottstein | ||
| Chief Executive Officer | ||
| /s/ David R. Mathers | ||
| David R. Mathers | ||
| Date: November 4, 2021 | Chief Financial Officer |