UNITED STATES
SECURITIES AND EXCHANGE COMMISSION
Washington, D.C. 20549
______________
Form 6-K
______________
REPORT OF FOREIGN PRIVATE ISSUER PURSUANT TO RULE 13a-16 OR 15d-16
UNDER THE SECURITIES EXCHANGE ACT OF 1934
October 27, 2022
Commission File Number 001-15244
CREDIT SUISSE GROUP AG
(Translation of registrant’s name into English)
Paradeplatz 8, 8001 Zurich, Switzerland
(Address of principal executive office)
______________
Commission File Number 001-33434
CREDIT SUISSE AG
(Translation of registrant’s name into English)
Paradeplatz 8, 8001 Zurich, Switzerland
(Address of principal executive office)
______________
Indicate by check mark whether the registrant files or will file annual reports under cover of Form 20-F or Form 40-F.
| Form 20-F ☒ | Form 40-F ☐ |
Indicate by check mark if the registrant is submitting the Form 6-K in paper as permitted by Regulation S-T Rule 101(b)(1):
Note: Regulation S-T Rule 101(b)(1) only permits the submission in paper of a Form 6-K if submitted solely to provide an attached annual report to security holders.
Indicate by check mark if the registrant is submitting the Form 6-K in paper as permitted by Regulation S-T Rule 101(b)(7):
Note: Regulation S-T Rule 101(b)(7) only permits the submission in paper of a Form 6-K if submitted to furnish a report or other document that the registrant foreign private issuer must furnish and make public under the laws of the jurisdiction in which the registrant is incorporated, domiciled or legally organized (the registrant’s “home country”), or under the rules of the home country exchange on which the registrant’s securities are traded, as long as the report or other document is not a press release, is not required to be and has not been distributed to the registrant’s security holders, and, if discussing a material event, has already been the subject of a Form 6-K submission or other Commission filing on EDGAR.
This report includes the slides for the presentation to investors in connection with 2022 Strategy Update.
Credit Suisse 2022 Strategy Update October 27, 2022

Credit Suisse 2022 Strategy Update Agenda 4 Time (GMT) Theme Presenter Duration 09:30 am Welcome and agenda Kinner Lakhani, Head of Group Strategy and Investor Relations 5’ 09:35 am Chairman’s Perspectives Axel P. Lehmann, Chairman of the Board of Directors 10’ 09:45 am Strategic Perspectives Ulrich Körner, Chief Executive Officer 30’ 10:15 am Financial Perspectives Dixit Joshi, Chief Financial Officer 30’ 10:45 am Q&A 60’ 11:45 am Close

Credit Suisse 2022 Strategy Update Strategic Perspectives Ulrich Körner Chief Executive Officer October 27, 2022


Creating a new Credit Suisse Build on a respected franchise and a blue-chip client base A simpler, more focused and more stable bank centered around Wealth Management and our Swiss home market supported by strong capabilities in Asset Management and Markets Led by a new team with very relevant experience and clear accountability A new Credit Suisse Benefitting all stakeholders For our clients, a bank built around their needs For our shareholders, sustainable returns and value creation For our employees, a global platform and a unified culture for entrepreneurial talent For our regulators and other stakeholders, a reliable and trustworthy partner Decisive actions Reallocate capital to Wealth Management and Swiss Bank businesses – more stable revenues, less capital intensive Accelerate cost reduction ~40% lower RWA / LE in IB3 Strengthen our capital ratio through divestments, exits and capital actions, whilst creating more value from existing assets ~2/3rd capital in WM, SB and AM2 2.5 bn lower cost 1.2 bn by 2023 >13.5% CET1 ratio Radically restructure the Investment Bank Highly connected Markets business with industry-leading Investor Products franchise Carve out CS First Boston as an independent Capital Markets and Advisory bank Capital release from exits and significant exposure reduction for Securitized Products 6 Metrics and targets, 20251 1 In CHF unless otherwise stated, please refer to later pages for detailed definition 2 Excluding Corporate Center 3 Compared to 3Q22, from wind-down of the Non-Core Unit and capital release from Securitized Products
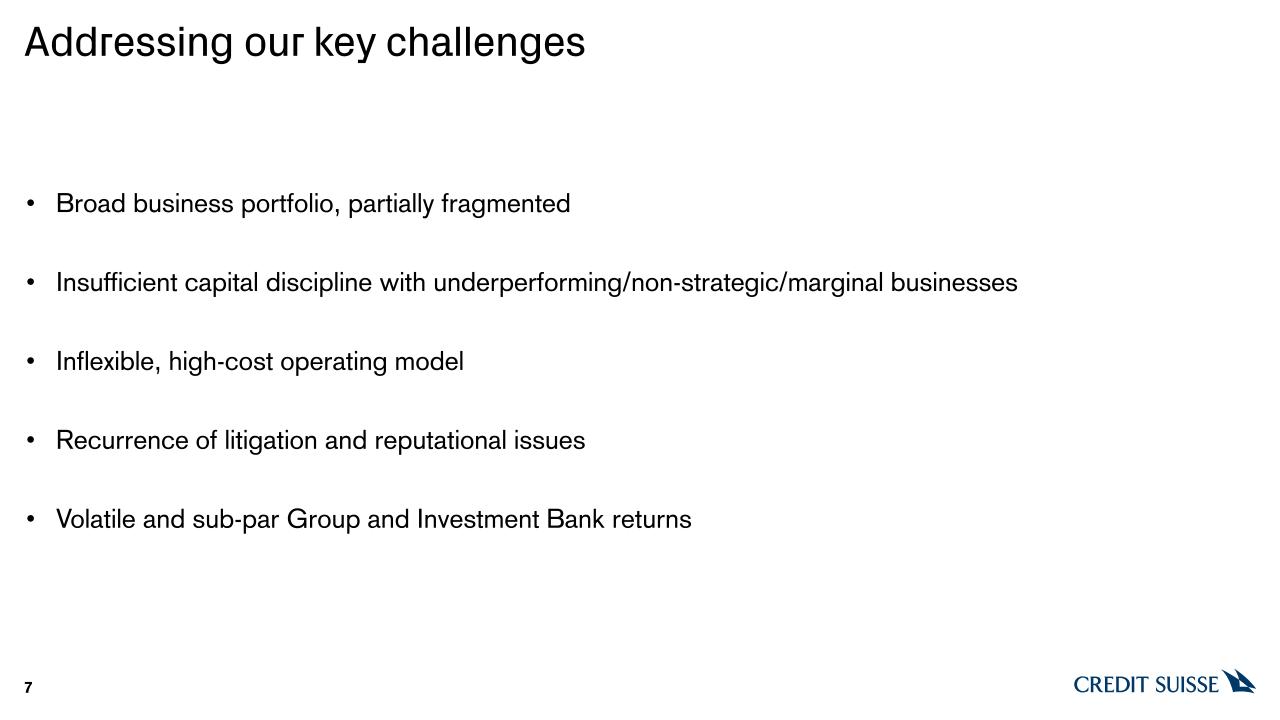
Addressing our key challenges 7 Volatile and sub-par Group and Investment Bank returns Insufficient capital discipline with underperforming/non-strategic/marginal businesses Inflexible, high-cost operating model Recurrence of litigation and reputational issues Broad business portfolio, partially fragmented
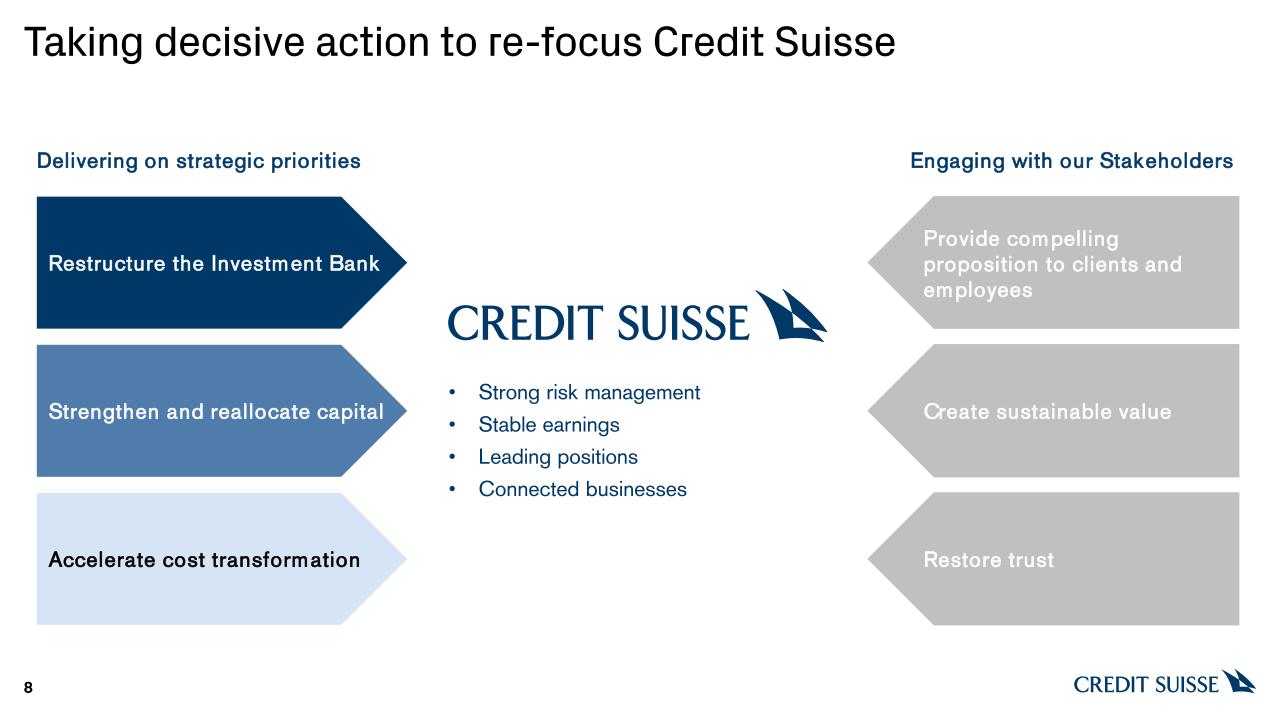
Taking decisive action to re-focus Credit Suisse 8 Engaging with our Stakeholders Delivering on strategic priorities Restructure the Investment Bank Accelerate cost transformation Restore trust Provide compelling proposition to clients and employees Strong risk management Stable earnings Leading positions Connected businesses Create sustainable value Strengthen and reallocate capital
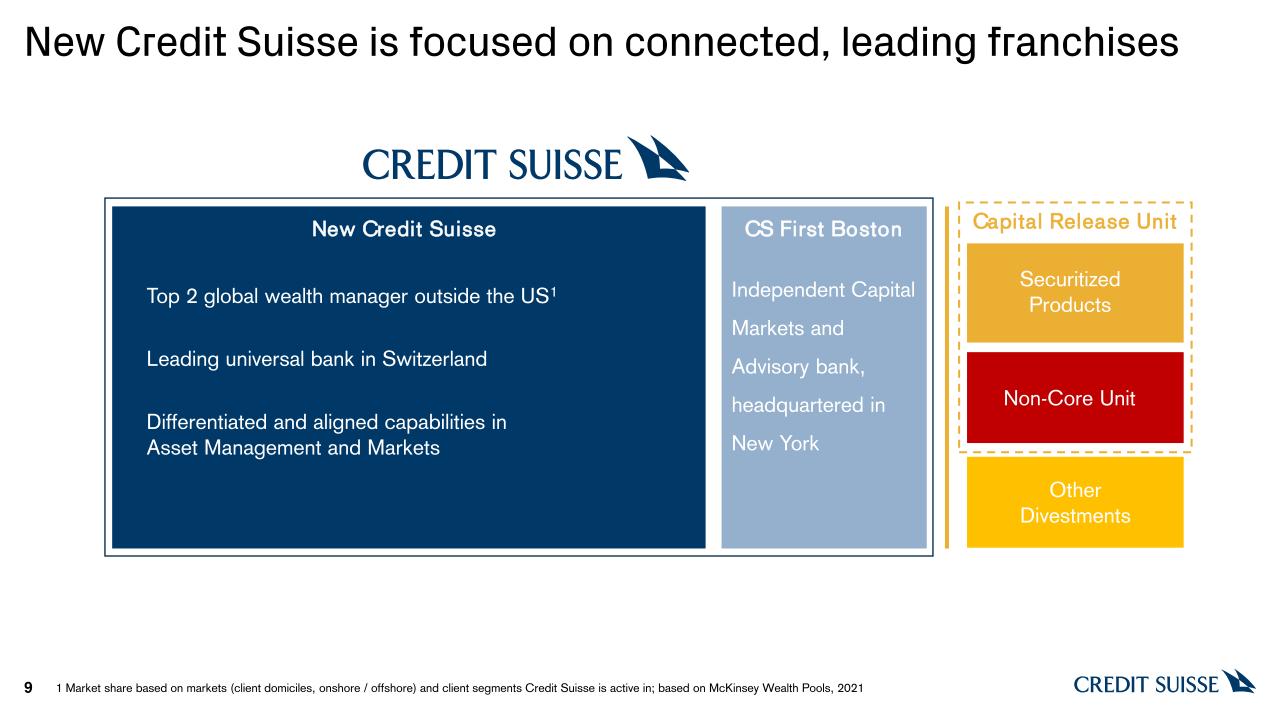
New Credit Suisse is focused on connected, leading franchises New Credit Suisse CS First Boston Capital Release Unit Securitized Products Other divestments Non-Core Unit Top 2 global wealth manager outside the US1 Leading universal bank in Switzerland Differentiated and aligned capabilities in Asset Management and Markets Independent Capital Markets and Advisory bank, headquartered in New York 9 1 Market share based on markets (client domiciles, onshore / offshore) and client segments Credit Suisse is active in; based on McKinsey Wealth Pools, 2021 Other Divestments

10 Our leading franchises Attractive markets Leading positions Strong track record Wealth Management Growing above GDP Low capital intensity High barriers to entry #2 Wealth Manager outside the US (UHNW, HNW)1 Top 3 in Europe, Asia, Middle East2 14% avg. RoRC†, 3 Swiss Bank Very resilient economy Very low leverage vs. other economies #1 in Investment Banking for years4 Top 2 in Corporate Banking5 #1 in Institutional Clients6 #1 in Digital only retail7 12% avg. RoRC†, 3 Asset Management Growing above GDP Low capital intensity #2 in Switzerland8 Multi-specialist asset manager with strengths in specialist products / capabilities 43% avg. RoRC†, 3 Note: Results excluding certain items in our reported results are non-GAAP financial measures. See the appendix of this presentation for detailed information and defined terms as well as important presentation and other information relating to non-GAAP financial measures, including reconciliations. 1 Market share based on markets (client domiciles, onshore / offshore) and client segments Credit Suisse is active in; based on McKinsey Wealth Pools, 2021 2 Euromoney Global PB and WM Survey 2021, category: Best PB Services Overall 3 Avg. of 2018-3Q22 adjusted return on regulatory capital 4 Dealogic #1 for last 14 years except 2015 where CS IB was #2, as of June 2021 5 McKinsey and BCG 2021 6 BCG 2021 7 By account balance 8 By Assets under Management Cross-asset Investor Products and tailored Equities, FX and Rates capabilities Markets capabilities

Investment Bank: ~40% reduction in IB RWA and LE in USD bn; illustrative 28% Markets Connected market access & solutions 3Q22RWA CS First Boston Independent Capital Markets &Advisory bank 22 Securitized Products Market-leading, but unconnected to remaining business Non-Core Unit Non-strategic/low return businesses and markets 100% 90 21 22 25 24% 23% 25% Carve out Align & streamline Wind down 11 Reduce exposure Note: Historical information presented according to the new divisional structure is a preliminary estimate based on management accounts and subject to change Leverage exposure 109 75 85 116 385
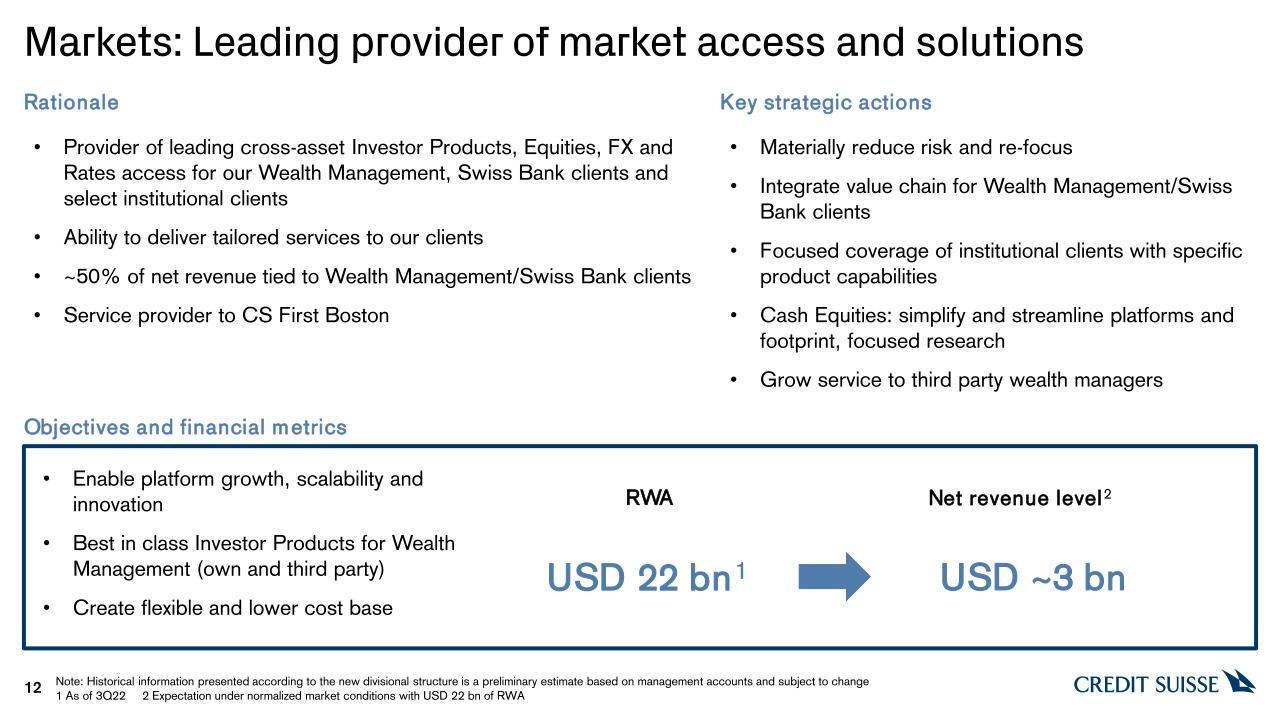
Markets: Leading provider of market access and solutions 12 Key strategic actions Enable platform growth, scalability and innovation Best in class Investor Products for Wealth Management (own and third party) Create flexible and lower cost base Provider of leading cross-asset Investor Products, Equities, FX and Rates access for our Wealth Management, Swiss Bank clients and select institutional clients Ability to deliver tailored services to our clients ~50% of net revenue tied to Wealth Management/Swiss Bank clients Service provider to CS First Boston Materially reduce risk and re-focus Integrate value chain for Wealth Management/Swiss Bank clients Focused coverage of institutional clients with specific product capabilities Cash Equities: simplify and streamline platforms and footprint, focused research Grow service to third party wealth managers Rationale Net revenue level2 USD ~3 bn RWA Note: Historical information presented according to the new divisional structure is a preliminary estimate based on management accounts and subject to change 1 As of 3Q22 2 Expectation under normalized market conditions with USD 22 bn of RWA Objectives and financial metrics USD 22 bn1

CS First Boston: Independent Capital Markets and Advisory bank 13 Objectives and financial metrics Premium standing with clients and talent Sustainably creating economic value through the cycle Creates strategic optionality for the Group Rooted in strong positions in North America, largest and most attractive capital market Independent proposition and partnership model to be competitive in attracting and retaining the best talent and shaping a strong culture More global and broader than boutiques, more focused than bulge bracket players Well-established First Boston heritage in Capital Markets and Advisory, leader in Financial Sponsors and Leveraged Finance for 20 years Key strategic actions Carve out business from Investment Bank, transform into partnership model, create independent platform Attract external capital for Leveraged Finance Firm open to third party capital from anchor investors Capital-light and focused offering outside North America to support global clients Preferred long-term partnership with new Credit Suisse Rationale Net revenue level2 USD >2.5 bn RWA USD >20 bn1 Note: Historical information presented according to the new divisional structure is a preliminary estimate based on management accounts and subject to change 1 As of 3Q22 2 Expectation under normalized market conditions with USD >20 bn of RWA
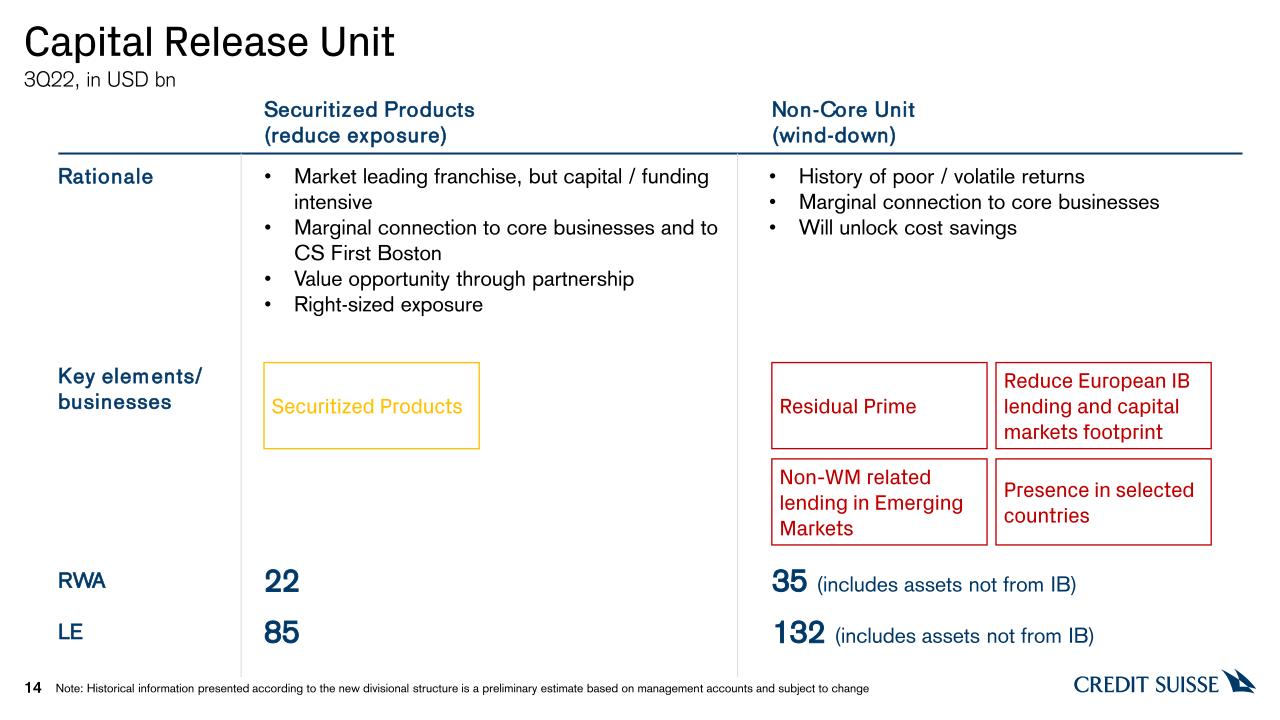
Capital Release Unit 14 3Q22, in USD bn Rationale Non-Core Unit (wind-down) History of poor / volatile returns Marginal connection to core businesses Will unlock cost savings Market leading franchise, but capital / funding intensive Marginal connection to core businesses and to CS First Boston Value opportunity through partnership Right-sized exposure Securitized Products (reduce exposure) Note: Historical information presented according to the new divisional structure is a preliminary estimate based on management accounts and subject to change LE 132 (includes assets not from IB) Key elements/ businesses Non-WM related lending in Emerging Markets Reduce European IB lending and capital markets footprint Residual Prime Presence in selected countries Securitized Products 85 RWA 35 (includes assets not from IB) 22

Allocate more capital to our higher return businesses 1 Based on current structure pre-GTS and pre-AFG pay-away 2 Including Basel III reforms 3 Includes Fixed income sales and trading, Equity sales and trading, Capital markets revenues and Advisory and other fees 4 Includes Wealth Management, Swiss Bank and Asset Management revenues on an adjusted basis 5 Estimates and assumptions are based on currently available information and beliefs, expectations and opinions of management and include all known facts and decisions as of October 27, 2022. Actual results may differ. 15 RWA Mix (excl. CC) Revenue Mix (excl. CC and CRU) Investment Bank Wealth Management, Swiss Bank and Asset Management New Credit Suisse Capital Release Unit 2025 3Q221 13% Markets CS First Boston 9% Investment Bank3 Wealth Management, Swiss Bank and Asset Management4 2018-3Q22 2025 Estimate2,5 Estimate5 14% CS First Boston New Credit Suisse Markets
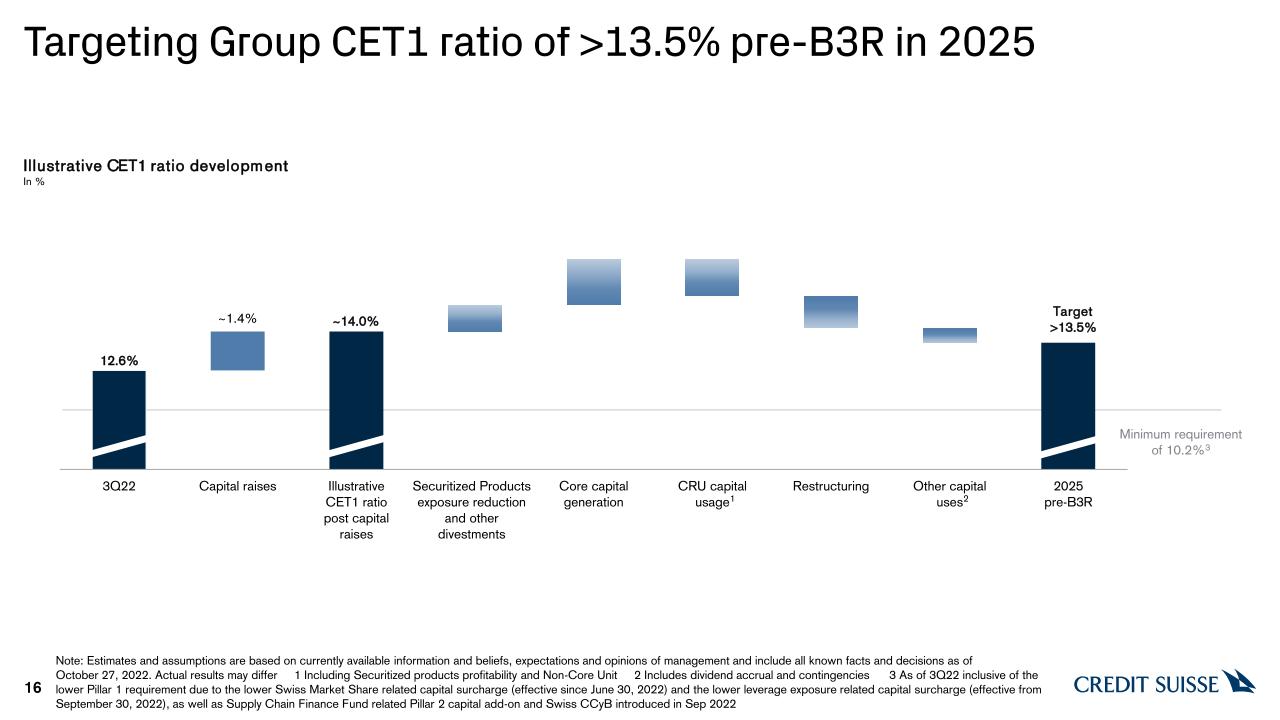
Targeting Group CET1 ratio of >13.5% pre-B3R in 2025 1 ~14.0% Illustrative CET1 ratio developmentIn % Minimum requirement of 10.2%3 Note: Estimates and assumptions are based on currently available information and beliefs, expectations and opinions of management and include all known facts and decisions as of October 27, 2022. Actual results may differ 1 Including Securitized products profitability and Non-Core Unit 2 Includes dividend accrual and contingencies 3 As of 3Q22 inclusive of the lower Pillar 1 requirement due to the lower Swiss Market Share related capital surcharge (effective since June 30, 2022) and the lower leverage exposure related capital surcharge (effective from September 30, 2022), as well as Supply Chain Finance Fund related Pillar 2 capital add-on and Swiss CCyB introduced in Sep 2022 16 Target>13.5% 2
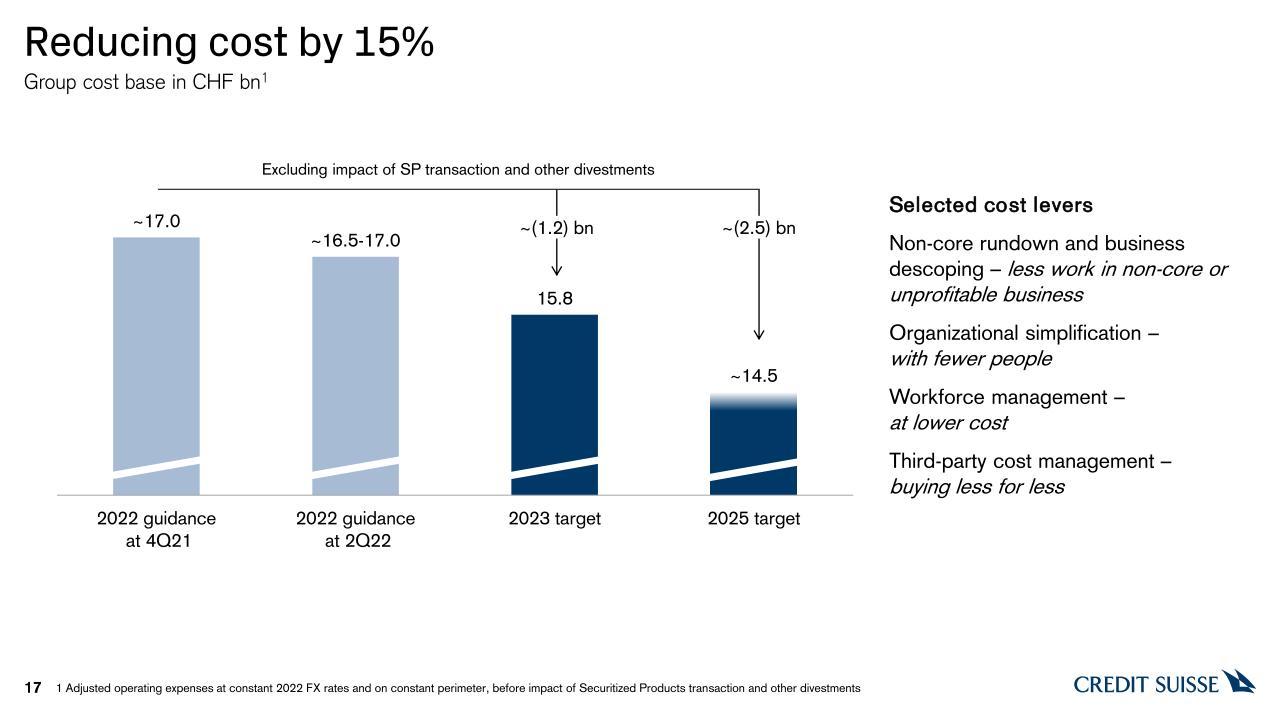
Reducing cost by 15% 1 Adjusted operating expenses at constant 2022 FX rates and on constant perimeter, before impact of Securitized Products transaction and other divestments 17 Selected cost levers Non-core rundown and business descoping – less work in non-core or unprofitable business Organizational simplification – with fewer people Workforce management – at lower cost Third-party cost management – buying less for less Group cost base in CHF bn1 ~(2.5) bn ~(1.2) bn Excluding impact of SP transaction and other divestments

18 Nominal dividend 2022-2024;meaningful distribution from 2025 onwards Cost base1 CHF ~14.5 bn Core Return on Tangible Equity‡>8% Group Return on Tangible Equity‡~6% CET1 ratio>13.5% pre-B3R 2025 Financial Targets Restructure the Investment Bank Strengthen and reallocate capital Accelerate cost transformation Summary – Financial targets to unlock value 1 Adjusted operating expenses at constant 2022 FX rates and on constant perimeter, before impact of Securitized Products transaction and other divestments
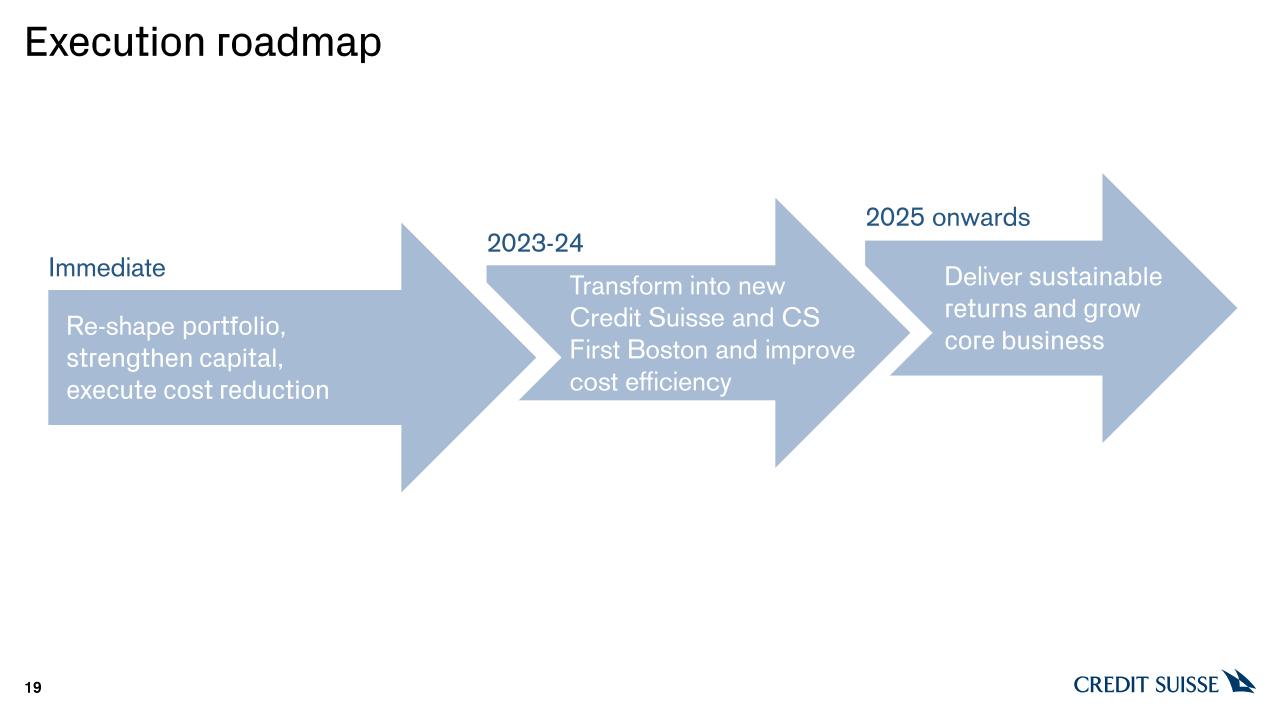
Execution roadmap 19 2025 onwards onwards Stabilize and re-shape portfolio, secure capital Deliver sustainable returns and grow core business 2023-24 Stabilize and re-shape portfolio, secure capital Transform into new Credit Suisse and CS First Boston and improve cost efficiency Immediate Stabilize and re-shape portfolio, secure capital Re-shape portfolio, strengthen capital, execute cost reduction

What is different this time 20 Radically restructuring the Investment Bank Clear near-term accountability for each milestone of our targets New Executive Board with significant relevant experience, strong track record of execution Strongly capitalized to deliver on our targets Resolving legacy issues head-on
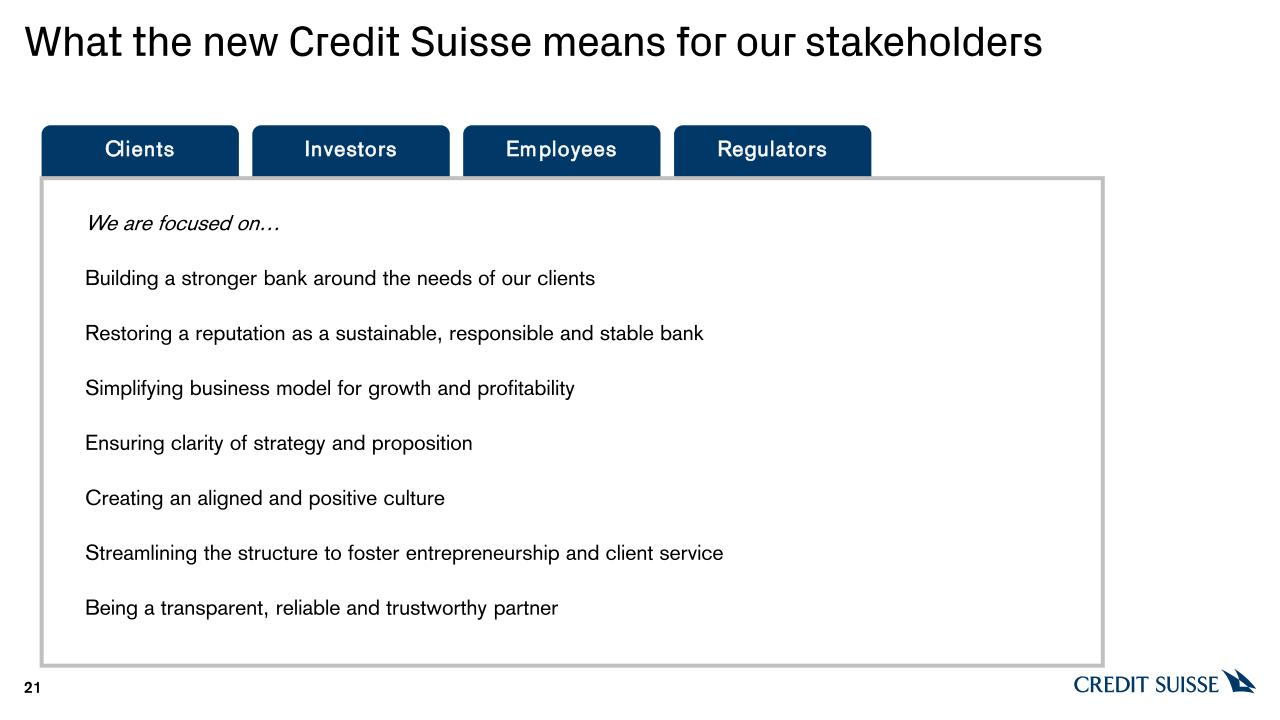
What the new Credit Suisse means for our stakeholders 21 Clients Investors Employees Regulators We are focused on… Building a stronger bank around the needs of our clients Restoring a reputation as a sustainable, responsible and stable bank Simplifying business model for growth and profitability Ensuring clarity of strategy and proposition Creating an aligned and positive culture Streamlining the structure to foster entrepreneurship and client service Being a transparent, reliable and trustworthy partner

Appendix
Notes 42 General notes Throughout this presentation rounding differences may occur Results excluding certain items included in our reported results are non-GAAP financial measures Our cost base target is measured using adjusted operating expenses at constant 2022 FX rates and on constant perimeter, before impact of Securitized Products transaction and other divestments Unless otherwise noted, all CET1 capital, CET1 ratio, CET1 leverage ratio, Tier 1 leverage ratio, risk-weighted assets and leverage exposure figures shown in these presentations are as of the end of the respective period Specific notes † Regulatory capital is calculated as the average of 13.5% of RWA and 4.25% of leverage exposure and return on regulatory capital, a non-GAAP financial measure, is calculated using income/(loss) after tax and assumes a tax rate of 25% from 2020 onward. For the Investment Bank, return on regulatory capital is based on US dollar denominated numbers. Return on regulatory capital excluding certain items included in our reported results is calculated using results excluding such items, applying the same methodology. Adjusted return on regulatory capital excluding certain items included in our reported results is calculated using results excluding such items, applying the same methodology. ‡ Return on tangible equity, a non-GAAP financial measure, is calculated as annualized net income attributable to shareholders divided by average tangible shareholders’ equity. Tangible shareholders’ equity, a non-GAAP financial measure, is calculated by deducting goodwill and other intangible assets from total shareholders’ equity as presented in our balance sheet. Abbreviations AFG = Asia Pacific Financing Group; APAC = Asia Pacific; avg = average; B3R = Basel III Reform; BCBS = Basel Committee on Banking Supervision; BIS = Bank for International Settlements; bn = billion; bps = basis points; CCyB = Countercyclical buffer; CET1 = Common Equity Tier 1; CHF = Swiss Franc; CRU = Capital Release Unit; CS = Credit Suisse; CtB = Change the Bank; CVA = Credit Valuation Adjustment; EEA = European Economic Area; EM = Emerging Markets; EU = European Union; FINMA = Swiss Financial Market Supervisory Authority FINMA; FinSA = Swiss Federal Act on Financial Services; FRTB = Fundamental review of the trading book; FTE = Full-time equivalent; FX = Foreign Exchange; GAAP = Generally Accepted Accounting Principles; GDP = Gross Domestic Product; GTS = Global Trading Solutions; IB = Investment Bank; IRB = Internal ratings-based; k = thousand; LE = Leverage exposure; mn = million; NCU = Non-Core Unit; OpRisk = Operational Risk; PCL = Provision for credit losses; RoRC = Return on Regulatory Capital; RoTE = Return on tangible equity; RWA = Risk-weighted assets; SP = Securitized Products; vs. = versus; UK = United Kingdom; USD = United States Dollar; WM = Wealth Management
Dixit Joshi Chief Financial Officer October 27, 2022 Credit Suisse 2022 Strategy Update Financial Perspectives
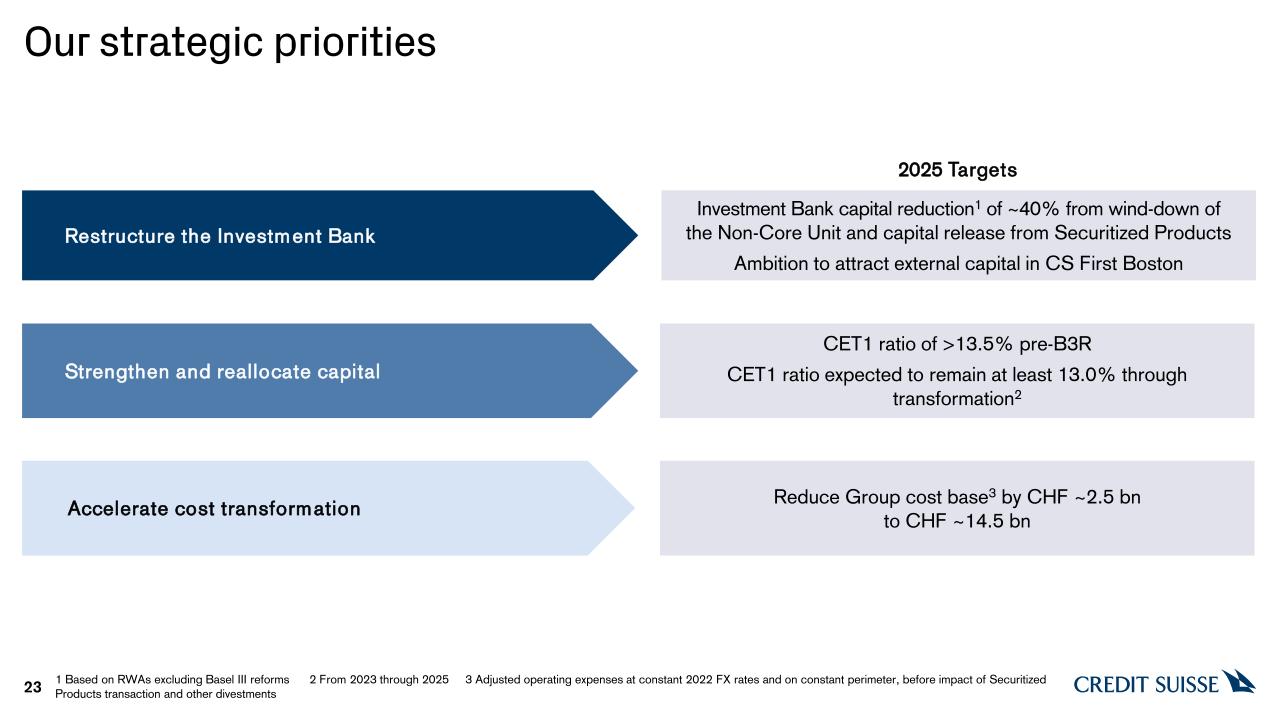
Our strategic priorities 23 Investment Bank capital reduction1 of ~40% from wind-down of the Non-Core Unit and capital release from Securitized Products Ambition to attract external capital in CS First Boston Restructure the Investment Bank CET1 ratio of >13.5% pre-B3R CET1 ratio expected to remain at least 13.0% through transformation2 Strengthen and reallocate capital Reduce Group cost base3 by CHF ~2.5 bn to CHF ~14.5 bn Accelerate cost transformation 2025 Targets 1 Based on RWAs excluding Basel III reforms 2 From 2023 through 2025 3 Adjusted operating expenses at constant 2022 FX rates and on constant perimeter, before impact of Securitized Products transaction and other divestments
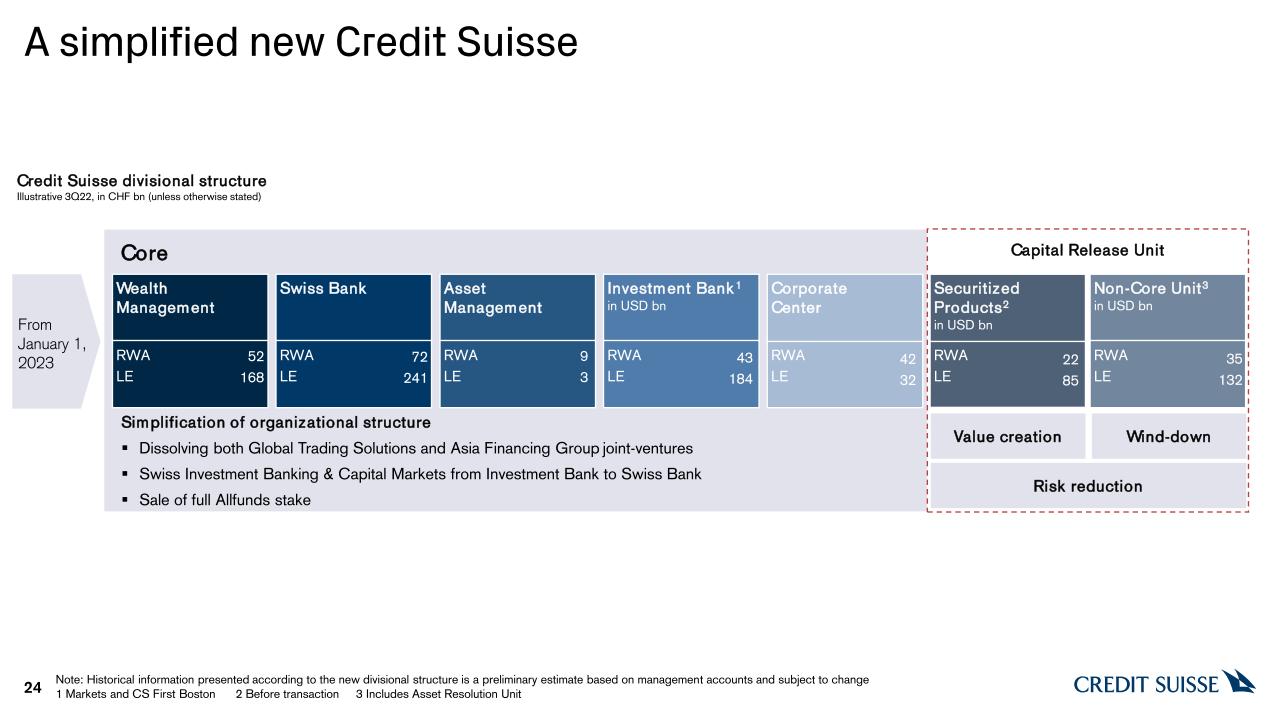
Risk reduction 24 Credit Suisse divisional structure Illustrative 3Q22, in CHF bn (unless otherwise stated) Note: Historical information presented according to the new divisional structure is a preliminary estimate based on management accounts and subject to change 1 Markets and CS First Boston 2 Before transaction 3 Includes Asset Resolution Unit A simplified new Credit Suisse From January 1, 2023 Asset Management Wealth Management RWA LE 52 168 Investment Bank1 in USD bn Swiss Bank [ ] [ ] [ RWA LE 72 241 RWA LE RWA LE 43 184 9 3 RWA LE Corporate Center 42 32 Core Simplification of organizational structure Dissolving both Global Trading Solutions and Asia Financing Group joint-ventures Swiss Investment Banking & Capital Markets from Investment Bank to Swiss Bank Sale of full Allfunds stake Non-Core Unit3 in USD bn RWA LE 35 132 RWA LE Securitized Products2 in USD bn 22 85 Capital Release Unit Value creation Wind-down

25 Markets Cross Asset Investor Products Equities Focused FX Align & streamline Exposure reduction Note: Historical information presented according to the new divisional structure is a preliminary estimate based on management accounts and subject to change1 Ex-China, India and Brazil 2 Ex-Wealth Management related businesses CS First Boston Capital Markets Advisory Financing High connectivity with Wealth Management, Swiss Bank and CS First Boston Independent Capital Markets & Advisory bank Securitized Products Asset Securitization Mortgage Servicing Non-Core Unit Prime Residual EM Trading1 & Financing2 Market leading but low connectivity and high capital usage Wind down 3Q22 ~(30)% USD ~(25) bn Investment Bank RWA in USD bn; illustrative Investment Bank Leverage Exposure in USD bn; illustrative Investment Bank Capital Cost Carve out 2020 Non-strategic, low returns and higher risk SP We are making clear strategic choices in our Investment Bank Investment Bank Capital Release Unit 65 ~(30)% USD ~(120) bn SP 269 ~(50)% USD ~(45) bn ~(50)% USD ~(200) bn

26 Transform Credit Suisse into a capital-light model Investment Bank RWA expected at <1/5th of Group by 2025 vs. 1/3rd at 3Q22 Wealth Management, Swiss Bank and Asset Management Investment Bank Corporate Center2 Capital Release Unit3 Corporate Center CS First Boston 3Q22 RWA1 2025E RWA2 Note: Estimates and assumptions are based on currently available information and beliefs, expectations and opinions of management and include all known facts and decisions as of October 27, 2022. Actual results may differ 1 Based on current structure pre-GTS and AFG pay-away 2 Including Basel III reforms 3 Including Asset Resolution Unit and Securitized Products 4 Based on RWAs excluding Basel III reforms Target Investment Bank capital reduction4 of ~40% from wind-down of the Non-Core Unit and capital release from Securitized Products Ambition to attract external capital in CS First Boston NewCredit Suisse 66% Markets Investment Bank Capital Cost

Drive a more stable business mix 27 Revenue mix1 Based on adjusted net revenues, in % Sales & Trading NewCredit Suisse Markets CS First Boston Investment Banking & Capital Markets Net interest & recurring income Transaction & other Investment Bank Wealth Management, Swiss Bank and Asset Management Net interest & recurring income Transaction & other Note: Estimates and assumptions are based on currently available information and beliefs, expectations and opinions of management and include all known facts and decisions as of October 27, 2022. Actual results may differ 1 Excluding Corporate Center and Capital Release Unit ~+13 pp. ~(13) pp. Investment Bank Capital Cost
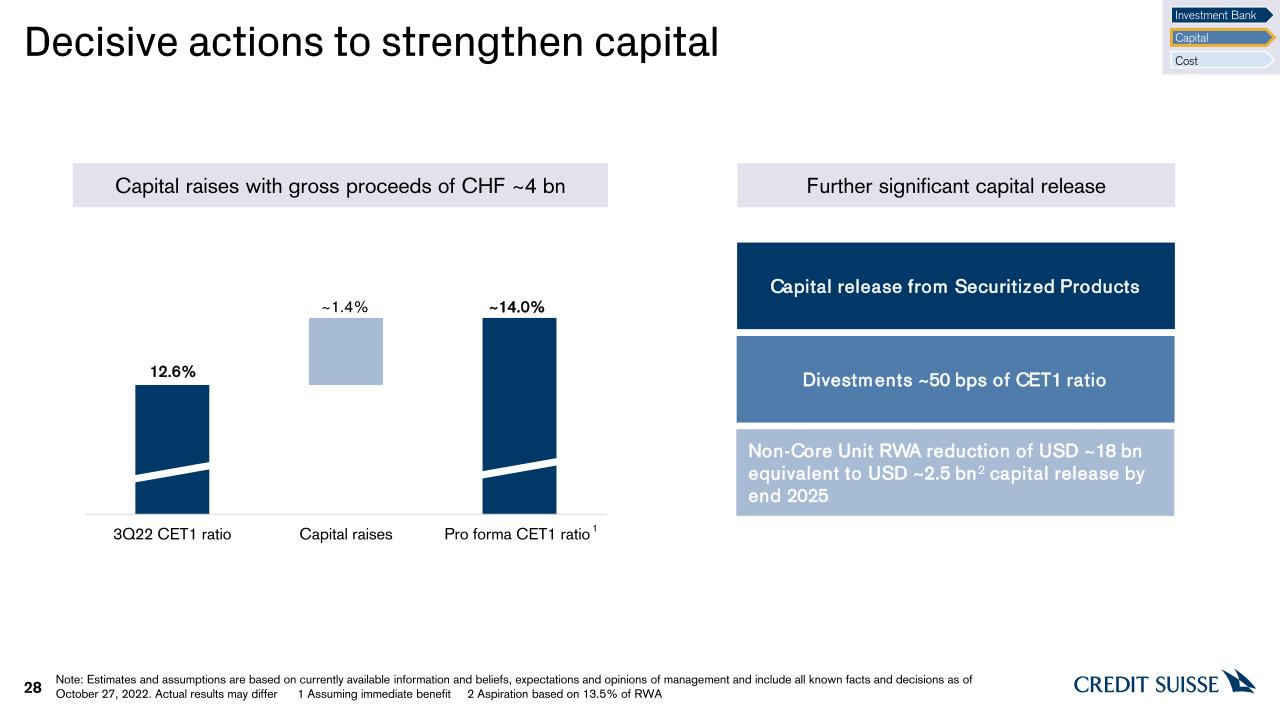
Decisive actions to strengthen capital 28 12.6% ~1.4% ~14.0% 1 Note: Estimates and assumptions are based on currently available information and beliefs, expectations and opinions of management and include all known facts and decisions as of October 27, 2022. Actual results may differ 1 Assuming immediate benefit 2 Aspiration based on 13.5% of RWA Further significant capital release Capital raises with gross proceeds of CHF ~4 bn Divestments ~50 bps of CET1 ratio Non-Core Unit RWA reduction of USD ~18 bn equivalent to USD ~2.5 bn2 capital release by end 2025 Investment Bank Capital Cost Capital release from Securitized Products
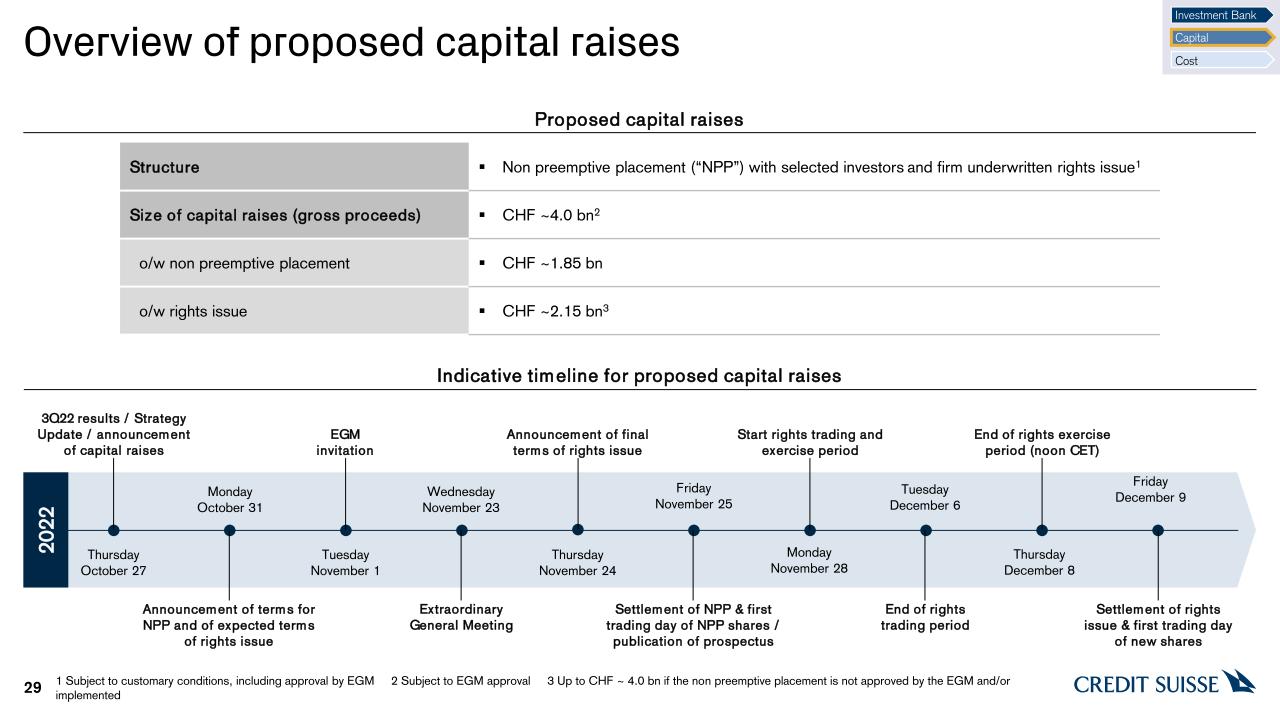
Overview of proposed capital raises 29 Proposed capital raises Indicative timeline for proposed capital raises Structure Non preemptive placement (“NPP”) with selected investors and firm underwritten rights issue1 Size of capital raises (gross proceeds) CHF ~4.0 bn2 o/w non preemptive placement CHF ~1.85 bn o/w rights issue CHF ~2.15 bn3 1 Subject to customary conditions, including approval by EGM 2 Subject to EGM approval 3 Up to CHF ~ 4.0 bn if the non preemptive placement is not approved by the EGM and/or implemented 2022 TuesdayNovember 1 EGMinvitation WednesdayNovember 23 ExtraordinaryGeneral Meeting FridayNovember 25 Settlement of NPP & first trading day of NPP shares / publication of prospectus MondayNovember 28 Start rights trading andexercise period TuesdayDecember 6 End of rights trading period ThursdayDecember 8 End of rights exercise period (noon CET) FridayDecember 9 Settlement of rights issue & first trading day of new shares MondayOctober 31 Announcement of terms for NPP and of expected terms of rights issue ThursdayOctober 27 3Q22 results / Strategy Update / announcement of capital raises ThursdayNovember 24 Announcement of final terms of rights issue Investment Bank Capital Cost
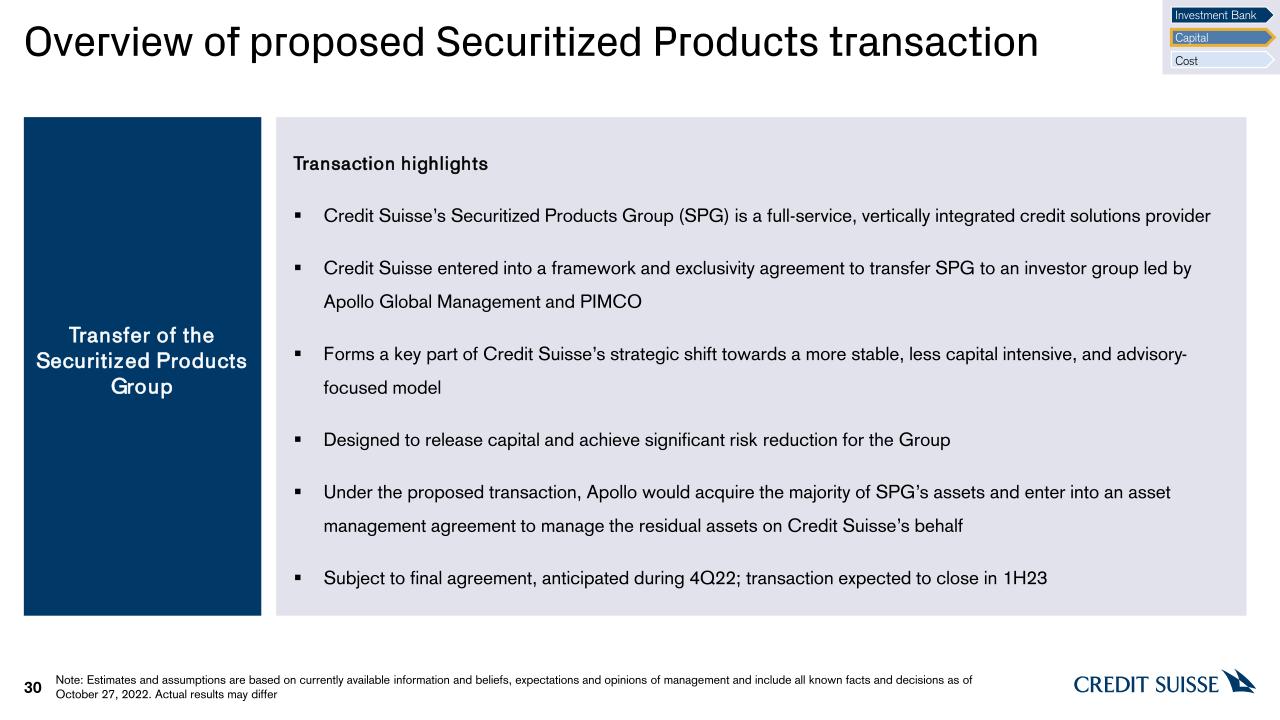
Overview of proposed Securitized Products transaction 30 Note: Estimates and assumptions are based on currently available information and beliefs, expectations and opinions of management and include all known facts and decisions as of October 27, 2022. Actual results may differ Transaction highlights Credit Suisse’s Securitized Products Group (SPG) is a full-service, vertically integrated credit solutions provider Credit Suisse entered into a framework and exclusivity agreement to transfer SPG to an investor group led by Apollo Global Management and PIMCO Forms a key part of Credit Suisse’s strategic shift towards a more stable, less capital intensive, and advisory-focused model Designed to release capital and achieve significant risk reduction for the Group Under the proposed transaction, Apollo would acquire the majority of SPG’s assets and enter into an asset management agreement to manage the residual assets on Credit Suisse’s behalf Subject to final agreement, anticipated during 4Q22; transaction expected to close in 1H23 Transfer of the Securitized Products Group Investment Bank Capital Cost
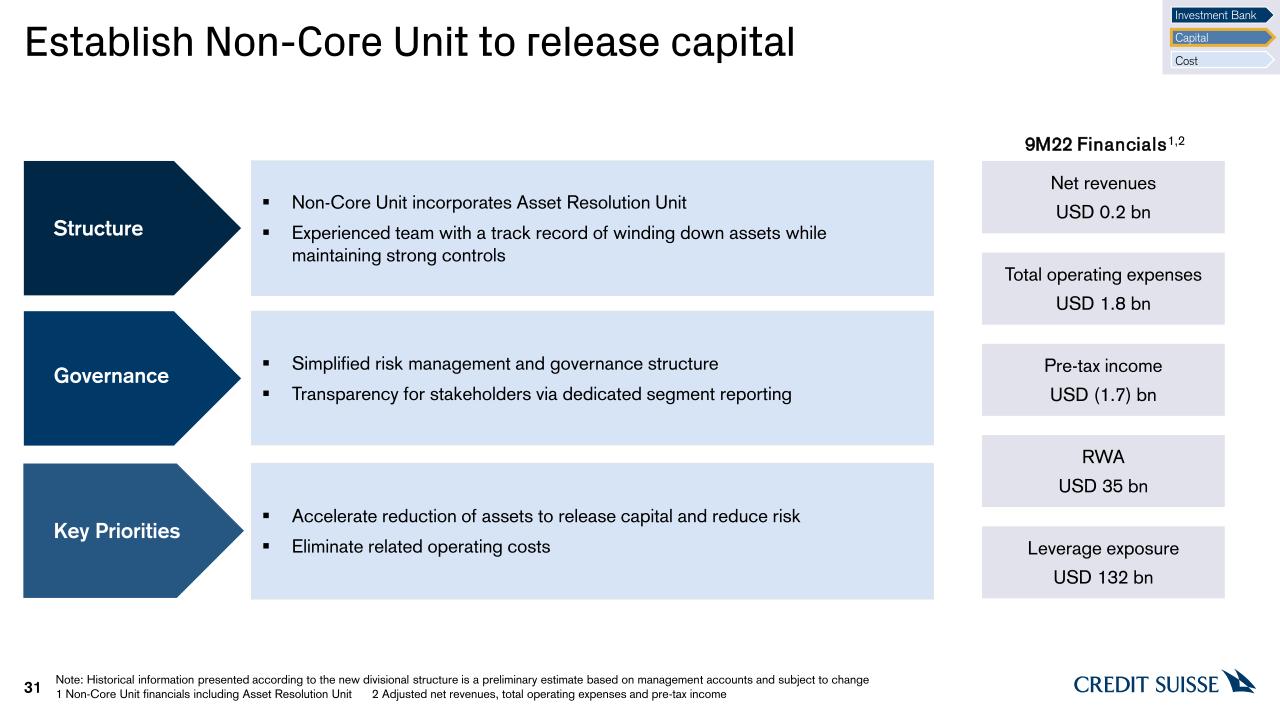
31 Establish Non-Core Unit to release capital Governance Key Priorities Structure Non-Core Unit incorporates Asset Resolution Unit Experienced team with a track record of winding down assets while maintaining strong controls Accelerate reduction of assets to release capital and reduce risk Eliminate related operating costs Simplified risk management and governance structure Transparency for stakeholders via dedicated segment reporting Note: Historical information presented according to the new divisional structure is a preliminary estimate based on management accounts and subject to change1 Non-Core Unit financials including Asset Resolution Unit 2 Adjusted net revenues, total operating expenses and pre-tax income Net revenues USD 0.2 bn 9M22 Financials1,2 Total operating expenses USD 1.8 bn Pre-tax income USD (1.7) bn RWA USD 35 bn Leverage exposure USD 132 bn Investment Bank Capital Cost
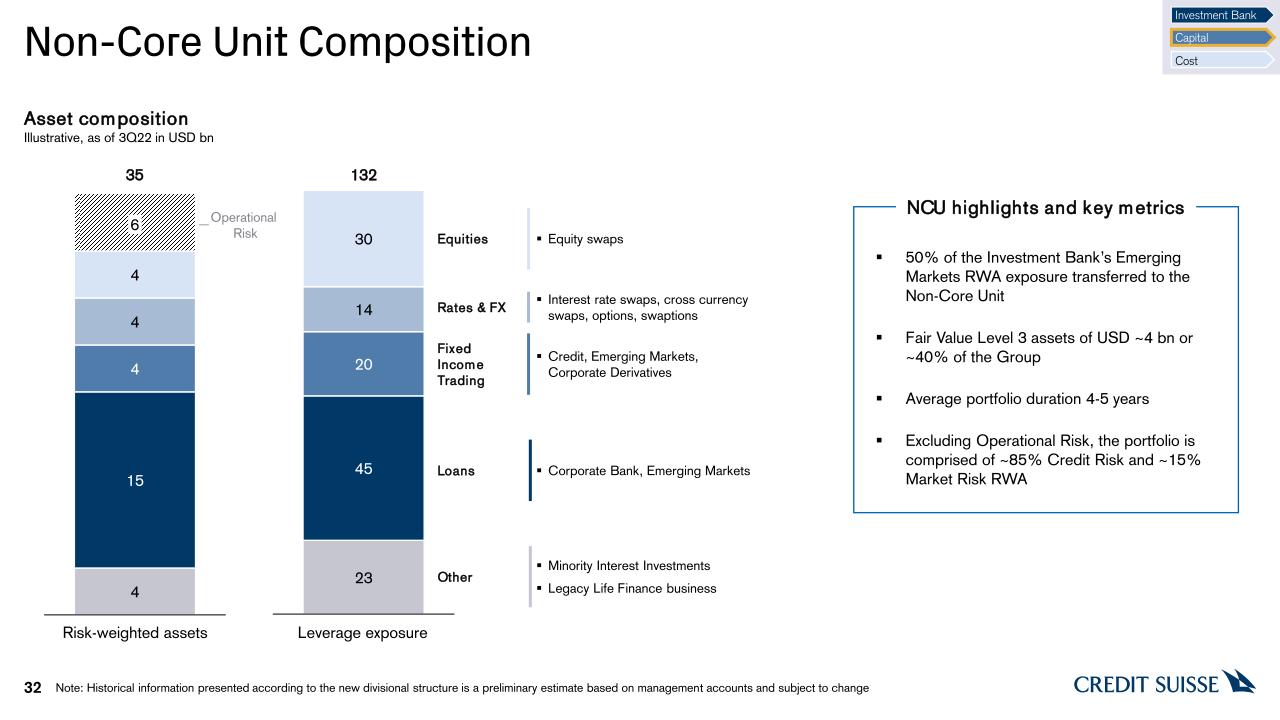
Non-Core Unit Composition 32 Risk-weighted assets Leverage exposure Asset composition Illustrative, as of 3Q22 in USD bn 6 35 Operational Risk 132 Credit, Emerging Markets, Corporate Derivatives Fixed Income Trading Equity swaps Equities Interest rate swaps, cross currency swaps, options, swaptions Rates & FX Minority Interest Investments Legacy Life Finance business Other Loans Corporate Bank, Emerging Markets 50% of the Investment Bank’s Emerging Markets RWA exposure transferred to the Non-Core Unit Fair Value Level 3 assets of USD ~4 bn or ~40% of the Group Average portfolio duration 4-5 years Excluding Operational Risk, the portfolio is comprised of ~85% Credit Risk and ~15% Market Risk RWA Note: Historical information presented according to the new divisional structure is a preliminary estimate based on management accounts and subject to change NCU highlights and key metrics Investment Bank Capital Cost
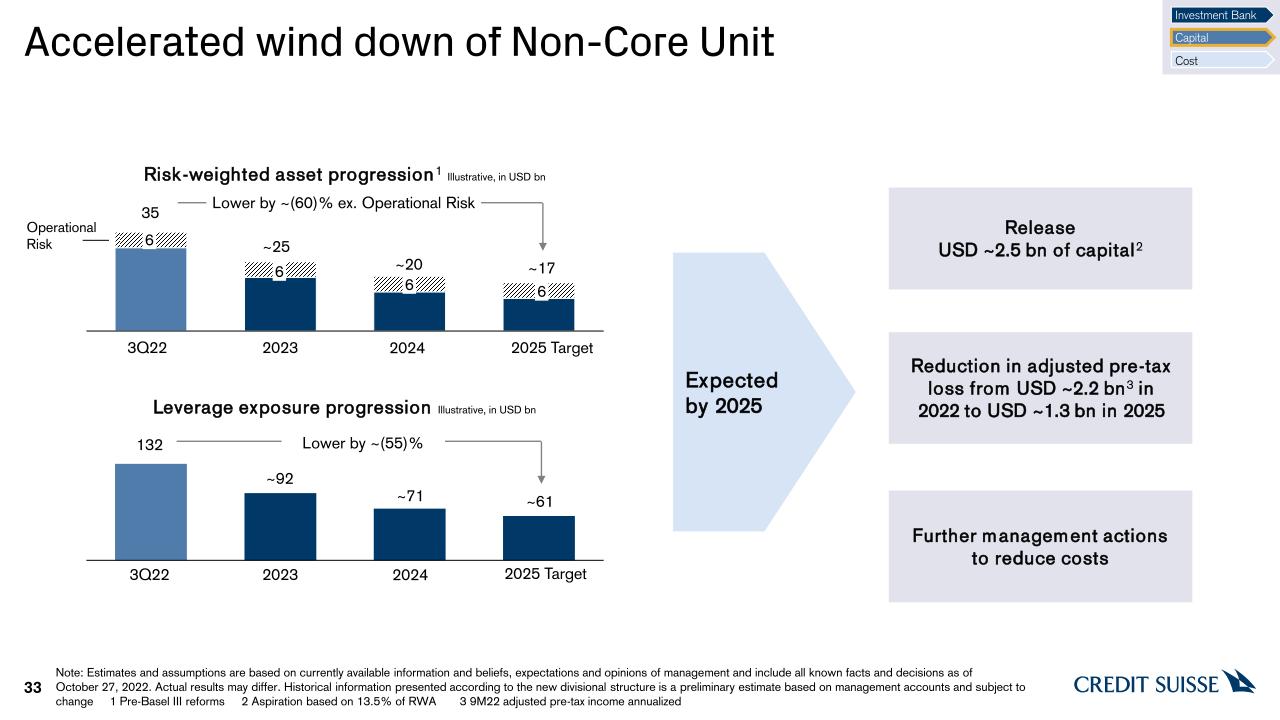
Accelerated wind down of Non-Core Unit 6 20 35 6 2023 3Q22 6 2025 Target ~25 ~17 2025 Target 3Q22 ~61 132 Lower by ~(55)% Lower by ~(60)% ex. Operational Risk 33 Risk-weighted asset progression1 Illustrative, in USD bn Leverage exposure progression Illustrative, in USD bn ~20 2024 6 ~92 ~71 2023 2024 Release USD ~2.5 bn of capital2 Reduction in adjusted pre-tax loss from USD ~2.2 bn3 in 2022 to USD ~1.3 bn in 2025 Expected by 2025 Further management actions to reduce costs Operational Risk Note: Estimates and assumptions are based on currently available information and beliefs, expectations and opinions of management and include all known facts and decisions as of October 27, 2022. Actual results may differ. Historical information presented according to the new divisional structure is a preliminary estimate based on management accounts and subject to change 1 Pre-Basel III reforms 2 Aspiration based on 13.5% of RWA 3 9M22 adjusted pre-tax income annualized Investment Bank Capital Cost
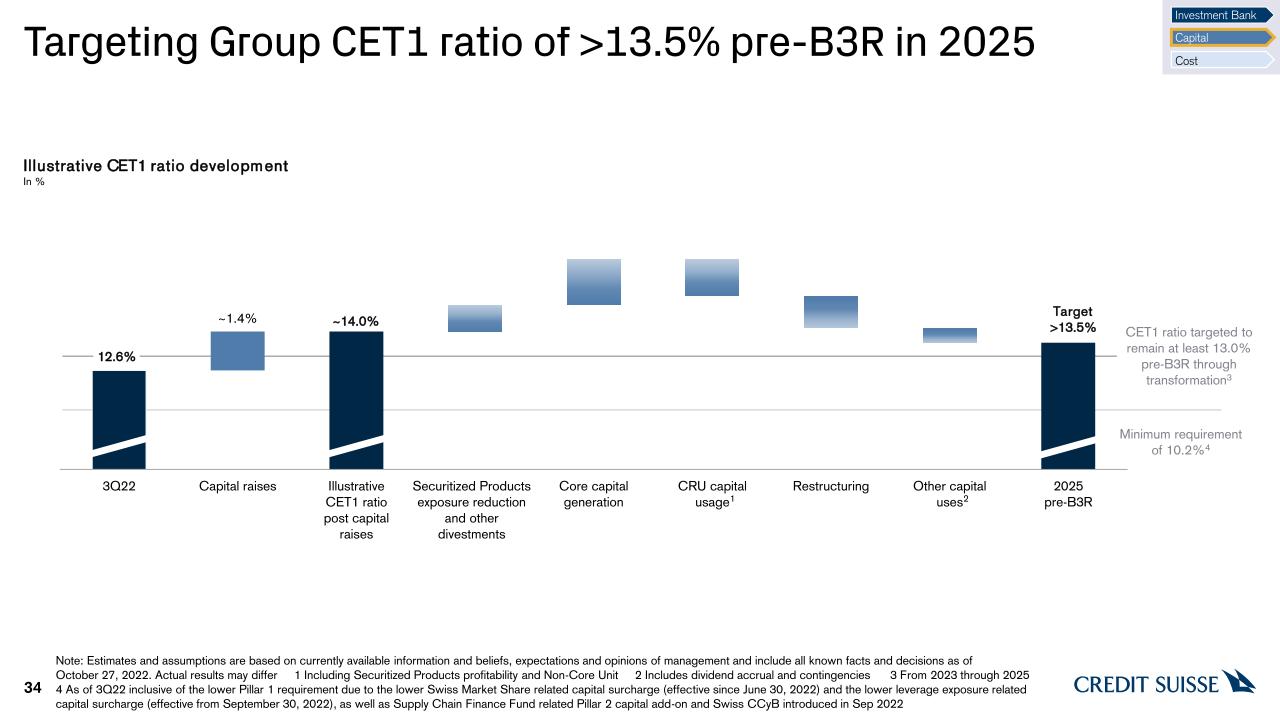
Targeting Group CET1 ratio of >13.5% pre-B3R in 2025 1 CET1 ratio targeted to remain at least 13.0%pre-B3R through transformation3 ~14.0% Illustrative CET1 ratio developmentIn % Minimum requirement of 10.2%4 Note: Estimates and assumptions are based on currently available information and beliefs, expectations and opinions of management and include all known facts and decisions as of October 27, 2022. Actual results may differ 1 Including Securitized Products profitability and Non-Core Unit 2 Includes dividend accrual and contingencies 3 From 2023 through 2025 4 As of 3Q22 inclusive of the lower Pillar 1 requirement due to the lower Swiss Market Share related capital surcharge (effective since June 30, 2022) and the lower leverage exposure related capital surcharge (effective from September 30, 2022), as well as Supply Chain Finance Fund related Pillar 2 capital add-on and Swiss CCyB introduced in Sep 2022 34 Target>13.5% 2 Investment Bank Capital Cost

Regulatory capital inflation significantly reduced by our strategic actions 35 Estimated RWA increase from Basel III reformsIn CHF bn FRTB CVA FRTB R-IRB R-IRB Net impact ~15 Basel III reform impact Reduced CVA impact primarily driven by exposure reduction Reduced Operational Risk RWA impact from Group strategic actions since 2020 B3R CET1 ratio go-live impact of ~70 bps Current guidance for FY2024 Standardized Operational Risk Net impact ~35 - 40 FRTB FRTB CVA Standardized Operational Risk ~(60%) Note: Estimates and assumptions are based on currently available information and beliefs, expectations and opinions of management and include all known facts and decisions as of October 27, 2022. Actual results may differ Investment Bank Capital Cost
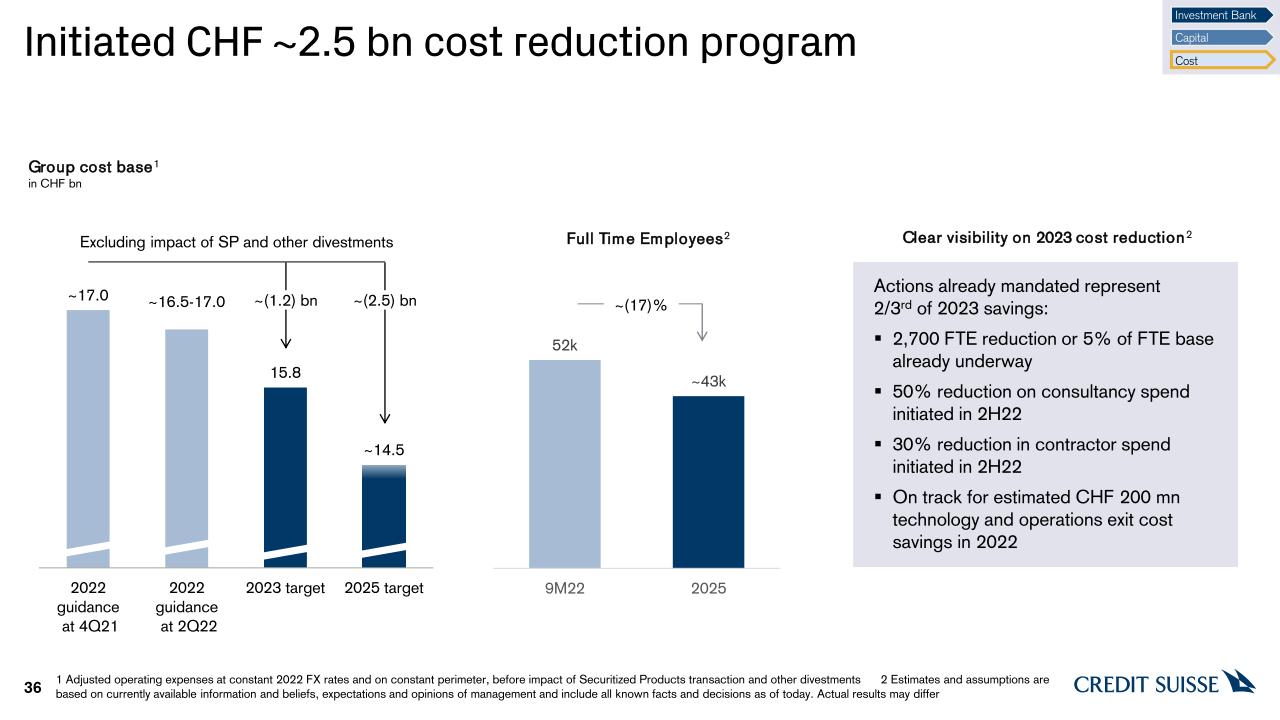
Initiated CHF ~2.5 bn cost reduction program 36 Group cost base1 in CHF bn ~(2.5) bn Actions already mandated represent 2/3rd of 2023 savings: 2,700 FTE reduction or 5% of FTE base already underway 50% reduction on consultancy spend initiated in 2H22 30% reduction in contractor spend initiated in 2H22 On track for estimated CHF 200 mn technology and operations exit cost savings in 2022 Clear visibility on 2023 cost reduction2 ~(1.2) bn Excluding impact of SP and other divestments 1 Adjusted operating expenses at constant 2022 FX rates and on constant perimeter, before impact of Securitized Products transaction and other divestments 2 Estimates and assumptions are based on currently available information and beliefs, expectations and opinions of management and include all known facts and decisions as of today. Actual results may differ Investment Bank Capital Cost Full Time Employees2 ~(17)%

Relentless focus on driving down our cost base through key transformation initiatives 37 Reshaped Investment Bank enables direct cost reduction and rationalization of related Group infrastructure Descoping of unprofitable activities with more focused business footprint, reduced legal entities, reduced IT spend on non-core businesses Reduction of internal services and non-revenue producing roles and lower complexity of governance and processes Non-Core Unit rundown and business descoping Workforce management Organizational simplification Efficiency savings to support strategic investments in business, technology and people Risk management controls and standards continue to be prioritized Improved mix of near/offshored resourcing, and optimized combination of in/outsourcing Shift to more optimized ‘spans and layers’ with improved seniority mix 30% reduction in contractor spend initiated in 2H22 Simpler organizational structure with aim to eliminate duplication, improve productivity Remove complex and manual processes, supported by continued digitalization program 2,700 FTE reduction or 5% of FTE base already underway. Full financial impact will be reflected in 2023 Third-party cost management Reset spend on all third parties including consultancy, market data, legal and property Outsourced procurement model to achieve market leading pricing 50% reduction on consultancy spend initiated in 2H22 Investment Bank Capital Cost
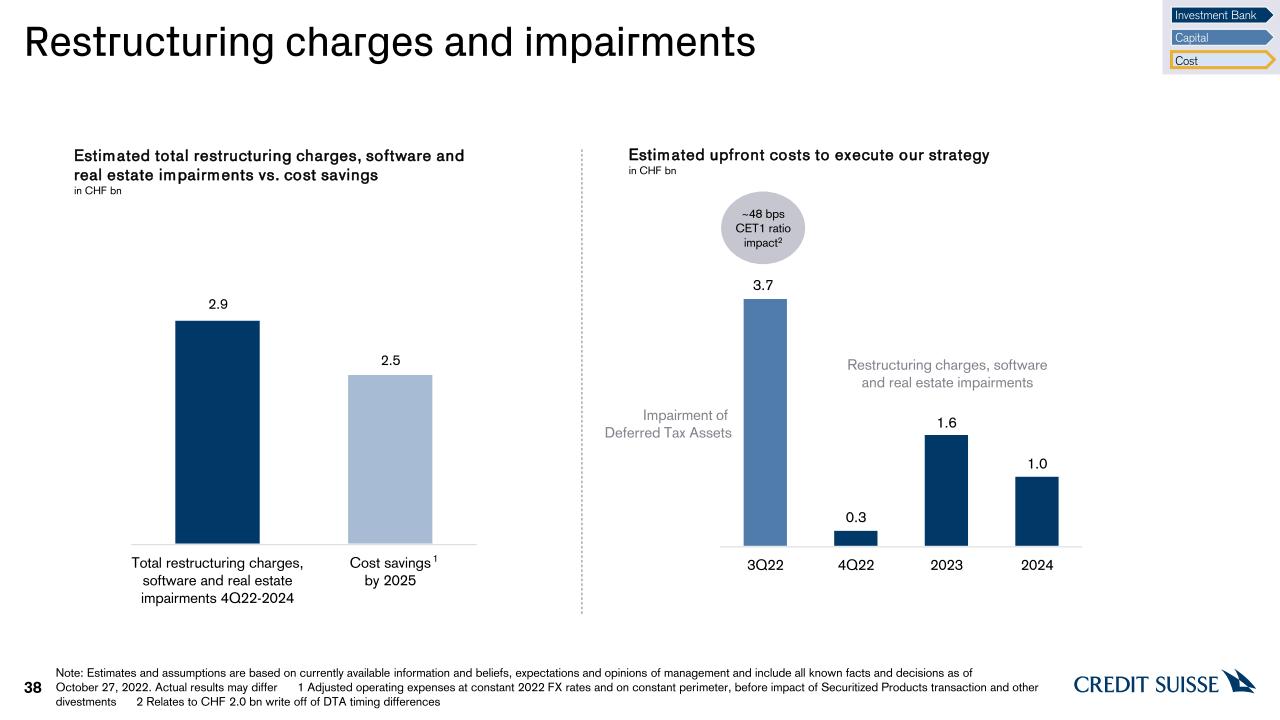
38 Restructuring charges and impairments 2.9 2.5 Estimated total restructuring charges, software and real estate impairments vs. cost savingsin CHF bn Estimated upfront costs to execute our strategyin CHF bn Impairment of Deferred Tax Assets 3.7 0.3 1.6 ~48 bps CET1 ratio impact2 1 Note: Estimates and assumptions are based on currently available information and beliefs, expectations and opinions of management and include all known facts and decisions as of October 27, 2022. Actual results may differ 1 Adjusted operating expenses at constant 2022 FX rates and on constant perimeter, before impact of Securitized Products transaction and other divestments 2 Relates to CHF 2.0 bn write off of DTA timing differences Restructuring charges, software and real estate impairments 1.0 Investment Bank Capital Cost

We are targeting a core RoTE of >8% and a Group RoTE of ~6% by 2025 39 Group Return on Tangible Equity Illustrative development, based on CHF Note: Results excluding certain items in our reported results are non-GAAP financial measures. See the appendix of this presentation for detailed information and defined terms as well as important presentation and other information relating to non-GAAP financial measures. Estimates and assumptions are based on currently available information and beliefs, expectations and opinions of management and include all known facts and decisions as of today. Actual results may differ 1 Estimate based on 2025 tax rate and 2025 average tangible shareholders equity 2 Including Securitized Products, other divestments impact and provisions for credit losses 3 Core includes Group returns, ex-NCU and Securitized Products ‡ ‡ ‡ ‡ 1 In the medium-term, our new business mix will support higher Group RoTE 2 ‡ 3 Wealth Management, Swiss Bank and Asset Management to benefit from rising rates and business growth Capital Markets and Advisory revenue normalization

We are focused on the disciplined execution of our strategy 40 Note: Estimates and assumptions are based on currently available information and beliefs, expectations and opinions of management and include all known facts and decisions as of October 27, 2022. Actual results may differ 1 Based on RWAs excluding Basel III reforms 2 Pre-Basel III reforms 3 From 2023 through 2025 4 Adjusted operating expenses at constant 2022 FX rates and on constant perimeter, before impact of Securitized Products transaction and other divestments Our 2025 Financial Targets Accelerate cost transformation Relentless focus on driving down our cost base by CHF ~2.5 bn Restructure the Investment Bank Target Investment Bank capital reduction1 of ~40% from wind-down of the Non-Core Unit and capital release from Securitized Products Ambition to attract external capital in CS First Boston Capital raises with gross proceeds of CHF ~4.0 bn leading to a pro forma CET1 ratio of ~14.0% Capital Release Unit and other divestments to release CHF >5 bn of capital by 2025 Strengthen and reallocate capital Costs 2023 Group cost base4 CHF 15.8 bn 2025 Group cost base4 CHF ~14.5 bn Returns Core Return on Tangible Equity‡ >8% Group Return on Tangible Equity‡ ~6% Capital CET1 ratio2 >13.5% in 2025 CET1 ratio2 through transformation3at least 13.0% Nominal dividend 2022-2024;meaningful distribution from 2025 onwards

Appendix

Notes 42 General notes Throughout this presentation rounding differences may occur Results excluding certain items included in our reported results are non-GAAP financial measures Our cost base target is measured using adjusted operating expenses at constant 2022 FX rates and on constant perimeter, before impact of Securitized Products transaction and other divestments Unless otherwise noted, all CET1 capital, CET1 ratio, CET1 leverage ratio, Tier 1 leverage ratio, risk-weighted assets and leverage exposure figures shown in these presentations are as of the end of the respective period Specific notes † Regulatory capital is calculated as the average of 13.5% of RWA and 4.25% of leverage exposure and return on regulatory capital, a non-GAAP financial measure, is calculated using income/(loss) after tax and assumes a tax rate of 25% from 2020 onward. For the Investment Bank, return on regulatory capital is based on US dollar denominated numbers. Return on regulatory capital excluding certain items included in our reported results is calculated using results excluding such items, applying the same methodology. Adjusted return on regulatory capital excluding certain items included in our reported results is calculated using results excluding such items, applying the same methodology. ‡ Return on tangible equity, a non-GAAP financial measure, is calculated as annualized net income attributable to shareholders divided by average tangible shareholders’ equity. Tangible shareholders’ equity, a non-GAAP financial measure, is calculated by deducting goodwill and other intangible assets from total shareholders’ equity as presented in our balance sheet. Abbreviations AFG = Asia Pacific Financing Group; APAC = Asia Pacific; avg = average; B3R = Basel III Reform; BCBS = Basel Committee on Banking Supervision; BIS = Bank for International Settlements; bn = billion; bps = basis points; CCyB = Countercyclical buffer; CET1 = Common Equity Tier 1; CHF = Swiss Franc; CRU = Capital Release Unit; CS = Credit Suisse; CtB = Change the Bank; CVA = Credit Valuation Adjustment; EEA = European Economic Area; EM = Emerging Markets; EU = European Union; FINMA = Swiss Financial Market Supervisory Authority FINMA; FinSA = Swiss Federal Act on Financial Services; FRTB = Fundamental review of the trading book; FTE = Full-time equivalent; FX = Foreign Exchange; GAAP = Generally Accepted Accounting Principles; GDP = Gross Domestic Product; GTS = Global Trading Solutions; IB = Investment Bank; IRB = Internal ratings-based; k = thousand; LE = Leverage exposure; mn = million; NCU = Non-Core Unit; OpRisk = Operational Risk; PCL = Provision for credit losses; RoRC = Return on Regulatory Capital; RoTE = Return on tangible equity; RWA = Risk-weighted assets; SP = Securitized Products; vs. = versus; UK = United Kingdom; USD = United States Dollar; WM = Wealth Management

Footnotes are an integral part of this presentation. See slides • in the appendix of this presentation for detailed information, including important presentation and other information relating to non-GAAP financial measures, and defined terms. 43
SIGNATURES
Pursuant to the requirements of the Securities Exchange Act of 1934, the registrants have duly caused this report to be signed on their behalf by the undersigned, thereunto duly authorized.
| CREDIT SUISSE GROUP AG and CREDIT SUISSE AG | ||
| (Registrants) | ||
| By: | /s/ Reto Hösli | |
Reto Hösli | ||
| Director | ||
| /s/ Annina Müller | ||
| Annina Müller | ||
| Date: October 27, 2022 | Vice President |