UNITED STATES SECURITIES AND EXCHANGE COMMISSION
Washington, D.C. 20549
Form 6-K
REPORT OF FOREIGN PRIVATE ISSUER PURSUANT TO RULE 13a-16 OR 15d-16 UNDER THE SECURITIES EXCHANGE ACT OF 1934
April 24, 2023
Commission File Number 001-15244
Credit Suisse Group AG
(Translation of registrant’s name into English)
Paradeplatz 8, 8001 Zurich, Switzerland
(Address of principal executive office)
Commission File Number 001-33434
Credit Suisse AG
(Translation of registrant’s name into English)
Paradeplatz 8, 8001 Zurich, Switzerland
(Address of principal executive office)
Indicate by check mark whether the registrant files or will file annual reports under cover of Form 20-F or Form 40-F.
Form 20-F  Form 40-F
Form 40-F This report includes the media release in connection with the 1Q23 results.
Media Release Zurich, April 24, 2023 |
Ad hoc announcement pursuant to Art. 53 LR
Credit Suisse reports pre-tax income of CHF 12.8 bn with a CET1 ratio of 20.3% in 1Q23; results reflect write-down of CHF 15 bn AT1 capital notes
___________________________________________________________________________________________________________________________________________________________________________
Credit Suisse Group results for 1Q23
| Reported (CHF mn) | 1Q23 | 4Q22 | 1Q22 | Δ4Q22 | Δ1Q22 |
| Net revenues | 18,467 | 3,060 | 4,412 | - | 319% |
| Provision for credit losses | 83 | 41 | (110) | - | - |
| Total operating expenses | 5,620 | 4,334 | 4,950 | 30% | 14% |
| Pre-tax income/(loss) | 12,764 | (1,315) | (428) | - | - |
| Income tax expense/(benefit) | 345 | 82 | (151) | 321% | - |
| Net income/(loss) attributable to shareholders | 12,432 | (1,393) | (273) | - | - |
| Return on tangible equity | 117.5% | (13.5)% | (2.6)% | - | - |
| Cost/income ratio | 30.4% | 142% | 112% | - | - |
| Net New Assets (NNA)/Net Asset Outflows - CHF bn | (61.2) | (110.5) | 7.9 | - | - |
| Assets under Management (AuM) - CHF bn | 1,253 | 1,294 | 1,555 | (3)% | (19)% |
| Adjusted* (CHF mn) | 1Q23 | 4Q22 | 1Q22 | Δ4Q22 | Δ1Q22 |
| Net revenues | 2,734 | 2,964 | 4,582 | (8)% | (40)% |
| Provision for credit losses | 83 | 41 | 45 | - | - |
| Total operating expenses | 3,966 | 3,938 | 4,237 | 1% | (6)% |
| Pre-tax income/(loss) | (1,316) | (1,015) | 300 | - | - |
| Capital ratios | 1Q23 | 4Q22 | 1Q22 | Δ4Q22 | Δ1Q22 |
| CET1 ratio | 20.3% | 14.1% | 13.8% | - | - |
| CET1 ratio excl. AT1 write-down | 14.3% | ||||
| Tier 1 leverage ratio | 7.6% | 7.7% | 6.1% | - | - |
| CET1 leverage ratio | 7.6% | 5.4% | 4.3% | - | - |
Media Release Zurich, April 24, 2023 |
Summary of 1Q23 performance
Credit Suisse’s performance in 1Q23 was mainly impacted by actions leading up to and stemming from the planned merger between Credit Suisse Group AG (Credit Suisse) and UBS Group AG (UBS), which was announced on March 19, 2023, and by significant deposit and net asset outflows.
Credit Suisse will work closely with UBS to ensure that the transaction is completed in a timely manner. The consummation of the merger remains subject to customary closing conditions.
Credit Suisse reported pre-tax income of CHF 12.8 bn in 1Q23. The 1Q23 result primarily reflected the write-down to zero of CHF 15 bn of Additional Tier 1 (AT1) capital notes as ordered by the Swiss Financial Market Supervisory Authority FINMA (FINMA) in light of the aforementioned planned merger. Reported pre-tax income was further affected by a CHF 0.7 bn gain from the sale of a significant part of the Securitized Products Group (SPG) (Apollo transaction) to entities and funds managed by affiliates of Apollo Global Management (collectively, Apollo), offset by a goodwill impairment charge of CHF 1.3 bn almost entirely recognized in Wealth Management (WM) and CHF 0.3 bn in restructuring expenses. Credit Suisse recorded an adjusted* pre-tax loss of CHF 1.3 bn for the quarter.
The Group’s common equity tier 1 ratio (CET1) increased to 20.3% as of the end of 1Q23, up from 14.1% at the end of 4Q22. The increase in CET1 capital was mainly driven by the write-down of the AT1 capital notes as ordered by FINMA.
Credit Suisse experienced significant net asset outflows, in particular in the second half of March 2023. These outflows have moderated but have not yet reversed as of April 24, 2023. For 1Q23, Credit Suisse reported net asset outflows of CHF 61.2 bn. Deposit outflows represented 57% of Wealth Management (WM) and Swiss Bank (SB) net asset outflows in 1Q23.
As of the end of 1Q23, assets under management (AuM) of CHF 1.3 trn decreased by CHF 41 bn compared to the end of 4Q22. At the Group level, net asset outflows in 1Q23 were CHF 61.2 bn or 5% of AuM as of the end of 4Q22, in particular following net asset outflows in the second half of March 2023 across all businesses.
| ◾ | In WM, net asset outflows in 1Q23 represented 9% of AuM reported as of the end of 4Q22. |
| ◾ | In the SB, net asset outflows in 1Q23 represented 1% of AuM reported as of the end of 4Q22. |
| ◾ | In Asset Management (AM), net asset outflows in 1Q23 represented 3% of AuM reported as of the end of 4Q22. |
In the second half of March 2023, Credit Suisse experienced significant withdrawals of cash deposits as well as non-renewal of maturing time deposits. Customer deposits declined by CHF 67 bn in 1Q23. These outflows, which were most acute in the days immediately preceding and following the announcement of the merger, stabilized to much lower levels, but had not yet reversed as of April 24, 2023.
The Swiss National Bank (SNB) granted Credit Suisse access to significant credit facilities that provide substantial liquidity support to the bank, a portion of which are supported by default guarantees provided by the Swiss government. As of March 31, 2023, the net amount of borrowings under these facilities amounted to CHF 108 bn after repayments of CHF 60 bn in the quarter, with further repayments of CHF 10 bn as of April 24, 2023.
The Group’s three-month average daily Liquidity Coverage Ratio (LCR) was 178% as of the end of 1Q23, improved from lower levels earlier in the quarter after benefitting from the liquidity facilities from the SNB.
Prior to the significantly increased outflows, on March 14, 2023, the quarter to date daily average LCR was approximately 153%, and improved from the three-month average daily LCR of 144% at the end of 2022.
Compared to 4Q22, net revenues were significantly higher, primarily reflecting higher net revenues in the Corporate Center (CC), the Capital Release Unit (CRU) and in the Investment Bank (IB), partially offset by lower net revenues in WM, AM and SB. The increase in the CC was primarily driven by treasury results, which reflected the write-down of the AT1 capital notes. The increase in the CRU mainly reflected the gain on the Apollo transaction. Net revenues in the IB increased compared to low levels in 4Q22 and included gains on increased buyback activity principally in the structured notes portfolio across equities and fixed income at prices reflecting significantly wider credit spreads. The decrease in WM mainly reflected lower net interest income and lower other revenues which reflected a gain on the sale of real estate in 4Q22. The decrease in AM was driven by decreased investment and partnership income, partially offset by higher performance and transaction revenues. The decrease in the SB was primarily driven by lower other revenues and lower net interest income.
Compared to 4Q22, total operating expenses increased 30% in 1Q23, mainly reflecting the goodwill impairment charge and increases in compensation and benefits, partially offset by lower general and administrative expenses and lower restructuring expenses. Compensation and benefits increased 16%, including the acceleration of deferred compensation expenses due to the cancellation of outstanding deferred compensation awards. General and administrative expenses decreased 19%, primarily reflecting lower litigation expenses. Adjusted* total operating expenses were stable compared to 4Q22.
Following a review of the Group’s financial plans to reflect the deposit and AuM outflows in 1Q23, the Group concluded that the estimated fair value of the WM reporting unit was below its related carrying value and as a result a goodwill impairment charge of CHF 1.3 bn was recorded for the quarter, resulting in a goodwill balance of zero for that reporting unit. The fair value of the remaining reporting units with goodwill (SB and AM) exceeded their related carrying values and no further impairments were necessary as of March 31, 2023.
The reduction in AuM and deposits in 1Q23 is expected to lead to reduced net interest income and recurring commissions and fees. In particular, this will likely lead to a substantial loss in WM in 2Q23.
In light of the merger announcement, the adverse revenue impact from the previously disclosed exit from non-core businesses and exposures, restructuring charges and funding costs, Credit Suisse would also expect the IB and the Group to report a substantial loss before taxes in 2Q23 and 2023. The Group’s actual results will depend on a number of factors, including the performance of the IB and WM divisions; deposit or net asset flows; the continued exit of non-core positions; goodwill, software and other impairments; litigation; regulatory actions; credit spreads and related funding costs; the usage and availability of the SNB liquidity facilities; the impact of continued voluntary and involuntary employee attrition and the outcome of certain other items, including potential real estate sales. Credit Suisse is taking proactive measures to protect its client franchise, manage risks and facilitate operational stability.
Strategy Execution Update
The bank continued to execute on certain strategic actions:
| ◾ | SPG: Achieved approximately USD 48 bn reduction in the asset equivalent exposures of SPG and related financing |
Media Release Zurich, April 24, 2023 |
businesses since 3Q22, or >85% of targeted reduction of approximately USD 55 bn.
| ◾ | Non-Core Unit (NCU): Reduced Risk Weighted Assets (RWA) and leverage exposure by approximately USD 4 bn and approximately USD 14 bn1, respectively since 4Q22. |
| ◾ | Cost actions: Progress on cost transformation program with adjusted* operating expenses 6% lower YoY in 1Q23 due to lower general and administrative expenses and compensation and benefits. Achieved reduction in number of employees of approximately 9% since 3Q222. |
| ◾ | CS First Boston: Credit Suisse Group AG, and M. Klein & Co LLC have mutually agreed to terminate the acquisition of The Klein Group, LLC (i.e., the investment banking business of M. Klein & Co. LLC) by Credit Suisse considering Credit Suisse’s recently announced merger with UBS Group AG. |
Effective January 1, 2023, Credit Suisse includes the results of WM, SB, AM, IB, CC and CRU.
___________________________________________________________________________________________________________________________________________________________________________
Divisional summaries
| Wealth Management (WM) | |
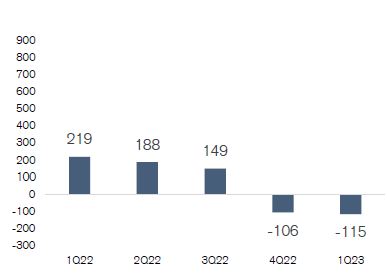 Restated adjusted* pre-tax income/loss QoQ in CHF million | 1Q23 ◾ WM’s adjusted* net revenues were down 33% vs. 1Q22. Net interest income was down 37%, mainly reflecting lower loan margins on lower average loan volumes, higher costs related to interest rate management and higher funding costs, partially offset by higher deposit margins despite significantly lower average deposit volumes. Recurring commissions and fees declined 17%, reflecting lower average AuM. Transaction- and performance-based revenues were down 43%, primarily due to reduced client activity, but were 9% higher QoQ. ◾ Adjusted* operating expenses in WM were down 8% vs. 1Q22. This was due to lower general and administrative expenses, driven by lower professional services fees and allocated corporate function costs. ◾ WM had an adjusted* 1Q23 pre-tax loss of CHF 115 mn. The reported pre-tax loss of CHF 1.5 bn includes a goodwill impairment charge of CHF 1.3 bn and restructuring expenses of CHF 46 mn. ◾ WM experienced net asset outflows of CHF 47.1 bn in 1Q23 driven by outflows across all regions. |
Swiss Bank (SB) | |
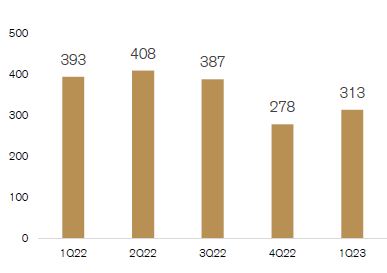 Restated adjusted* pre-tax income QoQ in CHF million | 1Q23 ◾ Adjusted* net revenues were down 8% vs. 1Q22. Net interest income was down 11% YoY. Higher deposit income was offset by decreased income from loans, as well as by the absence of SNB threshold benefits following the increase of interest rates. Net interest income in 1Q23 was down 2% compared to 4Q22. Recurring commissions and fees declined 8% YoY, which reflected lower average AuM. Transaction-based revenues were down 12% due to decreased client activity and lower revenues from the Swiss investment banking business. ◾ Adjusted* operating expenses were down 3% vs. 1Q22. This was driven by lower discretionary compensation expenses as well as decreased Group-wide operating costs. ◾ The SB had an adjusted* pre-tax income of CHF 313 mn, down 20% vs. 1Q22. This reflects the lower net revenues and higher non- specific provisions for credit losses, which were partially offset by lower operating expenses. ◾ The net asset outflows of CHF 6.9 bn in 1Q23 mainly reflected outflows in the private clients business. |
_________________________________________________________________________
1 Excluding the impact from reductions in high-quality liquid assets (HQLA) allocations
2 FTE reduction includes notified reductions in workforce who were on the payroll as of end of 1Q23
Media Release Zurich, April 24, 2023 |
| Asset Management (AM) | |
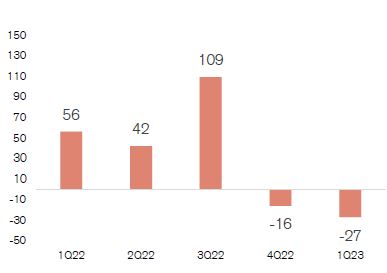 Restated adjusted* pre-tax income QoQ in CHF million | 1Q23 ◾ Adjusted* net revenues were down 45% vs. 1Q22 reflecting decreased investment and partnership income and lower management fees, partially offset by higher performance and transaction revenues. The decrease in investment and partnership income was mainly due to a currency translation adjustment and impairment on the planned partial disposal of an investment. ◾ Adjusted* operating expenses were down 24% vs. 1Q22 primarily driven by lower expenses related to the Supply Chain Finance Funds (SCFF) matter, reduced discretionary compensation expenses and declining commission expenses. ◾ The adjusted* pre-tax loss of CHF 27 mn compared to adjusted* pre- tax income of CHF 56 mn in 1Q22 and mainly reflected reduced net revenues despite lower total operating expenses. ◾ AM experienced net asset outflows of CHF 11.6 bn. These were driven by outflows from traditional investments, in particular fixed income and index solutions, and from alternative investments, primarily related to outflows in credit. |
Investment Bank (IB) | |
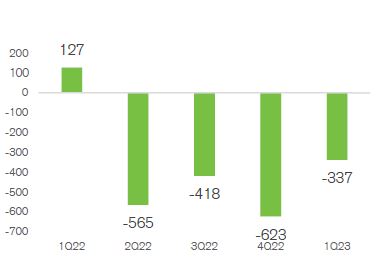 Restated adjusted* pre-tax income/loss QoQ in USD million | 1Q23 ◾ IB adjusted* net revenues of USD 1.1 bn increased 70% vs. 4Q22 but declined 37% vs. 1Q22. Performance was impacted by less favorable markets conditions YoY exacerbated by previously disclosed issues affecting Credit Suisse, which led to lower client activity across businesses. These declines were partially offset by gains of USD 257 mn on increased buyback activity principally in the structured notes portfolio across equities and fixed income at prices reflecting significantly wider own credit spreads. Equities Sales & Trading revenues of USD 457 mn declined 36% YoY vs. a strong 1Q22, driven by lower revenues in Equity Derivatives and Cash Equities. Fixed Income revenues of USD 301 mn declined 5% as strong activity in Investment Grade trading and Rates was offset by reduced revenues in the Foreign Exchange franchise. Capital Markets and Advisory revenue of USD 343 mn was down 51% vs. 1Q22 reflecting lower global fees across the industry and reduced market share. ◾ Adjusted* operating expenses of USD 1.4 bn were down 9% YoY due to reduced compensation and benefits and lower revenue-related expenses. ◾ The IB had an adjusted* 1Q23 pre-tax loss of USD 337 mn. The IB reported a pre-tax loss of USD 487 mn, which included restructuring expenses of USD 115 mn and goodwill impairment charge of USD 33 mn. ◾ Significantly reduced capital usage. The IB’s risk-weighted assets were down 1% and leverage exposure was down 7% vs.4Q22. |
Media Release Zurich, April 24, 2023 |
Capital Release Unit (CRU)
1Q23
| ◾ | Adjusted* net revenues were down USD 1.0 bn vs. 1Q22. This decrease was driven by a loss of revenues from businesses transferred from the IB, particularly from SPG. The CRU also saw losses on the valuation of certain financing arrangements associated with the Apollo transaction. |
| ◾ | Adjusted* operating expenses of USD 686 mn were down 9% vs. 1Q22. The decrease in 1Q23 was driven by lower compensation and benefits and lower commission expenses. The decrease in compensation and benefits reflected lower discretionary compensation expenses and lower salaries, primarily relating to the exit of prime services. The decrease in commission expenses was mainly driven by reduced trading activity, most notably from the prime services business. |
| ◾ | The CRU had an adjusted* pre-tax loss of USD 1.1 bn. The reported pre-tax loss of USD 445 mn included primarily a USD 0.8bn gain on the sale of a significant part of the SPG to Apollo, partially offset by a loss of revenues from businesses transferred from the IB, particularly from SPG. |
Media Release Zurich, April 24, 2023 |
Contact details
Kinner Lakhani, Investor Relations, Credit Suisse Tel: +41 44 333 71 49
Email: investor.relations@credit-suisse.com
Dominik von Arx, Corporate Communications, Credit Suisse Tel: +41 844 33 88 44
Email: media.relations@credit-suisse.com
The Earnings Release for 1Q23 is available to download from 06:45 CET today at: www.credit-suisse.com/results
___________________________________________________________________________________________________________________________________________________________________________
Abbreviations
AM – Asset Management; AuM – assets under management; bn – billion; CET1 – common equity tier 1; CHF – Swiss francs; FINMA – Swiss Financial Market Supervisory Authority FINMA; FTE – Full time equivalent; GAAP – Generally accepted accounting principles; HQLA – high-quality liquid assets; IB – Investment Bank; LCR – Liquidity Coverage Ratio; mn – million; NCU – Non- Core Unit; NNA – net new assets; QoQ – Quarter on Quarter; RWA – risk- weighted assets; SB – Swiss Bank; SNB – Swiss National Bank; SCFF – Supply Chain Finance Funds; SEC – US Securities and Exchange Commission; SPG – Securitized Product Group; trn – trillion; USD – US dollar; WM – Wealth Management; YoY – Year on Year
Important information
This document contains select information from the full 1Q23 Earnings Release that Credit Suisse believes is of particular interest to media professionals. The complete 1Q23 Earnings Release, which has been distributed simultaneously, contains more comprehensive information about our results and operations for the reporting quarter, as well as important information about our reporting methodology and some of the terms used in this document. The complete 1Q23 Earnings Release is not incorporated by reference into this document.
The Group’s independent registered public accounting firm has not completed a review of the financial information contained in the 1Q23 Earnings Release. Any subsequent review may result in changes to that information.
We may not achieve all of the expected benefits of our strategic initiatives, such as in relation to the proposed transaction between Credit Suisse and UBS, our intended reshaping of the bank, cost reductions and strengthening and reallocating capital. Factors beyond our control, including but not limited to the market and economic conditions (including macroeconomic and other challenges and uncertainties, for example, resulting from Russia’s invasion of Ukraine), the reaction by our clients, employees and others to our proposed initiatives, enhanced risks to our businesses during the contemplated transitions, changes in laws, rules or regulations and other challenges discussed in our public filings, such as reputational harm resulting from prior events or reactions to our strategic initiatives, could limit our ability to achieve some or all of the expected benefits of these initiatives. Our ability to implement our strategy objectives could also be impacted by timing risks, obtaining all required approvals and other factors. See also the “Cautionary Statement regarding forward-looking information” below, “Risk factors” in I – Information on the company in our Annual Report 2022 and “Risk factors” in Credit Suisse in our 1Q23 Earnings Release.
In particular, the terms “Estimate”, “Illustrative”, “Ambition”, “Objective”, “Outlook”, “Guidance”, “Goal”, “Commitment” and “Aspiration” are not intended to be viewed as targets or projections, nor are they considered to be Key Performance Indicators. All such estimates, illustrations, ambitions, objectives, outlooks, guidance, goals, commitments and aspirations, as well as any other forward-looking statements described as targets or projections, are subject to a large number of inherent risks, assumptions and uncertainties, many of which are completely outside of our control. These risks, assumptions and uncertainties include, but are not limited to, general market conditions, market volatility, increased inflation, interest rate volatility and levels, global and regional economic conditions, challenges and uncertainties resulting from Russia’s invasion of Ukraine, political uncertainty, geopolitical conflicts, changes in tax policies, scientific or technological developments, evolving sustainability strategies, including changes in approach due to shifting market expectations and business trends, the need for concurrent actions and efforts by external parties and other actors that are outside of our control to achieve our sustainability-related goals and initiatives, changes in the nature or scope of our operations, including as a result of our recently announced strategy initiatives, changes in carbon markets, regulatory changes, changes in levels of client activity as a result of any of the foregoing and other factors. Accordingly, these statements, which speak only as of the date made, are not guarantees of future performance and should not be relied on for any purpose. We do not intend to update these estimates, illustrations, ambitions, objectives, outlooks, guidance, goals, commitments, aspirations, targets, projections or any other forward-looking statements. For these reasons, we caution you not to place undue reliance upon any forward- looking statements.
In preparing this document, management has made estimates and assumptions that affect the numbers presented. Actual results may differ. Annualized numbers do not take into account variations in operating results, seasonality and other factors and may not be indicative of actual, full-year results. Figures throughout this document may also be subject to rounding adjustments. All opinions and views constitute good faith judgments as of the date of writing without regard to the date on which the reader may receive or access the information. This information is subject to change at any time without notice and we do not intend to update this information.
Return on tangible equity, a non-GAAP financial measure, is calculated as annualized net income attributable to shareholders divided by average tangible shareholders’ equity. Tangible shareholders’ equity, a non-GAAP financial measure, is calculated by deducting goodwill and other intangible assets from total shareholders’ equity as presented in our balance sheet. Management believes that return on tangible equity is meaningful as it is a measure used and relied upon by industry analysts and investors to assess valuations and capital adequacy. Adjusted* return on tangible equity excluding certain items included in our reported results is calculated using results excluding such items, applying the same methodology. For end-1Q23, tangible shareholders’ equity excluded goodwill of CHF 1,324 million and other intangible assets of CHF 428 million from total shareholders’ equity of CHF 54,066 million as presented in our balance sheet. For end-4Q22, tangible shareholders’ equity excluded goodwill of CHF 2,903 million and other intangible assets of CHF 458 million from total shareholders’ equity of CHF 45,129 million as presented in our balance sheet. For end-1Q22, tangible shareholders’ equity excluded goodwill of CHF 2,931 million and other intangible assets of CHF 307 million from total shareholders’ equity of CHF 44,442 million as presented in our balance sheet.
Credit Suisse is subject to the Basel framework, as implemented in Switzerland, as well as Swiss legislation and regulations for systemically important banks, which include capital, liquidity, leverage and large exposure requirements and rules for emergency plans designed to maintain systemically relevant functions in the event of threatened insolvency. Credit Suisse has adopted the Bank for International Settlements (BIS) leverage ratio framework, as issued by the Basel Committee on Banking Supervision (BCBS) and implemented in Switzerland by the Swiss Financial Market Supervisory Authority FINMA (FINMA).
Unless otherwise noted, all CET1 ratio, CET1 leverage ratio, Tier-1 leverage ratio, risk-weighted assets and leverage exposure figures in this document are as of the end of the respective period.
Unless otherwise noted, leverage exposure is based on the BIS leverage ratio framework and consists of period-end balance sheet assets and prescribed
Media Release Zurich, April 24, 2023 |
regulatory adjustments. The tier 1 leverage ratio and CET1 leverage ratio are calculated as BIS tier 1 capital and CET1 capital, respectively, divided by period end leverage exposure.
Investors and others should note that we announce important company information (including quarterly earnings releases and financial reports as well as our annual sustainability report) to the investing public using press releases, SEC and Swiss ad hoc filings, our website and public conference calls and webcasts. We also routinely use our Twitter account @creditsuisse (https://twitter.com/creditsuisse), our LinkedIn account (https://www.linkedin.com/company/credit-suisse/), our Instagram accounts (https://www.instagram.com/creditsuisse_careers/ and https://www.instagram.com/creditsuisse_ch/), our Facebook account (https://www.facebook.com/creditsuisse/) and other social media channels as additional means to disclose public information, including to excerpt key messages from our public disclosures. We may share or retweet such messages through certain of our regional accounts, including through Twitter at @csschweiz (https://twitter.com/csschweiz) and @csapac (https://twitter.com/csapac). Investors and others should take care to consider such abbreviated messages in the context of the disclosures from which they are excerpted. The information we post on these social media accounts is not a part of this document.
Information referenced in this document, whether via website links or otherwise, is not incorporated into this document.
Certain material in this document has been prepared by Credit Suisse on the basis of publicly available information, internally developed data and the interpretation of various sources of information, including other third-party sources believed to be reliable. These sources of information may be limited in terms of accuracy, availability and timeliness. Credit Suisse has not sought to independently verify information obtained from public and third-party sources and makes no representations or warranties as to accuracy, completeness, reasonableness or reliability of such information.
In various tables, use of “–” indicates not meaningful or not applicable.
The English language version of this document is the controlling version.
*Refers to results excluding certain items included in our reported results. These are non-GAAP financial measures. For a reconciliation to the most directly comparable US GAAP measures, see the Appendix of this Media Release.
| Appendix |
| Key metrics | |||||||||||
| in / end of | % change | ||||||||||
| 1Q23 | 4Q22 | 1Q22 | QoQ | YoY | |||||||
| Credit Suisse Group results (CHF million) | |||||||||||
| Net revenues | 18,467 | 3,060 | 4,412 | – | 319 | ||||||
| Provision for credit losses | 83 | 41 | (110) | 102 | – | ||||||
| Compensation and benefits | 2,398 | 2,062 | 2,458 | 16 | (2) | ||||||
| General and administrative expenses | 1,392 | 1,710 | 2,148 | (19) | (35) | ||||||
| Commission expenses | 207 | 210 | 298 | (1) | (31) | ||||||
| Goodwill impairment | 1,324 | – | 0 | – | – | ||||||
| Restructuring expenses | 299 | 352 | 46 | (15) | – | ||||||
| Total other operating expenses | 3,222 | 2,272 | 2,492 | 42 | 29 | ||||||
| Total operating expenses | 5,620 | 4,334 | 4,950 | 30 | 14 | ||||||
| Income/(loss) before taxes | 12,764 | (1,315) | (428) | – | – | ||||||
| Income tax expense/(benefit) | 345 | 82 | (151) | 321 | – | ||||||
| Net income/(loss) attributable to shareholders | 12,432 | (1,393) | (273) | – | – | ||||||
| Balance sheet statistics (CHF million) | |||||||||||
| Total assets | 540,291 | 531,358 | 739,554 | 2 | (27) | ||||||
| Risk-weighted assets | 243,431 | 250,540 | 273,043 | (3) | (11) | ||||||
| Leverage exposure | 653,047 | 650,551 | 878,023 | 0 | (26) | ||||||
| Assets under management and net new assets (CHF billion) | |||||||||||
| Assets under management | 1,252.6 | 1,293.6 | 1,554.9 | (3.2) | (19.4) | ||||||
| Net new assets/(net asset outflows) | (61.2) | (110.5) | 7.9 | (44.6) | – | ||||||
| Basel III regulatory capital and leverage statistics (%) | |||||||||||
| CET1 ratio | 20.3 | 14.1 | 13.8 | – | – | ||||||
| CET1 leverage ratio | 7.6 | 5.4 | 4.3 | – | – | ||||||
| Tier 1 leverage ratio | 7.6 | 7.7 | 6.1 | – | – | ||||||
Page A-1
| Appendix |
Results excluding certain items included in our reported results are non-GAAP financial measures. Management believes that such results provide a useful presentation of our operating results for purposes of assessing our Group and divisional performance consistently over time, on a basis that excludes items that management does not consider representative of our underlying performance. Provided below is a reconciliation to the most directly comparable US GAAP measures.
| Reconciliation of adjustment items | |||||||
| Group | |||||||
| in | 1Q23 | 4Q22 | 1Q22 | ||||
| Results (CHF million) | |||||||
| Net revenues | 18,467 | 3,060 | 4,412 | ||||
| Real estate (gains)/losses | (1) | (191) | (164) | ||||
| (Gains)/losses on business sales | (726) | 0 | 3 | ||||
| (Gain)/loss on InvestLab/Allfunds Group | 0 | 75 | 353 | ||||
| (Gain)/loss on equity investment in SIX Group AG | 0 | 20 | (5) | ||||
| Archegos | 0 | 0 | (17) | ||||
| Additional tier 1 securities write-down | (15,007) | 0 | 0 | ||||
| Adjusted net revenues | 2,733 | 2,964 | 4,582 | ||||
| Provision for credit losses | 83 | 41 | (110) | ||||
| Archegos | 0 | 0 | 155 | ||||
| Adjusted provision for credit losses | 83 | 41 | 45 | ||||
| Total operating expenses | 5,620 | 4,334 | 4,950 | ||||
| Goodwill impairment | (1,324) | 0 | 0 | ||||
| Restructuring expenses | (299) | (352) | (46) | ||||
| Major litigation provisions | (22) | (34) | (653) | ||||
| Expenses related to real estate disposals | (3) | 0 | (3) | ||||
| Expenses related to equity investment in Allfunds Group | 0 | (2) | 0 | ||||
| Archegos | (6) | (8) | (11) | ||||
| Adjusted total operating expenses | 3,966 | 3,938 | 4,237 | ||||
| Income/(loss) before taxes | 12,764 | (1,315) | (428) | ||||
| Adjusted income/(loss) before taxes | (1,316) | (1,015) | 300 | ||||
| Adjusted return on regulatory capital (%) | (12.9) | (9.1) | 2.4 | ||||
| Adjusted return on tangible equity (%) | (16.5) | (9.6) | 4.3 | ||||
Page A-2
| Appendix |
| Wealth Management | |||||||||||
| in / end of | % change | ||||||||||
| 1Q23 | 4Q22 | 1Q22 | QoQ | YoY | |||||||
| Results (CHF million) | |||||||||||
| Net revenues | 893 | 1,094 | 1,342 | (18) | (33) | ||||||
| Provision for credit losses | 21 | (5) | 26 | – | (19) | ||||||
| Total operating expenses | 2,333 | 1,164 | 1,318 | 100 | 77 | ||||||
| Loss before taxes | (1,461) | (65) | (2) | – | – | ||||||
| Metrics | |||||||||||
| Cost/income ratio (%) | 261.3 | 106.4 | 98.2 | – | – | ||||||
| Assets under management (CHF billion) | 502.5 | 540.5 | 707.0 | (7.0) | (28.9) | ||||||
| Net new assets/(net asset outflows) (CHF billion) | (47.1) | (92.7) | 4.8 | – | – | ||||||
| Gross margin (annualized) (bp) | 66 | 75 | 74 | – | – | ||||||
| Net margin (annualized) (bp) | (108) | (5) | – | – | – | ||||||
| Reconciliation of adjustment items | |||||||
| Wealth Management | |||||||
| in | 1Q23 | 4Q22 | 1Q22 | ||||
| Results (CHF million) | |||||||
| Net revenues | 893 | 1,094 | 1,342 | ||||
| Real estate (gains)/losses | 0 | (122) | (20) | ||||
| (Gains)/losses on business sales | 0 | 0 | 3 | ||||
| (Gain)/loss on equity investment in SIX Group AG | 0 | 10 | (2) | ||||
| Adjusted net revenues | 893 | 982 | 1,323 | ||||
| Provision for credit losses | 21 | (5) | 26 | ||||
| Total operating expenses | 2,333 | 1,164 | 1,318 | ||||
| Goodwill impairment | (1,294) | – | – | ||||
| Restructuring expenses | (46) | (65) | (10) | ||||
| Major litigation provisions | (6) | (6) | (230) | ||||
| Adjusted total operating expenses | 987 | 1,093 | 1,078 | ||||
| Loss before taxes | (1,461) | (65) | (2) | ||||
| Adjusted income/(loss) before taxes | (115) | (106) | 219 | ||||
| Adjusted return on regulatory capital (%) | (5.7) | (4.8) | 9.3 | ||||
Page A-3
| Appendix |
| Swiss Bank | |||||||||||
| in / end of | % change | ||||||||||
| 1Q23 | 4Q22 | 1Q22 | QoQ | YoY | |||||||
| Results (CHF million) | |||||||||||
| Net revenues | 973 | 1,016 | 1,144 | (4) | (15) | ||||||
| Provision for credit losses | 40 | 28 | 23 | 43 | 74 | ||||||
| Total operating expenses | 646 | 682 | 642 | (5) | 1 | ||||||
| Income before taxes | 287 | 306 | 479 | (6) | (40) | ||||||
| Metrics | |||||||||||
| Cost/income ratio (%) | 66.4 | 67.1 | 56.1 | – | – | ||||||
| Assets under management (CHF billion) | 526.6 | 525.8 | 582.5 | 0.2 | (9.6) | ||||||
| Net new assets/(net asset outflows) (CHF billion) | (6.9) | (8.3) | 6.0 | – | – | ||||||
| Gross margin (annualized) (bp) | 73 | 77 | 78 | – | – | ||||||
| Net margin (annualized) (bp) | 21 | 23 | 33 | – | – | ||||||
| Reconciliation of adjustment items | |||||||
| Swiss Bank | |||||||
| in | 1Q23 | 4Q22 | 1Q22 | ||||
| Results (CHF million) | |||||||
| Net revenues | 973 | 1,016 | 1,144 | ||||
| Real estate (gains)/losses | (1) | (51) | (84) | ||||
| (Gain)/loss on equity investment in SIX Group AG | 0 | 10 | (3) | ||||
| Adjusted net revenues | 972 | 975 | 1,057 | ||||
| Provision for credit losses | 40 | 28 | 23 | ||||
| Total operating expenses | 646 | 682 | 642 | ||||
| Restructuring expenses | (27) | (13) | (1) | ||||
| Adjusted total operating expenses | 619 | 669 | 641 | ||||
| Income before taxes | 287 | 306 | 479 | ||||
| Adjusted income before taxes | 313 | 278 | 393 | ||||
| Adjusted return on regulatory capital (%) | 9.9 | 8.6 | 11.8 | ||||
Page A-4
| Appendix |
| Asset Management | |||||||||||
| in / end of | % change | ||||||||||
| 1Q23 | 4Q22 | 1Q22 | QoQ | YoY | |||||||
| Results (CHF million) | |||||||||||
| Net revenues | 187 | 261 | 339 | (28) | (45) | ||||||
| Provision for credit losses | 0 | 1 | 0 | (100) | – | ||||||
| Total operating expenses | 218 | 288 | 282 | (24) | (23) | ||||||
| Income/(loss) before taxes | (31) | (28) | 57 | 11 | – | ||||||
| Metrics | |||||||||||
| Cost/income ratio (%) | 116.6 | 110.3 | 83.2 | – | – | ||||||
| Reconciliation of adjustment items | |||||||
| Asset Management | |||||||
| in | 1Q23 | 4Q22 | 1Q22 | ||||
| Results (CHF million) | |||||||
| Net revenues | 187 | 261 | 339 | ||||
| Real estate (gains)/losses | 0 | 0 | (1) | ||||
| Adjusted net revenues | 187 | 261 | 338 | ||||
| Provision for credit losses | 0 | 1 | 0 | ||||
| Total operating expenses | 218 | 288 | 282 | ||||
| Restructuring expenses | (4) | (12) | – | ||||
| Adjusted total operating expenses | 214 | 276 | 282 | ||||
| Income/(loss) before taxes | (31) | (28) | 57 | ||||
| Adjusted income/(loss) before taxes | (27) | (16) | 56 | ||||
| Adjusted return on regulatory capital (%) | (13.8) | (7.4) | 27.0 | ||||
Page A-5
| Appendix |
| Investment Bank | |||||||||||
| in / end of | % change | ||||||||||
| 1Q23 | 4Q22 | 1Q22 | QoQ | YoY | |||||||
| Results (CHF million) | |||||||||||
| Net revenues | 1,017 | 621 | 1,609 | 64 | (37) | ||||||
| Provision for credit losses | 18 | 2 | (3) | – | – | ||||||
| Total operating expenses | 1,447 | 1,394 | 1,450 | 4 | 0 | ||||||
| Income/(loss) before taxes | (448) | (775) | 162 | (42) | – | ||||||
| Metrics | |||||||||||
| Cost/income ratio (%) | 142.3 | 224.5 | 90.1 | – | – | ||||||
| Results (USD million) | |||||||||||
| Net revenues | 1,102 | 647 | 1,740 | 70 | (37) | ||||||
| Provision for credit losses | 19 | 3 | (4) | – | – | ||||||
| Total operating expenses | 1,570 | 1,453 | 1,569 | 8 | 0 | ||||||
| Income/(loss) before taxes | (487) | (809) | 175 | (40) | – | ||||||
| Net revenue detail | |||||||
| in / end of | 1Q23 | 4Q22 | 1Q22 | ||||
| Net revenue detail (USD million) | |||||||
| Fixed income sales and trading | 301 | 208 | 317 | ||||
| Equity sales and trading | 457 | 74 | 711 | ||||
| Capital markets | 260 | 176 | 475 | ||||
| Advisory and other fees | 83 | 190 | 225 | ||||
| Other revenues | 1 | (1) | 12 | ||||
| Net revenues | 1,102 | 647 | 1,740 | ||||
Page A-6
| Appendix |
| Reconciliation of adjustment items | |||||||
| Investment Bank | |||||||
| in | 1Q23 | 4Q22 | 1Q22 | ||||
| Results (CHF million) | |||||||
| Net revenues | 1,017 | 621 | 1,609 | ||||
| Real estate (gains)/losses | 0 | 0 | (50) | ||||
| Adjusted net revenues | 1,017 | 621 | 1,559 | ||||
| Provision for credit losses | 18 | 2 | (3) | ||||
| Total operating expenses | 1,447 | 1,394 | 1,450 | ||||
| Goodwill impairment | (30) | 0 | 0 | ||||
| Restructuring expenses | (106) | (165) | (4) | ||||
| Major litigation provisions | 0 | (12) | 0 | ||||
| Expenses related to real estate disposals | (2) | 0 | (2) | ||||
| Adjusted total operating expenses | 1,309 | 1,217 | 1,444 | ||||
| Income/(loss) before taxes | (448) | (775) | 162 | ||||
| Adjusted income/(loss) before taxes | (310) | (598) | 118 | ||||
| Adjusted return on regulatory capital (%) | (17.5) | (29.0) | 5.0 | ||||
| Reconciliation of adjustment items | |||||||||||||||
| Investment Bank | |||||||||||||||
| in | 1Q23 | 4Q22 | 1Q22 | ||||||||||||
| Results (USD million) | |||||||||||||||
| Net revenues | 1,102 | 647 | 1,740 | ||||||||||||
| Real estate (gains)/losses | 0 | 0 | (54) | ||||||||||||
| Adjusted net revenues | 1,102 | 647 | 1,686 | ||||||||||||
| Provision for credit losses | 19 | 3 | (4) | ||||||||||||
| Total operating expenses | 1,570 | 1,453 | 1,569 | ||||||||||||
| Goodwill impairment | (33) | 0 | 0 | ||||||||||||
| Restructuring expenses | (115) | (175) | (4) | ||||||||||||
| Major litigation provisions | 0 | (12) | 0 | ||||||||||||
| Expenses related to real estate disposals | (2) | 1 | (2) | ||||||||||||
| Adjusted total operating expenses | 1,420 | 1,267 | 1,563 | ||||||||||||
| Income/(loss) before taxes | (487) | (809) | 175 | ||||||||||||
| Adjusted income/(loss) before taxes | (337) | (623) | 127 | ||||||||||||
| Adjusted return on regulatory capital (%) | (17.5) | (29.0) | 5.0 | ||||||||||||
Page A-7
| Appendix |
| Capital Release Unit | |||||||||||
| in / end of | % change | ||||||||||
| 1Q23 | 4Q22 | 1Q22 | QoQ | YoY | |||||||
| Results (CHF million) | |||||||||||
| Net revenues | 345 | (141) | 191 | – | 81 | ||||||
| Provision for credit losses | 4 | 15 | (155) | (73) | – | ||||||
| Total operating expenses | 740 | 710 | 740 | 4 | 0 | ||||||
| Loss before taxes | (399) | (866) | (394) | (54) | 1 | ||||||
| Results (USD million) | |||||||||||
| Net revenues | 361 | (148) | 207 | – | 74 | ||||||
| Provision for credit losses | 5 | 15 | (168) | (67) | – | ||||||
| Total operating expenses | 801 | 736 | 801 | 9 | 0 | ||||||
| Income/(loss) before taxes | (445) | (899) | (426) | (51) | 4 | ||||||
| Reconciliation of adjustment items | |||||||
| Capital Release Unit | |||||||
| in | 1Q23 | 4Q22 | 1Q22 | ||||
| Adjusted results (CHF million) | |||||||
| Net revenues | 345 | (141) | 191 | ||||
| Real estate (gains)/losses | 0 | 0 | (9) | ||||
| (Gains)/losses on business sales | (726) | 0 | 0 | ||||
| (Gain)/loss on InvestLab/Allfunds Group | 0 | 75 | 353 | ||||
| Archegos | 0 | 0 | (17) | ||||
| Adjusted net revenues | (381) | (66) | 518 | ||||
| Provision for credit losses | 4 | 15 | (155) | ||||
| Archegos | 0 | 0 | 155 | ||||
| Adjusted provision for credit losses | 4 | 15 | 0 | ||||
| Total operating expenses | 740 | 710 | 740 | ||||
| Restructuring expenses | (99) | (44) | (33) | ||||
| Major litigation provisions | 0 | (28) | 0 | ||||
| Expenses related to real estate disposals | (1) | 0 | (1) | ||||
| Expenses related to equity investment in Allfunds Group | 0 | (2) | 0 | ||||
| Archegos | (6) | (8) | (11) | ||||
| Adjusted total operating expenses | 634 | 628 | 695 | ||||
| Loss before taxes | (399) | (866) | (394) | ||||
| Adjusted loss before taxes | (1,019) | (709) | (177) | ||||
Page A-8
| Appendix |
| Reconciliation of adjustment items | |||||||||||||||
| Capital Release Unit | |||||||||||||||
| in | 1Q23 | 4Q22 | 1Q22 | ||||||||||||
| Adjusted results (USD million) | |||||||||||||||
| Net revenues | 361 | (148) | 207 | ||||||||||||
| Real estate (gains)/losses | 0 | 0 | (9) | ||||||||||||
| (Gains)/losses on business sales | (777) | 0 | 0 | ||||||||||||
| (Gain)/loss on InvestLab/Allfunds Group | 0 | 74 | 381 | ||||||||||||
| Archegos | 0 | 0 | (19) | ||||||||||||
| Adjusted net revenues | (416) | (74) | 560 | ||||||||||||
| Provision for credit losses | 5 | 15 | (168) | ||||||||||||
| Archegos | 0 | 0 | 167 | ||||||||||||
| Adjusted provision for credit losses | 5 | 15 | (1) | ||||||||||||
| Total operating expenses | 801 | 736 | 801 | ||||||||||||
| Restructuring expenses | (108) | (47) | (35) | ||||||||||||
| Major litigation provisions | 0 | (31) | 0 | ||||||||||||
| Expenses related to real estate disposals | 0 | (1) | (1) | ||||||||||||
| Expenses related to equity investment in Allfunds Group | 0 | (2) | 0 | ||||||||||||
| Archegos | (7) | (8) | (12) | ||||||||||||
| Adjusted total operating expenses | 686 | 647 | 753 | ||||||||||||
| Loss before taxes | (445) | (899) | (426) | ||||||||||||
| Adjusted loss before taxes | (1,107) | (736) | (192) | ||||||||||||
Page A-9
| Appendix |
This document contains statements that constitute forward-looking statements. In addition, in the future we, and others on our behalf, may make statements that constitute forward-looking statements. Such forward-looking statements may include, without limitation, statements relating to the following:
■ our statements as to the proposed transaction between Credit Suisse and UBS;
■ our plans, targets or goals;
■ our future economic performance or prospects;
■ the potential effect on our future performance of certain contingencies; and
■ assumptions underlying any such statements.
Words such as “may,” “could,” “achieves,” “believes,” “anticipates,” “expects,” “intends” and “plans” and similar expressions are intended to identify forward-looking statements but are not the exclusive means of identifying such statements. We do not intend to update these forward-looking statements.
By their very nature, forward-looking statements involve inherent risks and uncertainties, both general and specific, and risks exist that predictions, forecasts, projections and other outcomes described or implied in forward-looking statements will not be achieved. We caution you that a number of important factors could cause results to differ materially from the plans, targets, goals, expectations, estimates and intentions expressed in such forward-looking statements. Additionally, many of these factors are beyond our control. These factors include, but are not limited to:
■ the consummation of the proposed transaction between Credit Suisse and UBS, and the timing and implementation thereof;
■ the ability to maintain sufficient liquidity and access capital markets;
■ market volatility, increases in inflation and interest rate fluctuations or developments affecting interest rate levels;
■ the ongoing significant negative consequences, including reputational harm, of the Archegos and supply chain finance funds matters, as well as other recent events, and our ability to successfully resolve these matters;
■ the impact of media reports and social media speculation about our business and its performance;
■ the extent of outflows of deposits and assets or future net new asset generation across our divisions;
■ our ability to improve our risk management procedures and policies and hedging strategies;
■ the strength of the global economy in general and the strength of the economies of the countries in which we conduct our operations, in particular, but not limited to, the risk of negative impacts of COVID-19 on the global economy and financial markets, Russia’s invasion of Ukraine, the resulting sanctions from the US, EU, UK, Switzerland and other countries and the risk of continued slow economic recovery or downturn in the EU, the US or other developed countries or in emerging markets in 2023 and beyond;
■ the emergence of widespread health emergencies, infectious diseases or pandemics, such as COVID-19, and the actions that may be taken by governmental authorities to contain the outbreak or to counter its impact;
■ potential risks and uncertainties relating to the severity of impacts from the COVID-19 pandemic, including potential material adverse effects on our business, financial condition and results of operations;
■ the direct and indirect impacts of deterioration or slow recovery in residential and commercial real estate markets;
■ adverse rating actions by credit rating agencies in respect of us, sovereign issuers, structured credit products or other credit-related exposures;
■ the ability to achieve our strategic initiatives, including those related to our targets, ambitions and goals, such as our financial ambitions as well as various goals and commitments to incorporate certain environmental, social and governance considerations into our business strategy, products, services and risk management processes;
■ our ability to achieve our announced comprehensive new strategic direction for the Group and significant changes to its structure and organization;
■ our ability to successfully implement the divestment of any non-core business;
■ the future level of any impairments and write-downs resulting from strategy changes and their implementation;
■ the ability of counterparties to meet their obligations to us and the adequacy of our allowance for credit losses;
■ the effects of, and changes in, fiscal, monetary, exchange rate, trade and tax policies;
■ the effects of currency fluctuations, including the related impact on our business, financial condition and results of operations due to moves in foreign exchange rates;
■ geopolitical and diplomatic tensions, instabilities and conflicts, including war, civil unrest, terrorist activity, sanctions or other geopolitical events or escalations of hostilities, such as Russia’s invasion of Ukraine;
■ political, social and environmental developments, including climate change and evolving ESG-related disclosure standards;
■ the ability to appropriately address social, environmental and sustainability concerns that may arise from our business activities;
■ the effects of, and the uncertainty arising from, the UK’s withdrawal from the EU;
■ the possibility of foreign exchange controls, expropriation, nationalization or confiscation of assets in countries in which we conduct our operations;
■ operational factors such as systems failure, human error, or the failure to implement procedures properly;
■ the risk of cyber attacks, information or security breaches or technology failures on our reputation, business or operations, the risk of which is increased while large portions of our employees work remotely;
■ the adverse resolution of litigation, regulatory proceedings and other contingencies;
■ actions taken by regulators with respect to our business and practices and possible resulting changes to our business organization, practices and policies in countries in which we conduct our operations;
■ the effects of changes in laws, regulations or accounting or tax standards, policies or practices in countries in which we conduct our operations;
■ the discontinuation of LIBOR and other interbank offered rates and the transition to alternative reference rates;
■ the potential effects of changes in our legal entity structure;
■ competition or changes in our competitive position in geographic and business areas in which we conduct our operations;
■ the ability to retain and recruit qualified personnel;
■ the ability to protect our reputation and promote our brand;
■ the ability to increase market share and control expenses;
■ technological changes instituted by us, our counterparties or competitors;
■ the timely development and acceptance of our new products and services and the perceived overall value of these products and services by users;
■ acquisitions, including the ability to integrate acquired businesses successfully, and divestitures, including the ability to sell non-core assets; and
■ other unforeseen or unexpected events and our success at managing these and the risks involved in the foregoing.
We caution you that the foregoing list of important factors is not exclusive. When evaluating forward-looking statements, you should carefully consider the foregoing factors and other uncertainties and events, including the information set forth in “Risk factors” in I – Information on the company in our Annual Report 2022 and in “Risk factors” in Credit Suisse in our 1Q23 Earnings Release.
Page A-10
Signatures
Pursuant to the requirements of the Securities Exchange Act of 1934, the registrants have duly caused this report to be signed on their behalf by the undersigned, thereunto duly authorized.
CREDIT SUISSE GROUP AG and CREDIT SUISSE AG
(Registrants)
Date: April 24, 2023
By:
/s/ Ulrich Körner
/s/ Dixit Joshi
Ulrich Körner
Dixit Joshi
Chief Executive Officer
Chief Financial Officer