FORM 6-K
SECURITIES AND EXCHANGE COMMISSION
Washington, D.C. 20549
Report of Foreign Private Issuer
Pursuant to Rule 13a-16 or 15d-16
of the Securities Exchange Act of 1934
14 June 2005
O2 plc
Wellington Street
Slough, Berkshire SL1 1YP, England
(Address of principal executive offices)
Indicate by check mark whether the registrant files or will file annual reports under cover Form 20-F or Form 40-F
| Form 20-F | Form 40-F |
Indicate by check mark whether the registrant by furnishing the information contained in this Form is also thereby furnishing the information to the Commission pursuant to Rule 12g3-2(b) under the Securities Exchange Act of 1934.
| Yes | No  |
If "Yes" is marked, indicate below the file number assigned to the registrant in connection with Rule 12g3-2(b): 82 ________
Enclosure:
O2 Annual Report and Financial Statements 2005
![]()
Contents
Please see cautionary statement regarding forward-looking
statements on page 92.
Financial highlights1
2005 | 2004 | 2003 | ||||
£m | £m | £m | ||||
| Group turnover | 6,683 | 5,646 | 4,611 | |||
| EBITDA2 | 1,768 | 1,367 | 858 | |||
| Exceptional operating charges | (45 | ) | (75 | ) | (8,300 | ) |
| Group operating profit/(loss) | 341 | 159 | (8,658 | ) | ||
| Capital expenditure | 1,415 | 1,213 | 885 | |||
| Year end net debt | 78 | 366 | 549 | |||
1Continuing operations.
2EBITDA is our earnings before interest, tax, depreciation, amortisation and exceptional items, excluding our share of the operating profits and losses of our joint ventures and associates. EBITDA is not a measure of financial performance under UK GAAP and may not be comparable to similarly titled measures of other companies, because EBITDA is not uniformly defined. EBITDA should not be considered by investors as an alternative to Group operating profit/(loss) or profit/(loss) on ordinary activities before taxation as an indication of operating performance, or as an alternative to cash flow from operating activities as an indication of cash flows. EBITDA is one of the key financial measures used by the Group for evaluating financial performance, and is discussed in the operating and financial review and prospects on page 23.

| Across the Group: | |
| • | Record number of customer additions – 3.26 million |
| • | Customer base reached almost 24 million |
| • | Group turnover increased by over £1 billion |
| • | Pre-tax profit trebled over previous year |
| • | Inaugural final dividend of 2.25 pence per share proposed |
o2.com 1
| • | Strong financial performance |
| • | First dividend earlier than planned |
| • | Capital reorganisation approved |
| • | New company name – O2 plc |
| • | In shape for next phase of development |
I would like to welcome you to this, the first annual report since our change of name to O2 plc and my first since I was appointed Chairman of your Company.
In 2004/05, all of O2’s businesses performed well and the Group delivered another year of strong revenue and profit growth, with turnover from continuing operations up more than 18 per cent and underlying earnings per share 63 per cent ahead of last year. Since our demerger from BT in November 2001, there has been a transformation in the Group’s operational and financial performance. We have been delighted, as a result, to be able to establish a policy of sustainable dividends earlier than originally expected. The Group has produced both earnings growth and a positive cash flow. We believe strongly that shareholders should benefit directly from this and, accordingly, we are very pleased to be able to propose an inaugural final dividend of 2.25 pence per share.
The payment of a dividend for 2004/05 and our new policy of sustainable dividends reflect our confidence in the Company’s future prospects, and our commitment to deliver returns for shareholders.
As you will know, a capital reorganisation, announced in November 2004, was required to enable us to make the dividend payment. I am pleased that shareholders overwhelmingly approved the Company's proposals at an Extraordinary General Meeting, following Court approval of the Scheme of Arrangement. The Scheme became effective on 14 March 2005 when dealings in new O2 plc shares began on the London Stock Exchange.
We also recognised that, as a legacy of the demerger from BT, the former mmO2 share register included a large number of very small shareholders. The cost of servicing such a large number of shareholders was
significant and was set to rise further with the payment of dividends. Therefore, shareholders had the option of electing to receive, in exchange for their existing shares in mmO2 plc, either new shares in O2 plc or a cash consideration. In the event, some 833,000 holders, owning up to 1,000 shares each, received the cash alternative. This has allowed the Company to secure a long-term reduction in the costs of servicing its shareholders, whilst remaining one of the ten most widely held public companies in the UK with more than nine out of ten shareholders being retail investors.
As part of the reorganisation proposals, mmO2’s American Depositary Receipts were delisted from the New York Stock Exchange. There is no intention to seek a US listing for O2 shares. In view of the disproportionate costs arising from continued registration with the US SEC, we intend also to deregister from the SEC.
Board changes
I joined the Company as a non- executive Director in April 2003 and became Chairman of mmO2 plc at the conclusion of the Company’s Annual General Meeting in July 2004, when David Varney stood down. I would like to thank David Varney for handing over the Company in such good shape. Having successfully led the Company since demerger, David has now taken up the new and challenging position of executive chairman of HM Revenue & Customs.
There have been other important changes in the Board over the past year.
David McGlade, CEO of O2 UK, stepped down from the Board and left the Company at the end of the financial year in March 2005. He has returned to America to become CEO of Intelsat. David led the turnaround in O2 UK’s performance since demerger, and the successful establishment of the O2 brand in the UK. He has been succeeded as CEO of O2 UK by the former UK Chief Financial Officer, Matthew Key, who has also been appointed to the Executive Committee of O2 plc.
During the year, the Board was further strengthened with the appointment of Patrick Lupo, Kathleen O’Donovan and Rudolf Lamprecht as non- executive Directors. Previously chief executive and then executive chairman of DHL Worldwide Express, Patrick brings with him a wealth of experience in international sales, service and distribution. Kathleen has joined the Audit Committee reflecting her expertise in the capital and financial markets, having been Chief Financial Officer at Invensys plc and chair of the audit committee of the Court of the Bank of England. She also brings relevant experience from a number of non- executive directorships, which includes the music recording and publishing group, EMI. Rudolf’s deep understanding
o2.com 2
of sales, marketing and customer segmentation as a Board member at Siemens AG, as well as his knowledge of the German market, mean that all three will make a major contribution to our strategy of focusing on improving the customer experience and organic growth as we continue to drive the Company forward.
Three non-executive Directors – Paul Myners, Neelie Kroes and Ian Meakins – stepped down from the Board. Paul Myners decided to become chairman of Marks & Spencer, Neelie Kroes left following her nomination by the Dutch Government as its new EU Commissioner, and Ian Meakins wished to devote himself to his new role as chief executive officer of Alliance UniChem. I would like to thank Paul, Neelie and Ian, all of whom have contributed to the successful establishment of O2 as a FTSE 100 company with a strong balance sheet and a powerful O2 brand.
Andrew Sukawaty, who has made an outstanding contribution as senior independent Director and Deputy Chairman since the demerger, has elected to stand down from these roles owing to an increase in other business commitments. He remains a key non- executive Director and shareholders will continue to benefit from his close involvement in the business. Stephen Hodge was appointed Deputy Chairman and senior independent Director, and joined the Nomination and Governance Committee. Patrick Lupo became Chairman of the Remuneration Committee in plac e of Andrew Sukawaty, who remained a member of that committee.
Corporate Responsibility
We take seriously our responsibility to the communities in which we operate. We strongly believe that companies who respond to the needs of the communities in which they work, and of the wider world, are more likely to succeed on a sustainable basis. I am pleased that our efforts in these areas were recognised last year. O2 was the top scoring mobile phone operator in the Dow Jones Sustainability Indexes. We were included in the FTSE4Good, the Business in the Community Corporate Responsibility (CR) Index and the Top 100 Global Sustainability Reporters list.
Under our Can Do in the Community programme, we have successfully developed a number of community projects across our territories, while measures to support employee fund-raising and giving to charity through payroll have been launched. In total we contributed £1.7 million in charitable donations across the Group, of which over £600,000 came from UK-based companies, and a further £500,000 to the Tsunami appeal. Most importantly, our employees continued to give their time and imagination to a wide range of fund-raising schemes.
At O2 we are sensitive to public concerns over issues such as health and the use of mobile phones, the siting of masts, and the protection of the vulnerable. To help parents and others make informed choices, we have introduced measures such as age verification, parental controls, filters and barring. In addition, we help fund on-going research and are committed to effective, responsible communications, producing leaflets on subjects ranging from health issues to advice to parents on personal safety, bullying and internet grooming. All of this information is available in our retail outlets and online. A separate Corporate Responsibility report will be published in July 2005.
The excellent performance of our individual businesses also won independent recognition in the form of a number of important awards. I am particularly proud that O2 was voted “Best Large Company to Work For” in Ireland and placed in the top 15 medium-sized employers in Germany. One of our key objectives at O2 is to improve the day-to-day working lives of our employees and to ensure that work is an environment that they enjoy. We are in the process of introducing Balance – a new flexible approach
to employee benefits designed to help with the management of work/life choices. It would allow, for example, our staff to substitute extra payments for life insurance or additional child-care vouchers for unwanted holiday time.
Looking ahead
We are financially strong and have built a powerful, iconic O2 brand. Revenue is growing fast, the Company has modest debt and, with a strong management team led by Peter Erskine, our CEO, we have so far outperformed most City expectations. O2 is in a good position. Taking the Company forward to the next phase of its development and further strengthening its position in Germany, the United Kingdom and Ireland will be challenging but achievable.
I believe that Germany represents the most significant new opportunity for O2 and it is for this reason that the Board has authorised a substantial extra capital investment into our German business. Its performance has substantially exceeded our expectations and the impressive momentum and growth in revenue and profitability that O2 Germany has achieved over recent years is continuing apace.
Improving customer satisfaction and reducing churn are the greatest challenges that the mobile industry faces. Ownership of mobile phones is now so widespread, and the degree of competitiveness so intense, that we must change our emphasis from striving to acquire new customers towards retaining those we already have. I am determined that O2 will take a lead in these areas. We will focus on gaining a closer understanding of our customers’ needs and behaviour, to find the best way in which we can reward their loyalty. We will work even harder to differentiate our business by delivering intuitive, easy-to-use and fairly priced products and services – particularly in the data field – that our customers value highly, based on proven technology. And we will continue to ensure that we work to make a difference to the communities in which we operate, building a sustainable business for the future.
We aim to grow the dividend towards our medium-term target pay-out ratio of 50 per cent of underlying earnings, reflecting our confidence in the Company’s ability to continue to grow revenue, earnings and cash flow, and our commitment to deliver attractive returns to shareholders.

David Arculus
Chairman
o2.com 3
| • | Strong revenue and profit growth |
| • | Accelerated investment in Germany |
| • | Focus on enhanced customer experience |
| • | Airwave service fully operational |
| • | Increased take-up of data services |
In 2004/05, O2 has delivered further strong revenue and profit growth across all our businesses. In the face of determined competition, we had a record year for customer additions and achieved a significant increase in earnings before interest, tax, depreciation, amortisation and exceptional items (EBITDA), and operating profit. Group revenue from continuing operations grew by over £1 billion and pre-tax profit more than trebled to £309 million. Underlying earnings per share were 63 per cent ahead of last year and net debt was reduced by £288 million to £78 million.
The uptake of data services accelerated. These now generate revenues of over £1.4 billion per annum and account for more than 23 per cent of our gross service revenues. During the year, we launched our business and consumer 3G services in the UK and Germany, with Ireland to follow later this year. Our data offering will be significantly enhanced in the second half of 2005 by our agreement with NTT DoCoMo to provide its mobile internet service in all our key markets.
O2 UK
In a highly competitive market with ten players, O2 UK showed good momentum, adding 1.1 million new customers – made up of 785,000 pre-pay and 335,000 contract additions – taking its customer base to 14.4 million. We have reduced the number of pre-pay net additions to allow for an element of double counting when existing pre-pay customers buy a new handset or SIM card. Despite the impact of the termination rate cut imposed by Ofcom in September 2004, service revenue showed further growth, due to strong voice and increasing data usage. Texting grew by 34 per cent, reinforcing our market- leading position. Data is not just about texting – more than one-third of customers used a non-text data service during the year. Our Tesco Mobile joint venture, which is reported separately from O2 UK, also continued to
perform well, with its active customer base reaching 500,000 shortly after Christmas 2004. In such a competitive market, the cost of customer churn is an issue, but at O2 UK EBITDA rose by 14 per cent to £1,183 million on a 14 per cent increase in service revenues.
We plan to deploy significant new resources into the customer-facing areas of our UK operations – including the creation of 2,000 new jobs, opening a fourth major UK customer service centre and further expanding our shop network. By delivering a better customer experience, we aim to improve customer loyalty and develop a sustainable basis for enhanced long-term returns. The cost of this expansion has been offset by efficiencies in non customer-facing activities, resulting in a reduction of some 500 positions and an exceptional operating charge of £45 million recognised in 2004/05.
O2 Germany
The performance of O2 Germany last year was outstanding. The business is now recognised as the most dynamic and innovative in the German market. After what was, by any measure, an extremely strong first half, growth continued over the rest of the year. Service revenue increased by 28 per cent to €2,474 million and EBITDA increased to €500 million. Our momentum in Germany has been driven by a rapid increase in the customer base – O2 Germany has a very attractive range of products and services and markets them aggressively. We added nearly 2 million new customers, approaching one-third of net new additions in the German marketplace. These are high-value customers. O2 Germany has market- leading ARPU thanks largely to our unique O2 Genion Homezone service. In October 2004, we launched a new joint venture, Tchibo Mobilfunk, which had attracted more than 250,000 pre-pay customers by the end of the financial year. We are now aiming to continue this growth in what is Europe’s largest telecoms market. Over a five-year period starting in April 2004, we aim to spend between €3 billion and €3.5 billion on increasing our investment in network quality and population coverage – this is €1 billion to €1.5 billion more than previously planned. By the end of the period, we will be able to offer high-quality mobile services across our own 3G network, underpinning further growth and also higher profitability as we reduce our reliance on roaming agreements with other operators.
O2 Ireland
Innovative and competitive services and tariffs, together with the strength of the O2 brand, have continued to drive growth in customers at O2 Ireland, together with an on-going rise in usage levels. Customers in Ireland consistently use their mobile phones over 50 per cent more than in our other territories. This growth in customer numbers, to over 1.5 million, led to another year of strong financial performance with service revenue increasing by 13 per cent to €816 million and EBITDA 9 per cent higher at €327 million. The Irish
o2.com 4
market is becoming increasingly competitive. Four network operators are now active and others are expressing an interest, following proposed measures to allow mobile virtual network operators access to the networks of existing players.
O2 Airwave
The roll-out of our Airwave network for the emergency services was completed, on time and on budget, at the end of March 2005. Airwave, which makes communities safer by providing communication where and when it matters most, has now been delivered to all police forces in England, Scotland and Wales. Over 150,000 police officers will have access to the service, together with more than 78 other public safety agencies that have also signed up to Airwave. The system has already contributed to a reduction in crime, improved officer safety and, in the case of Hereford & Worcester Ambulance Trust, saved over 150 lives. O2 Airwave has been shortlisted for similar contracts to provide nationwide communications for the Ambulance and Fire Services. We see many opportunities to provide secure and reliable communications to a wide range of new users.
Manx Telecom
Manx Telecom, our subsidiary on the Isle of Man, was the first company in Europe to launch a live 3G service, in December 2001, providing O2 with a valuable learning experience and hands-on knowledge of the potential of 3G. Building on this success, Manx Telecom is now set to run Europe’s first super-fast 3G service, using HSDPA technology. This offers communication speeds up to three times those of current 3G services. Once again we expect that this will provide other O2 businesses with vital insights into future mobile services. The technology will be rolled out across all of our territories from 2006.
Strategy
Our strategic framework for the coming year is driven by the same high but realistic aspirations that have delivered such strong growth to our business since demerger. To continue to meet those aspirations we will be addressing some key priorities in 2005/06.
Superior revenue and profit growth despite the competitive landscape: O2 UK continues to focus on winning and retaining more high-value customers in order to drive further revenue improvements. In Germany, there is significant room for growth at recent rates and our accelerated investment programme will provide a springboard to achieve this. O2 Airwave will be making a strong financial contribution in its first full year of operation.
Best customer experience to give substance to our iconic O2 brand: quality, value and innovation are the keys to maintaining the strength of the O2 brand and differentiating us from our competitors. To keep the loyalty and trust of our customers, we must give them the service that they want and products that work – which is why we have been cautious in the timing of our 3G launch. We do not necessarily want to be the first to market but we do want to be the best. Our aim is to keep the O2 brand fresh, with fewer, better services, all designed to enhance the customer experience – we are investing in the platforms and people to achieve this.
Operationally efficient, agile and innovative organisation: we will be driving our businesses to realise efficiency gains, using our growing insight into our customers’ needs and behaviour to align our costs more closely to what customers value most. We have innovative joint ventures with Tchibo in Germany and Tesco in the UK, and other multi- territory partnerships.
Mobile data services that our customers really value: “texting” has become a way of life, whether in
person-to-person messages, texting questions to the Prime Minister or voting off Big Brother contestants. We carried a record 50 million texts on Christmas Day 2004 and texting continues to grow in all markets. Driven by O2 Active, our award-winning mobile internet portal, we are also starting to see significant growth in non-text data usage, revenues from which have increased by 50 per cent over the past 12 months. The mobile sector is poised for even more dramatic growth as we focus on developing new mobile data products and value-added services.
A high-speed network, as provided by 3G, is the key to future mobile data services, enabling customers to migrate to advanced, content-rich applications. We believe there will be a mass market for these services starting in late 2005 and building over the next few years.
We are rolling out the 3G network in all of our territories, matching capacity to known mobile data demand. We have invested in training and billing systems and we have highly specified and well- functioning devices. To complete the picture, we signed a long-term agreement with NTT DoCoMo Inc, Japan’s largest mobile communications provider, to launch a mobile internet service under the i-mode® brand in the UK and Ireland in Autumn 2005. A similar service will be available in Germany from Spring 2006. This service, which will complement O2 Active, has a proven track record in Western Europe of lifting uptake, usage and revenue from data services, due to its ease of use and huge breadth and depth of tailored internet content.
The appeal of these services will be significantly enhanced through the progressive introduction of HSDPA technology. This offers speeds significantly better than 3G and will, in effect, provide a true mobile broadband experience. In addition, we are engaged in the UK’s first trial of multi- channel mobile TV.
Looking ahead
In the UK, we are expecting revenues to grow at a mid-single digit rate, reflecting the impact of the remaining five months of the call termination rate cut in September 2004 and continuing competition in a highly penetrated market. Competitive forces, coupled with O2 UK’s substantial investment in customer-facing capabilities to attract and retain long-term customers, are expected to lead to a broadly stable EBITDA margin. We are expecting further strong revenue growth in Germany, driven mainly by a continued rapid growth in our customer base there. On the back of strong revenue growth, O2 Germany’s EBITDA margin is expected to rise further, to around 20 per cent, after absorbing the impact of UMTS network running costs and on-going national roaming costs. Capital expenditure overall should be broadly in line with last year. Higher investment in our UMTS network, particularly in Germany, will be offset by a reduction in spending at O2 Airwave, following completion of its network roll-out.

Peter Erskine
Chief Executive Officer
o2.com 5
History and development of the Company
On 14 February 2005, the shareholders of mmO2 approved the proposals for a capital reorganisation to create distributable reserves through a Court- approved Scheme of Arrangement (the Scheme). The reorganisation was required in order that the Company could implement a sustainable dividend policy and make distributions to shareholders. Following shareholder approval, mmO2 was acquired by a new company, O2, which effected a reduction of its share capital to create distributable reserves. The Scheme became effective on 14 March 2005, on which date dealings in O2 shares commenced on the London Stock Exchange.
Under the Scheme, mmO2 shareholders exchanged their existing shares in mmO2 for new shares in O2 on a one-for-one basis. mmO2 shareholders also had the option of electing to receive, in exchange for their existing shares in mmO2, either new shares in O2 or cash consideration under a cash alternative. Shareholders who took no action were deemed to have elected for the cash alternative. This cash consideration consisted of the amount received through a placing in the market of the new shares on behalf of the shareholders electing for the cash alternative. The value of the cash alternative was £1.30 including the premium of 5 pence per share. The cash alternative (and therefore the size of the placing) was limited to 300,000,000 O2 shares.
The Board has also reviewed the US listing and the associated ADR programme which is a legacy of the demerger from BT. As part of the reorganisation, mmO2’s ADRs were delisted from the New York Stock Exchange on 11 March 2005 and O2 has not established an ADR programme nor a US listing for the new shares in O2. The Board is currently pursuing deregistration of O2 shares from the Securities and Exchange Commission.
During the second half of the financial year ended 31 March 2004, mmO2 transferred O2 Online, Products O2 and certain other central functions to the operating businesses, to simplify lines of management, reduce costs, and improve speed of execution. This restructuring, which reduced headcount by 200, led to an exceptional operating charge of £75 million being incurred in the second half of the year ended 31 March 2004. As a consequence of this streamlining, as from 1 April 2004, O2 Online and Products O2 are no longer being operated as separate businesses.
On 20 February 2004, we announced that our Board of Directors had received and considered a proposal by Royal K.P.N. N.V., the Dutch telecommunications group. The Board carefully considered the proposal but rejected it as not being in the best interests of our shareholders.
On 14 April 2003, we announced that we had agreed the sale of O2 Netherlands to Greenfield Capital Partners, an independent private equity and finance group with interests in the telecoms sector, for € 25 million in cash, which was paid on completion of the transaction on 3 June 2003.
Our Group
We are a leading provider of mobile communications services in Europe, with wholly owned businesses in the United Kingdom, Germany, Ireland and the Isle of Man.
We are a leading provider of mobile communications services in Europe, with wholly owned businesses in the United Kingdom, Germany, Ireland and the Isle of Man.
We have almost 24 million customers and approximately 15,000 employees. We reported revenues for the year ended 31 March 2005 of £6,683 million. Data represented 23.3 per cent of gross service revenues for the financial year ended 31 March 2005.
The businesses in the UK and Ireland are both established and profitable, with a track record of revenue and customer growth and a strong presence in high-value markets, such as business and mobile data services. In the UK, our Tesco Mobile joint venture performed well, reporting that its active customer base reached 500,000 shortly after Christmas. In Ireland, the growth in customer numbers led to another year of strong financial performance.
O2 Germany remains the fastest growing operator in Germany. It experienced strong service revenue growth for the full financial year ended 31 March 2005, driven by the continuing rapid growth in the customer base. Performance in Germany has exceeded expectations thanks largely to our unique Genion service.
We announced on 1 April 2005 that O2 Airwave had completed the nationwide network – on time and on budget – to provide every police force in England, Scotland and Wales with state of the art, secure digital communications. The completion of the five-year programme that has rolled out the largest public safety mobile communications network of its kind in Europe is a milestone in the efforts being made to cut bureaucracy and improve safety for the police and the general public. Over 100,000 police officers are now using Airwave.
Manx Telecom is unique within the Group, providing mobile, fixed line and internet services in the Isle of Man. It was also the pioneer of UMTS networks, the platform on which we, in measured stages, will supply services Europe-wide. We chose Manx Telecom to run Europe’s first superfast 3G trial, in partnership with Lucent Technologies, using HSDPA technology. HSDPA offers the possibility of communication speeds up to three times faster than current commercial UMTS services.
As we reported last year, we became a founding member of Starmap Mobile Alliance in October 2003, a group of independent mobile phone operators who are joining forces in readiness for the international roll-out of UMTS services. Starmap aims to provide a “home-away-from-home” experience by introducing seamless roaming and multimedia connectivity to more than 46 million customers in ten European countries. In addition, we have established the Tesco Mobile and Tchibo Mobilfunk joint venture businesses in the UK and Germany respectively.
o2.com 6
Our technology
Our success in Germany has encouraged us to accelerate the growth of the business by means of increased network investment to deliver a high-quality customer experience from our own UMTS platform. At the same time we have launched our consumer UMTS service in the UK, a move that will be significantly enhanced in the second half of 2005 by our strategic agreement with NTT DoCoMo to provide its mobile internet service in our key markets.
Our success in Germany has encouraged us to accelerate the growth of the business by means of increased network investment to deliver a high-quality customer experience from our own UMTS platform. At the same time we have launched our consumer UMTS service in the UK, a move that will be significantly enhanced in the second half of 2005 by our strategic agreement with NTT DoCoMo to provide its mobile internet service in our key markets.
We signed a long-term strategic agreement with NTT DoCoMo, Japan’s largest mobile communications provider under which we will launch a mobile internet service using i-mode® capability in the UK, Germany and Ireland. This partnership will complement our existing expertise in data services with NTT DoCoMo’s experience in non-SMS data and its extensive research and development capabilities. Customers will benefit from easy-to-use services, rich content applications and messaging across a range of advanced handsets.
Under the terms of the agreement, we are licensed by NTT DoCoMo to offer the i-mode® capability to our 24 million customers. Already the world’s most popular mobile internet platform with more than 48 million subscribers using over 6,100 official content sites in ten countries and regions, we will make the i-mode® capability available on an extensive selection of advanced multimedia handsets and devices from major Asian, European and US manufacturers. These currently include NEC, Panasonic, Siemens, Motorola and Samsung, amongst others.
O2 UK and O2 Ireland will have exclusive use of the i-mode® brand and technology in their respective markets. O2 Germany will launch a service based on i-mode® technology under its own brand.
The appeal of these services will be significantly enhanced as we roll out HSDPA with speeds of up to 1Mbps (compared with UMTS with speeds of 384kbps) to all our customers, offering a true mobile broadband experience.
Our products and services
On 27 January 2005, we announced that we would introduce a range of attractive new handsets and an enhanced O2 Active portal over our UMTS network. The move builds on our leadership in non-voice services and unique O2 branded handsets. In the UK, UMTS services have been available for our business users since October 2004 and our consumers since 1 February 2005, and in Germany to our business users since April 2004 and all consumers shortly thereafter.
Consumers who purchase UMTS devices from us will enjoy a wider range of new and original content, including: film from Warner Bros Online (previews, behind the scenes and interviews); lifestyle from titles such as GQ, FHM and Glamour; the latest music videos and tracks from major recording artists and MTV; news from ITN; and sports, including England Rugby and Arsenal Football. They will also benefit from faster download speeds and video calling. The launch also marks the arrival of a new and improved version of the
innovative O2 Active portal, which has been re- designed to take advantage of richer, faster, more capable UMTS-based features.
To mark the introduction of our UMTS service for consumers, we launched the only own- branded UMTS handset in the UK market to date – the competitively priced O2 X4.
Based on the highly successful design principles of our existing X-range of handsets, which includes the popular O2 Xda II®, the O2 X4 sports a sleek clamshell design with a high-quality 262,000-colour main screen display. The O2 X4 is equipped with a 1.3 megapixel camera with an 8x zoom lens and advanced “flash mechanic”; it also includes an MP3 music player, video downloading and streaming capabilities, 10Mb of phone memory and 64Mb of additional capacity via a removable memory card.
In addition to the O2 X4, we will offer UMTS customers a range of handsets from leading manufacturers, including the Nokia 6630, Samsung Z107, Motorola V975 and the Sony Erickson V800. This will be expanded going forward through existing handset procurement channels and the NTT DoCoMo partnership.
In Germany we recently launched an innovative, high-speed offering, O2 surf@home, a service that directly complements O2 Genion. Using this innovative UMTS data service, O2 customers are able to connect to the internet from their homes at fixed line rates. The combination of O2 Genion with O2 surf@home will enable complete fixed line substitution and increase customer value and loyalty.
Our strategy
Our primary goal is to create shareholder value by becoming the fastest growing major European mobile operator in revenue and profitability. We have a number of specific growth opportunities including further investment in our networks in Germany, improving the customer experience in the UK and Ireland, O2 Airwave moving into full operations, and maximising the potential of key partnerships such as Tesco Mobile and Tchibo Mobilfunk.
We will continue to build on the momentum created by our successful brand, ensuring that, whenever customers come into contact with us, the expectations created by the brand are met. In this way, we aim to become an integral part of customers’ lives and improve our ability to attract and retain higher-value customers.
We plan to deploy significant additional resources into the customer-facing areas of our UK operations –including the creation of 2,000 new retail and customer service staff over the next two years, opening a fourth major UK customer service centre and further expanding our retail network. By delivering a better customer experience, we aim to improve customer loyalty and develop a sustainable basis for enhanced long-term returns. The cost of this expansion has been offset by efficiencies in non customer-facing activities, resulting in a reduction of some 500 positions and an exceptional operating charge of £45 million recognised in the financial year ended 31 March 2005.
o2.com 7
Business review continued
| The following table represents the turnover for each of our continuing operating businesses for the three financial years ended 31 March: | |||||||
Year ended 31 March | |||||||
2005 | 2004 | 2003 | |||||
£m | £m | £m | |||||
| Continuing operations | |||||||
| O2 UK | 4,030 | 3,451 | 3,025 | ||||
| O2 Germany | 1,865 | 1,508 | 1,060 | ||||
| O2 Ireland | 585 | 529 | 442 | ||||
| O2 Airwave | 169 | 89 | 16 | ||||
| Manx Telecom | 53 | 50 | 48 | ||||
| O2 Online | – | 140 | 93 | ||||
| Intragroup eliminations | (19 | ) | (121 | ) | (73 | ) | |
| Total | 6,683 | 5,646 | 4,611 | ||||
Operations (by country)
O2 UK
Operational performance
O2 UK delivered a strong operating and financial performance during the financial year ended 31 March 2005. Customer numbers, service revenue, ARPU and EBITDA all showed continued growth. Success was driven by innovative new services and customer propositions, a series of successful marketing campaigns and further improvements in network quality. All of these aided the continued development of the “iconic” O2 brand.
Total customer numbers grew by 1.1 million to 14.4 million helping to drive a 14 per cent growth in net service revenue to £3,627 million. The quality of our customer base also continued to improve. This was evidenced by post-pay ARPU for the financial year ended 31 March 2005 rising £17 compared with the previous year to £542, while pre-pay ARPU rose £2 on the previous year to £143. On a blended basis, ARPU was £281 at year end, an increase of £9. Rising ARPU occurred despite the impact of the regulatory price cut in September reduced our rolling ARPU by £11 by the end of the year (see “Regulation In The United Kingdom” on page 16). EBITDA, one of our key indicators of profitability, reached £1,183 million, a 14 per cent year on year increase.
We retained our focus on mobile “data” (non-voice services). The volume of text messages carried on our network hit 1 billion texts per month by the end of the financial year ended 31 March 2005. This continued focus on text and other messaging services such as e-mail and picture messages, as well as non-voice services like music, content downloads and information services helped data services revenue reach 24.2 per cent of O2 UK service revenue, an increase of 3.8 per cent over last year.
Further development of O2 Active, the simple-to-use portal for news, information and downloads, helped
drive this success. A revamped, more intuitive homepage, including a scrolling ticker of news headlines, received positive customer feedback and drove higher usage. As at 31 March 2005, O2 Active was available on 100 different handsets.
A number of innovative O2 sourced and branded devices helped us build increased brand differentiation and drive service usage. We extended our O2 Xda signature range of wireless personal digital assistants with the launch of the O2 Xda II, the O2 Xda IIs and the O2 Xda IIi. Features include web browsing, e-mail, LAN/WAN access, camera and video functionality, and a range of office applications. The O2 Xda II’s integrated digital music player also allows customers to download and play music tracks making it appealing to high-spending consumers who are amongst the most intensive mobile users. We also added three new phones to our “X” range of O2 branded handsets, the O2 X2, the O2 X3 and the O2 X4, our first own branded UMTS phone. All are unique to O2 and have a wide range of multimedia functions.
As part of our on-going investment in service capability, we rolled out the first phase of our UMTS network in the UK, launching initial services to business customers in October 2004 and consumers in February 2005. The launch of our UMTS service is an evolution of our successful services strategy. Because UMTS technology offers faster data speeds, it allows customers with UMTS-enabled devices to enjoy richer information and entertainment content, and new interactive services. For example, O2 Active can now be accessed at faster speeds, provides 3D interactive and multiplayer games, and has greater video capability and content such as film and music videos. As it is a new technology, we believe UMTS services will initially appeal to early adopters, building towards mass-market adoption in the latter part of the financial year ending 31 March 2006.
In the mass consumer market, we continued to develop innovative propositions and promotions that proved appealing to our customers. For example, we introduced O2 Friends for pre-pay customers (half-price calls and messages to three chosen numbers) and “Happy Hour” (offering free messaging between 7 p.m. and 8 p.m.) for both pre-pay and post-pay customers.
In the business market, we grew our direct sales force and introduced new pricing and service propositions. These included the O2 Welcome service for larger corporate customers, designed to make switching from other networks trouble-free by giving dedicated support, advice and information at the customer’s premises. O2 Network Manager, another innovation for corporate customers, was also launched. Network Manager measures the service level given to corporate customers to an agreed standard to enable us to improve their network experience. The O2 for Business marketing campaign promoted the quality of O2’s network.
These initiatives helped us acquire many new corporate customers such as DHL as well as growing business with customers such as Superdrug and West Yorkshire Police.
In the market for small and medium sized businesses (SME), we launched O2 Business Zones which offered 40 per cent off calls to two chosen area codes. This was introduced in response to customer feedback that many small businesses make most of their calls within their local area. We also introduced a new set of
o2.com 8
tariffs providing “shared minutes” and “shared bundles” (for example, data minutes) for small businesses to use across all mobile phones on their account. Demand from businesses of all sizes for the BlackBerry™ mobile e-mail service increased.
In October 2004, O2 UK launched O2 Connection Manager. The service provides business customers on the move with a simple way to connect their laptop computer to the O2 data network using whichever of our UMTS, GPRS or WLAN network best suits. WLAN is a relatively new technology, appealing to early adopters from which we expect to see growth over time. Following agreements signed with WLAN operators, O2 now provides WLAN access in over 6,700 UK locations including hotels, airports, coffee shops, bars and pubs.
The percentage of total sales delivered through O2’s own channels (O2 stores, O2 Online store and O2’s direct sales force) continued to increase and we expect the proportion of sales through our own channels to continue to rise during the financial year ending 31 March 2006. We believe this will enable us to deliver a better customer relationship. The number of O2 retail stores grew by 26 to reach 257 by the year end.
A key element of our strategy is to differentiate O2 by delivering a better overall customer experience through, amongst other things, higher service quality. Improvements in overall service quality last year focused on two main areas – improvements in our network performance and enhancements to our customer service capabilities.
Our main indicator of network performance and quality is minutes per drop (MPD) – the number of minutes between dropped voice calls. This improved through the year and is now at its highest ever level.
In the area of customer service, we continued to make significant investment in our single billing and customer relationship management system across all O2 UK operations. Work already completed on the project has, for example, enabled on-line customers to view their bills online. Also a new web-based tool in retail stores allows new customers’ mobile phones to be set up and activated on the spot. As we implemented these during the year, we encountered a number of challenges around service and billing communications. We have now tackled these and put increased focus on managing service and billing quality.
The strong appeal and distinctiveness of the O2 brand also continued to help us differentiate from our competitors. Brand awareness continued to climb last year and brand consideration is at an all time high. This has been assisted by O2 UK’s sponsorships of the World Cup winning England rugby team, the 2004 Football Association Premiership champions Arsenal, and Capital Radio’s drive-time and a host of music events, as well as the strong appeal of our market propositions. Recognising the contribution made by the O2 brand to its business performance, O2 UK won the Institute of Practitioners in Advertising’s (IPA) prestigious Grand Prix award for 2004. This award recognises companies that have marketed their brand most effectively with the best return on investment. We also won the Mobile Data Association’s “Best Network of the Decade” award for being the most innovative in “encouraging the uptake of mobile data over the past ten years.”
Market dynamics
Our performance was achieved against the backdrop of stiff and increasing competition. Traditional competitors including Vodafone, Orange and T-Mobile continue to grow. 3, the newest network operator with a purely UMTS network, has built strong momentum. 3 has been growing through a mixture of aggressive tariffs and high handset subsidies and we expect them to continue this strategy. Tesco Mobile, our 50/50 joint venture with Tesco, has delivered sustained growth. In December 2004, 14 months after its launch, Tesco Mobile had attracted over half a million customers. The joint venture addresses sections of the family market that we do not currently target with the O2 brand through Tesco’s network of supermarkets and “Metro” stores. We expect competition to intensify again this year with several new MVNOs entering the market, which coincides with slowing overall growth in new customers.
Corporate responsibility
We believe that companies who respond to the needs of the communities in which they work are more likely to deliver good business results. We look in particular to support initiatives where mobile services can be used to tackle social needs, where our employees can become involved, and where we can raise the profile of O2 as well.
In July 2004, O2 UK launched its new charity partnership with Weston Spirit, the charity co- founded by Simon Weston OBE to help young people at risk of social exclusion reach their full potential. Over the next two years, our new partnership aims to deliver a ground- breaking mentoring programme to support personal development of young people. We have already recruited more than 70 O2 UK mentors who have been trained to provide advice, support and encouragement to young people assigned to them through a series of local school partners. Elsewhere, we are supporting HM Prison Service’s “Prison Me No Way” campaign. O2 UK employees have joined forces with the emergency services to provide crime and safety awareness workshops to schools throughout the UK. Following the successful “Teach UR Mum 2 Text” campaign during the financial year ended 31 March 2004, O2 UK last year supported Milly’s Fund’s “Summer Textin’ Tips” campaign which provides personal safety advice to young people while they are travelling. We are also funding the development of medical devices using mobile technology to monitor asthma and cystic fibrosis patients remotely. Trials with asthma patients have already proved a success with many more patients monitoring their breathing on a regular basis compared with conventional methods.
We are aware that mobile phone masts are not always popular and we work hard to address people’s concerns. Opposition to masts, does, however, have to be balanced with the strong demand from over 50 million UK users of mobile services and extensive research showing no known health risks.
We have consistently taken a proactive approach to the issue of child safety and mobile phones. As the first mobile operator in the UK to join the Internet Watch Foundation, and a signatory to the industry’s Code of Practice for the self- regulation of new forms of content, O2 UK has introduced controls to allow parents to manage their children’s access to inappropriate content or experiences. In addition, we have sought to provide customers with advice on the nature and use of mobile services and have also published a series of
o2.com 9
Business review continued
leaflets giving advice to children on issues such as the sensible use of camera phones, safety in chatrooms, and dealing with nuisance calls and bullying.
Regulatory issues
In January 2005, Ofcom began consultations on the release of future mobile spectrum over the next five years. Of particular importance will be the UMTS expansion band (2500MHz-2690MHz). There is likely to be a protracted public debate on the timing and terms for future spectrum releases.
Looking ahead
We will continue our focus on improving profitability by growing our base of high-value customers and improving business efficiency. A key priority will be customer retention as more intense competition has increased pressure on the rate of churn. In order to deliver an enhanced customer experience and strengthen customer loyalty, we plan to redeploy significant additional resources into customer-facing areas including the opening of a fourth major call centre in the UK, and further expanding the O2 retail network. To support these initiatives, we plan to hire over 2,000 new retail and customer service staff over the next two years, offsetting the cost of this expansion by targeting efficiencies across a wide range of managerial and administrative functions. This is expected to result in a reduction of up to 500 permanent non-customer facing positions in the financial year ending 31 March 2006.
Investment in our UMTS network will continue as we expand the network across the UK, initially focusing on the areas of greatest demand. The range of UMTS capable phones in our handset portfolio will increase as will the content offered through our O2 Active portal.
We plan to launch a mobile internet service based on i-mode® capability later this year in an exclusive agreement with the Japanese operator NTT DoCoMo. This will give us competitive differentiation by providing our customers with access to the most comprehensive and flexible internet service available on mobile phones, on a wide range of handsets from several vendors. The i-mode® capability is a mature service that has been proved to generate higher ARPUs in other countries than any other competing technology or platform. Already the world’s most popular mobile internet platform, it has more than 48 million subscribers using over 6,100 official content sites in ten countries. We believe this will be a compelling mobile internet service.
O2 Germany
Operational performance
O2 Germany has established itself as the most dynamic and innovative operator in the German market, which is the largest in Europe. In the financial year ended 31 March 2005, both revenues and customer numbers grew at an accelerating pace throughout the year, outstripping both our expectations and the growth of other competitors, leading to further improvements in market share. By attracting a significant proportion of high-value customers and tightly controlling operating costs, O2 Germany has translated this rapid growth in subscribers into a substantial improvement in profitability. Overall customer numbers grew
by 33 per cent. Blended ARPU decreased by €3, for two reasons. Firstly, ARPU (especially postpaid) decreased in the final quarter of the financial year ended 31 March 2005 due to termination rate cuts in the German mobile market. Secondly, O2 acquired a higher share of prepaid customers, which had an effect on overall blended ARPU despite an increase in prepaid ARPU. Service revenues at constant exchange rates were 28 per cent higher at £1,687 million and EBITDA reached £341 million with a margin of 18.3 per cent. In the light of this accelerating growth, over the next five years the business will step up the rate of investment in its UMTS network to reduce national roaming costs, enhance customer experience and secure population coverage that is competitive with the market leaders.
Our customers’ experience of the O2 brand is central to our growth strategy. In addition to our increasing focus on customer segmentation, and on identifying and meeting the needs of our various customers, we have directed a stronger focus towards direct sales channels. O2 has increased the number of O2 shops to 119 and other points of sale to more than 9,000. Our O2 Online shop has continued to show a strong performance with a high rate of net new additions as well as low SACs, and good ARPU. Our customers also value a real face-to-face presence. To enhance customer experience and further build brand image, the first flagship O2 store was opened in Munich in December 2004.
In October 2004, O2 Germany launched the Tchibo Mobilfunk offer jointly with Tchibo, a well-established consumer brand known for its value-for-money offers, as branded reseller managed by a 50:50 joint venture. This additional and exclusive sales channel complements O2’s target segments and has been very successful. The product proposition was unique in Germany at launch: a Tchibo branded, transparent flat pre-paid tariff on very attractive terms. Tchibo Mobilfunk has so far attracted in excess of 250,000 pre-pay customers. In December 2004, Mobilcom was the first service provider in the German market to offer O2 pre-paid products – at first on a dealer basis. New O2 offers through service provider channels will become available in the current year.
Our unique O2 Genion product, which continues to be a key driver of gross additions, underpins our strategic focus on more profitable customers, generating higher ARPU and a considerably lower churn rate than other mobile products. Customers attracted from other operators usually generate a higher ARPU because they change their patterns of usage with O2 Genion. Thanks to its advanced technology, O2 Genion offers innovative services in combinatio n with reduced tariffs in a geographical area chosen by the customer, usually near the home or workplace. This is a unique service in the German – and also European – market.
In our target business market, we have been winning major new customers with an expanded Business Unit team and forging new partnerships with sales channels and software suppliers. We also extended our range of tariff packages and services, both tailored to the specific needs of our business customers. During the year, O2 Germany acquired a number of new high-profile customers, including MTU Aero Engines, Tchibo and Christian Dior. Partnerships with our long- standing customers, such as BMW, have been strengthened. For example, we have equipped the world’s most modern automobile manufacturing plant – the BMW production site in Leipzig – with our O2 Genion Campus solution.
o2.com 10
O2 Germany seeks to bring solutions to its customers rather than just transmission capacity. To this end, we have stepped up our co- operation agreements with around 20 partner companies, including Siemens SBS, UNISYS, Tobit Software, Sun Microsystems and Extended Systems, to offer our business customers mobile solutions in such areas as field service control and mobile data security. Customers can use our O2 Xda, the laptop card UMTS/GPRS as well as BlackBerry™, among other platforms.
Internationally, our business customers benefit from products and services for mobile communication in more than 150 countries and the networks of over 300 roaming partners. In our partner networks within the Starmap Mobile Alliance, we are offering uniform and especially cost attractive conditions for mobile work and telephony.
Revenues from mobile data products also grew strongly with non-SMS text data usage making an increasingly important contribution. The volume of SMS text messages sent during the year increased by 33 per cent and data as a proportion of service revenue rose from 19.5 per cent to 21.8 per cent in the financial year ended 31 March 2005. Some 24 per cent of our customers now use non-SMS data services.
The launch of high-speed UMTS services in the current financial year should add increasing momentum to our mobile data revenues. O2 began its UMTS service in April 2004 offering a UMTS laptop card to its business users, and followed this with laptop and UMTS handset surfing for consumers. In addition to mobile internet access, which offers download speeds of up to 384kbps, O2 customers on UMTS have been able to make video calls and make use of a broad range of video streams.
In July 2004, we launched our first UMTS- enabled tariff – O2 Active. In a complementary way to O2 Genion, O2 Active enables us to target high-value customer groups, attracted by O2 Active’s simplicity and value-for-money attributes. Minute bundles include calls to all networks, fixed line and voicemail at anytime and anywhere. Extra minutes always have the same price. As well as the usual O2 surf@home (WAP flat rate) and O2 Music packs, O2 Active customers can also book SMS and voice packs including the O2 Afterwork Pack, allowing unlimited calls in the evening to fixed and other O2 numbers and the O2 Weekend Pack, with a 1,000 minute bundle.
The high quality and appeal of our O2 Active portal service has already gained external recognition. Europe´s best selling telecom magazine “Connect” gave O2 Active two awards – from both readers and experts – as the best mobile portal in Germany – ahead of Vodafone live! and other competitors ’ services. In November 2004, this advanced version of the O2 Active portal was also rolled out to most GPRS phones – with a speed option giving the users the choice of a faster version of that portal without losing any information. Our strategy has been vindicated by the subsequent strong growth in the number of monthly portal users who bring us higher traffic and premium content income.
Market dynamics
The German mobile phone market grew by 9 per cent last year and market penetration rose to 83 per cent in March 2005 compared with 76 per cent in March 2004. About 7 million customers were acquired during the financial year leading to about 73 million mobile connections. There are currently four mobile network operators in Germany – T- Mobile, Vodafone, E-Plus and O2 Germany. Competitiveness in the German market has increased as a result of high penetration levels and increasing market saturation. During the year, high-speed UMTS services were introduced by all operators based on combined GPRS/UMTS data cards and, since Christmas, UMTS handsets.
Corporate responsibility
O2 continued its engagement with the German Children and Youth Foundation and the SCHOLA-21 project. Following the launch of a new internet platform in English, O2 developed flyers, handbooks and contacts to international networks and schools. O2 began a schools competition in partnership with the German Olympic Association with the topic: “Olympia – more than Olympic Games”. We also supported another GOA project – “Kinder bewegen” – that aims to improve the movement of children, making donations to ten “Kindergartens” for a three-year period. O2 is supporting new learning software, “Polly and Fred”, that enables schoolchildren to learn how to handle their handsets properly in a play environment.
Looking ahead
For the coming year, O2 will adhere to its target of profitable growth supported by the extension of sales channels, including service providers and Tchibo. At CeBIT in March 2005, we launched an innovative, high-speed offering, O2 surf@home, a service that directly complementsO2 Genion. Using this innovative UMTS data service, O2 customers are able to connect to the internet from their homes at fixed line rates. The combination of O2 Genion with O2 surf@home enables complete fixed line substitution and increase customer value and loyalty. Innovative tariff models such as bundle tariffs or tariffs driving prepaid/postpaid convergence (e.g. prepaid top-up vouchers) will further help to increase cost control for the customer, but also drive ARPU for O2.
There will be a renewed focus on customer retention (due to slower market growth and high market churn) backed by further initiatives to improve the quality of our sales channels, products and customer service. Our customer segmentation strategy will aim to drive up customer satisfaction by meeting the expectations of those asking for more simplicity on the one hand and the increasing number of customers starting to use advanced data services on the other.
In response to our success, we have launched an initiative to enable us to operate as a sustainable business in the medium term. We are stepping up the rate of capital spending with the aim of becoming a full network operator by extending and accelerating the roll-out of our UMTS network and reducing national roaming. This will enhance the customer experience by delivering higher coverage and improved download rates while, at the same time, reducing our operating costs. W e will seek more aggressive growth with new products, for example by extending our unique O2 Genion offering, and continue to attract and retain high value customers, backed by superior quality at the point of sale and customer service. We aim in the medium term to match the profitability of similarly positioned network operators in other markets.
o2.com 11
Business review continued
O2 Ireland
Operational performance
The focus for O2 Ireland over the past year has been to excel in offering our customers the best possible experience each and every time they interact with O2. This focus has meant a renewed effort in improving all areas where we are in contact with our customers, from a commitment to “walk out working” products, to a superior customer care service and an efficient and customer friendly high-street presence through O2 Retail.
Throughout the financial year ended 31 March 2005, O2 Ireland has continued to improve its business performance, maintain current market share, and build upon the strength of the O2 brand.
With regard to customer acquisition up to March 2005, O2 Ireland had a particularly successful year. We announced the addition of 142,000 net new customers to the O2 network, representing a 10 per cent increase from the same period the previous year. This was largely driven by a very strong Christmas period with over 91,000 new customers joining the O2 network, ahead of our competitors’ performance. In addition to gaining new customers, we also succeeded in retaining our customers despite a range of competitive tariffs in the market, and despite the ease of mobile portability (changing networks without changing one’s number).
With blended ARPU rising 1 per cent to €565, service revenue at constant exchange rates was 13 per cent higher at £556 million and EBITDA was £223 million, a 7 per cent increase with a margin of 38.1 per cent.
Bolstered by one of the most “iconic” advertising campaigns ever conducted in Ireland, Network Powered Ireland, the O2 brand has continued to strengthen apace. In the third quarter of 2004, Total Spontaneous Awareness of the O2 brand stood at 91 per cent. We were pleased that the Network Powered Campaign was named Best Integrated Campaign by Marketing Magazine.
Brand awareness was further supported by high level sponsorships and associations. These included O2 in the Park, the Smurfit European Open and our association with golf and rugby sporting stars such as Padraig Harrington and Brian O’Driscoll respectively. In the business arena, last year saw joint initiatives with Dublin Chamber of Commerce through our sponsorship of E-Week to mark the accession of 15 new member States to the European Union and our on-going support of regional Chambers of Commerce around the country.
Driven by our focus on improving our customer experience, O2 Ireland continues to excel in customer service. Customer Care satisfaction scores improved throughout the financial year ended 31 March 2005 and O2 Retail excelled among its peers, proven by high scores in mystery shop activity. We communicated the benefits to our customers of certain services, for example music, through innovative new initiatives such as the opening of the Experience Zone at Dublin’s Point Theatre in September 2004.
A significant new development last year was the introduction of a new retail concept called O2 Experience. Three O2 Experience Stores were opened – two in Dublin and one in Cork – which give customers the chance to view live demonstrations of all our products. Reaction to the stores has been very positive.
We are constantly seeking to make life and business easier for both our consumer and business customers. To this end, we introduced an exciting range of new products and services. For business customers, these included the Fujitsu Siemens – O2 Work Everywhere Package, O2 Instant and the O2 Connection Manager. These products, all of which are aimed at saving time and money, have been well received in the business and corporate markets. Our consumer customers benefited from the introduction of reduced tariffs in 2004 and an exciting range of handsets and devices including the new BlackBerry™.
Maintaining the highest-quality network in order to maximise customer satisfaction remains a key focus of our business. Central to the success of our business is the maintenance and development of our GSM and UMTS networks, which are rated among the best in the world. Last year, we invested almost €3 million a week in our network infrastructure. We continue to build our network in a cost efficient and environmentally friendly way and continue, where possible, to share existing sites of other mobile operators and utilities providers.
We made progress in the building of our UMTS network, now extending to over 35 per cent of the population. Limited trials of our UMTS service began in mid-2004 and plans are in place to bring commercial UMTS services to Ireland in mid-2005.
Market dynamics
The Irish market continues to be a highly challenging one for the mobile industry with penetration levels of mobile phones in the population now standing at over 90 per cent. O2 Ireland holds the second biggest share of the market with around 40 per cent. 2004 saw continued momentum by Meteor Mobile Communications with further gains in market share. 3 entered the market in January 2004 and has begun to roll-out its UMTS network. Meanwhile, potential competitors in the telecommunications sector have expressed an interest in the mobile market following the proposed measures by ComReg (the Irish communications regulator) in December 2004 to encourage and allow MVNOs to access the networks of both O2 Ireland and Vodafone Ireland.
Corporate responsibility
2004 saw an expansion of our CSR programme with the introduction of a range of exciting initiatives. The O2 Ability Awards, run in conjunction with The Aisling Foundation, is the first awards programme to recognise Irish businesses that demonstrate best practice in the employment of people with disabilities. Our support of the O2 Ability Awards has associated O2 in a positive way with a topical issue that is currently high on the Irish social agenda.
o2.com 12
O2 Ireland has continued to acknowledge those of its employees who work with charities outside their working days through our Can Do in the Community Awards. These awards recognise the contribution made by employees to their local communities or selected charities outside working hours.
In June 2004, O2, working closely with the Irish Cellular Industry Association (ICIA), launched the first ever Irish Code of Practice for the responsible and secure use of mobile services. The ICIA also published a Parents’ Guide and announced a joint industry trial on content filtering, led by O2 Ireland.
We are in our second year of sponsoring National Tree Week in conjunction with the Tree Council of Ireland and Coillte (the Irish Forestry Board). During National Tree Week in March 2004, over 300 events such as forest walks, talks and tree planting ceremonies took place.
2004 saw the launch of our participation in the phone-recycling scheme, Fonebak®, that enables customers to deposit their unused or broken mobile phones in recycle bins in all our O2 Retail stores throughout Ireland. The scheme also provides funding for environmental charities such as National Tree Council of Ireland and the international charity, Rainforest Concern.
Looking ahead
O2 Ireland will concentrate on maintaining a competitive edge in a highly competitive market and in a more onerous regulatory environment. We will maintain our focus on putting the needs of our customers first and offering them a superior service while ensuring that our products and services meet their requirements. We will continue to drive demand for data services and to increase revenue from this part of our business, building on the momentum gained in 2004.
O2 Ireland will be the first and only mobile operator in Ireland to bring a mobile internet service based on the i-mode® capability to customers from autumn 2005. This will bring a completely new customer experience to Irish consumers in terms of higher quality and fast access to content and an exciting range of handsets. Progress on our UMTS network continues and we are on target to bring commercial UMTS services to the market later in 2005.
Along with maintaining and improving the customer experience, we will aim to lift our operational performance again, building on last year’s success by meeting our growth targets for revenue, EBIDTA and customer numbers.
O2 Airwave
Operational performance
The Airwave network was completed, on time and on budget, at the end of March 2005. The Airwave service, with its commitment to making communities safer by providing communication where and when it matters most, has now been delivered to all 51 police forces in England, Scotland and Wales and the British Transport Police. The network, under the terms of a £2.9 billion, 19-year contract with the Home Office
signed in 2000, has been built in fewer than five years, during which some 3,300 masts have been erected and over 1 million miles of road driven to test the service. It is arguably one of the most successful PFI projects to date. Over 99 per cent of mainland Great Britain is now covered by the service with 100 per cent population coverage.
By the end of March 2005, O2 Airwave had more than 100,000 users, double the level of a year previously. In addition to the police, O2 Airwave has won 38 new customers outside the main Police Information Technology Organisation contract, taking the total number of additional public service customers to 78. They include the Ministry of Defence police, the Prison Service, British Energy, Mersey Regional Ambulance Service, Harley Street Ambulance Service, RAF Cranwell Police, the Highways Agency, the UK Atomic Energy Authority Constabulary and Norfolk Local Autho rity. Completion of the network roll-out led to a near doubling of revenues and, with tight control of costs, this led to an EBITDA of £72 million compared with £1 million in the previous year. We invested a further £218 million in the network last year but, with completion achieved, this figure will fall significantly in the coming 12 months.
Airwave is a sophisticated, fully encrypted digital radio system, which cannot be scanned or monitored by outsiders. It allows the police to communicate seamlessly and securely throughout England, Scotland and Wales. Airwave’s multifunctional handsets, combining a digital radio and mobile phone, also operate as data terminals – enabling officers in the field to access local and national databases. In addition, Airwave provides a common platform for Public Safety Users, giving them true interoperability and comprehensive geographical coverage. Using Airwave, police officers from different forces can talk to one another or to officers from other emergency services, whatever their location, who can in turn communicate directly with one another. For the first time, Airwave will allow effective, and potentially life-saving, co- ordination of rescue efforts by the emergency services. The ability of networks to keep working in times of emergency is critical. The Airwave response to incid ents caused by bad weather like Boscastle in Cornwall in August 2004, and Carlisle in Cumbria in January 2005, proved the network’s innate resilience – the service kept going when other communications networks failed and was used by all the emergency services dealing with these major incidents.
Growth opportunities
The continued threat of terrorism, the incidence of major accidents and heightened awareness of the impact of natural disasters all demonstrate the increasing importance of secure and “joined- up” communications in both urban and more remote areas. Against this background, there are significant opportunities for growth in the Airwave service.
The Civil Contingencies Act 2004 is likely to have a significant impact on all public safety organisations in their need to comply with the new legislation as first or second line responders and will present Airwave with a wider target audience. We will also continue to market the service to other public safety users, including the utility companies, the Ministry of Defence, Health organisations, Fire Service, CCTV operators, Ports Police, and other Government organisations such as the Department of Works and Pensions, Customs & Excise, the Inland Revenue, the Immigration Service, the Environment Agency, HM Prisons, and local authorities.
o2.com 13
Business review continued
Mobile data represents a significant opportunity for O2 Airwave. In December 2004, O2 Airwave began the Lancashire Police data trial with the Lancashire Constabulary, the largest ever mobile data trial in the UK, involving 280 users. Using the O2 Airwave Mobile Applications Gateway, Lancashire police officers are able to gain secure, continuous access to databases while on the move. O2 Airwave is uniquely placed to develop its market through the expansion of relevant mobile data applications for the police and other public safety customers. Currently 45 police forces have direct access from their handsets over the Airwave network to the Police National Computer, allowing interrogation of vehicle registration and peoples’ names in seconds. Scottish police forces also have access to the Scottish Criminal Records Office.
In the coming year, we will be offering a portfolio of mobile data products and services for deployment in our key markets. Helping to meet the demand for greater visibility of the police within communities, our portfolio will consist of a range of data devices to meet both in-vehicle and hand-held needs. It will include a suite of mobile applications designed to reduce police bureaucracy and eliminate unnecessary paperwork – both Home Office priorities. Network-based gateways that enable feature-rich applications will be backed by the touchstones of unmatched technology and customer service for which O2 Airwave is renowned. Much of this portfolio of services has been developed from the successful experience gained from working with trial customers such as the Lancashire Police Force.
In the case of Ambulance and Fire Services, much of their day-to-day work makes use of mobile data capabilities to deliver information to where it is needed the most. Hereford & Worcester Ambulance Trust has been using a patient telemetry service over the Airwave network since May 2002. Patients’ vital data can be monitored by ambulance crews and transmitted over the Airwave network directly to hospital Accident & Emergency units, enabling life-saving treatment to begin at the scene of an incident, for example the use of clot-removing drugs which dramatically improve the chances of survival and recovery. Every minute saved in the treatment of heart attack patients adds about 11 days to life expectancy. One hundred interventions were made by Hereford and Worcester Ambulance Trust using the Airwave service in the first six months of service, leading to patients’ lives being saved and extended.
Airwave need not be restricted to Great Britain. Opportunities also exist to repeat our success overseas. Any venture, whether approached directly or with partners, would, however, be carefully assessed for viability and would have to fit with O2 Airwave’s strategy before it went ahead.
Corporate responsibility
O2 Airwave assesses its responsibility to its customers against key performance indicators created by those customers, which we strive to meet or exceed. We have also established a reporting structure to conform with key indices developed by the Group in areas including the environment, waste management, employee satisfaction and treatment of our supply chain. In November 2004, we achieved our key target of complying with the ISO 14001 international standard for environmental management. In May 2004, O2 Airwave participated in the Corporate Responsibility audit carried out by Ernst & Young.
O2 Airwave seeks to be an active participant in the community. As part of our Community Involvement programme, we have sponsored two police dogs, the Lancashire Fire and Rescue safety help line, a Sportsmobile project with Bolton Lads and Girls Club, an Airwave Charity Golf Day, Middlesbrough Under 14s rugby club, and an anti- bullying campaign run by South Wales Police. Money has also been raised for a variety of good causes ranging from Milly’s Fund to the Tsunami appeal. In September 2004, an O2 Airwave team climbed England’s highest mountain and rowed England’s longest lake in under 12 hours, raising £15,000 for a Mini for Milly’s Fund. O2 Airwave will continue to provide a secondee to the London Resilience Team, set up to ensure London and the regions keep working at times of disaster.
Looking ahead
Increasing government funding into crime prevention, detection and improving public safety is leading to increased police numbers and a greater reliance on new technology as services such as Ambulance and Fire modernise and replace existing technology. All these developments provide opportunities for O2 Airwave to deliver new services and allow safety organisations to improve their services to the public.
As emergency services customers start to take up mobile data, there is likely to be increased competition in the mobile data market, from the traditional mobile operators as well as niche players. However, we believe O2 Airwave is well placed to penetrate the mobile data market with our unique proposition based on the Airwave network and the Mobile Applications Gateway (MAG). The MAG delivers fast access to numerous databases and the intelligence to link these together, providing safety officers with on the job remote access to critical information. O2 Airwave will become a true data solutions provider offering a unique range of mobile data services to the customers it serves.
The priorities for O2 Airwave going forward are to grow the business by meeting the needs of existing and new customers through developing propositions that improve the safety of the nation. We will enhance our service to customers through the way we manage them on a daily basis and ensure that we deliver benchmark standards for our network and service. We will invest in our operational support systems and the capabilities of our people to strengthen our business as we grow.
Manx Telecom
Operational performances
Manx Telecom is a wholly owned subsidiary of O2 on the Isle of Man, holding licences to run fixed and mobile telephony and internet services. Manx Telecom is an ISP in its own right with a portfolio of quality internet access and hosting products and services.
Because of its successful track record as the first company in Europe to launch a live UMTS service back in December 2001, Manx Telecom was chosen by O2 to run Europe’s first superfast 3G trial, in partnership with Lucent Technologies, using HSDPA technology. HSDPA offers the possibility of communication speeds up to three times faster than current commercial UMTS services.
o2.com 14
The installation of a Prepay Intelligent Network (IN) platform in November 2004 is enabling the company to offer a range of new services to its pre-pay mobile customers. MMS on pre-pay was launched in December 2004, WAP and full web access over GPRS was made available to pre-pay customers in March 2005, and the launch of outbound pre-pay roaming is planned for early in the next financial year. The average number of SMS (texts) sent per month increased to over 3.5 million by 31 March 2005.
On 1 March 2005, Manx Telecom introduced the first in a series of planned new tariff packages for its fixed line customers. Called Choice, the new tariff offers free calls to local fixed line phones at evenings and weekends, plus a 30 per cent reduction in local daytime call charges, for a monthly line rental charge of £13.00.
Manx Telecom has continued with its major investment programme to make broadband available to as many customers on the Isle of Man as possible. The installation of a number of “mini DSLAM” sites in more remote areas around the Island has increased coverage to around 99 per cent of local homes and businesses and take-up is currently around 19 per cent.
Work is well under way on a major contract, announced last year, to design, supply, implement and support, in partnership with Dimension Data, a new island-wide network infrastructure for the Isle of Man Government. A requirement of this contract was that Manx Telecom should become certified to BS7799 Security standard, and the company became the first company on the Isle of Man to achieve this in December 2004.
Capital spending during the year was £10 million compared with £9 million in the previous financial year. We constantly monitor how well we are performing in the view of our customers. Regular surveys throughout the year measuring customer satisfaction showed that 85 per cent of customers were “Very Satisfied” with the service they had received.
Market dynamics
Manx Telecom is the only provider of mobile and fixed telephony on the island.
Corporate responsibility
Manx Telecom, in association with the Isle of Man Government, has provided a number of wireless (WiFi) hotspots at key locations around the Island, including at Isle of Man Airport. As part of the Isle of Man Government’s E-Island strategy to encourage the use of Internet technology on the island, Internet access at these sites is being provided free to users for the first year.
In December 2004, Manx Telecom completed its certification to ISO 14001, the international standard for environmental management.
Manx Telecom continues to sponsor the Manx Telecomputer Bus and a number of other local charities, organisations and events, especially those involving young people, information technology and sport. These include the Road to Wimbledon junior tennis tournament, the Isle of Man junior cricket team tour of Holland, a junior cricket coaching programme and a local cycling Time Trial League. The company also provided mobile phone equipment for a new college course relating to mobile technology for students with learning difficulties.
Looking ahead
We are looking forward to offering our customers the chance to trial the new superfast 3G services which will make available exciting new, video-based applications and services. We will also continue our active support of the Isle of Man Government in offering a world-class telecommunications infrastructure to help attract new companies and inward investment to the island in support of the Island’s e- business strategy.
Regulation
We conduct most of our business in the United Kingdom, Germany, Ireland and the Isle of Man. We are therefore subject to national regulation in each of those countries as well as European Union-wide regulation.
Regulation in the EU
Regulation in the EU is governed by the EU regulatory framework for the electronic communications sector (the EU Framework). The EU Framework comprises four principal Directives. Amongst other things, the Directives set out policy objectives and regulatory principles that National Regulatory Authorities (NRAs) must follow: they provide for a new authorisation system for companies which provide electronic communications networks and services, co ntain measures to ensure the universal provision of basic services to consumers, and set out the terms on which providers may access each other’s networks and services. Importantly, the EU Framework also harmonises the rules for deciding when regulation may be imposed on electronic communications providers. In particular, it provides that electronic communications providers can usually only be subject to specific regulation in markets in which they have SMP. SMP, for these purposes, is aligned to the competition law concept of dominance, which essentially means an ability to act independently of customers, suppliers and competitors.
The European Commission (the Commission) identified in a Recommendation (published in February 2003) a list of markets which may be such as to justify the application of specific regulation (the Recommendation). The Recommendation includes the following mobile markets: (i) access and call origination on public mobile telephone networks; (ii) voice call termination on individual mobile networks; and (iii) wholesale national market for international roaming on public mobile networks.
NRAs must conduct market reviews in order to determine whether any companies have SMP in any of the markets identified in the Recommendation. NRAs may also, with the Commission’s consent, review markets that are not listed in the Recommendation. Where a company is found to have SMP in any market, the regulator must impose one or more of the following SMP conditions on it: transparency; non-discrimination;
o2.com 15
Business review continued
accounting separation; access; price control and cost accounting. In exceptional circumstances, a regulator may impose additional or alternative obligations, but these have to be approved by the Commission. If a company is found not to have SMP in a market, then SMP conditions cannot be imposed on it, and existing regulation must be removed.
Regulation in the United Kingdom
Implementation of the New EU Regulatory Framework
The EU Framework was implemented in the UK by the Communications Act 2003 (Communications Act) on 25 July 2003. Under the Communications Act, responsibility for the regulation of electronic communications networks and services lies with the Office of Communications (Ofcom).
Market reviews
In the UK, the regulator concluded in November 2003 that no mobile network operator (either individually or jointly) had SMP in the market for access and call origination on public mobile telephone networks. This meant that various regulatory obligations which had previously been imposed on us and Vodafone were lifted.
In June 2004, Ofcom completed its review of voice call termination on individual mobile networks. As a result of that review, Ofcom concluded that the charges we made to other operators for terminating calls on our network (call termination) had to be cut. From 1 September 2004, Ofcom required us to lower our call termination charges from an average of 8.03 pence per minute to an average of 5.63 pence per minute. Ofcom recently indicated its intention to apply the charge control until March 2007, and to conduct a wide-ranging review of voice call termination regulation with a view to determining the regulatory regime with effect from April 2007.
Ofcom has also commenced a review of the wholesale international roaming market in the UK. This review is being co-ordinated with a number of regulators in other EEA member states, all of which sent questionnaires to operators in their respective countries in December 2004. On conclusion of the review, regulators will decide whether it is necessary to regulate wholesale roaming.
National roaming
O2 UK and Vodafone are subject to an obligation to negotiate a national roaming agreement with the new entrant mobile network operator, 3 (the National Roaming Condition). In accordance with this obligation, we entered into an agreement with 3 to permit it to use our second generation network to originate and terminate calls to and from its subscribers while it builds its own UMTS network. On 22 December 2004, 3 invited mobile operators to tender for the supply of second generation roaming services to 3 when the exclusivity period in their agreement with O2 expires. Although Ofcom proposed discontinuing the National Roaming Condition in July 2004, its decision on this issue has been postponed pending the outcome of 3’s tendering exercise.
Regulation in Germany
The EU Framework was implemented in Germany at the end of June 2004 by the Telecommunication Act (TKG). Responsibility for regulation of electronic communications networks and services lies with the telecommunications regulator, RegTP.
RegTP is currently reviewing the three relevant mobile markets (access and call origination, voice call termination and wholesale international roaming), and is not expected to conclude these reviews before the second quarter of 2005. As part of its review of voice call termination, RegTP has reached the preliminary conclusion that all mobile operators have SMP in the market for call termination on their own networks. RegTP is currently consulting with third parties on this preliminary position.
During the fourth quarter of 2004, we agreed with the German fixed network operator (T-Com) to reduce our wholesale termination charges in Germany. However, at the end of 2004 a fixed operator known as “01051” asked us to offer them a lower termination charge. The matter was referred to RegTP, which approved our German termination charges. 01051 has appealed RegTP’s decision.
Regulation in Ireland
The EU Framework was implemented into Irish law on 25 July 2003. Responsibility for regulation of the communications industry in Ireland lies with a three-person regulatory body, known as the Commission for Communications Regulation (ComReg).
Following its market review, on 22 February 2005 ComReg issued a decision designating us and Vodafone with SMP in the wholesale mobile access and call origination market in Ireland.
On 9 December 2004, ComReg also issued a consultation on appropriate remedies in the wholesale mobile access and call origination market. It proposed to place obligations on us and Vodafone to provide access to our networks on reasonable request (and not to withdraw access services already provided, such as the national roaming services provided by O2 Ireland to Meteor), as well as certain non-discrimination, cost-orientation, accounting separation and cost accounting obligations. ComReg proposes to issue a further consultation on the detailed draft measures relating to price control and cost accounting issues.
On 21 March 2005, we notified the Minister for Communications, Marine and Natural Resources, and ComReg of our intention to appeal ComReg’s SMP decision. We expect the Minister to convene an Appeal Panel, which must endeavour to determine the appeal within four months.
In July 2003, we agreed with ComReg to reduce mobile termination rates by Retail Price Index minus 8 per cent per annum for the period 31 August 2003 to 31 August 2005. In 2004, ComReg found that all four mobile operators in Ireland have SMP on the market for call termination on their own networks. This decision has been appealed by 3 to the national Appeal Panel, which has yet to reach a decision on the matter. ComReg has yet to publish its decision on the remedies to be imposed.
o2.com 16
ComReg has also commenced its review of the national market for wholesale international roaming. This review is being co-ordinated with a number of regulators in other EEA member states, including Ofcom in the UK. On conclusion of the review, regulators will decide whether it is necessary to regulate national markets for wholesale international roaming.
Regulation in the Isle of Man
The Isle of Man is a self-governing Crown Dependency with its own parliament and is not part of the United Kingdom or the EU. Accordingly, Manx legislation and regulations predominantly govern our operations in the Isle of Man.
On 1 January 2004, our new licence extension, awarded by the Isle of Man Government for 15 years, came into force.
Competition law
EU competition law
We are subject to the general competition law of the EU and, in particular, Articles 81 and 82 of the EC Treaty (Article 81 and Article 82), which prohibit anti- competitive agreements or concerted practices and the abuse of a dominant position respectively where there is an effect on trade between EU Member States.
EU competition law is enforced by the Commission and, since 1 May 2004, has also been enforced by national competition authorities and national courts. Companies which breach EU competition law can be subjected to fines of up to 10 per cent of a group’s worldwide annual turnover. They may also be sued in national courts by third parties which suffer loss as a result of the breach.
We are also subject to the national competition law of the countries in which we operate. In the UK, Germany and Ireland, national competition law broadly mirrors the provisions of EU competition law, prohibiting anti-competitive agreements or concerted practices and the abuse of a dominant position.
International roaming charges
The Commission has been investigating the price of wholesale international mobile roaming services in the UK and Germany. In the context of this investigation, on 26 July 2004 the Commission sent us and Vodafone two separate “statements of objections” in the UK. The statements of objections allege that our wholesale international roaming charges were excessive from 1998 until September 2003 and that this amounted to an infringement of Article 82. However, the Commission has not yet reached a final decision on whether there was an infringement. O2 is currently responding to the statement of objections.
Infrastructure sharing and national roaming
We have a UMTS infrastructure-sharing and national roaming agreement with T-Mobile in Germany. The agreement was formally notified to the Commission for negative clearance or exemption under Article 81 and cleared by Decision of 16 July 2003.
The Commission took the view that the infrastructure sharing aspects of the agreements did not restrict competition. National roaming, on the other hand, was considered restrictive of competition, but was granted exemption from Article 81 for certain specified time periods. We lodged an appeal with the European Court of First Instance on 25 September 2003.
We also have a 2G national roaming agreement with T-Mobile in Germany. The German competition authority indicated in August 1999 that national roaming agreements may infringe competition laws but that, in the case of our agreement with T-Mobile, this was unlikely to be the case at that time. However, it reserved the right to review this position.
Key markets
Europe includes some of the most advanced markets for mobile services in the world. These markets are characterised by relatively high mobile penetration rates and high GDP per capita. Across Western Europe, the proportion of total voice traffic carried over mobile rather than fixed-line networks continues to increase. These markets are also seeing an increasing proportion of mobile revenues attributable to mobile data services and we expect this trend to continue.
Our mobile businesses cover two of the largest markets in Europe, with the UK and German markets giving us access to a total population of approximately 148 million people. All our markets have seen growth over the last few years in the number of mobile telephone users, in large part reflecting strong demand for competitively priced pre-pay offerings. Our markets are seeing the emergence of additional wholesale opportunities for network operators. Through wholesale agreements, network operators are able to sell capacity and services on a large scale to other service providers and mobile virtual network operators.
Historically, the number of customer connections to mobile telephone networks in the markets where we are present has been greater during the second half of the financial year than during the first half, primarily due to increased sales during the Christmas period. See “Operating and financial review and prospects – Factors affecting our business”.
o2.com 17
Business review continued
The table below presents selected data regarding the principal countries in Europe in which our businesses operate.
| Active mobile1 | ||||||||||
| customers’ | O2 | |||||||||
| penetration | customers | |||||||||
| at 31 March | at 31 March | |||||||||
| Population1 | 2005 | 2005 | ||||||||
| Country | (in millions) | (per cent) | (in 000’s) | |||||||
| Germany | 84 | 83 | 7,976 | |||||||
| United Kingdom | 60 | 103 | 14,384 | |||||||
| Ireland | 4 | 97 | 1,533 | |||||||
| Total | 148 | 23,893 | ||||||||
| 1 Source: EMC Worldwide Cellular Database, May 2005. |
| Note: The number of customers shown in the table above is equivalent to the number of active SIM cards. Hence, where some people have more than one active SIM card, it is possible for penetration to exceed 100 per cent. |
Employees
The Group had the full time equivalent of 14,914 employees at 31 March 2005, as set forth by country in the table below:
| Country | Number of employees | |||
| United Kingdom | 9,141 | |||
| Germany | 3,919 | |||
| Ireland | 1,577 | |||
| Isle of Man | 277 | |||
| Total | 14,914 | |||
For the year ended 31 March 2005, the aggregate number of temporary staff employed by our businesses was 1,686.
In the United Kingdom, a number of our employees are represented by two recognised unions: Connect, which has representation rights in respect of junior management employees, and the Communications Workers Union, which has representation rights in respect of clerical, engineering and technical employees.
Membership of these unions is individual and voluntary. In addition, a non- unionised employee representative body represents certain managers. Our other operating businesses also meet with their employee representative bodies, or works councils, regularly. We believe that our businesses have a good relationship with our employees and their representatives.
Network and service platform technology
Transforming our networks to mobile broadband has continued with the build out of UMTS across the UK, Germany and Ireland to give data speeds up to 384kbps. This is being extended into the Isle of Man later this year (Lucent core & radio) with an upgraded UMTS deployment that will incorporate HSDPA technology with customer speeds up to 1Mbps and IMS (Internet Protocol Multimedia services) that provides richer services. As this is rolled out to all our customers it will enable them to quickly and easily download DVD-quality film clips, audio and video, interactive multiplayer games, multimedia music tracks, “push-to-watch” services as well as access large email attachments – three times faster than today’s commercial UMTS networks. These speeds have already been extended this year by giving access to our customers to public WLANs in transit areas. This has been added to in Germany with O2 surf@home to give home internet access via our UMTS network. All these enhanced capabilities require an easy-to-use customer experience for the ever increasing array of internet services. Therefore, we are adding Japan’s successful NTT DoCoMo i-mode® technology to give superior performance from a tightly specified device to network service. This will be launched in UK and Ireland second half of 2005 and under our own brand in Germany next year.
| Information technology The information technology deployed in the Group is critical to the efficient and effective operation of the businesses. The focus for each business has been to: | |
| • | continually raise the standard of our service to our customers and the processes within our organisation; |
| • | maintain tight cost controls; |
| • | exploit investment in new systems, with development aimed at increasing our agility; and |
| • | work together to leverage cross-Group benefits. |
IT systems are fundamental to the delivery of high standards of service to our customers, in our shops, in billing, in customer care and in use of our services. It remains a priority to ensure these systems operate effectively and there have been a number of initiatives to ensure they perform as well as the best in the industry. Additionally, improvements in internal processes and reporting are being strengthened through the Group’s compliance with the Sarbanes-Oxley Act of 2002.
While we have ensured that our IT costs are competitive within the industry, increased competition within our geography is driving tighter controls, and greater effectiveness. Recent strategic investments are now on-stream and are being exploited. Investment in new systems will continue where this is required to support our business priorities.
The IT community from each of the operating businesses has continued to work together where benefits have been clearly identified. This has enabled us to improve our common infrastructure, use common products and to deploy Group-wide systems where a common approach is required. Additional framework contracts with key suppliers have been agreed including HP, Sun and Oracle.
o2.com 18
<<
| Corporate responsibility | |
Looking ahead, our businesses have major IT projects to underpin the business strategy. These include initiatives to improve our agility and time-to- market, which are expected to impact the coming year, and projects to further enhance billing and care, and to ensure a consistently high-quality end-to-end customer experience.
Intellectual property
We have actively taken steps to protect our brand, including the acquisition of core trade mark registrations for the O2 brand and related brand materials. In addition, we have other pending trade mark applications in ancillary classes in the UK, the European Community and other countries worldwide.
In the last year we have also strengthened the monitoring procedures in respect of the use of our brand and have increased the amount of enforcement action we take in response to infringement.
The steps we are taking to protect our brand include litigation and we are currently pursuing two significant trade mark infringement actions through the courts: one in the UK for infringement of our “bubble” imagery and one in Europe for infringement of “O2”.
Insurance
We maintain the types and amounts of insurance customary in the industries and countries in which our Group operates, including coverage for employee-related accidents and injuries and property damage. We consider our insurance coverage and that of our operating businesses to be adequate both as to the nature of the risks covered and amounts insured for the business conducted by us.
Mobile communications are an everyday part of people’s lives, offering exciting new ways to keep in touch both socially and in business. We focus on finding new ways to reward customer loyalty and go to great lengths to understand their individual needs and concerns. To achieve this, we recognise that customers sometimes have contrasting attitudes to their mobile phone. They may see it as a vital accessory to their lives, but also have concerns about the technology and the way we behave as a company. We are engaging with a wide variety of interest groups to understand better what is expected from our business. Our aim is to match our market offering with responsible and accountable policies and bring the benefits of mobile communications to society at large.
We are determined to take full account of the social, environmental and ethical (SEE) impacts of our business. We approach this as a daily challenge requiring processes, measurement and stretching performance targets. Our key SEE risks are covered in this section of the report and in more detail in our separate corporate responsibility report.
Our corporate responsibility achievements have received wide external recognition. We are represented in the main sustainability indices and funds: the Dow Jones Sustainability Indexes, the Business in the Community Corporate Responsibility index as the highest scoring mobile operator, the FTSE4Good Index, and as members of the Ethibel investment and sustainability registers. During 2004/05, we received the Association of Chartered and Certified Accountants’ Sustainability Reporting commendation for “innovative reporting”, the Charities Aid Foundation “Corporates and Communities Awards for Online CSR Reporting” and the European Strategic Risk Management Award for “Best CSR Programme of the Year”.
Governance and management of corporate responsibility issues
To cope with constant change requires a commitment to risk management and we use it to identify, measure and control uncertain future events that could threaten the assets, revenue, brand, reputation or shareholder value of the Company.
We adhere to the Disclosure Guidelines on Social Responsibility set out by the Association of British Insurers to manage the significant SEE risks that may affect us. We manage these risks by assessing their potential impact, likelihood and our appetite to manage them, and develop strategies to mitigate them. We update a Group-wide risk register every month with the key risks we face, supported by separate registers in each of our operating businesses. The Combined Code (Turnbull Guidance section) guides our risk management policy and procedures. Controls are scrutinised as part of a cyclical risk-based audit approach, overseen by our Audit Committee.
Our corporate responsibility activities are managed by full-time practitioners in each of our operating businesses. Their work is co- ordinated through the monthly Corporate Responsibility Forum – chaired by Corporate Affairs Director Richard Poston. Significant issues are reported to our Executive Committee at least every six months and through quarterly corporate responsibility updates. An executive Director or senior
o2.com 19
Corporate responsibility continued
manager champions each key SEE aspect and reports regularly to the Group Board. Their remuneration is partly linked to their success in meeting key SEE objectives.
In 2004/05, the Board was briefed on a range of SEE issues through six-monthly corporate responsibility reports as well as through specific reports on issues including community investment, health and safety, mast siting, privacy, adult content, child protection, environmental management, diversity and general employment issues. A summary report on our confidential help facility – set up to enable our employees to report ethical concerns, in confidence – was also presented at each Audit Committee meeting.
Our environmental and health and safety practices are monitored through third party audits carried out by certification agencies for our ISO14001 and OHSAS 18001 registrations. An external party assesses all SEE risks and this newly established risk review underpins our insurance arrangements. UK compliance to the industry-agreed Ten Commitments on responsible mast siting is independently reviewed by Deloitte & Touche on behalf of the Mobile Operators Association. Assurance for our separate corporate responsibility report is provided by Ernst & Young.
Business Principles
We have developed our own set of Business Principles which dictate the high standards of behaviour we set ourselves as a company. Everyone within O2 is made aware of our Business Principles and encouraged to take responsibility for living by them in their work. Uptake of mandatory training has increased in this area. During the year, we issued a new compliance leaflet to our employees. They are encouraged to report any potential breaches of our principles in confidence and we maintain a register of any concerns.
Marketplace
New mobile services and devices are transforming the way we live and interact. But the technology poses some important social challenges. Crucial among these is the protection of children and ethical sourcing.
We have proactively raised awareness about child protection and helped develop industry codes of practice on the responsible use of mobile services. We do not market mobile phones to under-16s, we monitor our chat rooms and offer call barring and age verification processes to ensure proper controls. We have published a series of consumer leaflets on the safe and responsible use of mobile services. We have also taken part in the “Prison Me No Way” awareness workshops in schools in the UK and have helped fund and develop a module on the responsible use of mobiles to be included in the German curriculum. O2 Ireland led Europe’s first trial in conjunction with the Irish mobile industry to test the capability of software for filtering mobile camera phone images and offensive websites.
We undertook our first supplier audits in 2004/05 to assess ethical practices in our supply chain. We encourage our suppliers to adopt high-level working practices and materials sourcing, and refer to our Business Principles in all Group-wide contracts. We are working through the Global e-Sustainability Initiative to establish a common framework for supplier audits and to promote ethical practices across the industry.
Health
Although research has found no evidence of health risks from mobile technology operating below the scientifically based exposure guidelines, we respond to public concerns about handsets, masts and cell sites. O2 is committed to funding independent research in this area, and helps to fund the joint UK industry/government Mobile Telecommunications and Health Research programme, and the German Deutsches Mobilfunk Forschungsprogramm, as well as contributes to the World Health Organisation’s International EMF Project on radio frequency emissions. We partic ipate in and help fund a number of industry groups, including the UK Mobile Operators Association (MOA) and GSM Europe (GSME) within which we are chairing the Health and Environment Working Group. The MOA champions the Ten Commitments on responsible mast siting. O2 Airwave and O2 UK are working openly to meet these. Our other operating companies have committed to comply with similar guidelines by GSME.
We have restated our commitment to providing health and safety information to the public and published a new O2 advisory leaflet on these issues, available in O2 stores and online on www.o2.com/cr.
Environment and sustainability
The direct environmental impact of our business activities is relatively small but environmental protection is a critical element of our operations. We have set targets for each area of potential impact which we describe in our separate corporate responsibility report.
Our participation in the Fonebak® initiative enables the recovery and recycling of mobile phones in the UK, Ireland and the Isle of Man through our offices, retail and online outlets. Since its launch in 2002, we have recovered nearly 170,000 phones and a growing number of corporate customers are now involved. In Germany, we use a similar scheme by Greener Solutions.
During 2004/05, all of our operating businesses achieved registration to the international environmental standard ISO14001, a first in our industry. We continue to review and control our environmental performance through the O2 Environmental Forum. During 2004/05, our energy consumption reached 239,359 tonnes of CO2. We initiated a number of programmes reducing our carbon footprint and establishing alternative power sources. These initiatives are important to help us minimise our increasing energy consumption following the uptake of 3G services. By the end of March 2005, we were procuring 17 per cent of our electricity from renewable sources. We have reduced our waste to landfill by recycling and segregating our waste streams, and established a new measure for reusing and recycling IT equipment. We support a number of bio- diversity projects, including the work of our charity partners Rainforest Concern, and the National Tree Council of Ireland, and by establishing conservation areas around our office facilities in Germany.
Workplace
We nurture a high-performance workplace culture in which diverse people can thrive, offering competitive rewards, opportunities for personal development, a modern working environment and flexible working arrangements.
o2.com 20
| Operating and financial review and prospects | |
The United Nations Universal Declaration of Human Rights and International Labour Organisation Declarations continue to guide our employment policies. The well-being of our employees is safeguarded by our Group-wide health and safety strategy promoted by our Group health, safety and environmental champion, Peter Richardson, O2 Airwave Managing Director.
The Executive Committee has endorsed an action plan to meet our aspirations for diversity and inclusion across O2. In the UK we are working with the Employers’ Forum on Disability, the Two Ticks scheme and Remploy for the employment of disabled people. O2 Ireland sponsored the first ever O2 Ability Awards which promote the recruitment and employment of people with disabilities. Reflect O2 continues as a channel for employee feedback and assessment of engagement levels throughout O2. 79 per cent of our employees took part in the latest survey on how people view their leaders, the way they are managed, the O2 spirit and O2’s customer focus.
We negotiate with employees through trade unions, works councils or representative bodies. We continue to give some of our people limited paid time off to fulfil community roles such as business mentors, school governors and special constables. During the year, O2 UK won one of The Guardian newspaper’s Good Employer awards. O2 Ireland won the Best Company to Work For (with over 1,000 employees) Award by the Great Place to Work Institute and ranked in the top five places to work in Europe. O2 Germany was eleventh in the Great Place to Work ranking published by business magazine Capital.
Community
Investment in the communities we serve is an essential part of our approach to corporate responsibility. In 2004/05, we made cash donations worth £2.2 million to our chosen charities and community projects, of which £636,266 was made from UK-based companies. In 2004, we held the inaugural O2 Community Awards to recognise people across the business who give their time and ideas to charity.
Our “Can Do Giving” give-as-you-earn scheme continues to grow. Can Do Matching is our scheme to top-up employee charitable fund raising.
Community Investment activities are devolved to our operating businesses. Last year, we established a mentoring partnership with Weston Spirit in the UK. In Germany, we worked with SCHOLA-21 and the German Olympic Association. O2 Ireland engaged in a number of initiatives including the CITY youth and technology project in Dublin. Manx Telecom helped employees raise funds for a new hospice, while O2 Airwave supported the LookAlive road safety programme.
Further information can be found online in our independently verified corporate responsibility report at: www.o2. com/cr/report05, or on request from the O2 plc Corporate Responsibility function (cr@o2.com).
This commentary discusses, and is based on, the audited consolidated financial statements of the Group prepared in accordance with UK Generally Accepted Accounting Principles (UK GAAP), included on pages 66 to 89. This commentary should be read in conjunction with those financial statements.
Definitions of the non- financial operating metrics (including ARPU, churn, subscriber acquisition costs (SACs), pre-pay customers and post-pay customers) used in this commentary can be found in the non-financial metrics section on page 90 of this document.
Composition of our Group
Throughout the year, we provided voice and data mobile communications services and products in the United Kingdom, Germany and Ireland through our wholly-owned mobile businesses, O2 UK, O2 Germany and O2 Ireland, respectively. We also supplied fixed and mobile communications services in the Isle of Man through our wholly-owned subsidiary, Manx Telecom, and we operate a secure national digital radio service for the police forces of England, Scotland and Wales through our O2 Airwave business.
All our businesses have been included throughout the periods covered by the consolidated financial statements with the exception of O2 Netherlands which was included up to 3 June 2003, the date at which our disposal of this business completed and control passed to the purchaser. O2 Online, our internet portal business, was operated as a separate legal entity until 1 April 2004 when the main business of O2 Online was subsumed into the operations of O2 UK.
Capital reorganisation
Merger accounting
O2 plc was incorporated on 10 December 2004 as part of the capital reorganisation described in note 19 to the financial statements. The purpose of the capital reorganisation was to create distributable reserves in O2 plc to allow the implementation of the Group’s distribution policy. These financial statements are O2 plc’s first company and consolidated financial statements.
On 14 March 2005, O2 plc was introduced as the new holding company of the mmO2 plc Group pursuant to a Scheme of Arrangement (the Scheme) under section 425 of the Companies Act 1985, whereby O2 plc issued shares in return for the existing shares in mmO2 plc. Shareholders were also offered the opportunity to realise, for cash, their shareholding in mmO2 plc in a cost effective manner.
The Directors consider that in substance the Scheme constituted two distinct transactions being firstly, the insertion of the new holding company, O2 plc, and secondly, a placing of shares on behalf of certain shareholders who elected to receive the consideration for their shares in mmO2 plc in cash. The insertion of a new holding company constitutes a group reconstruction as defined by Financial Reporting Standard (FRS)6 “Acquisitions and mergers” and has been accounted for using merger accounting principles. The premium paid to shareholders who elected to receive their consideration in cash has been recognised as a deduction from the Group profit and loss account reserve.
o2.com 21
Operating and financial review and prospects continued
The consolidated financial statements for the year ended 31 March 2005 comprise the results of O2 plc from incorporation to 31 March 2005 together with the results of the O2 Group from the 14 March 2005 to the end of the financial year and the results of the mmO2 Group from 1 April 2004 to 13 March 2005. The comparative information presented is as previously published for the mmO2 Group except where otherwise stated.
O2 plc purchased mmO2 plc for share consideration. Certain mmO2 shareholders, holding 299,500,644 ordinary shares of mmO2 plc, elected to receive the consideration for their shares in mmO2 in cash. All other shareholders, holding 8,403,362,095 ordinary shares of 0.1 pence each in mmO2, received the same number of new ordinary shares of 80 pence each in the Company as they previously held in mmO2. In order to fund the cash consideration the Company issued and allotted 299,500,644 ordinary shares in the Company via a placement with investors on the London Stock Exchange’s market for listed securities on 17 March 2005. This placement raised £374,375,805. The remaining cash consideration of £14,975,032, representing a premium of five pence per share owing to shareholders electing to receive the cash, was funded by the Group.
The Board of mmO2 also reviewed the US listing and the associated ADR programme which is a legacy of the demerger from BT. As part of the reorganisation, mmO2’s ADRs were delisted from the New York Stock Exchange at the time that the Scheme became effective and O2 plc has not established an equivalent ADR programme nor a US listing for the new shares in O2 plc. The Board has also reviewed the consequences of continued SEC registration although the timing of any application to deregister has not yet been determined by the Board.
Factors affecting our business
Certain key factors affecting our results of operations in the three years ended 31 March 2005 are discussed below.
The mobile telecommunications market
The Western European mobile telecommunications market has high penetration rates and is highly competitive. As a consequence we focus on customer retention and on generating increased usage from existing customers through both voice services and data applications. We also focus on acquiring higher spending contract customers, and SACs for certain customers, in particular high value post-pay customers, may increase.
Pre-pay products
Pre-pay customers pay in advance for their usage, and comprise the majority of our customer base across the Group. Our pre-pay customers account for 66 per cent of our customers in the United Kingdom, 45 per cent in Germany and 74 per cent in Ireland.
In each of our mobile telecommunications businesses, on average, pre-pay customers spend less than post-pay customers. Nonetheless, pre-pay services offer us several significant advantages, including lower SAC,
higher average per minute charges, reduced credit risk and lower administrative costs. However, lower average outgoing usage minutes for pre-pay customers results in lower ARPU. As our ARPU from pre-pay customers is lower than for post-pay customers, to maintain profitability we give lower handset discounts to pre-pay customers, in line with general industry practice.
Seasonality
Historically, the number of new customer connections to mobile telephone networks in the markets where we are present has been greater during the second half of the financial year than during the first half, primarily owing to increased sales during the Christmas period. Therefore, our revenues from equipment sales and connection charges, and the aggregate costs of customer equipment and dealer commissions and our other related costs of sales, have been greater during the second half of the financial year than during the first half. However, this trend may not continue and it is difficult to predict the seasonality of customer connections in the future.
Impact of regulation
Our businesses operate in highly regulated markets, and governmental regulation frequently limits the revenue we may receive from certain sources. The regulatory climate in the territories in which our businesses operate is discussed in the regulation section of our business review.
Foreign currency translation
The Company publishes its Group financial statements in Sterling (£). The subsidiaries in Germany and Ireland report their results and financial position in Euros (€). Consequently, fluctuations in the value of Sterling against the Euro affect the amount at which these items are reported in the Company’s Group financial statements, even if their value has not changed in their original currency.
Critical accounting policies
Our consolidated financial statements are prepared in accordance with accounting principles that are generally accepted in the UK. As part of these reporting guidelines, management are required to identify and disclose the accounting policies relating to all aspects of the results and financial position of our Group used in preparing the financial statements. The preparation of consolidated financial statements requires management to make estimates and judgements that affect the reported amounts of assets, liabilities, revenues and expenses, as well as the disclosure of certain contingent assets and liabilities. The accounting policies used in preparing our Group’s financial statements for the year ended 31 March 2005 are disclosed in note 1 of those financial statements.
The following accounting policies are considered to be critical to the understanding of the consolidated financial statements. These policies have the potential to have a significant impact on the Group’s financial statements, either because of the significance of the financial statement item to which they relate, or because they require a high degree of judgement and estimation owing to the uncertainty involved in measuring, at a specific point in time, events that are continuous in nature.
o2.com 22
Tangible and intangible fixed assets
We estimate the useful lives of tangible assets, goodwill and other intangible assets in order to determine the amount of depreciation and amortisation to be charged in any reporting period. These useful lives are estimated at the time the asset is acquired, and are based on historical experience with similar assets as well as taking into account future anticipated events affecting their life. Changes in technology or changes in the Group’s intended use of these assets may cause the estimated life or the value of these assets to change.
We perform a review of the estimated useful life, residual value and depreciation method for each category of tangible fixed assets (being land and buildings, plant and equipment and assets in the course of construction), at the end of every reporting period. Our review of these assets may indicate that their lives need to be lengthened or shortened, resulting in a decreased or increased depreciation charge respectively in future periods. Alternatively, our review may indicate a decrease in the value of the asset, recognised by an impairment charge.
Fixed asset impairments
In accordance with UK GAAP, we assess the carrying values of our intangible fixed assets (including goodwill) at the end of the first full financial year following acquisition, and all our fixed assets (tangible, intangible and goodwill) in any accounting period if events or changes in circumstances indicate that the carrying values may not be recoverable. Factors we believe are important and may trigger an impairment review could include the following:
| >> | a significant decline in a fixed asset’s market value; |
| >> | a significant adverse change in the business or the market in which the fixed asset is involved; |
| >> | a significant adverse change in the statutory or other regulatory environment; or |
| >> | significant underperformance relative to expected or forecast operating results. |
Under UK GAAP, when a triggering event has occurred, we perform an impairment review by comparing the carrying value of the income generating unit (IGU) with its recoverable amount. The recoverable amount is deemed to be the higher of the IGU’s value-in-use and its net realisable value. Unless an IGU is to be disposed of, the recoverable amount is deemed to be equal to its value-in-use, which is determined by calculating the net present value of its future estimated cash flows.
We have not identified any events requiring an impairment review to be performed in the current year.
Revenue recognition
In turnover we only recognise transactions that are considered to be part of our principal on-going operations. In particular:
| >> | voice and data service revenue is recognised in the profit and loss account based on minutes of airtime processed over the Group’s networks; |
| >> | turnover derived from connection fees and subscriptions is recognised evenly over the estimated customer relationship period, or the contracted period to which they relate; |
| >> | income received from sales of pre-pay call cards is deferred until the customer uses the value in the card to pay for relevant calls; and |
| >> | revenues from handsets are recognised at the point of sale. |
The Group recognises revenue on a gross basis where its role is that of principal in a transaction. The gross basis represents the gross value of the billing to the customer after trade discounts, with any related costs being charged to operating expenses. Where the Group acts as agent in a transaction, the net revenue earned is recognised as turnover.
Debtor recoverability
In connection with recording revenue, we maintain provisions for doubtful debts for estimated losses that result from the inability of a portion of our customers to make required payments. We base our provision on historical results and future expectations, the economic and competitive environment and other relevant factors, and review the provision regularly.
Mast site restoration provisions
We have certain legal obligations relating to the restoration of leased property to its original condition at the end of the lease term. This obligation relates principally to mast sites. We provide for the expected costs of restoring those sites on which we believe that we will have a material liability. The provision is based on assumptions covering the lease term, the characteristics of the site, the expected cost of restoring the site and the period of time before the obligation is expected to be incurred. There is inherent uncertainty given the long period over which certain leases run and actual restoration costs may differ to those estimated.
Financial performance measurement
We define EBITDA as our earnings before interest, tax, depreciation, amortisation and exceptional items, excluding our share of operating profits and losses of our joint ventures and associates. We use EBITDA, a non-GAAP financial measure, as one of the key performance indicators for evaluating the financial performance of our business units. We believe that EBITDA provides an important measure of the underlying operating performance of our Group because it excludes recurring non-cash items such as depreciation and amortisation. We believe that this measure is also used by readers of this Annual Report in order to assess our performance against other comparable companies. Other measures used include revenues, operating profit or loss and capital expenditure.
We also believe that EBITDA is one of the key indicators of our borrowing potential as indicated by the financial covenants attaching to some of our credit facilities which require compliance with EBITDA targets and EBITDA-based ratios. Further details are provided in the treasury management and policies section on page 37.
As EBITDA is not a measure of financial performance under UK GAAP, it may not be comparable to similarly titled measures of other companies because EBITDA is not uniformly defined. EBITDA should not be considered by investors as an alternative to group operating profit or loss or profit or loss on ordinary activities before taxation as an indication of operating performance, or as an alternative to cash flow from operating activities as an indication of cash flows.
o2.com 23
Operating and financial review and prospects continued
Group operating profit is considered to be the UK GAAP financial measure most directly comparable to EBITDA. The reconciliation of EBITDA to group operating profit/(loss), including O2 Netherlands, for the three years ended 31 March 2005 is as follows:
| 2005 | 2004 | 2003 | |||||
| £m | £m | £m | |||||
| EBITDA | 1,768 | 1,367 | 859 | ||||
| Depreciation1 | (931 | ) | (926 | ) | (932 | ) | |
| Goodwill amortisation | (200 | ) | (201 | ) | (374 | ) | |
| UMTS licence amortisation | (169 | ) | – | – | |||
| Other amortisation | (82 | ) | (7 | ) | (31 | ) | |
| Operating profit/(loss) before exceptional items | 386 | 233 | (478 | ) | |||
| Exceptional items | (45 | ) | (75 | ) | (8,300 | ) | |
| Group operating profit/(loss) | 341 | 158 | (8,778 | ) | |||
| 1In the years ended 31 March 2005 and 2004, excludes depreciation of £6 million and £2 million respectively charged as exceptional items as part of the reorganisation and restructuring discussed in the exceptional items section on page 28. |
Sale of O2 Netherlands
The sale of O2 Netherlands, our wholly-owned Dutch subsidiary, to Greenfield Capital Partners completed on 3 June 2003 for €25 million in cash. The total loss on sale arising on completion was £1,369 million which, after utilisation of the provision recognised in 2003, resulted in a non- operating exceptional loss of £5 million in the year ended 31 March 2004.
In accordance with Financial Reporting Standard 3 (FRS 3) “Reporting financial performance”, the results of O2 Netherlands for the two years ended 31 March 2004 and 31 March 2003 have been classified as discontinued.
The summarised results of the Group, excluding O2 Netherlands, for the three years ended 31 March 2005 are:
| Year ended 31 March | |||||||
| 2005 | 2004 | 2003 | |||||
| £m | £m | £m | |||||
| Group turnover | 6,683 | 5,646 | 4,611 | ||||
| Cost of sales | (3,799 | ) | (3,291 | ) | (2,854 | ) | |
| Gross profit | 2,884 | 2,355 | 1,757 | ||||
| Administrative expenses before exceptional items | (2,498 | ) | (2,121 | ) | (2,115 | ) | |
| Group operating profit/(loss) before exceptional items | 386 | 234 | (358 | ) | |||
| Exceptional items | (45 | ) | (75 | ) | (8,300 | ) | |
| Group operating profit/(loss) | 341 | 159 | (8,658 | ) | |||
Definition of segments
In the year ended 31 March 2004, we undertook a restructuring of our central functions and rationalisation of our property portfolio. In the year ended 31 March 2005 the activities of O2 Online and Products O2, which were previously reported as the “mobile internet services” segment, are reported within the segments in which they now reside. As the information is not readily available, the comparatives have not been restated and these businesses are reported separately in line with day-to-day managerial and budgetary control at that time.
Operating results
Introduction to results of operations
The main components of turnover, cost of sales and administrative expenses, which form our results of operations, are described below.
| Turnover | |
| Our turnover from operations can be analysed into two areas: service and other revenues (including equipment), with service revenue our principal source of income. These income streams are briefly described below: | |
| >> | service revenue is derived from our customers’ use of our mobile networks. This includes both voice-related airtime and data services, such as SMS and GPRS. It also includes interconnection fees from other networks terminating calls on our customers’ mobile phones, and roaming fees from other network customers using our networks; |
| >> | other revenue includes equipment revenue derived from the sale of handsets and other accessories, income we recognise when acting as a service provider for non-O2 customers, national roaming and wholesale contracts revenue. It also includes connection charges and revenue from other sources such as voice messaging and paging services. |
| Cost of sales | |
| The principal items within cost of sales are: | |
| >> | service cost of sales which consists principally of interconnection charges and operation and maintenance costs relating to our networks. Interconnection charges are payments made by us to other fixed line or mobile network operators domestically and abroad when our customers use voice or data services which terminate on other networks. These costs are variable in nature, increasing as the usage of the network increases. Costs relating to the operation and maintenance of our networks mainly comprise core transmission costs, mast site leases, network equipment maintenance and depreciation charges related to our network assets. These costs are more fixed in nature, and depend on the size of the network not the usage of the network, although they will increase as we depreciate our UMTS networks from the date of launch of commercial services; |
| >> | other cost of sales includes the cost of purchasing handsets and other hardware items, costs associated with the provision of roaming and wholesale contracts and the network cost of providing voice messaging and paging services. |
o2.com 24
| Administrative expenses before exceptional items Principal administrative expenses are: | |
| >> | promotional and advertising expenses, primarily comprising bonuses and commissions paid to retailers, for the acquisition and retention of customers. They also include expenditure on advertising, marketing and loyalty programmes; |
| >> | overhead expenses including personnel costs relating to functions such as finance, planning, network, regulatory, legal, marketing and customer care. They also include property charges, facilities, training and information technology support; |
| >> | depreciation charges on non-network assets; and |
| >> | amortisation charges on goodwill arising on the acquisition of businesses, on our UMTS telecommunications licences from the date of market launch of UMTS services and on other intangible assets. |
Exceptional items
Exceptional items are large non-recurring incomes or expenses that have been disclosed separately to avoid distortion of the underlying trading result.
O2 consolidated results of operations for the three years ended 31 March 2005, 2004 and 2003
The following table presents certain financial data for our Group, including O2 Netherlands, for the years ended 31 March 2005, 2004 and 2003 extracted from our consolidated financial statements:
| 2005 | 2004 | 2003 | |||||
| £m | £m | £m | |||||
| Group turnover | 6,683 | 5,694 | 4,874 | ||||
| Cost of sales | (3,799 | ) | (3,314 | ) | (3,060 | ) | |
| Gross profit | 2,884 | 2,380 | 1,814 | ||||
| Administrative expenses before exceptional items | (2,498 | ) | (2,147 | ) | (2,292 | ) | |
| Exceptional items | (45 | ) | (75 | ) | (8,300 | ) | |
| Group operating profit/(loss) | 341 | 158 | (8,778 | ) | |||
| Group’s share of operating result of joint ventures and associates | (3 | ) | – | 5 | |||
| Total operating profit/(loss) | 338 | 158 | (8,773 | ) | |||
| Costs of capital reorganisation | (20 | ) | – | – | |||
| Total loss on sale of business | – | (5 | ) | (1,364 | ) | ||
| Net interest payable and similar charges | (9 | ) | (58 | ) | (66 | ) | |
| Profit/(loss)on ordinary activities before taxation | 309 | 95 | (10,203 | ) | |||
| Taxation | (8 | ) | 71 | 55 | |||
| Profit/(loss)for the financial year | 301 | 166 | (10,148 | ) | |||
| Dividends | (196 | ) | – | – | |||
| Retained profit/(loss) for the year | 105 | 166 | (10,148 | ) | |||
| 1EBITDA is our earnings before interest, tax, depreciation, amortisation and exceptional items, excluding our share of operating profits and losses of our joint ventures and associates. The use of EBITDA as a financial performance measure is discussed on page 23. | |||||||
Year ended 31 March 2005 compared to the year ended 31 March 2004 Group turnover
The following table shows contributions of our businesses to Group turnover:
| Year ended 31 March | |||||||
| 2005 | 2004 | per cent | |||||
| £m | £m | variation | |||||
| Continuing operations | |||||||
| O2 UK | 4,030 | 3,451 | 17 | ||||
| O2 Germany | 1,865 | 1,508 | 24 | ||||
| O2 Ireland | 585 | 529 | 11 | ||||
| O2 Airwave | 169 | 89 | 90 | ||||
| O2 Online | – | 140 | – | ||||
| Manx Telecom | 53 | 50 | 6 | ||||
| Intragroupeliminations | (19 | ) | (121 | ) | (84 | ) | |
| 6,683 | 5,646 | 18 | |||||
| Discontinued operations | |||||||
| O2 Netherlands | – | 48 | (100 | ) | |||
| Total | 6,683 | 5,694 | 17 | ||||
Group turnover from continuing operations increased by 18 per cent from £5,646 million for the year ended 31 March 2004 to £6,683 million for the year ended 31 March 2005. All our businesses contributed to the rise in Group turnover. The principal reasons for the increases in our mobile telecommunications businesses were the overall rise in subscriber numbers in the current year and the increased usage of the Group’s services by subscribers.
A description of the significant new products and services offered by the Group during the year, and the development of the O2 brand, are given in the business review on pages 6 to 19.
O2 UK
O2 UK’s overall turnover increased by 17 per cent from £3,451 million for the year ended 31 March 2004 to £4,030 million for the year ended 31 March 2005. O2 UK’s total active customer base increased from 13.3 million at 31 March 2004 to 14.4 million at 31 March 2005, an increase of over 8 per cent.
o2.com 25
Operating and financial review and prospects continued
The following table provides an analysis of O2 UK’s turnover:
| Year ended 31 March | |||||||
| 2005 | 2004 | per cent | |||||
| £m | £m | variation | |||||
| Service | 3,627 | 3,183 | 14 | ||||
| Equipment and other | 403 | 268 | 50 | ||||
| Total | 4,030 | 3,451 | 17 | ||||
Service revenues Service revenue is the principal element of O2 UK’s turnover, comprising 90 per cent of O2 UK’s group turnover for the year ended 31 March 2005. O2 UK’s service revenue increased by 14 per cent from £3,183 million for the year ended 31 March 2004 to £3,627 million for the year ended 31 March 2005. Of this, service revenue from post-pay customers remains the principal source of income, accounting for 66 per cent of the total service revenue for the year ended 31 March 2005 (2004: 65 per cent).
O2 UK’s service revenue has grown as a result of a combination of an increase in the subscriber base and an increase in ARPU.
At 31 March 2005 our post-pay customer base totalled 4.9 million compared to 4.6 million at 31 March 2004 which represents 335,000 net additions for the year. Our mix of brand, devices and propositions has continued to appeal to new customers. Despite this, post-pay churn for the year ended 31 March 2005 was 31 per cent which is a rise of 5 percentage points from the churn of 26 per cent recorded for the year ended 31 March 2004. This reflects the increasingly competitive market in the UK and the loss of the BT employee corporate account which in itself contributed 2 per cent to churn.
ARPU for both post-pay and pre-pay customers has grown in the year, despite the impact of the termination rate cut imposed by the regulator in September 2004. Post-pay ARPU has increased from £525 for the year ended 31 March 2004 to £542 for the year ended 31 March 2005. Pre-pay ARPU has increased from £141 for the year ended 31 March 2004 to £143 for the year ended 31 March 2005. Voice usage continued to increase and average voice minutes of use per customer increased by 11 per cent to 137 minutes per month during the year ended 31 March 2005. Data ARPU also grew £13 year-on-year, to leave total blended ARPU £9 higher than last year, at £281. Data revenue, as a proportion of total service revenues, was driven by a 34 per cent year-on-year growth in the number of SMS messages handled (from 8.0 billion in the 2004 financial year to 10.7 billion in the 2005 financial year), along with an increasing contribution from non-SMS revenues, which accounted for 3.7 per cent of service revenue in the fourth quarter.
Equipment and other revenues Equipment revenues have increased over the 2004 financial year reflecting the higher level of gross customer connections than in 2004. Other revenues have increased owing to the continued growth in national roaming and wholesale contracts.
O2 Germany
O2 Germany’s overall turnover increased by 24 per cent from £1,508 million for the year ended 31 March 2004 to £1,865 million for the year ended 31 March 2005. O2 Germany’s total active customer base increased by 33 per cent from 6.0 million at 31 March 2004 to 8.0 million at 31 March 2005.
The following table provides an analysis of O2 Germany’s turnover:
| Year ended 31 March | |||||||
| 2005 | 2004 | per cent | |||||
| £m | £m | variation | |||||
| Service | 1,687 | 1,347 | 25 | ||||
| Equipment and other | 178 | 161 | 11 | ||||
| Total | 1,865 | 1,508 | 24 | ||||
Service Service revenue is the principal element of O2 Germany’s turnover, comprising 90 per cent of total turnover for the year ended 31 March 2005. O2 Germany’s service revenue increased by 25 per cent from £1,347 million for the year ended 31 March 2004 to £1,687 million for the year ended 31 March 2005. Of this, service revenue from post-pay customers is the principal source of income, with post-pay revenue for the year ended 31 March 2005 accounting for 83 per cent of the total (2004: 84 per cent).
This increase in service revenue is principally the result of a significant increase in the active subscriber base described above. In particular, the net post-pay customer additions in the year ended 31 March 2005 were 890,000, representing 45 per cent of total net additions. The pre-pay customer base increased by 44 per cent from the 2004 financial year to the 2005 financial year, with pre-pay customers totalling 3.6 million at 31 March 2005. Of this, the new Tchibo Mobilfunk channel has contributed in excess of 250,000 pre-pay customers since its launch in October 2004. The growth in service revenue is also affected by foreign exchange, and translating O2 Germany’s service revenue in 2005 at the exchange rates prevailing in the prior year would increase the reported growth in turnover by £31 million.
In the post-pay market, O2 Germany’s Active bundles were launched in July 2004 and proved very successful with high value customers, with approximately 40 per cent of new contract customers in the second half of the 2005 financial year subscribing to an Active bundle. In the year ended 31 March 2005, the popular O2 Genion Homezone service, our location based tariffing technology, accounted for 50 per cent of new contract customers. These propositions contributed to the proportion of contract customers in O2 Germany’s customer base at 31 March 2005 being nearly 55 per cent.
Post-pay ARPU has decreased from £375 for the year ended 31 March 2004 to £362 for the year ended 31 March 2005. In local currency, the fall is less significant (from €540 in the financial year 2004 to €531 in the financial year 2005) which is a function of the weakening of the Euro during the 2005 financial year. Average customer voice minutes of use remained constant year-on-year, at 118 minutes per month. The fall in blended ARPU can be ascribed to the cut in termination rates suffered in the year and the increasing number of pre-pay customers, as a proportion of the overall customer base, who on average generate lower ARPU than our post-pay customers.
o2.com 26
The proportion of data revenues compared to total service revenues rose to 21.8 per cent for the year ended 31 March 2005 compared to 19.5 per cent for the year ended 31 March 2004. The principal element of data revenue is generated by text messages and O2 Germany recorded nearly 2.4 billion text messages in the year ended 31 March 2005, an increase of one third over the previous year. The success of data propositions also drove non-SMS data uptake and usage, and the number of customers at the year-end who had used a non-SMS data service during the previous 90 days was 1.9 million, 24 per cent of the total base.
Equipment and other revenues Within this category, equipment revenues have risen by 9 per cent to £160 million compared to the prior year which is principally owing to the increase in gross additions in the 2005 year compared to the 2004 year.
O2 Ireland
O2 Ireland’s revenue has increased by 11 per cent from £529 million for the year ended 31 March 2004 to £585 million for the year ended 31 March 2005. This increase in revenue is attributable to an increase of 142,000 in the customer base. Post-pay customer numbers increased from 381,000 at 31 March 2004 to 403,000 active subscribers at 31 March 2005, and the pre-pay customer base increased from 1,010,000 at 31 March 2004 to 1,130,000 at 31 March 2005.
O2 Airwave
Revenue at our O2 Airwave business has increased by 90 per cent from £89 million for the year ended 31 March 2004 to £169 million for the year ended 31 March 2005. On 1 April 2005, O2 Airwave announced that the roll-out of the secure digital communication network for the police forces of England, Scotland and Wales was complete in all 51 forces across England, Scotland and Wales.
Net operating expenses before exceptional items
Net operating expenses before exceptional items comprises cost of sales and administrative expenses. Net operating expenses from continuing operations (excluding O2 Netherlands) increased by 16 per cent from £5,412 million for the 2004 financial year to £6,297 million for the 2005 financial year. This reflects the increase in the cost of sales arising from the growth in turnover described earlier and the commencement of amortisation of the UMTS licences in our UK and German businesses following commercial launch of UMTS services during the year. Foreign exchange has also had an effect and translating the net operating expenses of our overseas businesses at the exchange rates prevailing in the prior year would increase these costs by £43 million.
Group cost of sales
Group cost of sales from continuing operations increased by 15 per cent from £3,291 million for the year ended 31 March 2004 to £3,799 million for the year ended 31 March 2005. The increase in cost of sales for the 2005 financial year is lower than the increase in Group turnover of 17 per cent owing to the improvement in gross margin percentage in our businesses. The gross profit margin of the Group, excluding O2 Netherlands, increased by one percentage point to 43 per cent.
The gross margin percentage (gross profit divided by turnover) of our newer business in Germany is lower than those of our more established businesses in the UK and Ireland. O2 Germany is still building its customer base and, as revenues grow, additional contribution is made towards the fixed element of cost of sales, which increases the margin. As a consequence, in the year ended 31 March 2005, O2 Germany increased its gross margin by 6 percentage points to 44 per cent. As our O2 Airwave business matures, we expect its gross margin to improve similarly.
Group administrative expenses before exceptional items
Group administrative expenses before exceptional items from continuing operations, which exclude O2 Netherlands, have increased by £377 million from £2,121 million for the year ended 31 March 2004 to £2,498 million for the year ended 31 March 2005. During the year, O2 UK and O2 Germany have launched commercial UMTS services, and in line with Group accounting policy, the UMTS licences held by these businesses have commenced amortisation. The charge for the year ended 31 March 2005 is £169 million. Additionally, amortisation in O2 Germany also includes £78 million in respect of the T-Mobile network sharing agreement.
Administrative expenses have also increased owing to a rise in marketing expenditure reflecting the competitive environment in which our businesses operate and the continued growth in the size of the business. Administrative expenses excluding UMTS licence and other amortisation and marketing expenditure have risen only 4 per cent.
An analysis of the net operating expenses before exceptional items between our operating companies is provided in the table below:
| Year ended 31 March | |||||||
| 2005 | 2004 | per cent | |||||
| £m | £m | variation | |||||
| Continuing operations | |||||||
| O2 UK | 3,464 | 2,899 | 19 | ||||
| O2 Germany | 1,955 | 1,579 | 24 | ||||
| O2 Ireland | 430 | 389 | 11 | ||||
| O2 Online | – | 224 | – | ||||
| O2 Airwave | 151 | 119 | 27 | ||||
| Other operations and central costs | 97 | 1 | – | ||||
| Goodwill amortisation | 200 | 201 | – | ||||
| Total | 6,297 | 5,412 | 16 | ||||
o2.com 27
Operating and financial review and prospects continued
O2 UK
O2 UK’s net operating expenses before exceptional items have increased by 19 per cent, from £2,899 million for the year ended 31 March 2004, to £3,464 million for the year ended 31 March 2005.
O2 UK’s gross profit margin, being gross profit expressed as a proportion of O2 UK’s group turnover, has declined from 44 per cent in the year ended 31 March 2004 to 41 per cent for the year ended 31 March 2005. This is attributable to firstly the integration of the business of O2 Online and Products O2 on 1 April 2004 discussed above and secondly the increasing cost of supplying devices to customers. Handsets are increasingly sophisticated and we have experienced greater demand for more costly devices with additional features such as cameras.
O2 UK’s depreciation charge has increased from £488 million in the year ended 31 March 2004 to
£558 million in the year ended 31 March 2005, an increase of 14 per cent. This reflects the commencement of depreciation on the UMTS network assets and a larger fixed asset base as well as a review of certain asset lives, mainly software.
Advertising and marketing expenditure for the year ended 31 March 2005 has increased year on year reflecting the general level of competition in the market. Post-pay SACs have increased from £160 to £172 per subscriber and pre-pay SACs have increased from £16 to £19 per subscriber.
O2 Germany
O2 Germany’s net operating expenses before exceptional items increased from £1,579 million for the year ended 31 March 2004 to £1,955 million for the year ended 31 March 2005.
Under a long-standing agreement, T-Mobile Deutschland GmbH (T- Mobile) currently provides national roaming capacity to O2 Germany in areas where O2 Germany has not developed its own network. The cost of the contract is determined based on a fixed number of minutes available to O2 Germany and includes certain capital payments to T-Mobile.
In November 2004 O2 Germany announced a strategy to deliver faster customer growth and to step up the level of investment in its UMTS network. To sustain the rapid growth in subscribers experienced in O2 Germany, we aim to deliver UMTS network quality and population coverage competitive with the two market leaders. This will require additional capital expenditure on our UMTS network which we expect to a significant extent to be offset by a reduction in operating costs, including lower national roaming costs, and by faster revenue growth.
The total depreciation charge (for both network and non- network fixed assets) was £241 million for the year ended 31 March 2005, a 18 per cent decrease over the charge for the year ended 31 March 2004 of £295 million.
Blended subscriber acquisition costs have fallen by 8 per cent from £119 per subscriber for the year ended 31 March 2004 to £110 per subscriber for the year ended 31 March 2005. The fall in blended SAC is mainly attributable to the increasing proportion of pre-pay customers in the new connections mix.
O2 Ireland
Net operating expenses before exceptional items for O2 Ireland have increased by 11 per cent from £389 million for the year ended 31 March 2004 to £430 million for the year ended 31 March 2005. The increase is consistent with the growth of this business and reflects the stable margins reported by O2 Ireland.
O2 Airwave
The net operating expenses of our O2 Airwave business have increased by 27 per cent, or £32 million, from 2004 to 2005 as the business has expanded and the roll-out of the network has been completed.
Goodwill amortisation
The Group’s goodwill amortisation charge was £200 million for the year ended 31 March 2005 which is consistent year on year and reflects the systematic charge recognised against our Group’s goodwill value.
Exceptional items
In the year ended 31 March 2005, we incurred an exceptional operating charge of £45 million and an exceptional non- operating charge of £20 million. The exceptional operating charge related to the redeployment of resources within O2 UK into customer facing areas and away from non- customer facing areas. This is in line with O2 UK’s strategy of delivering an enhanced customer experience and increasing customer loyalty. The charge comprises redundancy and property costs. No cash was expended in the year ended 31 March 2005. The exceptional non- operating charge related to the costs of the capital reorganisation described in note 19 to the financial statements. This charge gave rise to a cash outflow of £15 million in the year.
In the year ended 31 March 2004, we incurred an exceptional operating charge of £75 million in respect of the restructuring of central functions and the resultant rationalisation of our property portfolio. This arose on the transfer of O2 Online, Products O2 and certain other central functions to our operating businesses in the UK, Germany and Ireland and included provisions relating to redundancies and the termination of property leases. This charge gave rise to a cash outflow of £17 million in that year.
The sale of O2 Netherlands to Greenfield Capital Partners completed on 3 June 2003 for €25 million in cash. The total loss on sale arising on completion was £1,369 million which, after utilisation of the provision recognised in 2003, resulted in an exceptional non- operating loss of £5 million in the year ended 31 March 2004.
The impairment review performed during the year ended 31 March 2003 resulted in an exceptional non-cash operating charge in respect of our continuing businesses of £8,300 million. This comprised charges relating mainly to the impairment of UMTS licences and goodwill in O2 UK and O2 Germany (totalling
o2.com 28
£2,300 million and £4,700 million respectively) and the impairment of goodwill in O2 Ireland of £1,300 million.
EBITDA
EBITDA is our earnings before interest, tax, depreciation, amortisation and exceptional items, excluding our share of operating profits and losses of our joint ventures and associates. All our mobile telecommunications businesses have generated positive EBITDA over the last three financial years.
The reconciliation of EBITDA to Group operating profit/(loss), the closest UK GAAP financial measure, by business is as follows:
| Group operating | Exceptional | |||||||||||||||||||
| profit/(loss) | Depreciation | Amortisation | items | EBITDA | ||||||||||||||||
| 2005 | 2004 | 2005 | 2004 | 2005 | 2004 | 2005 | 2004 | 2005 | 2004 | |||||||||||
| £m | £m | £m | £m | £m | £m | £m | £m | £m | £m | |||||||||||
| Continuing operations | ||||||||||||||||||||
| O2 UK | 371 | 346 | 558 | 488 | 209 | 150 | 45 | 57 | 1,183 | 1,041 | ||||||||||
| O2 Germany | (90 | ) | (72 | ) | 241 | 295 | 190 | – | – | 2 | 341 | 225 | ||||||||
| O2 Ireland | 106 | 87 | 65 | 67 | 52 | 53 | – | 1 | 223 | 208 | ||||||||||
| O2 Airwave | 19 | (31 | ) | 53 | 31 | – | – | – | 1 | 72 | 1 | |||||||||
| O2 Online | – | (93 | ) | – | 36 | – | 4 | – | 10 | – | (43 | ) | ||||||||
| Other operations | (65 | ) | (78 | ) | 14 | 8 | – | 1 | – | 4 | (51 | ) | (65 | ) | ||||||
| 341 | 159 | 931 | 925 | 451 | 208 | 45 | 75 | 1,768 | 1,367 | |||||||||||
| Discontinued operations | ||||||||||||||||||||
| O2 Netherlands | – | (1 | ) | – | 1 | – | – | – | – | – | – | |||||||||
| 341 | 158 | 931 | 926 | 451 | 208 | 45 | 75 | 1,768 | 1,367 | |||||||||||
The following table shows contributions of our businesses to Group EBITDA:
| Year ended 31 March | |||||||
| 2005 | 2004 | per cent | |||||
| £m | £m | variation | |||||
| Continuing operations | |||||||
| O2 UK | 1,183 | 1,041 | 14 | ||||
| O2 Germany | 341 | 225 | 52 | ||||
| O2 Ireland | 223 | 208 | 7 | ||||
| O2 Airwave | 72 | 1 | – | ||||
| O2 Online | – | (43 | ) | – | |||
| Other operations and central costs | (51 | ) | (65 | ) | (22 | ) | |
| Discontinued operations | 1,768 | 1,367 | 29 | ||||
| O2 Netherlands | – | – | – | ||||
| Total | 1,768 | 1,367 | 29 | ||||
Group EBITDA from continuing operations has increased by 29 per cent from £1,367 million for the year ended 31 March 2004 to £1,768 million for the year ended 31 March 2005. The increased EBITDA contribution has come from all the trading operations of the Group.
Group operating profit
In the year ended 31 March 2004, we recorded our first ever group operating profit of £158 million. This has increased by 116 per cent to £341 million in the year ended 31 March 2005. Excluding exceptional items, our Group’s total operating profit has increased by 66 per cent from £233 million in the 2004 financial year to £386 million in the 2005 financial year.
Net interest
Net interest payable relates to the finance charges payable on external debt, net of interest received on amounts invested. In the 2005 financial year we incurred a net interest charge of £9 million, a decrease of 84 per cent over the 2004 financial year which reflects the decrease in net debt over that period. In the 2005 financial year, the principal elements of our interest charge were the interest on our revolving credit facility (“RCF”) amounting to £4 million (2004: £8 million) and interest of £57 million (2004: £62 million) accruing on our long-term bonds, which we issued in January 2002. In accordance with UK GAAP, we are amortising the issue costs of our bank facility and our bonds over the lives of the facilities (five and ten years respectively), through the interest line in the profit and loss account. Amortisation of these costs amounted to £8 million in the 2005 financial year (2004: £4 million) with the increase representing an accelerated charge arising from the reduction in our RCF during the year. We also incur interest charges on the O2 UK loan notes and on our finance leases and other borrowings, and have received interest on our short-term investments. Further details are contained in the liquidity and capital resources section on page 35.
Tax on loss on ordinary activities
We recognised a tax charge of £8 million for the year ended 31 March 2005 compared to a credit of £71 million for the year ended 31 March 2004. The overall charge reflects a prudent view of the utilisation of our Group’s tax losses in the UK and Germany and the related deferred tax assets. Overall we continue to recognise a net deferred tax liability.
Dividends
We have proposed an inaugural final dividend of 2.25 pence per share for the year ended 31 March 2005. This dividend, totalling £196 million, will be paid on 26 August 2005 to shareholders on the register on 5 August 2005.
o2.com 29
Operating and financial review and prospects continued
Year ended 31 March 2004 compared to the year ended 31 March 2003
Group turnover
The following table shows contributions of our businesses to Group turnover:
| Year ended 31 March | ||||||
| 2004 | 2003 | per cent | ||||
| £m | £m | variation | ||||
| Continuing operations | ||||||
| O2 UK | 3,451 | 3,025 | 14 | |||
| O2 Germany | 1,508 | 1,060 | 42 | |||
| O2 Ireland | 529 | 442 | 20 | |||
| O2 Online | 140 | 93 | 51 | |||
| Other operations | 139 | 64 | 117 | |||
| Intragroup eliminations | (121 | ) | (73 | ) | 66 | |
| 5,646 | 4,611 | 22 | ||||
| Discontinued operations | ||||||
| O2 Netherlands | 48 | 263 | (82 | ) | ||
| Total | 5,694 | 4,874 | 17 | |||
Group turnover from continuing operations increased by 22 per cent from £4,611 million for the year ended 31 March 2003 to £5,646 million for the year ended 31 March 2004. All our businesses contributed to the rise in Group turnover. The principal reasons for the increases in our mobile telecommunications businesses were the overall rise in subscriber numbers in the current year and the increased usage of the Group’s services by subscribers. The rise in turnover of our other operations is due mainly to our Airwave business which contributed £73 million of the increase.
The strengthening of the Euro during 2004 also improved the growth. Translating the results of our overseas business at the exchange rates prevailing in the prior year would have reduced the reported growth in turnover by £153 million.
O2 UK
O2 UK’s overall turnover increased by 14 per cent from £3,025 million for the year ended 31 March 2003 to £3,451 million for the year ended 31 March 2004. O2 UK’s total active customer base increased from 12.1 million at 31 March 2003 to 13.3 million at 31 March 2004, an increase of 10 per cent. This included a net increase in post-pay subscribers of over half a million customers.
The following table provides an analysis of O2 UK’s turnover:
| Year ended 31 March | ||||||
| 2004 | 2003 | per cent | ||||
| £m | £m | variation | ||||
| Service | 3,183 | 2,738 | 16 | |||
| Equipment and other | 268 | 287 | (7 | ) | ||
| Total | 3,451 | 3,025 | 14 | |||
Service revenues Service revenue is the principal element of O2 UK’s turnover, comprising 92 per cent of total turnover for the year ended 31 March 2004. O2 UK’s service revenue increased by 16 per cent from £2,738 million for the year ended 31 March 2003 to £3,183 million for the year ended 31 March 2004. Of this, service revenue from post-pay customers remains the principal source of income, accounting for over 65 per cent of the total. This represents a decrease from the 67 per cent recorded for the year ended 31 March 2003 and is a function of the strong growth in pre-pay ARPU in the year ended 31 March 2004.
O2 UK’s revenue has grown as a result of a combination of an increase in the subscriber base, partly arising from improving levels of retention of existing post-pay users, and an increase in post-pay ARPU.
Post-pay subscriber gross additions for the year ended 31 March 2004 total 1.7 million, taking our total post-pay customer base to 4.6 million (representing 516,000 net additions for the year). Post-pay churn for the year ended 31 March 2004 was 26 per cent, a fall of two percentage points from the churn of 28 per cent recorded for the year ended 31 March 2003. This reflects our efforts to attract higher- spending customers through innovative products and services as well as targeted and successful campaigns in the business market.
We have also increased our use of ARPU-share incentive arrangements with independent distributors to increase revenue and reduce churn.
ARPU for both post-pay and pre-pay customers grew strongly in the year. Post-pay ARPU increased from £503 for the year ended 31 March 2003 to £525 for the year ended 31 March 2004. Pre-pay ARPU increased from £121 for the year ended 31 March 2003 to £141 for the year ended 31 March 2004.
Data revenues, as a proportion of total service revenues, increased steadily through the year from 17.1 per cent for the year ended 31 March 2003 to 20.4 per cent for the year ended 31 March 2004. Data revenue as a proportion of total service revenue for the final quarter of the year ended 31 March 2004 was 22.3 per cent. Included within these statistics, the popularity of text messages continued to grow, with in excess of 8 billion messages sent during the year ended 31 March 2004, compared with 5.8 billion during the year ended 31 March 2003.
Equipment and other revenues Equipment revenues increased marginally in the 2004 financial year compared to the 2003 financial year. Although the level of gross additions to our subscriber base has remained level in 2004 compared to 2003, handset prices have generally decreased year on year, the effect of which has been offset by the sales mix. Other revenues have fallen by almost one-quarter from 2003 to
o2.com 30
2004 reflecting a reduction in service provider and non-mobile retail revenues, which is partially offset by increased revenue from national roaming and wholesale contracts.
O2 Germany
O2 Germany’s overall turnover increased by 42 per cent from £1,060 million for the year ended 31 March 2003 to £1,508 million for the year ended 31 March 2004. O2 Germany’s total active customer base increased by 24 per cent from 4.8 million at 31 March 2003 to slightly less than 6.0 million at 31 March 2004.
The following table provides an analysis of O2 Germany’s turnover:
| Year ended 31 March | ||||||
| 2004 | 2003 | per cent | ||||
| £m | £m | variation | ||||
| Service | 1,347 | 944 | 43 | |||
| Equipment and other | 161 | 116 | 39 | |||
| Total | 1,508 | 1,060 | 42 | |||
Service Service revenue is the principal element of O2 Germany’s turnover, comprising 89 per cent of total turnover for the year ended 31 March 2004. O2 Germany’s service revenue increased by 43 per cent from £944 million for the year ended 31 March 2003 to £1,347 million for the year ended 31 March 2004. Of this, service revenue from post-pay customers is the principal source of income, with post-pay revenue accounting for 84 per cent of the total.
This increase in service revenue is principally the result of a significant increase in the active subscriber base described above. In particular, the post-pay customer additions in the year ended 31 March 2004 were 836,000, representing 71 per cent of total net additions. The pre-pay customer base increased by 15 per cent from the 2003 financial year to the 2004 financial year, with pre-pay customers totalling 2.5 million at 31 March 2004. A further contributory factor in the growth in service revenue is the effect of foreign exchange. Translating O2 Germany’s service revenue in 2004 at the exchange rates prevailing in the prior year would reduce the reported growth in turnover by £101 million.
A large proportion of the post-pay additions during the year relate to customers who have subscribed to the O2 Genion Homezone service, our location-based tariffing technology, which allows reduced call rates within a small geographical area, usually at home. O2 Germany also offers an equivalent service to business customers. Both O2Genion Home and Business are part of our drive across the Group to attract high-value customers. At 31 March 2004, over 42 per cent of the total customer base subscribed to the O2 Genion service compared with 30 per cent at 31 March 2003.
Post-pay ARPU has increased from £341 for the year ended 31 March 2003 to £375 for the year ended 31 March 2004. This rise is a function of the continuing drive to win higher spending customers.
O2 Germany have continued to offer advanced data services during the 2004 financial year. This has been reflected in the increase in the proportion of data revenues compared to total service revenues which have risen to 19.5 per cent during the year ended 31 March 2004. The proportion for the three months ended 31 March 2004 reached 20.7 per cent. The principal element of data revenue is generated by text messages and O2 Germany recorded in excess of 1.8 billion text messages in the year ended 31 March 2004, an increase of 466 million messages over last year.
Equipment revenues Equipment revenues have risen by 56 per cent to £147 million compared to the prior year. This is principally owing to the increase of almost 500,000 gross additions in the 2004 year compared to the 2003 year.
O2 Ireland
O2 Ireland’s revenue has increased by 20 per cent from £442 million for the year ended 31 March 2003 to £529 million for the year ended 31 March 2004. This increase in revenue is a combination of an increase of 136,000 in the customer base and an 11 per cent rise in blended ARPU. Post-pay customer numbers increased from 366,000 at 31 March 2003 to 381,000 active subscribers at 31 March 2004 and the pre-pay customer base increased from 889,000 at 31 March 2003 to 1,010,000 at 31 March 2004.
A further contributory factor in the growth in revenue is the effect of foreign exchange. Translating O2 Ireland’s revenue in 2004 at the exchange rates prevailing in the prior year would reduce the reported growth in turnover by £40 million.
O2 Airwave
Revenue at our Airwave business has increased by over 450 per cent from £16 million for the year ended 31 March 2003 to £89 million for the year ended 31 March 2004. The roll-out of the secure digital communication network for the police forces of England, Scotland and Wales continued during the year and by 31 March 2004 had achieved live status in 35 of the country’s 51 forces.
O2 Online
During the year ended 31 March 2004, O2 Online acted as the online sales channel for O2 UK and as the developer of the Group’s mobile data capability. Subsequent to the year end, the operations of O2 Online and Products O2 have been transferred to O2 UK as part of the reorganisation undertaken in the year ended 31 March 2004.
O2 Online generated internal revenue mainly from connection fees, airtime voucher sales and the provision of WAP gateway and portal services to other Group companies. External revenues include sales of devices outside the Group’s territories, paid-for alerts and ring-tones and advertising.
In the current year, gross connections through the Online channel doubled compared to the 2003 year to over 1.0 million.
o2.com 31
Operating and financial review and prospects continued
Net operating expenses before exceptional items
Net operating expenses before exceptional items comprises cost of sales and administrative expenses. Net operating expenses from continuing operations (excluding O2 Netherlands) increased by 8 per cent from £4,969 million for the 2003 financial year to £5,412 million for the 2004 financial year. This reflects the increase in the cost of sales arising from the growth in turnover described earlier. Translating the net operating expenses of our overseas businesses at the exchange rates prevailing in the prior year would reduce these costs by £147 million.
Group cost of sales
Group cost of sales from continuing operations increased by 15 per cent from £2,854 million for the year ended 31 March 2003 to £3,291 million for the year ended 31 March 2004. The increase in cost of sales for the 2004 financial year is commensurate with the increase in Group turnover of 22 per cent, partly offset by the improvement in gross margin percentage in our businesses. The gross profit margin of the Group, excluding O2 Netherlands, increased by 4 percentage points to 42 per cent.
The gross margin percentage (gross profit divided by turnover) of our newer business in Germany is lower than those of our more established businesses in the UK and Ireland. O2 Germany is in the process of building its customer base and, as revenues grow, additional contribution is made towards the fixed element of cost of sales, which increases the margin. As a consequence, in the year ended 31 March 2004, O2 Germany increased its gross margin by 10 percentage points to 38 per cent.
Group administrative expenses before exceptional items
Group administrative expenses before exceptional items from continuing operations, which exclude O2 Netherlands, have increased from £2,115 million for the year ended 31 March 2003 to £2,121 million for the year ended 31 March 2004. Given the growth in subscribers and revenues in 2004, the static level of administrative expenses before exceptional items reflects the benefit of a full year of cost savings following the restructuring undertaken by the Group in the 2002 and 2003 financial years, and certain savings already realised from the reorganisation started in 2004. Translating the administrative expenses of our overseas business at the exchange rates prevailing in the prior year would reduce them by £62 million from the £2,121 million reported.
Group administrative expenses before exceptional items from continuing operations, as a percentage of turnover, have decreased from 46 per cent in the 2003 financial year to 38 per cent in the 2004 financial year.
An analysis of the net operating expenses before exceptional items between our operating companies is provided in the table below:
| Year ended 31 March | |||||||
| 2004 | 2003 | per cent | |||||
| £m | £m | variation | |||||
| O2 UK | 2,899 | 2,691 | 8 | ||||
| O2 Germany | 1,579 | 1,295 | 22 | ||||
| O2 Ireland | 389 | 356 | 9 | ||||
| O2 Online | 224 | 216 | 4 | ||||
| Other operations and central costs | 120 | 71 | 69 | ||||
| Goodwill amortisation | 201 | 340 | (41 | ) | |||
| Total | 5,412 | 4,969 | 9 | ||||
O2 UK
O2 UK’s net operating expenses before exceptional items have increased by 8 per cent, from £2,691 million for the year ended 31 March 2003, to £2,899 million for the year ended 31 March 2004.
The variable element of O2 UK’s service cost of sales has increased in line with the network usage. Interconnection charges increased significantly during the financial year 2004, compared to the year ended 31 March 2003, reflecting increased calls from O2 UK customers terminating on other networks including other mobile networks whose termination charges are generally higher than charges levied by fixed-line network providers.
O2 UK’s depreciation charge has increased from £477 million in the year ended 31 March 2003 to £488 million in the year ended 31 March 2004, an increase of 2 per cent.
The advertising and marketing spend for the year ended 31 March 2004 has remained static year on year reflecting the focused nature of the spend in this area. Within this, subscriber acquisition costs have fallen as the unit cost of connections has declined despite an increase in the volume of gross subscribed additions. Post-pay SACs have decreased from £177 to £160 per subscriber and pre-pay SACs have decreased from £25 to £16 per subscriber.
Compared to the year ended 31 March 2003, O2 UK’s overheads have increased by 8 per cent for the year ended 31 March 2004, which, despite the increased turnover and concentration on improving customer service, reflects the cost control measures during the year and the cost savings which continue to be derived from the restructuring of the business announced in February 2002.
O2 Germany
O2 Germany’s net operating expenses before exceptional items increased from £1,295 million for the year ended 31 March 2003 to £1,579 million for the year ended 31 March 2004.
o2.com 32
T-Mobile Deutschland GmbH (T- Mobile) provides national roaming capacity to O2 Germany in areas where O2 Germany has not developed its own network. The cost of the contract is determined based on a fixed number of minutes available to O2 Germany. In February 2003, an extension to this agreement gave O2 Germany access to T-Mobile’s 3G network over a longer period. The access provides us with an effective route to provide UMTS services to our customers in Germany.
Net operating expenses as a percentage of turnover was 122 per cent for the 2003 financial year and for the 2004 financial year has fallen to 105 per cent. This reflects the rapid growth in revenues at O2 Germany. For O2 Germany, we expect this ratio to be higher than the same ratio of our more established businesses, as it is a newer business and is in the process of building up its customer base.
The total depreciation charge (for both network and non- network fixed assets) was £295 million for the year ended 31 March 2004, a 14 per cent increase over the charge for the year ended 31 March 2003 of £259 million. This reflects the continuing investment by O2 Germany in their network.
Blended subscriber acquisition costs have increased by 11 per cent from £107 per subscriber for the year ended 31 March 2003 to £119 per subscriber for the year ended 31 March 2004. The Euro-denominated SAC has remained static for both pre-pay and post-pay connections from 2003 to 2004. The increase in blended SAC is mainly attributable to the strengthening of the Euro against Sterling from 2003 to 2004 which increases the SAC when translated into Sterling for reporting purposes.
O2 Ireland
Net operating expenses before exceptional items for O2 Ireland have increased by 9 per cent from £356 million for the year ended 31 March 2003 to £389 million for the year ended 31 March 2004.
The principal reason for the increase is the expansion of the business in the 2004 financial year as the total turnover of O2 Ireland has grown by 20 per cent from the 2003 financial year to the 2004 financial year. The effect of the revenue increase was reduced as a result of the continuing cost control measures.
O2 Online
O2 Online’s net operating expenses before exceptional items increased by 4 per cent from £216 million for the year ended 31 March 2003 to £224 million for the year ended 31 March 2004. This reflects the Group’s continued focus on developing mobile data capability while at the same time minimising expenditure prior to the transfer of the trade to O2 UK immediately after the 2004 year end.
O2 Airwave
Within other operations and central costs, the net operating expenses of our O2 Airwave business have increased by £68 million from 2003 to 2004 as the business has expanded.
Goodwill amortisation
The Group’s goodwill amortisation charge relating to continuing operations before the exceptional impairment charge recognised in the 2003 financial year decreased from £340 million in the 2003 financial year to £201 million in the 2004 financial year. This is due to the impairment charge recognised in 2003 which reduced the ongoing annual amortisation charge.
Exceptional items
In the year ended 31 March 2004, we incurred an exceptional operating charge of £75 million in respect of the restructuring of central functions and the resultant rationalisation of our property portfolio and a non- operating exceptional charge of £5 million relating to the completion of the sale of O2 Netherlands. These are discussed earlier in this operating and financial review and prospects.
In 2003, we recognised an exceptional non-cash charge relating to the impairment of fixed assets in our continuing businesses (being our UK, German and Irish businesses) of £8,300 million.
EBITDA
EBITDA is our earnings before interest, tax, depreciation, amortisation and exceptional items, excluding our share of operating profits and losses of our joint ventures and associates. Our businesses with larger market shares in their countries of operation, O2 UK and O2 Ireland, have generated positive EBITDA over the last three financial years. O2 Germany, a newer business, has historically made EBITDA losses, until the 2003 financial year, during which O2 Germany achieved a positive EBITDA result for the first time and in the 2004 financial year has achieved an EBITDA margin of 15 per cent.
The following table shows contributions of our businesses to Group EBITDA:
| Year ended 31 March | |||||||
| 2004 | 2003 | per cent | |||||
| £m | £m | variation | |||||
| Continuing operations | |||||||
| O2 UK | 1,041 | 837 | 24 | ||||
| O2 Germany | 225 | 27 | 733 | ||||
| O2 Ireland | 208 | 157 | 32 | ||||
| O2 Online | (43 | ) | (73 | ) | (41 | ) | |
| Other operations | (64 | ) | (90 | ) | (29 | ) | |
| 1,367 | 858 | 59 | |||||
| Discontinued operations | |||||||
| O2 Netherlands | – | 1 | – | ||||
| Total | 1,367 | 859 | 59 | ||||
Group EBITDA from continuing operations has increased by 59 per cent from £858 million for the year ended 31 March 2003 to £1,367 million for the year ended 31 March 2004. The increased EBITDA contribution has come from all the trading operations of the Group.
o2.com 33
Operating and financial review and prospects continued
The reconciliation of EBITDA to Group operating profit/(loss), the most directly comparable UK GAAP financial measure, by business is as follows:
| Group operating | Exceptional | |||||||||||||||||||
| profit/(loss) | Depreciation | Amortisation | items | EBITDA | ||||||||||||||||
| 2004 | 2003 | 2004 | 2003 | 2004 | 2003 | 2004 | 2003 | 2004 | 2003 | |||||||||||
| £m | £m | £m | £m | £m | £m | £m | £m | £m | £m | |||||||||||
| Continuing operations | ||||||||||||||||||||
| O2 UK | 346 | (2,116 | ) | 488 | 478 | 150 | 175 | 57 | 2,300 | 1,041 | 837 | |||||||||
| O2 Germany | (72 | ) | (4,979 | ) | 295 | 259 | – | 47 | 2 | 4,700 | 225 | 27 | ||||||||
| O2 Ireland | 87 | (1,331 | ) | 67 | 67 | 53 | 121 | 1 | 1,300 | 208 | 157 | |||||||||
| O2 Online | (93 | ) | (122 | ) | 36 | 34 | 4 | 15 | 10 | – | (43 | ) | (73 | ) | ||||||
| Other businesses | (109 | ) | (110 | ) | 39 | 20 | 1 | – | 5 | – | (64 | ) | (90 | ) | ||||||
| 159 | (8,658 | ) | 925 | 858 | 208 | 358 | 75 | 8,300 | 1,367 | 858 | ||||||||||
| Discontinued operations | ||||||||||||||||||||
| O2 Netherlands | (1 | ) | (120 | ) | 1 | 74 | – | 47 | – | – | – | 1 | ||||||||
| 158 | (8,778 | ) | 926 | 932 | 208 | 405 | 75 | 8,300 | 1,367 | 859 | ||||||||||
Total operating profit/(loss)
We recorded our first ever total operating profit in the year ended 31 March 2004, of £158 million. This compares with a total operating loss of the Group for the year ended 31 March 2003 of £8,773 million which included the exceptional impairment charge of £8,300 referred to above. Excluding exceptional items, the total operating loss recorded in 2003 of £473 million reversed to a profit of £233 million in 2004. This can be ascribed to both increased revenues generated by all our businesses arising from the increased number of subscribers and the rise in ARPUs and to the continuing cost control exhibited by our businesses.
Net interest payable
Net interest payable relates to the finance charges payable on external debt, net of interest received on amounts invested. In the 2004 financial year we incurred an interest charge totalling £58 million, a decrease of 12 per cent over the 2003 financial year reflecting the decrease in net debt over that period. In the 2004 financial year, the principal elements of our interest charge were the interest on our revolving credit facility amounting to £8 million (2003: &po und;12 million) and the interest accrued, of £62 million (2003: £63 million) on our long-term bonds, which we issued in January 2002. In accordance with UK GAAP, we are amortising the issue costs of our bank facility and our bonds over the lives of the facilities (five and ten years respectively), through the interest line in the profit and loss account. Amortisation of these costs amounted to £4 million in the 2004 financial year (2003: £3 million). We also incur interest charges on the O2 UK loan notes and on our finance leases and other borrowings, and have received interest on our short-term investments. See the liquidity and capital resources section on page 35.
Tax on profit and ordinary activities
We have recognised a tax credit of £71 million for the year ended 31 March 2004 compared to a credit of £55 million for the year ended 31 March 2003. The increase in the tax credit is principally as a result of the improved financial performance of the Group for the 2004 financial year and the related recognition of certain losses as deferred tax assets. However, overall the Group continues to have a net deferred tax liability.
Balance sheets as at 31 March 2005 and 31 March 2004
Our Group’s summary balance sheet is presented below:
| 2005 | 2004 | ||||
| £m | £m | ||||
| Fixed assets | |||||
| Intangible assets | 7,045 | 7,354 | |||
| Tangible assets | 4,449 | 3,996 | |||
| Investments | 2 | 5 | |||
| 11,496 | 11,355 | ||||
| Current assets | 2,473 | 2,043 | |||
| Creditors: amounts falling due within one year | (2,031 | ) | (1,678 | ) | |
| Net current assets | 442 | 365 | |||
| Creditors: amounts falling due after more than one year | (1,403 | ) | (1,375 | ) | |
| Provisions for liabilities and charges | (254 | ) | (251 | ) | |
| Net assets | 10,281 | 10,094 | |||
| Shareholders’ funds | 10,281 | 10,094 | |||
Intangible fixed assets comprise goodwill, UMTS licences and other intangible assets. Their aggregate carrying value has fallen from £7,354 million at 31 March 2004 to £7,045 million at 31 March 2005. This is a result of amortisation charges of £200 million against goodwill, £169 million against UMTS licences and £82 million against other intangibles. These charges are partially offset by gains on foreign exchange which arise on the retranslation of our Euro- denominated intangible assets into Sterling, and £59 million of additions.
The carrying value of tangible fixed assets has increased from £3,996 million at 31 March 2004 to £4,449 million at 31 March 2005 as a result of £1,356 million of additions partly offset by depreciation charges of £937 million and currency movements of £36 million.
Investments comprise our investments in joint ventures and associates where the carrying value is positive.
Net current assets have increased from £365 million at 31 March 2004 to £442 million at 31 March 2005, primarily as a result of an increase in cash and current asset investments during the year which is partially offset by the amount owing for the proposed final dividend.
o2.com 34
Creditors falling due after more than one year comprise principally our Group’s long-term bonds and have increased from £1,375 million at 31 March 2004 to £1,403 million at 31 March 2005. This is primarily owing to the weakening of the Euro during the 2005 financial year which has increased the reported Sterling value of our Euro-denominated bonds. We have also entered into additional finance leases which is partly offset by the movement of amounts nearing maturity into current liabilities.
Liquidity and capital resources
The following table sets forth our cash flows for the years ended 31 March 2005, 2004 and 2003 extracted from our consolidated financial statements.
| 2005 | 2004 | 2003 | |||||
| £m | £m | £m | |||||
| Net cash inflow from operating activities | 1,755 | 1,391 | 1,033 | ||||
| Returns on investments and servicing of finance | (43 | ) | (62 | ) | (63 | ) | |
| Tax paid | (15 | ) | (13 | ) | (4 | ) | |
Net cash outflow from capital expenditure and financial investment | (1,348 | ) | (1,114 | ) | (868 | ) | |
| Acquisitions and disposals | (2 | ) | (6 | ) | – | ||
| Cash inflow before management of liquid resources and financing | 347 | 196 | 98 | ||||
| Management of liquid resources | (302 | ) | (191 | ) | (3 | ) | |
| Net cash outflow from financing | (27 | ) | (50 | ) | (47 | ) | |
| Increase/(decrease) in cash in the year | 18 | (45 | ) | 48 | |||
Net cash inflow from operating activities
Our operating activities provided cash of £1,755 million, £1,391 million and £1,033 million during the three years ended 31 March 2005, 2004 and 2003 respectively. Our Group operating profit of £341 million, £158 million and loss of £8,778 million in each of the years were offset by significant non-cash depreciation and amortisation charges totalling £1,388 million, £1,136 million and £9,637 million (including in 2005 and 2004 exceptional depreciation of £6 million and £2 million respectively and in 2003 an operating exceptional charge of £8,300 million).
Returns on investment and servicing of finance
Net cash outflows for servicing of finance in the 2005 year have decreased from £62 million to £43 million in comparison to the 2004 financial year. The reduction is mostly attributable to higher short-term investments generating an increase in interest income of £15 million, a dividend of £7 million received from our associate and a one-off cash inflow of £22 million arising from the settlement of the cross-currency element of our interest rate swaps. These inflows were offset by cash outflows of £32 million on the settlement of forward foreign exchange contracts as part of our Group’s hedging strategy which is discussed in note 26 to the financial statements. The cash outflow for the year ended 31 March 2005 in respect of interest paid was £71 million (2004: £78 million, 2003: £81 million), mostly in relation to our long-term bonds.
Tax paid
The total tax paid by our Group in the year ended 31 March 2005 was £15 million, an increase over 2004 and 2003 during which the Group paid £13 million and £4 million respectively.
Net cash outflow from capital expenditure and financial investment
Cash outflow in respect of capital expenditure for the 2005 financial year was £1,348 million, an increase of 21 per cent over the equivalent outflow of £1,114 million for the 2004 financial year. This increase arises principally in our mobile telecommunications businesses in the UK and Germany. The increase is a consequence of the ongoing expenditure on rolling out our planned UMTS networks, which accounted for 35 per cent of capital expenditure at O2 UK and 30 per cent at O2 Germany in the year ended 31 March 2005. Around 15 per cent of capital expenditure by O2 UK in the 2005 financial year related to investment in new customer care systems.
Capital expenditure at our O2 Airwave business fell in the year ended 2005 from the level in 2004 as the roll-out of the network completed.
Capital expenditure in the year ended 31 March 2003 of £885 million related mainly to tangible fixed asset purchases across our footprint in respect of network expansion and improvement.
Across our Group, there are generally timing differences between the recognition of a new fixed asset in our financial statements, and the cash payment, because we are often able to secure delayed non-interest bearing payment terms with our capital suppliers.
The following table presents the capital additions recognised for each of the years in the three-year period ended 31 March 2005:
| 2005 | 2004 | 2003 | |||||||||
| £m | £m | £m | |||||||||
| Continuing operations | |||||||||||
| O2 UK | 638 | 502 | 362 | ||||||||
| O2 Germany | 388 | 308 | 141 | ||||||||
| O2 Ireland | 100 | 52 | 59 | ||||||||
| O2 Airwave | 218 | 243 | 163 | ||||||||
| O2 Online | – | 14 | 21 | ||||||||
| Other operations | 14 | 11 | 8 | ||||||||
| UMTS licences and other intangible assets | 57 | 83 | 131 | ||||||||
| 1,415 | 1,213 | 885 | |||||||||
| Discontinued operations | |||||||||||
| O2 Netherlands | – | 5 | 59 | ||||||||
| Total | 1,415 | 1,218 | 944 | ||||||||
o2.com 35
Operating and financial review and prospects continued
Total capital expenditure by continuing operations, excluding O2 Netherlands, for the year ended 31 March 2005 has increased by 17 per cent to £1,415 million from £1,213 million for the year ended 31 March 2004. In 2005, capital expenditure included a network sharing agreement payment in Germany of £57 million, in addition to a payment of £83 million made in 2004. In the 2003 financial year, the Group purchased a UMTS licence in Ireland for £73 million.
We expect to incur significant capital expenditure in the medium term, a material portion of which relates to the roll-out of our UMTS networks. We expect to fund our future capital spend from our bank facilities and long-term bonds described below, and from net cash flows from operations. The Group will maintain tight control of its investment programme, and in particular will aim to match the timing and quantum of capital expenditure on our UMTS network roll-out with the emerging demand for mobile data services.
Acquisitions and disposals
During the year ended 31 March 2005, we invested £2 million in a new joint venture, Tchibo Mobilfunk.
During the year ended 31 March 2004, we sold O2 Netherlands for €25 million. The sale proceeds, net of cash disposed with O2 Netherlands, were £7 million. In 2004, we also invested £5 million in Tesco Mobile Limited, our joint venture with Tesco.
Financing
During the year ended 31 March 2005, we incurred a net cash outflow from financing of £27 million. This was principally in relation to loan repayments of £21 million and the costs of the capital reorganisation and premium paid to mmO2 shareholders totalling £30 million, offset by cash received for issued shares vesting under various employee share option schemes which realised an inflow of £24 million. The cash outflow in the year ended 31 March 2004 was £50 million being mainly in relation to loan repayments of £53 million. We also issued shares vesting under various employee option schemes which realised a cash inflow of £3 million. The cash outflow in the year ended 31 March 2003 was £47 million being mainly the redemption of O2 UK loan notes during the first half of the 2003 financial year. Our financing activities are further described below.
Sources of liquidity and capital resources
Our principal sources of liquidity are cash from operating activities, bank financing and bond financing described below.
Total gross debt at 31 March 2005 amounted to £1,404 million (2004: £1,382 million), including the O2 UK hire purchase obligations (the QTE leases), the obligations of which are fully offset by cash deposits held in trust. Net debt was £78 million (2004: £366 million). Included in the total gross debt are €1,000 million and £375 million of eurobonds issued in January 2002 which have a five year and ten year term respectively. Loan notes outstanding in aggregate amounted to £7 million (2004: £8 million) and are redeemable at any time at the option of the holder.
As at 31 March 2005 bank financing comprised a syndicated facility totalling £1,000 million with a final maturity date of 15 October 2009. During the year, both the previous £1,725m syndicated facility and the £100m bilateral facility, maturing in September 2006, were cancelled. As at 31 March 2005, the syndicated facility was undrawn.
Interest on loans drawn under the syndicated facility is calculated at a margin above LIBOR (or in the case of Euro advances, EURIBOR). The margin varies according to the long-term credit rating assigned to O2 plc by major credit rating agencies but is subject to a maximum of 0.6 per cent. As at 31 March 2005, the syndicated facility bears a margin under 0.5 per cent.
Interest on our eurobonds is at a fixed rate at 6.375 per cent per annum and 7.625 per cent per annum on the Euro and the Sterling bond issues respectively. Interest on the €1,000 million bond issue has been swapped to floating rate and calculated at a margin above EURIBOR. As at 31 March 2004, interest on €500 million of the eurobond was calculated at a margin above Sterling LIBOR as a result of cross-currency swaps. The cancellation of the cross-currency element of those swaps, as detailed below in foreign exchange management, resulted in €500 million of the Eurobond reverting to a floating rate calculated above EURIBOR.
The Group’s contractual obligations, including commitments for future payments under hire purchase contracts, and long- and short-term debt arrangements are summarised in the table below. Details of these obligations are fully disclosed in notes 15, 16, 17 and 23 to the Group’s financial statements.
| Future commitments at 31 March 2005 | Payments due by period | |||||||||
| Less than | 1 to 3 | 3 to 5 | After | |||||||
| Total | 1 year | years | years | 5 years | ||||||
| £m | £m | £m | £m | £m | ||||||
| Debentures | 1,056 | – | 683 | – | 373 | |||||
| Obligations under finance leases and hire purchase contracts | 308 | 40 | 60 | 100 | 108 | |||||
| Loan notes | 7 | 7 | – | – | – | |||||
| Other loans and borrowings | 33 | 9 | 15 | 9 | – | |||||
| Other creditors | 55 | – | 13 | 6 | 36 | |||||
Commitments provided in the accounts | 1,459 | 56 | 771 | 115 | 517 | |||||
| Operating lease commitments1 | 1,931 | 205 | 358 | 308 | 1,060 | |||||
| Other commitments1 | 112 | 25 | 46 | 41 | – | |||||
Total future commitments (excluding capital) | 3,502 | 286 | 1,175 | 464 | 1,577 | |||||
| 1Not recognised as a liability by the Group in accordance with UK GAAP. | ||||||||||
o2.com 36
Treasury management and policies
Group Treasury (Treasury) operates as a centralised service for the Group. The role of Treasury is to identify, monitor and manage financial risk within the framework of Board approved policies and delegated authorities. Treasury is not permitted to add to the financial risks inherent in our business and may not undertake speculative activity.
The principal financial risks of our Group are identified below.
Banking covenants
Our current policy is to fully fund our business plan through access to the debt capital markets and other sources of funding. Borrowing is centralised and there are no material local facilities. The Group is committed to maintaining the key financial ratios, as set out in the covenants relating to the multi-currency revolving credit facility, of Group EBITDA to interest and net debt to Group EBITDA. As at 31 March 2005, actual ratios were Group EBITDA to interest of 884.0 times (2004: 23.6 times, 2003: 13.0 times) and net debt of 0.04 times Group EBITDA (2004: 0.3 times, 2003: 0.6 times). As at 31 March 2005, the Group’s projected funding requirements were fully funded through a combination of bonds issued under the Group’s bond financing programme (£375 million and €1,000 million) and committed bank facilities (£1 billion).
Foreign exchange management
The policy of the Group is to hedge (primarily by the use of forward foreign exchange contracts) identified foreign exchange flows, although the current level of transaction risk exposure is low due to the fact that cash flows are primarily domestic in each Group company. The policy of the Group regarding foreign exchange translation risk is to manage material risk on the translation of foreign currency assets and liabilities into pounds sterling primarily through natural offsets and the use of currency debt, cross-currency and foreign exchange swaps and forwards. At 31 March 2004, the majority of net debt was denominated in pounds sterling after taking account of the effect of derivative and non derivative hedging instruments. As anticipated in the 2004 Annual Report and Accounts, the cash flows in the Euro denominated overseas businesses and the improved visibility of their future financial profile has led us to increase the level of hedging of our overseas assets. This was achieved through the redenomination of our existing Euro debt, through the cancellation of cross-currency and foreign exchange swaps, and the use of forward foreign exchange contracts totalling €1,800 million. The on-going effect of this hedging is that the €1,000 million of Euro borrowings and the forward foreign exchange contracts are exposed to foreign exchange rate fluctuations which are recognised in the statement of total recognised gains and losses as they hedge net investments in overseas businesses.
Interest rate management
The debt level within the Group is a key determinant of the impact of interest rates. It is current policy to fix or protect expected interest flows where Group profits or key financial ratios would be materially at risk from interest rate movements. Treasury maintains the proportion of fixed rate debt within a Board approved range of 25 to 75 per cent by the issuance of fixed rate debt and the use of derivative instruments (primarily
interest rate swaps). As at 31 March 2005, and after taking into account the effect of derivative instruments, 38 per cent (2004: 39 per cent, 2003: 36 per cent) of gross borrowings (excluding the QTE lease which is fully defeased) were fixed for a period of at least three years (2004: three years, 2003: three years). Based on the net debt as at 31 March 2005, a one per cent rise in market interest rates would increase debt costs which would be more than offset by investment deposit returns. The effect on our Group’s profit before tax of a one per cent rise in market interest rates would be an increase of £3 million (2004: nil, 2003: adverse effect £7 million).
Credit risk management
It is our current policy to mitigate credit risk to our financial counter-parties through the application of strict counter-party limits. Counter-party limits are based on credit ratings issued by the main credit rating agencies and outstanding transactions are weighted according to potential risk to the Group. Counter-party limits are reviewed on a regular basis by Treasury.
Off balance sheet arrangements
We do not participate in, or secure financing for, any unconsolidated special purpose entities.
Research and development, patents and licences
We have not engaged in any significant research and development activities during any of the last three financial years.
Outlook and prospects
In O2 UK, we expect mid-single digit growth in net service revenue, reflecting the remaining five months’ impact of the September 2004 termination rate cut, and continuing competition in what is now a highly penetrated mobile market. The EBITDA margin is expected to remain broadly stable reflecting the competitiveness of the market and O2 UK’s programme to allocate substantial resources to develop additional customer-facing capabilities, and achieve higher long-term customer retention.
In O2 Germany, we expect to deliver further strong service revenue growth, mainly driven by continued rapid growth of the customer base. The EBITDA margin is expected to improve further, to around 20 per cent, reflecting O2 Germany’s continuing prioritisation of revenue growth as well as the impact of UMTS network running costs and the continued costs of national roaming.
Capital expenditure is expected to be broadly in line with the total incurred in the year ended 31 March 2005 (excluding the network sharing agreement payments in Germany), with higher UMTS network investment, particularly in Germany, offsetting the reduction in O2 Airwave capital expenditure due to completion of the police network roll-out.
In the five-year period from 1 April 2004 O2 Germany is expected to incur total capital expenditure in the range €3 billion to €3.5 billion which is €1 billion to €1.5 billion higher than previously planned.
o2.com 37
Operating and financial review and prospects continued
International Financial Reporting Standards
The Council of the European Union announced in June 2002 that listed companies in Europe would be required to adopt International Financial Reporting Standards (IFRS) for accounting periods beginning on or after 1 January 2005. The adoption of IFRS will apply to the Group for the first time for the year ending 31 March 2006.
In 2003, the Group formed a project team to manage the transition from existing UK Generally Accepted Accounting Principles (UK GAAP) to IFRS. The project is sponsored by the Chief Financial Officer and involves specialists from the Group Finance function as well as representatives from each of the Group’s operating businesses. The project is mostly complete and we expect to publish our first IFRS reconciliation, comprising our transition balance sheet at 1 April 2004 and the profit and loss account and balance sheet for the six months ended 30 September 2004 and the year ended 31 March 2005, in July 2005 at the time of our first quarter non- financial metrics press release.
The initial phase of the project involved a high level assessment of potential issues, the preparation of a project plan and identification of the key work streams in the operating businesses and at a group level, supported by work programmes in these areas. We also considered which, if any, of the optional transitional provisions within IFRS 1 “First time adoption of International Financial Reporting Standards” to adopt. The second phase of the project involved the restatement and reconciliation of opening balances to IFRS and the adjustment of reporting systems to capture new data requirements for on-going IFRS reporting.
In preparing the discussion below, we have used our knowledge of the expected standards and interpretations which we expect to apply in our first full IFRS financial statements. However, the facts, circumstances and accounting policies we adopt could change by that date. IFRS is subject to ongoing review and endorsement by the European Union, and possible amendment by interpretative guidance from the International Accounting Standards Board may occur. IFRS is also being applied in the United Kingdom and in a large number of other countries simultaneously for the first time. Owing to a number of new and revised standards in IFRS, there is not yet a significant body of established practice to use in forming opinions regarding interpretation and application. Accordingly, practice is continuing to evolve. At this preliminary stage, therefore, the full financial effect of reporting under IFRS as it will be applied and reported on in our Group’s first IFRS financial statements cannot be determined with certainty and may be subject to change.
However, our work on the project indicates that the major areas of difference between UK GAAP and IFRS which will impact our Group comprise the following:
Goodwill
IFRS 3 “Business combinations” prohibits the annual amortisation of goodwill and instead subjects such goodwill to an annual impairment review. The carrying value of our goodwill at the date of transition to IFRS is fixed and the amortisation ceases from that date.
Intangible assets
IAS 38 “Intangible assets” considers, inter alia, whether an asset which incorporates both tangible and intangible elements should be classed as a tangible fixed asset or an intangible fixed asset. The treatment is determined by an assessment of which element is more significant. Certain elements of our software, which are currently classed as a tangible fixed asset, will be reclassified to intangible fixed assets.
Pension accounting
Under UK GAAP, we account for our pension schemes using SSAP 24 “Pension costs” and have elected under the transitional rules of FRS 17 “Retirement benefits” to make disclosures only. IAS 19 “Employee benefits” is similar, but not identical to, FRS 17. IAS 19 and FRS 17 are conceptually different to SSAP 24 as they require any defined benefit pension scheme surplus or deficit to be recognised on our Group’s balance sheet.
On transition to IFRS, we expect to recognise the full assets and liabilities of our defined benefit pension schemes on our balance sheet. Thereafter, IAS 19 permits two approaches for the recognition of actuarial gains and losses. Under the first option, a portion of actuarial gains and losses are recognised on our balance sheet, based on the application of a “corridor”. This corridor is defined as the greater of 10 per cent of the scheme’s assets or liabilities, and actuarial gains and losses below this threshold are not required to be recognised. Any actuarial gains and losses exceeding the corridor are recognised in the profit and loss account over a period representing the expected average remaining working lives of employees participating in the scheme. Under the second option, actuarial gains and losses are recognised in full in the statement of changes in equity, rather than in the profit and loss account, in the period in which they arise. The profit and loss account charge comprises an operating cost and an interest cost. Our principal pension scheme, the O2 Pension Plan, operates for the majority of UK employees and is divided into defined benefit and defined contribution sections. The defined benefit section comprises mainly active members because all deferred and pensioner members at 30 June 2002 remained in the BT Pension Scheme following our demerger from BT in November 2001.
Accounting for share schemes
We have historically accounted for share scheme costs under UK GAAP using the intrinsic value. IFRS 2 “Share based payments” requires the value of all share based payments to be measured, and an expense recognised in the profit and loss account, based on fair value. The fair value of the share schemes is estimated using a valuation model and involves complex mathematical modelling. It is often, but not always, the case that the fair value is higher than the intrinsic value. Additionally, under UK GAAP, Inland Revenue approved SAYE schemes are exempt from the requirement to recognise a charge whereas under IFRS there is no such exemption.
Financial instruments
IAS 39 “Financial instruments: recognition and measurement” details how to value and account for all financial instruments, including derivative instruments such as interest rate swaps, cross-currency swaps and forward contracts used to reduce exposure to interest rate and currency risk. Under IAS 39, all financial
o2.com 38
<<
| Risk factors |
instruments are required to be recognised on the balance sheet at fair value. If a derivative financial instrument is designated as a hedge, the movement in the fair value of the derivatives can be recognised directly through reserves in certain circumstances, which offsets the opposite movement in the fair value of the hedged item, also in reserves. All other movements in the fair value of financial instruments must be recognised as an income or expense in the profit and loss account.
We have prepared documentation in line with the provisions of IAS 39 for all hedging instruments and have established an ongoing procedure for testing the effectiveness of these hedges which should permit the adoption of hedge accounting for our financial instruments.
Deferred taxation
IAS 12 “Income taxes” bases the calculation of the deferred tax assets and liabilities on the difference between tax carrying values and balance sheet carrying values, rather than the income statement approach required by FRS 19 “Deferred tax”. As a result, the scope of IAS 12 is wider than that of FRS 19.
IAS 12 requires a deferred tax liability in respect of rolled over gains to be recognised, irrespective of whether there is an expectation that the gain will crystallise. We expect to recognise a deferred tax liability on transition to IFRS relating to a gain arising prior to our demerger from BT. The gain arose on BT's disposal of the UK Yell business and was rolled over into the goodwill purchased on the acquisition of O2 Germany. On the subsequent disposal of this goodwill for tax purposes, the deferred tax liability will reverse and be recognised as a credit in the profit and loss account of the Group in the period in which it reverses.
Business risks
We face increasing competition from new and existing providers of mobile services
We are competing increasingly with new mobile service providers, virtual network operators and resellers of mobile services. Also, competition from existing service providers may be more intense than anticipated, driving down prices. Failure to compete effectively could result in a decrease in our customers, revenues and profitability.
We face competing technologies
We face competition from communications technologies that are under development or that will be developed in the future, including cordless technologies and private and shared radio networks. As a result of current trends in the telecommunications industry in Europe, such as the rapid convergence of technologies, we expect there to be further technological advances in the future. Failure to compete could result in a decrease in our customers, revenues and profitability.
Alleged health risks associated with mobile telecommunications could lead to decreased usage of our services and products, increased difficulty in obtaining transmitter sites or potential liability
Public concern about the alleged or perceived health risks of mobile communications could have a detrimental impact on our business through negative customer perception of our brand, services or products, difficulties in retaining or attracting customers, reduced usage times per customer of our mobile telecommunications services or increased difficulty in obtaining transmitter sites. There can be no assurance that further medical research and studies will refute a link between the radio frequency emissions of wireless handsets and base stations and these health concerns. Government authorities could increase regulation of wireless handsets and base stations as a result of these health concerns, or wireless companies, including us, could be held liable for costs or damages associated with these concerns, which could have a negative impact on our business.
In addition, regulators may reduce the prescribed limits for exposure to electromagnetic radiation in the countries in which we operate, which would mean that the exclusion areas around our antennas in those countries may have to increase in some situations. In this event we may suffer additional costs associated with repositioning our network equipment and we may experience delays in the roll-out of our networks.
We fail to maintain the momentum necessary to achieve economic scale in Germany
If our increased network investment fails to deliver a high-quality customer experience from our own UMTS platform, this could have a significant negative impact on the profitability of our business.
Implementation of a new billing and operational system for O2 UK
Implementation may affect operational performance and customer satisfaction if the major releases are not completed successfully. Our reputation may be damaged by real or implied failure of our billing systems resulting in a significant negative impact on the profitability of our businesses.
o2.com 39
Risk factors continued
We may fail to achieve our strategic goal of earning revenues from more sophisticated data services
If the market for non-SMS data services does not grow as quickly as we currently anticipate and SMS yields fall faster than we currently anticipate and voice price erosion increases faster than we currently anticipate and, if we do not build the correct business model and capabilities to remain competitive in the dataworld, we could experience a negative impact on our business and results of operations.
We may be disadvantaged by our UMTS offerings
Our UMTS offerings may suffer as a consequence of later launches. This could have a negative impact on our business and our results of operations.
Misuse of our networks by our customers through fraud or in a way that damages our reputation
Certain customers may misuse our networks in ways which damage our reputation, for example using the network to make inappropriate contact with children, spamming or propagation of viruses. Certain customers may also misuse our networks in ways which impact our costs or revenues, including fraud. This could have a negative impact on our business.
We may fail to positively differentiate our customer experience and/or fail to implement our customer plan
Slower implementation timetables, higher costs and poorer customer experience may undermine the value of our brand and could limit our ability to attract and retain high value customers, which in turn could have a negative impact on our business and our results of operation.
Competition law and regulatory risks
We operate in highly regulated markets that limit our flexibility to manage our business
We must comply with an extensive range of requirements that regulate and supervise the licensing, construction and operation of our networks and the provision and pricing of our products and services in countries in which we operate. We must also co-operate with agencies or other governmental authorities that regulate and supervise the allocation of frequency spectrum and which monitor and enforce regulation and competition laws which apply to the mobile telecommunications industry. Our business and results of operations could be materially adversely affected by changes in the law, regulation or government policies directed at the mobile telecommunications markets in which we operate. In particular, decisions by regulators and competition authorities relating to tariffs, interconnection or the effects of expansion into new markets, or the accessibility of our network to mobile virtual network operators or service providers could have a negative impact on our business and results of operations.
Action by the Commission or regulators may result in fines and a decrease in roaming revenues
If the Commission finds that there have been infringements of Article 82 EC Treaty in the markets for international roaming services in which we operate, it may fine us. The Commission could also require us to reduce our wholesale charges for international roaming or to change the way in which such charges are set.
In addition, national regulators in the UK, Germany or Ireland may seek to regulate our international roaming charges, if they find that we have SMP on the wholesale roaming market.
Any fines or future regulation of roaming charges could have a negative impact on our business and results of our operations.
We may be subject to new regulatory obligations
New or more onerous regulatory obligations may be imposed on us under the EU Regulatory Framework in Germany, the UK and Ireland. Depending upon the obligations imposed, this could have a significant effect on the profitability of our businesses.
We face increased regulation in Ireland
In Ireland, ComReg has determined that we have SMP in the mobile access and origination market and has required us to meet reasonable requests for wholesale access (including national roaming) by third parties on a non-discriminatory basis. ComReg has reserved the right to intervene in the event that commercial negotiations fail or should intervention otherwise be required. If this happens, ComReg may require us to comply with cost orientation, cost accounting and accounting separation obligations. We are appealing both the SMP and remedies decisions but if unsuccessful, we will continue to be subject to this increased regulation in the market, which could have a significant effect on the profitability of our business in Ireland.
o2.com 40
Board of directors
David Arculus (58) Chairman (b) (d)
David Arculus was appointed to the Board in 2003 and became Chairman on 28 July 2004 at the conclusion of mmO2’s 2004 Annual General Meeting. Mr Arculus is Chairman of the Better Regulation Task Force and a non-executive Director of Barclays. He has also served as Chairman of Severn Trent. Mr Arculus was previously Chairman of IPC Group Limited and, before that, Group Managing Director of EMAP.
EXECUTIVE DIRECTORS
Peter Erskine (53) Chief Executive Officer (b) (c)
Peter Erskine was appointed to the Board in 2001 as Chief Executive Officer. He joined the Company from BT where, since March 1993, he held a number of senior positions including Director of BT Mobile, President and Chief Executive of Concert, and, from 1998, Managing Director of BT Cellnet. Prior to joining BT, he was European Vice President of Sales and Customer Service for Mars and Senior Vice President Sales and Marketing for UNITEL. Mr Erskine is also a member of the Advisory Board of the University of Reading Business School.
David Finch (49) Chief Financial Officer (b) (c)
David Finch was initially appointed to the Board in 2001. Mr Finch is the Company’s Chief Financial Officer and has extensive experience in financial management, having previously held senior finance positions at Exel, Novar (formerly Caradon) and Grand Metropolitan. In addition to Group Finance, he has direct responsibility for the Group Treasury and Investor Relations functions.
Rudolf Gröger (50) CEO O2 Germany (c)
Rudolf Gröger was appointed to the Board in 2003. He joined the Company in October 2001 as Chief Executive Officer of O2 Germany. Prior to this, he was Managing Director of T-Systems International GmbH, a subsidiary of Deutsche Telekom, from 1999 to 2001. He played a key role in the acquisition of Debis Systemhaus GmbH and its integration into Deutsche Telekom. He has also worked for Siemens and was head of its German information and communication product operations.
NON- EXECUTIVE DIRECTORS
Stephen Hodge (63) (a) (d) (e)
Stephen Hodge was appointed to the Board in 2001. Mr Hodge was Director of Finance of the Royal Dutch/Shell Group, prior to his retirement in September 2001, where he had responsibility for all financial and investor relations issues for the Shell Group and its parent companies. He has extensive knowledge of the financial management of international companies, having worked throughout the world including Australia, the Netherlands, Venezuela and Argentina in a variety of financial positions. He is Chairman of Shell Pensions Trust Limited and Deputy Chairman of the Franchise Board of Lloyd’s of London. Mr Hodge was appointed as non-executive Deputy Chairman and senior independent Director on 1 January 2005.
David Chance (48) (a) (d)
David Chance was appointed to the Board in 2003. Mr Chance was Deputy Managing Director of BSkyB until June 1998 and is Chairman of Modern Times Group and Top Up TV Limited, and is a non-executive Director of ITV and Sunderland AFC. He previously held senior marketing and business development roles at US telecoms companies, Scientific Atlanta and Grass Valley Group, and European satellite broadcaster, SES.
Rudolf Lamprecht (56)
Rudolf Lamprecht was appointed to the Board on 30 March 2005. He is presently a member of the Management Committee of Siemens with responsibility for Osram (lighting), the Fujitsu joint venture and household appliances. He was previously a Board member at Siemens and held a number of senior positions, including President of information and communications products. He is highly experienced in complex business-to-business technology, sales cycles and multiple channels to market.
Patrick Lupo (54) (e)
Patrick Lupo was appointed to the Board on 10 August 2004. Mr Lupo was previously Chief Executive and then Executive Chairman of DHL Worldwide Express. He is currently a non-executive Director of Hilton Group and was also, until March 2004, a non-executive Director of WH Smith. Patrick Lupo held a number of senior positions at DHL Airways Inc and DHL Worldwide Express between 1984 and 2001, where he was instrumental in establishing it as the global market leaders in international express and logistics.
Kathleen O’Donovan (47) (a)
Kathleen O’Donovan was appointed to the Board on 30 March 2005. She currently chairs both the audit committee of the Court of the Bank of England and the pension fund of Invensys, the engineering group where she was previously Chief Financial Officer. She is also Deputy Chairman and senior non-executive Director of Great Portland Estates, and holds non-executive directorships at Prudential and EMI Group.
Andrew Sukawaty (49) (d) (e)
Andrew Sukawaty was appointed to the Board in 2001. Mr Sukawaty was the non-executive Deputy Chairman of the Company and senior independent Director until 31 December 2004. He is Chairman and Chief Executive Officer of Inmarsat Group. He is President of Cable Partners Europe LLC, which invests in and operates cable television services in Europe. He is Chairman of Xyratex Group Limited. He is a former Chairman of Telenet. He has considerable experience in the mobile telephone industry and telecommunications industries in the United States and Europe, having at different times in those periods held the offices of Chief Executive and President of Sprint PCS, Chief Executive Officer of NTL, and Chief Operating Officer of Mercury One2One. He has also been a former Chairman of the Cellular Telephone and Internet Association (CTIA) in the United States.
COMPANY SECRETARY AND GENERAL COUNSEL
Philip Bramwell (48)
Philip Bramwell joined the Company from BT, where he was employed since 1998, initially as Legal Manager, Group Strategy and Development and then as Chief Counsel, Corporate Development. Before joining BT, he was a partner in DDV, a European specialist telecommunications consultancy firm. Prior to this, he held the position of Vice President and General Counsel at BellSouth Europe and Legal Advisor at SmithKlineBeecham Pharmaceuticals international division. He was called to the Bar in 1983.
| Key to membership of Board Committees: | |
| (a) Audit Committee | (d) Nomination and Governance Committee |
| (b) Chairman’s Committee | (e) Remuneration Committee |
| (c) Executive Committee | |
| All of the non-executive Directors are considered independent of the management of the Company. | |
o2.com 41
Report of the directors
The Directors have pleasure in presenting to shareholders their report and the audited financial statements of O2 plc for the year ended 31 March 2005.
New holding company
O2 plc was incorporated on 10 December 2004 and it became the holding company of mmO2 plc and the mmO2 group of companies on 14 March 2005 pursuant to a scheme of arrangement under section 425 of the Companies Act 1985 (the Scheme).
Scheme of Arrangement
The Scheme was overwhelmingly approved by shareholders at a Court Meeting and Extraordinary General Meeting of mmO2 plc held on 14 February 2005. Under the Scheme, shares in mmO2 plc were exchanged for shares in O2 plc on a one-for-one basis. Shareholders also had the option of electing to receive, in exchange for their existing shares in mmO2, either new shares in O2 plc or cash consideration under the Cash Alternative. Shareholders who took no action were deemed to have elected for the Cash Alternative. The O2 plc shares of holders who successfully elected for the Cash Alternative were placed in the market. This was limited to 300,000,000 O2 plc shares.
References to the Company and the Board throughout this Annual Report and Financial Statements refer to O2 plc from 14 March 2005 onwards and prior to that to mmO2 plc. References to the Group refer to O2 plc and its subsidiaries from 14 March 2005 onwards and prior to that to mmO2 plc and its subsidiaries.
As part of the Scheme, mmO2 ADRs were delisted from the New York Stock Exchange on 11 March 2005 and neither an ADR programme nor a US listing has been established for the shares in O2 plc.
The Board is currently pursuing deregistration of O2 plc shares from the Securities and Exchange Commission. In order to facilitate this deregistration process, the O2 Articles of Association include temporary provisions to limit ownership of O2 plc shares by US resident shareholders.
Principal activity
The Group is a leading provider of mobile communications services in Europe and has traded through its wholly-owned subsidiaries in the UK, Germany, Ireland and the Isle of Man throughout the year. The Group also provides a nationwide mobile radio service designed to serve the needs of the police and other emergency services in England, Wales and Scotland through O2 Airwave. O2 UK has a 50 per cent interest in a joint venture, Tesco Mobile, to sell exclusively Tesco branded mobile services in Tesco stores across the UK, using O2’s technology and network. In addition, O2 Germany has a 50 per cent interest in Tchibo Mobilfunk, a joint venture with Tchibo GmbH, which is selling an O2 pre-pay mobile service in Germany. It is also a founding member of the Starmap Mobile Alliance, a group of independent mobile phone operators who have joined forces in readiness for the international roll-out of UMTS services. The business review on pages 6 to 19 and the operating and financial review and prospects on pages 21 to 39 contain a review of the business during the year and an indication of future developments, and form part of this report.
Results
The audited financial statements are presented on pages 66 to 89. The Directors are pleased to recommend an inaugural final dividend of 2.25 pence per share for the year ended 31 March 2005. This dividend will be paid on 26 August 2005 to shareholders on the register on 5 August 2005.
Directors
The names and biographical details of the current Directors of O2 plc are given on page 41.
All the Directors of mmO2 plc who held office on 4 January 2005 were appointed to the Board of O2 plc by shareholders’ resolution on 4 January 2005. Rudolf Lamprecht and Kathleen O’Donovan were additionally appointed on 30 March 2005 and Ian Meakins and David McGlade resigned on 30 March 2005 and 31 March 2005 respectively. Peter King and Adrian Knight were Directors of O2 plc from incorporation until their resignations on 5 January 2005.
During the year, David Varney retired as a Director and Chairman of mmO2 plc on 28 July 2004 at the conclusion of the 2004 Annual General Meeting and David Arculus became Chairman from that time. Paul Myners and Neelie Kroes resigned from the Board on 10 August 2004 and 31 August 2004 respectively and Patrick Lupo, who was appointed to the Board on 10 August 2004, was elected a Director of the Company by shareholders at the Extraordinary General Meeting of mmO2 plc held on 14 February 2005.
The Company’s Articles of Association provide that Directors are required to retire by rotation every three years. It is the Board’s intention that shareholders will be given the opportunity to re-elect Directors within that timescale. David Chance and Rudolf Gröger will retire by rotation this year and are proposed for re-election at the 2005 Annual General Meeting together with David Arculus who changed his role during the year. In addition, any Director appointed during the year is required to retire and seek election by shareholders at the next Annual General Meeting. Accordingly, Rudolf Lamprecht and Kathleen O’Donovan will seek election at the forthcoming Annual General Meeting.
Details of the Directors’ service contracts, emoluments and share interests as at the financial year-end can be found in the report on directors’ remuneration on pages 51 to 64.
Share capital
Details of the authorised and issued share capital of the Company at 31 March 2005 and details of share allotments made during the year are given in note 19 to the financial statements.
By a special resolution of the shareholders dated 5 January 2005, 02 plc was authorised to make market purchases of up to 871,175,625 of its own ordinary shares. This authority expires at the conclusion of the 2005 Annual General Meeting and a similar authority will be sought at that meeting for a further year, based on approximately 10 per cent of the Company’s issued share capital as at 31 March 2005.
o2.com 42
Substantial shareholdings
At 10 May 2005, the following notifications had been received by the Company in respect of holdings of three per cent or more of the Company’s issued share capital:
| Number of | Percentage of | |||
| O2 plc | issued ordinary | |||
| Shareholder | ordinary shares | share capital | ||
| The Capital Group Companies, Inc | 649,424,088 | 7.46 | ||
| Legal & General Investment Management Limited | 308,947,551 | 3.54 | ||
Interest of management in certain transactions
During and at the end of the 2005 financial year, none of the Company’s Directors had a significant interest in any material transaction in relation to the Group’s business.
Employees
The Company operates a number of employee share schemes, including savings-related option schemes, which encourage regular saving and enable employees to acquire options over shares in the Company, and an all employee share ownership plan in the UK allowing employees to buy shares in the Company.
The Company has a wide range of communication channels with employees including face-to-face meetings, team briefings, audio conferences and a comprehensive Company intranet that includes a regular newsletter. The aim of all these channels is to ensure employees fully understand the Group’s objectives and its operational and financial performance. In addition, the Company conducts annual attitude surveys and maintains a constructive dialogue with unions, employee representative bodies and works councils.
The Company continues to be committed to the development of all people in the organisation and actively promotes this through many training and development initiatives. People are encouraged and supported in maintaining personal development plans. The Company has invested in e-learning technology to give people better access to a wide range of learning opportunities.
The Group is committed to employment policies that follow best practice, based on equal opportunities for all, and recognises that a diverse workforce is a strength in a competitive marketplace. The Company has a Diversity Champion at Executive Committee level and integrates equal opportunity into all its management processes. This approach extends to the fair treatment of people with disabilities in relation to their recruitment, training and development. Full consideration and every effort are given to the retention of people who become disabled during employment. O2 UK is a member of the Employers’ Forum on Disability.
Policy on the payment of suppliers
The Group aims to pay all of its creditors promptly. The payment terms for major contracts are agreed at the same time as other terms are negotiated with individual suppliers. It is the Group’s policy to make payments for other purchases within 30 working days of the invoice date, provided that the relevant invoice is presented in a timely fashion and is complete.
The Group had 35 days’ purchases outstanding as at 31 March 2005 (2004: 34 days) based on the average daily amount invoiced by suppliers during the year.
Corporate governance
A report on corporate governance is set out on pages 45 to 50.
Community involvement
During the financial year, the Group made cash donations to charitable and community organisations totalling £2,239,795 of which £636,266 was made from UK-based companies. As in previous years, no political donations were made. Further details regarding the Company’s involvement in the community are set out in the corporate responsibility section of this report on pages 19 to 21.
Auditors
Resolutions concerning the appointment of the auditors and authorising the Directors to set their remuneration will be proposed at the Annual General Meeting.
Annual General Meeting
The resolutions to be proposed at the Annual General Meeting to be held on Wednesday, 27 July 2005, together with explanatory notes, appear in the separate Notice of Annual General Meeting sent to all shareholders.
By Order of the Board
Philip Bramwell
Company Secretary and General Counsel
17 May 2005
Registered Office: Wellington Street, Slough,
Berkshire SL1 1YP
Registered number: 5310128
o2.com 43
Statement of directors’ responsibility
Company law requires the Directors to prepare financial statements for each financial year that give a true and fair view of the state of affairs of the Company and the Group and of the profit or loss of the Group for that period.
In preparing these financial statements the Directors are required to:
| >> | select suitable accounting policies and then apply them consistently; |
| >> | make judgements and estimates that are reasonable and prudent; |
| >> | state whether applicable accounting standards have been followed, subject to any material departures disclosed and explained in the financial statements. |
The Directors confirm that they have complied with the above requirements in preparing the financial statements. The financial statements have complied with UK disclosure requirements in this report in order to present a consistent picture to all shareholders.
The Directors are responsible for keeping proper accounting records that disclose with reasonable accuracy at any time the financial position of the Company and the Group and to enable them to ensure the financial statements comply with the Companies Act 1985. They are also responsible for safeguarding the assets of the Company and the Group and hence for taking reasonable steps for the prevention and detection of fraud and other irregularities.
The Directors are responsible for the maintenance and integrity of the Group website. The Directors understand that uncertainty regarding legal requirements is compounded as information published on the internet is accessible in many countries with different legal requirements relating to the preparation and dissemination of financial statements.
By Order of the Board
Philip Bramwell
Company Secretary and General Counsel
o2.com 44
Report on corporate governance
The Board supports high standards in corporate governance. The application during the financial year of the principles in Section 1 of the July 2003 Combined Code on Corporate Governance (the Combined Code) is described in the appropriate sections of this statement and in the report on directors’ remuneration on pages 51 to 64.
The Directors consider that the Company has fully complied with the provisions set out in Section 1 of the Combined Code, except in the following respects. David Arculus was also Chairman of Severn Trent Plc at the time of his appointment on 28 July 2004. Mr Arculus confirmed before his appointment that he would relinquish his chairmanship of Severn Trent Plc by 31 December 2004 and has done so. The service contract in respect of Rudolf Gröger is now terminable on 12 months’ notice. However, in the event of termination of Mr Gröger’s employment within 12 months of a change of control of O2 or its German business, the employer is obliged to make a cash payment equal to two times his base salary and a payment equal to the bonus expected for an on-target performance.
The Board
The Directors’ biographies appear on page 41.
The Board currently comprises the Chairman, Chief Executive Officer, Chief Financial Officer, one further executive Director, and six non-executive Directors, which is considered to be an effective size and balance for the Company. The Board considers that all the non-executive Directors are independent under the criteria set out in the Combined Code. In determining that position, the Board in particular had regard to Rudolf Lamprecht’s membership of the Management Committee of Siemens, which has a business relationship with the O2 Group. The level of that business relationship is not considered material in the overall O2 Group context and therefore would not affect or interfere with or compromise his independent judgement as a Director of the Company. The Board also considered that David Arculus was independent at the date of the announcement of his appointment as Chairman in 2004.
The division of responsibilities between the Chairman and the Chief Executive Officer has been set out in writing and agreed by the Board.
During the year, Stephen Hodge replaced Andrew Sukawaty as Deputy Chairman and senior independent Director. The Deputy Chairman is recognised as the senior independent Director to whom concerns can be conveyed independently of the Chairman, Chief Executive Officer or Chief Financial Officer by other Directors or by shareholders.
The differing roles of executive Directors and non-executive Directors are clearly delineated, with both having fiduciary duties towards shareholders.
Non-executive Directors are appointed initially for three years. The non-executive Directors’ letters of appointment set out their expected time commitment and key elements of the role. Their appointment is subject to one month’s notice from either the Company or the Director. Towards the end of the three-year period, the Board will consider whether to continue the appointment for a further three-year period. Where appropriate, the three-year period commences from the time the non-executive Director first became a Director of mmO2 plc.
At the time of a Director’s appointment to the Board, an internal induction programme is provided on the Group’s strategic and business plans and developments to date. The content of this induction programme and, where appropriate, any additional training which may be required by the Director is kept under review. Directors are also advised of their legal and other obligations as a Director of a listed company.
In accordance with the Combined Code and the Company’s Articles of Association, all Directors submit themselves for re-election every three years.
The Board as a whole is collectively responsible for the success of the Company and provides entrepreneurial leadership of the Company within a framework of prudent and effective controls which enables risk to be assessed and managed. It sets out the Company’s values and standards and ensures that its obligations to its shareholders and other stakeholders are understood and met.
The Board has regular scheduled meetings throughout the year together with an annual off-site conference to review and discuss corporate strategy. Main Board meetings are also held periodically at the premises of the operating countries of the Group. Additional meetings are held as necessary. During the financial year ended 31 March 2005, the Board had eight scheduled Board meetings.
The Board has a formal schedule of matters specifically reserved to it for decision, including the approval of strategic plans and the annual operating plan, significant investments and capital projects, and treasury and risk management policies. All Directors take decisions objectively in the interests of the Company.
Guidelines are in place concerning the content, presentation and timely delivery of papers by management to Directors for each Board meeting, so that the Directors have enough information to be properly briefed. Where issues arise at Board meetings, the Chairman ensures that all Directors are properly briefed and, where necessary, appropriate further enquiries are made.
All Directors have access to the advice and services of the Company Secretary who, under the direction of the Chairman, is responsible to the Board for ensuring that Board procedures are followed, maintaining compliance with all applicable rules and regulations, and advising the Board on all governance matters. The appointment and removal of the Company Secretary is a matter for the Board as a whole. There is an agreed procedure for enabling the Directors to take independent professional advice at the Company’s expense, should they consider this to be necessary.
o2.com 45
Report on corporate governance continued
Whilst not actively involved in the day-to-day management of the Company, the non-executive Directors play an important role in bringing their independent judgement and considerable knowledge and experience to the Board’s deliberations with their advice being reflected in management meetings. They have regular contact with senior managers in the businesses.
During the financial year, the Chairman met regularly with non-executive Directors without the executive Directors present, and the non-executive Directors also met without the Chairman present under the leadership of the senior independent Director. The Deputy Chairman carried out a review of the Chairman’s performance.
During the financial year, the Board conducted an internal review of its performance and that of its principal Board Committees and individual Directors. Each Director completed a comprehensive questionnaire and there were one-to-one interviews between the Chairman and each Director. Directors were asked to comment on matters such as the culture and approach of the Board, the effective setting of strategy based on information about the business and how the market operates, the quality and timeliness of information provided, the composition of the Board, the role of the senior independent Director, Board meeting processes, the form of continuing professional development, and communication of Board decisions and discussions. The results of this review were considered in one-to-one discussions with the Chairman and collectively at a Board meeting. The Directors concluded that the Board and its Committees operated effectively and that, as individuals, the Directors were each contributing to the overall effectiveness of the Board.
There is a programme of regular dialogue with major institutional shareholders and fund managers, and summaries of these discussions and meetings are provided to the Board. These summaries and reports enable the Directors to gain an understanding of the views and opinions of those with an interest in the Company.
The Company maintains Directors’ and Officers’ Liability Insurance in respect of legal action that might be brought against its Directors. The Companies (Audit, Investigations and Community Enterprise) Act 2004 came into force on 6 April 2005. This Act amends the Companies Act 1985 by permitting the grant of Qualifying Third Party Indemnity Provisions (QTPIP) by a company to its directors. Such indemnities extend, amongst other things, to the payment of a Director’s defence costs in an action brought by the Company or by a third party, subject to the repayment of such costs in certain circumstances. The Board believes that it is in the best interests of the Company to attract and retain the services of the most able Directors by offering competitive terms of engagement, including the granting of indemnities on terms consistent with the latest statutory provisions. Accordingly, on 13 May 2005, the Board approved the granting of indemnities in the form permitted by the QTPIP to all Directors. Further details of the indemnities will be included in the Directors’ report in the Company’s 2006 Annual Report.
The Board has adopted appropriate governance policies dealing with the conduct of Board affairs and has delegated responsibility for monitoring the day-to-day performance of the Group as a whole, allocation of resources within agreed plans, implementation of policies and decisions relating to specific value-related
commitments to the Executive Committee and designated managers in accordance with a schedule of delegated authorities.
Attendance
The attendance of Directors at programmed Board and principal Board Committee meetings held during the year is detailed in the table below:
| Nomination and | |||||||||||||||
| Governance | Remuneration | ||||||||||||||
| Director | Board | Audit Committee | Committee | Committee | |||||||||||
| Held* | Attended | Held* | Attended | Held* | Attended | Held* | Attended | ||||||||
| D Arculus | 8 | 8 | 2 | 2 | 4 | 3 | n/a | n/a | |||||||
| D Chance | 8 | 8 | 4 | 4 | 4 | 3 | n/a | n/a | |||||||
| P Erskine | 8 | 8 | n/a | n/a | n/a | n/a | n/a | n/a | |||||||
| D Finch | 8 | 8 | n/a | n/a | n/a | n/a | n/a | n/a | |||||||
| R Gröger | 8 | 7 | n/a | n/a | n/a | n/a | n/a | n/a | |||||||
| S Hodge | 8 | 8 | 4 | 4 | 2 | 2 | 8 | 7 | |||||||
| N Kroes | 4 | 3 | 2 | 2 | n/a | n/a | 3 | 2 | |||||||
| R Lamprecht | – | – | n/a | n/a | n/a | n/a | n/a | n/a | |||||||
| P Lupo | 5 | 4 | n/a | n/a | n/a | n/a | 5 | 5 | |||||||
| D McGlade | 8 | 8 | n/a | n/a | n/a | n/a | n/a | n/a | |||||||
| I Meakins | 8 | 6 | 4 | 2 | n/a | n/a | 7 | 5 | |||||||
| P Myners | 4 | 3 | n/a | n/a | 2 | 2 | 3 | 2 | |||||||
| K O’Donovan | – | – | – | – | n/a | n/a | n/a | n/a | |||||||
| A Sukawaty | 8 | 7 | n/a | n/a | 4 | 4 | 8 | 8 | |||||||
| D Varney | 3 | 3 | n/a | n/a | 1 | 1 | n/a | n/a | |||||||
| *During the period a director was in office or a member of a committee | |||||||||||||||
The Board also met as required in relation to the Scheme of Arrangement of mmO2 plc. Arrangements were made for any Directors who were unable to attend meetings to discuss the agenda items with the relevant Chairman of that meeting in advance.
Board Committees
The Board has delegated authority to the Committees described below on specific matters. All of the Committees have formal terms of reference. Minutes of meetings are formally recorded.
The terms of reference of the Audit, Nomination and Governance, and Remuneration Committees are posted on the Company’s website and are available, on request, from the Company Secretary and General Counsel who acts as Secretary to these Committees. The Board reviews the membership of the Committees on an annual basis at the start of each financial year or more frequently as circumstances require.
o2.com 46
Chairman’s Committee
Chairman: David Arculus
The Chairman’s Committee advises and assists the Chairman in the preparation for Board meetings. The Committee also acts on behalf of the Board between scheduled Board meetings, in exceptional circumstances, where it is not possible or practicable to convene a meeting of the Board. In addition to the Chairman, Peter Erskine and David Finch are members of the Committee. David Arculus became a member and Chairman of the Committee on 28 July 2004 when David Varney retired from the Board.
Audit Committee
Chairman: Stephen Hodge
The Committee comprises Stephen Hodge, David Chance, and Kathleen O’Donovan (appointed 30 March 2005). During the year, Neelie Kroes and Ian Meakins were members of the Committee until their resignations from the Board on 31 August 2004 and 30 March 2005 respectively. In addition, David Arculus was a member of the Committee until 28 July 2004 when he became Chairman of the Company. Since that time, he has attended meetings of the Committee in his capacity as Chairman at the invitation of the Committee.
The Committee monitors the integrity of the Company’s financial statements; reviews the Company’s internal control system and risk management systems; monitors and reviews the effectiveness of the Company’s internal audit function; makes recommendations to the Board in relation to the appointment of the external auditors and recommends the audit fee (and terms of engagement) to the Board following appointment by the shareholders in general meeting; monitors and reviews the external auditor’s independence, objectivity and effectiveness; considers management’s response to any major external or internal audit recommendations; approves the appointment or dismissal of the Head of Internal Audit; reviews the Company’s procedure for responding to calls made to its confidential helpline facility; and considers other topics, such as the Company’s policies for preventing or detecting fraud and its code of corporate conduct/business ethics.
Further details of the Committee and a report of its work during the financial year are set out below.
Audit Committee Report
The composition of the Committee is as described above. Further details of the members of the Committee and their relevant financial experience are set out in the biographies of the Directors on page 41.
Stephen Hodge, as Chairman of the Committee, is considered by the Board to be the audit committee financial expert and the member of the Committee with recent and relevant financial experience. Prior to becoming Deputy Chairman, he received an additional fee of £5,000 for acting as Chairman of the Committee, which is included in the Directors’ remuneration table contained in the report on directors’ remuneration on page 58.
The Company Secretary and General Counsel is secretary to the Committee and minutes of meetings are circulated to all Board members. Regular attendees at Committee meetings, at the invitation of the Committee, include the Chairman, Chief Executive Officer, Chief Financial Officer, the Head of Internal Audit and representatives of the external auditors. The Committee has authority to seek any information that it requires from any employee, authority to obtain independent professional advice and access to sufficient resources generally to carry out its activities.
The Committee undertook a review of its work and its terms of reference during the year and reported back to the Board.
The Committee met four times during the financial year. Following each meeting, the Committee members met with the external auditors in private. The Committee members have also met privately with the Head of Internal Audit.
The Committee worked to a structured programme of activities, with agenda matters focused to coincide with key events of the annual financial reporting cycle, together with standing items that the Committee is required to consider at each meeting. The Committee reviewed the following matters and reported its conclusions to the Board:
| >> | the financial disclosures contained in the Company’s annual and interim reports to shareholders and other interested parties; |
| >> | various accounting matters, including the Company’s accounting policies, raised by management and the external auditor in the context of the financial disclosures; |
| >> | the Group’s risk management process, including monitoring and progress on the management of key risks identified by the Company and within the Group’s operating businesses; |
| >> | the effectiveness of internal controls and measures to detect and prevent fraud; |
| >> | the annual external audit plan for the Group’s auditors. This review included the audit objectives, auditor independence and objectivity policies, partner rotation, audit scope, team composition, timetable, deliverables and fee proposal; |
| >> | the amount and purpose of non-audit fees. The Board has a formal policy governing the independence of the Company’s external auditors and defining those non-audit services that may be provided to the Group, including those which require the prior approval of the Committee. Details of non-audit services are reviewed at each meeting of the Committee. Further details of the statutory audit and non-audit services fees are set out in note 27 to the financial statements. The policy also covers employment of former auditor employees by the Company and audit partner rotation; |
| >> | the external auditors’ year-end report and the findings of their work and confirmation that all significant matters had been satisfactorily resolved; |
| >> | the performance of the external auditor, which resulted in the Committee recommending the appointment of PricewaterhouseCoopers LLP as auditors to the Company; and |
| >> | the internal audit plan and resources for the internal audit function. This review included detailed reports from the Head of Internal Audit on progress on matters identified in the plan, current resources of the internal audit function and updates on matters requested by the Committee. |
o2.com 47
Report on corporate governance continued
The Committee noted, during its review of non-audit services by the external auditors, that the level of non-audit service fees for this financial year was higher than that for the last financial year due to the Company’s external auditors’ involvement in the Scheme of Arrangement and related matters.
The Committee received briefings from the Chief Financial Officer on the implications for financial reporting of International Financial Reporting Standards, which will apply to the Company in respect of the financial year 2005/06.
The Committee reviewed the policy for the handling of complaints received by the Company regarding accounting, internal accounting controls or auditing matters and for the confidential, anonymous submission by employees of concerns regarding questionable accounting, auditing, employment, ethical or other matters.
The Committee also reviewed, for recommendation to the Board, the Company’s compliance programme to ensure the Group complies with its Business Principles and relevant regulatory and legal obligations.
The Committee received regular updates from the Company Secretary and General Counsel on corporate governance issues in the UK and US, principally those arising from the Combined Code and the US Sarbanes-Oxley Act of 2002. It also received regular reports from a project team responsible for the establishment of a control framework consistent with the requirements of Section 404 of the Sarbanes-Oxley Act.
The Committee also received minutes of all meetings of the Disclosure Committee. Details of the remit of this Committee are provided in the internal control section of this report.
Nomination and Governance Committee
Chairman: David Arculus
The Committee comprises David Arculus, David Chance, Stephen Hodge and Andrew Sukawaty. During the year, David Varney and Paul Myners were members of the Committee until they ceased to be Directors on 28 July 2004 and 10 August 2004 respectively. Stephen Hodge was appointed to the Committee on 11 November 2004 and David Arculus replaced David Varney as Chairman of the Committee on 28 July 2004. The Committee is responsible for reviewing the structure, size and composition of the Board and for recommending candidates for Board membership for the approval of the Board.
In the appointment of new Directors, the Committee reviews the current balance of skills on the Board. It draws up a specification to include any specific knowledge or expertise it considers of future benefit to the Board having regard to the business throughout the Group and the overall strategy. External search agents are used during the recruitment process. The agents put forward a shortlist of candidates for the Committee to review before submitting its recommendation to the Board. Whilst the Chairman of the Board chairs this Committee, he is not permitted to chair meetings when the appointment of his successor is being reviewed.
The Committee ensures that the performance of the Chairman, senior independent Director and other Directors is regularly reviewed.
During the financial year, the Committee met four times. It recommended to the Board those Directors who should retire by rotation and seek re-election at the 2004 Annual General Meeting and considered the leadership needs and succession plans of the Group as a whole. It has a sub-committee comprising all the non-executive Directors to review the performance evaluation processes and succession plans for all Directors. The process relating to the selection of the new Chairman in 2004 was conducted by an ad-hoc committee of independent Directors headed by the Deputy Chairman and advised by an independent executive search agency.
Remuneration Committee
Chairman: Patrick Lupo
The Committee comprises Patrick Lupo, Stephen Hodge and Andrew Sukawaty. During the year, Paul Myners, Neelie Kroes and Ian Meakins were members of the Committee until they ceased to be Directors on 10 August 2004, 31 August 2004 and 30 March 2005 respectively. Patrick Lupo joined the Committee on 10 August 2004 and assumed the chairmanship of the Committee from Andrew Sukawaty on 11 November 2004. The Committee is responsible for determining the framework and broad policy for the remuneration of the Chairman, all executive Directors, the Company Secretary and General Counsel, and members of the Executive Committee, and for determining, within agreed terms of reference, specific remuneration packages for each of these, including any pension rights, any compensation payments and the implementation of executive incentive schemes. The Committee operates on the principle that members of the executive management should be provided with appropriate incentives to encourage superior performance and should, in a fair and responsible manner, be rewarded for their individual contributions to the success of the Group. The report on directors’ remuneration is set out on pages 51 to 64.
The Executive Committee, chaired by Peter Erskine, and comprising the other executive Directors and his senior executive team, is responsible for the executive day-to-day running of the Company, the preparation and maintenance of strategic plans for the Group, and monitoring the day-to-day performance of the Group as a whole.
US corporate governance compliance
The Company is required to comply with those provisions of the Sarbanes-Oxley Act of 2002 implemented by the Securities and Exchange Commission as applicable to foreign issuers during the period it remains registered with the Securities and Exchange Commission.
Dialogue with shareholders
The Company is committed to on-going development of open and effective communications with shareholders. The Chief Executive Officer and the Chief Financial Officer regularly meet with institutional shareholders and analysts and the Company’s Annual General Meeting is used as an opportunity to communicate with private investors and encourage their participation. All substantial issues, including the adoption of the annual report and financial statements, are proposed at the Annual General Meeting on separate resolutions. All of the resolutions proposed at the 2004 Annual General Meeting were conducted
o2.com 48
by way of a poll in accordance with best practice. The poll results were notified to the UK Listing Authority and published on the Company’s website following verification by the Company’s share registrar. All the resolutions to be proposed at the 2005 Annual General Meeting will also be proposed by way of a poll. It is intended that the Chairmen of the Audit, Nomination and Governance, and Remuneration Committees will be available to answer questions at the Annual General Meeting.
The Company’s website provides financial and other business information about the Group. It contains an archive of past announcements and annual reports, share price information and a calendar of events as well as information on O2’s approach to corporate responsibility and the Company’s Business Principles.
Going concern
The Directors have reviewed the Group’s liquid resources and borrowing facilities, and the Group’s budget and cash flow forecast for the year to 31 March 2006, and outline projections for the subsequent year. On the basis of this review, the Directors are satisfied that the Group has adequate resources to continue in operational existence for the foreseeable future. For this reason, the Directors adopt the going-concern basis in the preparation of the financial statements.
Internal control
Responsibility
The Board has overall responsibility for the Group’s systems of internal control and risk management and for reviewing their effectiveness. These systems are designed to manage, rather than eliminate, the risk of failure to achieve business objectives; any system can provide only reasonable assurance against material mis-statement or loss, not absolute assurance.
The Audit Committee, on behalf of the Board, considers the effectiveness of the operation of internal control procedures in the Group during the financial year.
Control environment
The Board sets policies on Internal Control and Risk Management that are implemented by management. These policies are in accordance with “The Guidance on Internal Control (The Turnbull Guidance)” section of the Combined Code.
Following an extensive internal consultation and external benchmarking exercise, the Group Risk Management policy has been reviewed, updated and authorised by the Board during the year.
Risk Management, Internal Control compliance and Internal Audit are the responsibility of separate functions within the Company but operate holistically to deliver an effective internal control system.
Risk management
The Group has a detailed on-going risk management process for identifying, evaluating and managing the significant risks faced by the Company and embedding a risk awareness and management culture throughout the Group.
Risk assessment and evaluation take place as an integral part of the Group’s strategic planning cycle and this includes the consideration of major business risks by senior management.
| The risk management process comprises the following key elements: | |
| >> | Group operating companies and key functions in the business carry out risk assessments, to determine the nature and extent of risks facing the Company; |
| >> | the Executive Committee undertakes a formal Group-wide risk review every six months, which is reviewed by the Board. Risk management is a formal item at each Executive Committee meeting; |
| >> | registers are produced which detail significant risks and indicate likelihood, impact, and the level of controls, together with mitigating actions; |
| >> | the profiles of the significant risks from the registers are summarised and tracked using a consolidated risk map; |
| >> | senior management is accountable and responsible for managing risks within the Group, supported by dedicated risk managers. These risk managers assist in embedding risk management within the business culture via risk forums, team meetings, training sessions and the Company’s intranet; |
| >> | the Internal Audit function also promotes effective risk management in the business’ operations; and |
| >> | a fast track process exists for identifying and responding to evolving risks and significant changes to existing risks so that they are reported to an appropriate level of management and corrective action is taken. |
Review of effectiveness
At the half and full year, the Chief Executive Officer requests a formal confirmation of the review and assessment of internal controls and other aspects of corporate governance in the form of a Corporate Governance Certificate from the chief executive officer and the chief financial officer of each Operating Business, together with each of the members of the Executive Committee and the Company Secretary and General Counsel.
| A report is then provided to the Audit Committee which includes: | |
| >> | the Group risk registers, risk maps and dashboards; |
| >> | the Group Corporate Governance Certificates signed by the Chief Executive Officer and Chief Financial Officer. |
| In order to perform its review of the effectiveness of the system of internal control across the Group, the Audit Committee uses this information together with: | |
| >> | any significant failings that may have been identified during the internal control reporting process; |
o2.com 49
Report on corporate governance continued
| >> | the regular assessments of the quality of the Internal Control and Risk Management process carried out by the Group Head of Internal Audit as part of a cyclical risk-based audit approach; and |
| >> | the external auditors’ reports. |
| The Audit Committee then reports its conclusions to the Board. | |
Joint ventures
In the case of joint ventures and associated undertakings, where the Group does not have operating responsibility, our policy is to influence and encourage adoption of our own standards of Internal Control and Risk Management and to offer practical advice wherever appropriate.
Disclosure
The Company has a Disclosure Committee which considers the materiality of information and the respective disclosure obligations in releases made to regulatory bodies. This Committee assists the Chief Executive Officer and Chief Financial Officer to evaluate the effectiveness of the Group’s disclosure controls and procedures to ensure that material information relating to the Group is made known to them by others.
Annual assessment
The Board has reviewed the nature, extent and changes to the significant risks to the business. The Group’s current key risks are summarised in risk factors on pages 39 and 40.
On behalf of the Board, the Audit Committee has reviewed regularly the effectiveness of the system of internal controls and reported its findings to the Board.
The Chief Executive Officer and Chief Financial Officer have concluded, after evaluating the effectiveness of the Group’s internal and disclosure controls within the past 90 days, that O2’s internal and disclosure controls and procedures are effective in ensuring that material information relating to the Company is made known to them by others within the Group. The procedures provide reasonable assurance that problems are identified on a timely basis and dealt with accordingly.
There were no significant changes to the Company’s internal controls or to other factors that could significantly affect internal controls subsequent to the date of the most recent evaluation.
These processes have been in place for the whole of the financial year and have continued up to the date on which this document was approved.
Business principles
To reinforce our commitment to achieve best practice in our standards of business ethics and corporate governance, O2 has a set of Business Principles covering the whole Group, including its Directors and senior financial officers, which have been endorsed by the Chairman. There have been no waivers or changes to these Business Principles during the year. The Company also continues to require its business partners and suppliers to apply these principles when dealing with O2. A copy is available on the Company’s website.
These high-level principles are supported by a Confidential Help facility comprising telephone, post and e-mail, which is available to employees who want to report incidents and for those who have questions regarding the application of the principles.
The Company’s Confidential Help policy has been externally benchmarked and updated during the year.
Compliance programme
It is O2’s policy to be fully compliant with its Business Principles and local legal and regulatory requirements.
The Board has approved a detailed compliance policy which describes the compliance programme.
Online and direct training is available to ensure that all employees are aware of our Business Principles and know how they should be applied.
Executive Committee members are required to confirm compliance with our Business Principles as part of the Corporate Governance Certification process.
Corporate responsibility
The Board takes account of significant social, environmental and ethical issues that affect the Group. This includes risks and opportunities that relate to our people, our supply chain, our customers, the environment and society around us.
The management of these issues is covered in the corporate responsibility section of this report, on pages 19 to 21, which contains information in accordance with the Disclosure Guidelines on Social Responsibility, issued by the Association of British Insurers.
We are also producing a separate externally-verified Corporate Responsibility report, which will be available in July 2005, or on the Company’s website www.o2.com/cr/report05 or on request from the Company Secretary.
o2.com 50
Report on directors’ remuneration
This report has been prepared by the Remuneration Committee (the Committee) and approved by the Board. A resolution will be put to shareholders at the 2005 Annual General Meeting to invite them to consider and vote on this report.
Dear Shareholder
As you know, O2 operates in highly competitive and rapidly changing markets, but has delivered outstanding revenue and profit growth in 2004/05. Of particular note have been the announcement of our distribution policy, the restructuring of the Company and the continued strong growth of O2 Germany. This success has allowed the Committee to build on its remuneration strategy in support of the Group’s strategic goals. The delivery of sustainable returns for our shareholders remains key and we continue to ensure that our performance measures for reward are closely linked to improvements in revenue growth, profitability, operational efficiency and providing a better experience for our customers.
O2 is a maturing business with a progressive and innovative business strategy; however, there are considerable challenges ahead. Whilst quarter on quarter performance improvements are encouraging, we continue to face increasingly tough competition in the UK. It is therefore critical that we maintain this momentum through the continuity of our management team, which has largely been stable since demerger.
On that basis, during 2004/05 we continued the dialogue with our shareholders regarding our remuneration strategy and policy. The feedback highlighted specific concerns which we have addressed through a revised remuneration approach which addresses the strategic objectives of the business. Reward at O2 will focus on exceptional annual operational performance, year on year progress towards longer term business growth and delivery of long-term shareholder value. We will achieve this through an increase in the annual bonus opportunity (delivered in deferred O2 shares) in addition to making performance share awards. The Performance Share Plan will be the long-term incentive scheme used in 2005/06 and beyond.
I am greatly encouraged by the active dialogue with our shareholders and have every confidence that our remuneration approach for the forthcoming financial year will link to and support the business strategy, as well as ensure the retention of our management team and continued creation of long-term shareholder value.
Patrick Lupo
Chairman of the Remuneration Committee
| Remuneration Committee Role The Committee is responsible for determining policy on the remuneration and performance of the Chairman, executive Directors and the Senior Management Team (comprising the other members of the Executive Committee and the Company Secretary and General Counsel). It determines, within agreed terms of reference, specific remuneration packages for each of the roles above, including: | |
| >> | service contracts; |
| >> | salaries; |
| >> | benefits; |
| >> | pension rights; |
| >> | any compensation payments; and |
| >> | the operation of the O2 Executive Share Portfolio. |
Membership and meetings
The Committee consists of independent non-executive Directors. No member of the Committee has any personal financial interest, other than as a shareholder, in the matters to be decided by the Committee.
The Committee comprises Patrick Lupo, Stephen Hodge, and Andrew Sukawaty. During the year, Neelie Kroes, Ian Meakins and Paul Myners were members of the Committee until they ceased to be Directors on 31 August 2004, 30 March 2005 and 10 August 2004 respectively. Patrick Lupo joined the Committee on 10 August 2004 and assumed the chairmanship of the Committee from Andrew Sukawaty on 11 November 2004. The Chairman and Chief Executive Officer are invited to attend meetings of the Committee, except when their own remuneration is discussed. The Committee had eight programmed meetings during the year and also met on two further occasions.
Advisers
The Committee takes advice from both inside and outside the Group on a range of remuneration matters, to ensure that it is able to exercise informed judgement in determining a remuneration policy that supports the business, is market competitive and represents good practice.
The Committee consulted the Chief Executive Officer on matters relating to the remuneration of the other executive Directors who report to him. The Chairman and Group HR Director were consulted in relation to the remuneration of all executive Directors.
The advisers listed in the table overleaf provided services to the Committee in the year ended 31 March 2005:
o2.com 51
Report on directors’ remuneration continued
| Advisers | Services provided | Other services provided to O2 plc | ||
| Deloitte & Touche LLP | Appointed by the Committee to provide independent advice on executive remuneration matters. | Audit services in relation to the O2 Pension Plan and, specialist corporation tax, VAT, and expatriate services. | ||
| New Bridge Street Consultants LLP | Independently monitor and measure the Total Shareholder Return performance of the Company. | None. | ||
| Towers Perrin | Provision of market remuneration data. | Advice on benefits policy. | ||
| Freshfields Bruckhaus Deringer | Legal advice on long-term incentives and Directors’service contracts. | Legal advice on certain corporate matters. | ||
| Lane, Clark & Peacock | Provision of data for pension accounting and disclosures and advice in respect of executive pension provision. | Actuaries for the Group. | ||
| Hewitt, Bacon and Woodrow | Pensions advice in relation to the forthcoming changes in pensions legislation. | None. | ||
Remuneration policy
This section of the report sets out the Group’s policy on executive Directors’ remuneration for the year ending 31 March 2006 and, as far as possible, for subsequent years. O2 has a sufficiently flexible remuneration approach to support the changing needs of the business. Any changes in policy for subsequent years will be described in future reports on Directors’ remuneration.
| The Committee has adopted the following principles: | |
| >> | the Committee sets base salaries which reflect contribution, criticality to the business and general wage levels elsewhere in the Group. Decisions are made with reference to a range around the median of the relevant market for the individual although the Company may pay more to recruit a high-calibre executive; |
| >> | emphasis is placed on rewarding business performance, and therefore we seek to position the total compensation packages at upper quartile for superior performance; and |
| >> | performance-related incentives with stretching business performance targets to drive and reward superior performance from our executives whilst at the same time aligning the interests of the leadership team with those of our shareholders. |
These principles are applied to all employees to recruit, retain and motivate the highest calibre of employee throughout the business. On an annual basis the Committee reviews the relationship between the base pay of the executive Directors with the base pay of reporting levels below executive Directors’ level.
Total reward approach
We adopt a total reward approach which comprises a combined focus on base pay, short and long-term incentives, pension and benefit provision. We believe that total reward should encourage superior performance at all levels (Group, Operating Business and individual). The Committee considers it vital to align the interests of the leadership team with those of shareholders, by linking a significant proportion of the package to the creation of shareholder value. The chart below shows that, on the basis of achievement of “on target” bonus and long-term incentives, the balance between fixed and performance-related pay is 37:63.
Fixed vs performance-related pay
When determining total reward levels, the Committee takes account of the UK market and looks wider than simply the telecoms sector. This approach allows us to structure reward appropriately, with the right level of performance-related remuneration, rather than reflecting solely the remuneration practices adopted in our industry.
o2.com 52
Each element of remuneration has been designed to support the overall reward strategy, in turn helping to deliver business performance success:
| Reward element | Purpose | Measures/influencing factors | ||
| Base salary | Reflects position within the Company, performance and contribution to the success of the organisation. | Individual contribution and market review. | ||
| Annual incentives | Incentivises participants towards superior annual business performance and aligns employee interests with those of shareholders. | Group and Operating Business key performance indicators (KPIs). | ||
| Long-term incentives | Ensures alignment with shareholder interests and incentivises towards share price growth. | Total Shareholder Return (TSR) – compares the net return of an O2 shareholder (share price growth and assumed reinvestment of any dividends) with that of a shareholder in each of a group of comparator companies. | ||
| Benefits | An integral element of total reward reflecting competitive market provision. The main benefits are a company car or cash equivalent; healthcare for the executive and family; dental care, and a personal tax and financial planning allowance. | Market driven. | ||
| Pensions | The core benefit in maintaining standard of living after employment. | Market driven. | ||
| Total reward | The constituents of the above providefor a total reward package that has the potentia lto be at the upper quartile level for superior performance. | Combination of all of the above. | ||
Elements of executive Directors’ remuneration
Base salary
Base pay is reviewed (but not necessarily increased) annually by the Committee with effect from 1 June. As at 31 March 2005, the annual salaries payable to the Chief Executive Officer, Chief Financial Officer, CEO of O2 Germany and CEO of O2 UK were £675,000, £430,000, €650,000 and £420,000 respectively. The annual salaries for the Chief Executive Officer, Chief Financial Officer and CEO of O2 Germany with effect from 1 June 2005 can be found on page 58. The CEO of O2 UK resigned from the Board on 31 March 2005. His successor to this role is not an executive Director.
Annual incentives
Annual incentive arrangements are based on a balance of KPIs that the Committee considers to be key drivers of shareholder value including EBITDA and EBIT (indicators of strong financial performance); net service revenue, data ARPU and customer satisfaction targets (crucial to future growth and profitability). The Committee sets demanding targets which we believe represent results consistent with shareholder expectations. Stretch bonus targets represent superior performance.
As outlined on page 51, following dialogue with our shareholders, annual bonus opportunity will increase by half, and the resulting bonus will be delivered two-thirds in cash and one-third in deferred O2 shares.
The deferred shares will be held in trust for three years and vesting will generally depend on the executive remaining in service. No further performance condition will apply on vesting. Delivering the additional annual bonus opportunity in shares aligns our executives’ interests with those of our shareholders and provides a means of retention.
The first award of deferred shares under this arrangement will be made in July 2005. This represents the transition from the Deferred Equity Incentive Plan, which included a deferred share element for retention in 2004 (see page 55) and the proposed long-term incentive arrangements in 2005 (see page 54).
For the year ended 31 March 2005 and the year ending 31 March 2006, the bonus opportunity as a percentage of base salary (including the deferred shares element) payable to the CEO and CFO is 100 per cent of salary for on-target performance and 150 per cent of salary for maximum performance. The CEOs of Operating Businesses each have an on-target and maximum bonus potential of 120 per cent of salary and 180 per cent of salary.
Bonuses are not pensionable. The Chairman does not participate in annual incentive arrangements. Details of the actual cash annual bonuses payable in respect of the year ended 31 March 2005 can be found on page 58.
Long-term incentives
The Committee believes it is important to adapt the incentive arrangements offered in future years to support the Group’s fast changing business requirements. This will be achieved through the use of a flexible long-term incentive portfolio (the O2 Executive Share Portfolio) described overleaf, which the Committee actively reviews to ensure that incentives remain appropriate to the needs of the business. Other than in exceptional circumstances, executives will only be made an award under one plan in any year.
All employees of the O2 Group are eligible to participate in long-term incentives at the discretion of the Committee. The Committee determines the appropriate performance targets and reviews the extent to which they have been met. Awards and options are not pensionable.
o2.com 53
Report on directors’ remuneration continued
Share ownership
The Committee has introduced shareholding guidelines which require executive Directors to build up a shareholding of one times base salary and for the Senior Management Team to build a shareholding of 50 per cent of base salary.
Long-term incentives for 2005/06
Following consultation with shareholders, the Committee has recommended that the Performance Share Plan will be the primary form of long-term incentive for the year ending 31 March 2006. The Committee proposes to make awards of performance shares linked to the Company’s TSR performance for most of our executives as it believes that TSR is the most appropriate means of aligning the interests of executives with those of shareholders.
In the case of the CEO of O2 Germany and a small number of senior O2 Germany employees, performance share awards will be made based solely on controllable EBIT margin and net service revenue growth of O2 Germany over a three-year performance period. This is due to the major growth opportunity that the German mobile market represents for O2, with clear potential to increase shareholder value. The Company intends to increase its investment in Germany and accelerate the build-out of the 3G network. These performance measures have been chosen because:
| >> | service revenue is both a measure of absolute size and of growth, and can be correlated to profitability; |
| >> | controllable EBIT is a similar measure to underlying earnings, which is the key financial measure in determining regular dividends for our shareholders. |
A stretching achievement level will be set for each measure, for which 30 per cent of the total award will vest. Below this level none of the award will vest. For achievement of the maximum performance level, which will represent superior performance and, we believe, significant shareholder value, 100 per cent of the award will vest. Both measures must be achieved at maximum for the full award to vest. The maximum vesting level under this arrangement would represent compound annual revenue growth in the region of 20 per cent in the three-year period to 2007/08 and an EBITDA margin by that time in the mid-twenties.
The Committee will determine the level of vesting from this incentive, and will set, review and measure each of the targets (and performance against the targets) to satisfy itself that any payout is a genuine reflection of underlying financial performance over the period. At the time of vesting, the Committee will explain the rationale for any payout.
O2 Executive Share Portfolio – Summary of Plans
| Performance Share Plan Purpose: to focus performance on the creation of long-term and sustained shareholder value. | |
| Year ended 31 March 2005 Performance shares were not awarded to executive Directors, but were made to senior managers in 2004/05. | |
| Performance measure | |
>> | Vesting is subject to the Company’s TSR performance against a comparator group over a fixed three-year period as set out below: |
| TSR ranking | % Performance Shares Vest | |
| Below median | 0% | |
| Median | 30% | |
| Upper quartile | 100% | |
| (Vesting on a straight line basis between median and upper quartile performance.) | ||
| >> | The comparator group consists of the constituents of the FTSEurofirst 300 Telecommunications Index (formerly known as the FTSE E300 Telecoms Service Index) at the time awards are made (shown below). This index was chosen by the Committee as it closely compares the Company with its business sector. |
| BT Group | Tele2 B | |
| Cable & Wireless | Telecom Ital.Mobl. | |
| Cosmote Mobile | Telecom Italia | |
| Deutsche Telekom (Xet) | Telecom Italia Rnc | |
| France Telecom | Telefonica | |
| Ote-Hellenic Telc. | Telekom Austria | |
| Pt Telecom Sgps | Telenor | |
| Kpn Kon | Teliasonera | |
| Swisscom R | Vodafone Group | |
| TDC | O2 |
| >> | Awards will only vest to the extent that the Committee is satisfied that the Company’s TSR performance is a genuine reflection of the Company’s underlying financial performance over the period. |
| >> | There are no retesting opportunities. |
| Year ending 31 March 2006 Awards of performance shares will be made to executive Directors, the Senior Management Team and other senior managers at the discretion of the Committee. | |
| The vesting schedule, performance condition and comparator group will be as set out above for executive Directors except for the CEO of O2 Germany and a small number of senior O2 Germany employees as outlined opposite. | |
o2.com 54
O2 Executive Share Portfolio – Summary of Plans
| Deferred Equity Incentive Plan (DEIP) Purpose: to drive short-term business goals through the Deferred Award, and focus performance on the creation of shareholder value over the long term through the Performance Uplift award. | |
| Year ended 31 March 2005 Executive Directors received a Deferred Award and Performance Uplift. Details of awards made to executive Directors can be found on page 60. | |
| There are two parts to the DEIP: | |
| Deferred Award | |
| >> | The Deferred Award is an entitlement to shares equal in value to half of the annual bonus earned in respect of the preceding financial year (i.e. 2003/04). Vesting is subject to continued employment, but no further corporate performance condition. |
| Performance Uplift | |
| >> | The maximum Performance Uplift is equal to twice the Deferred Award. Vesting is subject to the long-term performance of the Company. |
| Performance measure | |
| >> | Vesting of the Performance Uplift is subject to the Company’s TSR performance against a comparator group over a fixed three-year period as set out below: |
| TSR ranking | % Performance Uplift vests | |
| Below median | 0% | |
| Median | 30% | |
| Upper quintile (top 20%) | 100% | |
| (Vesting on a straight line basis between median and upper quintile performance.) | ||
| >> | The comparator group for Performance Uplift awards made in 2004/05 consisted of the constituents of the FTSEurofirst 300 Telecommunications Index at the date of award (the constituents are the same as those shown on page 54 for awards made under the Performance Share Plan in 2004/05). This index was chosen by the Committee as it closely compares the Company with its business sector. |
| >> | The Performance Uplift will only vest to the extent that the Committee is satisfied that the Company’s TSR performance is a genuine reflection of the Company’s underlying financial performance over the period. |
| >> | There are no retesting opportunities. |
| Year ending 31 March 2006 There are no plans to operate the DEIP in the forthcoming year. | |
| Share Option Plan Purpose: to focus on share price growth and the creation of long-term shareholder value. | |
| Year ended 31 March 2005 Share options were not granted under this plan. | |
| Year ending 31 March 2006 There are currently no intentions to make any awards to executive Directors under this plan. However, the Committee will retain the flexibility to grant options in exceptional circumstances; for example, if required to secure an appointment. Should options be granted in the future, the Committee will have regard to best practice at the time on retesting and performance conditions. | |
| Options previously granted had the following provisions: | |
| Performance measure | |
| >> | Vesting of options is subject to the Company’s TSR performance against a comparator group over a fixed three-year period as set out below: |
| TSR ranking | % of options exercisable | |
| Below median | 0% | |
| Median | 50% | |
| Upper quartile (top 25%) | 100% | |
| (Vesting on a straight line basis between median and upper quartile performance.) | ||
| >> | If the performance goal is not satisfied in full on the first performance test, it can be retested on two subsequent occasions, on the fourth and fifth anniversaries of grant, extending the length of the performance period at each test. The proportion of options that can be exercised will increase if the Company’s TSR performance improves between the test dates. |
| >> | The comparator group consisted of the constituents of the FTSE 100 Index at the time the options were granted. |
| >> | The options will only become exercisable to the extent that the Committee is satisfied that the Company’s TSR performance is a genuine reflection of the Company’s underlying financial performance over the period. |
o2.com 55
Report on directors’ remuneration continued
O2 Executive Share Portfolio – Summary of Plans
| Restricted Share Plan Purpose: to encourage personal investment in the Company and act as a retention tool. | |
| Year ended 31 March 2005 | |
| >> | Restricted shares were not awarded to executive Directors. |
| >> | The Company made a one-off award of restricted shares to the Chairman upon his appointment, details of which can be found on pages 57 and 60. |
| >> | Awards over restricted shares were made to a small number of senior managers. Restricted shares will usually vest on the third anniversary of grant, if the conditions below are met. |
| Performance measure | |
| >> | In order for the restricted shares to vest in full, participants must personally build and maintain an equivalent number of O2 shares until the vesting date as well as remaining in employment with the O2 Group until this time. |
| >> | The awards vest on a pro rata basis if the participant builds up a lower personal investment. |
| Year ending 31 March 2006 There is currently no intention to make any awards to executive Directors under this plan. However, the Committee will retain the flexibility to grant awards in exceptional circumstances; for example, if required to secure an appointment. | |
Capital reorganisation of the Company
As a result of the capital reorganisation which became effective on 14 March 2005, all options and awards granted over mmO2 plc shares under the Executive Share Portfolio were automatically rolled over into options and awards over an identical number of O2 plc shares. There was no change to option prices, to the number of shares under option/award, or to the length of the vesting period. Where options/awards over shares are subject to TSR, this will be measured in respect of mmO2’s performance and O2’s performance over the relevant period as necessary.
Legacy long-term incentives
Outstanding awards under long-term incentive arrangements originally implemented prior to the Company’s demerger from BT are described on pages 62 and 63.
Pension benefits
There are pension arrangements in place in the main jurisdictions in which the O2 Group operates. Schemes vary in accordance with local market practices in each jurisdiction, and as such there are various arrangements in place for executive Directors and the Senior Management Team.
Peter Erskine and David Finch are entitled to final salary related pension benefits up to the UK statutory earnings cap. In addition, they are entitled to supplementary pension benefits in respect of earnings above the statutory earnings cap (comprising unfunded final salary related benefits in the case of Peter Erskine and funded defined contribution benefits in the case of David Finch).
These arrangements will be affected by changes to the current UK pension regime resulting from the Finance Act 2004. The Committee is currently reviewing appropriate actions to take in response to these changes and will report further next year.
Peter Erskine’s pension arrangements provide for a total pension of two-thirds of final salary at age 60, inclusive of any retained benefits from his previous employment, and a widow’s pension of two-thirds of his pension. The majority of his pension is provided outside the O2 Pension Plan as an unfunded benefit promise from the Company.
David Finch’s pension arrangements provide for an annual accrual of 1/30 of the earnings cap within the O2 Pension Plan, subject to any restriction due to retained benefits. In addition, he is entitled to a supplementary defined contribution benefit, the level of which is determined on an annual basis. For the year to 31 March 2005 this was equal to 32.5 per cent of basic salary; 21 per cent was paid to a Funded Unapproved Retirement Benefit Scheme (FURBS) and 11.5 per cent was paid as a cash supplement.
Rudolf Gröger’s pension arrangements provide for a pension at age 60 of 20 per cent of salary after the first three years of service and an annual pension accrual of 1.5 per cent of salary thereafter. The benefit is provided by the Company as an unfunded pension promise.
David McGlade received a cash allowance in lieu of pension benefits of 20 per cent of basic salary from 1 April 2004 to 31 May 2004 and 30 per cent of basic salary from 1 June 2004.
David Varney, who retired as Chairman on 28 July 2004, did not participate in any O2 plc pension arrangements. David Arculus’s pension arrangements are set out on pages 57 and 59.
Life cover of four times salary is provided for David Arculus, Peter Erskine, David Finch and David McGlade, whilst he was a Director, and was provided for David Varney whilst he was Chairman.
Details of pension arrangements within O2 are set out in note 30 to the financial statements.
Contracts and notice periods
It is the Committee’s general policy that executive Directors will have contracts and service agreements with similar provisions.
o2.com 56
| The service contracts and notice periods for the executive Directors are set out below: | ||
| Effective date of | ||
| Director | service agreement | Notice period |
| P Erskine1 | 24 October 2001 | 12 months |
| D Finch1 | 19 November 2001 | 12 months |
| R Gröger1 | 1 April 2003 | 12 months |
| D McGlade2 | 1 April 2003 | 12 months |
| 1 | Peter Erskine and David Finch are employed by mmO2 plc but have each entered into an amendment letter with effect from 14 March 2005 to reflect the implementation of the reorganisation to establish O2 plc as the holding company for the Group with effect from that date. Rudolf Gröger’s contract is with O2 (Germany) Management GmbH and has been amended in similar respects. |
| 2 | David McGlade left the Company on 31 March 2005. |
The Company may in its discretion terminate without notice and make a payment in lieu of notice equal to the sum of 12 months’ pay including the value of employers’ pension contributions, benefits, and a bonus payment of not less than the previous year’s bonus. This payment in lieu of notice provision does not prevent the Company from terminating as a result of breach of contract, which may enable the Company to pay a reduced amount by requiring greater mitigation.
On termination of employment within 12 months following a change of control, the Company is obliged to make a payment equal to the base salary, the value of employer pension contributions and benefits for the notice period, plus additional payments generally equal to the annual bonus potential for that year, and in respect of the loss of rights under share incentive schemes.
In the event of termination of Rudolf Gröger’s employment within 12 months following a change of control of O2 or its German business, the employer is obliged to make a cash payment equal to two times his base salary and bonus. The amount of bonus payable will be that expected for on-target performance. This reflects German market practice for senior executives.
David Arculus, who served previously as a non-executive Director of the Company, agreed to serve as Chairman with effect from 28 July 2004 under an agreement dated 4 May 2004. His time commitment is an average of two days per week although in practice the Chairman is available at any time. The notice period required by the Company to terminate this agreement is 12 months. On a change of control, in the event that his agreement is terminated, he will be entitled to 12 months’ pay in lieu of notice. This can be subject to mitigation in the event that he finds a comparable alternative role.
Chairman’s remuneration
The Chairman’s remuneration is determined by the Committee. Upon appointment he was entitled to an annual fee of £325,000 as Chairman, of which £28,254 is, at his request, paid into his personal pension arrangements. Following a review of the remuneration of the Chairman, it was agreed that, with effect from 1 June 2005, the annual fee payable will be £355,000. The Chairman does not participate in O2 plc annual incentive arrangements. The Chairman has agreed to invest 15 per cent of his after-tax fee in the Company’s shares, to be retained until his retirement as Chairman.
The Chairman has been granted a one-time award of restricted shares the vesting of which is subject to him building a substantial personal shareholding in the Company. Details of the award can be found on page 60.
Remuneration of non-executive Directors
The fees of non-executive Directors are determined by the Chairman and executive Directors who have access to independent advice.
Each non-executive Director has agreed that a portion of their after-tax fee, equivalent to a minimum of 50 per cent and up to a maximum of 100 per cent, would be invested in shares. This arrangement was approved by the Board in 2002, but was suspended for the period 1 October 2003 to 31 December 2004. Fees are paid quarterly in arrears and the shares are allotted on the same basis. The non-executive Directors do not participate in any of O2’s pension or incentive arrangements and receive no benefits.
| As at 31 March 2005: | |
| (a) | the basic annual fee payable to the non-executive Directors was £40,000 plus an additional fee of £5,000 for membership of the Audit and Remuneration Committees, £3,000 for the Nomination and Governance Committee and an additional fee of £5,000 per annum for chairmanship of a committee; and |
| (b) | the annual fee payable to the Deputy Chairman of the Company was £100,000. |
| Following a review of the remuneration of the non-executive Directors, it was agreed that with effect from 1 April 2005 the annual fees payable to the non-executive Directors will be as follows: | |
| (a) | the basic annual fee payable will be £50,000 plus an additional fee of £7,500 for membership of the Audit and Remuneration Committees, £3,750 for the Nomination and Governance Committee and an additional fee of £7,500 per annum for chairmanship of a committee; and |
| (b) | the annual fee payable to the Deputy Chairman of the Company remains unchanged. |
Each non-executive Director has a letter of appointment with O2 plc covering, amongst other items, their terms of appointment and expected time commitment, together with a general statement of their role and duties. Non-executive Directors are appointed initially for three years unless otherwise terminated earlier by and at the discretion of either party upon one month’s written notice. Non-executive Directors are typically expected to serve two three-year terms subject to satisfactory performance and re-election by shareholders.
Changes to the Board
As previously reported, David Varney retired as Chairman at the conclusion of the Company’s AGM on 28 July 2004. No compensation for loss of office was paid to David Varney on his retirement. David Arculus has served as Chairman with effect from that date.
David McGlade stepped down from the Board on 31 March 2005. No compensation for loss of office was paid.
Patrick Lupo was appointed as a non-executive Director on 10 August 2004. Rudolph Lamprecht and Kathleen O’Donovan were appointed as non-executive Directors on 30 March 2005. Paul Myners, Neelie Kroes and Ian Meakins resigned as non-executive Directors on 10 August 2004, 31 August 2004 and 30 March 2005 respectively.
o2.com 57
Report on directors’ remuneration continued
Directors’ remuneration (excluding pension arrangements) for the year ended 31 March 2005
| Salary and fees | Annual bonus | Benefits excluding | 1 | Total | 2 | Total | 3 | Salary/fees as at | |||||||||
| pensions | |||||||||||||||||
| 2005 | 2004 | 2005 | 2004 | 2005 | 2004 | 2005 | 2004 | 1 June 2005 | |||||||||
| £ | £ | £ | £ | £ | £ | £ | £ | £ | |||||||||
| Current directors | |||||||||||||||||
| D Arculus | 280,847 | 4 | 48,000 | – | – | 16,787 | – | 297,634 | 48,000 | 355,000 | |||||||
| P Erskine5 | 665,833 | 607,500 | 568,404 | 564,200 | 35,241 | 40,602 | 1,269,478 | 1,212,302 | 725,000 | ||||||||
| D Finch | 425,000 | 395,833 | 430,000 | 364,000 | 28,222 | 24,705 | 883,222 | 784,538 | 6 | 460,000 | |||||||
| R Gröger7 | 439,992 | 399,211 | 534,847 | 499,896 | 25,146 | 20,543 | 999,985 | 919,650 | 473,134 | ||||||||
| D McGlade | 414,167 | 372,500 | 391,980 | 462,000 | 24,162 | 100,047 | 830,309 | 934,547 | – | ||||||||
| D Chance | 48,000 | 48,000 | – | – | – | – | 48,000 | 48,000 | 61,250 | ||||||||
| S Hodge | 66,667 | 8 | 55,000 | – | – | – | – | 66,667 | 55,000 | 100,000 | |||||||
| R Lamprecht9 | – | – | – | – | – | – | – | – | 50,000 | ||||||||
| P Lupo10 | 30,856 | – | – | – | – | – | 30,856 | – | 65,000 | ||||||||
| K O’Donovan9 | – | – | – | – | – | – | – | – | 57,500 | ||||||||
| A Sukawaty | 87,000 | 11 | 100,000 | – | – | – | – | 87,000 | 100,000 | 61,250 | |||||||
| Former directors | |||||||||||||||||
| D Varney12 | 113,844 | 350,000 | – | – | 42,911 | 13 | 36,125 | 156,755 | 386,125 | – | |||||||
| N Kroes14 | 20,833 | 50,000 | – | – | – | – | 20,833 | 50,000 | – | ||||||||
| I Meakins15 | 50,000 | 50,000 | – | – | – | – | 50,000 | 50,000 | – | ||||||||
| P Myners16 | 17,290 | 48,000 | – | – | – | – | 17,290 | 48,000 | – | ||||||||
| 1 | Benefits include car provision or cash allowance, healthcare, financial planning, dental care, home security and life cover. |
| 2 | Certain Directors received pension supplements for the year ended 31 March 2005. Details of these payments can be found on page 59 below the pensions table. |
| 3 | Total aggregate remuneration for 2004 excludes long-term incentive gains which were included in the report for the year ended 31 March 2004. |
| 4 | Includes aggregate fees earned as a non-executive Director and Chairman designate for the period 1 April 2004 to 28 July 2004. |
| 5 | Highest paid Director. |
| 6 | Excludes£146,717 gains from long-term incentives which were included in the report for the year ended 31 March 2004. |
| 7 | Rudolf Gröger’s remuneration has been converted from Euro to Sterling at an exchange rate of£1 =€1.45836. |
| 8 | Appointed as Deputy Chairman of the Company on 1 January 2005. |
| 9 | Appointed on 30 March 2005. |
| 10 | Appointed on 10 August 2004. |
| 11 | Andrew Sukawaty stepped down as Deputy Chairman of the Company on 31 December 2004 but remains on the Board. |
| 12 | Retired at the conclusion of the Company’s AGM on 28 July 2004. |
| 13 | In addition to the benefits listed in Note 1, David Varney received a payment for outstanding holiday entitlement. |
| 14 | Resigned from the Board on 31 August 2004. |
| 15 | Resigned from the Board on 30 March 2005. |
| 16 | Resigned from the Board on 10 August 2004. |
Aggregate remuneration paid to the Senior Management Team
The aggregate remuneration of the Senior Management Team for services in all capacities during the 2005 financial year was £2.6 million. In addition, loans outstanding to senior officers of the Company as at 31 March 2005 were £119,643.
o2.com 58
<<
Pensions
The table below includes the information required in relation to defined benefit schemes under the UKLA Listing Rules and Schedule 7A of the Companies Act 1985.
| Real increase in accrued pension during year | Increase in accrued pension during year (including inflation) | Transfer value of real increase in accrued benefit (less Directors’ | Increase in transfer value less Directors’ contri- butions £000 | Directors’ contri- butions £000 | |||||||||||||||||||||
| Total accrued pension | 1 | Transfer value | 2,3 | ||||||||||||||||||||||
| At | At | At | At | ||||||||||||||||||||||
| 31 March | 31 March | 31 March | 31 March | contributions) | 2,3 | ||||||||||||||||||||
| 2005 | 2004 | 2005 | 2004 | 2005 | 2004 | 2005 | 2004 | 2005 £ 000 | 2004 £ 000 | ||||||||||||||||
| £000 | £000 | £000 | £000 | £000 | £000 | £000 | £000 | ||||||||||||||||||
| Peter Erskine | |||||||||||||||||||||||||
| O2 Pension Plan | 41 | 37 | 490 | 407 | 3 | 3 | 4 | 4 | 25 | 20 | 68 | 15 | |||||||||||||
| Unfunded Plan | 246 | 203 | 4,161 | 3,124 | 36 | 39 | 43 | 43 | 606 | 598 | 1,037 | – | |||||||||||||
| Total | 287 | 240 | 4,651 | 3,531 | 39 | 42 | 47 | 47 | 631 | 618 | 1,105 | 15 | |||||||||||||
| David Finch | 12 | 9 | 114 | 72 | 3 | 3 | 3 | 4 | 31 | 27 | 42 | – | |||||||||||||
| Rudolf Gröger4 | 93 | 69 | 2,281 | 1,540 | 23 | 35 | 24 | 35 | 545 | 744 | 741 | – | |||||||||||||
| 1 | The accrued annual pension represents the maximum defined benefit liability for O2. The amounts will be reduced by any retained benefits from previous employment. |
| 2 | The transfer values have been calculated on the basis of actuarial advice. The transfer values of the Inland Revenue approved benefits have been calculated in accordance with Actuarial Guidance Note GN11 using the assumptions adopted by the O2 Pension Plan Actuary. The unapproved element of pension benefits has been valued using assumptions appropriate to the FRS17 accounting standard, which are consistent with GN11 principles. The increase in transfer values has been caused by each executive Director’s increase in salary and length of service. |
| 3 | These figures represent liabilities of the Company and the O2 Pension Plan, not sums paid or due to the individual. |
| 4 | The figures in £ sterling have been converted from Euros at an exchange rate of €1:£0.6803 as at 31 March 2005 and €1:£0.6943 as at 31 March 2004. |
For the year ended 31 March 2005, David Arculus received employer’s contributions of £16,482 (£28,254 per annum) into his personal pension arrangements. For the year ended 31 March 2005, in respect of David Finch, £89,250 (£83,125 for the year ended 31 March 2004) was paid to a defined contribution Funded Unapproved Retirement Benefit Scheme (FURBS) and £48,875 (£45,521 for the year ended 31 March 2004) was paid as a cash supplement. For the year ended 31 March 2005, David McGlade received a cash allowance of £117,833 (£74,500 for the year ended 31 March 2004) in lieu of pension benefits.
Directors’ interests in the shares of the Company
Beneficial interests
The beneficial interests of the Directors and their immediate families in ordinary shares of 0.1p each in the Company as at 31 March 2005 as set out in the table below.
| As at 31 March 2005 | As at 1 April 2004 | |||
| DavidArculus | 338,281 | 1,2 | 24,078 | |
| Peter Erskine | 965,910 | 1,2 | 537,027 | |
| David Finch | 1,028,768 | 812,816 | ||
| Rudolf Gröger | 63,944 | – | ||
| David McGlade | 670,986 | 335,496 | ||
| DavidChance | 15,029 | 15,029 | ||
| Stephen Hodge | 91,914 | 91,914 | ||
| Rudolf Lamprecht | – | – | ||
| Patrick Lupo | 73,048 | – | ||
| Kathleen O’Donovan | – | – | ||
| Andrew Sukawaty | 83,576 | 83,576 | ||
| 1 | Since 31 March 2005 Peter Erskine and David Finch have each acquired 208 additional ordinary shares under the terms of the O2 Share Ownership Plan. There have been no other changes in the Directors’ beneficial and non- beneficial interests in share capital, including options to subscribe for shares, or in the debentures of the Company and its subsidiaries between 31 March 2005 and 10 May 2005. |
| 2 | Includes shares held by trustee of the O2 Share Ownership Plan. |
The Senior Management Team beneficially own less than 1 per cent of the Company’s outstanding ordinary shares.
o2.com 59
Report on directors’ remuneration continued
Performance Share Plan
The table below shows the number of performance shares which remained outstanding to executive Directors as at 31 March 2005.
| Granted | |||||||||||||||||
| during the | |||||||||||||||||
| Number | year ended | Number | |||||||||||||||
| at 1 April | 31 March | at 31 March | |||||||||||||||
| Date of award | 2004 | 2005 | Vested | Lapsed | 2005 | Vesting date | |||||||||||
| PeterErskine | 31/07/03 | 1,403,773 | – | – | – | 1,403,773 | 31/07/06 | ||||||||||
| David Finch | 31/07/03 | 905,660 | – | – | – | 905,660 | 31/07/06 | ||||||||||
| Rudolf Gröger | 31/07/03 | 859,245 | – | – | – | 859,245 | 31/07/06 | ||||||||||
| David McGlade | 31/07/03 | 815,094 | – | – | (815,094 | )1 | – | – | |||||||||
| 1David McGlade left the Company on 31 March 2005 and his award over performance shares lapsed in full. |
A summary of the performance condition can be found on page 54.
Deferred Equity Incentive Plan
The table below shows the number of deferred equity shares awarded to executive Directors during the year ended 31 March 2005.
| Number at 1 April 2004 | Granted during the year ended 31 March 2005 | Number at 31 March 2005 | Vesting date | ||||||||||||||||
| Number of Deferred AwardShares | Number of Performance Uplift shares | Total number of shares | |||||||||||||||||
| Date of award | Vested | Lapsed | |||||||||||||||||
| Peter Erskine | 29/07/04 | – | 329,941 | 659,883 | 989,824 | – | – | 989,824 | 29/07/07 | ||||||||||
| David Finch | 29/07/04 | – | 212,865 | 425,730 | 638,595 | – | – | 638,595 | 29/07/07 | ||||||||||
| Rudolf Gröger | 29/07/04 | – | 282,105 | 564,210 | 846,315 | – | – | 846,315 | 29/07/07 | ||||||||||
| David McGlade | 29/07/04 | – | 270,175 | 540,350 | 810,525 | – | (810,525 | )1 | – | – | |||||||||
1David McGlade left the Company on 31 March 2005 and his award over deferred equity shares lapsed in full. |
A summary of the performance condition can be found on page 55.
Restricted Share Plan
The table below shows the number of restricted shares which remained outstanding to Directors during the year ended 31 March 2005.
| Market price | Number | Awarded during | Number | ||||||||||||||||
| on date of | at 1 April | the year ended | at 31 March | Vesting/ | Price on date | ||||||||||||||
| Date of award | award | 2004 | 31 March 2005 | Vested | Lapsed | 2005 | Lapse date | of vesting | |||||||||||
| David Arculus1 | 29/07/04 | 85.5p | – | 292,397 | – | – | 292,397 | 29/07/07 | – | ||||||||||
| Peter Erskine2 | 23/11/01 | – | 575,815 | – | (575,815 | ) | – | – | 23/11/04 | 115.50p | |||||||||
| David Finch2,3 | 23/11/01 | – | 201,536 | – | (201,536 | ) | – | – | 23/11/04 | 116.25p | |||||||||
| Rudolf Gröger2 | 23/11/01 | – | 156,592 | – | – | (156,592 | ) | – | 23/11/04 | – | |||||||||
| David McGlade2,4,5 | 23/11/01 | – | 38,579 | – | (33,549 | ) | (5,030 | ) | – | 23/11/04 | $21.61 | ||||||||
| 1 | David Arculus was granted a restricted share award over 292,397 shares (with a market value of 85.5p at the time of grant) with effect from 29 July 2004. This represents an amendment to the original award terms involving a reduction in the number of shares under award and the removal of a corporate performance condition to which the original award was subject. The restricted share award will vest on 29 July 2007 provided Mr Arculus builds up a personal shareholding of 350,877 shares by 28 July 2005 and remains with the Company until the vesting date. |
| 2 | Restricted share awards were granted on terms that they will only vest on the third anniversary of grant, if a significant personal shareholding in the Company equal to the number of shares under award is built within 18 months of grant and retained until the vesting date as well as remaining in employment with the Group.The awards vest on a pro-rata basis if the participant builds up a lower personal investment. |
| 3 | The personal shareholding requirement for David Finch was equal to one-third of the shares under award at 23 November 2001. |
| 4 | The restricted share award granted to David McGlade on 23 November 2001 was in the form of ADSs (one mmO2 ADS equalled 10 ordinary shares). |
| 5 | The dollar-sterling exchange rate on the date of vesting was£1 = $1.8688 |
o2.com 60
Share Option Plan
The table below shows the number of executive share options which remained outstanding to Directors during the year ended 31 March 2005.Vesting is subject to the satisfaction of corporate performance criteria as detailed on page 55.
| Options | |||||||||||||||||||
| granted during | Price on | ||||||||||||||||||
| Number at | the year ended | Number at | Option | date of | Period | ||||||||||||||
| Grant date | 1 April 2004 | 31 March 2005 | Exercised | Lapsed | 31 March 2005 | price | exercise | exercisable | |||||||||||
| Peter Erskine | 23 Nov 01 | 1 | 1,724,137 | – | – | – | 1,724,137 | 87p | – | 23 Nov 04- | |||||||||
| 22 Nov 11 | |||||||||||||||||||
| 25 Jul 02 | 2 | 3,554,347 | – | – | – | 3,554,347 | 46p | – | 25 Jul 05- | ||||||||||
| 24 Jul 12 | |||||||||||||||||||
| David Finch | 23 Nov 01 | 1 | 1,206,896 | – | – | – | 1,206,896 | 87p | – | 23 Nov 04- | |||||||||
| 22 Nov 11 | |||||||||||||||||||
| 25 Jul 02 | 2 | 2,445,652 | – | – | – | 2,445,652 | 46p | – | 25 Jul 05- | ||||||||||
| 24 Jul 12 | |||||||||||||||||||
| Rudolf Gröger | 23 Nov 01 | 1 | 625,168 | – | (462,624 | ) | – | 162,544 | 87p | 123p | 23 Nov 04- | ||||||||
| 22 Nov 11 | |||||||||||||||||||
| 25 Jul 02 | 2 | 1,763,373 | – | – | – | 1,763,373 | 46p | – | 25 Jul 05- | ||||||||||
| 24 Jul 12 | |||||||||||||||||||
| David McGlade | 23 Nov 01 | 1,3 | 122,059 | – | (90,323 | ) | (31,736 | ) | – | $11.873 | 126p | – | |||||||
| 25 Jul 02 | 2,4 | 2,184,782 | – | – | – | 2,184,782 | 46p | – | 25 Jul 05- | ||||||||||
| 31 Mar 06 | |||||||||||||||||||
| David Varney | 23 Nov 01 | 1,5 | 1,724,137 | – | (1,275,860 | ) | – | 448,277 | 87p | 114p | 23 Nov 04- | ||||||||
| 28 Jul 05 | |||||||||||||||||||
| 25 Jul 02 | 2,5 | 3,260,869 | – | – | – | 3,260,869 | 46p | – | 25 Jul 05- | ||||||||||
| 18 Oct 05 | |||||||||||||||||||
| 1For options granted in the year ended 31 March 2002 (ie. 23 November 2001), the first performance test took place in November 2004. TSR performance from 19 November 2001 (the start of the performance period) to 18 November 2004 placed the Company at 31st position within the comparator group and resulted in 74 per cent of share options becoming exercisable. Performance will be tested in respect of the unexercisable portion of the option on 18 November 2005. Should the remaining portion of the option not be exercisable at that time, a final retest will occur on 18 November 2006. In the case of David McGlade who resigned from the Board on 31 March 2005, the balance of his option outstanding lapsed in full. |
| 2For options granted in the year ended 31 March 2003 (i.e. 25 July 2002), the first performance test is expected to be July 2005. TSR performance from 18 July 2002 (the start of the performance period) to 31 March 2005 placed the Company at first position within the comparator group. |
| 3The options granted to David McGlade on 23 November 2001 were in the form of ADSs (one mmO2 ADS equalled 10 ordinary shares). The value realisable from shares acquired on exercise is the difference between the price on the date of exercise and the option price. David McGlade converted his option over ADSs to ordinary shares on exercise and made a gain of £576,622. The sterling-dollar exchange rate on 7 March 2005 was £1 = $1.9114. |
| 4On resigning as a Director of O2 plc on 31 March 2005, the Committee permitted David McGlade to retain his options for the maximum periods referred to in the final column above. The exercisability of these options is dependent on the applicable performance targets being met. |
| 5On retiring as Chairman of the Company on 28 July 2004, the Committee permitted David Varney to retain his options for the maximum periods referred to in the final column above. The exercisability of these options is dependent on the applicable performance targets being met. |
o2.com 61
Report on directors’ remuneration continued
Sharesave
The table below shows the sharesave options over ordinary shares in the Company held by Directors during the year ended 31 March 2005.
| Number at 1 April 2004 | Number at 31 March 2005 | Price on date of exercise | |||||||||||||||||
| Exercise price | |||||||||||||||||||
| Grant date | Granted | Exercised | Lapsed | Period exercisable | |||||||||||||||
| Peter Erskine | 21 Dec 2001 | 12,978 | – | (12,978 | ) | – | – | 73.2p | 123.5p | 14 Feb 2005- | |||||||||
| 13 Aug 2005 | |||||||||||||||||||
| 17 Dec 2004 | – | 18,040 | – | – | 18,040 | 91.6p | – | 1 Feb 2010- | |||||||||||
| 31 Jul 2010 | |||||||||||||||||||
| David Finch | 21 Dec 2001 | 12,978 | – | (12,978 | ) | – | – | 73.2p | 123.5p | 14 Feb 2005- | |||||||||
| 13 Aug 2005 | |||||||||||||||||||
| 17 Dec 2004 | – | 10,343 | – | – | 10,343 | 91.6p | – | 1 Feb 2008- | |||||||||||
| 31 Jul 2008 | |||||||||||||||||||
| DavidMcGlade1 | 20 Dec 2002 | 21,477 | – | – | (21,477 | ) | – | 44p | – | – | |||||||||
| David Varney2 | 21 Dec 2001 | 12,978 | – | – | (12,978 | ) | – | 73.2p | – | – | |||||||||
| 1David McGlade resigned from the Board on 31 March 2005 and his sharesave options lapsed in full. 2David Varney resigned from the Board on 28 July 2004 and his sharesave options lapsed in full. |
Legacy long-term incentives
Peter Erskine had the following O2 shares under award from BT Legacy Share Awards. Following demerger, these awards were adjusted to relate solely to O2 shares, and any performance measure has been translated into a measure of O2 performance from demerger to the end of the performance period.
| Number of | |||||||||||||||||
| O2 shares | Number at | Price on | |||||||||||||||
| 1 April | 31 March | date of | |||||||||||||||
| Name | Plan | Year of award | 2004 | Vested | Lapsed | 2005 | vesting | Vesting date | |||||||||
| Peter Erskine | BT Executive Share Plan | 1999 | 1 | 144,198 | – | (144,198 | ) | – | – | 2004 | |||||||
| Peter Erskine | BT Deferred Bonus Plan | 2001 | 2 | 127,656 | (127,656 | ) | – | – | 88.25p | 2004 | |||||||
| 1The performance period for the 1999 BT Executive Share Plan ended on 31 March 2004. The TSR performance condition was not met and as a result the award over 144,198 shares lapsed in May 2004. |
| 2The vesting of shares awarded under the BT Deferred Bonus Plan was subject only to continued employment with the Company. |
o2.com 62
Legacy Option Plan
Subsisting options over BT shares granted under BT executive share option plans have been replaced with options over O2 shares, granted under the O2 Legacy Option Plan, for those participants now employed by O2. The replacement options were granted on the same terms and are exercisable between the same dates as the options for which they were exchanged.
There are no performance conditions relating to the vesting of these options other than continued employment with the O2 Group. This reflects the terms of the underlying BT Option plan. The legacy options will be satisfied using new issue shares, and options granted under this plan do not count towards the dilution limits established for O2 share option plans. No further options will be granted under this plan.
The table below shows options over BT shares held by David Varney and David McGlade prior to demerger.
| Number at | Number at | ||||||||||||||||
| 1 April | 31 March | Option | Price on | ||||||||||||||
| Grant date | 2004 | Exercised | Lapsed | 2005 | price | date of exercise | Date exercisable | ||||||||||
| David McGlade1 | 1 October 2000 | 113,440 | (113,440 | ) | – | – | $23.243 | 126p | 1 Oct 2001- | ||||||||
| 30 Sept 2006 | |||||||||||||||||
| David Varney | 22 June 2001 | 491,272 | (491,272 | ) | – | – | 101.7p | 114p | 2004- | ||||||||
| 28 July 2005 | |||||||||||||||||
| 1David McGlade’s legacy options were awarded in the form of ADSs (one mmO2 ADS equalled 10 ordinary shares) and on exercise the ADSs were converted into ordinary shares. David McGlade made a gain of£48,893. The sterling-dollar exchange rate on 7 March 2005 was£1 = $1.9114. |
Share price
The closing market price of the Company’s shares at 31 March 2005 was 119.25p and the range from 1 April 2004 to that date was 84.25p to 131.25p.
Non- beneficial interests
At 31 March 2005, all executive Directors had a non-beneficial interest in 956,316 O2 plc ordinary shares held in trust by Hill Samuel Offshore Trust Company Limited as trustee of the O2 Restricted Share Plan, O2 Performance Share Plan and O2 Deferred Equity Incentive Plan.
Performance graph
The performance graph illustrates the Company’s TSR performance for the period from 19 November 2001 (when the Company was first listed following its demerger from BT) to 31 March 2005, compared to the FTSE 100 Index and the FTSEurofirst 300 Telecommunications Index. The FTSE 100 Index was selected by the Committee because it is recognised as an externally valid and robust comparator group of UK-based companies of similar size to the Company in terms of market capitalisation. The FTSEurofirst 300 Telecommunications Index was chosen because it more closely compares the Company within its sector. The graph relates to mmO2 plc’s performance pr ior to 14 March 2005, and O2 plc’s performance thereafter.
The graph shows the growth in value of£100 invested on 19 November 2001 (including the reinvestment of dividends). It does not relate to the Company’s TSR performance as reflected in O2 long-term incentives.
Total shareholder return against the FTSE 100 Index and FTSEurofirst 300 Telecommunications Index
Source: Thomson Financial
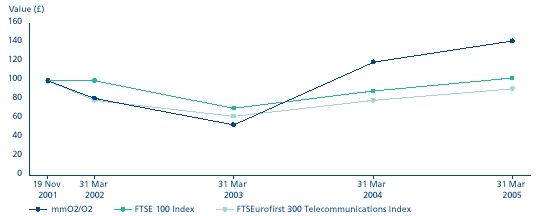
o2.com 63
Report on directors’ remuneration continued
All- employee share schemes
The Committee believes that it is in the interests of all employees across the business to be given the opportunity to own O2 shares, and wishes to encourage this by taking advantage of favourable tax treatment where available for employees.
| >> | the O2 Sharesave Plan, under which the Directors can grant options to all employees across the business to acquire shares at an exercise price set at a discount of up to 20 per cent to the market value of a share at the time of invitation; and |
| >> | the O2 Share Ownership Plan, under which UK employees can acquire O2 shares on tax-favoured terms. |
Policy on outside appointments
It is the Group’s policy to support executive Directors and senior managers taking external directorships or similar roles where it is beneficial for both the individual concerned and the Group and does not detract from their responsibilities to the Group. The number of such appointments must not exceed two, only one of which may be with a FTSE 100 company. Appointments relating to executive Directors and Executive Committee members require the prior approval of the Board. Appointments relating to other senior executives require the prior approval of the Chairman. The Company permits the executive Director or senior executive concerned to retain any fees earned from such a position provided they are at a reasonable level. Peter Erskine is a member of the University of Reading Business School Advisory Board. David McGlade, who left the Board on 31 March 2005, is a non-executive Director of a US-based company called PureMatrix. None of the executive Directors received fees in respect of these external directorships.
Compliance
This report complies with the Directors’ Remuneration Report Regulations 2002 (the Regulations). The Regulations require the Group’s auditors to report to shareholders on the auditable part of the report and to state whether, in their opinion, that part of the report has been properly prepared in accordance with the Companies Act 1985 (as amended by the Regulations). The auditable sections of the report are the tables relating to Directors’ remuneration, Directors’ pensions and Directors’ interests in share schemes on pages 60 to 63 and the accompanying footnotes. The Company’s compliance with the Combined Code is set out in the Report on corporate governance.
By Order of the Board
Patrick Lupo
Chairman of the Remuneration Committee
17 May 2005
o2.com 64
Report of the auditors
Independent auditors’ report to the members of O2 plc
We have audited the financial statements which comprise the profit and loss account, the balance sheet, the cash flow statement, the statement of total recognised gains and losses and the related notes which have been prepared under the historical cost convention and the accounting policies set out in the statement of accounting policies. We have also audited the disclosures required by Part 3 of Schedule 7A to the Companies Act 1985 contained in the report on directors’ remuneration (“the auditable part”).
Respective responsibilities of directors and auditors
The Directors’ responsibilities for preparing the annual report and the financial statements in accordance with applicable United Kingdom law and accounting standards are set out in the statement of directors’ responsibilities. The Directors are also responsible for preparing the report on directors’ remuneration.
Our responsibility is to audit the financial statements and the auditable part of the report on directors’ remuneration in accordance with relevant legal and regulatory requirements and United Kingdom Auditing Standards issued by the Auditing Practices Board. This report, including the opinion, has been prepared for and only for the Company’s members as a body in accordance with Section 235 of the Companies Act 1985 and for no other purpose. We do not, in giving this opinion, accept or assume responsibility for any other purpose or to any other person to whom this report is shown or into whose hands it may come save where expressly agreed by our prior consent in writing.
We report to you our opinion as to whether the financial statements give a true and fair view and whether the financial statements and the auditable part of the report on directors’ remuneration have been properly prepared in accordance with the Companies Act 1985. We also report to you if, in our opinion, the directors’ report is not consistent with the financial statements, if the Company has not kept proper accounting records, if we have not received all the information and explanations we require for our audit, or if information specified by law regarding directors’ remuneration and transactions is not disclosed.
We read the other information contained in the annual report and consider the implications for our report if we become aware of any apparent misstatements or material inconsistencies with the financial statements. The other information comprises only the directors’ report, the unaudited part of the directors’ remuneration report, the Chairman’s statement, the Chief Executive Officer’s review, the operating and financial review and prospects, and the corporate governance statement.
We review whether the corporate governance statement reflects the Company’s compliance with the nine provisions of the 2003 FRC Combined Code specified for our review by the Listing Rules of the Financial Services Authority, and we report if it does not. We are not required to consider whether the Board’s statements on internal control cover all risks and controls, or form an opinion on the effectiveness of the Group’s corporate governance procedures or its risk and control procedures.
Basis of audit opinion
We conducted our audit in accordance with auditing standards issued by the Auditing Practices Board. An audit includes examination, on a test basis, of evidence relevant to the amounts and disclosures in the financial statements and the auditable part of the report on directors’ remuneration. It also includes an assessment of the significant estimates and judgements made by the Directors in the preparation of the financial statements, and of whether the accounting policies are appropriate to the Company’s circumstances, consistently applied and adequately disclosed.
We planned and performed our audit so as to obtain all the information and explanations which we considered necessary in order to provide us with sufficient evidence to give reasonable assurance that the financial statements and the auditable part of the report on directors’ remuneration are free from material misstatement, whether caused by fraud or other irregularity or error. In forming our opinion we also evaluated the overall adequacy of the presentation of information in the financial statements.
Opinion| In our opinion: | |
| >> | the financial statements give a true and fair view of the state of affairs of the Company and the Group at 31 March 2005 and of the profit and cash flows of the Group for the year then ended; |
| >> | the financial statements have been properly prepared in accordance with the Companies Act 1985; and |
| >> | those parts of the report on directors’ remuneration required by Part 3 of Schedule 7A to the Companies Act 1985 have been properly prepared in accordance with the Companies Act 1985. |
PricewaterhouseCoopers LLP
Chartered Accountants and Registered Auditors
London
17 May 2005
o2.com 65
Group profit and loss account
Year ended 31 March 2005
| 2005 | 2004 | 2003 | ||||||||
| Note | £m | £m | £m | |||||||
Turnover: Group and share of joint ventures and associates | 6,890 | 5,859 | 5,020 | |||||||
Group’s share of joint ventures and associates turnover | (207 | ) | (165 | ) | (146 | ) | ||||
| Group turnover | 2 | 6,683 | 5,694 | 4,874 | ||||||
Net operating expenses (including exceptional items) | 3 | (6,342 | ) | (5,536 | ) | (13,652 | ) | |||
| EBITDA1 | 1,768 | 1,367 | 859 | |||||||
| Depreciation before exceptional items | (931 | ) | (926 | ) | (932 | ) | ||||
| Goodwill amortisation | (200 | ) | (201 | ) | (374 | ) | ||||
| UMTS licences amortisation | (169 | ) | – | – | ||||||
| Other amortisation | (82 | ) | (7 | ) | (31 | ) | ||||
| Operating profit/(loss) before exceptional items | 386 | 233 | (478 | ) | ||||||
| Exceptional items | 5 | (45 | ) | (75 | ) | (8,300 | ) | |||
| Group operating profit/(loss) | 3,4 | 341 | 158 | (8,778 | ) | |||||
Group’s share of operating (loss)/profit of joint ventures and associates | (3 | ) | – | 5 | ||||||
| Total operating profit/(loss) | 338 | 158 | (8,773 | ) | ||||||
| Costs of capital reorganisation | 5 | (20 | ) | – | – | |||||
| Loss on sale of business – discontinued operation | 5 | – | (5 | ) | (1,364 | ) | ||||
| Net interest payable and similar charges | 6 | (9 | ) | (58 | ) | (66 | ) | |||
Profit/(loss) on ordinary activities before taxation | 309 | 95 | (10,203 | ) | ||||||
| Tax on profit/(loss) on ordinary activities | 7 | (8 | ) | 71 | 55 | |||||
| Profit/(loss) for the financial year | 20 | 301 | 166 | (10,148 | ) | |||||
| Dividends | 8,20 | (196 | ) | – | – | |||||
| Retained profit/(loss) for the year | 105 | 166 | (10,148 | ) | ||||||
| Basic earnings/(loss) per share (pence) | 9 | 3.5 | 1.9 | (117.0 | ) | |||||
| Diluted earnings/(loss) per share (pence) | 9 | 3.4 | 1.9 | (117.0 | ) | |||||
| Dividend per share | 2.25 | – | – | |||||||
All results in the current year derive from continuing operations.
Group balance sheet
As at 31 March 2005
| 2005 | 2004 | ||||||
| As restated | |||||||
| Note | £m | £m | |||||
| Fixed assets | |||||||
| Intangible assets | 10 | 7,045 | 7,354 | ||||
| Tangible assets | 11 | 4,449 | 3,996 | ||||
| Investments | 12 | 2 | 5 | ||||
| 11,496 | 11,355 | ||||||
| Current assets | |||||||
| Stocks | 87 | 84 | |||||
| Debtors | 13 | 1,060 | 943 | ||||
| Investments | 14 | 1,285 | 993 | ||||
| Cash at bank and in hand | 41 | 23 | |||||
| 2,473 | 2,043 | ||||||
| Creditors: amounts falling due within one year | 15 | (2,031 | ) | (1,678 | ) | ||
| Net current assets | 442 | 365 | |||||
| Total assets less current liabilities | 11,938 | 11,720 | |||||
Creditors: amounts falling due after more than one year | 16 | (1,403 | ) | (1,375 | ) | ||
| Provisions for liabilities and charges | 18 | (254 | ) | (251 | ) | ||
| Net assets | 10,281 | 10,094 | |||||
| Capital and reserves | |||||||
| Called up share capital | 19 | 9 | 9 | ||||
| Share premium | 20 | 375 | 3 | ||||
| Other reserves | 20 | 2,913 | 11,074 | ||||
| Profit and loss account | 20 | 6,984 | (992 | ) | |||
| Shareholders’ funds | 10,281 | 10,094 | |||||
The Company balance sheet is shown in note 31.
These financial statements were approved by the Board of Directors on 17 May 2005 and were signed on its behalf by:
| Peter Erskine | David Finch |
| Chief Executive Officer | Chief Financial Officer |
| 1EBITDA is our earnings before interest, tax, depreciation, amortisation and exceptional items, excluding our share of the operating profits and losses of our joint ventures and associates. EBITDA is not a measure of financial performance under UK GAAP and may not be comparable to similarly titled measures of other companies, because EBITDA is not uniformly defined. EBITDA should not be considered by investors as an alternative to Group operating profit or profit on ordinary activities before taxation as an indication of operating performance, or as an alternative to cash flow from operating activities as an indication of cash flows. EBITDA is one of the key financial measures used by the Group for evaluating financial performance, and is discussed in the operating and financial review and prospects on page 23. |
The accompanying notes are an integral part of these financial statements.
o2.com 66
Group statement of total recognised gains and losses
Year ended 31 March 2005
| 2005 | 2004 | 2003 | |||||||
| Note | £m | £m | £m | ||||||
| Profit/(loss) for the financial year | 301 | 166 | (10,148 | ) | |||||
| Currency translation differences arising on foreign currency net investments less translation differences on debt designated as a hedge of foreign currency net investments | 20 | 68 | (144 | ) | 1,333 | ||||
| Premium paid to shareholders electing for cash alternative in capital reorganisation | 19,20 | (15 | ) | – | – | ||||
Total recognised gains and losses relating to the year | 354 | 22 | (8,815 | ) | |||||
Reconciliation of group operating profit to operating cash flows
Year ended 31 March 2005
| 2005 | 2004 | 2003 | |||||
| £m | £m | £m | |||||
| Group operating profit/(loss) | 341 | 158 | (8,778 | ) | |||
| Depreciation and amortisation charges | 1,388 | 1,136 | 9,637 | ||||
| Loss on disposal of fixed assets | 2 | 5 | 8 | ||||
| Increase in stocks | (2 | ) | (17 | ) | (5 | ) | |
| (Increase)/decrease in debtors | (84 | ) | (88 | ) | 166 | ||
| Increase in creditors | 98 | 142 | 58 | ||||
| Increase/(decrease) in provisions | 12 | 55 | (53 | ) | |||
| Net cash inflow from operating activities | 1,755 | 1,391 | 1,033 | ||||
Group net debt
As at 31 March 2005
| 2005 | 2004 | ||||||
| Note | £m | £m | |||||
| Cash at bank and in hand | 41 | 23 | |||||
| Current asset investments | 14 | 1,285 | 993 | ||||
| 1,326 | 1,016 | ||||||
| Euro medium-term notes (net of issue costs) | 16 | (1,056 | ) | (1,012 | ) | ||
| Loan notes | 15 | (7 | ) | (8 | ) | ||
| Obligations under finance leases and hire purchase contracts | 17 | (308 | ) | (325 | ) | ||
| Other loans and borrowings | 15,16 | (33 | ) | (37 | ) | ||
| Net debt | (78 | ) | (366 | ) | |||
Group cash flow statement
Year ended 31 March 2005
| 2005 | 2004 | 2003 | |||||||
| Note | £m | £m | £m | ||||||
| Net cash inflow from operating activities | 1,755 | 1,391 | 1,033 | ||||||
| Returns on investments and servicing of finance | 21 | (43 | ) | (62 | ) | (63 | ) | ||
| Taxation | 21 | (15 | ) | (13 | ) | (4 | ) | ||
| Capital expenditure and financial investment | 21 | (1,348 | ) | (1,114 | ) | (868 | ) | ||
| Acquisitions and disposals | 21 | (2 | ) | (6 | ) | – | |||
Cash inflow before management of liquid resources and financing | 347 | 196 | 98 | ||||||
| Management of liquid resources | 21 | (302 | ) | (191 | ) | (3 | ) | ||
| Financing | 21 | (27 | ) | (50 | ) | (47 | ) | ||
| Increase/(decrease) in cash in the year | 22 | 18 | (45 | ) | 48 | ||||
The accompanying notes are an integral part of these financial statements.
o2.com 67
Notes to the financial statements
1. Accounting policies
Accounting conventions
The financial statements are prepared under the historical cost convention and in accordance with applicable accounting standards and generally accepted accounting principles in the United Kingdom (UK GAAP).
The financial statements include the results of O2 plc and its subsidiaries. All principal subsidiary undertakings’ financial years are coterminous with those of O2 plc. On consolidation, all intercompany balances and transactions have been eliminated.
Certain amounts relating to the prior year have been reclassified to conform to the current year presentation.
Basis of preparation
Merger accounting
O2 plc was incorporated on 10 December 2004 as part of the capital reorganisation described in note 19. The purpose of the capital reorganisation was to create distributable reserves in O2 plc to allow the implementation of the Group’s distribution policy. These financial statements are O2 plc’s first company and consolidated financial statements.
On 14 March 2005, O2 plc was introduced as the new holding company of the mmO2 plc Group pursuant to a Scheme of Arrangement (the Scheme) under section 425 of the Companies Act 1985, whereby O2 plc issued shares in return for the existing shares in mmO2 plc. Subsequently, O2 plc effected a reduction in its share capital to create distributable reserves. Shareholders were also offered the opportunity to realise, for cash, their shareholding in mmO2 plc in a cost effective manner.
The Directors consider that in substance the Scheme constituted two distinct transactions being firstly, the insertion of the new holding company, O2 plc, and secondly, a placing of shares on behalf of certain shareholders who elected to receive the consideration for their shares in mmO2 plc in cash. The insertion of a new holding company constitutes a group reconstruction as defined by Financial Reporting Standard (FRS) 6 “Acquisitions and mergers” and has been accounted for using merger accounting principles. The premium paid to shareholders who elected to receive their consideration in cash has been recognised as a deduction from the Group profit and loss account reserve.
The consolidated financial statements for the year ended 31 March 2005 comprise the results of O2 plc from incorporation to 31 March 2005 together with the results of the O2 plc group from the 14 March 2005 to the end of the financial year and the results of the mmO2 group from 1 April 2004 to 13 March 2005. The comparative information presented is as previously published for the mmO2 plc Group except where otherwise stated.
Change in accounting policy
The Group has adopted the Urgent Issues Task Force Abstract 38 (UITF 38) “Accounting for ESOP trusts” in the year ended 31 March 2005, which requires that a company’s own shares held through an ESOP trust be shown as a deduction from shareholders’ funds until such time as the shares vest unconditionally. Previously these shares were recorded at cost less amortisation charged to date and shown as a fixed asset investment.
The comparative figures have been restated to reflect the adoption of UITF 38. The aggregate impact on the previously reported figures is to reduce total equity shareholders’ funds at 1 April 2002 by £3 million (31 March 2003: £3 million, 31 March 2004: increase by £3 million). The adoption of UITF 38 has no effect on the profit and loss account.
Turnover
Group turnover, which excludes value added tax and other sales taxes, comprises the value of services provided, equipment sales and other revenue.
Mobile telecommunications service turnover includes turnover earned for usage of the Group’s wireless network for voice and data transmission by the Group’s customers, subscription fees and interconnect revenue. Post-pay customers are billed in arrears based on usage and turnover is recognised when the service is rendered. Turnover for pre-pay customers is recorded as deferred revenue prior to commencement of services and is recognised as the pre-pay services are rendered. Inbound roaming revenue, earned from other mobile operators whose customers roam onto the O2 network, and outbound roaming revenue, earned from customers roaming outside their domestic coverage area, are recognised based upon usage. Subscription fees are recognised evenly throughout the periods to which they relate.
Hardware turnover principally consists of revenue from the sale of wireless mobile devices. The revenue and related expenses associated with the sale of wireless handsets and accessories are recognised when the products are delivered and accepted by the customer. Other sales include connection charges which are deferred and recognised over the estimated customer relationship period.
Revenue is recognised on a gross basis where the Group’s role is that of principal in a transaction. The gross basis represents the gross value of the billing to the customer after trade discounts, with any related costs being charged to operating expenses. Where the Group acts as agent in a transaction, the net revenue earned is recognised as turnover.
Subscriber acquisition costs
Subscriber acquisition costs, which include the commission costs associated with acquiring new subscribers and other incremental costs of customer acquisition, are charged to the profit and loss account as incurred.
Research and development
Expenditure on research and development is written off in the year in which it is incurred.
Foreign currencies
Transactions denominated in foreign currencies are translated at the exchange rate on the day the transaction occurred or at the contracted forward rate of exchange if hedged by a forward exchange contract or similar hedging arrangement. Monetary assets and liabilities denominated in foreign currencies are translated at the rates ruling at the balance sheet date or at the forward rate of exchange if hedged.
Net assets of foreign subsidiary undertakings, including related goodwill, are translated into sterling at the rates ruling at the balance sheet date. The profit or loss and cash flows for the year of foreign subsidiary
o2.com 68
undertakings are translated at the average rates of exchange for the year. Exchange adjustments arising on the translation into sterling of the opening net assets and profits or losses for the year retained by foreign subsidiary undertakings are recognised in reserves and reported in the statement of total recognised gains and losses. Exchange gains and losses arising on foreign currency net borrowings used to hedge the Group’s foreign currency net investments are also recognised directly in reserves.
All other exchange gains or losses are dealt with in the profit and loss account.
Goodwill
Goodwill, arising from the purchase of subsidiary undertakings and interests in joint ventures and associates, represents the excess of the fair value of the purchase consideration over the fair value of the net assets acquired.
For all acquisitions arising on or after 1 April 1998, the goodwill arising is capitalised as an intangible asset. The goodwill is amortised on a straight-line basis from the time of acquisition over a period estimated by management to be its useful economic life. The useful economic life is normally 20 years and is subject to review if and when an event or change occurs which may affect the asset life.
For acquisitions made before the adoption of FRS 10 “Goodwill and intangible assets” on 1 April 1998, the goodwill arising was written off directly to reserves. The goodwill written off directly to reserves will be charged to the profit and loss account on the subsequent disposal of the business to which it relates.
Other intangible fixed assets
Licence fees paid to governments, which permit telecommunication activities to be operated for defined periods, are capitalised at cost and are amortised from the market launch of service to the end of the licence period on a straight-line basis. Other licences are amortised over the period of the licence on a straight-line basis. Other intangible assets are amortised over their estimated useful economic life on a straight-line basis.
Tangible fixed assets
Tangible fixed assets are stated at historical cost less depreciation. The cost of tangible fixed assets includes directly attributable incremental costs incurred in their acquisition and installation.
Depreciation is provided on tangible fixed assets from the date they are brought into use over their estimated useful lives on a straight-line basis, taking into account any residual values. The lives assigned to tangible fixed assets are:
| Freehold buildings | 40 years | |
| Leasehold land and buildings | Unexpired portion of lease or 40 years, whichever is the shorter | |
| Network assets | 5 to 15 years | |
| Computers, software and office equipment | 2 to 6 years | |
| Motor vehicles | 5 years | |
No depreciation is provided on freehold land or assets in course of construction.
Joint ventures and associates
Investments in joint ventures and associates are included in the consolidated financial statements using the equity method of accounting. The profit and loss account includes the Group’s share of the profits or losses of joint ventures and associates. In instances in which the Group holds an interest in the net liabilities of its joint ventures and associates, such interests are recognised in creditors: amounts falling due within one year.
Fixed asset impairment
Goodwill and other intangible assets are reviewed for impairment at the end of the first full financial year following acquisition and, together with tangible fixed assets, in other periods if events or changes in circumstances indicate that the carrying values may not be recoverable. Such events may include continuing operating losses, technological obsolescence or significant adverse changes in the business or the market in which the fixed asset is used.
The impairment review is performed by comparing the carrying value of the asset, or group of assets, with their recoverable amount. For assets used in the continuing operations of the Group the recoverable amount is the assets’ value in use which is estimated by calculating the present value of its future cash flows. For assets to be disposed, the recoverable amount is the assets’ net realisable value. Impairment charges are recognised in the profit and loss account to the extent that the carrying value exceeds the recoverable amount in the period in which the impairment is identified.
Stocks
Stocks comprise mainly handsets and are stated at the lower of cost and net realisable value (which reflects the value to the business of the handset in the hands of the subscriber) on a first-in, first-out basis, after provisions for obsolescence.
Debtors
Debtors are stated at estimated net realisable value. Net realisable value is the invoiced amount less provisions for bad and doubtful debtors. Provisions are made specifically against debtors where there is evidence of a dispute or an inability to pay. An additional provision is made based on an analysis of balances by age, previous losses experienced and general economic conditions.
Provisions
Provisions are recognised by the Group when three criteria are met: (i) the Group has a constructive or legal obligation as a result of a past event; (ii) if it is probable that a transfer of economic benefits will be required to settle the obligation; and (iii) a reliable estimate of the obligation can be made.
A provision is made for the present value of the cost of restoration of mast sites at the date of acquisition of the site in accordance with FRS 12 “Provisions, contingent liabilities and contingent assets”.
Share based payments
The cost of awards to employees of shares or share options is recognised as an operating expense over the period of the employees’ performance to which the award relates. The cost of the award is based on
o2.com 69
Notes to the financial statements continued
1. Accounting policies continued
the difference between the award or option exercise price and the market value of the shares at the date of grant and is adjusted for the likelihood of performance criteria being achieved. The profit and loss account charge is matched by a reserve recognised within shareholders’ funds for equity settled awards.
The Group has taken advantage of the exemption available under UITF 17 (revised) “Employee share schemes” not to account for Inland Revenue approved Save-As-You-Earn (SAYE) schemes.
The assets and liabilities of ESOP Trusts are included in the accounts of the sponsoring employer. Until such time as own shares vest unconditionally in employees, the consideration paid for the shares is deducted from the profit and loss account reserve.
Post-retirement benefits
The Group operates a number of pension schemes as disclosed in note 30 to the financial statements. All pension schemes are accounted for in accordance with the provisions of Statement of Standard Accounting Practice (SSAP) 24 “Accounting for pension costs”. The Group continues to apply the transitional disclosure requirements set out in FRS 17 “Retirement benefits”.
For funded and unfunded defined benefit schemes, the expected costs of providing pensions and other post-retirement benefits, as calculated periodically by professionally qualified independent actuaries, are charged to the profit and loss account so as to spread the cost over the service lives of employees in the schemes in such a way that the pension cost is a substantially level percentage of current and expected future pensionable payroll. For the funded schemes, the assets of the schemes are held separately from those of the principal employer. For the unfunded schemes, no contributions are made by either employees or the employer to a separate pension fund and a provision is recorded on the balance sheet to recognise the cumulative accrued liability of the Group.
The Group also supports a number of defined contribution pension schemes where the benefits are based on the level of contributions paid. Costs arising from these schemes are charged to the profit and loss account in the period to which they relate.
Deferred taxation
Deferred tax is provided in full on all timing differences which result in an obligation at the balance sheet date to pay more tax, or a right to pay less tax, at a future date, at rates expected to apply when they crystallise based on current tax rates and law. Timing differences arise from the inclusion of items of income and expenditure in taxation computations in periods different from those in which they are included in the financial statements. Deferred tax assets are recognised to the extent that it is regarded as more likely than not that they will be recovered. Deferred tax assets and liabilities are not discounted.
Debt issue costs
Debt instruments are stated at the amount of net proceeds received. Debt issue costs are amortised over the term of the debt to ensure a constant rate of charge.
Derivative financial instruments
Derivative financial instruments are used to manage the Group’s exposure to fluctuations in interest rates and foreign currency exchange rates. Interest rate swaps, currency swaps and forward exchange contracts are accounted for as hedges when they alter the risk profile of an existing underlying exposure of the Group.
All derivative financial instruments held for hedging purposes are identified as hedges of the underlying asset or liability from inception. To qualify as a hedge the derivative must be established in accordance with specific guidelines and must be effective on inception and throughout its life.
Forward exchange contracts, used to hedge net foreign currency investments in overseas businesses, are translated at the closing rates of exchange. Net realised and unrealised gains and losses arising on these hedging instruments are recognised in the statement of total recognised gains and losses to offset the translation gains or losses arising on the net investments being hedged. Forward points (comprising the interest rate differential between the currencies) inherent in forward exchange contracts are recognised in the profit and loss account over the term of the contracts.
Interest rate differentials on interest rate swaps qualifying as hedges are recognised by adjusting interest payable.
Other forward exchange contracts hedging transaction exposures are revalued at the year end at the prevailing forward rate with net unrealised gains and losses being matched to the underlying transactions being hedged.
Leases and hire purchase contracts
Rentals under operating leases are charged to the profit and loss account in equal annual instalments over the periods of the leases.
Assets held under finance leases and hire purchase contracts are capitalised at the present value of the minimum lease payments on the inception of the leases and depreciated over the shorter of the period of the lease and the estimated useful economic lives of the assets. Finance charges are allocated over the period of the lease in proportion to the capital amount outstanding and are charged to the profit and loss account.
o2.com 70
2. Segmental analysis
The Group’s operations have been divided internally into two classes of business, in line with day-to-day managerial and budgetary control during the year:
1) the supply of mobile telecommunications services and products; and
2) other businesses, comprising O2 Airwave, a secure national radio service business, and Manx Telecom, a fixed and mobile telecommunications business in the Isle of Man.
Businesses within the mobile telecommunications services segment mainly derive their turnover from the calls made and received by their customers using mobile telephones, from subscription fees charged to their contract customers and from handset equipment sales.
In the year ended 31 March 2004, the Group undertook a restructuring of its central functions and rationalised its property portfolio as described in note 5. For the year ended 31 March 2005 the activities of O2 Online and Products O2, which were previously reported as the “mobile internet services” segment, are reported within the segments in which they now reside. As the information is not readily available, the comparatives have not been restated and these businesses are reported separately in line with day-to-day managerial and budgetary control at that time.
Turnover is based on the country of invoice origination, which is not materially different to turnover by destination. Central overheads and adjustments includes central costs and other consolidation adjustments.
The segmental disclosures in respect of profit and loss account items are presented below:
| Year ended 31 March 2005 | Year ended 31 March 2004 | Year ended 31 March 2003 | |||||||||||||||||
| Group turnover | Depreciation and | Total operating profit/(loss) | Group turnover | Depreciation and | Total operating profit/(loss) | Group turnover | Depreciation, amortisation | Total operating loss | |||||||||||
| amortisation | 1 | amortisation | 1 | and impairment | 1 | ||||||||||||||
| £m | £m | £m | £m | £m | £m | £m | £m | £m | |||||||||||
| Continuing operations | |||||||||||||||||||
| Mobile telecommunications | UK | 4,030 | 773 | 370 | 3,451 | 638 | 346 | 3,025 | 2,953 | (2,111 | ) | ||||||||
| Germany | 1,865 | 431 | (92 | ) | 1,508 | 295 | (72 | ) | 1,060 | 5,006 | (4,979 | ) | |||||||
| Ireland | 585 | 117 | 106 | 529 | 120 | 87 | 442 | 1,488 | (1,331 | ) | |||||||||
| Total mobile telecommunications | 6,480 | 1,321 | 384 | 5,488 | 1,053 | 361 | 4,527 | 9,447 | (8,421 | ) | |||||||||
| Mobile internet services | UK | 140 | 42 | (93 | ) | 93 | 49 | (122 | ) | ||||||||||
| Other businesses | UK | 222 | 61 | 35 | 139 | 37 | (13 | ) | 64 | 19 | (23 | ) | |||||||
| Central overheads and adjustments | – | 6 | (81 | ) | – | 3 | (96 | ) | – | 1 | (87 | ) | |||||||
| Inter-segment eliminations | (19 | ) | – | – | (121 | ) | – | – | (73 | ) | – | – | |||||||
| 6,683 | 1,388 | 338 | 5,646 | 1,135 | 159 | 4,611 | 9,516 | (8,653 | ) | ||||||||||
| Discontinued operation | |||||||||||||||||||
| Mobile telecommunications | The Netherlands | – | – | – | 48 | 1 | (1 | ) | 263 | 121 | (120 | ) | |||||||
| Group total | 6,683 | 1,388 | 338 | 5,694 | 1,136 | 158 | 4,874 | 9,637 | (8,773 | ) | |||||||||
1In the years ended 31 March 2005 and 2004, depreciation includes a charge of £6 million and £2 million respectively included within the exceptional operating cost disclosed in note 5. In the year ended 31 March 2003, the exceptional depreciation, amortisation and impairment charged to total operating profit of £8,300 million comprised a charge of £2,401 million in respect of impairment of goodwill and £5,899 million in respect of impairment of telecommunication licences and investments held in the Group’s businesses.
o2.com 71
Notes to the financial statements continued
2. Segmental analysis continued
The segmental disclosures in respect of balance sheet items are presented below:
| Year ended and as at 31 March 2005 | Year ended and as at 31 March 2004 | Year ended and as at 31 March 2003 | ||||||||||||||||||
| Net operating assets/ | Net operating | Net operating | ||||||||||||||||||
| Capital | Tangible | Capital | Tangible | assets/ | Capital | Tangible | assets/ | |||||||||||||
| expenditure | 1 | fixed assets | (liabilities) | 2 | expenditure | 1 | fixed assets | (liabilities) | 2 | expenditure | 1 | fixed assets | (liabilities) | 2 | ||||||
| £m | £m | £m | £m | £m | £m | £m | £m | £m | ||||||||||||
| Continuing operations | ||||||||||||||||||||
| Mobile telecommunications | UK | 637 | 2,210 | 5,744 | 502 | 2,118 | 5,945 | 362 | 2,111 | 6,226 | ||||||||||
| Germany | 388 | 1,229 | 3,203 | 308 | 1,051 | 3,160 | 141 | 1,072 | 3,203 | |||||||||||
| Ireland | 100 | 273 | 1,078 | 52 | 233 | 1,086 | 57 | 257 | 1,186 | |||||||||||
| Total mobile telecommunications | 1,125 | 3,712 | 10,025 | 862 | 3,402 | 10,191 | 560 | 3,440 | 10,615 | |||||||||||
| Mobile internet services | UK | – | – | – | 12 | 22 | 13 | 17 | 48 | 20 | ||||||||||
| Other businesses | UK | 228 | 735 | 656 | 252 | 568 | 450 | 170 | 353 | 295 | ||||||||||
| Central assets and adjustments | 3 | 2 | (190 | ) | 2 | 4 | (62 | ) | 1 | 3 | (109 | ) | ||||||||
| 1,356 | 4,449 | 10,491 | 1,128 | 3,996 | 10,592 | 748 | 3,844 | 10,821 | ||||||||||||
| Discontinued operation | ||||||||||||||||||||
| Mobile telecommunications | The Netherlands | – | – | – | 5 | – | – | 59 | 31 | 12 | ||||||||||
| Group total | 1,356 | 4,449 | 10,491 | 1,133 | 3,996 | 10,592 | 807 | 3,875 | 10,833 | |||||||||||
1Capital expenditure comprises tangible fixed asset additions.
2Net operating assets/(liabilities) comprise tangible and intangible fixed assets (including goodwill), stocks, debtors, creditors (excluding debt) falling due within and after more than one year and provisions (excluding deferred tax).
Group turnover
| Year ended 31 March 2005 | Year ended 31 March 2004 | Year ended 31 March 2003 | ||||||||||||||||||||||||||||
| Inter-segment | Inter-segment | Inter-segment | ||||||||||||||||||||||||||||
| UK | Germany | Ireland | eliminations | Total | UK | Germany | Ireland | eliminations | Total | UK | Germany | Ireland | eliminations | Total | ||||||||||||||||
| £m | £m | £m | £m | £m | £m | £m | £m | £m | £m | £m | £m | £m | £m | £m | ||||||||||||||||
| Continuing operations | ||||||||||||||||||||||||||||||
| Mobile telecommunications | ||||||||||||||||||||||||||||||
| Service turnover | 3,627 | 1,687 | 556 | – | 5,870 | 3,183 | 1,347 | 500 | – | 5,030 | 2,738 | 944 | 415 | – | 4,097 | |||||||||||||||
| Equipment and other turnover | 403 | 178 | 29 | – | 610 | 268 | 161 | 29 | – | 458 | 287 | 116 | 27 | – | 430 | |||||||||||||||
| Total mobile telecommunications turnover | 4,030 | 1,865 | 585 | – | 6,480 | 3,451 | 1,508 | 529 | – | 5,488 | 3,025 | 1,060 | 442 | – | 4,527 | |||||||||||||||
| Mobile internet services | – | – | – | – | – | 140 | – | – | – | 140 | 93 | – | – | – | 93 | |||||||||||||||
| Other businesses | 222 | – | – | – | 222 | 139 | – | – | – | 139 | 64 | – | – | – | 64 | |||||||||||||||
| Inter-segment eliminations | – | – | – | (19 | ) | (19 | ) | – | – | – | (121 | ) | (121 | ) | – | – | – | (73 | ) | (73 | ) | |||||||||
| 4,252 | 1,865 | 585 | (19 | ) | 6,683 | 3,730 | 1,508 | 529 | (121 | ) | 5,646 | 3,182 | 1,060 | 442 | (73 | ) | 4,611 | |||||||||||||
| Discontinued operations | ||||||||||||||||||||||||||||||
| Mobile telecommunications – | ||||||||||||||||||||||||||||||
| The Netherlands | – | 48 | 263 | |||||||||||||||||||||||||||
| Group turnover | 6,683 | 5,694 | 4,874 | |||||||||||||||||||||||||||
Joint ventures and associates
Total turnover for the year ended 31 March 2005 was £6,890 million (2004: £5,859 million, 2003: £5,020 million) and included £196 million (2004: £165 million, 2003: £146 million) representing the Group’s share of the turnover of its joint ventures and associates in the UK mobile telecommunications business and £11 million (2004: nil, 2003: nil) representing the Group’s share of the turnover of its joint venture in the German mobile telecommunications business. The Group’s share of the operating loss of its joint ventures and associates was £3 million (2004: nil, 2003: £5 million profit). The Group’s interest in the aggregate liabilities of its joint ventures and associates at 31 March 2005 was £1 million (2004: assets of £5 million, 2003: nil).
o2.com 72
3. Net operating expenses
| Year ended 31 March 2005 | Year ended 31 March 2004 | Year ended 31 March 2003 | ||||||||||||||||
| . | Continuing | Discontinued | Continuing | Discontinued | Continuing | Discontinued | ||||||||||||
| operations | operation | Total | operations | operation | Total | operations | operation | Total | ||||||||||
| £m | £m | £m | £m | £m | £m | £m | £m | £m | ||||||||||
| Year ended 31 March 2005 | ||||||||||||||||||
| Group turnover | 6,683 | – | 6,683 | 5,646 | 48 | 5,694 | 4,611 | 263 | 4,874 | |||||||||
| Cost of sales | (3,799 | ) | – | (3,799 | ) | (3,291 | ) | (23 | ) | (3,314 | ) | (2,854 | ) | (206 | ) | (3,060 | ) | |
| Gross profit | 2,884 | – | 2,884 | 2,355 | 25 | 2,380 | 1,757 | 57 | 1,814 | |||||||||
| Administrative expenses | (2,543 | ) | – | (2,543 | ) | (2,196 | ) | (26 | ) | (2,222 | ) | (10,415 | ) | (177 | ) | (10,592 | ) | |
| Administrative expenses before exceptional items | (2,498 | ) | – | (2,498 | ) | (2,121 | ) | (26 | ) | (2,147 | ) | (2,115 | ) | (177 | ) | (2,292 | ) | |
| Exceptional items | (45 | ) | – | (45 | ) | (75 | ) | – | (75 | ) | (8,300 | ) | – | (8,300 | ) | |||
| Group operating profit | 341 | – | 341 | 159 | (1 | ) | 158 | (8,658 | ) | (120 | ) | (8,778 | ) | |||||
Net operating expenses comprise cost of sales and administrative expenses (including exceptional operating items) and total £6,342 million in 2005 (2004: £5,536 million, 2003: £13,652 million).
4. Group operating profit
| Group operating profit/(loss) is stated after charging/(crediting): | 2005 | 2004 | 2003 | |||||||
| £m | £m | £m | ||||||||
| Depreciation of tangible fixed assets: | ||||||||||
| Owned1 | 904 | 900 | 907 | |||||||
| Held under hire purchase contracts | 33 | 28 | 25 | |||||||
| Amortisation of intangible fixed assets (before impairment): | ||||||||||
| Goodwill | 200 | 201 | 374 | |||||||
| UMTS licences | 169 | – | – | |||||||
| Other | 82 | 7 | 31 | |||||||
| Rentals under operating leases: | ||||||||||
| Hire of plant and machinery | 12 | 10 | 12 | |||||||
| Other operating leases | 154 | 158 | 171 | |||||||
| Staff costs (note 29) | 613 | 548 | 521 | |||||||
| Own work capitalised | (118 | ) | (106 | ) | (62 | ) | ||||
| Loss ondisposal of fixed assets | 2 | 5 | 8 | |||||||
| Research and development costs | 8 | 10 | 9 | |||||||
| 1Includes exceptional depreciation of £6 million in 2005 and £2 million in 2004. | ||||||||||
5. Exceptional items
In the year ended 31 March 2005, the Group incurred an exceptional operating charge of £45 million and an exceptional non- operating charge of £20 million.
The exceptional operating charge relates to the redeployment of resources within O2 UK into customer facing areas and away from non- customer facing areas. This is in line with O2 UK’s strategy of delivering an enhanced customer experience and increasing customer loyalty. The charge comprises redundancy and property costs. No cash was expended in the year ended 31 March 2005. The exceptional non- operating charge relates to the costs of the capital reorganisation described in note 19. This charge gave rise to a cash outflow of £15 million in the year.
In the year ended 31 March 2004, the Group incurred an exceptional operating charge of £75 million in respect of the restructuring of central functions and the resultant rationalisation of the Group’s property portfolio. This arose on the transfer of O2 Online, Products O2 and certain other central functions to the Group’s operating businesses in the UK, Germany and Ireland and includes provisions relating to redundancies and the termination of property leases. This charge gave rise to a cash outflow of £17 million in that year.
The impairment review performed by the Group during the year ended 31 March 2003 resulted in an exceptional non-cash operating charge in respect of the Group’s continuing businesses of £8,300 million. This comprised charges relating mainly to the impairment of UMTS licences and goodwill in O2 UK and O2 Germany (totalling £2,300 million and £4,700 million respectively) and the impairment of goodwill in O2 Ireland of £1,300 million.
The sale of O2 Netherlands to Greenfield Capital Partners completed on 3 June 2003 for €25 million in cash. The total loss on sale arising on completion was £1,369 million which, after utilisation of the provision recognised in 2003, resulted in a non-operating exceptional loss of £5 million in the year ended 31 March 2004. In accordance with FRS 3 “Reporting financial performance”, the results of O2 Netherlands have been classified as discontinued.
o2.com 73
Notes to the financial statements continued
6. Net interest payable and similar charges
| 2005 | 2004 | 2003 | |||||
| £m | £m | £m | |||||
| Group | |||||||
| Interest receivable and similar income: | |||||||
| Cash and current asset investment deposits | 33 | 17 | 16 | ||||
| Forward foreign exchange contracts (note26) | 24 | – | – | ||||
| Other | 6 | 3 | 3 | ||||
| Interest payable and similar charges: | |||||||
| Bank loans, overdrafts and other borrowings | (8 | ) | (13 | ) | (19 | ) | |
| Amortisation of debt issue costs | (8 | ) | (4 | ) | (3 | ) | |
| Debentures | (57 | ) | (62 | ) | (63 | ) | |
| Group net interest payable | (10 | ) | (59 | ) | (66 | ) | |
| Share of joint ventures and associates | |||||||
| Interest receivable and similar income | 1 | 1 | – | ||||
| Net interest payable | (9 | ) | (58 | ) | (66 | ) | |
7. Tax on profit on ordinary activities
| 2005 | 2004 | 2003 | ||||
| £m | £m | £m | ||||
| Current tax | ||||||
| Non-United Kingdom tax | (14 | ) | (13 | ) | (8 | ) |
| Adjustments in respect of prior periods | 1 | 1 | – | |||
| Tax on Group’s share of results of joint ventures and associates | (1 | ) | (1 | ) | (2 | ) |
| Total current tax charge | (14 | ) | (13 | ) | (10 | ) |
| Deferred tax | ||||||
| Origination and reversal of timing differences | 1 | 86 | 72 | |||
| Adjustments in respect of prior periods | 5 | (2 | ) | (7 | ) | |
| Total deferred tax credit | 6 | 84 | 65 | |||
Tax (charge)/credit on profit/(loss) on ordinary activities | (8 | ) | 71 | 55 | ||
Current tax
In the year ended 31 March 2005, the profit on ordinary activities before taxation was £309 million (2004: £95 million, 2003: loss of £10,203 million).
The tax assessed for the year varied from the amount computed by applying the corporation tax rate to profit or loss on ordinary activities before taxation. The differences were attributable to the following factors:
| 2005 | 2004 | 2003 | ||||
| £m | £m | £m | ||||
United Kingdom corporation tax on profit/(loss) at 30% | (93 | ) | (29 | ) | 3,061 | |
| Non-deductible depreciation, amortisation and impairment | (122 | ) | (78 | ) | (2,387 | ) |
| Non-deductible non-United Kingdom losses | 1 | – | (23 | ) | ||
| Non-United Kingdom tax rate differences | 35 | 16 | 7 | |||
| Capital allowances in excess/(deficit) of depreciation | 31 | (1 | ) | (14 | ) | |
| Losses carried forward | – | (30 | ) | (657 | ) | |
| Losses brought forward and utilised | 134 | 138 | – | |||
| Non-deductible losses on sale of discontinued operations | – | (2 | ) | – | ||
| Other timing differences and adjustments | (1 | ) | (28 | ) | 3 | |
| Prior year adjustments | 1 | 1 | – | |||
| Current tax charge for year | (14 | ) | (13 | ) | (10 | ) |
The Group expects to be able to claim capital allowances in excess of depreciation in future years which will affect future tax charges.
Deferred tax
The deferred taxation credit arises as follows:
| 2005 | 2004 | 2003 | ||||
| £m | £m | £m | ||||
| Excess capital allowances | 22 | (15 | ) | (4 | ) | |
| Other timing differences | (21 | ) | 101 | 76 | ||
| Adjustments in respect of prior periods | 5 | (2 | ) | (7 | ) | |
| Total deferred tax credit | 6 | 84 | 65 | |||
Other timing differences include the recognition of a deferred tax asset of £55 million in respect of UK tax losses carried forward owing to sufficient certainty regarding the availability of future taxable profits.
Deferred tax assets in respect of certain other UK and German losses carried forward and other timing differences totalling £5,185 million have not been recognised due to insufficient certainty regarding the availability of appropriate future taxable profits.
No deferred tax is recognised on the unremitted earnings of overseas subsidiaries.
o2.com 74
8. Dividends
| 2005 | ||||||
| pence per share | £m | |||||
| Proposed final | 2.25 | 196 | ||||
The final dividend of 2.25 pence per share will be paid on 26 August 2005 to shareholders on the register at the close of business on 5 August 2005.
9. Earnings per share
Earnings per share has been calculated by dividing the profit for the year by the weighted average number of ordinary shares in issue during that year, as follows:
| 2005 | 2004 | 2003 | ||||
| Profit/(loss) for the financial year (£million) | 301 | 166 | (10,148 | ) | ||
| Weighted average number of ordinary shares in issue during the year and used to calculate basic earnings per share (number of shares, millions) | 8,681 | 8,671 | 8,670 | |||
| Dilutive potential ordinary shares (number of shares, millions) | 120 | 44 | – | |||
| Weighted average number of ordinary shares outstanding and used to calculate diluted earnings per share (number of shares, millions) | 8,801 | 8,715 | 8,670 | |||
| Basic earnings per share (pence) | 3.5 | 1.9 | (117.0 | ) | ||
| Diluted earnings per share (pence) | 3.4 | 1.9 | (117.0 | ) | ||
Underlying earnings per share has been calculated by dividing the underlying profit for the year by the weighted average number of ordinary shares in issue during that year. Underlying profit is calculated as follows:
| 2005 | 2004 | 2003 | |||||
| £m | £m | £m | |||||
| Profit/(loss) for the financial year | 301 | 166 | (10,148 | ) | |||
| Goodwill amortisation | 200 | 201 | 374 | ||||
| UMTS licences amortisation | 169 | – | – | ||||
| Operating exceptional items | 45 | 75 | 8,300 | ||||
| Non-operating exceptional items | 20 | 5 | 1,364 | ||||
| Underlying earnings | 735 | 447 | (110 | ) | |||
| Underlying earnings per share (pence) | 8.5 | 5.2 | (1.3 | ) | |||
In accordance with the principles of merger accounting as applicable to group reorganisations described in note 1, earnings per share has been calculated as if O2 plc had in issue the share capital of mmO2 plc prior to 14 March 2005.
10. Intangible assets
| UMTS | ||||||||
| Goodwill | licences | Other | Total | |||||
| £m | £m | £m | £m | |||||
| Cost | ||||||||
| At 1 April 2004 | 9,704 | 9,797 | 151 | 19,652 | ||||
| Additions | – | – | 59 | 59 | ||||
| Currency movements | 178 | 164 | 1 | 343 | ||||
| At 31 March 2005 | 9,882 | 9,961 | 211 | 20,054 | ||||
| Amortisation | ||||||||
| At 1 April 2004 | 6,515 | 5,778 | 5 | 12,298 | ||||
| Charge for the year | 200 | 169 | 82 | 451 | ||||
| Currency movements | 156 | 103 | 1 | 260 | ||||
| At 31 March 2005 | 6,871 | 6,050 | 88 | 13,009 | ||||
| Net book value | ||||||||
| At 31 March 2005 | 3,011 | 3,911 | 123 | 7,045 | ||||
| At 31 March 2004 | 3,189 | 4,019 | 146 | 7,354 | ||||
o2.com 75
Notes to the financial statements continued
11. Tangible assets
| Assets in | ||||||||||
| Land and | Plant and | course of | ||||||||
| buildings | equipment | construction | Total | |||||||
| £m | £m | £m | £m | |||||||
| Cost | ||||||||||
| At 1 April 2004 | 349 | 6,482 | 708 | 7,539 | ||||||
| Additions | 5 | 562 | 789 | 1,356 | ||||||
| Transfers | 24 | 963 | (987 | ) | – | |||||
| Disposals | (7 | ) | (194 | ) | – | (201 | ) | |||
| Currency movements | 1 | 71 | 3 | 75 | ||||||
| At 31 March 2005 | 372 | 7,884 | 513 | 8,769 | ||||||
| Depreciation | ||||||||||
| At 1 April 2004 | 146 | 3,397 | – | 3,543 | ||||||
| Charge for the year1 | 40 | 897 | – | 937 | ||||||
| Disposals | (7 | ) | (192 | ) | – | (199 | ) | |||
| Currency movements | – | 39 | – | 39 | ||||||
| At 31 March 2005 | 179 | 4,141 | – | 4,320 | ||||||
| Net book value | ||||||||||
| At 31 March 2005 | 193 | 3,743 | 513 | 4,449 | ||||||
| At 31 March 2004 | 203 | 3,085 | 708 | 3,996 | ||||||
| 1The charge for the year includes an exceptional charge of £6 million relating to the reorganisation described in note 5. | ||||||||||
The net book value of land and buildings comprises:
| 2005 | 2004 | ||||
| £m | £m | ||||
| Freehold | 73 | 76 | |||
| Long leases | 26 | 23 | |||
| Short leases | 94 | 104 | |||
| Net book value | 193 | 203 | |||
| The net book value of assets held under finance leases and hire purchase contracts comprises: | |||||
| Cost | 748 | 733 | |||
| Accumulated depreciation | (401 | ) | (368 | ) | |
| Net book value | 347 | 365 | |||
12. Fixed asset investments
| Interests in | |||||||
| joint ventures | Own shares £m | Total £m | |||||
| and associates | |||||||
| Group | £m | ||||||
| Cost | |||||||
| At 1 April 2004 | 98 | 6 | 104 | ||||
| Prior period adjustment relating to UITF 38 (note 1) | – | (6 | ) | (6 | ) | ||
| At 1 April 2004 (as restated) | 98 | – | 98 | ||||
| Additions | 4 | – | 4 | ||||
| Dividend received from associate | (7 | ) | – | (7 | ) | ||
| Loss retained for the year | (3 | ) | – | (3 | ) | ||
| Reclassifications1 | 3 | – | 3 | ||||
| At 31 March 2005 | 95 | – | 95 | ||||
| Provisions | |||||||
| At 1 April 2004 | 93 | 6 | 99 | ||||
| Prior period adjustment relating to UITF 38 (note 1) | – | (6 | ) | (6 | ) | ||
| At 1 April 2004 (as restated) and at 31 March 2005 | 93 | – | 93 | ||||
| Net book value | |||||||
| At 31 March 2005 | 2 | – | 2 | ||||
| At 31 March 2004 | 5 | – | 5 | ||||
| 1Represents the reclassification of the Group’s interest in the net liabilities of our joint ventures and associates to creditors: amounts falling due within one year. | |||||||
| Shares in | ||
| subsidiary | ||
| undertakings | ||
| Parent company | £m | |
| Cost and net book value | ||
| On incorporation | – | |
| Additions | 7,116 | |
| At 31 March 2005 | 7,116 | |
The Directors consider that disclosing full particulars of all subsidiary undertakings would lead to a statement of excessive length. A list of principal subsidiary undertakings is given in note 25.
o2.com 76
13. Debtors
| Parent | ||||||
| Group | company | |||||
| 2005 | 2004 | 2005 | ||||
| £m | £m | £m |
| Trade debtors | 578 | 508 | – | |||
| Other debtors | 93 | 25 | 1 | |||
| Prepayments | 112 | 166 | – | |||
| Accrued income | 277 | 244 | – | |||
| 1,060 | 943 | 1 | ||||
14. Current asset investments
| Group | ||||
| 2005 | 2004 | |||
| £m | £m | |||
| Money market deposits | 953 | 631 | ||
| Money market funds | 57 | 69 | ||
| Other deposits | 275 | 293 | ||
| 1,285 | 993 | |||
Other deposits of £275 million (2004: £293 million) are funds held in trust to meet the O2 UK hire purchase obligations disclosed in note 17. A further US$79 million (2004: US$102 million) in money market deposits is cash collateral for the bank guarantees issued to cover specific risks under the same hire purchase obligations.
15. Creditors: amounts falling due within one year
| Parent | |||||
| Group | company | ||||
| 2005 | 2004 | 2005 | |||
| £m | £m | £m |
| Other loans (note 17) | 9 | 6 | – | |||
| Loan notes (note 17) | 7 | 8 | – | |||
| Obligations under finance leases and hire purchase contracts (note 17) | 40 | 40 | – | |||
| Trade creditors | 595 | 497 | – | |||
| Amounts owed to group undertakings | – | – | 4 | |||
| Corporation tax | 7 | 9 | – | |||
| Other taxation and social security | 75 | 61 | – | |||
| Other creditors | 29 | 39 | – | |||
| Accrued expenses | 846 | 816 | – | |||
| Deferred income | 227 | 202 | – | |||
| Dividend payable | 196 | – | 196 | |||
| 2,031 | 1,678 | 200 | ||||
16. Creditors: amounts falling due after more than one year
| Parent | ||||||
| Group | company | |||||
| 2005 | 2004 | 2005 | ||||
| £m | £m | £m | ||||
| Debentures (note 17) | 1,056 | 1,012 | – | |||
| Other loans (note 17) | 24 | 31 | – | |||
| Obligations under finance leases and hire purchasecontracts (note 17) | 268 | 285 | – | |||
| Amounts owed to group undertakings | – | – | 18 | |||
| Other creditors | 55 | 47 | – | |||
| 1,403 | 1,375 | 18 | ||||
17. Debentures and other borrowings
| Group | |||||
| 2005 | 2004 | ||||
| £m | £m | ||||
| Analysis of loan repayments | |||||
| Within one year or on demand | 16 | 14 | |||
| Between one and two years | 690 | 7 | |||
| Between two and five years | 17 | 663 | |||
| After five years | 373 | 373 | |||
| 1,096 | 1,057 | ||||
In January 2002 mmO2 plc issued two debentures in the form of a €1,000 million 6.375% fixed rate bond and a £375 million 7.625% fixed rate bond which have a five and ten year term respectively. The debentures are recognised at the amount of net proceeds received and after the effects of any related hedging instruments. At 31 March 2005 the carrying value includes unamortised issue costs of £4 million (2004: £5 million).
Loan notes of £132 million were issued by O2 UK between March 1999 and April 2000 for the purchase of certain businesses. At 31 March 2005 loan notes totalling £7 million (2004: £8 million) were outstanding and repayable on demand.
| Obligations under finance leases and hire purchase contracts | Group | ||||
| 2005 | 2004 | ||||
| £m | £m | ||||
| Within one year | 41 | 41 | |||
| Between one and five years | 191 | 138 | |||
| After five years | 166 | 254 | |||
| 398 | 433 | ||||
| Less: finance charges allocated to future periods | (90 | ) | (108 | ) | |
| 308 | 325 | ||||
Obligations under finance leases and hire purchase contracts are mainly in respect of hire purchase agreements for plant and equipment. On 30 March 2001 and 9 April 2001 hire purchase financing contracts
o2.com 77
Notes to the financial statements continued
17. Debentures and other borrowings continued
were signed between O2 UK and a number of US leasing trusts. Under the contracts O2 UK sold and repurchased material portions of its GSM radio and switching equipment. O2 UK has deposited sufficient funds with a trust company to meet the future hire purchase obligations. The deposit account is included in current asset investments. The hire purchase agreement is for 16 years with an early buy out option after 12 years. In accordance with the Separation Agreement signed on demerger, BT continues to guarantee all future hire purchase obligations of O2 UK which has provided a counter indemnity to BT for this guarantee.
Future gross finance lease and hire purchase payments payable by the Group as at 31 March 2005 are as follows:
| £m | |||
| Payable in the year ending 31 March | |||
| 2005 | 41 | ||
| 2006 | 34 | ||
| 2007 | 31 | ||
| 2008 | 43 | ||
| 2009 | 83 | ||
| Thereafter | 166 | ||
| Total future gross finance lease and hire purchase payments | 398 | ||
18. Provisions for liabilities and charges
| Deferred | Other | |||||||
| taxation | Restructuring | provisions | Total | |||||
| £m | £m | £m | £m | |||||
| At 1 April 2004 | 137 | 54 | 60 | 251 | ||||
| (Credit)/charge for the year | (6 | ) | 39 | (5 | ) | 28 | ||
| Utilised in the year | – | (24 | ) | (1 | ) | (25 | ) | |
| At 31 March 2005 | 131 | 69 | 54 | 254 | ||||
Deferred taxation
The elements of deferred taxation provided for in the financial statements are as follows:
| 2005 | 2004 | ||||
| £m | £m | ||||
| Accelerated capital allowances | 194 | 281 | |||
| Other | 4 | (22 | ) | ||
| Unrelieved tax losses carried forward | (67 | ) | (122 | ) | |
| Total provision for deferred taxation | 131 | 137 | |||
The restructuring provision arises in respect of the exceptional operating charges recognised in the years ended 31 March 2005 and 31 March 2004 and described in note 5.
Other provisions includes £16 million (2004: £26 million) in respect of mast site restoration costs and £18 million (2004: £16 million) in respect of unfunded pensions liabilities. It also includes amounts provided for legal claims.
19. Called up share capital
| 2005 | 2005 | |||
| Number of shares | £m | |||
| Authorised | ||||
| Ordinary shares of 0.1 pence each | 20,000,000,000 | 20 | ||
| Called up, allotted and fully paid | ||||
| Ordinary shares of 0.1 pence each | 8,704,068,599 | 9 | ||
O2 plc was incorporated as a public limited company on 10 December 2004 with an authorised share capital of £51,000, comprising 10,000 ordinary shares of 10 pence each and 50,000 redeemable preference shares of £1 each. Of these shares, 2 ordinary shares of 10 pence each were taken up by the subscribers to the memorandum of association. By ordinary resolution passed on 21 December 2004, 50,000 non-voting redeemable preference shares of £1 each were issued and allotted at par. On 5 January 2005, a further 14 ordinary shares of 10 pence each were issued and allotted at par. By extraordinary general meeting on 5 January 2005, the ordinary shares of 10 pence each were consolidated at a ratio of 8 to 1 into ordinary shares of 80 pence each and the authorised share capital was increased from £51,000 to £16,000,050,000 by the creation of 19,999,998,750 additional ordinary shares of 80 pence each.
On 14 March 2005, pursuant to a Court approved scheme of arrangement under section 425 of the Companies Act 1985, the Company purchased mmO2 plc (mmO2) for share consideration. Certain mmO2 shareholders, holding 299,500,644 ordinary shares of mmO2 plc, elected to receive the consideration for their shares in mmO2 in cash. All other shareholders, holding 8,403,362,095 ordinary shares of 0.1 pence each in mmO2, received the same number of new ordinary shares of 80 pence each in the Company as they previously held in mmO2. In order to fund the cash consideratio n the Company issued and allotted 299,500,644 ordinary shares in the Company via a placement with investors on the London Stock Exchange’s market for listed securities on 17 March 2005. This placement raised £374,375,805. The remaining cash consideration of £14,975,032, representing a premium of five pence per share owing to shareholders electing to receive the cash, was funded by the Group.
Further, on 14 March 2005, the two 80 pence ordinary shares arising on the share consolidation on 5 January 2005 were transferred to the Company at par value and were cancelled in accordance with sections 146(1)(b) and 146(2)(a) of the Companies Act 1985.
On 16 March 2005, the share capital of the Company was reduced by cancelling paid up share capital to the extent of 79.9 pence on each issued ordinary share and reducing the nominal value of each such share from 80 pence to 0.1 pence; and reducing the nominal value of each unissued ordinary share of 80 pence to 0.1 pence. This created distributable reserves of £6,714,286,314.
On 17 March 2005, 50,000 £1 redeemable preference shares were redeemed at par.
During the period from 1 April 2004 to 13 March 2005 mmO2 issued 28.2 million ordinary shares of 0.1 pence each for a total cash consideration of £23.4 million. Since the Court approved capital reduction on 14 March 2005, the Company has issued 1.2 million ordinary shares of 0.1 pence each for a total cash consideration of £0.9 million. All proceeds received during the year arose on the exercise of employee (including Director) share options. Details of the share option and share award schemes operated by the Group are described in note 29.
o2.com 78
20. Reconciliation of movements in shareholders’ funds
| Called up share capital | Share premium | Other reserves | Profit and loss account | Total shareholders’ funds | |||||||
| Group | £m | £m | £m | £m | £m | ||||||
| At 1 April 2002 as previously reported | 9 | – | 22,656 | (3,831 | ) | 18,834 | |||||
| Prior period adjustment relating to UITF 38 (note 1) | – | – | – | (3 | ) | (3 | ) | ||||
| At 1 April 2002 (as restated) | 9 | – | 22,656 | (3,834 | ) | 18,831 | |||||
| Retained loss for the year | – | – | – | (10,148 | ) | (10,148 | ) | ||||
| Reinstatement of goodwill previously | |||||||||||
| written off to reserves | – | – | – | 47 | 47 | ||||||
| Purchase of mmO2 plc ordinary shares | – | – | – | (2 | ) | (2 | ) | ||||
| Share schemes charge for the year | – | – | – | 2 | 2 | ||||||
| Transfer from profit and loss account | – | – | (10,569 | ) | 10,569 | – | |||||
| Currency translation differences | – | – | – | 1,333 | 1,333 | ||||||
| At 31 March 2003 (as restated) | 9 | – | 12,087 | (2,033 | ) | 10,063 | |||||
| Retained profit for the year | – | – | – | 166 | 166 | ||||||
| Shares issued on share scheme | – | 3 | – | – | 3 | ||||||
| Share schemes exercises charge for the year | – | – | – | 6 | 6 | ||||||
| Transfer from profit and loss account | – | – | (1,013 | ) | 1,013 | – | |||||
| Currency translation differences | – | – | – | (144 | ) | (144 | ) | ||||
| At 31 March 2004 (as restated) | 9 | 3 | 11,074 | (992 | ) | 10,094 | |||||
| Profit for the financial year | – | – | – | 301 | 301 | ||||||
| Dividends | – | – | – | (196 | ) | (196 | ) | ||||
| Purchase of mmO2 plc ordinary shares | – | – | – | (1 | ) | (1 | ) | ||||
| Shares issued on share scheme exercises | – | 24 | – | – | 24 | ||||||
| Share schemes charge for the year | – | – | – | 6 | 6 | ||||||
| Issue of shares in exchange for shares in mmO2 plc1 | 6,714 | (26 | ) | (7,062 | ) | (15 | ) | (389 | ) | ||
| Placing of O2 plc shares on 17 March 20051 | – | 374 | – | – | 374 | ||||||
| Court approved capital reduction1 | (6,714 | ) | – | – | 6,714 | – | |||||
| Transfer from profit and loss account | – | – | (1,099 | ) | 1,099 | – | |||||
| Currency translation differences | – | – | – | 68 | 68 | ||||||
| At 31 March 2005 | 9 | 375 | 2,913 | 6,984 | 10,281 | ||||||
| 1Transaction arising during capital reorganisation described in note 19. | |||||||||||
Other reserves originally arose on the Group’s demerger from British Telecommunications plc (BT). They relate to the difference between the carrying value of the Group held by BT prior to demerger (representing BT’s investments and funding in the Group) and amounts settled with BT on demerger to acquire the assets and liabilities of the Group. The merger difference arising in the year ended 31 March 2005 during the capital reorganisation has been offset against these other reserves.
Aggregate goodwill as at 31 March 2005 in respect of acquisitions completed prior to 1 April 1998 of £15 million (2004: £15 million, 2003: £15 million) has been written off against reserves in accordance with the accounting policy existing prior to the adoption of FRS 10 “Goodwill and intangible assets”.
| Called up share capital | Share premium | Profit and loss account | Total shareholders’ funds | ||||||
| Company | £m | £m | £m | £m | |||||
| On incorporation | – | – | – | – | |||||
| Profit for the financial period | – | – | 1 | 1 | |||||
| Dividends | – | – | (196 | ) | (196 | ) | |||
| Shares issued on share scheme exercises | – | 1 | – | 1 | |||||
| Transfer of shares held by the O2 plc Share Ownership Trust | – | – | (1 | ) | (1 | ) | |||
| Issue of shares in exchange for shares in mmO2 plc1 | 6,723 | – | – | 6,723 | |||||
| Court approved capital reduction1 | (6,714 | ) | – | 6,714 | – | ||||
| Placing of O2 plc shares on 17 March 20051 | – | 374 | – | 374 | |||||
| At 31 March 2005 | 9 | 375 | 6,518 | 6,902 | |||||
| 1 Transaction arising duringcapital reorganisation described in note 19. | |||||||||
The Company has taken advantage of section 230 of the Companies Act 1985 not to present the Company’s own profit and loss account. The profit attributable to the shareholders of the Company for the period from incorporation on 10 December 2004 to 31 March 2005 was £1 million.
Disclosures under UITF 38
The O2 plc Share Ownership Trust (the Trust) was established in 2001 to encourage and facilitate the holding and distribution of shares and other benefits for certain Group employees. The shares are conditionally gifted to employees under certain share award plans and held in the Trust.
| 2005 | 2004 | ||||
| Number of shares held1 (number of shares, million) | 1.0 | 2.7 | |||
| Market value of shares held2 (£ million) | 1 | 3 | |||
| Profit and loss account reserve reduction in relation to own shares (£ million) | 1 | 2 | |||
| 1Shares which have not vested unconditionally to employees at the end of the year. | |||||
| 2Based on respective year end share prices. |
o2.com 79
Notes to the financial statements continued
21. Analysis of cash flows for headings netted in the cash flow statement
| 2005 | 2004 | 2003 | |||||
| £m | £m | £m | |||||
| Returns on investments and servicing of finance | |||||||
| Interest received | 28 | 16 | 18 | ||||
| Settlement of cross-currency swaps | 22 | – | – | ||||
| Dividend received from associate | 7 | – | – | ||||
| Interest paid | (68 | ) | (78 | ) | (81 | ) | |
| Settlement of forward foreign exchange contracts (note 26) | (32 | ) | – | – | |||
| (43 | ) | (62 | ) | (63 | ) | ||
| Taxation | |||||||
| Non-United Kingdom corporation tax paid | (15 | ) | (13 | ) | (4 | ) | |
| Capital expenditure and financial investment | |||||||
| Purchase of tangible fixed assets | (1,287 | ) | (1,035 | ) | (779 | ) | |
| Purchase of intangible fixed assets | (60 | ) | (85 | ) | (89 | ) | |
| Purchase of own shares | (1 | ) | – | – | |||
| Sale of tangible fixed assets | – | 6 | – | ||||
| (1,348 | ) | (1,114 | ) | (868 | ) | ||
| Acquisitions and disposals | |||||||
| Deferred consideration arising on purchase of subsidiary undertakings | – | (8 | ) | – | |||
| Sale of subsidiary undertakings (2004 disposed net of £10 million cash) | – | 7 | – | ||||
| Investment in joint venture | (2 | ) | (5 | ) | – | ||
| (2 | ) | (6 | ) | – | |||
| Management of liquid resources | |||||||
| Increase in money market deposits and money market funds | (302 | ) | (191 | ) | (3 | ) | |
| Financing | |||||||
| Issue of ordinary share capital | 24 | 3 | – | ||||
| Premium paid to mmO2 shareholders in capital reorganisation (note 19) | (15 | ) | – | – | |||
| Costs of capital reorganisation (note 19) | (15 | ) | – | – | |||
| Loan repayments | (21 | ) | (53 | ) | (47 | ) | |
| (27 | ) | (50 | ) | (47 | ) | ||
22. Analysis of net debt
| At 1 April 2004 £m | Cash flow £m | Non- cash changes £m | At 31 March 2005 £m | ||||||
| Cash at bank and in hand | 23 | 18 | – | 41 | |||||
| Current asset investments | 993 | 302 | (10 | ) | 1,285 | ||||
| 1,016 | 320 | (10 | ) | 1,326 | |||||
| Debt due after one year | (1,043 | ) | – | (37 | ) | (1,080 | ) | ||
| Debt due within one year | (14 | ) | 8 | (10 | ) | (16 | ) | ||
| Obligations under finance leases and hire purchase contracts | (325 | ) | 13 | 4 | (308 | ) | |||
| (366 | ) | 341 | (53 | ) | (78 | ) | |||
Reconciliation of net cash flow to movements in net debt
| 2005 | 2004 | 2003 | |||||
| £m | £m | £m | |||||
| Increase/(decrease) in cash in the year | 18 | (45 | ) | 48 | |||
| Management of liquid resources | 302 | 191 | 3 | ||||
| Cash outflow from decrease in debt | 21 | 53 | 47 | ||||
| Change in net debt resulting from cash flows | 341 | 199 | 98 | ||||
| Other non-cash movements | (53 | ) | (16 | ) | (30 | ) | |
| Decrease in net debt in the year | 288 | 183 | 68 | ||||
| Net debt at beginning of year | (366 | ) | (549 | ) | (617 | ) | |
| Net debt at end of year | (78 | ) | (366 | ) | (549 | ) | |
Non-cash changes relate principally to the inception of new finance leases, interest accrued thereon and foreign exchange gains and losses arising in relation to items of net debt held in foreign currencies.
23. Financial commitments and contingent liabilities
Operating lease commitments
At 31 March 2005 the Group was committed to making the following payments during the next year in respect of operating leases:
| 2005 | 2004 | |||||||
| Land and | Land and | |||||||
| buildings | Other | buildings | Other | |||||
| £m | £m | £m | £m | |||||
| Leases which expire | ||||||||
| Within one year | 4 | 5 | 2 | 1 | ||||
| Between one and five years | 33 | 10 | 31 | 12 | ||||
| After five years | 146 | 7 | 148 | – | ||||
| 183 | 22 | 181 | 13 | |||||
o2.com 80
Future minimum operating lease payments due by the Group as at 31 March 2005 are as follows:
| £m | |||
| Payable in the year ending 31 March | |||
| 2006 | 205 | ||
| 2007 | 185 | ||
| 2008 | 173 | ||
| 2009 | 162 | ||
| 2010 | 146 | ||
| Thereafter | 1,060 | ||
| Total future minimum operating lease payments | 1,931 | ||
Other commitments
| 2005 | 2004 | ||||
| £m | £m | ||||
| Contracts placed for capital expenditure not provided in the accounts | 414 | 353 | |||
| Contracts placed for non-capital expenditure not provided in the accounts | 112 | 113 | |||
| Total other commitments | 526 | 466 | |||
mmO2 plc has provided a guarantee of all liabilities of Airwave O2 Limited under its contracts with the Police Information Technology Organisation (PITO) and the police force customers.
Other than as detailed in note 17, the Group has no contingent liabilities or guarantees on which material losses are expected. The Group has insurance cover to certain limits for major risks on property and major claims in connection with legal liabilities arising in the course of its operations.
The Group does not believe there are any pending legal proceedings which would have a material adverse effect on the financial position or results of operations of the Group.
24. Related party disclosures
During the year the Group entered into transactions with related parties as follows:
During the year ended 31 March 2005, the Group provided partly paid equity totalling £4 million to its join
| 2005 | 2004 | ||||
| £m | £m | ||||
| Turnover | |||||
| The Link Stores Limited | 22 | 39 | |||
| Tesco Mobile Limited | 12 | 3 | |||
| Purchases | |||||
| The Link Stores Limited | (33 | ) | (47 | ) | |
| Tchibo Mobilfunk GmbH & CP KG | (4 | ) | – | ||
| Total net transactions | (3 | ) | (5 | ) | |
During the year ended 31 March 2005, the Group provided partly paid equity totalling £4 million to its joint venture, Tchibo Mobilfunk. The balance outstanding at 31 March 2005 was £2 million.
During the year ended 31 March 2005, the Group provided a combination of loans and partly paid equity totalling £3 million (2004: £6 million) to its joint venture, Tesco Mobile Limited. The loan balance outstanding at 31 March 2005 was £2 million (2004: £3 million). The Group also provided other services to Tesco Mobile Limited with a value of £7 million (2004: £3 million) and equipment and other services to Tchibo Mobilfunk with a value of £15 million. At 31 March 2005, Tchibo Mobilfunk owed £6 million to the Group. All transactions were at arm’s length rates.
Related party transactions with Directors are detailed in the Report on Directors’ remuneration from page 51 to 64.
25. Principal subsidiary undertakings and associates
The principal operating subsidiary undertakings are detailed below, all of which are included in the Group financial statements.
| Name | Country of incorporation and operation | Activity | Portion of ordinary shares held % | ||||
| mmO2 plc | England and Wales | Intermediate holding company | 100 | ||||
| O2 Holdings Limited1 | England and Wales | Intermediate holding company | 100 | ||||
| O2 (UK) Limited | England and Wales | Mobile cellular telephone system provider and operator | 100 | ||||
| O2 (Germany) GmbH & Co. OHG | Germany | Mobile cellular telephone system provider and operator | 100 | ||||
| O2 Communications (Ireland) Limited | Ireland | Mobile cellular telephone system provider and operator | 100 | ||||
| Airwave O2 Limited2 | England and Wales | Secure digital radio service for public safety organisations | 100 | ||||
| Manx Telecom Limited | Isle of Man | Telecommunication services supplier | 100 | ||||
| 1O2 Limited changed its name to O2 Holdings Limited on 10 December 2004. | |||||||
2Airwave mmO2 Limited changed its name to Airwave O2 Limited on 14 March 2005. | |||||||
The shares held in mmO2 plc are held directly by O2 plc. The shares in O2 Holdings Limited are held directly by mmO2 plc. The shares of the other operating companies are held by O2 Holdings Limited or its wholly owned subsidiaries. The accounting reference date of the principal operating subsidiary undertakings is 31 March.
The Group also owns a 50 per cent stake in two joint ventures, Tesco Mobile Limited and Tchibo Mobilfunk GmbH & CP KG, and a 40 per cent stake in an associate, The Link Stores Limited. Tesco Mobile Limited supplies mobile electronic communications and related services to consumers and is incorporated in England and Wales and operates throughout the United Kingdom. The accounting reference date of Tesco Mobile Limited is 28 February. Tchibo Mobilfunk is a telecommunications equipment retailer and is incorporated in and operates in Germany. The Link Stores Limited is a telecommunications equipment retailer which is incorporated and operates in England and Wales.
o2.com 81
Notes to the financial statements continued
26. Financial instruments and risk management
Financial risks are identified and managed by a centralised group treasury function. The Group’s treasury policy, including details of the nature, terms and credit risk associated with financial instruments with off-balance sheet risk are described in the treasury management and policies section of the operating and financial review and prospects on page 37.
The Group holds or issues financial instruments principally to finance its operations, for the temporary investment of short-term funds and to manage currency and interest rate risks arising from its operations. Further details on the financing of operations is contained in the source of liquidity and capital resources section of the Operating and financial review and prospects on page 36.
The Group uses derivative financial instruments to manage its exposure to market risks such as changes in interest rates and foreign exchange rates. The objective is to match the profile and characteristics of Group funding of equity and debt to that of the assets funded and to mitigate foreign exchange risk under the guidelines approved by the Board of Directors in accordance with the Group’s treasury policy.
Short-term debtors and creditors, where permitted by FRS 13 “Derivatives and Other Financial Instruments: Disclosures”, have been excluded from the following disclosures, which are after taking account of interest rate and currency swaps where applicable.
Fair value of financial instruments
The book and fair values of the Group’s financial assets and financial liabilities at 31 March 2005 are:
| 2005 | 2004 | ||||||||
| Book value | Fair value | Book value | Fair value | ||||||
| £m | £m | £m | £m | ||||||
| Liabilities | |||||||||
| Debentures | (1,060 | ) | (1,146 | ) | (1,042 | ) | (1,135 | ) | |
| Hire purchase contracts | (308 | ) | (319 | ) | (325 | ) | (334 | ) | |
| Loan notes | (7 | ) | (7 | ) | (8 | ) | (8 | ) | |
| Other loans and borrowings | (33 | ) | (33 | ) | (37 | ) | (37 | ) | |
| Total financial liabilities | (1,408 | ) | (1,505 | ) | (1,412 | ) | (1,514 | ) | |
| Assets | |||||||||
| Hire purchase contracts | 275 | 298 | 293 | 315 | |||||
| Short-term deposits | 953 | 953 | 631 | 631 | |||||
| Money market funds | 57 | 57 | 69 | 69 | |||||
| Cash at bank and in hand | 41 | 41 | 23 | 23 | |||||
| Total financial assets | 1,326 | 1,349 | 1,016 | 1,038 | |||||
Derivative financial instruments held to manage the interest rate and currency profile of the Group are as follows:
| 2005 | 2004 | ||||||||
| Book value | Fair value | Book value | Fair value | ||||||
| £m | £m | £m | £m | ||||||
| Interest rate swaps | – | 24 | – | 17 | |||||
| Cross-currency swaps | – | – | 25 | 44 | |||||
| Forward foreign exchange contracts | 24 | 25 | 4 | 4 | |||||
| 24 | 49 | 29 | 65 | ||||||
Fair value
Fair value is the amount at which a financial instrument could be exchanged in an arm’s length transaction between informed and willing parties other than in a forced or liquidation sale. Book values are stated before deducting any unamortised issue costs, which are disclosed in note 17.
The fair value of interest rate swaps, currency swaps and forward foreign exchange contracts is based on the market price of comparable instruments where available or, if not available, by the discounting of future cash flows to net present values using appropriate interest and currency rates.
The fair value of the short-term deposits, money market funds, cash at bank and short-term borrowings approximates to the book carrying value due to the short-term or on demand maturity of these instruments. For long-term borrowings the fair value of the sterling and euro denominated bonds have been estimated using quoted market prices.
Hedging activities
Under the Group’s accounting policy detailed in note 1 to the financial statements, certain gains and losses on derivative instruments used for hedging are not recognised in the financial statements. The gains and losses are as follows:
| Gains | |||
| £m | |||
| Unrecognised gains at 1 April 2004 | 36 | ||
| Gains arising in previous years that were recognised in the year | – | ||
| Gains arising in previous years that were not recognised in the year | 36 | ||
| Losses arising in the year that were not recognised in the year | (11 | ) | |
| Unrecognised gains on hedges at 31 March 2005 | 25 | ||
| Of which: | |||
| Gains expected to be recognised in the year ended 31 March 2006 | 1 | ||
| Gains expected to be recognised after 31 March 2006 | 24 | ||
Currency exposures
At 31 March 2005, the net foreign currency exposure comprising of monetary assets and liabilities of the Group that are not denominated in the functional currency of the individual Group company was £7 million (2004: £4 million) denominated primarily in US$.
o2.com 82
Financial instruments held for trading purposes
The Group does not trade in financial instruments.
Financial assets
Financial assets consist of sterling and Euro denominated cash at bank, short-term money market deposits and investments in a AAA-rated money market fund. Money market deposits have a maturity profile between overnight and three months and earn interest at market rates. Investments in the money market fund can be called on either a same day or next day basis and yield income or interest on the basis of performance of the underlying assets measured against one-week and three-month LIBOR or EURIBOR benchmarks.
| Cash at bank and in hand | Hire | Short-term deposits and money market funds | 2005 Total | Cash at bank and in hand | Hire purchase related assets | Short-term deposits and money market funds | 2004 Total | ||||||||||
| £m | £m | £m | £m | £m | £m | £m | £m | ||||||||||
| Currency | |||||||||||||||||
| Sterling | 7 | – | 711 | 718 | (3 | ) | – | 461 | 458 | ||||||||
| Euro | 24 | – | 257 | 281 | 22 | – | 184 | 206 | |||||||||
| Other | 10 | 275 | 42 | 327 | 4 | 293 | 55 | 352 | |||||||||
At 31 March 2005 | 41 | 275 | 1,010 | 1,326 | 23 | 293 | 700 | 1,016 | |||||||||
At 31 March 2005, the Group had no fixed rate financial assets.
Financial liabilities
| Non-interest bearing financial liabilities | Fixed rate financial liabilities | Floating rate financial liabilities | Total | Fixed rate | 2005 Fixed rate financial liabilities weighted average period for which rate is fixed | ||||||||
| £m | £m | £m | £m | % | (years) | ||||||||
| Currency | |||||||||||||
| Sterling | – | 427 | 7 | 434 | 7.3 | % | 6.3 | ||||||
| Euro | 2 | – | 686 | 688 | – | – | |||||||
| Other | – | 286 | – | 286 | 7.4 | % | 5.5 | ||||||
| At 31 March 2005 | 2 | 713 | 693 | 1,408 | 7.3 | % | 6.0 | ||||||
| Fixed rate financial liabilities | Floating rate financial liabilities | Total | Fixed rate financial liabilities weighted average interest rate | 2004 Fixed rate financial liabilities weighted average period for which rate is fixed | |||||||
| £m | £m | £m | % | (years) | |||||||
| Currency | |||||||||||
| Sterling | 431 | 570 | 1,001 | 7.3 | % | 7.2 | |||||
| Euro | – | 80 | 80 | – | – | ||||||
| Other | 306 | – | 306 | 7.4 | % | 6.1 | |||||
| At 31 March 2004 | 737 | 650 | 1,387 | 7.4 | % | 6.7 | |||||
The cash flows of the Group’s overseas businesses, O2 Germany and O2 Ireland, and the improved visibility of the future financial profile of the Group, has resulted in a decision to increase the level of hedging of our overseas assets. This was achieved through the redenomination of the Group’s existing Euro borrowings and through the use of €1,800 million of forward foreign exchange contracts, which commenced in June 2004.
The ongoing effect of the hedge implementation is that the Euro borrowings totalling €1,000 million, which are a component of net debt, are exposed to foreign exchange rate fluctuations, and the interest charge is impacted by the forward foreign exchange contracts which has reduced the current year net interest charge by £24 million. Additionally, the foreign exchange gains or losses, arising on the retranslation of the Euro borrowings and on the forward foreign exchange contracts, are recognised in the statement of total recognised gains and los ses as they hedge certain assets of the overseas businesses.
The Group has €1,000 million of Euro borrowings that are classified as floating rate at 31 March 2005 (2004: €500 million). The Group had €500 million of cross currency interest rate swaps, which classified € 500 million of Euro borrowings as floating rate in sterling for the year ended 31 March 2004. The cross-currency element was cancelled during the year realising a one-off cash inflow of £22 million which, when combined with the revaluation of the relevant Euro denominated debt at that time, had no material impact on net debt.
Floating rate financial liabilities bear interest rates, based on relevant EURIBOR equivalents, which are fixed in advance for periods of six months.
Borrowing facilities
At 31 March 2005, the Group had an undrawn committed floating rate syndicated facility totalling £1,000 million, which matures in 2009. This facility incurs commitment fees at market rates. At 31 March 2005, all conditions precedent had been met.
o2.com 83
Notes to the financial statements continued
27. Auditors’ remuneration
The aggregate fees paid to auditors during the year for audit and other services is analysed below:
| 2005 | 2004 | 2003 | |||||
| £000 | £000 | £000 | |||||
| Audit services: | |||||||
| UK | 665 | 600 | 500 | ||||
| Other countries | 370 | 400 | 500 | ||||
| Total countries audit fees | 1,035 | 1,000 | 1,000 | ||||
| Audit-related regulatory reporting | 32 | 32 | 17 | ||||
| Sarbanes-Oxley compliance reporting | 279 | – | – | ||||
| International Financial Reporting Standards reporting | 150 | – | – | ||||
| Total audit and audit-related fees | 1,496 | 1,032 | 1,017 | ||||
| Non-audit fees: | |||||||
| Other assurance services | 869 | 339 | 687 | ||||
| Tax compliance | 180 | 166 | 125 | ||||
| Tax advisory | 338 | 280 | 171 | ||||
| Systems implementation | – | – | 176 | ||||
| Total non-audit fees | 1,387 | 785 | 1,159 | ||||
Other non-audit assurance services includes fees totalling £630,000 in respect of the capital reorganisation described in note 19. Non-audit fees arising in the UK were £991,000 (2004: £498,000, 2003: £490,000).
The audit fees for the Company were £10,000.
28. Directors’ emoluments
The emoluments of the Directors for the year ended 31 March 2005 were, in summary, as follows:
| 2005 | 2004 | 2003 | |||||
| £000 | £000 | £000 | |||||
| Salaries | 2,336 | 2,405 | 1,408 | ||||
| Performance related bonus | 1,925 | 2,265 | 593 | ||||
| Other benefits | 172 | 249 | 102 | ||||
| 4,433 | 4,919 | 2,103 | |||||
| Payments to non-executive Directors | 325 | 399 | 251 | ||||
| Total emoluments | 4,758 | 5,318 | 2,354 | ||||
During the year, three directors (2004: three, 2003: two) accrued retirement benefits under a defined benefit pension plan. In addition, contributions of £89,250 (2004: £83,125, 2003: £77,875) in respect of one director (2004: one, 2003: one) were paid to a defined contribution pension plan.
Gains arising during the year ended 31 March 2005 on the exercise of share options were £1,214,442, and on the vesting of long-term incentive plans were £1,399,955 (2004: share options nil, long-term incentive plans £146,717; 2003: share options nil, long-term incentive plans £157,636).
More detailed information concerning directors’ remuneration, shareholdings, pension entitlement, share options and long-term incentive plans is shown in the report on directors’ remuneration on pages 51 to 64.
29. Employees
| 2005 | 2004 | 2003 | |||||
| No. | No. | No. | |||||
| Average number of full time employee equivalents (including executive Directors) by class of business: | |||||||
| Mobile telecommunications | 13,005 | 11,133 | 11,643 | ||||
| Mobile internet services | – | 301 | 269 | ||||
| Other businesses | 906 | 913 | 866 | ||||
| Total employees | 13,911 | 12,347 | 12,778 | ||||
| Average number of full time employee equivalents (including executive Directors) by geographic area: | |||||||
| UK | 8,709 | 7,328 | 7,081 | ||||
| Germany | 3,675 | 3,494 | 3,527 | ||||
| Other | 1,527 | 1,525 | 2,170 | ||||
| Total employees | 13,911 | 12,347 | 12,778 | ||||
The costs incurred in respect of these employees were:
| 2005 | 2004 | 2003 | |||||
| £m | £m | £m | |||||
| Wages and salaries | 514 | 456 | 446 | ||||
| Social security costs | 64 | 58 | 47 | ||||
| Employee share ownership scheme | 9 | 8 | 4 | ||||
| Pension costs (note 30) | 26 | 26 | 24 | ||||
| Total staff costs | 613 | 548 | 521 | ||||
At 31 March 2005, the Group employed 14,914 (2004: 12,905, 2003: 12,476) full time employee equivalents.
The Group operates a number of employee incentive schemes including a sharesave plan, a share ownership plan and various executive and employee option schemes. The report on directors’ remuneration on pages 51 to 64 contains full details of the directors’ interests in these schemes.
As a result of the capital reorganisation described in note 19, on 14 March 2005 all mmO2 plc options and awards outstanding at that date were replaced by options and awards over O2 plc shares.
The share option plans operated by the Group are:
O2 Sharesave Plan
The O2 Sharesave Plan is a savings related share option scheme available to all UK, Isle of Man and Irish employees. The scheme enables employees to acquire shares in the Company at an agreed price through monthly savings at the end of a three or five year SAYE contract. A sharesave scheme also operates in Germany.
o2.com 84
29. Employees continued
O2 Executive Share Option Plan
Executive Share Options have been granted to certain employees of the Group on terms such that they usually become exercisable on the third anniversary of grant subject to the achievement of certain performance criteria. If these criteria are not met on the third anniversary of grant, they are retested on the fourth and fifth anniversaries. All such options have an exercise price equal to the market value at grant date and have a life of ten years. In the year ended 31 March 2005, no options were granted to employees under this plan (2004: nil, 2003: 1,041 employees for nil consideration).
O2 Legacy Option Plan
Options over BT shares granted under BT Executive Share Option Plans were replaced with options over O2 shares, granted under the Legacy Option Plan, for those participants now employed by O2. The r eplacement options were granted on the same terms, and are exercisable between the same dates, as the options for which they were exchanged. The exercise price of these options equals the market value as at original grant date. Options are normally exercisable up until the tenth anniversary of the date of the original grant.
Options outstanding under the O2 Sharesave Plan, O2 Executive Share Option Plan and O2 Legacy Option Plan as at 31 March 2005, together with their exercise prices and vesting periods, are as follows:
| Options outstanding over ordinary shares | Options exercisable over ordinary shares | ||||||||||
| Weighted- | |||||||||||
| average | Weighted- | Weighted- | |||||||||
| remaining | average | average | |||||||||
| Number | contractual | exercise | Number | exercise | |||||||
| outstanding | life | price | exercisable | price | |||||||
| Range of exercise prices | (m) | (years) | (£) | (m) | (£) | ||||||
| £0.44 | 32 | 1 | 0.44 | – | – | ||||||
| £0.46 | 70 | 7 | 0.46 | – | – | ||||||
| £0.48 | 1 | 8 | 0.48 | – | – | ||||||
| £0.54 | 13 | 2 | 0.54 | – | – | ||||||
| £0.64-0.69 | 4 | 7 | 0.68 | 3 | 0.69 | ||||||
| £0.73 | 3 | 1 | 0.73 | 1 | 0.73 | ||||||
| £0.87 | 18 | 7 | 0.87 | 9 | 0.87 | ||||||
| £0.92 | 9 | 3 | 0.92 | – | – | ||||||
| £1.16-1.93 | 1 | 6 | 1.61 | 1 | 1.61 | ||||||
| 151 | 5 | 0.55 | 14 | 0.83 | |||||||
Options granted, exercised and lapsed during the years ended 31 March 2005 and 2004 under these share option plans were as follows:
| Options over ordinary shares | Options over ADSs | |||||||||
| Ordinary shares | ADS1 | |||||||||
| Savings- | Weighted- | Weighted- | ||||||||
| related | Other | average | Other | average | ||||||
| share | share | exercise | share | exercise | ||||||
| options | options | price | options | price | ||||||
| (m) | (m) | (£) | (m) | (£) | ||||||
| Balance at 31 March 2003 | 45 | 138 | 0.60 | 3 | 1.49 | |||||
| Granted | 15 | – | 0.54 | – | – | |||||
| Lapsed | (5 | ) | (23 | ) | (0.76 | ) | (1 | ) | (1.69 | ) |
| Exercised | – | (4 | ) | (0.70 | ) | – | – | |||
| Balance at 31 March 2004 | 55 | 111 | 0.57 | 2 | 0.93 | |||||
| Granted | 9 | – | 0.92 | – | – | |||||
| Lapsed | (4 | ) | – | 0.60 | (1 | ) | 0.82 | |||
| Exercised | (3 | ) | (17 | ) | 0.77 | (1 | ) | 0.63 | ||
| Balance at 31 March 2005 | 57 | 94 | 0.55 | – | – | |||||
| 1Share options over American Depositary Shares (ADSs) have exercise prices termed in US Dollars. For purposes of disclosure, these options’ exercise prices have been translated into Sterling at the year end exchange rate. As each ADS represents ten ordinary shares, the number of options and exercise prices have been adjusted by this ratio to reflect the options on a like for like basis. As a consequence of the implementation of the capital reorganisation in March 2005, the mmO2 ADS programme was terminated, and all ADSs have been converted into either O2 plc ordinary shares or cash. | ||||||||||
Share award plans
The share award plans operated by the Group are:
O2 Restricted Share Plan
Restricted share awards have been granted to a small group of senior executives on terms that they will normally only vest on the third anniversary of grant if the participant builds up a predetermined personal shareholding in the Group and remains in employment with the Group. The weighted average market value at grant date of the 2 million shares granted under this plan in the year ended 31 March 2005 was £0.88. No shares were granted under this plan in the years ended 31 March 2004 and 31 March 2003.
O2 Performance Share Plan
Performance related share awards were granted to certain senior employees during the year ended 31 March 2005 and 31 March 2004. These awards will vest on the third anniversary of grant if the Company meets certain performance criteria, and the participant remains in employment with the Group. The weighted average market value at grant date of the 12 million (2004: 26.4 million) shares granted under this plan in the year ended 31 March 2005 was £0.88 (2004: £0.53).
o2.com 85
Notes to the financial statements continued
29. Employees continued
O2 Deferred Equity Incentive Plan (DEIP)
Participants in the DEIP receive share awards that include a deferred element and a performance element. The deferred element generally vests three years after grant subject to continued employment with the Group. The performance element is subject to the long-term performance of the Group and continued employment with the Group. DEIP awards have been granted to a small group of senior executives during the year ended 31 March 2005. The weighted average market value at grant date of the 8 million shares in the year ended 31 March 2005 was £0.88.
30. Pension costs
The Group operates a number of pension schemes in its businesses. All the Group’s pension schemes are provided through either defined benefit or defined contribution arrangements. Defined benefit schemes generally provide pensions based on the employee’s length of service and their final pensionable salary.
Defined contribution schemes offer employees individual funds which are converted into pension benefits on retirement. The assets of the schemes are held independently of the Group’s finances.
The O2 Pension Plan
The O2 Pension Plan (O2 PP) provides the pension benefits for the majority of UK employees and is divided into defined contribution and defined benefit sections.
Defined contribution section
Prior to 1 July 2002, the Group participated in the BT Retirement Plan (BTRP), a defined contribution scheme established by BT. Members of the BTRP could elect to transfer their funds under management into the new O2 Plan (defined contribution section) on its inception. These funds were transferred on 14 March 2003.
Defined benefit section
Following the Group’s demerger from BT and until 30 June 2002, the Group was a participating employer in the BT Pension Scheme (BTPS), a funded defined benefit pension scheme. While participating the Group paid to the BTPS a predetermined percentage of the pensionable payroll costs of those Group employees who were members of the scheme. These costs have been charged in the period to which they relate.
On 1 July 2002 the O2 PP was established for employees in the United Kingdom and a share of the assets of the BTPS of the members electing to transfer their benefits to the new plan were transferred to the O2 PP on 17 March 2003. The benefits of all deferred and pensioner members at 30 June 2002 remain in the BTPS.
From 1 July 2002, the Group has been the principal employer of the O2 PP. The pension costs have been assessed in accordance with the advice of a qualified independent actuary using the projected unit method and taking assets at market value. The defined benefit sections of the O2 PP are closed to new entrants and therefore the current service cost is likely to increase as the members approach retirement.
Actuarial valuation
The first full actuarial valuation of the defined benefit sections of the O2 PP was undertaken at 30 June 2003 by a professionally qualified independent actuary using the projected unit method. The purpose of this valuation was to design a future funding plan to ensure that contributions to the plan are sufficient to meet future liabilities. As at 30 June 2003 the assets of the O2 PP had a market value of £230 million and were sufficient to cover 86 per cent of the benefits accrued to members at that date on the ongoing funding measure. As a result of the valuation, the Group has increased the employer’s regular contribution rate from 11.6 per cent to 13.1 per cent of pensionable salaries with effect from 1 April 2004. In order to meet the deficit, additional annual payments of £4.4 million are payable for 13 years (subject to review at future valuations). The employee’s contribution rate remains at 6 per cent of pensionable salary.
The main actuarial assumptions used in the valuation were as follows:
| % | |||
| Nominal rate of increase in salaries | 3.75-4.25 | ||
| Nominal rate of increase of pensions in payment | 2.50 | ||
| Investment return pre retirement | 7.00 | ||
| Investment return post retirement | 5.50 | ||
| Inflation assumption | 2.50 | ||
Other Group pension plans
The Group operates several other defined benefit pension schemes. In the Isle of Man benefits are provided by a funded defined benefit pension scheme that is closed to new entrants. The Group also operates unfunded defined benefit schemes in the UK and in Germany. A provision, determined in accordance with SSAP 24, is recorded on the balance sheet to recognise the cumulative accrued liability for the unfunded schemes as disclosed in note 18.
Until May 2001 the O2 Germany main scheme was unfunded. This scheme has been changed to a funded arrangement with payments being made to provide for previously unfunded liabilities over the period to the active members’ retirements. The vast majority of members of the O2 Germany main scheme are now accruing benefits under an insured arrangement. The other defined benefit schemes in Germany are unfunded.
The Group operates defined contribution schemes in Germany, Ireland and the Isle of Man. The assets of these defined contribution arrangements are held separately from those of the Group in independently administered funds.
o2.com 86
30. Pension costs continued
Disclosures under SSAP 24 “Accounting for pension costs”
The total cost charged to the profit and loss account for all the Group’s pension schemes is as follows:
| 2005 | 2004 | 2003 | |||||
| £m | £m | £m | |||||
| O2 Pension Plan cost | 16 | 16 | 12 | ||||
| Contributions to the BT Pension Scheme | – | – | 4 | ||||
| Other defined benefit schemes | 3 | 3 | 4 | ||||
| Defined contribution schemes | 7 | 7 | 4 | ||||
| 26 | 26 | 24 | |||||
Within the total cost analysed above, the regular cost is £23 million (2004: £24 million, 2003: £24 million).
The Group has recognised an asset of £5 million (2004: nil, 2003: nil) representing the excess of cumulative funding over the accumulated pension cost on the O2 PP and amounts totalling a net liability of £16 million (2004: £15 million, 2003: £11 million) representing the excess of cumulative pension cost over accumulated funding on other schemes.
As at 30 June 2003, the assets of the O2 PP were sufficient to cover 95 per cent of the benefits accrued to members based on the SSAP 24 accounting basis, which is used to calculate the pension charge recognised in the profit and loss account.
The number of members in each of the Group’s main pension schemes is as follows:
| 2005 | 2004 | |||||||
| Active | Total | Active | Total | |||||
| No. | No. | No. | No. | |||||
| O2 PP | 5,113 | 6,133 | 4,014 | 4,596 | ||||
| O2 Germany schemes | 3,148 | 3,267 | 2,996 | 3,008 | ||||
| Isle of Man scheme | 273 | 448 | 281 | 437 | ||||
| O2 Ireland scheme | 996 | 1,481 | 918 | 1,112 | ||||
| UK unfunded arrangement | 13 | 23 | 15 | 23 | ||||
| 9,543 | 11,352 | 8,224 | 9,176 | |||||
The principal assumptions used to determine the pension cost under SSAP 24 for the defined benefit section of the O2 PP for the year were:
| 2005 | 2004 | ||||
| % | % | ||||
| Nominal rate of increase in salaries | 3.75-4.25 | 3.75-4.25 | |||
| Nominal rate of increase of pensions in payment | 2.50 | 2.50 | |||
| Investment return pre retirement | 7.50 | 7.50 | |||
| Investment return post retirement | 5.70 | 5.70 | |||
| Inflation assumption | 2.50 | 2.50 | |||
The assumptions for the other defined benefit schemes around the Group are consistent with those used for the O2 PP.
Disclosures under FRS 17 “Retirement benefits”
In accordance with the transitional arrangements of FRS 17 “Retirement benefits”, certain information regarding the Group’s pension arrangements are disclosed below.
The actuarial valuation of the O2 PP as at 30 June 2003 has been updated to 31 March 2005 by an independent qualified actuary in accordance with the transitional arrangements of FRS 17. In accordance with FRS 17, the defined benefit liabilities have been measured using the projected unit method. Plan assets are stated at their market value.
The main assumptions adopted for the O2 PP under FRS 17 are as follows:
| 2005 | 2004 | 2003 | ||||
| % | % | % | ||||
| Nominal rate of increase in salaries | 4.15-4.65 | 4.05-4.55 | 3.75 | |||
| Nominal rate of increase of pensions in payment | ||||||
| – Pension increases with inflation | 2.90 | 2.80 | 2.50 | |||
| – Pension increases with inflation limited to 5 per cent p.a. | 2.70 | 2.60 | 2.40 | |||
| Discount rate | 5.50 | 5.70 | 5.80 | |||
| Inflation assumption | 2.90 | 2.80 | 2.50 | |||
| Expected long-term return for: | ||||||
| – Equities | 7.70 | 7.80 | 7.50 | |||
| – UK Government bonds | 4.70 | 4.70 | – | |||
| – Other bonds | 5.50 | 5.70 | – | |||
| – Other | 4.70 | 4.60 | 3.80 | |||
The assumptions, adopted for FRS 17 purposes, for the other defined benefit schemes around the Group are consistent with those used for the O2 PP.
o2.com 87
Notes to the financial statements continued
30. Pension costs continued
The assets and liabilities of the defined benefit pension schemes are:
| O2 PP £m | Other schemes £ m | 2005 Total £ m | O2 PP £m | Other schemes £ m | 2004 Total £m | O2 PP £m | Other schemes £m | 2003 Total £m | |||||||||||
| Fair value of assets comprises | : | ||||||||||||||||||
| – Equities | 306 | 13 | 319 | 245 | 12 | 257 | 177 | 11 | 188 | ||||||||||
| – UK Government bonds | 17 | 7 | 24 | 14 | 6 | 20 | – | 5 | 5 | ||||||||||
| – Other bonds | 16 | 2 | 18 | 14 | 2 | 16 | – | 5 | 5 | ||||||||||
| – Other | 4 | 2 | 6 | 5 | 1 | 6 | 20 | – | 20 | ||||||||||
| Fair value of assets | 343 | 24 | 367 | 278 | 21 | 299 | 197 | 21 | 218 | ||||||||||
| Present value of liabilities | (444 | ) | (51 | ) | (495 | ) | (362 | ) | (42 | ) | (404 | ) | (268 | ) | (39 | ) | (307 | ) | |
| Deficit | (101 | ) | (27 | ) | (128 | ) | (84 | ) | (21 | ) | (105 | ) | (71 | ) | (18 | ) | (89 | ) | |
| Related deferred tax asset | 30 | 8 | 38 | 25 | 6 | 31 | 21 | 5 | 26 | ||||||||||
| Net pension liability | (71 | ) | (19 | ) | (90 | ) | (59 | ) | (15 | ) | (74 | ) | (50 | ) | (13 | ) | (63 | ) | |
The following table sets out the amounts which would be charged to the profit and loss account for the year ended 31 March 2005 and statement of total recognised gains and losses in accordance with the requirements of FRS 17 for the Group’s defined benefit plans:
| O2 PP | Other schemes | 2005 Total | O2 PP | Other schemes | 2004 Total | |||||||
| £m | £m | £m | £m | £m | £m | |||||||
| Analysis of the amount charged to operating profit: | ||||||||||||
| Current service cost (employers) | 20 | 2 | 22 | 16 | 2 | 18 | ||||||
| Curtailment and settlement1 | (3 | ) | – | (3 | ) | – | (2 | ) | (2 | ) | ||
| Vested past service cost | 5 | – | 5 | 2 | – | 2 | ||||||
| Total operating charge | 22 | 2 | 24 | 18 | – | 18 | ||||||
| Analysis of the amount credited/(charged) to net interest: | ||||||||||||
| Expected return on pension plan assets | 22 | 1 | 23 | 15 | 1 | 16 | ||||||
| Interest on pension plan liabilities | (22 | ) | (2 | ) | (24 | ) | (16 | ) | (2 | ) | (18 | ) |
| Net return | – | (1 | ) | (1 | ) | (1 | ) | (1 | ) | (2 | ) | |
| Analysis of the amount recognised in the statement of total recognised gains and losses: | ||||||||||||
| Actual return less expected return on pension plan assets2 | 17 | 1 | 18 | 39 | 2 | 41 | ||||||
| Experience gains and losses arising on plan liabilities | – | (1 | ) | (1 | ) | 6 | (1 | ) | 5 | |||
| Changes in assumptions underlying the present value of plan liabilities | (33 | ) | (4 | ) | (37 | ) | (57 | ) | (4 | ) | (61 | ) |
| Actuarial loss recognised in the statement of total recognised gains and losses | (16 | ) | (4 | ) | (20 | ) | (12 | ) | (3 | ) | (15 | ) |
| 1In 2004 relates to the disposal of O2 Netherlands. | ||||||||||||
| 2Excluding the returns on assets of the Group’s defined contribution arrangements which do not affect the balance sheet liability. | ||||||||||||
o2.com 88
| Movement in deficit during the year | Other | |||||
| O2 PP | schemes | Total | ||||
| £m | £m | £m | ||||
| Deficit at 1 April 2003 | (71 | ) | (18 | ) | (89 | ) |
| Total current service cost1 | (24 | ) | (3 | ) | (27 | ) |
| Total contributions1 | 26 | 2 | 28 | |||
| Curtailment and settlement gain | – | 2 | 2 | |||
| Vested past service costs | (2 | ) | – | (2 | ) | |
| Other finance income | (1 | ) | (1 | ) | (2 | ) |
Actuarial loss recognised in the statement of total recognised gains and losses | (12 | ) | (3 | ) | (15 | ) |
| Deficit in plan at 31 March 2004 | (84 | ) | (21 | ) | (105 | ) |
| Total current service cost | (27 | ) | (3 | ) | (30 | ) |
| Total contributions | 28 | 2 | 30 | |||
| Curtailment and settlement gain | 3 | – | 3 | |||
| Vested past service costs | (5 | ) | – | (5 | ) | |
| Other finance cost | – | (1 | ) | (1 | ) | |
Actuarial loss recognised in the statement of total recognised gains and losses | (16 | ) | (4 | ) | (20 | ) |
| Deficit in plan at 31 March 2005 | (101 | ) | (27 | ) | (128 | ) |
| 1Includes £2 million in respect of the restructuring disclosed in note 5. | ||||||
History of experience gains and losses | 2005 | 2004 | 2003 | |||||||||
| Other | Other | Other | ||||||||||
| O2 PP | schemes | O2 PP | schemes | O2 PP | schemes | |||||||
| £m | £m | £m | £m | £m | £m | |||||||
| Difference between the expected and actual return on plan assets: | ||||||||||||
| Amount – gain/(loss) | 17 | 1 | 39 | 2 | (62 | ) | (7 | ) | ||||
| Percentage of plan assets | 5% | 3% | 14% | 11% | (32% | ) | (33% | ) | ||||
| Experience gains and losses on plan liabilities: | ||||||||||||
| Amount – (loss)/gain | – | (1 | ) | 6 | (2 | ) | (4 | ) | 2 | |||
Percentage of the present value of plan liabilities | – | (1% | ) | 2% | (4% | ) | (1% | ) | 5% | |||
| Total amount recognised in statement of total recognised gains and losses: | ||||||||||||
| Amount – loss | (16 | ) | (4 | ) | (12 | ) | (3 | ) | (40 | ) | (6 | ) |
Percentage of the present value of plan liabilities | (4% | ) | (7% | ) | (3% | ) | (8% | ) | (15% | ) | (15% | ) |
The Group has applied the transitional provision of FRS 17. The analysis of the profit and loss account that would have arisen had FRS 17 been fully implemented is as follows:
| 2005 | 2004 | |||
| £m | £m | |||
| Profit and loss account | 6,984 | (992 | ) | |
| Amounts recognised under SSAP 24 | 11 | 15 | ||
| Pension deficit under FRS17 (net of related deferred tax asset) | (90 | ) | (74 | ) |
| Profit and loss account including pension deficit | 6,905 | (1,051 | ) | |
| 31. Parent company balance sheet of O2 plc at 31 March 2005 | ||||
| 2005 | ||||
| Note | £m | |||
| Fixed assets | ||||
| Investments in subsidiary undertakings | 12 | 7,116 | ||
| Current assets | ||||
| Debtors | 13 | 1 | ||
| Cash at bank and in hand | 3 | |||
| 4 | ||||
| Creditors: amounts falling due within one year | 15 | (200 | ) | |
| Net current assets | (196 | ) | ||
| Total assets less current liabilities | 6,920 | |||
| Creditors: amounts falling due after more than one year | 16 | (18 | ) | |
| Net assets | 6,902 | |||
| Capital and reserves | ||||
| Called up share capital | 19 | 9 | ||
| Share premium | 20 | 375 | ||
| Profit and loss account | 20 | 6,518 | ||
| Shareholders’ funds | 6,902 | |||
| O2 plc was incorporated on 10 December 2004 and these are O2 plc’s first financial statements. | ||||
These financial statements were approved by the Board of Directors on 17 May 2005 and were signed on its behalf by:
| Peter Erskine | David Finch |
| Chief Executive Officer | Chief Financial Officer |
o2.com 89
Non-financial metrics
| 2005 | 2004 | 2003 | 2005 | 2004 | 2003 | 2005 | 2004 | 2003 | 2005 | 2004 | 2003 | |||||||||||||||
| O2 UK | O2 Germany | |||||||||||||||||||||||||
| Customer numbers (thousands)1 | ARPU (£)2 | Customer numbers (thousands)1 | ARPU (£)2 | |||||||||||||||||||||||
| Pre-pay | 9,472 | 8,687 | 7,989 | Pre-pay | 143 | 141 | 121 | Pre-pay | 3,620 | 2,516 | 2,182 | Pre-pay | 95 | 96 | 83 | |||||||||||
| Post-pay | 4,912 | 4,577 | 4,061 | Post-pay | 542 | 525 | 503 | Post-pay | 4,356 | 3,466 | 2,630 | Post-pay | 362 | 375 | 341 | |||||||||||
| Total | 14,384 | 13,264 | 12,050 | Blended | 281 | 272 | 247 | Total | 7,976 | 5,982 | 4,812 | Blended | 248 | 254 | 219 | |||||||||||
| Churn3 | SAC per connection (£)4 | Churn3 | SAC per connection (£)4 | |||||||||||||||||||||||
| Pre-pay | 37% | 33% | 31% | Pre-pay | 19 | 16 | 25 | Pre-pay | 16% | 17% | 16% | Pre-pay | 22 | 17 | 16 | |||||||||||
| Post-pay | 31% | 26% | 28% | Post-pay | 172 | 160 | 177 | Post-pay | 15% | 17% | 16% | Post-pay | 190 | 175 | 161 | |||||||||||
| Blended | 35% | 30% | 30% | Blended | 66 | 64 | 79 | Blended | 16% | 17% | 16% | Blended | 110 | 119 | 107 | |||||||||||
| Data as a percentage of service revenue5 | 24.2% | 20.4% | 17.1% | Data as a percentage of service revenue5 | 21.8% | 19.5% | 19.3% | |||||||||||||||||||
| 2005 | 2004 | 2003 | 2005 | 2004 | 2003 | 2005 | 2004 | 2003 | 2005 | 2004 | 2003 | |||||||||||||||
| O2 Ireland | Manx Telecom | |||||||||||||||||||||||||
| Customer numbers (thousands)1 | ARPU (£)2 | Customer numbers (thousands)1 | ARPU (£)2 | |||||||||||||||||||||||
| Pre-pay | 1,130 | 1,010 | 889 | Pre-pay | 244 | 248 | 220 | Pre-pay | 41 | 42 | 38 | Pre-pay | 128 | 123 | 115 | |||||||||||
| Post-pay | 403 | 381 | 366 | Post-pay | 762 | 736 | 656 | Post-pay | 22 | 21 | 21 | Post-pay | 630 | 623 | 556 | |||||||||||
| Total | 1,533 | 1,391 | 1,255 | Blended | 385 | 388 | 351 | Total | 63 | 63 | 59 | Blended | 297 | 289 | 288 | |||||||||||
| Data as a percentage of service revenue5 | 21.2% | 19.9% | 15.3% | |||||||||||||||||||||||
| Notes on non- financial metrics | |
| 1Customer numbers – represent customers who are active. Customers are treated as being active if they have used the network in the preceding three months. | |
| 2Average Revenue Per User (ARPU) – is calculated by dividing total service r evenue from sales to customers for the preceding 12 months by the weighted average number of active customers for the same period. Total service revenue includes revenue from inbound roaming. ARPU is calculated using gross service revenue before deduction of wholesale discounts. O2 UK ARPU includes mobile number portability (MNP) revenue. | |
| 3Churn – is calculated by expressing the sum of disconnections for the preceding 12 months as a percentage of the weighted average number of active customers for the same period. | |
| 4Subscriber Acquisition Cost (SAC) per connection – is calculated by dividing the total cost of acquisition (comprising total cost of handset (including handset costs, SIM costs and packaging) less handset r evenue plus commissions paid to sales channels) for the preceding 12 months by the total number of connections over the same period. | |
| 5Data as a percentage of service revenue – data revenue comprises revenue generated from the sale of SMS, WAP, GPRS and UMTS services. | |
o2.com 90
Five year summary
| Selected profit and loss account information | ||||||||||
| 2005 | 2004 | 2003 | 2002 | 2001 | ||||||
| £m | £m | £m | £m | £m | ||||||
| Group turnover | 6,683 | 5,694 | 4,874 | 4,276 | 3,200 | |||||
Net operating expenses before exceptional items | (6,297 | ) | (5,461 | ) | (5,352 | ) | (4,982 | ) | (3,543 | ) |
| Exceptional items | (45 | ) | (75 | ) | (8,300 | ) | (150 | ) | (2,821 | ) |
| EBITDA1 | 1,768 | 1,367 | 859 | 433 | 317 | |||||
| Group operating profit/(loss) | 341 | 158 | (8,778 | ) | (856 | ) | (3,164 | ) | ||
Group’s share of operating result of joint ventures and associates | (3 | ) | – | 5 | 8 | (286 | ) | |||
| Costs of capital reorganisation | (20 | ) | – | – | – | – | ||||
Loss/provision for loss on sale of business | – | (5 | ) | (1,364 | ) | – | – | |||
Net interest payable and similar charges | (9 | ) | (58 | ) | (66 | ) | (25 | ) | (9 | ) |
Profit/(loss) on ordinary activities before taxation | 309 | 95 | (10,203 | ) | (873 | ) | (3,459 | ) | ||
Tax on profit/(loss) on ordinary activities | (8 | ) | 71 | 55 | 23 | (70 | ) | |||
Profit/(loss) on ordinary activities after taxation | 301 | 166 | (10,148 | ) | (850 | ) | (3,529 | ) | ||
| Minority interests | – | – | – | – | (4 | ) | ||||
| Profit/(loss) for the financial year | 301 | 166 | (10,148 | ) | (850 | ) | (3,533 | ) | ||
| Dividends | (196 | ) | – | – | – | – | ||||
| Retained profit/(loss)for the year | 105 | 166 | (10,148 | ) | (850 | ) | (3,533 | ) | ||
Basic earnings/(loss) per share (pence) | 3.5 | 1.9 | (117.0 | ) | (9.8 | ) | (40.7 | ) | ||
Underlying earnings/(loss) per share (pence) | 8.5 | 5.2 | (1.3 | ) | (3.8 | ) | (4.9 | ) | ||
| Dividend per share | 2.25 | – | – | – | – | |||||
| 1EBITDA is our earnings before interest, tax, depreciation, amortisation and exceptional items, excluding our share of operating profits and losses of our joint ventures and associates. | ||||||||||
| Selected balance sheet information | ||||||||||
| 2005 | 2004 | 2003 | 2002 | 2001 | ||||||
| £m | £m | £m | £m | £m | ||||||
| Fixed assets | ||||||||||
| Intangible assets | 7,045 | 7,354 | 7,582 | 15,992 | 15,624 | |||||
| Tangible assets | 4,449 | 3,996 | 3,875 | 4,094 | 3,727 | |||||
| Investments | 2 | 5 | – | 34 | 33 | |||||
| Total fixed assets | 11,496 | 11,355 | 11,457 | 20,120 | 19,384 | |||||
| Current assets | 2,473 | 2,043 | 1,913 | 2,037 | 1,785 | |||||
Creditors: amounts falling due within one year | (2,031 | ) | (1,678 | ) | (1,572 | ) | (1,521 | ) | (1,504 | ) |
Creditors: amounts falling due after more than one year | (1,403 | ) | (1,375 | ) | (1,451 | ) | (1,403 | ) | (399 | ) |
Provisions for liabilities and charges | (254 | ) | (251 | ) | (284 | ) | (402 | ) | (206 | ) |
| Net assets | 10,281 | 10,094 | 10,063 | 18,831 | 19,060 | |||||
| Shareholders’ funds | 10,281 | 10,094 | 10,063 | 18,831 | 19,068 | |||||
| Equity minority interests | – | – | – | – | (8 | ) | ||||
| 10,281 | 10,094 | 10,063 | 18,831 | 19,060 | ||||||
o2.com 91
Additional information for shareholders
Third party trade marks
Third parties’ trade marks used in this document remain the property of the third party concerned.
| Cautionary statement regarding forward-looking statements This annual report and financial statements contains certain forward-looking statements. We may also make written or oral forward-looking statements in: | |
| >> | our periodic reports to the US Securities and Exchange Commission, also known as the SEC, on Forms 20-F and 6-K; |
| >> | our half-yearly reports; |
| >> | our press releases and other written materials; and |
| >> | oral statements made by our officers, Directors or employees to third parties. |
We have based these forward- looking statements on our current plans, expectations and projections about future events. These forward- looking statements are subject to risks, uncertainties and assumptions about us. Forward- looking statements speak only as of the date they are made.
Statements that are not historical facts, including statements about our beliefs and expectations are forward-looking statements. Words like “believe”, “anticipate”, “expect”, “intend”, “seek”, “will”, “plan”, “could”, “may”, “might”, “project”, “goal”, “target” and similar expressions often identify forward-looking statements but are not the only ways we identify these statements.
These statements may be found in “Risk factors”, “Business review”, “Operating and financial review and prospects”, and in this annual report generally. Our actual results could differ materially from those anticipated in these forward-looking statements as a result of various factors, including all the risks discussed in the above-mentioned sections.
If any one or more of the foregoing assumptions are ultimately incorrect, our actual results may differ from our expectations based on these assumptions. Also, the sector and markets in which we operate may not grow over the next several years as expected, or at all. The failure of these markets to grow as expected may have a material adverse effect on our business, operating results and financial condition and the market price of our ordinary shares.
The information on our website, any website mentioned in this annual report or any website directly or indirectly linked to our or any other website mentioned in this annual report is not incorporated by reference into this annual report and you should not rely on it.
Listings
The ordinary shares of O2 plc were listed on the London Stock Exchange on 14 March 2005, pursuant to the Scheme of Arrangement of mmO2 plc.
| Analysis of shareholdings | |||||||
| Ordinary shares | |||||||
| of 0.1p each | |||||||
| Size of shareholding | Number of | Percentage | Number of | Percentage | |||
| at 31 March 2005 | shareholders | of total | shares held | of total | |||
| 1 – 500 | 266,127 | 35.58 | 74,594,694 | 0.86 | |||
| 501 – 999 | 157,118 | 21.01 | 110,913,190 | 1.27 | |||
| 1,000 – 9,999 | 319,193 | 42.68 | 649,306,837 | 7.46 | |||
| 10,000 – 99,999 | 4,289 | 0.57 | 79,278,779 | 0.91 | |||
| 100,000 – 999,999 | 643 | 0.09 | 243,357,671 | 2.80 | |||
| 1,000,000 – 4,999,999 | 333 | 0.04 | 772,646,728 | 8.88 | |||
| 5,000,000 and above | 217 | 0.03 | 6,773,970,700 | 77.82 | |||
| Total | 747,920 | 100.00 | 8,704,068,599 | 100.00 | |||
At 31 March 2005, the number of holders of record of O2 plc ordinary shares in the USA was 1,067 with holdings of 1,459,834 ordinary shares.
Capital Gains Tax
At the time of the demerger of mmO2 plc from BT, the confirmed official opening prices for mmO2 plc ordinary shares and BT Group plc ordinary shares for Capital Gains Tax (“CGT”) purposes, were 82.75 pence and 285.75 pence respectively. This means that, of the total value of 368.5 pence, 22.456 per cent was attributable to mmO2 and 77.544 per cent to BT Group.
Accordingly, for CGT calculations, the base cost of your mmO2 plc ordinary shares is calculated by multiplying the acquisition cost of your BT shareholding by 22.456 per cent and the base cost of your BT Group plc ordinary shares is calculated by multiplying the acquisition cost of your BT shareholding by 77.544 per cent.
Following the Scheme of Arrangement of mmO2 plc dated on 12 January 2005 becoming effective on 14 March 2005, reference to mmO2 plc shares should be read as reference to O2 plc shares.
ShareGift
The Orr Mackintosh Foundation (ShareGift) operates a charity share donation scheme for shareholders with small parcels of shares whose value makes it uneconomic to sell them. Details of the scheme are available on the ShareGift internet site www. sharegift.org.
Cassettes for visually impaired shareholders
The Company’s Annual Review is available on audio cassette. Copies can be obtained, free of charge, from the Registrar, Lloyds TSB Registrars, by calling Freefone 0808 100 4102.
o2.com 92
Annual Report and Financial Statements
Further copies of our Annual Report and Financial Statements can be obtained by contacting our Registrar, Lloyds TSB Registrars, on Freefone 0808 100 4102.
Annual General Meeting
The Annual General Meeting will be held at The Hexagon, Queens Walk, Reading, Berkshire RG1 7UA on Wednesday, 27 July 2005 at 11.00 a.m.
Dividend
To register your bank details and allow dividend payments to be sent directly to a bank account, please contact Lloyds TSB Registrars or complete and return the mandate form that will be attached to your dividend cheque in August 2005.
Shareview
Many shareholders prefer to receive their reports online rather than through the post. You can do this by registering with Shareview, which is easy and free. Go to Shareview at www. shareview.co.uk – click on “register now”, and complete the on-screen application form.
Shareview, which is operated by Lloyds TSB Registrars, gives O2 shareholders access to special services over the internet. You will be able to check the details of your O2 shareholding at any time. As a Shareview user you will be able to view indicative prices of shares of other companies of which you are a shareholder and who use Lloyds TSB as their Registrar.
An e-mail will be sent to you when there is an item for you to view on the shareholder pages on www.o2.com.
In future, when a dividend payment is made, it will be possible to download your tax voucher in respect of dividend payments by logging on to Shareview’s website at www. shareview.co.uk with your access number and password, and click on “e-Tax vouchers”. You can print or save the details if you need to enter them in self- assessment forms. There will also be a useful summary showing the details of payments within a given tax period.
O2 plc offers its UK shareholders Shareview Dealing, an internet and telephone share sale and purchase service operated by Lloyds TSB Registrars. Log on to www. shareview.co. uk/dealing or call them on 0870 850 0852 between 8.30 a.m. and 4.30 p.m., Monday to Friday, for more information about the service and for details of their rates.
Lloyds TSB Registrars is a division of Lloyds TSB Bank plc, authorised and regulated by the Financial Services Authority and a signatory to the Banking Codes.
Duplicate mailings
You may have received separate sets of documents as it may not have been possible to combine your records. Any shareholder who now wishes to stop the additional mailings by combining their records should contact Lloyds TSB Registrars.
| Financial calendar/results announcements | ||
| Annual General Meeting | 27 July 2005 | |
| Proposed dates | ||
Q1 Trading Statement and publication of IFRS financial information | July 2005 | |
Proposed Inaugural Final Dividend of 2.25 pence per share payable to shareholders who are on the register on 5 August 2005 | 26 August 2005 | |
| Interim Results | November 2005 | |
| Interim Dividend | January 2006 | |
| Q3 Trading Statement | February 2006 | |
| Preliminary Announcement | May 2006 | |
Publication of the Annual Report and Financial Statements | June 2006 |
Shareholder enquiries
Lloyds TSB Registrars maintain the Company’s share register and provide a shareholder helpline service (details below). Shareholders should contact the Registrar if they have any enquiries about their shareholding.
| The Registrar | |
| Lloyds TSBRegistrars (3501) | O2 plc shareholder helpline |
| TheCauseway | Freefone: 0808 100 4102 |
| Worthing | Fax: 01903 833371 |
| West Sussex BN99 6DA | From outside the UK |
| Tel: +44 121 415 7102 | |
| Fax: +44 1903 833371 |
General enquiries
O2 plc
Wellington Street
Slough
Berkshire SL1 1YP
e-mail: shareholders@o2.com
o2.com 93
Definitions
| The following definitions apply throughout this document unless the context requires otherwise: | ||
| “Airwave” | A secure TETRA communications system for the emergency services and other Public Safety Users. | |
| “analogue” | The first generation of mobile telecommunications technology in which radio signals are modulated proportionally by the strength and frequency of audio sounds. | |
| “ARPU” | Average Revenue Per User. | |
| “CRM” | Customer Relationship Management. | |
| “GPRS” | General Packet Radio Service. A technology, sometimes referred to as 2.5G, that allows customers to remain connected to the network between calls for the receipt and transmission of data. | |
| “GSM” | The Global System for Mobile communications. Originally defined as a pan-European standard for digital cellular telephone networks to support roaming, it is now one of the world’s main digital mobile standards. | |
| “HSDPA” | High Speed Downlink Packet Access, widely regarded as the next enhancement to 3G, also referred to as superfast 3G. | |
| “IFRS” | International Financial Reporting Standards. | |
| “ISP” | Internet Service Provider. | |
| “Manx Telecom” | Manx Telecom Limited, a company incorporated in the Isle of Man with registered number 28059. | |
| “mmO2” | mmO2 plc, a company incorporated in England and Wales with registered number 4190833. | |
| “MMS” | Multimedia Messaging Services. | |
| “MVNO” | Mobile Virtual Network Operators. Mobile operators that do not own spectrum and usually do not have their own network infrastructure. | |
| “O2 Ordinary Shares” | ||
| or “ordinary shares” | Ordinary shares of 0.1 pence each in the capital of O2. | |
| “O2” | O2 plc, a company incorporated in England and Wales with registered number 5310128 or, where the context requires, a reference to its subsidiaries or associated undertakings. | |
| “O2” | A reference to our trade name or brand. | |
| “O2 Group” | O2 plc and its subsidiary undertakings from time to time. | |
| “O2 Airwave” | Airwave O2 Limited, a company incorporated in England and Wales with a registered number 3985643. | |
| “O2 Germany” | O2 (Germany) GmbH & Co. OHG, a company incorporated in Germany. | |
| “O2 Ireland” | O2 Communications (Ireland) Limited, a company incorporated in Ireland. | |
| “O2 Netherlands” | O2 (Netherlands) B.V., a company incorporated in the Netherlands. | |
| “O2 UK” | O2 (UK) Limited, a company incorporated in England and Wales with registered number 1743099. | |
| “PDA” | Personal Digital Assistant. | |
| “Public Safety Users” or “PSU” | Any organisation, as determined by Ofcom, which has broadly fulfilled the following criteria: (a) responds to emergencies; (b) is involved in emergency situations reasonably frequently; (c) is civilian, or is required to respond to civilian emergencies; and (d) requires interaction with those who respond to emergencies. | |
| “SAC” | Subscriber Acquisition Cost. | |
| “SMP” | Significant Market Power. | |
| “SMS” | A service sometimes known as text messaging, which enables mobile telephone users to send and receive written messages on their handsets. | |
| “TETRA” | Terrestrial Trunked Radio. Radio technology used in networks that require a high level of security and availability. | |
| “UMTS” | Universal Mobile Telecommunications System. An international standard of third generation, or 3G, mobile telecommunications. | |
| “WAP” | Wireless Application Protocol. A global, open standard for accessing online services through mobile devices. | |
| “we” or “us” or “our” | O2 and/or, if the context so requires, one or more members of the O2 Group. |
o2.com 94
Notes
o2.com 95
Notes
o2.com 96

SIGNATURE
Pursuant to the requirements of the Securities Exchange Act of 1934, the registrant has duly caused this report to be signed on its behalf by the undersigned, thereunto duly authorized.
| O2 plc | |||
| Date: 14 June 2005 | By: | /s/ Robert Harwood | |
| ROBERT HARWOOD | |||
| Assistant Secretary |