As filed with the Securities and Exchange Commission on 25 February 2020
UNITED STATES
SECURITIES AND EXCHANGE COMMISSION
Washington, D.C. 20549
FORM 20-F
o REGISTRATION STATEMENT PURSUANT TO SECTION 12(b) OR 12(g) OF THE SECURITIES EXCHANGE ACT OF 1934
OR
x ANNUAL REPORT PURSUANT TO SECTION 13 OR 15(d) OF THE SECURITIES EXCHANGE ACT OF 1934
For the fiscal year ended 31 December 2019
OR
o TRANSITION REPORT PURSUANT TO SECTION 13 OR 15(d) OF THE SECURITIES EXCHANGE ACT OF 1934
OR
o SHELL COMPANY REPORT PURSUANT TO SECTION 13 OR 15(d) OF THE SECURITIES EXCHANGE ACT OF 1934
Commission file number 001-15246
LLOYDS BANKING GROUP plc
(previously Lloyds TSB Group plc)
(Exact name of Registrant as Specified in Its Charter)
Scotland
(Jurisdiction of Incorporation or Organization)
25 Gresham Street
London EC2V 7HN
United Kingdom
(Address of Principal Executive Offices)
Kate Cheetham, Company Secretary
Tel +44 (0) 20 7356 2104, Fax +44 (0) 20 7356 1808
25 Gresham Street
London EC2V 7HN
United Kingdom
(Name, telephone, e-mail and/or facsimile number and address of Company contact person)
Securities registered or to be registered pursuant to Section 12(b) of the Act:
| Title of each class | Trading symbol | Name of each exchange on which registered |
| Ordinary shares of nominal value 10 pence each, represented by American Depositary Shares | | The New York Stock Exchange |
| $1,500,000,000 4.344% Subordinated Securities due in 2048 | LYG48A | The New York Stock Exchange |
| $824,033,000 5.3% Subordinated Securities due 2045 | LYG45 | The New York Stock Exchange |
| $1,750,000,000 3.574% Senior Notes due in 2028 (callable in 2027) | LYG28A | The New York Stock Exchange |
| $1,500,000,000 4.375% Senior Notes due 2028 | LYG28B | The New York Stock Exchange |
| $1,250,000,000 4.55% Senior Notes due 2028 | LYG28C | The New York Stock Exchange |
| $1,250,000,000 3.75% Senior Notes due 2027 | LYG27 | The New York Stock Exchange |
| $1,500,000,000 4.65% Subordinated Securities due 2026 | LYG26 | The New York Stock Exchange |
| $1,500,000,000 4.45% Senior Notes due 2025 | LYG25A | The New York Stock Exchange |
| $1,327,685,000 4.582% Subordinated Securities due 2025 | LYG25 | The New York Stock Exchange |
| $1,250,000,000 3.5% Senior Notes due 2025 | LYG25 | The New York Stock Exchange |
| $1,000,000,000 3.90% Senior Notes due 2024 | LYG24A | The New York Stock Exchange |
| $1,000,000,000 4.5% Subordinated Securities due 2024 | LYG24 | The New York Stock Exchange |
| $1,500,000,000 2.858% Senior Notes due 2023 | LYG23B | The New York Stock Exchange |
| $1,750,000,000 4.05% Senior Notes due 2023 | LYG23A | The New York Stock Exchange |
| $2,250,000,000 2.907% Senior Notes due 2023 (callable in 2022) | LYG23 | The New York Stock Exchange |
| $1,500,000,000 3.0% Senior Notes due 2022 | LYG22 | The New York Stock Exchange |
| $1,500,000,000 2.25% Senior Notes due 2022 | LYG22 | The New York Stock Exchange |
| $1,250,000,000 3.3% Senior Notes due 2021 | LYG21A | The New York Stock Exchange |
| $1,000,000,000 Floating Rate Senior Notes due 2021 | LYG21B | The New York Stock Exchange |
| $500,000,000 Floating Rate Senior Notes due 2021 | LYG21A | The New York Stock Exchange |
| $1,000,000,000 3.1% Senior Notes due 2021 | LYG21 | The New York Stock Exchange |
| $2,500,000,000 6.375% Senior Notes due 2021 | LYG21 | The New York Stock Exchange |
| $1,000,000,000 2.7% Senior Notes due 2020 | LYG20A | The New York Stock Exchange |
| $1,000,000,000 2.4% Senior Notes due 2020 | LYG20 | The New York Stock Exchange |
Securities registered or to be registered pursuant to Section 12(g) of the Act:
None
Securities for which there is a reporting obligation pursuant to Section 15(d) of the Act:
7.50% Fixed Rate Reset Additional Tier 1 Perpetual Subordinated Contingent Convertible Securities
6.75% Callable Fixed Rate Reset AT1 Perpetual Subordinated Contingent Convertible Securities
5.125% Callable Fixed Rate Reset AT1 Perpetual Subordinated Contingent Convertible Securities
The number of outstanding shares of each of Lloyds Banking Group plc’s classes of capital or common stock as of 31 December 2019 was:
| Ordinary shares, nominal value 10 pence each | | | 70,052,557,838 |
| Preference shares, nominal value 25 pence each | | | 412,201,226 |
| Preference shares, nominal value 25 cents each | | | 809,160 |
| Preference shares, nominal value 25 euro cents each | | | Nil |
Indicate by check mark if the registrant is a well-known seasoned issuer, as defined in Rule 405 of the Securities Act.
Yes x No o
If this report is an annual or transition report, indicate by check mark if the registrant is not required to file reports pursuant to Section 13 or 15(d) of the Securities Exchange Act of 1934.
Yes o No x
Indicate by check mark whether the registrant: (1) has filed all reports required to be filed by Section 13 or 15(d) of the Securities Exchange Act of 1934 during the preceding 12 months (or for such shorter period that the registrant was required to file such reports) and (2) has been subject to such filing requirements for the past 90 days.
Yes x No o
Indicate by check mark whether the registrant has submitted electronically and posted on its corporate Web site, if any, every Interactive Data File required to be submitted and posted pursuant to Rule 405 of Regulation S-T (§232.405 of this chapter) during the preceding 12 months (or for such shorter period that the registrant was required to submit and post such files).
Yes x No o
Indicate by check mark whether the registrant is a large accelerated filer, an accelerated filer, a non-accelerated filer, or an emerging growth company.
See the definitions of “large accelerated filer,” “accelerated filer,” and “emerging growth company” in Rule 12b-2 of the Exchange Act. (Check one):
Large accelerated filer x Accelerated filer o Non-Accelerated filer o Emerging Growth Company o
If an emerging growth company that prepares its financial statements in accordance with U.S. GAAP, indicate by check mark if the registrant has elected not to use the extended transition period for complying with any new or revised financial accounting standards†provided pursuant to Section 13(a) of the Exchange Act.
Yes o No o
Indicate by check mark which basis of accounting the registrant has used to prepare the financial statements including in this filing:
U.S. GAAP o International Financial Reporting Standards as issued by the International Accounting Standards Board x Other o
If ‘Other’ has been checked in response to the previous question, indicate by check mark which financial statement item the registrant has elected to follow:
Item 17 o Item o 18
If this is an annual report, indicate by check mark whether the registrant is a shell company (as defined in Rule 12b-2 of the Exchange Act).
Yes o No x
†The term “new or revised financial accounting standard” refers to any update issued by the Financial Accounting Standards Board to its Accounting Standards Codification after April 5, 2012.
PRESENTATION OF INFORMATION
In this annual report, references to the ‘Company’ are to Lloyds Banking Group plc; references to ‘Lloyds Banking Group’, ‘Lloyds’ or the ‘Group’ are to Lloyds Banking Group plc and its subsidiary and associated undertakings; references to ‘Lloyds Bank’ are to Lloyds Bank plc; and references to the ‘consolidated financial statements’ or ‘financial statements’ are to Lloyds Banking Group’s consolidated financial statements included in this annual report. References to the ‘Financial Conduct Authority’ or ‘FCA’ and to the ‘Prudential Regulation Authority’ or ‘PRA’ are to the United Kingdom (the UK) Financial Conduct Authority and the UK Prudential Regulation Authority. References to the ‘Financial Services Authority’ or ‘FSA’ are to their predecessor organisation, the UK Financial Services Authority.
The consolidated financial statements have been prepared in accordance with International Financial Reporting Standards (IFRS) as issued by the International Accounting Standards Board (IASB). Certain disclosures required by IFRS have been included in sections highlighted as ‘Audited’ within the Operating and financial review and prospects section of this Annual Report on Form 20-F on pages 15 to 112. Disclosures marked as audited indicate that they are within the scope of the audit of the financial statements taken as a whole; these disclosures are not subject to a separate opinion.
In this annual report, amounts described as ‘statutory’ refer to amounts included within the Group’s consolidated financial statements.
Lloyds Banking Group publishes its consolidated financial statements expressed in British pounds (‘pounds sterling’, ‘sterling’ or ‘£’), the lawful currency of the UK. In this annual report, references to ‘pence’ and ‘p’ are to one-hundredth of one pound sterling; references to ‘US dollars’, ‘US$’ or ‘$’ are to the lawful currency of the United States (the US); references to ‘cent’ or ‘c’ are to one-hundredth of one US dollar; references to ‘euro’ or ‘€’ are to the lawful currency of the member states of the European Union (EU) that have adopted a single currency in accordance with the Treaty establishing the European Communities, as amended by the Treaty of European Union; references to ‘euro cent’ are to one-hundredth of one euro; and references to ‘Japanese yen’, ‘Japanese ¥’ or ‘¥’ are to the lawful currency of Japan. Solely for the convenience of the reader, this annual report contains translations of certain pounds sterling amounts into US dollars at specified rates. These translations should not be construed as representations by Lloyds Banking Group that the pounds sterling amounts actually represent such US dollar amounts or could be converted into US dollars at the rate indicated or at any other rate. Unless otherwise stated, the translations of pounds sterling into US dollars have been made at the noon buying rate in New York City for cable transfers in pounds sterling as certified for customs purposes by the Federal Reserve Bank of New York (the Noon Buying Rate) in effect on 31 December 2019. The Noon Buying Rate on 31 December 2019 differs from certain of the actual rates used in the preparation of the consolidated financial statements, which are expressed in pounds sterling, and therefore US dollar amounts appearing in this annual report may differ significantly from actual US dollar amounts which were translated into pounds sterling in the preparation of the consolidated financial statements in accordance with IFRS.
BUSINESS OVERVIEW
Lloyds Banking Group is a leading provider of financial services to individual and business customers in the UK. At 31 December 2019, Lloyds Banking Group’s total assets were £833,893 million and Lloyds Banking Group had 63,069 employees (on a full-time equivalent basis). Lloyds Banking Group plc’s market capitalisation at that date was £43,783 million. The Group reported a profit before tax for the 12 months to 31 December 2019 of £4,393 million, and its capital ratios at that date were 21.3 per cent for total capital, 16.7 per cent for tier 1 capital and 13.6 per cent for common equity tier 1 capital.
Set out below is the Group’s summarised income statement for each of the last two years:
| | | 2019
£m | | | 2018
£m | |
| Net interest income | | | 10,180 | | | | 13,396 | |
| Other income | | | 32,176 | | | | 8,695 | |
| Total income | | | 42,356 | | | | 22,091 | |
| Insurance claims | | | (23,997 | ) | | | (3,465 | ) |
| Total income, net of insurance claims | | | 18,359 | | | | 18,626 | |
| Operating expenses | | | (12,670 | ) | | | (11,729 | ) |
| Trading surplus | | | 5,689 | | | | 6,897 | |
| Impairment | | | (1,296 | ) | | | (937 | ) |
| Profit before tax | | | 4,393 | | | | 5,960 | |
Lloyds Banking Group’s main business activities are retail and commercial banking and long-term savings, protection and investment and it operates primarily in the UK. Services are offered through a number of well recognised brands including Lloyds Bank, Halifax, Bank of Scotland and Scottish Widows, and through a range of distribution channels including the largest branch network and digital bank in the UK.
At 31 December 2019, the Group’s three primary operating divisions, which are also financial reporting segments, were: Retail; Commercial Banking; and Insurance and Wealth. Retail provides banking, mortgages, personal loans, motor finance, credit cards and other financial services to personal and small business customers. Commercial Banking provides banking and related services to business clients, from small and medium-sized entities (SMEs) to large corporates. Insurance and Wealth provides long-term savings, protection and investment products as well as general insurance products.
Profit before tax is analysed on pages 17 to 22 on a statutory basis and, for the Group’s segments, on pages 24 to 30 on an underlying basis. The key principles adopted in the preparation of this basis of reporting are described on page 24. The Group Executive Committee, which is the chief operating decision maker for the Group, reviews the Group’s internal reporting based around these segments (which reflect the Group’s organisational and management structures) in order to assess performance and allocate resources; this reporting is on an underlying basis. IFRS 8,Operating Segmentsrequires that the Group presents its segmental profit before tax on the basis reviewed by the chief operating decision maker that is most consistent with the measurement principles used in measuring the Group’s statutory profit before tax. Accordingly, the Group presents its segmental underlying basis profit before tax in note 4 to the financial statements in compliance with IFRS 8. The table below shows the results of Lloyds Banking Group’s segments in the last two fiscal years, and their aggregation. Further information on non-GAAP measures and the reconciliations required by the Securities and Exchange Commission’s Regulation G are set out on pages F-25 to F-29.
| | | 2019
£m | | | 2018
£m | 1
|
| Retail | | | 3,839 | | | | 4,211 | |
| Commercial Banking | | | 1,777 | | | | 2,183 | |
| Insurance and Wealth | | | 1,101 | | | | 927 | |
| Other | | | 814 | | | | 745 | |
| Profit before tax – underlying basis | | | 7,531 | | | | 8,066 | |
| 1 | Segmental analysis restated, as explained on page F-25. |
Lloyds Banking Group plc was incorporated as a public limited company and registered in Scotland under the UK Companies Act 1985 on 21 October 1985 with the registered number 95000. Lloyds Banking Group plc’s registered office is The Mound, Edinburgh EH1 1YZ, Scotland, and its principal executive offices in the UK are located at 25 Gresham Street, London EC2V 7HN, United Kingdom, telephone number + 44 (0) 20 7626 1500.
SELECTED CONSOLIDATED FINANCIAL DATA
The financial information set out in the tables below has been derived from the annual reports and accounts of Lloyds Banking Group plc for each of the past five years adjusted, where restatement was required, for subsequent changes in accounting policy and presentation.
| | | | 2019 | | | | 20181,2 | | | | 20171,2,3 | | | | 20161,2,3 | | | | 20151,2,3 | |
| Income statement data for the year ended 31 December (£m) | | | | | | | | | | | | | | | | | | | | |
| Total income, net of insurance claims | | | 18,359 | | | | 18,626 | | | | 18,659 | | | | 17,267 | | | | 17,421 | |
| Operating expenses | | | (12,670 | ) | | | (11,729 | ) | | | (12,346 | ) | | | (12,627 | ) | | | (15,387 | ) |
| Trading surplus | | | 5,689 | | | | 6,897 | | | | 6,313 | | | | 4,640 | | | | 2,034 | |
| Impairment losses | | | (1,296 | ) | | | (937 | ) | | | (688 | ) | | | (752 | ) | | | (390 | ) |
| Profit before tax | | | 4,393 | | | | 5,960 | | | | 5,625 | | | | 3,888 | | | | 1,644 | |
| Profit for the year | | | 3,006 | | | | 4,506 | | | | 3,999 | | | | 2,255 | | | | 1,036 | |
| Profit for the year attributable to ordinary shareholders | | | 2,459 | | | | 3,975 | | | | 3,494 | | | | 1,742 | | | | 546 | |
| Dividends for the year4,5 | | | 2,375 | | | | 2,288 | | | | 2,195 | | | | 2,175 | | | | 1,962 | |
| Balance sheet data at 31 December (£m) | | | | | | | | | | | | | | | | | | | | |
| Share capital | | | 7,005 | | | | 7,116 | | | | 7,197 | | | | 7,146 | | | | 7,146 | |
| Shareholders’ equity | | | 41,697 | | | | 43,434 | | | | 43,551 | | | | 42,670 | | | | 41,234 | |
| Other equity instruments | | | 5,906 | | | | 6,491 | | | | 5,355 | | | | 5,355 | | | | 5,355 | |
| Customer deposits | | | 421,320 | | | | 418,066 | | | | 418,124 | | | | 415,460 | | | | 418,326 | |
| Subordinated liabilities | | | 17,130 | | | | 17,656 | | | | 17,922 | | | | 19,831 | | | | 23,312 | |
| Loans and advances to customers | | | 494,988 | | | | 484,858 | | | | 472,498 | | | | 457,958 | | | | 455,175 | |
| Total assets | | | 833,893 | | | | 797,598 | | | | 812,109 | | | | 817,793 | | | | 806,688 | |
| Share information | | | | | | | | | | | | | | | | | | | | |
| Basic earnings per ordinary share | | | 3.5p | | | | 5.5p | | | | 4.9p | | | | 2.4p | | | | 0.8p | |
| Diluted earnings per ordinary share | | | 3.4p | | | | 5.5p | | | | 4.8p | | | | 2.4p | | | | 0.8p | |
| Net asset value per ordinary share | | | 59.5p | | | | 61.0p | | | | 60.5p | | | | 59.8p | | | | 57.9p | |
| Dividends per ordinary share4,6 | | | 3.37p | | | | 3.21p | | | | 3.05p | | | | 3.05p | | | | 2.75p | |
| Equivalent cents per share6,7 | | | 4.33c | | | | 4.14c | | | | 4.06c | | | | 3.95c | | | | 4.03c | |
| Market price per ordinary share (year end) | | | 62.5p | | | | 51.9p | | | | 68.1p | | | | 62.5p | | | | 73.1p | |
| Number of shareholders (thousands) | | | 2,361 | | | | 2,404 | | | | 2,450 | | | | 2,510 | | | | 2,563 | |
| Number of ordinary shares in issue (millions)8 | | | 70,053 | | | | 71,164 | | | | 71,973 | | | | 71,374 | | | | 71,374 | |
| Financial ratios (%)9 | | | | | | | | | | | | | | | | | | | | |
| Dividend payout ratio10 | | | 96.6 | | | | 57.6 | | | | 62.8 | | | | 124.9 | | | | 359.3 | |
| Post-tax return on average shareholders’ equity | | | 5.7 | | | | 9.3 | | | | 8.0 | | | | 4.1 | | | | 1.3 | |
| Post-tax return on average assets | | | 0.36 | | | | 0.55 | | | | 0.49 | | | | 0.27 | | | | 0.12 | |
| Average shareholders’ equity to average assets | | | 5.2 | | | | 5.3 | | | | 5.3 | | | | 5.2 | | | | 5.1 | |
| Cost:income ratio11 | | | 69.0 | | | | 63.0 | | | | 66.2 | | | | 73.1 | | | | 88.3 | |
| Capital ratios (%) | | | | | | | | | | | | | | | | | | | | |
| Total capital | | | 21.3 | | | | 22.9 | | | | 21.2 | | | | 21.2 | | | | 21.5 | |
| Tier 1 capital | | | 16.7 | | | | 18.2 | | | | 17.2 | | | | 16.8 | | | | 16.4 | |
| Common equity tier 1 capital/Core tier 1 capital | | | 13.6 | | | | 14.6 | | | | 14.1 | | | | 13.4 | | | | 12.8 | |
| 1 | The Group has adopted IFRS 16Leaseswith effect from 1 January 2019, in accordance with the transition requirements of the standard, comparative information has not been restated. |
| 2 | The Group has implemented the amendments to IAS 12Income Taxeswith effect from 1 January 2019 and as a result tax relief on distributions on other equity instruments, previously taken directly to retained profits, is now reported within tax expense in the income statement. Comparatives have been restated. |
| 3 | The Group adopted IFRS 9 and IFRS 15 with effect from 1 January 2018; in accordance with the transition requirements, comparative information was not restated. |
| 4 | Annual dividends comprise both interim and estimated final dividend payments. The total dividend for the year represents the interim dividend paid during the year and the final dividend, which is paid and accounted for in the following year. |
| 5 | Dividends for the year in 2016 included a special dividend totalling £356 million; (2015: £357 million). |
| 6 | Dividends per ordinary share in 2016 included a recommended special dividend of 0.5 pence (2015: 0.5 pence). |
| 7 | Translated into US dollars at the Noon Buying Rate on the date each payment was made, with the exception of the final dividend in respect of 2019, which has been translated at the Noon Buying Rate on 14 February 2020. |
| 8 | For 2016 and previous years, this figure excluded the limited voting ordinary shares owned by the Lloyds Bank Foundations. The limited voting ordinary shares were redesignated as ordinary shares on 1 July 2017. |
| 9 | Averages are calculated on a monthly basis from the consolidated financial data of Lloyds Banking Group. |
| 10 | Total dividend for the year divided by earnings attributable to ordinary shareholders adjusted for tax relief on distributions to other equity holders. |
| 11 | The cost:income ratio is calculated as total operating expenses as a percentage of total income (net of insurance claims). |
BUSINESS
HISTORY AND DEVELOPMENT OF LLOYDS BANKING GROUP
The history of the Group can be traced back to the 18th century when the banking partnership of Taylors and Lloyds was established in Birmingham, England. Lloyds Bank Plc was incorporated in 1865 and during the late 19th and early 20th centuries entered into a number of acquisitions and mergers, significantly increasing the number of banking offices in the UK. In 1995, it continued to expand with the acquisition of the Cheltenham and Gloucester Building Society.
TSB Group plc became operational in 1986 when, following UK Government legislation, the operations of four Trustee Savings Banks and other related companies were transferred to TSB Group plc and its new banking subsidiaries. By 1995, the TSB Group had, either through organic growth or acquisition, developed life and general insurance operations, investment management activities, and a motor vehicle hire purchase and leasing operation to supplement its retail banking activities.
In 1995, TSB Group plc merged with Lloyds Bank Plc. Under the terms of the merger, the TSB and Lloyds Bank groups were combined under TSB Group plc, which was re-named Lloyds TSB Group plc, with Lloyds Bank Plc, which was subsequently re-named Lloyds TSB Bank plc, the principal subsidiary. In 1999, the businesses, assets and liabilities of TSB Bank plc, the principal banking subsidiary of the TSB Group prior to the merger, and its subsidiary Hill Samuel Bank Limited were vested in Lloyds TSB Bank plc, and in 2000, Lloyds TSB Group acquired Scottish Widows. In addition to already being one of the leading providers of banking services in the UK, the acquisition of Scottish Widows also positioned Lloyds TSB Group as one of the leading suppliers of long-term savings and protection products in the UK.
The HBOS Group had been formed in September 2001 by the merger of Halifax plc and Bank of Scotland. The Halifax business began with the establishment of the Halifax Permanent Benefit Building Society in 1852; the society grew through a number of mergers and acquisitions including the merger with Leeds Permanent Building Society in 1995 and the acquisition of Clerical Medical in 1996. In 1997 the Halifax converted to plc status and floated on the London stock market. Bank of Scotland was founded in July 1695, making it Scotland’s first and oldest bank.
On 18 September 2008, with the support of the UK Government, the boards of Lloyds TSB Group plc and HBOS plc announced that they had reached agreement on the terms of a recommended acquisition by Lloyds TSB Group plc of HBOS plc. The shareholders of Lloyds TSB Group plc approved the acquisition at the Company’s general meeting on 19 November 2008. On 16 January 2009, the acquisition was completed and Lloyds TSB Group plc changed its name to Lloyds Banking Group plc.
Pursuant to two placing and open offers which were completed by the Company in January and June 2009 and the Rights Issue completed in December 2009, the UK Government acquired 43.4 per cent of the Company’s issued ordinary share capital. Following sales of shares in September 2013 and March 2014 and the completion of trading plans with Morgan Stanley & Co. International plc (Morgan Stanley), the UK Government completed the sale of its shares in May 2017, returning the Group to full private ownership.
Pursuant to its decision approving state aid to the Group, the European Commission required the Group to dispose of a retail banking business meeting minimum requirements for the number of branches, share of the UK personal current accounts market and proportion of the Group’s mortgage assets. Following disposals in 2014, the Group sold its remaining interest in TSB to Banco de Sabadell (Sabadell) in 2015, and all EC state aid requirements were met by 30 June 2017.
On 1 June 2017, following the receipt of competition and regulatory approval, the Group acquired 100 per cent of the ordinary share capital of MBNA Limited, which together with its subsidiaries operates a UK consumer credit card business, from FIA Jersey Holdings Limited, a wholly-owned subsidiary of Bank of America.
The Group successfully launched its new non ring-fenced bank, Lloyds Bank Corporate Markets plc in 2018, transferring in the non ring-fenced business from the rest of the Group, thereby meeting its legal requirements under ring-fencing legislation.
On 23 October 2018, the Group announced a partnership with Schroders to create a market-leading wealth management proposition. The three key components of the partnership are: (i) the establishment of a new financial planning joint venture; (ii) the Group taking a 19.9 per cent stake in Schroders high net worth UK wealth management business; and (iii) the appointment of Schroders as the active investment manager of approximately £80 billion of the Group’s insurance and wealth related assets. The joint venture, Schroders Personal Wealth, was launched to the market in the third quarter of 2019. The Group’s interest in the joint venture is 50.1 per cent.
BUSINESS
STRATEGY OF LLOYDS BANKING GROUP
The Group is a leading provider of financial services to individual and business customers in the UK. The Group’s main business activities are retail and commercial banking, and long-term savings, protection and investment. Services are provided through a number of well recognised brands including Lloyds Bank, Halifax, Bank of Scotland and Scottish Widows and through a range of distribution channels, including the largest branch network and digital bank in the UK.
As the Group looks to the future, it sees the external environment evolving rapidly. Changing customer behaviours, the pace of technological evolution and changes in regulation all present opportunities. Given the Group’s strong capabilities and the significant progress made in recent years, the Group believes that it is in a unique position to compete and win in this environment by developing additional competitive advantages. The Group will continue to transform itself to succeed in this digital world and the next phase of its strategy will ensure that the Group has the capabilities to deliver future success.
STRATEGIC PRIORITIES
In 2018 the Group launched the third phase of its strategic plan. The Group identified four strategic priorities focused on the financial needs and behaviours of the customer of the future: further enhancing the Group’s leading customer experience; further digitising the Group; maximising Group capabilities; and transforming ways of working. The Group will invest more than £3 billion in these strategic initiatives through the plan period that will drive the Group’s transformation into a digitised, simple, low risk, customer-focused UK financial services provider.
Delivering a leading customer experience
The Group will drive stronger customer relationships through best in class propositions while continuing to provide the Group’s customers with brilliant servicing and a seamless experience across all channels. This will include:
| – | remaining the number 1 digital bank in the UK with open banking functionality; |
| | |
| – | unrivalled reach with UK’s largest branch network serving complex needs; and |
| | |
| – | data-driven and personalised customer propositions. |
Digitising the Group
The Group will deploy new technology to drive additional operational efficiencies that will make banking simple and easier for customers whilst reducing operating costs, pursuing the following initiatives:
| – | deeper end-to-end transformation targeting over 70 per cent of cost base; |
| | |
| – | simplification and progressive modernisation of our data and IT infrastructure; and |
| | |
| – | technology enabled productivity improvements across the business. |
Maximising the Group’s capabilities
The Group will deepen customer relationships, grow in targeted segments and better address our customers’ banking and insurance needs as an integrated financial services provider. This will include:
| – | increasing Financial Planning and Retirement (FP&R) open book assets by more than £50 billion by 2020 with more than 1 million new pension customers; |
| | |
| – | implementing an integrated FP&R proposition with single customer view; and |
| | |
| – | start-up, SME and Mid Market net lending growth (more than £6 billion in the plan period). |
Transforming ways of working
The Group is making its biggest ever investment in people, increasing colleague training and development by 50 per cent to 4.4 million hours per annum and embracing new technology to drive better customer outcomes. The hard work, commitment and expertise of the Group’s colleagues has enabled it to deliver to date and the Group will further invest in capabilities and agile working practices. The Group has already restructured the business and reorganised the leadership team to ensure effective implementation of the new strategy.
BUSINESS AND ACTIVITIES OF LLOYDS BANKING GROUP
The Group’s activities are organised into three financial reporting segments: Retail; Commercial Banking; and Insurance and Wealth. In 2019 the Group transferred Cardnet, its card payment acceptance service, from Retail into Commerical Banking and also transferred certain equity business from Commercial Banking into Central items. Comparatives have been restated accordingly.
Further information on the Group’s financial reporting segments is set out on pages 27 to 29 and in note 4 to the financial statements.
MATERIAL CONTRACTS
The Company and its subsidiaries are party to various contracts in the ordinary course of business.
BUSINESS
ENVIRONMENTAL MATTERS
Helping the transition to a sustainable low carbon economy
The UK is committed to the vision of a sustainable, low carbon future. The Group’s unique position within the UK economy means that the successful transition to a more sustainable, low carbon economy is of strategic importance.
The Group supports the aims of the 2015 Paris Agreement and the UK Government’s Clean Growth Strategy, which will require a radical reinvention of ways of working, living and doing business including new Government policies and sustainable finance solutions. In 2018 the Group set out its Sustainability Strategy and when reporting on its progress, the Group supports the Taskforce on Climate-Related Financial Disclosure (TCFD) framework, and currently plans to achieve full disclosure by 2022 in line with the TCFD recommendations and the UK Government’s Green Finance Strategy.
OUR STRATEGY
The Group’s goal and approach
As a signal of the Group’s commitment the Group has set an ambitious goal, working with customers, Government and the market to help reduce the emissions it finances by more than 50 per cent by 2030, supporting the UK’s ambition to be net zero by 2050 and the 2015 Paris Agreement. During the course of 2020, the Group intends to conduct a review of its portfolio to establish its current financed emissions and set appropriate metrics and targets for material sectors.
In order to meet its goal, the Group will:
 | Identify new opportunities to support customers and clients and finance the UK transition to a low carbon economy |
| | |
| Identify and manage material sustainability and climate related risks across the Group, disclosing these, their impacts on the Group and its financial planning processes, in line with the TCFD framework |
| | |
| Use the Group’s scale and reach to help drive progress towards a sustainable and resilient UK economy through engagement with customers, communities, industry, Government, shareholders and suppliers |
| | |
| Embed sustainability into the way the Group does business and manages its own operations in a more sustainable way |
The Group’s ambition
The Group has set itself seven leadership ambitions to support the UK’s transition to a sustainable future:
Business: become a leading UK commercial bank for sustainable growth, supporting clients to transition to sustainable business models and operations, and to pursue new clean growth opportunities
Homes: be a leading UK provider of customer support on energy efficient, sustainable homes
Vehicles: be a leading UK provider of low emission/green vehicle fleets
Pensions and investments: be a leading UK pension provider that offers customers and colleagues sustainable investment choices, and challenge the companies the Group invests in to behave more sustainably and responsibly
Insurance: be a leading UK insurer in improving the resilience of customers’ lives against extreme weather caused by climate change
Green bonds: be a leading UK bank in the green/sustainable bonds market
The Group’s own footprint: be a leading UK bank in reducing the Group’s own carbon footprint and challenging suppliers to ensure the Group’s own consumption of resources, goods and services is sustainable
Metrics and targets
In 2018, the Group committed to develop a reporting framework to track performance against our sustainability strategy. This includes measures for: the Group’s own energy use, emissions, water and waste; Group and portfolio metrics that drive emission reductions related to financing activity; the amount of green finance provided; and metrics that track climate change risk (including exposure to high carbon sectors and sectors at high risk from climate change).
The complexity of accessing robust data has prevented the Group from setting a full suite of targets in 2019. The Group intends, however, to set appropriate targets during 2020 for material sectors. The Group’s new goal to help reduce the emissions it finances by more than 50 per cent by 2030 will frame the level of ambition across the Group’s targets and metrics.
Extending the Group’s own carbon footprint measurement
The Group met its 2030 carbon reduction target in 2019, having reduced emissions by 63 per cent since 2009. The Group also expanded its Scope 3 emissions measurement to include additional categories of emissions from business travel and colleague commuting. The Group continues to pursue our targets to reduce emissions by 80 per cent by 2050, operational waste by 80 per cent by 2025 (compared to 2014/15) and water consumption by 40 per cent by 2030 (compared to 2009). The Group will be developing new carbon, energy and travel targets in 2020.
Green finance
The Group has provided more than £4.9 billion in green finance since 2016 through its Clean Growth Finance Initiative, Commercial Real Estate Green Loans Initiative, Renewable Energy Financing, and green bonds facilitation. While green loan standards are evolving, the Group has teamed up with leading sustainability consultants when developing green finance products to determine a list of qualifying green criteria. These green finance products support a range of eligible activity including; reducing emissions, improving energy efficiency, reducing waste, improving water efficiency, and funding low carbon transport and renewable energy.
BUSINESS
Climate risk sectors
In line with TCFD recommendations, the Group has identified its loans and advances to customers in high carbon sectors and a selection of other sectors that will be exposed to transition risk (see table). This is the Group’s initial view and will be reviewed as its transition risk insight develops. The Group continues to work with customers to support transition, taking into account both risks and opportunities.
The Group’s exposure to high carbon sectors is low (less than 0.5 per cent of total loans and advances to customers). In addition, data for these loans and advances is presented at an overall sector level and not all customers in these sectors will have high emissions or be exposed to significant transition risks. For example:
 | Utilities includes financing to entities that have both renewable energy and non-renewable energy generation. The Group has provided finance for more than 40 renewable energy projects, including supporting projects such as the Neart na Gaoithe offshore wind farm; |
| | |
| Real estate and mortgages will include loans and advances supported by assets which have a full range of Energy Performance Certificate (EPC) ratings including energy efficient properties; |
| | |
| UK motor finance includes loans and advances for low emission vehicles. |
| | |
| Loans and advances to customers in high carbon sectors and selected other sectors subject to transition risks. |
| | | | | | | Loans and advances to
customers (£m)2 | | % of total loans and advances
to customers3 |
| Sector/area1 | | Dec-2019 | | | Dec-2018 | | | Dec-2019 | | Dec-2018 |
 | | Energy | | Coal Mining | | | 21 | | | | 28 | | | | <0.01 | % | | | <0.01 | % |
| | | | Oil and Gas | | | 1,368 | | | | 975 | | | | 0.27 | % | | | 0.20 | % |
| | Utilities | | (Electric and Gas) | | | 964 | | | | 1,251 | | | | 0.19 | % | | | 0.26 | % |
| | Total | | | | | 2,353 | | | | 2,254 | | | | 0.47 | % | | | 0.46 | % |
 | | Agriculture, Forestry and Fishing | | | 7,558 | | | | 7,314 | | | | 1.52 | % | | | 1.50 | % |
| | Construction and Real Estate | | | 28,228 | | | | 29,470 | | | | 5.67 | % | | | 6.04 | % |
| | Transportation (Automotive, Aviation, Shipping and Rail) | | | 4,353 | | | | 5,429 | | | | 0.87 | % | | | 1.11 | % |
| | Cement, Chemicals and Steel Manufacture | | | 143 | | | | 250 | | | | 0.03 | % | | | 0.05 | % |
| | Mortgages | | | 299,141 | | | | 297,497 | | | | 60.05 | % | | | 60.96 | % |
| | UK Motor Finance | | | 15,976 | | | | 14,933 | | | | 3.21 | % | | | 3.06 | % |
| 1 | Exposures are based on 2007 Standard Industrial Classification codes except for Agriculture, Forestry and Fishing (based on NACE code A00-0) and Mortgages and UK Motor Finance, where the full portfolios have been used. These exposures will include green and other sustainable finance loans, which support the transition to the low carbon economy. As such, these figures and/or trends should not be read as the only measure to gauge transition risk or financed emissions. |
| 2 | Disclosures are based on loans and advances to customers on a statutory basis, before allowance for impairment losses. Analysis covers at least 95% of loans and advances and does not include data from the Insurance and Wealth division. |
| 3 | Total loan and advances to customers were £488,088m at 31 December 2018 and £498,247m at 31 December 2019. |
Risk management
Climate risk is a key emerging risk for the Group. The Group’s approach to identifying and managing climate risk is founded on embedding it into its existing risk management framework, and integrating it through policies, authorities and risk control mechanisms. During 2019, the Group updated its TCFD implementation plan to incorporate Prudential Regulatory Authority (PRA) supervisory expectations and refined deliverables, with further resource invested in the programme.
In 2019, the Group included commentary on climate change risk within its Internal Capital Capacity Adequacy Assessment Process (ICAAP) submission, and in 2020 the Group is building on this through its analysis of initial scenarios to assess the impact on capital requirements. The Group is also engaged in the industry response to the Bank of England Discussion Paper to identify the best approach to explore the financial risks posed by climate change within its 2021 Biennial Exploratory Scenario (BES).
The Group has updated its external sector statements to include positions on six new sectors including manufacturing, automotive, agriculture, animal welfare, fisheries and UNESCO World Heritage Sites. This is in addition to the existing statements on power, coal, mining, oil and gas, forestry and defence. www.lloydsbankinggroup.com/Our-Group/responsible-business/reporting-centre/. The Group’s statement on coal has been updated and made more ambitious. The Group continues with its policy of not financing new coal fired power stations. The Group has now tightened its requirements for providing general banking or funding, and now requires new clients to have less than 30 per cent of their revenue from the operation of coal fired power stations and/or coal mines (previously less than 50 per cent).
In addition, existing customers whose overall operations include coal mining and coal power generation or who supply equipment or services to the sector will be expected to explain how they plan to reduce their reliance on revenue from coal fired power stations and/or coal mines. This includes reducing such revenue to less than 30 per cent by 2025 and, where relevant, to eliminate UK coal power generation in line with UK Government commitments.
Sustainability is now a mandatory part of credit applications in Commercial Banking for facilities greater than £500,000, and we continue to develop sector specific guidance to help relationship managers identify climate risks. The Group will review climate risk as part of the 2020 annual refresh of the Group’s Risk Appetite.
In line with TCFD, the Group is also developing forward-looking scenario analysis, incorporating physical and transition risks, to help identify risks and opportunities over the short, medium and long-term. For example, Commercial Banking are conducting analysis on the real estate sector for business as usual and low carbon transition scenarios and the Insurance business has conducted an initial climate stress test. The Group is working with external consultants to enhance scenario analysis across divisions and will use the outputs to support scenario analysis assessments and inform credit risk appetite decisions and future disclosures.
BUSINESS
Governance
Given the strategic importance of the Group’s sustainability ambitions, the Group’s governance structure provides clear oversight and ownership of the sustainability strategy. This includes:

Lloyds Banking Group Board Responsible Business Committee Group Executive Committee Group Executive Sustainability Committee Other internal governance Audit Committee Board Risk Committee GEC Risk Committee Divisional Risk Committees Group sustainability team Divisional forums/ working groups Group sustainability forum TCFD working group
| – | The Responsible Business Committee (RBC), a sub-committee of the Board, chaired by Sara Weller, Group Non-Executive Director and which includes the Chairman, Lord Blackwell as a member |
| | |
| – | The Group Executive Sustainability Committee (GESC) which provides oversight and recommends decisions to the Group Executive Committee (GEC) |
| | |
| – | The TCFD working group, co-chaired by senior executives in risk and sustainability, coordinates the implementation of the TCFD recommendations and supports adherence to key regulatory requirements on climate risk |
| | |
| – | The Group Chief Risk Officer (CRO) has assumed responsibility for identifying and managing the risks arising from climate change, alongside the CROs for key legal entities |
Our Group sustainability team is supported by divisional sustainability governance forums led by Divisional Managing Directors, ensuring a coordinated approach to oversight, delivery and reporting of the Group’s sustainability strategy.
How we are delivering against our ambitions
In 2019, the Group has focused on developing new products, services and processes to achieve its ambitions, and progress has been recognised.
 | Lloyds Banking Group achieved the Leadership level in the 2019 Carbon Disclosure Project (CDP) Climate Change survey, scoring an A minus; the highest placed financial services firm on the Fortune Sustainability All Stars list; and won the Real Estate Capital Sustainable Finance Provider of the Year |
| | |
| One in 14 electric cars in the UK was supplied by Group subsidiary Lex Autolease in 2019, supported by a £1 million cashback offer on pure electric vehicle (EV) orders, reducing future carbon dioxide emissions by an estimated 28 kilotonnes |
| | |
| The Group continues to partner with the Cambridge Institute for Sustainability Leadership to provide high quality training to executives and colleagues in risk management, product development and client facing roles. In 2019, over 800 colleagues were trained, ensuring they are able to support clients on this journey |
| | |
| Since 2018 the Group has supported renewable energy projects that power the equivalent of 5.1 million homes, achieving the Group’s Helping Britain Prosper Plan 2020 target a year early |
Evolving our disclosure
In 2020, the Group will continue to review and enhance its methodologies and framework for reporting Environmental, Social and Governance risks. This review will take into account a range of industry guidelines including TCFD, Principles for Responsible Banking, Sustainability Accounting Standards Board (SASB), the evolving World Economic Forum (WEF) ESG standards, and regulatory reporting requirements with a view to further enhancing our disclosures and responding to the evolving needs of both our shareholders and other stakeholders.
BUSINESS
Initiatives and collaboration
Climate change is a global challenge that requires collaboration across companies and industries to ensure the risks and opportunities can be adequately identified and managed. To support this, the Group participates in several industry initiatives and has signed up to key principles that drive action on climate change and sustainability, including:
United Nations Environment Programme
Finance Initiative (UNEP FI)
The Group became a member of UNEP FI in 2019 and joined its Phase 2 Banking TCFD Pilot.
The Group also became a signatory to the Principles for Responsible Banking and Principles for Sustainable Insurance.
Coalition for Climate Resilient Investment
In September 2019, the Group joined the newly formed coalition that aims to transform infrastructure investment by integrating climate risks into decision making.
University of Cambridge Banking Environment Initiative (BEI) – Bank 2030
The Group has been working with 12 leading banks to develop a roadmap for how the industry can direct capital towards environmentally and socially sustainable economic development.
The Climate Group
In 2019, the Group was one of only a handful of businesses globally to sign up to all three of The Climate Group’s campaigns:
| RE100 – a commitment to source 100 per cent of the Group’s electricity from renewable sources by 2030 (achieved in 2019) |
| | |
| EP100 – a commitment to set ambitious energy productivity targets by 2030 |
| | |
| EV100 – a commitment to accelerate the transition to Electric Vehicles by 2030 |
Climate Financial Risk Forum
In 2019, the Group joined the PRA and FCA’s joint Climate Financial Risk Forum, participating in the Risk Management Working Group that aims to deliver a UK best practice handbook on implementation of the TCFD recommendations.
Greenhouse gas emissions
The Group has voluntarily reported greenhouse gas emissions and environmental performance since 2009, and since 2013 this has been reported in line with the requirements of the Companies Act 2006. Our total emissions, in tonnes of CO2equivalent, are reported in the table below. Deloitte LLP has provided limited level ISAE 3000 (Revised) and ISAE 3410 assurance over selected non-financial indicators as noted by . Their full, independent assurance statement is available online at www.lloydsbankinggroup.com/our-group/responsible-business
Methodology
The Group follows the principles of the Greenhouse Gas (GHG) Protocol Corporate Accounting and Reporting Standard to calculate our Scope 1, 2 and 3 emissions from our worldwide operations. The reporting period is 1 October 2018 to 30 September 2019, which is different to that of the Directors’ report (January 2019 – December 2019). This is in line with Regulations in that the majority of the emissions reporting year falls within the period of the Directors’ Report. Emissions are reported based on an operational boundary. The scope of reporting is in line with the GHG Protocol and covers Scope 1, Scope 2 and Scope 3 emissions. Reported Scope 1 emissions cover emissions generated from gas and oil used in buildings, emissions from UK company-owned vehicles used for business travel and emissions from the use of air conditioning and chiller/refrigerant plant. Reported Scope 2 emissions cover emissions generated from the use and purchase of electricity for own use, calculated using both the location and market based methodologies. Reported Scope 3 emissions relate to business travel and commuting undertaken by colleagues and emissions associated with waste and the extraction and distribution of each of our energy sources; electricity, gas and oil. In 2019 the Group has expanded Scope 3 emissions as part of our sustainability strategy to increase transparency of reporting of the Group’s carbon footprint, and to drive reductions in additional categories of emissions; these include Waste Emissions, Upstream Business Travel (the well to tank emissions of rail, air, road vehicles, hired vehicles); Hotels; Commuting; Tube; Taxis. A detailed definition of these emissions can be found in the Group’s 2019 Reporting Criteria online at www.lloydsbankinggroup.com/our-group/responsible-business
Intensity ratio
| Legacy | | | | | | | | | |
| | | Oct 2018 –
Sept 2019 | | | Oct 2017 –
Sept 2018 | | | Oct 2016 –
Sept 2017 | |
| GHG emissions (CO2e) per £m of underlying income (Location Based)1 | | | 11.5 | | | | 13.0 | | | | 15.5 | |
| GHG emissions (CO2e) per £m of underlying income (Market Based)1 | | | 5.6 | | | | 6.2 | | | | 16.4 | |
| | | | | | | | | | | | | |
| Expanded | | | | | | | | | | | | |
| | | | Oct 2018 –
Sept 2019 | | | | Oct 2017 –
Sept 2018 | | | | Oct 2016 –
Sept 2017 | |
| GHG emissions (CO2e) per £m of underlying income (Location Based) – expanded scope2 | | | 15.8 | | | | 17.3 | | | | – | |
| GHG emissions (CO2e) per £m of underlying income (Market Based) – expanded scope2 | | | 9.9 | | | | 10.5 | | | | – | |
| 1 | Intensities have been restated for 2016-2017 and 2017-2018 to reflect changes to emissions data only, replacing estimated data with actuals; underlying income figures for those years have not changed. |
| 2 | Scope 3 emissions have been expanded to include additional elements within the Group’s own operations including emissions from waste, colleague commuting and additional elements of business travel (including taxis, tube, well to tank emissions of business travel and hotels). We have disclosed these figures parallel to legacy scope numbers to allow fairer comparison to numbers previously disclosed and to demonstrate performance versus our previous targets. |
BUSINESS
This year, the Group’s overall location based carbon emissions were 207,768 tCO2e; a 14.6 per cent decrease since 2018 and 63.1 per cent against the Group’s 2009 baseline (legacy scope). Reductions achieved are attributable to an extensive energy optimisation programme and reductions in business travel, alongside decarbonisation of the UK electricity grid. In addition, there has been a reduction in property foot print and headcount.
The Group’s market based emissions figure is equal to 101,042 tCO2e – a comparative decrease of 12.9 per cent year on year and 82.0 per cent against 2009 baseline. Further reductions in market emissions are attributable to the purchase of renewable energy certificates for each of the Group’s operations outside of the UK equivalent to their consumption since January 2019. The Group continues to source solar, wind, hydro and biomass Renewable Energy Guarantees of Origin (REGOs) equivalent to our total UK electricity consumption.
| CO2E emissions (tonnes) – Expanded scope | | | | | | | | | |
| CO2E Emissions Tonnes: | | Oct18 –
Sep19 | | | Oct17 –
Sep181 | | | Oct16 –
Sep171 | |
| Total CO2e (market based) | | | 179,324 | | | | 197,484 | | | | n/a | |
| Total CO2e (location based) | | | 286,051 | | | | 324,816 | | | | n/a | |
| Total Scope 1 | | | 47,524 | | | | 49,299 | | | | 51,953 | |
| Total Scope 2 (market based) | | | 387 | | | | 1,951 | | | | 178,711 | |
| Total Scope 2 (location based) | | | 107,113 | | | | 129,284 | | | | 162,598 | |
| Total Scope 32 | | | 131,414 | | | | 146,233 | | | | n/a | |
| |
| CO2E emissions (tonnes) – Legacy scope | | | | | | | | | | | | |
| CO2E Emissions Tonnes: | | | Oct18 –
Sep19 | | | | Oct17 –
Sep181 | | | | Oct16 –
Sep171 | |
| Total CO2e (market based) | | | 101,042 | | | | 115,961 | | | | 303,065 | |
| Total CO2e (location based) | | | 207,768 | | | | 243,293 | | | | 286,892 | |
| Total Scope 3 | | | 53,131 | | | | 64,710 | | | | 72,876 | |
| 1 | Restated 2018/2017 and 2017/2016 emissions data to improve the accuracy of reporting, using actual data to replace estimates. |
| | |
| | Emissions in tonnes CO2e in line with the GHG Protocol Corporate Standard (2004) including revised Scope 2 guidance (2015) which discloses a Market Based figure in addition to the Location Based figure. |
| | |
| | The measure and reporting criteria for Scope 1, 2, 3 emissions is provided in the Lloyds Banking Group Reporting Criteria statement available online at www.lloydsbankinggroup.com/our-group/responsible-business |
| | |
| | Scope 1 emissions include mobile and stationary combustion of fuel and operation of facilities. |
| | |
| | Scope 2 emissions have been calculated in accordance with GHG Protocol guidelines, in both Location and Market Based methodologies. |
| | |
| 2 | Scope 3 emissions have been expanded to include additional elements within the Group’s own operations including emissions from waste, colleague commuting and additional elements of business travel (including taxis, tube, well to tank emissions of business travel and hotels). We have also disclosed legacy scope numbers to allow fairer comparison to numbers previously disclosed and to demonstrate performance versus our previous targets. |
| | |
| Indicator is subject to Limited ISAE3000 (revised) and 3410 (ISAE3410) assurance by Deloitte LLP for the 2019 Annual Responsible Business Reporting. Deloitte’s 2019 assurance statement and the 2019 Reporting Criteria are available online at www.lloydsbankinggroup.com/our-group/responsible-business |
Omissions
Emissions associated with joint ventures and investments are not included in this disclosure as they fall outside the scope of our operational boundary. The Group does not have any emissions associated with imported heat, steam or imported cooling and is not aware of any other material sources of omissions from our reporting.
PROPERTIES
At 31 December 2019, Lloyds Banking Group occupied 1,768 properties in the UK. Of these, 371 were held as freeholds and 1,397 as leasehold. The majority of these properties are retail branches, widely distributed throughout England, Scotland, Wales and Northern Ireland. Other buildings include the Lloyds Banking Group’s head office in the City of London with other customer service and support centres located to suit business needs but clustered largely in eight core geographic conurbations – London, Edinburgh, Glasgow, Midlands (Birmingham), Northwest (Chester and Manchester), West Yorkshire (Halifax and Leeds), South (Brighton and Andover) and Southwest (Bristol and Cardiff).
In addition, there are 132 properties which are either sub-let or vacant. There are also a number of Automated Teller Machine (ATM) units situated throughout the UK, the majority of which are held as leasehold. The Group also has business operations elsewhere in the world, primarily holding property on a leasehold basis.
BUSINESS
LEGAL ACTIONS AND REGULATORY MATTERS
During the ordinary course of business the Group is subject to threatened or actual legal proceedings and regulatory reviews and investigations both in the UK and overseas. Set out below is a summary of the more significant matters.
PROVISIONS FOR FINANCIAL COMMITMENTS AND GUARANTEES
Provisions are recognised for expected credit losses on undrawn loan commitments and financial guarantees.
PAYMENT PROTECTION INSURANCE (EXCLUDING MBNA)
The Group increased the provision for PPI costs by a further £2,450 million in the year ended 31 December 2019, bringing the total amount provided to £21,875 million.
The charge in 2019 was largely due to the significant increase in PPI information requests (PIRs) leading up to the deadline for submission of claims on 29 August 2019, and also reflects costs relating to complaints received from the Official Receiver as well as administration costs. An initial review of around 60 per cent of the five million PIRs received in the run-up to the PPI deadline has been undertaken, with the conversion rate remaining low, and consistent with the provision assumption of around 10 per cent. The Group has reached final agreement with the Official Receiver.
At 31 December 2019, a provision of £1,578 million remained unutilised relating to complaints and associated administration costs excluding amounts relating to MBNA. Total cash payments were £2,201 million during the year ended 31 December 2019.
Sensitivities
The total amount provided for PPI represents the Group’s best estimate of the likely future cost. A number of risks and uncertainties remain including processing the remaining PIRs and outstanding complaints. The cost could differ from the Group’s estimates and the assumptions underpinning them, and could result in a further provision being required. These may also be impacted by any further regulatory changes and potential additional remediation arising from the continuous improvement of the Group’s operational practices.
For every one per cent increase in PIR conversion rate on the stock as at the industry deadline, the Group would expect an additional charge of approximately £100 million.
PAYMENT PROTECTION INSURANCE (MBNA)
MBNA increased its PPI provision by £367 million in the year ended 31 December 2019 but the Group’s exposure continues to remain capped at £240 million under the terms of the sale and purchase agreement.
OTHER PROVISIONS FOR LEGAL ACTIONS AND REGULATORY MATTERS
In the course of its business, the Group is engaged in discussions with the PRA, FCA and other UK and overseas regulators and other governmental authorities on a range of matters. The Group also receives complaints in connection with its past conduct and claims brought by or on behalf of current and former employees, customers, investors and other third parties and is subject to legal proceedings and other legal actions. Where significant, provisions are held against the costs expected to be incurred in relation to these matters and matters arising from related internal reviews. During the year ended 31 December 2019 the Group charged a further £445 million in respect of legal actions and other regulatory matters, and the unutilised balance at 31 December 2019 was £528 million (31 December 2018: £861 million). The most significant items are as follows.
Arrears handling related activities
The Group has provided an additional £188 million in the year ended 31 December 2019 for the costs of identifying and rectifying certain arrears management fees and activities, taking the total provided to date to £981 million. The Group has put in place a number of actions to improve its handling of customers in these areas and has made good progress in reimbursing arrears fees to impacted customers.
Packaged bank accounts
The Group had provided a total of £795 million up to 31 December 2018 in respect of complaints relating to alleged mis-selling of packaged bank accounts, with no further amounts provided during the year ended 31 December 2019. A number of risks and uncertainties remain, particularly with respect to future volumes.
Customer claims in relation to insurance branch business in Germany
The Group continues to receive claims in Germany from customers relating to policies issued by Clerical Medical Investment Group Limited (subsequently renamed Scottish Widows Limited), with smaller numbers received from customers in Austria and Italy. The industry-wide issue regarding notification of contractual ‘cooling off’ periods continued to lead to an increasing number of claims in 2016 and 2017. Whilst complaint volumes have declined, new litigation claim volumes per month have remained fairly constant throughout 2019. Up to 31 December 2019 the Group had provided a total of £656 million. The validity of the claims facing the Group depends upon the facts and circumstances in respect of each claim. As a result, the ultimate financial effect, which could be significantly different from the current provision, will be known only once all relevant claims have been resolved.
HBOS Reading – review
The Group has now completed its compensation assessment for all 71 business customers within the customer review, with more than 98 per cent of these offers to individuals accepted. In total, more than £100 million in compensation has been offered to victims of the HBOS Reading fraud prior to the publication of Sir Ross Cranston’s independent quality assurance review of the customer review, of which £94 million has so far been accepted, in addition to £9 million for ex-gratia payments and £6 million for the re-imbursements of legal fees. Sir Ross’s review was concluded on 10 December 2019 and made a number of recommendations, including a re-assessment of direct and consequential losses by an independent panel. The Group has committed to implementing Sir Ross’s recommendations in full. In addition, further ex gratia payments of £35,000 have been made to 200 individuals in recognition of the additional delay which will be caused whilst the Group takes further steps to implement Sir Ross’s recommendations. It is not possible to estimate at this stage what the financial impact will be.
HBOS Reading – FCA investigation
The FCA’s investigation into the events surrounding the discovery of misconduct within the Reading-based Impaired Assets team of HBOS has concluded. The Group has settled the matter with the FCA and paid a fine of £45.5 million, as per the FCA’s final notice dated 21 June 2019.
BUSINESS
INTERCHANGE FEES
With respect to multi-lateral interchange fees (MIFs), the Group is not involved in the ongoing litigation (as described below) which involves card schemes such as Visa and Mastercard. However, the Group is a member/licensee of Visa and Mastercard and other card schemes. The litigation in question is as follows:
| – | litigation brought by retailers against both Visa and Mastercard continues in the English Courts (and includes appeals heard by the Supreme Court, judgment awaited); and |
| – | litigation brought on behalf of UK consumers in the English Courts against Mastercard. |
Any impact on the Group of the litigation against Visa and Mastercard remains uncertain at this time. Insofar as Visa is required to pay damages to retailers for interchange fees set prior to June 2016, contractual arrangements to allocate liability have been agreed between various UK banks (including the Group) and Visa Inc, as part of Visa Inc’s acquisition of Visa Europe in 2016. These arrangements cap the maximum amount of liability to which the Group may be subject, and this cap is set at the cash consideration received by the Group for the sale of its stake in Visa Europe to Visa Inc in 2016.
LIBOR AND OTHER TRADING RATES
In July 2014, the Group announced that it had reached settlements totalling £217 million (at 30 June 2014 exchange rates) to resolve with UK and US federal authorities legacy issues regarding the manipulation several years ago of Group companies’ submissions to the British Bankers’ Association (BBA) London Interbank Offered Rate (LIBOR) and Sterling Repo Rate. The Swiss Competition Commission concluded its investigation against Lloyds Bank plc in June 2019. The Group continues to cooperate with various other government and regulatory authorities, including a number of US State Attorneys General, in conjunction with their investigations into submissions made by panel members to the bodies that set LIBOR and various other interbank offered rates.
Certain Group companies, together with other panel banks, have also been named as defendants in private lawsuits, including purported class action suits, in the US in connection with their roles as panel banks contributing to the setting of US Dollar, Japanese Yen and Sterling LIBOR and the Australian BBSW Reference Rate. Certain of the plaintiffs’ claims have been dismissed by the US Federal Court for Southern District of New York (subject to appeals).
Certain Group companies are also named as defendants in (i) UK based claims; and (ii) two Dutch class actions, raising LIBOR manipulation allegations. A number of the claims against the Group in relation to the alleged mis-sale of interest rate hedging products also include allegations of LIBOR manipulation.
It is currently not possible to predict the scope and ultimate outcome on the Group of the various outstanding regulatory investigations not encompassed by the settlements, any private lawsuits or any related challenges to the interpretation or validity of any of the Group’s contractual arrangements, including their timing and scale.
UK SHAREHOLDER LITIGATION
In August 2014, the Group and a number of former directors were named as defendants in a claim by a number of claimants who held shares in Lloyds TSB Group plc (LTSB) prior to the acquisition of HBOS plc, alleging breaches of duties in relation to information provided to shareholders in connection with the acquisition and the recapitalisation of LTSB. Judgment was delivered on 15 November 2019. The Group and former directors successfully defended the claims. The claimants have sought permission to appeal. It is currently not possible to determine the ultimate impact on the Group (if any).
TAX AUTHORITIES
The Group has an open matter in relation to a claim for group relief of losses incurred in its former Irish banking subsidiary, which ceased trading on 31 December 2010. In 2013 HMRC informed the Group that their interpretation of the UK rules which allow the offset of such losses denies the claim for group relief of losses. If HMRC’s position is found to be correct, management estimate that this would result in an increase in current tax liabilities of approximately £800 million (including interest) and a reduction in the Group’s deferred tax asset of approximately £250 million. The Group does not agree with HMRC’s position and, having taken appropriate advice, does not consider that this is a case where additional tax will ultimately fall due. There are a number of other open matters on which the Group is in discussion with HMRC (including the tax treatment of certain costs arising from the divestment of TSB Banking Group plc), none of which is expected to have a material impact on the financial position of the Group.
MORTGAGE ARREARS HANDLING ACTIVITIES – FCA INVESTIGATION
On 26 May 2016, the Group was informed that an enforcement team at the FCA had commenced an investigation in connection with the Group’s mortgage arrears handling activities. It is not currently possible to make a reliable assessment of any liability resulting from the investigation including any financial penalty.
CONTINGENT LIABILITIES RELATING TO OTHER LEGAL ACTIONS AND REGULATORY MATTERS
In addition, during the ordinary course of business the Group is subject to other complaints and threatened or actual legal proceedings (including class or group action claims) brought by or on behalf of current or former employees, customers, investors or other third parties, as well as legal and regulatory reviews, challenges, investigations and enforcement actions, both in the UK and overseas. All such material matters are periodically reassessed, with the assistance of external professional advisers where appropriate, to determine the likelihood of the Group incurring a liability. In those instances where it is concluded that it is more likely than not that a payment will be made, a provision is established to management’s best estimate of the amount required at the relevant balance sheet date. In some cases it will not be possible to form a view, for example because the facts are unclear or because further time is needed properly to assess the merits of the case, and no provisions are held in relation to such matters. In these circumstances, specific disclosure in relation to a contingent liability will be made where material. However the Group does not currently expect the final outcome of any such case to have a material adverse effect on its financial position, operations or cash flows.
BUSINESS
COMPETITIVE ENVIRONMENT
The Group provides financial services to individual and business customers, predominantly in the UK but also overseas. The main business activities of the Group are retail and commercial banking and long-term savings, protection and investment.
MARKET DYNAMICS
The Group continues to operate in an increasingly competitive environment, driven by regulatory changes, shifting customer behaviours and increasing levels of innovation across the sector.
Across the Group’s traditional business lines, ring-fencing regulation has seen a number of competitors deploy excess liquidity to support asset growth within the UK, specifically within mortgages where customer rates have in the last few years hit record lows. While this is beneficial for customers, this has depressed margins across the UK banking sector and more recently has resulted in some smaller participants stepping back from the market.
Beyond this, digital-only providers have grown their share of the UK market within the past year. This growth has predominantly been driven by neo-banks that provide a more traditional customer offering alongside leading digital functionality and are able to target selected customer segments. This is supported by the emergence of marketplace models which enable these providers to collaborate with more specialist fintechs to provide a broader suite of products and financial services, both for personal and business banking customers.
In response, a number of traditional competitors have attempted to replicate the success of neo-banks by developing their own digital-only offerings, often under separate and newly created brand names. A number of international peers have also entered the UK market through digital only challengers, taking advantage of the supportive regulatory environment and increasing similarity in customer behaviours across multiple geographies.
Elsewhere, The Group has also started to see the first signs of large technology companies participating in financial services, often partnering with local incumbent banks across different geographies. While the scale of their future ambitions is uncertain at this stage, the power of their brand and large customer bases pose future disruption threats.
THE GROUP’S RESPONSE
The Group continues to respond effectively to the increasingly competitive environment, supported by its significant reach and proven track record of providing products and services that its customers value with this underpinned by significant investment capacity.
Across its core markets such as mortgages, the Group looked to prioritise value while maintaining share and supporting its purpose of Helping Britain Prosper. As marginal players have withdrawn from the market, the Group has more recently strengthened its position, including through the acquisition of Tesco Bank’s mortgage portfolio in September. Alongside this, the Group has also continued to invest in areas where it is under-represented, such as Insurance and Commercial Banking, in line with the commitments outlined at the start of this strategic plan.
In response to changes to the competitive environment from the ongoing shift in digital usage and new entrants, the Group’s multi-channel and multi-brand offering enables it to continue to effectively meet the varying needs of its diverse customer base. The Group’s digital channel is now its most prominent, with 75 per cent of products now originated digitally and we operates the largest digital bank in the UK with 16.4 million customers and 10.7 million mobile app customers, while its customer satisfaction scores remain strong.
In addition, the Group remains committed to retaining the largest branch network in the UK. This allows its customers to interact with the Group in whichever way they prefer, while also providing a human touch point for more complex financial needs. The Group’s network is also key to building and deepening its business banking relationships. The Group sees these as unique competitive advantages, and combined with its ongoing commitment to innovation, provide the Group with a strong platform to maintain relevance and deepen relationships with its customer base.
Link to principal risks
| Regulatory and legal |
| Conduct |
| Operational |
| People |
Link to strategic priorities
| Delivering a leading customer experience |
| Maximising Group capabilities |
For more information see “Risk Factors – Business and economic risks – The Group’s businesses are conducted in competitive environments, with increased competition scrutiny, and the Group’s financial performance depends upon management’s ability to respond effectively to competitive pressures and scrutiny.”
This page is intentionally blank
operating and financial reView and prospects
The results discussed below are not necessarily indicative of Lloyds Banking Group’s results in future periods. The following information contains certain forward looking statements. For a discussion of certain cautionary statements relating to forward looking statements, seeForward looking statements.
The following discussion is based on and should be read in conjunction with the consolidated financial statements and the related notes thereto included elsewhere in this annual report. For a discussion of the accounting policies used in the preparation of the consolidated financial statements, seeAccounting policiesin note 2 to the financial statements.
TABLE OF CONTENTS
operating and financial reView and prospects
OVERVIEW AND TREND INFORMATION
ECONOMY
Highlights
| Given our focus on UK customers, the Group’s prospects are closely linked to the fortunes of the UK economy. |
| On the assumption that the global economy remains broadly stable, we would expect the UK economy to grow in 2020 to 2022 at a pace slightly above that achieved in the past two years. |
| Our low risk business model and focus on efficiency positions us well irrespective of macro conditions. Nevertheless, if the economy was to be impacted significantly by crystallisation of either domestic or international risks, Group financial performance would be impacted. |
Overview
As a leading UK bank, our prospects are closely aligned to the outlook for the UK economy. Through 2019, the economy continued to show resilience to twin challenges from a slowing global economy and increasing domestic political uncertainty. Although growth of the UK economy has slowed to its weakest since the financial crisis a decade ago, and interest rates remain very low, unemployment has fallen further to a 44 year low and house prices have continued to grow. Barring any sudden shocks to business or consumer confidence, growth is expected to rise mildly in 2020, but international trade-protectionism, the current coronavirus outbreak in China, geo-political instability and the nature of the UK’s exit from the EU, all present risks to that outlook.
Market dynamics
During 2019, there have been divergent trends between UK businesses and households. For businesses, uncertainty for the domestic political and economic outlook translated into a second consecutive year of reduced investment spending and commercial real estate prices fell slightly. Low productivity growth remains a key challenge for the UK economy, however, the flip-side has been buoyant employment. Households continued to increase spending in 2019 as low unemployment boosted pay growth whilst softening global growth reduced inflation.
The UK housing market remained subdued through much of 2019, although falling mortgage rates and the election of a government with a strong Parliamentary majority appeared to be beginning to stimulate the market towards the end of the year. The level of housing transactions was broadly flat at around 20 per cent lower than the norm prior to 2008, with muted price growth.
The economic outlook appears to be improving. Nevertheless, in a long-term context growth is expected to remain subdued and interest rates low - core to that is the low rate of productivity growth, with the recent weakness of businesses’ investment spending suggesting a significant improvement is unlikely near-term. Uncertainty for some UK companies may persist in 2020 and drag on investment as the UK attempts to negotiate a comprehensive trade deal with the EU to a tight timescale. However, improved pay growth is likely to support households’ spending, and the likely fiscal stimulus is expected to provide some boost to the economy.
The fundamental drivers behind the subdued trends in the housing market are expected to remain in place - the high level of prices relative to incomes that constrains first-time-buyer demand, and expectations that interest rates could rise from their current low level.
There are, of course, significant risks to this outlook. The growth-cycle in both of the world’s largest economies - US and China - is in its mature stage, and the coronavirus outbreak and ongoing trade war could complicate the task of policymakers in guiding growth towards a stable and sustainable level. Conversely, high asset prices and corporate debt levels in some countries could be vulnerabilities if an improvement in global economic growth and a resulting rise in interest rates causes unexpected shifts in currencies or herd behaviour in financial markets as shareholders change their appetite between different types of investments. Domestically, the future trading relationship with the EU remains uncertain, as does businesses’ response to that uncertainty.
Barring sudden shocks stemming from these challenges, the UK economy is expected to grow through 2020 to 2022 at around 1.5 per cent, slightly above the 1.4 per cent average across the past two years. The unemployment rate is expected to rise only a little from its current 44 year low. The outlook for the bank rate is uncertain, but capacity constraints and a fiscal boost may support a moderate increase in interest rates. House prices are expected to continue to grow mildly.
This picture of subdued but broadly stable growth is likely to be reflected across our markets. Consumer credit growth has slowed significantly over the past couple of years after a prior period of strong growth, but we expect that the slowdown has now run its course.
Our response
Given our UK focus, the Group’s prospects are closely linked to the performance of the UK economy. Our low risk, stable business model and focus on efficiency positions us well to continue to support customers irrespective of macro conditions.
CRITICAL ACCOUNTING POLICIES
The preparation of financial statements requires management to make estimates and assumptions that affect amounts reported therein. Due to the inherent uncertainty involved in making estimates, actual results reported in future periods may be based upon amounts which differ from those estimates.
The accounting policies that are deemed critical to the Group’s results and financial position, based upon materiality and significant judgements and estimates, are set out in note 3 to the financial statements.
FUTURE ACCOUNTING DEVELOPMENTS
Future developments in relation to the Group’s IFRS reporting are discussed in note 56 to the financial statements.
operating and financial reView and prospects
RESULTS OF OPERATIONS – 2019 AND 2018
SUMMARY
| | | 2019
£m | | | 20181
£m | |
| Net interest income | | | 10,180 | | | | 13,396 | |
| Other income | | | 32,176 | | | | 8,695 | |
| Total income | | | 42,356 | | | | 22,091 | |
| Insurance claims | | | (23,997 | ) | | | (3,465 | ) |
| Total income, net of insurance claims | | | 18,359 | | | | 18,626 | |
| Operating expenses | | | (12,670 | ) | | | (11,729 | ) |
| Trading surplus | | | 5,689 | | | | 6,897 | |
| Impairment | | | (1,296 | ) | | | (937 | ) |
| Profit before tax | | | 4,393 | | | | 5,960 | |
| Tax expense | | | (1,387 | ) | | | (1,454 | ) |
| Profit for the year | | | 3,006 | | | | 4,506 | |
| | | | | | | | | |
| Profit attributable to ordinary shareholders | | | 2,459 | | | | 3,975 | |
| Profit attributable to other equity holders1 | | | 466 | | | | 433 | |
| Profit attributable to equity holders | | | 2,925 | | | | 4,408 | |
| Profit attributable to non-controlling interests | | | 81 | | | | 98 | |
| Profit for the year | | | 3,006 | | | | 4,506 | |
| 1 | Restated to reflect amendments to IAS 12, see note 1 on page F-13. The impact on the year ended 31 December 2018 was an increase in profit for the year of £106 million and on the year ended 31 December 2017 was an increase in profit for the year of £102 million; there was no impact on profit before tax, total shareholder’s equity or on earnings per share in either year. |
During the year ended 31 December 2019, the Group recorded a profit before tax of £4,393 million, a decrease of £1,567 million, or 26 per cent, compared with a profit before tax in 2018 of £5,960 million.
Total income, net of insurance claims, decreased by £267 million, or 1 per cent, to £18,359 million in 2019 compared with £18,626 million in 2018, comprising a £2,949 million increase in other income, net of insurance claims, more than offset by a decrease of £3,216 million in net interest income.
Net interest income was £10,180 million in 2019; a decrease of £3,216 million, or 24 per cent compared to £13,396 million in 2018. There was a significant increase in the amounts payable to unit holders in Open-Ended Investment Companies (OEICs) included in the consolidated results of the Group to £1,822 million in 2019 from a credit of £844 million in 2018. This increase reflects positive market movements in the year, with both equity and debt investments generating significant gains over 2019 compared to negative returns during 2018. The change in population of consolidated OEICs in 2019 compared to 2018 did not have a significant impact. After adjusting for this, net interest income was £550 million, or 4 per cent lower. Average interest-earning assets increased by £14,782 million, or 3 per cent, to £595,003 million in 2019 compared to £580,221 million in 2018 as a result of increased holdings of reverse repurchase agreement balances; excluding these balances average interest-earning assets reduced as growth in targeted segments has been more than offset by lower balances in the closed mortgage book and the impact of the sale of the Irish mortgage portfolio in the first half of 2018. The net interest margin decreased, with the benefit of lower deposit costs, higher Retail current account balances and a benefit from aligning credit card terms, more than offset by continued pressure on asset margins, particularly in the mortgage market.
Other income, net of insurance claims, was £2,949 million, or 56 per cent, higher at £8,179 million in 2019 compared to £5,230 million in 2018. There were increased gains within trading income on policyholder assets in the insurance business, as a result of market performance over the year, particularly in equities, but this was offset by a higher level of insurance claims. Insurance claims expense was £20,532 million higher at £23,997 million in 2019 compared to £3,465 million in 2018. The insurance claims expense in respect of life and pensions business was £20,580 million higher at £23,710 million in 2019 compared to £3,130 million in 2018. Insurance claims in respect of general insurance business were £48 million or 14 per cent, lower at £287 million in 2019 compared to £335 million in 2018, reflecting the run off of closed books.
Fee and commission income was £92 million, or 3 per cent, lower at £2,756 million compared to £2,848 million in 2018 as a result of decreases in commercial and private banking and asset management fees, in part due to the transfer of business into the Group’s new wealth management joint venture. Fee and commission expense decreased by £36 million, or 3 per cent, to £1,350 million compared with £1,386 million in 2018. Insurance premium income was £385 million, or 4 per cent, higher at £9,574 million in 2019 compared with £9,189 million in 2018; there was an increase of £413 million in life insurance premiums only partly offset by a £28 million decrease in general insurance premiums. The increase in life insurance premiums reflects higher levels of bulk annuity deals and the impact of completion of the acquisition of the Zurich workplace pensions business. Other operating income was £988 million, or 51 per cent, higher at £2,908 million in 2019 compared to £1,920 million in 2018, due mainly to an improvement in the income from movement in value of in-force insurance business and the gain on establishment of the wealth management joint venture.
Operating expenses increased by £941 million, or 8 per cent to £12,670 million in 2019 compared with £11,729 million in 2018 reflecting an increase of £1,545 million in charges for redress payments to customers in respect of PPI and other conduct related matters from £1,350 million in 2018 to £2,895 million in 2019. Excluding these charges from both years, operating expenses were £604 million, or 6 per cent, lower at £9,775 million in 2019 compared to £10,379 million in 2018 as a decrease in restructuring costs was coupled with operating cost savings driven by increased efficiency from digitalisation and process improvements. Staff costs were £511 million, or 11 per cent, lower at £4,251 million in 2019 compared with £4,762 million in 2018; as a result of decreased pension charges and redundancy costs. Premises and equipment costs were £238 million lower at £491 million in 2019 compared with £729 million in 2018 following the implementation of IFRS 16. Other expenses were £110 million, or 4 per cent, lower at £2,373 million in 2019 compared with £2,483 million in 2018. Depreciation and amortisation costs were £255 million, or 11 per cent, higher at £2,660 million in 2019 compared to £2,405 million in 2018 due to the charge for depreciation of the right-of-use asset following implementation of IFRS 16.
operating and financial reView and prospects
Impairment losses increased by £359 million, or 38 per cent, to £1,296 million in 2019 compared with £937 million in 2018. Impairment losses in respect of loans and advances to customers were £285 million, or 28 per cent, higher at £1,307 million in 2019 compared with £1,022 million in 2018; this increase is primarily driven by two material corporate cases in Commercial Banking, along with some weakening in used car prices.
In 2019, the Group recorded a tax expense of £1,387 million compared to a tax expense of £1,454 million in 2018. The effective tax rate was 31.6 per cent, compared to the standard UK corporation tax rate of 19.0 per cent. The higher rate was principally as a result of the increase in non-deductible conduct provision charges in relation to PPI, partially offset by the release of a deferred tax liability.
Total assets were £36,295 million, or 5 per cent, higher at £833,893 million at 31 December 2019 compared to £797,598 million at 31 December 2018. Loans and advances to customers increased in the year by £10,130 million to £494,988 million, compared to £484,858 million at 31 December 2018, as a result of a £14,117 million increase in holdings of reverse repurchase agreement balances, as part of a rebalancing of the Group’s liquid asset portfolio. Adjusting for this, loans and advances to customers were £3,987 million, or 1 per cent, lower at £440,388 million compared to £444,375 million at 31 December 2018; an increase of £3,694 million from the acquisition of the Tesco Bank mortgage portfolio and continued growth in targeted segments such as SME and motor finance was more than offset by reductions in the closed mortgage book and in Commercial Banking following a balance sheet optimisation initiative. Financial assets held at fair value through profit or loss increased by £1,660 million overall, holdings within the insurance business increased by £19,952 million as a result of positive market movements on policyholder assets and an increase of £7,350 million on completion of the acquisition of the Zurich workplace pensions and savings business. However, holdings in the banking business were £18,292 million lower as a result of the reduction in trading activities. Property, plant and equipment was £804 million, or 7 per cent, higher at £13,104 million compared to £12,300 million at 31 December 2018; an increase of £1,716 million as a result of the right-of-use asset recognised on transition to IFRS 16, and net additions in the year, have been partly offset by depreciation. Assets arising from reinsurance contracts held increased by £15,707 million, to £23,567 million, compared to £7,860 million at 31 December 2018, largely as a result of an increase of £13,616 million on completion of the acquisition of the Zurich UK workplace pensions and savings business.
Total liabilities were £38,688 million, or 5 per cent, higher at £786,087 million compared to £747,399 million at 31 December 2018. Customer deposits were £3,254 million, or 1 per cent, higher at £421,320 million at 31 December 2019 compared to £418,066 million at 31 December 2018 as a £7,712 million increase in repurchase agreement balances and growth in retail current account balances has been partly offset by lower levels of retail savings products and commercial deposits. Debt securities in issue were £6,521 million higher at £97,689 million at 31 December 2019 compared to £91,168 million at 31 December 2018 following new issuances to maintain funding levels. Insurance and investment contract liabilities have increased by £36,181 million, or 32 per cent, from £112,727 million at 31 December 2018 to £148,908 million at 31 December 2019 as a result of £20,981 million arising on acquisition of the Zurich workplace pensions and savings business together with the impact of new business inflows and policyholder investment gains. Financial liabilities at fair value through profit or loss were £9,061 million, or 30 per cent, lower at £21,486 million at 31 December 2019 compared to £30,547 million at 31 December 2018 following reductions in trading book repurchase agreements, in line with the lower levels of trading activity.
Total equity has decreased by £2,393 million, or 5 per cent, from £50,199 million at 31 December 2018 to £47,806 million at 31 December 2019 as a result of the effect of the defined benefit pension scheme revaluation and a reduction of £1,095 million as a result of the Group’s share buyback programme; retained profits were offset by dividends paid and distributions on other equity instruments.
The Group’s common equity tier 1 (CET1) capital ratio has reduced to 13.6 per cent (31 December 2018: 14.6 per cent), primarily driven by the Group’s share buyback programme, the interim dividend paid during the year and the accrual for the 2019 full year ordinary dividend and the defined benefit pension scheme remeasurements.
During 2019 the Prudential Regulation Authority (PRA) reduced the Group’s Pillar 2A CET1 requirement from 2.7 per cent to 2.6 per cent. Separately, the Financial Policy Committee of the Bank of England announced an increase in the Countercyclical Capital Buffer (CCYB) rate for the UK from 1.0 per cent to 2.0 per cent, effective from December 2020. During 2020 the PRA will consult on a proposed reduction in Pillar 2A total capital requirements by 50 per cent of this increase in the CCYB, equivalent to reducing the Pillar 2A CET1 requirement by 28 per cent of the increase. Taking into account the current and potential future changes to capital requirements, the Board’s view of the ongoing level of CET1 capital required by the Group to grow the business, meet regulatory requirements and cover uncertainties continues to be c.12.5 per cent plus a management buffer of c.1 per cent.
The total capital ratio reduced to 21.3 per cent compared to 22.9 per cent at 31 December 2018, primarily reflecting the reduction in common equity tier 1 capital and the net reduction in Additional Tier 1 securities, offset in part by the reduction in risk-weighted assets.
Risk-weighted assets reduced by £2,935 million, or 1 per cent, to £203,431 million, primarily reflecting the optimisation of the Commercial Banking portfolio, offset in part by mortgage model updates, the implementation of IFRS 16 and the acquisition of the Tesco UK prime residential mortgage portfolio.
The UK leverage ratio reduced to 5.1 per cent compared to 5.5 per cent at 31 December 2018, primarily reflecting the reduction in the fully loaded tier 1 capital position, offset in part by a reduction in the exposure measure.
The Group has recommended a final ordinary dividend of 2.25 pence per share (2018: 2.14 pence per share). This is in addition to the interim ordinary dividend of 1.12 pence per share (2018: 1.07 pence per share) that was paid in September 2019. The total ordinary dividend per share for 2019 of 3.37 pence per share has increased by 5 per cent, from 3.21 pence in 2018.
operating and financial reView and prospects
NET INTEREST INCOME
| | | 2019 | | | 2018 | |
| Net interest income £m | | | 10,180 | | | | 13,396 | |
| Average interest-earning assets £m | | | 595,003 | | | | 580,221 | |
| Average rates: | | | | | | | | |
| Gross yield on interest-earning assets %1 | | | 2.83 | | | | 2.82 | |
| Interest spread %2 | | | 1.52 | | | | 2.22 | |
| Net interest margin %3 | | | 1.71 | | | | 2.31 | |
| 1 | Gross yield is the rate of interest earned on average interest-earning assets. |
| 2 | Interest spread is the difference between the rate of interest earned on average interest-earning assets and the rate of interest paid on average interest-bearing liabilities. |
| 3 | The net interest margin represents the interest spread together with the contribution of interest-free liabilities. It is calculated by expressing net interest income as a percentage of average interest-earning assets. |
Net interest income was £10,180 million in 2019, a decrease of £3,216 million, or 24 per cent, compared to £13,396 million in 2018. Net interest income in 2019 includes a charge of £1,822 million in respect of amounts attributable to third party investors in respect of its consolidated Open-Ended Investment Companies (OEICs), compared to a credit in 2018 of £844 million, as a result of favourable market movements during 2019; the change in population of consolidated OEICs in 2019 compared to 2018 did not have a significant impact. After adjusting for the amounts payable to unitholders, net interest income was £550 million, or 4 per cent, lower at £12,002 million in 2019 compared to £12,552 million in 2018.
Average interest-earning assets were £14,782 million, or 3 per cent, higher at £595,003 million in 2019 compared to £580,221 million in 2018, due to increased holdings of reverse repurchase agreement balances; excluding these and similar balances average interest-earning assets were stable, with the impact of the acquisition of the Tesco Bank mortgage portfolio and growth in targeted segments, in particular SME and UK Motor Finance, more than offset by lower balances in the closed mortgage book and the impact of the sale of the Irish mortgage portfolio in the first half of 2018. Average interest-earning assets in Retail were £690 million, lower at £341,638 million in 2019 compared to £342,328 million in 2018 and average relationship lending and similar interest-earning assets in Commercial Banking were £985 million, or 1 per cent, higher at £92,215 million in 2019 compared to £91,230 million in 2018, as the balance sheet reductions took place towards the end of the year. Average interest-earning assets across the rest of the Group were £14,487 million, or 10 per cent, higher at £161,150 million in 2019 compared to £146,663 million in 2018, reflecting an increase in average reverse repurchase agreement balances.
The net interest margin was 60 basis points lower at 1.71 per cent in 2019 compared to 2.31 per cent in 2018. Adjusting net interest income for the amounts allocated to unitholders in Open-Ended Investment Companies, the net interest margin was 14 basis points lower at 2.02 per cent in 2019 compared to 2.16 per cent in 2018, with the benefit of lower deposit costs, higher Retail current account balances and a benefit from aligning credit card terms, more than offset by continued pressure on asset margins, particularly in the mortgage market.
operating and financial reView and prospects
OTHER INCOME
| | | 2019
£m | | | 2018
£m | |
| Fee and commission income: | | | | | | | | |
| Current account fees | | | 659 | | | | 650 | |
| Credit and debit card fees | | | 982 | | | | 993 | |
| Commercial banking fees | | | 248 | | | | 305 | |
| Unit trust and insurance broking | | | 206 | | | | 221 | |
| Private banking and asset management | | | 69 | | | | 97 | |
| Factoring | | | 103 | | | | 83 | |
| Other fees and commissions | | | 489 | | | | 499 | |
| | | | 2,756 | | | | 2,848 | |
| Fee and commission expense | | | (1,350 | ) | | | (1,386 | ) |
| Net fee and commission income | | | 1,406 | | | | 1,462 | |
| Net trading income | | | 18,288 | | | | (3,876 | ) |
| Insurance premium income | | | 9,574 | | | | 9,189 | |
| Gains on sale of financial assets at fair value through other comprehensive income | | | 196 | | | | 275 | |
| Gain related to establishment of joint venture | | | 244 | | | | – | |
| Other | | | 2,468 | | | | 1,645 | |
| Other operating income | | | 2,908 | | | | 1,920 | |
| Total other income | | | 32,176 | | | | 8,695 | |
Other income was £23,481 million higher at £32,176 million in 2019 compared to £8,695 million in 2018.
Fee and commission income was £92 million, or 3 per cent, lower at £2,756 million in 2019 compared with £2,848 million in 2018. Current account fees were £9 million, or 1 per cent, higher at £659 million in 2019 compared to £650 million in 2018, but there was a decrease of £11 million, or 1 per cent, in credit and debit card fees from £993 million in 2018 to £982 million in 2019 following a restructuring of late charge fees. Commercial banking fees were £57 million, or 19 per cent, lower at £248 million in 2019 compared to £305 million in 2018 as a result of reductions in lending as part of a balance sheet optimisation initiative. Private banking and asset management fees were £28 million, or 29 per cent, lower at £69 million in 2019 compared to £97 million in 2018 following the transfer of business into the Group’s new wealth management joint venture; and other fees and commissions receivable were £10 million, or 2 per cent, lower at £489 million in 2019 compared to £499 million in 2018.
Fee and commission expense was £36 million, or 3 per cent, lower at £1,350 million in 2019 compared to £1,386 million in 2018; lower interchange fees followed reduced customer usage of ATMs and there were reductions in value-added account package costs and other fees payable.
Net trading income was £22,164 million, higher at £18,288 million in 2019 compared with a loss of £3,876 million in 2018. Net trading income within the insurance businesses was £22,303 million, higher at of £17,273 million in 2019 compared to a loss of £5,030 million in 2018, which reflected strong investment performance in 2019 compared to market losses in 2018 on both debt security and equity investments. Net trading income within the Group’s banking activities was £139 million, or 12 per cent, lower at £1,015 million in 2019 compared to £1,154 million in 2018; the Group’s trading activities have reduced.
Insurance premium income was £9,574 million in 2019 compared with £9,189 million in 2018; an increase of £385 million, or 4 per cent. Earned premiums in respect of the Group’s long-term life and pensions business were £413 million, or 5 per cent, higher at £8,932 million in 2019 compared to £8,519 million in 2018 reflecting an increased level of bulk annuity deals in 2019 and the impact of the completion of the acquisition of Zurich Insurance Group’s UK workplace pensions and savings business. General insurance earned premiums were £28 million, or 4 per cent, lower at £642 million in 2019 compared with £670 million in 2018 as a result of reduced new business and the continued run-off of closed books.
Other operating income was £988 million, or 51 per cent, higher at £2,908 million in 2019 compared to £1,920 million in 2018. There was an improvement of £880 million in the movement in value of in-force business as a result of improved market conditions as well as the favourable impact of assumption changes. In 2019 the Group also realised a gain of £244 million from transactions relating to the establishment of the Schroders Personal Wealth joint venture.
operating and financial reView and prospects
OPERATING EXPENSES
| | | 2019
£m | | | 2018
£m | |
| Administrative expenses: | | | | | | | | |
| Staff: | | | | | | | | |
| Salaries | | | 2,539 | | | | 2,482 | |
| Performance-based compensation | | | 380 | | | | 509 | |
| Social security costs | | | 325 | | | | 343 | |
| Pensions and other post-retirement benefit schemes | | | 532 | | | | 705 | |
| Restructuring costs | | | 92 | | | | 249 | |
| Other staff costs | | | 383 | | | | 474 | |
| | | | 4,251 | | | | 4,762 | |
| Premises and equipment: | | | | | | | | |
| Rent and rates | | | 93 | | | | 370 | |
| Repairs and maintenance | | | 187 | | | | 190 | |
| Other | | | 211 | | | | 169 | |
| | | | 491 | | | | 729 | |
| Other expenses: | | | | | | | | |
| Communications and data processing | | | 1,038 | | | | 1,121 | |
| Advertising and promotion | | | 170 | | | | 197 | |
| Professional fees | | | 226 | | | | 287 | |
| UK bank levy | | | 224 | | | | 225 | |
| Other | | | 715 | | | | 653 | |
| | | | 2,373 | | | | 2,483 | |
| Depreciation and amortisation: | | | | | | | | |
| Depreciation of tangible fixed assets | | | 2,064 | | | | 1,852 | |
| Amortisation of acquired value of in-force non-participating investment contracts | | | 30 | | | | 40 | |
| Amortisation of other intangible assets | | | 566 | | | | 513 | |
| | | | 2,660 | | | | 2,405 | |
| Total operating expenses, excluding regulatory provisions | | | 9,775 | | | | 10,379 | |
| Regulatory provisions: | | | | | | | | |
| Payment protection insurance provision | | | 2,450 | | | | 750 | |
| Other regulatory provisions | | | 445 | | | | 600 | |
| | | | 2,895 | | | | 1,350 | |
| Total operating expenses | | | 12,670 | | | | 11,729 | |
| Cost:income ratio (%)1 | | | 69.0 | | | | 63.0 | |
| 1 | Total operating expenses divided by total income, net of insurance claims. |
Operating expenses increased by £941 million, or 8 per cent, to £12,670 million in 2019 compared with £11,729 million in 2018 due to an increase in the charge for conduct related matters.
Staff costs were £511 million, or 11 per cent, lower in 2019 at £4,251 million compared to £4,762 million in 2018. On a full-time equivalent basis, the Group had 63,069 employees at the end of 2019, a reduction of 1,859 from 64,928 employees at 31 December 2018. Salaries were £57 million, or 2 per cent, higher at £2,539 million in 2019 compared with £2,482 million in 2018 as the benefit of the reduction in staff numbers has been more than offset by the effect of annual pay rises and the acquisition of the Zurich work place pensions business. Pension costs were £173 million, or 25 per cent, lower at £532 million in 2019 compared to £705 million in 2018, in part due to the inclusion in 2018 of a past service charge of £108 million following legal clarification of requirements regarding Guaranteed Minimum Pension benefits, compared to a charge of £33 million in 2019. Social security costs were £18 million, or 5 per cent, lower at £325 million in 2019 compared with £343 million in 2018. Restructuring costs were £157 million lower at £92 million in 2019 compared to £249 million in 2018, reflecting a significant reduction in charges in relation to the Group’s strategic investment plans, and other staff costs were £91 million, or 19 per cent, lower at £383 million in 2019 compared with £474 million in 2018.
Premises and equipment costs were £238 million, or 33 per cent, lower at £491 million in 2019 compared to £729 million in 2018 following the implementation of IFRS 16, as a result of which rent and rates were £277 million lower at £93 million in 2019 compared to £370 million in 2018; repairs and maintenance costs were £3 million, or 2 per cent, lower at £187 million in 2019 compared to £190 million in 2018 and other premises and equipment costs increased by £42 million, or 25 per cent, from £169 million in 2018 to £211 million in 2019 reflecting a lower level of gains on disposal of premises and other fixed assets.
OPERATING AND FINANCIAL REVIEW AND PROSPECTS
Other expenses, excluding the regulatory provisions charges, were £110 million, or 4 per cent, lower at £2,373 million in 2019 compared with £2,483 million in 2018. Communications and data processing costs were £83 million, or 7 per cent, lower at £1,038 million in 2019 compared with £1,121 million in 2018 as a result of the renegotiation of contracts and costs in 2018 relating to ring-fencing and the integration of MBNA. Professional fees were £61 million, or 21 per cent, lower at £226 million in 2019 compared to £287 million in 2018, as a result of the expenditure incurred in 2018 on ring-fencing and other projects, and advertising and promotion costs were £27 million, or 14 per cent, lower at £170 million in 2019 compared with £197 million in 2018, again due to ring-fencing related expenditure in 2018. Other costs were £62 million, or 9 per cent, higher at £715 million in 2019 compared with £653 million in 2018.
Depreciation and amortisation costs were £255 million, or 11 per cent, higher at £2,660 million in 2019 compared with £2,405 million in 2018, as a result of the implementation of IFRS 16; charges for the depreciation of tangible fixed assets were £212 million, or 11 per cent, higher at £2,064 million in 2019 compared to £1,852 million in 2018, due to a charge of £216 million on the right-of-use asset. The charge for the amortisation of intangible assets was £53 million, or 10 per cent, higher at £566 million in 2019 compared to £513 million in 2018, reflecting the impact of increased levels of software capitalisation.
The Group incurred a regulatory provisions charge in operating expenses of £2,895 million in 2019 compared to £1,350 million in 2018 of which £2,450 million related to payment protection insurance; this charge was largely due to the significant increase in PPI information requests (PIRs) leading up to the deadline for submission of claims on 29 August 2019, and also reflects costs relating to complaints received from the Official Receiver as well as administration costs. An initial review of around 60 per cent of the five million PIRs received in the run-up to the PPI deadline has been undertaken, with the conversion rate remaining low, and consistent with the provision assumption of around 10 per cent. The Group has also reached final agreement with the Official Receiver. The unutilised provision at 31 December 2019 was £1,578 million. The charge in relation to other conduct issues was £445 million in 2019, compared to £600 million in 2018; this charge included £188 million (2018: £151 million) in respect of arrears handling activities.
IMPAIRMENT
| | | 2019
£m | | | 2018
£m | |
| Impairment losses on financial assets carried at amortised cost | | | | | | | | |
| Loans and advances to banks | | | – | | | | 1 | |
| Loans and advances to customers | | | 1,307 | | | | 1,022 | |
| Debt securities | | | – | | | | – | |
| Other assets | | | 5 | | | | 1 | |
| Total impairment losses on financial assets carried at amortised cost | | | 1,312 | | | | 1,024 | |
| Impairment of financial assets carried at fair value through other comprehensive income | | | (1 | ) | | | (14 | ) |
| Loan commitments and financial guarantees | | | (15 | ) | | | (73 | ) |
| Total impairment charged to the income statement | | | 1,296 | | | | 937 | |
Impairment losses increased by £359 million, or 38 per cent, to £1,296 million in 2019 compared to £937 million in 2018. Credit quality remains strong; the increased impairment charge was primarily driven by two material corporate cases in Commercial Banking, along with some weakening in used car prices.
The impairment charge in respect of loans and advances to customers was £285 million, or 28 per cent, higher at £1,307 million in 2019 compared to £1,022 million in 2018. In Retail, impairment charges increased as a result of some weakening in used car prices, methodology refinements and lower cash recoveries following prior year debt sales. In Commercial Banking, the increased charge was driven by the two material corporate impairments.
OPERATING AND FINANCIAL REVIEW AND PROSPECTS
TAXATION
| | | 2019
£m | | | 20181
£m | |
| UK corporation tax: | | | | | | | | |
| Current tax on profits for the year | | | (1,389 | ) | | | (1,280 | ) |
| Adjustments in respect of prior years | | | 96 | | | | 11 | |
| | | | (1,293 | ) | | | (1,269 | ) |
| Foreign tax: | | | | | | | | |
| Current tax on profits for the year | | | (70 | ) | | | (34 | ) |
| Adjustments in respect of prior years | | | 2 | | | | 5 | |
| | | | (68 | ) | | | (29 | ) |
| Current tax charge | | | (1,361 | ) | | | (1,298 | ) |
| Deferred tax | | | (26 | ) | | | (156 | ) |
| Tax expense | | | (1,387 | ) | | | (1,454 | ) |
| 1 | Restated to reflect amendments to IAS 12, see note 1 on page F-13. |
In 2019, a tax expense of £1,387 million arose on the profit before tax of £4,393 million and in 2018 a tax expense of £1,454 million arose on the profit before tax of £5,960 million.
The tax expense for 2019 represents an effective tax rate of 31.6 per cent compared to 24.4 per cent in 2018 and compared to a statutory corporation tax rate of 19.0 per cent in both 2018 and 2019. The increase in effective tax rate compared to 2018 was largely due to the increase in non-deductible conduct provision charges in relation to PPI, partially offset by the benefit of a prior year deferred tax adjustment.
OPERATING AND FINANCIAL REVIEW AND PROSPECTS
DIVISIONAL INFORMATION
The requirements for IFRS segmental reporting are set out in IFRS 8,Operating Segmentswhich mandates that an entity’s segmental reporting should reflect the way in which its operations are viewed and judged by its chief operating decision maker. As a consequence, the Group’s statutory segmental reporting follows the underlying basis as explained below (see also note 4 to the financial statements).
The Group Executive Committee, which is the chief operating decision maker for the Group, reviews the Group’s internal reporting based around these segments (which reflect the Group’s organisational and management structures) in order to assess performance and allocate resources. The segments are differentiated by the type of products provided and by whether the customers are individuals or corporate entities and the performance assessment includes a consideration of each segment’s net interest revenue; consequently the total interest income and expense for all reportable segments is presented on a net basis. The internal reporting is on an underlying profit before tax basis. The Group Executive Committee believes that this basis better represents the underlying performance of the Group. IFRS 8 requires that the Group presents its segmental profit before tax on the basis reviewed by the chief operating decision maker that is most consistent with the measurement principles used in measuring the Group’s statutory profit before tax. Accordingly, the Group presents its segmental underlying basis profit before tax in note 4 to the financial statements.
The aggregate total of the underlying basis segmental results constitutes a non-GAAP measure as defined in the United States Securities and Exchange Commission’s Regulation G. Management uses aggregate underlying profit before tax, a non-GAAP measure, as a measure of performance and believes that it provides important information for investors because it is a comparable representation of the Group’s performance. Profit before tax is the comparable GAAP measure to aggregate underlying profit before tax. The table below sets out the reconciliation of this non-GAAP measure to its comparable GAAP measure.
The Group’s activities are organised into three financial reporting segments: Retail; Commercial Banking; and Insurance and Wealth.
During 2019, the Group transferred Cardnet, its card payment acceptance service, from Retail into Commercial Banking and also transferred certain equity business from Commercial Banking into Central items. Comparatives have been restated accordingly.
Comparisons of results on a historical consolidated statutory basis are impacted by a number of items. In order to provide more meaningful and relevant comparatives, the results of the Group and divisions are presented on an ‘underlying’ basis. The following items are excluded in arriving at underlying profit:
| | – | restructuring, including severance-related costs, the costs of implementing regulatory reform including ring-fencing, the rationalisation of the non-branch property portfolio, the establishment of the Schroders strategic partnership, the integration of MBNA and Zurich’s UK workplace pensions and savings business; |
| | | |
| | – | market volatility and other items, which includes the effects of certain asset sales, the volatility relating to the Group’s own debt and hedging arrangements and that arising in the insurance businesses and insurance gross up, the unwind of acquisition-related fair value adjustments and the amortisation of purchased intangible assets; and |
| | | |
| | – | payment protection insurance provisions. |
The results of the businesses are set out below on the underlying basis:
| | | 2019
£m | | | 20181
£m | |
| Retail | | | 3,839 | | | | 4,211 | |
| Commercial Banking | | | 1,777 | | | | 2,183 | |
| Insurance and Wealth | | | 1,101 | | | | 927 | |
| Other | | | 814 | | | | 745 | |
| Underlying profit before tax | | | 7,531 | | | | 8,066 | |
| 1 | Segmental analysis restated, as explained above. |
OPERATING AND FINANCIAL REVIEW AND PROSPECTS
Reconciliation of statutory profit to underlying profit before tax for the year
| | | Note | | | 2019
£m | | | 2018
£m | |
| Statutory profit before tax | | | | | | | 4,393 | | | | 5,960 | |
| Market volatility and asset sales | | | 1 | | | | (126 | ) | | | 50 | |
| Amortisation of purchased intangibles | | | 2 | | | | 68 | | | | 108 | |
| Restructuring costs | | | 3 | | | | 471 | | | | 879 | |
| Fair value unwind and other items | | | 4 | | | | 275 | | | | 319 | |
| Payment protection insurance provision | | | 5 | | | | 2,450 | | | | 750 | |
| Underlying profit before tax | | | | | | | 7,531 | | | | 8,066 | |
| 1. | Market volatility and asset sales |
Market volatility and asset sales of £126 million included adverse movements in banking volatility and a gain on establishment of the Schroders Personal Wealth joint venture as well as the one-off charge for exiting the Standard Life Aberdeen investment management agreement. Also included was positive insurance and policyholder interests volatility, which is a deduction from statutory profit before tax in the reconciliation above, totalling £76 million compared to negative volatility of £103 million in 2018.
This insurance and policyholder interests volatility comprises the following:
| | | 2019
£m | | | 2018
£m | |
| Insurance volatility | | | 230 | | | | (506 | ) |
| Policyholder interests volatility | | | 193 | | | | 46 | |
| Insurance hedging arrangements | | | (347 | ) | | | 357 | |
| Total | | | 76 | | | | (103 | ) |
Management believes that excluding volatility from underlying profit before tax provides useful information for investors on the performance of the business as it excludes amounts included within profit before tax which do not accrue to the Group’s equity holders and excludes the impact of changes in market variables which are beyond the control of management.
The most significant limitations associated with excluding volatility from the underlying basis results are:
| (i) | Insurance volatility requires an assumption to be made for the normalised return on equities and other investments; and |
| | |
| (ii) | Insurance volatility impacts on the Group’s regulatory capital position, even though it is not included within underlying profit before tax. |
Management compensates for the limitations above by:
| (i) | Monitoring closely the assumptions used to calculate the normalised return used within the calculation of insurance volatility; these assumptions are disclosed below; and |
| | |
| (ii) | Producing separate reports on the Group’s current and forecast capital ratios. |
Insurance volatility
The Group’s insurance business has policyholder liabilities that are supported by substantial holdings of investments. IFRS requires that the changes in both the value of the liabilities and investments are reflected within the income statement. The value of the liabilities does not move exactly in line with changes in the value of the investments. As the investments are substantial, movements in their value can have a significant impact on the profitability of the Group. Management believes that it is appropriate to disclose the division’s results on the basis of an expected return in addition to results based on the actual return. The impact of the actual return on these investments differing from the expected return is included within insurance volatility.
The expected gross investment returns used to determine the underlying profit of the business are based on prevailing market rates and published research into historical investment return differentials for the range of assets held. The basis for calculating these expected returns reflects an average of the 15 year swap rate over the preceding 12 months updated throughout the year to reflect changing market conditions. The volatility movements in the period were largely driven by insurance volatility arising from equity market movements and credit spreads. The capital impact of equity market movements is hedged within Insurance and this also reduces the IFRS earnings exposure.
Policyholder interests volatility
The application of accounting standards results in the introduction of other sources of significant volatility into the pre-tax profits of the life, pensions and investments business. In order to provide a clearer representation of the performance of the business, and consistent with the way in which it is managed, adjustments are made to remove this volatility from underlying profits. The effect of these adjustments is separately disclosed as policyholder interests volatility.
Accounting standards require that tax on policyholder investment returns relating to life products should be included in the Group’s tax charge rather than being offset against the related income. The result is, therefore, to either increase or decrease profit before tax with a related change in the tax charge. Timing and measurement differences exist between provisions for tax and charges made to policyholders. Consistent with the expected approach taken in respect of insurance volatility, differences in the expected levels of the policyholder tax provision and policyholder charges are adjusted through policyholder interests volatility. In 2019, the statutory results before tax included a credit to other income which relates to policyholder interests volatility totalling £193 million reflecting movements in equity, bond and gilt returns relating to life products.
OPERATING AND FINANCIAL REVIEW AND PROSPECTS
Insurance hedging arrangements
The Group actively manages its exposures to interest rate, foreign currency exchange rate, inflation and market movements within the banking book through a comprehensive hedging strategy. This helps to mitigate earnings volatility and reduces the impact of market movements on the capital position.
| 2. | Amortisation of purchased intangibles |
The Group incurred a charge for the amortisation of intangible assets, principally those recognised on the acquisition of HBOS, of £68 million (2018: £108 million).
Restructuring costs were £471 million (2018: £879 million) and included severance costs relating to the Group’s strategic investment plans as well as the costs of the integration of MBNA and Zurich’s UK workplace pensions and savings business and the establishment of the Schroders Personal Wealth Joint venture.
| 4. | Fair value unwind and other items |
The statutory results include the impact of the acquisition-related fair value adjustments, arising from the acquisition of HBOS and MBNA. In 2019 the principal financial effect of the fair value unwind is to reflect the effective interest rates applicable at the date of acquisition, on liabilities that were acquired at values that differed from their original book value.
| 5. | Payment protection insurance (PPI) provision |
The PPI charge of £2,450 million was largely due to the significant increase in PPI information requests (PIRs) leading up to the deadline for submission of claims on 29 August 2019, and also reflects costs relating to complaints received from the Official Receiver as well as administration costs. An initial review of around 60 per cent of the five million PIRs received in the run-up to the PPI deadline has been undertaken, with the conversion rate remaining low, and consistent with the provision assumption of around 10 per cent. The Group has also reached final agreement with the Official Receiver. The unutilised provision at 31 December 2019 was £1,578 million.
OPERATING AND FINANCIAL REVIEW AND PROSPECTS
DIVISIONAL RESULTS
RETAIL
Retail offers a broad range of financial service products to personal and business banking customers, including current accounts, savings, mortgages, credit cards, unsecured loans, motor finance and leasing solutions. Its aim is to be the best bank for customers in the UK, by building deep and enduring relationships that deliver value, and by providing them with choice and flexibility, with propositions increasingly personalised to their needs. Retail operates a multi-brand and multi-channel strategy. It continues to simplify its business and provide more transparent products, helping to improve service levels and reduce conduct risks, whilst working within a prudent risk appetite.
| | | 2019
£m | | | 20181
£m | |
| Net interest income | | | 8,807 | | | | 9,060 | |
| Other income | | | 2,014 | | | | 2,097 | |
| Total income | | | 10,821 | | | | 11,157 | |
| Operating lease depreciation | | | (946 | ) | | | (921 | ) |
| Net income | | | 9,875 | | | | 10,236 | |
| Operating costs | | | (4,760 | ) | | | (4,897 | ) |
| Remediation | | | (238 | ) | | | (267 | ) |
| Total costs | | | (4,998 | ) | | | (5,164 | ) |
| Impairment | | | (1,038 | ) | | | (861 | ) |
| Underlying profit | | | 3,839 | | | | 4,211 | |
| 1 | Restated, as explained on page F-25. |
Underlying profit reduced by £372 million, or 9 per cent, to £3,839 million in 2019 compared to £4,211 million in 2018.
Net interest income reduced by £253 million, or 3 per cent, to £8,807 million in 2019 compared to £9,060 million in 2018, reflecting continued pressure on mortgage margins, partly offset by lower funding costs and a benefit from aligning credit card terms.
Other income decreased £83 million, or 4 per cent, to £2,014 million in 2019 compared to £2,097 million in 2018, reflecting a lower Lex Fleet size.
Operating lease depreciation increased £25 million, or 3 per cent, to £946 million in 2019 compared to £921 million in 2018, reflecting some weakening in used car prices through the first three quarters of 2019, partly offset by lower Lex fleet size.
Operating expenses reduced by £137 million, or 3 per cent, to £4,760 million in 2019 compared to £4,897 million in 2018 as increased investment in the business was more than offset by efficiency savings.
Remediation costs decreased by £29 million, or 11 per cent to £238 million in 2019 compared to £267 million in 2018.
Impairment increased by £177 million, or 21 per cent, to £1,038 million in 2019 compared to £861 million in 2018, as a result of some weakening in used car prices, methodology refinements and lower cash recoveries following prior year debt sales, while underlying drivers remain strong, particularly in the mortgage book.
OPERATING AND FINANCIAL REVIEW AND PROSPECTS
COMMERCIAL BANKING
Commercial Banking has a client-led, low risk, capital efficient strategy, committed to supporting UK-based clients and international clients with a link to the UK. Through its segmented client coverage model it provides clients with a range of products and services such as lending, transactional banking, working capital management, risk management and debt capital markets services. Continued investment in capabilities and digital propositions enables the delivery of a leading customer experience, supported by increasingly productive relationship managers, with more time spent on value-adding activities.
| | | 2019
£m | | | 20181
£m | |
| Net interest income | | | 2,918 | | | | 3,013 | |
| Other income | | | 1,422 | | | | 1,670 | |
| Total income | | | 4,340 | | | | 4,683 | |
| Operating lease depreciation | | | (21 | ) | | | (35 | ) |
| Net income | | | 4,319 | | | | 4,648 | |
| Operating costs | | | (2,081 | ) | | | (2,191 | ) |
| Remediation | | | (155 | ) | | | (203 | ) |
| Total costs | | | (2,236 | ) | | | (2,394 | ) |
| Impairment | | | (306 | ) | | | (71 | ) |
| Underlying profit | | | 1,777 | | | | 2,183 | |
| 1 | Restated, as explained on page F-25. |
Commercial Banking underlying profit decreased by £406 million, or 19 percent to £1,777 million in 2019 compared to £2,183 million in 2018 reflecting lower income and higher impairments partially offset by lower expenses.
Net interest income decreased by £95 million, or 3 per cent, to £2,918 million in 2019 compared to £3,013 million in 2018 reflecting asset margin pressure.
Other income decreased by £248 million to £1,422 million in 2019 compared to £1,670 million in 2018 reflecting challenging market conditions leading to lower levels of client activity, particularly in markets.
Operating costs decreased by £110 million to £2,081 million in 2019 compared to £2,191 million in 2018 reflecting efficiency savings and despite increased investment.
Remediation costs decreased by £48 million to £155 million in 2019 compared to £203 million in 2018.
Impairments increased by £235 million, to £306 million charge in 2019 compared to £71 million in 2018 with the increase driven by two individual corporate cases.
OPERATING AND FINANCIAL REVIEW AND PROSPECTS
INSURANCE AND WEALTH
Insurance and Wealth offers insurance, investment and wealth management products and services. It supports over 10 million customers with assets under administration of £170 billion and annualised annuity payments in retirement of over £1 billion. The Group continues to invest significantly in the development of the business, with the aims of capturing considerable opportunities in pensions and financial planning, offering customers a single home for their banking and insurance needs and driving growth across intermediary and relationship channels through a strong distribution model.
| | | 2019
£m | | | 2018
£m | |
| Net interest income | | | 112 | | | | 123 | |
| Other income | | | 2,021 | | | | 1,865 | |
| Total income | | | 2,133 | | | | 1,988 | |
| Operating costs | | | (982 | ) | | | (1,021 | ) |
| Remediation | | | (50 | ) | | | (39 | ) |
| Total costs | | | (1,032 | ) | | | (1,060 | ) |
| Impairment | | | – | | | | (1 | ) |
| Underlying profit | | | 1,101 | | | | 927 | |
Underlying profit from Insurance and Wealth was £174 million, or 19 per cent higher at £1,101 million compared to £927 million in 2018 as a result of an increase of £145 million in total income and a £39 million decrease in operating costs, partly offset by an increase in remediation costs.
Net interest income decreased by £11 million, or 9 per cent, to £112 million from £123 million in 2018.
Other income increased by £156 million, or 8 per cent to £2,021 million from £1,865 million in 2018. Life and pensions new business income was up 19 per cent to £628 million. Higher experience and other items includes a one-off benefit from the change in investment management provider. General insurance income net of claims increased, benefitting from benign weather in 2019.
Operating costs were £39 million lower with cost savings offsetting higher investment in the business.
Remediation increased by £11 million, or 27 per cent, to £50 million from £39 million.
INCOME BY PRODUCT GROUP
| | | 2019 | | | 2018 | |
| | | New
business
income
£m | | | Existing
business
income
£m | | | Total
income
£m | | | New
business
income
£m | | | Existing
business
income
£m | | | Total
income
£m | |
| Workplace, planning and retirement | | | 387 | | | | 120 | | | | 507 | | | | 333 | | | | 153 | | | | 486 | |
| Individual and bulk annuities | | | 209 | | | | 68 | | | | 277 | | | | 160 | | | | 84 | | | | 244 | |
| Protection | | | 21 | | | | 24 | | | | 45 | | | | 20 | | | | 22 | | | | 42 | |
| Longstanding life, pensions and investments | | | 11 | | | | 384 | | | | 395 | | | | 13 | | | | 414 | | | | 427 | |
| | | | 628 | | | | 596 | | | | 1,224 | | | | 526 | | | | 673 | | | | 1,199 | |
| Life and pensions experience and other items | | | | | | | | | | | 255 | | | | | | | | | | | | 143 | |
| General Insurance | | | | | | | | | | | 326 | | | | | | | | | | | | 272 | |
| | | | | | | | | | | | 1,805 | | | | | | | | | | | | 1,614 | |
| Wealth | | | | | | | | | | | 328 | | | | | | | | | | | | 374 | |
| Total income | | | | | | | | | | | 2,133 | | | | | | | | | | | | 1,988 | |
New business income has increased by £102 million to £628 million, driven by increases in new members in existing workplace schemes, increased auto enrolment workplace contributions and bulk annuities.
Existing business income has decreased by £77 million from £673 million, due to the equity hedging strategy to reduce capital and earnings volatility.
Experience and other items contributed a net benefit of £255 million. This was £112 million higher than 2018 and includes a one-off benefit from the change in investment management provider.
OPERATING AND FINANCIAL REVIEW AND PROSPECTS
OTHER
Other comprises Central items which include income and expenditure not attributed to divisions, including the costs of certain central and head office functions and the Group’s private equity business, Lloyds Development Capital.
| | | 2019
£m | | | 20181
£m | |
| Total income | | | 815 | | | | 896 | |
| Operating costs | | | (52 | ) | | | (56 | ) |
| Remediation | | | (2 | ) | | | (91 | ) |
| Total costs | | | (54 | ) | | | (147 | ) |
| Impairment release (charge) | | | 53 | | | | (4 | ) |
| Underlying profit | | | 814 | | | | 745 | |
| 1 | Restated, as explained on page F-25. |
Profit before tax was £69 million, or 9 per cent, higher at £814 million in 2019 compared to £745 million in 2018.
Total income, which includes the central recovery of the Group’s distributions on other equity instruments and gains on the sale of gilts and other liquid assets, reduced by £81 million, or 9 per cent to £815 million compared to £896 million in 2018.
Total costs were £93 million lower at £54 million in 2019 compared to £147 million in 2018 reflecting a £89 million reduction in the remediation charge from £91 million in 2018 to £2 million in 2019.
There was an impairment release of £53 million compared to a small charge of £4 million in 2018; the credit in 2019 included releases relating to the reassessment of credit risk associated with debt instruments held within the Group’s equity investments business.
RESULTS OF OPERATIONS – 2017
The Group’s results for the year ended 31 December 2017, and a discussion of the results for the year ended 31 December 2018 compared to those for the year ended 31 December 2017 (prior to the restatement described in the footnote to the table on page 17), were included in the 2018 Form 20-F, filed on 25 February 2019.
OPERATING AND FINANCIAL REVIEW AND PROSPECTS
AVERAGE BALANCE SHEET AND NET INTEREST INCOME
| | | 2019 | | 2018 | | 2017 |
| | | Average
balance
£m | | | Interest
income
£m | | | Yield
% | | | Average
balance
£m | | | Interest
income
£m | | | Yield
% | | | Average
balance
£m | | | Interest
income
£m | | | Yield
% | |
| Assets | | | | | | | | | | | | | | | | | | | | | | | | | | | | | | | | | | | | |
| Financial assets at amortised cost: | | | | | | | | | | | | | | | | | | | | | | | | | | | | | | | | | | | | |
| Loans and advances to banks | | | 65,504 | | | | 514 | | | | 0.78 | | | | 67,609 | | | | 565 | | | | 0.84 | | | | 67,049 | | | | 271 | | | | 0.40 | |
| Loans and advances to customers | | | 497,574 | | | | 15,790 | | | | 3.17 | | | | 476,149 | | | | 15,078 | | | | 3.17 | | | | 464,944 | | | | 14,712 | | | | 3.16 | |
| Debt securities | | | 5,464 | | | | 122 | | | | 2.23 | | | | 4,129 | | | | 66 | | | | 1.60 | | | | 3,332 | | | | 43 | | | | 1.29 | |
| Held-to-maturity investments | | | | | | | | | | | | | | | | | | | | | | | | | | | – | | | | – | | | | – | |
| Financial assets at fair value through other comprehensive income | | | 26,461 | | | | 435 | | | | 1.64 | | | | 32,334 | | | | 640 | | | | 1.98 | | | | | | | | | | | | | |
| Available-for-sale financial assets | | | | | | | | | | | | | | | | | | | | | | | | | | | 50,049 | | | | 980 | | | | 1.96 | |
| Total interest-earning assets of banking book | | | 595,003 | | | | 16,861 | | | | 2.83 | | | | 580,221 | | | | 16,349 | | | | 2.82 | | | | 585,374 | | | | 16,006 | | | | 2.73 | |
| Total interest-earning financial assets at fair value through profit or loss | | | 72,457 | | | | 1,637 | | | | 2.26 | | | | 83,887 | | | | 1,758 | | | | 2.10 | | | | 79,754 | | | | 1,772 | | | | 2.22 | |
| Total interest-earning assets | | | 667,460 | | | | 18,498 | | | | 2.77 | | | | 664,108 | | | | 18,107 | | | | 2.73 | | | | 665,128 | | | | 17,778 | | | | 2.67 | |
| Allowance for impairment losses on financial assets held at amortised cost | | | (3,468 | ) | | | – | | | | | | | | (3,074 | ) | | | | | | | | | | | (2,161 | ) | | | | | | | | |
| Non-interest earning assets | | | 167,480 | | | | – | | | | | | | | 157,026 | | | | | | | | | | | | 155,853 | | | | | | | | | |
| Total average assets and interest income | | | 831,472 | | | | 18,498 | | | | 2.22 | | | | 818,060 | | | | 18,107 | | | | 2.21 | | | | 818,820 | | | | 17,778 | | | | 2.17 | |
| | | | | | | | | | | | | | | | | | | | | | | | | | | | | | | | | | | | | |
| | | 2019 | | 2018 | | 2017 |
| | | Average
interest
earning
assets
£m | | | Net
interest
income
£m | | | Net
interest
margin
% | | | Average
interest
earning
assets
£m | | | Net
interest
income
£m | | | Net
interest
margin
% | | | Average
interest
earning
assets
£m | | | Net
interest
income
£m | | | Net
interest
margin
% | |
| Average interest-earning assets and net interest income: | | | | | | | | | | | | | | | | | | | | | | | | | | | | | | | | | | | | |
| Banking business | | | 595,003 | | | | 10,180 | | | | 1.71 | | | | 580,221 | | | | 13,396 | | | | 2.31 | | | | 585,374 | | | | 10,912 | | | | 1.86 | |
| Trading securities and other financial assets at fair value through profit or loss | | | 72,457 | | | | 1,356 | | | | 1.87 | | | | 83,887 | | | | 1,191 | | | | 1.42 | | | | 79,754 | | | | 1,294 | | | | 1.62 | |
| | | | 667,460 | | | | 11,536 | | | | 1.73 | | | | 664,108 | | | | 14,587 | | | | 2.20 | | | | 665,128 | | | | 12,206 | | | | 1.84 | |
OPERATING AND FINANCIAL REVIEW AND PROSPECTS
| | | 2019 | | 2018 | | 2017 |
| | | Average
balance
£m | | | Interest
expense
£m | | | Cost
% | | | Average
balance
£m | | | Interest
expense
£m | | | Cost
% | | | Average
balance
£m | | | Interest
expense
£m | | | Cost
% | |
| Liabilities and shareholders’ funds | | | | | | | | | | | | | | | | | | | | | | | | | | | | | | | | | | | | |
| Deposits by banks | | | 11,164 | | | | 96 | | | | 0.86 | | | | 8,405 | | | | 117 | | | | 1.39 | | | | 6,758 | | | | 80 | | | | 1.18 | |
| Customer deposits | | | 341,254 | | | | 2,015 | | | | 0.59 | | | | 342,929 | | | | 1,812 | | | | 0.53 | | | | 348,662 | | | | 1,721 | | | | 0.49 | |
| Liabilities to banks and customers under sale and repurchase agreements | | | 26,905 | | | | 301 | | | | 1.12 | | | | 25,634 | | | | 245 | | | | 0.96 | | | | 18,943 | | | | 110 | | | | 0.58 | |
| Debt securities in issue1 | | | 97,456 | | | | 1,204 | | | | 1.24 | | | | 86,099 | | | | 234 | | | | 0.27 | | | | 72,762 | | | | 266 | | | | 0.37 | |
| Lease liabilities | | | 1,684 | | | | 42 | | | | 2.49 | | | | 41 | | | | 1 | | | | 2.46 | | | | 21 | | | | 1 | | | | 2.38 | |
| Amounts payable to unitholders in consolidated open-ended investment vehicles | | | 13,352 | | | | 1,822 | | | | 13.65 | | | | 13,915 | | | | (844 | ) | | | (6.07 | ) | | | 15,675 | | | | 1,435 | | | | 9.15 | |
| Subordinated liabilities | | | 17,682 | | | | 1,201 | | | | 6.79 | | | | 18,193 | | | | 1,388 | | | | 7.63 | | | | 18,674 | | | | 1,481 | | | | 7.93 | |
| Total interest-bearing liabilities of banking book | | | 509,497 | | | | 6,681 | | | | 1.31 | | | | 495,216 | �� | | | 2,953 | | | | 0.60 | | | | 481,495 | | | | 5,094 | | | | 1.06 | |
| Total interest-bearing liabilities of trading book | | | 26,101 | | | | 281 | | | | 1.08 | | | | 44,101 | | | | 567 | | | | 1.29 | | | | 55,288 | | | | 478 | | | | 0.86 | |
| Total interest-bearing liabilities | | | 535,598 | | | | 6,962 | | | | 1.30 | | | | 539,317 | | | | 3,520 | | | | 0.65 | | | | 536,783 | | | | 5,572 | | | | 1.04 | |
| Interest-free liabilities | | | | | | | | | | | | | | | | | | | | | | | | | | | | | | | | | | | | |
| Non-interest bearing customer accounts | | | 74,906 | | | | | | | | | | | | 72,913 | | | | | | | | | | | | 66,276 | | | | | | | | | |
| Other interest-free liabilities | | | 171,611 | | | | | | | | | | | | 157,072 | | | | | | | | | | | | 166,403 | | | | | | | | | |
| Non-controlling interests and shareholders’ funds | | | 49,357 | | | | | | | | | | | | 48,758 | | | | | | | | | | | | 49,358 | | | | | | | | | |
| Total average liabilities and interest expense | | | 831,472 | | | | 6,962 | | | | 0.84 | | | | 818,060 | | | | 3,520 | | | | 0.43 | | | | 818,820 | | | | 5,572 | | | | 0.68 | |
| 1 | The impact of the Group’s hedging arrangements is included on this line; excluding this impact the weighted average effective interest rate in respect of debt securities in issue would be 2.57 per cent (2018: 2.68 per cent; 2017: 2.43 per cent). |
Loans and advances to banks and customers include impaired lending; interest on this lending has been recognised using the effective interest rate method, as required by IAS 39 in 2017 and by IFRS 9 in 2018 and 2019.
Following the reduction in the Group’s non-UK activities, an analysis between domestic and foreign operations is not provided.
OPERATING AND FINANCIAL REVIEW AND PROSPECTS
CHANGES IN NET INTEREST INCOME – VOLUME AND RATE ANALYSIS
The following table allocates changes in net interest income between volume and rate for 2019 compared with 2018 and for 2018 compared with 2017. Where variances have arisen from both changes in volume and rate these are allocated to volume.
| | | 2019 compared with 2018
Increase/(decrease) | | 2018 compared with 2017
Increase/(decrease) |
| | | | | | | | | | | | | | | | | | | |
| | | Total change
£m | | | | Volume
£m | | | | Rate
£m | | | Total change
£m | | | | Volume
£m | | | | Rate
£m | |
| Interest receivable and similar income | | | | | | | | | | | | | | | | | | | | | | | | |
| At amortised cost: | | | | | | | | | | | | | | | | | | | | | | | | |
| Loans and advances to banks | | | (51 | ) | | | (16 | ) | | | (35 | ) | | | 294 | | | | 5 | | | | 289 | |
| Loans and advances to customers | | | 712 | | | | 679 | | | | 33 | | | | 366 | | | | 355 | | | | 11 | |
| Debt securities | | | 56 | | | | 30 | | | | 26 | | | | 23 | | | | 13 | | | | 10 | |
| Financial assets at fair value through other comprehensive income (2017: available-for-sale financial assets) | | | (205 | ) | | | (96 | ) | | | (109 | ) | | | (340 | ) | | | (351 | ) | | | 11 | |
| Total banking book interest receivable and similar income | | | 512 | | | | 597 | | | | (85 | ) | | | 343 | | | | 22 | | | | 321 | |
| Total interest receivable and similar income on financial assets at fair value through profit or loss | | | (121 | ) | | | (258 | ) | | | 137 | | | | (14 | ) | | | 87 | | | | (101 | ) |
| Total interest receivable and similar income | | | 391 | | | | 339 | | | | 52 | | | | 329 | | | | 109 | | | | 220 | |
| Interest payable | | | | | | | | | | | | | | | | | | | | | | | | |
| Deposits by banks | | | (21 | ) | | | 24 | | | | (45 | ) | | | 37 | | | | 23 | | | | 14 | |
| Customer deposits | | | 203 | | | | (10 | ) | | | 213 | | | | 91 | | | | (30 | ) | | | 121 | |
| Liabilities to banks and customers under sale and repurchase agreements | | | 56 | | | | 14 | | | | 42 | | | | 135 | | | | 64 | | | | 71 | |
| Debt securities in issue | | | 970 | | | | 141 | | | | 829 | | | | (32 | ) | | | 36 | | | | (68 | ) |
| Lease liabilities | | | 41 | | | | 41 | | | | – | | | | – | | | | – | | | | – | |
| Amounts payable to unitholders in consolidated open-ended investment vehicles | | | 2,666 | | | | (77 | ) | | | 2,743 | | | | (2,279 | ) | | | 107 | | | | (2,386 | ) |
| Subordinated liabilities | | | (187 | ) | | | (35 | ) | | | (152 | ) | | | (93 | ) | | | (37 | ) | | | (56 | ) |
| Total banking book interest payable | | | 3,728 | | | | 98 | | | | 3,630 | | | | (2,141 | ) | | | 163 | | | | (2,304 | ) |
| Total interest payable on trading and other liabilities at fair value through profit or loss | | | (286 | ) | | | (194 | ) | | | (92 | ) | | | 89 | | | | (144 | ) | | | 233 | |
| Total interest payable | | | 3,442 | | | | (96 | ) | | | 3,538 | | | | (2,052 | ) | | | 19 | | | | (2,071 | ) |
OPERATING AND FINANCIAL REVIEW AND PROSPECTS
RISK OVERVIEW
EFFECTIVE RISK MANAGEMENT AND CONTROL
THE GROUP’S APPROACH TO RISK Risk management is at the heart of the Group’s strategy to become the best bank for customers. The Group’s mission is to protect its customers, colleagues and the Group, whilst enabling sustainable growth in targeted segments. This is achieved through informed risk decision-making and robust risk management, supported by a consistent risk-focused culture. This risk overview provides a summary of risk management within the Group, with a prudent approach and rigorous controls to support sustainable business growth and minimise losses. Through a strong and independent risk function, a robust control framework is maintained to identify and escalate current and emerging risks, support sustainable growth within Group risk appetite, and to drive and inform good risk reward decisions. The risk management section from pages 41 to 108 provides a more in-depth picture of how risk is managed within the Group, detailing the Group’s emerging risks from pages 44 to 45, approach to stress testing, risk governance, committee structure, appetite for risk and a full analysis of the principal risk categories, the framework by which risks are identified, managed, mitigated and monitored. | | RISK AS A STRATEGIC DIFFERENTIATOR Risks are identified, managed, mitigated and monitored using the Group’s comprehensive enterprise risk management framework, and its well-articulated risk appetite provides a clear framework for decision-making. The principal risks the Group face, which could significantly impact the delivery of the Group’s strategy, are discussed on pages 49 to 108. The Group believe effective risk management can be a strategic differentiator, in particular: 
Prudent approach to risk Being low risk is fundamental to the Group’s business model and drives its participation choices. Strategy and risk appetite are developed in tandem and together outline the parameters within which the Group operates. | |
Strong control framework The Group’s enterprise risk management framework is the foundation for the delivery of effective risk control and ensures that the Group risk appetite is continually developed and controlled. The Board is responsible for approving the Group’s risk appetite statement annually. Board-level metrics are cascaded into more detailed business appetite metrics and limits.
Business focus and accountability Risk management is an integral feature of how the Group measure and manage performance – for individuals, businesses and the Group. In the first line of defence, business units are accountable for managing risk with oversight from a strong and independent second line of defence Risk division.
Effective risk analysis, management and reporting Regular close monitoring and comprehensive reporting to all levels of management and the Board ensures appetite limits are maintained and subject to stress analysis at a risk type and portfolio level, as appropriate. |
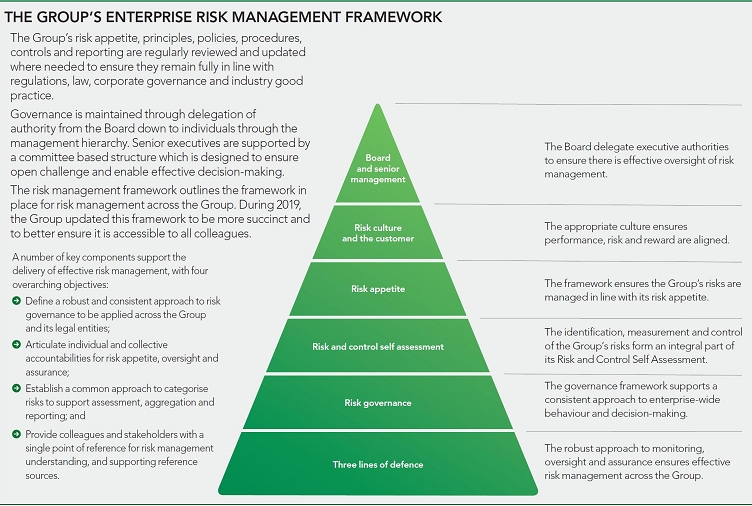
OPERATING AND FINANCIAL REVIEW AND PROSPECTS
RISK CULTURE AND THE CUSTOMER The effectiveness of the Group’s risk management approach relies upon a culture of transparency and openness that is encouraged by both the Board and senior management. Based on the Group’s conservative business model, prudent approach to risk management, and guided by the Board, the senior management articulates the core risk values to which the Group aspires, and sets the tone from the top, with a strong focus on building and sustaining long-term relationships with customers through the economic cycle. The Group’s Code of Responsibility reinforces colleague accountability for the risks they take and their responsibility to prioritise their customers’ needs. 
| | | Tone from the top Senior leaders set a clear tone from the top and lead by example, reflecting the Group values; putting customers first, keeping it simple, and making a difference together, encouraging a culture of intellectual curiosity and proactive risk management amongst all colleagues. Accountability Risk management is a team effort with all colleagues playing their part and taking full individual responsibility for their actions. Effective communication and challenge The Group is open, honest and transparent with risk colleagues working in collaboration with business areas to: 
Support effective risk management;
Understand root causes when things go wrong;
Share lessons learned; and
Provide constructive challenge. Incentives Remuneration, performance management and succession planning that support the Group’s core values and put the customer at the heart of everything the Group do. | | | |
2019 THEMES The Group’s priorities for risk management have continued to evolve, alongside progression of the Group’s strategy and development of external factors. The Group’s principal risks are outlined over the next few pages but some themes have been particularly prevalent in 2019. Climate risk Climate change is a key global risk, impacting customers, investors and the Group in making the required transition towards a low carbon economy. The Group is committed to delivering the Task Force for Climate-Related Financial Disclosures by 2022 and are taking steps to fully integrate climate risk into the Group’s existing Enterprise Risk Management Framework, including the Group’s policies, risk appetite, controls and disclosures. The Group continues to invest in supporting this activity as part of the wider sustainability strategy, and are also active participants in a number of external initiatives to help drive consistency across the industry. | | EU exit Given the vast majority of the Group’s business is in the UK, the direct impact on the Group from leaving the EU is relatively small and have taken the necessary steps to ensure continuity of the Group’s limited EU business activities, where permitted. The Group’s UK focus means its performance is inextricably linked to the health of the UK economy. Economic performance has remained resilient in recent years and whilst the near term outlook for the UK economy remains unclear given UK/EU trade agreement negotiations, the Group continues to monitor closely. The Group is also taking a prudent approach to balance sheet, accelerating issuance where appropriate. The Group’s customer focused strategy remains the right one. Guided by the overriding principle of Helping Britain Prosper, the Group continue to focus on customer needs and support the Group’s personal and business customers. The Group have delivered on its commitment to lend £18 billion to UK businesses in 2019, reaffirming support for the UK economy. | | Change / Execution risk Delivering change is a key part of how the Group continues to serve its customers, fulfil its strategic objectives, and deliver its aim of Helping Britain Prosper. During 2019, key change initiatives included digitising of the Group and transforming ways of working. There has also been significant delivery of regulatory change in order to adapt to the changing regulatory landscape. The Group continues its drive to deliver a leading customer experience whilst managing a complex and varied change portfolio. Focus on improvements to the control environment and managing within risk appetite has enabled the safe delivery of change. The need to protect existing processes and minimise adverse impact on colleagues and clients will support the delivery of a leading customer experience. |
OPERATING AND FINANCIAL REVIEW AND PROSPECTS
THE GROUP’S PRINCIPAL RISKS
Principal risks and uncertainties are reported regularly to the Board Risk Committee. Change/execution, data and operational resilience have been elevated from existing risks to principal risks during 2019, and strategic added as a new principal risk


The risk that, in delivering the change agenda, the Group fails to ensure compliance with laws and regulation, maintain effective customer service and availability, and/or operate within our approved risk appetite.
Example
Ineffective change/execution risk management could lead to increased periods of time where the Group cannot serve its customers, and could lead to impacts associated with other risk types such as regulatory censure.
Risk Appetite
The Group have limited appetite for negative impacts on customers, colleagues, or the Group as a result of change activity.
Mitigation
| Continued focus on strengthening the control environment, maturation of the change policy and associated policies and procedures, which set out the principles and key controls that apply across the business and are aligned to the Group risk appetite. Senior Management continue to drive improvements to Change and Execution Risk metrics, in particular those affecting customers and colleagues. |
| | |
| Businesses assess the potential impacts of undertaking any change activity on their ability to execute effectively, and the potential consequences for the existing risk profiles. |
Further detail on principal risks, including mitigation on page 50
Alignment to strategic priorities and future focus
 | Delivering a leading customer experience |
| | The Group recognise the importance of delivering the strategic priorities and will continue to invest in the transformation of the Group to deliver a leading customer experience. |
| | |
| New principal risk |
| | |
| Change and Execution risk was elevated from a secondary risk to a principal risk in recognition of the significant volumes of complex change the Group is currently undertaking to deliver its strategy. This includes key change initiatives, digitising the Group and transforming ways of working which will help to future-proof against the heightened risks associated with the use of new technologies and manage regulatory requirements and expectations. The decision aligns with the Group’s progress in developing and embedding its change and execution risk management capabilities. |
| | |

The risk that the Group fail to effectively govern, manage, and control its data (including data processed by third party suppliers) leading to unethical decisions, poor customer outcomes, loss of value and mistrust.
Example
The loss of trust from customers, colleagues, business partners or regulators arising from a failure to manage and control the Group’s data.
Risk Appetite
The Group have limited appetite for material events or losses that occur due to the inappropriate use of data.
Mitigation
| Significant investment has been made to enhance the maturity of data risk management in recent years. |
| In addition, the General Data Protection programme which delivered the necessary infrastructure to achieve compliance with the new regulations in May 2018, a number of other large investments have been made. |
Further detail on principal risks, including mitigation on page 50
Alignment to strategic priorities and future focus
| Delivering a leading customer experience |
| The quality of the data that the Group holds and the choices the Group make in how it is used is a key strategic enabler to future business growth, delivering a leading customer experience and Helping Britain Prosper. |
| The Group recognises that lawful, fair and transparent collection and appropriate use of data, is critical to delivering a leading customer experience and maintaining trust across the wider industry. |
| Internal programmes ensure that data is used correctly, and the control environment is regularly assessed through both internal and third-party testing. |
| | |
| New principal risk |
| | |
| Data was elevated from a secondary risk to a principal risk as one of the Group’s most valuable assets. It is critical to the business and is the subject of significant regulatory oversight and media focus. The Group is trusted with large volumes of data, and the Group must ensure that the information it holds is accurate, secure and managed appropriately. |
| | |

The risk that the Group fail to design resilience into business operations, underlying infrastructure and controls (people, process, technology) so that it is able to withstand external or internal events which could impact the continuation of operations, and fails to respond in a way which meets customer and stakeholder expectations and needs when the continuity of operations is compromised.
Example
Ineffective risk management could lead to vital services not being available to customers and stakeholders.
Risk Appetite
The Group have a limited appetite for disruption to services to customers and stakeholders from significant unexpected events.
Mitigation
| The Group has increased its focus on operational resilience and has updated its strategy to reflect changing priorities of both customers and regulators. |
Further detail on principal risks, including mitigation on page 51
Alignment to strategic priorities and future focus
| Delivering a leading customer experience |
| End-to-end resilience of the Group’s critical processes is a key strategic priority and the Group operational resilience programmes continue to invest in improving the control environment and resilience. The Group continues to exercise, test and improve its resilience through scenario testing as well as learning from real events (those impacting the Group but also those impacting others) through understanding the root cause. |
| The Group recognises the importance of its operational resilience to customers, markets and the wider financial sector. |
| | |
| New principal risk |
| | |
| Operational resilience was elevated from a secondary risk to a principal risk as the ability to continue operations when subject to internal or external incidents, safeguarding the Group’s most critical processes and assets, protecting colleagues, continuing to service customers and minimising any impact on the banking systems is crucial. |
| | |
OPERATING AND FINANCIAL REVIEW AND PROSPECTS

The risks which result from strategic plans which do not adequately reflect trends in external factors, ineffective business strategy execution, or failure to respond in a timely manner to external environments or changes in stakeholder behaviours and expectations.
Example
| The financial services sector operates in an evolving regulatory and competitive environments with an increased pace, scale and complexity of change which creates a risk to the Group’s strategic plans. |
| Shareholder expectations continue to evolve potentially impacting the Group’s role in society. |
| Greater competition for specialist skill sets (such as data science and engineering), alongside demographic challenges in the working population, may result in a skills shortage impacting delivery of key strategic initiatives. |
Risk Appetite
The Group has business plans that are responsive to internal and external factors including changes to the regulatory, macroeconomic and competitive environments.
Mitigation
| Continued digitisation of customer journeys, thereby enabling the delivery of market leading customer experiences that are seamless, accessible and personal. |
| Robust operating and contingency planning to ensure potential impacts of strategic initiatives and external drivers are mitigated. |
Further detail on principal risks, including mitigation on page 52
Alignment to strategic priorities and future focus
| Delivering a leading customer experience |
| The Group’s forward looking approach to managing strategic risk will help the Group identify new risks and opportunities, and allow the Group to be better prepared to respond to changes in the regulatory and competitive environments. |
| | |
| New principal risk |
| | |
| | Strategic risk is a new principal risk in acknowledgment of the increasing rate of change in customer expectations, regulatory and competitive environments along with the demands for specialist skills to meet these evolving needs. This aligns with the strategic priorities to deliver a leading customer experience by digitising the Group, maximising Group capabilities and transforming ways of working. |

The risk that parties with whom the Group have contracted fail to meet their financial obligations (both on or off balance sheet).
Example
Observed or anticipated changes in the economic environment could impact profitability due to an increase in delinquency, defaults, write-downs and/or expected credit losses.
Risk Appetite
The Group has a conservative and well balanced credit portfolio through the economic cycle, generating an appropriate return on equity, in line with the Group’s target return on equity in aggregate.
Mitigation
| Prudent, through the cycle credit principles, risk policies and appetite statements. |
| Robust models and controls. |
Further detail on principal risks, including mitigation on page 52
Alignment to strategic priorities and future focus
 | Maximising Group capabilities |
| The Group seek to support sustainable growth in targeted segments. The Group has a conservative and well-balanced credit portfolio, managed through the economic cycle and supported by strong credit portfolio management. |
| The Group is committed to better addressing customers’ banking needs through consistent, fair and responsible credit risk decisions, aligned to customers’ circumstances, whilst staying within prudent risk appetite. |
| Portfolios have benefitted from relatively favourable economic conditions and a prolonged period of low interest rates. Impairments remain below long-term levels, but are expected to increase as impairments normalise. |
Key risk indicators
£1,296m
Impairment charge
2018: £937m

The risk of financial penalties, regulatory censure, criminal or civil enforcement action or customer detriment as a result of failure to identify, assess, correctly interpret, comply with, or manage regulatory and/or legal requirements.
Example
Failure to deliver key regulatory changes or to comply with ongoing requirements.
Risk Appetite
The Group interprets and complies with all relevant regulation and all applicable laws (including codes of conduct which could have legal implications) and/or legal obligations.
Mitigation
| Group policies and procedures set out the principles and key controls that should apply across the business which are aligned to the Group risk appetite. |
| Business units identify, assess and implement policy and regulatory requirements and establish local controls, processes, procedures and resources to ensure appropriate governance and compliance. |
Further detail on principal risks, including mitigation on page 81
Alignment to strategic priorities and future focus
| Delivering a leading customer experience |
| The Group is committed to operating sustainably and responsibly, and commit significant resource and expense to ensure it meets its legal and regulatory obligations. |
| The Group responds as appropriate to impending legislation, regulation and associated consultations and participate in industry bodies. The Group continues to be proactive in responding to significant ongoing and new legislation, regulation and court proceedings. |
OPERATING AND FINANCIAL REVIEW AND PROSPECTS
Risk overview continued

The risk of customer detriment across the customer lifecycle including: failures in product management, distribution and servicing activities; from other risks materialising, or other activities which could undermine the integrity of the market or distort competition, leading to unfair customer outcomes, regulatory censure, reputational damage or financial loss.
Example
The most significant conduct cost in recent years has been PPI mis-selling.
Risk Appetite
The Group delivers fair outcomes for its customers.
Mitigation
| Simplified and enhanced conduct policies and procedures in place to ensure appropriate controls and processes that deliver fair customer outcomes, and support market integrity and competition requirements. |
| Active engagement with regulatory bodies and other stakeholders to develop understanding of concerns related to customer treatment, effective competition and market integrity, to ensure that the Group’s strategic conduct focus continues to meet evolving stakeholder expectations. |
Further detail on principal risks, including mitigation on page 82
Alignment to strategic priorities and future focus
| Delivering a leading customer experience |
| As the Group transforms the business, minimising conduct risk is critical to achieving its strategic goals and meeting regulatory standards. |
| The Group has senior committees that ensure its focus on embedding a customer-centric culture and delivering fair outcomes across the Group. The conduct risk framework continues to support this through robust and effective management. This supports the Group’s vision of being the best bank for customers, enabling the delivery of a leading customer experience through effective root cause analysis and learning from customer feedback. |

The risk of loss from inadequate or failed internal processes, people and systems, or from external events.
Example
Ineffective risk management could lead to adverse customer impact, reputational damage and financial loss, across all of the Group’s principal risks.
Risk Appetite
The Group has robust controls in place to manage operational losses, reputational events and regulatory breaches. The Group identifies and assesses emerging risks and acts to mitigate these.
Mitigation
| The Group continues to review and invest in its control environment to ensure it addresses the inherent risks faced. |
| The Group employs a range of risk management strategies, including: avoidance, mitigation, transfer (including insurance) and acceptance. |
Further detail on principal risks, including mitigation on page 82
Alignment to strategic priorities and future focus
| Delivering a leading customer experience |
| | The Group continues to manage operational risk within the appetite articulated by the Board and in compliance with legal and regulatory requirements to ensure a robust control environment and a positive customer experience. |

The risk that the Group fail to provide an appropriate colleague and customer-centric culture, supported by robust reward and wellbeing policies and processes; effective leadership to manage colleague resources; effective talent and succession management; and robust control to ensure all colleague-related requirements are met.
Example
Inability to attract or retain colleagues with key skills could impact the achievement of business objectives.
Risk Appetite
The Group leads responsibly and proficiently, manages people resource effectively, supports and develops colleague talent, and meets legal and regulatory obligations related to its people.
Mitigation
| Focusing on leadership and colleague engagement, through delivery of strategies to attract, retain and develop high calibre people together with implementation of rigorous succession planning. |
| Continued focus on the Group’s culture by developing and delivering initiatives that reinforce the appropriate behaviours which generate the best possible long-term outcomes for customers and colleagues. |
Further detail on principal risks, including mitigation on page 84
Alignment to strategic priorities and future focus
 | Transforming ways of working |
| Regulatory requirements relating to personal accountability and remuneration rules could affect the ability to attract and retain the calibre of colleagues required to meet changing customer needs. The Group recognises the challenges in delivering the Group’s strategic priorities and it will continue to invest in the development of colleague capabilities and agile working practices. This investment will deliver a leading customer experience and allow the Group to respond quickly to customers’ rapidly changing decision-making in a digital era. |
OPERATING AND FINANCIAL REVIEW AND PROSPECTS

The risk of adverse developments in the timing, frequency and severity of claims for insured/underwritten events and in customer behaviour, leading to reductions in earnings and/or value. Example Uncertain property insurance claims impact Insurance earnings and capital, e.g. extreme weather conditions, such as flooding, can result in high property damage claims. Risk Appetite The Group has robust controls in place to manage the insurance underwriting risk inherent in the products its Insurance business offers to meet customer needs. Mitigation General Insurance exposure to accumulations of risk and possible catastrophes is mitigated by reinsurance arrangements broadly spread over different reinsurers. Insurance processes on underwriting, claims management, pricing and product design. Further detail on principal risks, including mitigation on page 84 Alignment to strategic priorities and future focus Delivering a leading customer experience The Group is committed to meeting the changing needs of customers by working to provide a range of insurance products via multiple channels. The focus is on delivering a leading customer experience by helping customers protect themselves today whilst preparing for a secure financial future. Strategic growth initiatives within Insurance are developed and managed in line with a defined risk appetite, aligned to the Group risk appetite and strategy. | | | 
The risk that the Group has a sub-optimal quantity or quality of capital or that capital is inefficiently deployed across the Group. Example A worsening macroeconomic environment could lead to adverse financial performance, which could deplete capital resources and/ or increase capital requirements due to a deterioration in customers’ creditworthiness. Alternatively a shortage of capital could arise from an increase in the amount of capital that needs to be held. Risk Appetite The Group maintains capital levels commensurate with a prudent level of solvency and aim to deliver consistent and high quality returns to shareholders. Mitigation The Group has a capital management framework that includes the setting of capital risk appetite. The Group maintains a recovery plan which sets out a range of potential mitigating actions that could be taken in response to a stress. Further detail on principal risks, including mitigation on page 85 Alignment to strategic priorities and future focus. Maximising Group capabilities Ensuring the Group holds an appropriate level of capital to maintain financial resilience and market confidence underpins its strategic objectives of supporting the UK economy, and growth in targeted segments through the cycle. | | | 
Funding risk is the risk that the Group does not have sufficiently stable and diverse sources of funding or the funding structure is inefficient. Liquidity risk is the risk that the Group does not have sufficient financial resources to meet its commitments when they fall due, or can only secure them at excessive cost. Example A deterioration in either the Group’s or the UK’s credit rating, or a sudden and significant withdrawal of customer deposits, would adversely impact the Group’s funding and liquidity position. Risk Appetite The Group maintains a prudent liquidity profile and a balance sheet structure that limits the reliance on potentially volatile sources of funding. Mitigation The Group manages and monitors liquidity risks and ensures that liquidity risk management systems and arrangements are adequate with regard to the internal risk appetite, Group strategy and regulatory requirements The Group’s funding and liquidity position is underpinned by its significant customer deposit base, and is supported by strong relationships across customer segments Further detail on principal risks, including mitigation on page 94 Alignment to strategic priorities and future focus Maximising Group capabilities The Group maintain a strong funding position in line with its low risk strategy, and the loan to deposit ratio remains within the target range. The Group’s funding position allows us to grow targeted business segments, and better address our customers’ needs. |
| | | | | | | |
| | | | | | | |
Key risk indicators £17,515m Life and pensions present value
of new business premiums 2018: £14,384m £671m General insurance underwritten
total gross premiums 2018: £690m | | | Key risk indicators 13.8%1 CET1 ratio 2018: 13.9%1,2 5.2%1 UK leveraged ratio 2018: 5.6%1 1 Adjusted basis 2 Incorporates the effects of the share buyback announced in February 2019. | | | Key risk indicators £118bn LCR eligible assets 2018: £129bn 107% Loan to deposit ratio 2018: 107% |
| | | | | | | |
OPERATING AND FINANCIAL REVIEW AND PROSPECTS

The risk that the Group’s organisational infrastructure fails to provide robust oversight of decision making and the control mechanisms to ensure strategies and management instructions are implemented effectively. Examples Inadequate or complex governance arrangements to address ring-fencing requirements and the potential impact of EU exit could result in a weaker control environment, delays in decision making and lack of clear accountability. Non-compliance with, or breaches of SMCR requirements could result in lack of clear accountability, and legal and regulatory consequences. Risk Appetite The Group has governance arrangements that support the effective long-term operation of the business, maximise shareholder value and meet regulatory and societal expectations. Mitigation Defining individual and collective accountabilities for risk management, risk oversight and risk assurance through a three lines of defence model which supports the discharge of responsibilities to customers, shareholders and regulators; Outlining governance arrangements which articulate the enterprise-wide approach to risk management Further detail on principal risks, including mitigation on page 101 Alignment to strategic priorities and future focus Delivering a leading customer experience Ring-fencing ensures that the Group is safer and continues to deliver a leading customer experience by providing further protection to core retail and SME deposits, increasing transparency of the Group’s operations and facilitating the options available in resolution. The Group’s governance framework and strong culture of ownership and accountability enabled effective, on time, compliance with the SMCR requirements and enable the Group to demonstrate clear accountability for decisions. | | | 
The risk that the Group’s capital or earnings profile is affected by adverse market rates, in particular interest rates and credit spreads in the banking business, equity, credit spreads and interest rates in the Insurance business, and credit spreads in the Group’s defined benefit pension schemes. Examples Earnings are impacted by the Group’s ability to forecast and model customer behaviour accurately and establish appropriate hedging strategies. The Insurance business is exposed indirectly to equity risk through the value of future management charges on policyholder funds. Credit spread and interest rate risk within the Insurance business primarily arises from bonds and loans used to back annuities. Narrowing credit spreads will increase the cost of pension scheme benefits. Risk Appetite The Group has robust controls in place to manage its inherent market risk and does not engage in any proprietary trading, reflecting the customer focused nature of the Group’s activities Mitigation Structural hedge programmes implemented to manage liability margins and margin compression. Equity and credit spread risks are closely monitored and, where appropriate, asset and liability matching is undertaken. The Group’s defined benefit pension schemes continue to monitor their credit allocation as well as the hedges in place against nominal rate and inflation movements. Further detail on principal risks, including mitigation on page 102 Alignment to strategic priorities and future focus Maximising Group capabilities The Group actively manages its exposure to movements in market rates, to drive lower volatility earnings and offer a comprehensive customer proposition with hedging strategies to support strategic aims. Mitigating actions are implemented to reduce the impact of market movements, resulting in a more stable capital position. Effective interest rate and inflation hedging has kept volatility in the Group’s defined benefit pension schemes low. This combined with improved market conditions has helped keep the schemes in IAS 19 surplus in 2019. This allows the Group to more efficiently utilise available capital resources. Key risk indicators £550m IAS 19 pension surplus 2018: £1,146m | | | 
The risk of financial loss, regulatory censure, reputational damage or customer detriment, as a result of deficiencies in the development, application and ongoing operation of Models and Rating Systems. Example The consequences of inadequate models could include: inappropriate levels of capital or impairments; inappropriate credit or pricing decisions; and adverse impacts on funding or liquidity, or the Group’s earnings and profits. Risk Appetite Material models are performing in line with expectations. Mitigation The model risk management framework, established by and with continued oversight from an independent team in the Risk division, provides the foundation for managing and mitigating model risk within the Group. Further detail on principal risks, including mitigation on page 108 Alignment to strategic priorities and future focus Digitising the Group The Group’s models play a vital role in supporting the strategy to ensure profitable growth in targeted segments and the drive toward automation and digital solutions to enhance customer outcomes. Model risk management helps ensure these models are implemented in a controlled and safe manner for both the Group and customers. |
| | | | | The Group’s emerging risks are shown on pages 44 to 45 and a full analysis of the Group’s risk categories is on pages 49 to 108. |
| | | | | | | |
OPERATING AND FINANCIAL REVIEW AND PROSPECTS
RISK MANAGEMENT
Risk management is at the heart of the Group’s strategy to become the best bank for customers.
The Group’s mission is to protect customers, shareholders, colleagues and the Group, whilst enabling sustainable growth in targeted segments. This is achieved through informed risk decisions and robust risk management, supported by a consistent risk-focused culture.
The risk overview (pages 34 to 40) provides a summary of risk management within the Group. It highlights the important role of risk as a strategic differentiator, key areas of focus for risk during 2019, and the role of risk management in enhancing the customer experience, along with an overview of the Group’s enterprise risk management framework, and the principal risks faced by the Group.
This full risk management section provides a more in-depth picture of how risk is managed within the Group, detailing the Group’s emerging risks, approach to stress testing, risk governance, committee structure, appetite for risk and a full analysis of the principal risk categories (pages 49 to 108), and the framework by which risks are identified, managed, mitigated and monitored.
Each principal risk category is described and managed using the following standard headings: definition, exposures, measurement, mitigation and monitoring.
THE GROUP’S APPROACH TO RISK
The Group operates a prudent approach to risk with rigorous management controls to support sustainable business growth and minimise losses. Through a strong and independent risk function (Risk division), a robust control framework is maintained to identify and escalate current and emerging risks, support sustainable growth within the Group’s risk appetite, and to drive and inform good risk reward decision-making.
To meet ring-fencing requirements from 1 January 2019, core UK retail financial services and ancillary retail activities have been ring-fenced from other activities of the Group. The Group enterprise risk management framework and Group risk appetite apply across the Group and are supplemented by risk management frameworks and risk appetites for the sub-groups to meet sub-group specific needs. In each case these operate within the Group parameters. The Group’s corporate governance framework applies across Lloyds Banking Group plc, Lloyds Bank plc, Bank of Scotland plc and HBOS plc. It is tailored where needed to meet the entity specific needs of Lloyds Bank plc and Bank of Scotland plc, and supplementary corporate governance frameworks are in place to address sub-group specific requirements of the other sub-groups (Lloyds Bank Corporate Markets, Insurance and Lloyds Banking Group Equity Investments).
The Group’s enterprise risk management framework (ERMF) (see risk overview, page 34) is structured to align with the industry-accepted internal control framework standards.
The ERMF applies to every area of the business and covers all types of risk. It is reviewed, updated and approved by the Board at least annually to reflect any changes in the nature of the Group’s business and external regulations, law, corporate governance and industry best practice. The ERMF provides the Group with an effective mechanism for developing and embedding risk policies and risk management strategies which are aligned with the risks faced by its businesses. It also seeks to facilitate effective communication on these matters across the Group.
ROLE OF THE BOARD AND SENIOR MANAGEMENT
Key responsibilities of the Board and senior management include:
| approval of the ERMF and Board risk appetite. |
| | |
| approval of Group-wide risk principles and policies. |
| | |
| the cascade of delegated authority (for example to Board sub-committees and the Group Chief Executive). |
| | |
| effective oversight of risk management consistent with risk appetite. |
RISK APPETITE
Risk appetite is defined within the Group as ‘the amount and type of risk that the Group is prepared to seek, accept or tolerate’ in delivering the Group strategy.
Group strategy and risk appetite are developed in tandem. Business planning aims to optimise value within risk appetite parameters and deliver on the Group’s promise to Help Britain Prosper.
The Group’s risk appetite statement details the risk parameters within which the Group operates. The statement forms part of the Group’s control framework and is embedded into policies, authorities and limits, to guide decision-making and risk management. The Board is responsible for approving the Group’s risk appetite statement at least annually. Group Board-level metrics are cascaded into more detailed business appetite metrics and limits.
Group risk appetite headlines are outlined within The Group’s Principal Risks section on pages 36 to 40.
GOVERNANCE FRAMEWORKS
The Group’s approach to risk is founded on a robust control framework and a strong risk management culture which are the foundation for the delivery of effective risk management and guide the way all employees approach their work, behave and make decisions.
Governance is maintained through delegation of authority from the Board to individuals through the management hierarchy. Senior executives are supported by a committee based structure which is designed to ensure open challenge and support effective decision-making.
The Group’s risk appetite, principles, policies, procedures, controls and reporting are regularly reviewed and updated where needed to ensure they remain fully in-line with regulation, law, corporate governance and industry good practice.
The interaction of the executive and non-executive governance structures relies upon a culture of transparency and openness that is encouraged by both the Board and senior management.
Board-level engagement, coupled with the direct involvement of senior management in Group-wide risk issues at Group Executive Committee level, ensures that escalated issues are promptly addressed and remediation plans are initiated where required.
Line managers are directly accountable for identifying and managing risks in their individual businesses, ensuring that business decisions strike an appropriate balance between risk and reward and are consistent with the Group’s risk appetite.
Clear responsibilities and accountabilities for risk are defined across the Group through a three lines of defence model which ensures effective independent oversight and assurance in respect of key decisions.
The risk committee governance framework is outlined on page 46.
THREE LINES OF DEFENCE MODEL
The ERMF is implemented through a ‘three lines of defence’ model which defines clear responsibilities and accountabilities and ensures effective independent oversight and assurance activities take place covering key decisions.
Business lines (first line) have primary responsibility for risk decisions, identifying, measuring, monitoring and controlling risks within their areas of accountability. They are required to establish effective governance and control frameworks for their business to be compliant with Group policy requirements, to maintain appropriate risk management skills, mechanisms and toolkits, and to act within Group risk appetite parameters set and approved by the Board.
Risk division (second line) is a centralised function, headed by the Chief Risk Officer, providing oversight and independent constructive challenge to the effectiveness of risk decisions taken by business management, providing proactive advice and guidance, reviewing, challenging and reporting on the risk profile of the Group and ensuring that mitigating actions are appropriate.
It also has a key role in promoting the implementation of a strategic approach to risk management reflecting the risk appetite and ERMF agreed by the Board that encompasses:
OPERATING AND FINANCIAL REVIEW AND PROSPECTS
| overseeing embedding of effective risk management processes. |
| | |
| transparent, focused risk monitoring and reporting. |
| | |
| provision of expert and high quality advice and guidance to the Board, executives and management on strategic issues and horizon scanning, including pending regulatory changes. |
| | |
| a constructive dialogue with the first line through provision of advice, development of common methodologies, understanding, education, training, and development of new risk management tools. |
The primary role of Group Internal Audit (third line) is to help the Board and senior executive management protect the assets, reputation and sustainability of the Group. Group Internal Audit is led by the Group Chief Internal Auditor. Group Internal Audit provides independent assurance to the Audit Committee and the Board through performing reviews and engaging with committees and senior executive management, providing opinion and challenge on risk and the state of the control environment. Group Internal Audit is a single independent internal audit function, reporting to the Board Audit Committee of the Group and the Board Audit Committee of the key subsidiaries.
RISK AND CONTROL CYCLE FROM IDENTIFICATION TO REPORTING
To allow senior management to make informed risk decisions, the business follows a continuous risk management approach which includes producing appropriate, accurate and focused risk reporting. The risk and control cycle sets out how this should be approached, with the appropriate controls and processes in place. This cycle, from identification to reporting, ensures consistency and is intended to manage and mitigate the risks impacting the Group.
The process for risk identification, measurement and control is integrated into the overall framework for risk governance. Risk identification processes are forward-looking to ensure emerging risks are identified. Risks are captured and measured using robust and consistent quantification methodologies. The measurement of risks includes the application of stress testing and scenario analysis, and considers whether relevant controls are in place before risks are incurred.
Identified risks are reported on a monthly basis or as frequently as necessary to the appropriate committee. The extent of the risk is compared to the overall risk appetite as well as specific limits or triggers. When thresholds are breached, committee minutes are clear on the actions and timeframes required to resolve the breach and bring risk within tolerances. There is a clear process for escalation of risks and risk events.
All business areas complete a Control Effectiveness Review (CER) annually, reviewing the effectiveness of their internal controls and putting in place a programme of enhancements where appropriate. The CER reports are approved at divisional risk committees or directly by the relevant member of the Group Executive Committee to confirm the accuracy of the assessment. This key process is overseen and independently challenged by Risk division, reviewed by Group Internal Audit against the findings of its assurance activities, and reported to the Board. No significant failings or weaknesses were identified during the 2019 review.
RISK CULTURE
Based on the Group’s conservative business model, prudent approach to risk management, and guided by the Board, the senior management articulates the core risk values to which the Group aspires, and sets the tone at the top, with a strong focus on building and sustaining long-term relationships with customers, through the economic cycle. The Group’s Code of Responsibility reinforces colleagues’ accountability for the risks they take and their responsibility to prioritise their customers’ needs.
RISK RESOURCES AND CAPABILITIES
Appropriate mechanisms are in place to avoid over-reliance on key personnel or system/technical expertise within the Group. Adequate resources are in place to serve customers both under normal working conditions and in times of stress, and monitoring procedures are in place to ensure that the level of available resource can be increased if required. Colleagues undertake appropriate training to ensure they have the skills and knowledge necessary to enable them to deliver fair outcomes for customers.
There is ongoing investment in risk systems and models alongside the Group’s investment in customer and product systems and processes. This drives improvements in risk data quality, aggregation and reporting leading to effective and efficient risk decisions.
FINANCIAL REPORTING RISK MANAGEMENT SYSTEMS AND INTERNAL CONTROLS
The Group maintains risk management systems and internal controls relating to the financial reporting process which are designed to:
| ensure that accounting policies are appropriately and consistently applied, transactions are recorded accurately, and undertaken in accordance with delegated authorities, that assets are safeguarded and liabilities are properly stated. |
| | |
| enable the calculation, preparation and reporting of financial, prudential regulatory and tax outcomes in accordance with applicable International Financial Reporting Standards, statutory and regulatory requirements. |
| | |
| enable certifications by the Senior Accounting Officer relating to maintenance of appropriate tax accounting and in accordance with the 2009 Finance Act. |
| | |
| ensure that disclosures are made on a timely basis in accordance with statutory and regulatory requirements (for example UK Finance Code for Financial Reporting Disclosure and the US Sarbanes Oxley Act). |
| | |
| ensure ongoing monitoring to assess the impact of emerging regulation and legislation on financial, prudential regulatory and tax reporting. |
| | |
| ensure an accurate view of the Group’s performance to allow the Board and senior management to appropriately manage the affairs and strategy of the business as a whole and each of its sub-groups. |
The Group has a Disclosure Committee which assists the Group Chief Executive and Chief Financial Officer in fulfilling their disclosure responsibilities under relevant listing and other regulatory and legal requirements. In addition, the Audit Committee reviews the quality and acceptability of the Group’s financial disclosures. For further information on the Audit Committee’s responsibilities relating to financial reporting see pages 160 to 163.
RISK DECISION-MAKING AND REPORTING
Risk analysis and reporting enables better understanding of risks and returns, supporting the identification of opportunities as well as better management of risks.
An aggregate view of the Group’s overall risk profile, key risks and management actions, and performance against risk appetite is reported to and discussed monthly at the Group Risk Committee with regular reporting to the Board Risk Committee and the Board.
Rigorous stress testing exercises are carried out to assess the impact of a range of adverse scenarios with different probabilities and severities to inform strategic planning.
The Chief Risk Officer regularly informs the Board Risk Committee of the aggregate risk profile and has direct access to the Chairman and members of Board Risk Committee.
OPERATING AND FINANCIAL REVIEW AND PROSPECTS
Table A:Exposure to risk arising from the business activities of the Group
The table below provides a high level guide to how the Group’s business activities are reflected through its risk-weighted assets. Details of the business activities for each division are provided in the Divisional results on pages 27 to 30.
| | | | | Commercial | | Insurance and | | Central | | |
| | | Retail | | Banking | | Wealth1 | | items2 | | Group |
| | | £bn | | £bn | | £bn | | £bn | | £bn |
| Risk-weighted assets (RWAs) | | | | | | | | | | |
| – Credit risk | | 78.7 | | 66.3 | | 0.7 | | 14.3 | | 160.0 |
| – Counterparty credit risk3 | | – | | 4.7 | | – | | 1.2 | | 5.9 |
| – Market risk | | – | | 1.8 | | – | | – | | 1.8 |
| – Operational risk | | 19.7 | | 4.6 | | 0.6 | | 0.6 | | 25.5 |
| Total (excluding threshold) | | 98.4 | | 77.4 | | 1.3 | | 16.1 | | 193.2 |
| – Threshold4 | | – | | – | | – | | 10.2 | | 10.2 |
| Total | | 98.4 | | 77.4 | | 1.3 | | 26.3 | | 203.4 |
| 1 | As a separate regulated business, Insurance (excluding Wealth) maintains its own solvency requirements, including appropriate management buffers, and reports directly to the Insurance Board. Insurance does not hold any RWAs as its assets are removed from the Group’s regulatory capital calculations. However, in accordance with capital rules part of the Group’s equity investment in Insurance is included in the calculation of threshold RWAs, while the remainder is taken as a deduction from common equity tier 1 (CET1) capital. |
| | |
| 2 | Central items include assets held outside the main operating divisions, including the assets of Group Corporate Treasury which holds the Group’s liquidity portfolio, and other supporting functions. |
| | |
| 3 | Exposures relating to the default fund of a central counterparty and credit valuation adjustment risk are included in counterparty credit risk. |
| | |
| 4 | Threshold RWAs reflect the proportion of significant investments and deferred tax assets that are permitted to be risk-weighted instead of deducted from CET1 capital. Significant investments primarily arise from the investment in the Group’s Insurance business. |
PRINCIPAL RISKS
The Group’s principal risks are shown in the risk overview (pages 36 to 40). The Group’s emerging risks are shown overleaf. Full analysis of the Group’s risk categories is on pages 49 to 108.
OPERATING AND FINANCIAL REVIEW AND PROSPECTS
EMERGING RISKS
The Group considers the following to be risks that have the potential to increase in significance and affect the performance of the Group. These risks are considered alongside the Group’s operating plan.
| Risk | Key mitigating actions |
Regulatory and legal: The financial sector continues to experience increasing regulation from various bodies, including government and regulators. Regulatory rules and laws from both the UK and overseas may affect the Group’s operation, placing pressure on expert resource and investment priorities. | – The Group work closely with regulatory authorities and industry bodies to ensure that the Group can identify and respond to the evolving regulatory and legal landscape. – The Group actively implement programmes to deliver legal, regulatory and mandatory change requirements. |
Climate: The key risks are financial, derived from both physical risks (climate and weather-related events) and transition risks resulting from the process of adjustment towards a low carbon economy. Climate change extends across multiple risk types e.g. credit, market, conduct and operational. For example, physical and transition risks could result in the impairment of asset values, may impact the creditworthiness of the Group’s clients, and the products and services the Group’s customers require. The focus on these risks by key stakeholders including businesses, clients, shareholders, governments and regulators is increasing, aligned to the evolving societal, regulatory and political landscape. There also remains a risk that campaign groups or other bodies could seek to take legal or other action against the Group and/or the financial services industry for investing in or lending to organisations that they deem to be responsible for, or contributing to, climate change. | – The Group’s risk management approach to climate change reflects its commitment to adopting the framework set out by the Financial Stability Board’s Task Force on Climate-related Financial Disclosures (TCFD). – The Group Chief Risk Officer (CRO) has assumed responsibility for identifying and managing the risks arising from climate change, alongside the CROs for key legal entities. – The Group are integrating risk management of financial risks posed by climate change in the existing enterprise risk management framework, including in policies, risk appetite and controls. – The Group continue to support customers and clients in managing the financial risks from the UK’s transition to a low carbon economy. |
Cyber: Increases in the volume and sophistication of cyber-attacks alongside the growth in connected devices continues to heighten the potential for cyber-enabled crime. Increases in geopolitical tensions increase the indirect threat of a sophisticated attack on the Group. The capability of organised crime groups is growing rapidly, which along with the commoditisation of cyber-crime increases the likelihood that the Group or one of its suppliers will be the direct target of a sophisticated attack. This increases the risk of the Group’s exposure through its supply chain. | – Continued investment in and focus on the Group’s Cyber programme to ensure confidentiality and integrity of data and availability of systems. Key areas of focus relate to access controls, network security, disruptive technology, and denial of service capability. – Embedding of Group Cyber control framework aligned to industry recognised cyber security framework (National Institute of Standards and Technology, NIST). – Three year cyber strategy to deliver an industry-leading approach across the Group and to embed innovation in the Group’s approach to cyber. – Increased business and colleague engagement through education and awareness, phishing testing and cultural MI. Cyber risk is governed through all key risk committees and there are quarterly reviews of all cyber risks. |
| Political uncertainties including EU trade deal: Following the UK’s exit from the EU, significant negotiation is now required on the terms of the future trade agreement. As a result, the possibility of a limited or no deal at the end of the transition period remains and could manifest in prolonged business uncertainty across the UK, including in the financial services sector. This continued lack of clarity over the UK’s relationship with the EU and other foreign countries, and ongoing challenges in the Eurozone, including weak growth, raise additional uncertainty for the UK’s economic outlook. There also remains the possibility of a further referendum on Scottish independence. | – Engagement with politicians, regulators, officials, media, trade and other bodies to monitor external developments and reassure the Group’s commitment to Helping Britain Prosper. – Entities established in the EU ensure continuity of certain business activities; contingency planning in relation to wider areas of impact. – Group Corporate Treasury tracking market conditions closely and actively managing the Group’s balance sheet. – Credit applications and sector reviews include assessment of EU related risks. Initiatives in place to help clients effectively identify and mitigate or manage such risks. |
Competition: Adoption of technological trends is accelerating with customer preferences increasingly shaped by tech giants and other challengers who are able to exploit their own infrastructure and are impacted by different market dynamics. Regulation is focusing on lowering barriers for new entrants, which could have an adverse impact on the Group’s market position. Operational complexity has the potential to restrict the Group’s speed of response to market trends. Inability to leverage data and innovate could lead to loss of market share as challengers capitalise on Open Banking. Timely delivery of GSR3 objectives remains key to addressing the competitive challenges facing the Group. | – The Group is transforming the business to improve customer experience by digitising customer journeys and leveraging branches for complex needs, in response to customers’ evolving needs and expectations. – The Group will deepen insight into customer segments, their perception of brands and what they value. – Agility will be increased by consolidating platforms and building new architecture aligned with customer journeys. – The Group is responsive to changing customer behaviour/business models and adjusts its risk management approach as appropriate – GSR3 is designed to support the Group to strengthen its competitive position. |
| Data: Advancements in new technologies and new services, an increasing external threat landscape, and changing regulatory requirements increase the need for the Group to effectively govern, manage, and protect its data (or the data shared with third-party suppliers). Failure to manage data risk effectively can result in unethical decisions, poor customer outcomes, loss of value to the Group and mistrust. | – The Group’s strategy is to introduce advanced data management practices, based on Group-wide standards, data-first culture and modern enterprise data platforms, supported by a simplified modern IT architecture. – The Group has implemented Open Banking and actively monitors implications for customers, including protection from fraud. – The Group is making a significant investment to improve data privacy, including the security of data and oversight of third-parties. |
OPERATING AND FINANCIAL REVIEW AND PROSPECTS
| Risk | Key mitigating actions |
Macroeconomic headwinds: The UK economic outlook remains uncertain, since it is unclear how businesses will respond to the uncertainty relating to ongoing negotiations of international trade agreements, especially with the EU. Markets have priced continued low UK interest rates, but rapid growth in labour costs resulting from low unemployment and weak productivity growth could boost inflation more than anticipated, pushing interest rate expectations upward. These factors, combined with current levels of consumer indebtedness, could lead to downward pressure on credit quality. Internationally, growing protectionism remains a significant risk to stability of the global economy. Notwithstanding the recent first agreement on trade between the US and China, the fundamental nature of the disagreement suggests that roll-back of tariffs applied so far will prove difficult and further escalation is eminently possible. US tariffs on Europe may also increase. More widely, concerns remain that elevated government indebtedness in advanced economies and limited headroom for conventional monetary policy could render the next global downturn more prolonged and lead to a sustained period of stagflation. These circumstances may spur the wider adoption of less conventional monetary policies such as negative interest rates. | – High levels of liquidity provided by central banks has boosted asset values and reduced spreads across a wide range of assets, but creates vulnerability to a sharp correction if the global economy turns down. – Wide array of risks considered in setting strategic plans. – Capital and liquidity are reviewed regularly through committees, ensuring compliance with risk appetite and regulatory requirements. – The Group has a robust through the cycle credit risk appetite, including appropriate product, sector and single name concentration parameters, robust sector appetite statements and policies, as well as affordability and indebtedness controls at origination. In addition to ongoing focused monitoring, portfolio deep dives are conducted and regular larger exposure reviews. Enhancements have been made to the Group’s use of early warning indicators, including sector-specific indicators. |
| Geopolitical: Current geopolitical uncertainties or political upheavals could further impede the global economic recovery, heighten instability and impact markets. Terrorist activity including cyber-attacks also has the potential to trigger changes in the economic outlook, market risk pricing and funding conditions. Additionally, the more recent coronavirus outbreak and related global health issues could potentially impact economies and markets. | – Risk appetite criteria limit single counterparty exposures complemented by a UK-focused strategy. – The Chief Security Office develops and maintains a framework for external incidents, including financial stability, to ensure the incident response team convenes and acts as a rapid reaction group, should an external crisis occur. – The Chief Security Office also maintains the operational resilience framework to embed resilience activities across the Group and limit the impact of internal or external events. – Hedging of market risk considers, inter alia, potential shocks as a result of geopolitical events. |
Financial services transformation impact on customers:The risk that transformation of the financial services industry and the Group does not adequately consider vulnerable customers. As technology and innovation move at increasing pace, the more vulnerable customers could be at a disadvantage. The increase in execution only propositions due to digitisation may lead to increased conduct risk where customers (including vulnerable customers) choose unsuitable products. The Group’s approach to customer segmentation will need to ensure conduct and reputational risks are well managed. Further, there is a risk of systematic, unintended consequences within decision-making undertaken by machine learning which could occur on a large scale in a short period of time, creating new operational risks that affect financial and non-financial outcomes, for example credit portfolio anomalies or conduct impacts. This is relevant for the Group at present as the delivery of GSR3 utilises new technologies. | – Group vulnerability strategy and associated actions being developed through the value stream operating model. – Digital principles are being agreed across the Group, primarily aimed at preventing material conduct residual risk and giving customers an optimal, informative and fair buying journey to mitigate the increased risks. – Emerging customer risks, including those pertaining to vulnerable customers, are managed through customer segmentation strategy governance throughout the change lifecycle. – Technology risks, including those related to machine learning, are escalated and discussed through governance to ensure ongoing monitoring of any emerging unintended consequences. |
Transition from IBORs to Alternative Risk Free Reference Rates: Widely used benchmark rates, such as the London Interbank Offered Rate (‘LIBOR’), have been subject to increasing regulatory scrutiny, with regulators signalling the need to use alternative benchmark rates. As a result, existing benchmark rates may be discontinued or the basis on which they are calculated may change. Uncertainty as to the nature of such potential changes may adversely affect the value of a broad array of financial products, including any LIBOR-based securities, loans and derivatives. This may impact the availability and cost of hedging instruments and borrowings. Any changes could have important implications for customers, for example: necessitating amendments to existing documents and contracts; and differential in performance of benchmark rates and financial products which reference them. | – The Group is working closely with the Bank of England initiated Working Group on Sterling Risk-Free Reference Rates on the transition away from LIBOR in the UK. – Maintaining close engagement with the FCA on potential impacts. – Working closely with industry bodies to understand and manage the impact of benchmark transition in other geographies. – Transition programme established and the appointment of an IBOR Transition Director as accountable executive. – Developed a communication strategy for customers to ensure they understand the risks or outcomes they might face from transition. – Developing an implementation plan for new products and a transition plan for legacy products, taking into account market developments and lead times for product, process and system changes – Implementing an internal communication strategy to ensure that all staff are aware and have the tools and training required. |
OPERATING AND FINANCIAL REVIEW AND PROSPECTS
RISK GOVERNANCE
The risk governance structure below is integral to effective risk management across the Group. Risk division is appropriately represented on key committees to ensure that risk management is discussed in these meetings. This structure outlines the flow and escalation of risk information and reporting from business areas and Risk division to Group Executive Committee and Board. Conversely, strategic direction and guidance is cascaded down from the Board and Group Executive Committee.
Company Secretariat supports senior and Board-level committees, and supports the Chairs in agenda planning. This gives a further line of escalation outside the three lines of defence.
Table B: Risk governance structure
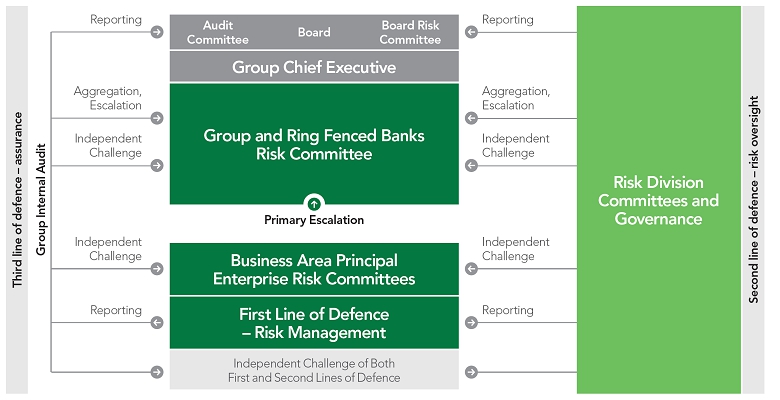
OPERATING AND FINANCIAL REVIEW AND PROSPECTS
BOARD, EXECUTIVE AND RISK COMMITTEES
The Group’s risk governance structure (see table B) strengthens risk evaluation and management, while also positioning the Group to manage the changing regulatory environment in an efficient and effective manner.
Assisted by the Board Risk and Audit Committees, the Board approves the Group’s overall governance, risk and control frameworks and risk appetite. Refer to the Corporate Governance section on pages 143 to 169, for further information on Board committees.
The divisional and functional risk committees review and recommend divisional and functional risk appetite and monitor local risk profile and adherence to appetite.
Table C:Executive and Risk Committees
The Group Chief Executive is supported by the following:
| Committees | | Risk focus |
| Group Executive Committee (GEC) | | Assists the Group Chief Executive in exercising their authority in relation to material matters having strategic, cross-business area or Group-wide implications. |
| Group and Ring-Fenced Banks Risk Committees (GRC) | | Responsible for the development, implementation and effectiveness of the Group’s enterprise risk management framework, the clear articulation of the Group’s risk appetite and monitoring and reviewing of the Group’s aggregate risk exposures and concentrations of risk. |
| Group and Ring-Fenced Banks Asset and Liability Committees (GALCO) | | Responsible for the strategic direction of the Group’s assets and liabilities and the profit and loss implications of balance sheet management actions. The committee reviews and determines the appropriate allocation of capital, funding and liquidity, and market risk resources and makes appropriate trade-offs between risk and reward. |
| Group and Ring-Fenced Banks Customer First Committees | | Provides a Group-wide perspective of customer experience and the governing body of customer plans and targets including governing targets and plans, oversight of customer outcomes and experience, and learning through best practice externally and leveraging Group memberships and partnerships. |
| Group and Ring-Fenced Banks Cost Management Committees | | Leads and shapes the Group’s approach to cost management, ensuring appropriate governance and process over Group-wide cost management activities and effective control of the Group’s cost base. |
| Group and Ring-Fenced Banks Conduct Review Committees | | Provides senior management oversight, challenge and accountability in connection with the Group’s engagement with conduct review matters as agreed with the Group Chief Executive. |
| Group and Ring-Fenced Banks People Committees | | Oversees the Group’s people and colleague policies, the remuneration policy and Group-wide remuneration matters, oversees compliance with Senior Manager and Certification Regime (SM&CR) and other regulatory requirements, monitors colleague engagement surveys, progress of the Group towards its culture targets and oversees the implementation of action plans. |
| Group and Ring-Fenced Banks Sustainability Committees | | Recommends and implements the strategy and plans for delivering the Group’s aspiration to be viewed as a trusted responsible business as part of the purpose of Helping Britain Prosper. |
| Senior Independent Performance Adjustment and Conduct Committees | | Responsible for providing recommendations regarding performance adjustment, including the individual risk-adjustment process and risk-adjusted performance assessment, and making final decisions on behalf of the Group on the appropriate course of action relating to conduct breaches, under the formal scope of the SM&CR. |
| Group and Ring-Fenced Banks Strategic Review 3 Committees | | Responsible for monitoring the progress of transformation across the Group, acting as a clearing house to resolve issues and facilitate resolution of issues where necessary and to drive the execution of the Group’s transformation agenda as agreed by the Group Chief Executive. |
| The Group Risk Committee is supported through escalation and ongoing reporting by business area risk committees, cross-divisional committees addressing specific matters of Group-wide significance and the following second line of defence Risk committees which ensure effective oversight of risk management: |
| Credit Risk Committees | | Review material credit risk, both current and emerging, and adherence to agreed risk appetite; provide insight into the performance of material credit portfolios against expectation, forecast, metrics, portfolio controls to ensure they remain within agreed credit risk appetite; provide assurance that new business is being written within agreed credit risk appetite; ensure credit risk exposures causing concerns and any risks or issues are identified as early as possible so that remedial action may be taken; review information on credit impairment levels and allowance for expected credit losses; review information on the performance of credit risk models; and the reporting of monitoring activities relating to residual value risk. |
| Group Market Risk Committee | | Reviews and recommends market risk appetites. Monitors and oversees market risk exposures across the Group and adherence to Board risk appetite. Approves the framework and designation of books between the Trading Book and the Banking Book for regulatory purposes. Responsible for reviewing and proposing changes to the market risk management framework, and for reviewing adequacy of data quality for managing market risks. |
OPERATING AND FINANCIAL REVIEW AND PROSPECTS
| Committees | | Risk focus |
| Group Conduct, Compliance and Operational Risk Committee | | Acts as a Risk community forum to independently challenge and oversee the Group-wide risk and control environment, using read-across and lessons learned from the three lines of defence to ensure that the Group-wide risk profile adapts to emerging risks, trends and themes, and the control environment is sustainable to deliver the Bank of the Future. |
| Group Fraud and Financial Crime Prevention Committee | | The Fraud and Financial Crime Prevention Committee brings together accountable stakeholders and subject matter experts to ensure that the development and application of fraud and financial crime risk management complies with the Group’s Strategic Aims, Group Corporate Responsibility, Group risk appetite and Group Fraud and Financial Crime (Anti-Money Laundering, Anti-bribery and Sanctions) policies. It provides direction and appropriate focus on priorities to enhance the Group’s fraud and financial crime risk management capabilities in line with business and customer objectives whilst aligning to the Group’s target operating model. |
| Group Financial Risk Committee | | Responsible for overseeing, reviewing, challenging and recommending to senior executives and Board committees on internal and regulatory stress tests, Internal Capital Adequacy Assessment Process, Individual Liquidity Adequacy Assessment Process, Pillar 3 disclosures, Recovery and Resolution Plans, and other analysis as required. |
| Group Capital Risk Committee | | Responsible for providing oversight of all relevant capital matters within the Group, Ring Fenced bank and material subsidiaries, including the Group’s latest capital position and plans, risk appetite proposals, Pillar 2 development updates relating to ICAAP, Recovery and Resolution and the impact from regulatory reforms and accounting developments specific to capital. |
| Group Model Governance Committee | | Responsible for approving the model governance framework, the associated policy and related principles and procedures; reviewing and approving models, model changes, model extensions and capital post model adjustments; recommending those models which require GRC approval to GRC; approving summary of model performance, approving any appropriate corrective actions; and supporting approval of risk appetite performance and escalating as required. |
| Ring Fenced Bank Perimeter Oversight Committee | | The Committee escalates perimeter control breaches to the Ring-Fenced Banks’ Board and the Ring-Fenced Banks’ Board Risk Committee. |
CAPITAL STRESS TESTING
OVERVIEW
Stress testing is recognised as a key risk management tool by the Boards, senior management, the businesses and the Risk and Finance functions of all parts of the Group and its legal entities. It is fully embedded in the planning process of the Group and its legal entities as a key activity in medium-term planning, and senior management is actively involved in stress testing activities via a strict governance process.
Scenario stress testing is used for:
Risk Identification:
| Understand key vulnerabilities of the Group and its key legal entities under adverse economic conditions. |
| | |
| Risk Appetite: |
| | |
| Assess the results of the stress test against the risk appetite of all parts of the Group to ensure the Group and its legal entities are managed within their risk parameters. |
| | |
| Inform the setting of risk appetite by assessing the underlying risks under stress conditions. |
| | |
| Strategic and Capital Planning: |
| | |
| Allow senior management and the Boards of the Group and its applicable legal entities to adjust strategies if the plan does not meet risk appetite in a stressed scenario. |
| | |
| Support the Internal Capital Adequacy Assessment Process (ICAAP) by demonstrating capital adequacy, and meet the requirements of regulatory stress tests that are used to inform the setting of the Prudential Regulation Authority (PRA) and management buffers (see capital risk on pages 85 to 94) of the Group and its separately regulated legal entities. |
| | |
| Risk Mitigation: |
| | |
| | Drive the development of potential actions and contingency plans to mitigate the impact of adverse scenarios. Stress testing also links directly to the recovery planning process of the Group and its legal entities. |
REGULATORY STRESS TESTS
In 2019, the Group participated in both the Annual Cyclical Scenario (ACS) UK stress test and the Biennial Exploratory Scenario (BES) run by the Bank of England (BoE). Despite the severity of the ACS stress, the Group exceeded the capital and leverage hurdles on a transitional basis, after the application of management actions and as a consequence was not required to take any capital actions. The BoE continues to review the outputs of the BES exercise.
INTERNAL STRESS TESTS
On at least an annual basis, the Group conducts macroeconomic stress tests of the operating plan, which are supplemented with higher-level refreshes if necessary. The exercise aims to highlight the key vulnerabilities of the Group’s and its legal entities’ business plans to adverse changes in the economic environment, and to ensure that there are adequate financial resources in the event of a downturn.
REVERSE STRESS TESTING
Reverse stress testing is used to explore the vulnerabilities of the Group’s and its key legal entities’ strategies and plans to extreme adverse events that would cause the businesses to fail. Where this identifies plausible scenarios with an unacceptably high risk, the Group or its entities will adopt measures to prevent or mitigate that and reflect these in strategic plans.
OTHER STRESS TESTING ACTIVITY
The Group’s stress testing programme also involves undertaking assessments of liquidity scenarios, market risk sensitivities and scenarios, and business specific scenarios (see the principal risk categories on pages 138 to 187 for further information on risk-specific stress testing). If required, ad hoc stress testing exercises are also undertaken to assess emerging risks, as well as in response to regulatory requests. This wide ranging programme provides a comprehensive view of the potential impacts arising from the risks to which the Group is exposed and reflects the nature, scale and complexity of the Group. From 2020 onwards, climate change risk stress testing will be considered as part of the implementation of the recommendations of the Taskforce on Climate-related Financial Disclosures (TCFD).
OPERATING AND FINANCIAL REVIEW AND PROSPECTS
METHODOLOGY
The stress tests at all levels must comply with all regulatory requirements, achieved through the comprehensive construction of macroeconomic scenarios and a rigorous divisional, functional, risk and executive review and challenge process, supported by analysis and insight into impacts on customers and business drivers.
The engagement of all required business, Risk and Finance teams is built into the preparation process, so that the appropriate analysis of each risk category’s impact upon the business plans is understood and documented. The methodologies and modelling approach used for stress testing ensure that a clear link is shown between the macroeconomic scenarios, the business drivers for each area and the resultant stress testing outputs. All material assumptions used in modelling are documented and justified, with a clearly communicated review and sign-off process. Modelling is supported by expert judgement and is subject to the Group Model Governance Policy.
GOVERNANCE
Clear accountabilities and responsibilities for stress testing are assigned to senior management and the Risk and Finance functions throughout the Group and its key legal entities. This is formalised through the Group Business Planning and Stress Testing Policy and Procedure, which are reviewed at least annually.
The Group Financial Risk Committee (GFRC), chaired by the Chief Risk Officer and attended by the Chief Financial Officer and other senior Risk and Finance colleagues, is the committee that has primary responsibility for overseeing the development and execution of the Group’s and Ring-Fenced Bank’s stress tests. Lloyds Bank Corporate Markets (LBCM) Risk Committee performs a similar function within the scope of LBCM.
The review and challenge of the Group’s and Ring-Fenced Bank’s detailed stress forecasts, the key assumptions behind these, and the methodology used to translate the economic assumptions into stressed outputs conclude with the divisional Finance Directors’, appropriate Risk Directors’ and Managing Directors’ sign-off. The outputs are then presented to GFRC and Board Risk Committee for review and challenge, before being approved by the Board. There is a similar process within LBCM for the governance of the LBCM-specific results.
FULL ANALYSIS OF RISK CATEGORIES
The Group’s risk framework covers all types of risk which affect the Group and could impact on the achievement of its strategic objectives. A detailed description of each category is provided on pages 50 to 108.
Risk categories recognised by the Group are periodically reviewed to ensure that they reflect the Group risk profile in light of internal and external factors, such as the Group strategy and the regulatory environment in which it operates. There have been no changes to the risk categories during 2019.
| Principal risk categories | Secondary risk categories | | |
| Change/Execution risk | – Change/Execution | | |
| Page 50 | | | |
| | | | |
| Data risk | – Data | | |
| Page 50 | | | |
| | | | |
| Operational resilience risk | – Operational resilience | | |
| Page 51 | | | |
| | | | |
| Strategic risk | – Strategic | | |
| Page 52 | | | |
| | | | |
| Credit risk | – Retail credit | – Commercial credit | |
| Page 52 | | | |
| | | | |
| Regulatory and legal risk | – Regulatory compliance | – Legal | |
| Page 81 | | | |
| | | | |
| Conduct risk | – Conduct | | |
| Page 82 | | | |
| | | | |
| Operational risk | – Business process | – Financial reporting | – Physical security/health and safety |
| Page 82 | – Cyber and information security | – Fraud | – Sourcing |
| | – External service provision | – Internal service provision | |
| | – Financial crime | – IT systems | |
| | | | |
| People risk | – People | | |
| Page 84 | | | |
| | | | |
| Insurance underwriting risk | – Insurance underwriting | | |
| Page 84 | | | |
| | | | |
| Capital risk | – Capital | | |
| Page 85 | | | |
| | | | |
| Funding and liquidity risk | – Funding and liquidity | | |
| Page 94 | | | |
| | | | |
| Governance risk | – Governance | | |
| Page 101 | | | |
| | | | |
| Market risk | – Trading book | – Pensions | |
| Page 102 | – Banking book | – Insurance | |
| | | | |
| Model risk | – Model | | |
| Page 108 | | | |
The Group considers both reputational and financial impact in the course of managing all its risks and therefore does not classify reputational impact as a separate risk category.
OPERATING AND FINANCIAL REVIEW AND PROSPECTS
CHANGE AND EXECUTION RISK
DEFINITION
Change and execution is defined as the risk that, in delivering its change agenda, the Group fails to ensure compliance with laws and regulation, maintain effective customer service and availability, and/or operation within the Group’s risk appetite.
EXPOSURES
Change and execution risks arise when the Group undertakes activities which require products, processes, people, systems or controls to change. These changes can be as a result of external drivers (for example, a new piece of regulation that requires the Group to put in place a new process or reporting) and internal drivers (such as the strategic transformation that is outlined in GSR3).
MEASUREMENT
The Group currently measures change and execution risk against a defined risk appetite metric which is a combination of lead, quality and delivery indicators across the investment portfolio. These indicators are reported through defined internal governance structures in the form of a monthly execution risk dashboard. An associated measure, based on the aggregate performance of the dashboard is included in the Group Balanced Scorecard.
MITIGATION
The Group takes a range of mitigating actions with respect to change and execution risk. These include the following:
| The Board establishes a Group-wide risk appetite and metric for change and execution risk. |
| | |
| Ensuring compliance with the Change policy and associated policies and procedures, which set out the principles and key controls that apply across the business and are aligned to the Group risk appetite. |
| | |
| Businesses assess the potential impacts of undertaking any change activity on their ability to execute effectively, and the potential consequences for the existing risk profiles. |
| | |
| The implementation of effective governance and control frameworks to ensure adequate controls are in place to manage the change activity and act to mitigate the change and execution risks identified. These controls are monitored in line with the Change policy and any additional monitoring that is deemed necessary. |
| | |
| Events related to change activities are escalated and managed appropriately in line with risk framework guidance. |
MONITORING
Change and execution risks from across the Group are monitored and reported through to Board and Group Governance Committees in accordance with the Group’s enterprise risk management framework and aligned to our GSR3 activities. Risk exposures are discussed monthly through established governance through to Group Transformation Risk Committee with upwards reporting to Board Risk and Executive Committees. In addition, oversight, challenge and reporting are completed at Risk division level to provide oversight of management of risks and the effectiveness of controls, recommending follow up remedial action if required. All material change and execution risk events are escalated in accordance with the formal Group Operational Risk policy and Change policy.
DATA RISK
DEFINITION
Data risk is defined as the risk of the Group failing to effectively govern, manage and control its data (including data processed by third party suppliers), leading to unethical decisions, poor customer outcomes, loss of value to the Group and mistrust.
EXPOSURES
Data risk is present in all aspects of the business where data is processed, both within the Group and by third parties including colleague and contractor, prospective and existing customer, client lifecycle and insight processes. Data risk manifests:
| When personal data is not gathered legally, for a legitimate purpose, or is not managed/protected from misuse and/or processed in a way that complies with General Data Protection Regulations (GDPR) and other data privacy regulatory obligations. |
| | |
| When data quality (accuracy, completeness, consistency, uniqueness, validity and timeliness) is not managed, resulting in data used in systems, processes and products not being fit for the intended purpose. |
| | |
| When data records are not created, retained, protected and destroyed appropriately and when data records cannot be retrieved in a timely manner. |
| | |
| When data governance fails to provide robust oversight of data decision-making and the control mechanisms to ensure strategies and management instructions are implemented effectively. |
| | |
| When data standards are not maintained across core data, data management risks are not managed and data related issues are not remediated as a result of poor data management resulting in inaccurate, incomplete data that is not available at the right time, to the right people, to enable business decisions to be made, and regulatory reporting requirements to be fulfilled. |
| | |
| When critical data mapping and data information standards are not followed impacting compliance, traceability and understanding of data. |
MEASUREMENT
Data risk is measured through a series of quantitative and qualitative indicators, aligned to key sources of data risk for the Group covering data governance, data management and data privacy and ethics. In addition to risk appetite measures and limits, data risks and controls are monitored and governed on a monthly basis through divisional risk committees. Significant issues are escalated to Group Risk Committee.
MITIGATION
Data risk is a key component of the Group’s enterprise risk management framework, where the focus is on the end to end management of data risk. This ensures that risks are identified, measured, managed, monitored and reported using the risk and control self-assessment process. Significant investment has been made to enhance the maturity of data risk management in recent years. In addition to the General Data Protection programme which delivered the necessary infrastructure to achieve compliance with the new regulations in May 2018, a number of other large investments and remediation projects include:
| Enhancing capability by investing in professional training for data privacy managers. |
| | |
| Enhancing assurance over of suppliers. |
| | |
| Delivered enhanced controls and processes for data retention and destruction, deleting large volumes of historic over-retained data. |
| | |
| Delivering increased level of data maturity against the Data Management Capability Assessment Model. |
| | |
| Where required, these projects have also delivered enhancements to colleague and client training, vetting procedures and access controls processes. |
MONITORING
Data risk is governed through divisional risk committees and significant issues are escalated to Group Risk Committee, in accordance with the Group’s enterprise risk management framework. Risk exposures are discussed at divisional risk committees, where oversight, challenge and reporting are completed to assess the effectiveness of controls. Remedial action is recommended, if required. All material data risk events are escalated in accordance with the Group Operational Risk policy and Data risk policies to the respective divisional Managing Directors and Conduct, Compliance and Operational Risk, including, where personal data is concerned, the Group Data Protection Officer. In addition, Group-wide data risk issues and the top data risks that Group faces are discussed at Group Data Committee.
A number of activities support the close monitoring of data risk including:
OPERATING AND FINANCIAL REVIEW AND PROSPECTS
| Design and monitoring of data risk appetite metrics, including key risk indicators and key performance indicators. |
| | |
| Monitoring and reporting of progress against the Data Capability Assessment Model. |
| | |
| Monitoring of significant data related issues. |
| | |
| Identification and effective mitigation of data risk when planning and implementing transformation or business change. |
| | |
| Implementation of effective controls to mitigate data risk, including data privacy, ethics, data management and records management. |
| | |
| Effective monitoring and testing of compliance with data privacy and data management regulatory requirements. For example GDPR and Basel Committee on Banking Supervision (BCBS 239) requirements. |
| | |
| Horizon scanning for changes in the external environment, including but not limited to changes to laws, rules and regulations. |
OPERATIONAL RESILIENCE RISK
DEFINITION
Operational resilience risk is defined as the risk that the Group fails to design resilience into business operations, underlying infrastructure and controls (people, process, technology) so that it is able to withstand external or internal events which could impact the continuation of operations, and/or fails to respond in a way which meets customer and stakeholder expectations and needs when the continuity of operations is compromised.
EXPOSURES
Ineffective operational resilience risk management could lead to vital services not being available to customers, and in extreme circumstances, bank failure could result. The Group has in place a transparent and effective operating model to identify and monitor critical business processes from a customer, Group and financial industry perspective. The failure to adequately build resilience into a critical business process may occur in a variety of ways, including:
| The Group being overly reliant on one location to deliver a critical business process. |
| | |
| The Group not having an adequate succession plan in place for designated subject matter experts. |
| | |
| The Group being overly reliant on a supplier which fails to provide a service. |
| | |
| A weakness in the Group’s cyber or security defences leaving it vulnerable to an attack. |
| | |
| The Group failing to upgrade its IT systems and leaving them vulnerable to failure. |
| | |
| Operational resilience and damage to physical assets including: terrorist acts, other acts of war or hostility, geopolitical, pandemic or other such events. |
Effective operational resilience ensures the Group designs resilience into its systems, is able to withstand and/or recover from a significant unexpected event occurring and can continue to provide services to its customers. A significant outage could result in customers being unable to access accounts or conduct transactions, which as well as presenting significant reputational risk for the Group would negatively impact the Group’s purpose of Helping Britain Prosper. Operational resilience is also an area of continued regulatory and industry focus, similar in importance to financial resilience.
Failure to manage operational resilience effectively could impact the following other risk categories:
| Regulatory compliance – non-compliance with new/existing operational resilience regulations, for example, through failure to identify emerging regulation or not embedding regulatory requirements within the Group’s policies, processes and procedures. |
| | |
| Operational risk – being unable to safely provide customers with business services. |
| | |
| Conduct risk – an operational resilience failure may render the Group liable to fines from the FCA for poor conduct. |
| | |
| Market risk – the Group being unable to provide key services could have ramifications for the wider market and could impact share price. |
MEASUREMENT
Operational resilience risk is managed across the Group through the Group’s enterprise risk management framework and Operational risk policies. The Group’s enterprise risk management framework includes a risk and control self-assessment process, risk impact likelihood matrix, key risk and control indicators, risk appetite, a robust incident management and escalation process, scenario analysis and an operational losses process. Board risk appetite metrics are in place and are well understood. These specific measures are subject to ongoing monitoring and reporting, including a mandatory review of thresholds on at least an annual basis. To strengthen the management of operational resilience risk, the Group mobilised an operational resilience enhancement programme which is designed to focus on end to end resilience and the management of key risks to critical processes.
MITIGATION
The Group has increased its focus on operational resilience and has updated its operational resilience strategy to reflect changing priorities of both customers and regulators. The Group is carefully considering the publication of the consultation paper by the FCA, PRA and Bank of England (December 2019). Focus will be given to ensure that the Group’s strategy and approach to operational resilience aligns with industry thinking and expectation. At the core of its approach to operational resilience are the Group’s critical business processes which drive all activity, including further mapping of the processes to identify any additional resilience requirements such as impact tolerances in the event of a service outage. The Group continues to develop playbooks that guide its response to a range of interruptions from internal and external threats and tests these through scenario-based testing and exercising.
The Group’s strategic review considers the changing risk management requirements, adapting the change delivery model to be more agile and develop the people skills and capabilities needed to be a ‘Bank of the Future’. The Group continues to review and invest in its control environment to ensure it addresses the risks it faces. Risks are reported and discussed at local governance forums and escalated to executive management and Board as appropriate. The Group employs a range of risk management strategies, including: avoidance, mitigation, transfer (including insurance) and acceptance. Where there is a reliance on third-party suppliers to provide services, the Group’s sourcing policy ensures that outsourcing initiatives follow a defined process including due diligence, risk evaluation and ongoing assurance.
Mitigating actions to the principal operational resilience risk are:
| Cyber: the threat landscape associated with cyber risk continues to evolve and there is significant regulatory attention on this subject. The Board continues to invest heavily to protect the Group from cyber-attacks. Investment continues to focus on improving the Group’s approach to identity and access management, improving capability to detect and respond to cyber-attacks and improved ability to manage vulnerabilities across the estate. |
| | |
| IT resilience: the Group continues to optimise its approach to IT and operational resilience by investing in technology improvements and enhancing the resilience of systems that support the Group’s critical business processes, primarily through the technology resilience programme, with independent verification of progress on an annual basis. The Board recognises the role that resilient technology plays in achieving the Group’s strategy of becoming the best bank for customers and in maintaining banking services across the wider industry. As such, the Board dedicates considerable time and focus to this subject at both the Board and the Board Risk Committee, and continues to sponsor key investment programmes that enhance resilience. |
| | |
| People: the Group acknowledges the risks associated to the failure to maintain appropriately skilled and available colleagues. The Group continues to optimise its approach to ensure that where applicable, colleagues are capable of supporting a critical business process. Key controls and processes are regularly reported to committee(s) and alignment to the Group Strategic Review is closely monitored. |
| | |
| Property: the Group’s property portfolio remains a key focus in ensuring resilience requirements are appropriately maintained. Processes are in place to identify key buildings where a critical business process is performed. Depending on criticality, a number of mitigating controls are in place to manage the risk of severe critical business process disruption. The Group remains committed to investment in the upkeep of the property portfolio, primarily through the Group Property upkeep investment programme. |
| | |
| Sourcing: the threat landscape associated with third party suppliers and the critical services they provide continues to receive a significant amount |
OPERATING AND FINANCIAL REVIEW AND PROSPECTS
| | of regulatory attention. The Group acknowledges the importance demonstrating control and responsibility for those critical business services which could cause significant harm to our customers. Risks and controls are regularly reported through committee(s) and is further supported via the mobilisation of the Sourcing enterprise programme. |
MONITORING
Monitoring and reporting of operational resilience risk is undertaken at Board, Group, entity and divisional committees. Each committee monitors key risks, control effectiveness, key risk and control indicators, events, operational losses, risk appetite metrics and the results of independent testing conducted by the Risk division and/or Group Internal Audit.
The Group maintains a formal approach to operational resilience risk event escalation, whereby material events are identified, captured and escalated. Root causes are determined, and action plans put in place to ensure an optimum level of control to keep customers and the business safe, reduce costs, and improve efficiency.
STRATEGIC RISK
DEFINITION
The risks which result from strategic plans which do not adequately reflect trends in external factors, ineffective business strategy execution, or failure to respond in a timely manner to external environments or changes in stakeholder behaviours and expectations.
EXPOSURES
The Group faces significant risks due to the changing regulatory and competitive environments in the financial services sector, with an increased pace, scale and complexity of change. Customers, shareholders and employees expectations continue to evolve, with indications that current societal trends may accelerate, impacting the Group’s ability to respond accordingly, and negatively impacting the Group’s relevance in society.
MEASUREMENT
The Group assesses and monitors the impact of the strategic risk implications of new business, product entries and other strategic initiatives, as part of the business planning processes and stress testing scenarios.
MITIGATION
The Group has a number of mitigating actions to manage strategic risk, including:
| Continued digitisation of customer journeys, thereby enabling the delivery of market leading customer experiences that are seamless, accessible and personal. |
| | |
| Robust operating and contingency planning to ensure potential impacts of strategic initiatives and external drivers are mitigated. |
| | |
| Continued focus on increasing the efficiency of the Group’s operations to ensure investment capacity, responsiveness and effectiveness to respond to external trends. |
| | |
| Development of a compelling colleague proposition to continue to attract talent to the Group. |
MONITORING
A review of the Group’s emerging and strategic risks, which includes the risks to the current strategic review and the mitigating actions, is undertaken on an annual basis and the findings are reported to the Group and Board Risk Committees.
CREDIT RISK
DEFINITION
Credit risk is defined as the risk that parties with whom the Group has contracted fail to meet their financial obligations (both on and off-balance sheet).
EXPOSURES
The principal sources of credit risk within the Group arise from loans and advances, contingent liabilities, commitments, debt securities and derivatives to customers, financial institutions and sovereigns. The credit risk exposures of the Group are set out in note 53 on page F-99.
In terms of loans and advances, (for example mortgages, term loans and overdrafts) and contingent liabilities (for example credit instruments
such as guarantees and documentary letters of credit), credit risk arises both from amounts advanced and commitments to extend credit to a customer or bank. With respect to commitments to extend credit, the Group is also potentially exposed to an additional loss up to an amount equal to the total unutilised commitments. However, the likely amount of loss may be less than the total unutilised commitments, as most retail and certain commercial lending commitments may be cancelled based on regular assessment of the prevailing creditworthiness of customers. Most commercial term commitments are also contingent upon customers maintaining specific credit standards.
Credit risk also arises from debt securities and derivatives. The total notional principal amount of interest rate, exchange rate, credit derivative and other contracts outstanding at 31 December 2019 is shown on page 67. The notional principal amount does not, however, represent the Group’s credit risk exposure, which is limited to the current cost of replacing contracts with a positive value to the Group. Such amounts are reflected in note 53 on page F-99.
Additionally, credit risk arises from leasing arrangements where the Group is the lessor. Note 2(J) on page F-17 provides details on the Group’s approach to the treatment of leases.
Credit risk exposures in the Insurance and Wealth division relate mostly to bond and loan assets which, together with some related swaps, are used to fund annuity commitments within Shareholder funds; plus balances held in liquidity funds to manage Insurance division’s liquidity requirements, and exposure to reinsurers.
The investments held in the Group’s defined benefit pension schemes also expose the Group to credit risk. Note 36 on page F-63 provides further information on the defined benefit pension schemes’ assets and liabilities.
Loans and advances, contingent liabilities, commitments, debt securities and derivatives also expose the Group to refinance risk. Refinance risk is the possibility that an outstanding exposure cannot be repaid at its contractual maturity date. If the Group does not wish to refinance the exposure then there is refinance risk if the obligor is unable to repay by securing alternative finance. This may occur for a number of reasons which may include: the borrower is in financial difficulty, because the terms required to refinance are outside acceptable appetite at the time or the customer is unable to refinance externally due to a lack of market liquidity. Refinance risk exposures are managed in accordance with the Group’s existing credit risk policies, processes and controls, and are not considered to be material given the Group’s prudent and through the cycle credit risk appetite. Where heightened refinance risk exists exposures are minimised through intensive account management and, where appropriate, are classed as impaired and/or forborne.
MEASUREMENT
The process for credit risk identification, measurement, and control is integrated into the Board-approved framework for credit risk appetite and governance.
Credit risk is measured from different perspectives using a range of appropriate modelling and scoring techniques at a number of levels of granularity, including total balance sheet, individual portfolio, pertinent concentrations and individual customer – for both new business and existing lending. Key metrics, such as total exposure, risk-weighted assets, new business quality, concentration risk and portfolio performance, are reported monthly to Risk Committees.
Measures such as expected credit loss (ECL), risk-weighted assets, observed credit performance, predicted credit quality (usually from predictive credit scoring models), collateral cover and quality, and other credit drivers (such as cash flow, affordability, leverage and indebtedness) are used to enable effective risk measurement across the Group.
In addition, stress testing and scenario analysis are used to estimate impairment losses and capital demand forecasts for both regulatory and internal purposes and to assist in the formulation of credit risk appetite.
As part of the ‘three lines of defence’ model, Risk division is the second line of defence providing oversight and independent challenge to key risk decisions taken by business management. Risk division also tests the effectiveness of credit risk management and internal credit risk controls. This includes ensuring that the control and monitoring of higher risk and vulnerable portfolios and sectors is appropriate and confirming that appropriate loss allowances for impairment are in place. Output from these reviews helps to inform credit risk appetite and credit policy.
As the third line of defence, Group Internal Audit undertakes regular risk-based reviews to assess the effectiveness of Credit risk management and controls.
OPERATING AND FINANCIAL REVIEW AND PROSPECTS
MITIGATION
The Group uses a range of approaches to mitigate Credit risk.
Prudent, through the cycle credit principles, risk policies and appetite statements: the independent Risk division sets out the credit principles, credit risk policies and credit risk appetite statements. These are subject to regular review and governance, with any changes subject to an approval process. Risk teams monitor credit performance trends and the outlook. Risk teams also test the adequacy of and adherence to credit risk policies and processes throughout the Group. This includes tracking portfolio performance against an agreed set of credit risk appetite tolerances.
Robust models and controls: see model risk on page 108.
Limitations on concentration risk: there are portfolio controls on certain industries, sectors and products to reflect risk appetite as well as individual, customer and bank limit risk tolerances. Credit policies and appetite statements are aligned to the Group’s risk appetite and restrict exposure to higher risk countries and potentially vulnerable sectors and asset classes. Note 18 on page F-99 provides an analysis of loans and advances to customers by industry (for commercial customers) and product (for retail customers). Exposures are monitored to prevent both an excessive concentration of risk and single name concentrations. These concentration risk controls are not necessarily in the form of a maximum limit on exposure, but may instead require new business in concentrated sectors to fulfil additional minimum policy and/or guideline requirements. The Group’s largest credit limits are regularly monitored by the Board Risk Committee and reported in accordance with regulatory requirements.
Defined country risk management framework: the Board sets a broad maximum country risk appetite. Within this, the Executive Credit Approval Committee approves the Group country risk framework and sovereign limits on an annual basis. Risk based appetite for all countries is set within the independent Risk division, taking into account economic, financial, political and social factors as well as the approved business and strategic plans of the Group.
Specialist expertise: credit quality is managed and controlled by a number of specialist units within the business and Risk division, which provide for example: intensive management and control; security perfection; maintenance of customer and facility records; expertise in documentation for lending and associated products; sector-specific expertise; and legal services applicable to the particular market segments and product ranges offered by the Group.
Stress testing: the Group’s credit portfolios are subject to regular stress testing. In addition to the Group led, PRA, EBA and other regulatory stress tests, exercises focused on individual divisions and portfolios are also performed. For further information on stress testing process, methodology and governance see page 48.
Frequent and robust Credit risk oversight and assurance: oversight and assurance of credit risk is undertaken by independent credit risk oversight functions operating within the Risk division which are part of the Group’s second line of defence. Their primary objective is to provide reasonable and independent oversight that credit risk is being effectively managed and to ensure that appropriate controls are in place and being adhered to. Group Internal Audit also provides assurance to the Board Audit Committee on the effectiveness of credit risk management controls across the Group’s activities.
Collateral
The principal types of acceptable collateral include:
| residential and commercial properties; |
| | |
| charges over business assets such as premises, inventory and accounts receivable; |
| | |
| financial instruments such as debt securities; |
| | |
| vehicles; |
| | |
| cash; and |
| | |
| guarantees received from third-parties. |
The Group maintains appetite parameters on the acceptability of specific classes of collateral.
For non-mortgage retail lending to small businesses, collateral may include second charges over residential property and the assignment of life cover.
Collateral held as security for financial assets other than loans and advances is determined by the nature of the underlying exposure. Debt securities, including treasury and other bills, are generally unsecured, with the exception of asset-backed securities and similar instruments such as covered bonds, which are secured by portfolios of financial assets. Collateral is generally not held against loans and advances to financial
institutions. However, securities are held as part of reverse repurchase or securities borrowing transactions or where a collateral agreement has been entered into under a master netting agreement. Derivative transactions with financial counterparties are typically collateralised under a Credit Support Annex (CSA) in conjunction with the International Swaps and Derivatives Association (ISDA) Master Agreement. Derivative transactions with non-financial customers are not usually supported by a CSA.
The requirement for collateral and the type to be taken at origination will be based upon the nature of the transaction and the credit quality, size and structure of the borrower. For non-retail exposures if required, the Group will often seek that any collateral include a first charge over land and buildings owned and occupied by the business, a debenture over the assets of a company or limited liability partnership, personal guarantees, limited in amount, from the directors of a company or limited liability partnership and key man insurance. The Group maintains policies setting out which types of collateral valuation are acceptable, maximum loan to value (LTV) ratios and other criteria that are to be considered when reviewing an application. Other than for project finance, object finance and income-producing real estate where charges over the subject assets are required, the provision of collateral will not determine the outcome of an application. Notwithstanding this, the fundamental business proposition must evidence the ability of the business to generate funds from normal business sources to repay a customer or counterparty’s financial commitment, rather than reliance on the disposal of any security provided.
The extent to which collateral values are actively managed will depend on the credit quality and other circumstances of the obligor and type of underlying transaction. Although lending decisions are primarily based on expected cash flows, any collateral provided may impact the pricing and other terms of a loan or facility granted. This will have a financial impact on the amount of net interest income recognised and on internal loss given default estimates that contribute to the determination of asset quality and returns.
The Group requires collateral to be realistically valued by an appropriately qualified source, independent of both the credit decision process and the customer, at the time of borrowing. In certain circumstances, for Retail residential mortgages this may include the use of automated valuation models based on market data, subject to accuracy criteria and LTV limits. Where third-parties are used for collateral valuations, they are subject to regular monitoring and review. Collateral values are subject to review, which will vary according to the type of lending, collateral involved and account performance. Such reviews are undertaken to confirm that the value recorded remains appropriate and whether revaluation is required, considering for example, account performance, market conditions and any information available that may indicate that the value of the collateral has materially declined. In such instances, the Group may seek additional collateral and/or other amendments to the terms of the facility. The Group adjusts estimated market values to take account of the costs of realisation and any discount associated with the realisation of the collateral when estimating credit losses.
The Group considers risk concentrations by collateral providers and collateral type with a view to ensuring that any potential undue concentrations of risk are identified and suitably managed by changes to strategy, policy and/or business plans.
The Group seeks to avoid correlation or wrong-way risk where possible. Under the Group’s repurchase (repo) policy, the issuer of the collateral and the repo counterparty should be neither the same nor connected. The same rule applies for derivatives. Risk division has the necessary discretion to extend this rule to other cases where there is significant correlation. Countries with a rating equivalent to AA- or better may be considered to have no adverse correlation between the counterparty domiciled in that country and the country of risk (issuer of securities).
Refer to note 53 on page F-117 for further information on collateral.
Additional mitigation for Retail customers
The Group uses a variety of lending criteria when assessing applications for mortgages and unsecured lending. The general approval process uses credit acceptance scorecards and involves a review of an applicant’s previous credit history using internal data and information held by Credit Reference Agencies (CRA).
The Group also assesses the affordability and sustainability of lending for each borrower. For secured lending this includes use of an appropriate stressed interest rate scenario. Affordability assessments for all lending are compliant with relevant regulatory and conduct guidelines. The Group takes reasonable steps to validate information used in the assessment of a customer’s income and expenditure.
OPERATING AND FINANCIAL REVIEW AND PROSPECTS
In addition, the Group has in place quantitative limits such as maximum limits for individual customer products, the level of borrowing to income and the ratio of borrowing to collateral. Some of these limits relate to internal approval levels and others are policy limits above which the Group will typically reject borrowing applications. The Group also applies certain criteria that are applicable to specific products for example applications for buy-to-let mortgages.
For UK mortgages, the Group’s policy permits owner occupier applications with a maximum loan to value (LTV) of 95 per cent. This can increase to 100 per cent for specific products where additional security is provided by a supporter of the applicant and held on deposit by the Group. Applications with an LTV above 90 per cent are subject to enhanced underwriting criteria, including higher scorecard cut-offs and loan size restrictions.
Buy-to-let mortgages within Retail are limited to a maximum loan size of £1,000,000 and 75 per cent LTV. Buy-to-let applications must pass a minimum rental cover ratio of 125 per cent under stressed interest rates, after applicable tax liabilities. Portfolio landlords (customers with four or more mortgaged buy-to-let properties) are subject to additional controls including evaluation of overall portfolio resilience.
The Group’s policy is to reject any application for a lending product where a customer is registered as bankrupt or insolvent, or has a recent County Court Judgment or financial default registered at a CRA used by the Group above de minimis thresholds. In addition, the Group typically rejects applicants where total unsecured debt, debt-to-income ratios, or other indicators of financial difficulty exceed policy limits.
Where credit acceptance scorecards are used, new models, model changes and monitoring of model effectiveness are independently reviewed and approved in accordance with the governance framework set by the Group Model Governance Committee.
Additional mitigation for Commercial customers
Individual credit assessment and independent sanction of customer and bank limits: with the exception of small exposures to SME customers where certain relationship managers have limited delegated sanctioning authority, credit risk in commercial customer portfolios is subject to sanction by the independent Risk division, which considers the strengths and weaknesses of individual transactions, the balance of risk and reward, and how credit risk aligns to the Group and Divisional risk appetite. Exposure to individual counterparties, groups of counterparties or customer risk segments is controlled through a tiered hierarchy of delegated sanctioning authorities and risk based recommended maximum limit parameters. Approval requirements for each decision are based on a number of factors including, but not limited to, the transaction amount, the customer’s aggregate facilities, credit policy, risk appetite, credit risk ratings and the nature and term of the risk. The Group’s credit risk appetite criteria for counterparty and customer loan Underwriting is generally the same as that for loans intended to be held to maturity. All hard loan/bond Underwriting must be sanctioned by Risk division. A pre-approved credit matrix may be used for ‘best efforts’ underwriting.
Counterparty credit limits: limits are set against all types of exposure in a counterparty name, in accordance with an agreed methodology for each exposure type. This includes credit risk exposure on individual derivatives and securities financing transactions, which incorporates potential future exposures from market movements against agreed confidence intervals. Aggregate facility levels by counterparty are set and limit breaches are subject to escalation procedures.
Daily settlement limits: settlement risk arises in any situation where a payment in cash, securities or equities is made in the expectation of a corresponding receipt in cash, securities or equities. Daily settlement limits are established for each relevant counterparty to cover the aggregate of all settlement risk arising from the Group’s market transactions on any single day. Where possible, the Group uses Continuous Linked Settlement in order to reduce FX settlement risk.
Master netting agreements
It is credit policy that a Group approved master netting agreement must be used for all derivative and traded product transactions and must be in place prior to trading, with separate documentation required for each Group entity providing facilities. This requirement extends to trades with clients and the counterparties used for the Bank’s own hedging activities, which may also include clearing trades with Central Counterparties (CCPs). Any exceptions must be approved by the appropriate credit sanctioner. Master netting agreements do not generally result in an offset of balance sheet assets and liabilities for accounting purposes, as transactions are usually settled on a gross basis. However, within relevant jurisdictions and for appropriate counterparty types, master nettings agreements do reduce
the credit risk to the extent that, if an event of default occurs, all trades with the counterparty may be terminated and settled on a net basis. The Group’s overall exposure to credit risk on derivative instruments subject to master netting agreements can change substantially within a short period, since this is the net position of all trades under the master netting agreement.
Other credit risk transfers
The Group also undertakes asset sales, credit derivative based transactions, securitisations (including Significant Risk Transfer transactions), purchases of credit default swaps and purchase of credit insurance as a means of mitigating or reducing credit risk and/or risk concentration, taking into account the nature of assets and the prevailing market conditions.
MONITORING
In conjunction with Risk division, businesses identify and define portfolios of credit and related risk exposures and the key behaviours and characteristics by which those portfolios are managed and monitored. This entails the production and analysis of regular portfolio monitoring reports for review by senior management. Risk division in turn produces an aggregated view of credit risk across the Group, including reports on material credit exposures, concentrations, concerns and other management information, which is presented to the divisional risk committees, Group Risk Committee and the Board Risk Committee.
Models
The performance of all models used in credit risk is monitored in line with the Group’s model governance framework – see model risk on page 108.
Intensive care of customers in financial difficulty
The Group operates a number of solutions to assist borrowers who are experiencing financial stress. The material elements of these solutions through which the Group has granted a concession, whether temporarily or permanently, are set out below.
Forbearance
The Group’s aim in offering forbearance and other assistance to customers in financial distress is to benefit both the customer and the Group by supporting its customers and acting in their best interests by, where possible, bringing customer facilities back into a sustainable position.
The Group offers a range of tools and assistance to support customers who are encountering financial difficulties. Cases are managed on an individual basis, with the circumstances of each customer considered separately and the action taken judged as being appropriate and sustainable for both the customer and the Group.
Forbearance measures consist of concessions towards a debtor that is experiencing or about to experience difficulties in meeting its financial commitments. This can include modification of the previous terms and conditions of a contract or a total or partial refinancing of a troubled debt contract, either of which would not have been required had the debtor not been experiencing financial difficulties.
The provision and review of such assistance is controlled through the application of an appropriate policy framework and associated controls. Regular review of the assistance offered to customers is undertaken to confirm that it remains appropriate, alongside monitoring of customers’ performance and the level of payments received.
The Group classifies accounts as forborne at the time a customer in financial difficulty is granted a concession. Non-performing exposures can be reclassified as Performing Forborne after a minimum 12 month cure period, providing there are no past due amounts or concerns regarding the full repayment of the exposure. A minimum of a further 24 months must pass from the date the forborne exposure was reclassified as Performing Forborne before the account can exit forbearance. If conditions to exit forbearance are not met at the end of this probation period, the exposure shall continue to be identified as forborne until all the conditions are met.
The Group’s treatment of loan renegotiations is included in the impairment policy in note 2(H) on page F-16.
OPERATING AND FINANCIAL REVIEW AND PROSPECTS
Customers receiving support from UK government sponsored programmes
To assist customers in financial distress, the Group participates in UK government sponsored programmes for households, including the Income Support for Mortgage Interest programme, under which the government pays the Group all or part of the interest on the mortgage on behalf of the customer. This is provided as a government loan which the customer must repay.
THE GROUP CREDIT RISK PORTFOLIO IN 2019
Overview
| Credit quality remains strong despite an uncertain environment |
| The Group’s loan portfolios continue to be well positioned, reflecting the Group’s effective risk management and continue to benefit from a low interest rate environment |
| The net asset quality ratio increased to 29 basis points (2018: 21 basis points) as did the impairment charge to £1,291 million (2018: £937 million). This was primarily driven by material charges against two corporate cases in Commercial Banking, along with some weakening in used car prices in Retail |
| Stage 2 loans as a proportion of total loans and advances to customers increased by 0.5 percentage points to 5.7 per cent (31 December 2018: 5.2 per cent) |
| Stage 2 expected credit loss allowances as a percentage of drawn balances (coverage) decreased to 3.8 per cent (31 December 2018: 4.2 per cent), largely driven by a reduction in expected credit loss (ECL) |
| Table D: | Group impairment charge |
| | | Loans
and
advances
to banks and
other assets
£m | | | Loans
and
advances
to customers
£m | | | Financial
assets at
fair value
through other
comprehensive
income
£m | | | Undrawn
balances
£m | | | 2019
Total
£m | | | 2018¹
£m | |
| Retail | | | – | | | | 1,063 | | | | – | | | | (25 | ) | | | 1,038 | | | | 861 | |
| Commercial Banking | | | – | | | | 297 | | | | (1 | ) | | | 10 | | | | 306 | | | | 71 | |
| Insurance and Wealth | | | 5 | | | | – | | | | – | | | | – | | | | 5 | | | | 1 | |
| Central Items | | | – | | | | (53 | ) | | | – | | | | – | | | | (53 | ) | | | 4 | |
| Total impairment charge | | | 5 | | | | 1,307 | | | | (1 | ) | | | (15 | ) | | | 1,296 | | | | 937 | |
| Asset quality ratio | | | | | | | | | | | | | | | | | | | 0.29 | % | | | 0.21 | % |
| Gross asset quality ratio | | | | | | | | | | | | | | | | | | | 0.37 | % | | | 0.28 | % |
| 1 | Prior period segmental comparatives restated. See note 4 on page F-25. |
Group loans and advances to customers
The following pages contain analysis of the Group’s loans and advances to customers by sub-portfolio. Loans and advances to customers are categorised into the following stages:
Stage 1 assets comprise of newly originated assets (unless purchased or originated credit impaired), as well as those which have not experienced a significant increase in credit risk. These assets carry an expected credit loss allowance equivalent to the expected credit losses that result from those default events that are possible within 12 months of the reporting date (12 month expected credit losses).
Stage 2 assets are those which have experienced a significant increase in credit risk since origination. These assets carry an expected credit loss allowance equivalent to the expected credit losses arising over the lifetime of the asset (lifetime expected credit losses).
Stage 3 assets have either defaulted or are otherwise considered to be credit impaired. These assets carry a lifetime expected credit loss.
Purchased or originated credit impaired assets (POCI) are those that have been originated or acquired in a credit impaired state. This includes within the definition of credit impaired the purchase of a financial asset at a deep discount that reflects impaired credit losses.
OPERATING AND FINANCIAL REVIEW AND PROSPECTS
| Table E: | Group loans and advances to customers |
| | | Total
£m | | | Stage 1
£m | | | Stage 2
£m | | | Stage 3
£m | | | Purchased or
originated
credit-impaired
£m | | | Stage 3
as % of
total
% | |
| At 31 December 2019 | | | | | | | | | | | | | | | | | | | | | | | | |
| Retail | | | 344,218 | | | | 305,502 | | | | 22,518 | | | | 2,484 | | | | 13,714 | | | | 0.7 | |
| Commercial Banking | | | 96,763 | | | | 87,323 | | | | 5,993 | | | | 3,447 | | | | – | | | | 3.6 | |
| Insurance and Wealth | | | 862 | | | | 753 | | | | 32 | | | | 77 | | | | – | | | | 8.9 | |
| Central items | | | 56,404 | | | | 56,397 | | | | – | | | | 7 | | | | – | | | | – | |
| Total gross lending | | | 498,247 | | | | 449,975 | | | | 28,543 | | | | 6,015 | | | | 13,714 | | | | 1.2 | |
| Expected credit loss allowance on drawn balances | | | (3,259 | ) | | | (675 | ) | | | (995 | ) | | | (1,447 | ) | | | (142 | ) | | | | |
| Net balance sheet carrying value | | | 494,988 | | | | 449,300 | | | | 27,548 | | | | 4,568 | | | | 13,572 | | | | | |
| Expected credit loss allowances (drawn and undrawn) as a percentage of gross lending (%)1 | | | 0.7 | | | | 0.2 | | | | 3.8 | | | | 25.0 | | | | 1.0 | | | | | |
| | | | | | | | | | | | | | | | | | | | | | | | | |
| At 31 December 20182 | | | | | | | | | | | | | | | | | | | | | | | | |
| Retail | | | 341,682 | | | | 305,160 | | | | 18,741 | | | | 2,390 | | | | 15,391 | | | | 0.7 | |
| Commercial Banking | | | 101,824 | | | | 92,002 | | | | 6,592 | | | | 3,230 | | | | – | | | | 3.2 | |
| Insurance and Wealth | | | 865 | | | | 804 | | | | 6 | | | | 55 | | | | – | | | | 6.4 | |
| Central items | | | 43,637 | | | | 43,565 | | | | 6 | | | | 66 | | | | – | | | | 0.2 | |
| Total gross lending | | | 488,008 | | | | 441,531 | | | | 25,345 | | | | 5,741 | | | | 15,391 | | | | 1.2 | |
| Expected credit loss allowance on drawn balances | | | (3,150 | ) | | | (525 | ) | | | (994 | ) | | | (1,553 | ) | | | (78 | ) | | | | |
| Net balance sheet carrying value | | | 484,858 | | | | 441,006 | | | | 24,351 | | | | 4,188 | | | | 15,313 | | | | | |
| Expected credit loss allowances (drawn and undrawn) as a percentage of gross lending (%)1 | | | 0.7 | | | | 0.1 | | | | 4.2 | | | | 28.4 | | | | 0.5 | | | | | |
| 1 | Stage 3 ECL allowances as a percentage of drawn balances are calculated excluding loans in recoveries in Retail of £205 million (31 December 2018: £250 million). |
| 2 | Prior period segmental comparatives restated. See note4on page F-25. |
| Table F: | Group’s total expected credit loss allowance |
| | | At
31 Dec 2019
£m | | | At
31 Dec 2018
£m | |
| Customer related balances | | | | | | | | |
| Drawn | | | 3,259 | | | | 3,150 | |
| Undrawn | | | 177 | | | | 193 | |
| | | | 3,436 | | | | 3,343 | |
| Other assets | | | 19 | | | | 19 | |
| Total expected credit loss allowance | | | 3,455 | | | | 3,362 | |
OPERATING AND FINANCIAL REVIEW AND PROSPECTS
| Table G: | Group expected credit loss allowances (drawn and undrawn) as a percentage of loans and advances to customers |
| | | Total | | Stage 1 | | Stage 2 | | Stage 3 | | Purchased or
originated
credit-impaired |
| | | £m | | | As % of
drawn
balances
% | | | £m | | | As % of
drawn
balances
% | | | £m | | | As % of
drawn
balances
% | | | £m | | | As % of
drawn
balances1
% | | | £m | | | As % of
drawn
balances
% | |
| At 31 December 2019 | | | | | | | | | | | | | | | | | | | | | | | | | | | | | | | | | | | | | | | | |
| Retail | | | 2,090 | | | | 0.6 | | | | 639 | | | | 0.2 | | | | 819 | | | | 3.6 | | | | 490 | | | | 21.5 | | | | 142 | | | | 1.0 | |
| Commercial Banking | | | 1,313 | | | | 1.4 | | | | 115 | | | | 0.1 | | | | 252 | | | | 4.2 | | | | 946 | | | | 27.4 | | | | – | | | | – | |
| Insurance and Wealth | | | 17 | | | | 2.0 | | | | 6 | | | | 0.8 | | | | 1 | | | | 3.1 | | | | 10 | | | | 13.0 | | | | – | | | | – | |
| Central items | | | 16 | | | | – | | | | 10 | | | | – | | | | – | | | | – | | | | 6 | | | | 85.7 | | | | – | | | | – | |
| Total | | | 3,436 | | | | 0.7 | | | | 770 | | | | 0.2 | | | | 1,072 | | | | 3.8 | | | | 1,452 | | | | 25.0 | | | | 142 | | | | 1.0 | |
| At 31 December 20182 | | | | | | | | | | | | | | | | | | | | | | | | | | | | | | | | | | | | | | | | |
| Retail | | | 1,768 | | | | 0.5 | | | | 493 | | | | 0.2 | | | | 713 | | | | 3.8 | | | | 484 | | | | 22.6 | | | | 78 | | | | 0.5 | |
| Commercial Banking | | | 1,486 | | | | 1.5 | | | | 111 | | | | 0.1 | | | | 338 | | | | 5.1 | | | | 1,037 | | | | 32.1 | | | | – | | | | – | |
| Insurance and Wealth | | | 18 | | | | 2.1 | | | | 6 | | | | 0.7 | | | | 1 | | | | 16.7 | | | | 11 | | | | 20.0 | | | | – | | | | – | |
| Central items | | | 71 | | | | 0.2 | | | | 38 | | | | 0.1 | | | | 6 | | | | 100.0 | | | | 27 | | | | 40.9 | | | | – | | | | – | |
| Total | | | 3,343 | | | | 0.7 | | | | 648 | | | | 0.1 | | | | 1,058 | | | | 4.2 | | | | 1,559 | | | | 28.4 | | | | 78 | | | | 0.5 | |
| 1 | Stage 3 ECL allowances as a percentage of drawn balances are calculated excluding loans in recoveries in Retail of £205 million (31 December 2018: £250 million). |
| 2 | Prior period segmental comparatives restated. See note 4 on page F-25. |
| Table H: | Group Stage 2 loans and advances to customers |
| | | Total | | Up to date | | 1-30 days past due | | Over 30 days past due |
| | | | | | | | | | | | PD movements | | Other1 | | | | | | | | | | | | | | | | | | |
| | | Gross
lending
£m | | | ECL
£m | | | As % of
gross
lending
% | | | Gross
lending
£m | | | ECL
£m | | | As % of
gross
lending
% | | | Gross
lending
£m | | | ECL
£m | | | As % of
gross
lending
% | | | Gross
lending
£m | | | ECL
£m | | | As % of
gross
lending
% | | | Gross
lending
£m | | | ECL
£m | | | As % of
gross
lending
% | |
| At 31 December 2019 | | | | | | | | | | | | | | | | | | | | | | | | | | | | | | | | | | | | | | | | | | | | | | | | | | | | | | | | | | | | |
| Retail | | | 22,518 | | | | 819 | | | | 3.6 | | | | 13,359 | | | | 341 | | | | 2.6 | | | | 4,959 | | | | 238 | | | | 4.8 | | | | 2,373 | | | | 130 | | | | 5.5 | | | | 1,827 | | | | 110 | | | | 6.0 | |
| Commercial Banking | | | 5,993 | | | | 252 | | | | 4.2 | | | | 3,911 | | | | 179 | | | | 4.6 | | | | 1,700 | | | | 64 | | | | 3.8 | | | | 117 | | | | 8 | | | | 6.8 | | | | 265 | | | | 1 | | | | 0.4 | |
| Insurance and Wealth | | | 32 | | | | 1 | | | | 3.1 | | | | – | | | | – | | | | – | | | | 28 | | | | 1 | | | | 3.6 | | | | 1 | | | | – | | | | – | | | | 3 | | | | – | | | | – | |
| Central items | | | – | | | | – | | | | – | | | | – | | | | – | | | | – | | | | – | | | | – | | | | – | | | | – | | | | – | | | | – | | | | – | | | | – | | | | – | |
| Total | | | 28,543 | | | | 1,072 | | | | 3.8 | | | | 17,270 | | | | 520 | | | | 3.0 | | | | 6,687 | | | | 303 | | | | 4.5 | | | | 2,491 | | | | 138 | | | | 5.5 | | | | 2,095 | | | | 111 | | | | 5.3 | |
| At 31 December 2018 | | | | | | | | | | | | | | | | | | | | | | | | | | | | | | | | | | | | | | | | | | | | | | | | | | | | | | | | | | | | |
| Retail | | | 18,741 | | | | 713 | | | | 3.8 | | | | 10,017 | | | | 248 | | | | 2.5 | | | | 4,488 | | | | 250 | | | | 5.6 | | | | 2,441 | | | | 113 | | | | 4.6 | | | | 1,795 | | | | 102 | | | | 5.7 | |
| Commercial Banking | | | 6,592 | | | | 338 | | | | 5.1 | | | | 4,169 | | | | 177 | | | | 4.2 | | | | 1,851 | | | | 110 | | | | 5.9 | | | | 455 | | | | 42 | | | | 9.2 | | | | 117 | | | | 9 | | | | 7.7 | |
| Insurance and Wealth | | | 6 | | | | 1 | | | | 16.7 | | | | 3 | | | | – | | | | – | | | | 1 | | | | – | | | | – | | | | – | | | | – | | | | – | | | | 2 | | | | 1 | | | | 50.0 | |
| Central items | | | 6 | | | | 6 | | | | 100.0 | | | | – | | | | – | | | | – | | | | 6 | | | | 6 | | | | 100.0 | | | | – | | | | – | | | | – | | | | – | | | | – | | | | – | |
| Total | | | 25,345 | | | | 1,058 | | | | 4.2 | | | | 14,189 | | | | 425 | | | | 3.0 | | | | 6,346 | | | | 366 | | | | 5.8 | | | | 2,896 | | | | 155 | | | | 5.4 | | | | 1,914 | | | | 112 | | | | 5.9 | |
| 1 | Includes forbearance, client and product-specific indicators not reflected within quantitative probability of default assessments. |
OPERATING AND FINANCIAL REVIEW AND PROSPECTS
The Group’s assessment of a significant increase in credit risk, and resulting categorisation of Stage 2, includes customers moving into early arrears as well as a broader assessment that an up to date customer has experienced a level of deterioration in credit risk since origination. A more sophisticated assessment is required for up to date customers, which varies across divisions and product type. This assessment incorporates specific triggers such as a significant proportionate increase in probability of default relative to that at origination, recent arrears, forbearance activity, internal watch lists and external bureau flags. Up to date exposures in Stage 2 are likely to show lower levels of expected credit loss (ECL) allowance relative to those that have already moved into arrears given that an arrears status typically reflects a stronger indication of future default and greater likelihood of credit losses.
Additional information
The measurement of ECL reflects an unbiased probability-weighted range of possible future economic outcomes. The Group achieves this by selecting four economic scenarios to reflect the range of outcomes; the central scenario reflects the Group’s base case assumptions used for medium term planning purposes, an upside and a downside scenario are also selected together with a severe downside scenario. The base case, upside and downside scenarios carry a 30 per cent weighting; the severe downside is weighted at 10 per cent. The table below shows the decomposition of the final probability-weighted ECL for each forward-looking economic scenario. The stage allocation for an asset is based on the overall scenario probability-weighted PD and, hence, the Stage 2 allocation is constant across all the scenarios.
The table below shows the ECL calculated under each scenario.
| | | Upside
£m | | | Base Case
£m | | | Downside
£m | | | Severe
Downside
£m | | | Probability-
weighted
£m | |
| Secured | | | 317 | | | | 464 | | | | 653 | | | | 1,389 | | | | 569 | |
| Other Retail | | | 1,443 | | | | 1,492 | | | | 1,564 | | | | 1,712 | | | | 1,521 | |
| Commercial | | | 1,211 | | | | 1,258 | | | | 1,382 | | | | 1,597 | | | | 1,315 | |
| Other | | | 50 | | | | 50 | | | | 50 | | | | 50 | | | | 50 | |
| At 31 December 2019 | | | 3,021 | | | | 3,264 | | | | 3,649 | | | | 4,748 | | | | 3,455 | |
OPERATING AND FINANCIAL REVIEW AND PROSPECTS
RETAIL
| The credit quality of the Retail portfolios remains strong and continues to benefit from robust credit risk management, including affordability and indebtedness controls at origination and a prudent approach to risk appetite. The economic environment continues to benefit from high employment rates, positive real wage growth and household indebtedness remaining below pre-crisis levels. |
| | – | New business quality remains strong. |
| | – | The flow of loans entering arrears remains at low levels. |
| | – | Stage 3 loans and advances as a percentage of total was unchanged at 0.7 per cent (31 December 2018: 0.7 per cent). |
| Loans and advances increased to £344 billion (31 December 2018: £342 billion). |
| The impairment charge increased to £1,038 million in 2019 compared to £861 million in the same period in 2018, driven by a number of items including some weakening in used car prices, provisioning methodology refinements and lower cash recoveries following prior year debt sales, partially offset by releases following a reassessment of cases in long-term default and improvements in the Secured portfolio. |
Portfolios
| Secured credit quality remained strong, with flow to arrears stable at low levels. Total secured loans and advances are broadly flat at £289.2 billion (31 December 2018: £288.2 billion), with an improved asset risk mix. |
| | The average indexed loan to value (LTV) remained broadly stable at 44.9 per cent (31 December 2018: 44.3 per cent) and the proportion of balances with an LTV of greater than 90 per cent remained flat at 2.5 per cent. The average LTV of new business increased to 64.3 per cent (31 December 2018: 62.5 per cent). |
| | The impairment release of £167 million in 2019 compared to a charge of £38 million in 2018. This reflects provision releases due to improved credit quality of the portfolio and a reassessment of Secured cases in long-term default. |
| Unsecured loans and advances remained broadly flat at £28.4 billion. The impairment charge increased by £265 million to £948 million for 2019 (2018: £683 million), due to provisioning methodology refinements, including the alignment of credit card methodologies, and lower cash recoveries following prior year debt sales. |
| The motor finance portfolio continued to grow in 2019, with loans and advances increasing by 7.0 per cent to £16.0 billion (31 December 2018: £14.9 billion). The portfolio continues to benefit from a prudent approach to residual values at origination and provisions through the loan lifecycle. Residual value provisions, which are included in ECL allowances for Stage 1 and Stage 2, have increased to £201 million at 31 December 2019 (31 December 2018: £99 million). This is due to an anticipated increase in residual value deficits following some weakening in used car prices, a change in approach relating to the recognition of voluntary terminations and book growth. As a result of this, the impairment charge increased to £203 million for 2019 (2018: £113 million). |
| Other loans and advances increased by £0.2 billon to £10.6 billion. The impairment charge was £54 million for 2019 (2018: £27 million). This increase is partly due to the non-repeat of prior year IFRS 9 methodology refinements in Business Banking. |
OPERATING AND FINANCIAL REVIEW AND PROSPECTS
| Table I: | Retail impairment charge |
| | | 2019 | | | 2018 | | | Change | |
| | | £m | | | £m | | | % | |
| Secured | | | (167 | ) | | | 38 | | | | | |
| Unsecured1 | | | 948 | | | | 683 | | | | (39 | ) |
| UK Motor Finance | | | 203 | | | | 113 | | | | (80 | ) |
| Other2,3 | | | 54 | | | | 27 | | | | (100 | ) |
| Total impairment charge | | | 1,038 | | | | 861 | | | | (21 | ) |
| Asset quality ratio | | | 0.30% | | | | 0.25% | | | | 5bp | |
| 1 | Unsecured includes Credit cards, Loans and Overdrafts. |
| | |
| 2 | Other includes Business Banking, Europe and Retail run-off. |
| | |
| 3 | Prior period segmental comparatives restated. See note 4 on page F-25. |
| Table J: | Retail loans and advances to customers |
| | | | | | | | | | | | | | | Purchased | | | Stage 3 as | |
| | | | | | | | | | | | | | | or originated | | | % of | |
| | | Total | | | Stage 1 | | | Stage 2 | | | Stage 3 | | | credit-impaired | | | total | |
| | | £m | | | £m | | | £m | | | £m | | | £m | | | % | |
| At 31 December 2019 | | | | | | | | | | | | | | | | | | | | | | | | |
| Secured | | | 289,198 | | | | 257,043 | | | | 16,935 | | | | 1,506 | | | | 13,714 | | | | 0.5 | |
| Unsecured1 | | | 28,411 | | | | 24,921 | | | | 2,812 | | | | 678 | | | | – | | | | 2.4 | |
| UK Motor Finance | | | 15,976 | | | | 13,884 | | | | 1,942 | | | | 150 | | | | – | | | | 0.9 | |
| Other2 | | | 10,633 | | | | 9,654 | | | | 829 | | | | 150 | | | | – | | | | 1.4 | |
| Total gross lending | | | 344,218 | | | | 305,502 | | | | 22,518 | | | | 2,484 | | | | 13,714 | | | | 0.7 | |
| Expected credit loss allowance on drawn balances | | | (1,961 | ) | | | (563 | ) | | | (766 | ) | | | (490 | ) | | | (142 | ) | | | | |
| Net balance sheet carrying value | | | 342,257 | | | | 304,939 | | | | 21,752 | | | | 1,994 | | | | 13,572 | | | | | |
| Expected credit loss allowances (drawn and undrawn) as a percentage of gross lending (%)3 | | | 0.6 | | | | 0.2 | | | | 3.6 | | | | 21.5 | | | | 1.0 | | | | | |
| |
| At 31 December 2018 | | | | | | | | | | | | | | | | | | | | | | | | |
| Secured | | | 288,235 | | | | 257,797 | | | | 13,654 | | | | 1,393 | | | | 15,391 | | | | 0.5 | |
| Unsecured1 | | | 28,115 | | | | 24,705 | | | | 2,707 | | | | 703 | | | | – | | | | 2.5 | |
| UK Motor Finance | | | 14,933 | | | | 13,224 | | | | 1,580 | | | | 129 | | | | – | | | | 0.9 | |
| Other2 | | | 10,399 | | | | 9,434 | | | | 800 | | | | 165 | | | | – | | | | 1.6 | |
| Total gross lending | | | 341,682 | | | | 305,160 | | | | 18,741 | | | | 2,390 | | | | 15,391 | | | | 0.7 | |
| Expected credit loss allowance on drawn balances | | | (1,613 | ) | | | (389 | ) | | | (662 | ) | | | (484 | ) | | | (78 | ) | | | | |
| Net balance sheet carrying value | | | 340,069 | | | | 304,771 | | | | 18,079 | | | | 1,906 | | | | 15,313 | | | | | |
| Expected credit loss allowances (drawn and undrawn) as a percentage of gross lending (%)3 | | | 0.5 | | | | 0.2 | | | | 3.8 | | | | 22.6 | | | | 0.5 | | | | | |
| 1 | Unsecured includes Credit cards, Loans and Overdrafts. |
| | |
| 2 | Other includes Business Banking, Europe and Retail run-off. |
| | |
| 3 | Stage 3 ECL allowances as a percentage of drawn balances are calculated excluding loans in recoveries for unsecured of £184 million (31 December 2018: £233 million) and £21 million (31 December 2018: £17 million) for Business Banking in Other. |
OPERATING AND FINANCIAL REVIEW AND PROSPECTS
| Table K: | Retail expected credit loss allowances (drawn and undrawn) as a percentage of loans and advances to customers |
| | | | | | | | | | | | | | | | | | | | | | | | | | | Purchased | |
| | | | | | | | | | | | | | | | | | | | | | | | | | | or originated | |
| | | Total | | | Stage 1 | | | Stage 2 | | | Stage 3 | | | credit-impaired | |
| | | | | | As % of | | | | | | As % of | | | | | | As % of | | | | | | As % of | | | | | | As % of | |
| | | | | | drawn | | | | | | drawn | | | | | | drawn | | | | | | drawn | | | | | | drawn | |
| | | | | | balances | | | | | | balances | | | | | | balances | | | | | | balances1 | | | | | | balances | |
| | | £m | | | % | | | £m | | | % | | | £m | | | % | | | £m | | | % | | | £m | | | % | |
| At 31 December 2019 | | | | | | | | | | | | | | | | | | | | | | | | | | | | | | | | | | | | | | | | |
| Secured | | | 569 | | | | 0.2 | | | | 24 | | | | – | | | | 281 | | | | 1.7 | | | | 122 | | | | 8.1 | | | | 142 | | | | 1.0 | |
| Unsecured2 | | | 1,007 | | | | 3.6 | | | | 363 | | | | 1.5 | | | | 411 | | | | 14.6 | | | | 233 | | | | 47.2 | | | | – | | | | – | |
| UK Motor Finance3 | | | 387 | | | | 2.4 | | | | 216 | | | | 1.6 | | | | 87 | | | | 4.5 | | | | 84 | | | | 56.0 | | | | – | | | | – | |
| Other4 | | | 127 | | | | 1.2 | | | | 36 | | | | 0.4 | | | | 40 | | | | 4.8 | | | | 51 | | | | 39.5 | | | | – | | | | – | |
| Total | | | 2,090 | | | | 0.6 | | | | 639 | | | | 0.2 | | | | 819 | | | | 3.6 | | | | 490 | | | | 21.5 | | | | 142 | | | | 1.0 | |
| At 31 December 2018 | | | | | | | | | | | | | | | | | | | | | | | | | | | | | | | | | | | | | | | | |
| Secured | | | 460 | | | | 0.2 | | | | 38 | | | | – | | | | 226 | | | | 1.7 | | | | 118 | | | | 8.5 | | | | 78 | | | | 0.5 | |
| Unsecured2 | | | 896 | | | | 3.2 | | | | 287 | | | | 1.2 | | | | 379 | | | | 14.0 | | | | 230 | | | | 48.9 | | | | – | | | | – | |
| UK Motor Finance3 | | | 290 | | | | 1.9 | | | | 127 | | | | 1.0 | | | | 78 | | | | 4.9 | | | | 85 | | | | 65.9 | | | | – | | | | – | |
| Other4 | | | 122 | | | | 1.2 | | | | 41 | | | | 0.4 | | | | 30 | | | | 3.8 | | | | 51 | | | | 34.5 | | | | – | | | | – | |
| Total | | | 1,768 | | | | 0.5 | | | | 493 | | | | 0.2 | | | | 713 | | | | 3.8 | | | | 484 | | | | 22.6 | | | | 78 | | | | 0.5 | |
| 1 | Stage 3 ECL allowances as a percentage of drawn balances are calculated excluding loans in recoveries for unsecured of £184 million (31 December 2018: £233 million) and £21 million (31 December 2018: £17 million) for Business Banking within other. |
| | |
| 2 | Unsecured includes Credit cards, Loans and Overdrafts. |
| | |
| 3 | UK Motor Finance for Stages 1 and 2 include £201 million (31 December 2018: £99 million) relating to provisions against residual values of vehicles subject to finance leasing agreements. These provisions are included within the calculation of coverage ratios. |
| | |
| 4 | Other includes Business Banking, Europe and Retail run-off. |
| Table L: | Retail Stage 2 loans and advances to customers |
| | | Total | | | Up to date | | | 1-30 days past due | | | Over 30 days past due | |
| | | | | | | | | | | | PD movement | | | Other3 | | | | | | | | | | | | | | | | | | | |
| | | | | | | | | As % of | | | | | | | | | As % of | | | | | | | | | As % of | | | | | | | | | As % of | | | | | | | | | As % of | |
| | | Gross | | | | | | gross | | | Gross | | | | | | gross | | | Gross | | | | | | gross | | | Gross | | | | | | gross | | | Gross | | | | | | gross | |
| | | lending | | | ECL | | | lending | | | lending | | | ECL | | | lending | | | lending | | | ECL | | | lending | | | lending | | | ECL | | | lending | | | lending | | | ECL | | | lending | |
| | | £m | | | £m | | | % | | | £m | | | £m | | | % | | | £m | | | £m | | | % | | | £m | | | £m | | | % | | | £m | | | £m | | | % | |
| At 31 December 2019 | | | | | | | | | | | | | | | | | | | | | | | | | | | | | | | | | | | | | | | | | | | | | |
| Secured | | | 16,935 | | | | 281 | | | | 1.7 | | | | 10,846 | | | | 83 | | | | 0.8 | | | | 2,593 | | | | 107 | | | | 4.1 | | | | 1,876 | | | | 33 | | | | 1.8 | | | | 1,620 | | | | 58 | | | | 3.6 | |
| Unsecured1 | | | 2,812 | | | | 411 | | | | 14.6 | | | | 1,661 | | | | 217 | | | | 13.1 | | | | 772 | | | | 90 | | | | 11.7 | | | | 282 | | | | 67 | | | | 23.8 | | | | 97 | | | | 37 | | | | 38.1 | |
| UK Motor Finance | | | 1,942 | | | | 87 | | | | 4.5 | | | | 543 | | | | 27 | | | | 5.0 | | | | 1,232 | | | | 30 | | | | 2.4 | | | | 135 | | | | 21 | | | | 15.6 | | | | 32 | | | | 9 | | | | 28.1 | |
| Other2 | | | 829 | | | | 40 | | | | 4.8 | | | | 309 | | | | 14 | | | | 4.5 | | | | 362 | | | | 11 | | | | 3.0 | | | | 80 | | | | 9 | | | | 11.3 | | | | 78 | | | | 6 | | | | 7.7 | |
| Total | | | 22,518 | | | | 819 | | | | 3.6 | | | | 13,359 | | | | 341 | | | | 2.6 | | | | 4,959 | | | | 238 | | | | 4.8 | | | | 2,373 | | | | 130 | | | | 5.5 | | | | 1,827 | | | | 110 | | | | 6.0 | |
| At 31 December 2018 | | | | | | | | | | | | | | | | | | | | | | | | | | | | | | | | | | | | | | | | | | | | | | | | | | | | | | | | | | | | |
| Secured | | | 13,654 | | | | 226 | | | | 1.7 | | | | 8,318 | | | | 62 | | | | 0.7 | | | | 1,800 | | | | 77 | | | | 4.3 | | | | 1,955 | | | | 30 | | | | 1.5 | | | | 1,581 | | | | 57 | | | | 3.6 | |
| Unsecured1 | | | 2,707 | | | | 379 | | | | 14.0 | | | | 998 | | | | 149 | | | | 14.9 | | | | 1,357 | | | | 144 | | | | 10.6 | | | | 258 | | | | 53 | | | | 20.5 | | | | 94 | | | | 33 | | | | 35.1 | |
| UK Motor Finance | | | 1,580 | | | | 78 | | | | 4.9 | | | | 488 | | | | 26 | | | | 5.3 | | | | 915 | | | | 21 | | | | 2.3 | | | | 146 | | | | 23 | | | | 15.8 | | | | 31 | | | | 8 | | | | 25.8 | |
| Other2 | | | 800 | | | | 30 | | | | 3.8 | | | | 213 | | | | 11 | | | | 5.2 | | | | 416 | | | | 8 | | | | 1.9 | | | | 82 | | | | 7 | | | | 8.5 | | | | 89 | | | | 4 | | | | 4.5 | |
| Total | | | 18,741 | | | | 713 | | | | 3.8 | | | | 10,017 | | | | 248 | | | | 2.5 | | | | 4,488 | | | | 250 | | | | 5.6 | | | | 2,441 | | | | 113 | | | | 4.6 | | | | 1,795 | | | | 102 | | | | 5.7 | |
| 1 | Unsecured includes Credit cards, Loans and Overdrafts. |
| | |
| 2 | Other includes Business Banking, Europe and Retail run-off. |
| | |
| 3 | Includes forbearance and product-specific indicators not reflected within quantitative PD assessments. |
OPERATING AND FINANCIAL REVIEW AND PROSPECTS
| Table M: | Retail secured loans and advances to customers |
| | | At 31 Dec | | | At 31 Dec | |
| | | 2019 | | | 2018 | |
| | | £m | | | £m | |
| Mainstream | | | 227,975 | | | | 223,230 | |
| Buy-to-let | | | 49,086 | | | | 51,322 | |
| Specialist | | | 12,137 | | | | 13,683 | |
| Total | | | 289,198 | | | | 288,235 | |
Interest only mortgages
The Group provides interest only mortgages to owner occupier mortgage customers whereby only payments of interest are made for the term of the mortgage with the customer responsible for repaying the principal outstanding at the end of the loan term. At 31 December 2019, owner occupier interest only balances as a proportion of total owner occupier balances had reduced to 23.9 per cent (31 December 2018: 26.7 per cent). The average indexed loan to value remained at 41.2 per cent (31 December 2018: 41.2 per cent).
For existing interest only mortgages, a contact strategy is in place during the term of the mortgage to ensure that customers are aware of their obligations to repay the principal upon maturity of the loan.
Treatment strategies are in place to help customers anticipate and plan for repayment of capital at maturity and support those who may have difficulty in repaying the principal amount. A dedicated specialist team supports customers who have passed their contractual maturity date and are unable to fully repay the principal. A range of treatments are offered to customers based on their individual circumstances to create fair and sustainable outcomes.
OPERATING AND FINANCIAL REVIEW AND PROSPECTS
| Table N: | Analysis of owner occupier interest only mortgages |
| | | At 31 Dec | | | At 31 Dec | |
| | | 2019 | | | 2018 | |
| | | Total | | | Total | |
| Interest only balances (£m) | | | 57,437 | | | | 63,138 | |
| Stage 1% | | | 75.6 | | | | 79.1 | |
| Stage 2% | | | 10.0 | | | | 6.6 | |
| Stage 3% | | | 1.2 | | | | 1.0 | |
| Purchased or originated credit impaired % | | | 13.2 | | | | 13.3 | |
| |
| Average loan to value (%)1 | | | 41.2 | | | | 41.2 | |
| |
| Maturity profile (£m) | | | | | | | | |
| Due | | | 1,459 | | | | 1,144 | |
| 1 year | | | 1,968 | | | | 2,405 | |
| 2-5 years | | | 9,852 | | | | 10,229 | |
| 6-10 years | | | 18,606 | | | | 18,562 | |
| >11 years | | | 25,552 | | | | 30,798 | |
| |
| Past term interest only balances (£m)2 | | | 1,677 | | | | 1,635 | |
| Stage 1% | | | 0.9 | | | | 2.8 | |
| Stage 2% | | | 23.9 | | | | 16.8 | |
| Stage 3% | | | 21.8 | | | | 17.9 | |
| Purchased or originated credit impaired % | | | 53.4 | | | | 62.5 | |
| |
| Average loan to value (%)1 | | | 35.7 | | | | 34.9 | |
| Negative equity (%) | | | 2.8 | | | | 2.8 | |
| 1 | 2019 interest only LTVs (loan to value) use Markit’s 2019 Halifax House Price Index; 2018 LTVs have been restated on the same basis. |
| | |
| 2 | Balances where all interest only elements have moved past term. Some may subsequently have had a term extension, so are no longer classed as due. |
Retail forbearance
The basis of disclosure for forbearance is aligned to definitions used in the European Banking Authority’s FINREP reporting. Total forbearance for the major retail portfolios has improved by £546 million to £6.2 billion driven primarily by a reduction in customers where arrears are written on to the loan balance (capitalisations).
The main customer treatments included are: repair, where arrears are written on to the loan balance and the arrears position cancelled; instances where there are suspensions of interest and/or capital repayments; past term interest only mortgages; and refinance personal loans.
As a percentage of loans and advances, forbearance loans improved to 1.8 per cent at 31 December 2019 (31 December 2018: 2.0 per cent).
Total expected credit losses (ECL) as a proportion of loans and advances which are forborne has increased to 5.0 per cent (31 December 2018: 4.3 per cent).
| Table O: | Retail forborne loans and advances (audited) |
| | | | | | | | | | | | | | | Expected credit | |
| | | | | | | | | | | | Of which | | | losses as a % of | |
| | | | | | | | | | | | purchased or | | | total loans and | |
| | | | | | Of which | | | Of which | | | originated | | | advances which | |
| | | Total | | | Stage 2 | | | Stage 3 | | | credit impaired | | | are forborne1 | |
| | | £m | | | £m | | | £m | | | £m | | | % | |
| At 31 December 2019 | | | | | | | | | | | | | | | |
| Secured | | | 5,559 | | | | 1,156 | | | | 736 | | | | 3,659 | | | | 2.1 | |
| Unsecured2 | | | 540 | | | | 168 | | | | 305 | | | | – | | | | 31.2 | |
| UK Motor Finance | | | 63 | | | | 35 | | | | 26 | | | | – | | | | 30.4 | |
| Total | | | 6,162 | | | | 1,359 | | | | 1,067 | | | | 3,659 | | | | 5.0 | |
| At 31 December 2018 | | | | | | | | | | | | | | | | | | | | |
| Secured | | | 6,089 | | | | 1,136 | | | | 642 | | | | 4,241 | | | | 1.6 | |
| Unsecured2 | | | 563 | | | | 204 | | | | 289 | | | | – | | | | 30.3 | |
| UK Motor Finance | | | 56 | | | | 30 | | | | 25 | | | | – | | | | 34.8 | |
| Total | | | 6,708 | | | | 1,370 | | | | 956 | | | | 4,241 | | | | 4.3 | |
| 1 | Expected credit loss allowance as a percentage of total loans and advances which are forborne is calculated excluding loans in recoveries for Unsecured (31 December 2019: £82 million; 31 December 2018: £107 million). |
| | |
| 2 | 2019 balances include MBNA, 2018 balances have been restated on the same basis |
OPERATING AND FINANCIAL REVIEW AND PROSPECTS
COMMERCIAL BANKING
| Despite the challenging environment, the overall credit quality of the portfolio and new business remains good. The portfolio continues to benefit from effective risk management and low interest rates. Notwithstanding the current competitive market conditions, the Group is maintaining its prudent, well-defined and controlled through the cycle credit risk appetite. |
| | |
| The possibility of a no-deal exit from the European Union remains given the timelines for striking a trade deal. Developments continue to be monitored proactively and various initiatives are in place to mitigate ‘No Deal’ risk to ensure portfolio quality is maintained whilst supporting the Group’s purpose of Helping Britain Prosper. |
| | |
| There are headwinds in a number of sectors including agriculture, construction, manufacturing and consumer related sectors such as retail. Performance and monitoring of vulnerable sectors remains a key focus at this stage of the credit cycle. |
| | |
| Dynamic internal and external key performance indicators are monitored closely to help identify early signs of deterioration. |
| | |
| Portfolios remain well positioned and are subject to ongoing risk mitigation actions as appropriate. Monitoring indicates no material deterioration in the credit quality of the portfolio. |
| | |
| Net impairment charge of £306 million compared with a net charge of £71 million in 2018 is largely as a result of gross charges on two corporate cases, rather than any material deterioration in the underlying portfolio. These were partially offset by a net release in Stage 1 and 2 ECL, driven by enhancements to model methodology and data, including the approach to modelling loan amortisation. The impact of this was weighted toward the SME portfolio. Excluding the two large corporate cases, gross charges in 2019 were lower than 2018. |
| | |
| The size and nature of the commercial portfolio results in some volatility as cases move between stages. Stage 3 loans as a proportion of total loans and advances to customers has increased to 3.6 per cent (31 December 2018: 3.2 per cent). Stage 3 ECL allowance as a percentage of Stage 3 drawn balances has reduced to 27.4 per cent (31 December 2018: 32.1 per cent), predominantly due to the change in mix of assets due to write-offs and the transfer in of a small number of larger, individually assessed names with lower likelihood of net loss. |
| | |
| Stage 2 loans as a proportion of total loans and advances to customers remained broadly stable at 6.2 per cent (31 December 2018: 6.5 per cent). Stage 2 ECL allowances as a percentage of Stage 2 drawn balances were lower at 4.2 per cent (31 December 2018: 5.1 per cent) with the reduction weighted toward SME mainly due to enhanced approach to loan amortisation within the IFRS 9 model and a number of other model refinements |
OPERATING AND FINANCIAL REVIEW AND PROSPECTS
Portfolios
| The SME and Mid Markets portfolios are domestically focused and reflect both our prudent credit risk appetite and the underlying performance of the UK economy. |
| | |
| The Global Corporates business continues to have a predominance of UK based, and to a lesser extent, US and European-based multi-national investment grade clients. The portfolio remains of good quality and is well positioned for the current economic outlook. |
| | |
| Through clearly defined sector strategies, Financial Institutions serves predominantly investment grade counterparties with whom relationships are either client driven or held to support the Group’s funding, liquidity or general hedging requirements. Overall performance of the portfolio remains good. |
| | |
| The commercial real estate business within the Group’s Mid Markets and Global Corporates portfolio is focused on clients operating in the UK commercial property market ranging in size from medium-sized private real estate entities up to publicly listed property companies. Credit quality remains good with minimal impairments and stressed loans. Recognising this is a cyclical sector, appropriate caps are in place to control exposure and business propositions continue to be written in line with a prudent, through the cycle risk appetite with conservative LTVs, strong quality of income and proven management teams. |
| Table P: | Commercial Banking impairment charge |
| | | 2019 | | | 2018¹ | | | Change | |
| | | £m | | | £m | | | % | |
| SME | | | (65 | ) | | | 64 | | | | | |
| Other | | | 371 | | | | 7 | | | | | |
| Total impairment charge | | | 306 | | | | 71 | | | | (331 | ) |
| Asset quality ratio | | | 0.30% | | | | 0.06% | | | | 24bp | |
| 1 | Prior period segmental comparatives restated. See note 4 on page F-25. |
| Table Q: | Commercial Banking loans and advances to customers |
| | | | | | | | | | | | | | | Stage 3 | |
| | | | | | | | | | | | | | | as % of | |
| | | Total | | | Stage 1 | | | Stage 2 | | | Stage 3 | | | total | |
| | | £m | | | £m | | | £m | | | £m | | | % | |
| At 31 December 2019 | | | | | | | | | | | | | | | |
| SME | | | 30,698 | | | | 27,455 | | | | 2,523 | | | | 720 | | | | 2.3 | |
| Other | | | 66,065 | | | | 59,868 | | | | 3,470 | | | | 2,727 | | | | 4.1 | |
| Total gross lending | | | 96,763 | | | | 87,323 | | | | 5,993 | | | | 3,447 | | | | 3.6 | |
| Expected credit loss allowance on drawn balances | | | (1,265 | ) | | | (96 | ) | | | (228 | ) | | | (941 | ) | | | | |
| Net balance sheet carrying value | | | 95,498 | | | | 87,227 | | | | 5,765 | | | | 2,506 | | | | | |
| Expected credit loss allowances (drawn and undrawn) as a percentage of gross lending (%) | | | 1.4 | | | | 0.1 | | | | 4.2 | | | | 27.4 | | | | | |
| At 31 December 20181 | | | | | | | | | | | | | | | | | | | | |
| SME | | | 30,296 | | | | 26,099 | | | | 3,484 | | | | 713 | | | | 2.4 | |
| Other1 | | | 71,528 | | | | 65,903 | | | | 3,108 | | | | 2,517 | | | | 3.5 | |
| Total gross lending | | | 101,824 | | | | 92,002 | | | | 6,592 | | | | 3,230 | | | | 3.2 | |
| Expected credit loss allowance on drawn balances | | | (1,449 | ) | | | (93 | ) | | | (325 | ) | | | (1,031 | ) | | | | |
| Net balance sheet carrying value | | | 100,375 | | | | 91,909 | | | | 6,267 | | | | 2,199 | | | | | |
| Expected credit loss allowances (drawn and undrawn) as a percentage of gross lending (%) | | | 1.5 | | | | 0.1 | | | | 5.1 | | | | 32.1 | | | | | |
| 1 | Prior period segmental comparatives restated. See note 4 on page F-25. |
| Table R: | Commercial Banking expected credit loss allowances (drawn and undrawn) as a percentage of loans and advances to customers |
| | | Total | | | Stage 1 | | | Stage 2 | | | Stage 3 | |
| | | | | | As % of | | | | | | As % of | | | | | | As % of | | | | | | As % of | |
| | | | | | drawn | | | | | | drawn | | | | | | drawn | | | | | | drawn | |
| | | | | | balances | | | | | | balances | | | | | | balances | | | | | | balances | |
| | | £m | | | % | | | £m | | | % | | | £m | | | % | | | £m | | | % | |
| At 31 December 2019 | | | | | | | | | | | | | | | | | | | | | | | | | | | | | | | | |
| SME | | | 273 | | | | 0.9 | | | | 45 | | | | 0.2 | | | | 127 | | | | 5.0 | | | | 101 | | | | 14.0 | |
| Other | | | 1,040 | | | | 1.6 | | | | 70 | | | | 0.1 | | | | 125 | | | | 3.6 | | | | 845 | | | | 31.0 | |
| Total | | | 1,313 | | | | 1.4 | | | | 115 | | | | 0.1 | | | | 252 | | | | 4.2 | | | | 946 | | | | 27.4 | |
| At 31 December 20181 | | | | | | | | | | | | | | | | | | | | | | | | | | | | | | | | |
| SME | | | 384 | | | | 1.3 | | | | 40 | | | | 0.2 | | | | 231 | | | | 6.6 | | | | 113 | | | | 15.8 | |
| Other | | | 1,102 | | | | 1.5 | | | | 71 | | | | 0.1 | | | | 107 | | | | 3.4 | | | | 924 | | | | 36.7 | |
| Total | | | 1,486 | | | | 1.5 | | | | 111 | | | | 0.1 | | | | 338 | | | | 5.1 | | | | 1,037 | | | | 32.1 | |
| 1 | Prior period segmental comparatives restated. See note 4 on page F-25. |
OPERATING AND FINANCIAL REVIEW AND PROSPECTS
| Table S: | Commercial Banking Stage 2 loans and advances to customers |
| | | Total | | | Up to date | | | 1-30 days past due | | | Over 30 days past due | |
| | | | | | | | | | | | PD movement | | | Other1 | | | | | | | | | | | | | | | | | | | |
| | | | | | | | | As % of | | | | | | | | | As % of | | | | | | | | | As % of | | | | | | | | | As % of | | | | | | | | | As % of | |
| | | Gross | | | | | | gross | | | Gross | | | | | | gross | | | Gross | | | | | | gross | | | Gross | | | | | | gross | | | Gross | | | | | | gross | |
| | | lending | | | ECL | | | lending | | | lending | | | ECL | | | lending | | | lending | | | ECL | | | lending | | | lending | | | ECL | | | lending | | | lending | | | ECL | | | lending | |
| | | £m | | | £m | | | % | | | £m | | | £m | | | % | | | £m | | | £m | | | % | | | £m | | | £m | | | % | | | £m | | | £m | | | % | |
| At 31 December 2019 | | | | | | | | | | | | | | | | | | | | | | | | | | | | | | | | | | | | | | | | | | | | | | | | | | | | | | | | | | | | |
| SME | | | 2,523 | | | | 127 | | | | 5.0 | | | | 2,030 | | | | 104 | | | | 5.1 | | | | 410 | | | | 17 | | | | 4.1 | | | | 56 | | | | 6 | | | | 10.7 | | | | 27 | | | | – | | | | – | |
| Other | | | 3,470 | | | | 125 | | | | 3.6 | | | | 1,881 | | | | 75 | | | | 4.0 | | | | 1,290 | | | | 47 | | | | 3.6 | | | | 61 | | | | 2 | | | | 3.3 | | | | 238 | | | | 1 | | | | 0.4 | |
| Total | | | 5,993 | | | | 252 | | | | 4.2 | | | | 3,911 | | | | 179 | | | | 4.6 | | | | 1,700 | | | | 64 | | | | 3.8 | | | | 117 | | | | 8 | | | | 6.8 | | | | 265 | | | | 1 | | | | 0.4 | |
| At 31 December 2018 | | | | | | | | | | | | | | | | | | | | | | | | | | | | | | | | | | | | | | | | | | | | | | | | | | | | | | | | | | | | |
| SME | | | 3,484 | | | | 231 | | | | 6.6 | | | | 2,376 | | | | 116 | | | | 4.9 | | | | 661 | | | | 65 | | | | 9.8 | | | | 383 | | | | 41 | | | | 10.7 | | | | 64 | | | | 9 | | | | 14.1 | |
| Other | | | 3,108 | | | | 107 | | | | 3.4 | | | | 1,793 | | | | 61 | | | | 3.4 | | | | 1,190 | | | | 45 | | | | 3.8 | | | | 72 | | | | 1 | | | | 1.4 | | | | 53 | | | | – | | | | – | |
| Total | | | 6,592 | | | | 338 | | | | 5.1 | | | | 4,169 | | | | 177 | | | | 4.2 | | | | 1,851 | | | | 110 | | | | 5.9 | | | | 455 | | | | 42 | | | | 9.2 | | | | 117 | | | | 9 | | | | 7.7 | |
| 1 | Includes client-specific indicators not reflected within quantitative PD assessments. |
Commercial Banking UK Direct Real Estate LTV analysis
| | The Group classifies Direct Real Estate as exposure which is directly supported by cash flows from property activities (as opposed to trading activities, such as hotels, care homes and housebuilders). Exposures to social housing providers is also excluded. |
| | |
| Focus remains on the UK market, on good quality customers, with a proven track record in real estate and where cash flows are robust. |
| | |
| | Commercial Banking UK Direct Real Estate gross lending stood at £13.6 billion at 31 December 2019 (net of exposures subject to protection through Significant Risk Transfer securitisations). The Group has a further £0.47 billion of UK Direct Real Estate exposure in Business Banking within Retail. |
| | |
| Approximately 60 per cent of loans and advances to UK Direct Real Estate relate to commercial real estate with the remainder related to residential real estate. The portfolio continues to be heavily weighted towards investment real estate (c. 90 per cent) over development. |
| | |
| The LTV profile of the UK Direct Real Estate portfolio in Commercial Banking remains robust. |
| | |
| Both investment and development lending is subject to specific credit risk appetite criteria. Development lending criteria includes maximum loan to gross development value and maximum loan to cost, with funding typically only released against completed work as confirmed by the Group’s monitoring quantity surveyor. |
| Table T: | LTV – UK Direct Real Estate |
| | | At 31 December 20191,2 | | | At 31 December 20181,2 | |
| | | Stage 1/2 | | | Stage 3 | | | Total | | | | | | Stage 1/2 | | | Stage 3 | | | Total | | | | |
| | | £m | | | £m | | | £m | | | % | | | £m | | | £m | | | £m | | | % | |
| Investment Exposures > £1m | | | | | | | | | | | | | | | | | | | | | | | | | | | | | | | | |
| Less than 60% | | | 6,136 | | | | 89 | | | | 6,225 | | | | 79.2 | | | | 8,838 | | | | 101 | | | | 8,939 | | | | 79.8 | |
| 60% to 70% | | | 917 | | | | 14 | | | | 931 | | | | 11.8 | | | | 1,190 | | | | 7 | | | | 1,197 | | | | 10.7 | |
| 70% to 80% | | | 117 | | | | 7 | | | | 124 | | | | 1.6 | | | | 267 | | | | 41 | | | | 308 | | | | 2.7 | |
| 80% to 100% | | | 138 | | | | 38 | | | | 176 | | | | 2.2 | | | | 79 | | | | 11 | | | | 90 | | | | 0.8 | |
| 100% to 120% | | | 26 | | | | 37 | | | | 63 | | | | 0.8 | | | | 27 | | | | 25 | | | | 52 | | | | 0.5 | |
| 120% to 140% | | | 4 | | | | 12 | | | | 16 | | | | 0.2 | | | | – | | | | 1 | | | | 1 | | | | – | |
| Greater than 140% | | | 18 | | | | 1 | | | | 19 | | | | 0.2 | | | | 18 | | | | 46 | | | | 64 | | | | 0.6 | |
| Unsecured3 | | | 311 | | | | – | | | | 311 | | | | 4.0 | | | | 520 | | | | 31 | | | | 551 | | | | 4.9 | |
| Total Investment >£1m | | | 7,667 | | | | 198 | | | | 7,865 | | | | 100.0 | | | | 10,939 | | | | 263 | | | | 11,202 | | | | 100.0 | |
| Investment <£1m4 | | | 3,455 | | | | 88 | | | | 3,543 | | | | | | | | 3,679 | | | | 105 | | | | 3,784 | | | | | |
| Total Investment | | | 11,122 | | | | 286 | | | | 11,408 | | | | | | | | 14,618 | | | | 368 | | | | 14,986 | | | | | |
| Development | | | 1,805 | | | | 58 | | | | 1,863 | | | | | | | | 1,698 | | | | 111 | | | | 1,809 | | | | | |
| Total | | | 12,927 | | | | 344 | | | | 13,271 | | | | | | | | 16,316 | | | | 479 | | | | 16,795 | | | | | |
| 1 | Excludes Commercial Banking UK Direct Real Estate exposures subject to protection through Significant Risk Transfer transactions. |
| | |
| 2 | Excludes Islands Commercial UK Direct Real Estate of £0.35 billion (31 December 2018: £0.45 billion). |
| | |
| 3 | Predominantly Investment grade corporate CRE lending where the Group is relying on the corporate covenant. |
| | |
| 4 | December 2019 <£1m investment exposures have an LTV profile broadly similar to the >£1m investment exposures. |
OPERATING AND FINANCIAL REVIEW AND PROSPECTS
Commercial Banking forbearance
| Table U: | Commercial Banking forborne loans and advances (audited) |
| | | | | | Of which | |
| | | Total | | | Stage 3 | |
| | | £m | | | £m | |
| At 31 December 2019 | | | | | | |
| Type of forbearance | | | | | | |
| Refinancing | | | 70 | | | | 41 | |
| Modification | | | 4,216 | | | | 3,322 | |
| Total | | | 4,286 | | | | 3,363 | |
| At 31 December 2018 | | | | | | | | |
| Type of forbearance | | | | | | | | |
| Refinancing | | | 38 | | | | 29 | |
| Modification | | | 3,834 | | | | 2,949 | |
| Total | | | 3,872 | | | | 2,978 | |
| Table V: | Derivative credit risk exposures |
| | | | | | 2019 | | | | | | | | | 2018 | | | | |
| | | | �� | | Traded over the counter | | | | | | | | | Traded over the counter | | | | |
| | | Traded on | | | Settled | | | Not settled | | | | | | Traded on | | | Settled | | | Not settled | | | | |
| | | recognised | | | by central | | | by central | | | | | | recognised | | | by central | | | by central | | | | |
| | | exchanges | | | counterparties | | | counterparties | | | Total | | | exchanges | | | counterparties | | | counterparties | | | Total | |
| | | £m | | | £m | | | £m | | | £m | | | £m | | | £m | | | £m | | | £m | |
| Notional balances | | | | | | | | | | | | | | | | | | | | | | | | | | | | | | | | |
| Foreign exchange | | | – | | | | 8 | | | | 421,143 | | | | 421,151 | | | | – | | | | 45 | | | | 385,680 | | | | 385,725 | |
| Interest rate | | | 199,986 | | | | 6,211,948 | | | | 250,392 | | | | 6,662,326 | | | | 128,221 | | | | 4,950,912 | | | | 689,882 | | | | 5,769,015 | |
| Equity and other | | | 4,820 | | | | – | | | | 6,594 | | | | 11,414 | | | | 9,247 | | | | – | | | | 5,898 | | | | 15,145 | |
| Credit | | | – | | | | – | | | | 16,959 | | | | 16,959 | | | | – | | | | – | | | | 13,757 | | | | 13,757 | |
| Total | | | 204,806 | | | | 6,211,956 | | | | 695,088 | | | | 7,111,850 | | | | 137,468 | | | | 4,950,957 | | | | 1,095,217 | | | | 6,183,642 | |
| Fair values | | | | | | | | | | | | | | | | | | | | | | | | | | | | | | | | |
| Assets | | | | | | | 1,820 | | | | 24,499 | | | | | | | | | | | | 144 | | | | 23,448 | | | | | |
| Liabilities | | | | | | | (1,794 | ) | | | (23,928 | ) | | | | | | | | | | | (150 | ) | | | (21,222 | ) | | | | |
| Net asset | | | | | | | 26 | | | | 571 | | | | | | | | | | | | (6 | ) | | | 2,226 | | | | | |
The total notional principal amount of interest rate, exchange rate, credit derivative and equity and other contracts outstanding at 31 December 2019 and 31 December 2018 is shown in the table above. The notional principal amount does not, however, represent the Group’s credit risk exposure, which is limited to the current cost of replacing contracts with a positive value to the Group. Such amounts are reflected in note 53 on page F-99.
OPERATING AND FINANCIAL REVIEW AND PROSPECTS
Environmental risk management
As appropriate, the Group considers the management of the environmental impact of its lending activities. The Group-wide credit risk principles require all credit risk to be incurred with due regard to environmental legislation and the Group’s Code of Responsibility. The Group’s external sector statements determine the appetite for many activities that impact the environment. The Group seeks to reduce detrimental impacts and support clients as they improve their own environmental footprint.
The Group’s business areas and sub-groups are each exposed to different types and levels of climate-related risk in their operations. For example, the general insurance function regularly uses weather, climate and environmental models and data to assess its insurance risk from covered perils such as windstorm and flood. A team of specialist scientists are employed within underwriting to do this work and they also regularly monitor the state of climate science to assess the need to include its potential impacts within pricing and solvency.
The Group has been a signatory to the Equator Principles since 2008 and has adopted and applied the expanded scope of Equator Principles III and committed itself to adoption of Equator Principles 4 during 2020. The Equator Principles support the Group’s approach to assessing and managing environmental and social issues in project finance, project-related corporate loans and bridge loans. The Group has also been a signatory to the UN Principles for Responsible Investment (UNPRI) since 2012, which incorporate ESG (environmental, social and governance) risk considerations in asset management. Scottish Widows is responsible for the annual UNPRI reporting process.
Within Commercial Banking, an electronic Environmental Risk Screening Tool is the primary mechanism for assessing environmental risk for lending transactions. This system provides screening of location specific and sector based risks that may be present in a transaction. Where a risk is identified, the transaction is referred to the Group’s expert in-house environmental risk team for further review and assessment. Where required, the Group’s panel of environmental consultants provide additional expert support.
Colleague training is provided on environmental risk management as part of the standard suite of Commercial Banking credit risk courses. To support this training, a range of online resources are available to colleagues, including environmental risk theory, procedural guidance, and information on environmental legislation and sector-specific environmental impacts. The Group also continue to partner with the Cambridge Institute for Sustainability Leadership to provide high quality training to executives and colleagues focused on risk management, product development and in client-facing roles.
Table W:Environmental risk management approach
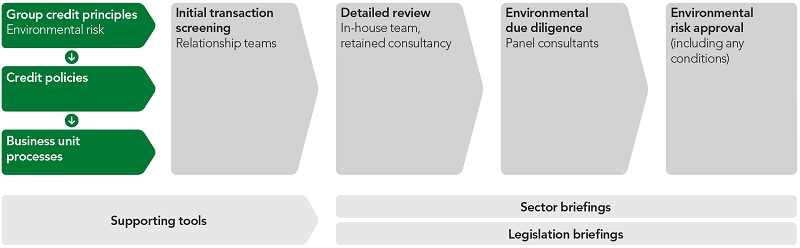
OPERATING AND FINANCIAL REVIEW AND PROSPECTS
LOAN PORTFOLIO
ANALYSIS OF LOANS AND ADVANCES TO BANKS AND CUSTOMERS
The following table analyses loans and advances to banks and customers by category of loan at 31 December for each of the five years listed.
| | | | 2019
£m | | | | 2018
£m | | | | 2017
£m | | | | 2016
£m | | | | 2015
£m | |
| Loans and advances to banks | | | 9,777 | | | | 6,285 | | | | 6,611 | | | | 26,902 | | | | 25,117 | |
| Loans and advances to customers: | | | | | | | | | | | | | | | | | | | | |
| Mortgages | | | 299,141 | | | | 297,498 | | | | 304,665 | | | | 306,682 | | | | 312,877 | |
| Other personal lending | | | 29,272 | | | | 28,699 | | | | 28,757 | | | | 20,761 | | | | 20,579 | |
| Agriculture, forestry and fishing | | | 7,558 | | | | 7,314 | | | | 7,461 | | | | 7,269 | | | | 6,924 | |
| Energy and water supply | | | 1,432 | | | | 1,517 | | | | 1,609 | | | | 2,320 | | | | 3,247 | |
| Manufacturing | | | 6,093 | | | | 8,260 | | | | 7,886 | | | | 7,285 | | | | 5,953 | |
| Construction | | | 4,285 | | | | 4,684 | | | | 4,428 | | | | 4,535 | | | | 4,952 | |
| Transport, distribution and hotels | | | 13,016 | | | | 14,113 | | | | 14,074 | | | | 13,320 | | | | 13,526 | |
| Postal and telecommunications | | | 1,923 | | | | 2,711 | | | | 2,148 | | | | 2,564 | | | | 2,563 | |
| Financial, business and other services | | | 89,763 | | | | 77,505 | | | | 57,006 | | | | 49,197 | | | | 43,072 | |
| Property companies | | | 27,596 | | | | 28,451 | | | | 30,980 | | | | 32,192 | | | | 32,228 | |
| Lease financing | | | 1,671 | | | | 1,822 | | | | 2,094 | | | | 2,628 | | | | 2,751 | |
| Hire purchase | | | 16,497 | | | | 15,434 | | | | 13,591 | | | | 11,617 | | | | 9,536 | |
| Total loans | | | 508,024 | | | | 494,293 | | | | 481,310 | | | | 487,272 | | | | 483,325 | |
| Allowance for impairment losses1 | | | (3,261 | ) | | | (3,152 | ) | | | (2,201 | ) | | | (2,412 | ) | | | (3,033 | ) |
| Total loans and advances net of allowance for impairment losses | | | 504,763 | | | | 491,141 | | | | 479,109 | | | | 484,860 | | | | 480,292 | |
| 1 | The allowances for loan losses at 31 December 2019 and 2018 were measured in accordance with IFRS 9; for earlier years, they were determined in accordance with IAS 39. |
Following the reduction in the Group’s non-UK activities, an analysis between domestic and foreign operations is not provided.
OPERATING AND FINANCIAL REVIEW AND PROSPECTS
SUMMARY OF LOAN LOSS EXPERIENCE
The following table analyses the movements in the allowance for impairment losses on loans and advances to banks and customers (drawn balances) for each of the five years listed. Allowances for loan losses in 2018 and 2019 were measured in accordance with IFRS 9; for earlier years they were determined in accordance with IAS 39.
| | | | 2019
£m | | | | 2018
£m | | | | 2017
£m | | | | 2016
£m | | | | 2015
£m | |
| Balance at end of preceding year | | | 3,152 | | | | 2,201 | | | | 2,412 | | | | 3,033 | | | | 6,414 | |
| Adjustment on adoption of IFRS 9 | | | | | | | 1,023 | | | | | | | | | | | | | |
| Balance at 1 January 2018 | | | | | | | 3,224 | | | | | | | | | | | | | |
| Exchange and other adjustments | | | 312 | | | | 126 | | | | 132 | | | | 69 | | | | (246 | ) |
| Disposal of businesses | | | – | | | | (181 | ) | | | – | | | | – | | | | (82 | ) |
| Advances written off: | | | | | | | | | | | | | | | | | | | | |
| Loans and advances to customers: | | | | | | | | | | | | | | | | | | | | |
| Mortgages | | | (99 | ) | | | (12 | ) | | | (42 | ) | | | (42 | ) | | | (71 | ) |
| Other personal lending | | | (1,111 | ) | | | (988 | ) | | | (925 | ) | | | (728 | ) | | | (853 | ) |
| Agriculture, forestry and fishing | | | (5 | ) | | | (4 | ) | | | (1 | ) | | | (1 | ) | | | (1 | ) |
| Energy and water supply | | | (1 | ) | | | – | | | | – | | | | (9 | ) | | | (73 | ) |
| Manufacturing | | | (11 | ) | | | (11 | ) | | | (40 | ) | | | (19 | ) | | | (126 | ) |
| Construction | | | (226 | ) | | | (82 | ) | | | (65 | ) | | | (96 | ) | | | (21 | ) |
| Transport, distribution and hotels | | | (51 | ) | | | (42 | ) | | | (65 | ) | | | (64 | ) | | | (728 | ) |
| Postal and telecommunications | | | (6 | ) | | | (2 | ) | | | – | | | | (189 | ) | | | (11 | ) |
| Financial, business and other services | | | (149 | ) | | | (244 | ) | | | (158 | ) | | | (712 | ) | | | (604 | ) |
| Property companies | | | (139 | ) | | | (134 | ) | | | (136 | ) | | | (215 | ) | | | (1,648 | ) |
| Lease financing | | | – | | | | – | | | | (2 | ) | | | – | | | | (31 | ) |
| Hire purchase | | | (84 | ) | | | (57 | ) | | | (65 | ) | | | (36 | ) | | | (37 | ) |
| Loans and advances to banks | | | – | | | | – | | | | – | | | | – | | | | – | |
| Total advances written off | | | (1,882 | ) | | | (1,576 | ) | | | (1,499 | ) | | | (2,111 | ) | | | (4,204 | ) |
| Recoveries of advances written off: | | | | | | | | | | | | | | | | | | | | |
| Loans and advances to customers: | | | | | | | | | | | | | | | | | | | | |
| Mortgages | | | 62 | | | | 20 | | | | 17 | | | | 44 | | | | 35 | |
| Other personal lending | | | 343 | | | | 333 | | | | 419 | | | | 329 | | | | 366 | |
| Energy and water supply | | | – | | | | 84 | | | | – | | | | 3 | | | | 5 | |
| Manufacturing | | | 10 | | | | 10 | | | | – | | | | 80 | | | | – | |
| Construction | | | 2 | | | | 65 | | | | 4 | | | | 78 | | | | – | |
| Transport, distribution and hotels | | | 2 | | | | 9 | | | | 15 | | | | 50 | | | | 63 | |
| Postal and telecommunications | | | – | | | | 1 | | | | – | | | | – | | | | – | |
| Financial, business and other services | | | 2 | | | | 42 | | | | 6 | | | | 241 | | | | 193 | |
| Property companies | | | 1 | | | | 16 | | | | – | | | | 34 | | | | 101 | |
| Lease financing | | | – | | | | – | | | | 19 | | | | – | | | | – | |
| Hire purchase | | | 3 | | | | – | | | | 2 | | | | 2 | | | | 1 | |
| Total recoveries of advances written off | | | 425 | | | | 580 | | | | 482 | | | | 861 | | | | 764 | |
| Total net advances written off | | | (1,457 | ) | | | (996 | ) | | | (1,017 | ) | | | (1,250 | ) | | | (3,440 | ) |
OPERATING AND FINANCIAL REVIEW AND PROSPECTS
| | | | 2019
£m | | | | 2018
£m | | | | 2017
£m | | | | 2016
£m | | | | 2015
£m | |
| Effect of unwinding of discount recognised through interest income | | | (53 | ) | | | (44 | ) | | | (23 | ) | | | (32 | ) | | | (56 | ) |
| Allowances for impairment losses charged against income for the year: | | | | | | | | | | | | | | | | | | | | |
| Loans and advances to customers: | | | | | | | | | | | | | | | | | | | | |
| Mortgages | | | (167 | ) | | | 29 | | | | (119 | ) | | | (23 | ) | | | 33 | |
| Other personal lending | | | 948 | | | | 699 | | | | 596 | | | | 438 | | | | 437 | |
| Agriculture, forestry and fishing | | | (4 | ) | | | 10 | | | | 2 | | | | 3 | | | | 1 | |
| Energy and water supply | | | (3 | ) | | | (8 | ) | | | – | | | | (4 | ) | | | 35 | |
| Manufacturing | | | 7 | | | | 9 | | | | 5 | | | | (48 | ) | | | 23 | |
| Construction | | | 5 | | | | 15 | | | | 85 | | | | 143 | | | | 13 | |
| Transport, distribution and hotels | | | 326 | | | | 47 | | | | (19 | ) | | | (35 | ) | | | (88 | ) |
| Postal and telecommunications | | | 5 | | | | (2 | ) | | | 1 | | | | 191 | | | | (2 | ) |
| Financial, business and other services | | | 64 | | | | 79 | | | | 42 | | | | 6 | | | | 77 | |
| Property companies | | | (48 | ) | | | 56 | | | | (7 | ) | | | (166 | ) | | | (140 | ) |
| Lease financing | | | – | | | | – | | | | – | | | | 15 | | | | 31 | |
| Hire purchase | | | 174 | | | | 88 | | | | 111 | | | | 72 | | | | 23 | |
| Loans and advances to banks | | | – | | | | 1 | | | | – | | | | – | | | | – | |
| Total allowances for impairment losses charged against income for the year | | | 1,307 | | | | 1,023 | | | | 697 | | | | 592 | | | | 443 | |
| Total balance at end of year | | | 3,261 | | | | 3,152 | | | | 2,201 | | | | 2,412 | | | | 3,033 | |
| Ratio of net write-offs during the year to average loans outstanding during the year | | | 0.3 | % | | | 0.2 | % | | | 0.2 | % | | | 0.3 | % | | | 0.8 | % |
Following the reduction in the Group’s non-UK activities, an analysis between domestic and foreign operations is not provided.
The Group ’s impairment allowances in respect of loans and advances to banks and customers increased by £109 million, or 3 per cent, from £3,152 million at 31 December 2018 to £3,261 million at 31 December 2019, the charge to the income statement of £1,307 million being offset by net advances written off of £1,457 million (advances written off of £1,882 million less recoveries of £425 million). The increase in the charge to the income statement from £1,023 million in 2018 to £1,307 million in 2019 reflects, in particular, two material corporate cases in Commercial Banking. By category of lending, the most significant elements of the charge to the income statement were charges of £948 million in respect of other personal lending, £326 million in respect of transport, distribution and hotels, £64 million in respect of financial, business and other services and £174 million in respect of hire purchase partly offset by a release of £167 million relating to mortgages. Of the net advances written off of £1,457 million, £768 million related to other personal lending, £224 million related to construction and £138 million to property companies.
OPERATING AND FINANCIAL REVIEW AND PROSPECTS
The following table analyses the coverage of the allowance for loan losses by category of loans.
| | | 2019
Allowance1
£m | | | 2019
Percentage
of loans
in each
category to
total loans
% | | | 2018
Allowance1
£m | | | 2018
Percentage of
loans
in each
category to
total loans
% | | | 2017
Allowance1
£m | | | 2017
Percentage of
loans
in each
category to
total loans
% | | | 2016
Allowance1
£m | | | 2016
Percentage of
loans
in each
category to
total loans
% | | | 2015
Allowance1
£m | | | 2015
Percentage of
loans
in each
category to
total loans
% | |
| Balance at year end applicable to: | | | | | | | | | | | | | | | | | | | | | | | | | | | | | | | | | | | | | | | | |
| Loans and advances to banks | | | 2 | | | | 1.9 | | | | 2 | | | | 1.3 | | | | – | | | | 1.4 | | | | – | | | | 5.5 | | | | – | | | | 5.2 | |
| Loans and advances to customers: | | | | | | | | | | | | | | | | | | | | | | | | | | | | | | | | | | | | | | | | |
| Mortgages | | | 611 | | | | 58.9 | | | | 509 | | | | 60.1 | | | | 485 | | | | 63.4 | | | | 576 | | | | 63.0 | | | | 479 | | | | 64.7 | |
| Other personal lending | | | 933 | | | | 5.8 | | | | 823 | | | | 5.8 | | | | 381 | | | | 6.0 | | | | 356 | | | | 4.3 | | | | 388 | | | | 4.3 | |
| Agriculture, forestry and fishing | | | 47 | | | | 1.5 | | | | 19 | | | | 1.5 | | | | 8 | | | | 1.6 | | | | 13 | | | | 1.5 | | | | 15 | | | | 1.4 | |
| Energy and water supply | | | 7 | | | | 0.3 | | | | 11 | | | | 0.3 | | | | 5 | | | | 0.3 | | | | 6 | | | | 0.5 | | | | 20 | | | | 0.7 | |
| Manufacturing | | | 58 | | | | 1.2 | | | | 65 | | | | 1.7 | | | | 35 | | | | 1.6 | | | | 84 | | | | 1.5 | | | | 70 | | | | 1.2 | |
| Construction | | | 305 | | | | 0.8 | | | | 514 | | | | 0.9 | | | | 410 | | | | 0.9 | | | | 319 | | | | 0.9 | | | | 165 | | | | 1.0 | |
| Transport, distribution and hotels | | | 503 | | | | 2.6 | | | | 161 | | | | 2.9 | | | | 57 | | | | 2.9 | | | | 161 | | | | 2.7 | | | | 219 | | | | 2.8 | |
| Postal and telecommunications | | | 9 | | | | 0.4 | | | | 10 | | | | 0.5 | | | | 5 | | | | 0.4 | | | | 5 | | | | 0.5 | | | | 4 | | | | 0.5 | |
| Financial, business and other services | | | 274 | | | | 17.7 | | | | 476 | | | | 15.7 | | | | 312 | | | | 11.9 | | | | 312 | | | | 10.1 | | | | 811 | | | | 8.9 | |
| Property companies | | | 147 | | | | 5.4 | | | | 294 | | | | 5.8 | | | | 343 | | | | 6.4 | | | | 470 | | | | 6.6 | | | | 790 | | | | 6.7 | |
| Lease financing | | | – | | | | 0.3 | | | | – | | | | 0.4 | | | | – | | | | 0.4 | | | | – | | | | 0.5 | | | | – | | | | 0.6 | |
| Hire purchase | | | 365 | | | | 3.2 | | | | 268 | | | | 3.1 | | | | 160 | | | | 2.8 | | | | 110 | | | | 2.4 | | | | 72 | | | | 2.0 | |
| Total balance at year end | | | 3,261 | | | | 100.0 | | | | 3,152 | | | | 100.0 | | | | 2,201 | | | | 100.0 | | | | 2,412 | | | | 100.0 | | | | 3,033 | | | | 100.0 | |
| 1 | The allowances for loan losses at 31 December 2019 and 2018 were measured in accordance with IFRS 9; for earlier years, they were determined in accordance with IAS 39. |
Following the reduction in the Group’s non-UK activities, an analysis between domestic and foreign operations is not provided.
OPERATING AND FINANCIAL REVIEW AND PROSPECTS
RISK ELEMENTS IN THE LOAN PORTFOLIO AND POTENTIAL PROBLEM LOANS
IFRS 9, which was adopted by the Group on 1 January 2018, requires that:
– interest is recognised on all loans and advances and, as a result, no loan is classified as non-accrual; and
– an allowance for expected credit losses is recognised on all loans and advances irrespective of whether any payments are past due.
As a result, the Group no longer analyses its loans between those that are neither past due nor impaired, past due but not impaired, impaired with no provision held and impaired with a provision.
Whilst IFRS 7 was amended to recognise the impact of IFRS 9, it still requires detailed qualitative and quantitative disclosures about loan portfolios. The Group revised its disclosures accordingly; the following tables are presented in respect of the Group’s credit risk elements and potential problem loans.
| | | 2019 and
2018 | | | 2017 and
earlier years | |
| Days past due for loans and advances that are considered to have experienced a significant increase in credit risk, but are not credit-impaired | | | ü | | | | | |
| Days past due for loans past due but not impaired | | | | | | | ü | |
| Credit quality of all loans and advances | | | ü | | | | | |
| Credit quality of loans neither past due nor impaired | | | | | | | ü | |
| Interest foregone on non-performing lending | | | ü | | | | ü | |
| Analysis of impairment and provision status | | | | | | | ü | |
OPERATING AND FINANCIAL REVIEW AND PROSPECTS
SIGNIFICANT INCREASE IN CREDIT RISK
31 December 2019 and 2018
The table below analyses the Group’s loans and advances to customers and banks that are considered to have experienced a significant increase in credit risk, but are not credit-impaired, according to the number of days that have elapsed since the last payment received by the Group was due from the borrower; the analysis of lending has been prepared based on the division in which the asset is held.
| | | | | | | | | | | | | | | | | | | |
| | | Loans and | | | Loans and advances to customers |
| | | advances | | | Retail – | | | Retail – | | | | | | | | | | |
| | | to banks | | | mortgages | | | other | | | Commercial | | | Other | | | Total | |
| | | £m | | | £m | | | £m | | | £m | | | £m | | | £m | |
| 31 December 2019 | | | | | | | | | | | | | | | | | | | | | | | | |
| Up to date | | | – | | | | 13,439 | | | | 4,879 | | | | 5,611 | | | | 28 | | | | 23,957 | |
| 1-30 days past due | | | – | | | | 1,876 | | | | 497 | | | | 117 | | | | 1 | | | | 2,491 | |
| Over 30 days past due | | | – | | | | 1,620 | | | | 207 | | | | 265 | | | | 3 | | | | 2,095 | |
| Total | | | – | | | | 16,935 | | | | 5,583 | | | | 5,993 | | | | 32 | | | | 28,543 | |
| 31 December 2018 | | | | | | | | | | | | | | | | | | | | | | | | |
| Up to date | | | 3 | | | | 10,118 | | | | 4,387 | | | | 6,020 | | | | 10 | | | | 20,535 | |
| 1-30 days past due | | | – | | | | 1,955 | | | | 486 | | | | 455 | | | | – | | | | 2,896 | |
| Over 30 days past due | | | – | | | | 1,581 | | | | 214 | | | | 117 | | | | 2 | | | | 1,914 | |
| Total | | | 3 | | | | 13,654 | | | | 5,087 | | | | 6,592 | | | | 12 | | | | 25,345 | |
A financial asset is “past due” if a counterparty has failed to make a payment when contractually due.
LOANS PAST DUE BUT NOT IMPAIRED
31 December 2017 and earlier years
The loans that are past due but not impaired are analysed in the table below according to the number of days that have elapsed since the last payment received by the Group was due from the borrower. The analysis of lending between retail and commercial has been prepared based upon the type of exposure and not the business segment in which the exposure is recorded. Included within retail are exposures to personal customers and small businesses, whilst included within commercial are exposures to corporate customers and other large institutions.
| | | | | | | | | | | | | | | | | | Loans and | |
| | | | | | | | | | | | | | | | | | advances | |
| | | | | | | | designated | |
| | | Loans and | | | Loans and advances to customers | | at fair value | |
| | | advances | | | Retail – | | | Retail – | | | | | | | | | through | |
| (audited) | | to banks
£m | | | mortgages
£m | | | other
£m | | | Commercial
£m | | | Total
£m | | | profit or loss
£m | |
| 31 December 2017 | | | | | | | | | | | | | | | | | | | | | | | | |
| 0-30 days | | | 6 | | | | 3,057 | | | | 458 | | | | 246 | | | | 3,761 | | | | – | |
| 30-60 days | | | – | | | | 1,115 | | | | 111 | | | | 10 | | | | 1,236 | | | | – | |
| 60-90 days | | | – | | | | 785 | | | | 3 | | | | 13 | | | | 801 | | | | – | |
| 90-180 days | | | – | | | | 977 | | | | 3 | | | | 8 | | | | 988 | | | | – | |
| Over 180 days | | | – | | | | – | | | | 10 | | | | 59 | | | | 69 | | | | – | |
| Total | | | 6 | | | | 5,934 | | | | 585 | | | | 336 | | | | 6,855 | | | | – | |
| 31 December 2016 | | | | | | | | | | | | | | | | | | | | | | | | |
| 0-30 days | | | 14 | | | | 3,547 | | | | 285 | | | | 157 | | | | 3,989 | | | | – | |
| 30-60 days | | | – | | | | 1,573 | | | | 75 | | | | 37 | | | | 1,685 | | | | – | |
| 60-90 days | | | – | | | | 985 | | | | 2 | | | | 74 | | | | 1,061 | | | | – | |
| 90-180 days | | | – | | | | 1,235 | | | | 6 | | | | 14 | | | | 1,255 | | | | – | |
| Over 180 days | | | – | | | | – | | | | 18 | | | | 23 | | | | 41 | | | | – | |
| Total | | | 14 | | | | 7,340 | | | | 386 | | | | 305 | | | | 8,031 | | | | – | |
| 31 December 2015 | | | | | | | | | | | | | | | | | | | | | | | | |
| 0-30 days | | | 111 | | | | 4,066 | | | | 276 | | | | 248 | | | | 4,590 | | | | – | |
| 30-60 days | | | – | | | | 1,732 | | | | 81 | | | | 100 | | | | 1,913 | | | | – | |
| 60-90 days | | | – | | | | 1,065 | | | | 9 | | | | 52 | | | | 1,126 | | | | – | |
| 90-180 days | | | – | | | | 1,370 | | | | 8 | | | | 19 | | | | 1,397 | | | | – | |
| Over 180 days | | | – | | | | – | | | | 19 | | | | 44 | | | | 63 | | | | – | |
| Total | | | 111 | | | | 8,233 | | | | 393 | | | | 463 | | | | 9,089 | | | | – | |
A financial asset is “past due” if a counterparty has an amount outstanding beyond its contractual due date.
OPERATING AND FINANCIAL REVIEW AND PROSPECTS
POTENTIAL PROBLEM LOANS
Potential problem loans are loans where known information about possible credit problems causes management to have concern as to the borrower’s ability to comply with the present loan repayment terms.
31 December 2019 and 2018
IFRS 7 requires the disclosure of information about the credit quality of loans and advances. The Group’s disclosures analyse its loans (gross drawn exposures) based on the internal credit ratings systems used by the Group; these differ between Retail and Commercial, reflecting the characteristics of their exposures and the way that they are managed by the Group.
| | | Probability of | | | 2019 | | | 2018 | |
| Gross drawn exposures | | default range | | | £m | | | £m | |
| Loans and advances to banks: | | | | | | | | | | | | |
| CMS 1-10 | | | 0.00-0.50% | | | | 9,777 | | | | 6,180 | |
| CMS 11-14 | | | 0.51-3.00% | | | | – | | | | 105 | |
| CMS 15-18 | | | 3.01-20.00% | | | | – | | | | – | |
| CMS 19 | | | 20.01-99.99% | | | | – | | | | – | |
| CMS 20-23 | | | 100% | | | | – | | | | – | |
| | | | | | | | 9,777 | | | | 6,285 | |
| Loans and advances to customers: | | | | | | | | | | | | |
| Retail - mortgages | | | | | | | | | | | | |
| RMS 1-6 | | | 0.00-4.50% | | | | 270,522 | | | | 268,524 | |
| RMS 7-9 | | | 4.51-14.00% | | | | 2,067 | | | | 1,766 | |
| RMS 10 | | | 14.01-20.00% | | | | 414 | | | | 262 | |
| RMS 11-13 | | | 20.01-99.99% | | | | 975 | | | | 899 | |
| RMS 14 | | | 100% | | | | 15,220 | | | | 16,784 | |
| | | | | | | | 289,198 | | | | 288,235 | |
| Retail - unsecured | | | | | | | | | | | | |
| RMS 1-6 | | | 0.00-4.50% | | | | 23,249 | | | | 23,442 | |
| RMS 7-9 | | | 4.51-14.00% | | | | 3,595 | | | | 2,845 | |
| RMS 10 | | | 14.01-20.00% | | | | 265 | | | | 239 | |
| RMS 11-13 | | | 20.01-99.99% | | | | 624 | | | | 886 | |
| RMS 14 | | | 100% | | | | 678 | | | | 703 | |
| | | | | | | | 28,411 | | | | 28,115 | |
| Retail - UK Motor Finance | | | | | | | | | | | | |
| RMS 1-6 | | | 0.00-4.50% | | | | 14,865 | | | | 13,872 | |
| RMS 7-9 | | | 4.51-14.00% | | | | 682 | | | | 619 | |
| RMS 10 | | | 14.01-20.00% | | | | 99 | | | | 111 | |
| RMS 11-13 | | | 20.01-99.99% | | | | 180 | | | | 202 | |
| RMS 14 | | | 100% | | | | 150 | | | | 129 | |
| | | | | | | | 15,976 | | | | 14,933 | |
| Retail - Other | | | | | | | | | | | | |
| RMS 1-6 | | | 0.00-4.50% | | | | 9,910 | | | | 9,737 | |
| RMS 7-9 | | | 4.51-14.00% | | | | 409 | | | | 256 | |
| RMS 10 | | | 14.01-20.00% | | | | 7 | | | | 7 | |
| RMS 11-13 | | | 20.01-99.99% | | | | 157 | | | | 234 | |
| RMS 14 | | | 100% | | | | 150 | | | | 165 | |
| | | | | | | | 10,633 | | | | 10,399 | |
| Total Retail | | | | | | | 344,218 | | | | 341,682 | |
OPERATING AND FINANCIAL REVIEW AND PROSPECTS
| | | Probability of | | | 2019 | | | 2018 | |
| Gross drawn exposures (continued) | | default range | | | £m | | | £m | |
| Commercial | | | | | | | | | | | | |
| CMS 1-10 | | | 0.00-0.50% | | | | 60,259 | | | | 65,189 | |
| CMS 11-14 | | | 0.51-3.00% | | | | 27,960 | | | | 28,922 | |
| CMS 15-18 | | | 3.01-20.00% | | | | 4,928 | | | | 4,429 | |
| CMS 19 | | | 20.01-99.99% | | | | 169 | | | | 54 | |
| CMS 20-23 | | | 100% | | | | 3,447 | | | | 3,230 | |
| | | | | | | | 96,763 | | | | 101,824 | |
| Other | | | | | | | | | | | | |
| RMS 1-6 | | | 0.00-4.50% | | | | 786 | | | | 810 | |
| RMS 7-9 | | | 4.51-14.00% | | | | 40 | | | | – | |
| RMS 10 | | | 14.01-20.00% | | | | – | | | | – | |
| RMS 11-13 | | | 20.01-99.99% | | | | – | | | | – | |
| RMS 14 | | | 100% | | | | 84 | | | | 55 | |
| | | | | | | | 910 | | | | 865 | |
| CMS 1-10 | | | 0.00-0.50% | | | | 56,356 | | | | 43,565 | |
| CMS 11-14 | | | 0.51-3.00% | | | | – | | | | 6 | |
| CMS 15-18 | | | 3.01-20.00% | | | | – | | | | – | |
| CMS 19 | | | 20.01-99.99% | | | | – | | | | – | |
| CMS 20-23 | | | 100% | | | | – | | | | 66 | |
| | | | | | | | 56,356 | | | | 43,637 | |
| Total loans and advances to customers | | | | | | | 498,247 | | | | 488,008 | |
| | | | | | | | | | | | | |
| In respect of: | | | | | | | | | | | | |
| Retail | | | | | | | 344,218 | | | | 341,682 | |
| Commercial | | | | | | | 96,763 | | | | 101,824 | |
| Other | | | | | | | 57,266 | | | | 44,502 | |
| Total loans and advances to customers | | | | | | | 498,247 | | | | 488,008 | |
OPERATING AND FINANCIAL REVIEW AND PROSPECTS
31 December 2017 and earlier years
IFRS 7 required the disclosure of information about the credit quality of loans and advances that were neither past due nor impaired. The Group’s disclosures analyse these loans between those that the Group believed were of good quality, satisfactory quality, lower quality and those that were below standard but not impaired. The below standard but not impaired balances represented potential problem loans. The analysis of lending between retail and commercial has been prepared based upon the type of exposure and not the business segment in which the exposure is recorded. Included within retail are exposures to personal customers and small businesses, whilst included within commercial are exposures to corporate customers and other large institutions.
| | | | | | | | | | | | | | | | | | Loans and | |
| | | | | | | | | | | | | | | | | | advances | |
| | | | | | | | | | | | | | | | | | designated | |
| | | Loans and | | | Loans and advances to customers | | at fair value | |
| | | advances | | | Retail – | | | Retail – | | | | | | | | | through | |
| (audited) | | to banks
£m | | | mortgages
£m | | | other
£m | | | Commercial
£m | | | Total
£m | | | profit or loss
£m | |
| 31 December 2017 | | | | | | | | | | | | | | | | | | | | | | | | |
| Good quality | | | 6,351 | | | | 294,748 | | | | 43,145 | | | | 81,121 | | | | | | | | 31,548 | |
| Satisfactory quality | | | 198 | | | | 790 | | | | 4,770 | | | | 30,154 | | | | | | | | 42 | |
| Lower quality | | | 28 | | | | 32 | | | | 286 | | | | 4,807 | | | | | | | | – | |
| Below standard, but not impaired | | | – | | | | 195 | | | | 696 | | | | 314 | | | | | | | | – | |
| Total | | | 6,577 | | | | 295,765 | | | | 48,897 | | | | 116,396 | | | | 461,058 | | | | 31,590 | |
| 31 December 2016 | | | | | | | | | | | | | | | | | | | | | | | | |
| Good quality | | | 26,745 | | | | 295,286 | | | | 34,195 | | | | 72,083 | | | | | | | | 33,049 | |
| Satisfactory quality | | | 87 | | | | 814 | | | | 4,479 | | | | 30,433 | | | | | | | | 30 | |
| Lower quality | | | 3 | | | | 39 | | | | 387 | | | | 6,433 | | | | | | | | – | |
| Below standard, but not impaired | | | 53 | | | | 164 | | | | 417 | | | | 415 | | | | | | | | – | |
| Total | | | 26,888 | | | | 296,303 | | | | 39,478 | | | | 109,364 | | | | 445,145 | | | | 33,079 | |
| 31 December 2015 | | | | | | | | | | | | | | | | | | | | | | | | |
| Good quality | | | 24,670 | | | | 301,403 | | | | 33,589 | | | | 63,453 | | | | | | | | 33,156 | |
| Satisfactory quality | | | 311 | | | | 527 | | | | 4,448 | | | | 28,899 | | | | | | | | 15 | |
| Lower quality | | | 4 | | | | 27 | | | | 476 | | | | 7,210 | | | | | | | | 3 | |
| Below standard, but not impaired | | | 21 | | | | 106 | | | | 373 | | | | 439 | | | | | | | | – | |
| Total | | | 25,006 | | | | 302,063 | | | | 38,886 | | | | 100,001 | | | | 440,950 | | | | 33,174 | |
OPERATING AND FINANCIAL REVIEW AND PROSPECTS
INTEREST FOREGONE ON NON-PERFORMING LENDING
The table below summarises the interest foregone on impaired lending.
| | | 2019 | |
| | | £m | |
| Interest income that would have been recognised under original contract terms | | | 313 | |
| Interest income included in profit | | | (198 | ) |
| Interest foregone | | | 115 | |
ANALYSIS OF IMPAIRMENT AND PROVISION STATUS
31 December 2017 and earlier years
The table below shows separately those loans that are (i) neither past due nor impaired, (ii) past due but not impaired, (iii) impaired, but not requiring a provision and (iv) impaired with a provision.
| | | | | | | | | | | | | | | | | Loans and | |
| | | | | | | | | | | | | | | | | advances | |
| | | | | | | | | | | | | | | | | designated | |
| | Loans and | | | Loans and advances to customers | | at fair value | |
| | advances | | | Retail – | | | Retail – | | | | | | | | | through | |
| (audited) | to banks
£m | | | mortgages
£m | | | other
£m | | | Commercial
£m | | | Total
£m | | | profit or loss
£m | |
| 31 December 2017 | | | | | | | | | | | | | | | | | | | | | | | |
| Neither past due nor impaired | | 6,577 | | | | 295,765 | | | | 48,897 | | | | 116,396 | | | | 461,058 | | | | 31,590 | |
| Past due but not impaired | | 6 | | | | 5,934 | | | | 585 | | | | 336 | | | | 6,855 | | | | – | |
| Impaired – no provision required | | 28 | | | | 640 | | | | 306 | | | | 700 | | | | 1,646 | | | | – | |
| – provision held | | – | | | | 3,529 | | | | 1,053 | | | | 1,613 | | | | 6,195 | | | | – | |
| Gross | | 6,611 | | | | 305,868 | | | | 50,841 | | | | 119,045 | | | | 475,754 | | | | 31,590 | |
| 31 December 2016 | | | | | | | | | | | | | | | | | | | | | | | |
| Neither past due nor impaired | | 26,888 | | | | 296,303 | | | | 39,478 | | | | 109,364 | | | | 445,145 | | | | 33,079 | |
| Past due but not impaired | | 14 | | | | 7,340 | | | | 386 | | | | 305 | | | | 8,031 | | | | – | |
| Impaired – no provision required | | – | | | | 784 | | | | 392 | | | | 689 | | | | 1,865 | | | | – | |
| – provision held | | – | | | | 3,536 | | | | 1,038 | | | | 2,056 | | | | 6,630 | | | | – | |
| Gross | | 26,902 | | | | 307,963 | | | | 41,294 | | | | 112,414 | | | | 461,671 | | | | 33,079 | |
| 31 December 2015 | | | | | | | | | | | | | | | | | | | | | | | |
| Neither past due nor impaired | | 25,006 | | | | 302,063 | | | | 38,886 | | | | 100,001 | | | | 440,950 | | | | 33,174 | |
| Past due but not impaired | | 111 | | | | 8,233 | | | | 393 | | | | 463 | | | | 9,089 | | | | – | |
| Impaired – no provision required | | – | | | | 732 | | | | 690 | | | | 1,092 | | | | 2,514 | | | | – | |
| – provision held | | – | | | | 3,269 | | | | 911 | | | | 2,896 | | | | 7,076 | | | | – | |
| Gross | | 25,117 | | | | 314,297 | | | | 40,880 | | | | 104,452 | | | | 459,629 | | | | 33,174 | |
The analysis of lending between retail and commercial has been prepared based upon the type of exposure and not the business segment in which the exposure is recorded. Included within retail are exposures to personal customers and small businesses, whilst included within commercial are exposures to corporate customers and other large institutions.
OPERATING AND FINANCIAL REVIEW AND PROSPECTS
TROUBLED DEBT RESTRUCTURINGS
The Company’s accounting policy for loans that are renegotiated is set out in note 2(H) to the financial statements. In accordance with IFRS 9, an impairment provision is recognised on all loans; as a result, the Company amended these disclosures in 2018. Loans modified by the Group during the year as a result of a customer’s financial difficulties were credit-impaired at 31 December 2019 and 2018 and are included within the forborne balances set out in the table below.
| | | | | Purchased | | | | | | | |
| | | | | or originated | | | | | | | |
| | Credit-impaired | | | credit-impaired | | | Other | | | Total | |
| | forborne | | | forborne | | | forborne | | | forborne | |
| | loans and | | | loans and | | | loans and | | | loans and | |
| | advances | | | advances | | | advances | | | advances | |
| | £m | | | £m | | | £m | | | £m | |
| At 31 December 2019 | | | | | | | | | | | | | | | |
| Retail: | | | | | | | | | | | | | | | |
| Secured | | 736 | | | | 3,659 | | | | 1,164 | | | | 5,559 | |
| Unsecured | | 305 | | | | – | | | | 235 | | | | 540 | |
| UK Motor Finance | | 26 | | | | – | | | | 37 | | | | 63 | |
| Total Retail | | 1,067 | | | | 3,659 | | | | 1,436 | | | | 6,162 | |
| Commercial | | 3,363 | | | | – | | | | 923 | | | | 4,286 | |
| At 31 December 2018 | | | | | | | | | | | | | | | |
| Retail: | | | | | | | | | | | | | | | |
| Secured | | 642 | | | | 4,241 | | | | 1,206 | | | | 6,089 | |
| Unsecured | | 289 | | | | – | | | | 274 | | | | 563 | |
| UK Motor Finance | | 25 | | | | – | | | | 31 | | | | 56 | |
| Total Retail | | 956 | | | | 4,241 | | | | 1,511 | | | | 6,708 | |
| Commercial | | 2,978 | | | | – | | | | 894 | | | | 3,872 | |
| | | | | | | | | | | | | | | | |
| | | | | | | | | | | | | | Impairment | |
| | Total forborne loans | | | Total forborne loans | | | Total loans and | | | allowance as a % of | |
| | and advances which | | | and advances which | | | advances which are | | | loans and advances | |
| | are not impaired | | | are impaired | | | forborne | | | which are forborne | |
| | £m | | | £m | | | £m | | | % | |
| At 31 December 2017 | | | | | | | | | | | | | | | |
| UK secured retail | | 1,291 | | | | 137 | | | | 1,428 | | | | 4.3 | |
| UK unsecured retail | | 55 | | | | 139 | | | | 194 | | | | 38.6 | |
| Consumer credit cards | | 105 | | | | 190 | | | | 295 | | | | 36.0 | |
| Asset Finance UK Retail | | 15 | | | | 19 | | | | 34 | | | | 36.6 | |
| Run off: Ireland secured retail | | 213 | | | | 25 | | | | 238 | | | | 21.0 | |
| Commercial Banking | | 447 | | | | 1,927 | | | | 2,374 | | | | 35.0 | |
| Run off: Corporate Real Estate, other Corporate and Specialist Finance | | – | | | | 715 | | | | 715 | | | | 44.1 | |
| At 31 December 2016 | | | | | | | | | | | | | | | |
| UK secured retail | | 1,879 | | | | 217 | | | | 2,096 | | | | 4.7 | |
| UK unsecured retail | | 20 | | | | 107 | | | | 127 | | | | 40.5 | |
| Consumer credit cards | | 93 | | | | 119 | | | | 212 | | | | 29.0 | |
| Asset Finance UK Retail | | 55 | | | | 62 | | | | 117 | | | | 27.0 | |
| Run off: Ireland secured retail | | 137 | | | | 19 | | | | 156 | | | | 16.6 | |
| Commercial Banking | | 466 | | | | 2,197 | | | | 2,663 | | | | 31.1 | |
| Run off: Corporate Real Estate, other Corporate and Specialist Finance | | 3 | | | | 995 | | | | 998 | | | | 51.1 | |
OPERATING AND FINANCIAL REVIEW AND PROSPECTS
| | | | | | | | | | | Impairment | |
| | Total forborne loans | | | Total forborne loans | | | Total loans and | | | allowance as a % of | |
| | and advances which | | | and advances which | | | advances which are | | | loans and advances | |
| | are not impaired | | | are impaired | | | forborne | | | which are forborne | |
| | £m | | | £m | | | £m | | | % | |
| At 31 December 2015 | | | | | | | | | | | | | | | |
| UK secured retail | | 2,929 | | | | 173 | | | | 3,102 | | | | 4.2 | |
| UK unsecured retail | | 28 | | | | 119 | | | | 147 | | | | 40.0 | |
| Consumer credit cards | | 105 | | | | 120 | | | | 225 | | | | 26.8 | |
| Asset Finance UK Retail | | 49 | | | | 51 | | | | 100 | | | | 25.5 | |
| Run off: Ireland secured retail | | 143 | | | | 26 | | | | 169 | | | | 13.3 | |
| Commercial Banking | | 986 | | | | 2,543 | | | | 3,529 | | | | 30.9 | |
| Run off: Corporate Real Estate, other Corporate and Specialist Finance | | 9 | | | | 1,771 | | | | 1,780 | | | | 52.5 | |
| Run-off Ireland: Commercial real estate and corporate | | 32 | | | | 5 | | | | 37 | | | | 0.0 | |
The Group assesses whether a loan benefiting from a UK Government-sponsored programme is impaired or a troubled debt restructuring using the same accounting policies and practices as it does for loans not benefiting from such a programme.
Further information on the schemes operated by the Group to assist borrowers who are experiencing financial stress and on the Group’s forborne loans is set out on pages 54 to 55, page 63 and page 67.
ASSETS ACQUIRED IN EXCHANGE FOR ADVANCES
In most circumstances in the US, title to property securing residential real estate transfers to the lender upon foreclosure. The loan is written off and the property acquired in this way is reported in a separate balance sheet category with any recoveries recorded as an offset to the provision for loan losses recorded in the year. Upon sale of the acquired property, gains or losses are recorded in the income statement as a gain or loss on acquired property.
In the UK, although a bank is entitled to enforce a first charge on a property held as security, it typically does so only to the extent of enforcing its power of sale. In accordance with IFRS and industry practice, Lloyds Banking Group usually takes control of a property held as collateral on a loan at repossession without transfer of title. Loans subject to repossession continue to be reported as loans in the balance sheet. The Group’s gains or losses on sale of the acquired property are recorded within the provision for loan losses during the reporting period.
The difference in practices has no effect on net income reported in the UK compared to that reported in the US but it does result in a difference in classification of losses and recoveries in the income statement. It also has the effect of causing UK banks to report an increased level of non-performing loans compared with US banks.
In certain circumstances the Group takes physical possession of assets held as collateral against wholesale lending. In such cases, the assets are carried on the Group’s balance sheet and are classified according to the Group’s accounting policies.
CROSS BORDER OUTSTANDINGS
The business of Lloyds Banking Group involves exposures in non-local currencies. These cross border outstandings comprise loans (including accrued interest), acceptances, interest-bearing deposits with other banks, other interest-bearing investments and any other monetary assets which are denominated in non-local currency. The following table analyses, by type of borrower, foreign outstandings which individually represent in excess of 1 per cent of Lloyds Banking Group’s total assets.
| | | | | | | | | Governments | | | Banks and other | | | Commercial, | |
| | | | | | | | | and official | | | financial | | | industrial | |
| | | | | | Total | | | institutions | | | institutions | | | and other | |
| | | % of assets | | | £m | | | £m | | | £m | | | £m | |
| At 31 December 2019: | | | | | | | | | | | | | | | | | | | | |
| United States of America | | | 1.0 | | | | 8,741 | | | | 3,191 | | | | 4,831 | | | | 719 | |
| At 31 December 2018: | | | | | | | | | | | | | | | | | | | | |
| United States of America | | | 1.6 | | | | 12,502 | | | | 4,045 | | | | 5,091 | | | | 3,366 | |
| At 31 December 2017: | | | | | | | | | | | | | | | | | | | | |
| United States of America | | | 1.6 | | | | 12,963 | | | | 6,760 | | | | 3,205 | | | | 2,998 | |
At 31 December 2019, United States of America had commitments of £3,773 million.
At 31 December 2019, no countries had cross-border outstandings of between 0.75 per cent and 1 per cent of assets.
At 31 December 2018, no countries had cross border outstandings of between 0.75 per cent and 1 per cent of assets.
At 31 December 2017, no countries had cross border outstandings of between 0.75 per cent and 1 per cent of assets.
OPERATING AND FINANCIAL REVIEW AND PROSPECTS
REGULATORY AND LEGAL RISK
DEFINITION
Regulatory and legal risk is defined as the risk of financial penalties, regulatory censure, criminal or civil enforcement action or customer detriment as a result of failure to identify, assess, correctly interpret, comply with, or manage regulatory and/or legal requirements.
EXPOSURES
Whilst the Group has a zero risk appetite for material regulatory breaches or material legal incidents, the Group remains exposed to them, driven by significant ongoing and new legislation, regulation and court proceedings in the UK and overseas which in each case needs to be interpreted, implemented and embedded into day-to-day operational and business practices across the Group.
MEASUREMENT
Regulatory and legal risks are measured against a defined risk appetite metric, which is an assessment of material regulatory breaches and material legal incidents.
MITIGATION
The Group undertakes a range of key mitigating actions to manage regulatory and legal risk. These include the following:
| The Board has established a Group-wide risk appetite and metric for regulatory and legal risk. |
| | |
| Group policies and procedures set out the principles and key controls that should apply across the business which are aligned to the Group risk appetite. Mandated policies and processes require appropriate control frameworks, management information, standards and colleague training to be implemented to identify and manage regulatory and legal risk. |
| Business units identify, assess and implement policy and regulatory requirements and establish local controls, processes, procedures and resources to ensure appropriate governance and compliance. |
| | |
| Business units regularly produce management information to assist in the identification of issues and test management controls are working effectively. |
| | |
| Risk and Legal departments provide oversight, proactive support and constructive challenge to the business in identifying and managing regulatory and legal issues. |
| | |
| Risk department conducts thematic reviews of regulatory compliance and provides oversight of regulatory compliance assessments across businesses and divisions where appropriate. |
| | |
| Business units, with the support of divisional and Group-level teams, conduct ongoing horizon scanning to identify and address changes in regulatory and legal requirements. |
| | |
| The Group engages with regulatory authorities and industry bodies on forthcoming regulatory changes, market reviews and investigations, ensuring programmes are established to deliver new regulation and legislation. |
MONITORING
Material risks are managed through the relevant divisional-level committees, with review and escalation through Group level committees where appropriate, including the escalation of any material regulatory breaches or material legal incidents.
OPERATING AND FINANCIAL REVIEW AND PROSPECTS
CONDUCT RISK
DEFINITION
Conduct risk is defined as the risk of customer detriment across the customer lifecycle including: failures in product management, distribution and servicing activities; from other risks materialising, or other activities which could undermine the integrity of the market or distort competition, leading to unfair customer outcomes, regulatory censure, reputational damage or financial loss.
EXPOSURES
The Group faces significant conduct risks, which affect all aspects of the Group’s operations and all types of customers.
Conduct risks can impact directly or indirectly on our customers and could materialise from a number of areas across the Group, including:
| Business and strategic planning that does not sufficiently consider customer needs. |
| | |
| Ineffective management and monitoring of products and their distribution (including the sales process). |
| | |
| Unclear, unfair, misleading or untimely customer communications. |
| | |
| A culture that is not sufficiently customer-centric. |
| | |
| Poor governance of colleagues’ incentives and rewards and approval of schemes which drive unfair customer outcomes. |
| | |
| Ineffective management and oversight of legacy conduct issues. |
| | |
| Ineffective management of customers’ complaints or claims. |
| | |
| Outsourcing of customer service and product delivery to third-parties that do not have the same level of control, oversight and culture as the Group. |
There is a high level of scrutiny regarding financial institutions’ treatment of customers, including those in vulnerable circumstances, from regulatory bodies, the media, politicians and consumer groups.
There continues to be a significant focus on market misconduct, resulting from previous issues such as London Inter-bank Offered Rate (LIBOR) and foreign exchange (FX).
Due to the level of enhanced focus on conduct, there is a risk that certain aspects of the Group’s current or legacy business may be determined by the Financial Conduct Authority, other regulatory bodies or the courts as not being conducted in accordance with applicable laws or regulations, in a manner that fails to deliver fair and reasonable customer treatment, or is inconsistent with market integrity or competition requirements.
MEASUREMENT
To articulate its conduct risk appetite, the Group has sought more granularity through the use of suitable Conduct Risk Appetite Metrics (CRAMs) and tolerances that indicate where it may be operating outside its conduct risk appetite. These include Board-level conduct risk metrics covering an assessment of overall CRAMs performance, out of appetite CRAMs, UK Financial Ombudsman Service (FoS) change rates and complaints.
CRAMs have been designed for services and product families offered by the Group and are measured by a consistent set of common metrics. These contain a range of product design, sales and process metrics to provide a more holistic view of conduct risks; some products also have a suite of additional bespoke metrics.
Each of the tolerances for the metrics are agreed for the individual product or service and are regularly tracked. At a consolidated level these metrics are part of the Board risk appetite. The Group has, and continues to, evolve its approach to conduct risk measurements, including those supporting customer vulnerability, process delivery and customer journeys.
MITIGATION
The Group takes a range of mitigating actions with respect to conduct risk and remains focused on delivering a leading customer experience. The Group’s ongoing commitment to good customer outcomes sets the tone from the top and supports the development of the right customer-centric culture – strengthening links between actions to support conduct, culture and customer and enabling more effective control management. Actions to encourage good conduct include:
| Conduct risk appetite established at Group and business area level, with metrics included in the Group risk appetite to ensure ongoing focus. |
| Simplified and enhanced conduct policies and procedures in place to ensure appropriate controls and processes that deliver fair customer outcomes, and support market integrity and competition requirements. |
| | |
| Customer needs considered through divisional customer plans, with integral conduct lens, reviewed and challenged by Group Customer First Committee (GCFC). |
| | |
| Cultural transformation: achieving a values-led culture through a focus on behaviours to ensure the Group transforms its culture for success in a digital world. This is supported by strong direction and tone from senior executives and the Board. |
| | |
| Continuous embedding of the customer vulnerability framework. Development and continued oversight of the implementation of the vulnerability strategy continues through the Group Customer Vulnerability Committee (GCVC) operating at a senior level to prioritise change, drive implementation and ensure consistency across the Group. The Group is also in the third year of its partnership with Macmillan to support customers with cancer, has launched specialist support for those impacted by financial and domestic abuse and has signed up to standards supporting customers with mental health problems. |
| | |
| Enhanced product governance framework to ensure products continue to offer customers fair value, and consistently meet their needs throughout their product life cycle; reviewed and challenged by Group Product Governance Committee (GPGC). |
| | |
| Enhanced complaints management through effectively responding to, and learning from, root causes of complaint volumes and FoS change rates. |
| | |
| Review and oversight of thematic conduct agenda items at senior committees, ensuring holistic consideration of key Group-wide conduct risks. |
| | |
| Robust recruitment and training, with a continued focus on how the Group manages colleagues’ performance with clear customer accountabilities. |
| | |
| Ongoing engagement with third-parties involved in serving the Group’s customers to ensure consistent delivery. |
| | |
| Monitoring and testing of customer outcomes to ensure the Group delivers fair outcomes for customers whilst making continuous improvements to products, services and processes. |
| | |
| Continued focus on market conduct and member of the Fixed Income, Currencies and Commodities Markets Standard Board. |
| | |
| Adoption of robust change delivery methodology to enable prioritisation and delivery of initiatives to address conduct challenges. |
| | |
| Continued focus on proactive identification and mitigation of conduct risk in the GSR3. |
| | |
| Active engagement with regulatory bodies and other stakeholders to develop understanding of concerns related to customer treatment, effective competition and market integrity, to ensure that the Group’s strategic conduct focus continues to meet evolving stakeholder expectations. |
MONITORING
Monitoring and reporting is undertaken at Board, Group, entity and divisional committees. As part of the reporting of CRAMs, a robust outcomes testing regime is in place to determine whether the Group is delivering fair outcomes for customers.
GCFC acts as the guardian of customer experience and has responsibility for monitoring and reviewing plans and actions to improve it, providing oversight of customer outcomes and customer experience and providing challenge to divisions to make changes to support the delivery of the Group’s vision and foster a customer-centric culture.
OPERATIONAL RISK
DEFINITION
Operational risk is defined as the risk of loss resulting from inadequate or failed internal processes, people and systems or from external events.
OPERATING AND FINANCIAL REVIEW AND PROSPECTS
EXPOSURES
The principal operational risks to the Group which could result in customer detriment, unfair customer outcomes, financial loss, disruption and/or reputational damage are:
| A cyber-attack. |
| | |
| Failure of IT systems, due to volume of change, and/or aged infrastructure. |
| | |
| Internal and/or external fraud or financial crime. |
| | |
| Failure to ensure compliance with increasingly complex and detailed regulation including anti-money laundering, anti-bribery, counter-terrorist financing, and financial sanctions and prohibitions laws and regulations. |
A number of these risks could increase where there is a reliance on third-party suppliers to provide services to the Group or its customers.
MEASUREMENT
Operational risk is managed across the Group through an operational risk framework and operational risk policies. The operational risk framework includes a risk and control self-assessment process, risk impact likelihood matrix, key risk and control indicators, risk appetite, a robust operational event management and escalation process, scenario analysis and an operational losses process.
Table X below shows high level loss and event trends for the Group using Basel II categories. Based on data captured on the Group’s Risk and Control Self-Assessment, in 2019 the highest frequency of events occurred in external fraud (67.89 per cent) and execution, delivery and process management (18.04 per cent). Clients, products and business practices accounted for 72.70 per cent of losses by value, driven by legacy issues where impacts materialised in 2019 (excluding PPI).
Table X:Operational risk events by risk category (losses greater than or equal to £10,000), excluding PPI1
| | | % of total volume | | % of total losses |
| | | 2019 | | | 2018 | | | 2019 | | | 2018 | |
| Business disruption and system failures | | | 0.78 | | | | 1.46 | | | | 2.45 | | | | 3.53 | |
| Clients, products and business practices | | | 12.84 | | | | 12.30 | | | | 72.70 | | | | 65.12 | |
| Damage to physical assets | | | 0.15 | | | | 1.64 | | | | 0.03 | | | | 0.21 | |
| Employee practices and workplace safety | | | 0.10 | | | | 0.06 | | | | 0.01 | | | | – | |
| Execution, delivery and process management | | | 18.04 | | | | 21.21 | | | | 20.60 | | | | 25.96 | |
| External fraud | | | 67.89 | | | | 62.98 | | | | 4.16 | | | | 5.05 | |
| Internal fraud | | | 0.20 | | | | 0.35 | | | | 0.05 | | | | 0.13 | |
| Total | | | 100.00 | | | | 100.00 | | | | 100.00 | | | | 100.00 | |
| 1 | 2018 breakdowns have been restated to reflect a number of events that have been reclassified following an internal review. |
Operational risk losses and scenario analysis is used to inform the Internal Capital Adequacy Assessment Process (ICAAP). The Group calculates its minimum (Pillar I) operational risk capital requirements using The Standardised Approach (TSA). Pillar II is calculated using internal and external loss data and extreme but plausible scenarios that may occur in the next 12 months.
MITIGATION
The Group’s strategic review considers the changing risk management requirements, adapting the change delivery model to be more agile and develop the people skills and capabilities needed to be a ‘Bank of the Future’. The Group continues to review and invest in its control environment to ensure it addresses the inherent risks faced. Risks are reported and discussed at local governance forums and escalated to executive management and Board as appropriate to ensure the correct level of visibility and engagement. The Group employs a range of risk management strategies, including: avoidance, mitigation, transfer (including insurance) and acceptance. Where there is a reliance on third-party suppliers to provide services, the Group’s sourcing policy ensures that outsourcing initiatives follow a defined process including due diligence, risk evaluation and ongoing assurance.
Mitigating actions to the principal operational risks are:
| The threat landscape associated with cyber risk continues to evolve and there is significant regulatory attention on this subject. The Board continues to invest heavily to protect the Group from malicious cyber-attacks. Investment continues to focus on improving the Group’s approach to identity and access management, improving capability to detect and respond to cyber-attacks and improved ability to manage vulnerabilities across the estate. |
| | |
| The Group continues to optimise its approach to IT by investing in technology improvements; focusing on simplification of IT architecture; and decommissioning legacy systems in order to maintain reliable banking services for its customers. IT risk mitigation programmes are in place to continually improve customers’ experience, which receive considerable time and focus at Board and Board Risk Committees. |
| | |
| The Group adopts a risk based approach to mitigate the internal and external fraud risks it faces, reflecting the current and emerging fraud risks within the market. Fraud risk appetite metrics holistically cover the impacts of fraud in terms of losses to the Group, costs of fraud systems and operations, and customer experience of actual and attempted fraud. Oversight of the appropriateness and performance of these |
| | metrics is undertaken regularly through business area and Group-level committees. This approach drives a continual programme of prioritised enhancements to the Group’s technology, process and people related controls, with an emphasis on preventative controls supported by real time detective controls wherever feasible. Group-wide policies and operational control frameworks are maintained and designed to provide customer confidence, protect the Group’s commercial interests and reputation, comply with legal requirements and meet regulatory requirements. The Group’s fraud awareness programme remains a key component of its fraud control environment, and awareness of fraud risk is supported by mandatory training for all colleagues. The Group also plays an active role with other financial institutions, industry bodies, and enforcement agencies in identifying and combatting fraud. |
| | |
| The Group continues to lead and support industry wide activity to help address fraud, such as leadership on the design and implementation of the industry code for Authorised Push Payment (APP) fraud, in addition to making more bespoke commitments with key partners, such as the City of London Police. Such initiatives support the continued enhancement of the Group’s control framework, whilst contributing to the raising of standards across the industry. The Group also continues to make material annual investments in both technology and colleague development to help mitigate this growing area of risk. |
| | |
| The Group has adopted policies and procedures designed to detect and prevent the use of its banking network for money laundering, terrorist financing, bribery, tax evasion, human trafficking, modern-day slavery and wildlife trafficking, and activities prohibited by legal and regulatory sanctions. Against a background of increasingly complex and detailed laws and regulations, and of increased criminal and terrorist activity, the Group regularly reviews and assesses its policies, procedures and organisational arrangements to keep them current, effective and consistent across markets and jurisdictions. The Group requires mandatory training on these topics for all employees. Specifically, the anti-money laundering procedures include ‘know-your-customer’ requirements, transaction monitoring technologies, reporting of suspicions of money laundering or terrorist financing to the applicable regulatory authorities, and interaction between the Group’s Financial Intelligence Unit and external agencies and other financial institutions. The Anti-Bribery Policy prohibits the payment, offer, acceptance or request of a bribe, including ‘facilitation payments’ by any employee or agent and provides a confidential reporting service for anonymous reporting of suspected or actual bribery activity. The Sanctions and |
OPERATING AND FINANCIAL REVIEW AND PROSPECTS
| | the Related Prohibitions Policy sets out a framework of controls for compliance with legal and regulatory sanctions. |
MONITORING
Monitoring and reporting of operational risk is undertaken at Board, Group, entity and divisional committees. Each committee monitors key risks, control effectiveness, key risk and control indicators, events, operational losses, risk appetite metrics and the results of independent testing conducted by Risk and/or Internal Audit.
The Group maintains a formal approach to operational risk event escalation, whereby material events are identified, captured and escalated. Root causes of events are determined, and action plans put in place to ensure an optimum level of control to keep customers and the business safe, reduce costs, and improve efficiency.
The insurance programme is monitored and reviewed regularly, with recommendations being made to the Group’s senior management annually prior to each renewal. Insurers are monitored on an ongoing basis, to ensure counterparty risk is minimised. A process is in place to manage any insurer rating changes or insolvencies.
PEOPLE RISK
DEFINITION
The risk that the Group fails to provide an appropriate colleague and customer-centric culture, supported by robust reward and wellbeing policies and processes; effective leadership to manage colleague resources; effective talent and succession management; and robust control to ensure all colleague-related requirements are met.
EXPOSURES
The Group’s management of material people risks is critical to its capacity to deliver against its strategic objectives and to be the best bank for customers, particularly in the context of increasing volumes of organisational, political and external market change and increasing digitisation. The Group is exposed to the following key people risks:
| Failure to recruit, develop and retain colleagues, including ineffective management of succession planning or failure to identify appropriate talent pipeline. |
| | |
| The increasing digitisation of the business is changing the capability mix required and may impact the Group’s ability to attract and retain talent. |
| | |
| Senior Managers and Certification Regime (SM&CR) and additional regulatory constraints on remuneration structures may impact the Group’s ability to attract and retain talent. |
| | |
| Failure to manage capacity, colleagues having excessive demands placed on them resulting in wellbeing issues and business objectives not being met. |
| | |
| Failure to meet all colleague-related legal and regulatory requirements. |
| | |
| Ineffective leadership, poor communication, weak performance, inappropriate remuneration policies. |
| | |
| Colleague engagement may continue to be challenged by ongoing media attention on culture within the banking sector, conduct and ethical considerations. |
| | |
| Inadequately designed people processes that are not resilient to withstand unexpected events. |
MEASUREMENT
People risk is measured through a series of quantitative and qualitative indicators, aligned to key sources of people risk for the Group such as succession, retention, colleague engagement and wellbeing. In addition to risk appetite measures and limits, people risks and controls are monitored on a monthly basis via the Group’s risk governance framework and reporting structures.
MITIGATION
The Group takes many mitigating actions with respect to people risk. Key areas of focus include:
| Focusing on leadership and colleague engagement, through delivery of strategies to attract, retain and develop high calibre people together with implementation of rigorous succession planning. |
| | |
| Continued focus on the Group’s culture by developing and delivering initiatives that reinforce the appropriate behaviours which generate the best possible long-term outcomes for customers and colleagues. |
| | |
| Managing organisational capability and capacity through divisional people strategies to ensure there are the right skills and resources to meet customers’ needs and deliver the Group’s strategic plan. |
| | |
| Maintain effective remuneration arrangements to ensure they promote an appropriate culture and colleague behaviours that meet customer needs and regulatory expectations. |
| | |
| Ensuring colleague wellbeing strategies and support are in place to meet colleague needs, and that the skills and capability growth required to build a workforce for the ‘Bank of the Future’ are achieved. |
| | |
| Ensuring compliance with legal and regulatory requirements related to SM&CR, embedding compliant and appropriate colleague behaviours in line with Group policies, values and its people risk priorities. |
| | |
| Ongoing consultation with the Group’s recognised unions on changes which impact their members. |
| | |
| Reviewing and enhancing people processes to ensure they are fit for purpose and operationally resilient. |
MONITORING
Monitoring and reporting is undertaken at Board, Group, entity and divisional committees. Key people risk metrics are reported and discussed monthly at the Group People Risk Committee with escalation to Group Risk and Executive Committees and the Board where required.
All material people risk events are escalated in accordance with the Group Operational Risk Policy.
INSURANCE UNDERWRITING RISK
DEFINITION
Insurance underwriting risk is defined as the risk of adverse developments in the timing, frequency and severity of claims for insured/underwritten events and in customer behaviour, leading to reductions in earnings and/or value.
EXPOSURES
The major source of insurance underwriting risk within the Group is the Insurance business.
Longevity and persistency are key risks within the life and pensions business. Longevity risk arises from the annuity portfolios where policyholders’ future cash flows are guaranteed at retirement and increases in life expectancy, beyond current assumptions, will increase the cost of annuities. Longevity risk exposures are expected to increase with the Insurance business growth in the annuity market. Persistency assumptions are set to give a best estimate, however customer behaviour may result in increased cancellations or cessation of contributions.
The Group’s defined benefit pension schemes also expose the Group to longevity risk. For further information please refer to the defined benefit pension schemes component of the market risk section and note 36 to the financial statements.
Property insurance risk is a key risk within the General Insurance business, through Home Insurance. Exposures can arise, for example, in extreme weather conditions such as flooding, when property damage claims are higher than expected.
OPERATING AND FINANCIAL REVIEW AND PROSPECTS
MEASUREMENT
Insurance underwriting risks are measured using a variety of techniques including stress, reverse stress and scenario testing, as well as stochastic modelling. Current and potential future insurance underwriting risk exposures are assessed and aggregated on a range of stresses including risk measures based on 1-in-200 year stresses for the Insurance business’ regulatory capital assessments and other supporting measures where appropriate, including those set out in note 33 to the financial statements.
MITIGATION
Insurance underwriting risk in the Insurance business is mitigated in a number of ways:
| General Insurance exposure to accumulations of risk and possible catastrophes is mitigated by reinsurance arrangements broadly spread over different reinsurers. Detailed modelling, including that of the potential losses under various catastrophe scenarios, supports the choice of reinsurance arrangements. |
| | |
| Insurance processes on underwriting, claims management, pricing and product design. |
| | |
| Longevity risk transfer and hedging solutions are considered on a regular basis and since 2017 the Group have reinsured £3.1 billion of annuitant longevity. A team of longevity and pricing experts has been built to support the annuity proposition. |
| | |
| Exposure limits by risk type are assessed through the business planning process and used as a control mechanism to ensure risks are taken within risk appetite. |
MONITORING
Insurance underwriting risks in the Insurance business are monitored by Insurance senior executive committees and ultimately the Insurance Board. Significant risks from the Insurance business and the defined benefit pension schemes are reviewed by the Group Executive and Group Risk Committees and Board.
Insurance underwriting risk exposures within the Insurance business are monitored against risk appetite. The Insurance business monitors experiences against expectations, for example business volumes and mix, claims and persistency experience. The effectiveness of controls put in place to manage insurance underwriting risk is evaluated and significant divergences from experience or movements in risk exposures are investigated and remedial action taken.
CAPITAL RISK
DEFINITION
Capital risk is defined as the risk that the Group has a sub-optimal quantity or quality of capital or that capital is inefficiently deployed across the Group.
EXPOSURES
A capital risk exposure arises when the Group has insufficient capital resources to support its strategic objectives and plans, and to meet both regulatory and external stakeholder requirements and expectations. This could arise due to a depletion of the Group’s capital resources as a result of the crystallisation of any of the risks to which it is exposed. Alternatively a shortage of capital could arise from an increase in the amount of capital that needs to be held either at Group level, Ring-Fenced Bank (RFB) sub-group level or at a regulated entity level. The Group’s capital management approach is focused on maintaining sufficient capital resources across all regulated levels of its structure in order to prevent such exposures while optimising value for shareholders.
MEASUREMENT
The Group maintains capital levels commensurate with a prudent level of solvency and aims to deliver consistent and high quality returns to shareholders. To support this the capital risk appetite is calibrated by taking into consideration both an internal view of the amount of capital the Group should hold as well as recognising external regulatory requirements.
The Group measures both its capital requirements and the amount of capital resources it holds to meet those requirements through applying the regulatory framework defined by the Capital Requirements Directive and Regulation (CRD IV), as amended by provisions of the revised Capital Requirements Regulation (CRR II) that came into force in June 2019. Directive requirements are implemented in the UK by the Prudential Regulation Authority (PRA) and supplemented through additional regulation under the PRA Rulebook. Further details of the regulatory capital and leverage frameworks that the Group is subject to, including the means by which its capital and leverage requirements and capital resources are calculated, will be provided in the Group’s Pillar 3 Report.
The minimum amount of total capital, under Pillar 1 of the regulatory framework, is set at 8 per cent of total risk-weighted assets. At least 4.5 per cent of risk-weighted assets are required to be covered by common equity tier 1 (CET1) capital and at least 6 per cent of risk-weighted assets are required to be covered by tier 1 capital. These minimum Pillar 1 requirements are supplemented by additional minimum requirements under Pillar 2A of the regulatory framework, the aggregate of which is referred to as the Group’s Total Capital Requirement (TCR), and a number of regulatory capital buffers as described below.
Additional minimum requirements under Pillar 2A are set by the PRA as a firm-specific Individual Capital Requirement (ICR) reflecting a point in time estimate, which may change over time, of the minimum amount of capital that is needed by the Group to cover risks that are not fully covered by Pillar 1, such as credit concentration and operational risk, and those risks not covered at all by Pillar 1, such as pensions and interest rate risk in the banking book (IRRBB). The Group’s Pillar 2A capital requirement at 31 December 2019 was 4.6 per cent of risk-weighted assets, of which 2.6 per cent must be met by CET1 capital.
The Group is also required to hold a number of regulatory capital buffers which are required to be met with CET1 capital.
Systemic buffers are designed to hold systemically important banks to higher capital standards, so that they can withstand a greater level of stress before requiring resolution.
| Although the Group is not currently classified as a global systemically important institution (G-SII) under the Capital Requirements Directive, it has been classified as an ‘other’ systemically important institution (O-SII) by the PRA. The O-SII buffer is set to zero in the UK. |
| | |
| The systemic risk buffer (SRB) came into force for UK ring-fenced banks during 2019, with the PRA setting a buffer of 2.0 per cent of risk-weighted assets for the RFB sub-group. The size of the buffer applied to the RFB sub-group is dependent upon its total assets. The SRB equates to 1.7 per cent of risk-weighted assets at Group level, with the difference reflecting the risk-weighted assets of the Group that are not in the Ring-Fenced Bank sub-group and for which the SRB does not therefore apply. |
The capital conservation buffer (CCB) is a standard buffer of 2.5 per cent of risk-weighted assets designed to provide for losses in the event of stress.
The countercyclical capital buffer (CCYB) is time-varying and is designed to require banks to hold additional capital to remove or reduce the build-up of systemic risk in times of credit boom, providing additional loss absorbing capacity and acting as an incentive for banks to constrain further credit growth. The amount of the buffer is determined by reference to buffer rates applied by the Bank of England’s Financial Policy Committee (FPC) for the individual countries where the Group has relevant credit exposures. The CCYB rate for the UK is currently set at 1.0 per cent and will increase to 2.0 per cent from December 2020 following a review by the FPC of the appropriate level to set in the current standard risk environment. As a result of this change the PRA will consult in 2020 on a reduction in Pillar 2A capital requirements by 50 per cent of the relevant bank specific increase in the CCYB, which would leave overall loss absorbing capacity (MREL) broadly unchanged, but increase the Group’s requirement plus buffers for CET1 by c.65 basis points.
OPERATING AND FINANCIAL REVIEW AND PROSPECTS
The Bank of England’s Financial Policy Committee (FPC) regularly considers the adequacy of the UK CCYB rate in light of the evolution of the overall risk environment. As at 31 December 2019 non-zero buffer rates also currently apply for Bulgaria, the Czech Republic, Denmark, France, Hong Kong, Iceland, Ireland, Lithuania, Norway, Slovakia and Sweden. During 2020 Belgium, Germany, and Luxembourg will implement non-zero buffer rates. The Group’s overall countercyclical capital buffer at 31 December 2019 was 0.9 per cent of risk-weighted assets which reflects the concentration of exposures of the Group to the UK.
As part of the capital planning process, forecast capital positions are subjected to wide ranging programme of stress testing to determine the adequacy of the Group’s capital resources against the minimum requirements, including the ICR. The PRA considers outputs from both the Group’s internal stress tests and the annual Bank of England stress test, in conjunction with the Group’s other regulatory capital buffers and non-stress related elements, as part of the process for informing the setting of a bank-specific capital buffer for the Group, known as the PRA Buffer. The PRA requires this buffer to remain confidential between the Group and the PRA.
All buffers are required to be met with CET1 capital. Usage of the PRA Buffer would trigger a dialogue between the Group and the PRA to agree what action is required whereas a breach of the CRD IV combined buffer (all other regulatory buffers, as referenced above) would give rise to mandatory restrictions upon any discretionary capital distributions.
In addition to the risk-based capital framework outlined above, the Group is also subject to minimum capital requirements under the UK Leverage Ratio Framework. The leverage ratio is calculated by dividing fully loaded tier 1 capital resources by the leverage exposure which is a defined measure of on-balance sheet assets and off-balance sheet items.
The minimum leverage ratio requirement under the UK Leverage Ratio Framework is 3.25 per cent. This is supplemented by a time-varying countercyclical leverage buffer (CCLB) which is determined by multiplying the leverage exposure measure by 35 per cent of the countercyclical capital buffer (CCYB) rate. As at 31 December 2019 the CCLB for the Group was 0.3 per cent. This is set to increase in proportion to the increase in the countercyclical capital buffer following the FPC’s decision to increase the UK CCYB rate to 2.0 per cent with effect from December 2020. An additional leverage ratio buffer (ALRB) of 0.7 per cent applies to the Ring-Fenced Bank sub-group and is determined by multiplying the Ring-Fenced Bank sub-group leverage exposure measure by 35 per cent of the SRB. This equates to 0.6 per cent of the total leverage exposure measure at Group level.
At least 75 per cent of the 3.25 per cent minimum leverage ratio requirement as well as 100 per cent of regulatory leverage buffers must be met by CET1 capital.
The leverage ratio framework does not currently give rise to higher regulatory capital requirements for the Group than the risk-based capital framework.
MITIGATION
The Group has a capital management framework that includes the setting of capital risk appetite. Close monitoring of capital and leverage ratios is undertaken to ensure the Group meets regulatory requirements and risk appetite levels and deploys its capital resources efficiently. Comprehensive stress testing analyses take place to evidence capital adequacy.
The Group maintains a recovery plan which sets out a range of potential mitigating actions that could be taken in response to a stress. For example, the Group is able to accumulate additional capital through the retention of profits over time, which can be enhanced through reducing or cancelling dividend payments and share buybacks, by raising new equity via, for example, a rights issue or debt exchange and by raising additional tier 1 or tier 2 capital securities. The cost and availability of additional capital is dependent upon market conditions and perceptions at the time. The Group is also able to manage the demand for capital through management actions including adjusting its lending strategy, risk hedging strategies and through business disposals.
MONITORING
The Group’s capital is actively managed and monitoring capital ratios is a key factor in the Group’s planning processes and stress testing, which separately cover the Ring-Fenced Bank sub-group and key individual banking entities. Multi-year base-case forecasts of the Group’s capital position, based upon the Group’s operating plan, are produced at least annually to inform the Group’s capital plan whilst shorter term forecasts are more frequently undertaken to understand and respond to variations of the Group’s actual performance against the plan. The Group’s capital plan is tested for capital adequacy using a range of stress scenarios and sensitivities covering adverse economic conditions as well as other adverse factors that could impact the Group.
The Group’s capital plan also considers the impact of IFRS 9 which has the potential to increase bank capital volatility. Under stress this is primarily a result of provisioning for assets that are not in default at an earlier stage than would have been the case under IAS 39.
In the short to medium term the IFRS 9 transitional arrangements for capital, which the Group has adopted, will provide some stability in capital requirements against the increased provisioning, measurement uncertainty and volatility introduced by IFRS 9.
For the Bank of England Annual Cyclical Scenario stress test, the Bank of England has taken action to avoid an unwarranted de facto increase in capital requirements that could result from the interaction of IFRS 9. The stress hurdle rates for banks participating in the exercise are adjusted to recognise the additional resilience provided by the earlier provisions taken under IFRS 9. The Bank of England is considering options for a more enduring treatment of IFRS9 provisions in the capital framework and alternative options will be explored further during the 2020 Bank of England ACS stress test.
Regular reporting of actual and base case and stress scenario projected ratios for Group, the Ring-Fenced Bank sub-group and key legal entities is undertaken, including submissions to the Group Capital Risk Committee (GCRC), Group Financial Risk Committee (GFRC), Group Asset and Liability Committee (GALCO), Group Risk Committee (GRC), Board Risk Committee (BRC) and the Board. Capital policies and procedures are well established and subject to independent oversight.
The regulatory framework within which the Group operates continues to evolve and further detail on this will be provided in the Group’s Pillar 3 report. The Group continues to monitor these developments very closely, analysing the potential capital impacts to ensure that, through organic capital generation and management actions, the Group continues to maintain a strong capital position that exceeds both minimum regulatory requirements and the Group’s risk appetite and is consistent with market expectations.
Target capital ratios
The Board’s view of the ongoing level of CET1 capital required by the Group to grow the business, meet regulatory requirements and cover uncertainties continues to be c12.5 per cent plus a management buffer of c.1 per cent.
This takes into account, amongst other things:
| the minimum Pillar 1 CET1 capital requirement of 4.5 per cent of risk-weighted assets. |
| | |
| the Group’s Pillar 2A set by the PRA. During the year the PRA reduced the Group’s Pillar 2A requirement from 4.7 per cent to 4.6 per cent of risk-weighted assets at 31 December 2019, of which 2.6 per cent must be met by CET1 capital. |
| | |
| the capital conservation buffer (CCB) requirement of 2.5 per cent of risk-weighted assets. |
| | |
| the Group’s current countercyclical capital buffer (CCYB) requirement of 0.9 per cent of risk-weighted assets, which is set to increase following the FPC’s decision to increase the UK CCYB rate from 1.0 per cent to 2.0 per cent, effective from December 2020. In conjunction the PRA will consult during 2020 on a proposed reduction in Pillar 2A capital requirements by 50 per cent of this increase in the CCYB, equivalent to reducing the Pillar 2A CET1 requirement by 28 per cent of the increase. |
| | |
| the Ring-Fenced Bank sub-group’s systemic risk buffer (SRB) of 2.0 per cent of risk-weighted assets, which equates to 1.7 per cent of risk weighted assets at Group level. |
| | |
| the Group’s PRA Buffer, which the PRA sets after taking account of the results of the annual PRA stress test and other information, as well as outputs from the Group’s internal stress tests. The PRA requires the PRA Buffer itself to remain confidential between the Group and the PRA. |
OPERATING AND FINANCIAL REVIEW AND PROSPECTS
Dividend policy
The Group has established a policy to pay a progressive and sustainable ordinary dividend. Any growth in the ordinary dividend will be decided by the Board in light of the circumstances at the time.
The Board also gives due consideration to the return of capital through the use of special dividends or share buybacks. Surplus capital represents capital over and above the amount management wish to retain to grow the business, meet regulatory requirements and cover uncertainties. The amount of required capital may vary from time to time depending on circumstances and by its nature there can be no guarantee that any return of surplus capital will be appropriate.
The ability of the Group to pay a dividend is also subject to constraints including the availability of distributable reserves, legal and regulatory restrictions and the Group’s financial and operating performance.
Distributable reserves are determined as required by the Companies Act 2006 by reference to a company’s individual financial statements. At 31 December 2019 Lloyds Banking Group plc (‘the Company’) had accumulated distributable reserves of approximately £10 billion. Substantially all of the Company’s merger reserve is available for distribution under UK company law as a result of transactions undertaken to recapitalise the Company in 2009.
Lloyds Banking Group plc acts as a holding company which also issues capital and other securities to capitalise and fund the activities of the Group. The profitability of the holding company, and its ability to sustain dividend payments, is therefore dependent upon the continued receipt of dividends from its main operating subsidiaries, including Lloyds Bank plc (the Ring-Fenced Bank), Lloyds Bank Corporate Markets plc (the non-ring-fenced bank), LBG Equity Investments Limited and Scottish Widows Group Limited (the insurance business). The principal operating subsidiary is Lloyds Bank plc which, at 31 December 2019, had a consolidated CET1 capital ratio of 14.3 per cent (31 December 2018: 14.9 per cent). A number of Group subsidiaries, principally those with banking and insurance activities, are subject to regulatory capital requirements which require minimum amounts of capital to be maintained relative to their size and risk. The Group actively manages the capital of its subsidiaries, which includes monitoring the regulatory capital ratios for its banking and insurance subsidiaries and, on a consolidated basis, the RFB sub-group against approved risk appetite levels. The Group operates a formal capital management policy which requires all subsidiary entities to remit surplus capital to their parent companies.
In May 2019 the Group announced that it will move to the payment of quarterly dividends in 2020, with the first quarterly dividend in respect of the period to 31 March 2020 payable in June 2020. The new approach will result in three equal interim ordinary dividend payments for the first three quarters of the year followed by, subject to performance, a larger final dividend for the fourth quarter of the year. The first three quarterly payments, payable in June, September and December will be equal to 20 per cent of the previous year’s total ordinary dividend per share. The fourth quarter payment will be announced with the full year results, with the amount continuing to deliver a full year dividend payment that reflects the Group’s financial performance and objective of a progressive and sustainable ordinary dividend.
Minimum requirement for own funds and eligible liabilities (MREL)
In 2015, the Financial Stability Board established an international standard for the total loss absorbing capacity (TLAC) of global systemically important banks (G-SIBs). The standard, which applies from 1 January 2019, is designed to enhance the resilience of the global financial system by ensuring that failing G-SIBs have sufficient capital to absorb losses and recapitalise under resolution, whilst continuing to provide critical banking services.
At EU level, G-SIBs are subject to the minimum requirements for own funds and eligible liabilities (MREL) that came into force in June 2019 following the implementation of CRR II. The MREL framework reflects the European implementation of the global TLAC standard. The purpose of MREL is to require firms to maintain sufficient own funds and eligible liabilities that are capable of credibly bearing losses or recapitalising a bank whilst in resolution. MREL requirements can be satisfied by a combination of regulatory capital and certain unsecured liabilities (which must be subordinate to a firm’s operating liabilities).
In the UK the Bank of England has implemented the requirements of the TLAC standard through a statement of policy on MREL (the MREL SoP).
As the Group is not classified as a G-SIB it is not directly subject to the CRR II MREL requirements. However the Group is subject to the Bank of England’s MREL SoP and must therefore maintain a minimum level of MREL resources from 1 January 2020. The Group operates a single point of entry (SPE) resolution strategy, with Lloyds Banking Group plc as the designated resolution entity.
Applying the Bank of England’s MREL SoP to current minimum capital requirements, the Group’s indicative MREL requirement, excluding regulatory capital and leverage buffers, is as follows:
| From 1 January 2020, the higher of 2 times Pillar 1 plus Pillar 2A, equivalent to 20.6 per cent of risk-weighted assets, or 6.5 per cent of the UK leverage ratio exposure measure |
| | |
| From 1 January 2022, the higher of 2 times Pillar 1 plus 2 times Pillar 2A, equivalent to 25.2 per cent of risk-weighted assets, or 6.5 per cent of the UK leverage ratio exposure measure. |
In addition, CET1 capital cannot be used to meet both MREL requirements and capital or leverage buffers.
The Bank of England will review the calibration of MREL in 2020 before setting final end-state requirements to be met from 2022. This review will take into consideration any changes to the capital framework, including the finalisation of the Basel III reforms.
Internal MREL requirements will also apply to the Group’s material sub-groups and entities, including the RFB sub-group, Lloyds Bank plc, Bank of Scotland plc and Lloyds Bank Corporate Markets plc, from 1 January 2020.
OPERATING AND FINANCIAL REVIEW AND PROSPECTS
Analysis of capital position
The Group’s adjusted CET1 capital build amounted to 207 basis points before PPI, and to 86 basis points after the in-year PPI charge, reflecting:
| Underlying capital build (198 basis points), including the dividend paid up by the Insurance business in February 2020 in relation to its 2019 earnings (18 basis points) |
| | |
| Other movements (20 basis points), reflecting market movements and the continued optimisation of Commercial Banking risk-weighted assets, net of additional pension contributions and model updates |
| | |
| Offset by a reduction of 121 basis points relating to the in-year PPI charge and 11 basis points relating to the impact of changes arising from the implementation of IFRS 16 on risk-weighted assets. |
The Group’s capital position also benefitted by 34 basis points as a result of the cancellation of the remaining c.£650 million of the 2019 buyback programme, as announced in September 2019. The Group used 9 basis points of capital for the acquisition of the Tesco UK prime residential mortgage portfolio.
Overall the Group’s CET1 capital ratio is 15.0 per cent on an adjusted basis before ordinary dividends and 13.8 per cent on an adjusted basis after ordinary dividends (31 December 2018: 13.9 per cent an adjusted, after ordinary dividends and incorporating the effects of the share buyback announced in February 2019).
Excluding the Insurance dividend paid in February 2020 the Group’s actual CET1 ratio is 13.6 per cent after ordinary dividends (31 December 2018: 14.6 per cent).
The accrual for foreseeable dividends reflects the recommended final ordinary dividend of 2.25 pence per share.
The transitional total capital ratio, after ordinary dividends, reduced to 21.3 per cent (21.5 per cent on an adjusted basis), largely reflecting the reduction in CET1 capital and the net reduction in AT1 capital instruments, partially offset by the reduction in risk-weighted assets.
The UK leverage ratio, after ordinary dividends, reduced from 5.6 per cent on an adjusted basis to 5.2 per cent on an adjusted basis, largely reflecting the reduction in the fully loaded tier 1 capital position, partially offset by a reduction in the exposure measure.
Total capital requirement
The Group’s total capital requirement (TCR) as at 31 December 2019, being the aggregate of the Group’s Pillar 1 and current Pillar 2A capital requirements, was £25,608 million (31 December 2018: £26,124 million).
Capital resources
An analysis of the Group’s capital position as at 31 December 2019 is presented in the following section on both a CRD IV transitional arrangements basis and a CRD IV fully loaded basis, as amended by provisions of the revised Capital Requirements Regulation (CRR II) that came into force in June 2019. In addition the Group’s capital position reflects the application of the transitional arrangements for IFRS 9.
OPERATING AND FINANCIAL REVIEW AND PROSPECTS
Table Y:Capital resources
The table below summarises the consolidated capital position of the Group. The Group’s Pillar 3 Report will provide a comprehensive analysis of the own funds of the Group.
| | | Transitional | | | Fully loaded | |
| | | At 31 Dec
2019
£m | | | At 31 Dec
2018
£m | | | At 31 Dec
2019
£m | | | At 31 Dec
2018
£m | |
| Common equity tier 1 | | | | | | | | | | | | | | | | |
| Shareholders’ equity per balance sheet | | | 41,697 | | | | 43,434 | | | | 41,697 | | | | 43,434 | |
| Adjustment to retained earnings for foreseeable dividends | | | (1,586 | ) | | | (1,523 | ) | | | (1,586 | ) | | | (1,523 | ) |
| Deconsolidation adjustments1 | | | 2,337 | | | | 2,273 | | | | 2,337 | | | | 2,273 | |
| Adjustment for own credit | | | 26 | | | | (280 | ) | | | 26 | | | | (280 | ) |
| Cash flow hedging reserve | | | (1,504 | ) | | | (1,051 | ) | | | (1,504 | ) | | | (1,051 | ) |
| Other adjustments | | | 247 | | | | (19 | ) | | | 247 | | | | (19 | ) |
| | | | 41,217 | | | | 42,834 | | | | 41,217 | | | | 42,834 | |
| less: deductions from common equity tier 1 | | | | | | | | | | | | | | | | |
| Goodwill and other intangible assets | | | (4,179 | ) | | | (3,667 | ) | | | (4,179 | ) | | | (3,667 | ) |
| Prudent valuation adjustment | | | (509 | ) | | | (529 | ) | | | (509 | ) | | | (529 | ) |
| Excess of expected losses over impairment provisions and value adjustments | | | (243 | ) | | | (27 | ) | | | (243 | ) | | | (27 | ) |
| Removal of defined benefit pension surplus | | | (531 | ) | | | (994 | ) | | | (531 | ) | | | (994 | ) |
| Securitisation deductions | | | (185 | ) | | | (191 | ) | | | (185 | ) | | | (191 | ) |
| Significant investments1 | | | (4,626 | ) | | | (4,222 | ) | | | (4,626 | ) | | | (4,222 | ) |
| Deferred tax assets | | | (3,200 | ) | | | (3,037 | ) | | | (3,200 | ) | | | (3,037 | ) |
| Common equity tier 1 capital | | | 27,744 | | | | 30,167 | | | | 27,744 | | | | 30,167 | |
| Additional tier 1 | | | | | | | | | | | | | | | | |
| Other equity instruments | | | 5,881 | | | | 6,466 | | | | 5,881 | | | | 6,466 | |
| Preference shares and preferred securities2 | | | 4,127 | | | | 4,008 | | | | – | | | | – | |
| Transitional limit and other adjustments | | | (2,474 | ) | | | (1,804 | ) | | | – | | | | – | |
| | | | 7,534 | | | | 8,670 | | | | 5,881 | | | | 6,466 | |
| less: deductions from tier 1 | | | | | | | | | | | | | | | | |
| Significant investments1 | | | (1,286 | ) | | | (1,298 | ) | | | – | | | | – | |
| Total tier 1 capital | | | 33,992 | | | | 37,539 | | | | 33,625 | | | | 36,633 | |
| Tier 2 | | | | | | | | | | | | | | | | |
| Other subordinated liabilities2 | | | 13,003 | | | | 13,648 | | | | 13,003 | | | | 13,648 | |
| Deconsolidation of instruments issued by insurance entities1 | | | (1,796 | ) | | | (1,767 | ) | | | (1,796 | ) | | | (1,767 | ) |
| Adjustments for transitional limit and non-eligible instruments | | | 2,278 | | | | 1,504 | | | | (2,204 | ) | | | (1,266 | ) |
| Amortisation and other adjustments | | | (3,101 | ) | | | (2,717 | ) | | | (3,101 | ) | | | (2,717 | ) |
| | | | 10,384 | | | | 10,668 | | | | 5,902 | | | | 7,898 | |
| less: deductions from tier 2 | | | | | | | | | | | | | | | | |
| Significant investments1 | | | (960 | ) | | | (973 | ) | | | (2,246 | ) | | | (2,271 | ) |
| Total capital resources | | | 43,416 | | | | 47,234 | | | | 37,281 | | | | 42,260 | |
| | | | | | | | | | | | | | | | | |
| Risk-weighted assets | | | 203,431 | | | | 206,366 | | | | 203,431 | | | | 206,366 | |
| | | | | | | | | | | | | | | | | |
| Common equity tier 1 capital ratio3 | | | 13.6% | | | | 14.6% | | | | 13.6% | | | | 14.6% | |
| Tier 1 capital ratio | | | 16.7% | | | | 18.2% | | | | 16.5% | | | | 17.8% | |
| Total capital ratio | | | 21.3% | | | | 22.9% | | | | 18.3% | | | | 20.5% | |
| 1 | For regulatory capital purposes, the Group’s Insurance business is deconsolidated and replaced by the amount of the Group’s investment in the business. A part of this amount is deducted from capital (via ’significant investments’ in the table above) and the remaining amount is risk-weighted, forming part of threshold risk-weighted assets. |
| | |
| 2 | Preference shares, preferred securities and other subordinated liabilities are categorised as subordinated liabilities in the balance sheet. |
| | |
| 3 | The common equity tier 1 ratio is 13.8 per cent on an adjusted basis reflecting the dividend paid up by the Insurance business in February 2020 in relation to its 2019 earnings (31 December 2018: 13.9 per cent on an adjusted basis, incorporating the effects of the share buyback announced in February 2019). |
OPERATING AND FINANCIAL REVIEW AND PROSPECTS
Movements in capital resources
The key difference between the transitional capital calculation as at 31 December 2019 and the fully loaded equivalent is primarily related to capital securities that previously qualified as tier 1 or tier 2 capital, but that do not fully qualify under the regulation, which can be included in additional tier 1 (AT1) or tier 2 capital (as applicable) up to specified limits which reduce by 10 per cent per annum until 2022. In addition, following revisions to eligibility criteria for capital instruments under CRR II, certain tier 1 capital instruments of the Group that will transition to tier 2 capital by 2022 will cease to qualify as regulatory capital in June 2025. The key movements on a transitional basis are set out in the table below.
Table Z:Movements in capital resources
| | | Common
Equity tier 1
£m | | | Additional
Tier 1
£m | | | Tier 2
£m | | | Total
capital
£m | |
| At 31 December 2018 | | | 30,167 | | | | 7,372 | | | | 9,695 | | | | 47,234 | |
| Banking profit attributable to ordinary shareholders1 | | | 2,228 | | | | – | | | | – | | | | 2,228 | |
| Movement in foreseeable dividends2 | | | (63 | ) | | | – | | | | – | | | | (63 | ) |
| Dividends paid out on ordinary shares during the year | | | (2,312 | ) | | | – | | | | – | | | | (2,312 | ) |
| Dividends received from the Insurance business1 | | | 450 | | | | – | | | | – | | | | 450 | |
| Share buyback completed | | | (1,095 | ) | | | – | | | | – | | | | (1,095 | ) |
| IFRS 9 transitional adjustment to retained earnings | | | (49 | ) | | | – | | | | – | | | | (49 | ) |
| Movement in treasury shares and employee share schemes | | | 233 | | | | – | | | | – | | | | 233 | |
| Pension movements: | | | | | | | | | | | | | | | | |
| Removal of defined benefit pension surplus | | | 463 | | | | – | | | | – | | | | 463 | |
| Movement through other comprehensive income | | | (1,117 | ) | | | – | | | | – | | | | (1,117 | ) |
| Fair value through other comprehensive income reserve | | | (142 | ) | | | – | | | | – | | | | (142 | ) |
| Prudent valuation adjustment | | | 20 | | | | – | | | | – | | | | 20 | |
| Deferred tax asset | | | (163 | ) | | | – | | | | – | | | | (163 | ) |
| Goodwill and other intangible assets | | | (512 | ) | | | – | | | | – | | | | (512 | ) |
| Excess of expected losses over impairment provisions and value adjustments | | | (216 | ) | | | – | | | | – | | | | (216 | ) |
| Significant investments | | | (404 | ) | | | 12 | | | | 13 | | | | (379 | ) |
| Movements in other equity, subordinated debt and other tier 2 items: | | | | | | | | | | | | | | | | |
| Repurchases, redemptions and other | | | – | | | | (2,032 | ) | | | (284 | ) | | | (2,316 | ) |
| Issuances | | | – | | | | 896 | | | | – | | | | 896 | |
| Other movements | | | 256 | | | | – | | | | – | | | | 256 | |
| At 31 December 2019 | | | 27,744 | | | | 6,248 | | | | 9,424 | | | | 43,416 | |
| 1 | Under the regulatory framework, profits made by Insurance are removed from CET1 capital. However, when dividends are paid to the Group by Insurance these are recognised through CET1 capital. The £450 million of dividends received from Insurance during the year include £350 million in respect of their 2018 full year ordinary dividend and £100 million in respect of their 2019 interim ordinary dividend. |
| | |
| 2 | Reflects the accrual for the 2019 full year ordinary dividend and the reversal of the accrual for the 2018 full year ordinary dividend which was paid during the year. |
CET1 capital resources have reduced by £2,423 million over the year, primarily reflecting:
| the interim dividend paid in September 2019 and the accrual for the 2019 full year ordinary dividend |
| | |
| the extent of the 2019 share buyback programme completed during the year prior to the cancellation of the remaining 2019 buyback programme in September 2019 |
| | |
| the impact of additional pension contributions made during the year |
| | |
| the increase in other intangible assets, excess expected losses and significant investments in financial sector entities |
| | |
| offset in part by profit generation during the year (net of PPI provision charges), the receipt of dividends paid by the Insurance business during the year and movements in treasury shares and employee share schemes |
AT1 capital resources have reduced by £1,124 million over the year, primarily reflecting a redemption during the year and the annual reduction in the transitional limit applied to grandfathered AT1 capital instruments, offset in part by the issuance of new capital instruments.
Tier 2 capital resources have reduced by £271 million over the year, largely reflecting the amortisation of dated instruments and a reduction in eligible provisions, partially offset by the transitioning of grandfathered AT1 instruments to tier 2.
OPERATING AND FINANCIAL REVIEW AND PROSPECTS
Table AA:Minimum requirement for own funds and eligible liabilities (MREL)
An analysis of the Group’s current transitional MREL position is provided below.
| | | Transitional2 |
| | | At 31 Dec
2019
£m | | | At 31 Dec
2018
£m | |
| Total capital resources (transitional basis) | | | 43,416 | | | | 47,234 | |
| Ineligible AT1 and tier 2 instruments1 | | | (874 | ) | | | (613 | ) |
| Amortised portion of eligible tier 2 instruments issued by Lloyds Banking Group plc | | | 24 | | | | – | |
| Senior unsecured securities issued by Lloyds Banking Group plc | | | 23,554 | | | | 20,213 | |
| Total MREL resources2 | | | 66,120 | | | | 66,834 | |
| Risk-weighted assets | | | 203,431 | | | | 206,366 | |
| MREL ratio3 | | | 32.5% | | | | 32.4% | |
| Leverage exposure measure | | | 654,387 | | | | 663,277 | |
| MREL leverage ratio | | | 10.1% | | | | 10.1% | |
| 1 | Instruments with less than one year to maturity or governed under non-EEA law without a contractual bail-in clause. |
| | |
| 2 | Until 2022, externally issued regulatory capital in operating entities can count towards the Group’s MREL to the extent that such capital would count towards the Group’s consolidated capital resources. |
| | |
| 3 | The MREL ratio is 32.6 per cent on an adjusted basis upon recognition of the dividend paid up by the Insurance business in February 2020 in relation to its 2019 earnings (31 December 2018: 32.6 per cent on an adjusted basis). |
During 2019, the Group issued externally £3.5 billion (sterling equivalent) of senior unsecured securities from Lloyds Banking Group plc which, while not included in total capital, are eligible to meet MREL requirements. Combined with previous issuances made over the last few years the Group remains comfortably positioned to meet MREL requirements from 1 January 2020 and, as at 31 December 2019, had a transitional MREL ratio of 32.5 per cent of risk-weighted assets.
Total MREL resources reduced by £714 million, largely as a result of the reduction in total capital resources, offset in part by the increase in senior unsecured securities following the issuances made during the year.
Table AB:Risk-weighted assets
| | | At 31 Dec
2019
£m | | | At 31 Dec
2018
£m | |
| Foundation Internal Ratings Based (IRB) Approach | | | 53,842 | | | | 60,555 | |
| Retail IRB Approach | | | 63,208 | | | | 59,522 | |
| Other IRB Approach | | | 18,544 | | | | 15,666 | |
| IRB Approach | | | 135,594 | | | | 135,743 | |
| Standardised (STA) Approach | | | 24,420 | | | | 25,757 | |
| Credit risk | | | 160,014 | | | | 161,500 | |
| Counterparty credit risk | | | 5,083 | | | | 5,718 | |
| Contributions to the default funds of central counterparties | | | 210 | | | | 830 | |
| Credit valuation adjustment risk | | | 584 | | | | 702 | |
| Operational risk | | | 25,482 | | | | 25,505 | |
| Market risk | | | 1,790 | | | | 2,085 | |
| Underlying risk-weighted assets | | | 193,163 | | | | 196,340 | |
| Threshold risk-weighted assets1 | | | 10,268 | | | | 10,026 | |
| Total risk-weighted assets | | | 203,431 | | | | 206,366 | |
| 1 | Threshold risk-weighted assets reflect the element of significant investments and deferred tax assets that are permitted to be risk-weighted instead of being deducted from CET1 capital. Significant investments primarily arise from investment in the Group’s Insurance business. |
OPERATING AND FINANCIAL REVIEW AND PROSPECTS
Table AC:Risk-weighted assets movement by key driver
| | | Credit risk
IRB
£m | | | Credit risk
STA
£m | | | Credit risk
total1
£m | | | Counterparty
credit risk2
£m | | | Market risk
£m | | | Operational risk
£m | | | Total
£m | |
| Total risk-weighted assets as at 31 December 2018 | | | | | | | | | | | | | | | | | | | | | | | | | | | 206,366 | |
| Less threshold risk-weighted assets3 | | | | | | | | | | | | | | | | | | | | | | | | | | | (10,026 | ) |
| Risk-weighted assets as at 31 December 2018 | | | 135,743 | | | | 25,757 | | | | 161,500 | | | | 7,250 | | | | 2,085 | | | | 25,505 | | | | 196,340 | |
| Asset size | | | (2,707 | ) | | | (1,184 | ) | | | (3,891 | ) | | | (257 | ) | | | (110 | ) | | | – | | | | (4,258 | ) |
| Asset quality | | | 2,190 | | | | (682 | ) | | | 1,508 | | | | (672 | ) | | | – | | | | – | | | | 836 | |
| Model updates | | | 2,284 | | | | – | | | | 2,284 | | | | – | | | | (110 | ) | | | – | | | | 2,174 | |
| Methodology and policy | | | (1,083 | ) | | | (747 | ) | | | (1,830 | ) | | | (339 | ) | | | 4 | | | | – | | | | (2,165 | ) |
| Acquisitions and disposals | | | – | | | | 1,326 | | | | 1,326 | | | | – | | | | – | | | | – | | | | 1,326 | |
| Movements in risk levels (market risk only) | | | – | | | | – | | | | – | | | | – | | | | (79 | ) | | | – | | | | (79 | ) |
| Foreign exchange movements | | | (833 | ) | | | (50 | ) | | | (883 | ) | | | (105 | ) | | | – | | | | – | | | | (988 | ) |
| Other | | | – | | | | – | | | | – | | | | – | | | | – | | | | (23 | ) | | | (23 | ) |
| Risk-weighted assets as at 31 December 2019 | | | 135,594 | | | | 24,420 | | | | 160,014 | | | | 5,877 | | | | 1,790 | | | | 25,482 | | | | 193,163 | |
| Threshold risk-weighted assets3 | | | | | | | | | | | | | | | | | | | | | | | | | | | 10,268 | |
| Risk-weighted assets as at 31 December 2019 | | | | | | | | | | | | | | | | | | | | | | | | | | | 203,431 | |
| 1 | Credit risk includes securitisation risk-weighted assets. |
| | |
| 2 | Counterparty credit risk includes movements in contributions to the default funds of central counterparties and movements in credit valuation adjustment risk. |
| | |
| 3 | Threshold risk-weighted assets reflect the element of significant investments and deferred tax assets that are permitted to be risk-weighted instead of being deducted from CET1 capital. Significant investments primarily arise from investments in the Group’s Insurance business. |
The risk-weighted assets movement table provides analysis of the movement in risk-weighted assets in the period by risk type and an insight into the key drivers of the movements. The key driver analysis is compiled on a monthly basis through the identification and categorisation of risk-weighted asset movements and is subject to management judgment.
Credit risk, risk-weighted assets:
| Asset size reduction of £3.9 billion, largely driven by commercial portfolio management, includes changes in book size (both drawn and undrawn balances) and composition, excluding acquisitions and disposals. |
| | |
| Asset quality increase of £1.5 billion includes increases in the valuation of equity investments as well as movements due to changes in borrower risk, including changes in the macro-economic environment |
| | |
| Model updates increase in risk-weighted assets of £2.3 billion which relates to changes to the Retail mortgage models |
| | |
| Methodology and policy changes reduced risk-weighted assets by £1.8 billion principally as a result of securitisation activity, partially offset by the introduction of IFRS 16. |
| | |
| Acquisition and disposals increase of £1.3 billion reflects the purchase of the Tesco Bank UK prime residential mortgage portfolio. |
Counterparty credit risk, risk-weighted assets reduced by £1.4 billion due to reduced contributions to the default fund of a central counterparty, movement in CVA and a reduction in asset size.
Market risk, risk-weighted assets reductions of £0.3 billion were driven by refinements to internal models, a change in the business model following ring-fencing and movement in risk levels.
Leverage ratio
Analysis of leverage movements
The Group’s fully loaded UK leverage ratio reduced to 5.1 per cent, primarily driven by the reduction in tier 1 capital. This was partially offset by the £8.9 billion reduction in the leverage exposure measure which largely reflected the reduction in the derivatives exposure measure and off-balance sheet items.
On an adjusted basis the UK leverage ratio reduced to 5.2 per cent from 5.6 per cent, on an adjusted basis at 31 December 2018.
The derivatives exposure measure, representing derivative financial instruments per the balance sheet net of deconsolidation and derivatives adjustments, reduced by £3.6 billion during the period, predominantly reflecting a move from a collateralised-to-market to a settled-to-market approach for swaps transacted through a central counterparty.
The SFT exposure measure, representing SFT assets per the balance sheet net of deconsolidation and other SFT adjustments, reduced by £0.6 billion during the period, largely reflecting a reduction in volumes.
Off-balance sheet items reduced by £3.2 billion during the period, reflecting an overall reduction in corporate facilities driven by commercial portfolio management, offset in part by new residential mortgage offers placed.
The average UK leverage ratio of 5.0 per cent over the quarter largely reflected a higher average exposure measure compared to the position at 31 December 2019, with the reductions in the derivative exposure measure and off-balance sheet items described above largely occurring towards the end of the quarter.
OPERATING AND FINANCIAL REVIEW AND PROSPECTS
Table AD:Leverage ratio
| | | Fully loaded |
| | | At 31 Dec
2019
£m | | | At 31 Dec
2018
£m | |
| Total tier 1 capital for leverage ratio | | | | | | | | |
| Common equity tier 1 capital | | | 27,744 | | | | 30,167 | |
| Additional tier 1 capital | | | 5,881 | | | | 6,466 | |
| Total tier 1 capital | | | 33,625 | | | | 36,633 | |
| Exposure measure | | | | | | | | |
| Statutory balance sheet assets | | | | | | | | |
| Derivative financial instruments | | | 26,369 | | | | 23,595 | |
| Securities financing transactions | | | 67,424 | | | | 69,301 | |
| Loans and advances and other assets | | | 740,100 | | | | 704,702 | |
| Total assets | | | 833,893 | | | | 797,598 | |
| Qualifying central bank claims | | | (49,590 | ) | | | (50,105 | ) |
| Deconsolidation adjustments1 | | | | | | | | |
| Derivative financial instruments | | | (1,293 | ) | | | (1,376 | ) |
| Securities financing transactions | | | (334 | ) | | | (487 | ) |
| Loans and advances and other assets | | | (167,410 | ) | | | (130,048 | ) |
| Total deconsolidation adjustments | | | (169,037 | ) | | | (131,911 | ) |
| Derivatives adjustments | | | | | | | | |
| Adjustments for regulatory netting | | | (11,298 | ) | | | (8,828 | ) |
| Adjustments for cash collateral | | | (12,551 | ) | | | (10,536 | ) |
| Net written credit protection | | | 458 | | | | 539 | |
| Regulatory potential future exposure | | | 16,337 | | | | 18,250 | |
| Total derivatives adjustments | | | (7,054 | ) | | | (575 | ) |
| Securities financing transactions adjustments | | | 1,164 | | | | 40 | |
| Off-balance sheet items | | | 53,191 | | | | 56,393 | |
| Regulatory deductions and other adjustments | | | (8,180 | ) | | | (8,163 | ) |
| Total exposure measure2 | | | 654,387 | | | | 663,277 | |
| Average exposure measure3 | | | 667,433 | | | | | |
| UK Leverage ratio2,4 | | | 5.1% | | | | 5.5% | |
| Average UK leverage ratio3 | | | 5.0% | | | | | |
| CRD IV exposure measure5 | | | 703,977 | | | | 713,382 | |
| CRD IV leverage ratio5 | | | 4.8% | | | | 5.1% | |
| 1 | Deconsolidation adjustments relate to the deconsolidation of certain Group entities that fall outside the scope of the Group’s regulatory capital consolidation, being primarily the Group’s Insurance business. |
| | |
| 2 | Calculated in accordance with the UK Leverage Ratio Framework which requires qualifying central bank claims to be excluded from the leverage exposure measure. |
| | |
| 3 | The average UK leverage ratio is based on the average of the month end tier 1 capital position and average exposure measure over the quarter (1 October 2019 to 31 December 2019). The average of 5.0 per cent compares to 4.9 per cent at the start and 5.1 per cent at the end of the quarter. |
| | |
| 4 | The UK leverage ratio is 5.2 per cent on an adjusted basis upon recognition of the dividend paid up by the Insurance business in February 2020 in relation to its 2019 earnings (31 December 2018: 5.6 per cent on an adjusted basis). |
| | |
| 5 | Calculated in accordance with CRD IV rules which include central bank claims within the leverage exposure measure. |
OPERATING AND FINANCIAL REVIEW AND PROSPECTS
Table AE :Application of IFRS 9 on a full impact basis for capital and leverage
| | | IFRS 9 full impact | |
| | | At 31 Dec
2019 | | | At 31 Dec
2018 | |
| Common equity tier 1 (£m) | | | 27,002 | | | | 29,592 | |
| Transitional tier 1 (£m) | | | 33,249 | | | | 36,964 | |
| Transitional total capital (£m) | | | 43,153 | | | | 47,195 | |
| Total risk-weighted assets (£m) | | | 203,083 | | | | 206,614 | |
| Common equity tier 1 ratio (%) | | | 13.3% | | | | 14.3% | |
| Transitional tier 1 ratio (%) | | | 16.4% | | | | 17.9% | |
| Transitional total capital ratio (%) | | | 21.2% | | | | 22.8% | |
| UK leverage ratio exposure measure (£m) | | | 653,643 | | | | 663,182 | |
| UK leverage ratio (%) | | | 5.0% | | | | 5.4% | |
The Group has opted to apply paragraph 4 of CRR Article 473a (the ‘transitional rules’) which allows for additional capital relief in respect of any post 1 January 2018 increase in Stage 1 and Stage 2 IFRS 9 expected credit loss provisions (net of regulatory expected losses) during the transition period. As at 31 December 2019 no additional capital relief has been recognised.
Stress testing
The Group undertakes a wide-ranging programme of stress testing providing a comprehensive view of the potential impacts arising from the risks to which the Group and its key legal entities are exposed. One of the most important uses of stress testing is to assess the resilience of the operational and strategic plans of the Group and its legal entities to adverse economic conditions and other key vulnerabilities. As part of this programme the Group conducted a macroeconomic stress test of the four year operating plan in the first quarter of 2019.
The Group also participates in the UK wide Annual Cyclical Scenario stress tests run by the Bank of England. In the 2019 Bank of England stress test the Group exceeded the capital and leverage hurdles on a transitional basis after the application of management actions and was not required to take any action as a result of the test.
G-SIB indicators
Although the Group is not currently classified as a Global Systemically Important Bank (G-SIB), by virtue of the Group’s leverage exposure measure exceeding €200 billion the Group is required to report G-SIB indicator metrics to the PRA. The Group’s indicator metrics used within the 2019 Basel G-SIBs annual exercise will be disclosed from April 2020 and the results are expected to be made available by the Basel Committee later this year.
Insurance businesses
The business transacted by the insurance companies within the Group comprises both life insurance business and General Insurance business. Life insurance business comprises unit-linked business, non-profit business and with-profits business.
Scottish Widows Limited (SW Ltd) holds the only with-profit fund managed by the Group. Each insurance company within the Group is regulated by the PRA.
The Solvency II regime for insurers and insurance groups came into force from 1 January 2016. The insurance businesses are required to calculate solvency capital requirements and available capital on a risk-based approach. The Insurance business of the Group calculates regulatory capital on the basis of an internal model, which was approved by the PRA on 5 December 2015, with the latest major change to the model approved in December 2019.
The minimum required capital must be maintained at all times throughout the year. These capital requirements and the capital available to meet them are regularly estimated in order to ensure that capital maintenance requirements are being met.
All minimum regulatory requirements of the insurance companies have been met during the year.
FUNDING AND LIQUIDITY RISK
DEFINITION
Funding risk is defined as the risk that the Group does not have sufficiently stable and diverse sources of funding. Liquidity risk is defined as the risk that the Group has insufficient financial resources to meet its commitments as they fall due.
EXPOSURE
Liquidity exposure represents the potential stressed outflows in any future period less expected inflows. The Group considers liquidity exposure from both an internal and a regulatory perspective.
MEASUREMENT
Liquidity risk is managed through a series of measures, tests and reports that are primarily based on contractual maturities with behavioural overlays as appropriate. Note 53 on page F-120 sets out an analysis of assets and liabilities by relevant maturity grouping. The Group undertakes quantitative and qualitative analysis of the behavioural aspects of its assets and liabilities in order to reflect their expected behaviour.
MITIGATION
The Group manages and monitors liquidity risks and ensures that liquidity risk management systems and arrangements are adequate with regard to the internal risk appetite, Group strategy and regulatory requirements. Liquidity policies and procedures are subject to independent internal oversight by Risk. Overseas branches and subsidiaries of the Group may also be required to meet the liquidity requirements of the entity’s domestic country. Management of liquidity requirements is performed by the overseas branch or subsidiary in line with Group policy. Liquidity risk of the Insurance business is actively managed and monitored within the Insurance business. The Group plans funding requirements over the life of the funding plan, combining business as usual and stressed conditions. The Group manages its liquidity position both with regard to its internal risk appetite and the Liquidity Coverage Ratio (LCR) as required by the PRA and Capital Requirements Directive and Regulation (CRD IV) liquidity requirements.
The Group’s funding and liquidity position is underpinned by its significant customer deposit base, and is supported by strong relationships across customer segments. The Group has consistently observed that in aggregate the retail deposit base provides a stable source of funding. Funding concentration by counterparty, currency and tenor is monitored on an ongoing basis and where concentrations do exist, these are managed as part of the planning process and limited by internal funding and liquidity risk monitoring framework, with analysis regularly provided to senior management.
To assist in managing the balance sheet, the Group operates a Liquidity Transfer Pricing (LTP) process which: allocates relevant interest expenses from the centre to the Group’s banking businesses within the internal management accounts; helps drive the correct inputs to customer pricing; and is consistent with regulatory requirements. LTP makes extensive use of behavioural maturity profiles, taking account of expected customer loan prepayments and stability of customer deposits, modelled on historic data.
The Group can monetise liquid assets quickly, either through the repurchase agreements (repo) market or through outright sale. In addition, the Group has pre-positioned a substantial amount of assets at the Bank of England’s Discount Window Facility which can be used to access additional liquidity in a time of stress. The Group considers diversification
OPERATING AND FINANCIAL REVIEW AND PROSPECTS
across geography, currency, markets and tenor when assessing appropriate holdings of liquid assets. The Group’s liquid asset buffer is available for deployment at immediate notice, subject to complying with regulatory requirements.
Liquidity risk within the Insurance business may result from: the inability to sell financial assets quickly at their fair values; an insurance liability falling due for payment earlier than expected; the inability to generate cash inflows as anticipated; an unexpected large operational event; or from a general insurance catastrophe, for example, a significant weather event. Liquidity risk is actively managed and monitored within the Insurance business to ensure that it remains within approved risk appetite, so that even under stress conditions, there is sufficient liquidity to meet obligations.
MONITORING
Daily monitoring and control processes are in place to address internal and regulatory liquidity requirements. The Group monitors a range of market and internal early warning indicators on a daily basis for early signs of liquidity risk in the market or specific to the Group. This captures regulatory metrics as well as metrics the Group considers relevant for its liquidity profile. These are a mixture of quantitative and qualitative measures, including: daily variation of customer balances; changes in maturity profiles; funding concentrations; changes in LCR outflows; credit default swap (CDS) spreads; and basis risks.
The Group carries out internal stress testing of its liquidity and potential cash flow mismatch position over both short (up to one month) and longer-term horizons against a range of scenarios forming an important part of the internal risk appetite. The scenarios and assumptions are reviewed at least annually to ensure that they continue to be relevant to the nature of the business including reflecting emerging horizon risks to the Group. For further information on the Group’s 2019 liquidity stress testing results refer to page 98.
The Group maintains a Contingency Funding Framework as part of the wider Recovery Plan which is designed to identify emerging liquidity concerns at an early stage, so that mitigating actions can be taken to avoid a more serious crisis developing. Contingency Funding Plan invocation and escalation processes are based on analysis of five major quantitative and qualitative components, comprising assessment of: early warning indicators; prudential and regulatory liquidity risk limits and triggers; stress testing results; event and systemic indicators; and market intelligence.
Funding and liquidity management in 2019
The Group has maintained its strong funding and liquidity position with a stable loan to deposit ratio of 107 per cent.
During 2019, the Group repaid its Funding for Lending Scheme (FLS) contractual maturities of £12.1 billion and early repaid £4.5 billion of its Term Funding Scheme (TFS) drawings, representing all of its 2020 TFS maturities. This has reduced the balance of FLS outstanding to £1 billion and the balance of TFS to £15.4 billion as at 31 December 2019.
The Group’s liquidity coverage ratio (LCR) was 137 per cent (based on a monthly rolling average over the previous 12 months) as at 31 December 2019 calculated on a consolidated basis based on the EU Delegated Act. Following the implementation of structural reform, liquidity risk is managed at a legal entity level with the Group consolidated LCR representing the composite of the ring-fenced bank and non ring-fenced bank entities.
The Group’s credit ratings continue to reflect its robust balance sheet, resilient underlying profitability and bail-in capital position. There were no changes to the ratings over 2019, although in November, Moody’s revised the Group’s and Lloyds Bank plc’s outlooks to negative due to concern relating to the UK’s exit from the European Union. In March Fitch placed the majority of UK banks, including the Group’s entities, on Ratings Watch Negative before stabilising the ratings in December given the reduced risk of a no-deal exit from the EU.
OPERATING AND FINANCIAL REVIEW AND PROSPECTS
Table AF:Group funding position
| | | | | | | | | | |
| | | At 31 Dec
2019
£bn | | | At 31 Dec
2018
£bn | | | Change
% | |
| Funding requirement | | | | | | | | | | | | |
| Loans and advances to customers1 | | | 440.4 | | | | 444.4 | | | | (1 | ) |
| Loans and advances to banks2 | | | 8.1 | | | | 5.9 | | | | 37 | |
| Debt securities at amortised cost | | | 3.9 | | | | 4.0 | | | | (5 | ) |
| Reverse repurchase agreements | | | – | | | | – | | | | – | |
| Financial assets at fair value through other comprehensive income – non-LCR eligible3 | | | 0.1 | | | | 0.8 | | | | (75 | ) |
| Cash and balances at central bank – non-LCR eligible4 | | | 5.7 | | | | 5.8 | | | | (2 | ) |
| Funded assets | | | 458.2 | | | | 460.9 | | | | – | |
| Other assets5 | | | 251.7 | | | | 212.9 | | | | 18 | |
| | | | 709.9 | | | | 673.8 | | | | | |
| On balance sheet LCR eligible liquid assets | | | | | | | | | | | | |
| Reverse repurchase agreements | | | 56.2 | | | | 40.9 | | | | 37 | |
| Cash and balances at central banks4 | | | 49.4 | | | | 48.9 | | | | 1 | |
| Debt securities at amortised cost | | | 1.6 | | | | 1.2 | | | | 42 | |
| Financial assets at fair value through other comprehensive income | | | 25.0 | | | | 24.0 | | | | 4 | |
| Trading and fair value through profit and loss | | | 4.0 | | | | 11.9 | | | | (66 | ) |
| Repurchase agreements | | | (12.2 | ) | | | (3.1 | ) | | | | |
| | | | 124.0 | | | | 123.8 | | | | – | |
| Total Group assets | | | 833.9 | | | | 797.6 | | | | 5 | |
| Less: other liabilities5 | | | (230.6 | ) | | | (187.9 | ) | | | 23 | |
| Funding requirement | | | 603.3 | | | | 609.7 | | | | (1 | ) |
| Funded by | | | | | | | | | | | | |
| Customer deposits6 | | | 411.8 | | | | 416.3 | | | | | |
| Wholesale funding7 | | | 128.3 | | | | 123.3 | | | | 4 | |
| | | | 540.1 | | | | 539.6 | | | | – | |
| Term funding scheme | | | 15.4 | | | | 19.9 | | | | (23 | ) |
| Total equity | | | 47.8 | | | | 50.2 | | | | (5 | ) |
| Total funding | | | 603.3 | | | | 609.7 | | | | (1 | ) |
| 1 | Excludes reverse repos of £54.6 billion (31 December 2018: £40.5 billion). |
| 2 | Excludes £0.1 billion (31 December 2018: £nil) of loans and advances to banks within the Insurance business and £1.6 billion (31 December 2018: £0.4 billion) of reverse repurchase agreements. |
| 3 | Non-LCR eligible liquid assets comprise a diversified pool of highly rated unencumbered collateral (including retained issuance). |
| 4 | Cash and balances at central banks are combined in the Group’s balance sheet. |
| 5 | Other assets and other liabilities primarily include balances in the Group’s Insurance business and the fair value of derivative assets and liabilities. |
| 6 | Excludes repos of £9.5 billion (31 December 2018: £1.8 billion). |
| 7 | The Group’s definition of wholesale funding aligns with that used by other international market participants; including interbank deposits, debt securities in issue and subordinated liabilities. |
OPERATING AND FINANCIAL REVIEW AND PROSPECTS
Table AGReconciliation of Group funding to the balance sheet (audited)
| | | Included in
funding
analysis
£bn | | | Repos
and cash
collateral
received by
Insurance
£bn | | | Fair value
and other
accounting
methods
£bn | | | Balance
sheet
£bn | |
| At 31 December 2019 | | | | | | | | | | | | | | | | |
| Deposits from banks | | | 9.6 | | | | 18.7 | | | | (0.1 | ) | | | 28.2 | |
| Debt securities in issue | | | 102.1 | | | | – | | | | (4.4 | ) | | | 97.7 | |
| Subordinated liabilities | | | 16.6 | | | | – | | | | 0.5 | | | | 17.1 | |
| Total wholesale funding | | | 128.3 | | | | 18.7 | | | | | | | | | |
| Customer deposits | | | 411.8 | | | | 9.5 | | | | – | | | | 421.3 | |
| Total | | | 540.1 | | | | 28.2 | | | | | | | | | |
| At 31 December 2018 | | | | | | | | | | | | | | | | |
| Deposits from banks | | | 8.3 | | | | 22.1 | | | | (0.1 | ) | | | 30.3 | |
| Debt securities in issue | | | 97.1 | | | | – | | | | (5.9 | ) | | | 91.2 | |
| Subordinated liabilities | | | 17.9 | | | | – | | | | (0.2 | ) | | | 17.7 | |
| Total wholesale funding | | | 123.3 | | | | 22.1 | | | | | | | | | |
| Customer deposits | | | 416.3 | | | | 1.8 | | | | – | | | | 418.1 | |
| Total | | | 539.6 | | | | 23.9 | | | | | | | | | |
Table AH:Analysis of 2019 total wholesale funding by residual maturity
| | | Less
than one
month
£bn | | | One to
three
months
£bn | | | Three to
six months
£bn | | | Six to nine
months
£bn | | | Nine
months
to one year
£bn | | | One to
two years
£bn | | | Two to
five years
£bn | | | More than
five years
£bn | | | Total at
31 Dec
2019
£bn | | | Total at
31 Dec
2018
£bn | |
| Deposits from banks | | | 7.3 | | | | 1.3 | | | | 0.3 | | | | 0.1 | | | | 0.1 | | | | 0.2 | | | | 0.3 | | | | – | | | | 9.6 | | | | 8.3 | |
| Debt securities in issue: | | | | | | | | | | | | | | | | | | | | | | | | | | | | | | | | | | | | | | | | |
| Certificates of deposit | | | 1.2 | | | | 2.6 | | | | 2.8 | | | | 2.4 | | | | 1.2 | | | | 0.4 | | | | – | | | | – | | | | 10.6 | | | | 12.0 | |
| Commercial paper | | | 1.3 | | | | 3.5 | | | | 2.8 | | | | 0.9 | | | | 0.4 | | | | – | | | | – | | | | – | | | | 8.9 | | | | 8.0 | |
| Medium-term notes | | | 1.0 | | | | 0.8 | | | | 1.8 | | | | 1.2 | | | | 0.2 | | | | 6.6 | | | | 19.3 | | | | 17.1 | | | | 48.0 | | | | 45.4 | |
| Covered bonds | | | 0.8 | | | | 1.3 | | | | – | | | | 2.9 | | | | – | | | | 6.1 | | | | 10.6 | | | | 7.0 | | | | 28.7 | | | | 27.1 | |
| Securitisation | | | 0.4 | | | | – | | | | 1.1 | | | | 0.9 | | | | 0.4 | | | | 1.7 | | | | 1.4 | | | | – | | | | 5.9 | | | | 4.6 | |
| | | | 4.7 | | | | 8.2 | | | | 8.5 | | | | 8.3 | | | | 2.2 | | | | 14.8 | | | | 31.3 | | | | 24.1 | | | | 102.1 | | | | 97.1 | |
| Subordinated liabilities | | | – | | | | 1.2 | | | | – | | | | 1.0 | | | | 0.1 | | | | 0.5 | | | | 4.3 | | | | 9.5 | | | | 16.6 | | | | 17.9 | |
| Total wholesale funding1 | | | 12.0 | | | | 10.7 | | | | 8.8 | | | | 9.4 | | | | 2.4 | | | | 15.5 | | | | 35.9 | | | | 33.6 | | | | 128.3 | | | | 123.3 | |
| 1 | The Group’s definition of wholesale funding aligns with that used by other international market participants; including interbank deposits, debt securities and subordinated liabilities. |
Table AI:Total wholesale funding by currency (audited)
| | | Sterling
£bn | | | US Dollar
£bn | | | Euro
£bn | | | Other
currencies
£bn | | | Total
£bn | |
| At 31 December 2019 | | | 28.7 | | | | 49.6 | | | | 40.9 | | | | 9.1 | | | | 128.3 | |
| At 31 December 2018 | | | 25.8 | | | | 45.2 | | | | 42.8 | | | | 9.5 | | | | 123.3 | |
Table AJ:Analysis of 2019 term issuance (audited)
| | | Sterling
£bn | | | US Dollar
£bn | | | Euro
£bn | | | Other
currencies
£bn | | | Total
£bn | |
| Securitisation | | | 1.6 | | | | 0.4 | | | | – | | | | – | | | | 2.0 | |
| Medium-term notes | | | 0.5 | | | | 3.2 | | | | 1.8 | | | | 1.1 | | | | 6.6 | |
| Covered bonds | | | 2.0 | | | | 0.8 | | | | 2.8 | | | | – | | | | 5.6 | |
| Private placements1 | | | 0.1 | | | | 0.3 | | | | 0.9 | | | | – | | | | 1.3 | |
| Subordinated liabilities2 | | | 0.5 | | | | 0.4 | | | | – | | | | – | | | | 0.9 | |
| Total issuance | | | 4.7 | | | | 5.1 | | | | 5.5 | | | | 1.1 | | | | 16.4 | |
| 1 | Private placements include structured bonds. |
| 2 | Consists of AT1 issuances. |
OPERATING AND FINANCIAL REVIEW AND PROSPECTS
The Group continues to access wholesale funding markets across a wide range of products, currencies and investors to maintain a stable and diverse source of funds. In 2019, the Group has continued with this approach to funding, including capital and funding from the holding company, Lloyds Banking Group plc, as needed to transition towards final UK Minimum Requirements for Own Funds and Eligible Liabilities (MREL). The Group will continue to issue funding trades from Lloyds Bank plc, the ring-fenced bank operating company, across senior unsecured, covered bonds, ABS and RMBS. In 2019, the Group launched an operating company funding programme for LBCM, the non-ring-fenced bank, and have since issued a number of trades for this entity including an inaugural five year £500 million senior unsecured public benchmark transaction. The maturity of the Funding for Lending and Term Funding Schemes are fully factored into the Group’s funding plans.
Liquidity Portfolio
At 31 December 2019, the banking business had £118.3 billion of highly liquid unencumbered LCR eligible assets (31 December 2018: £129.4 billion), of which £115.7 billion is LCR level 1 eligible (31 December 2018: £128.6 billion) and £2.6 billion is LCR level 2 eligible (31 December 2018: £0.8 billion). These assets are available to meet cash and collateral outflows and regulatory requirements. Total LCR eligible liquid assets represent over five times the Group’s money market funding less than one year to maturity (excluding derivative collateral margins and settlement accounts) and thus provide a substantial buffer in the event of market dislocation. The Insurance business manages a separate liquidity portfolio to mitigate insurance liquidity risk.
Table AK:LCR eligible assets
| | | At 31 Dec
2019
£bn | | | At 31 Dec
2018
£bn | | | Change
% | | | Average
2019
£bn | | | Average
2018
£bn | |
| Level 1 | | | | | | | | | | | | | | | | | | | | |
| Cash and central bank reserves | | | 49.4 | | | | 48.9 | | | | 1 | | | | 50.9 | | | | 58.1 | |
| High quality government/MDB/agency bonds1 | | | 63.9 | | | | 78.7 | | | | (19 | ) | | | 76.4 | | | | 66.2 | |
| High quality covered bonds | | | 2.4 | | | | 1.0 | | | | | | | | 1.9 | | | | 0.8 | |
| Total | | | 115.7 | | | | 128.6 | | | | (10 | ) | | | 129.2 | | | | 125.1 | |
| Level 22 | | | 2.6 | | | | 0.8 | | | | | | | | 1.5 | | | | 0.8 | |
| Total LCR eligible assets | | | 118.3 | | | | 129.4 | | | | (9 | ) | | | 130.7 | | | | 125.9 | |
| 1 | Designated multilateral development bank (MDB). |
| 2 | Includes Level 2A and Level 2B. |
Table AL:LCR eligible assets by currency
| | | Sterling
£bn | | | US Dollar
£bn | | | Euro
£bn | | | Other
currencies
£bn | | | Total
£bn | |
| At 31 December 2019 | | | | | | | | | | | | | | | | | | | | |
| Level 1 | | | 91.5 | | | | 11.7 | | | | 12.5 | | | | – | | | | 115.7 | |
| Level 2 | | | 1.7 | | | | 0.5 | | | | 0.4 | | | | – | | | | 2.6 | |
| Total | | | 93.2 | | | | 12.2 | | | | 12.9 | | | | – | | | | 118.3 | |
| At 31 December 2018 | | | | | | | | | | | | | | | | | | | | |
| Level 1 | | | 98.2 | | | | 19.8 | | | | 10.6 | | | | – | | | | 128.6 | |
| Level 2 | | | 0.4 | | | | 0.4 | | | | – | | | | – | | | | 0.8 | |
| Total | | | 98.6 | | | | 20.2 | | | | 10.6 | | | | – | | | | 129.4 | |
The banking business also has a significant amount of non-LCR eligible liquid assets which are eligible for use in a range of central bank or similar facilities. Future use of such facilities will be based on prudent liquidity management and economic considerations, having regard for external market conditions.
Stress testing results
Internal liquidity stress testing results at 31 December 2019 showed that the banking business had liquidity resources representing 158 per cent of modelled outflows over a three month period from all wholesale funding sources, retail and corporate deposits, intraday requirements and rating dependent contracts under the Group’s most severe liquidity stress scenario.
This scenario includes a two notch downgrade of the Group’s current long-term debt rating and accompanying one notch short-term downgrade implemented instantaneously by all major rating agencies.
Encumbered assets
This disclosure provides further detail on the availability of assets that could be used to support potential future funding requirements of the Group.
The disclosure is not designed to identify assets that would be available in the event of a resolution or bankruptcy.
The Board and the Group Asset and Liability Committee (GALCO) monitor and manage total balance sheet encumbrance using a number of risk appetite metrics. At 31 December 2019, the Group had £60.6 billion (31 December 2018: £53.4 billion) of externally encumbered on-balance sheet assets with counterparties other than central banks. The increase in encumbered assets was primarily driven by an increase in covered bond issuance. The Group also had £639.5 billion (31 December 2018: £584.3 billion) of unencumbered on-balance sheet assets, and £133.7 billion (31 December 2018: £159.8 billion) of pre-positioned and encumbered assets held with central banks, the reduction in the latter was primarily driven by a decrease in encumbrance relating to FLS and TFS maturities in the year. Primarily, the Group encumbers mortgages, unsecured lending and credit card receivables through the issuance programmes and tradable securities through securities financing activity. The Group mainly positions mortgage assets at central banks.
OPERATING AND FINANCIAL REVIEW AND PROSPECTS
Table AM:On balance sheet encumbered and unencumbered assets
| | | Encumbered with
counterparties other
than central banks | | Pre-
positioned
and | | | Unencumbered assets
not pre-positioned
with central banks | | | |
| | | Securitisations
£m | | | Covered
bond
£m | | | Other
£m | | | Total
£m | | | encumbered
assets
held with
central banks
£m | | | Readily
realisable1
£m | | | Other
realisable
assets2
£m | | | Cannot be
used3
£m | | | Total
£m | | | Total
£m | |
| At 31 December 2019 | | | | | | | | | | | | | | | | | | | | | | | | | | | | | | | | | | | | | | | | |
| Cash and balances at central banks | | | – | | | | – | | | | – | | | | – | | | | – | | | | 49,270 | | | | – | | | | 5,860 | | | | 55,130 | | | | 55,130 | |
| Financial assets at fair value through profit or loss | | | 51 | | | | – | | | | 4,834 | | | | 4,885 | | | | – | | | | 2,469 | | | | – | | | | 152,835 | | | | 155,304 | | | | 160,189 | |
| Derivative financial instruments | | | – | | | | – | | | | – | | | | – | | | | – | | | | – | | | | – | | | | 26,369 | | | | 26,369 | | | | 26,369 | |
| Financial assets at amortised cost: | | | | | | | | | | | | | | | | | | | | | | | | | | | | | | | | | | | | | | | | |
| Loans and advances to banks | | | – | | | | – | | | | 1 | | | | 1 | | | | – | | | | 1,858 | | | | 3,851 | | | | 4,065 | | | | 9,774 | | | | 9,775 | |
| Loans and advances to customers | | | 7,319 | | | | 33,161 | | | | 7,109 | | | | 47,589 | | | | 133,732 | | | | 14,087 | | | | 171,370 | | | | 128,210 | | | | 313,667 | | | | 494,988 | |
| Debt securities | | | – | | | | – | | | | 553 | | | | 553 | | | | – | | | | 3,200 | | | | – | | | | 1,791 | | | | 4,991 | | | | 5,544 | |
| | | | 7,319 | | | | 33,161 | | | | 7,663 | | | | 48,143 | | | | 133,732 | | | | 19,145 | | | | 175,221 | | | | 134,066 | | | | 328,432 | | | | 510,307 | |
| Financial assets at fair value through other comprehensive income | | | – | | | | – | | | | 7,617 | | | | 7,617 | | | | – | | | | 16,919 | | | | – | | | | 556 | | | | 17,475 | | | | 25,092 | |
| Other4 | | | – | | | | – | | | | – | | | | – | | | | – | | | | – | | | | 514 | | | | 56,292 | | | | 56,806 | | | | 56,806 | |
| Total assets | | | 7,370 | | | | 33,161 | | | | 20,114 | | | | 60,645 | | | | 133,732 | | | | 87,803 | | | | 175,735 | | | | 375,978 | | | | 639,516 | | | | 833,893 | |
| At 31 December 2018 | | | | | | | | | | | | | | | | | | | | | | | | | | | | | | | | | | | | | | | | |
| Cash and balances at central banks | | | – | | | | – | | | | – | | | | – | | | | – | | | | 49,645 | | | | – | | | | 5,018 | | | | 54,663 | | | | 54,663 | |
| Trading and other financial assets at fair value through profit or loss | | | 54 | | | | – | | | | 2,646 | | | | 2,700 | | | | – | | | | 5,190 | | | | – | | | | 150,639 | | | | 155,829 | | | | 158,529 | |
| Derivative financial instruments | | | – | | | | – | | | | – | | | | – | | | | – | | | | – | | | | – | | | | 23,595 | | | | 23,595 | | | | 23,595 | |
| Financial assets at amortised cost: | | | | | | | | | | | | | | | | | | | | | | | | | | | | | | | | | | | | | | | | |
| Loans and advances to banks | | | – | | | | – | | | | 12 | | | | 12 | | | | – | | | | 1,223 | | | | 2,555 | | | | 2,493 | | | | 6,271 | | | | 6,283 | |
| Loans and advances to customers | | | 5,774 | | | | 29,041 | | | | 6,012 | | | | 40,827 | | | | 159,822 | | | | 12,098 | | | | 155,278 | | | | 116,833 | | | | 284,209 | | | | 484,858 | |
| Debt securities | | | – | | | | – | | | | 2,627 | | | | 2,627 | | | | – | | | | 2,581 | | | | 4 | | | | 26 | | | | 2,611 | | | | 5,238 | |
| | | | 5,774 | | | | 29,041 | | | | 8,651 | | | | 43,466 | | | | 159,822 | | | | 15,902 | | | | 157,837 | | | | 119,352 | | | | 293,091 | | | | 496,379 | |
| Financial assets at fair value through other comprehensive income: | | | – | | | | – | | | | 7,278 | | | | 7,278 | | | | – | | | | 17,114 | | | | – | | | | 423 | | | | 17,537 | | | | 24,815 | |
| Other4 | | | – | | | | – | | | | – | | | | – | | | | – | | | | 56 | | | | 612 | | | | 38,949 | | | | 39,617 | | | | 39,617 | |
| | | | | | | | | | | | | | | | | | | | | | | | | | | | | | | | | | | | | | | | | |
| Total assets | | | 5,828 | | | | 29,041 | | | | 18,575 | | | | 53,444 | | | | 159,822 | | | | 87,907 | | | | 158,449 | | | | 337,976 | | | | 584,332 | | | | 797,598 | |
| 1 | Assets regarded by the Group to be readily realisable in the normal course of business, to secure funding, meet collateral needs, or be sold to reduce potential future funding requirements, and are not subject to any restrictions on their use for these purposes. |
| 2 | Assets where there are no restrictions on their use to secure funding, meet collateral needs, or be sold to reduce potential future funding requirements, but are not readily realisable in the normal course of business in their current form. |
| 3 | The following assets are classified as unencumbered – cannot be used: assets held within the Group’s Insurance businesses which are generally held to either back liabilities to policyholders or to support the solvency of the Insurance subsidiaries; assets held within consolidated limited liability partnerships which provide security for the Group’s obligations to its pension schemes; assets segregated in order to meet the Financial Resilience requirements of the PRA’s Supervisory Statement 9/6 ‘Operational Continuity in Resolution’; assets pledged to facilitate the use of intra-day payment and settlement systems; and reverse repos and derivatives balance sheet ledger items. |
| 4 | Other comprises: items in the course of collection from banks; investment properties; goodwill; value in-force business; other intangible assets; tangible fixed assets; current tax recoverable; deferred tax assets; retirement benefit assets; investments in joint ventures and associates; assets arising from reinsurance contracts held and other assets. |
The above table sets out the carrying value of the Group’s encumbered and unencumbered assets, separately identifying those that are available to support the Group’s funding needs. The table does not include collateral received by the Group (i.e. from reverse repos) that is not recognised on its balance sheet, the vast majority of which the Group is permitted to repledge.
OPERATING AND FINANCIAL REVIEW AND PROSPECTS
FUNDING AND LIQUIDITY RISK – CONTRACTUAL CASH OBLIGATIONS
The following table sets out the amounts and maturities of Lloyds Banking Group’s contractual cash obligations at 31 December 2019.
| | | Within
one year
£m | | | One to three
years
£m | | | Three to
five years
£m | | | Over five
years
£m | | | Total
£m | |
| Long-term debt – dated | | | 2,442 | | | | 356 | | | | 2,345 | | | | 7,343 | | | | 12,486 | |
| Debt securities in issue | | | 29,977 | | | | 26,556 | | | | 19,082 | | | | 29,605 | | | | 105,220 | |
| Lease liabilities | | | 241 | | | | 429 | | | | 315 | | | | 859 | | | | 1,844 | |
| Capital commitments | | | 405 | | | | – | | | | – | | | | – | | | | 405 | |
| Other purchase obligations | | | 1,232 | | | | 1,946 | | | | 1,209 | | | | 929 | | | | 5,316 | |
| | | | 34,297 | | | | 29,287 | | | | 22,951 | | | | 38,736 | | | | 125,271 | |
Other purchase obligations include amounts expected to be payable in respect of material contracts entered into by Lloyds Banking Group, in the ordinary course of business, for the provision of outsourced and other services. The cost of these services will be charged to the income statement as it is incurred. Lloyds Banking Group also has a constructive obligation to ensure that its defined post-retirement benefit schemes remain adequately funded. The amount and timing of Lloyds Banking Group’s cash contributions to these schemes is uncertain and will be affected by factors such as future investment returns and demographic changes. Lloyds Banking Group expects to make cash contributions of at least £1,200 million to these schemes in 2020.
At 31 December 2019, Lloyds Banking Group also had £4,642 million of preference shares, preferred securities and undated subordinated liabilities outstanding.
At 31 December 2019, the principal sources of potential liquidity for Lloyds Banking Group plc were dividends received from its directly owned subsidiary companies, particularly Lloyds Bank plc and Scottish Widows Group Limited, and loans from this and other Lloyds Banking Group companies. The ability of Lloyds Bank to pay dividends going forward, or for Lloyds Bank or other Lloyds Banking Group companies to make loans to Lloyds Banking Group plc, depends on a number of factors, including their own regulatory capital requirements, distributable reserves and financial performance.
OFF-BALANCE SHEET ARRANGEMENTS
A table setting out the amounts and maturities of Lloyds Banking Group’s other commercial commitments and guarantees at 31 December 2019 is included in note 53 to the financial statements. These commitments and guarantees are not included in Lloyds Banking Group’s consolidated balance sheet.
Lending commitments are agreements to lend to customers in accordance with contractual provisions; these are either for a specified period or, as in the case of credit cards and overdrafts, represent a revolving credit facility which can be drawn down at any time, provided that the agreement has not been terminated. The total amounts of unused commitments do not necessarily represent future cash requirements, in that commitments often expire without being drawn upon.
Lloyds Banking Group’s banking businesses are also exposed to liquidity risk through the provision of securitisation facilities to certain corporate customers. At 31 December 2019, Lloyds Banking Group offered securitisation facilities to its corporate and financial institution client base through its conduit securitisation vehicles, Argento, Cancara and Grampian. These are funded in the global asset-backed commercial paper market. The assets and obligations of these conduits are included in Lloyds Banking Group’s consolidated balance sheet. Lloyds Banking Group provides short-term asset-backed commercial paper liquidity support facilities on commercial terms to the issuers of the commercial paper, for use in the event of a market disturbance should they be unable to roll over maturing commercial paper or obtain alternative sources of funding.
Details of securitisations and other special purpose entity arrangements entered into by Lloyds Banking Group are provided in notes 32 and 49 to the financial statements. The successful development of Lloyds Banking Group’s ability to securitise its own assets has provided a mechanism to tap a well established market, thereby diversifying Lloyds Banking Group’s funding base.
Within Lloyds Banking Group’s insurance businesses, the principal sources of liquidity are premiums received from policyholders, charges levied upon policyholders, investment income and the proceeds from the sale and maturity of investments. The investment policies followed by Lloyds Banking Group’s life assurance companies take account of anticipated cash flow requirements including by matching the cash inflows with projected liabilities where appropriate. Cash deposits and highly liquid government securities are available to provide liquidity to cover any higher than expected cash outflows.
OPERATING AND FINANCIAL REVIEW AND PROSPECTS
GOVERNANCE RISK
DEFINITION
Governance risk is defined as the risk that the Group’s organisational infrastructure fails to provide robust oversight of decision-making and the control mechanisms to ensure strategies and management instructions are implemented effectively.
EXPOSURES
The internal and corporate governance arrangements of major financial institutions continue to be subject to a high level of regulatory and public scrutiny. The Group’s exposure to governance risk is also reflective of the significant volume of existing and proposed legislation and regulation, both within the UK and across the multiple jurisdictions within which it operates, with which it must comply.
MEASUREMENT
The Group’s governance arrangements are assessed against new or proposed legislation and regulation and best practice among peer organisations in order to identify any areas of enhancement required.
MITIGATION
The Group’s enterprise risk management framework (ERMF) establishes robust arrangements for risk governance, in particular by:
| Defining individual and collective accountabilities for risk management, risk oversight and risk assurance through a three lines of defence model which supports the discharge of responsibilities to customers, shareholders and regulators; |
| | |
| Outlining governance arrangements which articulate the enterprise-wide approach to risk management; and |
| | |
| Supporting a consistent approach to Group-wide behaviour and risk decision-making through a Group policy framework which helps everyone understand their responsibilities by clearly articulating and communicating rules, standards, boundaries and risk appetite measures which can be controlled, enforced and monitored. |
Under the banner of the ERMF, training modules are in place to support all colleagues in understanding and fulfilling their risk responsibilities.
The Group’s Code of Responsibility embodies its values and reflect its commitment to operating responsibly and ethically both at a business and an individual level. All colleagues are required to adhere to the code in all aspects of their roles.
Effective implementation of the ERMF mutually reinforces and is reinforced by the Group’s risk culture, which is embedded in its approach to recruitment, selection, training, performance management and reward.
MONITORING
A review of the Group’s ERMF, which includes the status of the Group’s principles and policy framework, and the design and operational effectiveness of key governance committees, is undertaken on an annual basis and the findings are reported to the Group Risk Committee, Board Risk Committee and the Board.
For further information on corporate governance see pages 143 to 169.
OPERATING AND FINANCIAL REVIEW AND PROSPECTS
MARKET RISK
DEFINITION
Market risk is defined as the risk that unfavourable market moves (including changes in and increased volatility of interest rates, market-implied inflation rates, credit spreads and prices for bonds, foreign exchange rates, equity, property and commodity prices and other instruments) lead to reductions in earnings and/or value.
Balance sheet linkages
The information provided in table AN aims to facilitate the understanding of linkages between banking, trading, and insurance balance sheet items and the positions disclosed in the Group’s market risk disclosures.
Table AN:Market risk linkage to the balance sheet
| | | | | | Banking | | | | | |
| 2019 | | Total
£m | | | Trading
book only
£m | | | Non-trading
£m | | | Insurance
£m | | | Primary market risk factor |
| Assets | | | | | | | | | | | | | | | | | | |
| Cash and balances at central banks | | | 55,130 | | | | – | | | | 55,130 | | | | – | | | Interest rate |
| Financial assets at fair value through profit or loss | | | 160,189 | | | | 17,982 | | | | 5,352 | | | | 136,855 | | | Interest rate, foreign exchange, credit spread |
| Derivative financial instruments | | | 26,369 | | | | 18,885 | | | | 5,119 | | | | 2,365 | | | Interest rate, foreign exchange, credit spread |
| Financial assets at amortised cost | | | | | | | | | | | | | | | | | | |
| Loans and advances to banks | | | 9,775 | | | | – | | | | 9,710 | | | | 65 | | | Interest rate |
| Loans and advances to customers | | | 494,988 | | | | – | | | | 494,948 | | | | 40 | | | Interest rate |
| Debt securities | | | 5,544 | | | | – | | | | 5,544 | | | | – | | | Interest rate, credit spread |
| | | | 510,307 | | | | – | | | | 510,202 | | | | 105 | | | |
| Financial assets at fair value through other comprehensive income | | | 25,092 | | | | – | | | | 25,092 | | | | – | | | Interest rate, foreign exchange, credit spread |
| Value of in-force business | | | 5,558 | | | | – | | | | – | | | | 5,558 | | | Equity |
| Other assets | | | 51,248 | | | | – | | | | 22,410 | | | | 28,838 | | | Interest rate |
| Total assets | | | 833,893 | | | | 36,867 | | | | 623,305 | | | | 173,721 | | | |
| | | | | | | | | | | | | | | | | | | |
| Liabilities | | | | | | | | | | | | | | | | | | |
| Deposit from banks | | | 28,179 | | | | – | | | | 28,179 | | | | – | | | Interest rate |
| Customer deposits | | | 421,320 | | | | – | | | | 421,320 | | | | – | | | Interest rate |
| Financial liabilities at fair value through profit or loss | | | 21,486 | | | | 13,955 | | | | 7,531 | | | | – | | | Interest rate, foreign exchange |
| Derivative financial instruments | | | 25,779 | | | | 15,654 | | | | 7,719 | | | | 2,406 | | | Interest rate, foreign exchange, credit spread |
| Debt securities in issue | | | 97,689 | | | | – | | | | 97,689 | | | | – | | | Interest rate, credit spread |
| Liabilities arising from insurance and investment contracts | | | 148,908 | | | | – | | | | – | | | | 148,908 | | | Credit spread |
| Subordinated liabilities | | | 17,130 | | | | – | | | | 15,335 | | | | 1,795 | | | Interest rate, foreign exchange |
| Other liabilities | | | 25,596 | | | | – | | | | 10,678 | | | | 14,918 | | | Interest rate |
| Total liabilities | | | 786,087 | | | | 29,609 | | | | 588,451 | | | | 168,027 | | | |
The defined benefit pension schemes’ assets and liabilities are included under Other assets and Other liabilities in this table and note 36 on page F-61 provides further information.
The Group’s trading book assets and liabilities are originated within the Commercial Banking division. Within the Group’s balance sheet these fall under the trading assets and liabilities and derivative financial instruments. The assets and liabilities are classified as trading books if they meet the requirements as set out in the Capital Requirements Regulation, article 104. Further information on these activities can be found under the Trading portfolios section on page 107.
Derivative assets and liabilities are held by the Group for three main purposes; to provide risk management solutions for clients, to manage portfolio risks arising from client business and to manage and hedge the Group’s own risks. Insurance business assets and liabilities relate to policyholder funds, as well as shareholder invested assets, including annuity funds. The Group recognises the value of in-force business in respect of Insurance’s long-term life assurance contracts as an asset in the balance sheet (see note 25, page F-51).
The Group ensures that it has adequate cash and balances at central banks and stocks of high quality liquid assets (e.g. gilts or US Treasury securities) that can be converted easily into cash to meet liquidity requirements. The majority of these assets are asset swapped and held at fair value through other comprehensive income with the remainder held as financial assets at fair value through profit and loss. Further information on these balances can be found under funding and liquidity risk on page 94.
The majority of debt issuance originates from the Group’s capital and funding activities and the interest rate risk of the debt issued is hedged by swapping them into a floating rate.
The non-trading book primarily consists of customer on-balance sheet activities and the Group’s capital and funding activities, which expose it to the risk of adverse movements in market prices, predominantly interest rates, credit spreads, exchange rates and equity prices, as described in further detail within the Banking activities section (page 103).
OPERATING AND FINANCIAL REVIEW AND PROSPECTS
MEASUREMENT
In addition to measuring single factors, Group risk appetite is calibrated primarily to five multi-risk Group economic scenarios, and is supplemented with sensitivity-based measures. The scenarios assess the impact of unlikely, but plausible, adverse stresses on income with the worst case for banking activities, defined benefit pensions, insurance and trading portfolios reported against independently, and across the Group as a whole.
The Group risk appetite is cascaded first to the Group Asset and Liability Committee (GALCO), chaired by the Chief Financial Officer, where risk appetite is approved and monitored by risk type, and then to Group Market Risk Committee (GMRC) where risk appetite is sub-allocated by division. These metrics are reviewed regularly by senior management to inform effective decision-making.
MITIGATION
GALCO is responsible for approving and monitoring group market risks, management techniques, market risk measures, behavioural assumptions, and the market risk policy. Various mitigation activities are assessed and undertaken across the Group to manage portfolios and seek to ensure they remain within approved limits. The mitigation actions will vary dependent on exposure but will, in general, look to reduce risk in a cost effective manner by offsetting balance sheet exposures and externalising to the financial markets dependent on market liquidity. The market risk policy is owned by Group Corporate Treasury (GCT) and refreshed annually. The policy is underpinned by supplementary market risk procedures, which define specific market risk management and oversight requirements.
MONITORING
GALCO and the GMRC regularly review high level market risk exposure as part of the wider risk management framework. They also make recommendations to the Board concerning overall market risk appetite and Group Market Risk Policy. Exposures at lower levels of delegation are monitored at various intervals according to their volatility, from daily in the case of trading portfolios to monthly or quarterly in the case of less volatile portfolios. Levels of exposures compared to approved limits and triggers are monitored by Risk and where appropriate, escalation procedures are in place.
How market risks arise and are managed across the Group’s activities is considered in more detail below.
BANKING ACTIVITIES
Exposures
The Group’s banking activities expose it to the risk of adverse movements in market prices, predominantly interest rates, credit spreads, exchange rates and equity prices. The volatility of market values can be affected by both the transparency of prices and the amount of liquidity in the market for the relevant asset, liability or instrument.
Interest rate risk
Yield curve risk in the Group’s divisional portfolios, and in the Group’s capital and funding activities arises from the different repricing characteristics of the Group’s non-trading assets, liabilities (see loans and advances to customers and customer deposits in table AN) and off-balance sheet positions.
Basis risk arises from the possible changes in spreads, for example where the bank lends with reference to a central bank rate but funds with reference to LIBOR, and the spread between these two rates widens or tightens.
Optionality risk arises predominantly from embedded optionality within assets, liabilities or off-balance sheet items where either the Group or the customer can affect the size or timing of cash flows. One example of this is mortgage prepayment risk where the customer owns an option allowing them to prepay when it is economical to do so. This can result in customer balances amortising more quickly or slowly than anticipated due to customers’ response to changes in economic conditions.
Foreign exchange risk
Economic foreign exchange exposure arises from the Group’s investment in its overseas operations (net investment exposures are disclosed in note 53 on page F-98). In addition, the Group incurs foreign exchange risk through non-functional currency flows from services provided by customer-facing divisions, the Group’s debt and capital management programmes and is exposed to volatility in its CET1 ratio, due to the impact of changes in foreign exchange rates on the retranslation of non-sterling-denominated RWAs.
Equity risk
Equity risk arises primarily from three different sources;
| the Group’s private equity investments held by Lloyds Development Capital within the Equities sub-group. |
| | |
| the Group’s strategic equity holdings, for example Visa Inc Preference Shares, now held in the Equities sub-group. |
| | |
| a small exposure to Lloyds Banking Group share price through deferred shares and deferred options granted to employees as part of their benefits package. |
Credit spread risk
Credit spread risk arises largely from (i) the liquid asset portfolio held in the management of Group liquidity, comprising of government, supranational and other eligible assets; (ii) the Credit Valuation Adjustment (CVA) and Debit Valuation Adjustment (DVA) sensitivity to credit spreads; (iii) a number of the Group’s structured medium-term notes where we have elected to fair value the notes through the profit and loss account; and (iv) banking book assets held at fair value in Commercial Banking under IFRS 9.
OPERATING AND FINANCIAL REVIEW AND PROSPECTS
Measurement
Interest rate risk exposure is monitored monthly using, primarily:
Market value sensitivity: this methodology considers all repricing mismatches (behaviourally adjusted where appropriate) in the current balance sheet and calculates the change in market value that would result from an instantaneous 25, 100 and 200 basis points parallel rise or fall in the yield curve (subject to an appropriate floor). The market value sensitivities are calculated on a static balance sheet using principal cash flows excluding interest, commercial margins and other spread components and are therefore discounted at the risk free zero-coupon rate.
Interest income sensitivity: this measures the 12 month impact on future net interest income arising from various economic scenarios. These include instantaneous 25, 100 and 200 basis point parallel shifts in all yield curves and the five Group economic scenarios (subject to an appropriate floor). These scenarios are reviewed every year and are designed to replicate severe but plausible economic events, capturing risks that would not be evident through the use of parallel shocks alone such as basis risk and steepening or flattening of the yield curve. An additional negative rates scenario is also used for information purposes where all floors are removed; however this is not measured against the limit framework.
Unlike the market value sensitivities, the interest income sensitivities incorporate additional behavioural assumptions as to how and when individual products would reprice in response to changing rates. In addition a dynamic balance sheet is used which includes the run-off of current assets and liabilities and the addition of planned new business.
Reported sensitivities are not necessarily predictive of future performance as they do not capture additional management actions that would likely be taken in response to an immediate, large, movement in interest rates. These actions could reduce the net interest income sensitivity, help mitigate any adverse impacts or they may result in changes to total income that are not captured in the net interest income.
Structural hedge limits: the structural hedging programme managing interest rate risk in the banking book relies on a number of assumptions made around customer behaviour. A material mismatch between assumptions and reality could lead to a deterioration in earnings. In order to monitor this risk a number of metrics are in place to enhance understanding of risks within this portfolio.
The Group has an integrated Asset and Liability Management (ALM) system which supports non-traded asset and liability management of the Group. This provides a single consolidated tool to measure and manage interest rate repricing profiles (including behavioural assumptions), perform stress testing and produce forecast outputs. The Group is aware that any assumptions based model is open to challenge. A full behavioural review is performed annually, or in response to changing market conditions, to ensure the assumptions remain appropriate and the model itself is subject to annual re-validation, as required under the Group Model Governance Policy. The key behavioural assumptions are:
| embedded optionality within products. |
| | |
| the duration of balances that are contractually repayable on demand, such as current accounts and overdrafts, together with net free reserves of the Group. |
| | |
| the re-pricing behaviour of managed rate liabilities namely variable rate savings. |
Table AO below shows, split by material currency, the Group’s market value sensitivities to an instantaneous parallel up and down 25 and 100 basis points change to all interest rates.
Table AO: Group Banking activities: market value sensitivity
| | | 2019 | | 2018 |
| | | | Up
25bps
£m | | | | Down
25bps
£m | | | | Up
100bps
£m | | | | Down
100bps
£m | | | | Up
25bps
£m | | | | Down
25bps
£m | | | | Up
100bps
£m | | | | Down
100bps
£m | |
| Sterling | | | 13.6 | | | | (13.6 | ) | | | 52.7 | | | | (47.4 | ) | | | 29.1 | | | | (29.5 | ) | | | 113.7 | | | | (122.4 | ) |
| US Dollar | | | (5.6 | ) | | | 5.8 | | | | (21.3 | ) | | | 24.3 | | | | (7.8 | ) | | | 7.8 | | | | (30.6 | ) | | | 31.9 | |
| Euro | | | (7.2 | ) | | | 2.3 | | | | (27.0 | ) | | | 11.1 | | | | (3.0 | ) | | | 1.7 | | | | (11.2 | ) | | | 7.2 | |
| Other | | | 0.2 | | | | (0.2 | ) | | | 0.8 | | | | (0.8 | ) | | | (0.1 | ) | | | 0.1 | | | | (0.4 | ) | | | 0.5 | |
| Total | | | 1.0 | | | | (5.7 | ) | | | 5.2 | | | | (12.8 | ) | | | 18.2 | | | | (19.9 | ) | | | 71.5 | | | | (82.8 | ) |
OPERATING AND FINANCIAL REVIEW AND PROSPECTS
This is a risk based disclosure and the amounts shown would be amortised in the income statement over the duration of the portfolio.
The market value sensitivity is driven by temporary customer flow positions not yet hedged plus other positions occasionally held, within limits, by the Group’s wholesale funding desks in order to minimise overall funding and hedging costs. The level of risk is low relative to the size of the total balance sheet.
Table AP below shows supplementary value sensitivity to a steepening and flattening (c.100 basis points around the 3 year point) in the yield curve. This ensures there are no unintended consequences to managing risk to parallel shifts in rates.
Table AP:Group Banking activities: market value sensitivity to a steepening and flattening of the yield curve
| | | 2019 | | 2018 |
| | | Steepener
£m | | | Flattener
£m | | | Steepener
£m | | | Flattener
£m | |
| Sterling | | | 46.6 | | | | (47.5 | ) | | | 38.3 | | | | (36.5 | ) |
| US Dollar | | | (13.2 | ) | | | 15.3 | | | | 6.5 | | | | (5.7 | ) |
| Euro | | | (15.5 | ) | | | 9.7 | | | | (6.8 | ) | | | 3.6 | |
| Other | | | 0.4 | | | | (0.4 | ) | | | (0.1 | ) | | | 0.1 | |
| Total | | | 18.3 | | | | (22.9 | ) | | | 37.9 | | | | (38.5 | ) |
The table below shows the banking book income sensitivity to an instantaneous parallel up and down 25 and 100 basis points change to all interest rates.
Table AQ:Group Banking activities: net interest income sensitivity
| | | 2019 | | 2018 |
| | | Up
25bps
£m | | | Down
25bps
£m | | | Up
100bps
£m | | | Down
100bps
£m | | | Up
25bps
£m | | | Down
25bps
£m | | | Up
100bps
£m | | | Down
100bps
£m | |
| Client facing activity and associated hedges | | | 109.4 | | | | (147.9 | ) | | | 430.8 | | | | (702.8 | ) | | | 76.2 | | | | (125.4 | ) | | | 341.6 | | | | (538.6 | ) |
Income sensitivity is measured over a rolling 12 month basis.
The increase in the net interest income sensitivity to a downwards 100bps shock reflects additional margin compression risk within retail savings and a reduction in the size of the structural hedge.
Basis risk, foreign exchange, equity, and credit spread risks are measured primarily through scenario analysis by assessing the impact on profit before tax over a 12 month horizon arising from a change in market rates, and reported within the Board risk appetite on a monthly basis. Supplementary measures such as sensitivity and exposure limits are applied where they provide greater insight into risk positions. Frequency of reporting supplementary measures varies from daily to quarterly appropriate to each risk type.
Mitigation
The Group’s policy is to optimise reward whilst managing its market risk exposures within the risk appetite defined by the Board. The Group Market Risk Policy and procedures outlines the hedging process, and the centralisation of risk from divisions into GCT, e.g. via the transfer pricing framework. GCT is responsible for managing the centralised risk and does this through natural offsets of matching assets and liabilities, and appropriate hedging activity of the residual exposures, subject to the authorisation and mandate of GALCO within the Board risk appetite. The hedges are externalised to the market by derivative desks within GCT and Commercial Banking Markets. The Group mitigates income statement volatility through hedge accounting. This reduces the accounting volatility arising from the Group’s economic hedging activities by utilising both LIBOR and bank base rate assets. Any hedge accounting ineffectiveness that leads to accounting volatility is continuously monitored.
The largest residual risk exposure arises from balances that are deemed to be insensitive to changes in market rates (including current accounts, a portion of variable rate deposits and investable equity), and is managed through the Group’s structural hedge. Consistent with the Group’s strategy to deliver stable returns, GALCO seeks to minimise large reinvestment risk, and to smooth earnings over a range of investment tenors. The structural hedge consists of longer-term fixed rate assets or interest rate swaps and the amount and duration of the hedging activity is reviewed regularly by GALCO.
Whilst the bank faces margin compression in low rate environments, its exposure to pipeline and prepayment risk are not considered material and are hedged in line with expected customer behaviour. These are appropriately monitored and controlled through divisional Asset and Liability Committees (ALCOs).
Net investment foreign exchange exposures are managed centrally by GCT, by hedging non-sterling asset values with currency borrowing.
Economic foreign exchange exposures arising from non-functional currency flows are identified by divisions and transferred and managed centrally. The Group also has a policy of forward hedging its forecasted currency profit and loss to year end. The Group makes use of both accounting and economic foreign exchange exposures, as an offset against the impact of changes in foreign exchange rates on the value of non-sterling-denominated RWAs. This involves the holding of a structurally open currency position; sensitivity is minimised where, for a given currency, the ratio of the structural open position to RWAs equals the CET1 ratio. Continually evaluating this structural open currency position against evolving non-sterling-denominated RWAs, mitigates volatility in the Group’s CET1 ratio.
Monitoring
The appropriate limits and triggers are monitored by senior executive committees within the banking divisions. Banking assets, liabilities and associated hedging are actively monitored and if necessary rebalanced to be within agreed tolerances.
DEFINED BENEFIT PENSION SCHEMES
Exposures
The Group’s defined benefit pension schemes are exposed to significant risks from their assets and liabilities. The liability discount rate exposes the Group to interest rate risk and credit spread risk, which are partially offset by fixed interest assets (such as gilts and corporate bonds) and swaps. Equity and alternative asset risk arises from direct asset holdings. Scheme membership exposes the Group to longevity risk.
For further information on defined benefit pension scheme assets and liabilities please refer to note 36 on page F-61.
Measurement
Management of the schemes’ assets is the responsibility of the Trustees of the schemes who are responsible for setting the investment strategy and for agreeing funding requirements with the Group. The Group will be liable for meeting any funding deficit that may arise. As part of the triennial valuation process, the Group will agree with the Trustees a funding strategy to eliminate the deficit over an appropriate period.
Longevity risk is measured using both 1-in-20 year stresses (risk appetite) and 1-in-200 year stresses (regulatory capital).
Mitigation
The Group takes an active involvement in agreeing mitigation strategies with the schemes’ Trustees. An interest rate and inflation hedging programme is in place to reduce liability risk. The schemes have also reduced equity allocation and invested the proceeds in credit assets. The Trustees have put
OPERATING AND FINANCIAL REVIEW AND PROSPECTS
in place a longevity swap to mitigate longevity risk. The merits of longevity risk transfer and hedging solutions are reviewed regularly.
Monitoring
In addition to the wider risk management framework, governance of the schemes includes two specialist pensions committees.
The surplus, or deficit, in the schemes is tracked monthly along with various single factor and scenario stresses which consider the assets and liabilities holistically. Key metrics are monitored monthly including the Group’s capital resources of the scheme, the performance against risk appetite triggers, and the performance of the hedged asset and liability matching positions.
INSURANCE PORTFOLIOS
Exposures
The main elements of market risk to which the Group is exposed through the Insurance business are equity, credit spread, interest rate and inflation.
| Equity risk arises indirectly through the value of future management charges on policyholder funds. These management charges form part of the value of in-force business (see note 25 on page F-51). Equity risk also arises in the with-profits funds but is less material. |
| | |
| Credit spread risk mainly arises from annuities where policyholders’ future cash flows are guaranteed at retirement. Exposure arises if the |
| | market value of the assets which are held to back these liabilities, mainly corporate bonds and loans, do not perform in line with expectations. |
| | |
| Interest rate risk arises through holding credit and interest assets mainly in the annuity book and also to cover general insurance liabilities, capital requirements and risk appetite. |
| | |
| Inflation exposure arises from a combination of inflation linked policyholder benefits and inflation assumptions used to project future expenses. |
Measurement
Current and potential future market risk exposures within Insurance are assessed using a range of techniques including stress, reverse stress and scenario testing, as well as stochastic modelling.
Risk measures include 1-in-200 year stresses used for regulatory capital assessments and single factor stresses for profit before tax.
Table AR demonstrates the impact of the Group’s UK Recession scenario on the Insurance business’ portfolio (with no diversification benefit, but after the impact of Group consolidation on interest rate and credit spreads). The amounts include movements in assets, liabilities and the value of in-force business in respect of insurance contracts and participating investment contracts.
Table AR:Insurance business: profit before tax sensitivities
| | | Increase (reduction)
in profit before tax |
| | | 2019
£m | | | 2018
£m | |
| Interest rates – decrease 100 basis points | | | 116 | | | | 297 | |
| Inflation – increase 50 basis points | | | 30 | | | | 93 | |
| Credit spreads – 100% widening | | | (859 | ) | | | (823 | ) |
| Equity – 30% fall | | | (68 | ) | | | (38 | ) |
| Property – 25% fall | | | (47 | ) | | | (50 | ) |
| Total | | | (828 | ) | | | (521 | ) |
Further stresses that show the effect of reasonably possible changes in key assumptions, including the risk-free rate, equity investment volatility, widening of credit default spreads on corporate bonds and an increase in illiquidity premium, as applied to profit before tax are set out in note 33 on page F-60.
One of the consequences of preparations for the formation of the Ring Fenced Bank was to reduce the impact of some stresses within the Insurance business, though Group exposures may not have materially changed. Examples of this include centralisation of defined benefit pension schemes, and the transfer of specific hedging programmes from the corporate centre to the business unit where the exposure emanated.
Mitigation
Equity and credit spread risks are closely monitored and, where appropriate, asset liability matching is undertaken to mitigate risk. Unit matching has been used since 2018 to reduce the sensitivity of equity movements by matching unit-linked liabilities on a best-estimate view. Hedging strategies are also in place to reduce exposure from unit-linked funds and the with-profit funds.
Interest rate risk in the annuity book is mitigated by investing in assets whose cash flows closely match those on the projected future liabilities. It is not possible to eliminate risk completely as the timing of insured events is uncertain and bonds are not available at all of the required maturities. As a result, the cash flows cannot be precisely matched and so sensitivity tests are used to test the extent of the mismatch.
Other market risks (e.g. interest rate exposure outside the annuity book and inflation) are also closely monitored and where considered appropriate, hedges are put in place to reduce exposure.
Monitoring
Market risks in the Insurance business are monitored by Insurance senior executive committees and ultimately the Insurance Board. Monitoring includes the progression of market risk capital against risk appetite limits, as well as the sensitivity of profit before tax to combined market risk stress scenarios and in year market movements. Asset and liability matching positions and hedges in place are actively monitored and if necessary rebalanced to be within agreed tolerances. In addition market risk is controlled via approved investment policies and mandates.
OPERATING AND FINANCIAL REVIEW AND PROSPECTS
TRADING PORTFOLIOS
Exposures
The Group’s trading activity is small relative to its peers and does not engage in any proprietary trading activities. The Group’s trading activity is undertaken solely to meet the financial requirements of commercial and retail customers for foreign exchange, credit and interest rate products. These activities support customer flow and market making activities.
All trading activities are performed within the Commercial Banking division. While the trading positions taken are generally small, any extreme moves in the main risk factors and other related risk factors could cause significant losses in the trading book depending on the positions at the time. The average 95 per cent 1-day trading VaR (Value at Risk; diversified across risk factors) was £0.9 million for 31 December 2019 compared to £0.8 million for 31 December 2018.
Trading market risk measures are applied to all of the Group’s regulatory trading books and they include daily VaR (table AS), sensitivity based measures, and stress testing calculations.
Measurement
The Group internally uses VaR as the primary risk measure for all trading book positions.
Table AS shows some relevant statistics for the Group’s 1-day 95 per cent confidence level VaR that are based on 300 historical consecutive business days to year end 2019 and year end 2018.
The risk of loss measured by the VaR model is the minimum expected loss in earnings given the 95 per cent confidence. The total and average trading VaR numbers reported below have been obtained after the application of the diversification benefits across the five risk types, but does not reflect any diversification between Lloyds Bank Corporate Markets and any other entities. The maximum and minimum VaR reported for each risk category did not necessarily occur on the same day as the maximum and minimum VaR reported at Group level.
OPERATING AND FINANCIAL REVIEW AND PROSPECTS
Table AS:Trading portfolios: VaR (1-day 95 per cent confidence level) (audited)
| | | | | | At 31 December 2019 | | | | | | | | | At 31 December 2018 | | | | |
| | | Close
£m | | | Average
£m | | | Maximum
£m | | | Minimum
£m | | | Close
£m | | | Average
£m | | | Maximum
£m | | | Minimum
£m | |
| Interest rate risk | | | 0.6 | | | | 0.8 | | | | 1.6 | | | | 0.4 | | | | 0.6 | | | | 0.7 | | | | 1.8 | | | | 0.4 | |
| Foreign exchange risk | | | 0.1 | | | | 0.1 | | | | 0.3 | | | | 0.0 | | | | 0.1 | | | | 0.1 | | | | 2.1 | | | | – | |
| Equity risk | | | – | | | | – | | | | – | | | | – | | | | – | | | | – | | | | – | | | | – | |
| Credit spread risk | | | 0.1 | | | | 0.2 | | | | 0.3 | | | | 0.1 | | | | 0.2 | | | | 0.2 | | | | 0.7 | | | | 0.1 | |
| Inflation risk | | | 0.4 | | | | 0.2 | | | | 0.6 | | | | 0.1 | | | | 0.3 | | | | 0.3 | | | | 0.7 | | | | 0.2 | |
| All risk factors before diversification | | | 1.2 | | | | 1.3 | | | | 2.2 | | | | 0.9 | | | | 1.2 | | | | 1.3 | | | | 3.0 | | | | 0.9 | |
| Portfolio diversification | | | (0.4 | ) | | | (0.4 | ) | | | | | | | | | | | (0.4 | ) | | | (0.5 | ) | | | | | | | | |
| Total VaR | | | 0.8 | | | | 0.9 | | | | 1.6 | | | | 0.5 | | | | 0.8 | | | | 0.8 | | | | 2.1 | | | | 0.4 | |
The market risk for the trading book continues to be low with respect to the size of the Group and compared to our peers. This reflects the fact that the Group’s trading operations are customer-centric and focused on hedging and recycling client risks.
Although it is an important market standard measure of risk, VaR has limitations. One of them is the use of a limited historical data sample which influences the output by the implicit assumption that future market behaviour will not differ greatly from the historically observed period. Another known limitation is the use of defined holding periods which assumes that the risk can be liquidated or hedged within that holding period. Also calculating the VaR at the chosen confidence interval does not give enough information about potential losses which may occur if this level is exceeded. The Group fully recognises these limitations and supplements the use of VaR with a variety of other measurements which reflect the nature of the business activity. These include detailed sensitivity analysis, position reporting and a stress testing programme.
Trading book VaR (1-day 99 per cent) is compared daily against both hypothetical and actual profit and loss. The 1-day 99 per cent VaR chart for Lloyds Banking Group can be found in the Group’s Pillar 3 Report.
Mitigation
The level of exposure is controlled by establishing and communicating the approved risk limits and controls through policies and procedures that define the responsibility and authority for risk taking. Market risk limits are clearly and consistently communicated to the business. Any new or emerging risks are brought within risk reporting and defined limits.
Monitoring
Trading risk appetite is monitored daily with 1-day 95 per cent VaR and stress testing limits. These limits are complemented with position level action triggers and profit and loss referrals. Risk and position limits are set and managed at both desk and overall trading book levels. They are reviewed at least annually and can be changed as required within the overall Group risk appetite framework.
MODEL RISK
DEFINITION
Model risk is defined as the risk of financial loss, regulatory censure, reputational damage or customer detriment, as a result of deficiencies in the development, application or ongoing operation of models and rating systems.
Models are defined as quantitative methods that process input data into quantitative outputs, or qualitative outputs (including ordinal letter output) which have a quantitative measure associated with them. Model Governance Policy is restricted to specific categories of application of models, principally financial risk, treasury and valuation, with certain exclusions, such as prescribed calculations and project appraisal calculations.
EXPOSURES
There are over 300 models in the Group performing a variety of functions including:
| capital calculation; |
| | |
| credit decisioning, including fraud; |
| | |
| pricing models; |
| | |
| impairment calculation; |
| | |
| stress testing and forecasting; and |
| | |
| market risk measurement. |
As a result of the wide scope and breadth of coverage, there is exposure to model risk across a number of the Group’s principal risk categories.
MEASUREMENT
The Group risk appetite framework is the key component for measuring the Group’s model risk. Reported monthly to the Group Risk Committee and Board, focus is placed on the performance of the Group’s most material models.
MITIGATION
The model risk management framework, established by and with continued oversight from an independent team in the Risk division, provides the foundation for managing and mitigating model risk within the Group. Accountability is cascaded from the Board and senior management via the Group enterprise risk management framework.
This provides the basis for the Group Model Governance Policy, which defines the mandatory requirements for models across the Group, including:
| the scope of models covered by the policy; |
| | |
| model materiality; |
| | |
| roles and responsibilities, including ownership, independent oversight and approval; and |
| | |
| key principles and controls regarding data integrity, development, validation, implementation, ongoing maintenance and revalidation, monitoring, and the process for non-compliance. |
The model owner takes responsibility for ensuring the fitness for purpose of the models and rating systems, supported and challenged by the independent specialist Group function.
The above ensures all models in scope of policy, including those involved in regulatory capital calculation, are developed consistently and are of sufficient quality to support business decisions and meet regulatory requirements.
MONITORING
The Group Model Governance Committee is the primary body for overseeing model risk. Policy requires that key performance indicators are monitored for every model to ensure they remain fit for purpose and all issues are escalated appropriately. Material model issues are reported to Group and Board Risk Committees monthly with more detailed papers as necessary to focus on key issues.
OPERATING AND FINANCIAL REVIEW AND PROSPECTS
INVESTMENT PORTFOLIO, MATURITIES, DEPOSITS, SHORT-TERM BORROWINGS
Financial assets at fair value through profit or loss; financial assets at fair value through other comprehensive income (2017: available-for-sale financial assets); and debt securities held at amortised cost
The following table sets out the book values and valuation (fair value) of the Group’s debt securities, treasury and other bills and equity shares at 31 December for each of the three years indicated.
| | | 2019
Book value
£m | | | 2019
Valuation
£m | | | 2018
Book value
£m | | | 2018
Valuation
£m | | | 2017
Book value
£m | | | 2017
Valuation
£m | |
| Financial assets at fair value through profit or loss | | | | | | | | | | | | | | | | | | | | | | | | |
| US treasury and US government agencies | | | 194 | | | | 194 | | | | 474 | | | | 474 | | | | 1,458 | | | | 1,458 | |
| Other government securities | | | 18,660 | | | | 18,660 | | | | 17,621 | | | | 17,621 | | | | 20,562 | | | | 20,562 | |
| Other public sector securities | | | 2,126 | | | | 2,126 | | | | 2,064 | | | | 2,064 | | | | 1,527 | | | | 1,527 | |
| Bank and building society certificates of deposit | | | 984 | | | | 984 | | | | 1,105 | | | | 1,105 | | | | 222 | | | | 222 | |
| Mortgage-backed securities | | | 468 | | | | 468 | | | | 225 | | | | 225 | | | | 400 | | | | 400 | |
| Other asset-backed securities | | | 258 | | | | 258 | | | | 349 | | | | 349 | | | | 1,021 | | | | 1,021 | |
| Corporate and other debt securities | | | 18,216 | | | | 18,216 | | | | 18,310 | | | | 18,310 | | | | 19,990 | | | | 19,990 | |
| Treasury bills and other bills | | | 19 | | | | 19 | | | | 20 | | | | 20 | | | | 18 | | | | 18 | |
| Equity shares | | | 95,789 | | | | 95,789 | | | | 77,485 | | | | 77,485 | | | | 86,090 | | | | 86,090 | |
| | | | 136,714 | | | | 136,714 | | | | 117,653 | | | | 117,653 | | | | 131,288 | | | | 131,288 | |
| Financial assets at fair value through other comprehensive income | | | | | | | | | | | | | | | | | | | | | | | | |
| US treasury and US government agencies | | | 1,979 | | | | 1,979 | | | | 3,963 | | | | 3,963 | | | | | | | | | |
| Other government securities | | | 11,119 | | | | 11,119 | | | | 15,008 | | | | 15,008 | | | | | | | | | |
| Bank and building society certificates of deposit | | | – | | | | – | | | | 118 | | | | 118 | | | | | | | | | |
| Mortgage-backed securities | | | 121 | | | | 121 | | | | 120 | | | | 120 | | | | | | | | | |
| Other asset-backed securities | | | 60 | | | | 60 | | | | 131 | | | | 131 | | | | | | | | | |
| Corporate and other debt securities | | | 11,051 | | | | 11,051 | | | | 5,151 | | | | 5,151 | | | | | | | | | |
| Treasury and other bills | | | 535 | | | | 535 | | | | 303 | | | | 303 | | | | | | | | | |
| Equity shares | | | 227 | | | | 227 | | | | 21 | | | | 21 | | | | | | | | | |
| | | | 25,092 | | | | 25,092 | | | | 24,815 | | | | 24,815 | | | | | | | | | |
| Available-for-sale financial assets | | | | | | | | | | | | | | | | | | | | | | | | |
| US treasury and US government agencies | | | | | | | | | | | | | | | | | | | 6,760 | | | | 6,760 | |
| Other government securities | | | | | | | | | | | | | | | | | | | 27,948 | | | | 27,948 | |
| Bank and building society certificates of deposit | | | | | | | | | | | | | | | | | | | 167 | | | | 167 | |
| Mortgage-backed securities | | | | | | | | | | | | | | | | | | | 1,156 | | | | 1,156 | |
| Other asset-backed securities | | | | | | | | | | | | | | | | | | | 255 | | | | 255 | |
| Corporate and other debt securities | | | | | | | | | | | | | | | | | | | 4,615 | | | | 4,615 | |
| Equity shares | | | | | | | | | | | | | | | | | | | 1,197 | | | | 1,197 | |
| | | | | | | | | | | | | | | | | | | | 42,098 | | | | 42,098 | |
| Debt securities held at amortised cost | | | | | | | | | | | | | | | | | | | | | | | | |
| Mortgage-backed securities | | | 3,007 | | | | 3,007 | | | | 3,272 | | | | 3,396 | | | | 2,366 | | | | 2,351 | |
| Other asset-backed securities | | | 876 | | | | 876 | | | | 780 | | | | 642 | | | | 1,260 | | | | 1,225 | |
| Corporate and other debt securities | | | 1,664 | | | | 1,654 | | | | 1,192 | | | | 1,206 | | | | 43 | | | | 10 | |
| | | | 5,547 | | | | 5,537 | | | | 5,244 | | | | 5,244 | | | | 3,669 | | | | 3,586 | |
| Allowance for impairment losses | | | (3 | ) | | | – | | | | (6 | ) | | | – | | | | (26 | ) | | | – | |
| | | | 5,544 | | | | 5,537 | | | | 5,238 | | | | 5,244 | | | | 3,643 | | | | 3,586 | |
OPERATING AND FINANCIAL REVIEW AND PROSPECTS
MATURITIES AND WEIGHTED AVERAGE YIELDS OF INTEREST-BEARING SECURITIES
The weighted average yield for each range of maturities is calculated by dividing the annualised interest income prevailing at 31 December 2019 by the book value of securities held at that date.
| | | Maturing within
one year | | Maturing after one but
within five years | | Maturing after five but
within ten years | | Maturing after
ten years |
| | | Amount
£m | | | Yield
% | | | Amount
£m | | | Yield
% | | | Amount
£m | | | Yield
% | | | Amount
£m | | | Yield
% | |
| Financial assets at fair value through profit or loss | | | | | | | | | | | | | | | | | | | | | | | | | | | | | | | | |
| US treasury and US government agencies | | | – | | | | – | | | | 68 | | | | 2.6 | | | | 86 | | | | 2.3 | | | | 40 | | | | 3.5 | |
| Other government securities | | | 958 | | | | 3.2 | | | | 2,667 | | | | 1.7 | | | | 2,829 | | | | 1.7 | | | | 12,206 | | | | 2.6 | |
| Other public sector securities | | | 1 | | | | 5.0 | | | | 487 | | | | 1.9 | | | | 294 | | | | 3.2 | | | | 1,344 | | | | 2.7 | |
| Bank and building society certificates of deposit | | | 984 | | | | 0.7 | | | | – | | | | – | | | | – | | | | – | | | | – | | | | – | |
| Mortgage-backed securities | | | – | | | | – | | | | 5 | | | | 2.0 | | | | 192 | | | | 4.2 | | | | 271 | | | | 4.3 | |
| Other asset-backed securities | | | 15 | | | | 5.0 | | | | 26 | | | | 3.8 | | | | 6 | | | | 4.0 | | | | 211 | | | | 2.3 | |
| Corporate and other debt securities | | | 311 | | | | 2.5 | | | | 3,256 | | | | 4.2 | | | | 4,361 | | | | 4.1 | | | | 10,288 | | | | 3.3 | |
| Treasury bills and other bills | | | 19 | | | | 1.5 | | | | – | | | | – | | | | – | | | | – | | | | – | | | | – | |
| | | | 2,288 | | | | | | | | 6,509 | | | | | | | | 7,768 | | | | | | | | 24,360 | | | | | |
| Financial assets at fair value through other comprehensive income | | | | | | | | | | | | | | | | | | | | | | | | | | | | | | | | |
| US treasury and US government agencies | | | – | | | | – | | | | 549 | | | | 0.2 | | | | 1,430 | | | | 5.5 | | | | – | | | | – | |
| Other government securities | | | 664 | | | | 7.0 | | | | 6,183 | | | | 2.7 | | | | 3,505 | | | | 2.0 | | | | 767 | | | | 3.0 | |
| Bank and building society certificates of deposit | | | – | | | | – | | | | – | | | | – | | | | – | | | | – | | | | – | | | | – | |
| Mortgage-backed securities | | | – | | | | – | | | | – | | | | – | | | | 18 | | | | 0.9 | | | | 103 | | | | 0.0 | |
| Other asset-backed securities | | | – | | | | – | | | | – | | | | – | | | | – | | | | – | | | | 60 | | | | 4.2 | |
| Corporate and other debt securities | | | 525 | | | | 1.5 | | | | 8,776 | | | | 1.6 | | | | 1,750 | | | | 2.5 | | | | – | | | | – | |
| Treasury and other bills | | | 165 | | | | 0.7 | | | | 229 | | | | 2.1 | | | | 141 | | | | 2.1 | | | | – | | | | – | |
| | | | 1,354 | | | | | | | | 15,737 | | | | | | | | 6,844 | | | | | | | | 930 | | | | | |
| Debt securities held at amortised cost | | | | | | | | | | | | | | | | | | | | | | | | | | | | | | | | |
| Mortgage-backed securities | | | – | | | | – | | | | 1,913 | | | | 1.7 | | | | – | | | | – | | | | 1,094 | | | | 1.5 | |
| Other asset-backed securities | | | 11 | | | | 0.0 | | | | 381 | | | | 0.2 | | | | 484 | | | | 1.4 | | | | – | | | | – | |
| Corporate and other debt securities | | | 139 | | | | 1.8 | | | | 871 | | | | 2.9 | | | | 646 | | | | 2.3 | | | | 8 | | | | 1.9 | |
| | | | 150 | | | | | | | | 3,165 | | | | | | | | 1,130 | | | | | | | | 1,102 | | | | | |
The Group’s investment holdings at 31 December 2019 include £28,303 million due from the UK government and its agencies.
OPERATING AND FINANCIAL REVIEW AND PROSPECTS
MATURITY ANALYSIS AND INTEREST RATE SENSITIVITY OF LOANS AND ADVANCES TO CUSTOMERS AND BANKS AT 31 DECEMBER 2019
The following table analyses the maturity profile and interest rate sensitivity of loans by type on a contractual repayment basis at 31 December 2019. Following the reduction in the Group’s non-UK activities, an analysis between domestic and foreign operations is not provided.
All amounts are before deduction of impairment allowances. Demand loans are included in the ‘maturing in one year or less’ category.
| | | Maturing in one
year or less
£m | | | Maturing after
one but within
five years
£m | | | Maturing after
five years
£m | | | Total
£m | |
| Loans and advances to banks | | | 6,422 | | | | 57 | | | | 3,298 | | | | 9,777 | |
| Loans and advances to customers: | | | | | | | | | | | | | | | | |
| Mortgages | | | 14,138 | | | | 51,009 | | | | 233,994 | | | | 299,141 | |
| Other personal lending | | | 4,079 | | | | 5,871 | | | | 19,322 | | | | 29,272 | |
| Property companies | | | 3,560 | | | | 13,010 | | | | 11,026 | | | | 27,596 | |
| Financial, business and other services | | | 69,807 | | | | 11,826 | | | | 8,130 | | | | 89,763 | |
| Transport, distribution and hotels | | | 6,440 | | | | 3,985 | | | | 2,591 | | | | 13,016 | |
| Manufacturing | | | 3,658 | | | | 1,892 | | | | 543 | | | | 6,093 | |
| Other | | | 8,696 | | | | 17,678 | | | | 6,992 | | | | 33,366 | |
| Total loans | | | 116,800 | | | | 105,328 | | | | 285,896 | | | | 508,024 | |
| Of which: | | | | | | | | | | | | | | | | |
| Fixed interest rate | | | 73,986 | | | | 50,235 | | | | 162,151 | | | | 286,372 | |
| Variable interest rate | | | 42,814 | | | | 55,093 | | | | 123,745 | | | | 221,652 | |
| | | | 116,800 | | | | 105,328 | | | | 285,896 | | | | 508,024 | |
DEPOSITS
The following tables show the details of the Group’s average customer deposits in each of the past three years.
| | | 2019
Average
balance
£m | | | 2019
Average
rate
% | | | 2018
Average
balance
£m | | | 2018
Average
rate
% | | | 2017
Average
balance
£m | | | 2017
Average
rate
% | |
| Non-interest bearing demand deposits | | | 74,906 | | | | – | | | | 72,913 | | | | – | | | | 66,276 | | | | – | |
| Interest-bearing demand deposits | | | 85,251 | | | | 0.50 | | | | 92,190 | | | | 0.41 | | | | 94,627 | | | | 0.33 | |
| Savings deposits | | | 162,290 | | | | 0.50 | | | | 152,304 | | | | 0.38 | | | | 168,013 | | | | 0.23 | |
| Time deposits | | | 93,713 | | | | 0.82 | | | | 98,476 | | | | 0.86 | | | | 86,043 | | | | 1.15 | |
| Total average deposits | | | 416,160 | | | | 0.48 | | | | 415,883 | | | | 0.44 | | | | 414,959 | | | | 0.41 | |
Following the reduction in the Group’s non-UK activities, an analysis between domestic and foreign operations is not provided.
CERTIFICATES OF DEPOSIT AND OTHER TIME DEPOSITS
The following table gives details of the Group’s certificates of deposit issued and other time deposits at 31 December 2019 individually in excess of US $100,000 (or equivalent in another currency) by time remaining to maturity. Following the continuing reduction in the Group’s non-UK activities, an analysis between domestic and foreign operations is not provided.
| | | 3 months
or less
£m | | | Over 3 months
but within
6 months
£m | | | Over 6 months
but within
12 months
£m | | | Over
12 months
£m | | | Total
£m | |
| Certificates of deposit | | | 2,643 | | | | 4,277 | | | | 3,398 | | | | 280 | | | | 10,598 | |
| Time deposits | | | 15,899 | | | | 4,703 | | | | 4,990 | | | | 2,245 | | | | 27,837 | |
| Total | | | 18,542 | | | | 8,980 | | | | 8,388 | | | | 2,525 | | | | 38,435 | |
OPERATING AND FINANCIAL REVIEW AND PROSPECTS
SHORT-TERM BORROWINGS
Short-term borrowings are included within the balance sheet captions ‘Deposits by banks’, ‘Customer accounts’ and ‘Debt securities in issue’ and are not identified separately on the balance sheet. The short-term borrowings of the Group consist of overdrafts from banks, securities sold under agreements to repurchase, notes issued as part of the lending securitisations, certificates of depost issued, commercial paper and promissory notes issued and other marketable paper. Securities sold under agreements to repurchase and covered bonds are the only potentially significant short-term borrowings of the Group.
The following tables give details of the significant short-term borrowings of the Group for each of the past three years.
| | | 2019
£m | | | 2018
£m | | | 2017
£m | |
| Liabilities in respect of securities sold under repurchase agreements | | | | | | | | | |
| Balance at the year end | | | 27,635 | | | | 22,988 | | | | 25,813 | |
| Average balance for the year | | | 26,905 | | | | 25,634 | | | | 18,943 | |
| Maximum balance during the year | | | 31,241 | | | | 25,813 | | | | 25,813 | |
| Average interest rate during the year | | | 1.1% | | | | 1.0% | | | | 0.6% | |
| Interest rate at the year end | | | 1.3% | | | | 2.1% | | | | 1.4% | |
| Covered bonds | | | | | | | | | | | | |
| Balance at the year end | | | 29,821 | | | | 28,194 | | | | 26,132 | |
| Average balance for the year | | | 29,674 | | | | 27,028 | | | | 26,765 | |
| Maximum balance during the year | | | 30,953 | | | | 28,194 | | | | 30,521 | |
| Average interest rate during the year | | | 2.7% | | | | 3.0% | | | | 3.2% | |
| Interest rate at the year end | | | 2.4% | | | | 2.7% | | | | 2.8% | |
MANAGEMENT AND EMPLOYEES
DIRECTORS AND SENIOR MANAGEMENT
The Group is led by the Board comprising a Chairman (who was independent on appointment), independent Non-Executive Directors and Executive Directors with a wide range of experience. The appointment of Directors is considered by the Nomination and Governance Committee and approved by the Board. Following the provisions in the articles of association, Directors must stand for election by the shareholders at the first annual general meeting following their appointment. In line with UK Corporate Governance best practice, all Directors are subject to annual re-election by shareholders at each annual general meeting thereafter. Independent Non-Executive Directors are appointed for an initial term of three years after which their appointment may continue subject to an annual review. Their appointment may be terminated, in accordance with statute and the articles of association, at any time with immediate effect and without compensation.
The Board meets regularly. In 2019, a total of 11 scheduled meetings were held.
The roles of the Chairman, the Group Chief Executive and the Board and its governance arrangements, including the schedule of matters specifically reserved to the Board for decision, are reviewed annually. The matters reserved to the Board for decision include the approval of the annual report and accounts and any other financial statements; the payment of dividends; the long-term objectives of the Group; the strategies necessary to achieve these objectives; the Group’s budgets and plans; significant capital expenditure items; significant investments and disposals; the basis of allocation of capital within the Group; the organisational structure of the Group; the arrangements for ensuring that the Group manages risks effectively; any significant change in accounting policies or practices; the appointment of the Company’s main professional advisers (other than the auditors) and their fees (where significant); and the determination of Board and Committee structures, together with their size and composition.
According to the articles of association, the business and affairs of the Company are managed by the Directors, who have delegated to management the power to make decisions on operational matters, including those relating to credit, liquidity and market risk, within an agreed framework.
All Directors have access to the services of the Company Secretary, and independent professional advice is available to the Directors at the Group’s expense, where they judge it necessary to discharge their duties as directors.
The Chairman has a private discussion at least once a year with each Director on a wide range of issues affecting the Group, including any matters which the Directors, individually, wish to raise.
There is an induction programme for all Directors, which is tailored to their specific requirements having regard to their specific role on the Board and their skills and experience to date.
The Directors and senior management of Lloyds Banking Group plc are:
NON-EXECUTIVE DIRECTORS
1. Lord Blackwell Chairman
Age: 67
Chairman of the Nomination and Governance Committee, Member of the Remuneration Committee, the Responsible Business Committee and the Board Risk Committee
Appointed: June 2012 (Board), April 2014 (Chairman)
Skills, experience and contribution:
Deep financial services knowledge including insurance and banking
Significant experience with strategic planning and implementation
Regulatory and public policy experience gained from senior positions in Downing Street, Regulators and a wide range of industries
Credibility with key stakeholders
Strong leadership qualities
Lord Blackwell is an experienced Chairman and Non-Executive Director within the financial services sector having previously been Chairman of Scottish Widows Group. He was previously Senior Independent Director and Chairman of the UK Board for Standard Life and Director of Group Development at NatWest Group. His past Board roles have also included Chairman of Interserve plc, and Non-Executive Director of Halma plc, Dixons Group, SEGRO and Ofcom. He was Head of the Prime Minister’s Policy Unit from 1995 to 1997 and was appointed a Life Peer in 1997.
External appointments: Governor of the Yehudi Menuhin School and a member of the Governing Body of the Royal Academy of Music.
2. Anita Frew Deputy Chairman
Age: 62
Member of the Audit Committee, the Nomination and Governance Committee, the Remuneration Committee, the Responsible Business Committee and the Board Risk Committee
Appointed: December 2010 (Board), May 2014 (Deputy Chairman), May 2017 to December 2019 (Senior Independent Director)
Skills, experience and contribution:
Significant board, financial and general management experience
Experience across a range of sectors, including banking, asset and investment management, manufacturing and utilities
Extensive experience as chairman in a range of industries
Strong board governance experience, including investor relations and remuneration
Anita was previously Chairman of Victrex plc, the Senior Independent Director of Aberdeen Asset Management and IMI plc, an Executive Director of Abbott Mead Vickers, a Non-Executive Director of Northumbrian Water and has held various investment and marketing roles at Scottish Provident and the Royal Bank of Scotland.
External appointments: Chairman of Croda International Plc and a Non-Executive Director of BHP Billiton.
MANAGEMENT AND EMPLOYEES
3. Alan Dickinson Senior Independent Director
Age: 69
Chairman of the Board Risk Committee, Member of the Audit Committee, the Nomination and Governance Committee and the Remuneration Committee.
Appointed: September 2014 (Board), December 2019 (Senior Independent Director)
Skills, experience and contribution:
Highly regarded retail and commercial banker
Strong strategic, risk and core banking experience
Regulatory and public policy experience
Alan has 37 years’ experience with the Royal Bank of Scotland, most notably as Chief Executive of RBS UK. Alan was a Non-Executive Director of Willis Limited and Chairman of its Risk Committee. He was formerly Chairman of Brown, Shipley & Co. Limited, a Non-Executive Director of Nationwide Building Society, where he was Chairman of its Risk Committee and a Governor of Motability.
External appointments: Chairman of Urban&Civic plc and Non-Executive Director of England and Wales Cricket Board.
4. Simon Henry Independent Director
Age: 58
Chairman of the Audit Committee and Member of the Board Risk Committee
Appointed: June 2014
Skills, experience and contribution:
Deep international experience in board level strategy and execution
Extensive knowledge of financial markets, treasury and risk management
Qualification as an Audit Committee Financial Expert
Strong board governance experience, including investor relations and remuneration
Simon was formerly Chief Financial Officer and Executive Director of Royal Dutch Shell plc. He was also previously Chair of the European Round Table CFO Taskforce and a Member of the Main Committee of the 100 Group of UK FTSE CFOs.
External appointments: Non-Executive Director of Rio Tinto plc and Rio Tinto Limited and Chair of their Audit Committee, Independent Director of PetroChina Company Limited, Member of the Defence Board and Chair of the Defence Audit Committee, UK Government, Member of the Advisory Panel of CIMA and of the Advisory Board of the Centre for European Reform.
5. Sarah Legg Independent Director
Age: 52
Member of the Audit Committee and the Board Risk Committee
Appointed: December 2019
Skills, experience and contribution:
Strong financial leadership skills
Significant experience in financial and regulatory reporting
Strong transformation programme experience
Sarah has spent her entire career in financial services with HSBC in finance leadership roles. She was the Group Financial Controller and a Group General Manager of HSBC until early 2019 and previously Chief Financial Officer for HSBC’s Asia Pacific region. She also spent 8 years as a Non-Executive Director on the Board of Hang Seng Bank Limited, a Hong Kong listed bank.
External appointments: Honorary Vice President of The Hong Kong Society for Rehabilitation and Chair of the Campaign Advisory Board of King’s College, Cambridge University.
6. Lord Lupton CBE Independent Director and Chairman of Lloyds Bank Corporate Markets plc
Age: 64
Member of the Responsible Business Committee and the Board Risk Committee
Appointed: June 2017
Skills, experience and contribution:
Extensive international corporate experience, especially in financial markets
Strong board governance experience, including investor relations and remuneration
Regulatory and public policy experience
Significant experience in strategic planning and implementation
Lord Lupton was Deputy Chairman of Baring Brothers, co-founded the London office of Greenhill & Co., and was Chairman of Greenhill Europe. He was previously Chairman of Trustees of Dulwich Picture Gallery, a Trustee of the British Museum, Governor of Downe House School and a member of the International Advisory Board of Global Leadership Foundation. He became a Life Peer in October 2015 and is a former Treasurer of the Conservative Party. He served on the House of Lords Select Committee on Charities.
External appointments: Senior Advisor to Greenhill Europe, Trustee of the Lovington Foundation and Chairman of the Board of Visitors of the Ashmolean Museum with effect from 1 January 2020.
MANAGEMENT AND EMPLOYEES
7. Amanda Mackenzie OBE Independent Director
Age: 56
Member of the Remuneration Committee, the Responsible Business Committee and the Board Risk Committee
Appointed: October 2018
Skills, experience and contribution:
Extensive experience in responsible business
Considerable customer engagement experience
Strong digital technology experience
Significant marketing and brand background
Amanda was a member of Aviva’s Group Executive for seven years and Chief Marketing and Communications Officer. Prior to her current role, Amanda was seconded from Aviva as Executive Adviser to Project Everyone, to help launch the United Nations Sustainable Development Goals. She has over 25 years’ of commercial business practice, including director roles at British Airways AirMiles, BT, Hewlett Packard Inc, British Gas and as a Non-Executive Director of Mothercare plc. Amanda is a Life Fellow of the Royal Society of Arts and Fellow and past President of the Marketing Society.
External appointments: Chief Executive of Business in the Community – The Prince’s Responsible Business Network.
8. Nick Prettejohn Independent Director and Chairman of Scottish Widows Group
Age: 59
Member of the Audit Committee, the Nomination and Governance Committee and the Board Risk Committee
Appointed: June 2014
Skills, experience and contribution:
Deep financial services experience, particularly in insurance
In-depth regulatory knowledge and experience
Governance experience and strong leadership qualities
Significant experience in strategic planning and implementation
Nick has served as Chief Executive of Lloyd’s of London, Prudential UK and Europe and Chairman of Brit Insurance. He is a former Non-Executive Director of the Prudential Regulation Authority and of Legal & General Group Plc as well as Chairman of the Financial Services Practitioner Panel and the Financial Conduct Authority’s Financial Advice Working Group. He was previously a Member of the BBC Trust and Chairman of the Britten-Pears Foundation.
External appointments: Chairman of Reach plc (formerly Trinity Mirror plc) and of their Nomination Committee. He is also Chairman of the Royal Northern College of Music and a member of the Board of Opera Ventures.
9. Stuart Sinclair Independent Director
Age: 66
Chairman of the Remuneration Committee, Member of the Responsible Business Committee, the Board Risk Committee and the Nomination and Governance Committee
Appointed: January 2016
Skills, experience and contribution:
Extensive experience in retail banking, insurance and consumer finance
Governance and regulatory experience
Significant experience in strategic planning and implementation
Experience in consumer analysis, marketing and distribution
Stuart is a former Non-Executive Director of TSB Banking Group plc, TSB Bank plc, LV Group, Virgin Direct and Vitality Health (formerly Prudential Health). He was previously the Interim Chairman of Provident Financial plc and a former Senior Independent Director of Swinton Group Limited. In his executive career, he was President and Chief Operating Officer of Aspen Insurance after spending nine years with General Electric as Chief Executive Officer of the UK Consumer Finance business then President of GE Capital China. Before that he was Chief Executive Officer of Tesco Personal Finance and Director of UK Retail Banking at the Royal Bank of Scotland. He was a Council member of The Royal Institute for International Affairs (Chatham House).
External appointments: Senior Independent Director and Chair of the Risk & Capital Committee at QBE UK Limited (formerly QBE Insurance (Europe) Limited).
10. Sara Weller CBE Independent Director
Age: 58
Chairman of the Responsible Business Committee, Member of the Nomination and Governance Committee, the Remuneration Committee and the Board Risk Committee
Appointed: February 2012
Skills, experience and contribution:
Background in retail and associated sectors, including financial services
Strong board governance experience, including investor relations and remuneration
Passionate advocate of customers, the community, financial inclusion and the development of digital skills
Considerable experience of boards at both executive and non-executive level
Sara’s previous appointments include Managing Director of Argos, various senior positions at J Sainsbury (including Deputy Managing Director), Chairman of the Planning Inspectorate, Lead Non-Executive Director at the Department of Communities and Local Government, a Board member at the Higher Education Funding Council, a Governing Council Member of Cambridge University, a Non-Executive Director of Mitchells & Butlers as well as a number of senior management roles for Abbey National and Mars Confectionery.
External appointments: Non-Executive Director of United Utilities Group and Chair of their Remuneration Committee, Lead Non-Executive Director at the Department for Work and Pensions, Chair of the Remuneration Committee of New College, Oxford and Trustee of Lloyds Bank Foundation for England and Wales.
MANAGEMENT AND EMPLOYEES
EXECUTIVE DIRECTORS
11. António Horta-Osório Executive Director and Group Chief Executive
Age: 56
Appointed: January 2011 (Board), March 2011 (Group Chief Executive)
Skills, experience and contribution:
Extensive experience in, and understanding of, both retail and commercial banking built over a period of more than 30 years, working both internationally and in the UK
Drive, enthusiasm and commitment to customers
Proven ability to build and lead strong management teams
António previously worked for Citibank and Goldman Sachs and held various senior management positions at Grupo Santander before becoming its Executive Vice President and member of the Group’s Management Committee. He was a Non-Executive Director of Santander UK and subsequently its Chief Executive. He is also a former Non-Executive Director of the Court of the Bank of England.
External appointments: Non-Executive Director of EXOR N.V., Fundação Champalimaud and Sociedade Francisco Manuel dos Santos in Portugal, a member of the Board of Stichting INPAR Management/Enable and Chairman of the Wallace Collection.
12. William Chalmers Executive Director and Chief Financial Officer
Age: 51
Appointed: August 2019
Skills, experience and contribution:
Significant board level strategic and financial leadership experience including strategic planning and development, mergers and acquisitions, equity and debt capital structuring and risk management
Worked in financial services for over 25 years
William was previously Co-Head of the Global Financial Institutions Group at Morgan Stanley. Prior to that, he held a number of senior roles at Morgan Stanley, including Head of EMEA Financial Institutions Group. Before joining Morgan Stanley, William worked for JP Morgan, again in the Financial Institutions Group.
External appointments: None.
13. Juan Colombás Executive Director and Chief Operating Officer
Age: 57
Appointed: November 2013 (Board), January 2011 to September 2017 (Chief Risk Officer), September 2017 (Chief Operating Officer)
Skills, experience and contribution:
Significant banking and risk management experience
International business and management experience
Juan is responsible for leading a number of critical Group functions and driving the transformation activities across the Group in order to build the Bank of the Future. He was previously the Chief Risk Officer and an Executive Director of Santander’s UK business. Prior to this, he held a number of senior risk, control and business management roles across the Corporate, Investment, Retail and Risk Divisions of the Santander Group. He was previously the Vice Chairman of the International Financial Risk Institute.
External appointments: Member of the FCA Practitioner Panel.
| 1 | Lord Blackwell has announced his plan to retire as Group Chairman at or before the AGM in 2021. |
| 2 | Alan Dickinson has succeeded Anita Frew as Senior Independent Director on 1 December 2019 and will succeed her as Deputy Chairman when she retires from the Board at the AGM in May 2020. |
| 3 | Juan Colombás has announced his plan to retire from the Group in July 2020. |
EMPLOYEES
As at 31 December 2019, the Group employed 63,069 people (on a full-time equivalent basis), compared with 64,928 at 31 December 2018 and 67,905 at 31 December 2017. At 31 December 2019, 62,327 employees were located in the UK, 403 in continental Europe, 277 in the Americas, and 62 in the rest of the world. At the same date, 33,933 people were employed in Retail, 6,505 in Commercial Banking, 4,911 in Insurance and Wealth, and 17,720 in other functions.
The Group has Codes of Responsibility which apply to all employees. The Codes of Responsibility can be found at: www.lloydsbankinggroup.com/Responsible-Business.
COMPENSATION
Remuneration Content
| | Chairman’s statement and remuneration policy overview 117-121 |
| | |
| | Annual report on remuneration 122-133 |
| | |
| | 2020 Remuneration Policy 134-142 |
DEAR SHAREHOLDER
On behalf of the Board I am pleased to present the Directors’ Remuneration Report for the year ended 31 December 2019 and the proposed Directors’ Remuneration Policy (our ‘Policy’) for which we are seeking your support and approval at our Annual General Meeting in May 2020.
Our upcoming AGM marks the beginning of our next remuneration policy cycle, which will run until the end of 2022. This offered the opportunity to take a fresh look at how we incentivise and reward our colleagues, and what values and outcomes we wish to encourage.
The timing coincided with a great deal of public interest in matters of executive pay, fairness, employee engagement and the pay gap between those at the top of organisations compared to other colleagues. We have been active participants in these discussions, through meetings with shareholders, our unions, the Investment Association and some members of Parliament, as well as through an open dialogue with colleagues on a variety of topics related to their pay and benefits. These talks have had a material impact on the priorities and recommendations of the Remuneration Committee throughout the last year. In the pages which follow, the proposals which have emerged from these discussions are laid out in detail.
While we were pleased to receive over 90 per cent support for our Annual Report on Remuneration at the AGM in 2019, we heard during that process a continued desire for greater simplicity and transparency in our approach. To that end, we started to make changes early in 2019, without waiting for our full redesign to be finalised.
In November 2019, we announced our decision, subject to AGM approval, to reduce pension allowances for Executive Directors to 15 per cent of salary in a single step in 2020 with no offsetting adjustment in salary or other remuneration. We are also
making improvements to pensions for all the 50,000 colleagues who participate in Defined Contribution (DC) arrangements (the majority of our workforce) to make all members eligible for a maximum employer contribution of 15 per cent, and to increase the employer contribution for our lower paid colleagues by one per cent. This represents a significant investment of approximately £20 million per annum in our colleagues and aligns the employer contributions available to the wider workforce with those of Executive Directors. At the same time, the Group supports the third largest private sector defined benefit (DB) scheme accruing benefits for a further 16,000 current colleagues.
We have listened to feedback and the external sentiment around executive remuneration. Some of the sentiments that resonated with me and my Committee were that executive remuneration should be re-evaluated in the context of colleagues as a whole; be truly variable and not managed within a ‘corridor’ without being closely aligned with outcomes. We have tackled these sentiments head on with our proposals in the new Policy by reducing the new maximum opportunity for Executive Directors and by demonstrating with this year’s outcomes that performance and conduct do have material consequences, resulting in lower total remuneration.
OUR NEW POLICY
In approaching the refresh of the Directors’ Remuneration Policy, my committee colleagues and I thought carefully about what behaviours and outcomes we wanted to see and how the remuneration structure could support them. We approached the review with the following core aims:
| | | |
| | | |
 | | Remuneration should be linked to the Group’s purpose of Helping Britain Prosper |
| | | |
 | | Remuneration should reward and drive the right behaviours and outcomes and reflect both strategic (non-financial) and financial achievements |
| | | |
 | | Remuneration should be designed in a manner that is clear for all stakeholders and reflects their expectations |
| | | |
 | | Remuneration should be easy to explain and be viewed as fair |
| | | |
| | | |
It was with these objectives in mind that we designed the new Policy detailed on page 134 and summarised on page 119. The key headlines are as follows:
| | The maximum pension allowance for Executive Directors is reduced to 15 per cent of salary |
| | |
| | We are introducing a new long-term variable reward plan to align pay more closely to our business model of producing sustainable long-term returns |
| | |
| | As a result of the new Policy, the Group Chief Executive’s fixed pay will reduce by 8 per cent and his maximum total remuneration opportunity by 29 per cent |
Given the feedback we have received, we hope you will support the aims and the methods we outline, and vote accordingly ahead of the AGM in May.
GROUP PERFORMANCE AND VARIABLE REMUNERATION
For 2019, the performance of the Group was resilient in a challenging and uncertain economic environment. Despite a softening of margins and income, continued discipline in operating costs enabled the Group to maintain its significant investment in digitising and transforming the way we support customers, as well as to pay an increased dividend to shareholders. Financial results were however heavily impacted by the PPI provision of £2.45 billion; therefore a significant downward adjustment was made to the Group Performance Share pool to reflect this along with other conduct-related costs. The final 2019 Group Performance Share pool is £310.1 million, which is a reduction of 33 per cent compared to 2018. The vesting of the 2017 Executive Group Ownership Share was similarly affected by financial performance and shareholder returns, with a formulaic vesting outcome of 49.7 per cent. No discretion was used to change the vesting outcome.
The performance and strategic progress of the Group was however overshadowed by significant non-financial conduct issues during the latter part of the year, not least the findings of Sir Ross Cranston’s review into how the Group has treated customers who were the victims of the HBOS Reading fraud. These issues are reflected in the variable reward outcomes for Executive Directors.
COMPENSATION
EXECUTIVE DIRECTOR VARIABLE REWARDS DECISIONS
As a result of the overall performance of the Group and the issues faced during 2019, the Group Chief Executive and Chief Operating Officer independently requested that they be withdrawn from consideration for Group Performance Share awards for 2019. The Committee exercised its discretion to accept this request and welcomed the judgement shown in volunteering it as a consequence of the non-financial conduct issues mentioned above. No downward adjustment has been made to the overall Group Performance Share pool as a result of these individual decisions, which was therefore distributed to other colleagues outside the executive team.
For the newly appointed Chief Financial Officer, overall performance for 2019 was assessed at 3.12 out of 5 with a corresponding Group Performance Share award of £195,528. An award of 250 per cent of salary will be awarded under the final Executive Group Ownership Share to the Group Chief Executive and 237.5 per cent for Chief Financial Officer. No Group Ownership Share award is being made to the Chief Operating Officer who has announced his retirement. Further details of awards are provided on pages 124 and 130.
Executive Director total remuneration outcomes
The information below summarises Executive Director remuneration for the 2018 and 2019 performance years. Full details are provided in the Single total figure of remuneration table on page 122.
| Director | | 2018 | | | 2019 | | | | |
| António Horta Osório Group Chief Executive | | £ | 6.54m | | | £ | 4.73m | | |  | 28 | % |
| Juan Colombás Chief Operating Officer | | £ | 3.42m | | | £ | 2.58m | | | | 25 | % |
| William Chalmers Chief Financial Officer 1 Aug 2019 | | | – | | | £ | 5.14m | | | | | – |
| George Culmer Former Chief Financial Officer 1 Jan-1 Aug 2019 | | £ | 3.43m | | | £ | 1.95m | | | | | – |
HOW WE HAVE RESPONDED TO YOUR FEEDBACK
Together with my Committee members, I look forward to hearing your views on the remuneration arrangements outlined in the report and we hope the new Policy alongside the resolutions relating to remuneration will receive your support at the upcoming AGM.

Stuart Sinclair
Chairman, Remuneration Committee
COMPENSATION
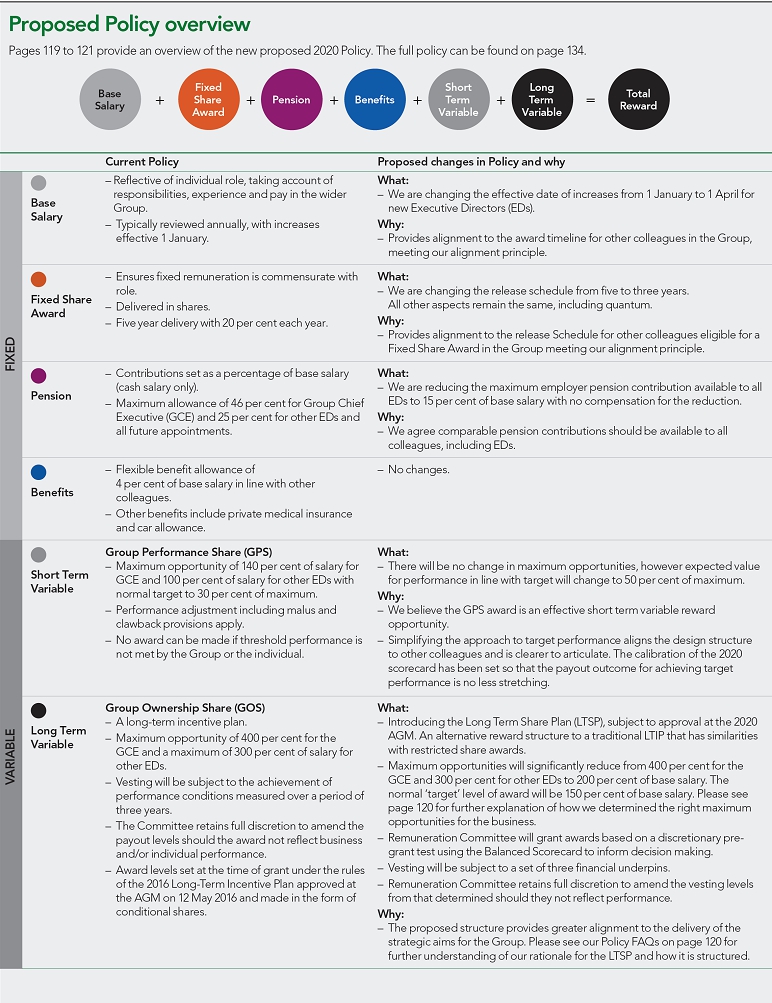
Proposed Policy overview
Pages 134 to 142 provide an overview of the new proposed 2020 Policy. The full policy can be found on page 115.
Current PolicyProposed changes in Policy and why
Base Salary – Reflective of individual role, taking account of responsibilities, experience and pay in the wider Group. – Typically reviewed annually, with increases effective 1 January. What: – We are changing the effective date of increases from 1 January to 1 April for new Executive Directors (EDs). Why: – Provides alignment to the award timeline for other colleagues in the Group, meeting our alignment principle.
Fixed Share Award– Ensures fixed remuneration is commensurate with role. – Delivered in shares. – 20 per cent released over five years. What: – We are changing the release schedule from five to three years. All other aspects remain the same, including quantum. Why: – Provides alignment to the release Schedule for other colleagues eligible for a Fixed Share Award in the Group meeting our alignment principle.
Pension – Contributions set as a percentage of base salary (cash salary only). – Maximum allowance of 46 per cent for Group Chief Executive (GCE) and 25 per cent for other EDs and all future appointments. What: – We are reducing the maximum employer pension contribution available to all EDs to 15 per cent of base salary with no compensation for the reduction. Why: – We agree comparable pension contributions should be available to all colleagues, including EDs.
Benefits – Flexible benefit allowance of 4 per cent of base salary in line with other colleagues. – Other benefits include private medical insurance and car allowance. – No changes.
Short Term Variable Group Performance Share (GPS) – Maximum opportunity of 140 per cent of salary for GCE and 100 per cent of salary for other EDs with normal target to 30 per cent of maximum. – Performance adjustment including malus and clawback provisions apply. – No award can be made if threshold performance is not met by the Group or the individual. What: – There will be no change in maximum opportunities, however expected value for performance in line with target will change to 50 per cent of maximum. Why: – We believe the GPS award is an effective short term variable reward opportunity. – Simplifying the approach to target performance aligns the design structure to other colleagues and is clearer to articulate. The approach to target setting has been adjusted to ensure that the outcome is no less stretching to achieve.
Long Term Variable Group Ownership Share (GOS) – A long-term incentive plan. – Maximum opportunity of 400 per cent for the GCE and a maximum of 300 per cent of salary for other EDs. – Vesting will be subject to the achievement of performance conditions measured over a period of three years. – The Committee retains full discretion to amend the payout levels should the award not reflect business and/or individual performance. – Award levels set at the time of grant under the rules of the 2016 Long-Term Incentive Plan approved at the AGM on 12 May 2016 and made in the form of conditional shares. What: – Introducing the Long Term Share Plan (LTSP), subject to approval at the 2020 AGM. An alternative reward structure to a traditional LTIP that has similarities with restricted share awards. – Maximum opportunities will significantly reduce from 400 per cent for the GCE and 300 per cent for other EDs to 200 per cent of base salary. The normal ‘target’ level of award will be 150 per cent of base salary. Please see page 101 for further explanation of how we determined the right maximum opportunities for the business. – Remuneration Committee will grant awards based on a discretionary pre-grant test using the Balanced Scorecard to inform decision making. – Vesting will be subject to a set of three financial underpins. – Remuneration Committee retains full discretion to amend the vesting levels from that determined should they not reflect performance. Why: – The proposed structure provides greater alignment to the delivery of the strategic aims for the Group. Please see our Policy FAQs on page 120 for further understanding of our rationale for the LTSP and how it is structured.
The Group’s approach to shareholding requirements
The Group currently operates a shareholding policy, please see page 127 for further details.
The Group considers it important to ensure Executive Directors continue to have a substantial shareholding after employment to continue to align their interests with shareholders over a longer time horizon than simply whilst in role. Our existing reward structures and the structure designed through the Long Term Share Plan, which, in line with regulatory requirements, mean that a substantial proportion of variable reward for Executive Directors and other senior employees takes the form of shares, deferred and held over a period of up to eight years. These structures achieve the outcomes intended from the introduction of a post-employment shareholding requirement and ensure that Executive Directors continue to meet their shareholding requirements for a minimum of two years after leaving the Group. On this basis, the Group already complies with best practice and therefore no formal post-employment shareholding policy is necessary.
COMPENSATION
New Policy FAQs
Long Term Share Plan  Why did you decide the new Long Term Share Plan is more appropriate for your business compared to the traditional LTIP? Why did you decide the new Long Term Share Plan is more appropriate for your business compared to the traditional LTIP?
We believe this Policy cycle is the most opportune time to restructure our reward package and introduce the LTSP for the following core reasons. Lower and less volatile potential reward outcomes aligned to a stable long-term business model We believe that a reward package that has less volatile outcomes is more reflective of our objective of delivering stable and sustainable returns and will incentivise stewardship over longer timeframes. A simpler structure with one set of annual metrics In recent years we have received significant feedback on the complexity of our reward structures. Removing multiple scorecards and focusing on a single simplified Balanced Scorecard will give management clearer line of sight and greater alignment of interests to long-term company performance. Amending the existing LTIP by reducing the number of measures was considered. However, we felt that this would not match the wider objectives of alignment to the Group’s strategy and the experience of colleagues. The use of a single Balanced Scorecard to inform both variable reward components provides clear line of sight to important annual and strategic measures, which can be tracked year on year through our disclosure. Promote fairness and consistency The structure supports reducing the gap between colleague and executive remuneration; the increase in certainty of award outcomes is offset by reduced opportunities. Performance against strategic goals will be assessed and Committee discretion will play an important role The Committee will have four opportunities to test performance, using a mixture of clear metrics and discretion, applied against a pre-determined approach.  Balanced Scorecard Balanced Scorecard
Strategic decisions will, as now, be measured through the inclusion of both financial and non-financial performance metrics within the Balanced Scorecard Individual assessment As now, the Committee will determine if an Executive Director’s personal performance justifies a variation in the assessment of performance or award values determined by the Balanced Scorecard, and will explain how this is determined | | | Pre-grant test Committee discretion, incorporating an assessment of risk and conduct, will be applied where actual behaviours or outcomes are not adequately captured in the Balanced Scorecard assessment Underpin assessment The Committee will make an assessment against the three financial underpins. In addition, the Committee will consider applying a downward discretionary adjustment by asking itself whether there are any non-financial factors that should be considered at vesting What factors will the Committee take into account when exercising discretion? When considering the use of discretion in conjunction with the underpin assessment, the Committee will consider the following key questions: Do the Group’s financial results and capital position adequately reflect risk, conduct and any other non-financial considerations? Has the Group suffered a serious conduct event or has severe reputational damage arisen from the Group not living its values? Has the bank lived up to its ambition to be the Best Bank for Customers? The Committee will explain its reasons for applying discretion in either direction, or for not doing so. How did you determine the new maximum opportunity for the Long Term Share Plan and did you consider shareholder guidelines that there should be at least a 50 per cent discount when moving to a restricted share model? We are reducing the maximum opportunity for the Group Chief Executive’s long-term awards by 50 per cent from 400 per cent to 200 per cent of base salary, and the normal ‘target’ level of award to 150 per cent of base salary. Unlike a number of restricted share schemes, our Long Term Share Plan will have a pre-grant test to determine the value of awards. As outlined, this will be based on the Balanced Scorecard (consistent with the short term variable award) with the expectation that the achievement of an overall outcome in line with target will lead to an award of 150 per cent of base salary. Under the Group Ownership Share Plan Executive Directors were eligible to receive a maximum award of 300 per cent. We wanted consistency in award maximum for all Executive Directors. This therefore marks a discount of 33 per cent but we are confident this is appropriate for the business given the use of a pre-grant test, underpins and the Committee’s intention to use discretion where appropriate. Why did the Committee decide that the three underpins chosen for the plan are the most appropriate? The pre-vest test against defined underpins after three years is an important feature to guard against the potential of ‘rewards for | | | failure.’ After considerable debate, we are confident that focusing on capital strength, relative returns and a progressive and sustainable ordinary dividend aligns with our commitments to shareholders. Underpins will be measured over a three year period year period from grant and each underpin element will determine the vesting of 33 per cent of the original award. The Committee will have discretion to consider any other events before confirming the vesting of awards using the questions outlined above. Balanced Scorecard How does the use of the Balanced Scorecard ensure that Executive Directors are rewarded for performance aligned to the strategic objectives of the Group? The Balanced Scorecard is considered by non-executives and management to be a transparent and effective tool to drive and assess performance while meeting regulatory requirements. Each measure has pre-set underlying objectives determined by the Remuneration Committee at the start of the performance year. In the interest of transparency, the Committee can confirm that for 2020 there is no change1 to the 15 measures in the 2019 Balanced Scorecard (fully disclosed on page 123) which the Committee consider provide sufficient breadth across the Group’s core business objectives and the optimum balance to measure our performance as a simple, low-risk, customer-focused UK financial services provider: Customer measures (33%) Providing a leading customer experience sits at the core of our strategy. The Group customer dashboard provides an assessment of how effectively we are serving customers across all brands, products and services, while other measures focused on complaint handling, customer perception, and trust in the Group, measure how effectively we are at being the best bank for customers. Colleagues and Conduct measures (33%) Colleagues are critical to the delivery of the Group’s long-term strategy and we confirmed our investment in training and development as part of transforming ways of working to drive better customer outcomes. Ensuring the way we operate is aligned with the Group’s low-risk appetite, as well as in line with the Group’s cultural aspiration, values and behaviours is key to our long-term success. Finance measures (33%) Our financial measures assess the Group’s ability to deliver a capital efficient, low cost and profitable bank. 1 The measure in relation to external reputation has been expanded to now also include relationship with the Group’s regulators. |
COMPENSATION
OUR NEW VARIABLE REWARD STRUCTURE
The Group’s purpose is to support our customers, colleagues and communities and to Help Britain Prosper. The Group’s business model is to be a low risk UK bank and rewards for the executive management team in that business should reflect and encourage the steady creation of shareholder value over the long-term, best measured through the share price. The long-term sustainable success of the business is driven by meeting the needs of different stakeholders and our proposed move to Long Term (restricted) Share awards within our revised variable reward structure | | | supports these strategic aims. To gain greater understanding of why we believe the implementation of this new approach is now appropriate for the Group and aligns to our business model in our Policy FAQs on page 120. The diagram below illustrates the performance inputs, underpin assessment and delivery of the Group’s proposed short and long-term variable reward structures. The new structure has multiple test points to ensure the Remuneration Committee can use its discretion and make an evaluation beyond formulaic outcomes. Further details on the use of discretion are explained in full within the Policy on page 137. | | | Removing complex standalone LTIP metrics and instead using a simplified Balanced Scorecard will give management clearer line of sight and greater alignment of interest to long-term share price performance whilst the underpin and pre-vest test, combined with the long-term delivery of shares over up to eight years, ensure that long-term and multi-year performance assessment is not compromised. |

HOW THE NEW STRUCTURE OPERATES Y1 Y2 Y3 Y4 Y5 Y6 Y7 Y8 40% 60% Pre-grant performance assessment and sizing of award determined at Remuneration Committee’s discretion, taking into consideration the key questions outlined on page 120. Long Term Share Plan Award Balanced Scorecard Individual ED Assessments Group Performance Share Long Term Share Plan Underpin Assessment 1 yr hold 1 yr hold 1 yr hold 1 yr hold 1 yr hold 33% 33% 33% CET 1 Ratio ROTE Ordinary Dividend Remuneration Committee evaluation. See page 120 for further detail. In light of the Chief Operating Officer, Juan Colombás’ retirement announcement in 2020, an illustration has not been provided here. Underpins (Pre-Vest Test)* Group CET1 ratio above the guided management buffer each year, including all regulatory buffers Group ROTE exceeds average for UK peer banks (excluding the Group) over the 3 years Actual dividend payments do not fall below stated progress policy in any year of the vesting period 40% 20% 40% 20% 20% TEST 20% 1 yr hold 20% 1 yr hold 20% 1 yr hold * Indicative underpin definition; final details to be confirmed in 2020 DRR Implementation Report.
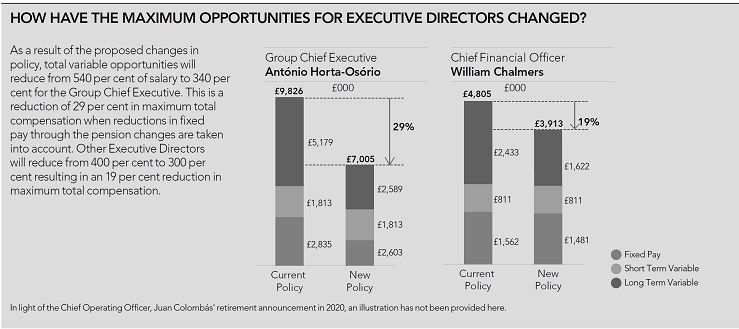
HOW HAVE THE MAXIMUM OPPORTUNITIES FOR EXECUTIVE DIRECTORS CHANGED? As a result of the proposed changes in policy, total variable opportunities will reduce from 540 per cent of salary to 340 per cent for the Group Chief Executive. This is a reduction of 29 per cent in maximum total compensation when reductions in fixed pay through the pension changes are taken into account. Other Executive Directors will reduce from 400 per cent to 300 per cent resulting in an 19 per cent reduction in maximum total compensation. New Policy Current Policy £000 £000 £2,828 £2,603 £1,813 £1,813 £5,180 29% £2,589 Chief Financial Officer William Chalmers Group Chief Executive António Horta-Osório £1,552 £1,473 £811 £811 £2,433 19% £1,622 Fixed Pay Short Term Variable Long Term Variable Current Policy New Policy Current Policy In light of the Chief Operating Officer, Juan Colombás’ retirement announcement in 2020, an illustration has not been provided here.
COMPENSATION
2019 Annual report on remuneration
EXECUTIVE DIRECTOR SINGLE TOTAL FIGURE OF REMUNERATION
| | | António Horta-Osório | | Juan Colombás | | William Chalmers | | George Culmer | | Total |
| £000 | | 2019 | | 2018 | | 2019 | | 2018 | | 2019 | | 2018 | | 2019 | | 2018 | | 2019 | | 2018 |
| Base Salary | | 1,269 | | 1,244 | | 795 | | 779 | | 331 | | – | | 461 | | 776 | | 2,856 | | 2,799 |
| Fixed Share Award | | 1,050 | | 900 | | 497 | | 497 | | 252 | | – | | 298 | | 504 | | 2,097 | | 1,901 |
| Benefits | | 166 | | 157 | | 74 | | 68 | | 19 | | – | | 41 | | 49 | | 300 | | 274 |
| Pension | | 419 | | 573 | | 199 | | 195 | | 83 | | – | | 130 | | 194 | | 831 | | 962 |
| Total Fixed Pay | | 2,904 | | 2,874 | | 1,565 | | 1,539 | | 685 | | – | | 930 | | 1,523 | | 6,084 | | 5,936 |
| Group Performance Share1 | | – | | 1,178 | | – | | 527 | | 81 | | – | | 113 | | 527 | | 194 | | 2,232 |
| Group Ownership Share/Long Term Incentive (LTIP)2,3 | | 1,821 | | 2,490 | | 1,011 | | 1,355 | | – | | – | | 911 | | 1,374 | | 3,743 | | 5,219 |
| Total Variable Pay | | 1,821 | | 3,668 | | 1,011 | | 1,882 | | 81 | | – | | 1,024 | | 1,901 | | 3,937 | | 7,451 |
| Other Remuneration4 | | 2 | | 2 | | 1 | | 1 | | – | | – | | 1 | | 1 | | 4 | | 4 |
| Buy out award5 | | – | | – | | – | | – | | 4,378 | | – | | – | | – | | 4,378 | | – |
| Total Remuneration | | 4,727 | | 6,544 | | 2,577 | | 3,422 | | 5,144 | | – | | 1,955 | | 3,425 | | 14,403 | | 13,391 |
| 1 | William Chalmers was awarded a full year Group Performance Share award of £195,528 which has been pro-rated to reflect five months as an Executive Director for the purpose of the table above. Awards for William Chalmers and George Culmer will be made in March 2020 in a combination of cash and shares. 40 per cent will be released in the first year following the award with £2,000 paid in cash, and the balance of the upfront 40 per cent delivered in shares; 50 per cent of which will be subject to holding until March 2021. The remaining 60 per cent is deferred into shares with 40 per cent vesting in 2021 and 20 per cent in 2022. 50 per cent of each release will be subject to a further 12-month holding in line with regulatory requirements. |
| | |
| 2 | The 2017 Group Ownership Share (GOS) vesting (see page 125) at 49.7 per cent and dividend equivalents awarded in shares were confirmed by the Remuneration Committee at its meeting on 18 February 2020. The total number of shares vesting were 2,643,386 and 425,413 shares delivered in respect of dividend equivalents for António Horta-Osório, 1,467,137 shares vesting and 236,113 shares delivered in respect of dividend equivalents for Juan Colombás and 1,322,490 shares vesting and 212,834 shares delivered in respect of dividend equivalents for George Culmer. This award was pro-rated to reflect George’s leave date. William Chalmers was not granted a 2017 GOS award. The average share price between 1 October 2019 and 31 December 2019 (59.34 pence) has been used to indicate the value. The shares were awarded in 2017 based on a share price of 68.814p pence and as such no part of the reported value is attributable to share price appreciation. |
| | |
| 3 | LTIP and dividend equivalent figures for 2018 have been adjusted to reflect the share price on the date of vesting (62.9679 pence) instead of the average price (56.04 pence) reported in the 2018 report. |
| | |
| 4 | Other remuneration payments comprise income from all employee share plans, which arises through employer matching or discounting of employee purchases. |
| | |
| 5 | William Chalmers joined the Group on 3 June 2019 and was appointed as Chief Financial Officer on 1 August 2019 on the retirement of George Culmer. He was granted deferred cash of £2,046,097 and deferred share awards over 4,086,632 Shares, to replace unvested awards from his former employer, Morgan Stanley, that were forfeited as a result of him joining the Group. The deferred cash and the number of Shares over which the deferred share awards were granted was calculated using the USD:GBP exchange rate and the respective mid-market closing prices of Mr Chalmers’ previous employer and the Group on 3 June 2019. |
| | |
| | The awards are subject to a vesting schedule and retention periods that match the vesting schedule and retention periods of the awards forfeited and as a result, the awards vest in tranches until January 2022. The awards were granted pursuant to Listing Rule 9.4.2, and in accordance with the regulatory requirements for buy-outs and are subject to clawback. Clawback will also apply to any awards exercised prior to the first anniversary of employment. |
PENSION AND BENEFITS
| Pension/Benefits £ | | António Horta-Osório | | Juan Colombás | | William Chalmers | | George Culmer |
| Cash allowance in lieu of pension contribution | | 418,865 | | 198,735 | | 82,806 | | 129,892 |
| Car or car allowance | | 12,000 | | 12,000 | | 5,000 | | 19,646 |
| Flexible benefits payments | | 49,776 | | 31,174 | | 13,249 | | 20,783 |
| Private medical insurance | | 42,341 | | 19,246 | | 279 | | 481 |
| Tax preparation | | 24,000 | | 9,000 | | – | | – |
| Transportation | | 37,606 | | 2,359 | | – | | – |
DEFINED BENEFIT PENSION ARRANGEMENTS
António Horta-Osório has a conditional unfunded pension commitment. This was a partial buy-out of a pension forfeited on joining from Santander Group. It is an Employer-Financed Retirement Benefits Scheme (EFRBS). The EFRBS provides benefits on a defined benefit basis at a normal retirement age of 65. The benefit in the EFRBS accrued during the six years following commencement of employment, therefore ceasing to accrue as of 31 December 2016.
The EFRBS was subject to performance conditions and it provided for a percentage of the GCE’s base salary or reference salary in the 12 months before retirement or leaving. No additional benefit is due in the event of early retirement. The rate of pension accrued in each year depended on share price conditions being met. In March 2019, the GCE asked that his defined benefit pension be based on a percentage of his pensionable salary in 2014. The total pension due is now fixed at 6 per cent of his 2014 reference salary of £1,220,000, or £73,200.
There are no other Executive Directors with defined benefit pension entitlements.
Under terms agreed when joining the Group, Juan Colombás is entitled to a conditional lump sum benefit of £718,996 either (i) on reaching normal retirement age of 65 unless he voluntarily resigns or is dismissed for cause, or (ii) on leaving due to long-term sickness or death.
COMPENSATION
CALCULATING THE 2019 GROUP PERFORMANCE SHARE OUTCOME

| Allocating Underlying Profit | | |
| To simplify the approach to determining the Group Performance Share outcome for 2019, the Committee agreed that a fixed 5 per cent of Underlying Profit (UP) would be used as a starting position for the overall pool. | | £8,349m1 x 5% =£417.4m |
| The threshold, below which no bonus is payable, remains set at 20 per cent below target UP. | | |
| For 2019, UP target was £8,637 million, actual UP was £8,349 million. | | |
1 Underlying profit of £7,531m, adjusted by £21m for year-on-year Prudential Value Adjustment in line with regulatory requirement, £445m for conduct and costs, and £352m for Group Performance Share expenses in 2019.
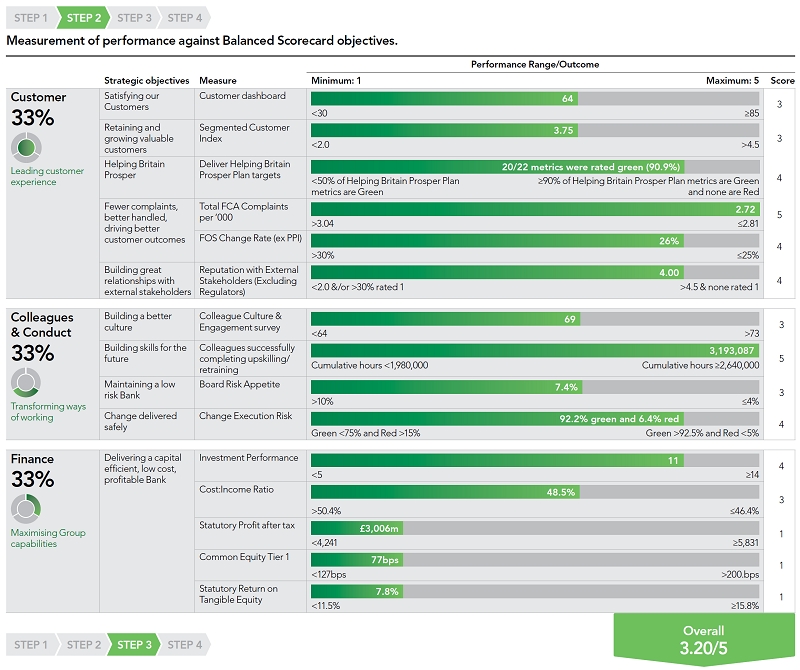
STEP 1 STEP 2 STEP 3 STEP 4 Measurement of performance against Balanced Scorecard objectives. Strategic objectives Measure Performance Range/Outcome Minimum: 1 Maximum: 5 Score Customer 33% Leading customer experience Satisfying our Customers Customer dashboard 64 <30 .85 3 Retaining and growing valuable customers Segmented Customer Index 3.75 <2.0 >4.5 3 Helping Britain Prosper Deliver Helping Britain Prosper Plan targets 20/22 metrics were rated green (90.9%) <50% of Helping Britain Prosper Plan 4 metrics are Green .90% of Helping Britain Prosper Plan metrics are Green and none are Red Fewer complaints, better handled, driving better customer outcomes Total FCA Complaints per e 000 2.72 <3.04 .2.81 5 FOS Change Rate (ex PPI) 26% >30% .25% 4 Building great relationships with external stakeholders Reputation with External Stakeholders (Excluding Regulators) 4.00 <2.0 &/or >30% rated 1 >4.5 & none rated 1 4 Colleagues & Conduct 33% Transforming ways of working Building a better culture Colleague Culture & Engagement survey 69 <64 >73 3 Building skills for the future Colleagues successfully completing upskilling/ retraining 3,193,087 Cumulative hours <1,980,000 Cumulative hours .2,640,000 5 Maintaining a low risk Bank Board Risk Appetite 7.4% >10% .4% 3 Change delivered safely Change Execution Risk 92.2% green and 6.4% red Green <75% and Red >15% Green >92.5% and Red <5% 4 Finance 33% Maximising Group capabilities Delivering a capital efficient, low cost, profitable Bank Investment Performance 11 <5 .14 4 Cost:Income Ratio 48.5% >50.4% .46.4% 3 Statutory Profit after tax ‘3,006m <4,241 .5,831 1 Common Equity Tier 1 77bps <127bps >200.bps 1 Statutory Return on Tangible Equity 7.8% <11.5% .15.8% 1 STEP 1 STEP 2 STEP 3 STEP 4
Application of Group performance modifier
The modifier determined by Group Balanced Scorecard performance is applied to the proportion of UP allocated under Step 1.
| 2019 Balanced Scorecard Outcome | 1.00-1.49 | 1.5-1.79 | 1.8-2.09 | 2.1-2.39 | 2.4-2.69 | 2.7-2.99 | 3.0-3.29 | 3.3-3.59 | 3.6-3.89 | 3.9-4.19 | 4.2-4.49 | 4.5-4.79 | 4.8-5 |
| Group Balanced Scorecard Modifier | 0.00 | 0.55 | 0.70 | 0.80 | 0.90 | 0.95 | 1.00 | 1.05 | 1.10 | 1.15 | 1.20 | 1.25 | 1.30 |
| Group Balanced Scorecard Modifier | £417.4m x 1.00 =£417.4m |

| Application of adjustments for risk, conduct and other factors. | | |
| The overall pool was reduced by £107.3m to reflect the impact of conduct-related provisions and regulatory fines received during 2019. | | £107.3m |
| Overall GPS pool | | £310.1m |
COMPENSATION
EXECUTIVE DIRECTORS’ GROUP PERFORMANCE SHARE OUTCOME FOR 2019

Balanced Scorecard performance
Individual awards for Executive Directors are determined through the assessment of individual performance using the Group or their divisional balanced scorecard. Awards will not be made if the Group does not meet threshold financial performance or if an individual receives a score below 2.6 out of 5.

Group Chief Executive António Horta-Osório The Group Chief Executive’s performance assessment for 2019 reflected the Group’s objectives For Group Balanced Scorecard please see page 103 Chief Operating Officer Juan Colombás Chief Operating Office Scorecard rating BSC category Assessment Customer 3.00 Colleague & Conduct 3.63 Finance 4.33 Chief Financial Officer William Chalmers Finance Division Scorecard rating BSC category Assessment Customer 3.00 Colleague & Conduct 3.29 Finance 2.71 Finance Division Scorecard rating BSC category Assessment Customer 3.00 Colleague & Conduct 3.29 Finance 2.71
Individual Performance Assessment and Committee Discretion
Personal contribution and how performance has been achieved through leadership approach may be considered where it diverges from scorecard outcomes. Judgement may be applied in deciding whether personal contribution should alter the mechanical outcome provided by balanced scorecard metrics.
Key considerations factored into assessing performance and overall rating include, but are not limited to, the following:

Other performance considerations Strong progress in executing the Group’s strategic transformation programme, with significant investment in technology, people and improved customer propositions Further progress on the strategy for growing our Financial Planning & Retirement business with the successful launch of our Schroders Personal Wealth joint venture But acknowledged organisational failures in the Group’s handling of some customers, including the victims of the historic HBOS Reading fraud Other performance considerations Strong leadership and oversight of the Group’s strategic transformation programme, transforming the Group for success in a digital world. Further investment and improvements delivered in the Group’s operational resilience, resulting in a c30% reduction in critical incident occurrences in 2019. Acknowledged failures in the handling of customers impacted by the historic HBOS reading fraud. Other performance considerations Strong start to tenure as CFO, overseeing a challenging second half, marked by the substantial increase in PPI provision related to the deadline for claims submission. Delivered costs, investments and FTE favourable to plan in 2019, maintaining cost efficiency versus peers. Successful acquisition of the Tesco mortgage book finalised under William’s stewardship Other performance considerations Prior to his retirement at the end of July, George oversaw delivery of a good financial performance in H1, with market leading efficiency and returns Balance sheet strength maintained with lower capital requirement Maintained prudent approach to growth and risk The Group Chief Executive and Chief Operating Officer voluntarily requested to be withdrawn from consideration for a 2019 award. Overall score 3.12/5 Overall score 3.12/5
GPS award commensurate with performance determined
Awards are initially based on pre-determined formulaic pay out ranges, commensurate with performance scores as follows:

Individual Performance Score 1.00 – 2.59 – Threshold 2.60 – 2.69– 2.70– 2.99– Target 3.00– 3.29– 3.30– 3.59– 3.60– 3.89– 3.90– 4.19– 4.20– 4.49– 4.50– 4.79– 4.80– 5.00– Maximum Opportunity (% of maximum) 0% 0.0% – 19.5%– 19.5% – 30.0%– 30.0% – 40.5% 40.5% – 51.0% 51.0% – 61.5%– 61.5% – 72.0%– 72.0% – 82.5% 82.5% – 93.0% 93.0% – 100.0%–
Committee determine final award outcome
Judgement is applied by the Remuneration Committee to determine award levels with the formulaic pay-out ranges.
The Remuneration Committee exercised its overall discretion to accept the voluntary withdrawal of the Group Chief Executive and Chief Operating Officer from consideration for a 2019 GPS award. Accordingly, no award value was determined.
Executive
Directors | Balanced
Scorecard | Final
Individual
Score | Award
(% of max) | Group
Funding
Modifier1 | Final
Award
(% of max) | GPS Maximum
Opportunity
(% of salary) | Final Award
(% of salary) | Final Award
(£) |
| António Horta–Osório | Group | – | – | – | – | 140% | – | – |
| Juan Colombás | Chief Operating Office | – | – | – | 100% | – | – |
| William Chalmers | Finance | 3.12 | 34.2% | 71.9% | 24.6% | 100% | 24.6% | £195,528 |
| George Culmer2 | Finance | 3.12 | 34.2% | 24.6% | 100% | 24.6% | £113,407 |
| 1 | The overall GPS pool was 28.1 per cent below the target pool of £431.2 million. Therefore, a downward adjustment of 28.1 per cent was applied to the award recommendations of William Chalmers and George Culmer. |
| | |
| 2 | Award pro-rated to reflect working days of employment. |
COMPENSATION
2017 EXECUTIVE GROUP OWNERSHIP SHARE
Group Ownership Share (GOS) Awards in the form of conditional rights to free shares in 2017 were made over shares with a value of 300 per cent of reference salary for the GCE and 275 per cent of salary for the former CFO and COO. These awards are vesting at 49.7 per cent, as detailed in the table below. The formulaic outcome reflects the Group’s solid financial and strong strategic performance over the three years ended 31 December 2019, balanced against a challenging economic and political environment impacting negatively on share price performance. This has resulted in no vesting for the Total Shareholder Return component and lower than expected Economic Profit.
The Committee has an overarching discretion to reduce the level of award that will vest, regardless of whether the performance condition for partial or full vesting has been met. This qualitative judgement ensures that vesting is not simply driven by a formula that may give an unexpected or unintended remuneration outcome compared to Group performance and that share price performance can also be considered. The Committee agreed that no adjustment would be applied to the vesting outcome of 49.7 per cent.
Shares will vest on a pro–rata basis up to the seventh anniversary of the award grant and each set of vested shares will be subject to a further holding period. Further details on deferral and holding can be found on pages 110-111.
| Weighting | | Measure | | Threshold | | Maximum | | Actual | | Vesting |
| 30% | | Absolute Total Shareholder Return | | 8% p.a. | | 16% p.a. | | 5.6% p.a. | | 0.00% |
| 25% | | Economic Profit1 | | £3,074m | | £3,769m | | £3,138m | | 7.97% |
| 10% | | Cost : Income Ratio2 | | 47.2% | | 45.7% | | 45.9% | | 8.00% |
| 10% | | Customer Complaint Handling | | 3.52 complaints per 1,000 | | 3.18 complaints per 1,000 | | 2.72 | | 5.00% |
| | | FCA reportable complaints | | | | | | | | |
| | | | | | | | | | | |
| | | Financial Ombudsman Service (FOS) uphold rate | | =< 29% FOS uphold rate | | =<25% FOS uphold rate | | 26% | | 3.75% |
| 10% | | Customer Satisfaction | | | | | | | | |
| | | Group performance relative to market peers | | 3rd | | 1st | | 1st | | 10.00% |
| 7.5% | | Digital | | | | | | | | |
| | | Active Customer Growth | | 14.3m | | 14.9m | | 15.0m | | 7.50% |
| 7.5% | | People | | | | | | | | |
| | | Employee Engagement Index | | 67 | | 73 | | 74 | | 7.50% |
| | | | | | | Award (% maximum) vesting 49.70% |
| 1 | A measure of profit taking into account Expected Losses, tax and a charge for equity utilisation |
| | |
| 2 | Adjusted to exclude remediation costs |
SINGLE TOTAL FIGURE OF REMUNERATION FOR CHAIRMAN AND NON-EXECUTIVE DIRECTORS
| | | Fees £000 | | Benefits £0002 | | Total £000 |
| | | 2019 | | 2018 | | 2019 | | 2018 | | 2019 | | 2018 |
| Chairman and current Non–Executive Directors | | | | | | | | | | | | |
| Lord Blackwell | | 758 | | 743 | | 12 | | 12 | | 770 | | 755 |
| Alan Dickinson | | 240 | | 230 | | 1 | | – | | 241 | | 230 |
| Anita Frew | | 356 | | 380 | | 1 | | – | | 357 | | 380 |
| Simon Henry | | 186 | | 182 | | – | | – | | 186 | | 182 |
| Lord Lupton | | 314 | | 318 | | 1 | | – | | 315 | | 318 |
| Amanda Mackenzie OBE | | 156 | | 31 | | – | | – | | 156 | | 31 |
| Nick Prettejohn | | 471 | | 449 | | 5 | | – | | 476 | | 449 |
| Stuart Sinclair | | 210 | | 172 | | – | | – | | 210 | | 172 |
| Sara Weller CBE | | 203 | | 199 | | 4 | | – | | 207 | | 199 |
| Sarah Legg1 | | 6 | | – | | – | | – | | 6 | | – |
| Former Non–Executive Directors | | | | | | | | – | | | | |
| Deborah McWhinney | | – | | 174 | | – | | – | | – | | 174 |
| 1 | Appointed 1 December 2019. |
| | |
| 2 | The Chairman receives a car allowance of £12,000. Other benefits relate to reimbursement for expenses incurred in the course of duties. |
PAYMENTS FOR LOSS OF OFFICE
George Culmer retired as Chief Financial Officer and an Executive Director with effect from 1 August 2019 and retired from the Group on 2 August 2019.
He received a payment of £79,595 in lieu of unused annual leave entitlement up to his Retirement Date. In accordance with contractual entitlements, George was entitled to a capped contribution of up to £10,000 (excluding VAT) towards legal fees incurred in connection with his retirement from the Company.
In accordance with retirement provisions, George has maintained outstanding deferred Group Performance Share awards under the 2016 GPS Plan (83,466 Shares), 2017 GPS Plan (176,108 Shares) and under the 2018 GPS Plan (501,341 Shares) which continue to be released on their scheduled release dates, subject to the relevant terms (including post-vesting holding periods, malus and, where applicable, clawback and deductions for national insurance and income tax).
A 2019 Group Performance Share award was made, pro-rated for the period of 2019 elapsed to George Culmer’s retirement date, as described on page 105. This award is subject to deferral, holding periods, malus and clawback. Under the Executive Group Ownership Plan Rules (Executive GOS), George Culmer’s outstanding 2017 and 2018 Executive GOS awards will be time pro-rated to his retirement date (2017 becomes 2,660,946 Shares and 2018 becomes 2,144,958 Shares). The awards remain subject to the performance measures which apply to the relevant awards and will continue to vest at the normal vesting dates and be released on their scheduled release dates, subject to the relevant terms (including post-vesting retention periods, malus and, where applicable, clawback and to deductions for national insurance and income tax).
No other payment for loss of office were made in 2019.
COMPENSATION
PAYMENTS WITHIN THE REPORTING YEAR TO PAST DIRECTORS
There were no payments made to past directors in 2019.
EXTERNAL APPOINTMENTS
António Horta-Osório – During the year ended 31 December 2019, the GCE served as a Non- Executive Director of Exor, Fundação Champalimaud, Stichting INPAR Management/Enable and Sociedade Francisco Manuel dos Santos. The Group Chief Executive is entitled to retain the fees, which were £349,303 in total.
No other Executive Director served as a Non-Executive Director in 2019.
RELATIVE IMPORTANCE OF SPEND ON PAY
The graphs illustrate the total remuneration of all Group employees compared with returns of capital to shareholders in the form of dividends and share buyback.

Dividend £m 2019 2018 [xxx] 4,039 Salaries and performance-based compensation £m 2019 2018 2,919 2,991
| 1 | 2019: Ordinary dividend in respect of the financial year ended 31 December 2019, partly paid in 2019 and partly to be paid in 2020. 2018: Ordinary dividend in respect of the financial year ended 31 December 2018, partly paid in 2018 and partly paid in 2019 and intended share buyback. |
COMPARISON OF RETURNS TO SHAREHOLDERS AND GCE TOTAL REMUNERATION
The chart below shows the historical total shareholder return (TSR) of Lloyds Banking Group plc compared with the FTSE 100 as required by the regulations.
The FTSE 100 index has been chosen as it is a widely recognised equity index of which Lloyds Banking Group plc has been a constituent throughout this period.
TSR INDICES – LLOYDS BANKING GROUP AND FTSE 100
Growth in the value of a hypothetical £100 holding since 31 December 2009 (to 31 December 2019)

Growth in the value of a hypothetical £100 holding since 31 December 2009 (to 31 December 2019) Value of £100 invested on 31 December 2009 250 0 25 50 75 100 125 150 175 200 225 Dec 2009 Dec 2010 Dec 2011 Dec 2012 Dec 2013 Dec 2014 Dec 2015 Dec 2016 Dec 2017 Dec 2018 Dec 2019
| | | CEO | | 2010 | | 2011 | | 2012 | | 2013 | | 2014 | | 2015 | | 2016 | | 2017 | | 2018 | | 2019 |
| GCE single figure of remunerati on £000 | | J E Daniels | | 2,572 | | 855 | | – | | – | | – | | – | | – | | – | | – | | – |
| | António Horta-Osório | | – | | 1,765 | | 3,398 | | 7,475 | | 11,540 | | 8,704 | | 5,791 | | 6,434 | | 6,544 | | 4,727 |
| | | | | | | | | | | | | | | | | | | | | | | |
Annual bonus/
GPS payout (% of maximum opportunity) | | J E Daniels | | 62% | | 0% | | – | | – | | – | | – | | – | | – | | – | | – |
| | António Horta-Osório | | – | | – | | 62% | | 71% | | 54% | | 57% | | 77% | | 77% | | 67.60% | | – |
| | | | | | | | | | | | | | | | | | | | | | | |
| Long-term incentive vesting (% of maximum opportunity) | | J E Daniels | | 0% | | 0% | | – | | – | | – | | – | | – | | – | | – | | – |
| | António Horta-Osório | | – | | 0% | | 0% | | 54% | | 97% | | 94.18% | | 55% | | 66.30% | | 68.70% | | 49.7% |
| | | | | | | | | | | | | | | | | | | | | | | |
| TSR component vesting (% of maximum) | | J E Daniels | | 0% | | 0% | | – | | – | | – | | – | | – | | – | | – | | |
| | António Horta-Osório | | – | | 0% | | 0% | | 25.30% | | 30% | | 30% | | 0% | | 0% | | 0% | | 0% |
Notes: J E Daniels served as GCE until 28 February 2011; António Horta-Osório was appointed GCE from 1 March 2011. António Horta-Osório declined to take a bonus in 2011 and independently requested that he be withdrawn from consideration for a Group Performance Share award in 2019.
COMPENSATION
DIRECTORS’ SHARE INTERESTS AND SHARE AWARDS
DIRECTORS’ INTERESTS
| | | Number of shares | | Number of options | | Total shareholding1 | | Value |
| | | Owned outright | | Unvested
subject to
continued
employment | | Unvested
subject to
performance | | Unvested
subject to
continued
employment | | Vested
unexercised | | Total at
31 December
2019 | | Total at
20 February
2020 | | Expected value
at 31 December
2019 (£000s)2 |
| Executive Directors | | | | | | | | | | | | |
| António Horta-Osório | | 20,817,507 | | 1,509,516 | | 19,729,182 | | 53,618 | | | | 42,109,823 | | 42,110,475 | 7 | 20,165 |
| Juan Colombás | | 10,713,340 | | 694,247 | | 11,171,375 | | 29,109 | | | | 22,608,071 | | 22,608,639 | 7 | 10,645 |
| William Chalmers³ | | 705,398 | | – | | – | | 3,268,460 | | | | 3,973,858 | | 3,973,858 | | 2,485 |
| George Culmer4 | | 16,626,666 | | 677,449 | | 6,854,490 | | – | | | | 24,158,605 | | 24,158,605 | | 12,967 |
| Non-Executive Directors | | | | | | | | | | | | |
| Lord Blackwell | | 150,000 | | – | | – | | – | | – | | 150,000 | | 150,000 | | n/a |
| Alan Dickinson | | 200,000 | | – | | – | | – | | – | | 200,000 | | 200,000 | | n/a |
| Anita Frew | | 450,000 | | – | | – | | – | | – | | 450,000 | | 450,000 | | n/a |
| Simon Henry | | 250,000 | | – | | – | | – | | – | | 250,000 | | 250,000 | | n/a |
| Sarah Legg5 | | 0 | | – | | – | | – | | – | | 0 | | 0 | | – |
| Lord Lupton | | 1,000,000 | | – | | – | | – | | – | | 1,000,000 | | 1,000,000 | | n/a |
| Amanda Mackenzie OBE | | 63,567 | | – | | – | | – | | – | | 63,567 | | 63,567 | | n/a |
| Nick Prettejohn6 | | 69,280 | | – | | – | | – | | – | | 69,280 | | 69,280 | | n/a |
| Stuart Sinclair | | 362,664 | | – | | – | | – | | – | | 362,664 | | 362,664 | | n/a |
| Sara Weller CBE | | 372,988 | | – | | – | | – | | – | | 372,988 | | 372,988 | | n/a |
| 1 | Including holdings of connected persons. |
| | |
| 2 | Awards subject to performance under the GOS had an expected value of 50 per cent of face value at grant (in line with the Remuneration Policy). Values are based on the 31 December 2019 closing price of 62.535 pence. |
| | |
| 3 | Appointed 1 August 2019. |
| | |
| 4. | Retired as Chief Financial Officer and an Executive Director with effect from 1 August 2019 and from the Group 2 August 2019. The number of shares in respect of which the GOS Awards (unvested subject to performance) vests, will be reduced to reflect the period from the start of the Performance Period to 2 August 2019, date of leaving, at the point of vest. |
| | |
| 5 | Appointed 1 December 2019. |
| | |
| 6 | In addition, Nick Prettejohn held 400 6.475 per cent preference shares at 1 January 2019 and 31 December 2019. |
| | |
| 7 | The changes in beneficial interests for António Horta-Osório (652 shares), Juan Colombás (568 shares) relate to ‘partnership’ and ‘matching’ shares acquired under the Lloyds Banking Group Share Incentive Plan between 31 December 2019 and 20 February 2020. There have been no other changes up to 20 February 2020. |
SHAREHOLDING REQUIREMENTS
Executives are expected to build and maintain a company shareholding in direct proportion to their remuneration in order to align their interests to those of shareholders. The minimum shareholding requirements Executive Directors are expected to meet are as follows: 350 per cent of base salary for the GCE and 250 per cent of base salary for other Executive Directors. Newly appointed individuals will have three years from appointment to achieve the shareholding requirement. In the event that exceptional individual circumstances exist resulting in an Executive not being able to comply with the Policy, the Remuneration Committee will consider whether an exception should apply.
In addition to the Group’s shareholding requirements, shares vesting are subject to holding periods in line with regulatory requirements.
For the year ending 31 December 2019, the GCE and COO continued to meet their shareholding requirements, as detailed within the illustration below. William currently holds 52 per cent of his salary in shares and will have until 2 June 2022 to achieve the requirement. At the time of his departure in August 2019, George Culmer held 1,233 per cent of his salary in shares.
The Group does not operate a formal post-employment shareholding policy. Existing reward structures and the Long Term Share Plan under the proposed new Policy have been designed in line with regulatory requirements and ensure that a substantial proportion of variable reward for Executive Directors and other senior employees takes the form of shares deferred and held over a period of up to eight years. These structures already ensure that Executive Directors continue to meet our shareholding requirements for a minimum of two years after leaving the Group.
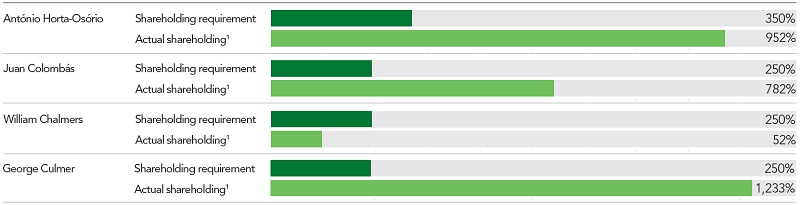
António Horta-Osório 350% George Culmer 250% 782% 1,233% 952% Juan Colombás 250% 52% William Chalmers Shareholding requirement Actual shareholding1 Shareholding requirement Actual shareholding1 Shareholding requirement Actual shareholding1 0 130 260 390 520 650 780 910 1040 1170 1300 0 130 260 390 520 650 780 910 1040 1170 1300 0 130 260 390 520 650 780 910 1040 1170 1300 Shareholding requirement Actual shareholding1
| 1 | Calculated using the average share price for the period 1 January 2019 to 31 December 2019 (58.07 pence). Includes ordinary shares acquired through the vesting of the deferred Group Performance Share plan, Fixed Share Awards as the shares have no performance conditions; American Deposit Receipts (ADRs) with each one ADR equating to four shares, Executive Share Awards which have vested but have not been exercised; shares held in the Share Incentive Plan (SIP) Trust, i.e. Free, Partnership, Matching and Dividend shares which are no longer subject to forfeiture, as defined in the SIP Rules. Shares held by Connected Persons, as defined by the Companies Act, but broadly meaning spouse or partner and children, may also be included. |
None of those who were Directors at the end of the year had any other interest in the capital of Lloyds Banking Group plc or its subsidiaries.
COMPENSATION
OUTSTANDING SHARE PLAN INTERESTS
| | | | | | | | | Vested / | | | | At 31 | | | | Exercise periods | | |
| | | At 1 January
2019 | | Granted/
awarded | | Dividends
awarded | | released /
exercised | | Lapsed | | December
2019 | | Exercise price | | From | | To | | Note |
| António Horta-Osório | | | | | | | | | | | | | | | | | | | | |
| LTIP 2016-2018 | | 5,015,210 | | – | | 509,271 | | 3,445,449 | | 1,569,761 | | – | | | | | | | | 1,2,3 |
| GOS 2017-2019 | | 5,318,685 | | – | | – | | – | | – | | 5,318,685 | | | | | | | | 3 |
| GOS 2018-2020 | | 6,725,221 | | | | – | | – | | – | | 6,725,221 | | | | | | | | 3 |
| GOS 2019-2021 | | | | 7,685,276 | | | | | | | | 7,685,276 | | | | | | | | 3, 4 |
| Deferred GPS awarded in 2018 | | 1,166,466 | | | | | | 777,644 | | | | 388,822 | | | | | | | | 10 |
| Deferred GPS awarded in 2019 | | | | 1,494,258 | | – | | 373,564 | | – | | 1,120,694 | | | | | | | | 6 |
| 2016 Sharesave | | 14,554 | | – | | – | | – | | – | | 14,554 | | 47.49p | | 01/01/2020 | | 30/06/2020 | | |
| 2017 Sharesave | | 21,728 | | | | – | | – | | – | | 21,728 | | 51.03p | | 01/01/2021 | | 30/06/2021 | | |
| 2019 Sharesave | | | | 17,336 | | | | | | | | 17,336 | | 39.87p | | 01/01/2023 | | 30/06/2023 | | |
| Juan Colombás | | | | | | | | | | | | | | | | | | | | |
| LTIP2016-2018 | | 2,728,973 | | – | | 277,114 | | 1,874,804 | | 854,169 | | – | | | | | | | | 1,2,3 |
| GOS 2017-2019 | | 2,951,987 | | | | – | | – | | – | | 2,951,987 | | | | | | | | 3 |
| GOS 2018-2020 | | 3,807,302 | | | | – | | – | | – | | 3,807,302 | | | | | | | | 3 |
| GOS 2019-2021 | | | | 4,412,086 | | | | | | | | 4,412,086 | | | | | | | | 3,4 |
| Deferrred GPS awarded in 2018 | | 528,320 | | | | | | 352,212 | | | | 176,108 | | | | | | | | 10 |
| Deferred GPS awarded in 2019 | | | | 668,453 | | | | 167,112 | | | | 501,341 | | | | | | | | 6 |
| 2016 Sharesave | | 29,109 | | – | | – | | – | | – | | 29,109 | | 47.49p | | 01/01/2020 | | 30/06/2020 | | |
| William Chalmers | | | | | | | | | | | | | | | | | | | | |
| Share Buy-Out | | | | 818,172 | | | | 818,172 | | | | | | | | | | | | 7,8 |
| | | | | 1,457,748 | | | | | | | | 1,457,748 | | | | 28/01/2020 | | 27/01/2025 | | 7 |
| | | | | 1,124,627 | | | | | | | | 1,124,627 | | | | 28/01/2021 | | 27/01/2026 | | 7 |
| | | | | 686,085 | | | | | | | | 686,085 | | | | 28/01/2022 | | 27/01/2027 | | 7 |
| George Culmer | | | | | | | | | | | | | | | | | | | | |
| LTIP 2016-2018 | | 2,767,409 | | – | | 281,017 | | 1,901,209 | | 866,200 | | – | | | | | | | | 1,2,3 |
| GOS 2017-2019 | | 2,993,565 | | | | – | | – | | – | | 2,993,565 | | | | | | | | 3,5 |
| GOS 2018-2020 | | 3,860,925 | | | | – | | – | | – | | 3,860,925 | | | | | | | | 3,5 |
| Deferred GPS awarded in 2018 | | 528,320 | | | | | | 352,212 | | | | 176,108 | | | | | | | | 10 |
| Deferred GPS awarded in 2019 | | | | 668,453 | | | | 167,112 | | | | 501,341 | | | | | | | | 6 |
| 2016 Sharesave | | 14,554 | | – | | – | | 13,341 | | 1,213 | | – | | 47.49p | | | | | | 9 |
| 1. | The shares awarded in March 2016 vested on 7 March 2019. The closing market price of the Group’s ordinary shares on that date was 62.15 pence. Shares vested are subject to a further two-year holding period. |
| | |
| 2. | 2016 LTIP award was eligible to receive an amount equal in value to any dividends paid during the performance period. Dividend equivalents have been paid based on the number of shares vested and have been paid in shares. The dividend equivalent shares were paid on 7 March 2019. The closing market price of the Group’s ordinary shares on that date was 62.15 pence. The dividend equivalent shares are not subject to any holding period. |
| | |
| 3. | All GOS have performance periods ending 31 December at the end of the three-year period. Awards were made in the form of conditional rights to free shares. |
| | |
| 4. | Awards (in the form of conditional rights to free shares) in 2019 were made over shares with a value of 300 per cent of salary for António Horta-Osório (7,685,276 shares with a face value of £3,733,200) and 275 per cent for Juan Colombás (4,412,086 shares with a face value of £2,143,215). No award was made to George Culmer. The share price used to calculate face value is the average price over the five days prior to grant (27 February to 5 March 2019), which was 63.052 pence. As regulations prohibit the payment of dividend equivalents on awards in 2018 and subsequent years, the number of shares awarded has been determined by applying a discount factor to the share price on award. An adjustment of 29.8 per cent was applied. Performance conditions for this award are set out in the table on page 110. |
| | |
| 5. | The number of Shares in respect of the 2017 and 2018 GOS Awards are stated in full and will be reduced to reflect the period from the start of the Performance Period to the date of leaving (2 August 2019) at the point of vest in accordance with the appropriate plan rules. |
| | |
| 6. | Part of GPS is deferred into shares (in the form of conditional rights to free shares). The face value of the share awards in respect of GPS granted in March 2019 was £942,160 (1,494,258 shares) for António Horta-Osório; £421,473 (668,453 shares) for Juan Colombás and £421,473 (668,453) for George Culmer. The share price used to calculate the face value is the average price over the five days prior to grant (27 February to 5 March 2019), which was 63.052 pence. |
| | |
| 7. | William Chalmers joined the Group on 3 June 2019 and was appointed as Chief Financial Officer on 1 August 2019 on the retirement of George Culmer. He was granted deferred cash of £2,046,097 and deferred share awards over 4,086,632 Shares, to replace unvested awards from his former employer, Morgan Stanley, that were forfeited as a result of him joining the Group. The deferred cash and the number of Shares over which the deferred share awards were granted was calculated using the USD:GBP exchange rate of 1.2664 and the respective mid-market closing prices of Mr Chalmers’ previous employer and the Group on 3 June 2019 (57.05 pence) resulting in a face value of the awards of £4,377,521. The award is subject to vesting terms in line with those forfeited as set out above, and is on materially the same terms as the Executive Group Ownership Share (ExGOS), including the discretions as summarised on page 93 of the 2017 Annual Report, but as the award is a buy-out it is not subject to performance conditions and is not subject to time pro-rating in a good leaver circumstances. The award is subject to malus and clawback on the same terms as ExGOS awards, and in addition is subject to clawback in the event of resignation within one year of grant. The value of the award is not pensionable. |
| | |
| 8. | Options vested on 18 July 2019 and William Chalmers exercised on 1 August 2019. The closing market price of the Group’s ordinary shares on that date was 52.84 pence. Mr Chalmers retained all the shares apart from 384,733 shares which were sold to meet income tax and National Insurance contributions. Shares are subject to a six month holding period from the date of vesting on 18 July 2019. |
| | |
| 9. | Mr Culmer had six months from his date of retirement to exercise his Sharesave options. Options were exercised on 7 November 2019 and savings made to date were used to buy shares. The closing market price of the Group’s ordinary shares on that date was 57.20 pence. |
| | |
| 10. | Part of GPS is deferred into shares. The face value of the share awards in respect of GPS granted in March 2018 was £1,058,016 (1,555,288 shares) for António Horta-Osório; £479,200 (704,426 shares) for Juan Colombás and £479,200 (704,426) for George Culmer. The share price used to calculate the face value is the average price over the five days prior to grant (27 February to 5 March 2019), which was 63.052 pence. |
COMPENSATION
2019 GROUP OWNERSHIP SHARE PERFORMANCE MEASURES (FOR AWARDS MADE IN MARCH 2019)
Meeting threshold performance will result in 25 per cent vesting of each metric, relative to each weighting.
| Strategic priorities | | Measure | | Basis of payout range | | Metric | | Weighting |
| Creating the best customerexperience | | Customer satisfaction | | Major Group average ranking over2021 | | Threshold: 3rd
Maximum: 1st | | 10% |
| | | Digital net promoter score | | Set relative to 2021 targets | | Threshold: 65.3
Maximum: 68.3 | | 7.5% |
| | | FCA total reportable complaints and FinancialOmbudsman Service (FOS) change rate | | Set relative to 2021 targetsAverage rates over 2020 | | Threshold: 2.891and ≤ 29%2
Maximum: 2.611and ≤ 25%2 | | 10% |
| Becoming simpler andmore efficient | | Statutory economic profit3 | | Set relative to 2021 targets | | Threshold: £2,210m
Maximum: £3,315m | | 25% |
| | | Cost:income ratio | | Set relative to 2021 targets | | Threshold: 45.9%
Maximum: 43.4% | | 10% |
| Delivering sustainablegrowth | | Absolute total shareholder return (TSR) | | Growth in share price includingdividends over 3-year period | | Threshold: 8% p.a.
Maximum: 16% p.a. | | 30% |
| Building the best team | | Employee engagement index | | Set relative to 2021 markets norms | | Threshold: +5% vs. 2021 UK Norm
Maximum: +2% vs. 2021 UK HighPerforming Norm | | 7.5% |
| 1 | FCA reportable complaints per 1,000 accounts. |
| | |
| 2 | FOS uphold rate. |
| | |
| 3 | A measure of profit taking into account Expected Losses, tax and a charge for equity utilisation. |
IMPLEMENTATION OF THE POLICY IN 2020
The 2020 Remuneration Policy is subject to approval at the Annual General Meeting in May 2020. We propose to implement the Policy in the following ways subject to shareholder approval. A final 2020 Group Ownership Share award will be granted under the existing Remuneration Policy prior to the AGM when the 2020 Remuneration Policy is intended to come into effect.

Base Salary | | The Group has applied a total pay budget of 2.4 per cent including a minimumpay award of £500 for eligible colleagues. Focussing on lower paid colleagues andcolleagues paid lower in their pay range, the Group’s pay approach ensures over 63 percent of colleague will receive a pay award of 2.5 per cent or more. The pay budget forsenior executives is set below the budget for the wider colleague at 2 per cent. | | It was agreed that a salary increase of 2 per cent would applyfor the Group Chief Executive (GCE) and Chief FinancialOfficer (CFO). Following confirmation that the ChiefOperating Officer (COO) is due to retire in 2020, his salary isdue to remain in line with 2019. Salaries will therefore be as follows: GCE: £1,294,674 (with effect from 1 January 2020) COO: £794,938 CFO: £810,837 (with effect from 1 April 2020) |

Fixed ShareAward | | Awards remain unchanged from 2019 as follows: GCE: £1,050,000 COO: £497,000 CFO: £504,000 | | Subject to approval shares will be released in equal tranchesover three years. (See page 135 for further details). |

Pension | | With effect from 1 January 2020, pension allowances will be reduced for all ExecutiveDirectors to 15 per cent of base salary. Any new Executive Director appointments in2020 will also attract a maximum allowance of 15 per cent of base salary. | | Over 50,000 colleagues participate in the Group’s DefinedContribution (DC) Pension scheme. We therefore believe theDC pension provisions provide an accurate reflection of thepension rate available to the majority of the workforce. Witheffect from July 2020 the maximum employer contributionfor all colleagues will be 15 per cent of base salary andExecutive Directors will be aligned to the majority of theworkforce. |

Benefits | | Benefits remain unchanged from 2019. Executive Directors receive a flexible benefitallowance in line with colleagues, (4 per cent of base salary). This can be used to selectbenefits including life assurance and critical illness cover. Other benefits include carallowance, transportation tax preparation and private medical cover. | | |
GroupPerformanceShare | | The approach to determining the Group’s Group Performance Share outcome for2020 will remain aligned to the approach from 2019. A fixed five per cent of adjustedUnderlying Profit (UP) will be used as a starting position for the overall pool. Thisremains within the maximum plan limit of 10 per cent of UP and a financial performancethreshold will be set at 20 per cent below the Group’s underlying profit target, at whichno award will be payable. A measurement of the Group’s performance will be assessed against BalancedScorecard objectives and receive a score from 1 to 5. The Group Balanced Scorecardmust exceed a threshold score of 1.5, below which no award will be payable. The fixed 5 per cent of UP will be adjusted by a scorecard modifier commensurate withthe Group Balanced Scorecard performance score. Adjustments for conduct and riskfactors will also be considered when determining the final overall pool. Individual maximum opportunities for Executive Directors remain unchanged from2019 at 140 per cent of base salary for the GCE and 100 per cent of base salary for otherExecutive Directors. Individual awards will be based on pre-determined formulaic pay out rangescommensurate with performance and will be determined by the RemunerationCommittee through the assessment of a balanced scorecard and an individualperformance assessment. The Committee will determine if an Executive Director’spersonal performance justifies a variation up or down in the rating or award valuesdetermined by the scorecard, and will explain how this is determined. The Group ChiefExecutive’s individual performance will be measured through the Group BalancedScorecard, the Chief Operating Officer will be measured through the Chief OperatingOffice scorecard and the Chief Financial Officer will be measured through the FinanceDivision scorecard. | | The 2020 scorecards will provide a balanced view acrossfinancial, operational and strategic measures equallyweighted between 15 financial, customer and colleague andconduct measures. Target will be assessed against a ratingscale of 1 to 5. The Committee considers the specific targets thatapply to 2020 to be commercially sensitive but willprovide information on the level of payout relative to theperformance achieved in next year’s annual report onremuneration. For the 2020 performance year, any Group PerformanceShare opportunity will be awarded in March 2021 in acombination of cash (up to 50 per cent) and shares. 40 percent will be released in the first year following the awardwith £2,000 paid in cash, and the balance of the upfront 40per cent delivered in shares; 50 per cent of which will besubject to holding until March 2022. The remaining 60 percent is deferred into shares with 40 per cent vesting in 2022and 20 per cent in 2023. 50 per cent of each release will besubject to a further 12-month holding in line with regulatoryrequirements. The Committee may consider the application of malusand clawback as outlined in the performance adjustmentsection. |
COMPENSATION

GroupOwnershipShare | | A Group Ownership Share award will be granted in relation to 2019 performance underthe terms of the current Remuneration Policy. On the basis of the new Long Term SharePlan being approved by shareholders at the 2020 AGM, no further Group OwnershipShare awards would then be made. The maximum Group Ownership Share award for Executive Directors is 300 per cent ofsalary and the Remuneration Committee has to ability to grant an award up to 400 percent of salary for exceptional circumstances for the Group Chief Executive. Followingconfirmation that the Chief Operating Officer (COO) is due to retire in 2020, no awardwill be made. Awards in 2020 are being made as follows: GCE: 250 per cent of base salary COO: No award CFO: 237.5 per cent of base salary As regulations prohibit the payment of dividend equivalents on awards, the number ofshares subject to the award has been determined by applying a discount factor to theshare price on grant, as previously disclosed. The Committee approved an adjustmentof 29.03 per cent for colleagues who are senior managers, including the ExecutiveDirectors. | | Awards will be subject to a three-year performance periodwith vesting between the third and seventh anniversaryof award, on a pro-rata basis. Any shares released aresubject to a further holding period in line with regulatoryrequirements and market practice. Meeting thresholdperformance will result in 25 per cent vesting of each metric,relative to each weighting. Awards made in 2020 will vest based on the Group’sperformance against the financial and strategic measures,set out below. In line with the current Remuneration Policy,the Committee has full discretion to amend payout levelsshould the award not reflect business and/or individualperformance. Business performance includes, but is notlimited to, consideration of returns to shareholders. There are no changes to proposed financial and strategicmeasures to provide consistency with the 2019 plan andcontinued alignment to the key strategic priorities as set outin the third Group Strategic Review. The Committee may consider the application of malusand clawback as outlined in the performance adjustmentsection. |
| | | Strategic priorities | | Measure | | Basis of payout range | | Metric | | Weighting |
Group
Ownership Share continued | | Creating the best customerexperience | | Customer satisfaction | | Major Group averageranking over 2022 | | Threshold: 3rd
Maximum: 1st | | 10% |
| | | | Digital net promoter score | | Set relative to 2022 targets | | Threshold: 65.3
Maximum: 68.3 | | 7.5% |
| | | | FCA total reportablecomplaints and FinancialOmbudsman Service (FOS)change rate | | Set relative to 2022 targetsAverage rates over 2022 | | Threshold: 2.65
Maximum: 2.52
Threshold: 30%
Maximum: 25% | | 15% |
| | Becoming simpler and more Statutory economic profit1efficient | | Set relative to 2022 targets | | Threshold: £1,965m
Maximum: £2,948 | | 25% |
| | | | Cost: income ratio | | Set relative to 2022 targets | | Threshold: 46.4%
Maximum: 43.9% | | 10% |
| | Delivering sustainablegrowth | | Absolute total shareholderreturn (TSR) | | Growth in share priceincluding dividends over3-year period | | Threshold: 8%
Maximum: 16% | | 40% |
| | Building the best team | | Employee engagementindex | | Set relative to 2022 marketsnorms | | Threshold: +5% vs UK norm
Maximum: +2% vs UK HighPerforming Norm | | 7.5% |
| | | | | | | | | | | |
| 1 | A measure of profit taking into account expected losses, tax and a charge for equity utilisation. |

Performanceadjustment | | Performance adjustment is determined by the Remuneration Committee and/orBoard Risk Committee and may result in a reduction of up to 100 per cent of the GPSand/or GOS opportunity for the relevant period. It can be applied on a collective orindividual basis. When considering collective adjustment, the Senior IndependentPerformance Adjustment and Conduct Committee (SIPACC) submits a report to theRemuneration Committee and Board Risk Committee regarding any adjustmentsrequired to balanced scorecards or the overall GPS and/or GOS outcome to reflectin-year or prior year risk matters. The application of malus will generally be considered when: – there is reasonable evidence of employee misbehaviour or material error or thatthey participated in conduct which resulted in losses for the Group or failed to meetappropriate standards of fitness and propriety; – there is material failure of risk management at a Group, business area, division and/or business unit level; – the Committee determines that the financial results for a given year do not supportthe level of variable remuneration awarded; and/or | | – any other circumstances where the Committee consideradjustments should be made. Judgement on individual performance adjustment isinformed by taking into account the severity of the issue,the individual’s proximity to the issue and the individual’sbehaviour in relation to the issue. Individual adjustmentmay be applied through adjustments to balancedscorecard assessments and/or through reducing the GPSand/or GOS outcome. Awards are subject to clawback for a period of up to sevenyears after the date of award which may be extended to10 years where there is an ongoing internal or regulatoryinvestigation. The application of clawback will generally be consideredwhen: – there is reasonable evidence of employee misbehaviouror material error; or – there is material failure of risk management at a Group,business area, division and/or business unit level. |
COMPENSATION
CHAIRMAN AND NON-EXECUTIVE DIRECTOR FEES IN 2019
The annual fee for the Chairman was increased by 2 per cent to £772,855, in line with the overall salary budget for the executive population. The annual Non-Executive Director fees were increased by 2 per cent, in line with the base salary increase awarded to the senior management of the Group. These changes took effect from 1 January 2020.
| | | 2020 | | 2019 |
| Basic Non-Executive Director fee | | £81,200 | | £79,600 |
| Deputy Chairman | | £106,000 | | £104,000 |
| Senior Independent Director | | £63,600 | | £62,400 |
| Audit Committee Chairmanship | | £74,300 | | £72,800 |
| Remuneration Committee Chairmanship | | £74,300 | | £72,800 |
| Risk Committee Chairmanship | | £74,300 | | £72,800 |
| Responsible Business Committee Chairmanship | | £42,400 | | £41,600 |
| IT Forum Chairmanship | | £42,400 | | £41,600 |
| Audit Committee Membership | | £34,000 | | £33,300 |
| Remuneration Committee Membership | | £34,000 | | £33,300 |
| Risk Committee Membership | | £34,000 | | £33,300 |
| Responsible Business Committee Membership1 | | £15,900 | | £15,600 |
| Nomination and Governance Committee Membership | | £15,900 | | £15,600 |
Non-Executive Directors may receive more than one of the above fees.
PERCENTAGE CHANGE IN REMUNERATION LEVELS
Figures for ‘All employees’ are calculated using figures for all colleagues eligible for the GPS plan. This population is considered to be the most appropriate group of employees for these purposes because its remuneration structure is consistent with that of the GCE. For 2019, 66,216colleagues were included in this category.
| | % change in base salary
(2018 to 2019) | | % change in GPS
(2018 to 2019) | | % change in benefits
(2018 to 2019) |
| GCE (salary increase effective 1 January 2020) | | 2.0% | | (100%)1 | | 2.0% |
| All employees | | 2.4%2 | | (31.7%)2 | | 2.4%2 |
| 1 | Reflects the increase in base salary from 1 January 2019 against which the award is determined. |
| | |
| 2 | Adjusted for movements in colleagues numbers and other impacts to ensure a like-for-like comparison. Salary increases effective 1 April 2020. |
GENDER PAY
We have further reduced our gender pay gap in 2019 resulting in a 1.9 per cent improvement since 2017.
At Lloyds Banking Group we are committed to promoting a diverse and inclusive working environment. Our focus is on improving the gender pay and bonus gaps by increasing the proportion of women in senior roles. In doing so, the gender gaps will reduce over time. We are committed to attracting and retaining the best talent and we are pleased that our 2019 mean gender pay and bonus gaps have reduced further this year.
The reduction in the pay gap can be attributed to an improvement in female representation across the Bank, with an increase in the proportion of female colleagues in senior roles. The proportion of women in the upper pay quartile for the Group has increased. We are pleased to see that our efforts have started to decrease our gender pay gap, however we are aware that there continue to be more men in senior roles. Addressing female representation across the Bank will take time and we are committed to achieving our gender targets will have an impact on our pay gaps in future years. Further information is available at: https://www.lloydsbankinggroup.com/globalassets/our-group/responsible-business/ reporting-centre/lloyds-banking-group-gender-pay-gap-report-2019.pdf

2018 2019 Mean Pay Gap % 31.5% 30.9% 2018 2019 Mean Bonus Gap % 66.4% 64.2%
COMPENSATION
CEO PAY RATIO
| | Total Compensation | | Fixed pay |
| Year | Methodology | P25
(Lower Quartile) | P50
(Median) | P75
(Upper Quartile) | | P25
(Lower Quartile) | P50
(Median) | P75
(Upper Quartile) |
| 2019 | A | 179:1 | 128:1 | 71:1 | | 114:1 | 82:1 | 47:1 |
| 2018 | A | 237:1 | 169:1 | 93:1 | | 113:1 | 81:1 | 48:1 |
| 2017 | A | 245:1 | 177:1 | 97:1 | | 113:1 | 82:1 | 48:1 |
Y-o-Y
(2018 vs 2019) | | | (24%) | | | | 1% | |
Notes to the calculation:
| The 2019 total remuneration for the colleagues identified at P25, P50 and P75 are as follows: £26,419, £36,975, £66,944. |
| | |
| The 2019 base salary for the colleagues identified at P25, P50 and P75 are as follows: £22,227, £31,671, £50,431. |
| | |
| The P25, P50 and P75 colleagues were determined on 12 February 2020 based on calculating total remuneration for all UK employees for the 2019 financial year. Payroll data from 1 January 2019 to 31 December 2019 and variable remuneration outcomes approved in February 2020 were used. |
| | |
| Methodology option A has been used and was selected on the basis that it provided the most accurate means of identifying the median, lower and upper quartile colleagues. |
| | |
| Colleague total remuneration has been calculated in line with the single total figure of remuneration. The single total figure of remuneration calculated for each of the 62,364 UK colleagues includes full time equivalent base pay, Group Performance Share awards for the 2019 performance year, vesting Group Ownership Share awards (for eligible colleagues), core benefits, pension, overtime and shift payments, travel/relocation payments (for eligible colleagues) and private medical benefit. |
| | |
| The average share price between 1 October 2019 and 31 December 2019 (59.34 pence) has been used to indicate the value of vesting Group Ownership Share awards. |
| | |
| The colleague identified at P50 did not receive a separate car benefit and does not participate in the long-term incentive plan. As a result, the ratio does not provide a direct comparison to the total remuneration of the Group Chief Executive. |
| | |
| Each of the three individuals identified was a full-time employee during the year. |
| | |
| Due to operational constraints, inflationary adjustments to defined benefit pensions are excluded. |
| | |
| All other data has been calculated in line with the methodology for the single total figure of remuneration for the Group Chief Executive. |
The median ratio has decreased 24 per cent year-on-year. The reduction is largely attributed to the Group Chief Executive’s request to withdraw from consideration by the Remuneration Committee (the Committee) for a Group Performance Share award for 2019. Volatility in variable reward outcomes has contributed to the year-on-year changes in the ratio.
The Committee is thoughtful of the volatility in pay ratios due to variable reward outcomes. Although the pay ratio is used as a useful reference point to inform policy-setting, the Committee takes into account a number of other factors to assess colleague pay progression.
For the majority of colleagues, year-on-year changes in remuneration are principally driven by pay increases. We are committed to reducing the pay gap between executives and wider colleagues and continue to remain focused on addressing the gap from the bottom up and not just from the top down. To support this, the Group has a commitment to pay progression and a continued focus on ensuring higher pay awards for colleagues who are lower paid, or paid lower within their pay range.
For 2020, the pay budget has been set at 2.4 per cent, with over 63 per cent of colleagues at lower grades receiving a pay award of 2.5 per cent or over. The pay budget for senior colleagues was set lower, at 2 per cent.
A minimum pay award of £500 will apply for all eligible colleagues and pay awards of up to 3.5 per cent for the lowest paid colleagues. We are proud to be an accredited Living Wage employer since 2015, and from April 2020 we will go further and raise the minimum salary for all full-time colleagues to £18,200, reflecting a rate of £10 per hour. For some colleagues this will result in an increase of up to 3.94 per cent and is 22 per cent greater than the National Living Wage and 70 pence greater than current National Living Wage Foundation’s UK wide real Living Wage.
We believe our approach to pay progression has contributed to the reduction of the 2019 median pay ratio and supports reducing the gap between executive and wider colleague pay over time. For example, the colleague who is now at P25 for 2019 received a 2.69 per cent pay increase which brought them up from P24 to that level.
REMUNERATION COMMITTEE
The Committee comprises six Non-Executive Directors; Stuart Sinclair (Chair), Lord Blackwell, Alan Dickinson, Anita Frew, Sara Weller and Amanda Mackenzie; to provide a balanced and independent view on remuneration matters. Stuart Sinclair has been Chair of the Committee since 1 September 2018 and has been a member of the Committee since January 2016. For further details of Committee membership and attendance at meetings, please see page 145.
The purpose of the Committee is to set the remuneration for all Executive Directors and the Chairman, including pension rights and any compensation payments. It recommends and monitors the level and structure of remuneration for senior management and material risk takers. It also considers, agrees and recommends to the Board an overall remuneration policy and philosophy for the Group that is aligned with its long-term business strategy, its business objectives, its risk appetite, purpose and values and the long-term interests of the Group, and recognises the interests of relevant stakeholders, including the wider workforce. The Committee’s operation is designed to ensure that no conflicts of interest arise, and in particular, the Committee ensures that no individual is present when matters relating to their own remuneration are discussed.
Mercer was appointed by the Committee in 2016 following a competitive tender process and was retained for 2019. The Committee is of the view that Mercer provides independent remuneration advice to the Committee and does not have any connections with the Group or any director that may impair its independence. The broader Mercer company provides unrelated advice on accounting and investments. During the year the Committee requested advice and independent research on market and best practice in relation to fixed and variable reward structures to support formulating the Policy. Mercer attended Committee meetings upon invitation and fees payable for the provision of services in 2019 were £31,630.
COMPENSATION
HOW THE REMUNERATION COMMITTEE SPENT ITS TIME IN 2019 AND COMPLIANCE WITH THE 2018 CORPORATE GOVERNANCE CODE
EXECUTIVES Key highlights: Assurance that the new Policy supports the delivery of the Group’s purpose and long-term goals whilst rewarding the right behaviours in line with the Group’s culture and values. | | COLLEAGUES AND WIDER WORKFORCE Key highlights: Delivery of the Group’s new performance management approach ‘Your Best’ and colleague understanding of the link between performance and reward. | | ADDITIONAL STAKEHOLDERS Key highlights: Consideration of a balanced range of opinions from stakeholders on remuneration matters. |
| Oversight and approval | | Oversight | | Oversight and engagement |
Review of 2018 performance andremuneration for EDs and seniormanagement. Particularly focused ondiscussing and challenging performanceoutcomes and the direct implications ofrisk and conduct on reward outcomes. Comfortable that the Directors’ Remuneration Policy worked effectively in 2019, ensuring that there was true alignment between pay and performance notwithstanding that there were areas of development to consider when designing the new policy. The 2019 executive pay budget was setin the context of the wider colleague paybudget. Pay increases were approvedon the basis that they were lower thanpay increases for wider colleagues. Theimplications of pay increases on futureCEO pay ratios and the Group’s approachto pay progression was considered. Code Provision 40. When designing thenew Directors’ Remuneration Policy, theCommittee has aimed to design clear andtransparent remuneration structures thatreduce complexity and promote behavioursthat support the Group’s purpose, valuesand culture. Risk and conduct has beenconsidered to avoid rewarding for failureand the range of possible values of rewardsEDs can potentially receive have beenreviewed. Please see pages 117 to 121 forexamples of how we have considered the key principles of Provision 40 in 2019. | | 2020 Colleague Pension Policy and how the changes support the Group’s culture. When finalising the changes to the Group’s DC employer pension offering including the reduction to ED pensions, the potential impact on pay ratios including gender pay were considered. Received a quarterly report on key colleague and wider workforce reward activity including in-year spend on colleague pay increases and a review of the Group Remuneration Policy for third party suppliers sharing enhancements to the assessment framework used to ensure third party reward polices align to the Group’s own principles. Constructive engagement with the Group’s recognised Unions, particularly on the deployment of the Group Performance Share model with the introduction of ‘Your Best’, the improvements to the DC pension scheme for all colleagues, the broader reward package the Group offers and 2019 discussions on pay budgets. Together the Unions are recognised across a bargaining unit of circa. 95 per cent of colleagues and continue to play a valuable role in representing colleagues across the Group. To support colleagues to better understand the approach to determining GPS awards across the Group, including Executive Directors, the Committee gained insight into how the Group has used internal media channels to explain the process in a clear and transparent way and to emphasise the link between pay and performance. | | Regular updates on corporate governance and institutional remuneration principles changes. The regulators were invited to attend committee meetings in 2019 and gain greater understanding of Committee debates in relation to performance and reward outcomes. The Chair attended the Work and Pensions Select Committee and reiterated intentions to focus on purpose and behaviour when designing the Policy in its entirety whilst also gaining further insight into external sentiment felt in relation to executive pensions. |
| | | | | | | | |
STATEMENT OF VOTING AT ANNUAL GENERAL MEETING
The table below sets out the voting outcome at the Annual General Meeting in May 2019 in relation to the annual report on remuneration and the Remuneration Policy, last voted on in 2017.
| | | Votes cast in favour | | Votes cast against | | Votes withheld |
| | | Number of shares
(millions) | | Percentage of
votes cast | | Number of shares
(millions) | | Percentage of
votes cast | | Number of shares
(millions) |
| 2018 annual report on remuneration (advisory vote) | | 43,322 | | 91.95% | | 3,790 | | 8.05% | | 1,006 |
| Directors’ remuneration policy (binding vote in 2017) | | 47,673 | | 98.03% | | 959 | | 1.97% | | 535 |
COMPENSATION
2020 Remuneration policy
Approval for this Remuneration Policy will be sought at the AGM on 21 May 2020 and, if approved, will take effect from that date.
It is intended that approval of the Remuneration Policy will be sought at three-year intervals, unless amendments to the Policy are required, in which case further shareholder approval will be sought. Information on how the Policy will be implemented in 2020 is included in the annual report on remuneration.
The objective of the Policy is to align individual reward with the Group’s performance, the interests of its shareholders and a prudent approach to risk management. In this way, the requirements of the major stakeholders are balanced: customers, shareholders, employees, and regulators.
The policy is based on principles which are applicable to all employees within the Group and, in particular, the principle that the reward package should support the delivery of the Group’s purpose of Helping Britain Prosper and the strategic aim of becoming the best bank for customers whilst delivering long-term superior and sustainable returns to shareholders. It fosters performance in line with the Group’s values and behaviours, encourages effective risk disciplines and is in line with relevant regulations and codes of best practice.
DECISION MAKING PROCESS FOR DETERMINING THE POLICY AND CONSIDERATION OF STAKEHOLDER VIEWS
In formulating the Policy, the Remuneration Committee has consulted extensively with a number of stakeholders including institutional shareholders and the Group’s main regulators, the Prudential Regulation Authority (PRA) and the Financial Conduct Authority (FCA). A formal consultation on the remuneration of Executive Directors was not undertaken with colleagues. However, constructive engagement with the Group’s recognised Unions took place on key elements of the reward package and the unions continue to play a valuable role in representing colleagues across the Group. The Committee also increased its level of oversight on remuneration matters for colleagues and the wider workforce in 2019, receiving overviews and analysis on key reward matters on a quarterly basis to support decisions in relation to executive remuneration.
The Chairman of the Remuneration Committee alongside senior management consulted with shareholders extensively and the proposed amendments to the Policy were deliberated by the Remuneration Committee at three separate committee meetings. Throughout the process, the Committee Chair kept an open dialogue with key stakeholders to provide updates on amendments and additional points of consideration within the Policy following their feedback. The final Policy is proposed on the basis that it has been widely consulted on with stakeholders and has been designed to align to the Group’s culture, values and purpose whilst also remaining aligned to wider stakeholder interests.
No Executive Director has been involved in the determination of their own remuneration but has remained well informed to ensure alignment between executive and wider colleague remuneration structures. To manage conflicts of interests effectively, Executive Directors were asked to step out of committee meetings and relevant paperwork was also redacted for individuals if required. The Committee has also considered gender pay and CEO pay ratio analysis when finalising policy proposals.
DIRECTORS’ REMUNERATION POLICY AND GROUP REMUNERATION POLICY ALIGNMENT
There is no significant difference between the Policy for Executive Directors and that for other colleagues. If a significant difference for any individual were proposed, this would be subject to approval by the Remuneration Committee (within regulatory requirements). The table below summarises how the Policy applies across the Group.
| | | Executive Directors | Group Executive
Committee | Other Material
Risk Takers | Other Employees |
| Fixed | Base salary | ü | ü | ü | ü |
| | Fixed share award1 | ü | ü | ü | ü |
| | Pension and benefits | ü | ü | ü | ü |
| Variable | Short-term incentive | ü | ü | ü | ü |
| | Long term incentive1 | ü | ü | ü | ü |
| 1 | Eligibility based on seniority and/or role. |
| BASE SALARY | | |
| Purpose and link to strategy | | To support the recruitment and retention of Executive Directors of the calibre required to develop and deliver theGroup’s strategic priorities. Base salary reflects the role of the individual, taking account of market competitiveness,responsibilities and experience, and pay in the Group as a whole. |
| Operation | | Base salaries are typically reviewed annually with any increases normally taking effect from 1 January for existingExecutive Directors and 1 April for future appointments. When determining and reviewing base salary levels,the Committee takes into account base salary increases for employees throughout the Group and ensures thatdecisions are made within the following two parameters: – An objective assessment of the individual’s responsibilities and the size and scope of their role, using objectivejob-sizing methodologies. – Pay for comparable roles in comparable publicly listed financial services groups of a similar size. Salary may be paid in sterling or other currency and at an exchange rate determined by the Committee. |
| Maximum potential | | The Committee will make no increase which it believes is inconsistent with the two parameters above. Increaseswill normally be in line with the increase awarded to the overall employee population. However, a greater salaryincrease may be appropriate in certain circumstances, such as a new appointment made on a salary below a marketcompetitive level, where phased increases are planned, or where there has been an increase in the responsibilitiesof an individual. Where increases are awarded in excess of the wider employee population, the Committee willprovide an explanation in the relevant annual report on remuneration. |
| Performance measures | | N/A |
| Changes | | The effective date will change from January to April each year for future Executive Directors to align delivery with the rest of the workforce. |
COMPENSATION
| Fixed share award | | |
| Purpose and link to strategy | | To ensure that total fixed remuneration is commensurate with role and to provide a competitive reward packagefor Executive Directors with an appropriate balance of fixed and variable remuneration, in line with regulatoryrequirements. |
| Operation | | The fixed share award will be delivered entirely in Lloyds Banking Group shares, released over three years with33 per cent being released each year following the year of award. The Committee can, however, decide to deliversome or all of it in the form of cash. |
| Maximum potential | | The maximum award is 100 per cent of base salary. |
| Performance measures | | N/A |
| Changes | | Delivery of vested shares will change from five to three years to align the delivery schedule with other colleagueseligible to receive a Fixed Share Award. |
| Pension | | |
| Purpose and link to strategy | | To provide cost effective and market competitive retirement benefits, supporting Executive Directors in buildinglong-term retirement savings. |
| Operation | | Executive Directors are entitled to participate in the Group’s defined contribution scheme with companycontributions set as a percentage of salary. An individual may elect to receive some or all of their pension allowance as cash in lieu of pension contribution. |
| Maximum potential | | The maximum allowance for all Executive Directors is 15 per cent of base salary. All future appointments asExecutive Directors will also attract a maximum allowance of 15 per cent of base salary in line with the majority of theworkforce. Maximum allowance may be increased or decreased in order to remain aligned. |
| Performance measures | | N/A |
| Changes | | Maximum employer pension contribution available has been reduced to 15 per cent of cash salary with nocompensation for the reduction to align to the maximum employer pension contribution available to colleagues onthe defined contribution pension scheme. |
| Benefits | | |
| Purpose and link to strategy | | To provide flexible benefits as part of a competitive remuneration package. |
| Operation | | Benefits may include those currently provided and disclosed in the annual report on remuneration.Core benefits include a company car or car allowance, private medical insurance, life insurance and other benefitsthat may be selected through the Group’s flexible benefits plan. Additional benefits may be provided to individuals in certain circumstances such as relocation. This may includebenefits such as accommodation, relocation, and travel. The Committee retains the right to provide additionalbenefits depending on individual circumstances. When determining and reviewing the level of benefits provided, the Committee ensures that decisions are madewithin the following two parameters: – An objective assessment of the individual’s responsibilities and the size and scope of their role, using objectivejob-sizing methodologies. – Benefits for comparable roles in comparable publicly listed financial services groups of a similar size. |
| Maximum potential | | The Committee will only make increases in the benefits currently provided which it believes are consistent with thetwo parameters above. Executive Directors receive a flexible benefits allowance, in line with all other colleagues. The flexible benefits allowance does not currently exceed 4 per cent of base salary. |
| Performance measures | | N/A |
| Changes | | No change to Policy |
| All-employee plans | | |
| Purpose and link to strategy | | Executive Directors are eligible to participate in HMRC-approved share plans which promote share ownershipby giving employees an opportunity to invest in Group shares. |
| Operation | | Executive Directors may participate in these plans in line with HMRC guidelines currently prevailing (where relevant),on the same basis as other eligible employees. |
| Maximum potential | | Participation levels may be increased up to HMRC limits as amended from time to time. The monthly savings limitsfor Save As You Earn (SAYE) is currently £500. The maximum value of shares that may be purchased under theShare Incentive Plan (SIP) in any year is currently £1,800 with a two-for-one match. Currently a three-for-two match is operated up to a maximum colleague investment of £30 per month. The maximum value of free shares that may be awarded in any year is £3,600. |
| Performance measures | | N/A |
| Changes | | No change to policy |
COMPENSATION
| Group Performance Share plan |
| Purpose and link to strategy | | To incentivise and reward the achievement of the Group’s annual financial and strategic targets whilst supportingthe delivery of long-term superior and sustainable returns. |
| Operation | | Measures and targets are set annually and awards are determined by the Committee after the year end basedon performance against the targets set. The Group Performance Share may be delivered partly in cash, shares,notes or other debt instruments including contingent convertible bonds. Where all or part of any award is deferred,the Committee may adjust these deferred awards in the event of any variation of share capital, demerger, specialdividend or distribution or amend the terms of the plan in accordance with the plan rules. Where an award or a deferred award is in shares or other share-linked instrument, the number of shares tobe awarded may be calculated using a fair value or based on discount to market value, as appropriate. The Committee applies its judgement to determine the payout level commensurate with business and/orindividual performance or other factors as determined by the Committee. The Committee may reduce the levelof award (including to zero), apply additional conditions to the vesting, or delay the vesting of deferred awards to aspecified date or until conditions set by the Committee are satisfied, where it considers it appropriate. Awards maybe subject to malus and clawback for a period of up to seven years after the date of award which may be extendedto 10 years where there is an ongoing internal or regulatory investigation. |
| Maximum potential | | The maximum Group Performance Share opportunities are 140 per cent of base salary for the GCE and 100 per centof base salary for other Executive Directors. |
| Performance measures | | Measures and targets are set annually by the Committee in line with the Group’s strategic business plan and furtherdetails are set out in the annual report on remuneration for the relevant year. |
| | | Measures consist of both financial and non-financial measures and the weighting of these measures will bedetermined annually by the Committee. The weightings of the performance measures for the 2020 financialyear are set out for 2019 on page 129. All assessments of performance are ultimately subject to the Committee’sjudgement, but no award will be made if threshold performance (as determined by the Committee) is not met forfinancial measures or the individual receives a score of 2.6 out of 5 or below. The normal ‘target’ level of the GroupPerformance Share is 50 per cent of maximum opportunity. The Committee is committed to providing transparency in its decision making in respect of Group PerformanceShare awards and will disclose historic measures and target information together with information relating to howthe Group has performed against those targets in the annual report on remuneration for the relevant year exceptto the extent that this information is deemed to be commercially sensitive, in which case it will be disclosed once itis deemed not to be sensitive. |
| Changes | | The normal ‘target’ level of the Group Performance Share has changed to 50 per cent of maximum opportunityfrom 30 per cent. |
| Long Term Share plan |
| Purpose and link to strategy | | Long term variable reward opportunity to align executive management incentives and behaviours to the Group’sobjectives of delivering long-term superior and sustainable returns. The Long Term Share Plan will incentivestewardship over a long time horizon and promote good governance through a simple alignment with the interestof shareholders. |
| Operation | | From 2021, awards will be granted under the rules of the 2020 Long-Term Share Plan, subject to shareholderapproval at the AGM on 21 May 2020. Awards are made in the form of conditional shares and award levels are set atthe time of grant, in compliance with regulatory requirements, and may be subject to a discount in determining totalvariable remuneration under the rules set by the European Banking Authority. The number of shares to be awardedmay be calculated using a fair value or based on a discount to market value, as appropriate. Vesting will be subject to an assessment of underpin thresholds being maintained measured over a period of threeyears, or such longer period, as determined by the Committee. The Committee retains full discretion to amend the payout levels should the award not reflect business and/orindividual performance. The Committee may reduce (including to zero) the level of the award, apply additionalconditions to the vesting, or delay the vesting of awards to a specified date or until conditions set by the Committeeare satisfied, where it considers it appropriate. Awards may be subject to malus and clawback for a period of up to seven years after the date of award which maybe extended to 10 years where there is an ongoing internal or regulatory investigation. |
| Maximum potential | | The maximum Long Term Share Plan opportunity is 200 per cent of base salary for all Executive Directors includingthe GCE. |
| Performance measures | | An award may be granted by the Remuneration Committee taking into account an assessment of performance ofthe Company, any Member of the Group or business unit or team, and/or the performance, conduct or capability ofthe Participant, on such basis as the Committee determine. The normal ‘target’ level of the Long Term Share award is 150 per cent of base salary. No further performance conditions will apply. However vesting will be subject to the underpins and RemunerationCommittee discretion as described above. |
| Changes | | The Long Term Share Plan replaces the Executive Group Ownership Share Plan. |
COMPENSATION
| Deferral of variable remuneration and holding periods |
| Operation | The Group Performance Share and Long Term Share plans are both considered variable remuneration for the purpose of regulatory payment and deferral requirements. The payment of variable remuneration and deferral levels are determined at the time of award and in compliance with regulatory requirements (which currently require that at least 60 per cent of total variable remuneration is deferred for seven years with pro rata vesting between the third and seventh year, and at least 50 per cent of total variable remuneration is paid in shares or other equity linked instruments subject to a holding period in line with current regulatory requirements).
A proportion of the aggregate variable remuneration may vest immediately on award. The remaining proportion of the variable remuneration is then deferred in line with regulatory requirements. |
| Changes | No change in deferral requirements. |
Further information on which performance measures were chosen and how performance targets and underpin thresholds are set are disclosed in the relevant sections throughout the report.
DISCRETION IN RELATION TO VARIABLE REWARDS
The Committee retains discretion with regards to these plans. This relates to:
| the timing, size and type of awards and holding periods, subject to policy maxima, and the annual setting of targets; |
| where qualitative performance measures or underpins are used and performance against those measures or underpins is not commensurate with the Group’s overall financial or strategic performance over the performance period; |
| where qualitative underpin thresholds are used and performance against those underpins is not commensurate with the Group’s overall financial performance over the underpin period; |
| adjustment of targets and measures if events occur which cause it to determine that it is appropriate to do so. The Committee also retains the right to change performance measures and the weighting of measures, including following feedback from regulators, shareholders and/or other stakeholders; and amending the plan rules in accordance with their terms and or amending the basis of operation (including but not limited to the approach in respect of dividend equivalents) including in light of any change to regulatory requirements or guidance or feedback from regulators; |
| to exercise discretion in accordance with the rules, including in relation to whether or not malus or clawback provisions would apply, in connection with recruitment, or terminations of employment, or corporate events affecting the Company; |
| adjustments required in certain circumstances (e.g. rights issues, corporate restructuring events and special dividends); |
| the exercise of the Committee’s discretion will be disclosed in accordance with regulatory requirements. |
LEGACY AWARDS AND RESTRICTIONS ON PAYMENTS
Awards in respect of the Group Performance Share and under the long-term incentive Group Ownership share will be granted in 2020 under the terms of the Directors’ remuneration policy approved by shareholders on 11 May 2017 (the “2017 Policy”). No further awards would be made under the long-term incentive Group Ownership share (or the terms of the 2017 Policy) unless the new Long Term Share Plan 2020 was not approved by shareholders. The Committee reserves the right to make any remuneration payments/awards and any payments/awards for loss of office, notwithstanding that they are not in line with the policy set out above where the terms of the payment/award were agreed (i) before the 2017 policy came into effect; (ii) pursuant to the 2017 policy; or (iii) at a time when the relevant individual was not a Director of the Group and, in the opinion of the Committee, the payment/award was not in consideration for the individual becoming a Director of the Group. Such payments/awards will have been set out in the annual report on remuneration for the relevant year. They include awards and payments made under previous approved remuneration policy and payments in relation to deferred Group Performance Share awards and long-term incentive’ Group Ownership share awards granted in 2018, 2019 and, as referred to above, 2020.
COMPENSATION
ILLUSTRATION OF APPLICATION OF REMUNERATION POLICY
The charts below illustrate possible remuneration outcomes under the following three scenarios:
| 1. | The maximum that may be paid, assuming full Group Performance Share payout and full vesting under the new Long Term Share plan. For the Long Term Share Plan, an indication of the maximum remuneration receivable assumes a share price appreciation of 50 per cent during the period in which the award is subject to underpins. The basis of the calculation of the share price appreciation is that the share price embedded in the calculation for the ‘maximum’ bar chart is assumed to increase by 50 per cent across the performance period. |
| | |
| 2. | The expected value of remuneration for performance midway between threshold and maximum, assuming 50 per cent of maximum Group Performance Share opportunity and a Long Term Share award granted at 150 per cent of salary. It is also assumed that the Long Term Share Award will vest in full. |
| | |
| 3. | The minimum that may be paid, where only the fixed element is paid (base salary, benefits, pension and the fixed share award). |
Amounts are based on based salaries as at 1 January 2020 for the Group Chief Executive and Chief Operating Officer and 1 April 2020 for the Chief Financial Officer. Implementation of the Policy in 2020 is set out in the annual report on remuneration.
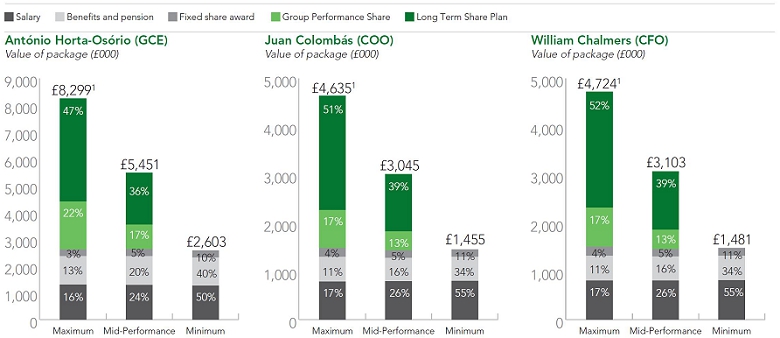
| 1 | Maximum values of reward package take into account the assumed 50 per cent share price appreciation. Maximum total compensation (£000) without share price appreciation is £7,005 for António Horta-Osório, £3,840 for Juan Colombás and £3,913 for William Chalmers. |
APPROACH TO RECRUITMENT AND APPOINTMENT TO THE BOARD
In determining appropriate remuneration arrangements on hiring a new Executive Director, the Committee will take into account all relevant factors. This may include the experience and calibre of the individual, local market practice, the existing remuneration arrangements for other executives and the business circumstances. The Committee will seek to ensure that arrangements are in the best interests of both the Group and its shareholders and will seek not to pay more than is necessary.
The Committee may make awards on hiring an external candidate to ‘buy-out’ remuneration arrangements forfeited on leaving a previous employer. In doing so the Committee will take account of relevant factors including any performance conditions attached to these awards, the form in which they were granted (e.g. cash or shares), the currency of the awards, and the timeframe of awards. Any such award made will be made in accordance with the PRA’s Rulebook and made on a comparable basis to those forfeited and subject to malus and clawback at the request of the previous employer as required by the PRA rules.
The package will normally be aligned with the remuneration policy as described in the policy report. However, the Committee retains the discretion to make appropriate remuneration decisions outside the standard policy to facilitate the recruitment of an individual of the calibre required and in exceptional cases.
This may, for example, include the following circumstances:
| An interim recruit, appointed to fill an Executive Director role on a short-term basis. |
| Exceptional circumstances requiring the Chairman to take on an executive function on a short-term basis. |
| An Executive Director recruited at a time in the year when it would be inappropriate to provide a Group Performance Share or Long Term Share award for that year, for example, where there may be insufficient time to assess performance. In this situation the Committee may feel it appropriate to transfer the quantum in respect of the months employed during the year to the subsequent year so that reward is provided on a fair basis. |
| An Executive Director recruited from a business or location where benefits are provided that do not fall into the definition of ‘variable remuneration forfeited’ but where the Committee considers it reasonable to buy-out these benefits. |
| Transitional arrangements for overseas hires, which might include relocation expenses and accommodation. |
The maximum level of variable remuneration (excluding buy-out awards) that may be awarded to new Executive Directors is equal to 200 per cent of fixed remuneration, including any discount permitted by the European Banking Authority. In making any such remuneration decisions, the Committee will apply any appropriate performance measures in line with those applied to other Executive Directors.
A full explanation will be provided of any buy-out award or discretionary payment.
COMPENSATION
SERVICE AGREEMENTS
The service contracts of all current Executive Directors are terminable on 12 months’ notice from the Group and six months’ notice from the individual.
The Chairman also has a letter of appointment. His engagement may be terminated on six months’ notice by either the Group or him.
| | | Notice to be given by the Group | | Date of service agreement |
| Lord Blackwell | | 6 months | | 31 March 2014 |
| António Horta-Osório | | 12 months | | 3 November 2010 |
| William Chalmers | | 12 months | | 3 June 2019 |
| Juan Colombás | | 12 months | | 30 November 2010 |
Under his contract (dated 3 November 2010), António Horta-Osório (GCE) is entitled to an amount equivalent to base salary and pension allowance as a payment in lieu of notice if notice to terminate is given by the Group. If notice to terminate is given by the GCE, he is entitled to an amount equivalent to base salary if the Group chooses to make a payment in lieu of notice. Such payments in lieu will be made in monthly instalments subject to mitigation. He is also entitled to six months’ notice from the Group in the event of his long-term incapacity. As part of a buy-out of a pension forfeited on joining from Santander, the GCE is also entitled to the provision of a conditional unfunded pension commitment, subject to performance conditions as described further in the annual report on remuneration. In the event of long-term incapacity, if the GCE does not perform his duties for a period of at least 26 weeks (in aggregate over a 12 month period), the Group shall be entitled to terminate his employment by giving six months’ notice. In all other respects, the terms of the GCE’s contract in relation to payments for loss of office match those set out below for new directors.
Under terms agreed when joining the Group, Juan Colombás is entitled to a conditional lump sum benefit, payable either (i) on reaching normal retirement age unless he voluntarily resigns or is dismissed for cause, or (ii) on leaving due to long-term sickness or death, as described further in the annual report on remuneration.
The service contracts and letters of appointment are available for inspection at the Company’s registered office.
NOTICE PERIODS
Newly-appointed Executive Directors will be employed on contracts that include the following provisions:
| The individual will be required to give six months’ notice if they wish to leave and the Group will give 12 months’ notice other than for material misconduct or neglect or other circumstances where the individual may be summarily dismissed by written notice. In exceptional circumstances, new joiners will be offered a longer notice period (typically reducing to 12 months within two years of joining). |
| In the event of long-term incapacity, if the Executive Director does not perform their duties for a period of at least 26 weeks (in aggregate over a 12 month period), the Group shall be entitled to terminate the executive’s employment by giving three months’ notice. |
| At any time after notice to terminate is given by either the Group or the Executive Director, the Group may require the Executive Director to take leave for some or all of the notice period. |
| At any time, at its absolute discretion, the Group may elect to terminate the individual’s employment by paying to the Executive Director, in lieu of the notice period, an amount equivalent to base salary, subject to mitigation as described more fully in the termination payments section of this report. |
COMPENSATION
TERMINATION PAYMENTS
It is the Group’s policy that where compensation on termination is due, it should be paid on a phased basis, mitigated in the event that alternative employment is secured. Where it is appropriate to make a bonus payment ( known as Group Performance Share) to the individual, this should relate to the period of actual service, rather than the full notice period. Any Group Performance Share payment will be determined on the basis of performance as for all continuing employees and will remain subject to performance adjustment (malus and clawback) and deferral. Generally, on termination of employment, Group Performance Share awards, in flight Group Ownership Share awards, Long Term Share Plan awards and other rights to payments will lapse except where termination falls within one of the reasons set out below. In the event of redundancy, the individual may receive a payment in line with statutory entitlements at that time. If an Executive Director is dismissed for gross misconduct, the Executive Director will receive normal contractual entitlements until the date of termination and all deferred Group Performance Share, Group Ownership Share and Long Term Share Plan awards will lapse.
| | | Base salary | | Fixed share award | | Pension, benefits and
other fixed remuneration |
| Resignation | | In the case of resignation to take up new employment, paid until date of termination (including any period of leave required by the Group). In the case of resignation for other reasons, base salary will be paid in monthly instalments for the notice period (or any balance of it), offset by earnings from new employment during this period. | | Awards continue and are released at the normal time and the number of shares subject to the award in the current year will be reduced to reflect the date of termination. | | Paid until date of termination including any period of leave required by the Group (subject to individual benefit scheme rules). |
| Redundancy or termination by mutual agreement | | Paid until date of termination (including any period of leave required by the Group). In respect of the balance of any notice period, base salary will be paid in monthly instalments, offset by earnings from new employment during this period. | | Awards will normally continue and be released at the normal time and the number of shares subject to the award in the current year will be reduced to reflect the date of termination unless, in the case of mutual agreement, the Committee determines that exceptional circumstances apply in which case shares may be released on termination. | | Paid until date of termination including any period of leave required by the Group (subject to individual benefit scheme rules). |
| Retirement/ill health, injury, permanent disability/death | | Paid until date of retirement/death. For ill health, injury or permanent disability which results in the loss of employment, paid for the applicable notice period (including any period of leave required by the Group). | | Awards will normally continue and be released at the normal time and the number of shares subject to the award in the current year will be reduced to reflect the date of termination except for (i) death where shares are released on the date of termination; or (ii) in the case of permanent disability the Committee determines that exceptional circumstances apply in which case shares may be released on the date of termination. | | Paid until date of death/ retirement (subject to individual benefit scheme rules). For ill health, injury, permanent disability, paid for the notice period including any period of leave required by the Group (subject to individual benefit scheme rules). |
| Change of control or merger | | N/A | | Awards will be payable on the date of the Change of Control and the number of shares subject to the award will be reduced to reflect the shorter accrual period. The Committee may decide that vested awards will be exchanged for (and future awards made over) shares in the acquiring company or other relevant company. | | N/A |
| Other reason where the Committee determines that the executive should be treated as a good leaver | | Paid until date of termination (including any period of leave required by the Group). In respect of the balance of any notice period, base salary will be paid in monthly instalments, offset by earnings from new employment during this period. | | Awards continue and are released at the normal time and the number of shares subject to the award in the current year will be reduced to reflect the date of termination. | | Paid until date of termination including any period of leave required by the Group (subject to individual benefit scheme rules). |
COMPENSATION
| | | Group Performance Share
(Annual bonus plan)1 | | Long Term Share Plan
(Long term variable reward plan)2 | | Chairman and
Non-Executive Director fees3 |
| Resignation | | Unvested deferred Group Performance Share awards are forfeited and in-year Group Performance Share awards are accrued until the date of termination (or the commencement of garden leave if earlier) unless the Committee determines otherwise (in exceptional circumstances), in which case such awards are subject to deferral, malus and clawback. | | Awards lapse on date of leaving (or on notice of leaving) unless the Committee determines otherwise in exceptional circumstances that they will vest on the original vesting date (or exceptionally on the date of leaving). Where award is to vest it will be subject to the underpins and time pro-rating (for months worked in underpin period). Malus and clawback will apply. | | Paid until date of leaving Board. |
| Redundancy or termination by mutual agreement | | For cases of redundancy, unvested deferred Group Performance Share awards are retained and in-year Group Performance Share awards are accrued until the date of termination (or the commencement of garden leave if earlier). Such awards would be subject to deferral, malus and clawback. For termination by mutual agreement, the same approach as for resignation would apply. | | Awards vest on the original vesting date (or exceptionally on the date of leaving). Vesting is subject to the underpins and time pro-rating (for months worked in underpin period). Malus and clawback will apply. | | Paid until date of leaving Board. |
| Retirement/ill health, injury, permanent disability | | Unvested deferred Group Performance Share awards are retained and in-year Group Performance Share awards are accrued until the date of termination (or the commencement of garden leave if earlier). Such awards would be subject to deferral, malus and clawback. | | Awards vest on the original vesting date (or exceptionally on the date of leaving). Vesting is subject to the underpins and time pro-rating (for months worked in underpin period). Malus and clawback will apply. | | Paid until date of leaving Board. |
| Death | | Unvested deferred Group Performance Share awards are retained and in-year Group Performance Share awards are accrued until the date of termination. Deferred Group Performance Share awards vest on death in cash, unless the Committee determines otherwise. | | Awards vest in full on the date of death unless in exceptional circumstances the Remuneration Committee determines that the underpins or pre-vest test do not support full vesting. | | Paid until date of leaving Board. |
| Change of control or merger2 | | In-year Group Performance Share accrued up until date of change of control or merger (current year). Where there is a Corporate Event, deferred Group Performance Share awards vest to the extent and timing determined by the Committee in its absolute discretion. | | Awards vest on date of event. Vesting is subject to the underpins and time pro-rating (for months worked in underpin period unless determined otherwise). Malus and clawback will normally apply. Instead of vesting, awards may be exchanged for equivalent awards over the shares of the acquiring company or another company or equivalent cash based awards. | | Paid until date of leaving Board. |
| Other reason where the Committee determines that the executive should be treated as a good leaver | | Unvested deferred Group Performance Share awards are retained and in-year Group Performance Share awards are accrued until the date of termination (or the commencement of garden leave if earlier). Deferred Group Performance Share awards vest in line with normal timeframes and are subject to malus and clawback. The Committee may allow awards to vest early if it considers it appropriate. | | Awards vest on the original vesting date (or exceptionally on the date of leaving). Vesting is subject to the underpins and time pro-rating (for months worked in underpin period). Malus and clawback will apply. | | Paid until date of leaving Board. |
| 1 | If any Group Performance Share is to be paid to the Executive Director for the current year, this will be determined on the basis of performance for the period of actual service, rather than the full notice period (and so excluding any period of leave required by the Group). |
| 2 | Reference to change of control or merger includes a compromise or arrangement under section 899 of the Companies Act 2006 or equivalent. Fixed share awards may also be released/exchanged in the event of a resolution for the voluntary winding up of the Company; a demerger, delisting, distribution (other than an ordinary dividend) or other transaction, which, in the opinion of the Committee, might affect the current or future value of any award; or a reverse takeover, merger by way of a dual listed company or other significant corporate event, as determined by the Committee. In the event of a demerger, special dividend or other transaction which would in the Committee’s opinion affect the value of awards, the Committee may allow a deferred Group Performance Share award or a long term incentive award to vest to the extent relevant performance conditions are met to that date and if the Committee so determined, on a time pro-rated basis (unless determined otherwise) to reflect the number of months of the underpin period worked. |
| 3 | The Chairman is entitled to six months’ notice. |
| 4 | The terms applicable on a cessation of employment to Group Ownership Share Awards are as shown on page 133 of the 2017 Remuneration Policy. |
COMPENSATION
On termination, the Executive Director will be entitled to payment for any accrued but untaken holiday calculated by reference to base salary and fixed share award.
The cost of legal, tax or other advice incurred by an Executive Director in connection with the termination of their employment and/or the cost of support in seeking alternative employment may be met up to a maximum of £100,000. Additional payments may be made where required to settle legal disputes, or as consideration for new or amended post-employment restrictions.
Where an Executive Director is in receipt of expatriate or relocation expenses at the time of termination (as at the date of the AGM no current Executive Directors are in receipt of such expenses), the cost of actual expenses incurred may continue to be reimbursed for up to 12 months after termination or, at the Group’s discretion, a one-off payment may be made to cover the costs of premature cancellation. The cost of repatriation may also be covered.
REMUNERATION POLICY TABLE FOR CHAIRMAN AND NON-EXECUTIVE DIRECTORS
The table below sets out the remuneration policy for Non-Executive Directors (NEDs).
CHAIRMAN AND NON-EXECUTIVE DIRECTOR FEES AND BENEFITS
| Purpose and link to strategy | To provide an appropriate reward to attract and retain a high-calibre individual with the relevant skills, knowledge and experience. |
| Operation | The Committee is responsible for evaluating and making recommendations to the Board with regards to the Chairman’s fees. The Chairman does not participate in these discussions. |
| | The GCE and the Chairman are responsible for evaluating and making recommendations to the Board in relation to the fees of the NEDs. |
| | When determining and reviewing fee and benefit levels, the Committee ensures that decisions are made within the following parameters: |
| | – The individual’s skills and experience. – An objective assessment of the individual’s responsibilities and the size and scope of their role, using objective sizing methodologies. – Fees and benefits for comparable roles in comparable publicly listed financial services groups of a similar size. |
| | The Chairman receives an all-inclusive fee, which is reviewed periodically plus benefits including life insurance, car allowance, medical insurance and transportation. The Committee retains the right to provide additional benefits depending on individual circumstances. |
| | NEDs are paid a basic fee plus additional fees for the chairmanship/membership of committees and for membership of Group companies/boards/non-board level committees. |
| | Additional fees are also paid to the senior independent director and to the deputy chairman to reflect additional responsibilities. |
| | Any increases normally take effect from 1 January of a given year. |
| | The Chairman and the NEDs are not entitled to receive any payment for loss of office (other than in the case of the Chairman’s fees for the six month notice period) and are not entitled to participate in the Group’s bonus, share plan or pension arrangements. |
| | NEDs are reimbursed for expenses incurred in the course of their duties, such as travel and accommodation expenses, on a grossed-up basis (where applicable). |
| Maximum potential | The Committee will make no increase in fees or benefits currently provided which it believes is inconsistent with the parameters above. |
| Performance metrics | N/A |
| Changes | No change to policy. |
LETTERS OF APPOINTMENT
The Non-Executive Directors all have letters of appointment and are appointed for an initial term of three years after which their appointment may continue subject to an annual review. Non-Executive Directors may have their appointment terminated, in accordance with statute and the articles of association, at any time with immediate effect and without compensation.
DATE OF LETTER OF APPOINTMENT
| NED | | Date of letter of appointment | | Date of appointment |
| Alan Dickinson | | 26 June 2014 | | 8 September 2014 |
| Anita Frew | | 17 November 2010 | | 1 December 2010 |
| Simon Henry | | 1 May 2014 | | 26 June 2014 |
| Nick Prettejohn | | 1 April 2014 | | 23 June 2014 |
| Stuart Sinclair | | 26 November 2015 | | 04 January 2016 |
| Sara Weller | | 31 January 2012 | | 01 February 2012 |
| Lord Lupton | | 2 March 2017 | | 01 June 2017 |
| Amanda Mackenzie | | 17 April 2018 | | 01 October 2018 |
| Sarah Legg | | 21 October 2019 | | 01 December 2019 |
All Directors are subject to annual re-election by shareholders.
The service contracts and letters of appointments are available for inspection at the Company’s registered office.
CORPORATE GOVERNANCE
STATEMENT ON US CORPORATE GOVERNANCE STANDARDS
The Board is committed to the delivery of the Group’s strategy which will transform the Group for success in a digital world. The Board’s strategy is underpinned by high standards of corporate governance designed to ensure consistency and rigour in its decision making. This report explains how those standards, in particular, those laid down in the Financial Reporting Council’s UK Corporate Governance Code 2018 (the UK Code), apply in practice to ensure that the Board and management work together for the long-term benefit of the Company and its shareholders. The UK Code can be accessed at www.frc.org.uk.
To assist the Board in carrying out its functions and to provide independent oversight of internal control and risk management, certain responsibilities are delegated to the Board’s Committees. The Board is kept up to date on the activities of the Committees through reports from each of the Committee Chairmen. Terms of Reference for each of the Committees are available on the website at www.lloydsbankinggroup.com. Information on the membership, role and activities of the Nomination and Governance Committee, the Audit Committee, the Board Risk Committee and the Responsible Business Committee can be found on pages 157 to 168.
Further information about the work of the Remuneration Committee is included on pages 117 to 118 and 132 to 133.
As a non-US company listed on the New York Stock Exchange (NYSE) Lloyds Banking Group plc is required to disclose any significant ways in which its corporate governance practices differ from those followed by domestic US companies listed on the NYSE, key differences are set out in the paragraphs below. As Lloyds Banking Group plc’s main listing is on the London Stock Exchange, it follows the principles contained in the UK Code. The Group confirms that it applied the principles and complied with all the provisions of the Code throughout 2019 except in relation to that part of provision 36 that provides that the remuneration committee should develop a formal policy for post-employment shareholding requirements encompassing both unvested and vested shares. Compliance with the UK Code is discussed further on page 155.
The NYSE corporate governance listing standards require domestic US companies to adopt and disclose corporate governance policies. For Lloyds Banking Group plc, consistent with the principles of the UK Code, the Nomination and Governance Committee sets the corporate governance principles applicable to the Company and oversees the annual evaluation of the performance of the Board, its Committees and its individual members.
Under the NYSE corporate governance listing standards, the remuneration, nomination and governance committees of domestic US companies must be comprised of entirely independent directors. However for Lloyds Banking Group plc, again consistent with the principles of the UK Code, the Remuneration Committee and the Nomination and Governance Committee include the Chairman, with all other members being independent Non-Executive Directors.
CORPORATE GOVERNANCE
A letter from the Chairman
Delivering on the Group’s purpose – Helping Britain Prosper
 | The Board recognises
the importance of
meeting the Group’s
responsibilities and duties
both to shareholders
and the communities that the
Group serves across the UK. Lord Blackwell Chairman |  |
CHAIRMAN’S LETTER | | | BOARD AND COMMITTEE CHANGES | | | announced that I plan to retire as Group Chairman at or before the AGM in 2021 as I will by then have served some nine years on the Group Board. The Board has initiated a search process to allow time to identify my successor and enable an orderly handover. QUARTERLY DIVIDEND I am pleased to report that the Board approved the Group moving to the payment of quarterly dividends in 2020, with the first quarterly dividend in respect of the first quarter of 2020 payable in June 2020. The Group has around 2.4 million shareholders, the vast majority of whom are retail shareholders, and this approach will provide a more regular flow of dividend income to all shareholders whilst accelerating the receipt of payments. Further information on quarterly dividends can be found on page F-76. BOARD EFFECTIVENESS The Board carried out an annual evaluation of its effectiveness during the year. This was an internal evaluation, which ran between October 2019 and January 2020 and was overseen by the Nomination and Governance Committee. The process which was undertaken and the findings of the review can be found on pages 152 to 153, together with information about the Board’s progress against the 2018 review actions. CORPORATE GOVERNANCE CODE The year under review was the first year that the Code has applied to the Group. The Group’s statement of compliance with the Code and a summary of the requirements of the Code can be found on pages 155 to 156. The Group also implemented its approach to workforce engagement. 
Lord Blackwell Chairman |
This Corporate Governance Report details the Group’s approach to governance in practice, how the Board operates and the key activities of the Board during the year, together with information on the annual Board evaluation process. It also includes the reports from each of the Board’s principal Committees. The Board recognises the importance of meeting the Group’s responsibilities and duties both to shareholders and the communities the Group serves across the UK. These are embedded into the Group’s processes and thinking. The Group’s commitment to good governance and the directors’ duties, including under s.172 of the Companies Act 2006, make sure that the Group continually challenges its assumptions and risks. The Group’s purpose to Help Britain Prosper reflects the understanding that a sustainable business organisation needs to continuously demonstrate its value as a responsible corporate citizen. A major focus over the last year has been the continued implementation of the Group’s strategic transformation programme. This has required a substantial investment in colleague skills and culture to support the re-shaping of roles around the new ways of working. The Board has devoted considerable time to reviewing the way this is being implemented, including a two day joint Board and Executive offsite. The Group has paid particular attention to the management of the risks arising from the implementation of new technologies, the new ways of working and the overall pace of change. 2019 has also been the first year in which the Group has operated under the new ring-fencing governance requirements. Further details of the Group’s ring-fencing governance structure and the Board’s oversight of the strategic transformation programme are set out on pages 151 and 150 respectively. | | | Succession planning and the composition of the Board and its committees are important components of good governance. There were a number of changes to the Board and Committees during the year. George Culmer retired as Chief Financial Officer and Executive Director of the Group on 1 August 2019 and was succeeded by William Chalmers, who brought a wealth of experience to the Group. George was a crucial member of the team that helped turn Lloyds around and left with our thanks and best wishes for the future. Following a recruitment process led by the Nomination and Governance Committee, Sarah Legg was appointed to the Board in December 2019 as a new independent Non-Executive Director and Catherine Woods will join the Board on 1 March 2020 as a new independent Non-Executive Director. While selected on merit, these appointments help meet the Group’s commitments to both gender and BAME diversity. Sarah became a member of the Audit and Board Risk Committees and Catherine will join the Board Risk and Remuneration Committees. Anita Frew stepped down as Senior Independent Director on 1 December 2019 and will retire as Deputy Chairman and Non-Executive Director at the AGM in May 2020. Anita has been an extremely valuable Board member, and will be much missed. Alan Dickinson succeeded Anita as Senior Independent Director on 1 December 2019 and will also take on the role of Deputy Chairman following Anita’s retirement from the Board. Alan’s significant board, financial and regulatory experience, including as a chairman, make him ideally suited to this role. Juan Colombás, Executive Director and Chief Operating Officer, announced that he plans to retire in July 2020 after many years as a senior executive in which he has made a major contribution to the transformation of the Group. In line with the UK Corporate Governance Code 2018 (the ‘Code’), I also | | |
CORPORATE GOVERNANCE
Corporate governance report
The Group’s Board in 20191

Board and Committee composition and attendance at scheduled meetings in 20196
| | | | | Nomination and | | Audit | | Board Risk | | Remuneration | | Responsible |
| Board member | | Board | | Governance Committee | | Committee | | Committee | | Committee | | Business Committee |
| Lord Blackwell (C) | | 11/11 | | 7/7 | | – | | 8/8 | | 6/6 | | 4/4 |
| António Horta-Osório | | 11/11 | | – | | – | | – | | – | | – |
| William Chalmers1 | | 3/3 | | – | | – | | – | | – | | – |
| Juan Colombás | | 11/11 | | – | | – | | – | | – | | – |
| George Culmer1 | | 8/8 | | – | | – | | – | | – | | – |
| Alan Dickinson2 | | 11/11 | | 7/7 | | 6/6 | | 8/8 | | 6/6 | | – |
| Anita Frew2 | | 11/11 | | 7/7 | | 6/6 | | 8/8 | | 6/6 | | 3/44 |
| Simon Henry | | 10/114 | | – | | 6/6 | | 7/84 | | – | | – |
| Sarah Legg3 | | – | | – | | – | | – | | – | | – |
| Lord Lupton | | 11/11 | | – | | 3/3 | | 8/8 | | – | | 1/25 |
| Amanda Mackenzie | | 11/11 | | – | | – | | 8/8 | | 3/3 | | 4/4 |
| Nick Prettejohn | | 11/11 | | 5/5 | | 6/6 | | 8/8 | | – | | – |
| Stuart Sinclair | | 11/11 | | – | | – | | 8/8 | | 6/6 | | 4/4 |
| Sara Weller | | 11/11 | | 7/7 | | – | | 7/84 | | 6/6 | | 4/4 |
| | |
| 1 | George Culmer retired from, and William Chalmers was appointed to, the Board on 1 August 2019. |
| | |
| 2 | Alan Dickinson succeeded Anita Frew as Senior Independent Director on 1 December 2019. |
| | |
| 3 | Sarah Legg joined the Board and respective Committees on 1 December 2019. There were no meetings in December 2019. |
| | |
| 4 | Unable to attend due to a scheduling clash with a prior business commitment. |
| | |
| 5 | Unable to attend due to a scheduling clash with another Group business commitment. |
| | |
| 6 | Where a Director is unable to attend a meeting s/he receives papers in advance and has the opportunity to provide comments to the Chairman of the Board or to the relevant Committee Chairman. |
| | |
| Chairman |
BEYOND BOARD MEETINGS Non-Executive Directors regularly meet with senior management and spend time increasing their understanding of the business through site visits, formal briefing sessions or more informal events including breakfast meetings with senior colleagues. These informal meetings allow Directors greater time to discuss business in an informal setting, ensuring that there is sufficient time for the Board to discuss matters of a material nature at Board meetings. | | | Non-Executive Directors see attendance at Board and Committee meetings as only one part of their role. In addition to the annual schedule of Board and Committee meetings, the Non-Executive Directors undertake a full programme of activities and engagements each year. Where further training or awareness is identified, such as new technology, regulations or sector advances, deep dives are held with the relevant field expert to provide overviews, chances to raise questions, and debate the impacts on business in an informal setting. | | | The Board held joint discussions with Scottish Widows Group Limited in April and Lloyds Bank Corporate Markets plc in September. These meetings are important in respect of both governance and the sharing of best practice. They also provide the opportunity for in-depth focus on both insurance and corporate markets matters. Performance and business updates are also provided, and, in the case of Lloyds Bank Corporate Markets plc, updates on key milestones in respect of the development of this new bank. |
CORPORATE GOVERNANCE
How the Board works
Meetings, activities and processes
THE RIGHT PROCESSES IN PLACE TO DELIVER ON THE GROUP’S STRATEGY During the year, there were 11 scheduled Board meetings, with details of attendance shown on page 145. In addition to formal meetings, the Board meets as necessary to consider matters of a time-sensitive nature. The Chairman and the Chairmen of each Committee ensure Board and Committee meetings are structured to facilitate open discussion, debate and challenge. The Board is supported by its Committees which make recommendations on matters delegated to them under the Corporate Governance Framework, in particular in relation to Board appointments, internal control risk, financial reporting, governance and remuneration issues. The management of all Committees is in keeping with the basis on which meetings of the Board are managed. Each of the Committees’ structures facilitates open discussion and debate, with steps taken to ensure adequate time for members of the Committees to consider proposals which are put forward. | | | The Executive Directors make decisions within clearly defined parameters which are documented within the Corporate Governance Framework. However, where appropriate, any activities outside the ordinary course of business are brought to the full Board for their consideration, even if the matters fall within the agreed parameters. The Corporate Governance Framework helps to ensure that decisions are made by management with the correct authority. In the rare event of a Director being unable to attend a meeting, the Chairman of the respective meeting discusses the matters proposed with the Director concerned wherever possible, seeking their support and feedback accordingly. The Chairman subsequently represents those views at the meeting. The Board recognises the need to be adaptable and flexible to respond to changing circumstances and emerging business priorities, whilst ensuring the continuing monitoring and oversight of core issues. The Group has a comprehensive and continuous agenda setting and escalation process in place to ensure that the Board has the right information at the right time and in the right format to enable the Directors | | | to make the right decisions. The Chairman leads the process, assisted by the Group Chief Executive and Company Secretary. The process ensures that sufficient time is being set aside for strategic discussions and business critical items. The process of escalating issues and agenda setting is reviewed at least annually as part of the Board effectiveness review with enhancements made to the process, where necessary, to ensure it remains effective. Details of the meeting process are provided below. The Non-Executive Directors also receive regular updates from the Group Chief Executive’s office including a weekly email which gives context to current issues. In-depth and background materials are regularly provided via a designated area on the secure electronic Board portal. A full schedule of matters reserved for the Board and Terms of Reference for each of the principal Committees can be found at www.lloydsbankinggroup.com/our-group/ corporate-governance |
 | A yearly planner is prepared by the Company Secretary to map out the flow of key items of business to the Board. Board venues are agreed and colleagues in the areas that the Board will visit are engaged at both senior management and operational level. |
 | The Chairman holds monthly meetings to review the draft agenda and planner with the Company Secretary and Chief of Staff, as well as quarterly meetings with a wider group of central functions, to identify emerging issues. The draft Board agenda is discussed with the Chairman and the Group Chief Executive and reviewed at GEC meetings. Matters may be added to agendas in response to external events, Non-Executive Director requests, regulatory initiatives and the quarterly Board topic review meetings. |
 | Templates and guidelines are included within targeted training for authors of papers to ensure consistency and high quality of information. Meeting packs are uploaded and communicated to all Directors via a secure electronic Board portal typically a week in advance of the meeting to ensure sufficient time to review the matters which are to be discussed and seek clarification or any additional information. |
 | Executive meetings are held ahead of all Board and Committee meetings to ensure matters being presented to the Board have been through a thorough discussion and escalation process. Committee meetings are generally held prior to Board meetings, with the Chairman of each Committee then reporting matters discussed to the Board. Non-Executive discussions and informal dinners are held prior to most Board meetings, some of which also include the Group Chief Executive. |
 | Board meetings have certain standing items, such as a report from the Group Chief Executive and Chief Financial Officer on Group performance, reports from the Chairmen of Committees and principal subsidiaries and updates from certain GEC members. The agenda includes free agenda discussion time. Topics for deep dives or additional items are discussed when required and include business, governance and regulatory updates. The Board makes full use of technology such as video conferencing, teleconferencing, a Board portal and tablets/devices in its meeting arrangements. This leads to greater flexibility, security and efficiency in Board paper distribution and meeting arrangements. |
 | The Board has the chance to meet colleagues within the business and, if any additional meetings are required to provide more details, these are arranged. Minutes and matters arising from the Board meeting are produced and circulated to the Directors for review and feedback. Those responsible for matters arising are asked to provide updates to a subsequent meeting. |
CORPORATE GOVERNANCE
How the Board workscontinued
Key focus areas
The Board sets the strategy, oversees its delivery and establishes the culture, values and standards of the Group. The Board ensures that the Group manages risk effectively, monitors financial performance and reporting and ensures that appropriate and effective succession planning arrangements and remuneration policies are in place. It provides and encourages entrepreneurial leadership across the Group within this framework. This page 147 and page 148 show the key focus areas of the Board during the year and highlight the link between those focus areas and the Group’s strategic objectives. Also listed are stakeholder groups central to the matters considered and decisions taken. The agenda for each Board meeting is discussed in advance with the Chairman and Chief Executive Officer and reviewed at Group Executive Committee meetings and includes 30 minutes ‘free agenda’ discussion time. Regular updates are provided to the Board by the Chairmen of the Audit, Nomination and Governance, Remuneration, Responsible Business and Board Risk Committees as well as by the Chief Executive Officer, the Chief Financial Officer, the Chief Operating Officer and the Chairman and the chairmen of the Lloyds Bank Corporate Markets plc and Scottish Widows Group Limited boards. |
| LEADING CUSTOMER EXPERIENCE |
| | |
 | DIGITISING THE GROUP |
| | |
| MAXIMISING GROUP CAPABILITIES |
| | |
| TRANSFORMING WAYS OF WORKING |
 |
| |
| REVIEWED AND APPROVED THE |
| HELPING BRITAIN PROSPER PLAN |
| |
| Link to strategic priorities: |  |
| Link to stakeholder groups: |
| Customers; Community and Environment; Suppliers |
| |
| DISCUSSED CONDUCT, CULTURE AND |
| VALUES – CULTURE DASHBOARD AND |
| CHANGE MANAGEMENT |
| |
| Link to strategic priorities: | |
| Link to stakeholder groups: |
| Customers; Colleagues; Regulatory and Government; Suppliers |
|
| |
| RECEIVED REPORTS ON RESPONSIBLEBUSINESS INCLUDING ONCLIMATE CHANGE MATTERS ANDSUSTAINABILITY |
| Link to strategic priorities: | |
| Link to stakeholder groups: |
| Customers; Colleagues; Community and Environment; Shareholders; Suppliers; Regulatory and Government |
|
|
| |
| REVIEWED AND APPROVED THE GROUP’S DIVERSITY POLICY |
|
| Link to strategic priorities: | |
| Link to stakeholder groups: |
| Colleagues |
| |
| CONSIDERED UPDATES ON WORKFORCE ENGAGEMENT |
|
| Link to strategic priorities: | |
| Link to stakeholder groups: |
| Colleagues |
| |
| CONSIDERED UPDATES ON PROPOSED NEW REMUNERATION POLICY |
|
| Link to strategic priorities: | |
| Link to stakeholder groups: |
| Colleagues; Regulatory and Government; |
| Shareholders |
| |
 |
| |
| DISCUSSED THE GROUP’S |
| PERFORMANCE AGAINST CUSTOMER DASHBOARD |
|
| Link to strategic priorities: | |
| Link to stakeholder groups: |
| Customers |
| |
|
|
| DISCUSSED IMPROVEMENTS IN CUSTOMER OUTCOMES FROM STRATEGIC TRANSFORMATION PLAN (GSR3) |
| Link to strategic priorities: | |
| Link to stakeholder groups: |
| Customers; Regulatory and Government |
| |
| DISCUSSED HOW THE GROUPSUPPORTS VULNERABLE CUSTOMERSAND CUSTOMERS IN FINANCIALDIFFICULTY |
| Link to strategic priorities: | |
| Link to stakeholder groups: |
| Customers; Regulatory and Government |
| |
| DISCUSSED THE ANNUAL REVIEW OFCUSTOMER CONDUCT FRAMEWORKAND RISK |
| Link to stakeholder groups: | |
| Customers; Regulatory and Government |
| |
| DEEP DIVE ON STRONG CUSTOMERAUTHENTICATION |
| Link to strategic priorities: | |
| Link to stakeholder groups: |
| Customers; Regulatory and Government |
| |
| DEEP DIVE ON OPEN BANKING |
| Link to strategic priorities: | |
| Link to stakeholder groups: |
| Customers; Regulatory and Government |
| |
| DISCUSSED PROCESSES ANDOUTCOMES FOR THE FAIR TREATMENTOF CUSTOMER COMPLAINTS ANDREMEDIATION |
| Link to strategic priorities: | |
| Link to stakeholder groups: |
| Customers; Regulatory and Government |
| |
| |
| DEEP DIVE ON DATA ETHICS |
| Link to strategic priorities: | |
| Link to stakeholder groups: |
| Customers; Regulatory and Government |
| |
 |
| |
| APPROVED THE 2019 BUDGET |
| |
| DISCUSSED THE REGULAR FINANCEREPORT, FORECASTS AND CAPITALAND LIQUIDITY POSITIONS |
| |
| REVIEWED AND APPROVED INCOMESTATEMENT, DRAFT RESULTS ANDPRESENTATIONS TO ANALYSTS |
| Link to stakeholder groups: |
| Colleagues; Shareholders |
| |
| REVIEWED AND APPROVED FUNDINGAND LIQUIDITY PLANS AND CAPITALPLAN |
| Link to stakeholder groups: |
| Regulatory and Government |
| |
| APPROVED THE PAYMENT OF FINALAND INTERIM DIVIDENDS |
| Link to stakeholder groups: |
| Shareholders |
| |
| APPROVED THE LAUNCH OF A SHAREBUYBACK PROGRAMME AND ITSSUBSEQUENT CURTAILMENT ASCONDITIONS CHANGED |
| Link to stakeholder groups: |
| Shareholders |
| |
| APPROVED THE PAYMENT OFQUARTERLY DIVIDENDS |
| Link to stakeholder groups: |
| Shareholders |
| |
| CONSIDERED UPDATES ONSTRUCTURAL HEDGING STRATEGY & GROUP CORPORATE TREASURY’SREGULAR MANAGEMENTINFORMATION REPORT |
| Link to stakeholder groups: |
| Regulatory and Government |
| |
| RECEIVED AN ANNUAL UPDATE ONPENSION SCHEME VALUATIONS |
| Link to stakeholder groups: |
| Customers |
| |
| DISCUSSED GSR3 AND FOUR YEAROPERATING PLAN |
| Link to strategic priorities: | |
| |
| REVIEWED AND APPROVED BASELPILLAR 3 DISCLOSURES |
| Link to stakeholder groups: |
| Regulatory and Government |
| |
| REVIEWED AND APPROVED ANNUALREPORT AND FORM 20-F |
| Link to stakeholder groups: |
| Regulatory and Government; Shareholders |
CORPORATE GOVERNANCE
| REVIEWED AND APPROVED GROUP TREASURY PLAN 2020 |
| |
Link to stakeholder groups:
Regulatory and Government |
| |
 |
| |
| CONSIDERED AN UPDATE ON THE IMPLEMENTATION OF THE GROUP’S RING-FENCING MODEL |
Link to stakeholder groups:
Customers; Regulatory and Government |
| |
| DISCUSSED OUTCOME OF BOARD EFFECTIVENESS REVIEW AND AGREED ACTIONS ARISING FROM IT |
Link to stakeholder groups:
Shareholders |
| |
| DISCUSSED CHAIRMAN’S PERFORMANCE REVIEW |
Link to stakeholder groups:
Shareholders |
| |
| APPROVED AGM DOCUMENTATION AND RECEIVED UPDATE ON VOTING |
Link to stakeholder groups:
Shareholders |
| |
| REVIEWED AND APPROVED THE CORPORATE GOVERNANCE FRAMEWORK |
Link to stakeholder groups:
Shareholders |
| |
| REVIEWED AND APPROVED VARIOUS GROUP POLICIES INCLUDING THE SIGNING AUTHORITIES, AND BOARD AND GEC DEALING POLICY |
Link to stakeholder groups:
Colleagues; Regulatory and Government |
| |
| CONSIDERED UPDATED BOARD SKILLS MATRIX |
Link to stakeholder groups:
Shareholders |
| |
| CONSIDERED REVIEWS OF CHAIRMAN’S FEE (WITHOUT CHAIRMAN PRESENT) AND NON-EXECUTIVE DIRECTORS’ FEES (WITH NON-EXECUTIVE DIRECTORS ABSTAINING) |
| |
| REVIEWED AND APPROVED GOING CONCERN STATEMENT |
| |
| DISCUSSED UPDATE ON BANKING STANDARDS BOARD 2018 SURVEY |
Link to stakeholder groups:
Colleagues; Regulatory and Government |
| |
| APPROVED BOARD AND BOARD COMMITTEE APPOINTMENTS |
| |
| CONSIDERED BOARD, BOARD COMMITTEE AND EXECUTIVE SUCCESSION PLANS |
| Link to stakeholder groups: Colleagues; Shareholders |
 |
| |
| APPROVED ATTESTATION OF RING-FENCING COMPLIANCE |
Link to stakeholder groups:
Customers; Regulatory and Government |
| |
| CONSIDERED WHISTLEBLOWING UPDATES |
Link to stakeholder groups:
Colleagues; Customers; Regulatory and Government |
| |
| CONSIDERED REGULATORY UPDATES |
Link to stakeholder groups:
Regulatory and Government |
| |
| RECEIVED UPDATES ON THE SENIOR MANAGER AND CERTIFICATION REGIME |
Link to stakeholder groups:
Regulatory and Government |
| |
| DISCUSSED THE FCA FIRM EVALUATION LETTER |
Link to stakeholder groups:
Regulatory and Government |
| |
| HELD DISCUSSIONS WITH THE PRA |
Link to stakeholder groups:
Regulatory and Government |
| |
 |
| |
| APPROVED GROUP RISK APPETITE |
Link to stakeholder groups:
Customers; Shareholders; Colleagues;
Community and Environment; Regulatory and Government; Suppliers |
| |
| CONSIDERED CYBER SECURITY UPDATES |
Link to stakeholder groups:
Colleagues; Customers; Suppliers |
| |
| CONSIDERED KEY AREAS OF CONDUCT RISK |
Link to stakeholder groups:
Colleagues; Customers; Regulatory and Government |
| |
| REVIEWED AND APPROVED PRA STRESS TESTING RESULTS |
| Link to stakeholder groups: |
| Customers; Shareholders; Regulatory and Government |
| |
| REVIEWED AND APPROVED THE RISK MANAGEMENT FRAMEWORK |
Link to stakeholder groups:
Customers; Shareholders; Colleagues;
Regulatory and Government; Suppliers |
| |
| APPROVED ANNUAL REVIEW OF GROUP RING-FENCING POLICY |
Link to stakeholder groups:
Customers; Regulatory and Government |
 |
| |
| TWO STRATEGY AWAY DAYS TO REVIEWTHE PROGRESS IN IMPLEMENTING THEGROUP’S STRATEGY |
| Link to strategic priorities: | |
| Link to stakeholder groups: |
| Customers; Shareholders; Colleagues; |
| Community and Environment; Regulatory andGovernment; Suppliers |
| |
| DEEP DIVE ON DATA AND MACHINEINTELLIGENCE PROGRAMME |
| Link to strategic priorities: | |
| Link to stakeholder groups: |
| Customers; Colleagues; Regulatoryand Government |
| |
| DEEP DIVE ON OPEN BANKINGAND ON STRONG CUSTOMERIDENTIFICATION |
| Link to strategic priorities: | |
| Link to stakeholder groups: |
| Customers; Regulatory and Government |
| |
| DEEP DIVE ON FINTECH |
| Link to strategic priorities: | |
| Link to stakeholder groups: |
| Customers; Colleagues |
| |
| CONSIDERED AND APPROVED LARGETRANSACTIONS AND CONTRACTS |
| Link to strategic priorities: | |
| Link to stakeholder groups: |
| Customers; Shareholders; Suppliers |
| |
| CONSIDERED THE GROUP’S EU EXITPREPARATIONS |
| Link to strategic priorities: | |
| Link to stakeholder groups: |
| Customers; Shareholders; Colleagues; |
| Community and Environment; Regulatory andGovernment; Suppliers |
| |
Deep dive sessions The Board regularly takes the opportunity to hold deep dive sessions with senior management outside formal Board meetings. The purpose of the sessions is to provide the Board with deeper insight into key areas of strategic focus, whilst providing Directors with a greater understanding and appreciation for the subject matter to help drive better quality of debate and enhance knowledge. The sessions are structured to allow plenty of opportunity for discussion and include presentations and videos. Details of the deep dive sessions that were held in 2019 are set out in the key focus areas section on pages 147 and 148. In addition, detailed updates were received from, and joint discussions held with, Scottish Widows Group Limited and Lloyds Bank Corporate Markets plc. |
CORPORATE GOVERNANCE
How the Board workscontinued
Governance in action
BOARD OVERSIGHT: CULTURE The Group aims to continually develop a values-led culture with the Board providing sponsorship of this approach. The Group’s values and behaviours are the foundation of the Group’s culture, providing a clear framework to ensure everyone in the Group understands what is expected of each other every day. Despite many strengths, the Board recognises that the Group’s culture needs to continually change to ensure the business can adapt rapidly to a changing environment while delivering the best outcomes for customers. The Group’s culture plan is driven by the Group’s three core values; putting customers first, keeping it simple and making a difference together and these are underpinned by the Group’s six drivers of culture: Vision and Values, Leaders and Line Managers, Communication and Colleague Voice, Enabling and Developing Colleagues, Reward and Recognition and Accountability and Empowerment. These are also reflected in divisional plans and align to the FCA’s four key drivers of culture. Culture initiatives are designed and delivered collaboratively, with input from colleagues and various teams across the Group, including divisional culture leads, Inclusion and Diversity, Responsible Business and Group Corporate Affairs. | The Board provides oversight and direction of culture activities and believes that establishing the right culture is important to ensure the Group builds an environment where all colleagues feel included, empowered and inspired to do the right things for customers. During 2019, the Board assessed and monitored the Group’s progress on culture through regular updates at Board meetings, which included: regular updates on the Group strategic review, which incorporates the biggest ever investment in colleagues, with a significant focus on transforming the way the Group works and its culture quarterly workforce engagement reports, which provide an update on culture initiatives and colleague feedback specific bi-annual updates on culture initiatives An understanding of the impact of the management initiatives is developed by reviewing a wide range of data and metrics, including the outputs from the Group’s colleague engagement survey, the Banking Standards Board assessment and other business metrics. As a result of this oversight, the Group’s culture plan and associated activities are regularly refined and tailored to incorporate insight into the Group’s progress. By doing this, the Group | is able to recognise areas of positive progress and understand where it still has more work to do so that the Group can focus on areas for improvement. Culture highlights from 2019 include: Continued roll out and embedding of Your Best, the Group’s transformational approach to performance management and career development. As part of the roll out the Group undertook the biggest capability uplift for line managers ever seen across the Group Simplifying and improving the Group’s ways of working, through focusing on key colleague journeys Continued focus on developing the skills required for the future, with significant progress made towards achieving the Group’s commitment to deliver 4.4 million additional learning and development hours during 2018 to 2020 Building resilience through a range of interventions for colleagues throughout the organisation, including the launch of an online portal providing access to a wide range of resources The Group has a number of initiatives planned for 2020 to accelerate cultural change, in particular in relation to empathy and promoting simplicity. |
| | | |
The Group is
committed to
Helping Britain
Prosper by supporting a
thriving low carbon
economy Sara Weller Non-Executive Director and
Chairman, Responsible Business
Committee | 
HOW DOES THE BOARD OVERSEE THE GROUP’S SUSTAINABILITY STRATEGY? Given the strategic importance of the Group’s sustainability ambitions, the Group’s governance structure provides clear oversight and ownership of the sustainability strategy. The Board of Directors as a whole is responsible for sustainability and has oversight via the Responsible Business Committee, a sub-committee of the Board, chaired by me and which includes the Chairman, Lord Blackwell, and Deputy Chairman, Anita Frew, as members. The Responsible Business Committee regularly reports to the Board to enable the Board to discuss pertinent issues as whole. Day to day accountability for sustainability rests with executive management, in particular the Group Chief Executive.
HOW IMPORTANT IS SUSTAINABILITY AND THE MANAGEMENT OF CLIMATE CHANGE RISK TO THE GROUP? Sustainability and climate change has become a pressing priority for the country and beyond. Over the past year the Group has been working, right across the business, on the best ways to respond to these challenges, and has developed a sustainability strategy which is committed to supporting the UK’s transition to a sustainable, low-carbon economy, and | is fully aligned to the Paris Agreement and the UK’s commitment to a net zero future by 2050. From the Group’s position at the heart of the UK economy, the Group is committed to supporting the UK successfully to engage with the challenges and opportunities presented by climate change and the carbon economy. The Group has identified and will manage material sustainability related risks across the Group, disclosing these in line with the Task Force on Climate-related Financial Disclosures (TCFD) recommendations. The Group has created a detailed implementation plan for the TCFD and the PRA supervisory expectations related to climate change. The Group has appointed Senior Management Function positions responsible for Climate Change risk, covering the three main legal entities, for example, for Lloyds Bank and Bank of Scotland this is the Chief Risk Officer.
CAN YOU TELL US ABOUT YOUR PERSONAL HIGHLIGHTS IN 2019? There are so many matters on which great progress has been made in 2019. However, if I had to pick a couple of areas, I would choose highlights where colleagues have gone the extra mile and more to support individuals at the risk of disadvantage. Firstly the Group’s Digital Skills Academy, piloted in Manchester and now rolling out to other cities, starting with Bristol. Secondly, the Group’s work to provide support to Mental Health UK to allow them to set up the UK’s first Money and Mental Health Advice line. |
CORPORATE GOVERNANCE
Q&A WITH STUART SINCLAIR
2020 marks the
beginning of a
new policy period
that must remain
relevant for three
years. This offered
the opportunity for
a fresh look. Stuart Sinclair Non-Executive Director and
Chairman, Remuneration
Committee |
HOW DOES THE BOARD OVERSEE THE GROUP’S REMUNERATION POLICY AND GET ASSURANCE THAT IT HAS BEEN DESIGNED TO ALIGN TO THE GROUP’S PURPOSE AND VALUES AND IS CLEARLY LINKED TO THE SUCCESSFUL DELIVERY OF THE COMPANY’S LONG-TERM STRATEGY? This year, the Group was given an opportunity to take a step back and think about the remuneration philosophy for the Group and focus on what the Group’s main stakeholders would like the Group to consider. I personally have spent considerable time listening to a wide cross-section of the Group’s investor base, as well as receiving the input of stakeholders such as recognised unions, regulators and the Work and Pensions Select Committee. With the insights from these discussions in mind, the Remuneration Committee has been able to discuss a great deal of material with management and independent advisers to gain comfort that the final proposals the Remuneration Committee recommended to the Board are suitable and align to the Group’s culture and values.
WHAT HAS BEEN YOUR GREATEST CHALLENGE SINCE BECOMING REMUNERATION COMMITTEE CHAIRMAN? The greatest challenge lay in crafting a new Remuneration Policy for the Group that would remain relevant for three years, while also being commercially sensible. To achieve this, Committee members spent time with a large cross section of investors and others (as noted in the Directors’ Remuneration Report), while, as ever, being mindful of the need to set pay at a level which will continue to attract candidates who can run large, complex | organisations. In this remuneration period, the task is made all the more challenging by the need to find senior people who have appreciation for technology and innovation generally and how it can improve customer experience while helping the cost structure. It was also important, in this round, to build in as much optionality as possible, so that change in society’s expectations or regulation or indeed the market for top talent could be accommodated within the new Policy. The various tests which have been engineered into the Policy, along with the continued expectation of Committee override and discretion, give the Committee some reassurance that a degree of future proofing has been built in.
IN YOUR OPINION, WHAT MAKES AN EFFECTIVE REMUNERATION COMMITTEE TO SUPPORT THE BOARD? The Remuneration Committee’s role is to ask the right questions, get comfortable the Committee has engaged with the right stakeholders and listened to them properly to give the Board assurance that the proposals the Committee put forward are right for the Group. Composition of the Committee is important and it has a mix of male and female Non-Executive Directors with a wealth of financial and non-financial, executive and non-executive experience to bring to the table. Importantly, all Committee members also have a good understanding of what factors, both internal and external, have an impact on remuneration. |
| | | |
| | | |
BOARD OVERSIGHT: OPERATIONAL RESILIENCE The Board believes that operational resilience has become ever more important: maintaining the Group’s most important services for the Group’s customers and the market in which the Group operates is critical and requires ongoing focus as the Group becomes more reliant on technology against a changing threat landscape. Operational Resilience receives significant attention from the Board, primarily through the Board Risk Committee. The Board approves the list of the Group’s most important business services annually, reviews a suite of operational resilience Board Risk Appetite Metrics on at least a quarterly basis and the operational resilience risk profile monthly, as it represents one of the Group’s most important non-financial risks. Please see page 166 for a summary of operational resilience matters considered by the Board Risk Committee. The Board also approved, and receives regular updates from the Group Chief Operating Officer, on progress against the Group’s Operational Resilience strategy, and the operational resilience investment programmes that are delivering the strategy. | BOARD OVERSIGHT: TRANSFORMATION The Board is responsible for the overall strategic direction of the Group and has been engaged with the Group’s strategy to transform its business for success in a digital world through multiple touchpoints throughout the year. These have included: the annual cycle of two strategy away days to debate priorities and agree implementation plans a suite of formal Board metrics and qualitative reporting to monitor progress and risks Deep dives sessions on key areas (see pages 147 and 148 for more information); Customer insight sessions with workstream teams in research labs and other locations (see page 154 for more information) a range of informal interactions to feel the pulse. These touchpoints enable the Board to oversee the Group’s transformation strategy, continually challenge and develop that strategy and take informed decisions on the critical issues relating to the Group’s strategy. | |
CORPORATE GOVERNANCE
How the Board workscontinued
GROUP STRUCTURE AND
RING-FENCING GOVERNANCE
ARRANGEMENTS From 1 January 2019 UK legislation requires large UK banks to separate personal banking services such as current and savings accounts from riskier activities, such as investment banking, in other parts of their business. This is called ring-fencing. The Group has established a Group structure and governance arrangements which are appropriate for the Group and meet the regulatory requirements. Lloyds Bank plc and Bank of Scotland plc are the banks, within the Group, which have been included within the ring-fence (together, the ‘Ring-Fenced Banks’). The governance structure focuses on ensuring: Independent decision making by the Ring-Fenced Bank Boards – on any matters where there might be a conflict between the interests of the Ring-Fenced Banks and the interests of another part of the Group Risks affecting the Ring-Fenced Banks are considered and managed from the Ring-Fenced Banks’ perspective – including maintenance of the capital adequacy and liquidity of the Ring-Fenced Banks Clear and effective governance at both Ring-Fenced Bank and Lloyds Banking Group plc level – including second and third lines of defence in respect of risk management | GROUP STRUCTURE The subsidiaries of the Group are structured into the following sub-groups under Lloyds Banking Group plc providing effective governance for the business undertaken in each sub group: ‘Ring-Fenced Banks sub-group’ containing Lloyds Bank plc and Bank of Scotland plc (including the Halifax and MBNA businesses), serving both their UK personal and commercial customers ‘Non Ring-Fenced bank sub-group’ - Lloyds Bank Corporate Markets plc (LBCM) - which provides products and services to Group customers that are not allowed within the ring-fence as well as serving Financial Service customers and holding the Group’s subsidiaries and branches outside the UK ‘Insurance sub-group’ under Scottish Widows Group Limited (including Scottish Widows Limited) ‘Equity sub-group’ under LBG Equity Investments Limited, for which the principal subsidiary is Lloyds Development Capital Limited | BOARD STRUCTURES Since the Ring-Fenced Banks represent the core banking activity of the Group, all of the Directors of Lloyds Banking Group plc also sit on the Boards of the Ring-Fenced Banks, which are chaired by the Group Chairman. The ring-fencing governance structures have been operating since 1 January 2019. The Group Chief Executive is also Chief Executive of the Ring Fenced Banks. In addition, the Ring-Fenced Bank Boards have three additional independent Non-Executive Directors. These Ring-Fenced Bank only directors are independent of the management and the rest of the Group and play a critical role in the governance structure, with an enhanced role in managing any potential conflicts between the Ring-Fenced Banks and the Group. One of the Directors, Nigel Hinshelwood, acts as Senior Independent Director of the Ring-Fenced Banks and also chairs the cross-Group Information Technology and Cyber Security Advisory Forum. Lloyds Bank Corporate Markets has its own Board as a separately constituted and regulated banking subsidiary, chaired by a Non-Executive Group Board Member – Lord Lupton – and with its own independent non-executive directors. Scottish Widows Group, which is regulated as an insurance group, similarly has its own Board with independent Non-Executive Directors, and is chaired by a Group Non-Executive Director – Nick Prettejohn. The Chief Executives and Functional Heads of these businesses have reporting lines to the Group executives, and the Group Board receives regular updates on their strategic development and performance. |
| ANTÓNIO HORTA-OSÓRIO VISITS GLASGOW |
Group Chief Executive António Horta-Osório undertook a number of visits throughout the UK in 2019. During his regional visit to Glasgow in October 2019, António took the opportunity to spend time with Group teams and customers, including holding a town hall, a recognition dinner to celebrate colleagues and all they are doing to Help Britain Prosper and embody the Group’s values and a business breakfast with local Small and Medium-sized Enterprise and Corporate clients. Across the two days António heard directly from colleagues about their work and their successes, passion, drive and commitment to improve the business for the benefit of customers and the Group. Whilst meeting the Connect and Resolve teams in the Group’s Atlantic Quay building, António listened in to customer calls with the teams who support Schroders Personal Wealth and handle credit disputes. He also watched mobile messaging interactions with customers, seeing and hearing first-hand how | the Group is meeting its customers’ needs through a range of channels and products. This experience was part of the Reconnecting with Customers pilot programme, launched in July 2019 to bring senior leaders across the Group closer to customers and customer-facing teams. The Credit Disputes team shared with António the success it has had in improving the customer journey for credit card disputes. António was able to see the difference this transformation has made for customers by dialling into a live credit dispute call. | |
CORPORATE GOVERNANCE
Assessing the Board’s effectiveness
BOARD EVALUATION HOW THE BOARD PERFORMS AND IS EVALUATED The annual evaluation, which is facilitated externally at least once every three years, provides an opportunity to consider ways of identifying greater efficiencies, maximising strengths and highlighting areas of further development to enable the Board continuously to improve its own performance and the performance of the Group. The Chairman of the Board, with the support of the Nomination and Governance Committee, leads the Board in considering and responding to the annual review of the Board’s effectiveness, which includes a review of its Committees and individual Directors. Performance evaluation of the Chairman is carried out by the Non-Executive Directors, led by the Senior Independent Director, taking into | | | account the views of the Executive Directors. The Board is in the second year of its three year evaluation cycle. An external evaluation was conducted in 2018, facilitated by EgonZehnder¹, an external board review specialist, with an internal evaluation having been carried out in respect of 2019. The current expectation is that the 2020 evaluation will be conducted internally. 2019 EVALUATION OF THE BOARD’S PERFORMANCE The 2019 evaluation was conducted internally between October 2019 and January 2020 by the Company Secretary, and was overseen by the Nomination and Governance Committee. The 2019 review sought the Directors’ views on a range of topics including: strategy; planning and performance; risk and control; Board composition and size; balance of skills, | | | experience and knowledge; diversity; culture; how members work together, and with executive management, to achieve objectives; the Board’s calendar and agenda; the quality and timeliness of information; and support for Directors and Committees. The topics were selected by the Company Secretary and the Chairman of the Nomination and Governance Committee as being the most pertinent when considering the Board’s effectiveness. If Directors have concerns about the Company or a proposed action which cannot be resolved, their concerns are recorded in the Board minutes. Also on resignation, Non-Executive Directors are encouraged to provide a written statement of any concerns to the Chairman, for circulation to the Board. No such concerns were raised in 2019 and up to the date of this report. |
| INTERNAL EVALUATION PROCESS | | |
| | | | | |
OCTOBER 2019 Detailed questionnaire issued to all Directors by the Company Secretary OCTOBER 2019 TO JANUARY 2020 Individual meetings held between each Director and the Company Secretary to discuss responses and opportunity for Directors to raise any other matters concerning the Board or its Committees. | | DECEMBER 2019 TO JANUARY 2020 Report prepared by the Company Secretary based on the questionnaire results and matters raised in individual meetings. JANUARY 2020 Draft report discussed by the Company Secretary with the Chairman. Final report discussed at a meeting of the Board, following its consideration by the Nomination and Governance Committee. | | APRIL 2020 Actions to be recommended to the Board by the Nomination and Governance Committee to reflect the Board discussion in January. Subsequently the Board will consider the recommendations and agree an action plan. |
| | HIGHLIGHTS FROM THE 2019 REVIEW |
| The evaluation concluded that the performance of the Board, its Committees, the Chairman and each of the Directors continues to be effective. All Directors demonstrated commitment to their roles and contributed effectively. The Board is also regarded as very able, collegiate and well-run, with an open and supportive culture and strong governance relating to risks and controls. The key findings and areas for consideration include the following: |
| | | | | | | |
| | | | Findings | | Areas for consideration | |
| | | | | | | |
| |  | | Ring-fencing governance requirements, with an increased number of participants at the Board, require individual Directors and the Chairman and Committee Chairmen to manage meetings, to ensure all Directors are able to contribute fully and effectively. | | Whilst ring-fencing governance has been embedded successfully, it is important to streamline governance processes further and ensure the Board’s and its Committees’ time is used to best effect. | |
| | | | | | | |
| | | | | | | |
| |  | | The Board’s detailed engagement in the formulation of strategy is seen as a key strength, with the strategy away days playing an important role in this. | | Continue to increase time allowed in Board meetings for expansive discussion of broader strategic issues and themes. | |
| | | | | | | |
| | | | | | | |
| |  | | Board deep dives into particular topics and the continued use of more informal Board sessions to facilitate greater depth of discussion continue to be appreciated. Whilst the quality of Board papers was seen to have improved, there remain concerns about the length of Board papers and the inclusion of unnecessary detail. | | Board and Committee papers to be shorter in length and the amount of time spent in Board meetings on presentations to be reduced, to allow more time for open discussion and debate. | |
| 1 | At the time of the 2018 review EgonZehnder provided certain Board and senior management level services from time to time, including in respect of succession planning as detailed on page 67 of the 2018 Annual Report and Accounts, otherwise EgonZehnder had no other connection with the Group. |
CORPORATE GOVERNANCE
How the Board workscontinued
| | PROGRESS AGAINST THE 2018 EXTERNAL BOARD EFFECTIVENESS REVIEW |
| | |
| | During the year, work focused particularly on the Board becoming more outwardly focused and ensuring that the Board agenda was less rooted in regulatory compliance and risk mitigation. A summary of the Board’s progress against the actions arising from the 2018 effectiveness review are set out below. |
| | | | | | | |
| | | | Recommendations from the 2018 evaluation | | Actions taken during 2019 | |
| | | | | | | |
| |  | | Board agenda to become less rooted in regulatory compliance and risk mitigation. Board to become more outwardly focused. | | Added 30 minutes ‘free agenda’ discussion time to Board meetings June strategy session updated views of external environment (customer, technology, competition, society) to prepare for 2020 discussions on GSR4 Executive Director performance reports continue to evolve towards flagging issues and priorities Regular competition reports to include more on the activities of new competitors Chairman to continue moving focus of agenda to give more time to business discussions | |
| | | | | | | |
| |  | | Ensure size of Board and large attendance at Committee meetings does not inhibit debate | | Requirement for Board and Committee Chairmen to be more directive when required Commitments by individual Directors to self-discipline contributions Continued use of informal sessions to air issues that need more discussion | |
| | | | | | | |
| |  | | Further streamline meeting papers and agendas to enable more expansive discussion | | Continued to streamline length and time spent on ‘taken as read’ reports Further development and simplification of GSR3 reporting | |
| | | | | | | |
| |  | | Continue to evolve Board skills and diversity | | Chairman continued to share succession timetables and skills matrix for discussion in Nomination and Governance Committee and wider Board Reviewed wording of Board diversity objective during 2019 | |
| | | | | | | |
| |  | | Look at ways to better leverage individual Non-Executive Director skills and experience | | Chairman discussed and agreed potential focus areas with Non-Executive Directors during regular performance reviews Individual Non-Executive Directors encouraged to communicate topics they are engaging with to other Non-Executive Directors | |
| | | | | | | |
| LORD BLACKWELL’S VISIT TO BIRMINGHAM |
As part of his programme of regional visits, Lord Blackwell spent time in Birmingham in September. He met colleagues from Lloyds Bank and Halifax branches, as well as spending time with colleagues from Brindley Place. Lord Blackwell took part in the branch team talk with colleagues from the Lloyds Bank Branch. Topics covered the Group’s joint venture with Schroders Personal Wealth, customer referrals and supporting local communities. There were questions for Lord Blackwell covering the economic environment, digital technology, the Group’s brands and its branch network. | | | Lord Blackwell was joined all day on this visit by Kendall Akhurst, a colleague from Group Transformation. As a strong advocate for, and member of, the Group’s Access network, which supports colleagues with disabilities, Kendall was particularly interested in the visit to the Birmingham Disability Resource Centre (BDRC). The BDRC is one of the many charities the Group supports through its charitable Foundations and provides support for people with all kinds of disabilities. Lord Blackwell spent time hearing about the wide range of support BDRC has received from the Group and also from people who use the centre and their experience of the Journey to Work scheme, which aims to help people turn their lives around by building up their confidence and self-esteem to get back into work. After the branch and charity visits, Lord Blackwell moved to Brindley Place where he hosted a recognition lunch for around 20 colleagues from Group Client Information Office and Commercial, discussing their successes and also what challenges they | | | might be facing. He then spent time with teams from within those divisions and heard about work to investigate suspicious activity reports raised from branches, the cash management and payments model office, the automation journey for payments, including demonstrations of robotics and also how the Group is supporting business clients through their trade journey. The visit continued with a Town Hall session for around 80 colleagues at which Lord Blackwell invited questions and answered a wide variety of questions covering topics such as resilience for colleagues and the Group, his own mentors and inspirations, the branch network, EU exit and leadership styles and skills. The visit ended with a recognition dinner for 25 colleagues to celebrate how they have truly lived the Group’s values and what they have done to embody the Group’s purpose of Helping Britain Prosper. |
CORPORATE GOVERNANCE
Internal control
BOARD RESPONSIBILITY The Board is responsible for the Group’s risk management and internal control systems, which are designed to facilitate effective and efficient operations and to ensure the quality of internal and external reporting and compliance with applicable laws and regulations. The Directors and senior management are committed to maintaining a robust control framework as the foundation for the delivery of effective risk management. The Directors acknowledge their responsibilities in relation to the Group’s risk management and internal control systems and for reviewing their effectiveness. In establishing and reviewing the risk management and internal control systems, the Directors carried out a robust assessment of the emerging and principal risks facing the company, including those that would threaten its business model, future performance, solvency or liquidity and reputation, the likelihood of a risk event occurring and the costs of control. The process for identification, evaluation and management of the emerging and principal risks faced by the Group is integrated into the Group’s overall framework for risk governance. The risk identification, evaluation and management process also identifies whether the controls in place result in an acceptable level of risk. At Group level, a consolidated risk report and risk appetite dashboard are reviewed and regularly debated by the Executive Group Risk Committee, Board Risk Committee and the Board to ensure that they are satisfied with the overall risk profile, risk accountabilities and | | | mitigating actions. The report and dashboard provide a monthly view of the Group’s overall risk profile, key risks and management actions, together with performance against risk appetite and an assessment of emerging risks which could affect the Group’s performance over the life of the operating plan. Information regarding the main features of the internal control and risk management systems in relation to the financial reporting process is provided within risk management on pages 41 to 108. The Board concluded that the Group’s risk management arrangements are adequate to provide assurance that the risk management systems put in place are suitable with regard to the Group’s profile and strategy. CONTROL EFFECTIVENESS REVIEW An annual control effectiveness review (CER) is undertaken to evaluate the effectiveness of the Group’s control framework with regard to its material risks, and to ensure management actions are in place to address key gaps or weaknesses in the control framework. Business areas and head office functions assess the controls in place to address all material risk exposures across all risk types. The CER considers all material controls, including financial, operational and compliance controls. Senior management approve the CER findings which are reviewed and independently challenged by the Risk Division and Group Internal Audit and reported to the Board. Action plans are implemented to address any control deficiencies. | | | REVIEWS BY THE BOARD The effectiveness of the risk management and internal control systems is reviewed regularly by the Board and the Audit Committee, which also receives reports of reviews undertaken by the Risk Division and Group Internal Audit. The Audit Committee receives reports from the Company’s auditor, PricewaterhouseCoopers LLP (which include details of significant internal control matters that they have identified), and has a discussion with the auditor at least once a year without executives present, to ensure that there are no unresolved issues of concern. The Group’s risk management and internal control systems are regularly reviewed by the Board and are consistent with the Guidance on Risk Management, Internal Control and Related Financial and Business Reporting issued by the Financial Reporting Council and compliant with the requirements of CRD IV. They have been in place for the year under review and up to the date of the approval of the annual report. The Group has determined a pathway to compliance with BCBS 239 risk data aggregation and risk reporting requirements and continues to actively manage enhancements. |
| LORD BLACKWELL AND NON-EXECUTIVE DIRECTOR VISITS TO CUSTOMER INSIGHT SESSIONS |
Lord Blackwell and a number of Non-Executive Directors attended multiple Customer Insight sessions during 2019. The Group’s customers’ world is changing at pace so it is important to stay in touch with the reality of customers’ daily lives, their changing needs and priorities. Customer insight sessions are held monthly in research labs and other locations across the | | | country to hear directly from customers about their lives and what is important to them. The discussions cover topics such as life priorities and money management providing a rich insight into evolving needs, attitudes and behaviours. This insight is a valuable input into understanding how customers’ lives are evolving to help develop the Group’s strategic direction. | | | The Chairman and Non-Executive Directors were impressed by customers’ openness and willingness to share their views. The sessions they attended gave a deep insight into customers’ lives and needs and their ideas on how a bank can provide a leading customer experience. |
CORPORATE GOVERNANCE
Complying with the UK Corporate Governance Code 2018
The UK Corporate Governance Code 2018 (the ‘Code’) applied to the financial year ended 31 December 2019. The Group confirms that it applied the main principles and complied with all the provisions of the Code throughout the year except in relation to that part of provision 36 that provides that the remuneration committee should develop a formal policy for post-employment shareholding requirements encompassing both unvested and vested shares. Whilst the Remuneration Committee has not introduced a formal post-employment shareholding policy, the existing reward structure ensures that Executive Directors will continue to meet the Group’s shareholding requirements for a minimum of two years after leaving the Group. On this basis, the Group believes that it already complies with best practice and with the spirit of provision 36 notwithstanding the fact that a specific formal policy has not been introduced. Please refer to pages 119 and 127 for a more detailed explanation of the Group’s approach to post-employment shareholding requirements.
The Code is publicly available at www.frc.org.uk. This page and the following page explain how the Group has applied the principles and related provisions of the Code during the year. The alphabetical references in the paragraphs below correspond to the principles, and related provisions, of the Code.
The Group has adopted the UK Finance Code for Financial Reporting Disclosure and its 2019 financial statements have been prepared in compliance with its principles.
| 1. Board Leadership and Company Purpose |
| | Independent | Responsibilities |
Chairman
Lord Blackwell | | Lord Blackwell leads the Board and promotes the highest standards of corporate governance. He leads in building an effective and complementary Board, and sets the Board’s agenda. The Chairman also leads Board succession planning and ensures effective communication with shareholders. |
Executive Directors Group Chief Executive
António Horta-Osório | | António Horta-Osório manages and leads the Group on a day-to-day basis, making decisions on matters affecting the operation and performance of the Group’s business and the delivery of the Board’s approved strategy. He delegates aspects of his authority, as permitted under the Corporate Governance Framework, to other members of the Group Executive Committee. |
Chief Financial Officer
William Chalmers1 | | Under the leadership of the Group Chief Executive, William Chalmers, who joined the Board during the year, and Juan Colombás make and implement decisions in all matters affecting operations, performance and strategy. They provide specialist knowledge and experience to the Board. Together with António Horta-Osório, William Chalmers and Juan Colombás design, develop and implement strategic plans and deal with day-to-day operations of the Group. |
Chief Operating Officer
Juan Colombás | |
Non-Executive Directors
Deputy Chairman
Anita Frew |  | As Deputy Chairman, Anita Frew supports the Chairman in representing the Board and acts as a spokesperson for the Group. She deputises for the Chairman and is available to the Board for consultation and advice. The Deputy Chairman may also represent the Group’s interests to official enquiries and review bodies. Having spent nine years on the Board, Anita will retire at the forthcoming AGM. Anita’s independence up to the point of her retirement is confirmed on page 156. |
Senior Independent Director
Alan Dickinson | | As Senior Independent Director, Alan Dickinson is a sounding board for the Chairman and Group Chief Executive. He acts as a conduit for the views of other Non-Executive Directors and conducts the Chairman’s annual performance appraisal. He is available to help resolve shareholders’ concerns and attends meetings with major shareholders and financial analysts to understand issues and concerns. |
| Simon Henry | | The Non-Executive Directors challenge management constructively and help develop and set the Group’s strategy. They actively participate in Board decision-making and scrutinise management performance. The Non-Executive Directors satisfy themselves on the integrity of financial information and review the Group’s risk exposures and controls. The Non-Executive Directors, through the Remuneration Committee, also determine the remuneration of Executive Directors. |
| Sarah Legg2 | |
| Lord Lupton | |
| Amanda Mackenzie | |
| Nick Prettejohn | |
| Stuart Sinclair | |
| Sara Weller | |
Group Company Secretary
Kate Cheetham | | Kate Cheetham was appointed Group Company Secretary during the course of the year, and in this role advises the Board on matters relating to governance, ensuring good information flows and comprehensive practical support is provided to Directors. She maintains the Group’s Corporate Governance Framework and organises Directors’ induction and training. The Company Secretary also communicates with shareholders as appropriate and ensures due regard is paid to their interests. Both the appointment and removal of the Group Company Secretary is a matter for the Board as a whole. |
| 1 | William Chalmers joined the Board with effect from 1 August 2019. |
| 2 | Sarah Legg joined the Board with effect from 1 December 2019. |
A.The Group is led by an effective, committed Board, which is collectively responsible for the long-term, sustainable success of the Group, ensuring due regard is paid to the interests of the Group’s stakeholders, with its effectiveness assessed with an annual Board effectiveness review, discussed further on page 152 to 153. The Group’s Corporate Governance Framework, which is reviewed annually by the Board, sets out the key decisions and matters reserved for the Board’s approval, which includes matters relating to the Group’s long-term strategy and priorities. Further details of the Corporate Governance Framework can be found online at www.lloydsbankinggroup.com/our-group/corporate-governance, and on page 146.
B.The Board assumes responsibility for establishing the purpose of the Company, setting its strategy, establishing its culture, and determining the values to be observed in achieving that strategy. Central to this is the Company’s role as a trusted and responsible business, with the Board’s Responsible Business Committee overseeing the Group’s ambitions in this regard. The Group’s approach to acting as a responsible business is discussed in the report of the Responsible Business Committee on page 168.
C.The Board retains ultimate responsibility for ensuring adequate resource is available to meet agreed objectives and strategy, and ensures such resources are responsibly and effectively deployed. The effective management of risk is central to the Company’s strategy, supported by the Group’s enterprise risk management framework, as discussed in the risk management report on pages 41 to 108.
D.The Board recognises that engaging with and acting on the needs of the Group’s stakeholders is key to achieving the strategy and long-term objectives of the Company.
CORPORATE GOVERNANCE
E.All policy and practice relating to Group colleagues is developed and implemented in a way which is consistent with the Group’s purpose and values, with the Board receiving regular updates on matters relevant to colleagues. The Board has appointed Anita Frew as its whistleblowing champion, with responsibility for overseeing the integrity, independence and effectiveness of the Group’s whistleblowing procedures. In addition, the Audit Committee reviews reports on whistleblowing to ensure there are arrangements in place which colleagues can use in confidence to report relevant concerns, as discussed on page 163 and reports on such review to the Board.
| 2. Division of Responsibilities |
F.The Chairman has overall responsibility for the leadership of the Board and for ensuring its effectiveness in all aspects of its operation. The responsibilities of the Chairman in this regard are formalised within the Corporate Governance Framework. Lord Blackwell was independent on appointment.
G.The balance of skills, experience, independence and knowledge on the Board is the responsibility of the Nomination and Governance Committee, and is reviewed annually or whenever appointments are considered. Having the right balance of skills and experience helps to ensure Directors discharge their duties effectively. The Nomination and Governance Committee monitors whether there are any relationships or circumstances which may affect a Director’s independence. Following the most recent review of independence, the Committee concluded that all Non-Executive Directors are independent in character and judgement, as shown on page 157. As of 1 December 2019, Anita Frew had spent 9 years on the Board and will retire at the AGM in May. In relation to the period from 1 December 2019, being the ninth anniversary of Anita’s appointment to the Board, to her retirement at the AGM in May, the Board considered and agreed that the period beyond nine years as a director did not impact on Anita’s level of independence or the effectiveness of her contributions and her continuing treatment as an independent Non-Executive Director of the Company for that period. The decision was based on a number of factors including consideration of Anita’s interests outside the Group and the continued challenge and oversight Anita provides in the role, whilst noting the benefits of enabling the phased transition of responsibilities to other Non-Executive Directors during this short period. More information on the annual Board effectiveness review can be found on pages 152 to 153 and information on the Board Diversity Policy can be found on page 158.
H.Non-Executive Directors are advised of time commitments prior to their appointment and are required to devote such time as is necessary to discharge their duties effectively. The time commitments of the Directors are considered by the Board on appointment and annually thereafter, and, following the most recent review, the Board is satisfied there are no directors whose time commitments are considered to be a matter for concern. External appointments, which may affect existing time commitments relevant to the Board, must be agreed with the Chairman, and prior Board approval must be obtained before taking on any new external appointments. The Board has not approved any significant external commitments during 2019. No Executive Director has taken up more than one Non-Executive Director role at a FTSE100 company or taken up the chairmanship of such a company. More information on Directors’ attendance at meetings can be found on page 145.
I.The Chairman, supported by the Group Company Secretary, ensures that Board members receive appropriate and timely information. The Group provides access, at its expense, to the services of independent professional advisers in order to assist Directors in their role. Board Committees are also provided with sufficient resources to discharge their duties.
| 3. Composition, Succession and Evaluation |
J.The process for Board appointments is led by the Nomination and Governance Committee, which makes recommendations to the Board. A combination of open advertising and an external search consultancy is used for the appointment of the Chairman and Non-Executive Directors. More details about succession planning can be found on page 157 and 159. More information about the work of the Nomination and Governance Committee can be found on pages 157 to 159.
K.The Chairman leads the training and development of Directors and the Board regularly reviews and agrees with each Director their individual and combined training and development needs. The Chairman personally ensures that on appointment each Director receives a full, formal and tailored induction. The emphasis is on ensuring the induction brings the business and its issues alive, taking account of the specific role
the Director has been appointed to fulfil and their skills and experience to date. Directors who take on or change roles during the year attend induction meetings in respect of those new roles. The Group Company Secretary maintains a training and development log for each Director.
At the 2020 AGM all Directors will seek re-election or election save for Anita Frew, who will be stepping down at the 2020 AGM. Being the first AGM since their respective appointments, William Chalmers and Sarah Legg will stand for election, together with Catherine Woods, who, as announced in October 2019, will join the Board on 1 March 2020. The Board believes that all Directors continue to be effective and committed to their roles.
L.An internally facilitated Board evaluation was completed in 2019, with an externally facilitated evaluation having taken place in 2018. Individual evaluation is carried out by the Chairman on behalf of the Board. Performance evaluation of the Chairman is carried out by the Non-Executive Directors, led by the Senior Independent Director, taking into account the views of the Executive Directors. More information on the Board effectiveness review can be found on pages 152 to 153, along with the findings, actions, and progress made during the year.
| 4. Audit, Risk and Internal Control |
M.The Board has delegated a number of responsibilities to the Audit Committee, including oversight of financial reporting processes, the effectiveness of internal controls and the risk management framework, whistleblowing arrangements and the work undertaken by the external and internal auditors. The Audit Committee reports regularly to the Board on its activities, and its report for 2019, confirming how it has discharged its duties can be found on pages 160 to 163.
N.Requirements that the Annual Report is fair, balanced and understandable are considered throughout the drafting and reviewing process and the Board has concluded that the 2019 Annual Report meets this requirement. Related information on the Company’s business model and strategy can be found on pages 4 to 14.
O.The Board is responsible for the Group’s risk management and internal controls systems, including the determination of the nature and extent of risk the Company is willing to take. Risk is further managed through the Board approved Risk Control Framework, as discussed in the risk management report on pages 41 to 108. The Audit Committee assumes further responsibility for the effectiveness of internal controls, with the Board Risk Committee assuming responsibility for the review of the risk culture of the Group, ensuring the correct ‘tone from the top’ in respect of risk management.
P.The Group is committed to offering all colleagues a reward package that is competitive, performance-driven and fair and its Remuneration Policy is designed to promote the long-term and sustainable success of the Company. Compensation on pages 117 to 142 provides further details regarding the remuneration of Directors. The current Remuneration Policy can be found in the 2016 Annual Report and Accounts and remains unchanged since last approved by shareholders at the 2017 AGM. A new Remuneration Policy will be proposed for approval by shareholders at the 2020 AGM.
Q.The Remuneration Committee seeks to ensure all remuneration policy, including that relevant to executive remuneration, is fair and transparent. The work of the Remuneration Committee during the year, including its review of the Remuneration Policy, is discussed further in its report on page 133.
R.The Remuneration Policy seeks to ensure all remuneration decisions made by Directors fully consider the wider circumstances as relevant to that decision, including, but not limited to, individual performance. The Remuneration Committee’s decision making in respect of remuneration outcomes is discussed further in Compensation on pages 117 to 142 which includes additional confirmation of the use of remuneration consultants, including where any such consultant has another connection to the Company.
CORPORATE GOVERNANCE
Nomination and Governance Committee report
| Good succession planning and recognition of diversity is integral to maintaining a strong Board and supporting the development of the Executive population. Lord Blackwell Chairman, Nomination and Governance Committee | |
DEAR SHAREHOLDER I am pleased to report on the activity of the Nomination and Governance Committee (the ‘Committee’) during 2019. BOARD AND GEC CHANGES As set out in my introduction to the Governance Report on page 144 there have been a number of changes to the Board and its Committees during the year, all of which have been overseen by the Committee. During the year, the Committee undertook a thorough process to identify and assess candidates which resulted in the appointment of two new Group Non-Executive Directors: Sarah Legg was appointed to the Board on 1 December 2019 and Catherine Woods will join the Board on 1 March 2020. While selected on the basis of their strong banking experience and skills, these two appointments help meet the Group’s continuing commitment to gender diversity. Sarah’s appointment also supports our objective of BAME diversity. Details of the selection process can be found on page 159. The Committee oversaw the planned transition of the Senior Independent Director role from Anita Frew to Alan Dickinson with effect from 1 December 2019, ahead of Anita’s planned retirement from the Board at the forthcoming AGM when Alan will also succeed her as Deputy Chairman. Alan’s breadth and depth of experience make him ideally suited to the role of Deputy Chairman and Senior Independent Director. Following the Group’s announcement in February 2019, William Chalmers joined the Board on 1 August 2019 as an Executive Director and Chief Finance Officer, succeeding George Culmer. As announced in October 2019, Juan Colombás plans to retire from the Group in July 2020, and I plan to retire as Group Chairman at or before the AGM in 2021, by which time I will have served 9 years on the Group Board. The Committee has initiated a search process for my successor under the leadership of the Senior Independent Director. A number of changes have also been made to the membership of Board Committees during the year, reflecting Board changes and the ongoing review of Committee membership. | | | SUCCESSION PLANNING As can be seen from these changes, the Committee continued to focus on succession planning at both a Board and Executive level, building on work undertaken in previous years. The Committee continues to keep under review, on an ongoing basis, the structure, size and composition of the Board and its Committees, making recommendations to the Board as appropriate. Consideration was given to anticipated retirements from the Group Board over the next two years, together with the need to ensure the appropriate mix of knowledge, skills and experience, and diversity. At an Executive level, the Committee considered the overall health of the Executive talent pipeline, together with detailed Executive succession planning aimed at supporting the development of executives for the Bank of the Future. Further detail on succession planning can be found on page 159. BOARD EFFECTIVENESS AND TRAINING As highlighted in my introduction to the Governance Report on page 144, an internal Board effectiveness review, undertaken by the Company Secretary, was overseen by the Committee. The Committee also considered, and recommended to the Board, actions arising from the previous externally facilitated review undertaken by Egon Zehnder. Full details are provided on pages 152 to 153. Annually, as part of the Board effectiveness review, the Committee also undertakes a review of its own effectiveness. The findings of this review, which were considered by the Committee at its meeting in January 2020, found that the Committee had met its key objectives and carried out its responsibilities effectively. The Committee also oversees training undertaken by the Non-Executive Directors. Learning and engagement opportunities have been undertaken by all Non-Executive Directors in relation to material aspects of the Group’s business. | | | INDEPENDENCE AND TIME COMMITMENTS Based on its assessment for 2019, the Committee is satisfied that, throughout the year, all Non-Executive Directors remained independent1as to both character and judgement. The Committee, and the Board gave specific consideration to Anita Frew’s continuing independence as detailed on page 156. In recommending Directors for re-election, the Committee reviews the performance of each Non-Executive Director and their ability to continue meeting the time commitments required, taking into consideration individual capabilities, skills and experiences and any relationships that have been disclosed. All Directors were considered to have appropriate roles. THE GROUP’S CORPORATE GOVERNANCE FRAMEWORK The annual review of the Corporate Governance Framework was undertaken during the year with the inclusion of further enhancements to the ring-fenced banking governance arrangements which came into effect on 1 January 2019, together with various other minor amendments, and updates to committee terms of reference. As part of its broader governance responsibilities, the Committee also considered regular updates on developments in corporate governance, including the initiation of HM Treasury’s review of the financial services regulatory framework, provided ongoing oversight of the embedding of the ring-fenced banks’ governance structure and considered correspondence with shareholders. UK CORPORATE GOVERNANCE CODE As highlighted in last year’s report and referred to in the Governance Report, the Financial Reporting Council’s amended UK Corporate Governance Code (the ‘Code’), came into effect from 1 January 2019, with requirements relating to the annual report applicable to the report and accounts for the year ended 31 December 2019. The Group applied the Code. The Group’s statement of |
| | | | | | | |
| 1 | The Chairman was independent on appointment in accordance with the Code. Following the Financial Reporting Council’s Guidance on Board Effectiveness, the Chairman is not subject to the Code’s independence test, other than on appointment. |
CORPORATE GOVERNANCE
compliance with the Code and a summary of the requirements of the Code can be found on pages 155 and 156. COMMITTEE PURPOSE AND RESPONSIBILITIES The purpose of the Committee is to keep the Board’s governance, composition, skills, experience, knowledge, independence and succession arrangements under review and to make appropriate recommendations to the Board to ensure the Company’s arrangements are consistent with the highest corporate governance standards. The Committee reports to the Board on how it discharges its responsibilities and makes recommendations to the Board, all of which have been accepted during the year. The Committee’s terms of reference can be found at www.lloydsbankinggroup.com/our-group/corporate-governance. COMMITTEE COMPOSITION, SKILLS AND EXPERIENCE To ensure a broad representation of experienced and independent Directors, membership of the Committee comprises the Chairman, Deputy Chairman, the Chairman of the Board Risk Committee (and Senior Independent Director since December 2019), the Chairman of the Group’s Insurance Subsidiary, and the Chairman of the Responsible Business Committee. In addition, as announced on 25 November 2019, Stuart Sinclair, Chairman of the Remuneration Committee, was appointed as a member of the Committee with effect from 1 December 2019. The Group Chief Executive attends meetings as appropriate. Details of Committee memberships and meeting attendance can be found on page 145. Lord Blackwell Chairman, Nomination and
Governance Committee | | | THE BOARD DIVERSITY POLICY The Board Diversity Policy (the ‘Policy’) sets out the Board of Lloyds Banking Group’s approach to diversity and provides a high level indication of the Board’s approach to diversity in senior management roles which is governed in greater detail through the Group’s policies. The Board places great emphasis on ensuring that its membership reflects diversity in its broadest sense. Consideration is given to the combination of demographics, skills, experience, race, age, gender, educational and professional background and other relevant personal attributes on the Board to provide the range of perspectives, insights and challenge needed to support good decision making. New appointments are made on merit, taking account of the specific skills and experience, independence and knowledge needed to ensure a rounded Board and the diversity benefits each candidate can bring to the overall Board composition. As part of the decision to appoint Sarah Legg and Catherine Woods to the Board, diversity was considered in its broadest sense. These appointments bring strong banking and asset management experience to the Group. Objectives for achieving Board diversity may be set on a regular basis. In April (and then again in January 2020) the Board considered and approved updates to aspirations set out in the Board Diversity Policy relating to gender diversity and the number of senior roles held by Black, Asian and Minority Ethnic (BAME) executives. On gender diversity the Board is committed to maintaining at least 3 female Board members and over time will expect female representation on the Board to match the 40 per cent target that the Group has set for senior executives. Reflecting these aspirations, the Board will aim to meet the Hampton-Alexander objective of 33 per cent female representation by, or as soon as possible after, the target date of 2020. | | | Female representation on the Board is currently 31 per cent (based on four female Directors and nine male Directors). The Group also set a target of 8 per cent of senior roles to be held by BAME executives by 2020. At Board level , the Group aims to meet the objectives of the Parker review for at least one BAME Board member by, or as soon as possible after, the target date of 2021. The appointment of Sarah Legg in 2019 supports this objective. As noted, the Board places high emphasis on ensuring the development of diversity in senior management roles within the Group and supports and oversees the Group’s objectives of achieving 40 per cent of senior roles held by female executives by 2020, and of 8 per cent of senior roles being held by BAME executives by 2020. This is underpinned by a range of policies within the Group to help provide mentoring and development opportunities for female and BAME executives and to ensure unbiased career progression opportunities. Progress on this objective is monitored by the Board and built into its assessment of executive performance. As at 31 December 2019, female representation within senior management and their direct reports was 31.1 per cent in total (29.4 per cent and 31.3 per cent respectively). Female representation across all senior roles was 36.8 per cent, and BAME representation in senior roles was 6.7 per cent. A copy of the Policy is available on the Group’s website at www. lloydsbankinggroup.com/our-group/responsible-business |
CORPORATE GOVERNANCE
Nomination and Governance Committee reportcontinued
SUCCESSION PLANNING | | | | | | |
| | | | | | | |
Effective succession planning contributes to the delivery of the Group’s strategy by ensuring the desired mix of skills and experience of Board members now and in the future. The Board is also committed to recognising and nurturing talent within the executive and management levels across the Group to ensure the Group creates opportunities to develop current and future leaders. The role of succession planning in promoting diversity is recognised and the Group has a range of policies which promote the engagement of underrepresented groups within the business in order to build a diverse talent pipeline. The Committee supports the Chairman in keeping the composition of the Board and its Committees under regular review and | | | in leading the appointment process for nominations to the Board. This has been a particular area of focus during 2019, with a number of changes to Board Committee membership, and the appointment of two new Non-Executive Directors, discussed further below. Central to this is an ongoing assessment, led by the Chairman, of the collective Board’s technical and governance skill set. From this the Chairman creates a Board skills matrix which is used to track the Board’s strengths and identify any gaps in the desired collective skills profile of Board. Various factors are taken into consideration such as the Group’s future strategic direction, and helping ensure due weight is given to diversity in its broadest sense. The skills matrix was considered in the appointment of Sarah Legg and Catherine Woods and | | | the appointment of Alan Dickinson as Senior Independent Director and, in due course, also as Deputy Chairman. Outcomes of the annual Board evaluation process are also taken into consideration. During the year, the Committee also considered the adequacy of succession arrangements for key senior management roles, also taking into consideration the changing opportunities as the shape of the Group continues to evolve through delivery of the Group’s strategy. The Chairman is responsible for developing and maintaining a succession plan for the Group Chief Executive who is, in turn, primarily responsible for developing and maintaining succession plans for key leadership positions in the senior executive team. |
| | | | | | | |
| APPOINTMENT PROCESS - ASSESSMENT OF NEW NON-EXECUTIVE DIRECTORS |
| | | | | | | |
| Outcome | | | Key considerations | | | |
| | | | | | | |
| During the year the Committee led the search process for, and appointment of, new Non-Executive Directors which culminated in the appointment of Sarah Legg, who joined the Board on 1 December, and Catherine Woods who will join the Board on 1 March 2020. | | | In establishing criteria for the new appointments, the Committee considered a number of factors including the collective Board’s technical and governance skill set, anticipated retirements in 2020 and 2021 based on current FRC Code guidance, and support for the Group’s diversity objectives. | | | |
| | | | | | | |
 | |  | |  | |  | |  | |  |
| | | | | | | | | | | |
| The Committee considered a number of search firms before appointing Heidrick & Struggles1to assist with the identification of potential candidates based on the Board’s criteria. | | The Committee were provided with a list of potential candidates for consideration, from which a short list was identified. | | Interviews were then held between the candidates, the Chairman and the Senior Independent Director. | | Further meetings for selected candidates were held with other members of the Board. | | After further consideration, the Committee recommended to the Board the appointment of the preferred candidates. | | The Board formally approved the appointments, subject to any remaining checks and approvals required. |
| 1 | Aside from assisting with senior recruitment Heidrick & Struggles have no other connection to the Company, or individual Directors. |
CORPORATE GOVERNANCE
Audit Committee report
| | The Committee has
delivered on its key
responsibilities, ensuring
oversight of financial
reporting and the
control environment. Simon Henry Chairman, Audit Committee | |
| DEAR SHAREHOLDER | | | transition in January 2021 to Deloitte LLP as the Group’s external auditor. The Committee also expects to review ongoing developments in the Group’s approach to climate change reporting, as this area continues to develop. The Committee will also consider the developments in Corporate Governance, external audit practice, and regulation of this industry, arising from reviews by Sir Donald Brydon and others. The Committee has already given initial consideration to the matters these reviews have raised, and will continue to contribute to the ongoing consultation processes. Simon Henry Chairman, Audit Committee COMMITTEE PURPOSE AND RESPONSIBILITIES The purpose of the Committee is to monitor and review the Group’s financial and narrative reporting arrangements, the effectiveness of the internal controls (including over financial reporting) and the risk management framework, whistleblowing arrangements and each of the internal and external audit processes, including the statutory audit of the consolidated financial statements and the independence of the statutory auditor. The Committee reports to the Board on how it discharges its responsibilities and makes recommendations to the Board, all of which have been accepted during the year. A full list of responsibilities is detailed in the Committee’s terms of reference, which can be found at www.lloydsbankinggroup.com/our-group/corporate-governance. In satisfying its purpose, the Committee undertakes the functions detailed within Disclosure Guidance and Transparency Rule 7.1.3R. During the year the Committee considered a number of issues relating to the Group’s financial reporting. These issues are summarised on the following pages, including discussion of the conclusions the Committee reached, and the key factors considered in reaching conclusions, including a continuing focus on the judgements and assumptions used by management in its models. In addition, the Committee considered a number of other issues not related directly to financial reporting, including internal controls, internal audit and external audit. These issues are also discussed in detail in the next section, including insight | | | into the key factors considered by the Committee in reaching its conclusion. COMMITTEE COMPOSITION, SKILLS, EXPERIENCE AND OPERATION The Committee acts independently of the executive to ensure the interests of the shareholders are properly protected in relation to financial reporting and internal control. All members of the Committee are independent Non-Executive Directors with competence in the financial sector and their biographies can be found on pages 113 to 116. Simon Henry is a Chartered Global Management Accountant and has extensive knowledge of financial markets, treasury, risk management and international accounting standards. He is a member having recent and relevant financial experience for the purposes of the UK Corporate Governance Code and is the Audit Committee financial expert for SEC purposes. During the course of the year, the Committee held separate sessions with the internal and external audit teams, without members of the executive management present. For details of how the Committee was run, see page 146. Annually the Committee undertakes an effectiveness review. The review forms part of the Board evaluation process with Directors being asked to complete parts of the questionnaire relating to the Committees of which they were members. The findings of the review were considered by the Committee at its January 2020 meeting. On the basis of the evaluation the feedback was that the performance of the Committee continues to be effective. Whilst the Committee’s membership comprises the Non-Executive Directors noted on page 145, all Non-Executive Directors may attend meetings as agreed with the Chairman of the Committee. The Group Financial Controller, Chief Internal Auditor, the external auditor, the Group Chief Executive, the Chief Financial Officer, the Chief Risk Officer and the Chief Operating Officer also attend meetings as appropriate. Details of Committee membership and meeting attendance can be found on page 145. |
I am pleased to report on how the Group Audit Committee (the ‘Committee’) has discharged its responsibilities throughout 2019. The Committee has continued to focus on the issues relevant to the Group’s financial reporting, including consideration of key accounting judgements, and ensuring the integrity of financial reporting and related disclosures. The Committee has also spent a significant proportion of its time considering other related areas, including monitoring of the Group’s internal control framework, to ensure it remains effective and fit for purpose. The key sources of information here remain the company’s Financial Controllership, the Risk function, Internal Audit and External Audit. The Committee is hence receiving multiple, independent and objective reports, in support of assurance provided. Assessing the final provisioning for the costs relating to Payment Protection Insurance redress has remained a significant area of judgement in the Group’s financial reporting, with the Committee continuing to challenge management’s assumptions used to calculate the Group’s provision. Reports from management were considered on the ongoing application of IFRS 9, including challenge of management judgements underpinning credit impairment provisions. The Committee also oversaw the successful implementation of IFRS 16, which was adopted by the Group on 1 January 2019, and received updates from the project to implement IFRS 17, which is expected to be effective for the 2022 financial year. The potential for economic uncertainty arising from the exit of the UK from the European Union was considered in particular in respect of any potential impact on the Group’s credit impairment provision. The Committee continued to oversee the role of Group Internal Audit, with particular focus on the key risk themes across the Group, including the transformation programmes, which continue to play an increasingly important role in the Group’s strategy. The Committee also oversaw the establishment of a sub-committee to consider improvements in the Group’s whistleblowing arrangements. Looking ahead to 2020, beyond continued focus on financial reporting and related controls, the Committee will oversee the | | | | |
CORPORATE GOVERNANCE
Audit Committee Reportcontinued
FINANCIAL REPORTING
During the year, the Committee considered the following issues in relation to the Group’s financial statements and disclosures, with input from management, Risk Division, Group Internal Audit and the external auditor
| | | ACTIVITIES FOR THE YEAR | | | |
| | | | | Key issues | | Committee review and conclusion | |
| | |  Payment Protection Insurance (PPI) Payment Protection Insurance (PPI) | | Management judgement is usedto determine the assumptionsused to calculate the Group’sPPI provision. Following thedeadline for submission of claimsin August 2019, the principalyear-end assumptions used inthe calculation are the extentto which customer enquiriesconvert to valid complaints, arethen upheld, the average redressto be paid and expected futureadministration costs. During 2019, the Group madeprovisions totalling £2,450 millionin respect of PPI. | | The Committee reviewed management’s assumptions used to calculate the Group’sprovision for PPI redress and associated administration costs. The overall cost remainsuncertain and the Committee considered management’s use of sensitivities used toevaluate this uncertainty. The Committee concluded that the provision for PPI redress and the Group’s externaldisclosures were appropriate. The disclosures relating to PPI are set out in note 38:‘Other provisions’ of the financial statements. The Committee’s consideration of PPI is discussed further on page 162. | |
| | |  Other conduct provisions Other conduct provisions | | There were relatively few newconduct matters in 2019. TheGroup made provisions totalling£445 million in respect of otherconduct matters, including£188 million for costs of identifyingand rectifying certain arrearsmanagement fees and activities. | | The Committee has considered management’s assessment of the provisions requiredfor other conduct matters and was satisfied that the provisions were appropriate.The disclosures relating to other conduct provisions are set out in note 38: ‘Otherprovisions’ of the financial statements. | |
| | |  Allowance for impairment on loans and advances Allowance for impairment on loans and advances | | The Group’s impairment provisionis dependent on management’sjudgements on matters such asfuture interest rates, house pricesand unemployment rates, as wellas its assessment of a customer’scurrent financial positionand whether it has suffered asignificant increase in credit risk. The allowance for impairmentlosses on loans and advancesto customers at 31 December2019 was £3,259 million(2018: £3,150 million). | | During the year, the Committee has challenged both the level of provision held by theGroup, and the judgements and estimates used to calculate the provision. It regularlyreviewed management’s analysis of the Group’s lending portfolios. As part of eachof its reviews, the Committee considered management’s assessment of the potentialimpact of the UK leaving the European Union. The Committee has also consideredthe disclosure recommendations published by The Taskforce on Disclosures aboutExpected Credit Losses in December 2019. The Committee was satisfied that the impairment provisions and associateddisclosures were appropriate. The disclosures relating to impairment provisionsare set out in note 20: ‘Allowance for impairment losses’ and note 53: ‘Financial riskmanagement’ of the financial statements. | |
| | |  Retirement benefit obligations Retirement benefit obligations | | The value of the Group’s definedbenefit pension plan obligationsis determined by making financialand demographic assumptions,both of which are significantestimates made by management. | | The Committee reviewed the process used by management to determine anappropriate discount rate and considered the other critical assumptions underlyingthe calculation of the defined benefit liabilities, including those in respect of inflationand mortality. The Committee was satisfied that management had used appropriate assumptionsthat reflected the Group’s most recent experience and were consistent with marketdata and other information. The Committee was also satisfied that the Group’s disclosures made in respect ofretirement benefit obligations are appropriate. The relevant disclosures are set out innote 36: ‘Retirement benefit obligations’ of the financial statements. The defined benefitobligation at 31 December 2019 was £45,241 million (31 December 2018: £41,092 million). | |
| | |  Recoverability of deferred tax asset Recoverability of deferred tax asset | | A deferred tax asset can berecognised only to the extent that it is more likely than not to berecoverable. The recoverability of thedeferred tax asset in respect of carryforward losses requires considerationof the future levels of the Group’staxable profit and the legal entities inwhich the profit will arise. | | The Committee considered management’s assessment of forecast taxable profitsbased on the Group’s operating plan, the split of these forecasts by legal entity andthe Group’s long-term financial and strategic plans. The Committee agreed with management’s judgement that the deferred taxassets were appropriately supported by forecast taxable profits, taking intoaccount the Group’s long-term financial and strategic plans. The disclosuresrelating to deferred tax are set out in note 37: ‘Deferred tax’ of the financialstatements. The Group’s net deferred tax asset at 31 December 2019 was£2,622 million (31 December 2018: £2,453 million). | |
| | |  Uncertain tax provisions Uncertain tax provisions | | The Group has open taxmatters which require it to make judgements about the most likelyoutcome for the purposes ofcalculating its tax position. | | The Committee reviewed management’s assessment of the Group’s uncertain taxpositions which took into account the views of the relevant tax authorities and anyexternal advice it received. The Committee was satisfied that the provisions and disclosures made in respect ofuncertain tax positions were appropriate. The relevant disclosures are set out in note 48:‘Contingent liabilities, commitments and guarantees’ of the financial statements. | |
| | | | | | | | |
CORPORATE GOVERNANCE
| | | | | | | | |
| | | | | Key issues | | Committee review and conclusion | |
| | | | | | | | |
| | |  Value-In-Force (VIF) asset and insurance liabilities Value-In-Force (VIF) asset and insurance liabilities | | Determining the value of the VIFasset and insurance liabilitiesrequires management to makesignificant estimates for botheconomic and non-economicactuarial assumptions. | | The Committee considered updates from management and from the Group’sInsurance Audit Committee summarising its activities, which included a review of theeconomic and non-economic assumptions made by management to determine theGroup’s VIF asset and insurance liabilities. The most significant assumptions were inrespect of annuitant mortality, workplace pension persistency and expenses. The Committee was satisfied that the assumptions used to calculate the VIF asset(2019: £5,558 million; 2018: £4,762 million) and liabilities arising from insurance contractsand participating investment contracts (2019: £111,449 million; 2018: £98,874 million)were appropriate. The disclosures are set out in note 25: ‘Value of in-force business’and note 32: ‘Liabilities arising from insurance contracts and participating investmentcontracts’ of the financial statements. | |
| | |  Wealth management partnership Wealth management partnership | | Determining the appropriateaccounting for certain one- off transactions requiresmanagement to assess the factsand circumstances specific to eachtransaction. | | During 2019, the Group entered into a wealth management partnership with Schrodersplc. This involved the Group retaining a 50.1 per cent ownership interest in an entityinto which it transferred assets under management and associated advisers from itsexisting business. Determining the appropriate accounting classification of the newactivities required management judgement. The Committee reviewed the accountingproposed by management which determined that the entity should be accounted foras a joint venture and was satisfied that this was appropriate. The relevant disclosures are set out in note 23 of the financial statements. | |
| | |  IFRS 16 Leases IFRS 16 Leases | | The Committee has discussed the requirement of IFRS 16 which the Group adopted on 1 January 2019. | | The Committee noted that the principal impact of the standard on the Group wasto recognise property leases ‘on-balance sheet’ rather than as operating leases. TheCommittee was satisfied that the disclosures made in respect of IFRS 16 in the Group’sfinancial statements were appropriate. | |
| | |  IFRS Insurance contracts IFRS Insurance contracts | | IFRS 17 Insurance Contracts isexpected to be effective for theyear ending 31 December 2022. | | The Committee received an update on the Group’s IFRS 17 implementation project,which noted that, whilst the effective date of the standard is expected to be deferred,the Group will broadly maintain its existing timetable for elements of the programmethat will improve processes. The Committee also noted the progress made to dateon the IT development and actuarial models. The Committee was satisfied with theGroup’s progress and its disclosure included in note 56 to the financial statementssetting out the impact of accounting standards that were not effective for the Group at31 December 2019. | |
| | | | | | | | |
| | | PAYMENT PROTECTION INSURANCE The Group increased its provision for payment protection insurance (PPI) redress and associated administration costs by £2,450 million in the year ended 31 December 2019, bringing the total amount provided to £21,875 million. As in previous years, the Committee has reviewed management’s assumptions used to calculate the Group’s provision. In the lead up to the 29 August 2019 deadline for the submission of claims (the Industry Deadline), the Group received a significant number of PPI Information Requests (PIRs). Management determined that the rate at which these enquiries convert to valid claims was a significant judgement in 2019, with the quality of PIRs deteriorating as the Industry Deadline approached. | | The Committee reviewed management’s assessment that the quality of the PIRs received in the period leading up to the deadline was low, with about one in ten PIRs leading to a valid claim, and its calculation that an additional provision of £1,800 million was required in the third quarter. At the year end, the Committee reviewed management’s assessment that, based on actual experience in the fourth quarter of 2019, no further provision was required. The overall cost associated with PPI remains uncertain and the Committee has considered management’s use of sensitivities used to evaluate this uncertainty. At 31 December 2019, for every one per cent increase in the PIR conversion rate on the stock at the Industry Deadline, the Group would expect an additional charge of approximately £100 million. | | |
CORPORATE GOVERNANCE
Audit Committee Reportcontinued
| | | | | | | |
OTHER SIGNIFICANT ISSUES The following matters were also considered by the Committee: RISK MANAGEMENT AND INTERNAL CONTROL SYSTEMS Full details of the internal control and risk management systems in relation to the financial reporting process are given within the risk management section on pages 41 to 108. Specific related matters that the Committee considered for the year included: the effectiveness of systems for internal control, financial reporting and risk management the extent of the work undertaken by the Finance teams across the Group to ensure that the control environment continued to operate effectively the major findings of internal investigations into control weaknesses, fraud or misconduct and management’s response along with any control deficiencies identified through the assessment of the effectiveness of the internal controls over financial reporting under the US Sarbanes-Oxley Act The Committee was satisfied that internal controls over financial reporting were appropriately designed and operating effectively. RISK WEIGHTED ASSETS The Committee asked management to prepare a summary of the Group’s end-to-end processes to calculate its risk-weighted assets, highlighting those areas that require management judgement and interpretation. Whilst no issues were identified, it was agreed further internal assurance work would be undertaken. The Committee also asked that a programme of targeted external assurance reviews be carried out; it will review the findings from both the internal and external reviews in 2020. CLIMATE-RELATED FINANCIAL DISCLOSURE The Committee has received updates on the Group’s plans to develop disclosures implementing the Taskforce on Climate-Related Financial Disclosure recommendations by 2022 and the Group’s proposed current year Annual Report disclosure. Climate change disclosure will remain an area of focus for the Committee and it will continue to monitor its development during the coming year. Q1 AND Q3 INTERIM MANAGEMENT STATEMENTS (‘IMS’) The Committee considered the processes and format of the Company’s IMS reporting and concluded that improvements could be made, which resulted in simplification of IMS reporting in Q1 and Q3 for 2019. | | | GROUP INTERNAL AUDIT In monitoring the activity, role and effectiveness of the internal audit function and their audit programme the Committee: monitored the effectiveness of Group Internal Audit and their audit programme through quarterly reports on the activities undertaken and a report from the Quality Assurance function within Group Internal Audit monitored the progress of internal audit’s coverage of key risk themes across the Group, including Transformation and Change, Cyber & Information Security, Data Management and IT, Business & Operational Resilience approved the annual audit plan and budget, including resource and reviewed progress against the plan through the year assessed Group Internal Audit’s resources and skills (supplemented by externally sourced subject matter experts as required) as adequate to fulfil its mandate monitored and assessed the independence of Group Internal Audit considered the major findings of significant internal audits, and management’s response SPEAK UP (THE GROUP’S WHISTLEBLOWING SERVICE) The Committee received and considered reports from management on the Group’s whistleblowing arrangements. The Committee reviewed the reports to ensure there are arrangements in place which colleagues can use in confidence to report concerns about inappropriate and unacceptable practices, and that there is proportionate and independent investigation of such matters or appropriate follow up. The Committee reported on its consideration of whistleblowing arrangements to the Board. The Committee also established an interim sub-committee to consider whistleblowing cases where allegations relate to Material Risk Takers or Senior Managers, and to oversee improvements being made to the Group’s whistleblowing arrangements. AUDITOR INDEPENDENCE AND REMUNERATION Both the Board and the external auditor have policies and procedures designed to protect the independence and objectivity of the external auditor. The Committee has received confirmation from Deloitte, the incoming auditor from 2021, that it is independent of the Group as at 1 January 2020. This will permit Deloitte to commence audit planning activities in the first half of 2020. In January 2020, the Committee amended its non-audit service policy to reflect revisions made by the Financial Reporting Council to its rules and to require Deloitte to comply with the policy. The main change related to due diligence services, which can no longer be provided to the Group by | | | either PwC or Deloitte. In addition to detailing those services that the Committee prohibits the external auditor from providing to the Group, the policy pre-approves certain services provided the fee is below a threshold; all other permitted services must be specifically approved in advance by the Committee. Prior to engagement of the auditor for a permitted service, the policy requires that senior management confirms whether the Committee has pre-approved the service or specific approval is required. The total amount of fees paid to the auditor for both audit and non-audit related services in 2019 is disclosed in note 12 to the financial statements. EXTERNAL AUDITOR The Committee oversees the relationship with the external auditor (PwC) including its terms of engagement and remuneration, and monitors its independence and objectivity. Mark Hannam has been PwC’s senior statutory audit partner for the Group and the Company since the beginning of 2016, and attends all meetings of the Committee. During 2019, the Committee reviewed PwC’s audit plan, including the underlying methodology, and PwC’s risk identification processes. In its assessment of PwC’s performance and effectiveness, the Committee has considered: PwC’s interactions with the Committee; the responses to a questionnaire issued to the Group’s businesses, Finance, Risk and Internal Audit; and the FRC’s Audit Quality Inspection Report published in July 2019. The Committee concluded that it was satisfied with the auditor’s performance and recommended to the Board a proposal for the re-appointment of the auditor at the Company’s AGM. STATUTORY AUDIT SERVICES COMPLIANCE The Company and the Group confirm compliance with the provisions of The Statutory Audit Services for Large Companies Market Investigation (Mandatory Use of Competitive Tender Processes and Audit Committee Responsibilities) Order 2014 (the ‘Order’) for the year to 31 December 2019. PwC has been auditor to the Company and the Group since 1995, and will continue as auditor until the year ending 31 December 2020. In October 2018, the Board, following a tender exercise and formal review to choose a new auditor and the recommendation of the Committee, approved the proposed appointment of Deloitte LLP. Subject to shareholder approval, Deloitte LLP will undertake the Group audit for the year ending 31 December 2021. The Company and the Group have no plans therefore as at the date of this report to conduct a tender exercise for external audit services. |
CORPORATE GOVERNANCE
Board Risk Committee report
 | | | The Group’s resilience, through strategic change and continually emerging risks, has been a core consideration. Alan Dickinson Chairman, Board Risk Committee | | |  |
| | | | | | | |
| DEAR SHAREHOLDER I am pleased to report on how the Board Risk Committee (the ‘Committee‘) has discharged its responsibilities throughout 2019. During the year, the Committee again focused on a wide range of existing and emerging risks, using dedicated sub-committees and effective planning of the agenda to ensure that focus and attention was given to those risks which were considered to be of ongoing importance to the Group and its customers. The environment within which the Group operates remained subject to continually evolving risks with considerable degrees of change and uncertainty. The Committee was concerned to oversee the successful delivery of significant regulatory change such as the embedding of ring-fenced banking, data risk and operational resilience. Operational resilience has been elevated to a primary risk category along with change and execution risk, recognising the extensive Group strategic change agenda. The Committee was pleased to see that good progress was made with the management of customer rectifications. The Committee also focused very closely on conduct risks and, in particular, the Group’s management of customers in financial difficulty, including implementation of a revised operating model to improve customer outcomes. Each of these areas will be subject to ongoing focus in 2020. Other areas of focus for the year ahead will include continued improvements in the Group’s treatment of vulnerable customers, fraud and financial crime, consumer indebtedness, and continually evolving risks within IT and cyber – as part of the broader operational resilience agenda. The Committee will again consider impacts on the Group’s broader risk profiles arising from delivery of the strategic change agenda. Inevitably, the external environment continues to provide challenges and potential impacts for the Group’s risk profile which the Committee continues to closely monitor. The Committee has concluded that the Group continues to have strong discipline in the management of both emerging and existing risks, and the Committee’s work continues to support the Group in achieving its core aim of operating as a digitised, simple, low risk provider of financial services. Alan Dickinson Chairman, Board Risk Committee | | | COMMITTEE PURPOSE AND RESPONSIBILITIES The purpose of the Committee is to review the risk culture of the Group, setting the tone from the top in respect of risk management. The Committee is also responsible for ensuring the risk culture is fully embedded and supports at all times the Group’s agreed risk appetite, covering the extent and categories of risk which the Board considers as acceptable for the Group. In seeking to achieve this, the Committee assumes responsibility for monitoring the Group’s risk management framework, which embraces risk principles, policies, methodologies, systems, processes, procedures and people. It also includes the review of new, or material amendments to risk principles and policies, and overseeing any action resulting from material breaches of such policy. More details on the Group’s wider approach to risk management can be found in the risk management section on pages 41 to 108. Full details of the Committee’s responsibilities are set out in its terms of reference, which can be found at www.lloydsbankinggroup.com/our-group/corporate-governance COMMITTEE COMPOSITION, SKILLS, EXPERIENCE AND OPERATION The Committee is composed of Non-Executive Directors, who provide core banking and risk knowledge, together with breadth of experience which brings knowledge from other sectors, and a clear awareness of the importance of putting the customer at the centre of all that the Group does. All Non-Executive Directors are members of the Committee. The Chief Risk Officer has full access to the Committee and attends all meetings. The Chief Internal Auditor and members of the Executive also attend meetings, as appropriate. Annually the Committee undertakes an effectiveness review. The review forms part of the Board evaluation process with Directors being asked to complete parts of the questionnaire relating to the Committees of which they were members. The findings of the review were considered by the Committee at its January 2020 meeting. On the basis of | | | the evaluation, the feedback was that the performance of the Committee continues to be effective. Details of Committee membership and meeting attendance can be found on page 145. As the most senior risk committee in the Group, the Committee interacts with other related risk committees, including the executive Group Risk Committee. Such interaction assists with the agenda planning process, where in addition to annual agenda planning, matters considered by the Group Risk Committee are reviewed to ensure escalation of all relevant matters to the Committee. MATTERS CONSIDERED BY THE COMMITTEE Over the course of the year the Committee considered a wide range of risks facing the Group, both standing and emerging, across all key areas of risk management, in addition to risk culture and risk appetite, as noted above. As part of this review, certain risks were identified which required further detailed consideration. Set out on the following pages is a summary of these risks, with an outline of the material factors considered by the Committee, and the conclusions which were ultimately reached. During 2019, the Committee continued to utilise established sub-committees to provide additional focus on areas such as IT resilience and cyber, and stress testing and recovery planning. The Committee receives regular updates from the Lloyds Bank Corporate Markets and Insurance business sub-groups, which summarise the key discussions and decisions taken at the relevant entities’ risk committees. These sub-committees enable members of the Committee to dedicate additional time and resource to achieving a more in-depth understanding of the topics covered, and enable further review and challenge of the associated risks. |
CORPORATE GOVERNANCE
Board Risk Committee reportcontinued
| | | ACTIVITIES DURING THE YEAR | | | |
| | | | | Key issues | | Committee review and conclusion | |
| | | CONDUCT RISK | | | | | |
| | |  | | The Committee continues to focus closely on the Group’s management of customer rectifications. | | Throughout 2019 the Committee has considered reports on the Group’s Rectifications portfolio performance, with particular interest in reducing the number of customers with outstanding remediations. The Committee has noted continued progress in the pace and quality of remediations, delivering a reduction in the number of customers awaiting redress and improvements in customer outcomes. The Committee has remained close to progress on material rectifications, including HBOS Reading.
Conclusion:Root cause analysis and read-across activities continue to improve and embed across the Group with good progress in reducing the volume of rectification programmes and customers impacted. This will remain a key focus for the Committee in 2020. | |
| | | | | | | | |
| | |  | | The Committee continues to focus closely on the Group’s management of conduct risks and issues associated with customers in financial difficulty. | | During 2019, the Committee considered reports on the ongoing activity to improve the way the Group supports customers experiencing financial difficulty. The Committee held a deep dive into financial difficulty cases to provide deeper insight into root cause analysis and the actions being taken to improve customer outcomes. Other key focus areas included the initiatives being delivered and progressed through the Financial Wellbeing lab and implementation of a revised operating model to improve outcomes. The Committee also noted the impact of a potential economic downturn and new regulatory requirements such as Persistent Debt. Conclusion:Whilst progress has been made, further improvement in the Group’s treatment of customers in financial difficulty will be a key focus area in 2020. | |
| | |  | | The Committee continues to focus on ensuring the Group is resolving customer complaints in a timely and fair manner and eradicating the causes for complaints. | | The Committee continues to focus on ensuring the Group has an effective framework for managing complaints including root cause analysis to establish lessons learned and help prevent similar issues in the future. Consideration has been given to complaint metric performance via Board Risk Appetites and quality as measured by the Financial Ombudsman Service. Conclusion:The Group continues to make good progress in reducing the causes for customer complaints however focus needs to remain on reducing the time taken to resolve complaints in 2020 and to learn from root cause analysis. | |
| | |  | | Vulnerable customers represent a significant proportion of the Group’s customer base and continue to be an area of close focus with increasing regulatory focus. | | The Committee recognises the importance of the Group’s vulnerability strategy in delivering customer outcomes, against a backdrop of increasing regulatory focus and noted the Group’s response to the FCA’s consultation on Vulnerable Customers, considering the potential impact on the Group’s strategy going forward. The Committee considered the progress that continues to be made to implement the Group’s vulnerability strategy, and the enhancements made to support the embedding of regulatory Framework and Guidance. The Committee noted the actions in train, including defining solutions to allow vulnerability information to be recorded and shared, the continued development of vulnerability dashboards and enhancements to the control framework along with the proposals for an enhanced approach to investment prioritisation for vulnerability initiatives. Conclusion:The Committee recognise the importance of this subject and the increasing regulatory focus. It will continue to require ongoing focus and investment to execute the Group’s strategy in relation to vulnerable customers and meet external expectations. | |
| | |  | | During the year the Committee has increased focus on climate change, sustainability and the potential impact to the Group and impact on the Group’s customers. | | Climate change and sustainability have been added as top areas of ongoing focus and the Committee has increased consideration of the risks that may arise. The Group is committed to delivering Taskforce on Climate-related Financial Disclosure Recommendations (TCFD) and is working to ensure that regulatory expectations with regards to managing the financial risks arising from climate change are met. A proactive approach is required to continue to anticipate the sustainability impact on client’s business models. Conclusion:The Committee will continue to closely monitor climate change and sustainability risks, looking at the impact on both the Group and its customers, and the delivery of TCFD and other commitments. | |
| | | FINANCIAL RISK – COVERING CREDIT AND MARKET RISK | |
| | |  | | The Committee continues to review the Commercial lending portfolio through regular credit quality update papers, including reviews of key portfolio and sector trends observed and external threats to portfolio performance. | | Detailed reviews allowed the Committee to assess the overall quality of the portfolio and new business written. Risk levels and credit exposure, including to material individual names, were monitored with reference to management information and risk appetite limits, as appropriate. Key sector concentrations, including commercial real estate and the funds business, as well as those sectors more vulnerable to the wider economic backdrop or structural change, were also examined in greater detail, including construction, manufacturing and consumer related sectors, such as retail. Specific consideration was also given to the automotive sector, which continues to face into disruptors such as new technologies and changing consumer behaviours. The Committee also considered the Group’s approach to credit policies and individual transaction limits, and reviewed summary details of transactions and portfolio reviews that were assessed at the Group’s most senior credit committee. Conclusion:Overall Commercial Banking credit quality remained broadly stable. Origination quality has been maintained, supported by a consistent through-the-cycle approach to risk appetite. The portfolio continues to be monitored closely with consideration given to the macroeconomic outlook and emerging trends. | |
| | | | | | | | |
CORPORATE GOVERNANCE
| | | | | | | |
| | | | Key issues | | Committee review and conclusion | |
| |  | | The Committee reviewed the risks relating to retail lending indebtedness. | | Consideration was given to the Group’s lending controls, risk appetite monitoring and new lending indebtedness risk for the consumer unsecured, motor, retail secured and buy-to-let portfolios. The Committee noted that lending controls, risks appetite metrics and segmented reporting for both indebtedness and affordability assessments are in place, and acknowledged the Group’s continued actions closely to monitor and control higher risk and marginal indebtedness segments and reduce exposure over time. The Committee reviewed management action which had also been taken within retail secured lending, including buy-to-let, to protect against contagion risk from growth in consumer debt levels, and to ensure that customers’ finances were resilient to stress. Conclusion:The Committee was satisfied that the appropriate lending controls and monitoring are in place for affordability and indebtedness and noted progress made to strengthen these and improve visibility of customers’ debt positions. | |
| | OPERATIONAL RISK | | | |
| |  | | Operational resilience is one of the Group’s most important non-financial risks. Key focus in 2019 has been to continue to enhance the existing approach to operational resilience and strengthen the control environment, to improve the Group’s ability to respond to incidents and continue delivering key services to the Group’s customers. | | Key areas of focus for the Committee have included updates on the Group’s operational resilience programmes, progress against the operational resilience strategy and continued regulatory engagement in advance of the publication of Bank of England’s consultation paper. Given the significance of the risk to the Group, the Committee is supported by the IT and Cyber Advisory Forum specifically focused on IT and cyber risks. The Committee has reviewed papers relating to Group operational resilience investment, proposals for considering Impact Tolerances and Advanced Intrusion Testing. Conclusion:In 2019, operational resilience was classified as a primary risk. The Committee takes the operational resilience of its services very seriously and has drawn valuable insight from having independent advice and guidance. It has agreed risk appetite statements for critical services and will continue to strengthen these to reflect the increased focus on resilience. The Committee considers that governance of operational resilience risk is robust and that activities in plan will ensure the ongoing resilience of key services to the Group’s customers. | |
| |  | | The Committee continues to focus on data governance, privacy and data ethics risks including oversight of the Group’s compliance with the General Data Protection Regulation (GDPR), and the associated risks and controls. | | Data risk continues to be an area of significant regulatory and media attention. The Committee has remained focused on ensuring effective controls are in place regarding the governance, privacy, ethics and management of the Group‘s customers’ data. Third party oversight controls continue to embed and mature following the successful implementation of GDPR. Compliance with the principles of the Basel Committee of Banking Supervision (BCBS) also remains a key area of focus. Conclusion:The Group continues to enhance the controls required to identify and manage data risk. | |
| |  | | The Committee recognises the importance of People risk management to ensure the Group has the right capabilities and culture as the Group builds the Bank of the Future. | | Throughout 2019, the Committee has continued to focus on the People risk profile, recognising the challenges faced with successfully delivering the Group’s strategic agenda, alongside the regulatory change agenda. The Group recognises the increasing demands on colleagues and is focusing on the ongoing monitoring of colleague wellbeing and engagement, and on developing colleague skills to achieve capability enhancement for a digital era. Particular consideration is given to critical populations and high performing individuals to support the Group’s core commitments. The Group has also made significant progress in evolving and refining the compliance control environment for the Senior Manager and Certification Regime (SMCR) and delivery of the SMCR extension was completed in 2019. Conclusion:Regular monitoring continues to confirm that the People risk profile is managed effectively. The Committee ensures the necessary risk oversight as the Group continues to deliver simplified colleague processes and maximises colleague skills and potential to achieve the workforce of the future. | |
| |  | | The Committee continues to focus on the risks associated with delivery and embedding of an extensive strategic change agenda, including both discretionary and regulatory change. | | The Committee continues to focus on the risks associated with the extensive Group strategic change agenda, recognising the challenges faced in ensuring both successful delivery and embedding of change. Change and execution risk has been elevated to a primary risk category to recognise the risk attached to the delivery of GSR3 and its impact on the enterprise wide risk profile. The Group has matured in its ability to define, measure and report execution risk. The articulation and quantification of this risk continues to embed through regular reviews of the execution risk dashboard and its metrics, as well as the implementation of the change and execution risk library. An area of focus has been on increasing understanding of the wider risk impacts of the initiatives that are driving investment funding decisions and the impact of GSR3 on the Group’s risk profile. For instance, as GSR3 is transforming both ways of working and colleague journeys, there is a deeper understanding of the impact of those changes on People risk. The Group continues to increase its use of agile delivery approaches and tools and change oversight has been reviewed and refreshed to support this. Conclusion:Change and execution risk will remain an area of focus for the Committee as the Group continues to increase its understanding of the change and execution risk associated with its transformation agenda and evolve its change delivery approaches. Further focus is required fully to reflect the enterprise wide impacts of the Group’s strategic agenda into business risk profiles and to leverage this awareness in key investment funding decisions. | |
| | | | | | | |
CORPORATE GOVERNANCE
Board Risk Committee reportcontinued
| | | | | | | | |
| | | | | Key issues | | Committee review and conclusion | |
| | |  | | The Committee continues to consider key economic and political risks, particularly given the increasingly uncertain outlook. | | The Committee continues to consider key economic and political risks. Consideration is focused on risks that may impact the Group’s central economics forecast that is incorporated into the Group’s four year operating plan. Continuation of the current global trade tensions, deterioration in the UK property market or UK productivity, or a global economic slowdown and low (or negative) interest rates could have an adverse impact on profitability, capital generation and the Group’s credit risk profile. Conclusion:The Committee will continue to closely monitor risks arising from economic uncertainty. The Committee will also focus on risks emerging due to slower economic growth and political challenges, as well as risks from wider global events. | |
| | |  | | Negotiations continue to determine the final terms of the UK’s exit from the EU. The prolonged uncertainty regarding the options, timing and the process itself could affect the outlook for the UK and global economy. | | The key risks for the Group include volatility and possible discontinuities in financial markets, impact on the Group’s customers’ trading performance, financial position and credit profile, and ability to continue to operate in line with current practice across borders. When reviewing the possible impacts of the EU Exit, the Committee has given particular consideration to the Group’s strong UK focus and UK-centric strategy. The Committee continues to closely monitor developments, with specific focus on the trading, financial, operational impacts for the Group, as well as the cyber, physical security and fraud risks, and the continued support of Group customers. Conclusion:The Group’s EU exit contingency plans continue to be closely monitored by the Committee via specific regular updates, covering both operational status and external developments, a suite of early warning indicators and corresponding risk mitigation plans. | |
| | |  | | Financial Crime is a priority for the UK Government, law enforcement and regulators. The Committee continues to monitor the Group’s management of financial crime risk in light of continued legislative change and regulatory scrutiny. | | The Committee acknowledged the continued focus the Group places on the fight against financial crime and is playing an active part in developing and delivering on the strategic aims of HM Government’s Economic Crime Reform programme, including designing and delivering improvements in the UK SARs (Suspicious Activity Reporting) regime. This is a multi-year programme delivering through a private and public partnership, and for which the Group is represented by the Chief Operating Officer attending the Home Office’s Economic Crime Strategic Board. The Committee also recognised significant strengthening of the Group’s intelligence capability to inform assessment of risk, for example the work to understand exposure to allegations of money laundering through Baltic banks; and cash-based money laundering through instant deposit machines. Conclusion:The Committee noted satisfaction with the standard of compliance documented in the MLRO report, and acknowledged the action plans in place across the Group to further enhance the Group’s position. Additionally, the Committee acknowledged the strategic plans in place to further enhance and digitise the Group’s financial crime control framework, designed to deliver more effective and agile controls whilst improving the customer experience. | |
| | |  | | The Committee continues to closely monitor the Group’s management of fraud risk, whilst minimising the impact of controls on genuine customer journeys. | | The Committee considered the challenging and evolving nature of the fraud risk environment influenced by factors such as an increasing sophistication of fraud typologies and an uplift in industry reported gross fraud losses. The Committee noted the correlated impact on the Group’s gross authorised fraud losses albeit Group market share remains below the Group’s market share of transactions. Gross unauthorised fraud losses at both industry and Group level rose during 2019. However, they remain within Group appetite and the Group’s net losses remain stable year on year on a like-for-like basis. Additionally, the Committee acknowledged the leading role the Group has played in the development of an industry code for authorised push payment fraud. The code was implemented in May 2019 and the Group has demonstrated compliance and good customer outcomes. Some operational improvements, expectations from the Financial Ombudsman’s Service regarding the provision of warnings and the issue of funding cases where neither the financial institution nor the customer is to blame continue to be addressed. Conclusion:The Committee noted the positive work undertaken in the detection and prevention of fraud and recognised the continuing efforts of the Group to protect the integrity of genuine customer journeys with strategic plans aimed at enhancing the fraud control environment of the Group which reflect the comprehensive nature of the challenge and require internal evolution and external engagements. | |
| | | REGULAR REPORTING CATEGORIES | |
| | |  | | Managing regulatory risk continues to be a key focus within the Group due to the significant amount of highly complex and interdependent regulatory reform that the Group has managed in 2019, and will continue to manage in 2020. | | The Committee has continued focus on ensuring effective controls and oversight to comply with existing regulatory obligations, as well as receiving regular updates on emerging regulatory and legal risks. There have been ongoing significant regulatory change and oversight programmes in which the Board has placed increased focus to ensure successful execution, including the Basel Committee on Banking Supervision (BCBS 239), IBOR Transition, EU Exit, product pricing, customers in financial difficulty, HBOS Reading and climate change. In addition, a key area of focus for the Committee has been ensuring ring-fencing requirements have been fully embedded and the Committee has operated in line with its commitments to the PRA and continued to demonstrate independent decision making for the ring-fenced bank. Key topics have included reviews of the ring-fenced bank perimeter, management of legal entity conflicts and governance. Conclusion:The Group continues to place significant focus on implementing complex regulatory changes, as well as ensuring effective horizon scanning of upcoming trends. The Committee has discussed the topics raised, and will continue to closely monitor compliance with regulatory requirements, including ring-fencing in 2020. Regulatory risk will remain a priority area of focus for the Committee in 2020. | |
| | | | | | | | |
CORPORATE GOVERNANCE
Responsible Business Committee report
| | The Group has a
responsibility to help
address some of the
challenges faced by the
UK. The Group manages
this through its Helping
Britain Prosper plan. Sara Weller CBE Chairman, Responsible Business Committee | |
DEAR SHAREHOLDER I am pleased to report on the activity of the Responsible Business Committee (the ‘Committee’), during a busy 2019. The Committee continues to oversee and track progress against the Group’s Helping Britain Prosper Plan, including reviewing performance against strategic aims, focusing on digital skills, sustainability and the Group’s Charitable Foundations. The Group made good progress against targets in the Helping Britain Prosper Plan. Some examples, set out later on this page, include the launch of a unique Resilience portal to support colleagues mental health. The Group was recognised by Fortune magazine as a leading business worldwide for its work on both sustainability and mental health. The Group continued to support its UK-wide Charitable Foundations, showcasing the work they do, including with domestic abuse and mental health charities. The Committee regularly reviewed progress on the Group’s aim to have more women in senior roles. It also discussed the Group’s opportunity and plans to advance the representation of colleagues from BAME backgrounds at all levels. I would like to thank the thousands of colleagues across the entire Group for their hard work and extraordinary commitment to supporting Responsible Business activity in their daily work, as well as by volunteering over 246,000 hours of their time and helping to raise over £11 million to date for the Group’s charity of the year, Mental Health UK. The following report gives more examples of Group activity to Help Britain Prosper in 2019. I hope you find it both interesting and informative. Sara Weller Chairman, Responsible Business Committee | | | HOW THE COMMITTEE SPENT ITS TIME IN 2019 The Committee continued to focus on the three material areas aligned to the Bank of the Future, with the aim of enabling people, businesses and communities to be ready for the future:
Digital SkillsThe programme was reviewed regularly, with updates on the direction of and progress with the Lloyds Bank Academy which successfully launched a second location in Bristol. The Committee also considered ‘future.now’ launched by the Lord Mayor of London, bringing together organisations to boost digital skills in the UK.
The Group’sSustainabilitystrategy made consistent progress in 2019. A number of targets were achieved ahead of plan such as the EV1000 initiative of supporting 1,000 electric vehicles which was achieved during the third quarter of 2019. The Committee continues to present challenge on the Group’s strategy of developing new products and strategies to help and support customers in a sustainable way. The Company’s sustainability strategy is available on the Group’s website www.lloydsbankinggroup.com/our-group/ responsible-business.
The relationship between the Group and theCharitable Foundationsis a key area of focus and the Group worked closely with the Foundations to showcase the work they do. The Committee continues to review the work done to support the Charitable Foundations work in the charitable sector through strengthening skills-based volunteering across their-supported charities. In other activities, the Committee undertook an in-depth review of Inclusion and Diversity within the Group, focusing on BAME colleagues. This demonstrated some of the Group’s strengths and uniqueness but also identified opportunities to strengthen further its approach to attracting and developing talent. The Committee looked closely at progress on mental health and resilience in conjunction with the launch of a Resilience portal for colleagues. This highlighted scientific research into human behaviours provided by medical professionals based on clinical data. | | | The Committee will continue to discuss and monitor the effectiveness of the portal. At each meeting, updates have been provided on the performance against the metrics of the Helping Britain Prosper Plan. COMMITTEE PURPOSE AND OPERATION The Committee supports the Board in overseeing the Group’s performance as a Responsible Business by providing oversight of, and support for, the Group’s strategy and plans for embedding responsible business as part of the Group’s purpose to Help Britain Prosper. This Committee provides oversight and challenge on activities which impact the Group’s trust and reputation and by considering and recommending to the Board for approval the Responsible Business Report and Helping Britain Prosper Plan. The Committee’s Chair reviews the forward agenda regularly to ensure that the focus of the Committee’s work is on its key priorities and members have sufficient time at meetings to raise issues of concern and to engage in constructive dialogue with colleagues. COMMITTEE COMPOSITION, ATTENDANCE AT MEETINGS AND EFFECTIVENESS REVIEW The Committee is composed of Non-Executive Directors. Representatives from Group Internal Audit and the Chief Operating Office attend meetings as appropriate. During the year, the Committee met its key objectives and carried out its responsibilities effectively, as confirmed by the annual effectiveness review. The Committee will consider the output from the 2019 effectiveness review and whether amendments could be made to its current working arrangements. Details of committee membership and meeting attendance can be found on page 145. |
CORPORATE GOVERNANCE
DISCLOSURE CONTROLS AND PROCEDURES
As of 31 December 2019, Lloyds Banking Group, under the supervision and with the participation of the Group’s management, including the Group Chief Executive and the Chief Financial Officer, performed an evaluation of the effectiveness of the Group’s disclosure controls and procedures. Based on this evaluation, the Group Chief Executive and Chief Financial Officer concluded that the Company’s disclosure controls and procedures, at 31 December 2019, were effective for gathering, analysing and disclosing with reasonable assurance the information that Lloyds Banking Group is required to disclose in the reports it files under the Securities Exchange Act of 1934, within the time periods specified in the SEC’s rules and forms. Lloyds Banking Group’s management necessarily applied its judgement in assessing the costs and benefits of such controls and procedures, which by their nature can provide only reasonable assurance regarding management’s control objectives.
CHANGES IN INTERNAL CONTROL OVER FINANCIAL REPORTING
There have been no changes in the Lloyds Banking Group’s internal control over financial reporting during the year ended 31 December 2019 that have materially affected, or are reasonably likely to materially affect, the Lloyds Banking Group’s internal control over financial reporting.
MANAGEMENT REPORT ON INTERNAL CONTROL OVER FINANCIAL REPORTING
The management of Lloyds Banking Group plc is responsible for establishing and maintaining adequate internal control over financial reporting. Lloyds Banking Group plc’s internal control over financial reporting is a process designed to provide reasonable assurance regarding the reliability of financial reporting and the preparation of financial statements for external purposes in accordance with IFRS.
The Company’s internal control over financial reporting includes those policies and procedures that (i) pertain to the maintenance of records that, in reasonable detail, accurately and fairly reflect transactions and dispositions of assets; (ii) provide reasonable assurance that transactions are recorded as necessary to permit preparation of financial statements in accordance with IFRS and that receipts and expenditures are being made only in accordance with authorisations of management and directors of Lloyds Banking Group plc; and (iii) provide reasonable assurance regarding prevention or timely detection of unauthorised acquisition, use, or disposition of the Company’s assets that could have a material effect on the financial statements.
Internal control systems, no matter how well designed, have inherent limitations and may not prevent or detect misstatements. Also, projections of any evaluation of effectiveness to future periods are subject to the risk that controls may become inadequate because of changes in conditions, or that the degree of compliance with the policies and procedures may deteriorate.
The management of Lloyds Banking Group plc assessed the effectiveness of the Company’s internal control over financial reporting at 31 December 2019 based on the criteria established in Internal Control – Integrated Framework 2013 issued by the Committee of Sponsoring Organisations of the Treadway Commission (COSO). Based on this assessment, management concluded that, at 31 December 2019, the Company’s internal control over financial reporting was effective.
PricewaterhouseCoopers LLP, an independent registered public accounting firm, has issued opinions on the Company’s consolidated financial statements and on its internal controls over financial reporting. These opinions appear on page F-2.
GOING CONCERN
The going concern of the Company and the Group is dependent on successfully funding their respective balance sheets and maintaining adequate levels of capital. In order to satisfy themselves that the Company and the Group have adequate resources to continue to operate for the foreseeable future, the Directors have considered a number of key dependencies which are set out in the risk management section under principal risks and uncertainties: funding and liquidity on page 39 and pages 94 to 100 and capital position on pages 85 to 94. Additionally, the Directors have considered capital and funding projections for the Company and the Group. Accordingly, the Directors conclude that the Company and the Group have adequate resources to continue in operational existence for a period of at least 12 months from the date of approval of the financial statements and therefore it is appropriate to continue to adopt the going concern basis in preparing the accounts.
MAJOR SHAREHOLDERS AND RELATED PARTY TRANSACTIONS
MAJOR SHAREHOLDERS
All shareholders within a class of the Company’s shares have the same voting rights. As at14 February 2020 the Company had received notification under the FCA Disclosure Guidance and Transparency Rules (‘DTR’) of the following holdings in the Company’s issued ordinary share capital.
| | | | | |
| | | Interest in shares | | % of issued share capital
/voting rights4 |
| BlackRock Inc. | | 3,668,756,7651 | | 5.14% |
| Harris Associates L.P. | | 3,551,514,5712,3 | | 4.99% |
| 1 | The notification of 13 May 2015 provided by BlackRock Inc. under Rule 5 of the DTR identifies (i) an indirect holding of 3,599,451,380 shares in the Company representing 5.04 per cent of the voting rights in the Company, and (ii) a holding of 69,305,385 in other financial instruments in respect of the Company representing 0.09 per cent of the voting rights of the Company. BlackRock Inc.’s holding most recently notified to the Company under Rule 5 of the DTR varies from the holding disclosed in BlackRock Inc.’s Schedule 13-G filing with the US Securities and Exchange Commission dated 5 February 2020, which identifies beneficial ownership of 4,698,292,748 shares in the Company representing 6.7 per cent of the issued share capital in the Company. This variance is attributable to different notification and disclosure requirements between these regulatory regimes. The notifiable holding by BlackRock Inc. received by the Company has not changed since 31 December 2015. Prior to 31 December 2015, BlackRock Inc.’s holding in the Company was not required to be disclosed under the US Securities and Exchange Commission rules. |
| | |
| 2 | An indirect holding. |
| | |
| 3 | On 18 September 2017, Harris Associates L.P. disclosed under the DTR beneficial ownership of 3,607,058,758 ordinary shares, representing 5.01% of that share class. On 31 October 2018, Harris Associates L.P. made a further disclosure under the DTR of a decrease in their holding, to 3,551,514,571 ordinary shares, representing 4.99% of that share class, the notified percentage remaining below 5% as at the end of 2019. |
| | |
| 4 | Percentage correct as at the date of notification. |
As at 14 February 2020, the Company had 2,358,597 registered ordinary shareholders. The majority of the Company’s ordinary shareholders are registered in the United Kingdom. 2,375,557,133 ordinary shares, representing 3.38 per cent of the Company’s issued share capital, were held by BNY Mellon as depositary for the ordinary share American Depositary Share Programme through which there were 185 record holders.
Additionally, the majority of the Company’s preference shareholders are registered in the United Kingdom, with a further 1 record holder with an address in the United States registered through the Company’s preference share American Depositary Share Programme.
RELATED PARTY TRANSACTIONS
The Group, as at 31 December 2019, had related party transactions with 22 key management personnel, certain of its pension funds, collective investment schemes and joint ventures and associates. See note 47 to the financial statements.
REGULATION
APPROACH OF THE FINANCIAL CONDUCT AUTHORITY (“FCA”)
As per the Financial Services and Markets Act FSMA (amended by the Financial Services Act 2012), the FCA has a strategic objective to ensure that the relevant markets function well. In support of this, the FCA has three operational objectives: to secure an appropriate degree of protection for consumers; to protect and enhance the integrity of the UK financial system and to promote effective competition in the interests of consumers.
The FCA Handbook sets out rules and guidance across a range of conduct issues with which financial institutions are required to comply including high level principles of business and detailed conduct of business standards and reporting standards.
APPROACH OF THE PRUDENTIAL REGULATION AUTHORITY (“PRA”)
The PRA is part of the Bank of England, with responsibility for the prudential regulation and supervision of circa 1500 banks, building societies, credit unions, insurers and major investment firms. Their strategy is to deliver a resilient financial sector by seeking: an appropriate quantity and quality of capital and liquidity; effective risk management; robust business models; and sound governance including clear accountability of firms’ management. This strategy supports their two statutory objectives: to promote the safety and soundness of these firms; and to contribute to the securing of an appropriate degree of protection for policyholders (for insurers).
Through regulation, the PRA sets standards/policies which it expects firms to meet, and monitors firm’s compliance. The supervision approach includes three key characteristics:
| – | Use of judgement to determine whether financial firms are safe and sound, whether insurers provide appropriate protection for policyholders and whether firms continue to meet the Threshold Conditions (including maintaining appropriate capital and liquidity, and having suitable management arrangements). |
| | |
| – | A forward looking approach to assess firms against risks which may arise in the future. |
| | |
| – | Focus on those issues and those firms that pose the greatest risk to the stability of the UK financial system and policyholders. |
The PRA will change a firm’s business model if they judge that mitigating risk measures are insufficient.
OTHER BODIES IMPACTING THE REGULATORY REGIME
THE BANK OF ENGLAND AND HM TREASURY
The agreed framework for co-operation in the field of financial stability in the financial markets is detailed in the Memorandum of Understanding published jointly by HM Treasury, the FCA and the Bank of England (now including the PRA) (together, the “Tripartite Authorities”). The Bank of England has specific responsibilities in relation to financial stability, including: (i) ensuring the stability of the monetary system; (ii) oversight of the financial system infrastructure, in particular payments systems in the UK and abroad; and (iii) maintaining a broad overview of the financial system through its monetary stability role.
UK FINANCIAL OMBUDSMAN SERVICE (“FOS”)
The FOS provides consumers with a free and independent service designed to resolve disputes where the customer is not satisfied with the response received from the regulated firm. The FOS resolves disputes for eligible persons that cover most financial products and services provided in (or from) the UK. The jurisdiction of the FOS extends to include firms conducting activities under the Consumer Credit Act 1974. Although the FOS takes account of relevant regulation and legislation, its guiding principle is to resolve cases individually on merit on the basis of what is fair and reasonable; in this regard, the FOS is not bound by law or even its own precedent. The final decisions made by the FOS are legally binding on regulated firms who also have a requirement under the FCA rules to ensure that lessons learned as a result of determinations by the FOS are effectively applied in future complaint handling.
THE FINANCIAL SERVICES COMPENSATION SCHEME (“FSCS”)
The FSCS was established under the FSMA and is the UK’s statutory fund of last resort for customers of authorised financial services firms. Companies within the Group are responsible for contributing to compensation schemes in respect of banks and other authorised financial services firms that are unable to meet their obligations to customers. The FSCS can pay compensation to customers if a firm is unable, or likely to be unable, to pay claims against it. The FSCS is funded by levies on firms authorised by the PRA and the FCA, including companies within the Group.
LENDING STANDARDS BOARD
The Lending Standards Board is responsible for overseeing the Standards of Lending Practice (for both personal and business customers). The Standards of Lending Practice for personal customers cover six main areas: Financial promotions and communications; product sales; account maintenance and servicing; money management; financial difficulty; and customer vulnerability across key lending (current account overdrafts, credit cards, loans and chargecards) to consumers and charities with an income of less than £1 million. The Standards of Lending Practice for business customers apply to business customers, which at the point of lending have an annual turnover of up to £25 million. The standards cover nine main areas: product information; product sale; declined applications; product execution; credit monitoring; treatment of customers in financial difficulty; business support units; portfolio management; and customers in vulnerable circumstances for products including loans, overdrafts, commercial mortgages, credit cards, and chargecards.
UK COMPETITION AND MARKETS AUTHORITY (“CMA”)
The objective of the CMA is to promote competition to ensure that markets work well for consumers, businesses and the economy. Since 1 April 2014 the CMA has, with the FCA, exercised the competition functions previously exercised by the Office of Fair Trading and the Competition Commission. Through its five strategic goals (delivering effective enforcement; extending competition frontiers; refocusing competition protection; achieving professional excellence; and, developing integrated performance) the CMA impacts the banking sector in a number of ways, including powers to investigate and prosecute a number of criminal offences under competition law. In addition, the CMA is now the lead enforcer under the Unfair Terms in Consumer Contracts Regulations 1999.
UK INFORMATION COMMISSIONER’S OFFICE
The UK Information Commissioner’s Office is responsible for overseeing implementation of the Data Protection Act 2018 which enshrines the General Data Protection Regulation. This Act regulates, among other things, the retention and use of data relating to individual customers. The Freedom of Information Act 2000 (the “FOIA”) sets out a scheme under which any person can obtain information held by, or on behalf of, a “public authority” without needing to justify the request. A public authority will not be required to disclose information if certain exemptions set out in the FOIA apply.
REGULATION
THE PAYMENTS SYSTEM REGULATOR (“PSR”)
The PSR is an independent economic regulator for the £75 trillion payment systems industry, which was launched in April 2015. Payment systems form a vital part of the UK’s financial system – they underpin the services that enable funds to be transferred between people and institutions. The purpose of PSR is to make payment systems work well for those that use them. The PSR is a subsidiary of the FCA, but has its own statutory objectives, Managing Director and Board. In summary its objectives are: (i) to ensure that payment systems are operated and developed in a way that considers and promotes the interests of all the businesses and consumers that use them; (ii) to promote effective competition in the markets for payment systems and services – between operators, payment services providers and infrastructure providers; and (iii) to promote the development of and innovation in payment systems, in particular the infrastructure used to operate those systems.
COMPETITION REGULATION
The FCA obtained concurrent competition powers with the CMA on 1 April 2015 in relation to the provision of financial services in the UK, in addition to supplementing its existing competition objective. The FCA has been undertaking a programme of work to assess markets across financial services to ascertain whether or not competition is working effectively in the best interests of consumers. In addition, the PRA also has a secondary objective under the Financial Services (Banking Reform) Act to, so far as reasonably possible, act in a way which facilitates effective competition.
The FCA announced on 3 November 2016 that it will take action to improve competition in the current account market, following the CMA’s recommendations in the publication of its competition investigation into personal current account (PCA) and SME Banking (9 August 2016). The FCA have published their final report into the ’Strategic Review of Retail Banking Business Models’ (18 December 2018) recognising that PCAs are an important source of competitive advantage for major banks. The focus on high cost credit continues with further forward work on its proposals to simplify the pricing of all overdrafts and end higher prices for unarranged overdrafts. The FCA continues to act as an observer on the “Open Banking” steering group and be involved in developing and testing “prompts” to encourage customers to consider their banking arrangements.
The UK Government has a continuing interest in competition.
The current regulatory regime may lead to greater UK Government and regulatory scrutiny or intervention in the future, ranging from enforced product and service developments and payment system changes to significant structural changes. This could have a significant effect on the Group’s operations, financial condition or the business of the Group.
EU REGULATION
Financial institutions operating in the UK are currently subject to the relevant EU legislation, which is regularly reviewed at EU level and could be subject to change, including as a result of how it is transported into UK law following the UK’s exit from the EU. The Group will continue to monitor changes to legislation, providing specialist input on their drafting and assess the likely impact on its business.
U.S. REGULATION
Until 2018 Lloyds Bank and Bank of Scotland plc (“BoS”) maintained branches in New York, each licensed by the New York State Department of Financial Services (“NYDFS”) and subject to regulation and examination by the NYDFS and the Federal Reserve Bank of New York (“FRBNY”). BoS also maintained a representative office in Houston, Texas (authorized by the Texas Department of Banking (“TXB”), and subject to regulation and examination by TXB and the Federal Reserve Bank of Dallas). On 11 July 2018, the New York branch of BoS was closed and its license surrendered to the NYDFS, and the NYDFS confirmed to BoS in October, 2018 that the voluntary liquidation of the BoS New York branch under the New York State Banking Law was considered concluded. On 31 December 2018, Lloyds Bank advised the NYDFS that the Lloyds Bank New York branch was closed and Lloyds Bank surrendered its New York branch license to the NYDFS on that date and the voluntary liquidation of the Lloyds Bank New York branch was completed in 2019. The closure of the New York branches of Lloyds Bank and BoS was a consequence of the need by both banks to comply with the geographic limitations of the Ring-fencing Rules (as defined in the Risk Factors section). The BoS Houston representative office was also closed by BoS on 31 December 2018. In July, 2018, applications filed on behalf of Lloyds Bank Corporate Markets plc (“LBCM”) with the Board of Governors of the Federal Reserve System (“Federal Reserve Board”) and the NYDFS to permit LBCM to establish a branch in New York were approved, and on 27 July 2018, LBCM’s New York branch license was issued by the NYDFS. Also in July, 2018, at the request of Lloyds Bank, the NYDFS issued a representative office license to Lloyds Bank. Under the New York State Banking Law, the NYDFS has the authority, in certain circumstances, to take possession of the business and property located in New York State of a bank, such as LBCM, which maintains a licensed branch in New York State. Such circumstances generally include violations of law, unsafe business practices and insolvency.
The existence of a branch of LBCM in the U.S. subjects the LBCM, the Company and its subsidiaries doing business or conducting activities in the U.S. to oversight by the Federal Reserve Board.
As of the end of 2018, each of the Company, Lloyds Bank, HBOS, BoS and LBCM was a foreign banking organisation treated as a bank holding company within the meaning of the U.S. Bank Holding Company Act of 1956 (“BHC Act”) in accordance with the provisions of the International Banking Act of 1978 and each had elected, with the permission of the Federal Reserve Board, to be treated as a financial holding company under the BHC Act. Because, as a result of the Ring-fencing Rules, from and after January 1, 2019, neither Lloyds Bank nor BoS may maintain branches or own substantial equity stakes in entities organized outside of the European Economic Area, each ceased to be treated as a financial holding company under the BHC Act from and after that date. HBOS has no direct or indirect investments or activities in the U.S., and also ceased to be treated as a financial holding company. However, each of the Company and LBCM will continue to be treated as a financial holding company under the BHC Act.
Financial holding companies may engage in a broader range of financial and related activities than are permitted to bank holding companies that do not maintain financial holding company status, including underwriting and dealing in all types of securities. A financial holding company and its depository institution subsidiaries must meet certain capital ratios and be deemed to be “well managed” for purposes of the Federal Reserve Board’s regulations. A financial holding company’s direct and indirect activities and investments in the United States are limited to those that are “financial in nature” or “incidental” or “complementary” to a financial activity, as determined by the Federal Reserve Board.
REGULATION
Financial holding companies are also subject to approval requirements in connection with certain acquisitions or investments. For example, the Group is required to obtain the prior approval of the Federal Reserve Board before acquiring, directly or indirectly, the ownership or control of more than 5 per cent of any class of the voting shares of any U.S. bank or bank holding company.
The Group’s U.S. broker dealer, Lloyds Securities Inc. (“LSI”), is subject to regulation and supervision by the Securities and Exchange Commission and the Financial Industry Regulatory Authority, including sales methods, trade practices, use of safekeeping of customers’ funds and securities, capital structure, recordkeeping, conduct of directors, officers and employees and other matters pertinent to its securities business. In order to comply with the change to Ring-Fencing Rules (as defined in the Risk Factors section), LSI became an indirect, wholly-owned subsidiary of LBCM on July 1, 2018 as a result of the sale of 100% of the shares of LSI’s direct parent (Lloyds America Securities Corporation) by Lloyds Bank to LBCM.
A major focus of U.S. governmental policy relating to financial institutions in recent years has been combating money laundering and terrorist financing and enforcing compliance with U.S. economic sanctions, with serious legal and reputational consequences for any failures arising in these areas. The Group engages, or has engaged, in a limited amount of business with counterparties in certain countries which the U.S. State Department currently designates as state sponsors of terrorism, including Iran, Syria, Sudan and North Korea. The Group intends to engage in new business in such jurisdictions only in very limited circumstances where the Group is satisfied concerning legal, compliance and reputational issues. At 31 December 2019, the Group did not believe that the Group’s business activities relating to countries designated as state sponsors of terrorism were material to its overall business.
The Group estimates that the value of the Group’s business in respect of such states represented less than 0.01 per cent of the Group’s total assets and, for the year ended December 2019, the Group believes that the Group’s revenues from all activities relating to such states were less than 0.001 per cent of its total income, net of insurance claims. This information has been compiled from various sources within the Group, including information manually collected from relevant business units, and this has necessarily involved some degree of estimate and judgement.
The Dodd-Frank Wall Street Reform and Consumer Protection Act of 2010 (the “Dodd-Frank Act”), established a regulatory framework for swap dealers and major swap participants including the requirement for entities that are swap dealers and major swap participants to register with the U.S. Commodity Futures Trading Commission (“CFTC”). Each of Lloyds Bank and LBCM is registered as a swap dealer and as such, is subject to regulation and supervision by the CFTC and the National Futures Association with respect to certain of its swap activities, including risk management practices, trade documentation and reporting, business conduct and recordkeeping, among others. On 8 January 2020, the Bank filed an NFA Form 7-W with the NFA to deregister as a swap dealer with the CFTC, effective 7 February 2020. The NFA has confirmed to us that Lloyds Bank plc status is ‘in transition’, and confirmation of de-registration is anticipated imminently.
DISCLOSURE PURSUANT TO SECTION 219 OF THE IRAN THREAT REDUCTION AND SYRIA HUMAN RIGHTS ACT (ITRA)
Since the introduction of an enhanced financial sanctions policy, the Group has been proactive in reducing its dealings with Iran and individuals and entities associated with Iran. There remain a small number of historic Iran-related business activities which the Group has not yet been able to terminate for legal or contractual reasons.
Pursuant to ITRA Section 219, the Group notes that during 2019, its non-US affiliates, Lloyds Bank plc and Bank of Scotland plc, received or made payments involving entities owned or controlled by the Government of Iran as defined under section 560.304 of title 31, Code of Federal Regulations, and/or designated under Executive Order 13382 or 13224. In all cases, the payment was permitted under UK and EU sanctions legislation, specific authority was sought from and granted by HM Treasury, the UK’s Competent Authority to provide such authorisations or the payment(s) were credited to a blocked account, held in the name of the entity, in accordance with UK and EC sanctions legislation.
Gross revenues from these activities were approximately £9,000. Net profits from these activities were approximately £9,000.
The Group’s businesses, being reported below, are conducted in compliance with applicable laws in respect of Iran and Syria sanctions and, except as noted below, the Group intends to continue these historic activities until it is able to legally terminate the contractual relationships or to maintain/manage them in accordance with prevailing sanctions obligations. The nature of these activities is as follows:
| 1. | Limited and infrequent payments made to and received from entities directly or indirectly linked to the Government of Iran. Such payments are only made if they comply with UK regulation and legislation and/or licence from the U.S. Treasury Department’s Office of Foreign Assets Control. |
| | |
| 2. | Payments made to a blocked account in the name of Commercial Bank of Syria related to historic guarantees, entered into by the Group between 1997 and 2008, the majority of which relate to Bail Bonds for vessels. The Commercial Bank of Syria is designated under Executive Order 13382. |
| | |
| 3. | Sums paid out from a pension trust fund to UK nationals resident in the UK who were employees of a company indirectly owned or controlled by an entity designated under Executive Order 13382 that is also owned or controlled by the Government of Iran. |
| | |
| 4. | Lloyds continues to provide payment clearing services to a UK based and UK authorised bank, one of whose account holders is an entity designated under Executive Order 13224 (although not by the UK or EU authorities). Lloyds concludes from the nature of such payment clearing services that revenue and profit (if any) arising from indirectly providing such services to the designated entity is negligible and not material to the Group’s activities and in any event does not flow directly from the designated entity. To the extent that the activities of the designated entity and its UK authorised bank continue to comply with UK regulation and legislation, Lloyds intends to continue its activities and keep them under review. |
LISTING INFORMATION
TRADING MARKETS
The ordinary shares of Lloyds Banking Group plc are listed and traded on the London Stock Exchange under the symbol ‘LLOY’. The prices for shares as quoted in the official list of the London Stock Exchange are in pounds sterling. Lloyds Banking Group plc American Depositary Shares (ADSs) are listed on the New York Stock Exchange under the symbol ‘LYG’. Each ADS represents four ordinary shares.
ADR FEES
The Group’s depositary, The Bank of New York Mellon, collects its fees for delivery and surrender of ADSs directly from investors depositing shares or surrendering ADSs for the purpose of withdrawal or from intermediaries acting for them. The depositary collects fees for making distributions to investors by deducting those fees from the amounts distributed or by selling a portion of distributable property to pay the fees. The depositary may collect its annual fee for depositary services by deductions from cash distributions or by directly billing investors or by charging the book-entry system accounts of participants acting for them. The depositary may generally refuse to provide fee-attracting services until its fees for those services are paid.
| Persons depositing or withdrawing shares must pay: | | For: |
| $5.00 (or less) per 100 ADSs (or portion of 100 ADSs) | | Issuance of ADSs, including issuances resulting from a distribution of shares or rights or other property. Cancellation of ADSs for the purpose of withdrawal, including if the deposit agreement terminates. |
| $.02 (or less) per ADS | | Any cash distribution to ADS registered holders. |
| A fee equivalent to the fee that would be payable if securities distributed had been shares and the shares had been deposited for issuance of ADSs | | Distribution of securities distributed to holders of deposited securities which are distributed by the depositary to ADS registered holders. |
| $.02 (or less) per ADSs per calendar year | | Depositary services. |
| Registration or transfer fees | | Transfer and registration of shares on the share register to or from the name of the depositary or its agent when you deposit or withdraw shares. |
| Expenses of the depositary | | Cable, telex and facsimile transmissions (when expressly provided in the deposit agreement). Converting foreign currency to US dollars. |
| Taxes and other governmental charges the depositary or the custodian have to pay on any ADS or share underlying an ADS, for example, stock transfer taxes, stamp duty or withholding taxes | | As necessary. |
| Any charges incurred by the depositary or its agents for servicing the deposited securities | | As necessary. |
FEES RECEIVED TO DATE
In 2019, the Company received from the depositary $811,275 for continuing annual stock exchange listing fees, standard out-of-pocket maintenance costs for the ADSs (consisting of the expenses of postage and envelopes for mailing annual and interim financial reports, printing and distributing dividend checks, electronic filing of US Federal tax information, mailing required tax forms, stationery, postage, facsimile, and telephone calls), any applicable performance indicators relating to the ADS facility, underwriting fees and legal fees.
FEES TO BE PAID IN THE FUTURE
The Bank of New York Mellon, as depositary, has agreed to reimburse the Company for maintenance expenses that they incur for the ADS program. The depositary has agreed to reimburse the Company for its continuing annual stock exchange listing fees. The depositary has also agreed to pay the standard out-of-pocket maintenance costs for the ADSs, which consist of the expenses of postage and envelopes for mailing annual and interim financial reports, printing and distributing dividend checks, electronic filing of US Federal tax information, mailing required tax forms, stationery, postage, facsimile, and telephone calls. It has also agreed to reimburse the Company annually for certain investor relationship programs or special investor relations promotional activities. In certain instances, the depositary has agreed to provide additional payments to the Company based on any applicable performance indicators relating to the ADS facility. There are limits on the amount of expenses for which the depositary will reimburse the Company, but the amount of reimbursement available to the Company is not necessarily tied to the amount of fees the depositary collects from investors.
DIVIDENDS
Lloyds Banking Group plc’s ability to pay dividends is restricted under UK company law. Dividends may only be paid if distributable profits are available for that purpose. In the case of a public limited company, a dividend may only be paid if the amount of net assets is not less than the aggregate of the called-up share capital and undistributable reserves and if the payment of the dividend will not reduce the amount of the net assets to less than that aggregate. In addition, a company cannot pay a dividend if any of its UK insurance subsidiaries is insolvent on a regulatory valuation basis or, in the case of regulated entities, if the payment of a dividend results in regulatory capital requirements not being met. Similar restrictions exist over the ability of Lloyds Banking Group plc’s subsidiary companies to pay dividends to their immediate parent companies. Furthermore, in the case of Lloyds Banking Group plc, dividends may only be paid if sufficient distributable profits are available for distributions due in the financial year on certain preferred securities. The board has the discretion to decide whether to pay a dividend and the amount of any dividend. In making this decision, the board is mindful of the level of dividend cover and, consequently, profit growth may not necessarily result in increases in the dividend. In the case of American Depositary Shares, dividends are paid through The Bank of New York Mellon which acts as paying and transfer agent.
The Group has a progressive and sustainable ordinary dividend policy whilst maintaining the flexibility to return surplus capital through buybacks or special dividends.
In May 2019 the Group announced that it will move to the payment of quarterly dividends in 2020, with the first quarterly dividend in respect of Q1 2020 payable in June 2020. The new approach will be to adopt three equal interim ordinary dividend payments for the first three quarters of the year followed by, subject to performance, a larger final dividend for the fourth quarter of the year. The first three quarterly payments, payable in June, September and December will be 20 per cent of the previous year’s total ordinary dividend per share. The fourth quarter payment will be announced with the full year results, with the amount continuing to deliver a full year dividend payment that reflects the Group’s financial performance and our objective of a progressive and sustainable ordinary dividend. The final dividend will continue to be paid in May, following approval at the AGM. The Group believes that this approach will provide a more regular flow of dividend income to all shareholders whilst accelerating the receipt of payments. In addition to the Group’s progressive and sustainable ordinary dividend policy the Board will continue to give consideration to the distribution of surplus capital at the end of each year.
Given the business performance in 2019 the Board has recommended a final ordinary dividend of 2.25 pence per share. This is in addition to the interim ordinary dividend of 1.12 pence per share that was announced in the 2019 half year results. The recommended total ordinary dividend per share for 2019 of 3.37 pence per share has increased by 5 per cent from 3.21 pence per share in 2018.
The table below sets out the interim and final dividends in respect of the ordinary shares for fiscal years 2015 through 2019. The sterling amounts have been converted into US dollars at the Noon Buying Rate in effect on each payment date with the exception of the recommended final dividend for 2019, for which the sterling amount has been converted in US dollars at the Noon Buying Rate on 14 February 2020.
| | | Interim ordinary
dividend
per share
(pence) | | | Interim ordinary
dividend
per share
(cents) | | | Final ordinary
dividend
per share
(pence) | | | Final ordinary
dividend
per share
(cents) | |
| 20151 | | | 0.75 | | | | 1.14 | | | | 1.5 | | | | 2.17 | |
| 20162 | | | 0.85 | | | | 1.10 | | | | 1.70 | | | | 2.20 | |
| 2017 | | | 1.00 | | | | 1.34 | | | | 2.05 | | | | 2.72 | |
| 2018 | | | 1.07 | | | | 1.41 | | | | 2.14 | | | | 2.73 | |
| 2019 | | | 1.12 | | | | 1.40 | | | | 2.25 | | | | 2.93 | |
| 1 | For 2015, the Board also made a capital distribution in the form of a special dividend of 0.5 pence per share (0.72 cents per share). This is not listed in the table above. |
| | |
| 2 | For 2016, the Board also made a capital distribution in the form of a special dividend of 0.5 pence per share (0.65 cents per share). This is not listed in the table above. |
ARTICLES OF ASSOCIATION OF LLOYDS BANKING GROUP PLC
For information regarding the Articles of Association, please refer to the discussion under the corresponding section of the Annual Report on Form 20-F for the year ended 31 December 2018, filed with the SEC on 25 February 2019, which discussion is hereby incorporated by reference into this document.
https://www.lloydsbankinggroup.com/globalassets/documents/investors/2018/2018_lbg_form_20f.pdf
EXCHANGE CONTROLS
There are no UK laws, decrees or regulations that restrict Lloyds Banking Group plc’s import or export of capital, including the availability of cash and cash equivalents for use by Lloyds Banking Group, or that affect the remittance of dividends, interest or other shareholders’ payments to non-UK holders of Lloyds Banking Group plc shares, except as set out inTaxation.
TAXATION
TAXATION
The following discussion is intended only as a general guide to current UK and US federal income tax considerations relevant to US holders (as defined below in the section on US federal income tax considerations) of Lloyds Banking Group ordinary shares or ADSs. It is based on current law and tax authority practice and the terms of the current UK/US income tax treaty (the Treaty), all of which are subject to change at any time, possibly with retroactive effect.
The Treaty for the avoidance of double taxation with respect to taxes on income entered into force following the exchange of instruments of ratification by the UK Parliament and the US Senate on 31 March 2003.
This summary does not consider your personal circumstances, and it is not a substitute for tax advice. Any person who is in any doubt as to his tax position should consult his own professional adviser.
UK TAXATION OF CHARGEABLE GAINS
Subject to the provisions set out in the next paragraph in relation to temporary non-residents, US holders generally will not be liable for UK tax on chargeable gains unless they carry on a trade, profession or vocation in the UK through a branch or agency and the ordinary shares or ADSs are or have been used or held by or for the purposes of the branch or agency, in which case such US holder might, depending on individual circumstances, be liable to UK tax on chargeable gains on any disposition of ordinary shares or ADSs.
An individual US holder who is only temporarily not resident in the UK may, under anti-avoidance legislation, still be liable for UK tax on chargeable gains realised, subject to any available exemption, relief and/or foreign tax credit.
A US holder who is an individual and who has, on or after 17 March 1998, ceased to be resident or ordinarily resident for tax purposes in the UK for a period of five or fewer years of assessment and who disposes of ordinary shares or ADSs during that period may be liable, on return to the UK, to UK taxation on chargeable gains arising during the period of absence, subject to any available exemption, relief and/or foreign tax credit.
UK TAXATION OF DIVIDENDS
Lloyds Banking Group plc will not be required to withhold tax at source when paying a dividend on the ordinary shares or ADSs to a US holder.
STAMP DUTY AND STAMP DUTY RESERVE TAX
Any conveyance or transfer on sale of ordinary shares (whether effected using the CREST settlement system or not) will be subject to UK stamp duty or stamp duty reserve tax (SDRT). The transfer on sale of ordinary shares will be liable to ad valorem UK stamp duty or SDRT, generally at the rate of 0.5 per cent of the consideration paid (rounded up to the next multiple of £5 in the case of stamp duty). Stamp duty is usually the liability of the purchaser or transferee of the ordinary shares. An unconditional agreement to transfer such ordinary shares will be liable to SDRT, generally at the rate of 0.5 per cent of the consideration paid, but such liability will be cancelled, or, if already paid, refunded, if the agreement is completed by a duly stamped transfer within six years of the agreement having become unconditional. SDRT is normally the liability of the purchaser or transferee of the ordinary shares.
UK tax law requires that when Lloyds Banking Group plc issues ordinary shares or a holder of ordinary shares transfers such shares to the custodian or nominee for the depositary to facilitate the issue of ADSs to a person representing the ordinary shares or to a person providing clearance services (or their nominee or agent), a liability to UK stamp duty or SDRT at the rate of 1.5 per cent (rounded up to the next multiple of £5 in the case of the stamp duty) of either the issue price or, in the case of transfer, the listed price of the ordinary shares, calculated in sterling, will arise. However, following litigation, HMRC now accepts that the charge to SDRT at 1.5 per cent on the issue of shares into clearance services or depository receipt schemes is not compatible with EU law, and will not apply the charge. Where a holder of ordinary shares transfers such shares to the custodian or nominee for the depositary or clearance services this charge will apply, and generally be payable by the person receiving the ADSs or transferring the ordinary shares into the clearance service.
No liability to stamp duty or SDRT will arise as a result of the cancellation of any ADSs with the ordinary shares that they represent being transferred to the ADS holder.
No liability to UK stamp duty or SDRT will arise on a transfer of ADSs provided that any document that gives effect to such transfer is not executed in the UK and remains at all subsequent times outside the UK. An agreement to transfer ADSs will not give rise to a liability to SDRT.
US FEDERAL INCOME TAX CONSIDERATIONS
The following summary describes material US federal income tax consequences of the ownership and disposition of ADSs or ordinary shares to the US holders described below, but it does not purport to be a comprehensive description of all of the tax considerations that may be relevant to a decision to own such securities. The summary applies only to US holders that hold ADSs or ordinary shares as capital assets for US federal income tax purposes.
This discussion does not address any alternative minimum or Medicare Contribution tax consequences, nor does it address US federal tax consequences to US holders that are subject to special rules, such as:
| – | certain financial institutions; |
| | |
| – | dealers or traders in securities that use a mark-to-market method of tax accounting; |
| | |
| – | persons holding ADSs or ordinary shares as part of a hedge, straddle, wash sale, conversion or other integrated transaction or holders entering into a constructive sale with respect to ADSs or ordinary shares; |
| | |
| – | persons whose functional currency for US federal income tax purposes is not the US dollar; |
| | |
| – | persons who acquired ADSs or ordinary shares pursuant to the exercise of any employee stock option or otherwise as compensation; |
| | |
| – | tax-exempt entities, ‘individual retirement accounts’ or ‘Roth IRAs’; |
| | |
| – | persons holding ADSs or ordinary shares in connection with a trade or business conducted outside of the United States; |
| | |
| – | partnerships or other entities classified as partnerships for US federal income tax purposes; or |
TAXATION
| – | persons that own or are deemed to own 10 per cent or more (by vote or value) of the shares of Lloyds Banking Group plc. |
If an entity that is classified as a partnership for US federal income tax purposes holds ADSs or ordinary shares, the US federal income tax treatment of a partner will generally depend on the status of the partner and the activities of the partnership. Partnerships holding ADSs or ordinary shares and partners in such partnerships should consult their tax advisers as to the particular US federal income tax consequences of holding and disposing of the ADSs or ordinary shares.
This summary is based on the US Internal Revenue Code of 1986, as amended (the Code), administrative pronouncements, judicial decisions and final, temporary and proposed Treasury Regulations, as well as the Treaty, all as of the date hereof, changes to any of which may affect the tax consequences described herein, possibly with retroactive effect. It is also based in part on representations of the depositary and assumes that each obligation provided for in or otherwise contemplated by the Deposit Agreement or any other related document will be performed in accordance with its terms.
As used herein, a ‘US holder’ is a person that for US federal income tax purposes is a beneficial owner of ADSs or ordinary shares and:
| – | a citizen or individual resident of the United States; |
| | |
| – | a corporation, or other entity taxable as a corporation, created or organised in or under the laws of the United States, any state therein or the District of Columbia; or |
| | |
| – | an estate or trust the income of which is subject to US federal income taxation regardless of its source. |
In general, a US holder who owns ADSs should be treated as the owner of the underlying shares represented by those ADSs for US federal income tax purposes. Accordingly, no gain or loss should be recognised if a US holder exchanges ADSs for the underlying shares represented by those ADSs.
The US Treasury has expressed concerns that parties to whom American depositary shares are released before shares are delivered to the depositary (‘pre-release’), or intermediaries in the chain of ownership between holders and the issuer of the security underlying the American depositary shares, may be taking actions that are inconsistent with the claiming of foreign tax credits by US holders of American depositary shares. Such actions would also be inconsistent with the claiming of the reduced rate of tax applicable to dividends received by certain non-corporate US holders. Accordingly, the availability of the preferential tax rate for dividends received by certain non-corporate US holders, described below, could be affected by actions taken by such parties or intermediaries.
Owners of ADSs or ordinary shares should consult their tax advisers as to the US, UK or other tax consequences of the ownership and disposition of such securities in their particular circumstances, including the effect of any US state or local tax laws.
TAXATION OF DISTRIBUTIONS
Distributions paid on ADSs or ordinary shares, other than certain pro rata distributions of ordinary shares, will generally be treated as dividends to the extent paid out of Lloyds Banking Group plc’s current or accumulated earnings and profits (as determined in accordance with US federal income tax principles). Because Lloyds Banking Group plc does not maintain calculations of its earnings and profits under US federal income tax principles, it is expected that distributions generally will be reported to US holders as dividends. The dividends will generally be foreign-source income to US holders and will not be eligible for the dividends-received deduction generally allowed to US corporations under the Code.
Subject to applicable limitations and the discussion above regarding concerns expressed by the US Treasury, dividends paid to certain non-corporate US holders may be taxable at favourable rates. Non-corporate US holders should consult their tax advisers to determine whether the favourable rates will apply to dividends they receive and whether they are subject to any special rules that limit their ability to be taxed at these favourable rates.
Dividends will be included in a US Holder’s income on the date of the US Holder’s or, in the case of ADSs, the depositary’s receipt of the dividend. The amount of a dividend will equal the US dollar value of the pounds sterling received, calculated by reference to the exchange rate in effect on the date of receipt regardless of whether the payment is converted into US dollars on the date of receipt. If the pounds sterling received as a dividend are not converted into US dollars on the date of receipt, then the US holder’s tax basis in the pounds sterling received will equal such US dollar value and the US holder may realise a foreign exchange gain or loss on the subsequent conversion into US dollars. Generally, any gains or losses resulting from the conversion of pounds sterling into US dollars will be treated as US-source ordinary income or loss.
TAXATION OF CAPITAL GAINS
Gain or loss realised by a US holder on a sale or other disposition of ADSs or ordinary shares will generally be subject to US federal income tax as capital gain or loss in an amount equal to the difference between the US holder’s tax basis in the ADSs or ordinary shares disposed of and the amount realised on the disposition, in each case as determined in US dollars. Gains or losses, if any, will generally be US-source and will be long-term if the US Holder held the ADSs or ordinary shares for more than one year. The deductibility of losses is subject to limitations.
INFORMATION REPORTING AND BACKUP WITHHOLDING
Dividends paid on, and the sale proceeds from, ADSs or ordinary shares that are made within the US or through certain US-related financial intermediaries may be subject to information reporting and backup withholding requirements unless the US holder:
| – | is a corporation or other exempt recipient, or |
| | |
| – | in the case of backup withholding, the US holder provides a correct taxpayer identification number and certifies that it is not subject to backup withholding. |
The amount of any backup withholding from a payment to a US holder will be allowed as a credit against the US holder’s US federal income tax liability and may entitle it to a refund, provided that the required information is timely furnished to the Internal Revenue Service.
WHERE YOU CAN FIND MORE INFORMATION
The SEC maintains a website at www.sec.gov which contains, in electronic form, each of the reports and other information that the Group has filed electronically with the SEC.
References herein to Lloyds Banking Group websites are textual references only and information on or accessible through such websites does not form part of and is not incorporated into this Form 20-F.
ENFORCEABILITY OF CIVIL LIABILITIES
Lloyds Banking Group plc is a public limited company incorporated under the laws of Scotland. Most of Lloyds Banking Group plc’s directors and executive officers and certain of the experts named herein are residents of the UK. A substantial portion of the assets of Lloyds Banking Group plc, its subsidiaries and such persons, are located outside the United States. As a result, it may not be possible for investors to effect service of process within the United States upon all such persons or to enforce against them in US courts judgments obtained in such courts, including those predicated upon the civil liability provisions of the federal securities laws of the United States. Furthermore, Lloyds Banking Group plc has been advised by its solicitors that there is doubt as to the enforceability in the UK, in original actions or in actions for enforcement of judgments of US courts, of certain civil liabilities, including those predicated solely upon the federal securities laws of the United States.
RISK FACTORS
Set out below is a summary of certain risk factors which could affect Lloyds Banking Group’s future results and may cause them to differ from expected results materially. The factors discussed below should not be regarded as a complete and comprehensive statement of all potential risks and uncertainties that Lloyds Banking Group’s businesses face. This section should be read in conjunction with the more detailed information contained in this document, including as set forth in sections entitled “Business”, “Regulation” and “Operating and financial review and prospects”. For information on Lloyds Banking Group’s risk management policies and procedures (including the elevation of certain existing risks to principal risks during 2019), see “Lloyds Banking Group — Operating and financial review and prospects — Risk Management”.
ECONOMIC AND FINANCIAL RISKS
| 1. | The Group’s businesses are subject to inherent and indirect risks arising from general macroeconomic conditions in the UK in particular, but also in the Eurozone, the U.S., Asia and globally |
The Group’s businesses are subject to inherent and indirect risks arising from general and sector-specific economic conditions in the markets in which it operates, particularly the UK, where the Group’s earnings are predominantly generated, and the Group’s operations are increasingly concentrated following the strategic reduction of its international presence. Whilst the Group’s revenues are predominantly generated in the United Kingdom, the Group does have some credit exposure in countries outside the UK even if it does not have direct exposure or a presence in such countries. Any significant macroeconomic deterioration in the UK and/or other economies such as the slowing of economic growth significantly below long-term average levels, rising unemployment, reduced corporate profitability, reduced personal income levels, inflationary pressures, including those arising from the sterling’s depreciation, reduced UK Government and/or consumer expenditure, increased corporate, SME or personal insolvency rates, borrowers’ reduced ability to repay loans, increased tenant defaults, fluctuations in commodity prices and changes in foreign exchange rates could have a material adverse effect on the results of operations, financial condition or prospects of the Group.
In the Eurozone for example, the pace of economic recovery, which has lagged behind that of other advanced countries following the global recession, has started to slow. High levels of private and public debt, continued weakness in the financial sector and reform fatigue remain a concern. Conversely, further monetary policy stimulus from the European Central Bank could undermine financial stability by encouraging a further build-up of unsustainable debt. In addition, increased political uncertainty in the Eurozone, and fragmentation risk in the EU and UK, could create financial instability and have a negative impact on the Eurozone and global economies. Any default on the sovereign debt of a Eurozone country and the resulting impact on other Eurozone countries, including the potential that some countries could leave the Eurozone, could materially affect the capital and the funding position of participants in the banking industry, including the Group.
Moreover, the effects on the UK, European and global economies of the exit of one or more EU member states from the Economic and Monetary Union, or the redenomination of financial instruments from the Euro to a different currency, are extremely uncertain and very difficult to predict and protect fully against in view of: (i) the potential for economic and financial instability in the Eurozone and possibly in the UK; (ii) the lasting impact on governments’ financial positions of the global financial crisis; (iii) the uncertain legal position; and (iv) the fact that many of the risks related to the business are totally, or in part, outside the control of the Group. If any such events were to occur, they may result in: (a) significant market dislocation; (b) heightened counterparty risk; (c) an adverse effect on the management of market risk and, in particular, asset and liability management due, in part, to redenomination of financial assets and liabilities; (d) an indirect risk of counterparty failure; or (e) further political uncertainty in the UK or other countries, any of which could have a material adverse effect on the results of operations, financial condition or prospects of the Group.
In addition, the effects on the UK, European and global economies of the uncertainties arising from the results of the referendum and the process of the UK’s exit from the EU are difficult to predict but may include economic and financial instability in the UK, Europe and the global economy and the other types of risks described in “Regulatory and Legal Risks– Legal and regulatory risk arising from the UK’s exit from the European Union could adversely impact the Group’s business, results of operations, financial condition and prospects”. In the event of any substantial weakening in the UK’s economic growth, the possible policy of decreases in interest rates by the Bank of England or sustained low or negative interest rates would put further pressure on the Group’s interest margins and adversely affect the Group’s profitability and prospects. Furthermore, such market conditions may also result in an increase in the Group’s pension deficit.
In addition, whilst it is possible that the current U.S. administration’s economic policies might have an adverse effect on U.S. and global growth as well as global trade prospects, it is also possible that expansionary policies could boost U.S. and international growth temporarily at a time of limited spare capacity resulting in higher U.S. inflation and interest rates which could in turn significantly impact global investor risk appetite and pricing expectations, sparking elevated financial market volatility and a tightening of financial conditions. Concerns remain around the impact of increased tariffs on trade between the U.S. and other nations including China, Canada and the EU. The potential for escalation of trade disputes and any retaliatory actions taken may adversely impact the global economic outlook.
Developing macroeconomic uncertainty in emerging markets, in particular the slowdown of international trade and industrial production, the high and growing level of debt in China and the risk of a sharp slowdown in Chinese economic growth, which may be exacerbated by attempts to de-risk its highly leveraged economy, or a devaluation of the Renminbi could pose threats to global economic recovery. External debt levels are higher now in emerging markets than before the global financial crisis, which could lead to higher levels of defaults and non-performing loans, in particular in an environment of rising interest rates.
Any adverse changes affecting the economies of the countries in which the Group has significant direct and indirect credit exposures and any further deterioration in global macroeconomic conditions, including as a result of geopolitical events, global health issues, acts of war or terrorism, could have a material adverse effect on the Group’s results of operations, financial condition or prospects.
| 2. | The Group’s businesses are subject to inherent risks concerning borrower and counterparty credit quality which have affected and may adversely impact the recoverability and value of assets on the Group’s balance sheet |
The Group has exposures to many different products, counterparties, obligors and other contractual relationships and the credit quality of its exposures can have a significant impact on the Group’s earnings. Credit risk exposures are categorised as either “retail” or “corporate” and reflect the risks inherent in the Group’s lending and lending-related activities and its insurance business primarily in respect of investment holdings and exposures to reinsurers.
Adverse changes in the credit quality of the Group’s UK and/or international borrowers and counterparties or collateral held in support of exposures, or in their behaviour or businesses, may reduce the value of the Group’s assets and materially increase the Group’s write-downs and allowances for impairment losses. Credit risk can be affected by a range of factors outside the Group’s control, which include but are not limited to an adverse economic environment, reduced UK and global consumer and/or government spending and benefits, inflation, changes in the credit rating of individual
RISK FACTORS
counterparties, the debt levels of individual contractual counterparties, increased unemployment, reduced asset values, increased personal or corporate insolvency levels, falling stock and bond/other financial markets, reduced corporate profits, over-indebtedness, changes in interest rates or foreign exchange rates, counterparty challenges to the interpretation or validity of contractual arrangements, an increase in credit spreads, changes to insolvency regimes which make it harder to enforce against counterparties, changes in consumer and customer demands and requirements, negative reputational impact or direct campaigns which adversely impact customers, industries or sectors and any external factors of a political, legislative, environmental or regulatory nature, including changes in accounting rules and changes to tax legislation and rates.
In particular, the Group has exposure to concentration risk where its business activities focus particularly on a single obligor, related/connected group of obligors or a similar type of customer (borrower, sovereign, financial institution or central counterparty), product, industrial sector or geographic location, including the UK.
The Group’s credit exposure includes residential mortgage lending (in the UK and, to a lesser extent, the Netherlands) and commercial real estate lending, including lending secured against secondary and tertiary commercial assets in the UK. As a result, decreases in residential or commercial property values and/or increases in tenant defaults are likely to lead to higher impairment charges, which could materially affect the Group’s results of operations, financial condition or prospects. The Group’s retail customer portfolios will remain strongly linked to the UK economic environment, with house price deterioration, unemployment increases, inflationary pressures, consumer over-indebtedness and prolonged low or rising interest rates among the factors that may impact secured and unsecured retail credit exposures. Deterioration in used vehicle prices, including as a result of changing consumer demand, could result in increased provisions and/or losses and/or accelerated depreciation charges. The Group also has significant credit exposure to certain individual counterparties in higher risk and cyclical asset classes and sectors (such as commercial real estate, financial intermediation, manufacturing, leveraged lending, oil and gas and related sectors, hotels, commodities trading, automotive and related sectors, construction, agriculture, consumer-related sectors (such as retail and leisure), housebuilders and outsourcing services).
The Group’s corporate lending portfolio also contains substantial exposure to large and mid-sized, public and private companies. Exposures to sectors that have experienced cyclical weakness in recent years, coupled with a historic strategy of taking large single name concentrations to non-listed companies and entrepreneurs, and taking exposure at various levels of the capital structure, may give rise to (albeit reducing) single name and risk capital exposure. As in the UK, the Group’s lending business overseas is also exposed to a small number of long-term customer relationships and these single name concentrations place the Group at risk of loss should default occur. Any disruption to the liquidity or transparency of the financial markets may result in the Group’s inability to sell or syndicate securities, loans or other instruments or positions held (including through underwriting), thereby leading to concentrations in these positions. These concentrations could expose the Group to losses if the mark-to-market value of the securities, loans or other instruments or positions declines causing the Group to take write-downs. Moreover, the inability to reduce the Group’s positions not only increases the market and credit risks associated with such positions, but also increases the level of risk-weighted assets on the Group’s balance sheet, thereby increasing its capital requirements and funding costs, all of which could materially adversely affect the Group’s results of operations, financial condition or prospects. The Group’s corporate portfolios are also susceptible to “fallen angel” risk, that is, the probability of significant default increases following material unexpected events, resulting in the potential for large losses.
In addition, all lending decisions, and decisions related to other exposures (including, but not limited to, undrawn commitments, derivative, equity, contingent and/ or settlement risks), are dependent on the Group’s assessment of each customer’s ability to repay and the value of any underlying security. There is an inherent risk that the Group has incorrectly assessed the credit quality and/or the ability or willingness of borrowers to repay, possibly as a result of incomplete or inaccurate disclosure by those borrowers or as a result of the inherent uncertainty that is involved in the exercise of constructing and using models to estimate the risk of lending to counterparties.
| 3. | The Group’s businesses are subject to inherent risks concerning liquidity and funding, particularly if the availability of traditional sources of funding such as retail deposits or the access to wholesale funding markets becomes more limited |
Liquidity and funding continues to remain a key area of focus for the Group and the industry as a whole. Like all major banks, the Group is dependent on confidence in the short and long-term wholesale funding markets. The Group relies on customer savings and transmission balances, as well as ongoing access to the global wholesale funding markets to meet its funding needs. The ability of the Group to gain access to wholesale and retail funding sources on satisfactory economic terms is subject to a number of factors outside its control, such as liquidity constraints, general market conditions, regulatory requirements, the encouraged or mandated repatriation of deposits by foreign wholesale or central bank depositors and the level of confidence in the UK banking system.
The Group’s profitability or solvency could be adversely affected if access to liquidity and funding is constrained, made more expensive for a prolonged period of time or if the Group experiences an unusually high and unforeseen level of withdrawals. In such circumstances, the Group may not be in a position to continue to operate or meet its regulatory minimum liquidity requirements without additional funding support, which it may be unable to access (including government and central bank facilities).
The Group is also subject to the risk of deterioration of the commercial soundness and/or perceived soundness of other financial services institutions within and outside the UK. Financial services institutions that deal with each other are interrelated as a result of trading, investment, clearing, counterparty and other relationships. This presents systemic risk and may adversely affect financial intermediaries, such as clearing agencies, clearing houses, banks, securities firms and exchanges with which the Group interacts on a daily basis, any of which could have a material adverse effect on the Group’s ability to raise new funding. A default by, or even concerns about the financial resilience of, one or more financial services institutions could lead to further significant systemic liquidity problems, or losses or defaults by other financial institutions, which could have a material adverse effect on the Group’s results of operations, financial condition or prospects.
Corporate and institutional counterparties may also seek to reduce aggregate credit exposures to the Group (or to all banks) which could increase the Group’s cost of funding and limit its access to liquidity. The funding structure employed by the Group may also prove to be inefficient, thus giving rise to a level of funding cost where the cumulative costs are not sustainable over the longer term.
In addition, medium-term growth in the Group’s lending activities will rely, in part, on the availability of retail deposit funding on appropriate terms, which is dependent on a variety of factors outside the Group’s control, such as general macroeconomic conditions and market volatility, the confidence of retail depositors in the economy, the financial services industry and the Group, as well as the availability and extent of deposit guarantees. Increases in the cost of retail deposit funding will impact on the Group’s margins and affect profit, and a lack of availability of retail deposit funding could have a material adverse effect on the Group’s future growth. Any loss in consumer confidence in the Group could significantly increase the amount of retail deposit withdrawals in a short period of time. See “Economic and Financial Risks – The Group’s businesses are subject to inherent and indirect risks arising from general macroeconomic conditions in the UK in particular, but also in the Eurozone, the U.S., Asia and globally”.
RISK FACTORS
In recent years, the Group has also made use of central bank funding schemes such as the Bank of England’s Term Funding Scheme and Funding for Lending Scheme. Following the closures of these schemes in 2018, the Group has to replace matured central bank scheme funding, which could cause an increased dependence on term funding issuances. If the wholesale funding markets were to suffer stress or central bank provision of liquidity to the financial markets is abruptly curtailed, or the Group’s credit ratings are downgraded, it is likely that wholesale funding will prove more difficult to obtain.
Any of the refinancing or liquidity risks mentioned above, in isolation or in concert, could have a material adverse effect on the Group’s results or operations and its ability to meet its financial obligations as they fall due.
| 4. | A reduction in the Group’s longer-term credit rating could materially adversely affect the Group’s results of operations, financial condition or prospects |
Rating agencies regularly evaluate the Group and the Company, and their ratings of longer-term debt are based on a number of factors which can change over time, including the Group’s financial strength as well as factors not entirely within the Group’s control, including conditions affecting the financial services industry generally, and the legal and regulatory frameworks affecting the Group’s legal structure, business activities and the rights of its creditors. In light of the difficulties in the financial services industry and the financial markets, there can be no assurance that the Group or the Company will maintain their current ratings. The credit rating agencies may also revise the ratings methodologies applicable to issuers within a particular industry or political or economic region. If credit rating agencies perceive there to be adverse changes in the factors affecting an issuer’s credit rating, including by virtue of change to applicable ratings methodologies, the credit rating agencies may downgrade, suspend or withdraw the ratings assigned to an issuer and/or its securities. Downgrades of the Group’s longer-term credit rating could lead to additional collateral posting and cash outflow, significantly increase its borrowing costs, limit its issuance capacity in the capital markets and weaken the Group’s competitive position in certain markets.
| 5. | The Group’s businesses are inherently subject to the risk of market fluctuations, which could have a material adverse effect on the results of operations, financial condition or prospects of the Group |
The Group’s businesses are inherently subject to risks in financial markets including changes in, and increased volatility of, interest rates, inflation rates, credit spreads, foreign exchange rates, commodity, equity, bond and property prices and the risk that its customers act in a manner which is inconsistent with the Group’s business, pricing and hedging assumptions. Movements in these markets will continue to have a significant impact on the Group in a number of key areas.
For example, adverse market movements have had and may continue to have an adverse effect, upon the financial condition of the defined benefit pension schemes of the Group. The schemes’ main exposures are to real rate risk and credit spread risk. These risks arise from two main sources: the “AA” corporate bond liability discount rate and asset holdings.
In addition, the Group’s banking and trading activities are also subject to market movements. For example, changes in interest rate levels, interbank margins over official rates, yield curves and spreads affect the interest rate margin realised between lending and borrowing costs. The potential for future volatility and margin changes remains. Competitive pressures on fixed rates or product terms in existing loans and deposits may restrict the Group in its ability to change interest rates applying to customers in response to changes in official and wholesale market rates.
The insurance business of the Group is exposed indirectly to equity and credit markets through the value of future management charges on policyholder funds. Credit spread and interest rate risk within insurance primarily arises from bonds and loans used to back annuities. The performance of the investment markets will thus have a direct impact upon the profit from investment contracts and on the insurance value in force and the Group’s results of operations, financial condition or prospects.
Changes in foreign exchange rates, including with respect to the U.S. dollar and the Euro, may also have a material adverse effect the Group’s financial position and/or forecasted earnings.
| 6. | Market conditions have resulted, and are expected to result in the future, in material changes to the estimated fair values of financial assets of the Group, including negative fair value adjustments |
The Group has exposures to securities, derivatives and other investments, including asset-backed securities, structured investments and private equity investments that are recorded by the Group at fair value, which may be subject to further negative fair value adjustments in view of the volatile global markets and challenging economic environment.
In volatile markets, hedging and other risk management strategies (including collateralisation and the purchase of credit default swaps) may not be as effective as they are in normal market conditions, due in part to the decreasing credit quality of hedge counterparties, and general illiquidity in the markets within which transactions are executed.
In circumstances where fair values are determined using financial valuation models, the Group’s valuation methodologies may require it to make assumptions, judgements and estimates in order to establish fair value. These valuation models are complex and the assumptions used are difficult to make and are inherently uncertain. This uncertainty may be amplified during periods of market volatility and illiquidity. Any consequential impairments, write-downs or adjustments could have a material adverse effect on the Group’s results of operations, capital ratios, financial condition or prospects.
Any of these factors could cause the value ultimately realised by the Group for its securities and other investments to be lower than their current fair value or require the Group to record further negative fair value adjustments, which may have a material adverse effect on its results of operations, financial condition or prospects.
| 7. | Any tightening of monetary policy in jurisdictions in which the Group operates could affect the financial condition of its customers, clients and counterparties, including governments and other financial institutions |
Quantitative easing measures implemented by major central banks, adopted alongside record low interest rates to support recovery from the global financial crisis, have arguably helped loosen financial conditions and reduce borrowing costs. These measures may have supported liquidity and valuations for asset classes that are vulnerable to rapid price corrections as financial conditions tighten, potentially causing losses to investors and increasing the risk of default on the Group’s exposure to these sectors.
Monetary policy in the United Kingdom and in the markets in which the Group operates has been highly accommodative in recent years, however there remains considerable uncertainty as to the direction of interest rates and the pace of change, as set by the Bank of England and other major central banks. In the UK, monetary policy has further been supported by the Bank of England and HM Treasury “Funding for Lending” scheme (which closed in January 2018), the “Help to Buy” scheme (which closed in November 2019), the “Term Funding Scheme” (which closed in February 2018) and the purchase of corporate bonds in the UK. However, such a long period of stimulus has increased uncertainty over the impact of its reduction, which could
RISK FACTORS
lead to a risk of higher borrowing costs in wholesale markets, generally weaker than expected growth, or even contracting gross domestic product (“GDP”), reduced business and consumer confidence, higher levels of unemployment or underemployment, adverse changes to levels of inflation and falling property prices in the markets in which the Group operates, and consequently to an increase in delinquency rates and default rates among its customers. Similar risks result from the low level of inflation in developed economies, which in Europe particularly could deteriorate into sustained deflation if policy measures prove ineffective and economic growth weakens. Reduced monetary stimulus and the actions and commercial soundness of other financial institutions have the potential to impact market liquidity. The adverse impact on the credit quality of the Group’s customers and counterparties, coupled with a decline in collateral values, could lead to a reduction in recoverability and value of the Group’s assets and higher levels of expected credit loss allowances, which could have an adverse effect on the Group’s operations, financial condition or prospects.
| 8. | The Group’s insurance business and defined benefit pension schemes are subject to insurance risks |
The insurance business of the Group is exposed to short-term and longer-term variability arising from uncertain longevity due to annuity portfolios. The Group’s defined benefit pension schemes are also exposed to longevity risk. Increases in life expectancy (longevity) beyond current allowances will increase the cost of annuities and pension scheme benefits and may adversely affect the Group’s financial condition and results of operations.
Customer behaviour in the insurance business may result in increased cancellations or ceasing of contributions at a rate in excess of business assumptions. Consequent reduction in policy persistency and fee income would have an adverse impact upon the profitability of the insurance business of the Group.
The insurance business of the Group is also exposed to the risk of uncertain insurance claim rates. For example, extreme weather conditions can result in high property damage claims and higher levels of theft can increase claims on home insurance. These claims rates may differ from business assumptions and negative developments may adversely affect the Group’s financial condition and results of operations.
To a lesser extent the insurance business is exposed to mortality, morbidity and expense risk. Adverse developments in any of these factors may adversely affect the Group’s financial condition and results of operations.
| 9. | The Group may be required to record credit value adjustments, funding value adjustments and debit value adjustments on its derivative portfolio, which could have a material adverse effect on the Group’s results of operations, financial condition or prospects |
The Group continually seeks to limit and manage counterparty credit risk exposure to market counterparties. Credit value adjustment (“CVA”) and funding value adjustment (“FVA”) reserves are held against uncollateralised derivative exposures and a risk management framework is in place to mitigate reserve value changes. CVA is an expected loss calculation that incorporates current market factors including counterparty credit spreads. FVA reserves are held to capitalise the cost of funding uncollateralised derivative exposures. The Group also calculates a debit value adjustment to reflect own credit spread risk as part of the fair value of derivative liabilities.
Deterioration in the creditworthiness of financial counterparties, or large adverse financial market movements, could impact the size of CVA and FVA reserves and result in a material charge to the Group’s profit and loss account which could have a material adverse effect on the Group’s results of operations, financial condition or prospects.
| 10. | The Group is exposed to risks related to the uncertainty surrounding the integrity and continued existence of reference rates |
Reference rates and indices, including interest rate benchmarks, such as the London Interbank Offered Rate (“LIBOR”) and the Euro Interbank Offered Rate (“EURIBOR”), which are used to determine the amounts payable under financial instruments or the value of such financial instruments (“Benchmarks”), have, in recent years, been the subject of political and regulatory scrutiny as to how they are created and operated. This has resulted in regulatory reform and changes to existing Benchmarks, with further changes anticipated. These reforms and changes may cause a Benchmark to perform differently than it has done in the past or to be discontinued.
At this time, it is not possible to predict the overall effect (including financial impacts) of any such reforms and changes, any establishment of alternative reference rates or any other reforms to these reference rates that may be enacted, including the potential or actual discontinuance of LIBOR publication, any transition away from LIBOR or ongoing reliance on LIBOR for some legacy products.
Uncertainty as to the nature of such potential changes, alternative reference rates (including, without limitation, SONIA, €STER and SOFR or term versions of those rates) or other reforms may adversely affect a broad array of financial products, including any LIBOR-based or EURIBOR-based securities, loans and derivatives that are included in the Group’s financial assets and liabilities, that use these reference rates and may impact the availability and cost of hedging instruments and borrowings. If any of these reference rates are no longer available, the Group may incur additional expenses in effecting the transition from such reference rates, and may be subject to disputes, which could have an adverse effect on the Group’s results of operations. In addition, it can have important operational impacts through the Group’s systems and infrastructure as all systems will need to account for the changes in the reference rates. Any of these factors may have a material adverse effect on the Group’s results of operations, financial condition or prospects.
REGULATORY AND LEGAL RISKS
| 1. | The Group and its businesses are subject to substantial regulation and oversight. Adverse legal or regulatory developments could have a material adverse effect on the Group’s business, results of operations, financial condition or prospects |
The Group and its businesses are subject to legislation, regulation, court proceedings, policies and voluntary codes of practice in the UK, the EU and the other markets in which the Group operates which are impacted by factors beyond the Group’s control, including:
| | (i) | general changes in government, central bank or regulatory policy, or changes in regulatory regimes that may influence investor decisions in particular markets in which the Group operates, and which may change the structure of those markets and the products offered or may increase the costs of doing business in those markets; |
| | | |
| | (ii) | external bodies applying or interpreting standards, laws, regulations or contracts differently to the Group; |
| | | |
| | (iii) | an uncertain and rapidly evolving prudential regulatory environment which could materially adversely affect the Group’s ability to maintain liquidity and increase its funding costs; |
| | | |
| | (iv) | changes in competitive and pricing environments, including markets investigations, or one or more of the Group’s regulators intervening to mandate the pricing of the Group’s products, as a consumer protection measure; |
RISK FACTORS
| | (v) | one or more of the Group’s regulators intervening to prevent or delay the launch of a product or service, or prohibiting an existing product or service; |
| | | |
| | (vi) | further requirements relating to financial reporting, corporate governance, corporate structure and conduct of business and employee compensation; |
| | | |
| | (vii) | expropriation, nationalisation, confiscation of assets and changes in legislation relating to foreign ownership; |
| | | |
| | (viii) | changes to regulation and legislation relating to economic and trading sanctions, money laundering and terrorist financing; and |
| | | |
| | (ix) | regulatory changes which influence business strategy, particularly the rate of growth of the business, or which impose conditions on the sales and servicing of products, which have the effect of making such products unprofitable or unattractive to sell. |
These laws and regulations include (i) increased regulatory oversight, particularly in respect of conduct issues; (ii) prudential regulatory developments, including ring-fencing; and (iii) increased legislative requirements, such as the Banking Reform Act, the Competition and Market Authority Open Banking programme, the Second Payment Services Directive (“PSD2”), the General Data Protection Regulation (“GDPR”), Markets in Financial Instruments Directive (“MiFID II”), which is made up of MiFID (2014/65/EU) and the Markets in Financial Instruments Regulation (MiFIR - 600/2014/EU), and the Deposit Guarantee Schemes Directive 2014/49/EU (the “recast DGSD”).
Unfavourable developments across any of these areas as a result of the factors above could materially affect the Group’s ability to maintain appropriate liquidity, increase its funding costs, constrain the operation of its business and/or have a material adverse effect on the Group’s business, results of operations and financial condition.
| 2. | The Group faces risks associated with its compliance with a wide range of laws and regulations |
The Group is exposed to risk associated with compliance with laws and regulations, including:
| | (i) | certain aspects of the Group’s activities and business may be determined by the relevant authorities, the Financial Ombudsman Service (the “FOS”), or the courts, to have not been conducted in accordance with applicable laws or regulations, or, in the case of the FOS, with what is fair and reasonable in the Ombudsman’s opinion; |
| | | |
| | (ii) | the possibility of alleged mis-selling of financial products or the mishandling of complaints related to the sale of such products by or attributed to a member of the Group, resulting in disciplinary action or requirements to amend sales processes, withdraw products, or provide restitution to affected customers, all of which may require additional provisions; |
| | | |
| | (iii) | risks relating to compliance with, or enforcement actions in respect of, existing and/or new regulatory or reporting requirements, including as a result of a change in focus of regulation or a transfer of responsibility for regulating certain aspects of the Group’s activities and business to other regulatory bodies; |
| | | |
| | (iv) | contractual and other obligations may either not be enforceable as intended or may be enforced against the Group in an adverse way; |
| | | |
| | (v) | the intellectual property of the Group (such as trade names) may not be adequately protected; |
| | | |
| | (vi) | the Group may be liable for damages to third-parties harmed by the conduct of its business; and |
| | | |
| | (vii) | the risk of regulatory proceedings, enforcement actions and/or private litigation, arising out of regulatory investigations or otherwise (brought by individuals or groups of plaintiffs) in the UK and other jurisdictions. |
Regulatory and legal actions pose a number of risks to the Group, including substantial monetary damages or fines, the amounts of which are difficult to predict and may exceed the amount of provisions set aside to cover such risks. See “Regulatory and Legal Risks – The financial impact of legal proceedings and regulatory risks might be material but is difficult to quantify. Amounts eventually paid may materially exceed the amount of provisions set aside to cover such risks, or existing provisions may need to be materially increased in response to changing circumstances, as has been the case in respect of payment protection insurance redress payments”. In addition, the Group may be subject, including as a result of regulatory actions, to other penalties and injunctive relief, civil or private litigation arising out of a regulatory investigation or otherwise, the potential for criminal prosecution in certain circumstances and regulatory restrictions on the Group’s business, all of which can have a negative effect on the Group’s reputation as well as taking a significant amount of management time and resources away from the implementation of the Group’s strategy.
The Group may settle litigation or regulatory proceedings prior to a final judgement or determination of liability to avoid the cost, management efforts or negative business, regulatory or reputational consequences of continuing to contest liability, even when the Group believes that it has no liability or when the potential consequences of failing to prevail would be disproportionate to the costs of settlement. Furthermore, the Group may, for similar reasons, reimburse counterparties for their losses even in situations where the Group does not believe that it is legally compelled to do so. Failure to manage these risks adequately could materially affect the Group, both financially and reputationally.
| 3. | Legal and regulatory risk arising from the UK’s exit from the European Union could adversely impact the Group’s business, operations, financial condition and prospects |
Following the UK’s exit from the EU, there remains significant uncertainty around the terms of their future trade agreement. This uncertainty may be exacerbated by the possible re-emergence of a further Scottish independence referendum and / or differential arrangements for Northern Ireland relative to the rest of the UK.
The Group is subject to substantial EU-derived laws, regulation and oversight, which will be impacted as a result of the UK’s exit from the EU. In particular, after the transition period, the Group and its counterparties may no longer be able to rely on the European passporting framework for financial services. This could result in the loss of customers and / or the requirement for the Group to apply for authorisation in further EU jurisdictions where it is to continue business, with associated costs and operational considerations. Any actions taken as a result of the ongoing uncertainty, as well as new or amended legislation and regulation, may have a significant impact on the Group’s operations, profitability and business model.
| 4. | The Group and its subsidiaries are subject to resolution planning requirements |
The Bank of England and the PRA have published final rules for a resolvability assessment framework (the “Resolvability Assessment Framework”), with full implementation of the framework required by 2022. This will require the Group to carry out a detailed assessment of its preparations for resolution. The new rules on the Resolvability Assessment Framework may affect the way in which the Group manages its business and ultimately impact the
RISK FACTORS
profitability of the Group. Further, the publication of the outcome of such assessment may affect the way the Company and the Group is perceived by the market which, in turn, may affect the secondary market value of its securities.
| 5. | The Group and its subsidiaries are subject to regulatory actions which may be taken in the event of a bank or Group failure |
Under the Banking Act 2009, as amended, (the “Banking Act”), substantial powers have been granted to HM Treasury, the Bank of England and the PRA and FCA (together, the “Authorities”) as part of the special resolution regime (the “SRR”). These powers enable the Authorities to deal with and stabilise UK-incorporated institutions with permission to accept deposits (including members of the Group) and their parent entities (including the Company) if they are failing or are likely to fail to satisfy certain threshold conditions.
The SRR consists of five stabilisation options: (i) transfer of all or part of the business of the relevant entity or the shares of the relevant entity to a private sector purchaser; (ii) transfer of all or part of the business of the relevant entity to a “bridge bank” established and wholly owned by the Bank of England; (iii) transfer all or part of the relevant entity or “bridge bank” to an asset management vehicle; (iv) making of one or more resolution instruments by the Bank of England; and (v) temporary public ownership of the relevant entity. HM Treasury may also take a parent company of a relevant entity into temporary public ownership where certain conditions are met. Certain ancillary powers include the power to modify contractual arrangements in certain circumstances. The powers granted to resolution authorities under the Bank Recovery and Resolution Directive (“BRRD”) include, but are not limited to: (i) a “write-down and conversion power” relating to Tier 1 and Tier 2 capital instruments and (ii) a “bail-in” power relating to the majority of unsecured liabilities (including the capital instruments and senior unsecured debt securities issued by the Group). Such loss absorption powers give resolution authorities the ability to write-down or write-off all or a portion of the claims of certain unsecured creditors of a failing institution or group and/or to convert certain debt claims into another security, including ordinary shares of the surviving group entity, if any. Such resulting ordinary shares may be subject to severe dilution, transfer for no consideration, write-down or write-off. Generally, losses are to be taken in accordance with the priority of claims under normal insolvency proceedings. The Banking Act and secondary legislation made thereunder provides certain limited safeguards for creditors in specific circumstances. For example, a holder of debt securities issued by the Company should not suffer a worse outcome than it would in insolvency proceedings. However, this “no creditor worse off” safeguard may not apply in relation to an application of the write-down and conversion power in circumstances where a stabilisation power is not also used; holders of debt instruments which are subject to the power may, however, have ordinary shares transferred to or issued to them by way of compensation. The exercise of mandatory write-down and conversion power under the Banking Act or any suggestion of such exercise could, therefore, materially adversely affect the rights of the holders of equity and debt securities and the price or value of their investment and/or the ability of the Group to satisfy its obligations under such debt securities.
Resolution authorities also have powers to amend the terms of contracts (for example, varying the maturity of a debt instrument) and to override events of default or termination rights that might be invoked as a result of the exercise of the resolution powers, which could have a material adverse effect on the rights of holders of the equity and debt securities issued by the Group, including through a material adverse effect on the price of such securities. The Banking Act also gives the Bank of England the power to override, vary or impose contractual obligations between a UK bank, its holding company and its group undertakings for reasonable consideration, in order to enable any transferee or successor bank to operate effectively. There is also power for HM Treasury to amend the law (excluding provisions made by or under the Banking Act) for the purpose of enabling it to use the regime powers effectively, potentially with retrospective effect.
The determination that securities and other obligations issued by the Group will be subject to loss absorption is likely to be inherently unpredictable and may depend on a number of factors which may be outside of the Group’s control. This determination will also be made by the relevant UK resolution authority and there may be many factors, including factors not directly related to the Company or the Group, which could result in such a determination. Because of this inherent uncertainty and given that both BRRD and the relevant provisions of the Banking Act remain untested in practice, it will be difficult to predict when, if at all, the exercise of a loss absorption power may occur which would result in a principal write-off or conversion to other securities, including the ordinary shares of the Company. Moreover, as the criteria that the relevant UK resolution authority will be obliged to consider in exercising any loss absorption power provide it with considerable discretion, holders of the securities issued by the Group may not be able to refer to publicly available criteria in order to anticipate a potential exercise of any such power and consequently its potential effect on the Group and the securities issued by the Group.
Potential investors in the securities issued by the Group should consider the risk that a holder may lose some or all of its investment, including the principal amount plus any accrued interest, if such statutory loss absorption measures are acted upon. The BRRD and applicable state aid rules provide that, other than in certain limited circumstances set out in the BRRD, extraordinary governmental financial support will only be available to the Group as a last resort once the write-down and conversion powers and resolution tools referred to above have been exploited to the maximum extent possible. Accordingly, it is unlikely that investors in securities issued by the Company will benefit from such support even if it were provided.
Holders of the Group’s securities may have limited rights or no rights to challenge any decision of the relevant UK resolution authority to exercise the UK resolution powers or to have that decision reviewed by a judicial or administrative process or otherwise. Accordingly, trading behaviour in respect of such securities is not necessarily expected to follow the trading behaviour associated with other types of securities that are not subject to such resolution powers. Further, the introduction or amendment of such recovery and resolution powers, and/or any implication or anticipation that they may be used, may have a significant adverse effect on the market price of such securities, even if such powers are not used.
The minimum requirement for own funds and eligible liabilities (“MREL”) applies to EU and UK financial institutions and covers own funds and debt instruments that are capable of being written-down or converted to equity in order to prevent a financial institution or its group from failing in a crisis. The Bank of England has set a final MREL conformance date of 1 January 2022 with interim compliance required by 1 January 2020.
In addition, the Group’s costs of doing business may increase by amendments made to the Banking Act in relation to deposits covered by the UK Financial Services Compensation Scheme (the “FSCS”). The Group contributes to compensation schemes such as the FSCS in respect of banks and other authorised financial services firms that are unable to meet their obligations to customers. Further provisions in respect of these costs are likely to be necessary in the future. The ultimate cost to the industry, which will also include the cost of any compensation payments made by the FSCS and, if necessary, the cost of meeting any shortfall after recoveries on the borrowings entered into by the FSCS, remains uncertain but may be significant and may have a material effect on the Group’s business, results of operations or financial condition.
| 6. | The Group is subject to the risk of having insufficient capital resources and / or not meeting liquidity requirements |
If the Group has, or is perceived to have, a shortage of regulatory capital or to be unable to meet its regulatory minimum liquidity requirements, then it may be subject to regulatory interventions and sanctions and may suffer a loss of confidence in the market with the result that access to sources of liquidity and funding may become constrained, more expensive or unavailable. This, in turn, may affect the Group’s capacity to continue its business operations, pay future dividends and make other distributions or pursue acquisitions or other strategic opportunities, impacting future growth potential.
RISK FACTORS
See also the risk factor above entitled “The Group’s businesses are subject to inherent risks concerning liquidity and funding, particularly if the availability of traditional sources of funding such as retail deposits or the access to wholesale funding markets becomes more limited”.
A shortage of capital could arise from (i) a depletion of the Group’s capital resources through increased costs or liabilities and reduced asset values which could arise as a result of the crystallisation of credit-related risks, regulatory and legal risks, business and economic risks, operational risks, financial soundness-related risks and other risks; and/or (ii) an increase in the amount of capital that is needed to be held; and/or (iii) changes in the manner in which the Group is required to calculate its capital and/or the risk-weightings applied to its assets. This might be driven by a change to the actual level of risk faced by the Group or to changes in the minimum capital required by legislation or by the regulatory authorities. For example, an aggregated risk-weighted asset output floor has been proposed by the Basel Committee with a transitional period from 2022 to 2027. There remains uncertainty until such rules are translated into draft European and UK legislation. Further, in the context of the UK’s departure from the EU, the application of the output floor in the United Kingdom will be a matter for the UK legislature and the Group’s prudential regulators.
If, in response to higher capital requirements or a shortage, or perceived shortage, of regulatory capital, the Group raises additional capital through the issuance of shares, existing shareholders may experience a dilution of their holdings. If a capital or debt instrument is converted to ordinary shares as a result of a trigger within the contractual terms of the instrument or through the exercise of statutory powers then, depending upon the terms of the conversion, existing shareholders may experience a dilution of their holdings. Separately, the Group may address a shortage of capital by acting to reduce leverage exposures and/or risk-weighted assets, for example by way of business disposals. Such actions may impact the profitability of the Group.
Whilst the Group monitors current and expected future capital, MREL and liquidity requirements, including having regard to both leverage and risk weighted assets-based requirements, and seeks to manage and plan the prudential position accordingly and on the basis of current assumptions regarding future regulatory capital and liquidity requirements, there can be no assurance that the assumptions will be accurate in all respects or that it will not be required to take additional measures to strengthen its capital or liquidity position. Market expectations as to capital and liquidity levels may also increase, driven by, for example, the capital and liquidity levels (or targets) of peer banking groups.
The Group’s borrowing costs and access to capital markets, as well as its ability to lend or carry out certain aspects of its business, could also be affected by future prudential regulatory developments more generally, including (i) evolving European and global prudential and regulatory changes, including the application of final CRRII and CRD V rules from June 2021, and the implementation of Basel IV reforms in Europe and the UK; (ii) regulatory changes in other jurisdictions to which the Group has exposure and (iii) the evolving regulatory and legal impacts of the UK’s exit from the EU.
Any of the risks mentioned above could have a material adverse effect on the Group’s liquidity, results of operations, its ability to continue its business operations and its financial condition.
| 7. | The financial impact of legal proceedings and regulatory risks may be material and is difficult to quantify. Amounts eventually paid may materially exceed the amount of provisions set aside to cover such risks, or existing provisions may need to be materially increased in response to changing circumstances, as has been the case in respect of payment protection insurance (“PPI”) redress payments |
Where provisions have already been taken in published financial statements of the Group or results announcements for ongoing legal or regulatory matters, these have been recognised, in accordance with IAS 37 (“Provisions, Contingent Liabilities and Contingent Assets”) (“IAS 37”), as the best estimate of the expenditure required to settle the obligation as at the reporting date. Such estimates are inherently uncertain and it is possible that the eventual outcomes may differ materially from current estimates, resulting in future increases or decreases to the required provisions, or actual losses that exceed or fall short of the provisions taken.
Excluding MBNA Limited (“MBNA”), the Group increased provisions for expected PPI costs by a further £2.5 billion in the year ended 31 December 2019. The charge in 2019 related largely to a significant increase in PPI information requests (PIRs) leading up to the deadline for submission of claims on 29 August 2019, associated administration costs and costs associated with the Official Receiver.
This brings the total amount provided for at the end of 2019 to £21.9 billion, of which £1.6 billion remains unutilised relating to complaints and associated administration costs.
With regard to MBNA, as announced in December 2016, the Group’s exposure is capped at £240 million and is already provided for through an indemnity received from Bank of America. MBNA increased its PPI provision by £367 million in the year ended 31 December 2019 but the Group’s exposure continues to remain capped at £240 million under this indemnity.
Provisions have not been taken where no obligation (as defined in IAS 37) has been established, whether associated with a known or potential future litigation or regulatory matter. Accordingly, an adverse decision in any such matters could result in significant losses to the Group which have not been provided for. Such losses would have an adverse impact on the Group’s financial condition and operations.
In November 2014, the UK Supreme Court ruled in Plevin v Paragon Personal Finance Limited [2014] UKSC 61 (“Plevin”) that failure to disclose to a customer a “high” commission payment on a single premium PPI policy sold with a consumer credit agreement created an unfair relationship between the lender and the borrower under s140 of the Consumer Credit Act 1974. It did not define a tipping point above which commission was deemed “high”. The disclosure of commission was not a requirement of the FSA’s (now FCA’s) Insurance: Conduct of Business sourcebook rules for the sale of general insurance (including PPI). Permission to appeal the redress outcome in the Plevin case was refused by the Court of Appeal in July 2015 and by the President of the Family Division in November 2015.
In November 2015 and August 2016, the FCA consulted on the introduction of a two year industry deadline by which consumers would need to make their PPI complaints or lose their right to have them assessed, and proposed rules and guidance about how firms should handle PPI complaints fairly in light of the Plevin judgment discussed above. On 2 March 2017, the FCA confirmed an industry deadline of 29 August 2019. The FCA’s rules to address Plevin commenced on 29 August 2017. The industry deadline also applies to the handling of these complaints. It is anticipated that the industry deadline could have encouraged eligible consumers to bring their claims earlier than would have otherwise been expected in the absence of an industry deadline for having complaints assessed. The FCA’s rules, issued on 2 March 2017, could have a material adverse effect on the Group’s reputation, business, financial condition, results of operations and prospects.
Further, no assurance can be given that the Group will not incur liability in connection with any past, current or future non-compliance with legislation or regulation, and any such non-compliance could be significant and materially adversely affect the Group’s reputation, business, financial condition, results of operations and prospects.
RISK FACTORS
| 8. | The Group must comply with anti-money laundering, counter terrorist financing, anti-bribery and sanctions regulations, and a failure to prevent or detect any illegal or improper activities fully or on a timely basis could negatively impact customers and expose the Group to liability |
The Group is required to comply with applicable anti-money laundering, anti-terrorism, sanctions, anti-bribery and other laws and regulations in the jurisdictions in which it operates. These extensive laws and regulations require the Group, amongst other things, to adopt and enforce “know-your-customer” policies and procedures and to report suspicions of money laundering and terrorist financing, and in some countries specific transactions to the applicable regulatory authorities. These laws and regulations have become increasingly complex and detailed, require improved systems and sophisticated monitoring and compliance personnel, and have become the subject of enhanced government and regulatory supervision.
The Group has adopted policies and procedures aimed at detecting and preventing the use of its banking network and services for money laundering, financing terrorism, bribery, tax evasion, human trafficking, modern day slavery, wildlife trafficking and related activities. These controls, however, may not eliminate instances where third parties seek to use the Group’s products and services to engage in illegal or improper activities. In addition, while the Group reviews its relevant counterparties’ internal policies and procedures with respect to such matters, the Group, to a large degree, relies upon its relevant counterparties to maintain and properly apply their own appropriate anti-money laundering procedures. Such measures, procedures and compliance may not be effective in preventing third parties from using the Group (and its relevant counterparties) as a conduit for money laundering and terrorist financing (including illegal cash operations) without the Group’s (and its relevant counterparties’) knowledge. If the Group is associated with, or even accused of being associated with, or becomes a party to, money laundering or terrorist financing, the Group’s reputation could suffer and it could become subject to fines, sanctions and/or legal enforcement (including being added to any “black lists” that would prohibit certain parties from engaging in transactions with the Group), any one of which could have a material adverse effect on the Group’s results of operations, financial condition and prospects.
Furthermore, failure to comply with trade and economic sanctions, both primary and secondary (which are frequently subject to change by relevant governments and agencies in the jurisdictions in which the Group operates) and failure to comply fully with other applicable compliance laws and regulations, may result in the imposition of fines and other penalties on the Group, including the revocation of licences. In addition, the Group’s business and reputation could suffer if customers use its banking network for money laundering, financing terrorism, or other illegal or improper purposes.
| 9. | Failure to manage the risks associated with changes in taxation rates or applicable tax laws, or misinterpretation of such tax laws, could materially adversely affect the Group’s results of operations, financial condition or prospects |
Tax risk is the risk associated with changes in taxation rates, applicable tax laws, misinterpretation of such tax laws, disputes with relevant tax authorities in relation to historic transactions, or conducting a challenge to a relevant tax authority. Failure to manage this risk adequately could cause the Group to suffer losses due to additional tax charges and other financial costs including penalties. Such failure could lead to adverse publicity, reputational damage and potentially costs materially exceeding current provisions, in each case to an extent which could have an adverse effect on the Group’s results of operations, financial condition or prospects.
BUSINESS AND OPERATIONAL RISKS
| 1. | Operational risks, including the risk that the Group fails to design resilience into business operations, underlying infrastructure and controls, including weaknesses or failures in the Group’s processes, systems and security, and risks due to reliance on third party services and products could materially adversely affect the Group’s operations |
Operational risks, through inadequate or failed processes, systems (including financial reporting and risk monitoring processes) or security, or from people-related or external events, including the risk of fraud and other criminal acts carried out against the Group, are present in the Group’s businesses. The Group’s businesses are dependent on processing and reporting accurately and efficiently a high volume of complex transactions across numerous and diverse products and services, in different currencies and subject to a number of different legal and regulatory regimes. Any weakness or errors in these processes, systems or security could have an adverse effect on the Group’s results, reporting of such results, and on the ability to deliver appropriate customer outcomes during the affected period which may lead to an increase in complaints and damage to the reputation of the Group.
Specifically, failure to develop, deliver or maintain effective IT solutions in line with the Group’s operating environment could have a material adverse impact on customer service and business operations. Any prolonged loss of service availability could damage the Group’s ability to service its customers, could result in compensation costs and could cause long-term damage to the Group’s business and brand. See “Business and Operational Risks - The Group’s business is subject to risks related to cybercrime.”
Third parties such as suppliers and vendors upon which the Group relies for important products and services could also be sources of operational risk, specifically with regard to security breaches affecting such parties. The Group may be required to take steps to protect the integrity of its operational systems, thereby increasing its operational costs. Additionally, any problems caused by these third parties, including as a result of their not providing the Group their services for any reason, their performing their services poorly, or employee misconduct, could adversely affect the Group’s ability to deliver products and services to customers and otherwise to conduct business. Replacing these third party vendors or moving critical services from one provider to another could also entail significant delays and expense.
The Group is also exposed to risk of fraud, cyberattack and other criminal activities (both internal and external) due to the operational risks inherent in banking operations. These risks are also present when the Group relies on outside suppliers or vendors to provide services to the Group and its customers. Fraudsters may target any of the Group’s products, services and delivery channels, including lending, internet banking, payments, bank accounts and cards. This may result in financial loss to the Group and/or the Group’s customers, poor customer experience, reputational damage, potential litigation and regulatory proceedings. Industry reported gross fraud losses have continued to increase as both financial institutions and their customers are targeted. Fraud losses and their impacts on customers and the wider society are now an increasing priority for consumer groups, regulators and the UK Government. Any weakness or errors in the Group’s processes, systems or security could have an adverse effect on the Group’s results and on the ability to deliver appropriate customer responses, which may lead to an increase in complaints and damage to the Group’s reputation. Please see “Regulatory and Legal Risks – The Group must comply with anti-money laundering, counter terrorist financing, anti-bribery and sanctions regulations, and a failure to prevent or detect any illegal or improper activities fully or on a timely basis could negatively impact customers and expose the Group to liability”.
| 2. | The Group is exposed to conduct risk |
The Group is exposed to various forms of conduct risk in its operations. Conduct risk is the risk of customer detriment due to poor design, distribution and execution of products and services or other activities which could undermine the integrity of the market or distort competition, leading to unfair customer outcomes, regulatory censure and financial and reputational loss. Such risks are inherent in banking services. Forms of conduct risk include business and strategic planning that does not sufficiently consider customer need (leading to products being offered beyond target markets and
RISK FACTORS
mis-selling of financial products), ineffective management and monitoring of products and their distribution (which could result in customers receiving unfair outcomes), customer communications that are unclear, unfair, misleading or untimely (which could impact customer decision-making and result in customers receiving unfair outcomes), a culture that is not sufficiently customer-centric (potentially driving improper decision-making and unfair outcomes for customers), outsourcing of customer service and product delivery via third-parties that do not have the same level of control, oversight and customer-centric culture as the Group (which could result in potentially unfair or inconsistent customer outcomes), the possibility of alleged mis-selling of financial products (which could require amendments to sales processes, withdrawal of products or the provision of restitution to affected customers, all of which may require additional provisions in the Group’s financial accounts), ineffective management of customer complaints or claims (which could result in customers receiving unfair outcomes), ineffective processes or procedures to support customers, including those in potentially vulnerable circumstances (which could result in customers receiving unfair outcomes or treatments which do not support their needs), and poor governance of colleagues’ incentives and rewards and approval of schemes which drive unfair customer outcomes. Ineffective management and oversight of legacy conduct issues can also result in customers who are undergoing remediation being unfairly treated and therefore further rectification being required. The Group is also exposed to the risk of engaging in, or failing to manage, conduct which could constitute market abuse, undermine the integrity of a market in which it is active, distort competition or create conflicts of interest. Each of these risks can lead to regulatory censure, reputational damage, regulatory intervention/enforcement, the imposition of lengthy remedial redress programmes and financial penalties or other loss for the Group, all of which could have a material adverse effect on the Group’s results of operations, financial condition or prospects.
| 3. | The Group’s business is subject to risks related to cybercrime |
The Group holds personally identifiable information on its systems aligned to product and services delivered to customers. Protection is delivered in accordance with data protection legislation, including GDPR. In certain international locations, there are additional regulatory requirements that must be followed for business conducted in that jurisdiction. In the U.S., for example, the Company was required from February 2018 to formally attest that it complies with specific cyber security requirements put forth by the New York State Department of Financial Services in Part 500 of Title 23 of the Official Compilation of Codes, Rules and Regulations of the State of New York.
The Group’s IT infrastructure, and that of third parties on whom the Group relies, may be vulnerable to cyber-attacks, malware, denial of services, unauthorised access and other events that have a security impact. Such an event may impact the confidentiality or integrity of the Group’s or its clients’, employees’ or counterparties’ information or the availability of services to customers. As a result of such an event or a failure in the Group’s cyber security policies, the Group could experience material financial loss, loss of competitive position, regulatory actions, breach of client contracts, reputational harm or legal liability, which, in turn, could have a material adverse effect on the Group’s results of operations, financial condition or prospects. The Group may be required to spend additional resources to modify its protective measures or to investigate and remediate vulnerabilities or other exposures, and it may be subject to litigation and financial losses that are either not insured against fully or not fully covered through any insurance that it maintains. The Group is committed to continued participation in industry-wide activity relating to cyber risk. This includes working with relevant regulatory and government departments to evaluate the approach the Group is taking to mitigate this risk and sharing relevant information across the financial services sector.
| 4. | The Group is subject to the emerging risks associated with climate change |
The risks associated with climate change are coming under an increasing focus, both in the UK and internationally, from governments, regulators and large sections of society. These risks include: physical risks, arising from climate and weather-related events of increasing severity and/or frequency; transition risks resulting from the process of adjustment towards a lower carbon economy (including stranded, redundant or prohibited assets); and liability risks arising from the Group or clients experiencing litigation or reputational damage as a result of sustainability issues.
Physical risks from climate change arise from a number of factors and relate to specific weather events and longer term shifts in the climate. The nature and timing of extreme weather events are uncertain but they are increasing in frequency and their impact on the economy is predicted to be more acute in the future. The potential impact on the economy includes, but is not limited to, lower GDP growth, higher unemployment and significant changes in asset prices and profitability of industries. Such risks could lead to deteriorating claims experience for the Group’s general insurance business, out of line with the original assessment of risk that was used to set price and capital adequacy. This could pose a threat to both profitability and the strength of the solvency position of the general insurance business. Climate change related increases in risk could also necessitate the withdrawal of cover from areas that become uninsurable due to extreme inundation risk, opening the Group up to reputational damage in its withdrawal of such support. The physical risks could also lead to the disruption of business activity at client’s locations. In addition, the Group’s premises and resilience may also suffer physical damage due to weather events leading to increased costs for the Group.
The move towards a low-carbon economy will also create transition risks, due to potential significant and rapid developments in the expectations of policymakers, regulators and society resulting in policy, regulatory and technological changes which could impact the Group. These risks may cause the impairment of asset values, impact the creditworthiness of clients of the Group, and impact defaults among retail customers (including through the ability of customers to repay their mortgages, as well as the impact on the value of the underlying property), which could result in currently profitable business deteriorating over the term of agreed facilities. They may also adversely affect a policyholder’s returns.
In January 2020, the Group announced an ambitious goal to work with customers, government and the market to help reduce the emissions the Group finances by more than 50 percent by 2030 (see Environmental Matters – Helping the transition to a sustainable low carbon economy). Achieving this goal will require, among other things: customers to change their behaviours; governments to introduce new policies, incentives and to invest in infrastructure; new market developments; and technological advancements. If these changes, most of which are out of the Group’s control, do not occur, the Group may have difficulty achieving its targets. Furthermore, in order to reach its targets, the Group will need to further develop sustainable finance products and may be required to alter its business model.
If the Group does not adequately embed the risks associated with climate change identified above into its risk framework to appropriately measure, manage and disclose the various financial and operational risks it faces as a result of climate change, or fails to adapt its strategy and business model to the changing regulatory requirements and market expectations on a timely basis, this could have an adverse impact on the Group’s results of operations, financial condition and prospects.
| 5. | The Group’s businesses are conducted in competitive environments, with increased competition scrutiny, and the Group’s financial performance depends upon management’s ability to respond effectively to competitive pressures and scrutiny |
The markets for UK financial services, and the other markets within which the Group operates, are competitive, and management expects such competition to continue or intensify. This expectation is due to competitor behaviour, new entrants to the market (including a number of new retail banks as well as non-traditional financial services providers), consumer demand, technological changes such as the growth of digital banking, and the impact of regulatory actions and other factors. The Group’s financial performance and its ability to maintain existing or capture additional market share depends significantly upon the competitive environment and management’s response thereto.
The competitive environment can be, and is, influenced by intervention by the UK Government competition authorities and/or European regulatory bodies and/or governments of other countries in which the Group operates, including in response to any perceived lack of competition within these markets. This may significantly impact the competitive position of the Group relative to its international competitors, which may be subject to different forms of government intervention.
The Competition and Markets Authority (the “CMA”) launched a full market investigation into competition in the SME banking and personal current account (“PCA”) markets in November 2014 and published its final report on 9 August 2016, followed by the Retail Banking Market Investigation Order 2017 on 2 February 2017. The key final remedies include: the introduction of “Open Banking”, the publication of service quality information and
RISK FACTORS
customer information prompts. Recommendations were also made regarding improvements to current account switching, monthly maximum charges for PCA overdraft users, overdraft notifications and additional measures to assist small business in comparing the different products available.
Additionally, the internet and mobile technologies are changing customer behaviour and the competitive environment. There has been a steep rise in customer use of mobile banking over the last four years. The Group faces competition from established providers of financial services as well as from banking business developed by non-financial companies, including technology companies with strong brand recognition.
As a result of any restructuring or evolution in the market, there may emerge one or more new viable competitors in the UK banking market or a material strengthening of one or more of the Group’s existing competitors in that market. Any of these factors or a combination thereof could result in a significant reduction in the profit of the Group.
| 6. | The Group could fail to attract or retain senior management or other key employees |
The Group’s success depends on its ability to attract, retain and develop high calibre talent. If the Group was to unexpectedly lose a member of its key management or fail to maintain one of the strategic relationships of the Group’s key management team, its business and results of operations could be materially adversely affected.
In addition, the Group also relies upon the services of other third-party providers for certain services and it may exercise limited control over the activities and business practices of these providers and any inability on the Group’s part to maintain satisfactory commercial relationships with them or their failure to provide quality services could adversely affect the Group’s business.
Attracting additional and retaining existing skilled personnel is fundamental to the continued growth of the Group’s business. Personnel costs, including salaries, are increasing as the general level of prices and the standard of living increases in the countries in which the Group does business and as industry-wide demand for suitably qualified personnel increases. No assurance can be given that the Group will successfully attract new personnel or retain existing personnel required to continue to expand the Group’s business and to successfully execute and implement the Group’s business strategy. In addition, the uncertainty resulting from the UK’s exit from the EU on foreign nationals’ long-term residency permissions in the UK may make it challenging for the Group to retain and recruit colleagues with relevant skills and experience.
| 7. | The Group may fail to execute its ongoing strategic change initiatives, and the expected benefits of such initiatives may not be achieved on time or as planned |
In order to maintain and enhance the Group’s strategic position, it continues to invest in new initiatives and programmes. The Group acknowledges the challenges faced with delivering these initiatives and programmes alongside the extensive agenda of regulatory and legal changes whilst safely operating existing systems and controls.
As the Group continues to deliver this strategy there is considerable focus on digitisation and ensuring the Group meets customer demands through digital and mobile platforms.
The successful completion of these programmes and the Group’s other strategic initiatives requires ongoing subjective and complex judgements, including forecasts of economic conditions in various parts of the world, and can be subject to significant risks. For example, the Group’s ability to execute its strategic initiatives successfully may be adversely impacted by a significant global macroeconomic downturn, legacy issues, limitations in the Group’s management or operational capacity and capability or significant and unexpected regulatory change in countries in which the Group operates.
Failure to execute the Group’s strategic initiatives successfully could have an adverse effect on the Group’s ability to achieve the stated targets and other expected benefits of these initiatives, and there is also a risk that the costs associated with implementing such initiatives may be higher than expected or benefits may be lesser than expected. Both of these factors could materially adversely impact the Group’s results of operations, financial condition or prospects.
| 8. | The Group may be unable to fully capture the expected value from acquisitions, which could materially and adversely affect the Group’s results of operations, financial condition or prospects |
The Group may from time to time undertake acquisitions as part of its growth strategy, which could subject the Group to a number of risks, such as: (i) the rationale and assumptions underlying the business plans supporting the valuation of a target business may prove inaccurate, in particular with respect to synergies and expected commercial demand; (ii) the Group may fail to successfully integrate any acquired business, including its technologies, products and personnel; (iii) the Group may fail to retain key employees, customers and suppliers of any acquired business; (iv) the Group may be required or wish to terminate pre-existing contractual relationships, which could prove costly and/or be executed at unfavourable terms and conditions; (v) the Group may fail to discover certain contingent or undisclosed liabilities in businesses that it acquires, or its due diligence to discover any such liabilities may be inadequate; and (vi) it may be necessary to obtain regulatory and other approvals in connection with certain acquisitions and there can be no assurance that such approvals will be obtained and even if granted, that there will be no burdensome conditions attached to such approvals, all of which could materially and adversely affect the Group’s results of operations, financial conditions or prospects.
| 9. | The Group could be exposed to industrial action and increased labour costs resulting from a lack of agreement with trade unions |
Within the Group, there are currently two recognised unions for the purposes of collective bargaining. Combined, these collective bargaining arrangements apply to around 95 per cent of the Group’s total workforce.
Where the Group or its employees or their unions seek to change any of their contractual terms, a consultation and negotiation process is undertaken. Such a process could potentially lead to increased labour costs or, in the event that any such negotiations were to be unsuccessful and result in formal industrial action, the Group could experience a work stoppage that could materially adversely impact its business, financial condition and results of operations.
| 10. | The Group’s financial statements are based, in part, on assumptions and estimates |
The preparation of the Group’s financial statements requires management to make judgements, estimates and assumptions that affect the reported amounts of assets, liabilities, income and expenses. Due to the inherent uncertainty in making estimates, actual results reported in future periods may be based upon amounts which differ from those estimates. Estimates, judgements and assumptions are continually evaluated and are based on historical experience and other factors, including expectations of future events that are believed to be reasonable under the circumstances. Revisions to accounting estimates are recognised in the period in which the estimate is revised and in any future periods affected.
RISK FACTORS
The consolidated financial statements are prepared using judgements, estimates and assumptions based on information available at the reporting date. If one or more of these judgements, estimates and assumptions is subsequently revised as a result of new factors or circumstances emerging, there could be a material adverse effect on the Group’s results of operations, financial condition or prospects and a corresponding impact on its funding requirements and capital ratios.
| 11. | The Company is dependent on the receipt of dividends from its subsidiaries to meet its obligations, including its payment obligations with respect to its debt securities |
The Company is a non-operating holding company. The principal sources of the Company’s income are, and are expected to continue to be, distributions from operating subsidiaries which also hold the principal assets of the Group. As a separate legal entity, the Company relies on such distributions in order to be able to meet its obligations (including its payment obligations with respect to its debt securities), and to create distributable reserves for payment of dividends to ordinary shareholders.
The ability of the Company’s subsidiaries (including subsidiaries incorporated outside the UK) to pay dividends and the Company’s ability to receive distributions from its investments in other entities will also be subject not only to their financial performance but also to applicable local laws and other restrictions. These restrictions could include, among others, any regulatory requirements, leverage requirements, any statutory reserve requirements and any applicable tax laws. There may also be restrictions as a result of current or forthcoming ring-fencing requirements, including those relating to the payment of dividends and the maintenance of sufficient regulatory capital on a sub-consolidated basis at the level of the ring-fenced bank sub-group. These laws and restrictions could limit the payment of dividends and distributions to the Company by its subsidiaries and any other entities in which it holds an investment from time to time, which could restrict the Company’s ability to meet its obligations and/or to pay dividends to ordinary shareholders.
| 12. | The Company may not pay a dividend on its ordinary shares in any given financial/calendar year |
The determination of the Board of Directors of the Company (the “Board”) in any given year of whether the Company can or should pay a dividend on its ordinary shares, or the amount of such dividend, is subject to a number of factors.
The Board must determine the optimum level of investment to responsibly foster growth and to fund investment initiatives in the business, including organic growth or growth through acquisitions as part of its growth strategy, as well as the appropriate level of capital for the Group to retain to meet current and evolving regulatory requirements and to cover uncertainties.
These determinations will change year to year based on the performance of the Group’s business in general, factors affecting its financial position (including capital, funding, liquidity and leverage), the economic environment in which the Group operates, the contractual terms of certain of the Group’s regulatory capital securities and other factors outside of the Group’s control, which could arise as a result of the crystallisation of credit-related risks, regulatory and legal risks, business and economic risks, operational risks, financial soundness-related risks and other risks described herein, many of which may impact the amount of capital that is generated over the course of the year. The Board’s decisions in relation to these matters will have an impact on the ability of the Company to pay a dividend on its ordinary shares in any given year.
| 13. | Volatility in the price of the Company’s ordinary shares may affect the value of any investment in the Company |
The market price of the Company’s ordinary shares could be volatile and subject to significant fluctuations due to various factors, some of which may be unrelated to the Group’s operating performance or prospects. These include economic or political disruption in the main jurisdictions in which the Group operates, any regulatory changes affecting the Group’s operations, developments in the industry or its competitors, the operating and share price performance of other companies in the industries and markets in which the Group operates, the potential placing of large volumes of the Company’s ordinary shares in the market, or speculation about the Group’s business in the press, media or investment communities. Furthermore, the Group’s results of operations and prospects from time to time may vary from the expectations of rating agencies, market analysts or investors. Any of these events could result in volatility in the market prices of the Company’s ordinary shares. In general, prospective investors should be aware that the value of an investment in the Company’s ordinary shares may go down as well as up.
FORWARD LOOKING STATEMENTS
This document contains certain forward looking statements within the meaning of Section 21E of the US Securities Exchange Act of 1934, as amended, and section 27A of the US Securities Act of 1933, as amended, with respect to the business, strategy, plans and/or results of Lloyds Banking Group plc together with its subsidiaries (the Group) and its current goals and expectations relating to its future financial condition and performance. Statements that are not historical facts, including statements about the Group’s or its directors’ and/or management’s beliefs and expectations, are forward looking statements.
Words such as ‘believes’, ‘anticipates’, ‘estimates’, ‘expects’, ‘intends’, ‘aims’, ‘potential’, ‘will’, ‘would’, ‘could’, ‘considered’, ‘likely’, ‘estimate’ and variations of these words and similar future or conditional expressions are intended to identify forward looking statements but are not the exclusive means of identifying such statements.
Examples of such forward looking statements include, but are not limited to: projections or expectations of the Group’s future financial position including profit attributable to shareholders, provisions, economic profit, dividends, capital structure, portfolios, net interest margin, capital ratios, liquidity, risk-weighted assets (RWAs), expenditures or any other financial items or ratios; litigation, regulatory and governmental investigations; the Group’s future financial performance; the level and extent of future impairments and write-downs; statements of plans, objectives or goals of the Group or its management including in respect of statements about the future business and economic environments in the UK and elsewhere including, but not limited to, future trends in interest rates, foreign exchange rates, credit and equity market levels and demographic developments; statements about competition, regulation, disposals and consolidation or technological developments in the financial services industry; and statements of assumptions underlying such statements.
By their nature, forward looking statements involve risk and uncertainty because they relate to events and depend upon circumstances that will or may occur in the future.
Factors that could cause actual business, strategy, plans and/or results (including but not limited to the payment of dividends) to differ materially from forward looking statements made by the Group or on its behalf include, but are not limited to: general economic and business conditions in the UK and internationally; market related trends and developments; fluctuations in interest rates, inflation, exchange rates, stock markets and currencies; any impact of the transition from IBORs to alternative reference rates; the ability to access sufficient sources of capital, liquidity and funding when required; changes to the Group’s credit ratings; the ability to derive cost savings and other benefits including, but without limitation as a result of any acquisitions, disposals and other strategic transactions; the ability to achieve strategic objectives; changing customer behaviour including consumer spending, saving and borrowing habits; changes to borrower or counterparty credit quality; concentration of financial exposure; management and monitoring of conduct risk; instability in the global financial markets, including Eurozone instability, instability as a result of uncertainty surrounding the exit by the UK from the European Union (EU) and as a result of such exit and the potential for other countries to exit the EU or the Eurozone and the impact of any sovereign credit rating downgrade or other sovereign financial issues; political instability including as a result of any UK general election; technological changes and risks to the security of IT and operational infrastructure, systems, data and information resulting from increased threat of cyber and other attacks; natural, pandemic and other disasters, adverse weather and similar contingencies outside the Group’s control; inadequate or failed internal or external processes or systems; acts of war, other acts of hostility, terrorist acts and responses to those acts, geopolitical, pandemic or other such events; risks relating to climate change; changes in laws, regulations, practices and accounting standards or taxation, including as a result of the exit by the UK from the EU, or a further possible referendum on Scottish independence; changes to regulatory capital or liquidity requirements and similar contingencies outside the Group’s control; the policies, decisions and actions of governmental or regulatory authorities or courts in the UK, the EU, the US or elsewhere including the implementation and interpretation of key legislation and regulation together with any resulting impact on the future structure of the Group; the ability to attract and retain senior management and other employees and meet its diversity objectives; actions or omissions by the Group’s directors, management or employees including industrial action; changes to the Group’s post-retirement defined benefit scheme obligations; the extent of any future impairment charges or write-downs caused by, but not limited to, depressed asset valuations, market disruptions and illiquid markets; the value and effectiveness of any credit protection purchased by the Group; the inability to hedge certain risks economically; the adequacy of loss reserves; the actions of competitors, including non-bank financial services, lending companies and digital innovators and disruptive technologies; and exposure to regulatory or competition scrutiny, legal, regulatory or competition proceedings, investigations or complaints.
Lloyds Banking Group may also make or disclose written and/or oral forward looking statements in reports filed with or furnished to the US Securities and Exchange Commission, Lloyds Banking Group annual reviews, half-year announcements, proxy statements, offering circulars, prospectuses, press releases and other written materials and in oral statements made by the directors, officers or employees of Lloyds Banking Group to third parties, including financial analysts.
Except as required by any applicable law or regulation, the forward looking statements contained in this document are made as of today’s date, and the Group expressly disclaims any obligation or undertaking to release publicly any updates or revisions to any forward looking statements contained in this document to reflect any change in the Group’s expectations with regard thereto or any change in events, conditions or circumstances on which any such statement is based. The information, statements and opinions contained in this document do not constitute a public offer under any applicable law or an offer to sell any securities or financial instruments or any advice or recommendation with respect to such securities or financial instruments.
LLOYDS BANKING GROUP STRUCTURE
The following subsidiaries are disclosed as principal subsidiaries in note 57 to the consolidated financial statements; the list below includes all significant subsidiaries, and certain other subsidiaries as noted below, of the Company at 31 December 2019.
| Name of subsidiary undertaking | | Country of
registration/
incorporation | | Percentage of equity share
capital and voting
rights held | | Nature of business | | Registered office |
| Lloyds Bank plc | | England | | 100% | | Banking and financial services | | 25 Gresham Street |
| | | | | | | | | London EC2V 7HN |
| Scottish Widows Limited | | Scotland | | 100%* | | Life assurance | | 25 Gresham Street |
| | | | | | | | | London EC2V 7HN |
| HBOS plc | | Scotland | | 100%* | | Holding company | | The Mound |
| | | | | | | | | Edinburgh EH1 1YZ |
| Bank of Scotland plc | | Scotland | | 100%* | | Banking and financial services | | The Mound |
| | | | | | | | | Edinburgh EH1 1YZ |
| Lloyds Bank Corporate Markets plc1 | | England | | 100% | | Banking and financial services | | 25 Gresham Street |
| | | | | | | | | London EC2V 7HN |
* Indirect interest
| 1 | Subsidiary that does not meet quantitative threshold for significance. Included for consistency with the consolidated financial statements. |
INDEX TO THE CONSOLIDATED FINANCIAL STATEMENTS
REPORT OF INDEPENDENT REGISTERED PUBLIC ACCOUNTING FIRM
To the board of directors and shareholders of Lloyds Banking Group plc
OPINIONS ON THE FINANCIAL STATEMENTS AND INTERNAL CONTROL OVER FINANCIAL REPORTING
We have audited the accompanying consolidated balance sheets of Lloyds Banking Group plc and its subsidiaries (the “Company”) as of31 December 2019and 31 December 2018,and the related consolidatedincome statements, consolidated statements of comprehensive income, consolidated statements of changes in equity and consolidated cash flow statements for each of the three years in the period ended31 December 2019, including the related notes (collectively referred to as the “consolidated financial statements”). We also have audited the Company’s internal control over financial reporting as of 31 December 2019, based on criteria established inInternal Control - Integrated Framework(2013)issued by the Committee of Sponsoring Organizations of the Treadway Commission (COSO).
In our opinion, the consolidated financial statements referred to above present fairly, in all material respects, the financial position of the Company as of 31 December 2019 and 31 December 2018, and the results of its operations and its cash flows for each of the three years in the period ended31 December 2019in conformity with International Financial Reporting Standards as issued by the International Accounting Standards Board. Also in our opinion, the Company maintained, in all material respects, effective internal control over financial reporting as of 31 December 2019, based on criteria established inInternal Control - Integrated Framework (2013)issued by the COSO.
CHANGES IN ACCOUNTING PRINCIPLES
As discussed in Note 1 to the consolidated financial statements, the Company changed the manner in which it accounts for leases in 2019 and the manner in which it accounts for financial instruments and revenue from contracts with customers in 2018.
BASIS FOR OPINIONS
The Company's management is responsible for these consolidated financial statements, for maintaining effective internal control over financial reporting, and for its assessment of the effectiveness of internal control over financial reporting, included in Management's Report on Internal Control over Financial Reporting appearing on page 169 of the 2019 Annual Report on Form 20-F. Our responsibility is to express opinions on the Company’s consolidated financial statements and on the Company's internal control over financial reporting based on our audits. We are a public accounting firm registered with the Public Company Accounting Oversight Board (United States) (PCAOB) and are required to be independent with respect to the Company in accordance with the U.S. federal securities laws and the applicable rules and regulations of the Securities and Exchange Commission and the PCAOB.
We conducted our audits in accordance with the standards of the PCAOB. Those standards require that we plan and perform the audits to obtain reasonable assurance about whether the consolidated financial statements are free of material misstatement, whether due to error or fraud, and whether effective internal control over financial reporting was maintained in all material respects.
Our audits of the consolidated financial statements included performing procedures to assess the risks of material misstatement of the consolidated financial statements, whether due to error or fraud, and performing procedures that respond to those risks. Such procedures included examining, on a test basis, evidence regarding the amounts and disclosures in the consolidated financial statements. Our audits also included evaluating the accounting principles used and significant estimates made by management, as well as evaluating the overall presentation of the consolidated financial statements. Our audit of internal control over financial reporting included obtaining an understanding of internal control over financial reporting, assessing the risk that a material weakness exists, and testing and evaluating the design and operating effectiveness of internal control based on the assessed risk. Our audits also included performing such other procedures as we considered necessary in the circumstances. We believe that our audits provide a reasonable basis for our opinions.
DEFINITION AND LIMITATIONS OF INTERNAL CONTROL OVER FINANCIAL REPORTING
A company’s internal control over financial reporting is a process designed to provide reasonable assurance regarding the reliability of financial reporting and the preparation of financial statements for external purposes in accordance with generally accepted accounting principles. A company’s internal control over financial reporting includes those policies and procedures that (i) pertain to the maintenance of records that, in reasonable detail, accurately and fairly reflect the transactions and dispositions of the assets of the company; (ii) provide reasonable assurance that transactions are recorded as necessary to permit preparation of financial statements in accordance with generally accepted accounting principles, and that receipts and expenditures of the company are being made only in accordance with authorizations of management and directors of the company; and (iii) provide reasonable assurance regarding prevention or timely detection of unauthorized acquisition, use, or disposition of the company’s assets that could have a material effect on the financial statements.
Because of its inherent limitations, internal control over financial reporting may not prevent or detect misstatements. Also, projections of any evaluation of effectiveness to future periods are subject to the risk that controls may become inadequate because of changes in conditions, or that the degree of compliance with the policies or procedures may deteriorate.
CRITICAL AUDIT MATTERS
The critical audit matters communicated below are matters arising from the current period audit of the consolidated financial statements that were communicated or required to be communicated to the audit committee and that (i) relate to accounts or disclosures that are material to the consolidated financial statements and (ii) involved our especially challenging, subjective, or complex judgments. The communication of critical audit matters does not alter in any way our opinion on the consolidated financial statements, taken as a whole, and we are not, by communicating the critical audit matters below, providing separate opinions on the critical audit matters or on the accounts or disclosures to which they relate.
ALLOWANCE FOR EXPECTED CREDIT LOSSES
As described in Notes 2, 3 and 20 to the consolidated financial statements, the allowance for expected credit losses (ECL) was £3,455 million as of 31 December 2019. The calculation of the allowance for ECL required management to make a number of judgments, assumptions and estimates. The most significant included probability of default, lifetime of an exposure, significant increase in credit risk, post-model adjustments and forward looking information. The measurement of the allowance for ECL is required to reflect a probability-weighted range of possible future outcomes. Alongside a defined central scenario three further scenarios are generated around specified points along the loss distribution to reflect the range of outcomes. The allowance for ECL for individual exposures takes into account the value of any collateral held, repayments, or other mitigants of loss.
The principal considerations for our determination that performing procedures relating to the allowance for ECL is a critical audit matter are (i) there was significant judgment by management in determining the allowance, which in turn led to a high degree of auditor subjectivity in
REPORT OF INDEPENDENT REGISTERED PUBLIC ACCOUNTING FIRM
performing procedures related to the impairment models, key assumptions, such as probability of default and significant increase in credit risk, post-model adjustments, the expected future cash flows related to individual exposures, the determination of the central scenario and the economic model used to select and weight the three further economic scenarios, which were used to estimate the allowance, (ii) there was significant judgment and effort in evaluating audit evidence related to these models, judgments and assumptions used to determine the allowance and (iii) the audit effort involved the use of professionals with specialised skill and knowledge.
Addressing the matter involved performing procedures and evaluating audit evidence in connection with forming our overall opinion on the consolidated financial statements. These procedures included testing the effectiveness of controls relating to the estimation process, which included controls over the data, models and assumptions used in determining the allowance for ECL. These procedures also included, among others, the involvement of professionals with specialised skill and knowledge to assist in testing management’s process to estimate the allowance for ECL including evaluating the appropriateness of methodology and models, evaluating the reasonableness of significant assumptions used in the impairment models, such as probability of default and significant increase in credit risk, and testing post model adjustments. It also included evaluating the reasonableness of key assumptions in the central scenario and the selection and weighting of the three further economic scenarios. Evaluating the assumptions used in the economic model involved assessing their reasonableness against external data and economic events that have occurred. We also assessed the reasonableness of the expected future cash flows related to individually assessed exposures.
PROVISION FOR PAYMENT PROTECTION INSURANCE
As described in Notes 3 and 38 to the consolidated financial statements, the provision for payment protection insurance (PPI) was £1,880 million as of 31 December 2019. The calculation of the provision for PPI requires the use of significant judgment. It involves forming a view on matters which are inherently uncertain such as the conversion ratio of PPI information requests to complaints.
The principal considerations for our determination that performing procedures relating to the provision for PPI is a critical audit matter are (i) there was significant judgment exercised by management in determining the provision, which in turn led to a high degree of auditor subjectivity in performing procedures related to the calculation model and key assumption, being the conversion ratio of PPI information requests to complaints, used to estimate the provision and (ii) there was significant judgment and effort in evaluating audit evidence related to the model and the key assumption used to determine the provision.
Addressing the matter involved performing procedures and evaluating audit evidence in connection with forming our overall opinion on the consolidated financial statements. These procedures included testing the effectiveness of controls relating to the calculation model used in determining the provision. These procedures also included, among others, testing management’s process to estimate the provision, including evaluating the appropriateness of the methodology and the model, and evaluating the reasonableness of the conversion ratio of PPI information requests to complaints. Evaluating this assumption involved assessing its reasonableness against historical data and comparing it to actual experience.
INSURANCE ACTUARIAL ASSUMPTIONS
As described in Notes 3, 25, 32 and 33 to the consolidated financial statements, the value of in-force business asset was £5,558 million and the liabilities arising from insurance contracts and participating investment contracts were £111,449 million as of 31 December 2019. The value of in-force business asset represents the present value of future profits expected to arise from the portfolio of in-force life insurance and participating investment contracts. The valuation of this asset and the liabilities arising from insurance contracts and participating investment contracts required management to make assumptions about future economic and operating conditions which are inherently uncertain. Some of the highly judgmental economic and non-economic assumptions used include future investment returns, future mortality rates, future expenses and future policyholder behaviour.
The principal considerations for our determination that performing procedures relating to insurance actuarial assumptions is a critical audit matter are (i) there was significant judgment by management to determine the actuarial assumptions, such as future investment returns, future mortality rates, future expenses and future policyholder behaviour, used to calculate the value of in-force business asset and the liabilities arising from insurance and participating contracts, (ii) there was significant judgment and audit effort to evaluate the evidence obtained related to these assumptions and (iii) the audit effort involved the use of professionals with specialised skill or knowledge.
Addressing the matter involved performing procedures and evaluating audit evidence in connection with forming our overall opinion on the consolidated financial statements. These procedures included testing the effectiveness of controls relating to the determination of the actuarial assumptions, such as the future investment returns, future mortality rates, future expenses and future policyholder behaviour. These procedures also included, among others, the involvement of professionals with specialised skill and knowledge to assist in assessing the reasonableness of the actuarial assumptions, and where appropriate, comparing them to peers in the insurance market or benchmarking data.
DEFINED BENEFIT OBLIGATION
As described in Notes 3 and 36 to the consolidated financial statements, the carrying value of the defined benefit obligation was £45,241 million as of 31 December 2019. The valuation of the defined benefit obligation required management to make a number of assumptions. The key assumptions are the discount rate applied to future cash flows, the rate of inflation and the expected lifetime of the schemes’ members. The discount rate is set by management with reference to market yields at the end of the reporting period on high quality corporate bonds in the currency and with a term consistent with the defined benefit pension schemes’ obligations. The rate of inflation is set by management with reference to market indices. The expected lifetime of the schemes’ members is set by management by considering latest market practice and actual experience in determining both current mortality expectations and the rate of future mortality improvement.
The principal considerations for our determination that performing procedures relating to the defined benefit obligation is a critical audit matter are (i) there was significant judgment by management to determine the discount rate to be applied to the future cash flows, the rate of inflation and the expected lifetime of the schemes’ members, which in turn led to significant auditor judgment and audit effort to evaluate the evidence obtained related to the actuarial models, inputs and assumptions and (ii) the audit effort involved the use of professionals with specialised skill or knowledge.
Addressing the matter involved performing procedures and evaluating audit evidence in connection with forming our overall opinion on the consolidated financial statements. These procedures included testing the effectiveness of controls relating to the estimation process, which included controls over data, models and key assumptions such as the discount rate applied to future cash flows, the rate of inflation and the expected lifetime of the schemes’ members, used to calculate the defined benefit obligation. These procedures also included, among others, the involvement of professionals with specialised skill and knowledge to assist in testing management’s process to estimate the defined benefit obligation, including evaluating the appropriateness of methodology and models, and evaluating the reasonableness of key assumptions, such as the discount rate, the rate of inflation and the expected lifetime of the schemes’ members. Evaluating the assumptions used in the models involved assessing their reasonableness by comparing them to our own independently determined benchmarks.
REPORT OF INDEPENDENT REGISTERED PUBLIC ACCOUNTING FIRM
VALUATION OF CERTAIN LEVEL 3 FINANCIAL INSTRUMENT ASSETS
As described in Notes 3, 50 and 53 to the consolidated financial statements, the carrying value of the level 3 financial instrument assets held at fair value was £15,316 million as of 31 December 2019. Within this balance, there were two portfolios (Loans and advances to customers of £8,250 million and debt securities of £1,643 million) which are each concentrations of similar, non-traded assets. Loans and advances to customers classified as level 3 are valued using a discounted cash flow model. The key assumptions within this model include the credit ratings applied to borrowers and the illiquidity premiums. In relation to debt securities, where there is limited trading activity, management uses valuation models and consensus pricing information from third party pricing services to determine an appropriate valuation.
The principal considerations for our determination that performing procedures relating to the valuation of certain level 3 financial instrument assets is a critical audit matter are (i) there was judgment by management to determine the fair value of the level 3 financial instrument assets using valuation models which relied upon unobservable inputs, (ii) there was judgment required to evaluate the audit evidence obtained related to the valuation models, key assumptions, such as the credit ratings and illiquidity premiums, and consensus pricing information and (iii) the audit effort involved the use of professionals with specialised skill or knowledge.
Addressing the matter involved performing procedures and evaluating audit evidence in connection with forming our overall opinion on the consolidated financial statements. These procedures included testing the effectiveness of controls relating to the valuation of the financial instrument assets, including controls over the methodology, key assumptions, such as the credit ratings and illiquidity premiums, and pricing information. These procedures also included, among others, the involvement of professionals with specialised skill and knowledge to assist in reviewing the methodology, assessing the reasonableness of key assumptions, such as the credit ratings and illiquidity premiums, and developing an independent range of prices and comparing these to management’s estimate.
/s/ PricewaterhouseCoopers LLP
London, United Kingdom
25 February 2020
We have served as the Company’s auditor since 1995.
CONSOLIDATED INCOME STATEMENT
for the year ended 31 December
| | | | | | 2019 | | | 2018† | | | 2017† | |
| | | Note | | | £ million | | | £ million | | | £ million | |
| Interest and similar income | | | | | 16,861 | | | | 16,349 | | | | 16,006 | |
| Interest and similar expense | | | | | (6,681 | ) | | | (2,953 | ) | | | (5,094 | ) |
| Net interest income | | 5 | | | 10,180 | | | | 13,396 | | | | 10,912 | |
| Fee and commission income | | | | | 2,756 | | | | 2,848 | | | | 2,965 | |
| Fee and commission expense | | | | | (1,350 | ) | | | (1,386 | ) | | | (1,382 | ) |
| Net fee and commission income | | 6 | | | 1,406 | | | | 1,462 | | | | 1,583 | |
| Net trading income | | 7 | | | 18,288 | | | | (3,876 | ) | | | 11,817 | |
| Insurance premium income | | 8 | | | 9,574 | | | | 9,189 | | | | 7,930 | |
| Other operating income | | 9 | | | 2,908 | | | | 1,920 | | | | 1,995 | |
| Other income | | | | | 32,176 | | | | 8,695 | | | | 23,325 | |
| Total income | | | | | 42,356 | | | | 22,091 | | | | 34,237 | |
| Insurance claims | | 10 | | | (23,997 | ) | | | (3,465 | ) | | | (15,578 | ) |
| Total income, net of insurance claims | | | | | 18,359 | | | | 18,626 | | | | 18,659 | |
| Regulatory provisions | | | | | (2,895 | ) | | | (1,350 | ) | | | (2,165 | ) |
| Other operating expenses | | | | | (9,775 | ) | | | (10,379 | ) | | | (10,181 | ) |
| Total operating expenses | | 11 | | | (12,670 | ) | | | (11,729 | ) | | | (12,346 | ) |
| Trading surplus | | | | | 5,689 | | | | 6,897 | | | | 6,313 | |
| Impairment | | 13 | | | (1,296 | ) | | | (937 | ) | | | (688 | ) |
| Profit before tax | | | | | 4,393 | | | | 5,960 | | | | 5,625 | |
| Tax expense | | 14 | | | (1,387 | ) | | | (1,454 | ) | | | (1,626 | ) |
| Profit for the year | | | | | 3,006 | | | | 4,506 | | | | 3,999 | |
| | | | | | | | | | | | | | | |
| Profit attributable to ordinary shareholders | | | | | 2,459 | | | | 3,975 | | | | 3,494 | |
| Profit attributable to other equity holders1 | | | | | 466 | | | | 433 | | | | 415 | |
| Profit attributable to equity holders | | | | | 2,925 | | | | 4,408 | | | | 3,909 | |
| Profit attributable to non-controlling interests | | | | | 81 | | | | 98 | | | | 90 | |
| Profit for the year | | | | | 3,006 | | | | 4,506 | | | | 3,999 | |
| | | | | | | | | | | | | | | |
| Basic earnings per share | | 15 | | | 3.5p | | | | 5.5p | | | | 4.9p | |
| Diluted earnings per share | | 15 | | | 3.4p | | | | 5.5p | | | | 4.8p | |
The accompanying notes are an integral part of the consolidated financial statements.
CONSOLIDATED STATEMENT OF COMPREHENSIVE INCOME
for the year ended 31 December
| | | 2019 | | | 20181 | | | 20171 | |
| | | £ million | | | £ million | | | £ million | |
| Profit for the year | | | 3,006 | | | | 4,506 | | | | 3,999 | |
| Other comprehensive income | | | | | | | | | | | | |
| Items that will not subsequently be reclassified to profit or loss: | | | | | | | | | | | | |
| Post-retirement defined benefit scheme remeasurements: | | | | | | | | | | | | |
| Remeasurements before tax | | | (1,433 | ) | | | 167 | | | | 628 | |
| Tax | | | 316 | | | | (47 | ) | | | (146 | ) |
| | | | (1,117 | ) | | | 120 | | | | 482 | |
| Movements in revaluation reserve in respect of equity shares held at fair value through other comprehensive income: | | | | | | | | | | | | |
| Change in fair value | | | – | | | | (97 | ) | | | | |
| Tax | | | 12 | | | | 22 | | | | | |
| | | | 12 | | | | (75 | ) | | | | |
| Gains and losses attributable to own credit risk: | | | | | | | | | | | | |
| (Losses) gains before tax | | | (419 | ) | | | 533 | | | | (55 | ) |
| Tax | | | 113 | | | | (144 | ) | | | 15 | |
| | | | (306 | ) | | | 389 | | | | (40 | ) |
| Share of other comprehensive income of associates and joint ventures | | | – | | | | 8 | | | | – | |
| | | | | | | | | | | | | |
| Items that may subsequently be reclassified to profit or loss: | | | | | | | | | | | | |
| Movements in revaluation reserve in respect of debt securities held at fair value through other comprehensive income: | | | | | | | | | | | | |
| Change in fair value | | | (30 | ) | | | (37 | ) | | | | |
| Income statement transfers in respect of disposals | | | (196 | ) | | | (275 | ) | | | | |
| Impairment recognised in the income statement | | | (1 | ) | | | – | | | | | |
| Tax | | | 71 | | | | 119 | | | | | |
| | | | (156 | ) | | | (193 | ) | | | | |
| Movements in revaluation reserve in respect of available for sale financial assets: | | | | | | | | | | | | |
| Change in fair value | | | | | | | | | | | 303 | |
| Income statement transfers in respect of disposals | | | | | | | | | | | (446 | ) |
| Income statement transfers in respect of impairment | | | | | | | | | | | 6 | |
| Tax | | | | | | | | | | | 63 | |
| | | | | | | | | | | | (74 | ) |
| Movement in cash flow hedging reserve: | | | | | | | | | | | | |
| Effective portion of changes in fair value taken to other comprehensive income | | | 1,209 | | | | 234 | | | | (363 | ) |
| Net income statement transfers | | | (608 | ) | | | (701 | ) | | | (651 | ) |
| Tax | | | (148 | ) | | | 113 | | | | 283 | |
| | | | 453 | | | | (354 | ) | | | (731 | ) |
| Currency translation differences (tax: nil) | | | (12 | ) | | | (8 | ) | | | (32 | ) |
| Other comprehensive income for the year, net of tax | | | (1,126 | ) | | | (113 | ) | | | (395 | ) |
| Total comprehensive income for the year | | | 1,880 | | | | 4,393 | | | | 3,604 | |
| | | | | | | | | | | | | |
| Total comprehensive income attributable to ordinary shareholders | | | 1,333 | | | | 3,862 | | | | 3,099 | |
| Total comprehensive income attributable to other equity holders | | | 466 | | | | 433 | | | | 415 | |
| Total comprehensive income attributable to equity holders | | | 1,799 | | | | 4,295 | | | | 3,514 | |
| Total comprehensive income attributable to non-controlling interests | | | 81 | | | | 98 | | | | 90 | |
| Total comprehensive income for the year | | | 1,880 | | | | 4,393 | | | | 3,604 | |
The accompanying notes are an integral part of the consolidated financial statements.
CONSOLIDATED BALANCE SHEET
at 31 December
| | | | | 2019 | | | 2018 | |
| | | Note | | £ million | | | £ million | |
| Assets | | | | | | | | |
| Cash and balances at central banks | | | | | 55,130 | | | | 54,663 | |
| Items in the course of collection from banks | | | | | 313 | | | | 647 | |
| Financial assets at fair value through profit or loss | | 16 | | | 160,189 | | | | 158,529 | |
| Derivative financial instruments | | 17 | | | 26,369 | | | | 23,595 | |
| Loans and advances to banks | | | | | 9,775 | | | | 6,283 | |
| Loans and advances to customers | | | | | 494,988 | | | | 484,858 | |
| Debt securities | | | | | 5,544 | | | | 5,238 | |
| Financial assets at amortised cost | | 18 | | | 510,307 | | | | 496,379 | |
| Financial assets at fair value through other comprehensive income | | 21 | | | 25,092 | | | | 24,815 | |
| Investments in joint ventures and associates | | 22 | | | 304 | | | | 91 | |
| Goodwill | | 24 | | | 2,324 | | | | 2,310 | |
| Value of in-force business | | 25 | | | 5,558 | | | | 4,762 | |
| Other intangible assets | | 26 | | | 3,808 | | | | 3,347 | |
| Property, plant and equipment | | 27 | | | 13,104 | | | | 12,300 | |
| Current tax recoverable | | | | | 7 | | | | 5 | |
| Deferred tax assets | | 37 | | | 2,666 | | | | 2,453 | |
| Retirement benefit assets | | 36 | | | 681 | | | | 1,267 | |
| Assets arising from reinsurance contracts held | | | | | 23,567 | | | | 7,860 | |
| Other assets | | 28 | | | 4,474 | | | | 4,575 | |
| Total assets | | | | | 833,893 | | | | 797,598 | |
The accompanying notes are an integral part of the consolidated financial statements.
CONSOLIDATED BALANCE SHEET
at 31 December
| Equity and liabilities | | Note | | 2019
£ million | | | 2018
£ million | |
| Liabilities | | | | | | | | |
| Deposits from banks | | | | | 28,179 | | | | 30,320 | |
| Customer deposits | | | | | 421,320 | | | | 418,066 | |
| Items in course of transmission to banks | | | | | 373 | | | | 636 | |
| Financial liabilities at fair value through profit or loss | | 29 | | | 21,486 | | | | 30,547 | |
| Derivative financial instruments | | 17 | | | 25,779 | | | | 21,373 | |
| Notes in circulation | | | | | 1,079 | | | | 1,104 | |
| Debt securities in issue | | 30 | | | 97,689 | | | | 91,168 | |
| Liabilities arising from insurance contracts and participating investment contracts | | 32 | | | 111,449 | | | | 98,874 | |
| Liabilities arising from non-participating investment contracts | | 34 | | | 37,459 | | | | 13,853 | |
| Other liabilities | | 35 | | | 20,333 | | | | 19,633 | |
| Retirement benefit obligations | | 36 | | | 257 | | | | 245 | |
| Current tax liabilities | | | | | 187 | | | | 377 | |
| Deferred tax liabilities | | 37 | | | 44 | | | | – | |
| Other provisions | | 38 | | | 3,323 | | | | 3,547 | |
| Subordinated liabilities | | 39 | | | 17,130 | | | | 17,656 | |
| Total liabilities | | | | | 786,087 | | | | 747,399 | |
| Equity | | | | | | | | | | |
| Share capital | | 40 | | | 7,005 | | | | 7,116 | |
| Share premium account | | 41 | | | 17,751 | | | | 17,719 | |
| Other reserves | | 42 | | | 13,695 | | | | 13,210 | |
| Retained profits | | 43 | | | 3,246 | | | | 5,389 | |
| Shareholders’ equity | | | | | 41,697 | | | | 43,434 | |
| Other equity instruments | | 44 | | | 5,906 | | | | 6,491 | |
| Total equity excluding non-controlling interests | | | | | 47,603 | | | | 49,925 | |
| Non-controlling interests | | | | | 203 | | | | 274 | |
| Total equity | | | | | 47,806 | | | | 50,199 | |
| Total equity and liabilities | | | | | 833,893 | | | | 797,598 | |
The accompanying notes are an integral part of the consolidated financial statements.
CONSOLIDATED STATEMENT OF CHANGES IN EQUITY
for the year ended 31 December
| | | Attributable to equity shareholders | | | | | | | | | |
| | | Share capital
and premium
£ million | | | Other
reserves
£ million | | | Retained
profits
£ million | | | Total
£ million | | | Other
equity
instruments
£ million | | | Non-
controlling
interests
£ million | | | Total
£ million | |
| Balance at 1 January 2019 | | | 24,835 | | | | 13,210 | | | | 5,389 | | | | 43,434 | | | | 6,491 | | | | 274 | | | | 50,199 | |
| Comprehensive income | | | | | | | | | | | | | | | | | | | | | | | | | | | | |
| Profit for the year | | | – | | | | – | | | | 2,925 | | | | 2,925 | | | | – | | | | 81 | | | | 3,006 | |
| Other comprehensive income | | | | | | | | | | | | | | | | | | | | | | | | | | | | |
| Post-retirement defined benefit scheme remeasurements, net of tax | | | – | | | | – | | | | (1,117 | ) | | | (1,117 | ) | | | – | | | | – | | | | (1,117 | ) |
| Movements in revaluation reserve in respect of financial assets held at fair value through other comprehensive income, net of tax: | | | | | | | | | | | | | | | | | | | | | | | | | | | | |
| Debt securities | | | – | | | | (156 | ) | | | – | | | | (156 | ) | | | – | | | | – | | | | (156 | ) |
| Equity shares | | | – | | | | 12 | | | | – | | | | 12 | | | | – | | | | – | | | | 12 | |
| Gains and losses attributable to own credit risk, net of tax | | | – | | | | – | | | | (306 | ) | | | (306 | ) | | | – | | | | – | | | | (306 | ) |
| Movements in cash flow hedging reserve, net of tax | | | – | | | | 453 | | | | – | | | | 453 | | | | – | | | | – | | | | 453 | |
| Currency translation differences (tax: £nil) | | | – | | | | (12 | ) | | | – | | | | (12 | ) | | | – | | | | – | | | | (12 | ) |
| Total other comprehensive income | | | – | | | | 297 | | | | (1,423 | ) | | | (1,126 | ) | | | – | | | | – | | | | (1,126 | ) |
| Total comprehensive income | | | – | | | | 297 | | | | 1,502 | | | | 1,799 | | | | – | | | | 81 | | | | 1,880 | |
| Transactions with owners | | | | | | | | | | | | | | | | | | | | | | | | | | | | |
| Dividends | | | – | | | | – | | | | (2,312 | ) | | | (2,312 | ) | | | – | | | | (138 | ) | | | (2,450 | ) |
| Distributions on other equity instruments | | | – | | | | – | | | | (466 | ) | | | (466 | ) | | | – | | | | – | | | | (466 | ) |
| Issue of ordinary shares | | | 107 | | | | – | | | | – | | | | 107 | | | | – | | | | – | | | | 107 | |
| Share buyback | | | (189 | ) | | | 189 | | | | (1,095 | ) | | | (1,095 | ) | | | – | | | | – | | | | (1,095 | ) |
| Redemption of preference shares | | | 3 | | | | (3 | ) | | | – | | | | – | | | | – | | | | – | | | | – | |
| Issue of other equity instruments (note 44) | | | – | | | | – | | | | (3 | ) | | | (3 | ) | | | 896 | | | | – | | | | 893 | |
| Redemptions of other equity instruments (note 44) | | | – | | | | – | | | | – | | | | – | | | | (1,481 | ) | | | – | | | | (1,481 | ) |
| Movement in treasury shares | | | – | | | | – | | | | (3 | ) | | | (3 | ) | | | – | | | | – | | | | (3 | ) |
| Value of employee services: | | | | | | | | | | | | | | | | | | | | | | | | | | | | |
| Share option schemes | | | – | | | | – | | | | 71 | | | | 71 | | | | – | | | | – | | | | 71 | |
| Other employee award schemes | | | – | | | | – | | | | 165 | | | | 165 | | | | – | | | | – | | | | 165 | |
| Changes in non-controlling interests | | | – | | | | – | | | | – | | | | – | | | | – | | | | (14 | ) | | | (14 | ) |
| Total transactions with owners | | | (79 | ) | | | 186 | | | | (3,643 | ) | | | (3,536 | ) | | | (585 | ) | | | (152 | ) | | | (4,273 | ) |
| Realised gains and losses on equity shares held at fair value through other comprehensive income | | | – | | | | 2 | | | | (2 | ) | | | – | | | | – | | | | – | | | | – | |
| At 31 December 2019 | | | 24,756 | | | | 13,695 | | | | 3,246 | | | | 41,697 | | | | 5,906 | | | | 203 | | | | 47,806 | |
Further details of movements in the Group’s share capital, reserves and other equity instruments are provided in notes 40, 41, 42, 43 and 44.
The accompanying notes are an integral part of the consolidated financial statements.
CONSOLIDATED STATEMENT OF CHANGES IN EQUITY
for the year ended 31 December
| | | Attributable to equity shareholders | | | | | | | | | |
| | | Share capital
and premium
£ million | | | Other
reserves
£ million | | | Retained
profits
£ million | | | Total
£ million | | | Other
equity
instruments
£ million | | | Non-
controlling
interests
£ million | | | Total
£ million | |
| Balance at 31 December 2017 | | | 24,831 | | | | 13,815 | | | | 4,905 | | | | 43,551 | | | | 5,355 | | | | 237 | | | | 49,143 | |
| Adjustment on adoption of IFRS 9 and IFRS 15 | | | – | | | | (262 | ) | | | (929 | ) | | | (1,191 | ) | | | – | | | | – | | | | (1,191 | ) |
| Balance at 1 January 2018 | | | 24,831 | | | | 13,553 | | | | 3,976 | | | | 42,360 | | | | 5,355 | | | | 237 | | | | 47,952 | |
| Comprehensive income | | | | | | | | | | | | | | | | | | | | | | | | | | | | |
| Profit for the year1 | | | – | | | | – | | | | 4,408 | | | | 4,408 | | | | – | | | | 98 | | | | 4,506 | |
| Other comprehensive income | | | | | | | | | | | | | | | | | | | | | | | | | | | | |
| Post-retirement defined benefit scheme remeasurements, net of tax | | | – | | | | – | | | | 120 | | | | 120 | | | | – | | | | – | | | | 120 | |
| Share of other comprehensive income of associates and joint ventures | | | – | | | | – | | | | 8 | | | | 8 | | | | – | | | | – | | | | 8 | |
| Movements in revaluation reserve in respect of financial assets held at fair value through other comprehensive income, net of tax: | | | | | | | | | | | | | | | | | | | | | | | | | | | | |
| Debt securities | | | – | | | | (193 | ) | | | – | | | | (193 | ) | | | – | | | | – | | | | (193 | ) |
| Equity shares | | | – | | | | (75 | ) | | | – | | | | (75 | ) | | | – | | | | – | | | | (75 | ) |
| Gains and losses attributable to own credit risk, net of tax | | | – | | | | – | | | | 389 | | | | 389 | | | | – | | | | – | | | | 389 | |
| Movements in cash flow hedging reserve, net of tax | | | – | | | | (354 | ) | | | – | | | | (354 | ) | | | – | | | | – | | | | (354 | ) |
| Currency translation differences (tax: £nil) | | | – | | | | (8 | ) | | | – | | | | (8 | ) | | | – | | | | – | | | | (8 | ) |
| Total other comprehensive income | | | – | | | | (630 | ) | | | 517 | | | | (113 | ) | | | – | | | | – | | | | (113 | ) |
| Total comprehensive income | | | – | | | | (630 | ) | | | 4,925 | | | | 4,295 | | | | – | | | | 98 | | | | 4,393 | |
| Transactions with owners | | | | | | | | | | | | | | | | | | | | | | | | | | | | |
| Dividends | | | – | | | | – | | | | (2,240 | ) | | | (2,240 | ) | | | – | | | | (61 | ) | | | (2,301 | ) |
| Distributions on other equity instruments1 | | | – | | | | – | | | | (433 | ) | | | (433 | ) | | | – | | | | – | | | | (433 | ) |
| Issue of ordinary shares | | | 162 | | | | – | | | | – | | | | 162 | | | | – | | | | – | | | | 162 | |
| Share buyback | | | (158 | ) | | | 158 | | | | (1,005 | ) | | | (1,005 | ) | | | – | | | | – | | | | (1,005 | ) |
| Issue of other equity instruments | | | – | | | | – | | | | (5 | ) | | | (5 | ) | | | 1,136 | | | | – | | | | 1,131 | |
| Movement in treasury shares | | | – | | | | – | | | | 40 | | | | 40 | | | | – | | | | – | | | | 40 | |
| Value of employee services: | | | | | | | | | | | | | | | | | | | | | | | | | | | | |
| Share option schemes | | | – | | | | – | | | | 53 | | | | 53 | | | | – | | | | – | | | | 53 | |
| Other employee award schemes | | | – | | | | – | | | | 207 | | | | 207 | | | | – | | | | – | | | | 207 | |
| Total transactions with owners | | | 4 | | | | 158 | | | | (3,383 | ) | | | (3,221 | ) | | | 1,136 | | | | (61 | ) | | | (2,146 | ) |
| Realised gains and losses on equity shares held at fair value through other comprehensive income | | | – | | | | 129 | | | | (129 | ) | | | – | | | | – | | | | – | | | | – | |
| At 31 December 2018 | | | 24,835 | | | | 13,210 | | | | 5,389 | | | | 43,434 | | | | 6,491 | | | | 274 | | | | 50,199 | |
The accompanying notes are an integral part of the consolidated financial statements.
CONSOLIDATED STATEMENT OF CHANGES IN EQUITY
for the year ended 31 December
| | | Attributable to equity shareholders | | | | | | | | | |
| | | Share capital
and premium
£ million | | | Other
reserves
£ million | | | Retained
profits
£ million | | | Total
£ million | | | Other equity
instruments
£ million | | | Non-controlling
interests
£ million | | | Total
£ million | |
| Balance at 1 January 2017 | | | 24,768 | | | | 14,652 | | | | 3,250 | | | | 42,670 | | | | 5,355 | | | | 440 | | | | 48,465 | |
| Comprehensive income | | | | | | | | | | | | | | | | | | | | | | | | | | | | |
| Profit for the year1 | | | – | | | | – | | | | 3,909 | | | | 3,909 | | | | – | | | | 90 | | | | 3,999 | |
| Other comprehensive income | | | | | | | | | | | | | | | | | | | | | | | | | | | | |
| Post-retirement defined benefit scheme remeasurements, net of tax | | | – | | | | – | | | | 482 | | | | 482 | | | | – | | | | – | | | | 482 | |
| Movements in revaluation reserve in respect of available-for-sale financial assets, net of tax | | | – | | | | (74 | ) | | | – | | | | (74 | ) | | | – | | | | – | | | | (74 | ) |
| Gains and losses attributable to own credit risk, net of tax | | | – | | | | – | | | | (40 | ) | | | (40 | ) | | | – | | | | – | | | | (40 | ) |
| Movements in cash flow hedging reserve, net of tax | | | – | | | | (731 | ) | | | – | | | | (731 | ) | | | – | | | | – | | | | (731 | ) |
| Currency translation differences (tax: £nil) | | | – | | | | (32 | ) | | | – | | | | (32 | ) | | | – | | | | – | | | | (32 | ) |
| Total other comprehensive income | | | – | | | | (837 | ) | | | 442 | | | | (395 | ) | | | – | | | | – | | | | (395 | ) |
| Total comprehensive income | | | – | | | | (837 | ) | | | 4,351 | | | | 3,514 | | | | – | | | | 90 | | | | 3,604 | |
| Transactions with owners | | | | | | | | | | | | | | | | | | | | | | | | | | | | |
| Dividends | | | – | | | | – | | | | (2,284 | ) | | | (2,284 | ) | | | – | | | | (51 | ) | | | (2,335 | ) |
| Distributions on other equity instruments1 | | | – | | | | – | | | | (415 | ) | | | (415 | ) | | | – | | | | – | | | | (415 | ) |
| Issue of ordinary shares | | | 63 | | | | – | | | | – | | | | 63 | | | | – | | | | – | | | | 63 | |
| Movement in treasury shares | | | – | | | | – | | | | (411 | ) | | | (411 | ) | | | – | | | | – | | | | (411 | ) |
| Value of employee services: | | | | | | | | | | | | | | | | | | | | | | | | | | | | |
| Share option schemes | | | – | | | | – | | | | 82 | | | | 82 | | | | – | | | | – | | | | 82 | |
| Other employee award schemes | | | – | | | | – | | | | 332 | | | | 332 | | | | – | | | | – | | | | 332 | |
| Changes in non-controlling interests | | | – | | | | – | | | | – | | | | – | | | | – | | | | (242 | ) | | | (242 | ) |
| Total transactions with owners | | | 63 | | | | – | | | | (2,696 | ) | | | (2,633 | ) | | | – | | | | (293 | ) | | | (2,926 | ) |
| Balance at 31 December 2017 | | | 24,831 | | | | 13,815 | | | | 4,905 | | | | 43,551 | | | | 5,355 | | | | 237 | | | | 49,143 | |
1 Restated, see note 1.
The accompanying notes are an integral part of the consolidated financial statements.
CONSOLIDATED CASH FLOW STATEMENT
for the year ended 31 December
| | | Note | | 2019
£ million | | | 2018
£ million | | | 2017
£ million | |
| Profit before tax | | | | | 4,393 | | | | 5,960 | | | | 5,625 | |
| Adjustments for: | | | | | | | | | | | | | | |
| Change in operating assets | | 54(A | ) | | (11,049 | ) | | | (4,472 | ) | | | (15,492 | ) |
| Change in operating liabilities | | 54(B | ) | | 3,642 | | | | (8,673 | ) | | | (4,282 | ) |
| Non-cash and other items | | 54(C | ) | | 15,573 | | | | (2,892 | ) | | | 11,982 | |
| Tax paid | | | | | (1,278 | ) | | | (1,030 | ) | | | (1,028 | ) |
| Net cash provided by (used in) operating activities | | | | | 11,281 | | | | (11,107 | ) | | | (3,195 | ) |
| Cash flows from investing activities | | | | | | | | | | | | | | |
| Purchase of financial assets | | | | | (9,730 | ) | | | (12,657 | ) | | | (7,862 | ) |
| Proceeds from sale and maturity of financial assets | | | | | 9,631 | | | | 26,806 | | | | 18,675 | |
| Purchase of fixed assets | | | | | (3,442 | ) | | | (3,514 | ) | | | (3,655 | ) |
| Proceeds from sale of fixed assets | | | | | 1,432 | | | | 1,334 | | | | 1,444 | |
| Acquisition of businesses, net of cash acquired | | 54(E | ) | | (21 | ) | | | (49 | ) | | | (1,923 | ) |
| Disposal of businesses, net of cash disposed | | 54(F | ) | | – | | | | 1 | | | | 129 | |
| Net cash (used in) provided by investing activities | | | | | (2,130 | ) | | | 11,921 | | | | 6,808 | |
| Cash flows from financing activities | | | | | | | | | | | | | | |
| Dividends paid to ordinary shareholders | | | | | (2,312 | ) | | | (2,240 | ) | | | (2,284 | ) |
| Distributions on other equity instruments | | | | | (466 | ) | | | (433 | ) | | | (415 | ) |
| Dividends paid to non-controlling interests | | | | | (138 | ) | | | (61 | ) | | | (51 | ) |
| Interest paid on subordinated liabilities | | | | | (1,178 | ) | | | (1,268 | ) | | | (1,275 | ) |
| Proceeds from issue of subordinated liabilities | | | | | – | | | | 1,729 | | | | – | |
| Proceeds from issue of other equity instruments | �� | | | | 893 | | | | 1,131 | | | | – | |
| Proceeds from issue of ordinary shares | | | | | 36 | | | | 102 | | | | 14 | |
| Share buyback | | | | | (1,095 | ) | | | (1,005 | ) | | | – | |
| Repayment of subordinated liabilities | | | | | (818 | ) | | | (2,256 | ) | | | (1,008 | ) |
| Redemption of other equity instruments | | | | | (1,481 | ) | | | – | | | | – | |
| Net cash used in financing activities | | | | | (6,559 | ) | | | (4,301 | ) | | | (5,019 | ) |
| Effects of exchange rate changes on cash and cash equivalents | | | | | (5 | ) | | | 3 | | | | – | |
| Change in cash and cash equivalents | | | | | 2,587 | | | | (3,484 | ) | | | (1,406 | ) |
| Cash and cash equivalents at beginning of year | | | | | 55,224 | | | | 58,708 | | | | 62,388 | |
| Cash and cash equivalents at end of year | | 54(D | ) | | 57,811 | | | | 55,224 | | | | 60,982 | |
| Adjustment on adoption of IFRS 9 | | | | | | | | | | | | | (2,274 | ) |
| Cash and cash equivalents at 1 January 2018 | | | | | | | | | | | | | 58,708 | |
The accompanying notes are an integral part of the consolidated financial statements.
Notes to the consolidated financial statements
for the year ended 31 December
NOTE 1: BASIS OF PREPARATION
The consolidated financial statements of Lloyds Banking Group plc and its subsidiary undertakings (the Group) have been prepared in accordance with International Financial Reporting Standards (IFRS). IFRS comprises accounting standards prefixed IFRS issued by the International Accounting Standards Board (IASB) and those prefixed IAS issued by the IASB’s predecessor body as well as interpretations issued by the IFRS Interpretations Committee (IFRS IC) and its predecessor body. On adoption of IFRS 9 in 2018, the Group elected to continue applying hedge accounting under IAS 39.
The financial information has been prepared under the historical cost convention, as modified by the revaluation of investment properties, financial assets measured at fair value through other comprehensive income, trading securities and certain other financial assets and liabilities at fair value through profit or loss and all derivative contracts. As stated on page 169, the directors consider that it is appropriate to continue to adopt the going concern basis in preparing the financial statements.
The Group adopted IFRS 16Leasesfrom 1 January 2019. IFRS 16 replaces IAS 17Leasesand addresses the classification and measurement of all leases. The Group’s accounting as a lessor under IFRS 16 is substantially unchanged from its approach under IAS 17; however for lessee accounting there is no longer a distinction between the accounting for finance and operating leases. For all assets the lessee recognises a right-of-use asset and a corresponding liability at the date at which the leased asset is available for use. Assets and liabilities arising from a lease are initially measured on a present value basis. The lease payments are discounted using the interest rate implicit in the lease, if that rate can be determined, or the lessee’s incremental borrowing rate. Lease payments are allocated between the liability and finance cost. The finance cost is charged to profit or loss over the lease period so as to produce a constant periodic rate of interest on the remaining balance of the liability for each period. The right-of-use asset is depreciated over the shorter of the asset’s useful life and the lease term on a straight-line basis. Payments associated with leases with a lease term of 12 months or less and leases of low-value assets are recognised as an expense in profit or loss on a straight-line basis.
The Group elected to apply the standard retrospectively with the cumulative effect of initial application being recognised at 1 January 2019, comparatives have therefore not been restated. There was no impact on shareholders’ equity. Further details of the impact of adoption of IFRS 16 are provided in note 55.
The Group has also implemented the amendments to IAS 12Income Taxeswith effect from 1 January 2019 and as a result tax relief on distributions on other equity instruments, previously taken directly to retained profits, is reported within tax expense in the income statement. Comparatives have been restated. Adoption of these amendments to IAS 12 has resulted in a reduction in tax expense and an increase in profit for the year in 2019 of £115 million (2018: £106 million; 2017: £102 million) for the Group and £89 million (2018: £82 million; 2017: £79 million) for the Company. There is no impact on shareholders’ equity or on earnings per share.
The Group has early adopted the hedge accounting amendmentsInterest Rate Benchmark Reform, issued by the IASB as a response to issues arising from the planned replacement of interest rate benchmarks in a number of jurisdictions. The amendments confirm that entities applying hedge accounting can continue to assume that the interest rate benchmark on which the hedged cash flows and cash flows of the hedging instrument are based is not altered as a result of the uncertainties of the interest rate benchmark reform. Comparatives have not been restated. Further details are provided in note 53.
Details of those IFRS pronouncements which will be relevant to the Group but which were not effective at 31 December 2019 and which have not been applied in preparing these financial statements are given in note 56.
The Group adopted IFRS 9 and IFRS 15 with effect from 1 January 2018.
NOTE 2: ACCOUNTING POLICIES
The Group’s accounting policies are set out below. These accounting policies have been applied consistently.
(A) Consolidation
The assets, liabilities and results of Group undertakings (including structured entities) are included in the financial statements on the basis of accounts made up to the reporting date. Group undertakings include subsidiaries, associates and joint ventures.
(1) SUBSIDIARIES
Subsidiaries are entities controlled by the Group. The Group controls an entity when it has power over the entity, is exposed to, or has rights to, variable returns from its involvement with the entity, and has the ability to affect those returns through the exercise of its power. This generally accompanies a shareholding of more than one half of the voting rights although in certain circumstances a holding of less than one half of the voting rights may still result in the ability of the Group to exercise control. The existence and effect of potential voting rights that are currently exercisable or convertible are considered when assessing whether the Group controls another entity. The Group reassesses whether or not it controls an entity if facts and circumstances indicate that there are changes to any of the above elements. Subsidiaries are fully consolidated from the date on which control is transferred to the Group; they are de-consolidated from the date that control ceases.
The Group consolidates collective investment vehicles if its beneficial ownership interests give it substantive rights to remove the external fund manager over the investment activities of the fund. Where a subsidiary of the Group is the fund manager of a collective investment vehicle, the Group considers a number of factors in determining whether it acts as principal, and therefore controls the collective investment vehicle, including: an assessment of the scope of the Group’s decision making authority over the investment vehicle; the rights held by other parties including substantive removal rights without cause over the Group acting as fund manager; the remuneration to which the Group is entitled in its capacity as decision maker; and the Group’s exposure to variable returns from the beneficial interest it holds in the investment vehicle. Consolidation may be appropriate in circumstances where the Group has less than a majority beneficial interest. Where a collective investment vehicle is consolidated the interests of parties other than the Group are reported in other liabilities and the movement in these interests in interest expense.
Structured entities are entities that are designed so that their activities are not governed by way of voting rights. In assessing whether the Group has power over such entities in which it has an interest, the Group considers factors such as the purpose and design of the entity; its practical ability to direct the relevant activities of the entity; the nature of the relationship with the entity; and the size of its exposure to the variability of returns of the entity.
The treatment of transactions with non-controlling interests depends on whether, as a result of the transaction, the Group loses control of the subsidiary. Changes in the parent’s ownership interest in a subsidiary that do not result in a loss of control are accounted for as equity transactions; any difference between the amount by which the non-controlling interests are adjusted and the fair value of the consideration paid or received is recognised directly in equity and attributed to the owners of the parent entity. Where the Group loses control of the subsidiary, at the date when control is lost the amount of any non-controlling interest in that former subsidiary is derecognised and any investment retained in the former subsidiary is remeasured to its fair value; the gain or loss that is recognised in profit or loss on the partial disposal of the subsidiary includes the gain or loss on the remeasurement of the retained interest.
Intercompany transactions, balances and unrealised gains and losses on transactions between Group companies are eliminated.
NOTES TO THE CONSOLIDATED FINANCIAL STATEMENTS
NOTE 2: ACCOUNTING POLICIEScontinued
The acquisition method of accounting is used to account for business combinations by the Group. The consideration for the acquisition of a subsidiary is the fair value of the assets transferred, the liabilities incurred and the equity interests issued by the Group. The consideration includes the fair value of any asset or liability resulting from a contingent consideration arrangement. Acquisition related costs are expensed as incurred except those relating to the issuance of debt instruments (see (E)(5) below) or share capital (see (P) below). Identifiable assets acquired and liabilities assumed in a business combination are measured initially at their fair value at the acquisition date.
(2) JOINT VENTURES AND ASSOCIATES
Joint ventures are joint arrangements over which the Group has joint control with other parties and has rights to the net assets of the arrangements. Joint control is the contractually agreed sharing of control of an arrangement and only exists when decisions about the relevant activities require the unanimous consent of the parties sharing control. Associates are entities over which the Group has significant influence. Significant influence is the power to participate in the financial and operating policy decisions of the entity, but is not control or joint control of those policies, and is generally achieved through holding between 20 per cent and 50 per cent of the voting share capital of the entity.
The Group utilises the venture capital exemption for investments where significant influence or joint control is present and the business unit operates as a venture capital business. These investments are designated at initial recognition at fair value through profit or loss. Otherwise, the Group’s investments in joint ventures and associates are accounted for by the equity method of accounting.
(B) Goodwill
Goodwill arises on business combinations and represents the excess of the cost of an acquisition over the fair value of the Group’s share of the identifiable assets, liabilities and contingent liabilities acquired. Where the fair value of the Group’s share of the identifiable assets, liabilities and contingent liabilities of the acquired entity is greater than the cost of acquisition, the excess is recognised immediately in the income statement.
Goodwill is recognised as an asset at cost and is tested at least annually for impairment. If an impairment is identified the carrying value of the goodwill is written down immediately through the income statement and is not subsequently reversed. At the date of disposal of a subsidiary, the carrying value of attributable goodwill is included in the calculation of the profit or loss on disposal.
(C) Other intangible assets
Intangible assets which have been determined to have a finite useful life are amortised on a straight line basis over their estimated useful life as follows: up to 7 years for capitalised software; 10 to 15 years for brands and other intangibles.
Intangible assets with finite useful lives are reviewed at each reporting date to assess whether there is any indication that they are impaired. If any such indication exists the recoverable amount of the asset is determined and in the event that the asset’s carrying amount is greater than its recoverable amount, it is written down immediately. Certain brands have been determined to have an indefinite useful life and are not amortised. Such intangible assets are reassessed annually to reconfirm that an indefinite useful life remains appropriate. In the event that an indefinite life is inappropriate a finite life is determined and an impairment review is performed on the asset.
(D) Revenue recognition
(1) NET INTEREST INCOME
Interest income and expense are recognised in the income statement for all interest-bearing financial instruments using the effective interest method, except for those classified at fair value through profit or loss. The effective interest method is a method of calculating the amortised cost of a financial asset or liability and of allocating the interest income or interest expense over the expected life of the financial instrument. The effective interest rate is the rate that exactly discounts the estimated future cash payments or receipts over the expected life of the financial instrument to the gross carrying amount of the financial asset (before adjusting for expected credit losses) or to the amortised cost of the financial liability, including early redemption fees, and related penalties, and premiums and discounts that are an integral part of the overall return. Direct incremental transaction costs related to the acquisition, issue or disposal of a financial instrument are also taken into account. Interest income from non-credit impaired financial assets is recognised by applying the effective interest rate to the gross carrying amount of the asset; for credit impaired financial assets, the effective interest rate is applied to the net carrying amount after deducting the allowance for expected credit losses. Impairment policies are set out in (H) below.
(2) FEE AND COMMISSION INCOME AND EXPENSE
Fees and commissions receivable which are not an integral part of the effective interest rate are recognised as income as the Group fulfils its performance obligations. The Group’s principal performance obligations arising from contracts with customers are in respect of value added current accounts, credit cards and debit cards. These fees are received, and the Group’s provides the service, monthly; the fees are recognised in income on this basis. The Group also receives certain fees in respect of its asset finance business where the performance obligations are typically fulfilled towards the end of the customer contract; these fees are recognised in income on this basis. Where it is unlikely that the loan commitments will be drawn, loan commitment fees are recognised in fee and commission income over the life of the facility, rather than as an adjustment to the effective interest rate for loans expected to be drawn. Incremental costs incurred to generate fee and commission income are charged to fees and commissions expense as they are incurred.
(3) OTHER
Dividend income is recognised when the right to receive payment is established.
Revenue recognition policies specific to trading income are set out in E(3) below, life insurance and general insurance business are detailed below (see (M) below); those relating to leases are set out in (J)(1) below.
(E) Financial assets and liabilities
On initial recognition, financial assets are classified as measured at amortised cost, fair value through other comprehensive income or fair value through profit or loss, depending on the Group’s business model for managing the financial assets and whether the cash flows represent solely payments of principal and interest. The Group assesses its business models at a portfolio level based on its objectives for the relevant portfolio, how the performance of the portfolio is managed and reported, and the frequency of asset sales. Financial assets with embedded derivatives are considered in their entirety when considering their cash flow characteristics. The Group reclassifies financial assets when and only when its business model for managing those assets changes. A reclassification will only take place when the change is significant to the Group’s operations and will occur at a portfolio level and not for individual instruments; reclassifications are expected to be rare. Equity investments are measured at fair value through profit or loss unless the Group elects at initial recognition to account for the instruments at fair value through other comprehensive income. For these instruments, principally strategic investments, dividends are recognised in profit or loss but fair value gains and losses are not subsequently reclassified to profit or loss following derecognition of the investment.
NOTES TO THE CONSOLIDATED FINANCIAL STATEMENTS
NOTE 2: ACCOUNTING POLICIEScontinued
The Group initially recognises loans and advances, deposits, debt securities in issue and subordinated liabilities when the Group becomes a party to the contractual provisions of the instrument. Regular way purchases and sales of securities and other financial assets and trading liabilities are recognised on trade date, being the date that the Group is committed to purchase or sell an asset.
Financial assets are derecognised when the contractual right to receive cash flows from those assets has expired or when the Group has transferred its contractual right to receive the cash flows from the assets and either: substantially all of the risks and rewards of ownership have been transferred; or the Group has neither retained nor transferred substantially all of the risks and rewards, but has transferred control.
Financial liabilities are derecognised when the obligation is discharged, cancelled or expires.
(1) FINANCIAL INSTRUMENTS MEASURED AT AMORTISED COST
Financial assets that are held to collect contractual cash flows where those cash flows represent solely payments of principal and interest are measured at amortised cost. A basic lending arrangement results in contractual cash flows that are solely payments of principal and interest on the principal amount outstanding. Where the contractual cash flows introduce exposure to risks or volatility unrelated to a basic lending arrangement such as changes in equity prices or commodity prices, the payments do not comprise solely principal and interest. Financial assets measured at amortised cost are predominantly loans and advances to customers and banks together with certain debt securities used by the Group to manage its liquidity. Loans and advances are initially recognised when cash is advanced to the borrower at fair value inclusive of transaction costs. Interest income is accounted for using the effective interest method (see (D) above).
Financial liabilities are measured at amortised cost, except for trading liabilities and other financial liabilities designated at fair value through profit or loss on initial recognition which are held at fair value.
(2) FINANCIAL ASSETS MEASURED AT FAIR VALUE THROUGH OTHER COMPREHENSIVE INCOME
Financial assets that are held to collect contractual cash flows and for subsequent sale, where the assets’ cash flows represent solely payments of principal and interest, are recognised in the balance sheet at their fair value, inclusive of transaction costs. Interest calculated using the effective interest method and foreign exchange gains and losses on assets denominated in foreign currencies are recognised in the income statement. All other gains and losses arising from changes in fair value are recognised directly in other comprehensive income, until the financial asset is either sold or matures, at which time the cumulative gain or loss previously recognised in other comprehensive income is recognised in the income statement other than in respect of equity shares, for which the cumulative revaluation amount is transferred directly to retained profits. The Group recognises a charge for expected credit losses in the income statement (see (H) below). As the asset is measured at fair value, the charge does not adjust the carrying value of the asset, it is reflected in other comprehensive income.
(3) FINANCIAL INSTRUMENTS MEASURED AT FAIR VALUE THROUGH PROFIT OR LOSS
Financial assets are classified at fair value through profit or loss where they do not meet the criteria to be measured at amortised cost or fair value through other comprehensive income or where they are designated at fair value through profit or loss to reduce an accounting mismatch. All derivatives are carried at fair value through profit or loss.
The assets backing the insurance and investment contracts issued by the Group do not meet the criteria to be measured at amortised cost or fair value through other comprehensive income as they are managed on a fair value basis and accordingly are measured at fair value through profit or loss. Similarly, trading securities, which are debt securities and equity shares acquired principally for the purpose of selling in the short term or which are part of a portfolio which is managed for short-term gains, do not meet these criteria and are also measured at fair value through profit or loss. Financial assets measured at fair value through profit or loss are recognised in the balance sheet at their fair value. Fair value gains and losses together with interest coupons and dividend income are recognised in the income statement within net trading income.
Financial liabilities are measured at fair value through profit or loss where they are trading liabilities or where they are designated at fair value through profit or loss in order to reduce an accounting mismatch; where the liabilities are part of a group of liabilities (or assets and liabilities) which is managed, and its performance evaluated, on a fair value basis; or where the liabilities contain one or more embedded derivatives that significantly modify the cash flows arising under the contract and would otherwise need to be separately accounted for. Financial liabilities measured at fair value through profit or loss are recognised in the balance sheet at their fair value. Fair value gains and losses are recognised in the income statement within net trading income in the period in which they occur, except that gains and losses attributable to changes in own credit risk are recognised in other comprehensive income.
The fair values of assets and liabilities traded in active markets are based on current bid and offer prices respectively. If the market is not active the Group establishes a fair value by using valuation techniques. The fair values of derivative financial instruments are adjusted where appropriate to reflect credit risk (via credit valuation adjustments (CVAs), debit valuation adjustments (DVAs) and funding valuation adjustments (FVAs)), market liquidity and other risks.
(4) BORROWINGS
Borrowings (which include deposits from banks, customer deposits, debt securities in issue and subordinated liabilities) are recognised initially at fair value, being their issue proceeds net of transaction costs incurred. These instruments are subsequently stated at amortised cost using the effective interest method.
Preference shares and other instruments which carry a mandatory coupon or are redeemable on a specific date are classified as financial liabilities. The coupon on these instruments is recognised in the income statement as interest expense. Securities which carry a discretionary coupon and have no fixed maturity or redemption date are classified as other equity instruments. Interest payments on these securities are recognised, net of tax, as distributions from equity in the period in which they are paid. An exchange of financial liabilities on substantially different terms is accounted for as an extinguishment of the original financial liability and the recognition of a new financial liability. The difference between the carrying amount of a financial liability extinguished and the new financial liability is recognised in profit or loss together with any related costs or fees incurred.
When a financial liability is exchanged for an equity instrument, the new equity instrument is recognised at fair value and any difference between the carrying value of the liability and the fair value of the new equity is recognised in profit or loss.
(5) SALE AND REPURCHASE AGREEMENTS (INCLUDING SECURITIES LENDING AND BORROWING)
Securities sold subject to repurchase agreements (repos) continue to be recognised on the balance sheet where substantially all of the risks and rewards are retained. Funds received under these arrangements are included in deposits from banks, customer deposits, or trading liabilities. Conversely, securities purchased under agreements to resell (reverse repos), where the Group does not acquire substantially all of the risks and rewards of ownership, are recorded as loans and advances measured at amortised cost or trading securities. The difference between sale and repurchase price is treated as interest and accrued over the life of the agreements using the effective interest method.
NOTES TO THE CONSOLIDATED FINANCIAL STATEMENTS
NOTE 2: ACCOUNTING POLICIEScontinued
Securities borrowing and lending transactions are typically secured; collateral takes the form of securities or cash advanced or received. Securities lent to counterparties are retained on the balance sheet. Securities borrowed are not recognised on the balance sheet, unless these are sold to third parties, in which case the obligation to return them is recorded at fair value as a trading liability. Cash collateral given or received is treated as a loan and advance measured at amortised cost or customer deposit.
(F) Derivative financial instruments and hedge accounting
As permitted by IFRS 9, the Group continues to apply the requirements of IAS 39 to its hedging relationships. All derivatives are recognised at their fair value. Derivatives are carried on the balance sheet as assets when their fair value is positive and as liabilities when their fair value is negative. Refer to note 50(3) (Financial instruments: Financial assets and liabilities carried at fair value) for details of valuation techniques and significant inputs to valuation models.
Changes in the fair value of all derivative instruments, other than those in effective cash flow and net investment hedging relationships, are recognised immediately in the income statement. As noted in (2) and (3) below, the change in fair value of a derivative in an effective cash flow or net investment hedging relationship is allocated between the income statement and other comprehensive income.
Derivatives embedded in a financial asset are not considered separately; the financial asset is considered in its entirety when determining whether its cash flows are solely payments of principal and interest. Derivatives embedded in financial liabilities and insurance contracts (unless the embedded derivative is itself an insurance contract) are treated as separate derivatives when their economic characteristics and risks are not closely related to those of the host contract and the host contract is not carried at fair value through profit or loss. These embedded derivatives are measured at fair value with changes in fair value recognised in the income statement. In accordance with IFRS 4 Insurance Contracts, a policyholder’s option to surrender an insurance contract for a fixed amount is not treated as an embedded derivative.
Hedge accounting allows one financial instrument, generally a derivative such as a swap, to be designated as a hedge of another financial instrument such as a loan or deposit or a portfolio of such instruments. At the inception of the hedge relationship, formal documentation is drawn up specifying the hedging strategy, the hedged item, the hedging instrument and the methodology that will be used to measure the effectiveness of the hedge relationship in offsetting changes in the fair value or cash flow of the hedged risk. The effectiveness of the hedging relationship is tested both at inception and throughout its life and if at any point it is concluded that it is no longer highly effective in achieving its documented objective, hedge accounting is discontinued. Note 17 provides details of the types of derivatives held by the Group and presents separately those designated in hedge relationships. In respect of interest rate benchmark reform, the Group assumes that the interest rate benchmark on which the hedged cash flows and/or the hedged risk are based, or the interest rate benchmark on which the cash flows of the hedging instrument are based, are not altered as a result of interest rate benchmark reform. The Group does not discontinue a hedging relationship during the period of uncertainty arising from the interest rate benchmark reform solely because the actual results of the hedge are not highly effective.
(1) FAIR VALUE HEDGES
Changes in the fair value of derivatives that are designated and qualify as fair value hedges are recorded in the income statement, together with the changes in the fair value of the hedged asset or liability that are attributable to the hedged risk; this also applies if the hedged asset is classified as a financial asset at fair value through other comprehensive income. If the hedge no longer meets the criteria for hedge accounting, changes in the fair value of the hedged item attributable to the hedged risk are no longer recognised in the income statement. The cumulative adjustment that has been made to the carrying amount of the hedged item is amortised to the income statement using the effective interest method over the period to maturity.
(2) CASH FLOW HEDGES
The effective portion of changes in the fair value of derivatives that are designated and qualify as cash flow hedges is recognised in other comprehensive income in the cash flow hedging reserve. The gain or loss relating to the ineffective portion is recognised immediately in the income statement. Amounts accumulated in equity are reclassified to the income statement in the periods in which the hedged item affects profit or loss. When a hedging instrument expires or is sold, or when a hedge no longer meets the criteria for hedge accounting, any cumulative gain or loss existing in equity at that time remains in equity and is recognised in the income statement when the forecast transaction is ultimately recognised in the income statement. When a forecast transaction is no longer expected to occur, the cumulative gain or loss that was reported in equity is immediately transferred to the income statement.
(3) NET INVESTMENT HEDGES
Hedges of net investments in foreign operations are accounted for similarly to cash flow hedges. Any gain or loss on the hedging instrument relating to the effective portion of the hedge is recognised in other comprehensive income, the gain or loss relating to the ineffective portion is recognised immediately in the income statement. Gains and losses accumulated in equity are included in the income statement when the foreign operation is disposed of. The hedging instrument used in net investment hedges may include non-derivative liabilities as well as derivative financial instruments.
(G) Offset
Financial assets and liabilities are offset and the net amount reported in the balance sheet when there is a legally enforceable right of set-off and there is an intention to settle on a net basis, or realise the asset and settle the liability simultaneously. Cash collateral on exchange traded derivative transactions is presented gross unless the collateral cash flows are always settled net with the derivative cash flows. In certain situations, even though master netting agreements exist, the lack of management intention to settle on a net basis results in the financial assets and liabilities being reported gross on the balance sheet.
(H) Impairment of financial assets
The impairment charge in the income statement includes the change in expected credit losses and certain fraud costs. Expected credit losses are recognised for loans and advances to customers and banks, other financial assets held at amortised cost, financial assets measured at fair value through other comprehensive income, and certain loan commitments and financial guarantee contracts. Expected credit losses are calculated as an unbiased and probability-weighted estimate using an appropriate probability of default, adjusted to take into account a range of possible future economic scenarios, and applying this to the estimated exposure of the Group at the point of default after taking into account the value of any collateral held, repayments, or other mitigants of loss and including the impact of discounting using the effective interest rate.
At initial recognition, allowance (or provision in the case of some loan commitments and financial guarantees) is made for expected credit losses resulting from default events that are possible within the next 12 months (12-month expected credit losses). In the event of a significant increase in credit risk since origination, allowance (or provision) is made for expected credit losses resulting from all possible default events over the expected life of the financial instrument (lifetime expected credit losses). Financial assets where 12-month expected credit losses are recognised are considered to be Stage 1; financial assets which are considered to have experienced a significant increase in credit risk since initial recognition are in Stage 2; and financial assets which have
NOTES TO THE CONSOLIDATED FINANCIAL STATEMENTS
NOTE 2: ACCOUNTING POLICIEScontinued
defaulted or are otherwise considered to be credit impaired are allocated to Stage 3. Some Stage 3 assets, mainly in Commercial Banking, are subject to individual rather than collective assessment. Such cases are subject to a risk-based impairment sanctioning process, and these are reviewed and updated at least quarterly, or more frequently if there is a significant change in the credit profile.
An assessment of whether credit risk has increased significantly since initial recognition considers the change in the risk of default occurring over the remaining expected life of the financial instrument. The assessment is unbiased, probability-weighted and uses forward-looking information consistent with that used in the measurement of expected credit losses. In determining whether there has been a significant increase in credit risk, the Group uses quantitative tests based on relative and absolute probability of default (PD) movements linked to internal credit ratings together with qualitative indicators such as watchlists and other indicators of historical delinquency, credit weakness or financial difficulty. However, unless identified at an earlier stage, the credit risk of financial assets is deemed to have increased significantly when more than 30 days past due. Where the credit risk subsequently improves such that it no longer represents a significant increase in credit risk since initial recognition, the asset is transferred back to Stage 1.
Assets are transferred to Stage 3 when they have defaulted or are otherwise considered to be credit impaired. Default is considered to have occurred when there is evidence that the customer is experiencing financial difficulty which is likely to affect significantly the ability to repay the amount due. IFRS 9 contains a rebuttable presumption that default occurs no later than when a payment is 90 days past due. The Group uses this 90 day backstop for all its products except for UK mortgages. For UK mortgages, the Group uses a backstop of 180 days past due as mortgage exposures more than 90 days past due, but less than 180 days, typically show high cure rates and this aligns with the Group’s risk management practices.
In certain circumstances, the Group will renegotiate the original terms of a customer’s loan, either as part of an ongoing customer relationship or in response to adverse changes in the circumstances of the borrower. In the latter circumstances, the loan will remain classified as either Stage 2 or Stage 3 until the credit risk has improved such that it no longer represents a significant increase since origination (for a return to Stage 1), or the loan is no longer credit impaired (for a return to Stage 2). Renegotiation may also lead to the loan and associated allowance being derecognised and a new loan being recognised initially at fair value.
Purchased or originated credit-impaired financial assets (POCI) include financial assets that are purchased or originated at a deep discount that reflects incurred credit losses. At initial recognition, POCI assets do not carry an impairment allowance; instead, lifetime expected credit losses are incorporated into the calculation of the effective interest rate. All changes in lifetime expected credit losses subsequent to the assets’ initial recognition are recognised as an impairment charge.
A loan or advance is normally written off, either partially or in full, against the related allowance when the proceeds from realising any available security have been received or there is no realistic prospect of recovery and the amount of the loss has been determined. Subsequent recoveries of amounts previously written off decrease the amount of impairment losses recorded in the income statement. For both secured and unsecured retail balances, the write-off takes place only once an extensive set of collections processes has been completed, or the status of the account reaches a point where policy dictates that continuing attempts to recover are no longer appropriate. For commercial lending, a write-off occurs if the loan facility with the customer is restructured, the asset is under administration and the only monies that can be received are the amounts estimated by the administrator, the underlying assets are disposed and a decision is made that no further settlement monies will be received, or external evidence (for example, third party valuations) is available that there has been an irreversible decline in expected cash flows.
(I) Property, plant and equipment
Property, plant and equipment (other than investment property) is included at cost less accumulated depreciation. The value of land (included in premises) is not depreciated. Depreciation on other assets is calculated using the straight-line method to allocate the difference between the cost and the residual value over their estimated useful lives, as follows: the shorter of 50 years and the remaining period of the lease for freehold/long and short leasehold premises; the shorter of 10 years and, if lease renewal is not likely, the remaining period of the lease for leasehold improvements; 10 to 20 years for fixtures and furnishings; and 2 to 8 years for other equipment and motor vehicles.
The assets’ residual values and useful lives are reviewed, and adjusted if appropriate, at each balance sheet date.
Assets are reviewed for impairment whenever events or changes in circumstances indicate that the carrying amount may not be recoverable. In the event that an asset’s carrying amount is determined to be greater than its recoverable amount it is written down immediately. The recoverable amount is the higher of the asset’s fair value less costs to sell and its value in use.
Investment property comprises freehold and long leasehold land and buildings that are held either to earn rental income or for capital accretion or both, primarily within the life insurance funds. In accordance with the guidance published by the Royal Institution of Chartered Surveyors, investment property is carried at fair value based on current prices for similar properties, adjusted for the specific characteristics of the property (such as location or condition). If this information is not available, the Group uses alternative valuation methods such as discounted cash flow projections or recent prices in less active markets. These valuations are reviewed at least annually by independent professionally qualified valuers. Investment property being redeveloped for continuing use as investment property, or for which the market has become less active, continues to be valued at fair value.
(J) Leases
Under IFRS 16, a lessor is required to determine whether a lease is a finance or operating lease. A lessee is not required to make this determination.
(1) AS LESSOR
Assets leased to customers are classified as finance leases if the lease agreements transfer substantially all the risks and rewards of ownership to the lessee but not necessarily legal title. All other leases are classified as operating leases. When assets are subject to finance leases, the present value of the lease payments, together with any unguaranteed residual value, is recognised as a receivable, net of allowances for expected credit losses, within loans and advances to banks and customers. The difference between the gross receivable and the present value of the receivable is recognised as unearned finance lease income. Finance lease income is recognised in interest income over the term of the lease using the net investment method (before tax) so as to give a constant rate of return on the net investment in the leases. Unguaranteed residual values are reviewed regularly to identify any impairment.
Operating lease assets are included within property, plant and equipment at cost and depreciated over their estimated useful lives, which equates to the lives of the leases, after taking into account anticipated residual values. Operating lease rental income is recognised on a straight-line basis over the life of the lease.
The Group evaluates non-lease arrangements such as outsourcing and similar contracts to determine if they contain a lease which is then accounted for separately.
NOTES TO THE CONSOLIDATED FINANCIAL STATEMENTS
NOTE 2: ACCOUNTING POLICIES continued
(2) AS LESSEE
Leases are recognised as a right-of-use asset and a corresponding liability at the date at which the leased asset is available for use by the Group. Assets and liabilities arising from a lease are initially measured on a present value basis. The lease payments are discounted using the interest rate implicit in the lease, if that rate can be determined, or the Group’s incremental borrowing rate appropriate for the right-of-use asset arising from the lease.
Lease payments are allocated between the liability and finance cost. The finance cost is charged to profit or loss over the lease period so as to produce a constant periodic rate of interest on the remaining balance of the liability for each period. The right-of-use asset is depreciated over the shorter of the asset’s useful life and the lease term on a straight-line basis.
Payments associated with short-term leases and leases of low-value assets are recognised on a straight-line basis as an expense in profit or loss. Short-term leases are leases with a lease term of twelve months or less. Low-value assets comprise IT equipment and small items of office furniture.
(K) Employee benefits
Short-term employee benefits, such as salaries, paid absences, performance-based cash awards and social security costs are recognised over the period in which the employees provide the related services.
(1) PENSION SCHEMES
The Group operates a number of post-retirement benefit schemes for its employees including both defined benefit and defined contribution pension plans. A defined benefit scheme is a pension plan that defines an amount of pension benefit that an employee will receive on retirement, dependent on one or more factors such as age, years of service and salary. A defined contribution plan is a pension plan into which the Group pays fixed contributions; there is no legal or constructive obligation to pay further contributions.
Scheme assets are included at their fair value and scheme liabilities are measured on an actuarial basis using the projected unit credit method. The defined benefit scheme liabilities are discounted using rates equivalent to the market yields at the balance sheet date on high-quality corporate bonds that are denominated in the currency in which the benefits will be paid, and that have terms to maturity approximating to the terms of the related pension liability. The Group’s income statement charge includes the current service cost of providing pension benefits, past service costs, net interest expense (income), and plan administration costs that are not deducted from the return on plan assets. Past service costs, which represents the change in the present value of the defined benefit obligation resulting from a plan amendment or curtailment, are recognised when the plan amendment or curtailment occurs. Net interest expense (income) is calculated by applying the discount rate at the beginning of the period to the net defined benefit liability or asset.
Remeasurements, comprising actuarial gains and losses, the return on plan assets (excluding amounts included in net interest expense (income) and net of the cost of managing the plan assets), and the effect of changes to the asset ceiling (if applicable) are reflected immediately in the balance sheet with a charge or credit recognised in other comprehensive income in the period in which they occur. Remeasurements recognised in other comprehensive income are reflected immediately in retained profits and will not subsequently be reclassified to profit or loss.
The Group’s balance sheet includes the net surplus or deficit, being the difference between the fair value of scheme assets and the discounted value of scheme liabilities at the balance sheet date. Surpluses are only recognised to the extent that they are recoverable through reduced contributions in the future or through refunds from the schemes. In assessing whether a surplus is recoverable, the Group considers its current right to obtain a refund or a reduction in future contributions and does not anticipate any future acts by other parties that could change the amount of the surplus that may ultimately be recovered.
The costs of the Group’s defined contribution plans are charged to the income statement in the period in which they fall due.
(2) SHARE-BASED COMPENSATION
The Group operates a number of equity-settled, share-based compensation plans in respect of services received from certain of its employees. The value of the employee services received in exchange for equity instruments granted under these plans is recognised as an expense over the vesting period of the instruments, with a corresponding increase in equity. This expense is determined by reference to the fair value of the number of equity instruments that are expected to vest. The fair value of equity instruments granted is based on market prices, if available, at the date of grant. In the absence of market prices, the fair value of the instruments at the date of grant is estimated using an appropriate valuation technique, such as a Black-Scholes option pricing model or a Monte Carlo simulation. The determination of fair values excludes the impact of any non-market vesting conditions, which are included in the assumptions used to estimate the number of options that are expected to vest. At each balance sheet date, this estimate is reassessed and if necessary revised. Any revision of the original estimate is recognised in the income statement, together with a corresponding adjustment to equity. Cancellations by employees of contributions to the Group’s Save As You Earn plans are treated as non-vesting conditions and the Group recognises, in the year of cancellation, the amount of the expense that would have otherwise been recognised over the remainder of the vesting period. Modifications are assessed at the date of modification and any incremental charges are charged to the income statement.
(L) Taxation
Tax expense comprises current and deferred tax. Current and deferred tax are charged or credited in the income statement except to the extent that the tax arises from a transaction or event which is recognised, in the same or a different period, outside the income statement (either in other comprehensive income, directly in equity, or through a business combination), in which case the tax appears in the same statement as the transaction that gave rise to it. The tax consequences of the Group’s dividend payments (including distributions on other equity instruments), if any, are charged or credited to the statement in which the profit distributed originally arose.
Current tax is the amount of corporate income taxes expected to be payable or recoverable based on the profit for the period as adjusted for items that are not taxable or not deductible, and is calculated using tax rates and laws that were enacted or substantively enacted at the balance sheet date.
Current tax includes amounts provided in respect of uncertain tax positions when management expects that, upon examination of the uncertainty by Her Majesty’s Revenue and Customs (HMRC) or other relevant tax authority, it is more likely than not that an economic outflow will occur. Provisions reflect management’s best estimate of the ultimate liability based on their interpretation of tax law, precedent and guidance, informed by external tax advice as necessary. Changes in facts and circumstances underlying these provisions are reassessed at each balance sheet date, and the provisions are re-measured as required to reflect current information.
For the Group’s long-term insurance businesses, the tax expense is analysed between tax that is payable in respect of policyholders’ returns and tax that is payable on the shareholders’ returns. This allocation is based on an assessment of the rates of tax which will be applied to the returns under the current UK tax rules.
NOTES TO THE CONSOLIDATED FINANCIAL STATEMENTS
NOTE 2: ACCOUNTING POLICIES continued
Deferred tax is recognised on temporary differences arising between the tax bases of assets and liabilities and their carrying amounts in the balance sheet. Deferred tax is calculated using tax rates and laws that have been enacted or substantively enacted at the balance sheet date, and which are expected to apply when the related deferred tax asset is realised or the deferred tax liability is settled.
Deferred tax liabilities are generally recognised for all taxable temporary differences but not recognised for taxable temporary differences arising on investments in subsidiaries where the reversal of the temporary difference can be controlled and it is probable that the difference will not reverse in the foreseeable future. Deferred tax liabilities are not recognised on temporary differences that arise from goodwill which is not deductible for tax purposes.
Deferred tax assets are recognised to the extent it is probable that taxable profits will be available against which the deductible temporary differences can be utilised, and are reviewed at each balance sheet date and reduced to the extent that it is no longer probable that sufficient taxable profits will be available to allow all or part of the asset to be recovered.
Deferred tax assets and liabilities are not recognised in respect of temporary differences that arise on initial recognition of assets and liabilities acquired other than in a business combination. Deferred tax is not discounted.
(M) Insurance
The Group undertakes both life insurance and general insurance business. Insurance and participating investment contracts are accounted for under IFRS 4Insurance Contracts, which permits (with certain exceptions) the continuation of accounting practices for measuring insurance and participating investment contracts that applied prior to the adoption of IFRS. The Group, therefore, continues to account for these products using UK GAAP and UK established practice.
Products sold by the life insurance business are classified into three categories:
| – | Insurance contracts – these contracts transfer significant insurance risk and may also transfer financial risk. The Group defines significant insurance risk as the possibility of having to pay benefits on the occurrence of an insured event which are significantly more than the benefits payable if the insured event were not to occur. These contracts may or may not include discretionary participation features. |
| | |
| – | Investment contracts containing a discretionary participation feature (participating investment contracts) – these contracts do not transfer significant insurance risk, but contain a contractual right which gives the holder the right to receive, in addition to the guaranteed benefits, further additional discretionary benefits or bonuses that are likely to be a significant proportion of the total contractual benefits and the amount and timing of which is at the discretion of the Group, within the constraints of the terms and conditions of the instrument and based upon the performance of specified assets. |
| | |
| – | Non-participating investment contracts – these contracts do not transfer significant insurance risk or contain a discretionary participation feature. |
The general insurance business issues only insurance contracts.
(1) LIFE INSURANCE BUSINESS
(I) ACCOUNTING FOR INSURANCE AND PARTICIPATING INVESTMENT CONTRACTS
Premiums and claims
Premiums received in respect of insurance and participating investment contracts are recognised as revenue when due except for unit-linked contracts on which premiums are recognised as revenue when received. Claims are recorded as an expense on the earlier of the maturity date or the date on which the claim is notified.
Liabilities
Changes in the value of liabilities are recognised in the income statement through insurance claims.
| – | Insurance and participating investment contracts in the Group’s with-profit funds |
| | |
| | Liabilities of the Group’s with-profit funds, including guarantees and options embedded within products written by these funds, are stated at their realistic values in accordance with the Prudential Regulation Authority’s realistic capital regime, except that projected transfers out of the funds into other Group funds are recorded in the unallocated surplus (see below). |
| | |
| – | Insurance and participating investment contracts which are not unit-linked or in the Group’s with-profit funds |
| | |
| | A liability for contractual benefits that are expected to be incurred in the future is recorded when the premiums are recognised. The liability is calculated by estimating the future cash flows over the duration of in-force policies and discounting them back to the valuation date allowing for probabilities of occurrence. The liability will vary with movements in interest rates and with the cost of life insurance and annuity benefits where future mortality is uncertain. |
| | |
| | Assumptions are made in respect of all material factors affecting future cash flows, including future interest rates, mortality and costs. |
| | |
| – | Insurance and participating investment contracts which are unit-linked |
| | |
| | Liabilities for unit-linked insurance contracts and participating investment contracts are stated at the bid value of units plus an additional allowance where appropriate (such as for any excess of future expenses over charges). The liability is increased or reduced by the change in the unit prices and is reduced by policy administration fees, mortality and surrender charges and any withdrawals. Benefit claims in excess of the account balances incurred in the period are also charged through insurance claims. Revenue consists of fees deducted for mortality, policy administration and surrender charges. |
Unallocated surplus
Any amounts in the with-profit funds not yet determined as being due to policyholders or shareholders are recognised as an unallocated surplus which is shown separately from liabilities arising from insurance contracts and participating investment contracts.
(II) ACCOUNTING FOR NON-PARTICIPATING INVESTMENT CONTRACTS
The Group’s non-participating investment contracts are primarily unit-linked. These contracts are accounted for as financial liabilities whose value is contractually linked to the fair values of financial assets within the Group’s unitised investment funds. The value of the unit-linked financial liabilities is determined using current unit prices multiplied by the number of units attributed to the contract holders at the balance sheet date. Their value is never less than the amount payable on surrender, discounted for the required notice period where applicable. Investment returns (including movements in fair value and investment income) allocated to those contracts are recognised in the income statement through insurance claims.
Deposits and withdrawals are not accounted for through the income statement but are accounted for directly in the balance sheet as adjustments to the non-participating investment contract liability.
NOTES TO THE CONSOLIDATED FINANCIAL STATEMENTS
NOTE 2: ACCOUNTING POLICIES continued
The Group receives investment management fees in the form of an initial adjustment or charge to the amount invested. These fees are in respect of services rendered in conjunction with the issue and management of investment contracts where the Group actively manages the consideration received from its customers to fund a return that is based on the investment profile that the customer selected on origination of the contract. These services comprise an indeterminate number of acts over the lives of the individual contracts and, therefore, the Group defers these fees and recognises them over the estimated lives of the contracts, in line with the provision of investment management services.
Costs which are directly attributable and incremental to securing new non-participating investment contracts are deferred. This asset is subsequently amortised over the period of the provision of investment management services and its recoverability is reviewed in circumstances where its carrying amount may not be recoverable. If the asset is greater than its recoverable amount it is written down immediately through fee and commission expense in the income statement. All other costs are recognised as expenses when incurred.
(III) VALUE OF IN-FORCE BUSINESS
The Group recognises as an asset the value of in-force business in respect of insurance contracts and participating investment contracts. The asset represents the present value of the shareholders’ interest in the profits expected to emerge from those contracts written at the balance sheet date. This is determined after making appropriate assumptions about future economic and operating conditions such as future mortality and persistency rates and includes allowances for both non-market risk and for the realistic value of financial options and guarantees. Each cash flow is valued using the discount rate consistent with that applied to such a cash flow in the capital markets. The asset in the consolidated balance sheet is presented gross of attributable tax and movements in the asset are reflected within other operating income in the income statement.
The Group’s contractual rights to benefits from providing investment management services in relation to non-participating investment contracts acquired in business combinations and portfolio transfers are measured at fair value at the date of acquisition. The resulting asset is amortised over the estimated lives of the contracts. At each reporting date an assessment is made to determine if there is any indication of impairment. Where impairment exists, the carrying value of the asset is reduced to its recoverable amount and the impairment loss recognised in the income statement.
(2) GENERAL INSURANCE BUSINESS
The Group both underwrites and acts as intermediary in the sale of general insurance products. Underwriting premiums are included in insurance premium income, net of refunds, in the period in which insurance cover is provided to the customer; premiums received relating to future periods are deferred in the balance sheet within liabilities arising from insurance contracts and participating investment contracts on a basis that reflects the length of time for which contracts have been in force and the projected incidence of risk over the term of the contract and only credited to the income statement when earned. Broking commission is recognised when the underwriter accepts the risk of providing insurance cover to the customer. Where appropriate, provision is made for the effect of future policy terminations based upon past experience.
The underwriting business makes provision for the estimated cost of claims notified but not settled and claims incurred but not reported at the balance sheet date. The provision for the cost of claims notified but not settled is based upon a best estimate of the cost of settling the outstanding claims after taking into account all known facts. In those cases where there is insufficient information to determine the required provision, statistical techniques are used which take into account the cost of claims that have recently been settled and make assumptions about the future development of the outstanding cases. Similar statistical techniques are used to determine the provision for claims incurred but not reported at the balance sheet date. Claims liabilities are not discounted.
(3) LIABILITY ADEQUACY TEST
At each balance sheet date liability adequacy tests are performed to ensure the adequacy of insurance and participating investment contract liabilities net of related deferred cost assets and value of in-force business. In performing these tests current best estimates of discounted future contractual cash flows and claims handling and policy administration expenses, as well as investment income from the assets backing such liabilities, are used. Any deficiency is immediately charged to the income statement, initially by writing off the relevant assets and subsequently by establishing a provision for losses arising from liability adequacy tests.
(4) REINSURANCE
Contracts entered into by the Group with reinsurers under which the Group is compensated for benefits payable on one or more contracts issued by the Group are recognised as assets arising from reinsurance contracts held. Where the underlying contracts issued by the Group are classified as insurance contracts and the reinsurance contract transfers significant insurance risk on those contracts to the reinsurer, the assets arising from reinsurance contracts held are classified as insurance contracts. Where the underlying contracts issued by the Group are classified as non-participating investment contracts and the reinsurance contract transfers financial risk on those contracts to the reinsurer, the assets arising from reinsurance contracts held are classified as non-participating investment contracts.
Assets arising from reinsurance contracts held – Classified as insurance contracts
Amounts recoverable from or due to reinsurers are measured consistently with the amounts associated with the reinsured contracts and in accordance with the terms of each reinsurance contract and are regularly reviewed for impairment. Premiums payable for reinsurance contracts are recognised as an expense when due within insurance premium income. Changes in the reinsurance recoverable assets are recognised in the income statement through insurance claims.
Assets arising from reinsurance contracts held – Classified as non-participating investment contracts
These contracts are accounted for as financial assets whose value is contractually linked to the fair values of financial assets within the reinsurers’ investment funds. Investment returns (including movements in fair value and investment income) allocated to these contracts are recognised in insurance claims. Deposits and withdrawals are not accounted for through the income statement but are accounted for directly in the balance sheet as adjustments to the assets arising from reinsurance contracts held.
(N) Foreign currency translation
Items included in the financial statements of each of the Group’s entities are measured using the currency of the primary economic environment in which the entity operates (the functional currency). Foreign currency transactions are translated into the appropriate functional currency using the exchange rates prevailing at the dates of the transactions. Foreign exchange gains and losses resulting from the settlement of such transactions and from the translation at year end exchange rates of monetary assets and liabilities denominated in foreign currencies are recognised in the income statement, except when recognised in other comprehensive income as qualifying cash flow or net investment hedges. Non-monetary assets that are measured at fair value are translated using the exchange rate at the date that the fair value was determined. Translation differences on equities and similar non-monetary items held at fair value through profit and loss are recognised in profit or loss as part of the fair value gain or loss. Translation differences on non-monetary financial assets measured at fair value through other comprehensive income, such as equity shares, are included in the fair value reserve in equity unless the asset is a hedged item in a fair value hedge.
NOTES TO THE CONSOLIDATED FINANCIAL STATEMENTS
NOTE 2: ACCOUNTING POLICIES continued
The results and financial position of all group entities that have a functional currency different from the presentation currency are translated into the presentation currency as follows: the assets and liabilities of foreign operations, including goodwill and fair value adjustments arising on the acquisition of a foreign entity, are translated into sterling at foreign exchange rates ruling at the balance sheet date; and the income and expenses of foreign operations are translated into sterling at average exchange rates unless these do not approximate to the foreign exchange rates ruling at the dates of the transactions in which case income and expenses are translated at the dates of the transactions.
Foreign exchange differences arising on the translation of a foreign operation are recognised in other comprehensive income and accumulated in a separate component of equity together with exchange differences arising from the translation of borrowings and other currency instruments designated as hedges of such investments (see (F)(3) above). On disposal or liquidation of a foreign operation, the cumulative amount of exchange differences relating to that foreign operation are reclassified from equity and included in determining the profit or loss arising on disposal or liquidation.
(O) Provisions and contingent liabilities
Provisions are recognised in respect of present obligations arising from past events where it is probable that outflows of resources will be required to settle the obligations and they can be reliably estimated.
Contingent liabilities are possible obligations whose existence depends on the outcome of uncertain future events or those present obligations where the outflows of resources are uncertain or cannot be measured reliably. Contingent liabilities are not recognised in the financial statements but are disclosed unless they are remote.
Provision is made for expected credit losses in respect of irrevocable undrawn loan commitments and financial guarantee contracts (see (H) above).
(P) Share capital
Incremental costs directly attributable to the issue of new shares or options or to the acquisition of a business are shown in equity as a deduction, net of tax, from the proceeds. Dividends paid on the Group’s ordinary shares are recognised as a reduction in equity in the period in which they are paid.
Where the Company or any member of the Group purchases the Company’s share capital, the consideration paid is deducted from shareholders’ equity as treasury shares until they are cancelled; if these shares are subsequently sold or reissued, any consideration received is included in shareholders’ equity.
(Q) Cash and cash equivalents
For the purposes of the cash flow statement, cash and cash equivalents comprise cash and non-mandatory balances with central banks and amounts due from banks with a maturity of less than three months.
NOTE 3: CRITICAL ACCOUNTING JUDGEMENTS AND ESTIMATES
The preparation of the Group’s financial statements in accordance with IFRS requires management to make judgements, estimates and assumptions in applying the accounting policies that affect the reported amounts of assets, liabilities, income and expenses. Due to the inherent uncertainty in making estimates, actual results reported in future periods may be based upon amounts which differ from those estimates. Estimates, judgements and assumptions are continually evaluated and are based on historical experience and other factors, including expectations of future events that are believed to be reasonable under the circumstances.
The significant judgements made by management in applying the Group’s accounting policies and the key sources of estimation uncertainty in these financial statements, which together are deemed critical to the Group’s results and financial position, are as follows:
Allowance for expected credit losses
The Group recognises an allowance for expected credit losses for loans and advances to customers and banks, other financial assets held at amortised cost, financial assets measured at fair value through other comprehensive income and certain loan commitment and financial guarantee contracts. At 31 December 2019 the Group’s expected credit loss allowance was £3,455 million (31 December 2018: £3,362 million), of which £3,278 million (31 December 2018: £3,169 million) was in respect of drawn balances.
The calculation of the Group’s expected credit loss (ECL) allowances and provisions against loan commitments and guarantees under IFRS 9 requires the Group to make a number of judgements, assumptions and estimates. The most significant are set out below.
DEFINITION OF DEFAULT
The probability of default (PD) of an exposure, both over a 12 month period and over its lifetime, is a key input to the measurement of the ECL allowance. Default has occurred when there is evidence that the customer is experiencing significant financial difficulty which is likely to affect the ability to repay amounts due. The definition of default adopted by the Group is described in note 2(H) Impairment of financial assets. The Group has rebutted the presumption in IFRS 9 that default occurs no later than when a payment is 90 days past due for UK mortgages. As a result, at 31 December 2019, approximately £0.6 billion of UK mortgages (31 December 2018: £0.6 billion) were classified as Stage 2 rather than Stage 3; the impact on the Group’s ECL allowance was not material.
LIFETIME OF AN EXPOSURE
The PD of a financial asset is dependent on its expected life. A range of approaches, segmented by product type, has been adopted by the Group to estimate a product’s expected life. These include using the full contractual life and taking into account behavioural factors such as early repayments and refinancing. For non-revolving retail assets, the Group has assumed the expected life for each product to be the time taken for all significant losses to be observed. For retail revolving products, the Group has considered the losses beyond the contractual term over which the Group is exposed to credit risk. For commercial overdraft facilities, the average behavioural life has been used. Changes to the assumed expected lives of the Group’s assets could impact the ECL allowance recognised by the Group.
SIGNIFICANT INCREASE IN CREDIT RISK
Performing assets are classified as either Stage 1 or Stage 2. An ECL allowance equivalent to 12 months expected losses is established against assets in Stage 1; assets classified as Stage 2 carry an ECL allowance equivalent to lifetime expected losses. Assets are transferred from Stage 1 to Stage 2 when there has been a significant increase in credit risk (SICR) since initial recognition.
The Group uses a quantitative test together with qualitative indicators to determine whether there has been a SICR for an asset. For retail, a deterioration in the Retail Master Scale of four grades for credit cards, personal loans or overdrafts, three grades for personal mortgages, or two grades for UK motor finance accounts is treated as a SICR. For Commercial a doubling of PD with a minimum increase in PD of 1 per cent and a resulting change in the underlying grade is treated as a SICR. All financial assets are assumed to have suffered a SICR if they are more than 30 days past due.
NOTES TO THE CONSOLIDATED FINANCIAL STATEMENTS
NOTE 3: CRITICAL ACCOUNTING JUDGEMENTS AND ESTIMATES continued
The setting of precise trigger points combined with risk indicators requires judgement. The use of different trigger points may have a material impact upon the size of the ECL allowance. The Group monitors the effectiveness of SICR criteria on an ongoing basis.
POST-MODEL ADJUSTMENTS
Limitations in the Group’s impairment models or input data may be identified through the on-going assessment and validation of the output of the models. In these circumstances, management make appropriate adjustments to the Group’s allowance for impairment losses to ensure the overall provision adequately reflects all material risks. These adjustments are generally determined taking into account the particular attributes of the exposure which have not been adequately captured by the primary impairment models.
At 31 December 2019, significant post-model adjustments included within the allowance for expected credit losses amounted to £161 million (2018: £195 million), less than 5 percent of overall provisions. This comprises increases for the additional end of term risk on interest only mortgages of £132 million (2018: £114 million); mortgage accounts in long term default of £33 million (2018: £47 million); the extension of modelled lifetime on Retail revolving products of £36 million (2018: £34 million); and a decrease from the temporary effects of bureau data changes which artificially inflate PDs, and the resulting ECL, of £40 million; (2018: Nil).
FORWARD LOOKING INFORMATION
The measurement of expected credit losses is required to reflect an unbiased probability-weighted range of possible future outcomes. In order to do this, the Group has developed an economic model to project a wide range of key impairment drivers using information derived mainly from external sources. These drivers include factors such as the unemployment rate, the house price index, commercial property prices and corporate credit spreads. The model-generated economic scenarios for the six years beyond 2019 are mapped to industry-wide historical loss data by portfolio. Combined losses across portfolios are used to rank the scenarios by severity of loss. Alongside a defined central scenario three further scenarios are generated by averaging a group of individual scenarios around specified points along the loss distribution to reflect the range of outcomes. The central scenario reflects the Group’s base case assumptions used for medium-term planning purposes, an upside and a downside scenario are also produced together with a severe downside scenario. Rare occurrences of adverse economic events can lead to relatively large credit losses which means that typically the most likely outcome is less than the probability-weighted outcome of the range of possible future events. To allow for this a relatively unlikely severe downside scenario is therefore included. At 31 December 2018 and 2019, the base case, upside and downside scenarios each carry a 30 per cent weighting; the severe downside scenario is weighted at 10 per cent. The choice of alternative scenarios and scenario weights is a combination of quantitative analysis and judgemental assessment to ensure that the full range of possible outcomes and material non-linearity of losses are captured. A committee under the chairmanship of the Chief Economist meets quarterly, to review and, if appropriate, recommend changes to the economic scenarios to the Chief Financial Officer and Chief Risk Officer. Findings dealing with all aspects of the expected credit loss calculation are presented to the Group Audit Committee.
For each major product grouping models have been developed which utilise historical credit loss data to produce PDs for each scenario; an overall weighted average PD is used to assist in determining the staging of financial assets and related ECL.
The key UK economic assumptions made by the Group averaged over a five-year period are shown below:
| | | At 31 December 2019 | | At 31 December 2018 |
| | | | | | | | | | | | Severe | | | | | | | | | | | | Severe | |
| | | Base case | | | Upside | | | Downside | | | downside | | | Base case | | | Upside | | | Downside | | | downside | |
| Economic assumptions | | % | | | % | | | % | | | % | | | % | | | % | | | % | | | % | |
| Interest rate | | | 1.25 | | | | 2.04 | | | | 0.49 | | | | 0.11 | | | | 1.25 | | | | 2.34 | | | | 1.30 | | | | 0.71 | |
| Unemployment rate | | | 4.3 | | | | 3.9 | | | | 5.8 | | | | 7.2 | | | | 4.5 | | | | 3.9 | | | | 5.3 | | | | 6.9 | |
| House price growth | | | 1.3 | | | | 5.0 | | | | (2.6 | ) | | | (7.1 | ) | | | 2.5 | | | | 6.1 | | | | (4.8 | ) | | | (7.5 | ) |
| Commercial real estate price growth | | | (0.2 | ) | | | 1.8 | | | | (3.8 | ) | | | (7.1 | ) | | | 0.4 | | | | 5.3 | | | | (4.7 | ) | | | (6.4 | ) |
The Group’s base-case economic scenario has changed little over the year and reflects a broadly stable outlook for the economy. Although there remains considerable uncertainty about the economic consequences of the UK’s exit from the European Union, the Group considers that at this stage the range of possible economic outcomes is adequately reflected in its choice and weighting of scenarios. The averages shown above do not fully reflect the peak to trough changes in the stated assumptions over the period. The tables below illustrate the variability of the assumptions from the start of the scenario period to the peak and trough.
| | | At 31 December 2019 | | At 31 December 2018 |
| | | | | | | | | | | | Severe | | | | | | | | | | | | Severe | |
| | | Base case | | | Upside | | | Downside | | | downside | | | Base case | | | Upside | | | Downside | | | downside | |
| Economic assumptions – start to peak | | % | | | % | | | % | | | % | | | % | | | % | | | % | | | % | |
| Interest rate | | | 1.75 | | | | 2.56 | | | | 0.75 | | | | 0.75 | | | | 1.75 | | | | 4.00 | | | | 1.75 | | | | 1.25 | |
| Unemployment rate | | | 4.6 | | | | 4.6 | | | | 6.9 | | | | 8.3 | | | | 4.8 | | | | 4.3 | | | | 6.3 | | | | 8.6 | |
| House price growth | | | 6.0 | | | | 26.3 | | | | (1.9 | ) | | | (2.3 | ) | | | 13.7 | | | | 34.9 | | | | 0.6 | | | | (1.6 | ) |
| Commercial real estate price growth | | | 0.1 | | | | 10.4 | | | | (0.6 | ) | | | (1.1 | ) | | | 0.1 | | | | 26.9 | | | | (0.5 | ) | | | (0.5 | ) |
| | | | | | | | | | | | | | | | | | | | | | | | | | | | | | | | | |
| | | At 31 December 2019 | | At 31 December 2018 |
| | | | | | | | | | | | Severe | | | | | | | | | | | | Severe | |
| | | Base case | | | Upside | | | Downside | | | downside | | | Base case | | | Upside | | | Downside | | | downside | |
| Economic assumptions – start to trough | | % | | | % | | | % | | | % | | | % | | | % | | | % | | | % | |
| Interest rate | | | 0.75 | | | | 0.75 | | | | 0.35 | | | | 0.01 | | | | 0.75 | | | | 0.75 | | | | 0.75 | | | | 0.25 | |
| Unemployment rate | | | 3.8 | | | | 3.4 | | | | 3.9 | | | | 3.9 | | | | 4.1 | | | | 3.5 | | | | 4.3 | | | | 4.2 | |
| House price growth | | | (1.9 | ) | | | (0.8 | ) | | | (14.8 | ) | | | (33.1 | ) | | | 0.4 | | | | 2.3 | | | | (26.5 | ) | | | (33.5 | ) |
| Commercial real estate price growth | | | (0.9 | ) | | | 0.3 | | | | (17.5 | ) | | | (30.9 | ) | | | (0.1 | ) | | | 0.0 | | | | (23.8 | ) | | | (33.8 | ) |
The table below shows the extent to which a higher ECL allowance has been recognised to take account of forward looking information from the weighted multiple economic scenarios. The most significant difference between these bases arises on UK mortgages as the probability weighted ECL includes the
NOTES TO THE CONSOLIDATED FINANCIAL STATEMENTS
NOTE 3: CRITICAL ACCOUNTING JUDGEMENTS AND ESTIMATEScontinued
impact of house price movements on the loss given default. For other portfolios adjustment is made only for the probability of default. All non-modelled provisions, including post model adjustments, are based on the probability weighted modelled ECL across all scenarios.
| | | At 31 December 2019 | | At 31 December 2018 |
| | | | | | Probability | | | | | | | | | Probability | | | | |
| | | Base case | | | weighted | | | Difference | | | Base case | | | weighted | | | Difference | |
| Impact of multiple economic scenarios | | £m | | | £m | | | £m | | | £m | | | £m | | | £m | |
| UK mortgages | | | 464 | | | | 569 | | | | 105 | | | | 253 | | | | 460 | | | | 207 | |
| Other Retail | | | 1,492 | | | | 1,521 | | | | 29 | | | | 1,294 | | | | 1,308 | | | | 14 | |
| Commercial Banking | | | 1,258 | | | | 1,315 | | | | 57 | | | | 1,472 | | | | 1,513 | | | | 41 | |
| Other | | | 50 | | | | 50 | | | | – | | | | 81 | | | | 81 | | | | – | |
| | | | 3,264 | | | | 3,455 | | | | 191 | | | | 3,100 | | | | 3,362 | | | | 262 | |
The table below shows the Group’s ECL for the upside and downside scenarios using a 100 per cent weighting, with stage allocation based on each specific scenario.
| | | At 31 December 2019 | | At 31 December 2018 |
| | | Upside | | | Downside | | | Upside | | | Downside | |
| | | £m | | | £m | | | £m | | | £m | |
| ECL allowance | | | 3,001 | | | | 3,677 | | | | 2,775 | | | | 3,573 | |
| | | | | | | | | | | | | | | | | |
The impact of changes in the UK unemployment rate and House Price Index (HPI) have also been assessed. Although such changes would not be observed in isolation, as economic indicators tend to be correlated in a coherent scenario, this gives insight into the sensitivity of the Group’s ECL to changes in these two critical economic factors. The assessment has been made against the base case with the reported staging unchanged. The changes to HPI and the unemployment rate have been phased in to the forward-looking economic outlook over three years. The table below shows the impact on the Group’s ECL resulting from a decrease/increase in Loss Given Default for a 10 percentage point (pp) increase/ decrease in the UK House Price Index (HPI). |
| | | | | | | | | | | | | | | | | |
| | | At 31 December 2019 | | At 31 December 2018 |
| | | 10pp increase | | | 10pp decrease | | | 10pp increase | | | 10pp decrease | |
| | | in HPI | | | in HPI | | | in HPI | | | in HPI | |
| ECL impact, £m | | | (110 | ) | | | 147 | | | | (114 | ) | | | 154 | |
| | | | | | | | | | | | | | | | | |
| The table below shows the impact on the Group’s ECL resulting from a decrease/increase for a 1 percentage point (pp) increase/decrease in the UK unemployment rate. |
| | | | | | | | | | | | | | | | | |
| | | At 31 December 2019 | | At 31 December 2018 |
| | | 1pp increase in | | | 1pp decrease in | | | 1pp increase in | | | 1pp decrease in | |
| | | unemployment | | | unemployment | | | unemployment | | | unemployment | |
| ECL impact, £m | | | 141 | | | | (143 | ) | | | 172 | | | | (155 | ) |
Valuation of assets and liabilities arising from insurance business
At 31 December 2019, the Group recognised a value of in-force business asset of £5,311 million (2018: £4,491 million) and an acquired value of in-force business asset of £247 million (2018: £271 million).
The value of in-force business asset represents the estimated present value of future profits expected to arise from the portfolio of in-force life insurance and participating investment contracts. The valuation of this asset requires assumptions to be made about future economic and operating conditions which are inherently uncertain and changes could significantly affect the value attributed to this asset. The methodology used to value this asset and the key assumptions that have been made in determining the carrying value of the value of in-force business asset at 31 December 2019 are set out in note 25.
At 31 December 2019, the Group carried total liabilities arising from insurance contracts and participating investment contracts of £111,449 million (2018: £98,874 million). Elements of the valuations of liabilities arising from insurance contracts and participating investment contracts require management to estimate future investment returns, future mortality rates, future expenses and future policyholder behaviour. These estimates are subject to significant uncertainty. The methodology used to value these liabilities and the key assumptions that have been made in determining their carrying value are set out in note 32.
The effect on the Group’s profit before tax and shareholders’ equity of changes in key assumptions used in determining the life insurance assets and liabilities is set out in note 33.
Defined benefit pension scheme obligations
The net asset recognised in the balance sheet at 31 December 2019 in respect of the Group’s defined benefit pension scheme obligations was £550 million (comprising an asset of £681 million and a liability of £131 million) (2018: a net asset of £1,146 million comprising an asset of £1,267 million and a liability of £121 million). The Group’s accounting policy for its defined benefit pension scheme obligations is set out in note 2(K).
The accounting valuation of the Group’s defined benefit pension schemes’ liabilities requires management to make a number of assumptions. The key areas of estimation uncertainty are the discount rate applied to future cash flows and the expected lifetime of the schemes’ members. The discount rate is required to be set with reference to market yields at the end of the reporting period on high quality corporate bonds in the currency and with a term consistent with the defined benefit pension schemes’ obligations. The average duration of the schemes’ obligations is approximately 18 years. The market for bonds with a similar duration is illiquid and, as a result, significant management judgement is required to determine an appropriate yield curve on which to base the discount rate. The cost of the benefits payable by the schemes will also depend upon the life expectancy of the members. The Group considers latest market practice and actual experience in determining the appropriate assumptions for both current mortality expectations and the rate of
NOTES TO THE CONSOLIDATED FINANCIAL STATEMENTS
NOTE 3: CRITICAL ACCOUNTING JUDGEMENTS AND ESTIMATEScontinued
future mortality improvement. It is uncertain whether this rate of improvement will be sustained going forward and, as a result, actual experience may differ from current expectations. The effect on the net accounting surplus or deficit and on the pension charge in the Group’s income statement of changes to the principal actuarial assumptions is set out in part (v) of note 36.
Recoverability of deferred tax assets
At 31 December 2019 the Group carried deferred tax assets on its balance sheet of £2,666 million (2018: £2,453 million) principally relating to tax losses carried forward. Further information on the Group’s deferred tax assets and uncertain tax positions is provided in notes 37 and 48 respectively.
Estimation of income taxes includes the assessment of recoverability of deferred tax assets. Deferred tax assets are only recognised to the extent they are considered more likely than not to be recoverable based on existing tax laws and forecasts of future taxable profits against which the underlying tax deductions can be utilised. The Group has recognised a deferred tax asset of £3,611 million (2018: £3,778 million) in respect of UK trading losses carried forward. Substantially all of these losses have arisen in Bank of Scotland plc and Lloyds Bank plc, and they will be utilised as taxable profits arise in those legal entities in future periods.
The Group’s expectations as to the level of future taxable profits take into account the Group’s long-term financial and strategic plans, and anticipated future tax-adjusting items. In making this assessment, account is taken of business plans, the Board-approved operating plan and the expected future economic outlook, as well as the risks associated with future regulatory change. Under current law there is no expiry date for UK trading losses not yet utilised, although (since Finance Act 2016) banking losses that arose before 1 April 2015 can only be used against 25 per cent of taxable profits arising after 1 April 2016, and they cannot be used to reduce the surcharge on banking profits. This restriction in utilisation means that the value of the deferred tax asset is only expected to be fully recovered by 2039. It is possible that future tax law changes could materially affect the value of these losses ultimately realised by the Group.
As disclosed in note 37, deferred tax assets totalling £428 million (2018: £584 million) have not been recognised in respect of certain capital and trading losses carried forward, unrelieved foreign tax credits and other tax deductions, as there are currently no expected future taxable profits against which these assets can be utilised.
Regulatory provisions
At 31 December 2019, the Group carried provisions of £2,408 million (2018: £2,385 million) against the cost of making redress payments to customers and the related administration costs in connection with historical regulatory breaches.
Determining the amount of the provisions, which represent management’s best estimate of the cost of settling these issues, requires the exercise of significant judgement and estimate. It will often be necessary to form a view on matters which are inherently uncertain, such as the scope of reviews required by regulators, and to estimate the number of future complaints, the extent to which they will be upheld, the average cost of redress and the impact of legal decisions that may be relevant to claims received. Consequently the continued appropriateness of the underlying assumptions is reviewed on a regular basis against actual experience and other relevant evidence and adjustments made to the provisions where appropriate.
More detail on the nature of the assumptions that have been made and key sensitivities is set out in note 38.
Fair value of financial instruments
At 31 December 2019, the carrying value of the Group’s financial instrument assets held at fair value was £211,650 million (2018: £206,939 million), and its financial instrument liabilities held at fair value was £47,265 million (2018: £51,920 million).
In accordance with IFRS 13 Fair Value Measurement, the Group categorises financial instruments carried on the balance sheet at fair value using a three level hierarchy. Financial instruments categorised as level 1 are valued using quoted market prices and therefore minimal estimates are made in determining fair value. The fair value of financial instruments categorised as level 2 and, in particular, level 3 is determined using valuation techniques including discounted cash flow analysis and valuation models.
The valuation techniques for level 2 and level 3 financial instruments involve management judgement and estimates the extent of which depends on the complexity of the instrument and the availability of market observable information. In addition, in line with market practice, the Group applies credit, debit and funding valuation adjustments in determining the fair value of its uncollateralised derivative positions. A description of these adjustments is set out in note 50. Further details of the Group’s level 3 financial instruments and the sensitivity of their valuation including the effect of applying reasonably possible alternative assumptions in determining their fair value are also set out in note 50. Details about sensitivities to market risk arising from trading assets and other treasury positions can be found on page 108.
NOTES TO THE CONSOLIDATED FINANCIAL STATEMENTS
NOTE 4: SEGMENTAL ANALYSIS
Lloyds Banking Group provides a wide range of banking and financial services in the UK and in certain locations overseas.
The Group Executive Committee (GEC) has been determined to be the chief operating decision maker for the Group. The Group’s operating segments reflect its organisational and management structures. The GEC reviews the Group’s internal reporting based around these segments in order to assess performance and allocate resources. GEC considers interest income and expense on a net basis and consequently the total interest income and expense for all reportable segments is presented net. The segments are differentiated by the type of products provided and by whether the customers are individuals or corporate entities.
The segmental results and comparatives are presented on an underlying basis, the basis reviewed by the chief operating decision maker. The effects of the following are excluded in arriving at underlying profit:
| – | market volatility and asset sales, including the effects of certain asset sales, the volatility relating to the Group’s own debt and hedging arrangements and that arising in the insurance businesses; |
| | |
| – | the unwind of acquisition-related fair value adjustments and the amortisation of purchased intangible assets; |
| | |
| – | restructuring costs, principally comprising severance costs, the costs of integrating newly acquired businesses, the cost of regulatory reform and the rationalisation of the non-branch property portfolio; and |
| | |
| – | payment protection insurance. |
For the purposes of the underlying income statement, operating lease depreciation (net of gains on disposal of operating lease assets) is shown as an adjustment to total income.
During 2019, the Group transferred Cardnet, its card payment acceptance service, from Retail into Commercial Banking and also transferred certain equity business from Commercial Banking into Central items. Comparative figures have been restated accordingly.
The Group’s activities are organised into three financial reporting segments: Retail; Commercial Banking; and Insurance and Wealth.
Retail offers a broad range of financial service products, including current accounts, savings, mortgages, motor finance and unsecured consumer lending to personal and small business customers.
Commercial Banking provides a range of products and services such as lending, transactional banking, working capital management, risk management and debt capital markets services to SMEs, corporates and financial institutions.
Insurance and Wealth offers insurance, investment and wealth management products and services.
Other includes income and expenditure not attributed to divisions, including the costs of certain central and head office functions and the Group’s private equity business, Lloyds Development Capital.
Inter-segment services are generally recharged at cost, although some attract a margin. In particular a profit margin is charged on the internal commission arrangements between the UK branch and other distribution networks and the insurance product manufacturing businesses within the Group. Inter-segment lending and deposits are generally entered into at market rates, except that non-interest bearing balances are priced at a rate that reflects the external yield that could be earned on such funds.
For the majority of those derivative contracts entered into by business units for risk management purposes, the business unit recognises the net interest income or expense on an accrual accounting basis and transfers the remainder of the movement in the fair value of the derivative to the central function where the resulting accounting volatility is managed where possible through the establishment of hedge accounting relationships. Any change in fair value of the hedged instrument attributable to the hedged risk is also recorded within the central function. This allocation of the fair value of the derivative and change in fair value of the hedged instrument attributable to the hedged risk avoids accounting asymmetry in segmental results and leads to accounting volatility, which is managed centrally and reported within Other.
NOTES TO THE CONSOLIDATED FINANCIAL STATEMENTS
NOTE 4: SEGMENTAL ANALYSIS continued
| | | Retail
£m | | | Commercial
Banking
£m | | | Insurance
and Wealth
£m | | | Other
£m | | | Underlying
basis total
£m | |
| Year ended 31 December 2019 | | | | | | | | | | | | | | | | | | | | |
| Net interest income | | | 8,807 | | | | 2,918 | | | | 112 | | | | 540 | | | | 12,377 | |
| Other income, net of insurance claims | | | 2,014 | | | | 1,422 | | | | 2,021 | | | | 275 | | | | 5,732 | |
| Total underlying income, net of insurance claims | | | 10,821 | | | | 4,340 | | | | 2,133 | | | | 815 | | | | 18,109 | |
| Operating lease depreciation1 | | | (946 | ) | | | (21 | ) | | | – | | | | – | | | | (967 | ) |
| Net income | | | 9,875 | | | | 4,319 | | | | 2,133 | | | | 815 | | | | 17,142 | |
| Operating costs | | | (4,760 | ) | | | (2,081 | ) | | | (982 | ) | | | (52 | ) | | | (7,875 | ) |
| Remediation | | | (238 | ) | | | (155 | ) | | | (50 | ) | | | (2 | ) | | | (445 | ) |
| Total costs | | | (4,998 | ) | | | (2,236 | ) | | | (1,032 | ) | | | (54 | ) | | | (8,320 | ) |
| Impairment (charge) credit | | | (1,038 | ) | | | (306 | ) | | | – | | | | 53 | | | | (1,291 | ) |
| Underlying profit | | | 3,839 | | | | 1,777 | | | | 1,101 | | | | 814 | | | | 7,531 | |
| External income | | | 13,109 | | | | 3,394 | | | | 1,740 | | | | (134 | ) | | | 18,109 | |
| Inter-segment income (expense) | | | (2,288 | ) | | | 946 | | | | 393 | | | | 949 | | | | – | |
| Segment underlying income, net of insurance claims | | | 10,821 | | | | 4,340 | | | | 2,133 | | | | 815 | | | | 18,109 | |
| Segment external assets | | | 350,585 | | | | 145,060 | | | | 175,869 | | | | 162,379 | | | | 833,893 | |
| Segment customer deposits | | | 252,056 | | | | 145,122 | | | | 13,677 | | | | 10,465 | | | | 421,320 | |
| Segment external liabilities | | | 259,964 | | | | 183,390 | | | | 182,333 | | | | 160,400 | | | | 786,087 | |
| Analysis of segment underlying other income, net of insurance claims: | | | | | | | | | | | | | | | | | | | | |
| Current accounts | | | 518 | | | | 136 | | | | 5 | | | | – | | | | 659 | |
| Credit and debit card fees | | | 652 | | | | 330 | | | | – | | | | – | | | | 982 | |
| Commercial banking and treasury fees | | | – | | | | 248 | | | | – | | | | – | | | | 248 | |
| Unit trust and insurance broking | | | 9 | | | | – | | | | 197 | | | | – | | | | 206 | |
| Private banking and asset management | | | – | | | | 4 | | | | 65 | | | | – | | | | 69 | |
| Factoring | | | – | | | | 103 | | | | – | | | | – | | | | 103 | |
| Other fees and commissions | | | 54 | | | | 249 | | | | 156 | | | | 30 | | | | 489 | |
| Fees and commissions receivable | | | 1,233 | | | | 1,070 | | | | 423 | | | | 30 | | | | 2,756 | |
| Fees and commissions payable | | | (571 | ) | | | (321 | ) | | | (405 | ) | | | (53 | ) | | | (1,350 | ) |
| Net fee and commission income | | | 662 | | | | 749 | | | | 18 | | | | (23 | ) | | | 1,406 | |
| Operating lease rental income | | | 1,225 | | | | 25 | | | | – | | | | – | | | | 1,250 | |
| Rental income from investment properties | | | – | | | | – | | | | 191 | | | | – | | | | 191 | |
| Gains less losses on disposal of financial assets at fair value through other comprehensive income | | | – | | | | (5 | ) | | | – | | | | 201 | | | | 196 | |
| Lease termination income | | | – | | | | 12 | | | | – | | | | – | | | | 12 | |
| Trading income | | | 47 | | | | 812 | | | | – | | | | 278 | | | | 1,137 | |
| Insurance and other, net of insurance claims | | | 206 | | | | 72 | | | | 2,216 | | | | (954 | ) | | | 1,540 | |
| Other external income, net of insurance claims | | | 1,478 | | | | 916 | | | | 2,407 | | | | (475 | ) | | | 4,326 | |
| Inter-segment other income | | | (126 | ) | | | (243 | ) | | | (404 | ) | | | 773 | | | | – | |
| Segment other income, net of insurance claims | | | 2,014 | | | | 1,422 | | | | 2,021 | | | | 275 | | | | 5,732 | |
| Other segment items reflected in | | | | | | | | | | | | | | | | | | | | |
| income statement above: | | | | | | | | | | | | | | | | | | | | |
| Depreciation and amortisation | | | 1,712 | | | | 315 | | | | 181 | | | | 452 | | | | 2,660 | |
| Increase in value of in-force business | | | – | | | | – | | | | 825 | | | | – | | | | 825 | |
| Defined benefit scheme charges | | | 108 | | | | 43 | | | | 19 | | | | 75 | | | | 245 | |
| Other segment items: | | | | | | | | | | | | | | | | | | | | |
| Additions to fixed assets | | | 2,208 | | | | 260 | | | | 174 | | | | 1,007 | | | | 3,649 | |
| Investments in joint ventures and associates at end of year | | | 4 | | | | – | | | | – | | | | 300 | | | | 304 | |
| 1 | Net of profits on disposal of operating lease assets of £41 million. |
NOTES TO THE CONSOLIDATED FINANCIAL STATEMENTS
NOTE 4: SEGMENTAL ANALYSIS continued
| | | Retail
£m | | | Commercial
Banking
£m | | | Insurance
and Wealth
£m | | | Other
£m | | | Underlying
basis total
£m | |
| Year ended 31 December 20181 | | | | | | | | | | | | | | | | | | | | |
| Net interest income | | | 9,060 | | | | 3,013 | | | | 123 | | | | 518 | | | | 12,714 | |
| Other income, net of insurance claims | | | 2,097 | | | | 1,670 | | | | 1,865 | | | | 378 | | | | 6,010 | |
| Total underlying income, net of insurance claims | | | 11,157 | | | | 4,683 | | | | 1,988 | | | | 896 | | | | 18,724 | |
| Operating lease depreciation2 | | | (921 | ) | | | (35 | ) | | | – | | | | – | | | | (956 | ) |
| Net income | | | 10,236 | | | | 4,648 | | | | 1,988 | | | | 896 | | | | 17,768 | |
| Operating costs | | | (4,897 | ) | | | (2,191 | ) | | | (1,021 | ) | | | (56 | ) | | | (8,165 | ) |
| Remediation | | | (267 | ) | | | (203 | ) | | | (39 | ) | | | (91 | ) | | | (600 | ) |
| Total costs | | | (5,164 | ) | | | (2,394 | ) | | | (1,060 | ) | | | (147 | ) | | | (8,765 | ) |
| Impairment (charge) credit | | | (861 | ) | | | (71 | ) | | | (1 | ) | | | (4 | ) | | | (937 | ) |
| Underlying profit | | | 4,211 | | | | 2,183 | | | | 927 | | | | 745 | | | | 8,066 | |
| External income | | | 13,022 | | | | 4,889 | | | | 1,895 | | | | (1,082 | ) | | | 18,724 | |
| Inter-segment income (expense) | | | (1,865 | ) | | | (206 | ) | | | 93 | | | | 1,978 | | | | – | |
| Segment underlying income, net of insurance claims | | | 11,157 | | | | 4,683 | | | | 1,988 | | | | 896 | | | | 18,724 | |
| Segment external assets | | | 349,412 | | | | 165,030 | | | | 140,487 | | | | 142,669 | | | | 797,598 | |
| Segment customer deposits | | | 252,808 | | | | 148,635 | | | | 14,063 | | | | 2,560 | | | | 418,066 | |
| Segment external liabilities | | | 259,778 | | | | 191,687 | | | | 147,673 | | | | 148,261 | | | | 747,399 | |
| Analysis of segment underlying other income, net of insurance claims | | | | | | | | | | | | | | | | | | | | |
| Current accounts | | | 503 | | | | 142 | | | | 5 | | | | – | | | | 650 | |
| Credit and debit card fees | | | 660 | | | | 332 | | | | 1 | | | | – | | | | 993 | |
| Commercial banking and treasury fees | | | – | | | | 305 | | | | – | | | | – | | | | 305 | |
| Unit trust and insurance broking | | | 13 | | | | – | | | | 208 | | | | – | | | | 221 | |
| Private banking and asset management | | | – | | | | 5 | | | | 92 | | | | – | | | | 97 | |
| Factoring | | | – | | | | 83 | | | | – | | | | – | | | | 83 | |
| Other fees and commissions | | | 52 | | | | 253 | | | | 163 | | | | 31 | | | | 499 | |
| Fees and commissions receivable | | | 1,228 | | | | 1,120 | | | | 469 | | | | 31 | | | | 2,848 | |
| Fees and commissions payable | | | (601 | ) | | | (311 | ) | | | (418 | ) | | | (56 | ) | | | (1,386 | ) |
| Net fee and commission income | | | 627 | | | | 809 | | | | 51 | | | | (25 | ) | | | 1,462 | |
| Operating lease rental income | | | 1,305 | | | | 38 | | | | – | | | | – | | | | 1,343 | |
| Rental income from investment properties | | | – | | | | – | | | | 197 | | | | – | | | | 197 | |
| Gains less losses on disposal of financial assets at fair value through other comprehensive income | | | – | | | | – | | | | – | | | | 275 | | | | 275 | |
| Lease termination income | | | – | | | | 7 | | | | – | | | | – | | | | 7 | |
| Net trading income, excluding insurance | | | 71 | | | | 711 | | | | – | | | | 282 | | | | 1,064 | |
| Insurance and other, net of insurance claims | | | 247 | | | | 356 | | | | 2,146 | | | | (1,087 | ) | | | 1,662 | |
| Other external income, net of insurance claims | | | 1,623 | | | | 1,112 | | | | 2,343 | | | | (530 | ) | | | 4,548 | |
| Inter-segment other income | | | (153 | ) | | | (251 | ) | | | (529 | ) | | | 933 | | | | – | |
| Segment other income, net of insurance claims | | | 2,097 | | | | 1,670 | | | | 1,865 | | | | 378 | | | | 6,010 | |
| Other segment items reflected in income statement above: | | | | | | | | | | | | | | | | | | | | |
| Depreciation and amortisation | | | 1,573 | | | | 278 | | | | 154 | | | | 400 | | | | 2,405 | |
| Decrease in value of in-force business | | | – | | | | – | | | | (55 | ) | | | – | | | | (55 | ) |
| Defined benefit scheme charges | | | 121 | | | | 49 | | | | 20 | | | | 215 | | | | 405 | |
| Other segment items: | | | | | | | | | | | | | | | | | | | | |
| Additions to fixed assets | | | 2,092 | | | | 208 | | | | 223 | | | | 991 | | | | 3,514 | |
| Investments in joint ventures and associates at end of year | | | 4 | | | | – | | | | – | | | | 87 | | | | 91 | |
| 1 | Restated, see page F-25. |
| | |
| 2 | Net of profits on disposal of operating lease assets of £60 million. |
NOTES TO THE CONSOLIDATED FINANCIAL STATEMENTS
NOTE 4: SEGMENTAL ANALYSIS continued
| | | Retail
£m | | | Commercial
Banking
£m | | | Insurance
and Wealth
£m | | | Other
£m | | | Underlying basis
total
£m | |
| Year ended 31 December 20171 | | | | | | | | | | | | | | | | | | | | |
| Net interest income | | | 8,695 | | | | 3,040 | | | | 133 | | | | 452 | | | | 12,320 | |
| Other income, net of insurance claims | | | 2,150 | | | | 1,803 | | | | 1,846 | | | | 406 | | | | 6,205 | |
| Total underlying income, net of insurance claims | | | 10,845 | | | | 4,843 | | | | 1,979 | | | | 858 | | | | 18,525 | |
| Operating lease depreciation2 | | | (947 | ) | | | (105 | ) | | | – | | | | (1 | ) | | | (1,053 | ) |
| Net income | | | 9,898 | | | | 4,738 | | | | 1,979 | | | | 857 | | | | 17,472 | |
| Operating costs | | | (4,847 | ) | | | (2,249 | ) | | | (1,040 | ) | | | (48 | ) | | | (8,184 | ) |
| Remediation | | | (633 | ) | | | (173 | ) | | | (40 | ) | | | (19 | ) | | | (865 | ) |
| Total costs | | | (5,480 | ) | | | (2,422 | ) | | | (1,080 | ) | | | (67 | ) | | | (9,049 | ) |
| Impairment (charge) credit | | | (710 | ) | | | (95 | ) | | | – | | | | 10 | | | | (795 | ) |
| Underlying profit | | | 3,708 | | | | 2,221 | | | | 899 | | | | 800 | | | | 7,628 | |
| External income | | | 12,606 | | | | 3,181 | | | | 1,883 | | | | 855 | | | | 18,525 | |
| Inter-segment income (expense) | | | (1,761 | ) | | | 1,662 | | | | 96 | | | | 3 | | | | – | |
| Segment underlying income, net of insurance claims | | | 10,845 | | | | 4,843 | | | | 1,979 | | | | 858 | | | | 18,525 | |
| Segment external assets | | | 350,051 | | | | 177,763 | | | | 151,986 | | | | 132,309 | | | | 812,109 | |
| Segment customer deposits | | | 253,127 | | | | 148,313 | | | | 13,770 | | | | 2,914 | | | | 418,124 | |
| Segment external liabilities | | | 258,246 | | | | 224,918 | | | | 157,824 | | | | 121,978 | | | | 762,966 | |
| Analysis of segment underlying other income, net of insurance claims: | | | | | | | | | | | | | | | | | | | | |
| Current accounts | | | 572 | | | | 135 | | | | 5 | | | | – | | | | 712 | |
| Credit and debit card fees | | | 640 | | | | 312 | | | | 1 | | | | – | | | | 953 | |
| Commercial banking and treasury fees | | | – | | | | 321 | | | | – | | | | – | | | | 321 | |
| Unit trust and insurance broking | | | 10 | | | | – | | | | 214 | | | | – | | | | 224 | |
| Private banking and asset management | | | – | | | | 5 | | | | 93 | | | | – | | | | 98 | |
| Factoring | | | – | | | | 91 | | | | – | | | | – | | | | 91 | |
| Other fees and commissions | | | 95 | | | | 273 | | | | 184 | | | | 14 | | | | 566 | |
| Fees and commissions receivable | | | 1,317 | | | | 1,137 | | | | 497 | | | | 14 | | | | 2,965 | |
| Fees and commissions payable | | | (636 | ) | | | (287 | ) | | | (380 | ) | | | (79 | ) | | | (1,382 | ) |
| Net fee and commission income | | | 681 | | | | 850 | | | | 117 | | | | (65 | ) | | | 1,583 | |
| Operating lease rental income | | | 1,281 | | | | 63 | | | | – | | | | – | | | | 1,344 | |
| Rental income from investment properties | | | – | | | | 1 | | | | 212 | | | | – | | | | 213 | |
| Gains less losses on disposal of available-for-sale financial assets | | | – | | | | 5 | | | | (3 | ) | | | 444 | | | | 446 | |
| Lease termination income | | | – | | | | 74 | | | | – | | | | – | | | | 74 | |
| Trading income | | | 26 | | | | 481 | | | | – | | | | (89 | ) | | | 418 | |
| Insurance and other, net of insurance claims | | | 6 | | | | (6 | ) | | | 2,223 | | | | (96 | ) | | | 2,127 | |
| Other external income, net of insurance claims | | | 1,313 | | | | 618 | | | | 2,432 | | | | 259 | | | | 4,622 | |
| Inter-segment other income | | | 156 | | | | 335 | | | | (703 | ) | | | 212 | | | | – | |
| Segment other income, net of insurance claims | | | 2,150 | | | | 1,803 | | | | 1,846 | | | | 406 | | | | 6,205 | |
| Other segment items reflected in income statement above: | | | | | | | | | | | | | | | | | | | | |
| Depreciation and amortisation | | | 1,547 | | | | 322 | | | | 197 | | | | 304 | | | | 2,370 | |
| Increase in value of in-force business | | | – | | | | – | | | | (165 | ) | | | – | | | | (165 | ) |
| Defined benefit scheme charges | | | 149 | | | | 53 | | | | 25 | | | | 132 | | | | 359 | |
| Other segment items: | | | | | | | | | | | | | | | | | | | | |
| Additions to fixed assets | | | 2,431 | | | | 130 | | | | 274 | | | | 820 | | | | 3,655 | |
| Investments in joint ventures and associates at end of year | | | 12 | | | | – | | | | – | | | | 53 | | | | 65 | |
| 1 | Restated see page F-25. |
| | |
| 2 | Net of profits on disposal of operating lease assets of £32 million. |
NOTES TO THE CONSOLIDATED FINANCIAL STATEMENTS
NOTE 4: SEGMENTAL ANALYSIS continued
Reconciliation of underlying basis to statutory results
The underlying basis is the basis on which financial information is presented to the chief operating decision maker which excludes certain items included in the statutory results. The table below reconciles the statutory results to the underlying basis.
| | | | | | Removal of: | | | | |
| | | Lloyds
Banking
Group
statutory
£m | | | Volatility
and other
items1
£m | | | Insurance
gross up2
£m | | | PPI
£m | | | Underlying
basis
£m | |
| Year ended 31 December 2019 | | | | | | | | | | | | | | | | | | | | |
| Net interest income | | | 10,180 | | | | 379 | | | | 1,818 | | | | – | | | | 12,377 | |
| Other income, net of insurance claims | | | 8,179 | | | | (426 | ) | | | (2,021 | ) | | | – | | | | 5,732 | |
| Total income, net of insurance claims | | | 18,359 | | | | (47 | ) | | | (203 | ) | | | – | | | | 18,109 | |
| Operating lease depreciation3 | | | | | | | (967 | ) | | | – | | | | – | | | | (967 | ) |
| Net income | | | 18,359 | | | | (1,014 | ) | | | (203 | ) | | | – | | | | 17,142 | |
| Operating expenses | | | (12,670 | ) | | | 1,697 | | | | 203 | | | | 2,450 | | | | (8,320 | ) |
| Impairment | | | (1,296 | ) | | | 5 | | | | – | | | | – | | | | (1,291 | ) |
| Profit before tax | | | 4,393 | | | | 688 | | | | – | | | | 2,450 | | | | 7,531 | |
| | | | | | | | | | | | | | | | | | | | | |
| | | | | | Removal of: | | | | |
| | | Lloyds
Banking
Group
statutory
£m | | | Volatility
and other
items4
£m | | | Insurance
gross up2
£m | | | PPI
£m | | | Underlying
basis
£m | |
| Year ended 31 December 2018 | | | | | | | | | | | | | | | | | | | | |
| Net interest income | | | 13,396 | | | | 152 | | | | (834 | ) | | | – | | | | 12,714 | |
| Other income, net of insurance claims | | | 5,230 | | | | 107 | | | | 673 | | | | – | | | | 6,010 | |
| Total income, net of insurance claims | | | 18,626 | | | | 259 | | | | (161 | ) | | | – | | | | 18,724 | |
| Operating lease depreciation3 | | | | | | | (956 | ) | | | – | | | | – | | | | (956 | ) |
| Net income | | | 18,626 | | | | (697 | ) | | | (161 | ) | | | – | | | | 17,768 | |
| Operating expenses | | | (11,729 | ) | | | 2,053 | | | | 161 | | | | 750 | | | | (8,765 | ) |
| Impairment | | | (937 | ) | | | – | | | | – | | | | – | | | | (937 | ) |
| Profit before tax | | | 5,960 | | | | 1,356 | | | | – | | | | 750 | | | | 8,066 | |
| | | | | | | | | | | | | | | | | | | | | |
| | | | | | Removal of: | | | | |
| | | Lloyds
Banking
Group
statutory
£m | | | Volatility
and other
items5
£m | | | Insurance
gross up2
£m | | | PPI
£m | | | Underlying
basis
£m | |
| Year ended 31 December 2017 | | | | | | | | | | | | | | | | | | | | |
| Net interest income | | | 10,912 | | | | 228 | | | | 1,180 | | | | – | | | | 12,320 | |
| Other income, net of insurance claims | | | 7,747 | | | | (186 | ) | | | (1,356 | ) | | | – | | | | 6,205 | |
| Total income, net of insurance claims | | | 18,659 | | | | 42 | | | | (176 | ) | | | – | | | | 18,525 | |
| Operating lease depreciation3 | | | | | | | (1,053 | ) | | | – | | | | – | | | | (1,053 | ) |
| Net income | | | 18,659 | | | | (1,011 | ) | | | (176 | ) | | | – | | | | 17,472 | |
| Operating expenses | | | (12,346 | ) | | | 1,821 | | | | 176 | | | | 1,300 | | | | (9,049 | ) |
| Impairment | | | (688 | ) | | | (107 | ) | | | – | | | | – | | | | (795 | ) |
| Profit before tax | | | 5,625 | | | | 703 | | | | – | | | | 1,300 | | | | 7,628 | |
| 1 | In the year ended 31 December 2019 this comprises the effects of asset sales (gains of £214 million); volatility and other items (losses of £88 million); the amortisation of purchased intangibles (£68 million); restructuring (£471 million, comprising severance related costs, the integration of Zurich’s UK workplace pensions and savings business and costs associated with establishing the Schroders Personal Wealth joint venture); and the fair value unwind and other items (losses of £275 million). |
| | |
| 2 | The Group’s insurance businesses’ income statements include income and expenditure which are attributable to the policyholders of the Group’s long-term assurance funds. These items have no impact in total upon the profit attributable to equity shareholders and, in order to provide a clearer representation of the underlying trends within the business, these items are shown net within the underlying results. |
| | |
| 3 | Net of profits on disposal of operating lease assets of £41 million (2018: £60 million; 2017: £32 million). |
| | |
| 4 | Comprises the effects of asset sales (loss of £145 million); volatility and other items (gains of £95 million); the amortisation of purchased intangibles (£108 million); restructuring (£879 million, comprising severance related costs, the rationalisation of the non-branch property portfolio, the work on implementing the ring-fencing requirements and the integration of MBNA and Zurich’s UK workplace pensions and savings business); and the fair value unwind and other items (losses of £319 million). |
| | |
| 5 | Comprises the effects of asset sales (gain of £30 million); volatile items (gain of £263 million); liability management (loss of £14 million); the amortisation of purchased intangibles (£91 million); restructuring costs (£621 million, principally comprising costs relating to the Simplification programme; the rationalisation of the non-branch property portfolio, the work on implementing the ring-fencing requirements and the integration of MBNA); and the fair value unwind and other items (loss of £270 million). |
Geographical areas
Following the reduction in the Group’s non-UK activities, an analysis between UK and non-UK activities is no longer provided.
NOTES TO THE CONSOLIDATED FINANCIAL STATEMENTS
NOTE 5: NET INTEREST INCOME
| | | Weighted average
effective interest rate | | | | | | | | | |
| | | 2019 | | | 2018 | | | 2017 | | | 2019 | | | 2018 | | | 2017 | |
| | | % | | | % | | | % | | | £m | | | £m | | | £m | |
| Interest and similar income: | | | | | | | | | | | | | | | | | | | | | | | | |
| Loans and advances to customers | | | 3.17 | | | | 3.17 | | | | 3.16 | | | | 15,790 | | | | 15,078 | | | | 14,712 | |
| Loans and advances to banks | | | 0.78 | | | | 0.84 | | | | 0.40 | | | | 514 | | | | 565 | | | | 271 | |
| Debt securities held at amortised cost | | | 2.23 | | | | 1.60 | | | | 1.29 | | | | 122 | | | | 66 | | | | 43 | |
| Interest receivable on financial assets held at amortised cost | | | 2.89 | | | | 2.87 | | | | 2.81 | | | | 16,426 | | | | 15,709 | | | | 15,026 | |
| Financial assets at fair value through other comprehensive income | | | 1.64 | | | | 1.98 | | | | | | | | 435 | | | | 640 | | | | | |
| Available-for-sale financial assets | | | | | | | | | | | 1.96 | | | | | | | | | | | | 980 | |
| Total interest and similar income1 | | | 2.83 | | | | 2.82 | | | | 2.73 | | | | 16,861 | | | | 16,349 | | | | 16,006 | |
| Interest and similar expense: | | | | | | | | | | | | | | | | | | | | | | | | |
| Deposits from banks, excluding liabilities under sale and repurchase transactions | | | 0.86 | | | | 1.39 | | | | 1.18 | | | | (96 | ) | | | (117 | ) | | | (80 | ) |
| Customer deposits, excluding liabilities under sale and repurchase transactions | | | 0.59 | | | | 0.53 | | | | 0.49 | | | | (2,015 | ) | | | (1,812 | ) | | | (1,721 | ) |
| Debt securities in issue2 | | | 1.24 | | | | 0.27 | | | | 0.37 | | | | (1,204 | ) | | | (234 | ) | | | (266 | ) |
| Subordinated liabilities | | | 6.79 | | | | 7.63 | | | | 7.93 | | | | (1,201 | ) | | | (1,388 | ) | | | (1,481 | ) |
| Lease liabilities | | | 2.49 | | | | 2.46 | | | | 2.38 | | | | (42 | ) | | | (1 | ) | | | (1 | ) |
| Liabilities under sale and repurchase agreements | | | 1.12 | | | | 0.96 | | | | 0.58 | | | | (301 | ) | | | (245 | ) | | | (110 | ) |
| Interest payable on liabilities held at amortised cost | | | 0.98 | | | | 0.79 | | | | 0.79 | | | | (4,859 | ) | | | (3,797 | ) | | | (3,659 | ) |
| Amounts payable to unitholders in consolidated open-ended investment vehicles4 | | | 13.64 | | | | (6.07 | ) | | | 9.15 | | | | (1,822 | ) | | | 844 | | | | (1,435 | ) |
| Total interest and similar expense3 | | | 1.31 | | | | 0.60 | | | | 1.06 | | | | (6,681 | ) | | | (2,953 | ) | | | (5,094 | ) |
| Net interest income | | | | | | | | | | | | | | | 10,180 | | | | 13,396 | | | | 10,912 | |
| 1 | Includes £26 million (2018: £31 million; 2017: £12 million) of interest income on liabilities with negative interest rates and £45 million (2018: £46 million; 2017: £49 million) in respect of interest income on finance leases. |
| | |
| 2 | The impact of the Group’s hedging arrangements is included on this line; excluding this impact the weighted average effective interest rate in respect of debt securities in issue would be 2.57 per cent (2018: 2.68 per cent; 2017: 2.43 per cent). |
| | |
| 3 | Includes £119 million (2018: £10 million; 2017: £50 million) of interest expense on assets with negative interest rates. |
| | |
| 4 | Where a collective investment vehicle is consolidated the interests of parties other than the Group are reported in other liabilities and the movement in these interests in interest expense. |
Included within interest and similar income is £198 million (2018: £227 million; 2017: £179 million) in respect of credit-impaired financial assets. Net interest income also includes a credit of £608 million (2018: credit of £701 million; 2017: credit of £651 million) transferred from the cash flow hedging reserve (see note 42).
NOTE 6: NET FEE AND COMMISSION INCOME
| | | 2019 | | | 2018 | | | 2017 | |
| | | £m | | | £m | | | £m | |
| Fee and commission income: | | | | | | | | | | | | |
| Current accounts | | | 659 | | | | 650 | | | | 712 | |
| Credit and debit card fees | | | 982 | | | | 993 | | | | 953 | |
| Commercial banking and treasury fees | | | 248 | | | | 305 | | | | 321 | |
| Unit trust and insurance broking | | | 206 | | | | 221 | | | | 224 | |
| Private banking and asset management | | | 69 | | | | 97 | | | | 98 | |
| Factoring | | | 103 | | | | 83 | | | | 91 | |
| Other fees and commissions | | | 489 | | | | 499 | | | | 566 | |
| Total fee and commission income | | | 2,756 | | | | 2,848 | | | | 2,965 | |
| Fee and commission expense | | | (1,350 | ) | | | (1,386 | ) | | | (1,382 | ) |
| Net fee and commission income | | | 1,406 | | | | 1,462 | | | | 1,583 | |
Fees and commissions which are an integral part of the effective interest rate form part of net interest income shown in note 5. Fees and commissions relating to instruments that are held at fair value through profit or loss are included within net trading income shown in note 7.
At 31 December 2019, the Group held on its balance sheet £293 million (31 December 2018: £282 million) in respect of services provided to customers and £140 million (31 December 2018: £168 million) in respect of amounts received from customers for services to be provided after the balance sheet date. Current unsatisfied performance obligations amount to £270 million (31 December 2018: £314 million); the Group expects to receive substantially all of this revenue by 2022.
Income recognised during the year ended 31 December 2019 included £54 million in respect of amounts included in the contract liability balance at 31 December 2018 and £9 million in respect of amounts from performance obligations satisfied in previous years.
The most significant performance obligations undertaken by the Group are in respect of current accounts, the provision of other banking services for commercial customers, credit and debit card services and investment management services.
NOTES TO THE CONSOLIDATED FINANCIAL STATEMENTS
NOTE 6: NET FEE AND COMMISSION INCOME continued
In respect of current accounts, the Group receives fees for the provision of bank account and transaction services such as ATM services, fund transfers, overdraft facilities and other value-added offerings.
For commercial customers, alongside its provision of current accounts, the Group provides other corporate banking services including factoring and commitments to provide loan financing. Loan commitment fees are included in fees and commissions where the loan is not expected to be drawn down by the customer.
The Group receives interchange and merchant fees, together with fees for overseas use and cash advances, for provision of card services to cardholders and merchants.
Investment management services principally comprise the management and administration of policyholders’ funds in accordance with investment mandates. Fees are generally based on the value of the assets under management.
NOTE 7: NET TRADING INCOME
| | | 2019 | | | 2018 | | | 2017 | |
| | | £m | | | £m | | | £m | |
| Foreign exchange translation (losses) gains | | | (255 | ) | | | 342 | | | | (174 | ) |
| Gains on foreign exchange trading transactions | | | 677 | | | | 580 | | | | 517 | |
| Total foreign exchange | | | 422 | | | | 922 | | | | 343 | |
| Investment property (losses) gains (note 27) | | | (108 | ) | | | 139 | | | | 230 | |
| Securities and other gains (losses) (see below) | | | 17,974 | | | | (4,937 | ) | | | 11,244 | |
| Net trading income | | | 18,288 | | | | (3,876 | ) | | | 11,817 | |
Securities and other gains comprise net gains (losses) arising on assets and liabilities held at fair value through profit or loss as follows:
| | | 2019 | | | 2018 | | | 2017 | |
| | | £m | | | £m | | | £m | |
| Net income arising on assets and liabilities mandatorily held at fair value through profit or loss: | | | | | | | | | | | | |
| Financial instruments held for trading | | | 120 | | | | (8 | ) | | | 404 | |
| Other financial instruments mandatorily held at fair value through profit or loss: | | | | | | | | | | | | |
| Debt securities, loans and advances | | | 3,509 | | | | (26 | ) | | | 1,122 | |
| Equity shares | | | 14,559 | | | | (4,747 | ) | | | 9,862 | |
| | | | 18,188 | | | | (4,781 | ) | | | 11,388 | |
| Net (expense) income arising on assets and liabilities designated at fair value through profit or loss | | | (214 | ) | | | (156 | ) | | | (144 | ) |
| Securities and other gains | | | 17,974 | | | | (4,937 | ) | | | 11,244 | |
| |
| NOTE 8: INSURANCE PREMIUM INCOME | | | | | | | | | | | | |
| | | | | | | | | | | | | |
| | | 2019 | | | 2018 | | | 2017 | |
| | | £m | | | £m | | | £m | |
| Life insurance | | | | | | | | | | | | |
| Gross premiums: | | | | | | | | | | | | |
| Life and pensions | | | 6,827 | | | | 6,612 | | | | 6,273 | |
| Annuities | | | 2,483 | | | | 2,178 | | | | 1,082 | |
| | | | 9,310 | | | | 8,790 | | | | 7,355 | |
| Ceded reinsurance premiums | | | (378 | ) | | | (271 | ) | | | (168 | ) |
| Net earned premiums | | | 8,932 | | | | 8,519 | | | | 7,187 | |
| Non-life insurance | | | | | | | | | | | | |
| Net earned premiums | | | 642 | | | | 670 | | | | 743 | |
| Total net earned premiums | | | 9,574 | | | | 9,189 | | | | 7,930 | |
| |
| NOTE 9: OTHER OPERATING INCOME | | | | | | | | | | | | |
| | | | | | | | | | | | | |
| | | | 2019 | | | | 2018 | | | | 2017 | |
| | | | £m | | | | £m | | | | £m | |
| Operating lease rental income | | | 1,250 | | | | 1,343 | | | | 1,344 | |
| Rental income from investment properties (note 27) | | | 191 | | | | 197 | | | | 213 | |
| Gains less losses on disposal of financial assets at fair value through other comprehensive income (2017: available-for-sale financial assets) (note 42) | | | 196 | | | | 275 | | | | 446 | |
| Movement in value of in-force business (note 25) | | | 825 | | | | (55 | ) | | | (165 | ) |
| Gain related to establishment of joint venture (note 23) | | | 244 | | | | – | | | | – | |
| Share of results of joint ventures and associates (note 22) | | | 6 | | | | 9 | | | | 6 | |
| Other | | | 196 | | | | 151 | | | | 151 | |
| Total other operating income | | | 2,908 | | | | 1,920 | | | | 1,995 | |
NOTES TO THE CONSOLIDATED FINANCIAL STATEMENTS
NOTE 10: INSURANCE CLAIMS
| | | 2019 | | | 2018 | | | 2017 | |
| Insurance claims comprise: | | £m | | | £m | | | £m | |
| Life insurance and participating investment contracts | | | | | | | | | | | | |
| Claims and surrenders | | | (8,684 | ) | | | (8,735 | ) | | | (8,898 | ) |
| Change in insurance and participating investment contracts (note 32) | | | (12,633 | ) | | | 4,565 | | | | (9,067 | ) |
| Change in non-participating investment contracts | | | (2,664 | ) | | | 628 | | | | 2,836 | |
| | | | (23,981 | ) | | | (3,542 | ) | | | (15,129 | ) |
| Reinsurers’ share | | | 290 | | | | 404 | | | | 35 | |
| | | | (23,691 | ) | | | (3,138 | ) | | | (15,094 | ) |
| Change in unallocated surplus | | | (19 | ) | | | 8 | | | | (147 | ) |
| Total life insurance and participating investment contracts | | | (23,710 | ) | | | (3,130 | ) | | | (15,241 | ) |
| Non-life insurance | | | | | | | | | | | | |
| Total non-life insurance claims, net of reinsurance | | | (287 | ) | | | (335 | ) | | | (337 | ) |
| Total insurance claims | | | (23,997 | ) | | | (3,465 | ) | | | (15,578 | ) |
| Life insurance and participating investment contracts gross claims and surrenders can also be analysed as follows: | | | | | |
| Deaths | | | (674 | ) | | | (721 | ) | | | (675 | ) |
| Maturities | | | (1,122 | ) | | | (1,198 | ) | | | (1,280 | ) |
| Surrenders | | | (5,523 | ) | | | (5,548 | ) | | | (5,674 | ) |
| Annuities | | | (1,104 | ) | | | (1,032 | ) | | | (985 | ) |
| Other | | | (261 | ) | | | (236 | ) | | | (284 | ) |
| Total life insurance gross claims and surrenders | | | (8,684 | ) | | | (8,735 | ) | | | (8,898 | ) |
| | | | | | | | | | | | | |
| NOTE 11: OPERATING EXPENSES | | | | | | | | | | | | |
| | | | | | | | | | | | | |
| | | | 2019 | | | | 2018 | | | | 2017 | |
| | | | £m | | | | £m | | | | £m | |
| Staff costs: | | | | | | | | | | | | |
| Salaries | | | 2,539 | | | | 2,482 | | | | 2,679 | |
| Performance-based compensation | | | 380 | | | | 509 | | | | 473 | |
| Social security costs | | | 325 | | | | 343 | | | | 361 | |
| Pensions and other post-retirement benefit schemes (note 36) | | | 532 | | | | 705 | | | | 625 | |
| Restructuring costs | | | 92 | | | | 249 | | | | 24 | |
| Other staff costs | | | 383 | | | | 474 | | | | 448 | |
| | | | 4,251 | | | | 4,762 | | | | 4,610 | |
| Premises and equipment: | | | | | | | | | | | | |
| Rent and rates | | | 93 | | | | 370 | | | | 365 | |
| Repairs and maintenance | | | 187 | | | | 190 | | | | 231 | |
| Other | | | 211 | | | | 169 | | | | 134 | |
| | | | 491 | | | | 729 | | | | 730 | |
| Other expenses: | | | | | | | | | | | | |
| Communications and data processing | | | 1,038 | | | | 1,121 | | | | 882 | |
| Advertising and promotion | | | 170 | | | | 197 | | | | 208 | |
| Professional fees | | | 226 | | | | 287 | | | | 328 | |
| UK bank levy | | | 224 | | | | 225 | | | | 231 | |
| Other | | | 715 | | | | 653 | | | | 814 | |
| | | | 2,373 | | | | 2,483 | | | | 2,463 | |
| Depreciation and amortisation: | | | | | | | | | | | | |
| Depreciation of property, plant and equipment (note 27) | | | 2,064 | | | | 1,852 | | | | 1,944 | |
| Amortisation of acquired value of in-force non-participating investment contracts (note 25) | | | 30 | | | | 40 | | | | 34 | |
| Amortisation of other intangible assets (note 26) | | | 566 | | | | 513 | | | | 392 | |
| | | | 2,660 | | | | 2,405 | | | | 2,370 | |
| Goodwill impairment | | | – | | | | – | | | | 8 | |
| Total operating expenses, excluding regulatory provisions | | | 9,775 | | | | 10,379 | | | | 10,181 | |
| Regulatory provisions: | | | | | | | | | | | | |
| Payment protection insurance provision (note 38) | | | 2,450 | | | | 750 | | | | 1,300 | |
| Other regulatory provisions (note 38) | | | 445 | | | | 600 | | | | 865 | |
| | | | 2,895 | | | | 1,350 | | | | 2,165 | |
| Total operating expenses | | | 12,670 | | | | 11,729 | | | | 12,346 | |
NOTES TO THE CONSOLIDATED FINANCIAL STATEMENTS
NOTE 11: OPERATING EXPENSES continued
Performance-based compensation
The table below analyses the Group’s performance-based compensation costs between those relating to the current performance year and those relating to earlier years.
| | | 2019 | | | 2018 | | | 2017 | |
| | | £m | | | £m | | | £m | |
| Performance-based compensation expense comprises: | | | | | | | | | | | | |
| Awards made in respect of the year ended 31 December | | | 244 | | | | 362 | | | | 334 | |
| Awards made in respect of earlier years | | | 136 | | | | 147 | | | | 139 | |
| | | | 380 | | | | 509 | | | | 473 | |
| |
| Performance-based compensation expense deferred until later years comprises: | | | | | | | | | | | | |
| Awards made in respect of the year ended 31 December | | | 113 | | | | 152 | | | | 127 | |
| Awards made in respect of earlier years | | | 36 | | | | 37 | | | | 35 | |
| | | | 149 | | | | 189 | | | | 162 | |
Performance-based awards expensed in 2019 include cash awards amounting to £89 million (2018: £137 million; 2017: £102 million).
Average headcount
The average number of persons on a headcount basis employed by the Group during the year was as follows:
| | | 2019 | | | 2018 | | | 2017 | |
| UK | | | 69,321 | | | | 71,857 | | | | 75,150 | |
| Overseas | | | 762 | | | | 769 | | | | 794 | |
| Total | | | 70,083 | | | | 72,626 | | | | 75,944 | |
NOTE 12: AUDITORS’ REMUNERATION
Fees payable to the Company’s auditors by the Group are as follows:
| | | 2019 | | | 2018 | | | 2017 | |
| | | £m | | | £m | | | £m | |
| | | | | | | | | | |
| Fees payable for the audit of the Company’s current year annual report | | | 1.5 | | | | 1.5 | | | | 1.5 | |
| Fees payable for other services: | | | | | | | | | | | | |
| Audit of the Company’s subsidiaries pursuant to legislation | | | 20.2 | | | | 19.1 | | | | 18.6 | |
| Other services supplied pursuant to legislation | | | 3.5 | | | | 2.9 | | | | 3.0 | |
| Total audit fees | | | 25.2 | | | | 23.5 | | | | 23.1 | |
| Other services – audit related fees | | | 1.0 | | | | 1.2 | | | | 1.2 | |
| Total audit and audit related fees | | | 26.2 | | | | 24.7 | | | | 24.3 | |
| Other non-audit fees: | | | | | | | | | | | | |
| Services relating to corporate finance transactions | | | – | | | | – | | | | 1.2 | |
| Other services | | | 0.7 | | | | 2.0 | | | | 2.4 | |
| Total other non-audit fees | | | 0.7 | | | | 2.0 | | | | 3.6 | |
| Total fees payable to the Company’s auditors by the Group | | | 26.9 | | | | 26.7 | | | | 27.9 | |
The following types of services are included in the categories listed above:
Audit fees: This category includes fees in respect of the audit of the Group’s annual financial statements and other services in connection with regulatory filings. Other services supplied pursuant to legislation relate primarily to costs incurred in connection with client asset assurance and with the Sarbanes-Oxley Act requirements associated with the audit of the Group’s financial statements filed on its Form 20-F.
Audit related fees: This category includes fees in respect of services for assurance and related services that are reasonably related to the performance of the audit or review of the financial statements, for example acting as reporting accountants in respect of debt prospectuses required by the listing rules.
Other non-audit fees: This category includes due diligence relating to corporate finance, including venture capital transactions and other assurance services. The auditors are not engaged to provide tax services.
It is the Group’s policy to use the auditors on assignments in cases where their knowledge of the Group means that it is neither efficient nor cost effective to employ another firm of accountants.
NOTES TO THE CONSOLIDATED FINANCIAL STATEMENTS
NOTE 12: AUDITORS’ REMUNERATIONcontinued
The Group has procedures that are designed to ensure auditor independence, including prohibiting certain non-audit services. All audit and non-audit assignments must be pre-approved by the audit committee on an individual engagement basis; for certain types of non-audit engagements where the fee is ‘de minimis’ the audit committee has pre-approved all assignments subject to confirmation by management. On a quarterly basis, the audit committee receives and reviews a report detailing all pre-approved services and amounts paid to the auditors for such pre-approved services.
During the year, the auditors also earned fees payable by entities outside the consolidated Lloyds Banking Group in respect of the following:
| | | 2019 | | | 2018 | | | 2017 | |
| | | £m | | | £m | | | £m | |
| Audits of Group pension schemes | | | 0.1 | | | | 0.1 | | | | 0.1 | |
| Audits of the unconsolidated Open Ended Investment Companies managed by the Group | | | 0.4 | | | | 0.3 | | | | 0.3 | |
| Reviews of the financial position of corporate and other borrowers | | | 0.2 | | | | 0.4 | | | | 0.2 | |
| Acquisition due diligence and other work performed in respect of potential venture capital investments | | | – | | | | – | | | | 0.1 | |
NOTE 13: IMPAIRMENT
| | | | | | | | | | | | Purchased or | | | | |
| | | | | | | | | | | | originated | | | | |
| | | Stage 1 | | | Stage 2 | | | Stage 3 | | | credit-impaired | | | Total | |
| | | £m | | | £m | | | £m | | | £m | | | £m | |
| Year ended 31 December 2019 | | | | | | | | | | | | | | | |
| Impact of transfers between stages | | | (17 | ) | | | 89 | | | | 532 | | | | – | | | | 604 | |
| Other changes in credit quality | | | 4 | | | | 1 | | | | 899 | | | | (106 | ) | | | 798 | |
| Additions (repayments) | | | 94 | | | | (39 | ) | | | (84 | ) | | | (87 | ) | | | (116 | ) |
| Methodology, model and assumption changes | | | 33 | | | | (27 | ) | | | 8 | | | | – | | | | 14 | |
| Other items | | | (4 | ) | | | – | | | | – | | | | – | | | | (4 | ) |
| | | | 127 | | | | (65 | ) | | | 823 | | | | (193 | ) | | | 692 | |
| Total impairment | | | 110 | | | | 24 | | | | 1,355 | | | | (193 | ) | | | 1,296 | |
| | | | | | | | | | | | | | | | | | | | | |
| In respect of: | | | | | | | | | | | | | | | | | | | | |
| Loans and advances to banks | | | – | | | | – | | | | – | | | | – | | | | – | |
| Loans and advances to customers | | | 139 | | | | 10 | | | | 1,351 | | | | (193 | ) | | | 1,307 | |
| Financial assets at amortised cost | | | 139 | | | | 10 | | | | 1,351 | | | | (193 | ) | | | 1,307 | |
| Other assets | | | – | | | | – | | | | 5 | | | | – | | | | 5 | |
| Impairment charge on drawn balances | | | 139 | | | | 10 | | | | 1,356 | | | | (193 | ) | | | 1,312 | |
| Loan commitments and financial guarantees | | | (28 | ) | | | 14 | | | | (1 | ) | | | – | | | | (15 | ) |
| Financial assets at fair value through other comprehensive income | | | (1 | ) | | | – | | | | – | | | | – | | | | (1 | ) |
| Total impairment | | | 110 | | | | 24 | | | | 1,355 | | | | (193 | ) | | | 1,296 | |
| | | | | | | | | | | | | | | | |
| | | | | | | | | | | | Purchased or | | | | |
| | | | | | | | | | | | originated | | | | |
| | | Stage 1 | | | Stage 2 | | | Stage 3 | | | credit-impaired | | | Total | |
| | | £m | | | £m | | | £m | | | £m | | | £m | |
| Year ended 31 December 2018 | | | | | | | | | | | | | | | |
| Impact of transfers between stages | | | (12 | ) | | | 51 | | | | 446 | | | | – | | | | 485 | |
| Other changes in credit quality | | | (20 | ) | | | (47 | ) | | | 541 | | | | 69 | | | | 543 | |
| Additions (repayments) | | | 18 | | | | (82 | ) | | | 43 | | | | (69 | ) | | | (90 | ) |
| Methodology, model and assumption changes | | | (71 | ) | | | (21 | ) | | | 72 | | | | – | | | | (20 | ) |
| Other items | | | (13 | ) | | | – | | | | 32 | | | | – | | | | 19 | |
| | | | (86 | ) | | | (150 | ) | | | 688 | | | | – | | | | 452 | |
| Total impairment | | | (98 | ) | | | (99 | ) | | | 1,134 | | | | – | | | | 937 | |
| | | | | | | | | | | | | | | | | | | | | |
| In respect of: | | | | | | | | | | | | | | | | | | | | |
| Loans and advances to banks | | | 1 | | | | – | | | | – | | | | – | | | | 1 | |
| Loans and advances to customers | | | (66 | ) | | | (51 | ) | | | 1,139 | | | | – | | | | 1,022 | |
| Financial assets at amortised cost | | | (65 | ) | | | (51 | ) | | | 1,139 | | | | – | | | | 1,023 | |
| Other assets | | | – | | | | – | | | | 1 | | | | – | | | | 1 | |
| Impairment charge on drawn balances | | | (65 | ) | | | (51 | ) | | | 1,140 | | | | – | | | | 1,024 | |
| Loan commitments and financial guarantees | | | (19 | ) | | | (48 | ) | | | (6 | ) | | | – | | | | (73 | ) |
| Financial assets at fair value through other comprehensive income | | | (14 | ) | | | – | | | | – | | | | – | | | | (14 | ) |
| Total impairment | | | (98 | ) | | | (99 | ) | | | 1,134 | | | | – | | | | 937 | |
NOTES TO THE CONSOLIDATED FINANCIAL STATEMENTS
NOTE 13: IMPAIRMENT continued
The Group’s impairment charge comprises the following items:
TRANSFERS BETWEEN STAGES
The net impact on the impairment charge of transfers between stages.
OTHER CHANGES IN CREDIT QUALITY
Changes in loss allowance as a result of movements in risk parameters that reflect changes in customer quality, but which have not resulted in a transfer to a different stage. This also contains the impact on the impairment charge as a result of write-offs and recoveries, where the related loss allowances are reassessed to reflect ultimate realisable or recoverable value.
ADDITIONS (REPAYMENTS)
Expected loss allowances are recognised on origination of new loans or further drawdowns of existing facilities. Repayments relate to the reduction of loss allowances as a result of repayments of outstanding balances.
METHODOLOGY, MODEL AND ASSUMPTION CHANGES
Increase or decrease in impairment charge as a result of adjustments to the models used for expected credit loss calculations; either as changes to the model inputs or to the underlying assumptions, as well as the impact of changing the models used.
| | | 2017 | |
| | | £m | |
| Impairment losses on loans and receivables: | | | | |
| Loans and advances to customers | | | 697 | |
| Debt securities classified as loans and receivables | | | (6 | ) |
| Total impairment losses on loans and receivables | | | 691 | |
| Impairment of available-for-sale financial assets | | | 6 | |
| Other credit risk provisions | | | (9 | ) |
| Total impairment charged to the income statement | | | 688 | |
| Movements in the Group’s impairment allowances are shown in note 20. | | | | |
NOTE 14: TAX EXPENSE
(A) Analysis of tax expense for the year
| | | | 2019 | | | | 20181 | | | | 20171 | |
| | | | £m | | | | £m | | | | £m | |
| UK corporation tax: | | | | | | | | | | | | |
| Current tax on profit for the year | | | (1,389 | ) | | | (1,280 | ) | | | (1,240 | ) |
| Adjustments in respect of prior years | | | 96 | | | | 11 | | | | 122 | |
| | | | (1,293 | ) | | | (1,269 | ) | | | (1,118 | ) |
| Foreign tax: | | | | | | | | | | | | |
| Current tax on profit for the year | | | (70 | ) | | | (34 | ) | | | (40 | ) |
| Adjustments in respect of prior years | | | 2 | | | | 5 | | | | 10 | |
| | | | (68 | ) | | | (29 | ) | | | (30 | ) |
| Current tax expense | | | (1,361 | ) | | | (1,298 | ) | | | (1,148 | ) |
| |
| Deferred tax: | | | | | | | | | | | | |
| Current year | | | (165 | ) | | | (127 | ) | | | (430 | ) |
| Adjustments in respect of prior years | | | 139 | | | | (29 | ) | | | (48 | ) |
| Deferred tax expense | | | (26 | ) | | | (156 | ) | | | (478 | ) |
| Tax expense | | | (1,387 | ) | | | (1,454 | ) | | | (1,626 | ) |
| | | | | | | | | | | | | |
| The income tax expense is made up as follows: | | | | | | | | | | | | |
| | | | | | | | | | | | | |
| | | | 2019 | | | | 20181 | | | | 20171 | |
| | | | £m | | | | £m | | | | £m | |
| Tax (expense) credit attributable to policyholders | | | (148 | ) | | | 14 | | | | (82 | ) |
| Shareholder tax expense | | | (1,239 | ) | | | (1,468 | ) | | | (1,544 | ) |
| Tax expense | | | (1,387 | ) | | | (1,454 | ) | | | (1,626 | ) |
NOTES TO THE CONSOLIDATED FINANCIAL STATEMENTS
NOTE 14: TAX EXPENSEcontinued
(B) Factors affecting the tax expense for the year
The UK corporation tax rate for the year was 19.0 per cent (2018: 19.0 per cent; 2017: 19.25 per cent). An explanation of the relationship between tax expense and accounting profit is set out below:
| | | | 2019 | | | | 20181 | | | | 20171 | |
| | | | £m | | | | £m | | | | £m | |
| Profit before tax | | | 4,393 | | | | 5,960 | | | | 5,625 | |
| UK corporation tax thereon | | | (835 | ) | | | (1,132 | ) | | | (1,083 | ) |
| Impact of surcharge on banking profits | | | (364 | ) | | | (409 | ) | | | (429 | ) |
| Non-deductible costs: conduct charges | | | (370 | ) | | | (101 | ) | | | (287 | ) |
| Non-deductible costs: bank levy | | | (43 | ) | | | (43 | ) | | | (44 | ) |
| Other non-deductible costs | | | (121 | ) | | | (90 | ) | | | (59 | ) |
| Non-taxable income | | | 40 | | | | 87 | | | | 72 | |
| Tax relief on coupons on other equity instruments | | | 89 | | | | 83 | | | | 79 | |
| Tax-exempt gains on disposals | | | 102 | | | | 124 | | | | 128 | |
| Recognition (derecognition) of losses that arose in prior years | | | 18 | | | | (9 | ) | | | – | |
| Remeasurement of deferred tax due to rate changes | | | (6 | ) | | | 32 | | | | (9 | ) |
| Differences in overseas tax rates | | | (14 | ) | | | 6 | | | | (15 | ) |
| Policyholder tax | | | (67 | ) | | | (62 | ) | | | (66 | ) |
| Policyholder deferred tax asset in respect of life assurance expenses | | | (53 | ) | | | 73 | | | | – | |
| Adjustments in respect of prior years | | | 237 | | | | (13 | ) | | | 88 | |
| Tax effect of share of results of joint ventures | | | – | | | | – | | | | (1 | ) |
| Tax expense | | | (1,387 | ) | | | (1,454 | ) | | | (1,626 | ) |
NOTE 15: EARNINGS PER SHARE
| | | | 2019 | | | | 20181 | | | | 20171 | |
| | | | £m | | | | £m | | | | £m | |
| Profit attributable to equity shareholders – basic and diluted | | | 2,459 | | | | 3,975 | | | | 3,494 | |
| 1 Restated, see note 1. | | | | | | | | | | | | |
| | | | 2019 | | | | 2018 | | | | 2017 | |
| | | | million | | | | million | | | | million | |
| Weighted average number of ordinary shares in issue – basic | | | 70,603 | | | | 71,638 | | | | 71,710 | |
| Adjustment for share options and awards | | | 682 | | | | 641 | | | | 683 | |
| Weighted average number of ordinary shares in issue – diluted | | | 71,285 | | | | 72,279 | | | | 72,393 | |
| Basic earnings per share | | | 3.5p | | | | 5.5p | | | | 4.9p | |
| Diluted earnings per share | | | 3.4p | | | | 5.5p | | | | 4.8p | |
Basic earnings per share are calculated by dividing the net profit attributable to equity shareholders by the weighted average number of ordinary shares in issue during the year, which has been calculated after deducting 25 million (2018: 38 million; 2017: 57 million) ordinary shares representing the Group’s holdings of own shares in respect of employee share schemes.
For the calculation of diluted earnings per share the weighted average number of ordinary shares in issue is adjusted to assume conversion of all dilutive potential ordinary shares that arise in respect of share options and awards granted to employees. The number of shares that could have been acquired at the average annual share price of the Company’s shares based on the monetary value of the subscription rights attached to outstanding share options and awards is determined. This is deducted from the number of shares issuable under such options and awards to leave a residual bonus amount of shares which are added to the weighted-average number of ordinary shares in issue, but no adjustment is made to the profit attributable to equity shareholders.
There were 24 million anti-dilutive share options and awards excluded from the calculation of diluted earnings per share (2018: none; 2017: none).
NOTES TO THE CONSOLIDATED FINANCIAL STATEMENTS
NOTE 16: FINANCIAL ASSETS AT FAIR VALUE THROUGH PROFIT OR LOSS
These assets are comprised as follows:
| | | 31 December 2019 | | 31 December 2018 |
| | | | | | Other financial | | | | | | | | | Other financial | | | | |
| | | | | | assets | | | | | | | | | assets | | | | |
| | | | | | mandatorily at | | | | | | | | | mandatorily at | | | | |
| | | | | | fair value | | | | | | | | | fair value | | | | |
| | | Trading | | | through | | | | | | Trading | | | through | | | | |
| | | assets | | | profit or loss | | | Total | | | assets | | | profit or loss | | | Total | |
| | | £m | | | £m | | | £m | | | £m | | | £m | | | £m | |
| Loans and advances to customers | | | 10,422 | | | | 10,654 | | | | 21,076 | | | | 26,886 | | | | 10,964 | | | | 37,850 | |
| Loans and advances to banks | | | 513 | | | | 1,886 | | | | 2,399 | | | | 848 | | | | 2,178 | | | | 3,026 | |
| Debt securities: | | | | | | | | | | | | | | | | | | | | | | | | |
| Government securities | | | 6,791 | | | | 12,063 | | | | 18,854 | | | | 7,192 | | | | 10,903 | | | | 18,095 | |
| Other public sector securities | | | – | | | | 2,126 | | | | 2,126 | | | | – | | | | 2,064 | | | | 2,064 | |
| Bank and building society certificates of deposit | | | – | | | | 984 | | | | 984 | | | | – | | | | 1,105 | | | | 1,105 | |
| Asset-backed securities: | | | | | | | | | | | | | | | | | | | | | | | | |
| Mortgage-backed securities | | | 6 | | | | 462 | | | | 468 | | | | 10 | | | | 215 | | | | 225 | |
| Other asset-backed securities | | | 17 | | | | 241 | | | | 258 | | | | 63 | | | | 286 | | | | 349 | |
| Corporate and other debt securities | | | 233 | | | | 17,983 | | | | 18,216 | | | | 247 | | | | 18,063 | | | | 18,310 | |
| | | | 7,047 | | | | 33,859 | | | | 40,906 | | | | 7,512 | | | | 32,636 | | | | 40,148 | |
| Equity shares | | | – | | | | 95,789 | | | | 95,789 | | | | – | | | | 77,485 | | | | 77,485 | |
| Treasury and other bills | | | – | | | | 19 | | | | 19 | | | | – | | | | 20 | | | | 20 | |
| Total | | | 17,982 | | | | 142,207 | | | | 160,189 | | | | 35,246 | | | | 123,283 | | | | 158,529 | |
Other financial assets at fair value through profit or loss include assets backing insurance contracts and investment contracts of £136,855 million (31 December 2018: £116,903 million). Included within these assets are investments in unconsolidated structured entities of £38,177 million (31 December 2018: £26,028 million), see note 49.
For amounts included above which are subject to repurchase and reverse repurchase agreements see note 53.
Notes to the consolidated financial statements
NOTE 17: DERIVATIVE FINANCIAL INSTRUMENTS
The fair values and notional amounts of derivative instruments are set out in the following table:
| | | 31 December 2019 | | 31 December 2018 |
| | | Contract/
notional
amount
£m | | | Fair value
assets
£m | | | Fair value
liabilities
£m | | | Contract/
notional
amount
£m | | | Fair value
assets
£m | | | Fair value
liabilities
£m | |
| Trading and other | | | | | | | | | | | | | | | | | | | | | | | | |
| Exchange rate contracts: | | | | | | | | | | | | | | | | | | | | | | | | |
| Spot, forwards and futures | | | 44,095 | | | | 681 | | | | 616 | | | | 41,571 | | | | 746 | | | | 549 | |
| Currency swaps | | | 349,606 | | | | 3,857 | | | | 5,425 | | | | 311,491 | | | | 4,566 | | | | 3,709 | |
| Options purchased | | | 8,310 | | | | 452 | | | | – | | | | 10,202 | | | | 485 | | | | – | |
| Options written | | | 9,557 | | | | – | | | | 499 | | | | 11,393 | | | | – | | | | 495 | |
| | | | 411,568 | | | | 4,990 | | | | 6,540 | | | | 374,657 | | | | 5,797 | | | | 4,753 | |
| Interest rate contracts: | | | | | | | | | | | | | | | | | | | | | | | | |
| Interest rate swaps | | | 5,245,703 | | | | 17,318 | | | | 15,213 | | | | 4,381,271 | | | | 13,624 | | | | 12,629 | |
| Forward rate agreements | | | 555,742 | | | | 7 | | | | 13 | | | | 494,430 | | | | – | | | | 2 | |
| Options purchased | | | 27,158 | | | | 2,468 | | | | – | | | | 30,724 | | | | 2,107 | | | | – | |
| Options written | | | 23,610 | | | | – | | | | 2,216 | | | | 26,463 | | | | – | | | | 1,997 | |
| Futures | | | 199,884 | | | | 17 | | | | 22 | | | | 128,211 | | | | 16 | | | | 4 | |
| | | | 6,052,097 | | | | 19,810 | | | | 17,464 | | | | 5,061,099 | | | | 15,747 | | | | 14,632 | |
| Credit derivatives | | | 16,959 | | | | 83 | | | | 167 | | | | 13,757 | | | | 99 | | | | 181 | |
| Equity and other contracts | | | 11,414 | | | | 250 | | | | 503 | | | | 15,145 | | | | 389 | | | | 699 | |
| Total derivative assets/liabilities – trading and other | | | 6,492,038 | | | | 25,133 | | | | 24,674 | | | | 5,464,658 | | | | 22,032 | | | | 20,265 | |
| Hedging | | | | | | | | | | | | | | | | | | | | | | | | |
| Derivatives designated as fair value hedges: | | | | | | | | | | | | | | | | | | | | | | | | |
| Currency swaps | | | 34 | | | | 8 | | | | – | | | | 490 | | | | 3 | | | | 29 | |
| Interest rate swaps | | | 183,489 | | | | 798 | | | | 229 | | | | 150,971 | | | | 947 | | | | 187 | |
| | | | 183,523 | | | | 806 | | | | 229 | | | | 151,461 | | | | 950 | | | | 216 | |
| Derivatives designated as cash flow hedges: | | | | | | | | | | | | | | | | | | | | | | | | |
| Interest rate swaps | | | 426,740 | | | | 355 | | | | 743 | | | | 556,945 | | | | 358 | | | | 844 | |
| Currency swaps | | | 9,549 | | | | 75 | | | | 133 | | | | 10,578 | | | | 255 | | | | 48 | |
| | | | 436,289 | | | | 430 | | | | 876 | | | | 567,523 | | | | 613 | | | | 892 | |
| Total derivative assets/liabilities – hedging | | | 619,812 | | | | 1,236 | | | | 1,105 | | | | 718,984 | | | | 1,563 | | | | 1,108 | |
| Total recognised derivative assets/liabilities | | | 7,111,850 | | | | 26,369 | | | | 25,779 | | | | 6,183,642 | | | | 23,595 | | | | 21,373 | |
The notional amount of the contract does not represent the Group’s exposure to credit risk which is limited to the current cost of replacing contracts with a positive value to the Group should the counterparty default. To reduce credit risk the Group uses a variety of credit enhancement techniques such as netting and collateralisation, where security is provided against the exposure; a large proportion of the Group’s derivatives are held through exchanges such as London Clearing House and are collateralised through those exchanges. Further details are provided in note 53 Credit risk.
The Group holds derivatives as part of the following strategies:
| – | Customer driven, where derivatives are held as part of the provision of risk management products to Group customers; |
| | |
| – | To manage and hedge the Group’s interest rate and foreign exchange risk arising from normal banking business. The hedge accounting strategy adopted by the Group is to utilise a combination of fair value and cash flow hedge approaches as described in note 53; and |
| | |
| – | Derivatives held in policyholder funds as permitted by the investment strategies of those funds. |
| | |
| The principal derivatives used by the Group are as follows: |
| | |
| – | Interest rate related contracts include interest rate swaps, forward rate agreements and options. An interest rate swap is an agreement between two parties to exchange fixed and floating interest payments, based upon interest rates defined in the contract, without the exchange of the underlying principal amounts. Forward rate agreements are contracts for the payment of the difference between a specified rate of interest and a reference rate, applied to a notional principal amount at a specific date in the future. An interest rate option gives the buyer, on payment of a premium, the right, but not the obligation, to fix the rate of interest on a future loan or deposit, for a specified period and commencing on a specified future date. |
| | |
| – | Exchange rate related contracts include forward foreign exchange contracts, currency swaps and options. A forward foreign exchange contract is an agreement to buy or sell a specified amount of foreign currency on a specified future date at an agreed rate. Currency swaps generally involve the exchange of interest payment obligations denominated in different currencies; the exchange of principal can be notional or actual. A currency option gives the buyer, on payment of a premium, the right, but not the obligation, to sell specified amounts of currency at agreed rates of exchange on or before a specified future date. |
| | |
| – | Credit derivatives, principally credit default swaps, are used by the Group as part of its trading activity and to manage its own exposure to credit risk. A credit default swap is a swap in which one counterparty receives a premium at pre-set intervals in consideration for guaranteeing to make a specific payment should a negative credit event take place. |
| | |
| – | Equity derivatives are also used by the Group as part of its equity-based retail product activity to eliminate the Group’s exposure to fluctuations in various international stock exchange indices. Index-linked equity options are purchased which give the Group the right, but not the obligation, to buy or sell a specified amount of equities, or basket of equities, in the form of published indices on or before a specified future date. |
Notes to the consolidated financial statements
NOTE 17: DERIVATIVE FINANCIAL INSTRUMENTS continued
Details of the Group’s hedging instruments are set out below:
| | | Maturity |
| 31 December 2019 | | Up to 1 month
£m | | | 1-3 months
£m | | | 3-12 months
£m | | | 1-5 years
£m | | | Over 5 years
£m | | | Total
£m | |
| Fair value hedges | | | | | | | | | | | | | | | | | | | | | | | | |
| Interest rate | | | | | | | | | | | | | | | | | | | | | | | | |
| Cross currency swap | | | | | | | | | | | | | | | | | | | | | | | | |
| Notional | | | – | | | | – | | | | – | | | | – | | | | 34 | | | | 34 | |
| Average fixed interest rate | | | – | | | | – | | | | – | | | | – | | | | 1.28% | | | | | |
| Average EUR/GBP exchange rate | | | – | | | | – | | | | – | | | | – | | | | 1.38 | | | | | |
| Average USD/GBP exchange rate | | | – | | | | – | | | | – | | | | – | | | | – | | | | | |
| Average NOK/GBP exchange rate | | | – | | | | – | | | | – | | | | – | | | | – | | | | | |
| Interest rate swap | | | | | | | | | | | | | | | | | | | | | | | | |
| Notional | | | 331 | | | | 9,305 | | | | 37,948 | | | | 106,339 | | | | 29,566 | | | | 183,489 | |
| Average fixed interest rate | | | 2.58% | | | | 1.74% | | | | 1.22% | | | | 1.71% | | | | 2.81% | | | | | |
| Cash flow hedges | | | | | | | | | | | | | | | | | | | | | | | | |
| Foreign exchange | | | | | | | | | | | | | | | | | | | | | | | | |
| Currency swap | | | | | | | | | | | | | | | | | | | | | | | | |
| Notional | | | – | | | | 413 | | | | 1,611 | | | | 2,389 | | | | 5,136 | | | | 9,549 | |
| Average EUR/GBP exchange rate | | | – | | | | – | | | | – | | | | 1.05 | | | | 1.05 | | | | | |
| Average USD/GBP exchange rate | | | – | | | | 1.29 | | | | 1.30 | | | | 1.31 | | | | – | | | | | |
| Interest rate | | | | | | | | | | | | | | | | | | | | | | | | |
| Interest rate swap | | | | | | | | | | | | | | | | | | | | | | | | |
| Notional | | | 9,675 | | | | 23,589 | | | | 58,447 | | | | 209,108 | | | | 125,921 | | | | 426,740 | |
| Average fixed interest rate | | | 1.05% | | | | 1.22% | | | | 1.29% | | | | 1.47% | | | | 2.39% | | | | | |
NOTES TO THE CONSOLIDATED FINANCIAL STATEMENTS
Note 17: Derivative financial instruments continued
| | | Maturity |
| 31 December 2018 | | Up to 1 month
£m | | | 1-3 months
£m | | | 3-12 months
£m | | | 1-5 years
£m | | | Over 5 years
£m | | | Total
£m | |
| Fair value hedges | | | | | | | | | | | | | | | | | | | | | | | | |
| Interest rate | | | | | | | | | | | | | | | | | | | | | | | | |
| Cross currency swap | | | | | | | | | | | | | | | | | | | | | | | | |
| Notional | | | – | | | | 36 | | | | – | | | | 283 | | | | 171 | | | | 490 | |
| Average fixed interest rate | | | – | | | | 4.82% | | | | – | | | | 5.88% | | | | 4.44% | | | | | |
| Average EUR/USD exchange rate | | | – | | | | – | | | | – | | | | 1.13 | | | | – | | | | | |
| Average USD/GBP exchange rate | | | – | | | | – | | | | – | | | | 1.30 | | | | – | | | | | |
| Average NOK/GBP exchange rate | | | – | | | | 9.22 | | | | – | | | | 9.19 | | | | 9.03 | | | | | |
| Interest rate swap | | | | | | | | | | | | | | | | | | | | | | | | |
| Notional | | | 393 | | | | 417 | | | | 32,876 | | | | 86,451 | | | | 30,834 | | | | 150,971 | |
| Average fixed interest rate | | | 1.38% | | | | 2.06% | | | | 1.65% | | | | 1.75% | | | | 2.98% | | | | | |
| Cash flow hedges | | | | | | | | | | | | | | | | | | | | | | | | |
| Foreign exchange | | | | | | | | | | | | | | | | | | | | | | | | |
| Currency swap | | | | | | | | | | | | | | | | | | | | | | | | |
| Notional | | | 67 | | | | 47 | | | | 2,234 | | | | 2,111 | | | | 6,119 | | | | 10,578 | |
| Average USD/EUR exchange rate | | | 1.15 | | | | – | | | | 1.13 | | | | 1.10 | | | | 1.07 | | | | | |
| Average USD/GBP exchange rate | | | – | | | | 1.32 | | | | 1.34 | | | | 1.27 | | | | 1.28 | | | | | |
| Interest rate | | | | | | | | | | | | | | | | | | | | | | | | |
| Interest rate swap | | | | | | | | | | | | | | | | | | | | | | | | |
| Notional | | | 4,874 | | | | 11,204 | | | | 66,312 | | | | 292,712 | | | | 181,843 | | | | 556,945 | |
| Average fixed interest rate | | | 1.47% | | | | 1.03% | | | | 0.99% | | | | 1.46% | | | | 1.85% | | | | | |
The carrying amounts of the Group’s hedging instruments are as follows:
| | | Carrying amount of the hedging instrument |
| | | Contract/notional
amount | | | Assets | | | Liabilities | | | Changes in fair
value used for
calculating hedge
ineffectiveness
(YTD) | |
| 31 December 2019 | | £m | | | £m | | | £m | | | £m | |
| Fair value hedges | | | | | | | | | | | | | | | | |
| Interest rate | | | | | | | | | | | | | | | | |
| Currency swaps | | | 34 | | | | 8 | | | | – | | | | 2 | |
| Interest rate swaps | | | 183,489 | | | | 798 | | | | 229 | | | | 1,142 | |
| Cash flow hedges | | | | | | | | | | | | | | | | |
| Foreign exchange | | | | | | | | | | | | | | | | |
| Currency swaps | | | 9,549 | | | | 75 | | | | 133 | | | | (185 | ) |
| Interest rate | | | | | | | | | | | | | | | | |
| Interest rate swaps | | | 426,740 | | | | 355 | | | | 743 | | | | 992 | |
| | | | | | | | | | | | | | | | | |
| | | Carrying amount of the hedging instrument |
| | | Contract/notional
amount | | | Assets | | | Liabilities | | | Changes in fair
value used for
calculating hedge
ineffectiveness
(YTD) | |
| 31 December 2018 | | £m | | | £m | | | £m | | | £m | |
| Fair value hedges | | | | | | | | | | | | | | | | |
| Interest rate | | | | | | | | | | | | | | | | |
| Currency swaps | | | 490 | | | | 3 | | | | 29 | | | | (10 | ) |
| Interest rate swaps | | | 150,971 | | | | 947 | | | | 187 | | | | 104 | |
| Cash flow hedges | | | | | | | | | | | | | | | | |
| Foreign exchange | | | | | | | | | | | | | | | | |
| Currency swaps | | | 10,578 | | | | 255 | | | | 48 | | | | 229 | |
| Interest rate | | | | | | | | | | | | | | | | |
| Interest rate swaps | | | 556,945 | | | | 358 | | | | 844 | | | | (781 | ) |
All amounts are held within Derivative financial instruments.
Notes to the consolidated financial statements
Note 17: Derivative financial instruments continued
The Group’s hedged items are as follows:
| | | Carrying amount of the hedged
item | | | Accumulated amount of fair
value adjustment on the
hedged item | | | Change in fair
value of
hedged item
for | | | Cash flow hedge reserve | |
| | | | | | | | | | | | | | | ineffectiveness
assessment | | | Continuing | | | Discontinued | |
| | | Assets | | | Liabilities | | | Assets | | | Liabilities | | | (YTD) | | | hedges | | | hedges | |
| 31 December 2019 | | £m | | | £m | | | £m | | | £m | | | £m | | | £m | | | £m | |
| Fair value hedges | | | | | | | | | | | | | | | | | | | | | | | | | | | | |
| Interest rate | | | | | | | | | | | | | | | | | | | | | | | | | | | | |
| Fixed rate mortgages1 | | | 83,818 | | | | – | | | | 154 | | | | – | | | | (73 | ) | | | | | | | | |
| Fixed rate issuance2 | | | – | | | | 70,353 | | | | – | | | | 3,058 | | | | (1,333 | ) | | | | | | | | |
| Fixed rate bonds3 | | | 21,354 | | | | – | | | | 660 | | | | – | | | | 405 | | | | | | | | | |
| Cash flow hedges | | | | | | | | | | | | | | | | | | | | | | | | | | | | |
| Foreign exchange | | | | | | | | | | | | | | | | | | | | | | | | | | | | |
| Foreign currency issuance2 | | | | | | | | | | | | | | | | | | | 72 | | | | (2 | ) | | | 179 | |
| Customer deposits4 | | | | | | | | | | | | | | | | | | | 116 | | | | 18 | | | | (48 | ) |
| Interest rate | | | | | | | | | | | | | | | | | | | | | | | | | | | | |
| Customer loans1 | | | | | | | | | | | | | | | | | | | (680 | ) | | | 1,248 | | | | 336 | |
| Central bank balances5 | | | | | | | | | | | | | | | | | | | (263 | ) | | | 128 | | | | 163 | |
| Customer deposits4 | | | | | | | | | | | | | | | | | | | – | | | | (31 | ) | | | 5 | |
| | | | | | | | | | | | | |
| | | Carrying amount of the hedged
item | | | Accumulated amount of fair value
adjustment on the hedged item | | | Change in fair
value of
hedged item
for | | | Cash flow hedge reserve | |
| | | | | | | | | | | | | | | ineffectiveness
assessment | | | Continuing | | | Discontinued | |
| | | Assets | | | Liabilities | | | Assets | | | Liabilities | | | (YTD) | | | hedges | | | hedges | |
| 31 December 2018 | | £m | | | £m | | | £m | | | £m | | | £m | | | £m | | | £m | |
| Fair value hedges | | | | | | | | | | | | | | | | | | | | | | | | | | | | |
| Interest rate | | | | | | | | | | | | | | | | | | | | | | | | | | | | |
| Fixed rate mortgages1 | | | 53,136 | | | | – | | | | (45 | ) | | | – | | | | (173 | ) | | | | | | | | |
| Fixed rate issuance2 | | | – | | | | 63,746 | | | | – | | | | 1,598 | | | | 807 | | | | | | | | | |
| Fixed rate bonds3 | | | 23,285 | | | | – | | | | 232 | | | | – | | | | (666 | ) | | | | | | | | |
| Cash flow hedges | | | | | | | | | | | | | | | | | | | | | | | | | | | | |
| Foreign exchange | | | | | | | | | | | | | | | | | | | | | | | | | | | | |
| Foreign currency issuance2 | | | | | | | | | | | | | | | | | | | (165 | ) | | | 114 | | | | 327 | |
| Customer deposits4 | | | | | | | | | | | | | | | | | | | (62 | ) | | | 70 | | | | (78 | ) |
| Interest rate | | | | | | | | | | | | | | | | | | | | | | | | | | | | |
| Customer loans1 | | | | | | | | | | | | | | | | | | | 456 | | | | 867 | | | | 60 | |
| Central bank balances5 | | | | | | | | | | | | | | | | | | | (16 | ) | | | 30 | | | | 20 | |
| Customer deposits4 | | | | | | | | | | | | | | | | | | | (118 | ) | | | (9 | ) | | | (6 | ) |
| | |
| 1 | Included within loans and advances to customers. |
| | |
| 2 | Included within debt securities in issue. |
| | |
| 3 | Included within financial assets at fair value through other comprehensive income. |
| | |
| 4 | Included within customer deposits. |
| | |
| 5 | Included within cash and balances at central banks. |
The accumulated amount of fair value hedge adjustments remaining in the balance sheet for hedged items that have ceased to be adjusted for hedging gains and losses is a liability of £692 million (2018: liability of £170 million).
NOTES TO THE CONSOLIDATED FINANCIAL STATEMENTS
NOTE 17: DERIVATIVE FINANCIAL INSTRUMENTScontinued
Gains and losses arising from hedge accounting are summarised as follows:
| | | | | | | | | Amounts reclassified from reserves to
income statement as: |
| 31 December 2019 | | Gain (loss)
recognised in
other
comprehensive
income
£m | | | Hedge
ineffectiveness
recognised in the
income statement1
£m | | | Hedged cashflows
will no longer
occur
£m | | | Hedged item
affected income
statement
£m | | | Income statement
line item that
includes reclassified
amount
| |
| Fair value hedges | | | | | | | | | | | | | | | | | | | | |
| Interest rate | | | | | | | | | | | | | | | | | | | | |
| Fixed rate mortgages | | | | | | | 186 | | | | | | | | | | | | | |
| Fixed rate issuance | | | | | | | (32 | ) | | | | | | | | | | | | |
| Fixed rate bonds | | | | | | | (11 | ) | | | | | | | | | | | | |
| Cash flow hedges | | | | | | | | | | | | | | | | | | | | |
| Foreign exchange | | | | | | | | | | | | | | | | | | | | |
| Foreign currency issuance | | | (265 | ) | | | – | | | | (101 | ) | | | (92 | ) | | Interest expense | |
| Customer deposits | | | (22 | ) | | | – | | | | – | | | | 7 | | | Interest expense | |
| Interest rate | | | | | | | | | | | | | | | | | | | | |
| Customer loans | | | 651 | | | | 98 | | | | – | | | | (362 | ) | | Interest income | |
| Central bank balances | | | 237 | | | | 36 | | | | – | | | | (66 | ) | | Interest income | |
| Customer deposits | | | – | | | | – | | | | – | | | | 6 | | | Interest expense | |
| | | | | | | | | | | | | Amounts reclassified from reserves to
income statement as: | |
| 31 December 2018 | | | | | | Gain (loss)
recognised in other
comprehensive
income
£m | | | Hedge
ineffectiveness
recognised in the
income statement1
£m | | | Hedged item
affected income
statement
£m | | | Income statement line
item that includes
reclassified amount
| |
| Fair value hedges | | | | | | | | | | | | | | | | | | | | |
| Interest rate | | | | | | | | | | | | | | | | | | | | |
| Fixed rate mortgages | | | | | | | | | | | 106 | | | | | | | | | |
| Fixed rate issuance | | | | | | | | | | | (17 | ) | | | | | | | | |
| Fixed rate bonds | | | | | | | | | | | (27 | ) | | | | | | | | |
| Cash flow hedges | | | | | | | | | | | | | | | | | | | | |
| Foreign exchange | | | | | | | | | | | | | | | | | | | | |
| Foreign currency issuance | | | | | | | 85 | | | | – | | | | (81 | ) | | Interest expense | |
| Customer deposits | | | | | | | (22 | ) | | | (2 | ) | | | (32 | ) | | Interest expense | |
| Interest rate | | | | | | | | | | | | | | | | | | | | |
| Customer loans | | | | | | | (418 | ) | | | (17 | ) | | | (467 | ) | | Interest income | |
| Central bank balances | | | | | | | (63 | ) | | | (5 | ) | | | (52 | ) | | Interest income | |
| Customer deposits | | | | | | | (49 | ) | | | (1 | ) | | | (69 | ) | | Interest expense | |
| 1 | Hedge ineffectiveness is included in the income statement within net trading income. |
There was a gain of £101 million (2018: nil) reclassified from the cash flow hedging reserve for which hedge accounting had previously been used but for which the hedged future cash flows are no longer expected to occur.
NOTES TO THE CONSOLIDATED FINANCIAL STATEMENTS
NOTE 18: FINANCIAL ASSETS AT AMORTISED COST
YEAR ENDED 31 DECEMBER 2019
| Loans and advances to banks | | Stage 1
£m | | | Stage 2
£m | | | Stage 3
£m | | | Purchased or
originated
credit-impaired
£m | | | Total
£m | |
| At 1 January 2019 | | | 6,282 | | | | 3 | | | | – | | | | – | | | | 6,285 | |
| Exchange and other adjustments1 | | | (218 | ) | | | – | | | | – | | | | – | | | | (218 | ) |
| Additions (repayments) | | | 3,713 | | | | (3 | ) | | | – | | | | – | | | | 3,710 | |
| At 31 December 2019 | | | 9,777 | | | | – | | | | – | | | | – | | | | 9,777 | |
| Allowance for impairment losses | | | (2 | ) | | | – | | | | – | | | | – | | | | (2 | ) |
| Total loans and advances to banks | | | 9,775 | | | | – | | | | – | | | | – | | | | 9,775 | |
| | | | | | | | | | | | | | | | | | | | | |
| Loans and advances to customers | | | | | | | | | | | | | | | | | | | | |
| At 1 January 2019 | | | 441,531 | | | | 25,345 | | | | 5,741 | | | | 15,391 | | | | 488,008 | |
| Exchange and other adjustments1 | | | (498 | ) | | | (34 | ) | | | 47 | | | | 283 | | | | (202 | ) |
| Additions (repayments) | | | 13,554 | | | | (2,558 | ) | | | (858 | ) | | | (1,934 | ) | | | 8,204 | |
| Transfers to Stage 1 | | | 6,318 | | | | (6,286 | ) | | | (32 | ) | | | | | | | – | |
| Transfers to Stage 2 | | | (13,084 | ) | | | 13,516 | | | | (432 | ) | | | | | | | – | |
| Transfers to Stage 3 | | | (1,540 | ) | | | (1,440 | ) | | | 2,980 | | | | | | | | – | |
| | | | (8,306 | ) | | | 5,790 | | | | 2,516 | | | | | | | | – | |
| Recoveries | | | – | | | | – | | | | 397 | | | | 28 | | | | 425 | |
| Acquisition of portfolios2 | | | 3,694 | | | | – | | | | – | | | | – | | | | 3,694 | |
| Financial assets that have been written off during the year | | | | | | | | | | | (1,828 | ) | | | (54 | ) | | | (1,882 | ) |
| At 31 December 2019 | | | 449,975 | | | | 28,543 | | | | 6,015 | | | | 13,714 | | | | 498,247 | |
| Allowance for impairment losses | | | (675 | ) | | | (995 | ) | | | (1,447 | ) | | | (142 | ) | | | (3,259 | ) |
| Total loans and advances to customers | | | 449,300 | | | | 27,548 | | | | 4,568 | | | | 13,572 | | | | 494,988 | |
| | | | | | | | | | | | | | | | | | | | | |
| Debt securities | | | | | | | | | | | | | | | | | | | | |
| At 1 January 2019 | | | 5,238 | | | | – | | | | 6 | | | | – | | | | 5,244 | |
| Exchange and other adjustments1 | | | (94 | ) | | | – | | | | (2 | ) | | | – | | | | (96 | ) |
| Additions (repayments) | | | 400 | | | | – | | | | – | | | | – | | | | 400 | |
| Financial assets that have been written off during the year | | | | | | | | | | | (1 | ) | | | – | | | | (1 | ) |
| At 31 December 2019 | | | 5,544 | | | | – | | | | 3 | | | | – | | | | 5,547 | |
| Allowance for impairment losses | | | – | | | | – | | | | (3 | ) | | | – | | | | (3 | ) |
| Total debt securities | | | 5,544 | | | | – | | | | – | | | | – | | | | 5,544 | |
| Total financial assets at amortised cost | | | 464,619 | | | | 27,548 | | | | 4,568 | | | | 13,572 | | | | 510,307 | |
| | | | | | | | | | | | | | | | | | | | | |
| Movements in Retail mortgage balances were as follows: | | | | | | | | | | | | | | | | | | | | |
| Retail mortgages | | Stage 1
£m | | | Stage 2
£m | | | Stage 3
£m | | | Purchased or
originated
credit-impaired
£m | | | | Total
£m | |
| At 1 January 2019 | | | 257,797 | | | | 13,654 | | | | 1,393 | | | | 15,391 | | | | 288,235 | |
| Exchange and other adjustments1 | | | (1 | ) | | | – | | | | 2 | | | | 283 | | | | 284 | |
| Additions (repayments) | | | 799 | | | | (1,432 | ) | | | (416 | ) | | | (1,934 | ) | | | (2,983 | ) |
| Transfers to Stage 1 | | | 3,060 | | | | (3,057 | ) | | | (3 | ) | | | | | | | – | |
| Transfers to Stage 2 | | | (7,879 | ) | | | 8,242 | | | | (363 | ) | | | | | | | – | |
| Transfers to Stage 3 | | | (427 | ) | | | (472 | ) | | | 899 | | | | | | | | – | |
| | | | (5,246 | ) | | | 4,713 | | | | 533 | | | | | | | | – | |
| Recoveries | | | – | | | | – | | | | 29 | | | | 28 | | | | 57 | |
| Acquisition of portfolios2 | | | 3,694 | | | | – | | | | – | | | | – | | | | 3,694 | |
| Financial assets that have been written off during the year | | | | | | | | | | | (35 | ) | | | (54 | ) | | | (89 | ) |
| At 31 December 2019 | | | 257,043 | | | | 16,935 | | | | 1,506 | | | | 13,714 | | | | 289,198 | |
| Allowance for impairment losses | | | (23 | ) | | | (281 | ) | | | (122 | ) | | | (142 | ) | | | (568 | ) |
| Total loans and advances to customers | | | 257,020 | | | | 16,654 | | | | 1,384 | | | | 13,572 | | | | 288,630 | |
| 1 | Exchange and other adjustments includes certain adjustments, prescribed by IFRS 9, in respect of purchased or originated credit-impaired financial assets. |
| | |
| 2 | Acquisition of portfolios in 2019 relates to the purchase, completed in September 2019, of Tesco Bank’s UK residential mortgage portfolio. |
NOTES TO THE CONSOLIDATED FINANCIAL STATEMENTS
NOTE 18: FINANCIAL ASSETS AT AMORTISED COSTcontinued
Year ended 31 December 2018
| Loans and advances to banks | | Stage 1
£m | | | Stage 2
£m | | | Stage 3
£m | | | Purchased or
originated
credit-impaired
£m | | | Total
£m | |
| At 1 January 2018 | | | 4,245 | | | | 2 | | | | – | | | | – | | | | 4,247 | |
| Exchange and other adjustments | | | (29 | ) | | | 1 | | | | – | | | | – | | | | (28 | ) |
| Additions (repayments) | | | 2,066 | | | | – | | | | – | | | | – | | | | 2,066 | |
| At 31 December 2018 | | | 6,282 | | | | 3 | | | | – | | | | – | | | | 6,285 | |
| Allowance for impairment losses | | | (2 | ) | | | – | | | | – | | | | – | | | | (2 | ) |
| Total loans and advances to banks | | | 6,280 | | | | 3 | | | | – | | | | – | | | | 6,283 | |
| | | | | | | | | | | | | | | | | | | | | |
| Loans and advances to customers | | | | | | | | | | | | | | | | | | | | |
| At 1 January 2018 | | | 403,881 | | | | 37,245 | | | | 5,140 | | | | 17,973 | | | | 464,239 | |
| Exchange and other adjustments | | | 958 | | | | 32 | | | | – | | | | – | | | | 990 | |
| Additions (repayments) | | | 34,942 | | | | (2,187 | ) | | | (2,074 | ) | | | (2,609 | ) | | | 28,072 | |
| Transfers to Stage 1 | | | 19,524 | | | | (19,501 | ) | | | (23 | ) | | | | | | | – | |
| Transfers to Stage 2 | | | (15,743 | ) | | | 15,996 | | | | (253 | ) | | | | | | | – | |
| Transfers to Stage 3 | | | (2,031 | ) | | | (2,220 | ) | | | 4,251 | | | | | | | | – | |
| | | | 1,750 | | | | (5,725 | ) | | | 3,975 | | | | | | | | – | |
| Recoveries | | | – | | | | – | | | | 553 | | | | 27 | | | | 580 | |
| Disposal of businesses | | | – | | | | (4,020 | ) | | | (277 | ) | | | – | | | | (4,297 | ) |
| Financial assets that have been written off during the year | | | | | | | | | | | (1,576 | ) | | | – | | | | (1,576 | ) |
| At 31 December 2018 | | | 441,531 | | | | 25,345 | | | | 5,741 | | | | 15,391 | | | | 488,008 | |
| Allowance for impairment losses | | | (525 | ) | | | (994 | ) | | | (1,553 | ) | | | (78 | ) | | | (3,150 | ) |
| Total loans and advances to customers | | | 441,006 | | | | 24,351 | | | | 4,188 | | | | 15,313 | | | | 484,858 | |
| | | | | | | | | | | | | | | | | | | | | |
| Debt securities | | | | | | | | | | | | | | | | | | | | |
| At 1 January 2018 | | | 3,291 | | | | – | | | | 49 | | | | – | | | | 3,340 | |
| Exchange and other adjustments | | | 77 | | | | – | | | | (14 | ) | | | – | | | | 63 | |
| Additions (repayments) | | | 1,870 | | | | – | | | | – | | | | – | | | | 1,870 | |
| Financial assets that have been written off during the year | | | | | | | | | | | (29 | ) | | | – | | | | (29 | ) |
| At 31 December 2018 | | | 5,238 | | | | – | | | | 6 | | | | – | | | | 5,244 | |
| Allowance for impairment losses | | | – | | | | – | | | | (6 | ) | | | – | | | | (6 | ) |
| Total debt securities | | | 5,238 | | | | – | | | | – | | | | – | | | | 5,238 | |
| | | | | | | | | | | | | | | | | | | | | |
| Total financial assets at amortised cost | | | 452,524 | | | | 24,354 | | | | 4,188 | | | | 15,313 | | | | 496,379 | |
Movements on Retail mortgage balances were as follows:
| Retail mortgages | | Stage 1
£m | | | Stage 2
£m | | | Stage 3
£m | | | Purchased or
originated
credit-impaired
£m | | | Total
£m | |
| At 1 January 2018 | | | 251,707 | | | | 20,109 | | | | 1,232 | | | | 17,973 | | | | 291,021 | |
| Additions (repayments) | | | 989 | | | | (938 | ) | | | (239 | ) | | | (2,609 | ) | | | (2,797 | ) |
| Transfers to Stage 1 | | | 10,814 | | | | (10,805 | ) | | | (9 | ) | | | | | | | – | |
| Transfers to Stage 2 | | | (5,396 | ) | | | 5,691 | | | | (295 | ) | | | | | | | – | |
| Transfers to Stage 3 | | | (317 | ) | | | (403 | ) | | | 720 | | | | | | | | – | |
| | | | 5,101 | | | | (5,517 | ) | | | 416 | | | | | | | | – | |
| Recoveries | | | – | | | | – | | | | 3 | | | | 27 | | | | 30 | |
| Financial assets that have been written off during the year | | | | | | | | | | | (19 | ) | | | – | | | | (19 | ) |
| At 31 December 2018 | | | 257,797 | | | | 13,654 | | | | 1,393 | | | | 15,391 | | | | 288,235 | |
| Allowance for impairment losses | | | (37 | ) | | | (226 | ) | | | (118 | ) | | | (78 | ) | | | (459 | ) |
| Total loans and advances to customers | | | 257,760 | | | | 13,428 | | | | 1,275 | | | | 15,313 | | | | 287,776 | |
NOTES TO THE CONSOLIDATED FINANCIAL STATEMENTS
NOTE 18: FINANCIAL ASSETS AT AMORTISED COSTcontinued
The movement tables are compiled by comparing the position at 31 December to that at the beginning of the year. Transfers between stages are deemed to have taken place at the start of the reporting period, with all other movements shown in the stage in which the asset is held at 31 December, with the exception of those held within Purchased or originated credit-impaired, which are not transferrable.
Additions (repayments) comprise new loans originated and repayments of outstanding balances throughout the reporting period. Loans which are written off in the period are first transferred to Stage 3 before acquiring a full allowance and subsequent write-off.
NOTE 19: FINANCE LEASE RECEIVABLES
The Group’s finance lease receivables are classified as loans and advances to customers and accounted for at amortised cost. The balance is analysed as follows:
| | | 2019 | | | 2018 | |
| | | £m | | | £m | |
| Gross investment in finance leases, receivable: | | | | | | | | |
| Not later than 1 year | | | 490 | | | | 458 | |
| Later than 1 year and not later than 2 years | | | 347 | | | | 516 | |
| Later than 2 years and not later than 3 years | | | 181 | | | | 456 | |
| Later than 3 years and not later than 4 years | | | 145 | | | | 201 | |
| Later than 4 years and not later than 5 years | | | 208 | | | | 178 | |
| Later than 5 years | | | 883 | | | | 1,104 | |
| | | | 2,254 | | | | 2,913 | |
| Unearned future finance income on finance leases | | | (563 | ) | | | (1,068 | ) |
| Rentals received in advance | | | (20 | ) | | | (23 | ) |
| Net investment in finance leases | | | 1,671 | | | | 1,822 | |
| | | | | | | | | |
| The net investment in finance leases represents amounts recoverable as follows: | | | | | | | | |
| | | | | | | | | |
| | | | 2019 | | | | 2018 | |
| | | | £m | | | | £m | |
| Not later than 1 year | | | 406 | | | | 303 | |
| Later than 1 year and not later than 2 years | | | 326 | | | | 407 | |
| Later than 2 years and not later than 3 years | | | 130 | | | | 353 | |
| Later than 3 years and not later than 4 years | | | 103 | | | | 154 | |
| Later than 4 years and not later than 5 years | | | 171 | | | | 130 | |
| Later than 5 years | | | 535 | | | | 475 | |
| Net investment in finance leases | | | 1,671 | | | | 1,822 | |
Equipment leased to customers under finance leases primarily relates to structured financing transactions to fund the purchase of aircraft, ships and other large individual value items. There was an allowance for uncollectable finance lease receivables included in the allowance for impairment losses of £12 million (2018: £1 million).
Notes to the consolidated financial statements
NOTE 20: ALLOWANCE FOR IMPAIRMENT LOSSES
ANALYSIS OF MOVEMENT IN THE ALLOWANCE FOR IMPAIRMENT LOSSES BY STAGE
| Year ended 31 December 2019 | | Stage 1
£m | | | | Stage 2
£m | | | | Stage 3
£m | | | | Purchased or
originated
credit-impaired
£m | | | | Total
£m | | |
| In respect of drawn balances | | | | | | | | | | | | | | | | | | | | | | | | | |
| At 1 January 2019 | | | 527 | | | | | 994 | | | | | 1,570 | | | | | 78 | | | | | 3,169 | | |
| Exchange and other adjustments | | | 11 | | | | | (9 | ) | | | | 23 | | | | | 283 | | | | | 308 | | |
| | | | | | | | | | | | | | | | | | | | | | | | | | |
| Transfers to Stage 1 | | | 229 | | | | | (222 | ) | | | | (7 | ) | | | | | | | | | – | | |
| Transfers to Stage 2 | | | (53 | ) | | | | 92 | | | | | (39 | ) | | | | | | | | | – | | |
| Transfers to Stage 3 | | | (15 | ) | | | | (140 | ) | | | | 155 | | | | | | | | | | – | | |
| Impact of transfers between stages | | | (175 | ) | | | | 353 | | | | | 420 | | | | | | | | | | 598 | | |
| | | | (14 | ) | | | | 83 | | | | | 529 | | | | | | | | | | 598 | | |
| Other items charged to the income statement | | | 153 | | | | | (73 | ) | | | | 827 | | | | | (193 | ) | | | | 714 | | |
| Charge to the income statement (note 13) | | | 139 | | | | | 10 | | | | | 1,356 | | | | | (193 | ) | | | | 1,312 | | |
| Advances written off | | | | | | | | | | | | | (1,829 | ) | | | | (54 | ) | | | | (1,883 | ) | |
| Recoveries of advances written off in previous years | | | | | | | | | | | | | 397 | | | | | 28 | | | | | 425 | | |
| Discount unwind | | | | | | | | | | | | | (53 | ) | | | | – | | | | | (53 | ) | |
| At 31 December 2019 | | | 677 | | | | | 995 | | | | | 1,464 | | | | | 142 | | | | | 3,278 | | |
| | | | | | | | | | | | | | | | | | | | | | | | | | |
| In respect of undrawn balances | | | | | | | | | | | | | | | | | | | | | | | | | |
| At January 2019 | | | 123 | | | | | 64 | | | | | 6 | | | | | – | | | | | 193 | | |
| Exchange and other adjustments | | | – | | | | | (1 | ) | | | | – | | | | | – | | | | | (1 | ) | |
| | | | | | | | | | | | | | | | | | | | | | | | | | |
| Transfers to Stage 1 | | | 19 | | | | | (19 | ) | | | | – | | | | | | | | | | – | | |
| Transfers to Stage 2 | | | (4 | ) | | | | 4 | | | | | – | | | | | | | | | | – | | |
| Transfers to Stage 3 | | | (1 | ) | | | | (3 | ) | | | | 4 | | | | | | | | | | – | | |
| Impact of transfers between stages | | | (17 | ) | | | | 24 | | | | | (1 | ) | | | | | | | | | 6 | | |
| | | | (3 | ) | | | | 6 | | | | | 3 | | | | | | | | | | 6 | | |
| Other items charged to the income statement | | | (25 | ) | | | | 8 | | | | | (4 | ) | | | | – | | | | | (21 | ) | |
| Charge to the income statement (note 13) | | | (28 | ) | | | | 14 | | | | | (1 | ) | | | | – | | | | | (15 | ) | |
| At 31 December 2019 | | | 95 | | | | | 77 | | | | | 5 | | | | | – | | | | | 177 | | |
| Total at 31 December 2019 | | | 772 | | | | | 1,072 | | | | | 1,469 | | | | | 142 | | | | | 3,455 | | |
| | | | | | | | | | | | | | | | | | | | | | | | | | |
| In respect of: | | | | | | | | | | | | | | | | | | | | | | | | | |
| Loans and advances to banks | | | 2 | | | | | – | | | | | – | | | | | – | | | | | 2 | | |
| Loans and advances to customers: | | | | | | | | | | | | | | | | | | | | | | | | | |
| Retail mortgages | | | 23 | | | | | 281 | | | | | 122 | | | | | 142 | | | | | 568 | | |
| Other | | | 652 | | | | | 714 | | | | | 1,325 | | | | | – | | | | | 2,691 | | |
| | | | 675 | | | | | 995 | | | | | 1,447 | | | | | 142 | | | | | 3,259 | | |
| Debt securities | | | – | | | | | – | | | | | 3 | | | | | – | | | | | 3 | | |
| Financial assets at amortised cost | | | 677 | | | | | 995 | | | | | 1,450 | | | | | 142 | | | | | 3,264 | | |
| Other assets | | | – | | | | | – | | | | | 14 | | | | | – | | | | | 14 | | |
| Provisions in relation to loan commitments and financial guarantees | | | 95 | | | | | 77 | | | | | 5 | | | | | – | | | | | 177 | | |
| Total | | | 772 | | | | | 1,072 | | | | | 1,469 | | | | | 142 | | | | | 3,455 | | |
| Expected credit loss in respect of financial assets at fair value through other comprehensive income (memorandum item) | | | – | | | | | – | | | | | – | | | | | – | | | | | – | | |
Exchange and other adjustments include certain adjustments, prescribed by IFRS 9, in respect of purchased or originated credit-impaired financial assets.
Notes to the consolidated financial statements
NOTE 20: ALLOWANCE FOR IMPAIRMENT LOSSES continued
Movements in the Group’s allowance for impairment losses in respect of Retail mortgages were as follows:
| | | Stage 1
£m | | | | Stage 2
£m | | | | Stage 3
£m | | | | Purchased or
originated
credit-impaired
£m | | | | Total
£m | | |
| Balance at 1 January 2019 | | | 37 | | | | | 226 | | | | | 118 | | | | | 78 | | | | | 459 | | |
| Exchange and other adjustments | | | – | | | | | – | | | | | – | | | | | 283 | | | | | 283 | | |
| | | | | | | | | | | | | | | | | | | | | | | | | | |
| Transfers to Stage 1 | | | 17 | | | | | (17 | ) | | | | – | | | | | | | | | | – | | |
| Transfers to Stage 2 | | | (13 | ) | | | | 33 | | | | | (20 | ) | | | | | | | | | – | | |
| Transfers to Stage 3 | | | (5 | ) | | | | (21 | ) | | | | 26 | | | | | | | | | | – | | |
| Impact of transfers between stages | | | (15 | ) | | | | 105 | | | | | 39 | | | | | | | | | | 129 | | |
| | | | (16 | ) | | | | 100 | | | | | 45 | | | | | | | | | | 129 | | |
| Other items charged to the income statement | | | 3 | | | | | (45 | ) | | | | (59 | ) | | | | (193 | ) | | | | (294 | ) | |
| Charge to the income statement | | | (13 | ) | | | | 55 | | | | | (14 | ) | | | | (193 | ) | | | | (165 | ) | |
| Advances written off | | | | | | | | | | | | | (35 | ) | | | | (54 | ) | | | | (89 | ) | |
| Recoveries of advances written off in previous years | | | | | | | | | | | | | 29 | | | | | 28 | | | | | 57 | | |
| Discount unwind | | | | | | | | | | | | | 24 | | | | | – | | | | | 24 | | |
| At 31 December 2019 | | | 24 | | | | | 281 | | | | | 122 | | | | | 142 | | | | | 569 | | |
Notes to the consolidated financial statements
NOTE 20: ALLOWANCE FOR IMPAIRMENT LOSSES continued
| Year ended 31 December 2018 | | Stage 1
£m | | | | Stage 2
£m | | | | Stage 3
£m | | | | Purchased or
originated
credit-impaired
£m | | | | Total
£m | | |
| In respect of drawn balances | | | | | | | | | | | | | | | | | | | | | | | | | |
| Balance at 1 January 2018 | | | 590 | | | | | 1,147 | | | | | 1,491 | | | | | 32 | | | | | 3,260 | | |
| Exchange and other adjustments | | | 2 | | | | | – | | | | | 133 | | | | | – | | | | | 135 | | |
| | | | | | | | | | | | | | | | | | | | | | | | | | |
| Transfers to Stage 1 | | | 304 | | | | | (299 | ) | | | | (5 | ) | | | | | | | | | – | | |
| Transfers to Stage 2 | | | (46 | ) | | | | 85 | | | | | (39 | ) | | | | | | | | | – | | |
| Transfers to Stage 3 | | | (32 | ) | | | | (131 | ) | | | | 163 | | | | | | | | | | – | | |
| Impact of transfers between stages | | | (233 | ) | | | | 401 | | | | | 325 | | | | | | | | | | 493 | | |
| | | | (7 | ) | | | | 56 | | | | | 444 | | | | | | | | | | 493 | | |
| Other items charged to the income statement | | | (58 | ) | | | | (107 | ) | | | | 696 | | | | | – | | | | | 531 | | |
| Charge to the income statement (note 13) | | | (65 | ) | | | | (51 | ) | | | | 1,140 | | | | | – | | | | | 1,024 | | |
| Advances written off | | | | | | | | | | | | | (1,605 | ) | | | | – | | | | | (1,605 | ) | |
| Disposal of businesses | | | – | | | | | (102 | ) | | | | (79 | ) | | | | – | | | | | (181 | ) | |
| Recoveries of advances written off in previous years | | | | | | | | | | | | | 553 | | | | | 27 | | | | | 580 | | |
| Discount unwind | | | | | | | | | | | | | (63 | ) | | | | 19 | | | | | (44 | ) | |
| At 31 December 2018 | | | 527 | | | | | 994 | | | | | 1,570 | | | | | 78 | | | | | 3,169 | | |
| In respect of undrawn balances | | | | | | | | | | | | | | | | | | | | | | | | | |
| Balance at 1 January 2018 | | | 147 | | | | | 126 | | | | | – | | | | | – | | | | | 273 | | |
| Exchange and other adjustments | | | (5 | ) | | | | (14 | ) | | | | 12 | | | | | – | | | | | (7 | ) | |
| | | | | | | | | | | | | | | | | | | | | | | | | | |
| Transfers to Stage 1 | | | 28 | | | | | (28 | ) | | | | – | | | | | | | | | | – | | |
| Transfers to Stage 2 | | | (6 | ) | | | | 6 | | | | | – | | | | | | | | | | – | | |
| Transfers to Stage 3 | | | (2 | ) | | | | (5 | ) | | | | 7 | | | | | | | | | | – | | |
| Impact of transfers between stages | | | (25 | ) | | | | 22 | | | | | (5 | ) | | | | | | | | | (8 | ) | |
| | | | (5 | ) | | | | (5 | ) | | | | 2 | | | | | | | | | | (8 | ) | |
| Other items charged to the income statement | | | (14 | ) | | | | (43 | ) | | | | (8 | ) | | | | – | | | | | (65 | ) | |
| Charge to the income statement (note 13) | | | (19 | ) | | | | (48 | ) | | | | (6 | ) | | | | – | | | | | (73 | ) | |
| At 31 December 2018 | | | 123 | | | | | 64 | | | | | 6 | | | | | – | | | | | 193 | | |
| Total at 31 December 2018 | | | 650 | | | | | 1,058 | | | | | 1,576 | | | | | 78 | | | | | 3,362 | | |
| In respect of: | | | | | | | | | | | | | | | | | | | | | | | | | |
| Loans and advances to banks | | | 2 | | | | | – | | | | | – | | | | | – | | | | | 2 | | |
| Loans and advances to customers: | | | | | | | | | | | | | | | | | | | | | | | | | |
| Retail mortgages (see below) | | | 37 | | | | | 226 | | | | | 118 | | | | | 78 | | | | | 459 | | |
| Other | | | 488 | | | | | 768 | | | | | 1,435 | | | | | – | | | | | 2,691 | | |
| | | | 525 | | | | | 994 | | | | | 1,553 | | | | | 78 | | | | | 3,150 | | |
| Debt securities | | | – | | | | | – | | | | | 6 | | | | | – | | | | | 6 | | |
| Financial assets at amortised cost | | | 527 | | | | | 994 | | | | | 1,559 | | | | | 78 | | | | | 3,158 | | |
| Other assets | | | – | | | | | – | | | | | 11 | | | | | – | | | | | 11 | | |
| Provisions in relation to loan commitments and financial guarantees | | | 123 | | | | | 64 | | | | | 6 | | | | | – | | | | | 193 | | |
| Total | | | 650 | | | | | 1,058 | | | | | 1,576 | | | | | 78 | | | | | 3,362 | | |
| Expected credit loss in respect of financial assets at fair value through other comprehensive income (memorandum item): | | | 1 | | | | | – | | | | | – | | | | | – | | | | | 1 | | |
NOTES TO THE CONSOLIDATED FINANCIAL STATEMENTS
NOTE 20: ALLOWANCE FOR IMPAIRMENT LOSSES continued
Movements in the Group’s allowance for impairment losses in respect of Retail mortgages were as follows:
| | | Stage 1
£m | | | | Stage 2
£m | | | | Stage 3
£m | | | | Purchased or
originated
credit-impaired
£m | | | | Total
£m | |
| Balance at 1 January 2018 | | | 30 | | | | | 236 | | | | | 86 | | | | | 32 | | | | | 384 | |
| Exchange and other adjustments | | | – | | | | | 1 | | | | | 1 | | | | | – | | | | | 2 | |
| | | | | | | | | | | | | | | | | | | | | | | | | |
| Transfers to Stage 1 | | | 72 | | | | | (71 | ) | | | | (1 | ) | | | | | | | | | – | |
| Transfers to Stage 2 | | | (3 | ) | | | | 15 | | | | | (12 | ) | | | | | | | | | – | |
| Transfers to Stage 3 | | | (3 | ) | | | | (17 | ) | | | | 20 | | | | | | | | | | – | |
| Impact of transfers between stages | | | (48 | ) | | | | 82 | | | | | 40 | | | | | | | | | | 74 | |
| | | | 18 | | | | | 9 | | | | | 47 | | | | | | | | | | 74 | |
| Other items charged to the income statement | | | (11 | ) | | | | (20 | ) | | | | (5 | ) | | | | – | | | | | (36 | ) |
| Charge to the income statement | | | 7 | | | | | (11 | ) | | | | 42 | | | | | – | | | | | 38 | |
| Advances written off | | | | | | | | | | | | | (19 | ) | | | | – | | | | | (19 | ) |
| Recoveries of advances written off in previous years | | | | | | | | | | | | | 3 | | | | | 27 | | | | | 30 | |
| Discount unwind | | | | | | | | | | | | | 5 | | | | | 19 | | | | | 24 | |
| At 31 December 2018 | | | 37 | | | | | 226 | | | | | 118 | | | | | 78 | | | | | 459 | |
| | | | | | | | | | | | | | | | | | | | | | | | | |
| The Group income statement charge comprises: | | | | | | | | | | | | | | | | | | | | | | | | |
| | | | | | | | | | | | | | | | | | | | | | | | | |
| | | | | | | | | | | | | | | | | | | 2019
£m | | | | | 2018
£m | |
| Drawn balances | | | | | | | | | | | | | | | | | | 1,312 | | | | | 1,024 | |
| Undrawn balances | | | | | | | | | | | | | | | | | | (15 | ) | | | | (73 | ) |
| Financial assets at fair value through other comprehensive income | | | | | | | | | | | | | | | | | | (1 | ) | | | | (14 | ) |
| Total | | | | | | | | | | | | | | | | | | 1,296 | | | | | 937 | |
The movement tables are compiled by comparing the position at 31 December to that at the beginning of the year. Transfers between stages are deemed to have taken place at the start of the reporting period, with all other movements shown in the stage in which the asset is held at 31 December, with the exception of those held within Purchased or originated credit-impaired, which are not transferrable. As assets are transferred between stages, the resulting change in expected credit loss of £598 million (2018: £493 million) for drawn balances, and £6 million (2018: £8 million) for undrawn balances, is presented separately as Impacts of transfers between stages, in the stage in which the expected credit loss is recognised at the end of the reporting period.
Other items charged to the income statement include the movements in the expected credit loss as a result of new loans originated and repayments of outstanding balances throughout the reporting period. Loans which are written off in the period are first transferred to Stage 3 before acquiring a full allowance and subsequent write-off. Consequently, recoveries on assets previously written-off also occur in Stage 3 only.
NOTE 21: FINANCIAL ASSETS AT FAIR VALUE THROUGH OTHER COMPREHENSIVE INCOME
| | | 2019
£m | | | 2018
£m | |
| Debt securities: | | | | | | | | |
| Government securities | | | 13,098 | | | | 18,971 | |
| Bank and building society certificates of deposit | | | – | | | | 118 | |
| Asset-backed securities: | | | | | | | | |
| Mortgage-backed securities | | | 121 | | | | 120 | |
| Other asset-backed securities | | | 60 | | | | 131 | |
| Corporate and other debt securities | | | 11,051 | | | | 5,151 | |
| | | | 24,330 | | | | 24,491 | |
| Treasury and other bills | | | 535 | | | | 303 | |
| Equity shares | | | 227 | | | | 21 | |
| Total financial assets at fair value through other comprehensive income | | | 25,092 | | | | 24,815 | |
All assets were assessed at Stage 1 at 31 December 2018 and 2019.
Notes to the consolidated financial statements
NOTE 22: INVESTMENTS IN JOINT VENTURES AND ASSOCIATES
The Group’s share of results of, and investments in, equity accounted joint ventures and associates comprises:
| | | Joint ventures | | Associates | | Total |
| | | 2019
£m | | | 2018
£m | | | 2017
£m | | | 2019
£m | | | 2018
£m | | | 2017
£m | | | 2019
£m | | | 2018
£m | | | 2017
£m | |
| Share of income statement amounts: | | | | | | | | | | | | | | | | | | | | | | | | | | | | | | | | | | | | |
| Income | | | 66 | | | | 8 | | | | (5 | ) | | | (1 | ) | | | – | | | | 4 | | | | 65 | | | | 8 | | | | (1 | ) |
| Expenses | | | (59 | ) | | | 1 | | | | – | | | | – | | | | – | | | | – | | | | (59 | ) | | | 1 | | | | – | |
| Impairment | | | – | | | | – | | | | 7 | | | | – | | | | – | | | | – | | | | – | | | | – | | | | 7 | |
| Profit (loss) before tax | | | 7 | | | | 9 | | | | 2 | | | | (1 | ) | | | – | | | | 4 | | | | 6 | | | | 9 | | | | 6 | |
| Tax | | | – | | | | – | | | | – | | | | – | | | | – | | | | – | | | | – | | | | – | | | | – | |
| Share of post-tax results | | | 7 | | | | 9 | | | | 2 | | | | (1 | ) | | | – | | | | 4 | | | | 6 | | | | 9 | | | | 6 | |
| Share of other comprehensive income | | | – | | | | 8 | | | | – | | | | – | | | | – | | | | – | | | | – | | | | 8 | | | | – | |
| Share of total comprehensive income | | | 7 | | | | 17 | | | | 2 | | | | (1 | ) | | | – | | | | 4 | | | | 6 | | | | 17 | | | | 6 | |
| Share of balance sheet amounts: | | | | | | | | | | | | | | | | | | | | | | | | | | | | | | | | | | | | |
| Current assets | | | 347 | | | | 27 | | | | | | | | 5 | | | | 15 | | | | | | | | 352 | | | | 42 | | | | | |
| Non-current assets | | | 158 | | | | 54 | | | | | | | | 6 | | | | 17 | | | | | | | | 164 | | | | 71 | | | | | |
| Current liabilities | | | (35 | ) | | | (2 | ) | | | | | | | – | | | | (20 | ) | | | | | | | (35 | ) | | | (22 | ) | | | | |
| Non-current liabilities | | | (177 | ) | | | – | | | | | | | | – | | | | – | | | | | | | | (177 | ) | | | – | | | | | |
| Share of net assets at 31 December | | | 293 | | | | 79 | | | | | | | | 11 | | | | 12 | | | | | | | | 304 | | | | 91 | | | | | |
| Movement in investments over the year: | | | | | | | | | | | | | | | | | | | | | | | | | | | | | | | | | | | | |
| At 1 January | | | 79 | | | | 64 | | | | | | | | 12 | | | | 1 | | | | | | | | 91 | | | | 65 | | | | | |
| Exchange and other adjustments | | | – | | | | – | | | | | | | | – | | | | 1 | | | | | | | | – | | | | 1 | | | | | |
| Acquisitions | | | 1 | | | | – | | | | | | | | – | | | | – | | | | | | | | 1 | | | | – | | | | | |
| Establishment of joint venture (note 23) | | | 208 | | | | – | | | | | | | | – | | | | – | | | | | | | | 208 | | | | – | | | | | |
| Additional investments | | | – | | | | 12 | | | | | | | | – | | | | 11 | | | | | | | | – | | | | 23 | | | | | |
| Disposals | | | – | | | | – | | | | | | | | – | | | | (1 | ) | | | | | | | – | | | | (1 | ) | | | | |
| Share of post-tax results | | | 7 | | | | 9 | | | | | | | | (1 | ) | | | – | | | | | | | | 6 | | | | 9 | | | | | |
| Share of other comprehensive income | | | – | | | | 8 | | | | | | | | – | | | | – | | | | | | | | – | | | | 8 | | | | | |
| Dividends paid | | | (2 | ) | | | (14 | ) | | | | | | | – | | | | – | | | | | | | | (2 | ) | | | (14 | ) | | | | |
| Share of net assets at 31 December | | | 293 | | | | 79 | | | | | | | | 11 | | | | 12 | | | | | | | | 304 | | | | 91 | | | | | |
The Group’s unrecognised share of losses of associates for the year was £nil (2018: £4 million; 2017; £nil). For entities making losses, subsequent profits earned are not recognised until previously unrecognised losses are extinguished. The Group’s unrecognised share of losses net of unrecognised profits on a cumulative basis of associates is £17 million (2018: £17 million; 2017 £17 million) and of joint ventures is £3 million (2018: £3 million; 2017: £29 million).
Where entities have statutory accounts drawn up to a date other than 31 December management accounts are used when accounting for them by the Group.
NOTE 23: ACQUISITIONS
ACQUISITION OF WORKPLACE PENSIONS BUSINESS
On 1 July 2019, following the receipt of regulatory and legal approvals, the Group completed the acquisition of the UK workplace pensions and savings business of the Zurich Insurance Group. The total fair value of the purchase consideration in the year was £20 million, settled in cash.
The acquisition is intended to enhance Scottish Widows’ offering and broaden its participation in the financial planning and retirement segment whilst delivering a modern, flexible workplace savings platform.
The table below sets out the fair value of the identifiable assets and liabilities acquired.
| | | Book value as
at 1 July 2019
£m | | | Fair value
adjustments
£m | | | Fair value as at
1 July 2019
£m | |
| Assets | | | | | | | | | | | | |
| Financial assets at fair value through profit or loss | | | 7,350 | | | | – | | | | 7,350 | |
| Loans and advances to banks | | | 17 | | | | – | | | | 17 | |
| Value of in-force business | | | – | | | | 6 | | | | 6 | |
| Assets arising from reinsurance contracts held | | | 13,616 | | | | – | | | | 13,616 | |
| Other assets | | | 6 | | | | – | | | | 6 | |
| Total assets | | | 20,989 | | | | 6 | | | | 20,995 | |
| Liabilities | | | | | | | | | | | | |
| Liabilities arising from non-participating investment contracts | | | 20,981 | | | | – | | | | 20,981 | |
| Other liabilities | | | 8 | | | | – | | | | 8 | |
| Total liabilities | | | 20,989 | | | | – | | | | 20,989 | |
| Provisional fair value of net assets acquired | | | – | | | | 6 | | | | 6 | |
| Goodwill arising on acquisition | | | | | | | | | | | 14 | |
| Total consideration | | | | | | | | | | | 20 | |
NOTES TO THE CONSOLIDATED FINANCIAL STATEMENTS
NOTE 23: ACQUISITIONScontinued
The post-acquisition total income of the acquired business, which is included in the Group statutory consolidated income statement for the year ended 31 December 2019, is £22 million; the business also contributed profit before tax of £2 million for the same period.
Had the acquisition date been 1 January 2019, the Group’s consolidated total income would have been £18 million higher at £42,374 million and the Group’s consolidated profit before tax would have been £3 million lower at £4,390 million.
The carrying value of the goodwill arising on acquisition of £14 million has been reviewed at 31 December 2019, with appropriate assumptions made as to the future performance of the acquired business, and no adjustments are considered necessary.
WEALTH MANAGEMENT PARTNERSHIP
Following agreement with Schroders to enter into a partnership to create a new wealth management proposition, during 2019 the Group transferred approximately £13 billion of assets under management from its UK wealth management business and £12 billion of investment funds administered by its existing Authorised Corporate Director business into Scottish Widows Schroder Wealth Holdings Limited.
In connection with this partnership, the Group sold a 49.9 per cent interest in Scottish Widows Schroder Wealth Holdings Limited to Schroders Administration Limited in exchange for a 19.9 per cent interest in Schroder Wealth Holdings Limited, the holding company of Schroders plc’s existing UK wealth management business, valued at £202 million.
Following disposal of the 49.9 per cent interest, the Group accounts for its remaining 50.1 per cent interest in Scottish Widows Schroder Wealth Holdings Limited as a joint venture, which was recorded at a fair value upon initial recognition of £208 million.
The Group recognised a gain arising from these transactions of £244 million, net of a charge of £70 million for an onerous contract provision in relation to the services that it is now obligated to provide to the joint venture; this amount is recognised within other operating income.
NOTE 24: GOODWILL
| | | 2019
£m | | | 2018
£m | |
| At 1 January | | | 2,310 | | | | 2,310 | |
| Acquisition of businesses (note 23) | | | 14 | | | | – | |
| At 31 December | | | 2,324 | | | | 2,310 | |
| Cost1 | | | 2,664 | | | | 2,664 | |
| Accumulated impairment losses | | | (340 | ) | | | (354 | ) |
| At 31 December | | | 2,324 | | | | 2,310 | |
| 1 | For acquisitions made prior to 1 January 2004, the date of transition to IFRS, cost is included net of amounts amortised up to 31 December 2003. |
The goodwill held in the Group’s balance sheet is tested at least annually for impairment. For the purposes of impairment testing the goodwill is allocated to the appropriate cash generating unit; of the total balance of £2,324 million (2018: £2,310 million), £1,836 million, or 79 per cent of the total (2018: £1,836 million, 79 per cent of the total) has been allocated to Scottish Widows in the Group’s Insurance and Wealth division; £302 million, or 13 per cent of the total (2018: £302 million, or 13 per cent of the total) has been allocated to Cards in the Group’s Retail division; and £170 million, or 7 per cent of the total (2018: £170 million, 7 per cent of the total) to Motor Finance in the Group’s Retail division.
The recoverable amount of the goodwill relating to Scottish Widows has been based on a value-in-use calculation. The calculation uses pre-tax projections of future cash flows based upon budgets and plans approved by management covering a three-year period, the related run-off of existing business in force and a discount rate of 8 per cent. The budgets and plans are based upon past experience adjusted to take into account anticipated changes in sales volumes, product mix and margins having regard to expected market conditions and competitor activity. The discount rate is determined with reference to internal measures and available industry information. New business cash flows beyond the three-year period have been extrapolated using a steady 2 per cent growth rate which does not exceed the long-term average growth rate for the life assurance market. Management believes that any reasonably possible change in the key assumptions above would not cause the recoverable amount of Scottish Widows to fall below its balance sheet carrying value.
The recoverable amount of the goodwill relating to Motor Finance has also been based on a value-in-use calculation using pre-tax cash flow projections based on financial budgets and plans approved by management covering a four-year period and a discount rate of 14 per cent. The cash flows beyond the four-year period are extrapolated using a growth rate of 0.5 per cent which does not exceed the long-term average growth rates for the markets in which Motor Finance participates. Management believes that any reasonably possible change in the key assumptions above would not cause the recoverable amount of Motor Finance to fall below the balance sheet carrying value.
The recoverable amount of the goodwill relating to the Cards business has been based on a value-in-use calculation using pre-tax cash flow projections based on financial budgets and plans approved by management covering a five-year period and a discount rate of 10 per cent. The cash flows beyond the five year period assume no growth. Management believes that any reasonably possible change in the key assumptions above would not cause the recoverable amount of the Cards business to fall below the balance sheet carrying value.
NOTE 25: VALUE OF IN-FORCE BUSINESS
KEY ASSUMPTIONS
The impact of reasonably possible changes in the key assumptions made in respect of the Group’s life insurance business, which include the impact on the value of in force business, are disclosed in note 33.
The principal features of the methodology and process used for determining key assumptions used in the calculation of the value of in-force business are set out below:
ECONOMIC ASSUMPTIONS
Each cash flow is valued using the discount rate consistent with that applied to such a cash flow in the capital markets. In practice, to achieve the same result, where the cash flows are either independent of or move linearly with market movements, a method has been applied known as the ‘certainty equivalent’ approach whereby it is assumed that all assets earn a risk-free rate and all cash flows are discounted at a risk-free rate. The certainty equivalent approach covers all investment assets relating to insurance and participating investment contracts, other than the annuity business (where an illiquidity premium is included, see below).
A market-consistent approach has been adopted for the valuation of financial options and guarantees, using a stochastic option pricing technique calibrated to be consistent with the market price of relevant options at each valuation date. Further information on options and guarantees can be found in note 32.
NOTES TO THE CONSOLIDATED FINANCIAL STATEMENTS
NOTE 25: VALUE OF IN-FORCE BUSINESS continued
The liabilities in respect of the Group’s UK annuity business are matched by a portfolio of fixed interest securities, including a large proportion of corporate bonds and illiquid loan assets. The value of the in-force business asset for UK annuity business has been calculated after taking into account an estimate of the market premium for illiquidity in respect of corporate bond holdings and relevant illiquid loan assets. In determining the market premium for illiquidity, a range of inputs are considered which reflect actual asset allocation and relevant observable market data. The illiquidity premium is estimated to be 91 basis points at 31 December 2019 (2018: 128 basis points).
The risk-free rate is derived from the relevant swap curve with a deduction for credit risk.
The table below shows the resulting range of yields and other key assumptions at 31 December:
| | | 2019
% | | | 2018
% | |
| Risk-free rate (value of in-force non-annuity business)1 | | | 0.00 to 3.90 | | | | 0.00 to 4.05 | |
| Risk-free rate (value of in-force annuity business)1 | | | 0.91 to 4.81 | | | | 1.28 to 5.33 | |
| Risk-free rate (financial options and guarantees)1 | | | 0.00 to 3.90 | | | | 0.00 to 4.05 | |
| Retail price inflation | | | 3.11 | | | | 3.43 | |
| Expense inflation | | | 3.41 | | | | 3.75 | |
| 1 | All risk-free rates are quoted as the range of rates implied by the relevant forward swap curve. |
NON-MARKET RISK
An allowance for non-market risk is made through the choice of best estimate assumptions based upon experience, which generally will give the mean expected financial outcome for shareholders and hence no further allowance for non-market risk is required. However, in the case of operational risk, reinsurer default and the with-profit funds these can be asymmetric in the range of potential outcomes for which an explicit allowance is made.
NON-ECONOMIC ASSUMPTIONS
Future mortality, morbidity, expenses, lapse and paid-up rate assumptions are reviewed each year and are based on an analysis of past experience and on management’s view of future experience. Further information on these assumptions is given in note 32 and the effect of changes in key assumptions is given in note 33.
The gross value of in-force business asset in the consolidated balance sheet is as follows:
| | | 2019
£m | | | 2018
£m | |
| Acquired value of in-force non-participating investment contracts | | | 247 | | | | 271 | |
| Value of in-force insurance and participating investment contracts | | | 5,311 | | | | 4,491 | |
| Total value of in-force business | | | 5,558 | | | | 4,762 | |
| | | | | | | | | |
| The movement in the acquired value of in-force non-participating investment contracts over the year is as follows: | | | | | |
| | | | | | | | | |
| | | | 2019
£m | | | | 2018
£m | |
| At 1 January | | | 271 | | | | 306 | |
| Acquisition of business | | | 6 | | | | 5 | |
| Amortisation (note 11) | | | (30 | ) | | | (40 | ) |
| At 31 December | | | 247 | | | | 271 | |
The acquired value of in-force non-participating investment contracts includes £150 million (2018: £167 million) in relation to OEIC business.
NOTES TO THE CONSOLIDATED FINANCIAL STATEMENTS
NOTE 25: VALUE OF IN-FORCE BUSINESS continued
Movement in value of in-force business
The movement in the value of in-force insurance and participating investment contracts over the year is as follows:
| | | 2019
£m | | | 2018
£m | |
| At 1 January | | | 4,491 | | | | 4,533 | |
| Exchange and other adjustments | | | (5 | ) | | | 13 | |
| Movements in the year: | | | | | | | | |
| New business | | | 696 | | | | 675 | |
| Existing business: | | | | | | | | |
| Expected return | | | (274 | ) | | | (304 | ) |
| Experience variances | | | (43 | ) | | | (122 | ) |
| Assumption changes | | | 102 | | | | (67 | ) |
| Economic variance | | | 344 | | | | (237 | ) |
| Movement in the value of in-force business (note 9) | | | 825 | | | | (55 | ) |
| At 31 December | | | 5,311 | | | | 4,491 | |
This breakdown shows the movement in the value of in-force business only, and does not represent the full contribution that each item in the breakdown makes to profit before tax. This will also contain changes in the other assets and liabilities, including the effects of changes in assumptions used to value the liabilities, of the relevant businesses. The presentation of economic variance includes the impact of financial market conditions being different at the end of the year from those included in assumptions used to calculate new and existing business returns.
NOTE 26: OTHER INTANGIBLE ASSETS
| | | Brands
£m | | | Core deposit
intangible
£m | | | Purchased
credit card
relationships
£m | | | Customer-
related
intangibles
£m | | | Capitalised
software
enhancements
£m | | | Total
£m | |
| Cost: | | | | | | | | | | | | | | | | | | |
| At 1 January 2018 | | | 596 | | | | 2,770 | | | | 1,017 | | | | 538 | | | | 2,940 | | | | 7,861 | |
| Additions | | | – | | | | – | | | | – | | | | – | | | | 1,046 | | | | 1,046 | |
| Disposals | | | – | | | | – | | | | (15 | ) | | | – | | | | (55 | ) | | | (70 | ) |
| At 31 December 2018 | | | 596 | | | | 2,770 | | | | 1,002 | | | | 538 | | | | 3,931 | | | | 8,837 | |
| Exchange and other adjustments | | | – | | | | – | | | | – | | | | – | | | | 4 | | | | 4 | |
| Additions | | | – | | | | – | | | | – | | | | – | | | | 1,033 | | | | 1,033 | |
| Disposals | | | – | | | | – | | | | – | | | | – | | | | (10 | ) | | | (10 | ) |
| At 31 December 2019 | | | 596 | | | | 2,770 | | | | 1,002 | | | | 538 | | | | 4,958 | | | | 9,864 | |
| Accumulated amortisation: | | | | | | | | | | | | | | | | | | | | | | | | |
| At 1 January 2018 | | | 193 | | | | 2,770 | | | | 355 | | | | 519 | | | | 1,189 | | | | 5,026 | |
| Charge for the year | | | 23 | | | | – | | | | 71 | | | | 19 | | | | 400 | | | | 513 | |
| Disposals | | | – | | | | – | | | | (15 | ) | | | – | | | | (34 | ) | | | (49 | ) |
| At 31 December 2018 | | | 216 | | | | 2,770 | | | | 411 | | | | 538 | | | | 1,555 | | | | 5,490 | |
| Exchange and other adjustments | | | – | | | | – | | | | – | | | | – | | | | 4 | | | | 4 | |
| Charge for the year | | | – | | | | – | | | | 70 | | | | – | | | | 496 | | | | 566 | |
| Disposals | | | – | | | | – | | | | – | | | | – | | | | (4 | ) | | | (4 | ) |
| At 31 December 2019 | | | 216 | | | | 2,770 | | | | 481 | | | | 538 | | | | 2,051 | | | | 6,056 | |
| Balance sheet amount at 31 December 2019 | | | 380 | | | | – | | | | 521 | | | | – | | | | 2,907 | | | | 3,808 | |
| Balance sheet amount at 31 December 2018 | | | 380 | | | | – | | | | 591 | | | | – | | | | 2,376 | | | | 3,347 | |
Brands of £380 million (31 December 2018: £380 million) that have been determined to have indefinite useful lives and are not amortised. These brands use the Bank of Scotland name which has been in existence for over 300 years. These brands are well established financial services brands and there are no indications that they should not have an indefinite useful life.
The purchased credit card relationships represent the benefit of recurring income generated from portfolios of credit cards purchased. The balance sheet amount at 31 December 2019 is expected to be amortised over its remaining useful life of eight years.
NOTES TO THE CONSOLIDATED FINANCIAL STATEMENTS
NOTE 27: PROPERTY, PLANT AND EQUIPMENT
| | | Investment
properties
£m | | | Premises
£m | | | Equipment
£m | | | Operating
lease assets
£m | | | Right-of-
use asset1
£m | | | Total
£m | |
| Cost or valuation: | | | | | | | | | | | | | | | | | | |
| At 1 January 2018 | | | 3,699 | | | | 1,791 | | | | 5,068 | | | | 6,528 | | | | | | | | 17,086 | |
| Exchange and other adjustments | | | – | | | | – | | | | (6 | ) | | | 11 | | | | | | | | 5 | |
| Additions | | | – | | | | 72 | | | | 519 | | | | 1,755 | | | | | | | | 2,346 | |
| Expenditure on investment properties (see below) | | | 143 | | | | – | | | | – | | | | – | | | | | | | | 143 | |
| Change in fair value of investment properties (note 7) | | | 139 | | | | – | | | | – | | | | – | | | | | | | | 139 | |
| Disposals | | | (211 | ) | | | (647 | ) | | | (574 | ) | | | (1,540 | ) | | | | | | | (2,972 | ) |
| At 31 December 2018 | | | 3,770 | | | | 1,216 | | | | 5,007 | | | | 6,754 | | | | | | | | 16,747 | |
| Adjustment on adoption of IFRS 16 (note 55) | | | – | | | | – | | | | – | | | | – | | | | 1,716 | | | | 1,716 | |
| Balance at 1 January 2019 | | | 3,770 | | | | 1,216 | | | | 5,007 | | | | 6,754 | | | | 1,716 | | | | 18,463 | |
| Exchange and other adjustments | | | 16 | | | | 3 | | | | 5 | | | | (4 | ) | | | – | | | | 20 | |
| Additions | | | – | | | | 121 | | | | 522 | | | | 1,693 | | | | 196 | | | | 2,532 | |
| Expenditure on investment properties (see below) | | | 73 | | | | – | | | | – | | | | – | | | | – | | | | 73 | |
| Change in fair value of investment properties (note 7) | | | (108 | ) | | | – | | | | – | | | | – | | | | – | | | | (108 | ) |
| Disposals | | | (198 | ) | | | (245 | ) | | | (238 | ) | | | (1,694 | ) | | | (27 | ) | | | (2,402 | ) |
| At 31 December 2019 | | | 3,553 | | | | 1,095 | | | | 5,296 | | | | 6,749 | | | | 1,885 | | | | 18,578 | |
| Accumulated depreciation and impairment: | | | | | | | | | | | | | | | | | | | | | | | | |
| At 1 January 2018 | | | – | | | | 728 | | | | 2,125 | | | | 1,506 | | | | | | | | 4,359 | |
| Exchange and other adjustments | | | – | | | | 1 | | | | (8 | ) | | | 6 | | | | | | | | (1 | ) |
| Depreciation charge for the year | | | – | | | | 121 | | | | 715 | | | | 1,016 | | | | | | | | 1,852 | |
| Disposals | | | – | | | | (634 | ) | | | (534 | ) | | | (595 | ) | | | | | | | (1,763 | ) |
| At 31 December 2018 | | | – | | | | 216 | | | | 2,298 | | | | 1,933 | | | | | | | | 4,447 | |
| Exchange and other adjustments | | | – | | | | – | | | | (1 | ) | | | (36 | ) | | | 1 | | | | (36 | ) |
| Depreciation charge for the year | | | – | | | | 125 | | | | 715 | | | | 1,008 | | | | 216 | | | | 2,064 | |
| Disposals | | | – | | | | (225 | ) | | | (180 | ) | | | (595 | ) | | | (1 | ) | | | (1,001 | ) |
| At 31 December 2019 | | | – | | | | 116 | | | | 2,832 | | | | 2,310 | | | | 216 | | | | 5,474 | |
| Balance sheet amount at 31 December 2019 | | | 3,553 | | | | 979 | | | | 2,464 | | | | 4,439 | | | | 1,669 | | | | 13,104 | |
| Balance sheet amount at 31 December 2018 | | | 3,770 | | | | 1,000 | | | | 2,709 | | | | 4,821 | | | | – | | | | 12,300 | |
Expenditure on investment properties is comprised as follows:
| | | 2019
£m | | | 2018
£m | |
| Acquisitions of new properties | | | 21 | | | | 81 | |
| Additional expenditure on existing properties | | | 52 | | | | 62 | |
| | | | 73 | | | | 143 | |
Rental income of £191 million (2018: £197 million) and direct operating expenses arising from properties that generate rental income of £32 million (2018: £23 million) have been recognised in the income statement.
Capital expenditure in respect of investment properties which had been contracted for but not recognised in the financial statements was £7 million (2018: £33 million).
The table above analyses movements in investment properties, all of which are categorised as level 3. See note 50 for details of levels in the fair value hierarchy.
At 31 December the future minimum rentals receivable under non-cancellable operating leases were as follows:
| | | 2019
£m | | | 2018
£m | |
| Receivable within 1 year | | | 978 | | | | 1,095 | |
| 1 to 2 years | | | 620 | | | | 681 | |
| 2 to 3 years | | | 312 | | | | 332 | |
| 3 to 4 years | | | 102 | | | | 113 | |
| 4 to 5 years | | | 12 | | | | 30 | |
| Over 5 years | | | 2 | | | | 6 | |
| Total future minimum rentals receivable | | | 2,026 | | | | 2,257 | |
Equipment leased to customers under operating leases primarily relates to vehicle contract hire arrangements.
Notes to the consolidated financial statements
NOTE 28: OTHER ASSETS
| | | 2019 | | | 2018 | |
| | | £m | | | £m | |
| Deferred acquisition and origination costs | | | 83 | | | | 90 | |
| Settlement balances | | | 654 | | | | 743 | |
| Other assets and prepayments | | | 3,737 | | | | 3,742 | |
| Total other assets | | | 4,474 | | | | 4,575 | |
NOTE 29: FINANCIAL LIABILITIES AT FAIR VALUE THROUGH PROFIT OR LOSS
| | | 2019 | | | 2018 | |
| | | £m | | | £m | |
| Liabilities designated at fair value through profit or loss: | | | | | | | | |
| Debt securities in issue | | | 7,531 | | | | 7,085 | |
| Other | | | – | | | | 11 | |
| | | | 7,531 | | | | 7,096 | |
| Trading liabilities: | | | | | | | | |
| Liabilities in respect of securities sold under repurchase agreements | | | 11,048 | | | | 21,595 | |
| Other deposits | | | 98 | | | | 242 | |
| Short positions in securities | | | 2,809 | | | | 1,614 | |
| | | | 13,955 | | | | 23,451 | |
| Financial liabilities at fair value through profit or loss | | | 21,486 | | | | 30,547 | |
Liabilities designated at fair value through profit or loss primarily represent debt securities in issue which either contain substantive embedded derivatives which would otherwise need to be recognised and measured at fair value separately from the related debt securities, or which are accounted for at fair value to significantly reduce an accounting mismatch.
The amount contractually payable on maturity of the debt securities held at fair value through profit or loss at 31 December 2019 was £14,365 million, which was £6,834 million higher than the balance sheet carrying value (2018: £15,435 million, which was £8,350 million higher than the balance sheet carrying value). At 31 December 2019 there was a cumulative £33 million increase in the fair value of these liabilities attributable to changes in credit spread risk; this is determined by reference to the quoted credit spreads of Lloyds Bank plc, the issuing entity within the Group. Of the cumulative amount an increase of £419 million arose in 2019 and a decrease of £533 million arose in 2018.
For the fair value of collateral pledged in respect of repurchase agreements see note 53.
NOTE 30: DEBT SECURITIES IN ISSUE
| | | 2019 | | | 2018 | |
| | | £m | | | £m | |
| Medium-term notes issued | | | 41,291 | | | | 37,490 | |
| Covered bonds (note 31) | | | 29,821 | | | | 28,194 | |
| Certificates of deposit issued | | | 10,598 | | | | 12,020 | |
| Securitisation notes (note 31) | | | 7,288 | | | | 5,426 | |
| Commercial paper | | | 8,691 | | | | 8,038 | |
| Total debt securities in issue | | | 97,689 | | | | 91,168 | |
Notes to the consolidated financial statements
NOTE 31: SECURITISATIONS AND COVERED BONDS
SECURITISATION PROGRAMMES
Loans and advances to customers and debt securities carried at amortised cost include loans securitised under the Group’s securitisation programmes, the majority of which have been sold by subsidiary companies to bankruptcy remote structured entities. As the structured entities are funded by the issue of debt on terms whereby the majority of the risks and rewards of the portfolio are retained by the subsidiary, the structured entities are consolidated fully and all of these loans are retained on the Group’s balance sheet, with the related notes in issue included within debt securities in issue.
COVERED BOND PROGRAMMES
Certain loans and advances to customers have been assigned to bankruptcy remote limited liability partnerships to provide security for issues of covered bonds by the Group. The Group retains all of the risks and rewards associated with these loans and the partnerships are consolidated fully with the loans retained on the Group’s balance sheet and the related covered bonds in issue included within debt securities in issue.
The Group’s principal securitisation and covered bond programmes, together with the balances of the advances subject to these arrangements and the carrying value of the notes in issue at 31 December, are listed below. The notes in issue are reported in note 30.
| | | 2019 | | 2018 |
| | | Loans and
advances
securitised | | | Notes
in issue | | | Loans and
advances
securitised | | | Notes
in issue | |
| | | £m | | | £m | | | £m | | | £m | |
| Securitisation programmes | | | | | | | | | | | | |
| UK residential mortgages | | | 25,815 | | | | 23,505 | | | | 25,018 | | | | 22,485 | |
| Commercial loans | | | 5,116 | | | | 6,037 | | | | 5,746 | | | | 6,577 | |
| Credit card receivables | | | 8,164 | | | | 5,767 | | | | 8,060 | | | | 5,263 | |
| Motor vehicle finance | | | 3,450 | | | | 3,462 | | | | 2,850 | | | | 2,855 | |
| | | | 42,545 | | | | 38,771 | | | | 41,674 | | | | 37,180 | |
| Less held by the Group | | | | | | | (31,436 | ) | | | | | | | (31,701 | ) |
| Total securitisation programmes (notes 29 and 30)1 | | | | | | | 7,335 | | | | | | | | 5,479 | |
| Covered bond programmes | | | | | | | | | | | | | | | | |
| Residential mortgage-backed | | | 37,579 | | | | 29,321 | | | | 34,963 | | | | 27,694 | |
| Social housing loan-backed | | | 1,552 | | | | 600 | | | | 1,839 | | | | 1,200 | |
| | | | 39,131 | | | | 29,921 | | | | 36,802 | | | | 28,894 | |
| Less held by the Group | | | | | | | (100 | ) | | | | | | | (700 | ) |
| Total covered bond programmes (note 30) | | | | | | | 29,821 | | | | | | | | 28,194 | |
| Total securitisation and covered bond programmes | | | | | | | 37,156 | | | | | | | | 33,673 | |
| 1 | Includes £47 million (2018: £53 million) of securitisation notes held at fair value through profit or loss. |
Cash deposits of £4,703 million (2018: £4,102 million) which support the debt securities issued by the structured entities, the term advances related to covered bonds and other legal obligations are held by the Group. Additionally, the Group had certain contractual arrangements to provide liquidity facilities to some of these structured entities. At 31 December 2019 these obligations had not been triggered; the maximum exposure under these facilities was £56 million (2018: £88 million).
The Group has a number of covered bond programmes, for which limited liability partnerships have been established to ring-fence asset pools and guarantee the covered bonds issued by the Group. At the reporting date the Group had over-collateralised these programmes as set out in the table above to meet the terms of the programmes, to secure the rating of the covered bonds and to provide operational flexibility. From time-to-time, the obligations of the Group to provide collateral may increase due to the formal requirements of the programmes. The Group may also voluntarily contribute collateral to support the ratings of the covered bonds.
The Group recognises the full liabilities associated with its securitisation and covered bond programmes within debt securities in issue, although the obligations of the Group in respect of its securitisation issuances are limited to the cash flows generated from the underlying assets. The Group could be required to provide additional support to a number of the securitisation programmes to support the credit ratings of the debt securities issued, in the form of increased cash reserves and the holding of subordinated notes. Further, certain programmes contain contractual obligations that require the Group to repurchase assets should they become credit impaired.
The Group has not provided financial or other support by voluntarily offering to repurchase assets from any of its public securitisation programmes during 2019 (2018: none).
Notes to the consolidated financial statements
NOTE 32: LIABILITIES ARISING FROM INSURANCE CONTRACTS AND PARTICIPATING INVESTMENT CONTRACTS
Insurance contract and participating investment contract liabilities are comprised as follows:
| | | 2019 | | 2018 |
| | | Gross | | | Reinsurance1 | | | Net | | | Gross | | | Reinsurance1 | | | Net | |
| | | £m | | | £m | | | £m | | | £m | | | £m | | | £m | |
| Life insurance (see (1) below): | | | | | | | | | | | | | | | | | | | | | | | | |
| Insurance contracts | | | 96,812 | | | | (715 | ) | | | 96,097 | | | | 84,366 | | | | (716 | ) | | | 83,650 | |
| Participating investment contracts | | | 14,063 | | | | – | | | | 14,063 | | | | 13,912 | | | | – | | | | 13,912 | |
| | | | 110,875 | | | | (715 | ) | | | 110,160 | | | | 98,278 | | | | (716 | ) | | | 97,562 | |
| Non-life insurance contracts (see (2) below): | | | | | | | | | | | | | | | | | | | | | | | | |
| Unearned premiums | | | 333 | | | | (14 | ) | | | 319 | | | | 342 | | | | (13 | ) | | | 329 | |
| Claims outstanding | | | 241 | | | | – | | | | 241 | | | | 254 | | | | – | | | | 254 | |
| | | | 574 | | | | (14 | ) | | | 560 | | | | 596 | | | | (13 | ) | | | 583 | |
| Total | | | 111,449 | | | | (729 | ) | | | 110,720 | | | | 98,874 | | | | (729 | ) | | | 98,145 | |
| 1 | Reinsurance balances are reported within assets. |
(1) Life insurance
The movement in life insurance contract and participating investment contract liabilities over the year can be analysed as follows:
| | | Insurance
contracts | | | Participating
investment
contracts | | | Gross | | | Reinsurance | | | Net | |
| | | £m | | | £m | | | £m | | | £m | | | £m | |
| At 1 January 2018 | | | 86,949 | | | | 15,881 | | | | 102,830 | | | | (563 | ) | | | 102,267 | |
| New business | | | 5,476 | | | | 31 | | | | 5,507 | | | | (42 | ) | | | 5,465 | |
| Changes in existing business | | | (8,072 | ) | | | (2,000 | ) | | | (10,072 | ) | | | (111 | ) | | | (10,183 | ) |
| Change in liabilities charged to the income statement | | | (2,596 | ) | | | (1,969 | ) | | | (4,565 | ) | | | (153 | ) | | | (4,718 | ) |
| Exchange and other adjustments | | | 13 | | | | – | | | | 13 | | | | – | | | | 13 | |
| At 31 December 2018 | | | 84,366 | | | | 13,912 | | | | 98,278 | | | | (716 | ) | | | 97,562 | |
| New business | | | 5,684 | | | | 37 | | | | 5,721 | | | | (45 | ) | | | 5,676 | |
| Changes in existing business | | | 6,798 | | | | 114 | | | | 6,912 | | | | 46 | | | | 6,958 | |
| Change in liabilities charged to the income statement (note 10) | | | 12,482 | | | | 151 | | | | 12,633 | | | | 1 | | | | 12,634 | |
| Exchange and other adjustments | | | (36 | ) | | | – | | | | (36 | ) | | | – | | | | (36 | ) |
| At 31 December 2019 | | | 96,812 | | | | 14,063 | | | | 110,875 | | | | (715 | ) | | | 110,160 | |
Liabilities for insurance contracts and participating investment contracts can be split into with-profit fund liabilities, accounted for using the PRA’s realistic capital regime (realistic liabilities) and non-profit fund liabilities, accounted for using a prospective actuarial discounted cash flow methodology, as follows:
| | | 2019 | | 2018 |
| | | With-profit
fund | | | Non-profit
fund | | | Total | | | With-profit
fund | | | Non-profit
fund | | | Total | |
| | | £m | | | £m | | | £m | | | £m | | | £m | | | £m | |
| Insurance contracts | | | 8,018 | | | | 88,794 | | | | 96,812 | | | | 7,851 | | | | 76,515 | | | | 84,366 | |
| Participating investment contracts | | | 7,222 | | | | 6,841 | | | | 14,063 | | | | 7,438 | | | | 6,474 | | | | 13,912 | |
| Total | | | 15,240 | | | | 95,635 | | | | 110,875 | | | | 15,289 | | | | 82,989 | | | | 98,278 | |
WITH-PROFIT FUND REALISTIC LIABILITIES
(I) BUSINESS DESCRIPTION
Scottish Widows Limited has the only with-profit funds within the Group. The primary purpose of the conventional and unitised business written in the with-profit funds is to provide a smoothed investment vehicle to policyholders, protecting them against short-term market fluctuations. Payouts may be subject to a guaranteed minimum payout if certain policy conditions are met. With-profit policyholders are entitled to at least 90 per cent of the distributed profits, with the shareholders receiving the balance. The policyholders are also usually insured against death and the policy may carry a guaranteed annuity option at retirement.
(II) METHOD OF CALCULATION OF LIABILITIES
With-profit liabilities are stated at their realistic value, the main components of which are:
| – | With-profit benefit reserve, the total asset shares for with-profit policies; |
| | |
| – | Cost of options and guarantees (including guaranteed annuity options); |
| | |
| – | Deductions levied against asset shares; |
| | |
| – | Planned enhancements to with-profits benefits reserve; and |
| | |
| – | Impact of the smoothing policy. |
Notes to the consolidated financial statements
Note 32: Liabilities arising from insurance contracts and participating investment contractscontinued
(III) ASSUMPTIONS
Key assumptions used in the calculation of with-profit liabilities, and the processes for determining these, are:
Investment returns and discount rates
With-profit fund liabilities are valued on a market-consistent basis, achieved by the use of a valuation model which values liabilities on a basis calibrated to tradable market option contracts and other observable market data. The with-profit fund financial options and guarantees are valued using a stochastic simulation model where all assets are assumed to earn, on average, the risk-free yield and all cash flows are discounted using the risk-free yield. The risk-free yield is defined as the spot yield derived from the relevant swap curve, adjusted for credit risk. Further information on significant options and guarantees is given below.
Guaranteed annuity option take-up rates
Certain pension contracts contain guaranteed annuity options that allow the policyholder to take an annuity benefit on retirement at annuity rates that were guaranteed at the outset of the contract. For contracts that contain such options, key assumptions in determining the cost of options are economic conditions in which the option has value, mortality rates and take up rates of other options. The financial impact is dependent on the value of corresponding investments, interest rates and longevity at the time of the claim.
Investment volatility
The calibration of the stochastic simulation model uses implied volatilities of derivatives where possible, or historical volatility where it is not possible to observe meaningful prices.
Mortality
The mortality assumptions, including allowances for improvements in longevity for annuitants, are set with regard to the Group’s actual experience where this is significant, and relevant industry data otherwise.
Lapse rates (persistency)
Lapse rates refer to the rate of policy termination or the rate at which policyholders stop paying regular premiums due under the contract.
Historical persistency experience is analysed using statistical techniques. As experience can vary considerably between different product types and for contracts that have been in force for different periods, the data is broken down into broadly homogenous groups for the purposes of this analysis.
The most recent experience is considered along with the results of previous analyses and management’s views on future experience, taking into consideration potential changes in future experience that may result from guarantees and options becoming more valuable under adverse market conditions, in order to determine a ‘best estimate’ view of what persistency will be. In determining this best estimate view a number of factors are considered, including the credibility of the results (which will be affected by the volume of data available), any exceptional events that have occurred during the period under consideration, any known or expected trends in underlying data and relevant published market data.
(IV) OPTIONS AND GUARANTEES WITHIN THE WITH-PROFIT FUNDS
The most significant options and guarantees provided from within the With-Profit Funds are in respect of guaranteed minimum cash benefits on death, maturity, retirement or certain policy anniversaries, and guaranteed annuity options on retirement for certain pension policies.
For those policies written in Scottish Widows pre-demutualisation containing potentially valuable options and guarantees, under the terms of the Scheme a separate memorandum account was set up, within the With-Profit Fund originally held in Scottish Widows plc and subsequently transferred into Scottish Widows Limited, called the Additional Account which is available, inter alia, to meet any additional costs of providing guaranteed benefits in respect of those policies. The Additional Account had a value at 31 December 2019 of £2.6 billion (2018: £2.5 billion). The eventual cost of providing benefits on policies written both pre and post demutualisation is dependent upon a large number of variables, including future interest rates and equity values, demographic factors, such as mortality, and the proportion of policyholders who seek to exercise their options. The ultimate cost will therefore not be known for many years.
As noted above, the liabilities of the With-Profit Funds are valued using a market-consistent stochastic simulation model which places a value on the options and guarantees which captures both their intrinsic value and their time value.
The most significant economic assumptions included in the model are risk-free yield and investment volatility.
NON-PROFIT FUND LIABILITIES
(I) BUSINESS DESCRIPTION
The Group principally writes the following types of life insurance contracts within its non-profit funds. Shareholder profits on these types of business arise from management fees and other policy charges.
Unit-linked business
This includes unit-linked pensions and unit-linked bonds, the primary purpose of which is to provide an investment vehicle where the policyholder is also insured against death.
Life insurance
The policyholder is insured against death or permanent disability, usually for predetermined amounts. Such business includes whole of life and term assurance and long-term creditor policies.
Annuities
The policyholder is entitled to payments for the duration of their life and is therefore insured against surviving longer than expected.
(II) METHOD OF CALCULATION OF LIABILITIES
The non-profit fund liabilities are determined on the basis of recognised actuarial methods and involve estimating future policy cash flows over the duration of the in-force book of policies, and discounting the cash flows back to the valuation date allowing for probabilities of occurrence.
(III) ASSUMPTIONS
Generally, assumptions used to value non-profit fund liabilities are prudent in nature and therefore contain a margin for adverse deviation. This margin for adverse deviation is based on management’s judgement and reflects management’s views on the inherent level of uncertainty. The key assumptions used in the measurement of non-profit fund liabilities are:
Notes to the consolidated financial statements
NOTE 32: LIABILITIES ARISING FROM INSURANCE CONTRACTS AND PARTICIPATING INVESTMENT CONTRACTScontinued
Interest rates
The rates of interest used are determined by reference to a number of factors including the redemption yields on fixed interest assets at the valuation date.
Margins for risk are allowed for in the assumed interest rates, including reductions made to the available yields to allow for default risk based upon the credit rating of the securities allocated to the insurance liability.
Mortality and morbidity
The mortality and morbidity assumptions, including allowances for improvements in longevity for annuitants, are set with regard to the Group’s actual experience where this provides a reliable basis, and relevant industry data otherwise, and include a margin for adverse deviation.
Lapse rates (persistency)
Lapse rates are allowed for on some non-profit fund contracts. The process for setting these rates is as described for with-profit liabilities, however a prudent scenario is assumed by the inclusion of a margin for adverse deviation within the non-profit fund liabilities.
Maintenance expenses
Allowance is made for future policy costs explicitly. Expenses are determined by reference to an internal analysis of current and expected future costs plus a margin for adverse deviation. Explicit allowance is made for future expense inflation.
Key changes in assumptions
A detailed review of the Group’s assumptions in 2019 resulted in the following key impacts on profit before tax:
| – | Change in persistency assumptions (£67 million decrease). |
| – | Change in the assumption in respect of current and future mortality and morbidity rates (£164 million increase). |
| – | Change in expenses assumptions (£208 million increase). |
Included within change in expenses assumptions are the impacts associated with exiting the Standard Life Aberdeen investment management agreement.
These amounts include the impacts of movements in liabilities and value of the in-force business in respect of insurance contracts and participating investment contracts.
(IV) OPTIONS AND GUARANTEES OUTSIDE THE WITH-PROFIT FUNDS
A number of typical guarantees are provided outside the With-Profit Funds such as guaranteed payments on death (e.g. term assurance) or guaranteed income for life (e.g. annuities). In addition, certain personal pension policyholders in Scottish Widows, for whom reinstatement to their occupational pension scheme was not an option, have been given a guarantee that their pension and other benefits will correspond in value to the benefits of the relevant occupational pension scheme. The key assumptions affecting the ultimate value of the guarantee are future salary growth, gilt yields at retirement, annuitant mortality at retirement, marital status at retirement and future investment returns. There is currently a provision, calculated on a deterministic basis, of £64 million (2018: £39 million) in respect of those guarantees.
(2) Non-life insurance
For non-life insurance contracts, the methodology and assumptions used in relation to determining the bases of the earned premium and claims provisioning levels are derived for each individual underwritten product. Assumptions are intended to be neutral estimates of the most likely or expected outcome. There has been no significant change in the assumptions and methodologies used for setting reserves.
The movements in non-life insurance contract liabilities and reinsurance assets over the year have been as follows:
| | | 2019 | | | 2018 | |
| | | £m | | | £m | |
| Provisions for unearned premiums | | | | | | |
| Gross provision at 1 January | | | 342 | | | | 358 | |
| Increase in the year | | | 663 | | | | 681 | |
| Release in the year | | | (672 | ) | | | (697 | ) |
| Change in provision for unearned premiums charged to income statement | | | (9 | ) | | | (16 | ) |
| Gross provision at 31 December | | | 333 | | | | 342 | |
| Reinsurers’ share | | | (14 | ) | | | (13 | ) |
| Net provision at 31 December | | | 319 | | | | 329 | |
These provisions represent the liability for short-term insurance contracts for which the Group’s obligations are not expired at the year end.
| | | 2019 | | | 2018 | |
| | | £m | | | £m | |
| Claims outstanding | | | | | | |
| Gross claims outstanding at 1 January | | | 254 | | | | 225 | |
| Cash paid for claims settled in the year | | | (300 | ) | | | (306 | ) |
| Increase/(decrease) in liabilities charged to the income statement1 | | | 287 | | | | 335 | |
| | | | (13 | ) | | | 29 | |
| Gross claims outstanding at 31 December | | | 241 | | | | 254 | |
| Reinsurers’ share | | | – | | | | – | |
| Net claims outstanding at 31 December | | | 241 | | | | 254 | |
| Notified claims | | | 128 | | | | 170 | |
| Incurred but not reported | | | 113 | | | | 84 | |
| Net claims outstanding at 31 December | | | 241 | | | | 254 | |
| 1 | Of which an increase of £335 million (2018: £367 million) was in respect of current year claims and a decrease of £48 million (2018: a decrease of £32 million) was in respect of prior year claims. |
NOTES TO THE CONSOLIDATED FINANCIAL STATEMENTS
NOTE 33: LIFE INSURANCE SENSITIVITY ANALYSIS
The following table demonstrates the effect of reasonably possible changes in key assumptions on profit before tax and equity disclosed in these financial statements assuming that the other assumptions remain unchanged. In practice this is unlikely to occur, and changes in some assumptions may be correlated. These amounts include movements in assets, liabilities and the value of the in-force business in respect of insurance contracts and participating investment contracts. The impact is shown in one direction but can be assumed to be reasonably symmetrical.
| | | | | 2019 | | | 2018 | |
| | | | | Increase | | | | | | Increase | | | | |
| | | | | (reduction | ) | | Increase | | | (reduction | ) | | Increase | |
| | | | | in profit | | | (reduction | ) | | in profit | | | (reduction | ) |
| | | Change in | | before tax | | | in equity | | | before tax | | | in equity | |
| | | variable | | £m | | | £m | | | £m | | | £m | |
| Non-annuitant mortality and morbidity1 | | 5% reduction | | | 19 | | | | 16 | | | | 22 | | | | 18 | |
| Annuitant mortality2 | | 5% reduction | | | (293 | ) | | | (243 | ) | | | (234 | ) | | | (194 | ) |
| Lapse rates3 | | 10% reduction | | | 107 | | | | 89 | | | | 89 | | | | 74 | |
| Future maintenance and investment expenses4 | | 10% reduction | | | 299 | | | | 248 | | | | 262 | | | | 217 | |
| Risk-free rate5 | | 0.25% reduction | | | 33 | | | | 28 | | | | 76 | | | | 63 | |
| Guaranteed annuity option take up6 | | 5% addition | | | (1 | ) | | | (1 | ) | | | (3 | ) | | | (2 | ) |
| Equity investment volatility7 | | 1% addition | | | (2 | ) | | | (1 | ) | | | (5 | ) | | | (4 | ) |
| Widening of credit default spreads on corporate bonds8 | | 0.25% addition | | | (424 | ) | | | (352 | ) | | | (364 | ) | | | (303 | ) |
| Increase in illiquidity premia9 | | 0.10% addition | | | 191 | | | | 159 | | | | 153 | | | | 127 | |
Assumptions have been flexed on the basis used to calculate the value of in-force business and the realistic and statutory reserving bases.
| 1 | This sensitivity shows the impact of reducing mortality and morbidity rates on non-annuity business to 95 per cent of the expected rate. |
| | |
| 2 | This sensitivity shows the impact on the annuity and deferred annuity business of reducing mortality rates to 95 per cent of the expected rate. |
| | |
| 3 | This sensitivity shows the impact of reducing lapse and surrender rates to 90 per cent of the expected rate. |
| | |
| 4 | This sensitivity shows the impact of reducing maintenance expenses and investment expenses to 90 per cent of the expected rate. |
| | |
| 5 | This sensitivity shows the impact on the value of in-force business, financial options and guarantee costs, statutory reserves and asset values of reducing the risk-free rate by 25 basis points. |
| | |
| 6 | This sensitivity shows the impact of a flat 5 per cent addition to the expected rate. |
| | |
| 7 | This sensitivity shows the impact of a flat 1 per cent addition to the expected rate. |
| | |
| 8 | This sensitivity shows the impact of a 25 basis point increase in credit default spreads on corporate bonds and the corresponding reduction in market values. Swap curves, the risk-free rate and illiquidity premia are all assumed to be unchanged. |
| | |
| 9 | This sensitivity shows the impact of a 10 basis point increase in the allowance for illiquidity premia. It assumes the overall spreads on assets are unchanged and hence market values are unchanged. Swap curves and the non-annuity risk-free rate are both assumed to be unchanged. The increased illiquidity premium increases the annuity risk-free rate. |
NOTE 34: LIABILITIES ARISING FROM NON-PARTICIPATING INVESTMENT CONTRACTS
The movement in liabilities arising from non-participating investment contracts may be analysed as follows:
| | | 2019 | | | 2018 | |
| | | £m | | | £m | |
| At 1 January | | | 13,853 | | | | 15,447 | |
| Acquisition of business (note 23) | | | 20,981 | | | | – | |
| New business | | | 1,810 | | | | 668 | |
| Changes in existing business | | | 815 | | | | (2,262 | ) |
| At 31 December | | | 37,459 | | | | 13,853 | |
The balances above are shown gross of reinsurance. As at 31 December 2019, related reinsurance balances were £21 million (2018: £20 million); reinsurance balances are reported within assets. Liabilities arising from non-participating investment contracts are categorised as level 2. See note 50 for details of levels in the fair value hierarchy.
NOTE 35: OTHER LIABILITIES
| | | 2019 | | | 2018 | |
| | | £m | | | £m | |
| Settlement balances | | | 760 | | | | 485 | |
| Unitholders’ interest in Open Ended Investment Companies1 | | | 11,928 | | | | 12,933 | |
| Unallocated surplus within insurance businesses | | | 400 | | | | 382 | |
| Lease liabilities | | | 1,844 | | | | 46 | |
| Other creditors and accruals | | | 5,401 | | | | 5,787 | |
| Total other liabilities | | | 20,333 | | | | 19,633 | |
| 1 | Where a collective investment vehicle is consolidated the interests of parties other than the Group are reported at fair value in other liabilities. |
NOTES TO THE CONSOLIDATED FINANCIAL STATEMENTS
NOTE 35: OTHER LIABILITIES continued
The maturity of the Group’s lease liabilities was as follows:
| | | 2019 | | | 2018 | |
| | | £m | | | £m | |
| Not later than 1 year | | | 241 | | | | 10 | |
| Later than 1 year and not later than 2 years | | | 222 | | | | 9 | |
| Later than 2 years and not later than 3 years | | | 207 | | | | 7 | |
| Later than 3 years and not later than 4 years | | | 170 | | | | 6 | |
| Later than 4 years and not later than 5 years | | | 145 | | | | 2 | |
| Later than 5 years | | | 859 | | | | 12 | |
| | | | 1,844 | | | | 46 | |
The Group adopted IFRS 16Leasesfrom 1 January 2019, see note 1.
NOTE 36: RETIREMENT BENEFIT OBLIGATIONS
| | | 2019 | | | 2018 | | | 2017 | |
| | | £m | | | £m | | | £m | |
| Charge to the income statement | | | | | | | | | |
| Defined benefit pension schemes | | | 241 | | | | 401 | | | | 362 | |
| Other post-retirement benefit schemes | | | 4 | | | | 4 | | | | 7 | |
| Total defined benefit schemes | | | 245 | | | | 405 | | | | 369 | |
| Defined contribution pension schemes | | | 287 | | | | 300 | | | | 256 | |
| Total charge to the income statement (note 11) | | | 532 | | | | 705 | | | | 625 | |
| | | 2019 | | | 2018 | |
| | | £m | | | £m | |
| Amounts recognised in the balance sheet | | | | | | |
| Retirement benefit assets | | | 681 | | | | 1,267 | |
| Retirement benefit obligations | | | (257 | ) | | | (245 | ) |
| Total amounts recognised in the balance sheet | | | 424 | | | | 1,022 | |
| | | | | | | | | |
| The total amount recognised in the balance sheet relates to: | | | | | | | | |
| | | | 2019 | | | | 2018 | |
| | | | £m | | | | £m | |
| Defined benefit pension schemes | | | 550 | | | | 1,146 | |
| Other post-retirement benefit schemes | | | (126 | ) | | | (124 | ) |
| Total amounts recognised in the balance sheet | | | 424 | | | | 1,022 | |
Pension schemes
DEFINED BENEFIT SCHEMES
(I) CHARACTERISTICS OF AND RISKS ASSOCIATED WITH THE GROUP’S SCHEMES
The Group has established a number of defined benefit pension schemes in the UK and overseas. All significant schemes are based in the UK, with the three most significant being the main section of the Lloyds Bank Pension Schemes No. 1, the Lloyds Bank Pension Scheme No. 2 and the HBOS Final Salary Pension Scheme. At 31 December 2019, these schemes represented 94 per cent of the Group’s total gross defined benefit pension assets (2018: 94 per cent). These schemes provide retirement benefits calculated as a percentage of final pensionable salary depending upon the length of service; the minimum retirement age under the rules of the schemes at 31 December 2019 is generally 55 although certain categories of member are deemed to have a contractual right to retire at 50.
The Group operates both funded and unfunded pension arrangements; the majority, including the three most significant schemes, are funded schemes in the UK. All of these UK funded schemes are operated as separate legal entities under trust law, are in compliance with the Pensions Act 2004 and are managed by a Trustee Board (the Trustee) whose role is to ensure that their Scheme is administered in accordance with the Scheme rules and relevant legislation, and to safeguard the assets in the best interests of all members and beneficiaries. The Trustee is solely responsible for setting investment policy and for agreeing funding requirements with the employer through the funding valuation process. The Board of Trustees must be composed of representatives of the Company and plan participants in accordance with the Scheme’s regulations.
A valuation to determine the funding status of each scheme is carried out at least every three years, whereby scheme assets are measured at market value and liabilities (technical provisions) are measured using prudent assumptions. If a deficit is identified a recovery plan is agreed between the employer and the scheme Trustee and sent to the Pensions Regulator for review. The Group has not provided for these deficit contributions as the future economic benefits arising from these contributions are expected to be available to the Group. The Group’s overseas defined benefit pension schemes are subject to local regulatory arrangements.
The most recent triennial funding valuation of the Group’s three main schemes, based on the position as at 31 December 2016, showed an aggregate funding deficit of £7.3 billion (a funding level of 85.6 per cent) compared to a £5.2 billion deficit (a funding level of 85.9 per cent) for the previous valuation as at 30 June 2014. In the light of this funding deficit, and in contemplation of the changes that the Group had made as a result of its Structural Reform Programme, the Group agreed a recovery plan with the trustees. Under the plan, deficit contributions of £618 million were paid during 2019, and these
NOTES TO THE CONSOLIDATED FINANCIAL STATEMENTS
NOTE 36: RETIREMENT BENEFIT OBLIGATIONS continued
will rise to £798 million in 2020, £1,287 million in 2021 and £1,305 million per annum from 2022 to 2024. Contributions in the later years will be subject to review and renegotiation at subsequent funding valuations. The next funding valuation is due to be completed by March 2021 with an effective date of 31 December 2019. The deficit contributions are in addition to the regular contributions to meet benefits accruing over the year, and to cover the expenses of running the scheme. The Group currently expects to pay contributions of approximately £1,200 million to its defined benefit schemes in 2020.
During 2009, the Group made one-off contributions to the Lloyds Bank Pension Scheme No 1 and Lloyds Bank Pension Scheme No 2 in the form of interests in limited liability partnerships for each of the two schemes which hold assets to provide security for the Group’s obligations to the two schemes. At 31 December 2019, the limited liability partnerships held assets of approximately £6.7 billion. The limited liability partnerships are consolidated fully in the Group’s balance sheet.
The Group has also established three private limited companies which hold assets to provide security for the Group’s obligations to the HBOS Final Salary Pension Scheme, a section of the Lloyds Bank Pension Scheme No 1 and the Lloyds Bank Offshore Pension Scheme. At 31 December 2019 these held assets of approximately £4.8 billion in aggregate. The private limited companies are consolidated fully in the Group’s balance sheet. The terms of these arrangements require the Group to maintain assets in these vehicles to agreed minimum values in order to secure obligations owed to the relevant Group pension schemes. The Group has satisfied this requirement during 2019.
The last funding valuations of other Group schemes were carried out on a number of different dates. In order to report the position under IAS 19 as at 31 December 2019 the most recent valuation results for all schemes have been updated by qualified independent actuaries. The funding valuations use a more prudent approach to setting the discount rate and more conservative longevity assumptions than the IAS 19 valuations.
In July 2018 a decision was sought from the High Court in respect of the requirement to equalise the Guaranteed Minimum Pension (GMP) benefits accrued between 1990 and 1997 from contracting out of the State Earnings Related Pension Scheme. In its judgment handed down on 26 October 2018 the High Court confirmed the requirement to treat men and women equally with respect to these benefits and a range of methods that the Trustee is entitled to adopt to achieve equalisation. The Group recognised a past service cost of£108 million in respect of equalisation in 2018 and, following agreement of the detailed implementation approach with the Trustee, a further£33 million has been recognised in 2019.
(II) AMOUNTS IN THE FINANCIAL STATEMENTS
| | | 2019 | | | 2018 | |
| | | £m | | | £m | |
| Amount included in the balance sheet | | | | | | |
| Present value of funded obligations | | | (45,241 | ) | | | (41,092 | ) |
| Fair value of scheme assets | | | 45,791 | | | | 42,238 | |
| Net amount recognised in the balance sheet | | | 550 | | | | 1,146 | |
| |
| | | | 2019 | | | | 2018 | |
| | | | £m | | | | £m | |
| Net amount recognised in the balance sheet | | | | | | | | |
| At 1 January | | | 1,146 | | | | 509 | |
| Net defined benefit pension charge | | | (241 | ) | | | (401 | ) |
| Actuarial gains (losses) on defined benefit obligation | | | (4,958 | ) | | | 1,707 | |
| Return on plan assets | | | 3,531 | | | | (1,558 | ) |
| Employer contributions | | | 1,062 | | | | 863 | |
| Exchange and other adjustments | | | 10 | | | | 26 | |
| At 31 December | | | 550 | | | | 1,146 | |
| |
| | | | 2019 | | | | 2018 | |
| | | | £m | | | | £m | |
| Movements in the defined benefit obligation | | | | | | | | |
| At 1 January | | | (41,092 | ) | | | (44,384 | ) |
| Current service cost | | | (201 | ) | | | (261 | ) |
| Interest expense | | | (1,172 | ) | | | (1,130 | ) |
| Remeasurements: | | | | | | | | |
| Actuarial losses – experience | | | (29 | ) | | | (439 | ) |
| Actuarial (losses) gains – demographic assumptions | | | 471 | | | | (201 | ) |
| Actuarial gains (losses) – financial assumptions | | | (5,400 | ) | | | 2,347 | |
| Benefits paid | | | 2,174 | | | | 3,079 | |
| Past service cost | | | (44 | ) | | | (108 | ) |
| Curtailments | | | – | | | | (12 | ) |
| Settlements | | | 17 | | | | 17 | |
| Exchange and other adjustments | | | 35 | | | | – | |
| At 31 December | | | (45,241 | ) | | | (41,092 | ) |
NOTES TO THE CONSOLIDATED FINANCIAL STATEMENTS
NOTE 36: RETIREMENT BENEFIT OBLIGATIONS continued
| | | 2019 | | | 2018 | |
| | | £m | | | £m | |
| Analysis of the defined benefit obligation: | | | | | | |
| Active members | | | (6,413 | ) | | | (6,448 | ) |
| Deferred members | | | (16,058 | ) | | | (14,208 | ) |
| Pensioners | | | (21,032 | ) | | | (18,885 | ) |
| Dependants | | | (1,738 | ) | | | (1,551 | ) |
| | | | (45,241 | ) | | | (41,092 | ) |
| | | 2019 | | | 2018 | |
| | | £m | | | £m | |
| Changes in the fair value of scheme assets | | | | | | |
| At 1 January | | | 42,238 | | | | 44,893 | |
| Return on plan assets excluding amounts included in interest income | | | 3,531 | | | | (1,558 | ) |
| Interest income | | | 1,220 | | | | 1,152 | |
| Employer contributions | | | 1,062 | | | | 863 | |
| Benefits paid | | | (2,174 | ) | | | (3,079 | ) |
| Settlements | | | (18 | ) | | | (18 | ) |
| Administrative costs paid | | | (43 | ) | | | (41 | ) |
| Exchange and other adjustments | | | (25 | ) | | | 26 | |
| At 31 December | | | 45,791 | | | | 42,238 | |
The expense recognised in the income statement for the year ended 31 December comprises:
| | | 2019 | | | 2018 | | | 2017 | |
| | | £m | | | £m | | | £m | |
| Current service cost | | | 201 | | | | 261 | | | | 295 | |
| Net interest amount | | | (48 | ) | | | (22 | ) | | | (1 | ) |
| Past service credits and curtailments | | | – | | | | 12 | | | | 10 | |
| Settlements | | | 1 | | | | 1 | | | | 3 | |
| Past service cost – plan amendments | | | 44 | | | | 108 | | | | 14 | |
| Plan administration costs incurred during the year | | | 43 | | | | 41 | | | | 41 | |
| Total defined benefit pension expense | | | 241 | | | | 401 | | | | 362 | |
(III) COMPOSITION OF SCHEME ASSETS
| | | 2019 | | | 2018 | |
| | | Quoted | | | Unquoted | | | Total | | | Quoted | | | Unquoted | | | Total | |
| | | £m | | | £m | | | £m | | | £m | | | £m | | | £m | |
| Equity instruments | | | 555 | | | | 39 | | | | 594 | | | | 637 | | | | 222 | | | | 859 | |
| Debt instruments1: | | | | | | | | | | | | | | | | | | | | | | | | |
| Fixed interest government bonds | | | 8,893 | | | | – | | | | 8,893 | | | | 7,449 | | | | – | | | | 7,449 | |
| Index-linked government bonds | | | 18,207 | | | | – | | | | 18,207 | | | | 16,477 | | | | – | | | | 16,477 | |
| Corporate and other debt securities | | | 10,588 | | | | – | | | | 10,588 | | | | 8,813 | | | | – | | | | 8,813 | |
| Asset-backed securities | | | – | | | | – | | | | – | | | | 138 | | | | – | | | | 138 | |
| | | | 37,688 | | | | – | | | | 37,688 | | | | 32,877 | | | | – | | | | 32,877 | |
| Property | | | – | | | | 158 | | | | 158 | | | | – | | | | 556 | | | | 556 | |
| Pooled investment vehicles | | | 4,773 | | | | 10,585 | | | | 15,358 | | | | 4,578 | | | | 10,494 | | | | 15,072 | |
| Money market instruments, cash, derivatives and other assets and liabilities | | | 204 | | | | (8,211 | ) | | | (8,007 | ) | | | (283 | ) | | | (6,843 | ) | | | (7,126 | ) |
| At 31 December | | | 43,220 | | | | 2,571 | | | | 45,791 | | | | 37,809 | | | | 4,429 | | | | 42,238 | |
| 1 | Of the total debt instruments, £33,134 million (31 December 2018: £29,033 million) were investment grade (credit ratings equal to or better than ‘BBB’). |
Notes to the consolidated financial statements
Note 36: Retirement benefit obligationscontinued
The assets of all the funded plans are held independently of the Group’s assets in separate trustee administered funds.
The pension schemes’ pooled investment vehicles comprise:
| | | 2019 | | | 2018 | |
| | | £m | | | £m | |
| Equity funds | | | 2,429 | | | | 2,329 | |
| Hedge and mutual funds | | | 2,886 | | | | 2,487 | |
| Liquidity funds | | | 1,126 | | | | 2,329 | |
| Bond and debt funds | | | 971 | | | | 313 | |
| Other | | | 7,946 | | | | 7,614 | |
| At 31 December | | | 15,358 | | | | 15,072 | |
The Trustee’s approach to investment is focused on acting in the members’ best financial interests, with the integration of ESG (Environmental, Social and Governance) considerations into investment management processes and practices. This policy is reviewed annually (or more frequently as required) and has been shared with the schemes’ investment managers for implementation.
(IV) ASSUMPTIONS
The principal actuarial and financial assumptions used in valuations of the defined benefit pension schemes were as follows:
| | | 2019 | | | 2018 | |
| | | % | | | % | |
| Discount rate | | | 2.05 | | | | 2.90 | |
| Rate of inflation: | | | | | | | | |
| Retail Prices Index | | | 2.94 | | | | 3.20 | |
| Consumer Price Index | | �� | 1.99 | | | | 2.15 | |
| Rate of salary increases | | | 0.00 | | | | 0.00 | |
| Weighted-average rate of increase for pensions in payment | | | 2.57 | | | | 2.73 | |
| | | | 2019 | | | | 2018 | |
| | | | Years | | | | Years | |
| Life expectancy for member aged 60, on the valuation date: | | | | | | | | |
| Men | | | 27.5 | | | | 27.8 | |
| Women | | | 29.2 | | | | 29.4 | |
| Life expectancy for member aged 60, 15 years after the valuation date: | | | | | | | | |
| Men | | | 28.5 | | | | 28.8 | |
| Women | | | 30.3 | | | | 30.6 | |
The mortality assumptions used in the UK scheme valuations are based on standard tables published by the Institute and Faculty of Actuaries which were adjusted in line with the actual experience of the relevant schemes. The table shows that a member retiring at age 60 at 31 December 2019 is assumed to live for, on average, 27.5 years for a male and 29.2 years for a female. In practice there will be much variation between individual members but these assumptions are expected to be appropriate across all members. It is assumed that younger members will live longer in retirement than those retiring now. This reflects the expectation that mortality rates will continue to fall over time as medical science and standards of living improve. To illustrate the degree of improvement assumed the table also shows the life expectancy for members aged 45 now, when they retire in 15 years’ time at age 60.
(V) AMOUNT TIMING AND UNCERTAINTY OF FUTURE CASH FLOWS
Risk exposure of the defined benefit schemes
Whilst the Group is not exposed to any unusual, entity specific or scheme specific risks in its defined benefit pension schemes, it is exposed to a number of significant risks, detailed below:
Inflation rate risk: the majority of the plans’ benefit obligations are linked to inflation both in deferment and once in payment. Higher inflation will lead to higher liabilities although this will be materially offset by holdings of inflation-linked gilts and, in most cases, caps on the level of inflationary increases are in place to protect against extreme inflation.
Interest rate risk: The defined benefit obligation is determined using a discount rate derived from yields on AA-rated corporate bonds. A decrease in corporate bond yields will increase plan liabilities although this will be materially offset by an increase in the value of bond holdings and through the use of derivatives.
Longevity risk: The majority of the schemes obligations are to provide benefits for the life of the members so increases in life expectancy will result in an increase in the plans’ liabilities.
Investment risk: Scheme assets are invested in a diversified portfolio of debt securities, equities and other return-seeking assets. If the assets underperform the discount rate used to calculate the defined benefit obligation, it will reduce the surplus or increase the deficit. Volatility in asset values and the discount rate will lead to volatility in the net pension asset on the Group’s balance sheet and in other comprehensive income. To a lesser extent this will also lead to volatility in the pension expense in the Group’s income statement.
The ultimate cost of the defined benefit obligations to the Group will depend upon actual future events rather than the assumptions made. The assumptions made are unlikely to be borne out in practice and as such the cost may be higher or lower than expected.
Sensitivity analysis
The effect of reasonably possible changes in key assumptions on the value of scheme liabilities and the resulting pension charge in the Group’s income statement and on the net defined benefit pension scheme asset, for the Group’s three most significant schemes, is set out below. The sensitivities
Notes to the consolidated financial statements
Note 36: Retirement benefit obligations continued
provided assume that all other assumptions and the value of the schemes’ assets remain unchanged, and are not intended to represent changes that are at the extremes of possibility. The calculations are approximate in nature and full detailed calculations could lead to a different result. It is unlikely that isolated changes to individual assumptions will be experienced in practice. Due to the correlation of assumptions, aggregating the effects of these isolated changes may not be a reasonable estimate of the actual effect of simultaneous changes in multiple assumptions.
| | | Effect of reasonably possible alternative assumptions |
| | | Increase (decrease)
in the income
statement charge | | (Increase) decrease in the
net defined benefit pension
scheme surplus |
| | | 2019 | | | 2018 | | | 2019 | | | 2018 | |
| | | £m | | | £m | | | £m | | | £m | |
| Inflation (including pension increases):1 | | | | | | | | | | | | | | | | |
| Increase of 0.1 per cent | | | 12 | | | | 14 | | | | 467 | | | | 410 | |
| Decrease of 0.1 per cent | | | (12 | ) | | | (14 | ) | | | (460 | ) | | | (395 | ) |
| Discount rate:2 | | | | | | | | | | | | | | | | |
| Increase of 0.1 per cent | | | (20 | ) | | | (27 | ) | | | (763 | ) | | | (670 | ) |
| Decrease of 0.1 per cent | | | 21 | | | | 25 | | | | 784 | | | | 686 | |
| Expected life expectancy of members: | | | | | | | | | | | | | | | | |
| Increase of one year | | | 40 | | | | 43 | | | | 1,636 | | | | 1,299 | |
| Decrease of one year | | | (39 | ) | | | (42 | ) | | | (1,575 | ) | | | (1,257 | ) |
| | |
| 1 | At 31 December 2019, the assumed rate of RPI inflation is 2.94 per cent and CPI inflation 1.99 per cent (2018: RPI 3.20 per cent and CPI 2.15 per cent). |
| | |
| 2 | At 31 December 2019, the assumed discount rate is 2.05 per cent (2018: 2.90 per cent). |
Sensitivity analysis method and assumptions
The sensitivity analysis above reflects the impact on the liabilities of the Group’s three most significant schemes which account for over 90 per cent of the Group’s defined benefit obligations. Whilst differences in the underlying liability profiles for the remainder of the Group’s pension arrangements mean they may exhibit slightly different sensitivities to variations in these assumptions, the sensitivities provided above are indicative of the impact across the Group as a whole.
The inflation assumption sensitivity applies to both the assumed rate of increase in the Consumer Prices Index (CPI) and the Retail Prices Index (RPI), and include the impact on the rate of increases to pensions, both before and after retirement. These pension increases are linked to inflation (either CPI or RPI) subject to certain minimum and maximum limits.
The sensitivity analysis (including the inflation sensitivity) does not include the impact of any change in the rate of salary increases as pensionable salaries have been frozen since 2 April 2014.
The life expectancy assumption has been applied by allowing for an increase/decrease in life expectation from age 60 of one year, based upon the approximate weighted average age for each scheme. Whilst this is an approximate approach and will not give the same result as a one year increase in life expectancy at every age, it provides an appropriate indication of the potential impact on the schemes from changes in life expectancy.
There was no change in the methods and assumptions used in preparing the sensitivity analysis from the prior year.
Asset-liability matching strategies
The main schemes’ assets are invested in a diversified portfolio, consisting primarily of debt securities. The investment strategy is not static and will evolve to reflect the structure of liabilities within the schemes. Specific asset-liability matching strategies for each pension plan are independently determined by the responsible governance body for each scheme and in consultation with the employer.
A significant goal of the asset-liability matching strategies adopted by Group schemes is to reduce volatility caused by changes in market expectations of interest rates and inflation. In the main schemes, this is achieved by investing scheme assets in bonds, primarily fixed interest gilts and index linked gilts, and by entering into interest rate and inflation swap arrangements. These investments are structured to take into account the profile of scheme liabilities, and actively managed to reflect both changing market conditions and changes to the liability profile.
On 28 January 2020, the main schemes entered into a £10 billion longevity insurance arrangement to hedge around 20 per cent of the schemes’ exposure to unexpected increases in life expectancy. This arrangement will form part of the schemes’ investment portfolio and will provide income to the schemes in the event that pensions are paid out for longer than expected. The transaction is structured as a pass-through with Scottish Widows as the insurer, and onwards reinsurance to Pacific Life Re Limited.
At 31 December 2019 the asset-liability matching strategy mitigated around 106 per cent of the liability sensitivity to interest rate movements and around 103 per cent of the liability sensitivity to inflation movements. In addition a small amount of interest rate sensitivity arises through holdings of corporate and other debt securities.
Notes to the consolidated financial statements
Note 36: Retirement benefit obligations continued
Maturity profile of defined benefit obligation
The following table provides information on the weighted average duration of the defined benefit pension obligations and the distribution and timing of benefit payments:
| | | 2019
Years | | | 2018
Years | |
| Duration of the defined benefit obligation | | 18 | | | 18 | |
| | | | 2019 | | | | 2018 | |
| | | | £m | | | | £m | |
| Maturity analysis of benefits expected to be paid: | | | | | | | | |
| Within 12 months | | | 1,274 | | | | 1,225 | |
| Between 1 and 2 years | | | 1,373 | | | | 1,299 | |
| Between 2 and 5 years | | | 4,455 | | | | 4,303 | |
| Between 5 and 10 years | | | 8,426 | | | | 8,305 | |
| Between 10 and 15 years | | | 9,229 | | | | 9,416 | |
| Between 15 and 25 years | | | 17,400 | | | | 18,417 | |
| Between 25 and 35 years | | | 13,999 | | | | 15,631 | |
| Between 35 and 45 years | | | 8,291 | | | | 9,924 | |
| In more than 45 years | | | 3,160 | | | | 4,270 | |
Maturity analysis method and assumptions
The projected benefit payments are based on the assumptions underlying the assessment of the obligations, including allowance for expected future inflation. They are shown in their undiscounted form and therefore appear large relative to the discounted assessment of the defined benefit obligations recognised in the Group’s balance sheet. They are in respect of benefits that have been accrued prior to the respective year-end date only and make no allowance for any benefits that may have been accrued subsequently.
DEFINED CONTRIBUTION SCHEMES
The Group operates a number of defined contribution pension schemes in the UK and overseas, principally Your Tomorrow and the defined contribution sections of the Lloyds Bank Pension Scheme No. 1.
During the year ended 31 December 2019 the charge to the income statement in respect of defined contribution schemes was £287 million (2018: £300 million; 2017: £256 million), representing the contributions payable by the employer in accordance with each scheme’s rules.
Other post-retirement benefit schemes
The Group operates a number of schemes which provide post-retirement healthcare benefits to certain employees, retired employees and their dependants. The principal scheme relates to former Lloyds Bank staff and under this scheme the Group has undertaken to meet the cost of post-retirement healthcare for all eligible former employees (and their dependants) who retired prior to 1 January 1996. The Group has entered into an insurance contract to provide these benefits and a provision has been made for the estimated cost of future insurance premiums payable.
For the principal post-retirement healthcare scheme, the latest actuarial valuation of the liability was carried out at 31 December 2019 by qualified independent actuaries. The principal assumptions used were as set out above, except that the rate of increase in healthcare premiums has been assumed at 6.54 per cent (2018: 6.81 per cent).
Movements in the other post-retirement benefits obligation:
| | | 2019 | | | 2018 | |
| | | £m | | | £m | |
| At 1 January | | | (124 | ) | | | (144 | ) |
| Actuarial (losses) gains | | | (6 | ) | | | 18 | |
| Insurance premiums paid | | | 7 | | | | 5 | |
| Charge for the year | | | (4 | ) | | | (4 | ) |
| Exchange and other adjustments | | | 1 | | | | 1 | |
| At 31 December | | | (126 | ) | | | (124 | ) |
NOTE 37: DEFERRED TAX
The Group’s deferred tax assets and liabilities are as follows:
| | | 2019 | | | 2018 | | | | | 2019 | | | 2018 | |
| Statutory position | | £m | | | £m | | | Tax disclosure | | £m | | | £m | |
| Deferred tax assets | | | 2,666 | | | | 2,453 | | | Deferred tax assets | | | 4,917 | | | | 4,731 | |
| Deferred tax liabilities | | | (44 | ) | | | – | | | Deferred tax liabilities | | | (2,295 | ) | | | (2,278 | ) |
| Asset at 31 December | | | 2,622 | | | | 2,453 | | | Asset at 31 December | | | 2,622 | | | | 2,453 | |
The statutory position reflects the deferred tax assets and liabilities as disclosed in the consolidated balance sheet and takes into account the ability of the Group to net assets and liabilities where there is a legally enforceable right of offset. The tax disclosure of deferred tax assets and liabilities ties to the amounts outlined in the tables below which splits the deferred tax assets and liabilities by type, before such netting.
Notes to the consolidated financial statements
Note 37: Deferred tax continued
As a result of legislation enacted in 2016, the UK corporation tax rate will reduce from 19 per cent to 17 per cent on 1 April 2020. The Group measures its deferred tax assets and liabilities at the value expected to be recoverable or payable in future periods, and re-measures them at each reporting date based on the most recent estimates of utilisation or settlement, including the impact of bank surcharge where appropriate. The deferred tax impact of this re-measurement to 17 per cent in 2019 is a charge of £6 million in the income statement and a credit of £5 million in other comprehensive income.
During the December 2019 election campaign, the UK government stated its intention to maintain the corporation tax rate at 19 per cent on 1 April 2020. Had this rate change been substantively enacted at 31 December 2019, the effect would have been to increase net deferred tax assets by £294 million.
On 29 October 2018, the UK government announced its intention to restrict the use of capital tax losses to 50 per cent of any future gains arising. Had this restriction been substantively enacted at 31 December 2019, the effect would have been to reduce net deferred tax assets by £50 million.
Movements in deferred tax liabilities and assets (before taking into consideration the offsetting of balances within the same taxing jurisdiction) can be summarised as follows:
| | | Tax losses | | | Property,
plant and
equipment | | | Pension
liabilities | | | Provisions | | | Share-based
payments | | | Derivatives | | | Other
temporary
differences | | | Total | |
| Deferred tax assets | | £m | | | £m | | | £m | | | £m | | | £m | | | £m | | | £m | | | £m | |
| At 1 January 2018 | | | 4,034 | | | | 743 | | | | 90 | | | | 380 | | | | 51 | | | | – | | | | 16 | | | | 5,314 | |
| (Charge) credit to the income statement | | | (256 | ) | | | (100 | ) | | | 64 | | | | (45 | ) | | | (6 | ) | | | – | | | | (5 | ) | | | (348 | ) |
| (Charge) credit to other comprehensive income | | | – | | | | – | | | | (92 | ) | | | (138 | ) | | | – | | | | – | | | | – | | | | (230 | ) |
| Other (charge) credit to equity | | | – | | | | – | | | | – | | | | – | | | | (5 | ) | | | – | | | | – | | | | (5 | ) |
| At 31 December 2018 | | | 3,778 | | | | 643 | | | | 62 | | | | 197 | | | | 40 | | | | – | | | | 11 | | | | 4,731 | |
| (Charge) credit to the income statement | | | (167 | ) | | | (1 | ) | | | (83 | ) | | | (87 | ) | | | 4 | | | | 149 | | | | 174 | | | | (11 | ) |
| (Charge) credit to other comprehensive income | | | – | | | | – | | | | 74 | | | | 116 | | | | – | | | | – | | | | – | | | | 190 | |
| Other (charge) credit to equity | | | – | | | | – | | | | – | | | | – | | | | 7 | | | | – | | | | – | | | | 7 | |
| At 31 December 2019 | | | 3,611 | | | | 642 | | | | 53 | | | | 226 | | | | 51 | | | | 149 | | | | 185 | | | | 4,917 | |
| | | | | | | | | | | | | | | | | | | | | | | | | | | | | | | | | |
| | | | | | | Long-term
assurance
business | | | Acquisition
fair value | | | Pension
assets | | | Derivatives | | | Asset
revaluations1 | | | Other
temporary
differences | | | Total | |
| Deferred tax liabilities | | | | | | £m | | | £m | | | £m | | | £m | | | £m | | | £m | | | £m | |
| At 1 January 2018 | | | | | | | (799 | ) | | | (879 | ) | | | (181 | ) | | | (499 | ) | | | (207 | ) | | | (140 | ) | | | (2,705 | ) |
| (Charge) credit to the income statement | | | | | | | 162 | | | | 142 | | | | (67 | ) | | | (19 | ) | | | (33 | ) | | | 7 | | | | 192 | |
| (Charge) credit to other comprehensive income | | | | | | | – | | | | – | | | | (25 | ) | | | 113 | | | | 141 | | | | – | | | | 229 | |
| Exchange and other adjustments | | | | | | | – | | | | – | | | | – | | | | – | | | | – | | | | 6 | | | | 6 | |
| At 31 December 2018 | | | | | | | (637 | ) | | | (737 | ) | | | (273 | ) | | | (405 | ) | | | (99 | ) | | | (127 | ) | | | (2,278 | ) |
| (Charge) credit to the income statement | | | | | | | (193 | ) | | | 221 | | | | 59 | | | | (48 | ) | | | (19 | ) | | | (35 | ) | | | (15 | ) |
| (Charge) credit to other comprehensive income | | | | | | | – | | | | – | | | | 64 | | | | (148 | ) | | | 83 | | | | – | | | | (1 | ) |
| Exchange and other adjustments | | | | | | | – | | | | – | | | | – | | | | – | | | | – | | | | (1 | ) | | | (1 | ) |
| At 31 December 2019 | | | | | | | (830 | ) | | | (516 | ) | | | (150 | ) | | | (601 | ) | | | (35 | ) | | | (163 | ) | | | (2,295 | ) |
| 1 | Financial assets at fair value through other comprehensive income. |
Deferred tax not recognised
Deferred tax of £24 million (2018: £90 million) has been recognised in respect of the future tax benefit of some expenses of the life assurance business carried forward. The deferred tax asset not recognised in respect of the remaining expenses is approximately £254 million (2018: £371 million), and these expenses can be carried forward indefinitely. The unrecognised deferred tax asset has reduced in 2019, as a significant amount of brought forward expenses have been utilised in the last year.
Deferred tax assets of approximately £48 million (2018: £78 million) have not been recognised in respect of £280 million of UK tax losses and other temporary differences which can only be used to offset future capital gains. UK capital losses can be carried forward indefinitely.
In addition, no deferred tax asset is recognised in respect of unrelieved foreign tax credits of £46 million (2018: £46 million), as there are no expected future taxable profits against which the credits can be utilised. These credits can be carried forward indefinitely.
No deferred tax has been recognised in respect of foreign trade losses where it is not more likely than not that we will be able to utilise them in future periods. Of the asset not recognised, £35 million (2018: £36 million) relates to losses that will expire if not used within 20 years, and £45 million (2018: £53 million) relates to losses with no expiry date.
As a result of parent company exemptions on dividends from subsidiaries and on capital gains on disposal there are no significant taxable temporary differences associated with investments in subsidiaries, branches, associates and joint arrangements.
Notes to the consolidated financial statements
NOTE 38: OTHER PROVISIONS
| | | Provisions for
financial
commitments
and guarantees | | | Payment
protection
insurance | | | Other
regulatory
provisions | | | Other | | | Total | |
| | | £m | | | £m | | | £m | | | £m | | | £m | |
| At 31 December 2018 | | | 193 | | | | 1,524 | | | | 861 | | | | 969 | | | | 3,547 | |
| Adjustment on adoption of IFRS 16 (note 55) | | | | | | | | | | | | | | | (97 | ) | | | (97 | ) |
| Balance at 1 January 2019 | | | | | | | | | | | | | | | 872 | | | | 3,450 | |
| Exchange and other adjustments | | | (1 | ) | | | 367 | | | | – | | | | (39 | ) | | | 327 | |
| Provisions applied | | | – | | | | (2,461 | ) | | | (778 | ) | | | (593 | ) | | | (3,832 | ) |
| Charge for the year | | | (15 | ) | | | 2,450 | | | | 445 | | | | 498 | | | | 3,378 | |
| At 31 December 2019 | | | 177 | | | | 1,880 | | | | 528 | | | | 738 | | | | 3,323 | |
Provisions for financial commitments and guarantees
Provisions are recognised for expected credit losses on undrawn loan commitments and financial guarantees. See also note 20.
Payment protection insurance (excluding MBNA)
The Group increased the provision for PPI costs by a further £2,450 million in the year ended 31 December 2019, bringing the total amount provided to £21,875 million.
The charge in 2019 was largely due to the significant increase in PPI information requests (PIRs) leading up to the deadline for submission of claims on 29 August 2019, and also reflects costs relating to complaints received from the Official Receiver as well as administration costs. An initial review of around 60 per cent of the five million PIRs received in the run-up to the PPI deadline has been undertaken, with the conversion rate remaining low, and consistent with the provision assumption of around 10 per cent. The Group has reached final agreement with the Official Receiver.
At 31 December 2019, a provision of £1,578 million remained unutilised relating to complaints and associated administration costs excluding amounts relating to MBNA. Total cash payments were £2,201 million during the year ended 31 December 2019.
SENSITIVITIES
The total amount provided for PPI represents the Group’s best estimate of the likely future cost. A number of risks and uncertainties remain including processing the remaining PIRs and outstanding complaints. The cost could differ from the Group’s estimates and the assumptions underpinning them, and could result in a further provision being required. These may also be impacted by any further regulatory changes and potential additional remediation arising from the continuous improvement of the Group’s operational practices.
For every one per cent increase in PIR conversion rate on the stock as at the industry deadline, the Group would expect an additional charge of approximately £100 million.
Payment protection insurance (MBNA)
MBNA increased its PPI provision by £367 million in the year ended 31 December 2019 but the Group’s exposure continues to remain capped at £240 million under the terms of the sale and purchase agreement.
Notes to the consolidated financial statements
Other provisions for legal actions and regulatory matters
In the course of its business, the Group is engaged in discussions with the PRA, FCA and other UK and overseas regulators and other governmental authorities on a range of matters. The Group also receives complaints in connection with its past conduct and claims brought by or on behalf of current and former employees, customers, investors and other third parties and is subject to legal proceedings and other legal actions. Where significant, provisions are held against the costs expected to be incurred in relation to these matters and matters arising from related internal reviews. During the year ended 31 December 2019 the Group charged a further £445 million in respect of legal actions and other regulatory matters, and the unutilised balance at 31 December 2019 was £528 million (31 December 2018: £861 million). The most significant items are as follows.
ARREARS HANDLING RELATED ACTIVITIES
The Group has provided an additional £188 million in the year ended 31 December 2019 for the costs of identifying and rectifying certain arrears management fees and activities, taking the total provided to date to £981 million. The Group has put in place a number of actions to improve its handling of customers in these areas and has made good progress in reimbursing arrears fees to impacted customers.
PACKAGED BANK ACCOUNTS
The Group had provided a total of £795 million up to 31 December 2018 in respect of complaints relating to alleged mis-selling of packaged bank accounts, with no further amounts provided during the year ended 31 December 2019. A number of risks and uncertainties remain, particularly with respect to future volumes.
CUSTOMER CLAIMS IN RELATION TO INSURANCE BRANCH BUSINESS IN GERMANY
The Group continues to receive claims in Germany from customers relating to policies issued by Clerical Medical Investment Group Limited (subsequently renamed Scottish Widows Limited), with smaller numbers received from customers in Austria and Italy. The industry-wide issue regarding notification of contractual ‘cooling off’ periods continued to lead to an increasing number of claims in 2016 and 2017. Whilst complaint volumes have declined, new litigation claim volumes per month have remained fairly constant throughout 2019. Up to 31 December 2019 the Group had provided a total of £656 million. The validity of the claims facing the Group depends upon the facts and circumstances in respect of each claim. As a result, the ultimate financial effect, which could be significantly different from the current provision, will be known only once all relevant claims have been resolved.
HBOS READING – REVIEW
The Group has now completed its compensation assessment for all 71 business customers within the customer review, with more than 98 per cent of these offers to individuals accepted. In total, more than £100 million in compensation has been offered to victims of the HBOS Reading fraud prior to the publication of Sir Ross Cranston’s independent quality assurance review of the customer review, of which £94 million has so far been accepted, in addition to £9 million for ex-gratia payments and £6 million for the re-imbursements of legal fees. Sir Ross’s review was concluded on 10 December 2019 and made a number of recommendations, including a re-assessment of direct and consequential losses by an independent panel. The Group has committed to implementing Sir Ross’s recommendations in full. In addition, further ex gratia payments of £35,000 have been made to 200 individuals in recognition of the additional delay which will be caused whilst the Group takes steps to implement Sir Ross’s recommendations. It is not possible to estimate at this stage what the financial impact will be.
HBOS READING – FCA INVESTIGATION
The FCA’s investigation into the events surrounding the discovery of misconduct within the Reading-based Impaired Assets team of HBOS has concluded. The Group has settled the matter with the FCA and paid a fine of £45.5 million, as per the FCA’s final notice dated 21 June 2019.
Other
Following the sale of TSB Banking Group plc, the Group raised a provision of £665 million in relation to various ongoing commitments; £117 million of this provision remained unutilised at 31 December 2019.
Provisions are made for staff and other costs related to Group restructuring initiatives at the point at which the Group becomes committed to the expenditure. At 31 December 2019 provisions of £129 million (31 December 2018: £191 million) were held.
The Group carries provisions of £118 million (2018: £122 million) for indemnities and other matters relating to legacy business disposals in prior years.
NOTES TO THE CONSOLIDATED FINANCIAL STATEMENTS
NOTE 39: SUBORDINATED LIABILITIES
The movement in subordinated liabilities during the year was as follows:
| | | Preference
shares
£m | | | Preferred
securities
£m | | | Undated
subordinated
liabilities
£m | | | Dated
subordinated
liabilities
£m | | | Total
£m | |
| At 1 January 2018 | | | 813 | | | | 3,690 | | | | 565 | | | | 12,854 | | | | 17,922 | |
| Issued during the year | | | – | | | | – | | | | – | | | | 1,729 | | | | 1,729 | |
| Repurchases and redemptions during the year1 | | | – | | | | (614 | ) | | | – | | | | (1,642 | ) | | | (2,256 | ) |
| Foreign exchange movements | | | 18 | | | | 131 | | | | 20 | | | | 377 | | | | 546 | |
| Other movements (all non-cash) | | | (28 | ) | | | (2 | ) | | | 3 | | | | (258 | ) | | | (285 | ) |
| At 31 December 2018 | | | 803 | | | | 3,205 | | | | 588 | | | | 13,060 | | | | 17,656 | |
| Repurchases and redemptions during the year1 | | | (3 | ) | | | (49 | ) | | | (53 | ) | | | (713 | ) | | | (818 | ) |
| Foreign exchange movements | | | (12 | ) | | | (83 | ) | | | (36 | ) | | | (402 | ) | | | (533 | ) |
| Other movements (all non-cash) | | | 114 | | | | 152 | | | | 18 | | | | 541 | | | | 825 | |
| At 31 December 2019 | | | 902 | | | | 3,225 | | | | 517 | | | | 12,486 | | | | 17,130 | |
| 1 | The repurchases and redemptions resulted in cash outflows of £818 million (2018: £2,256 million). |
| Issued during 2018 | | | |
| Dated subordinated liabilities | | £m | |
| 1.75% Subordinated Fixed Rate Notes 2028 callable 2023 | | | 664 | |
| 4.344% Subordinated Fixed Rate Notes callable 2048 | | | 1,065 | |
| | | | 1,729 | |
| Repurchases and redemptions during 2019 | | | | |
| Preference shares | | | £m | |
| 6.3673% Non-cumulative Fixed to Floating Rate Preference Shares callable 2019 | | | 3 | |
| Preferred securities | | | £m | |
| 13% Step-up Perpetual Capital Securities callable 2019 | | | 49 | |
| Undated subordinated liabilities | | | £m | |
| 6.5% Undated Subordinated Step-up Notes callable 2019 | | | 1 | |
| 7.375% Undated Subordinated Guaranteed Bonds | | | 52 | |
| | | | 53 | |
| Dated subordinated liabilities | | | £m | |
| 10.375% Subordinated Fixed to Fixed Rate Notes 2024 callable 2019 | | | 135 | |
| 9.375% Subordinated Bonds 2021 | | | 328 | |
| 6.375% Subordinated Instruments 2019 | | | 250 | |
| | | | 713 | |
| Repurchases and redemptions during 2018 | | | | |
| Preferred securities | | | £m | |
| 6.461% Guaranteed Non-voting Non-cumulative Perpetual Preferred Securities | | | 600 | |
| Undated Perpetual Preferred Securities | | | 14 | |
| | | | 614 | |
| Dated subordinated liabilities | | | £m | |
| 10.5% Subordinated Bonds callable 2018 | | | 150 | |
| 6.75% Subordinated Fixed Rate Notes callable 2018 | | | 1,492 | |
| | | | 1,642 | |
These securities will, in the event of the winding-up of the issuer, be subordinated to the claims of depositors and all other creditors of the issuer, other than creditors whose claims rank equally with, or are junior to, the claims of the holders of the subordinated liabilities. The subordination of specific subordinated liabilities is determined in respect of the issuer and any guarantors of that liability. The claims of holders of preference shares and preferred securities are generally junior to those of the holders of undated subordinated liabilities, which in turn are junior to the claims of holders of the dated subordinated liabilities. The Group has not had any defaults of principal, interest or other breaches with respect to its subordinated liabilities during 2019 (2018: none).
NOTES TO THE CONSOLIDATED FINANCIAL STATEMENTS
NOTE 40: SHARE CAPITAL
(1) Authorised share capital
As permitted by the Companies Act 2006, the Company removed references to authorised share capital from its articles of association at the annual general meeting on 5 June 2009. This change took effect from 1 October 2009.
(2) Issued and fully paid share capital
| | | 2019
Number of shares | | | 2018
Number of shares | | | 2017
Number of shares | | | 2019
£m | | | 2018
£m | | | 2017
£m | |
| Ordinary shares of 10p (formerly 25p) each | | | | | | | | | | | | | | | | | | | | | |
| At 1 January | | | 71,163,592,264 | | | | 71,972,949,589 | | | | 71,373,735,357 | | | | 7,116 | | | | 7,197 | | | | 7,138 | |
| Issued under employee share schemes | | | 775,882,951 | | | | 768,551,098 | | | | 518,293,181 | | | | 78 | | | | 77 | | | | 51 | |
| Share buyback programme (note 42) | | | (1,886,917,377 | ) | | | (1,577,908,423 | ) | | | – | | | | (189 | ) | | | (158 | ) | | | – | |
| Redesignation of limited voting ordinary shares (see below) | | | – | | | | – | | | | 80,921,051 | | | | – | | | | – | | | | 8 | |
| At 31 December | | | 70,052,557,838 | | | | 71,163,592,264 | | | | 71,972,949,589 | | | | 7,005 | | | | 7,116 | | | | 7,197 | |
| Limited voting ordinary shares of 10p (formerly 25p) each | | | | | | | | | | | | | | | | | | | | | | | | |
| At 1 January | | | – | | | | – | | | | 80,921,051 | | | | – | | | | – | | | | 8 | |
| Redesignation to ordinary shares | | | – | | | | – | | | | (80,921,051 | ) | | | – | | | | – | | | | (8 | ) |
| At 31 December | | | – | | | | – | | | | – | | | | – | | | | – | | | | – | |
| Total issued share capital | | | | | | | | | | | | | | | 7,005 | | | | 7,116 | | | | 7,197 | |
SHARE ISSUANCES
In 2019, 776 million shares (2018: 769 million shares; 2017: 518 million shares) were issued in respect of employee share schemes.
(3) Share capital and control
There are no restrictions on the transfer of shares in the Company other than as set out in the articles of association and:
| – | certain restrictions which may from time to time be imposed by law and regulations (for example, insider trading laws); |
| – | where directors and certain employees of the Company require the approval of the Company to deal in the Company’s shares; and |
| – | pursuant to the rules of some of the Company’s employee share plans where certain restrictions may apply while the shares are subject to the plans. |
Where, under an employee share plan operated by the Company, participants are the beneficial owners of shares but not the registered owners, the voting rights are normally exercised by the registered owner at the direction of the participant. Outstanding awards and options would normally vest and become exercisable on a change of control, subject to the satisfaction of any performance conditions at that time.
In addition, the Company is not aware of any agreements between shareholders that may result in restrictions on the transfer of securities and/or voting rights.
Information regarding significant direct or indirect holdings of shares in the Company can be found on page 170.
The directors have authority to allot and issue ordinary and preference shares and to make market purchases of ordinary and preference shares as granted at the annual general meeting on 16 May 2019. The authority to issue shares and the authority to make market purchases of shares will expire at the next annual general meeting. Shareholders will be asked, at the annual general meeting, to give similar authorities.
Subject to any rights or restrictions attached to any shares, on a show of hands at a general meeting of the Company every holder of shares present in person or by proxy and entitled to vote has one vote and on a poll every member present and entitled to vote has one vote for every share held.
Further details regarding voting at the annual general meeting can be found in the notes to the notice of the annual general meeting.
ORDINARY SHARES
The holders of ordinary shares, who held 100 per cent of the total ordinary share capital at 31 December 2019, are entitled to receive the Company’s report and accounts, attend, speak and vote at general meetings and appoint proxies to exercise voting rights. Holders of ordinary shares may also receive a dividend (subject to the provisions of the Company’s articles of association) and on a winding up may share in the assets of the Company.
LIMITED VOTING ORDINARY SHARES
At the annual general meeting on 11 May 2017, the Company’s shareholders approved the redesignation of the 80,921,051 limited voting ordinary shares held by the Lloyds Bank Foundations as ordinary shares of 10 pence each. The redesignation took effect on 1 July 2017 and the redesignated shares now rank equally with the existing issued ordinary shares of the Company.
The Company has entered into deeds of covenant with the Foundations under the terms of which the Company makes annual donations. The deeds of covenant in effect as at 31 December 2019 provide that such annual donations will cease in certain circumstances, including the Company providing nine years’ notice. Such notice has been given to the Lloyds TSB Foundation for Scotland.
PREFERENCE SHARES
The Company has in issue various classes of preference shares which are all classified as liabilities under accounting standards and which are included in note 39.
NOTES TO THE CONSOLIDATED FINANCIAL STATEMENTS
NOTE 41: SHARE PREMIUM ACCOUNT
| | | 2019
£m | | | 2018
£m | | | 2017
£m | |
| At 1 January | | | 17,719 | | | | 17,634 | | | | 17,622 | |
| Issued under employee share schemes | | | 29 | | | | 85 | | | | 12 | |
| Redemption of preference shares1 | | | 3 | | | | – | | | | – | |
| At 31 December | | | 17,751 | | | | 17,719 | | | | 17,634 | |
| 1 | During the year ended 31 December 2019, the Company redeemed all of its outstanding 6.3673% Non-cumulative Fixed to Floating Rate Preference Shares at their combined sterling par value of £3 million. These preference shares had been accounted for as subordinated liabilities. On redemption an amount of £3 million was transferred from the distributable merger reserve to the share premium account. |
NOTE 42: OTHER RESERVES
| | | 2019
£m | | | 2018
£m | | | 2017
£m | |
| Other reserves comprise: | | | | | | | | | | | | |
| Merger reserve | | | 7,763 | | | | 7,766 | | | | 7,766 | |
| Capital redemption reserve | | | 4,462 | | | | 4,273 | | | | 4,115 | |
| Revaluation reserve in respect of debt securities held at fair value through other comprehensive income | | | 123 | | | | 279 | | | | | |
| Revaluation reserve in respect of equity shares held at fair value through other comprehensive income | | | 19 | | | | 5 | | | | | |
| Revaluation reserve in respect of available-for-sale financial assets | | | | | | | | | | | 685 | |
| Cash flow hedging reserve | | | 1,504 | | | | 1,051 | | | | 1,405 | |
| Foreign currency translation reserve | | | (176 | ) | | | (164 | ) | | | (156 | ) |
| At 31 December | | | 13,695 | | | | 13,210 | | | | 13,815 | |
The merger reserve primarily comprises the premium on shares issued in January 2009 as part of the recapitalisation of the Group and the acquisition of HBOS plc.
The capital redemption reserve represents transfers from distributable reserve in accordance with companies’ legislation upon the redemption of ordinary and preference share capital.
The revaluation reserves in respect of debt securities and equity shares held at fair value through other comprehensive income represent the cumulative after tax unrealised change in the fair value of financial assets so classified since initial recognition; or in the case of financial assets obtained on acquisitions of businesses, since the date of acquisition.
The cash flow hedging reserve represents the cumulative after tax gains and losses on effective cash flow hedging instruments that will be reclassified to the income statement in the periods in which the hedged item affects profit or loss.
The foreign currency translation reserve represents the cumulative after-tax gains and losses on the translation of foreign operations and exchange differences arising on financial instruments designated as hedges of the Group’s net investment in foreign operations.
| | | 2019
£m | | | 2018
£m | | | 2017
£m | |
| Merger reserve | | | | | | | | | | | | |
| At 1 January | | | 7,766 | | | | 7,766 | | | | 7,766 | |
| Redemption of preference shares (note 41) | | | (3 | ) | | | – | | | | – | |
| At 31 December | | | 7,763 | | | | 7,766 | | | | 7,766 | |
| | | | | | | | | | | | | |
| | | | 2019
£m | | | | 2018
£m | | | | 2017
£m | |
| Capital redemption reserve | | | | | | | | | | | | |
| At 1 January | | | 4,273 | | | | 4,115 | | | | 4,115 | |
| Shares cancelled under share buyback programmes (see below) | | | 189 | | | | 158 | | | | – | |
| At 31 December | | | 4,462 | | | | 4,273 | | | | 4,115 | |
On 20 February 2019 the Group announced the launch of a share buyback programme to repurchase outstanding ordinary shares and the programme commenced on 1 March 2019; the Group bought back and cancelled 1,887 million shares under the programme, for a total consideration, including expenses, of £1,095 million. Upon cancellation £189 million, being the nominal value of the shares repurchased, was transferred to the capital redemption reserve.
Under a similar programme in 2018, the Group bought back and cancelled 1,578 million shares for a total consideration, including expenses, of £1,005 million; £158 million was transferred to the capital redemption reserve.
NOTES TO THE CONSOLIDATED FINANCIAL STATEMENTS
NOTE 42: OTHER RESERVES continued
| | | 2019
£m | | | 2018
£m | |
| Revaluation reserve in respect of debt securities held at fair value through other comprehensive income | | | | | | | | |
| At 1 January | | | 279 | | | | 472 | |
| | | | | | | | | |
| Change in fair value | | | (30 | ) | | | (37 | ) |
| Deferred tax | | | 10 | | | | 35 | |
| | | | (20 | ) | | | (2 | ) |
| Income statement transfer in respect of disposals (note 9) | | | (196 | ) | | | (275 | ) |
| Deferred tax | | | 61 | | | | 84 | |
| | | | (135 | ) | | | (191 | ) |
| Impairment recognised in the income statement | | | (1 | ) | | | – | |
| At 31 December | | | 123 | | | | 279 | |
| | | | | | | | | |
| | | | 2019
£m | | | | 2018
£m | |
| Revaluation reserve in respect of equity shares held at fair value through other comprehensive income | | | | | | | | |
| At 1 January | | | 5 | | | | (49 | ) |
| | | | | | | | | |
| Change in fair value | | | – | | | | (97 | ) |
| Deferred tax | | | 12 | | | | 22 | |
| | | | 12 | | | | (75 | ) |
| Realised gains and losses transferred to retained profits | | | 14 | | | | 151 | |
| Deferred tax | | | (12 | ) | | | (22 | ) |
| | | | 2 | | | | 129 | |
| At 31 December | | | 19 | | | | 5 | |
NOTES TO THE CONSOLIDATED FINANCIAL STATEMENTS
NOTE 42: OTHER RESERVES continued
Movements in other reserves were as follows:
| | | | | | | | | 2017
£m | |
| Revaluation reserve in respect of available-for-sale financial assets | | | | | | | | | | | | |
| At 1 January | | | | | | | | | | | 759 | |
| | | | | | | | | | | | | |
| Change in fair value of available-for-sale financial assets | | | | | | | | | | | 303 | |
| Deferred tax | | | | | | | | | | | (26 | ) |
| Current tax | | | | | | | | | | | (4 | ) |
| | | | | | | | | | | | 273 | |
| Income statement transfers: | | | | | | | | | | | | |
| Disposals (note 9) | | | | | | | | | | | (446 | ) |
| Deferred tax | | | | | | | | | | | 93 | |
| Current tax | | | | | | | | | | | – | |
| | | | | | | | | | | | (353 | ) |
| | | | | | | | | | | | | |
| Impairment | | | | | | | | | | | 6 | |
| Deferred tax | | | | | | | | | | | – | |
| | | | | | | | | | | | 6 | |
| At 31 December | | | | | | | | | | | 685 | |
| | | | | | | | | | | | | |
| | | | 2019
£m | | | | 2018
£m | | | | 2017
£m | |
| Cash flow hedging reserve | | | | | | | | | | | | |
| At 1 January | | | 1,051 | | | | 1,405 | | | | 2,136 | |
| Change in fair value of hedging derivatives | | | 1,209 | | | | 234 | | | | (363 | ) |
| Deferred tax | | | (303 | ) | | | (69 | ) | | | 121 | |
| | | | 906 | | | | 165 | | | | (242 | ) |
| Income statement transfers | | | (608 | ) | | | (701 | ) | | | (651 | ) |
| Deferred tax | | | 155 | | | | 182 | | | | 162 | |
| | | | (453 | ) | | | (519 | ) | | | (489 | ) |
| At 31 December | | | 1,504 | | | | 1,051 | | | | 1,405 | |
| | | | | | | | | | | | | |
| | | | 2019
£m | | | | 2018
£m | | | | 2017
£m | |
| Foreign currency translation reserve | | | | | | | | | | | | |
| At 1 January | | | (164 | ) | | | (156 | ) | | | (124 | ) |
| Currency translation differences arising in the year | | | (12 | ) | | | (8 | ) | | | (21 | ) |
| Foreign currency gains on net investment hedges (tax: £nil) | | | – | | | | – | | | | (11 | ) |
| At 31 December | | | (176 | ) | | | (164 | ) | | | (156 | ) |
NOTES TO THE CONSOLIDATED FINANCIAL STATEMENTS
NOTE 43: RETAINED PROFITS
| | | | 2019 | | | | 20181 | | | | 20171 | |
| | | | £m | | | | £m | | | | £m | |
| At 31 December 2017 | | | | | | | 4,905 | | | | | |
| Adjustment on adoption of IFRS 9 and IFRS 15 | | | | | | | (929 | ) | | | | |
| At 1 January | | | 5,389 | | | | 3,976 | | | | 3,250 | |
| Profit for the year | | | 2,925 | | | | 4,408 | | | | 3,909 | |
| Dividends paid2 | | | (2,312 | ) | | | (2,240 | ) | | | (2,284 | ) |
| Issue costs of other equity instruments (net of tax) (note 44) | | | (3 | ) | | | (5 | ) | | | – | |
| Distributions on other equity instruments | | | (466 | ) | | | (433 | ) | | | (415 | ) |
| Share buyback programmes (note 42) | | | (1,095 | ) | | | (1,005 | ) | | | – | |
| Realised gains and losses on equity shares held at fair value through other comprehensive income | | | (2 | ) | | | (129 | ) | | | | |
| Post-retirement defined benefit scheme remeasurements | | | (1,117 | ) | | | 120 | | | | 482 | |
| Share of other comprehensive income of associates and joint ventures | | | – | | | | 8 | | | | – | |
| Gains and losses attributable to own credit risk (net of tax)3 | | | (306 | ) | | | 389 | | | | (40 | ) |
| Movement in treasury shares | | | (3 | ) | | | 40 | | | | (411 | ) |
| Value of employee services: | | | | | | | | | | | | |
| Share option schemes | | | 71 | | | | 53 | | | | 82 | |
| Other employee award schemes | | | 165 | | | | 207 | | | | 332 | |
| At 31 December | | | 3,246 | | | | 5,389 | | | | 4,905 | |
| 1 | Restated, see note 1. |
| | |
| 2 | Net of a credit in respect of unclaimed dividends written-back in accordance with the Company’s Articles of Association in 2017. |
| | |
| 3 | During 2017 the Group derecognised, on redemption, financial liabilities on which cumulative fair value movements relating to own credit of £3 million net of tax, had been recognised directly in retained profits. |
Retained profits are stated after deducting £575 million (2018: £499 million; 2017: £611 million) representing 902 million (2018: 909 million; 2017: 861 million) treasury shares held.
The payment of dividends by subsidiaries and the ability of members of the Group to lend money to other members of the Group may be subject to regulatory or legal restrictions, the availability of reserves and the financial and operating performance of the entity. Details of such restrictions and the methods adopted by the Group to manage the capital of its subsidiaries are provided under Capital Risk on page 87.
NOTE 44: OTHER EQUITY INSTRUMENTS
| | | 2019 | | | 2018 | | | 2017 | |
| | | £m | | | £m | | | £m | |
| At 1 January | | | 6,491 | | | | 5,355 | | | | 5,355 | |
| Issued in the year: | | | | | | | | | | | | |
| US dollar notes ($1,500 million nominal) | | | – | | | | 1,136 | | | | – | |
| US dollar notes ($500 million nominal) | | | 396 | | | | – | | | | – | |
| Sterling notes (£500 million nominal) | | | 500 | | | | – | | | | – | |
| Redemption | | | (1,481 | ) | | | – | | | | – | |
| At 31 December | | | 5,906 | | | | 6,491 | | | | 5,355 | |
During the year ended 31 December 2019 the Group issued £500 million of sterling and £396 million (US$500 million) of US dollar Additional Tier 1 (AT1) securities; issue costs of £3 million, net of tax, were charged to retained profits.
On 27 June 2019 the Group redeemed, at par, £1,481 million of Additional Tier 1 securities at their first call date.
The AT1 securities are Fixed Rate Resetting Perpetual Subordinated Contingent Convertible Securities with no fixed maturity or redemption date.
The principal terms of the AT1 securities are described below:
| – | The securities rank behind the claims against Lloyds Banking Group plc of (a) unsubordinated creditors, (b) claims which are, or are expressed to be, subordinated to the claims of unsubordinated creditors of Lloyds Banking Group plc but not further or otherwise or (c) whose claims are, or are expressed to be, junior to the claims of other creditors of Lloyds Banking Group, whether subordinated or unsubordinated, other than those whose claims rank, or are expressed to rank, pari passu with, or junior to, the claims of the holders of the AT1 Securities in a winding-up occurring prior to a conversion event being triggered. |
| – | The securities bear a fixed rate of interest until the first call date. After the initial call date, in the event that they are not redeemed, the AT1 securities will bear interest at rates fixed periodically in advance for five year periods based on market rates. |
| | |
| – | Interest on the securities will be due and payable only at the sole discretion of Lloyds Banking Group plc, and Lloyds Banking Group plc may at any time elect to cancel any Interest Payment (or any part thereof) which would otherwise be payable on any Interest Payment Date. There are also certain restrictions on the payment of interest as specified in the terms. |
| | |
| – | The securities are undated and are repayable, at the option of Lloyds Banking Group plc, in whole at the first call date, or on any fifth anniversary after the first call date. In addition, the AT1 securities are repayable, at the option of Lloyds Banking Group plc, in whole for certain regulatory or tax reasons. Any repayments require the prior consent of the PRA. |
| | |
| – | The securities convert into ordinary shares of Lloyds Banking Group plc, at a pre-determined price, should the fully loaded Common Equity Tier 1 ratio of the Group fall below 7.0 per cent. |
NOTES TO THE CONSOLIDATED FINANCIAL STATEMENTS
NOTE 45: DIVIDENDS ON ORDINARY SHARES
The directors have recommended a final dividend, which is subject to approval by the shareholders at the Annual General Meeting, of 2.25 pence per share (2018: 2.14 pence per share; 2017: 2.05 pence per share) representing a total dividend of £1,586 million (2018: £1,523 million; 2017: £1,475 million), which will be paid on 27 May 2020. The financial statements do not reflect recommended dividends.
Dividends paid during the year were as follows:
| | | 2019 | | | 2018 | | | 2017 | | | | | | | | | | |
| | | pence | | | pence | | | pence | | | 2019 | | | 2018 | | | 2017 | |
| | | per share | | | per share | | | per share | | | £m | | | £m | | | £m | |
| Recommended by directors at previous year end: | | | | | | | | | | | | | | | | | | |
| Final dividend | | | 2.14 | | | | 2.05 | | | | 1.70 | | | | 1,523 | | | | 1,475 | | | | 1,212 | |
| Special dividend | | | – | | | | – | | | | 0.50 | | | | – | | | | – | | | | 356 | |
| Interim dividend paid in the year | | | 1.12 | | | | 1.07 | | | | 1.00 | | | | 789 | | | | 765 | | | | 720 | |
| | | | 3.26 | | | | 3.12 | | | | 3.20 | | | | 2,312 | | | | 2,240 | | | | 2,288 | |
The cash cost of the dividends paid in the year was £2,312 million (2018: £2,240 million; 2017: £2,284 million), in 2017 this was net of a credit in respect of unclaimed dividends written-back in accordance with the Company’s Articles of Association.
In May 2019 the Group announced that it will move to the payment of quarterly dividends in 2020, with the first quarterly dividend in respect of the first quarter of 2020 payable in June 2020. The new approach will be to adopt three equal interim ordinary dividend payments for the first three quarters of the year followed by, subject to performance, a larger final dividend for the fourth quarter of the year. The first three quarterly payments, payable in June, September and December will be 20 per cent of the previous year’s total ordinary dividend per share. The fourth quarter payment will be announced with the full year results. The final dividend will continue to be paid in May, following approval at the AGM. The Group believes that this approach will provide a more regular flow of dividend income to all shareholders whilst accelerating the receipt of payments.
The trustees of the following holdings of Lloyds Banking Group plc shares in relation to employee share schemes retain the right to receive dividends but have chosen to waive their entitlement to the dividends on those shares as indicated: the Lloyds Banking Group Share Incentive Plan (holding at 31 December 2019: 6,508,529 shares, 31 December 2018: 5,538,164 shares, waived rights to all dividends), the HBOS Share Incentive Plan Trust (holding at 31 December 2019: 445,625 shares, 31 December 2018: 445,625 shares, waived rights to all dividends), the Lloyds Banking Group Employee Share Ownership Trust (holding at 31 December 2019: 11,656,155 shares, 31 December 2018: 5,679,119 shares, on which it waived rights to all dividends) and Lloyds Group Holdings (Jersey) Limited (holding at 31 December 2019: nil, 31 December 2018: 42,846 shares, waived rights to all but a nominal amount of one penny in total).
NOTE 46: SHARE-BASED PAYMENTS
Charge to the income statement
The charge to the income statement is set out below:
| | | 2019 | | | 2018 | | | 2017 | |
| | | £m | | | £m | | | £m | |
| Deferred bonus plan | | | 261 | | | | 325 | | | | 313 | |
| Executive and SAYE plans: | | | | | | | | | | | | |
| Options granted in the year | | | 16 | | | | 14 | | | | 17 | |
| Options granted in prior years | | | 59 | | | | 71 | | | | 81 | |
| | | | 75 | | | | 85 | | | | 98 | |
| Share plans: | | | | | | | | | | | | |
| Shares granted in the year | | | 17 | | | | 16 | | | | 17 | |
| Shares granted in prior years | | | 20 | | | | 17 | | | | 9 | |
| | | | 37 | | | | 33 | | | | 26 | |
| Total charge to the income statement | | | 373 | | | | 443 | | | | 437 | |
During the year ended 31 December 2019 the Group operated the following share-based payment schemes, all of which are equity settled.
Group Performance Share plan
The Group operates a Group Performance Share plan that is equity settled. Bonuses in respect of employee performance in 2019 have been recognised in the charge in line with the proportion of the deferral period completed.
NOTES TO THE CONSOLIDATED FINANCIAL STATEMENTS
NOTE 46: SHARE-BASED PAYMENTScontinued
Save-As-You-Earn schemes
Eligible employees may enter into contracts through the Save-As-You-Earn (SAYE) schemes to save up to £500 per month and, at the expiry of a fixed term of three years, have the option to use these savings within six months of the expiry of the fixed term to acquire shares in the Group at a discounted price of no less than 80 per cent of the market price at the start of the invitation.
Movements in the number of share options outstanding under the SAYE schemes are set out below:
| | | 2019 | | | 2018 | |
| | | | | | Weighted | | | | | | Weighted | |
| | | | | | average | | | | | | average | |
| | | Number of | | | exercise price | | | Number of | | | exercise price | |
| | | options | | | (pence | ) | | options | | | (pence | ) |
| Outstanding at 1 January | | | 802,994,918 | | | | 49.30 | | | | 860,867,088 | | | | 51.34 | |
| Granted | | | 487,654,212 | | | | 39.87 | | | | 188,866,162 | | | | 47.92 | |
| Exercised | | | (27,303,963 | ) | | | 51.23 | | | | (135,721,404 | ) | | | 59.00 | |
| Forfeited | | | (15,830,204 | ) | | | 48.69 | | | | (22,909,999 | ) | | | 49.85 | |
| Cancelled | | | (130,068,149 | ) | | | 49.03 | | | | (78,073,042 | ) | | | 50.66 | |
| Expired | | | (49,352,741 | ) | | | 58.74 | | | | (10,033,887 | ) | | | 55.20 | |
| Outstanding at 31 December | | | 1,068,094,073 | | | | 44.55 | | | | 802,994,918 | | | | 49.30 | |
| Exercisable at 31 December | | | 227,139 | | | | 60.70 | | | | 68,378 | | | | 60.02 | |
The weighted average share price at the time that the options were exercised during 2019 was £0.59 (2018: £0.67). The weighted average remaining contractual life of options outstanding at the end of the year was 2.22 years (2018: 2.16 years).
The weighted average fair value of SAYE options granted during 2019 was £0.10 (2018: £0.13). The fair values of the SAYE options have been determined using a standard Black-Scholes model.
Other share option plans
LLOYDS BANKING GROUP EXECUTIVE SHARE PLAN 2003
The Plan was adopted in December 2003 and under the Plan share options may be granted to senior employees. Options under this plan have been granted specifically to facilitate recruitment (to compensate new recruits for any lost share awards), and also to make grants to key individuals for retention purposes. In some instances, grants may be made subject to individual performance conditions.
Participants are not entitled to any dividends paid during the vesting period.
| | | 2019 | | | 2018 | |
| | | | | | Weighted | | | | | | Weighted | |
| | | | | | average | | | | | | average | |
| | | Number of | | | exercise price | | | Number of | | | exercise price | |
| | | options | | | (pence | ) | | options | | | (pence | ) |
| Outstanding at 1 January | | | 10,263,028 | | | | Nil | | | | 14,523,989 | | | | Nil | |
| Granted | | | 2,336,171 | | | | Nil | | | | 3,914,599 | | | | Nil | |
| Exercised | | | (4,455,481 | ) | | | Nil | | | | (6,854,043 | ) | | | Nil | |
| Vested | | | (69,005 | ) | | | Nil | | | | (148,109 | ) | | | Nil | |
| Forfeited | | | (39,250 | ) | | | Nil | | | | (662,985 | ) | | | Nil | |
| Lapsed | | | (400,825 | ) | | | Nil | | | | (510,423 | ) | | | Nil | |
| Outstanding at 31 December | | | 7,634,638 | | | | Nil | | | | 10,263,028 | | | | Nil | |
| Exercisable at 31 December | | | 2,683,267 | | | | Nil | | | | 3,305,442 | | | | Nil | |
The weighted average fair value of options granted in the year was £0.59 (2018: £0.55). The fair values of options granted have been determined using a standard Black-Scholes model. The weighted average share price at the time that the options were exercised during 2019 was £0.60 (2018: £0.65). The weighted average remaining contractual life of options outstanding at the end of the year was 3.8 years (2018: 5.2 years).
NOTES TO THE CONSOLIDATED FINANCIAL STATEMENTS
NOTE 46: SHARE-BASED PAYMENTS continued
Other share plans
LLOYDS BANKING GROUP EXECUTIVE SHARE OWNERSHIP PLAN
The plan, introduced in 2006, is aimed at delivering shareholder value by linking the receipt of shares to an improvement in the performance of the Group over a three year period. Awards are made within limits set by the rules of the plan, with the limits determining the maximum number of shares that can be awarded equating to three times annual salary. In exceptional circumstances this may increase to four times annual salary.
At the end of the performance period for the 2016 grant, the targets had not been fully met and therefore these awards vested in 2019 at a rate of 68.7 per cent.
| | | 2019 | | | 2018 | |
| | | Number of | | | Number of | |
| | | shares | | | shares | |
| Outstanding at 1 January | | | 417,385,636 | | | | 370,804,915 | |
| Granted | | | 174,490,843 | | | | 160,586,201 | |
| Vested | | | (88,318,950 | ) | | | (73,270,301 | ) |
| Forfeited | | | (55,029,439 | ) | | | (48,108,870 | ) |
| Dividend award | | | 11,376,655 | | | | 7,373,691 | |
| Outstanding at 31 December | | | 459,904,745 | | | | 417,385,636 | |
Awards in respect of the 2017 grant vested in 2020 at a rate of 49.7 per cent. For the 2017 grant, participants are entitled to any dividends paid during the vesting period. An amount equal in value to any dividends paid between the award date and the date the Remuneration Committee determine that the performance conditions were met, will be paid, based on the number of shares that vest. The Remuneration Committee can determine if any dividends are to be paid in cash or in shares. Details of the performance conditions for the plan are provided in Compensation.
The weighted average fair value of awards granted in the year was £0.45 (2018: £0.48).
CFO BUYOUT
William Chalmers joined the Group on 3 June 2019 and was appointed as Chief Financial Officer on 1 August 2019 on the retirement of George Culmer. He was granted deferred share awards over 4,086,632 shares, to replace unvested awards from his former employer, Morgan Stanley, that were forfeited as a result of him joining the Group.
| | | 2019 | |
| | | Number of | |
| | | shares | |
| Outstanding at 1 January | | – | |
| Granted | | | 4,086,632 | |
| Exercised | | | (818,172 | ) |
| Outstanding at 31 December | | | 3,268,460 | |
The weighted average fair value of awards granted in the year was £0.55.
The fair value calculations at 31 December 2019 for grants made in the year, using Black-Scholes models and Monte Carlo simulation, are based on the following assumptions:
| | | | | | Executive | | | | | | | |
| | | | | | Share Plan | | | | | | | |
| | | Save-As-You-Earn | | | 2003 | | | LTIP | | | CFO Buyout | |
| Weighted average risk-free interest rate | | | 0.36% | | | | 0.62% | | | | 0.83% | | | | 0.64% | |
| Weighted average expected life | | | 3.2 years | | | | 1.3 years | | | | 3.7 years | | | | 1.4 years | |
| Weighted average expected volatility | | | 20% | | | | 23% | | | | 27% | | | | 19% | |
| Weighted average expected dividend yield | | | 4.0% | | | | 4.0% | | | | 4.0% | | | | 4.0% | |
| Weighted average share price | | | £0.53 | | | | £0.62 | | | | £0.63 | | | | £0.58 | |
| Weighted average exercise price | | | £0.40 | | | | Nil | | | | Nil | | | | Nil | |
Expected volatility is a measure of the amount by which the Group’s shares are expected to fluctuate during the life of an option. The expected volatility is estimated based on the historical volatility of the closing daily share price over the most recent period that is commensurate with the expected life of the option. The historical volatility is compared to the implied volatility generated from market traded options in the Group’s shares to assess the reasonableness of the historical volatility and adjustments made where appropriate.
Share Incentive Plan
FREE SHARES
An award of shares may be made annually to employees up to a maximum of £3,600. The shares awarded are held in trust for a mandatory period of three years on the employee’s behalf, during which period the employee is entitled to any dividends paid on such shares. The award is subject to a non-market based condition. If an employee leaves the Group within this three year period for other than a ‘good’ reason, all of the shares awarded will be forfeited.
On 9 May 2019, the Group made an award of £200 (2018: £200) of shares to all eligible employees. The number of shares awarded was 22,422,337 (2018: 21,513,300), with an average fair value of £0.62 (2018: £0.67) based on the market price at the date of award.
NOTES TO THE CONSOLIDATED FINANCIAL STATEMENTS
NOTE 46: SHARE-BASED PAYMENTS continued
MATCHING SHARES
The Group undertakes to match shares purchased by employees up to the value of £45 per month; these matching shares are held in trust for a mandatory period of three years on the employee’s behalf, during which period the employee is entitled to any dividends paid on such shares. The award is subject to a non-market based condition: if an employee leaves within this three year period for other than a ‘good’ reason, all of the matching shares are forfeited. Similarly if the employees sell their purchased shares within three years, their matching shares are forfeited.
The number of shares awarded relating to matching shares in 2019 was 37,346,812 (2018: 34,174,161), with an average fair value of £0.56 (2018: £0.63), based on market prices at the date of award.
Fixed share awards
Fixed share awards were introduced in 2014 in order to ensure that total fixed remuneration is commensurate with role and to provide a competitive reward package for certain Lloyds Banking Group employees, with an appropriate balance of fixed and variable remuneration, in line with regulatory requirements. The fixed share awards are delivered in Lloyds Banking Group shares, released over five years with 20 per cent being released each year following the year of award. The number of shares purchased in 2019 was 8,239,332 (2018: 8,965,562).
The fixed share award is not subject to any performance conditions, performance adjustment or clawback. On an employee leaving the Group, there is no change to the timeline for which shares will become unrestricted.
NOTE 47: RELATED PARTY TRANSACTIONS
Key management personnel
Key management personnel are those persons having authority and responsibility for planning, directing and controlling the activities of an entity; the Group’s key management personnel are the members of the Lloyds Banking Group plc Group Executive Committee together with its Non-Executive Directors.
The table below details, on an aggregated basis, key management personnel compensation:
| | | 2019 | | | 2018 | | | 2017 | |
| | | £m | | | £m | | | £m | |
| Compensation | | | | | | | | | |
| Salaries and other short-term benefits | | | 15 | | | | 14 | | | | 13 | |
| Post-employment benefits | | | – | | | | – | | | | – | |
| Share-based payments | | | 15 | | | | 18 | | | | 22 | |
| Total compensation | | | 30 | | | | 32 | | | | 35 | |
Aggregate contributions in respect of key management personnel to defined contribution pension schemes were £nil (2018: £nil; 2017: £0.05 million).
| | | 2019 | | | 2018 | | | 2017 | |
| | | million | | | million | | | million | |
| Share option plans | | | | | | | | | |
| At 1 January | | | – | | | | 1 | | | | 3 | |
| Granted, including certain adjustments (includes entitlements of appointed key management personnel) | | | – | | | | – | | | | – | |
| Exercised/lapsed (includes entitlements of former key management personnel) | | | – | | | | (1 | ) | | | (2 | ) |
| At 31 December | | | – | | | | – | | | | 1 | |
| | | 2019
million | | | 2018
million | | | 2017
million | |
| Share plans | | | | | | | | | |
| At 1 January | | | 84 | | | | 82 | | | | 65 | |
| Granted, including certain adjustments (includes entitlements of appointed key management personnel) | | | (46 | ) | | | 39 | | | | 37 | |
| Exercised/lapsed (includes entitlements of former key management personnel) | | | (29 | ) | | | (37 | ) | | | (20 | ) |
| At 31 December | | | 101 | | | | 84 | | | | 82 | |
The tables below detail, on an aggregated basis, balances outstanding at the year end and related income and expense, together with information relating to other transactions between the Group and its key management personnel:
| | | 2019
£m | | | 2018
£m | | | 2017
£m | |
| Loans | | | | | | | | | |
| At 1 January | | | 2 | | | | 2 | | | | 4 | |
| Advanced (includes loans of appointed key management personnel) | | | 1 | | | | 1 | | | | 1 | |
| Repayments (includes loans of former key management personnel) | | | (1 | ) | | | (1 | ) | | | (3 | ) |
| At 31 December | | | 2 | | | | 2 | | | | 2 | |
The loans are on both a secured and unsecured basis and are expected to be settled in cash. The loans attracted interest rates of between 6.45 per cent and 24.20 per cent in 2019 (2018: 6.70 per cent and 24.20 per cent; 2017: 6.45 per cent and 23.95 per cent).
NOTES TO THE CONSOLIDATED FINANCIAL STATEMENTS
NOTE 47: RELATED PARTY TRANSACTIONS continued
No provisions have been recognised in respect of loans given to key management personnel (2018 and 2017: £nil).
| | | 2019
£m | | | 2018
£m | | | 2017
£m | |
| Deposits | | | | | | | | | |
| At 1 January | | | 20 | | | | 20 | | | | 12 | |
| Placed (includes deposits of appointed key management personnel) | | | 44 | | | | 33 | | | | 41 | |
| Withdrawn (includes deposits of former key management personnel) | | | (41 | ) | | | (33 | ) | | | (33 | ) |
| At 31 December | | | 23 | | | | 20 | | | | 20 | |
Deposits placed by key management personnel attracted interest rates of up to 3.0 per cent (2018: 3.5 per cent; 2017: 4.0 per cent).
At 31 December 2019, the Group did not provide any guarantees in respect of key management personnel (2018 and 2017: none).
At 31 December 2019, transactions, arrangements and agreements entered into by the Group’s banking subsidiaries with directors and connected persons included amounts outstanding in respect of loans and credit card transactions of £0.6 million with four directors and two connected persons (2018: £0.5 million with three directors and three connected persons; 2017: £0.01 million with three directors and two connected persons).
Subsidiaries
In accordance with IFRS 10 Consolidated financial statements, transactions and balances with subsidiaries have been eliminated on consolidation.
Pension funds
The Group provides banking and some investment management services to certain of its pension funds. At 31 December 2019, customer deposits of £169 million (2018: £225 million) and investment and insurance contract liabilities of £127 million (2018: £79 million) related to the Group’s pension funds.
Collective investment vehicles
The Group manages 141 (2018: 131) collective investment vehicles, such as Open Ended Investment Companies (OEICs) and of these 75 (2018: 82) are consolidated. The Group invested £804 million (2018: £620 million) and redeemed £1,771 million (2018: £404 million) in the unconsolidated collective investment vehicles during the year and had investments, at fair value, of £3,417 million (2018: £2,513 million) at 31 December. The Group earned fees of £127 million from the unconsolidated collective investment vehicles during 2019 (2018: £128 million).
Joint ventures and associates
At 31 December 2019 there were loans and advances to customers of £75 million (2018: £57 million) outstanding and balances within customer deposits of £5 million (2018: £2 million) relating to joint ventures and associates.
In addition to the above balances, the Group has a number of other associates held by its venture capital business that it accounts for at fair value through profit or loss. At 31 December 2019, these companies had total assets of approximately £4,761 million (2018: £4,091 million), total liabilities of approximately £5,322 million (2018: £4,616 million) and for the year ended 31 December 2019 had turnover of approximately £4,286 million (2018: £4,522 million) and made a loss of approximately £190 million (2018: net loss of £125 million). In addition, the Group has provided £1,266 million (2018: £1,141 million) of financing to these companies on which it received £86 million (2018: £49 million) of interest income in the year.
As discussed in note 23, in October 2019, the Group established a wealth management joint venture with Schroders. The Group subsequently transferred approximately £12 billion of managed assets at fair value.
NOTE 48: CONTINGENT LIABILITIES, COMMITMENTS AND GUARANTEES
Interchange fees
With respect to multi-lateral interchange fees (MIFs), the Group is not involved in the ongoing litigation (as described below) which involves card schemes such as Visa and Mastercard. However, the Group is a member/licensee of Visa and Mastercard and other card schemes. The litigation in question is as follows:
| – | litigation brought by retailers against both Visa and Mastercard continues in the English Courts (and includes appeals heard by the Supreme Court, judgment awaited); and |
| | |
| – | litigation brought on behalf of UK consumers in the English Courts against Mastercard. |
Any impact on the Group of the litigation against Visa and Mastercard remains uncertain at this time. Insofar as Visa is required to pay damages to retailers for interchange fees set prior to June 2016, contractual arrangements to allocate liability have been agreed between various UK banks (including the Group) and Visa Inc, as part of Visa Inc’s acquisition of Visa Europe in 2016. These arrangements cap the maximum amount of liability to which the Group may be subject, and this cap is set at the cash consideration received by the Group for the sale of its stake in Visa Europe to Visa Inc in 2016.
LIBOR and other trading rates
In July 2014, the Group announced that it had reached settlements totalling £217 million (at 30 June 2014 exchange rates) to resolve with UK and US federal authorities legacy issues regarding the manipulation several years ago of Group companies’ submissions to the British Bankers’ Association (BBA) London Interbank Offered Rate (LIBOR) and Sterling Repo Rate. The Swiss Competition Commission concluded its investigation against Lloyds Bank plc in June 2019. The Group continues to cooperate with various other government and regulatory authorities, including a number of US State Attorneys General, in conjunction with their investigations into submissions made by panel members to the bodies that set LIBOR and various other interbank offered rates.
Certain Group companies, together with other panel banks, have also been named as defendants in private lawsuits, including purported class action suits, in the US in connection with their roles as panel banks contributing to the setting of US Dollar, Japanese Yen and Sterling LIBOR and the Australian BBSW Reference Rate. Certain of the plaintiffs’ claims have been dismissed by the US Federal Court for Southern District of New York (subject to appeals).
NOTES TO THE CONSOLIDATED FINANCIAL STATEMENTS
NOTE 48: CONTINGENT LIABILITIES, COMMITMENTS AND GUARANTEES continued
Certain Group companies are also named as defendants in (i) UK based claims; and (ii) two Dutch class actions, raising LIBOR manipulation allegations. A number of the claims against the Group in relation to the alleged mis-sale of interest rate hedging products also include allegations of LIBOR manipulation.
It is currently not possible to predict the scope and ultimate outcome on the Group of the various outstanding regulatory investigations not encompassed by the settlements, any private lawsuits or any related challenges to the interpretation or validity of any of the Group’s contractual arrangements, including their timing and scale.
UK shareholder litigation
In August 2014, the Group and a number of former directors were named as defendants in a claim by a number of claimants who held shares in Lloyds TSB Group plc (LTSB) prior to the acquisition of HBOS plc, alleging breaches of duties in relation to information provided to shareholders in connection with the acquisition and the recapitalisation of LTSB. Judgment was delivered on 15 November 2019. The Group and former directors successfully defended the claims. The claimants have sought permission to appeal. It is currently not possible to determine the ultimate impact on the Group (if any).
Tax authorities
The Group has an open matter in relation to a claim for group relief of losses incurred in its former Irish banking subsidiary, which ceased trading on 31 December 2010. In 2013 HMRC informed the Group that their interpretation of the UK rules which allow the offset of such losses denies the claim for group relief of losses. If HMRC’s position is found to be correct, management estimate that this would result in an increase in current tax liabilities of approximately £800 million (including interest) and a reduction in the Group’s deferred tax asset of approximately £250 million. The Group does not agree with HMRC’s position and, having taken appropriate advice, does not consider that this is a case where additional tax will ultimately fall due. There are a number of other open matters on which the Group is in discussion with HMRC (including the tax treatment of certain costs arising from the divestment of TSB Banking Group plc), none of which is expected to have a material impact on the financial position of the Group.
Mortgage arrears handling activities – FCA investigation
On 26 May 2016, the Group was informed that an enforcement team at the FCA had commenced an investigation in connection with the Group’s mortgage arrears handling activities. It is not currently possible to make a reliable assessment of any liability resulting from the investigation including any financial penalty.
Other legal actions and regulatory matters
In addition, during the ordinary course of business the Group is subject to other complaints and threatened or actual legal proceedings (including class or group action claims) brought by or on behalf of current or former employees, customers, investors or other third parties, as well as legal and regulatory reviews, challenges, investigations and enforcement actions, both in the UK and overseas. All such material matters are periodically reassessed, with the assistance of external professional advisers where appropriate, to determine the likelihood of the Group incurring a liability. In those instances where it is concluded that it is more likely than not that a payment will be made, a provision is established to management’s best estimate of the amount required at the relevant balance sheet date. In some cases it will not be possible to form a view, for example because the facts are unclear or because further time is needed properly to assess the merits of the case, and no provisions are held in relation to such matters. In these circumstances, specific disclosure in relation to a contingent liability will be made where material. However the Group does not currently expect the final outcome of any such case to have a material adverse effect on its financial position, operations or cash flows.
Contingent liabilities, commitments and guarantees arising from the banking business
| | | 2019
£m | | | 2018
£m | |
| Contingent liabilities | | | | | | |
| Acceptances and endorsements | | | 74 | | | | 194 | |
| Other: | | | | | | | | |
| Other items serving as direct credit substitutes | | | 366 | | | | 632 | |
| Performance bonds and other transaction-related contingencies | | | 2,454 | | | | 2,425 | |
| | | | 2,820 | | | | 3,057 | |
| Total contingent liabilities | | | 2,894 | | | | 3,251 | |
The contingent liabilities of the Group arise in the normal course of its banking business and it is not practicable to quantify their future financial effect.
| | | 2019
£m | | | 2018
£m | |
| Commitments and guarantees | | | | | | |
| Documentary credits and other short-term trade-related transactions | | | – | | | | 1 | |
| Forward asset purchases and forward deposits placed | | | 189 | | | | 731 | |
| Undrawn formal standby facilities, credit lines and other commitments to lend: | | | | | | | | |
| Less than 1 year original maturity: | | | | | | | | |
| Mortgage offers made | | | 12,684 | | | | 11,594 | |
| Other commitments and guarantees | | | 85,735 | | | | 85,060 | |
| | | | 98,419 | | | | 96,654 | |
| 1 year or over original maturity | | | 34,945 | | | | 37,712 | |
| Total commitments and guarantees | | | 133,553 | | | | 135,098 | |
Of the amounts shown above in respect of undrawn formal standby facilities, credit lines and other commitments to lend, £63,504 million (2018: £64,884 million) was irrevocable.
NOTES TO THE CONSOLIDATED FINANCIAL STATEMENTS
NOTE 48: CONTINGENT LIABILITIES, COMMITMENTS AND GUARANTEES continued
Capital commitments
Excluding commitments in respect of investment property (note 27), capital expenditure contracted but not provided for at 31 December 2019 amounted to £405 million (2018: £378 million). Of this amount, £400 million (2018: £369 million) related to assets to be leased to customers under operating leases. The Group’s management is confident that future net revenues and funding will be sufficient to cover these commitments.
NOTE 49: STRUCTURED ENTITIES
The Group’s interests in structured entities are both consolidated and unconsolidated. Detail of the Group’s interests in consolidated structured entities are set out in: note 31 for securitisations and covered bond vehicles, note 36 for structured entities associated with the Group’s pension schemes, and below in part (A) and (B). Details of the Group’s interests in unconsolidated structured entities are included below in part (C).
(A) Asset-backed conduits
In addition to the structured entities discussed in note 31, which are used for securitisation and covered bond programmes, the Group sponsors an active asset-backed conduit, Cancara, which invests in client receivables and debt securities. The total consolidated exposure of Cancara at 31 December 2019 was £3,735 million (2018: £5,122 million), comprising £3,670 million of loans and advances (2018: £5,012 million) and £65 million of debt securities (2018: £110 million).
All lending assets and debt securities held by the Group in Cancara are restricted in use, as they are held by the collateral agent for the benefit of the commercial paper investors and the liquidity providers only. The Group provides liquidity facilities to Cancara under terms that are usual and customary for standard lending activities in the normal course of the Group’s banking activities. During 2019 there have continued to be planned drawdowns on certain liquidity facilities for balance sheet management purposes, supporting the programme to provide funding alongside the proceeds of the asset-backed commercial paper issuance. The Group could be asked to provide support under the contractual terms of these arrangements including, for example, if Cancara experienced a shortfall in external funding, which may occur in the event of market disruption.
The external assets in Cancara are consolidated in the Group’s financial statements.
(B) Consolidated collective investment vehicles and limited partnerships
The assets of the Insurance business held in consolidated collective investment vehicles, such as Open-Ended Investment Companies and limited partnerships, are not directly available for use by the Group. However, the Group’s investment in the majority of these collective investment vehicles is readily realisable. As at 31 December 2019, the total carrying value of these consolidated collective investment vehicle assets and liabilities held by the Group was £68,724 million (2018: £62,648 million).
The Group has no contractual arrangements (such as liquidity facilities) that would require it to provide financial or other support to the consolidated collective investment vehicles; the Group has not previously provided such support and has no current intentions to provide such support.
(C) Unconsolidated collective investment vehicles and limited partnerships
The Group’s direct interests in unconsolidated structured entities comprise investments in collective investment vehicles, such as Open-Ended Investment Companies, and limited partnerships with a total carrying value of £38,177 million at 31 December 2019 (2018: £26,028 million), included within financial assets designated at fair value through profit and loss (see note 16). These investments include both those entities managed by third parties and those managed by the Group. At 31 December 2019, the total asset value of these unconsolidated structured entities, including the portion in which the Group has no interest, was £2,363 billion (2018: £2,435 billion).
Given the nature of these investments, the Group’s maximum exposure to loss is equal to the carrying value of the investment. However, the Group’s investments in these entities are primarily held to match policyholder liabilities in the Insurance division and the majority of the risk from a change in the value of the Group’s investment is matched by a change in policyholder liabilities. The collective investment vehicles are primarily financed by investments from investors in the vehicles.
During the year the Group has not provided any non-contractual financial or other support to these entities and has no current intention of providing any financial or other support. There were no transfers from/to these unconsolidated collective investment vehicles and limited partnerships.
The Group considers itself the sponsor of a structured entity where it is primarily involved in the design and establishment of the structured entity; and further where the Group transfers assets to the structured entity; market products associated with the structured entity in its own name and/or provide guarantees regarding the structured entity’s performance.
The Group sponsors a range of diverse investment funds and limited partnerships where it acts as the fund manager or equivalent decision maker and markets the funds under one of the Group’s brands.
The Group earns fees from managing the investments of these funds. The investment management fees that the Group earned from these entities, including those in which the Group held no ownership interest at 31 December 2019, are reported in note 6.
NOTES TO THE CONSOLIDATED FINANCIAL STATEMENTS
NOTE 50: FINANCIAL INSTRUMENTS
(1) Measurement basis of financial assets and liabilities
The accounting policies in note 2 describe how different classes of financial instruments are measured, and how income and expenses, including fair value gains and losses, are recognised. The following table analyses the carrying amounts of the financial assets and liabilities by category and by balance sheet heading.
| | | | | | Mandatorily held at fair value
through profit or loss | | | | | | | | | | | | | | | | |
| | | Derivatives
designated
as hedging
instruments
£m | | | Held for
trading
£m | | | Other
£m | | | Designated at
fair value
through profit
or loss
£m | | | At fair value
through other
comprehensive
income
£m | | | Held at
amortised
cost
£m | | | Insurance
contracts
£m | | | Total
£m | |
| At 31 December 2019 | | | | | | | | | | | | | | | | | | | | | | | | | | | | | | | | |
| Financial assets | | | | | | | | | | | | | | | | | | | | | | | | | | | | | | | | |
| Cash and balances at central banks | | | – | | | | – | | | | – | | | | – | | | | – | | | | 55,130 | | | | – | | | | 55,130 | |
| Items in the course of collection from banks | | | – | | | | – | | | | – | | | | – | | | | – | | | | 313 | | | | – | | | | 313 | |
| Financial assets at fair value through profit or loss | | | – | | | | 17,982 | | | | 142,207 | | | | – | | | | – | | | | – | | | | – | | | | 160,189 | |
| Derivative financial instruments | | | 1,236 | | | | 25,133 | | | | – | | | | – | | | | – | | | | – | | | | – | | | | 26,369 | |
| Loans and advances to banks | | | – | | | | – | | | | – | | | | – | | | | – | | | | 9,775 | | | | – | | | | 9,775 | |
| Loans and advances to customers | | | – | | | | – | | | | – | | | | – | | | | – | | | | 494,988 | | | | – | | | | 494,988 | |
| Debt securities | | | – | | | | – | | | | – | | | | – | | | | – | | | | 5,544 | | | | – | | | | 5,544 | |
| Financial assets at amortised cost | | | – | | | | – | | | | – | | | | – | | | | – | | | | 510,307 | | | | – | | | | 510,307 | |
| Financial assets at fair value through other comprehensive income | | | – | | | | – | | | | – | | | | – | | | | 25,092 | | | | – | | | | – | | | | 25,092 | |
| Assets arising from reinsurance contracts held | | | – | | | | – | | | | – | | | | – | | | | – | | | | – | | | | 23,567 | | | | 23,567 | |
| Total financial assets | | | 1,236 | | | | 43,115 | | | | 142,207 | | | | – | | | | 25,092 | | | | 565,750 | | | | 23,567 | | | | 800,967 | |
| Financial liabilities | | | | | | | | | | | | | | | | | | | | | | | | | | | | | | | | |
| Deposits from banks | | | – | | | | – | | | | – | | | | – | | | | – | | | | 28,179 | | | | – | | | | 28,179 | |
| Customer deposits | | | – | | | | – | | | | – | | | | – | | | | – | | | | 421,320 | | | | – | | | | 421,320 | |
| Items in course of transmission to banks | | | – | | | | – | | | | – | | | | – | | | | – | | | | 373 | | | | – | | | | 373 | |
| Financial liabilities at fair value through profit or loss | | | – | | | | 13,955 | | | | – | | | | 7,531 | | | | – | | | | – | | | | – | | | | 21,486 | |
| Derivative financial instruments | | | 1,105 | | | | 24,674 | | | | – | | | | – | | | | – | | | | – | | | | – | | | | 25,779 | |
| Notes in circulation | | | – | | | | – | �� | | | – | | | | – | | | | – | | | | 1,079 | | | | – | | | | 1,079 | |
| Debt securities in issue | | | – | | | | – | | | | – | | | | – | | | | – | | | | 97,689 | | | | – | | | | 97,689 | |
| Liabilities arising from insurance contracts and participating investment contracts | | | – | | | | – | | | | – | | | | – | | | | – | | | | – | | | | 111,449 | | | | 111,449 | |
| Liabilities arising from non-participating investment contracts | | | – | | | | – | | | | – | | | | – | | | | – | | | | – | | | | 37,459 | | | | 37,459 | |
| Other | | | – | | | | – | | | | – | | | | – | | | | – | | | | 1,844 | | | | 400 | | | | 2,244 | |
| Subordinated liabilities | | | – | | | | – | | | | – | | | | – | | | | – | | | | 17,130 | | | | – | | | | 17,130 | |
| Total financial liabilities | | | 1,105 | | | | 38,629 | | | | – | | | | 7,531 | | | | – | | | | 567,614 | | | | 149,308 | | | | 764,187 | |
NOTES TO THE CONSOLIDATED FINANCIAL STATEMENTS
NOTE 50: FINANCIAL INSTRUMENTS continued
| | | | | | Mandatorily held at fair value
through profit or loss | | | | | | | | | | | | | | | | |
| | | Derivatives
designated
as hedging
instruments
£m | | | Held for
trading
£m | | | Other
£m | | | Designated at
fair value
through profit or
loss
£m | | | At fair value
through other
comprehensive
income
£m | | | Held at
amortised
cost
£m | | | Insurance
contracts
£m | | | Total
£m | |
| At 31 December 2018 | | | | | | | | | | | | | | | | | | | | | | | | | | | | | | | | |
| Financial assets | | | | | | | | | | | | | | | | | | | | | | | | | | | | | | | | |
| Cash and balances at central banks | | | – | | | | – | | | | – | | | | – | | | | – | | | | 54,663 | | | | – | | | | 54,663 | |
| Items in the course of collection from banks | | | – | | | | – | | | | – | | | | – | | | | – | | | | 647 | | | | – | | | | 647 | |
| Financial assets at fair value through profit or loss | | | – | | | | 35,246 | | | | 123,283 | | | | – | | | | – | | | | – | | | | – | | | | 158,529 | |
| Derivative financial instruments | | | 1,563 | | | | 22,032 | | | | – | | | | – | | | | – | | | | – | | | | – | | | | 23,595 | |
| Loans and advances to banks | | | – | | | | – | | | | – | | | | – | | | | – | | | | 6,283 | | | | – | | | | 6,283 | |
| Loans and advances to customers | | | – | | | | – | | | | – | | | | – | | | | – | | | | 484,858 | | | | – | | | | 484,858 | |
| Debt securities | | | – | | | | – | | | | – | | | | – | | | | – | | | | 5,238 | | | | – | | | | 5,238 | |
| Financial assets at amortised cost | | | – | | | | – | | | | – | | | | – | | | | – | | | | 496,379 | | | | – | | | | 496,379 | |
| Financial assets at fair value through other comprehensive income | | | – | | | | – | | | | – | | | | – | | | | 24,815 | | | | – | | | | – | | | | 24,815 | |
| Assets arising from reinsurance contracts held | | | – | | | | – | | | | – | | | | – | | | | – | | | | – | | | | 7,860 | | | | 7,860 | |
| Total financial assets | | | 1,563 | | | | 57,278 | | | | 123,283 | | | | – | | | | 24,815 | | | | 551,689 | | | | 7,860 | | | | 766,488 | |
| Financial liabilities | | | | | | | | | | | | | | | | | | | | | | | | | | | | | | | | |
| Deposits from banks | | | – | | | | – | | | | – | | | | – | | | | – | | | | 30,320 | | | | – | | | | 30,320 | |
| Customer deposits | | | – | | | | – | | | | – | | | | – | | | | – | | | | 418,066 | | | | – | | | | 418,066 | |
| Items in course of transmission to banks | | | – | | | | – | | | | – | | | | – | | | | – | | | | 636 | | | | – | | | | 636 | |
| Financial liabilities at fair value through profit or loss | | | – | | | | 23,451 | | | | – | | | | 7,096 | | | | – | | | | – | | | | – | | | | 30,547 | |
| Derivative financial instruments | | | 1,108 | | | | 20,265 | | | | – | | | | – | | | | – | | | | – | | | | – | | | | 21,373 | |
| Notes in circulation | | | – | | | | – | | | | – | | | | – | | | | – | | | | 1,104 | | | | – | | | | 1,104 | |
| Debt securities in issue | | | – | | | | – | | | | – | | | | – | | | | – | | | | 91,168 | | | | – | | | | 91,168 | |
| Liabilities arising from insurance contracts and participating investment contracts | | | – | | | | – | | | | – | | | | – | | | | – | | | | – | | | | 98,874 | | | | 98,874 | |
| Liabilities arising from non-participating investment contracts | | | – | | | | – | | | | – | | | | – | | | | – | | | | – | | | | 13,853 | | | | 13,853 | |
| Other | | | – | | | | – | | | | – | | | | – | | | | – | | | | 46 | | | | 382 | | | | 428 | |
| Subordinated liabilities | | | – | | | | – | | | | – | | | | – | | | | – | | | | 17,656 | | | | – | | | | 17,656 | |
| Total financial liabilities | | | 1,108 | | | | 43,716 | | | | – | | | | 7,096 | | | | – | | | | 558,996 | | | | 113,109 | | | | 724,025 | |
NOTES TO THE CONSOLIDATED FINANCIAL STATEMENTS
NOTE 50: FINANCIAL INSTRUMENTS continued
(2) Fair value measurement
Fair value is the price that would be received to sell an asset or paid to transfer a liability in an orderly transaction between market participants at the measurement date. It is a measure as at a specific date and may be significantly different from the amount which will actually be paid or received on maturity or settlement date.
Wherever possible, fair values have been calculated using unadjusted quoted market prices in active markets for identical instruments held by the Group. Where quoted market prices are not available, or are unreliable because of poor liquidity, fair values have been determined using valuation techniques which, to the extent possible, use market observable inputs, but in some cases use non-market observable inputs. Valuation techniques used include discounted cash flow analysis and pricing models and, where appropriate, comparison to instruments with characteristics similar to those of the instruments held by the Group. The Group measures valuation adjustments for its derivative exposures on the same basis as the derivatives are managed.
The carrying amount of the following financial instruments is a reasonable approximation of fair value: cash and balances at central banks, items in the course of collection from banks, assets arising from reinsurance contracts held, items in course of transmission to banks, notes in circulation and liabilities arising from non-participating investment contracts.
Because a variety of estimation techniques are employed and significant estimates made, comparisons of fair values between financial institutions may not be meaningful. Readers of these financial statements are thus advised to use caution when using this data to evaluate the Group’s financial position.
Fair value information is not provided for items that are not financial instruments or for other assets and liabilities which are not carried at fair value in the Group’s consolidated balance sheet. These items include intangible assets, such as the value of the Group’s branch network, the long-term relationships with depositors and credit card relationships; premises and equipment; and shareholders’ equity. These items are material and accordingly the Group believes that the fair value information presented does not represent the underlying value of the Group.
VALUATION CONTROL FRAMEWORK
The key elements of the control framework for the valuation of financial instruments include model validation, product implementation review and independent price verification. These functions are carried out by appropriately skilled risk and finance teams, independent of the business area responsible for the products.
Model validation covers both qualitative and quantitative elements relating to new models. In respect of new products, a product implementation review is conducted pre- and post-trading. Pre-trade testing ensures that the new model is integrated into the Group’s systems and that the profit and loss and risk reporting are consistent throughout the trade life cycle. Post-trade testing examines the explanatory power of the implemented model, actively monitoring model parameters and comparing in-house pricing to external sources. Independent price verification procedures cover financial instruments carried at fair value. The frequency of the review is matched to the availability of independent data, monthly being the minimum. Valuation differences in breach of established thresholds are escalated to senior management. The results from independent pricing and valuation reserves are reviewed monthly by senior management.
Formal committees, consisting of senior risk, finance and business management, meet at least quarterly to discuss and approve valuations in more judgemental areas, in particular for unquoted equities, structured credit, over-the-counter options and the Credit Valuation Adjustment (CVA) reserve.
VALUATION OF FINANCIAL ASSETS AND LIABILITIES
Assets and liabilities carried at fair value or for which fair values are disclosed have been classified into three levels according to the quality and reliability of information used to determine the fair values.
LEVEL 1
Level 1 fair value measurements are those derived from unadjusted quoted prices in active markets for identical assets or liabilities. Products classified as level 1 predominantly comprise equity shares, treasury bills and other government securities.
LEVEL 2
Level 2 valuations are those where quoted market prices are not available, for example where the instrument is traded in a market that is not considered to be active or valuation techniques are used to determine fair value and where these techniques use inputs that are based significantly on observable market data. Examples of such financial instruments include most over-the-counter derivatives, financial institution issued securities, certificates of deposit and certain asset-backed securities.
LEVEL 3
Level 3 portfolios are those where at least one input which could have a significant effect on the instrument’s valuation is not based on observable market data. Such instruments would include the Group’s venture capital and unlisted equity investments which are valued using various valuation techniques that require significant management judgement in determining appropriate assumptions, including earnings multiples and estimated future cash flows. Certain of the Group’s asset-backed securities and derivatives, principally where there is no trading activity in such securities, are also classified as level 3.
Transfers out of the level 3 portfolio arise when inputs that could have a significant impact on the instrument’s valuation become market observable after previously having been non-market observable. In the case of asset-backed securities this can arise if more than one consistent independent source of data becomes available. Conversely transfers into the portfolio arise when consistent sources of data cease to be available.
NOTES TO THE CONSOLIDATED FINANCIAL STATEMENTS
NOTE 50: FINANCIAL INSTRUMENTS continued
(3) Financial assets and liabilities carried at fair value
(A) FINANCIAL ASSETS, EXCLUDING DERIVATIVES
VALUATION HIERARCHY
At 31 December 2019, the Group’s financial assets carried at fair value, excluding derivatives, totalled £185,281 million (31 December 2018: £183,344 million). The table below analyses these financial assets by balance sheet classification, asset type and valuation methodology (level 1, 2 or 3, as described on page F-85). The fair value measurement approach is recurring in nature. There were no significant transfers between level 1 and 2 during the year.
Valuation hierarchy
| | | Level 1 | | | Level 2 | | | Level 3 | | | Total | |
| | | £m | | | £m | | | £m | | | £m | |
| At 31 December 2019 | | | | | | | | | | | | |
| Financial assets at fair value through profit or loss | | | | | | | | | | | | | | | | |
| Loans and advances to customers | | | – | | | | 10,164 | | | | 10,912 | | | | 21,076 | |
| Loans and advances to banks | | | 18 | | | | 2,381 | | | | – | | | | 2,399 | |
| Debt securities: | | | | | | | | | | | | | | | | |
| Government securities | | | 18,618 | | | | 236 | | | | – | | | | 18,854 | |
| Other public sector securities | | | – | | | | 2,071 | | | | 55 | | | | 2,126 | |
| Bank and building society certificates of deposit | | | 52 | | | | 932 | | | | – | | | | 984 | |
| Asset-backed securities: | | | | | | | | | | | | | | | | |
| Mortgage-backed securities | | | – | | | | 468 | | | | – | | | | 468 | |
| Other asset-backed securities | | | – | | | | 158 | | | | 100 | | | | 258 | |
| Corporate and other debt securities | | | – | | | | 16,381 | | | | 1,835 | | | | 18,216 | |
| | | | 18,670 | | | | 20,246 | | | | 1,990 | | | | 40,906 | |
| Treasury and other bills | | | 19 | | | | – | | | | – | | | | 19 | |
| Equity shares | | | 93,766 | | | | 17 | | | | 2,006 | | | | 95,789 | |
| Total financial assets at fair value through profit or loss | | | 112,473 | | | | 32,808 | | | | 14,908 | | | | 160,189 | |
| Financial assets at fair value through other comprehensive income | | | | | | | | | | | | | | | | |
| Debt securities: | | | | | | | | | | | | | | | | |
| Government securities | | | 12,860 | | | | 238 | | | | – | | | | 13,098 | |
| Bank and building society certificates of deposit | | | – | | | | – | | | | – | | | | – | |
| Asset-backed securities: | | | | | | | | | | | | | | | | |
| Mortgage-backed securities | | | – | | | | – | | | | 121 | | | | 121 | |
| Other asset-backed securities | | | – | | | | – | | | | 60 | | | | 60 | |
| Corporate and other debt securities | | | 16 | | | | 11,035 | | | | – | | | | 11,051 | |
| | | | 12,876 | | | | 11,273 | | | | 181 | | | | 24,330 | |
| Treasury and other bills | | | 535 | | | | – | | | | – | | | | 535 | |
| Equity shares | | | – | | | | – | | | | 227 | | | | 227 | |
| Total financial assets at fair value through other comprehensive income | | | 13,411 | | | | 11,273 | | | | 408 | | | | 25,092 | |
| Total financial assets carried at fair value, excluding derivatives | | | 125,884 | | | | 44,081 | | | | 15,316 | | | | 185,281 | |
NOTES TO THE CONSOLIDATED FINANCIAL STATEMENTS
NOTE 50: FINANCIAL INSTRUMENTS continued
| | | Level 1 | | | Level 2 | | | Level 3 | | | Total | |
| | | £m | | | £m | | | £m | | | £m | |
| At 31 December 2018 | | | | | | | | | | | | |
| Financial assets at fair value through profit or loss | | | | | | | | | | | | | | | | |
| Loans and advances to customers | | | – | | | | 27,285 | | | | 10,565 | | | | 37,850 | |
| Loans and advances to banks | | | – | | | | 3,026 | | | | – | | | | 3,026 | |
| Debt securities: | | | | | | | | | | | | | | | | |
| Government securities | | | 17,926 | | | | 169 | | | | – | | | | 18,095 | |
| Other public sector securities | | | – | | | | 2,064 | | | | – | | | | 2,064 | |
| Bank and building society certificates of deposit | | | 84 | | | | 1,021 | | | | – | | | | 1,105 | |
| Asset-backed securities: | | | | | | | | | | | | | | | | |
| Mortgage-backed securities | | | – | | | | 219 | | | | 6 | | | | 225 | |
| Other asset-backed securities | | | – | | | | 231 | | | | 118 | | | | 349 | |
| Corporate and other debt securities | | | – | | | | 16,840 | | | | 1,470 | | | | 18,310 | |
| | | | 18,010 | | | | 20,544 | | | | 1,594 | | | | 40,148 | |
| Treasury and other bills | | | 20 | | | | – | | | | – | | | | 20 | |
| Equity shares | | | 75,701 | | | | 26 | | | | 1,758 | | | | 77,485 | |
| Total financial assets at fair value through profit or loss | | | 93,731 | | | | 50,881 | | | | 13,917 | | | | 158,529 | |
| Financial assets at fair value through other comprehensive income | | | | | | | | | | | | | | | | |
| Debt securities: | | | | | | | | | | | | | | | | |
| Government securities | | | 18,847 | | | | 124 | | | | – | | | | 18,971 | |
| Bank and building society certificates of deposit | | | – | | | | 118 | | | | – | | | | 118 | |
| Asset-backed securities: | | | | | | | | | | | | | | | | |
| Mortgage-backed securities | | | – | | | | – | | | | 120 | | | | 120 | |
| Other asset-backed securities | | | – | | | | 5 | | | | 126 | | | | 131 | |
| Corporate and other debt securities | | | 32 | | | | 5,119 | | | | – | | | | 5,151 | |
| | | | 18,879 | | | | 5,366 | | | | 246 | | | | 24,491 | |
| Treasury and other bills | | | 303 | | | | – | | | | – | | | | 303 | |
| Equity shares | | | – | | | | – | | | | 21 | | | | 21 | |
| Total financial assets at fair value through other comprehensive income | | | 19,182 | | | | 5,366 | | | | 267 | | | | 24,815 | |
| Total financial assets carried at fair value, excluding derivatives | | | 112,913 | | | | 56,247 | | | | 14,184 | | | | 183,344 | |
MOVEMENTS IN LEVEL 3 PORTFOLIO
The table below analyses movements in level 3 financial assets, excluding derivatives, carried at fair value (recurring measurement).
| | | 2019 | | 2018 |
| | | Financial assets
at fair value
through profit
or loss | | | Financial assets
at fair value
through other
comprehensive
income | | | Total level 3
assets carried
at fair value,
excluding
derivatives
(recurring basis | ) | | Financial assets
at fair value
through profit or
loss | | | Financial assets
at fair value
through other
comprehensive
income | | | Total level 3
assets carried at
fair value,
excluding
derivatives
(recurring basis | ) |
| | | £m | | | £m | | | £m | | | £m | | | £m | | | £m | |
| At 1 January | | | 13,917 | | | | 267 | | | | 14,184 | | | | 14,152 | | | | 302 | | | | 14,454 | |
| Exchange and other adjustments | | | (85 | ) | | | (10 | ) | | | (95 | ) | | | 87 | | | | (2 | ) | | | 85 | |
| Gains recognised in the income statement within other income | | | 794 | | | | – | | | | 794 | | | | 439 | | | | – | | | | 439 | |
| (Losses) gains recognised in other comprehensive income within the revaluation reserve in respect of financial assets at fair value through other comprehensive income | | | – | | | | 12 | | | | 12 | | | | – | | | | (4 | ) | | | (4 | ) |
| Purchases/increases to customer loans | | | 2,579 | | | | 207 | | | | 2,786 | | | | 2,480 | | | | 2 | | | | 2,482 | |
| Sales | | | (2,807 | ) | | | (87 | ) | | | (2,894 | ) | | | (3,593 | ) | | | (95 | ) | | | (3,688 | ) |
| Transfers into the level 3 portfolio | | | 644 | | | | 19 | | | | 663 | | | | 815 | | | | 348 | | | | 1,163 | |
| Transfers out of the level 3 portfolio | | | (134 | ) | | | – | | | | (134 | ) | | | (463 | ) | | | (284 | ) | | | (747 | ) |
| At 31 December | | | 14,908 | | | | 408 | | | | 15,316 | | | | 13,917 | | | | 267 | | | | 14,184 | |
| Gains (losses) recognised in the income statement, within other income, relating to the change in fair value of those assets held at 31 December | | | 269 | | | | – | | | | 269 | | | | (104 | ) | | | – | | | | (104 | ) |
NOTES TO THE CONSOLIDATED FINANCIAL STATEMENTS
NOTE 50: FINANCIAL INSTRUMENTS continued
VALUATION METHODOLOGY FOR FINANCIAL ASSETS, EXCLUDING DERIVATIVES
Loans and advances to customers and banks
The fair value of these assets is determined using discounted cash flow techniques. The discount rates are derived from market observable interest rates, a risk margin that reflects loan credit ratings and an incremental illiquidity premium based on historical spreads at origination on similar loans.
Debt securities
Debt securities measured at fair value and classified as level 2 are valued by discounting expected cash flows using an observable credit spread applicable to the particular instrument.
Where there is limited trading activity in debt securities, the Group uses valuation models, consensus pricing information from third party pricing services and broker or lead manager quotes to determine an appropriate valuation. Debt securities are classified as level 3 if there is a significant valuation input that cannot be corroborated through market sources or where there are materially inconsistent values for an input. Asset classes classified as level 3 mainly comprise certain collateralised loan obligations and collateralised debt obligations.
Equity investments
Unlisted equity and fund investments are valued using different techniques in accordance with the Group’s valuation policy and International Private Equity and Venture Capital Guidelines.
Depending on the business sector and the circumstances of the investment, unlisted equity valuations are based on earnings multiples, net asset values or discounted cash flows.
| – | A number of earnings multiples are used in valuing the portfolio including price earnings, earnings before interest and tax and earnings before interest, tax, depreciation and amortisation. The particular multiple selected being appropriate for the type of business being valued and is derived by reference to the current market-based multiple. Consideration is given to the risk attributes, growth prospects and financial gearing of comparable businesses when selecting an appropriate multiple. |
| | |
| – | Discounted cash flow valuations use estimated future cash flows, usually based on management forecasts, with the application of appropriate exit yields or terminal multiples and discounted using rates appropriate to the specific investment, business sector or recent economic rates of return. Recent transactions involving the sale of similar businesses may sometimes be used as a frame of reference in deriving an appropriate multiple. |
| | |
| – | For fund investments the most recent capital account value calculated by the fund manager is used as the basis for the valuation and adjusted, if necessary, to align valuation techniques with the Group’s valuation policy. |
Unlisted equity investments and investments in property partnerships held in the life assurance funds are valued using third party valuations. Management take account of any pertinent information, such as recent transactions and information received on particular investments, to adjust the third party valuations where necessary.
(B) FINANCIAL LIABILITIES, EXCLUDING DERIVATIVES
VALUATION HIERARCHY
At 31 December 2019, the Group’s financial liabilities carried at fair value, excluding derivatives, comprised its financial liabilities at fair value through profit or loss and totalled £21,486 million (31 December 2018: £30,547 million). The table below analyses these financial liabilities by balance sheet classification and valuation methodology (level 1, 2 or 3, as described on page F-85). The fair value measurement approach is recurring in nature. There were no significant transfers between level 1 and 2 during the year.
| | | Level 1 | | | Level 2 | | | Level 3 | | | Total | |
| | | £m | | | £m | | | £m | | | £m | |
| At 31 December 2019 | | | | | | | | | | | | |
| Financial liabilities at fair value through profit or loss | | | | | | | | | | | | |
| Liabilities designated at fair value through profit or loss | | | – | | | | 7,483 | | | | 48 | | | | 7,531 | |
| Trading liabilities: | | | | | | | | | | | | | | | | |
| Liabilities in respect of securities sold under repurchase agreements | | | – | | | | 11,048 | | | | – | | | | 11,048 | |
| Other deposits | | | – | | | | 98 | | | | – | | | | 98 | |
| Short positions in securities | | | 2,781 | | | | 28 | | | | – | | | | 2,809 | |
| | | | 2,781 | | | | 11,174 | | | | – | | | | 13,955 | |
| Total financial liabilities carried at fair value, excluding derivatives | | | 2,781 | | | | 18,657 | | | | 48 | | | | 21,486 | |
| At 31 December 2018 | | | | | | | | | | | | | | | | |
| Financial liabilities at fair value through profit or loss | | | | | | | | | | | | | | | | |
| Liabilities designated at fair value through profit or loss | | | – | | | | 7,085 | | | | 11 | | | | 7,096 | |
| Trading liabilities: | | | | | | | | | | | | | | | | |
| Liabilities in respect of securities sold under repurchase agreements | | | – | | | | 21,595 | | | | – | | | | 21,595 | |
| Other deposits | | | – | | | | 242 | | | | – | | | | 242 | |
| Short positions in securities | | | 1,464 | | | | 150 | | | | – | | | | 1,614 | |
| | | | 1,464 | | | | 21,987 | | | | – | | | | 23,451 | |
| Total financial liabilities carried at fair value, excluding derivatives | | | 1,464 | | | | 29,072 | | | | 11 | | | | 30,547 | |
NOTES TO THE CONSOLIDATED FINANCIAL STATEMENTS
NOTE 50: FINANCIAL INSTRUMENTS continued
The table below analyses movements in the level 3 financial liabilities portfolio, excluding derivatives.
| | | 2019 | | | 2018 | |
| | | £m | | | £m | |
| At 1 January | | | 11 | | | | – | |
| Losses (gains) recognised in the income statement within other income | | | – | | | | – | |
| Redemptions | | | (5 | ) | | | – | |
| Transfers into the level 3 portfolio | | | 52 | | | | 11 | |
| Transfers out of the level 3 portfolio | | | (10 | ) | | | – | |
| At 31 December | | | 48 | | | | 11 | |
| Gains recognised in the income statement, within other income, relating to the change in fair value of those liabilities held at 31 December | | | – | | | | – | |
VALUATION METHODOLOGY FOR FINANCIAL LIABILITIES, EXCLUDING DERIVATIVES
Liabilities held at fair value through profit or loss
These principally comprise debt securities in issue which are classified as level 2 and their fair value is determined using techniques whose inputs are based on observable market data. The carrying amount of the securities is adjusted to reflect the effect of changes in own credit spreads and the resulting gain or loss is recognised in other comprehensive income.
At 31 December 2019, the own credit adjustment arising from the fair valuation of £7,531 million (2018: £7,085 million) of the Group’s debt securities in issue designated at fair value through profit or loss resulted in a loss of £419 million (2018: gain of £533 million), before tax, recognised in other comprehensive income.
Trading liabilities in respect of securities sold under repurchase agreements
The fair value of these liabilities is determined using discounted cash flow techniques. The discount rates are derived from observable repo curves specific to the type of security sold under the repurchase agreement.
(C) DERIVATIVES
All of the Group’s derivative assets and liabilities are carried at fair value. At 31 December 2019, such assets totalled £26,369 million (31 December 2018: £23,595 million) and liabilities totalled £25,779 million (31 December 2018: £21,373 million). The table below analyses these derivative balances by valuation methodology (level 1, 2 or 3, as described on page F-85). The fair value measurement approach is recurring in nature. There were no significant transfers between level 1 and level 2 during the year.
| | | 2019 | | 2018 |
| | | Level 1 | | | Level 2 | | | Level 3 | | | Total | | | Level 1 | | | Level 2 | | | Level 3 | | | Total | |
| | | £m | | | £m | | | £m | | | £m | | | £m | | | £m | | | £m | | | £m | |
| Derivative assets | | | 50 | | | | 25,456 | | | | 863 | | | | 26,369 | | | | 93 | | | | 22,575 | | | | 927 | | | | 23,595 | |
| Derivative liabilities | | | (54 | ) | | | (24,358 | ) | | | (1,367 | ) | | | (25,779 | ) | | | (132 | ) | | | (20,525 | ) | | | (716 | ) | | | (21,373 | ) |
Where the Group’s derivative assets and liabilities are not traded on an exchange, they are valued using valuation techniques, including discounted cash flow and options pricing models, as appropriate. The types of derivatives classified as level 2 and the valuation techniques used include:
| – | Interest rate swaps which are valued using discounted cash flow models; the most significant inputs into those models are interest rate yield curves which are developed from publicly quoted rates. |
| | |
| – | Foreign exchange derivatives that do not contain options which are priced using rates available from publicly quoted sources. |
| | |
| – | Credit derivatives which are valued using standard models with observable inputs, except for the items classified as level 3, which are valued using publicly available yield and credit default swap (CDS) curves. |
| | |
| – | Less complex interest rate and foreign exchange option products which are valued using volatility surfaces developed from publicly available interest rate cap, interest rate swaption and other option volatilities; option volatility skew information is derived from a market standard consensus pricing service. For more complex option products, the Group calibrates its models using observable at-the-money data; where necessary, the Group adjusts for out-of-the-money positions using a market standard consensus pricing service. |
Complex interest rate and foreign exchange products where there is significant dispersion of consensus pricing or where implied funding costs are material and unobservable are classified as level 3.
Where credit protection, usually in the form of credit default swaps, has been purchased or written on asset-backed securities, the security is referred to as a negative basis asset-backed security and the resulting derivative assets or liabilities have been classified as either level 2 or level 3 according to the classification of the underlying asset-backed security.
Certain unobservable inputs used to calculate CVA, FVA, and own credit adjustments, are not significant in determining the classification of the derivative and debt instruments. Consequently, these inputs do not form part of the Level 3 sensitivities presented.
NOTES TO THE CONSOLIDATED FINANCIAL STATEMENTS
NOTE 50: FINANCIAL INSTRUMENTS continued
The table below analyses movements in level 3 derivative assets and liabilities carried at fair value.
| | | 2019 | | 2018 |
| | | Derivative
assets | | | Derivative
liabilities | | | Derivative
assets | | | Derivative
liabilities | |
| | | £m | | | £m | | | £m | | | £m | |
| At 1 January | | | 927 | | | | (716 | ) | | | 1,056 | | | | (804 | ) |
| Exchange and other adjustments | | | (27 | ) | | | 4 | | | | 7 | | | | (5 | ) |
| Losses (gains) recognised in the income statement within other income | | | 81 | | | | (75 | ) | | | (84 | ) | | | 49 | |
| Purchases (additions) | | | 4 | | | | (4 | ) | | | – | | | | (68 | ) |
| (Sales) redemptions | | | (19 | ) | | | 47 | | | | (52 | ) | | | 112 | |
| Transfers into the level 3 portfolio | | | 415 | | | | (959 | ) | | | – | | | | – | |
| Transfers out of the level 3 portfolio | | | (518 | ) | | | 336 | | | | – | | | | – | |
| At 31 December | | | 863 | | | | (1,367 | ) | | | 927 | | | | (716 | ) |
| Gains (losses) recognised in the income statement, within other income, relating to the change in fair value of those assets or liabilities held at 31 December | | | (14 | ) | | | 18 | | | | (424 | ) | | | 82 | |
DERIVATIVE VALUATION ADJUSTMENTS
Derivative financial instruments which are carried in the balance sheet at fair value are adjusted where appropriate to reflect credit risk, market liquidity and other risks.
| (i) | Uncollateralised derivative valuation adjustments, excluding monoline counterparties |
The following table summarises the movement on this valuation adjustment account during 2018 and 2019:
| | | 2019 | | | 2018 | |
| | | £m | | | £m | |
| At 1 January | | | 562 | | | | 521 | |
| Income statement charge (credit) | | | (134 | ) | | | 47 | |
| Transfers | | | (5 | ) | | | (6 | ) |
| At 31 December | | | 423 | | | | 562 | |
| | | | | | | | | |
| Represented by: | | | | | | | | |
| | | | | | | | | |
| | | | 2019 | | | | 2018 | |
| | | | £m | | | | £m | |
| Credit Valuation Adjustment | | | 278 | | | | 409 | |
| Debit Valuation Adjustment | | | (27 | ) | | | (79 | ) |
| Funding Valuation Adjustment | | | 172 | | | | 232 | |
| | | | 423 | | | | 562 | |
Credit and Debit Valuation Adjustments (CVA and DVA) are applied to the Group’s over-the-counter derivative exposures with counterparties that are not subject to standard interbank collateral arrangements. These exposures largely relate to the provision of risk management solutions for corporate customers within the Commercial Banking division.
A CVA is taken where the Group has a positive future uncollateralised exposure (asset). A DVA is taken where the Group has a negative future uncollateralised exposure (liability). These adjustments reflect interest rates and expectations of counterparty creditworthiness and the Group’s own credit spread respectively.
The CVA is sensitive to:
| – | the current size of the mark-to-market position on the uncollateralised asset; |
| | |
| – | expectations of future market volatility of the underlying asset; and |
| | |
| – | expectations of counterparty creditworthiness. |
In circumstances where exposures to a counterparty become impaired, any associated derivative valuation adjustment is transferred and assessed for specific loss alongside other non-derivative assets and liabilities that the counterparty may have with the Group.
Market Credit Default Swap (CDS) spreads are used to develop the probability of default for quoted counterparties. For unquoted counterparties, internal credit ratings and market sector CDS curves and recovery rates are used. The Loss Given Default (LGD) is based on market recovery rates and internal credit assessments.
The combination of a one notch deterioration in the credit rating of derivative counterparties and a ten per cent increase in LGD increases the CVA by £60 million. Current market value is used to estimate the projected exposure for products not supported by the model, which are principally complex interest rate options that are traded in very low volumes. For these, the CVA is calculated on an add-on basis (although no such adjustment was required at 31 December 2019).
The DVA is sensitive to:
| – | the current size of the mark-to-market position on the uncollateralised liability; |
| | |
| – | expectations of future market volatility of the underlying liability; and |
| | |
| – | the Group’s own CDS spread. |
NOTES TO THE CONSOLIDATED FINANCIAL STATEMENTS
NOTE 50: FINANCIAL INSTRUMENTS continued
A one per cent rise in the CDS spread would lead to an increase in the DVA of £99 million.
The risk exposures that are used for the CVA and DVA calculations are strongly influenced by interest rates. Due to the nature of the Group’s business the CVA/DVA exposures tend to be on average the same way around such that the valuation adjustments fall when interest rates rise. A one per cent rise in interest rates would lead to a £63 million fall in the overall valuation adjustment to £188 million. The CVA model used by the Group does not assume any correlation between the level of interest rates and default rates.
The Group has also recognised a Funding Valuation Adjustment to adjust for the net cost of funding uncollateralised derivative positions. This adjustment is calculated on the expected future exposure discounted at a suitable cost of funds. A ten basis points increase in the cost of funds will increase the funding valuation adjustment by approximately £21 million.
(ii) Market liquidity
The Group includes mid to bid-offer valuation adjustments against the expected cost of closing out the net market risk in the Group’s trading positions within a timeframe that is consistent with historical trading activity and spreads that the trading desks have accessed historically during the ordinary course of business in normal market conditions.
At 31 December 2019, the Group’s derivative trading business held mid to bid-offer valuation adjustments of £80 million (2018: £80 million).
(D) SENSITIVITY OF LEVEL 3 VALUATIONS
| | | | | | | At 31 December 2019 | | At 31 December 2018 |
| | | | | | | | | | Effect of reasonably possible
alternative assumptions2 | | | | | | Effect of reasonably possible
alternative assumptions2 | |
| | | | | Significant unobservable | | Carrying
value | | | Favourable
changes | | | Unfavourable
changes | | | Carrying
value | | | Favourable
changes | | | Unfavourable
changes | |
| | | Valuation techniques | | inputs1 | | £m | | | £m | | | £m | | | £m | | | £m | | | £m | |
| Financial assets at fair value through profit or loss | | | | | | | | | | | | | | | | | | | | | | | | | | |
| Loans and advances to customers | | Discounted cash flows | | Interest rate spreads (bps) 47bps/108bps | | | 10,912 | | | | 401 | | | | (384 | ) | | | 10,565 | | | | 380 | | | | (371 | ) |
| Debt securities | | Discounted cash flows | | Credit spreads (bps) (1bps/2bps) | | | 61 | | | | 1 | | | | (1 | ) | | | 274 | | | | 92 | | | | (21 | ) |
| Equity and venture capital investments | | Market approach | | Earnings multiple (1.5//15.4) | | | 1,948 | | | | 89 | | | | (89 | ) | | | 1,657 | | | | 54 | | | | (55 | ) |
| | | Underlying asset/net asset value (incl. property prices)3 | | n/a | | | 935 | | | | 89 | | | | (113 | ) | | | 523 | | | | 48 | | | | (57 | ) |
| Unlisted equities, debt securities and property partnerships in the life funds | | Underlying asset/net asset value (incl. property prices), broker quotes or discounted cash flows3 | | n/a | | | 1,052 | | | | 19 | | | | (41 | ) | | | 898 | | | | 2 | | | | (45 | ) |
| | | | | | | | 14,908 | | | | | | | | | | | | 13,917 | | | | | | | | | |
| Financial assets at fair value through other comprehensive income | | | | | | | | | | | | | | | | | | | | | | | | | | |
| Asset-backed securities | | Lead manager or broker quote/consensus pricing | | n/a | | | 181 | | | | 6 | | | | (6 | ) | | | 246 | | | | 3 | | | | (5 | ) |
| Equity and venture capital investments | | Underlying asset/net asset value (incl. property prices)3 | | n/a | | | 227 | | | | 7 | | | | (6 | ) | | | 21 | | | | 2 | | | | (2 | ) |
| | | | | | | | 408 | | | | | | | | | | | | 267 | | | | | | | | | |
| Derivative financial assets | | | | | | | | | | | | | | | | | | | | | | | | | | |
| Interest rate derivatives | | Option pricing model | | Interest rate volatility (14%/115%) | | | 863 | | | | 5 | | | | (6 | ) | | | 927 | | | | 7 | | | | (5 | ) |
| | | | | | | | 863 | | | | | | | | | | | | 927 | | | | | | | | | |
| Level 3 financial assets carried at fair value | | | | | 16,179 | | | | | | | | | | | | 15,111 | | | | | | | | | |
| Financial liabilities at fair value through profit or loss | | Discounted cash flows | | Interest rate spreads (+/–50bps) | | | 48 | | | | 1 | | | | (1 | ) | | | 11 | | | | – | | | | – | |
| Derivative financial liabilities | | | | | | | | | | | | | | | | | | | | | | | | | | |
| Interest rate derivatives | | Option pricing model | | Interest rate volatility (14%/115%) | | | 1,367 | | | | – | | | | – | | | | 716 | | | | – | | | | – | |
| | | | | | | | 1,367 | | | | | | | | | | | | 716 | | | | | | | | | |
| Level 3 financial liabilities carried at fair value | | | 1,415 | | | | | | | | | | | | 727 | | | | | | | | | |
| 1 | Ranges are shown where appropriate and represent the highest and lowest inputs used in the level 3 valuations. |
| | |
| 2 | Where the exposure to an unobservable input is managed on a net basis, only the net impact is shown in the table. |
| | |
| 3 | Underlying asset/net asset values represent fair value. |
NOTES TO THE CONSOLIDATED FINANCIAL STATEMENTS
NOTE 50: FINANCIAL INSTRUMENTS continued
UNOBSERVABLE INPUTS
Significant unobservable inputs affecting the valuation of debt securities, unlisted equity investments and derivatives are as follows:
| – | Interest rates and inflation rates are referenced in some derivatives where the payoff that the holder of the derivative receives depends on the behaviour of those underlying references through time. |
| | |
| – | Credit spreads represent the premium above the benchmark reference instrument required to compensate for lower credit quality; higher spreads lead to a lower fair value. |
| | |
| – | Volatility parameters represent key attributes of option behaviour; higher volatilities typically denote a wider range of possible outcomes. |
| | |
| – | Earnings multiples are used to value certain unlisted equity investments; a higher earnings multiple will result in a higher fair value. |
REASONABLY POSSIBLE ALTERNATIVE ASSUMPTIONS
Valuation techniques applied to many of the Group’s level 3 instruments often involve the use of two or more inputs whose relationship is interdependent. The calculation of the effect of reasonably possible alternative assumptions included in the table above reflects such relationships.
Debt securities
Reasonably possible alternative assumptions have been determined in respect of the Group’s structured credit investment by flexing credit spreads.
Derivatives
Reasonably possible alternative assumptions have been determined in respect of swaptions in the Group’s derivative portfolios which are priced using industry standard option pricing models. Such models require interest rate volatilities which may be unobservable at longer maturities. To derive reasonably possible alternative valuations these volatilities have been flexed within a range of 10 per cent to 128 per cent (2018: 19 per cent to 80 per cent).
Unlisted equity, venture capital investments and investments in property partnerships
The valuation techniques used for unlisted equity and venture capital investments vary depending on the nature of the investment. Reasonably possible alternative valuations for these investments have been calculated by reference to the approach taken, as appropriate to the business sector and investment circumstances and as such the following inputs have been considered:
| – | for valuations derived from earnings multiples, consideration is given to the risk attributes, growth prospects and financial gearing of comparable businesses when selecting an appropriate multiple; |
| | |
| – | the discount rates used in discounted cash flow valuations; and |
| | |
| – | in line with International Private Equity and Venture Capital Guidelines, the values of underlying investments in fund investments portfolios. |
(4) Financial assets and liabilities carried at amortised cost
(A) FINANCIAL ASSETS
VALUATION HIERARCHY
The table below analyses the fair values of the financial assets of the Group which are carried at amortised cost by valuation methodology (level 1, 2 or 3, as described on page F-85). Financial assets carried at amortised cost are mainly classified as level 3 due to significant unobservable inputs used in the valuation models. Where inputs are observable, debt securities are classified as level 1 or 2.
| | | | | | | | | Valuation hierarchy |
| | | Carrying value
£m | | | Fair value
£m | | | Level 1
£m | | | Level 2
£m | | | Level 3
£m | |
| At 31 December 2019 | | | | | | | | | | | | | | | |
| Financial assets at amortised cost: | | | | | | | | | | | | | | | |
| Loans and advances to customers: Stage 1 | | | 449,300 | | | | 450,465 | | | | – | | | | 54,600 | | | | 395,865 | |
| Loans and advances to customers: Stage 2 | | | 27,548 | | | | 28,259 | | | | – | | | | – | | | | 28,259 | |
| Loans and advances to customers: Stage 3 | | | 4,568 | | | | 3,508 | | | | – | | | | – | | | | 3,508 | |
| Loans and advances to customers: purchased or originated credit-impaired | | | 13,572 | | | | 13,572 | | | | – | | | | – | | | | 13,572 | |
| Loans and advances to customers | | | 494,988 | | | | 495,804 | | | | – | | | | 54,600 | | | | 441,204 | |
| Loans and advances to banks | | | 9,775 | | | | 9,773 | | | | – | | | | 1,555 | | | | 8,218 | |
| Debt securities | | | 5,544 | | | | 5,537 | | | | – | | | | 5,526 | | | | 11 | |
| Reverse repos included in above amounts: | | | | | | | | | | | | | | | | | | | | |
| Loans and advances to customers | | | 54,600 | | | | 54,600 | | | | – | | | | 54,600 | | | | – | |
| Loans and advances to banks | | | 1,555 | | | | 1,555 | | | | – | | | | 1,555 | | | | – | |
| At 31 December 2018 | | | | | | | | | | | | | | | | | | | | |
| Financial assets at amortised cost: | | | | | | | | | | | | | | | | | | | | |
| Loans and advances to customers: Stage 1 | | | 441,006 | | | | 440,542 | | | | – | | | | 40,483 | | | | 400,059 | |
| Loans and advances to customers: Stage 2 | | | 24,351 | | | | 25,516 | | | | – | | | | – | | | | 25,516 | |
| Loans and advances to customers: Stage 3 | | | 4,188 | | | | 3,289 | | | | – | | | | – | | | | 3,289 | |
| Loans and advances to customers: purchased or originated credit-impaired | | | 15,313 | | | | 15,313 | | | | – | | | | – | | | | 15,313 | |
| Loans and advances to customers | | | 484,858 | | | | 484,660 | | | | – | | | | 40,483 | | | | 444,177 | |
| Loans and advances to banks | | | 6,283 | | | | 6,286 | | | | – | | | | 461 | | | | 5,825 | |
| Debt securities | | | 5,238 | | | | 5,244 | | | | – | | | | 5,233 | | | | 11 | |
| Reverse repos included in above amounts: | | | | | | | | | | | | | | | | | | | | |
| Loans and advances to customers | | | 40,483 | | | | 40,483 | | | | – | | | | 40,483 | | | | – | |
| Loans and advances to banks | | | 461 | | | | 461 | | | | – | | | | 461 | | | | – | |
NOTES TO THE CONSOLIDATED FINANCIAL STATEMENTS
NOTE 50: FINANCIAL INSTRUMENTS continued
VALUATION METHODOLOGY
Loans and advances to customers
The Group provides loans and advances to commercial, corporate and personal customers at both fixed and variable rates. Due to their short term nature, the carrying value of the variable rate loans and those relating to lease financing is assumed to be their fair value.
To determine the fair value of loans and advances to customers, loans are segregated into portfolios of similar characteristics. A number of techniques are used to estimate the fair value of fixed rate lending; these take account of expected credit losses based on historic trends, prevailing market interest rates and expected future cash flows. For retail exposures, fair value is usually estimated by discounting anticipated cash flows (including interest at contractual rates) at market rates for similar loans offered by the Group and other financial institutions. Certain loans secured on residential properties are made at a fixed rate for a limited period, typically two to five years, after which the loans revert to the relevant variable rate. The fair value of such loans is estimated by reference to the market rates for similar loans of maturity equal to the remaining fixed interest rate period. The fair value of commercial loans is estimated by discounting anticipated cash flows at a rate which reflects the effects of interest rate changes, adjusted for changes in credit risk.
Loans and advances to banks
The carrying value of short dated loans and advances to banks is assumed to be their fair value. The fair value of loans and advances to banks is estimated by discounting the anticipated cash flows at a market discount rate adjusted for the credit spread of the obligor or, where not observable, the credit spread of borrowers of similar credit quality.
Debt securities
The fair values of debt securities are determined predominantly from lead manager quotes and, where these are not available, by alternative techniques including reference to credit spreads on similar assets with the same obligor, market standard consensus pricing services, broker quotes and other research data.
Reverse repurchase agreements
The carrying amount is deemed a reasonable approximation of fair value given the short-term nature of these instruments.
(B) FINANCIAL LIABILITIES
VALUATION HIERARCHY
The table below analyses the fair values of the financial liabilities of the Group which are carried at amortised cost by valuation methodology (level 1, 2 or 3, as described on page F-85).
| | | | | | | | | Valuation hierarchy |
| | | Carrying value
£m | | | Fair value
£m | | | Level 1
£m | | | Level 2
£m | | | Level 3
£m | |
| At 31 December 2019 | | | | | | | | | | | | | | | |
| Deposits from banks | | | 28,179 | | | | 28,079 | | | | – | | | | 28,079 | | | | – | |
| Customer deposits | | | 421,320 | | | | 421,728 | | | | – | | | | 416,493 | | | | 5,235 | |
| Debt securities in issue | | | 97,689 | | | | 100,443 | | | | – | | | | 100,443 | | | | – | |
| Subordinated liabilities | | | 17,130 | | | | 19,783 | | | | – | | | | 19,783 | | | | – | |
| Repos included in above amounts: | | | | | | | | | | | | | | | | | | | | |
| Deposits from banks | | | 18,105 | | | | 18,105 | | | | – | | | | 18,105 | | | | – | |
| Customer deposits | | | 9,530 | | | | 9,530 | | | | – | | | | 9,530 | | | | – | |
| At 31 December 2018 | | | | | | | | | | | | | | | | | | | | |
| Deposits from banks | | | 30,320 | | | | 30,322 | | | | – | | | | 30,322 | | | | – | |
| Customer deposits | | | 418,066 | | | | 418,450 | | | | – | | | | 412,283 | | | | 6,167 | |
| Debt securities in issue | | | 91,168 | | | | 93,233 | | | | – | | | | 93,233 | | | | – | |
| Subordinated liabilities | | | 17,656 | | | | 19,564 | | | | – | | | | 19,564 | | | | – | |
| Repos included in above amounts: | | | | | | | | | | | | | | | | | | | | |
| Deposits from banks | | | 21,170 | | | | 21,170 | | | | – | | | | 21,170 | | | | – | |
| Customer deposits | | | 1,818 | | | | 1,818 | | | | – | | | | 1,818 | | | | – | |
VALUATION METHODOLOGY
Deposits from banks and customer deposits
The fair value of bank and customer deposits repayable on demand is assumed to be equal to their carrying value.
The fair value for all other deposits is estimated using discounted cash flows applying either market rates, where applicable, or current rates for deposits of similar remaining maturities.
Debt securities in issue
The fair value of short-term debt securities in issue is approximately equal to their carrying value. Fair value for other debt securities is calculated based on quoted market prices where available. Where quoted market prices are not available, fair value is estimated using discounted cash flow techniques at a rate which reflects market rates of interest and the Group’s own credit spread.
Subordinated liabilities
The fair value of subordinated liabilities is determined by reference to quoted market prices where available or by reference to quoted market prices of similar instruments. Subordinated liabilities are classified as level 2, since the inputs used to determine their fair value are largely observable.
Repurchase agreements
The carrying amount is deemed a reasonable approximation of fair value given the short term nature of these instruments.
NOTES TO THE CONSOLIDATED FINANCIAL STATEMENTS
NOTE 50: FINANCIAL INSTRUMENTS continued
(5) Reclassifications of financial assets
Other than the reclassifications on adoption of IFRS 9 on 1 January 2018, there have been no reclassifications of financial assets in 2018 or 2019.
NOTE 51: TRANSFERS OF FINANCIAL ASSETS
There were no significant transferred financial assets which were derecognised in their entirety, but with ongoing exposure. Details of transferred financial assets that continue to be recognised in full are as follows.
The Group enters into repurchase and securities lending transactions in the normal course of business that do not result in derecognition of the financial assets as substantially all of the risks and rewards, including credit, interest rate, prepayment and other price risks are retained by the Group. In all cases, the transferee has the right to sell or repledge the assets concerned.
As set out in note 31, included within financial assets measured at amortised cost are loans transferred under the Group’s securitisation and covered bond programmes. As the Group retains all of a majority of the risks and rewards associated with these loans, including credit, interest rate, prepayment and liquidity risk, they remain on the Group’s balance sheet. Assets transferred into the Group’s securitisation and covered bond programmes are not available to be used by the Group whilst the assets are within the programmes. However, the Group retains the right to remove loans from the covered bond programmes where they are in excess of the programme’s requirements. In addition, where the Group has retained some of the notes issued by securitisation and covered bond programmes, the Group has the ability to sell or pledge these retained notes.
The table below sets out the carrying values of the transferred assets and the associated liabilities. For repurchase and securities lending transactions, the associated liabilities represent the Group’s obligation to repurchase the transferred assets. For securitisation programmes, the associated liabilities represent the external notes in issue (note 31). Except as otherwise noted below, none of the liabilities shown in the table below have recourse only to the transferred assets.
| | | 2019 | | 2018 |
| | | Carrying
value of
transferred
assets
£m | | | Carrying
value of
associated
liabilities
£m | | | Carrying
value of
transferred
assets
£m | | | Carrying
value of
associated
liabilities
£m | |
| Repurchase and securities lending transactions | | | | | | | | | | | | |
| Financial assets at fair value through profit or loss | | | 9,186 | | | | 3,364 | | | | 6,815 | | | | 961 | |
| Financial assets at fair value through other comprehensive income | | | 7,897 | | | | 5,875 | | | | 7,279 | | | | 5,337 | |
| Securitisation programmes | | | | | | | | | | | | | | | | |
| Financial assets at amortised cost: | | | | | | | | | | | | | | | | |
| Loans and advances to customers1 | | | 42,545 | | | | 7,335 | | | | 41,674 | | | | 5,479 | |
| 1 | The carrying value of associated liabilities excludes securitisation notes held by the Group of £31,436 million (31 December 2018: £31,701 million). |
NOTES TO THE CONSOLIDATED FINANCIAL STATEMENTS
NOTE 52: OFFSETTING OF FINANCIAL ASSETS AND LIABILITIES
The following information relates to financial assets and liabilities which have been offset in the balance sheet and those which have not been offset but for which the Group has enforceable master netting agreements or collateral arrangements in place with counterparties.
| | | | | | | | | | | | Related amounts where set off in
the balance sheet not permitted3 | | Potential
net amounts | |
| At 31 December 2019 | | Gross amounts
of assets and
liabilities1
£m | | | Amounts offset
in the balance
sheet2
£m | | | Net amounts
presented in
the balance
sheet
£m | | | Cash collateral
received/
pledged
£m | | | Non-cash
collateral
received/
pledged
£m | | | if offset
of related
amounts
permitted
£m | |
| Financial assets | | | | | | | | | | | | | | | | | | |
| Financial assets at fair value through profit or loss: | | | | | | | | | | | | | | | | | | | | | | | | |
| Excluding reverse repos | | | 148,920 | | | | – | | | | 148,920 | | | | – | | | | (2,825 | ) | | | 146,095 | |
| Reverse repos | | | 24,165 | | | | (12,896 | ) | | | 11,269 | | | | (366 | ) | | | (10,903 | ) | | | – | |
| | | | 173,085 | | | | (12,896 | ) | | | 160,189 | | | | (366 | ) | | | (13,728 | ) | | | 146,095 | |
| Derivative financial instruments | | | 79,735 | | | | (53,366 | ) | | | 26,369 | | | | (7,650 | ) | | | (13,892 | ) | | | 4,827 | |
| Loans and advances to banks: | | | | | | | | | | | | | | | | | | | | | | | | |
| Excluding reverse repos | | | 8,220 | | | | – | | | | 8,220 | | | | (3,377 | ) | | | – | | | | 4,843 | |
| Reverse repos | | | 1,555 | | | | – | | | | 1,555 | | | | – | | | | (1,555 | ) | | | – | |
| | | | 9,775 | | | | – | | | | 9,775 | | | | (3,377 | ) | | | (1,555 | ) | | | 4,843 | |
| Loans and advances to customers: | | | | | | | | | | | | | | | | | | | | | | | | |
| Excluding reverse repos | | | 440,388 | | | | – | | | | 440,388 | | | | (2,392 | ) | | | (2,123 | ) | | | 435,873 | |
| Reverse repos | | | 58,959 | | | | (4,359 | ) | | | 54,600 | | | | – | | | | (54,600 | ) | | | – | |
| | | | 499,347 | | | | (4,359 | ) | | | 494,988 | | | | (2,392 | ) | | | (56,723 | ) | | | 435,873 | |
| Debt securities | | | 5,544 | | | | – | | | | 5,544 | | | | – | | | | (211 | ) | | | 5,333 | |
| Financial assets at fair value through other comprehensive income | | | 25,092 | | | | – | | | | 25,092 | | | | – | | | | (5,859 | ) | | | 19,233 | |
| Financial liabilities | | | | | | | | | | | | | | | | | | | | | | | | |
| Deposits from banks: | | | | | | | | | | | | | | | | | | | | | | | | |
| Excluding repos | | | 10,074 | | | | – | | | | 10,074 | | | | (8,016 | ) | | | – | | | | 2,058 | |
| Repos | | | 18,105 | | | | – | | | | 18,105 | | | | – | | | | (18,105 | ) | | | – | |
| | | | 28,179 | | | | – | | | | 28,179 | | | | (8,016 | ) | | | (18,105 | ) | | | 2,058 | |
| Customer deposits: | | | | | | | | | | | | | | | | | | | | | | | | |
| Excluding repos | | | 413,659 | | | | (1,869 | ) | | | 411,790 | | | | (1,850 | ) | | | (2,123 | ) | | | 407,817 | |
| Repos | | | 9,530 | | | | – | | | | 9,530 | | | | – | | | | (9,530 | ) | | | – | |
| | | | 423,189 | | | | (1,869 | ) | | | 421,320 | | | | (1,850 | ) | | | (11,653 | ) | | | 407,817 | |
| Financial liabilities at fair value through profit or loss: | | | | | | | | | | | | | | | | | | | | | | | | |
| Excluding repos | | | 10,438 | | | | – | | | | 10,438 | | | | – | | | | – | | | | 10,438 | |
| Repos | | | 28,303 | | | | (17,255 | ) | | | 11,048 | | | | – | | | | (11,048 | ) | | | – | |
| | | | 38,741 | | | | (17,255 | ) | | | 21,486 | | | | – | | | | (11,048 | ) | | | 10,438 | |
| Derivative financial instruments | | | 77,276 | | | | (51,497 | ) | | | 25,779 | | | | (5,770 | ) | | | (16,364 | ) | | | 3,645 | |
NOTES TO THE CONSOLIDATED FINANCIAL STATEMENTS
NOTE 52: OFFSETTING OF FINANCIAL ASSETS AND LIABILITIES continued
| | | | | | | | | | | | Related amounts where set off in
the balance sheet not permitted3 | | Potential
net amounts | |
| At 31 December 2018 | | Gross amounts
of assets and
liabilities1
£m | | | Amounts offset
in the balance
sheet2
£m | | | Net amounts
presented in
the balance
sheet
£m | | | Cash collateral
received/
pledged
£m | | | Non-cash
collateral
received/
pledged
£m | | | if offset
of related
amounts
permitted
£m | |
| Financial assets | | | | | | | | | | | | | | | | | | |
| Financial assets at fair value through profit or loss: | | | | | | | | | | | | | | | | | | | | | | | | |
| Excluding reverse repos | | | 130,172 | | | | – | | | | 130,172 | | | | – | | | | (978 | ) | | | 129,194 | |
| Reverse repos | | | 33,472 | | | | (5,115 | ) | | | 28,357 | | | | (622 | ) | | | (27,735 | ) | | | – | |
| | | | 163,644 | | | | (5,115 | ) | | | 158,529 | | | | (622 | ) | | | (28,713 | ) | | | 129,194 | |
| Derivative financial instruments | | | 78,607 | | | | (55,012 | ) | | | 23,595 | | | | (6,039 | ) | | | (15,642 | ) | | | 1,914 | |
| Loans and advances to banks: | | | | | | | | | | | | | | | | | | | | | | | | |
| Excluding reverse repos | | | 5,822 | | | | – | | | | 5,822 | | | | (2,676 | ) | | | – | | | | 3,146 | |
| Reverse repos | | | 461 | | | | – | | | | 461 | | | | – | | | | (461 | ) | | | – | |
| | | | 6,283 | | | | – | | | | 6,283 | | | | (2,676 | ) | | | (461 | ) | | | 3,146 | |
| Loans and advances to customers: | | | | | | | | | | | | | | | | | | | | | | | | |
| Excluding reverse repos | | | 447,020 | | | | (2,645 | ) | | | 444,375 | | | | (1,319 | ) | | | (3,241 | ) | | | 439,815 | |
| Reverse repos | | | 42,494 | | | | (2,011 | ) | | | 40,483 | | | | – | | | | (40,483 | ) | | | – | |
| | | | 489,514 | | | | (4,656 | ) | | | 484,858 | | | | (1,319 | ) | | | (43,724 | ) | | | 439,815 | |
| Debt securities | | | 5,238 | | | | – | | | | 5,238 | | | | – | | | | – | | | | 5,238 | |
| Financial assets at fair value through other comprehensive income | | | 24,815 | | | | – | | | | 24,815 | | | | – | | | | (5,361 | ) | | | 19,454 | |
| Financial liabilities | | | | | | | | | | | | | | | | | | | | | | | | |
| Deposits from banks: | | | | | | | | | | | | | | | | | | | | | | | | |
| Excluding repos | | | 9,150 | | | | – | | | | 9,150 | | | | (5,291 | ) | | | – | | | | 3,859 | |
| Repos | | | 21,170 | | | | – | | | | 21,170 | | | | – | | | | (21,170 | ) | | | – | |
| | | | 30,320 | | | | – | | | | 30,320 | | | | (5,291 | ) | | | (21,170 | ) | | | 3,859 | |
| Customer deposits: | | | | | | | | | | | | | | | | | | | | | | | | |
| Excluding repos | | | 417,652 | | | | (1,404 | ) | | | 416,248 | | | | (1,370 | ) | | | (3,241 | ) | | | 411,637 | |
| Repos | | | 1,818 | | | | – | | | | 1,818 | | | | – | | | | (1,818 | ) | | | – | |
| | | | 419,470 | | | | (1,404 | ) | | | 418,066 | | | | (1,370 | ) | | | (5,059 | ) | | | 411,637 | |
| Financial liabilities at fair value through profit or loss: | | | | | | | | | | | | | | | | | | | | | | | | |
| Excluding repos | | | 8,952 | | | | – | | | | 8,952 | | | | – | | | | – | | | | 8,952 | |
| Repos | | | 28,721 | | | | (7,126 | ) | | | 21,595 | | | | – | | | | (21,595 | ) | | | – | |
| | | | 37,673 | | | | (7,126 | ) | | | 30,547 | | | | – | | | | (21,595 | ) | | | 8,952 | |
| Derivative financial instruments | | | 77,626 | | | | (56,253 | ) | | | 21,373 | | | | (3,995 | ) | | | (17,313 | ) | | | 65 | |
| 1 | After impairment allowance. |
| | |
| 2 | The amounts set off in the balance sheet as shown above represent derivatives and repurchase agreements with central clearing houses which meet the criteria for offsetting under IAS 32. |
| | |
| 3 | The Group enters into derivatives and repurchase and reverse repurchase agreements with various counterparties which are governed by industry standard master netting agreements. The Group holds and provides cash and securities collateral in respective of derivative transactions covered by these agreements. The right to set off balances under these master netting agreements or to set off cash and securities collateral only arises in the event of non-payment or default and, as a result, these arrangements do not qualify for offsetting under IAS 32. |
The effects of over collateralisation have not been taken into account in the above table.
NOTES TO THE CONSOLIDATED FINANCIAL STATEMENTS
NOTE 53: FINANCIAL RISK MANAGEMENT
As a bancassurer, financial instruments are fundamental to the Group’s activities and, as a consequence, the risks associated with financial instruments represent a significant component of the risks faced by the Group.
The primary risks affecting the Group through its use of financial instruments are: credit risk; market risk, which includes interest rate risk and foreign exchange risk; liquidity risk; capital risk; and insurance risk. Information about the Group’s exposure to each of the above risks and capital can be found on pages 41 to 108. The following additional disclosures, which provide quantitative information about the risks within financial instruments held or issued by the Group, should be read in conjunction with that earlier information.
Market risk
Interest rate risk arises from the different repricing characteristics of the assets and liabilities. Liabilities are either insensitive to interest rate movements, for example interest free or very low interest customer deposits, or are sensitive to interest rate changes but bear rates which may be varied at the Group’s discretion and that for competitive reasons generally reflect changes in the Bank of England’s base rate. The rates on the remaining deposits are contractually fixed for their term to maturity.
Many banking assets are sensitive to interest rate movements; there is a large volume of managed rate assets such as variable rate mortgages which may be considered as a natural offset to the interest rate risk arising from the managed rate liabilities. However, a significant proportion of the Group’s lending assets, for example many personal loans and mortgages, bear interest rates which are contractually fixed.
The Group’s risk management policy is to optimise reward whilst managing its market risk exposures within the risk appetite defined by the Board. The largest residual risk exposure arises from balances that are deemed to be insensitive to changes in market rates (including current accounts, a portion of variable rate deposits and investable equity), and is managed through the Group’s structural hedge. The structural hedge consists of longer-term fixed rate assets or interest rate swaps and the amount and duration of the hedging activity is reviewed regularly by the Group Asset and Liability Committee. Further details on the Group market risk policy can be found on page 102.
The Group establishes hedge accounting relationships for interest rate risk using cash flow hedges and fair value hedges. The Group is exposed to cash flow interest rate risk on its variable rate loans and deposits together with its floating rate subordinated debt. The derivatives used to manage the structural hedge may be designated into cash flow hedges to manage income statement volatility. The economic items related to the structural hedge, for example current accounts, are not eligible hedged items under IAS 39 for inclusion into accounting hedge relationships. The Group is exposed to fair value interest rate risk on its fixed rate customer loans, its fixed rate customer deposits and the majority of its subordinated debt, and to cash flow interest rate risk on its variable rate loans and deposits together with its floating rate subordinated debt. The Group applies netting between similar risks before applying hedge accounting.
Hedge ineffectiveness arises during the management of interest rate risk due to residual unhedged risk. Sources of ineffectiveness, which the Group may decide to not fully mitigate, can include basis differences, timing differences and notional amount differences. The effectiveness of accounting hedge relationships is assessed between the hedging derivatives and the documented hedged item, which can differ to the underlying economically hedged item.
At 31 December 2019 the aggregate notional principal of interest rate swaps designated as fair value hedges was £183,489 million (2018: £150,971 million) with a net fair value asset of £569 million (2018: asset of £760 million) (note 17). The gains on the hedging instruments were £1,144 million (2018: gains of £94 million). The losses on the hedged items attributable to the hedged risk were £1,001 million (2018: losses of £32 million). The gains and losses relating to the fair value hedges are recorded in net trading income.
In addition the Group has cash flow hedges which are primarily used to hedge the variability in the cost of funding within the commercial business. The notional principal of the interest rate swaps designated as cash flow hedges at 31 December 2019 was £426,740 million (2018: £556,945 million) with a net fair value liability of £388 million (2018: liability of £486 million) (note 17). In 2019, ineffectiveness recognised in the income statement that arises from cash flow hedges was a gain of £134 million (2018: loss of £25 million).
INTEREST RATE BENCHMARK REFORM
As discussed in note 1, the Group has applied the hedge accounting amendmentsInterest Rate Benchmark Reformto hedge accounting relationships directly affected by the replacement of interest rate benchmarks. Under these amendments, for the purposes of:
| – | determining whether a forecast transaction is highly probable; |
| | |
| – | determining whether the hedged future cash flows are expected to occur; |
| | |
| – | determining whether a hedge is expected to be highly effective in achieving offsetting changes in fair value or cash flows attributable to the hedged risk; and |
| | |
| – | determining whether an accounting hedging relationship should be discontinued because of a failure of the retrospective effectiveness test |
the Group has assumed that the interest rate benchmark on which the hedged risk or the cash flows of the hedged item or hedging instrument are based is not altered by uncertainties resulting from the proposed interest rate benchmark reform. In addition, for a fair value hedge of a non-contractually specified benchmark portion of interest rate risk, the Group assesses only at inception of the hedge relationship and not on an ongoing basis that the risk is separately identifiable and hedge effectiveness can be measured.
The Group’s most significant hedge accounting relationships are exposed to the following interest rate benchmarks: Sterling LIBOR, US Dollar LIBOR and Euro LIBOR. The notional of the hedged items that the Group has designated into cash flow hedge relationships that is directly affected by the interest rate benchmark reform is £29,202 million, of which £25,438 million relates to Sterling LIBOR. These are principally loans and advances to customers in Commercial Banking. In addition, the interest rate benchmark reforms affect assets designated in fair value hedges with a notional of £102,969 million, of which £98,278 million is in respect of sterling LIBOR, and liabilities designated in fair value hedges with a notional of £62,295 million, of which £9,186 million is in respect of sterling LIBOR. These fair value hedges principally relate to mortgages in Retail and debt securities in issue.
The Group is managing the process to transition to alternative benchmark rates under its Group-wide IBOR Transition Programme. This programme is working towards ensuring that the Group has the market capability and infrastructure to deal with the reform. The programme also encompasses the associated impacts on accounting and reporting and includes dealing with the impact on hedge accounting relationships of the transition to alternative reference rates. Further information on the Group’s programme is set out on page 45.
The significant assumptions and judgements that the Group has made in applying these requirements include the following:
| – | a hedge accounting relationship is assumed to be affected by the interest rate benchmark reform if the reform gives rise to uncertainties about the timing and/or amount of the interest rate benchmark-based cash flows of the hedged items and/or of the hedging instrument; |
NOTES TO THE CONSOLIDATED FINANCIAL STATEMENTS
NOTE 53: FINANCIAL RISK MANAGEMENT continued
| – | where the hedged item is a forecast transaction then, in the absence of any certainty in relation to the interest rate benchmark reform, assessments have been determined as to whether the forecast transaction is highly probable assuming that the interest rate benchmark on which the hedged cash flows are based is not altered as a result of the interest rate benchmark reform; |
| | |
| – | any reclassification of amounts in cash flow hedge reserves to profit or loss have been based on assessing whether the hedged cash flows are no longer expected to occur assuming that the interest rate benchmark on which the hedged cash flows are based is not altered as a result of the interest rate benchmark reform; and |
| | |
| – | all benchmark rate referenced hedged items and hedging instruments included in hedging relationships are subject to uncertainty due to interest rate benchmark reform. |
In accordance with the Interest Rate Benchmark Reform amendments to IAS 39, the Group will cease to apply prospectively the reliefs outlined above when the uncertainty arising from interest rate benchmark reform is no longer present with respect to the timing and the amount of the interest rate benchmark-based cash flows of the hedged item (or for the effectiveness assessments, the hedging instrument). The reliefs will be disapplied earlier if the hedging relationship is discontinued or the entire amount accumulated in the cash flow hedge reserve with respect to that hedging relationship is reclassified to profit or loss for a reason other than interest rate benchmark reform.
At 31 December 2019, the notional amount of the hedging instruments in hedging relationships to which these amendments apply was £604,602 million, of which £117,076 million relates to Sterling LIBOR fair value hedges and £400,439 million relates to Sterling LIBOR cash flow hedges.
The corporate and retail businesses incur foreign exchange risk in the course of providing services to their customers. All non-structural foreign exchange exposures in the non-trading book are transferred to the trading area where they are monitored and controlled. These risks reside in the authorised trading centres who are allocated exposure limits. The limits are monitored daily by the local centres and reported to the market and liquidity risk function in London. Associated VaR and the closing, average, maximum and minimum are disclosed on page 108. The Group also manages foreign currency risk via cash flow hedge accounting, utilising currency swaps.
Risk arises from the Group’s investments in its overseas operations. The Group’s structural foreign currency exposure is represented by the net asset value of the foreign currency equity and subordinated debt investments in its subsidiaries and branches. Gains or losses on structural foreign currency exposures are taken to reserves.
The Group ceased all hedging of the currency translation risk of the net investment in foreign operations on 1 January 2018.
The Group’s main overseas operations are in the Americas and Europe. Details of the Group’s structural foreign currency exposures are as follows:
| (C) | FUNCTIONAL CURRENCY OF GROUP OPERATIONS |
| | | | 2019 | | | 2018 |
| | | | Euro
£m | | | US Dollar
£m | | | Other
non-sterling
£m | | | Euro
£m | | | US Dollar
£m | | | Other
non-sterling
£m | |
| Exposure | | | | 63 | | | | 93 | | | | 48 | | | | 112 | | | | 59 | | | | 60 | |
NOTES TO THE CONSOLIDATED FINANCIAL STATEMENTS
NOTE 53: FINANCIAL RISK MANAGEMENT continued
Credit risk
The Group’s credit risk exposure arises in respect of the instruments below and predominantly in the United Kingdom. Information about the Group’s exposure to credit risk, credit risk management, measurement and mitigation can be found on pages 52 to 80.
(A) MAXIMUM CREDIT EXPOSURE
The maximum credit risk exposure of the Group in the event of other parties failing to perform their obligations is detailed below. No account is taken of any collateral held and the maximum exposure to loss, which includes amounts held to cover unit-linked and With Profits funds liabilities, is considered to be the balance sheet carrying amount or, for non-derivative off-balance sheet transactions and financial guarantees, their contractual nominal amounts.
| | | 2019 | | 2018 |
| | | | Maximum
exposure
£m | | | | Offset2
£m | | | Net exposure
£m | | | | Maximum
exposure
£m | | | | Offset2
£m | | | Net exposure
£m | |
| Loans and advances to banks, net1 | | | 9,775 | | | | – | | | | 9,775 | | | | 6,283 | | | | – | | | | 6,283 | |
| Loans and advances to customers, net1 | | | 494,988 | | | | (2,792 | ) | | | 492,196 | | | | 484,858 | | | | (3,241 | ) | | | 481,617 | |
| Debt securities, net1 | | | 5,544 | | | | – | | | | 5,544 | | | | 5,238 | | | | – | | | | 5,238 | |
| Financial assets at amortised cost | | | 510,307 | | | | (2,792 | ) | | | 507,515 | | | | 496,379 | | | | (3,241 | ) | | | 493,138 | |
| Financial assets at fair value through other comprehensive income3 | | | 24,865 | | | | – | | | | 24,865 | | | | 24,794 | | | | – | | | | 24,794 | |
| Financial assets at fair value through profit or loss:3,4 | | | | | | | | | | | | | | | | | | | | | | | | |
| Loans and advances | | | 23,475 | | | | – | | | | 23,475 | | | | 40,876 | | | | – | | | | 40,876 | |
| Debt securities, treasury and other bills | | | 40,925 | | | | – | | | | 40,925 | | | | 40,168 | | | | – | | | | 40,168 | |
| | | | 64,400 | | | | – | | | | 64,400 | | | | 81,044 | | | | – | | | | 81,044 | |
| Derivative assets | | | 26,369 | | | | (14,696 | ) | | | 11,673 | | | | 23,595 | | | | (14,327 | ) | | | 9,268 | |
| Assets arising from reinsurance contracts held | | | 23,567 | | | | – | | | | 23,567 | | | | 7,860 | | | | – | | | | 7,860 | |
| Off-balance sheet items: | | | | | | | | | | | | | | | | | | | | | | | | |
| Acceptances and endorsements | | | 74 | | | | – | | | | 74 | | | | 194 | | | | – | | | | 194 | |
| Other items serving as direct credit substitutes | | | 366 | | | | – | | | | 366 | | | | 632 | | | | – | | | | 632 | |
| Performance bonds and other transaction-related contingencies | | | 2,454 | | | | – | | | | 2,454 | | | | 2,425 | | | | – | | | | 2,425 | |
| Irrevocable commitments and guarantees | | | 63,504 | | | | – | | | | 63,504 | | | | 64,884 | | | | – | | | | 64,884 | |
| | | | 66,398 | | | | – | | | | 66,398 | | | | 68,135 | | | | – | | | | 68,135 | |
| | | | 715,906 | | | | (17,488 | ) | | | 698,418 | | | | 701,807 | | | | (17,568 | ) | | | 684,239 | |
| | |
| 1 | Amounts shown net of related impairment allowances. |
| | |
| 2 | Offset items comprise deposit amounts available for offset, and amounts available for offset under master netting arrangements, that do not meet the criteria under IAS 32 to enable loans and advances and derivative assets respectively to be presented net of these balances in the financial statements. |
| | |
| 3 | Excluding equity shares. |
| | |
| 4 | Includes assets within the Group’s unit-linked funds for which credit risk is borne by the policyholders and assets within the Group’s With-Profits funds for which credit risk is largely borne by the policyholders. Consequently, the Group has no significant exposure to credit risk for such assets which back related contract liabilities. |
(B) CONCENTRATIONS OF EXPOSURE
The Group’s management of concentration risk includes single name, industry sector and country limits as well as controls over the Group’s overall exposure to certain products. Further information on the Group’s management of this risk is included within Credit risk mitigation on page 53.
At 31 December 2019 the most significant concentrations of exposure were in mortgages (comprising 60 per cent of total loans and advances to customers) and to financial, business and other services (comprising 18 per cent of the total).
| | | 2019
£m | | | 2018
£m | |
| Agriculture, forestry and fishing | | | 7,558 | | | | 7,314 | |
| Energy and water supply | | | 1,432 | | | | 1,517 | |
| Manufacturing | | | 6,093 | | | | 8,260 | |
| Construction | | | 4,285 | | | | 4,684 | |
| Transport, distribution and hotels | | | 13,016 | | | | 14,113 | |
| Postal and telecommunications | | | 1,923 | | | | 2,711 | |
| Property companies | | | 27,596 | | | | 28,451 | |
| Financial, business and other services | | | 89,763 | | | | 77,505 | |
| Personal: | | | | | | | | |
| Mortgages1 | | | 299,141 | | | | 297,498 | |
| Other | | | 29,272 | | | | 28,699 | |
| Lease financing | | | 1,671 | | | | 1,822 | |
| Hire purchase | | | 16,497 | | | | 15,434 | |
| Total loans and advances to customers before allowance for impairment losses | | | 498,247 | | | | 488,008 | |
| Allowance for impairment losses (note 18) | | | (3,259 | ) | | | (3,150 | ) |
| Total loans and advances to customers | | | 494,988 | | | | 484,858 | |
| 1 | Includes both UK and overseas mortgage balances. |
Following the reduction in the Group’s non-UK activities, an analysis of credit risk exposures by geographical region has not been provided.
NOTES TO THE CONSOLIDATED FINANCIAL STATEMENTS
NOTE 53: FINANCIAL RISK MANAGEMENT continued
(C) CREDIT QUALITY OF ASSETS
LOANS AND ADVANCES
The analysis of lending has been prepared based on the division in which the asset is held; with the business segment in which the exposure is recorded reflected in the ratings system applied. The internal credit ratings systems used by the Group differ between Retail and Commercial, reflecting the characteristics of these exposures and the way that they are managed internally; these credit ratings are set out below. All probabilities of default (PDs) include forward-looking information and are based on 12 month values, with the exception of credit impaired.
Stage 3 assets include balances of £205 million (2018: £250 million) (with outstanding amounts due of approximately £1,700 million (2018: £2,200 million)) which have been subject to a partial write-off and where the Group continues to enforce recovery action.
Stage 2 and Stage 3 assets with a carrying amount of £219 million (2018: £1,000 million) were modified during the year. No material gain or loss was recognised by the Group.
| Gross drawn exposures | | PD range | | Stage 1
£m | | | Stage 2
£m | | | Stage 3
£m | | | Purchased or
originated
credit-impaired
£m | | | Total
£m | |
| At 31 December 2019 | | | | | | | | | | | | | | | | | | | | | | |
| Loans and advances to banks: | | | | | | | | | | | | | | | | | | | | | | |
| CMS 1-10 | | 0.00-0.50% | | | 9,777 | | | | – | | | | – | | | | – | | | | 9,777 | |
| CMS 11-14 | | 0.51-3.00% | | | – | | | | – | | | | – | | | | – | | | | – | |
| CMS 15-18 | | 3.01-20.00% | | | – | | | | – | | | | – | | | | – | | | | – | |
| CMS 19 | | 20.01-99.99% | | | – | | | | – | | | | – | | | | – | | | | – | |
| CMS 20-23 | | 100% | | | – | | | | – | | | | – | | | | – | | | | – | |
| | | | | | 9,777 | | | | – | | | | – | | | | – | | | | 9,777 | |
| Loans and advances to customers: | | | | | | | | | | | | | | | | | | | | | | |
| Retail - mortgages | | | | | | | | | | | | | | | | | | | | | | |
| RMS 1-6 | | 0.00-4.50% | | | 257,028 | | | | 13,494 | | | | – | | | | – | | | | 270,522 | |
| RMS 7-9 | | 4.51-14.00% | | | 15 | | | | 2,052 | | | | – | | | | – | | | | 2,067 | |
| RMS 10 | | 14.01-20.00% | | | – | | | | 414 | | | | – | | | | – | | | | 414 | |
| RMS 11-13 | | 20.01-99.99% | | | – | | | | 975 | | | | – | | | | – | | | | 975 | |
| RMS 14 | | 100% | | | – | | | | – | | | | 1,506 | | | | 13,714 | | | | 15,220 | |
| | | | | | 257,043 | | | | 16,935 | | | | 1,506 | | | | 13,714 | | | | 289,198 | |
| Retail - unsecured | | | | | | | | | | | | | | | | | | | | | | |
| RMS 1-6 | | 0.00-4.50% | | | 22,151 | | | | 1,098 | | | | – | | | | – | | | | 23,249 | |
| RMS 7-9 | | 4.51-14.00% | | | 2,676 | | | | 919 | | | | – | | | | – | | | | 3,595 | |
| RMS 10 | | 14.01-20.00% | | | 76 | | | | 189 | | | | – | | | | – | | | | 265 | |
| RMS 11-13 | | 20.01-99.99% | | | 18 | | | | 606 | | | | – | | | | – | | | | 624 | |
| RMS 14 | | 100% | | | – | | | | – | | | | 678 | | | | – | | | | 678 | |
| | | | | | 24,921 | | | | 2,812 | | | | 678 | | | | – | | | | 28,411 | |
| Retail - UK Motor Finance | | | | | | | | | | | | | | | | | | | | | | |
| RMS 1-6 | | 0.00-4.50% | | | 13,568 | | | | 1,297 | | | | – | | | | – | | | | 14,865 | |
| RMS 7-9 | | 4.51-14.00% | | | 314 | | | | 368 | | | | – | | | | – | | | | 682 | |
| RMS 10 | | 14.01-20.00% | | | – | | | | 99 | | | | – | | | | – | | | | 99 | |
| RMS 11-13 | | 20.01-99.99% | | | 2 | | | | 178 | | | | – | | | | – | | | | 180 | |
| RMS 14 | | 100% | | | – | | | | – | | | | 150 | | | | – | | | | 150 | |
| | | | | | 13,884 | | | | 1,942 | | | | 150 | | | | – | | | | 15,976 | |
| Retail - Other | | | | | | | | | | | | | | | | | | | | | | |
| RMS 1-6 | | 0.00-4.50% | | | 9,520 | | | | 390 | | | | – | | | | – | | | | 9,910 | |
| RMS 7-9 | | 4.51-14.00% | | | – | | | | 409 | | | | – | | | | – | | | | 409 | |
| RMS 10 | | 14.01-20.00% | | | – | | | | 7 | | | | – | | | | – | | | | 7 | |
| RMS 11-13 | | 20.01-99.99% | | | 134 | | | | 23 | | | | – | | | | – | | | | 157 | |
| RMS 14 | | 100% | | | – | | | | – | | | | 150 | | | | – | | | | 150 | |
| | | | | | 9,654 | | | | 829 | | | | 150 | | | | – | | | | 10,633 | |
| Total Retail | | | | | 305,502 | | | | 22,518 | | | | 2,484 | | | | 13,714 | | | | 344,218 | |
NOTES TO THE CONSOLIDATED FINANCIAL STATEMENTS
NOTE 53: FINANCIAL RISK MANAGEMENT continued
| Gross drawn exposures (continued) | | PD range | | Stage 1
£m | | | Stage 2
£m | | | Stage 3
£m | | | Purchased or
originated
credit-impaired
£m | | | Total
£m | |
| At 31 December 2019 | | | | | | | | | | | | | | | | | | | | | | |
| Commercial | | | | | | | | | | | | | | | | | | | | | | |
| CMS 1-10 | | 0.00-0.50% | | | 59,880 | | | | 379 | | | | – | | | | – | | | | 60,259 | |
| CMS 11-14 | | 0.51-3.00% | | | 25,638 | | | | 2,322 | | | | – | | | | – | | | | 27,960 | |
| CMS 15-18 | | 3.01-20.00% | | | 1,805 | | | | 3,123 | | | | – | | | | – | | | | 4,928 | |
| CMS 19 | | 20.01-99.99% | | | – | | | | 169 | | | | – | | | | – | | | | 169 | |
| CMS 20-23 | | 100% | | | – | | | | – | | | | 3,447 | | | | – | | | | 3,447 | |
| | | | | | 87,323 | | | | 5,993 | | | | 3,447 | | | | – | | | | 96,763 | |
| Other | | | | | | | | | | | | | | | | | | | | | | |
| RMS 1-6 | | 0.00-4.50% | | | 754 | | | | 32 | | | | – | | | | – | | | | 786 | |
| RMS 7-9 | | 4.51-14.00% | | | 40 | | | | – | | | | – | | | | – | | | | 40 | |
| RMS 10 | | 14.01-20.00% | | | – | | | | – | | | | – | | | | – | | | | – | |
| RMS 11-13 | | 20.01-99.99% | | | – | | | | – | | | | – | | | | – | | | | – | |
| RMS 14 | | 100% | | | – | | | | – | | | | 84 | | | | – | | | | 84 | |
| | | | | | 794 | | | | 32 | | | | 84 | | | | – | | | | 910 | |
| CMS 1-10 | | 0.00-0.50% | | | 56,356 | | | | – | | | | – | | | | – | | | | 56,356 | |
| CMS 11-14 | | 0.51-3.00% | | | – | | | | – | | | | – | | | | – | | | | – | |
| CMS 15-18 | | 3.01-20.00% | | | – | | | | – | | | | – | | | | – | | | | – | |
| CMS 19 | | 20.01-99.99% | | | – | | | | – | | | | – | | | | – | | | | – | |
| CMS 20-23 | | 100% | | | – | | | | – | | | | – | | | | – | | | | – | |
| | | | | | 56,356 | | | | – | | | | – | | | | – | | | | 56,356 | |
| Total loans and advances to customers | | | | | 449,975 | | | | 28,543 | | | | 6,015 | | | | 13,714 | | | | 498,247 | |
| | | | | | | | | | | | | | | | | | | | | | | |
| In respect of: | | | | | | | | | | | | | | | | | | | | | | |
| Retail | | | | | 305,502 | | | | 22,518 | | | | 2,484 | | | | 13,714 | | | | 344,218 | |
| Commercial | | | | | 87,323 | | | | 5,993 | | | | 3,447 | | | | – | | | | 96,763 | |
| Other | | | | | 57,150 | | | | 32 | | | | 84 | | | | – | | | | 57,266 | |
| Total loans and advances to customers | | | | | 449,975 | | | | 28,543 | | | | 6,015 | | | | 13,714 | | | | 498,247 | |
NOTES TO THE CONSOLIDATED FINANCIAL STATEMENTS
NOTE 53: FINANCIAL RISK MANAGEMENT continued
| Expected credit losses in respect of drawn exposures | | PD range | | Stage 1
£m | | | Stage 2
£m | | | Stage 3
£m | | | Purchased or
originated
credit-impaired
£m | | | Total
£m | |
| At 31 December 2019 | | | | | | | | | | | | | | | | | | | | | | |
| Loans and advances to banks: | | | | | | | | | | | | | | | | | | | | | | |
| CMS 1-10 | | 0.00-0.50% | | | 2 | | | | – | | | | – | | | | – | | | | 2 | |
| CMS 11-14 | | 0.51-3.00% | | | – | | | | – | | | | – | | | | – | | | | – | |
| CMS 15-18 | | 3.01-20.00% | | | – | | | | – | | | | – | | | | – | | | | – | |
| CMS 19 | | 20.01-99.99% | | | – | | | | – | | | | – | | | | – | | | | – | |
| CMS 20-23 | | 100% | | | – | | | | – | | | | – | | | | – | | | | – | |
| | | | | | 2 | | | | – | | | | – | | | | – | | | | 2 | |
| Loans and advances to customers: | | | | | | | | | | | | | | | | | | | | | | |
| Retail - mortgages | | | | | | | | | | | | | | | | | | | | | | |
| RMS 1-6 | | 0.00-4.50% | | | 23 | | | | 183 | | | | – | | | | – | | | | 206 | |
| RMS 7-9 | | 4.51-14.00% | | | – | | | | 39 | | | | – | | | | – | | | | 39 | |
| RMS 10 | | 14.01-20.00% | | | – | | | | 13 | | | | – | | | | – | | | | 13 | |
| RMS 11-13 | | 20.01-99.99% | | | – | | | | 46 | | | | – | | | | – | | | | 46 | |
| RMS 14 | | 100% | | | – | | | | – | | | | 122 | | | | 142 | | | | 264 | |
| | | | | | 23 | | | | 281 | | | | 122 | | | | 142 | | | | 568 | |
| Retail - unsecured | | | | | | | | | | | | | | | | | | | | | | |
| RMS 1-6 | | 0.00-4.50% | | | 188 | | | | 42 | | | | – | | | | – | | | | 230 | |
| RMS 7-9 | | 4.51-14.00% | | | 103 | | | | 92 | | | | – | | | | – | | | | 195 | |
| RMS 10 | | 14.01-20.00% | | | 7 | | | | 34 | | | | – | | | | – | | | | 41 | |
| RMS 11-13 | | 20.01-99.99% | | | 3 | | | | 193 | | | | – | | | | – | | | | 196 | |
| RMS 14 | | 100% | | | – | | | | – | | | | 233 | | | | – | | | | 233 | |
| | | | | | 301 | | | | 361 | | | | 233 | | | | – | | | | 895 | |
| Retail - UK Motor Finance | | | | | | | | | | | | | | | | | | | | | | |
| RMS 1-6 | | 0.00-4.50% | | | 203 | | | | 30 | | | | – | | | | – | | | | 233 | |
| RMS 7-9 | | 4.51-14.00% | | | 10 | | | | 15 | | | | – | | | | – | | | | 25 | |
| RMS 10 | | 14.01-20.00% | | | – | | | | 10 | | | | – | | | | – | | | | 10 | |
| RMS 11-13 | | 20.01-99.99% | | | 1 | | | | 32 | | | | – | | | | – | | | | 33 | |
| RMS 14 | | 100% | | | – | | | | – | | | | 84 | | | | – | | | | 84 | |
| | | | | | 214 | | | | 87 | | | | 84 | | | | – | | | | 385 | |
| Retail - Other | | | | | | | | | | | | | | | | | | | | | | |
| RMS 1-6 | | 0.00-4.50% | | | 25 | | | | 9 | | | | – | | | | – | | | | 34 | |
| RMS 7-9 | | 4.51-14.00% | | | – | | | | 27 | | | | – | | | | – | | | | 27 | |
| RMS 10 | | 14.01-20.00% | | | – | | | | – | | | | – | | | | – | | | | – | |
| RMS 11-13 | | 20.01-99.99% | | | – | | | | 1 | | | | – | | | | – | | | | 1 | |
| RMS 14 | | 100% | | | – | | | | – | | | | 51 | | | | – | | | | 51 | |
| | | | | | 25 | | | | 37 | | | | 51 | | | | – | | | | 113 | |
| Total Retail | | | | | 563 | | | | 766 | | | | 490 | | | | 142 | | | | 1,961 | |
NOTES TO THE CONSOLIDATED FINANCIAL STATEMENTS
NOTE 53: FINANCIAL RISK MANAGEMENT continued
| Expected credit losses in respect of drawn exposures (continued) | | PD range | | Stage 1
£m | | | Stage 2
£m | | | Stage 3
£m | | | Purchased or
originated
credit-impaired
£m | | | Total
£m | |
| At 31 December 2019 | | | | | | | | | | | | | | | | | | | | | | |
| Commercial | | | | | | | | | | | | | | | | | | | | | | |
| CMS 1-10 | | 0.00-0.50% | | | 33 | | | | 1 | | | | – | | | | – | | | | 34 | |
| CMS 11-14 | | 0.51-3.00% | | | 50 | | | | 37 | | | | – | | | | – | | | | 87 | |
| CMS 15-18 | | 3.01-20.00% | | | 13 | | | | 174 | | | | – | | | | – | | | | 187 | |
| CMS 19 | | 20.01-99.99% | | | – | | | | 16 | | | | – | | | | – | | | | 16 | |
| CMS 20-23 | | 100% | | | – | | | | – | | | | 941 | | | | – | | | | 941 | |
| | | | | | 96 | | | | 228 | | | | 941 | | | | – | | | | 1,265 | |
| Other | | | | | | | | | | | | | | | | | | | | | | |
| RMS 1-6 | | 0.00-4.50% | | | 6 | | | | 1 | | | | – | | | | – | | | | 7 | |
| RMS 7-9 | | 4.51-14.00% | | | – | | | | – | | | | – | | | | – | | | | – | |
| RMS 10 | | 14.01-20.00% | | | – | | | | – | | | | – | | | | – | | | | – | |
| RMS 11-13 | | 20.01-99.99% | | | – | | | | – | | | | – | | | | – | | | | – | |
| RMS 14 | | 100% | | | – | | | | – | | | | 16 | | | | – | | | | 16 | |
| | | | | | 6 | | | | 1 | | | | 16 | | | | – | | | | 23 | |
| CMS 1-10 | | 0.00-0.50% | | | 10 | | | | – | | | | – | | | | – | | | | 10 | |
| CMS 11-14 | | 0.51-3.00% | | | – | | | | – | | | | – | | | | – | | | | – | |
| CMS 15-18 | | 3.01-20.00% | | | – | | | | – | | | | – | | | | – | | | | – | |
| CMS 19 | | 20.01-99.99% | | | – | | | | – | | | | – | | | | – | | | | – | |
| CMS 20-23 | | 100% | | | – | | | | – | | | | – | | | | – | | | | – | |
| | | | | | 10 | | | | – | | | | – | | | | – | | | | 10 | |
| Total loans and advances to customers | | | | | 675 | | | | 995 | | | | 1,447 | | | | 142 | | | | 3,259 | |
| | | | | | | | | | | | | | | | | | | | | | | |
| In respect of: | | | | | | | | | | | | | | | | | | | | | | |
| Retail | | | | | 563 | | | | 766 | | | | 490 | | | | 142 | | | | 1,961 | |
| Commercial | | | | | 96 | | | | 228 | | | | 941 | | | | – | | | | 1,265 | |
| Other | | | | | 16 | | | | 1 | | | | 16 | | | | – | | | | 33 | |
| Total loans and advances to customers | | | | | 675 | | | | 995 | | | | 1,447 | | | | 142 | | | | 3,259 | |
NOTES TO THE CONSOLIDATED FINANCIAL STATEMENTS
NOTE 53: FINANCIAL RISK MANAGEMENT continued
| Gross undrawn exposures | | PD range | | Stage 1
£m | | | Stage 2
£m | | | Stage 3
£m | | | Purchased or
originated
credit-impaired
£m | | | Total
£m | |
| At 31 December 2019 | | | | | | | | | | | | | | | | | |
| Loans and advances to customers: | | | | | | | | | | | | | | | | | |
| Retail - mortgages | | | | | | | | | | | | | | | | | |
| RMS 1-6 | | 0.00-4.50% | | | 12,242 | | | | 62 | | | | – | | | | – | | | | 12,304 | |
| RMS 7-9 | | 4.51-14.00% | | | 1 | | | | 1 | | | | – | | | | – | | | | 2 | |
| RMS 10 | | 14.01-20.00% | | | – | | | | – | | | | – | | | | – | | | | – | |
| RMS 11-13 | | 20.01-99.99% | | | – | | | | – | | | | – | | | | – | | | | – | |
| RMS 14 | | 100% | | | – | | | | – | | | | 8 | | | | 79 | | | | 87 | |
| | | | | | 12,243 | | | | 63 | | | | 8 | | | | 79 | | | | 12,393 | |
| Retail - unsecured | | | | | | | | | | | | | | | | | | | | | | |
| RMS 1-6 | | 0.00-4.50% | | | 60,653 | | | | 1,986 | | | | – | | | | – | | | | 62,639 | |
| RMS 7-9 | | 4.51-14.00% | | | 389 | | | | 218 | | | | – | | | | – | | | | 607 | |
| RMS 10 | | 14.01-20.00% | | | 5 | | | | 39 | | | | – | | | | – | | | | 44 | |
| RMS 11-13 | | 20.01-99.99% | | | 1 | | | | 73 | | | | – | | | | – | | | | 74 | |
| RMS 14 | | 100% | | | – | | | | – | | | | 83 | | | | – | | | | 83 | |
| | | | | | 61,048 | | | | 2,316 | | | | 83 | | | | – | | | | 63,447 | |
| Retail - UK Motor Finance | | | | | | | | | | | | | | | | | | | | | | |
| RMS 1-6 | | 0.00-4.50% | | | 1,181 | | | | – | | | | – | | | | – | | | | 1,181 | |
| RMS 7-9 | | 4.51-14.00% | | | 193 | | | | 4 | | | | – | | | | – | | | | 197 | |
| RMS 10 | | 14.01-20.00% | | | – | | | | – | | | | – | | | | – | | | | – | |
| RMS 11-13 | | 20.01-99.99% | | | – | | | | – | | | | – | | | | – | | | | – | |
| RMS 14 | | 100% | | | – | | | | – | | | | – | | | | – | | | | – | |
| | | | | | 1,374 | | | | 4 | | | | – | | | | – | | | | 1,378 | |
| Retail - Other | | | | | | | | | | | | | | | | | | | | | | |
| RMS 1-6 | | 0.00-4.50% | | | 1,240 | | | | – | | | | – | | | | – | | | | 1,240 | |
| RMS 7-9 | | 4.51-14.00% | | | – | | | | 62 | | | | – | | | | – | | | | 62 | |
| RMS 10 | | 14.01-20.00% | | | – | | | | – | | | | – | | | | – | | | | – | |
| RMS 11-13 | | 20.01-99.99% | | | – | | | | – | | | | – | | | | – | | | | – | |
| RMS 14 | | 100% | | | – | | | | – | | | | 3 | | | | – | | | | 3 | |
| | | | | | 1,240 | | | | 62 | | | | 3 | | | | – | | | | 1,305 | |
| Total Retail | | | | | 75,905 | | | | 2,445 | | | | 94 | | | | 79 | | | | 78,523 | |
NOTES TO THE CONSOLIDATED FINANCIAL STATEMENTS
NOTE 53: FINANCIAL RISK MANAGEMENT continued
| Gross undrawn exposures (continued) | | PD range | | Stage 1
£m | | | Stage 2
£m | | | Stage 3
£m | | | Purchased or
originated
credit-impaired
£m | | | Total
£m | |
| At 31 December 2019 | | | | | | | | | | | | | | | | | |
| Commercial | | | | | | | | | | | | | | | | | | | | | | |
| CMS 1-10 | | 0.00-0.50% | | | 47,707 | | | | 76 | | | | – | | | | – | | | | 47,783 | |
| CMS 11-14 | | 0.51-3.00% | | | 5,134 | | | | 850 | | | | – | | | | – | | | | 5,984 | |
| CMS 15-18 | | 3.01-20.00% | | | 258 | | | | 327 | | | | – | | | | – | | | | 585 | |
| CMS 19 | | 20.01-99.99% | | | – | | | | 43 | | | | – | | | | – | | | | 43 | |
| CMS 20-23 | | 100% | | | – | | | | – | | | | 5 | | | | – | | | | 5 | |
| | | | | | 53,099 | | | | 1,296 | | | | 5 | | | | – | | | | 54,400 | |
| Other | | | | | | | | | | | | | | | | | | | | | | |
| RMS 1-6 | | 0.00-4.50% | | | 239 | | | | – | | | | – | | | | – | | | | 239 | |
| RMS 7-9 | | 4.51-14.00% | | | – | | | | – | | | | – | | | | – | | | | – | |
| RMS 10 | | 14.01-20.00% | | | – | | | | – | | | | – | | | | – | | | | – | |
| RMS 11-13 | | 20.01-99.99% | | | – | | | | – | | | | – | | | | – | | | | – | |
| RMS 14 | | 100% | | | – | | | | – | | | | – | | | | – | | | | – | |
| | | | | | 239 | | | | – | | | | – | | | | – | | | | 239 | |
| CMS 1-10 | | 0.00-0.50% | | | 391 | | | | – | | | | – | | | | – | | | | 391 | |
| CMS 11-14 | | 0.51-3.00% | | | – | | | | – | | | | – | | | | – | | | | – | |
| CMS 15-18 | | 3.01-20.00% | | | – | | | | – | | | | – | | | | – | | | | – | |
| CMS 19 | | 20.01-99.99% | | | – | | | | – | | | | – | | | | – | | | | – | |
| CMS 20-23 | | 100% | | | – | | | | – | | | | – | | | | – | | | | – | |
| | | | | | 391 | | | | – | | | | – | | | | – | | | | 391 | |
| Total loans and advances to customers | | | | | 129,634 | | | | 3,741 | | | | 99 | | | | 79 | | | | 133,553 | |
| | | | | | | | | | | | | | | | | | | | | | | |
| In respect of: | | | | | | | | | | | | | | | | | | | | | | |
| Retail | | | | | 75,905 | | | | 2,445 | | | | 94 | | | | 79 | | | | 78,523 | |
| Commercial | | | | | 53,099 | | | | 1,296 | | | | 5 | | | | – | | | | 54,400 | |
| Other | | | | | 630 | | | | – | | | | – | | | | – | | | | 630 | |
| Total loans and advances to customers | | | | | 129,634 | | | | 3,741 | | | | 99 | | | | 79 | | | | 133,553 | |
NOTES TO THE CONSOLIDATED FINANCIAL STATEMENTS
NOTE 53: FINANCIAL RISK MANAGEMENT continued
| Expected credit losses in respect of undrawn exposures | | PD range | | Stage 1
£m | | | Stage 2
£m | | | Stage 3
£m | | | Purchased or
originated
credit-impaired
£m | | | Total
£m | |
| At 31 December 2019 | | | | | | | | | | | | | | | | | |
| Loans and advances to customers: | | | | | | | | | | | | | | | | | | | | | | |
| Retail - mortgages | | | | | | | | | | | | | | | | | | | | | | |
| RMS 1-6 | | 0.00-4.50% | | | 1 | | | | – | | | | – | | | | – | | | | 1 | |
| RMS 7-9 | | 4.51-14.00% | | | – | | | | – | | | | – | | | | – | | | | – | |
| RMS 10 | | 14.01-20.00% | | | – | | | | – | | | | – | | | | – | | | | – | |
| RMS 11-13 | | 20.01-99.99% | | | – | | | | – | | | | – | | | | – | | | | – | |
| RMS 14 | | 100% | | | – | | | | – | | | | – | | | | – | | | | – | |
| | | | | | 1 | | | | – | | | | – | | | | – | | | | 1 | |
| Retail - unsecured | | | | | | | | | | | | | | | | | | | | | | |
| RMS 1-6 | | 0.00-4.50% | | | 56 | | | | 24 | | | | – | | | | – | | | | 80 | |
| RMS 7-9 | | 4.51-14.00% | | | 6 | | | | 8 | | | | – | | | | – | | | | 14 | |
| RMS 10 | | 14.01-20.00% | | | – | | | | 3 | | | | – | | | | – | | | | 3 | |
| RMS 11-13 | | 20.01-99.99% | | | – | | | | 15 | | | | – | | | | – | | | | 15 | |
| RMS 14 | | 100% | | | – | | | | – | | | | – | | | | – | | | | – | |
| | | | | | 62 | | | | 50 | | | | – | | | | – | | | | 112 | |
| Retail - UK Motor Finance | | | | | | | | | | | | | | | | | | | | | | |
| RMS 1-6 | | 0.00-4.50% | | | 2 | | | | – | | | | – | | | | – | | | | 2 | |
| RMS 7-9 | | 4.51-14.00% | | | – | | | | – | | | | – | | | | – | | | | – | |
| RMS 10 | | 14.01-20.00% | | | – | | | | – | | | | – | | | | – | | | | – | |
| RMS 11-13 | | 20.01-99.99% | | | – | | | | – | | | | – | | | | – | | | | – | |
| RMS 14 | | 100% | | | – | | | | – | | | | – | | | | – | | | | – | |
| | | | | | 2 | | | | – | | | | – | | | | – | | | | 2 | |
| Retail - Other | | | | | | | | | | | | | | | | | | | | | | |
| RMS 1-6 | | 0.00-4.50% | | | 11 | | | | – | | | | – | | | | – | | | | 11 | |
| RMS 7-9 | | 4.51-14.00% | | | – | | | | 3 | | | | – | | | | – | | | | 3 | |
| RMS 10 | | 14.01-20.00% | | | – | | | | – | | | | – | | | | – | | | | – | |
| RMS 11-13 | | 20.01-99.99% | | | – | | | | – | | | | – | | | | – | | | | – | |
| RMS 14 | | 100% | | | – | | | | – | | | | – | | | | – | | | | – | |
| | | | | | 11 | | | | 3 | | | | – | | | | – | | | | 14 | |
| Total Retail | | | | | 76 | | | | 53 | | | | – | | | | – | | | | 129 | |
NOTES TO THE CONSOLIDATED FINANCIAL STATEMENTS
NOTE 53: FINANCIAL RISK MANAGEMENT continued
| Expected credit losses in respect of undrawn exposures (continued) | | PD range | | Stage 1
£m | | | Stage 2
£m | | | Stage 3
£m | | | Purchased or
originated
credit-impaired
£m | | | Total
£m | |
| At 31 December 2019 | | | | | | | | | | | | | | | | | |
| Commercial | | | | | | | | | | | | | | | | | | | | | | |
| CMS 1-10 | | 0.00-0.50% | | | 11 | | | | – | | | | – | | | | – | | | | 11 | |
| CMS 11-14 | | 0.51-3.00% | | | 7 | | | | 9 | | | | – | | | | – | | | | 16 | |
| CMS 15-18 | | 3.01-20.00% | | | 1 | | | | 13 | | | | – | | | | – | | | | 14 | |
| CMS 19 | | 20.01-99.99% | | | – | | | | 2 | | | | – | | | | – | | | | 2 | |
| CMS 20-23 | | 100% | | | – | | | | – | | | | 5 | | | | – | | | | 5 | |
| | | | | | 19 | | | | 24 | | | | 5 | | | | – | | | | 48 | |
| Other | | | | | | | | | | | | | | | | | | | | | | |
| RMS 1-6 | | 0.00-4.50% | | | – | | | | – | | | | – | | | | – | | | | – | |
| RMS 7-9 | | 4.51-14.00% | | | – | | | | – | | | | – | | | | – | | | | – | |
| RMS 10 | | 14.01-20.00% | | | – | | | | – | | | | – | | | | – | | | | – | |
| RMS 11-13 | | 20.01-99.99% | | | – | | | | – | | | | – | | | | – | | | | – | |
| RMS 14 | | 100% | | | – | | | | – | | | | – | | | | – | | | | – | |
| | | | | | – | | | | – | | | | – | | | | – | | | | – | |
| CMS 1-10 | | 0.00-0.50% | | | – | | | | – | | | | – | | | | – | | | | – | |
| CMS 11-14 | | 0.51-3.00% | | | – | | | | – | | | | – | | | | – | | | | – | |
| CMS 15-18 | | 3.01-20.00% | | | – | | | | – | | | | – | | | | – | | | | – | |
| CMS 19 | | 20.01-99.99% | | | – | | | | – | | | | – | | | | – | | | | – | |
| CMS 20-23 | | 100% | | | – | | | | – | | | | – | | | | – | | | | – | |
| | | | | | – | | | | – | | | | – | | | | – | | | | – | |
| Total loans and advances to customers | | | | | 95 | | | | 77 | | | | 5 | | | | – | | | | 177 | |
| | | | | | | | | | | | | | | | | | | | | | | |
| In respect of: | | | | | | | | | | | | | | | | | | | | | | |
| Retail | | | | | 76 | | | | 53 | | | | – | | | | – | | | | 129 | |
| Commercial | | | | | 19 | | | | 24 | | | | 5 | | | | – | | | | 48 | |
| Other | | | | | – | | | | – | | | | – | | | | – | | | | – | |
| Total loans and advances to customers | | | | | 95 | | | | 77 | | | | 5 | | | | – | | | | 177 | |
NOTES TO THE CONSOLIDATED FINANCIAL STATEMENTS
NOTE 53: FINANCIAL RISK MANAGEMENT continued
| Gross drawn exposures | | PD range | | Stage 1
£m | | | Stage 2
£m | | | Stage 3
£m | | | Purchased or
originated
credit-impaired
£m | | | Total
£m | |
| At 31 December 2018 | | | | | | | | | | | | | | | | | |
| Loans and advances to banks: | | | | | | | | | | | | | | | | | | | | | | |
| CMS 1-10 | | 0.00-0.50% | | | 6,177 | | | | 3 | | | | – | | | | – | | | | 6,180 | |
| CMS 11-14 | | 0.51-3.00% | | | 105 | | | | – | | | | – | | | | – | | | | 105 | |
| CMS 15-18 | | 3.01-20.00% | | | – | | | | – | | | | – | | | | – | | | | – | |
| CMS 19 | | 20.01-99.99% | | | – | | | | – | | | | – | | | | – | | | | – | |
| CMS 20-23 | | 100% | | | – | | | | – | | | | – | | | | – | | | | – | |
| | | | | | 6,282 | | | | 3 | | | | – | | | | – | | | | 6,285 | |
| Loans and advances to customers: | | | | | | | | | | | | | | | | | | | | | | |
| Retail - mortgages | | | | | | | | | | | | | | | | | | | | | | |
| RMS 1-6 | | 0.00-4.50% | | | 257,740 | | | | 10,784 | | | | – | | | | – | | | | 268,524 | |
| RMS 7-9 | | 4.51-14.00% | | | 57 | | | | 1,709 | | | | – | | | | – | | | | 1,766 | |
| RMS 10 | | 14.01-20.00% | | | – | | | | 262 | | | | – | | | | – | | | | 262 | |
| RMS 11-13 | | 20.01-99.99% | | | – | | | | 899 | | | | – | | | | – | | | | 899 | |
| RMS 14 | | 100% | | | – | | | | – | | | | 1,393 | | | | 15,391 | | | | 16,784 | |
| | | | | | 257,797 | | | | 13,654 | | | | 1,393 | | | | 15,391 | | | | 288,235 | |
| Retail - unsecured | | | | | | | | | | | | | | | | | | | | | | |
| RMS 1-6 | | 0.00-4.50% | | | 22,363 | | | | 1,079 | | | | – | | | | – | | | | 23,442 | |
| RMS 7-9 | | 4.51-14.00% | | | 2,071 | | | | 774 | | | | – | | | | – | | | | 2,845 | |
| RMS 10 | | 14.01-20.00% | | | 72 | | | | 167 | | | | – | | | | – | | | | 239 | |
| RMS 11-13 | | 20.01-99.99% | | | 199 | | | | 687 | | | | – | | | | – | | | | 886 | |
| RMS 14 | | 100% | | | – | | | | – | | | | 703 | | | | – | | | | 703 | |
| | | | | | 24,705 | | | | 2,707 | | | | 703 | | | | – | | | | 28,115 | |
| Retail - UK Motor Finance | | | | | | | | | | | | | | | | | | | | | | |
| RMS 1-6 | | 0.00-4.50% | | | 12,918 | | | | 954 | | | | – | | | | – | | | | 13,872 | |
| RMS 7-9 | | 4.51-14.00% | | | 301 | | | | 318 | | | | – | | | | – | | | | 619 | |
| RMS 10 | | 14.01-20.00% | | | – | | | | 111 | | | | – | | | | – | | | | 111 | |
| RMS 11-13 | | 20.01-99.99% | | | 5 | | | | 197 | | | | – | | | | – | | | | 202 | |
| RMS 14 | | 100% | | | – | | | | – | | | | 129 | | | | – | | | | 129 | |
| | | | | | 13,224 | | | | 1,580 | | | | 129 | | | | – | | | | 14,933 | |
| Retail - Other | | | | | | | | | | | | | | | | | | | | | | |
| RMS 1-6 | | 0.00-4.50% | | | 9,033 | | | | 704 | | | | – | | | | – | | | | 9,737 | |
| RMS 7-9 | | 4.51-14.00% | | | 190 | | | | 66 | | | | – | | | | – | | | | 256 | |
| RMS 10 | | 14.01-20.00% | | | – | | | | 7 | | | | – | | | | – | | | | 7 | |
| RMS 11-13 | | 20.01-99.99% | | | 211 | | | | 23 | | | | – | | | | – | | | | 234 | |
| RMS 14 | | 100% | | | – | | | | – | | | | 165 | | | | – | | | | 165 | |
| | | | | | 9,434 | | | | 800 | | | | 165 | | | | – | | | | 10,399 | |
| Total Retail | | | | | 305,160 | | | | 18,741 | | | | 2,390 | | | | 15,391 | | | | 341,682 | |
NOTES TO THE CONSOLIDATED FINANCIAL STATEMENTS
NOTE 53: FINANCIAL RISK MANAGEMENT continued
| Gross drawn exposures (continued) | | PD range | | Stage 1
£m | | | Stage 2
£m | | | Stage 3
£m | | | Purchased or
originated
credit-impaired
£m | | | Total
£m | |
| At 31 December 2018 | | | | | | | | | | | | | | | | | |
| Commercial | | | | | | | | | | | | | | | | | |
| CMS 1-10 | | 0.00-0.50% | | | 65,089 | | | | 100 | | | | – | | | | – | | | | 65,189 | |
| CMS 11-14 | | 0.51-3.00% | | | 25,472 | | | | 3,450 | | | | – | | | | – | | | | 28,922 | |
| CMS 15-18 | | 3.01-20.00% | | | 1,441 | | | | 2,988 | | | | – | | | | – | | | | 4,429 | |
| CMS 19 | | 20.01-99.99% | | | – | | | | 54 | | | | – | | | | – | | | | 54 | |
| CMS 20-23 | | 100% | | | – | | | | – | | | | 3,230 | | | | – | | | | 3,230 | |
| | | | | | 92,002 | | | | 6,592 | | | | 3,230 | | | | – | | | | 101,824 | |
| Other | | | | | | | | | | | | | | | | | | | | | | |
| RMS 1-6 | | 0.00-4.50% | | | 804 | | | | 6 | | | | – | | | | – | | | | 810 | |
| RMS 7-9 | | 4.51-14.00% | | | – | | | | – | | | | – | | | | – | | | | – | |
| RMS 10 | | 14.01-20.00% | | | – | | | | – | | | | – | | | | – | | | | – | |
| RMS 11-13 | | 20.01-99.99% | | | – | | | | – | | | | – | | | | – | | | | – | |
| RMS 14 | | 100% | | | – | | | | – | | | | 55 | | | | – | | | | 55 | |
| | | | | | 804 | | | | 6 | | | | 55 | | | | – | | | | 865 | |
| CMS 1-10 | | 0.00-0.50% | | | 43,565 | | | | – | | | | – | | | | – | | | | 43,565 | |
| CMS 11-14 | | 0.51-3.00% | | | – | | | | 6 | | | | – | | | | – | | | | 6 | |
| CMS 15-18 | | 3.01-20.00% | | | – | | | | – | | | | – | | | | – | | | | – | |
| CMS 19 | | 20.01-99.99% | | | – | | | | – | | | | – | | | | – | | | | – | |
| CMS 20-23 | | 100% | | | – | | | | – | | | | 66 | | | | – | | | | 66 | |
| | | | | | 43,565 | | | | 6 | | | | 66 | | | | – | | | | 43,637 | |
| Total loans and advances to customers | | | | | 441,531 | | | | 25,345 | | | | 5,741 | | | | 15,391 | | | | 488,008 | |
| | | | | | | | | | | | | | | | | | | | | | | |
| In respect of: | | | | | | | | | | | | | | | | | | | | | | |
| Retail | | | | | 305,160 | | | | 18,741 | | | | 2,390 | | | | 15,391 | | | | 341,682 | |
| Commercial | | | | | 92,002 | | | | 6,592 | | | | 3,230 | | | | – | | | | 101,824 | |
| Other | | | | | 44,369 | | | | 12 | | | | 121 | | | | – | | | | 44,502 | |
| Total loans and advances to customers | | | | | 441,531 | | | | 25,345 | | | | 5,741 | | | | 15,391 | | | | 488,008 | |
NOTES TO THE CONSOLIDATED FINANCIAL STATEMENTS
NOTE 53: FINANCIAL RISK MANAGEMENT continued
| Expected credit losses in respect of drawn exposures | | PD range | | Stage 1
£m | | | Stage 2
£m | | | Stage 3
£m | | | Purchased or
originated
credit-impaired
£m | | | Total
£m | |
| At 31 December 2018 | | | | | | | | | | | | | | | | | |
| Loans and advances to banks: | | | | | | | | | | | | | | | | | |
| CMS 1-10 | | 0.00-0.50% | | | 2 | | | | – | | | | – | | | | – | | | | 2 | |
| CMS 11-14 | | 0.51-3.00% | | | – | | | | – | | | | – | | | | – | | | | – | |
| CMS 15-18 | | 3.01-20.00% | | | – | | | | – | | | | – | | | | – | | | | – | |
| CMS 19 | | 20.01-99.99% | | | – | | | | – | | | | – | | | | – | | | | – | |
| CMS 20-23 | | 100% | | | – | | | | – | | | | – | | | | – | | | | – | |
| | | | | | 2 | | | | – | | | | – | | | | – | | | | 2 | |
| Loans and advances to customers: | | | | | | | | | | | | | | | | | | | | | | |
| Retail - mortgages | | | | | | | | | | | | | | | | | | | | | | |
| RMS 1-6 | | 0.00-4.50% | | | 37 | | | | 141 | | | | – | | | | – | | | | 178 | |
| RMS 7-9 | | 4.51-14.00% | | | – | | | | 34 | | | | – | | | | – | | | | 34 | |
| RMS 10 | | 14.01-20.00% | | | – | | | | 9 | | | | – | | | | – | | | | 9 | |
| RMS 11-13 | | 20.01-99.99% | | | – | | | | 42 | | | | – | | | | – | | | | 42 | |
| RMS 14 | | 100% | | | – | | | | – | | | | 118 | | | | 78 | | | | 196 | |
| | | | | | 37 | | | | 226 | | | | 118 | | | | 78 | | | | 459 | |
| Retail - unsecured | | | | | | | | | | | | | | | | | | | | | | |
| RMS 1-6 | | 0.00-4.50% | | | 135 | | | | 45 | | | | – | | | | – | | | | 180 | |
| RMS 7-9 | | 4.51-14.00% | | | 57 | | | | 83 | | | | – | | | | – | | | | 140 | |
| RMS 10 | | 14.01-20.00% | | | 4 | | | | 29 | | | | – | | | | – | | | | 33 | |
| RMS 11-13 | | 20.01-99.99% | | | 3 | | | | 172 | | | | – | | | | – | | | | 175 | |
| RMS 14 | | 100% | | | – | | | | – | | | | 228 | | | | – | | | | 228 | |
| | | | | | 199 | | | | 329 | | | | 228 | | | | – | | | | 756 | |
| Retail - UK Motor Finance | | | | | | | | | | | | | | | | | | | | | | |
| RMS 1-6 | | 0.00-4.50% | | | 114 | | | | 19 | | | | – | | | | – | | | | 133 | |
| RMS 7-9 | | 4.51-14.00% | | | 6 | | | | 15 | | | | – | | | | – | | | | 21 | |
| RMS 10 | | 14.01-20.00% | | | – | | | | 11 | | | | – | | | | – | | | | 11 | |
| RMS 11-13 | | 20.01-99.99% | | | 1 | | | | 34 | | | | – | | | | – | | | | 35 | |
| RMS 14 | | 100% | | | – | | | | – | | | | 78 | | | | – | | | | 78 | |
| | | | | | 121 | | | | 79 | | | | 78 | | | | – | | | | 278 | |
| Retail - Other | | | | | | | | | | | | | | | | | | | | | | |
| RMS 1-6 | | 0.00-4.50% | | | 30 | | | | 25 | | | | – | | | | – | | | | 55 | |
| RMS 7-9 | | 4.51-14.00% | | | 2 | | | | 2 | | | | – | | | | – | | | | 4 | |
| RMS 10 | | 14.01-20.00% | | | – | | | | – | | | | – | | | | – | | | | – | |
| RMS 11-13 | | 20.01-99.99% | | | – | | | | 1 | | | | – | | | | – | | | | 1 | |
| RMS 14 | | 100% | | | – | | | | – | | | | 60 | | | | – | | | | 60 | |
| | | | | | 32 | | | | 28 | | | | 60 | | | | – | | | | 120 | |
| Total Retail | | | | | 389 | | | | 662 | | | | 484 | | | | 78 | | | | 1,613 | |
NOTES TO THE CONSOLIDATED FINANCIAL STATEMENTS
NOTE 53: FINANCIAL RISK MANAGEMENT continued
| Expected credit losses in respect of drawn exposures (continued) | | PD range | | Stage 1
£m | | | Stage 2
£m | | | Stage 3
£m | | | Purchased or
originated
credit-impaired
£m | | | Total
£m | |
| At 31 December 2018 | | | | | | | | | | | | | | | | | |
| Commercial | | | | | | | | | | | | | | | | | |
| CMS 1-10 | | 0.00-0.50% | | | 32 | | | | 1 | | | | – | | | | – | | | | 33 | |
| CMS 11-14 | | 0.51-3.00% | | | 50 | | | | 86 | | | | – | | | | – | | | | 136 | |
| CMS 15-18 | | 3.01-20.00% | | | 11 | | | | 231 | | | | – | | | | – | | | | 242 | |
| CMS 19 | | 20.01-99.99% | | | – | | | | 7 | | | | – | | | | – | | | | 7 | |
| CMS 20-23 | | 100% | | | – | | | | – | | | | 1,031 | | | | – | | | | 1,031 | |
| | | | | | 93 | | | | 325 | | | | 1,031 | | | | – | | | | 1,449 | |
| Other | | | | | | | | | | | | | | | | | | | | | | |
| RMS 1-6 | | 0.00-4.50% | | | 43 | | | | 1 | | | | – | | | | – | | | | 44 | |
| RMS 7-9 | | 4.51-14.00% | | | – | | | | – | | | | – | | | | – | | | | – | |
| RMS 10 | | 14.01-20.00% | | | – | | | | – | | | | – | | | | – | | | | – | |
| RMS 11-13 | | 20.01-99.99% | | | – | | | | – | | | | – | | | | – | | | | – | |
| RMS 14 | | 100% | | | – | | | | – | | | | 11 | | | | – | | | | 11 | |
| | | | | | 43 | | | | 1 | | | | 11 | | | | | | | | 55 | |
| CMS 1-10 | | 0.00-0.50% | | | – | | | | – | | | | – | | | | – | | | | – | |
| CMS 11-14 | | 0.51-3.00% | | | – | | | | 6 | | | | – | | | | – | | | | 6 | |
| CMS 15-18 | | 3.01-20.00% | | | – | | | | – | | | | – | | | | – | | | | – | |
| CMS 19 | | 20.01-99.99% | | | – | | | | – | | | | – | | | | – | | | | – | |
| CMS 20-23 | | 100% | | | – | | | | – | | | | 27 | | | | – | | | | 27 | |
| | | | | | – | | | | 6 | | | | 27 | | | | – | | | | 33 | |
| Total loans and advances to customers | | | | | 525 | | | | 994 | | | | 1,553 | | | | 78 | | | | 3,150 | |
| | | | | | | | | | | | | | | | | | | | | | | |
| In respect of: | | | | | | | | | | | | | | | | | | | | | | |
| Retail | | | | | 389 | | | | 662 | | | | 484 | | | | 78 | | | | 1,613 | |
| Commercial | | | | | 93 | | | | 325 | | | | 1,031 | | | | – | | | | 1,449 | |
| Other | | | | | 43 | | | | 7 | | | | 38 | | | | – | | | | 88 | |
| Total loans and advances to customers | | | | | 525 | | | | 994 | | | | 1,553 | | | | 78 | | | | 3,150 | |
NOTES TO THE CONSOLIDATED FINANCIAL STATEMENTS
NOTE 53: FINANCIAL RISK MANAGEMENT continued
| Gross undrawn exposures | | PD range | | Stage 1
£m | | | Stage 2
£m | | | Stage 3
£m | | | Purchased or
originated
credit-impaired
£m | | | Total
£m | |
| At 31 December 2018 | | | | | | | | | | | | | | | | | | | | | | |
| Loans and advances to customers: | | | | | | | | | | | | | | | | | | | | | | |
| Retail - mortgages | | | | | | | | | | | | | | | | | | | | | | |
| RMS 1-6 | | 0.00-4.50% | | | 12,024 | | | | 19 | | | | – | | | | – | | | | 12,043 | |
| RMS 7-9 | | 4.51-14.00% | | | 2 | | | | 1 | | | | – | | | | – | | | | 3 | |
| RMS 10 | | 14.01-20.00% | | | – | | | | – | | | | – | | | | – | | | | – | |
| RMS 11-13 | | 20.01-99.99% | | | – | | | | – | | | | – | | | | – | | | | – | |
| RMS 14 | | 100% | | | – | | | | – | | | | 5 | | | | 90 | | | | 95 | |
| | | | | | 12,026 | | | | 20 | | | | 5 | | | | 90 | | | | 12,141 | |
| Retail - unsecured | | | | | | | | | | | | | | | | | | | | | | |
| RMS 1-6 | | 0.00-4.50% | | | 57,433 | | | | 1,811 | | | | – | | | | – | | | | 59,244 | |
| RMS 7-9 | | 4.51-14.00% | | | 391 | | | | 155 | | | | – | | | | – | | | | 546 | |
| RMS 10 | | 14.01-20.00% | | | 10 | | | | 27 | | | | – | | | | – | | | | 37 | |
| RMS 11-13 | | 20.01-99.99% | | | 3 | | | | 51 | | | | – | | | | – | | | | 54 | |
| RMS 14 | | 100% | | | – | | | | – | | | | 36 | | | | – | | | | 36 | |
| | | | | | 57,837 | | | | 2,044 | | | | 36 | | | | – | | | | 59,917 | |
| Retail - UK Motor Finance | | | | | | | | | | | | | | | | | | | | | | |
| RMS 1-6 | | 0.00-4.50% | | | 1,565 | | | | – | | | | – | | | | – | | | | 1,565 | |
| RMS 7-9 | | 4.51-14.00% | | | 141 | | | | – | | | | – | | | | – | | | | 141 | |
| RMS 10 | | 14.01-20.00% | | | – | | | | – | | | | – | | | | – | | | | – | |
| RMS 11-13 | | 20.01-99.99% | | | – | | | | – | | | | – | | | | – | | | | – | |
| RMS 14 | | 100% | | | – | | | | – | | | | – | | | | – | | | | – | |
| | | | | | 1,706 | | | | – | | | | – | | | | – | | | | 1,706 | |
| Retail - Other | | | | | | | | | | | | | | | | | | | | | | |
| RMS 1-6 | | 0.00-4.50% | | | 1,381 | | | | 47 | | | | – | | | | – | | | | 1,428 | |
| RMS 7-9 | | 4.51-14.00% | | | – | | | | – | | | | – | | | | – | | | | – | |
| RMS 10 | | 14.01-20.00% | | | – | | | | – | | | | – | | | | – | | | | – | |
| RMS 11-13 | | 20.01-99.99% | | | 360 | | | | – | | | | – | | | | – | | | | 360 | |
| RMS 14 | | 100% | | | – | | | | – | | | | 3 | | | | – | | | | 3 | |
| | | | | | 1,741 | | | | 47 | | | | 3 | | | | – | | | | 1,791 | |
| Total Retail | | | | | 73,310 | | | | 2,111 | | | | 44 | | | | 90 | | | | 75,555 | |
NOTES TO THE CONSOLIDATED FINANCIAL STATEMENTS
NOTE 53: FINANCIAL RISK MANAGEMENT continued
| Gross undrawn exposures (continued) | | PD range | | Stage 1
£m | | | Stage 2
£m | | | Stage 3
£m | | | Purchased or
originated
credit-impaired
£m | | | Total
£m | |
| At 31 December 2018 | | | | | | | | | | | | | | | | | | | | | | |
| Commercial | | | | | | | | | | | | | | | | | | | | | | |
| CMS 1-10 | | 0.00-0.50% | | | 51,632 | | | | – | | | | – | | | | – | | | | 51,632 | |
| CMS 11-14 | | 0.51-3.00% | | | 6,501 | | | | 693 | | | | – | | | | – | | | | 7,194 | |
| CMS 15-18 | | 3.01-20.00% | | | 126 | | | | 297 | | | | – | | | | – | | | | 423 | |
| CMS 19 | | 20.01-99.99% | | | 31 | | | | 11 | | | | – | | | | – | | | | 42 | |
| CMS 20-23 | | 100% | | | – | | | | – | | | | 6 | | | | – | | | | 6 | |
| | | | | | 58,290 | | | | 1,001 | | | | 6 | | | | – | | | | 59,297 | |
| Other | | | | | | | | | | | | | | | | | | | | | | |
| RMS 1-6 | | 0.00-4.50% | | | 246 | | | | – | | | | – | | | | – | | | | 246 | |
| RMS 7-9 | | 4.51-14.00% | | | – | | | | – | | | | – | | | | – | | | | – | |
| RMS 10 | | 14.01-20.00% | | | – | | | | – | | | | – | | | | – | | | | – | |
| RMS 11-13 | | 20.01-99.99% | | | – | | | | – | | | | – | | | | – | | | | – | |
| RMS 14 | | 100% | | | – | | | | – | | | | – | | | | – | | | | – | |
| | | | | | 246 | | | | – | | | | – | | | | – | | | | 246 | |
| CMS 1-10 | | 0.00-0.50% | | | – | | | | – | | | | – | | | | – | | | | – | |
| CMS 11-14 | | 0.51-3.00% | | | – | | | | – | | | | – | | | | – | | | | – | |
| CMS 15-18 | | 3.01-20.00% | | | – | | | | – | | | | – | | | | – | | | | – | |
| CMS 19 | | 20.01-99.99% | | | – | | | | – | | | | – | | | | – | | | | – | |
| CMS 20-23 | | 100% | | | – | | | | – | | | | – | | | | – | | | | – | |
| | | | | | – | | | | – | | | | – | | | | – | | | | – | |
| Total loans and advances to customers | | | | | 131,846 | | | | 3,112 | | | | 50 | | | | 90 | | | | 135,098 | |
| | | | | | | | | | | | | | | | | | | | | | | |
| In respect of: | | | | | | | | | | | | | | | | | | | | | | |
| Retail | | | | | 73,310 | | | | 2,111 | | | | 44 | | | | 90 | | | | 75,555 | |
| Commercial | | | | | 58,290 | | | | 1,001 | | | | 6 | | | | – | | | | 59,297 | |
| Other | | | | | 246 | | | | – | | | | – | | | | – | | | | 246 | |
| Total loans and advances to customers | | | | | 131,846 | | | | 3,112 | | | | 50 | | | | 90 | | | | 135,098 | |
NOTES TO THE CONSOLIDATED FINANCIAL STATEMENTS
NOTE 53: FINANCIAL RISK MANAGEMENT continued
| Expected credit losses in respect of undrawn exposures | | PD range | | Stage 1
£m | | | Stage 2
£m | | | Stage 3
£m | | | Purchased or
originated
credit-impaired
£m | | | Total
£m | |
| At 31 December 2018 | | | | | | | | | | | | | | | | | | | | | | |
| Loans and advances to customers: | | | | | | | | | | | | | | | | | | | | | | |
| Retail - mortgages | | | | | | | | | | | | | | | | | | | | | | |
| RMS 1-6 | | 0.00-4.50% | | | 1 | | | | – | | | | – | | | | – | | | | 1 | |
| RMS 7-9 | | 4.51-14.00% | | | – | | | | – | | | | – | | | | – | | | | – | |
| RMS 10 | | 14.01-20.00% | | | – | | | | – | | | | – | | | | – | | | | – | |
| RMS 11-13 | | 20.01-99.99% | | | – | | | | – | | | | – | | | | – | | | | – | |
| RMS 14 | | 100% | | | – | | | | – | | | | – | | | | – | | | | – | |
| | | | | | 1 | | | | – | | | | – | | | | – | | | | 1 | |
| Retail - unsecured | | | | | | | | | | | | | | | | | | | | | | |
| RMS 1-6 | | 0.00-4.50% | | | 85 | | | | 26 | | | | – | | | | – | | | | 111 | |
| RMS 7-9 | | 4.51-14.00% | | | 5 | | | | 10 | | | | – | | | | – | | | | 15 | |
| RMS 10 | | 14.01-20.00% | | | – | | | | 3 | | | | – | | | | – | | | | 3 | |
| RMS 11-13 | | 20.01-99.99% | | | – | | | | 10 | | | | – | | | | – | | | | 10 | |
| RMS 14 | | 100% | | | – | | | | – | | | | – | | | | – | | | | – | |
| | | | | | 90 | | | | 49 | | | | – | | | | – | | | | 139 | |
| Retail - UK Motor Finance | | | | | | | | | | | | | | | | | | | | | | |
| RMS 1-6 | | 0.00-4.50% | | | 2 | | | | – | | | | – | | | | – | | | | 2 | |
| RMS 7-9 | | 4.51-14.00% | | | – | | | | – | | | | – | | | | – | | | | – | |
| RMS 10 | | 14.01-20.00% | | | – | | | | – | | | | – | | | | – | | | | – | |
| RMS 11-13 | | 20.01-99.99% | | | – | | | | – | | | | – | | | | – | | | | – | |
| RMS 14 | | 100% | | | – | | | | – | | | | – | | | | – | | | | – | |
| | | | | | 2 | | | | – | | | | – | | | | – | | | | 2 | |
| Retail - Other | | | | | | | | | | | | | | | | | | | | | | |
| RMS 1-6 | | 0.00-4.50% | | | 11 | | | | 2 | | | | – | | | | – | | | | 13 | |
| RMS 7-9 | | 4.51-14.00% | | | – | | | | – | | | | – | | | | – | | | | – | |
| RMS 10 | | 14.01-20.00% | | | – | | | | – | | | | – | | | | – | | | | – | |
| RMS 11-13 | | 20.01-99.99% | | | – | | | | – | | | | – | | | | – | | | | – | |
| RMS 14 | | 100% | | | – | | | | – | | | | – | | | | – | | | | – | |
| | | | | | 11 | | | | 2 | | | | – | | | | – | | | | 13 | |
| Total Retail | | | | | 104 | | | | 51 | | | | – | | | | – | | | | 155 | |
NOTES TO THE CONSOLIDATED FINANCIAL STATEMENTS
NOTE 53: FINANCIAL RISK MANAGEMENT continued
| | | | | | | | | | | | | | Purchased or | | | | |
| | | | | | | | | | | | | | originated | | | | |
| | | | | Stage 1 | | | Stage 2 | | | Stage 3 | | | credit-impaired | | | Total | |
| Expected credit losses in respect of undrawn exposures (continued) | | PD range | | £m | | | £m | | | £m | | | £m | | | £m | |
| At 31 December 2018 | | | | | | | | | | | | | | | | | |
| Commercial | | | | | | | | | | | | | | | | | |
| CMS 1-10 | | 0.00-0.50% | | | 9 | | | | – | | | | – | | | | – | | | | 9 | |
| CMS 11-14 | | 0.51-3.00% | | | 7 | | | | 7 | | | | – | | | | – | | | | 14 | |
| CMS 15-18 | | 3.01-20.00% | | | 1 | | | | 5 | | | | – | | | | – | | | | 6 | |
| CMS 19 | | 20.01-99.99% | | | 1 | | | | 1 | | | | – | | | | – | | | | 2 | |
| CMS 20-23 | | 100% | | | – | | | | – | | | | 6 | | | | – | | | | 6 | |
| | | | | | 18 | | | | 13 | | | | 6 | | | | – | | | | 37 | |
| Other | | | | | | | | | | | | | | | | | | | | | | |
| RMS 1-6 | | 0.00-4.50% | | | 1 | | | | – | | | | – | | | | – | | | | 1 | |
| RMS 7-9 | | 4.51-14.00% | | | – | | | | – | | | | – | | | | – | | | | – | |
| RMS 10 | | 14.01-20.00% | | | – | | | | – | | | | – | | | | – | | | | – | |
| RMS 11-13 | | 20.01-99.99% | | | – | | | | – | | | | – | | | | – | | | | – | |
| RMS 14 | | 100% | | | – | | | | – | | | | – | | | | – | | | | – | |
| | | | | | 1 | | | | – | | | | – | | | | – | | | | 1 | |
| CMS 1-10 | | 0.00-0.50% | | | – | | | | – | | | | – | | | | – | | | | – | |
| CMS 11-14 | | 0.51-3.00% | | | – | | | | – | | | | – | | | | – | | | | – | |
| CMS 15-18 | | 3.01-20.00% | | | – | | | | – | | | | – | | | | – | | | | – | |
| CMS 19 | | 20.01-99.99% | | | – | | | | – | | | | – | | | | – | | | | – | |
| CMS 20-23 | | 100% | | | – | | | | – | | | | – | | | | – | | | | – | |
| | | | | | – | | | | – | | | | – | | | | – | | | | – | |
| Total loans and advances to customers | | | | | 123 | | | | 64 | | | | 6 | | | | – | | | | 193 | |
| | | | | | | | | | | | | | | | | | | | | | | |
| In respect of: | | | | | | | | | | | | | | | | | | | | | | |
| Retail | | | | | 104 | | | | 51 | | | | – | | | | – | | | | 155 | |
| Commercial | | | | | 18 | | | | 13 | | | | 6 | | | | – | | | | 37 | |
| Other | | | | | 1 | | | | – | | | | – | | | | – | | | | 1 | |
| Total loans and advances to customers | | | | | 123 | | | | 64 | | | | 6 | | | | – | | | | 193 | |
NOTES TO THE CONSOLIDATED FINANCIAL STATEMENTS
NOTE 53: FINANCIAL RISK MANAGEMENT continued
DEBT SECURITIES HELD AT AMORTISED COST
An analysis by credit rating of the Group’s debt securities held at amortised cost is provided below:
| | | 2019 | | 2018 |
| | | Investment | | | | | | | | | Investment | | | | | | | |
| | | grade1 | | | Other2 | | | Total | | | grade1 | | | Other2 | | | Total | |
| | | £m | | | £m | | | £m | | | £m | | | £m | | | £m | |
| Asset-backed securities: | | | | | | | | | | | | | | | | | | |
| Mortgage-backed securities | | | 3,007 | | | | – | | | | 3,007 | | | | 3,263 | | | | 9 | | | | 3,272 | |
| Other asset-backed securities | | | 876 | | | | – | | | | 876 | | | | 763 | | | | 17 | | | | 780 | |
| | | | 3,883 | | | | – | | | | 3,883 | | | | 4,026 | | | | 26 | | | | 4,052 | |
| Corporate and other debt securities | | | 1,650 | | | | 14 | | | | 1,664 | | | | 1,176 | | | | 16 | | | | 1,192 | |
| Gross exposure | | | 5,533 | | | | 14 | | | | 5,547 | | | | 5,202 | | | | 42 | | | | 5,244 | |
| Allowance for impairment losses | | | | | | | | | | | (3 | ) | | | | | | | | | | | (6 | ) |
| Total debt securities held at amortised cost | | | | | | | | | | | 5,544 | | | | | | | | | | | | 5,238 | |
| 1 | Credit ratings equal to or better than ‘BBB’. |
| | |
| 2 | Other comprises sub-investment grade (31 December 2019: £nil; 31 December 2018: £6 million) and not rated (31 December 2019: £14 million; 31 December 2018: £36 million). |
FINANCIAL ASSETS AT FAIR VALUE THROUGH OTHER COMPREHENSIVE INCOME (EXCLUDING EQUITY SHARES)
An analysis of the Group’s financial assets at fair value through other comprehensive income is included in note 19. The credit quality of the Group’s financial assets at fair value through other comprehensive income (excluding equity shares) is set out below:
| | | 2019 | | 2018 |
| | | Investment | | | | | | | | | Investment | | | | | | | |
| | | grade1 | | | Other2 | | | Total | | | grade1 | | | Other2 | | | Total | |
| | | £m | | | £m | | | £m | | | £m | | | £m | | | £m | |
| Debt securities: | | | | | | | | | | | | | | | | | | |
| Government securities | | | 13,084 | | | | 14 | | | | 13,098 | | | | 18,971 | | | | – | | | | 18,971 | |
| Bank and building society certificates of deposit | | | – | | | | – | | | | – | | | | 118 | | | | – | | | | 118 | |
| Asset-backed securities: | | | | | | | | | | | | | | | | | | | | | | | | |
| Mortgage-backed securities | | | 121 | | | | – | | | | 121 | | | | 120 | | | | – | | | | 120 | |
| Other asset-backed securities | | | – | | | | 60 | | | | 60 | | | | – | | | | 131 | | | | 131 | |
| | | | 121 | | | | 60 | | | | 181 | | | | 120 | | | | 131 | | | | 251 | |
| Corporate and other debt securities | | | 11,036 | | | | 15 | | | | 11,051 | | | | 4,934 | | | | 217 | | | | 5,151 | |
| Total debt securities | | | 24,241 | | | | 89 | | | | 24,330 | | | | 24,143 | | | | 348 | | | | 24,491 | |
| Treasury and other bills | | | 535 | | | | – | | | | 535 | | | | 303 | | | | – | | | | 303 | |
| Total financial assets at fair value through other comprehensive income | | | 24,776 | | | | 89 | | | | 24,865 | | | | 24,446 | | | | 348 | | | | 24,794 | |
| 1 | Credit ratings equal to or better than ‘BBB’. |
| | |
| 2 | Other comprises sub-investment grade (31 December 2019: £89 million; 31 December 2018: £85 million) and not rated (31 December 2019: £nil; 31 December 2018: £263 million). |
NOTES TO THE CONSOLIDATED FINANCIAL STATEMENTS
NOTE 53: FINANCIAL RISK MANAGEMENT continued
DEBT SECURITIES, TREASURY AND OTHER BILLS HELD AT FAIR VALUE THROUGH PROFIT OR LOSS
An analysis of the Group’s financial assets at fair value through profit or loss is included in note 14. The credit quality of the Group’s debt securities, treasury and other bills held at fair value through profit or loss is set out below:
| | | 2019 | | 2018 |
| | | Investment | | | | | | | | | Investment | | | | | | | |
| | | grade1 | | | Other2 | | | Total | | | grade1 | | | Other2 | | | Total | |
| | | £m | | | £m | | | £m | | | £m | | | £m | | | £m | |
| Debt securities, treasury and other bills held at fair value through profit or loss | | | | | | | | | | | | | | | | | | |
| Trading assets: | | | | | | | | | | | | | | | | | | |
| Government securities | | | 6,791 | | | | – | | | | 6,791 | | | | 7,192 | | | | – | | | | 7,192 | |
| Asset-backed securities: | | | | | | | | | | | | | | | | | | | | | | | | |
| Mortgage-backed securities | | | 1 | | | | 5 | | | | 6 | | | | 10 | | | | – | | | | 10 | |
| Other asset-backed securities | | | 14 | | | | 3 | | | | 17 | | | | 63 | | | | – | | | | 63 | |
| | | | 15 | | | | 8 | | | | 23 | | | | 73 | | | | – | | | | 73 | |
| Corporate and other debt securities | | | 232 | | | | 1 | | | | 233 | | | | 228 | | | | 19 | | | | 247 | |
| Total held as trading assets | | | 7,038 | | | | 9 | | | | 7,047 | | | | 7,493 | | | | 19 | | | | 7,512 | |
| Other assets held at fair value through profit or loss: | | | | | | | | | | | | | | | | | | | | | | | | |
| Government securities | | | 12,044 | | | | 19 | | | | 12,063 | | | | 10,903 | | | | – | | | | 10,903 | |
| Other public sector securities | | | 2,118 | | | | 8 | | | | 2,126 | | | | 2,059 | | | | 5 | | | | 2,064 | |
| Bank and building society certificates of deposit | | | 984 | | | | – | | | | 984 | | | | 1,105 | | | | – | | | | 1,105 | |
| Asset-backed securities: | | | | | | | | | | | | | | | | | | | | | | | | |
| Mortgage-backed securities | | | 452 | | | | 10 | | | | 462 | | | | 208 | | | | 7 | | | | 215 | |
| Other asset-backed securities | | | 241 | | | | – | | | | 241 | | | | 283 | | | | 3 | | | | 286 | |
| | | | 693 | | | | 10 | | | | 703 | | | | 491 | | | | 10 | | | | 501 | |
| Corporate and other debt securities | | | 15,932 | | | | 2,051 | | | | 17,983 | | | | 16,141 | | | | 1,922 | | | | 18,063 | |
| Total debt securities held at fair value through profit or loss | | | 31,771 | | | | 2,088 | | | | 33,859 | | | | 30,699 | | | | 1,937 | | | | 32,636 | |
| Treasury bills and other bills | | | 19 | | | | – | | | | 19 | | | | 20 | | | | – | | | | 20 | |
| Total other assets held at fair value through profit or loss | | | 31,790 | | | | 2,088 | | | | 33,878 | | | | 30,719 | | | | 1,937 | | | | 32,656 | |
| Total held at fair value through profit or loss | | | 38,828 | | | | 2,097 | | | | 40,925 | | | | 38,212 | | | | 1,956 | | | | 40,168 | |
| 1 | Credit ratings equal to or better than ‘BBB’. |
| | |
| 2 | Other comprises sub-investment grade (2019: £251 million; 2018: £411 million) and not rated (2019: £1,846 million; 2018: £1,545 million). |
Credit risk in respect of trading and other financial assets at fair value through profit or loss held within the Group’s unit-linked funds is borne by the policyholders and credit risk in respect of with-profits funds is largely borne by the policyholders. Consequently, the Group has no significant exposure to credit risk for such assets which back those contract liabilities.
DERIVATIVE ASSETS
An analysis of derivative assets is given in note 17. The Group reduces exposure to credit risk by using master netting agreements and by obtaining collateral in the form of cash or highly liquid securities. In respect of the Group’s net credit risk relating to derivative assets of £11,673 million (2018: £9,268 million), cash collateral of £7,650 million (2018: £6,039 million) was held and a further £274 million was due from OECD banks (2018: £213 million).
| | | 2019 | | 2018 |
| | | Investment | | | | | | | | | Investment | | | | | | | |
| | | grade1 | | | Other2 | | | Total | | | grade1 | | | Other2 | | | Total | |
| | | £m | | | £m | | | £m | | | £m | | | £m | | | £m | |
| Trading and other | | | 22,991 | | | | 2,142 | | | | 25,133 | | | | 19,797 | | | | 2,235 | | | | 22,032 | |
| Hedging | | | 1,178 | | | | 58 | | | | 1,236 | | | | 1,534 | | | | 29 | | | | 1,563 | |
| Total derivative financial instruments | | | 24,169 | | | | 2,200 | | | | 26,369 | | | | 21,331 | | | | 2,264 | | | | 23,595 | |
| 1 | Credit ratings equal to or better than ‘BBB’. |
| | |
| 2 | Other comprises sub-investment grade (2019: £1,555 million; 2018: £1,920 million) and not rated (2019: £645 million; 2018: £344 million). |
FINANCIAL GUARANTEES AND IRREVOCABLE LOAN COMMITMENTS
Financial guarantees represent undertakings that the Group will meet a customer’s obligation to third parties if the customer fails to do so. Commitments to extend credit represent unused portions of authorisations to extend credit in the form of loans, guarantees or letters of credit. The Group is theoretically exposed to loss in an amount equal to the total guarantees or unused commitments, however, the likely amount of loss is expected to be significantly less; most commitments to extend credit are contingent upon customers maintaining specific credit standards.
(D) COLLATERAL HELD AS SECURITY FOR FINANCIAL ASSETS
A general description of collateral held as security in respect of financial instruments is provided on page 53. The Group holds collateral against loans and advances and irrevocable loan commitments; qualitative and, where appropriate, quantitative information is provided in respect of this collateral below. Collateral held as security for financial assets at fair value through profit or loss and for derivative assets is also shown below.
NOTES TO THE CONSOLIDATED FINANCIAL STATEMENTS
NOTE 53: FINANCIAL RISK MANAGEMENTcontinued
The Group holds collateral in respect of loans and advances to banks and customers as set out below. The Group does not hold collateral against debt securities, comprising asset-backed securities and corporate and other debt securities, which are classified as financial assets held at amortised cost.
LOANS AND ADVANCES TO BANKS
There were reverse repurchase agreements which are accounted for as collateralised loans within loans and advances to banks with a carrying value of £1,555 million (2018: £461 million), against which the Group held collateral with a fair value of £1,516 million (2018: £481 million).
These transactions were generally conducted under terms that are usual and customary for standard secured lending activities.
LOANS AND ADVANCES TO CUSTOMERS
Retail lending
Mortgages
An analysis by loan-to-value ratio of the Group’s residential mortgage lending is provided below. The value of collateral used in determining the loan-to-value ratios has been estimated based upon the last actual valuation, adjusted to take into account subsequent movements in house prices, after making allowances for indexation error and dilapidations.
In some circumstances, where the discounted value of the estimated net proceeds from the liquidation of collateral (i.e. net of costs, expected haircuts and anticipated changes in the value of the collateral to the point of sale) is greater than the estimated exposure at default, no credit losses are expected and no ECL allowance is recognised.
| | | | | | As at 31 December 2019 | | | | | | | | | As at 31 December 2018 | | | | |
| | | Stage 1
£m | | | Stage 2
£m | | | Stage 3
£m | | | Purchased
or
originated
credit-
impaired
£m | | | Total gross
£m | | | Stage 1
£m | | | Stage 2
£m | | | Stage 3
£m | | | Purchased
or
originated
credit-
impaired
£m | | | Total gross
£m | |
| Drawn balances | | | | | | | | | | | | | | | | | | | | | | | | | | | | | | | | | | | | | | | | |
| Less than 70 per cent | | | 179,566 | | | | 13,147 | | | | 1,174 | | | | 10,728 | | | | 204,615 | | | | 185,556 | | | | 10,728 | | | | 1,035 | | | | 11,846 | | | | 209,165 | |
| 70 per cent to 80 per cent | | | 44,384 | | | | 2,343 | | | | 181 | | | | 1,751 | | | | 48,659 | | | | 41,827 | | | | 1,802 | | | | 190 | | | | 1,884 | | | | 45,703 | |
| 80 per cent to 90 per cent | | | 27,056 | | | | 1,057 | | | | 86 | | | | 677 | | | | 28,876 | | | | 24,854 | | | | 832 | | | | 95 | | | | 1,032 | | | | 26,813 | |
| 90 per cent to 100 per cent | | | 5,663 | | | | 199 | | | | 34 | | | | 207 | | | | 6,103 | | | | 4,957 | | | | 164 | | | | 39 | | | | 302 | | | | 5,462 | |
| Greater than 100 per cent | | | 374 | | | | 189 | | | | 31 | | | | 351 | | | | 945 | | | | 603 | | | | 128 | | | | 34 | | | | 327 | | | | 1,092 | |
| Total | | | 257,043 | | | | 16,935 | | | | 1,506 | | | | 13,714 | | | | 289,198 | | | | 257,797 | | | | 13,654 | | | | 1,393 | | | | 15,391 | | | | 288,235 | |
| | | | | | As at 31 December 2019 | | | | | | | | | As at 31 December 2018 | | | | |
| | | Stage 1
£m | | | Stage 2
£m | | | Stage 3
£m | | | Purchased
or
originated
credit-
impaired
£m | | | Total
£m | | | Stage 1
£m | | | Stage 2
£m | | | Stage 3
£m | | | Purchased
or
originated
credit-
impaired
£m | | | Total
£m | |
| Expected credit losses on drawn balances | | | | | | | | | | | | | | | | | | | | | | | | | | | | | | | | | | | | | | | | |
| Less than 70 per cent | | | 6 | | | | 104 | | | | 41 | | | | 44 | | | | 195 | | | | 3 | | | | 94 | | | | 34 | | | | 19 | | | | 150 | |
| 70 per cent to 80 per cent | | | 7 | | | | 75 | | | | 29 | | | | 38 | | | | 149 | �� | | | 11 | | | | 51 | | | | 24 | | | | 12 | | | | 98 | |
| 80 per cent to 90 per cent | | | 7 | | | | 58 | | | | 25 | | | | 23 | | | | 113 | | | | 14 | | | | 47 | | | | 27 | | | | 16 | | | | 104 | |
| 90 per cent to 100 per cent | | | 2 | | | | 17 | | | | 12 | | | | 10 | | | | 41 | | | | 4 | | | | 16 | | | | 14 | | | | 9 | | | | 43 | |
| Greater than 100 per cent | | | 1 | | | | 27 | | | | 15 | | | | 27 | | | | 70 | | | | 5 | | | | 18 | | | | 19 | | | | 22 | | | | 64 | |
| Total | | | 23 | | | | 281 | | | | 122 | | | | 142 | | | | 568 | | | | 37 | | | | 226 | | | | 118 | | | | 78 | | | | 459 | |
Other
The majority of non-mortgage retail lending is unsecured. At 31 December 2019, Stage 3 non-mortgage lending amounted to £610 million, net of an impairment allowance of £368 million (2018: £631 million, net of an impairment allowance of £366 million).
Stage 1 and Stage 2 non-mortgage retail lending amounted to £54,042 million (2018: £52,450 million). Lending decisions are predominantly based on an obligor’s ability to repay from normal business operations rather than reliance on the disposal of any security provided. Collateral values are rigorously assessed at the time of loan origination and are thereafter monitored in accordance with business unit credit policy.
The Group credit risk disclosures for unimpaired non-mortgage retail lending report assets gross of collateral and therefore disclose the maximum loss exposure. The Group believes that this approach is appropriate.
Commercial lending
Reverse repurchase transactions
At 31 December 2019 there were reverse repurchase agreements which were accounted for as collateralised loans with a carrying value of £54,600 million (2018: £40,483 million), against which the Group held collateral with a fair value of £52,982 million (2018: £42,339 million), all of which the Group was able to repledge. There were no collateral balances in the form of cash provided in respect of reverse repurchase agreements included in these amounts (2018: £nil). These transactions were generally conducted under terms that are usual and customary for standard secured lending activities.
Stage 3 secured lending
The value of collateral is re-evaluated and its legal soundness re-assessed if there is observable evidence of distress of the borrower; this evaluation is used to determine potential loss allowances and management’s strategy to try to either repair the business or recover the debt.
NOTES TO THE CONSOLIDATED FINANCIAL STATEMENTS
NOTE 53: FINANCIAL RISK MANAGEMENTcontinued
At 31 December 2019, Stage 3 secured commercial lending amounted to £966 million, net of an impairment allowance of £243 million (2018: £658 million, net of an impairment allowance of £215 million). The fair value of the collateral held in respect of impaired secured commercial lending was £744 million (2018: £590 million). In determining the fair value of collateral, no specific amounts have been attributed to the costs of realisation. For the purposes of determining the total collateral held by the Group in respect of impaired secured commercial lending, the value of collateral for each loan has been limited to the principal amount of the outstanding advance in order to eliminate the effects of any over-collateralisation and to provide a clearer representation of the Group’s exposure.
Stage 3 secured commercial lending and associated collateral relates to lending to property companies and to customers in the financial, business and other services; transport, distribution and hotels; and construction industries.
Stage 1 and Stage 2 secured lending
For Stage 1 and Stage 2 secured commercial lending, the Group reports assets gross of collateral and therefore discloses the maximum loss exposure. The Group believes that this approach is appropriate as collateral values at origination and during a period of good performance may not be representative of the value of collateral if the obligor enters a distressed state.
Stage 1 and Stage 2 secured commercial lending is predominantly managed on a cash flow basis. On occasion, it may include an assessment of underlying collateral, although, for Stage 3 lending, this will not always involve assessing it on a fair value basis. No aggregated collateral information for the entire unimpaired secured commercial lending portfolio is provided to key management personnel.
FINANCIAL ASSETS AT FAIR VALUE THROUGH PROFIT OR LOSS (EXCLUDING EQUITY SHARES)
Included in financial assets at fair value through profit or loss are reverse repurchase agreements treated as collateralised loans with a carrying value of £11,269 million (2018: £28,356 million). Collateral is held with a fair value of £11,081 million (2018: £36,101 million), all of which the Group is able to repledge. At 31 December 2019, £9,605 million had been repledged (2018: £31,013 million).
In addition, securities held as collateral in the form of stock borrowed amounted to £32,888 million (2018: £51,202 million). Of this amount, £30,594 million (2018: £49,233 million) had been resold or repledged as collateral for the Group’s own transactions.
These transactions were generally conducted under terms that are usual and customary for standard secured lending activities.
DERIVATIVE ASSETS, AFTER OFFSETTING OF AMOUNTS UNDER MASTER NETTING ARRANGEMENTS
The Group reduces exposure to credit risk by using master netting agreements and by obtaining collateral in the form of cash or highly liquid securities. In respect of the net derivative assets after offsetting of amounts under master netting arrangements of £11,673 million (2018: £9,268 million), cash collateral of £7,650 million (2018: £6,039 million) was held.
IRREVOCABLE LOAN COMMITMENTS AND OTHER CREDIT-RELATED CONTINGENCIES
At 31 December 2019, the Group held irrevocable loan commitments and other credit-related contingencies of £66,398 million (2018: £68,135 million). Collateral is held as security, in the event that lending is drawn down, on £12,391 million (2018: £10,661 million) of these balances.
COLLATERAL REPOSSESSED
During the year, £413 million of collateral was repossessed (2018: £245 million), consisting primarily of residential property.
In respect of retail portfolios, the Group does not take physical possession of properties or other assets held as collateral and uses external agents to realise the value as soon as practicable, generally at auction, to settle indebtedness. Any surplus funds are returned to the borrower or are otherwise dealt with in accordance with appropriate insolvency regulations. In certain circumstances the Group takes physical possession of assets held as collateral against commercial lending. In such cases, the assets are carried on the Group’s balance sheet and are classified according to the Group’s accounting policies.
(E) COLLATERAL PLEDGED AS SECURITY
The Group pledges assets primarily for repurchase agreements and securities lending transactions which are generally conducted under terms that are usual and customary for standard securitised borrowing contracts.
REPURCHASE TRANSACTIONS
Deposits from banks
Included in deposits from banks are balances arising from repurchase transactions of £18,105 million (2018: £21,170 million); the fair value of the collateral provided under these agreements at 31 December 2019 was £17,545 million (2018: £19,615 million).
Customer deposits
Included in customer deposits are balances arising from repurchase transactions of £9,530 million (2018: £1,818 million); the fair value of the collateral provided under these agreements at 31 December 2019 was £9,221 million (2018: £1,710 million).
Financial liabilities at fair value through profit or loss
The fair value of collateral pledged in respect of repurchase transactions, accounted for as secured borrowing, where the secured party is permitted by contract or custom to repledge was £8,324 million (2018: £28,438 million).
SECURITIES LENDING TRANSACTIONS
The following on balance sheet financial assets have been lent to counterparties under securities lending transactions:
| | | 2019
£m | | | 2018
£m | |
| Financial assets at fair value through profit or loss | | | 5,857 | | | | 5,837 | |
| Financial assets at fair value through other comprehensive income | | | 2,020 | | | | 1,917 | |
| | | | 7,877 | | | | 7,754 | |
SECURITISATIONS AND COVERED BONDS
In addition to the assets detailed above, the Group also holds assets that are encumbered through the Group’s asset-backed conduits and its securitisation and covered bond programmes. Further details of these assets are provided in note 31.
NOTES TO THE CONSOLIDATED FINANCIAL STATEMENTS
NOTE 53: FINANCIAL RISK MANAGEMENT continued
Liquidity risk
Liquidity risk is defined as the risk that the Group has insufficient financial resources to meet its commitments as they fall due, or can only secure them at excessive cost. Liquidity risk is managed through a series of measures, tests and reports that are primarily based on contractual maturity. The Group carries out monthly stress testing of its liquidity position against a range of scenarios, including those prescribed by the PRA. The Group’s liquidity risk appetite is also calibrated against a number of stressed liquidity metrics.
The table below analyses assets and liabilities of the Group into relevant maturity groupings based on the remaining contractual period at the balance sheet date; balances with no fixed maturity are included in the over 5 years category. Certain balances, included in the table below on the basis of their residual maturity, are repayable on demand upon payment of a penalty.
(A) MATURITIES OF ASSETS AND LIABILITIES
| | | Up to
1 month
£m | | | 1-3
months
£m | | | 3-6
months
£m | | | 6-9
months
£m | | | 9-12
months
£m | | | 1-2
years
£m | | | 2-5
years
£m | | | Over 5
years
£m | | | Total
£m | |
| At 31 December 2019 | | | | | | | | | | | | | | | | | | | | | | | | | | | | | | | | | | | | |
| Assets | | | | | | | | | | | | | | | | | | | | | | | | | | | | | | | | | | | | |
| Cash and balances at central banks | | | 55,128 | | | | 2 | | | | – | | | | – | | | | – | | | | – | | | | – | | | | – | | | | 55,130 | |
| Financial assets at fair value through profit or loss | | | 7,195 | | | | 3,689 | | | | 3,016 | | | | 1,710 | | | | 451 | | | | 2,801 | | | | 5,385 | | | | 135,942 | | | | 160,189 | |
| Derivative financial instruments | | | 583 | | | | 739 | | | | 627 | | | | 404 | | | | 336 | | | | 1,294 | | | | 2,763 | | | | 19,623 | | | | 26,369 | |
| Loans and advances to banks | | | 4,953 | | | | 1,017 | | | | 265 | | | | 124 | | | | 91 | | | | 26 | | | | – | | | | 3,299 | | | | 9,775 | |
| Loans and advances to customers | | | 35,973 | | | | 26,036 | | | | 23,283 | | | | 12,626 | | | | 11,425 | | | | 29,917 | | | | 74,416 | | | | 281,312 | | | | 494,988 | |
| Debt securities held at amortised cost | | | 131 | | | | 19 | | | | – | | | | – | | | | – | | | | 74 | | | | 3,085 | | | | 2,235 | | | | 5,544 | |
| Financial assets at fair value through other comprehensive income | | | 111 | | | | 179 | | | | 729 | | | | 102 | | | | 234 | | | | 2,929 | | | | 12,809 | | | | 7,999 | | | | 25,092 | |
| Other assets | | | 2,224 | | | | 1,155 | | | | 533 | | | | 160 | | | | 520 | | | | 568 | | | | 1,218 | | | | 50,428 | | | | 56,806 | |
| Total assets | | | 106,298 | | | | 32,836 | | | | 28,453 | | | | 15,126 | | | | 13,057 | | | | 37,609 | | | | 99,676 | | | | 500,838 | | | | 833,893 | |
| Liabilities | | | | | | | | | | | | | | | | | | | | | | | | | | | | | | | | | | | | |
| Deposits from banks | | | 4,530 | | | | 2,715 | | | | 267 | | | | 85 | | | | 55 | | | | 15,686 | | | | 433 | | | | 4,408 | | | | 28,179 | |
| Customer deposits | | | 382,885 | | | | 12,945 | | | | 6,716 | | | | 4,377 | | | | 3,207 | | | | 6,742 | | | | 1,752 | | | | 2,696 | | | | 421,320 | |
| Derivative financial instruments and financial liabilities at fair value through profit or loss | | | 5,182 | | | | 6,101 | | | | 2,579 | | | | 784 | | | | 528 | | | | 1,644 | | | | 5,238 | | | | 25,209 | | | | 47,265 | |
| Debt securities in issue | | | 4,070 | | | | 9,159 | | | | 7,135 | | | | 7,418 | | | | 1,963 | | | | 13,618 | | | | 30,897 | | | | 23,429 | | | | 97,689 | |
| Liabilities arising from insurance and investment contracts | | | 1,213 | | | | 1,658 | | | | 2,370 | | | | 2,348 | | | | 2,882 | | | | 9,028 | | | | 24,870 | | | | 104,539 | | | | 148,908 | |
| Other liabilities | | | 4,541 | | | | 1,914 | | | | 772 | | | | 893 | | | | 1,682 | | | | 898 | | | | 906 | | | | 13,990 | | | | 25,596 | |
| Subordinated liabilities | | | – | | | | 1,339 | | | | 96 | | | | 1,137 | | | | 108 | | | | 575 | | | | 4,105 | | | | 9,770 | | | | 17,130 | |
| Total liabilities | | | 402,421 | | | | 35,831 | | | | 19,935 | | | | 17,042 | | | | 10,425 | | | | 48,191 | | | | 68,201 | | | | 184,041 | | | | 786,087 | |
| At 31 December 2018 | | | | | | | | | | | | | | | | | | | | | | | | | | | | | | | | | | | | |
| Assets | | | | | | | | | | | | | | | | | | | | | | | | | | | | | | | | | | | | |
| Cash and balances at central banks | | | 54,662 | | | | 1 | | | | – | | | | – | | | | – | | | | – | | | | – | | | | – | | | | 54,663 | |
| Financial assets at fair value through profit or loss | | | 10,686 | | | | 8,826 | | | | 8,492 | | | | 5,133 | | | | 2,587 | | | | 2,090 | | | | 5,467 | | | | 115,248 | | | | 158,529 | |
| Derivative financial instruments | | | 579 | | | | 688 | | | | 418 | | | | 336 | | | | 441 | | | | 1,064 | | | | 3,075 | | | | 16,994 | | | | 23,595 | |
| Loans and advances to banks | | | 2,594 | | | | 520 | | | | 584 | | | | 172 | | | | 203 | | | | 160 | | | | – | | | | 2,050 | | | | 6,283 | |
| Loans and advances to customers | | | 36,326 | | | | 19,383 | | | | 18,415 | | | | 14,378 | | | | 11,318 | | | | 30,459 | | | | 72,028 | | | | 282,551 | | | | 484,858 | |
| Debt securities held as at amortised cost | | | 7 | | | | – | | | | – | | | | 521 | | | | – | | | | – | | | | 2,262 | | | | 2,448 | | | | 5,238 | |
| Financial assets at fair value through other comprehensive income | | | 166 | | | | 453 | | | | 249 | | | | 800 | | | | 1,685 | | | | 2,536 | | | | 11,496 | | | | 7,430 | | | | 24,815 | |
| Other assets | | | 2,667 | | | | 1,552 | | | | 196 | | | | 238 | | | | 219 | | | | 387 | | | | 1,118 | | | | 33,240 | | | | 39,617 | |
| Total assets | | | 107,687 | | | | 31,423 | | | | 28,354 | | | | 21,578 | | | | 16,453 | | | | 36,696 | | | | 95,446 | | | | 459,961 | | | | 797,598 | |
| Liabilities | | | | | | | | | | | | | | | | | | | | | | | | | | | | | | | | | | | | |
| Deposits from banks | | | 2,793 | | | | 1,688 | | | | 748 | | | | 54 | | | | 45 | | | | 4,758 | | | | 16,052 | | | | 4,182 | | | | 30,320 | |
| Customer deposits | | | 380,753 | | | | 10,623 | | | | 5,628 | | | | 4,543 | | | | 4,431 | | | | 6,421 | | | | 3,244 | | | | 2,423 | | | | 418,066 | |
| Derivative financial instruments and financial liabilities at fair value through profit or loss | | | 5,160 | | | | 11,877 | | | | 5,048 | | | | 1,663 | | | | 522 | | | | 1,104 | | | | 4,108 | | | | 22,438 | | | | 51,920 | |
| Debt securities in issue | | | 4,172 | | | | 5,692 | | | | 9,007 | | | | 4,668 | | | | 1,694 | | | | 13,062 | | | | 28,676 | | | | 24,197 | | | | 91,168 | |
| Liabilities arising from insurance and investment contracts | | | 1,844 | | | | 1,850 | | | | 2,316 | | | | 2,302 | | | | 2,104 | | | | 7,995 | | | | 20,986 | | | | 73,330 | | | | 112,727 | |
| Other liabilities | | | 4,403 | | | | 3,201 | | | | 733 | | | | 1,182 | | | | 1,383 | | | | 756 | | | | 232 | | | | 13,652 | | | | 25,542 | |
| Subordinated liabilities | | | 85 | | | | 145 | | | | 95 | | | | 251 | | | | – | | | | 2,600 | | | | 2,559 | | | | 11,921 | | | | 17,656 | |
| Total liabilities | | | 399,210 | | | | 35,076 | | | | 23,575 | | | | 14,663 | | | | 10,179 | | | | 36,696 | | | | 75,857 | | | | 152,143 | | | | 747,399 | |
NOTES TO THE CONSOLIDATED FINANCIAL STATEMENTS
NOTE 53: FINANCIAL RISK MANAGEMENTcontinued
The above tables are provided on a contractual basis. The Group’s assets and liabilities may be repaid or otherwise mature earlier or later than implied by their contractual terms and readers are, therefore, advised to use caution when using this data to evaluate the Group’s liquidity position. In particular, amounts in respect of customer deposits are usually contractually payable on demand or at short notice. However, in practice, these deposits are not usually withdrawn on their contractual maturity.
The table below analyses financial instrument liabilities of the Group, excluding those arising from insurance and participating investment contracts, on an undiscounted future cash flow basis according to contractual maturity, into relevant maturity groupings based on the remaining period at the balance sheet date; balances with no fixed maturity are included in the over 5 years category.
| | | Up to
1 month
£m | | | 1-3
months
£m | | | 3-12
months
£m | | | 1-5
years
£m | | | Over 5
years
£m | | | Total
£m | |
| At 31 December 2019 | | | | | | | | | | | | | | | | | | | | | | | | |
| Deposits from banks | | | 5,009 | | | | 2,564 | | | | 762 | | | | 20,066 | | | | 317 | | | | 28,718 | |
| Customer deposits | | | 385,864 | | | | 14,433 | | | | 14,327 | | | | 10,661 | | | | 1,393 | | | | 426,678 | |
| Financial liabilities at fair value through profit or loss | | | 4,370 | | | | 5,543 | | | | 2,255 | | | | 2,690 | | | | 14,653 | | | | 29,511 | |
| Debt securities in issue | | | 5,335 | | | | 9,858 | | | | 19,205 | | | | 54,638 | | | | 36,321 | | | | 125,357 | |
| Liabilities arising from non-participating investment contracts | | | 37,459 | | | | – | | | | – | | | | – | | | | – | | | | 37,459 | |
| Other liabilities (Lease liabilities) | | | 2 | | | | 61 | | | | 190 | | | | 803 | | | | 946 | | | | 2,002 | |
| Subordinated liabilities | | | 942 | | | | 1,462 | | | | 1,918 | | | | 7,837 | | | | 14,857 | | | | 27,016 | |
| Total non-derivative financial liabilities | | | 438,981 | | | | 33,921 | | | | 38,657 | | | | 96,695 | | | | 68,487 | | | | 676,741 | |
| Derivative financial liabilities: | | | | | | | | | | | | | | | | | | | | | | | | |
| Gross settled derivatives – outflows | | | 43,118 | | | | 44,379 | | | | 34,012 | | | | 36,012 | | | | 18,238 | | | | 175,759 | |
| Gross settled derivatives – inflows | | | (40,829 | ) | | | (42,954 | ) | | | (32,966 | ) | | | (34,758 | ) | | | (17,753 | ) | | | (169,260 | ) |
| Gross settled derivatives – net flows | | | 2,289 | | | | 1,425 | | | | 1,046 | | | | 1,254 | | | | 485 | | | | 6,499 | |
| Net settled derivatives liabilities | | | 23,648 | | | | 48 | | | | 122 | | | | 700 | | | | 2,201 | | | | 26,719 | |
| Total derivative financial liabilities | | | 25,937 | | | | 1,473 | | | | 1,168 | | | | 1,954 | | | | 2,686 | | | | 33,218 | |
| At 31 December 2018 | | | | | | | | | | | | | | | | | | | | | | | | |
| Deposits from banks | | | 2,820 | | | | 2,710 | | | | 1,022 | | | | 20,920 | | | | 3,502 | | | | 30,974 | |
| Customer deposits | | | 380,985 | | | | 10,584 | | | | 14,169 | | | | 11,634 | | | | 1,554 | | | | 418,926 | |
| Financial liabilities at fair value through profit or loss | | | 9,693 | | | | 10,984 | | | | 7,553 | | | | 930 | | | | 10,771 | | | | 39,931 | |
| Debt securities in issue | | | 5,942 | | | | 7,314 | | | | 22,564 | | | | 48,233 | | | | 24,201 | | | | 108,254 | |
| Liabilities arising from non-participating investment contracts | | | 13,853 | | | | – | | | | – | | | | – | | | | – | | | | 13,853 | |
| Subordinated liabilities | | | 247 | | | | 1,017 | | | | 1,144 | | | | 8,231 | | | | 19,328 | | | | 29,967 | |
| Total non-derivative financial liabilities | | | 413,540 | | | | 32,609 | | | | 46,452 | | | | 89,948 | | | | 59,356 | | | | 641,905 | |
| Derivative financial liabilities: | | | | | | | | | | | | | | | | | | | | | | | | |
| Gross settled derivatives – outflows | | | 39,165 | | | | 27,976 | | | | 23,978 | | | | 43,239 | | | | 33,763 | | | | 168,121 | |
| Gross settled derivatives – inflows | | | (38,301 | ) | | | (27,283 | ) | | | (23,134 | ) | | | (40,690 | ) | | | (28,933 | ) | | | (158,341 | ) |
| Gross settled derivatives – net flows | | | 864 | | | | 693 | | | | 844 | | | | 2,549 | | | | 4,830 | | | | 9,780 | |
| Net settled derivatives liabilities | | | 13,511 | | | | 103 | | | | 209 | | | | 782 | | | | 2,193 | | | | 16,798 | |
| Total derivative financial liabilities | | | 14,375 | | | | 796 | | | | 1,053 | | | | 3,331 | | | | 7,023 | | | | 26,578 | |
The majority of the Group’s non-participating investment contract liabilities are unit-linked. These unit-linked products are invested in accordance with unit fund mandates. Clauses are included in policyholder contracts to permit the deferral of sales, where necessary, so that linked assets can be realised without being a forced seller.
The principal amount for undated subordinated liabilities with no redemption option is included within the over five years column; interest of approximately £29 million (2018: £27 million) per annum which is payable in respect of those instruments for as long as they remain in issue is not included beyond five years.
NOTES TO THE CONSOLIDATED FINANCIAL STATEMENTS
NOTE 53: FINANCIAL RISK MANAGEMENT continued
Further information on the Group’s liquidity exposures is provided on pages 94 to 100.
Liabilities arising from insurance and participating investment contracts are analysed on a behavioural basis, as permitted by IFRS 4, as follows:
| | | Up to
1 month
£m | | | 1-3
months
£m | | | 3-12
months
£m | | | 1-5
years
£m | | | Over 5
years
£m | | | Total
£m | |
| At 31 December 2019 | | | 1,340 | | | | 1,240 | | | | 5,378 | | | | 25,349 | | | | 78,142 | | | | 111,449 | |
| At 31 December 2018 | | | 1,667 | | | | 1,624 | | | | 5,925 | | | | 25,414 | | | | 64,244 | | | | 98,874 | |
For insurance and participating investment contracts which are neither unit-linked nor in the Group’s with-profit funds, in particular annuity liabilities, the aim is to invest in assets such that the cash flows on investments match those on the projected future liabilities.
The following tables set out the amounts and residual maturities of the Group’s off balance sheet contingent liabilities, commitments and guarantees.
| | | Up to
1 month
£m | | | 1-3
months
£m | | | 3-6
months
£m | | | 6-9
months
£m | | | 9-12
months
£m | | | 1-3
years
£m | | | 3-5
years
£m | | | Over 5
years
£m | | | Total
£m | |
| At 31 December 2019 | | | | | | | | | | | | | | | | | | | | | | | | | | | |
| Acceptances and endorsements | | | 25 | | | | 24 | | | | 4 | | | | – | | | | 21 | | | | – | | | | – | | | | – | | | | 74 | |
| Other contingent liabilities | | | 381 | | | | 409 | | | | 387 | | | | 177 | | | | 207 | | | | 475 | | | | 101 | | | | 683 | | | | 2,820 | |
| Total contingent liabilities | | | 406 | | | | 433 | | | | 391 | | | | 177 | | | | 228 | | | | 475 | | | | 101 | | | | 683 | | | | 2,894 | |
| Lending commitments and guarantees | | | 68,638 | | | | 2,682 | | | | 15,297 | | | | 4,637 | | | | 7,367 | | | | 17,365 | | | | 14,114 | | | | 3,264 | | | | 133,364 | |
| Other commitments | | | – | | | | 1 | | | | 16 | | | | 5 | | | | – | | | | 72 | | | | 43 | | | | 52 | | | | 189 | |
| Total commitments and guarantees | | | 68,638 | | | | 2,683 | | | | 15,313 | | | | 4,642 | | | | 7,367 | | | | 17,437 | | | | 14,157 | | | | 3,316 | | | | 133,553 | |
| Total contingents, commitments and guarantees | | | 69,044 | | | | 3,116 | | | | 15,704 | | | | 4,819 | | | | 7,595 | | | | 17,912 | | | | 14,258 | | | | 3,999 | | | | 136,447 | |
| At 31 December 2018 | | | | | | | | | | | | | | | | | | | | | | | | | | | | | | | | | | | | |
| Acceptances and endorsements | | | 64 | | | | 83 | | | | 34 | | | | 13 | | | | – | | | | – | | | | – | | | | – | | | | 194 | |
| Other contingent liabilities | | | 450 | | | | 484 | | | | 203 | | | | 223 | | | | 150 | | | | 665 | | | | 133 | | | | 749 | | | | 3,057 | |
| Total contingent liabilities | | | 514 | | | | 567 | | | | 237 | | | | 236 | | | | 150 | | | | 665 | | | | 133 | | | | 749 | | | | 3,251 | |
| Lending commitments and guarantees | | | 67,055 | | | | 2,947 | | | | 4,474 | | | | 6,055 | | | | 16,123 | | | | 17,737 | | | | 15,374 | | | | 4,602 | | | | 134,367 | |
| Other commitments | | | 428 | | | | – | | | | – | | | | 2 | | | | 92 | | | | 20 | | | | 13 | | | | 176 | | | | 731 | |
| Total commitments and guarantees | | | 67,483 | | | | 2,947 | | | | 4,474 | | | | 6,057 | | | | 16,215 | | | | 17,757 | | | | 15,387 | | | | 4,778 | | | | 135,098 | |
| Total contingents, commitments and guarantees | | | 67,997 | | | | 3,514 | | | | 4,711 | | | | 6,293 | | | | 16,365 | | | | 18,422 | | | | 15,520 | | | | 5,527 | | | | 138,349 | |
NOTE 54: CONSOLIDATED CASH FLOW STATEMENT
(A) Change in operating assets
| | | 2019
£m | | | 2018
£m | | | 2017
£m | |
| Change in financial assets held at amortised cost | | | (12,423 | ) | | | (27,038 | ) | | | (24,747 | ) |
| Change in derivative financial instruments and financial assets at fair value through profit or loss | | | 3,887 | | | | 22,046 | | | | 9,916 | |
| Change in other operating assets | | | (2,513 | ) | | | 520 | | | | (661 | ) |
| Change in operating assets | | | (11,049 | ) | | | (4,472 | ) | | | (15,492 | ) |
| | | | | | | | | | | | | |
| (B) Change in operating liabilities | | | | | | | | | | | | |
| | | | | | | | | | | | | |
| | | | 2019 | | | | 2018 | | | | 2017 | |
| | | | £m | | | | £m | | | | £m | |
| Change in deposits from banks | | | (2,140 | ) | | | 515 | | | | 13,415 | |
| Change in customer deposits | | | 3,248 | | | | (322 | ) | | | 2,913 | |
| Change in debt securities in issue | | | 6,631 | | | | 18,579 | | | | (3,600 | ) |
| Change in derivative financial instruments and liabilities at fair value through profit or loss | | | (5,078 | ) | | | (24,606 | ) | | | (12,481 | ) |
| Change in investment contract liabilities | | | 2,625 | | | | (1,594 | ) | | | (4,665 | ) |
| Change in other operating liabilities1 | | | (1,644 | ) | | | (1,245 | ) | | | 136 | |
| Change in operating liabilities | | | 3,642 | | | | (8,673 | ) | | | (4,282 | ) |
| 1 | Includes £82 million (2018: £27 million; 2017: £2 million) in respect of lease liabilities. |
NOTES TO THE CONSOLIDATED FINANCIAL STATEMENTS
NOTE 54: CONSOLIDATED CASH FLOW STATEMENT continued
(C) Non-cash and other items
| | | 2019
£m | | | 2018
£m | | | 2017
£m | |
| Depreciation and amortisation | | | 2,660 | | | | 2,405 | | | | 2,370 | |
| Revaluation of investment properties | | | 108 | | | | (139 | ) | | | (230 | ) |
| Allowance for loan losses | | | 1,312 | | | | 1,024 | | | | 691 | |
| Write-off of allowance for loan losses, net of recoveries | | | (1,458 | ) | | | (1,025 | ) | | | (1,061 | ) |
| Impairment charge relating to undrawn balances | | | (15 | ) | | | (73 | ) | | | (9 | ) |
| Impairment of financial assets at fair value through other comprehensive income (2017: available-for-sale financial assets) | | | (1 | ) | | | (14 | ) | | | 6 | |
| Change in insurance contract liabilities | | | 12,593 | | | | (4,547 | ) | | | 9,168 | |
| Payment protection insurance provision | | | 2,450 | | | | 750 | | | | 1,300 | |
| Other regulatory provisions | | | 445 | | | | 600 | | | | 865 | |
| Other provision movements | | | (165 | ) | | | (518 | ) | | | (8 | ) |
| Net charge (credit) in respect of defined benefit schemes | | | 245 | | | | 405 | | | | 369 | |
| Unwind of discount on impairment allowances | | | (53 | ) | | | (44 | ) | | | (23 | ) |
| Foreign exchange impact on balance sheet1 | | | 533 | | | | 191 | | | | 125 | |
| Interest expense on subordinated liabilities | | | 1,228 | | | | 1,388 | | | | 1,436 | |
| Net gain on sale of financial assets at fair value through other comprehensive income (2017: available-for-sale financial assets) | | | (196 | ) | | | (275 | ) | | | (446 | ) |
| Hedging valuation adjustments on subordinated debt | | | 440 | | | | (429 | ) | | | (327 | ) |
| Value of employee services | | | 236 | | | | 260 | | | | 414 | |
| Transactions in own shares | | | (3 | ) | | | 40 | | | | (411 | ) |
| Accretion of discounts and amortisation of premiums and issue costs | | | 445 | | | | 1,947 | | | | 1,701 | |
| Share of post-tax results of associates and joint ventures | | | (6 | ) | | | (9 | ) | | | (6 | ) |
| Gain on establishment of joint venture | | | (244 | ) | | | – | | | | – | |
| Transfers to income statement from reserves | | | (608 | ) | | | (701 | ) | | | (650 | ) |
| Profit on disposal of tangible fixed assets | | | (32 | ) | | | (104 | ) | | | (120 | ) |
| Other non-cash items | | | (35 | ) | | | (34 | ) | | | – | |
| Total non-cash items | | | 19,879 | | | | 1,098 | | | | 15,154 | |
| Contributions to defined benefit schemes | | | (1,069 | ) | | | (868 | ) | | | (587 | ) |
| Payments in respect of payment protection insurance provision | | | (2,461 | ) | | | (2,104 | ) | | | (1,657 | ) |
| Payments in respect of other regulatory provisions | | | (778 | ) | | | (1,032 | ) | | | (928 | ) |
| Other | | | 2 | | | | 14 | | | | – | |
| Total other items | | | (4,306 | ) | | | (3,990 | ) | | | (3,172 | ) |
| Non-cash and other items | | | 15,573 | | | | (2,892 | ) | | | 11,982 | |
| 1 | When considering the movement on each line of the balance sheet, the impact of foreign exchange rate movements is removed in order to show the underlying cash impact. |
(D) Analysis of cash and cash equivalents as shown in the balance sheet
| | | 2019 | | | 2018 | | | 2017 | |
| | | £m | | | £m | | | £m | |
| | | | | | | | | | |
| Cash and balances at central banks | | | 55,130 | | | | 54,663 | | | | 58,521 | |
| Less: mandatory reserve deposits1 | | | (3,289 | ) | | | (2,553 | ) | | | (957 | ) |
| | | | 51,841 | | | | 52,110 | | | | 57,564 | |
| Loans and advances to banks | | | 9,775 | | | | 6,283 | | | | 6,611 | |
| Less: amounts with a maturity of three months or more | | | (3,805 | ) | | | (3,169 | ) | | | (3,193 | ) |
| | | | 5,970 | | | | 3,114 | | | | 3,418 | |
| Total cash and cash equivalents | | | 57,811 | | | | 55,224 | | | | 60,982 | |
| 1 | Mandatory reserve deposits are held with local central banks in accordance with statutory requirements; these deposits are not available to finance the Group’s day-to-day operations. |
Included within cash and cash equivalents at 31 December 2019 is £49 million (31 December 2018: £40 million; 1 January 2018 £48 million; 31 December 2017: £2,322 million) held within the Group’s long-term insurance and investments businesses, which is not immediately available for use in the business.
NOTES TO THE CONSOLIDATED FINANCIAL STATEMENTS
NOTE 54: CONSOLIDATED CASH FLOW STATEMENTcontinued
(E) Acquisition of group undertakings and businesses
| | | 2019
£m | | | 2018
£m | | | 2017
£m | |
| Net assets acquired: | | | | | | | | | | | | |
| Cash and cash equivalents | | | – | | | | – | | | | 123 | |
| Loans and advances to customers | | | – | | | | – | | | | 7,811 | |
| Available-for-sale financial assets | | | | | | | | | | | 16 | |
| Financial assets at fair value through profit or loss | | | 7,350 | | | | – | | | | – | |
| Assets arising from reinsurance contracts held | | | 13,616 | | | | – | | | | – | |
| Intangible assets | | | – | | | | 21 | | | | 702 | |
| Property, plant and equipment | | | – | | | | – | | | | 6 | |
| Other assets | | | 29 | | | | 6 | | | | 414 | |
| Deposits from banks1 | | | – | | | | – | | | | (6,431 | ) |
| Liabilities arising from non-participating investment contracts | | | (20,981 | ) | | | – | | | | – | |
| Other liabilities | | | (8 | ) | | | (1 | ) | | | (927 | ) |
| Goodwill arising on acquisition | | | 14 | | | | – | | | | 302 | |
| Cash consideration | | | 20 | | | | 26 | | | | 2,016 | |
| Less: Cash and cash equivalents acquired | | | – | | | | – | | | | (123 | ) |
| Net cash outflow arising from acquisition of subsidiaries and businesses | | | 20 | | | | 26 | | | | 1,893 | |
| Acquisition of and additional investment in joint ventures | | | 1 | | | | 23 | | | | 30 | |
| Net cash outflow from acquisitions in the year | | | 21 | | | | 49 | | | | 1,923 | |
| 1 | Upon acquisition in 2017, the funding of MBNA was assumed by Lloyds Bank plc. |
(F) Disposal and closure of group undertakings and businesses
| | | 2019
£m | | | 2018
£m | | | 2017
£m | |
| Loans and advances to customers | | | – | | | | – | | | | 342 | |
| Non-controlling interests | | | – | | | | – | | | | (242 | ) |
| Other net assets (liabilities) | | | – | | | | 1 | | | | 29 | |
| | | | – | | | | 1 | | | | 129 | |
| | | | | | | | | | | | | |
| Net assets | | | – | | | | 1 | | | | 129 | |
| | | | | | | | | | | | | |
| Non-cash consideration received | | | – | | | | – | | | | – | |
| (Loss) profit on sale | | | – | | | | – | | | | – | |
| Cash consideration received on losing control of group undertakings and businesses | | | – | | | | 1 | | | | 129 | |
| Cash and cash equivalents disposed | | | – | | | | – | | | | – | |
| Net cash inflow (outflow) | | | – | | | | 1 | | | | 129 | |
NOTES TO THE CONSOLIDATED FINANCIAL STATEMENTS
NOTE 55: ADOPTION OF IFRS 16
The Group adopted IFRS 16Leasesfrom 1 January 2019 and elected to apply the standard retrospectively with the cumulative effect of initial application being recognised at that date; comparative information has therefore not been restated. Comparative information was prepared in accordance with IAS 17. Under IAS 17, where the Group was lessee it charged operating lease rentals to the income statement on a straight-line basis over the life of the lease.
Operating lease commitments as at 31 December 2018 amounted to £2,043 million. Lease liabilities amounting to £1,813 million in respect of leased properties previously accounted for as operating leases were recognised at 1 January 2019. These liabilities were measured at the present value of the remaining lease payments, discounted using the Group’s incremental borrowing rate appropriate for the related right-of-use asset as at that date, adjusted to exclude short-term leases and leases of low-value assets of approximately £20 million. The weighted-average borrowing rate applied to these lease liabilities was 2.43 per cent in the UK, where the majority of the obligations arise, and 5.10 per cent in the US. The corresponding right-of-use asset of £1,716 million was measured at an amount equal to the lease liabilities, adjusted for lease liabilities recognised at 31 December 2018 of £97 million. The right-of-use asset and lease liabilities are included within property, plant and equipment and other liabilities respectively. There was no impact on shareholders’ equity.
In applying IFRS 16 for the first time, the Group has used a number of practical expedients permitted by the standard; the most significant of which were the use of a single discount rate to a portfolio of leases with reasonably similar characteristics; reliance on previous assessments of whether a lease is onerous; and the use of hindsight in determining the lease term where the contract contains options to extend or terminate the lease. The Group has also elected not to apply IFRS 16 to contracts that were not identified as containing a lease under IAS 17 and IFRIC 4Determining whether an Arrangement contains a Lease.
NOTE 56: FUTURE ACCOUNTING DEVELOPMENTS
The following pronouncements are not applicable for the year ending 31 December 2019 and have not been applied in preparing these financial statements. Save as disclosed below, the impact of these accounting changes is still being assessed by the Group and reliable estimates cannot be made at this stage.
IFRS 17 Insurance Contracts
IFRS 17 replaces IFRS 4Insurance Contractsand is currently effective for annual periods beginning on or after 1 January 2021 although, in its Exposure Draft published on 26 June 2019, the International Accounting Standards Board proposed delaying implementation until 1 January 2022.
IFRS 17 requires insurance contracts and participating investment contracts to be measured on the balance sheet as the total of the fulfilment cash flows and the contractual service margin. Changes to estimates of future cash flows from one reporting date to another are recognised either as an amount in profit or loss or as an adjustment to the expected profit for providing insurance coverage, depending on the type of change and the reason for it. The effects of some changes in discount rates can either be recognised in profit or loss or in other comprehensive income as an accounting policy choice. The risk adjustment is released to profit and loss as an insurer’s risk reduces. Profits which are currently recognised through a Value in Force asset, will no longer be recognised at inception of an insurance contract. Instead, the expected profit for providing insurance coverage is recognised in profit or loss over time as the insurance coverage is provided. The standard will have a significant impact on the accounting for the insurance and participating investment contracts issued by the Group.
The Group’s IFRS 17 project is progressing to plan. Work has focussed on interpreting the requirements of the standard, developing methodologies and accounting policies, and assessing the changes required to reporting and other systems. The development of the Group’s data warehousing and actuarial liability calculation processes required for IFRS 17 reporting is progressing.
Minor amendments to other accounting standards
The IASB has issued a number of minor amendments to IFRSs effective 1 January 2020 (including IFRS 3Business Combinationsand IAS 1Presentation of Financial Statements). These amendments are not expected to have a significant impact on the Group.
NOTES TO THE CONSOLIDATED FINANCIAL STATEMENTS
NOTE 57: PARENT COMPANY DISCLOSURES
A COMPANY INCOME STATEMENT
| | | 2019
£m | | | 20181
£m | | | 20171
£m | |
| Net interest (expense) income | | | (108 | ) | | | (173 | ) | | | (121 | ) |
| Dividends received from subsidiary undertakings | | | 5,150 | | | | 4,000 | | | | 2,650 | |
| Other income | | | 682 | | | | 524 | | | | 142 | |
| Total income | | | 5,724 | | | | 4,351 | | | | 2,671 | |
| Operating expenses | | | (289 | ) | | | (246 | ) | | | (255 | ) |
| Trading surplus | | | 5,435 | | | | 4,105 | | | | 2,416 | |
| Impairment | | | 4 | | | | (3 | ) | | | – | |
| Profit on ordinary activities before tax | | | 5,439 | | | | 4,102 | | | | 2,416 | |
| Tax expense | | | (24 | ) | | | 2 | | | | 62 | |
| Profit for the year | | | 5,415 | | | | 4,104 | | | | 2,478 | |
| Profit attributable to ordinary shareholders | | | 4,949 | | | | 3,671 | | | | 2,063 | |
| Profit attributable to other equity holders | | | 466 | | | | 433 | | | | 415 | |
| Profit for the year | | | 5,415 | | | | 4,104 | | | | 2,478 | |
NOTES TO THE CONSOLIDATED FINANCIAL STATEMENTS
NOTE 57: PARENT COMPANY DISCLOSURES continued
B COMPANY BALANCE SHEET
| | | 2019
£m | | | 2018
£m | |
| Assets | | | | | | |
| Non-current assets: | | | | | | |
| Investment in subsidiaries | | | 48,597 | | | | 46,725 | |
| Loans to subsidiaries | | | 14,660 | | | | 24,211 | |
| Deferred tax assets | | | – | | | | 9 | |
| | | | 63,257 | | | | 70,945 | |
| Current assets: | | | | | | | | |
| Derivative financial instruments | | | 760 | | | | 256 | |
| Financial assets at fair value through profit or loss | | | 12,516 | | | | 588 | |
| Other assets | | | 983 | | | | 955 | |
| Amounts due from subsidiaries | | | 27 | | | | 27 | |
| Cash and cash equivalents | | | 29 | | | | 57 | |
| Current tax recoverable | | | 1 | | | | 76 | |
| | | | 14,316 | | | | 1,959 | |
| Total assets | | | 77,573 | | | | 72,904 | |
| Equity and liabilities | | | | | | | | |
| Capital and reserves: | | | | | | | | |
| Share capital | | | 7,005 | | | | 7,116 | |
| Share premium account | | | 17,751 | | | | 17,719 | |
| Merger reserve | | | 7,420 | | | | 7,423 | |
| Capital redemption reserve | | | 4,462 | | | | 4,273 | |
| Retained profits | | | 3,950 | | | | 2,103 | |
| Shareholders’ equity | | | 40,588 | | | | 38,634 | |
| Other equity instruments | | | 5,906 | | | | 6,491 | |
| Total equity | | | 46,494 | | | | 45,125 | |
| Non-current liabilities: | | | | | | | | |
| Debt securities in issue | | | 20,018 | | | | 20,394 | |
| Subordinated liabilities | | | 5,961 | | | | 6,043 | |
| Deferred tax liabilities | | | 2 | | | | – | |
| | | | 25,981 | | | | 26,437 | |
| Current liabilities: | | | | | | | | |
| Derivative financial instruments | | | 438 | | | | 209 | |
| Financial liabilities at fair value through profit or loss | | | 3,464 | | | | – | |
| Other liabilities | | | 1,196 | | | | 1,133 | |
| | | | 5,098 | | | | 1,342 | |
| Total liabilities | | | 31,079 | | | | 27,779 | |
| Total equity and liabilities | | | 77,573 | | | | 72,904 | |
NOTES TO THE CONSOLIDATED FINANCIAL STATEMENTS
NOTE 57: PARENT COMPANY DISCLOSURES continued
C COMPANY STATEMENT OF CHANGES IN EQUITY
| | | Share capital
and premium
£m | | | Merger
reserve
£m | | | Capital
redemption
reserve
£m | | | Retained
profits1
£m | | | Total
shareholders’
equity
£m | | | Other equity
instruments
£m | | | Total
equity
£m | |
| Balance at 1 January 2017 | | | 24,768 | | | | 7,423 | | | | 4,115 | | | | 1,584 | | | | 37,890 | | | | 5,355 | | | | 43,245 | |
| Total comprehensive income1,2 | | | – | | | | – | | | | – | | | | 2,478 | | | | 2,478 | | | | – | | | | 2,478 | |
| Dividends paid | | | – | | | | – | | | | – | | | | (2,284 | ) | | | (2,284 | ) | | | – | | | | (2,284 | ) |
| Distributions on other equity instruments1 | | | – | | | | – | | | | – | | | | (415 | ) | | | (415 | ) | | | – | | | | (415 | ) |
| Issue of ordinary shares | | | 63 | | | | – | | | | – | | | | – | | | | 63 | | | | – | | | | 63 | |
| Movement in treasury shares | | | – | | | | – | | | | – | | | | (277 | ) | | | (277 | ) | | | – | | | | (277 | ) |
| Value of employee services: | | | | | | | | | | | | | | | | | | | | | | | | | | | | |
| Share option schemes | | | – | | | | – | | | | – | | | | 82 | | | | 82 | | | | – | | | | 82 | |
| Other employee award schemes | | | – | | | | – | | | | – | | | | 332 | | | | 332 | | | | – | | | | 332 | |
| Balance at 31 December 2017 | | | 24,831 | | | | 7,423 | | | | 4,115 | | | | 1,500 | | | | 37,869 | | | | 5,355 | | | | 43,224 | |
| Adjustment on adoption of IFRS 9 | | | – | | | | – | | | | – | | | | (2 | ) | | | (2 | ) | | | – | | | | (2 | ) |
| Balance at 1 January 2018 | | | 24,831 | | | | 7,423 | | | | 4,115 | | | | 1,498 | | | | 37,867 | | | | 5,355 | | | | 43,222 | |
| Total comprehensive income1,2 | | | – | | | | – | | | | – | | | | 4,104 | | | | 4,104 | | | | – | | | | 4,104 | |
| Dividends paid | | | – | | | | – | | | | – | | | | (2,240 | ) | | | (2,240 | ) | | | – | | | | (2,240 | ) |
| Distributions on other equity instruments1 | | | – | | | | – | | | | – | | | | (433 | ) | | | (433 | ) | | | – | | | | (433 | ) |
| Issue of ordinary shares | | | 162 | | | | – | | | | – | | | | – | | | | 162 | | | | – | | | | 162 | |
| Share buy-back programme | | | (158 | ) | | | – | | | | 158 | | | | (1,005 | ) | | | (1,005 | ) | | | – | | | | (1,005 | ) |
| Issue of AT1 securities | | | – | | | | – | | | | – | | | | (7 | ) | | | (7 | ) | | | 1,136 | | | | 1,129 | |
| Movement in treasury shares | | | – | | | | – | | | | – | | | | (74 | ) | | | (74 | ) | | | – | | | | (74 | ) |
| Value of employee services: | | | | | | | | | | | | | | | | | | | | | | | | | | | | |
| Share option schemes | | | – | | | | – | | | | – | | | | 53 | | | | 53 | | | | – | | | | 53 | |
| Other employee award schemes | | | – | | | | – | | | | – | | | | 207 | | | | 207 | | | | – | | | | 207 | |
| Balance at 31 December 2018 | | | 24,835 | | | | 7,423 | | | | 4,273 | | | | 2,103 | | | | 38,634 | | | | 6,491 | | | | 45,125 | |
| Comprehensive income | | | | | | | | | | | | | | | | | | | | | | | | | | | | |
| Total comprehensive income2 | | | – | | | | – | | | | – | | | | 5,415 | | | | 5,415 | | | | – | | | | 5,415 | |
| Dividends paid | | | – | | | | – | | | | – | | | | (2,312 | ) | | | (2,312 | ) | | | – | | | | (2,312 | ) |
| Distributions on other equity instruments | | | – | | | | – | | | | – | | | | (466 | ) | | | (466 | ) | | | – | | | | (466 | ) |
| Redemption of preference shares | | | 3 | | | | (3 | ) | | | – | | | | – | | | | – | | | | – | | | | – | |
| Issue of ordinary shares | | | 107 | | | | – | | | | – | | | | – | | | | 107 | | | | – | | | | 107 | |
| Share buy back programme | | | (189 | ) | | | – | | | | 189 | | | | (1,095 | ) | | | (1,095 | ) | | | – | | | | (1,095 | ) |
| Issue of other equity instruments | | | – | | | | – | | | | – | | | | (5 | ) | | | (5 | ) | | | 896 | | | | 891 | |
| Redemption of other equity instruments | | | – | | | | – | | | | – | | | | – | | | | – | | | | (1,481 | ) | | | (1,481 | ) |
| Movement in treasury shares | | | – | | | | – | | | | – | | | | 74 | | | | 74 | | | | – | | | | 74 | |
| Value of employee services: | | | | | | | | | | | | | | | | | | | | | | | | | | | | |
| Share option schemes | | | – | | | | – | | | | – | | | | 71 | | | | 71 | | | | – | | | | 71 | |
| Other employee award schemes | | | – | | | | – | | | | – | | | | 165 | | | | 165 | | | | – | | | | 165 | |
| Balance at 31 December 2019 | | | 24,756 | | | | 7,420 | | | | 4,462 | | | | 3,950 | | | | 40,588 | | | | 5,906 | | | | 46,494 | |
| | |
| 1 | Restated, see note 1. |
| | |
| 2 | Total comprehensive income comprises only the profit for the year. |
NOTES TO THE CONSOLIDATED FINANCIAL STATEMENTS
NOTE 57: PARENT COMPANY DISCLOSURES continued
D COMPANY CASH FLOW STATEMENT
| | | 2019
£m | | | 2018
£m | | | 2017
£m | |
| Profit before tax | | | 5,439 | | | | 4,102 | | | | 2,416 | |
| Fair value and exchange adjustments and other non-cash items | | | (166 | ) | | | (715 | ) | | | 495 | |
| Change in other assets | | | (11,975 | ) | | | (572 | ) | | | 18 | |
| Change in other liabilities and other items | | | 3,151 | | | | 7,538 | | | | 8,431 | |
| Dividends received | | | (5,150 | ) | | | (4,000 | ) | | | (2,650 | ) |
| Distributions on other equity instruments receivedº | | | (366 | ) | | | (324 | ) | | | (292 | ) |
| Tax (paid) received | | | 70 | | | | 660 | | | | (197 | ) |
| Net cash provided by (used in) operating activities | | | (8,997 | ) | | | 6,689 | | | | 8,221 | |
| Cash flows from investing activities | | | | | | | | | | | | |
| Return of capital contribution | | | 5 | | | | 9 | | | | 77 | |
| Dividends received | | | 5,150 | | | | 4,000 | | | | 2,650 | |
| Distributions on other equity instruments received | | | 366 | | | | 324 | | | | 292 | |
| Acquisition of and capital injections to subsidiaries | | | (1,648 | ) | | | (12,753 | ) | | | (320 | ) |
| Return of capital | | | – | | | | 11,114 | | | | – | |
| Amounts advanced to subsidiaries | | | (1,812 | ) | | | (21,577 | ) | | | (8,476 | ) |
| Repayment of loans to subsidiaries | | | 11,257 | | | | 12,602 | | | | 475 | |
| Interest received on loans to subsidiaries | | | 395 | | | | 370 | | | | 244 | |
| Net cash (used in) provided by investing activities | | | 13,713 | | | | (5,911 | ) | | | (5,058 | ) |
| Cash flows from financing activities | | | | | | | | | | | | |
| Dividends paid to ordinary shareholders | | | (2,312 | ) | | | (2,240 | ) | | | (2,284 | ) |
| Distributions on other equity instruments | | | (466 | ) | | | (433 | ) | | | (415 | ) |
| Issue of subordinated liabilities | | | – | | | | 1,729 | | | | – | |
| Interest paid on subordinated liabilities | | | (314 | ) | | | (275 | ) | | | (248 | ) |
| Share buy-back | | | (1,095 | ) | | | (1,005 | ) | | | – | |
| Issue of other equity instruments | | | 891 | | | | 1,129 | | | | – | |
| Redemptions of other equity instruments | | | (1,481 | ) | | | – | | | | – | |
| Repayment of subordinated liabilities | | | (3 | ) | | | – | | | | – | |
| Proceeds from issue of ordinary shares | | | 36 | | | | 102 | | | | 14 | |
| Net cash provided by financing activities | | | (4,744 | ) | | | (993 | ) | | | (2,933 | ) |
| Change in cash and cash equivalents | | | (28 | ) | | | (215 | ) | | | 230 | |
| Cash and cash equivalents at beginning of year | | | 57 | | | | 272 | | | | 42 | |
| Cash and cash equivalents at end of year | | | 29 | | | | 57 | | | | 272 | |
E INTERESTS IN SUBSIDIARIES
The principal subsidiaries, all of which have prepared accounts to 31 December and whose results are included in the consolidated accounts of Lloyds Banking Group plc, are:
| | | Country of
registration/
Incorporation | | Percentage
of equity
share capital
and voting
rights held | | Nature of business |
| Lloyds Bank plc | | England | | 100% | | Banking and financial services |
| Scottish Widows Limited | | Scotland | | 100%1 | | Life assurance |
| HBOS plc | | Scotland | | 100%1 | | Holding company |
| Bank of Scotland plc | | Scotland | | 100%1 | | Banking and financial services |
| Lloyds Bank Corporate Markets plc | | England | | 100% | | Banking and financial services |
The principal area of operation for each of the above subsidiaries is the United Kingdom.
GLOSSARY
| Term used | | US equivalent or brief description. |
| Accounts | | Financial statements. |
| Articles of association | | Articles and bylaws. |
| Associates | | Long-term equity investments accounted for by the equity method. |
| Attributable profit | | Net income. |
| Balance sheet | | Statement of financial position. |
| Broking | | Brokerage. |
| Building society | | A building society is a mutual institution set up to lend money to its members for house purchases. See also ‘Demutualisation’. |
| Buy-to-let mortgages | | Buy-to-let mortgages are those mortgages offered to customers purchasing residential property as a rental investment. |
| Called-up share capital | | Ordinary shares, issued and fully paid. |
| Contract hire | | Leasing. |
| Creditors | | Payables. |
| Debtors | | Receivables. |
| Deferred tax | | Deferred income tax. |
| Demutualisation | | Process by which a mutual institution is converted into a public limited company. |
| Depreciation | | Amortisation. |
| Endowment mortgage | | An interest-only mortgage to be repaid by the proceeds of an endowment insurance policy which is assigned to the lender providing the mortgage. The sum insured, which is payable on maturity or upon the death of the policyholder, is used to repay the mortgage. |
| Finance lease | | Capital lease. |
| Freehold | | Ownership with absolute rights in perpetuity. |
| Leasehold | | Land or property which is rented from the owner for a specified term under a lease. At the expiry of the term the land or property reverts back to the owner. |
| Lien | | Under UK law, a right to retain possession pending payment. |
| Life assurance | | Life insurance. |
| Loan capital | | Long-term debt. |
| Members | | Shareholders. |
| National Insurance | | A form of taxation payable in the UK by employees, employers and the self-employed. It is part of the UK’s national social security system and ultimately controlled by HM Revenue & Customs. |
| Nominal value | | Par value. |
| Open Ended Investment Company (OEIC) | | Mutual fund. |
| Ordinary shares | | Common stock. |
| Overdraft | | A line of credit, contractually repayable on demand unless a fixed-term has been agreed, established through a customer’s current account. |
| Preference shares | | Preferred stock. |
| Premises | | Real estate. |
| Profit attributable to equity shareholders | | Net income. |
| Provisions | | Reserves. |
| Regular premium | | Premiums which are payable throughout the duration of a policy or for some shorter fixed period. |
| Reinsurance | | The insuring again by an insurer of the whole or part of a risk that it has already insured with another insurer called a reinsurer. |
GLOSSARY
| Term used | | US equivalent or brief description. |
| Retained profits | | Retained earnings. |
| Share capital | | Capital stock. |
| Shareholders’ equity | | Stockholders’ equity. |
| Share premium account | | Additional paid-in capital. |
| Shares in issue | | Shares outstanding. |
| Single premium | | A premium in relation to an insurance policy payable once at the commencement of the policy. |
| Specialist mortgages | | Specialist mortgages include those mortgage loans provided to customers who have self-certified their income. New mortgage lending of this type has not been offered by the Group since early 2009. |
| Undistributable reserves | | Restricted surplus. |
| Write-offs | | Charge-offs. |
FORM 20-F CROSS REFERENCE SHEET
| | Form 20–F Item Number and Caption | | Location | | Page |
| Part I | | | | | | |
| Item 1. | Identity of Directors, Senior Management and Advisers | | | | |
| | A. | Directors and senior management | | Not applicable. | | |
| | B. | Advisers | | Not applicable. | | |
| | C. | Auditors | | Not applicable. | | |
| Item 2. | Offer Statistics and Expected Timetable | | | | |
| | A. | Offer statistics | | Not applicable. | | |
| | B. | Method and expected timetable | | Not applicable. | | |
| Item 3. | Key Information | | | | |
| | A. | Selected financial data | | “Selected consolidated financial data” | | 3 |
| | B. | Capitalisation and indebtedness | | Not applicable. | | |
| | C. | Reason for the offer and use of proceeds | | Not applicable. | | |
| | D. | Risk factors | | “Risk factors” | | 180–190 |
| Item 4. | Information on the Company | | | | |
| | A. | History and development of the company | | “Business overview” | | 2 |
| | | | | “Business – History and development of Lloyds Banking Group” | | 4 |
| | | | | “Business – Legal actions and regulatory matters” | | 11–12 |
| | | | | “Operating and financial review and prospects – Divisional information” | | 24–26 |
| | | | | “Where you can find more information” | | 179 |
| | | | | “Corporate Governance – Governance in action” | | 149–151 |
| | B. | Business overview | | “Business overview” | | 2 |
| | | | | “Business – Legal actions and regulatory matters” | | 11–12 |
| | | | | “Operating and financial review and prospects – Divisional information” | | 24–26 |
| | | | | “Regulation” | | 171–173 |
| | C. | Organisational structure | | “Lloyds Banking Group structure” | | 192 |
| | D. | Property, plant and equipment | | “Business – Properties” | | 10 |
| Item 4A. | Unresolved Staff Comments | | Not applicable. | | |
| Item 5. | Operating and Financial Review and Prospects | | | | |
| | A. | Operating results | | “Operating and financial review and prospects” | | 15–112 |
| | | | | “Regulation” | | 171–173 |
| | | | | “Operating and financial review and prospects – Market Risk” | | 102–108 |
| | B. | Liquidity and capital resources | | “Operating and financial review and prospects – Risk elements in the loan portfolio and potential problem loans – Cross border outstandings” | | 80 |
| | | | | “Operating and financial review and prospects – Funding and Liquidity Risk” | | 94–100 |
| | | | | “Operating and financial review and prospects – Capital risk” | | 85–94 |
| | | | | “Operating and financial review and prospects – Investment portfolio, maturities, deposits, short-term borrowings” | | 109–112 |
| | | | | “Dividends” | | 175 |
| | | | | “Notes to the consolidated financial statements – note 48” | | F-80–F-82 |
| | C. | Research and development, patents and licenses, etc. | | Not applicable. | | |
| | D. | Trend information | | “Operating and financial review and prospects – Overview and trend information” | | 16 |
| | E. | Off-balance sheet arrangements | | “Operating and financial review and prospects – Funding and liquidity risk – Off balance sheet arrangements” | | 100 |
| | | | | “Notes to the consolidated financial statements – note 53” | | F-97–F-122 |
| | F. | Tabular disclosure of contractual obligations | | “Operating and financial review and prospects – Funding and liquidity risk – Contractual cash obligations” | | 100 |
| | G. | Safe harbor | | “Forward looking statements” | | 191 |
| Item 6. | Directors, Senior Management and Employees | | | | |
| | A. | Directors and senior management | | “Management and employees – Directors and senior management” | | 113–116 |
| | B. | Compensation | | “Compensation” | | 117–142 |
| | | | | “Notes to the consolidated financial statements – note 11” | | F-32–F-33 |
| | C. | Board practices | | “Management and employees” | | 113–116 |
| | | | | “Articles of association of Lloyds Banking Group plc” | | 176 |
| | | | | “Compensation – Service agreements” | | 139 |
| | | | | “Corporate governance – Board Leadership and Company Purpose” | | 155–156 |
| | | | | “Corporate governance – Audit Committee Report” | | 160–163 |
| | | | | “Compensation – Annual report on remuneration – Remuneration Committee” | | 132–133 |
| | D. | Employees | | “Management and employees – Employees” | | 116 |
| | E. | Share ownership | | “Compensation – Directors’ share interests and share awards” | | 127–129 |
| | | | | “Notes to the consolidated financial statements – note 2” | | F-13 |
| Item 7. | Major Shareholders and Related Party Transactions | | | | |
| | A. | Major shareholders | | “Major shareholders and related party transactions – Major shareholders” | | 170 |
FORM 20-F CROSS REFERENCE SHEET
| | Form 20–F Item Number and Caption | | Location | | Page |
| | B. | Related party transactions | | “Major shareholders and related party transactions – Related party transactions” | | 170 |
| | | | | “Notes to the consolidated financial statements – note 47” | | F-79– F-80 |
| | C. | Interests of experts and counsel | | Not applicable. | | |
| Item 8. | Financial Information | | | | |
| | A. | Consolidated statements and other financial information | | “Consolidated financial statements” | | F-5–F-12 |
| | | | | “Notes to the consolidated financial statements” | | F-13–F-129 |
| | | | | “Report of the Independent Registered Public Accounting Firm” | | F-2–F-4 |
| | | | | “Business – Legal actions and regulatory matters” | | 11–12 |
| | | | | “Operating and financial review and prospects” | | 15–112 |
| | | | | “Dividends” | | 175 |
| | B. | Significant changes | | Not Applicable | | |
| Item 9. | The Offer and Listing | | | | |
| | A. | Offer and listing details | | “Listing information” | | 174 |
| | B. | Plan of distribution | | Not applicable. | | |
| | C. | Markets | | “Listing information” | | 174 |
| | D. | Selling shareholders | | Not applicable. | | |
| | E. | Dilution | | Not applicable. | | |
| | F. | Expenses of the issue | | Not applicable. | | |
| Item 10. | Additional Information | | | | |
| | A. | Share capital | | Not applicable. | | |
| | B. | Memorandum and articles of association | | “Articles of association of Lloyds Banking Group plc” | | 176 |
| | C. | Material contracts | | “Business – Material contracts” | | 5 |
| | D. | Exchange controls | | “Exchange controls” | | 176 |
| | E. | Taxation | | “Taxation” | | 177–178 |
| | F. | Dividends and paying agents | | Not applicable. | | |
| | G. | Statements by experts | | Not applicable. | | |
| | H. | Documents on display | | “Where you can find more information” | | 179 |
| | I. | Subsidiary information | | “Lloyds Banking Group structure” | | 192 |
| Item 11. | | Quantitative and Qualitative Disclosures about Market Risk | | “Operating and financial review and prospects – Credit risk” | | 52–80 |
| | | | | “Operating and financial review and prospects – Market risk” | | 102–108 |
| Item 12. | Description of Securities Other than Equity Securities | | | | |
| | A. | Debt securities | | Not applicable. | | |
| | B. | Warrants and rights | | Not applicable. | | |
| | C. | Other securities | | Not applicable. | | |
| | D. | American Depositary Shares | | “Listing information – ADR fees” | | 174 |
| Part II | | | | | | |
| Item 13. | Defaults, Dividends Arrearages and Delinquencies | | Not applicable. | | |
| Item 14. | Material Modifications to the Rights of Security Holders and | | Not applicable. | | |
| | Use of Proceeds | | | | |
| Item 15. | Controls and Procedures | | “Corporate governance” | | 143–169 |
| | | | | “Report of Independent Registered Public Accounting Firm” | | F-2–F-4 |
| Item 16. | Reserved by the Securities and Exchange Commission | | | | |
| | A. | Audit committee financial expert | | “Corporate governance – Audit Committee report” | | 160–163 |
| | B. | Code of ethics | | “Management and employees – Employees” | | 116 |
| | C. | Principal accountant fees and services | | “Corporate governance – Risk Management and internal control systems – Auditor independence and remuneration” | | 163 |
| | | | | “Notes to the consolidated financial statements – note 12 – Auditors’ Remuneration” | | F-33– F-34 |
| | D. | Exemptions from the listing standards for audit | | Not applicable. | | |
| | | committees | | | | |
| | E. | Purchases of equity securities by the issuer and affiliated purchasers | | Not applicable. | | |
| | F. | Change in registrant’s certifying accountant | | Not applicable. | | |
| | G. | Corporate governance | | “Corporate governance – Statement on US corporate governance standards” | | 143 |
| | H. | Mine safety disclosure | | Not applicable. | | |
| Part III | | | | | | |
| Item 17. | Financial statements | | See response to item 18. | | |
| Item 18. | Financial statements | | “Consolidated financial statements” | | F-5–F-12 |
| | | | | “Notes to the consolidated financial statements” | | F-13–F-129 |
| | | | | “Report of the Independent Registered Public Accounting Firm” | | F-2–F-4 |
| Item 19. | Exhibits | | See “Exhibit index” | | 197 |
EXHIBIT INDEX
| 1. | Articles of association of Lloyds Banking Group plc▲ |
| | |
| 2. | Neither Lloyds Banking Group plc nor any subsidiary is party to any single long-term debt instrument pursuant to which a total amount of securities exceeding 10 per cent of the Group’s total assets (on a consolidated basis) is authorised to be issued. Lloyds Banking Group plc hereby agrees to furnish to the Securities and Exchange Commission (the Commission), upon its request, a copy of any instrument defining the rights of holders of its long-term debt or the rights of holders of the long-term debt issued by it or any subsidiary for which consolidated or unconsolidated financial statements are required to be filed with the Commission. |
The exhibits shown above are listed according to the number assigned to them by the Form 20–F.
SIGNATURE
The registrant hereby certifies that it meets all of the requirements for filing on Form 20-F and that it has duly caused and authorised the undersigned to sign this annual report on its behalf.
| | LLOYDS BANKING GROUP plc | |
| | By: | /s/ W Chalmers | |
| | | | |
| | Name: | William Chalmers | |
| | Title: | Chief Financial Officer | |
| | | | |
| | | | |
| | Dated: | 25 February 2020 | |
