| OMB APPROVAL |
OMB Number: 3235-0570
Expires: August 31, 2020
Estimated average burden hours per response: 20.6
|
UNITED STATES
SECURITIES AND EXCHANGE COMMISSION
Washington, D.C. 20549
FORM N-CSR
CERTIFIED SHAREHOLDER REPORT OF REGISTERED
MANAGEMENT INVESTMENT COMPANIES
| Investment Company Act file number | 811-10529 | |
| The Investment House Funds |
| (Exact name of registrant as specified in charter) |
| 11100 Santa Monica Boulevard, Suite 270 | Los Angeles, California 90025 |
| (Address of principal executive offices) | (Zip code) |
Timothy J. Wahl
The Investment House LLC
| 11100 Santa Monica Boulevard, Suite 270 Los Angeles, California 90025 |
| (Name and address of agent for service) |
| Registrant's telephone number, including area code: | (310) 873-3020 | |
| Date of fiscal year end: | July 31 | |
| | | |
| Date of reporting period: | January 31, 2019 | |
Form N-CSR is to be used by management investment companies to file reports with the Commission not later than 10 days after the transmission to stockholders of any report that is required to be transmitted to stockholders under Rule 30e-1 under the Investment Company Act of 1940 (17 CFR 270.30e-1). The Commission may use the information provided on Form N-CSR in its regulatory, disclosure review, inspection, and policymaking roles.
A registrant is required to disclose the information specified by Form N-CSR, and the Commission will make this information public. A registrant is not required to respond to the collection of information contained in Form N-CSR unless the Form displays a currently valid Office of Management and Budget ("OMB") control number. Please direct comments concerning the accuracy of the information collection burden estimate and any suggestions for reducing the burden to the Secretary, Securities and Exchange Commission, 450 Fifth Street, NW, Washington, DC 20549-0609. The OMB has reviewed this collection of information under the clearance requirements of 44 U.S.C. § 3507.
Item 1. Reports to Stockholders.
Beginning on January 1, 2021, as permitted by regulations adopted by the U.S. Securities and Exchange Commission, paper copies of the Fund’s shareholder reports like this one will no longer be sent by mail, unless you specifically request paper copies of the reports from the Fund or from your financial intermediary, such as a broker-dealer or bank. Instead, the reports will be made available on a website, and you will be notified by mail each time a report is posted and provided with a website link to access the report.
If you already elected to receive shareholder reports electronically, you will not be affected by this change and you need not take any action. You may elect to receive shareholder reports and other communications from the Fund electronically by contacting the Fund at 1-888-456-9518 or, if you own these shares through a financial intermediary, by contacting your financial intermediary.
You may elect to receive all future reports in paper free of charge. You can inform the Fund that you wish to continue receiving paper copies of your shareholder reports by contacting the Fund at 1-888-456-9518. If you own shares through a financial intermediary, you may contact your financial intermediary or follow instructions included with this document to elect to continue to receive paper copies of your shareholder reports. Your election to receive reports in paper will apply to all Funds held with the Fund complex or at your financial intermediary.
The Investment House Growth Fund
Letter to Shareholders
January 31, 2019
We closed out the first half of fiscal 2019 on January 31, 2019, and would like to thank you for joining us as shareholders of The Investment House Growth Fund (the “Fund,” formerly the GKM Growth Fund). This is our 18th year advising the Fund, and for those of you who have been with us from the beginning, we are pleased to report a cumulative gain since inception of 305.76% versus 228.83% for the S&P 500. Since the Fund’s inception on December 28, 2001, the Fund has had an average annual return of 8.54% through January 31, 2019 versus 7.21% for the S&P 500 for the same period.
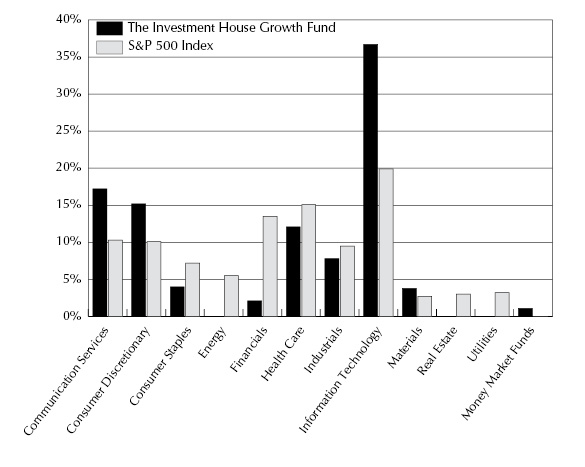
Our largest sector concentrations were in Information Technology (36.7% vs. 19.9% for the S&P) and Communication Services (17.2% vs. 10.3%), together comprising 51.9% of the Fund’s holdings at year end. The balance of our holdings were comprised of 15.2% Consumer Discretionary; 12.1% Health Care; 7.8% Industrials; 4.0% Consumer Staples; 3.8% Materials; 2.1% Financials; and 0% Utilities, Real Estate and Energy.
Our top 5 holdings comprised 34.2% of the portfolio, and were all related in some way to the Information Technology or Communication Services Sectors. It is important to remember that such categorizations we view as somewhat arbitrary, as they stretch across a vast landscape of different kinds of businesses, from social media (Facebook); to information management (Intuit); to a branded lifestyle, entertainment, and productivity ecosystem (Apple), to e-commerce (Amazon, Alibaba). In fact, in this age, it is very hard to find a business which does not, in some important way, directly make use of and benefit from Information Technology or Communication Services, and therefore we regard the combined 53.9% Information Technology (36.7%) and Communication Services (17.2%) categories membership of our portfolio companies as far more economically and financially diverse than the simple combined category titles of “Information Technology and Communication Services ” would suggest.
Below is a table reflecting the weights of the key S&P sectors versus the corresponding weights of The Investment House Growth Fund’s holdings:
Sector | S&P Weight | Fund Weight |
Communication Services | 10.3% | 17.2% |
Consumer Discretionary | 10.1% | 15.2% |
Consumer Staples | 7.2% | 4.0% |
Energy | 5.5% | 0 |
Financials | 13.5% | 2.1% |
Health Care | 15.1% | 12.1% |
Industrials | 9.5% | 7.8% |
Information Technology | 19.9% | 36.7% |
Materials | 2.7% | 3.8% |
Real Estate | 3.0% | 0 |
Utilities | 3.2% | 0 |
1
The size and first half performance of our 10 largest holdings are shown in the table below:
Fund Holding | Weight (%) | 8/1/18 – 1/31/19
Return % |
Facebook | 9.8 | -2.5 |
Amazon | 7.4 | -3.4 |
Alphabet (A & C) | 7.4 | -8.5 |
Intuit | 7.1 | 6.9 |
Apple | 5.6 | -11.7 |
Intuitive Surgical | 4.3 | 4.1 |
Alibaba | 3.7 | -8.8 |
PayPal Holdings | 3.6 | 7.7 |
Texas Instruments | 3.2 | -8.5 |
Total | 52.1 | |
RISK MANAGEMENT AND DIVERSIFICATION
Our attitude toward Risk Management remains the same: we define risk as the chance of permanent capital loss. We attempt to limit this risk by selecting excellent companies and manage portfolio risk by diversifying our separate company holdings. To the extent that such holdings, though in different companies, remain in or are related to the same sectors of the economy, then such concentrations may add to sector risk.
PORTFOLIO TURNOVER
We continue to believe that less portfolio activity with the right companies is far superior to more activity with the wrong ones. According to Morningstar, this policy of enlightened lethargy has resulted in an average annualized estimated “Tax-adjusted Pre-Liquidation Return” of 8.30% per year for the Fund since its inception through January 31, 2019 versus a pre-tax return of 8.54%. Our inactivity, therefore, has benefited you, our shareholders, by costing the Fund only 24 basis points (twenty four hundredths of a percentage point) in average annual returns over the course of our seventeen plus years. Of course, we still have just a little way to go to hit zero, but we are mighty close.
Our average rate of turnover for the fiscal year was approximately 7%. As in the past, we try to invest in companies we believe have strong, profitable competitive advantages which are growing and sustainable long into the future, such that time is our best friend in owning them. Sometimes we get it wrong, or there is a change in circumstance which requires a change in our positioning. In all cases though, we are motivated by producing the greatest after tax growth of capital consistent with our desire to minimize the risk of permanent capital loss.
The More Things Change The More They Stay The Same
The long run of successive up years in equity markets ended in 2018 with the S&P 500 falling 13.52% in the fourth quarter, with 9.03% of the loss occurring in December alone, the second worst December ever! As the chart below indicates, no sector of the U.S. equity market was spared.
2
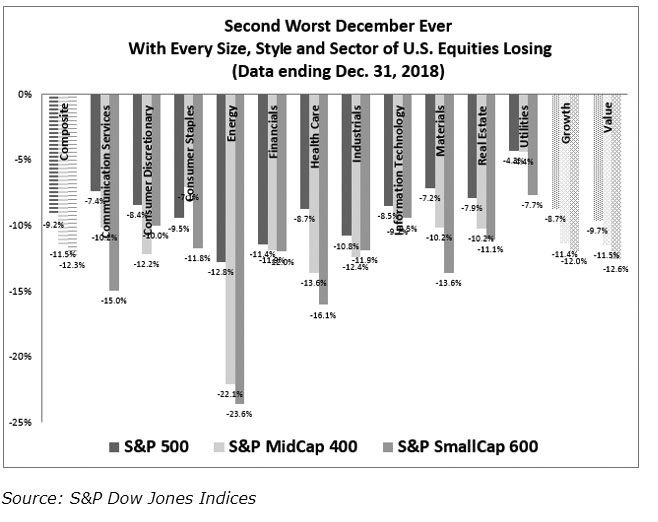
However, no sooner had the S&P 500 reached its 2018 nadir at 2346.58, then a succession of calming commentaries from the Fed, positive annual earnings reports with reasonable 2019 guidance, and cheaper valuations led to one of the strongest Januaries in decades, with the recovery amounting to 15.2% from the December low, and fully 8.0% from year end through January 2019. It is for this reason – occasionally wild market swings in both directions – that we focus on the long-term prospects of great companies, attempting to make use of temporary market swoons by acquiring them when they are on sale. While market events will no doubt continue to surprise, our focus on owning quality growth businesses remains steadfast.
Sincerely,
The Investment House LLC
3
Past performance is not predictive of future performance. Investment results and principal value will fluctuate so that shares, when redeemed, may be worth more or less than their original cost. Current performance may be higher or lower than the performance data quoted.
An investor should consider the investment objectives, risks, charges and expenses of the Fund carefully before investing. The Fund’s prospectus contains this and other important information. To obtain a copy of the Fund’s prospectus please visit www.tihfunds.com or call 1-888-456-9518 and a copy will be sent to you free of charge. Please read the prospectus carefully before you invest. The Investment House Growth Fund is distributed by Ultimus Fund Distributors, LLC.
The Letter to Shareholders seeks to describe some of the adviser’s current opinions and views of the financial markets. Although the adviser believes it has a reasonable basis for any opinions or views expressed, actual results may differ, sometimes significantly so, from those expected or expressed.
Some of the information given in this publication has been produced by unaffiliated third parties and, while it is deemed reliable, the adviser does not guarantee its timeliness, sequence, accuracy, adequacy, or completeness and makes no warranties with respect to results to be obtained from its use.
4
The Investment House Growth Fund
Performance Information
January 31, 2019 (Unaudited)
Comparison of the Change in Value of a $10,000 Investment in
The Investment House Growth Fund and the
S&P 500 Index Since Inception*

| | Average Annual Total Returns
(for periods ended January 31, 2019) | |
| | | 1 Year | 5 Years | 10 Years | Since
Inception* | |
| | The Investment House Growth Fund (a)(b) | (2.00%) | 11.53% | 17.23% | 8.54% | |
| | S&P 500 Index | (2.31%) | 10.96% | 15.00% | 7.21% | |
* | Initial public offering of shares was December 28, 2001. |
(a) | The Fund’s total returns shown do not reflect the deduction of taxes that a shareholder would pay on Fund distributions or the redemption of Fund shares. |
(b) | The Fund’s expense ratio for the six months ended January 31, 2019 was 1.43%. The expense ratio as disclosed in the December 1, 2018 prospectus was 1.43%. |
5
The Investment House Growth Fund
Portfolio Information
January 31, 2019 (Unaudited) |
Sector Diversification vs. the S&P 500 Index
(% of Total Investments)
Top 10 Holdings
Security Description | % of
Net Assets |
Facebook, Inc. - Class A | 9.8% |
Amazon.com, Inc. | 7.4% |
Intuit, Inc. | 7.1% |
Apple, Inc. | 5.6% |
Intuitive Surgical, Inc. | 4.3% |
Alphabet, Inc. - Class A | 3.7% |
Alibaba Group Holding Ltd. - ADR | 3.7% |
Alphabet, Inc. - Class C | 3.7% |
PayPal Holdings, Inc. | 3.6% |
Texas Instruments, Inc. | 3.2% |
6
The Investment House Growth Fund
Schedule of Investments
January 31, 2019 (Unaudited) |
COMMON STOCKS — 96.8% | | Shares | | | Value | |
Communication Services — 17.2% | | | | | | | | |
Interactive Media & Services — 17.2% | | | | | | | | |
Alphabet, Inc. - Class A (a) | | | 3,600 | | | $ | 4,053,204 | |
Alphabet, Inc. - Class C (a) | | | 3,609 | | | | 4,028,979 | |
Facebook, Inc. - Class A (a) | | | 65,000 | | | | 10,834,850 | |
| | | | | | | | 18,917,033 | |
Consumer Discretionary — 15.2% | | | | | | | | |
Hotels, Restaurants & Leisure — 2.3% | | | | | | | | |
Carnival Corporation | | | 30,000 | | | | 1,727,400 | |
Six Flags Entertainment Corporation | | | 14,000 | | | | 862,260 | |
| | | | | | | | 2,589,660 | |
Internet & Direct Marketing Retail — 12.9% | | | | | | | | |
Alibaba Group Holding Ltd. - ADR (a) | | | 24,000 | | | | 4,043,760 | |
Amazon.com, Inc. (a) | | | 4,725 | | | | 8,120,999 | |
Booking Holdings, Inc. (a) | | | 1,100 | | | | 2,016,091 | |
| | | | | | | | 14,180,850 | |
Consumer Staples — 4.0% | | | | | | | | |
Beverages — 0.6% | | | | | | | | |
Constellation Brands, Inc. - Class A | | | 4,000 | | | | 694,640 | |
| | | | | | | | | |
Food & Staples Retailing — 1.0% | | | | | | | | |
Costco Wholesale Corporation | | | 5,000 | | | | 1,073,150 | |
| | | | | | | | | |
Household Products — 2.4% | | | | | | | | |
Church & Dwight Company, Inc. | | | 22,000 | | | | 1,421,420 | |
Clorox Company (The) | | | 8,000 | | | | 1,187,040 | |
| | | | | | | | 2,608,460 | |
Financials — 2.1% | | | | | | | | |
Capital Markets — 2.1% | | | | | | | | |
Intercontinental Exchange, Inc. | | | 30,000 | | | | 2,302,800 | |
| | | | | | | | | |
Health Care — 10.1% | | | | | | | | |
Health Care Equipment & Supplies — 6.7% | | | | | | | | |
Baxter International, Inc. | | | 9,000 | | | | 652,410 | |
Intuitive Surgical, Inc. (a) | | | 9,000 | | | | 4,712,760 | |
Medtronic plc | | | 7,000 | | | | 618,730 | |
Stryker Corporation | | | 7,500 | | | | 1,331,775 | |
| | | | | | | | 7,315,675 | |
Health Care Providers & Services — 2.3% | | | | | | | | |
CVS Health Corporation | | | 9,000 | | | | 589,950 | |
Henry Schein, Inc. (a) | | | 25,400 | | | | 1,973,580 | |
| | | | | | | | 2,563,530 | |
7
The Investment House Growth Fund
Schedule of Investments
January 31, 2019 (Unaudited) (Continued) |
COMMON STOCKS — 96.8% (Continued) | | Shares | | | Value | |
Health Care — 10.1% (Continued) | | | | | | | | |
Life Sciences Tools & Services — 1.1% | | | | | | | | |
Charles River Laboratories International, Inc. (a) | | | 10,000 | | | $ | 1,231,900 | |
| | | | | | | | | |
Industrials — 7.8% | | | | | | | | |
Air Freight & Logistics — 2.9% | | | | | | | | |
FedEx Corporation | | | 11,000 | | | | 1,953,270 | |
XPO Logistics, Inc. (a) | | | 20,000 | | | | 1,215,600 | |
| | | | | | | | 3,168,870 | |
Airlines — 1.0% | | | | | | | | |
Delta Air Lines, Inc. | | | 23,000 | | | | 1,136,890 | |
| | | | | | | | | |
Commercial Services & Supplies — 2.2% | | | | | | | | |
Waste Management, Inc. | | | 25,000 | | | | 2,391,750 | |
| | | | | | | | | |
Machinery — 0.6% | | | | | | | | |
Cummins, Inc. | | | 4,500 | | | | 661,995 | |
| | | | | | | | | |
Road & Rail — 1.1% | | | | | | | | |
Norfolk Southern Corporation | | | 7,000 | | | | 1,174,180 | |
| | | | | | | | | |
Information Technology — 36.7% | | | | | | | | |
Communications Equipment — 1.0% | | | | | | | | |
Cisco Systems, Inc. | | | 24,000 | | | | 1,134,960 | |
| | | | | | | | | |
IT Services — 11.4% | | | | | | | | |
Accenture plc - Class A | | | 17,900 | | | | 2,748,545 | |
Automatic Data Processing, Inc. | | | 7,000 | | | | 978,880 | |
Paychex, Inc. | | | 24,000 | | | | 1,699,200 | |
PayPal Holdings, Inc. (a) | | | 45,000 | | | | 3,994,200 | |
Square, Inc. - Class A (a) | | | 25,000 | | | | 1,783,750 | |
Visa, Inc. - Class A | | | 10,000 | | | | 1,350,100 | |
| | | | | | | | 12,554,675 | |
Semiconductors & Semiconductor Equipment — 4.8% | | | | | | | | |
Intel Corporation | | | 23,000 | | | | 1,083,760 | |
QUALCOMM, Inc. | | | 13,700 | | | | 678,424 | |
Texas Instruments, Inc. | | | 35,000 | | | | 3,523,800 | |
| | | | | | | | 5,285,984 | |
Software — 12.5% | | | | | | | | |
Adobe, Inc. (a) | | | 12,000 | | | | 2,973,840 | |
Autodesk, Inc. (a) | | | 11,000 | | | | 1,619,200 | |
8
The Investment House Growth Fund
Schedule of Investments
January 31, 2019 (Unaudited) (Continued) |
COMMON STOCKS — 96.8% (Continued) | | Shares | | | Value | |
Information Technology — 36.7% (Continued) | | | | | | | | |
Software — 12.5% (Continued) | | | | | | | | |
Intuit, Inc. | | | 36,000 | | | $ | 7,769,520 | |
SAP SE - ADR | | | 13,000 | | | | 1,344,460 | |
| | | | | | | | 13,707,020 | |
Technology Hardware, Storage & Peripherals — 7.0% | | | | | | | | |
Apple, Inc. | | | 37,000 | | | | 6,158,280 | |
HP, Inc. | | | 70,000 | | | | 1,542,100 | |
| | | | | | | | 7,700,380 | |
Materials — 3.7% | | | | | | | | |
Chemicals — 3.7% | | | | | | | | |
Ecolab, Inc. | | | 15,000 | | | | 2,372,550 | |
Scotts Miracle-Gro Company (The) | | | 23,600 | | | | 1,754,660 | |
| | | | | | | | 4,127,210 | |
| | | | | | | | | |
Total Common Stocks (Cost $37,961,385) | | | | | | $ | 106,521,612 | |
|
EXCHANGE-TRADED FUNDS — 2.0% | | Shares | | | Value | |
iShares Nasdaq Biotechnology ETF (Cost $2,083,074) | | | 20,000 | | | $ | 2,193,800 | |
|
MONEY MARKET FUNDS — 1.1% | | Shares | | | Value | |
First American Government Obligations Fund - Class Z, 2.28% (b) (Cost $1,243,994) | | | 1,243,994 | | | $ | 1,243,994 | |
| | | | | | | | | |
Total Investments at Value — 99.9% (Cost $41,288,453) | | | | | | $ | 109,959,406 | |
| | | | | | | | | |
Other Assets in Excess of Liabilities — 0.1% | | | | | | | 110,818 | |
| | | | | | | | | |
Net Assets — 100.0% | | | | | | $ | 110,070,224 | |
ADR - American Depositary Receipt. |
(a) | Non-income producing security. |
(b) | The rate shown is the 7-day effective yield as of January 31, 2019. |
See accompanying notes to financial statements. |
9
The Investment House Growth Fund
Statement of Assets and Liabilities
January 31, 2019 (Unaudited) |
ASSETS | | | | |
Investments in securities: | | | | |
At cost | | $ | 41,288,453 | |
At value (Note 2) | | $ | 109,959,406 | |
Receivable for capital shares sold | | | 194,040 | |
Dividends and reclaims receivable | | | 63,461 | |
Total Assets | | | 110,216,907 | |
| | | | | |
LIABILITIES | | | | |
Payable for capital shares redeemed | | | 12,505 | |
Accrued investment advisory fees (Note 4) | | | 122,836 | |
Accrued Trustees’ fees (Note 4) | | | 11,342 | |
Total Liabilities | | | 146,683 | |
| | | | | |
NET ASSETS | | $ | 110,070,224 | |
| | | | | |
Net assets consist of: | | | | |
Paid-in capital | | $ | 42,816,890 | |
Accumulated earnings | | | 67,253,334 | |
Net assets | | $ | 110,070,224 | |
| | | | | |
Shares of beneficial interest outstanding (unlimited number of shares authorized, no par value) | | | 3,206,633 | |
| | | | | |
Net asset value, redemption price and offering price per share (Note 2) | | $ | 34.33 | |
See accompanying notes to financial statements. |
10
The Investment House Growth Fund
Statement of Operations
For the Six Months Ended January 31, 2019 (Unaudited) |
INVESTMENT INCOME | | | | |
Dividend income (Net of foreign tax of $2) | | $ | 506,466 | |
| | | | | |
EXPENSES | | | | |
Investment advisory fees (Note 4) | | | 774,410 | |
Trustees’ fees (Note 4) | | | 11,342 | |
Interest expense and bank fees (Note 5) | | | 5,081 | |
Total expenses | | | 790,833 | |
| | | | | |
NET INVESTMENT LOSS | | | (284,367 | ) |
| | | | | |
REALIZED AND UNREALIZED GAINS (LOSSES) ON INVESTMENTS | | | | |
Net realized gains from investment transactions | | | 103,352 | |
Net change in unrealized appreciation (depreciation) on investments | | | (5,162,480 | ) |
NET REALIZED AND UNREALIZED LOSSES ON INVESTMENTS | | | (5,059,128 | ) |
| | | | | |
NET DECREASE IN NET ASSETS RESULTING FROM OPERATIONS | | $ | (5,343,495 | ) |
See accompanying notes to financial statements. |
11
The Investment House Growth Fund
Statements of Changes in Net Assets |
| | Six Months
Ended
January 31, 2019
(Unaudited) | | | Year
Ended
July 31, 2018(a) | |
FROM OPERATIONS | | | | | | | | |
Net investment loss | | $ | (284,367 | ) | | $ | (567,695 | ) |
Net realized gains from investment transactions | | | 103,352 | | | | 363,001 | |
Net change in unrealized appreciation (depreciation) on investments | | | (5,162,480 | ) | | | 18,459,467 | |
Net increase (decrease) in net assets resulting from operations | | | (5,343,495 | ) | | | 18,254,773 | |
| | | | | | | | | |
FROM CAPITAL SHARE TRANSACTIONS | | | | | | | | |
Proceeds from shares sold | | | 7,484,803 | | | | 5,546,172 | |
Payments for shares redeemed | | | (3,632,955 | ) | | | (4,905,824 | ) |
Net increase in net assets from captial share transactions | | | 3,851,848 | | | | 640,348 | |
| | | | | | | | | |
TOTAL INCREASE (DECREASE) IN NET ASSETS | | | (1,491,647 | ) | | | 18,895,121 | |
| | | | | | | | | |
NET ASSETS | | | | | | | | |
Beginning of period | | | 111,561,871 | | | | 92,666,750 | |
End of period | | $ | 110,070,224 | | | $ | 111,561,871 | |
| | | | | | | | | |
CAPITAL SHARE ACTIVITY | | | | | | | | |
Shares sold | | | 211,340 | | | | 168,299 | |
Shares redeemed | | | (101,322 | ) | | | (146,842 | ) |
Net increase in shares outstanding | | | 110,018 | | | | 21,457 | |
Shares outstanding, beginning of period | | | 3,096,615 | | | | 3,075,158 | |
Shares outstanding, end of period | | | 3,206,633 | | | | 3,096,615 | |
(a) | As of July 31, 2018, accumulated net investment loss was ($367,259). |
See accompanying notes to financial statements. |
12
The Investment House Growth Fund
Financial Highlights |
Per Share Data and Ratios for a Share Outstanding Throughout Each Period |
| | | Six Months
Ended | | | Years Ended | |
| | January 31,
2019
(Unaudited) | | | July 31,
2018 | | | July 31,
2017 | | | July 31,
2016 | | | July 31,
2015 | | | July 31,
2014 | |
Net asset value at beginning of period | | $ | 36.03 | | | $ | 30.13 | | | $ | 24.03 | | | $ | 26.61 | | | $ | 23.89 | | | $ | 20.25 | |
| | | | | | | | | | | | | | | | | | | | | | | | | |
Income (loss) from investment operations: | | | | | | | | | | | | | | | | | | | | | | | | |
Net investment loss | | | (0.08 | ) | | | (0.18 | ) | | | (0.11 | ) | | | (0.11 | ) | | | (0.13 | ) | | | (0.10 | ) |
Net realized and unrealized gains (losses) on investments | | | (1.62 | ) | | | 6.08 | | | | 6.21 | | | | 0.94 | | | | 2.94 | | | | 4.27 | |
Total from investment operations | | | (1.70 | ) | | | 5.90 | | | | 6.10 | | | | 0.83 | | | | 2.81 | | | | 4.17 | |
| | | | | | | | | | | | | | | | | | | | | | | | | |
Less distributions: | | | | | | | | | | | | | | | | | | | | | | | | |
From net realized gains on investments | | | — | | | | — | | | | — | | | | (3.41 | ) | | | (0.09 | ) | | | (0.53 | ) |
| | | | | | | | | | | | | | | | | | | | | | | | | |
Net asset value at end of period | | $ | 34.33 | | | $ | 36.03 | | | $ | 30.13 | | | $ | 24.03 | | | $ | 26.61 | | | $ | 23.89 | |
| | | | | | | | | | | | | | | | | | | | | | | | | |
Total return (a) | | | (4.72 | %)(b) | | | 19.58 | % | | | 25.38 | % | | | 3.48 | % | | | 11.76 | % | | | 20.77 | % |
| | | | | | | | | | | | | | | | | | | | | | | | | |
Net assets at end of period (000’s) | | $ | 110,070 | | | $ | 111,562 | | | $ | 92,667 | | | $ | 74,348 | | | $ | 68,335 | | | $ | 59,941 | |
| | | | | | | | | | | | | | | | | | | | | | | | | |
Ratio of total expenses to average net assets | | | 1.43 | %(c) | | | 1.43 | % | | | 1.45 | % | | | 1.44 | % | | | 1.62 | % | | | 1.48 | % |
| | | | | | | | | | | | | | | | | | | | | | | | | |
Ratio of net expenses to average net assets excluding borrowing costs | | | 1.42 | %(c) | | | 1.42 | % | | | 1.43 | % | | | 1.43 | % | | | 1.42 | % | | | 1.43 | % |
| | | | | | | | | | | | | | | | | | | | | | | | | |
Ratio of net investment loss to average net assets | | | (0.51 | %)(c) | | | (0.55 | %) | | | (0.42 | %) | | | (0.53 | %) | | | (0.51 | %) | | | (0.43 | %) |
| | | | | | | | | | | | | | | | | | | | | | | | | |
Portfolio turnover rate | | | 7 | %(b) | | | 5 | % | | | 7 | % | | | 22 | % | | | 8 | % | | | 9 | % |
(a) | Total return is a measure of the change in value of an investment in the Fund over the periods covered, which assumes any dividends or capital gains distributions are reinvested in shares of the Fund. The returns shown do not reflect the deduction of taxes a shareholder would pay on Fund distributions or the redemption of Fund shares. |
(b) | Not annualized. |
(c) | Annualized. |
See accompanying notes to financial statements. |
13
The Investment House Growth Fund
Notes to Financial Statements
January 31, 2019 (Unaudited) |
1. Organization
The Investment House Growth Fund (the “Fund”) is a diversified series of The Investment House Funds (the “Trust”), an open-end management investment company established under the laws of Ohio by an Agreement and Declaration of Trust dated October 2, 2001.
The investment objective of the Fund is long term capital appreciation.
2. Significant Accounting Policies
In August 2018, the U.S. Securities and Exchange Commission (the “SEC”) adopted regulations that eliminated or amended disclosure requirements that were redundant or outdated in light of changes in SEC requirements, accounting principles generally accepted in the United States of America (“GAAP”), International Financial Reporting Standards or changes in technology or the business environment. These regulations were effective November 5, 2018, and the Fund is complying with them effective with these financial statements.
The Fund follows accounting and reporting guidance under Financial Accounting Standards Board (“FASB”) Accounting Standards Codification (“ASC”) Topic 946, “Financial Services – Investment Companies.” The following is a summary of the Fund’s significant accounting policies used in the preparation of its financial statements. These policies are in conformity with GAAP.
New Accounting Pronouncement – In August 2018, FASB issued Accounting Standards Update No. 2018-13 (“ASU 2018-13”), “Disclosure Framework – Changes to the Disclosure Requirements for Fair Value Measurement,” which amends the fair value measurement disclosure requirements of ASC Topic 820 (“ASC 820”), “Fair Value Measurement.” ASU 2018-13 includes new, eliminated, and modified disclosure requirements for ASC 820. In addition, ASU 2018-13 clarifies that materiality is an appropriate consideration when evaluating disclosure requirements. ASU 2018-13 is effective for fiscal years beginning after December 15, 2019, including interim periods therein. Early adoption is permitted and the Fund has adopted ASU 2018-13 with these financial statements.
Securities valuation – The Fund values its portfolio securities at market value as of close of regular trading on the New York Stock Exchange (the “NYSE”) (normally 4:00 p.m. Eastern time) on each business day the NYSE is open. Exchange-traded funds (“ETFs”) are valued at the last sale price on the security’s primary exchange. Lacking a last sale price, an exchange-traded security is generally valued at its last bid price. Securities traded on NASDAQ are valued at the NASDAQ Official Closing Price. Investments representing shares of money market funds and other open-end investment companies, except for ETFs, are valued at their net asset value (“NAV”) as reported by such companies. When using a quoted price and when the market for the security is considered active, the security will be classified as Level 1 within the fair value hierarchy (see below). If market prices are not available or The Investment House LLC, the investment adviser to the Fund (the “Adviser”), believes such prices do not accurately reflect the market value of such securities, securities
14
The Investment House Growth Fund
Notes to Financial Statements (Continued) |
will be valued by the Adviser at their fair value, according to procedures approved by the Board of Trustees and such securities will be classified as Level 2 or 3 within the fair value hierarchy, depending on the inputs used.
GAAP establishes a single authoritative definition of fair value, sets out a framework for measuring fair value and requires additional disclosures about fair value measurements.
Various inputs are used in determining the value of each of the Fund’s investments. These inputs are summarized in the three broad levels listed below:
● | Level 1 – quoted unadjusted prices for identical instruments in active markets to which the Fund has access at the date of measurement. |
● | Level 2 – quoted prices for similar instruments in active markets; quoted prices for identical or similar instruments in markets that are not active; and model-derived valuations in which all significant inputs and significant value drivers are observable in active markets. Level 2 inputs are those in markets for which there are few transactions, the prices are not current, little public information exists or instances where prices vary substantially over time or among brokered market makers. |
● | Level 3 – model derived valuations in which one or more significant inputs or significant value drivers are unobservable. Unobservable inputs are those inputs that reflect the Fund’s own assumptions that market participants would use to price the asset or liability based on the best available information. |
The inputs or methodology used for valuing securities are not necessarily an indication of the risks associated with investing in those securities. The inputs used to measure fair value may fall into different levels of the fair value hierarchy. In such cases, for disclosure purposes, the level in the fair value hierarchy within which the fair value measurement falls in its entirety is determined based on the lowest level input that is significant to the fair value measurement.
The following is a summary of the inputs used to value the Fund’s investments as of January 31, 2019 by security type:
| | Level 1 | | | Level 2 | | | Level 3 | | | Total | |
Common Stocks | | $ | 106,521,612 | | | $ | — | | | $ | — | | | $ | 106,521,612 | |
Exchange-Traded Funds | | | 2,193,800 | | | | — | | | | — | | | | 2,193,800 | |
Money Market Funds | | | 1,243,994 | | | | — | | | | — | | | | 1,243,994 | |
Total | | $ | 109,959,406 | | | $ | — | | | $ | — | | | $ | 109,959,406 | |
Refer to the Fund’s Schedule of Investments for a listing of the common stocks by sector and industry type. As of January 31, 2019, there were no Level 2 or Level 3 securities or derivative instruments held by the Fund.
Share valuation – The NAV is calculated daily by dividing the value of the Fund’s total assets, minus liabilities, by the total number of shares outstanding. The offering price and redemption price per share are equal to the NAV per share.
15
The Investment House Growth Fund
Notes to Financial Statements (Continued) |
Investment transactions and investment income – Investment transactions are accounted for on trade date. Realized gains and losses on investments sold are determined on a specific identification basis. Dividend income is recorded on the ex-dividend date. Interest income is accrued as earned. Withholding taxes on foreign dividends have been recorded in accordance with the Fund’s understanding of the applicable country’s tax rules and rates.
Distributions to shareholders – Dividends arising from net investment income and distributions of net realized capital gains, if any, are declared and paid annually in December. The amount of distributions from net investment income and net realized capital gains are determined in accordance with income tax regulations, which may differ from GAAP. Dividends and distributions are recorded on the ex-dividend date. There were no distributions paid to shareholders during the periods ended January 31, 2019 and July 31, 2018.
Estimates – The preparation of financial statements in conformity with GAAP requires management to make estimates and assumptions that affect the reported amounts of assets and liabilities and disclosure of contingent assets and liabilities as of the date of the financial statements and the reported amounts of increases and decreases in net assets from operations during the reporting period. Actual results could differ from those estimates.
Federal income tax – The Fund has qualified and intends to continue to qualify each year as a “regulated investment company” under Subchapter M of the Internal Revenue Code of 1986, as amended (the “Code”). By so qualifying, the Fund will not be subject to federal income taxes to the extent that the Fund distributes its net investment income and any net realized capital gains in accordance with the Code.
In order to avoid imposition of the excise tax applicable to regulated investment companies, it is also the Fund’s intention to declare as dividends in each calendar year at least 98% of its net investment income (earned during the calendar year) and 98.2% of its net realized capital gains (earned during the twelve months ended October 31) plus undistributed amounts from prior years.
The following information is computed on a tax basis for each item as of January 31, 2019:
Cost of portfolio investments | | $ | 41,288,453 | |
Gross unrealized appreciation | | $ | 69,591,473 | |
Gross unrealized depreciation | | | (920,520 | ) |
Net unrealized appreciation | | | 68,670,953 | |
Accumulated ordinary loss | | | (651,626 | ) |
Capital loss carryforwards | | | (869,345 | ) |
Other gains | | | 103,352 | |
Accumulated earnings | | $ | 67,253,334 | |
As of July 31, 2018, the Fund has long-term capital loss carryforwards of $869,345 for federal income tax purposes. These capital loss carryforwards, which do not expire, may be utilized in the current and future years to offset net realized capital gains, if any, prior to distributing such gains to shareholders.
16
The Investment House Growth Fund
Notes to Financial Statements (Continued) |
The Fund recognizes the tax benefits or expenses of uncertain tax positions only when the position is “more-likely-than-not” to be sustained assuming examination by tax authorities. Management has reviewed the tax positions taken on Federal income tax returns for the current and all open tax years (generally, three years) and has concluded that no provision for unrecognized tax benefits or expenses is required in these financial statements.
3. Investment Transactions
During the six months ended January 31, 2019, cost of purchases and proceeds from sales of investment securities, other than short-term investments, amounted to $7,871,803 and $6,879,218, respectively.
4. Transactions with Related Parties
A Trustee and certain officers of the Trust are affiliated with the Adviser, Ultimus Fund Solutions, LLC (“Ultimus”), the Fund’s administrator, transfer agent and fund accounting agent, or Ultimus Fund Distributors, LLC (the “Distributor”), the principal underwriter of the Fund’s shares.
Under the terms of a Management Agreement between the Trust and the Adviser, the Adviser serves as the investment adviser to the Fund. For its services, the Fund pays the Adviser an investment management fee, which is accrued daily and paid monthly, at the annual rate of 1.40% of the Fund’s average daily net assets. The Adviser pays all of the operating expenses of the Fund except brokerage, taxes, borrowing costs, fees and expenses of non-interested Trustees, extraordinary expenses and distribution and/or service related expenses incurred pursuant to Rule 12b-1 under the Investment Company Act of 1940 (if any).
The Trust has entered into mutual fund services agreements with Ultimus, pursuant to which Ultimus provides day-to-day operational services to the Fund including, but not limited to, accounting, administrative, transfer agent, dividend disbursing, and recordkeeping services. The fees payable to Ultimus are paid by the Adviser (not the Fund).
The Trust has entered into a Distribution Agreement with the Distributor, pursuant to which the Distributor provides distribution services to the Fund and serves as principal underwriter to the Fund. The Distributor is a wholly-owned subsidiary of Ultimus. The fees payable to the Distributor are paid by the Adviser (not the Fund).
The Fund pays each Trustee who is not affiliated with the Adviser $7,500 annually. Trustees who are affiliated with the Adviser do not receive compensation from the Fund.
5. Bank Line of Credit
The Fund has a secured bank line of credit with U.S. Bank, N.A. that provides a maximum borrowing of up to $20,000,000. The line of credit may be used to cover redemptions and/or it may be used by the Adviser for investment purposes. When used for investment purposes, the Fund will be using the investment technique of “leverage.” Because the Fund’s investments will fluctuate in value, whereas the interest obligations on borrowed funds may be fixed, during times of borrowing the Fund’s NAV may tend to increase more when its investments increase in value, and decrease more when its investments decrease in value.
17
The Investment House Growth Fund
Notes to Financial Statements (Continued) |
In addition, interest costs on borrowings may fluctuate with changing market interest rates and may partially offset or exceed the return earned on the borrowed funds. Also, during times of borrowing under adverse market conditions, the Fund might have to sell portfolio securities to meet interest or principal payments at a time when fundamental investment considerations would not favor such sales. Unless profits on assets acquired with borrowed funds exceed the costs of borrowing, the use of borrowing will diminish the investment performance of the Fund compared with what it would have been without borrowing.
Borrowings under this arrangement bear interest at a rate per annum equal to the Prime Rate minus 0.25% at the time of borrowing. The Fund also pays an annual renewal fee of $1,000. The line of credit matures on December 9, 2019. During the six months ended January 31, 2019, the Fund incurred $4,541 of interest expense and fees related to the borrowings. The average debt outstanding and the average interest rate for the days with borrowings during the six months ended January 31, 2019 were $833,567 and 4.75%. The largest outstanding borrowing during the six months ended January 31, 2019 was $3,284,000. As of January 31, 2019, the Fund did not have any outstanding borrowings.
6. Contingencies and Commitments
The Fund indemnifies the Trust’s officers and Trustees for certain liabilities that might arise from their performance of their duties to the Fund. Additionally, in the normal course of business, the Fund enters into contracts that contain a variety of representations and warranties and which provide general indemnifications. The Fund’s maximum exposure under these arrangements is unknown, as this would involve future claims that may be made against the Fund that have not yet occurred. However, based on experience, the Fund expects the risk of loss to be remote.
7. Sector Risk
If the Fund’s portfolio is overweighted in a certain sector, any negative development affecting that sector will have a greater impact on the Fund than a fund that is not overweighted in that sector. To the extent the Fund is overweighted in the Information Technology sector, it will be affected by developments affecting that sector. Companies in this sector may be significantly affected by intense competition. In addition, technology products may be subject to rapid obsolescence. As of January 31, 2019, the Fund had 36.7% of the value of its net assets invested in companies within the Information Technology sector.
8. Subsequent Events
The Fund is required to recognize in the financial statements the effects of all subsequent events that provide additional evidence about conditions that existed as of the date of the Statement of Assets and Liabilities. For non-recognized subsequent events that must be disclosed to keep the financial statements from being misleading, the Fund is required to disclose the nature of the event as well as an estimate of its financial effect, or a statement that such an estimate cannot be made. Management has evaluated subsequent events through the issuance of these financial statements and has noted no such events.
18
The Investment House Growth Fund
About Your Fund’s Expenses (Unaudited) |
We believe it is important for you to understand the impact of costs on your investment. As a shareholder of the Fund, you incur ongoing costs, including management fees and other operating expenses. The following examples are intended to help you understand your ongoing costs (in dollars) of investing in the Fund and to compare these costs with the ongoing costs of investing in other mutual funds.
A mutual fund’s ongoing costs are expressed as a percentage of its average net assets. This figure is known as the expense ratio. The examples below are based on an investment of $1,000 made at the beginning of the period shown and held for the entire period (August 1, 2018 – January 31, 2019).
The table below illustrates the Fund’s ongoing costs in two ways:
Actual fund return – This section helps you to estimate the actual expenses that you paid over the period. The “Ending Account Value” shown is derived from the Fund’s actual return, and the third column shows the dollar amount of operating expenses that would have been paid by an investor who started with $1,000 in the Fund. You may use the information here, together with the amount you invested, to estimate the expenses that you paid over the period.
To do so, simply divide your account value by $1,000 (for example, an $8,600 account value divided by $1,000 = 8.6), then multiply the result by the number given for the Fund under the heading “Expenses Paid During Period.”
Hypothetical 5% return – This section is intended to help you compare the Fund’s ongoing costs with those of other mutual funds. It assumes that the Fund had an annual return of 5% before expenses during the period shown, but that the expense ratio is unchanged. In this case, because the return used is not the Fund’s actual return, the results do not apply to your investment. The example is useful in making comparisons because the SEC requires all mutual funds to calculate expenses based on a 5% return before expenses. You can assess the Fund’s ongoing costs by comparing this hypothetical example with the hypothetical examples that appear in shareholder reports of other funds.
Note that expenses shown in the table are meant to highlight and help you compare ongoing costs only. The Fund does not impose any sales loads or redemption fees.
The calculations assume no shares were bought or sold during the period. Your actual costs may have been higher or lower, depending on the amount of your investment and the timing of any purchases or redemptions.
More information about the Fund’s expenses, including annual expense ratios for the most recent five fiscal years, can be found in this report. For additional information on operating expenses and other shareholder costs, please refer to the Fund’s prospectus.
19
The Investment House Growth Fund
About Your Fund’s Expenses (Unaudited) (Continued) |
| Beginning
Account Value
August 1, 2018 | Ending
Account Value
January 31, 2019 | Expenses Paid
During Period* |
Based on Actual Fund Return | $ 1,000.00 | $ 952.80 | $ 7.04 |
Based on Hypothetical 5% Return (before expenses) | $ 1,000.00 | $ 1,018.00 | $ 7.27 |
* | Expenses are equal to the Fund’s annualized expense ratio of 1.43% for the period, multiplied by the average account value over the period, multiplied by 184/365 (to reflect the one-half year period). |
Other Information (Unaudited)
A description of the policies and procedures that the Fund uses to vote proxies relating to portfolio securities is available without charge upon request by calling toll-free 1-888-456-9518, or on the SEC’s website at http://www.sec.gov. Information regarding how the Fund voted proxies relating to portfolio securities during the most recent 12-month period ended June 30 is available without charge upon request by calling toll-free 1-888-456-9518, or on the SEC’s website at http://www.sec.gov.
The Trust files a complete listing of portfolio holdings of the Fund with the SEC as of the end of the first and third quarters of each fiscal year on Form N-Q. The filings are available upon request by calling 1-888-456-9518. Furthermore, you may obtain a copy of the filings on the SEC’s website at http://www.sec.gov.
20
The Investment House Growth Fund
Advisory Agreement Approval (Unaudited) |
The Board of Trustees, including the Independent Trustees voting separately, have reviewed and approved the continuance of the Fund’s Management Agreement (the “Agreement”) with the Adviser. Approval took place at an in-person meeting held on September 25, 2018, at which all of the Trustees were present.
The Trustees were advised by independent counsel of their fiduciary obligations in approving the Agreement and the Trustees requested such information from the Adviser as they deemed reasonably necessary to evaluate the terms of the Agreement and whether the Agreement continues to be in the best interests of the Fund and its shareholders. The Trustees reviewed: (i) the investment performance of the Fund and the Adviser; (ii) the nature, extent and quality of the services provided by the Adviser; (iii) the costs of the services provided and the profits realized by the Adviser and its affiliates from its relationship with the Fund; (iv) the extent to which economies of scale will be realized as the Fund grows; (v) whether fee levels reflect these economies of scale for the benefit of the Fund’s shareholders; and (vi) whether the Fund’s advisory fee is reasonable in comparison to fees paid by other funds in its peer group and in absolute terms. The Trustees reviewed the background, qualifications, education and experience of the Adviser’s primary investment and key operational personnel. The Trustees also discussed and considered the quality of administrative and other services provided to the Trust, the Adviser’s compliance program, and the Adviser’s role in coordinating such services and programs. The Independent Trustees were advised by experienced independent counsel throughout the process. Prior to voting, the Independent Trustees reviewed the proposed continuance of the Agreement with management and also met in a private session with counsel at which no representatives of the Adviser were present.
Nature, extent and quality of services
The Independent Trustees considered the responsibilities of the Adviser under the Agreement, noting that the Adviser is responsible for providing the Fund with investment research and advice, and determining the securities to be purchased and sold in accordance with the investment objective and policies of the Fund. The Independent Trustees reviewed the Adviser’s Form ADV (Parts 1 and 2) and biographical information on each of the Adviser’s key personnel from its investment management and compliance teams. The Trustees also considered the Adviser’s compliance procedures and its commitment to compliance.
The Independent Trustees considered the Adviser’s responsibilities with regards to brokerage selection. The Trustees noted that the Adviser does not participate in any “soft dollar” arrangements.
Investment Results
The Independent Trustees reviewed information regarding the Fund’s historical performance as compared to the S&P 500 Index (its primary benchmark) and to other relevant averages. The Independent Trustees discussed the Fund’s performance for the one-year, five-year, and 10-year periods ended June 30, 2018, noting that the Fund outperformed compared to its benchmark index for all of the referenced periods, and also outperformed the average and median of all large cap growth funds, the Fund’s peer group as assigned by Morningstar, as well as the average and median of large cap growth funds with assets under $200 million.
21
The Investment House Growth Fund
Advisory Agreement Approval (Unaudited) (Continued) |
Advisory fees and total expenses
In reviewing the advisory fee and total expense ratio of the Fund, the Independent Trustees were provided with comparative expense and advisory fee information for equity funds classified by Morningstar as large cap growth funds. The Independent Trustees considered the Fund’s fee arrangement in which the Adviser is responsible for paying most of the Fund’s ordinary operating expenses out of its resources, noting that comparisons with the Fund’s overall expense ratio may be more relevant than comparisons of advisory fees only. The Independent Trustees specifically noted that the Fund’s total expense ratio of 1.45% is higher than the average and median of all funds classified by Morningstar as large cap growth (1.10% and 0.99%, respectively) and the average and median expense ratios of those funds within the Morningstar large cap growth category that are true no-load funds having less than $200 million in assets (1.01% and 0.99%, respectively).
The Independent Trustees also reviewed information regarding the advisory fees charged by the Adviser to its non-fund clients with similar investment mandates. They noted that the Adviser’s fee schedule ranges from 1.00% to 1.50% per annum depending on the level of assets managed by the Adviser. The Independent Trustees also considered the significant investment, operational and regulatory differences between advising a mutual fund and non-fund client accounts.
The Independent Trustees next reviewed the Adviser’s analysis of its profitability with respect to the Agreement and the Adviser’s balance sheet as of August 31, 2018. The Independent Trustees noted that the Adviser’s profitability analysis indicates that the Adviser incurred a modest net profit (without taking into account marketing and distribution expenses) with respect to the Agreement for the period covered by the analysis. The Independent Trustees also concluded that the Adviser possesses the financial resources necessary to serve as investment adviser to the Fund.
Ancillary benefits
The Independent Trustees considered the ancillary benefits that the Adviser may receive with regard to providing advisory services to the Fund and concluded that, in light of the amounts involved, these factors are only secondary factors in connection with the evaluation of the reasonableness of the advisory fees paid by the Fund.
Economies of Scale
The Independent Trustees considered economies of scale, noting that at the present time the Fund has not realized any significant economies of scale. They observed that as the Fund continues to grow in assets, this factor will become more relevant to their consideration process and it may become necessary at some future point for the Adviser to consider adding breakpoints to the Agreement.
22
The Investment House Growth Fund
Advisory Agreement Approval (Unaudited) (Continued) |
Conclusion
Based on their review, including their consideration of each of the factors referred to above, the Independent Trustees concluded that: (i) based on both the short-term and long-term performance of the Fund and the consistent application of the Fund’s investment strategies, as well as the other services provided under the Agreement, such as the selection of broker-dealers for executing portfolio transactions, monitoring adherence to the Fund’s investment restrictions, and overseeing the activities of the Fund’s other service providers, they believe that the Adviser has provided quality services to the Fund; (ii) the Fund’s overall expense ratio of 1.45% is reasonable compared to comparably managed funds; (iii) comparisons between the advisory fees payable to the Adviser with other comparably managed funds are not particularly meaningful due to the Adviser’s commitment to pay most of the Fund’s ordinary operating expenses out of the Adviser’s own resources; and (iv) the advisory fees charged by the Adviser to the Fund were within the range of advisory fees charged by the Adviser to its privately managed accounts. The Independent Trustees discussed the significant differences between the services provided by the Adviser to the Fund and those provided to the privately managed accounts. The Independent Trustees also discussed economies of scale, deciding that at the present time it would not be relevant to consider the extent to which economies of scale would be realized as the Fund grows and whether fee levels reflect these economies of scale. The Independent Trustees did note that if the Fund grows significantly in assets it may become necessary for the Adviser to consider adding fee breakpoints to the Agreement. The Independent Trustees also considered the “fallout benefits” to, and the profitability of, the Adviser but, given the amounts involved, viewed these as secondary factors in connection with the evaluation of the reasonableness of the advisory fees paid by the Fund.
No single factor was considered in isolation or to be determinative to the decision of the Trustees to approve continuance of the Agreement. Rather, the Trustees concluded, in light of a weighing and balancing of all factors considered, that it would be in the best interests of the Fund and its shareholders to renew the Agreement for an additional annual period.
23
This page intentionally left blank.
This page intentionally left blank.

Not required
| Item 3. | Audit Committee Financial Expert. |
Not required
| Item 4. | Principal Accountant Fees and Services. |
Not required
| Item 5. | Audit Committee of Listed Registrants. |
Not applicable
| Item 6. | Schedule of Investments. |
| (a) | Not applicable [schedule filed with Item 1] |
| Item 7. | Disclosure of Proxy Voting Policies and Procedures for Closed-End Management Investment Companies. |
Not applicable
| Item 8. | Portfolio Managers of Closed-End Management Investment Companies. |
Not applicable
| Item 9. | Purchases of Equity Securities by Closed-End Management Investment Company and Affiliated Purchasers. |
Not applicable
| Item 10. | Submission of Matters to a Vote of Security Holders. |
The registrant’s Committee of Independent Trustees shall review shareholder recommendations for nominations to fill vacancies on the registrant’s board of trustees if such recommendations are submitted in writing and addressed to the Committee at the registrant’s offices. The Committee may adopt, by resolution, a policy regarding its procedures for considering candidates for the board of trustees, including any recommended by shareholders.
| Item 11. | Controls and Procedures. |
(a) Based on their evaluation of the registrant’s disclosure controls and procedures (as defined in Rule 30a-3(c) under the Investment Company Act of 1940) as of a date within 90 days of the filing date of this report, the registrant’s principal executive officer and principal financial officer have concluded that such disclosure controls and procedures are reasonably designed and are operating effectively to ensure that material information relating to the registrant, including its consolidated subsidiaries, is made known to them by others within those entities, particularly during the period in which this report is being prepared, and that the information required in filings on Form N-CSR is recorded, processed, summarized, and reported on a timely basis.
(b) There were no changes in the registrant’s internal control over financial reporting (as defined in Rule 30a-3(d) under the Investment Company Act of 1940) that occurred during the second fiscal quarter of the period covered by this report that have materially affected, or are reasonably likely to materially affect, the registrant’s internal control over financial reporting.
| Item 12. | Disclosure of Securities Lending Activities for Closed-End Management Investment Companies. |
Not applicable
File the exhibits listed below as part of this Form. Letter or number the exhibits in the sequence indicated.
(a)(1) Any code of ethics, or amendment thereto, that is the subject of the disclosure required by Item 2, to the extent that the registrant intends to satisfy the Item 2 requirements through filing of an exhibit: Not required
(a)(2) A separate certification for each principal executive officer and principal financial officer of the registrant as required by Rule 30a-2(a) under the Act (17 CFR 270.30a-2(a)): Attached hereto
(a)(3) Any written solicitation to purchase securities under Rule 23c-1 under the Act (17 CFR 270.23c-1) sent or given during the period covered by the report by or on behalf of the registrant to 10 or more persons: Not applicable
(a)(4) Change in the registrant’s independent public accountants. Not applicable
(b) Certifications required by Rule 30a-2(b) under the Act (17 CFR 270.30a-2(b)): Attached hereto
| Exhibit 99.CERT | Certifications required by Rule 30a-2(a) under the Act |
| Exhibit 99.906CERT | Certifications required by Rule 30a-2(b) under the Act |
SIGNATURES
Pursuant to the requirements of the Securities Exchange Act of 1934 and the Investment Company Act of 1940, the registrant has duly caused this report to be signed on its behalf by the undersigned, thereunto duly authorized.
| (Registrant) | The Investment House Funds | | |
| | | | |
| By (Signature and Title)* | /s/ Timothy J. Wahl | |
| | | Timothy J. Wahl, President | |
| | | | |
| Date | April 3, 2019 | | |
| | | | |
| Pursuant to the requirements of the Securities Exchange Act of 1934 and the Investment Company Act of 1940, this report has been signed below by the following persons on behalf of the registrant and in the capacities and on the dates indicated. |
| | | | |
| By (Signature and Title)* | /s/ Timothy J. Wahl | |
| | | Timothy J. Wahl, President | |
| | | | |
| Date | April 3, 2019 | | |
| | | | |
| By (Signature and Title)* | /s/ Brian J. Lutes | |
| | | Brian J. Lutes, Treasurer and Principal Financial Officer | |
| | | | |
| Date | April 3, 2019 | | |
| * | Print the name and title of each signing officer under his or her signature. |