UNITED STATES
SECURITIES AND EXCHANGE COMMISSION
Washington, D.C. 20549
FORM N-CSR
CERTIFIED SHAREHOLDER REPORT OF REGISTERED
MANAGEMENT INVESTMENT COMPANIES
| Investment Company Act file number | 811-10529 | |
| The Investment House Funds |
| (Exact name of registrant as specified in charter) |
| 5940 S. Rainbow Blvd, Suite 400, PMB 57150 | Las Vegas, Nevada 89118 |
| (Address of principal executive offices) | (Zip code) |
Timothy J. Wahl
The Investment House LLC
| 5940 S. Rainbow Blvd., Suite 400, PMB 57150, Las Vegas, Nevada 89118 |
| (Name and address of agent for service) |
| Registrant's telephone number, including area code: | (310) 873-3020 | |
| Date of fiscal year end: | July 31 | |
| | | |
| Date of reporting period: | January 31, 2024 | |
Form N-CSR is to be used by management investment companies to file reports with the Commission not later than 10 days after the transmission to stockholders of any report that is required to be transmitted to stockholders under Rule 30e-1 under the Investment Company Act of 1940 (17 CFR 270.30e-1). The Commission may use the information provided on Form N-CSR in its regulatory, disclosure review, inspection, and policymaking roles.
A registrant is required to disclose the information specified by Form N-CSR, and the Commission will make this information public. A registrant is not required to respond to the collection of information contained in Form N-CSR unless the Form displays a currently valid Office of Management and Budget ("OMB") control number. Please direct comments concerning the accuracy of the information collection burden estimate and any suggestions for reducing the burden to the Secretary, Securities and Exchange Commission, 450 Fifth Street, NW, Washington, DC 20549-0609. The OMB has reviewed this collection of information under the clearance requirements of 44 U.S.C. § 3507.
Item 1. Reports to Stockholders.
| | | | | | | |
| | | | | | | |
| | | | | | | |
| | | | | | | |
| | | | | | | |
| | | | | | | |
| | | | | | | |
| | | | | | | |
| | | | | | | |
| | | | | | | |
| | | | | | | |
| | | | | | | |
| | | | | | | |
| | | | | | | |
| | | | | | | |
| | | | The Investment House Funds | | | |
| | | | | | | |
| | | | | | | |
| | | The Investment House Growth Fund | | |
| | | | | | | |
| | | | | | | |
| | | | | | | |
| | | | | | | |
| | | | | | | |
| | | | | | | |
| | | | | | | |
| | | | | | | |
| | | Semi-Annual Report | | |
| | | January 31, 2024 | | |
| | | (Unaudited) | | |
| | | | | |
| | | | | |
| | | | | |
| | | | | |
| | | | | |
| | | | | |
| | | | | |
| | | | | |
| | | | | |
| | | | | |
| | | | | |
| | | | | |
| | | | | |
| | | | | |
| | | | | |
| | | | | |
| | | | | |
| | | | | |
| | | | | |
| | | | | |
| | | | | |
| The Investment House Growth Fund |
| Performance Information |
| January 31, 2024 (Unaudited) |
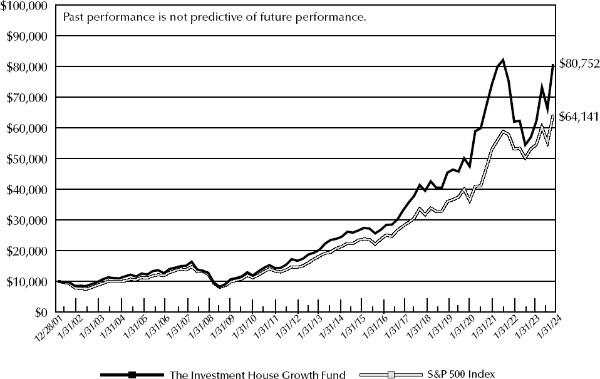
Comparison of the Change in Value of a $10,000 Investment in
The Investment House Growth Fund and the
S&P 500 Index Since Inception*
| | | | | | | | | | | |
| | Average Annual Total Returns
(for periods ended January 31, 2024) | |
| | | | | | | | | | | |
| | | | | | | | | | Since | |
| | | | 1 Year | | 5 Years | | 10 Years | | Inception* | |
| | The Investment House Growth Fund (a)(b) | | 41.89% | | 14.76% | | 13.13% | | 9.92% | |
| | S&P 500 Index | | 20.82% | | 14.30% | | 12.62% | | 8.78% | |
| | | | | | | | | | | |
| * | Initial public offering of shares was December 28, 2001. |
| (a) | The Fund’s total returns shown do not reflect the deduction of taxes that a shareholder would pay on Fund distributions or the redemption of Fund shares. |
| (b) | The Fund’s total expense ratio for the year ended July 31, 2023 was 1.42%. The expense ratio as disclosed in the December 1, 2023 prospectus was 1.43%. |
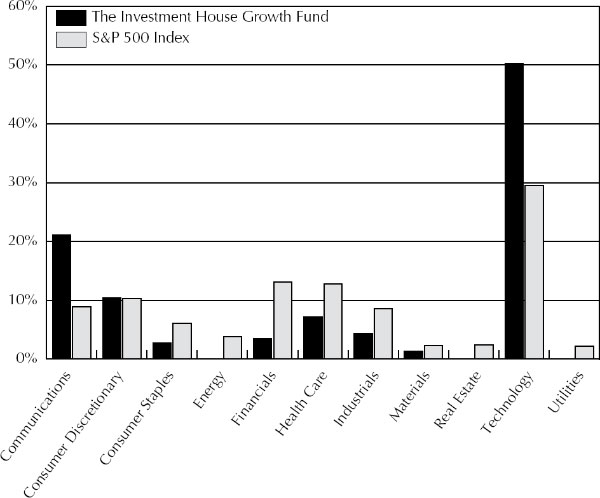
| The Investment House Growth Fund |
| Portfolio Information |
| January 31, 2024 (Unaudited) |
| Sector Diversification vs. the S&P 500 Index |
| (% of Net Assets) |
Top 10 Holdings
| | | % of |
| Security Description | | Net Assets |
| Meta Platforms, Inc. - Class A | | 11.7% |
| Intuit, Inc. | | 10.5% |
| Apple, Inc. | | 10.2% |
| Alphabet, Inc. - Classes A & C | | 9.4% |
| Amazon.com, Inc. | | 7.1% |
| NVIDIA Corporation | | 5.9% |
| Intuitive Surgical, Inc. | | 4.9% |
| Adobe, Inc. | | 3.6% |
| Accenture plc - Class A | | 3.1% |
| Texas Instruments, Inc. | | 2.7% |
| The Investment House Growth Fund |
| Schedule of Investments |
| January 31, 2024 (Unaudited) |
| COMMON STOCKS — 100.9% | | Shares | | | Value | |
| Communications — 21.1% | | | | | | | | |
| Internet Media & Services — 21.1% | | | | | | | | |
| Alphabet, Inc. - Class A (a) | | | 65,500 | | | $ | 9,176,550 | |
| Alphabet, Inc. - Class C (a) | | | 72,180 | | | | 10,235,124 | |
| Meta Platforms, Inc. - Class A (a) | | | 62,000 | | | | 24,188,680 | |
| | | | | | | | 43,600,354 | |
| Consumer Discretionary — 10.4% | | | | | | | | |
| E-Commerce Discretionary — 8.3% | | | | | | | | |
| Amazon.com, Inc. (a) | | | 94,500 | | | | 14,666,400 | |
| MercadoLibre, Inc. (a) | | | 1,500 | | | | 2,567,715 | |
| | | | | | | | 17,234,115 | |
| Retail - Discretionary — 2.1% | | | | | | | | |
| Lowe’s Companies, Inc. | | | 8,500 | | | | 1,809,140 | |
| RH (a) | | | 4,000 | | | | 1,013,920 | |
| Williams-Sonoma, Inc. | | | 8,000 | | | | 1,547,120 | |
| | | | | | | | 4,370,180 | |
| Consumer Staples — 2.7% | | | | | | | | |
| Household Products — 1.0% | | | | | | | | |
| Church & Dwight Company, Inc. | | | 22,000 | | | | 2,196,700 | |
| | | | | | | | | |
| Retail - Consumer Staples — 1.7% | | | | | | | | |
| Costco Wholesale Corporation | | | 5,000 | | | | 3,474,400 | |
| | | | | | | | | |
| Financials — 3.5% | | | | | | | | |
| Institutional Financial Services — 2.5% | | | | | | | | |
| Intercontinental Exchange, Inc. | | | 30,000 | | | | 3,819,900 | |
| Nu Holdings Ltd. - Class A (a) | | | 150,000 | | | | 1,291,500 | |
| | | | | | | | 5,111,400 | |
| Specialty Finance — 1.0% | | | | | | | | |
| American Express Company | | | 11,000 | | | | 2,208,140 | |
| | | | | | | | | |
| Health Care — 7.2% | | | | | | | | |
| Health Care Facilities & Services — 1.0% | | | | | | | | |
| Charles River Laboratories International, Inc. (a) | | | 10,000 | | | | 2,162,800 | |
| | | | | | | | | |
| Medical Equipment & Devices — 6.2% | | | | | | | | |
| Intuitive Surgical, Inc. (a) | | | 27,000 | | | | 10,211,940 | |
| Stryker Corporation | | | 7,500 | | | | 2,516,100 | |
| | | | | | | | 12,728,040 | |
See accompanying notes to financial statements.
| The Investment House Growth Fund |
| Schedule of Investments |
| January 31, 2024 (Unaudited) (Continued) |
| COMMON STOCKS — 100.9% (Continued) | | Shares | | | Value | |
| Industrials — 4.4% | | | | | | | | |
| Commercial Support Services — 1.1% | | | | | | | | |
| Waste Management, Inc. | | | 12,000 | | | $ | 2,227,560 | |
| | | | | | | | | |
| Machinery — 1.2% | | | | | | | | |
| Deere & Company | | | 6,000 | | | | 2,361,480 | |
| | | | | | | | | |
| Transportation & Logistics — 2.1% | | | | | | | | |
| Expeditors International of Washington, Inc. | | | 8,500 | | | | 1,073,805 | |
| Norfolk Southern Corporation | | | 7,000 | | | | 1,646,680 | |
| United Parcel Service, Inc. - Class B | | | 12,000 | | | | 1,702,800 | |
| | | | | | | | 4,423,285 | |
| Materials — 1.4% | | | | | | | | |
| Chemicals — 1.4% | | | | | | | | |
| Ecolab, Inc. | | | 15,000 | | | | 2,973,300 | |
| | | | | | | | | |
| Technology — 50.2% | | | | | | | | |
| Semiconductors — 9.6% | | | | | | | | |
| NVIDIA Corporation | | | 20,000 | | | | 12,305,400 | |
| QUALCOMM, Inc. | | | 13,700 | | | | 2,034,587 | |
| Texas Instruments, Inc. | | | 35,000 | | | | 5,604,200 | |
| | | | | | | | 19,944,187 | |
| Software — 20.0% | | | | | | | | |
| Adobe, Inc. (a) | | | 12,000 | | | | 7,413,360 | |
| Autodesk, Inc. (a) | | | 11,000 | | | | 2,791,910 | |
| CrowdStrike Holdings, Inc. - Class A (a) | | | 16,000 | | | | 4,680,000 | |
| Intuit, Inc. | | | 34,300 | | | | 21,654,619 | |
| Microsoft Corporation | | | 12,000 | | | | 4,770,960 | |
| | | | | | | | 41,310,849 | |
| Technology Hardware — 11.8% | | | | | | | | |
| Apple, Inc. | | | 114,703 | | | | 21,151,233 | |
| Motorola Solutions, Inc. | | | 10,000 | | | | 3,195,000 | |
| | | | | | | | 24,346,233 | |
See accompanying notes to financial statements.
| The Investment House Growth Fund |
| Schedule of Investments |
| January 31, 2024 (Unaudited) (Continued) |
| COMMON STOCKS — 100.9% (Continued) | | Shares | | | Value | |
| Technology — 50.2% (Continued) | | | | | | | | |
| Technology Services — 8.8% | | | | | | | | |
| Accenture plc - Class A | | | 17,900 | | | $ | 6,513,452 | |
| Automatic Data Processing, Inc. | | | 7,000 | | | | 1,720,460 | |
| Block, Inc. - Class A (a) | | | 25,000 | | | | 1,625,250 | |
| Paychex, Inc. | | | 24,000 | | | | 2,921,520 | |
| PayPal Holdings, Inc. (a) | | | 45,000 | | | | 2,760,750 | |
| Visa, Inc. - Class A | | | 10,000 | | | | 2,732,600 | |
| | | | | | | | 18,274,032 | |
| | | | | | | | | |
| Total Common Stocks (Cost $36,291,034) | | | | | | $ | 208,947,055 | |
| | | | | | | | | |
| MONEY MARKET FUNDS — 0.0% (b) | | Shares | | | Value | |
| First American Government Obligations Fund - Class Z, 5.21% (c) (Cost $803) | | | 803 | | | $ | 803 | |
| | | | | | | | | |
| Total Investments at Value — 100.9% | | | | | | | | |
| (Cost $36,291,837) (d) | | | | | | $ | 208,947,858 | |
| | | | | | | | | |
| Liabilities in Excess of Other Assets — (0.9%) | | | | | | | (1,904,442 | ) |
| | | | | | | | | |
| Net Assets — 100.0% | | | | | | $ | 207,043,416 | |
| (a) | Non-income producing security. |
| (b) | Percentage rounds to less than 0.1%. |
| (c) | The rate shown is the 7-day effective yield as of January 31, 2024. |
| (d) | All securities are pledged as collateral for the Fund’s bank line of credit (Note 5). See accompanying notes to financial statements. |
| The Investment House Growth Fund |
| Statement of Assets and Liabilities |
| January 31, 2024 (Unaudited) |
| ASSETS | | | |
| Investments in securities: | | | | |
| At cost | | $ | 36,291,837 | |
| At value (Note 2) | | $ | 208,947,858 | |
| Receivable for capital shares sold | | | 12,250 | |
| Dividends receivable | | | 100,563 | |
| Tax reclaims receivable | | | 11,874 | |
| Total Assets | | | 209,072,545 | |
| | | | | |
| LIABILITIES | | | | |
| Line of credit payable (Note 5) | | | 1,762,000 | |
| Payable for capital shares redeemed | | | 444 | |
| Accrued investment advisory fees (Note 4) | | | 244,286 | |
| Accrued Trustees’ fees (Note 4) | | | 11,250 | |
| Other liabilities | | | 11,149 | |
| Total Liabilities | | | 2,029,129 | |
| | | | | |
| NET ASSETS | | $ | 207,043,416 | |
| | | | | |
| Net assets consist of: | | | | |
| Paid-in capital | | $ | 35,926,790 | |
| Accumulated earnings | | | 171,116,626 | |
| Net assets | | $ | 207,043,416 | |
| | | | | |
| Shares of beneficial interest outstanding (unlimited number of shares authorized, no par value) | | | 3,044,351 | |
| | | | | |
| Net asset value, redemption price and offering price per share (Note 2) | | $ | 68.01 | |
See accompanying notes to financial statements.
| The Investment House Growth Fund |
| Statement of Operations |
| For the Six Months Ended January 31, 2024 (Unaudited) |
| INVESTMENT INCOME | | | | |
| Dividend income | | $ | 693,002 | |
| | | | | |
| EXPENSES | | | | |
| Investment advisory fees (Note 4) | | | 1,346,637 | |
| Borrowing costs and bank fees (Note 5) | | | 48,457 | |
| Trustees’ fees (Note 4) | | | 11,311 | |
| Total expenses | | | 1,406,405 | |
| | | | | |
| NET INVESTMENT LOSS | | | (713,403 | ) |
| | | | | |
| REALIZED AND UNREALIZED GAINS (LOSSES) ON INVESTMENTS | | | | |
| Net realized losses from investment transactions | | | (241,815 | ) |
| Net realized gains from in-kind redemptions | | | 4,472,113 | |
| Net change in unrealized appreciation (depreciation) on investments | | | 16,115,271 | |
| NET REALIZED AND UNREALIZED GAINS ON INVESTMENTS | | | 20,345,569 | |
| | | | | |
| NET INCREASE IN NET ASSETS RESULTING FROM OPERATIONS | | $ | 19,632,166 | |
See accompanying notes to financial statements.
| The Investment House Growth Fund |
| Statements of Changes in Net Assets |
| | | Six Months | | | | |
| | | Ended | | | Year | |
| | | January 31, 2024 | | | Ended | |
| | | (Unaudited) | | | July 31, 2023 | |
| FROM OPERATIONS | | | | | | | | |
| Net investment loss | | $ | (713,403 | ) | | $ | (966,537 | ) |
| Net realized gains (losses) from investment transactions | | | (241,815 | ) | | | 1,898,841 | |
| Net realized gains from in-kind redemptions | | | 4,472,113 | | | | — | |
| Net change in unrealized appreciation (depreciation) on investments | | | 16,115,271 | | | | 27,500,651 | |
| Net increase in net assets resulting from operations | | | 19,632,166 | | | | 28,432,955 | |
| | | | | | | | | |
| DISTRIBUTIONS TO SHAREHOLDERS (Note 2) | | | (886,283 | ) | | | — | |
| | | | | | | | | |
| FROM CAPITAL SHARE TRANSACTIONS | | | | | | | | |
| Proceeds from shares sold | | | 4,766,936 | | | | 7,108,569 | |
| Net asset value of shares issued in reinvestment of distributions to shareholders | | | 845,451 | | | | — | |
| Payments for shares redeemed | | | (12,632,232 | ) | | | (10,711,032 | ) |
| Net decrease in net assets from capital share transactions | | | (7,019,845 | ) | | | (3,602,463 | ) |
| | | | | | | | | |
| TOTAL INCREASE IN NET ASSETS | | | 11,726,038 | | | | 24,830,492 | |
| | | | | | | | | |
| NET ASSETS | | | | | | | | |
| Beginning of period | | | 195,317,378 | | | | 170,486,886 | |
| End of period | | $ | 207,043,416 | | | $ | 195,317,378 | |
| | | | | | | | | |
| CAPITAL SHARE ACTIVITY | | | | | | | | |
| Shares sold | | | 76,021 | | | | 138,725 | |
| Shares reinvested | | | 13,595 | | | | — | |
| Shares redeemed | | | (201,100 | ) | | | (219,804 | ) |
| Net decrease in shares outstanding | | | (111,484 | ) | | | (81,079 | ) |
| Shares outstanding, beginning of period | | | 3,155,835 | | | | 3,236,914 | |
| Shares outstanding, end of period | | | 3,044,351 | | | | 3,155,835 | |
See accompanying notes to financial statements.
| The Investment House Growth Fund |
| Financial Highlights |
Per Share Data and Ratios for a Share Outstanding Throughout Each Period
| | | Six Months | | | | | | | | | | | | | | | | |
| | | Ended | | | | | | | | | | | | | | | | |
| | | January 31, | | | Years Ended | |
| | | 2024 | | | July 31, | | | July 31, | | | July 31, | | | July 31, | | | July 31, | |
| | | (Unaudited) | | | 2023 | | | 2022 | | | 2021 | | | 2020 | | | 2019 | |
| Net asset value at beginning of period | | $ | 61.89 | | | $ | 52.67 | | | $ | 67.58 | | | $ | 49.80 | | | $ | 39.26 | | | $ | 36.03 | |
| Income (loss) from investment operations: | | | | | | | | | | | | | | | | | | | | | | | | |
| Net investment loss (a) | | | (0.24 | ) | | | (0.31 | ) | | | (0.49 | ) | | | (0.41 | ) | | | (0.21 | ) | | | (0.16 | ) |
| Net realized and unrealized gains (losses) on investments | | | 6.65 | | | | 9.53 | | | | (14.42 | ) | | | 18.19 | | | | 10.75 | | | | 3.39 | |
| Total from investment operations | | | 6.41 | | | | 9.22 | | | | (14.91 | ) | | | 17.78 | | | | 10.54 | | | | 3.23 | |
| Less distributions: | | | | | | | | | | | | | | | | | | | | | | | | |
| From net realized gains on investments | | | (0.29 | ) | | | — | | | | — | | | | — | | | | — | | | | — | |
| Net asset value at end of period | | $ | 68.01 | | | $ | 61.89 | | | $ | 52.67 | | | $ | 67.58 | | | $ | 49.80 | | | $ | 39.26 | |
| Total return (b) | | | 10.39 | % (c) | | | 17.50 | % | | | (22.06 | %) | | | 35.70 | % | | | 26.85 | % | | | 8.96 | % |
| Net assets at end of period (000’s) | | $ | 207,043 | | | $ | 195,317 | | | $ | 170,487 | | | $ | 224,304 | | | $ | 163,826 | | | $ | 126,744 | |
| Ratio of total expenses to average net assets (d) | | | 1.46 | % (f) | | | 1.42 | % | | | 1.41 | % | | | 1.41 | % | | | 1.42 | % | | | 1.42 | % |
| Ratio of net investment loss to average net assets (a)(d) | | | (0.74 | %) (e) | | | (0.60 | %) | | | (0.78 | %) | | | (0.71 | %) | | | (0.52 | %) | | | (0.47 | %) |
| Portfolio turnover rate | | | 0 | % (c)(g) | | | 9 | % | | | 10 | % | | | 1 | % | | | 11 | % | | | 6 | % |
| (a) | Recognition of net investment loss by the Fund is affected by the timing of the declarations of dividends by the underlying investment companies in which the Fund may invest. |
| (b) | Total return is a measure of the change in value of an investment in the Fund over the periods covered, which assumes any dividends or capital gains distributions are reinvested in shares of the Fund. The returns shown do not reflect the deduction of taxes a shareholder would pay on Fund distributions or the redemption of Fund shares. |
| (d) | The ratios of expenses and net investment loss to average net assets do not reflect the Fund’s proportionate share of expenses of the underlying investment companies in which the Fund may invest. |
| (f) | Includes 0.05% of borrowing costs (Note 5). |
| (g) | Percentage rounds to less than 1%. |
See accompanying notes to financial statements.
| The Investment House Growth Fund |
| Notes to Financial Statements |
| January 31, 2024 (Unaudited) |
The Investment House Growth Fund (the “Fund”) is a diversified series of The Investment House Funds (the “Trust”), an open-end management investment company established under the laws of Ohio by an Agreement and Declaration of Trust dated October 2, 2001.
The investment objective of the Fund is long term capital appreciation.
| 2. | Significant Accounting Policies |
The Fund follows accounting and reporting guidance under Financial Accounting Standards Board Accounting Standards Codification Topic 946, “Financial Services – Investment Companies.” The following is a summary of the Fund’s significant accounting policies used in the preparation of its financial statements. These policies are in conformity with accounting principles generally accepted in the United States of America (“GAAP”).
Regulatory update – Tailored Shareholder Reports for Mutual Funds and Exchange-Traded Funds (“ETFs”) – Effective January 24, 2023, the Securities and Exchange Commission (the “SEC”) adopted rule and form amendments to require mutual funds and ETFs to transmit concise and visually engaging streamlined annual and semiannual reports to shareholders that highlight key information. Other information, including financial statements, will no longer appear in a streamlined shareholder report but must be available online, delivered free of charge upon request, and filed on a semiannual basis on Form N-CSR. The rule and form amendments have a compliance date of July 24, 2024. At this time, management is evaluating the impact of these amendments on the shareholder reports for the Fund.
Securities valuation – The Fund values its portfolio securities at market value as of close of regular trading on the New York Stock Exchange (the “NYSE”) (normally 4:00 p.m. Eastern time) on each business day the NYSE is open. Exchange-traded funds (“ETFs”) are valued at the last sale price on the security’s primary exchange. Lacking a last sale price, an exchange-traded security is generally valued at its last bid price. Securities traded on NASDAQ are valued at the NASDAQ Official Closing Price. Investments representing shares of money market funds and other open-end investment companies, except for ETFs, are valued at their net asset value (“NAV”) as reported by such companies. When using a quoted price and when the market for the security is considered active, the security will be classified as Level 1 within the fair value hierarchy (see below). If market prices are not available or The Investment House LLC, the investment adviser to the Fund (the “Adviser”), believes such prices do not accurately reflect the market value of such securities, securities will be valued by the Adviser as “valuation designee”, in accordance with procedures adopted by the Board of Trustees (the “Board”) pursuant to Rule 2a-5 under the Investment Company Act of 1940, as amended (the “1940 Act”). The Adviser has adopted written policies and procedures for valuing securities and other assets in circumstances where market quotes are not readily available. In the event that market quotes are not readily available, and the security or asset cannot be valued pursuant to one of the valuation methods, the value of the security or asset will be determined in good faith by the Adviser pursuant to its policies
| The Investment House Growth Fund |
| Notes to Financial Statements (Continued) |
and procedures. On a quarterly basis, the Adviser’s fair valuation determinations, if any, will be reviewed by the Board. Under these policies, the securities will be classified as Level 2 or 3 within the fair value hierarchy, depending on the inputs used.
GAAP establishes a single authoritative definition of fair value, sets out a framework for measuring fair value and requires additional disclosures about fair value measurements.
Various inputs are used in determining the value of each of the Fund’s investments. These inputs are summarized in the three broad levels listed below:
| ● | Level 1 – quoted unadjusted prices for identical instruments in active markets to which the Fund has access at the date of measurement. |
| ● | Level 2 – quoted prices for similar instruments in active markets; quoted prices for identical or similar instruments in markets that are not active; and model-derived valuations in which all significant inputs and significant value drivers are observable in active markets. Level 2 inputs are those in markets for which there are few transactions, the prices are not current, little public information exists or instances where prices vary substantially over time or among brokered market makers. |
| ● | Level 3 – model derived valuations in which one or more significant inputs or significant value drivers are unobservable. Unobservable inputs are those inputs that reflect the Fund’s own assumptions that market participants would use to price the asset or liability based on the best available information. |
The inputs or methodology used for valuing securities are not necessarily an indication of the risks associated with investing in those securities. The inputs used to measure fair value may fall into different levels of the fair value hierarchy. In such cases, for disclosure purposes, the level in the fair value hierarchy within which the fair value measurement falls in its entirety is determined based on the lowest level input that is significant to the fair value measurement.
The following is a summary of the Fund’s investments and the inputs used to value the investments as of January 31, 2024 by security type:
| | | Level 1 | | | Level 2 | | | Level 3 | | | Total | |
| Common Stocks | | $ | 208,947,055 | | | $ | — | | | $ | — | | | $ | 208,947,055 | |
| Money Market Funds | | | 803 | | | | — | | | | — | | | | 803 | |
| Total | | $ | 208,947,858 | | | $ | — | | | $ | — | | | $ | 208,947,858 | |
| | | | | | | | | | | | | | | | | |
Refer to the Fund’s Schedule of Investments for a listing of the common stocks by sector and industry type. There were no Level 2 or Level 3 securities or derivative instruments held by the Fund as of or during the six months ended January 31, 2024.
Share valuation – The NAV is calculated daily by dividing the value of the Fund’s total assets, minus liabilities, by the total number of shares outstanding. The offering price and redemption price per share are equal to the NAV per share.
| The Investment House Growth Fund |
| Notes to Financial Statements (Continued) |
Investment transactions and investment income – Investment transactions are accounted for on trade date. Realized gains and losses on investments sold are determined on a specific identification basis. Dividend income is recorded on the ex-dividend date. Non-cash dividends included in dividend income, if any, are recorded at the fair market value of the securities received. Interest income is accrued as earned. Withholding taxes on foreign dividends have been recorded in accordance with the Fund’s understanding of the applicable country’s tax rules and rates.
Distributions to shareholders – Dividends arising from net investment income and distributions of net realized capital gains, if any, are declared and paid annually in December. The amount of distributions from net investment income and net realized capital gains are determined in accordance with income tax regulations, which may differ from GAAP. Dividends and distributions are recorded on the ex-dividend date. The tax character of the Fund’s distributions paid by the Fund during the periods ended January 31, 2024 and July 31, 2023 was as follows:
| | | Long-Term | | | Total | |
| Periods Ended | | Capital Gains | | | Distributions * | |
| January 31, 2024 | | $ | 886,283 | | | $ | 886,283 | |
| July 31, 2023 | | $ | — | | | $ | — | |
| * | Total Distributions may not tie to the amounts listed on the Statements of Changes in Net Assets due to reclassifications of the character of the distributions as a result of permanent differences between financial statements and income tax reporting. |
Estimates – The preparation of financial statements in conformity with GAAP requires management to make estimates and assumptions that affect the reported amounts of assets and liabilities and disclosure of contingent assets and liabilities as of the date of the financial statements and the reported amounts of increases and decreases in net assets from operations during the reporting period. Actual results could differ from those estimates.
Federal income tax – The Fund has qualified and intends to continue to qualify each year as a “regulated investment company” under Subchapter M of the Internal Revenue Code of 1986, as amended (the “Code”). By so qualifying, the Fund will not be subject to federal income taxes to the extent that the Fund distributes its net investment income and any net realized capital gains in accordance with the Code.
In order to avoid imposition of the excise tax applicable to regulated investment companies, it is also the Fund’s intention to declare as dividends in each calendar year at least 98% of its net investment income (earned during the calendar year) and 98.2% of its net realized capital gains (earned during the twelve months ended October 31) plus undistributed amounts from prior years.
| The Investment House Growth Fund |
| Notes to Financial Statements (Continued) |
The following information is computed on a tax basis for each item as of January 31, 2024:
| Cost of investments | | $ | 36,291,837 | |
| Gross unrealized appreciation | | $ | 172,702,281 | |
| Gross unrealized depreciation | | | (46,260 | ) |
| Net unrealized appreciation | | | 172,656,021 | |
| Accumulated ordinary loss | | | (1,297,375 | ) |
| Other losses | | | (242,020 | ) |
| Accumulated earnings | | $ | 171,116,626 | |
| | | | | |
During the six months ended January 31, 2024, the Fund realized $4,472,113 of net capital gains resulting from in-kind redemptions (redemptions in which shareholders who redeem Fund shares received investment securities held by the Fund rather than cash). The Fund recognized a gain on in-kind redemptions to the extent that the value of the distributed investment securities on the date of redemption exceeds the cost of those investment securities. Such gains are not taxable to the Fund and are not required to be distributed to shareholders. The Fund reclassified these gains against paid-in capital on the Statement of Assets and Liabilities. Such reclassification, the result of permanent differences between the financial statement and income tax reporting requirements, had no effect on the Fund’s net assets or NAV per share.
The Fund recognizes the tax benefits or expenses of uncertain tax positions only when the position is “more-likely-than-not” to be sustained assuming examination by tax authorities. Management has reviewed the tax positions taken on Federal income tax returns for the current and all open tax years (generally, three years) and has concluded that no provision for unrecognized tax benefits or expenses is required in these financial statements.
The Fund recognizes interest and penalties, if any, related to unrecognized tax benefits as income tax expense on the Statement of Operations. During the six months ended January 31, 2024, the Fund did not incur any interest or penalties.
| 3. | Investment Transactions |
During the six months ended January 31, 2024, cost of purchases and proceeds from sales of investment securities, other than short-term investments and in-kind transactions, if any, amounted to $793,106 and $1,881,086, respectively.
| 4. | Transactions with Related Parties |
A Trustee and certain officers of the Trust are affiliated with the Adviser, Ultimus Fund Solutions, LLC (“Ultimus”), the Fund’s administrator, transfer agent and fund accounting agent, or Ultimus Fund Distributors, LLC (the “Distributor”), the principal underwriter of the Fund’s shares.
Under the terms of a Management Agreement between the Trust and the Adviser, the Adviser serves as the investment adviser to the Fund. For its services, the Fund pays the Adviser an investment management fee, which is accrued daily and paid monthly, at the annual rate of
| The Investment House Growth Fund |
| Notes to Financial Statements (Continued) |
1.40% of the Fund’s average daily net assets. The Adviser pays all of the operating expenses of the Fund except brokerage, taxes, borrowing costs, fees and expenses of non-interested Trustees, extraordinary expenses and distribution and/or service related expenses incurred pursuant to Rule 12b-1 under the 1940 Act (if any).
The Trust has entered into mutual fund services agreements with Ultimus, pursuant to which Ultimus provides day-to-day operational services to the Fund including, but not limited to, accounting, administrative, transfer agent, dividend disbursing, and recordkeeping services. The fees payable to Ultimus are paid by the Adviser (not the Fund).
The Trust has entered into a Distribution Agreement with the Distributor, pursuant to which the Distributor provides distribution services to the Fund and serves as principal underwriter to the Fund. The Distributor is a wholly-owned subsidiary of Ultimus. The fees payable to the Distributor are paid by the Adviser (not the Fund).
The Fund pays each Trustee who is not affiliated with the Adviser $7,500 annually. Trustees who are affiliated with the Adviser do not receive compensation from the Fund.
PRINCIPAL HOLDER OF FUND SHARES
As of January 31, 2024, the following shareholder of record owned 25% or more of the outstanding shares of the Fund:
| Name of Record Owner | | % Ownership |
| Charles Schwab & Company (for the benefit of its customers) | | 53% |
A beneficial owner of 25% or more of the Fund’s outstanding shares may be considered a controlling person. That shareholder’s vote could have more significant effect on matters presented at a shareholders’ meeting.
The Fund has a secured bank line of credit with U.S. Bank, N.A. that provides a maximum borrowing of up to $20,000,000. The line of credit may be used to cover redemptions and/or it may be used by the Adviser for investment purposes. When used for investment purposes, the Fund will be using the investment technique of “leverage.” Because the Fund’s investments will fluctuate in value, whereas the interest obligations on borrowed funds may be fixed, during times of borrowing the Fund’s NAV may tend to increase more when its investments increase in value, and decrease more when its investments decrease in value.
In addition, interest costs on borrowings may fluctuate with changing market interest rates and may partially offset or exceed the return earned on the borrowed funds. Also, during times of borrowing under adverse market conditions, the Fund might have to sell portfolio securities to meet interest or principal payments at a time when fundamental investment considerations would not favor such sales. Unless profits on assets acquired with borrowed funds exceed the costs of borrowing, the use of borrowing will diminish the investment performance of the Fund compared with what it would have been without borrowing.
| The Investment House Growth Fund |
| Notes to Financial Statements (Continued) |
Borrowings under this arrangement bear interest at a rate per annum equal to the Prime Rate minus 0.25% at the time of borrowing. The Fund also pays an annual renewal fee of $1,000 plus any legal fees related to the arrangement. The line of credit matures February 5, 2025. During the six months ended January 31, 2024, the Fund incurred $48,457 of interest expense and fees related to the borrowings. The average debt outstanding and the average interest rate for the days with borrowing during the six months ended January 31, 2024 were $1,254,784 and 8.25%. The largest outstanding borrowing during the six months ended January 31, 2024 was $3,124,000. As of January 31, 2024, the Fund had $1,762,000 in outstanding borrowings.
| 6. | Contingencies and Commitments |
The Fund indemnifies the Trust’s officers and Trustees for certain liabilities that might arise from their performance of their duties to the Fund. Additionally, in the normal course of business, the Fund enters into contracts that contain a variety of representations and warranties and which provide general indemnifications. The Fund’s maximum exposure under these arrangements is unknown, as this would involve future claims that may be made against the Fund that have not yet occurred. However, based on experience, the Fund expects the risk of loss to be remote.
If the Fund’s portfolio is overweighted in a certain sector, any negative development affecting that sector will have a greater impact on the Fund than a fund that is not overweighted in that sector. To the extent the Fund is overweighted in the Technology sector, it will be affected by developments affecting that sector. Companies in this sector may be significantly affected by intense competition. In addition, technology products may be subject to rapid obsolescence. As of January 31, 2024, the Fund had 50.2% of the value of its net assets invested in companies within the Technology sector.
The Fund is required to recognize in the financial statements the effects of all subsequent events that provide additional evidence about conditions that existed as of the date of the Statement of Assets and Liabilities. For non-recognized subsequent events that must be disclosed to keep the financial statements from being misleading, the Fund is required to disclose the nature of the event as well as an estimate of its financial effect, or a statement that such an estimate cannot be made. Management has evaluated subsequent events through the issuance of these financial statements and has noted no such events.
| The Investment House Growth Fund |
| About Your Fund’s Expenses (Unaudited) |
We believe it is important for you to understand the impact of costs on your investment. As a shareholder of the Fund, you incur ongoing costs, including management fees and other operating expenses. The following examples are intended to help you understand your ongoing costs (in dollars) of investing in the Fund and to compare these costs with the ongoing costs of investing in other mutual funds.
A mutual fund’s ongoing costs are expressed as a percentage of its average net assets. This figure is known as the expense ratio. The examples below are based on an investment of $1,000 made at the beginning of the period shown and held for the entire period (August 1, 2023 – January 31, 2024).
The table below illustrates the Fund’s ongoing costs in two ways:
Actual fund return – This section helps you to estimate the actual expenses that you paid over the period. The “Ending Account Value” shown is derived from the Fund’s actual return, and the third column shows the dollar amount of operating expenses that would have been paid by an investor who started with $1,000 in the Fund. You may use the information here, together with the amount you invested, to estimate the expenses that you paid over the period.
To do so, simply divide your account value by $1,000 (for example, an $8,600 account value divided by $1,000 = 8.6), then multiply the result by the number given for the Fund under the heading “Expenses Paid During Period.”
Hypothetical 5% return – This section is intended to help you compare the Fund’s ongoing costs with those of other mutual funds. It assumes that the Fund had an annual return of 5% before expenses during the period shown, but that the expense ratio is unchanged. In this case, because the return used is not the Fund’s actual return, the results do not apply to your investment. The example is useful in making comparisons because the U.S. Securities and Exchange Commission (the “SEC”) requires all mutual funds to calculate expenses based on a 5% return before expenses. You can assess the Fund’s ongoing costs by comparing this hypothetical example with the hypothetical examples that appear in shareholder reports of other funds.
Note that expenses shown in the table are meant to highlight and help you compare ongoing costs only. The Fund does not impose any sales loads or redemption fees.
The calculations assume no shares were bought or sold during the period. Your actual costs may have been higher or lower, depending on the amount of your investment and the timing of any purchases or redemptions.
| The Investment House Growth Fund |
| About Your Fund’s Expenses (Unaudited) (Continued) |
More information about the Fund’s expenses, including annual expense ratios for the most recent five fiscal years, can be found in this report. For additional information on operating expenses and other shareholder costs, please refer to the Fund’s prospectus.
| | Beginning | Ending | |
| | Account Value | Account Value | Expenses Paid |
| | August 1, 2023 | January 31, 2024 | During Period* |
| Based on Actual Fund Return | $1,000.00 | $1,103.90 | $7.72 |
| Based on Hypothetical 5% Return (before expenses) | $1,000.00 | $1,017.80 | $7.41 |
| * | Expenses are equal to the Fund’s annualized expense ratio of 1.46% for the period, multiplied by the average account value over the period, multiplied by 184/366 (to reflect the one-half year period). |
| Other Information (Unaudited) |
A description of the policies and procedures that the Fund uses to vote proxies relating to portfolio securities is available without charge upon request by calling toll-free 1-888-456-9518, or on the SEC’s website at www.sec.gov. Information regarding how the Fund voted proxies relating to portfolio securities during the most recent 12-month period ended June 30 is available without charge upon request by calling toll-free 1-888-456-9518, or on the SEC’s website at www.sec.gov.
The Trust files a complete listing of portfolio holdings of the Fund with the SEC as of the end of the first and third quarters of each fiscal year as an exhibit to its reports on Form N-PORT. The filings are available upon request by calling 1-888-456-9518. Furthermore, you may obtain a copy of the filings on the SEC’s website at www.sec.gov and on the Fund’s website www.tihllc.com.
| The Investment House Growth Fund |
| Liquidity Risk Management Program (Unaudited) |
The Trust has adopted and implemented a written liquidity risk management program as required by Rule 22e-4 (the “Liquidity Rule”) under the Investment Company Act. The program is reasonably designed to assess and manage the Fund’s liquidity risk, taking into consideration, among other factors, the Fund’s investment strategy and the liquidity of its portfolio investments during normal and reasonably foreseeable stressed conditions; its short and long-term cash flow projections; and its cash holdings and access to other funding sources. The Board of Trustees approved the appointment of a Liquidity Risk Committee, which includes representatives from The Investment House LLC, the Fund’s investment adviser, and Ultimus Fund Solutions, LLC, the Fund’s Administrator. The Liquidity Risk Committee is responsible for the program’s administration and oversight and for reporting to the Board on at least an annual basis regarding the program’s operation and effectiveness. The Liquidity Risk Committee updated its assessment of the Fund’s liquidity risk profile, considering additional data gathered during the period August 1, 2022 through July 31, 2023 (the “Review Period”) and the adequacy and effectiveness of the liquidity risk management program’s operations during the Review Period in order to prepare a written report for the Board of Trustees (the “Report”) for consideration at its meeting held on September 26, 2023. The Report noted that during the Review Period the Fund did not experience unusual stress or disruption to its operations related to purchase and redemption activity. It further noted that during the Review Period the Fund held adequate levels of cash and highly liquid investments to meet shareholder redemption activities in accordance with applicable requirements. The Report concluded that (i) the Trust’s liquidity risk management program is reasonably designed to prevent violations of the Liquidity Rule and (ii) the Trust’s liquidity risk management program was effectively implemented during the Review Period.
This page intentionally left blank.
This page intentionally left blank.
This page intentionally left blank.
| | | | | | | |
| | | | | | | |
| | | | | | | |
| | | | | |
| | | | | |
| | | | | |
| | | | | |
| | | | | |
| | | THE INVESTMENT HOUSE FUNDS | | |
| | | | | |
| | | Investment Adviser | | |
| | | The Investment House LLC | | |
| | | 5940 S. Rainbow Blvd, Suite 400 | | |
| | | PMB 57150 | | |
| | | Las Vegas, NV 89118 | | |
| | | | | |
| | | Administrator | | |
| | | Ultimus Fund Solutions, LLC | | |
| | | 225 Pictoria Drive | | |
| | | Suite 450 | | |
| | | Cincinnati, Ohio 45246 | | |
| | | 1.888.456.9518 | | |
| | | | | |
| | | Legal Counsel | | |
| | | Practus, LLP | | |
| | | 11300 Tomahawk Creek Pkwy | | |
| | | Suite 310 | | |
| | | Leawood, Kansas 66211 | | |
| | | | | |
| | | Custodian | | |
| | | U.S. Bank, N.A. | | |
| | | 425 Walnut Street | | |
| | | Cincinnati, Ohio 45202 | | |
| | | | | |
| | | Board of Trustees | | |
| | | Darrin F. DelConte | | |
| | | Nicholas G. Tonsich | | |
| | | Timothy J. Wahl | | |
| | | Michael A. Zupanovich | | |
| | | | | |
| | | Officers | | |
| | | Timothy J. Wahl, President | | |
| | | Stacey A. Havens, Vice President | | |
| | | David L. Kahn, CCO and Secretary | | |
| | | Brian J. Lutes, Treasurer | | |
| | | | | |
| | | | | |
| | | | | |
| | | Investment House-SAR-24 | | |
| | | | | |
| | | | | |
| | | | | |
Item 2. Code of Ethics.
Not required
Item 3. Audit Committee Financial Expert.
Not required
Item 4. Principal Accountant Fees and Services.
Not required
Item 5. Audit Committee of Listed Registrants.
Not applicable
Item 6. Schedule of Investments.
| (a) | Not applicable [schedule filed with Item 1] |
Item 7. Disclosure of Proxy Voting Policies and Procedures for Closed-End Management Investment Companies.
Not applicable
| Item 8. | Portfolio Managers of Closed-End Management Investment Companies. |
Not applicable
Item 9. Purchases of Equity Securities by Closed-End Management Investment Company and Affiliated Purchasers.
Not applicable
Item 10. Submission of Matters to a Vote of Security Holders.
The registrant’s Committee of Independent Trustees shall review shareholder recommendations for nominations to fill vacancies on the registrant’s board of trustees if such recommendations are submitted in writing and addressed to the Committee at the registrant’s offices. The Committee may adopt, by resolution, a policy regarding its procedures for considering candidates for the board of trustees, including any recommended by shareholders.
Item 11. Controls and Procedures.
(a) Based on their evaluation of the registrant’s disclosure controls and procedures (as defined in Rule 30a-3(c) under the Investment Company Act of 1940) as of a date within 90 days of the filing date of this report, the registrant’s principal executive officer and principal financial officer have concluded that such disclosure controls and procedures are reasonably designed and are operating effectively to ensure that material information relating to the registrant, including its consolidated subsidiaries, is made known to them by others within those entities, particularly during the period in which this report is being prepared, and that the information required in filings on Form N-CSR is recorded, processed, summarized, and reported on a timely basis.
(b) There were no changes in the registrant’s internal control over financial reporting (as defined in Rule 30a-3(d) under the Investment Company Act of 1940) that occurred during the period covered by this report that have materially affected, or are reasonably likely to materially affect, the registrant’s internal control over financial reporting.
Item 12. Disclosure of Securities Lending Activities for Closed-End Management Investment Companies.
Not applicable
File the exhibits listed below as part of this Form. Letter or number the exhibits in the sequence indicated.
(a)(1) Any code of ethics, or amendment thereto, that is the subject of the disclosure required by Item 2, to the extent that the registrant intends to satisfy the Item 2 requirements through filing of an exhibit: Not required
(a)(2) A separate certification for each principal executive officer and principal financial officer of the registrant as required by Rule 30a-2(a) under the Act (17 CFR 270.30a-2(a)): Attached hereto
(1) Not applicable
(2) Change in the registrant’s independent public accountants. Not applicable
(b) Certifications required by Rule 30a-2(b) under the Act (17 CFR 270.30a-2(b)): Attached hereto
Exhibit 99.CERT Certifications required by Rule 30a-2(a) under the Act
Exhibit 99.906CERT Certifications required by Rule 30a-2(b) under the Act
SIGNATURES
Pursuant to the requirements of the Securities Exchange Act of 1934 and the Investment Company Act of 1940, the registrant has duly caused this report to be signed on its behalf by the undersigned, thereunto duly authorized.
| (Registrant) | The Investment House Funds | | |
| | | | |
| By (Signature and Title)* | /s/ Timothy J. Wahl | |
| | | Timothy J. Wahl, President | |
| | | | |
| Date | March 27, 2024 | | |
| | | | |
| Pursuant to the requirements of the Securities Exchange Act of 1934 and the Investment Company Act of 1940, this report has been signed below by the following persons on behalf of the registrant and in the capacities and on the dates indicated. |
| | | | |
| By (Signature and Title)* | /s/ Timothy J. Wahl | |
| | | Timothy J. Wahl, President | |
| | | | |
| Date | March 27, 2024 | | |
| | | | |
| By (Signature and Title)* | /s/ Brian J. Lutes | |
| | | Brian J. Lutes, Treasurer | |
| | | | |
| Date | March 27, 2024 | | |
* Print the name and title of each signing officer under his or her signature.