
Citibank
2007 Industrial Manufacturing Conference
March 2007

Safe Harbor
Today’s presentation includes forward
looking statements that involve risks.
Please refer to Form 10K for the year
ending December 31, 2006 for details on
factors that may influence results.
2
2

Strong Foundation for the Future
Diversified business portfolio
Industry
Geography
Recurring revenue
Dramatic growth
Operational excellence
Enterprise leverage
Strong balance sheet and cash generation
Positioned to Deliver Solid
Financial Results in All Economic Cycles
3
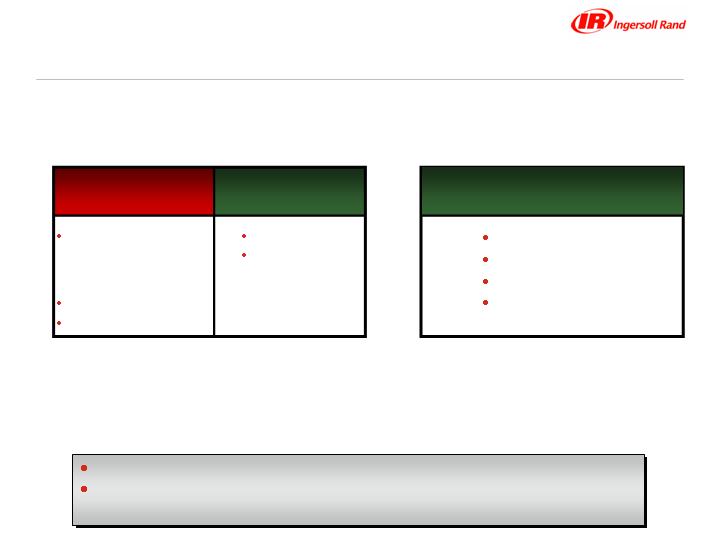
Where We Were
Heavy Machinery
Deep Cyclical
Engineered Products
Product-centric
Match GDP Growth
Change Averse
Low Tech
Disconnected Businesses
Happy to Be Good
Old Ingersoll Rand
4

Portfolio Transformation 2000 through 2007
Strategic review of prospects for all businesses
Strengthened core businesses
Improved marginal performers
Divested non-core operations ($4 Billion revenues)
Pumps
Bearings
Drills
Dresser-Rand
Road Development – Announced Feb. 2007
Made 65 bolt-on acquisitions since 2000 ($3 Billion revenues)
Core Platform to Deliver Consistent Growth
5
Where We Are Going
Heavy Machinery
Deep Cyclical
Engineered Products
Product-centric
Match GDP Growth
Change Averse
Low Tech
Disconnected Businesses
Diversified Industrial
Balanced Across the Cycle
Commercial Businesses
Customer Focused
Outpacing Market Growth
Change Culture
Innovative, Visionary
Leveraged Enterprise
Working to Be Great
Old Ingersoll Rand
New Ingersoll Rand
6
Dramatic Growth ...
Operational Excellence ...
Dual Citizenship ...
by focusing on innovative solutions
for our customers
by pursuing continuous improvement
in all our operations
by leveraging enterprise-wide strengths
Ingersoll Rand is a global
diversified enterprise with market
leading brands
We are dedicated to driving
Shareholder Value by achieving:
% of Total Revenue
* Primarily Pumps, Dresser-Rand, Drills, and Underground Mining Equipment
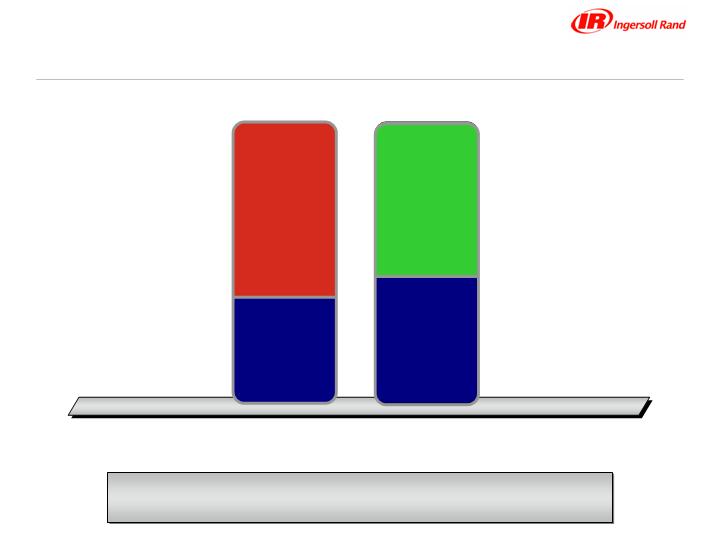
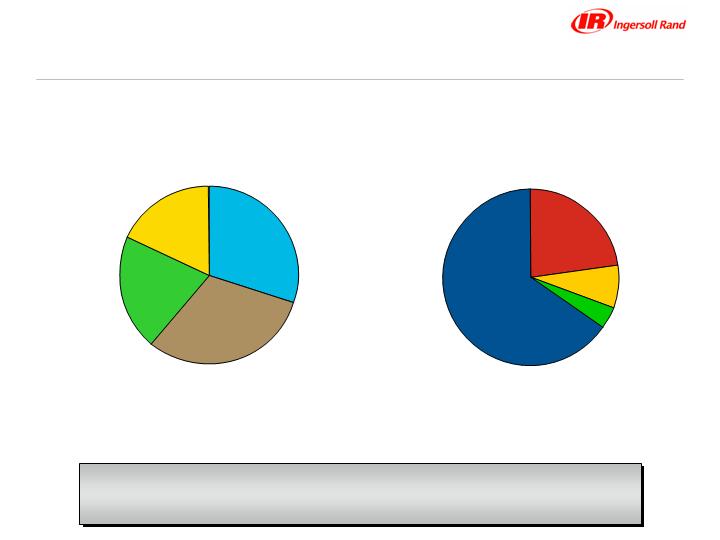
Substantial Upgrade of Business Portfolio
Higher Growth and Lower Cycles
62%
38%
57%
43%
Automotive Components
Road Development
*Mining & Process
Security Technologies
Industrial Technologies
(Utility Equipment
and Attachments)
Climate Control Tech.
Compact Vehicle Tech.
Security Technologies
Industrial Technologies
(Utility Equipment
and Attachments)
1994
2006
Divested
Acquired
We Have Transformed the Business Portfolio
Pro Forma for Sale of
Road Development
8

Sale to Volvo Construction AB of Sweden
$1.3 Billion net proceeds
Target completion for transaction second quarter of 2007
Record substantial earnings gain on sale
Net cash proceeds to exceed $900 Million
Continued reinvestment in core business for innovation
and consistent growth
Bolt on acquisitions
Share buyback
Sale of Road Development Business
9

Sale of Road Development
$725 Million revenues for full year 2006
Major product lines include:
Asphalt paving equipment
Compactors
Milling machines
Material handling equipment
Road Development earnings in 2007 reported in
discontinued operations
10
Segment Reporting Structure 2007
After Sale of Road Development
$ Millions
Construction Technologies Segment Eliminated
Utility Equipment and Attachment Results Reported in
Compact Vehicle Technologies Segment
Road Development
Sold
Utility Equipment
Attachments
Bobcat
Club Car
Construction
Technologies
Compact Vehicle
Technologies
Bobcat
Club Car
Utility Equipment
Attachments
Compact Vehicle
Technologies
2006 Segments
2007
Reported Revenues
$1,362
Reported Revenues
$2,641
Reported Revenues
Pro Forma 2006
$3,278
2006
11
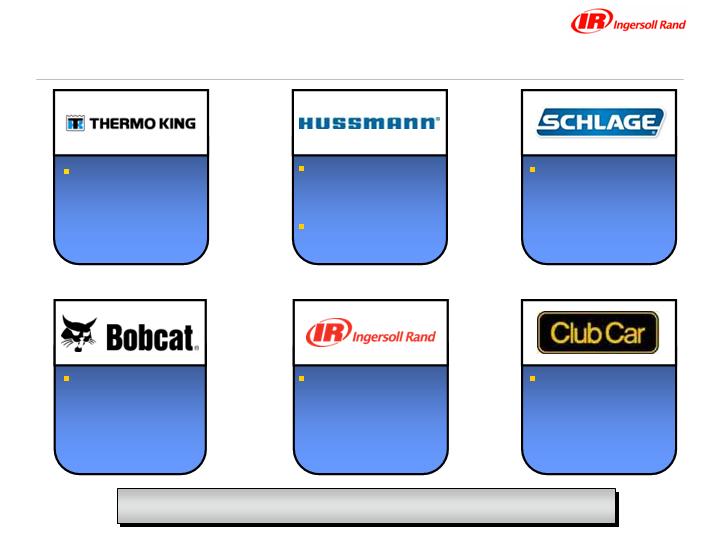
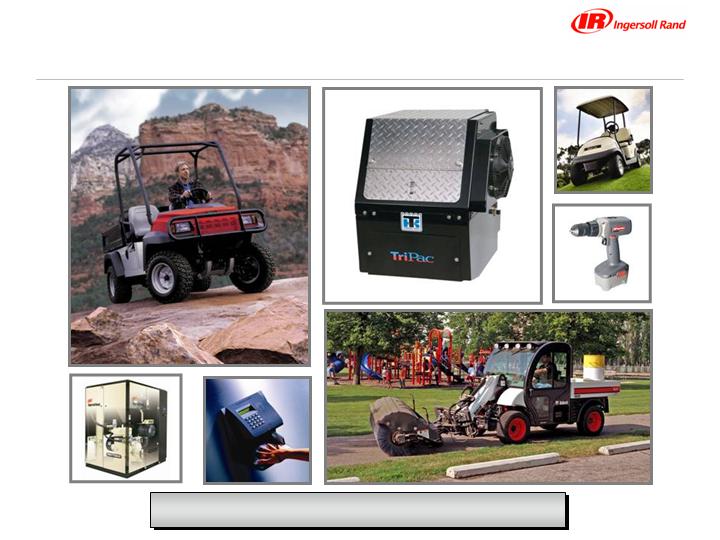
Powerful Market Leading Brands
#1 N. America
lock and door
hardware
#1 Worldwide
golf cars
#1 N. America
air compressors,
air tools
#1 Worldwide
compact
equipment
#1 N. America
remote display
cases
#1 N. American
service provider
#1 Worldwide
transport
refrigeration
#1 or #2 in Major Markets
12
A Balanced, Global Growth Portfolio
Diversified Product and Geographic Mix;
Growth in High Potential Markets
N. America
62%
Europe
25%
Latin
America
4%
Asia
9%
Compact Vehicle
Technologies
31%
Climate Control
Technologies
30%
Security
Technologies
21%
Industrial
Technologies
18%
2006 Pro Forma Revenues $10.7 Billion
Revenues Exclude Road Development
13
Dramatic Growth
Innovation
Recurring Revenue
Acquisitions
2006 and 2007
Growth Initiatives
14
Market-Defining Innovations
Innovation Across Our Businesses
15
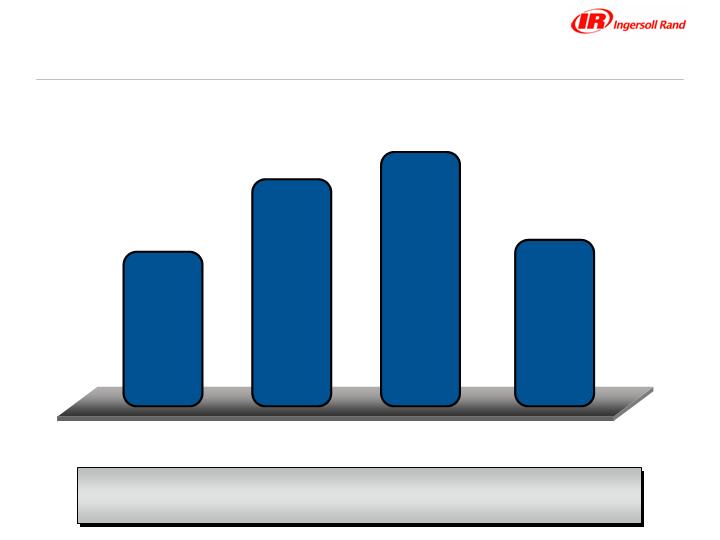
Innovation
Net Revenue from Innovation
$ Millions
Over $1.3 Billion in 2006 Revenues from Products
Introduced Over the Last 3 Years
2006
$225
2005
$335
$300
2004
$200
2003
16
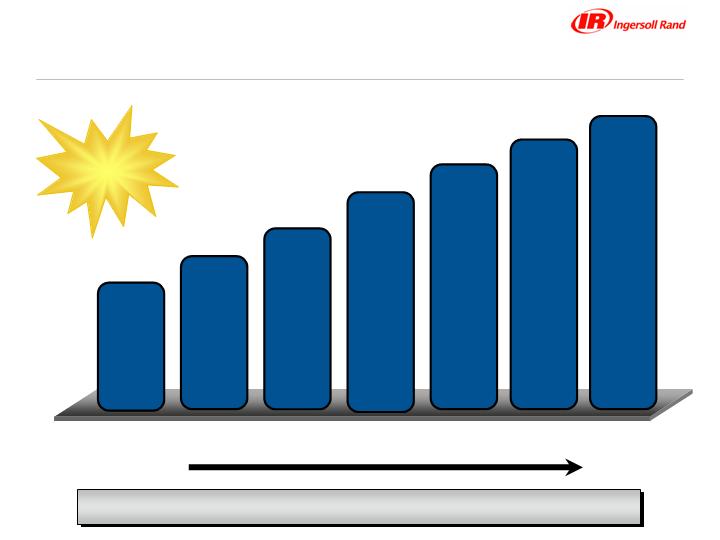
Recurring Revenue
Recurring Revenue More than Doubled Since 2000
$ Millions
21%
% of
Total
2000
$1,190
16%
2001
$1,323
2002
$1,455
2003
$1,705
2005
$2,173
$2,413
2006
2004
$1,908
11% Growth
in 2006
17

Acquisitions
More than 65 acquisitions since 2000; added more than
$3 billion in revenues
Continuing progress in 2006
ZEKS compressed-air treatment technologies
BOC Edwards low-pressure air business
Geith attachments
Expanding into New Products and Markets
18

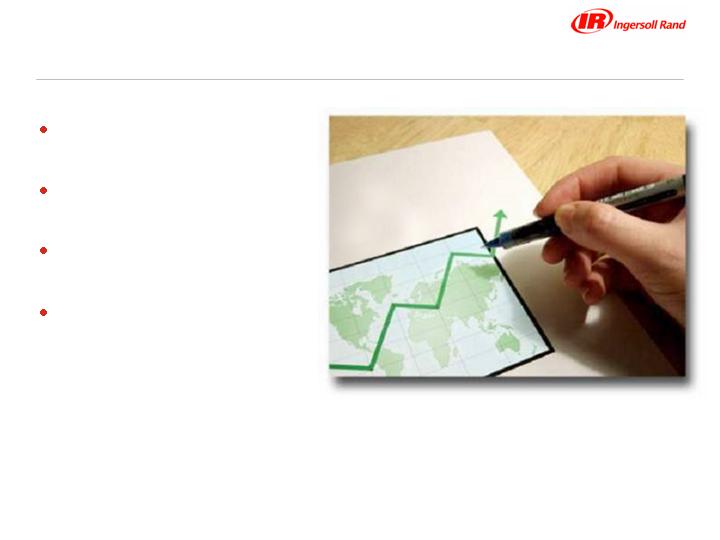
Increase Investments for Growth in 2006 and 2007
New product/new customer development
Expand geographic reach
Channel expansion
Recurring revenue growth
Completed $80 Mil. program in 2006, additional investment in
2007
Grow 2x GDP in Developed Countries
Grow 20% to 25% in Developing World
19
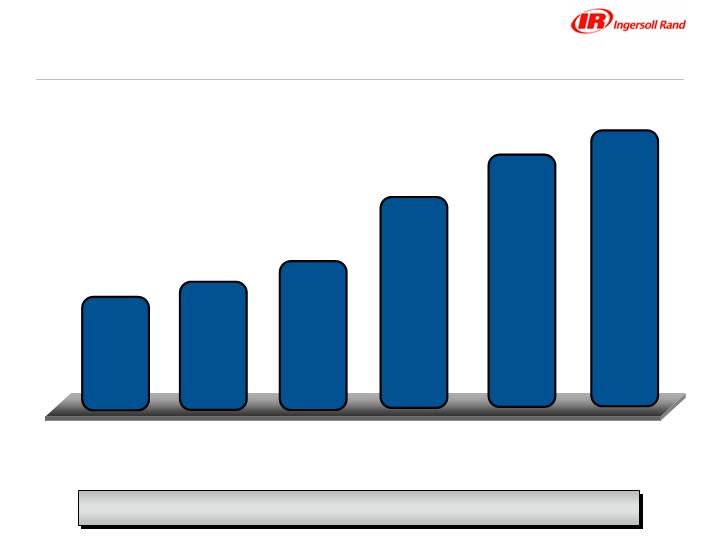
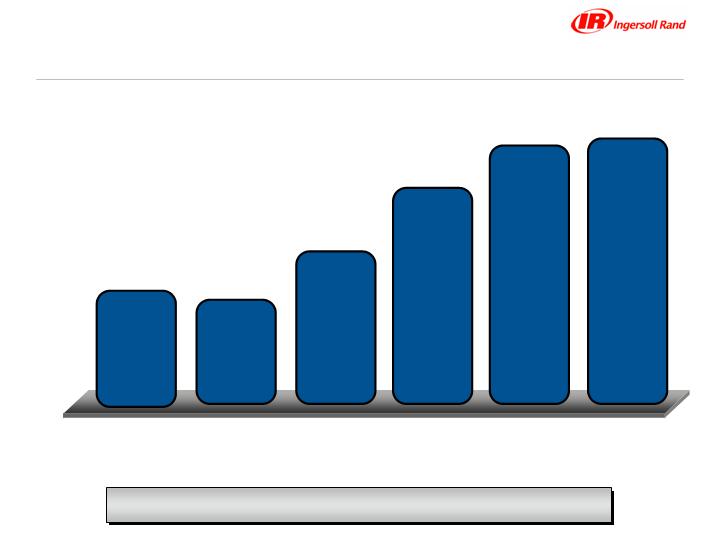
Annual Revenues
Demonstrating Growth Across Our Businesses
2004
13.9%
$9,394
2005
12.3%
$10,547
YOY
Growth
2003
8.8%
$8,249
2001
$7,389
$7,583
2002
2.6%
2006
8.2%
$11,409
20
Operational Excellence
Reduce costs
Improve processes
Increase efficiency
Institutionalize a continuous-improvement culture
Focus On Reducing Working Capital and CAPEX
A Simple Story; a Complex Effort:
21
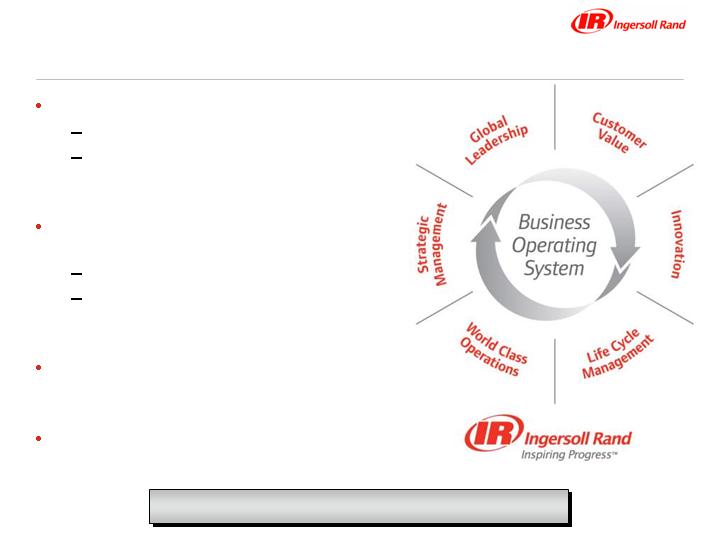
Operational Excellence
Expanding Lean Six Sigma
Positive impact on operations
Reduce costs, working capital
and CAPEX
Formalized business operating
system
Continuous improvement
Repeatable results across
business processes
Optimize processes using lean
methods and Six Sigma tools
Significant change to operating
culture
Improved Business Execution
22
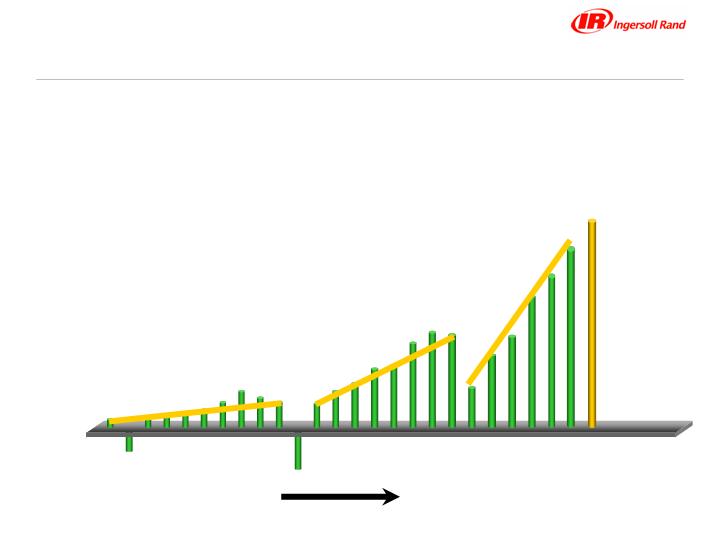
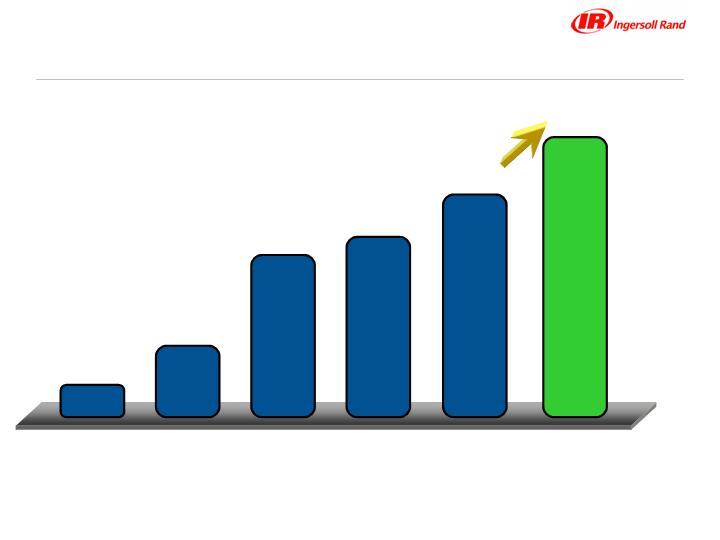
Earnings Per Share
Cyclical Machinery
Diversified Industrial
Target
12%- 15%
Annual Growth
-$1.00
-$0.50
$0.00
$0.50
$1.00
$1.50
$2.00
$2.50
$3.00
$3.50
$4.00
90
OO
O6
O7
2007 Forecast
$3.50-$3.60
$4.50
EPS
23
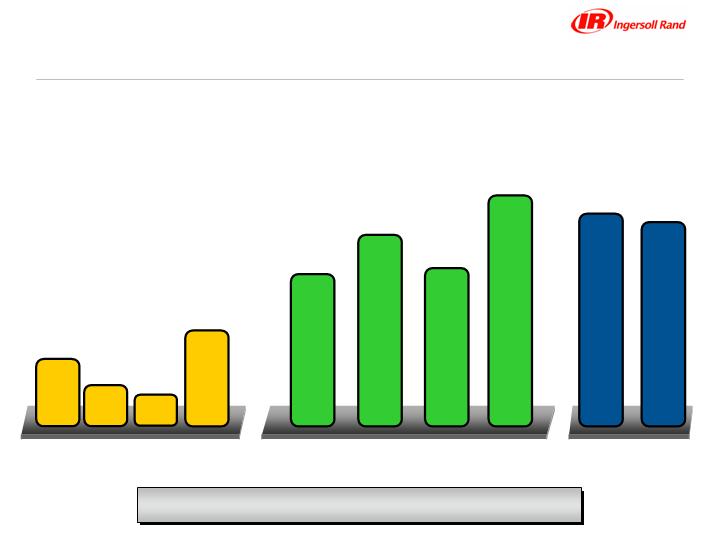
$762
Improved Available Cash Flow
$ Millions
* Excluding restructuring
Total $2.7 Billion
(2001 – 2004)
Total $304 Million
(1991 - 1994)
1992
1993
1991
$90
$143
$687*
2002
2001
$618*
$630
2003
1994
2004
$804
$38
$33
2005
$784
2006
$900 Million Target for 2007
24
ROIC
2004
13.0%
2005
14.0%
2003
8.3%
2001
8.6%
9.8%
2002
Improving the Way We Leverage Our Capital
Target 15%
2006
14.2%
25
Revenues
$ Millions
2002
$35
2003
$135
2004
$285
2005
$400
2006
$550
$750
2008
Target
Dual Citizenship
Enterprise Growth Initiatives
26

Dividends and Share Repurchase
13% Increase in quarterly dividends in 2006,
90% increase over last three years
Completed $2 Billion repurchase first authorized in 2004
Purchased 2.6 Million shares in October 2006
Purchased 51 Million shares since start of program,
reduced outstanding share count by 14%
New repurchase program authorized for $2 Billion in
December 2006
Deploying Cash to Create Shareholder Value
27

Cash Deployment
$ Millions
Balanced Approach to Cash Deployments
2006 Target Actual
Acquisitions $400 - $600 $122
Share Buyback 600 - 400 1,096
Subtotal $1,000 $ 1,218
R&D and Engineering 150 - 170 175
Growth Investments 80 77
Total $1.2 Billion $1.5 Billion
2007
Acquisitions $400 - $600
Share Buyback 600 - 400
Subtotal $1,000
R&D and Engineering 175 - 200
Growth Investments 80
OpEx Investments 70
Total $1.3 Billion
Additional Cash
Available from
the Sale of the
Road
Development
Business
28

Opportunity Ahead
Completed record year in 2006, expecting record revenues, EPS
and cash flow in 2007
Diversified business portfolio and lean business model to dampen
impact of market cycles
Deploying cash to generate value for shareholders
Additional purchasing power from sale of Road Development
Increased investments for growth and operational excellence
Well positioned to deliver
Consistent profitable growth
Strong cash flow
Successfully Executing Sound Long-term Growth Strategy
29
30