 6-26-12 2012 Annual Meeting Exhibit 99.1 |
 This brochure contains statements that plan for or anticipate the future. Forward-looking statements include statements about the Company's ability to develop and produce gold or other precious metals, statements about our future business plans and strategies, statements about future revenue and the receipt of working capital, and most other statements that are not historical in nature. Forward-looking statements are often identified by words such as "anticipate," "plan," "believe," "expect," "estimate," and the like. Because forward-looking statements involve future risks and uncertainties, there are factors that could cause actual results to differ materially from those expressed or implied, including those described in our filings with the SEC. Prospective investors are urged not to put undue reliance on these forward-looking statements. This presentation is to be read in conjunction with the most current 10K available at the Securities & Exchange Commission website www.sec.gov. or www.Goldresourcecorp.com Forward Looking Statements Forward Looking Statements |
 Engineered To Maximize Shareholder Value Engineered To Maximize Shareholder Value Delivering an aggressive growth profile of low cost, high margin production Demanding high returns on owner invested capital Distributing meaningful monthly dividends to maximize total return to owners Shareholder Focused Precious Metal Producer |
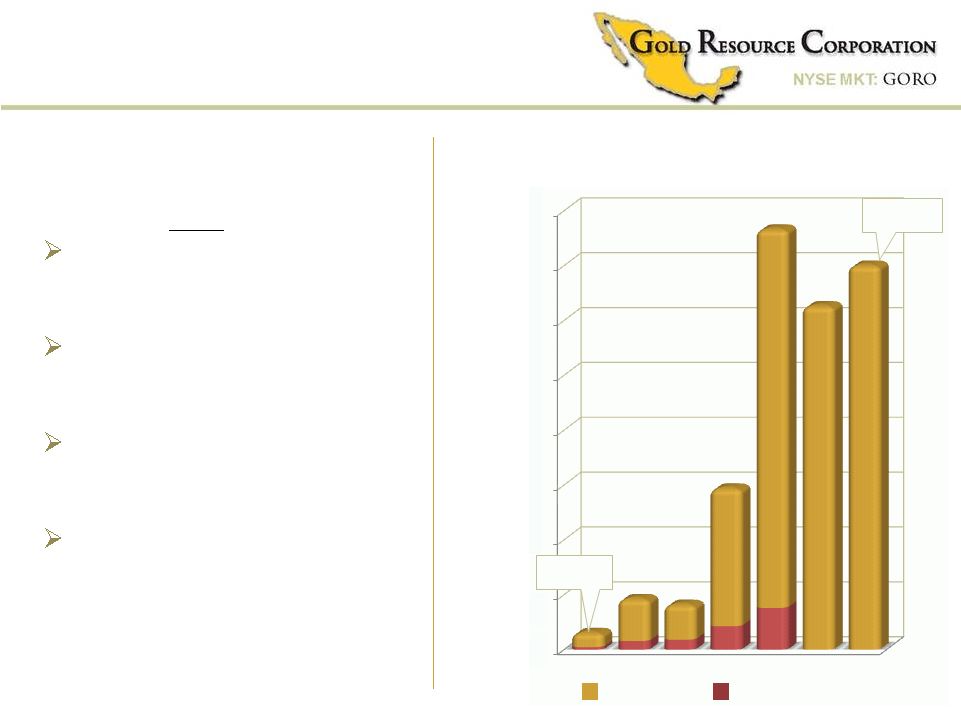
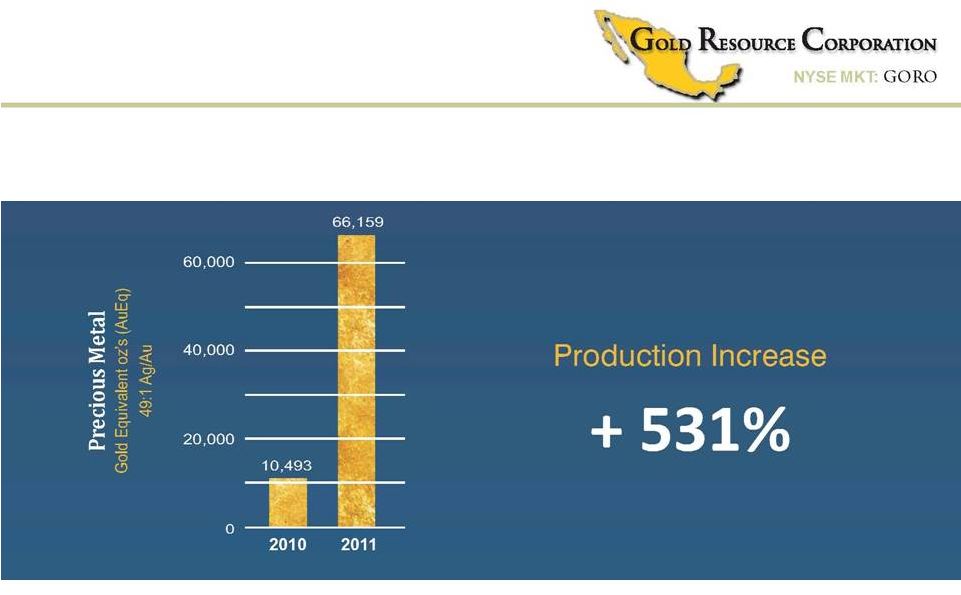 2011 Performance Highlights 2011 Performance Highlights |
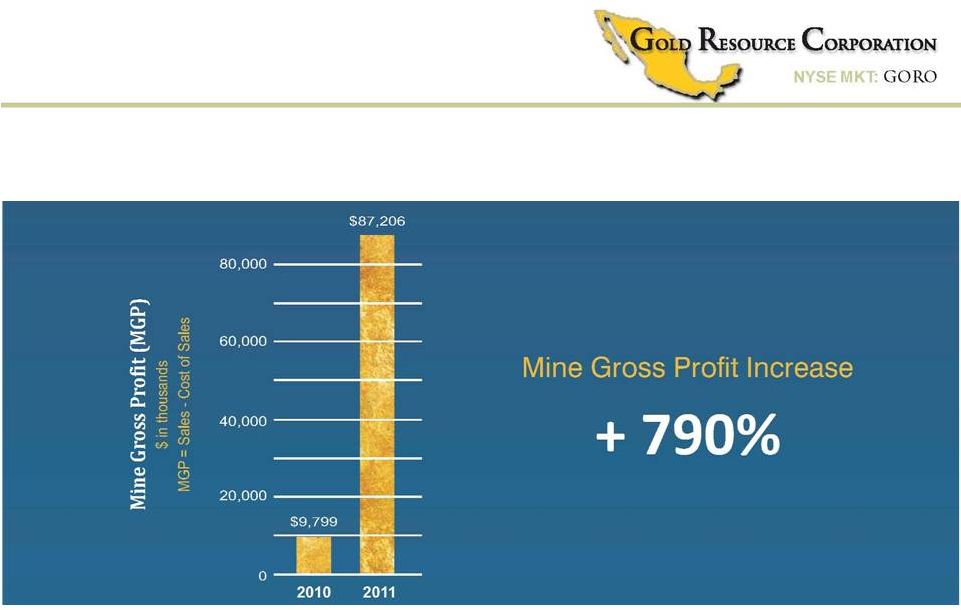 2011 Performance Highlights 2011 Performance Highlights |
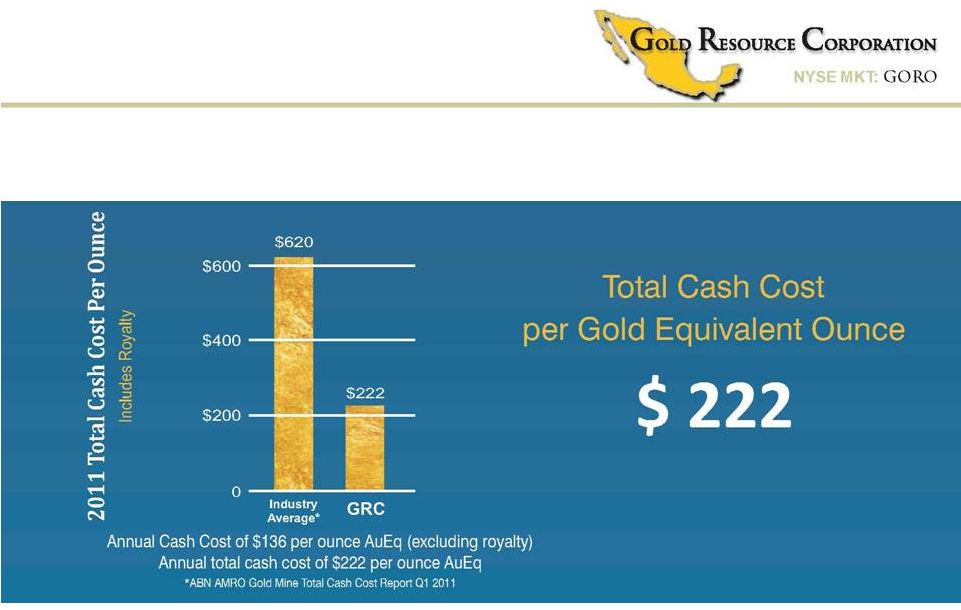 2011 Performance Highlights 2011 Performance Highlights |
 2011 Performance Highlights 2011 Performance Highlights |
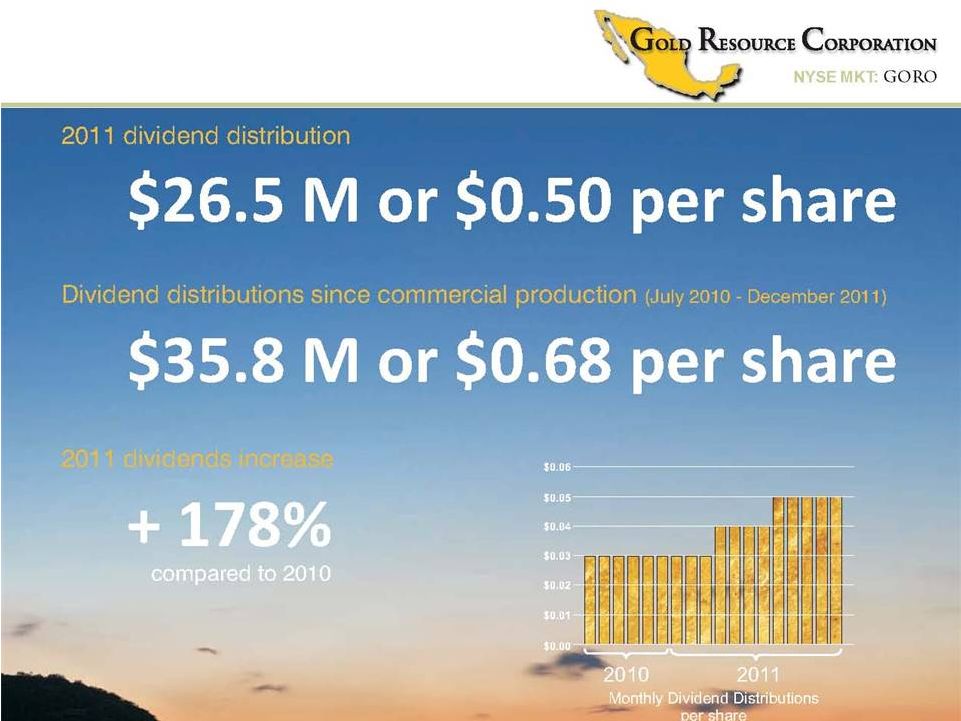 2011 Performance Highlights 2011 Performance Highlights |
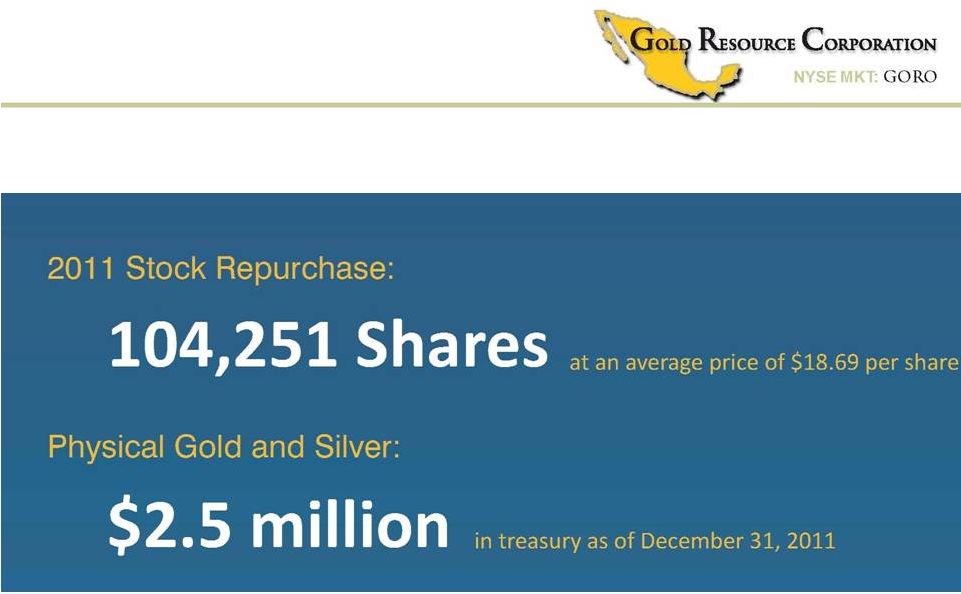 2011 Performance Highlights 2011 Performance Highlights |
 2011 Performance Highlights 2011 Performance Highlights |
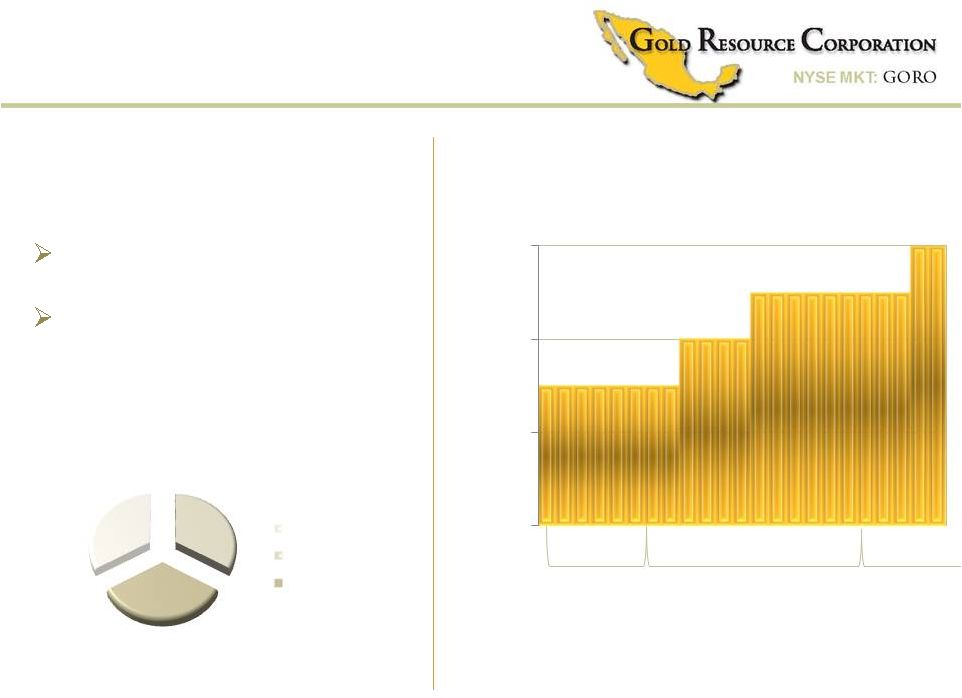
 Value Creation Value Creation 2011 set a strong foundation from which to continue to build shareholder value |
 Value Creation Value Creation Growth Equity and Income Equity |
 GROWTH EQUITY Value Creation Value Creation 2011 66,159 oz AuEq $87 Million $58 Million Mine Gross Profit = sales – cost of sales AuEq = precious metal gold equivalent ounce Oz = ounce Value Created Cumulative Funds Raised “IPO” 6-20-12 2006 2007 2008 2009 2010 2011 2012 Market Capitalization 0 200,000,000 400,000,000 600,000,000 800,000,000 1,000,000,000 1,200,000,000 1,400,000,000 1,600,000,000 Record Production Record Mine Gross Profit Record Net Income Aggressive Production Profile USD BILLIONS |
 2010 2011 2012 USD/ Month $0.06 / share monthly dividend $0.72 annually 2011 dividends = 30.5% MGP $26.5M of $87.5 MGP MGP / Mine Gross Profit = sales – cost of sales Value Creation Value Creation Dividends may vary in amount and consistency or be discontinued at management’s discretion depending on variables including but not limited to operational cash flows, Company development requirements and strategies, spot gold and silver prices, taxation, general market conditions and other factors described in the Company’s public filings. INCOME EQUITY 1/3 1/3 1/3 $0.00 $0.02 $0.04 $0.06 Consecutive Monthly Dividends since commercial production July 2010 Targeted Annualized MGP Deployment Growth Taxes Dividend Total dividends / share paid to date $0.95 |
 Dividend Impact Dividend Impact |
 $1.00 / share “IPO” $1.01 / share returned to shareholders since “IPO” Assumes June 2012 div. @ $0.06 payable in July Fiscal discipline and commitment to shareholders Major Milestone Major Milestone Total dividends to exceed “IPO” price / share Sept. 2006 |
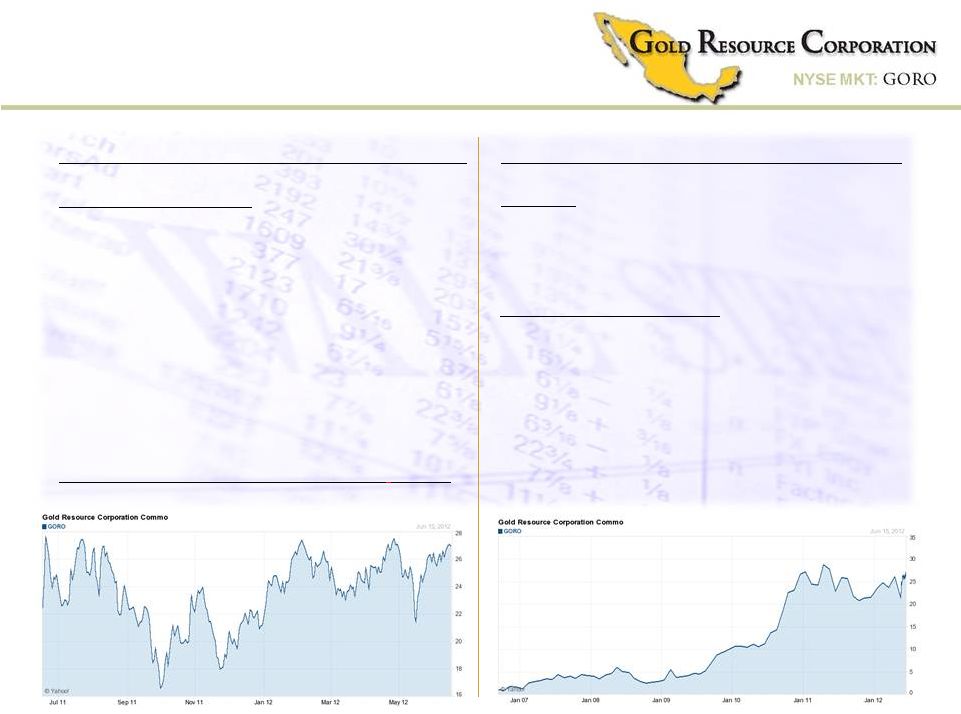
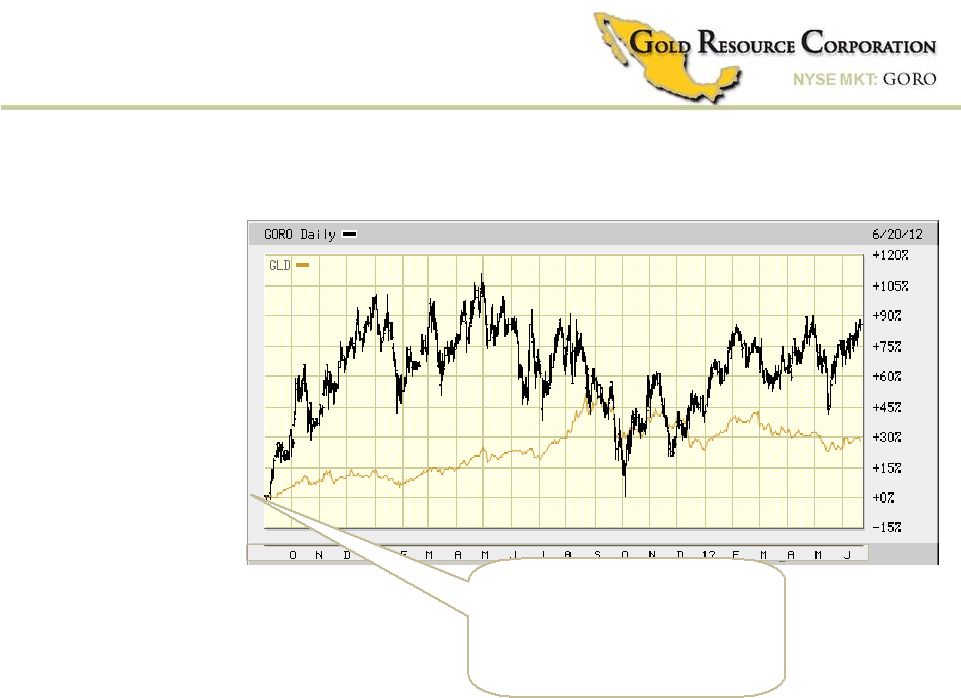 Dividend Impact On Share Price Dividend Impact On Share Price Performance? Performance? GORO- Gold Resource Corporation ~2 YEARS July , 2010 - Commercial Production - Initial Dividend GLD – SPDR Gold Trust (ETF) |
 GTU – Central Gold Trust XAU – Index, precious metal Co’s (#16 Co’) GORO- Gold Resource Corporation ~2 YEARS GDXJ – Market Vectors Junior Gold Miners ETF (#86 Co’s) Dividend Impact On Share Price Dividend Impact On Share Price Performance? Performance? July , 2010 - Commercial Production - Initial Dividend June, 2012 - Consistent Monthly Dividends |
 UNWPX – US Global Investors World Precious Minerals Fund (#183 Co’s) GORO- Gold Resource Corporation ~2 YEARS Dividend Impact On Share Price Dividend Impact On Share Price Performance? Performance? |
 Dividend & Yields Dividend & Yields Company Annual Dividend Estimate Yield % Share Price Close 6/18/2012 Agnico Eagle U.S.$0.81 1.9% U.S.$42.40 Barrick U.S.$0.80 2.0% U.S.$40.19 Goldcorp U.S.$0.54 1.4% U.S.$39.72 Kinross U.S.$0.16 1.8% U.S.$ 9.17 Newmont U.S.$1.40 2.8% U.S.$50.85 Yamana U.S.$0.22 1.4% U.S.$16.35 Royal Gold U.S.$0.60 0.8% U.S.$79.49 PEER AVERAGE 1.7% Gold Resource U.S.$0.72 2.7% U.S.$27.66 Source: Based on each company’s annual public filing and Bloomberg. |
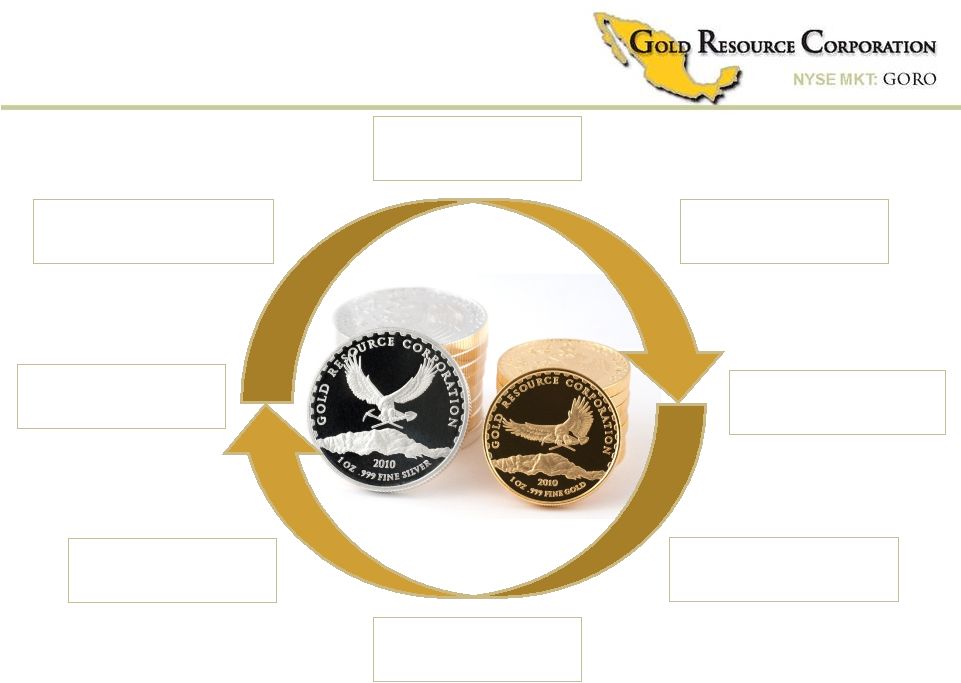
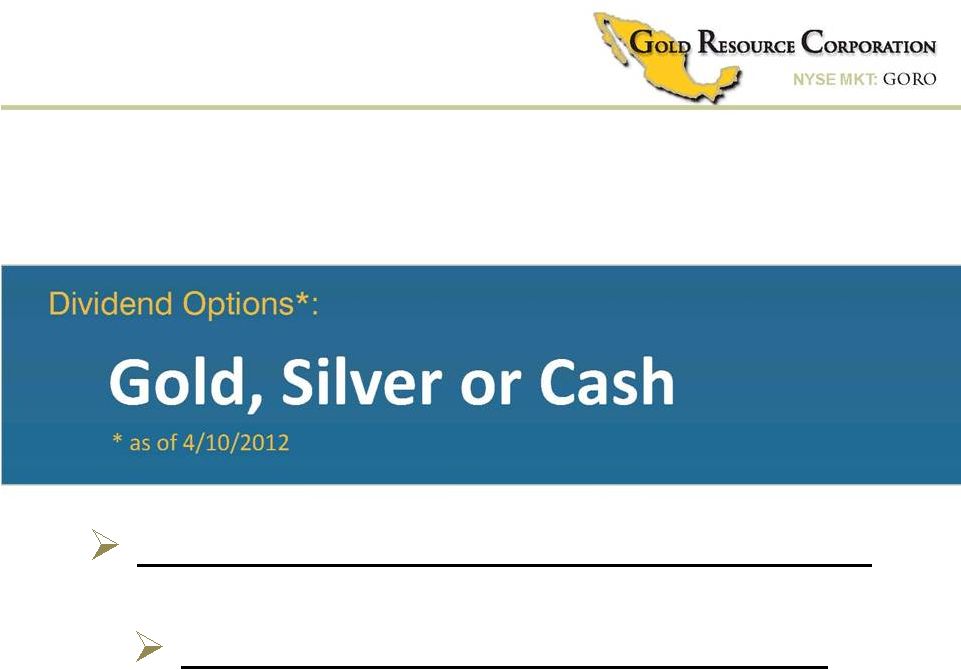 Committed to Gold and Silver Committed to Gold and Silver “GRC Eagles” rounds Unique Gold and Silver Dividend Program No Other Known Program of its Kind |
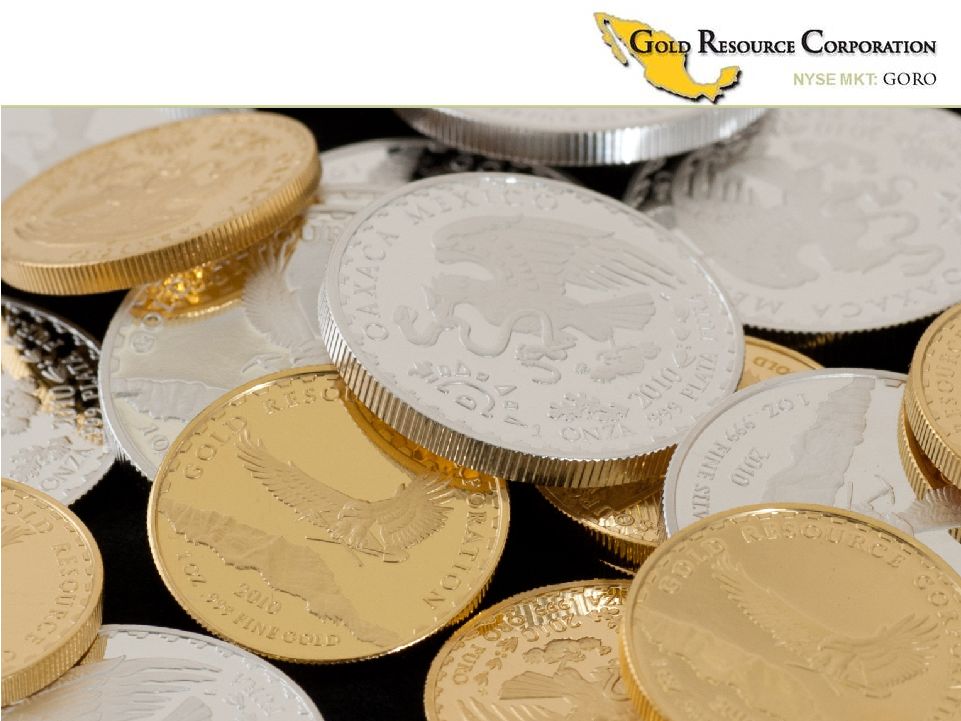 Gold and Silver Dividend Program Gold and Silver Dividend Program “GRC Eagles” rounds |
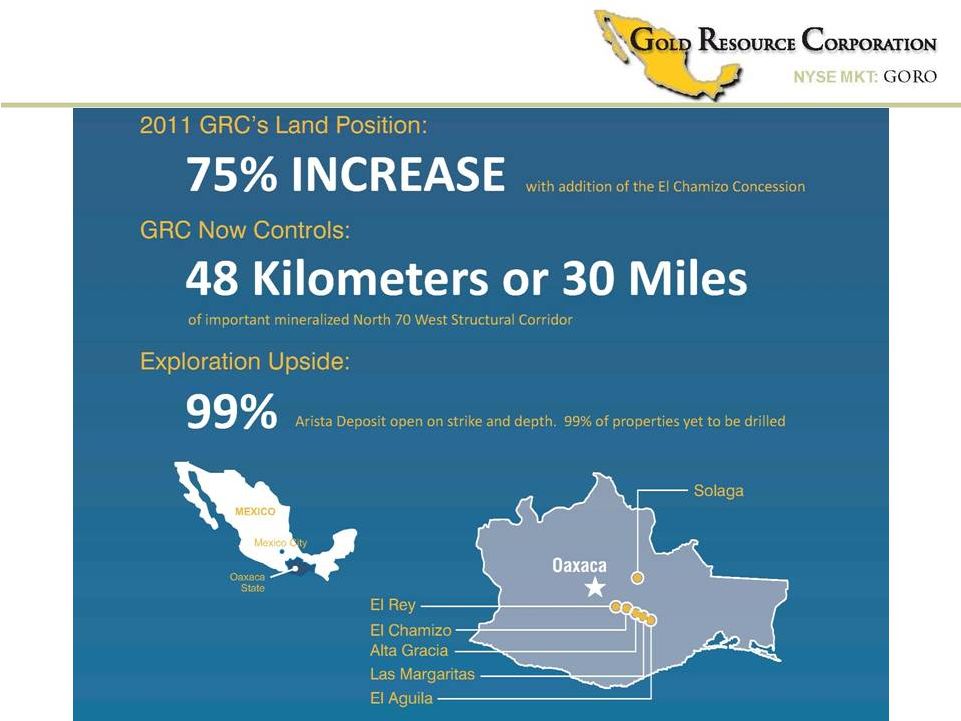
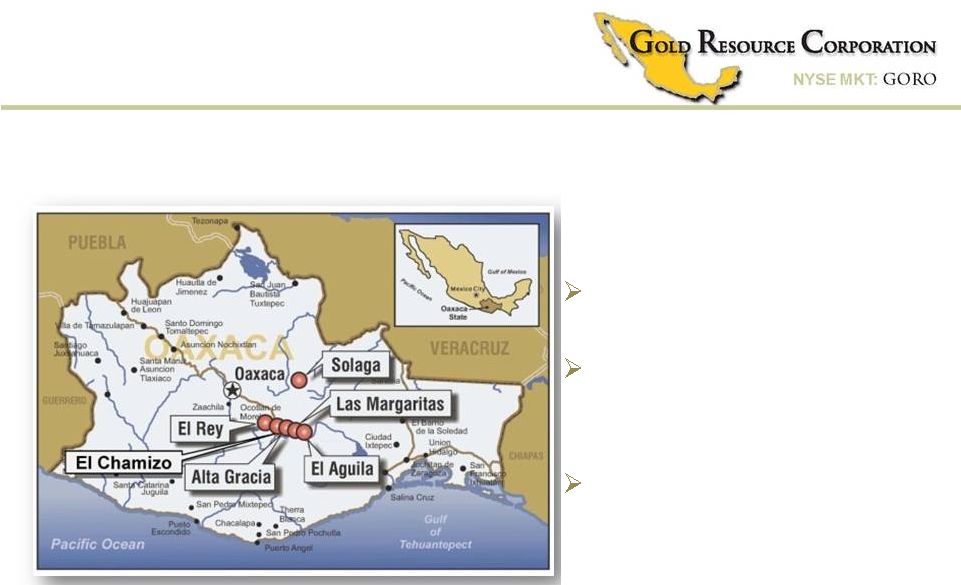
 Oaxaca Mining Unit Oaxaca Mining Unit Mining friendly jurisdiction 6 potential high-grade gold and silver properties (+200 square miles) Dominant land position: 48 kilometer mineralized structural corridor Oaxaca Mining Unit Property Interest Production Development Exploration El Aguila 100% El Rey 100% Alta Gracia 100% 100% El Chamizo 100% Solaga 100% Las Margaritas |
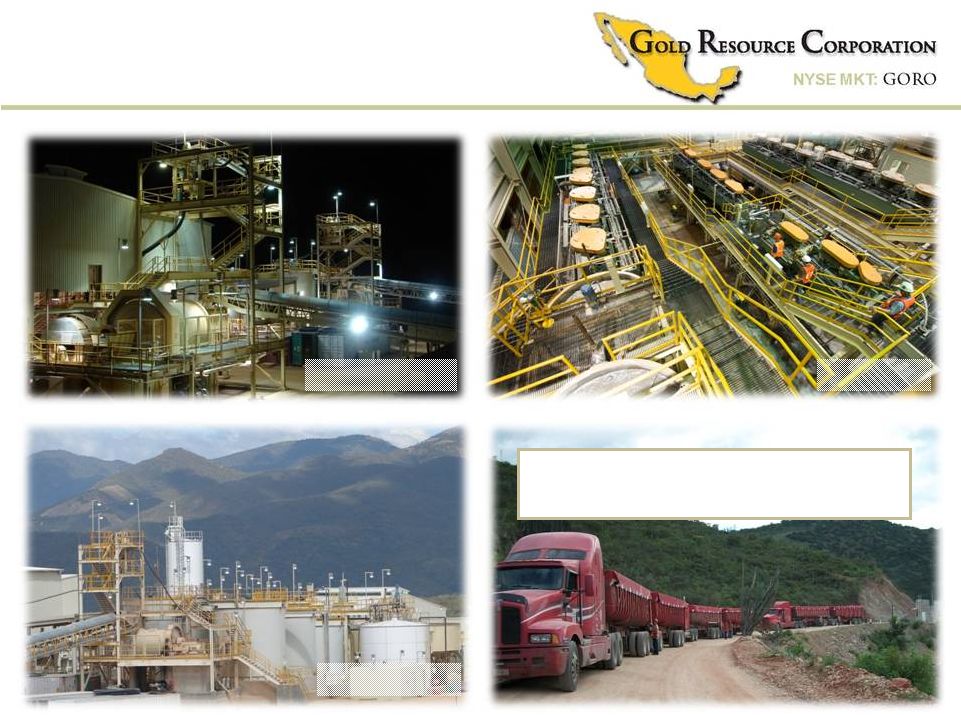 Flexible Mill Design Flexible Mill Design Flotation Agitated leach Two mill circuits 2011 Record Mine Gross Profit: $87 million |
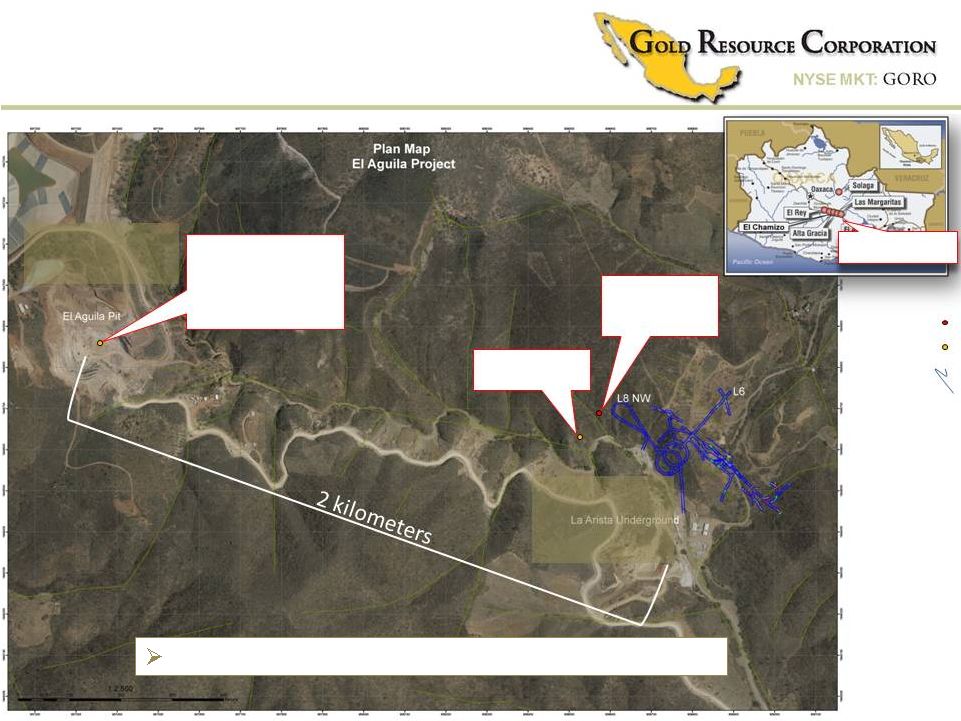
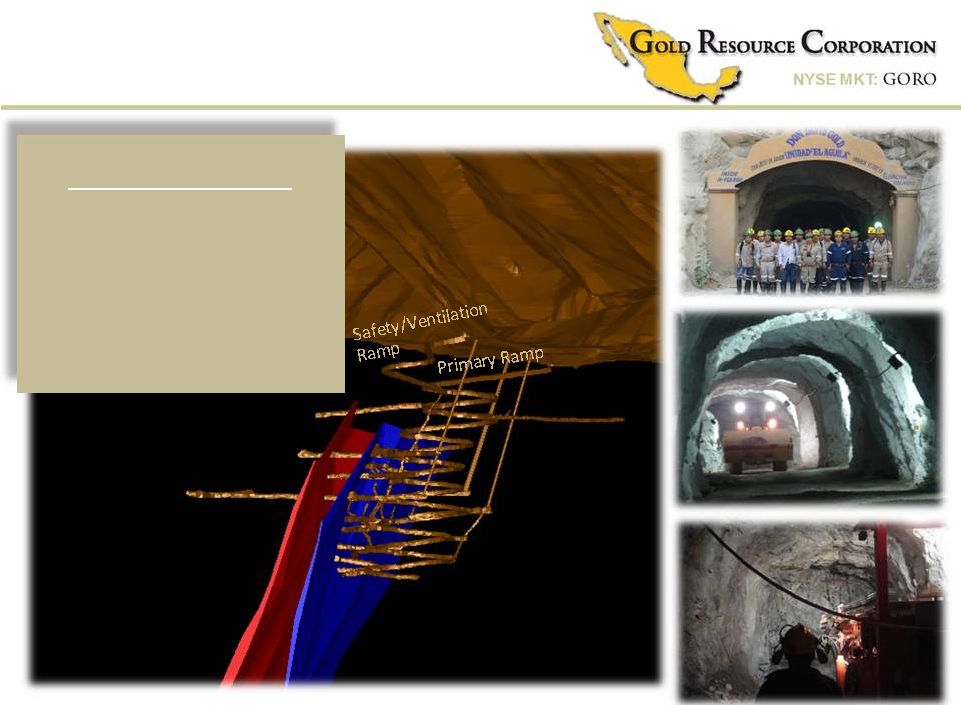 La Arista Deposit •Multiple en echelon veins •~500 meters of strike •~500 meters of depth •Deposit remains open Arista Vein Baja Vein Arista Underground Mine Arista Underground Mine Drill Station Drill Station |
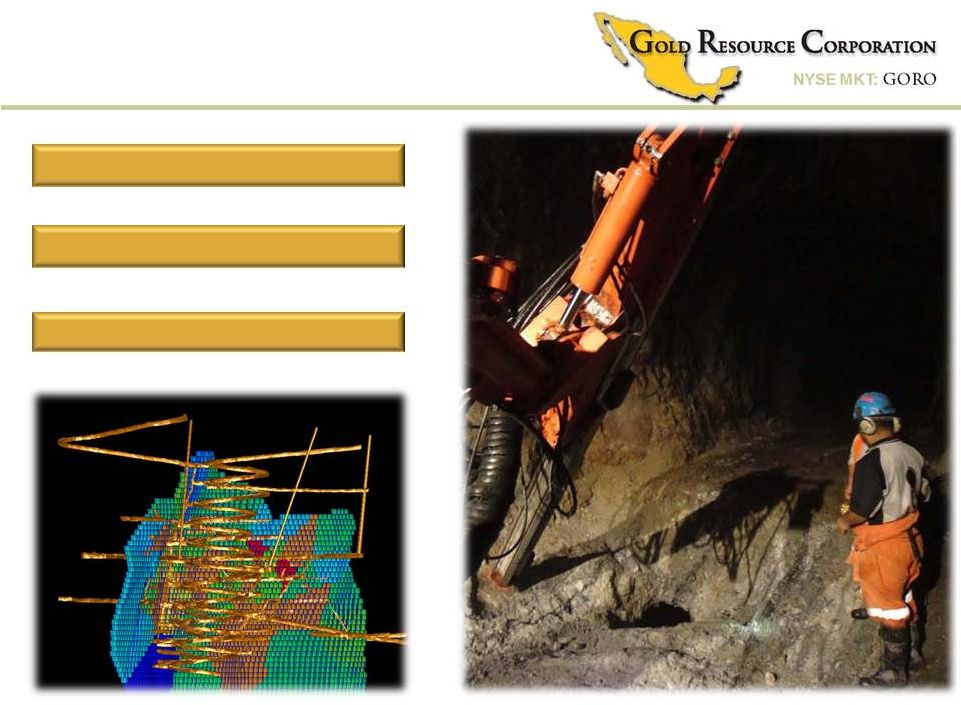 Arista Mine Development Arista Mine Development Sub-level long hole stoping Development ore Mine Development Baja Vein |
 Arista Mine Development Arista Mine Development Decline Veins Main Decline & Vein Drifts LEVEL 11 Level 11 Veins Sample # Au g/t Ag g/t Cu % Pb % Zn % 117652 141.73 1710 2.57 2.47 5.70 |
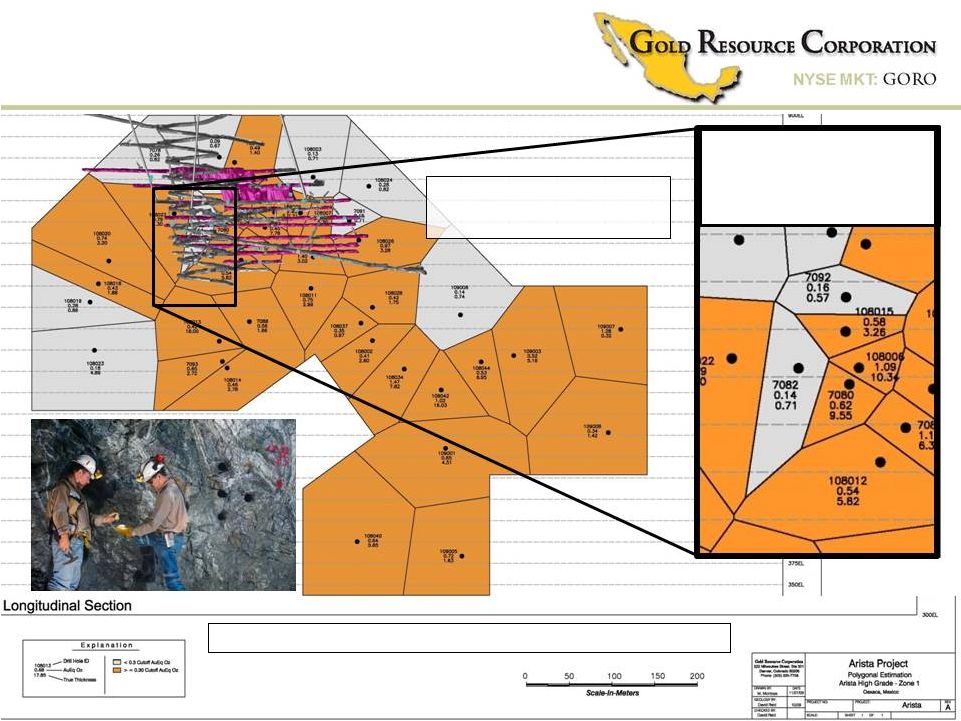 Arista Mine Development Arista Mine Development Internal Estimate, Not SEC Proven & Probable Reserves; see Risk Factors in Company’s 10K Grey Polygons A, B, C and D drilling indicated grade below cutoff. Actual mining demonstrated high- grade and polygons were/are being mined and processed. Deposit Open Deposit Open A B C D Polygonal envelope with mine development 3D overlay; internal estimate Arista vein (polygon12/09) Internal Estimate Primary Ramp |
 PRECIOUS METAL GOLD EQUIVALENT (AuEq) RESOURCE GRADE VS. PRODUCTION GRADE Cutoff IN-SITU ESTIMATES AuEq MINED GRADE PRODUCTION Grade PA&H (1) COMPANY (2) IN-SITU 13 Month Ave(3) Grams Tonnes oz/t g/t YR's oz/t g/t YR's oz/t g/t oz/t g/t 1* 4,480,711 0.20 6.22 10 7* 2,305,485 0.34 10.58 5 Mined Grade @ Actual Mill Head 9* 1,606,286 13.37 4 20% Dilution Grade After 9.33 2,962,000 0.53 16.49 7 Estimate Mining Dilution 0.51 15.86 242,014 0.41 12.75 AuEq = Precious Metal Gold Equivalent In-Situ = in place, not accounting for mining dilution (1) AuEq Estimate 2012 @ 50:1 Au,Ag Third Party Preliminary Estimate by Pincock Allen & Holt (PA&H) (2) AuEq Estimate 2009 @ 53:1 Au,Ag Internal Estimate (3) Actual mill headgrade processed March 1, 2011 to March 31, 2012 *Indicated & Inferred YR‘s = Mine life years at 440,000 tonnes mill throughput per year - NOT PROVEN AND PROBABLE RESERVES FOR U.S. REPORTING PURPOSES Arista High-Grade Deposit Arista High-Grade Deposit Estimates and Production Grade Estimates and Production Grade (Internal and Third Party Estimates, Not SEC Proven & Probable Reserves; see Risk Factors in Company’s 10K) 0.43 PA&H RESOURCE CRITERIA INCLUDES STANDARDS ESTABLISHED UNDER CANADIAN NI 43-101 FOR INDICATED AND INFERRED RESOURCES |
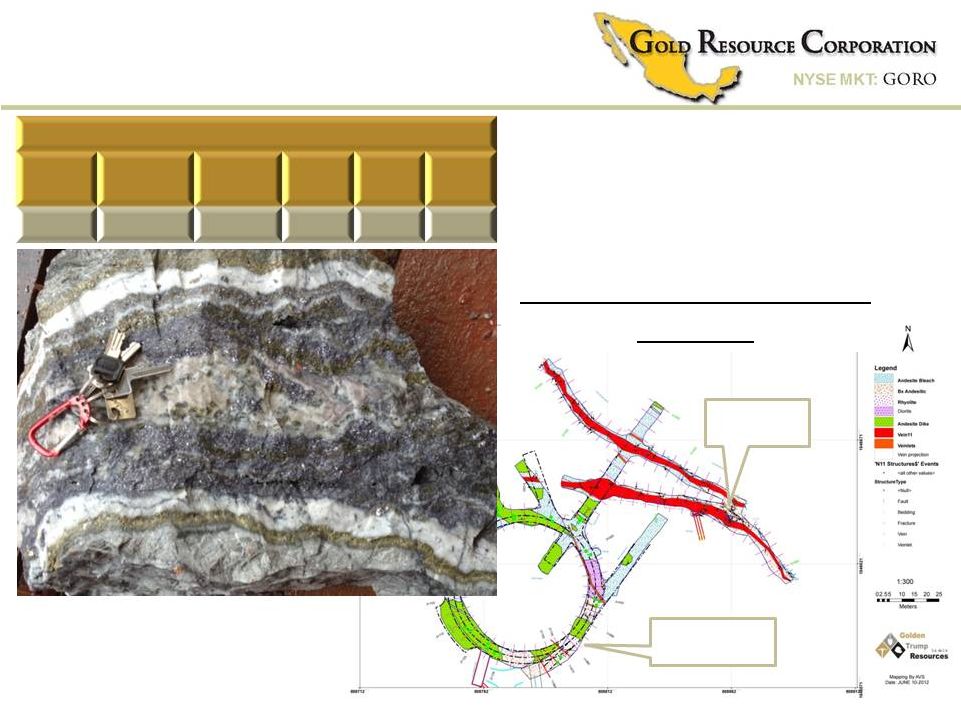
 Arista Area Expansion Potential Arista Area Expansion Potential .73 meters @ 9.9 g/t Au, 598 g/t Ag Drill hole Surface sample Rock chip @ 12 g/t Au Arista Mine development La Arista Underground Mine Potential feeder vein 2.5m@ 904 g/t Au, 9720 g/t Ag Channel sample El Aguila Open Pit Mine Potential for deposit expansion and/or new discoveries El Aguila |
 Arista Area Expansion Potential Arista Area Expansion Potential Arista Multiple Structures Dr. Ellis 6-21-12 Structure is Important to Epithermal Systems El Aguila |
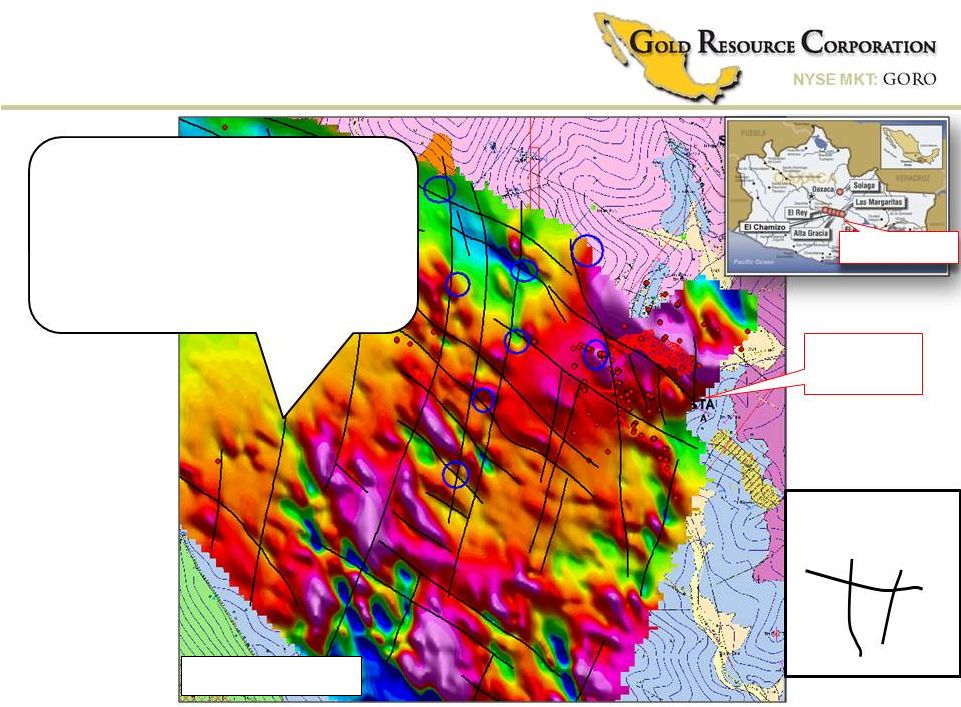
 Exploration Potential Exploration Potential 6 properties (+200 square miles) 5 properties consolidate 48km mineralized structural corridor Mineralization at each end and along trend |
 Alta Gracia Property Exploration Potential Exploration Potential El Rey Property El Rey Property Alta Gracia Property Alta Gracia Property Las Margaritas Las Margaritas Positive 2011 drill campaign Intercepted multiple mineralized structures 33 intercepts over 200 grams silver (1m intervals) Discovered high-grade gold vein system Working with all local interests Continue extending the existing shaft Setup an underground drill station Constructing access road First to drill this historic district Historic workings Las Margaritas Property El Rey Property |
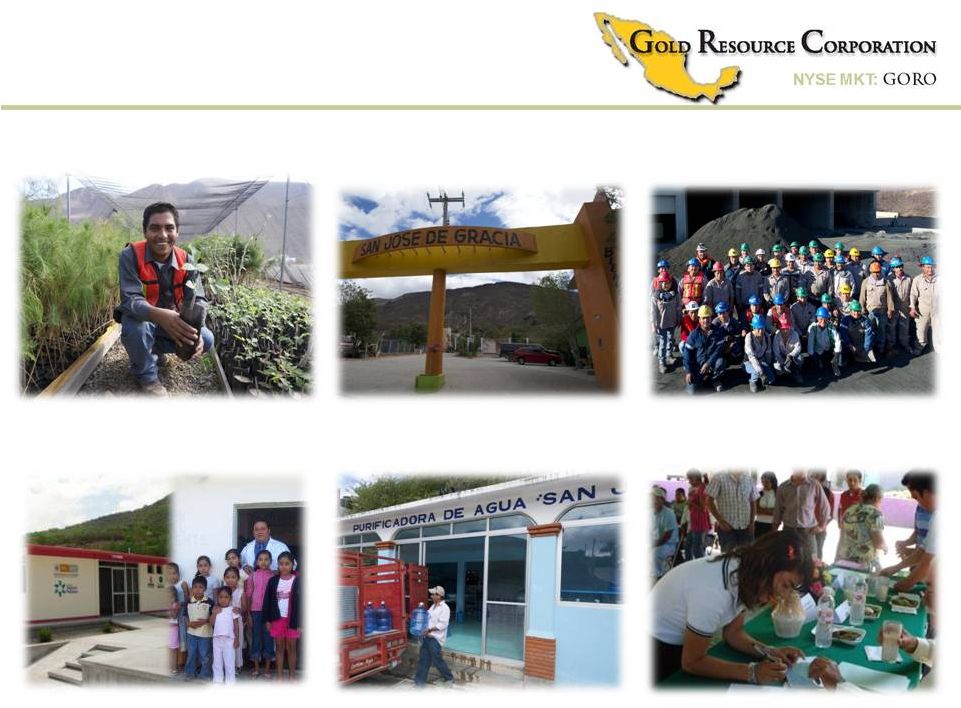 Corporate Citizenship Corporate Citizenship Plant Nursery/Reforestation Town Infrastructure Commitment to Hire Locally Health Clinic Dental Clinic Sustainable Development Student Scholarships |
       Substantial Shareholders Management ~15% Hochschild Mining plc ~28% Tocqueville Asset Management ~ 8% NFJ Investment Group ~ 6% Blackrock ~ 5% Vanguard ~ 2% Exchange NYSE MKT: GORO Present Capitalization Shares Outstanding 53,015,767 Treasury Shares (104,251) Options Outstanding 5,182,000 Warrants Outstanding 0 Shares Fully Diluted 58,197,767 Debt 0 Hedging 0 Bullion: #1672oz Gold #87641oz Silver ~$5.6Million Cash @ 3-31-12 $44 Million Tight Capital Structure Tight Capital Structure 12 months Market Cap @ $27.00/share $1.4Billion Liquidity Average Daily Volume (3m as of 6-18-12) ~267,000 52 wk Range Low/Hi $15.06-$28.74 Since 2006 “IPO” |
 (Potential targets and projections. Not guaranteed; see Risk Factors in Company’s 10K) Potential Catalysts Potential Catalysts Increasing production year over year Adding ounces to known deposits New deposit discoveries Secondary exchange listing Increasing dividends Additional Mining Unit |
 Second Mining Unit Second Mining Unit Mining friendly jurisdiction High-Grade Accretive Second Mining Unit Criteria st Oaxaca Mining Unit (1 mining unit) |
 The “Go To” The “Go To” Gold Company Gold Company (GRC targets, performance not guaranteed, see Risk Factors in Company’s 10K) Cash Cash Dividends Dividends Gold & Silver Gold & Silver Dividend Dividend Physical Physical Treasury Treasury Adding Adding Ounces Ounces Capitalize on Capitalize on Opportunities Opportunities Low Cost Low Cost Producer Producer Aggressive Aggressive Growth Curve Growth Curve |
 Thank You For Your Continued Support Thank You For Your Continued Support Low-Cost Precious Metals Producer Low-Cost Precious Metals Producer Growth Equity and Income Equity Growth Equity and Income Equity Premier Investment for Precious Metal Exposure Premier Investment for Precious Metal Exposure |