 June 19, 2014 Annual General Meeting Monthly Dividends: Gold, Silver or Cash Exhibit 99.1 |
 This brochure contains statements that plan for or anticipate the future. Forward-looking statements include statements about the Company's ability to develop and produce gold or other precious metals, statements about our future business plans and strategies, statements about future revenue and the receipt of working capital, and most other statements that are not historical in nature. Forward-looking statements are often identified by words such as "anticipate," "plan," "believe," "expect," "estimate," and the like. Because forward-looking statements involve future risks and uncertainties, there are factors that could cause actual results to differ materially from those expressed or implied, including those described in our filings with the SEC. Prospective investors are urged not to put undue reliance on these forward-looking statements. This presentation is to be read in conjunction with the most current 10K available at the Securities & Exchange Commission website www.sec.gov. or www.Goldresourcecorp.com 2 |
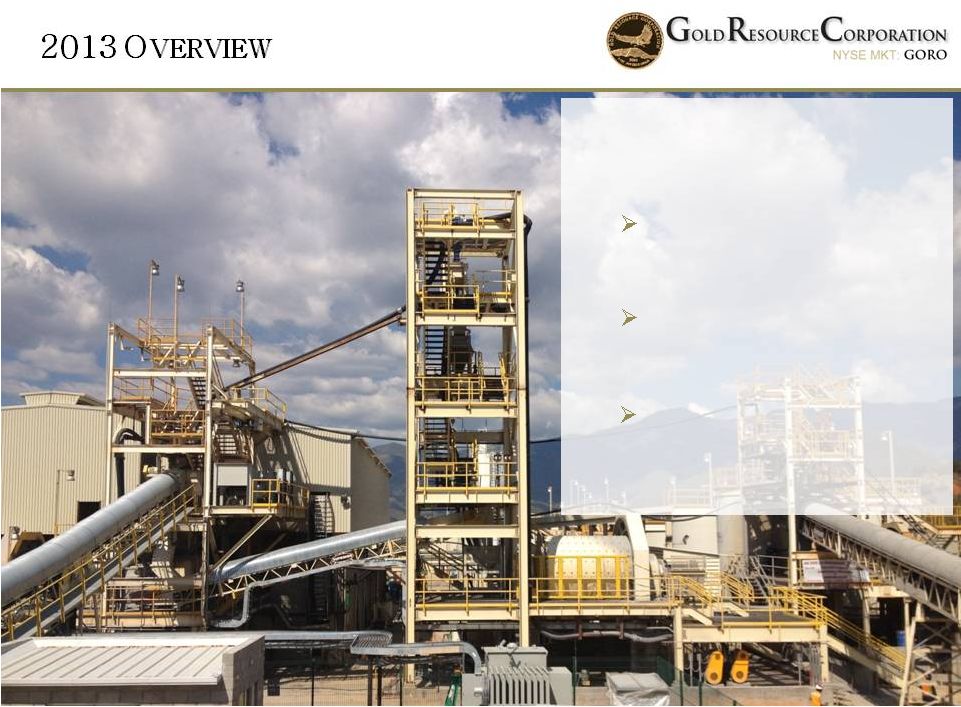 Volatile Mining Equity Bear Market of 2013 Reached production target 84,800 ounces AuEq Expanded mill capacity Continued monthly dividends Paid 46 consecutive monthly dividends to date ~1500 t/d capacity 3 |
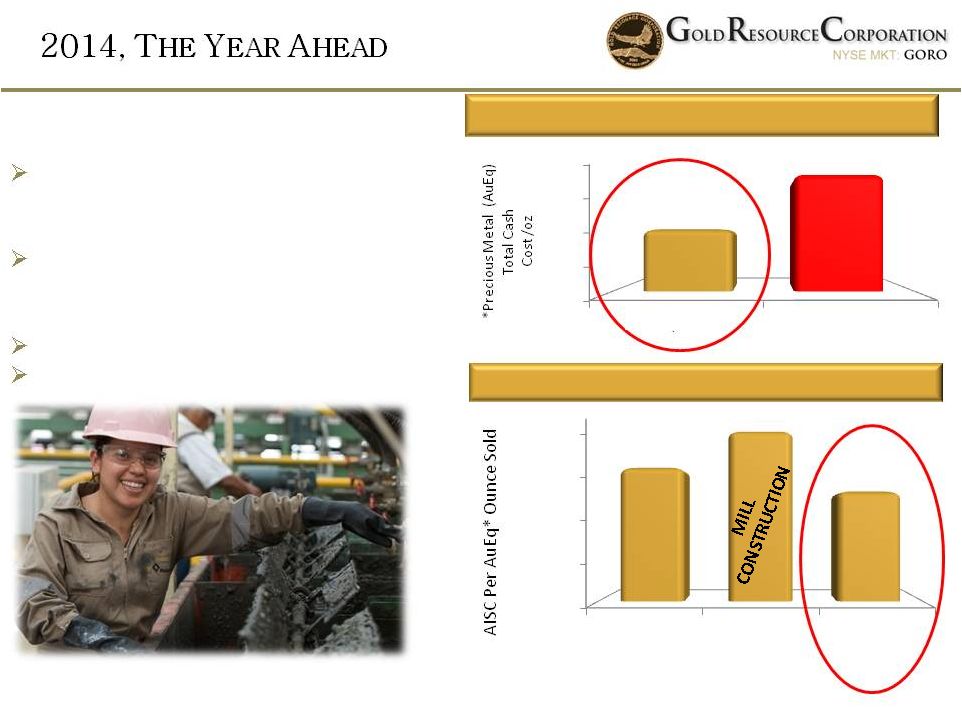 4 First Quarter Of 2014 Lowered costs of production Solid production start in Q1 Much Stronger Positioned Company Potentially capitalize on opportunities Gold Institute Total Cash Cost/Ounce All-In Sustaining Cost Per AuEq Ounce Sold *** * (**) (***) See Companies corporate presentation on its website for more detailed information on costs 62:1 Au,Ag 0 200 400 600 800 GRC Q1 2014 Industry Avg $422* $736** 63:1 Au,Ag 0 300 600 900 1200 GRC 2012 GRC 2013 GRC 2014 Q1 $994 $1,263 $816 54:1 Au,Ag 63:1 Au,Ag |
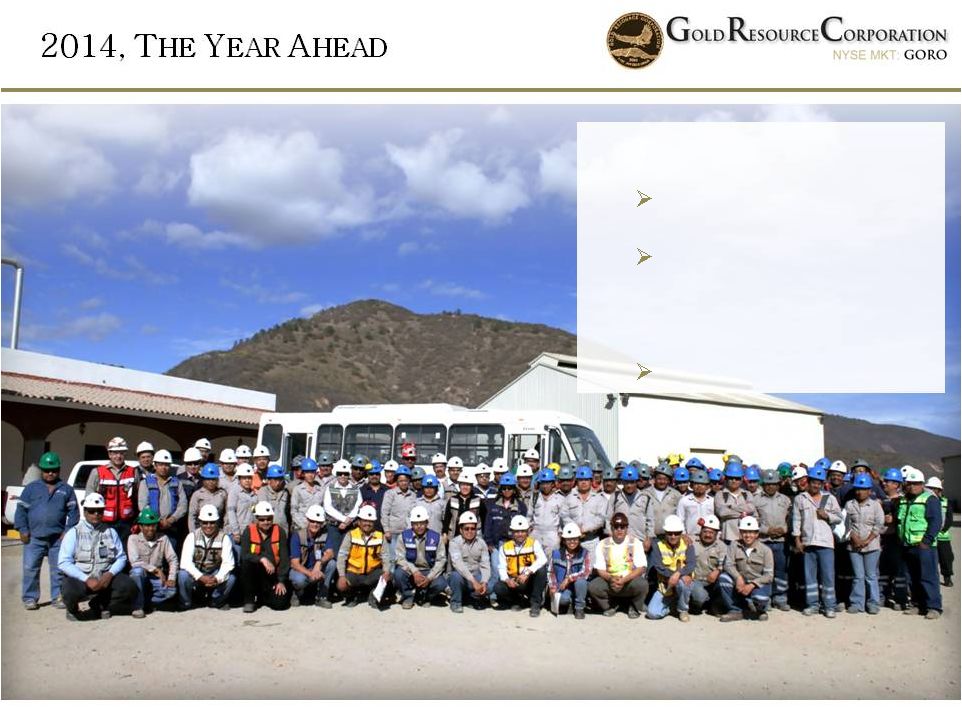 5 Oaxaca Mining Unit Strong management team On track to reach targeted production range: 85,000 – 100,000 oz’s AuEq Optimizing operations |
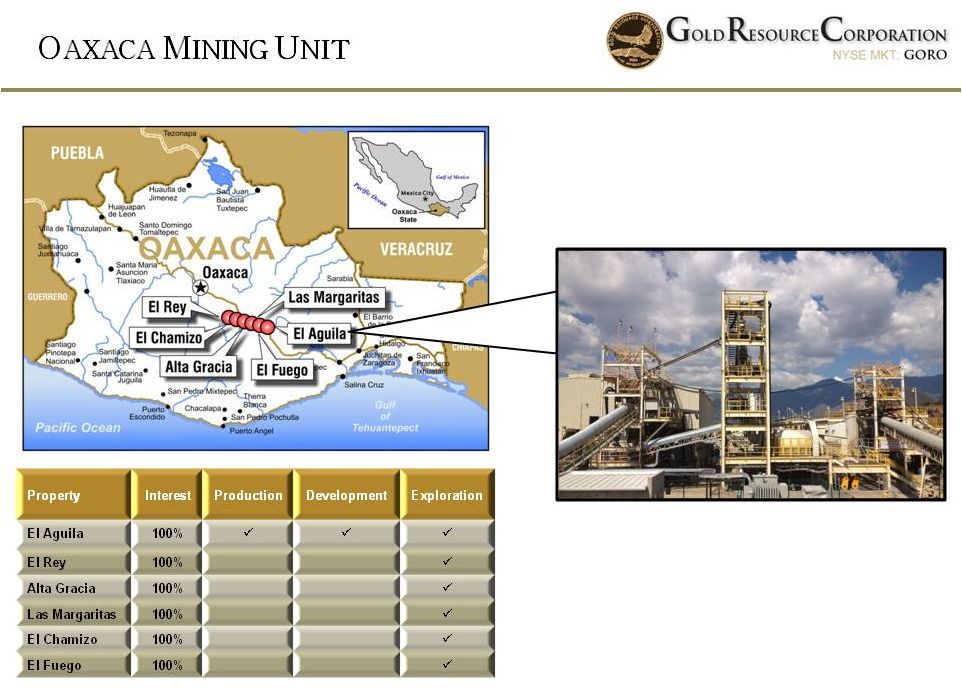 6 El Aguila Mill |
 7 Multiple Parallel veins Open on strike and depth Splay 05 December 2012 Baja Vein Arista Vein Alta Vein Splay 03 February 2013 |
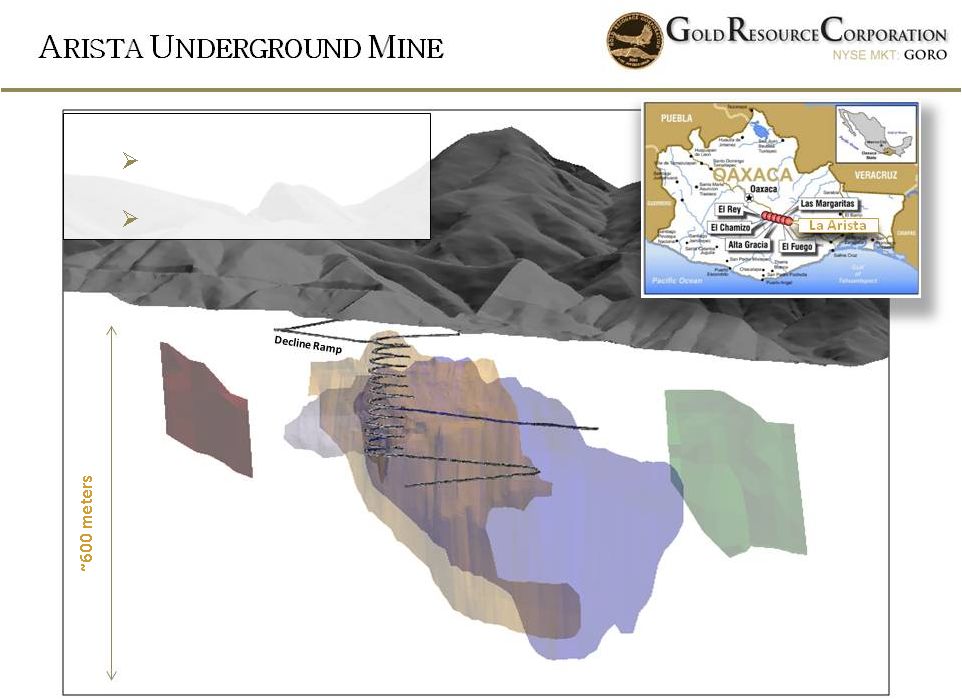
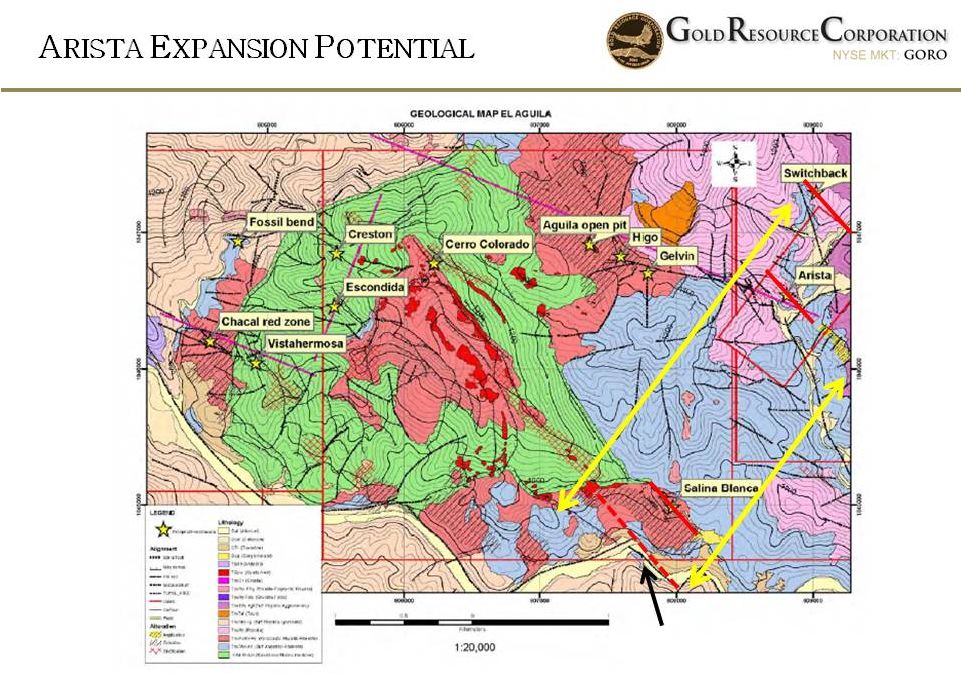
 ARISTA RIDGE 8 Oaxaca Mining Unit Exploration Arista deposit continues to expand New “Switchback” discovery a priority Multiple drill targets |
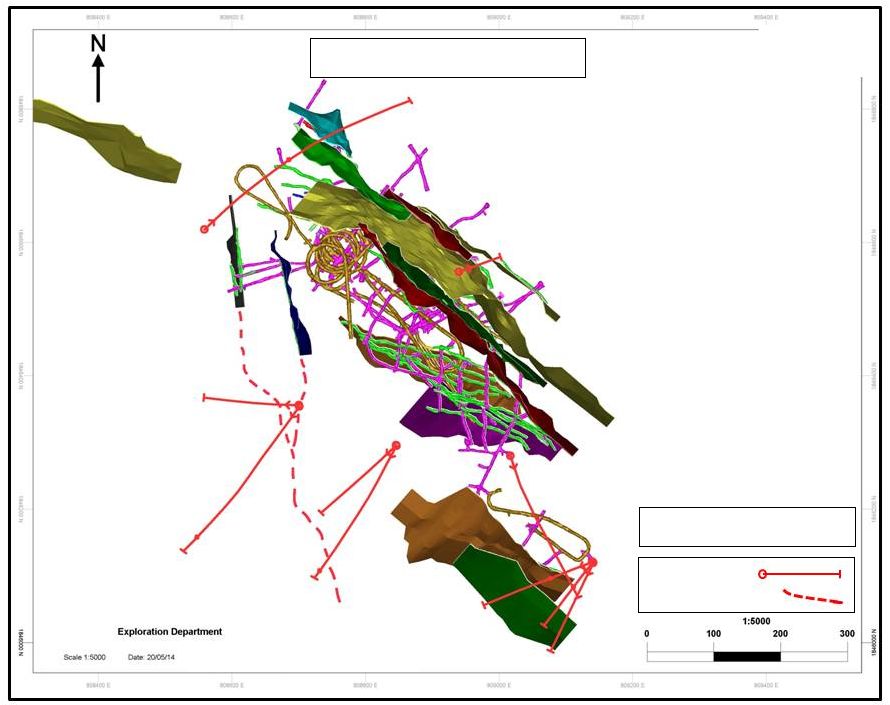 9 Arista Vein System: Plan Map Drill hole Vein Projection 1147020 1147011 1147013 1147019 1147017 514022 514018 514023 514025 ARISTA DEPOSIT 514009 El Aire Vein Santa Lucia Vein Socorro/Splay 5 Splay 6 Arista Deposit Plan View |
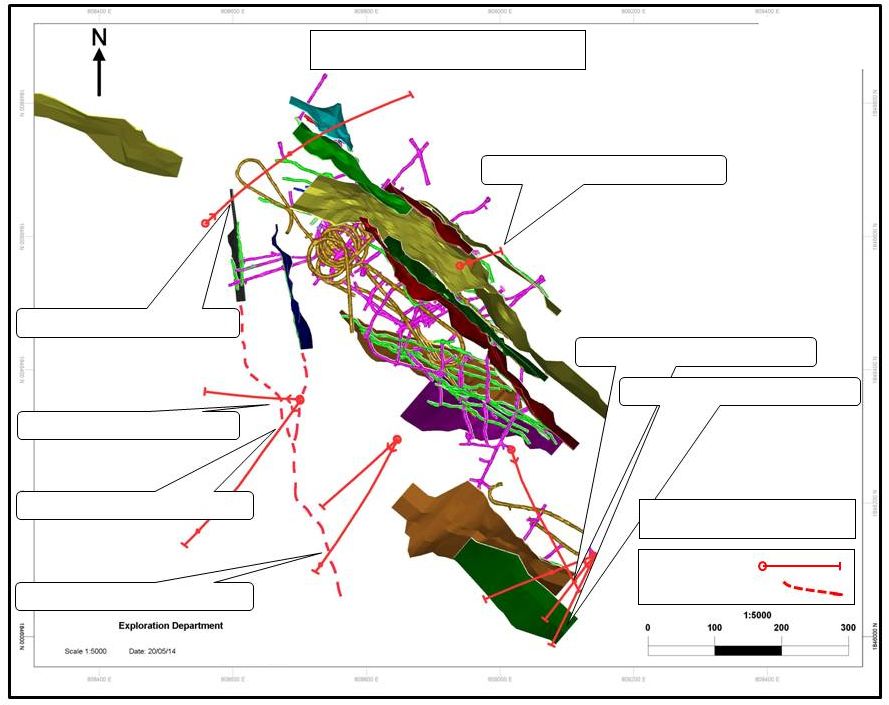 10 Arista Vein System: Plan Map Drill hole Vein Projection 1147020 1147011 1147013 1147019 1147017 514022 514018 514023 514025 2.06m@ 1.36 g/tAu, 813 g/tAg 2.68m@ 11.72 g/tAu, 748 g/tAg 0.41m@ 22.90 g/tAu, 5,330 g/tAg 2.43m@ 3.85 g/tAu, 681 g/tAg 1.41m@ 3.93 g/tAu, 2,223 g/tAg 1.41m@ 3.96 g/tAu, 1,078 g/tAg ARISTA DEPOSIT 514009 0.88m@ 2.95 g/tAu, 738 g/tAg El Aire Vein Santa Lucia Vein Socorro/Splay 5 Splay 6 Arista Deposit Plan View |
 11 0.41 meters of 22.90 g/t gold, 5,330 g/t silver, 1.89% copper, 3.28% lead & 7.42% zinc (118.25 g/t AuEq) on Socorro Vein. 0.57 meters of 0.27 g/t gold, 121 g/t silver, 0.10% copper, 3.60% lead & 11.20% zinc (9.07 g/t AuEq) on Un-Named Vein (Hanging Wall Baja Vein). Hole # 514015 (Termite) 0.65 meters of 0.01 g/t gold, 15 g/t silver, 0.11% copper, 6.95% lead & 10.41% zinc (8.34 g/t AuEq) on Un-Named Vein (Hanging Wall Baja Vein). Hole # 1147011 Hole # 514019 (Termite) Surface Underground Hole # 514009 (B-15) Hole # 514014 (Termite) 0.30 meters of 4.54 g/t gold, 555 g/t silver, 0.39% copper, 1.29% lead & 2.77% zinc (16.13 g/t AuEq) on Candelaria Vein. 0.65 meters of 0.11 g/t gold, 1,240 g/t silver, 0.03% copper, <0.01% lead & 0.02% zinc (20.49 g/t AuEq) on Un-Named Vein (Hanging Wall El Aire Vein) and 2.43 meters of 3.85 g/t gold, 681 g/t silver, 0.03% copper, 0.17% lead & 0.06% zinc (15.16 g/t AuEq) including 0.80 meters of 10.70 g/t gold, 1,865 g/t silver, 0.07% copper, 0.50% lead & 0.13% zinc (41.67 g/t AuEq) on El Aire Vein. Hole # 1147013 Hole # 1147017 1.41 meters of 3.96 g/t gold, 1,078 g/t silver, 0.06% copper, 0.18% lead & 0.38% zinc (21.98 g/t AuEq) including 0.51 meters of 9.37 g/t gold, 2,510 g/t silver, 0.16% copper, 0.46% lead & 0.88% zinc (51.35 g/t AuEq) on El Aire Vein. 0.88 meters of 2.95 g/t gold, 738 g/t silver, 0.18% copper, 0.77% lead & 1.18% zinc (16.24 g/t AuEq) including 0.55 meters of 4.49 g/t gold, 1,160 g/t silver, 0.28% copper, 1.23% lead & 1.86% zinc (25.38 g/t AuEq) on Splay 4 (?). |
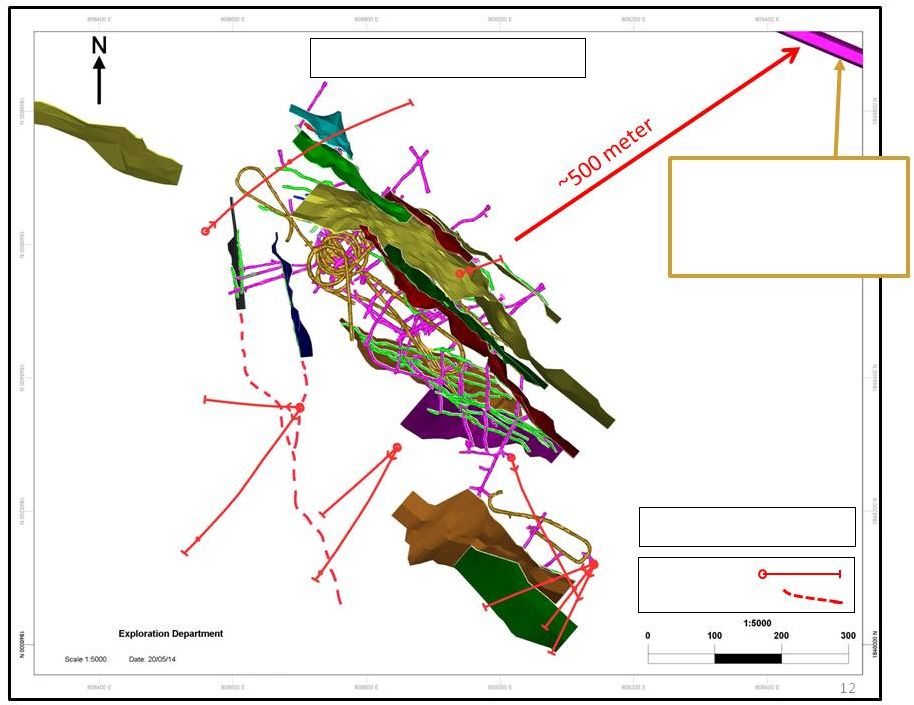 12 Arista Vein System: Plan Map Drill hole Vein Projection 1147020 1147011 1147013 1147019 1147017 514022 514018 514023 514025 ARISTA DEPOSIT 514009 El Aire Vein Santa Lucia Vein Socorro/Splay 5 Splay 6 Arista Deposit Plan View Switchback Discovery 15.47 m including 2.2 m 12.9 g/t Au and 410 g/t Ag |
 13 Switchback; extension of Arista deposit or parallel system 500 meters northeast |
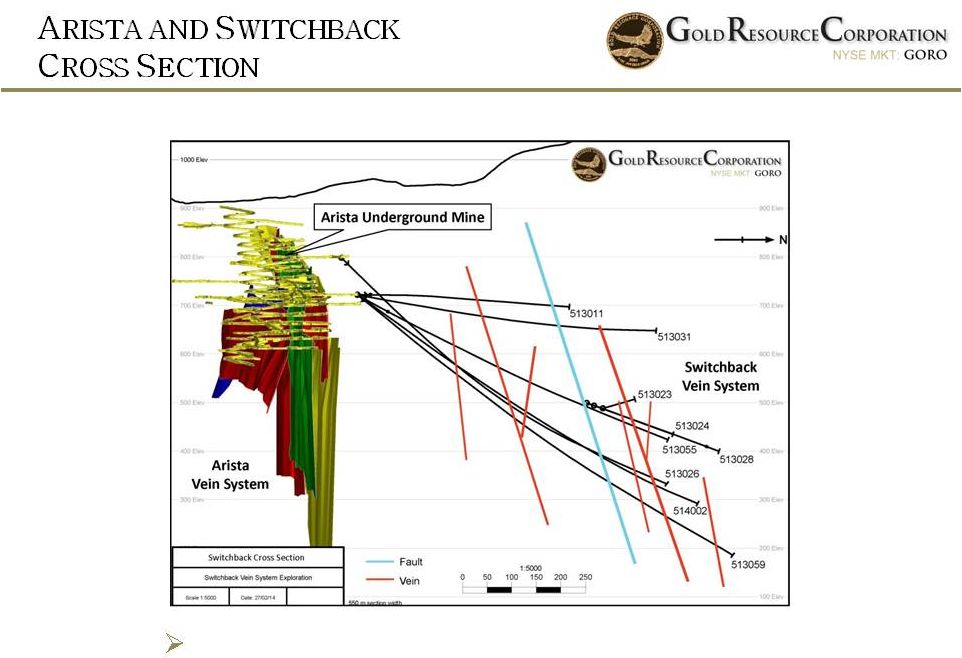
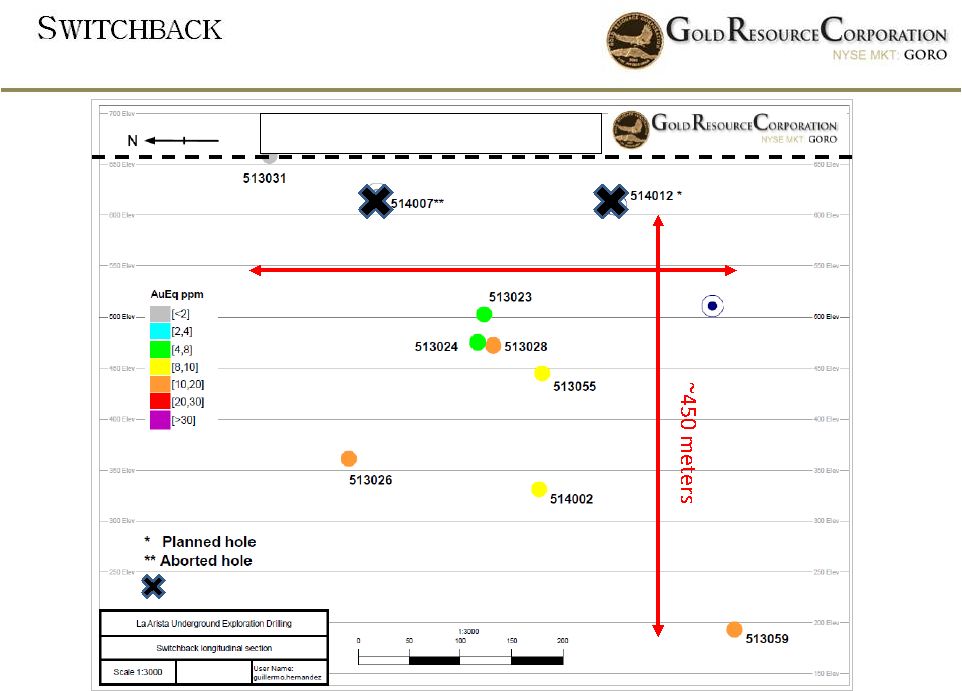 14 16 L 514021* ~450 meters * Switchback Longitudinal Section AuEq is all metal gold equivalent for this slide only Target not reached due to fault and horizontal drill orientation |
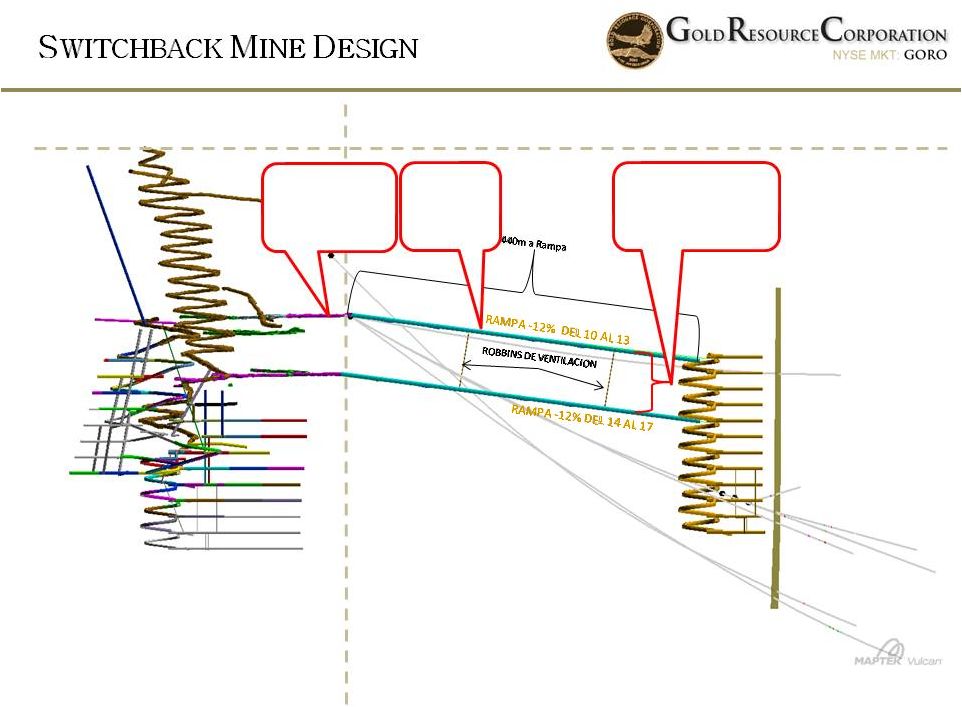 NIVEL_20 NIVEL_19 NIVEL_21 NIVEL_22 NIVEL_23 NIVEL_24 NIVEL_18 NIVEL_14 NIVEL_10 NIVEL_17 NIVEL_16 NIVEL_15 NIVEL_25 PROYECTO RAMPA NORTE PROYECTO RAMPA SUR RAMPA GENERAL NIVEL_20 NIVEL_19 NIVEL_21 NIVEL_22 NIVEL_23 NIVEL_24 NIVEL_18 NIVEL_14 NIVEL_17 NIVEL_16 NIVEL_15 NIVEL_13 15 Preliminary switchback mine design Planned drill station Arista mine Existing development Switchback Double drift to switchback mineralization |
 +55 km mineralized structural corridor *Drill results include Large Consolidated Land Position 6 properties • 684 square kilometers 55 kilometer mineralized structural corridor High-grade gold and silver • Epithermal deposits • Intermediate polymetallic • Skarn potential *1.2m @ 18 g/t Au 1853 g/t Ag 1.59 % Cu 1.76 % Pb 5.21 % Zn *1m @ 132 g/t Au *2.85m@ 27.0 g/t Au 2600 g/t Ag 16 |
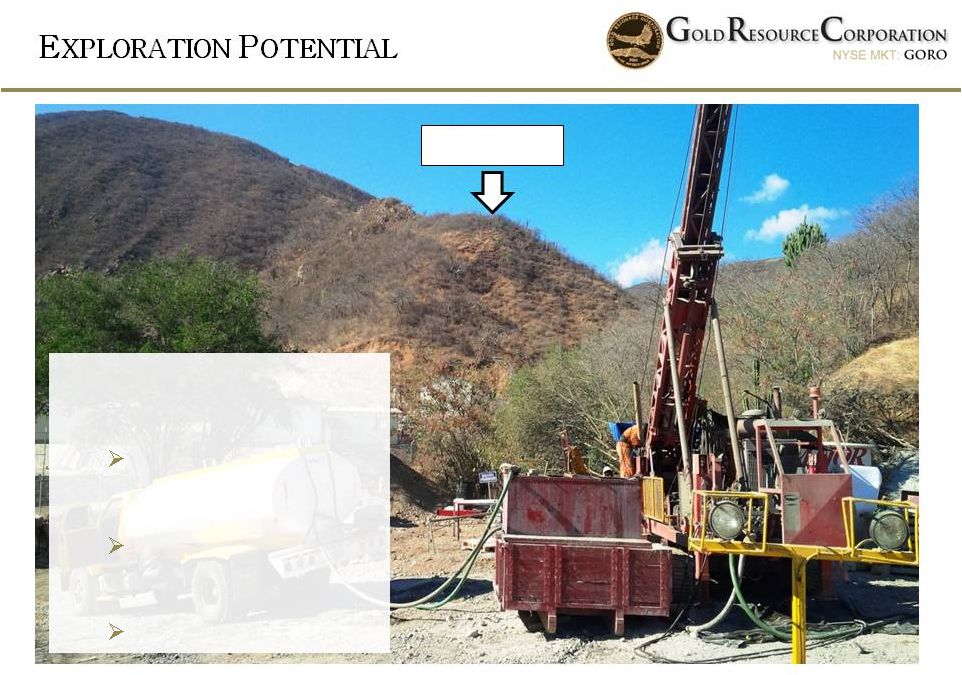
 17 Vein swarms |
 18 Additional New Target |
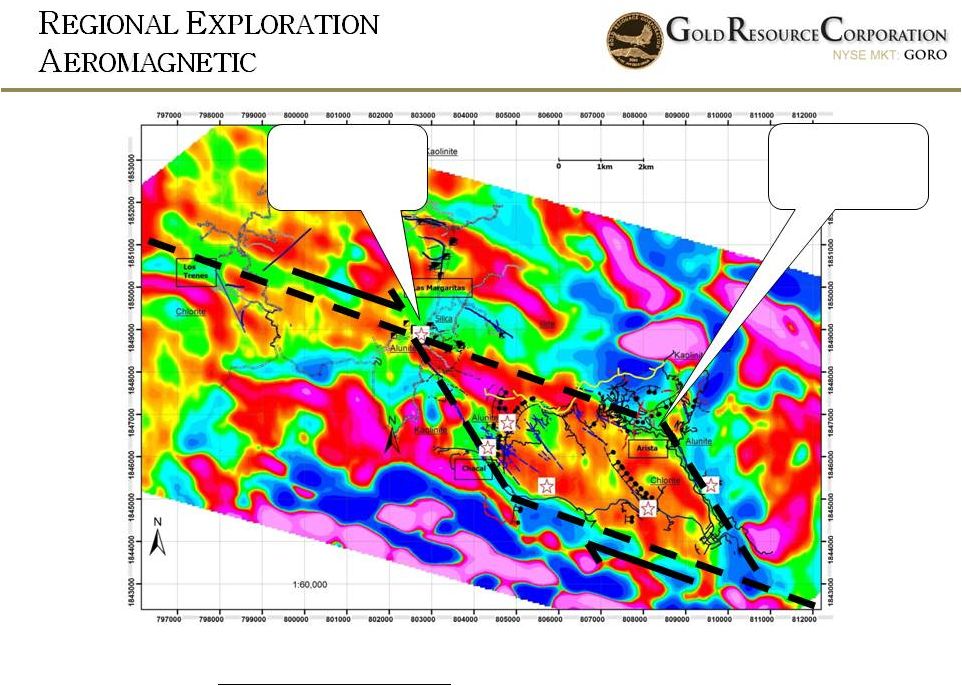 19 Amplitude Component Total Mag; Projected Depth From Surface is 500m. Local structures as blue lineaments. Red Stars = paleo-surface indicators of travertine La Arista Deposit Las Margaritas Searching for similar structural settings to Arista along North 70 West corridor |
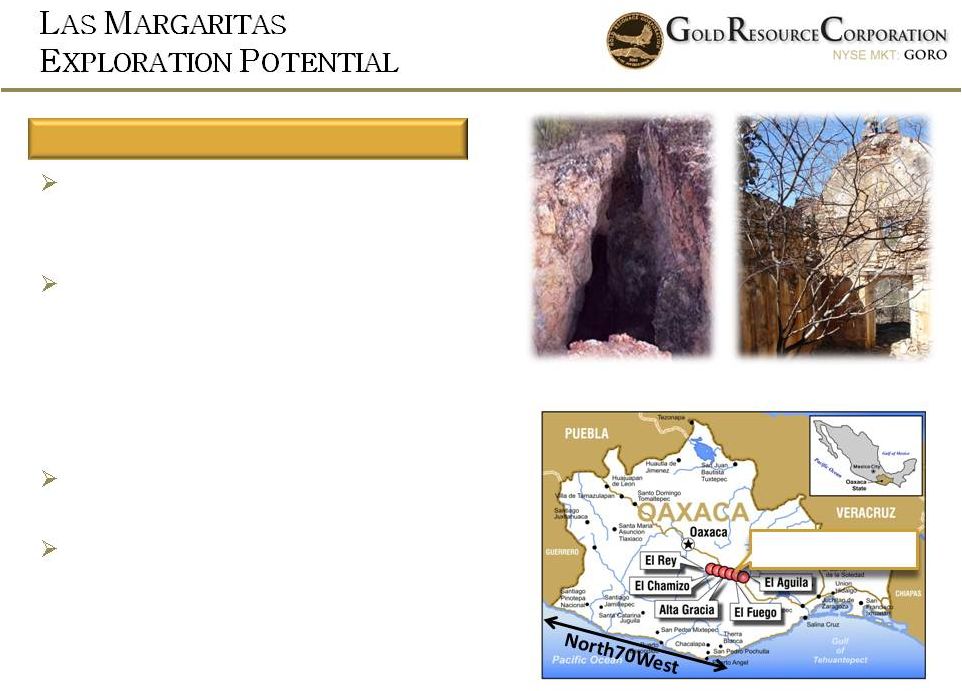 Las Margaritas Property Historic workings Ghost town Drill intercepts include Gold Silver Meters (down hole) 27.90 g/t 2600 g/t 2.85 Rock chip samples include Gold Silver 6.29 g/t 4150 g/t 5.25 g/t 2000 g/t 7.76 g/t 1850 g/t 3.46 g/t 1330 g/t High-grade gold / silver district mined Pre-Mexican Revolution (1910) The Mines of Mexico Mex. Gov. Publication 1905 "...the place in which has been found some of the richest ores in Mexico, some of the ores having reached the value of 18,000 [silver] ounces to the ton, and ores are frequently found which assay 4,000 and 5,000 [silver] ounces to the ton." 20 Las Margaritas |
 21 History demonstrates gold as a form of money and store of wealth for thousands of years, far longer than any current or historic fiat currency has ever survived World governments sustaining unprecedented debt levels creating fiat currencies out of thin air Currency wars threaten global fiat devaluations and potential inflation Gold historically and over the long term has been a store of wealth while being no one else's liability |
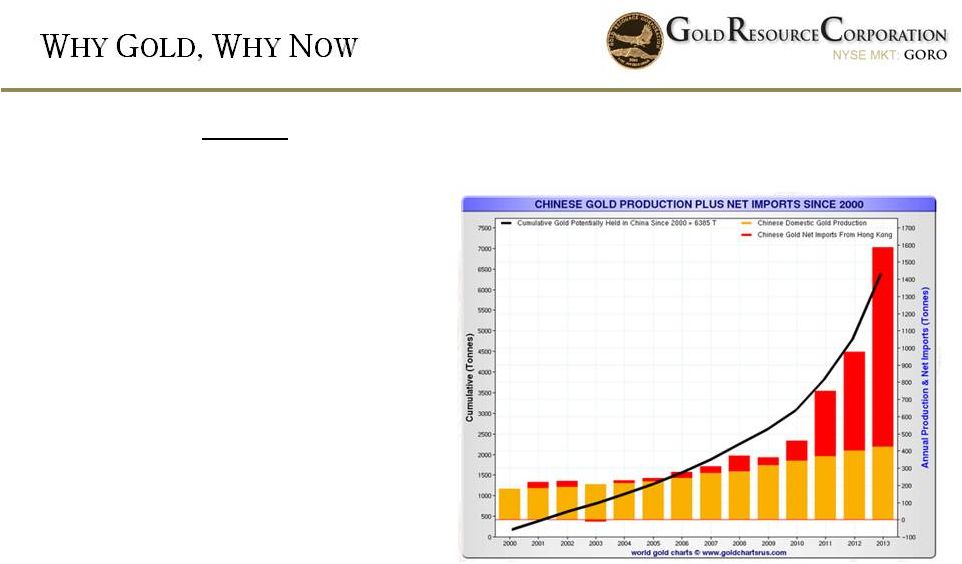 22 CHINA Now the largest gold producer and one of the largest importers of gold New middle class Unwinding their dollar exposure Encouraging citizens to purchase gold Buying hard assets including mines http://seekingalpha.com/article/2014211-a-true-statistical-mystery-what-happened-to-the-missing-chinese-gold |
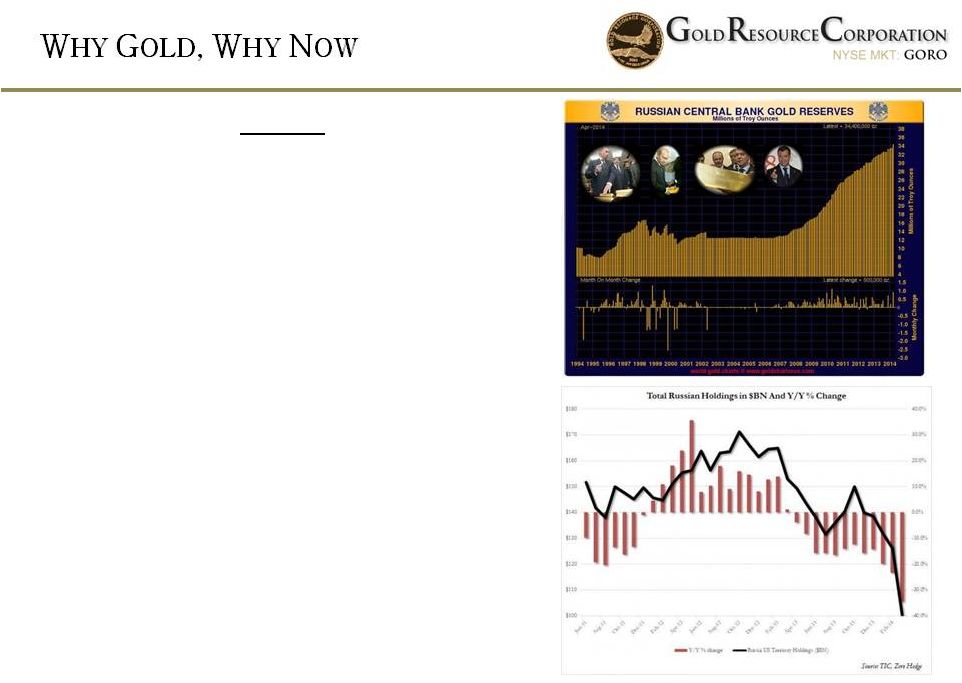 23 Russia Increasing gold reserves since 2007 and just bought an additional 900,000 ounces gold ($1.2 billion) in April 2014 Significantly reducing U.S. treasuries, $50 billion between October and March 2014. http://seekingalpha.com/article/2232763-russian-gold-reserves-increase-by-a-massive-amount-in-april-could-russia-cause-chaos-in-the-gold-market |
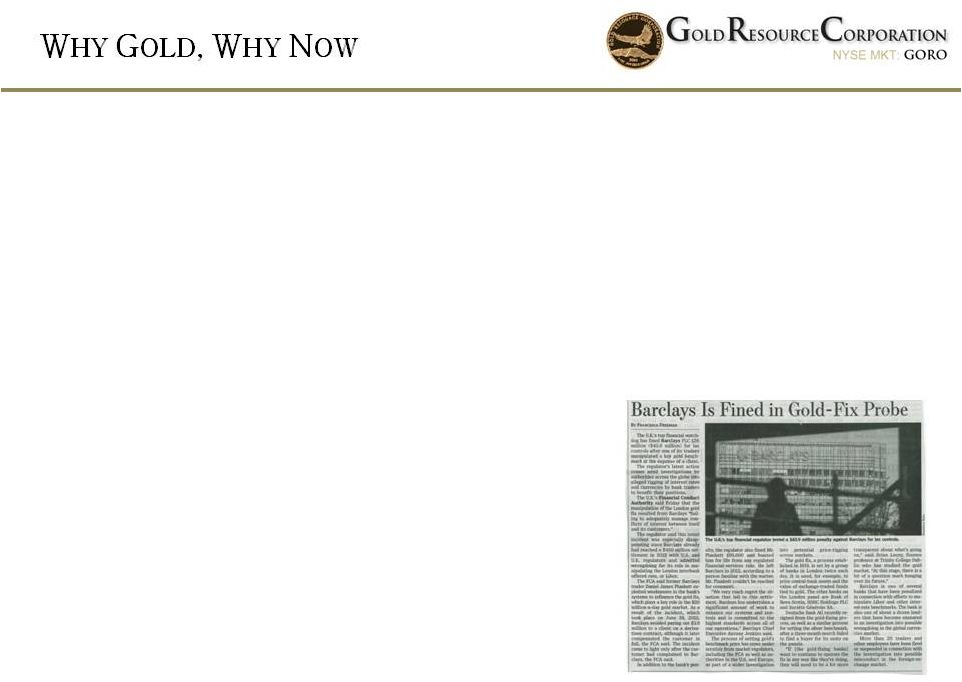 24 Many U.S. Bankers and major media calling for gold’s long term bull market end but what are the banks buying? Gold manipulators being exposed: Barclays recent $43.9 million settlement for gold-fix…are they the only one? Which Side Of Goldman Sachs Is Right About Gold? Oct. 9, 2013 7:57 AM ET | …”The head of Goldman Sachs's commodity research, Jeffrey Currie, reiterated his "sell" recommendation on gold today with a price target of $1050. Interestingly, and in direct conflict with Currie's market call on gold, Goldman Sachs Group (GS) filed an SEC 13-F disclosure at the end of June, which revealed that GS purchased over 3.7 million shares of the SPDR Gold Trust (GLD) during the 2nd quarter, making GS the 6th largest holder of GLD. Clearly there is a difference of opinion within the firm regarding the outlook for the price of gold. As an investor should you follow the guy selling research or do you follow the money? … http://seekingalpha.com/article/1735872-which-side-of-goldman-sachs- is-right-about-gold |
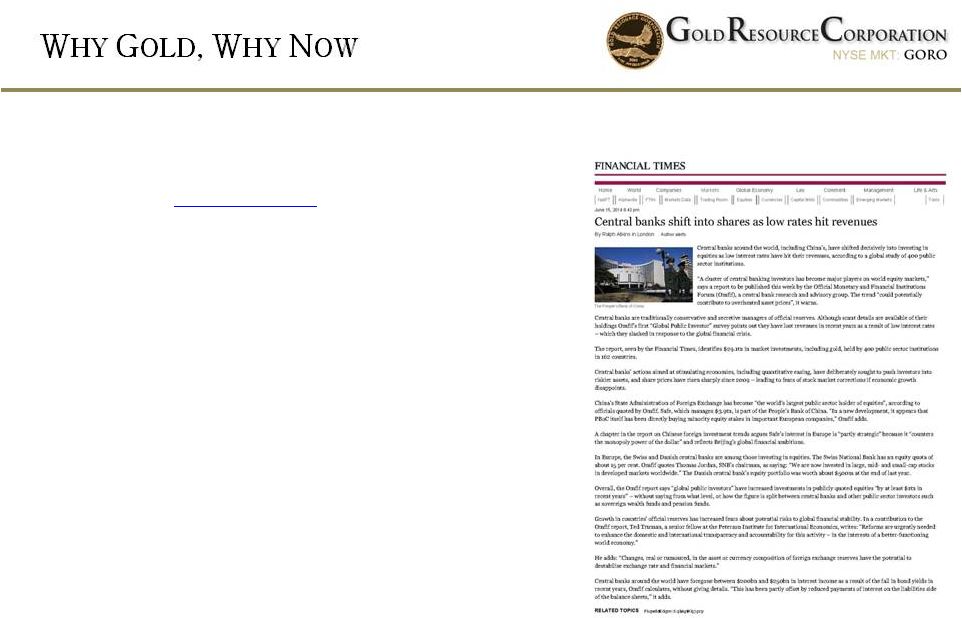
 25 “A cluster of central banking investors has become major players on world equity markets,” says a report to be published this week by the Official Monetary and Financial Institutions Forum (Omfif), a central bank research and advisory group. The trend “could potentially contribute to overheated asset prices”, it warns. “The report, seen by the Financial Times, identifies $29.1tn in market investments…” Financial Times June 15, 2014 |
 26 Financial Times June 15, 2014 Posted June 16th, 2014 at 2:07 PM (CST) by Jim Sinclair “OK, in perspective, the value of all stock markets on the planet added together are about $62 trillion, now it is revealed that $29 trillion or so has come from the world’s central banks. How did this happen? Do central banks have an extra $29 trillion to throw around? The answer of course is no they do not… unless they just print it up and presto, there it is ready and able for whatever folly they choose.” |
 27 Central Banks around the world are buying stocks in increasing size. To summarize, the global equity market is now one massive Ponzi scheme in which the dumb money are central banks themselves, the same banks who inject the liquidity to begin with. That would explain this. http://www.zerohedge.com/news/2014-06-15/cluster-central-banks-have-secretly-invested-29-trillion-market China’s State Administration of Foreign Exchange has become “the world’s largest public sector holder of equities”, as the report argues is “partly strategic” because it “counters the monopoly power of the dollar” and reflects Beijing’s global financial ambitions. Central Bankers Have Secretly Invest 29 trillion In Market Zero Hedge June 16, 2014 |
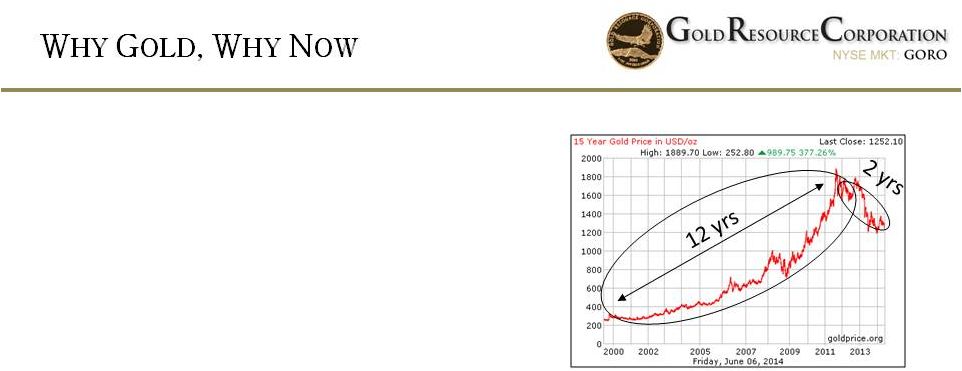 28 Gold’s 12 year bull market Healthy 2 year bear market correction 15 year gold price history in US dollars per ounce http://goldprice.org/gold-price-history.html#10_year_gold_price Recent bear market correction for gold mining equities has created an attractive entry point for those that missed gold’s prior bull market run Bear markets are for buying and bull markets are for selling The thesis to own gold not only remains intact during the correction but has intensified |
 29 |
 30 |
 31 |
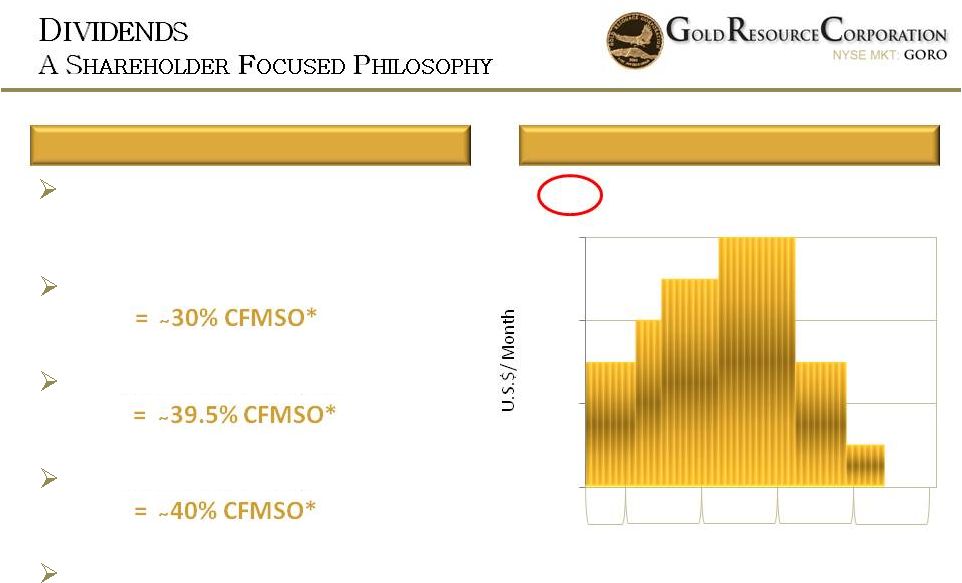 Dividends may vary in amount and consistency or be discontinued at management’s discretion depending on variables including but not limited to operational cash flows, Company development requirements, strategies, construction, spot gold and silver prices, taxation, general market conditions and other factors described in the Company’s public filings. Consecutive Monthly Dividends Income Equity 2010 2011 2012 2014 2013 32 $1.82 / share returned to shareholders $0.00 $0.02 $0.04 $0.06 2011 dividends = US$26.5m 2012 dividends = US$36.5m 2013 dividends = US$25.5m US$0.01/share monthly dividend Targeting ~1/3rd distribution of CFMSO* to shareholders US$0.12/share/yr currently *CFMSO= Cash Flow From Mine Site Operations: sales – cost of sales adding back non-cash items; depreciation, stock based compensation, accretion |
 33 Source: Based on each company’s annual public filing and Bloomberg. *Please view each company’s annual public filing for specific and detailed information on annual production total calculations. Company 2013 Au Production* Annual Dividend Estimate (US$/ share) Yield Share price close (5/12/2014, US$) Agnico Eagle 1,099,335 0.32 1.0% 33.40 Barrick 7,166,000 0.20 1.2% 17.36 Goldcorp 2,700,000 0.60 2.4% 24.84 Kinross 2,631,092 *Suspended 7/31/13 n/a 4.08 Newmont 5,100,000 0.10 0.4% 24.51 Yamana 1,200,010 0.15 2.1% 7.20 Royal Gold *N/A 0.84 1.3% 65.86 Average 1.4% Gold Resource 84,835 0.12 3.0% 4.00 |
 DIVIDENDS GENERATED PER OUNCE OF ANNUAL PRODUCTION* Source: Based on each company’s Annual Filings and Bloomberg. GRC targets, performance not guaranteed, see Risk Factors in Company’s 10K. PRODUCTION OUNCES REQUIRED TO GENERATE EACH $0.01 OF ANNUAL DIVIDEND n/a 358,300 510,000 80,000 45,000 34,354 7,070 34 *Current dividend vs 2013 annual production 0 0.0000002 0.0000004 0.0000006 0.0000008 0.000001 0.0000012 0.0000014 0.0000016 Kinross Barrick Newmont Yamana Goldcorp Agnico GORO |
 “GRC Eagles” rounds Shareholder Focused Precious Metal Producer Delivering a growth profile of low cost, high margin production Demanding high returns on owner invested capital Distributing meaningful monthly dividends to maximize total return to owners 35 |