SECURITIES AND EXCHANGE COMMISSION
Washington, D.C. 20549
_____________________
FORM 6-K
Report of Foreign Private Issuer Pursuant to Rule 13a-16 or
15d-16 of the Securities Exchange Act of 1934
For the month of May 2019
Commission File Number: 1-15256
_____________________
OI S.A. – In Judicial Reorganization
(Exact Name as Specified in its Charter)
N/A
(Translation of registrant’s name into English)
Rua Humberto de Campos, No. 425, 8th floor – Leblon
22430-190 Rio de Janeiro, RJ
Federative Republic of Brazil
(Address of principal executive offices)
(Indicate by check mark whether the registrant files or will file annual reports under cover of Form 20-F or Form 40-F.)
Form 20-F: ý Form 40-F: o
(Indicate by check mark if the registrant is submitting the Form 6-K in paper as permitted by Regulation S-T Rule 101(b)(1)):
Yes: o No: ý
(Indicate by check mark if the registrant is submitting the Form 6-K in paper as permitted by Regulation S-T Rule 101(b)(7)):
Yes: o No: ý
(Indicate by check mark whether the registrant by furnishing the information contained in this Form, the Registrant is also thereby furnishing the information to the Commission pursuant to Rule 12g3-2(b) under the Securities Exchange Act of 1934.)
Yes: o No: ý
If “Yes” is marked, indicate below the file number assigned to the
registrant in connection with Rule 12g3-2(b):

1Q19 HIGHLIGHTS | 
|
| |
| Earnings Release | May 13, 2019 |
| |
| |
| |
| |
| Conference Call | May 14, 2019 |
| in English | 10:00 a.m. (Brasília) / 9:00 a.m. (NY) / 1:00 p.m. (UK) |
| | Webcast:click here |
| | Telephone: +1 646 843 6054 (USA) / |
| | +55 (11) 2188-0155 (Other countries) / Code: Oi |
| | Replay available until 5/20/2019: |
| | +55 (11) 2188-0400 |
| Replay code: Oi |
| |
| |
| |
| Conference Call | May 14, 2019 |
| | 10:00 a.m. (Brasília) / |
| in Portuguese | 9:00 a.m. (NY) / 1:00 p.m. (UK) |
| SIMULTANEOUS | Webcast:click here |
| TRANSLATION | Telephone: +55 (11) 2188-0155 |
| | Code: Oi |
| | Replay available until 5/20/2019: |
| | +55 (11) 2188-0400 |
| Replay code: Oi |

Consolidated Information and Earnings Release (Unaudited)
This report contains the operating and financial performance of Oi S.A. – under Judicial Reorganization (“Oi S.A.” or “Oi” or “Company”) – and its subsidiaries for the first quarter of 2019.
1Q19 HIGHLIGHTS | 
|
1Q19 HIGHLIGHTS OF BRAZILIAN OPERATIONS
 30% MARKET SHARE OF NET ADDS IN POSTPAID + CONTROL IN 1Q19
· Growth in sales activity combined with migration of the prepaid base contributed to strong growth in the postpaid base in recent quarters.
 9.3% GROWTH IN POSTPAID + CONTROL CUSTOMER REVENUES YEAR ON YEAR
· Customer base growth contributed to the substantial increase in postpaid + control revenues.
 1.7 HOMES PASSED WITH FIBER (FTTH) AT THE END OF MARCH
· Addition of 480,000 HPs in 1Q19. Only in March, the Company built around 174,000 HPs.
 11.2% TAKE UP OF HOMES PASSED IN THE REGIONS WITH REUSE APPROACH
· After 7 months of the beginning of fiber implantation by reuse approach, the monthly occupancy rate is 1.4%, well above market benchmark, which is around 1% per month.
 1st IN NETFLIX’S ISP INDEX IN APRIL
· For the third month in a row, Oi Fiber was ranked first in broadband speed measured by Netflix, increasing the gap to the second place.
3
1Q19 HIGHLIGHTS | 
|
Summary
Table 1 – Highlights
4
1Q19 HIGHLIGHTS | 
|
IFRS 16 - Leases
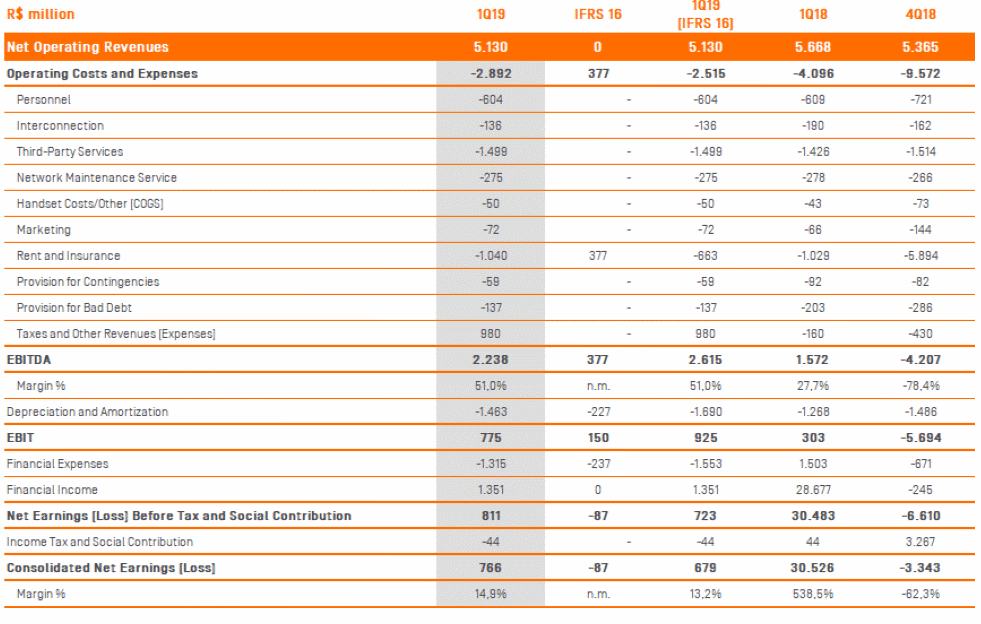
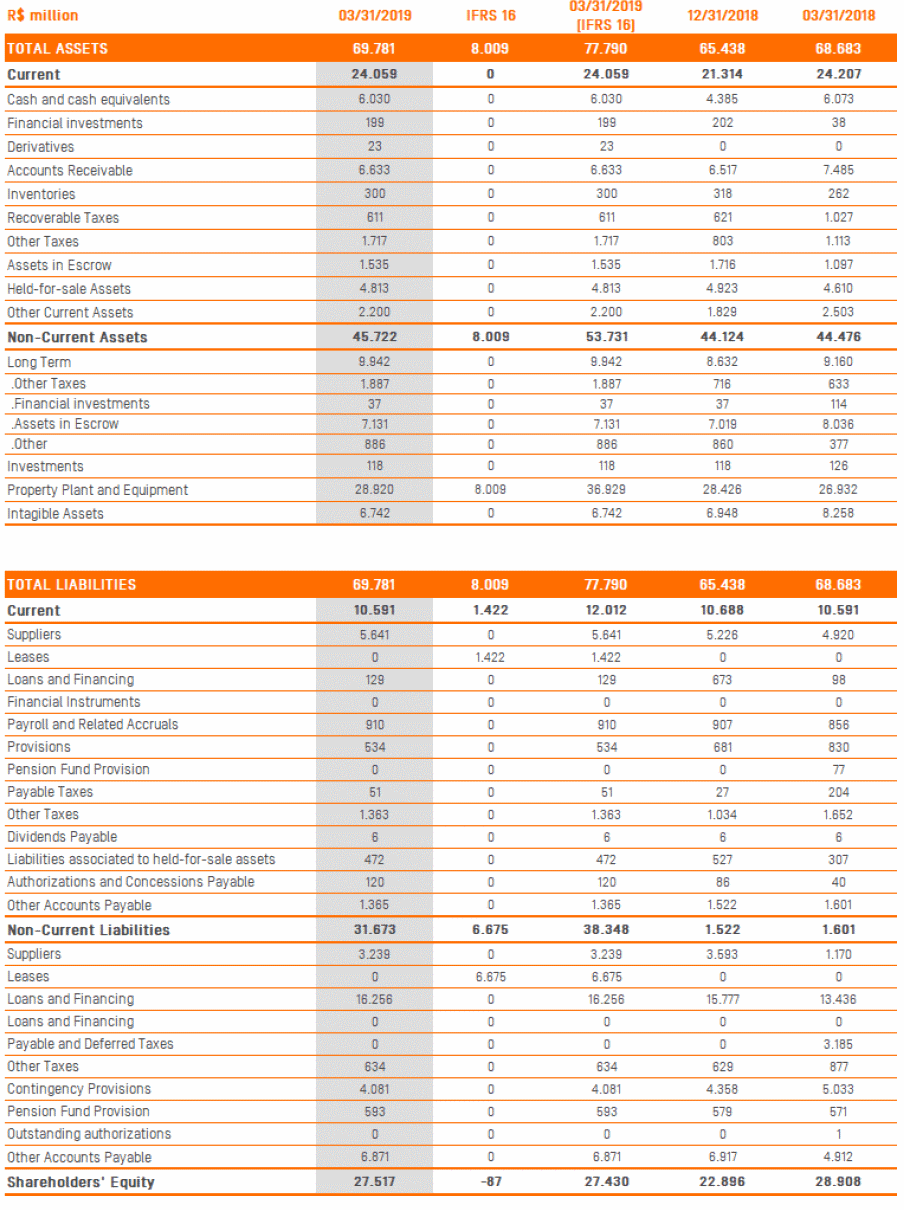
In the period ended March 31, 2019, the Company reported its results in accordance with IFRS 16, which came into effect on January 1, 2019. The standard sets forth the principles for the recognition, measurement, presentation and disclosure of leases and requires tenants to account for all leases under a single model in the balance sheet.
For purposes of comparability with prior periods, we exclude the effects of this standard in the sections of this document and we highlight at the end all the effects of the adoption of the IFRS 16, according to Tables 17 and 18.
5
OPERATING RESULTS | 
|
Net Revenues
Table 2 – Breakdown of Net Revenues
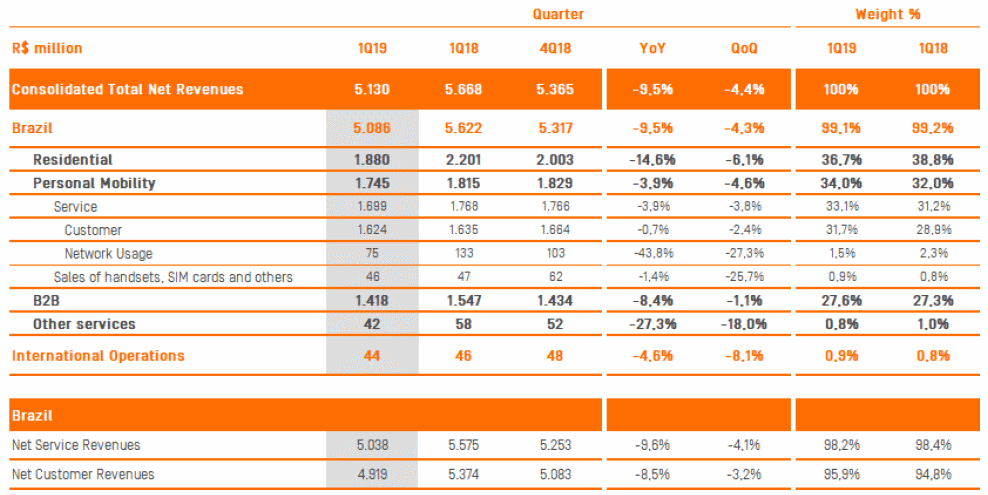
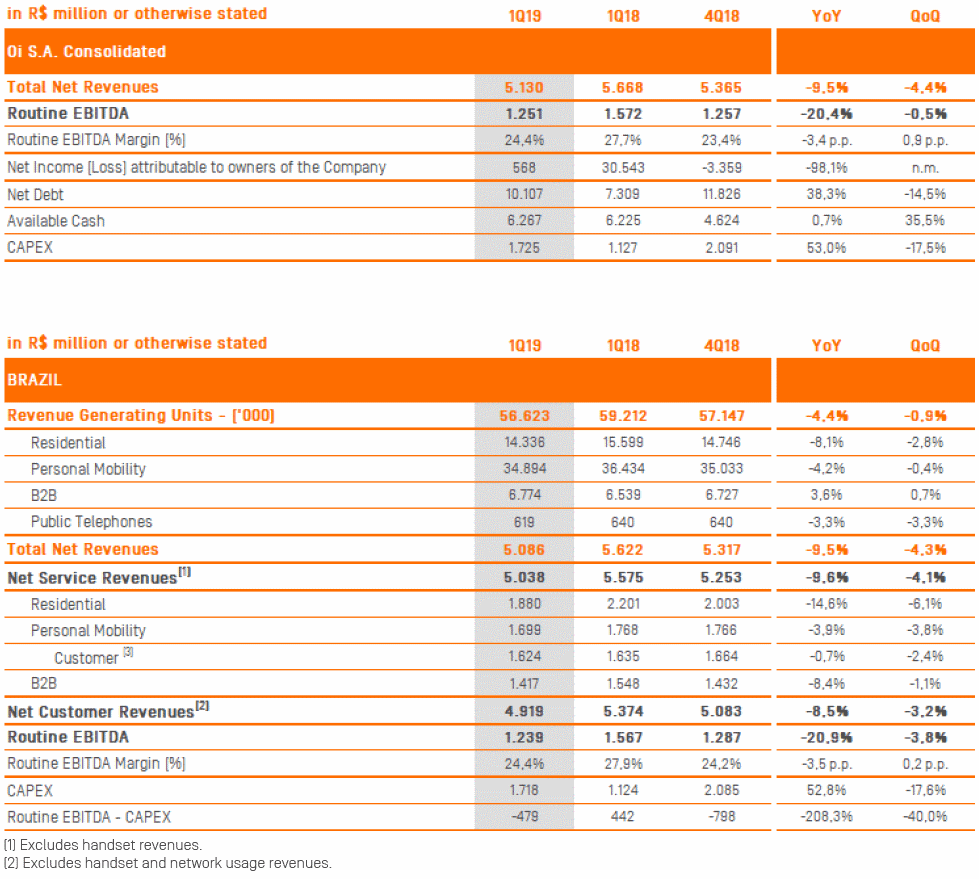
In 1Q19 consolidated net revenues totaled R$ 5,130 million, down 9.5% from 1Q18 and 4.4% lower than in the previous quarter. Net revenues from Brazilian operations (“Brazil”) came to R$ 5,086 million in 1Q19 (-9.5% y.o.y. and -4.3% q.o.q.), while net revenues from international operations (Africa and East Timor) totaled R$ 44 million (-4.6% y.o.y. and -8.1% q.o.q.)

Net revenues from Brazilian operations stood at R$ 5,086 million in 1Q19, 9.5% lower than in 1Q18 and down 4.4% from 4Q18. Fierce competition in the Residential segment, fewer business days in the first quarter this year (which had an impact on prepaid revenues) and the still slow recovery in the Corporate segment were the main reasons for the decline in revenues.
The three segments (Residential, Personal Mobility and B2B) continued to be impacted by a reduction in voice traffic. On the other hand, data revenues in the Personal Mobility segment and fiber revenues in the Residential segment continued to rise year on year, partially offsetting this decline.
Total net service revenues, which exclude handset revenues, stood at R$ 5,038 million in 1Q19 (-9.6% y.o.y. and -4.1% q.o.q.), while total net customer revenues, which exclude handset and network usage revenues, came to R$ 4,919 million (-8.5% y.o.y. and -3.2% q.o.q.).
6
OPERATING RESULTS | 
|
Residential
Table 3 – Net Revenues, RGUs and ARPU of the Residential segment

Net revenues from the Residential segment totaled R$ 1,880 million in 1Q19, down 14.6% from 1Q18 and 6.1% lower than in 4Q18. The decline in net revenues was mainly due to a reduction in the market for fixed line, a product that still accounts for a large share of the segment, and copper broadband, which is facing strong competition from regional providers. As a result, the Fiber Expansion Plan is essential for the Company’s future.
In 1Q19, the Company accelerated investments in fiber in order to deliver high-speed broadband to our customers’ homes and provide a better experience, advancing the structural strategy in order to increase profitability in the segment. This project uses an innovative approach, called "Network Reuse", which strengthens the robustness of the transportation network and the capillarity of the existing metropolitan fiber network in order to expand the availability of fiber-to-the-home (FTTH) with more agility, at an average cost 30% lower than the traditional approach and more commercially efficient, meeting the market demand.
Oi ended 1Q19 with 14,336 thousand RGUs in the Residential segment (-8.1% y.o.y. and -2.8% q.o.q.), mainly due to the reduction in both the copper broadband and the fixed line customer bases, the latter as a result of the natural market trend of reducing voice usage.
Residential ARPU
Residential ARPU totaled R$ 77.5 in 1Q19 (-4.0% y.o.y. and -2.6% q.o.q.). The ARPU reduction was mainly caused by a decrease in fixed line and broadband ARPU.
Fixed Line
The Company closed 1Q19 with 8,004 thousand fixed line customers in the Residential segment (-11.1% y.o.y. and -3.3% q.o.q.), reflecting the market trend of declining demand for voice services, which are being replaced by mobile services, especially, data services. As a result, fixed line ARPU, considering interconnection revenues, fell 11.4% year on year.
The Company’s strategy has been to increasingly focus on more profitable, bundled offers in order to build customer loyalty, thereby reducing churn rates in this segment. In 1Q19, the number of households with more than one Oi product grew 1.2 p.p. over 1Q18 and remained in line with 4Q18.
7
OPERATING RESULTS | 
|
Broadband
Oi ended 1Q19 with 4,759 thousand fixed broadband RGUs in the Residential segment (-6.4% y.o.y. and -2.5% q.o.q.). Intense competition from regional players who offer broadband services in small towns outside major urban centers continues to be the main obstacle to broadband growth.
Most of the Company’s current broadband base is composed of copper accesses (VDSL and ADSL). As part of its strategy, the Company has been intensifying its commercial activity based on different regional approaches, as well as taking one-off measures to tailor offers to different customer profiles. It is also accelerating growth and customer migration to fiber, as the main lever for resumption of growth, based on Oi’s infrastructure advantage, repositioning the Company.
Fiber
In 1Q19, Oi accelerated investments in fiber, with the “Reuse” strategy. In March 2019, we reached 1.7 million homes passed (HPs), around 480 thousand of which were built in 1Q19. The Company is currently able to build more than 200 thousand homes passed per month.
We closed 1Q19 with around 145 thousand homes connected (HCs) to the fiber and a take up rate of 8.7%. If we analyze only the take up rate of homes passed using the reuse approach, the rate is 11.2% in seven months, since the first launch, which gives an average monthly rate of 1.4%, significantly higher than the market benchmark of 1.0% per month. At the end of the first quarter, Oi Fiber was present in 38 municipalities.
Also, with the strategy of accelerating FTTH sales, Oi began selling IPTV via fiber.
Pay TV
The Residential pay-TV base grew 4.0% over 1Q18 and edged down 0.8% from 4Q18, totaling 1,574 thousand RGUs.
Oi recorded pay-TV net adds of 60 thousand RGUs compared to 1Q18 and net disconnections of 13 thousand RGUs compared to 4Q18. Oi TV’s penetration in households with an Oi fixed line reached 19.7% in 1Q19 (+2.8 p.p. y.o.y. and +0.5 p.p. q.o.q.). Pay-TV ARPU fell 1.1% from 4Q18.
Oi TV plays an essential role in the convergence strategy for the Residential segment, as it has been helping boostOi Total sales. Oi TV is a differentiated product that offers a wide range of content, with high definition channels (including open channels) in all plans, with the most complete offer providing up to 186 channels, 64 of which in HD. It also offers services like PenVR (content recording and live/pause service via pen drive available in any plan) and iPPV (purchase of pay-per-view events by remote control), Oi also offersTV Everywhere, which includes theOi Play virtual platform, reinforcing Oi’s positioning in providing more user autonomy and a better customer experience through the digitalization of services.
8
OPERATING RESULTS | 
|
Personal Mobility
Table 4 – Net Revenues and RGUs of the Personal Mobility segment
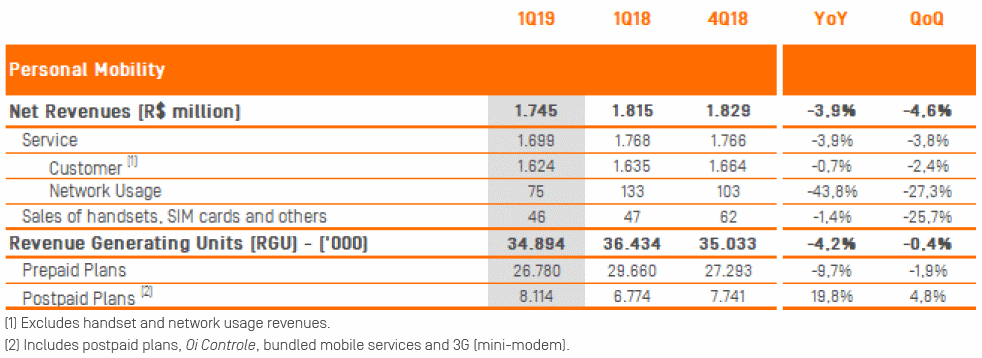
Personal Mobility net revenues totaled R$ 1,745 million in 1Q19 (-3.9% y.o.y. and -4.6% q.o.q.). In the annual comparison, the main impact was the decline in interconnection tariffs and the shrinkage of the prepaid segment. In the sequential comparison, the main influence was seasonality, as the first quarter has fewer business days, with a direct impact on prepaid recharge volume.
As mentioned above, the prepaid segment, which accounts for around 50% of mobility revenues, followed the downward trend of the market, impacted not only by high unemployment rates, but also by the migration of voice to data and cuts in MTR interconnection tariffs in recent years, which have been promoting the consolidation of SIM cards in the market, eliminating the need for a SIM card for each operator. On the other hand, this movement observed in the prepaid segment benefits the postpaid segment, as prepaid customers migrate to more attractive offers, especially control plans. As a result, we added 1,339 thousand users to our postpaid customer base, balancing the mix of revenues between postpaid + control and prepaid, with an increasing share of the postpaid + control segment in revenues.
The positive performance of postpaid products is a result of the strategy of converting prepaid customers into control customers, combined with Oi’s new offering portfolio, which is significantly simpler and more aligned with the market trend of migration from voice to data services. The launch of the new portfolio was made possible by higher investments in 4G and 4.5G, leading to an increase in the network’s traffic capacity, with improved usage performance and, consequently, a substantial improvement in the customer experience.
Customer revenues, which exclude interconnection and handset revenues, totaled R$ 1,624 million in 1Q19, in line with 1Q18 (-0.7%) and 2.4% lower than in 4Q18. In the same period, data revenues came to R$ 1,351 million, an increase of 30.7% over 1Q19 and 0.8% in relation to the previous quarter, accounting for 83.2% of total customer revenues in the quarter (versus 63.3% in 1Q18).
Meanwhile, network usage revenues totaled R$ 75 million in 1Q19, falling 43.8% from 1Q18 and 27.3% from 4Q18. The annual comparison was impacted by a decline in MTR tariffs. In February 2019, the same tariffs fell to R$ 0.01379, R$ 0.01471 and R$ 0.02517 in Regions I, II and III, respectively. Handset revenues totaled R$ 46 million, R$ 1 million less than in the previous year.
9
OPERATING RESULTS | 
|
Oi closed 1Q19 with 34,894 thousand RGUs in the Personal Mobility segment, down 4.2% from 1Q18 and in line with 4Q18 (-0.4%). Oi recorded 1,540 thousand net disconnections between 1Q18 and 1Q19, comprising 2,879 thousand net disconnections in the prepaid segment and 1,339 thousand net adds in the postpaid segment. Compared to 4Q18, the prepaid segment recorded a 9.7% reduction in net adds, while the postpaid segment grew 19.8%.
Oi’s mobile customer base (Personal Mobility + B2B) reached 37,659 thousand RGUs in 1Q19, 34,894 thousand of which in the Personal Mobility segment and 2,765 thousand in the B2B segment. Gross adds in the mobile segment totaled 4.3 million, while net disconnections (+0.9% y.o.y.) came to 44 thousand compared to the previous quarter.
Prepaid
The prepaid customer base closed 1Q19 with 26,780 thousand RGUs, down 9.7% from 1Q18, mainly due to (i) the policy of disconnection of inactive customers; (ii) the migration of customers from the prepaid to the postpaid + control segment; and (iii) the trend of consolidation of SIM cards in the market. Recharge volume (prepaid + control) decreased by 5.6% from 1Q18 and 7.6% compared to 4Q18. The number of customers making recharges fell 6.2% from 4Q18 and 11.1% from 1Q18, mainly driven by (i) a decline in the prepaid market as a whole and (ii) high unemployment rates, which have a direct impact on recharge revenues. As a result, revenues, including long distance revenues, dropped 8.9% year on year. As a result, prepaid ARPU fell 1% from 1Q18 and 6.6% from 4Q18.
Postpaid
Oi closed the quarter with 8,114 thousand RGUs in the postpaid + control segment (+19.8% y.o.y. and +4.8% q.o.q.), due to more competitive offerings and the strategy of encouraging prepaid customers to migrate to postpaid and control plans. Gross adds grew 52.8% over 1Q18 and 2.8% over in 4Q18, resulting in net adds of 1,339 thousand RGUs over 1Q18 and 373 thousand RGUs over 4Q18. The net adds market share accelerated the pace of growth and reached 30% in 1Q19. As a result, the segment already accounts for 23.3% of the total Personal Mobility base and is expected to grow even further for the coming quarters.
The positive RGUs results were reflected in revenues, including long-distance revenues, which climbed 9.3% over 1Q18 and 4.7% over 4Q18. Offer simplification and innovation, more aggressive sales, a strategy focused on regional offers and the refarming of the 1.8 GHz frequency range for 4G and 4.5G were the main drivers of these results in the postpaid + control segment.
2G, 3G and 4G LTE Coverage
Oi’s 2G coverage reached 3,446 municipalities in 1Q19 (94% of the country’s urban population), while 3G coverage reached 1,644 municipalities (+1.2% y.o.y.), or 81.6% of the Brazilian urban population.
At the end of 1Q19, 4G LTE coverage reached 907 municipalities, 10% more than in 1Q18, or 74% of Brazil’s urban population, 1 p.p. more than in 1Q18.
Mobile ARPU
Mobile ARPU stood at R$ 16.10 in 1Q19 (-1.3% y.o.y. and -2.4% q.o.q.). Excluding MTR revenues, mobile ARPU increased 1.9% over 1Q18 and edged down 0.8% from 4Q18.
10
OPERATING RESULTS | 
|
B2B
Table 5 – Net Revenues and RGUs of the B2B segment

Net revenues in the B2B segment amounted to R$ 1,418 million in 1Q19, 8.4% less than in 1Q18, mainly due to the decline in voice traffic, following the market trend, and the cut in the regulated fixed-to-mobile (VC) and interconnection (MTR) tariffs. Compared to 4Q18, net revenues fell 1.1%. The weak economic activity in the country has also been an important inhibitor factor for the recovery of the segment, since the market as a whole is in retraction.
Oi continued to record growth in the customer base over recent quarters, closing 1Q19 with 6,774 thousand RGUs in the B2B segment, an increase of 3.6% over 1Q18 and in line (+0.7%) with 4Q18, mainly driven by growth in the mobile customer base (+16.7% y.o.y. and +3.6% q.o.q.) and the pay-TV customer base (+14.2% y.o.y. and +0.3% q.o.q.). Net adds totaled 235 thousand RGUs compared to 1Q18 and 47 thousand RGUs compared to 4Q18.
The number of Corporate RGUs increased over both 1Q18 and 4Q18. The Company’s strategy to reverse the downward trend of revenues is to expand the offer of digital and IT solutions, increasing the share of these revenues in total B2B revenues and meeting the growing demand for corporate projects, as well as mitigating or offsetting the impacts of low demand for traditional services, which is a market trend. IT net revenues grew 26.1% over 1Q18 and 24.5% over 4Q18.
In the SME segment, the Company is adopting the Corporate strategy for medium enterprises and the B2C strategy for small enterprises, given their similarities. Oi is marketing regional offers and intensifying its commercial actions together with the “Network Reuse” approach to offering FTTH.
In the Wholesale segment, the strategy has been to increase the share of unregulated revenues in total revenues, aiming to optimize value creation with the existing infrastructure. In 2019, the segment is seeking to take advantage of opportunities to expand fiber and prepare the network for 5G.
11
OPERATING RESULTS | 
|
Operating Costs and Expenses
Table 6 – Breakdown of Routine Operating Costs and Expenses

In 1Q19, consolidated routine opex, including the international operations, totaled R$ 3,879 million (-5.3% y.o.y. and -5.6% q.o.q.).
Routine opex from Brazilian operations amounted to R$ 3,847 million in 1Q19, a decline of 5.1% from 1Q18 and 4.5% from 4Q18. Considering inflation (IPCA) of 4.58% in the last 12 months, this result corresponded to a decrease of 9.3% in real terms compared to 1Q18.
It is important to note that this cost and expense reduction has been based on efficiency and productivity gains, reflected in ongoing improvements in operational, quality and digital transformation indicators.
Personnel
Personnel costs and expenses totaled R$ 594 million in 1Q19, falling 1.1% from 1Q18 and 16.4% from 4Q18, due to a decline in the payment of variable compensation (variable compensation related to the partial achievement of goals for 2018 in the previous quarter), salaries and charges combined with productivity and operational efficiency gains.
Interconnection
Interconnection costs in Brazil ended 1Q19 at R$ 136 million (-28.1% y.o.y. and -16.0%), mainly as a result of the decline in the regulated tariffs.
12
OPERATING RESULTS | 
|
Third-party Services
Costs and expenses related to third-party services in Brazilian operations totaled R$ 1,487 million in 1Q19, up 5.5% over 1Q18 and in line with 4Q18 (-0.5%), the sequential increase was mainly due to higher Energy consumption, in addition to the Energy annual tariff adjustment and Content Acquisition, due to greater number of Pay TV users and the adjustment of contractual prices.
Network Maintenance Services
Network maintenance service costs and expenses in Brazilian operations totaled R$ 275 million in 1Q19, 1.2% lower than in 1Q18 and 3.3% higher than in 4Q18, due to the renegotiation of contracts with suppliers.
The reduction in network maintenance service costs and expenses was driven by increased efficiency in field operations and efficiency gains from process and customer service digitalization (Digital CO).
Handset Costs/Other (COGS)
Handset costs in Brazilian operations amounted to R$ 48 million in 1Q19, an increase of 25.8% over 1Q18, due to the Company’s strategy of offering more handsets at a discount in the postpaid segment. These costs declined 33.6% from 4Q18, due a reduction in the number of handsets sold.
Marketing
Marketing expenses totaled R$ 71 million in 1Q19, 9.1% higher than in 1Q18, due to more intense commercial activity, and 50.4% lower than in 4Q18, due to higher spending on seasonal marketing related to Black Friday and Christmas offerings (Oi Livre Natal, Pré Natal, Pós Black Friday and Broadband).
Rent and Insurance
Rent and insurance expenses in Brazilian operations totaled R$ 1,038 million in 1Q19, edging up 0.9% over 1Q18 and climbing 2.9% over 4Q18, mainly due to higher right-of-way costs, EILD (industrial exploration of dedicated line) costs and pole, tower and equipment rental fees, offset by the renegotiation of satellite contracts.
Provision for Contingencies
In 1Q19, personnel costs and expenses in Brazilian operations totaled R$ 59 million, 35.2% less than in 1Q18, driven by a lower number of new complaints to Anatel and strategic civil and labor claims, offset by JEC (Small Claims Court) claims and civil consumer cases.
Compared to 4Q18, the provision for contingencies increased 71.2%, driven by a higher number of tax, labor, civil consumer and JEC claims, offset by strategic civil claims and complaints to Anatel.
Provision for Bad Debt
The provision for bad debt totaled R$ 137 million in 1Q19, 32.3% lower than in 1Q18, due to an improvement in default levels, especially in the Corporate segment. In the sequential comparison, the provision for bad debt increased 4.4%, driven by default in the Retail and Wholesale segments.
13
OPERATING RESULTS | 
|
EBITDA
Table 7 – EBITDA and EBITDA margin
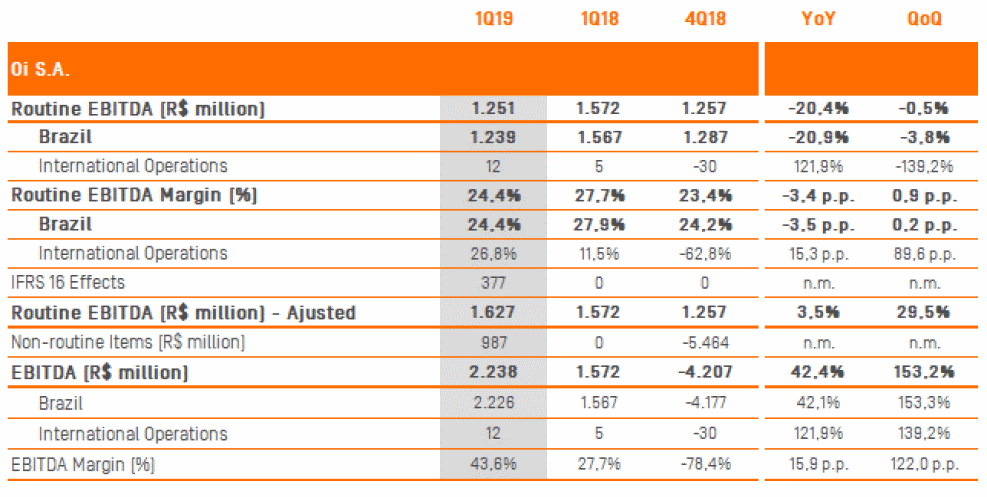
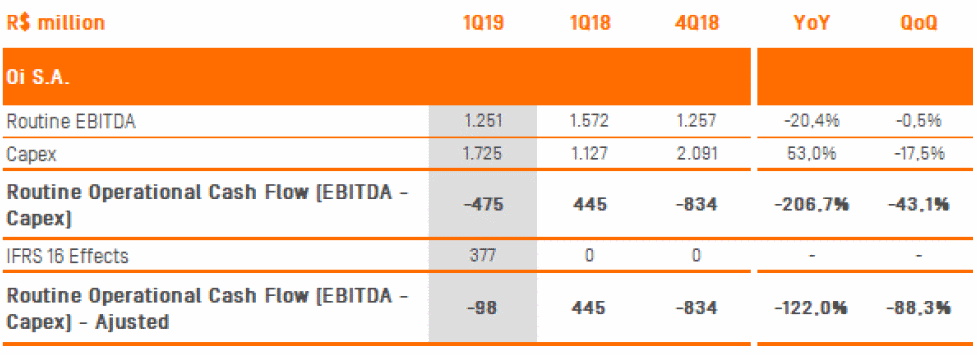
Consolidated routine EBITDA totaled R$ 1,251 million in 4Q18, 20.4% lower than in 1Q18 and in line with 4Q18 (0.5%).
Routine EBITDA from Brazilian operations amounted to R$ 1,239 million in 1Q19 (-20.9% y.o.y. and -3.8% q.o.q.). The routine EBITDA margin from Brazilian operations was 24.4%, 3.5 p.p. lower than in 1Q18 and in line with 4Q18 (0.2 p.p.). The EBITDA performance was driven by a reduction in revenues (mainly in the Residential segment) that outpaced the cost reduction.
Routine EBITDA from international operations (Africa and East Timor) came to R$ 12 million in the quarter, versus R$ 5 million in 1Q18 and R$ -30 million in 4Q18.
Non-routine items reached R$ 987 million and refer to recognition of PIS and COFINS gains on ICMS tax, as well as the recovery of amounts unduly paid to such title, which were the subject of a final decision in March 2019 (*).
(*) The Company and it’s subsidiaries file lawsuits claiming the right to exclude ICMS amounts from the calculation bases of the PIS and COFINS contribution, as well as the recovery of amounts unduly collected under such title, subject to the prescriptive period. In March 2019, favorable judgments were rendered in two of the three main lawsuits of the Company related to the discussion on the non-incidence of PIS and COFINS on ICMS, in the Federal Regional Courts of the 1st and 2nd Regions (Brasília and Rio de Janeiro). The third case is still pending before the Federal Regional Court of the 2nd Region. In this regard, the Company recorded on March 31, 2019 the amount R$ 2,024 million related to credits as mentioned above.
14
OPERATING RESULTS | 
|
Capex
Table 8 – Capex

The Company’s consolidated Capex, including international operations, totaled R$ 1,725 million in 1Q19 (+53% y.o.y. and -17.5% q.o.q.). Capex in Brazilian operations totaled R$ 1,718 million in 1Q19, up 52.8% over 1Q18 and down 17.6% from 4Q18, following the Company’s strategy of the company to accelerate projects in relation to Fiber and Mobile Broadband 4.5G.
The increase in Capex in 4Q18, in particular, reflected the acceleration of investments foreseen in the Company's Judicial Reorganization Plan, focusing on expansion of FTTH, high-speed broadband and 4G and 4.5G mobile coverage.
Operational Cash Flow (Routine EBITDA – Capex)
Table 9 - Operational Cash Flow
15
OPERATING RESULTS | 
|
Table 10 - Operational Cash Flow from Brazilian Operations
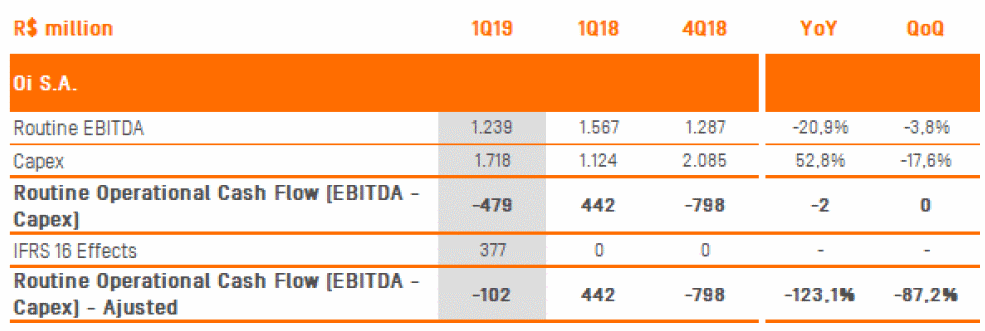
Consolidated routine operational cash flow (routine EBITDA minus Capex) was negative by R$ 475 million in 1Q19, while routine operational cash flow in Brazilian operations was negative by R$ 479 million, mainly due to acceleration of investments and lower revenues, which impacted EBITDA, as mentioned in theCapex andRevenues section.
Depreciation/Amortization
Table 11 – Depreciation and Amortization

Depreciation and amortization expenses totaled R$ 1,463 million in 1Q19 (+15.3% y.o.y. and -1.6% q.o.q.).
16
FINANCIAL RESULTS | 
|
Financial Results
Table 12 – Financial Result (Oi S.A. Consolidated)
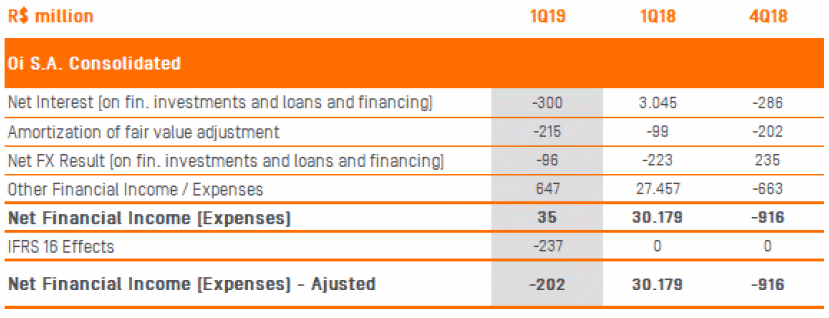
In 1Q19, Oi S.A. recorded a net financial expense of R$ 35 million, versus an expense of R$ 30,179 million in 1Q18 and an expense of R$ 916 million in 4Q18.
In the quarter, the reduction in expenses is mainly explained by the positive impact of the monetary restatement of the PIS and COFINS gains on ICMS tax in the amount of R$ 1,025 million, in "Other Financial Income / Expenses". On a year-over-year basis, net financial revenues in 1Q18 are mainly due to the positive effects resulting from the completion of the Company's Judicial Recovery process, namely the reversal of interest and IR on debt, the haircut of bonds and Adjustment gain to Fair Value.
"Net Interest Income" did not show large variations in the sequential comparison, but the "Net Foreign Exchange Result", which contributed with revenues of R$ 235 million in 4Q18 due to the appreciation of the Real against the Dollar of 3.22% in the quarter, represented financial expenses of R$ 96 million in 1Q19 due to the depreciation of the Real against the US dollar of 0.57% in the period.
17
FINANCIAL RESULTS | 
|
Net Earnings (Loss)
Table 13 – Net Earnings (Loss) (Oi S.A. Consolidated)
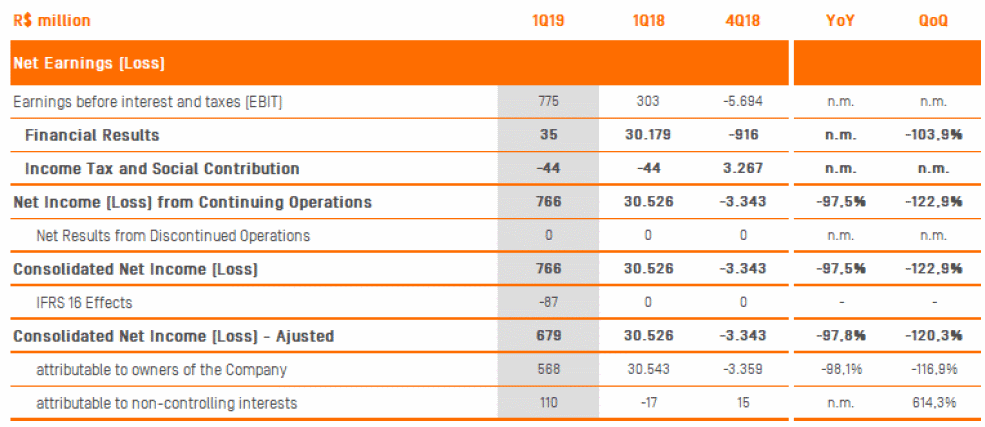
In 1Q19, the Company's operating earnings (loss) before the financial result and taxes (EBIT) came to earnings of R$ 775 million, versus earnings of R$ 303 million in 1Q18 and a loss of R$ 5,694 million in 4Q18. In 1Q19, the Company recorded a positive net financial result of R$ 35 million and an expense of R$ 44 million in income tax and social contribution, giving consolidated net income of R$ 766 million. Considering the effects of IFRS 16, consolidated net income totaled R$ 679 million.
18
DEBT & LIQUIDITY | 
|
Debt & Liquidity
Table 14 – Debt

Oi S.A. ended 1Q19 with consolidated gross debt of R$ 16,385 million, down 0.5%, or R$ 77 million, from 4Q18 and up 21.0%, or R$ 2,839 million, over 1Q18. The decline from 4Q18 was due to the amortization of the first installment of the interest on the Qualified Bond (R$ 712 million), partially offset by interest accrual and amortization of the present value adjustment, which contributed to increasing debt every quarter. The FX change had little impact on debt this quarter, given the relative stability of the real against the dollar. In addition to interest accrual and amortization of the present value adjustment, the annual change reflected the FX change of R$ 1.1 billion in the period (17.2% depreciation of the real against the dollar, gain from present value adjustment and hedge). At the end of 1Q19, debt in foreign currency accounted for 58.8% of total consolidated debt and 53.7% of fair value debt, with a consolidated average duration of approximately 12 years.
Considering the cash position of R$ 6,267 million at the end of March, the Company closed 1Q19 with net debt of R$ 10,107 million, R$ 1,719 million, or 14.5%, less than in 4Q18 and R$ 2,798 million, or 38.3%, more than in 1Q18. The net debt reduction in the quarter was mainly due to lower gross debt, in addition to the capital increase, as set forth in the Judicial Reorganization Plan, partially offset by the payment of the first installment to suppliers in the Company’s list of creditors, as well as acceleration of Capex and other non-recurring obligations related to the implementation of the Plan. Compared to 1Q18, the increase in net debt was mainly due to higher gross debt, as cash remained flat.
19
DEBT & LIQUIDITY | 
|
Table 15 – Cash Position (Brazilian Operations)

(
Table 16 – Gross Debt Breakdown

20
ADDITIONAL INFORMATION | 
|
Table 17 – Income Statement (Oi S.A. Consolidated)
21
ADDITIONAL INFORMATION | 
|
Table 18 – Financial Result (Oi S.A. Consolidated)
22
ADDITIONAL INFORMATION | 
|
Please note
The main tables in this Earnings Release will be available in Excel format in the “Financial Information / Quarterly Reports” section of the Company’s website (www.ri.oi.com.br/).
Definitions of the terms used in the Earnings Release are available in the Glossary section of the Company’s website:http://ri.oi.com.br/oi2012/web/conteudo_pt.asp?idioma=0&conta=28&tipo=44320
23
ADDITIONAL INFORMATION | 
|
Subsequent Events
· On April 3, 2019, Oi announced to the market the Approval of the Agreement between Oi and Pharol, in accordance with the terms of the Agreement entered into on January 8, 2019 by Oi, its direct shareholder Bratel and Pharol. Thus, the period for compliance with the second part of the obligations began on that date, including (a) the request for the termination of all disputes involving the Parties and indicated in the Agreement (“Litigation”) and (b) the delivery to Bratel of 33.8 million Oi shares held in Treasury, comprising 32 million common shares and 1.8 million preferred shares.
· On April 26, 2019, at 11:00 a.m., at the headquarters of Oi S.A. – in Judicial Reorganization, the Annual Shareholders’ Meeting was held to address the following matters: (1) To analyze the management accounts, examine, discuss and vote on the financial statements related to the fiscal year ended December 31, 2018; (2) To deliberate on the allocation of the results of the fiscal year ended December 31, 2018; (3) To establish the annual global amount of compensation for Management and members of the Company’s Fiscal Council; and (4) To elect the members of the Fiscal Council and their respective alternates.
· On the same day and at the same time, also at the headquarters of Oi S.A. – in Judicial Reorganization, an Extraordinary Shareholders’ Meeting was held to address the following matters: (i) To deliberate about the amendment and consolidation of the Bylaws with the purpose of converting the Audit, Risk, and Control Committee into a Statutory Audit Committees and to assign its members all of the functions of an audit committee currently exercised by the Fiscal Council, in compliance with applicable U.S. regulations; (ii) To approve the Long-Term Incentive Plan based on the shares issued by the Company for Executives; (iii) To approve the Long-Term Incentive Plan based on shares issued by the Company for the members of the Board of Directors; (iv) To approve the Company’s Loss Replacement Policy; and (v) To ratify all acts performed by the Company’s management in the scope of Judicial Reorganization.
· On April 26, 2019, Oi filed its Annual Report on Form 20-F for the fiscal year ended December 31, 2018 was filed with the United States Securities and Exchange Commission, or SEC.
24
ADDITIONAL INFORMATION | 
|
CVM INSTRUCTION 358, ART. 12:Direct or indirect controlling shareholders and shareholders who elect members of the Board of Directors or the Fiscal Council, and any other individual or legal entity, or group of persons, acting as a group or representing the same interests, that attains a direct or indirect interest representing five percent (5%) or more of a type or class of shares of the capital of a publicly-held company, must notify the Securities Commission (CVM) and the Company of the fact, in accordance with the above article.
Oi recommends that its shareholders comply with the terms of article 12 of CVM Instruction 358, but it takes no responsibility for the disclosure or otherwise of acquisitions or disposals by third parties of interests corresponding to 5% or more of any type or class of its share, or of rights over those shares or other securities that it has issued.
Table 19 – Shares of the Company’s Capital Stock

25
DISCLAIMER | 
|
Rio de Janeiro, May 13, 2019. This report includes consolidated financial and operating data for Oi S.A. – - Under Judicial Reorganization (“Oi S.A.” or “Oi” or “Company”) and its direct and indirect subsidiaries as of December 31, 2018. In compliance with CVM instructions, the data are presented in accordance with International Financial Reporting Standards (IFRS). Due to the seasonality of the telecom sector in its quarterly results, the Company will focus on comparing its financial results with the same period of the previous year.
This report contains projections and/or estimates of future events. The projections contained herein were compiled with due care, taking into account the current situation, based on work in progress and the corresponding estimates.
The use of terms such as “projects”, “estimates”, “anticipates”, “expects”, “plans”, “hopes” and so on, is intended to indicate possible trends and forward-looking statements which, clearly, involve uncertainty and risk, so that future results that may differ from current expectations. These statements are based on various assumptions and factors, including general economic, market, industry, and operational factors. Any changes to these assumptions or factors may lead to practical results that differ from current expectations. Excessive reliance should not be placed on these statements.
Forward-looking statements relate only to the date on which they are made, and the Company is not obliged to update them as new information or future developments arise. Oi takes no responsibility for transactions carried out or investment decisions taken on the basis of these projections or estimates. The financial information contained herein is unaudited and may therefore differ from the final results.
Oi – Investor Relations
Marcelo Ferreira +55 (21) 3131-1314 marcelo.asferreira@oi.net.br
Bruno Nader +55 (21) 3131-1629 bruno.nader@oi.net.br
26
SIGNATURES
Pursuant to the requirements of the Securities Exchange Act of 1934, the registrant has duly caused this report to be signed on its behalf by the undersigned, thereunto duly authorized.
Date: May 14, 2019
OI S.A. – In Judicial Reorganization
By: /s/ Carlos Augusto Machado Pereira de Almeida Brandão
Name: Carlos Augusto Machado Pereira de Almeida Brandão
Title: Chief Financial Officer and Investor Relations Officer


