SECURITIES AND EXCHANGE COMMISSION
Washington, D.C. 20549
_____________________
FORM 6-K
Report of Foreign Private Issuer Pursuant to Rule 13a-16 or
15d-16 of the Securities Exchange Act of 1934
For the month of February 2019
Commission File Number: 1-15256
_____________________
OI S.A. – In Judicial Reorganization
(Exact Name as Specified in its Charter)
N/A
(Translation of registrant’s name into English)
Rua Humberto de Campos, No. 425, 8th floor – Leblon
22430-190 Rio de Janeiro, RJ
Federative Republic of Brazil
(Address of principal executive offices)
(Indicate by check mark whether the registrant files or will file annual reports under cover of Form 20-F or Form 40-F.)
Form 20-F: ý Form 40-F: o
(Indicate by check mark if the registrant is submitting the Form 6-K in paper as permitted by Regulation S-T Rule 101(b)(1)):
Yes: o No: ý
(Indicate by check mark if the registrant is submitting the Form 6-K in paper as permitted by Regulation S-T Rule 101(b)(7)):
Yes: o No: ý
(Indicate by check mark whether the registrant by furnishing the information contained in this Form, the Registrant is also thereby furnishing the information to the Commission pursuant to Rule 12g3-2(b) under the Securities Exchange Act of 1934.)
Yes: o No: ý
If “Yes” is marked, indicate below the file number assigned to the
registrant in connection with Rule 12g3-2(b):


2

2Q19 HIGHLIGHTS OF BRAZILIAN OPERATIONS
2.8 HOMESPASSEDWITHFIBER(FTTH)ATTHEENDOFJULY
· HPsareexpectedtoreach4,6millionin2019and16millionin2021.
10.2 %TAKE-UPOFHOMESPASSEDWITHFIBERINJULY
· InJuly,weachieved291thousandofclientsconnectedwithFTTH,
33% MARKET SHARE OF POSTPAID NET ADDS IN 2Q19
· Salesactivityintensification,combinedwithnewpromotionsandmigrationfromtheprepaidbase contributedtothestrongperformanceofthepostpaidbaseinrecentquarters.
11.5 %YEAR-ON-YEARGROWTHINPOSTPAIDCUSTOMERREVENUES
· Strongcustomerbasegrowthcontributedtotheincreaseinpostpaidrevenues.
27%OFANNUALGROWTHINITCORPORATEREVENUES
· ITrevenuesareoneofthemaingrowthdriversofthecorporatesegment,duetohighvalue-added products.
3

Summary
Table 1 – Highlights

(1) Excludes handsetrevenues.
(2) Excludeshandsetandnetworkusagerevenues.
4

IFRS 16 - Leases
AsofJanuary1,2019,theCompanybeganadoptingtheIFRS16standardsthatcameintoeffectthen.The standard sets forth the principles for the recognition, measurement, presentation and disclosure of leases andrequirestenantstoaccountforallleasesunderasinglemodelinthebalancesheet.
Forcomparisonpurposes,weexcludedtheeffectsofthisstandardinthesectionsofthisdocument,andwe highlightalltheeffectsoftheadoptionoftheIFRS16inTables17and18attheendofthisdocument.
5

Net Revenue
Table 2 – Breakdown of Net Revenues

In2Q19consolidatednetrevenuestotaledR$5,091million,down8.2 from2Q18and0.8 lowerthaninthe previousquarter.NetrevenuesfromBrazilianoperations(“Brazil”)cametoR$5,046millionin2Q19(-8.1y.o.y.and-0.8 q.o.q.),whilenetrevenuesfrominternationaloperations(AfricaandEastTimor)totaledR$ 45million,dropoff-18.5 comparedwith2Q19andincreaseof2.6 versus lastquarter.
BRAZIL
NetrevenuefromBrazilianoperationstotaledR$5,046million,down8.1comparedto2Q18.Thethree segments(Residential,PersonalMobilityandB2B)continuetobeimpactedbythedropinvoicetraffic.Onthe otherhand,thegrowthinPersonalMobilitydatarevenue,ResidentialFTTHrevenueandCorporateITrevenue partiallyoffsetthisdecline.
Inthequarterlycomparisonitisalreadypossibletoobserveanimprovementinthetrend,withthesequential variationapproachingstability(-0.8,comparedto1Q19).Fibercustomerbasegrowthandstrongpostpaid growthinmobilityhavehelpedoffsetsomeofthedeclineincopper(fixedvoiceandbroadband)andprepaid services,consistentlyreducingthepaceofrevenuedeclinetotal.
Totalnetservicerevenues,whichexcluderevenuesfromhandsetsales,stoodatR$5,004millionin2Q19(-8.2 y.o.y.and-0.7 q.o.q.).Totalnetcustomerrevenues,whichexcludenetworkusageandhandset revenues,cametoR$4,900million(-7.2 y.o.y.and-0.4q.o.q.).
6
Residential
Table 3 – Net Revenues, RGUs and ARPU of the Residential segment

NetrevenuesfromtheResidentialsegmenttotaledR$1,857millionin2Q19(-12.1 y.o.y.and-1.2 q.o.q.). Thedeclineinnetrevenuessloweddowncomparedtopreviousquartersandcontinuedtobeimpactedby lowerfixedvoiceusage,partiallyoffsetbyhigherfiberrevenues,whichcontributestoreducingtheimpactof lossesoncopperrevenues.TheFiberExpansionPlanisthemainleverforthereversaloftheresidential segment revenuetrajectory
InlightofthedownturnintheResidentialsegment,theCompanycontinuedtoaccelerateinvestmentsin fiberinordertodeliverhigh-speedbroadbandtoourcustomers’homesandprovideabetterexperience, advancingthestrategyinordertoincreaseprofitabilityinthesegment.Thefiberexpansionprojectandits innovativeapproach,called“NetworkReuse”(FTTH),arepresentingconsistentresults.TheCompanyclosed 2Q19with2.5millionhomespassesandmorethan237thousandhomesconnected.
Oiended2Q19with14,011thousandRGUsintheResidentialsegment(-9.1y.o.y.and-2.3q.o.q.),mainly duetothereductioninboththecopperbroadbandandthefixedlinecustomerbases,thelatterasaresultof thenaturalmarkettrendofreducingvoiceusage.
Residential ARPU
ResidentialARPUtotaledR$78.9in2Q19,down0.6from2Q18andup1.8over1Q19,drivenbygrowthin broadbandandpay-TVARPUintheperiod.
Fixed Line
TheCompanyclosed2Q19with7,770thousandfixedlinecustomersintheResidentialsegment(-11.9 y.o.y. and-2.9q.o.q.),Inthefixedlinebusiness,weseethemarkettrendofdecliningdemandforvoiceservices, whichareincreasinglybeingreplacedbymobileservices,especiallydataservices.Asaresult,fixedline ARPU,consideringinterconnectionrevenues,fell10.6yearonyear.
TheCompany’sstrategyhasbeentoincreasinglyfocusonmoreprofitable,bundledoffersinordertobuild customerloyalty,therebyreducingchurnratesinthissegment.In2Q19,thenumberofhouseholdswithmore thanoneOiproductgrew0.4p.p.over2Q18andremainedinlinewith1Q19.
7
Broadband
Oiended2Q19with4,672thousandfixedbroadbandRGUsintheResidentialsegment(-7.5 y.o.y.and-1.8 q.o.q.).Thepercentageoffixedlinecustomerswhoalsohavebroadbandreached60.1,anall-timehigh, reinforcingtheefficiencyofthecommercialstrategyofsellingvoice,dataandpay-TVbundles.
Intensecompetitionfromregionalplayerswhoofferbroadbandservicesinsmalltownsoutsidemajorurban centerscontinuestobethemainobstacletobroadbandgrowth.
MostoftheCompany’scurrentbroadbandbaseiscomposedofcopperaccesses(VDSLandADSL).In accordancewiththestrategicplan,theCompanyhasbeenintensifyingitscommercialactivitybasedon differentregionalapproaches,aswellastakingspecificmeasurestotailorofferstodifferentconsumer market.Atthesametime,itisacceleratingtheexpansionandmigrationofcustomerstothefiber,themain driverofresumptionofgrowth,basedonOi’soutstandinginfrastructure.
Fiber
In2Q19,Oicontinuedtoaccelerateinvestmentsusingthe“Reuse”strategy.Attheendof2Q19,wereached2.5millionhomespassed(HPs),800thousandofwhichbuiltinthesecondquarter.TheCompanycurrently hasthecapacitytobuildmorethan350thousandhomespassedpermonth.Inaddition,accordingtothe Company’sstrategicplan,thegoalistoreach4.6millionhomespassedbytheendof2019and16million homespassedbytheendof2021.
Weclosed1H19withover237thousandhomesconnected(HCs)tothefiberandatake-uprateof9.7.Oi Fibrawaspresentin59municipalitiesattheendof2Q19.InJulywereached2.9millionHPsand290,000 connectedhomes,advancingto10.2occupancyrate.Inaddition,withthestrategyofacceleratingFTTH sales,OialsocontinuestosellingIPTVinfiber.
The Company's strategic focus is to leverage the undisputed leadership in fiber and infrastructure, maximizingvalueacrossallbusinesssegments.Oicurrentlyhasover360,000kilometersoffiberinthe country.
Oi Pay TV
TheResidentialpay-TVbasegrew1.6over2Q18andremainedinlinewiththepreviousquarter(-0.3), totaling1,569thousandRGUs.
Thenumberofpay-TVRGUsincreasedby25thousandover2Q18,butdeclinedby5thousandfrom1Q19.Oi TV’spenetrationinhouseholdswithanOifixedlinereached20.2in1Q19(+2.7p.p.y.o.y.and+0.5p.p. q.o.q.).Reinforcingtheeffectivenessofsalesofvoice,broadbandandpay-TVbundles.Pay-TVARPUrose0.5 from 1Q19.
8
Personal Mobility
Table 4 – Net Revenues and RGUs of the Personal Mobility segment

(1) Excludeshandsetandnetworkusagerevenues.
(2) Includespostpaidplans,OiControle,bundledmobileservicesand3G(mini-modem).
PersonalMobilitynetrevenuestotaledR$1,732millionin2Q19(-3.4y.o.y.and-0.8q.o.q.).Intheannual comparison,themainimpactswerethedeclineininterconnectiontariffsandtheshrinkageoftheprepaid segment,asobservedinthefirstquarterof2019.Inthepositiveside,thegrowthofthepostpaidcustomer baseandtherevenueoftheseproductsarecontributingtoreversetherevenuenegativetrendcurve.
The prepaid business is following the downward market trend and continues to be impacted by slow economic recovery and high unemployment rates. In addition, the reduction in interconnection tariffs and migrationfromvoicetodataalsocontributedtothedeclineinprepaidrevenues.Ontheotherhand,this movement observed intheprepaid segment benefits the postpaid segment, as prepaid customersmigrate tomoreattractiveoffers.Asaresult,1,500thousanduserswereaddedtoourpostpaidbaseyearonyear.
MostmobilerevenuesarecurrentlycomingfromPostpaidplans.Thepositiveperformanceofpostpaid productswasduetothestrategyofconvertingprepaidcustomerscombinedwithOi’snewofferingportfolio, whichissignificantlysimplerandmorealignedwiththemarkettrendofmigrationfromvoicetodata services.Thelaunchofthenewportfoliowasmadepossiblebycontinuedinvestmentsin4Gand4.5G,which increasedthenetwork’strafficcapacity,leadingtoimprovedusageperformanceand,consequently,a substantialimprovementinthecustomerexperience.
Customerrevenues,whichexcludeinterconnectionandhandsetrevenues,totaledR$1,633millionin2Q19,in linewith2Q18(-0.3)and0.6higherthanin1Q19.Inthesameperiod,datarevenuescametoR$1,372 million,anincreaseof23.7over2Q18and2.9over1Q19,accountingfor84.0oftotalcustomerrevenues in the quarter (versus 67.7in 2Q18).
NetworkusagerevenuetotaledR$58million,a50.2reductioncomparedtothesameperiodof2018and21.8 quarter-on-quarter.TheannualcomparisonisimpactedbythereductioninMTRrates.
Oiclosedthequarterwith34,701thousandRGUsinthePersonalMobilitysegment,down4.9from2Q18.Oi recorded1,775thousandnetdisconnectionsbetween2Q18and2Q19,comprising3,275thousandnet disconnectionsintheprepaidsegmentand1,500thousandnetaddsinthepostpaidsegment.Inthe sequentialcomparison,RGUsedgeddown0.6.Theprepaidsegmentfell2.3,closing2Q19with26,168 lines,whilethepostpaidsegmentrecorded420,000netadds,anincreaseof5.2,closingthequarterwith 8,533RGUs.
9
Oi’stotalmobilecustomerbase(PersonalMobility+B2B)totaled37,513RGUsin2Q19,2,812ofwhichinthe B2Bsegment.
Prepaid
Theprepaidcustomerbaseclosed2Q19with26,168thousandRGUs,down11.1from2Q18.Somefactors influence these data: (i) the policy of disconnection of inactive customers; (ii) the migration of customers from the prepaid to the postpaid segment; and (iii) the trend of consolidation of SIM cards in the market. Recharge volume decreased 6.6 from 2Q18 and 1.3 from 1Q19. The number of customers making rechargesfell2.0from1Q19and10.3from2Q18,mainlydueto(i)adeclineintheprepaidmarketasa wholeand(ii)highunemploymentrates,whichhaveadirectimpactonprepaidrevenues.Thishadanegative impactonrevenues(includinglongdistancerevenues)of10.3yearonyearand1.1quarteronquarter.As aresult,prepaidARPUfell1.4from2Q18,butrose0.6over1Q19.
Postpaid
Oiclosedthequarterwith8,533thousandRGUsinthepostpaidsegment(+21.3y.o.y.and+5.2q.o.q.),as aresultofmorecompetitiveofferingsandthestrategyofencouragingprepaidcustomerstomigrateto postpaidplans.Grossaddsgrew68,4over2Q18and12,7overin1T19,resultinginnetaddsof1,500 thousandRGUsovertheyearand420thousandRGUsoverthetrimester.Themarketshareofnetadds acceleratedthepaceofgrowthto33in2Q19.Asaresult,thissegmentalreadyaccountsfor24.6ofthe totalPersonalMobilitybaseandisexpectedtogrowevenfurtherinthecomingquarters.
Thepositivephysicalresultswerereflectedinrevenues(includinglong-distancerevenues),whichclimbed11.5over2Q18and2.5over1Q19.Offeringsimplificationandinnovation,moreaggressivesales,astrategy focusedonregionalofferingsandtherefarmingofthe1.8Ghzfrequencyrangefor4Gand4.5Gwerethemain driversoftheseresultsinthepostpaidsegment.
2G, 3G, 4G and 4.5G Coverage
Oi’s2Gcoveragereached3,451municipalities(93ofthecountry’surbanpopulation).Inthesameperiod, the3Gcoveragereached1,644municipalities(+0.9y.o.y.),or82oftheBrazilianurbanpopulation.
Attheendof2Q19,4Gcoveragereached907municipalities(+9y.o.y.),or74ofBrazil’surbanpopulation,1p.p.morethanin2Q18.Inaddition,4.5Gcoveragereached34municipalities,around12oftheurban population.
Mobile ARPU
MobileARPUstoodatR$16.10in2Q19(+0.2y.o.y.and+0.1q.o.q.).ExcludingMTRrevenues,mobileARPU increased 3.7over 2Q18 and 1.0 over 1Q19.
10
B2B
Table 5 – Net Revenues and RGUs of the B2B segment

(1) Includes postpaid plans,Oi Controle, bundled mobile services and 3G (mini-modem).
NetrevenuesintheB2BsegmentamountedtoR$1,419millionin2Q19,6.9lessthanin2Q18,mainlydueto thedeclineinvoicetraffic,followingthemarkettrend,andthecutintheregulatedfixed-to-mobile(VC)and interconnection(MTR)tariffs.Comparedto1Q19,netrevenuesremainedflat,edgingup0.1.Thesluggish economicrecoveryhasbeenslowingdownrecoveryinthesegment.
TheCompanyremainedcompetitiveandclosed2Q19with6,761thousandRGUs,3.4morethanin2Q18and inlinewiththepreviousquarter(-0.2),mainlyduetoanincreaseinthemobilebase(+16.8y.o.y.and+1.7q.o.q.)andthepay-TVbase(+15.3y.o.y.and+6.3q.o.q.).In2Q19,thenumberofRGUsincreasedby 220thousandover2Q18,butdecreasedby13thousandcomparedto1Q19.
The number of Corporate RGUs increased both in year-on-year and in quarter-on-quarter terms. The Company’sstrategytoincreaserevenuesisbasedontheintensificationoftheofferofdigitalandIT solutions,theimprovementoftherevenuemixandmeetingthegrowingdemandforcorporateprojects.Oi will become an integrator and provider of IT and telecommunication solutions, through advisory and customizedpositioning,creatingvalueforthecustomer.WeareofferinganextensiveportfolioofITsolutions, impactingcustomersthroughoutthevaluechain,fromconnectivitytoICTsolutions,focusedonIoT,cloud, outsourcingandprofessionalservices,amongotherstrategicservices.NetITrevenuesgrew26.8over2Q18 and 3.9 over1Q19.
IntheSMEsegment,theCompanyisadoptingtheCorporatestrategyformediumenterprisesandtheB2C strategyforsmallenterprises,giventheirmarketsimilarities.Oicontinuestomarketregionalofferingsand intensifyitscommercialactionstogetherwiththe“NetworkReuse”approachforFTTH.
IntheWholesalesegment,thestrategyhasbeentoincreasetheshareofunregulatedrevenuesintotal revenues,expandopportunitiesbyinvestinginlast-mileandon-sitefiber,andtakeadvantageofextensive andnon-replicableinfrastructure.In2019,thesegmentisseekingtoseizeopportunitiestoexpandfiberand preparethenetworkfor5G.
Withthegrowingdatademand,accelerationofthefiberprojectanditsinfrastructuredifferential,the Companyaimstopositionitselfastheleadingnationaltransmissionandnetworkprovider,andthefacilitator of5GinfrastructureinBrazil,capturingahugevaluepotentialinthewholesalemarket.
11
Additionally,thecompanyexpectstoleveragethissamefibercapillaritytoalsorepositionitselfinthe CorporatemarketasaproviderofintegratedTelecomandICTsolutions,capturinganincreasingrevenue sharefromthisgrowingmarket.
Operating Costs and Expenses
Table 6 – Breakdown of Routine Operating Costs and Expenses

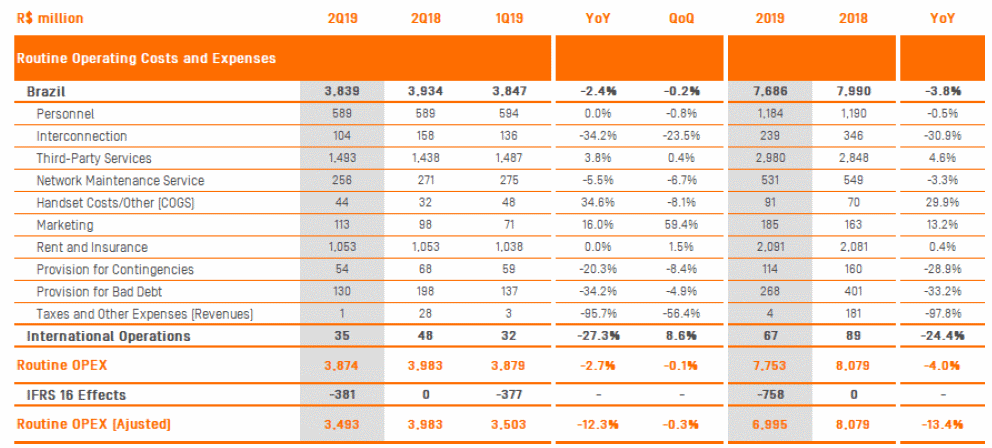
Consolidatedroutineopex,includinginternationaloperations,totaledR$3,874millionin2Q19(-2.7y.o.y.and-0.1q.o.q.).
RoutineopexfromBrazilianoperationsamountedtoR$3,839millionin2Q19,declining2.4from2Q18and0.2 from1Q19.Consideringinflation(IPCA)of3.37 inthelast12months,thisresultcorrespondedtoa decreaseof5.61inrealtermscomparedto2Q18.
Thisdeclineincostsandexpenseshasbeenbasedonefficiencyandproductivitygains,reflectedinongoing improvementsinoperational,qualityanddigitaltransformationindicators.
Personnel
PersonnelexpensestotaledR$589million,inlinewith2Q18(R$589million)and1Q19(R$594million).
Interconnection
InterconnectioncostsinBrazilended2Q19atR$104million,down34.2 from2Q18and23.5 lowerthanin1Q19,mainlyasaresultofthedeclineintheregulatedtariffs.
12
Third-party Services
Costsandexpensesrelatedtothird-partyservicesinBrazilianoperationstotaledR$1,493millionin2Q19,an increase of 3.8 over 2Q18, mainly due to the intensification of the Company's commercial activity, impacting sellingexpenses.
Network Maintenance Services
NetworkmaintenanceservicecostsandexpensesinBrazilianoperationstotaledR$256millionin2Q19,5.5 lowerthanin2Q18anddown6.7 from1Q19,Thisdeclinewasmainlyduetolowerpayphoneexpenses, following the approval of the General Plan of Universalization Goals - PGMU and gains from contract renegotiations.
Thereductioninnetworkmaintenanceservicecostsandexpenseswastheresultofourcontinuouseffortsto increaseefficiencyinfieldoperations,aswellasprocessandcustomerservicedigitalization(DigitalCO).
Handset Costs/Other (COGS)
HandsetcostsinBrazilianoperationsamountedtoR$44millionin2Q19,anincreaseof34.6over2Q18,due toachangeintheCompany’sstrategyovertheperiod,withtheofferofmoreaggressivediscountson handsetsalesinthepostpaidsegment.
Thesecostsdeclined8.1from1Q19,dueareductioninthenumberofhandsetssold.
Marketing
MarketingexpensestotaledR$113millionin2Q19,a16increaseover2Q18,duetointensifiedsales campaigns.
Inthesecondhalfof2019,theCompanycontinuedtostepupitscommercialactivities.Marketingexpenses movedup59.4,duetotheMother’sDaycampaignandcampaignsforprepaid,postpaidandfiberservice offerings.
Rent and Insurance
RentandinsuranceexpensesinBrazilianoperationstotaledR$1,053millionin2Q19,inlinewith2Q18and edgingup1.5 over1Q19,duetosatelliteexpenses.
Provision for Contingencies
TheprovisionforcontingenciesinBrazilianoperationstotaledR$54millionin2Q19,20.3lessthanin2Q18, duetolowervolumeofstrategiccivilclaims,provisionsforAnatel-relatedcontingenciesandlabor provisions.Thesegainswereoffsetbyanincreaseintaxandcorporateclaims.Comparedto1Q19,this provisionfellbyR$5million.
Provision for Bad Debt
TheprovisionforbaddebttotaledR$130millionin2Q19,34.2lowerthanin2Q18,duetoanimprovementin defaultlevelsintheRetailsegment.Comparedto1Q19,theprovisionforbaddebtfell4.9.
13
EBITDA
Table 7 – EBITDA and EBITDA margin

Consolidated routine EBITDA totaled R$ 1,218 million in 2Q19, falling 22.1 from 2Q18 and edging down 2.6 from R$ 1,251 million in 1Q19.
RoutineEBITDAfromBrazilianoperationsamountedtoR$1,208millionin2Q19(-22.4y.o.y.and-2,5 q.o.q.).TheroutineEBITDAmarginfromBrazilianoperationswas23.9,4.4p.p.lowerthanin2Q18andinline with1Q19(-0.4p.p.).TheEBITDAperformancewasdrivenbyareductioninrevenues,mainlyintheResidential segment,whichoutpacedthecostreductionmadebythecompany.
RoutineEBITDAfrominternationaloperations(AfricaandEastTimor)cametoR$10millioninthequarter, versusR$7millionin2Q18andR$12millionin1Q19.
Non-routineitemswereR$167millionnegativein2T19refertowrite-offarisingfromthecreditreconciliation andtaxincentivesfrompreviousperiods,withnoexpectationofrealization.
14
Investments
Table8–Capex

The Company’s consolidated Capex, including international operations, totaled R$ 2,061 million in 2Q19 (+50.7y.o.y.and+19.5q.o.q.).CapexinBrazilianoperationstotaledR$2,057millionin2Q19,increasing50.6 over 2Q18and19.5 over1Q19,intensifyingtheCompany’sstrategyofacceleratingfiberand4.5G mobile broadbandprojects.
TheincreaseinCapexin2Q19,inparticular,reflectedtheaccelerationofinvestmentsforeseeninthe Company'sStrategicPlan,focusingonexpansionofFTTH,high-speedbroadbandand4Gand4.5Gmobile coverage.
15
Operational Cash Flow (Routine EBITDA – Capex)
Table 9 - Operational Cash Flow

Table 10 - Operational Cash Flow from Brazilian Operations

Consolidatedroutineoperationalcashflow(routineEBITDAminusCapex)wasnegativebyR$843millionin 2Q19,whileroutineoperationalcashflowinBrazilianoperationswasnegativebyR$849million,mainlydueto accelerationofinvestmentsandlowerrevenues,whichimpactedEBITDA,asmentionedintheCapexand Revenuessection.
16
Depreciation/Amortization
Table 11 – Depreciation and Amortization

Depreciation and amortization expenses totaled R$ 1,496 million in 2Q19 (-6.0 y.o.y. and +2.3 q.o.q.).
17
Financial Results
Table 12 – Financial Result (Oi S.A. Consolidated)

In2Q19,OiS.A.recordedanetfinancialexpenseofR$1,374million,anincreaseofR$1,172millionover1Q19 andR$175millionover2Q18.
Inthequarter,theincreaseinfinancialexpenseswasexplainedbythenegativeimpactof"OtherFinancial Income/Expenses”,mainlyduetoapositiveimpactrelatedtothemonetaryrestatementofPISandCOFINS creditsonICMStaxofR$1,025millionin1Q19.However,thequarterbenefitedfromthe“NetFXResult”,which contributedR$125milliontofinancialincome,followingthe1.66appreciationoftherealagainsttheUS dollar,versusadepreciationinthepreviousquarter.The“NetInterest”and“AmortizationofFairValue Adjustment”linesdidnotvarysignificantlyinthesequentialcomparison.
Intheannualcomparison,itisworthmentioningthat,in2Q18,therealdepreciated16.01againsttheUS dollar,withanegativeimpactondollar-denominateddebt.Asaresult,theCompanyrecordedafinancial expenseofR$827millioninthe“NetFXResult”inthatquarter,contributingtothehighernetexpenseex-IFRS-16intheperiod.
.
18
Net Earnings(Loss)
Table 13 – Net Earnings (Loss) (Oi S.A. Consolidated)

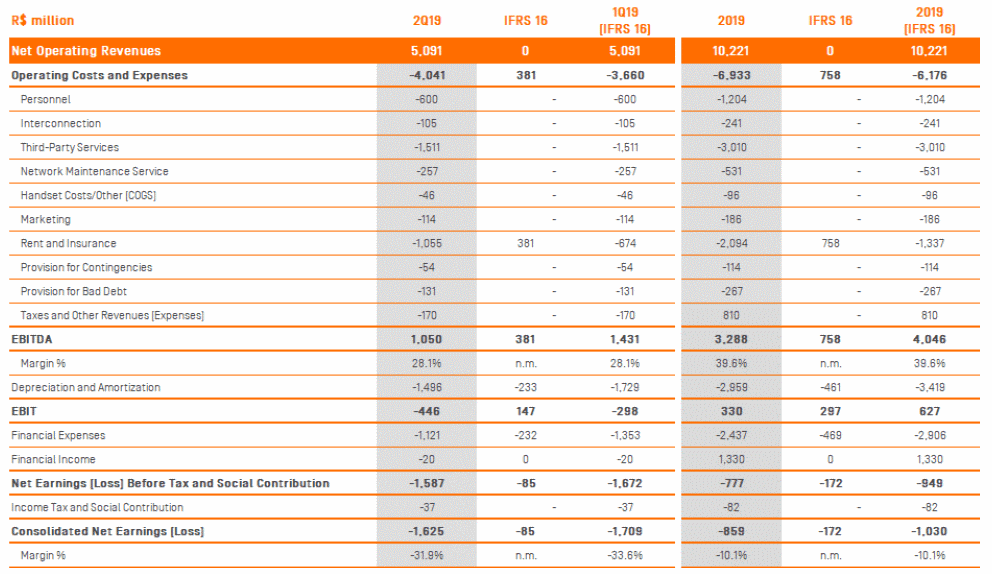
In2Q19,theCompany'soperatingearnings(loss)beforethefinancialresultandtaxes(EBIT)cametoalossof R$446million,versusearningsofR$128millionin2Q18andearningsofR$775millionin1Q19.In2Q19,the CompanyrecordedanetfinancialexpenseofR$1,142millionandincometaxandsocialcontribution expensesofR$37million,givingaconsolidatednetlossofR$1,625million.ConsideringtheeffectsofIFRS 16,theCompanyrecordedaconsolidatednetlossofR$1,709million.
19

Debt & Liquidity
Table 14 – Debt

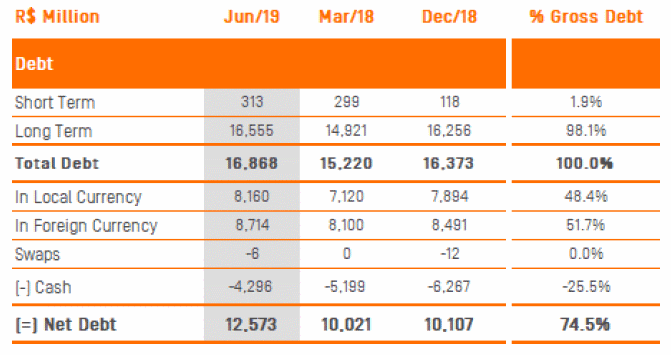
OiS.A.ended2Q19withconsolidatedgrossdebtofR$16,868million,anincreaseof3.0,orR$495million, over1Q19and10.8,orR$1,648million,over2Q18.Thesequentialandannualincreaseswereduetointerest accrualandamortizationofthepresentvalueadjustment,whichcontributedtoincreasingdebtevery quarter,partiallyoffsetbythepositiveimpactoftheappreciationoftherealagainsttheUSdollarinthe sequential(1.7)andtheannual(0.6)comparisonsoverdollar-denominateddebt.
At the end of 2Q19, debt in foreign currency accounted for 51.7 of fair value debt, with a consolidated average duration of approximately 11 years.
TheCompanyclosed2Q19withaconsolidatedcashpositionofR$4,296million,adeclineof31.5from March2019and17.4fromJune2018,resultinginnetdebtofR$12,573million.Thereductioninthecash positionwasmainlyduetonon-recurringandregulatoryobligationsinthequarter,suchasFisteland concessionfees,inadditiontotheaccelerationofCapexintheperiod.
20
Table 15 – Cash Position (Brazilian Operations)

Table 16 – Gross Debt Breakdown

21
Table 17 – Income Statement (Oi S.A. Consolidated)

22
Table 18 – Balance Sheet (Oi S.A. Consolidated)

23
Please note
The main tables in this Earnings Release will be available in Excel format in the “Financial Information/Quarterly Reports” section of the Company’s website(www.ri.oi.com.br/).
DefinitionsofthetermsusedintheEarningsReleaseareavailableintheGlossarysectionoftheCompany’s website: http://ri.oi.com.br/oi2012/web/conteudo_pt.asp?idioma=0&conta=28&tipo=44320
24
Subsequent Events
· OnJuly16,2019,furthertotheNoticestotheMarketdatedDecember3,2018andJanuary14,2019,the Companydiscloseditsstrategicplan,underwhichitispursuingstrategicalternativesforthefuture, focusing on improving its operational and financial performance in the context of the judicial reorganizationprocess.Pleasenotethatsaidplanincludesprojectionsandestimates(guidance)ofthe followingindicators,basedonreasonableassumptions,whicharesubjecttoseveralfactors:
· Netservicerevenues(2019–2024)–CompoundAnnualGrowthRate(CARG>2);
· RoutineEBITDAfor2019(betweenR$4.5billionandR$5.5billion);and
· RoutineEBITDA(2019–2021)–CompoundAnnualGrowthRate(CARG>15-20).
25
CVMINSTRUCTION358,ART.12:Directorindirectcontrollingshareholdersandshareholderswhoelect membersoftheBoardofDirectorsortheFiscalCouncil,andanyotherindividualorlegalentity,orgroupof persons,actingasagrouporrepresentingthesameinterests,thatattainsadirectorindirectinterest representingfivepercent(5)ormoreofatypeorclassofsharesofthecapitalofapublicly-heldcompany, mustnotifytheSecuritiesCommission(CVM)andtheCompanyofthefact,inaccordancewiththeabove article.
Oirecommendsthatitsshareholderscomplywiththetermsofarticle12ofCVMInstruction358,butittakes noresponsibilityforthedisclosureorotherwiseofacquisitionsordisposalsbythirdpartiesofinterests corresponding to 5 or more of any type or class of its share, or of rights over those shares or other securitiesthatithasissued.
Table 21 – Shares of the Company’s Capital Stock

Shareholding position as of 6/30/2019
(1) The outstanding shares do not consider the shares held by the Board of Directors and by the Executive Board.
26
RiodeJaneiro,August14,2019.ThisreportincludesconsolidatedfinancialandoperatingdataforOiS.A.– UnderJudicialReorganization(“OiS.A.”or“Oi”or“Company”)anditsdirectandindirectsubsidiariesasof June30,2019.IncompliancewithCVMinstructions,thedataarepresentedinaccordancewithInternational FinancialReportingStandards(IFRS).Duetotheseasonalityofthetelecomsectorinitsquarterlyresults,the Companywillfocusoncomparingitsfinancialresultswiththesameperiodofthepreviousyear.
This report contains projections and/or estimates of future events. The projections contained herein were compiledwithduecare,takingintoaccountthecurrentsituation,basedonworkinprogressandthe correspondingestimates.Theuseoftermssuchas“projects”,“estimates”,“anticipates”,“expects”,“plans”, “hopes”andsoon,isintendedtoindicatepossibletrendsandforward-lookingstatementswhich,clearly, involveuncertaintyandrisk,sothatfutureresultsthatmaydifferfromcurrentexpectations.These statementsarebasedonvariousassumptionsandfactors,includinggeneraleconomic,market,industry, andoperationalfactors.Anychangestotheseassumptionsorfactorsmayleadtopracticalresultsthatdiffer fromcurrentexpectations.Excessiverelianceshouldnotbeplacedonthesestatements.
Forward-lookingstatementsrelateonlytothedateonwhichtheyaremade,andtheCompanyisnotobliged toupdatethemasnewinformationorfuturedevelopmentsarise.Oitakesnoresponsibilityfortransactions carriedoutorinvestmentdecisionstakenonthebasisoftheseprojectionsorestimates.Thefinancial informationcontainedhereinisunauditedandmaythereforedifferfromthefinalresults.
Oi–InvestorRelations Marcelo Ferreira | +55(21)3131-1314 | marcelo.asferreira@oi.net.br |
Bruno Nader | +55(21)3131-1629 | bruno.nader@oi.net.br |
27
SIGNATURES
Pursuant to the requirements of the Securities Exchange Act of 1934, the registrant has duly caused this report to be signed on its behalf by the undersigned, thereunto duly authorized.
Date: August 19, 2019
OI S.A. – In Judicial Reorganization
By: /s/ Carlos Augusto Machado Pereira de Almeida Brandão
Name: Carlos Augusto Machado Pereira de Almeida Brandão
Title: Chief Financial Officer and Investor Relations Officer


