UNITED STATES
SECURITIES AND EXCHANGE COMMISSION
Washington, D.C. 20549
FORM N-CSR
CERTIFIED SHAREHOLDER REPORT OF REGISTERED MANAGEMENT INVESTMENT COMPANIES
Investment Company Act file number 811-10543
Name of Fund: BlackRock Core Bond Trust (BHK)
Fund Address: 100 Bellevue Parkway, Wilmington, DE 19809
Name and address of agent for service: John M. Perlowski, Chief Executive Officer, BlackRock Core Bond Trust,
55 East 52nd Street, New York, NY 10055
Registrant’s telephone number, including area code: (800) 882-0052, Option 4
Date of fiscal year end: 08/31/2017
Date of reporting period: 02/28/2017
Item 1 – Report to Stockholders
FEBRUARY 28, 2017
SEMI-ANNUAL REPORT (UNAUDITED)
|  |
BlackRock Core Bond Trust (BHK)
BlackRock Corporate High Yield Fund, Inc. (HYT)
BlackRock Income Trust, Inc. (BKT)
| Not FDIC Insured • May Lose Value • No Bank Guarantee |
| The Markets in Review |
Dear Shareholder,
Risk assets, such as stocks and high yield bonds, enjoyed strong performance in the 12 months ended February 28, 2017. It was a different story for higher-quality assets such as U.S. Treasuries, which generated muted returns after struggling in the latter part of 2016 as reflationary expectations in the United States helped drive a pick-up in global growth and investors braced for higher interest rates.
Markets showed great resilience during the period. Big surprises such as the United Kingdom’s vote to leave the European Union and the outcome of the U.S. presidential election brought spikes in equity market volatility, but they were ultimately short-lived. Instead, investors used the sell-offs to seize upon buying opportunities, allowing markets to quickly rebound. We believe this reinforces the case for taking the long view rather than reacting to short-term market noise.
The global reflationary theme — rising nominal growth, wages and inflation — was the dominant driver of asset returns during the period, outweighing significant political upheavals and uncertainty. This trend accelerated after the U.S. election and continued into the beginning of 2017, stoked by expectations for an extra boost to U.S. growth via fiscal policy.
Although economic momentum is gaining traction, the capacity for rapid global growth is restrained by structural factors including an aging population, low productivity growth and excess savings. A tempered economic growth trend and high valuations across most assets have set the stage for muted investment returns going forward.
Equity markets still have room to move, although the disparity between winners and losers is widening, making selectivity increasingly important. Fixed income investors are also facing challenges as bond markets recalibrate to accommodate rising rates and higher inflation expectations. And in a world where political risk and policy uncertainty abound, there is no lack of potential catalysts for higher volatility.
In this environment, investors need to think globally, extend their scope across a broad array of asset classes and be nimble as market conditions change. We encourage you to talk with your financial advisor and visit blackrock.com for further insight about investing in today’s markets.
Sincerely,

Rob Kapito
President, BlackRock Advisors, LLC

Rob Kapito
President, BlackRock Advisors, LLC
| Total Returns as of February 28, 2017 | ||||||||
| 6-month | 12-month | |||||||
U.S. large cap equities | 10.01 | % | 24.98 | % | ||||
U.S. small cap equities | 12.61 | 36.11 | ||||||
International equities | 4.90 | 15.75 | ||||||
Emerging market equities | 5.51 | 29.46 | ||||||
3-month Treasury bills | 0.22 | 0.39 | ||||||
U.S. Treasury securities | (6.17 | ) | (4.09 | ) | ||||
U.S. investment grade bonds | (2.19 | ) | 1.42 | |||||
Tax-exempt municipal | (2.51 | ) | 0.76 | |||||
U.S. high yield bonds | 5.43 | 21.83 | ||||||
| Past performance is no guarantee of future results. Index performance is shown for illustrative purposes only. You cannot invest directly in an index. | ||||||||
| 2 | THIS PAGE NOT PART OF YOUR FUND REPORT |
| Table of Contents | ||||
| Page | ||||
The Markets in Review | 2 | |||
Semi-Annual Report: | ||||
| 4 | ||||
| 10 | ||||
| 10 | ||||
| Financial Statements: | ||||
| 11 | ||||
| 65 | ||||
| 67 | ||||
| 68 | ||||
| 71 | ||||
| 73 | ||||
| 76 | ||||
| 92 | ||||
| 93 | ||||
| SEMI-ANNUAL REPORT | FEBRUARY 28, 2017 | 3 |
| Trust Summary as of February 28, 2017 | BlackRock Core Bond Trust | |||
| Trust Overview | ||
BlackRock Core Bond Trust’s (BHK) (the “Trust”) investment objective is to provide current income and capital appreciation. The Trust seeks to achieve its investment objective by investing at least 75% of its managed assets in bonds that are investment grade quality at the time of investment. The Trust’s investments will include a broad range of bonds, including corporate bonds, U.S. government and agency securities and mortgage-related securities. The Trust may invest up to 25% of its total managed assets in bonds that at the time of investment are rated Ba/BB or below by Moody’s Investors Service, Inc. (“Moody’s”), Standard & Poors Ratings Group (“S&P”), Fitch Ratings (“Fitch”) or another nationally recognized rating agency or bonds that are unrated but judged to be of comparable quality by the investment adviser. The Trust may invest up to 10% of its managed assets in bonds issued in foreign currencies. The Trust may invest directly in such securities or synthetically through the use of derivatives.
No assurance can be given that the Trust’s investment objective will be achieved.
| Trust Information | ||
Symbol on New York Stock Exchange (“NYSE”) | BHK | |
Initial Offering Date | November 27, 2001 | |
Current Distribution Rate on Closing Market Price as of February 28, 2017 ($13.34)1 | 5.85% | |
Current Monthly Distribution per Common Share2 | $0.065 | |
Current Annualized Distribution per Common Share2 | $0.780 | |
Economic Leverage as of February 28, 20173 | 30% |
| 1 | Current distribution rate on closing market price is calculated by dividing the current annualized distribution per share by the closing market price. The current distribution rate may consist of income, net realized gains and/or a tax return of capital. Past performance does not guarantee future results. |
| 2 | The distribution rate is not constant and is subject to change. |
| 3 | Represents reverse repurchase agreements outstanding as a percentage of total managed assets, which is the total assets of the Trust (including any assets attributable to borrowings) minus the sum of liabilities (other than borrowings representing financial leverage). For a discussion of leveraging techniques utilized by the Trust, please see The Benefits and Risks of Leveraging on page 10. |
| Performance and Portfolio Management Commentary | ||
Returns for the six months ended February 28, 2017 were as follows:
| Returns Based On | ||||||||
| Market Price | NAV | |||||||
BHK1,2 | (4.15 | )% | (2.10 | )% | ||||
Lipper Corporate BBB-Rated Debt Funds (Leveraged)3 | 0.44 | % | 0.54 | % | ||||
| 1 | All returns reflect reinvestment of dividends and/or distributions. |
| 2 | The Trust’s discount to NAV widened during the period, which accounts for the difference between performance based on price and performance based on NAV. |
| 3 | Average return. |
| Performance results may include adjustments made for financial reporting purposes in accordance with U.S. generally accepted accounting principles. |
The following discussion relates to the Trust’s absolute performance based on NAV:
What factors influenced performance?
| • | The largest detractors from performance included the Trust’s stance with respect to duration (and corresponding interest rate sensitivity) as well as the Trust’s yield curve positioning. Allocations to investment grade corporate securities, global sovereign/supranational/agency issues, residential mortgage-backed securities (“MBS”) and commercial mortgage-backed securities (“CMBS”) also detracted. |
| • | The largest positive contributions to the Trust’s absolute performance came from holdings of high yield corporate bonds, asset-backed securities (“ABS”) and capital securities. |
Describe recent portfolio activity.
| • | Over the six-month period, the Trust’s profile with respect to credit risk was essentially unchanged, while sector allocations were rotated to reflect the view that the economy is entering a reflationary period. In addition, the Trust’s allocation in global sovereign/supranational/agency issues was reduced and rotated into emerging market debt, investment grade corporate securities, high yield corporate bonds and CMBS. Lastly, agency collateralized mortgage obligations were added to the portfolio. |
Describe portfolio positioning at period end.
| • | As of period end, the Trust maintained diversified exposure within non-government spread sectors, including investment grade credit, high yield credit, CMBS and ABS, as well as smaller allocations to non-agency MBS and U.S. municipal bonds. The Trust also held exposure to government-related sectors such as U.S. Treasury securities, agency debt and agency MBS. |
The views expressed reflect the opinions of BlackRock as of the date of this report and are subject to change based on changes in market, economic or other conditions. These views are not intended to be a forecast of future events and are no guarantee of future results.
| 4 | SEMI-ANNUAL REPORT | FEBRUARY 28, 2017 |
| BlackRock Core Bond Trust |
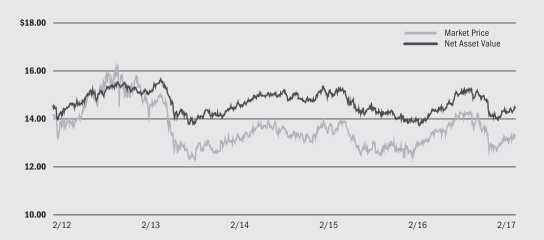
| Market Price and Net Asset Value Per Share Summary | ||||||||||
| 2/28/17 | 8/31/16 | Change | High | Low | ||||||||||||||||
Market Price | $ | 13.34 | $ | 14.33 | (6.91 | )% | $ | 14.34 | $ | 12.59 | ||||||||||
Net Asset Value | $ | 14.50 | $ | 15.25 | (4.92 | )% | $ | 15.29 | $ | 13.99 | ||||||||||
| Market Price and Net Asset Value History For the Past Five Years | ||||||||||
| Overview of the Trust’s Total Investments |
| Portfolio Composition | 2/28/17 | 8/31/16 | ||||||
Corporate Bonds | 49 | % | 47 | % | ||||
U.S. Treasury Obligations | 10 | 14 | ||||||
Preferred Securities | 9 | 10 | ||||||
Non-Agency Mortgage-Backed Securities | 9 | 10 | ||||||
Asset-Backed Securities | 8 | 8 | ||||||
U.S. Government Sponsored Agency Securities | 7 | 6 | ||||||
Short-Term Securities | 1 | 1 | ||||||
Municipal Bonds | 3 | 2 | ||||||
Foreign Agency Obligations | 2 | 2 | ||||||
Floating Rate Loan Interests | 2 | 1 | ||||||
Options Written | — | 1 | (1 | ) | ||||
Other1 | — | — | ||||||
| 1 | Representing less than 1% of the Trust’s total investments and Other may include Common Stocks and Options Purchased. |
| Credit Quality Allocation2,3 | 2/28/17 | 8/31/16 | ||||||
AAA/Aaa4 | 22 | % | 24 | % | ||||
AA/Aa | 6 | 4 | ||||||
A | 16 | 14 | ||||||
BBB/Baa | 30 | 22 | ||||||
BB/Ba | 12 | 17 | ||||||
B | 8 | 12 | ||||||
CCC/Caa | 3 | 4 | ||||||
N/R | 3 | 3 | ||||||
| 2 | For financial reporting purposes, credit quality ratings shown above reflect the highest rating assigned by either S&P or Moody’s if ratings differ. These rating agencies are independent, nationally recognized statistical rating organizations and are widely used. Investment grade ratings are credit ratings of BBB/Baa or higher. Below investment grade ratings are credit ratings of BB/Ba or lower. Investments designated N/R are not rated by either rating agency. Unrated investments do not necessarily indicate low credit quality. Credit quality ratings are subject to change. |
| 3 | Excludes Short-Term Securities, Options Purchased and Options Written. |
| 4 | The investment adviser evaluates the credit quality of not-rated investments based upon certain factors including, but not limited to, credit ratings for similar investments and financial analysis of sectors and individual investments. Using this approach, the investment adviser has deemed U.S. Government Sponsored Agency Securities and U.S. Treasury Obligations as AAA/Aaa. |
| SEMI-ANNUAL REPORT | FEBRUARY 28, 2017 | 5 |
| Trust Summary as of February 28, 2017 | BlackRock Corporate High Yield Fund, Inc. | |||
| Trust Overview |
BlackRock Corporate High Yield Fund, Inc.’s (HYT) (the “Trust”) primary investment objective is to provide shareholders with current income. The Trust’s secondary investment objective is to provide shareholders with capital appreciation. The Trust seeks to achieve its objectives by investing primarily in a diversified portfolio of fixed income securities which are rated at the time of investment to be below investment grade or, if unrated, are considered by the investment adviser to be of comparable quality. The Trust may invest directly in fixed income securities or synthetically through the use of derivatives.
No assurance can be given that the Trust’s investment objectives will be achieved.
| Trust Information | ||
Symbol on NYSE | HYT | |
Initial Offering Date | May 30, 2003 | |
Current Distribution Rate on Closing Market Price as of February 28, 2017 ($11.16)1 | 7.53% | |
Current Monthly Distribution per Common Share2 | $0.07 | |
Current Annualized Distribution per Common Share2 | $0.84 | |
Economic Leverage as of February 28, 20173 | 27% |
| 1 | Current distribution rate on closing market price is calculated by dividing the current annualized distribution per share by the closing market price. The current distribution rate may consist of income, net realized gains and/or a tax return of capital. Past performance does not guarantee future results. |
| 2 | The distribution rate is not constant and is subject to change. |
| 3 | Represents bank borrowings as a percentage of total managed assets, which is the total assets of the Trust (including any assets attributable to borrowings) minus the sum of liabilities (other than borrowings representing financial leverage). For a discussion of leveraging techniques utilized by the Trust, please see The Benefits and Risks of Leveraging on page 10. |
| Performance and Portfolio Management Commentary |
Returns for the six months ended February 28, 2017 were as follows:
| Returns Based On | ||||||||
| Market Price | NAV | |||||||
HYT1,2 | 7.14 | % | 8.00 | % | ||||
Lipper High Yield Funds (Leveraged)3 | 7.08 | % | 7.59 | % | ||||
| 1 | All returns reflect reinvestment of dividends and/or distributions. |
| 2 | The Trust’s discount to NAV widened during the period, which accounts for the difference between performance based on price and performance based on NAV. |
| 3 | Average return. |
| Performance results may include adjustments made for financial reporting purposes in accordance with U.S. generally accepted accounting principles. |
The following discussion relates to the Trust’s absolute performance based on NAV:
What factors influenced performance?
| • | High yield corporate bonds and floating rate loan interests (bank loans) both benefited from the strong appetite for credit during the six-month period. On a sector basis, the largest contributors to the Trust’s returns included the independent energy, metals & mining, and wireless sectors. From a credit-rating perspective, B-rated, BB-rated, and CCC-rated names were the largest contributors, as the lower credit-quality portions of both the high yield and bank loan markets drove the overall rally across the two asset classes. Finally, liquid high yield positions were substantial positive contributors to performance given the strong performance of the asset class over the period, including high yield exchange traded funds, credit default swap indexes and total return swaps. |
| • | From a sector perspective, the sole absolute detractor over the semi-annual period was natural gas. From a credit-rating perspective, CC- and C- names were slight detractors. From an asset allocation perspective, the only detractor for the period came from a small allocation to U.S. Treasury securities. |
Describe recent portfolio activity.
| • | As the high yield market rallied early in the period, the Trust maintained a slightly overweight market sensitivity, while remaining focused on quality and consistent cash-flow stories where balance sheets and asset coverage are strong. While lower-quality and stressed/distressed portions of the high yield market outperformed over the six months, the Trust remained underweight to the riskier, higher yielding portion of the market in order to prudently manage risk. In that vein, the Trust reduced risk across the consumer cyclical space and with respect to retailers in particular, on the view that the outlook for the space continues to deteriorate under pressure from declining sales and secular changes. By contrast, the Trust added to the cable & satellite and technology sectors over the period. |
Describe portfolio positioning at period end.
| • | The Trust held the majority of its portfolio in corporate bonds, with a modest allocation to floating rate bank loans. Within high yield corporates, the Trust was underweight in lower-coupon, more interest rate-sensitive bonds while being slightly overweight to single B-rated bonds. The Trust was overweight in high conviction CCC-rated issues while remaining underweight in the highest yielding segment of the lower-related universe where downside risks are greater if volatility picks up or credit sentiment weakens. The Trust continued to favor select equity/equity-like assets with more upside as a substitute to higher-beta (more market sensitive) CCC-rated notes, although this exposure was reduced over the period in favor of high yield issues. The Trust also maintained exposure to equity futures positions to help reduce portfolio risk. The Trust ended the period with a slight long position in equities, and a below-benchmark stance with respect to duration (and corresponding interest rate risk). |
| • | At period-end, top issuer overweights included Ligado Networks (wireless), Freeport McMoran Inc. (metals & mining), and Amaya Inc. (gaming). Core issuer/credit biases remained centered on cash-flow views, determination of a specific catalyst and/or idiosyncratic characteristics. |
The views expressed reflect the opinions of BlackRock as of the date of this report and are subject to change based on changes in market, economic or other conditions. These views are not intended to be a forecast of future events and are no guarantee of future results.
| 6 | SEMI-ANNUAL REPORT | FEBRUARY 28, 2017 |
| BlackRock Corporate High Yield Fund, Inc. |
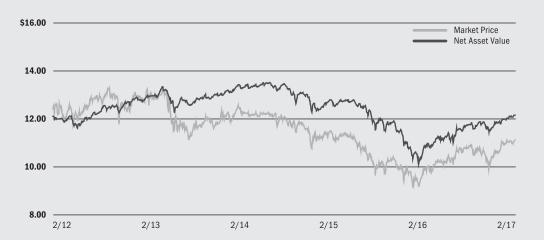
| Market Price and Net Asset Value Per Share Summary | ||||||||||
| 2/28/17 | 8/31/16 | Change | High | Low | ||||||||||||||||
Market Price | $ | 11.16 | $ | 10.88 | 2.57 | % | $ | 11.17 | $ | 9.86 | ||||||||||
Net Asset Value | $ | 12.19 | $ | 11.79 | 3.39 | % | $ | 12.19 | $ | 11.48 | ||||||||||
| Market Price and Net Asset Value History For the Past Five Years | ||||||||||
| Overview of the Trust’s Total Investments |
| Portfolio Composition | 2/28/17 | 8/31/16 | ||||||
Corporate Bonds | 81 | % | 79 | % | ||||
Floating Rate Loan Interests | 11 | 9 | ||||||
Preferred Securities | 4 | 4 | ||||||
Asset-Backed Securities | 1 | 2 | ||||||
Common Stocks | 3 | 4 | ||||||
Investment Companies | — | 1 | 1 | |||||
Other | — | 1 | 1 | |||||
| 1 | Representing less than 1% of the Trust’s total investments and Other may include Non-Agency Mortgage-Backed Securities, Warrants, Other Interests, Short-Term Securities and Options Purchased. |
| Credit Quality Allocation2,3 | 2/28/17 | 8/31/16 | ||||||
A | 1 | % | 3 | % | ||||
BBB/Baa | 7 | 10 | ||||||
BB/Ba | 39 | 40 | ||||||
B | 36 | 35 | ||||||
CCC/Caa | 11 | 8 | ||||||
N/R | 6 | 4 | ||||||
| 2 | For financial reporting purposes, credit quality ratings shown above reflect the highest rating assigned by either S&P or Moody’s if ratings differ. These rating agencies are independent, nationally recognized statistical rating organizations and are widely used. Investment grade ratings are credit ratings of BBB/Baa or higher. Below investment grade ratings are credit ratings of BB/Ba or lower. Investments designated N/R are not rated by either rating agency. Unrated investments do not necessarily indicate low credit quality. Credit quality ratings are subject to change. |
| 3 | Excludes Short-Term Securities, Options Purchased and Options Written. |
| SEMI-ANNUAL REPORT | FEBRUARY 28, 2017 | 7 |
| Trust Summary as of February 28, 2017 | BlackRock Income Trust, Inc. | |||
| Trust Overview |
BlackRock Income Trust, Inc.’s (BKT) (the “Trust”) investment objective is to manage a portfolio of high-quality securities to achieve both preservation of capital and high monthly income. The Trust seeks to achieve its investment objective by investing at least 65% of its assets in mortgage-backed securities. The Trust invests at least 80% of its assets in securities that are (i) issued or guaranteed by the U.S. government or one of its agencies or instrumentalities or (ii) rated at the time of investment either AAA by S&P or Aaa by Moody’s. The Trust may invest directly in such securities or synthetically through the use of derivatives.
No assurance can be given that the Trust’s investment objective will be achieved.
| Trust Information | ||
Symbol on NYSE | BKT | |
Initial Offering Date | July 22, 1988 | |
Current Distribution Rate on Closing Market Price as of February 28, 2017 ($6.26)1 | 5.08% | |
Current Monthly Distribution per Common Share2 | $0.0265 | |
Current Annualized Distribution per Common Share2 | $0.3180 | |
Economic Leverage as of February 28, 20173 | 29% |
| 1 | Current distribution rate on closing market price is calculated by dividing the current annualized distribution per share by the closing market price. The current distribution rate may consist of income, net realized gains and/or a tax return of capital. Past performance does not guarantee future results. |
| 2 | The distribution rate is not constant and is subject to change. |
| 3 | Represents reverse repurchase agreements outstanding as a percentage of total managed assets, which is the total assets of the Trust (including any assets attributable to borrowings) minus the sum of liabilities (other than borrowings representing financial leverage). For a discussion of leveraging techniques utilized by the Trust, please see the Benefits and Risks of Leveraging on page 10. |
| Performance and Portfolio Management Commentary |
Returns for the six months ended February 28, 2017 were as follows:
| Returns Based On | ||||||||
| Market Price | NAV | |||||||
BKT1,2 | (2.74 | )% | (0.56 | )% | ||||
Lipper US Mortgage Funds3 | 2.34 | % | 2.78 | % | ||||
| 1 | All returns reflect reinvestment of dividends and/or distributions. |
| 2 | The Trust’s discount to NAV widened during the period, which accounts for the difference between performance based on price and performance based on NAV. |
| 3 | Average return. |
| Performance results may include adjustments made for financial reporting purposes in accordance with U.S. generally accepted accounting principles. |
The following discussion relates to the Trust’s absolute performance based on NAV:
What factors influenced performance?
| • | The largest detractors from performance were the Trust’s allocations within agency collateralized mortgage obligations (“CMOs”), U.S. agency bonds, 30-year agency MBS pass-throughs and swaps/swaptions strategies. |
| • | The largest contributors to performance during the six-month period were the Trust’s strategies to manage risk utilizing U.S. Treasury futures held as short positions against the Trust’s long positions in agency mortgage-backed securities (“MBS”). This positioning benefited performance as rates moved higher. Other contributions to returns came from allocations |
to agency interest-only and principal-only bonds, positions in commercial mortgage-backed securities (“CMBS”) and allocations to legacy (i.e., issued prior to 2008) non-agency residential MBS. |
| • | The Trust uses interest rate derivatives including futures, options, swaps and swaptions, mainly for the purpose of managing duration, convexity (the rate at which duration changes in response to interest rate movements) and yield curve positioning. The use of derivatives had a positive impact on Trust performance for the period. |
Describe recent portfolio activity.
| • | The Trust decreased its holdings within agency pass-throughs during the period, while maintaining exposure to agency CMOs. The Trust’s allocation to legacy non-agency residential MBS was unchanged. Within CMBS, exposures were slightly reduced as the risk profile became less favorable in the wake of significant spread tightening. The Trust’s allocation to asset-backed securities remained minimal. |
Describe portfolio positioning at period end.
| • | As of period end, the Trust continued to be overweight in well-structured agency CMOs with call protected and seasoned collateral, and those which demonstrated more favorable prepayment characteristics. The Trust also maintained non-benchmark positions in legacy non-agency residential MBS and CMBS. |
The views expressed reflect the opinions of BlackRock as of the date of this report and are subject to change based on changes in market, economic or other conditions. These views are not intended to be a forecast of future events and are no guarantee of future results.
| 8 | SEMI-ANNUAL REPORT | FEBRUARY 28, 2017 |
| BlackRock Income Trust, Inc. |
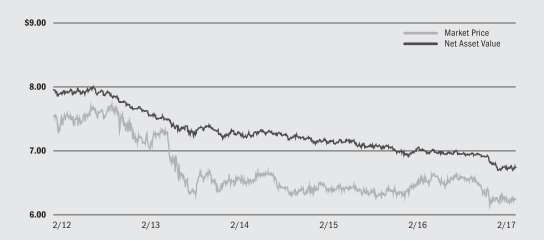
| Market Price and Net Asset Value Per Share Summary | ||||||||||
| 2/28/17 | 8/31/16 | Change | High | Low | ||||||||||||||||
Market Price | $ | 6.26 | $ | 6.60 | (5.15 | )% | $ | 6.61 | $ | 6.16 | ||||||||||
Net Asset Value | $ | 6.75 | $ | 6.96 | (3.02 | )% | $ | 6.98 | $ | 6.71 | ||||||||||
| Market Price and Net Asset Value History For the Past Five Years | ||||||||||
| Overview of the Trust’s Total Investments |
| Portfolio Composition | 2/28/17 | 8/31/16 | ||||||
U.S. Government Sponsored Agency Securities | 123 | % | 97 | % | ||||
U.S. Treasury Obligations | 3 | 2 | ||||||
Short-Term Securities | 1 | 1 | ||||||
Non-Agency Mortgage-Backed Securities | 1 | 1 | ||||||
Asset-Backed Securities | — | 1 | 1 | |||||
Borrowed Bonds1 | — | — | ||||||
TBA Sale Commitments | (28 | ) | (2 | ) | ||||
| 1 | Representing less than 0.50% of the Trust’s total investments. |
| Credit Quality Allocation2,3 | 2/28/17 | 8/31/16 | ||||||
AAA/Aaa4 | 99 | % | 99 | % | ||||
BBB | 1 | 1 | ||||||
| 2 | For financial reporting purposes, credit quality ratings shown above reflect the highest rating assigned by either S&P or Moody’s if ratings differ. These rating agencies are independent, nationally recognized statistical rating organizations and are widely used. Investment grade ratings are credit ratings of BBB/Baa or higher. Below investment grade ratings are credit ratings of BB/Ba or lower. Investments designated N/R are not rated by either rating agency. Unrated investments do not necessarily indicate low credit quality. Credit quality ratings are subject to change. |
| 3 | Excludes Money Market Funds. |
| 4 | The investment adviser evaluates the credit quality of not-rated investments based upon certain factors including, but not limited to, credit ratings for similar investments and financial analysis of sectors and individual investments. Using this approach, the investment adviser has deemed U.S. Government Sponsored Agency Securities and U.S. Treasury Obligations as AAA/Aaa. |
| SEMI-ANNUAL REPORT | FEBRUARY 28, 2017 | 9 |
| The Benefits and Risks of Leveraging |
The Trusts may utilize leverage to seek to enhance the distribution rate on, and net asset value (“NAV”) of, their common shares (“Common Shares”). However, these objectives cannot be achieved in all interest rate environments.
In general, the concept of leveraging is based on the premise that the financing cost of leverage, which is based on short-term interest rates, is normally lower than the income earned by a Trust on its longer-term portfolio investments purchased with the proceeds from leverage. To the extent that the total assets of the Trusts (including the assets obtained from leverage) are invested in higher-yielding portfolio investments, the Trusts’ shareholders benefit from the incremental net income. The interest earned on securities purchased with the proceeds from leverage is paid to shareholders in the form of dividends, and the value of these portfolio holdings is reflected in the per share NAV.
To illustrate these concepts, assume a Trust’s capitalization is $100 million and it utilizes leverage for an additional $30 million, creating a total value of $130 million available for investment in longer-term income securities. If prevailing short-term interest rates are 3% and longer-term interest rates are 6%, the yield curve has a strongly positive slope. In this case, a Trust’s financing costs on the $30 million of proceeds obtained from leverage are based on the lower short-term interest rates. At the same time, the securities purchased by a Trust with the proceeds from leverage earn income based on longer-term interest rates. In this case, a Trust’s financing cost of leverage is significantly lower than the income earned on a Trust’s longer-term investments acquired from such leverage proceeds, and therefore the holders of Common Shares (“Common Shareholders”) are the beneficiaries of the incremental net income.
However, in order to benefit shareholders, the return on assets purchased with leverage proceeds must exceed the ongoing costs associated with the leverage. If interest and other costs of leverage exceed the Trusts’ return on assets purchased with leverage proceeds, income to shareholders is lower than if the Trusts had not used leverage. Furthermore, the value of the Trusts’ portfolio investments generally varies inversely with the direction of long-term interest rates, although other factors can influence the value of portfolio investments. In contrast, the value of the Trusts’ obligations under their respective leverage arrangements generally does not fluctuate in relation to interest rates. As a result, changes in interest
rates can influence the Trusts’ NAVs positively or negatively. Changes in the future direction of interest rates are very difficult to predict accurately, and there is no assurance that the Trusts’ intended leveraging strategy will be successful.
The use of leverage also generally causes greater changes in each Trust’s NAV, market price and dividend rates than comparable portfolios without leverage. In a declining market, leverage is likely to cause a greater decline in the NAV and market price of a Trust’s shares than if the Trust were not leveraged. In addition, each Trust may be required to sell portfolio securities at inopportune times or at distressed values in order to comply with regulatory requirements applicable to the use of leverage or as required by the terms of leverage instruments, which may cause the Trusts to incur losses. The use of leverage may limit a Trust’s ability to invest in certain types of securities or use certain types of hedging strategies. Each Trust incurs expenses in connection with the use of leverage, all of which are borne by shareholders and may reduce income to the shareholders. Moreover, to the extent the calculation of the Trusts’ investment advisory fees includes assets purchased with the proceeds of leverage, the investment advisory fees payable to the Trust’s investment adviser will be higher than if the Trusts did not use leverage.
Each Trust may utilize leverage through a credit facility or reverse repurchase agreements as described in the Notes to Financial Statements.
Under the Investment Company Act of 1940, as amended (the “1940 Act”), the Trusts are permitted to issue debt up to 33 1/3% of their total managed assets. A Trust may voluntarily elect to limit its leverage to less than the maximum amount permitted under the 1940 Act. In addition, a Trust may also be subject to certain asset coverage, leverage or portfolio composition requirements imposed by its credit facility, which may be more stringent than those imposed by the 1940 Act.
If a Trust segregates or designates on its books and records cash or liquid assets having values not less than the value of a Trust’s obligations under the reverse repurchase agreement (including accrued interest) then such transaction is not considered a senior security and is not subject to the foregoing limitations and requirements under the 1940 Act.
| Derivative Financial Instruments |
The Trusts may invest in various derivative financial instruments. These instruments are used to obtain exposure to a security, commodity, index, market, and/or other asset without owning or taking physical custody of securities, commodities and/or other referenced assets or to manage market, equity, credit, interest rate, foreign currency exchange rate, commodity and/or other risks. Derivative financial instruments may give rise to a form of economic leverage and involve risks, including the imperfect correlation between the value of a derivative financial instrument and the underlying asset, possible default of the counterparty to the
transaction or illiquidity of the instrument. The Trusts’ successful use of a derivative financial instrument depends on the investment adviser’s ability to predict pertinent market movements accurately, which cannot be assured. The use of these instruments may result in losses greater than if they had not been used, may limit the amount of appreciation a Trust can realize on an investment and/or may result in lower distributions paid to shareholders. The Trusts’ investments in these instruments, if any, are discussed in detail in the Notes to Financial Statements.
| 10 | SEMI-ANNUAL REPORT | FEBRUARY 28, 2017 |
BlackRock Core Bond Trust (BHK) (Percentages shown are based on Net Assets) |
| Asset-Backed Securities | Par (000) | Value | ||||||||||
Asset-Backed Securities — 10.4% |
| |||||||||||
ALM VI Ltd., Series 2012-6A, Class B2R, 3.82%, 7/15/26 (a)(b) | USD | 1,000 | $ | 1,002,115 | ||||||||
Anchorage Capital CLO 9 Ltd., Series 2016-9A, Class D, 4.95%, 1/15/29 (a)(b) | 650 | 651,690 | ||||||||||
Apidos CDO, Series 2012-9AR, Class DR, 4.92%, 7/15/23 (a)(b) | 1,400 | 1,401,189 | ||||||||||
Apidos CLO XIX, Series 2014-19A, Class DR, 4.38%, 10/17/26 (a)(b) | 1,000 | 995,211 | ||||||||||
Ares XXVIII CLO, Ltd., Series 2013-3A, Class D, 4.52%, 10/17/24 (a)(b) | 1,000 | 1,000,874 | ||||||||||
Ares XXXII CLO, Ltd., Series 2014-32A, Class CR, 4.49%, 11/15/25 (a)(b) | 1,250 | 1,250,000 | ||||||||||
Atlas Senior Loan Fund, Ltd., 4.95%, 11/30/28 (a)(b) | 1,250 | 1,250,000 | ||||||||||
Atrium CDO Corp., Series 9A, Class D, 4.44%, 2/28/24 (a)(b) | 1,500 | 1,503,744 | ||||||||||
Battalion CLO VII Ltd., Series 2014-7A, Class C, 4.92%, 10/17/26 (a)(b) | 1,000 | 991,626 | ||||||||||
Bowman Park CLO, Ltd., Series 2014-1A, Class D2R, 4.38%, 11/23/25 (a)(b) | 3,000 | 3,000,000 | ||||||||||
CenterPoint Energy Transition Bond Co. LLC, Series 2012-1, Class A3, 3.03%, 10/15/25 | 2,210 | 2,276,248 | ||||||||||
CIFC Funding Ltd. (a)(b): | ||||||||||||
Series 2012-3A, Class B1R, 5.04%, 1/29/25 | 2,500 | 2,506,672 | ||||||||||
Series 2013-IA, Class B, 3.83%, 4/16/25 | 1,000 | 1,000,896 | ||||||||||
Series 2014-4A, Class D, 4.42%, 10/17/26 | 2,000 | 2,010,825 | ||||||||||
Countrywide Asset-Backed Certificates, Series 2006-13, Class 3AV2, 0.91%, 1/25/37 (a) | 288 | 279,683 | ||||||||||
DCP Rights LLC, Series 2014-1A, Class A, 5.46%, 10/25/44 (b) | 3,879 | 3,871,595 | ||||||||||
Dryden 34 Senior Loan Fund, Series 2014-34A, Class C, 3.82%, 10/15/26 (a)(b) | 1,000 | 996,187 | ||||||||||
Flatiron CLO Ltd., Series 2014-1A, Class D, 4.62%, 1/15/23 (a)(b) | 1,000 | 1,002,321 | ||||||||||
Galaxy XV CLO Ltd. (a)(b): | ||||||||||||
3.62%, 4/15/25 | 1,000 | 1,001,147 | ||||||||||
5.34%, 11/15/26 | 1,000 | 1,001,581 | ||||||||||
GoldenTree Loan Opportunities IX Ltd., Series 2014-9A, Class D, 4.54%, 10/29/26 | 1,000 | 995,080 | ||||||||||
Highbridge Loan Management Ltd., Series 5A-2015, Class C1, 4.24%, 1/29/26 (a)(b) | 4,000 | 4,019,518 | ||||||||||
Limerock CLO III LLC, Series 2014-3A, Class C, 4.63%, 10/20/26 (a)(b) | 3,750 | 3,697,971 | ||||||||||
Madison Park Funding IX Ltd., Series 2012-9AR, Class DR, 4.89%, 8/15/22 (a)(b) | 1,200 | 1,201,107 | ||||||||||
Madison Park Funding XV Ltd., Series 2014-15A, Class B1R, 1.00%, 1/27/26 (a)(b) | 1,800 | 1,800,050 | ||||||||||
Nelnet Student Loan Trust, Series 2006-1, Class A5, 1.16%, 8/23/27 (a) | 795 | 791,011 | ||||||||||
Neuberger Berman CLO XVIII Ltd., Series 2014-18A, Class CR, 5.29%, 11/14/27 (a)(b) | 2,250 | 2,267,631 | ||||||||||
Oaktree EIF II Ltd., Series 2015-B1A, Class C, 4.14%, 2/15/26 (a)(b) | 1,000 | 1,003,683 | ||||||||||
OCP CLO Ltd., Series 2012-2A, Class DR, 5.52%, 11/22/25 (a)(b) | 1,000 | 1,001,701 | ||||||||||
| Asset-Backed Securities | Par (000) | Value | ||||||||||
Asset-Backed Securities (continued) | ||||||||||||
Octagon Investment Partners XX Ltd., Series 2014-1A (a)(b): | ||||||||||||
Class C, 3.83%, 8/12/26 | USD | 750 | $ | 755,381 | ||||||||
Class D, 4.68%, 8/12/26 | 1,000 | 1,008,673 | ||||||||||
Octagon Investment Partners XXI Ltd., Series 2014-1A, Class C, 4.69%, 11/14/26 (a)(b) | 2,000 | 1,996,014 | ||||||||||
Octagon Investment Partners XXII Ltd., Series 2014-1A, Class C1, 4.29%, 11/25/25 (a)(b) | 2,000 | 1,991,308 | ||||||||||
OneMain Financial Issuance Trust, Series 2015-2A, Class C, 4.32%, 7/18/25 (b) | 5,000 | 4,986,153 | ||||||||||
OZLM Funding III, Ltd., Series 2013-3A, Class BR, 4.04%, 1/22/29 (a)(b) | 1,500 | 1,506,175 | ||||||||||
OZLM VII Ltd., Series 2014-7A, Class C, 4.62%, 7/17/26 (a)(b) | 470 | 472,144 | ||||||||||
OZLM VIII Ltd., Series 2014-8A, Class C, 4.52%, 10/17/26 (a)(b) | 1,750 | 1,749,816 | ||||||||||
Regatta V Funding Ltd., Series 2014-1A, Class C, 4.49%, 10/25/26 (a)(b) | 2,000 | 1,956,548 | ||||||||||
SLM Private Credit Student Loan Trust, Series 2004-B, Class A2, 1.16%, 6/15/21 (a) | 16 | 16,208 | ||||||||||
SLM Private Education Loan Trust (b): | ||||||||||||
Series 2012-A, Class A1, 2.17%, 8/15/25 (a) | 7 | 7,156 | ||||||||||
Series 2012-A, Class A2, 3.83%, 1/17/45 | 690 | 705,042 | ||||||||||
Series 2014-A, Class B, 3.50%, 11/15/44 | 500 | 498,195 | ||||||||||
SMB Private Education Loan Trust, Series 2015-C, Class C, 4.50%, 9/17/46 (b) | 5,900 | 5,931,402 | ||||||||||
Sound Point CLO IV Ltd., Series 2013-3A, Class D, 4.54%, 1/21/26 (a)(b) | 700 | 700,613 | ||||||||||
Sound Point CLO VII Ltd., Series 2014-3A, Class D, 4.64%, 1/23/27 (a)(b) | 1,250 | 1,256,869 | ||||||||||
Sound Point CLO XIV Ltd., Series 2016-3A, Class D, 4.73%, 1/23/29 (a)(b) | 1,550 | 1,556,129 | ||||||||||
Stewart Park CLO Ltd., Series 2015-1A, Class D, 4.47%, 4/15/26 (a)(b) | 1,000 | 996,900 | ||||||||||
Structured Asset Securities Corp., Series 2002-AL1, Class A2, 3.45%, 2/25/32 | 730 | 726,998 | ||||||||||
Voya CLO Ltd. (a)(b): | ||||||||||||
Series 2012-2AR, Class CR, 3.97%, 10/15/22 | 1,500 | 1,501,233 | ||||||||||
Series 2016-3A, Class C, 4.67%, 10/18/27 | 795 | 797,959 | ||||||||||
Series 2016-3A, Class D, 7.67%, 10/18/27 | 615 | 623,960 | ||||||||||
World Financial Network Credit Card Master Trust, Series 2012-C, Class C, 4.55%, 8/15/22 | 2,360 | 2,419,356 | ||||||||||
York CLO-4, Ltd., Series 2016-2A, Class D, 5.06%, 1/20/30 (a)(b) | 1,500 | 1,478,833 | ||||||||||
|
| |||||||||||
| 81,410,421 | ||||||||||||
Interest Only Asset-Backed Securities — 0.1% |
| |||||||||||
Sterling Bank Trust, Series 2004-2, Class Note, 2.08%, 3/30/30 (b) | 3,106 | 208,695 | ||||||||||
Sterling Coofs Trust, Series 2004-1, Class A, 2.36%, 4/15/29 (b) | 7,447 | 518,861 | ||||||||||
|
| |||||||||||
| 727,556 | ||||||||||||
| Total Asset-Backed Securities — 10.5% | 82,137,977 | |||||||||||
| Portfolio Abbreviations |
| AUD | Australian Dollar | EUR | Euro | NZD | New Zealand Dollar | |||||
| CAD | Canadian Dollar | EURIBOR | Euro Interbank Offered Rate | OTC | Over-the-Counter | |||||
| CDO | Collateralized Debt Obligation | GBP | British Pound | PIK | Payment-In-Kind | |||||
| CHF | Swiss Franc | GO | General Obligation Bonds | RB | Revenue Bonds | |||||
| CLO | Collateralized Loan Obligation | JPY | Japanese Yen | SEK | Swedish Krona | |||||
| CR | Custodian Receipt | LIBOR | London Interbank Offered Rate | USD | U.S. Dollar | |||||
| DIP | Debtor-In-Possession | LOC | Letter of Credit | |||||||
| ETF | Exchange-Traded Fund | NOK | Norwegian Krone |
See Notes to Financial Statements.
| SEMI-ANNUAL REPORT | FEBRUARY 28, 2017 | 11 |
Schedule of Investments (continued) | BlackRock Core Bond Trust (BHK) |
| Corporate Bonds | Par (000) | Value | ||||||||||
Aerospace & Defense — 1.1% |
| |||||||||||
Accudyne Industries Borrower/Accudyne Industries LLC, 7.75%, 12/15/20 (b) | USD | 370 | $ | 324,675 | ||||||||
Bombardier, Inc. (b): | ||||||||||||
8.75%, 12/01/21 | 621 | 687,757 | ||||||||||
6.00%, 10/15/22 | 84 | 84,105 | ||||||||||
6.13%, 1/15/23 | 107 | 107,000 | ||||||||||
7.50%, 3/15/25 | 306 | 318,240 | ||||||||||
Eaton Corp., 4.15%, 11/02/42 | 500 | 500,227 | ||||||||||
Harris Corp., 3.83%, 4/27/25 | 500 | 513,924 | ||||||||||
KLX, Inc., 5.88%, 12/01/22 (b) | 361 | 380,025 | ||||||||||
Koppers, Inc., 6.00%, 2/15/25 (b) | 151 | 157,040 | ||||||||||
Lockheed Martin Corp., 4.70%, 5/15/46 | 1,250 | 1,370,637 | ||||||||||
Moog, Inc., 5.25%, 12/01/22 (b) | 180 | 184,500 | ||||||||||
TransDigm, Inc.: | ||||||||||||
5.50%, 10/15/20 | 211 | 214,693 | ||||||||||
6.00%, 7/15/22 | 950 | 975,631 | ||||||||||
6.50%, 7/15/24 | 235 | 241,462 | ||||||||||
6.50%, 5/15/25 (b)(c) | 133 | 136,159 | ||||||||||
6.50%, 5/15/25 | 110 | 112,613 | ||||||||||
6.38%, 6/15/26 | 26 | 26,260 | ||||||||||
United Technologies Corp., 6.13%, 7/15/38 (d) | 1,450 | 1,876,526 | ||||||||||
|
| |||||||||||
| 8,211,474 | ||||||||||||
Air Freight & Logistics — 0.3% |
| |||||||||||
FedEx Corp., 4.75%, 11/15/45 | 1,250 | 1,313,054 | ||||||||||
XPO Logistics, Inc.: | ||||||||||||
5.75%, 6/15/21 | EUR | 100 | 111,872 | |||||||||
6.50%, 6/15/22 (b) | USD | 535 | 561,750 | |||||||||
6.13%, 9/01/23 (b) | 78 | 81,900 | ||||||||||
|
| |||||||||||
| 2,068,576 | ||||||||||||
Airlines — 2.3% |
| |||||||||||
Air Canada Pass-Through Trust, Series 2015-1, Class B, 3.88%, 9/15/24 (b) | 1,863 | 1,816,668 | ||||||||||
American Airlines Pass-Through Trust: | ||||||||||||
Series 2013-2, Class A, 4.95%, 7/15/24 (d) | 3,586 | 3,827,951 | ||||||||||
Series 2015-2, Class A, 4.00%, 3/22/29 | 1,465 | 1,501,140 | ||||||||||
Series 2015-2, Class AA, 3.60%, 3/22/29 | 1,465 | 1,471,843 | ||||||||||
Series 2017-1, Class B, 4.95%, 8/15/26 | 1,925 | 1,968,313 | ||||||||||
Continental Airlines Pass-Through Trust: | ||||||||||||
Series 2010-1, Class B, 6.00%, 7/12/20 | 401 | 415,093 | ||||||||||
Series 2012-3, Class C, 6.13%, 4/29/18 | 520 | 542,100 | ||||||||||
United Airlines Pass-Through Trust: | ||||||||||||
Series 2013-1, Class A, 4.30%, 2/15/27 | 3,509 | 3,688,794 | ||||||||||
Series 2014-2, Class B, 4.63%, 3/03/24 | 2,487 | 2,539,465 | ||||||||||
|
| |||||||||||
| 17,771,367 | ||||||||||||
Auto Components — 0.3% |
| |||||||||||
Allison Transmission, Inc., 5.00%, 10/01/24 (b) | 199 | 202,482 | ||||||||||
CNH Industrial Finance Europe SA, 2.88%, 5/17/23 | EUR | 175 | 192,735 | |||||||||
Delphi Automotive PLC, 4.40%, 10/01/46 | USD | 465 | 444,887 | |||||||||
Faurecia, 3.63%, 6/15/23 | EUR | 100 | 110,911 | |||||||||
Fiat Chrysler Finance Europe, 4.75%, 3/22/21 | 100 | 117,064 | ||||||||||
FTE Verwaltungs GmbH, 9.00%, 7/15/20 | 100 | 111,409 | ||||||||||
Icahn Enterprises LP/Icahn Enterprises Finance Corp.: | ||||||||||||
4.88%, 3/15/19 | USD | 367 | 372,964 | |||||||||
6.25%, 2/01/22 (b) | 80 | 82,600 | ||||||||||
6.75%, 2/01/24 (b) | 271 | 281,162 | ||||||||||
IHO Verwaltungs GmbH (e): | ||||||||||||
(2.75% Cash or 3.50% PIK), 2.75%, 9/15/21 | EUR | 100 | 109,423 | |||||||||
(3.25% Cash or 4.00% PIK), 3.25%, 9/15/23 | 100 | 109,913 | ||||||||||
(4.13% Cash or 4.88% PIK), 4.13%, 9/15/21 (b) | USD | 200 | 202,060 | |||||||||
| Corporate Bonds | Par (000) | Value | ||||||||||
Auto Components (continued) |
| |||||||||||
IHO Verwaltungs GmbH (e) (continued): | ||||||||||||
(4.50% Cash or 5.25% PIK), 4.50%, 9/15/23 (b) | USD | 200 | $ | 191,381 | ||||||||
|
| |||||||||||
| 2,528,991 | ||||||||||||
Automobiles — 0.9% |
| |||||||||||
Ford Motor Co., 4.75%, 1/15/43 (d) | 4,255 | 4,092,353 | ||||||||||
General Motors Co., 6.25%, 10/02/43 (d) | 2,506 | 2,854,727 | ||||||||||
|
| |||||||||||
| 6,947,080 | ||||||||||||
Banks — 1.8% |
| |||||||||||
Allied Irish Banks PLC, 4.13%, 11/26/25 (a) | EUR | 100 | 110,228 | |||||||||
Banco Popolare, 2.75%, 7/27/20 | 100 | 108,111 | ||||||||||
Bankia SA, 4.00%, 5/22/24 (a) | 200 | 216,366 | ||||||||||
Barclays PLC, 3.65%, 3/16/25 | USD | 4,320 | 4,213,819 | |||||||||
CaixaBank SA, 3.50%, 2/15/27 (a) | EUR | 100 | 109,014 | |||||||||
CIT Group, Inc.: | ||||||||||||
5.50%, 2/15/19 (b) | USD | 206 | 217,073 | |||||||||
5.38%, 5/15/20 | 410 | 438,700 | ||||||||||
5.00%, 8/01/23 | 395 | 417,713 | ||||||||||
Commerzbank AG: | ||||||||||||
7.75%, 3/16/21 | EUR | 100 | 127,792 | |||||||||
4.00%, 3/23/26 | 28 | 30,631 | ||||||||||
Cooperatieve Rabobank UA, 3.95%, 11/09/22 (d) | USD | 1,500 | 1,540,531 | |||||||||
HSBC Holdings PLC, 6.10%, 1/14/42 | 610 | 767,192 | ||||||||||
Santander Holdings USA, Inc., 4.50%, 7/17/25 | 2,000 | 2,047,134 | ||||||||||
Santander UK Group Holdings PLC, 2.88%, 8/05/21 | 1,250 | 1,237,315 | ||||||||||
Wells Fargo & Co., 3.90%, 5/01/45 | 2,250 | 2,170,042 | ||||||||||
|
| |||||||||||
| 13,751,661 | ||||||||||||
Beverages — 0.6% |
| |||||||||||
Anheuser-Busch InBev Finance, Inc., 4.90%, 2/01/46 (d) | 4,250 | 4,665,123 | ||||||||||
Biotechnology — 0.4% |
| |||||||||||
Amgen, Inc., 4.40%, 5/01/45 | 2,250 | 2,206,318 | ||||||||||
Gilead Sciences, Inc., 4.80%, 4/01/44 | 1,000 | 1,044,178 | ||||||||||
Senvion Holding GmbH, 6.63%, 11/15/20 | EUR | 100 | 110,362 | |||||||||
|
| |||||||||||
| 3,360,858 | ||||||||||||
Building Materials — 0.0% |
| |||||||||||
Dry Mix Solutions Investissements SAS, 3.93%, 6/15/21 (a) | 100 | 105,940 | ||||||||||
Titan Global Finance PLC, 3.50%, 6/17/21 | 100 | 110,005 | ||||||||||
|
| |||||||||||
| 215,945 | ||||||||||||
Building Products — 0.3% |
| |||||||||||
American Builders & Contractors Supply Co., Inc., 5.75%, 12/15/23 (b) | USD | 183 | 192,150 | |||||||||
Building Materials Corp. of America (b): | ||||||||||||
5.38%, 11/15/24 | 65 | 66,813 | ||||||||||
6.00%, 10/15/25 | 200 | 212,500 | ||||||||||
CPG Merger Sub LLC, 8.00%, 10/01/21 (b) | 520 | 544,700 | ||||||||||
Louisiana-Pacific Corp., 4.88%, 9/15/24 | 61 | 61,458 | ||||||||||
Masonite International Corp., 5.63%, 3/15/23 (b) | 200 | 206,500 | ||||||||||
Ply Gem Industries, Inc., 6.50%, 2/01/22 | 431 | 448,326 | ||||||||||
Standard Industries, Inc. (b): | ||||||||||||
5.13%, 2/15/21 | 29 | 30,233 | ||||||||||
5.50%, 2/15/23 | 138 | 143,520 | ||||||||||
USG Corp.: | ||||||||||||
8.25%, 1/15/18 | 300 | 315,000 | ||||||||||
5.50%, 3/01/25 (b) | 180 | 191,250 | ||||||||||
|
| |||||||||||
| 2,412,450 | ||||||||||||
Capital Markets — 2.2% |
| |||||||||||
CDP Financial, Inc., 5.60%, 11/25/39 (b)(d) | 5,890 | 7,380,771 | ||||||||||
Goldman Sachs Group, Inc., 3.75%, 5/22/25 (d) | 8,965 | 9,095,467 | ||||||||||
See Notes to Financial Statements.
| 12 | SEMI-ANNUAL REPORT | FEBRUARY 28, 2017 |
Schedule of Investments (continued) | BlackRock Core Bond Trust (BHK) |
| Corporate Bonds | Par (000) | Value | ||||||||||
Capital Markets (continued) |
| |||||||||||
Morgan Stanley, 4.00%, 7/23/25 | USD | 905 | $ | 937,059 | ||||||||
State Street Corp., 1.96%, 6/01/77 (a) | 140 | 125,300 | ||||||||||
|
| |||||||||||
| 17,538,597 | ||||||||||||
Chemicals — 0.8% |
| |||||||||||
Air Liquide Finance SA, 3.50%, 9/27/46 (b) | 360 | 337,174 | ||||||||||
Alpha 3 BV/Alpha US Bidco, Inc., 6.25%, 2/01/25 (b) | 400 | 400,000 | ||||||||||
Axalta Coating Systems LLC, 4.88%, 8/15/24 (b) | 161 | 164,220 | ||||||||||
Blue Cube Spinco, Inc.: | ||||||||||||
9.75%, 10/15/23 | 55 | 65,588 | ||||||||||
10.00%, 10/15/25 | 25 | 30,375 | ||||||||||
CF Industries, Inc.: | ||||||||||||
7.13%, 5/01/20 | 80 | 87,700 | ||||||||||
5.15%, 3/15/34 | 60 | 57,038 | ||||||||||
4.95%, 6/01/43 | 185 | 159,100 | ||||||||||
Chemours Co.: | ||||||||||||
6.63%, 5/15/23 | 182 | 193,147 | ||||||||||
7.00%, 5/15/25 | 44 | 47,795 | ||||||||||
Hexion, Inc., 10.38%, 2/01/22 (b) | 132 | 135,960 | ||||||||||
Huntsman International LLC, 4.88%, 11/15/20 | 101 | 104,535 | ||||||||||
Ineos Finance PLC, 4.00%, 5/01/23 | EUR | 100 | 110,310 | |||||||||
INEOS Group Holdings SA, 5.63%, 8/01/24 (b)(d) | USD | 200 | 203,900 | |||||||||
Inovyn Finance PLC, 6.25%, 5/15/21 | EUR | 100 | 112,633 | |||||||||
Methanex Corp., 3.25%, 12/15/19 | USD | 1,650 | 1,665,094 | |||||||||
Momentive Performance Materials, Inc., 3.88%, 10/24/21 | 735 | 720,300 | ||||||||||
NOVA Chemicals Corp., 5.25%, 8/01/23 (b) | 88 | 90,640 | ||||||||||
Platform Specialty Products Corp. (b): | ||||||||||||
10.38%, 5/01/21 | 37 | 41,579 | ||||||||||
6.50%, 2/01/22 | 934 | 976,030 | ||||||||||
PQ Corp., 6.75%, 11/15/22 (b) | 214 | 231,655 | ||||||||||
PSPC Escrow Corp., 6.00%, 2/01/23 | EUR | 100 | 111,263 | |||||||||
Tronox Finance LLC: | ||||||||||||
6.38%, 8/15/20 | USD | 141 | 143,468 | |||||||||
7.50%, 3/15/22 (b) | 43 | 44,935 | ||||||||||
Versum Materials, Inc., 5.50%, 9/30/24 (b) | 81 | 84,746 | ||||||||||
WR Grace & Co-Conn (b): | ||||||||||||
5.13%, 10/01/21 | 187 | 196,817 | ||||||||||
5.63%, 10/01/24 | 80 | 85,000 | ||||||||||
|
| |||||||||||
| 6,601,002 | ||||||||||||
Commercial Services & Supplies — 0.8% |
| |||||||||||
ADT Corp.: | ||||||||||||
3.50%, 7/15/22 | 402 | 381,397 | ||||||||||
4.13%, 6/15/23 | 55 | 52,938 | ||||||||||
4.88%, 7/15/32 (b) | 141 | 113,505 | ||||||||||
Advanced Disposal Services, Inc., 5.63%, 11/15/24 (b) | 151 | 154,398 | ||||||||||
Aviation Capital Group Corp. (b): | ||||||||||||
4.63%, 1/31/18 | 1,300 | 1,332,500 | ||||||||||
7.13%, 10/15/20 | 1,800 | 2,072,250 | ||||||||||
Brand Energy & Infrastructure Services, Inc., 8.50%, 12/01/21 (b) | 439 | 459,852 | ||||||||||
Harland Clarke Holdings Corp., 8.38%, 8/15/22 (b) | 190 | 196,294 | ||||||||||
Iron Mountain, Inc.: | ||||||||||||
6.00%, 10/01/20 (b) | 175 | 183,801 | ||||||||||
6.00%, 8/15/23 | 80 | 84,672 | ||||||||||
Mobile Mini, Inc., 5.88%, 7/01/24 | 299 | 312,455 | ||||||||||
Park Aerospace Holdings Ltd., 5.25%, 8/15/22 (b) | 162 | 168,885 | ||||||||||
Ritchie Bros Auctioneers, Inc., 5.38%, 1/15/25 (b) | 125 | 128,594 | ||||||||||
Silk Bidco AS, 7.50%, 2/01/22 | EUR | 100 | 113,885 | |||||||||
United Rentals North America, Inc.: | ||||||||||||
7.63%, 4/15/22 | USD | 31 | 32,366 | |||||||||
5.75%, 11/15/24 | 60 | 63,720 | ||||||||||
|
| |||||||||||
| 5,851,512 | ||||||||||||
| Corporate Bonds | Par (000) | Value | ||||||||||
Communications Equipment — 0.3% |
| |||||||||||
Alcatel-Lucent USA, Inc., 6.45%, 3/15/29 | USD | 648 | $ | 716,040 | ||||||||
CommScope, Inc., 5.00%, 6/15/21 (b) | 250 | 257,500 | ||||||||||
Nokia OYJ, 6.63%, 5/15/39 | 135 | 144,112 | ||||||||||
Zayo Group LLC/Zayo Capital, Inc.: | ||||||||||||
6.00%, 4/01/23 | 834 | 881,955 | ||||||||||
6.38%, 5/15/25 | 258 | 277,995 | ||||||||||
5.75%, 1/15/27 (b) | 143 | 151,194 | ||||||||||
|
| |||||||||||
| 2,428,796 | ||||||||||||
Construction & Engineering — 0.6% |
| |||||||||||
BlueLine Rental Finance Corp., 7.00%, 2/01/19 (b) | 369 | 376,380 | ||||||||||
Engility Corp., 8.88%, 9/01/24 (b) | 176 | 189,200 | ||||||||||
ITR Concession Co. LLC, 4.20%, 7/15/25 (b) | 4,000 | 4,066,160 | ||||||||||
|
| |||||||||||
| 4,631,740 | ||||||||||||
Construction Materials — 0.3% |
| |||||||||||
American Tire Distributors, Inc., 10.25%, 3/01/22 (b) | 164 | 162,770 | ||||||||||
HD Supply, Inc. (b): | ||||||||||||
5.25%, 12/15/21 | 790 | 833,450 | ||||||||||
5.75%, 4/15/24 | 481 | 508,657 | ||||||||||
LKQ Italia Bondco SpA, 3.88%, 4/01/24 | EUR | 157 | 177,764 | |||||||||
PulteGroup, Inc.: | ||||||||||||
5.50%, 3/01/26 | USD | 133 | 137,988 | |||||||||
6.00%, 2/15/35 | 27 | 26,595 | ||||||||||
Rexel SA, 3.50%, 6/15/23 | EUR | 100 | 110,805 | |||||||||
|
| |||||||||||
| 1,958,029 | ||||||||||||
Consumer Discretionary — 0.0% |
| |||||||||||
Nielsen Co. Luxembourg SARL, 5.00%, 2/01/25 (b) | USD | 117 | 117,877 | |||||||||
Silversea Cruise Finance Ltd., 7.25%, 2/01/25 (b) | 63 | 65,678 | ||||||||||
|
| |||||||||||
| 183,555 | ||||||||||||
Consumer Finance — 1.9% |
| |||||||||||
Ally Financial, Inc.: | ||||||||||||
6.25%, 12/01/17 | 320 | 330,950 | ||||||||||
4.63%, 3/30/25 | 190 | 194,275 | ||||||||||
8.00%, 11/01/31 | 1,803 | 2,217,690 | ||||||||||
Capital One Financial Corp., 4.75%, 7/15/21 (d) | 1,935 | 2,096,783 | ||||||||||
Corivas Campus Living USG LLC, 5.30%, 7/01/50 | 5,700 | 5,701,140 | ||||||||||
Ford Motor Credit Co. LLC: | ||||||||||||
8.13%, 1/15/20 | 1,530 | 1,766,970 | ||||||||||
4.25%, 9/20/22 | 1,600 | 1,675,894 | ||||||||||
Navient Corp.: | ||||||||||||
5.00%, 10/26/20 | 180 | 180,846 | ||||||||||
6.63%, 7/26/21 | 104 | 108,420 | ||||||||||
5.50%, 1/25/23 | 75 | 71,813 | ||||||||||
7.25%, 9/25/23 | 173 | 177,325 | ||||||||||
6.13%, 3/25/24 | 59 | 56,493 | ||||||||||
5.88%, 10/25/24 | 56 | 52,500 | ||||||||||
5.63%, 8/01/33 | 101 | 81,810 | ||||||||||
OneMain Financial Holdings LLC (b): | ||||||||||||
6.75%, 12/15/19 | 101 | 105,735 | ||||||||||
7.25%, 12/15/21 | 78 | 81,510 | ||||||||||
|
| |||||||||||
| 14,900,154 | ||||||||||||
Containers & Packaging — 0.8% |
| |||||||||||
Ardagh Packaging Finance PLC/Ardagh Holdings USA, Inc.: | ||||||||||||
6.75%, 1/31/21 (b) | 200 | 207,360 | ||||||||||
4.25%, 1/15/22 | EUR | 100 | 109,362 | |||||||||
4.25%, 9/15/22 (b)(c) | USD | 200 | 203,000 | |||||||||
2.75%, 3/15/24 (c) | EUR | 100 | 106,062 | |||||||||
6.75%, 5/15/24 | 100 | 117,196 | ||||||||||
6.00%, 2/15/25 (b)(c) | USD | 402 | 413,055 | |||||||||
See Notes to Financial Statements.
| SEMI-ANNUAL REPORT | FEBRUARY 28, 2017 | 13 |
Schedule of Investments (continued) | BlackRock Core Bond Trust (BHK) |
| Corporate Bonds | Par (000) | Value | ||||||||||
Containers & Packaging (continued) |
| |||||||||||
Ardagh Packaging Finance PLC/Ardagh MP Holdings USA, Inc. (b): | ||||||||||||
4.63%, 5/15/23 | USD | 271 | $ | 275,742 | ||||||||
7.25%, 5/15/24 | 1,475 | 1,607,750 | ||||||||||
Ball Corp., 5.00%, 3/15/22 | 141 | 149,284 | ||||||||||
Clearwater Paper Corp., 5.38%, 2/01/25 (b) | 181 | 180,548 | ||||||||||
Crown European Holdings SA, 3.38%, 5/15/25 | EUR | 100 | 109,727 | |||||||||
Flex Acquisition Co., Inc., 6.88%, 1/15/25 (b) | USD | 98 | 100,205 | |||||||||
JH-Holding Finance SA, 8.25%, 12/01/22 (e) | EUR | 100 | 114,773 | |||||||||
Reynolds Group Issuer, Inc./Reynolds Group Issuer LLC/Reynolds Group Issuer Lu: | ||||||||||||
5.75%, 10/15/20 | USD | 194 | 199,820 | |||||||||
6.88%, 2/15/21 | 305 | 313,001 | ||||||||||
4.52%, 7/15/21 (a)(b) | 438 | 449,497 | ||||||||||
5.13%, 7/15/23 (b) | 363 | 376,159 | ||||||||||
7.00%, 7/15/24 (b) | 393 | 422,721 | ||||||||||
Sappi Papier Holding GmbH, 4.00%, 4/01/23 | EUR | 100 | 112,296 | |||||||||
Sealed Air Corp. (b): | ||||||||||||
4.88%, 12/01/22 | USD | 365 | 377,319 | |||||||||
6.88%, 7/15/33 | 6 | 6,510 | ||||||||||
Signode Industrial Group Lux SA/Signode Industrial Group US, Inc., 6.38%, 5/01/22 (b) | 333 | 342,157 | ||||||||||
Verallia Packaging SASU, 5.13%, 8/01/22 | EUR | 100 | 112,402 | |||||||||
|
| |||||||||||
| 6,405,946 | ||||||||||||
Diversified Consumer Services — 0.3% |
| |||||||||||
APX Group, Inc.: | ||||||||||||
6.38%, 12/01/19 | USD | 33 | 33,949 | |||||||||
8.75%, 12/01/20 | 211 | 218,385 | ||||||||||
7.88%, 12/01/22 (b) | 130 | 140,725 | ||||||||||
7.88%, 12/01/22 | 86 | 93,095 | ||||||||||
Prime Security Services Borrower LLC/Prime Finance, Inc., 9.25%, 5/15/23 (b) | 1,168 | 1,277,500 | ||||||||||
Service Corp. International, 4.50%, 11/15/20 | 315 | 321,300 | ||||||||||
Sotheby’s, 5.25%, 10/01/22 (b) | 18 | 18,360 | ||||||||||
Tereos Finance Groupe I SA, 4.13%, 6/16/23 | EUR | 100 | 109,039 | |||||||||
|
| |||||||||||
| 2,212,353 | ||||||||||||
Diversified Financial Services — 3.6% |
| |||||||||||
AerCap Ireland Capital Ltd./AerCap Global Aviation Trust, 3.95%, 2/01/22 | USD | 750 | 776,160 | |||||||||
Aircastle Ltd., 6.25%, 12/01/19 | 353 | 384,770 | ||||||||||
Bank of America Corp. (d): | ||||||||||||
5.63%, 7/01/20 | 2,200 | 2,425,106 | ||||||||||
3.30%, 1/11/23 | 6,000 | 6,045,540 | ||||||||||
FBM Finance, Inc., 8.25%, 8/15/21 (b) | 80 | 85,616 | ||||||||||
FMR LLC, 4.95%, 2/01/33 (b)(d) | 2,300 | 2,437,131 | ||||||||||
Garfunkelux Holdco 3 SA, 8.50%, 11/01/22 | GBP | 100 | 129,669 | |||||||||
General Electric Capital Corp., 6.15%, 8/07/37 (d) | USD | 2,150 | 2,826,497 | |||||||||
General Motors Financial Co., Inc., 4.25%, 5/15/23 | 807 | 837,237 | ||||||||||
IntercontinentalExchange Group, Inc., 4.00%, 10/15/23 | 470 | 498,345 | ||||||||||
Jefferies Finance LLC/JFIN Co-Issuer Corp., 7.38%, 4/01/20 (b) | 595 | 605,412 | ||||||||||
Mercury Bondco PLC (e): | ||||||||||||
(7.13% Cash or 7.88% PIK), 7.13%, 5/30/21 | EUR | 100 | 104,880 | |||||||||
(8.25% Cash or 9.00% PIK), 8.25%, 5/30/21 | 100 | 108,059 | ||||||||||
Moody’s Corp., 4.50%, 9/01/22 (d) | USD | 1,800 | 1,931,924 | |||||||||
Northern Trust Corp., 3.95%, 10/30/25 (d) | 8,000 | 8,475,976 | ||||||||||
UniCredit SpA: | ||||||||||||
6.95%, 10/31/22 | EUR | 140 | 172,292 | |||||||||
5.75%, 10/28/25 (a) | 107 | 121,233 | ||||||||||
|
| |||||||||||
| 27,965,847 | ||||||||||||
| Corporate Bonds | Par (000) | Value | ||||||||||
Diversified Telecommunication Services — 3.5% |
| |||||||||||
AT&T, Inc. (d): | ||||||||||||
6.38%, 3/01/41 | USD | 520 | $ | 592,076 | ||||||||
5.15%, 3/15/42 | 2,400 | 2,375,484 | ||||||||||
4.75%, 5/15/46 | 2,710 | 2,534,189 | ||||||||||
CenturyLink, Inc.: | ||||||||||||
6.45%, 6/15/21 | 437 | 465,680 | ||||||||||
Series U, 7.65%, 3/15/42 | 99 | 90,585 | ||||||||||
Series Y, 7.50%, 4/01/24 | 108 | 116,100 | ||||||||||
Cincinnati Bell, Inc., 7.00%, 7/15/24 (b) | 451 | 476,933 | ||||||||||
Consolidated Communications, Inc., 6.50%, 10/01/22 | 68 | 67,830 | ||||||||||
Frontier Communications Corp.: | ||||||||||||
8.13%, 10/01/18 | 71 | 75,970 | ||||||||||
7.13%, 3/15/19 | 220 | 233,750 | ||||||||||
8.50%, 4/15/20 | 75 | 79,500 | ||||||||||
7.13%, 1/15/23 | 50 | 45,250 | ||||||||||
7.63%, 4/15/24 | 205 | 183,988 | ||||||||||
6.88%, 1/15/25 | 915 | 770,887 | ||||||||||
11.00%, 9/15/25 | 379 | 380,895 | ||||||||||
Level 3 Financing, Inc.: | ||||||||||||
5.38%, 8/15/22 | 165 | 171,064 | ||||||||||
5.63%, 2/01/23 | 149 | 153,843 | ||||||||||
5.13%, 5/01/23 | 95 | 96,900 | ||||||||||
5.38%, 1/15/24 | 165 | 169,331 | ||||||||||
5.38%, 5/01/25 | 140 | 144,550 | ||||||||||
5.25%, 3/15/26 (b) | 223 | 224,951 | ||||||||||
OTE PLC, 3.50%, 7/09/20 | EUR | 100 | 106,470 | |||||||||
SBA Communications Corp., 4.88%, 9/01/24 (b) | USD | 177 | 176,097 | |||||||||
Telecom Italia Capital SA: | ||||||||||||
6.38%, 11/15/33 | 95 | 95,950 | ||||||||||
6.00%, 9/30/34 | 300 | 296,250 | ||||||||||
7.20%, 7/18/36 | 105 | 111,195 | ||||||||||
Telecom Italia SpA: | ||||||||||||
3.25%, 1/16/23 | EUR | 141 | 157,904 | |||||||||
3.63%, 1/19/24 | 200 | 225,387 | ||||||||||
Verizon Communications, Inc. (d): | ||||||||||||
6.40%, 2/15/38 | USD | 6,879 | 8,207,514 | |||||||||
6.55%, 9/15/43 | 6,751 | 8,264,655 | ||||||||||
Windstream Corp., 7.75%, 10/01/21 | 17 | 17,510 | ||||||||||
Windstream Services LLC, 7.50%, 6/01/22 | 53 | 52,470 | ||||||||||
|
| |||||||||||
| 27,161,158 | ||||||||||||
Electric Utilities — 5.8% |
| |||||||||||
AES Corp., 4.88%, 5/15/23 | 210 | 208,530 | ||||||||||
Berkshire Hathaway Energy Co., 6.50%, 9/15/37 (d) | 5,515 | 7,221,005 | ||||||||||
Black Hills Corp., 3.15%, 1/15/27 | 405 | 389,123 | ||||||||||
Cleveland Electric Illuminating Co., 5.95%, 12/15/36 | 434 | 489,601 | ||||||||||
CMS Energy Corp., 5.05%, 3/15/22 (d) | 1,832 | 2,015,510 | ||||||||||
Duke Energy Carolinas LLC: | ||||||||||||
6.10%, 6/01/37 | 640 | 806,371 | ||||||||||
6.00%, 1/15/38 (d) | 1,675 | 2,125,434 | ||||||||||
4.25%, 12/15/41 (d) | 750 | 783,534 | ||||||||||
Duke Energy Florida LLC, 6.40%, 6/15/38 (d) | 770 | 1,036,207 | ||||||||||
E.ON International Finance BV, 6.65%, 4/30/38 (b) | 3,100 | 3,775,028 | ||||||||||
Electricite de France SA, 5.60%, 1/27/40 (b)(d) | 2,800 | 3,112,931 | ||||||||||
Florida Power Corp., 6.35%, 9/15/37 (d) | 2,775 | 3,696,580 | ||||||||||
Jersey Central Power & Light Co., 7.35%, 2/01/19 | 490 | 535,752 | ||||||||||
Ohio Power Co., Series D, 6.60%, 3/01/33 (d) | 3,000 | 3,773,514 | ||||||||||
PacifiCorp, 6.25%, 10/15/37 (d) | 1,225 | 1,605,502 | ||||||||||
Public Service Co. of Colorado, Series 17, 6.25%, 9/01/37 (d) | 2,550 | 3,325,873 | ||||||||||
Southern California Edison Co. (d): | ||||||||||||
5.63%, 2/01/36 | 1,300 | 1,587,447 | ||||||||||
Series A, 5.95%, 2/01/38 | 2,175 | 2,770,687 | ||||||||||
Southern Co., 4.40%, 7/01/46 | 1,000 | 996,053 | ||||||||||
See Notes to Financial Statements.
| 14 | SEMI-ANNUAL REPORT | FEBRUARY 28, 2017 |
Schedule of Investments (continued) | BlackRock Core Bond Trust (BHK) |
| Corporate Bonds | Par (000) | Value | ||||||||||
Electric Utilities (continued) |
| |||||||||||
Virginia Electric & Power Co., Series A, 6.00%, 5/15/37 (d) | USD | 3,920 | $ | 4,911,548 | ||||||||
|
| |||||||||||
| 45,166,230 | ||||||||||||
Electrical Equipment — 0.0% |
| |||||||||||
Anixter, Inc., 5.63%, 5/01/19 | 35 | 36,925 | ||||||||||
Areva SA, 4.88%, 9/23/24 | EUR | 50 | 53,558 | |||||||||
Trionista TopCo GmbH, 6.88%, 4/30/21 | 110 | 121,924 | ||||||||||
|
| |||||||||||
| 212,407 | ||||||||||||
Electronic Equipment, Instruments & Components — 0.1% |
| |||||||||||
CDW LLC/CDW Finance Corp.: | ||||||||||||
6.00%, 8/15/22 | USD | 280 | 296,450 | |||||||||
5.00%, 9/01/23 | 234 | 241,020 | ||||||||||
5.00%, 9/01/25 (c) | 72 | 73,035 | ||||||||||
SESI LLC, 7.13%, 12/15/21 | 60 | 61,650 | ||||||||||
|
| |||||||||||
| 672,155 | ||||||||||||
Energy Equipment & Services — 0.8% |
| |||||||||||
Ensco PLC: | ||||||||||||
4.50%, 10/01/24 | 99 | 85,140 | ||||||||||
5.20%, 3/15/25 | 25 | 22,125 | ||||||||||
Enterprise Products Operating LLC, 6.13%, 10/15/39 (d) | 1,400 | 1,649,409 | ||||||||||
Gates Global LLC/Gates Global Co., 6.00%, 7/15/22 (b) | 378 | 380,835 | ||||||||||
Genesis Energy LP/Genesis Energy Finance Corp.: | ||||||||||||
5.75%, 2/15/21 | 142 | 144,130 | ||||||||||
6.75%, 8/01/22 | 170 | 177,225 | ||||||||||
GrafTech International Ltd., 6.38%, 11/15/20 | 600 | 510,000 | ||||||||||
Halliburton Co., 5.00%, 11/15/45 | 500 | 542,783 | ||||||||||
Noble Holding International Ltd., 4.63%, 3/01/21 | 8 | 7,580 | ||||||||||
Pattern Energy Group, Inc., 5.88%, 2/01/24 (b) | 93 | �� | 95,441 | |||||||||
Pioneer Energy Services Corp., 6.13%, 3/15/22 | 185 | 172,744 | ||||||||||
Precision Drilling Corp.: | ||||||||||||
6.50%, 12/15/21 | 70 | 71,925 | ||||||||||
5.25%, 11/15/24 | 90 | 89,100 | ||||||||||
Transocean, Inc.: | ||||||||||||
6.00%, 3/15/18 | 195 | 199,875 | ||||||||||
7.38%, 4/15/18 | 20 | 20,550 | ||||||||||
5.80%, 10/15/22 | 444 | 415,140 | ||||||||||
9.00%, 7/15/23 (b) | 659 | 710,072 | ||||||||||
6.80%, 3/15/38 | 47 | 38,540 | ||||||||||
Trinidad Drilling Ltd., 6.63%, 2/15/25 (b) | 243 | 250,290 | ||||||||||
Weatherford International Ltd.: | ||||||||||||
7.75%, 6/15/21 | 185 | 199,569 | ||||||||||
8.25%, 6/15/23 | 80 | 86,800 | ||||||||||
9.88%, 2/15/24 (b) | 106 | 122,430 | ||||||||||
|
| |||||||||||
| 5,991,703 | ||||||||||||
Environmental, Maintenance, & Security Service — 0.1% |
| |||||||||||
Befesa Zinc SAU Via Zinc Capital SA, 8.88%, 5/15/18 | EUR | 100 | 108,212 | |||||||||
Tervita Escrow Corp., 7.63%, 12/01/21 (b) | USD | 276 | 288,420 | |||||||||
|
| |||||||||||
| 396,632 | ||||||||||||
Food & Staples Retailing — 0.7% |
| |||||||||||
Albertsons Cos. LLC/Safeway, Inc./New Albertson’s, Inc./Albertson’s LLC (b): | ||||||||||||
6.63%, 6/15/24 | 151 | 160,060 | ||||||||||
5.75%, 3/15/25 | 169 | 169,317 | ||||||||||
Aramark Services, Inc., 4.75%, 6/01/26 | 151 | 151,378 | ||||||||||
B&M European Value Retail SA, 4.13%, 2/01/22 | GBP | 100 | 129,224 | |||||||||
Casino Guichard Perrachon SA: | ||||||||||||
5.98%, 5/26/21 | EUR | 100 | 124,811 | |||||||||
4.56%, 1/25/23 | 100 | 118,464 | ||||||||||
CVS Health Corp., 5.13%, 7/20/45 (d) | USD | 2,000 | 2,228,126 | |||||||||
| Corporate Bonds | Par (000) | Value | ||||||||||
Food & Staples Retailing (continued) |
| |||||||||||
Dollar Tree, Inc., 5.75%, 3/01/23 | USD | 914 | $ | 969,982 | ||||||||
Pinnacle Foods Finance LLC/Pinnacle Foods Finance Corp., 5.88%, 1/15/24 | 42 | 44,415 | ||||||||||
Rite Aid Corp.: | ||||||||||||
6.75%, 6/15/21 | 258 | 268,965 | ||||||||||
6.13%, 4/01/23 (b) | 22 | 23,312 | ||||||||||
7.70%, 2/15/27 | 241 | 287,995 | ||||||||||
Walgreens Boots Alliance, Inc., 4.80%, 11/18/44 | 1,000 | 1,034,985 | ||||||||||
|
| |||||||||||
| 5,711,034 | ||||||||||||
Food Products — 0.2% |
| |||||||||||
Acosta, Inc., 7.75%, 10/01/22 (b) | 167 | 146,960 | ||||||||||
Aramark Services, Inc., 5.13%, 1/15/24 | 148 | 155,045 | ||||||||||
Darling Global Finance BV, 4.75%, 5/30/22 | EUR | 100 | 112,357 | |||||||||
JBS USA LLC/JBS USA Finance, Inc. (b): | ||||||||||||
7.25%, 6/01/21 | USD | 30 | 30,900 | |||||||||
5.88%, 7/15/24 | 92 | 96,140 | ||||||||||
5.75%, 6/15/25 | 316 | 326,270 | ||||||||||
Post Holdings, Inc. (b): | ||||||||||||
6.75%, 12/01/21 | 68 | 72,998 | ||||||||||
7.75%, 3/15/24 | 232 | 257,520 | ||||||||||
5.50%, 3/01/25 | 69 | 70,294 | ||||||||||
8.00%, 7/15/25 | 235 | 264,962 | ||||||||||
5.00%, 8/15/26 | 29 | 28,039 | ||||||||||
TreeHouse Foods, Inc., 6.00%, 2/15/24 (b) | 89 | 93,673 | ||||||||||
WhiteWave Foods Co., 5.38%, 10/01/22 | 119 | 129,710 | ||||||||||
|
| |||||||||||
| 1,784,868 | ||||||||||||
Health Care Equipment & Supplies — 0.4% |
| |||||||||||
Crimson Merger Sub, Inc., 6.63%, 5/15/22 (b) | 405 | 361,463 | ||||||||||
DJO Finco, Inc./DJO Finance LLC/DJO Finance Corp., 8.13%, 6/15/21 (b) | 716 | 633,660 | ||||||||||
Fresenius Medical Care US Finance II, Inc., 4.75%, 10/15/24 (b) | 80 | 82,176 | ||||||||||
IASIS Healthcare LLC/IASIS Capital Corp., 8.38%, 5/15/19 | 160 | 156,400 | ||||||||||
Mallinckrodt International Finance SA/Mallinckrodt CB LLC (b): | ||||||||||||
5.63%, 10/15/23 | 192 | 184,320 | ||||||||||
5.50%, 4/15/25 | 240 | 223,200 | ||||||||||
Medtronic, Inc., 4.50%, 3/15/42 | 750 | 791,765 | ||||||||||
Teleflex, Inc.: | ||||||||||||
3.88%, 8/01/17 (f) | 50 | 155,281 | ||||||||||
5.25%, 6/15/24 | 170 | 175,525 | ||||||||||
4.88%, 6/01/26 | 39 | 39,293 | ||||||||||
|
| |||||||||||
| 2,803,083 | ||||||||||||
Health Care Providers & Services — 1.6% |
| |||||||||||
Acadia Healthcare Co., Inc.: | ||||||||||||
5.63%, 2/15/23 | 296 | 304,140 | ||||||||||
6.50%, 3/01/24 | 41 | 43,563 | ||||||||||
Aetna, Inc.: | ||||||||||||
3.20%, 6/15/26 | 1,005 | 1,013,729 | ||||||||||
4.50%, 5/15/42 | 575 | 598,484 | ||||||||||
Alere, Inc., 6.38%, 7/01/23 (b) | 208 | 211,120 | ||||||||||
Amsurg Corp., 5.63%, 7/15/22 | 553 | 575,811 | ||||||||||
Centene Corp.: | ||||||||||||
5.63%, 2/15/21 | 401 | 422,052 | ||||||||||
6.13%, 2/15/24 | 51 | 55,335 | ||||||||||
4.75%, 1/15/25 | 285 | 293,194 | ||||||||||
CHS/Community Health Systems, Inc.: | ||||||||||||
5.13%, 8/15/18 | 101 | 101,631 | ||||||||||
8.00%, 11/15/19 | 98 | 95,795 | ||||||||||
5.13%, 8/01/21 | 150 | 147,375 | ||||||||||
6.88%, 2/01/22 | 265 | 232,537 | ||||||||||
DaVita HealthCare Partners, Inc., 5.13%, 7/15/24 | 366 | 373,549 | ||||||||||
Envision Healthcare Corp., 5.13%, 7/01/22 (b) | 365 | 373,669 | ||||||||||
See Notes to Financial Statements.
| SEMI-ANNUAL REPORT | FEBRUARY 28, 2017 | 15 |
Schedule of Investments (continued) | BlackRock Core Bond Trust (BHK) |
| Corporate Bonds | Par (000) | Value | ||||||||||
Health Care Providers & Services (continued) |
| |||||||||||
HCA, Inc.: | ||||||||||||
3.75%, 3/15/19 | USD | 264 | $ | 270,600 | ||||||||
6.50%, 2/15/20 | 652 | 715,759 | ||||||||||
4.75%, 5/01/23 | 562 | 589,397 | ||||||||||
5.00%, 3/15/24 | 315 | 331,931 | ||||||||||
5.38%, 2/01/25 | 772 | 807,705 | ||||||||||
5.25%, 4/15/25 | 66 | 70,373 | ||||||||||
5.88%, 2/15/26 | 284 | 304,590 | ||||||||||
5.25%, 6/15/26 | 361 | 381,306 | ||||||||||
4.50%, 2/15/27 | 408 | 406,980 | ||||||||||
HealthSouth Corp.: | ||||||||||||
5.75%, 11/01/24 | 176 | 179,520 | ||||||||||
5.75%, 9/15/25 | 141 | 142,763 | ||||||||||
2.00%, 12/01/43 (f) | 225 | 270,422 | ||||||||||
Hologic, Inc., 5.25%, 7/15/22 (b) | 360 | 375,300 | ||||||||||
MEDNAX, Inc., 5.25%, 12/01/23 (b) | 134 | 138,523 | ||||||||||
MPH Acquisition Holdings LLC, 7.13%, 6/01/24 (b) | 478 | 515,045 | ||||||||||
New Amethyst Corp., 6.25%, 12/01/24 (b) | 74 | 78,440 | ||||||||||
RegionalCare Hospital Partners Holdings, Inc., 8.25%, 5/01/23 (b) | 207 | 222,525 | ||||||||||
Surgery Center Holdings, Inc., 8.88%, 4/15/21 (b) | 48 | 51,360 | ||||||||||
Tenet Healthcare Corp.: | ||||||||||||
6.25%, 11/01/18 | 159 | 168,341 | ||||||||||
6.00%, 10/01/20 | 324 | 343,440 | ||||||||||
4.50%, 4/01/21 | 21 | 21,263 | ||||||||||
4.38%, 10/01/21 | 112 | 112,840 | ||||||||||
7.50%, 1/01/22 (b) | 93 | 100,673 | ||||||||||
8.13%, 4/01/22 | 789 | 826,477 | ||||||||||
6.75%, 6/15/23 | 501 | 496,616 | ||||||||||
|
| |||||||||||
| 12,764,173 | ||||||||||||
Health Care Technology — 0.0% |
| |||||||||||
Change Healthcare Holdings LLC/Change Healthcare Finance, Inc., 5.75%, 3/01/25 (b) | 121 | 124,970 | ||||||||||
Quintiles IMS, Inc., 3.25%, 3/15/25 (b) | EUR | 100 | 106,099 | |||||||||
|
| |||||||||||
| 231,069 | ||||||||||||
Hotels, Restaurants & Leisure — 2.4% |
| |||||||||||
Boyd Gaming Corp., 6.88%, 5/15/23 | USD | 172 | 185,760 | |||||||||
Caesars Entertainment Resort Properties LLC/Caesars Entertainment Resort Property, 8.00%, 10/01/20 | 1,346 | 1,408,252 | ||||||||||
CPUK Finance Ltd., 7.00%, 2/28/42 | GBP | 100 | 130,915 | |||||||||
ESH Hospitality, Inc., 5.25%, 5/01/25 (b) | USD | 88 | 88,770 | |||||||||
Gateway Casinos & Entertainment Ltd., 8.25%, 3/01/24 (b) | 48 | 48,780 | ||||||||||
International Game Technology PLC, 4.75%, 2/15/23 | EUR | 100 | 115,571 | |||||||||
Jacobs Entertainment, Inc., 7.88%, 2/01/24 (b) | USD | 45 | 46,238 | |||||||||
McDonald’s Corp., 3.70%, 1/30/26 | 510 | 523,295 | ||||||||||
MGM Resorts International: | ||||||||||||
8.63%, 2/01/19 | 47 | 51,935 | ||||||||||
5.25%, 3/31/20 | 50 | 52,625 | ||||||||||
6.75%, 10/01/20 | 127 | 139,979 | ||||||||||
6.63%, 12/15/21 | 620 | 692,075 | ||||||||||
7.75%, 3/15/22 | 20 | 23,350 | ||||||||||
4.63%, 9/01/26 | 86 | 84,279 | ||||||||||
New Red Finance, Inc., 6.00%, 4/01/22 (b) | 640 | 667,392 | ||||||||||
PortAventura Entertainment Barcelona BV, 7.25%, 12/01/20 | EUR | 100 | 109,850 | |||||||||
Sabre GLBL, Inc. (b): | ||||||||||||
5.38%, 4/15/23 | USD | 62 | 63,085 | |||||||||
5.25%, 11/15/23 | 185 | 187,775 | ||||||||||
Scientific Games International, Inc.: | ||||||||||||
7.00%, 1/01/22 (b) | 557 | 592,412 | ||||||||||
10.00%, 12/01/22 | 547 | 580,504 | ||||||||||
| Corporate Bonds | Par (000) | Value | ||||||||||
Hotels, Restaurants & Leisure (continued) |
| |||||||||||
Six Flags Entertainment Corp., 5.25%, 1/15/21 (b) | USD | 434 | $ | 446,152 | ||||||||
Station Casinos LLC, 7.50%, 3/01/21 | 570 | 594,225 | ||||||||||
Thomas Cook Group PLC, 6.25%, 6/15/22 | EUR | 100 | 112,879 | |||||||||
Unique Pub Finance Co. PLC: | ||||||||||||
Series A3, 6.54%, 3/30/21 | GBP | 2,374 | 3,210,363 | |||||||||
Series A4, 5.66%, 6/30/27 | 1,089 | 1,463,389 | ||||||||||
Series M, 7.40%, 3/28/24 | 3,000 | 4,036,351 | ||||||||||
Series N, 6.46%, 3/30/32 | 2,390 | 2,819,020 | ||||||||||
Vue International Bidco PLC, 7.88%, 7/15/20 | 100 | 128,949 | ||||||||||
Yum! Brands, Inc., 3.88%, 11/01/23 | USD | 66 | 64,680 | |||||||||
|
| |||||||||||
| 18,668,850 | ||||||||||||
Household Durables — 0.4% |
| |||||||||||
CalAtlantic Group, Inc.: | ||||||||||||
8.38%, 1/15/21 | 53 | 61,944 | ||||||||||
5.38%, 10/01/22 | 2 | 2,100 | ||||||||||
5.25%, 6/01/26 | 5 | 5,006 | ||||||||||
Century Communities, Inc., 6.88%, 5/15/22 | 460 | 480,125 | ||||||||||
Lennar Corp.: | ||||||||||||
4.13%, 1/15/22 | 77 | 77,963 | ||||||||||
4.75%, 11/15/22 | 130 | 133,705 | ||||||||||
4.88%, 12/15/23 | 85 | 87,763 | ||||||||||
4.75%, 5/30/25 | 180 | 182,250 | ||||||||||
Mattamy Group Corp., 6.88%, 12/15/23 (b) | 70 | 73,150 | ||||||||||
Newell Brands, Inc., 4.20%, 4/01/26 | 1,000 | 1,052,029 | ||||||||||
PulteGroup, Inc., 6.38%, 5/15/33 | 256 | 264,960 | ||||||||||
Riverbed Technology, Inc., 8.88%, 3/01/23 (b) | 155 | 165,462 | ||||||||||
Standard Pacific Corp., 5.88%, 11/15/24 | 15 | 16,088 | ||||||||||
Tempur Sealy International, Inc., 5.50%, 6/15/26 | 168 | 165,060 | ||||||||||
TRI Pointe Group, Inc.: | ||||||||||||
4.38%, 6/15/19 | 10 | 10,200 | ||||||||||
4.88%, 7/01/21 | 125 | 129,062 | ||||||||||
5.88%, 6/15/24 | 125 | 129,375 | ||||||||||
William Lyon Homes ,Inc., 5.88%, 1/31/25 (b) | 81 | 81,101 | ||||||||||
|
| |||||||||||
| 3,117,343 | ||||||||||||
Household Products — 0.1% |
| |||||||||||
ACCO Brands Corp., 5.25%, 12/15/24 (b) | 59 | 59,738 | ||||||||||
Prestige Brands, Inc., 6.38%, 3/01/24 (b) | 109 | 115,540 | ||||||||||
Spectrum Brands, Inc.: | ||||||||||||
6.63%, 11/15/22 | 355 | 375,412 | ||||||||||
6.13%, 12/15/24 | 112 | 119,179 | ||||||||||
5.75%, 7/15/25 | 22 | 23,375 | ||||||||||
|
| |||||||||||
| 693,244 | ||||||||||||
Independent Power and Renewable Electricity Producers — 0.2% |
| |||||||||||
Calpine Corp.: | ||||||||||||
6.00%, 1/15/22 (b) | 69 | 72,364 | ||||||||||
5.88%, 1/15/24 (b) | 84 | 88,620 | ||||||||||
5.50%, 2/01/24 | 5 | 4,950 | ||||||||||
Dynegy, Inc.: | ||||||||||||
6.75%, 11/01/19 | 425 | 437,750 | ||||||||||
7.38%, 11/01/22 | 151 | 148,357 | ||||||||||
7.63%, 11/01/24 | 80 | 76,000 | ||||||||||
8.00%, 1/15/25 (b) | 14 | 13,300 | ||||||||||
NRG Energy, Inc.: | ||||||||||||
7.88%, 5/15/21 | 32 | 33,200 | ||||||||||
6.63%, 3/15/23 | 25 | 25,313 | ||||||||||
6.25%, 5/01/24 | 25 | 25,000 | ||||||||||
7.25%, 5/15/26 | 69 | 70,984 | ||||||||||
6.63%, 1/15/27 (b) | 379 | 372,367 | ||||||||||
NRG Yield Operating LLC, 5.38%, 8/15/24 | 75 | 76,875 | ||||||||||
QEP Resources, Inc., 5.38%, 10/01/22 | 283 | 284,415 | ||||||||||
TerraForm Power Operating LLC, 6.38%, 2/01/23 (b)(g) | 126 | 130,410 | ||||||||||
|
| |||||||||||
| 1,859,905 | ||||||||||||
See Notes to Financial Statements.
| 16 | SEMI-ANNUAL REPORT | FEBRUARY 28, 2017 |
Schedule of Investments (continued) | BlackRock Core Bond Trust (BHK) |
| Corporate Bonds | Par (000) | Value | ||||||||||
Industrial Conglomerates — 0.6% |
| |||||||||||
General Electric Co.: | ||||||||||||
6.75%, 3/15/32 (d) | USD | 2,500 | $ | 3,409,900 | ||||||||
6.88%, 1/10/39 | 135 | 193,672 | ||||||||||
Smiths Group PLC, 3.63%, 10/12/22 (b) | 360 | 358,458 | ||||||||||
Vertiv Group Corp, 9.25%, 10/15/24 (b) | 293 | 314,609 | ||||||||||
|
| |||||||||||
| 4,276,639 | ||||||||||||
Insurance — 2.9% |
| |||||||||||
Allied World Assurance Co. Holdings Ltd., 4.35%, 10/29/25 | 1,495 | 1,499,249 | ||||||||||
American International Group, Inc., 3.75%, 7/10/25 (d) | 3,380 | 3,403,684 | ||||||||||
Aon PLC: | ||||||||||||
3.88%, 12/15/25 | 1,445 | 1,483,645 | ||||||||||
4.60%, 6/14/44 | 500 | 489,894 | ||||||||||
Assicurazioni Generali SpA (a): | ||||||||||||
7.75%, 12/12/42 | EUR | 100 | 126,084 | |||||||||
5.50%, 10/27/47 | 100 | 111,767 | ||||||||||
AXA SA, 5.25%, 4/16/40 (a) | 500 | 590,092 | ||||||||||
Five Corners Funding Trust, 4.42%, 11/15/23 (b)(d) | USD | 2,050 | 2,181,963 | |||||||||
Groupama SA, 6.00%, 1/23/27 | EUR | 100 | 108,293 | |||||||||
Hartford Financial Services Group, Inc., 5.13%, 4/15/22 | USD | 1,860 | 2,064,381 | |||||||||
HUB International Ltd. (b): | ||||||||||||
9.25%, 2/15/21 | 117 | 121,387 | ||||||||||
7.88%, 10/01/21 | 426 | 450,495 | ||||||||||
Liberty Mutual Group, Inc., 6.50%, 5/01/42 (b)(d) | 2,000 | 2,496,744 | ||||||||||
Lincoln National Corp., 3.35%, 3/09/25 (d) | 1,045 | 1,039,432 | ||||||||||
MetLife, Inc., 6.40%, 12/15/66 | 2,554 | 2,822,170 | ||||||||||
Muenchener Rueckversicherungs AG, 6.00%, 5/26/41 (a) | EUR | 400 | 503,124 | |||||||||
Prudential Financial, Inc. (d): | ||||||||||||
5.90%, 3/17/36 | USD | 500 | 608,145 | |||||||||
5.70%, 12/14/36 | 1,625 | 1,913,665 | ||||||||||
Radian Group, Inc., 5.25%, 6/15/20 | 185 | 194,712 | ||||||||||
Wayne Merger Sub LLC, 8.25%, 8/01/23 (b) | 286 | 301,730 | ||||||||||
|
| |||||||||||
| 22,510,656 | ||||||||||||
Internet Software & Services — 0.1% |
| |||||||||||
Equinix, Inc.: | ||||||||||||
4.88%, 4/01/20 | 173 | 177,325 | ||||||||||
5.88%, 1/15/26 | 245 | 261,689 | ||||||||||
Netflix, Inc.: | ||||||||||||
5.50%, 2/15/22 | 8 | 8,540 | ||||||||||
5.88%, 2/15/25 | 11 | 11,894 | ||||||||||
4.38%, 11/15/26 (b) | 452 | 448,045 | ||||||||||
Symantec Corp., 5.00%, 4/15/25 (b) | 106 | 108,803 | ||||||||||
|
| |||||||||||
| 1,016,296 | ||||||||||||
IT Services — 0.4% |
| |||||||||||
Ceridian HCM Holding, Inc., 11.00%, 3/15/21 (b) | 270 | 282,825 | ||||||||||
Fidelity National Information Services, Inc., 4.50%, 8/15/46 | 1,000 | 975,666 | ||||||||||
First Data Corp. (b): | ||||||||||||
7.00%, 12/01/23 | 683 | 734,225 | ||||||||||
5.75%, 1/15/24 | 1,424 | 1,475,620 | ||||||||||
|
| |||||||||||
| 3,468,336 | ||||||||||||
Life Sciences Tools & Services — 0.2% |
| |||||||||||
Thermo Fisher Scientific, Inc., 5.30%, 2/01/44 | 1,000 | 1,134,017 | ||||||||||
Machinery — 0.1% |
| |||||||||||
Gardner Denver, Inc., 6.88%, 8/15/21 (b) | 90 | 92,700 | ||||||||||
Navistar International Corp., 8.25%, 11/01/21 | 30 | 30,300 | ||||||||||
SPX FLOW, Inc. (b): | ||||||||||||
5.63%, 8/15/24 | 115 | 118,162 | ||||||||||
5.88%, 8/15/26 | 105 | 106,575 | ||||||||||
| Corporate Bonds | Par (000) | Value | ||||||||||
Machinery (continued) |
| |||||||||||
Terex Corp., 5.63%, 2/01/25 (b) | USD | 201 | $ | 206,276 | ||||||||
Trinseo Materials Operating SCA/Trinseo Materials Finance, Inc., 6.38%, 5/01/22 | EUR | 100 | 113,854 | |||||||||
|
| |||||||||||
| 667,867 | ||||||||||||
Marine — 0.3% |
| |||||||||||
Nakilat, Inc., Series A, 6.07%, 12/31/33 (b)(d) | USD | 2,150 | 2,491,420 | |||||||||
Media — 6.1% |
| |||||||||||
21st Century Fox America, Inc., 7.63%, 11/30/28 | 385 | 507,434 | ||||||||||
Adria Bidco BV, 7.88%, 11/15/20 | EUR | 100 | 110,575 | |||||||||
Altice Financing SA: | ||||||||||||
5.25%, 2/15/23 | 100 | 113,186 | ||||||||||
7.50%, 5/15/26 (b) | USD | 607 | 651,766 | |||||||||
Altice Luxembourg SA: | ||||||||||||
7.75%, 5/15/22 (b) | 200 | 212,750 | ||||||||||
6.25%, 2/15/25 | EUR | 100 | 112,561 | |||||||||
7.63%, 2/15/25 (b) | USD | 289 | 307,785 | |||||||||
Altice US Finance I Corp. (b): | ||||||||||||
5.38%, 7/15/23 | 770 | 802,725 | ||||||||||
5.50%, 5/15/26 | 293 | 302,889 | ||||||||||
AMC Networks, Inc.: | ||||||||||||
4.75%, 12/15/22 | 192 | 193,920 | ||||||||||
5.00%, 4/01/24 | 191 | 192,792 | ||||||||||
Cablevision Systems Corp.: | ||||||||||||
8.63%, 9/15/17 | 76 | 78,375 | ||||||||||
7.75%, 4/15/18 | 311 | 326,550 | ||||||||||
8.00%, 4/15/20 | 325 | 359,125 | ||||||||||
CBS Radio, Inc., 7.25%, 11/01/24 (b) | 149 | 159,058 | ||||||||||
CCO Holdings LLC/CCO Holdings Capital Corp.: | ||||||||||||
5.25%, 9/30/22 | 280 | 291,200 | ||||||||||
5.13%, 5/01/23 (b) | 359 | 372,462 | ||||||||||
5.75%, 2/15/26 (b) | 197 | 210,790 | ||||||||||
5.50%, 5/01/26 (b) | 278 | 295,027 | ||||||||||
5.13%, 5/01/27 (b) | 249 | 258,649 | ||||||||||
5.88%, 5/01/27 (b) | 616 | 661,646 | ||||||||||
Cequel Communications Holdings I LLC/Cequel Capital Corp. (b): | ||||||||||||
6.38%, 9/15/20 | 100 | 103,063 | ||||||||||
5.13%, 12/15/21 | 562 | 568,827 | ||||||||||
7.75%, 7/15/25 | 960 | 1,063,200 | ||||||||||
Charter Communications Operating LLC/Charter Communications Operating Capital, 4.91%, 7/23/25 | 4,000 | 4,213,612 | ||||||||||
Clear Channel International BV, 8.75%, 12/15/20 (b) | 284 | 301,040 | ||||||||||
Clear Channel Worldwide Holdings, Inc.: | ||||||||||||
6.50%, 11/15/22 | 2,050 | 2,090,432 | ||||||||||
Series B, 7.63%, 3/15/20 | 95 | 95,713 | ||||||||||
Comcast Cable Communications Holdings, Inc., 9.46%, 11/15/22 (d) | 2,600 | 3,495,778 | ||||||||||
Comcast Corp.: | ||||||||||||
6.45%, 3/15/37 (d) | 790 | 1,015,148 | ||||||||||
4.60%, 8/15/45 | 2,000 | 2,079,060 | ||||||||||
Cox Communications, Inc. (b): | ||||||||||||
6.95%, 6/01/38 | 1,000 | 1,089,372 | ||||||||||
8.38%, 3/01/39 (d) | 3,475 | 4,341,185 | ||||||||||
CSC Holdings LLC: | ||||||||||||
10.13%, 1/15/23 (b) | 790 | 914,425 | ||||||||||
5.25%, 6/01/24 | 430 | 432,687 | ||||||||||
10.88%, 10/15/25 (b) | 510 | 614,550 | ||||||||||
Discovery Communications LLC: | ||||||||||||
3.25%, 4/01/23 | 1,850 | 1,819,899 | ||||||||||
3.45%, 3/15/25 | 210 | 200,947 | ||||||||||
DISH DBS Corp.: | ||||||||||||
6.75%, 6/01/21 | 510 | 562,275 | ||||||||||
5.88%, 7/15/22 | 118 | 126,555 | ||||||||||
See Notes to Financial Statements.
| SEMI-ANNUAL REPORT | FEBRUARY 28, 2017 | 17 |
Schedule of Investments (continued) | BlackRock Core Bond Trust (BHK) |
| Corporate Bonds | Par (000) | Value | ||||||||||
Media (continued) |
| |||||||||||
DISH DBS Corp. (continued): | ||||||||||||
5.88%, 11/15/24 | USD | 99 | $ | 105,435 | ||||||||
7.75%, 7/01/26 | 575 | 672,750 | ||||||||||
DISH Network Corp., 3.38%, 8/15/26 (b)(f) | 175 | 210,656 | ||||||||||
eircom Finance DAC, 4.50%, 5/31/22 | EUR | 100 | 110,919 | |||||||||
GTT Escrow Corp., 7.88%, 12/31/24 (b) | USD | 50 | 52,375 | |||||||||
Hughes Satellite Systems Corp.: | ||||||||||||
7.63%, 6/15/21 | 64 | 70,960 | ||||||||||
5.25%, 8/01/26 (b) | 329 | 334,346 | ||||||||||
6.63%, 8/01/26 (b) | 64 | 66,600 | ||||||||||
iHeartCommunications, Inc.: | ||||||||||||
9.00%, 12/15/19 | 185 | 161,644 | ||||||||||
9.00%, 3/01/21 | 9 | 7,290 | ||||||||||
10.63%, 3/15/23 | 961 | 797,630 | ||||||||||
Intelsat Jackson Holdings SA: | ||||||||||||
7.25%, 4/01/19 | 467 | 447,152 | ||||||||||
7.25%, 10/15/20 | 249 | 230,325 | ||||||||||
5.50%, 8/01/23 | 427 | 351,207 | ||||||||||
Interpublic Group of Cos., Inc., 3.75%, 2/15/23 | 2,000 | 2,023,762 | ||||||||||
LG Finance Co. Corp., 5.88%, 11/01/24 (b) | 57 | 58,639 | ||||||||||
LGE HoldCo VI BV, 7.13%, 5/15/24 | EUR | 100 | 120,904 | |||||||||
McGraw-Hill Global Education Holdings LLC/McGraw-Hill Global Education Finance, 7.88%, 5/15/24 (b) | USD | 61 | 59,780 | |||||||||
MDC Partners, Inc., 6.50%, 5/01/24 (b) | 246 | 237,697 | ||||||||||
Midcontinent Communications / Midcontinent Finance Corp. (b): | ||||||||||||
6.25%, 8/01/21 | 340 | 353,260 | ||||||||||
6.88%, 8/15/23 | 66 | 71,115 | ||||||||||
NAI Entertainment Holdings/NAI Entertainment Holdings Finance Corp., 5.00%, 8/01/18 (b) | 117 | 118,024 | ||||||||||
National CineMedia LLC, 5.75%, 8/15/26 | 59 | 60,180 | ||||||||||
Nexstar Broadcasting, Inc., 5.63%, 8/01/24 (b) | 159 | 162,577 | ||||||||||
Nielsen Finance LLC/Nielsen Finance Co., 5.00%, 4/15/22 (b) | 211 | 217,330 | ||||||||||
Numericable Group SA, 5.38%, 5/15/22 | EUR | 106 | 117,125 | |||||||||
Outfront Media Capital LLC/Outfront Media Capital Corp.: | ||||||||||||
5.25%, 2/15/22 | USD | 55 | 57,131 | |||||||||
5.63%, 2/15/24 | 160 | 168,000 | ||||||||||
SFR Group SA (b): | ||||||||||||
6.00%, 5/15/22 | 345 | 357,831 | ||||||||||
7.38%, 5/01/26 | 1,501 | 1,555,411 | ||||||||||
Sirius XM Radio, Inc., 4.25%, 5/15/20 (b) | 463 | 468,787 | ||||||||||
TCI Communications, Inc., 7.88%, 2/15/26 (d) | 610 | 816,190 | ||||||||||
Telesat Canada/Telesat LLC, 8.88%, 11/15/24 (b) | 115 | 125,638 | ||||||||||
Time Warner, Inc., 6.10%, 7/15/40 | 830 | 951,736 | ||||||||||
Tribune Media Co., 5.88%, 7/15/22 | 573 | 585,176 | ||||||||||
Unitymedia Hessen GmbH & Co. KG/Unitymedia NRW GmbH, 4.00%, 1/15/25 | EUR | 100 | 111,714 | |||||||||
Univision Communications, Inc. (b): | ||||||||||||
5.13%, 5/15/23 | USD | 561 | 561,000 | |||||||||
5.13%, 2/15/25 | 351 | 346,174 | ||||||||||
UPCB Finance IV Ltd., 4.00%, 1/15/27 | EUR | 100 | 109,224 | |||||||||
Virgin Media Finance PLC, 5.75%, 1/15/25 (b) | USD | 515 | 528,519 | |||||||||
Virgin Media Secured Finance PLC: | ||||||||||||
5.50%, 8/15/26 (b) | 200 | 204,978 | ||||||||||
4.88%, 1/15/27 | GBP | 100 | 124,892 | |||||||||
6.25%, 3/28/29 | 100 | 134,682 | ||||||||||
WaveDivision Escrow LLC/WaveDivision Escrow Corp., 8.13%, 9/01/20 (b) | USD | 520 | 540,800 | |||||||||
Wind Acquisition Finance SA: | ||||||||||||
7.00%, 4/23/21 | EUR | 120 | 132,404 | |||||||||
7.38%, 4/23/21 (b) | USD | 800 | 833,000 | |||||||||
Ziggo Bond Finance BV, 5.88%, 1/15/25 (b) | 260 | 264,225 | ||||||||||
|
| |||||||||||
| 47,846,227 | ||||||||||||
| Corporate Bonds | Par (000) | Value | ||||||||||
Metals & Mining — 1.8% |
| |||||||||||
Alcoa, Inc.: | ||||||||||||
5.40%, 4/15/21 | USD | 340 | $ | 364,174 | ||||||||
5.13%, 10/01/24 | 445 | 460,797 | ||||||||||
5.90%, 2/01/27 | 70 | 74,987 | ||||||||||
5.95%, 2/01/37 | 30 | 30,713 | ||||||||||
Anglo American Capital PLC: | ||||||||||||
4.45%, 9/27/20 (b) | 100 | 104,700 | ||||||||||
4.13%, 4/15/21 (b) | 200 | 206,040 | ||||||||||
3.25%, 4/03/23 | EUR | 100 | 115,588 | |||||||||
4.88%, 5/14/25 (b) | USD | 200 | 207,500 | |||||||||
ArcelorMittal: | ||||||||||||
7.75%, 10/15/39 | 64 | 74,560 | ||||||||||
7.50%, 3/01/41 | 216 | 245,160 | ||||||||||
Cliffs Natural Resources, Inc. (b): | ||||||||||||
8.25%, 3/31/20 | 130 | 142,025 | ||||||||||
5.75%, 3/01/25 | 145 | 142,245 | ||||||||||
Constellium NV (b): | ||||||||||||
8.00%, 1/15/23 | 650 | 682,500 | ||||||||||
6.63%, 3/01/25 | 832 | 827,320 | ||||||||||
First Quantum Minerals Ltd., 7.00%, 2/15/21 (b) | 490 | 507,456 | ||||||||||
Freeport-McMoRan, Inc.: | ||||||||||||
2.30%, 11/14/17 | 189 | 188,527 | ||||||||||
2.38%, 3/15/18 | 1,564 | 1,556,180 | ||||||||||
3.10%, 3/15/20 | 620 | 607,600 | ||||||||||
4.00%, 11/14/21 | 121 | 116,160 | ||||||||||
3.55%, 3/01/22 | 324 | 300,915 | ||||||||||
3.88%, 3/15/23 | 774 | 712,080 | ||||||||||
5.40%, 11/14/34 | 278 | 243,945 | ||||||||||
5.45%, 3/15/43 | 737 | 630,135 | ||||||||||
Grinding Media, Inc./MC Grinding Media Canada, Inc., 7.38%, 12/15/23 (b) | 121 | 129,470 | ||||||||||
Joseph T Ryerson & Son, Inc., 11.00%, 5/15/22 (b) | 115 | 128,225 | ||||||||||
Kaiser Aluminum Corp., 5.88%, 5/15/24 | 74 | 77,700 | ||||||||||
Kinross Gold Corp.: | ||||||||||||
5.95%, 3/15/24 | 25 | 26,438 | ||||||||||
6.88%, 9/01/41 | 45 | 45,563 | ||||||||||
Novelis Corp. (b): | ||||||||||||
6.25%, 8/15/24 | 623 | 660,380 | ||||||||||
5.88%, 9/30/26 | 610 | 627,537 | ||||||||||
Peabody Securities Finance Corp. (b): | ||||||||||||
6.00%, 3/31/22 | 82 | 83,640 | ||||||||||
6.38%, 3/31/25 | 86 | 87,720 | ||||||||||
Rio Tinto Finance USA Ltd., 4.75%, 3/22/42 | 400 | 441,586 | ||||||||||
Steel Dynamics, Inc.: | ||||||||||||
5.13%, 10/01/21 | 550 | 567,187 | ||||||||||
5.25%, 4/15/23 | 345 | 359,266 | ||||||||||
5.50%, 10/01/24 | 48 | 51,062 | ||||||||||
Teck Resources Ltd.: | ||||||||||||
3.00%, 3/01/19 | 140 | 143,388 | ||||||||||
4.50%, 1/15/21 | 96 | 99,540 | ||||||||||
3.75%, 2/01/23 | 337 | 328,508 | ||||||||||
8.50%, 6/01/24 (b) | 250 | 291,875 | ||||||||||
6.13%, 10/01/35 | 61 | 63,135 | ||||||||||
6.00%, 8/15/40 | 400 | 401,000 | ||||||||||
6.25%, 7/15/41 | 43 | 44,613 | ||||||||||
5.20%, 3/01/42 | 378 | 358,034 | ||||||||||
5.40%, 2/01/43 | 188 | 179,070 | ||||||||||
ThyssenKrupp AG, 1.38%, 3/03/22 | EUR | 75 | 79,128 | |||||||||
United States Steel Corp., 8.38%, 7/01/21 (b) | USD | 215 | 241,875 | |||||||||
|
| |||||||||||
| 14,057,247 | ||||||||||||
Multi-Utilities — 0.0% |
| |||||||||||
NGL Energy Partners LP/NGL Energy Finance Corp.: | ||||||||||||
6.88%, 10/15/21 | 140 | 144,113 | ||||||||||
7.50%, 11/01/23 (b) | 130 | 136,825 | ||||||||||
|
| |||||||||||
| 280,938 | ||||||||||||
See Notes to Financial Statements.
| 18 | SEMI-ANNUAL REPORT | FEBRUARY 28, 2017 |
Schedule of Investments (continued) | BlackRock Core Bond Trust (BHK) |
| Corporate Bonds | Par (000) | Value | ||||||||||
Multiline Retail — 0.0% |
| |||||||||||
Neiman Marcus Group Ltd., 8.00%, 10/15/21 (b) | USD | 155 | $ | 97,263 | ||||||||
Oil, Gas & Consumable Fuels — 6.5% |
| |||||||||||
Alta Mesa Holdings LP/Alta Mesa Finance Services Corp., 7.88%, 12/15/24 (b) | 79 | 83,543 | ||||||||||
Anadarko Petroleum Corp., 5.55%, 3/15/26 | 1,500 | 1,684,755 | ||||||||||
Antero Midstream Partners LP/Antero Midstream Finance Corp., 5.38%, 9/15/24 (b) | 35 | 35,525 | ||||||||||
Antero Resources Corp.: | ||||||||||||
5.13%, 12/01/22 | 52 | 52,260 | ||||||||||
5.63%, 6/01/23 | 51 | 51,638 | ||||||||||
Apache Corp., 3.25%, 4/15/22 | 2,000 | 2,021,394 | ||||||||||
California Resources Corp., 8.00%, 12/15/22 (b) | 352 | 300,960 | ||||||||||
Callon Petroleum Co., 6.13%, 10/01/24 (b) | 140 | 145,950 | ||||||||||
Canadian Natural Resources Ltd., 3.90%, 2/01/25 | 500 | 508,139 | ||||||||||
Carrizo Oil & Gas, Inc., 6.25%, 4/15/23 | 95 | 96,188 | ||||||||||
Cheniere Corpus Christi Holdings LLC (b): | ||||||||||||
7.00%, 6/30/24 | 278 | 311,360 | ||||||||||
5.88%, 3/31/25 | 576 | 609,120 | ||||||||||
Chesapeake Energy Corp.: | ||||||||||||
4.27%, 4/15/19 (a) | 341 | 338,442 | ||||||||||
6.88%, 11/15/20 | 138 | 136,620 | ||||||||||
8.00%, 12/15/22 (b) | 184 | 194,580 | ||||||||||
8.00%, 1/15/25 (b)(d) | 214 | 212,395 | ||||||||||
ConocoPhillips Canada Funding Co., 5.95%, 10/15/36 (d) | 685 | 809,147 | ||||||||||
CONSOL Energy, Inc.: | ||||||||||||
5.88%, 4/15/22 | 1,708 | 1,665,300 | ||||||||||
8.00%, 4/01/23 | 48 | 50,040 | ||||||||||
Continental Resources, Inc.: | ||||||||||||
4.50%, 4/15/23 | 98 | 96,040 | ||||||||||
3.80%, 6/01/24 | 277 | 256,571 | ||||||||||
4.90%, 6/01/44 | 190 | 166,725 | ||||||||||
Crestwood Midstream Partners LP/Crestwood Midstream Finance Corp.: | ||||||||||||
6.00%, 12/15/20 | 25 | 25,719 | ||||||||||
6.25%, 4/01/23 | 20 | 20,750 | ||||||||||
CrownRock LP/CrownRock Finance, Inc. (b): | ||||||||||||
7.13%, 4/15/21 | 525 | 546,000 | ||||||||||
7.75%, 2/15/23 | 85 | 91,588 | ||||||||||
DCP Midstream LLC (b): | ||||||||||||
4.75%, 9/30/21 | 55 | 56,788 | ||||||||||
6.45%, 11/03/36 | 128 | 131,520 | ||||||||||
6.75%, 9/15/37 | 159 | 168,540 | ||||||||||
Denbury Resources, Inc.: | ||||||||||||
9.00%, 5/15/21 (b) | 501 | 539,827 | ||||||||||
5.50%, 5/01/22 | 110 | 90,750 | ||||||||||
Diamondback Energy, Inc., 5.38%, 5/31/25 (b) | 137 | 141,795 | ||||||||||
Eclipse Resources Corp., 8.88%, 7/15/23 | 45 | 46,463 | ||||||||||
Energy Transfer Equity LP: | ||||||||||||
5.88%, 1/15/24 | 544 | 584,800 | ||||||||||
5.50%, 6/01/27 | 216 | 228,690 | ||||||||||
Energy Transfer Partners LP: | ||||||||||||
4.05%, 3/15/25 | 500 | 502,398 | ||||||||||
4.75%, 1/15/26 | 1,250 | 1,309,505 | ||||||||||
5.30%, 4/15/47 | 540 | 539,633 | ||||||||||
Ensco Jersey Finance, Ltd., 3.00%, 1/31/24 (b) | 341 | 347,607 | ||||||||||
Ensco PLC, 8.00%, 1/31/24 (b) | 58 | 59,450 | ||||||||||
Enterprise Products Operating LLC, 3.70%, 2/15/26 | 500 | 506,256 | ||||||||||
EOG Resources, Inc.: | ||||||||||||
4.15%, 1/15/26 | 1,000 | 1,052,363 | ||||||||||
5.10%, 1/15/36 | 200 | 220,184 | ||||||||||
EP Energy LLC/Everest Acquisition Finance, Inc.: | ||||||||||||
9.38%, 5/01/20 | 221 | 216,027 | ||||||||||
8.00%, 11/29/24 (b) | 173 | 183,380 | ||||||||||
| Corporate Bonds | Par (000) | Value | ||||||||||
Oil, Gas & Consumable Fuels (continued) |
| |||||||||||
Extraction Oil & Gas Holdings LLC/Extraction Finance Corp., 7.88%, 7/15/21 (b) | USD | 208 | $ | 221,520 | ||||||||
Genesis Energy LP/Genesis Energy Finance Corp., 5.63%, 6/15/24 | 25 | 24,938 | ||||||||||
Great Western Petroleum LLC/Great Western Finance, Inc., 9.00%, 9/30/21 (b) | 210 | 221,550 | ||||||||||
Gulfport Energy Corp.: | ||||||||||||
6.63%, 5/01/23 | 51 | 51,893 | ||||||||||
6.00%, 10/15/24 (b) | 108 | 107,460 | ||||||||||
6.38%, 5/15/25 (b) | 60 | 60,300 | ||||||||||
Halcon Resources Corp., 6.75%, 2/15/25 (b) | 579 | 573,210 | ||||||||||
Hess Corp., 4.30%, 4/01/27 | 1,100 | 1,100,318 | ||||||||||
Hilcorp Energy I LP/Hilcorp Finance Co., 5.75%, 10/01/25 (b) | 47 | 46,648 | ||||||||||
KeySpan Gas East Corp., 5.82%, 4/01/41 (b)(d) | 1,010 | 1,233,762 | ||||||||||
Kinder Morgan, Inc.: | ||||||||||||
4.30%, 6/01/25 | 1,000 | 1,028,417 | ||||||||||
5.05%, 2/15/46 | 1,750 | 1,742,825 | ||||||||||
Marathon Petroleum Corp., 6.50%, 3/01/41 (d) | 2,049 | 2,318,247 | ||||||||||
Matador Resources Co.: | ||||||||||||
6.88%, 4/15/23 | 270 | 284,850 | ||||||||||
6.88%, 4/15/23 (b) | 300 | 316,500 | ||||||||||
MEG Energy Corp. (b): | ||||||||||||
6.50%, 3/15/21 | 560 | 572,600 | ||||||||||
6.38%, 1/30/23 | 15 | 13,313 | ||||||||||
7.00%, 3/31/24 | 540 | 486,000 | ||||||||||
6.50%, 1/15/25 | 572 | 559,130 | ||||||||||
MidAmerican Energy Co., 5.80%, 10/15/36 (d) | 1,500 | 1,853,254 | ||||||||||
MidAmerican Energy Holdings Co., 5.95%, 5/15/37 (d) | 1,750 | 2,169,984 | ||||||||||
Murphy Oil Corp.: | ||||||||||||
6.88%, 8/15/24 | 177 | 189,478 | ||||||||||
6.13%, 12/01/42 | 45 | 42,300 | ||||||||||
Nabors Industries, Inc., 0.75%, 1/15/24 (b) | 262 | 252,830 | ||||||||||
Newfield Exploration Co., 5.63%, 7/01/24 | 112 | 119,840 | ||||||||||
NGPL PipeCo LLC (b): | ||||||||||||
7.12%, 12/15/17 | 623 | 645,584 | ||||||||||
7.77%, 12/15/37 | 391 | 442,807 | ||||||||||
Noble Holding International, Ltd., 7.75%, 1/15/24 | 434 | 422,065 | ||||||||||
Oasis Petroleum, Inc.: | ||||||||||||
6.50%, 11/01/21 | 272 | 276,760 | ||||||||||
6.88%, 3/15/22 (d) | 189 | 192,249 | ||||||||||
2.63%, 9/15/23 (f) | 145 | 196,384 | ||||||||||
ONEOK, Inc.: | ||||||||||||
7.50%, 9/01/23 | 213 | 252,937 | ||||||||||
6.00%, 6/15/35 | 25 | 26,313 | ||||||||||
Paramount Resources Ltd., 6.88%, 6/30/23 (b) | 500 | 528,875 | ||||||||||
Parker Drilling Co.: | ||||||||||||
7.50%, 8/01/20 | 144 | 140,400 | ||||||||||
6.75%, 7/15/22 | 125 | 115,625 | ||||||||||
Parsley Energy LLC/Parsley Finance Corp. (b): | ||||||||||||
6.25%, 6/01/24 | 122 | 128,176 | ||||||||||
5.38%, 1/15/25 | 77 | 78,155 | ||||||||||
5.25%, 8/15/25 | 110 | 111,100 | ||||||||||
PBF Holding Co. LLC/PBF Finance Corp., 8.25%, 2/15/20 | 94 | 96,115 | ||||||||||
Petroleos Mexicanos, 5.38%, 3/13/22 (b) | 27 | 28,241 | ||||||||||
Plains All American Pipeline LP/PAA Finance Corp., 3.65%, 6/01/22 | 1,000 | 1,019,850 | ||||||||||
Precision Drilling Corp., 7.75%, 12/15/23 (b) | 50 | 54,125 | ||||||||||
QEP Resources, Inc., 5.25%, 5/01/23 | 33 | 32,505 | ||||||||||
Range Resources Corp. (b): | ||||||||||||
5.88%, 7/01/22 | 324 | 331,290 | ||||||||||
5.00%, 8/15/22 | 53 | 51,675 | ||||||||||
5.00%, 3/15/23 | 95 | 92,031 | ||||||||||
Resolute Energy Corp., 8.50%, 5/01/20 | 159 | 162,180 | ||||||||||
See Notes to Financial Statements.
| SEMI-ANNUAL REPORT | FEBRUARY 28, 2017 | 19 |
Schedule of Investments (continued) | BlackRock Core Bond Trust (BHK) |
| Corporate Bonds | Par (000) | Value | ||||||||||
Oil, Gas & Consumable Fuels (continued) |
| |||||||||||
Rockies Express Pipeline LLC (b): | ||||||||||||
5.63%, 4/15/20 | USD | 565 | $ | 596,075 | ||||||||
6.88%, 4/15/40 | 284 | 302,460 | ||||||||||
Rowan Cos., Inc.: | ||||||||||||
4.88%, 6/01/22 | 50 | 47,750 | ||||||||||
7.38%, 6/15/25 | 304 | 315,400 | ||||||||||
RSP Permian, Inc.: | ||||||||||||
6.63%, 10/01/22 | 179 | 189,292 | ||||||||||
5.25%, 1/15/25 (b) | 102 | 104,550 | ||||||||||
Sanchez Energy Corp.: | ||||||||||||
7.75%, 6/15/21 | 322 | 330,050 | ||||||||||
6.13%, 1/15/23 | 568 | 545,280 | ||||||||||
SESI LLC, 6.38%, 5/01/19 | 60 | 60,225 | ||||||||||
Seven Generations Energy Ltd., 8.25%, 5/15/20 (b) | 88 | 92,620 | ||||||||||
SM Energy Co.: | ||||||||||||
6.13%, 11/15/22 | 109 | 109,818 | ||||||||||
5.00%, 1/15/24 | 5 | 4,688 | ||||||||||
5.63%, 6/01/25 | 285 | 269,681 | ||||||||||
6.75%, 9/15/26 | 93 | 94,628 | ||||||||||
Southwestern Energy Co.: | ||||||||||||
5.80%, 1/23/20 | 690 | 683,100 | ||||||||||
6.70%, 1/23/25 | 40 | 38,400 | ||||||||||
Summit Midstream Holdings LLC/Summit Midstream Finance Corp., 5.75%, 4/15/25 | 40 | 40,600 | ||||||||||
Suncor Energy, Inc., 6.50%, 6/15/38 | 1,000 | 1,275,738 | ||||||||||
Sunoco Logistics Partners Operations LP, 3.90%, 7/15/26 | 310 | 306,175 | ||||||||||
Tallgrass Energy Partners LP/Tallgrass Energy Finance Corp. (b): | ||||||||||||
5.50%, 9/15/24 | 276 | 278,760 | ||||||||||
5.13%, 2/01/25 | 77 | 80,080 | ||||||||||
5.38%, 2/01/27 | 72 | 75,060 | ||||||||||
Targa Resources Partners LP/Targa Resources Partners Finance Corp.: | ||||||||||||
6.38%, 8/01/22 | 60 | 61,950 | ||||||||||
5.25%, 5/01/23 | 10 | 10,325 | ||||||||||
Tesoro Corp. (b): | ||||||||||||
4.75%, 12/15/23 | 298 | 308,430 | ||||||||||
5.13%, 12/15/26 | 416 | 439,920 | ||||||||||
Tesoro Logistics LP/Tesoro Logistics Finance Corp., 6.13%, 10/15/21 | 26 | 27,138 | ||||||||||
TransCanada PipeLines Ltd., 4.63%, 3/01/34 | 500 | 536,560 | ||||||||||
Weatherford International LLC, 6.80%, 6/15/37 | 60 | 56,550 | ||||||||||
Weatherford International Ltd.: | ||||||||||||
4.50%, 4/15/22 | 105 | 100,406 | ||||||||||
6.50%, 8/01/36 | 165 | 152,212 | ||||||||||
7.00%, 3/15/38 | 165 | 155,512 | ||||||||||
5.95%, 4/15/42 | 52 | 43,550 | ||||||||||
Western Gas Partners LP, 5.38%, 6/01/21 | 1,425 | 1,547,544 | ||||||||||
Whiting Petroleum Corp.: | ||||||||||||
5.00%, 3/15/19 | 480 | 484,200 | ||||||||||
5.75%, 3/15/21 | 23 | 22,885 | ||||||||||
6.25%, 4/01/23 | 40 | 40,100 | ||||||||||
WildHorse Resource Development Corp., 6.88%, 2/01/25 (b) | 157 | 155,037 | ||||||||||
Williams Cos., Inc., 5.75%, 6/24/44 | 647 | 653,470 | ||||||||||
Williams Partners LP: | ||||||||||||
3.60%, 3/15/22 | 600 | 611,352 | ||||||||||
4.00%, 9/15/25 | 750 | 759,406 | ||||||||||
WPX Energy, Inc.: | ||||||||||||
7.50%, 8/01/20 | 50 | 53,875 | ||||||||||
6.00%, 1/15/22 | 33 | 33,701 | ||||||||||
8.25%, 8/01/23 | 125 | 140,000 | ||||||||||
5.25%, 9/15/24 | 145 | 141,556 | ||||||||||
|
| |||||||||||
| 50,829,443 | ||||||||||||
| Corporate Bonds | Par (000) | Value | ||||||||||
Paper & Forest Products — 0.2% |
| |||||||||||
International Paper Co., 6.00%, 11/15/41 | USD | 870 | $ | 1,013,612 | ||||||||
Mercer International, Inc., 6.50%, 2/01/24 (b) | 53 | 54,060 | ||||||||||
Pfleiderer GmbH, 7.88%, 8/01/19 | EUR | 100 | 110,182 | |||||||||
Unifrax I LLC/Unifrax Holding Co., 7.50%, 2/15/19 (b) | USD | 180 | 179,550 | |||||||||
|
| |||||||||||
| 1,357,404 | ||||||||||||
Pharmaceuticals — 2.1% |
| |||||||||||
AbbVie, Inc.: | ||||||||||||
3.60%, 5/14/25 | 870 | 866,340 | ||||||||||
3.20%, 5/14/26 | 500 | 481,120 | ||||||||||
4.45%, 5/14/46 | 1,300 | 1,260,070 | ||||||||||
Actavis Funding SCS, 4.55%, 3/15/35 (d) | 2,140 | 2,156,157 | ||||||||||
Actavis, Inc., 3.25%, 10/01/22 (d) | 4,000 | 4,029,100 | ||||||||||
Baxalta, Inc., 5.25%, 6/23/45 | 500 | 543,346 | ||||||||||
DPx Holdings BV, 7.50%, 2/01/22 (b) | 75 | 79,547 | ||||||||||
Endo Finance LLC, 5.75%, 1/15/22 (b) | 95 | 88,112 | ||||||||||
Endo Finance LLC/Endo Finco, Inc. (b): | ||||||||||||
5.38%, 1/15/23 | 235 | 207,975 | ||||||||||
6.00%, 7/15/23 | 315 | 289,800 | ||||||||||
Forest Laboratories LLC, 5.00%, 12/15/21 (b) | 758 | 821,080 | ||||||||||
Grifols Worldwide Operations Ltd., 5.25%, 4/01/22 | 200 | 207,500 | ||||||||||
inVentiv Group Holdings, Inc./inVentiv Health, Inc./inVentiv Health Clinical, Inc., 7.50%, 10/01/24 (b) | 259 | 270,655 | ||||||||||
Jaguar Holding Co. II/Pharmaceutical Product Development LLC, 6.38%, 8/01/23 (b) | 795 | 855,619 | ||||||||||
Mylan NV, 3.95%, 6/15/26 | 750 | 732,570 | ||||||||||
NBTY, Inc., 7.63%, 5/15/21 (b) | 391 | 412,994 | ||||||||||
Synlab Bondco PLC, 6.25%, 7/01/22 | EUR | 100 | 114,691 | |||||||||
Tennessee Merger Sub, Inc., 6.38%, 2/01/25 (b) | USD | 470 | 467,650 | |||||||||
Teva Pharmaceutical Finance Netherlands III BV, 4.10%, 10/01/46 | 500 | 431,954 | ||||||||||
Valeant Pharmaceuticals International, Inc. (b): | ||||||||||||
6.75%, 8/15/18 | 1,133 | 1,116,005 | ||||||||||
6.38%, 10/15/20 | 505 | 459,550 | ||||||||||
5.63%, 12/01/21 | 364 | 306,670 | ||||||||||
5.88%, 5/15/23 | 220 | 179,025 | ||||||||||
6.13%, 4/15/25 | 320 | 254,800 | ||||||||||
|
| |||||||||||
| 16,632,330 | ||||||||||||
Real Estate Investment Trusts (REITs) — 1.0% |
| |||||||||||
ATF Netherlands BV, 2.13%, 3/13/23 | EUR | 100 | 107,522 | |||||||||
ERP Operating LP, 4.50%, 6/01/45 | USD | 1,155 | 1,208,725 | |||||||||
HCP, Inc., 4.00%, 6/01/25 (d) | 2,000 | 2,034,158 | ||||||||||
Hilton Domestic Operating Co., Inc., 4.25%, 9/01/24 (b) | 97 | 95,933 | ||||||||||
MGM Growth Properties Operating Partnership LP/MGP Finance Co-Issuer, Inc. (b): | ||||||||||||
5.63%, 5/01/24 | 766 | 810,045 | ||||||||||
4.50%, 9/01/26 | 187 | 181,857 | ||||||||||
Simon Property Group LP, 4.75%, 3/15/42 (d) | 1,670 | 1,781,294 | ||||||||||
Starwood Property Trust, Inc., 5.00%, 12/15/21 (b) | 157 | 163,084 | ||||||||||
Ventas Realty LP, 4.13%, 1/15/26 | 870 | 888,198 | ||||||||||
Ventas Realty LP/Ventas Capital Corp., 4.75%, 6/01/21 | 550 | 591,234 | ||||||||||
|
| |||||||||||
| 7,862,050 | ||||||||||||
Real Estate Management & Development — 0.7% |
| |||||||||||
Northwest Florida Timber Finance LLC, 4.75%, 3/04/29 (b)(d) | 4,600 | 4,329,750 | ||||||||||
Realogy Group LLC/Realogy Co-Issuer Corp. (b): | ||||||||||||
4.50%, 4/15/19 | 120 | 124,200 | ||||||||||
5.25%, 12/01/21 | 172 | 178,880 | ||||||||||
4.88%, 6/01/23 | 598 | 589,030 | ||||||||||
|
| |||||||||||
| 5,221,860 | ||||||||||||
See Notes to Financial Statements.
| 20 | SEMI-ANNUAL REPORT | FEBRUARY 28, 2017 |
Schedule of Investments (continued) | BlackRock Core Bond Trust (BHK) |
| Corporate Bonds | Par (000) | Value | ||||||||||
Road & Rail — 1.2% |
| |||||||||||
Avis Budget Car Rental LLC/Avis Budget Finance, Inc.: | ||||||||||||
5.13%, 6/01/22 (b) | USD | 495 | $ | 485,719 | ||||||||
5.50%, 4/01/23 | 5 | 5,000 | ||||||||||
6.38%, 4/01/24 (b) | 20 | 20,325 | ||||||||||
5.25%, 3/15/25 (b) | 425 | 406,937 | ||||||||||
Avis Budget Finance PLC, 4.13%, 11/15/24 | EUR | 100 | 105,325 | |||||||||
Burlington Northern Santa Fe LLC, 5.75%, 5/01/40 (d) | USD | 1,890 | 2,329,463 | |||||||||
CSX Corp., 4.75%, 5/30/42 | 350 | 374,109 | ||||||||||
Herc Rentals, Inc. (b): | ||||||||||||
7.50%, 6/01/22 | 118 | 127,440 | ||||||||||
7.75%, 6/01/24 | 8 | 8,800 | ||||||||||
Hertz Corp.: | ||||||||||||
5.88%, 10/15/20 | 322 | 313,950 | ||||||||||
6.25%, 10/15/22 | 138 | 131,790 | ||||||||||
5.50%, 10/15/24 (b) | 3 | 2,708 | ||||||||||
Lima Metro Line 2 Finance Ltd., 5.88%, 7/05/34 (b) | 5,000 | 5,287,500 | ||||||||||
United Rentals North America, Inc., 5.50%, 7/15/25 | 125 | 131,875 | ||||||||||
|
| |||||||||||
| 9,730,941 | ||||||||||||
Semiconductors & Semiconductor Equipment — 0.8% |
| |||||||||||
Advanced Micro Devices, Inc., 7.50%, 8/15/22 | 51 | 57,120 | ||||||||||
Analog Devices, Inc.: | ||||||||||||
3.90%, 12/15/25 | 470 | 483,668 | ||||||||||
3.50%, 12/05/26 | 345 | 343,116 | ||||||||||
Broadcom Corp./Broadcom Cayman Finance Ltd., 3.88%, 1/15/27 (b) | 2,850 | 2,869,839 | ||||||||||
Microchip Technology, Inc., 2.13%, 12/15/37 (f) | 40 | 121,050 | ||||||||||
Micron Technology, Inc.: | ||||||||||||
5.25%, 8/01/23 (b) | 206 | 207,802 | ||||||||||
5.50%, 2/01/25 | 25 | 25,813 | ||||||||||
5.63%, 1/15/26 (b) | 79 | 81,172 | ||||||||||
Series G, 3.00%, 11/15/43 (f) | 485 | 486,516 | ||||||||||
Microsemi Corp., 9.13%, 4/15/23 (b) | 26 | 29,965 | ||||||||||
NXP BV/NXP Funding LLC (b): | ||||||||||||
4.13%, 6/15/20 | 420 | 436,876 | ||||||||||
4.13%, 6/01/21 | 278 | 288,592 | ||||||||||
3.88%, 9/01/22 | 200 | 204,750 | ||||||||||
5.75%, 3/15/23 | 260 | 274,300 | ||||||||||
QUALCOMM, Inc., 4.65%, 5/20/35 | 250 | 264,040 | ||||||||||
Sensata Technologies BV, 5.00%, 10/01/25 (b) | 230 | 233,450 | ||||||||||
Xilinx, Inc., 2.63%, 6/15/17 (f) | 40 | 81,875 | ||||||||||
|
| |||||||||||
| 6,489,944 | ||||||||||||
Software — 1.6% |
| |||||||||||
ACI Worldwide, Inc., 6.38%, 8/15/20 (b) | 320 | 330,240 | ||||||||||
BMC Software Finance, Inc., 8.13%, 7/15/21 (b) | 851 | 863,765 | ||||||||||
Ensemble S Merger Sub, Inc., 9.00%, 9/30/23 (b) | 210 | 222,075 | ||||||||||
Genesys Telecommunications Laboratories Inc/Greeneden Lux 3 Sarl/Greeneden US Ho, 10.00%, 11/30/24 (b) | 115 | 125,062 | ||||||||||
Inception Merger Sub, Inc./Rackspace Hosting, Inc., 8.63%, 11/15/24 (b) | 344 | 362,490 | ||||||||||
Infinity Acquisition LLC/Infinity Acquisition Finance Corp., 7.25%, 8/01/22 (b) | 31 | 27,319 | ||||||||||
Infor US, Inc., 6.50%, 5/15/22 | 976 | 1,015,040 | ||||||||||
Informatica LLC, 7.13%, 7/15/23 (b) | 183 | 176,778 | ||||||||||
JDA Escrow LLC/JDA Bond Finance, Inc., 7.38%, 10/15/24 (b) | 114 | 119,700 | ||||||||||
Microsoft Corp., 3.50%, 11/15/42 (d) | 4,000 | 3,695,876 | ||||||||||
Nuance Communications, Inc. (b): | ||||||||||||
5.38%, 8/15/20 | 39 | 39,760 | ||||||||||
6.00%, 7/01/24 | 170 | 175,737 | ||||||||||
5.63%, 12/15/26 | 69 | 70,466 | ||||||||||
| Corporate Bonds | Par (000) | Value | ||||||||||
Software (continued) |
| |||||||||||
Oracle Corp., 5.38%, 7/15/40 (d) | USD | 3,025 | $ | 3,556,771 | ||||||||
PTC, Inc., 6.00%, 5/15/24 | 71 | 75,793 | ||||||||||
Solera LLC/Solera Finance, Inc., 10.50%, 3/01/24 (b) | 557 | 634,980 | ||||||||||
SS&C Technologies Holdings, Inc., 5.88%, 7/15/23 | 246 | 260,145 | ||||||||||
TIBCO Software, Inc., 11.38%, 12/01/21 (b) | 565 | 614,437 | ||||||||||
Veritas US, Inc./Veritas Bermuda Ltd.: | ||||||||||||
7.50%, 2/01/23 | EUR | 100 | 111,767 | |||||||||
10.50%, 2/01/24 (b) | USD | 200 | 216,000 | |||||||||
|
| |||||||||||
| 12,694,201 | ||||||||||||
Specialty Retail — 0.6% |
| |||||||||||
Asbury Automotive Group, Inc., 6.00%, 12/15/24 | 350 | 364,000 | ||||||||||
Group 1 Automotive, Inc., 5.00%, 6/01/22 | 240 | 247,200 | ||||||||||
Home Depot, Inc., 5.88%, 12/16/36 (d) | 1,660 | 2,122,494 | ||||||||||
JC Penney Corp., Inc.: | ||||||||||||
8.13%, 10/01/19 | 15 | 15,975 | ||||||||||
6.38%, 10/15/36 | 54 | 41,310 | ||||||||||
7.40%, 4/01/37 | 151 | 122,310 | ||||||||||
L Brands, Inc., 6.88%, 11/01/35 | 251 | 241,274 | ||||||||||
Lowe’s Cos, Inc., 4.38%, 9/15/45 | 1,000 | 1,056,723 | ||||||||||
Penske Automotive Group, Inc.: | ||||||||||||
5.38%, 12/01/24 | 297 | 301,455 | ||||||||||
5.50%, 5/15/26 | 127 | 126,136 | ||||||||||
|
| |||||||||||
| 4,638,877 | ||||||||||||
Technology Hardware, Storage & Peripherals — 0.7% |
| |||||||||||
Apple, Inc., 4.65%, 2/23/46 (d) | 2,400 | 2,609,674 | ||||||||||
Diamond 1 Finance Corp./Diamond 2 Finance Corp. (b): | ||||||||||||
4.42%, 6/15/21 | 90 | 94,378 | ||||||||||
7.13%, 6/15/24 | 438 | 483,953 | ||||||||||
6.02%, 6/15/26 | 110 | 120,953 | ||||||||||
8.35%, 7/15/46 | 95 | 123,884 | ||||||||||
Hewlett Packard Enterprise Co., 4.90%, 10/15/25 | 1,500 | 1,560,797 | ||||||||||
Western Digital Corp.: | ||||||||||||
7.38%, 4/01/23 (b) | 384 | 421,440 | ||||||||||
10.50%, 4/01/24 | 117 | 136,890 | ||||||||||
|
| |||||||||||
| 5,551,969 | ||||||||||||
Textiles, Apparel & Luxury Goods — 0.0% |
| |||||||||||
BiSoho SAS, 5.88%, 5/01/23 | EUR | 100 | 113,091 | |||||||||
Hanesbrands, Inc., 4.63%, 5/15/24 (b) | USD | 36 | 35,685 | |||||||||
Springs Industries, Inc., 6.25%, 6/01/21 | 36 | 37,170 | ||||||||||
|
| |||||||||||
| 185,946 | ||||||||||||
Tobacco — 1.5% |
| |||||||||||
Altria Group, Inc.: | ||||||||||||
9.95%, 11/10/38 | 516 | 874,302 | ||||||||||
10.20%, 2/06/39 | 894 | 1,531,008 | ||||||||||
5.38%, 1/31/44 (d) | 4,030 | 4,695,635 | ||||||||||
3.88%, 9/16/46 | 1,250 | 1,179,742 | ||||||||||
Reynolds American, Inc.: | ||||||||||||
4.45%, 6/12/25 | 635 | 671,424 | ||||||||||
7.00%, 8/04/41 | 1,000 | 1,204,186 | ||||||||||
5.85%, 8/15/45 | 1,500 | 1,783,074 | ||||||||||
|
| |||||||||||
| 11,939,371 | ||||||||||||
Transportation Infrastructure — 0.4% |
| |||||||||||
CEVA Group PLC, 7.00%, 3/01/21 (b) | 310 | 275,900 | ||||||||||
CMA CGM SA, 7.75%, 1/15/21 | EUR | 100 | 103,559 | |||||||||
I 595 Express LLC, 3.31%, 12/31/31 | USD | 1,349 | 1,326,852 | |||||||||
Penske Truck Leasing Co. LP/PTL Finance Corp., 3.40%, 11/15/26 (b) | 490 | 475,440 | ||||||||||
Transurban Finance Co. Property Ltd., 4.13%, 2/02/26 (b) | 580 | 596,742 | ||||||||||
|
| |||||||||||
| 2,778,493 | ||||||||||||
See Notes to Financial Statements.
| SEMI-ANNUAL REPORT | FEBRUARY 28, 2017 | 21 |
Schedule of Investments (continued) | BlackRock Core Bond Trust (BHK) |
| Corporate Bonds | Par (000) | Value | ||||||||||
Utilities — 0.0% |
| |||||||||||
ContourGlobal Power Holdings SA, 5.13%, 6/15/21 | EUR | 100 | $ | 112,148 | ||||||||
Wireless Telecommunication Services — 2.2% |
| |||||||||||
Communications Sales & Leasing, Inc./CSL Capital LLC: | ||||||||||||
6.00%, 4/15/23 (b) | USD | 101 | 106,050 | |||||||||
8.25%, 10/15/23 | 557 | 603,649 | ||||||||||
7.13%, 12/15/24 (b) | 261 | 268,830 | ||||||||||
Crown Castle Towers LLC, 6.11%, 1/15/40 (b) | 3,155 | 3,441,781 | ||||||||||
Digicel Ltd., 6.00%, 4/15/21 (b) | 1,550 | 1,432,727 | ||||||||||
GEO Group, Inc.: | ||||||||||||
5.13%, 4/01/23 | 278 | 278,695 | ||||||||||
6.00%, 4/15/26 | 42 | 43,722 | ||||||||||
Radiate Holdco LLC/Radiate Finance, Inc., 6.63%, 2/15/25 (b) | 181 | 181,679 | ||||||||||
Rogers Communications, Inc., 7.50%, 8/15/38 (d) | 2,325 | 3,124,774 | ||||||||||
Sprint Capital Corp.: | ||||||||||||
6.90%, 5/01/19 | 140 | 149,145 | ||||||||||
6.88%, 11/15/28 | 954 | 1,017,202 | ||||||||||
8.75%, 3/15/32 | 110 | 132,000 | ||||||||||
Sprint Communications, Inc.: | ||||||||||||
9.00%, 11/15/18 (b) | 1,445 | 1,580,469 | ||||||||||
7.00%, 3/01/20 (b) | 201 | 219,593 | ||||||||||
7.00%, 8/15/20 | 179 | 193,096 | ||||||||||
Sprint Corp.: | ||||||||||||
7.25%, 9/15/21 | 240 | 261,600 | ||||||||||
7.88%, 9/15/23 | 681 | 757,612 | ||||||||||
7.13%, 6/15/24 | 896 | 967,402 | ||||||||||
7.63%, 2/15/25 | 120 | 133,800 | ||||||||||
Sprint Spectrum Co. LLC/Sprint Spectrum Co. II LLC/Sprint Spectrum Co. III LLC, 3.36%, 3/20/23 (b) | 695 | 697,606 | ||||||||||
T-Mobile USA, Inc.: | ||||||||||||
6.63%, 4/28/21 | 490 | 509,698 | ||||||||||
6.73%, 4/28/22 | 130 | 135,200 | ||||||||||
6.00%, 3/01/23 | 250 | 264,375 | ||||||||||
6.84%, 4/28/23 | 40 | 42,664 | ||||||||||
6.50%, 1/15/24 | 240 | 257,880 | ||||||||||
6.38%, 3/01/25 | 37 | 39,774 | ||||||||||
6.50%, 1/15/26 | 138 | 151,628 | ||||||||||
|
| |||||||||||
| 16,992,651 | ||||||||||||
| Total Corporate Bonds — 67.9% | 530,709,444 | |||||||||||
| Floating Rate Loan Interests (a) | ||||||||||||
Air Freight & Logistics — 0.0% |
| |||||||||||
CEVA Group PLC, Synthetic LOC, 6.50%, 3/19/21 | 18 | 15,809 | ||||||||||
CEVA Intercompany BV, Dutch Term Loan, 6.54%, 3/19/21 | 19 | 16,269 | ||||||||||
CEVA Logistics Canada ULC, Canadian Term Loan, 6.54%, 3/19/21 | 3 | 2,427 | ||||||||||
CEVA Logistics US Holdings, Inc., Term Loan, 6.54%, 3/19/21 | 27 | 23,122 | ||||||||||
|
| |||||||||||
| 57,627 | ||||||||||||
Auto Components — 0.1% |
| |||||||||||
Gates Global LLC, Term Loan B, 4.25%, 7/06/21 | 273 | 272,783 | ||||||||||
Chemicals — 0.0% |
| |||||||||||
Atotech BV, 2017 Term Loan B1, 4.00%, 1/31/24 | 81 | 81,810 | ||||||||||
Chemours Co., Term Loan B, 3.79%, 5/12/22 | 16 | 16,368 | ||||||||||
MacDermid, Inc., Term Loan B5, 4.50%, 6/07/20 | 61 | 61,283 | ||||||||||
|
| |||||||||||
| 159,461 | ||||||||||||
| Floating Rate Loan Interests (a) | Par (000) | Value | ||||||||||
Commercial Services & Supplies — 0.0% |
| |||||||||||
Brand Energy & Infrastructure Services, Inc., Term Loan B, 4.76% - 4.79%, 11/26/20 | USD | 118 | $ | 118,498 | ||||||||
Diversified Telecommunication Services — 0.1% |
| |||||||||||
Virgin Media Investment Holdings Ltd., Term Loan I, 3.52%, 1/31/25 | 370 | 371,439 | ||||||||||
Zayo Group LLC: | ||||||||||||
2017 Term Loan B2, 3.50%, 1/19/24 | 392 | 395,670 | ||||||||||
|
| |||||||||||
| 767,109 | ||||||||||||
Electric Utilities — 0.1% |
| |||||||||||
TEX Operations Co. LLC: | ||||||||||||
Exit Term Loan B, 3.53%, 8/04/23 | 272 | 273,357 | ||||||||||
Exit Term Loan C, 3.53%, 8/04/23 | 59 | 59,241 | ||||||||||
Vistra Operations Co. LLC, 2016 Term Loan B2, 4.02%, 12/14/23 | 201 | 202,162 | ||||||||||
|
| |||||||||||
| 534,760 | ||||||||||||
Energy Equipment & Services — 0.0% |
| |||||||||||
Weatherford International Ltd., Term Loan, 3.09%, 7/13/20 | 225 | 219,875 | ||||||||||
Food & Staples Retailing — 0.0% |
| |||||||||||
BJ’s Wholesale Club, Inc.: | ||||||||||||
2017 1st Lien Term Loan, 4.75%, 2/03/24 | 131 | 129,936 | ||||||||||
2017 2nd Lien Term Loan, 8.50%, 2/03/25 | 90 | 89,869 | ||||||||||
|
| |||||||||||
| 219,805 | ||||||||||||
Health Care Equipment & Supplies — 0.1% |
| |||||||||||
Alere, Inc., 2015 Term Loan B, 4.25%, 6/18/22 | 203 | 203,524 | ||||||||||
DJO Finance LLC, 2015 Term Loan, 4.25%, 6/08/20 | 150 | 147,113 | ||||||||||
Immucor, Inc., Refinancing Term Loan B2, 5.00%, 8/17/18 | 271 | 267,094 | ||||||||||
|
| |||||||||||
| 617,731 | ||||||||||||
Health Care Providers & Services — 0.1% |
| |||||||||||
Community Health Systems, Inc.: | ||||||||||||
Term Loan G, 3.75%, 12/31/19 | 54 | 53,985 | ||||||||||
Term Loan H, 4.00%, 1/27/21 | 58 | 57,383 | ||||||||||
inVentiv Health, Inc., 2016 Term Loan B, 4.80%, 11/09/23 | 217 | 218,322 | ||||||||||
Team Health, Inc., 1st Lien Term Loan, 3.75%, 2/06/24 | 230 | 229,282 | ||||||||||
Vizient, Inc., 2016 Term Loan B, 5.00%, 2/13/23 | 68 | 68,992 | ||||||||||
|
| |||||||||||
| 627,964 | ||||||||||||
Health Care Technology — 0.0% |
| |||||||||||
Change Healthcare Holdings, Inc., 2017 Term Loan B, 3.80%, 2/08/24 | 183 | 183,763 | ||||||||||
Hotels, Restaurants & Leisure — 0.2% |
| |||||||||||
Amaya Holdings BV, 1st Lien Term Loan, 5.00%, 8/01/21 | 208 | 208,201 | ||||||||||
Caesars Entertainment Resort Properties LLC, Term Loan B, 7.00%, 10/11/20 | 1,368 | 1,379,506 | ||||||||||
|
| |||||||||||
| 1,587,707 | ||||||||||||
Industrial Conglomerates — 0.1% |
| |||||||||||
Cortes NP Acquisition Corp., Term Loan B, 6.00% - 6.04%, 11/30/23 | 457 | 460,462 | ||||||||||
Insurance — 0.0% |
| |||||||||||
Alliant Holdings I, Inc., 2015 Term Loan B, 4.50%, 8/12/22 | 81 | 82,077 | ||||||||||
IT Services — 0.0% |
| |||||||||||
TKC Holdings, Inc., 2017 Term Loan, 4.75%, 2/01/23 | 156 | 157,170 | ||||||||||
See Notes to Financial Statements.
| 22 | SEMI-ANNUAL REPORT | FEBRUARY 28, 2017 |
Schedule of Investments (continued) | BlackRock Core Bond Trust (BHK) |
| Floating Rate Loan Interests (a) | Par (000) | Value | ||||||||||
Machinery — 0.1% |
| |||||||||||
Silver II US Holdings LLC, Term Loan, 4.00%, 12/13/19 | USD | 310 | $ | 295,532 | ||||||||
Media — 0.2% |
| |||||||||||
iHeartCommunications, Inc., Term Loan D, 7.53%, 1/30/19 | 211 | 183,384 | ||||||||||
Intelsat Jackson Holdings SA, Term Loan B2, 3.75%, 6/30/19 | 924 | 917,640 | ||||||||||
Ziggo Secured Finance Partnership, Term Loan E, 3.27%, 4/23/25 | 149 | 149,426 | ||||||||||
|
| |||||||||||
| 1,250,450 | ||||||||||||
Multiline Retail — 0.0% |
| |||||||||||
Neiman Marcus Group, Inc., 2020 Term Loan, 4.25%, 10/25/20 | 189 | 151,870 | ||||||||||
Oil, Gas & Consumable Fuels — 0.3% |
| |||||||||||
California Resources Corp.: | ||||||||||||
Second Out Term Loan, 11.38%, 12/31/21 | 455 | 512,635 | ||||||||||
Term Loan A, 3.78%, 10/01/19 | 369 | 355,251 | ||||||||||
Chesapeake Energy Corp., Term Loan, 8.55%, 8/23/21 | 994 | 1,073,739 | ||||||||||
Energy Transfer Equity LP, 2017 Term Loan B, 3.53%, 2/02/24 | 173 | 173,087 | ||||||||||
Peabody Energy Corp., Exit Term Loan, 5.54%, 1/30/22 | 139 | 139,984 | ||||||||||
|
| |||||||||||
| 2,254,696 | ||||||||||||
Pharmaceuticals — 0.0% |
| |||||||||||
Valeant Pharmaceuticals International, Inc.: | ||||||||||||
Series A3 Tranche A, 4.54%, 10/20/18 | 46 | 45,545 | ||||||||||
Series D2 Term Loan B, 5.03%, 2/13/19 | 15 | 14,977 | ||||||||||
Series E Term Loan B, 5.27%, 8/05/20 | 62 | 62,088 | ||||||||||
|
| |||||||||||
| 122,610 | ||||||||||||
Professional Services — 0.0% |
| |||||||||||
Advantage Sales & Marketing, Inc., 2014 1st Lien Term Loan, 4.25%, 7/23/21 | 179 | 177,736 | ||||||||||
Information Resources, Inc., 1st Lien Term Loan, 5.25%, 1/18/24 | 49 | 49,582 | ||||||||||
|
| |||||||||||
| 227,318 | ||||||||||||
Software — 0.2% |
| |||||||||||
BMC Software Finance, Inc., Term Loan, 5.00%, 9/10/20 | 481 | 483,481 | ||||||||||
Infor (US), Inc., Term Loan B6, 3.75%, 2/01/22 | 148 | 148,440 | ||||||||||
Kronos, Inc., 2nd Lien Term Loan, 9.28%, 11/01/24 | 353 | 364,206 | ||||||||||
Optiv Security, Inc., 1st Lien Term Loan, 4.25%, 2/01/24 | 138 | 138,820 | ||||||||||
RP Crown Parent LLC, 2016 Term Loan B, 4.50%, 10/12/23 | 111 | 111,937 | ||||||||||
Tibco Software Inc., 2017 Term Loan B, 5.50%, 12/04/20 | 357 | 361,035 | ||||||||||
Veritas US Inc.: | ||||||||||||
Term Loan B1, 6.63%, 1/27/23 | 188 | 187,472 | ||||||||||
USD Last Out Term Loan B2, 8.63%, 1/29/23 | 16 | 15,800 | ||||||||||
|
| |||||||||||
| 1,811,191 | ||||||||||||
Specialty Retail — 0.0% |
| |||||||||||
Leslie’s Poolmart, Inc., 2016 Term Loan, 4.75%, 8/16/23 | 26 | 26,125 | ||||||||||
Textiles, Apparel & Luxury Goods — 0.0% |
| |||||||||||
Ascend Performance Materials LLC, Term Loan B, 6.50%, 8/12/22 | 187 | 188,099 | ||||||||||
| Total Floating Rate Loan Interests — 1.6% | 12,394,683 | |||||||||||
| Foreign Agency Obligations | Par (000) | Value | ||||||||||
Argentine Republic Government International Bond (b): | ||||||||||||
7.50%, 4/22/26 | USD | 3,875 | $ | 4,049,375 | ||||||||
7.63%, 4/22/46 | 3,121 | 3,142,847 | ||||||||||
Cyprus Government International Bond, 4.63%, 2/03/20 (b) | EUR | 1,210 | 1,388,602 | |||||||||
Iceland Government International Bond, 5.88%, 5/11/22 | USD | 3,555 | 4,027,058 | |||||||||
Italian Government International Bond, 5.38%, 6/15/33 | 2,925 | 3,156,815 | ||||||||||
Portugal Government International Bond, 5.13%, 10/15/24 (b) | 3,970 | 3,845,628 | ||||||||||
Slovenia Government International Bond, 5.85%, 5/10/23 (b) | 864 | 986,861 | ||||||||||
| Total Foreign Agency Obligations — 2.6% | 20,597,186 | |||||||||||
| Municipal Bonds | ||||||||||||
City of New York New York Municipal Water Finance Authority, Refunding RB, 2nd General Resolution: | ||||||||||||
Series EE, 5.50%, 6/15/43 | 930 | 1,055,978 | ||||||||||
Series GG, Build America Bonds, 5.72%, 6/15/42 | 1,390 | 1,806,972 | ||||||||||
Water & Sewer System, Series EE, 5.38%, 6/15/43 | 770 | 869,276 | ||||||||||
East Bay Municipal Utility District, RB, Build America Bonds, 5.87%, 6/01/40 | 1,900 | 2,437,662 | ||||||||||
Indianapolis Local Public Improvement Bond Bank, RB, Build America Bonds, 6.12%, 1/15/40 | 2,535 | 3,261,202 | ||||||||||
Metropolitan Transportation Authority, RB, Build America Bonds, Series C, 7.34%, 11/15/39 | 1,295 | 1,915,435 | ||||||||||
Municipal Electric Authority of Georgia Plant Vogtle Units 3 & 4, Refunding RB, Build America Bonds, Series A, 7.06%, 4/01/57 | 2,000 | 2,260,680 | ||||||||||
New York State Dormitory Authority, RB, Build America Bonds: | ||||||||||||
5.63%, 3/15/39 | 1,100 | 1,360,227 | ||||||||||
5.60%, 3/15/40 | 1,900 | 2,373,594 | ||||||||||
Port Authority of New York & New Jersey, RB, 159th Series, 6.04%, 12/01/29 | 780 | 977,831 | ||||||||||
State of California, GO, Build America Bonds, Various Purposes: | ||||||||||||
7.55%, 4/01/39 | 280 | 413,106 | ||||||||||
7.63%, 3/01/40 | 1,720 | 2,535,985 | ||||||||||
State of Illinois, GO, Pension, 5.10%, 6/01/33 | 2,000 | 1,854,300 | ||||||||||
University of California, RB, Build America Bonds, 5.95%, 5/15/45 | 885 | 1,112,790 | ||||||||||
| Total Municipal Bonds — 3.1% | 24,235,038 | |||||||||||
| Non-Agency Mortgage-Backed Securities | ||||||||||||
Collateralized Mortgage Obligations — 1.4% |
| |||||||||||
Banc of America Funding Corp., Series 2007-2, Class 1A2, 6.00%, 3/25/37 | 747 | 656,269 | ||||||||||
Countrywide Alternative Loan Trust: | ||||||||||||
Series 2005-64CB, Class 1A15, 5.50%, 12/25/35 | 1,379 | 1,312,743 | ||||||||||
Series 2006-OA21, Class A1, 0.97%, 3/20/47 (a) | 968 | 672,464 | ||||||||||
Credit Suisse Mortgage Capital Certificates, Series 2011-2R, Class 2A1, 3.06%, 7/27/36 (a)(b) | 509 | 507,110 | ||||||||||
See Notes to Financial Statements.
| SEMI-ANNUAL REPORT | FEBRUARY 28, 2017 | 23 |
Schedule of Investments (continued) | BlackRock Core Bond Trust (BHK) |
| Non-Agency Mortgage-Backed Securities | Par (000) | Value | ||||||||||
Collateralized Mortgage Obligations (continued) |
| |||||||||||
Freddie Mac Mortgage-Backed Securities, Series 4480, Class ZX, 4.00%, 11/15/44 | USD | 5,879 | $ | 6,128,039 | ||||||||
GMAC Mortgage Corp. Loan Trust, Series 2005-AR3, Class 5A1, 3.46%, 6/19/35 (a) | 518 | 510,808 | ||||||||||
GSR Mortgage Loan Trust: | ||||||||||||
Series 2006-4F, Class 1A1, 5.00%, 5/25/36 | 104 | 102,435 | ||||||||||
Series 2007-4F, Class 3A1, 6.00%, 7/25/37 | 249 | 224,579 | ||||||||||
JPMorgan Mortgage Trust, Series 2006-S3, Class 1A12, 6.50%, 8/25/36 | 88 | 71,548 | ||||||||||
Merrill Lynch Mortgage Investors, Inc., Series 2006-A3, Class 3A1, 3.38%, 5/25/36 (a) | 703 | 580,815 | ||||||||||
WaMu Mortgage Pass-Through Certificates, Series 2007-OA4, Class 1A, 1.38%, 5/25/47 (a) | 242 | 214,991 | ||||||||||
|
| |||||||||||
| 10,981,801 | ||||||||||||
Commercial Mortgage-Backed Securities — 11.0% |
| |||||||||||
Banc of America Merrill Lynch Commercial Mortgage Securities Trust, Series 2015-200P, Class C, 3.60%, 4/14/33 (a)(b) | 4,170 | 4,190,382 | ||||||||||
Citigroup Commercial Mortgage Trust: | ||||||||||||
Series 2013-GC15, Class B, 5.11%, 9/10/46 (a) | 7,183 | 7,938,232 | ||||||||||
Series 2016-P5, Class A4, 2.94%, 10/10/49 | 6,000 | 5,876,723 | ||||||||||
Citigroup/Deutsche Bank Commercial Mortgage Trust, Series 2006-CD3, Class AM, 5.65%, 10/15/48 | 1,723 | 1,726,179 | ||||||||||
Commercial Mortgage Trust: | ||||||||||||
Series 2008-LS1, Class A4B, 6.09%, 12/10/49 (a) | 935 | 947,303 | ||||||||||
Series 2013-300P, Class A1, 4.35%, 8/10/30 (b) | 1,330 | 1,445,977 | ||||||||||
Series 2013-CR11, Class B, 5.16%, 10/10/46 (a) | 7,000 | 7,695,331 | ||||||||||
Series 2013-LC6, Class B, 3.74%, 1/10/46 | 1,390 | 1,415,551 | ||||||||||
Series 2014-CR21, Class A3, 3.53%, 12/10/47 | 1,300 | 1,338,028 | ||||||||||
Series 2015-3BP, Class A, 3.18%, 2/10/35 (b) | 7,570 | 7,602,478 | ||||||||||
Series 2015-CR22, Class C, 4.13%, 3/10/48 (a) | 5,000 | 4,808,979 | ||||||||||
Series 2015-LC19, Class C, 4.26%, 2/10/48 (a) | 3,500 | 3,559,626 | ||||||||||
Core Industrial Trust, Series 2015-TEXW, Class D, 3.85%, 2/10/34 (a)(b) | 4,585 | 4,632,224 | ||||||||||
Credit Suisse Commercial Mortgage Trust, Series 2010-RR2, Class 2A, 5.94%, 9/15/39 (a)(b) | 587 | 586,409 | ||||||||||
CSAIL Commercial Mortgage Trust, Series 2015-C1 (a): | ||||||||||||
Class B, 4.04%, 4/15/50 | 1,110 | 1,146,283 | ||||||||||
Class C, 4.30%, 4/15/50 | 1,000 | 1,016,493 | ||||||||||
Class D, 3.80%, 4/15/50 (b) | 480 | 403,945 | ||||||||||
DBJPM Mortgage Trust, Series 2016-C3, Class A5, 2.89%, 9/10/49 | 2,485 | 2,434,725 | ||||||||||
DBRR Trust, Series 2011-C32, Class A3A, 5.21%, 6/17/49 (a)(b) | 371 | 371,536 | ||||||||||
GAHR Commercial Mortgage Trust, Series 2015-NRF, Class DFX, 3.38%, 12/15/34 (a)(b) | 6,170 | 6,234,153 | ||||||||||
GS Mortgage Securities Corp. II, Series 2013-GC10, Class B, 3.68%, 2/10/46 (b) | 2,505 | 2,558,095 | ||||||||||
JPMorgan Chase Commercial Mortgage Securities Trust: | ||||||||||||
Series 2004-LN2, Class A2, 5.12%, 7/15/41 | 23 | 23,251 | ||||||||||
Series 2016-NINE, Class A, 2.85%, 10/06/38 (a)(b) | 4,800 | 4,668,290 | ||||||||||
| Non-Agency Mortgage-Backed Securities | Par (000) | Value | ||||||||||
Commercial Mortgage-Backed Securities (continued) |
| |||||||||||
LB-UBS Commercial Mortgage Trust, Series 2007-C7, Class A3, 5.87%, 9/15/45 (a) | USD | 1,935 | $ | 1,970,503 | ||||||||
Morgan Stanley Capital I Trust, Series 2014-CPT, Class G, 3.45%, 7/13/29 (a)(b) | 3,200 | 3,107,688 | ||||||||||
Wachovia Bank Commercial Mortgage Trust, Series 2007-C33, Class A4, 5.98%, 2/15/51 (a) | 1,444 | 1,446,501 | ||||||||||
Wells Fargo Commercial Mortgage Trust, Series 2015-C28, Class A4, 3.54%, 5/15/48 | 3,205 | 3,291,145 | ||||||||||
WF-RBS Commercial Mortgage Trust, Series 2012-C8: | ||||||||||||
Class B, 4.31%, 8/15/45 | 1,395 | 1,475,028 | ||||||||||
Class C, 4.90%, 8/15/45 (a) | 1,795 | 1,863,468 | ||||||||||
|
| |||||||||||
| 85,774,526 | ||||||||||||
Interest Only Commercial Mortgage-Backed Securities — 0.2% |
| |||||||||||
Commercial Mortgage Loan Trust, Series 2015-LC21, Class XA, 0.87%, 7/10/48 (a) | 19,392 | 851,735 | ||||||||||
WF-RBS Commercial Mortgage Trust, Series 2012-C8, Class XA, 1.98%, 8/15/45 (a)(b) | 9,878 | 701,579 | ||||||||||
|
| |||||||||||
| 1,553,314 | ||||||||||||
| Total Non-Agency Mortgage-Backed Securities — 12.6% | 98,309,641 | |||||||||||
| Preferred Securities | ||||||||||||
| Capital Trusts | ||||||||||||
Banks — 3.0% |
| |||||||||||
Banco Santander SA, 6.25% (a)(h) | 100 | 104,484 | ||||||||||
Bank of Ireland, 7.38% (a)(h) | 200 | 226,358 | ||||||||||
BNP Paribas SA, 7.20% (a)(b)(h) | 2,000 | 2,157,500 | ||||||||||
Capital One Financial Corp., Series E, 5.55% (a)(h) | 3,500 | 3,622,500 | ||||||||||
Citigroup, Inc. (a)(h): | ||||||||||||
Series M, 6.30% | 4,000 | 4,225,000 | ||||||||||
Series P, 5.95% | 2,100 | 2,189,250 | ||||||||||
Series Q, 5.95% | 100 | 104,498 | ||||||||||
Series R, 6.13% | 605 | 639,824 | ||||||||||
Credit Agricole SA (a)(b)(h): | ||||||||||||
6.63% | 1,400 | 1,382,500 | ||||||||||
7.88% | 1,000 | 1,019,940 | ||||||||||
Intesa Sanpaolo SpA, 7.00% (a)(h) | 200 | 212,410 | ||||||||||
Nordea Bank AB, 6.13% (a)(b)(h) | 2,960 | 2,965,920 | ||||||||||
U.S. Bancorp, Series J, 5.30% (a)(h) | 311 | 316,442 | ||||||||||
Wells Fargo & Co. (a)(h): | ||||||||||||
Series S, 5.90% | 3,510 | 3,711,825 | ||||||||||
Series U, 5.88% | 430 | 464,400 | ||||||||||
|
| |||||||||||
| 23,342,851 | ||||||||||||
Capital Markets — 0.7% |
| |||||||||||
Goldman Sachs Group, Inc., Series L, 5.70% (a)(h) | 612 | 630,360 | ||||||||||
Morgan Stanley, Series H, 5.45% (a)(h) | 2,627 | 2,694,756 | ||||||||||
State Street Corp., Series F, 5.25% (a)(h) | 2,000 | 2,092,500 | ||||||||||
|
| |||||||||||
| 5,417,616 | ||||||||||||
Chemicals — 0.0% |
| |||||||||||
Lanxess AG, 4.50%, 12/06/76 (a) | 50 | 56,943 | ||||||||||
Solvay Finance SA, 5.12% 2/06/76 (a)(h) | 100 | 116,176 | ||||||||||
|
| |||||||||||
| 173,119 | ||||||||||||
See Notes to Financial Statements.
| 24 | SEMI-ANNUAL REPORT | FEBRUARY 28, 2017 |
Schedule of Investments (continued) | BlackRock Core Bond Trust (BHK) |
| Capital Trusts | Par (000) | Value | ||||||||||
Diversified Financial Services — 5.0% |
| |||||||||||
Bank of America Corp. (a)(h): | ||||||||||||
Series V, 5.13% | USD | 385 | $ | 389,331 | ||||||||
Series X, 6.25% | 4,620 | 4,943,862 | ||||||||||
Bank of New York Mellon Corp. (a)(h): | ||||||||||||
Series D, 4.50% (d) | 8,400 | 7,990,500 | ||||||||||
Series E, 4.95% | 2,000 | 2,065,000 | ||||||||||
Barclays PLC (a)(h): | ||||||||||||
7.25% | 200 | 248,165 | ||||||||||
7.88% | 200 | 209,810 | ||||||||||
JPMorgan Chase & Co. (a)(h): | ||||||||||||
Series 1, 7.90% | 7,000 | 7,280,000 | ||||||||||
Series Q, 5.15% | 3,000 | 3,008,100 | ||||||||||
Series U, 6.13% | 500 | 530,725 | ||||||||||
Series V, 5.00% | 6,710 | 6,750,327 | ||||||||||
Macquarie Bank Ltd., 10.25%, 6/20/57 (a) | 1,800 | 1,837,379 | ||||||||||
Royal Bank of Scotland Group PLC, 8.63% (a)(h) | 200 | 211,300 | ||||||||||
Societe Generale SA (a)(b)(h): | ||||||||||||
6.00% | 3,000 | 2,827,500 | ||||||||||
7.88% | 1,000 | 997,500 | ||||||||||
|
| |||||||||||
| 39,289,499 | ||||||||||||
Diversified Telecommunication Services — 0.0% |
| |||||||||||
Telefonica Europe BV, 4.20% (a)(h) | 200 | 222,209 | ||||||||||
Electric Utilities — 0.6% |
| |||||||||||
ComEd Financing III, 6.35%, 3/15/33 | 300 | 318,445 | ||||||||||
Electricite de France SA, 5.25% (a)(b)(h) | 4,200 | 4,105,500 | ||||||||||
Enel SpA (a): | ||||||||||||
5.00%, 1/15/75 | EUR | 100 | 113,091 | |||||||||
7.75%, 9/10/75 | GBP | 100 | 137,421 | |||||||||
Gas Natural Fenosa Finance BV, 4.13% (a)(h) | USD | 100 | 109,542 | |||||||||
|
| |||||||||||
| 4,783,999 | ||||||||||||
Industrial Conglomerates — 0.3% |
| |||||||||||
General Electric Co., Series D, 5.00% (a)(h) | 2,131 | 2,245,541 | ||||||||||
Insurance — 1.5% |
| |||||||||||
Allstate Corp (a): | ||||||||||||
5.75%, 8/15/53 | 2,000 | 2,157,500 | ||||||||||
6.50%, 5/15/57 | 4,100 | 4,694,500 | ||||||||||
Voya Financial, Inc., 5.65%, 5/15/53 (a) | 4,500 | 4,601,250 | ||||||||||
|
| |||||||||||
| 11,453,250 | ||||||||||||
Oil, Gas & Consumable Fuels — 0.0% |
| |||||||||||
DCP Midstream LLC, 5.85%, 5/21/43 (a)(b) | 30 | 28,050 | ||||||||||
Total Capital Trusts — 11.1% |
| 86,956,134 | ||||||||||
| Preferred Stocks | Shares | |||||||||||
Banks — 1.2% | ||||||||||||
U.S. Bancorp, Series G, 6.00% (a)(h) | 300,000 | 7,608,000 | ||||||||||
Wells Fargo & Co., 5.85% (a)(h) | 75,000 | 2,016,750 | ||||||||||
|
| |||||||||||
| 9,624,750 | ||||||||||||
Capital Markets — 0.7% |
| |||||||||||
Goldman Sachs Group, Inc., Series J, 5.50% (a)(h) | 92,000 | 2,451,800 | ||||||||||
SCE Trust III, 5.75% (a)(h) | 25,314 | 706,767 | ||||||||||
Morgan Stanley, Series K, 5.85% (a)(h) | 82,887 | 2,142,629 | ||||||||||
|
| |||||||||||
| 5,301,196 | ||||||||||||
Thrifts & Mortgage Finance — 0.0% |
| |||||||||||
Fannie Mae, Series S, 8.25% (a)(h) | 10,000 | 82,500 | ||||||||||
Total Preferred Stock — 1.9% |
| 15,008,446 | ||||||||||
| Trust Preferred | Shares | Value | ||||||||||
Diversified Financial Services — 0.1% | ||||||||||||
Citigroup Capital XIII, 7.88%, 10/30/40 | 29,583 | $ | 775,039 | |||||||||
Total Preferred Securities — 13.1% |
| 102,739,619 | ||||||||||
| U.S. Government Sponsored Agency Securities | Par (000) | |||||||||||
Agency Obligations — 1.5% | ||||||||||||
Fannie Mae, 5.63%, 7/15/37 (d) | USD | 1,600 | 2,167,971 | |||||||||
Federal Home Loan Bank (d): | ||||||||||||
5.25%, 12/09/22 | 1,375 | 1,607,697 | ||||||||||
5.37%, 9/09/24 | 2,175 | 2,613,260 | ||||||||||
Residual Funding Corp., 0.00%, 4/15/30 (i) | 6,055 | 4,004,232 | ||||||||||
Resolution Funding Corp., 0.00%, 7/15/18 - 10/15/18 (i) | 1,050 | 1,028,071 | ||||||||||
|
| |||||||||||
| 11,421,231 | ||||||||||||
Collateralized Mortgage Obligations — 3.3% |
| |||||||||||
Fannie Mae Mortgage-Backed Securities: | ||||||||||||
Series 2015-47, Class GL, 3.50%, 7/25/45 | 1,636 | 1,642,624 | ||||||||||
Series 2005-5, Class PK, 5.00%, 12/25/34 | 161 | 166,823 | ||||||||||
Series 1991-87, Class S, 24.62%, 8/25/21 (a) | 4 | 5,050 | ||||||||||
Series G-49, Class S, 953.85%, 12/25/21 (a) | — | (j) | 24 | |||||||||
Series G-07, Class S, 1,056.78%, 3/25/21 (a) | — | (j) | 192 | |||||||||
Freddie Mac Mortgage-Backed Securities: | ||||||||||||
Series 0173, Class RS, 9.99%, 11/15/21 (a) | — | (j) | 2 | |||||||||
Series 4350, Class DY, 4.00%, 6/15/44 | 2,830 | 3,048,720 | ||||||||||
Series 4549, Class TZ, 4.00%, 11/15/45 | 2,576 | 2,723,136 | ||||||||||
Series 4398, Class ZX, 4.00%, 9/15/54 | 8,452 | 8,924,583 | ||||||||||
Ginnie Mae Mortgage-Backed Securities, Series 2014-72, Class MQ, 4.00%, 2/20/44 | 8,858 | 9,321,457 | ||||||||||
|
| |||||||||||
| 25,832,611 | ||||||||||||
Commercial Mortgage-Backed Securities — 0.3% |
| |||||||||||
Freddie Mac, Series K013, Class A2, 3.97%, 1/25/21 (a) | 1,870 | 1,988,495 | ||||||||||
Interest Only Collateralized Mortgage Obligations — 0.8% |
| |||||||||||
Fannie Mae Mortgage-Backed Securities: | ||||||||||||
Series 1997-50, Class SI, 1.20%, 4/25/23 (a) | 42 | 1,125 | ||||||||||
Series 2012-M9, Class X1, 3.99%, 12/25/17 (a) | 11,407 | 154,041 | ||||||||||
Series 2012-96, Class DI, 4.00%, 2/25/27 | 5,965 | 518,085 | ||||||||||
Series 2012-47, Class NI, 4.50%, 4/25/42 | 5,721 | 1,285,239 | ||||||||||
Series G92-05, Class H, 9.00%, 1/25/22 | — | (j) | 21 | |||||||||
Series 094, Class 2, 9.50%, 8/25/21 | — | (j) | 33 | |||||||||
Series 1990-136, Class S, 19.93%, 11/25/20 (a) | 1 | 2 | ||||||||||
Series G-10, Class S, 1,022.36%, 5/25/21 (a) | — | (j) | 1 | |||||||||
Freddie Mac Mortgage-Backed Securities: | ||||||||||||
Series K707, Class X1, 1.53%, 12/25/18 (a) | 4,727 | 105,264 | ||||||||||
Series 2611, Class QI, 5.50%, 9/15/32 | 506 | 24,232 | ||||||||||
Series 1254, Class Z, 8.50%, 4/15/22 | 20 | 3,483 | ||||||||||
Series 1043, Class H, 41.53%, 2/15/21 (a) | 1 | 2 | ||||||||||
Ginnie Mae Mortgage-Backed Securities: | ||||||||||||
Series 2009-78, Class SD, 5.42%, 9/20/32 (a) | 5,962 | 993,356 | ||||||||||
Series 2009-116, Class KS, 5.70%, 12/16/39 (a) | 2,239 | 338,596 | ||||||||||
Series 2011-52, Class NS, 5.90%, 4/16/41 (a) | 16,741 | 3,076,966 | ||||||||||
|
| |||||||||||
| 6,500,446 | ||||||||||||
See Notes to Financial Statements.
| SEMI-ANNUAL REPORT | FEBRUARY 28, 2017 | 25 |
Schedule of Investments (continued) | BlackRock Core Bond Trust (BHK) |
| U.S. Government Sponsored Agency Securities | Par (000) | Value | ||||||||||
Mortgage-Backed Securities — 4.5% |
| |||||||||||
Fannie Mae Mortgage-Backed Securities: | ||||||||||||
3.00%, 8/01/43 (d) | USD | 10,809 | $ | 10,774,572 | ||||||||
4.00%, 12/01/41 - 12/01/43 | 5,726 | 6,046,961 | ||||||||||
4.50%, 7/01/41 - 4/01/42 (d) | 12,633 | 13,609,559 | ||||||||||
5.00%, 8/01/34 | 2,195 | 2,415,064 | ||||||||||
5.50%, 6/01/38 | 1,092 | 1,222,970 | ||||||||||
6.00%, 12/01/38 | 929 | 1,052,461 | ||||||||||
Freddie Mac Mortgage-Backed Securities, 6.00%, 4/1/17 - 12/1/18 | 25 | 27,021 | ||||||||||
Ginnie Mae Mortgage-Backed Securities: | ||||||||||||
5.50%, 8/15/33 | 58 | 64,459 | ||||||||||
8.00%, 7/15/24 | — | (j) | 218 | |||||||||
|
| |||||||||||
| 35,213,285 | ||||||||||||
Principal Only Collateralized Mortgage Obligations — 0.0% |
| |||||||||||
Fannie Mae Mortgage-Backed Securities (i): |
| |||||||||||
Series 203, Class 1, 0.00%, 2/25/23 | 2 | 2,278 | ||||||||||
Series 1993-51, Class E, 0.00%, 2/25/23 | 8 | 7,565 | ||||||||||
Series 1993-70, Class A, 0.00%, 5/25/23 | 1 | 1,186 | ||||||||||
Series 0228, Class 1, 0.00%, 6/25/23 | 2 | 1,913 | ||||||||||
|
| |||||||||||
| 12,942 | ||||||||||||
| Total U.S. Government Sponsored Agency Securities — 10.4% | 80,969,010 | |||||||||||
| U.S. Treasury Obligations | ||||||||||||
U.S. Treasury Bonds (d): | ||||||||||||
3.00%, 11/15/44 | 61,400 | 61,642,223 | ||||||||||
2.50%, 2/15/46 | 55,000 | 49,777,145 | ||||||||||
| Total U.S. Treasury Obligations — 14.2% | 111,419,368 | |||||||||||
| Total Long-Term Investments (Cost — $1,034,899,275) — 136.0% | 1,063,511,966 | |||||||||||
| Short-Term Securities — 4.0% | Shares | Value | ||||||||||
BlackRock Liquidity Funds, T-Fund, Institutional Class, 0.42% (k)(l) | 31,449,022 | $ | 31,449,022 | |||||||||
| Total Short-Term Securities (Cost — $31,449,022) — 4.0% | 31,449,022 | |||||||||||
| Options Purchased (Cost — $3,749,025) — 0.4% | 3,045,231 | |||||||||||
| Total Investments Before Options Written (Cost — $1,070,097,322) — 140.4% | 1,098,006,219 | |||||||||||
| Options Written (Premiums Received — $3,892,866) — (0.3)% | (2,608,566 | ) | ||||||||||
| Total Investments, Net of Options Written (Cost — $1,066,204,456) — 140.1% | 1,095,397,653 | |||||||||||
Liabilities in Excess of Other Assets — (40.1)% |
| (313,333,945 | ) | |||||||||
|
| |||||||||||
Net Assets — 100.0% | $ | 782,063,708 | ||||||||||
|
| |||||||||||
| Notes to Schedule of Investments | ||
| (a) | Variable rate security. Rate as of period end. |
| (b) | Security exempt from registration pursuant to Rule 144A under the Securities Act of 1933, as amended. These securities may be resold in transactions exempt from registration to qualified institutional investors. |
| (c) | When-issued security. |
| (d) | All or a portion of the security has been pledged as collateral in connection with outstanding reverse repurchase agreements. |
| (e) | Payment-in-kind security which may pay interest/dividends in additional par/shares and/or in cash. Rates shown are the current rate and possible payment rates. |
| (f) | Convertible security. |
| (g) | Step-up bond that pays an initial coupon rate for the first period and then a higher coupon rate for the following periods. Rate as of period end. |
| (h) | Perpetual security with no stated maturity date. |
| (i) | Zero-coupon bond. |
| (j) | Amount is less than $500. |
| (k) | During the six months ended February 28, 2017, investments in issuers considered to be affiliates of the Trust for purposes of Section 2(a)(3) of the Investment Company Act of 1940, as amended, were as follows: |
| Affiliate | Shares Held at August 31, 2016 | Net Activity | Shares Held at February 28, 2017 | Value at February 28, 2017 | Income | Net Realized Gain1 | Change in Unrealized Appreciation (Depreciation) | |||||||||||||||||||||
BlackRock Liquidity Funds, T-Fund, Institutional Class | — | 31,449,022 | 31,449,022 | $ | 31,449,022 | $ | 26,382 | $ | 77 | — | ||||||||||||||||||
BlackRock Liquidity Funds, TempFund, Institutional Class | 12,926,909 | (12,926,909 | ) | — | — | 49 | — | — | ||||||||||||||||||||
Total |
| $ | 31,449,022 | $ | 26,431 | $ | 77 | — | ||||||||||||||||||||
|
|
|
|
|
|
|
| |||||||||||||||||||||
1 Includes net capital gain distributions. |
| |||||||||||||||||||||||||||
See Notes to Financial Statements.
| 26 | SEMI-ANNUAL REPORT | FEBRUARY 28, 2017 |
Schedule of Investments (continued) | BlackRock Core Bond Trust (BHK) |
| (l) | Current yield as of period end. |
For Trust compliance purposes, the Trust’s industry classifications refer to one or more of the industry sub-classifications used by one or more widely recognized market indexes or rating group indexes, and/or as defined by the investment adviser. These definitions may not apply for purposes of this report, which may combine such industry sub-classifications for reporting ease.
| Reverse Repurchase Agreements | ||||||||||||||||||||||||||
| Counterparty | Interest Rate | Trade Date | Maturity Date1 | Face Value | Face Value Including Accrued Interest | Type of Non-Cash Underlying Collateral | Remaining Contractual Maturity of the Agreements | |||||||||||||||||||
Nomura Securities International, Inc. | 0.57 | % | 6/28/16 | Open | $ | 31,762,500 | $ | 31,875,098 | U.S. Treasury Obligations | Open/Demand | 1 | |||||||||||||||
RBC Capital Markets, LLC | 1.04 | % | 6/30/16 | Open | 2,859,500 | 2,872,825 | Corporate Bonds | Open/Demand | 1 | |||||||||||||||||
RBC Capital Markets, LLC | 1.04 | % | 9/14/16 | Open | 8,254,800 | 8,282,023 | Corporate Bonds | Open/Demand | 1 | |||||||||||||||||
RBC Capital Markets, LLC | 1.04 | % | 9/14/16 | Open | 7,598,100 | 7,623,241 | Corporate Bonds | Open/Demand | 1 | |||||||||||||||||
RBC Capital Markets, LLC | 1.04 | % | 9/14/16 | Open | 8,371,240 | 8,398,940 | Corporate Bonds | Open/Demand | 1 | |||||||||||||||||
RBC Capital Markets, LLC | 1.04 | % | 9/23/16 | Open | 5,880,000 | 5,898,097 | Corporate Bonds | Open/Demand | 1 | |||||||||||||||||
Credit Suisse Securities (USA) LLC | 1.00 | % | 10/14/16 | Open | 2,442,000 | 2,450,316 | Corporate Bonds | Open/Demand | 1 | |||||||||||||||||
Credit Suisse Securities (USA) LLC | 1.00 | % | 10/14/16 | Open | 606,450 | 608,408 | Corporate Bonds | Open/Demand | 1 | |||||||||||||||||
Credit Suisse Securities (USA) LLC | 1.00 | % | 10/14/16 | Open | 2,659,187 | 2,667,771 | Corporate Bonds | Open/Demand | 1 | |||||||||||||||||
RBC Capital Markets, LLC | 1.04 | % | 10/18/16 | Open | 4,735,250 | 4,748,056 | Corporate Bonds | Open/Demand | 1 | |||||||||||||||||
RBC Capital Markets, LLC | 1.04 | % | 10/18/16 | Open | 4,749,375 | 4,762,219 | Corporate Bonds | Open/Demand | 1 | |||||||||||||||||
HSBC Securities (USA), Inc. | 1.00 | % | 10/20/16 | Open | 3,705,000 | 3,715,333 | Corporate Bonds | Open/Demand | 1 | |||||||||||||||||
HSBC Securities (USA), Inc. | 1.00 | % | 10/20/16 | Open | 4,318,000 | 4,330,042 | Corporate Bonds | Open/Demand | 1 | |||||||||||||||||
RBC Capital Markets, LLC | 0.64 | % | 10/20/16 | Open | 3,770,000 | 3,778,780 | Corporate Bonds | Open/Demand | 1 | |||||||||||||||||
RBC Capital Markets, LLC | 0.64 | % | 10/20/16 | Open | 2,610,000 | 2,616,078 | Corporate Bonds | Open/Demand | 1 | |||||||||||||||||
RBC Capital Markets, LLC | 0.64 | % | 10/20/16 | Open | 3,380,000 | 3,387,872 | Corporate Bonds | Open/Demand | 1 | |||||||||||||||||
RBC Capital Markets, LLC | 0.64 | % | 10/20/16 | Open | 3,529,500 | 3,537,720 | Corporate Bonds | Open/Demand | 1 | |||||||||||||||||
RBC Capital Markets, LLC | 0.64 | % | 10/20/16 | Open | 2,386,250 | 2,391,807 | Corporate Bonds | Open/Demand | 1 | |||||||||||||||||
RBC Capital Markets, LLC | 0.64 | % | 10/20/16 | Open | 3,635,250 | 3,643,716 | Corporate Bonds | Open/Demand | 1 | |||||||||||||||||
RBC Capital Markets, LLC | 0.64 | % | 10/20/16 | Open | 3,346,875 | 3,354,670 | Corporate Bonds | Open/Demand | 1 | |||||||||||||||||
RBC Capital Markets, LLC | 0.64 | % | 10/20/16 | Open | 7,141,925 | 7,158,558 | Corporate Bonds | Open/Demand | 1 | |||||||||||||||||
RBC Capital Markets, LLC | 0.64 | % | 10/20/16 | Open | 3,073,000 | 3,080,157 | Corporate Bonds | Open/Demand | 1 | |||||||||||||||||
HSBC Securities (USA), Inc. | 1.00 | % | 10/21/16 | Open | 4,921,000 | 4,934,437 | Corporate Bonds | Open/Demand | 1 | |||||||||||||||||
HSBC Securities (USA), Inc. | 1.00 | % | 10/21/16 | Open | 7,991,000 | 8,012,820 | Capital Trusts | Open/Demand | 1 | |||||||||||||||||
HSBC Securities (USA), Inc. | 1.00 | % | 10/26/16 | Open | 4,193,000 | 4,204,205 | Corporate Bonds | Open/Demand | 1 | |||||||||||||||||
Barclays Capital, Inc. | (0.50 | )% | 11/09/16 | Open | 161,000 | 160,752 | Corporate Bonds | Open/Demand | 1 | |||||||||||||||||
Deutsche Bank AG | 1.45 | % | 12/13/16 | Open | 1,671,000 | 1,676,052 | Corporate Bonds | Open/Demand | 1 | |||||||||||||||||
Deutsche Bank AG | 1.45 | % | 12/13/16 | Open | 1,885,000 | 1,890,610 | Corporate Bonds | Open/Demand | 1 | |||||||||||||||||
Deutsche Bank AG | 1.45 | % | 12/13/16 | Open | 2,185,000 | 2,191,607 | Corporate Bonds | Open/Demand | 1 | |||||||||||||||||
Deutsche Bank AG | 1.45 | % | 12/13/16 | Open | 4,078,000 | 4,090,138 | Corporate Bonds | Open/Demand | 1 | |||||||||||||||||
Deutsche Bank AG | 1.45 | % | 12/13/16 | Open | 3,216,000 | 3,225,724 | Corporate Bonds | Open/Demand | 1 | |||||||||||||||||
Barclays Capital, Inc. | 1.20 | % | 12/15/16 | Open | 938,437 | 940,784 | Corporate Bonds | Open/Demand | 1 | |||||||||||||||||
Barclays Capital, Inc. | 1.20 | % | 12/15/16 | Open | 712,500 | 714,281 | Corporate Bonds | Open/Demand | 1 | |||||||||||||||||
Barclays Capital, Inc. | 1.25 | % | 12/15/16 | Open | 555,000 | 556,445 | Corporate Bonds | Open/Demand | 1 | |||||||||||||||||
Barclays Capital, Inc. | 1.25 | % | 12/15/16 | Open | 729,844 | 731,744 | Corporate Bonds | Open/Demand | 1 | |||||||||||||||||
Barclays Capital, Inc. | 1.25 | % | 12/15/16 | Open | 975,562 | 978,103 | Corporate Bonds | Open/Demand | 1 | |||||||||||||||||
Barclays Capital, Inc. | 1.25 | % | 12/15/16 | Open | 1,005,125 | 1,007,743 | Corporate Bonds | Open/Demand | 1 | |||||||||||||||||
Barclays Capital, Inc. | 1.25 | % | 12/15/16 | Open | 1,027,187 | 1,029,862 | Corporate Bonds | Open/Demand | 1 | |||||||||||||||||
Barclays Capital, Inc. | 1.25 | % | 12/15/16 | Open | 2,966,250 | 2,973,975 | Corporate Bonds | Open/Demand | 1 | |||||||||||||||||
Barclays Capital, Inc. | 1.25 | % | 12/15/16 | Open | 4,818,750 | 4,831,299 | Corporate Bonds | Open/Demand | 1 | |||||||||||||||||
HSBC Securities (USA), Inc. | 1.00 | % | 12/15/16 | Open | 4,132,000 | 4,140,608 | Corporate Bonds | Open/Demand | 1 | |||||||||||||||||
Merrill Lynch, Pierce, Fenner & Smith, Inc. | 0.54 | % | 12/15/16 | Open | 1,290,000 | 1,291,567 | U.S. Government Sponsored Agency Securities | Open/Demand | 1 | |||||||||||||||||
Merrill Lynch, Pierce, Fenner & Smith, Inc. | 0.54 | % | 12/15/16 | Open | 792,281 | 793,246 | U.S. Government Sponsored Agency Securities | Open/Demand | 1 | |||||||||||||||||
BNP Paribas Securities Corp. | 0.61 | % | 12/19/16 | Open | 1,011,169 | 1,012,385 | U.S. Government Sponsored Agency Securities | Open/Demand | 1 | |||||||||||||||||
BNP Paribas Securities Corp. | 0.61 | % | 12/19/16 | Open | 809,375 | 810,349 | U.S. Government Sponsored Agency Securities | Open/Demand | 1 | |||||||||||||||||
BNP Paribas Securities Corp. | 0.61 | % | 12/19/16 | Open | 1,318,625 | 1,320,211 | U.S. Government Sponsored Agency Securities | Open/Demand | 1 | |||||||||||||||||
BNP Paribas Securities Corp. | 0.61 | % | 12/19/16 | Open | 614,831 | 615,571 | U.S. Government Sponsored Agency Securities | Open/Demand | 1 | |||||||||||||||||
BNP Paribas Securities Corp. | 1.11 | % | 12/19/16 | Open | 790,000 | 791,729 | Corporate Bonds | Open/Demand | 1 | |||||||||||||||||
Credit Suisse Securities (USA) LLC | 0.95 | % | 12/19/16 | Open | 1,452,750 | 1,455,434 | Corporate Bonds | Open/Demand | 1 | |||||||||||||||||
Credit Suisse Securities (USA) LLC | 0.95 | % | 12/19/16 | Open | 1,117,313 | 1,119,376 | Corporate Bonds | Open/Demand | 1 | |||||||||||||||||
Credit Suisse Securities (USA) LLC | 1.00 | % | 12/19/16 | Open | 962,706 | 964,578 | Corporate Bonds | Open/Demand | 1 | |||||||||||||||||
See Notes to Financial Statements.
| SEMI-ANNUAL REPORT | FEBRUARY 28, 2017 | 27 |
Schedule of Investments (continued) | BlackRock Core Bond Trust (BHK) |
| Reverse Repurchase Agreements (concluded) | ||||||||||||||||||||||||||
| Counterparty | Interest Rate | Trade Date | Maturity Date1 | Face Value | Face Value Including Accrued Interest | Type of Non-Cash Underlying Collateral | Remaining Contractual Maturity of the Agreements | |||||||||||||||||||
RBC Capital Markets, LLC | 1.04 | % | 12/19/16 | Open | $ | 1,698,750 | $ | 1,702,234 | Corporate Bonds | Open/Demand | 1 | |||||||||||||||
RBC Capital Markets, LLC | 1.04 | % | 12/19/16 | Open | 1,473,063 | 1,476,084 | Corporate Bonds | Open/Demand | 1 | |||||||||||||||||
RBC Capital Markets, LLC | 1.04 | % | 12/19/16 | Open | 2,043,878 | 2,048,070 | Corporate Bonds | Open/Demand | 1 | |||||||||||||||||
RBC Capital Markets, LLC | 1.04 | % | 12/19/16 | Open | 4,675,000 | 4,684,589 | Corporate Bonds | Open/Demand | 1 | |||||||||||||||||
RBC Capital Markets, LLC | 1.04 | % | 12/19/16 | Open | 1,822,500 | 1,826,238 | Corporate Bonds | Open/Demand | 1 | |||||||||||||||||
RBC Capital Markets, LLC | 1.04 | % | 12/19/16 | Open | 2,130,975 | 2,135,346 | Corporate Bonds | Open/Demand | 1 | |||||||||||||||||
RBC Capital Markets, LLC | 1.04 | % | 12/19/16 | Open | 2,009,000 | 2,013,121 | Corporate Bonds | Open/Demand | 1 | |||||||||||||||||
RBC Capital Markets, LLC | 1.04 | % | 12/19/16 | Open | 1,997,888 | 2,001,985 | Corporate Bonds | Open/Demand | 1 | |||||||||||||||||
RBC Capital Markets, LLC | 1.04 | % | 12/19/16 | Open | 1,850,000 | 1,853,795 | Corporate Bonds | Open/Demand | 1 | |||||||||||||||||
RBC Capital Markets, LLC | 1.04 | % | 12/19/16 | Open | 1,900,700 | 1,904,599 | Corporate Bonds | Open/Demand | 1 | |||||||||||||||||
RBC Capital Markets, LLC | 1.04 | % | 12/19/16 | Open | 3,137,500 | 3,143,935 | Corporate Bonds | Open/Demand | 1 | |||||||||||||||||
RBC Capital Markets, LLC | 1.04 | % | 12/19/16 | Open | 1,463,000 | 1,466,001 | Corporate Bonds | Open/Demand | 1 | |||||||||||||||||
RBC Capital Markets, LLC | 1.04 | % | 12/19/16 | Open | 2,200,000 | 2,204,512 | Corporate Bonds | Open/Demand | 1 | |||||||||||||||||
RBC Capital Markets, LLC | 1.04 | % | 12/19/16 | Open | 1,704,938 | 1,708,435 | Corporate Bonds | Open/Demand | 1 | |||||||||||||||||
BNP Paribas Securities Corp. | 0.57 | % | 12/29/16 | Open | 60,555,750 | 60,619,182 | U.S. Treasury Obligations | Open/Demand | 1 | |||||||||||||||||
Barclays Capital, Inc. | (2.00 | )% | 2/09/17 | Open | 176,015 | 175,829 | Corporate Bonds | Open/Demand | 1 | |||||||||||||||||
HSBC Securities (USA), Inc. | 0.75 | % | 2/10/17 | 3/13/17 | 34,160,000 | 34,171,387 | U.S. Government Sponsored Agency Securities | Up to 30 Days | ||||||||||||||||||
Deutsche Bank AG | (1.00 | )% | 2/15/17 | Open | 198,000 | 197,934 | Corporate Bonds | Open/Demand | 1 | |||||||||||||||||
Deutsche Bank AG | 0.52 | % | 2/27/17 | Open | 22,562,500 | 22,562,826 | U.S. Treasury Obligations | Open/Demand | 1 | |||||||||||||||||
Total |
| $ | 326,894,364 | $ | 327,543,464 | |||||||||||||||||||||
|
| |||||||||||||||||||||||||
1 Certain agreements have no stated maturity and can be terminated by either party at any time. | ||||||||||||||||||||||||||
| Derivative Financial Instruments Outstanding as of Period End |
| Futures Contracts | ||||||||||||||||||||
| Contracts Long (Short) | Issue | Expiration | Notional Value | Unrealized Appreciation (Depreciation) | ||||||||||||||||
| (184 | ) | 2-Year U.S. Treasury Note | June 2017 | USD | 39,818,750 | $ | 6,859 | |||||||||||||
| 504 | 5-Year U.S. Treasury Note | June 2017 | USD | 59,322,375 | (66,596 | ) | ||||||||||||||
| (419 | ) | 10-Year U.S. Treasury Note | June 2017 | USD | 52,198,234 | (3,396 | ) | |||||||||||||
| 11 | 10-Year U.S. Ultra Long Treasury Note | June 2017 | USD | 1,473,313 | (1,133 | ) | ||||||||||||||
| (1 | ) | Euro BOBL | June 2017 | USD | 140,540 | (1 | ) | |||||||||||||
| (1 | ) | Euro Bund Future | June 2017 | USD | 172,481 | (75 | ) | |||||||||||||
| (106 | ) | Long U.S. Treasury Bond | June 2017 | USD | 16,075,563 | 6,793 | ||||||||||||||
| 26 | Ultra Long U.S. Treasury Bond | June 2017 | USD | 4,206,312 | 24,229 | |||||||||||||||
| 135 | 90-Day Euro Future | September 2017 | USD | 33,274,125 | (3,592 | ) | ||||||||||||||
| (135 | ) | 90-Day Euro Dollar | December 2017 | USD | 33,223,500 | 1,470 | ||||||||||||||
| 130 | 90-Day Euro Future | December 2018 | USD | 31,851,625 | (14,232 | ) | ||||||||||||||
| 10 | 90-Day Euro Future | March 2019 | USD | 2,448,500 | (1,690 | ) | ||||||||||||||
| (110 | ) | 90-Day Euro Future | December 2019 | USD | 26,874,375 | 7,214 | ||||||||||||||
| 25 | 90-Day Euro Future | March 2020 | USD | 6,105,000 | 3,872 | |||||||||||||||
Total | $ | (40,278 | ) | |||||||||||||||||
|
| |||||||||||||||||||
| Forward Foreign Currency Exchange Contracts | ||||||||||||||||||||||||
| Currency Purchased | Currency Sold | Counterparty | Settlement Date | Unrealized Appreciation (Depreciation) | ||||||||||||||||||||
| USD | 57,140 | EUR | 54,000 | Bank of America N.A. | 3/06/17 | $ | (76 | ) | ||||||||||||||||
| USD | 9,314,518 | EUR | 8,652,000 | Citibank N.A. | 3/06/17 | 147,309 | ||||||||||||||||||
| USD | 2,351,956 | EUR | 2,185,000 | Morgan Stanley & Co. International PLC | 3/06/17 | 36,843 | ||||||||||||||||||
| USD | 9,747,507 | GBP | 7,802,000 | Barclays Bank PLC | 3/06/17 | 65,813 | ||||||||||||||||||
| USD | 990,742 | GBP | 793,000 | Barclays Bank PLC | 3/06/17 | 6,689 | ||||||||||||||||||
| CHF | 3,845,802 | EUR | 3,610,000 | BNP Paribas S.A. | 3/15/17 | 5,338 | ||||||||||||||||||
| JPY | 436,453,152 | NZD | 5,340,000 | Credit Suisse International | 3/15/17 | 41,861 | ||||||||||||||||||
| NOK | 16,075,444 | AUD | 2,540,000 | Bank of America N.A. | 3/15/17 | (29,114 | ) | |||||||||||||||||
| NOK | 16,075,124 | AUD | 2,540,000 | BNP Paribas S.A. | 3/15/17 | (29,152 | ) | |||||||||||||||||
See Notes to Financial Statements.
| 28 | SEMI-ANNUAL REPORT | FEBRUARY 28, 2017 |
Schedule of Investments (continued) | BlackRock Core Bond Trust (BHK) |
| Forward Foreign Currency Exchange Contracts (concluded) | ||||||||||||||||||||||||||
| Currency Purchased | Currency Sold | Counterparty | Settlement Date | Unrealized Appreciation (Depreciation) | ||||||||||||||||||||||
| NZD | 5,340,000 | JPY | 434,041,074 | Citibank N.A. | 3/15/17 | $ | (20,381 | ) | ||||||||||||||||||
| USD | 3,856,332 | GBP | 3,100,000 | JPMorgan Chase Bank N.A. | 3/15/17 | 8,616 | ||||||||||||||||||||
| CAD | 2,535,889 | AUD | 2,520,000 | Barclays Bank PLC | 3/27/17 | (21,356 | ) | |||||||||||||||||||
| CAD | 2,563,412 | AUD | 2,520,000 | Barclays Bank PLC | 3/27/17 | (630 | ) | |||||||||||||||||||
| SEK | 17,302,843 | NOK | 16,215,000 | BNP Paribas S.A. | 3/27/17 | (15,178 | ) | |||||||||||||||||||
| USD | 9,348,758 | EUR | 8,806,000 | Bank of America N.A. | 4/05/17 | 4,854 | ||||||||||||||||||||
| USD | 2,319,672 | EUR | 2,185,000 | Bank of America N.A. | 4/05/17 | 1,204 | ||||||||||||||||||||
| USD | 9,700,949 | GBP | 7,801,602 | Barclays Bank PLC | 4/05/17 | 11,801 | ||||||||||||||||||||
| USD | 981,087 | GBP | 789,000 | Barclays Bank PLC | 4/05/17 | 1,194 | ||||||||||||||||||||
| SEK | 17,375,591 | NZD | 2,685,000 | Credit Suisse International | 4/18/17 | (1,741 | ) | |||||||||||||||||||
| Total | $ | 213,894 | ||||||||||||||||||||||||
|
| |||||||||||||||||||||||||
| Exchange-Traded Options Purchased | ||||||||||||||||||||
| Description | Put/ Call | Expiration Date | Strike Price | Contracts | Value | |||||||||||||||
10-Year U.S. Treasury Note Future | Put | 5/26/17 | USD | 122.00 | 25 | $ | 9,765 | |||||||||||||
| OTC Interest Rate Swaptions Purchased | ||||||||||||||||||||||||||||||||||||
| Description | Counterparty | Put/ Call | Exercise Rate | Pay/ Receive Exercise Rate | Floating Rate Index | Expiration Date | Notional Amount (000) | Value | ||||||||||||||||||||||||||||
10-Year Interest Rate Swap | Goldman Sachs Bank USA | Call | 2.24 | % | 3-Month LIBOR | Receive | 3/06/17 | USD | 5,100 | $ | 3,717 | |||||||||||||||||||||||||
2-Year Interest Rate Swap | Citibank N.A. | Call | 1.55 | % | 3-Month LIBOR | Receive | 1/25/18 | USD | 40,000 | 72,322 | ||||||||||||||||||||||||||
10-Year Interest Rate Swap | Deutsche Bank AG | Call | 2.64 | % | 3-Month LIBOR | Receive | 2/14/18 | USD | 2,500 | 91,726 | ||||||||||||||||||||||||||
2-Year Interest Rate Swap | Deutsche Bank AG | Call | 1.25 | % | 3-Month LIBOR | Receive | 10/17/18 | USD | 10,000 | 14,999 | ||||||||||||||||||||||||||
5-Year Interest Rate Swap | JPMorgan Chase Bank N.A. | Call | 2.45 | % | 3-Month LIBOR | Receive | 11/22/19 | USD | 8,500 | 208,887 | ||||||||||||||||||||||||||
5-Year Interest Rate Swap | Deutsche Bank AG | Call | 2.45 | % | 3-Month LIBOR | Receive | 12/02/19 | USD | 4,500 | 110,899 | ||||||||||||||||||||||||||
10-Year Interest Rate Swap1 | Deutsche Bank AG | Call | 2.60 | % | 3-Month LIBOR | Receive | 1/25/27 | USD | 1,900 | (22,279 | ) | |||||||||||||||||||||||||
10-Year Interest Rate Swap | Deutsche Bank AG | Call | 2.40 | % | 3-Month LIBOR | Receive | 2/08/27 | USD | 1,875 | 95,875 | ||||||||||||||||||||||||||
10-Year Interest Rate Swap | Goldman Sachs Bank USA | Put | 3.10 | % | 3-Month LIBOR | Pay | 1/03/18 | USD | 3,000 | 81,264 | ||||||||||||||||||||||||||
10-Year Interest Rate Swap | Deutsche Bank AG | Put | 2.64 | % | 3-Month LIBOR | Pay | 2/14/18 | USD | 2,500 | 58,315 | ||||||||||||||||||||||||||
5-Year Interest Rate Swap | JPMorgan Chase Bank N.A. | Put | 2.45 | % | 3-Month LIBOR | Pay | 11/22/19 | USD | 8,500 | 229,271 | ||||||||||||||||||||||||||
5-Year Interest Rate Swap | Deutsche Bank AG | Put | 2.45 | % | 3-Month LIBOR | Pay | 12/02/19 | USD | 4,500 | 122,210 | ||||||||||||||||||||||||||
10-Year Interest Rate Swap | Bank of America N.A. | Put | 3.50 | % | 3-Month LIBOR | Pay | 2/01/21 | USD | 4,000 | 126,923 | ||||||||||||||||||||||||||
10-Year Interest Rate Swap | Citibank N.A. | Put | 3.50 | % | 3-Month LIBOR | Pay | 2/01/21 | USD | 4,380 | 138,980 | ||||||||||||||||||||||||||
5-Year Interest Rate Swap | JPMorgan Chase Bank N.A. | Put | 3.25 | % | 3-Month LIBOR | Pay | 10/25/21 | USD | 6,890 | 156,370 | ||||||||||||||||||||||||||
5-Year Interest Rate Swap | Barclays Bank PLC | Put | 3.15 | % | 3-Month LIBOR | Pay | 10/27/21 | USD | 16,560 | 401,030 | ||||||||||||||||||||||||||
5-Year Interest Rate Swap | | Morgan Stanley & Co. International PLC | | Put | 3.50 | % | 3-Month LIBOR | Pay | 11/15/21 | USD | 7,000 | 136,524 | ||||||||||||||||||||||||
5-Year Interest Rate Swap | Goldman Sachs Bank USA | Put | 3.25 | % | 3-Month LIBOR | Pay | 12/16/21 | USD | 6,050 | 140,648 | ||||||||||||||||||||||||||
5-Year Interest Rate Swap | JPMorgan Chase Bank N.A. | Put | 3.25 | % | 3-Month LIBOR | Pay | 12/16/21 | USD | 6,200 | 144,135 | ||||||||||||||||||||||||||
5-Year Interest Rate Swap | Barclays Bank PLC | Put | 3.35 | % | 3-Month LIBOR | Pay | 1/04/22 | USD | 19,050 | 418,780 | ||||||||||||||||||||||||||
10-Year Interest Rate Swap | Credit Suisse International | Put | 1.25 | % | 6-Month LIBOR | Pay | 1/11/22 | JPY | 250,000 | 30,501 | ||||||||||||||||||||||||||
10-Year Interest Rate Swap | Credit Suisse International | Put | 1.55 | % | 6-Month LIBOR | Pay | 2/22/22 | JPY | 250,000 | 24,374 | ||||||||||||||||||||||||||
Total | $ | 2,785,471 | ||||||||||||||||||||||||||||||||||
|
| |||||||||||||||||||||||||||||||||||
1 Forward settling swaption. |
| |||||||||||||||||||||||||||||||||||
| OTC Options Purchased | ||||||||||||||||||||||||||
| Description | Put/ Call | Counterparty | Expiration Date | Strike Price | Notional Amount (000) | Value | ||||||||||||||||||||
AUD Currency | Call | Morgan Stanley & Co. International PLC | 03/23/17 | CAD | 1.02 | AUD | 10,080 | $ | 48,263 | |||||||||||||||||
NOK Curency | Call | Citibank N.A. | 03/23/17 | SEK | 1.08 | NOK | 97,040 | 54,183 | ||||||||||||||||||
AUD Currency | Put | Morgan Stanley & Co. International PLC | 03/17/17 | USD | 0.75 | AUD | 15,145 | 17,557 | ||||||||||||||||||
NZD Currency | Put | BNP Paribas S.A. | 03/23/17 | JPY | 79.50 | NZD | 10,680 | 32,433 | ||||||||||||||||||
EUR Currency | Put | UBS AG | 08/14/17 | USD | 1.03 | EUR | 7,315 | 97,559 | ||||||||||||||||||
Total | $ | 249,995 | ||||||||||||||||||||||||
|
| |||||||||||||||||||||||||
See Notes to Financial Statements.
| SEMI-ANNUAL REPORT | FEBRUARY 28, 2017 | 29 |
Schedule of Investments (continued) | BlackRock Core Bond Trust (BHK) |
| OTC Interest Rate Swaptions Written | ||||||||||||||||||||||||||||||
| Description | Counterparty | Put/ Call | Exercise Rate | Pay/ Receive Exercise Rate | Floating Rate Index | Expiration Date | Notional Amount (000) | Value | ||||||||||||||||||||||
30-Year Interest Rate Swap | Goldman Sachs Bank USA | Call | 2.51 | % | 3-Month LIBOR | Pay | 3/06/17 | USD | 1,030 | $ | (2,154 | ) | ||||||||||||||||||
5-Year Interest Rate Swap | Goldman Sachs Bank USA | Call | 1.87 | % | 3-Month LIBOR | Pay | 3/06/17 | USD | 4,930 | (770 | ) | |||||||||||||||||||
10-Year Interest Rate Swap | Citibank N.A. | Call | 2.30 | % | 3-Month LIBOR | Pay | 3/24/17 | USD | 7,500 | (38,559 | ) | |||||||||||||||||||
10-Year Interest Rate Swap | Barclays Bank PLC | Call | 2.47 | % | 3-Month LIBOR | Pay | 8/23/17 | USD | 2,500 | (57,771 | ) | |||||||||||||||||||
2-Year Interest Rate Swap | Goldman Sachs Bank USA | Call | 1.10 | % | 3-Month LIBOR | Pay | 11/22/17 | USD | 12,090 | (3,022 | ) | |||||||||||||||||||
2-Year Interest Rate Swap | Citibank N.A. | Call | 1.15 | % | 3-Month LIBOR | Pay | 11/29/17 | USD | 21,810 | (7,148 | ) | |||||||||||||||||||
5-Year Interest Rate Swap | Goldman Sachs Bank USA | Call | 0.15 | % | 6-Month EURIBOR | Pay | 12/04/17 | EUR | 5,700 | (37,332 | ) | |||||||||||||||||||
2-Year Interest Rate Swap | Bank of America N.A. | Call | 1.10 | % | 3-Month LIBOR | Pay | 12/04/17 | USD | 11,020 | (3,018 | ) | |||||||||||||||||||
2-Year Interest Rate Swap | Goldman Sachs Bank USA | Call | 1.10 | % | 3-Month LIBOR | Pay | 12/04/17 | USD | 10,790 | (2,955 | ) | |||||||||||||||||||
2-Year Interest Rate Swap | Barclays Bank PLC | Call | 1.05 | % | 3-Month LIBOR | Pay | 12/15/17 | USD | 39,800 | (9,466 | ) | |||||||||||||||||||
2-Year Interest Rate Swap | Deutsche Bank AG | Call | 1.45 | % | 3-Month LIBOR | Pay | 1/19/18 | USD | 21,500 | (27,953 | ) | |||||||||||||||||||
2-Year Interest Rate Swap | Citibank N.A. | Call | 1.05 | % | 3-Month LIBOR | Pay | 1/25/18 | USD | 60,000 | (18,998 | ) | |||||||||||||||||||
2-Year Interest Rate Swap | Goldman Sachs Bank USA | Call | 0.75 | % | 3-Month LIBOR | Pay | 4/12/18 | USD | 38,200 | (6,466 | ) | |||||||||||||||||||
2-Year Interest Rate Swap | Deutsche Bank AG | Call | 0.90 | % | 3-Month LIBOR | Pay | 10/17/18 | USD | 20,000 | (13,004 | ) | |||||||||||||||||||
2-Year Interest Rate Swap | Barclays Bank PLC | Call | 1.50 | % | 3-Month LIBOR | Pay | 1/11/19 | USD | 5,900 | (17,317 | ) | |||||||||||||||||||
2-Year Interest Rate Swap | Deutsche Bank AG | Call | 2.28 | % | 3-Month LIBOR | Pay | 2/01/19 | USD | 9,500 | (90,150 | ) | |||||||||||||||||||
5-Year Interest Rate Swap | Goldman Sachs Bank USA | Call | 1.70 | % | 3-Month LIBOR | Pay | 1/05/22 | USD | 5,000 | (76,156 | ) | |||||||||||||||||||
5-Year Interest Rate Swap | Deutsche Bank AG | Call | 1.75 | % | 3-Month LIBOR | Pay | 2/08/22 | USD | 5,000 | (80,280 | ) | |||||||||||||||||||
10-Year Interest Rate Swap | Citibank N.A. | Put | 2.60 | % | 3-Month LIBOR | Receive | 3/24/17 | USD | 7,500 | (6,824 | ) | |||||||||||||||||||
10-Year Interest Rate Swap | Barclays Bank PLC | Put | 2.47% | 3-Month LIBOR | Receive | 8/23/17 | USD | 2,500 | (45,625 | ) | ||||||||||||||||||||
5-Year Interest Rate Swap | Goldman Sachs Bank USA | Put | 1.15% | 6-Month EURIBOR | Receive | 9/11/17 | EUR | 10,800 | (4,899 | ) | ||||||||||||||||||||
5-Year Interest Rate Swap | Royal Bank of Scotland PLC | Put | 1.10% | 6-Month EURIBOR | Receive | 9/25/17 | EUR | 10,000 | (5,958 | ) | ||||||||||||||||||||
5-Year Interest Rate Swap | Citibank N.A. | Put | 1.00% | 6-Month EURIBOR | Receive | 10/23/17 | EUR | 6,670 | (6,433 | ) | ||||||||||||||||||||
5-Year Interest Rate Swap | UBS AG | Put | 1.00% | 6-Month EURIBOR | Receive | 10/26/17 | EUR | 12,300 | (12,203 | ) | ||||||||||||||||||||
5-Year Interest Rate Swap | Goldman Sachs Bank USA | Put | 1.00% | 6-Month EURIBOR | Receive | 10/30/17 | EUR | 14,000 | (14,289 | ) | ||||||||||||||||||||
2-Year Interest Rate Swap | Wells Fargo Bank N.A. | Put | 2.00% | 3-Month LIBOR | Receive | 11/21/17 | USD | 26,600 | (85,222 | ) | ||||||||||||||||||||
2-Year Interest Rate Swap | Goldman Sachs Bank USA | Put | 2.10% | 3-Month LIBOR | Receive | 11/22/17 | USD | 12,090 | (30,953 | ) | ||||||||||||||||||||
2-Year Interest Rate Swap | Citibank N.A. | Put | 2.15% | 3-Month LIBOR | Receive | 11/29/17 | USD | 21,810 | (52,039 | ) | ||||||||||||||||||||
2-Year Interest Rate Swap | Wells Fargo Bank N.A. | Put | 2.40% | 3-Month LIBOR | Receive | 12/01/17 | USD | 10,000 | (13,592 | ) | ||||||||||||||||||||
2-Year Interest Rate Swap | Bank of America N.A. | Put | 2.10% | 3-Month LIBOR | Receive | 12/04/17 | USD | 11,020 | (30,289 | ) | ||||||||||||||||||||
2-Year Interest Rate Swap | Goldman Sachs Bank USA | Put | 2.10% | 3-Month LIBOR | Receive | 12/04/17 | USD | 10,790 | (29,657 | ) | ||||||||||||||||||||
2-Year Interest Rate Swap | Barclays Bank PLC | Put | 1.95% | 3-Month LIBOR | Receive | 12/15/17 | USD | 39,800 | (159,638 | ) | ||||||||||||||||||||
10-Year Interest Rate Swap | Goldman Sachs Bank USA | Put | 3.00% | 3-Month LIBOR | Receive | 1/03/18 | USD | 7,430 | (83,305 | ) | ||||||||||||||||||||
5-Year Interest Rate Swap | UBS AG | Put | 1.00% | 6-Month EURIBOR | Receive | 1/08/18 | EUR | 7,200 | (11,638 | ) | ||||||||||||||||||||
2-Year Interest Rate Swap | Citibank N.A. | Put | 2.30% | 3-Month LIBOR | Receive | 1/25/18 | USD | 20,000 | (49,176 | ) | ||||||||||||||||||||
2-Year Interest Rate Swap | Goldman Sachs Bank USA | Put | 1.75% | 3-Month LIBOR | Receive | 4/12/18 | USD | 38,200 | (318,048 | ) | ||||||||||||||||||||
2-Year Interest Rate Swap | Goldman Sachs Bank USA | Put | 1.45% | 3-Month LIBOR | Receive | 6/27/18 | USD | 10,000 | (136,454 | ) | ||||||||||||||||||||
2-Year Interest Rate Swap | Citibank N.A. | Put | 1.40% | 3-Month LIBOR | Receive | 7/05/18 | USD | 10,000 | (145,715 | ) | ||||||||||||||||||||
2-Year Interest Rate Swap | Goldman Sachs Bank USA | Put | 1.50% | 3-Month LIBOR | Receive | 9/06/18 | USD | 26,000 | (367,750 | ) | ||||||||||||||||||||
2-Year Interest Rate Swap | Barclays Bank PLC | Put | 2.50% | 3-Month LIBOR | Receive | 10/17/18 | USD | 5,000 | (24,583 | ) | ||||||||||||||||||||
2-Year Interest Rate Swap | Barclays Bank PLC | Put | 2.50% | 3-Month LIBOR | Receive | 1/11/19 | USD | 5,900 | (35,564 | ) | ||||||||||||||||||||
2-Year Interest Rate Swap | Deutsche Bank AG | Put | 2.28% | 3-Month LIBOR | Receive | 2/01/19 | USD | 9,500 | (74,736 | ) | ||||||||||||||||||||
10-Year Interest Rate Swap | Bank of America N.A. | Put | 5.50% | 3-Month LIBOR | Receive | 2/01/21 | USD | 10,000 | (70,907 | ) | ||||||||||||||||||||
10-Year Interest Rate Swap | Citibank N.A. | Put | 5.50 | % | 3-Month LIBOR | Receive | 2/01/21 | USD | 10,950 | (77,643 | ) | |||||||||||||||||||
Total |
| $ | (2,385,659 | ) | ||||||||||||||||||||||||||
|
| |||||||||||||||||||||||||||||
| OTC Options Written | ||||||||||||||||||||||||||||||||
| Description | Put/ Call | Counterparty | Expiration Date | Strike Price | Notional Amount (000) | Value | ||||||||||||||||||||||||||
AUD Currency | Call | Morgan Stanley & Co. International PLC | 03/17/17 | NZD | 1.09 | AUD | 10,090 | $ | (3,907 | ) | ||||||||||||||||||||||
NOK Currency | Call | Citibank N.A. | 03/23/17 | SEK | 1.09 | NOK | 97,040 | (21,275 | ) | |||||||||||||||||||||||
NZD Currency | Call | BNP Paribas S.A. | 03/23/17 | JPY | 83.00 | NZD | 10,680 | (10,608 | ) | |||||||||||||||||||||||
NZD Currency | Call | Deutsche Bank AG | 04/12/17 | SEK | 6.55 | NZD | 16,135 | (97,323 | ) | |||||||||||||||||||||||
EUR Currency | Call | UBS AG | 05/12/17 | CHF | 1.09 | EUR | 14,635 | (62,157 | ) | |||||||||||||||||||||||
NZD Currency | Put | Deutsche Bank AG | 04/12/17 | SEK | 6.25 | NZD | 16,135 | (27,637 | ) | |||||||||||||||||||||||
Total | $ | (222,907 | ) | |||||||||||||||||||||||||||||
|
| |||||||||||||||||||||||||||||||
See Notes to Financial Statements.
| 30 | SEMI-ANNUAL REPORT | FEBRUARY 28, 2017 |
Schedule of Investments (continued) | BlackRock Core Bond Trust (BHK) |
| Centrally Cleared Credit Default Swaps — Sell Protection | ||||||||||||||||||||||||
| Issuer/Index | Receive Fixed Rate | Expiration Date | Credit Rating1 | Notional Amount (000)2 | Unrealized Depreciation | |||||||||||||||||||
Chesapeake Energy Corp. | 5.00 | % | 12/20/21 | CCC | USD | 270 | $ | (3,069 | ) | |||||||||||||||
1 Using Standard & Poor’s (“S&P’s”) rating of the issuer or the underlying securities of the index, as applicable. |
| |||||||||||||||||||||||
2 The maximum potential amount the Trust may pay should a negative credit event take place as defined under the terms of the agreement. |
| |||||||||||||||||||||||
| Centrally Cleared Interest Rate Swaps | ||||||||||||||||||||||||||||
| Fixed Rate | Floating Rate | Effective Date | Expiration Date | Notional Amount (000) | Unrealized Appreciation (Depreciation) | |||||||||||||||||||||||
| 0.77 | %1 | 3-Month LIBOR | N/A | 2/05/18 | USD | 107,000 | $ | 536,232 | ||||||||||||||||||||
| 1.67 | %2 | 3-Month LIBOR | 7/06/17 | 3 | 3/31/19 | USD | 9,110 | (1,469 | ) | |||||||||||||||||||
| 1.67 | %2 | 3-Month LIBOR | 7/06/17 | 3 | 3/31/19 | USD | 9,100 | (846 | ) | |||||||||||||||||||
| 1.68 | %2 | 3-Month LIBOR | 7/06/17 | 3 | 3/31/19 | USD | 16,950 | 1,229 | ||||||||||||||||||||
| 1.61 | %1 | 3-Month LIBOR | 11/16/17 | 3 | 11/16/19 | USD | 10,100 | 49,163 | ||||||||||||||||||||
| 1.65 | %1 | 3-Month LIBOR | 11/21/17 | 3 | 11/21/19 | USD | 19,500 | 82,506 | ||||||||||||||||||||
| 1.67 | %1 | 3-Month LIBOR | 11/21/17 | 3 | 11/21/19 | USD | 4,490 | 17,683 | ||||||||||||||||||||
| 1.95 | %1 | 3-Month LIBOR | 12/18/17 | 3 | 12/18/19 | USD | 6,300 | (6,863 | ) | |||||||||||||||||||
| 2.05 | %1 | 3-Month LIBOR | 12/19/17 | 3 | 12/19/19 | USD | 6,000 | (18,167 | ) | |||||||||||||||||||
| 2.06 | %1 | 3-Month LIBOR | 12/19/17 | 3 | 12/19/19 | USD | 6,000 | (18,518 | ) | |||||||||||||||||||
| 1.87 | %1 | 3-Month LIBOR | 1/19/18 | 3 | 1/19/20 | USD | 2,600 | 2,909 | ||||||||||||||||||||
| 1.95 | %1 | 3-Month LIBOR | 2/06/18 | 3 | 2/06/20 | USD | 260 | (5 | ) | |||||||||||||||||||
| 1.93 | %1 | 3-Month LIBOR | 2/14/18 | 3 | 2/14/20 | USD | 1,300 | 613 | ||||||||||||||||||||
| 1.96 | %1 | 3-Month LIBOR | 2/16/18 | 3 | 2/16/20 | USD | 2,500 | (208 | ) | |||||||||||||||||||
| 2.00 | %1 | 3-Month LIBOR | 2/16/18 | 3 | 2/16/20 | USD | 5,500 | (5,107 | ) | |||||||||||||||||||
| 2.01 | %1 | 3-Month LIBOR | 2/16/18 | 3 | 2/16/20 | USD | 1,500 | (1,611 | ) | |||||||||||||||||||
| 2.06 | %1 | 3-Month LIBOR | 2/20/18 | 3 | 2/20/20 | USD | 2,000 | (3,865 | ) | |||||||||||||||||||
| 2.00 | %1 | 3-Month LIBOR | 3/02/18 | 3 | 3/02/20 | USD | 3,500 | (1,985 | ) | |||||||||||||||||||
| 2.04 | %1 | 3-Month LIBOR | 3/02/18 | 3 | 3/02/20 | USD | 2,000 | (2,503 | ) | |||||||||||||||||||
| 2.13 | %1 | 3-Month LIBOR | 12/04/18 | 3 | 12/04/20 | USD | 5,000 | 3,953 | ||||||||||||||||||||
| 2.16 | %1 | 3-Month LIBOR | 12/04/18 | 3 | 12/04/20 | USD | 5,000 | 456 | ||||||||||||||||||||
| 2.11 | %1 | 3-Month LIBOR | 12/10/18 | 3 | 12/10/20 | USD | 5,000 | 5,864 | ||||||||||||||||||||
| 2.20 | %1 | 3-Month LIBOR | 12/14/18 | 3 | 12/14/20 | USD | 5,000 | (2,215 | ) | |||||||||||||||||||
| 2.25 | %1 | 3-Month LIBOR | 12/18/18 | 3 | 12/18/20 | USD | 5,000 | (7,133 | ) | |||||||||||||||||||
| 2.32 | %1 | 3-Month LIBOR | 1/24/19 | 3 | 1/24/21 | USD | 5,000 | (11,677 | ) | |||||||||||||||||||
| 1.68 | %1 | 3-Month LIBOR | 7/06/17 | 3 | 8/31/21 | USD | 26,160 | (38,869 | ) | |||||||||||||||||||
| 2.28 | %1 | 3-Month LIBOR | 6/30/17 | 3 | 2/15/24 | USD | 9,380 | (37,706 | ) | |||||||||||||||||||
| 1.97 | %2 | 3-Month LIBOR | 10/27/21 | 3 | 10/27/26 | USD | 2,170 | (67,157 | ) | |||||||||||||||||||
| 2.07 | %2 | 3-Month LIBOR | 10/29/21 | 3 | 10/29/26 | USD | 6,160 | (163,867 | ) | |||||||||||||||||||
| 2.60 | %2 | 3-Month LIBOR | 11/16/21 | 3 | 11/16/26 | USD | 2,240 | (8,209 | ) | |||||||||||||||||||
| 2.95 | %2 | 3-Month LIBOR | 12/21/21 | 3 | 12/21/26 | USD | 4,100 | 45,445 | ||||||||||||||||||||
| 2.75 | %2 | 3-Month LIBOR | 1/05/22 | 3 | 1/05/27 | USD | 6,930 | 16,967 | ||||||||||||||||||||
| 2.35 | %1 | 3-Month LIBOR | N/A | 1/06/27 | USD | 2,060 | (4,929 | ) | ||||||||||||||||||||
| 2.90 | %1 | 3-Month LIBOR | 1/27/27 | 3 | 1/27/37 | USD | 730 | (2,878 | ) | |||||||||||||||||||
| 2.58 | %2 | 3-Month LIBOR | N/A | 1/06/47 | USD | 830 | (1,121 | ) | ||||||||||||||||||||
| Total | $ | 356,112 | ||||||||||||||||||||||||||
|
| |||||||||||||||||||||||||||
1 Fund pays the fixed rate and receives the floating rate. | ||||||||||||||||||||||||||||
2 Fund pays the floating rate and receives the fixed rate. | ||||||||||||||||||||||||||||
3 Forward Swap. | ||||||||||||||||||||||||||||
| OTC Credit Default Swaps — Buy Protection | ||||||||||||||||||||||||||||||||
| Issuer/Index | Pay Fixed Rate | Counterparty | Expiration Date | Notional Amount (000) | Value | Premiums Paid | Unrealized Depreciation | |||||||||||||||||||||||||
Australia & New Zealand Banking Group Ltd. | 1.00 | % | Deutsche Bank AG | 9/20/17 | USD | 1 | $ | (3 | ) | $ | 2 | $ | (5 | ) | ||||||||||||||||||
Westpac Banking Corp. | 1.00 | % | Deutsche Bank AG | 9/20/17 | USD | 1 | (2 | ) | 2 | (4 | ) | |||||||||||||||||||||
Total | $ | (5 | ) | $ | 4 | $ | (9 | ) | ||||||||||||||||||||||||
|
| |||||||||||||||||||||||||||||||
See Notes to Financial Statements.
| SEMI-ANNUAL REPORT | FEBRUARY 28, 2017 | 31 |
Schedule of Investments (continued) | BlackRock Core Bond Trust (BHK) |
| OTC Credit Default Swaps — Sell Protection | ||||||||||||||||||||||||||||||
| Issuer/Index | Receive Fixed Rate | Counterparty | Expiration Date | Credit Rating1 | Notional Amount (000)2 | Value | Premiums Paid (Received) | Unrealized (Depreciation) | ||||||||||||||||||||||
Hellenic Telecommunications Organization SA | 5.00 | % | Barclays Bank PLC | 12/20/21 | B+ | EUR | 20 | $ | 1,502 | $ | 1,296 | $ | 206 | |||||||||||||||||
UniCredit SpA | 1.00 | % | Barclays Bank PLC | 12/20/21 | BBB- | EUR | 10 | (351 | ) | (562 | ) | 211 | ||||||||||||||||||
UniCredit SpA | 1.00 | % | BNP Paribas S.A. | 12/20/21 | BBB- | EUR | 5 | (182 | ) | (229 | ) | 47 | ||||||||||||||||||
Markit CMBX North America, Series 8 | 3.00 | % | Barclays Bank PLC | 10/17/57 | NR | USD | 5,000 | (761,170 | ) | (525,399 | ) | (235,771 | ) | |||||||||||||||||
Markit CMBX North America, Series 8 | 3.00 | % | Credit Suisse International | 10/17/57 | NR | USD | 2,500 | (380,585 | ) | (259,571 | ) | (121,014 | ) | |||||||||||||||||
Markit CMBX North America, Series 8 | 3.00 | % | Morgan Stanley & Co. International PLC | 10/17/57 | NR | USD | 5,550 | (844,899 | ) | (768,323 | ) | (76,576 | ) | |||||||||||||||||
Markit CMBX North America, Series 9 | 3.00 | % | Morgan Stanley & Co. International PLC | 9/17/58 | NR | USD | 9,450 | (1,180,041 | ) | (1,208,523 | ) | 28,482 | ||||||||||||||||||
Total |
| $ | (3,165,726 | ) | $ | (2,761,311 | ) | $ | (404,415 | ) | ||||||||||||||||||||
|
| |||||||||||||||||||||||||||||
1 Using S&P’s rating of the issuer or the underlying securities of the index, as applicable. |
| |||||||||||||||||||||||||||||
2 The maximum potential amount the Trust may pay should a negative credit event take place as defined under the terms of the agreement. |
| |||||||||||||||||||||||||||||
| Transactions in Options Written for the Six Months Ended February 28, 2017 | ||||||||||||||||
| Calls | ||||||||||||||||||||||||||||||||||
| Notional (000) | ||||||||||||||||||||||||||||||||||
| Contracts | AUD | EUR | GBP | NOK | NZD | USD | Premiums Received | |||||||||||||||||||||||||||
Outstanding options, beginning of period | — | 16,190 | 60,000 | — | — | — | $ | 365,930 | $ | 3,061,679 | ||||||||||||||||||||||||
Options written | — | 58,410 | 146,210 | 25,215 | 197,800 | 26,815 | 233,425 | 2,737,169 | ||||||||||||||||||||||||||
Options exercised | — | (16,090 | ) | (25,375 | ) | — | (100,760 | ) | — | (308,123 | ) | |||||||||||||||||||||||
Options expired | — | (32,230 | ) | (98,910 | ) | (18,940 | ) | — | — | (25,235 | ) | (815,492 | ) | |||||||||||||||||||||
Options closed | — | (16,190 | ) | (61,590 | ) | (6,275 | ) | — | — | (297,550 | ) | (3,157,950 | ) | |||||||||||||||||||||
| ||||||||||||||||||||||||||||||||||
Outstanding options, end of period | — | 10,090 | 20,335 | — | 97,040 | 26,815 | $ | 276,570 | $ | 1,517,283 | ||||||||||||||||||||||||
| ||||||||||||||||||||||||||||||||||
| Puts | ||||||||||||||||||||||||||||||||||||||
| Notional (000) | ||||||||||||||||||||||||||||||||||||||
| Contracts | AUD | CAD | EUR | GBP | NOK | NZD | USD | Premiums Received | ||||||||||||||||||||||||||||||
Outstanding options, beginning of period | — | — | — | 242,300 | 10,000 | — | $ | 450,260 | $ | 5,907,484 | ||||||||||||||||||||||||||||
Options written | — | 28,185 | 16,075 | 89,100 | 23,815 | 48,520 | 54,340 | 231,200 | 2,650,734 | |||||||||||||||||||||||||||||
Options exercised | — | — | — | (23,295 | ) | (17,540 | ) | — | — | (13,600 | ) | (451,215 | ) | |||||||||||||||||||||||||
Options expired | — | (28,185 | ) | (16,075 | ) | (39,995 | ) | (16,275 | ) | — | (38,205 | ) | (36,080 | ) | (860,795 | ) | ||||||||||||||||||||||
Options closed | — | — | — | (207,140 | ) | — | (48,520 | ) | — | (336,690 | ) | (4,870,625 | ) | |||||||||||||||||||||||||
| ||||||||||||||||||||||||||||||||||||||
Outstanding options, end of period | — | — | — | 60,970 | — | — | 16,135 | $ | 295,090 | $ | 2,375,583 | |||||||||||||||||||||||||||
| ||||||||||||||||||||||||||||||||||||||
| Derivative Financial Instruments Categorized by Risk Exposure |
As of period end, the fair values of derivative financial instruments located in the Statements of Assets and Liabilities were as follows:
| Assets — Derivative Financial Instruments | Commodity Contracts | Credit Contracts | Equity Contracts | Foreign Currency Exchange Contracts | Interest Rate Contracts | Other Contracts | Total | |||||||||||||||||||||
Futures contracts | Net unrealized appreciation1 | — | — | — | — | $ | 50,437 | — | $ | 50,437 | ||||||||||||||||||
Forward foreign currency exchange contracts | Unrealized appreciation on forward foreign currency exchange contracts | — | — | — | $ | 331,522 | — | — | 331,522 | |||||||||||||||||||
Options purchased2 | Investments at value — unaffiliated3 | — | — | — | 249,995 | 2,795,236 | — | 3,045,231 | ||||||||||||||||||||
Swaps — centrally cleared | Net unrealized appreciation1 | — | — | — | — | 763,020 | — | 763,020 | ||||||||||||||||||||
Swaps — OTC | Unrealized appreciation on OTC swaps; Swap premiums paid | — | $ | 30,246 | — | — | — | — | 30,246 | |||||||||||||||||||
| ||||||||||||||||||||||||||||
Total | — | $ | 30,246 | — | $ | 581,517 | $ | 3,608,693 | — | $ | 4,220,456 | |||||||||||||||||
| ||||||||||||||||||||||||||||
See Notes to Financial Statements.
| 32 | SEMI-ANNUAL REPORT | FEBRUARY 28, 2017 |
Schedule of Investments (continued) | BlackRock Core Bond Trust (BHK) |
| Liabilities — Derivative Financial Instruments | Commodity Contracts | Credit Contracts | Equity Contracts | Foreign Currency Exchange Contracts | Interest Rate Contracts | Other Contracts | Total | |||||||||||||||||||||||||||
Futures contracts | Net unrealized depreciation1 | — | — | — | — | $ | 90,715 | — | $ | 90,715 | ||||||||||||||||||||||||
Forward foreign currency exchange contracts | Unrealized depreciation on forward foreign currency exchange contracts | — | — | — | $ | 117,628 | — | — | 117,628 | |||||||||||||||||||||||||
Options written | Options written at value | — | — | — | 222,907 | 2,385,659 | — | 2,608,566 | ||||||||||||||||||||||||||
Swaps — centrally cleared | Net unrealized depreciation1 | — | $ | 3,069 | — | — | 406,908 | — | 409,977 | |||||||||||||||||||||||||
Swaps — OTC | Unrealized depreciation on OTC swaps; Swap premiums received | — | 3,195,977 | — | — | — | — | 3,195,977 | ||||||||||||||||||||||||||
|
| |||||||||||||||||||||||||||||||||
Total | — | $ | 3,199,046 | — | $ | 340,535 | $ | 2,883,282 | — | $ | 6,422,863 | |||||||||||||||||||||||
|
| |||||||||||||||||||||||||||||||||
1 Includes cumulative appreciation (depreciation) on futures contracts and centrally cleared swaps, if any, as reported in the Schedule of Investments. Only current day’s variation margin is reported within the Statements of Assets and Liabilities. |
| |||||||||||||||||||||||||||||||||
2 Includes forward settling swaption. |
| |||||||||||||||||||||||||||||||||
3 Includes options purchased at value as reported in the Schedule of Investments. |
| |||||||||||||||||||||||||||||||||
For the six months ended February 28, 2017, the effect of derivative financial instruments in the Statements of Operations was as follows:
| Net Realized Gain (Loss) from: | Commodity Contracts | Credit Contracts | Equity Contracts | Foreign Currency Exchange Contracts | Interest Rate Contracts | Other Contracts | Total | |||||||||||||||||||||||||
Futures contracts | — | — | — | — | $ | (824,024 | ) | — | $ | (824,024 | ) | |||||||||||||||||||||
Forward foreign currency exchange contracts | — | — | — | $ | 219,047 | — | — | 219,047 | ||||||||||||||||||||||||
Options purchased1 | — | — | — | (2,219,435 | ) | 513,327 | — | (1,706,108 | ) | |||||||||||||||||||||||
Options written | — | — | — | 1,697,311 | 900,328 | — | 2,597,639 | |||||||||||||||||||||||||
Swaps | — | $ | 208,710 | — | — | 2,296,753 | — | 2,505,463 | ||||||||||||||||||||||||
|
| |||||||||||||||||||||||||||||||
Total | — | $ | 208,710 | — | $ | (303,077 | ) | $ | 2,886,384 | — | $ | 2,792,017 | ||||||||||||||||||||
|
| |||||||||||||||||||||||||||||||
| Net Change in Unrealized Appreciation (Depreciation) on: | ||||||||||||||||||||||||||||||||
Futures contracts | — | — | — | — | $ | (2,161 | ) | — | $ | (2,161 | ) | |||||||||||||||||||||
Forward foreign currency exchange contracts | — | — | — | $ | 248,149 | — | — | 248,149 | ||||||||||||||||||||||||
Options purchased2 | — | — | — | 264,173 | (603,161 | ) | — | (338,988 | ) | |||||||||||||||||||||||
Options written | — | — | — | (100,588 | ) | (2,170,197 | ) | — | (2,270,785 | ) | ||||||||||||||||||||||
Swaps | — | $ | 14,201 | — | — | 266,089 | — | 280,290 | ||||||||||||||||||||||||
|
| |||||||||||||||||||||||||||||||
Total | — | $ | 14,201 | — | $ | 411,734 | $ | (2,509,430 | ) | — | $ | (2,083,495 | ) | |||||||||||||||||||
|
| |||||||||||||||||||||||||||||||
1 Options purchased are included in net realized gain (loss) from investments. |
| |||||||||||||||||||||||||||||||
2 Options purchased are included in net change in unrealized appreciation (depreciation) on investments. |
| |||||||||||||||||||||||||||||||
| Average Quarterly Balances of Outstanding Derivative Financial Instruments |
| Futures contracts: | ||||
Average notional value of contracts — long | $ | 126,009,000 | ||
Average notional value of contracts — short | $ | 156,044,800 | ||
| Forward foreign currency exchange contracts: | ||||
Average amounts purchased — in USD | $ | 90,973,976 | ||
Average amounts sold — in USD | $ | 39,041,487 | ||
| Options: | ||||
Average value of option contracts purchased | $ | 680,992 | ||
Average value of option contracts written | $ | 711,176 | ||
Average notional value of swaption contracts purchased | $ | 166,762,788 | ||
Average notional value of swaption contracts written | $ | 728,214,606 | ||
| Credit default swaps: | ||||
Average notional value — buy protection | $ | 1,000 | ||
Average notional value — sell protection | $ | 15,765,133 | ||
| Interest rate swaps: | ||||
Average notional value — pays fixed rate | $ | 243,620,129 | ||
Average notional amount-receives fixed rate | $ | 42,063,948 | ||
See Notes to Financial Statements.
| SEMI-ANNUAL REPORT | FEBRUARY 28, 2017 | 33 |
Schedule of Investments (continued) | BlackRock Core Bond Trust (BHK) |
For more information about the Trust’s investment risks regarding derivative financial instruments, refer to the Notes to Financial Statements.
| Derivative Financial Instruments — Offsetting as of Period End |
The Trust’s derivative assets and liabilities (by type) were as follows:
| Assets | Liabilities | |||||||
Derivative Financial Instruments: | ||||||||
Futures contracts | — | $ | 47,623 | |||||
Forward foreign currency exchange contracts | $ | 331,522 | 117,628 | |||||
Options | 3,067,510 | 1 | 2,630,845 | |||||
Swaps — centrally cleared | 1,148 | — | ||||||
Swaps — OTC2 | 30,246 | 3,195,977 | ||||||
|
|
|
| |||||
Total derivative assets and liabilities in the Statement of Assets and Liabilities | $ | 3,430,426 | $ | 5,992,073 | ||||
|
|
|
| |||||
Derivatives not subject to a master netting agreement or similar agreement (“MNA”) | (10,913 | ) | (47,623 | ) | ||||
|
|
|
| |||||
Total derivative assets and liabilities subject to an MNA | $ | 3,419,513 | $ | 5,944,450 | ||||
|
|
|
| |||||
1 Includes options purchased at value which is included in Investments at value — unaffiliated in the Statements of Assets and Liabilities and reported in the Schedule of Investments. |
| |||||||
2 Includes unrealized appreciation (depreciation) on OTC swaps and swap premiums paid/received in the Statements of Assets and Liabilities. |
| |||||||
The following table presents the Trust’s derivative assets and liabilities by counterparty net of amounts available for offset under a MNA and net of the related collateral received and pledged by the Trust:
| Counterparty | Derivative Assets Subject to an MNA by Counterparty | Derivatives Available for Offset1 | Non-cash Collateral Received | Cash Collateral Received2 | Net Amount of Derivative Assets3,6 | |||||||||||||||||||
Bank of America N.A. | $ | 132,981 | $ | (132,981 | ) | — | — | |||||||||||||||||
Barclays Bank PLC | 907,020 | (907,020 | ) | — | — | — | ||||||||||||||||||
BNP Paribas S.A. | 37,818 | (37,818 | ) | — | — | — | ||||||||||||||||||
Citibank N.A. | 412,794 | (412,794 | ) | — | — | — | ||||||||||||||||||
Credit Suisse International | 96,736 | (96,736 | ) | — | — | — | ||||||||||||||||||
Deutsche Bank AG | 494,028 | (433,371 | ) | — | $ | (40,000 | ) | $ | 20,657 | |||||||||||||||
Goldman Sachs Bank USA | 225,629 | (225,629 | ) | — | — | — | ||||||||||||||||||
JPMorgan Chase Bank N.A. | 747,279 | — | — | (747,279 | ) | — | ||||||||||||||||||
Morgan Stanley & Co. International PLC | 267,669 | (267,669 | ) | — | — | — | ||||||||||||||||||
UBS AG | 97,559 | (85,998 | ) | — | — | 11,561 | ||||||||||||||||||
|
| |||||||||||||||||||||||
Total | $ | 3,419,513 | $ | (2,600,016 | ) | — | $ | (787,279 | ) | $ | 32,218 | |||||||||||||
|
| |||||||||||||||||||||||
| Counterparty | Derivative Liabilities Subject to an MNA by Counterparty | Derivatives Available for Offset1 | Non-cash Collateral | Cash Collateral Pledged4 | Net Amount of Derivative Liabilities5,6 | |||||||||||||||||||
Bank of America N.A. | $ | 133,404 | $ | (132,981 | ) | — | — | $ | 423 | |||||||||||||||
Barclays Bank PLC | 1,133,682 | (907,020 | ) | — | — | 226,662 | ||||||||||||||||||
BNP Paribas S.A. | 55,167 | (37,818 | ) | — | — | 17,349 | ||||||||||||||||||
Citibank N.A. | 444,191 | (412,794 | ) | — | — | 31,397 | ||||||||||||||||||
Credit Suisse International | 382,326 | (96,736 | ) | — | $ | (285,590 | ) | — | ||||||||||||||||
Deutsche Bank AG | 433,371 | (433,371 | ) | — | — | — | ||||||||||||||||||
Goldman Sachs Bank USA | 1,114,210 | (225,629 | ) | — | (888,581 | ) | — | |||||||||||||||||
Morgan Stanley & Co. International PLC | 2,057,329 | (267,669 | ) | — | — | 1,789,660 | ||||||||||||||||||
Royal Bank of Scotland PLC | 5,958 | — | — | — | 5,958 | |||||||||||||||||||
UBS AG | 85,998 | (85,998 | ) | — | — | — | ||||||||||||||||||
Wells Fargo Bank N.A. | 98,814 | — | — | — | 98,814 | |||||||||||||||||||
|
| |||||||||||||||||||||||
Total | $ | 5,944,450 | $ | (2,600,016 | ) | — | $(1,174,171) | $ | 2,170,263 | |||||||||||||||
|
| |||||||||||||||||||||||
1 The amount of derivatives available for offset is limited to the amount of derivative assets and/or liabilities that are subject to an MNA. |
| |||||||||||||||||||||||
2 Excess of collateral received from the individual counterparty is not shown for financial reporting purposes. |
| |||||||||||||||||||||||
3 Net amount represents the net amount receivable from the counterparty in the event of default. |
| |||||||||||||||||||||||
4 Excess of collateral pledged from the individual counterparty is not shown for financial reporting purposes. |
| |||||||||||||||||||||||
5 Net amount represents the net amount payable due to the counterparty in the event of default. |
| |||||||||||||||||||||||
6 Net amount may also include forward foreign currency exchange contracts and currency options that are not required to be collateralized. |
| |||||||||||||||||||||||
See Notes to Financial Statements.
| 34 | SEMI-ANNUAL REPORT | FEBRUARY 28, 2017 |
Schedule of Investments (continued) | BlackRock Core Bond Trust (BHK) |
| Fair Value Hierarchy as of Period End |
Various inputs are used in determining the fair value of investments and derivative financial instruments. For information about the Trust’s policy regarding valuation of investments and derivative financial instruments, refer to the Notes to Financial Statements.
The following tables summarize the Trust’s investments and derivative financial instruments categorized in the disclosure hierarchy:
| Level 1 | Level 2 | Level 3 | Total | |||||||||||||
Assets: |
| |||||||||||||||
| Investments: | ||||||||||||||||
| Long-Term Investments: | ||||||||||||||||
Asset-Backed Securities | — | $ | 74,261,831 | $ | 7,876,146 | $ | 82,137,977 | |||||||||
Corporate Bonds | — | 523,681,452 | 7,027,992 | 530,709,444 | ||||||||||||
Floating Rate Loan Interests | — | 12,312,873 | 81,810 | 12,394,683 | ||||||||||||
Foreign Agency Obligations | — | 20,597,186 | — | 20,597,186 | ||||||||||||
Municipal Bonds | — | 24,235,038 | — | 24,235,038 | ||||||||||||
Non-Agency Mortgage-Backed Securities | — | 98,309,641 | — | 98,309,641 | ||||||||||||
Preferred Securities | $ | 15,783,485 | 86,956,134 | — | 102,739,619 | |||||||||||
U.S. Government Sponsored Agency Securities | — | 80,969,008 | 2 | 80,969,010 | ||||||||||||
U.S. Treasury Obligations | — | 111,419,368 | — | 111,419,368 | ||||||||||||
| Short-Term Securities: | ||||||||||||||||
Money Market Funds | 31,449,022 | — | — | 31,449,022 | ||||||||||||
Options Purchased: | ||||||||||||||||
Interest rate contracts1 | 9,765 | 2,785,471 | — | 2,795,236 | ||||||||||||
Foreign currency exchange contracts | — | 249,995 | — | 249,995 | ||||||||||||
|
| |||||||||||||||
Total | $ | 47,242,272 | $ | 1,035,777,997 | $ | 14,985,950 | $ | 1,098,006,219 | ||||||||
|
| |||||||||||||||
| Derivative Financial Instruments2 | ||||||||||||||||
Assets: | ||||||||||||||||
Credit contracts | — | $ | 28,946 | — | $ | 28,946 | ||||||||||
Foreign currency exchange contracts | — | 331,522 | — | 331,522 | ||||||||||||
Interest rate contracts | $ | 50,437 | 763,020 | — | 813,457 | |||||||||||
Liabilities: | ||||||||||||||||
Credit contracts | — | (436,439 | ) | — | (436,439 | ) | ||||||||||
Foreign currency exchange contracts | — | (340,535 | ) | — | (340,535 | ) | ||||||||||
Interest rate contracts | (90,715 | ) | (2,792,567 | ) | — | (2,883,282 | ) | |||||||||
|
| |||||||||||||||
Total | $ | (40,278 | ) | $ | (2,446,053 | ) | — | $ | (2,486,331 | ) | ||||||
|
| |||||||||||||||
1 Includes forward settling swaption.
2 Derivative financial instruments are swaps, futures contracts, forward foreign currency exchange contracts and options written. Swaps, futures contracts and forward foreign currency exchange contracts are valued at the unrealized appreciation (depreciation) on the instrument and options written are shown at value. |
| |||||||||||||||
The Trust may hold assets and/or liabilities in which the fair value approximates the carrying amount for financial statement purposes. As of period end, reverse repurchase agreements of $327,543,464 are categorized as Level 2 within the disclosure hierarchy.
During the six months ended February 28, 2017, there were no transfers between Level 1 and Level 2.
See Notes to Financial Statements.
| SEMI-ANNUAL REPORT | FEBRUARY 28, 2017 | 35 |
Schedule of Investments (concluded) | BlackRock Core Bond Trust (BHK) |
A reconciliation of Level 3 investments is presented when the Trust had a significant amount of Level 3 investments at the beginning and/or end of the period in relation to net assets. The following table is a reconciliation of Level 3 investments for which significant unobservable inputs were used in determining fair value:
| Asset-Backed Securities | Corporate Bonds | Floating Rate Loan Interests | Non-Agency Mortgage-Backed Securities | U.S. Government Sponsored Agency Securities | Total | |||||||||||||||||||
Assets: | ||||||||||||||||||||||||
Opening balance, as of August 31, 2016 | $ | 6,235,302 | $ | 7,833,603 | $ | 425,295 | — | $ | 2 | $ | 14,494,202 | |||||||||||||
Transfers into Level 3 | — | — | — | — | — | — | ||||||||||||||||||
Transfers out of Level 3 | (1,500,780 | ) | — | (425,295 | ) | — | — | (1,926,075 | ) | |||||||||||||||
Accrued discounts/premiums | (79,704 | ) | — | — | — | — | (79,704 | ) | ||||||||||||||||
Net realized gain (loss) | (4,600 | ) | — | — | $ | 2 | — | (4,598 | ) | |||||||||||||||
Net change in unrealized appreciation (depreciation)1,2 | 201,113 | (562,287 | ) | 1,013 | — | — | (360,161 | ) | ||||||||||||||||
Purchases | 6,079,815 | — | 80,797 | — | — | 6,160,612 | ||||||||||||||||||
Sales | (3,055,000 | ) | (243,324 | ) | — | (2 | ) | — | (3,298,326 | ) | ||||||||||||||
|
|
|
|
|
|
|
|
|
|
|
| |||||||||||||
Closing Balance, as of February 28, 2017 | $ | 7,876,146 | $ | 7,027,992 | $ | 81,810 | — | $ | 2 | $ | 14,985,950 | |||||||||||||
|
|
|
|
|
|
|
|
|
|
|
| |||||||||||||
Net change in unrealized appreciation (depreciation) on investments still held at February 28, 20172 | $ | 263,227 | $ | (562,287 | ) | $ | 1,013 | — | — | $ | (298,047 | ) | ||||||||||||
|
|
|
|
|
|
|
|
|
|
|
| |||||||||||||
1 Included in the related net change in unrealized appreciation (depreciation) in the Statement of Operations. |
| |||||||||||||||||||||||
2 Any difference between net change in unrealized appreciation (depreciation) and net change in unrealized appreciation (depreciation) on investments still held at February 28, 2017 is generally due to investments no longer held or categorized as Level 3 at period end. |
| |||||||||||||||||||||||
The Trust’s investments that are categorized as Level 3 were valued utilizing third party pricing information without adjustment. Such valuations are based on unobservable inputs. A significant change in third party information could result in a significantly lower or higher value of such Level 3 investments.
See Notes to Financial Statements.
| 36 | SEMI-ANNUAL REPORT | FEBRUARY 28, 2017 |
Consolidated Schedule of Investments February 28, 2017 (Unaudited) | BlackRock Corporate High Yield Fund, Inc. (HYT) (Percentages shown are based on Net Assets) |
| Common Stocks | Shares | Value | ||||||||||
Banks — 0.3% | ||||||||||||
Bank of America Corp. | 47,712 | $ | 1,177,532 | |||||||||
Citigroup, Inc. | 19,346 | 1,157,084 | ||||||||||
JPMorgan Chase & Co. | 12,869 | 1,166,189 | ||||||||||
Wells Fargo & Co. | 20,051 | 1,160,552 | ||||||||||
|
| |||||||||||
| 4,661,357 | ||||||||||||
Building Products — 0.0% | ||||||||||||
JELD-WEN Holding, Inc. (a) | 7,573 | 236,581 | ||||||||||
Capital Markets — 0.2% | ||||||||||||
Goldman Sachs Group, Inc. | 4,669 | 1,158,192 | ||||||||||
Morgan Stanley | 25,178 | 1,149,879 | ||||||||||
Uranium Participation Corp. (a) | 176,860 | 581,899 | ||||||||||
|
| |||||||||||
| 2,889,970 | ||||||||||||
Chemicals — 0.1% | ||||||||||||
Advanced Emissions Solutions, Inc. (a) | 168,580 | 1,815,607 | ||||||||||
Consumer Finance — 0.0% | ||||||||||||
Ally Financial, Inc. | 2 | 45 | ||||||||||
Diversified Financial Services — 0.3% | ||||||||||||
Concrete Investments II S.C.A. (a) | 4,997 | — | �� | |||||||||
Kcad Holdings I Ltd. (a) | 2,223,465,984 | 4,780,452 | ||||||||||
|
| |||||||||||
| 4,780,452 | ||||||||||||
Diversified Telecommunication Services — 0.0% |
| |||||||||||
Broadview Networks Holdings, Inc. (a) | 137,800 | 172,249 | ||||||||||
Energy Equipment & Services (b) — 0.1% |
| |||||||||||
Laricina Energy Ltd. (a) | 211,764 | 1 | ||||||||||
Osum Oil Sands Corp. (a) | 400,000 | 900,467 | ||||||||||
|
| |||||||||||
| 900,468 | ||||||||||||
Media — 0.0% | ||||||||||||
Emmis Communications Corp., Class A (a) | 7,210 | 19,972 | ||||||||||
Metals & Mining — 0.1% | ||||||||||||
Peninsula Energy Ltd. (a) | 2,051,920 | 1,030,451 | ||||||||||
Teck Resources Ltd., Class B | 35,860 | 717,558 | ||||||||||
|
| |||||||||||
| 1,748,009 | ||||||||||||
Oil, Gas & Consumable Fuels — 0.5% | ||||||||||||
Gener8 Maritime Corp. (a) | 965,338 | 4,710,849 | ||||||||||
Halcon Convertible Preferred | 35 | 2,720,025 | ||||||||||
|
| |||||||||||
| 7,430,874 | ||||||||||||
Real Estate Investment Trusts (REITs) — 0.0% |
| |||||||||||
Ovation Acquisition I LLC, (Acquired 12/29/15, cost $187,463) (c) | 12,175 | 12,175 | ||||||||||
Semiconductors & Semiconductor Equipment — 0.0% |
| |||||||||||
SunPower Corp. (a) | 1,025 | 8,979 | ||||||||||
Wireless Telecommunication Services — 0.3% |
| |||||||||||
T-Mobile U.S., Inc. (a) | 59,550 | 3,723,662 | ||||||||||
| Total Common Stocks — 1.9% | 28,400,400 | |||||||||||
| Asset-Backed Securities | Par (000) | |||||||||||
Asset-Backed Securities — 3.6% | ||||||||||||
Allegro CLO II, Ltd., Series 2014-1A, Class CR, 4.77%, 1/21/27 (d)(e) | USD | 1,000 | 1,000,000 | |||||||||
ALM Loan Funding (d)(e): | ||||||||||||
Series 2013-7R2A, Class BR, 3.64%, 10/15/27 | 500 | 502,150 | ||||||||||
Series 2013-8A, Class CR, 4.97%, 10/15/28 | 1,400 | 1,401,570 | ||||||||||
| Asset-Backed Securities | Par (000) | Value | ||||||||||
Asset-Backed Securities (continued) | ||||||||||||
ALM VII R Ltd., Series 2013-7RA, Class BR, 3.72%, 10/15/28 (d)(e) | USD | 500 | $ | 502,167 | ||||||||
ALM XI, Ltd., Series 2014-11A, Class D, 5.82%, 10/17/26 (d)(e) | 500 | 464,855 | ||||||||||
ALM XII Ltd., Series 2015-12A (d)(e): | ||||||||||||
Class C1, 4.77%, 4/16/27 | 1,500 | 1,503,642 | ||||||||||
Class D, 6.52%, 4/16/27 | 250 | 244,941 | ||||||||||
ALM XIV Ltd., Series 2014-14A, Class C, 4.49%, 7/28/26 (d)(e) | 500 | 497,895 | ||||||||||
AMMC CLO 18, Ltd., Series 2016-18A, Class D, 5.94%, 5/26/28 (d)(e) | 500 | 501,231 | ||||||||||
AMMC CLO 19, Ltd., Series 2016-19A, Class C, 3.68%, 10/15/28 (d)(e) | 413 | 411,355 | ||||||||||
AMMC CLO IX, Ltd., Series 2011-9A (d)(e): | ||||||||||||
Class DR, 6.67%, 1/15/22 | 1,000 | 1,000,448 | ||||||||||
Class ER, 8.67%, 1/15/22 | 1,000 | 1,000,647 | ||||||||||
Anchorage Capital CLO 3, Ltd., Series 2014-3A, Class C, 4.54%, 4/28/26 (d)(e) | 500 | 501,506 | ||||||||||
Anchorage Capital CLO 8, Ltd., Series 2016-8A, Class D, 5.24%, 7/28/28 (d)(e) | 1,000 | 1,006,894 | ||||||||||
Anchorage Capital CLO, Ltd., Series 2012-1A, Class DR, 8.27%, 1/13/27 (d)(e) | 600 | 604,272 | ||||||||||
APIDOS CLO, Series 2015-20A, Class BR, 3.62%, 1/16/27 (d)(e) | 250 | 250,250 | ||||||||||
Apidos CLO XIX, Series 2014-19A, Class CR, 3.23%, 10/17/26 (d)(e) | 500 | 498,144 | ||||||||||
Apidos CLO XVIII, Series 2014-18A, Class C, 4.69%, 7/22/26 (d)(e) | 550 | 552,489 | ||||||||||
Apidos CLO XXIII, Series 2015-23A, Class D2, 6.97%, 1/14/27 (d)(e) | 750 | 745,675 | ||||||||||
Ares XXXII CLO, Ltd., Series 2014-32A, Class CR, 4.49%, 11/15/25 (d)(e) | 750 | 750,000 | ||||||||||
Ares XXXIII CLO, Ltd., Series 2015-1A, Class CR, 5.16%, 12/05/25 (d)(e) | 1,000 | 995,044 | ||||||||||
Ares XXXIX CLO, Ltd., Series 2016-39A, Class E, 8.27%, 7/18/28 (d)(e) | 1,000 | 1,000,683 | ||||||||||
Ares XXXVII CLO, Ltd., Series 2015-4A (d)(e): | ||||||||||||
Class C, 5.27%, 10/15/26 | 1,000 | 1,009,198 | ||||||||||
Class D1, 7.82%, 10/15/26 | 500 | 499,547 | ||||||||||
Atrium CDO Corp., Series 9A, Class D, 4.55%, 2/28/24 (d)(e) | 750 | 751,872 | ||||||||||
Ballyrock CLO, Ltd., Series 2016-1A, Class C, 3.52%, 10/15/28 (d)(e) | 1,000 | 1,001,031 | ||||||||||
Betony CLO, Ltd., Series 2015-1A, Class CR, 3.76%, 4/15/27 (d)(e) | 250 | 251,823 | ||||||||||
BlueMountain CLO Ltd., Series 2012-2A, Class CR, 3.65%, 11/20/28 (d)(e) | 500 | 501,444 | ||||||||||
Carlyle Global Market Strategies CLO Ltd. (d)(e): | ||||||||||||
Series 2012-4A, Class DR, 5.13%, 1/20/29 | 500 | 500,000 | ||||||||||
Series 2013-3A, Class B, 3.67%, 7/15/25 | 500 | 500,538 | ||||||||||
Series 2014-1A, Class CR, 3.77%, 4/17/25 | 500 | 503,296 | ||||||||||
Series 2014-5A, Class C, 5.17%, 10/16/25 | 1,000 | 1,002,142 | ||||||||||
Series 2016-3A, Class D, 7.79%, 10/20/29 | 500 | 500,906 | ||||||||||
Cedar Funding, Ltd., Series 2014-3A, Class D, 4.60%, 5/20/26 (d)(e) | 535 | 527,514 | ||||||||||
CIFC Funding 2014-V, Ltd., Series 2014-5A, Class CR, 3.72%, 1/17/27 (d)(e) | 750 | 755,320 | ||||||||||
CIFC Funding 2015-III, Ltd., Series 2015-3A, Class E, 7.07%, 10/19/27 (d)(e) | 750 | 744,214 | ||||||||||
CIFC Funding Ltd. (d)(e): | ||||||||||||
Series 2014-2A, Class A3LR, 3.28%, 5/24/26 | 500 | 500,000 | ||||||||||
Series 2014-3A, Class C1, 3.84%, 7/22/26 | 1,250 | 1,258,288 | ||||||||||
See Notes to Financial Statements.
| SEMI-ANNUAL REPORT | FEBRUARY 28, 2017 | 37 |
Consolidated Schedule of Investments (continued) | BlackRock Corporate High Yield Fund, Inc. (HYT) |
| Asset-Backed Securities | Par (000) | Value | ||||||||||
Asset-Backed Securities (continued) | ||||||||||||
Dryden 36 Senior Loan Fund, Series 2014-36A (d)(e): | ||||||||||||
Class CR, 3.94%, 1/15/28 | USD | 250 | $ | 250,125 | ||||||||
Class DR, 4.64%, 1/15/28 | 1,000 | 1,000,000 | ||||||||||
HPS Loan Management 9-2016, Ltd., Series 9A-2016, Class D2, 7.47%, 7/19/27 (d)(e) | 800 | 784,363 | ||||||||||
LCM XV LP, Series 15A, Class C, 4.15%, 8/25/24 (d)(e) | 500 | 503,106 | ||||||||||
Madison Park Funding Ltd., Series 2014-14A,Class D, 4.63%, 7/20/26 (d)(e) | 500 | 502,329 | ||||||||||
Madison Park Funding XV, Ltd., Series 2014-15A, Class CR, 4.49%, 1/27/26 (d)(e) | 500 | 500,023 | ||||||||||
Mill Creek II CLO, Ltd., Series 2016-1A, Class E, 8.78%, 4/20/28 (d)(e) | 500 | 500,540 | ||||||||||
Neuberger Berman CLO XIII, Ltd., Series 2012-13A, Class C, 3.89%, 1/23/24 (d)(e) | 1,000 | 1,000,735 | ||||||||||
Neuberger Berman CLO XVII Ltd., Series 2014-17A, Class D, 4.58%, 8/04/25 (d)(e) | 500 | 500,526 | ||||||||||
Neuberger Berman CLO XVIII Ltd., Series 2014-18A (d)(e): | ||||||||||||
Class BR, 3.59%, 11/14/27 | 500 | 503,468 | ||||||||||
Class CR, 5.29%, 11/14/27 | 1,500 | 1,511,754 | ||||||||||
Neuberger Berman CLO XX, Ltd., Series 2015-20A, Class E, 7.47%, 1/15/28 (d)(e) | 500 | 495,805 | ||||||||||
Neuberger Berman CLO XXIII, Ltd., Series 2016-23A, Class E, 7.46%, 10/17/27 (d)(e) | 500 | 499,556 | ||||||||||
OCP CLO, Series 2014-7A, Class A1A, 2.63%, 10/20/26 (d)(e) | 500 | 501,586 | ||||||||||
Octagon Investment Partners 26 Ltd., Series 2016-1A, Class D, 5.97%, 4/15/27 (d)(e) | 500 | 501,742 | ||||||||||
Octagon Investment Partners 27, Ltd., Series 2016-1A, Class E, 8.12%, 7/15/27 (d)(e) | 1,000 | 1,002,501 | ||||||||||
Octagon Investment Partners XII Ltd., Series 2012-1AR, Class ER, 6.53%, 5/05/23 (d)(e) | 1,200 | 1,207,053 | ||||||||||
Octagon Investment Partners XVII, Ltd., Series 2013-1A, Class A2R, 2.72%, 10/25/25 (d)(e) | 1,500 | 1,500,750 | ||||||||||
Octagon Investment Partners XXII Ltd., Series 2014-1A (d)(e): | ||||||||||||
Class C1, 4.29%, 11/25/25 | 1,000 | 995,654 | ||||||||||
Class D1, 4.94%, 11/25/25 | 1,000 | 1,000,595 | ||||||||||
OneMain Financial Issuance Trust, Series 2015-2A, Class C, 4.32%, 7/18/25 (e) | 200 | 199,446 | ||||||||||
OZLM IX Ltd., Series 2014-9A, Class C, 4.63%, 1/20/27 (d)(e) | 1,000 | 1,000,170 | ||||||||||
OZLM IX, Ltd., Series 2014-9A Class CR, 1.00%, 1/20/27 (d)(e)(f) | 1,000 | 1,000,000 | ||||||||||
OZLM XII Ltd., Series 2015-12A, Class D, 6.44%, 4/30/27 (d)(e) | 250 | 239,963 | ||||||||||
Race Point IX CLO, Ltd., Series 2015-9A, Class A1, 2.53%, 4/15/27 (d)(e) | 500 | 501,013 | ||||||||||
Race Point VII CLO Ltd., Series 2012-7A, Class CR, 3.69%, 11/08/24 (d)(e) | 2,000 | 2,002,393 | ||||||||||
Sound Point CLO XII, Ltd., Series 2016-2A, Class E, 7.43%, 10/20/28 (d)(e) | 500 | 498,390 | ||||||||||
Symphony CLO Ltd., Series 2016-17A, Class D, 5.82%, 4/15/28 (d)(e) | 250 | 251,882 | ||||||||||
| Asset-Backed Securities | Par (000) | Value | ||||||||||
Asset-Backed Securities (continued) | ||||||||||||
Symphony CLO XI, Ltd., Series 2013-11A, Class B1, 3.22%, 1/17/25 (d)(e) | USD | 500 | $ | 506,248 | ||||||||
Venture XIII CLO Ltd., Series 2013-13A, Class D, 4.50%, 6/10/25 (d)(e) | 1,000 | 1,000,852 | ||||||||||
Venture XVII CLO, Ltd., Series 2014-17A, Class B1, 3.12%, 7/15/26 (d)(e) | 500 | 501,186 | ||||||||||
Venture XXVI CLO Ltd., Series 2017-26A, Class D, 5.29%, 1/20/29 (d)(e) | 750 | 750,000 | ||||||||||
Voya CLO Ltd. (d)(e): | ||||||||||||
Series 2014-4A, Class C, 5.02%, 10/14/26 | 1,750 | 1,752,945 | ||||||||||
Series 2016-3A, Class C, 4.67%, 10/18/27 | 1,000 | 1,003,722 | ||||||||||
Series 2016-3A, Class D, 7.67%, 10/18/27 | 500 | 507,285 | ||||||||||
Westcott Park CLO, Ltd., Series 2016-1A (d)(e): | ||||||||||||
Class D, 5.38%, 7/20/28 | 500 | 501,131 | ||||||||||
Class E, 8.23%, 7/20/28 | 500 | 505,500 | ||||||||||
| Total Asset-Backed Securities — 3.6% | 54,727,328 | |||||||||||
| Corporate Bonds | ||||||||||||
Aerospace & Defense — 2.2% | ||||||||||||
Accudyne Industries Borrower/Accudyne Industries LLC, 7.75%, 12/15/20 (e) | 2,808 | 2,464,020 | ||||||||||
Bombardier, Inc. (e): | ||||||||||||
8.75%, 12/01/21 | 4,765 | 5,277,237 | ||||||||||
6.00%, 10/15/22 | 1,726 | 1,728,158 | ||||||||||
6.13%, 1/15/23 | 518 | 518,000 | ||||||||||
7.50%, 3/15/25 | 3,184 | 3,311,360 | ||||||||||
KLX, Inc., 5.88%, 12/01/22 (e) | 3,539 | 3,725,505 | ||||||||||
Koppers, Inc., 6.00%, 2/15/25 (e) | 1,190 | 1,237,600 | ||||||||||
Meccanica Holdings USA, Inc., 6.25%, 1/15/40 (e) | 100 | 100,500 | ||||||||||
TransDigm, Inc.: | ||||||||||||
5.50%, 10/15/20 | 1,563 | 1,590,353 | ||||||||||
6.00%, 7/15/22 | 7,958 | 8,172,707 | ||||||||||
6.50%, 7/15/24 | 4,577 | 4,702,867 | ||||||||||
6.50%, 5/15/25 (e)(f) | 195 | 199,631 | ||||||||||
6.50%, 5/15/25 | 960 | 982,800 | ||||||||||
6.38%, 6/15/26 | 341 | 344,410 | ||||||||||
|
| |||||||||||
| 34,355,148 | ||||||||||||
Air Freight & Logistics — 0.6% | ||||||||||||
Air Medical Merger Sub Corp., 6.38%, 5/15/23 (e) | 1,321 | 1,284,673 | ||||||||||
National Air Cargo Group, Inc.: | ||||||||||||
11.88%, 5/02/18 | 265 | 257,844 | ||||||||||
11.88%, 5/08/18 | 506 | 492,042 | ||||||||||
XPO Logistics, Inc.: | ||||||||||||
5.75%, 6/15/21 | EUR | 383 | 428,472 | |||||||||
6.50%, 6/15/22 (e) | USD | 4,805 | 5,045,250 | |||||||||
6.13%, 9/01/23 (e) | 1,317 | 1,382,850 | ||||||||||
|
| |||||||||||
| 8,891,131 | ||||||||||||
Airlines — 1.1% | ||||||||||||
Norwegian Air Shuttle ASA Pass-Through Trust, Series 2016-1, Class B, 7.50%, 5/10/25 (e) | 1,895 | 2,030,019 | ||||||||||
US Airways Pass-Through Trust: | ||||||||||||
Series 2012-2, Class C, 5.45%, 6/03/18 | 5,720 | 5,848,700 | ||||||||||
Series 2013-1, Class B, 5.38%, 5/15/23 | 4,596 | 4,745,681 | ||||||||||
Virgin Australia Trust, Series 2013-1, Class C, 7.13%, 10/23/18 (e) | 3,685 | 3,758,965 | ||||||||||
|
| |||||||||||
| 16,383,365 | ||||||||||||
See Notes to Financial Statements.
| 38 | SEMI-ANNUAL REPORT | FEBRUARY 28, 2017 |
Consolidated Schedule of Investments (continued) | BlackRock Corporate High Yield Fund, Inc. (HYT) |
| Corporate Bonds | Par (000) | Value | ||||||||||
Auto Components — 1.4% | ||||||||||||
Adient Global Holdings, Ltd., 3.50%, 8/15/24 | EUR | 250 | $ | 271,180 | ||||||||
Allison Transmission, Inc., 5.00%, 10/01/24 (e) | USD | 827 | 841,472 | |||||||||
CNH Industrial Finance Europe SA, 2.88%, 5/17/23 | EUR | 625 | 688,340 | |||||||||
Faurecia, 3.63%, 6/15/23 | 300 | 332,732 | ||||||||||
Fiat Chrysler Finance Europe: | ||||||||||||
4.75%, 3/22/21 | 200 | 234,127 | ||||||||||
4.75%, 7/15/22 | 467 | 546,390 | ||||||||||
FTE Verwaltungs GmbH, 9.00%, 7/15/20 | 100 | 111,409 | ||||||||||
Goodyear Tire & Rubber Co., 5.00%, 5/31/26 | USD | 471 | 480,420 | |||||||||
Icahn Enterprises LP/Icahn Enterprises Finance Corp.: | ||||||||||||
4.88%, 3/15/19 | 7,711 | 7,836,304 | ||||||||||
6.25%, 2/01/22 (e) | 820 | 846,650 | ||||||||||
6.75%, 2/01/24 (e) | 1,816 | 1,884,100 | ||||||||||
IHO Verwaltungs GmbH (g): | ||||||||||||
(2.75% Cash or 3.50% PIK), 2.75%, 9/15/21 | EUR | 600 | 656,540 | |||||||||
(3.25% Cash or 4.00% PIK), 3.25%, 9/15/23 | 475 | 522,085 | ||||||||||
(3.75% Cash or 4.50% PIK), 3.75%, 9/15/26 | 225 | 242,834 | ||||||||||
(4.13% Cash or 4.88% PIK), 4.13%, 9/15/21 (e) | USD | 1,280 | 1,269,864 | |||||||||
(4.50% Cash or 5.25% PIK), 4.50%, 9/15/23 (e) | 1,367 | 1,332,996 | ||||||||||
Schaeffler Finance BV: | ||||||||||||
4.75%, 5/15/23 (e) | 1,440 | 1,481,818 | ||||||||||
3.25%, 5/15/25 | EUR | 100 | 114,560 | |||||||||
UCI International, Inc., 8.63%, 2/15/19 (a)(d)(h) | USD | 7,080 | 1,805,400 | |||||||||
|
| |||||||||||
| 21,499,221 | ||||||||||||
Banks — 1.6% |
| |||||||||||
Allied Irish Banks PLC, 4.13%, 11/26/25 (d) | EUR | 820 | 903,873 | |||||||||
Banca Popolare di Milano Scarl, 4.25%, 1/30/19 | 200 | 222,383 | ||||||||||
Banca Popolare di Vicenza, 0.50%, 2/03/20 | 400 | 419,915 | ||||||||||
Banco Espirito Santo SA (a)(h): | ||||||||||||
4.75%, 1/15/18 | 1,900 | 598,826 | ||||||||||
4.00%, 1/21/19 | 1,100 | 346,688 | ||||||||||
Banco Popolare, 2.75%, 7/27/20 | 800 | 864,890 | ||||||||||
Bank of Ireland, 4.25%, 6/11/24 (d) | 540 | 596,389 | ||||||||||
Bankia SA, 4.00%, 5/22/24 (d) | 1,600 | 1,730,927 | ||||||||||
CaixaBank SA, 3.50%, 2/15/27 (d) | 200 | 218,027 | ||||||||||
CIT Group, Inc.: | ||||||||||||
5.25%, 3/15/18 | USD | 4,320 | 4,464,202 | |||||||||
6.63%, 4/01/18 (e) | 1,400 | 1,466,500 | ||||||||||
5.50%, 2/15/19 (e) | 6,919 | 7,290,896 | ||||||||||
5.00%, 8/01/23 | 560 | 592,200 | ||||||||||
6.00%, 4/01/36 | 2,800 | 2,691,500 | ||||||||||
Commerzbank AG, 7.75%, 3/16/21 | EUR | 400 | 511,169 | |||||||||
Deutsche Pfandbriefbank AG, 4.60%, 2/22/27 | 200 | 220,666 | ||||||||||
Ibercaja Banco SA, 5.00%, 7/28/25 (d) | 300 | 316,549 | ||||||||||
Intesa Sanpaolo SpA: | ||||||||||||
6.63%, 9/13/23 | 1,100 | 1,374,788 | ||||||||||
3.93%, 9/15/26 | 200 | 217,018 | ||||||||||
|
| |||||||||||
| 25,047,406 | ||||||||||||
Beverages — 0.1% |
| |||||||||||
Ardagh Packaging Finance PLC/Ardagh Holdings USA, Inc., 4.13%, 5/15/23 | 275 | 309,966 | ||||||||||
Horizon Holdings I SASU, 7.25%, 8/01/23 | 100 | 112,455 | ||||||||||
Horizon Parent Holdings Sarl, (8.25% Cash), 8.25%, 2/15/22 (g) | 550 | 601,607 | ||||||||||
OI European Group BV, 3.13%, 11/15/24 | 100 | 108,066 | ||||||||||
|
| |||||||||||
| 1,132,094 | ||||||||||||
| Corporate Bonds | Par (000) | Value | ||||||||||
Biotechnology — 0.1% |
| |||||||||||
Senvion Holding GmbH, 6.63%, 11/15/20 | EUR | 700 | $ | 772,533 | ||||||||
Building Materials — 0.1% | ||||||||||||
Cemex Finance LLC, 4.63%, 6/15/24 | 400 | 448,605 | ||||||||||
Dry Mix Solutions Investissements SAS (d): | ||||||||||||
3.93%, 6/15/21 | 110 | 116,534 | ||||||||||
5.18%, 3/15/23 | 200 | 215,058 | ||||||||||
Titan Global Finance PLC, 3.50%, 6/17/21 | 100 | 110,005 | ||||||||||
|
| |||||||||||
| 890,202 | ||||||||||||
Building Products — 1.7% |
| |||||||||||
American Builders & Contractors Supply Co., Inc. (e): | ||||||||||||
5.63%, 4/15/21 | USD | 1,315 | 1,349,519 | |||||||||
5.75%, 12/15/23 | 982 | 1,031,100 | ||||||||||
BMBG Bond Finance SCA, 3.00%, 6/15/21 | EUR | 225 | 247,897 | |||||||||
Building Materials Corp. of America (e): | ||||||||||||
5.38%, 11/15/24 | USD | 665 | 683,553 | |||||||||
6.00%, 10/15/25 | 2,308 | 2,452,250 | ||||||||||
CPG Merger Sub LLC, 8.00%, 10/01/21 (e) | 4,330 | 4,535,675 | ||||||||||
Louisiana-Pacific Corp., 4.88%, 9/15/24 | 630 | 634,725 | ||||||||||
Masonite International Corp., 5.63%, 3/15/23 (e) | 2,950 | 3,045,875 | ||||||||||
Ply Gem Industries, Inc., 6.50%, 2/01/22 | 3,735 | 3,885,147 | ||||||||||
Standard Industries, Inc. (e): | ||||||||||||
5.13%, 2/15/21 | 284 | 296,070 | ||||||||||
5.50%, 2/15/23 | 1,576 | 1,639,040 | ||||||||||
USG Corp.: | ||||||||||||
8.25%, 1/15/18 | 4,320 | 4,536,000 | ||||||||||
5.50%, 3/01/25 (e) | 1,314 | 1,396,125 | ||||||||||
|
| |||||||||||
| 25,732,976 | ||||||||||||
Capital Markets — 1.5% | ||||||||||||
Blackstone CQP Holdco LP, 9.30%, 3/19/19 (e) | 21,244 | 21,483,119 | ||||||||||
E*Trade Financial Corp., Series A, 0.00%, 8/31/19 (i)(j) | 373 | 1,246,275 | ||||||||||
|
| |||||||||||
| 22,729,394 | ||||||||||||
Chemicals — 2.6% | ||||||||||||
Alpha 3 BV/Alpha US Bidco, Inc., 6.25%, 2/01/25 (e) | 3,350 | 3,350,000 | ||||||||||
Axalta Coating Systems Dutch Holding B BV, 3.75%, 1/15/25 | EUR | 225 | 248,526 | |||||||||
Axalta Coating Systems LLC, 4.88%, 8/15/24 (e) | USD | 1,451 | 1,480,020 | |||||||||
Blue Cube Spinco, Inc.: | ||||||||||||
9.75%, 10/15/23 | 425 | 506,813 | ||||||||||
10.00%, 10/15/25 | 190 | 230,850 | ||||||||||
CF Industries, Inc.: | ||||||||||||
7.13%, 5/01/20 | 860 | 942,775 | ||||||||||
5.15%, 3/15/34 | 540 | 513,338 | ||||||||||
4.95%, 6/01/43 | 2,110 | 1,814,600 | ||||||||||
Chemours Co.: | ||||||||||||
6.63%, 5/15/23 | 375 | 397,969 | ||||||||||
7.00%, 5/15/25 | 1,387 | 1,506,629 | ||||||||||
Hexion, Inc., 10.38%, 2/01/22 (e) | 1,470 | 1,514,100 | ||||||||||
Huntsman International LLC: | ||||||||||||
4.88%, 11/15/20 | 286 | 296,010 | ||||||||||
5.13%, 4/15/21 | EUR | 379 | 447,783 | |||||||||
5.13%, 11/15/22 | USD | 714 | 749,700 | |||||||||
Ineos Finance PLC, 4.00%, 5/01/23 | EUR | 548 | 604,499 | |||||||||
INEOS Group Holdings SA, 5.38%, 8/01/24 | 100 | 111,500 | ||||||||||
Inovyn Finance PLC, 6.25%, 5/15/21 | 200 | 225,266 | ||||||||||
Momentive Performance Materials, Inc., 3.88%, 10/24/21 | USD | 6,758 | 6,622,840 | |||||||||
Montichem Holdco 3 SA, 5.25%, 6/15/21 | EUR | 211 | 231,916 | |||||||||
NOVA Chemicals Corp. (e): | ||||||||||||
5.25%, 8/01/23 | USD | 349 | 359,470 | |||||||||
5.00%, 5/01/25 | 415 | 420,188 | ||||||||||
See Notes to Financial Statements.
| SEMI-ANNUAL REPORT | FEBRUARY 28, 2017 | 39 |
Consolidated Schedule of Investments (continued) | BlackRock Corporate High Yield Fund, Inc. (HYT) |
| Corporate Bonds | Par (000) | Value | ||||||||||
Chemicals (continued) | ||||||||||||
Platform Specialty Products Corp. (e): | ||||||||||||
10.38%, 5/01/21 | USD | 1,818 | $ | 2,042,977 | ||||||||
6.50%, 2/01/22 | 7,764 | 8,113,380 | ||||||||||
PQ Corp., 6.75%, 11/15/22 (e) | 2,197 | 2,378,252 | ||||||||||
PSPC Escrow Corp., 6.00%, 2/01/23 | EUR | 394 | 438,378 | |||||||||
Tronox Finance LLC: | ||||||||||||
6.38%, 8/15/20 | USD | 1,817 | 1,848,797 | |||||||||
7.50%, 3/15/22 (e) | 481 | 502,645 | ||||||||||
Versum Materials, Inc., 5.50%, 9/30/24 (e) | 834 | 872,572 | ||||||||||
WR Grace & Co-Conn, 5.13%, 10/01/21 (e) | 1,817 | 1,912,392 | ||||||||||
|
| |||||||||||
| 40,684,185 | ||||||||||||
Commercial Services & Supplies — 1.4% | ||||||||||||
ADT Corp.: | ||||||||||||
3.50%, 7/15/22 | 3,337 | 3,165,979 | ||||||||||
4.13%, 6/15/23 | 537 | 516,863 | ||||||||||
4.88%, 7/15/32 (e) | 2,365 | 1,903,825 | ||||||||||
Advanced Disposal Services, Inc., 5.63%, 11/15/24 (e) | 1,563 | 1,598,167 | ||||||||||
Bilbao Luxembourg SA, (10.50% Cash or 11.25% PIK), 10.50%, 12/01/18 (g) | EUR | 428 | 465,805 | |||||||||
Brand Energy & Infrastructure Services, Inc., 8.50%, 12/01/21 (e) | USD | 1,875 | 1,964,062 | |||||||||
Harland Clarke Holdings Corp., 8.38%, 8/15/22 (e) | 1,870 | 1,931,944 | ||||||||||
Iron Mountain Europe PLC, 6.13%, 9/15/22 | GBP | 100 | 131,375 | |||||||||
Mobile Mini, Inc., 5.88%, 7/01/24 | USD | 2,683 | 2,803,735 | |||||||||
Park Aerospace Holdings Ltd., 5.25%, 8/15/22 (e) | 1,631 | 1,700,317 | ||||||||||
Ritchie Bros Auctioneers, Inc., 5.38%, 1/15/25 (e) | 1,289 | 1,326,059 | ||||||||||
Silk Bidco AS, 7.50%, 2/01/22 | EUR | 247 | 281,297 | |||||||||
United Rentals North America, Inc.: | ||||||||||||
7.63%, 4/15/22 | USD | 1,992 | 2,079,787 | |||||||||
5.75%, 11/15/24 | 1,354 | 1,437,948 | ||||||||||
Verisure Holding AB, 6.00%, 11/01/22 | EUR | 185 | 213,530 | |||||||||
|
| |||||||||||
| 21,520,693 | ||||||||||||
Communications Equipment — 1.7% | ||||||||||||
Alcatel-Lucent USA, Inc., 6.45%, 3/15/29 | USD | 4,706 | 5,200,130 | |||||||||
Avaya, Inc., 7.00%, 4/01/19 (a)(e)(h) | 1,135 | 905,163 | ||||||||||
CommScope Technologies Finance LLC, 6.00%, 6/15/25 (e) | 712 | 761,840 | ||||||||||
CommScope, Inc. (e): | ||||||||||||
5.00%, 6/15/21 | 2,278 | 2,346,340 | ||||||||||
5.50%, 6/15/24 | 2,169 | 2,272,028 | ||||||||||
Nokia OYJ, 6.63%, 5/15/39 | 3,513 | 3,750,127 | ||||||||||
Zayo Group LLC/Zayo Capital, Inc.: | ||||||||||||
6.00%, 4/01/23 | 4,466 | 4,722,795 | ||||||||||
6.38%, 5/15/25 | 4,457 | 4,802,417 | ||||||||||
5.75%, 1/15/27 (e) | 1,481 | 1,565,861 | ||||||||||
|
| |||||||||||
| 26,326,701 | ||||||||||||
Construction & Engineering — 0.4% | ||||||||||||
BlueLine Rental Finance Corp., 7.00%, 2/01/19 (e) | 2,090 | 2,131,800 | ||||||||||
Engility Corp., 8.88%, 9/01/24 (e) | 1,728 | 1,857,600 | ||||||||||
Swissport Investments SA, 6.75%, 12/15/21 | EUR | 827 | 960,669 | |||||||||
Weekley Homes LLC/Weekley Finance Corp., 6.00%, 2/01/23 | USD | 862 | 831,830 | |||||||||
|
| |||||||||||
| 5,781,899 | ||||||||||||
Construction Materials — 1.3% | ||||||||||||
American Tire Distributors, Inc., 10.25%, 3/01/22 (e) | 1,839 | 1,825,207 | ||||||||||
Autodis SA: | ||||||||||||
4.05%, 5/01/22 (d) | EUR | 100 | 109,383 | |||||||||
4.38%, 5/01/22 | 150 | 165,616 | ||||||||||
| Corporate Bonds | Par (000) | Value | ||||||||||
Construction Materials (continued) | ||||||||||||
Beacon Roofing Supply, Inc., 6.38%, 10/01/23 | USD | 566 | $ | 611,988 | ||||||||
HD Supply, Inc. (e): | ||||||||||||
5.25%, 12/15/21 | 10,967 | 11,570,185 | ||||||||||
5.75%, 4/15/24 | 2,803 | 2,964,172 | ||||||||||
LKQ Italia Bondco SpA, 3.88%, 4/01/24 | EUR | 200 | 226,451 | |||||||||
PulteGroup, Inc., 5.50%, 3/01/26 | USD | 1,373 | 1,424,488 | |||||||||
Rexel SA: | ||||||||||||
3.50%, 6/15/23 | EUR | 972 | 1,077,022 | |||||||||
2.63%, 6/15/24 (f) | 250 | 265,247 | ||||||||||
|
| |||||||||||
| 20,239,759 | ||||||||||||
Consumer Discretionary — 0.1% | ||||||||||||
Nielsen Co. Luxembourg SARL, 5.00%, 2/01/25 (e) | USD | 1,178 | 1,186,835 | |||||||||
Silversea Cruise Finance Ltd., 7.25%, 2/01/25 (e) | 643 | 670,328 | ||||||||||
|
| |||||||||||
| 1,857,163 | ||||||||||||
Consumer Finance — 2.4% | ||||||||||||
Alliance Data Systems Corp. (e): | ||||||||||||
5.25%, 12/01/17 | 150 | 152,250 | ||||||||||
5.88%, 11/01/21 | 3,207 | 3,319,245 | ||||||||||
5.38%, 8/01/22 | 503 | 500,485 | ||||||||||
Ally Financial, Inc.: | ||||||||||||
5.13%, 9/30/24 | 1,230 | 1,302,262 | ||||||||||
4.63%, 3/30/25 | 904 | 924,340 | ||||||||||
8.00%, 11/01/31 | 18,930 | 23,283,900 | ||||||||||
Navient Corp.: | ||||||||||||
6.63%, 7/26/21 | 1,074 | 1,119,645 | ||||||||||
5.50%, 1/25/23 | 932 | 892,390 | ||||||||||
7.25%, 9/25/23 | 890 | 912,250 | ||||||||||
6.13%, 3/25/24 | 642 | 614,715 | ||||||||||
5.88%, 10/25/24 | 723 | 677,813 | ||||||||||
5.63%, 8/01/33 | 1,821 | 1,475,010 | ||||||||||
OneMain Financial Holdings LLC (e): | ||||||||||||
6.75%, 12/15/19 | 1,451 | 1,519,023 | ||||||||||
7.25%, 12/15/21 | 275 | 287,375 | ||||||||||
|
| |||||||||||
| 36,980,703 | ||||||||||||
Containers & Packaging — 3.5% | ||||||||||||
Ardagh Packaging Finance PLC/Ardagh Holdings USA, Inc.: | ||||||||||||
6.75%, 1/31/21 (e) | 1,458 | 1,511,654 | ||||||||||
4.29%, 5/15/21 (d)(e) | 393 | 403,316 | ||||||||||
6.00%, 6/30/21 (e) | 2,447 | 2,538,762 | ||||||||||
4.25%, 1/15/22 | EUR | 991 | 1,083,776 | |||||||||
4.25%, 9/15/22 (e)(f) | USD | 1,627 | 1,651,405 | |||||||||
2.75%, 3/15/24 (f) | EUR | 875 | 928,041 | |||||||||
6.75%, 5/15/24 | 450 | 527,382 | ||||||||||
6.00%, 2/15/25 (e)(f) | USD | 4,549 | 4,674,097 | |||||||||
Ardagh Packaging Finance PLC/Ardagh MP Holdings USA, Inc. (e): | ||||||||||||
6.25%, 1/31/19 | 3,868 | 3,929,153 | ||||||||||
4.63%, 5/15/23 | 1,738 | 1,768,415 | ||||||||||
7.25%, 5/15/24 | 7,410 | 8,076,900 | ||||||||||
Ball Corp.: | ||||||||||||
5.00%, 3/15/22 | 710 | 751,713 | ||||||||||
4.00%, 11/15/23 | 1,374 | 1,372,282 | ||||||||||
4.38%, 12/15/23 | EUR | 100 | 119,257 | |||||||||
Crown European Holdings SA: | ||||||||||||
4.00%, 7/15/22 | 558 | 656,171 | ||||||||||
3.38%, 5/15/25 | 403 | 442,201 | ||||||||||
Flex Acquisition Co., Inc., 6.88%, 1/15/25 (e) | USD | 1,012 | 1,034,770 | |||||||||
JH-Holding Finance SA, (8.25% PIK), 8.25%, 12/01/22 (g) | EUR | 300 | 344,318 | |||||||||
Norske Skog, 11.75%, 12/15/19 | 228 | 230,915 | ||||||||||
See Notes to Financial Statements.
| 40 | SEMI-ANNUAL REPORT | FEBRUARY 28, 2017 |
Consolidated Schedule of Investments (continued) | BlackRock Corporate High Yield Fund, Inc. (HYT) |
| Corporate Bonds | Par (000) | Value | ||||||||||
Containers & Packaging (continued) | ||||||||||||
Reynolds Group Issuer, Inc./Reynolds Group Issuer LLC/Reynolds Group Issuer Lu: | ||||||||||||
5.75%, 10/15/20 | USD | 6,454 | $ | 6,647,620 | ||||||||
4.52%, 7/15/21 (d)(e) | 3,894 | 3,996,217 | ||||||||||
5.13%, 7/15/23 (e) | 1,259 | 1,304,639 | ||||||||||
7.00%, 7/15/24 (e) | 4,659 | 5,011,337 | ||||||||||
Sappi Papier Holding GmbH, 4.00%, 4/01/23 | EUR | 150 | 168,445 | |||||||||
Sealed Air Corp.: | ||||||||||||
4.88%, 12/01/22 (e) | USD | 709 | 732,929 | |||||||||
4.50%, 9/15/23 | EUR | 560 | 664,129 | |||||||||
6.88%, 7/15/33 (e) | USD | 700 | 759,500 | |||||||||
Signode Industrial Group Lux SA/Signode Industrial Group US, Inc., 6.38%, 5/01/22 (e) | 1,901 | 1,953,277 | ||||||||||
Smurfit Kappa Acquisitions Unltd Co.: | ||||||||||||
2.38%, 2/01/24 | EUR | 100 | 108,345 | |||||||||
2.75%, 2/01/25 | 376 | 411,954 | ||||||||||
Verallia Packaging SASU, 5.13%, 8/01/22 | 575 | 646,313 | ||||||||||
|
| |||||||||||
| 54,449,233 | ||||||||||||
Diversified Consumer Services — 1.0% | ||||||||||||
APX Group, Inc.: | ||||||||||||
6.38%, 12/01/19 | USD | 337 | 346,689 | |||||||||
8.75%, 12/01/20 | 1,935 | 2,002,725 | ||||||||||
7.88%, 12/01/22 | 975 | 1,055,437 | ||||||||||
7.88%, 12/01/22 (e) | 1,520 | 1,645,400 | ||||||||||
Cognita Financing PLC, 7.75%, 8/15/21 | GBP | 225 | 295,083 | |||||||||
Prime Security Services Borrower LLC/Prime Finance, Inc., 9.25%, 5/15/23 (e) | USD | 8,349 | 9,131,719 | |||||||||
Sotheby’s, 5.25%, 10/01/22 (e) | 242 | 246,840 | ||||||||||
Tereos Finance Groupe I SA, 4.13%, 6/16/23 | EUR | 300 | 327,116 | |||||||||
|
| |||||||||||
| 15,051,009 | ||||||||||||
Diversified Financial Services — 1.4% | ||||||||||||
Aircastle Ltd.: | ||||||||||||
7.63%, 4/15/20 | USD | 128 | 145,120 | |||||||||
5.13%, 3/15/21 | 643 | 686,402 | ||||||||||
5.50%, 2/15/22 | 2,119 | 2,285,871 | ||||||||||
Arrow Global Finance PLC, 5.13%, 9/15/24 | GBP | 125 | 158,594 | |||||||||
Cabot Financial Luxembourg SA, 6.50%, 4/01/21 | 100 | 127,857 | ||||||||||
Deutsche Bank AG, 4.25%, 10/14/21 (e) | USD | 525 | 530,937 | |||||||||
DFC Finance Corp., (12.00% Cash or 11.00% PIK), 12.00%, 6/16/20 (e)(g) | 2,107 | 1,327,604 | ||||||||||
FBM Finance, Inc., 8.25%, 8/15/21 (e) | 625 | 668,875 | ||||||||||
Garfunkelux Holdco 3 SA, 8.50%, 11/01/22 | GBP | 225 | 291,755 | |||||||||
HRG Group, Inc., 7.88%, 7/15/19 | USD | 2,745 | 2,851,369 | |||||||||
Jefferies Finance LLC/JFIN Co-Issuer Corp. (e): | ||||||||||||
7.38%, 4/01/20 | 2,695 | 2,742,162 | ||||||||||
6.88%, 4/15/22 | 2,552 | 2,481,820 | ||||||||||
Lehman Brother Holding Escrow, 1.00%, 9/22/18 | 430 | 27,735 | ||||||||||
Lehman Brothers Holdings, Inc.: | ||||||||||||
5.38%, 10/17/17 | EUR | 350 | 30,127 | |||||||||
4.75%, 1/16/18 | 1,890 | 162,684 | ||||||||||
1.00%, 2/05/18 | 3,950 | 313,847 | ||||||||||
1.00%, 12/31/49 | USD | 1,535 | 99,007 | |||||||||
Lincoln Finance, Ltd., 6.88%, 4/15/21 | EUR | 100 | 114,517 | |||||||||
Mercury Bondco PLC (g): | ||||||||||||
(7.13% Cash or 7.88% PIK), 7.13%, 5/30/21 | 825 | 865,265 | ||||||||||
(8.25% Cash or 9.00% PIK), 8.25%, 5/30/21 | 564 | 609,210 | ||||||||||
Pershing Square Holdings, Ltd., 5.50%, 7/15/22 (e) | USD | 2,100 | 2,139,690 | |||||||||
ProGroup AG, 5.13%, 5/01/22 | EUR | 206 | 231,924 | |||||||||
UniCredit SpA: | ||||||||||||
6.95%, 10/31/22 | 375 | 461,497 | ||||||||||
5.75%, 10/28/25 (d) | 700 | 793,111 | ||||||||||
4.38%, 1/03/27 (d) | 675 | 733,953 | ||||||||||
| Corporate Bonds | Par (000) | Value | ||||||||||
Diversified Financial Services (continued) | ||||||||||||
WMG Acquisition Corp., 4.13%, 11/01/24 | EUR | 250 | $ | 279,787 | ||||||||
|
| |||||||||||
| 21,160,720 | ||||||||||||
Diversified Telecommunication Services — 3.7% | ||||||||||||
CenturyLink, Inc.: | ||||||||||||
6.45%, 6/15/21 | USD | 6,956 | 7,412,522 | |||||||||
Series U, 7.65%, 3/15/42 | 503 | 460,245 | ||||||||||
Series Y, 7.50%, 4/01/24 | 1,426 | 1,532,950 | ||||||||||
Cincinnati Bell, Inc., 7.00%, 7/15/24 (e) | 4,076 | 4,310,370 | ||||||||||
Consolidated Communications, Inc., 6.50%, 10/01/22 | 1,020 | 1,017,450 | ||||||||||
Frontier Communications Corp.: | ||||||||||||
8.13%, 10/01/18 | 1,113 | 1,190,910 | ||||||||||
7.13%, 3/15/19 | 1,445 | 1,535,313 | ||||||||||
8.50%, 4/15/20 | 3,080 | 3,264,800 | ||||||||||
6.25%, 9/15/21 | 2,025 | 1,933,875 | ||||||||||
7.13%, 1/15/23 | 1,330 | 1,203,650 | ||||||||||
7.63%, 4/15/24 | 1,897 | 1,702,557 | ||||||||||
6.88%, 1/15/25 | 4,856 | 4,091,180 | ||||||||||
11.00%, 9/15/25 | 1,955 | 1,964,775 | ||||||||||
Level 3 Financing, Inc.: | ||||||||||||
5.38%, 8/15/22 | 315 | 326,576 | ||||||||||
5.63%, 2/01/23 | 1,551 | 1,601,408 | ||||||||||
5.13%, 5/01/23 | 1,292 | 1,317,840 | ||||||||||
5.38%, 1/15/24 | 1,771 | 1,817,489 | ||||||||||
5.38%, 5/01/25 | 2,302 | 2,376,815 | ||||||||||
5.25%, 3/15/26 (e) | 1,973 | 1,990,264 | ||||||||||
OTE PLC, 3.50%, 7/09/20 | EUR | 300 | 319,409 | |||||||||
SBA Communications Corp., 4.88%, 9/01/24 (e) | USD | 2,489 | 2,476,306 | |||||||||
SoftBank Group Corp., 4.75%, 7/30/25 | EUR | 310 | 368,710 | |||||||||
Telecom Italia Capital SA: | ||||||||||||
6.38%, 11/15/33 | USD | 831 | 839,310 | |||||||||
6.00%, 9/30/34 | 3,879 | 3,830,512 | ||||||||||
7.20%, 7/18/36 | 690 | 730,710 | ||||||||||
Telecom Italia Finance SA, 7.75%, 1/24/33 | EUR | 380 | 525,767 | |||||||||
Telecom Italia SpA: | ||||||||||||
6.38%, 6/24/19 | GBP | 900 | 1,221,306 | |||||||||
3.25%, 1/16/23 | EUR | 300 | 335,967 | |||||||||
5.88%, 5/19/23 | GBP | 400 | 557,489 | |||||||||
5.30%, 5/30/24 (e) | USD | 640 | 651,200 | |||||||||
Telenet Finance V Luxembourg SCA, 6.75%, 8/15/24 | EUR | 1,982 | 2,328,495 | |||||||||
Windstream Corp., 7.75%, 10/01/21 | USD | 964 | 992,920 | |||||||||
Windstream Services LLC, 7.50%, 6/01/22 | 841 | 832,590 | ||||||||||
|
| |||||||||||
| 57,061,680 | ||||||||||||
Electric Utilities — 0.0% | ||||||||||||
Viridian Group FundCo II Ltd., 7.50%, 3/01/20 | EUR | 454 | 510,427 | |||||||||
Electrical Equipment — 0.2% | ||||||||||||
Areva SA, 4.88%, 9/23/24 | 700 | 749,811 | ||||||||||
Belden, Inc., 5.50%, 4/15/23 | 472 | 531,289 | ||||||||||
Trionista Holdco GmbH, 5.00%, 4/30/20 | 1,405 | 1,520,160 | ||||||||||
Trionista TopCo GmbH, 6.88%, 4/30/21 | 418 | 463,310 | ||||||||||
|
| |||||||||||
| 3,264,570 | ||||||||||||
Electronic Equipment, Instruments & Components — 0.4% |
| |||||||||||
CDW LLC/CDW Finance Corp.: | ||||||||||||
5.00%, 9/01/23 | USD | 4,354 | 4,484,620 | |||||||||
5.00%, 9/01/25 (f) | 714 | 724,267 | ||||||||||
SESI LLC, 7.13%, 12/15/21 | 655 | 673,013 | ||||||||||
|
| |||||||||||
| 5,881,900 | ||||||||||||
Energy Equipment & Services — 2.0% |
| |||||||||||
Ensco PLC: | ||||||||||||
4.50%, 10/01/24 | 884 | 760,240 | ||||||||||
5.20%, 3/15/25 | 270 | 238,950 | ||||||||||
See Notes to Financial Statements.
| SEMI-ANNUAL REPORT | FEBRUARY 28, 2017 | 41 |
Consolidated Schedule of Investments (continued) | BlackRock Corporate High Yield Fund, Inc. (HYT) |
| Corporate Bonds | Par (000) | Value | ||||||||||
Energy Equipment & Services (continued) |
| |||||||||||
Gates Global LLC/Gates Global Co.: | ||||||||||||
5.75%, 7/15/22 | EUR | 110 | $ | 115,951 | ||||||||
6.00%, 7/15/22 (e) | USD | 2,587 | 2,606,402 | |||||||||
Genesis Energy LP/Genesis Energy Finance Corp.: | ||||||||||||
5.75%, 2/15/21 | 283 | 287,245 | ||||||||||
6.75%, 8/01/22 | 2,236 | 2,331,030 | ||||||||||
Noble Holding International Ltd., 4.63%, 3/01/21 | 61 | 57,798 | ||||||||||
Pattern Energy Group, Inc., 5.88%, 2/01/24 (e) | 935 | 959,544 | ||||||||||
Pioneer Energy Services Corp., 6.13%, 3/15/22 | 2,090 | 1,951,537 | ||||||||||
Precision Drilling Corp.: | ||||||||||||
6.50%, 12/15/21 | 785 | 806,588 | ||||||||||
5.25%, 11/15/24 | 600 | 594,000 | ||||||||||
Transocean, Inc.: | ||||||||||||
4.25%, 10/15/17 | 1,339 | 1,346,900 | ||||||||||
6.00%, 3/15/18 | 4,050 | 4,151,250 | ||||||||||
7.38%, 4/15/18 | 175 | 179,813 | ||||||||||
5.55%, 10/15/22 | 2,075 | 1,940,125 | ||||||||||
9.00%, 7/15/23 (e) | 5,695 | 6,136,362 | ||||||||||
6.80%, 3/15/38 | 925 | 758,500 | ||||||||||
Trinidad Drilling Ltd., 6.63%, 2/15/25 (e) | 2,272 | 2,340,160 | ||||||||||
Weatherford International Ltd.: | ||||||||||||
7.75%, 6/15/21 | 1,271 | 1,371,091 | ||||||||||
8.25%, 6/15/23 | 420 | 455,700 | ||||||||||
9.88%, 2/15/24 (e) | 1,245 | 1,437,975 | ||||||||||
|
| |||||||||||
| 30,827,161 | ||||||||||||
Environmental, Maintenance, & Security Service — 0.2% |
| |||||||||||
Befesa Zinc SAU Via Zinc Capital SA, 8.88%, 5/15/18 | EUR | 380 | 411,207 | |||||||||
Tervita Escrow Corp., 7.63%, 12/01/21 (e) | USD | 2,397 | 2,504,865 | |||||||||
|
| |||||||||||
| 2,916,072 | ||||||||||||
Food & Staples Retailing — 1.5% |
| |||||||||||
Albertsons Cos. LLC/Safeway, Inc./New Albertson’s, Inc./Albertson’s LLC (e): | ||||||||||||
6.63%, 6/15/24 | 1,082 | 1,146,920 | ||||||||||
5.75%, 3/15/25 | 1,564 | 1,566,933 | ||||||||||
B&M European Value Retail SA, 4.13%, 2/01/22 | GBP | 225 | 290,754 | |||||||||
Bakkavor Finance 2 PLC, 8.25%, 2/15/18 | 326 | 406,033 | ||||||||||
Casino Guichard Perrachon SA: | ||||||||||||
5.98%, 5/26/21 | EUR | 200 | 249,622 | |||||||||
4.56%, 1/25/23 | 600 | 710,782 | ||||||||||
3.25%, 3/07/24 | 500 | 581,129 | ||||||||||
3.58%, 2/07/25 | 100 | 109,276 | ||||||||||
Dollar Tree, Inc.: | ||||||||||||
5.25%, 3/01/20 | USD | 262 | 269,467 | |||||||||
5.75%, 3/01/23 | 5,504 | 5,841,120 | ||||||||||
Family Dollar Stores, Inc., 5.00%, 2/01/21 | 1,434 | 1,530,795 | ||||||||||
Pinnacle Foods Finance LLC/Pinnacle Foods Finance Corp., 5.88%, 1/15/24 | 445 | 470,588 | ||||||||||
Rite Aid Corp.: | ||||||||||||
9.25%, 3/15/20 | 2,080 | 2,147,600 | ||||||||||
6.75%, 6/15/21 | 1,091 | 1,137,368 | ||||||||||
6.13%, 4/01/23 (e) | 4,650 | 4,927,372 | ||||||||||
7.70%, 2/15/27 | 256 | 305,920 | ||||||||||
Tesco PLC: | ||||||||||||
5.00%, 3/24/23 | GBP | 230 | 316,439 | |||||||||
6.00%, 12/14/29 | 200 | 282,309 | ||||||||||
|
| |||||||||||
| 22,290,427 | ||||||||||||
Food Products — 1.1% |
| |||||||||||
Acosta, Inc., 7.75%, 10/01/22 (e) | USD | 1,859 | 1,635,920 | |||||||||
Aramark Services, Inc.: | ||||||||||||
5.75%, 3/15/20 | 321 | 326,128 | ||||||||||
5.13%, 1/15/24 | 1,915 | 2,006,154 | ||||||||||
Darling Global Finance BV, 4.75%, 5/30/22 | EUR | 100 | 112,357 | |||||||||
| Corporate Bonds | Par (000) | Value | ||||||||||
Food Products (continued) |
| |||||||||||
FAGE International SA/FAGE USA Dairy Industry, Inc., 5.63%, 8/15/26 (e) | USD | 1,079 | $ | 1,103,277 | ||||||||
JBS USA LLC/JBS USA Finance, Inc. (e): | ||||||||||||
7.25%, 6/01/21 | 340 | 350,200 | ||||||||||
5.88%, 7/15/24 | 737 | 770,165 | ||||||||||
5.75%, 6/15/25 | 1,962 | 2,025,765 | ||||||||||
Post Holdings, Inc. (e): | ||||||||||||
7.75%, 3/15/24 | 3,953 | 4,387,830 | ||||||||||
8.00%, 7/15/25 | 869 | 979,798 | ||||||||||
5.00%, 8/15/26 | 1,243 | 1,201,819 | ||||||||||
TreeHouse Foods, Inc., 6.00%, 2/15/24 (e) | 976 | 1,027,240 | ||||||||||
WhiteWave Foods Co., 5.38%, 10/01/22 | 1,255 | 1,367,950 | ||||||||||
|
| |||||||||||
| 17,294,603 | ||||||||||||
Health Care Equipment & Supplies — 1.0% |
| |||||||||||
Crimson Merger Sub, Inc., 6.63%, 5/15/22 (e) | 3,373 | 3,010,403 | ||||||||||
DJO Finco, Inc./DJO Finance LLC/DJO Finance Corp., 8.13%, 6/15/21 (e) | 5,986 | 5,297,610 | ||||||||||
Fresenius Medical Care US Finance, Inc., 5.75%, 2/15/21 (e) | 1,055 | 1,148,631 | ||||||||||
IASIS Healthcare LLC/IASIS Capital Corp., 8.38%, 5/15/19 | 1,504 | 1,470,160 | ||||||||||
IDH Finance PLC, 6.25%, 8/15/22 | GBP | 105 | 124,752 | |||||||||
Mallinckrodt International Finance SA/Mallinckrodt CB LLC (e): | ||||||||||||
4.88%, 4/15/20 | USD | 980 | 982,450 | |||||||||
5.75%, 8/01/22 | 1,250 | 1,225,000 | ||||||||||
5.50%, 4/15/25 | 1,870 | 1,739,100 | ||||||||||
Teleflex, Inc., 4.88%, 6/01/26 | 684 | 689,130 | ||||||||||
|
| |||||||||||
| 15,687,236 | ||||||||||||
Health Care Providers & Services — 7.1% |
| |||||||||||
Acadia Healthcare Co., Inc.: | ||||||||||||
5.13%, 7/01/22 | 502 | 505,765 | ||||||||||
5.63%, 2/15/23 | 1,992 | 2,046,780 | ||||||||||
6.50%, 3/01/24 | 434 | 461,125 | ||||||||||
Alere, Inc., 6.38%, 7/01/23 (e) | 1,898 | 1,926,470 | ||||||||||
Amsurg Corp., 5.63%, 7/15/22 | 5,476 | 5,701,885 | ||||||||||
Centene Corp.: | ||||||||||||
5.63%, 2/15/21 | 2,516 | 2,648,090 | ||||||||||
4.75%, 5/15/22 | 2,467 | 2,556,429 | ||||||||||
6.13%, 2/15/24 | 391 | 424,235 | ||||||||||
4.75%, 1/15/25 | 1,385 | 1,424,819 | ||||||||||
CHS/Community Health Systems, Inc.: | ||||||||||||
5.13%, 8/15/18 | 427 | 429,669 | ||||||||||
8.00%, 11/15/19 | 993 | 970,657 | ||||||||||
5.13%, 8/01/21 | 1,320 | 1,296,900 | ||||||||||
6.88%, 2/01/22 | 2,609 | 2,289,397 | ||||||||||
DaVita HealthCare Partners, Inc.: | ||||||||||||
5.13%, 7/15/24 | 788 | 804,253 | ||||||||||
5.00%, 5/01/25 | 2,669 | 2,685,521 | ||||||||||
Envision Healthcare Corp., 5.13%, 7/01/22 (e) | 835 | 854,831 | ||||||||||
HCA Holdings, Inc., 6.25%, 2/15/21 | 5 | 5,444 | ||||||||||
HCA, Inc.: | ||||||||||||
3.75%, 3/15/19 | 2,911 | 2,983,775 | ||||||||||
6.50%, 2/15/20 | 4,735 | 5,198,036 | ||||||||||
7.50%, 2/15/22 | 1,059 | 1,221,821 | ||||||||||
5.88%, 3/15/22 | 1,840 | 2,030,900 | ||||||||||
4.75%, 5/01/23 | 512 | 536,960 | ||||||||||
5.88%, 5/01/23 | 4,096 | 4,454,400 | ||||||||||
5.00%, 3/15/24 | 4,905 | 5,168,644 | ||||||||||
5.38%, 2/01/25 | 4,860 | 5,084,775 | ||||||||||
5.25%, 4/15/25 | 813 | 866,861 | ||||||||||
5.88%, 2/15/26 | 3,125 | 3,351,562 | ||||||||||
5.25%, 6/15/26 | 4,406 | 4,653,837 | ||||||||||
4.50%, 2/15/27 | 2,772 | 2,765,070 | ||||||||||
See Notes to Financial Statements.
| 42 | SEMI-ANNUAL REPORT | FEBRUARY 28, 2017 |
Consolidated Schedule of Investments (continued) | BlackRock Corporate High Yield Fund, Inc. (HYT) |
| Corporate Bonds | Par (000) | Value | ||||||||||
Health Care Providers & Services (continued) |
| |||||||||||
HealthSouth Corp.: | ||||||||||||
5.13%, 3/15/23 | USD | 2,840 | $ | 2,840,000 | ||||||||
5.75%, 11/01/24 | 2,360 | 2,407,200 | ||||||||||
5.75%, 9/15/25 | 835 | 845,438 | ||||||||||
Hologic, Inc., 5.25%, 7/15/22 (e) | 1,930 | 2,012,025 | ||||||||||
HomeVi SAS, 6.88%, 8/15/21 | EUR | 141 | 157,791 | |||||||||
Marcolin SpA, 4.13%, 2/15/23 (d) | 125 | 135,835 | ||||||||||
MEDNAX, Inc., 5.25%, 12/01/23 (e) | USD | 1,134 | 1,172,272 | |||||||||
MPH Acquisition Holdings LLC, 7.13%, 6/01/24 (e) | 4,698 | 5,062,095 | ||||||||||
New Amethyst Corp., 6.25%, 12/01/24 (e) | 837 | 887,220 | ||||||||||
RegionalCare Hospital Partners Holdings, Inc., 8.25%, 5/01/23 (e) | 2,189 | 2,353,175 | ||||||||||
Sterigenics-Nordion Holdings LLC, 6.50%, 5/15/23 (e) | 424 | 433,540 | ||||||||||
Surgery Center Holdings, Inc., 8.88%, 4/15/21 (e) | 388 | 415,160 | ||||||||||
Surgical Care Affiliates, Inc., 6.00%, 4/01/23 (e) | 2,641 | 2,848,979 | ||||||||||
Tenet Healthcare Corp.: | ||||||||||||
6.25%, 11/01/18 | 1,308 | 1,384,845 | ||||||||||
4.75%, 6/01/20 | 1,805 | 1,841,100 | ||||||||||
4.46%, 6/15/20 (d) | 1,432 | 1,449,900 | ||||||||||
6.00%, 10/01/20 | 3,835 | 4,065,100 | ||||||||||
4.50%, 4/01/21 | 74 | 74,925 | ||||||||||
4.38%, 10/01/21 | 525 | 528,938 | ||||||||||
7.50%, 1/01/22 (e) | 949 | 1,027,292 | ||||||||||
8.13%, 4/01/22 | 4,228 | 4,428,830 | ||||||||||
6.75%, 6/15/23 | 6,195 | 6,140,794 | ||||||||||
Voyage Care Bondco PLC, 6.50%, 8/01/18 | GBP | 386 | 483,758 | |||||||||
WellCare Health Plans, Inc., 5.75%, 11/15/20 | USD | 1,066 | 1,100,778 | |||||||||
|
| |||||||||||
| 109,445,901 | ||||||||||||
Health Care Technology — 0.1% |
| |||||||||||
Change Healthcare Holdings LLC/Change Healthcare Finance, Inc., 5.75%, 3/01/25 (e) | 1,375 | 1,420,114 | ||||||||||
Quintiles IMS, Inc., 3.25%, 3/15/25 (e) | EUR | 350 | 371,346 | |||||||||
|
| |||||||||||
| 1,791,460 | ||||||||||||
Hotels, Restaurants & Leisure — 3.3% |
| |||||||||||
Boyd Gaming Corp., 6.88%, 5/15/23 | USD | 1,096 | 1,183,680 | |||||||||
Caesars Entertainment Resort Properties LLC/Caesars Entertainment Resort Property, 8.00%, 10/01/20 | 4,753 | 4,972,826 | ||||||||||
CPUK Finance Ltd., 7.00%, 2/28/42 | GBP | 275 | 360,015 | |||||||||
ESH Hospitality, Inc., 5.25%, 5/01/25 (e) | USD | 1,800 | 1,815,750 | |||||||||
Gateway Casinos & Entertainment Ltd., 8.25%, 3/01/24 (e) | 502 | 510,158 | ||||||||||
International Game Technology PLC: | ||||||||||||
6.25%, 2/15/22 (e) | 400 | 432,000 | ||||||||||
4.75%, 2/15/23 | EUR | 310 | 358,270 | |||||||||
Jacobs Entertainment, Inc., 7.88%, 2/01/24 (e) | USD | 465 | 477,788 | |||||||||
KFC Holding Co/Pizza Hut Holdings LLC/Taco Bell of America LLC (e): | ||||||||||||
5.00%, 6/01/24 | 255 | 261,783 | ||||||||||
5.25%, 6/01/26 | 1,176 | 1,215,690 | ||||||||||
MGM Resorts International: | ||||||||||||
8.63%, 2/01/19 | 790 | 872,950 | ||||||||||
6.75%, 10/01/20 | 2,727 | 3,005,699 | ||||||||||
6.63%, 12/15/21 | 1,130 | 1,261,363 | ||||||||||
7.75%, 3/15/22 | 610 | 712,175 | ||||||||||
4.63%, 9/01/26 | 792 | 776,152 | ||||||||||
New Red Finance, Inc., 6.00%, 4/01/22 (e) | 4,455 | 4,645,674 | ||||||||||
Pizzaexpress Financing 2 PLC, 6.63%, 8/01/21 | GBP | 300 | 383,423 | |||||||||
PortAventura Entertainment Barcelona BV, 7.25%, 12/01/20 | EUR | 439 | 482,240 | |||||||||
Regal Entertainment Group, 5.75%, 2/01/25 | USD | 489 | 503,670 | |||||||||
| Corporate Bonds | Par (000) | Value | ||||||||||
Hotels, Restaurants & Leisure (continued) |
| |||||||||||
Sabre GLBL, Inc. (e): | ||||||||||||
5.38%, 4/15/23 | USD | 1,516 | $ | 1,542,530 | ||||||||
5.25%, 11/15/23 | 807 | 819,105 | ||||||||||
Scientific Games International, Inc.: | ||||||||||||
7.00%, 1/01/22 (e) | 4,183 | 4,449,000 | ||||||||||
10.00%, 12/01/22 | 4,940 | 5,242,575 | ||||||||||
Six Flags Entertainment Corp., 5.25%, 1/15/21 (e) | 3,247 | 3,337,916 | ||||||||||
Snai SpA, 6.38%, 11/07/21 | EUR | 100 | 110,135 | |||||||||
Station Casinos LLC, 7.50%, 3/01/21 | USD | 5,785 | 6,030,862 | |||||||||
Thomas Cook Group PLC, 6.25%, 6/15/22 | EUR | 540 | 609,547 | |||||||||
Unique Pub Finance Co. PLC: | ||||||||||||
Series A3, 6.54%, 3/30/21 | GBP | 687 | 929,316 | |||||||||
Series A4, 5.66%, 6/30/27 | 670 | 900,802 | ||||||||||
Series N, 6.46%, 3/30/32 | 1,000 | 1,179,506 | ||||||||||
Vue International Bidco PLC, 7.88%, 7/15/20 | 520 | 670,536 | ||||||||||
Yum! Brands, Inc., 3.88%, 11/01/23 | USD | 721 | 706,580 | |||||||||
|
| |||||||||||
| 50,759,716 | ||||||||||||
Household Durables — 1.7% | ||||||||||||
Brookfield Residential Properties, Inc./Brookfield Residential US Corp., 6.13%, 7/01/22 (e) | 1,604 | 1,652,120 | ||||||||||
CalAtlantic Group, Inc.: | ||||||||||||
8.38%, 1/15/21 | 2,680 | 3,132,250 | ||||||||||
5.25%, 6/01/26 | 255 | 255,319 | ||||||||||
Lennar Corp.: | ||||||||||||
4.50%, 11/15/19 | 2,482 | 2,565,767 | ||||||||||
4.75%, 4/01/21 | 314 | 326,953 | ||||||||||
4.13%, 1/15/22 | 884 | 895,050 | ||||||||||
4.75%, 11/15/22 | 1,753 | 1,802,960 | ||||||||||
4.88%, 12/15/23 | 968 | 999,460 | ||||||||||
Mattamy Group Corp., 6.88%, 12/15/23 (e) | 708 | 739,860 | ||||||||||
PulteGroup, Inc., 6.38%, 5/15/33 | 2,805 | 2,903,175 | ||||||||||
Riverbed Technology, Inc., 8.88%, 3/01/23 (e) | 2,192 | 2,339,960 | ||||||||||
Ryland Group, Inc., 6.63%, 5/01/20 | 1,160 | 1,278,900 | ||||||||||
Standard Pacific Corp., 5.88%, 11/15/24 | 1,650 | 1,769,625 | ||||||||||
Tempur Sealy International, Inc., 5.50%, 6/15/26 | 1,487 | 1,460,978 | ||||||||||
TRI Pointe Group, Inc.: | ||||||||||||
4.38%, 6/15/19 | 1,060 | 1,081,200 | ||||||||||
4.88%, 7/01/21 | 1,275 | 1,316,438 | ||||||||||
5.88%, 6/15/24 | 770 | 796,950 | ||||||||||
William Lyon Homes ,Inc., 5.88%, 1/31/25 (e) | 1,005 | 1,006,256 | ||||||||||
|
| |||||||||||
| 26,323,221 | ||||||||||||
Household Products — 0.4% | ||||||||||||
ACCO Brands Corp., 5.25%, 12/15/24 (e) | 539 | 545,738 | ||||||||||
Prestige Brands, Inc., 6.38%, 3/01/24 (e) | 1,026 | 1,087,560 | ||||||||||
Spectrum Brands, Inc.: | ||||||||||||
6.63%, 11/15/22 | 1,385 | 1,464,637 | ||||||||||
6.13%, 12/15/24 | 1,832 | 1,949,431 | ||||||||||
5.75%, 7/15/25 | 635 | 674,688 | ||||||||||
|
| |||||||||||
| 5,722,054 | ||||||||||||
Independent Power and Renewable Electricity Producers — 1.2% |
| |||||||||||
Calpine Corp.: | ||||||||||||
6.00%, 1/15/22 (e) | 251 | 263,236 | ||||||||||
5.38%, 1/15/23 | 514 | 519,140 | ||||||||||
5.88%, 1/15/24 (e) | 1,389 | 1,465,395 | ||||||||||
Dynegy, Inc.: | ||||||||||||
6.75%, 11/01/19 | 4,240 | 4,367,200 | ||||||||||
7.38%, 11/01/22 | 1,735 | 1,704,638 | ||||||||||
7.63%, 11/01/24 | 805 | 764,750 | ||||||||||
8.00%, 1/15/25 (e) | 167 | 158,650 | ||||||||||
MPM Escrow LLC, 8.88%, 10/15/20 (d) | 3,738 | — | ||||||||||
NRG Energy, Inc.: | ||||||||||||
7.88%, 5/15/21 | 427 | 443,013 | ||||||||||
6.63%, 3/15/23 | 210 | 212,625 | ||||||||||
See Notes to Financial Statements.
| SEMI-ANNUAL REPORT | FEBRUARY 28, 2017 | 43 |
Consolidated Schedule of Investments (continued) | BlackRock Corporate High Yield Fund, Inc. (HYT) |
| Corporate Bonds | Par (000) | Value | ||||||||||
Independent Power and Renewable Electricity Producers (continued) |
| |||||||||||
NRG Energy, Inc. (continued): | ||||||||||||
6.25%, 5/01/24 | USD | 185 | $ | 185,000 | ||||||||
7.25%, 5/15/26 | 731 | 752,016 | ||||||||||
6.63%, 1/15/27 (e) | 4,087 | 4,015,477 | ||||||||||
NRG Yield Operating LLC, 5.38%, 8/15/24 | 645 | 661,125 | ||||||||||
QEP Resources, Inc., 5.38%, 10/01/22 | 2,169 | 2,179,845 | ||||||||||
TerraForm Power Operating LLC, 6.38%, 2/01/23 (e)(k) | 1,301 | 1,346,535 | ||||||||||
|
| |||||||||||
| 19,038,645 | ||||||||||||
Industrial Conglomerates — 0.2% | ||||||||||||
Vertiv Group Corp, 9.25%, 10/15/24 (e) | 2,512 | 2,697,260 | ||||||||||
Insurance — 0.8% | ||||||||||||
Assicurazioni Generali SpA (d): | ||||||||||||
7.75%, 12/12/42 | EUR | 400 | 504,337 | |||||||||
5.50%, 10/27/47 | 200 | 223,533 | ||||||||||
BNP Paribas Cardif SA, 4.03% (d)(l) | 100 | 105,388 | ||||||||||
Credit Agricole Assurances SA, 4.50% (d)(l) | 200 | 208,702 | ||||||||||
Groupama SA, 6.00%, 1/23/27 | 200 | 216,585 | ||||||||||
HUB International Ltd. (e): | ||||||||||||
9.25%, 2/15/21 | USD | 874 | 906,775 | |||||||||
7.88%, 10/01/21 | 5,484 | 5,799,330 | ||||||||||
Old Mutual PLC, 8.00%, 6/03/21 | GBP | 100 | 144,973 | |||||||||
Pension Insurance Corp. PLC, 6.50%, 7/03/24 | 175 | 223,234 | ||||||||||
Radian Group, Inc.: | ||||||||||||
5.25%, 6/15/20 | USD | 706 | 743,065 | |||||||||
7.00%, 3/15/21 | 366 | 408,090 | ||||||||||
Wayne Merger Sub LLC, 8.25%, 8/01/23 (e) | 2,687 | 2,834,785 | ||||||||||
|
| |||||||||||
| 12,318,797 | ||||||||||||
Internet Software & Services — 0.6% | ||||||||||||
Equinix, Inc.: | ||||||||||||
5.38%, 1/01/22 | 1,110 | 1,172,438 | ||||||||||
5.88%, 1/15/26 | 2,567 | 2,741,864 | ||||||||||
Netflix, Inc.: | ||||||||||||
5.50%, 2/15/22 | 2,087 | 2,227,873 | ||||||||||
5.88%, 2/15/25 | 241 | 260,581 | ||||||||||
4.38%, 11/15/26 (e) | 2,326 | 2,305,647 | ||||||||||
Symantec Corp., 5.00%, 4/15/25 (e) | 1,076 | 1,104,454 | ||||||||||
|
| |||||||||||
| 9,812,857 | ||||||||||||
IT Services — 2.2% | ||||||||||||
Ceridian HCM Holding, Inc., 11.00%, 3/15/21 (e) | 1,349 | 1,413,077 | ||||||||||
First Data Corp. (e): | ||||||||||||
7.00%, 12/01/23 | 9,254 | 9,948,050 | ||||||||||
5.75%, 1/15/24 | 17,655 | 18,294,994 | ||||||||||
WEX, Inc., 4.75%, 2/01/23 (e) | 4,804 | 4,779,980 | ||||||||||
|
| |||||||||||
| 34,436,101 | ||||||||||||
Leisure Time — 0.0% | ||||||||||||
Carlson Travel, Inc., 6.75%, 12/15/23 (e) | 517 | 541,558 | ||||||||||
Machinery — 0.4% | ||||||||||||
Gardner Denver, Inc., 6.88%, 8/15/21 (e) | 730 | 751,900 | ||||||||||
Navistar International Corp., 8.25%, 11/01/21 | 830 | 838,300 | ||||||||||
SPX FLOW, Inc. (e): | ||||||||||||
5.63%, 8/15/24 | 993 | 1,020,308 | ||||||||||
5.88%, 8/15/26 | 993 | 1,007,895 | ||||||||||
Terex Corp., 5.63%, 2/01/25 (e) | 1,562 | 1,603,002 | ||||||||||
Trinseo Materials Operating SCA/Trinseo Materials Finance, Inc., 6.38%, 5/01/22 | EUR | 490 | 557,883 | |||||||||
|
| |||||||||||
| 5,779,288 | ||||||||||||
Media — 15.1% | ||||||||||||
Adria Bidco BV, 7.88%, 11/15/20 | 350 | 387,012 | ||||||||||
Altice Financing SA: | ||||||||||||
5.25%, 2/15/23 | 485 | 548,953 | ||||||||||
6.63%, 2/15/23 (e) | USD | 345 | 363,113 | |||||||||
7.50%, 5/15/26 (e) | 6,112 | 6,562,760 | ||||||||||
| Corporate Bonds | Par (000) | Value | ||||||||||
Media (continued) | ||||||||||||
Altice Finco SA, 9.00%, 6/15/23 | EUR | 100 | $ | 120,772 | ||||||||
Altice Luxembourg SA: | ||||||||||||
7.25%, 5/15/22 | 300 | 337,286 | ||||||||||
7.75%, 5/15/22 (e) | USD | 2,649 | 2,817,874 | |||||||||
6.25%, 2/15/25 | EUR | 260 | 292,659 | |||||||||
7.63%, 2/15/25 (e) | USD | 653 | 695,445 | |||||||||
Altice US Finance I Corp. (e): | ||||||||||||
5.38%, 7/15/23 | 6,270 | 6,536,475 | ||||||||||
5.50%, 5/15/26 | 2,435 | 2,517,181 | ||||||||||
AMC Networks, Inc.: | ||||||||||||
4.75%, 12/15/22 | 2,358 | 2,381,580 | ||||||||||
5.00%, 4/01/24 | 756 | 763,091 | ||||||||||
Cablevision Systems Corp.: | ||||||||||||
8.63%, 9/15/17 | 949 | 978,656 | ||||||||||
7.75%, 4/15/18 | 1,393 | 1,462,650 | ||||||||||
8.00%, 4/15/20 | 2,224 | 2,457,520 | ||||||||||
CBS Radio, Inc., 7.25%, 11/01/24 (e) | 2,102 | 2,243,885 | ||||||||||
CCO Holdings LLC/CCO Holdings Capital Corp.: | ||||||||||||
5.25%, 9/30/22 | 1,235 | 1,284,400 | ||||||||||
5.13%, 5/01/23 (e) | 678 | 703,425 | ||||||||||
5.75%, 2/15/26 (e) | 1,227 | 1,312,890 | ||||||||||
5.50%, 5/01/26 (e) | 3,108 | 3,298,365 | ||||||||||
5.13%, 5/01/27 (e) | 2,013 | 2,091,004 | ||||||||||
5.88%, 5/01/27 (e) | 5,014 | 5,385,537 | ||||||||||
Cellnex Telecom SA, 2.38%, 1/16/24 | EUR | 200 | 213,999 | |||||||||
Cequel Communications Holdings I LLC/Cequel Capital Corp. (e): | ||||||||||||
5.13%, 12/15/21 | USD | 7,150 | 7,238,990 | |||||||||
7.75%, 7/15/25 | 6,079 | 6,732,492 | ||||||||||
Clear Channel International BV, 8.75%, 12/15/20 (e) | 3,146 | 3,334,760 | ||||||||||
Clear Channel Worldwide Holdings, Inc.: | ||||||||||||
6.50%, 11/15/22 | 14,758 | 15,169,287 | ||||||||||
Series B, 7.63%, 3/15/20 | 5,090 | 5,128,175 | ||||||||||
Columbus Cable Barbados Ltd., 7.38%, 3/30/21 (e) | 2,647 | 2,816,752 | ||||||||||
CSC Holdings LLC: | ||||||||||||
7.88%, 2/15/18 | 368 | 385,480 | ||||||||||
7.63%, 7/15/18 | 351 | 373,376 | ||||||||||
10.13%, 1/15/23 (e) | 4,320 | 5,000,400 | ||||||||||
5.25%, 6/01/24 | 4,065 | 4,090,406 | ||||||||||
6.63%, 10/15/25 (e) | 1,341 | 1,480,129 | ||||||||||
10.88%, 10/15/25 (e) | 7,081 | 8,532,605 | ||||||||||
DISH DBS Corp.: | ||||||||||||
6.75%, 6/01/21 | 109 | 120,173 | ||||||||||
5.88%, 7/15/22 | 2,817 | 3,021,232 | ||||||||||
5.00%, 3/15/23 | 2,119 | 2,177,272 | ||||||||||
5.88%, 11/15/24 | 1,001 | 1,066,065 | ||||||||||
7.75%, 7/01/26 | 5,340 | 6,247,800 | ||||||||||
DISH Network Corp., 3.38%, 8/15/26 (e)(j) | 1,894 | 2,279,902 | ||||||||||
eircom Finance DAC, 4.50%, 5/31/22 | EUR | 300 | 332,756 | |||||||||
GTT Escrow Corp., 7.88%, 12/31/24 (e) | USD | 1,435 | 1,503,163 | |||||||||
Hughes Satellite Systems Corp.: | ||||||||||||
7.63%, 6/15/21 | 595 | 659,706 | ||||||||||
5.25%, 8/01/26 (e) | 3,678 | 3,737,767 | ||||||||||
6.63%, 8/01/26 (e) | 801 | 833,537 | ||||||||||
iHeartCommunications, Inc.: | ||||||||||||
9.00%, 12/15/19 | 2,102 | 1,836,623 | ||||||||||
9.00%, 3/01/21 | 241 | 195,210 | ||||||||||
9.00%, 9/15/22 | 3,845 | 3,095,225 | ||||||||||
10.63%, 3/15/23 | 1,980 | 1,643,400 | ||||||||||
Intelsat Jackson Holdings SA: | ||||||||||||
7.25%, 4/01/19 | 3,414 | 3,268,905 | ||||||||||
7.25%, 10/15/20 | 3,097 | 2,864,725 | ||||||||||
5.50%, 8/01/23 | 3,868 | 3,181,430 | ||||||||||
LG Finance Co. Corp., 5.88%, 11/01/24 (e) | 598 | 615,193 | ||||||||||
See Notes to Financial Statements.
| 44 | SEMI-ANNUAL REPORT | FEBRUARY 28, 2017 |
Consolidated Schedule of Investments (continued) | BlackRock Corporate High Yield Fund, Inc. (HYT) |
| Corporate Bonds | Par (000) | Value | ||||||||||
Media (continued) | ||||||||||||
LGE HoldCo VI BV, 7.13%, 5/15/24 | EUR | 300 | $ | 362,712 | ||||||||
McGraw-Hill Global Education Holdings LLC/McGraw-Hill Global Education Finance, 7.88%, 5/15/24 (e) | USD | 639 | 626,220 | |||||||||
MDC Partners, Inc., 6.50%, 5/01/24 (e) | 2,003 | 1,935,399 | ||||||||||
Midcontinent Communications / Midcontinent Finance Corp. (e): | ||||||||||||
6.25%, 8/01/21 | 3,901 | 4,053,139 | ||||||||||
6.88%, 8/15/23 | 296 | 318,940 | ||||||||||
NAI Entertainment Holdings/NAI Entertainment Holdings Finance Corp., 5.00%, 8/01/18 (e) | 2,039 | 2,056,841 | ||||||||||
National CineMedia LLC, 5.75%, 8/15/26 | 605 | 617,100 | ||||||||||
Nexstar Broadcasting, Inc., 5.63%, 8/01/24 (e) | 1,540 | 1,574,650 | ||||||||||
Nielsen Finance LLC/Nielsen Finance Co., 5.00%, 4/15/22 (e) | 1,882 | 1,938,460 | ||||||||||
Numericable Group SA, 5.38%, 5/15/22 | EUR | 280 | 309,387 | |||||||||
Outfront Media Capital LLC/Outfront Media Capital Corp.: | ||||||||||||
5.25%, 2/15/22 | USD | 650 | 675,188 | |||||||||
5.63%, 2/15/24 | 1,064 | 1,117,200 | ||||||||||
Play Finance 2 SA, 5.25%, 2/01/19 | EUR | 1,070 | 1,148,271 | |||||||||
Radio One, Inc., 7.38%, 4/15/22 (e) | USD | 805 | 835,188 | |||||||||
SFR Group SA (e): | ||||||||||||
6.00%, 5/15/22 | 4,689 | 4,863,384 | ||||||||||
7.38%, 5/01/26 | 10,275 | 10,647,469 | ||||||||||
Sirius XM Radio, Inc. (e): | ||||||||||||
4.25%, 5/15/20 | 2,204 | 2,231,550 | ||||||||||
5.75%, 8/01/21 | 1,811 | 1,886,690 | ||||||||||
4.63%, 5/15/23 | 230 | 235,175 | ||||||||||
Sterling Entertainment Corp., 9.75%, 12/15/19 | 4,810 | 4,761,900 | ||||||||||
TEGNA, Inc., 5.13%, 10/15/19 | 857 | 879,496 | ||||||||||
Telesat Canada/Telesat LLC, 8.88%, 11/15/24 (e) | 1,246 | 1,361,255 | ||||||||||
Townsquare Media, Inc., 6.50%, 4/01/23 (e) | 517 | 507,953 | ||||||||||
Tribune Media Co., 5.88%, 7/15/22 | 5,320 | 5,433,050 | ||||||||||
Unitymedia Hessen GmbH & Co. KG/Unitymedia NRW GmbH: | ||||||||||||
5.63%, 4/15/23 | EUR | 166 | 189,505 | |||||||||
4.00%, 1/15/25 | 1,111 | 1,241,139 | ||||||||||
5.00%, 1/15/25 (e) | USD | 500 | 513,750 | |||||||||
4.63%, 2/15/26 | EUR | 100 | 114,966 | |||||||||
3.50%, 1/15/27 | 300 | 324,176 | ||||||||||
6.25%, 1/15/29 | 100 | 121,195 | ||||||||||
Univision Communications, Inc. (e): | ||||||||||||
5.13%, 5/15/23 | USD | 9,800 | 9,800,000 | |||||||||
5.13%, 2/15/25 | 4,868 | 4,801,065 | ||||||||||
UPC Holding BV, 6.75%, 3/15/23 | EUR | 200 | 230,157 | |||||||||
UPCB Finance IV Ltd., 4.00%, 1/15/27 | 400 | 436,896 | ||||||||||
Virgin Media Finance PLC: | ||||||||||||
4.50%, 1/15/25 | 183 | 204,048 | ||||||||||
5.75%, 1/15/25 (e) | USD | 3,518 | 3,610,347 | |||||||||
Virgin Media Receivables Financing Notes I DAC, 5.50%, 9/15/24 | GBP | 300 | 383,331 | |||||||||
Virgin Media Secured Finance PLC: | ||||||||||||
5.25%, 1/15/26 (e) | USD | 730 | 738,213 | |||||||||
5.50%, 8/15/26 (e) | 1,144 | 1,172,474 | ||||||||||
4.88%, 1/15/27 | GBP | 200 | 249,783 | |||||||||
6.25%, 3/28/29 | 829 | 1,116,513 | ||||||||||
WaveDivision Escrow LLC/WaveDivision Escrow Corp., 8.13%, 9/01/20 (e) | USD | 4,428 | 4,605,120 | |||||||||
Wind Acquisition Finance SA: | ||||||||||||
4.75%, 7/15/20 (e) | 250 | 254,063 | ||||||||||
7.00%, 4/23/21 | EUR | 400 | 441,346 | |||||||||
7.38%, 4/23/21 (e) | USD | 3,885 | 4,045,256 | |||||||||
Ziggo Bond Finance BV, 5.88%, 1/15/25 (e) | 2,643 | 2,685,949 | ||||||||||
Ziggo Secured Finance BV, 4.25%, 1/15/27 | EUR | 100 | 111,345 | |||||||||
|
| |||||||||||
| 232,486,722 | ||||||||||||
| Corporate Bonds | Par (000) | Value | ||||||||||
Metals & Mining — 7.7% |
| |||||||||||
Alcoa Nederland Holding BV, 7.00%, 9/30/26 (e) | USD | 681 | $ | 747,398 | ||||||||
Alcoa, Inc.: | ||||||||||||
6.15%, 8/15/20 | 1,330 | 1,456,350 | ||||||||||
5.13%, 10/01/24 | 3,854 | 3,990,817 | ||||||||||
5.90%, 2/01/27 | 760 | 814,150 | ||||||||||
6.75%, 1/15/28 | 477 | 524,700 | ||||||||||
5.95%, 2/01/37 | 674 | 690,008 | ||||||||||
Anglo American Capital PLC: | ||||||||||||
6.88%, 5/01/18 | GBP | 100 | 131,842 | |||||||||
1.50%, 4/01/20 | EUR | 800 | 866,610 | |||||||||
3.63%, 5/14/20 (e) | USD | 1,116 | 1,134,135 | |||||||||
4.45%, 9/27/20 (e) | 412 | 431,364 | ||||||||||
2.88%, 11/20/20 | EUR | 300 | 340,773 | |||||||||
2.50%, 4/29/21 | 100 | 112,424 | ||||||||||
3.50%, 3/28/22 | 200 | 234,093 | ||||||||||
3.25%, 4/03/23 | 100 | 115,588 | ||||||||||
4.88%, 5/14/25 (e) | USD | 2,578 | 2,674,675 | |||||||||
ArcelorMittal: | ||||||||||||
7.75%, 10/15/39 | 400 | 466,000 | ||||||||||
7.50%, 3/01/41 | 1,498 | 1,700,230 | ||||||||||
Cliffs Natural Resources, Inc. (e): | ||||||||||||
8.25%, 3/31/20 | 1,240 | 1,354,700 | ||||||||||
5.75%, 3/01/25 | 1,494 | 1,465,614 | ||||||||||
Constellium NV (e): | ||||||||||||
8.00%, 1/15/23 | 5,915 | 6,210,750 | ||||||||||
5.75%, 5/15/24 | 575 | 544,813 | ||||||||||
6.63%, 3/01/25 | 3,856 | 3,834,310 | ||||||||||
First Quantum Minerals Ltd. (e): | ||||||||||||
7.00%, 2/15/21 | 2,967 | 3,072,699 | ||||||||||
7.25%, 5/15/22 | 1,533 | 1,584,739 | ||||||||||
Freeport-McMoRan, Inc.: | ||||||||||||
2.30%, 11/14/17 | 1,337 | 1,333,657 | ||||||||||
2.38%, 3/15/18 | 15,430 | 15,352,850 | ||||||||||
3.10%, 3/15/20 | 2,080 | 2,038,400 | ||||||||||
4.00%, 11/14/21 | 2,078 | 1,994,880 | ||||||||||
3.55%, 3/01/22 | 4,332 | 4,023,345 | ||||||||||
3.88%, 3/15/23 | 7,561 | 6,956,120 | ||||||||||
5.40%, 11/14/34 | 689 | 604,598 | ||||||||||
5.45%, 3/15/43 | 7,799 | 6,668,145 | ||||||||||
Grinding Media, Inc./MC Grinding Media Canada, Inc., 7.38%, 12/15/23 (e) | 1,252 | 1,339,640 | ||||||||||
Joseph T Ryerson & Son, Inc., 11.00%, 5/15/22 (e) | 1,378 | 1,536,470 | ||||||||||
Kaiser Aluminum Corp., 5.88%, 5/15/24 | 773 | 811,650 | ||||||||||
Kinross Gold Corp.: | ||||||||||||
5.95%, 3/15/24 | 210 | 222,075 | ||||||||||
6.88%, 9/01/41 | 495 | 501,188 | ||||||||||
Novelis Corp. (e): | ||||||||||||
6.25%, 8/15/24 | 6,700 | 7,102,000 | ||||||||||
5.88%, 9/30/26 | 6,133 | 6,309,324 | ||||||||||
Peabody Securities Finance Corp. (e): | ||||||||||||
6.00%, 3/31/22 | 639 | 651,780 | ||||||||||
6.38%, 3/31/25 | 671 | 684,420 | ||||||||||
Steel Dynamics, Inc.: | ||||||||||||
5.13%, 10/01/21 | 3,085 | 3,181,406 | ||||||||||
6.38%, 8/15/22 | 1,345 | 1,405,525 | ||||||||||
5.25%, 4/15/23 | 949 | 988,241 | ||||||||||
5.50%, 10/01/24 | 1,540 | 1,638,252 | ||||||||||
5.00%, 12/15/26 (e) | 40 | 41,346 | ||||||||||
Teck Resources Ltd.: | ||||||||||||
3.00%, 3/01/19 | 1,460 | 1,495,332 | ||||||||||
4.50%, 1/15/21 | 902 | 935,261 | ||||||||||
3.75%, 2/01/23 | 2,129 | 2,075,349 | ||||||||||
8.50%, 6/01/24 (e) | 2,795 | 3,263,162 | ||||||||||
6.13%, 10/01/35 | 502 | 519,570 | ||||||||||
6.00%, 8/15/40 | 3,304 | 3,312,260 | ||||||||||
See Notes to Financial Statements.
| SEMI-ANNUAL REPORT | FEBRUARY 28, 2017 | 45 |
Consolidated Schedule of Investments (continued) | BlackRock Corporate High Yield Fund, Inc. (HYT) |
| Corporate Bonds | Par (000) | Value | ||||||||||
Metals & Mining (continued) |
| |||||||||||
Teck Resources Ltd. (continued): | ||||||||||||
6.25%, 7/15/41 | USD | 482 | $ | 500,075 | ||||||||
5.20%, 3/01/42 | 2,173 | 2,058,222 | ||||||||||
5.40%, 2/01/43 | 2,441 | 2,325,052 | ||||||||||
ThyssenKrupp AG, 1.38%, 3/03/22 | EUR | 375 | 395,638 | |||||||||
United States Steel Corp., 8.38%, 7/01/21 (e) | USD | 2,224 | 2,502,000 | |||||||||
|
| |||||||||||
| 119,266,015 | ||||||||||||
Multi-Utilities — 0.2% | ||||||||||||
NGL Energy Partners LP/NGL Energy Finance Corp.: | ||||||||||||
6.88%, 10/15/21 | 1,230 | 1,266,131 | ||||||||||
7.50%, 11/01/23 (e) | 1,765 | 1,857,663 | ||||||||||
|
| |||||||||||
| 3,123,794 | ||||||||||||
Multiline Retail — 0.1% | ||||||||||||
Groupe Fnac SA, 3.25%, 9/30/23 | EUR | 225 | 241,940 | |||||||||
Neiman Marcus Group Ltd., 8.00%, 10/15/21 (e) | USD | 1,298 | 814,495 | |||||||||
|
| |||||||||||
| 1,056,435 | ||||||||||||
Offshore Drilling & Other Services — 0.1% | ||||||||||||
Sensata Technologies BV, 5.63%, 11/01/24 (e) | 903 | 952,665 | ||||||||||
Oil, Gas & Consumable Fuels — 13.8% | ||||||||||||
Alta Mesa Holdings LP/Alta Mesa Finance Services Corp., 7.88%, 12/15/24 (e) | 801 | 847,058 | ||||||||||
Antero Midstream Partners LP/Antero Midstream Finance Corp., 5.38%, 9/15/24 (e) | 385 | 390,775 | ||||||||||
Antero Resources Corp.: | ||||||||||||
5.13%, 12/01/22 | 744 | 747,720 | ||||||||||
5.63%, 6/01/23 | 644 | 652,050 | ||||||||||
California Resources Corp., 8.00%, 12/15/22 (e) | 3,808 | 3,255,840 | ||||||||||
Callon Petroleum Co., 6.13%, 10/01/24 (e) | 817 | 851,723 | ||||||||||
Carrizo Oil & Gas, Inc., 6.25%, 4/15/23 | 871 | 881,888 | ||||||||||
Cheniere Corpus Christi Holdings LLC (e): | ||||||||||||
7.00%, 6/30/24 | 3,678 | 4,119,360 | ||||||||||
5.88%, 3/31/25 | 3,575 | 3,780,562 | ||||||||||
Chesapeake Energy Corp.: | ||||||||||||
4.27%, 4/15/19 (d) | 3,254 | 3,229,595 | ||||||||||
6.88%, 11/15/20 | 1,262 | 1,249,380 | ||||||||||
8.00%, 12/15/22 (e) | 2,477 | 2,619,427 | ||||||||||
8.00%, 1/15/25 (e) | 2,362 | 2,344,285 | ||||||||||
CONSOL Energy, Inc.: | ||||||||||||
5.88%, 4/15/22 | 15,816 | 15,420,600 | ||||||||||
8.00%, 4/01/23 | 116 | 120,930 | ||||||||||
Continental Resources, Inc.: | ||||||||||||
4.50%, 4/15/23 | 769 | 753,620 | ||||||||||
3.80%, 6/01/24 | 3,669 | 3,398,411 | ||||||||||
4.90%, 6/01/44 | 1,260 | 1,105,650 | ||||||||||
Crestwood Midstream Partners LP/Crestwood Midstream Finance Corp.: | ||||||||||||
6.00%, 12/15/20 | 230 | 236,613 | ||||||||||
6.25%, 4/01/23 | 175 | 181,563 | ||||||||||
CrownRock LP/CrownRock Finance, Inc. (e): | ||||||||||||
7.13%, 4/15/21 | 2,753 | 2,863,120 | ||||||||||
7.75%, 2/15/23 | 1,519 | 1,636,722 | ||||||||||
DCP Midstream LLC (e): | ||||||||||||
6.45%, 11/03/36 | 1,258 | 1,292,595 | ||||||||||
6.75%, 9/15/37 | 1,490 | 1,579,400 | ||||||||||
Denbury Resources, Inc.: | ||||||||||||
9.00%, 5/15/21 (e) | 2,046 | 2,204,565 | ||||||||||
5.50%, 5/01/22 | 2,617 | 2,159,025 | ||||||||||
4.63%, 7/15/23 | 910 | 709,800 | ||||||||||
Diamondback Energy, Inc., 5.38%, 5/31/25 (e) | 1,071 | 1,108,485 | ||||||||||
Eclipse Resources Corp., 8.88%, 7/15/23 | 550 | 567,875 | ||||||||||
| Corporate Bonds | Par (000) | Value | ||||||||||
Oil, Gas & Consumable Fuels (continued) | ||||||||||||
Energy Transfer Equity LP: | ||||||||||||
7.50%, 10/15/20 | USD | 665 | $ | 747,294 | ||||||||
5.88%, 1/15/24 | 4,667 | 5,017,025 | ||||||||||
5.50%, 6/01/27 | 1,965 | 2,080,444 | ||||||||||
Ensco PLC, 8.00%, 1/31/24 (e) | 984 | 1,008,600 | ||||||||||
EP Energy LLC/Everest Acquisition Finance, Inc.: | ||||||||||||
9.38%, 5/01/20 | 1,802 | 1,761,455 | ||||||||||
8.00%, 11/29/24 (e) | 2,318 | 2,457,080 | ||||||||||
Extraction Oil & Gas Holdings LLC/Extraction Finance Corp., 7.88%, 7/15/21 (e) | 1,843 | 1,962,795 | ||||||||||
Genesis Energy LP/Genesis Energy Finance Corp., 5.63%, 6/15/24 | 445 | 443,888 | ||||||||||
Great Western Petroleum LLC/Great Western Finance, Inc., 9.00%, 9/30/21 (e) | 2,007 | 2,117,385 | ||||||||||
Gulfport Energy Corp.: | ||||||||||||
6.63%, 5/01/23 | 638 | 649,165 | ||||||||||
6.00%, 10/15/24 (e) | 722 | 718,390 | ||||||||||
6.38%, 5/15/25 (e) | 661 | 664,305 | ||||||||||
Halcon Resources Corp., 6.75%, 2/15/25 (e) | 4,522 | 4,476,780 | ||||||||||
Hilcorp Energy I LP/Hilcorp Finance Co. (e): | ||||||||||||
5.00%, 12/01/24 | 1,758 | 1,683,285 | ||||||||||
5.75%, 10/01/25 | 102 | 101,235 | ||||||||||
MEG Energy Corp. (e): | ||||||||||||
6.50%, 3/15/21 | 4,781 | 4,888,572 | ||||||||||
6.38%, 1/30/23 | 665 | 590,188 | ||||||||||
7.00%, 3/31/24 | 3,561 | 3,204,900 | ||||||||||
6.50%, 1/15/25 | 5,797 | 5,666,567 | ||||||||||
Murphy Oil Corp.: | ||||||||||||
6.88%, 8/15/24 | 2,221 | 2,377,580 | ||||||||||
6.13%, 12/01/42 | 353 | 331,820 | ||||||||||
Newfield Exploration Co., 5.63%, 7/01/24 | 872 | 933,040 | ||||||||||
NGPL PipeCo LLC (e): | ||||||||||||
7.12%, 12/15/17 | 5,652 | 5,856,885 | ||||||||||
7.77%, 12/15/37 | 3,279 | 3,713,467 | ||||||||||
Noble Holding International, Ltd., 7.75%, 1/15/24 | 4,421 | 4,299,422 | ||||||||||
Noble Holding US Corp/Noble Drilling Services 6 LLC/Noble Drilling Holding LLC, 7.50%, 3/15/19 | 675 | 707,063 | ||||||||||
Oasis Petroleum, Inc.: | ||||||||||||
6.50%, 11/01/21 | 3,886 | 3,954,005 | ||||||||||
6.88%, 3/15/22 | 2,023 | 2,057,775 | ||||||||||
ONEOK, Inc.: | ||||||||||||
7.50%, 9/01/23 | 1,400 | 1,662,500 | ||||||||||
6.00%, 6/15/35 | 260 | 273,650 | ||||||||||
Paramount Resources Ltd., 6.88%, 6/30/23 (e) | 4,305 | 4,553,614 | ||||||||||
Parker Drilling Co.: | ||||||||||||
7.50%, 8/01/20 | 790 | 770,250 | ||||||||||
6.75%, 7/15/22 | 1,350 | 1,248,750 | ||||||||||
Parsley Energy LLC/Parsley Finance Corp. (e): | ||||||||||||
6.25%, 6/01/24 | 1,171 | 1,230,276 | ||||||||||
5.38%, 1/15/25 | 805 | 817,075 | ||||||||||
5.25%, 8/15/25 | 1,134 | 1,145,340 | ||||||||||
Petroleos Mexicanos, 5.38%, 3/13/22 (e) | 270 | 282,407 | ||||||||||
QEP Resources, Inc., 5.25%, 5/01/23 | 1,240 | 1,221,400 | ||||||||||
Range Resources Corp. (e): | ||||||||||||
5.88%, 7/01/22 | 3,456 | 3,533,760 | ||||||||||
5.00%, 8/15/22 | 530 | 516,750 | ||||||||||
5.00%, 3/15/23 | 1,058 | 1,024,938 | ||||||||||
Resolute Energy Corp., 8.50%, 5/01/20 | 1,549 | 1,579,980 | ||||||||||
Rockies Express Pipeline LLC (e): | ||||||||||||
6.00%, 1/15/19 | 1,984 | 2,083,200 | ||||||||||
5.63%, 4/15/20 | 695 | 733,225 | ||||||||||
6.88%, 4/15/40 | 3,820 | 4,068,300 | ||||||||||
See Notes to Financial Statements.
| 46 | SEMI-ANNUAL REPORT | FEBRUARY 28, 2017 |
Consolidated Schedule of Investments (continued) | BlackRock Corporate High Yield Fund, Inc. (HYT) |
| Corporate Bonds | Par (000) | Value | ||||||||||
Oil, Gas & Consumable Fuels (continued) | ||||||||||||
Rowan Cos., Inc.: | ||||||||||||
4.88%, 6/01/22 | USD | 195 | $ | 186,225 | ||||||||
7.38%, 6/15/25 | 3,003 | 3,115,612 | ||||||||||
RSP Permian, Inc.: | ||||||||||||
6.63%, 10/01/22 | 2,065 | 2,183,737 | ||||||||||
5.25%, 1/15/25 (e) | 1,046 | 1,072,150 | ||||||||||
Sanchez Energy Corp.: | ||||||||||||
7.75%, 6/15/21 | 138 | 141,450 | ||||||||||
6.13%, 1/15/23 | 6,455 | 6,196,800 | ||||||||||
SESI LLC, 6.38%, 5/01/19 | 480 | 481,800 | ||||||||||
Seven Generations Energy Ltd., 8.25%, 5/15/20 (e) | 852 | 896,730 | ||||||||||
SM Energy Co.: | ||||||||||||
1.50%, 7/01/21 (j) | 729 | 720,343 | ||||||||||
6.50%, 11/15/21 | 730 | 746,425 | ||||||||||
6.13%, 11/15/22 | 2,096 | 2,111,720 | ||||||||||
6.50%, 1/01/23 | 523 | 524,308 | ||||||||||
5.00%, 1/15/24 | 38 | 35,625 | ||||||||||
6.75%, 9/15/26 | 694 | 706,145 | ||||||||||
Southwestern Energy Co.: | ||||||||||||
5.80%, 1/23/20 | 5,361 | 5,307,390 | ||||||||||
6.70%, 1/23/25 | 460 | 441,600 | ||||||||||
Summit Midstream Holdings LLC/Summit Midstream Finance Corp., 5.75%, 4/15/25 | 696 | 706,440 | ||||||||||
Tallgrass Energy Partners LP/Tallgrass Energy Finance Corp. (e): | ||||||||||||
5.50%, 9/15/24 | 1,206 | 1,218,060 | ||||||||||
5.13%, 2/01/25 | 548 | 569,920 | ||||||||||
5.38%, 2/01/27 | 581 | 605,693 | ||||||||||
Targa Resources Partners LP/Targa Resources Partners Finance Corp.: | ||||||||||||
6.38%, 8/01/22 | 4,053 | 4,184,722 | ||||||||||
5.25%, 5/01/23 | 78 | 80,535 | ||||||||||
Tesoro Corp. (e): | ||||||||||||
4.75%, 12/15/23 | 2,707 | 2,801,745 | ||||||||||
5.13%, 12/15/26 | 3,533 | 3,736,147 | ||||||||||
Tesoro Logistics LP/Tesoro Logistics Finance Corp.: | ||||||||||||
6.13%, 10/15/21 | 321 | 335,044 | ||||||||||
6.25%, 10/15/22 | 3,154 | 3,374,780 | ||||||||||
Tullow Oil PLC: | ||||||||||||
6.00%, 11/01/20 (e) | 200 | 188,500 | ||||||||||
6.00%, 11/01/20 | 200 | 188,500 | ||||||||||
6.25%, 4/15/22 (e) | 200 | 186,500 | ||||||||||
Weatherford International LLC, 6.80%, 6/15/37 | 702 | 661,635 | ||||||||||
Weatherford International Ltd.: | ||||||||||||
4.50%, 4/15/22 | 655 | 626,344 | ||||||||||
6.50%, 8/01/36 | 1,505 | 1,388,362 | ||||||||||
7.00%, 3/15/38 | 1,576 | 1,485,380 | ||||||||||
5.95%, 4/15/42 | 476 | 398,650 | ||||||||||
Whiting Petroleum Corp.: | ||||||||||||
5.00%, 3/15/19 | 506 | 510,428 | ||||||||||
5.75%, 3/15/21 | 772 | 768,140 | ||||||||||
6.25%, 4/01/23 | 1,575 | 1,578,937 | ||||||||||
WildHorse Resource Development Corp., 6.88%, 2/01/25 (e) | 1,624 | 1,603,700 | ||||||||||
Williams Cos., Inc.: | ||||||||||||
4.55%, 6/24/24 | 1,004 | 1,019,060 | ||||||||||
5.75%, 6/24/44 | 4,687 | 4,733,870 | ||||||||||
WPX Energy, Inc.: | ||||||||||||
7.50%, 8/01/20 | 385 | 414,838 | ||||||||||
6.00%, 1/15/22 | 1,673 | 1,708,551 | ||||||||||
8.25%, 8/01/23 | 1,115 | 1,248,800 | ||||||||||
|
| |||||||||||
| 212,715,803 | ||||||||||||
| Corporate Bonds | Par (000) | Value | ||||||||||
Paper & Forest Products — 0.4% |
| |||||||||||
Mercer International, Inc., 6.50%, 2/01/24 (e) | USD | 1,219 | $ | 1,243,380 | ||||||||
Norbord, Inc., 6.25%, 4/15/23 (e) | 1,605 | 1,697,288 | ||||||||||
Pfleiderer GmbH, 7.88%, 8/01/19 | EUR | 430 | 473,782 | |||||||||
Unifrax I LLC/Unifrax Holding Co., 7.50%, 2/15/19 (e) | USD | 2,865 | 2,857,837 | |||||||||
|
| |||||||||||
| 6,272,287 | ||||||||||||
Personal Products — 0.0% |
| |||||||||||
Avon International Operations, Inc., 7.88%, 8/15/22 (e) | 569 | 605,211 | ||||||||||
Pharmaceuticals — 3.2% | ||||||||||||
DPx Holdings BV, 7.50%, 2/01/22 (e) | 2,670 | 2,831,869 | ||||||||||
Endo Finance LLC/Endo Finco, Inc. (e): | ||||||||||||
7.25%, 1/15/22 | 696 | 673,815 | ||||||||||
6.00%, 7/15/23 | 1,609 | 1,480,280 | ||||||||||
6.00%, 2/01/25 | 2,781 | 2,485,519 | ||||||||||
Ephios Bondco PLC, 6.25%, 7/01/22 | EUR | 675 | 774,162 | |||||||||
Ephios Holdco II PLC, 8.25%, 7/01/23 | 159 | 185,537 | ||||||||||
Grifols Worldwide Operations Ltd., 5.25%, 4/01/22 | USD | 4,047 | 4,198,763 | |||||||||
inVentiv Group Holdings, Inc./inVentiv Health, Inc./inVentiv Health Clinical, Inc., 7.50%, 10/01/24 (e) | 2,048 | 2,140,160 | ||||||||||
Jaguar Holding Co. II/Pharmaceutical Product Development LLC, 6.38%, 8/01/23 (e) | 7,115 | 7,657,519 | ||||||||||
NBTY, Inc., 7.63%, 5/15/21 (e) | 3,231 | 3,412,744 | ||||||||||
Synlab Bondco PLC, 6.25%, 7/01/22 | EUR | 210 | 240,850 | |||||||||
Tennessee Merger Sub, Inc., 6.38%, 2/01/25 (e) | USD | 4,530 | 4,507,350 | |||||||||
Valeant Pharmaceuticals International, Inc.: | ||||||||||||
6.75%, 8/15/18 (e) | 813 | 800,805 | ||||||||||
7.00%, 10/01/20 (e) | 4,173 | 3,880,890 | ||||||||||
6.38%, 10/15/20 (e) | 3,366 | 3,063,060 | ||||||||||
7.50%, 7/15/21 (e) | 2,475 | 2,273,906 | ||||||||||
6.75%, 8/15/21 (e) | 3,378 | 3,006,420 | ||||||||||
5.50%, 3/01/23 (e) | 77 | 62,081 | ||||||||||
4.50%, 5/15/23 | EUR | 226 | 187,081 | |||||||||
5.88%, 5/15/23 (e) | USD | 2,587 | 2,105,171 | |||||||||
6.13%, 4/15/25 (e) | 4,188 | 3,334,695 | ||||||||||
|
| |||||||||||
| 49,302,677 | ||||||||||||
Real Estate Investment Trusts (REITs) — 0.9% |
| |||||||||||
ATF Netherlands BV, 2.13%, 3/13/23 | EUR | 300 | 322,568 | |||||||||
Hilton Domestic Operating Co., Inc., 4.25%, 9/01/24 (e) | USD | 1,269 | 1,255,041 | |||||||||
iStar, Inc.: | ||||||||||||
4.00%, 11/01/17 | 685 | 687,569 | ||||||||||
5.00%, 7/01/19 | 480 | 488,400 | ||||||||||
MGM Growth Properties Operating Partnership LP/MGP Finance Co-Issuer, Inc. (e): | ||||||||||||
5.63%, 5/01/24 | 6,392 | 6,759,540 | ||||||||||
4.50%, 9/01/26 | 2,305 | 2,241,613 | ||||||||||
NH Hotel Group SA, 3.75%, 10/01/23 | EUR | 225 | 249,885 | |||||||||
Starwood Property Trust, Inc., 5.00%, 12/15/21 (e) | USD | 1,695 | 1,760,681 | |||||||||
|
| |||||||||||
| 13,765,297 | ||||||||||||
Real Estate Management & Development — 0.9% |
| |||||||||||
Annington Finance No 5 PLC, (13.00% Cash), 13.00%, 1/15/23 (g) | GBP | 360 | 514,836 | |||||||||
Aroundtown Property Holdings PLC (j): | ||||||||||||
3.00%, 5/05/20 | EUR | 300 | 418,759 | |||||||||
1.50%, 1/18/21 | 100 | 109,425 | ||||||||||
Punch Taverns Finance B Ltd., Series A6, 5.94%, 9/30/22 | GBP | 527 | 677,984 | |||||||||
Punch Taverns Finance PLC, Series M3, 5.86%, 10/15/27 (d) | 622 | 771,035 | ||||||||||
See Notes to Financial Statements.
| SEMI-ANNUAL REPORT | FEBRUARY 28, 2017 | 47 |
Consolidated Schedule of Investments (continued) | BlackRock Corporate High Yield Fund, Inc. (HYT) |
| Corporate Bonds | Par (000) | Value | ||||||||||
Real Estate Management & Development (continued) |
| |||||||||||
Realogy Group LLC/Realogy Co-Issuer Corp. (e): | ||||||||||||
4.50%, 4/15/19 | USD | 806 | $ | 834,210 | ||||||||
5.25%, 12/01/21 | 2,405 | 2,501,200 | ||||||||||
4.88%, 6/01/23 | 5,876 | 5,787,860 | ||||||||||
Rialto Holdings LLC/Rialto Corp., 7.00%, 12/01/18 (e) | 1,065 | 1,083,638 | ||||||||||
Woodside Homes Co. LLC/Woodside Homes Finance, Inc., 6.75%, 12/15/21 (e) | 1,195 | 1,251,762 | ||||||||||
|
| |||||||||||
| 13,950,709 | ||||||||||||
Road & Rail — 0.9% |
| |||||||||||
Avis Budget Car Rental LLC/Avis Budget Finance, Inc.: | ||||||||||||
5.13%, 6/01/22 (e) | 1,055 | 1,035,219 | ||||||||||
5.50%, 4/01/23 | 45 | 45,000 | ||||||||||
6.38%, 4/01/24 (e) | 1,105 | 1,122,956 | ||||||||||
5.25%, 3/15/25 (e) | 1,810 | 1,733,075 | ||||||||||
Avis Budget Finance PLC, 4.13%, 11/15/24 | EUR | 350 | 368,639 | |||||||||
EC Finance PLC, 5.13%, 7/15/21 | 675 | 741,017 | ||||||||||
Florida East Coast Holdings Corp., 6.75%, 5/01/19 (e) | USD | 2,037 | 2,093,017 | |||||||||
Herc Rentals, Inc. (e): | ||||||||||||
7.50%, 6/01/22 | 853 | 921,240 | ||||||||||
7.75%, 6/01/24 | 83 | 91,300 | ||||||||||
Hertz Corp.: | ||||||||||||
5.88%, 10/15/20 | 1,355 | 1,321,125 | ||||||||||
7.38%, 1/15/21 | 953 | 953,000 | ||||||||||
6.25%, 10/15/22 | 2,221 | 2,121,055 | ||||||||||
Hertz Holdings Netherlands BV, 4.13%, 10/15/21 | EUR | 425 | 453,442 | |||||||||
Loxam SAS, 3.50%, 5/03/23 | 150 | 156,885 | ||||||||||
Watco Cos. LLC/Watco Finance Corp., 6.38%, 4/01/23 (e) | USD | 1,093 | 1,144,918 | |||||||||
|
| |||||||||||
| 14,301,888 | ||||||||||||
Semiconductors & Semiconductor Equipment — 1.2% |
| |||||||||||
Advanced Micro Devices, Inc.: | ||||||||||||
7.50%, 8/15/22 | 422 | 472,640 | ||||||||||
7.00%, 7/01/24 | 409 | 436,738 | ||||||||||
Micron Technology, Inc.: | ||||||||||||
5.25%, 8/01/23 (e) | 1,989 | 2,006,404 | ||||||||||
5.50%, 2/01/25 | 220 | 227,150 | ||||||||||
5.63%, 1/15/26 (e) | 851 | 874,403 | ||||||||||
Series G, 3.00%, 11/15/43 (j) | 1,428 | 1,432,462 | ||||||||||
Microsemi Corp., 9.13%, 4/15/23 (e) | 257 | 296,193 | ||||||||||
NXP BV/NXP Funding LLC (e): | ||||||||||||
4.13%, 6/15/20 | 2,409 | 2,505,794 | ||||||||||
4.13%, 6/01/21 | 1,448 | 1,503,169 | ||||||||||
4.63%, 6/15/22 | 1,319 | 1,401,437 | ||||||||||
3.88%, 9/01/22 | 1,422 | 1,455,772 | ||||||||||
5.75%, 3/15/23 | 1,070 | 1,128,850 | ||||||||||
4.63%, 6/01/23 | 1,145 | 1,219,425 | ||||||||||
Sensata Technologies BV, 5.00%, 10/01/25 (e) | 3,923 | 3,981,845 | ||||||||||
|
| |||||||||||
| 18,942,282 | ||||||||||||
Software — 3.7% |
| |||||||||||
BMC Software Finance, Inc., 8.13%, 7/15/21 (e) | 6,672 | 6,772,080 | ||||||||||
CDW LLC/CDW Finance Corp., 5.50%, 12/01/24 | 4,917 | 5,162,850 | ||||||||||
Ensemble S Merger Sub, Inc., 9.00%, 9/30/23 (e) | 1,553 | 1,642,298 | ||||||||||
Genesys Telecommunications Laboratories Inc/Greeneden Lux 3 Sarl/Greeneden US Ho, 10.00%, 11/30/24 (e) | 1,055 | 1,147,313 | ||||||||||
Inception Merger Sub, Inc./Rackspace Hosting, Inc., 8.63%, 11/15/24 (e) | 3,971 | 4,184,441 | ||||||||||
Infinity Acquisition LLC/Infinity Acquisition Finance Corp., 7.25%, 8/01/22 (e) | 244 | 215,025 | ||||||||||
| Corporate Bonds | Par (000) | Value | ||||||||||
Software (continued) |
| |||||||||||
Infor Software Parent LLC/Infor Software Parent, Inc., (7.13% Cash or 7.88% PIK), 7.13%, 5/01/21 (e)(g) | USD | 3,521 | $ | 3,617,827 | ||||||||
Infor US, Inc., 6.50%, 5/15/22 | 7,829 | 8,142,160 | ||||||||||
Informatica LLC, 7.13%, 7/15/23 (e) | 946 | 913,836 | ||||||||||
JDA Escrow LLC/JDA Bond Finance, Inc., 7.38%, 10/15/24 (e) | 1,465 | 1,538,250 | ||||||||||
Nuance Communications, Inc. (e): | ||||||||||||
5.38%, 8/15/20 | 356 | 362,935 | ||||||||||
6.00%, 7/01/24 | 1,600 | 1,654,000 | ||||||||||
5.63%, 12/15/26 | 903 | 922,189 | ||||||||||
PTC, Inc., 6.00%, 5/15/24 | 722 | 770,735 | ||||||||||
Solera LLC/Solera Finance, Inc., 10.50%, 3/01/24 (e) | 7,107 | 8,101,980 | ||||||||||
SS&C Technologies Holdings, Inc., 5.88%, 7/15/23 | 4,047 | 4,279,702 | ||||||||||
TIBCO Software, Inc., 11.38%, 12/01/21 (e) | 4,736 | 5,150,400 | ||||||||||
Veritas US, Inc./Veritas Bermuda Ltd.: | ||||||||||||
7.50%, 2/01/23 | EUR | 300 | 335,300 | |||||||||
7.50%, 2/01/23 (e) | USD | 500 | 530,000 | |||||||||
10.50%, 2/01/24 (e) | 873 | 942,840 | ||||||||||
|
| |||||||||||
| 56,386,161 | ||||||||||||
Specialty Retail — 1.0% |
| |||||||||||
Asbury Automotive Group, Inc., 6.00%, 12/15/24 | 2,413 | 2,509,520 | ||||||||||
JC Penney Corp., Inc.: | ||||||||||||
8.13%, 10/01/19 | 117 | 124,605 | ||||||||||
6.38%, 10/15/36 | 874 | 668,610 | ||||||||||
7.40%, 4/01/37 | 874 | 707,940 | ||||||||||
L Brands, Inc.: | ||||||||||||
8.50%, 6/15/19 | 3,925 | 4,381,281 | ||||||||||
6.88%, 11/01/35 | 1,843 | 1,771,584 | ||||||||||
Penske Automotive Group, Inc.: | ||||||||||||
5.75%, 10/01/22 | 2,181 | 2,262,787 | ||||||||||
5.38%, 12/01/24 | 1,192 | 1,209,880 | ||||||||||
5.50%, 5/15/26 | 1,358 | 1,348,766 | ||||||||||
THOM Europe SAS, 7.38%, 7/15/19 | EUR | 100 | 110,707 | |||||||||
|
| |||||||||||
| 15,095,680 | ||||||||||||
Technology Hardware, Storage & Peripherals — 0.9% |
| |||||||||||
Diamond 1 Finance Corp./Diamond 2 Finance Corp. (e): | ||||||||||||
4.42%, 6/15/21 | USD | 1,565 | 1,641,131 | |||||||||
7.13%, 6/15/24 | 4,522 | 4,996,430 | ||||||||||
6.02%, 6/15/26 | 2,940 | 3,232,750 | ||||||||||
8.35%, 7/15/46 | 945 | 1,232,322 | ||||||||||
Western Digital Corp.: | ||||||||||||
7.38%, 4/01/23 (e) | 1,339 | 1,469,553 | ||||||||||
10.50%, 4/01/24 | 1,493 | 1,746,810 | ||||||||||
|
| |||||||||||
| 14,318,996 | ||||||||||||
Textiles, Apparel & Luxury Goods — 0.1% |
| |||||||||||
BiSoho SAS, 5.88%, 5/01/23 | EUR | 400 | 452,364 | |||||||||
Levi Strauss & Co., 3.38%, 3/15/27 | 225 | 242,870 | ||||||||||
Springs Industries, Inc., 6.25%, 6/01/21 | USD | 274 | 282,905 | |||||||||
|
| |||||||||||
| 978,139 | ||||||||||||
Thrifts & Mortgage Finance — 0.1% |
| |||||||||||
Amigo Luxembourg SA, 7.63%, 1/15/24 | GBP | 275 | 348,404 | |||||||||
Jerrold Finco PLC: | ||||||||||||
6.25%, 9/15/21 | 225 | 288,265 | ||||||||||
6.13%, 1/15/24 | 225 | 276,399 | ||||||||||
MGIC Investment Corp., 5.75%, 8/15/23 | USD | 1,117 | 1,181,228 | |||||||||
|
| |||||||||||
| 2,094,296 | ||||||||||||
Trading Companies & Distributors — 0.0% | ||||||||||||
Ashtead Capital, Inc., 5.63%, 10/01/24 (e) | 278 | 294,680 | ||||||||||
See Notes to Financial Statements.
| 48 | SEMI-ANNUAL REPORT | FEBRUARY 28, 2017 |
Consolidated Schedule of Investments (continued) | BlackRock Corporate High Yield Fund, Inc. (HYT) |
| Corporate Bonds | Par (000) | Value | ||||||||||
Transportation Infrastructure — 0.0% | ||||||||||||
CMA CGM SA, 7.75%, 1/15/21 | EUR | 100 | $ | 103,558 | ||||||||
WFS Global Holding SAS, 9.50%, 7/15/22 | 365 | 406,015 | ||||||||||
|
| |||||||||||
| 509,573 | ||||||||||||
Utilities — 0.0% |
| |||||||||||
ContourGlobal Power Holdings SA: | ||||||||||||
5.13%, 6/15/21 | 175 | 196,259 | ||||||||||
Series FEB, 5.13%, 6/15/21 | 125 | 140,185 | ||||||||||
|
| |||||||||||
| 336,444 | ||||||||||||
Wireless Telecommunication Services — 5.6% |
| |||||||||||
Communications Sales & Leasing, Inc./CSL Capital LLC: | ||||||||||||
6.00%, 4/15/23 (e) | USD | 837 | 878,850 | |||||||||
8.25%, 10/15/23 | 4,380 | 4,746,825 | ||||||||||
7.13%, 12/15/24 (e) | 2,239 | 2,306,170 | ||||||||||
Digicel Group Ltd., 7.13%, 4/01/22 (e) | 2,085 | 1,689,413 | ||||||||||
Digicel Ltd., 6.00%, 4/15/21 (e) | 5,407 | 4,997,906 | ||||||||||
GEO Group, Inc.: | ||||||||||||
5.88%, 1/15/22 | 350 | 364,438 | ||||||||||
5.13%, 4/01/23 | 300 | 300,750 | ||||||||||
5.88%, 10/15/24 | 2,030 | 2,090,900 | ||||||||||
6.00%, 4/15/26 | 530 | 551,730 | ||||||||||
Matterhorn Telecom SA, 3.88%, 5/01/22 | EUR | 635 | 697,946 | |||||||||
Radiate Holdco LLC/Radiate Finance, Inc., 6.63%, 2/15/25 (e) | USD | 1,857 | 1,863,964 | |||||||||
Sprint Capital Corp.: | ||||||||||||
6.90%, 5/01/19 | 640 | 681,805 | ||||||||||
6.88%, 11/15/28 | 9,002 | 9,598,382 | ||||||||||
8.75%, 3/15/32 | 408 | 489,600 | ||||||||||
Sprint Communications, Inc.: | ||||||||||||
9.00%, 11/15/18 (e) | 17,517 | 19,159,219 | ||||||||||
7.00%, 3/01/20 (e) | 673 | 735,252 | ||||||||||
7.00%, 8/15/20 | 597 | 644,014 | ||||||||||
Sprint Corp.: | ||||||||||||
7.25%, 9/15/21 | 922 | 1,004,980 | ||||||||||
7.88%, 9/15/23 | 3,897 | 4,335,412 | ||||||||||
7.13%, 6/15/24 | 13,385 | 14,451,651 | ||||||||||
T-Mobile USA, Inc.: | ||||||||||||
6.63%, 4/28/21 | 2,180 | 2,267,636 | ||||||||||
6.13%, 1/15/22 | 367 | 388,103 | ||||||||||
6.73%, 4/28/22 | 1,227 | 1,276,080 | ||||||||||
6.00%, 3/01/23 | 2,599 | 2,748,442 | ||||||||||
6.50%, 1/15/24 | 2,638 | 2,834,531 | ||||||||||
6.38%, 3/01/25 | 994 | 1,068,530 | ||||||||||
6.50%, 1/15/26 | 3,558 | 3,909,352 | ||||||||||
Wind Acquisition Finance SA, 4.00%, 7/15/20 | EUR | 824 | 889,531 | |||||||||
|
| |||||||||||
| 86,971,412 | ||||||||||||
Total Corporate Bonds — 110.2% |
| 1,699,613,635 | ||||||||||
| Floating Rate Loan Interests (d) | ||||||||||||
Air Freight & Logistics — 0.3% | ||||||||||||
Avolon TLB Borrower 1 (Luxembourg) Sarl, Term Loan B2, 3.50%, 1/13/22 | USD | 2,287 | 2,326,565 | |||||||||
CEVA Group PLC, Synthetic LOC, 6.50%, 3/19/21 | 916 | 796,643 | ||||||||||
CEVA Intercompany BV, Dutch Term Loan, 6.54%, 3/19/21 | 943 | 820,674 | ||||||||||
CEVA Logistics Canada ULC, Canadian Term Loan, 6.54%, 3/19/21 | 143 | 124,621 | ||||||||||
CEVA Logistics US Holdings, Inc., Term Loan, 6.54%, 3/19/21 | 1,343 | 1,168,523 | ||||||||||
|
| |||||||||||
| 5,237,026 | ||||||||||||
| Floating Rate Loan Interests (d) | Par (000) | Value | ||||||||||
Airlines — 0.4% |
| |||||||||||
Delta Air Lines, Inc., 2018 Term Loan B1, 3.27%, 10/18/18 | USD | 2,295 | $ | 2,307,443 | ||||||||
Northwest Airlines, Inc., Term Loan: | ||||||||||||
3.08%, 3/10/17 | 886 | 885,579 | ||||||||||
2.46%, 9/10/18 | 3,247 | 3,203,494 | ||||||||||
|
| |||||||||||
| 6,396,516 | ||||||||||||
Auto Components — 0.2% |
| |||||||||||
Gates Global LLC, Term Loan B, 4.25%, 7/06/21 | 3,640 | 3,640,695 | ||||||||||
Building Products — 0.1% | ||||||||||||
Wilsonart LLC, 2016 Term Loan, 4.50%, 12/19/23 | 1,437 | 1,445,608 | ||||||||||
Chemicals — 0.1% | ||||||||||||
Atotech BV, 2017 Term Loan B1, 4.00%, 1/31/24 | 828 | 836,280 | ||||||||||
Axalta Coating Systems US Holdings, Inc., Term Loan B1, 3.50%, 2/01/23 | 169 | 170,930 | ||||||||||
Chemours Co., Term Loan B, 3.79%, 5/12/22 | 121 | 122,279 | ||||||||||
MacDermid, Inc., Term Loan B5, 4.50%, 6/07/20 | 674 | 681,774 | ||||||||||
|
| |||||||||||
| 1,811,263 | ||||||||||||
Commercial Services & Supplies — 0.2% |
| |||||||||||
Brand Energy & Infrastructure Services, Inc., Term Loan B, 4.76% - 4.79%, 11/26/20 | 3,731 | 3,731,447 | ||||||||||
Containers & Packaging — 0.2% | ||||||||||||
Flex Acquisition Company, Inc., 1st Lien Term Loan, 4.25%, 12/29/23 | 3,263 | 3,285,025 | ||||||||||
Diversified Consumer Services — 0.3% | ||||||||||||
Gol LuxCo S.A., 1st Lien Term Loan, 6.50%, 8/31/20 | 3,885 | 3,977,269 | ||||||||||
Diversified Telecommunication Services — 0.8% |
| |||||||||||
Consolidated Communications, Inc., Term Loan B2, 4.00%, 10/05/23 | 2,185 | 2,197,476 | ||||||||||
Hawaiian Telcom Communications, Inc., Term Loan B, 5.25% - 5.29%, 6/06/19 | 1,399 | 1,399,272 | ||||||||||
Virgin Media Investment Holdings Ltd., Term Loan I, 3.52%, 1/31/25 | 3,886 | 3,901,117 | ||||||||||
Zayo Group LLC: | ||||||||||||
2017 Term Loan B2, 3.50%, 1/19/24 | 3,996 | 4,033,403 | ||||||||||
|
| |||||||||||
| 11,531,268 | ||||||||||||
Electric Utilities — 0.5% |
| |||||||||||
Energy Future Intermediate Holding Co. LLC, 2016 DIP Term Loan, 4.30%, 6/30/17 | 1,443 | 1,446,607 | ||||||||||
TEX Operations Co. LLC: | ||||||||||||
Exit Term Loan B, 3.53%, 8/04/23 | 3,335 | 3,350,194 | ||||||||||
Exit Term Loan C, 3.53%, 8/04/23 | 686 | 688,607 | ||||||||||
Vistra Operations Co. LLC, 2016 Term Loan B2, 4.02%, 12/14/23 | 2,079 | 2,091,017 | ||||||||||
|
| |||||||||||
| 7,576,425 | ||||||||||||
Energy Equipment & Services — 0.2% |
| |||||||||||
Weatherford International Ltd., Term Loan, 3.09%, 7/13/20 | 2,249 | 2,198,740 | ||||||||||
Food & Staples Retailing — 0.2% | ||||||||||||
BJ’s Wholesale Club, Inc.: | ||||||||||||
2017 1st Lien Term Loan, 4.75%, 2/03/24 | 1,369 | 1,357,884 | ||||||||||
2017 2nd Lien Term Loan, 8.50%, 2/03/25 | 934 | 932,636 | ||||||||||
|
| |||||||||||
| 2,290,520 | ||||||||||||
Health Care Equipment & Supplies — 0.4% |
| |||||||||||
Alere, Inc., 2015 Term Loan B, 4.25%, 6/18/22 | 1,611 | 1,613,823 | ||||||||||
DJO Finance LLC, 2015 Term Loan, 4.25%, 6/08/20 | 1,895 | 1,858,999 | ||||||||||
See Notes to Financial Statements.
| SEMI-ANNUAL REPORT | FEBRUARY 28, 2017 | 49 |
Consolidated Schedule of Investments (continued) | BlackRock Corporate High Yield Fund, Inc. (HYT) |
| Floating Rate Loan Interests (d) | Par (000) | Value | ||||||||||
Health Care Equipment & Supplies (continued) |
| |||||||||||
Immucor, Inc., Refinancing Term Loan B2, 5.00%, 8/17/18 | USD | 2,185 | $ | 2,156,331 | ||||||||
Mallinckrodt International Finance SA, Term Loan B, 3.75%, 9/24/24 | 765 | 767,869 | ||||||||||
|
| |||||||||||
| 6,397,022 | ||||||||||||
Health Care Providers & Services — 0.7% |
| |||||||||||
Air Medical Group Holdings, Inc., Term Loan B, 4.25%, 4/28/22 | 1,645 | 1,647,006 | ||||||||||
Community Health Systems, Inc.: | ||||||||||||
Term Loan G, 3.75%, 12/31/19 | 608 | 602,801 | ||||||||||
Term Loan H, 4.00%, 1/27/21 | 843 | 827,815 | ||||||||||
inVentiv Health, Inc., 2016 Term Loan B, 4.80%, 11/09/23 | 2,254 | 2,267,727 | ||||||||||
MPH Acquisition Holdings LLC, 2016 Term Loan B, 5.00%, 6/07/23 | 1,037 | 1,052,693 | ||||||||||
Surgery Center Holdings, Inc., 1st Lien Term Loan, 4.75%, 11/03/20 | 947 | 952,147 | ||||||||||
Team Health, Inc., 1st Lien Term Loan, 3.75%, 2/06/24 | 2,334 | 2,326,718 | ||||||||||
Vizient, Inc., 2016 Term Loan B, 5.00%, 2/13/23 | 668 | 677,074 | ||||||||||
|
| |||||||||||
| 10,353,981 | ||||||||||||
Health Care Technology — 0.1% |
| |||||||||||
Change Healthcare Holdings, Inc., 2017 Term Loan B, 3.80%, 2/08/24 | 1,724 | 1,731,189 | ||||||||||
Hotels, Restaurants & Leisure — 1.8% | ||||||||||||
Amaya Holdings BV: | ||||||||||||
1st Lien Term Loan, 5.00%, 8/01/21 | 4,850 | 4,853,300 | ||||||||||
2nd Lien Term Loan, 8.00%, 8/01/22 | 248 | 248,607 | ||||||||||
Bronco Midstream Funding LLC, Term Loan B, 5.06%, 8/15/20 | 5,185 | 5,210,790 | ||||||||||
Caesars Entertainment Operating Co., Term Loan B7 (Non RSA), 4.00%, 3/01/22 | 3,447 | 4,139,081 | ||||||||||
Caesars Entertainment Resort Properties LLC, Term Loan B, 7.00%, 10/11/20 | 13,218 | 13,328,254 | ||||||||||
Four Seasons Holdings, Inc., 1st Lien Term Loan, 4.00%, 11/30/23 | 275 | 278,732 | ||||||||||
|
| |||||||||||
| 28,058,764 | ||||||||||||
Industrial Conglomerates — 0.3% |
| |||||||||||
Cortes NP Acquisition Corp., Term Loan B, 6.00% - 6.03%, 11/30/23 | 4,617 | 4,649,939 | ||||||||||
Insurance — 0.1% | ||||||||||||
Alliant Holdings I, Inc., 2015 Term Loan B, 4.50%, 8/12/22 | 715 | 720,743 | ||||||||||
AssuredPartners, Inc., 2016 Term Loan B, 5.25%, 10/21/22 | 1,220 | 1,232,428 | ||||||||||
|
| |||||||||||
| 1,953,171 | ||||||||||||
IT Services — 0.1% |
| |||||||||||
TKC Holdings, Inc., 2017 Term Loan, 4.75%, 2/01/23 | 1,572 | 1,583,790 | ||||||||||
Machinery — 0.3% | ||||||||||||
Signode Industrial Group US, Inc., Term Loan B, 4.00%, 5/01/21 | 959 | 962,529 | ||||||||||
Silver II US Holdings LLC, Term Loan, 4.00%, 12/13/19 | 3,353 | 3,196,560 | ||||||||||
|
| |||||||||||
| 4,159,089 | ||||||||||||
Media — 1.0% |
| |||||||||||
iHeartCommunications, Inc., Term Loan D, 7.53%, 1/30/19 | 6,888 | 5,977,400 | ||||||||||
Intelsat Jackson Holdings SA, Term Loan B2, 3.75%, 6/30/19 | 8,606 | 8,547,644 | ||||||||||
| Floating Rate Loan Interests (d) | Par (000) | Value | ||||||||||
Media (continued) |
| |||||||||||
Ziggo Secured Finance Partnership, Term Loan E, 2.27%, 4/23/25 | USD | 1,507 | $ | 1,511,310 | ||||||||
|
| |||||||||||
| 16,036,354 | ||||||||||||
Metals & Mining — 0.1% |
| |||||||||||
FMG Resources August 2006 Property Ltd., Term Loan B, 3.75%, 6/30/19 | 1,248 | 1,254,984 | ||||||||||
Multiline Retail — 0.1% | ||||||||||||
Neiman Marcus Group, Inc., 2020 Term Loan, 4.25%, 10/25/20 | 1,434 | 1,153,555 | ||||||||||
Oil, Gas & Consumable Fuels — 1.9% | ||||||||||||
California Resources Corp.: | ||||||||||||
Second Out Term Loan, 11.38%, 12/31/21 | 3,580 | 4,033,479 | ||||||||||
Term Loan A, 3.78%, 10/01/19 | 3,790 | 3,645,131 | ||||||||||
Chesapeake Energy Corp., Term Loan, 8.55%, 8/23/21 | 10,287 | 11,109,445 | ||||||||||
CITGO Holding, Inc., 2015 Term Loan B, 9.50%, 5/12/18 | 2,503 | 2,542,460 | ||||||||||
Energy Transfer Equity LP, 2017 Term Loan B, 3.53%, 2/02/24 | 1,762 | 1,766,193 | ||||||||||
Peabody Energy Corp., Exit Term Loan, 5.54%, 1/30/22 | 1,456 | 1,466,308 | ||||||||||
Ultra Resources, Inc., Revolver, 0.00%, 4/06/17 (a)(h) | 4,600 | 4,697,750 | ||||||||||
|
| |||||||||||
| 29,260,766 | ||||||||||||
Pharmaceuticals — 0.5% |
| |||||||||||
DPx Holdings BV, 2014 Incremental Term Loan, 4.25%, 3/11/21 | 1,472 | 1,477,853 | ||||||||||
Jaguar Holding Co. II, 2015 Term Loan B, 4.25%, 8/18/22 | 3,552 | 3,569,980 | ||||||||||
Valeant Pharmaceuticals International, Inc.: | ||||||||||||
Series A3 Tranche A, 4.54%, 10/20/18 | 353 | 352,995 | ||||||||||
Series C2 Term Loan B, 5.28%, 12/11/19 | 677 | 680,453 | ||||||||||
Series D2 Term Loan B, 5.03%, 2/13/19 | 124 | 124,808 | ||||||||||
Series E Term Loan B, 5.27%, 8/05/20 | 1,515 | 1,523,520 | ||||||||||
Series F1 Term Loan B, 5.53%, 4/01/22 | 9 | 9,258 | ||||||||||
|
| |||||||||||
| 7,738,867 | ||||||||||||
Professional Services — 0.1% |
| |||||||||||
Advantage Sales & Marketing, Inc., 2014 1st Lien Term Loan, 4.25%, 7/23/21 | 1,662 | 1,653,441 | ||||||||||
Information Resources, Inc., 1st Lien Term Loan, 5.25%, 1/18/24 | 508 | 514,035 | ||||||||||
|
| |||||||||||
| 2,167,476 | ||||||||||||
Semiconductors & Semiconductor Equipment — 0.0% |
| |||||||||||
Microsemi Corp., 2015 Term Loan B, 3.03%, 1/15/23 | 289 | 291,064 | ||||||||||
Software — 1.5% | ||||||||||||
BMC Software Finance, Inc., Term Loan, 5.00%, 9/10/20 | 5,171 | 5,197,261 | ||||||||||
Infor (US), Inc., Term Loan B6, 3.75%, 2/01/22 | 1,970 | 1,971,795 | ||||||||||
Kronos, Inc.: | ||||||||||||
1st Lien Term Loan, | 3,719 | 3,761,211 | ||||||||||
2nd Lien Term Loan, 9.28%, 11/01/24 | 3,635 | 3,755,202 | ||||||||||
Optiv Security, Inc., 1st Lien Term Loan, 4.25%, 2/01/24 | 1,419 | 1,427,429 | ||||||||||
RP Crown Parent LLC, 2016 Term Loan B, 4.50%, 10/12/23 | 1,163 | 1,172,816 | ||||||||||
Tibco Software Inc., 2017 Term Loan B, 5.50%, 12/04/20 | 3,311 | 3,351,206 | ||||||||||
Veritas US Inc.: | ||||||||||||
Term Loan B1, 6.63%, 1/27/23 | 2,011 | 2,005,349 | ||||||||||
USD Last Out Term Loan B2, 8.63%, 1/29/23 | 125 | 123,437 | ||||||||||
|
| |||||||||||
| 22,765,706 | ||||||||||||
See Notes to Financial Statements.
| 50 | SEMI-ANNUAL REPORT | FEBRUARY 28, 2017 |
Consolidated Schedule of Investments (continued) | BlackRock Corporate High Yield Fund, Inc. (HYT) |
| Floating Rate Loan Interests (d) | Par (000) | Value | ||||||||||
Specialty Retail — 0.0% |
| |||||||||||
Leslie’s Poolmart, Inc., 2016 Term Loan, 4.75%, 8/16/23 | USD | 267 | $ | 267,456 | ||||||||
Technology Hardware, Storage & Peripherals — 0.0% |
| |||||||||||
Oberthur Technologies SA, 2016 Term Loan B1, 4.70%, 12/15/23 | 258 | 260,752 | ||||||||||
Textiles, Apparel & Luxury Goods — 0.4% |
| |||||||||||
Ascend Performance Materials LLC, Term Loan B, 6.50%, 8/12/22 | 5,321 | 5,358,097 | ||||||||||
Wireless Telecommunication Services — 2.0% |
| |||||||||||
Ligado Networks LLC, 2015 2nd Lien Term Loan, 13.50%, 12/07/20 (a)(h) | 37,045 | 29,126,247 | ||||||||||
Radiate Holdco LLC, 1st Lien Term Loan, 3.78%, 2/01/24 | 1,851 | 1,864,623 | ||||||||||
|
| |||||||||||
| 30,990,870 | ||||||||||||
| Total Floating Rate Loan Interests — 14.9% | 229,554,694 | |||||||||||
| Investment Companies — 0.1% | Shares | |||||||||||
United States — 0.1% | ||||||||||||
SPDR S&P Oil & Gas Exploration & Production ETF | 25,675 | 972,055 | ||||||||||
| Non-Agency Mortgage-Backed Securities | Par (000) | |||||||||||
Commercial Mortgage-Backed Securities — 0.1% |
| |||||||||||
GAHR Commercial Mortgage Trust 2015-NRF, Series 2015-NRF, Class FFX, 3.38%, 12/15/34 (d)(e) | USD | 1,925 | 1,874,969 | |||||||||
| Other Interests (m) | Beneficial Interest (000) | |||||||||||
United States — 0.0% | ||||||||||||
Lear Corp. Escrow | 1,250 | 13 | ||||||||||
| Preferred Securities | Par (000) | |||||||||||
| Capital Trusts | ||||||||||||
Banks — 1.4% | ||||||||||||
Allied Irish Banks PLC, 7.38% (d)(l) | USD | 410 | 451,185 | |||||||||
Banco Bilbao Vizcaya Argentaria SA (d)(l): | ||||||||||||
7.00% | 400 | 415,289 | ||||||||||
8.88% | 200 | 232,600 | ||||||||||
Banco Popular Espanol SA, 8.25% (d)(l) | 600 | 550,623 | ||||||||||
Banco Santander SA, 6.25% (d)(l) | 700 | 731,386 | ||||||||||
Bank of Ireland, 7.38% (d)(l) | 250 | 282,947 | ||||||||||
BNP Paribas SA, 7.20% | 100 | 107,875 | ||||||||||
Citigroup, Inc. (d)(l): | ||||||||||||
5.95% | 1,405 | 1,477,835 | ||||||||||
Series O, 5.88% | 2,405 | 2,483,162 | ||||||||||
Series P, 5.95% | 1,452 | 1,513,710 | ||||||||||
Series Q, 5.95% | 1,165 | 1,217,408 | ||||||||||
Series R, 6.13% | 615 | 650,399 | ||||||||||
Cooperatieve Rabobank UA, (d)(l) | ||||||||||||
5.50% | 200 | 217,262 | ||||||||||
6.63% | 200 | 228,724 | ||||||||||
| Capital Trusts | Par (000) | Value | ||||||||||
Banks (continued) | ||||||||||||
Danske Bank A/S, 5.75% (d)(l) | USD | 200 | $ | 224,329 | ||||||||
DNB Bank ASA, 6.50% (d)(l) | 400 | 420,000 | ||||||||||
Intesa Sanpaolo SpA (d)(l): | ||||||||||||
7.00% | 375 | 398,268 | ||||||||||
7.70% (e) | 200 | 189,750 | ||||||||||
7.75% | 250 | 270,422 | ||||||||||
National Westminster Bank PLC, Series C, 1.19% (d)(l) | 100 | 81,500 | ||||||||||
RZB Finance Jersey IV Ltd., 1.62% (d)(l) | 300 | 302,492 | ||||||||||
Swedbank Hypotek AB, 6.00% (d)(l) | 200 | 206,300 | ||||||||||
U.S. Bancorp, Series J, 5.30% (d)(l) | 3,084 | 3,137,970 | ||||||||||
Wells Fargo & Co. (d)(l): | ||||||||||||
Series S, 5.90% | 3,460 | 3,658,950 | ||||||||||
Series U, 5.88% | 1,375 | 1,485,000 | ||||||||||
|
| |||||||||||
| 20,935,386 | ||||||||||||
Capital Markets — 0.7% | ||||||||||||
Goldman Sachs Group, Inc., Series L, 5.70% (d)(l) | 5,218 | 5,374,540 | ||||||||||
Morgan Stanley (d)(l): | ||||||||||||
Series H, 5.45% | 3,309 | 3,394,346 | ||||||||||
Series J, 5.55% | 440 | 457,600 | ||||||||||
UBS Group AG (d)(l): | ||||||||||||
5.75% | 800 | 925,915 | ||||||||||
7.00% | 425 | 457,415 | ||||||||||
|
| |||||||||||
| 10,609,816 | ||||||||||||
Chemicals — 0.0% | ||||||||||||
Lanxess AG, 4.50%, 12/06/76 (d) | 225 | 256,242 | ||||||||||
Solvay Finance SA, 5.12% (d)(l) | 310 | 360,148 | ||||||||||
|
| |||||||||||
| 616,390 | ||||||||||||
Diversified Financial Services — 1.9% | ||||||||||||
Bank of America Corp. (d)(l): | ||||||||||||
Series AA, 6.10% | 3,011 | 3,212,361 | ||||||||||
Series V, 5.13% | 2,205 | 2,229,806 | ||||||||||
Series X, 6.25% | 2,874 | 3,075,467 | ||||||||||
Series Z, 6.50% | 1,816 | 1,983,399 | ||||||||||
Barclays PLC (d)(l): | ||||||||||||
7.88% | 325 | 340,941 | ||||||||||
7.38% | 450 | 558,371 | ||||||||||
Credit Agricole SA, 6.50% (d)(l) | 600 | 659,749 | ||||||||||
HBOS Capital Funding LP, 6.85% (l) | 400 | 407,000 | ||||||||||
JPMorgan Chase & Co., (d)(l): | ||||||||||||
6.75% | 5,324 | 5,896,330 | ||||||||||
Series Q, 5.15% | 850 | 852,295 | ||||||||||
Series U, 6.13% | 4,228 | 4,487,811 | ||||||||||
Series V, 5.00% | 3,075 | 3,093,481 | ||||||||||
Royal Bank of Scotland Group PLC, 8.63% (d)(l) | 982 | 1,037,483 | ||||||||||
Societe Generale SA, (d)(l): | ||||||||||||
7.38% | 200 | 264,301 | ||||||||||
7.88% (e) | 300 | 303,750 | ||||||||||
UniCredit SpA, 9.25% (d)(l) | 425 | 483,901 | ||||||||||
|
| |||||||||||
| 28,886,446 | ||||||||||||
Diversified Telecommunication Services — 0.3% | ||||||||||||
Koninklijke KPN NV, 6.13% (d)(l) | 566 | 642,373 | ||||||||||
Orange SA, 4.00% (d)(l): | ||||||||||||
4.00% | 600 | 669,011 | ||||||||||
5.75% | 100 | 131,394 | ||||||||||
Telefonica Europe BV (d)(l): | ||||||||||||
3.75% | 200 | 214,264 | ||||||||||
4.20% | 1,500 | 1,666,568 | ||||||||||
6.50% | 600 | 683,630 | ||||||||||
6.75% | 200 | 266,758 | ||||||||||
|
| |||||||||||
| 4,273,998 | ||||||||||||
See Notes to Financial Statements.
| SEMI-ANNUAL REPORT | FEBRUARY 28, 2017 | 51 |
Consolidated Schedule of Investments (continued) | BlackRock Corporate High Yield Fund, Inc. (HYT) |
| Capital Trusts | Par (000) | Value | ||||||||||
Electric Utilities — 0.1% | ||||||||||||
Enel SpA (d): | ||||||||||||
6.50%, 1/10/74 | USD | 689 | $ | 788,320 | ||||||||
7.75%, 9/10/75 | 105 | 144,292 | ||||||||||
Origin Energy Finance Ltd. (d): | ||||||||||||
4.00%, 6/16/71 | 410 | 442,998 | ||||||||||
7.88%, 9/16/74 | 100 | 113,275 | ||||||||||
|
| |||||||||||
| 1,488,885 | ||||||||||||
Insurance — 0.0% | ||||||||||||
Ethias SA, 5.00%, 1/14/26 | 200 | 207,040 | ||||||||||
Media — 0.0% | ||||||||||||
NBCUniversal Enterprise, Inc., 5.25% (e)(l) | 400 | 422,000 | ||||||||||
Metals & Mining — 0.0% | ||||||||||||
BHP Billiton Finance, Ltd., 4.75%, 4/22/76 (d) | 300 | 353,281 | ||||||||||
Oil, Gas & Consumable Fuels — 0.2% | ||||||||||||
DCP Midstream LLC, 5.85%, 5/21/43 (d)(e) | 225 | 210,375 | ||||||||||
Gas Natural Fenosa Finance BV, 3.38% (d)(l) | 1,200 | 1,231,361 | ||||||||||
Repsol International Finance BV, 4.50%, 3/25/75 (d) | 489 | 524,688 | ||||||||||
TOTAL SA, 3.88% (d)(l) | 625 | 704,964 | ||||||||||
|
| |||||||||||
| 2,671,388 | ||||||||||||
| Total Capital Trusts — 4.6% | 70,464,630 | |||||||||||
| Preferred Stocks | Shares | |||||||||||
Capital Markets — 0.3% | ||||||||||||
Morgan Stanley, Series K, 5.85% (d)(l) | 171,786 | 4,440,668 | ||||||||||
Diversified Financial Services — 0.0% | ||||||||||||
Concrete Investments II | 4,997 | 550,557 | ||||||||||
Hotels, Restaurants & Leisure — 1.1% | ||||||||||||
Amaya, Inc. (j) | 19,851 | 16,586,839 | ||||||||||
Wireless Telecommunication Services — 0.0% | ||||||||||||
CF-B L2 (D) LLC, (Aquired 4/08/15, cost $629,122) (c) | 633,461 | 597,544 | ||||||||||
| Total Preferred Stocks — 1.4% | 22,175,608 | |||||||||||
Trust Preferred — 0.4% | Shares | Value | ||||||||||
Diversified Financial Services — 0.4% | ||||||||||||
GMAC Capital Trust I, Series 2, 6.82%, 2/15/40 (d) | 256,246 | $ | 6,571,218 | |||||||||
| Total Preferred Securities — 6.4% | 99,211,456 | |||||||||||
| Warrants | ||||||||||||
Metals & Mining — 0.0% | ||||||||||||
Peninsula Energy Ltd.: | ||||||||||||
(1 Share for 1 Warrant, Expires 12/31/17, Strike Price AUD 0.08) | 288,820 | 2 | ||||||||||
(1 Share for 1 Warrant, Expires 12/31/18, Strike Price AUD 0.05) | 515,378 | 37,539 | ||||||||||
|
| |||||||||||
| 37,541 | ||||||||||||
Software — 0.0% | ||||||||||||
HMH Holdings/EduMedia (Issued/exercisable 3/09/10, 19 Shares for 1 Warrant, Expires 6/22/19, Strike Price $42.27) | 6,494 | 1,688 | ||||||||||
Transportation Infrastructure — 0.0% | ||||||||||||
Jack Cooper Enterprises, Inc., Class B | 10,633 | 68,264 | ||||||||||
| Total Warrants — 0.0% | 107,493 | |||||||||||
| Total Long-Term Investments (Cost — $2,116,332,827) — 137.2% | 2,114,462,043 | |||||||||||
| Short-Term Securities | ||||||||||||
Money Market Fund | ||||||||||||
BlackRock Liquidity Funds, T-Fund, Institutional Class, 0.42% (n)(o) | 534,637 | 534,637 | ||||||||||
| Total Short-Term Securities (Cost — $534,637) — 0.0% | 534,637 | |||||||||||
| Options Purchased (Cost — $991,640) — 0.0% | 444,198 | |||||||||||
| Total Investments Before Options Written (Cost — $2,117,859,104) — 137.2% | 2,115,440,878 | |||||||||||
| Options Written (Premiums Received — $103,169) — (0.0)% | (78,960 | ) | ||||||||||
Total Investments, Net of Options Written (Cost — $2,117,755,935) — 137.2% |
| 2,115,361,918 | ||||||||||
Liabilities in Excess of Other Assets — (37.2)% |
| (573,555,545 | ) | |||||||||
|
| |||||||||||
Net Assets — 100.0% |
| $ | 1,541,806,373 | |||||||||
|
| |||||||||||
| Notes to Schedule of Investments |
| (a) | Non-income producing security. |
| (b) | All or a portion of security is held by a wholly owned subsidiary. See Note 1 of the Notes to Financial Statements for details on the wholly owned subsidiary. |
| (c) | Restricted security as to resale, excluding 144A securities. As of period end, the Trust held restricted securities with a current value of $609,719 and an original cost of $816,585, which was 0.04% of its net assets. |
| (d) | Variable rate security. Rate as of period end. |
| (e) | Security exempt from registration pursuant to Rule 144A under the Securities Act of 1933, as amended. These securities may be resold in transactions exempt from registration to qualified institutional investors. |
| (f) | When-issued security. |
| (g) | Payment-in-kind security which may pay interest/dividends in additional par/shares and/or in cash. Rates shown are the current rate and possible payment rates. |
| (h) | Issuer filed for bankruptcy and/or is in default. |
| (i) | Zero-coupon bond. |
| (j) | Convertible security. |
| (k) | Step-up bond that pays an initial coupon rate for the first period and then a higher coupon rate for the following periods. Rate as of period end. |
| (l) | Perpetual security with no stated maturity date. |
See Notes to Financial Statements.
| 52 | SEMI-ANNUAL REPORT | FEBRUARY 28, 2017 |
Consolidated Schedule of Investments (continued) | BlackRock Corporate High Yield Fund, Inc. (HYT) |
| (m) | Other interests represent beneficial interests in liquidation trusts and other reorganization or private entities. |
| (n) | During the six months ended February 28, 2017, investments in issuers considered to be affiliates of the Trust for purposes of Section 2(a)(3) of the Investment Company Act of 1940, as amended, were as follows: |
| Affiliate | Shares Held at August 31, 2016 | Shares Purchased | Shares Sold | Shares Held at February 28, 2017 | Value at February 28, 2017 | Income | Net Realized | Change in Unrealized Depreciation | ||||||||||||||||||||||||||||
BlackRock Liquidity Funds, T-Fund, Institutional Class | — | 534,637 | 2 | — | 534,637 | $ | 534,637 | $ | 3,649 | $ | 5 | — | ||||||||||||||||||||||||
iShares iBoxx USD High Yield Corporate Bond ETF | 152,000 | 279,142 | (431,142 | ) | — | — | 172,128 | 32,072 | $ | (129,580 | ) | |||||||||||||||||||||||||
Total |
| $ | 534,637 | $ | 175,777 | $ | 32,077 | $ | (129,580 | ) | ||||||||||||||||||||||||||
|
| |||||||||||||||||||||||||||||||||||
1 Includes net capital gain distributions. |
| |||||||||||||||||||||||||||||||||||
2 Represents net shares purchased. |
| |||||||||||||||||||||||||||||||||||
| (o) | Current yield as of period end. |
For Trust compliance purposes, the Trust’s industry classifications refer to one or more of the industry sub-classifications used by one or more widely recognized market indexes or rating group indexes, and/or as defined by the investment adviser. These definitions may not apply for purposes of this report, which may combine such industry sub-classifications for reporting ease.
| Derivative Financial Instruments Outstanding as of Period End |
| Futures Contracts | ||||||||||||||||||||||
| Contracts Short | Issue | Expiration | Notional Value | Unrealized Appreciation (Depreciation) | ||||||||||||||||||
| (5 | ) | 5-Year U.S. Treasury Note | June 2017 | USD | 588,516 | $ | 814 | |||||||||||||||
| (20 | ) | Euro BOBL | June 2017 | USD | 2,810,799 | (19 | ) | |||||||||||||||
| (15 | ) | Euro Bund Future | June 2017 | USD | 2,587,212 | (1,124 | ) | |||||||||||||||
| (61 | ) | Russell 2000 E-Mini Index | March 2017 | USD | 4,224,250 | (93,852 | ) | |||||||||||||||
Total | $ | (94,181 | ) | |||||||||||||||||||
|
| |||||||||||||||||||||
| Forward Foreign Currency Exchange Contracts | ||||||||||||||||||||||||||
| Currency Purchased | Currency Sold | Counterparty | Settlement Date | Unrealized Appreciation (Depreciation) | ||||||||||||||||||||||
| EUR | 400,000 | USD | 430,186 | Goldman Sachs International | 3/06/17 | $ | (6,367 | ) | ||||||||||||||||||
| EUR | 614,000 | USD | 662,016 | Royal Bank of Canada | 3/06/17 | (11,454 | ) | |||||||||||||||||||
| GBP | 1,000,000 | USD | 1,246,555 | Australia and New Zealand Bank Group | 3/06/17 | (5,630 | ) | |||||||||||||||||||
| GBP | 200,000 | USD | 249,736 | Australia and New Zealand Bank Group | 3/06/17 | (1,551 | ) | |||||||||||||||||||
| GBP | 600,000 | USD | 748,985 | Commonwealth Bank of Australia | 3/06/17 | (4,430 | ) | |||||||||||||||||||
| GBP | 1,500,000 | USD | 1,875,198 | Northern Trust Co. | 3/06/17 | (13,811 | ) | |||||||||||||||||||
| USD | 1,214,853 | AUD | 1,605,000 | National Australia Bank Ltd. | 3/06/17 | (15,581 | ) | |||||||||||||||||||
| USD | 18,126,923 | CAD | 23,625,000 | National Australia Bank Ltd. | 3/06/17 | 339,214 | ||||||||||||||||||||
| USD | 5,291 | EUR | 5,000 | Australia and New Zealand Bank Group | 3/06/17 | (6 | ) | |||||||||||||||||||
| USD | 20,147 | EUR | 19,000 | Australia and New Zealand Bank Group | 3/06/17 | 15 | ||||||||||||||||||||
| USD | 795,730 | EUR | 750,000 | Goldman Sachs International | 3/06/17 | 1,069 | ||||||||||||||||||||
| USD | 104,944 | EUR | 99,000 | Goldman Sachs International | 3/06/17 | 49 | ||||||||||||||||||||
| USD | 380,941 | EUR | 360,000 | Goldman Sachs International | 3/06/17 | (496 | ) | |||||||||||||||||||
| USD | 77,093,561 | EUR | 71,621,000 | Morgan Stanley & Co. International PLC | 3/06/17 | 1,207,672 | ||||||||||||||||||||
| USD | 924,369 | EUR | 875,000 | Northern Trust Co. | 3/06/17 | (2,735 | ) | |||||||||||||||||||
| USD | 16,747,671 | GBP | 13,405,000 | Barclays Bank PLC | 3/06/17 | 113,077 | ||||||||||||||||||||
| USD | 1,916,160 | GBP | 1,529,000 | Citibank N.A. | 3/06/17 | 18,786 | ||||||||||||||||||||
| USD | 1,230,073 | AUD | 1,605,000 | Citibank N.A. | 4/05/17 | 487 | ||||||||||||||||||||
| USD | 17,859,597 | CAD | 23,625,000 | Morgan Stanley & Co. International PLC | 4/05/17 | 68,032 | ||||||||||||||||||||
| USD | 77,590,656 | EUR | 73,086,000 | Bank of America N.A. | 4/05/17 | 40,282 | ||||||||||||||||||||
| USD | 3,091,533 | EUR | 2,905,000 | Royal Bank of Scotland PLC | 4/05/17 | 9,084 | ||||||||||||||||||||
| USD | 14,286,066 | GBP | 11,489,000 | Barclays Bank PLC | 4/05/17 | 17,379 | ||||||||||||||||||||
| Total | $ | 1,753,085 | ||||||||||||||||||||||||
|
| |||||||||||||||||||||||||
See Notes to Financial Statements.
| SEMI-ANNUAL REPORT | FEBRUARY 28, 2017 | 53 |
Consolidated Schedule of Investments (continued) | BlackRock Corporate High Yield Fund, Inc. (HYT) |
| Exchange-Traded Options Purchased | ||||||||||||||||||||||||||||
| Description | Put/ Call | Expiration Date | Strike Price | Contracts | Value | |||||||||||||||||||||||
SPDR S&P 500 ETF Trust | Put | 4/21/17 | USD | 230.00 | 940 | $ | 195,050 | |||||||||||||||||||||
| OTC Interest Rate Swaptions Purchased | ||||||||||||||||||||||||||||||||||||||||
| Description | Counterparty | Put/ Call | Exercise Rate | Pay/ Receive Exercise Rate | Floating Rate Index | Expiration Date | Notional Amount (000) | Value | ||||||||||||||||||||||||||||||||
10-Year Interest Rate Swap | Citibank N.A. | Put | 2.60 | % | Pay | 3-Month LIBOR | 4/26/17 | USD | 25,310 | $ | 97,689 | |||||||||||||||||||||||||||||
10-Year Interest Rate Swap | Citibank N.A. | Put | 2.75 | % | Pay | 3-Month LIBOR | 6/26/17 | USD | 25,310 | 151,459 | ||||||||||||||||||||||||||||||
Total | $ | 249,148 | ||||||||||||||||||||||||||||||||||||||
|
| |||||||||||||||||||||||||||||||||||||||
| OTC Options Purchased | ||||||||||||||||||||||
| Description | Put/ Call | Counterparty | Expiration Date | Strike Price | Contract | Value | ||||||||||||||||
Marsico Parent Superholdco LLC | Call | Goldman Sachs & Co. | 12/14/19 | USD | 942.86 | 39 | — | |||||||||||||||
| Exchange-Traded Options Written | ||||||||||||||||||||
| Description | Put/ Call | Expiration Date | Strike Price | Contracts | Value | |||||||||||||||
SPDR S&P 500 ETF Trust | Put | 4/21/17 | USD | 220.00 | 940 | $ | (78,960 | ) | ||||||||||||
| Centrally Cleared Credit Default Swaps — Sell Protection | ||||||||||||||||||||||||||||
| Issuer/Index | Receive Fixed Rate | Expiration Date | Credit Rating1 | Notional Amount (000)2 | Unrealized Appreciation (Depreciation) | |||||||||||||||||||||||
Chesapeake Energy Corp. | 5.00% | 12/20/21 | CCC | USD | 425 | $ | (4,831 | ) | ||||||||||||||||||||
Markit CDX North America High Yield Index, Series 27, Version 2 | 5.00% | 12/20/21 | B+ | USD | 113,512 | 3,839,224 | ||||||||||||||||||||||
Total |
| $ | 3,834,393 | |||||||||||||||||||||||||
|
| |||||||||||||||||||||||||||
| OTC Credit Default Swaps — Sell Protection | ||||||||||||||||||||||||||||||||
| Issuer/Index | Receive Fixed Rate | Counterparty | Expiration Date | Credit Rating1 | Notional Amount (000)2 | Value | Premiums Paid (Received) | Unrealized Appreciation | ||||||||||||||||||||||||
CCO Holdings LLC | 8.00 | % | Deutsche Bank AG | 9/20/17 | NR | USD | 8,180 | $ | 485,805 | — | $ | 485,805 | ||||||||||||||||||||
UniCredit SpA | 1.00 | % | Barclays Bank PLC | 12/20/21 | BBB- | EUR | 100 | (3,510 | ) | $ | (5,622 | ) | 2,112 | |||||||||||||||||||
Hellenic Telecommunications Organization SA | 5.00 | % | Goldman Sachs International | 12/20/21 | B+ | EUR | 170 | 12,764 | 9,818 | 2,946 | ||||||||||||||||||||||
Total |
| $ | 495,059 | $ | 4,196 | $ | 490,863 | |||||||||||||||||||||||||
|
| |||||||||||||||||||||||||||||||
1 Using Standard & Poor’s (“S&P’s”) rating of the issuer or the underlying securities of the index, as applicable. |
| |||||||||||||||||||||||||||||||
2 The maximum potential amount the Trust may pay should a negative credit event take place as defined under the terms of the agreement. |
| |||||||||||||||||||||||||||||||
| OTC Total Return Swaps | ||||||||||||||||||||||||||||||
| Reference Entity | Fixed Rate/ Floating Rate | Counterparty | Effective Date | Expiration Date | Notional Amount (000) | Value | Premiums Received | Unrealized Appreciation | ||||||||||||||||||||||
iBoxx USD Liquid High Yield Index | 3-Month LIBOR | Goldman Sachs International | N/A | 3/20/17 | USD | 13,000 | $ | 756,925 | — | $ | 756,925 | |||||||||||||||||||
iBoxx USD Liquid High Yield Index | 3-Month LIBOR | Goldman Sachs International | N/A | 6/20/17 | USD | 1,800 | 92,232 | — | 92,232 | |||||||||||||||||||||
iBoxx USD Liquid High Yield Index | 3-Month LIBOR | Citibank N.A. | N/A | 6/20/17 | USD | 2,000 | 87,640 | — | 87,640 | |||||||||||||||||||||
iBoxx USD Liquid High Yield Index | 3-Month LIBOR | Goldman Sachs International | N/A | 6/20/17 | USD | 5,800 | 61,563 | $ | (8,195 | ) | 69,758 | |||||||||||||||||||
iBoxx USD Liquid High Yield Index | 3-Month LIBOR | JPMorgan Chase Bank N.A. | N/A | 9/20/17 | USD | 2,700 | 24,933 | (3,740 | ) | 28,673 | ||||||||||||||||||||
Morgan Stanley Energy Long Basket Index | FED Funds Effective Rate plus 0.25% | Morgan Stanley & Co. International PLC | N/A | 12/29/17 | USD | 29 | — | — | — | |||||||||||||||||||||
Total | $ | 1,023,293 | $ | (11,935 | ) | $ | 1,035,228 | |||||||||||||||||||||||
|
|
|
|
|
| |||||||||||||||||||||||||
See Notes to Financial Statements.
| 54 | SEMI-ANNUAL REPORT | FEBRUARY 28, 2017 |
Consolidated Schedule of Investments (continued) | BlackRock Corporate High Yield Fund, Inc. (HYT) |
| Transactions in Options Written for the Period Ended February 28, 2017 |
| Puts | ||||||||||||||||
| Contracts | Notional (000) | Premiums Received | ||||||||||||||
Outstanding options, beginning of period | — | $ | 10,000 | $ | 19,000 | |||||||||||
Options written | 6,044 | — | 574,078 | |||||||||||||
Options exercised | — | — | — | |||||||||||||
Options expired | — | (10,000 | ) | (19,000 | ) | |||||||||||
Options closed | (5,104 | ) | — | (470,909 | ) | |||||||||||
|
| |||||||||||||||
Outstanding options, end of period | 940 | — | $ | 103,169 | ||||||||||||
|
| |||||||||||||||
| Derivative Financial Instruments Categorized by Risk Exposure |
As of period end, the fair values of derivative financial instruments located in the Consolidated Statement of Assets and Liabilities were as follows:
| Assets — Derivative Financial Instruments | Commodity Contracts | Credit Contracts | Equity Contracts | Foreign Currency Exchange Contracts | Interest Rate Contracts | Other Contracts | Total | |||||||||||||||||||||||||||
Futures contracts | Net unrealized appreciation1 | — | — | — | — | $ | 814 | — | $ | 814 | ||||||||||||||||||||||||
Forward foreign currency exchange contracts | Unrealized appreciation on forward foreign currency exchange contracts | — | — | — | $ | 1,815,146 | — | — | 1,815,146 | |||||||||||||||||||||||||
Options purchased | Investments at value — unaffiliated2 | — | — | $ | 195,050 | — | 249,148 | — | 444,198 | |||||||||||||||||||||||||
Swaps — centrally cleared | Net unrealized appreciation1 | — | $ | 3,839,224 | — | — | — | — | 3,839,224 | |||||||||||||||||||||||||
Swaps — OTC | Unrealized appreciation on OTC swaps; Swap premiums paid | — | 500,681 | — | — | 1,035,228 | — | 1,535,909 | ||||||||||||||||||||||||||
|
| |||||||||||||||||||||||||||||||||
Total | — | $ | 4,339,905 | $ | 195,050 | $ | 1,815,146 | $ | 1,285,190 | — | $ | 7,635,291 | ||||||||||||||||||||||
|
| |||||||||||||||||||||||||||||||||
| Liabilities — Derivative Financial Instruments | ||||||||||||||||||||||||||||||||||
Futures contracts | Net unrealized depreciation1 | — | — | $ | 93,852 | — | $ | 1,143 | — | $ | 94,995 | |||||||||||||||||||||||
Forward foreign currency exchange contracts | Unrealized depreciation on forward foreign currency exchange contracts | — | — | — | $ | 62,061 | — | — | 62,061 | |||||||||||||||||||||||||
Options written | Options written at value | — | — | 78,960 | — | — | — | 78,960 | ||||||||||||||||||||||||||
Swaps — centrally cleared | Net unrealized depreciation1 | — | $ | 4,831 | — | — | — | — | 4,831 | |||||||||||||||||||||||||
Swaps — OTC | Unrealized depreciation on OTC swaps; Swap premiums received | — | 5,622 | — | — | 11,935 | — | 17,557 | ||||||||||||||||||||||||||
|
| |||||||||||||||||||||||||||||||||
Total | — | $ | 10,453 | $ | 172,812 | $ | 62,061 | $ | 13,078 | — | $ | 258,404 | ||||||||||||||||||||||
|
| |||||||||||||||||||||||||||||||||
1 Includes cumulative appreciation (depreciation) on futures contracts, if any, as reported in the Consolidated Schedule of Investments. Only current day’s variation margin is reported within the Consolidated Statement of Assets and Liabilities. |
| |||||||||||||||||||||||||||||||||
2 Includes options purchased at value as reported in the Consolidated Schedule of Investments. |
| |||||||||||||||||||||||||||||||||
For the six months ended February 28, 2017, the effect of derivative financial instruments in the Consolidated Statement of Operations was as follows:
| Net Realized Gain (Loss) from: | Commodity Contracts | Credit Contracts | Equity Contracts | Foreign Currency Exchange Contracts | Interest Rate | Other Contracts | Total | |||||||||||||||||||||||||
Futures contracts | — | — | $ | (3,983,948 | ) | — | $ | (79,268 | ) | — | $ | (4,063,216 | ) | |||||||||||||||||||
Forward foreign currency exchange contracts | — | — | — | $ | (2,045,808 | ) | — | — | (2,045,808 | ) | ||||||||||||||||||||||
Options purchased1 | — | — | (1,345,642 | ) | — | 1,406,631 | — | 60,989 | ||||||||||||||||||||||||
Options written | — | — | 422,268 | — | 19,000 | — | 441,268 | |||||||||||||||||||||||||
Swaps | — | $ | 2,190,991 | 227,611 | — | 1,555,796 | — | 3,974,398 | ||||||||||||||||||||||||
|
| |||||||||||||||||||||||||||||||
Total | — | $ | 2,190,991 | $ | (4,679,711 | ) | $ | (2,045,808 | ) | $ | 2,902,159 | — | $ | (1,632,369 | ) | |||||||||||||||||
|
| |||||||||||||||||||||||||||||||
| Net Change in Unrealized Appreciation (Depreciation) on: | ||||||||||||||||||||||||||||||||
Futures contracts | — | — | $ | 1,258,810 | — | $ | (329 | ) | — | $ | 1,258,481 | |||||||||||||||||||||
Forward foreign currency exchange contracts | — | — | — | $ | 1,859,320 | — | — | 1,859,320 | ||||||||||||||||||||||||
Options purchased2 | — | — | (64,318 | ) | — | (452,861 | ) | — | (517,179 | ) | ||||||||||||||||||||||
Options written | — | — | 24,209 | — | 3,041 | — | 27,250 | |||||||||||||||||||||||||
Swaps | — | $ | 3,595,831 | (215,712 | ) | — | (564,523 | ) | — | 2,815,596 | ||||||||||||||||||||||
|
| |||||||||||||||||||||||||||||||
Total | — | $ | 3,595,831 | $ | 1,002,989 | $ | 1,859,320 | $ | (1,014,672 | ) | — | $ | 5,443,468 | |||||||||||||||||||
|
| |||||||||||||||||||||||||||||||
1 Options purchased are included in net realized gain (loss) from investments. |
| |||||||||||||||||||||||||||||||
2 Options purchased are included in net change in unrealized appreciation (depreciation) on investments. |
| |||||||||||||||||||||||||||||||
See Notes to Financial Statements.
| SEMI-ANNUAL REPORT | FEBRUARY 28, 2017 | 55 |
Consolidated Schedule of Investments (continued) | BlackRock Corporate High Yield Fund, Inc. (HYT) |
| Average Quarterly Balances of Outstanding Derivative Financial Instruments | ||
| Futures contracts: | ||||
Average notional value of contracts — short | $ | 18,887,419 | ||
| Forward foreign currency exchange contracts: | ||||
Average amounts purchased — in USD | $ | 232,807,868 | ||
Average amounts sold — in USD | $ | 6,349,214 | ||
| Options: | ||||
Average value of option contracts purchased | $ | 344,712 | ||
Average value of option contracts written | $ | 146,913 | ||
Average value of options swaption contracts purchased | $ | 63,285,000 | ||
Average value of options swaption contracts written | $ | 10,000,000 | 1 | |
| Credit default swaps: | ||||
Average notional value — buy protection | $ | 5,674,920 | 1 | |
Average notional value — sell protection | $ | 108,988,200 | ||
| Total return swaps: | ||||
Average notional value | $ | 33,919,697 | ||
1 Actual amounts for the period are shown due to limited outstanding derivative financial instruments as of each quarter. |
| |||
For more information about the Trust’s investment risks regarding derivative financial instruments, refer to the Notes to Financial Statements.
| Derivative Financial Instruments — Offsetting as of Period End |
The Trust’s derivative assets and liabilities (by type) were as follows:
| Assets | Liabilities | |||||||
Futures contracts | $ | 66,506 | — | |||||
Forward foreign currency exchange contracts | 1,815,146 | $ | 62,061 | |||||
Options | 444,198 | 1 | 78,960 | |||||
Swaps — Centrally cleared | 46,823 | — | ||||||
Swaps — OTC2 | 1,535,909 | 17,557 | ||||||
|
|
|
| |||||
Total derivative assets and liabilities in the Consolidated Statement of Assets and Liabilities | $ | 3,908,582 | $ | 158,578 | ||||
|
|
|
| |||||
Derivatives not subject to a Master Netting Agreement or similar agreement (“MNA”) | (308,379 | ) | (78,960 | ) | ||||
|
|
|
| |||||
Total derivative assets and liabilities subject to an MNA | $ | 3,600,203 | $ | 79,618 | ||||
|
|
|
| |||||
1 Includes options purchased at value which is included in Investments at value — unaffiliated in the Consolidated Statement of Assets and Liabilities and reported in the Consolidated Schedule of Investments. |
| |||||||
2 Includes unrealized appreciation (depreciation) on OTC swaps and swap premiums paid/received in the Consolidated Statement of Assets and Liabilities. |
| |||||||
The following table presents the Trust’s derivative assets (and liabilities) by counterparty net of amounts available for offset under a MNA and net of the related collateral received by the Trust:
| Counterparty | Derivative Assets Subject to an MNA by Counterparty | Derivatives Available for Offset1 | Non-cash Collateral Received | Cash Collateral Received2 | Net Amount of Derivative Assets3,5 | |||||||||||||||||
Australia and New Zealand Bank Group | $ | 15 | $ | (15 | ) | — | — | — | ||||||||||||||
Bank of America N.A. | 40,282 | — | — | — | $ | 40,282 | ||||||||||||||||
Barclays Bank PLC | 132,568 | (5,622 | ) | — | — | 126,946 | ||||||||||||||||
Citibank N.A. | 356,061 | — | — | $ | (350,000 | ) | 6,061 | |||||||||||||||
Deutsche Bank AG | 485,805 | — | — | (485,805 | ) | — | ||||||||||||||||
Goldman Sachs International | 932,797 | (15,058 | ) | — | (917,739 | ) | — | |||||||||||||||
JPMorgan Chase Bank N.A. | 28,673 | (3,740 | ) | — | (24,933 | ) | — | |||||||||||||||
Morgan Stanley & Co. International PLC | 1,275,704 | — | — | — | 1,275,704 | |||||||||||||||||
National Austrailia Bank Ltd. | 339,214 | (15,581 | ) | — | — | 323,633 | ||||||||||||||||
Royal Bank of Scotland PLC | 9,084 | — | — | — | 9,084 | |||||||||||||||||
|
| |||||||||||||||||||||
Total | $ | 3,600,203 | $ | (40,016 | ) | — | $ | (1,778,477 | ) | $ | 1,781,710 | |||||||||||
|
| |||||||||||||||||||||
See Notes to Financial Statements.
| 56 | SEMI-ANNUAL REPORT | FEBRUARY 28, 2017 |
Consolidated Schedule of Investments (continued) | BlackRock Corporate High Yield Fund, Inc. (HYT) |
| Counterparty | Derivative Liabilities Subject to an MNA by Counterparty | Derivatives Available for Offset1 | Non-cash Collateral Pledged | Cash Collateral Pledged | Net Amount of Derivative Liabilities4,5 | |||||||||||||||
Australia and New Zealand Bank Group | $ | 7,187 | $ | (15 | ) | — | — | $ | 7,172 | |||||||||||
Barclays Bank PLC | 5,622 | (5,622 | ) | — | — | — | ||||||||||||||
Commonwealth Bank of Australia | 4,430 | — | — | — | 4,430 | |||||||||||||||
Goldman Sachs International | 15,058 | (15,058 | ) | — | — | — | ||||||||||||||
JPMorgan Chase Bank N.A. | 3,740 | (3,740 | ) | — | — | — | ||||||||||||||
National Austrailia Bank Ltd. | 15,581 | (15,581 | ) | — | — | — | ||||||||||||||
Northern Trust Co. | 16,546 | — | — | — | 16,546 | |||||||||||||||
Royal Bank of Canada | 11,454 | — | — | — | 11,454 | |||||||||||||||
|
| |||||||||||||||||||
Total | $ | 79,618 | $ | (40,016 | ) | — | — | $ | 39,602 | |||||||||||
|
| |||||||||||||||||||
1 The amount of derivatives available for offset is limited to the amount of derivative asset and/or liabilities that are subject to an MNA. |
| |||||||||||||||||||
2 Excess of collateral received from the individual counterparty is not shown for financial reporting purposes. |
| |||||||||||||||||||
3 Net amount represents the net amount receivable from the counterparty in the event of default. |
| |||||||||||||||||||
4 Net amount represents the net amount payable due to counterparty in the event of default. |
| |||||||||||||||||||
5 Net amount may also include forward foreign currency exchange contracts that are not required to be collateralized. |
| |||||||||||||||||||
| Fair Value Hierarchy as of Period End |
Various inputs are used in determining the fair value of investments and derivative financial instruments. For information about the Trust’s policy regarding valuation of investments and derivative financial instruments, refer to the Notes to Financial Statements.
The following tables summarize the Trust’s investments and derivative financial instruments categorized in the disclosure hierarchy:
| Level 1 | Level 2 | Level 3 | Total | |||||||||||||
Assets: |
| |||||||||||||||
| Investments: | ||||||||||||||||
Long-Term Investments: |
| |||||||||||||||
Common Stocks | $ | 15,104,159 | $ | 7,603,146 | $ | 5,693,095 | $ | 28,400,400 | ||||||||
Asset-Backed Securities | — | 47,720,703 | 7,006,625 | 54,727,328 | ||||||||||||
Corporate Bonds | — | 1,694,101,849 | 5,511,786 | 1,699,613,635 | ||||||||||||
Floating Rate Loan Interests | — | 222,898,943 | 6,655,751 | 229,554,694 | ||||||||||||
Investment Companies | 972,055 | — | — | 972,055 | ||||||||||||
Non-Agency Mortgage-Backed Securities | — | 1,874,969 | — | 1,874,969 | ||||||||||||
Other Interests | — | — | 13 | 13 | ||||||||||||
Preferred Securities | 11,011,886 | 70,464,630 | 17,137,396 | 98,613,912 | ||||||||||||
Warrants | — | 37,541 | 69,952 | 107,493 | ||||||||||||
Short-Term Securities | 534,637 | — | — | 534,637 | ||||||||||||
Options Purchased: |
| |||||||||||||||
Equity contracts | 195,050 | — | — | 195,050 | ||||||||||||
Interest rate contracts | — | 249,148 | — | 249,148 | ||||||||||||
Unfunded floating rate loan interests1 | — | 6,020 | — | 6,020 | ||||||||||||
|
|
|
|
|
|
|
| |||||||||
Subtotal | $ | 27,817,787 | $ | 2,044,956,949 | $ | 42,074,618 | $ | 2,114,849,354 | ||||||||
|
|
|
|
|
|
|
| |||||||||
Investments Valued at NAV2 |
| 597,544 | ||||||||||||||
|
| |||||||||||||||
Total | $ | 2,115,446,898 | ||||||||||||||
|
| |||||||||||||||
| Level 1 | Level 2 | Level 3 | Total | |||||||||||||
| Derivative Financial Instruments3 | ||||||||||||||||
Assets: | ||||||||||||||||
Credit contracts | — | $ | 4,330,087 | — | $ | 4,330,087 | ||||||||||
Foreign currency exchange contracts | — | 1,815,146 | — | 1,815,146 | ||||||||||||
Interest rate contracts | $ | 814 | 1,035,228 | — | 1,036,042 | |||||||||||
Liabilities: | ||||||||||||||||
Credit contracts | — | (4,831 | ) | — | (4,831 | ) | ||||||||||
Equity contracts | (172,812 | ) | — | — | (172,812 | ) | ||||||||||
Foreign currency exchange contracts | — | (62,061 | ) | — | (62,061 | ) | ||||||||||
Interest rate contracts | (1,143 | ) | — | — | (1,143 | ) | ||||||||||
|
| |||||||||||||||
Total | $ | (173,141 | ) | $ | 7,113,569 | — | $ | 6,940,428 | ||||||||
|
| |||||||||||||||
1 Unfunded floating rate loan interests are valued at the unrealized appreciation (depreciation) on the commitment. |
| |||||||||||||||
2 As of February 28, 2017, certain of the Trust’s Investments were fair valued using net asset value (“NAV”) per share and have been excluded from the fair value hierarchy. |
| |||||||||||||||
3 Derivative financial instruments are swaps, futures contracts, forward foreign currency exchange contracts, and options written. Swaps, futures contracts and forward foreign currency exchange contracts are valued at the unrealized appreciation (depreciation) on the instrument and options written are shown at value. |
| |||||||||||||||
See Notes to Financial Statements.
| SEMI-ANNUAL REPORT | FEBRUARY 28, 2017 | 57 |
Consolidated Schedule of Investments (concluded) | BlackRock Corporate High Yield Fund, Inc. (HYT) |
The Trust may hold assets and/or liabilities in which the fair value approximates the carrying amount for financial statement purposes. As of period end, bank borrowings payable of $577,000,000 are categorized as Level 2 within the disclosure hierarchy.
During the six months ended February 28, 2017, there were no transfers between Level 1 and Level 2.
A reconciliation of Level 3 Investments is presented when the Trust had a significant amount of Level 3 investments at the beginning and/or end of the period in relation to net assets. The following table is a reconciliation of Level 3 investments for which significant unobservable inputs were used in determining fair value:
| �� | Common Stocks | Asset-Backed Securities | Corporate Bonds | Floating Rate Loan Interests | Other Interests | Preferred Securities | Warrants | Total | ||||||||||||||||||||||||
Assets: | ||||||||||||||||||||||||||||||||
Opening balance, as of August 31, 20161 | $ | 1,725,910 | $ | 13,191,932 | $ | 5,853,024 | $ | 22,184,147 | $ | 13 | $ | 17,201,711 | $ | 13,361 | $ | 60,170,098 | ||||||||||||||||
Transfers into Level 3 | — | — | — | — | — | — | — | — | ||||||||||||||||||||||||
Transfers out of Level 32 | — | (8,516,932 | ) | — | (16,467,970 | ) | — | — | (130 | ) | (24,985,032 | ) | ||||||||||||||||||||
Accrued discounts/premiums | — | 466 | 1,774 | 47,661 | — | — | — | 49,901 | ||||||||||||||||||||||||
Net realized gain (loss) | — | 25,342 | (1,850,180 | ) | 54,555 | — | — | — | (1,770,283 | ) | ||||||||||||||||||||||
Net change in unrealized appreciation (depreciation)3,4 | 3,967,185 | 15,196 | 1,827,348 | 574 | — | (64,315 | ) | 56,721 | 5,802,709 | |||||||||||||||||||||||
Purchases | — | 4,990,621 | — | 3,701,213 | — | — | — | 8,691,834 | ||||||||||||||||||||||||
Sales | — | (2,700,000 | ) | (320,180 | ) | (2,864,429 | ) | — | — | — | (5,884,609 | ) | ||||||||||||||||||||
Closing Balance, as of February 28, 2017 | $ | 5,693,095 | $ | 7,006,625 | $ | 5,511,786 | $ | 6,655,751 | $ | 13 | $ | 17,137,396 | $ | 69,952 | $ | 42,074,618 | ||||||||||||||||
|
| |||||||||||||||||||||||||||||||
Net change in unrealized appreciation (depreciation) on investments still held at February 28, 20174 | $ | 3,967,185 | $ | 40,538 | $ | (20,659 | ) | $ | 574 | — | $ | (64,315 | ) | $ | 56,721 | $ | 3,980,044 | |||||||||||||||
|
| |||||||||||||||||||||||||||||||
1 The opening balance of preferred securities has been restated to exclude certain investments in the amount of $523,176 that were valued using NAV per share as no quoted market value is available and therefore have been excluded from the fair value hierarchy. |
| |||||||||||||||||||||||||||||||
2 As of August 31, 2016, the Trust used significant unobservable inputs in determining the value of certain investments. As of February 28, 2017, the Trust used observable inputs in determining the value of the same investments. As a result, investments at beginning of period value were transferred from Level 3 to Level 2 in the disclosure hierarchy. |
| |||||||||||||||||||||||||||||||
3 Included in the related net change in unrealized appreciation (depreciation) in the Consolidated Statement of Operations. |
| |||||||||||||||||||||||||||||||
4 Any difference between net change in unrealized appreciation (depreciation) and net change in unrealized appreciation (depreciation) on investments still held at February 28, 2017 is generally due to investments no longer held or categorized as Level 3 at period end. |
| |||||||||||||||||||||||||||||||
The Trust’s investments that are categorized as Level 3 were valued utilizing third party pricing information without adjustment. Such valuations are based on unobservable inputs. A significant change in third party information could result in a significantly lower or higher value of such Level 3 investments.
See Notes to Financial Statements.
| 58 | SEMI-ANNUAL REPORT | FEBRUARY 28, 2017 |
Schedule of Investments February 28, 2017 (Unaudited) | BlackRock Income Trust, Inc. (BKT) (Percentages shown are based on Net Assets) |
| Asset-Backed Securities | Par (000) | Value | ||||||
Asset-Backed Securities — 0.4% | ||||||||
Securitized Asset Backed Receivables LLC Trust, Series 2005-OP2, Class M1, 1.21%, 10/25/35 (a) | $ | 1,875 | $ | 1,730,551 | ||||
Small Business Administration Participation Certificates, Series 1997-20C, Class 1, 7.15%, 3/01/17 | 6 | 5,789 | ||||||
|
| |||||||
| 1,736,340 | ||||||||
Interest Only Asset-Backed Securities — 0.1% | ||||||||
Small Business Administration Participation Certificates, Series 2000-1, 1.00%, 3/15/21 | 286 | 2,499 | ||||||
Sterling Bank Trust, Series 2004-2, Class Note, 2.08%, 3/30/30 (b) | 1,654 | 111,132 | ||||||
Sterling Coofs Trust, Series 2004-1, Class A, 2.36%, 4/15/29 | 4,634 | 322,846 | ||||||
|
| |||||||
| 436,477 | ||||||||
| Total Asset-Backed Securities — 0.5% | 2,172,817 | |||||||
| Non-Agency Mortgage-Backed Securities | ||||||||
Collateralized Mortgage Obligations — 0.5% | ||||||||
Deutsche Securities, Inc. Mortgage Alternate Loan Trust, Series 2006-AR5, Class 22A, 5.50%, 10/25/21 | 188 | 182,602 | ||||||
HomeBanc Mortgage Trust, Series 2005-4, Class A1, 1.05%, 10/25/35 (a) | 1,404 | 1,357,979 | ||||||
Kidder Peabody Acceptance Corp., Series 1993-1, Class A6, 15.18%, 8/25/23 (a) | 34 | 36,638 | ||||||
Structured Adjustable Rate Mortgage Loan Trust, Series 2004-11, Class A, 3.26%, 8/25/34 (a) | 759 | 753,562 | ||||||
|
| |||||||
| 2,330,781 | ||||||||
Interest Only Collateralized Mortgage Obligations — 0.4% |
| |||||||
CitiMortgage Alternative Loan Trust, Series 2007-A5, Class 1A7, 6.00%, 5/25/37 | 421 | 93,393 | ||||||
IndyMac INDX Mortgage Loan Trust, Series 2006-AR33, Class 4AX, 0.17%, 1/25/37 | 41,794 | 52,242 | ||||||
MASTR Adjustable Rate Mortgages Trust, Series 2004-3, Class 3AX, 0.48%, 4/25/34 (c) | 5,313 | 106,268 | ||||||
MASTR Alternative Loans Trust, Series 2003-9, Class 15X2, 6.00%, 1/25/19 | 91 | 4,701 | ||||||
Morgan Stanley Mortgage Loan Trust, Series 2004-3, Class 1AX, 5.00%, 5/25/19 | 57 | 842 | ||||||
Sequoia Mortgage Trust, Series 2005-2, Class XA, 0.78%, 3/20/35 (a) | 22,888 | 629,430 | ||||||
Structured Adjustable Rate Mortgage Loan Trust, Series 2006-7, Class 3AS, 2.08%, 8/25/36 (a) | 9,708 | 703,800 | ||||||
Vendee Mortgage Trust, Series 1999-2, Class 1, 0.05%, 5/15/29 (a) | 25,145 | 25 | ||||||
|
| |||||||
| 1,590,701 | ||||||||
Principal Only Collateralized Mortgage Obligations — 0.1% |
| |||||||
Countrywide Home Loan Mortgage Pass-Through Trust, Series 2003-J8, 0.00%, 9/25/23 | 31 | 28,733 | ||||||
Drexel Burnham Lambert CMO Trust, Series K, Class 1, 0.00%, 9/23/17 | — | (d) | 13 | |||||
Residential Asset Securitization Trust, Series 2005-A15, Class 1A8, 0.00%, 2/25/36 | 314 | 254,503 | ||||||
Washington Mutual Alternative Mortgage Pass-Through Certificates, Series 2005-9, Class CP, 0.00%, 11/25/35 | 131 | 94,307 | ||||||
|
| |||||||
| 377,556 | ||||||||
| Total Non-Agency Mortgage-Backed Securities — 1.0% | 4,299,038 | |||||||
| U.S. Government Sponsored Agency Securities | Par (000) | Value | ||||||
Agency Obligations — 2.5% | ||||||||
Federal Housing Administration: | ||||||||
USGI Projects, Series 99, 7.43%, 6/01/21 - 10/01/23 | $ | 2,422 | $ | 2,313,965 | ||||
Reilly Projects, Series 41, 8.28%, 3/01/20 | 28 | 27,113 | ||||||
Residual Funding Corp.,, 0.00%, 4/15/30 (e) | 13,000 | 8,597,030 | ||||||
|
| |||||||
| 10,938,108 | ||||||||
Collateralized Mortgage Obligations — 63.6% |
| |||||||
Fannie Mae Mortgage-Backed Securities: | ||||||||
Series 2011-142, Class PE, 3.50%, 1/25/42 | 15,567 | 15,694,170 | ||||||
Series 2014-28, Class BD, 3.50, 8/25/43 | 6,050 | 6,336,976 | ||||||
Series 2014-28, Class BD, | ||||||||
Series 2010-136, Class CY, 4.00%, 12/25/40 | 3,060 | 3,296,679 | ||||||
Series 2011-117, Class CP, 4.00%, 11/25/41 | 14,350 | 15,434,228 | ||||||
Series 2011-99, Class CB, 4.50%, 10/25/41 | 43,000 | 47,801,079 | ||||||
Series 2010-47, Class JB, 5.00%, 5/25/30 | 10,000 | 10,857,927 | ||||||
Series 2003-135, Class PB, 6.00%, 1/25/34 | 8,212 | 8,716,231 | ||||||
Series 2004-31, Class ZG, 7.50%, 5/25/34 | 4,785 | 5,716,054 | ||||||
Series 1993-247, Class SN, 10.00%, 12/25/23 (a) | 100 | 121,145 | ||||||
Series 2005-73, Class DS, 15.53%, 8/25/35 (a) | 586 | 681,909 | ||||||
Series 1991-87, Class S, 24.62%, 8/25/21 (a) | 9 | 11,035 | ||||||
Series G-49, Class S, 953.85%, 12/25/21 (a) | — | (d) | 51 | |||||
Series G-07, Class S, 1,056.78%, 3/25/21 (a) | — | (d) | 413 | |||||
Series 1991-46, Class S, | — | (d) | 1 | |||||
Freddie Mac Mortgage-Backed Securities: | ||||||||
Series T-11, Class A9, 3.11%, 1/25/28 (a) | 774 | 806,474 | ||||||
Series 4242, Class PA, 3.50%, 5/15/41 | 6,202 | 6,435,270 | ||||||
Series 3762, Class LN, 4.00%, 11/15/40 | 2,000 | 2,121,739 | ||||||
Series 4269, Class PM, 4.00%, 8/15/41 | 8,884 | 9,337,157 | ||||||
Series 4016, Class BX, 4.00%, 9/15/41 | 15,408 | 16,772,174 | ||||||
Series 3688, Class PB, 4.50%, 8/15/32 | 10,000 | 10,480,194 | ||||||
Series 4316, Class VB, 4.50%, 3/15/34 | 10,787 | 11,691,266 | ||||||
Series 3856, Class PB, 5.00%, 5/15/41 | 10,000 | 11,200,545 | ||||||
Series 2758, Class KV, 5.50%, 5/15/23 | 1,324 | 1,330,281 | ||||||
Series 2927, Class BZ, 5.50%, 2/15/35 | 4,009 | 4,382,261 | ||||||
Series 2542, Class UC, 6.00%, 12/15/22 | 1,645 | 1,756,341 | ||||||
Series 0040, Class K, 6.50%, 8/17/24 | 99 | 112,860 | ||||||
Series 0019, Class F, 8.50%, 3/15/20 | 7 | 6,778 | ||||||
Series 2218, Class Z, 8.50%, 3/15/30 | 1,954 | 2,318,816 | ||||||
Series 0173, Class RS, 9.99%, 11/15/21 (a) | — | (d) | 2 | |||||
Series 1160, Class F, 36.89%, 10/15/21 (a) | 5 | 7,223 | ||||||
Ginnie Mae Mortgage-Backed Securities: | ||||||||
Series 2010-99, Class JM, 3.75%, 12/20/38 | 19,300 | 19,885,838 | ||||||
Series 2010-112, Class TL, 4.00%, 1/20/39 | 15,000 | 15,535,538 | ||||||
Series 2011-80, Class PB, 4.00%, 10/20/39 | 11,489 | 11,990,041 | ||||||
Series 2012-16, Class HJ, 4.00%, 9/20/40 | 10,000 | 10,536,849 | ||||||
Series 2011-88, Class PY, 4.00%, 6/20/41 | 15,402 | 16,072,150 | ||||||
Series 2015-96, Class ZM, 4.00%, 7/20/45 | 6,665 | 7,093,549 | ||||||
Series 2004-89, Class PE, 6.00%, 10/20/34 | 84 | 86,696 | ||||||
|
| |||||||
| 274,627,940 | ||||||||
Commercial Mortgage-Backed Securities — 0.1% |
| |||||||
Ginnie Mae Mortgage-Backed Securities, Series 2014-124, Class IE, 0.75%, 5/16/54 (a) | 9,674 | 455,429 | ||||||
Interest Only Collateralized Mortgage Obligations — 2.0% |
| |||||||
Fannie Mae Mortgage-Backed Securities: | ||||||||
Series 1997-50, Class SI, 1.20%, 4/25/23 (a) | 85 | 2,249 | ||||||
Series G92-60, Class SB, | 42 | 1,439 | ||||||
Series 2012-96, Class DI, 4.00%, 2/25/27 | 3,796 | 328,846 | ||||||
Series 2013-45, Class EI, 4.00%, 4/25/43 | 6,484 | 1,119,019 | ||||||
Series 2010-74, Class DI, 5.00%, 12/25/39 | 4,084 | 243,441 | ||||||
Series 2011-124, Class GS, | 7,974 | 665,822 | ||||||
Series 1997-90, Class M, 6.00%, 1/25/28 | 1,366 | 182,402 | ||||||
Series 1999-W4, 6.50%, 12/25/28 | 123 | 11,723 | ||||||
See Notes to Financial Statements.
| SEMI-ANNUAL REPORT | FEBRUARY 28, 2017 | 59 |
Schedule of Investments (continued) | BlackRock Income Trust, Inc. (BKT) |
| U.S. Government Sponsored Agency Securities | Par (000) | Value | ||||||
Interest Only Collateralized Mortgage Obligations (continued) |
| |||||||
Fannie Mae Mortgage-Backed Securities (continued): | ||||||||
Series 089, Class 2, 8.00%, 10/25/18 | $ | — | (d) | $ | 1 | |||
Series G92-05, Class H, 9.00%, 1/25/22 | 1 | 53 | ||||||
Series 094, Class 2, 9.50%, 8/25/21 | 1 | 70 | ||||||
Series 1990-136, Class S, 19.30%, 11/25/20 (a) | 3 | 4 | ||||||
Series 1991-139, Class PT, 648.35%, 10/25/21 | — | (d) | 1 | |||||
Series G-10, Class S, 1,022.36%, 5/25/21 (a) | — | (d) | 2 | |||||
Series G-12, Class S, 1,084.94%, 5/25/21 (a) | — | (d) | 1 | |||||
Freddie Mac Mortgage-Backed Securities: | ||||||||
Series 2559, 0.50%, 8/15/30 (a) | 34 | 192 | ||||||
Series 3745, Class IN, 4.00%, 1/15/35 | 11,643 | 623,806 | ||||||
Series 3744, Class PI, 4.00%, 6/15/39 | 9,068 | 1,006,823 | ||||||
Series 4026, 4.50%, 4/15/32 | 2,780 | 369,910 | ||||||
Series 2611, Class QI, 5.50%, 9/15/32 | 462 | 22,113 | ||||||
Series 1043, Class H, 41.53%, 2/15/21 (a) | 3 | 4 | ||||||
Ginnie Mae Mortgage-Backed Securities (a): | ||||||||
Series 2009-116, Class KS, 5.70%, 12/16/39 | 1,297 | 196,218 | ||||||
Series 2011-52, Class MJ, 5.87%, 4/20/41 | 9,557 | 1,698,930 | ||||||
Series 2011-52, Class NS, 5.90%, 4/16/41 | 11,040 | 2,029,094 | ||||||
|
| |||||||
| 8,502,163 | ||||||||
Mortgage-Backed Securities — 76.4% |
| |||||||
Fannie Mae Mortgage-Backed Securities: | ||||||||
2.50%, 4/01/31 - 10/01/31 | 10,122 | 10,171,616 | ||||||
3.00%, 1/01/43 - 3/01/47 | 86,808 | 86,449,579 | ||||||
3.50%, 10/01/42 - 10/01/45 | 24,535 | 25,266,360 | ||||||
4.00%, 1/01/41 - 3/01/47 (f) | 60,269 | 63,584,891 | ||||||
4.50%, 8/01/25 - 9/01/41 | 53,897 | 58,290,907 | ||||||
5.00%, 1/01/23 - 10/01/41 (f) | 34,728 | 38,291,731 | ||||||
5.50%, 7/01/17 - 10/01/39 | 14,874 | 16,606,291 | ||||||
6.50%, 12/01/37 - 10/01/39 | 4,880 | 5,517,410 | ||||||
7.50%, 2/01/22 | — | (d) | 11 | |||||
9.50%, 1/01/19 - 9/01/19 | 1 | 897 | ||||||
Freddie Mac Mortgage-Backed Securities: | ||||||||
2.93%, 10/01/34 (a) | 100 | 102,079 | ||||||
3.11%, 1/01/35 (a) | 167 | 170,901 | ||||||
5.00%, 2/01/22 - 4/01/22 | 144 | 152,417 | ||||||
5.50%, 1/01/39 | 17,876 | 20,067,432 | ||||||
9.00%, 9/01/20 | 4 | 3,686 | ||||||
Ginnie Mae Mortgage-Backed Securities: | ||||||||
5.00%, 10/15/39 | 4,607 | 5,121,063 | ||||||
7.50%, 8/15/21 - 11/15/23 | 63 | 65,837 | ||||||
8.00%, 10/15/22 - 8/15/27 | 36 | 39,602 | ||||||
9.00%, 4/15/20 - 9/15/21 | 2 | 1,969 | ||||||
|
| |||||||
| 329,904,679 | ||||||||
Principal Only Collateralized Mortgage Obligations — 0.2% |
| |||||||
Fannie Mae Mortgage-Backed Securities: (e) | ||||||||
Series 1991-7, Class J, 0.00%, 2/25/21 | 2 | 1,888 | ||||||
Series G93-2, Class KB, 0.00%, 1/25/23 | 52 | 49,152 | ||||||
Series 1993-51, Class E, 0.00%, 2/25/23 | 17 | 16,242 | ||||||
Series 203, Class 1, 0.00%, 2/25/23 | 5 | 4,891 | ||||||
Series 1993-70, Class A, 0.00%, 5/25/23 | 3 | 2,545 | ||||||
Series 0228, Class 1, 0.00%, 6/25/23 | 4 | 4,108 | ||||||
Series 1999-W4, 0.00%, 2/25/29 | 49 | 45,547 | ||||||
Series 2002-13, Class PR, 0.00%, 3/25/32 | 110 | 100,767 | ||||||
Freddie Mac Mortgage-Backed Securities: (e) | ||||||||
Series 1418, Class M, 0.00%, 11,15,22 | 17 | 16,096 | ||||||
Series 1571, Class G, 0.00%, 8/15/23 | 128 | 122,541 | ||||||
Series 1691, Class B, 0.00%, 3/15/24 | 257 | 238,558 | ||||||
Series T-8, Class A10, 0.00%, 11/15/28 | 29 | 29,284 | ||||||
|
| |||||||
| 631,619 | ||||||||
| Total U.S. Government Sponsored Agency Securities — 144.8% | 625,059,938 | |||||||
| U.S. Treasury Obligations | Par (000) | Value | ||||||
U.S. Treasury Bonds, 2.50%, 2/15/46 | $ | 2,500 | $ | 2,262,598 | ||||
U.S. Treasury Notes: | ||||||||
1.00%, 11/30/19 (f) | 2,965 | 2,931,875 | ||||||
1.38%, 8/31/20 (f) | 4,045 | 4,010,553 | ||||||
1.63%, 11/15/22 | 780 | 762,846 | ||||||
2.00%, 8/15/25 | 2,860 | 2,787,719 | ||||||
| Total U.S. Treasury Obligations — 2.9% | 12,755,591 | |||||||
Total Long-Term Investments (Cost — $657,330,981) — 149.2% |
| 644,287,384 | ||||||
| Short-Term Securities | Shares | |||||||
Money Market Funds — 1.3% | ||||||||
BlackRock Liquidity Funds, T-Fund, Institutional Class, 0.42% (g)(h) | 5,700,134 | 5,700,134 | ||||||
Par (000) | ||||||||
Borrowed Bond Agreement (i)(j) — 0.2% | ||||||||
Credit Suisse Securities (USA) LLC, 0.40%, Open (Purchased on 12/19/16 to be repurchased at $856,934. Collateralized by U.S. Treasury Bonds, 2.75%, 11/15/42, par and fair values of $917,000 and 880,141, respectively) | $ | 856 | 856,249 | |||||
| Total Short-Term Securities (Cost — $6,556,383) — 1.5% | 6,556,383 | |||||||
| Total Investments Before Borrowed Bonds and TBA Sale Commitments (Cost — $663,887,364) — 150.7% | 650,843,767 | |||||||
| Borrowed Bonds | ||||||||
U.S. Treasury Bonds, 2.75%, 11/15/42 | (917 | ) | (880,141 | ) | ||||
| Total Borrowed Bonds (Proceeds — $842,347) — (0.2)% | (880,141 | ) | ||||||
| TBA Sale Commitments | ||||||||
Fannie Mae Mortgage-Backed Securities (k): | ||||||||
2.50%, 3/01/32 | 10,100 | (10,126,582 | ) | |||||
3.00%, 3/01/47 - 4/01/47 | 76,350 | (75,794,261 | ) | |||||
4.00%, 3/01/47 - 4/01/47 | 41,000 | (43,050,349 | ) | |||||
5.00%, 3/01/47 | 12,900 | (14,142,760 | ) | |||||
| Total TBA Sale Commitments (Proceeds — $142,589,225) — (33.1)% | (143,113,952 | ) | ||||||
| Total Investments, Net of Borrowed Bonds and TBA Sale Commitments (Cost — $520,455,792) — 117.4% | 506,849,674 | |||||||
Liabilities in Excess of Other Assets — (17.4)% |
| (75,077,622 | ) | |||||
|
| |||||||
Net Assets — 100.0% |
| $ | 431,772,052 | |||||
|
| |||||||
See Notes to Financial Statements.
| 60 | SEMI-ANNUAL REPORT | FEBRUARY 28, 2017 |
Schedule of Investments (continued) | BlackRock Income Trust, Inc. (BKT) |
| Notes to Schedule of Investments |
| (a) | Variable rate security. Rate as of period end. |
| (b) | Security exempt from registration pursuant to Rule 144A under the Securities Act of 1933, as amended. These securities may be resold in transactions exempt from registration to qualified institutional investors. |
| (c) | Step-up bond that pays an initial coupon rate for the first period and then a higher coupon rate for the following periods. Rate as of period end. |
| (d) | Amount is less than $500. |
| (e) | Zero-coupon bond. |
| (f) | All or a portion of security has been pledged as collateral in connection with outstanding reverse repurchase agreements. |
| (g) | During the six months ended February 28, 2017, investments in issuers considered to be affiliates of the Trust for purposes of Section 2(a)(3) of the Investment Company Act of 1940, as amended, were as follows: |
| Affiliate | Shares Held at August 31, 2016 | Net Activity | Shares Held at February 28, 2017 | Value at February 28, 2017 | Income | Net Realized Gain1 | Change in Unrealized Appreciation (Depreciation) | |||||||||||||||||||||
BlackRock Liquidity Funds, T-Fund, Institutional Class | — | 5,700,134 | 5,700,134 | $ | 5,700,134 | $ | 17,431 | $ | 57 | — | ||||||||||||||||||
BlackRock Liquidity Funds, TempFund, Institutional Class | 7,183,580 | (7,183,580 | ) | — | — | — | — | — | ||||||||||||||||||||
Total |
| $ | 5,700,134 | $ | 17,431 | $ | 57 | — | ||||||||||||||||||||
|
| |||||||||||||||||||||||||||
1 Includes net capital gain distributions. |
| |||||||||||||||||||||||||||
| (h) | Current yield as of period end. |
| (i) | The amount to be repurchased assumes the maturity will be the day after period end. |
| (j) | Certain agreements have no stated maturity and can be terminated by either party at any time. |
| (k) | Represents or includes a TBA transaction. As of period end, unsettled TBA transactions were as follows: |
| Counterparty | Value | Unrealized Appreciation (Depreciation) | ||||||
Bank of Amareica N.A. | $ | (4,537,781 | ) | $ | (4,579 | ) | ||
Barclays Bank PLC | $ | (14,300,161 | ) | $ | (36,782 | ) | ||
Citigroup Global Marekets, Inc. | $ | (7,889,619 | ) | $ | 2,557 | |||
Credit Suisse Securities (USA) LLC | $ | (15,783,295 | ) | $ | (27,263 | ) | ||
Deutsche Bank Securities, Inc. | $ | (1,584,259 | ) | $ | 1,952 | |||
Goldman Sachs & Co. | $ | (27,759,201 | ) | $ | (27,372 | ) | ||
J.P. Morgan Securities LLC | $ | (25,175,913 | ) | $ | 97,404 | |||
For Trust compliance purposes, the Trust’s sector classifications refer to one or more of the sector sub-classifications used by one or more widely recognized market indexes or rating group indexes, and/or as defined by the investment adviser. These definitions may not apply for purposes of this report, which may combine such sector sub-classifications for reporting ease.
| Reverse Repurchase Agreements | ||||||||||||||||||||||||
| Counterparty | Interest Rate | Trade Date | Maturity Date1 | Face Value | Face Value Including Accrued Interest | Type of Non-Cash Underlying Collateral | Remaining Contractual Maturity of the Agreements | |||||||||||||||||
BNP Paribas Securities Corp. | 0.06 | % | 12/19/16 | Open | $ | 2,924,231 | $ | 2,924,577 | U.S. Treasury Obligations | Open/Demand1 | ||||||||||||||
BNP Paribas Securities Corp. | 0.54 | % | 12/19/16 | Open | 4,004,550 | 4,008,815 | U.S. Treasury Obligations | Open/Demand1 | ||||||||||||||||
HSBC Securities (USA), Inc. | 0.75 | % | 2/10/17 | 3/13/17 | 163,705,000 | 163,759,568 | U.S. Government Sponsored Agency Securities | Up to 30 Days | ||||||||||||||||
Citigroup Global Markets, Inc. | 0.78 | % | 2/16/17 | 3/16/17 | 4,306,000 | 4,307,213 | U.S. Government Sponsored Agency Securities | Up to 30 Days | ||||||||||||||||
Total |
| $ | 174,939,781 | $ | 175,000,173 | |||||||||||||||||||
|
| |||||||||||||||||||||||
1 Certain agreements have no stated maturity and can be terminated by either party at any time. | ||||||||||||||||||||||||
See Notes to Financial Statements.
| SEMI-ANNUAL REPORT | FEBRUARY 28, 2017 | 61 |
Schedule of Investments (continued) | BlackRock Income Trust, Inc. (BKT) |
| Derivative Financial Instruments Outstanding as of Period End |
| Futures Contracts | ||||||||||||||||||
| Contracts Long (Short) | Issue | Expiration | Notional Value | Unrealized Appreciation (Depreciation) | ||||||||||||||
| (90 | ) | 5-Year U.S. Treasury Note | June 2017 | $ | 10,593,281 | $ | 21,854 | |||||||||||
| (71 | ) | 10-Year U.S. Ultra Long Treasury Note | June 2017 | $ | 9,509,563 | (64,317 | ) | |||||||||||
| 92 | 2-Year U.S. Treasury Note | June 2017 | $ | 19,909,375 | (5,919 | ) | ||||||||||||
| (644 | ) | Long U.S. Treasury Bond | June 2017 | $ | 97,666,625 | 41,382 | ||||||||||||
| 285 | Ultra Long U.S. Treasury Bond | June 2017 | $ | 46,107,656 | 766,759 | |||||||||||||
Total | $ | 759,759 | ||||||||||||||||
|
| |||||||||||||||||
| OTC Interest Rate Swaps | ||||||||||||||||||||||||||||||||||
| Fixed Rate | Floating Rate | Counterparty | Effective Date | Expiration Date | Notional Amount (000) | Value | Premiums Received | Unrealized (Depreciation) | ||||||||||||||||||||||||||
| 4.31 | %1 | 3-Month LIBOR | Deutsche Bank AG | N/A | 10/01/18 | $ | 60,000 | $ | (3,643,801 | ) | — | $ | (3,643,801 | ) | ||||||||||||||||||||
| 3.43 | %2 | 3-Month LIBOR | JPMorgan Chase Bank N.A. | N/A | 3/28/21 | $ | 6,000 | 440,292 | $ | (115,487 | ) | 555,779 | ||||||||||||||||||||||
| 5.41 | %2 | 3-Month LIBOR | JPMorgan Chase Bank N.A. | N/A | 8/15/22 | $ | 9,565 | 1,707,555 | — | 1,707,555 | ||||||||||||||||||||||||
| Total | $ | (1,495,954 | ) | $ | (115,487 | ) | $ | (1,380,467 | ) | |||||||||||||||||||||||||
|
|
|
|
|
| |||||||||||||||||||||||||||||
1 Fund pays a fixed rate and receives the floating rate. | ||||||||||||||||||||||||||||||||||
2 Fund pays a floating rate and receives the fixed rate. | ||||||||||||||||||||||||||||||||||
| Derivative Financial Instruments Categorized by Risk Exposure |
As of period end, the fair values of derivative financial instruments located in the Statements of Assets and Liabilities were as follows:
| Assets — Derivative Financial Instruments | Commodity Contracts | Credit Contracts | Equity Contracts | Foreign Currency Exchange Contracts | Interest Rate Contracts | Other Contracts | Total | |||||||||||||||||||||||||||
Futures contracts | Net unrealized appreciation1 | — | — | — | — | $ | 829,995 | — | $ | 829,995 | ||||||||||||||||||||||||
Swaps — OTC | Unrealized appreciation on OTC swaps | — | — | — | — | 2,263,334 | — | 2,263,334 | ||||||||||||||||||||||||||
|
| |||||||||||||||||||||||||||||||||
Total | — | — | — | — | $ | 3,093,329 | — | $ | 3,093,329 | |||||||||||||||||||||||||
|
| |||||||||||||||||||||||||||||||||
| Liabilities — Derivative Financial Instruments | ||||||||||||||||||||||||||||||||||
Futures contracts | Net unrealized depreciation1 | — | — | — | — | $ | 70,236 | — | $ | 70,236 | ||||||||||||||||||||||||
Swaps — OTC | Unrealized depreciation on OTC swaps; Swap premiums received | — | — | — | — | 3,759,288 | — | 3,759,288 | ||||||||||||||||||||||||||
|
| |||||||||||||||||||||||||||||||||
Total | — | — | — | — | $ | 3,829,524 | — | $ | 3,829,524 | |||||||||||||||||||||||||
|
| |||||||||||||||||||||||||||||||||
1 Includes cumulative appreciation (depreciation) on futures contracts, if any, as reported in the Schedule of Investments. Only current day’s variation margin is reported within the Statements of Assets and Liabilities. |
| |||||||||||||||||||||||||||||||||
For the six months ended February 28, 2017, the effect of derivative financial instruments in the Statements of Operations was as follows:
| Net Realized Gain (Loss) from: | Commodity Contracts | Credit Contracts | �� | Equity Contracts | Foreign Currency Exchange Contracts | Interest Rate Contracts | Other Contracts | Total | ||||||||||||||||||||||||
Futures contracts | — | — | — | — | $ | 7,619,008 | — | $ | 7,619,008 | |||||||||||||||||||||||
Swaps | — | — | — | — | (766,747 | ) | — | (766,747 | ) | |||||||||||||||||||||||
|
| |||||||||||||||||||||||||||||||
Total | — | — | — | — | $ | 6,852,261 | — | $ | 6,852,261 | |||||||||||||||||||||||
|
| |||||||||||||||||||||||||||||||
| Net Change in Unrealized Appreciation (Depreciation) on: | ||||||||||||||||||||||||||||||||
Futures contracts | — | — | — | — | $ | 672,901 | — | $ | 672,901 | |||||||||||||||||||||||
Swaps | — | — | — | — | 541,175 | — | 541,175 | |||||||||||||||||||||||||
|
| |||||||||||||||||||||||||||||||
Total | — | — | — | — | $ | 1,214,076 | — | $ | 1,214,076 | |||||||||||||||||||||||
|
| |||||||||||||||||||||||||||||||
See Notes to Financial Statements.
| 62 | SEMI-ANNUAL REPORT | FEBRUARY 28, 2017 |
Schedule of Investments (continued) | BlackRock Income Trust, Inc. (BKT) |
| Average Quarterly Balances of Outstanding Derivative Financial Instruments | ||||
| Futures contracts: | ||||||||||||||
Average notional value of contracts — long | $ | 67,283,156 | ||||||||||||
Average notional value of contracts — short | $ | 137,136,461 | ||||||||||||
| Interest rate swaps: | ||||||||||||||
Average notional value — pays fixed rate | $ | 60,000,000 | ||||||||||||
Average notional value — receives fixed rate | $ | 15,565,000 | ||||||||||||
For more information about the Trust’s investment risks regarding derivative financial instruments, refer to the Notes to Financial Statements.
| Derivative Financial Instruments — Offsetting as of Period End | ||||||
The Trust’s derivative assets and liabilities (by type) were as follows:
| Assets | Liabilities | |||||||
| Derivative Financial Instruments: | ||||||||
Futures contracts | $ | 149,968 | $ | 181,156 | ||||
Swaps — OTC1 | 2,263,334 | 3,759,288 | ||||||
|
| |||||||
Total derivative assets and liabilities in the Statements of Assets and Liabilities | $ | 2,413,302 | $ | 3,940,444 | ||||
|
| |||||||
Derivatives not subject to a master netting agreement or similar agreement (“MNA”) | (149,968 | ) | (181,156 | ) | ||||
|
| |||||||
Total derivative assets and liabilities subject to an MNA | $ | 2,263,334 | $ | 3,759,288 | ||||
|
| |||||||
1 Includes unrealized appreciation(depreciation) on OTC swaps and swap premiums paid/received in the Statements of Assets and Liabilities. |
| |||||||
The following table presents the Trust’s derivative assets and liabilities by counterparty net of amounts available for offset under a MNA and net of the related collateral received and pledged by the Trust:
| Counterparty | Derivative Assets Subject to an MNA by Counterparty | Derivatives Available for Offset1 | Non-cash Collateral Received | Cash Collateral Received2 | Net Amount of Derivative Assets3 | |||||||||||||||||||
JPMorgan Chase Bank N. | $ | 2,263,334 | $ | (115,487 | ) | — | $ | (2,147,847 | ) | — | ||||||||||||||
| Counterparty | Derivative Liabilities Subject to an MNA by Counterparty | Derivatives Available for Offset1 | Non-cash Collateral Pledged | Cash Collateral Pledged4 | Net Amount of Derivative Liabilities5 | |||||||||||||||||||
Deutsche Bank AG | $ | 3,643,801 | — | — | $ | (3,643,801 | ) | — | ||||||||||||||||
JPMorgan Chase Bank N.A | 115,487 | $ | (115,487 | ) | — | — | — | |||||||||||||||||
|
| |||||||||||||||||||||||
Total | $ | 3,759,288 | $ | (115,487 | ) | — | $ | (3,643,801 | ) | — | ||||||||||||||
|
| |||||||||||||||||||||||
1 The amount of derivatives available for offset is limited to the amount of derivative assets and/or liabilities that are subject to an MNA. |
| |||||||||||||||||||||||
2 Excess of collateral received from the individual counterparty is not shown for financial reporting purposes |
| |||||||||||||||||||||||
3 Net amount represents the net amount receivable from the counterparty in the event of default. |
| |||||||||||||||||||||||
4 Excess of collateral pledged from the individual counterparty is not shown for financial reporting purposes. |
| |||||||||||||||||||||||
5 Net amount represents the net amount payable due to the counterparty in the event of default. |
| |||||||||||||||||||||||
| Fair Value Hierarchy as of Period End |
Various inputs are used in determining the fair value of investments and derivative financial instruments. For information about the Trust’s policy regarding valuation of investments and derivative financial instruments, refer to the Notes to Financial Statements.
The following tables summarize the Trust’s investments and derivative financial instruments categorized in the disclosure hierarchy:
| Level 1 | Level 2 | Level 3 | Total | |||||||||||||
Assets: |
| |||||||||||||||
| Investments: | ||||||||||||||||
| Long-Term Investments: | ||||||||||||||||
Asset-Backed Securities | — | $ | 1,736,340 | $ | 436,477 | $ | 2,172,817 | |||||||||
Non-Agency Mortgage-Backed Securities | — | 2,807,298 | 1,491,740 | 4,299,038 | ||||||||||||
U.S. Government Sponsored Agency Securities | — | 622,718,858 | 2,341,080 | 625,059,938 | ||||||||||||
U.S. Treasury Obligations | — | 12,755,591 | — | 12,755,591 | ||||||||||||
| Short-Term Securities: | ||||||||||||||||
Money Market Funds | $ | 5,700,134 | — | — | 5,700,134 | |||||||||||
Borrowed Bond Agreement | — | 856,249 | — | 856,249 | ||||||||||||
See Notes to Financial Statements.
| SEMI-ANNUAL REPORT | FEBRUARY 28, 2017 | 63 |
Schedule of Investments (concluded) | BlackRock Income Trust, Inc. (BKT) |
| Level 1 | Level 2 | Level 3 | Total | |||||||||||||
Liabilities: |
| |||||||||||||||
| Investments: | ||||||||||||||||
Borrowed Bonds | — | $ | (880,141 | ) | — | $ | (880,141 | ) | ||||||||
TBA Sale Commitments | — | (143,113,952 | ) | — | (143,113,952 | ) | ||||||||||
|
|
|
|
|
|
|
| |||||||||
Total | $ | 5,700,134 | $ | 496,880,243 | $ | 4,269,297 | $ | 506,849,674 | ||||||||
|
|
|
|
|
|
|
| |||||||||
| Derivative Financial Instruments1 | ||||||||||||||||
Assets: |
| |||||||||||||||
Interest rate contracts | $ | 829,995 | $ | 2,263,334 | — | $ | 3,093,329 | |||||||||
Liabilities: |
| |||||||||||||||
Interest rate contracts | (70,236 | ) | (3,643,801 | ) | — | (3,714,037 | ) | |||||||||
|
|
|
|
|
|
|
| |||||||||
Total | $ | 759,759 | $ | (1,380,467 | ) | — | $ | (620,708 | ) | |||||||
|
|
|
|
|
|
|
| |||||||||
1 Derivative financial instruments are swaps and futures contracts. Swaps and futures contracts are valued at the unrealized appreciation (depreciation) on the instrument. |
| |||||||||||||||
The Trust may hold assets and/or liabilities in which the fair value approximates the carrying amount for financial statement purposes. As of period end, reverse repurchase agreements of $175,000,173 are categorized as Level 2 within the disclosure hierarchy.
During the six months ended February 28, 2017, there were no transfers between Level 1 and Level 2.
A reconciliation of Level 3 investments is presented when the Trust had a significant amount of Level 3 investments at the beginning and/or end of the period in relation to net assets. The following table is a reconciliation of Level 3 investments for which significant unobservable inputs were used in determining fair value:
| Asset-Backed Securities | Non-Agency Mortgage-Backed Securities | U.S. Government Sponsored Agency Securities | Total | |||||||||||||
Assets: | ||||||||||||||||
Opening Balance, as of August 31, 2016 | $ | 468,888 | $ | 1,589,583 | $ | 2,580,068 | $ | 4,638,539 | ||||||||
Transfers into Level 3 | — | 12,150 | — | 12,150 | ||||||||||||
Transfers out of Level 3 | — | — | — | — | ||||||||||||
Accrued discounts/premiums | (61,704 | ) | — | (5,071 | ) | (66,775 | ) | |||||||||
Net realized gain (loss) | (43,544 | ) | (107 | ) | (5,220 | ) | (48,871 | ) | ||||||||
Net change in unrealized appreciation (depreciation)1,2 | 72,837 | (109,882 | ) | 21,459 | (15,586 | ) | ||||||||||
Purchases | — | — | — | — | ||||||||||||
Sales | — | (4 | ) | (250,156 | ) | (250,160 | ) | |||||||||
|
|
|
|
|
|
|
| |||||||||
Closing Balance, as of February 28, 2017 | $ | 436,477 | $ | 1,491,740 | $ | 2,341,080 | $ | 4,269,297 | ||||||||
|
|
|
|
|
|
|
| |||||||||
Net change in unrealized appreciation (depreciation) on investments held as of February 28, 20172 | $ | 72,837 | $ | (109,882 | ) | $ | 21,459 | $ | (15,586 | ) | ||||||
|
|
|
|
|
|
|
| |||||||||
1 Included in the related net change in unrealized appreciation (depreciation) in the Statements of Operations. |
| |||||||||||||||
2 Any difference between net change in unrealized appreciation (depreciation) and net change in unrealized appreciation (depreciation) on investments held as of February 28, 2017 is generally due to investments no longer held or categorized as Level 3 at period end. |
| |||||||||||||||
The Trust’s investments that are categorized as Level 3 were valued utilizing third party pricing information without adjustment. Such valuations are based on unobservable inputs. A significant change in third party information inputs could result in a significantly lower or higher value of such Level 3 investments.
See Notes to Financial Statements.
| 64 | SEMI-ANNUAL REPORT | FEBRUARY 28, 2017 |
| Statements of Assets and Liabilities |
| February 28, 2017 (Unaudited) | BlackRock Core Bond Trust (BHK) | BlackRock Corporate High Yield Fund, Inc. (HYT)1 | BlackRock Trust, Inc. | |||||||||
| Assets | ||||||||||||
Investments at value — unaffiliated2 | $ | 1,066,557,197 | $ | 2,114,906,241 | $ | 645,143,633 | ||||||
Investments at value — affiliated3 | 31,449,022 | 534,637 | 5,700,134 | |||||||||
Cash | 22,374 | 791,505 | — | |||||||||
| Cash pledged: | ||||||||||||
Collateral — reverse repurchase agreements | 6,527,000 | — | — | |||||||||
Collateral — OTC derivatives | 1,370,000 | — | 3,940,000 | |||||||||
Futures contracts | 778,548 | 275,150 | 1,842,260 | |||||||||
Centrally cleared swaps | 1,229,940 | 5,879,000 | — | |||||||||
Foreign currency at value4 | 1,635,287 | 207,963 | — | |||||||||
| Receivables: | ||||||||||||
Investments sold | 2,136,009 | 15,839,220 | 158,743 | |||||||||
Options written | 1,923 | — | — | |||||||||
TBA sale commitments | — | — | 142,589,225 | |||||||||
Dividends — unaffiliated | 27,422 | 15,600 | — | |||||||||
Dividends — affiliated | 8,793 | 1,054 | 3,987 | |||||||||
Interest — unaffiliated | 11,522,081 | 30,009,359 | 2,035,191 | |||||||||
Principal paydowns | — | — | 13,367 | |||||||||
Variation margin on futures contracts | — | 66,506 | 149,968 | |||||||||
Variation margin on centrally cleared swaps | 1,148 | 46,823 | — | |||||||||
Swap premiums paid | 1,300 | 9,818 | — | |||||||||
| Unrealized appreciation on: | ||||||||||||
Forward foreign currency exchange contracts | 331,522 | 1,815,146 | — | |||||||||
OTC swaps | 28,946 | 1,526,091 | 2,263,334 | |||||||||
Unfunded floating rate loan interests | — | 6,020 | — | |||||||||
Prepaid expenses | 36,668 | 76,314 | 28,315 | |||||||||
Other assets | 813,905 | — | 763 | |||||||||
|
| |||||||||||
Total assets | 1,124,479,085 | 2,172,006,447 | 803,868,920 | |||||||||
|
| |||||||||||
| Liabilities | ||||||||||||
Bank overdraft | — | — | 3,341 | |||||||||
| Cash received: | ||||||||||||
Collateral — OTC derivatives | 890,000 | 2,080,000 | 2,330,000 | |||||||||
Collateral — reverse repurchase agreements | 2,013,000 | — | 31,697 | |||||||||
Collateral — TBA commitments | — | — | 32,000 | |||||||||
Borrowed bonds at value5 | — | — | 880,141 | |||||||||
Options written at value6 | 2,608,566 | 78,960 | — | |||||||||
TBA sale commitments at value7 | — | — | 143,113,952 | |||||||||
Reverse repurchase agreements | 327,543,464 | — | 175,000,173 | |||||||||
| Payables: | ||||||||||||
Investments purchased | 4,545,939 | 47,031,103 | 46,055,069 | |||||||||
Swaps | — | 299,457 | — | |||||||||
Administration fees | — | — | 49,625 | |||||||||
Bank borrowings | — | 577,000,000 | — | |||||||||
Income dividends | 65,634 | 393,168 | 47,332 | |||||||||
Interest expense | — | 879,284 | 7,384 | |||||||||
Investment advisory fees | 422,128 | 967,030 | 214,482 | |||||||||
Officer’s and Trustees’ fees | 201,343 | 532,044 | 196,404 | |||||||||
Options written | 9,796 | — | — | |||||||||
Other accrued expenses | 373,232 | 859,410 | 194,824 | |||||||||
Principle paydowns | 140,287 | — | — | |||||||||
Variation margin on futures contracts | 47,623 | — | 181,156 | |||||||||
Swap premiums received | 2,762,607 | 17,557 | 115,487 | |||||||||
| Unrealized appreciation on: | ||||||||||||
Forward foreign currency exchange contracts | 117,628 | 62,061 | — | |||||||||
OTC swaps | 433,370 | — | 3,643,801 | |||||||||
Other liabilities | 240,760 | — | — | |||||||||
Contingencies | — | — | 8 | — | ||||||||
|
| |||||||||||
Total liabilities | 342,415,377 | 630,200,074 | 372,096,868 | |||||||||
|
| |||||||||||
Net Assets | $ | 782,063,708 | $ | 1,541,806,373 | $ | 431,772,052 | ||||||
|
| |||||||||||
| See Notes to Financial Statements. | ||||||
| SEMI-ANNUAL REPORT | FEBRUARY 28, 2017 | 65 | ||||
| Statements of Assets and Liabilities (concluded) |
| February 28, 2017 (Unaudited) | BlackRock Core Bond Trust (BHK) | BlackRock Corporate High Yield Fund, Inc. (HYT)1 | BlackRock Trust, Inc. | |||||||||
| Net Assets Consist of | ||||||||||||
Paid-in capital9,10,11 | $ | 761,161,052 | $ | 1,777,217,959 | $ | 478,262,054 | ||||||
Undistributed (distributions in excess of) net investment income | (534,465 | ) | 456,259 | 1,863,640 | ||||||||
Accumulated net realized loss | (7,875,939 | ) | (240,339,842 | ) | (34,127,152 | ) | ||||||
Net unrealized appreciation (depreciation) | 29,313,060 | 4,471,997 | (14,226,490 | ) | ||||||||
|
| |||||||||||
Net Assets | $ | 782,063,708 | $ | 1,541,806,373 | $ | 431,772,052 | ||||||
|
| |||||||||||
Net asset value, offering and redemption price per share | $ | 14.50 | $ | 12.19 | $ | 6.75 | ||||||
|
| |||||||||||
1 Consolidated Statement of Assets and Liabilities. | ||||||||||||
2 Investments at cost — unaffiliated | $ | 1,038,648,300 | $ | 2,117,324,467 | $ | 658,187,230 | ||||||
3 Investments at cost — affiliated | $ | 31,449,022 | $ | 534,637 | $ | 5,700,134 | ||||||
4 Foreign currency at cost | $ | 1,618,775 | $ | 208,836 | — | |||||||
5 Proceeds received from borrowed bonds | — | — | $ | 842,347 | ||||||||
6 Premiums received | $ | 3,892,866 | $ | 103,169 | — | |||||||
7 Proceeds from TBA sale commitments | — | — | $ | 142,589,225 | ||||||||
8 See Note 12 of the Notes to Financial Statements for details of contingencies. | ||||||||||||
9 Par value | $ | 0.001 | $ | 0.100 | $ | 0.010 | ||||||
10 Shares outstanding | 53,935,126 | 126,458,988 | 63,942,535 | |||||||||
11 Shares authorized | Unlimited | 200 million | 200 million | |||||||||
| See Notes to Financial Statements. | ||||||
| 66 | SEMI-ANNUAL REPORT | FEBRUARY 28, 2017 | ||||
| Statements of Operations |
| Six Months Ended February 28, 2017 (Unaudited) | BlackRock Core Bond Trust | BlackRock High Yield Fund, Inc. | BlackRock Trust, Inc. | |||||||||
| Investment Income | ||||||||||||
Interest — unaffiliated | $ | 24,555,273 | $ | 63,340,837 | $ | 10,370,390 | ||||||
Dividends — unaffiliated | 361,288 | 936,762 | — | |||||||||
Dividends — affiliated | 26,431 | 175,777 | 17,431 | |||||||||
Foreign taxes withheld | (15 | ) | (11,836 | ) | — | |||||||
|
| |||||||||||
Total investment income | 24,942,977 | 64,441,540 | 10,387,821 | |||||||||
|
| |||||||||||
| Expenses | ||||||||||||
Investment advisory | 2,740,787 | 6,160,096 | 1,408,579 | |||||||||
Professional | 86,505 | 215,746 | 52,999 | |||||||||
Accounting services | 74,376 | 53,743 | 51,051 | |||||||||
Custodian | 51,222 | 101,761 | 18,630 | |||||||||
Officer and Trustees | 49,529 | 98,413 | 32,904 | |||||||||
Transfer agent | 45,025 | 77,615 | 35,452 | |||||||||
Printing | 13,401 | 18,648 | 10,455 | |||||||||
Registration | 10,999 | 25,816 | 13,030 | |||||||||
Administration | — | — | 325,057 | |||||||||
Miscellaneous | 51,101 | 73,959 | 20,179 | |||||||||
|
| |||||||||||
Total expenses excluding interest expense and income tax | 3,122,945 | 6,825,797 | 1,968,336 | |||||||||
Interest expense | 1,089,968 | 3,892,868 | 604,614 | |||||||||
Income tax | — | 24,570 | — | |||||||||
|
| |||||||||||
Total expenses | 4,212,913 | 10,743,235 | 2,572,950 | |||||||||
Less fees waived by the Manager | (5,164 | ) | (21,535 | ) | (3,753 | ) | ||||||
|
| |||||||||||
Total expenses after fees waived | 4,207,749 | 10,721,700 | 2,569,197 | |||||||||
|
| |||||||||||
Net investment income | 20,735,228 | 53,719,840 | 7,818,624 | |||||||||
|
| |||||||||||
| Realized and Unrealized Gain (Loss) | ||||||||||||
| Net realized gain (loss) from: | ||||||||||||
Investments — unaffiliated | 2,586,448 | 19,064,267 | 1,991,847 | |||||||||
Investments — affiliated | — | 32,072 | — | |||||||||
Capital gain distributions from investment companies — affiliated | 77 | 5 | 57 | |||||||||
Payment by affiliate | — | 29,894 | — | |||||||||
Futures contracts | (824,024 | ) | (4,063,216 | ) | 7,619,008 | |||||||
Forward foreign currency exchange contracts | 219,047 | (2,045,808 | ) | — | ||||||||
Foreign currency transactions | 1,090,673 | 6,469,269 | — | |||||||||
Options written | 2,597,639 | 441,268 | — | |||||||||
Swaps | 2,505,463 | 3,974,398 | (766,747 | ) | ||||||||
Borrowed bonds | 23,345 | — | — | |||||||||
|
| |||||||||||
| 8,198,668 | 23,902,149 | 8,844,165 | ||||||||||
|
| |||||||||||
| Net change in unrealized appreciation (depreciation) on: | ||||||||||||
Investments — unaffiliated | (46,591,830 | ) | 26,848,523 | (20,958,587 | ) | |||||||
Investments — affiliated | — | (129,580 | ) | — | ||||||||
Futures contracts | (2,161 | ) | 1,258,481 | 672,901 | ||||||||
Forward foreign currency exchange contracts | 248,149 | 1,859,320 | — | |||||||||
Foreign currency translations | (50,064 | ) | (277,799 | ) | — | |||||||
Options written | (2,270,785 | ) | 27,250 | — | ||||||||
Swaps | 282,290 | 2,815,596 | 541,175 | |||||||||
Borrowed bonds | — | — | 138,517 | |||||||||
Unfunded floating rate loan interests | — | 6,020 | — | |||||||||
|
| |||||||||||
| (48,384,401 | ) | 32,407,811 | (19,605,994 | ) | ||||||||
|
| |||||||||||
Net realized and unrealized gain (loss) | (40,185,733 | ) | 56,309,960 | (10,761,829 | ) | |||||||
|
| |||||||||||
Net Increase (Decrease) in Net Assets Resulting from Operations | $ | (19,450,505 | ) | $ | 110,029,800 | $ | (2,943,205 | ) | ||||
|
| |||||||||||
1 Consolidated Statement of Operations. |
| |||||||||||
| See Notes to Financial Statements. | ||||||
| SEMI-ANNUAL REPORT | FEBRUARY 28, 2017 | 67 | ||||
| Statements of Changes in Net Assets | BlackRock Core Bond Trust (BHK) |
| Increase (Decrease) in Net Assets: | Six Months Ended February 28, 2017 (Unaudited) | Year Ended August 31, | ||||||
| Operations | ||||||||
Net investment income | $ | 20,735,228 | $ | 42,442,765 | ||||
Net realized gain (loss) | 8,198,668 | (9,103,783 | ) | |||||
Net change in unrealized appreciation (depreciation) | (48,384,401 | ) | 63,936,110 | |||||
|
| |||||||
Net increase (decrease) in net assets resulting from operations | (19,450,505 | ) | 97,275,092 | |||||
|
| |||||||
| Distributions to Shareholders1 | ||||||||
From net investment income | (21,034,700 | ) | (45,548,216 | ) | ||||
|
| |||||||
| Net Assets | ||||||||
Total increase (decrease) in net assets | (40,485,205 | ) | 51,726,876 | |||||
Beginning of period | 822,548,913 | 770,822,037 | ||||||
|
| |||||||
End of period | $ | 782,063,708 | $ | 822,548,913 | ||||
|
| |||||||
Distribution in excess of net investment income, end of period | $ | (534,465 | ) | $ | (234,993 | ) | ||
|
| |||||||
| 1 | Distributions for annual periods determined in accordance with federal income tax regulations. |
| See Notes to Financial Statements. | ||||||
| 68 | SEMI-ANNUAL REPORT | FEBRUARY 28, 2017 | ||||
| Consolidated Statements of Changes in Net Assets | BlackRock Corporate High Yield Fund, Inc. (HYT) |
| Increase (Decrease) in Net Assets: | Six Months Ended February 28, 2017 (Unaudited) | Year Ended August 31, | ||||||
| Operations | ||||||||
Net investment income | $ | 53,719,840 | $ | 104,178,797 | ||||
Net realized gain (loss) | 23,902,149 | (81,809,717 | ) | |||||
Net change in unrealized appreciation (depreciation) | 32,407,811 | 68,616,518 | ||||||
|
| |||||||
Net increase in net assets resulting from operations | 110,029,800 | 90,985,598 | ||||||
|
| |||||||
| Distributions to Shareholders1 | ||||||||
From net investment income | (59,618,596 | ) | (125,343,672 | ) | ||||
|
| |||||||
| Capital Share Transactions | ||||||||
Redemption of shares resulting from share repurchase program (including transaction costs) | (1,553,292 | ) | — | |||||
|
| |||||||
| Net Assets | ||||||||
Total increase (decrease) in net assets | 48,857,912 | (34,358,074 | ) | |||||
Beginning of period | 1,492,948,461 | 1,527,306,535 | ||||||
|
| |||||||
End of period | $ | 1,541,806,373 | $ | 1,492,948,461 | ||||
|
| |||||||
Undistributed net investment income, end of period | $ | 456,259 | $ | 6,355,015 | ||||
|
| |||||||
| 1 | Distributions for annual periods determined in accordance with federal income tax regulations. |
| See Notes to Financial Statements. | ||||||
| SEMI-ANNUAL REPORT | FEBRUARY 28, 2017 | 69 | ||||
| Statements of Changes in Net Assets | BlackRock Income Trust, Inc. (BKT) |
| Increase (Decrease) in Net Assets: | Six Months Ended February 28, 2017 (Unaudited) | Year Ended August 31, | ||||||
| Operations | ||||||||
Net investment income | $ | 7,818,624 | $ | 17,954,552 | ||||
Net realized gain (loss) | 8,844,165 | (7,232,394 | ) | |||||
Net change in unrealized appreciation (depreciation) | (19,605,994 | ) | 3,604,122 | |||||
|
| |||||||
Net increase (decrease) in net assets resulting from operations | (2,943,205 | ) | 14,326,280 | |||||
|
| |||||||
| Distributions to Shareholders1 | ||||||||
From net investment income | (10,166,864 | ) | (22,060,177 | ) | ||||
|
| |||||||
| Net Assets | ||||||||
Total decrease in net assets | (13,110,069 | ) | (7,733,897 | ) | ||||
Beginning of period | 444,882,121 | 452,616,018 | ||||||
|
| |||||||
End of period | $ | 431,772,052 | $ | 444,882,121 | ||||
|
| |||||||
Undistributed net investment income, end of period | $ | 1,863,640 | $ | 4,211,880 | ||||
|
| |||||||
| 1 | Distributions for annual periods determined in accordance with federal income tax regulations. |
| See Notes to Financial Statements. | ||||||
| 70 | SEMI-ANNUAL REPORT | FEBRUARY 28, 2017 | ||||
| Statements of Cash Flows |
| Six Months Ended February 28, 2017 (Unaudited) | BlackRock Core Bond | BlackRock High Yield | BlackRock Trust, Inc. | |||||||||
| Cash Provided by (Used for) Operating Activities | ||||||||||||
Net increase (decrease) in net assets resulting from operations | $ | (19,450,505 | ) | $ | 110,029,800 | $ | (2,943,205 | ) | ||||
Adjustments to reconcile net increase (decrease) in net assets resulting from operations to net cash provided by (used for) operating activities: | ||||||||||||
Proceeds from sales of long-term investments and principal paydowns | 211,695,566 | 752,471,248 | 617,030,975 | |||||||||
Net proceeds from sales of short-term securities | — | — | 1,562,537 | |||||||||
Purchases of long-term investments | (232,412,782 | ) | (723,595,275 | ) | (650,317,401 | ) | ||||||
Net purchases of short-term securities | (18,522,113 | ) | (534,637 | ) | — | |||||||
Amortization of premium and accretion of discount on investments | 1,891,105 | (1,659,214 | ) | 2,767,063 | ||||||||
Payments for borrowed bonds | (1,758,089 | ) | — | — | ||||||||
Proceeds from borrowed bonds | 1,781,434 | — | — | |||||||||
Premiums paid on closing options written | (7,878,141 | ) | (48,641 | ) | — | |||||||
Premiums received from options written | 5,548,886 | 574,078 | — | |||||||||
Net realized loss on investments and options written | (4,972,043 | ) | (18,492,773 | ) | (1,716,327 | ) | ||||||
Net unrealized gain (loss) on investments, options written, swaps, borrowed bonds and foreign currency translations | 48,685,283 | (27,221,257 | ) | 20,278,536 | ||||||||
(Increase) Decrease in Assets: |
| |||||||||||
Cash pledged: | ||||||||||||
Collateral — OTC derivatives | 2,650,000 | — | 1,100,000 | |||||||||
Collateral — reverse repurchase agreements | (6,527,000 | ) | — | 682,769 | ||||||||
Futures contracts | 571,422 | 1,293,000 | 681,000 | |||||||||
Centrally cleared swaps | 10,000 | (3,022,000 | ) | — | ||||||||
Receivables: |
| |||||||||||
Dividends — unaffiliated | — | (6,839 | ) | — | ||||||||
Dividends — affiliated | (5,656 | ) | (488 | ) | 2,589 | |||||||
Interest — unaffiliated | (397,412 | ) | (285,006 | ) | 94,458 | |||||||
Variation margin on futures contracts | 75,335 | 66,389 | (57,218 | ) | ||||||||
Variation margin on centrally cleared swaps | 4,758 | (46,823 | ) | — | ||||||||
Swap premiums paid | (1,293 | ) | 43,420 | — | ||||||||
Prepaid expenses | (23,060 | ) | (46,651 | ) | (16,668 | ) | ||||||
Other assets | (807,963 | ) | — | 5 | ||||||||
Increase (Decrease) in Liabilities: |
| |||||||||||
Cash received: | ||||||||||||
Collateral — reverse repurchase agreements | 809,000 | — | 31,697 | |||||||||
Collateral — borrowed bond agreements | 32,000 | |||||||||||
Collateral — OTC derivatives | 370,000 | (250,000 | ) | (1,000,000 | ) | |||||||
Payables: |
| |||||||||||
Swaps | — | 299,457 | — | |||||||||
Administration fees | — | — | (63,618 | ) | ||||||||
Interest expense and fees | 99,965 | 120,692 | (25,378 | ) | ||||||||
Investment advisory fees | (511,669 | ) | (1,094,774 | ) | (275,271 | ) | ||||||
Officer’s and Trustees’ fees | 4,395 | 25,322 | 14,250 | |||||||||
Other accrued expenses | 73,890 | 86,574 | 20,645 | |||||||||
Variation margin on futures contracts | 44,454 | — | 127,031 | |||||||||
Variation margin on centrally cleared swaps | — | (99,311 | ) | — | ||||||||
Swap premiums received | 1,961,252 | (781 | ) | (13,385 | ) | |||||||
|
| |||||||||||
Net cash provided by (used for) operating activities | (16,990,981 | ) | 88,605,510 | (12,002,916 | ) | |||||||
|
| |||||||||||
1 Consolidated Statement of Cash Flows. |
| |||||||||||
| See Notes to Financial Statements. | ||||||
| SEMI-ANNUAL REPORT | FEBRUARY 28, 2017 | 71 | ||||
| Statements of Cash Flows (concluded) |
| Six Months Ended February 28, 2017 (Unaudited) | BlackRock Core Bond | BlackRock High Yield | BlackRock Trust, Inc. | |||||||||
| Cash Provided by (Used for) Financing Activities | ||||||||||||
Cash dividends paid to Common Shareholders | $ | (21,051,920 | ) | $ | (59,680,116 | ) | $ | (10,167,288 | ) | |||
Net payments on redemption of Common Shares | — | (1,553,292 | ) | — | ||||||||
Payments on the bank borrowings | — | (332,000,000 | ) | — | ||||||||
Proceeds from bank borrowings | — | 305,000,000 | — | |||||||||
Increase (decrease) in bank overdraft | — | (2,604 | ) | 3,341 | ||||||||
Net borrowing of reverse repurchase agreements | 39,204,610 | — | 22,166,863 | |||||||||
|
| |||||||||||
Net cash provided by (used for) financing activities | 18,152,690 | (88,236,012 | ) | 12,002,916 | ||||||||
|
| |||||||||||
| Cash Impact from Foreign Exchange Fluctuations | ||||||||||||
Cash impact from foreign exchange fluctuations | $ | 13,477 | $ | (1,488 | ) | — | ||||||
|
| |||||||||||
| Cash and Foreign Currency | ||||||||||||
Net increase (decrease) in cash and foreign currency at value | 1,175,186 | 368,010 | — | |||||||||
Cash and foreign currency at value at beginning of period | 482,475 | 631,458 | — | |||||||||
|
| |||||||||||
Cash and foreign currency at value at end of period | $ | 1,657,661 | $ | 999,468 | — | |||||||
|
| |||||||||||
| Supplemental Disclosure of Cash Flow Information | ||||||||||||
Cash paid during the period for interest expense | $ | 990,003 | $ | 3,772,176 | $ | 629,992 | ||||||
|
| |||||||||||
1 Consolidated Statement of Cash Flows. | ||||||||||||
| See Notes to Financial Statements. | ||||||
| 72 | SEMI-ANNUAL REPORT | FEBRUARY 28, 2017 | ||||
| Financial Highlights | BlackRock Core Bond Trust (BHK) |
Six Months Ended February 28, | Year Ended August 31, | |||||||||||||||||||||||
| 2016 | 2015 | 2014 | 2013 | 2012 | ||||||||||||||||||||
| Per Share Operating Performance | ||||||||||||||||||||||||
Net asset value, beginning of period | $ | 15.25 | $ | 14.29 | $ | 15.24 | $ | 14.05 | $ | 15.21 | $ | 13.78 | ||||||||||||
|
| |||||||||||||||||||||||
Net investment income1 | 0.38 | 0.79 | 0.86 | 0.87 | 0.89 | 0.88 | ||||||||||||||||||
Net realized and unrealized gain (loss) | (0.74 | ) | 1.01 | (0.73 | ) | 1.23 | (1.11 | ) | 1.37 | |||||||||||||||
|
| |||||||||||||||||||||||
Net increase (decrease) from investment operations | (0.36 | ) | 1.80 | 0.13 | 2.10 | (0.22 | ) | 2.25 | ||||||||||||||||
|
| |||||||||||||||||||||||
| Distributions:2 | ||||||||||||||||||||||||
From net investment income | (0.39 | ) | (0.84 | ) | (1.04 | ) | (0.91 | ) | (0.94 | ) | (0.82 | ) | ||||||||||||
In excess of net investment income3 | — | — | (0.04 | ) | — | — | — | |||||||||||||||||
|
| |||||||||||||||||||||||
Total distributions | (0.39 | ) | (0.84 | ) | (1.08 | ) | (0.91 | ) | (0.94 | ) | (0.82 | ) | ||||||||||||
|
| |||||||||||||||||||||||
Net asset value, end of period | $ | 14.50 | $ | 15.25 | $ | 14.29 | $ | 15.24 | $ | 14.05 | $ | 15.21 | ||||||||||||
|
| |||||||||||||||||||||||
Market price, end of period | $ | 13.34 | $ | 14.33 | $ | 12.63 | $ | 13.64 | $ | 12.50 | $ | 15.41 | ||||||||||||
|
| |||||||||||||||||||||||
| Total Return4 | ||||||||||||||||||||||||
Based on net asset value | (2.10)% | 5 | 13.67% | 1.62% | 16.09% | 6 | (1.42)% | 17.06% | ||||||||||||||||
|
| |||||||||||||||||||||||
Based on market price | (4.15)% | 5 | 20.85% | 0.35% | 16.78% | (13.43)% | 28.78% | |||||||||||||||||
|
| |||||||||||||||||||||||
| Ratios to Average Net Assets | ||||||||||||||||||||||||
Total expenses | 1.08% | 7 | 0.97% | 0.95% | 8 | 1.06% | 8 | 1.03% | 0.95% | |||||||||||||||
|
| |||||||||||||||||||||||
Total expenses after fees waived | 1.08% | 7 | 0.97% | 0.95% | 8 | 1.02% | 8 | 0.98% | 0.94% | |||||||||||||||
|
| |||||||||||||||||||||||
Total expenses after fees waived and excluding interest expense | 0.80% | 7 | 0.78% | 0.82% | 8 | 0.91% | 8 | 0.86% | 0.86% | |||||||||||||||
|
| |||||||||||||||||||||||
Net investment income | 5.33% | 7 | 5.48% | 5.83% | 5.94% | 5.92% | 6.13% | |||||||||||||||||
|
| |||||||||||||||||||||||
| Supplemental Data | ||||||||||||||||||||||||
Net assets, end of period (000) | $ | 782,064 | $ | 822,549 | $ | 770,822 | $ | 412,078 | $ | 379,913 | $ | 411,136 | ||||||||||||
|
| |||||||||||||||||||||||
Borrowings outstanding, end of period (000) | $ | 327,543 | $ | 288,239 | $ | 303,651 | $ | 168,301 | $ | 172,537 | $ | 182,679 | ||||||||||||
|
| |||||||||||||||||||||||
Portfolio turnover rate9 | 19% | 35% | 55% | 82% | 100% | 290% | ||||||||||||||||||
|
| |||||||||||||||||||||||
| 1 | Based on average shares outstanding. |
| 2 | Distributions for annual periods determined in accordance with federal income tax regulations. |
| 3 | Taxable distribution. |
| 4 | Total returns based on market price, which can be significantly greater or less than the net asset value, may result in substantially different returns. Where applicable, excludes the effects of any sales charges and assumes the reinvestment of distributions. |
| 5 | Aggregate total return. |
| 6 | Includes proceeds received from a settlement of litigation, which impacted the Trust’s total return. Excluding these proceeds, the total return would have been 16.01%. |
| 7 | Annualized. |
| 8 | Includes reorganization costs associated with the Trust’s merger. Without these costs, total expenses, total expenses after fees waived and paid indirectly, and total expenses after fees waived and paid indirectly and excluding interest expense would have been 0.94%, 0.94% and 0.82% for the year ended August 31, 2015 and 1.00%, 0.96% and 0.85% for the year ended August 31, 2014, respectively. |
| 9 | Includes mortgage dollar roll transactions (“MDRs”). Additional information regarding portfolio turnover rate is as follows: |
| Six Months Ended February 28, 2017 (Unaudited) | Year Ended August 31, | |||||||||||||||||||||||
| 2016 | 2015 | 2014 | 2013 | 2012 | ||||||||||||||||||||
Portfolio turnover (excluding MDRs) | 19% | 35% | 51% | 48% | 63% | 237% | ||||||||||||||||||
|
| |||||||||||||||||||||||
| See Notes to Financial Statements. | ||||||
| SEMI-ANNUAL REPORT | FEBRUARY 28, 2017 | 73 | ||||
| Consolidated Financial Highlights | BlackRock Corporate High Yield Fund, Inc. (HYT) |
Six Months Ended February 28, 2017 | Year Ended August 31, | |||||||||||||||||||||||
| 2016 | 2015 | 2014 | 2013 | 2012 | ||||||||||||||||||||
| Per Share Operating Performance | ||||||||||||||||||||||||
Net asset value, beginning of period | $ | 11.79 | $ | 12.06 | $ | 13.47 | $ | 12.62 | $ | 12.32 | $ | 11.49 | ||||||||||||
|
| |||||||||||||||||||||||
Net investment income1 | 0.42 | 0.82 | 0.87 | 0.98 | 1.00 | 1.04 | ||||||||||||||||||
Net realized and unrealized gain (loss) | 0.45 | (0.10 | ) | (1.31 | ) | 0.91 | 0.41 | 0.83 | ||||||||||||||||
|
| |||||||||||||||||||||||
Net increase (decrease) from investment operations | 0.87 | 0.72 | (0.44 | ) | 1.89 | 1.41 | 1.87 | |||||||||||||||||
|
| |||||||||||||||||||||||
Distributions from net investment income2 | (0.47 | ) | (0.99 | ) | (0.97 | ) | (1.04 | ) | (1.11 | ) | (1.04 | ) | ||||||||||||
|
| |||||||||||||||||||||||
Net asset value, end of period | $ | 12.19 | $ | 11.79 | $ | 12.06 | 3 | $ | 13.47 | $ | 12.62 | $ | 12.32 | |||||||||||
|
| |||||||||||||||||||||||
Market price, end of period | $ | 11.16 | $ | 10.88 | $ | 9.97 | $ | 12.07 | $ | 11.37 | $ | 12.96 | ||||||||||||
|
| |||||||||||||||||||||||
| Total Return4 | ||||||||||||||||||||||||
Based on net asset value | 8.00% | 5 | 7.76% | (2.40)% | 3 | 16.21% | 11.90% | 17.14% | ||||||||||||||||
|
| |||||||||||||||||||||||
Based on market price | 7.14% | 5 | 20.29% | (9.96)% | 15.58% | (4.16)% | 26.30% | |||||||||||||||||
|
| |||||||||||||||||||||||
| Ratios to Average Net Assets | ||||||||||||||||||||||||
Total expenses | 1.44% | 6,7 | 1.39% | 7 | 1.37% | 1.35% | 8 | 1.54% | 9 | 1.51% | ||||||||||||||
|
| |||||||||||||||||||||||
Total expenses after fees waived | 1.44% | 6,7 | 1.39% | 7 | 1.37% | 1.35% | 8 | 1.54% | 9 | 1.51% | ||||||||||||||
|
| |||||||||||||||||||||||
Total expenses after fees waived and excluding interest expense and income tax | 0.92% | 6,7 | 0.93% | 7 | 0.96% | 0.98% | 8 | 1.16% | 9,10 | 1.19% | 11 | |||||||||||||
|
| |||||||||||||||||||||||
Net investment income | 7.22% | 6 | 7.30% | 6.88% | 7.40% | 7.83% | 8.84% | |||||||||||||||||
|
| |||||||||||||||||||||||
| Supplemental Data | ||||||||||||||||||||||||
Net assets, end of period (000) | $ | 1,541,806 | $ | 1,492,948 | $ | 1,527,307 | $ | 1,705,422 | $ | 446,847 | $ | 435,955 | ||||||||||||
|
| |||||||||||||||||||||||
Borrowings outstanding, end of period (000) | $ | 577,000 | $ | 604,000 | $ | 631,000 | $ | 723,000 | $ | 191,000 | $ | 181,000 | ||||||||||||
|
| |||||||||||||||||||||||
Asset coverage, end of period $1,000 of bank borrowing | $ | 3,672 | $ | 3,472 | $ | 3,419 | $ | 3,359 | $ | 3,340 | $ | 3,409 | ||||||||||||
|
| |||||||||||||||||||||||
Portfolio turnover rate | 36% | 66% | 57% | 64% | 77% | 61% | ||||||||||||||||||
|
| |||||||||||||||||||||||
| 1 | Based on average shares outstanding. |
| 2 | Distributions for annual periods determined in accordance with federal income tax regulations. |
| 3 | For financial reporting purposes, the market value of certain total return swaps were adjusted as of report date. Accordingly, the net asset value (“NAV”) per share and total return performance based on net asset value presented herein are different than the information previously published on August 31, 2015. |
| 4 | Total returns based on market price, which can be significantly greater or less than the net asset value, may result in substantially different returns. Where applicable, excludes the effects of any sales charges and assumes the reinvestment of distributions. |
| 5 | Aggregate total return. |
| 6 | Annualized. |
| 7 | Does not include expenses incurred indirectly as a result of investments in underlying funds of approximately 0.07% and 0.11% for the six months ended February 28, 2017 and the year ended August 31, 2016, respectively. |
| 8 | Includes reorganization costs. Without these costs, total expenses, total expenses after fees waived and paid indirectly, and total expenses after fees waived and paid indirectly and excluding interest expense would have been 1.34%, 1.34% and 0.97%, respectively. |
| 9 | Includes reorganization costs. Without these costs, total expenses, total expenses after fees waived and paid indirectly, and total expenses after fees waived and paid indirectly and excluding interest expense would have been 1.50%, 1.50% and 1.12%, respectively. |
| 10 | For the year ended August 31, 2013, the total expense ratio after fees waived and paid indirectly and excluding interest expense, borrowing costs and income tax was 1.15%. |
| 11 | For the year ended August 31, 2012, the total expense ratio after fees waived and paid indirectly and excluding interest expense and borrowing costs was 1.09%. |
| See Notes to Financial Statements. | ||||||
| 74 | SEMI-ANNUAL REPORT | FEBRUARY 28, 2017 | ||||
| Financial Highlights | BlackRock Income Trust, Inc. (BKT) |
Six Months Ended February 28, (Unaudited) | Year Ended August 31, | |||||||||||||||||||||||
| 2016 | 2015 | 2014 | 2013 | 2012 | ||||||||||||||||||||
| Per Share Operating Performance | ||||||||||||||||||||||||
Net asset value, beginning of period | $ | 6.96 | $ | 7.08 | $ | 7.27 | $ | 7.32 | $ | 7.94 | $ | 7.96 | ||||||||||||
|
| |||||||||||||||||||||||
Net investment income1 | 0.12 | 0.28 | 0.32 | 0.35 | 0.32 | 0.39 | ||||||||||||||||||
Net realized and unrealized gain (loss) | (0.17 | ) | (0.05 | ) | (0.11 | ) | 0.03 | (0.46 | ) | 0.06 | ||||||||||||||
|
| |||||||||||||||||||||||
Net increase (decrease) from investment operations | (0.05 | ) | 0.23 | 0.21 | 0.38 | (0.14 | ) | 0.45 | ||||||||||||||||
|
| |||||||||||||||||||||||
| Distributions:2 | ||||||||||||||||||||||||
From net investment income | (0.16 | ) | (0.35 | ) | (0.40 | ) | (0.43 | ) | (0.48 | ) | (0.27 | ) | ||||||||||||
From net realized gain | — | — | — | — | — | (0.20 | ) | |||||||||||||||||
|
| |||||||||||||||||||||||
Total distributions | (0.16 | ) | (0.35 | ) | (0.40 | ) | (0.43 | ) | (0.48 | ) | (0.47 | ) | ||||||||||||
|
| |||||||||||||||||||||||
Net asset value, end of period | $ | 6.75 | $ | 6.96 | $ | 7.08 | $ | 7.27 | $ | 7.32 | $ | 7.94 | ||||||||||||
|
| |||||||||||||||||||||||
Market price, end of period | $ | 6.26 | $ | 6.60 | $ | 6.30 | $ | 6.42 | $ | 6.40 | $ | 7.63 | ||||||||||||
|
| |||||||||||||||||||||||
| Total Return3 | ||||||||||||||||||||||||
Based on net asset value | (0.56)% | 4 | 3.64% | 3.56% | 6.05% | (1.45)% | 6.24% | |||||||||||||||||
|
| |||||||||||||||||||||||
Based on market price | (2.74)% | 4 | 10.44% | 4.35% | 7.12% | (10.34)% | 13.19% | |||||||||||||||||
|
| |||||||||||||||||||||||
| Ratios to Average Net Assets | ||||||||||||||||||||||||
Total expenses | 1.19% | 5.6 | 1.08% | 0.99% | 6 | 1.02% | 7 | 1.00% | 0.97% | |||||||||||||||
|
| |||||||||||||||||||||||
Total expenses after fees waived | 1.19% | 5,6 | 1.08% | 0.99% | 6 | 1.02% | 7 | 1.00% | 0.97% | |||||||||||||||
|
| |||||||||||||||||||||||
Total expenses after fees waived and excluding interest expense | 0.91% | 5,6 | 0.89% | 0.90% | 6 | 0.96% | 7 | 0.90% | 0.90% | |||||||||||||||
|
| |||||||||||||||||||||||
Net investment income | 3.61% | 5 | 4.01% | 4.48% | 4.74% | 4.18% | 4.86% | |||||||||||||||||
|
| |||||||||||||||||||||||
| Supplemental Data | ||||||||||||||||||||||||
Net assets, end of period (000) | $ | 431,772 | $ | 444,882 | $ | 452,616 | $ | 464,933 | $ | 467,948 | $ | 507,852 | ||||||||||||
|
| |||||||||||||||||||||||
Borrowings outstanding, end of period (000) | $ | 175,000 | $ | 152,859 | $ | 173,695 | $ | 205,415 | $ | 148,344 | $ | 119,706 | ||||||||||||
|
| |||||||||||||||||||||||
Portfolio turnover rate8 | 132% | 141% | 191% | 256% | 358% | 487% | ||||||||||||||||||
|
| |||||||||||||||||||||||
| 1 | Based on average shares outstanding. |
| 2 | Distributions for annual periods determined in accordance with federal income tax regulations. |
| 3 | Total returns based on market price, which can be significantly greater or less than the net asset value, may result in substantially different returns. Where applicable, excludes the effects of any sales charges and assumes the reinvestment of distributions. |
| 4 | Aggregate total return. |
| 5 | Annualized. |
| 6 | Does not include expenses incurred indirectly as a result of investments in underlying funds of approximately 0.01%. |
| 7 | Includes reorganization costs. Without these costs, total expenses, total expenses after fees waived and paid indirectly, and total expenses after fees waived and paid indirectly and excluding interest expense would have been 0.99%, 0.99% and 0.89% for the year ended August 31, 2015 and 0.97%, 0.97% and 0.90% for the year ended August 31, 2014, respectively. |
| 8 | Includes MDRs. Additional information regarding portfolio turnover rate is as follows: |
Six Months Ended 2017 | Year Ended August 31, | |||||||||||||||||||||||
| 2016 | 2015 | 2014 | 2013 | 2012 | ||||||||||||||||||||
Portfolio turnover (excluding MDRs) | 55% | 63% | 78% | 125% | 196% | 230% | ||||||||||||||||||
|
| |||||||||||||||||||||||
| See Notes to Financial Statements. | ||||||
| SEMI-ANNUAL REPORT | FEBRUARY 28, 2017 | 75 | ||||
| Notes to Financial Statements (Unaudited) |
1. Organization:
The following are registered under the Investment Company Act of 1940, as amended (the “1940 Act”), as closed-end management investment companies and are referred to herein collectively as the “Trusts”, or individually, a “Trust”:
| Trust Name | Herein Referred To As | Organized | Diversification Classification | |||||||||
BlackRock Core Bond Trust | BHK | Delaware | Diversified | |||||||||
BlackRock Corporate High Yield Trust, Inc. | HYT | Maryland | Diversified | |||||||||
BlackRock Income Trust, Inc. | BKT | Maryland | Diversified | |||||||||
The Boards of Directors and Boards of Trustees of the Trusts are collectively referred to throughout this report as the “Board of Trustees” or the “Board,” and the directors/trustees thereof are collectively referred to throughout this report as “Trustees.” The Trusts determine and make available for publication the net asset value (“NAV”) of their Common Shares on a daily basis.
The Trusts, together with certain other registered investment companies advised by BlackRock Advisors, LLC (“the “Manager”) or its affiliates, are included in a complex of closed-end Trusts referred to as the Closed-End Complex.
Basis of Consolidation: The accompanying consolidated financial statements of HYT include the accounts of BLK HYT (Luxembourg) Investments, S.a.r.l., BLK HYV (Luxembourg) Investments, S.a.r.l., BLK COY (Luxembourg) Investments, S.a.r.l. and BLK CYE (Luxembourg) Investments, S.a.r.l. collectively, (the “Taxable Subsidiaries”), which are wholly owned taxable subsidiaries of HYT which hold shares of private Canadian companies, Laricina Energy Ltd. and Osum Oil Sands Corp. Such shares are held in the Taxable Subsidiaries in order to realize benefits under the Double Tax Avoidance Convention between Canada and Luxembourg, the result of which is gains on the sale of such shares will generally not be subject to capital gains taxes in Canada. Income earned on the investment held by the Taxable Subsidiary may be taxable to such subsidiary in Luxembourg. A tax provision, if any, is included in expenses in the Consolidated Statement of Operations for HYT. The net assets of the Taxable Subsidiaries as of period end were $900,468, which is 0.1% of HYT’s consolidated net assets. Intercompany accounts and transactions, if any, have been eliminated. The Taxable Subsidiaries are subject to the same investment policies and restrictions that apply to HYT.
2. Significant Accounting Policies:
The financial statements are prepared in conformity with accounting principles generally accepted in the United States of America (“U.S. GAAP”), which may require management to make estimates and assumptions that affect the reported amounts of assets and liabilities in the financial statements, disclosure of contingent assets and liabilities at the date of the financial statements and the reported amounts of increases and decreases in net assets from operations during the reporting period. Actual results could differ from those estimates. Each Trust is considered an investment company under U.S. GAAP and follows the accounting and reporting guidance applicable to investment companies. Below is a summary of significant accounting policies:
Foreign Currency: Each Trust‘s books and records are maintained in U.S. dollars. Purchases and sales of investments are recorded at the rates of exchange prevailing on the respective dates of such transactions. Generally, when the U.S. dollar rises in value against a foreign currency, the investments denominated in that currency will lose value; the opposite effect occurs if the U.S. dollar falls in relative value.
Each Trust does not isolate the portion of the results of operations arising as a result of changes in the exchange rates from the changes in the market prices of investments held or sold for financial reporting purposes. Accordingly, the effects of changes in exchange rates on investments are not segregated in the Statements of Operations from the effects of changes in market prices of those investments, but are included as a component of net realized and unrealized gain (loss) from investments. Each Trust reports realized currency gains (losses) on foreign currency related transactions as components of net realized gain (loss) for financial reporting purposes, whereas such components are generally treated as ordinary income for U.S. federal income tax purposes.
Segregation and Collateralization: In cases where a Trust enters into certain investments (e.g., dollar rolls, TBA sale commitments, futures contracts, forward foreign currency exchange contracts, options written, swaps and short sales) or certain borrowings (e.g., reverse repurchase transactions) that would be treated as “senior securities” for 1940 Act purposes, a Trust may segregate or designate on its books and records cash or liquid assets having a market value at least equal to the amount of its future obligations under such investments or borrowings. Doing so allows the investment or borrowing to be excluded from treatment as a “senior security.” Furthermore, if required by an exchange or counterparty agreement, the Trust may be required to deliver/deposit cash and/or securities to/with an exchange, or broker-dealer or custodian as collateral for certain investments or obligations.
Investment Transactions and Investment Income: For financial reporting purposes, investment transactions are recorded on the dates the transactions are entered into (the trade dates). Realized gains and losses on investment transactions are determined on the identified cost basis. Dividend income is recorded on the ex-dividend date. Dividends from foreign securities where the ex-dividend date may have passed are subsequently recorded when the Trusts are informed of the ex-dividend date. Under the applicable foreign tax laws, a withholding tax at various rates may be imposed on capital gains, dividends and interest. Upon notification from issuers, some of the dividend income received from a real estate investment trust may be redesignated as a reduction of cost of the related investment and/or realized gain. Interest income, including amortization and accretion of premiums and discounts on debt securities, is recognized on the accrual basis.
| 76 | SEMI-ANNUAL REPORT | FEBRUARY 28, 2017 |
| Notes to Financial Statements (continued) | ||||
Distributions: Distributions from net investment income are declared and paid monthly. Distributions of capital gains are recorded on the ex-dividend date and made at least annually. Portions of return of capital distributions under U.S. GAAP may be taxed at ordinary income rates. The character of distributions is determined in accordance with U.S. federal income tax regulations, which may differ from U.S. GAAP. The portion of distributions that exceeds a Trust’s current and accumulated earnings and profits, as measured on a tax basis, constitute a non-taxable return of capital. Realized net capital gains can be offset by capital losses carried forward from prior years. However, certain Trusts have capital loss carryforwards from pre-2012 tax years that offset realized net capital gains but do not offset current earnings and profits. Consequently, if distributions in any tax year are less than the Trust’s current earnings and profits but greater than net investment income and net realized capital gains (taxable income), distributions in excess of taxable income are not treated as non-taxable return of capital, but rather may be taxable to shareholders at ordinary income rates. Under certain circumstances, taxable excess distributions could be significant.
Deferred Compensation Plan: Under the Deferred Compensation Plan (the “Plan”) approved by each Trust’s Board, the independent Trustees (“Independent Trustees”) may defer a portion of their annual complex-wide compensation. Deferred amounts earn an approximate return as though equivalent dollar amounts had been invested in common shares of certain other BlackRock Closed-End Funds selected by the Independent Trustees. This has the same economic effect for the Independent Trustees as if the Independent Trustees had invested the deferred amounts directly in certain other BlackRock Closed-End Funds.
The Plan is not funded and obligations thereunder represent general unsecured claims against the general assets of each Trust, if applicable. Deferred compensation liabilities are included in officer’s and trustees’ fees payable in the Statements of Assets and Liabilities and will remain as a liability of the Trusts until such amounts are distributed in accordance with the Plan.
Recent Accounting Standards: In November 2016, the Financial Accounting Standards Board issued Accounting Standards Update “Restricted Cash” which will require entities to include the total of cash, cash equivalents, restricted cash, and restricted cash equivalents in the beginning and ending cash balances in the Statements of Cash Flows. The guidance will be applied retrospectively and is effective for fiscal years beginning after December 15, 2017, and interim periods within those years. Management is evaluating the impact, if any, of this guidance on the Trusts’ presentation in the Statements of Cash Flows.
Indemnifications: In the normal course of business, a Trust enters into contracts that contain a variety of representations that provide general indemnification. A Trust’s maximum exposure under these arrangements is unknown because it involves future potential claims against a Trust, which cannot be predicted with any certainty.
Other: Expenses directly related to a Trust are charged to that Trust. Other operating expenses shared by several Funds, including other funds managed by the Manager, are prorated among those funds on the basis of relative net assets or other appropriate methods.
Through May 31, 2016, the Trusts had an arrangement with their custodian whereby credits were earned on uninvested cash balances, which could be used to reduce custody fees and/or overdraft charges. Credits previously earned may have been utilized until December 31, 2016. Under current arrangements effective June 1, 2016, the Trusts no longer earn credits on uninvested cash, and may incur charges on uninvested cash balances and overdrafts, subject to certain conditions.
3. Investment Valuation and Fair Value Measurements:
Investment Valuation Policies: The Trusts’ investments are valued at fair value (also referred to as “market value” within the financial statements) as of the close of trading on the New York Stock Exchange (“NYSE”) (generally 4:00 p.m., Eastern time). U.S. GAAP defines fair value as the price the Trusts would receive to sell an asset or pay to transfer a liability in an orderly transaction between market participants at the measurement date. The Trusts determine the fair values of their financial instruments using various independent dealers or pricing services under policies approved by the Board. The BlackRock Global Valuation Methodologies Committee (the “Global Valuation Committee”) is the committee formed by management to develop global pricing policies and procedures and to oversee the pricing function for all financial instruments.
Fair Value Inputs and Methodologies: The following methods and inputs are used to establish the fair value of each Trust’s assets and liabilities:
| • | Equity investments traded on a recognized securities exchange are valued at the official closing price each day, if available. For equity investments traded on more than one exchange, the official closing price on the exchange where the stock is primarily traded is used. Equity investments traded on a recognized exchange for which there were no sales on that day may be valued at the last available bid (long positions) or ask (short positions) price. |
| • | Fixed-income securities for which market quotations are readily available are generally valued using the last available bid prices or current market quotations provided by independent dealers or third party pricing services. Floating rate loan interests are valued at the mean of the bid prices from one or more independent brokers or dealers as obtained from a third party pricing service. Pricing services generally value fixed-income securities assuming orderly transactions of an institutional round lot size, but the Trusts may hold or transact in such securities in smaller, odd lot sizes. Odd lots often trade at lower prices than institutional round lots. The pricing services may use matrix pricing or valuation models that utilize certain inputs and assumptions to derive values, including transaction data (e.g., recent representative bids and offers), credit quality information, perceived market |
| SEMI-ANNUAL REPORT | FEBRUARY 28, 2017 | 77 |
| Notes to Financial Statements (continued) |
movements, news, and other relevant information. Certain fixed-income securities, including asset-backed and mortgage related securities may be valued based on valuation models that consider the estimated cash flows of each tranche of the entity, establish a benchmark yield and develop an estimated tranche specific spread to the benchmark yield based on the unique attributes of the tranche. The amortized cost method of valuation may be used with respect to debt obligations with sixty days or less remaining to maturity unless the Manager determines such method does not represent fair value. |
Generally, trading in foreign instruments is substantially completed each day at various times prior to the close of trading on the NYSE. Occasionally, events affecting the values of such instruments may occur between the foreign market close and the close of trading on the NYSE that may not be reflected in the computation of the Funds’ net assets. Each business day, the Funds use a pricing service to assist with the valuation of certain foreign exchange-traded equity securities and foreign exchange-traded and over-the-counter (“OTC”) options (the “Systematic Fair Value Price”). Using current market factors, the Systematic Fair Value Price is designed to value such foreign securities and foreign options at fair value as of the close of trading on the NYSE, which follows the close of the local markets
| • | Municipal investments (including commitments to purchase such investments on a “when-issued” basis) are valued on the basis of prices provided by dealers or pricing services. In determining the value of a particular investment, pricing services may use certain information with respect to transactions in such investments, quotations from dealers, pricing matrixes, market transactions in comparable investments and information with respect to various relationships between investments. |
| • | Investments in open-end U.S. mutual funds are valued at NAV each business day. |
| • | Futures contracts traded on exchanges are valued at their last sale price. |
| • | Securities and other assets and liabilities denominated in foreign currencies are translated into U.S. dollars using exchange rates determined as of the close of trading on the NYSE. Forward foreign currency exchange contracts are valued at the mean between the bid and ask prices and are determined as of the close of trading on the NYSE. Interpolated values are derived when the settlement date of the contract is an interim date for which quotations are not available |
| • | Exchange-traded options are valued at the mean between the last bid and ask prices at the close of the options market in which the options trade. An exchange-traded option for which there is no mean price is valued at the last bid (long positions) or ask (short positions) price. If no bid or ask price is available, the prior day’s price will be used, unless it is determined that the prior day’s price no longer reflects the fair value of the option. OTC options and options on swaps (“swaptions”) are valued by an independent pricing service using a mathematical model, which incorporates a number of market data factors, such as the trades and prices of the underlying instruments. |
| • | Swap agreements are valued utilizing quotes received daily by the Trusts’ pricing service or through brokers, which are derived using daily swap curves and models that incorporate a number of market data factors, such as discounted cash flows, trades and values of the underlying reference instruments. |
| • | To-be-announced (“TBA”) commitments are valued on the basis of last available bid prices or current market quotations provided by pricing services. |
If events (e.g., a company announcement, market volatility or a natural disaster) occur that are expected to materially affect the value of such investments, or in the event that the application of these methods of valuation results in a price for an investment that is deemed not to be representative of the market value of such investment, or if a price is not available, the investment will be valued by the Global Valuation Committee, or its delegate, in accordance with a policy approved by the Board as reflecting fair value (“Fair Valued Investments”). The fair valuation approaches that may be used by the Global Valuation Committee will include Market approach, Income approach and Cost approach. Valuation techniques such as discounted cash flow, use of market comparables and matrix pricing are types of valuation approaches and typically used in determining fair value. When determining the price for Fair Valued Investments, the Global Valuation Committee, or its delegate, seeks to determine the price that each Trust might reasonably expect to receive or pay from the current sale or purchase of that asset or liability in an arm’s-length transaction. Fair value determinations shall be based upon all available factors that the Global Valuation Committee, or its delegate, deems relevant and consistent with the principles of fair value measurement.
The Global Valuation Committee, or its delegate, employs various methods for calibrating valuation approaches for investments where an active market does not exist, including regular due diligence of Each Trust’s pricing vendors, regular reviews of key inputs and assumptions, transactional back-testing or disposition analysis to compare unrealized gains and losses to realized gains and losses, reviews of missing or stale prices and large movements in market values and reviews of any market related activity. The pricing of all Fair Valued Investments is subsequently reported to the Board or a committee thereof on a quarterly basis. As a result of the inherent uncertainty in valuation of these investments, the fair values may differ from the values that would have been used had an active market existed.
For investments in equity or debt issued by privately-held companies or funds (“Private Company” or collectively, the “Private Companies”) and other Fair Valued Investments, the fair valuation approaches that are used by third party pricing services utilize one or a combination of, but not limited to, the following inputs.
| 78 | SEMI-ANNUAL REPORT | FEBRUARY 28, 2017 |
| Notes to Financial Statements (continued) | ||||
Standard Inputs Generally Considered By Third Party Pricing Services
| Market approach | (i) recent market transactions, including subsequent rounds of financing, in the underlying investment or comparable issuers;
(ii) recapitalizations and other transactions across the capital structure; and
(iii) market multiples of comparable issuers. | |
| Income approach | (i) future cash flows discounted to present and adjusted as appropriate for liquidity, credit, and/or market risks;
(ii) quoted prices for similar investments or assets in active markets; and
(iii) other risk factors, such as interest rates, yield curves, volatilities, prepayment speeds, loss severities, credit risks, recovery rates, liquidation amounts and/or default rates. | |
| Cost approach | (i) audited or unaudited financial statements, investor communications and financial or operational metrics issued by the Private Company;
(ii) changes in the valuation of relevant indices or publicly traded companies comparable to the Private Company;
(iii) relevant news and other public sources; and
(iv) known secondary market transactions in the Private Company’s interests and merger or acquisition activity in companies comparable to the Private Company. |
Investments in series of preferred stock issued by Private Companies are typically valued utilizing Market approach in determining the enterprise value of the company. Such investments often contain rights and preferences that differ from other series of preferred and common stock of the same issuer. Valuation techniques such as an option pricing model (“OPM”), a probability weighted expected return model (“PWERM”) or a hybrid of those techniques are used in allocating enterprise value of the company, as deemed appropriate under the circumstances. The use of OPM and PWERM techniques involve a determination of the exit scenarios of the investment in order to appropriately allocate the enterprise value of the company among the various parts of its capital structure.
The Private Companies are not subject to the public company disclosure, timing, and reporting standards as other investments held by a Trust. Typically, the most recently available information by a Private Company is as of a date that is earlier than the date a Trust is calculating its NAV. This factor may result in a difference between the value of the investment and the price a Trust could receive upon the sale of the investment.
Fair Value Hierarchy: Various inputs are used in determining the fair value of investments and derivative financial instruments. These inputs to valuation techniques are categorized into a fair value hierarchy consisting of three broad levels for financial statement purposes as follows:
| • | Level 1 — unadjusted price quotations in active markets/exchanges for identical assets or liabilities that each Trust has the ability to access |
| • | Level 2 — other observable inputs (including, but not limited to, quoted prices for similar assets or liabilities in markets that are active, quoted prices for identical or similar assets or liabilities in markets that are not active, inputs other than quoted prices that are observable for the assets or liabilities (such as interest rates, yield curves, volatilities, prepayment speeds, loss severities, credit risks and default rates) or other market–corroborated inputs) |
| • | Level 3 — unobservable inputs based on the best information available in the circumstances, to the extent observable inputs are not available (including each Trust’s own assumptions used in determining the fair value of investments and derivative financial instruments) |
The hierarchy gives the highest priority to unadjusted quoted prices in active markets for identical assets or liabilities (Level 1 measurements) and the lowest priority to unobservable inputs (Level 3 measurements). Accordingly, the degree of judgment exercised in determining fair value is greatest for instruments categorized in Level 3. The inputs used to measure fair value may fall into different levels of the fair value hierarchy. In such cases, for disclosure purposes, the fair value hierarchy classification is determined based on the lowest level input that is significant to the fair value measurement in its entirety. Investments classified within Level 3 have significant unobservable inputs used by the Global Valuation Committee in determining the price for Fair Valued Investments. Level 3 investments include equity or debt issued by Private Companies. There may not be a secondary market, and/or there are a limited number of investors. Level 3 investments may also be adjusted to reflect illiquidity and/or non-transferability, with the amount of such discount estimated by the Global Valuation Committee in the absence of market information.
Changes in valuation techniques may result in transfers into or out of an assigned level within the hierarchy. In accordance with each Trust’s policy, transfers between different levels of the fair value hierarchy are deemed to have occurred as of the beginning of the reporting period. The categorization of a value determined for investments and derivative financial instruments is based on the pricing transparency of the investments and derivative financial instruments and is not necessarily an indication of the risks associated with investing in those securities.
As of February 28, 2017, certain investments of the HYT were valued using NAV per share as no quoted market value is available and therefore have been excluded from the fair value hierarchy.
4. Securities and Other Investments:
Asset-Backed and Mortgage-Backed Securities: Asset-backed securities are generally issued as pass-through certificates or as debt instruments. Asset-backed securities issued as pass-through certificates represent undivided fractional ownership interests in an underlying pool of assets. Asset-backed securities issued as debt instruments, which are also known as collateralized obligations are typically issued as the debt of a special purpose entity
| SEMI-ANNUAL REPORT | FEBRUARY 28, 2017 | 79 |
| Notes to Financial Statements (continued) |
organized solely for the purpose of owning such assets and issuing such debt. Asset-backed securities are often backed by a pool of assets representing the obligations of a number of different parties. The yield characteristics of certain asset-backed securities may differ from traditional debt securities. One such major difference is that all or a principal part of the obligations may be prepaid at any time because the underlying assets (i.e., loans) may be prepaid at any time. As a result, a decrease in interest rates in the market may result in increases in the level of prepayments as borrowers, particularly mortgagors, refinance and repay their loans. An increased prepayment rate with respect to an asset-backed security will have the effect of shortening the maturity of the security. In addition, a Trust may subsequently have to reinvest the proceeds at lower interest rates. If a Trust has purchased such an asset-backed security at a premium, a faster than anticipated prepayment rate could result in a loss of principal to the extent of the premium paid.
For mortgage pass-through securities (the “Mortgage Assets”), there are a number of important differences among the agencies and instrumentalities of the U.S. Government that issue mortgage-related securities and among the securities that they issue. For example, mortgage-related securities guaranteed by Ginnie Mae are guaranteed as to the timely payment of principal and interest by Ginnie Mae and such guarantee is backed by the full faith and credit of the United States. However, mortgage-related securities issued by Freddie Mac and Fannie Mae, including Freddie Mac and Fannie Mae guaranteed mortgage pass-through certificates, which are solely the obligations of Freddie Mac and Fannie Mae, are not backed by or entitled to the full faith and credit of the United States, but are supported by the right of the issuer to borrow from the U.S. Treasury.
Non-agency mortgage-backed securities are securities issued by non-governmental issuers and have no direct or indirect government guarantees of payment and are subject to various risks. Non-agency mortgage loans are obligations of the borrowers thereunder only and are not typically insured or guaranteed by any other person or entity. The ability of a borrower to repay a loan is dependent upon the income or assets of the borrower. A number of factors, including a general economic downturn, acts of God, terrorism, social unrest and civil disturbances, may impair a borrower’s ability to repay its loans.
Collateralized Debt Obligations: Collateralized debt obligations (“CDOs”), including collateralized bond obligations (“CBOs”) and collateralized loan obligations (“CLOs”), which are types of asset-backed securities. A CDO is an entity that is backed by a diversified pool of debt securities (CBOs) or syndicated bank loans (CLOs). The cash flows of the CDO can be split into multiple segments, called “tranches,” which will vary in risk profile and yield. The riskiest segment is the subordinated or “equity” tranche. This tranche bears the greatest risk of defaults from the underlying assets in the CDO and serves to protect the other, more senior, tranches from default in all but the most severe circumstances. Since it is shielded from defaults by the more junior tranches, a “senior” tranche will typically have higher credit ratings and lower yields than their underlying securities, and often receive investment grade ratings from one or more of the nationally recognized rating agencies. Despite the protection from the more junior tranches, senior tranches can experience substantial losses due to actual defaults, increased sensitivity to future defaults and the disappearance of one or more protecting tranches as a result of changes in the credit profile of the underlying pool of assets.
Multiple Class Pass-Through Securities: Multiple class pass-through securities, including collateralized mortgage obligations (“CMOs”) and commercial mortgage-backed securities, may be issued by Ginnie Mae, U.S. Government agencies or instrumentalities or by trusts formed by private originators of, or investors in, mortgage loans. In general, CMOs are debt obligations of a legal entity that are collateralized by a pool of residential or commercial mortgage loans or mortgage pass-through securities (the “Mortgage Assets”). The payments on these are used to make payments on the CMOs or multiple pass-through securities. Multiple class pass-through securities represent direct ownership interests in the Mortgage Assets. Classes of CMOs include interest only (“IOs”), principal only (“POs”), planned amortization classes and targeted amortization classes. IOs and POs are stripped mortgage-backed securities representing interests in a pool of mortgages, the cash flow from which has been separated into interest and principal components. IOs receive the interest portion of the cash flow while POs receive the principal portion. IOs and POs can be extremely volatile in response to changes in interest rates. As interest rates rise and fall, the value of IOs tends to move in the same direction as interest rates. POs perform best when prepayments on the underlying mortgages rise since this increases the rate at which the principal is returned and the yield to maturity on the PO. When payments on mortgages underlying a PO are slower than anticipated, the life of the PO is lengthened and the yield to maturity is reduced. If the underlying Mortgage Assets experience greater than anticipated prepayments of principal, a Trust’s initial investment in the IOs may not fully recoup.
Stripped Mortgage-Backed Securities: Stripped mortgage-backed securities are typically issued by the U.S. Government, its agencies and instrumentalities. Stripped mortgage-backed securities are usually structured with two classes that receive different proportions of the interest (IOs) and principal (POs) distributions on a pool of Mortgage Assets. Stripped mortgage-backed securities may be privately issued.
Zero-Coupon Bonds: Zero-coupon bonds are normally issued at a significant discount from face value and do not provide for periodic interest payments. These bonds may experience greater volatility in market value than other debt obligations of similar maturity which provide for regular interest payments.
Capital Securities and Trust Preferred Securities: Capital securities, including trust preferred securities, are typically issued by corporations, generally in the form of interest-bearing notes with preferred securities characteristics. In the case of trust preferred securities, an affiliated business trust of a corporation issues these securities, generally in the form of beneficial interests in subordinated debentures or similarly structured securities. The securities can be structured with either a fixed or adjustable coupon that can have either a perpetual or stated maturity date. For trust preferred securities, the issuing bank or corporation pays interest to the trust, which is then distributed to holders of these securities as a dividend. Dividends can be deferred without creating an event of default or acceleration, although maturity cannot take place unless all cumulative payment obligations have been met. The deferral of
| 80 | SEMI-ANNUAL REPORT | FEBRUARY 28, 2017 |
| Notes to Financial Statements (continued) | ||||
payments does not affect the purchase or sale of these securities in the open market. Payments on these securities are treated as interest rather than dividends for U.S. federal income tax purposes. These securities generally are rated below that of the issuing company’s senior debt securities and are freely callable at the issuer’s option.
Preferred Stock: Preferred stock has a preference over common stock in liquidation (and generally in receiving dividends as well), but is subordinated to the liabilities of the issuer in all respects. As a general rule, the market value of preferred stock with a fixed dividend rate and no conversion element varies inversely with interest rates and perceived credit risk, while the market price of convertible preferred stock generally also reflects some element of conversion value. Because preferred stock is junior to debt securities and other obligations of the issuer, deterioration in the credit quality of the issuer will cause greater changes in the value of a preferred stock than in a more senior debt security with similar stated yield characteristics. Unlike interest payments on debt securities, preferred stock dividends are payable only if declared by the issuer’s board of directors. Preferred stock also may be subject to optional or mandatory redemption provisions.
Warrants: Warrants entitle a Trust to purchase a specified number of shares of common stock and are non-income producing. The purchase price and number of shares are subject to adjustment under certain conditions until the expiration date of the warrants, if any. If the price of the underlying stock does not rise above the strike price before the warrant expires, the warrant generally expires without any value and a Trust will lose any amount it paid for the warrant. Thus, investments in warrants may involve more risk than investments in common stock. Warrants may trade in the same markets as their underlying stock; however, the price of the warrant does not necessarily move with the price of the underlying stock.
Floating Rate Loan Interests: Floating rate loan interests are typically issued to companies (the “borrower”) by banks, other financial institutions, or privately and publicly offered corporations (the “lender”). Floating rate loan interests are generally non-investment grade, often involve borrowers whose financial condition is troubled or uncertain and companies that are highly leveraged or in bankruptcy proceedings. In addition, transactions in floating rate loan interests may settle on a delayed basis, which may result to proceeds from the sale to not be readily available for a Trust to make additional investments or meet its redemption obligations. Floating rate loan interests may include fully funded term loans or revolving lines of credit. Floating rate loan interests are typically senior in the corporate capital structure of the borrower. Floating rate loan interests generally pay interest at rates that are periodically determined by reference to a base lending rate plus a premium. Since the rates reset only periodically, changes in prevailing interest rates (and particularly sudden and significant changes) can be expected to cause some fluctuations in the NAV of a Trust to the extent that it invests in floating rate loan interest. The base lending rates are generally the lending rate offered by one or more European banks, such as the London Interbank Offered Rate (“LIBOR”), the prime rate offered by one or more U.S. banks or the certificate of deposit rate. Floating rate loan interests may involve foreign borrowers, and investments may be denominated in foreign currencies. These investments are treated as investments in debt securities for purposes of a Trust’s investment policies.
When a Trust purchases a floating rate loan interest, it may receive a facility fee and when it sells a floating rate loan interest, it may pay a facility fee. On an ongoing basis, a Trust may receive a commitment fee based on the undrawn portion of the underlying line of credit amount of a floating rate loan interest. Facility and commitment fees are typically amortized to income over the term of the loan or term of the commitment, respectively. Consent and amendment fees are recorded to income as earned. Prepayment penalty fees, which may be received by a Trust upon the prepayment of a floating rate loan interest by a borrower, are recorded as realized gains. A Trust may invest in multiple series or tranches of a loan. A different series or tranche may have varying terms and carry different associated risks.
Floating rate loan interests are usually freely callable at the borrower’s option. A Trust may invest in such loans in the form of participations in loans (“Participations”) or assignments (“Assignments”) of all or a portion of loans from third parties. Participations typically will result in a Trust having a contractual relationship only with the lender, not with the borrower. A Trust has the right to receive payments of principal, interest and any fees to which it is entitled only from the lender selling the Participation and only upon receipt by the lender of the payments from the borrower. In connection with purchasing Participations, a Trust generally will have no right to enforce compliance by the borrower with the terms of the loan agreement, nor any rights of offset against the borrower. A Trust may not benefit directly from any collateral supporting the loan in which it has purchased the Participation. As a result, a Trust assumes the credit risk of both the borrower and the lender that is selling the Participation. A Trust’s investment in loan participation interests involves the risk of insolvency of the financial intermediaries who are parties to the transactions. In the event of the insolvency of the lender selling the Participation, a Trust may be treated as a general creditor of the lender and may not benefit from any offset between the lender and the borrower. Assignments typically result in a Trust having a direct contractual relationship with the borrower, and a Trust may enforce compliance by the borrower with the terms of the loan agreement.
In connection with floating rate loan interests, the Trusts may also enter into unfunded floating rate loan interests (“commitments”). In connection with these commitments, a Trust earns a commitment fee, typically set as a percentage of the commitment amount. Such fee income, which is included in interest income in the Statements of Operations, is recognized ratably over the commitment period. Unfunded floating rate loan interests are marked-to-market daily, and any unrealized appreciation (depreciation) is included in the Statements of Assets and Liabilities and Statements of Operations. As of period end, the Trusts had the following unfunded floating rate loan interests:
Trust | Borrower | Par | Commitment Amount | Value | Unrealized Appreciation | |||||||||||||
HYT | Oberthur Technologies S.A. | $ | 418,671 | $ | 416,578 | $ | 422,598 | $ | 6,020 | |||||||||
| SEMI-ANNUAL REPORT | FEBRUARY 28, 2017 | 81 |
| Notes to Financial Statements (continued) |
Forward Commitments and When-Issued Delayed Delivery Securities: Certain Trusts may purchase securities on a when-issued basis and may purchase or sell securities on a forward commitment basis. Settlement of such transactions normally occurs within a month or more after the purchase or sale commitment is made. A Trust may purchase securities under such conditions with the intention of actually acquiring them, but may enter into a separate agreement to sell the securities before the settlement date. Since the value of securities purchased may fluctuate prior to settlement, a Trust may be required to pay more at settlement than the security is worth. In addition, a Trust is not entitled to any of the interest earned prior to settlement. When purchasing a security on a delayed delivery basis, a Trust assumes the rights and risks of ownership of the security, including the risk of price and yield fluctuations. In the event of default by the counterparty, a Trust’s maximum amount of loss is the unrealized appreciation of unsettled when-issued transactions.
TBA Commitments: TBA commitments are forward agreements for the purchase or sale of mortgage-backed securities for a fixed price, with payment and delivery on an agreed upon future settlement date. The specific securities to be delivered are not identified at the trade date. However, delivered securities must meet specified terms, including issuer, rate and mortgage terms. When entering into TBA commitments, a Trust may take possession of or deliver the underlying mortgage-backed securities but can extend the settlement or roll the transaction. TBA commitments involve a risk of loss if the value of the security to be purchased or sold declines or increases, respectively, prior to settlement date.
In order to better define contractual rights and to secure rights that will help a Trust mitigate their counterparty risk, TBA commitments may be entered into by a Trust under Master Securities Forward Transaction Agreements (each, an “MSFTA”). An MSFTA typically contains, among other things, collateral posting terms and netting provisions in the event of default and/or termination event. The collateral requirements are typically calculated by netting the mark-to-market amount for each transaction under such agreement and comparing that amount to the value of the collateral currently pledged by a Trust and the counterparty. Cash collateral that has been pledged to cover the obligations of a Trust and cash collateral received from the counterparty, if any, is reported separately on the Statements of Assets and Liabilities as cash pledged as collateral for TBA commitments or cash received as collateral for TBA commitments, respectively. Non-cash collateral pledged by a Trust, if any, is noted in the Schedules of Investments. Typically, a Trust is permitted to sell, repledge or use the collateral it receives; however, the counterparty is not permitted to do so. To the extent amounts due to a Trust are not fully collateralized, contractually or otherwise, a Trust bears the risk of loss from counterparty non-performance.
Mortgage Dollar Roll Transactions: Certain Trusts may sell TBA mortgage-backed securities and simultaneously contract to repurchase substantially similar (i.e., same type, coupon and maturity) securities on a specific future date at an agreed upon price. During the period between the sale and repurchase, a Trust is not entitled to receive interest and principal payments on the securities sold. Mortgage dollar roll transactions are treated as purchases and sales and realize gains and losses on these transactions. Mortgage dollar rolls involve the risk that the market value of the securities that a Trust is required to purchase may decline below the agreed upon repurchase price of those securities.
Borrowed Bond Agreements: Repurchase agreements may be referred to as borrowed bond agreements when entered into in connection with short sales of bonds. In a borrowed bond agreement, a Trust borrows a bond from a counterparty in exchange for cash collateral. The agreement contains a commitment that the security and the cash will be returned to the counterparty and a Trust at a mutually agreed upon date. Certain agreements have no stated maturity and can be terminated by either party at any time. Earnings on cash collateral and compensation to the lender of the bond are based on agreed upon rates between a Trust and the counterparty. The value of the underlying cash collateral approximates the market value and accrued interest of the borrowed bond. To the extent that a borrowed bond transaction exceeds one business day, the value of the cash collateral in the possession of the counterparty is monitored on a daily basis to ensure the adequacy of the collateral. As the market value of the borrowed bond changes, the cash collateral is periodically increased or decreased with a frequency and in amounts prescribed in the borrowed bond agreement. A Trust may also experience delays in gaining access to the collateral.
Reverse Repurchase Agreements: Reverse repurchase agreements are agreements with qualified third party broker dealers in which a Trust sells securities to a bank or broker-dealer and agrees to repurchase the same securities at a mutually agreed upon date and price. A Trust receives cash from the sale to use for other investment purposes. During the term of the reverse repurchase agreement, a Trust continues to receive the principal and interest payments on the securities sold. Certain agreements have no stated maturity and can be terminated by either party at any time. Interest on the value of the reverse repurchase agreements issued and outstanding is based upon competitive market rates determined at the time of issuance. A Trust may utilize reverse repurchase agreements when it is anticipated that the interest income to be earned from the investment of the proceeds of the transaction is greater than the interest expense of the transaction. Reverse repurchase agreements involve leverage risk. If a Trust suffers a loss on its investment of the transaction proceeds from a reverse repurchase agreement, a Trust would still be required to pay the full repurchase price. Further, a Trust remains subject to the risk that the market value of the securities repurchased declines below the repurchase price. In such cases, a Trust would be required to return a portion of the cash received from the transaction or provide additional securities to the counterparty.
Cash received in exchange for securities delivered plus accrued interest due to the counterparty is recorded as a liability in the Statements of Assets and Liabilities at face value including accrued interest. Due to the short-term nature of the reverse repurchase agreements, face value approximates fair value. Interest payments made by a Trust to the counterparties are recorded as a component of interest expense in the Statements of Operations. In periods of increased demand for the security, a Trust may receive a fee for use of the security by the counterparty, which may result in interest income to a Trust.
| 82 | SEMI-ANNUAL REPORT | FEBRUARY 28, 2017 |
| Notes to Financial Statements (continued) | ||||
For the six months ended February 28, 2017, the average amount of reverse repurchase agreements outstanding and the daily weighted average interest rates were as follows:
Average Amount Outstanding | Daily Average Interest Rate | |||||||
BHK | $ | 321,790,078 | 0.68 | % | ||||
BKT | $ | 164,212,684 | 0.74 | % | ||||
Borrowed bond agreements and reverse repurchase transactions are entered into by a Trust under Master Repurchase Agreements (each, an “MRA”), which permit a Trust, under certain circumstances, including an event of default (such as bankruptcy or insolvency), to offset payables and/or receivables under the MRA with collateral held and/or posted to the counterparty and create one single net payment due to or from a Trust. With borrowed bond agreements and reverse repurchase transactions, typically a Trust and the counterparty under an MRA are permitted to sell, re-pledge, or use the collateral associated with the transaction. Bankruptcy or insolvency laws of a particular jurisdiction may impose restrictions on or prohibitions against such a right of offset in the event of the MRA counterparty’s bankruptcy or insolvency. Pursuant to the terms of the MRA, a Trust receives or posts securities as collateral with a market value in excess of the repurchase price to be paid or received by a Trust upon the maturity of the transaction. Upon a bankruptcy or insolvency of the MRA counterparty, a Trust is considered an unsecured creditor with respect to excess collateral and, as such, the return of excess collateral may be delayed.
As of period end, the following table is a summary of the Trust’s open reverse repurchase agreements by counterparty which are subject to offset under an MRA on a net basis:
| BHK | ||||||||||||||||||||
| Counterparty | Reverse Repurchase Agreements | Fair Value of Non-cash Collateral Pledged Accrued Interest1 | Cash Collateral Pledged/Received | Net Amount2 | ||||||||||||||||
Barclays Capital, Inc | $ | 14,100,817 | $ | (14,100,817 | ) | — | — | |||||||||||||
BNP Paribas Securities Corp. | 65,169,427 | (65,169,427 | ) | — | — | |||||||||||||||
Credit Suisse Securities (USA) LLC | 9,265,883 | (9,265,883 | ) | — | — | |||||||||||||||
Deutsche Bank AG | 35,834,891 | (35,834,891 | ) | — | — | |||||||||||||||
HSBC Securities (USA), Inc. | 63,508,832 | (63,508,832 | ) | — | — | |||||||||||||||
Merrill Lynch, Pierce, Fenner & Smith, Inc | 2,084,813 | (2,084,813 | ) | — | — | |||||||||||||||
Nomura Securities International, Inc | 31,875,098 | (31,875,098 | ) | — | — | |||||||||||||||
RBC Capital Markets, LLC | 105,703,703 | (105,703,703 | ) | — | — | |||||||||||||||
|
| |||||||||||||||||||
Total | $ | 327,543,464 | $ | (327,543,464 | ) | — | — | |||||||||||||
|
| |||||||||||||||||||
| 1 | Collateral with a value of $343,075,306 has been pledged in connection with open reverse repurchase agreements. Excess of collateral pledged to the individual counterparty is not shown for financial reporting purposes. |
| 2 | Net amount represents the net amount payable due to counterparty in the event of default. |
| BKT | ||||||||||||||
| Counterparty | Reverse Repurchase Agreements | Fair Value of Non-cash Collateral Pledged Including Accrued Interest1 | Cash Collateral Pledged/Received | Net Amount2 | ||||||||||
BNP Paribas Securities Corp. | $ | 6,933,392 | $ | (6,933,392 | ) | — | — | |||||||
Citigroup Global Markets, Inc. | 4,307,213 | (4,307,213 | ) | — | — | |||||||||
HSBC Securities (USA), Inc. | 163,759,568 | (163,759,568 | ) | — | — | |||||||||
|
| |||||||||||||
Total | $ | 175,000,173 | $ | (175,000,173 | ) | — | — | |||||||
|
| |||||||||||||
| 1 | Collateral with a value of $180,030,468 has been pledged in connection with open reverse repurchase agreements. Excess of collateral pledged to the individual counterparty is not shown for financial reporting purposes. |
| 2 | Net amount represents the net amount payable due to the counterparty in the event of default. |
As of period end, the following table is a summary of the Trust’s open borrowed bond agreements by counterparty which are subject to offset under an MRA on a net basis:
| BKT | ||||||||||||||||||||||||||||||||||||||||
| Counterparty | Borrowed Bond Agreements1 | Borrowed Bonds at Value including Accrued Interest2 | Exposure Due (to)/ from Counterparty before Collateral | Non-cash Collateral Received | Cash Collateral Received | Non-cash Collateral Pledged | Cash Collateral Pledged | Net Collateral (Received)/ Pledged | Net Exposure Due (to)/from Counterparty3 | |||||||||||||||||||||||||||||||
Credit Suisse Securities (USA) LLC | $ | 856,249 | $ | (887,525 | ) | $ | (31,276 | ) | — | — | — | — | — | $ | (31,276 | ) | ||||||||||||||||||||||||
| 1 | Included in investments at value-unaffiliated in the Statements of Assets and Liabilities. |
| 2 | Includes accrued interest on borrowed bonds in the amount of $7,384 which is included in interest expense payable in the Statements of Assets and Liabilities. |
| 3 | Net exposure represents the net receivable (payable) that would be due from/to the counterparty in the event of default. |
| SEMI-ANNUAL REPORT | FEBRUARY 28, 2017 | 83 |
| Notes to Financial Statements (continued) |
In the event the counterparty of securities under an MRA files for bankruptcy or becomes insolvent, a Trust’s use of the proceeds from the agreement may be restricted while the counterparty, or its trustee or receiver, determines whether or not to enforce a Trust’s obligation to repurchase the securities.
Short Sale Transactions: In short sale transactions, a Trust sells a security it does not hold in anticipation of a decline in the market price of that security. When a Trust makes a short sale, it will borrow the security sold short (borrowed bond) and deliver the fixed-income security to the counterparty to which it sold the security short. An amount equal to the proceeds received by a Trust is reflected as an asset and an equivalent liability. The amount of the liability is subsequently marked-to-market to reflect the market value of the short sale. A Trust is required to repay the counterparty interest on the security sold short, which, if applicable, is shown as interest expense in the Statements of Operations. A Trust is exposed to market risk based on the amount, if any, that the market value of the security increases beyond the market value at which the position was sold. Thus, a short sale of a security involves the risk that instead of declining, the price of the security sold short will rise. The short sale of securities involves the possibility of an unlimited loss since there is an unlimited potential for the market price of the security sold short to increase. A gain is limited to the price at which a Trust sold the security short. A realized gain or loss is recognized upon the termination of a short sale if the market price is either less than or greater than the proceeds originally received. There is no assurance that a Trust will be able to close out a short position at a particular time or at an acceptable price.
5. Derivative Financial Instruments:
The Trusts engage in various portfolio investment strategies using derivative contracts both to increase the returns of the Trusts and/or to manage their exposure to certain risks such as credit risk, equity risk, interest rate risk, foreign currency exchange rate risk, commodity price risk or other risks (e.g., inflation risk). Derivative financial instruments categorized by risk exposure are included in the Schedules of Investments. These contracts may be transacted on an exchange or OTC.
Futures Contracts: Certain Trusts invest in long and/or short positions in futures and options on futures contracts to gain exposure to, or manage exposure to changes in interest rates (interest rate risk), changes in the value of equity securities (equity risk) or foreign currencies (foreign currency exchange rate risk).
Futures contracts are agreements between the Trusts and a counterparty to buy or sell a specific quantity of an underlying instrument at a specified price and on a specified date. Depending on the terms of a contract, it is settled either through physical delivery of the underlying instrument on the settlement date or by payment of a cash amount on the settlement date. Upon entering into a futures contract, the Trusts are required to deposit initial margin with the broker in the form of cash or securities in an amount that varies depending on a contract’s size and risk profile. The initial margin deposit must then be maintained at an established level over the life of the contract.
Securities deposited as initial margin are designated in the Schedules of Investments and cash deposited, if any, is shown as cash pledged for futures contracts in the Statements of Assets and Liabilities. Pursuant to the contract, the Trusts agree to receive from or pay to the broker an amount of cash equal to the daily fluctuation in market value of the contract (“variation margin”). Variation margin is recorded as unrealized appreciation (depreciation) and, if any, shown as variation margin receivable (or payable) on futures contracts in the Statements of Assets and Liabilities. When the contract is closed, a realized gain or loss is recorded in the Statements of Operations equal to the difference between the value of the contract at the time it was opened and the value at the time it was closed. The use of futures contracts involves the risk of an imperfect correlation in the movements in the price of futures contracts and interest, foreign currency exchange rates or underlying assets.
Forward Foreign Currency Exchange Contracts: Certain Trusts enter into forward foreign currency exchange contracts to gain or reduce exposure to foreign currencies (foreign currency exchange rate risk).
A forward foreign currency exchange contract is an agreement between two parties to buy and sell a currency at a set exchange rate on a specified date. These contracts help to manage the overall exposure to the currencies in which some of the investments held by the Trusts are denominated and in some cases, may be used to obtain exposure to a particular market.
The contract is marked to market daily and the change in market value is recorded as unrealized appreciation (depreciation) in the Statements of Assets and Liabilities. When a contract is closed, a realized gain or loss is recorded in the Statements of Operations equal to the difference between the value at the time it was opened and the value at the time it was closed. Non-deliverable forward foreign currency exchange contracts are settled with the counterparty in cash without the delivery of foreign currency. The use of forward foreign currency exchange contracts involves the risk that the value of a forward foreign currency exchange contract changes unfavorably due to movements in the value of the referenced foreign currencies.
Options: Certain Trusts purchase and write call and put options to increase or decrease their exposure to the risks of underlying instruments, including equity risk, interest rate risk and/or commodity price risk and/or, in the case of options written, to generate gains from options premiums.
A call option gives the purchaser (holder) of the option the right (but not the obligation) to buy, and obligates the seller (writer) to sell (when the option is exercised) the underlying instrument at the exercise or strike price at any time or at a specified time during the option period. A put option gives the holder the right to sell and obligates the writer to buy the underlying instrument at the exercise or strike price at any time or at a specified time during the option period.
| 84 | SEMI-ANNUAL REPORT | FEBRUARY 28, 2017 |
| Notes to Financial Statements (continued) | ||||
Premiums paid on options purchased and premiums received on options written, as well as the daily fluctuation in market value, are included in investments at value — unaffiliated and options written at value, respectively, in the Statements of Assets and Liabilities. When an instrument is purchased or sold through the exercise of an option, the premium is offset against the cost or proceeds of the underlying instrument. When an option expires, a realized gain or loss is recorded in the Statements of Operations to the extent of the premiums received or paid. When an option is closed or sold, a gain or loss is recorded in the Statements of Operations to the extent the cost of the closing transaction exceeds the premiums received or paid. When the Trusts write a call option, such option is typically “covered,” meaning that they hold the underlying instrument subject to being called by the option counterparty. When the Trusts write a put option, such option is covered by cash in an amount sufficient to cover the obligation.
| • | Swaptions — Certain Trusts purchase and write options on swaps (“swaptions”) primarily to preserve a return or spread on a particular investment or portion of the Trusts’ holdings, as a duration management technique or to protect against an increase in the price of securities it anticipates purchasing at a later date. The purchaser and writer of a swaption is buying or granting the right to enter into a previously agreed upon interest rate or credit default swap agreement (interest rate risk and/or credit risk) at any time before the expiration of the option. |
| • | Foreign Currency Options — Certain Trusts purchase and write foreign currency options, foreign currency futures and options on foreign currency futures to gain or reduce exposure to foreign currencies (foreign currency exchange rate risk). Foreign currency options give the purchaser the right to buy from or sell to the writer a foreign currency at any time before the expiration of the option. |
In purchasing and writing options, the Trusts bear the risk of an unfavorable change in the value of the underlying instrument or the risk that they may not be able to enter into a closing transaction due to an illiquid market. Exercise of a written option could result in the Trusts purchasing or selling a security when it otherwise would not, or at a price different from the current market value.
Swaps: Certain Trusts enter into swap contracts to manage exposure to issuers, markets and securities. Such contracts are agreements between the Trusts and a counterparty to make periodic net payments on a specified notional amount or a net payment upon termination. Swap agreements are privately negotiated in the OTC market and may be entered into as a bilateral contract (“OTC swaps”) or centrally cleared (“centrally cleared swaps”).
For OTC swaps, any upfront premiums paid and any upfront fees received are shown as swap premiums paid and swap premiums received, respectively, in the Statements of Assets and Liabilities and amortized over the term of the contract. The daily fluctuation in market value is recorded as unrealized appreciation (depreciation) on OTC Swaps in the Statements of Assets and Liabilities. Payments received or paid are recorded in the Statements of Operations as realized gains or losses, respectively. When an OTC swap is terminated, a realized gain or loss is recorded in the Statements of Operations equal to the difference between the proceeds from (or cost of) the closing transaction and the Trusts’ basis in the contract, if any. Generally, the basis of the contract is the premium received or paid.
In a centrally cleared swap, immediately following execution of the swap contract, the swap contract is novated to a central counterparty (the “CCP”) and the Trusts’ counterparty on the swap agreement becomes the CCP. The Trusts are required to interface with the CCP through the broker. Upon entering into a centrally cleared swap, the Trusts are required to deposit initial margin with the broker in the form of cash or securities in an amount that varies depending on the size and risk profile of the particular swap. Securities deposited as initial margin are designated in the Schedules of Investments and cash deposited is shown as cash pledged for centrally cleared swaps in the Statements of Assets and Liabilities. Pursuant to the contract, the Trusts agree to receive from or pay to the broker an amount of cash equal to the daily fluctuation in market value of the contract (“variation margin”). Variation margin is recorded as unrealized appreciation (depreciation) and shown as variation margin receivable (or payable) on centrally cleared swaps in the Statements of Assets and Liabilities. Payments received from (paid to) the counterparty, including at termination, are recorded as realized gains (losses) in the Statements of Operations.
| • | Credit default swaps — Certain Trusts enter into credit default swaps to manage their exposure to the market or certain sectors of the market, to reduce their risk exposure to defaults of corporate and/or sovereign issuers or to create exposure to corporate and/or sovereign issuers to which they are not otherwise exposed (credit risk). |
The Trusts may either buy or sell (write) credit default swaps on single-name issuers (corporate or sovereign), a combination or basket of single-name issuers or traded indexes. Credit default swaps are agreements in which the protection buyer pays fixed periodic payments to the seller in consideration for a promise from the protection seller to make a specific payment should a negative credit event take place with respect to the referenced entity (e.g., bankruptcy, failure to pay, obligation acceleration, repudiation, moratorium or restructuring). As a buyer, if an underlying credit event occurs, the Trusts will either (i) receive from the seller an amount equal to the notional amount of the swap and deliver the referenced security or underlying securities comprising the index, or (ii) receive a net settlement of cash equal to the notional amount of the swap less the recovery value of the security or underlying securities comprising the index. As a seller (writer), if an underlying credit event occurs, the Trusts will either pay the buyer an amount equal to the notional amount of the swap and take delivery of the referenced security or underlying securities comprising the index or pay a net settlement of cash equal to the notional amount of the swap less the recovery value of the security or underlying securities comprising the index.
| • | Total return swaps — Certain Trusts enter into total return swaps to obtain exposure to a security or market without owning such security or investing directly in such market or to exchange the risk/return of one market (e.g., fixed income) with another market (e.g., equity or commodity prices) (equity risk, commodity price risk and/or interest rate risk). |
| SEMI-ANNUAL REPORT | FEBRUARY 28, 2017 | 85 |
| Notes to Financial Statements (continued) |
Total return swaps are agreements in which there is an exchange of cash flows whereby one party commits to make payments based on the total return (distributions plus capital gains/losses) of an underlying instrument in exchange for fixed or floating rate interest payments. If the total return of the instrument or index underlying the transaction exceeds or falls short of the offsetting fixed or floating interest rate obligation, the Trusts receive payment from or make a payment to the counterparty
| • | Interest rate swaps — Certain Trusts enter into interest rate swaps to gain or reduce exposure to interest rates or to manage duration, the yield curve or interest rate (interest rate risk). |
Interest rate swaps are agreements in which one party pays a stream of interest payments, either fixed or floating, in exchange for another party’s stream of interest payments, either fixed or floating, on the same notional amount for a specified period of time. In more complex interest rate swaps, the notional principal amount may decline (or amortize) over time.
| • | Forward swaps — Certain Trusts enter into forward interest rate swaps and forward total return swaps. In a forward swap, the Trust and the counterparty agree to make periodic net payments beginning on a specified date or a net payment at termination. |
Swap transactions involve, to varying degrees, elements of interest rate, credit and market risk in excess of the amounts recognized in the Statements of Assets and Liabilities. Such risks involve the possibility that there will be no liquid market for these agreements, that the counterparty to the agreements may default on its obligation to perform or disagree as to the meaning of the contractual terms in the agreements, and that there may be unfavorable changes in interest rates and/or market values associated with these transactions.
Master Netting Arrangements: In order to define their contractual rights and to secure rights that will help them mitigate their counterparty risk, the Trusts may enter into an International Swaps and Derivatives Association, Inc. Master Agreement (“ISDA Master Agreement”) or similar agreement with their counterparties. An ISDA Master Agreement is a bilateral agreement between each Trust and a counterparty that governs certain OTC derivatives and typically contains, among other things, collateral posting terms and netting provisions in the event of a default and/or termination event. Under an ISDA Master Agreement, each Trust may, under certain circumstances, offset with the counterparty certain derivative financial instruments’ payables and/or receivables with collateral held and/or posted and create one single net payment. The provisions of the ISDA Master Agreement typically permit a single net payment in the event of default including the bankruptcy or insolvency of the counterparty. Bankruptcy or insolvency laws of a particular jurisdiction may restrict or prohibit the right of offset in bankruptcy, insolvency or other events. In addition, certain ISDA Master Agreements allow counterparties to terminate derivative contracts prior to maturity in the event the Trusts’ net assets decline by a stated percentage or the Trusts fail to meet the terms of their ISDA Master Agreements. The result would cause the Trusts to accelerate payment of any net liability owed to the counterparty.
Collateral Requirements: For derivatives traded under an ISDA Master Agreement, the collateral requirements are typically calculated by netting the mark-to-market amount for each transaction under such agreement and comparing that amount to the value of any collateral currently pledged by the Trust and the counterparty.
Cash collateral that has been pledged to cover obligations of the Trusts and cash collateral received from the counterparty, if any, is reported separately on the Statements of Assets and Liabilities as cash pledged as collateral and cash received as collateral, respectively. Non-cash collateral pledged by the Trusts, if any, is noted in the Schedules of Investments. Generally, the amount of collateral due from or to a counterparty is subject to a certain minimum transfer amount threshold before a transfer is required, which is determined at the close of business of the Trusts. Any additional required collateral is delivered to/pledged by the Trusts on the next business day. Typically, the counterparty is not permitted to sell, re-pledge or use cash and non-cash collateral it receives. A Trust generally agrees not to use non-cash collateral that it receives but may, absent default or certain other circumstances defined in the underlying ISDA Master Agreement, be permitted to use cash collateral received. In such cases, interest may be paid pursuant to the collateral arrangement with the counterparty. To the extent amounts due to the Trusts from their counterparties are not fully collateralized, they bear the risk of loss from counterparty non-performance. Likewise, to the extent the Trusts have delivered collateral to a counterparty and stand ready to perform under the terms of their agreement with such counterparty, they bear the risk of loss from a counterparty in the amount of the value of the collateral in the event the counterparty fails to return such collateral. Based on the terms of agreements, collateral may not be required for all derivative contracts.
For financial reporting purposes, the Trusts not offset derivative assets and derivative liabilities that are subject to netting arrangements, if any, in the Statements of Assets and Liabilities.
6. Investment Advisory Agreement and Other Transactions with Affiliates:
The PNC Financial Services Group, Inc. is the largest stockholder and an affiliate of BlackRock, Inc. (“BlackRock”) for 1940 Act purposes.
Investment Advisory: Each Trust, entered into an Investment Advisory Agreement with the Manager, the Trust’s investment adviser, an indirect, wholly-owned subsidiary of BlackRock, to provide investment advisory and administration services. The Manager is responsible for the management of each Trust’s portfolio and provides the personnel, facilities, equipment and certain other services necessary to the operations of each Trust.
| 86 | SEMI-ANNUAL REPORT | FEBRUARY 28, 2017 |
| Notes to Financial Statements (continued) | ||||
For such services, BHK pays the Manager a monthly fee based on an annual rate of 0.50% of the average weekly value of the Trust’s managed assets. For purposes of calculating this fee, “managed assets” means the total assets of the Trust minus the sum of its accrued liabilities (other than the aggregate indebtedness constituting financial leverage).
For such services, HYT pays the Manager a monthly fee at an annual rate equal to 0.60% of the average daily value of the Trust’s net assets, plus the proceeds of any debt securities or outstanding borrowings used for leverage. For purposes of calculating this fee, “net assets” means the total assets of the Trust minus the sum of its accrued liabilities.
For such services, BKT pays the Manager a monthly fee at an annual rate equal to 0.65% of the average weekly value of the Trust’s net assets. For purposes of calculating this fee, “net assets” means the total assets of the Trust minus the sum of its accrued liabilities (including the aggregate indebtedness constituting financial leverage).
The Manager provides investment management and other services to the Taxable Subsidiary. The Manager does not receive separate compensation from the Taxable Subsidiary for providing investment management or administrative services. However, HYT pays the Manager based on HYT’s net assets, plus the proceeds of any debt securities or outstanding borrowings used for leverage, which includes the assets of the Taxable Subsidiary
Distribution Fees: HYT has entered into a Distribution Agreement with BlackRock Investments, LLC (“BRIL”), an affiliate of the Manager, to provide for distribution of HYT’s common shares on a reasonable best efforts basis through an equity shelf offering (a “Shelf Offering”) (the “Distribution Agreement”); however, as of February 28, 2017, HYT is no longer actively engaged in a Shelf Offering and has not filed a registration statement or a prospectus for any current Shelf Offering. Pursuant to the Distribution Agreement, HYT would compensate BRIL with respect to sales of common shares at a commission rate of 1.00% of the gross proceeds of the sale of HYT’s Common Shares and a portion of such commission would be re-allowed to broker-dealers engaged by BRIL.
Administration: BKT has an Administration Agreement with the Manager. The administration fee paid to the Manager is computed at an annual rate of 0.15% of the BKT’s average weekly net assets/managed assets.
Transfer Agent: Pursuant to written agreements, certain financial intermediaries, some of which may be affiliates, provide the Trusts with sub-accounting, recordkeeping, sub-transfer agency and other administrative services with respect to sub-accounts they service. For these services, these entities receive an asset-based fee or an annual fee per shareholder account, which will vary depending on share class and/or net assets.
Expense Waivers: The Manager voluntarily agreed to waive its investment advisory fees by the amount of investment advisory fees each Trust pays to the Manager indirectly through its investment in affiliated money market funds (the “affiliated money market fund waiver”). These amounts are included in fees waived by the Manager in the Statements of Operations. For the six months ended February 28, 2017, the amounts waived were as follows:
| BHK | HYT | BKT | ||||||||||
Amounts waived | $ | 5,164 | $ | 778 | $ | 3,753 | ||||||
Effective September 1, 2016, the Manager voluntarily agreed to waive its investment advisory fee with respect to any portion of the Trusts’ assets invested in affiliated equity or fixed-income mutual funds or affiliated exchange-traded funds that have a contractual management fee. Prior to September 1, 2016, the Manager did not waive such fees. On December 2, 2016, Manager entered into a Master Advisory Fee Agreement (“Agreement”), contractually committing to this arrangement through June 30, 2017. The Agreement can be renewed for annual periods thereafter, and may be terminated on 90 days’ notice, each subject to approval by a majority of the Trusts’ independent trustees. For the six months ended February 28, 2017, HYT waived $20,757 in investment advisory fees pursuant to these arrangements.
Officers and Trustees: Certain officers and/or trustees of the Trusts are officers and/or directors of BlackRock or its affiliates. The Trusts reimburse the Manager for a portion of the compensation paid to the Trusts’ Chief Compliance Officer, which is included in Officer and Trustees in the Statements of Operations.
Other Transactions: During the six months ended February 28, 2017, HYT received a reimbursement of $29,894 from an affiliate, which is shown as payment by affiliate in the Consolidated Statement of Operations, related to an operating error.
The Trusts may purchase securities from, or sell securities to, an affiliated fund provided the affiliation is due solely to having a common investment adviser, common officers, or common trustees. For the six months ended February 28, 2017, the purchase and sale transactions and any net realized gains (losses) with an affiliated funds in compliance with Rule 17a-7 under the 1940 Act were as follows:
| Purchases | Sales | Net Realized Loss | ||||||||||
HYT | — | $ | 117,656 | $ | (47 | ) | ||||||
| SEMI-ANNUAL REPORT | FEBRUARY 28, 2017 | 87 |
| Notes to Financial Statements (continued) |
7. Purchases and Sales:
For the six months ended February 28, 2017, purchases and sales of investments including paydowns, mortgage dollar rolls and TBA transactions and excluding short-term securities, were as follows:
| Purchases | ||||||||||||
| BHK | HYT | BKT | ||||||||||
Non-U.S. Government Securities | $ | 223,041,361 | $ | 740,274,879 | $ | 696,372,470 | ||||||
U.S. Government Securities | — | — | — | |||||||||
|
| |||||||||||
Total Purchases | $ | 223,041,361 | $ | 740,274,879 | $ | 696,372,470 | ||||||
|
| |||||||||||
| Sales | ||||||||||||
| BHK | HYT | BKT | ||||||||||
Non-U.S. Government Securities | $ | 178,988,653 | $ | 756,181,005 | $ | 745,496,202 | ||||||
U.S. Government Securities | 22,938,080 | — | — | |||||||||
|
| |||||||||||
Total Sales | $ | 201,926,733 | $ | 756,181,005 | $ | 745,496,202 | ||||||
|
| |||||||||||
For the six months ended February 28, 2017, purchases and sales related to mortgage dollar rolls for BKT were $405,818,828 and $405,207,080, respectively.
8. Income Tax Information:
It is the Trusts’ policy to comply with the requirements of the Internal Revenue Code of 1986, as amended, applicable to regulated investment companies, and to distribute substantially all of their taxable income to their shareholders. Therefore, no U.S. federal income tax provision is required, except with respect to any taxes related to the Taxable Subsidiaries.
Each Trust files U.S. federal and various state and local tax returns. No income tax returns are currently under examination. The statute of limitations on each Trust’s U.S. federal tax returns generally remains open for each of the four years ended August 31, 2016. The statutes of limitations on each Trust’s state and local tax returns may remain open for an additional year depending upon the jurisdiction.
Management has analyzed tax laws and regulations and their application to the Trusts as of February 28, 2017, inclusive of the open tax return years, and does not believe that there are any uncertain tax positions that require recognition of a tax liability in the Trusts’ financial statements.
As of August 31, 2016, the Trusts had capital loss carryforwards available to offset future realized capital gains through the indicated expiration dates as follows:
| Expires August 31, | BHK | HYT | BKT | |||||||||
No expiration date1 | $ | 11,373,636 | $ | 114,202,809 | $ | 43,751,932 | ||||||
2017 | 5,617,079 | 95,246,388 | — | |||||||||
2018 | — | 55,665,607 | — | |||||||||
|
| |||||||||||
Total | $ | 16,990,715 | $ | 265,114,804 | $ | 43,751,932 | ||||||
|
| |||||||||||
| 1 | Must be utilized prior to losses subject to expiration. |
As of February 28, 2017, gross unrealized appreciation and depreciation based on cost for U.S. federal income tax purposes were as follows:
| BHK | HYT | BKT | ||||||||||
Tax cost | $ | 1,069,927,918 | $ | 2,121,095,756 | $ | 663,931,304 | ||||||
|
| |||||||||||
Gross unrealized appreciation | $ | 52,688,720 | $ | 80,617,397 | $ | 18,230,038 | ||||||
Gross unrealized depreciation | (24,610,419 | ) | (86,272,275 | ) | (31,317,575 | ) | ||||||
|
| |||||||||||
Net unrealized appreciation (depreciation) | $ | 28,078,301 | $ | (5,654,878 | ) | $ | (13,087,537 | ) | ||||
|
| |||||||||||
9. Bank Borrowings:
HYT is party to a senior committed secured, 360-day rolling line of credit facility and a separate security agreement (the “SSB Agreement”) with State Street Bank and Trust Company (“SSB”). SSB may elect to terminate its commitment upon 360-days written notice to the Trust. As of period end, HYT has not received any notice to terminate. HYT has granted a security interest in substantially all of their assets to SSB.
The SSB Agreement allows for a maximum commitment of $732,000,000 for HYT.
Advances will be made by SSB to HYT, at HYT’s option of (a) the higher of (i) 0.80% above the Fed Trusts rate and (ii) 0.80% above Overnight LIBOR or (b) 0.80% above 7-day, 30-day, 60-day or 90-day LIBOR.
| 88 | SEMI-ANNUAL REPORT | FEBRUARY 28, 2017 |
| Notes to Financial Statements (continued) | ||||
In addition, HYT pays a commitment fee (based on the daily unused portion of the commitments). The fees associated with each of the agreements are included in the Statements of Operations as borrowing costs, if any. Advances to the Trusts as of period end are shown in the Statements of Assets and Liabilities as bank borrowings payable. Based on the short-term nature of the borrowings under the line of credit and the variable interest rate, the carrying amount of the borrowings approximates fair value.
HYT may not declare dividends or make other distributions on shares or purchase any such shares if, at the time of the declaration, distribution or purchase, asset coverage with respect to the outstanding short-term borrowings is less than 300%.
For the six months ended February 28, 2017, the average amount of bank borrowings and the daily weighted average interest rates for HYT for loans under the revolving credit agreements were $569,364,641 and 1.38%, respectively.
10. Principal Risks:
Many municipalities insure repayment of their bonds, which may reduce the potential for loss due to credit risk. The market value of these bonds may fluctuate for other reasons, including market perception of the value of such insurance, and there is no guarantee that the insurer will meet its obligation.
Inventories of municipal bonds held by brokers and dealers may decrease, which would lessen their ability to make a market in these securities. Such a reduction in market making capacity could potentially decrease a Trust’s ability to buy or sell bonds. As a result, a trust may sell a security at a lower price, sell other securities to raise cash, or give up an investment opportunity, any of which could have a negative impact on performance. If a Trust needed to sell large blocks of bonds, those sales could further reduce the bonds’ prices and impact performance.
In the normal course of business, the Trusts invest in securities and enter into transactions where risks exist due to fluctuations in the market (market risk) or failure of the issuer to meet all its obligations, including the ability to pay principal and interest when due (issuer credit risk). The value of securities held by the Trusts may decline in response to certain events, including those directly involving the issuers of securities owned by the Trusts. Changes arising from the general economy, the overall market and local, regional or global political and/or social instability, as well as currency, interest rate and price fluctuations, may also affect the securities’ value.
Each Trust may be exposed to prepayment risk, which is the risk that borrowers may exercise their option to prepay principal earlier than scheduled during periods of declining interest rates, which would force each Trust to reinvest in lower yielding securities. Each Trust may also be exposed to reinvestment risk, which is the risk that income from each Trust’s portfolio will decline if each Trust invests the proceeds from matured, traded or called fixed income securities at market interest rates that are below each Trust portfolio’s current earnings rate.
Valuation Risk: The market values of equities, such as common stocks and preferred securities or equity related investments, such as futures and options, may decline due to general market conditions which are not specifically related to a particular company. They may also decline due to factors which affect a particular industry or industries. A Trust may invest in illiquid investments and may experience difficulty in selling those investments in a timely manner at the price that it believes the investments are worth. Prices may fluctuate widely over short or extended periods in response to company, market or economic news. Markets also tend to move in cycles, with periods of rising and falling prices. This volatility may cause the Trust’s NAV to experience significant increases or decreases over short periods of time. If there is a general decline in the securities and other markets, the NAV of a Trust may lose value, regardless of the individual results of the securities and other instruments in which a Trust invests.
The price a Trust could receive upon the sale of any particular portfolio investment may differ from a Trust’s valuation of the investment, particularly for securities that trade in thin or volatile markets or that are valued using a fair valuation technique or a price provided by an independent pricing service. Changes to significant unobservable inputs and assumptions (i.e., publicly traded company multiples, growth rate, time to exit) due to the lack of observable inputs may significantly impact the resulting fair value and therefore a Trust’s results of operations. As a result, the price received upon the sale of an investment may be less than the value ascribed by a Trust, and a Trust could realize a greater than expected loss or lesser than expected gain upon the sale of the investment. A Trust’s ability to value its investments may also be impacted by technological issues and/or errors by pricing services or other third party service providers.
Counterparty Credit Risk: Similar to issuer credit risk, the Trusts may be exposed to counterparty credit risk, or the risk that an entity may fail to or be unable to perform on its commitments related to unsettled or open transactions. The Trusts manage counterparty credit risk by entering into transactions only with counterparties that the Manager believes have the financial resources to honor their obligations and by monitoring the financial stability of those counterparties. Financial assets, which potentially expose the Trusts to market, issuer and counterparty credit risks, consist principally of financial instruments and receivables due from counterparties. The extent of the Trusts’ exposure to market, issuer and counterparty credit risks with respect to these financial assets is approximately their value recorded in the Statements of Assets and Liabilities, less any collateral held by the Trusts.
A derivative contract may suffer a mark-to-market loss if the value of the contract decreases due to an unfavorable change in the market rates or values of the underlying instrument. Losses can also occur if the counterparty does not perform under the contract.
A Trust’s risk of loss from counterparty credit risk on OTC derivatives is generally limited to the aggregate unrealized gain less the value of any collateral held by such Trust.
| SEMI-ANNUAL REPORT | FEBRUARY 28, 2017 | 89 |
| Notes to Financial Statements |
For OTC options purchased, each Trust bears the risk of loss in the amount of the premiums paid plus the positive change in market values net of any collateral held by the Trusts should the counterparty fail to perform under the contracts. Options written by the Trusts do not typically give rise to counterparty credit risk, as options written generally obligate the Trusts, and not the counterparty, to perform. The Trusts may be exposed to counterparty credit risk with respect to options written to the extent the Trusts deposit collateral with its counterparty to a written option.
With exchange-traded options purchased and futures and centrally cleared swaps, there is less counterparty credit risk to the Trusts since the exchange or clearinghouse, as counterparty to such instruments, guarantees against a possible default. The clearinghouse stands between the buyer and the seller of the contract; therefore, credit risk is limited to failure of the clearinghouse. While offset rights may exist under applicable law, the Trust does not have a contractual right of offset against a clearing broker or clearinghouse in the event of a default (including the bankruptcy or insolvency). Additionally, credit risk exists in exchange-traded futures and centrally cleared swaps with respect to initial and variation margin that is held in a clearing broker’s customer accounts. While clearing brokers are required to segregate customer margin from their own assets, in the event that a clearing broker becomes insolvent or goes into bankruptcy and at that time there is a shortfall in the aggregate amount of margin held by the clearing broker for all its clients, typically the shortfall would be allocated on a pro rata basis across all the clearing broker’s customers, potentially resulting in losses to the Trusts.
Concentration Risk: Certain Trusts may invest in securities that are rated below investment grade quality (sometimes called “junk bonds”), which are predominantly speculative, have greater credit risk and generally are less liquid and have more volatile prices than higher quality securities.
The Trusts invest a significant portion of their assets in fixed income securities and/or use derivatives tied to the fixed income markets. Changes in market interest rates or economic conditions may affect the value and/or liquidity of such investments. Interest rate risk is the risk that prices of bonds and other fixed income securities will increase as interest rates fall and decrease as interest rates rise. The Trusts may be subject to a greater risk of rising interest rates due to the current period of historically low rates.
Certain Trusts invest a significant portion of their assets in securities backed by commercial or residential mortgage loans or in issuers that hold mortgage and other asset-backed securities. Investment percentages in these securities are presented in the Schedules of Investments. Changes in economic conditions, including delinquencies and/or defaults on assets underlying these securities, can affect the value, income and/or liquidity of such positions.
11. Capital Share Transactions:
BHK is authorized to issue an unlimited number of shares par value $0.001, all of which were initially classified as Common Shares. HYT is authorized to issue 200 million shares, par value $0.10, all of which were initially classified as Common Shares. BKT is authorized to issue 200 million shares, par value $0.01, all of which were initially classified as Common Shares. The Board is authorized, however, to reclassify any unissued Common Shares to Preferred Shares without approval of Common Shareholders.
Common Shares: HYT had previously filed a final prospectus with the U.S. Securities and Exchange Commission (“SEC”) allowing it to issue an additional 10,425,000 Common Shares through an equity shelf program (a “Shelf Offering”). HYT is no longer actively engaged in a Shelf Offering and has not filed a registration statement or a prospectus for any current Shelf Offering. HYT did not issue any Common Shares through the Shelf Offering. See Additional Information — Shelf Offering Program for additional information about the Shelf Offering.
Costs incurred by HYT in connection with the Shelf Offering are recorded as a deferred charge and amortized over 12 months.
On October 26, 2016, the Board approved the Trusts’ participation in an open market share repurchase program. The Trusts are eligible to purchase, at prevailing market prices, up to 5% of their common shares outstanding as of the close of business on October 28, 2016, subject to certain conditions. Repurchases may be made through November 30, 2017. There is no assurance that the Trusts will purchase shares in any particular amounts. For the six months ended February 28, 2017, HYT repurchased 140,680 shares at a cost of $1,553,292, including transaction costs. The total amount of the repurchase offer is reflected in HYT’s Consolidated Statement of Changes in Net Assets.
For the six months ended February 28, 2017 shares issued and outstanding remained constant for BHK and BKT. For the year ended August 31, 2016, shares issued and outstanding remained constant for BHK, HYT and BKT.
12. Contingencies:
In May 2015, the Motors Liquidation Company Avoidance Action Trust, as the Trust Administrator and Trustee of the General Motors bankruptcy estate, began serving amended complaints on defendants, which include former holders of certain General Motors debt (the “Debt”), in an adversary proceeding in the United States Bankruptcy Court for the Southern District of New York. In addition to HYT, the lawsuit also names over five hundred other institutional investors as defendants, some of which are also managed by BlackRock Advisors, LLC or its affiliates. The plaintiffs are seeking an order that HYT and other defendants return proceeds received in 2009 in full payment of the principal and interest on the Debt. The holders received a full repayment of a term loan pursuant to a court order in the General Motors bankruptcy proceeding with the understanding that the Debt was fully secured at the time of repayment. The plaintiffs contend that HYT and other defendants were not secured creditors at the time of the 2009 payments and therefore not entitled to the payments in full. HYT cannot predict the outcome of the lawsuit, or the effect, if any, on HYT’s net asset value. As such, no liability for litigation related to this
| 90 | SEMI-ANNUAL REPORT | FEBRUARY 28, 2017 |
| Notes to Financial Statements (concluded) | ||||
matter is reflected in the financial statements. Management cannot determine the amount of loss that will be realized by HYT but does not expect the loss to exceed the payment received in 2009. The amount of the proceeds received in 2009 is $3,528,671.
13. Subsequent Events:
Management’s evaluation of the impact of all subsequent events on the Trusts’ financial statements was completed through the date the financial statements were issued and the following items were noted:
| Common Dividend Per Share | ||||||||
| Paid1 | Declared2 | |||||||
BHK | $ | 0.0650 | $ | 0.0650 | ||||
HYT | $ | 0.0700 | $ | 0.0700 | ||||
BKT | $ | 0.0265 | $ | 0.0265 | ||||
| 1 | Net investment income dividend paid on March 31, 2017 to Common Shareholders of record on March 15, 2017. |
| 2 | Net investment income dividend declared on April 3, 2017, payable to Common Shareholders of record on April 13, 2017. |
| SEMI-ANNUAL REPORT | FEBRUARY 28, 2017 | 91 |
| Officers and Trustees | ||||
Richard E. Cavanagh, Chair of the Board and Trustee
Karen P. Robards, Vice Chair of the Board and Trustee
Michael J. Castellano, Trustee
Cynthia L. Egan, Trustee
Frank J. Fabozzi, Trustee
Jerrold B. Harris, Trustee
R. Glenn Hubbard, Trustee
W. Carl Kester, Trustee
Catherine A. Lynch, Trustee
Barbara G. Novick, Trustee
John M. Perlowski, Trustee, President and Chief Executive Officer
Jonathan Diorio, Vice President
Neal J. Andrews, Chief Financial Officer
Jay M. Fife, Treasurer
Charles Park, Chief Compliance Officer
Janey Ahn, Secretary
Investment Adviser BlackRock Advisors, LLC Wilmington, DE 19809 | Accounting Agent and Custodian State Street Bank and | Distributor BlackRock Investments, LLC1 | Address of the Trusts 100 Bellevue Parkway Wilmington, DE 19809 | |||
| Transfer Agent Computershare Trust Company, N.A. Canton, MA 02021 | Legal Counsel Skadden, Arps, Slate, Meagher & Flom LLP Boston, MA 02116 | Independent Registered | ||||
| 1 | For HYT. |
| 92 | SEMI-ANNUAL REPORT | FEBRUARY 28, 2017 |
| Additional Information |
| Trust Certification |
The Trusts are listed for trading on the NYSE and have filed with the NYSE their annual chief executive officer certification regarding compliance with the NYSE’s listing standards. The Trusts filed with the SEC the certification of its chief executive officer and chief financial officer required by section 302 of the Sarbanes-Oxley Act.
| Dividend Policy |
Each Trust’s dividend policy is to distribute all or a portion of its net investment income to its shareholders on a monthly basis. In order to provide shareholders with a more stable level of dividend distributions, the distributions paid by the Trusts for any particular month may be more or less than the amount of net investment income earned by the Trusts during such month. The portion of distributions that exceeds a Trust’s current and accumulated earnings and profits, which are measured on a tax basis, will constitute a nontaxable return of capital. Distributions in excess of a Trust’s taxable income and net capital gains, but not in excess of a Trust’s earnings and profits, will be taxable to shareholders as ordinary income and will not constitute a nontaxable return of capital. The Trusts’ current accumulated but undistributed net investment income, if any, is disclosed in the Statements of Assets and Liabilities, which comprises part of the financial information included in this report.
| General Information |
The Trusts do not make available copies of their Statements of Additional Information because the Trusts’ shares are not continuously offered, which means that the Statement of Additional Information of each Trust has not been updated after the completion of the respective Trust’s offerings and the information contained in each Trust’s Statement of Additional Information may have become outdated.
In accordance with Section 23(c) of the 1940 Act, the Trusts from time to time may purchase shares of its Common Shares in the open market or in private transactions.
During the period, there were no material changes in the Trusts’ investment objectives or policies or to the Trusts’ charter or by-laws that would delay or prevent a change of control of the Trusts that were not approved by the shareholders or in the principal risk factors associated with investment in the Trusts. There have been no changes in the persons who are primarily responsible for the day-to-day management of the Trusts’ portfolios.
Quarterly performance, semi-annual and annual reports, current net asset value and other information regarding the Trusts may be found on BlackRock’s website, which can be accessed at http://www.blackrock.com. This reference to BlackRock’s website is intended to allow investors public access to information regarding the Trusts and does not, and is not intended to, incorporate BlackRock’s website in this report.
Electronic Delivery
Shareholders can sign up for e-mail notifications of quarterly statements, annual and semi-annual shareholder reports by enrolling in the Trusts’ electronic delivery program. Electronic copies of shareholder reports are available on BlackRock’s website.
Shareholders Who Hold Accounts with Investment Advisers, Banks or Brokerages:
Please contact your financial advisor. Please note that not all investment advisers, banks or brokerages may offer this service.
Householding
The Trusts will mail only one copy of shareholder documents, including annual and semi-annual reports and proxy statements, to shareholders with multiple accounts at the same address. This practice is commonly called “householding” and is intended to reduce expenses and eliminate duplicate mailings of shareholder documents. Mailings of your shareholder documents may be householded indefinitely unless you instruct us otherwise. If you do not want the mailing of these documents to be combined with those for other members of your household, please call the Trusts at (800) 882-0052.
| SEMI-ANNUAL REPORT | FEBRUARY 28, 2017 | 93 |
| Additional Information (continued) |
| General Information (concluded) |
Availability of Quarterly Schedule of Investments
The Trusts file their complete schedule of portfolio holdings with the SEC for the first and third quarters of each fiscal year on Form N-Q. The Trusts’ Forms N-Q are available on the SEC’s website at http://www.sec.gov and may also be reviewed and copied at the SEC’s Public Reference Room in Washington, D.C. Information on how to access documents on the SEC’s website without charge may be obtained by calling (800) SEC-0330. The Trusts’ Forms N-Q may also be obtained upon request and without charge by calling (800) 882-0052.
Availability of Proxy Voting Policies and Procedures
A description of the policies and procedures that the Trusts use to determine how to vote proxies relating to portfolio securities is available upon request and without charge (1) by calling (800) 882-0052; (2) at http://www.blackrock.com; and (3) on the SEC’s website at http://www.sec.gov.
Availability of Proxy Voting Record
Information about how the Trusts voted proxies relating to securities held in the Trusts’ portfolios during the most recent 12-month period ended June 30 is available upon request and without charge (1) at http://www.blackrock.com or by calling (800) 882-0052; and (2) on the SEC’s website at http://www.sec.gov.
Availability of Trust Updates
BlackRock will update performance and certain other data for the Trusts on a monthly basis on its website in the “Closed-end Funds” section of http://www.blackrock.com as well as certain other material information as necessary from time to time. Investors and others are advised to check the website for updated performance information and the release of other material information about the Trusts. This reference to BlackRock’s website is intended to allow investors public access to information regarding the Trusts and does not, and is not intended to, incorporate BlackRock’s website in this report.
| Section 19(a) Notices |
BHK’s amounts and sources of distributions reported are estimates and are being provided to you pursuant to regulatory requirements and are not being provided for tax reporting purposes. The actual amounts and sources for tax reporting purposes will depend upon the Trust’s investment experience during the remainder of the fiscal year and may be subject to changes based on tax regulations. The Trust will provide a Form 1099-DIV each calendar year that will tell you how to report these distributions for U.S. federal income tax purposes.
| February 28, 2017 | ||||||||||||||||||||||||||||||||||||||||
| Total Cumulative Distributions for the Fiscal Period | % Breakdown of the Total Cumulative Distributions for the Fiscal Period | |||||||||||||||||||||||||||||||||||||||
| Net Investment Income | Net Realized Capital Gains Short Term | Net Realized Capital Gains Long Term | Return of Capital | Total Per Common Share | Net Investment Income | Net Realized Capital Gains Short Term | Net Realized Capital Gains Long Term | Return of Capital | Total Per Common Share | |||||||||||||||||||||||||||||||
BHK | $ | 0.390000 | — | — | — | $ | 0.390000 | 100 | % | 0 | % | 0 | % | 0 | % | 100 | % | |||||||||||||||||||||||
The Trust estimates that it has distributed more than the amount of earned income and net realized gains; therefore, a portion of the distribution may be a return of capital. A return of capital may occur, for example, when some or all of the shareholder's investment in the Trust is returned to the shareholder. A return of capital does not necessarily reflect the Trust's investment performance and should not be confused with "yield" or "income". When distributions exceed total return performance, the difference will incrementally reduce the Trust's net asset value per share.
Section 19(a) notices for the Trusts, as applicable, are available on the BlackRock website http://www.blackrock.com.
| 94 | SEMI-ANNUAL REPORT | FEBRUARY 28, 2017 |
| Additional Information (concluded) | ||||
| Shelf Offering Program |
From time-to-time, each Trust may seek to raise additional equity capital through an equity shelf program (a “Shelf Offering”). In a Shelf Offering, a Trust may, subject to market conditions, raise additional equity capital by issuing new Common Shares from time to time in varying amounts at a net price at or above the Trust’s net asset value (“NAV”) per Common Share (calculated within 48 hours of pricing). While any such Shelf Offering may allow a Trust to pursue additional investment opportunities without the need to sell existing portfolio investments, it could also entail risks — including that the issuance of additional Common Shares may limit the extent to which the Common Shares are able to trade at a premium to NAV in the secondary market.
None of the Trusts have filed a registration statement with respect to any current Shelf Offerings. This report is not an offer to sell Trust Common Shares and is not a solicitation of an offer to buy Trust Common Shares. If a Trust files a registration statement with respect to any current Shelf Offering, the prospectus contained therein will contain more complete information about the Trust and should be read carefully before investing.
| BlackRock Privacy Principles |
BlackRock is committed to maintaining the privacy of its current and former fund investors and individual clients (collectively, “Clients”) and to safeguarding their non-public personal information. The following information is provided to help you understand what personal information BlackRock collects, how we protect that information and why in certain cases we share such information with select parties.
If you are located in a jurisdiction where specific laws, rules or regulations require BlackRock to provide you with additional or different privacy-related rights beyond what is set forth below, then BlackRock will comply with those specific laws, rules or regulations.
BlackRock obtains or verifies personal non-public information from and about you from different sources, including the following: (i) information we receive from you or, if applicable, your financial intermediary, on applications, forms or other documents; (ii) information about your transactions with us, our affiliates, or others; (iii) information we receive from a consumer reporting agency; and (iv) from visits to our websites.
BlackRock does not sell or disclose to non-affiliated third parties any non-public personal information about its Clients, except as permitted by law or as is necessary to respond to regulatory requests or to service Client accounts. These non-affiliated third parties are required to protect the confidentiality and security of this information and to use it only for its intended purpose.
We may share information with our affiliates to service your account or to provide you with information about other BlackRock products or services that may be of interest to you. In addition, BlackRock restricts access to non-public personal information about its Clients to those BlackRock employees with a legitimate business need for the information. BlackRock maintains physical, electronic and procedural safeguards that are designed to protect the non-public personal information of its Clients, including procedures relating to the proper storage and disposal of such information.
| SEMI-ANNUAL REPORT | FEBRUARY 28, 2017 | 95 |
This report is intended for current holders. It is not a prospectus. Past performance results shown in this report should not be considered a representation of future performance. The Trusts have leveraged their Common Shares, which creates risks for Common Shareholders, including the likelihood of greater volatility of net asset value and market price of the Common Shares, and the risk that fluctuations in short-term interest rates may reduce the Common Shares’ yield. Statements and other information herein are as dated and are subject to change.

| CEFBHK-2/17-SAR |  |
| Item 2 – | Code of Ethics – Not Applicable to this semi-annual report |
| Item 3 – | Audit Committee Financial Expert – Not Applicable to this semi-annual report |
| Item 4 – | Principal Accountant Fees and Services – Not Applicable to this semi-annual report |
| Item 5 – | Audit Committee of Listed Registrants – Not Applicable to this semi-annual report |
| Item 6 – | Investments |
(a) The registrant’s Schedule of Investments is included as part of the Report to Stockholders filed under Item 1 of this Form.
(b) Not Applicable due to no such divestments during the semi-annual period covered since the previous Form N-CSR filing.
| Item 7 – | Disclosure of Proxy Voting Policies and Procedures for Closed-End Management Investment Companies – Not Applicable to this semi-annual report |
| Item 8 – | Portfolio Managers of Closed-End Management Investment Companies |
| (a) | Not Applicable to this semi-annual report. |
| (b) | As of the date of this filing, there have been no changes in any of the portfolio managers identified in the most recent annual report on Form N-CSR. |
| Item 9 – | Purchases of Equity Securities by Closed-End Management Investment Company and Affiliated Purchasers – Not Applicable |
Item 10 – Submission of Matters to a Vote of Security Holders – There have been no material changes to these procedures.
Item 11 – Controls and Procedures
(a) – The registrant’s principal executive and principal financial officers, or persons performing similar functions, have concluded that the registrant’s disclosure controls and procedures (as defined in Rule 30a-3(c) under the Investment Company Act of 1940, as amended (the “1940 Act”)) are effective as of a date within 90 days of the filing of this report based on the evaluation of these controls and procedures required by Rule 30a-3(b) under the 1940 Act and Rule 13a-15(b) under the Securities Exchange Act of 1934, as amended.
(b) – There were no changes in the registrant’s internal control over financial reporting (as defined in Rule 30a-3(d) under the 1940 Act) that occurred during the second fiscal quarter of the period covered by this report that have materially affected, or are reasonably likely to materially affect, the registrant’s internal control over financial reporting.
Item 12 – Exhibits attached hereto
(a)(1) – Code of Ethics – Not Applicable to this semi-annual report
(a)(2) – Certifications – Attached hereto
(a)(3) – Not Applicable
(b) – Certifications – Attached hereto
2
Pursuant to the requirements of the Securities Exchange Act of 1934 and the Investment Company Act of 1940, the registrant has duly caused this report to be signed on its behalf by the undersigned, thereunto duly authorized.
BlackRock Core Bond Trust
| By: | /s/ John M. Perlowski | |||
| John M. Perlowski | ||||
| Chief Executive Officer (principal executive officer) of | ||||
| BlackRock Core Bond Trust | ||||
Date: May 3, 2017
Pursuant to the requirements of the Securities Exchange Act of 1934 and the Investment Company Act of 1940, this report has been signed below by the following persons on behalf of the registrant and in the capacities and on the dates indicated.
| By: | /s/ John M. Perlowski | |||
| John M. Perlowski | ||||
| Chief Executive Officer (principal executive officer) of | ||||
| BlackRock Core Bond Trust | ||||
Date: May 3, 2017
| By: | /s/ Neal J. Andrews | |||
| Neal J. Andrews | ||||
| Chief Financial Officer (principal financial officer) of | ||||
| BlackRock Core Bond Trust | ||||
Date: May 3, 2017
3