UNITED STATES
SECURITIES AND EXCHANGE COMMISSION
WASHINGTON, D.C. 20549
FORM 20-F
☐ REGISTRATION STATEMENT PURSUANT TO SECTION 12(b) OR (g) OF THE SECURITIES EXCHANGE ACT OF 1934
OR
☒ ANNUAL REPORT PURSUANT TO SECTION 13 OR 15(d) OF THE SECURITIES EXCHANGE ACT OF 1934
For the fiscal year ended December 31, 2021
OR
☐ TRANSITION REPORT PURSUANT TO SECTION 13 OR 15(d) OF THE SECURITIES EXCHANGE ACT OF 1934
OR
☐ SHELL COMPANY REPORT PURSUANT TO SECTION 13 OR 15(d) OF THE SECURITIES EXCHANGE ACT OF 1934
Date of event requiring this shell company report
For the transition period from to
Commission file number 001-15266
| Banco de Chile |
| (Exact name of Registrant as specified in its charter) |
Bank of Chile |
| (Translation of Registrant’s name into English) |
Republic of Chile |
| (Jurisdiction of incorporation or organization) |
| Banco de Chile |
| Paseo Ahumada 251 |
Santiago, Chile |
| (Address of principal executive offices) |
Rolando Arias Sánchez (rarias@bancochile.cl) (562)-2653-3535 Paseo Ahumada 251 Santiago, Chile |
| (Name, Telephone, E-mail and/or Facsimile number and Address of Company Contact Person) |
Securities registered or to be registered pursuant to Section 12(b) of the Act.
Title of each class | Trading Symbol(s) | Name of each exchange on which registered | ||
American Depositary Shares, each representing 200 shares of common stock, without nominal (par) value (“ADSs”) | BCH | New York Stock Exchange | ||
| Shares of common stock, without nominal (par) value | New York Stock Exchange (for listing purposes only) |
Securities registered or to be registered pursuant to Section 12(g) of the Act.
None
(Title of Class)
Securities for which there is a reporting obligation pursuant to Section 15(d) of the Act.
None
(Title of Class)
Indicate the number of outstanding shares of each of the issuer’s classes of capital or common stock as of the close of the period covered by the annual report.
Shares of common stock: 101,017,081,114
Indicate by check mark if the registrant is a well-known seasoned issuer, as defined in Rule 405 of the Securities Act. ☒ Yes ☐ No
If this report is an annual or transition report, indicate by check mark if the registrant is not required to file reports pursuant to Section 13 or 15(d) of the Securities Exchange Act of 1934. ☐ Yes ☒ No
Note — Checking the box above will not relieve any registrant required to file reports pursuant to Section 13 or 15(d) of the Securities Exchange Act of 1934 from their obligations under those Sections.
Indicate by check mark whether the registrant (1) has filed all reports required to be filed by Section 13 or 15(d) of the Securities Exchange Act of 1934 during the preceding 12 months (or for such shorter period that the registrant was required to file such reports), and (2) has been subject to such filing requirements for the past 90 days. ☒ Yes ☐ No
Indicate by check mark whether the registrant has submitted electronically every Interactive Data File required to be submitted pursuant to Rule 405 of Regulation S-T (§232.405 of this chapter) during the preceding 12 months (or for such shorter period that the registrant was required to submit such files). ☒ Yes ☐ No
Indicate by check mark whether the registrant is a large accelerated filer, an accelerated filer, a non-accelerated filer, or an emerging growth company. See the definitions of “large accelerated filer,” “accelerated filer,” and “emerging growth company” in Rule 12b-2 of the Exchange Act. (Check one):
Large accelerated filer ☒ | Accelerated filer ☐ | Non-accelerated filer ☐ | Emerging growth company ☐ |
If an emerging growth company that prepares its financial statements in accordance with U.S. GAAP, indicate by check mark if the registrant has elected not to use the extended transition period for complying with any new or revised financial accounting standards† provided pursuant to Section 13(a) of the Exchange Act. ☐
†The term “new or revised financial accounting standard” refers to any update issued by the Financial Accounting Standards Board to its Accounting Standards Codification after April 5, 2012.
Indicate by check mark whether the registrant has filed a report on and attestation to its management’s assessment of the effectiveness of its internal control over financial reporting under Section 404(b) of the Sarbanes-Oxley Act (15 U.S.C. 7262(b)) by the registered public accounting firm that prepared or issued its audit report. ☒
Indicate by check mark which basis of accounting the registrant has used to prepare the financial statements included in this filing:
U.S. GAAP ☐ | International Financial Reporting Standards as issued by the International Accounting Standards Board ☒ | Other ☐ |
If “Other” has been checked in response to the previous question, indicate by check mark which financial statement item the registrant has elected to follow. ☐ Item 17 ☐ Item 18
If this is an annual report, indicate by check mark whether the registrant is a shell company (as defined in Rule 12b-2 of the Exchange Act). ☐ Yes ☒ No
(APPLICABLE ONLY TO ISSUERS INVOLVED IN BANKRUPTCY PROCEEDINGS DURING THE PAST FIVE YEARS)
Indicate by check mark whether the registrant has filed all documents and reports required to be filed by Sections 12, 13 or 15(d) of the Securities Exchange Act of 1934 subsequent to the distribution of securities under a plan confirmed by a court. ☐ Yes ☐ No
TABLE OF CONTENTS
i
SUMMARY OF RISK FACTORS
An investment in our ADSs is subject to a number of risks, including risks relating to the nature of our business as a financial institution in Chile. The following list summarizes some, but not all, of these risks. Please read the information in the section entitled “Risk Factors” for a more thorough description of these and other risks.
Risks Relating to our Operations and the Chilean Banking Industry
| ● | The growth of our loan portfolio in riskier segments may expose us to increased loan losses and require us to establish higher levels of allowances for loan losses in the future. |
| ● | Our loan portfolio may not continue to grow at the same or similar rates as it has in the past as a result of changes in macroeconomic trends and reforms to banking and non-banking rules, including those in response to the COVID-19 pandemic. |
| ● | Restrictions imposed by regulations, particularly with regards to capital adequacy, liquidity, credit risk provisioning, consumer protection, bankruptcy and taxation may constrain our operations and thereby adversely affect our financial condition and results of operations. |
| ● | The Chilean market for financial services is highly competitive. We compete with Chilean and foreign banks, and with other providers of financial services that are not part of the banking industry. Accordingly, competition within this market is increasing as banks and other non-banking competitors are continuously incorporating new and tailored products and services, while striving to improve service quality and to accelerate digital transformation. These dynamics may adversely impact our results of operations as they may translate into higher interest rates paid on deposits and lower interest rates earned on loans, resulting in decreased net interest margins. |
| ● | Our results of operations depend greatly on our net interest income. As a result, our results of our operations are affected by interest rate volatility and inflation. Changes in nominal interest rates and inflation could affect the interest rates earned on our interest-earning assets differently from the interest rates paid on our interest-bearing liabilities, resulting in net income reduction. Inflation and interest rates are sensitive to several factors beyond our control, including the Central Bank’s monetary policy, deregulation of the Chilean financial sector, local and international economic developments and political conditions, among other factors. |
| ● | The preparation of our financial statements requires management to make judgments and estimates that affect the amounts of assets, liabilities, income and expenses reported in our financial statements. Estimates and assumptions are based on historical experience, expert judgment and other factors, including expectations of future developments under certain alternative scenarios. Although assumptions and estimates are evaluated and revised on a continuous basis, we cannot rule out that projected scenarios could dramatically change in the short term, causing a severe impact on fundamentals and estimates, which could have a material impact on our results of operations and financial position. |
| ● | Operational problems, fraud, errors, criminal events or terrorism or other events relating to force majeure may have a material adverse impact on our business, financial condition and results of operations. |
| ● | Despite our policies and procedures to detect or prevent money laundering and other financial crime activities, we may not be able to fully detect them or on a timely basis. |
| ● | Cybersecurity events or interruptions could negatively affect our reputation or results of operations and may result in litigation. |
| ● | Our current credit ratings determine the cost and the terms upon which we are able to obtain funding in the ordinary course of business. Rating agencies regularly evaluate us by considering diverse factors, including our financial strength, the business environment and the economic backdrop in which we operate. Thus, any downgrade in Chile’s or our credit rating could increase our cost of funding, affecting our interest margins, results of operations and profitability. |
ii
Risks Relating to our American Depositary Shares (“ADSs”)
| ● | Our principal shareholders are in a position to elect a majority of the members of our board of directors and control all matters decided by a shareholder vote, including the approval of fundamental corporate transactions. Therefore, they may have interests that differ from those of our other shareholders and their significant share ownership may have an adverse effect on the future market price of our ADSs and shares. |
| ● | There may be a lack of liquidity and a limited market for our shares and ADSs, which could increase the volatility of the price of our ADSs. |
| ● | ADS holders may exercise voting rights associated with common stock only in accordance with the deposit agreement governing our ADSs. Accordingly, ADS holders will face practical limitations when exercising their voting rights because ADS holders must first receive a notice of a shareholders’ meeting from the Depositary and may then exercise their voting rights by instructing the Depositary, on a timely basis, on how they wish to vote. In addition, although Chilean law requires that we grant preemptive rights to all of our shareholders (including holders of ADSs) whenever we issue new shares, such an offering may not be possible unless a registration statement under the Securities Act is effective with respect to such rights and shares, or an exemption from the registration requirements thereunder were available. As a result, ADS holders may be unable to exercise voting rights at shareholders’ meetings and preemptive rights. |
| ● | COVID-19 or any other pandemic disease and health events will affect both the global and the Chilean economy, our business or results of operations and could affect our financial condition. |
Risks Relating to Chile
| ● | Our core business and transactions are with customers doing business in Chile. Accordingly, our ability to grow our business volumes and results of operations, as well as enhance our financial condition, in general, depends on the dynamics of the Chilean economy or the effects of economic developments in other countries affecting chile, and specific macroeconomic variables such as inflation, unemployment, interest rates, consumption and private investment. If the Chilean economy stagnates or falls into recession, such an occurrence could have an adverse effect on our business growth and the business growth of the Chilean banking industry in general. |
| ● | Currency fluctuations could adversely affect our results of operations, the value of our ADSs and any distributions on the ADSs. |
| ● | Chile has corporate disclosure standards different from those you may be familiar with in the United States. |
| ● | Chilean law may provide shareholders with fewer and less well-defined rights. |
| ● | Our operations are highly dependent on the Chilean political and social environment, as most of our customers and borrowers do business in Chile. Thus, our results of operations, including asset quality and profitability, could be negatively impacted by unfavorable political and diplomatic developments, social instability or unrest, as well as dramatic changes in public policies, including expropriation, nationalization, international ownership legislation, interest rate caps and tax policy. |
| ● | We are a party to collective bargaining agreements with various labor unions to which most of our employees belong. Disputes regarding the terms of these agreements, our potential inability to negotiate acceptable contracts with these unions, could result in strikes, work stoppages, or other slowdowns by the affected workers, among other things. In addition, recent and pending changes to Chilean labor and pension laws may increase costs. Therefore, reforms to labor and pension laws as well as labor strikes or slowdowns could adversely affect our results of operations. |
iii
FORWARD-LOOKING STATEMENTS
This annual report on Form 20-F contains “forward-looking statements” within the meaning of Section 27A of the Securities Act of 1933, as amended (the “Securities Act”), Section 21E of the Securities Exchange Act of 1934, as amended (the “Exchange Act”), and the safe harbor provisions of the Private Securities Litigation Reform Act of 1995. Although we have based these forward-looking statements on our expectations and projections about future events, it is possible that actual results may differ materially from our expectations. In many cases, we include a discussion of the factors that are most likely to cause forward-looking statements to differ from actual results together with the forward-looking statements themselves. These statements appear throughout this annual report, including, without limitation, under “Item 4. Information on the Company” and “Item 5. Operating and Financial Review and Prospects.” Examples of such forward-looking statements include:
| ● | projections of operating revenues, net income (loss), net income (loss) per share, capital expenditures, dividends, capital structure or other financial items or ratios; |
| ● | statements of our plans, objectives or goals, including those related to anticipated trends, competition and regulation; |
| ● | statements about market risks, including interest rate risk and foreign exchange risk; |
| ● | statements about our future economic performance or that of Chile or other countries in which we operate; and |
| ● | statements of assumptions underlying such statements. |
Words such as “believe,” “anticipate,” “plan,” “aims,” “seeks,” “expect,” “intend,” “target,” “objective,” “estimate,” “project,” “potential,” “predict,” “forecast,” “guideline,” “could,” “may,” “will,” “should” and similar expressions are intended to identify forward-looking statements but are not the exclusive means of identifying such statements. These statements may relate to (i) our asset growth and financing plans, (ii) trends affecting our financial condition or results of operations and (iii) the impact of competition and regulations, but are not limited to such topics. Forward-looking statements are not guarantees of future performance and involve risks and uncertainties, and actual results may differ materially from those described in such forward-looking statements included in this annual report as a result of various factors (including, without limitation, the actions of competitors, future global economic conditions, market conditions, foreign exchange rates and operating and financial risks), many of which are beyond our control. The occurrence of any such factors not currently expected by us could significantly alter the results set forth in these statements.
Factors that could cause actual results to differ materially and adversely include, but are not limited to:
| ● | changes in general economic, business, political or other conditions in Chile, or changes in general economic or business conditions in Latin America, the United States, Europe or Asia; |
| ● | changes in capital markets in general that may affect policies or attitudes towards lending to Chile or Chilean companies; |
| ● | increased costs; |
| ● | increased competition and changes in competition or pricing environments, including the effect of new technological developments; |
| ● | unanticipated increases in financing and other costs or the inability to obtain additional debt or equity financing on attractive terms; |
| ● | natural disasters or pandemics, such as the novel coronavirus known as COVID-19 (“COVID-19”); |
| ● | the effect of tax laws on our business; and |
| ● | the factors discussed under “Item 3. Key Information—Risk Factors.” |
You should not place undue reliance on forward-looking statements, which speak only as of the date that they were made. This cautionary statement should be considered in connection with any written or oral forward-looking statements that we may issue in the future. We do not undertake any obligation to publicly release any revisions to such forward-looking statements after the filing of this annual report to reflect later events or circumstances or to reflect the occurrence of unanticipated events.
iv
PRESENTATION OF FINANCIAL INFORMATION
We prepare our audited consolidated financial statements in Chilean pesos and in accordance with International Financial Reporting Standards (“IFRS”) in effect from time to time as issued by the International Accounting Standards Board (“IASB”).
Unless otherwise indicated, the financial information included in this annual report with respect to 2019, 2020 and 2021 has been derived from financial statements that have been prepared in accordance with IFRS. See Note 2(a) to our audited consolidated financial statements as of and for the year ended December 31, 2021 appearing elsewhere in this annual report. IFRS differs in certain significant respects from Chilean Generally Accepted Accounting Principles (the “Chilean GAAP”) as issued by the Superintendencia de Bancos e Instituciones Financieras de Chile (the “Superintendency of Banks and Financial Institutions” or “SBIF”). As a result, our financial information presented under IFRS is not directly comparable to any of our financial information presented under Chilean GAAP. Accordingly, readers should avoid such comparison.
In this annual report, references to “$,” “U.S.$,” “U.S. dollars” and “dollars” are to United States dollars, references to “pesos” or “Ch$” are to Chilean pesos (see Note 2(f)) to our audited consolidated financial statements as of and for the year ended December 31, 2021 appearing elsewhere in this annual report), and references to “UF” are to “Unidades de Fomento.” The UF is an inflation indexed Chilean monetary unit of account with a value in Chilean pesos that is linked to and adjusted daily to reflect changes in the Consumer Price Index (“CPI”) of the Instituto Nacional de Estadísticas (the “Chilean National Statistics Institute”). As of December 31, 2021 and March 31, 2022, one UF equaled Ch$30,991.74 and Ch$31,727.74, respectively.
This annual report contains translations of certain Chilean peso amounts into U.S. dollars at specified rates. These translations should not be construed as representations that the Chilean peso amounts actually represent such U.S. dollar amounts, were converted from U.S. dollars at the rate indicated in our audited consolidated financial statements as of and for the year ended December 31, 2021 or could be converted into U.S. dollars at the rate indicated. Banco de Chile utilizes the exchange rate of accounting representation, or spot exchange rate, for such matters. Thus, unless otherwise indicated, the U.S. dollar amounts have been translated from Chilean pesos based on the exchange rate of accounting representation as of December 30, 2021 as determined by our Treasury on a daily basis, based on the average of the daily closing bid and offer rates reported by Bloomberg for the Santiago Stock Exchange. As of December 30, 2021 (the latest practicable date, as December 31, 2021 was a banking holiday in Chile) and March 31, 2022, the exchange rates of accounting representation were Ch$852.63 = U.S. $1.00 and Ch$784.30 = U.S.$1.00, respectively. As of the same dates, the observed exchange rates, as published by Banco Central de Chile (the “Central Bank”), were Ch$850.25 = U.S.$1.00 and Ch$787.16 = U.S.$1.00, respectively.
The Federal Reserve Bank of New York does not report a noon buying rate for Chilean pesos.
Unless otherwise specified, all references in this annual report to total loans are to loans to customers before deducting allowances for loan losses, and they do not include loans to banks or contingent loans. In addition, all market share data and financial indicators for the Chilean banking system as compared to Banco de Chile’s financial information presented in this annual report are based on information published periodically by the Financial Market Commission (“CMF”) which is published under Chilean GAAP and prepared on a consolidated basis, unless otherwise indicated. For more information see “Item 4. Information on the Company—Business Overview—Competition.”
In this annual report, “past-due loans” are any loans for which the counterparty has failed to make a payment when contractually due, including installments that are overdue, plus the remaining balance of principal and interest on such loans. In order to distinguish between different overdue time periods, the corresponding time period is included after the term “Past-due Loans” (for example, “Past-due Loans—90 days or more”). For more information, please see “Item 4. Information on the Company—Selected Statistical Information—Analysis of Substandard and Past-Due Loans”
v
According to Chilean regulations, as of the filing date and for the purposes of this annual report, regulatory capital (“Total Capital” or “Regulatory Capital”) consists of:
| ● | CET1 Capital (“CET1”), which is composed of: (i) paid-in capital related to common shares, (ii) stock surplus (share premium) resulting from the issuance of instruments included in CET1, (iii) reserves, whether they come from net income, depreciation or expiration of perpetual bonds or not, (iv) accumulated other comprehensive income related to financial instruments measured at fair-value, (v) retained earnings or losses, net of provisions for minimum dividends, appreciation of perpetual bonds or interests/dividends paid on financial instruments issued for capital adequacy purposes and (vi) minority interest. The CET1, however, is subject to a set of adjustments that include: (i) minority interest, (ii) goodwill and intangible assets, (iii) deferred tax assets (not related to temporary differences), (iv) accumulated other comprehensive income related to cash flow hedge accounting derivatives, (v) insufficiency of credit risk allowances when using internal methodologies for risk weighted assets, (vi) earnings from the sale of securitized assets, (vii) accumulated gains or losses from changes in own issuer risk related to financial liabilities measured at fair value (such as debit value adjustment for derivatives), (viii) assets related to pension plans for staff, (ix) investments in own assets, (x) significant and not significant investments and (xi) threshold adjustments in line with Basel III. CET1, for compliance with minimum levels, must equal to at least 4.5% of risk-weighted assets; |
| ● | Additional Tier 1 Capital (“AT1”), which is comprised of perpetual bonds and preferred stocks that, for compliance with minimum levels, must be equal to at least 1.5% of risk-weighted assets, once the CET1 minimum requirements have been fulfilled. Instruments issued by banks’ subsidiaries do not get counted for these purposes; and |
| ● | Tier 2 Capital (“Tier 2”), which is composed of (i) subordinated bonds of up to 50% of CET1, excluding subordinated bonds issued by banks’ subsidiaries and (ii) voluntary provisions of up to 1.25% of credit risk-weighted assets if computed by standardized method or 0.625% if computed by internal method. Tier 2 capital may be computed, for compliance with minimum levels, with up to 2.0% of risk-weighted assets, once Tier 1 Capital minimum requirements have been fulfilled. |
These definitions for Total Capital or Regulatory Capital are in place since December 1, 2021. For more information, see “Item 3. Key Information—Risk Factors—Risks Relating to our Operations and the Chilean Banking Industry—Restrictions imposed by regulations may constrain our operations and thereby adversely affect our financial condition and results” and “Item 4. Information on the Company—Regulation and Supervision—Modifications to the General Banking Act.”
Certain figures included in this annual report and in our audited consolidated financial statements as of and for the year ended December 31, 2021 have been rounded for ease of presentation. Percentage figures included in this annual report have not in all cases been calculated on the basis of such rounded figures but on the basis of such amounts prior to rounding. For this reason, percentage amounts in this annual report may vary slightly from those obtained by performing the same calculations using the figures in our audited consolidated financial statements as of and for the year ended December 31, 2021. Certain other amounts that appear in this annual report may similarly not sum due to rounding.
Inflation figures are those reported by the Chilean National Statistics Institute, unless otherwise stated herein or required by the context.
vi
MACRO-ECONOMIC AND MARKET DATA
In this annual report, all macro-economic data relating to the Chilean economy is based on information published by the Central Bank. All market share data, financial indicators and other data relating to the Chilean financial system are based on information published periodically by the CMF, which is published under Chilean GAAP and prepared on a consolidated basis.
vii
Part I
Item 1 Identity of Directors, Senior Management and Advisers
Not Applicable.
Item 2 Offer Statistics and Expected Timetable
Not Applicable.
Item 3 Key Information
RISK FACTORS
The risks and uncertainties described below are not the only ones that we face. Additional risks and uncertainties that we do not know about or that we currently think are immaterial may also impair our business operations in the future. Any of the following risks, if they actually occur, could materially and adversely affect our business, results of operations, prospects and financial condition.
We are also subject to market risks that are presented both in this subsection and in Note 43 to our audited consolidated financial statements as of and for the year ended December 31, 2021 appearing elsewhere in this annual report.
Risks Relating to our Operations and the Chilean Banking Industry
The growth of our loan portfolio in riskier segments may expose us to increased loan losses.
During the last five years, our total loan portfolio has grown at a compounded average growth rate (“CAGR”) of 6.2% per year. This expansion has been primarily fostered by growth in both residential mortgage (8.4% per year on average) and commercial loans (6.3% per year on average) and, to a lesser extent, by a moderate growth in consumer loans (1.3% per year on average), which has been impacted by diverse economic factors. The growth in our loan book has been aligned with our mid-term strategic goals, which aim to diversify our business model by optimizing our risk-return relationship in order to maintain profitable growth. In 2020, however, as a result of the prevailing macroeconomic conditions due to the spread of COVID-19, loan growth was severely affected by lower demand for loans, higher unemployment and significant uncertainties regarding the economic outlook in Chile, resulting in a significant decrease in consumer loans granted to individuals and constrained growth in commercial loans for companies. For the year ended December 31, 2021, our loan portfolio was Ch$34,265,873 million, which represented a 10.8% annual increase as compared to the Ch$30,937,690 million we recorded as of December 31, 2020. Our allowances for loans losses decreased 19.7% on an annual basis from Ch$836,107 million in 2020 to Ch$673,496 million in 2021, mainly as a result of a significant decrease in expected credit losses associated with the recovery in economic activity in 2021 after the significant impact of the COVID-19 on the risk profiles of individuals, SMEs, middle market companies and, to a lesser extent, corporations in 2020, given mobility restrictions imposed by the health authority. For individuals, there was a significant improvement in credit quality during 2021 as a consequence of non-recurrent factors that increased disposable income and benefited the payment capacity of individual borrowers. These factors included: (i) direct money transfers made by the government to mitigate the economic effects of the pandemic on unemployment, measures that remained in 2021 in spite of the gradual lifting of mobility restrictions, (ii) the effect of three consecutive pension fund withdrawals and one withdrawal from life annuities (rentas vitalicias) as permitted by the Chilean congress at the end of 2020 and throughout 2021, which, in the aggregate, injected approximately U.S.$48,500 million to the local economy, and (iii) the improvement in unemployment figures as mobility restrictions began to be lifted. These trends also led us to update some of our provisioning models for both group-based and individually-evaluated customers, which coupled with an enhanced economic view going forward, translated into lower probabilities of default and lower credit risk allowances. As a result, our risk-index ratio (allowances for loan losses to total loans) decreased from 2.70% in 2020 to 1.97% in 2021.
1
Notwithstanding these recent trends, we recognize that the expansion experienced by our retail banking segment over the last years may expose us to higher levels of charge-offs and may require us to establish higher levels of allowances for loan losses in the future. This is due to the fact that the average retail customer is riskier than large companies and corporations, since they are more exposed to the economic cycle than wholesale customers as evidenced during the downturn caused by the COVID-19 pandemic. For example, individuals are impacted by economic factors such as employment and SMEs are impacted by economic conditions affecting domestic demand. For this reason, we are constantly striving to develop and utilize improved scoring and approval models, while strengthening our collection procedures in order to mitigate the risks associated with this business growth.
Our loan portfolio may not continue to grow at the same or similar rates as it has in the past.
Double-digit loan growth during the decade ending in 2013, particularly fostered by increased banking penetration of: (i) lower and middle income segments and (ii) small and medium-sized companies resulted in a marked expansion in consumer, mortgage and commercial loans in the Chilean banking industry. However, the deceleration of the local economy from 2013 to 2017 and the introduction of diverse reforms on general matters, including both banking and non-banking rules, have threatened both the industry’s pace of growth and banking penetration rate, leading to a slowdown in investment spending (capital expenditures) and deteriorated consumer confidence and business sentiment, as evidenced by the indices (Indice de Percepción Económica de los Consumidores (“IPEC”) and Indice Mensual de Confianza Empresarial (“IMCE”)) used by the Central Bank. This trend seemed to shift by the end of 2018, reflected by an economic recovery produced by a rebound in investment spending and GDP growth of 4.0%. This supported a stronger demand for commercial loans and an 11.9% annual growth of total loan balances managed by the Chilean banking industry as a whole (excluding operations of subsidiaries abroad). In 2019, however, GDP recorded a moderate annual expansion of 0.8%, highly influenced by the effect of the social unrest in Chile on October 18, 2019. Despite this subdued performance, the loan portfolio managed by the banking industry increased by 10.0% in nominal terms in 2019, mainly explained by a decoupled behavior of mortgage loans, evidenced by sustained growth of 11.2% over the course of the year. In 2020, the COVID-19 pandemic resulted in a GDP contraction of 6.0% for the Chilean economy and a surge in unemployment rate from 7.3% in December 2019 to 10.3% in December 2020, fostered by long-lasting lockdowns and other measures taken by the government in order to reduce mobility and social interaction across the country, which reduced or halted operations in many economic sectors for months. In this environment, the loan portfolio of the local banking industry grew only 2.4% in nominal terms (excluding operations of subsidiaries abroad), prompted by both residential mortgage loans, which continued to be decoupled from economic dynamics due to unprecedented low interest rates, and the governmental support program of guaranteed loans for SMEs and middle market companies, that increased loans balances. Consumer loans, instead, were substantially affected by the deteriorated macroeconomic scenario, through lower disposable income and the deteriorated payment capacity of borrowers.
In 2021, aligned with the recovery displayed by the local economy, as reflected by GDP growth of 11.7%, the loan portfolio managed by the banking industry also showed some signs of recovery by growing 10.1% in nominal terms. The overall economic activity was highly influenced by both higher inflation and higher than normal levels of household spending, promoted by above average liquidity among individuals. This had a second-round effect on loans to customers, as evidenced by a 6.7% increase in consumer loans, growth that was almost entirely explained by inflation. Although consumer loans began to accelerate by the second half of 2021, non-recurrent liquidity levels continued to significantly increase individuals’ disposable income. Loan growth was thus primarily steered by annual expansions of 13.5% in residential mortgage loans and 9.0% in commercial loans. Whereas growth in residential mortgage loans was explained by inflation and the decoupling of the real estate market from the economic dynamics as mentioned above, the increase in commercial loans was mainly influenced by the effect of the government support program for SMEs launched in February 2021, through which the government backed borrowers’ obligations with the banks in order to facilitate lending by covering credit risk.
Despite the recovery posted by the loan banking industry in 2021, many factors could adversely affect the growth rate of the industry and, therefore, the expansion of our loan portfolio in the future including, but not limited to: (i) a slowdown or negative GDP growth, (ii) changes in household or investment spending, (iii) changes in banking customers’ behavior, (iv) changes in banking regulation, (v) deterioration of consumer confidence and business sentiment, (vi) reforms to be introduced by the recently appointed administration or the ongoing constitutional convention entirely comprised of citizens (the “Constitutional Convention”), which may negatively impact the economic and business environment, and (vii) any effect related to social trends, social unrest, pandemics or any event affecting the growth potential of the Chilean economy. Similarly, this could affect our credit quality indicators causing us to establish higher allowances for loan losses. For more information, see “Item 4. Information on the Company—Regulation and Supervision” and “Item 4. Information on the Company—Selected Statistical Information.”
2
Restrictions imposed by regulations may constrain our operations and thereby adversely affect our financial condition and results of operations.
The CMF is the entity that oversees and regulates the Chilean financial market, which is comprised of publicly traded companies, insurance companies, insurance brokers, mutual funds and investment funds as well as the Chilean banking industry as a whole and some non-bank lenders. In addition to being subject to regulation by the CMF, in certain matters, we are also subject to regulations issued by the Central Bank. See “Item 4. Information on the Company—Regulation and Supervision.”
Pursuant to the Ley General de Bancos (the “General Banking Act”) all Chilean banks may, subject to the approval of the CMF, engage in certain non-banking businesses approved by the law. The CMF’s approval will depend on the risk of the activity and the strength of the bank. Furthermore, the General Banking Act currently imposes on the Chilean banking system a modified version of the capital adequacy guidelines issued by the Basel Committee on Banking Regulation and Supervisory Practices (the “Basel Committee”) and limits the discretion of the CMF to deny new banking licenses.
In 2018, the Chilean Congress passed modifications to the General Banking Act in diverse topics, including the adoption of Basel III guidelines for the Chilean banking industry. These modifications were enacted in Law No. 21,130 on December 27, 2018 and subsequently published on January 12, 2019. This law addresses four main topics aimed at modernizing the Chilean banking framework by: (i) adopting the Basel III guidelines, considering a phased-in transition from Basel I to be completed four years after the new specific banking framework was issued by the regulator (the implementation date was postponed from December 2020 to December 2021 in light of the impact that the COVID-19 outbreak had on the economy), (ii) introducing changes to the local regulator’s corporate governance, such that powers formerly vested in the SBIF (the former banking supervisor) were transferred to the CMF in June 2019, (iii) reforming the resolution regime for Chilean banks in the case of insolvency, and (iv) introducing changes in relation to confidential information of banks’ customers, among others topics. For more information, see “Item 4. Information on the Company—Regulation and Supervision— Modifications to the General Banking Act.”
In May 2019, the CMF began the publication for comment in respect of their rule-making on a diverse and wide array of topics associated with Basel III. By December 2020, 11 out of 12 final rules had been issued by the CMF while the pending one related to limits to large or single exposures (Article N°84 of the General Banking Act) was issued on November 3, 2021 after a period for comment. The methodology to activate or deactivate the countercyclical buffer, that should be defined by the Central Bank and monitored by the CMF, is still pending issuance.
Regarding capital requirements, since December 1, 2021 new regulatory thresholds have been imposed on local banks, based on the specific regulations issued by the CMF, as follows:
| Ø | CET1 ≥ 4.5% of risk-weighted assets (CET1 ratio); | |
| Ø | CET1 ≥ 3.0% of total risk assets (Leverage ratio); | |
| Ø | Tier 1 = CET1 + AT1 ≥ 6.0% of risk-weighted assets (Tier 1 ratio); | |
| Ø | Tier 1 + Tier 2 ≥ 8.0% of risk-weighted assets (Total Capital ratio); | |
| Ø | Conservation Buffer = 2.5% of risk-weighted assets; | |
| Ø | Countercyclical Buffer of up to 2.5% of risk-weighted assets, if any; | |
| Ø | Systemically-Important Banks (“D-SIB”) Buffer in the range of 1.0% to 3.5% of risk-weighted assets, if any; and | |
| Ø | Pillar 2 Buffer of up to 4.0% of risk-weighted assets, if any. |
For more detailed information on each specific regulation currently in effect and capital thresholds, see “Item 4. Information on the Company—Regulation and Supervision—Modifications to the General Banking Act.”
3
Our capital adequacy ratios under the previous and new regulatory frameworks, as of December 2021, are as follows:
| Capital Ratio | Basel I | Basel III | ||||||
| Leverage Ratio | 7.64 | % | 7.96 | % | ||||
| CET1 Ratio | 12.32 | 12.97 | ||||||
| Tier 1 Ratio | 13.32 | 13.97 | ||||||
| Total Capital Ratio | 16.43 | % | 17.30 | % | ||||
On March 31, 2021 the CMF announced that based on the information provided by local banks for the year ended December 31, 2020, there are six domestic systemically important banks, including us, which will be subject to systemic buffers, which will be determined by means of the methodology defined by the CMF. On March 30, 2022 the CMF announced the systemic buffers for the six banks previously determined to be systemically important banks. Based on the methodology established by the CMF for this purpose, the Chilean regulator has imposed a systemic buffer equivalent to 1.25% on us, which will be gradually introduced over a four year period starting December 1, 2022, and continuing at an annual and cumulative rate of 25% every year, completing the 1.25% (if maintained unchanged) on December 1, 2025. Likewise, the prior requirement associated with Article 35 bis of the General Banking Act will continue to decrease at a 25% rate (a process that began on December 1, 2021) reaching 0% on December 1, 2024. During the phase-in process, we must comply with the applicable Basel III systemic buffer and the remaining Article 35 bis buffer until extinguished. Although with the new systemic buffer we continue to be in full compliance with minimum requirements, we cannot be certain about any other potential capital buffers the regulator could impose to us and, therefore, we cannot assure you that our profitability will not be impacted by actions we may take in order to fulfill new regulatory thresholds. For more information, see “Item 4. Information on the Company—Regulation and Supervision—Modifications to the General Banking Act.”
Moreover, since 2016, banks have been required to report and monitor liquidity ratios, such as Liquidity Coverage Ratio (“LCR”) and Net Stable Funding Ratio (“NSFR”), for information purposes only. On May 4, 2018 the Central Bank published for comment an amendment to Chapter III.B.2.1 of Compendio de Normas Financieras (the Compendium of Financial Norms), focused on proposing a minimum requirement for the LCR, considering a phase-in period of five years, starting at 60% in 2019 and reaching the final limit of 100% in 2023 (with annual increments of 10% between 2019 and 2023). More recently, on November 11, 2021 the Chilean Central Bank published a modification to liquidity requirements established in Chapter III.B.2.1 of the Compendium of Financial Norms for public comment, including: (i) the anticipation of the 100% requirement for LCR starting January 1, 2022 instead of January 1, 2023 as originally scheduled, (ii) the establishment of a regulatory limit for the NSFR ratio equivalent to 100%, starting January 1, 2022 at 60% and increasing 10% each year until reaching 100% on January 1, 2026, (iii) changes to the liquidity reporting requirements through the incorporation of NSFR, (iv) changes in the treatment of financial instruments pledged as technical reserves (arising from demand deposits levels) in order to be computed as high quality liquid assets when determining LCR, (v) the softening of requisites for using behavioral models for C46 index, (vi) the removal of regulatory limits for C46 index in local currency, (vii) the introduction of contingency measures for breaches of regulatory limits for both the C46 index in foreign currency and the NSFR ratio, and (viii) the softening of measures for regulatory limits in case of local contingencies. In addition, as part of the same proposal, the Central Bank established that banks will be required to carry out an annual Internal Liquidity Adequacy Assessment Process (“ILAAP”), which will go into effect in April 2023, although the possibility of imposing additional High Quality Liquid Assets (“HQLA”) requirements based on the information disclosed in the ILAAP will be in effect only in April 2025. On March 8, 2022, the Chilean Central Bank published the final ruling associated with the changes proposed for Chapter III.B.2.1 of the Compendium of Financial Norms, which adopted, among others, the following relevant changes: (i) the removal of regulatory limit for 30-day and 90-day cash flows mismatches in local currency as measured by C46 index while maintaining the limit for 30-day cash flows mismatches in foreign currency as measured by the C46 index, (ii) the anticipation of the increase of the LCR limit to 90% for the period between January and June 2022 and to 100% from June 2022 onwards, (iii) the incorporation of a regulatory limit for NSFR starting in 60% in June 2022 and increasing 10% in January 2023 to 70% and subsequently 10% per year until reaching 100% in January 2026, (iv) the introduction of specifications on the treatment of securities pledged as technical reserves in order to take them into account as high quality liquid assets and (v) confirmation on the submission of the ILAAP starting April 2023. Even though we do not expect the enactment or entry into force of these requirements to have any material impact on our financial position, results of operations or profitability, we cannot assure that based on the ILAAP results we will not be subject to new liquidity requirements, which could have a material adverse effect on us. As of December 31, 2021 our LCR and NSFR were 228.3% and 113.2%, respectively and we were in fully compliance with the prevailing regulatory requirements. Based on the modifications introduced by the new regulation, although we expect our LCR ratio to decrease from current levels, we will stay in full compliance with all liquidity requirements. We cannot, however, assure you that we will remain in compliance with them if the regulator introduces new standards or requires us to maintain greater amounts of HQLA. This could also lead to acquire lower-margin financial instruments, which could have an adverse effect on results of operations.
4
As for credit risk matters, on July 6, 2018 the former SBIF published the final amendments to the provisioning rules for commercial loans evaluated on a group basis, which established standardized models for leasing loans, student loans and other commercial loans (not included in the former categories). In addition, the new set of rules also addressed other topics related to loan provisioning. The new provisioning criteria went into effect in July 2019 and had no material impact on our results of operations under both Chilean GAAP and IFRS. On April 27, 2021, to further align Chapter B-1 of the Compendium of Accounting Standards for Banks to the Basel III framework, the CMF published for comment some modifications to the Chapter B-1, such as those associated with loan provisioning guidelines for a more precise treatment for certain sub-segments of the group-based evaluated portfolio. The final rules were published on August 19, 2021 with no major changes in relation to the formerly proposed modifications. We do not foresee a material impact related to these modifications neither under Chilean GAAP nor IFRS. Nevertheless, we cannot be certain that future changes in the provisioning rules for other types of loans or related definitions will not affect our results under IFRS or Chilean GAAP, as applicable.
Additionally, the Chilean Government has focused on matters related to consumer protection in recent years. During the last decade, several legal and administrative regulations have been enacted and amended to strengthen consumer protection and the relationship between financial institutions and their customers. In May 2020, the Chilean Congress passed a law that modifies the current framework regarding liabilities for payment service providers (such as banks) in cases of fraudulent transactions in credit and debit cards, and in electronic funds transfers. Among other matters, these regulations require that charges or transfers that are objected to by the customer, must be returned by the payment service provider when the transaction does not exceed UF 35 (equivalent to Ch$1.1 million as of December 31, 2021), and if the value is higher, the payment service provider must return such amount (UF 35), enabling the financial entity to retain the excess to the extent it judicially proves wrongdoing from the customer. As expected, this new legislation has resulted in an increase in our liabilities towards customers due to digital fraud during 2020 and 2021 as compared to previous years, since we are now required by law to assume certain losses suffered by our customers before proving the fraud. Although we have implemented an array of measures and campaigns with our customers and have been able to adequately mitigate the impact of this legislation, we cannot assure you that we will not continue to see an increase in our liabilities as a result of this new legislation. For further information on the obligations and liabilities imposed by, and characteristics of, this new legislation, see “Item 4. Information on the Company—Regulation and Supervision—Consumer-Oriented Regulation” and “Item 5. Operating and Financial Review and Prospects—Results of Operations for the Years Ended December 31, 2019, 2020 and 2021—Operating Expenses”.
On April 20, 2021, new legislation that modifies consumer protection laws, prohibiting and limiting certain extrajudicial, or out-of-court, debt collection activities towards individuals and SMEs was enacted. Regarding banks, among other matters, this new law: (i) limits the number and type of out-of-court collection measures, (ii) requires keeping detailed records of such actions up to two years after they have been initiated, and (iii) prohibits the continuing of out-of-court collection actions once a collection has been initiated in court. In the year since this law was enacted, we have not seen any significant impacts on our results of operations that could be attributable to such regulation. We cannot, however, rule out that in the future this legislation could reduce our ability to recover delinquencies in our individuals’ and SMEs’ portfolios and could have an impact on our collection costs. This could also signify that we may have to modify strategies in our collection processes to ensure rigorous compliance with the applicable regulation and our internal policies. Consequently, we cannot rule out that this could have an adverse effect on Banco de Chile and the financial industry.
In 2021, a bill addressing a broad range of financial regulation and services was approved by the Chilean Congress and enacted by the Chilean Government. With respect to loan products, this law sets new rules on the application of interests and fees. The main modifications introduced by this new law are: (i) it states that no interests may be charged on the portion of credits that is already paid; (ii) it forbids charging simultaneously and jointly default interests with other kinds of interest over the same amount; and (iii) it establishes that, during the 12 months following the publication of this law, the CMF will dictate specific regulation addressing the extent by which fees or and/or commissions may be charged on credit transactions. These ancillary regulations, which are still pending to be issued by the CMF, could limit our ability to charge and earn fees or commissions on certain credits and loan products. Therefore, as of the date of this annual report, we cannot yet determine or rule out whether this new law will negatively affect our results of operations in the future.
5
In December 2021, Law 21,398 was enacted. Among other measures to enhance consumer protection, this law introduced rules such as: (i) requiring a competent court to construe certain provisions in favor of the consumer in court procedures, (ii) imposing new obligations applicable to financial service providers in connection with certain products, and (iii) introducing new minimum requirements for pre-payments in credit transactions, among other measures. These new measures may increase our due diligence, operating and legal costs, affect the growth of our customer base and increase the costs associated with the management of our consumer loan portfolio. However, given that this law was recently introduced and that further ancillary regulation is pending to be implemented, as of the date of this annual report, we cannot yet ascertain its impact, if any, on our results of operations in the future.
In addition, there are several bills being discussed in the Chilean Congress, which would modify matters related to loans and credit products, such as interest rate ceilings, prepayment fees and the possibility of capitalizing interests, most of which were introduced by members of the Chilean Congress during the October 2019 aftermath and the COVID-19 pandemic and include an array of amendments from different political constituencies. Some of them also aim to ease the financial burden of certain banking borrowers, such as SMEs and individuals. For example, one of these bills proposes to suspend six credit-related installments for consumer and mortgage loans by postponing these payments to the end of the liability, bearing no additional interests. Other bills introduced during 2021, if enacted, may increase the costs of our consumer loan and mortgage products by setting higher mandatory protections for customers. Another bill introduces additional requirements to judicially exercise rights attained to mortgage loan collaterals; while others may limit our capacity to gather detailed information throughout our risk evaluation process by, for instance, setting higher privacy standards. Moreover, yet another bill related to insolvency law, would limit a bank’s ability to deny providing certain banking products to personal banking customers (individuals) on the grounds that they have been debtors in an insolvency procedure in the past. If enacted, such law may limit the effectiveness of our credit evaluation process and the due diligence we perform over potential customers, as well as our asset quality, and require us to increase provisions for expected credit losses.
Since most of these bills are currently in the early or middle stages in the Chilean Congress, there is no certainty whether any or all of them will be further discussed or not, and as to when or how these bills could change the current regulatory framework if approved. Therefore, we cannot determine or assure you whether they will materially affect our business and, in turn, our financial condition and results of operations in the future.
From the taxation perspective, on August 23, 2018 the Chilean Government sent a bill to the Chilean Congress, which was intended to modernize the Chilean tax system. The Congress, in conjunction with the Government, introduced certain modifications to the original bill, which was passed by the Congress in January 2020 and enacted on February 24, 2020 (Law No. 21,210). Further measures were introduced as part of emergency plans to reactivate the economy following the COVID-19 pandemic. By the end of 2021, the Government submitted two bills to the Congress. The first one establishes a minimum pension for lower income pensioners while the other one proposes to reduce or eliminate tax exemptions in order to finance the former. The latter bill, which was enacted in February 2022 as Law No. 21,420, reduces or eliminates diverse tax exemptions including the following measures: (i) the extension of VAT to any service that was not formerly exempt for services provided after January 1, 2023, (ii) the establishment of the same treatment for financial and tax purposes for financial leasing agreements entered into on or after January 1, 2023, (iii) a 10% tax on capital gains produced by the sale of actively traded stocks (under definitions established by the Chilean Internal Revenue Service (“Chilean IRS”)) for sales performed on or after September 1, 2022, which will not apply to local or foreign institutional investors, (iv) an inheritance tax on profits from life insurance contracts agreed on or after February 4, 2022, (v) an increase in the wealth tax on real estate from 0.275% to 0.425% starting January 1, 2023, (vi) the elimination of the special VAT credit for construction companies targeting middle income homes starting January 1, 2025, (vii) the establishment of a 2.0% annual tax on luxury goods such as airplanes, helicopters, yachts and luxury vehicles, (viii) the reduction of tax benefits on middle income housing, namely, DFL No. 2 of 1959, by limiting the benefit to individuals only and for a maximum of two homes, regardless of the purchase date, starting January 1, 2023, (ix) the elimination of the tax credit on the purchase of fixed assets for large companies and (x) the increase of mining patents’ value.
6
The changes in the VAT applicable to services and the increase in the rate of wealth tax on real estate, will result in higher operating expenses for the Bank. Likewise, changes in tax benefits associated with the real estate and construction industries may lead to deceleration in demand for loans from individuals and companies for such purposes. In regards to the 10% tax applied to capital gains produced by the sale of actively traded stocks, this could negatively impact us in the future by means of: (i) a decrease in fee income from stock trading carried out by our securities brokerage or mutual funds subsidiaries, (ii) lower traded volume of our shares in Chile, (iii) taxes to be paid on our income by sales of own equity portfolio managed by our securities brokerage subsidiary, and (iv) higher taxes to be paid by investors who hold shares issued by us, among other factors. Additionally, these changes could also affect the financial leasing business in which we also participate. Nonetheless, as of the date of this annual report and based on information currently available to us, we do not foresee a material impact on our results of operations resulting from these initiatives.
Likewise, the recently appointed government administration for the four-year period ending March 11, 2026 has announced that it will send to the Congress one or more bills to: (i) remove or reduce the tax exemptions included in the current Chilean tax legislation, such as exemptions for capital gains on financial position, taxes on fuel for some economic sectors or VAT on some products or services, (ii) impose a wealth tax on taxpayers in the highest income bracket, (iii) levy the mining industry with additional royalty taxes and (iv) modify the tax regime from a semi-integrated system to totally non-integrated system, among other matters. However, we cannot yet determine whether any of these pieces of legislation, if passed, will have a material impact on our business, results of operations or financial condition in the future. Similarly, we cannot assure you these proposals if passed will not have a material impact on the taxes paid by our shareholders.
In August 2021, Law No. 21,365 was enacted, regulating interchange fees in the payment card market in Chile. An autonomous and technical committee was created to determine, on a periodic basis, the fees or rates to be charged by payment card issuers such as banks (“Interchange Rates”) to the operating companies (acquirers). The technical committee is comprised of four members, each appointed by the following institutions: The Central Bank; the CMF; the Office of National Economic Prosecution (Fiscalía Nacional Económica); and the Ministry of Finance. This committee has six months to announce the first transitory limits and, afterwards, Interchange Rates will be reset every three years. On February 5, 2022, the committee announced the new limits for interchange fees with a maximum fee of 0.6% for debit cards, 1.48% for credit cards and 1.04% for prepaid cards. Although we believe the transitory limits published in February 2022 will not have a material impact on our results of operations, given the uncertainty regarding the limits on interchange rates that could be determined by this technical committee in the future, we cannot yet be sure as to whether this new regulation will or will not have a negative impact on the banking industry and on our results of operations in the long term.
Furthermore, during the last years, diverse guidelines and regulations have been issued recommending or requiring companies to adopt policies and procedures with the purpose of enhancing the approach to environmental, governance and social (ESG) matters. Some of these regulations are still in the process of being implemented by Chilean companies. Although we believe that we have already deployed appropriate strategies, policies and procedures to address these matters, we cannot rule out that the adoption of new guidelines and regulations could limit our lending business, restrict our ability to recruit new customers, increase compliance requirements or result in higher operating or funding costs, among other effects that we cannot predict, given the still-developing and evolving regulatory environment.
Changes in regulations may also cause us to face increased compliance costs and limitations on our ability to pursue certain business opportunities and provide certain products and services. As some banking laws and regulations have been recently adopted, the way they are applied to the operations of financial institutions is still evolving. We cannot generally assure that laws or regulations will be adopted, enforced or interpreted in a manner that will not have a material adverse effect on our business and results of operations.
Lastly, we cannot assure you that regulators will not impose more restrictive limitations in the future on the activities of banks, including us, than those that are currently in effect. Any such change in terms of capital adequacy, liquidity, credit risk provisioning, consumer protection, bankruptcy and taxation, among other matters, could have a material adverse effect on our results of operations or financial condition in a fashion that we cannot determine in advance. For more information, see “Item 4. Information on the Company—Regulation and Supervision.”
7
Modifications to reserve requirements may affect our growth capacity and margins.
According to the Chilean banking regulation, demand deposits and time deposits are subject to reserve requirements of 9.0% and 3.6% (with terms of less than one year), respectively. However, the Central Bank is entitled to require banks to maintain reserves of up to 40.0% for demand deposits and up to 20.0% for time deposits, to the extent needed for monetary policy purposes. In addition, if the aggregate balance of demand deposits and other demand accounts (e.g., deposits in current accounts, other demand deposits or obligations payable on demand and incurred in the ordinary course of business, saving deposits that allow unconditional withdrawals that bear a stated maturity, and other deposits payable immediately unconditionally) held by a bank exceeds 2.5 times its Total Capital or Regulatory Capital (including CET1, additional Tier 1 capital and Tier 2 capital) the bank is required to set aside a technical reserve equivalent to the full amount of that excess. In addition, the Basel III framework recently implemented in Chile, through the General Banking Act, establishes that banks denominated as D-SIB could be subject to stricter technical reserve requirements by which the threshold of 2.5 times the Total Capital or Regulatory Capital could be reduced to 1.5 times. Conditions to set this additional requirement are part of the powers of the CMF, although the decision to impose such additional requirement must be agreed with the Central Bank. On March 31, 2021, the CMF announced that six local banks (including us) were designated as systemically important banks. On March 30, 2022 the CMF announced the systemic buffers for these six banks. The systemic buffer imposed on us is equivalent to 1.25%, as determined based on the prevailing methodology for this purpose. However, as of the date of this annual report, we have not received notice of the other requirements such as stricter technical reserve thresholds, which may be imposed on us due to our classification as a D-SIB. We cannot assure you that we will not be subject to such requirement in the future, which in turn could impact our capacity to afford balance sheet growth or lead us to raise funding from alternative sources, which could have a material adverse effect on our net interest margin. For more information on the implementation of the systemic buffer, see “Item 3. Key Information—Risk Factors—Restrictions imposed by regulations may constrain our operations and thereby adversely affect our financial condition and results of operations”.
Changes in accounting standards could impact our results.
The IASB, or other regulatory bodies, periodically introduce modifications to financial accounting and reporting standards under which we prepare our consolidated financial statements. These changes can materially impact the means by which we report financial information, affecting our results of operations. Also, we could be required to apply new or revised standards retroactively.
Currently, we cannot assure you that future changes in financial accounting and reporting standards will not substantially affect our results of operations or performance indicators, as we do not know the extent of future standards.
Increased competition and industry consolidation may adversely affect our operations.
The Chilean market for financial services is highly competitive. We compete with Chilean and foreign banks, with Banco del Estado de Chile, which is state-owned, and with other providers of financial services that are not part of the banking industry. In addition, the retail segment (which encompasses individuals and small and medium-sized companies) has become the target market of several banks, since banking penetration is still in progress in Chile, particularly in this segment. Accordingly, competition within this market is increasing as banks are continuously incorporating new and tailored products and services, while striving to improve service quality and to accelerate digital transformation. Further, following the new rules issued in the last years by the Chilean regulator, the processing and merchant acquiring services for payment cards (particularly related to new acquirers) may now be accomplished through a four-party mechanism, as done in some developed economies. This model facilitates the entry of new players. As of the date of this annual report, a significant part of merchant acquiring services continued to be provided in Chile by Transbank S.A. (of which we held a 26.16% direct ownership as of December 31, 2021), whereas some competitors have already begun to implement the new four-party model for their own business. As a result, net interest margins (once deducted provisions for loan losses) or fee-based income in these sub-segments could decline over time.
8
We also face increasingly significant competition from non-banking competitors in some of our credit products, especially credit cards and installment loans, including large department stores and private compensation funds, as well as saving and credit cooperatives. In addition, we face competition from other types of lenders, such as non-banking leasing, crowdfunding, factoring and automobile financing companies, especially in credit products, mutual funds, pension funds and insurance companies within the market for savings products and insurance companies in the market for mortgage loans. Likewise, other non-traditional providers of financial services have emerged over the last years, such as e-commerce, local and foreign fintech companies, Telecom companies, like internet and mobile phone providers, and more recently some marketplaces that may set and provide offerings, in the form of temporary financing, directly to their customers or providers. Some of these companies may have more resources than us, including larger customer bases, stronger brand recognition and more effective marketing tools to approach banking current or potential customers. They may also adopt more aggressive pricing, while devoting significant resources to technology, infrastructure and marketing as it is part of their core business. On top of that, some of these non-banking competitors are not or not fully regulated by the CMF for purposes of banking supervision. Therefore, they are not subject to the same specific solvency or liquidity requirements imposed by the banking regulator, among other requisites, as banks generally are. Nevertheless, banks continue to be the main suppliers of loans, leasing, factoring and mutual fund management, directly or indirectly through subsidiaries, while growing quickly in insurance brokerage services. However, we cannot assure you that this trend will continue in the future.
Likewise, we are aware that new competitors may enter the market, or existing competitors may innovate their services and strategies to improve the quality of services rendered to their customers. If we fail to effectively anticipate or adapt to new trends in the financial services industry, including changes in the way of delivering financial products and services, introduction of emerging technologies, changes in customer behavior or adaption of the kinds of services offered to or needed by them, our business may be adversely affected.
In addition, new technologies, including cryptocurrencies and payment systems, may result in substantial expenditures to adapt and update our existing products and services as we continue to grow our internet and mobile banking capabilities. Similarly, competitors could adapt faster than us to these new trends, which could lead to a temporary competitive disadvantage that could translate into lower revenues. Since we are aware of these new trends, we have devoted efforts to adapt our organizational structure in pursuit of enhanced flexibility to face new challenges while looking for business partnerships in order to take advantage of business opportunities arising in the market. We are also devoting efforts to deploy our digital strategy to offer tailored services and products to customers by leveraging our strategic capabilities and entering into alliances with other banking and non-banking providers. We cannot assure you that other competitors will not copy the strategy we have followed in terms of launching new digital products or entering into digital alliances or that they will not develop better solutions by acquiring more modern technology or designing more innovative solutions.
Also, in the past, increasing competition within the Chilean banking industry has been accompanied by a consolidation wave and the entry of international players into the system through multiple mergers and acquisitions. These trends have continued and resulted in the creation of larger and stronger banking conglomerates, offering a wide range of products and services and targeting most of the segments in the Chilean banking market. These dynamics may adversely impact our results of operations as they may translate into higher interest rates paid on deposits and lower interest rates earned on loans, resulting in decreased net interest margins.
For more information regarding past and recent changes in the Chilean banking industry see “Item 4. Information on the Company—Business Overview—Competition.”
Our exposure to certain segments of the retail market could lead to higher levels of total past-due loans and subsequent charge-offs.
Although we have historically been focused on wholesale banking, over the last years we have continued to reorient our commercial strategy to increase penetration of the retail banking segment. In fact, according to our management information systems, the share of the retail banking segment in our total loan book has increased from 58.0% in 2016 to 62.4% in 2021. Although this trend has been associated with an expansion in middle and higher income personal banking, our retail banking segment is also composed of small and medium-sized companies (approximately 14.9% of our total loan book as of December 31, 2021, which consists of companies with annual sales of up to ~Ch$2,200 million) and, to a much lesser extent, of lower-income individuals (approximately 1.9% of our total loan book as of December 31, 2021, which consists of individuals with monthly incomes ranging from Ch$180,000 to Ch$500,000). Since these customers are likely to be more severely affected by adverse developments in the Chilean economy than large corporations and higher-income individuals, such as those in 2020 as a result of the COVID-19 pandemic, we may be exposed to higher levels of past-due loans and subsequent charge-offs in the future, which could result in materially higher allowances for loan losses that could adversely affect our results of operations.
9
As of December 31, 2021, our past-due loans (loans 90-days or more past due) amounted to Ch$289,507 million, which represented a 3.3% annual decrease when compared to the Ch$299,408 million recorded in 2020. These figures translated into past-due ratios (loans 90-days or more past due over total loans) of 0.97% in 2020 and 0.85% in 2021. According to our management information systems, as of December 31, 2021 our past-due loans (loans 90-days or more past due) were composed of 81.6% retail banking 90-days or more past-due loans (consumer and residential mortgage loans to individuals, as well as commercial loans to small and medium sized companies) and 18.4% wholesale banking 90 days or more past-due loans (commercial loans to large companies and corporations). During the prior fiscal year, our past-due loans (90 days or more) portfolio was composed of 80.6% retail banking past-due loans (90 days or more) and 19.4% wholesale banking past-due loans (90 days or more).
Diverse economic and business dynamics contributed to the decrease in both the amount of past-due loans and our past-due loans ratio in 2021 when compared to 2020. In the case of past-due loans (loans 90- days or more past due), we experienced an annual decrease of approximately Ch$4,909 million in the retail banking segment and Ch$4,993 million in the wholesale banking segment, in each case, as compared to 2020. The decrease in the wholesale banking segment was supported by improved business conditions for companies in 2021, when mobility restrictions began to be gradually lifted and commercial activity returned to almost normal levels, benefiting companies’ turnover and results, which resulted in enhanced credit behavior. In the case of the retail banking segment, the improvement was related to a decrease in past-due consumer loans and to a lesser extent by lower past-due mortgage loans, which was partly offset by an increase in past-due loans granted to SMEs. The trend shown by individuals’ payment capacity had to do with the excess of liquidity in the economy produced by three consecutive pension fund withdrawals and the government aid package to support individuals, which increased disposable income by the end of 2020 but particularly throughout 2021. These factors positively impacted the payment behavior in both consumer and mortgage loans. Instead, the moderate increase in past-due loans of SMEs was primarily caused by lagged effects of COVID-19 on SMEs’ financial condition. As a result, past-due ratios (90 days or more past-due loans over total loans) decreased from 0.84% in 2020 to 0.51% in 2021 and from 1.21% in 2020 to 1.12% in 2021, in the wholesale banking and the retail banking segment, respectively.
Since the unpredictability of certain social developments, the effects of political and social events in Chile affecting consumer confidence and business sentiment, international events such as the COVID-19 pandemic, market fluctuations, changes to macroeconomic indicators, effects of global armed conflicts on the worldwide and the local economy and delayed effects of these developments, may affect our diverse customer segments, we cannot assure you that we will be able to maintain a balanced risk-return equation if global or local economic conditions deteriorate in the future. In this regard, economic recessions, social turmoil or market volatility could adversely affect the financial condition of our borrowers, which could translate into an increase in our non-performing loans, impair our loan portfolio and result in lower demand for our loans. Any of these trends could have a material adverse effect on our business, financial condition and results of operations.
For more information on past-due loans, see “Item 3. Key Information—Risk Factors—Risks Relating to our ADSs— Developments in international financial markets may adversely affect the market price of the ADSs and shares,” “Item 3. Key Information—Risk Factors—Risks Relating to our ADSs—COVID-19 or any other pandemic disease and health events will affect both the global and the Chilean economy, our business or results of operations and could affect our financial condition” and “Item 4. Information on the Company—Selected Statistical Information—Analysis of Substandard and Past-due loans.”
Our results of operations are affected by interest rate volatility and inflation.
Our results of operations depend greatly on our net interest income, which represented 70.5% of our total operating revenues in 2021. Changes in nominal interest rates and inflation could affect the interest rates earned on our interest-earning assets differently from the interest rates paid on our interest-bearing liabilities, resulting in net income reduction. Inflation and interest rates are sensitive to several factors beyond our control, including the Central Bank’s monetary policy, deregulation of the Chilean financial sector, local and international economic developments and political conditions, among other factors. In addition, changes in interest rates affect securities and other investments or assets that are recorded at fair value and are therefore exposed to potential negative fair value adjustments. Any volatility in interest rates could have a material adverse effect on our financial condition and results of operations. Also, real negative interest rates could negatively impact our ability to raise funding for our operations, particularly for short-term maturities, which could result in higher funding costs and lower net interest margin.
10
The average annual short-term nominal interest rate in Chile for 90 to 360 day deposits received by Chilean financial institutions was 2.72% in 2019, 0.86% in 2020 and 1.71% in 2021, following the trend seen in the monetary policy interest rate. For the same reason, the average interest rate paid by Chilean financial institutions for 90 to 360 days Chilean peso denominated deposits was 6.59% as of the three-month period ended on March 31, 2022. The average long-term nominal interest rate based on the interest rate of the five-year bonds traded in the secondary market, issued by both the Central Bank and the Chilean Government, was 3.31% in 2019, 1.93% in 2020 and 3.51% in 2021. In 2021, market interest rates began to steadily increase in Chile, particularly for longer maturities, based on various factors, including: (i) pension fund withdrawals that severely impacted the pricing of fixed-income securities, (ii) expectations of higher inflation in the near future, and (iii) the presidential election held in December 2021 that determined the administration that took office on March 11, 2022 and the potential consequences its results may have on the prevailing economic system. Based on this, the interest rate of five-year Chilean peso denominated bonds, issued by both the Central Bank and the Chilean Government, increased from 1.58% in December 2020 to 5.59% in December 2021 and to 6.76% in March 2022. In the three-month period ended on March 31, 2022, the interest rate for the same Central Bank and Chilean Government bonds averaged 6.20%.
Prior to 2021, inflation in Chile had been moderate, especially in comparison with periods of high inflation experienced in the 1980s and 1990s. High levels of inflation in Chile could adversely affect the Chilean economy, consumer purchasing power, household consumption and investment in machinery and equipment and, therefore, the demand for financing and our business. The annual inflation rate (as measured by annual changes in the CPI and as reported by the Chilean National Institute of Statistics) during the last five years and the first three months of 2022 was:
Year | Inflation (CPI Variation) | |||
| 2017 | 2.3 | % | ||
| 2018 | 2.6 | |||
| 2019 | 3.0 | |||
| 2020 | 3.0 | |||
| 2021 | 7.2 | |||
| 2022 (through March 31) | 3.4 | % | ||
Source: Chilean National Institute of Statistics
During 2021, the inflation rate, measured as CPI variation, was 7.2%. This annual increase was the consequence of many factors, although the sharp increase in household consumption, propelled by above average liquidity among individuals for the reasons mentioned earlier, was a primary cause behind higher-than-expected inflation as the local supply for products and services was not able to meet demand requirements in the short-term. This factor coupled with other inflationary pressures, such as: (i) the increase in the price of oil worldwide, (ii) the constraints experienced in the global supply chain, which translated into an increase in inflation worldwide and (iii) a depreciation of 19.8% of the Chilean peso against the U.S. dollar, which has a pass-through effect associated with the translation of imported goods into Chilean pesos. Although we benefit from a higher-than-expected inflation rate in Chile in the short-term, due to the structure of our assets and liabilities (we have a significant net asset position indexed to the inflation rate), significant and persistent increases or decreases in inflation with respect to current levels could adversely affect our net interest income, results of operations and, therefore, the value of our securities and medium-term profitability.
11
Additionally, measures taken by the Central Bank to control inflation may adversely affect the Chilean economy, the banking business and our results of operations and financial condition. In this regard, the measures adopted by the Central Bank in the past to control inflation have included the increase of the monetary policy interest rate, which has restricted the demand for loans while negatively affecting economic growth through constrained household spending and capital expenditures. In 2021, the Central Bank increased the monetary policy rate from 0.5% to 0.75% in July, to 1.5% in August, to 2.75% in October and to 4.0% in December 2021. Furthermore, the Central Bank has announced its intention to continue withdrawing the monetary stimulus by leading the monetary interest rate to neutral levels in the short-term, suggesting that further increases could take place in 2022. Accordingly, the Central Bank took the monetary policy interest rate to 5.50% in January 2022 while stating that additional hikes could be applied as long as inflation persists above the target range. As such, most recently, in March 2022, the monetary policy interest rate was increased by 150 basis points ending the month at 7.0%. Since our liabilities generally re-price faster than our assets, sudden and sequential increases in short-term rates could affect our net interest margin.
For more information, see “Item 3. Key Information—Risk Factors—Risks Relating to our ADSs—Developments in international financial markets may adversely affect the market price of the ADSs and shares,” “Item 3. Key Information—Risk Factors—Risks Relating to our ADSs—COVID-19 or any other pandemic disease and health events will affect both the global and the Chilean economy, our business or results of operations and could affect our financial condition,” “Item 5. Operating and Financial Review and Prospects—Operating Results—Overview—Inflation” and “Item 5. Operating and Financial Review and Prospects—Operating Results—Overview—Interest Rates.”
Part of the information included in our financial statements considers assumptions, estimates and modeling which, if inaccurate, could have a material impact on our results of operations and financial position.
The preparation of our financial statements requires management to make judgments and estimates that affect the amounts of assets, liabilities, income and expenses reported in our financial statements. Estimates and assumptions are based on historical experience, expert judgment and other factors, including expectations of future developments under certain alternative scenarios. Although assumptions and estimates are evaluated and revised on a continuous basis, we cannot rule out that projected scenarios could dramatically change in the short term, causing a severe impact on fundamentals and estimates.
We are also subject to model risk since the valuation of financial instruments relies on models (such as cash flows valuation models for fixed-income securities, valuation models for derivatives including technical approximations, value adjustments models for derivatives, and IFRS 9 forward-looking provisioning models, among others) and inputs, which, in some cases, are not observable. Accordingly, computed values for securities and financial instruments may be inaccurate or subject to change, since the inputs used for specific models may be unavailable, particularly for illiquid assets or under scenarios of financial turmoil. In these cases, we will make assumptions and judgments in order to establish the fair value of certain instruments, which involves uncertainty and may translate into inaccurate estimates of actual results.
For example, we assess the credit quality of our borrowers based on the information that is available in Chile regarding their indebtedness with the banking system as a whole. This includes information provided by the CMF, the local credit bureaus, databases we have created through the years and other public sources. However, as mentioned in this annual report, there are non-banking companies that are permitted to grant loans, particularly to individuals, in the form of credit card loans, leasing loans, factoring loans, and others. Information on the indebtedness of our customers and non-customers with these lenders is not publicly available or consolidated with borrowings from banks. As such, our assessment of customers for the scoring and provisioning processes may be based on partial, inaccurate or unreliable information on the borrowers’ creditworthiness, which could lead us to increase our expected credit losses in the future once complete information is fully available through the consolidation of customers’ indebtedness with all banking and non-banking lenders.
12
In addition, the cessation or replacement of certain rates, market indices or benchmarks extensively used by financial markets and practitioners for valuation purposes, such as interest rates or foreign exchange rates indices, could also impact the accuracy of the estimates we include in our financial statements. On July 27, 2017, the Chief Executive of the United Kingdom Financial Conduct Authority (FCA), which regulates the entity that oversees the London interbank offered rate (“LIBOR”), announced that the FCA will no longer persuade or compel banks to submit rates for the calculation of the LIBOR benchmark after 2021. Moreover, on March 5, 2021 the FCA made an announcement confirming that 35 LIBOR settings will either cease to be provided by any administrator or no longer be representative immediately after December 31, 2021 for all GBP, EUR, CHF and JPY LIBOR settings, and the one-week and two-month USD LIBOR, and after June 30, 2023 for the Overnight and one-month, three-month, six-month and 12-month USD LIBOR. Later, on October 20, 2021, in the United States, the Federal Reserve Board, the Federal Deposit Insurance Corporation and the Office of the Comptroller of the Currency released a joint statement mentioning that (i) after December 31, 2021, supervised companies should not increase exposures to LIBOR or extend the term of existing LIBOR contacts, (ii) starting January 1, 2022, a benchmark other than LIBOR should be used for the origination of new contracts and (iii) between December 31, 2021 and June 30, 2023, banking entities should amend formerly existing LIBOR contracts that do not clearly establish a fallback provision to replace LIBOR. The LIBOR reform and other similar changes may result in various risks for the financial and banking business, including but not limited to: (i) risk management, financial and accounting risks arising from market risk models and from valuation, hedging, discontinuation and recognition of financial instruments linked to benchmark rates; (ii) pricing risks arising from how changes to benchmark indices could impact pricing mechanisms on some instruments; (iii) communication risks arising from misunderstandings with customers or counterparties; (iv) the possibility that a limited number of transactions do not contemplate a LIBOR fallback provision; and (v) the necessity of adapting current IT systems, trading platforms, financial reporting infrastructure and clearing processes, among others. The implementation of alternative benchmark rates for USD, GBP, EUR, CHF and JPY LIBOR is still in progress. However, starting January 1, 2022 most banks, including us, have moved from LIBOR to the Secured Overnight Funding Rate (or “SOFR”) for newly originated transactions, which is the secured overnight financing rate published by the Federal Reserve Bank of New York on its website and is expected to be an appropriate replacement for LIBOR. This could have an adverse effect on our business, results of operations or financial condition if we are unable to agree on an alternative benchmark, like SOFR, with customers and financial counterparties holding contracts formerly based on LIBOR. Publication of SOFR began on April 3, 2018 and it therefore has a limited history. In addition, the future performance of SOFR cannot be predicted based on the limited historical performance. Prior observed patterns, if any, in the behavior of market variables and their relation to SOFR, such as correlations, may change in the future. While some pre-publication historical data have been released by the Federal Reserve Bank of New York, such analysis inherently involves assumptions, estimates and approximations. The future performance of SOFR and other alternative benchmarks, is currently impossible to predict and therefore no future performance of alternatives benchmarks may be inferred from historical simulations or historical performance. Furthermore, we may face a risk of litigation, disputes or other actions from clients, counterparties, customers, investors or others regarding the interpretation or enforcement of related provisions or if we fail to appropriately communicate the effect that the transition to alternative benchmark rates will have on existing and future products. Although we expect to adapt our valuation processes, IT infrastructure and pricing systems as new information arises, we can neither assure you nor calculate the impact this could have on our business and results of operations, if any.
As of December 31, 2021, we had on-balance and off-balance contracts that used LIBOR as a benchmark. Most of them have interests paid in LIBOR or are valued by using LIBOR as the prevailing discount rate, including derivatives, loans and master agreements, such as ISDA contracts. As of December 31, 2021, our on-balance assets based on LIBOR amounted to approximately U.S.$1,039 million and our liabilities based on LIBOR amounted to approximately U.S.$707 million. In the case of assets, as of December 31, 2021, approximately 29.4% was due to expire before June 30, 2023, while the remaining 70.6% was due to expire after June 30, 2023. As of the same date, in terms of liabilities, 68.8% is expiring before June 30, 2023 and 31.2% after that date. Most of the assets are associated with commercial credits linked to LIBOR granted to local customers. In terms of liabilities, most of them relate to financing for trade finance loans and, to a lesser extent, financial obligations. As of December 31, 2021, off-balance sheet arrangements based on LIBOR represented a net liability exposure of approximately U.S.$942 million, of which approximately 34.3% is due to expire before June 30, 2023 and the remaining 65.7% after that date. In addition to the fact that most of our foreign counterparties, particularly those associated with derivative contracts under ISDA agreements, are already set to move from LIBOR to SOFR as contracts consider fallback clauses that allow rate switching, we continue to deploy an action plan that includes: (i) the identification of our main exposures and risks related to the LIBOR transition, (ii) the development of new products linked to the new reference rate, (iii) revision of current contracts and renegotiation with some of our customers, (iv) the construction of new yield curves based on SOFR in order to address and value new derivative transactions, (v) the enhancement of our front and back office platforms to address the implementation of the new reference rate to migrate all former operations based on LIBOR, and (vi) closing newly originated on-balance and off-balance operations by using SOFR or comparable benchmarks in case of local counterparties or using local rates as part of the transaction. As of the date of this annual report, according to our estimates, switching from LIBOR to alternatives benchmarks such as SOFR is not expected to have a material impact on our results of operations. However, we cannot assure you that any other reforms and changes, any establishment of alternative reference rates or any other reforms to these reference rates that may be enacted will not have a material impact on our results of operations in the future.
13
In addition, the main accounting items subject to risk of incorrect valuation include impairment of loans to customers and advances to banks, valuation of fixed-income securities and financial derivatives held for trading, valuation and impairment of financial assets measured at fair value through other comprehensive income, and deferred tax assets and provisions for liabilities, among others. If our judgment, assumptions or models used in valuing these items are inaccurate, there could be a material effect on our results, funding requirements and capital ratios.
Market turmoil could result in material negative adjustments to the fair value of our financial assets, which could translate into a material effect on our results or financial condition.
Over the last decade worldwide financial markets have been subject to stress coming from diverse fronts that has resulted in sharp temporary changes in interest rates and credit spreads, including those related to the effects of the COVID-19 pandemic and, more recently, to the impact of geopolitical issues arising in eastern Europe, all of which have also affected the Chilean financial market. We have material exposures to debt securities issued by the Chilean Government and the Central Bank and other fixed-income investments in securities issued by local and foreign issuers. Most of these are booked at fair value with direct impact on our income statement or through other comprehensive income, while a remaining minor portion is measured at amortized cost. Therefore, these positions expose us to potential negative fair value adjustments in the short or medium term and to impairments in the long term, due to dramatic and unexpected changes in short- or long-term local and foreign interest rates and credit spreads. Any of these factors could have a material adverse effect on our results of operations and financial condition.
In 2020 and 2021, the Chilean financial market was affected by local non-recurrent factors including, but not limited to: (i) three pension fund withdrawals approved by the Chilean Congress to assist individuals in the context of the COVID-19 pandemic, which led to a change in the pricing of fixed-income securities as pension fund managers liquidated a significant part of their positions in order to overcome withdrawals, (ii) expectations of higher inflation, and (iii) political uncertainty associated with the run-off presidential election in December 2021. Also, in an effort to control inflation, the Central Bank increased the monetary policy rate four times between July and December 2021 from 0.5% to 4.0%, as part of a tightening cycle that is expected to continue in 2022. This was later increased further, as in the first quarter of 2022, the Central Bank raised the monetary policy interest rate twice, to reach 7.0% in March 2022. All of these factors resulted in significant increases for nominal and real interest rates through the whole yield curve. For instance, the average interest rates paid by Chilean banks on 90 to 360 day deposits increased from 0.40% in December 2020 to 5.06% in December 2021, while interest rates of the Central Bank’s five-year Chilean peso denominated bonds increased from 1.58% in December 2020 to 5.59% in December 2021 and to 6.76% in March 2022. All of these factors negatively impacted the market value of financial assets for the entire industry and us, including both financial instruments measured at fair value with direct impact on the income statement and those measured at fair value through other comprehensive income.
As of December 31, 2021, our fixed-income portfolio was composed of securities measured at fair value through profit and loss statement amounting to Ch$3,876,695 million (approximately U.S.$4,547 million) and financial instruments measured at fair value through other comprehensive income amounting to Ch$3,061,174 million (approximately U.S.$3,816 million), which are mostly concentrated in bonds and notes issued by the Central Bank and the Chilean Government. The approval of a fourth pension fund withdrawal, increased uncertainty regarding economic and social reforms to be implemented by Chile’s new administration, escalation of armed conflicts in eastern Europe including the involvement of additional countries leading to a global conflict, and internal or external forces sustaining persistent inflation, among other factors, could cause further increases in short- and long-term local interest rates, which could have additional impacts on the market value of our fixed-income portfolio measured at fair value.
14
See also “Item 3. Key Information—Risk Factors—Risks Relating to our ADSs—Developments in international financial markets may adversely affect the market price of the ADSs and shares” and “Item 3. Key Information—Risk Factors—Risks Relating to our ADSs—COVID-19 or any other pandemic disease and health events will affect both the global and the Chilean economy, our business or results of operations and could affect our financial condition.”
Operational problems, errors, criminal events or terrorism or other events relating to force majeure may have a material adverse impact on our business, financial condition and results of operations.
As all large financial institutions, we are exposed to many operational risks, including the risk of fraud by employees and outsiders, failure to obtain suitable internal authorizations, failure to properly document in-person and online transactions, equipment failures, mistakes made by employees and natural disasters, such as earthquakes, tsunamis, wildfires and floods.
Chile is located in one of the most seismically active regions in the world–Nazca tectonic plate. Our results of operations can be materially affected by natural disasters, particularly in locations where a significant portion of our loan portfolio is composed of real estate loans. These force majeure events related to nature include, but are not limited to, earthquakes, tsunamis and floods and may cause thorough damage which could impair the asset quality of our loan portfolio and our collateral as well as a material adverse impact on the economy of the affected region and therefore on our bank.
We could also be affected by operational disruptions associated with intentional or unintentional mass employee absence due to social unrest, demonstrations, street riots (such as the one witnessed since October 2019), transportation services interruptions, massive strikes or strikes at an industry level, massive epidemic or pandemic outbreaks, such as COVID-19, among others.
Furthermore, we may be exposed to criminal events, terrorist attacks or rioting that could result in physical damage to our buildings (including our headquarters, offices, branches and automatic teller machines (“ATMs”)) and/or injury to customers, employees and others. In addition, since activating certain aspects of our business continuity plan in response to the COVID-19 pandemic to allow many of our associates to work remotely, our associates’ ability to relocate to a secondary location in the event of any operational disruptions may be limited due to the pandemic. Although we maintain a system of operational controls composed of both trained staff and world-class technological resources that have been enhanced over the last years, as well as comprehensive contingency plans and security procedures, there can be no assurances that operational problems, errors, criminal events or terrorist attacks will not occur and that their occurrence will not have a material adverse impact on our results of operations, financial condition and the value of our shares and ADSs.
Despite our policies and procedures to detect or prevent money laundering and other financial crime activities, we may not be able to fully detect them or on a timely basis.
We are subject to many anti-money laundering (“AML”), anti-terrorism, anti-bribery and corruption laws and regulations. Further, due to our relationship with Citigroup, we have implemented similar AML policies that such bank has implemented which, in cases, are stricter than those applicable to Chilean banks.
We constantly update our policies and procedures for the purpose of timely detection and the prevention of the use of our banking network for money laundering and other criminal activities. Nevertheless, we are aware that new technologies, such as cryptocurrencies and innovative payment methods, could limit our ability to track the movement of funds.
Many threats can never be fully eliminated, and there will be instances where we may be used by other parties to engage in money laundering and other illegal or improper activities. Moreover, we rely on our employees to assist us by spotting such activities and reporting them, and our employees have varying degrees of experience in recognizing criminal tactics and understanding the level of sophistication of criminal organizations. If we are unable to apply the necessary scrutiny and oversight, there remains a risk of regulatory breach. If we are unable to comply fully with applicable laws, regulations and expectations, our regulators and relevant law enforcement agencies have the ability and authority to impose significant sanctions, fines and harsh penalties on us.
15
There are laws, regulations and policies that require us to, among other things, conduct full customer due diligence (including, but not limited to, sanctions and politically-exposed person screening), keep our customer, account and transaction information updated and, at the same time, implement and develop an array of policies and procedures to prevent the facilitation of financial crime. We conduct AML training programs for our employees on a regular basis to enable them to adequately detect and report suspicious transactions to our AML team, to allow for subsequent proper investigation from law enforcement agencies.
We have policies and procedures to reasonably assure the compliance with legal requirements and policies; however, our ability to comply thereto depends on improving detection and reporting capabilities and reducing variation in control processes and oversight accountability. The latter requires us to implement and enhance our business with effective controls and monitoring. We are also aware that financial crime is permanently evolving and is subject to increasingly stringent regulatory oversight and focus. This requires proactive and adaptable responses from us so that we are able to deter threats and criminality effectively and in a timely fashion.
The reputational damage to our business and brand could be severe if we were found to have breached AML, anti-bribery and corruption or sanctions requirements. Our reputation could also suffer if we are unable to protect our customers’ bank products and services from being used by criminals for illegal or improper purposes. Any such risks could have a material adverse effect on our results of operation, financial condition and prospects.
Cybersecurity events could negatively affect our reputation or results of operations and may result in litigation.
We have access to large amounts of confidential financial information and hold substantial financial assets belonging to our customers as well as to us. In addition, we provide our customers with continuous online access to their accounts. Customers have the ability to transfer substantial financial assets in Chile and abroad through electronic means, while purchasing goods or withdrawing funds with credit and debit cards issued by us. Among the most significant cyber-attack risks that we are constantly facing are internet fraud and loss of sensitive information, both from our customers and ourselves. In particular, loss from internet fraud occurs when cyber criminals extract funds directly from clients’ or our accounts using fraudulent schemes that may include internet-based fund transfers. We are also exposed to cyber-attacks, hacking and other cybersecurity incidents in the normal course of business. Thus, as a financial institution, we are under a constant threat of suffering losses due to these reasons. In addition, our risk and exposure to these matters remains heightened because of the evolving nature and complexity of these threats from cybercriminals and hackers, our plans to continue to provide and enhance our internet banking and mobile banking channels, and our plans to develop additional remote connectivity solutions to serve our customers. Accordingly, cybersecurity is a material risk for us.
There has recently been an increased level of attention focused on cyber-attacks against large corporations that include, but are not limited to, obtaining unauthorized access to digital systems for purposes of misappropriating cash, other assets or sensitive information, corrupting data or causing operational disruptions. Cybersecurity incidents, such as computer break-ins, phishing, identity theft and other disruptions, could negatively affect the security of information stored in and transmitted through our computer systems and network infrastructure. Subsequently, this may result in significant liability to us in excess of insurance coverage, which may carry low coverage limits, and may cause existing and potential customers to refrain from doing business with us. Additionally, cyber-attacks on our network or other systems could have a material adverse effect on our business and results of operations due to financial losses, losses of sensitive information, interruption or delays in our business and operations, regulatory fines, reimbursement or other compensation costs, compliance costs and reputational damage, among other things.
In 2018, we suffered a cybersecurity incident involving the theft of funds that subsequently resulted in an operational write-off of approximately Ch$6,900 million (or U.S.$9.9 million). The incident also caused temporary interruptions to some of our operations, affecting the quality of the services provided to our customers during a short period of time. In spite of the temporary damage to our IT infrastructure, we were able to contain any disruption by deploying a contingency plan, which allowed us to maintain the continuity of our operations, assure that our customers’ funds were absolutely secured, and comply with our short-term financial commitments. We took immediate action and communicated with our network of correspondent banks to recover the stolen funds. For more information on the incident, see “Item 5. Operating Results—Results of Operations for the Years Ended December 31, 2016, 2017 and 2018—Other Income (Loss), Net”, “Item 5. Operating Results—Results of Operations for the Years Ended December 31, 2016, 2017 and 2018—Operating Expenses” and “Item 4. Information about the Company—Our Business Strategy—Operating Efficiency and Productivity” in our annual report on Form 20-F for the year ended December 31, 2018 filed with the SEC on April 26, 2019.
16
Furthermore, in line with the enhancements in our cybersecurity standards that were performed during the last years, and to further improve our protections against events such as the one that occurred in May 2018, we have made significant efforts and taken steps to enhance our data security and IT infrastructure, including the purchase of protection systems and world-class infrastructure, among others. We reinforced our organizational structure and replaced our former Technological Security Area with our Cybersecurity Division in June 2018, whose main role is to be the first line of defense and be in charge of mitigating and managing cybersecurity threats, while at the same time improving cybersecurity policies, spreading related knowledge among our bank and customers and developing competences that all our employees must possess on this regard. In 2019, we continued to enhance our cybersecurity protocols and infrastructure by improving security in our networks, servers, workstations and digital applications. Similarly, we put significant efforts in enhancing access-control to our networks by using technological solutions and specialized software, while simultaneously improving our capabilities on detection and management of high-risk threats. Also, based on our efforts to change our staff’s culture on cybersecurity matters, we were able to timely detect and block phishing attempts targeting clients and non-clients. In 2020, given the effects of COVID-19 on our operations, most of our staff operated remotely, which accelerated our digital transformation while imposing a challenge for us in terms of cybersecurity, since our collaborators are accessing our network and servers from home. As such, we reinforced cybersecurity measures by implementing new protocols and tools. In 2021, our efforts were oriented to bolster the cybersecurity culture across the corporation by focusing in three main initiatives: (i) an awareness program intended to share with our collaborators the best practices and recommendations to face cybersecurity threats, (ii) the establishment of improved cybersecurity guidelines for selection and classification of providers, and (iii) the enhancement of existing information channels by which our staff reports cybersecurity threats.
Notwithstanding every measure taken to address cybersecurity matters, although we have not experienced any material losses in this matter and are currently performing our best efforts to prevent them, we cannot assure you that we will not suffer additional losses in the future related to these kinds of events.
The occurrence of any cyber-attack or information security breach could result in material adverse consequences to us, including damage to our reputation and the loss of customers. We could also face litigation or additional regulatory scrutiny. Litigation or regulatory actions in turn could lead to significant liability or other sanctions, including fines and penalties or reimbursement of customers adversely affected by this security breach. As mentioned above, although we did not suffer any material adverse effects as a result of the May 2018 cyber-attack, successful attacks or systems failures at our bank or at other financial institutions could lead to a general loss of customer confidence in financial institutions, including us.
In addition, we depend on a variety of internet-based data processing, communication, and information exchange platforms and networks. We cannot assure you that all of our systems are entirely free from vulnerability. Additionally, we enter into contracts with several third parties to provide our customers with data processing and communication services. Therefore, if information security is breached, or if one of our employees or external service providers breaches compliance procedures, information could be lost or misappropriated, which may affect our results of operations, damage others or result in potential litigation.
Further, in light of the high volume of transactions we process, the large number of our clients, partners and counterparties, the increasing sophistication of malicious actors, and our remote work environment in response to the COVID-19 pandemic, a cyber-attack could occur and persist for an extended period of time without detection. We expect that any investigation of a cyber-attack would take substantial amounts of time, and that there may be extensive delays before we obtain full and reliable information. Although we have substantially increased measures to address cybersecurity during the last years and, with the help of service providers, intend to continuously implement security technology devices and establish operational procedures to prevent such damage, we cannot assure you that these security measures will be successful.
17
Any downgrade in Chile’s or our credit rating could increase our cost of funding, affecting our interest margins, results of operations and profitability.
Our current credit ratings determine the cost and the terms upon which we are able to obtain funding in the ordinary course of business. Rating agencies regularly evaluate us by considering diverse factors, including our financial strength, the business environment and the economic backdrop in which we operate. Thus, methodologies used by rating agencies evaluate Chile’s sovereign debt ratings when determining our ratings. In addition, from time to time, rating agencies review and revise their methodologies, which in some cases could result in adjustments to Chile’s sovereign debt prevailing credit ratings or those of our debt. On March 24, 2021, Standard & Poor’s Ratings Service (“S&P”) downgraded Chile’s sovereign credit rating from A+ to A, while modifying the credit outlook from negative to stable in September 2021. The credit action taken by S&P was founded in the expected negative effects due to the COVID-19 pandemic and the effects of increasing social pressures that may lead the prevailing government to incur further social expenses and increase Chile’s current fiscal deficit in the long-run. Given the credit action taken by S&P on Chile’s sovereign credit rating, this rating agency also downgraded four local banks (excluding us) by one notch, while maintaining the negative outlook for the whole banking industry (including us), with the exception of Banco Estado (a state-owned bank) that received a stable outlook. In June 2021, S&P improved the outlook for two banks from negative to stable, excluding us.
As of the date of this annual report, S&P and Moody’s maintained our credit rating for unsecured long-term debt at levels of A and A1, respectively, both with a negative credit outlook (downgraded from the stable outlook in April 2020) due to the effects of the COVID-19 pandemic on the Chilean economy and banking activity, in conjunction with the slowdown evidenced by the Chilean economy since the social turmoil in October 2019. While Chile’s current long-term debt credit ratings remain investment grade, these credit ratings may deteriorate further and adversely affect our credit rating.
Any downgrade in our debt credit ratings could result in higher borrowing costs for us, while requiring us to post additional collateral or take other actions under some of our derivative and other contracts, and could limit our access to debt and capital markets. All of these factors could adversely impact our commercial business by affecting our ability to: (i) sell or market our products, (ii) obtain long-term debt in Chile or abroad, (iii) retain customers who need minimum ratings thresholds to operate with us, (iv) maintain derivative contracts that require us to have a minimum credit rating and (v) enter into new derivative contracts, which could impact our market risk profile, among other effects. Any of these factors could have an adverse effect on our liquidity, results of operations and financial condition.
Due to (i) the volatility in the financial markets and concerns about the soundness of developed and emerging economies, (ii) the still unpredictable impacts or lagged effects of the COVID-19 pandemic on the global and the local economies, (iii) changes to or attempts to modify the political or economic system by the Constitutional Convention which is currently drafting a new constitution, (iv) potential changes to be introduced in the fiscal policy or long-term government spending by the current or future government administrations in Chile, (v) reforms to be proposed or introduced by the recently appointed administration to modify the characteristics of the current economic and financial system, and (vi) the effects that current or potential geopolitical conflicts may have on the local economy, we cannot assure you that rating agencies will maintain our and Chile’s sovereign debt current ratings and outlooks.
As a financial institution, we are subject to reputational risk that could materially affect our results of operations or financial condition.
Corporate reputation is a crucial competitive advantage for us, as it allows us to attract and retain customers, appeal to investors and avoid employee attrition. Also, reputation is a key element in banking since access to funding is driven by the confidence of depositors and the opinion of ratings agencies on the value of our franchise. Therefore, any disreputable event, including employee misconduct, legal proceedings, regulatory sanctions, failure to deliver minimum standards of service quality, failure to comply with regulatory requirements, unethical behavior by our staff or involvement in political issues or public scandals (or gossip related thereto), complaints filed by customers or non-customers and fake news or alleged issues about us or our operations in social media could damage our reputation and produce significant harm to our results of operations or financial condition. Furthermore, our reputation is highly aligned with the reputation of the banking industry in which we participate and, therefore, actions by other providers of financial services or the banking industry as a whole could also harm our own reputation.
18
Similarly, the ability to manage potential conflicts of interest has become an increasingly important factor for our business given our widespread operations in many economic sectors with diverse third parties. Accordingly, the failure to address –or even the perceived failure to address– conflicts of interest could affect the willingness of customers and investors to work with us, or could lead to legal actions against us. In order to address and avoid these potential events, we are continuously improving our corporate governance standards by detecting potential failures and adopting world-class principles and procedures. Nevertheless, we cannot assure you that we will not face reputational events in the future that could harm our prospects or the value of our franchise. For more information on corporate governance, see “Item 6. Directors, Senior Management and Employees—Board Practices”.
Risks Relating to our American Depositary Shares (“ADSs”)
Our principal shareholders may have interests that differ from those of our other shareholders and their significant share ownership may have an adverse effect on the future market price of our ADSs and shares.
As of April 20, 2022, LQ Inversiones Financieras S.A. (“LQIF”), a holding company beneficially owned by Quiñenco S.A. and Citigroup Chile S.A., holds directly and indirectly approximately 51.2% of the voting rights of our shares. Subject to our bylaws and applicable law, these principal shareholders are in a position to elect a majority of the members of our board of directors and control all matters decided by a shareholder vote, including the approval of fundamental corporate transactions.
Actions taken by our principal shareholders with respect to the disposition of the shares or ADSs they beneficially own, or the perception that such actions may occur, may adversely affect the trading price of our shares on the various stock exchanges on which they are listed and, consequently, the market price of the ADSs.
There may be a lack of liquidity and a limited market for our shares and ADSs.
While our ADSs have been listed on the New York Stock Exchange (the “NYSE”) since the first quarter of 2002, there can be no assurance that an active trading market for our ADSs will be sustained. During 2021, a daily average volume of approximately 105,352 of our American Depositary Receipts (“ADRs”) were traded on the NYSE, according to data provided by Bloomberg. Although our shares are traded on the Santiago Stock Exchange and the Chilean Electronic Stock Exchange, the Chilean market for our shares in Chile is small and somewhat illiquid. As of April 20, 2022, approximately 48.8% of our outstanding shares were held by shareholders other than our principal shareholders, LQIF.
If an ADS holder withdraws the underlying shares from the ADR facility, the small size of the market, its limited liquidity, as well as our concentrated ownership, may impair the ability of the ADS holder to sell the shares in the Chilean market in the amount and at the price and time such holder desires, and could increase the volatility of the price of our ADSs.
ADS holders may be unable to exercise voting rights at shareholders’ meetings and preemptive rights.
ADS holders may exercise voting rights associated with common stock only in accordance with the deposit agreement governing our ADSs. Accordingly, ADS holders will face practical limitations when exercising their voting rights because ADS holders must first receive a notice of a shareholders’ meeting from the Depositary and may then exercise their voting rights by instructing the Depositary, on a timely basis, on how they wish to vote. This voting process necessarily will take longer for ADS holders than for direct common stockholders, who are able to exercise their vote by attending our shareholders’ meetings. Therefore, if the Depositary fails to receive timely voting instructions from some or all ADS holders, the Depositary will assume that ADS holders agree to give a discretionary proxy to a person designated by us to vote their ADSs on their behalf. Furthermore, ADS holders may not receive voting materials in time to instruct the Depositary to vote. Accordingly, ADS holders may not be able to properly exercise their voting rights.
19
Furthermore, the Ley Sobre Sociedades Anónimas No. 18,046 (the “Chilean Corporations Law”) and the Reglamento de Sociedades Anónimas (the “Chilean Corporations Regulation”) require that whenever we issue new common stock for cash, we grant preemptive rights to all of our shareholders (including holders of ADSs) to purchase a sufficient number of shares to maintain their existing ownership percentage. Such an offering would not be possible unless a registration statement under the Securities Act were effective with respect to such rights and common stock, or an exemption from the registration requirements thereunder were available.
We may elect not to make a registration statement available with respect to the preemptive rights and the common stock, in which case you may be unable to exercise your preemptive rights. If a registration statement is not filed, the depositary will sell such holders’ preemptive rights and distribute the proceeds thereof if a premium can be recognized over the cost of any such sale.
Developments in international financial markets may adversely affect the market price of the ADSs and shares.
The market price of our ADSs and shares may be adversely affected by volatility in international financial markets and unfavorable developments in global economic conditions. The market for Chilean securities and the Chilean economy as a whole are influenced by: (i) economic and market conditions in Chile’s main commercial partners such as the United States, Europe and certain emerging economies, especially Asian countries, (ii) economic as well as political developments in Latin American countries, and (iii) armed conflicts in which some of the Chile’s main trade partners participate or by which they could be affected. Although economic conditions are different in each country, investors’ reactions to specific issues in one country may affect the financial markets in others, including Chile.
After a long period of turbulence and volatility, which began in 2007 with the subprime mortgage crisis, when many U.S. banks and financial institutions disclosed significant write-downs related to their exposure to mortgage-backed securities and other similar financial instruments, the world’s economy began to show a gradual recovery thanks to significant government intervention for important banks worldwide, in order to maintain investors’ and customers’ confidence and to prevent bank runs. These government actions became less frequent as the U.S. and the global economy started to show signs of recovery. Nevertheless, the fiscal condition of many European countries remained weak for a protracted period of time, which, from time to time, created doubts about the financial condition of certain European banks. At the same time, stricter capital requirements were established for banks around the world, namely the Basel III framework or more recently the Basel IV framework.
During 2020, the COVID-19 pandemic was a principal source of instability for financial markets. Equity market valuations lowered significantly while liquidity in fixed income markets decreased dramatically, creating significant volatility and disruption in global financial markets, particularly in the early months of the pandemic, resulting in the fall of stock prices (including the price of our stock) and sudden increases in credit spreads. In the case of interest rates, monetary actions taken by many central banks around the world led short-term and long-term rates to historically low levels, in order to promote lending by banks and assure liquidity in the global financial system. These trends began to revert in 2021 as the pandemic seemed to be under control, massive lockdowns were gradually lifted, individuals and companies returned to normal activities and the vaccination process advanced around the globe. Many developed and developing economies recovered significantly from the contraction displayed in 2020. In fact, according to the International Monetary Fund, global GDP is estimated to have expanded 5.9% in 2021, whereas GDP of developed and emerging economies is estimated to have increased 5.0% and 6.5%, respectively, which were accompanied –or in some cases prompted– by increases in fiscal spending and also a boost in household spending in comparison with 2020, linked to both fiscal aid packages and a recovery in employment.
20
Additionally, given the effect of diverse economic events such as the United States-China trade war and, more recently, the COVID-19 pandemic on actual economic growth, the U.S. Federal Reserve reduced the federal fund rate starting in March and April 2020, by leading the monetary interest rate to from 1.75% at the beginning of the year to 0.25%, a level at which it remained until December 2021. Recently, the U.S. Federal Reserve has announced its intentions to begin to increase rates during the first half of the year to combat rising inflation. Furthermore, uncertainty regarding the future of emerging and developed economies continues to be a source of instability worldwide. For example, although the “trade war” between the United States and China, by which both countries seek to revise tariffs on the others’ imported goods, seemed to have improved, it continues to be a source of volatility for financial markets from time to time. Also, political and social instability in some Latin American countries like Colombia, Venezuela, Ecuador, Argentina and even Chile produced migration issues in more stable countries within the region. Moreover, the materialization of Brexit, armed conflicts in the Middle East and Asia, the ongoing tensions between the U.S. and Iran, the global migration crisis and waves of populism looming in different countries, as well as terrorism, illustrate volatile social and political environments that could harm foreign trade and economic growth for both developed and developing countries. These changes may also generate significant volatility in international markets and commodity prices. More recently, the armed conflict between Russia and Ukraine in eastern Europe, which threatens to become global if other countries decide to act, is another source of instability that could affect the global economic environment. As of December 31, 2021, and as of the date of this annual report, we do not have any exposure to customers or financial counterparties either in Ukraine or Russia.
Moreover, the slowdown of the Chinese economy has led to increasing volatility in the financial markets in the past, affecting international commodity prices, including copper, which is Chile’s main export. For example, during the first months of the COVID-19 pandemic, there was a slowdown in the Chinese economy due to the quarantine ordered by Chinese authorities in the most affected regions of the country. Due to the importance of copper exports and overall mining activity to Chilean economic growth, a prolonged slowdown in the Chinese economy, a Chinese-U.S. trade war or other developments may drive copper prices down and adversely affect the Chilean economy. Nevertheless, our exposure to the Chilean mining sector represented only 0.8% as of December 31, 2021 in terms of total loans.
The effect of all these trends on market volatility and the economic outlook of developed countries, emerging economies and Chile’s commercial partners could adversely impact the local economy, the local banking industry and, ultimately, our results of operations, financial condition and the price of our shares and ADS.
COVID-19 or any other pandemic disease and health events will affect both the global and the Chilean economy, our business or results of operations and could affect our financial condition.
Pandemic disease and health events, such as the outbreak of COVID-19, have the potential to negatively impact economic activities in many countries, including Chile, with subsequent adverse effects on our business growth, results of operations or financial condition.
Since the worldwide outbreak of COVID-19 in early 2020, countries have responded by taking various measures including mass quarantines, shelter-in-place orders, medical screenings, restricting or banning travel, limiting public gatherings, closing businesses and schools and suspending certain other economic activities. Actions taken by governmental authorities and other third parties in response to the pandemic may negatively impact our business, results of operations and financial condition.
In addition, concerns related to the evolution of the world economy due to COVID-19 lowered equity market valuations, decreased liquidity in fixed income markets that translated into a sudden increase in credit spreads while creating significant volatility and disruption in global financial markets, particularly in the early months of the pandemic, ultimately resulting in the fall of stock prices (including the price of our stock). Also, since new variant strains of COVID-19 appear from time to time, there continue to be concerns on the mid-term effects they will have on international trade (including supply chain disruptions and export levels), travel, employee productivity, employee illness, increased unemployment levels, securities markets, and other economic activities that may continue to have a destabilizing effect on financial markets and economic activity, particularly for companies in the financial sector. Although in certain countries some of the restrictions listed above have been relaxed in light of progressive success of vaccination, most of these countries have had to re-introduce partial or full-scale lockdowns due to new infection waves. Accordingly, the adverse social and economic effects of the pandemic continue to be a threat for economic growth.
21
In Chile, since the first cases of COVID-19 were detected in March 2020, the Chilean Government has taken diverse measures in order to prepare for and safeguard the country from a mass contagion and to control its spread. In March 2020, the Chilean Government declared a state of catastrophe in the entire country, which restricted freedom of movement and gathering. During the state of catastrophe, partial or total lockdowns with varying levels of severity and length took place in Chile, particularly during the second and the third quarters of 2020, which covered approximately 60% of the Chilean population in the peak of the pandemic. In the fourth quarter of 2020, the level of contagion decreased significantly, and lockdowns started to be lifted, a process that continued during 2021. Likewise, vaccination started by the end of 2020 and continued throughout 2021. Notwithstanding this, a second wave of contagion appeared by mid-March 2021, which caused the Chilean Government to implement new lockdowns for some neighborhoods while restricting some economic activities that are focused on social interaction. After that, the contagion rate began to decrease as a greater portion of the target population became vaccinated, which led the Chilean Government to end the state of catastrophe on September 30, 2021. Since that date, the contagion rate has increased in light of the Omicron COVID-19 variant and other variants that have subsequently emerged, however, given the high rate of vaccination, health authorities have not raised new concerns regarding new contagion waves. According to the Our World in Data website, as of December 31, 2021, approximately 90.5%, 86.5% and 57.8% of the target population had received at least one dose, two doses or a third booster dose of the vaccine. These figures have increased to 93.5%, 91.0% and 84.3% of the population receiving one dose, two doses and a booster dose of the vaccine as of March 31, 2022. The Ministry of Health defines “target population” as (1) critical population (i.e. individuals exposed to infection due to their work or functions); (2) healthy population (i.e. individuals between the ages of 18 and 59); and (3) population at risk (i.e. individuals with an increased risk of experiencing grave morbidity, sequels or death due to COVID-19 by reason of age or pre-existing conditions). The Chilean Government has also begun vaccinating children under 18 years of age and is currently rolling out the booster shot. Moreover, on September 6, 2021 the Public Health Institute (Instituto de Salud Pública) granted the necessary emergency approval for the vaccination of children between six and 12 years of age. Also, in February 2022, the Chilean government began a new vaccination process by promoting a fourth booster dose, which is still in progress as of the date of this annual report.
As vaccinations have increased and appear to be effective in slowing down the spread of COVID-19 and new variant strains, while preventing an increase in the death toll, the Chilean Government has continued to gradually modify the restriction program named “step-by-step”, which has been in effect since March 2020. The new program includes five stages ranging from total restriction (lockdown) to advanced opening, depending on many factors, including the number of new cases per capita in a specific area, size of vulnerable population and access to health services. From a macroeconomic point of view, these measures and the positive advance in the control of the pandemic contributed to the reactivation of the Chilean economy in 2021 as reflected by an annual GDP expansion of 11.7%. Even though GDP growth was mainly fostered by a significant increase of household spending primarily driven by support measures for individuals including direct money transfers (Emergency Income for the Family or Ingreso Familiar de Emergencia – “IFE”) from the Chilean Government and pension fund withdrawals permitted by the Chilean Congress, resulting in enhanced disposable income for individuals. To the extent that the improved vaccination and spread trends do not continue or reverse, the health authority may impose new restrictions, such as country-wide lockdowns, in connection with the appearance of new variants, which could result in a shutdown involving the Bank, our subsidiaries and some or all of our customers operations, such that we would be unable to meet the needs of our customers for an unknown period of time, which could adversely affect our results of operations by reducing revenues, decreasing our collection capabilities.
Furthermore, as the COVID-19 pandemic continues to cause a historic economic downturn, financial institutions face increased credit risk, strategic risk, operational risk, and compliance risk. The spread of new variants of COVID-19 continues to result, from time to time, in increased volatility in both the local and the international financial markets and economic indicators, such as exchange rates, interest rates, credit spreads and commodity prices. Any shocks or unexpected movements in these market factors could result in financial losses associated with our trading portfolio or financial assets measured at fair value through other comprehensive income, which could then cause deterioration of our financial condition or limitations to meet our liabilities. Furthermore, market fears could translate into liquidity constraints and reduced access to funding in both the local and the international markets, negatively affecting our net interest margin and net income. Adverse changes in the economy may also have a negative effect on the ability of our borrowers to make timely repayments of their loans, which could have an adverse impact on our earnings. In order to prepare for the impacts of this environment, the Chilean financial authorities made various decisions in order to ensure liquidity within the Chilean financial system, the Central Bank carried out consecutive reductions to the monetary policy rate by lowering the reference rate to 0.5%, level at which it remained from April 2020 to July 2021, when the Central Bank began to withdraw the monetary stimulus in an attempt to control inflation. However, additional decisions made by the Central Bank based on the evolution of the pandemic may affect our results of operations in the future. Lastly, contingency plans in order to address the emergency, including remote working arrangements, implementation of alternative offsite locations and so on, could have a negative impact on us in terms of operating expenses and lowered net income.
22
In terms of the direct effect on our results of operations and financial condition in 2021, they reflected the dynamics of the local economy and the banking system after the worst of the pandemic seemed to be overcome. In this regard, we recorded an annual expansion of 10.8% driven by advances in all lending products, in line with the end of total lockdowns and the reopening of diverse economic activities, particularly those involving social interaction. However, most of the loan growth continued to be driven by low margin lending products, such as residential mortgage and commercial loans, while consumer loans started to display positive growth only by the end of 2021. Thus, commercial loans increased 11.8% in 2021, based on both the FOGAPE Reactiva program (guaranteed by the government) and a moderate reactivation of capital expenditures by wholesale customers. In turn, the sustained upward trend in residential mortgage loans, which grew 10.2% in 2021, was supported by the decoupling of this product from economic drivers. Consumer loans, on the other hand, grew 7.6% in 2021, after the contraction of 2020, reflecting a more dynamic demand for personal banking.
From the funding perspective, since short-term interest rates remained at low levels throughout 2021, due to the measures adopted as consequence of the COVID-19 pandemic, the contribution of our non-interest-bearing demand deposits to our cost of funds continued to be negatively affected in 2021. This was accompanied by an increase of 32.3% in average balances of demand deposits, attributable to the excess of liquidity due to non-recurrent factors, such as direct money transfers from the Chilean Government and the approval of three pension fund withdrawals since 2020. This trend coupled with mid-term financing provided by the Central Bank bearing the monetary policy interest rate (0.5%), from which we further raised Ch$1,238,800 million in 2021 bearing the same rate (Ch$3,110,600 million in 2020). Based on these funding sources we replaced time deposits held by wholesale counterparties. For the same reason, we only reactivated long-term bond placements by the end of 2021, principally in foreign markets, by taking advantage of our credit rating. From the capital adequacy perspective, we continued to maintain a strong equity base in 2021, as reflected by a CET1 ratio that increased from 12.2% to 13.0% and a BIS ratio that increased from 16.0% to 17.3% between December 2020 and December 2021 amid the implementation of the Basel III guidelines in Chile that became effective for purposes of measuring capital and risk-weighted assets in December 2021.
In terms of results, our net income was Ch$1,056,317 million in 2021 as compared to the Ch$401,630 million recorded in 2020. The main drivers of this change were improvements in both provisions for expected credit losses and net interest income. Whereas provisions for expected credit losses recorded a sharp annual decrease, reflecting an overall improvement in the payment behavior of customers and an enhanced economic outlook that benefits forward-looking models, the higher net interest income was primarily attributable to the positive effect of higher inflation on our structural UF net asset exposure.
Although economic activity appears to be recovering, because there have been no comparable recent global pandemics that resulted in a similar global impact, we do not yet know the course and, as such, the full extent of the COVID-19 pandemic’s effects on our business, operations, or the global economy as a whole. Any future development will be highly uncertain and cannot be predicted, including the scope and duration of the pandemic, the effectiveness of our remote working arrangements, third party providers’ ability to support our operations, and any further action taken by governmental authorities and other third parties in response to the pandemic. As the economic impact due to the COVID-19 pandemic continues we cannot provide any assurances as to how long it will be before the COVID-19 pandemic abates and economic activity can begin to resume to pre-COVID-19 pandemic levels.
In the past, Chile has imposed controls on foreign investment and repatriation of investments that affected investments in, and earnings from, our ADSs.
Equity investments held in Chile by non-Chilean residents have historically been subject to various exchange control regulations that restrict the repatriation of investments and earnings from Chile. In April 2001, the Central Bank eliminated most of the regulations affecting foreign investors. However, foreign investors still have to provide the Central Bank with information related to equity investments and must conduct such operations within the Formal Exchange Market. Additional Chilean restrictions applicable to holders of our ADSs, the disposition of the shares underlying them, the repatriation of the proceeds from such disposition or the payment of dividends may be imposed in the future, and we can neither determine in advance nor advise you as to when or how those restrictions could impact you, if imposed.
If for any reason, including changes in Chilean law, the depositary for our ADSs were unable to convert Chilean pesos to U.S. dollars, investors would receive dividends and other distributions, if any, in Chilean pesos.
23
Risks Relating to Chile
Our growth and profitability depend on the level of economic activity in Chile.
Our core business and transactions are with customers doing business in Chile. Accordingly, our ability to grow our business volumes and results of operations, as well as enhance our financial condition, in general, depends on the dynamics of the Chilean economy or the effects of economic developments in other countries affecting Chile, and specific macroeconomic variables such as inflation, unemployment, interest rates, consumption and private investment. In the past, global financial crises, such as the 2008 financial crisis, have dramatically affected economic growth in developed countries, as well as in Chile where a subsequent slowdown in the local banking industry was observed due to lower levels of consumption and deteriorated credit quality in loan portfolios prompted by unemployment and financial stress experienced by certain economic sectors. In 2019, the local economy grew by only 0.8%, mainly as a result of the social turmoil that took place in Chile on October 18, 2019, which temporarily damaged the productive capacity, income-generating capacity and distribution networks of many economic sectors, resulting in decreased commercial activity and constrained working hours. During 2020, the local economy was severely affected by the impact of the COVID-19 pandemic on overall activity, primarily as a result of the long-lasting lockdowns imposed by the Chilean Government in order to control the spread of the virus across the country, which translated into: (i) a spike in unemployment from 7.1% in December 2019 to a peak of 12.3% in the three-month period between August 2020 and October 2020, which decreased to 10.3% in December 2020, (ii) an 8.0% decline in private consumption, caused by the sharp decrease in disposable income and mobility restrictions and (iii) a contraction of 9.3% in capital expenditures (gross fixed capital formation), since many investment projects were postponed in light of both uncertainty on the economic outlook, social distancing measures and lockdowns that impacted diverse economic sectors. These local events, coupled with the initial effects of the COVID-19 pandemic on Chile’s main trade partners’ economies, particularly China, Europe and the United States, battered the dynamics of some of its key export products. However, in the fourth quarter of 2020, local economic activity began to recover as mobility restrictions were lifted and certain industries, like construction, restaurants and manufacturing, returned to more normal activity. Likewise, household spending was positively impacted by the fiscal aid package implemented by the government to support individuals and the initial effects of two pension fund withdrawals approved by the Chilean Congress. Accordingly, in the fourth quarter of 2020, GDP recovered to 2019 levels, by advancing 0.4%. However, annual GDP contracted 6.0% in 2020.
In 2021, the Chilean economy showed a strong recovery, given both the low comparison base during same period in 2020, as well as a significant rebound in private consumption and, to a lesser extent, in private investment. According to figures reported by the Central Bank, GDP recorded an expansion of 11.7% in 2021 as compared to 2020, primarily driven by household spending, which increased 20.3% as a result of the extraordinary support measures for individuals that began in 2020, such as direct money transfers from the Chilean Government and an additional withdrawal from pension funds approved by the congress that positively impacted individuals’ disposable income. Furthermore, most of the mobility restrictions present in 2020 were gradually lifted in 2021, as a significant part of the population became fully vaccinated and contagion rates decreased steadily, which supported the reactivation of diverse industries, particularly those associated with retail, mass consumption and services. In terms of private investment in infrastructure, machinery and equipment, overall capital expenditures grew 17.6% in 2021 as compared 2020, while government spending expanded 10.3% within the same period, fostered by increasing social demands from the Chilean population and efforts to deal with the lingering effects of the COVID-19 pandemic. Furthermore, the dynamics that boosted household consumption and, to a lesser extent, investment, together with constrained inventories, led the Chilean balance of trade (defined as exports minus imports) to become negative in the year ended December 31, 2021, as reported by the Central Bank.
Although the effects of the COVID-19 pandemic on the local economy and most relevant economies worldwide, such as China, the United States and main European countries, have mostly subsided or significantly improved and the worldwide vaccination process is in progress, it is not clear that new infection waves will not arise, given the appearance of continued or new virus mutations. As such, we cannot assure you that the dynamics displayed by the Chilean economy in 2021 will remain or that the economic growth of Chile’s key international partners will improve or return to pre-COVID-19 levels. Likewise, social developments prompted by the COVID-19 pandemic or new variant strains, could also lead the Chilean economy to severely decelerate, stagnate or even fall into recession, which could have a subsequent adverse effect on our business growth and the business growth of the Chilean banking industry in general.
24
Additionally, social and political developments occurring in Chile, including the drafting of a new constitution and diverse social and economic reforms that are expected to be sponsored by Chile’s new government administration, which assumed power in March 2022, could affect both consumer confidence and business sentiment, which may in turn result in lowered demand for loans and banking services. Likewise, economic uncertainty linked to these developments could lead to increasing interest rates, higher inflation and an economic slowdown or downturn, which could affect our cost of funds, margins, results of operations, business volumes and financial condition.
Therefore, we cannot assure you that the local economy will grow in the coming years, as it has in the past, or that developments affecting the Chilean economy and the local banking industry will not materially affect our business, financial condition or results of operations. For more information, see “Item 5. Operating and Financial Review and Prospects—Operating Results—Impact of COVID-19 in 2021,” “Item 3. Key Information—Risk Factors—COVID-19 or any other pandemic disease and health events will affect both the global and the Chilean economy, our business or results of operations and could affect our financial condition” and “Item 5. Operating and Financial Review and Prospects—Trend Information—Impact of COVID-19 in 2021.”
Currency fluctuations could adversely affect our results of operations, the value of our ADSs and any distributions on the ADSs.
The Chilean Government’s economic policies and any future changes in the value of the Chilean peso with respect to the U.S. dollar could affect the dollar value of our common stock and our ADSs. Given the floating exchange rate regime that exists in Chile, the Chilean peso has been subject to large fluctuations in the past and this trend could occur again in the future. According to information published by the Central Bank (“Dólar Observado”, which differs from exchange rate of accounting representation or market exchange rate), between December 31, 2020 and December 31, 2021, the value of the U.S. dollar relative to the Chilean peso increased by approximately 19.8%, as compared to the decrease of 5.3% recorded in the period from December 31, 2019 to December 31, 2020. Chilean trading in the shares underlying our ADSs is conducted in Chilean pesos. Cash dividends associated with our shares of common stock are received in Chilean pesos by the depositary, which then converts such amounts to U.S. dollars at the then-prevailing exchange rate for making payments in respect of our ADSs. If the value of the U.S. dollar increases relative to the Chilean peso, the dollar value of our ADSs, and any distributions to be received from the depositary, will decrease. In addition, the depositary will incur customary currency conversion costs (to be borne by the holders of our ADSs) in connection with the conversion and subsequent distribution of dividends or other payments. For more information, see “Item 10. Additional Information—Exchange Controls.”
Since we manage assets and liabilities denominated in foreign currency, our results of operations may be affected by fluctuations in the exchange rates between the Chilean peso and the U.S. dollar, or the Chilean peso in relation to other currencies, despite our policy and Chilean regulations related to the general avoidance of material exchange rate mismatches. In order to reduce the effect of exchange rate mismatches, we enter into foreign exchange derivative transactions, including both hedge accounting derivatives and trading derivatives, that hedge most of our exposure to foreign currency. As of December 31, 2021, our foreign currency-denominated liabilities and Chilean peso-denominated liabilities, which contain repayment terms linked to changes in foreign currency exchange rates, exceeded our foreign currency-denominated assets and Chilean peso denominated assets, which contain repayment terms linked to changes in foreign currency exchange rates, by an amount of Ch$3,600 million (amounting to approximately U.S.$4.2 million as of December 31, 2021), or 0.11% of our paid-in capital and reserves.
We may decide to change our policy regarding exchange rate mismatches. Regulations that limit such mismatches may also be amended or eliminated by regulatory institutions. Higher exchange rate mismatches will increase our exposure to the depreciation of the Chilean peso, and any such depreciation may impair our capacity to service foreign-currency obligations and may, therefore, materially and adversely affect us, our financial condition and results of operations. Additionally, the economic policies of the Chilean Government and any future fluctuations of the Chilean peso, with respect to the U.S. dollar, could adversely affect our financial condition and results of operations.
25
Chile has corporate disclosure standards different from those you may be familiar with in the United States.
Chilean disclosure requirements for publicly listed companies differ from those in the United States in some significant respects. In addition, although Chilean law imposes restrictions on insider trading and price manipulation, the Chilean securities markets are not as highly regulated and closely supervised as the U.S. securities markets. Accordingly, the information available to you regarding our corporation will not be the same as the information available to shareholders of a U.S. company. For more information, see “Item 16G. Corporate Governance.”
Chilean law may provide shareholders with fewer and less well-defined rights.
Our corporate affairs are governed by our estatutos (bylaws) and the laws of Chile. Under such laws, our shareholders may have fewer or less well-defined rights than they might have as shareholders of a corporation incorporated in a U.S. jurisdiction. For example, our shareholders would not be entitled to appraisal rights in the event of a merger or other business combination undertaken by us.
Our business growth, asset quality and profitability may be affected by political, legal and economic uncertainty, as well as social developments and the drafting of a new constitution in Chile.
Our operations are highly dependent on the Chilean political and social environment, as most of our customers and borrowers do business in Chile. Thus, our results of operations could be negatively impacted by unfavorable political and diplomatic developments, social instability or unrest, as well as dramatic changes in public policies, including expropriation, nationalization, international ownership legislation, interest rate caps and tax policy.
In October 2019, a series of disruptive protests over a variety of social matters were initially sparked by the announcement of a subway fare increase in Santiago. Among these protests, some violent groups vandalized and looted public and private infrastructure in Santiago and other major cities. The protests and related violence have disrupted various economic activities throughout the country. In addition, many banks and other financial institutions experienced physical damages at their branches and ATMs. Although most of our damages were insured, 239 of the Bank’s branches and approximately 170 of our ATMs suffered varying levels of damage during this period, with nine of our branches and 109 ATMs being severely damaged.
The social unrest also led to increased volatility in the Chilean stock market, with a significant correction of stock prices and a sharp depreciation of the Chilean peso against the U.S. dollar, both of which were further affected by COVID-19 since 2020. Furthermore, share prices of local banks, including ours, suffered significant declines in the market, while bond spreads of local banks increased.
In response to the social unrest, the Chilean Government announced a social agenda intended to increase basic pensions, expand social health coverage, and reduce and stabilize tariffs for some public services. To fund these initiatives, the Chilean Government and the opposition agreed on amendments to certain tax legislation that was passed by the Chilean Congress and enacted on January 29, 2020. See “Item 5. Operating and Financial Review and Prospects—Operating Results—Income Tax and Item 10. Additional Information—Taxation—Chilean Tax Considerations”. The long-term effects of the social unrest are difficult to predict, but could include slower economic growth and higher unemployment rates, which could adversely affect our profitability and prospects. For example, an increase in the unemployment rate beyond what we predicted, or for a longer period than predicted, could diminish demand for loans and decrease our customers’ payment capacity to repay loans, increasing expected credit losses. Overall, we cannot assure you that the social unrest will decrease in Chile in the near future, and therefore, we can offer no assurance that it will not have a negative impact on economic growth, the overall Chilean business environment and our results of operations and financial condition.
Moreover, to address the social unrest initiated in October 2019, in November 2019, the majority of the local political parties agreed on a process to draft a project of new constitution to replace the current one dating from 1980. This process includes two referendums, the first of which was held in October 2020 to approve or reject the idea of drafting such a new constitution, at which time, the choice of drafting the project of new constitution by the Constitutional Convention won by a broad margin; the second referendum to approve or reject the finalized project of new constitution will be held on September 4, 2022.
26
In May 2021, the members of the Constitutional Convention were chosen in national elections. The Constitutional Convention initiated its functions in July 2021. Each new article of the new constitution must be approved by two thirds of the Constitutional Convention, which has until July 2022 to finalize the draft of the project of new constitution. The long-term effects of the implementation of a new constitution that will address among other matters, a reform to our current political, economic and institutional system, if approved by referendum, are still hard to predict. Therefore, we cannot rule out that economic growth and investment in Chile may be affected and, that as a consequence, our results of operations or financial condition, may also be affected.
In national elections held in December 2021, Mr. Gabriel Boric was elected as President and he assumed office on March 11, 2022. The Chilean Congress was also elected by the end of 2021. If there is a lack of control and alignment between the Congress and the Chilean President, delays in political and economic reforms could occur. Further, there can be no assurance as to the policies and reforms that the current administration and the newly elected Congress may take or their impact on Chile’s economic and fiscal situation, growth, stability, outlook and, consequently, as to the effects that any such policies or reforms may have on our business, financial condition and results of operations.
Reforms to labor and pension laws as well as labor strikes or slowdowns could adversely affect our results of operations.
We are a party to collective bargaining agreements with various labor unions to which most of our employees belong. Therefore, disputes regarding the terms of these agreements, or our potential inability to negotiate acceptable contracts with these unions, could result in strikes, work stoppages, or other slowdowns by the affected workers, among other things. If unionized workers were to engage in a strike, work stoppage, or other slowdown, or other employees were to become unionized, we could experience disruption of our operations or higher ongoing labor costs, either of which could have a material adverse effect on our results of operations. See “Item 6. Directors, Senior Management and Employees—Employees.”
Since 2017, a bill has been under consideration in the Chilean Congress aimed at reducing the maximum working hours from 45 to 40 hours per week, applicable to employees. Most recently in 2021, new bills have been introduced by members of the Chilean Congress on this matter, including one bill that aims to gradually reduce the maximum working hours to 38 per week within the fifth year of its enactment, while precluding employers from reducing wages. Another bill seeks to modify Chilean labor laws by increasing the participation of employees in companies’ profits and the way that this participation is calculated. The recently appointed administration has also stated that the reduction of weekly working hours is among its priorities in terms of labor reforms. These proposed legislations, if approved and enacted, could translate into higher ongoing labor costs, which could have an adverse effect on our results of operations and future financial condition.
Current labor legislation defines a company’s minimum services and emergency teams by the applicable labor regulator after negotiations between a company and each labor union prior to the commencement of a collective bargaining process. As such, minimum services refer to those functions of a company which must continue to be provided during a strike because they have been determined to be essential to protect assets and facilities, to prevent accidents, guarantee public utility services, meet the basic needs of the population and prevent environmental damage or harm to health. A company’s emergency teams are made up of workers assigned by each union to fulfill such minimum services. Therefore, in the event of futures strikes, we could face operational disruptions due to an inadequate number of minimum services and an insufficient staff for the emergency teams.
27
In recent years, the Chilean Government presented several bills with the purpose of improving the Chilean pension system. The most recent bills presented by the former Government mainly sought to increase minimum pensions, to introduce a social insurance scheme to adjust for longevity, and to increase the amount each worker must contribute to fund pensions. The nature of the entity that would collect and manage such an increase is also under discussion. However, the new Government has expressed an intention to propose its own reform to the pension system. Measures such as, but not limited to the following, may be presented: (i) replacing current private pension fund managers, (ii) transitioning from individual capitalization to a collective pension system, (iii) reinforcing the current solidarity pillar while maintaining individual capitalization and (iv) some initiatives combining certain aspects of (i) through (iii). Given the uncertainty regarding the reforms the new administration will propose and the differences from prior proposals, we are unable to predict what, if any, reform will be enacted or the final content of such pension reform, including whether pension funds will continue to operate under the current regulatory scheme. The potential adverse effect of any such proposed reform on our financial condition and results of operations cannot yet be ascertained.
Further, during the discussions between the Chilean Government and the Chilean Congress to reach an agreement on a feasible pension reform, as a result of the COVID-19 pandemic, three consecutive pension fund withdrawals and one withdrawal from life annuities (rentas vitalicias), jointly amounting to U.S.$48,500 million as of December 31, 2021 have been permitted by the Chilean Congress. In late 2021, a fourth extraordinary withdrawal from the pension funds was rejected by the Senate and, recently, in April 2022, two projects pursuing further withdrawals from the pension funds were also rejected by the Chilean Congress. Nevertheless, we cannot rule out that new withdrawals that may be proposed in the future, could be approved.
Uncertainty on the future of the Chilean pension system remains, since successive government administrations have not been able to reach an agreement with the Chilean Congress on an increase in the pension amounts to be received by Chilean pensioners. The recently appointed administration has committed to a change in the pension system, which would move from the current based on individual retirement accounts to one composed of individual accounts and colectivelly-funded pensions. We are unable to predict the final content of any pension reform and it is not clear whether pension funds will continue to operate under the current regulatory scheme. Therefore, we cannot assure you that our labor costs will not increase. Since the pension fund managers usually invest a portion of the funds they manage in certain debt instruments (for instance, bonds and time deposits), including those issued by Chilean banks, including us, if the amount of funds available in the pension fund system continues to decrease due to new withdrawals, the demand for both the long-term fixed-income securities we issue as debt to finance our operations and our shares of common stock will decrease, and we will not be able to raise funds from pension fund managers as in the past. As a result, there would be further restrictions to our access to long-term financing, compelling us to seek alternative funding sources in Chile and abroad, which may bear more expensive interest rates and include higher transactional costs, and, as a consequence, may have an adverse effect on our net interest margin, results of operations and financial condition in the long term.
28
Item 4 Information on the Company
History and Development of the Bank
Overview
We were founded in 1893, and we have been, for much of our history, among the largest and most profitable Chilean banks in terms of return on average assets and average equity in Chile. Our core business is commercial banking in Chile, providing traditional banking products and specialized financial services to our large and diversified customer base of individuals and companies.
Our legal name is Banco de Chile and we are organized as a banking corporation under the laws of Chile and were licensed by the CMF to operate as a commercial bank on September 17, 1996. Our main executive offices are located at Paseo Ahumada 251, Santiago, Chile, our telephone number is +56 (2) 2637-1111 and our website is www.bancochile.cl. Our representative in the United States is Puglisi & Associates, with offices at 850 Library Avenue, Suite 204, Newark, Delaware 19711.
We are a full-service financial institution that provides, directly and indirectly through our subsidiaries, a wide variety of lending and non-lending products and services to all segments of the Chilean financial market, providing our customers with powerful, differentiated and comprehensive value offerings. In addition to our traditional banking operations, our subsidiaries and affiliates permit us to offer a variety of non-banking but specialized financial services including securities brokerage, mutual funds management, investment banking, insurance brokerage, securitization and collection services.
Our business is not materially affected by seasonality.
We organize our operations and deliver our services to our customers through the following four principal business segments:
| (i) | retail banking; |
| (ii) | wholesale banking; |
| (iii) | treasury and money markets; and |
| (iv) | operations through subsidiaries. |
Through our retail banking segment, we provide our individual customers with credit cards, installment loans and residential mortgage loans, as well as traditional deposit services, such as current accounts, demand deposits, demand accounts, savings accounts and time deposits. We and our subsidiaries also offer financial solutions such as insurance brokerage, securities brokerage, mutual funds management, among others. In addition to personal banking, our retail segment comprises micro, small and medium sized companies that we serve by providing them with short- and long-term financing, deposit and cash management solutions, in addition to an array of financial services, such as insurance brokerage. Our banking services for wholesale customers include commercial loans (including factoring and leasing), trade finance, capital markets services, cash management and non-lending services, such as payroll, payment and collection services, as well as a wide range of treasury, financial advisory and risk management products.
In 2008, we enhanced our value offerings by entering into a strategic partnership with Citigroup Inc., as a result of our merger with Citibank Chile. We also offer international banking services through our representative office in Beijing and a worldwide network of correspondent banks.
According to the CMF, under Chilean GAAP, as of December 31, 2021, we ranked first in the Chilean banking industry in terms of net income attributable to equity holders with a market share of 21.4%. As of the same date and excluding operations of subsidiaries abroad, we were the second largest bank in Chile in terms of total loans with a market share of 16.7%, the largest provider of commercial loans with a market share of 17.1%, the second largest provider of consumer loans with a market share of 17.4% and the third largest private sector bank in terms of residential mortgage loans with a market share of 15.8%. As for liabilities, excluding operations of subsidiaries abroad, we were the largest private bank in Chile in terms of current accounts and demand deposit balances (net of clearance) with a market share of 21.6% and, more importantly, we ranked first in current account balances held by individuals with a market share of 25.3%, both as reported by the CMF and as of December 31, 2021. Lastly, according to the Chilean Association of Mutual Funds, as of December 31, 2021, we were the largest provider of mutual funds management services in Chile with a market share of 24.9%.
29
As of December 31, 2021, we had:
| ● | total assets of Ch$51,425,948 million (approximately U.S.$60,314.5 million); |
| ● | total loans of Ch$34,265,873 million (approximately U.S.$40,188.4 million), before deducting allowances for loan losses; |
| ● | total deposits of Ch$27,682,797 million (approximately U.S.$32,467.5 million), of which Ch$18,542,791 million (approximately U.S.$21,747.8 million) correspond to current account and demand deposits; |
| ● | equity (including net income, non-controlling interest and provisions for minimum dividends) of Ch$4,818,972 million (approximately U.S.$5,651.9 million); |
| ● | net income attributable to equity holders of Ch$1,056,316 million (approximately U.S.$1,238.9 million); and |
| ● | market capitalization of approximately Ch$6,778,246.1 million (approximately U.S.$7,949.8 million). |
As of December 31, 2021, we had 12,284 employees and delivered financial products and services through a nationwide distribution network of 272 branches and 1,761 ATMs. Our ATMs are part of a larger network of 7,553 ATMs operating in Chile, of which 4,775 ATMs operate under a network managed by Redbanc S.A., a company we partly own along with eight other private sector banks.
History
We were founded in 1893 as a result of the merger of Banco Nacional de Chile, Banco Agrícola and Banco de Valparaíso, which created the largest private sector bank in Chile. We have played an important role in the economic history of Chile. Before the creation of the Central Bank in 1926 and prior to the enactment of the General Banking Act, we were the main stabilization agent of the Chilean banking system, a role that is now performed by the Central Bank. Beginning in the early 1970s, the Chilean Government assumed control of a majority of Chilean banks, and all but one of the foreign banks that were operating at that time closed their branches and offices within the country. Throughout this era, we remained as a private sector bank, with the exception of a portion of our shares owned by the Chilean Government that were sold to private investors in 1975. Throughout our history we have developed a well-recognized brand name in Chile and expanded our operations in foreign markets, where we developed an extensive network of correspondent banks. In 1987 and 1988, we established four subsidiaries to provide a full range of specialized financial products and services as permitted by the General Banking Act. In 1999, we widened our scope of specialized financial services by creating our insurance brokerage and factoring subsidiaries. During the early 2000s, the Chilean banking industry witnessed intense merger and acquisition activity. In 2002, we merged with Banco de A. Edwards, which allowed us to expand our business to new customer segments. In 2008, we merged our operations with Citibank Chile. As a result of these consolidations, we currently operate a distribution network that is composed of three brand names, namely, “Banco de Chile” (which operates throughout Chile), “Banco Edwards-Citi” (which is primarily oriented to higher income segments) and “Banco CrediChile” (which is focused on consumer loans and demand accounts for lower- and middle-income segments).
30
During 2017, we were first in terms of net income and profitability within the local banking industry, with a market share of 26.1% and a Return-on-Average-Equity (“ROAE”) of 19.3%, both under our internal reporting policies. These achievements were attained during a difficult economic landscape, which resulted in a significant slowdown of the corporate lending business that impacted certain macroeconomic indicators such as unemployment, which adversely affected the credit quality of our personal banking business. Amid this environment, we maintained our customer-centric approach and focused on developing new ways to enhance the customer experience by expanding our service offerings, business platforms and benefits to our loyalty program. For example, we launched a new website for companies, aimed at serving corporates, other large companies and SME customers. Similarly, we created a new mobile application and upgraded existing ones. We released “MiInversion” which serves as a portfolio management platform for retail customers and developed new functionalities for the MiBanco application. We believe remote channels are the future of banking and are continuously promoting their use among customers while seeking new solutions to offer banking products through mobile or internet technologies. This strategy boosted demand for mobile and internet services that during 2017 reflected increases of 78% and 11% in monetary transactions using these means, respectively. In addition, our enhanced loyalty program added new alliances with two airlines and negotiated access to a VIP lounge for customers at the Santiago airport. These initiatives continue to demonstrate our commitment to superior customer service and have allowed us to obtain a 73.3 % average net promoter score in 2017, as measured by a syndicated study conducted by Consultores Asociados de Marketing Cadem S.A., or “CADEM,” the highest among our relevant peers. We also undertook transformational changes by assessing relevant processes in terms of efficiency, cost control and operational risk. We believe these actions are necessary to maintain our market leading position in an increasingly competitive banking industry. Lastly, we received recognition for our business performance and digital strategy including being recognized as the Best Bank in Chile, Best Digital Bank for Companies in Chile and Best Sub-Custodian Bank in Chile by Global Finance and being named the Best Mobile and Digital Bank in Chile and the Best Investment Bank in Chile by Global Banking & Finance Review.
Throughout 2018, we led the market in terms of net income attributable to equity holders with a 25.3% market share, which translated into an above-average ROAE of 19% (both figures under Chilean GAAP). Thanks to this performance, we were able to earn sufficient income to fully repay the subordinated debt held by SAOS with the Central Bank in April 2019. This was a significant milestone in our history, as we were able to pay off this debt 17 years before the original maturity date. In 2018, our loan book increased 9.7%, thanks to record sales in installment and mortgage loans while also adding a record amount of new current account holders. We also continued to focus on superior customer service, attaining first place in service quality among our peers by posting an average net promoter score of 71.2%, as measured by a syndicated study conducted by CADEM, and an attrition rate of only 6.2%, according to our management information system. Based on these attributes we received the “National Customer Satisfaction Award” and the “Consumer Loyalty Award” in 2018. Aligned with this view, we continued to develop our digital strategy in order to assure stability and efficiency on our diverse platforms while innovating in new products provided online and adding new functionalities to some of our applications (MiBanco, MiPago and MiInversion). Due to these improvements, the number of mobile transactions in our mobile platforms increased to 35.1 million in 2018, which represented an annual increase of 60.8%. Also, thanks to our digital banking strategy we were once again recognized as the “Best Digital and Mobile Bank in Chile” by Global Banking & Finance Review and “Innovative Digital Bank of the year in Chile” by The European Magazine. Cybersecurity was also a central point of attention for us in 2018. After the cyber-attack occurred in May 2018, on which we timely reacted based on solid security protocols, we decided to enhance our organizational structure and IT infrastructure by creating the new Cybersecurity Division, which took various actions in order to promote a cybersecurity culture across the company.
In 2019, we achieved significant accomplishments, all of which were aligned with our long-term strategy, while maintaining a clear focus on our customers’ needs. For example, we began the year signing a long-term, exclusive partnership for life and non-life insurance products with an international insurance company. We expect this partnership to provide our customers with a wide array of insurance solutions, as well as give us the ability to offer products with an excellent price-to-quality ratio. Additionally, we entered a commercial alliance with a local Chilean retailer, allowing us to expand our ATM network by 22.5% on average in Chile during 2019 when compared to 2018. Through these initiatives, we maintained our position as a market leader in fee-based income in 2019, while significantly widening the competitive gap with followers in the industry. During 2019, we also continued working to meet specific goals and improving our customer proximity in order to better meet their needs. To this purpose, we continued to deploy our digital transformation strategy by implementing a digital onboarding for customers seeking to remotely open a checking account. We continued developing our new service model to unify customer service under CrediChile and Banco de Chile brands through merging several branches. Through these initiatives, we continued being an industry leader among major banks in service quality, holding a net promoter score of 72.5% as of December 31, 2019 according to a syndicated study performed by ProCalidad. Further in 2019, we placed our first green bond to finance renewable energy projects in Chile while issuing a subordinated bond to take advantage of both low interest rates and the phase-in period proposed by the regulation in connection with the Basel III implementation in Chile. 2019 was also an iconic year for share ownership, since SAOS was able to fully repay the Central Bank subordinated debt on April 30, 2019 based on the dividend received from our net distributable earnings for the year ended December 31, 2018. Consequently, SM-Chile and SAOS entered into a liquidation process and their Banco de Chile voting rights were transferred to their respective shareholders. As a result, the free-float of our stock increased from approximately 32.09% to 48.74% (including Ergas group). Finally, as of December 31, 2019 we were the market-leading bank in Chile in net income attributable to equity holders and profitability, with a market share of 23.4% and a ROAE of 17.5% (under Chilean GAAP).
31
In 2020, our main achievements were related to both adapting our operations and processes to the contingencies produced by the COVID-19 pandemic, while being able to successfully overcome the financial challenge posed by the economic crisis caused by the pandemic. In order to continue adapting our operations to the increasing demand for remote settings and faster services from our customers, while still addressing the effects of mobility restrictions and lockdown, during 2020 we emphasized the importance of digital transformation within our organization. First, we enhanced some of our main mobile applications (MiBanco and MiPago) and our online websites for individuals, by optimizing their security protocols while providing better and more organized content to improve the user experience. In addition, one of the most important milestones of the year was the launch of the FAN account, our fully digital onboarding bank account that promotes financial inclusion among all income segments. We believe, this initiative enabled us to strengthen our market-leading position in demand deposits, as reflected by a market stake of 27.1% reached in demand deposit account balances held by individuals as of December 31, 2020 (excluding operations of subsidiaries abroad). As a consequence of these efforts on digital transformation, we were rewarded and recognized as the Innovative Digital Bank of the Year in Chile by The European magazine. Also, during 2020, we continued implementing our new service model for branches, while modernizing them in order to comply with the sanitary restrictions as a result of the COVID-19 pandemic. These actions, coupled with a set of other measures taken in order to guarantee our operational continuity, led us to being recognized as the leading bank in Best Service Quality in 2020 according to Adimark. Moreover, during the course of the year we improved our organizational structure by creating the Productivity and Efficiency Division, which aims to accelerate the implementation of initiatives intended to optimize our operations while identifying new opportunities to improve diverse processes. Likewise, we continued to reinforce our cybersecurity structure by creating three subdivisions in order to better cope with new challenges that digital transformation poses: (i) the Cybersecurity Operations unit, (ii) the Intelligence and Response unit, and (iii) the Detection and Containment unit. Throughout 2020, we also deployed the National Support Plan in order to support our customers that were affected by the COVID-19 pandemic. This initiative enabled customers to reschedule up to six installments of consumer, residential mortgage and commercial loans while reprogramming their credit card debt, as well as a special support program that granted government-guaranteed working capital loans to SMEs and large company clients. As of December 31, 2020, we had granted nearly Ch$1,890,000 million in these secured loans, representing a 6.1% of our total loan portfolio. Also, as of the same date, we had rescheduled approximately Ch$414,155 million of installments of consumer, mortgage and commercial loans.
In 2020, our results were undoubtedly affected by a deteriorated economic landscape caused by the COVID-19 pandemic. This context translated into downward trends in local and foreign interest rates, lower transactionality, reduced demand for loans and increasing unemployment, that led to a decline in customer income and a spike in risk expenses. However, due to our prudent risk policies, strict cost control and a proactive management of our Treasury and Money Market Operations business segment, we were able to deal with this challenge by posting a year-end net income attributable to equity holders of Ch$401,630, equivalent to a ROAE of 10.1%. Lastly, due to the establishment of additional allowances and the increase in equity during 2020, we had the strongest Capital Adequacy Ratio among major local banks, posting a year-end 16.0% BIS Ratio.
32
During 2021, under Chilean GAAP and according to the CMF, we once again led in terms of net income attributable to equity holders by recording a year-end market share of 21.4% within the banking industry, representing a ROAE of 20.16%, which denotes an annual expansion of 71.2% in net income (under Chilean GAAP). Regarding our loan portfolio, as of December 31, 2021, we recorded Ch$34,265,873 million in loan balances under IFRS, reaching a double-digit expansion on an annual basis. Our loan book was mostly influenced by solid annual increases in commercial and residential mortgage loans that grew steadily over the course of the year. While commercial loans continued to be influenced by the state-guaranteed loan program (FOGAPE and FOGAPE Reactiva), residential mortgage loans managed to expand aligned with higher-than-expected inflation and despite the pick-up in long-term interest rates during 2021. As for consumer loans, the contraction experienced by this lending product during 2020 and much of 2021 began steadily reversing over the last months of 2021 by gradually approaching pre-pandemic loan balances. Furthermore, in 2021, in regard to our digital transformation strategy, we continued to enhance the value offering behind the FAN Account, our full digital onboarding account, by implementing new services, such as: (i) a new customer service channel with a chatbot called FANi, (ii) full access to digital Banco de Chile’s ecosystem and (iii) cardless cash withdrawal. Thanks to these efforts, we managed to attract nearly 581,000 new clients during 2021, which were added to approximately 115,000 new current account holders, resulting in a year-end increase of 22.3% in current accounts and demand deposits and a market-leading share of 21.6% (according to the CMF). In addition, in December 2021, the phase-in period for implementation of the Basel III framework became effective in Chile, which includes new regulations in connection with regulatory capital and credit, market and operational risk-weighted assets. Our proactive approach to Basel III implementation has allowed us to remain as the strongest bank in terms of capital adequacy among major banks in Chile by recording Total Capital or Regulatory Capital and CET1 ratios of 17.3% and 13.0%, respectively, as of December 31, 2021, while having the highest amount of additional provisions (accounted for under Chilean GAAP) among private local banks as of the same date.
Furthermore, in 2021 we received an “A” rating from a recognized international ESG index that assesses diverse categories associated with this subject. This new rating, which denotes an improvement of three notches when compared to the former evaluation, reflects the strong accomplishments we have attained in ESG initiatives. In addition, in December 2021, we issued a U.S.$500 million 144A/Regulation S bond in the international capital markets in order to diversify our liability structure while generating funding for our long-term sustainability. This long-term debt placement joined a special bond issued a few months earlier that was intended to finance SMEs while promoting female development in their workplaces. Lastly, we successfully completed the final steps of our new service model for branches, which will allow us to provide better solutions and services to our customers while offering an improved customer experience through a more efficient, technological and modern branch network.
The 1982-1983 Economic Crisis and the Central Bank Subordinated Debt
During the 1982-1983 economic crisis, the Chilean banking system experienced significant instability that required the Central Bank and the Chilean Government to provide assistance to most Chilean private sector banks, including us. Subsequent to the crisis, like most major Chilean banks, we sold certain of our non-performing loans to the Central Bank at face value on terms that included a repurchase obligation. In 1989, banks were permitted to repurchase the portfolio of non-performing loans in exchange for assuming a subordinated obligation equal to the difference between the face and economic value of such loans, which we did in November 1989.
In November 1996, pursuant to Law No. 19,396, our shareholders approved a reorganization by which Banco de Chile was converted into a holding company named SM-Chile S.A. (SM-Chile). In turn, SM-Chile organized a new wholly-owned banking subsidiary named Banco de Chile, to which the former contributed all of its assets and liabilities, other than the Central Bank subordinated debt. In addition, SM-Chile created a second wholly-owned subsidiary named Sociedad Administradora de la Obligación Subordinada SAOS S.A. (SAOS) that, pursuant to a prior agreement with the Central Bank, assumed a new obligation in favor of the Central Bank that fully replaced the Central Bank’s subordinated debt and received 63.6% of our shares from SM-Chile. Thus, SAOS would repay the new obligation by means of the proceeds of the dividends it would receive from us. Pursuant to SM-Chile’s bylaws, that company would remain in existence until the Central Bank subordinated debt was completely paid off by SAOS, which finally occurred on April 30, 2019 by using the dividends distributed by us with charge to our net distributable earnings for the year ended December 31, 2018. Since that date, SM-Chile has been in the process of liquidation while SAOS was dissolved immediately. As of the date of this annual report, the liquidation process of SM-Chile is in progress and is expected to end by 2025.
As a consequence, the shares of Banco de Chile owned by SM-Chile and by SAOS were distributed among Banco de Chile’s shareholders and the former SM-Chile shareholders became our shareholders. Based on this LQ Inversiones Financieras S.A. and Inversiones LQ–SM Ltda., increased their direct ownership in Banco de Chile, from their prior shareholdings of 27.18% and 0.29%, respectively, to 46.34% and 4.81% in each case, while the public float of our stock increased significantly.
33
For more information on the Central Bank Subordinated Debt and the liquidation process of SM-Chile, see “Item 4. Information on the Company—History and Development of the Bank–History—The 1982 1983 Economic Crisis and the Central Bank Subordinated Debt” and “Item 7. Major Shareholders and Related Party Transactions—Ownership Structure” in the Form 20-F for the year ended December 31, 2020 filed with the SEC on April 30, 2021.
Merger with Banco de A. Edwards
On December 6, 2001, our shareholders approved our merger with Banco de A. Edwards, which became effective on January 1, 2002. Banco de A. Edwards had been listed on the NYSE since 1995, and since January 2002, we have been listed on the NYSE under the symbol BCH. We concluded the merger process with the consolidation of a new corporate structure and the integration of our technological platforms.
Merger with Citibank Chile
On December 27, 2007, our shareholders approved our merger with Citibank Chile, which became effective on January 1, 2008. During 2008, we integrated Citibank Chile’s technological platforms with ours and established a new organizational structure in order to satisfy the needs of our customers and to achieve important synergies. We concluded the merger process with the integration of Corporación Financiera Atlas S.A. (Citibank Chile’s consumer area) into our Consumer Finance Area (CrediChile), which allowed us to nearly double our customer base and market share in consumer finance. As result of this merger and integration process, we entered into the following agreements with Citigroup Inc. to provide a framework for our relationship with Citigroup Inc., its services and trademarks in Chile: (i) the Global Connectivity Agreement, (ii) the Cooperation Agreement, (iii) the Trademark License Agreement and, (iv) the Master Services Agreement. On October 22, 2015, we entered into a new Global Connectivity Agreement, a new Cooperation Agreement and a new Trademark License Agreement with Citigroup Inc. All of these new agreements replaced the original agreements we entered into on December 27, 2008. In addition, on January 26, 2017, we entered into a new Master Services Agreement with Citigroup Inc. All of these agreements have continued to be extended, amended and/or restated successively. For more information, see “Item 7. Major Shareholders and Related Party Transactions—Related Party Transactions.
Technological Projects
During 2017 we continued to develop the “Business Center” project, which is our new Sales & Customer Relationship Management tool. This system is expected to support significant improvements in the quality and responsiveness of our back-office and front-office operating processes to enhance our customer centric vision. We launched our Pricing 360° tool, which improves pricing through a deeper knowledge of account officers on customers’ needs, enabling us to provide tailored lending solutions to our diversified customer base. Similarly, we upgraded the “Time Deposits and Savings” module, which permits account officers to tailor offerings to personal banking customers. Moreover, we completed the renewal of our ATM network to meet the new security and quality standards required by the SBIF. Additionally, we launched two new platforms for companies. We renewed the website business platform for these customers by adding new functionalities, security standards and the ability to conduct paperless transactions. We implemented a new electronic platform for factoring, which is aimed at improving the interaction with customers by making transactions easier while also upgrading the middle and back-office systems for this business. In personal banking, we maintained our focus on innovation and digital banking by adding new functionalities to existing mobile applications including the authorization of web transactions through MiPass application, access to MiBanco by means of fingerprint scanner, e-commerce payments through MiPago and an on/off functionality for credit cards in MiBanco.
During 2018, we continued to enhance our diverse IT infrastructure and digital platforms in order to assure stability and efficiency to our processes, attract new potential clients while continuously improving the service provided to our current customers. To this extent, we focused on continued developing new stages of our new CRM system and sales platform by introducing a new pricing tool for individuals that allow our account officers to easily use and access to our customers’ information, and intensified our efforts to expand and improve our remote channels given the massive use of internet and fast adoption of smart phones. In that direction, we added new functionalities to some of our applications, and expanded our RedGiro service to the mobile banking, only available on our website until 2017.
34
In May 2018 we suffered a cyber-attack involving the theft of funds that subsequently resulted in an operational write-off of approximately Ch$6,900 million or U.S.$9.9 million (mostly recovered from the redemption of an insurance policy). Even though this incident temporarily affected certain services provided to our customers, we were able to maintain the continuity of our operations. In addition, as of this date, based on our internal analysis we have found no evidence whatsoever that our customers were affected by this incident in terms of misappropriation of funds. See “Item 3. Key Information—Risk Factors—Risks Relating to our Operations and the Chilean Banking Industry—Cybersecurity events could negatively affect our reputation or results of operations and may result in litigation.” This cybersecurity incident, although successfully overcome, posed new challenges for us in terms of cybersecurity infrastructure, controls and procedures. Thus, as part of the efforts to improve our cybersecurity risk management, we created the Cybersecurity Division in June 2018, which replaced our former Technological Security Area. The new division is the first line of defense for us on these matters and is in charge of mitigating and managing cybersecurity threats. The division is focused on managing projects aimed at improving our cybersecurity protocols and procedures. During 2018, the Cybersecurity Division undertook diverse IT projects in order to reinforce our infrastructure and cybersecurity capabilities, acquiring world-class protection software and firewalls while investing in specialized platforms to address this significant topic. During 2018, we invested approximately Ch$9,915 million in cybersecurity equipment and software and incurred approximately Ch$9,847 million in operating expenses related to cybersecurity matters. These disbursements almost doubled the total amount incurred in 2017.
In addition to executing our digital transformation strategy to improve customer experience, in 2019 we also developed and implemented various projects aimed at improving cybersecurity infrastructure, efficiency and customer service. We launched our E360° tool, which is a tactical dashboard that enables standardization of offerings, while also improving the management of commercial efforts, customer visits and promises to clients. In SMEs, middle market companies and Corporate Banking, we successfully migrated a majority of the customer base to a new web-based transactional platform, Banconexion 2.0. This platform was developed to address segment needs, delivering an improved customer experience while ensuring high security standards in banking operations. Furthermore, as a result of a commercial partnership with a local retailer, we were able to significantly expand our ATM network by 15%. Additionally, throughout 2019, we carried out various cybersecurity projects aimed at improving in-networks, workstations, servers and digital applications, while enhancing access-control through technological solutions and software. To increase efficiency and productivity, we developed new automated transactional platforms for foreign currency trading to help meet the needs of professional and non-professional counterparties. Lastly, we adopted a world-class module for collateral management, improving the administration of our derivative portfolio and counterparty risk.
In 2020, it became clear that the acceleration of our digital transformation was critical to remain competitive in this challenging industry. Since the beginning of the COVID-19 pandemic in our country, we have been continuously identifying upgrades in our models, processes and platforms in a year where our customers are increasingly demanding less physical contact, while still receiving fast, flexible and reliable services. In this context, in September 2020, we officially launched the FAN account, a 100% digital debit account for individuals. Moreover, we continued to migrate our middle market companies to Banconexion 2.0, the online transactional platform for companies. Furthermore, this platform was used to grant government-guaranteed working capital loans to SMEs and middle market companies, related to the FOGAPE program, which coupled with the National Support Plan that provided funding to our customers during the difficult times of the COVID-19 pandemic. In addition, an increased number of employees working at home compelled us to improve our cybersecurity protocols, such as the implementation of the Authentication Enrollment (MFA) platform that allows our collaborators to authorize their login to the Bank’s software through their personal smartphones. Furthermore, we updated our main website and both MiBanco and MiPago mobile apps, by improving their structure, security protocols and graphics, in order to offer an optimized and unified web view within our digital channels. Lastly, we also advanced in the implementation of “Pricing Empresas,” a pricing model for companies that seeks to improve our management and customer segmentation, as well as implementing a new module in the Murex system associated with collateral management for derivatives.
35
During 2021, we strengthened our transactional coverage, service standards as well as increased functionalities on our web and digital platforms, incorporating digital marketing tools which were crucial to providing effective and timely support to customers. First, we made upgrades in some of our mobile applications, most of them related to enhanced security protocols, updated graphics as well as new and optimized functionalities, to allow us to provide a unified offering through our digital channels. With that in mind, in order to make things easier for our clients, we launched a QR code payment service for SMEs through the MiPago and MiBanco applications, a service that is already available in more than 6,000 commercial locations across the country and in WebPay, an online secure payments gateway. We also implemented a smart-pay service for credit and debit cards that enables customers to make payments through their digital wallets, using Garmin Pay, Fitbit or Google Pay in smartphones and smartwatches. Similarly, we relaunched MiSeguro, our application that allows our customers to address and manage their insurance programs by adding new functionalities that will facilitate the acquisition of new insurance policies while simplifying after-sale support services. Moreover, in 2021 we completed the migration of our SMEs, large companies and corporate customer base to Banconexion 2.0, a new website for companies that aims to improve the customer experience by providing one of the highest cybersecurity standards within the banking industry, which coupled with the addition of new products to the platform that allowed our customers, for instance, to manage and apply for FOGAPE Reactiva loans completely through Banconexion 2.0. In addition, we launched the mobile application Mi Banconexion, a new mobile application that allows companies to visualize and monitor their balances and movements in banking accounts, credit cards and lines of credit. Furthermore, our online banking incorporated a new feature that enables customers to request the rescheduling of their installments of residential mortgage loans as well as the possibility to send payment orders abroad. In terms of our FAN account, our 100% digital debit account for individuals, we reached nearly 730,000 clients as of December 31, 2021. Lastly, we launched B-TV, a nationally televised live show intended to prompt direct and 100% online communication between clients and collaborators by providing relevant content to our viewers (commercial campaigns, talks, events, webinars, among others). Through this new communication channel, we expect to develop a closer relationship with our clients and the communities in which we operate.
Through these efforts we have maintained our commitment to anticipating changes and minimizing risks related to technological advances, including cybersecurity risks, as mentioned in “Item 3. Key Information—Risk Factors—Risks Relating to our Operations and the Chilean Banking Industry” and “Item 3. Key Information—Risk Factors—Risks Relating to our Operations and the Chilean Banking Industry—Cybersecurity events could negatively affect our reputation or results of operations and may result in litigation.”
Capital Expenditures
The following table sets forth our capital expenditures in each of the three years ended December 31, 2019, 2020 and 2021:
| For the Year Ended December 31, | ||||||||||||
| 2019 | 2020 | 2021 | ||||||||||
| BANK’S INTERNAL REPORTING POLICIES: | (in millions of Ch$) | |||||||||||
| Computer equipment | Ch$ | 28,117 | Ch$ | 20,658 | Ch$ | 22,367 | ||||||
| Furniture, machinery and installations | 2,656 | 1,510 | 2,349 | |||||||||
| Real estate | 12,555 | 6,303 | 9,477 | |||||||||
| Vehicles | 184 | — | — | |||||||||
| Subtotal | 43,512 | 28,471 | 34,193 | |||||||||
| Software | 20,928 | 18,631 | 30,222 | |||||||||
| Total | Ch$ | 64,440 | Ch$ | 47,102 | Ch$ | 64,415 | ||||||
Our budget for capital expenditures for 2022 amounts to approximately Ch$79,466 million, of which expenditures in information technology investments represent 78.2%, while infrastructure projects represent the remaining 21.8%. The budget for capital expenditures is in line with our mid-term strategic priorities of improving our efficiency and enhancing our customer service capabilities with a firm focus on digitalization. These capital expenditures will be principally financed by cash on hand and long-term debt financing.
Among the budgeted expenditures for information technology, 59.1% corresponds to new and ongoing IT projects undertaken by Banco de Chile, which are intended to provide us with business solutions for customers, technological stability, cybersecurity tools, improvements in productivity, enhancements in our communication network and cloud as well as reinforced cybersecurity infrastructure and systems. Of the remaining 40.9% budgeted for IT expenditures, 18.0% is intended for the renewal of our technological infrastructure, which includes further optimization of our nationwide ATM network, 14.7% relates to the development of applications in order to provide us with digital alternatives to meet customers’ needs, another 5.6% is aimed at supporting regulatory compliance requirements and the remaining 2.6% consists of investments in technological equipment and system improvements to be carried out by certain subsidiaries.
Our 2022 infrastructure expenditures budget includes disbursements associated with general maintenance investments (34.0%), the refurbishment of our branch network (30.0%), renovation and restoration of our corporate buildings (20.9%), implementation of security devices for branches (12.0%) and other initiatives related to subsidiaries and security expenditures (3.1%).
All of the aforementioned investments have been or will be made in Chile.
36
BUSINESS OVERVIEW
Our Competitive Strengths
Building on our knowledge of the Chilean financial market, we have historically been able to develop significant competitive advantages based on our strong brand recognition, our widespread branch network, the diversity and relative size of our customer base, our highly competitive funding structure, the superior asset quality of our loan portfolio as compared to our peers in Chile, an attractive risk-return relationship and our market leadership in a diverse range of financial products and services.
Our main competitive strengths are:
Brand Recognition and Strong Corporate Image
We have operated in the Chilean financial industry for 128 years under the “Banco de Chile” brand name. In order to provide our customers with specialized value offerings and a wider range of financial products and services, we have also developed the “Banco Edwards-Citi” and “Banchile” brand names. We believe our long-standing history in the Chilean market is recognized by our customers and the general public, who associate our brands with value, quality, reliability and social responsibility within the Chilean financial industry, as demonstrated in various polls conducted by well-known market research companies. We believe that our long history in the Chilean banking industry is a key element that differentiates us from our competitors.
Additionally, we believe that our merger with Citibank Chile reinforced our corporate image as a leading financial institution within Chile and allowed us to gain recognition among customers and investors all over the world.
We also believe that our strong corporate image is further strengthened by our commitment to social responsibility, which includes supporting the Teleton Foundation (a non-governmental organization dedicated to assisting and treating disabled Chilean children), our partnership with institutions dedicated to improving the quality of Chilean education, our participation in campaigns intended to improve the quality of life of needy people, our commitment to supporting and sponsoring diverse monetary and non-monetary campaigns for recovery efforts from natural disasters in Chile, including wildfires, earthquakes, floods and tsunamis, and the development of other initiatives intended to strengthen our role in, and contribution to, Chilean society. Furthermore, over the last years we have devoted efforts to improve our commitment to the environment by carrying out numerous initiatives.
In 2021, we received various distinctions due to our strong brand recognition within the banking industry. Among these awards, we ranked second in corporate responsibility and corporate governance among local banks, according to a study conducted by MERCO. Likewise, Global Finance magazine recognized us as the Best Bank in Chile at the Best Bank Awards 2021. According to studies conducted by GFK Adimark, we ranked first among comparable peers in various categories such as most reliable bank, most solvent bank in terms of capital base and the bank with the strongest commitment to its customers, for the year ended December 31, 2021.
Business Scale and Leading Market Position
We are one of the largest financial institutions in Chile and a market leader in a broad range of financial products and services within the Chilean financial system, as listed in the following table:
| As of December 31, 2021 | ||||||||
| Market Share | Market Position | |||||||
| Total Balances of Demand Deposits and Current Account (1) | 21.6 | % | 1st | |||||
| Current Accounts Balances held by Individuals | 25.3 | % | 1st | |||||
| Mutual Funds (Assets Under Management) | 24.3 | % | 1st | |||||
| Net Fees and Commissions Income | 20.3 | % | 1st | |||||
| Net Income of Securities Brokerage Subsidiary (2) | 25.1 | % | 1st | |||||
Source: Chilean Association of Mutual Funds and the CMF.
| (1) | Excluding operations of subsidiaries abroad and net of clearings. |
| (2) | Including the whole market and not only subsidiaries of local banks. |
37
We have traditionally had a strong presence in the wholesale segment by maintaining long-term relationships with major local and multinational companies that operate in Chile. We have been able to maintain this leading position by continuously improving our products and services and supplementing them with comprehensive and tailored service models that allow us to successfully serve our customers’ needs. We have also added value to our service offerings by including treasury products for hedging purposes, together with investment banking, insurance brokerage and other specialized financial services provided by our subsidiaries.
In addition, in recent years we have focused on further penetrating the retail banking market through diverse value offerings intended to cover our target demographics and enterprises. Therefore, in recent years we have prioritized the expansion of our residential mortgage portfolio and our presence in transactional services such as credit cards, current accounts and demand accounts, as we believe they are effective means to build long-term relationships and customer loyalty, while increasing cross-selling opportunities. For this reason, through our Individual and SME Banking Area, we aim to lead the market in services offered to high, medium and low-income individuals for whom we have developed an attractive and complete portfolio of financial services, including a full range of wealth management services through one of our subsidiaries. We supplement these value offerings with specific proposals for SMEs, which in recent years has coupled with value offerings satisfying small scale entrepreneurs’ financial needs and individual customers in outlying districts seeking deposit and transactional solutions. This broad variety of services has also enabled us to lead the Chilean market in terms of income from fees and commissions.
We believe our financial strength, prestige and brand recognition among Chilean customers have allowed us to become the market leader in terms of current account balances within the Chilean financial system, especially among individuals, who have demonstrated their preference for our services. Our position was further consolidated in the financial downturn that started in 2008 and the local social unrest in late 2019, when we benefited from a “flight-to-quality” effect as investors and depositors were seeking a reliable institution to keep their funds.
Broad and Diversified Customer Base
We believe that we have one of the largest customer bases among financial institutions in Chile. In recent years, we have been able to expand our customer base by providing attractive and tailored value offerings based on continuously improving segmentation and by applying sophisticated business intelligence tools. As of December 31, 2021, according to our management information system, we had approximately 1,338,549 core clients, which had at least a current account or a loan outstanding with us. In addition, with respect to our main banking products, as of December 31, 2021, we had approximately 1,081,119 current accounts holders, approximately 170,348 time deposit holders, approximately 114,026 saving account holders. Similarly, as of December 31, 2021, we were the largest privately-owned bank in terms of number of borrowers with a 18.1% market share associated with 1,026,722 debtors, according to data published by the CMF. As of the same date, according to the CMF, we had 1,471,584 credit card account holders.
We believe that our broad customer base is both an essential driver of our business and a valuable asset that enables us to cross-sell our traditional lending products and services along with non-lending services provided primarily through our subsidiaries, including our securities brokerage, mutual funds management, securitization, financial advisory, insurance brokerage and collection services.
Multichannel Distribution Approach
In order to better serve our customers, we offer a distribution approach composed of both physical and non-physical channels.
We are present in all regions of Chile and strive to be accessible to every Chilean customer through our large branch network as well as non-physical contact channels. As of December 31, 2021, we had a nationwide branch network of 272 branches, the second largest in Chile among private sector banks, according to information published by the CMF. This network is composed of 238 branches under our “Banco de Chile” brand name and 34 branches under our “Banco Edwards Citi” brand name. During 2021, we completed the consolidation process of our “Banco CrediChile” branches under the “Banco de Chile” brand name. We believe that our branch network enables us to develop close relationships with our customers and therefore we are constantly assessing new branch locations throughout Chile.
38
We have also complemented our branch network with non-physical remote channels, such as ATMs, internet-based online platforms and mobile banking applications. As of December 31, 2021, we had 1,761 ATMs throughout Chile and we provided our customers with specialized internet websites for each of the segments we target, coupled with diverse mobile banking applications, including MiBanco, MiBanconexion, MiBeneficio, MiCuenta, MiPago, MiPass, MiInversion and MiSeguro. During 2021, 81% of the total transactions (monetary and non-monetary) carried out by customers and non-customers in our distribution channels were performed through non-physical remote channels.
Proven Digital Banking and Business Intelligence Capabilities
Over the last years, digital transformation has been steadily increasing its importance within the Chilean banking industry, a trend that was accelerated during 2020 because of the health and social contingencies derived from the COVID-19 pandemic. In order to be aligned with our customers’ needs during such a challenging period, we made several cultural changes within our organization, which include the introduction of new financial products, services and technologies. By doing so, we expect to achieve sustainable growth in the coming years and to improve both our processes’ efficiency and the consumer experience with the Bank.
Key Pillars of Banco de Chile’s Digital Transformation Strategy

During 2021, we implemented several advances in both the back and front office aimed at improving customer experience by expanding digital channels, adding new products and functionalities. We have also continued increasing sales through these points of contact by working with advanced analytics in order to improve cross-selling. Additionally, we are working on developing a talent and digital culture across the Bank in order to bolster our capabilities while emboldening innovation.
One of the key pillars of our digital banking strategy has been the development of cutting-edge mobile applications and customized websites. Over the last years, we have devoted efforts to enhance our mobile banking platforms by developing and launching diverse applications, including MiBanco, Mi Pago, MiSeguro, MiInversion, MiPass and MiBeneficio. We are continually improving the functionalities and robustness of applications that enable our customers to perform most of the transactions they can execute on our websites, such as: (i) accessing their account balances, (ii) executing electronic money transfers, (iii) generating secure passwords to make such transfers, (iv) making cash advances from credit cards to checking accounts, (v) making bill payments, (vi) requesting for reimbursements from other Banco de Chile’s customers by scanning a QR code, and (vii) managing their personal investment portfolio by investing or disinvesting in equity, fixed-income and mutual funds, among others.
39
Also, in 2020, we launched FAN Account, which is a full digital onboarding demand account. As of December 31, 2021, we have reached 729,611 customers. In addition, throughout 2021 we added more functionalities to the FAN Account in order to improve customer experience while fostering loyalty.
We believe these and other similar initiatives have allowed us to continue improving our online channel usage rates, as illustrated in the table below, which sets forth information regarding the evolution of the numbers of transactions (monetary and non-monetary) carried out by customers and non-customers through our diverse distribution channels were performed through non-physical remote channels. See “Item 4. Distribution Channels and Electronic Banking”.
Competitive Funding Structure
We believe that we have a cost effective and highly competitive funding structure based on our leading market position in current accounts and demand deposits, especially among individuals. According to the CMF, as of December 31, 2021, with a 25.3% market share, we ranked first within the Chilean banking industry in current account and demand deposits held by individuals. Similarly, as of that same date and excluding operations of subsidiaries abroad, we were the first bank in Chile in terms of total balances of non-interest bearing current accounts and demand deposits representing 21.6% of the industry (net of clearing), as reported by the CMF. Our total balances of current accounts and demand deposits represented 35.9% of our funding structure as of December 31, 2021 (under Chilean GAAP), as compared to the 27.5% reported by the Chilean financial industry as a whole, excluding Banco de Chile. In addition, we have a solid base of funding from retail customers, who held demand deposits and time deposits that jointly represented 44% of our total funding as of December 31, 2021. This characteristic provides us with a stable source of funding that is reflected by a 30-day moving average renewal rate of retail time deposits which reached around 79% as of December 31, 2021.
We strive to diversify our liability structure in terms of sources, types of instruments and markets with the aim of maintaining a competitive cost of funding and improving our liquidity. In 2021 we were more active than in the previous year in terms of long-term debt placements in both local and overseas markets. The increase in debt issuance was the result of our mid-term funding strategy that aims to diversify our liability structure in order to finance loan growth at convenient cost of funds amid expectations of increasing interest rates a lower funding from demand deposits for the same reason. As such, we will continue monitoring market opportunities in order to take advantage of our superior credit rating within Chile and Latin America. In 2021 we carried out the following debt placements: (i) Ch$36,097 million in Japan with a 10-year maturity, (ii) Ch$31,203 million in Australia with a 10-year maturity, (iii) Ch$698,435 million in commercial paper, (iv) approximately Ch$115,483 million in Switzerland with a five-year maturity, (v) Ch$82,543 million in Japan with a five-year maturity, and (vi) Ch$419,345 million in the international capital markets through a Rule 144A/Regulation S issuance with a ten-year maturity.
We believe that our funding structure provides us with a cost advantage over many of our competitors (which use a higher proportion of interest-bearing liabilities), as current accounts and demand deposits are non-interest bearing in Chile. We also believe that our solid market position in demand deposits, together with our high international credit ratings, translated into one of the lowest costs of funding from liabilities associated with interest bearing deposits and long-term debt, among the five largest banks in Chile.
Prudent Risk Management & Superior Asset Quality
We are one of the Chilean financial institutions with the highest credit quality and the healthiest loan portfolio in Chile. We believe this asset quality is the result of our well-known prudent risk management approach and accurate credit risk models that are continuously being updated and have enabled us to maintain relatively low levels of past-due loans (loans 90 days or more past due) and high coverage indicators over the last few years. According to the CMF, and under our internal reporting policies, as of December 31, 2021, we had a delinquency ratio (loans 90 days or more past due as a percentage of total loans) of 0.85% which was well below the industry average delinquency ratio of 1.33% posted by the Chilean banking industry (excluding Banco de Chile) as of the same date. Additionally, according to data published by the CMF, as of December 31, 2021, we had a coverage ratio (allowances for loan losses over loans 90 days or more past due) of 248.2%, which was well above the industry average coverage ratio of 183.9% as of the same date (excluding Banco de Chile). Over the last years, the utilization of business intelligence tools has also contributed to an improvement in our credit risk management. In this regard, during 2018 we successfully re-launched our pre-approved loan program through which we target a select group of retail customers to help them meet their borrowing needs depending on their life cycle stage and credit profile. During 2019, we successfully added SMEs to the pre-approved loan program, which enabled us to maintain solid growth rates in this segment with contained credit risk. In 2020, we also adjusted and implemented new admission protocols for the credit granting process considering an economic landscape of higher uncertainty, increased unemployment and lower disposable income of our customers. In addition, we continued to implement “Pricing Empresas,” our pricing model for companies.
40
In 2021, we continued to improve our provisioning models while reinforcing our credit risk monitoring in order to reflect accurately the effects of the dynamics of the local economy on the payment behavior of our borrowers while being prepared to respond to lagging indicators of the effects of the pandemic on asset quality.
International Coverage
In 2008, we enhanced our value offerings by entering into a strategic partnership with Citigroup Inc., as a result of our merger with Citibank Chile, effective on January 1, 2008. As result of the merger and integration process, we entered into various agreements with Citigroup Inc. to establish a framework for our relationship with Citigroup Inc., including the services to be rendered by each party and the use of trademarks in Chile. For more information, see “Item 7. Major Shareholders and Related Party Transactions—Related Party Transactions.
This strategic alliance, backed by a Global Connectivity Agreement with Citigroup Inc., has allowed us to broaden our service offerings by adding a comprehensive portfolio of international financial services that previously we could only partially provide. Based on this relationship, we are able to provide our local customers with world-class financial services and participate with them in their international ventures. Furthermore, we provide a reliable business platform for Citibank’s customers who aim to operate in Chile.
Our Business Strategy
Mission
‘We are a leading and globally-connected corporation with a prestigious business tradition. We provide excellent financial services to all of our customer segments by offering creative and effective solutions while at the same time ensuring that we add value for our shareholders, employees and community as a whole.’
To accomplish this mission, we believe it is essential to attain industry leadership in all businesses and financial areas in which we operate, namely, profitability, efficiency, business scale, customer base, human resources development and corporate social responsibility.
Vision
‘We aspire to be, in all things we do, the best bank for our customers, the best place to work and the best investment for our shareholders. In order to accomplish this vision, we are committed to the development of our employees and the community as a whole.’
41
Our mission and vision commit us to all of the diverse stakeholders related to our business, including customers, employees, investors and the community. Thus, our vision is shared and internalized by all areas across the corporation, senior management and the board of directors while also constituting the basis for our strategic objectives. This vision requires initiatives to achieve comprehensive excellence in management, with customer satisfaction as our major goal. For this reason, we apply high industry standards in information technology, business models and service quality, all of which are summarized by the value creation cycle below:

Corporate Values
Our way of thinking is reflected by a set of values that are shared by our employees and shareholders, which are aimed at providing our customers with world-class financial solutions and quality standards.
| ● | Integrity |
| ● | Commitment |
| ● | Respect |
| ● | Loyalty |
| ● | Prudence |
| ● | Responsibility |
| ● | Justice |
Purpose
‘We are a company that contributes to the economic development of the country by generating favorable conditions for the development of individuals and enterprises, providing them with financial solutions that fit their needs at every stage of their lifetime.’
In order to accomplish this, we have made commitments to all of our stakeholders, since we are convinced that we will achieve excellence in all of our businesses and projects as long as we are able to satisfy stakeholders in their interactions with us.
42
Commitments
We aim to satisfy the expectations of the following stakeholders by:
| ● | Our Customers |
| ● | Offering innovative and top-quality banking products and financial services. |
| ● | Providing customers with excellent service based on customized relationships and a proactive attitude. |
| ● | Ensuring the availability and stability of physical and non-physical service channels. |
| ● | Maintaining trusted relationships in order to be our customers’ main bank. |
| ● | Our Employees |
| ● | Providing employees with career opportunities based on merit. |
| ● | Promoting a respectful and friendly work environment. |
| ● | Offering competitive compensation and economic benefits. |
| ● | Supplying adequate technological tools and infrastructure. |
| ● | Our Community |
| ● | Improving quality of life and managing adversity. |
| ● | Strengthening the quality of education in Chile. |
| ● | Promoting entrepreneurship. |
| ● | Protecting the environment. |
| ● | Building strong relationships with suppliers. |
| ● | Our Shareholders |
| ● | Leading the industry in net income generation and profitability. |
| ● | Maintaining a strong market position in terms of business volume. |
| ● | Fostering operating efficiency and productivity. |
| ● | Developing a prudent approach to risk management. |
43
Strategic Priorities
Our long-term strategy is intended to maintain profitable growth by placing the customer at the center of all of our decisions and continuously improving efficiency and productivity in all of our processes and procedures while maintaining a strong commitment to the country. These are our strategic priorities and we aspire to attain them through collaboration and teamwork.

Source: Banco de Chile.
| ● | Customer Centric Decision Making |
We aim to support our customers and meet their needs throughout their lives. In order to achieve this goal, we strive to promote customer proximity and reliability, while providing our customers with the best service quality within the local market.
In our retail banking segment, our aim is to lead the market by providing differentiated and comprehensive value offerings based on a deep and continuously improving segmentation that permits us to engage in profitable and high-growth potential business opportunities. Thus, we expect to expand our business and customer base by developing tailored service models, optimizing our branch network, enhancing our presence in the small and medium-size company market and reinforcing certain lending products that should enable us to consolidate long-term relationships with the upper and middle-income individual customers, particularly through payment channel usage (such as credit cards), digital banking, installment loans and residential mortgage loans. Similarly, we aspire to target lower-income individuals and microbusinesses by promoting payroll-deduction lending and attracting customers previously unattached to any bank through a basic array of services.
We firmly believe that there is room to grow in retail banking. Although Chile’s per capita GDP has increased fourfold over the last 30 years, banking penetration is still below that in developed countries, particularly in relation to residential mortgage and consumer loans. In fact, as of December 31, 2021, the loan book of the Chilean banking industry (excluding operations of subsidiaries abroad) represented 85% of Chilean GDP. As of the same date, mortgage and consumer loans represented 27% and 10%, respectively. On the other hand, according to the CMF, as of December 31, 2021, we had market shares of 15.8% and 17.4% in residential mortgage loans and consumer loans, respectively, both behind the market leader by 5.4% and 3.1% in each case. Given the fierce competition in the Chilean banking industry, in order to take advantage of these opportunities, we are continuously developing innovative products and services to diversify our revenue sources. Accordingly, we have strived to build comprehensive value offerings for our retail segment in order to continue enhancing our fee-based income by promoting digitalization of products and services provided to these customers while improving benefits related to our customer loyalty programs.
44
Similarly, in our wholesale banking segment, we aim to maintain a market-leading position in loans while growing profitably in a market that is characterized by low margins and fierce competition. We intend to accomplish these goals by increasing our cross-selling of non-lending products and services. For this reason, we are focused on improving our cash management services, enhancing our internet-based and mobile services, increasing the penetration of products designed by our treasury and money market operations segment, strengthening our presence in certain lending products such as leasing and factoring and promoting international businesses by taking advantage of the Global Connectivity Agreement we maintain with Citigroup and the specialized array of financial services offered by our subsidiaries, such as securities brokerage, mutual funds management and financial advisory in order to meet the needs of certain niches within this business segment. The success of our wholesale banking segment is critical to our ability to maintain sustainable growth in revenues, particularly in fee-based income. Thus, cross-selling is one of our main priorities in this segment.
In our treasury and money market operations segment, we intend to take advantage of our specialized knowledge in order to increase the penetration of widely-used products in our current customer base while offering innovative products to potential clients. Also, we continuously seek newer and more convenient funding choices, locally and internationally, in order to support our long-term business strategy by promoting an adequate diversification of our funding structure.
| ● | Main Achievements in 2021 |
(1) Leading Position in Demand Deposits
Our funding structure is one of our most important competitive advantages. In 2021, we continued to lead the industry among private banks in current accounts and demand deposit accounts by recruiting approximately 116,600 new current account holders. This recruitment partly sustained an 8.0% increase in the amount of current account holders, when compared to the holders we had as of December 31, 2020. Further, we achieved solid growth in the premium account holders base, which are accounts that have the highest average balance per current account in the local banking industry. We also continued to benefit from a flight-to-quality effect during 2021, amid the uncertainty produced by the COVID-19 pandemic among our customers as well as liquidity levels above average figures due to diverse non recurrent effects, which is supported by our superior credit rating and reputation, based on a strong soundness image.
Accordingly, we reached Ch$18,542,791 million in year–end demand deposit account balances in 2021, which represented a 22.3% increase compared to 2020. As of December 31, 2021, we held a market share of 21.6% in total demand deposit account balances within the industry, excluding the operations of subsidiaries abroad and net of clearing, which placed us as the largest privately-owned bank in Chile. More importantly, we held a market share of 25.6% in personal banking based on account balances, ranking first within the whole banking industry.
(2) FAN Account
In the second half of 2020, we launched the FAN Account, our full digital onboarding account designed for all type of individual customers. This account may be digitally opened without visiting our branches, with no paperwork but still subject to our strict account approval processes. Additionally, the FAN Account permits holders to perform local and international purchases with no entrance or maintenance fees, which pursues to promote financial inclusion. Also, the FAN account holders have access to all the benefits and platforms offered by the Bank to its customers. During 2021, we continued to enhance the value offering behind the FAN Account by implementing services, such as: (i) a new customer service channel with a chatbot called FANi, (ii) full access to digital Banco de Chile’s ecosystem and (iii) cardless cash withdrawal.
Based on these advantages, as of December 31, 2021 we had been able to attract new customers through FAN Account by reaching 581,418 new holders during the year, 94% of whom were not previously Banco de Chile account holders.
(3) Advances in Digital Banking
In 2020, we increased the use and development of new digital and remote channels in order to offer our customers tailored and timely services in order to meet their needs and also to preserve a long-term relationship with them.
45
Thus, during 2021 we continued to enhance our digital and mobile banking services, offering a set of mobile applications: MiBanco, MiCuenta, MiPago, MiPass, MiSeguro, MiInversion and MiBeneficio. Particularly, we made upgrades in MiBanco, MiPago and MiSeguro, most of them related to enhanced security protocols, updated graphics as well as new and optimized functionalities, to allow us to provide a unified offering between our digital channels. Likewise, we implemented a smart-pay service that enables customers to make payments through their smartphones and smartwatches while launching a QR code payment service for SMEs through MiPago application. We also updated our personal banking internet-based platform by bringing more functionalities, integrating analytics tools and making our website’s interface more intuitive to allow clients to navigate it more easily.
Also, in 2021, we migrated our SMEs, large companies and corporate customer base to Banconexion 2.0, which is a new website for companies that aims to improve the customer experience by providing one of the highest cybersecurity standards within the banking industry.
As a result of these efforts, in 2021 we were once again recognized as the most Innovative Digital Bank of the Year in Chile by The European magazine.
(4) Continuous Improvements in Service Quality
We are convinced that in a highly competitive industry such as the Chilean banking system, a customer-centric focus is critical to generating loyalty and creating long-term profitable relationships. We believe that our high service quality is a competitive strength that differentiates us from competitors and supports our long-term strategy by responding to the preferences of our current and potential customers. Accordingly, we strive to continuously improve our relationships with customers by developing commercial strategies and value offerings aligned with their needs, as well as improving our response time and customer satisfaction indicators. Consistent with this view, during 2021 we continued enhancing our commitment to service quality, improving existing and developing new online channels and new functionalities for mobile applications, while implementing organizational changes to provide our customers with a more comprehensive approach and customized solutions.
We believe that our continued focus on our strategy and customers have contributed to our leading position among our peers in terms of service quality perception, as illustrated by rankings conducted by GFK Adimark in which we were we ranked first among our main banking peers in terms of the preferred bank to switch into with a 19% of positive mentions for the year ended December 31, 2021, nearly 7%, on average, above our main peers.
We believe that our effort in developing comprehensive and customized value offerings for customers has contributed to improve the customer experience over time, and that the solutions that we launched have allowed us to maintain customer satisfaction at healthy levels as reflected by a net promoter score of 68% as of December 31, 2021, according to a syndicated study conducted by Procalidad. This has also been supported by an average attrition rate of 3.6% for year ended December 31, 2021, which favorably compares to the 4.3% attrition rate recorded in 2020 and the 6.2% average attrition rate posted sequentially between 2017 and 2019, according to our management information system.
| ● | Operating Efficiency and Productivity |
We believe that efficiency and productivity are key competitive strengths that we have to maintain in order to sustain profitable growth in a changing business environment that is under increasing regulatory focus. Accordingly, we aim to become a productive and efficiency-oriented organization in all business aspects by developing simple, effective, secure and low-cost processes while maintaining the tightest cost control in the industry. To accomplish these goals, we have invested in information technology and the development of simpler, more manageable, secure and modern business processes and platforms to attain faster response times and higher productivity. We also continue to enhance our strategic development capabilities, increase our business scale, develop economies of scope by incorporating new financially related products and services, optimize our branch network, enhance our remote transactional channels, improve our credit processes, develop a higher level of automation in our internal processes and consolidate our cost control policy and monitoring procedures.
46
We are continuously developing and optimizing internal processes in order to reduce and manage our expenses. Throughout 2021, we continued to enhance our IT infrastructure in order to increase stability and efficiency for all of our customers. Likewise, we continued to disburse financial resources to reinforce our IT infrastructure in respect of cybersecurity matters. We believe this is the best way to improve our operating efficiency and enhance security standards while properly meeting our customers’ needs, which are increasingly linked to digital channels, fast response and timely service. For more information see “Item 4. Information on the Company—Capital Expenditures”
| ● | Main Achievements in 2021 |
(1) Branch Network and Headcount Optimization
We believe that remote channels are key to the future of banking, particularly amid new regulatory requirements, intensified competition, the entry of new banking players and higher reputational exposure, all of which translates into higher costs. Similarly, customers are increasingly demanding new and innovative distribution channels and visiting branches less, given lack of time, but mostly due to the massive use of internet and the fast adoption of smartphones. In 2018, these trends led us to undertake financial and strategic analyses aimed at revising our entire branch network in terms of profitability, location, layout and services offered through these channels. In 2021, we continued to deploy this analysis by considering demographic change, physical coverage, and customers’ profiles, among other topics. In this regard, our current service model strategy includes the integration of the CrediChile network into the Banco de Chile’s network. Through these means, we believe that we are able to provide superior and tailored local solutions, as well as reduce operational costs.
As a result, we have reduced our branch network from 390 locations as of December 31, 2018 to 272 branches as of December 31, 2021. Most of this decrease was related to our efficiency and branch optimization program.
Likewise, the deployment of our efficiency program has enabled us to streamline diverse internal processes with a front-to-back approach that, along with organizational restructuring we have carried out in order to both imprint an efficiency-focused culture across the corporation and due to the branch network optimization, has translated into a steady decline in headcount from 13,831 employees in 2018 to 12,284 employees in December 2021, which represents an 11.2% contraction.
(2) Cost Control & Productivity Initiatives
Cost control has become one of our key efficiency pillars, for which we have established a specialized area that is implementing a cross-enterprise cost management program that seeks incremental savings gains in all the activities we carry out. In 2021, our cost base recorded a slight 0.6% annual increase when compared to 2020, mainly as a result of the implementation of a wide array of long-term cost control initiatives focused on improving and streamlining our processes by means of a front-to-back approach in order to improve productivity while reinforcing cost efficiency in the long-run. In line with this, we have significantly revised our organizational structure in order to carry out the changes we need to align the corporate culture with our digital transformation strategy across the Bank. Likewise, we have a multidisciplinary board that assesses the feasibility, adequacy and the value added by new capital expenditures and major expenses, which has enabled us to control our cost base closer. Based on these initiatives, our cost-to-income ratio improved from 45.4% in 2020 to 39.6% in 2021, mostly explained by higher operating revenues. For more information, see “Item 5. Operating and Financial Review and Prospects—Results of Operations for the Years Ended December 31, 2019, 2020 and 2021—Operating Expenses.”
The previously mentioned achievements have allowed us to improve certain ratios such as loans per employees, loans per branches and operating expenses to assets, as displayed in the following table, as of the dates indicated:
| For the Year Ended December 31, | ||||||||||||
| 2019 | 2020 | 2021 | ||||||||||
| BANK’S INTERNAL REPORTING POLICIES: | (in millions of Ch$) | |||||||||||
| Operational Ratios | ||||||||||||
| Loans per Branch (Millions of Ch$) | 83,620 | 92,626 | 125,942 | |||||||||
| Loans per Employee (Millions of Ch$) | 2,213 | 2,355 | 2,789 | |||||||||
| Expenses to Total Loans (%) | 3.0 | % | 2.9 | % | 2.6 | % | ||||||
47
| ● | Commitment to Chile |
Banco de Chile is devoted to focus on the progress of its customers by means of providing them with a wide array of services while supporting their funding needs. As an extension of this view, Banco de Chile is committed to the development of Chile and its individuals and companies by providing innovative tools that contribute to improve their quality of life. In this regard, we firmly believe that modern companies need to create effective mechanisms to build positive connections with all of their stakeholders and the society in which they carry out their business activities. This has become increasingly important in the midst of societal changes in Chile and worldwide.
This view is shared by the Bank and its employees, who support the development of Chile through diverse methods such as promoting social progress, contributing to environmental protection, decreasing extreme poverty, providing high-quality education to needy people, assisting disabled young people, fostering cultural development and embracing campaigns intended to overcome the effects of specific adverse events such as natural disasters.
| ● | Main Achievements in 2021 |
(1) Entrepreneurship Support
During 2021, we supported diverse entrepreneurship by assisting our customers in the context of the economic recovery observed throughout the year once mobility restrictions began to be lifted and commercial activity returned to most of the industries. Thus, for instance, we satisfied SMEs funding needs by granting Ch$1,234,501 million in secured loans associated with the FOGAPE Reactiva Program as of December 31, 2021.
In addition, we launched the Sixth National Entrepreneur Challenge, which attracted approximately 24,000 of micro and SMEs across Chile. This initiative is part of our SMEs for Chile Program and aims to provide entrepreneurs with training and tools that permit SMEs to improve their management and ensure their sustainability over time. Likewise, this initiative permits entrepreneurs to enter into an ecosystem in which they will increase visibility, boost sales and generate stronger and long-lasting relationships with their current and potential customers. The finalists participated in an unprecedented TV show, where they received support and mentoring from specialists in management, marketing and entrepreneurship matters while allowing them to make their business stories and ventures known across the country.
Likewise, during November 2021, we launched the new TV network show Rutas para Chile, which is a joint effort between us and a collaborative network integrated by players focused on entrepreneurship in Chile such as Universidad del Desarrollo Ventures, Fundación País Digital, Propyme, Nubox, Cebra, COMPITE and Multivende. This network aims to promote the expansion of SMEs in the country to increase their sales, improve the management of their businesses and support entrepreneurship. The TV program aims to promote tourism across the country by showcasing Chilean SMEs and entrepreneurs participating in the tourism industry across the country.
Also, as part of our Digital Transformation strategy, we have put at disposal of our SME customers new payment service, Mi Pago QR, based on scanning a QR Code or purchase code to facilitate transactions between entrepreneurs and their customer. This payment service is already available in more than 6,000 commercial locations across the country and in WebPay. By means of this new service, our customers may use their mobile phones to pay for services and products without needing a physical card.
(2) Environmental Sustainability
Environmental sustainability has become a crucial goal for us, which has led us to think and take business actions in what we believe is a sustainable approach by caring for the environment and working to leave a better planet for future generations. For this reason, in the context of a new World Environment Day, we implemented a new Sustainable Welcome Kit for Personal Banking new customers, which includes compostable bags and cards created from recycled plastic. In order to do this, we modified the Welcome Kit from a traditional cardboard box to a compostable corn bag that degrades between three to six months without requiring an industrial process, which compares to the 500 years that it takes for a normal plastic bag to degrade. In addition, one of the main and most innovative products to be included in this new Welcome Kit are the cards made from 85% recycled plastic, which maintain the same properties of the former, but considerably reduce the impact of CO2 emissions by 36% for each card produced, as well as saving energy by 50% and water by 75%. The new Welcome Kit is also expected to reduce the use of paper by 15 tons per year, thanks to the incorporation of a QR code, by which new customers will be able to access the Welcome Customer’s Guide digitally, in addition to eliminating checkbooks. In 2021, we also managed to reduce our GHG footprint and paper consumption by 27% and 3% respectively.
48
(3) Social Responsibility and COVID-19
As a result of our continuous focus on providing our employees and customers with a secure environment while taking all the sanitary measures defined by the health authority, in April 2021 we were recognized as one of the most responsible companies and with the best corporate governance in Chile in the tenth edition of the Corporate Responsibility and Governance ranking conducted by the Corporate Reputation Business Monitor, MERCO Chile. In a year marked by the COVID-19 pandemic, we ranked second, out of 100 Chilean companies. The ranking highlights the 100 most responsible companies with the best corporate governance, and measures their commitment to sustainability, social responsibility, contribution to the community, ethics and transparency.
Likewise, in November 2021, we became the first local bank to receive the COVID-19 Seal granted by Mutual de Seguridad (a non-for-profit labor accidents insurer to which we are affiliated), which certifies that all our branches, phone banking and headquarters across the country fully comply with preventive measures, recommendations and regulations promoted by the health authority during the pandemic. This recognition reflects our commitment and constant concern for the safety and health of our employees and customers.
(4) Financial Education “Cuentas con el Chile Program”
We have a strong commitment to financial education, which has materialized through diverse initiatives. The “Cuentas con el Chile” program is a financial education and wellness program, which aims to contribute to financial education and inclusion through the implementation of various activities, including digital financial education, face-to-face financial education and financial education mentoring. In 2020, this initiative trained 4,634 entrepreneurs, including micro-entrepreneurs, SMEs, sector leaders, neighborhood leaders, migrants and students from different universities, schools and regions of Chile. In order to continue contributing to education and inclusion, in 2021, for the second consecutive year, we carried out our financial education course, a free program that targets high school students in the country. This year, approximately 2,429 students from 35 schools across the country benefited from mentoring in financial education matters, based on contents developed by AgentPiggy, a financial education program for children that complies with the requirements of the Education Ministry. These students joined the 3,415 students trained in 2020 under the same course.
(5) Disability Inclusion
Our commitment to disabled people is permanent. In 2021 we worked once again alongside Teleton for its annual fund-raising campaign by putting our nationwide distribution network, which includes internet-based platforms and mobile applications for smartphones, in addition to other technological resources, at Teleton’s disposal. We have been supporting the Teleton Foundation since its establishment 43 years ago, supporting disabled athletes and artists, and we continued to make important monetary donations to the Foundation.
We also continued to promote our Inclusion Policy across the corporation. This policy is intended to improve our knowledge of physical disability and develop higher sensitivity with respect to the treatment of disabled people. We believe this is the first step to improve the service we render to customers who experience this reality while providing our disabled employees with supportive workplace conditions and benefits. Under this approach, we created the Advisory Council which is composed of 54 representatives from across the entire corporation and its various divisions.
Additionally, we held the fourth consecutive season of Expo Inclusión, an inclusive recruitment fair through which we aim to strengthen our commitment to support people with disabilities. In October 2021, more than 180 organizations and 50 presenters participated during this initiative that generated nearly 180 job opportunities. As a result, in 2021 over 1.3% of our staff had been identified as members of a disabled group, which is above the minimum required by the Chilean law. Moreover, we have continued to advance our plan of special benefits for our current disabled employees while implementing inclusive recruitment processes.
49
(6) Material Advances in ESG
All of the achievements mentioned earlier, as well as our solid corporate governance, have allowed us to achieve significant advances in ESG and we have recognized in that front. During 2021, we received an A rating from a prestigious international index that assesses diverse categories associated with ESG. This rating represented a three notch improvement from the former evaluation and reflects the strong accomplishments we have attained over the last year in ESG related matters, given our firm commitment to the community, the environment and our way of doing business.
| ● | Teamwork |
One of the main goals of any corporation is to align employees’ perspectives with the company’s culture. In Banco de Chile, every worker has a crucial role in allowing us to achieve our strategic goals. In exchange for that, we believe all of our staff receives fair compensation and have access to benefits and policies that enable them to expand their professional capabilities in a work environment is committed to remain free of accidents, professional illnesses, work harassment, mobbing and discrimination.
In order to consolidate profitable growth, achieve high standards of service quality, attain operating efficiency and maintain a commitment to the country over the long run, we must have a motivated and highly qualified workforce committed to our corporate values. Accordingly, we strive to develop a distinctive culture among our employees by promoting: (i) a clear focus on the customer, (ii) confidence and responsibility, (iii) leadership and empowerment, (iv) collaboration and teamwork and (v) innovation and continuous improvement.
| ● | Main Achievements in 2021 |
(1) Talent Attraction
We believe that talent attraction is crucial in order to achieve our medium-term goals. Consequently, we have devoted efforts over the last years in order to improve our participation in university fairs while strengthening our presence on social networks and reinforcing IT tools in order to expand our reach to prospective candidates. In 2021, we ranked first in the general ranking of “Merco Talento Chile 2021”, as in the last eight editions, which awarded us as the best organization in the country in terms of talent attraction and retention.
(2) Other initiatives
We also seek to remain one of the most respected employers in Chile. We continue to strengthen our connection to our employees in order to align corporate values and goals with their career development and personal goals. In this regard, we have continued to focus on developing leadership capabilities and overall technical skills through training activities. Similarly, we have deployed diverse presentations on topics of interest for our employees, which have been conducted by specialized lecturers that transmit their experiences and knowledge on dealing with various professional situations. We believe these initiatives are aligned with our strategy and the professional development that our team aspires to achieve.
Ownership Structure
The following diagram shows our share ownership structure as of April 20, 2022:

50
Principal Business Activities
We are a full-service financial institution that provides, directly and indirectly through our subsidiaries and affiliates, a wide variety of lending and non-lending products and services to all segments of the Chilean financial market. Accordingly, for management purposes we organize our operations in the following four business segments:
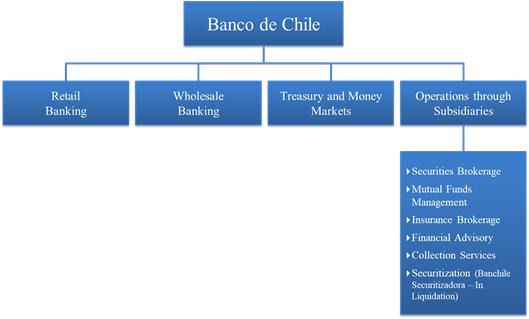
The information related to our business segments presented in this section has been prepared in accordance with our internal reporting policies. See “Item 5. Operating and Financial Review and Prospects—Operating Results—Results of Operations for the Years Ended December 31, 2019, 2020 and 2021—Business Segments” and “Item 5. Operating and Financial Review and Prospects—Operating Results—Results of Operations for the Years Ended December 31, 2019, 2020 and 2021—Summary of Differences between Internal Reporting Policies and IFRS” for a description of the most significant differences between our internal reporting policies and IFRS.
On February 4, 2021, we began a voluntary and anticipated dissolution process for Banchile Securitizadora S.A. as approved by the subsidiary’s shareholders during the extraordinary meeting held on the same date. The dissolution was approved by the CMF and the process of liquidation is still in progress.
The following table sets forth information on the composition of our loan portfolio and our consolidated income before income tax in accordance with our internal reporting policies for the year ended December 31, 2021, allocated among our principal business segments:
| For the Year Ended December 31, 2021 | ||||||||||||
| Total Loans | % Participation in Total Loans | Income before Income Tax(1) | ||||||||||
| (in millions of Ch$, except percentages) | ||||||||||||
| BANK’S INTERNAL REPORTING POLICIES: | ||||||||||||
| Retail banking | Ch$ | 21,358,977 | 62.4 | % | Ch$ | 492,044 | ||||||
| Wholesale banking | 12,865,005 | 37.6 | 345,244 | |||||||||
| Treasury and money market operations | — | — | 52,854 | |||||||||
| Operations through subsidiaries | 32,202 | 0.1 | 81,332 | |||||||||
| Other (adjustments and eliminations) | — | — | — | |||||||||
| Total | Ch$ | 34,256,184 | 100.0 | % | Ch$ | 971,472 | ||||||
| (1) | This net income breakdown is used for internal reporting and planning purposes and it is based on, among other things, our estimated funding cost and direct and indirect cost allocations. This breakdown may differ in some extents from breakdowns of our operating income for financial reporting and regulatory purposes. Separate information on the operations, assets and income of our financial services subsidiaries and affiliates is provided below under “—Operations through Subsidiaries.” |
51
The following table sets forth our consolidated operating revenues in accordance with our internal reporting policies, allocated among our principal business segments, for the years indicated:
| For the Year Ended December 31, | ||||||||||||
| 2019 | 2020 | 2021 | ||||||||||
| (in millions of Ch$) | ||||||||||||
| BANK’S INTERNAL REPORTING POLICIES: | ||||||||||||
| Retail banking | Ch$ | 1,325,916 | Ch$ | 1,231,644 | Ch$ | 1,376,821 | ||||||
| Wholesale banking | 478,283 | 481,076 | 621,472 | |||||||||
| Treasury and money market operations | 25,659 | 69,572 | 56,673 | |||||||||
| Operations through subsidiaries | 199,611 | 177,931 | 196,148 | |||||||||
| Other (adjustments and eliminations) | (14,949 | ) | (21,480 | ) | (20,857 | ) | ||||||
| Total Operating Revenues | Ch$ | 2,014,520 | Ch$ | 1,938,743 | Ch$ | 2,230,257 | ||||||
The following table sets forth a geographic market breakdown of our operating revenues in accordance with our internal reporting policies, for the years indicated:
| For the Year Ended December 31, | ||||||||||||
| 2019 | 2020 | 2021 | ||||||||||
| (in millions of Ch$) | ||||||||||||
| BANK’S INTERNAL REPORTING POLICIES: | ||||||||||||
| Chile | Ch$ | 2,029,469 | Ch$ | 1,960,223 | Ch$ | 2,251,114 | ||||||
| Banking operations | 1,829,858 | 1,782,292 | 2,054,966 | |||||||||
| Operations through subsidiaries | 199,611 | 177,931 | 196,148 | |||||||||
| Foreign operations | — | — | — | |||||||||
| Operations through subsidiaries | — | — | — | |||||||||
| Other (adjustments and eliminations) | (14,949 | ) | (21,480 | ) | (20,857 | ) | ||||||
| Total Operating Revenues | Ch$ | 2,014,520 | Ch$ | 1,938,743 | Ch$ | 2,230,257 | ||||||
The following table sets forth a breakdown of our loan portfolio by customer and business segments, in accordance with our internal reporting policies for the year ended December 31, 2021:
| For the Year Ended December 31, 2021 | ||||||||||||||||
| Commercial Loans | Mortgage Loans | Consumer Loans | Total Loans | |||||||||||||
| (in millions of Ch) | ||||||||||||||||
| BANK’S INTERNAL REPORTING POLICIES: | ||||||||||||||||
| Individuals (Personal Banking) | Ch$ | 2,630,044 | Ch$ | 9,572,924 | Ch$ | 4,055,118 | Ch$ | 16,258,086 | ||||||||
| Small & Medium Enterprises | 4,159,425 | 752,575 | 188,891 | 5,100,891 | ||||||||||||
| Retail Banking | 6,789,469 | 10,325,499 | 4,244,009 | 21,358,977 | ||||||||||||
| Corporate Banking | 5,095,033 | — | 5 | 5,095,037 | ||||||||||||
| Special Businesses | 2,617,882 | — | 39 | 2,617,921 | ||||||||||||
| Large Companies | 5,126,233 | 21,154 | 4,659 | 5,152,046 | ||||||||||||
| Wholesale Banking | 12,839,148 | 21,154 | 4,703 | 12,865,005 | ||||||||||||
| Subsidiaries | 32,202 | — | — | 32,202 | ||||||||||||
| Total | Ch$ | 19,660,819 | Ch$ | 10,346,653 | Ch$ | 4,248,712 | Ch$ | 34,256,184 | ||||||||
Retail Banking Segment
Our retail banking segment serves the financial needs of individuals and small and medium sized companies through our branch network. As of December 31, 2021, our retail banking segment managed 238 branches operating under our “Banco de Chile” and “Banco Edwards-Citi” brand names and 34 branches within the “Banco CrediChile” network. As of December 31, 2021, loans granted by our retail banking segment amounted to Ch$21,358,977 million and represented 62.4% of our total loans as of the same date.
52
In terms of composition, as set forth in the following table, as of December 31, 2021 our retail segment’s loan portfolio was principally focused on residential mortgage loans, which represented 48.3% of the segment’s loan book. The remaining loans were distributed between commercial loans (31.8%) and consumer (19.9%).
| As of December 31, 2021 | ||||||||
| (in millions of Ch$, | ||||||||
| except percentages) | ||||||||
| BANK’S INTERNAL REPORTING POLICIES: | ||||||||
| Commercial loans | ||||||||
| Commercial credits | Ch$ | 6,009,732 | 28.1 | % | ||||
| Leasing contracts | 494,263 | 2.3 | ||||||
| Other loans | 285,474 | 1.3 | ||||||
| Total Commercial Loans | 6,789,473 | 31.8 | ||||||
| Residential Mortgage Loans | 10,325,499 | 48.3 | ||||||
| Consumer Loans | ||||||||
| Installment loans | 2,874,149 | 13.5 | ||||||
| Credit cards | 1,196,119 | 5.6 | ||||||
| Lines of credit and other loans | 173,741 | 0.8 | ||||||
| Total Consumer Loans | 4,244,009 | 19.9 | ||||||
| Total | Ch$ | 21,358,977 | 100.0 | % | ||||
We serve the retail market through our Individuals and SME Area, which is responsible for offering financial services to individuals with monthly incomes over Ch$180,000 (or Ch$2.1 million per year), small and medium sized companies with annual sales of up to approximately Ch$2,200 million and micro businesses. This area manages our branch network operating under the brand names “Banco de Chile” and “Banco Edwards Citi” and had 272 branches as of December 31, 2021. For purposes of personal banking, the Individuals and SME Area maintains a segmentation to provide costumers of all income segments ranging from Consumer Finance (monthly income from Ch$180,000 to Ch$500,000) to premium customers (middle- and high-income segments) with tailored value propositions. As reported on our Form 20-F for the year ended December 31, 2020 filed with the SEC on April 30, 2021, during 2021, we completed the merger of our former Consumer Finance Area (CrediChile) into our Individuals and SME Area.
The strategy followed by our Individuals and SME Area is mainly focused on sub segmentation, multi brand positioning, cross sell of lending and non-lending products and service quality based on customized service models for specific customer needs. Also, loyalty programs have been increasingly incorporated into our commercial targets for each sub segment and they have enabled us to increase the use of our credit cards and our fee-based income. In addition, the area’s operations count on the support of specialized call centers, mobile and internet banking services, along with a wide range of management tools that allow us to measure returns, the performance of cross sold products and the effectiveness of marketing campaigns. Similarly, over the last years the area has strengthened value offering for SMEs by promoting a close relationship, while accompanying entrepreneurs in the diverse stages of their life cycle.
We also focus on developing and marketing innovative and customized products targeted to satisfy the needs of our Consumer Finance and microbusinesses customers while introducing them to the banking system. We complement the services offered by our other business segments, especially our wholesale market segment, by offering services to employers, such as direct deposit capabilities for payroll payment purposes, which in turn enable employees to use our deposit services. In recent years, we have strived to improve our value offering services by designing and implementing two new financial services, ‘Caja Chile’ and ‘Microbusiness Banking’. The former consists of a limited range of basic financial services (e.g. deposits, withdrawals and bill payments) offered to customers and non-customers through remote IT platforms located in small convenience stores within socially and/or geographically isolated areas of Chile. On the other hand, the ‘Microbusiness Banking’ is a specialized portfolio of financial services designed for microbusiness (generally personal businesses) that includes financial advisory, lending and non-lending products and general financial solutions for a segment that has been traditionally uncovered by the banking services.
53
During 2021, the Individuals and SME Area focused on targeted growth opportunities while developing new business solutions and benefits for its clients in order to improve our customers’ experience. Additionally, because of the COVID-19 outbreak, since 2020, we have witnessed an unprecedented scenario where digital banking has played a major role, which encouraged us to continue providing enhanced digital solutions in order to meet our customers’ needs, particularly in the context of the COVID-19 pandemic. In addition, prompted by higher levels of liquidity among individuals given three withdrawals from pension funds and direct government money transfer to them, demand deposits held by this area grew 43% on average when compared to 2020 (under internal reporting policies). We also believe that our brand recognition and strong corporate image helped us to further increase this source of funding against the uncertain context of the COVID-19 pandemic, as investors and depositors sought reliable institutions to keep their funds. Similarly, as mentioned earlier, in 2020 we launched the FAN account, our new online onboarding bank account, which reinforced our leadership in both digital banking and demand deposit accounts. During 2021, we were active in growing in this digital onboarding and made available several new tools for these customers that aided in strengthening ties with them, such as cross-selling insurance, credit and investment products, which led to nearly 581,000 additional new FAN account holders in our customer base that completed over 50 million transactions
Furthermore, we continually strive to improve benefits for our credit card account holders and other customers by widening strategic partnership and alliances mostly through our loyalty program named Dolares-Premio (a credit card points system). During 2021, more than 450,000 customers made use of these benefits by exchanging their Dolares-Premio for tickets, discounts or other benefits. Also, given the contraction in commercial activity in 2020 due to the COVID-19 pandemic, during 2021 we reactivated our partnership with Sky Airlines, which led to an annual growth of 63% in clients’ redeeming benefits. As for SMEs, in February 2021, we deployed the FOGAPE Reactiva program, the continuation of the government-backed COVID-19 loans granted in 2020, to support SMEs. In addition, thanks to these actions, we ranked first among privately-owned banks in the “Bank that supports SMEs and entrepreneurs” category, according to a study conducted by Adimark. Lastly, as of December 31, 2021, commercial loans granted to microbusinesses accounted for approximately Ch$32,228 million, associated with 8,484 borrowers. At the same time, we finalized the implementation of our new service model by merging branches in certain locations for Banco de Chile and former CrediChile customers, which in turn allows us to benefit from economies of scale by optimizing the use of spaces.
In 2021, the Individuals and SME Area also achieved significant increases in lending and saving products. In this regard, throughout the year the segment’s customer base grew by approximately 79,703 new current account holders and attained record sales of new installment and residential mortgage loans granted to its customers.
As of December 31, 2021, the Individuals and SME Area served approximately 1,308,649 core customers (those holding a current account or a loan outstanding) of which 927,043 were individuals, 138,056 were small and medium sized Chilean companies and 243,550 were Consumer Finance clients. This customer base resulted jointly in total loans granted to 1,076,114 borrowers, which included 139,372 residential mortgage loans debtors, 128.609 commercial loan debtors, 380,456 utilized lines of credit and 361,860 installment loans. As of the same date, the Commercial Finance held 1,051,808 current accounts, 120,503 savings accounts and 367,207 time deposits.
As of December 31, 2021, 73.1% of our loans managed by this area were granted to individuals, which represents Ch$15,604,418 million. As of the same date, Ch$5,100,891 million (23.9% of loans granted to retail banking clients) and Ch$653,668 million (3.1%) were granted to SMEs and Consumer Finance clients, respectively.
We offer a variety of financial services to individuals, SMEs and microbusinesses, directly through the Individuals and SME Area or indirectly through our subsidiaries, such as current accounts, automatic bill payment, debit cards, credit cards, revolving credit lines, residential mortgage loans, consumer loans, commercial loans, mortgage loans for general purposes, leasing agreements, factoring services, mutual funds management and stock brokerage, trade finance, payments and collections, insurance brokerage (which includes life and casualty insurance), savings instruments and foreign currency services.
Installment Loans
Our consumer installment loans are generally incurred, up to a customer’s approved credit limit, to afford purchases of goods and/or services, such as cars, travels, household furnishings and education, among others. Consumer loans may be denominated in both pesos and UF, bear fixed or variable interest rates and are generally repayable in installments over a period of up to 45 months.
54
As of December 31, 2021, we had Ch$2,541,102 million in installment loans granted by our Individuals and SME Area, which accounted for 59.9% of the retail market business segment’s consumer loans. Most of these installment loans are denominated in Chilean pesos and are payable on a monthly basis.
Residential Mortgage Loans
As of December 31, 2021, we had outstanding residential mortgage loans of Ch$10,346,652 million (under internal reporting policies considering the Bank as a whole), which represented 30.2% of our total loan book as of the same date. According to information published by the CMF, as of December 31, 2021, we were Chile’s third largest private sector bank in terms of year-end mortgage loans balances, accounting for approximately 15.8% of mortgage loans granted by the Chilean banking industry, excluding operations of banks’ subsidiaries operating abroad.
Our residential mortgage loans are generally denominated in UF and have maturities ranging from five to 30 years. As of December 31, 2021, the average residual maturity of our residential mortgage loan portfolio was 16.4 years. Originally, we funded our residential mortgage loans through the issuance of mortgage finance bonds, which are recourse obligations only to us with payment terms that are matched to the residential loans. Also, the mortgage finance bonds bear real market interest rates plus a fixed spread over the variable rate of the UF, which permits us to partially reduce our exposure to interest rate fluctuations and inflation. Chilean banking regulations allow us to finance up to 100% of a residential mortgage loan with mortgage finance bonds, based on the purchase price of the property securing the loan or the appraised value of such property. In addition, we generally require that the monthly payments on a residential mortgage loan not exceed 25% of the borrower’s household after tax monthly income, when the customer belongs to the low-income population segment. However, that limit may be adjusted for the middle- and high-income population segments.
Over the last decade, we have also promoted the expansion of Mutuos Hipotecarios, a mortgage lending product, which is not financed by mortgage finance bonds, but instead through our general funds. As of December 31, 2021, our residential mortgage loan portfolio was principally composed of Mutuos Hipotecarios, as customers have preferred them due to their flexibility and simplicity (for instance the interest rate is known in advance by the customer, which is not the case for mortgage finance bonds that are traded in the secondary market and, therefore, subject to discounts), as they are easier to prepay and permit financing of up to 100% of the purchase price (as stated by the applicable local regulation), although banks limit such maximum financing portion based on internal credit policies and economic cycles, among others.
The following table sets forth the composition of our residential mortgage loan portfolio by product type:
| As of December 31, 2021 | ||||||||
| (in millions of Ch$, except percentages) | ||||||||
| BANK’S INTERNAL REPORTING POLICIES: | ||||||||
| Secured Residential Mortgage Loans(1) | ||||||||
| Loans financed with Mortgage Bonds | Ch$ | 10,340,588 | 99.9 | % | ||||
| Mutuos Hipotecarios | 6,063 | 0.1 | ||||||
| Total Secured Residential Mortgage Loans | Ch$ | 10,346,650 | 100.0 | % | ||||
| (1) | Corresponds to the Bank’s total secured residential mortgage loans and not only those associated with the Individuals and SME Area. |
As shown above, as of December 31, 2021 residential mortgage loans related to Mutuos Hipotecarios represented 99.9% of our total residential mortgage loan portfolio, while the remaining 0.1% corresponded to mortgage loans financed with Mortgage Bonds. As of the same date, the Mutuos Hipotecarios portfolio had an average origination period of four years (the period from the date when the loans were granted to the specified date). Conversely, as of December 31, 2021, loans financed with Mortgage Bonds had an average origination period of 19 years (the period from the date when the loans were granted). In terms of credit risk, in 2021, loans related to Mutuos Hipotecarios, as well as those financed with Mortgage Bonds, had low gross (before recoveries) credit risk ratios of 0.05% and 0.69%, respectively. It is important to mention that the residential mortgage loan portfolio financed with Mortgage Bonds is annually increasing in an amount, and as a proportion of, the total residential mortgage loan portfolio because it is composed of old loans and the instrument is no longer offered by the Bank.
55
Regarding Mortgage Bonds that finance residential mortgage loans, the Bank is solely responsible for the payment of the Mortgage Bond obligation to the mortgage bond holders, regardless of the payment behavior of the residential mortgage borrower. Accordingly, in the ordinary course of business, none of our residential mortgage loans serves as a guarantee or collateral for our mortgage bonds.
For those loans that finance a higher portion of the property appraised value, we demand that customers comply with stricter requirements, which are verified during the credit assessment stage. These requirements are related to: (i) the history of the relationship between the Bank and the customer (new or current client), (ii) credit risk scores, (iii) monthly income, (iv) type of job (employed or self-employed) and (v) years employed. In order to illustrate the above mentioned, the table below sets forth an example of requirements for residential mortgage loans that finance up to 80% and more than 80% of the property value, with a common term and granted to employed as well as self-employed new customers.
Credit–granting Requirements
(in millions of Ch$, except percentages)
Requirements | ||||||||
| Loan–to–Value Ratio | ≤80% | >80% | ||||||
| New Customers(1) | ||||||||
| Employed | ||||||||
| Years employed | ≥1 year | ≥1 year | ||||||
| Monthly Income | ≥Ch$0.5 | ≥Ch$2.1 | ||||||
| Self-Employed | ||||||||
| Years Employed(2) | ≥2 years | ≥2 years | ||||||
| Monthly Income | ≥Ch$0.5 | ≥Ch$2.1 | ||||||
| New Customers with a University degree(3) | ||||||||
| Employed | ||||||||
| Years employed | ≥1 year | ≥1 year | ||||||
| Monthly Income | ≥Ch$0.5 | ≥Ch$0.9 | ||||||
| Self-Employed | ||||||||
| Years Employed(2) | ≥2 years | ≥2 years | ||||||
| Monthly Income | ≥Ch$0.5 | ≥Ch$0.9 | ||||||
| (1) | Refers to customers with or without university degree, who do not supplement income with a guarantor’s income. |
| (2) | In the case of self-employed customers, years employed refers to the minimum period of time in which the customer has filed annual tax bills with the Chilean Internal Revenue Service. |
| (3) | Refers to customers with university degree awarded by a group of universities according to our internal credit approval process. |
During 2021, only 1.5% of the residential mortgage loans granted to our customers financed between 90% and 100% of the property value. Similarly, during 2021, loans financing between 75% and 90% of the property appraised value represented 45.0% of these loans, loans financing between 50% and 75% of the property value represented 42.4% of these loans, and loans financing less than 50% of the property value represented 11.1% of these loans. According to our prudent risk approach, we have been tightening our credit granting policy for residential mortgage loans by restricting the loan financing limit as a percentage of the property’s value, although higher financing may be granted to longstanding customers within specific segments. This explains the decrease in the share of residential mortgage loans that financed between 90% and 100% of the property value over the last years, from 14.9% in 2015 to 1.5% in 2021.
56
An additional feature of our mortgage loans is that mortgaged property sometimes, and under certain conditions, secures some of the mortgagor’s other credits with us, including installment loans and due balances associated with credit cards and credit lines. Our total amount of loans secured by real estate guarantees, their loan–to–value (LTV) ratio and their relative share in our total loan portfolio, as of December 31, 2021, are depicted in the table below:
| As of December 31, 2021 | ||||||||||||
| Outstanding Balance | LTV(2)(3) | % of Bank’s Total Loans | ||||||||||
| (in millions of Ch$, except percentages) | ||||||||||||
| BANK’S INTERNAL REPORTING POLICIES: | ||||||||||||
| Secured Loans(1) | ||||||||||||
| Residential Mortgage Loans | Ch$ | 10,346,650 | 64.6 | % | 30.2 | % | ||||||
| Other than mortgage loans | 1,114,217 | 19.6 | 3.3 | |||||||||
| Total Secured Loans | Ch$ | 11,460,868 | 71.5 | % | 33.5 | % | ||||||
| (1) | Corresponds to the Bank’s total secured loans and not only those associated with the Individuals and SME Area. |
| (2) | LTV ratio is computed as the amount of secured loans divided by the value of their associated collateral. |
| (3) | For other-than-mortgage loans, the LTV ratio is computed as the amount of the excess guarantee (after deductions) of the balance of the associated residential mortgage loans, as those guarantees are initially established in order to secure the residential mortgage loan. |
The LTV ratios provided above are based on estimated property values that we update monthly with the collateral valuation models managed by our Retail Credit Risk Division. These models determine a rate of depreciation that provides an updated collateral value, based on variables such as geographic location, last appraisal date, type of property and type of customer. Accordingly, the LTV ratios set forth above take into account the most recent available data regarding collateral values.
In addition, the following table sets forth the composition of the other-than-mortgage loans secured by real estate guarantees:
| As of December 31, 2021 | ||||||||
| (in millions of Ch$, except percentages) | ||||||||
| BANK’S INTERNAL REPORTING POLICIES: | ||||||||
| Secured Other-than-Mortgage Loans(1) | ||||||||
| Consumer Loans | Ch$ | 819,614 | 73.6 | % | ||||
| Credit Cards | 256,619 | 23.0 | ||||||
| Credit Lines | 37,983 | 3.4 | ||||||
| Total Secured Other-than-Mortgage Loans | Ch$ | 1,114,217 | 100.0 | % | ||||
| (1) | Corresponds to the Bank’s total secured Other-than-Mortgage Loans and not only those associated with the Individuals and SME Area. |
Unlike in other countries, in addition to the specific legal rights afforded by the mortgage loan (including foreclosure rights), the Bank may collect the pending balance of the mortgage loan over other assets of the mortgage debtor based on certain legal liens provided by law (derecho de prenda general). Regarding the foreclosure processes, as permitted by Chilean regulations we may write-off secured loans (such as residential mortgage loans) the earlier of 48 months from the date the loans become overdue and once we have made all efforts for recovering the past-due loans without success. This applies to residential mortgage loans financed with mortgage finance bonds as well as for Mutuos Hipotecarios. Our foreclosure processes comply with the procedures specified by Chilean regulation. However, as we strive to continuously improve our collection processes, we have achieved average terms of 11 months for foreclosures associated with residential mortgage loans.
As for our historical loss rates, we periodically review our collateral pricing models by adjusting the parameters that support them, such as appreciation and depreciation rates, as well as updated recovery and loss rates, based on historical and empirical data. Thus, we normally revise our collateral pricing models by incorporating updated information from re-appraised assets or foreclosure processes that have been completed by the Bank in the past.
In addition, the valuation of guarantees is based on a prudent approach, which aims to anticipate and cover unexpected reductions in their market price as a result of changes in market variables, such as an unforeseen slowdown in the global or local economy, lack of liquidity of real estate assets or decrease in real salaries. Accordingly, our collateral pricing models depreciate the value of the guarantee regarding the market value determined by an independent appraiser. This approach has allowed us to minimize the loss rates, as the value obtained from auctions (if foreclosure applies) generally exceeds the value assigned to the asset as guarantee.
57
Credit Cards
As of December 31, 2021, we issued both individual and corporate Visa and MasterCard credit cards. In addition to traditional credit cards, our portfolio also includes co-branded cards. As of December 31, 2021, we had two loyalty programs or cobranding agreements, namely “Travel Club” and “Entel Visa”. Credit cards issued under these cobranding agreements supplemented the credit cards that we issued under the brand names Banco de Chile and Banco Edwards-Citi. In addition, as of December 31, 2021, we offered 18 types of credit cards, targeting diverse types of segments and encompassing different benefits, including: Visa Corporate, Visa Corporate Signature, Visa Dorada, Visa Infinite, Visa Infinite Plus, Visa Internacional, Visa Platinum, Visa Platinum Pyme, Visa Pyme/Empresarial, Visa Signature, Visa Signature Entel, Visa FAN Internacional, MasterCard Black, MasterCard Dorada, MasterCard Internacional, MasterCard Platinum, MasterCard Corporate and MasterCard Corporate Executive.
Our affiliate, Transbank S.A., provides us with merchant acquisition and credit card processing services. As of December 31, 2021, Transbank S.A. had 11 shareholders (including us) and as of the same date, our equity ownership in Transbank S.A. was 26.16%. Upon obtaining the required regulatory approvals, on November 29, 2021, the shareholder banks of Nexus S.A., including us, sold 100% of the respective shares that each held in Nexus.
As of December 31, 2021, we had 1,305,128 valid credit card accounts, with 1,471,584 credit cards issued to individuals and small and medium sized companies (according to the CMF), held by 1,110,364 customers. Total charges on our credit cards during 2021 amounted to approximately Ch$5,118,314 million, with Ch$4,858,045 million corresponding to purchases in Chile and abroad and Ch$260,269 million corresponding to cash withdrawals both within Chile and abroad. The amount of purchases made by our customers accounted for 16.2% of the total purchase volume of banks’ credit cards in 2021, according to statistics provided by the CMF. Similarly, our market share in terms of cash withdrawals and automatic bill charges were 9.3% and 17.2% as of the same date, according to the CMF.
As of December 31, 2021, our credit card loans to individuals and small and medium sized companies amounted to Ch$1,110,779 million and represented 26.2% of our retail market business segment’s consumer loans.
We believe that the Chilean market for credit cards has a high growth potential, especially among lower- and middle-income customer segments, as fees should continue to decline due to increasing competition from other traditional banks operating in Chile and non-banking players, such as large department stores and other companies, from diverse industries, involved in the issuance of credit cards. As a result, we strive to develop customized commercial strategies to reinforce this payment channel by applying business intelligence tools that enable us to satisfy the needs of our diverse customer base. Following the new rules issued in the last years by our regulator, the processing and merchant acquiring services for credit and debit cards (particularly related to new acquirers) may now be accomplished through a four-party mechanism, in order to facilitate the entry of new players. As of the date of this annual report, most merchant acquiring services continued to be provided by Transbank S.A. in Chile, but some competitors have already begun to create new merchant payment processing subsidiaries (also known as “acquirers” or companies in charge of payment processing), which may change the market dynamics in the future.
Commercial Credits
Commercial credits granted by our Individuals and SME Area mainly consist of project financing, long-term financing and working capital loans granted to small and medium sized companies, which are denominated in Chilean pesos, UF and U.S. dollars and may bear fixed or variable rates of interest with average maturities of approximately four years (excluding non-residential mortgage loans). As of December 31, 2021, our Individuals and SME Area had outstanding commercial loans of Ch$5,965,240 million, representing 27.9% of the retail banking segment’s total loans and 17.4% of our total loans as of the same date.
Leasing Contracts
Leasing contracts are financial leases for capital equipment and property. Leasing contracts may bear fixed or variable interest rates and they generally have terms that range from one to five years for equipment and from five to 20 years for properties. Most of these contracts are denominated in UF. As of December 31, 2021, our Individuals and SME Area had outstanding leasing contracts of Ch$494,261 million, representing 2.3% of the retail banking segment’s total loans and 1.4% of our total loans as of the same date.
58
Lines of Credit
As of December 31, 2021, the Individuals and SME Area had approximately 847,093 approved lines of credit to individual customers and small and medium sized companies. Also, the unit had outstanding advances to 340,763 individual customers and small and medium sized companies that totaled Ch$161,494 million, or 0.8% of the retail banking segment’s total loans and 0.5% of our total loans.
Our lines of credit for individual customers are generally available on a revolving basis, up to an approved credit limit, and may be used for any purpose. Advances under lines of credit are denominated in Chilean pesos and bear an interest rate that is set monthly.
Debit Cards
We offer different types of debit cards to our customers. Depending on their specifications, these cards can be used for banking transactions at ATMs that operate on the local network provided by Redbanc and the local network of merchants participating in the local Redcompra debit program. Also, our debit cards can be used internationally through the Visa International PLUS network or the international network of merchants associated with the Electron program. We name these debit cards depending on the card’s specific features and the link between the brand and target market which they serve. During 2021, we offered the following debit cards: Visa Infinite, Visa Estándar, Visa Estandar FAN, Visa Signature, Visa Platinum, Visa Debit Business and debit cards for companies. As of December 31, 2021, according to the CMF, we held a 10.2% market share of debit card transactions, which corresponds to approximately 243 million transactions throughout the year, according to the CMF.
Deposit Products
We strategically offer deposit products to increase our deposit-taking activities as a means of diversifying our sources of funding. We believe that the deposits of our individual customers provide us with a relatively low-cost, stable source of funding, as well as an opportunity to cross-market our other products and services. In this regard, we offer current accounts, time deposits and savings accounts to our individual customers. Current accounts are Chilean peso-denominated and the majority bear no interest (approximately 0.05% or 579 of our total current accounts are interest-bearing), and savings accounts are denominated in UF and bear a fixed-interest rate. Time deposits may be denominated in Chilean pesos, UF and U.S. dollars and most of them bear interest at a fixed rate with terms that range between seven to 360 days.
While demand has historically been focused on UF-denominated deposits during periods of high inflation, demand for Chilean peso-denominated deposits has increased in recent years as a consequence of lower and more stable inflation rates in Chile.
In the last two years, we have seen an important increase in demand deposits. In fact, amid the high volatility and low interest rates observed in the financial markets throughout 2008 and 2009 (in line with monetary stimulus undertaken by central banks worldwide to overcome the financial crisis), we benefited from a flight-to-quality effect, since customers increasingly deposited their funds in their current accounts managed by us, particularly those denominated in Chilean pesos, as they preferred liquidity to investing in products with low profitability. A similar phenomenon has taken place over the last few years as a result of the Central Bank’s monetary stimulus plan in response to (i) Chile’s economic slowdown towards the end of 2013 and (ii) inflation below the Central Bank’s target. Hence, as low interest rates have prevailed in Chile since 2014 interest rates paid on Chilean peso-denominated saving accounts and time deposits have remained low. The same flight-to-quality effect mentioned earlier took place in the last quarter of 2019 and, more importantly, during 2020, as a consequence of the social unrest in Chile and the effects of the COVID-19 pandemic, respectively, when both uncertainty regarding the economic outlook and low interest rates motivated depositors to seek safer products and financial institutions, while maintaining enough liquidity in case of contingencies. This trend has encouraged investors to prefer current accounts balances over interest-bearing deposits. As a result, according to our management information system, annual average balances of current accounts and demand deposits managed by our Individuals and SME Area increased by 43.2% and 42.9% in 2020 and 2021, respectively.
59
Wholesale Banking Segment
Our wholesale banking segment serves the needs of corporate customers. In 2021, this business segment recorded annual operating revenues of approximately Ch$621,472 million, which represented 27.9% of our total operating revenues. Also, for the year ended December 31, 2021 this segment recorded an income before income tax of Ch$345,244 million, which represented 35.5% of our consolidated income before income tax. As of December 31, 2021, loans granted by this business segment amounted to Ch$12,865,005 million and represented 37.6% of our total loan portfolio.
The following table sets forth the composition of our portfolio of loans to the wholesale market in accordance with our internal reporting policies, as of December 31, 2021:
| As of December 31, 2021 | ||||||||
| (in millions of Ch$, except percentages) | ||||||||
| BANK’S INTERNAL REPORTING POLICIES: | ||||||||
| Commercial credits | Ch$ | 9,993,747 | 77.7 | % | ||||
| Foreign trade loans | 1,178,260 | 9.2 | ||||||
| Leasing loans | 1,117,800 | 8.7 | ||||||
| Factoring loans | 425,985 | 3.3 | ||||||
| Other loans | 149,213 | 1.2 | ||||||
| Total | Ch$ | 12,865,005 | 100.0 | % | ||||
As of December 31, 2021, we had 10,849 debtors out of a total of 29,898 core customers (those holding either a loan or a current account with us). Our wholesale customers are engaged in a wide range of economic sectors. As of December 31, 2021, loans granted by our wholesale banking segment were mainly related to:
| ● | financial services (approximately 23.6% of all loans granted by this business segment); |
| ● | construction (approximately 9.6% of all loans granted by this business segment); |
| ● | manufacturing (approximately 9.4% of all loans granted by this business segment); |
| ● | commerce and trade (approximately 8.5% of all loans granted by this business segment); |
| ● | communication and transportation (approximately 8.1% of all loans granted by this business segment); |
| ● | agriculture, forestry and fishing (approximately 5.9% of all loans granted by this business segment); |
| ● | community, social and personal services (approximately 2.8% of all loans granted by this business segment); |
| ● | utilities (approximately 2.0% of all loans granted by this business segment); and |
| ● | mining (approximately 0.8% of all loans granted by this business segment). |
In line with our strategy of identifying and differentiating market segments in order to provide improved value propositions for a diversified customer base, two of our areas provide our wholesale customer base with banking and financial products and services: (i) the Corporate Area, (ii) the Special Business Area and (iii) the Large Companies Area.
60
Corporate Area
The Corporate Area provides banking products and services to corporations with annual sales exceeding approximately Ch$90,000 million. This area’s customers consist of a large proportion of Chile’s publicly-traded and non-listed companies, subsidiaries of multinational companies and conglomerates operating in Chile (including those operating in the financial, commercial, manufacturing, industrial and infrastructure sectors), projects and concessions, as well as family offices (wealth management). Thus, in addition to traditional lending products, this area offers a wide range of non-lending services related to project finance, deal structuring associated with business acquisitions, cash management, deposits and funds administration, financial advisory, among others. Also, this area is in charge of coordinating and overseeing both our Leasing Business and our International Private Banking Unit.
In May 2021, some subsegments of the Corporate Area were migrated to the Large Companies Area, while the Special Business Area was spun-off from the Corporate Area.
As of December 31, 2021, the Corporate Area had approximately 1,072 debtors out of a total of approximately 4,121 core customers (those holding either a current account or a loan with us). Also, this area managed total outstanding loans of Ch$5,095,038 million, which represented 14.9% of our total loan book as of the same date.
The following table sets forth the composition of our Corporate Area’s loan portfolio in accordance with our internal reporting policies, as of December 31, 2021:
| As of December 31, 2021 | ||||||||
| (in millions of Ch$, except percentages) | ||||||||
| BANK’S INTERNAL REPORTING POLICIES: | ||||||||
| Commercial credits | Ch$ | 4,164,739 | 81.7 | % | ||||
| Foreign trade loans | 471,035 | 9.2 | ||||||
| Factoring loans | 235,794 | 4.6 | ||||||
| Leasing loans | 132,940 | 2.6 | ||||||
| Other loans | 48,546 | 1.0 | ||||||
| Total | Ch$ | 5,095,038 | 100.0 | % | ||||
We offer a wide range of products to large corporations that include short- and long-term financing, working capital loans, mortgage loans, leasing, long-term syndicated loans and factoring, as well as investment banking services offered by our subsidiary Banchile Asesoría Financiera S.A. We also offer cash management, including payment services (payrolls, suppliers, pensions, dividends, etc.), collection services and connections to international funds transfer networks, as well as traditional deposit products, in particular current accounts.
In cash management, as of December 31, 2021, we were party to approximately 9,346 payment service contracts and approximately 858 collection service agreements with corporations. We believe that cash management and payment service contracts, in particular, provide us with a source of low-cost deposits and the opportunity to cross sell our products and fees to payees, many of whom maintain accounts with us. Under our collection contracts, we act as a collection agent for our corporate customers, providing centralized collection services for their accounts receivable and other similar payments. For the year ended December 31, 2021, joint volumes associated with collection and payment agreements increased by approximately 34.9% when compared to 2020.
In order to provide highly competitive and differentiated services, our Corporate Area has the direct support of our Treasury and Money Market Operations segment, which directly fulfills our corporate customers’ liquidity, short-term loans and hedging needs. We have also improved our technology to facilitate connections with customers and enhance their self-service practices. Similarly, we offer derivative products, which we believe have become increasingly important, especially those associated with Chilean peso-U.S. dollar and UF-U.S. dollar forward contracts, cross currency swaps, interest rate swaps and options, among other derivative products.
In recent years, the market for loans to corporations in Chile has been characterized by reduced margins due to increasing competition and moderate expansion in terms of borrowing. This fierce competition has involved not only local banking players but also, increasingly, overseas lenders who are eager to lend to Chilean companies that hold high credit ratings supported by a high sovereign credit rating. For this reason, we have focused on optimizing the profitability in this segment by enhancing our cross selling through the generation and enhancement of fee-based services, such as payroll processing, dividend payments and billing services, as well as computer banking services. This strategy has enabled us to maintain profitable and long-term relationships with our corporate customers while preserving the ability to grant loans when appropriate business opportunities arise.
61
Accordingly, during 2021, our Corporate Area focused on: (i) maximizing cross-selling and profitability at the level of each business relationship, (ii) improving the customer experience in their interaction with the bank’s distribution channels and (iii) promoting and motivating the area’s team to encourage “innovation” in all the business aspects managed by account officers. These initiatives are intended to optimize the risk-return relationship of this segment through non-lending revenues and customer proximity. In all of these topics, but particularly in cross-selling, the synergies that arise from the Global Connectivity Agreement with Citigroup have been important when assisting our corporate customers with offshore transactions, derivatives structuring and financial advisory services.
As mentioned earlier, during 2021 the local economy posted a strong recovery after the slowdown evidenced in 2020 due to the COVID-19 pandemic, recording an annual GDP expansion of 11.7%, according to the local Central Bank. Even though this performance was highly influenced by government support programs that boosted private consumption, overall investment spending also grew on an annual basis, which in turn was partly explained by the reactivation of several industries across the country given greater mobility and social interaction amid the successful vaccination program carried out in Chile. This performance, coupled with a low comparison base from 2020, translated into an annual increase of 19.7% in loan balances managed by the Corporate Area, mainly influenced by an increase in commercial credits, factoring loans and trade finance loans, the latter one explained by higher international trade in 2021 when compared to 2020. Moreover, during 2021, the Corporate Area recorded a significant increase in demand deposits, as well as enhanced cross-selling opportunities across our Corporate customers, particularly in derivative instruments. Lastly, we created Mi Banconexion, a new mobile application for companies where they can visualize and monitor their balances and movements in banking accounts, credit cards and lines of credit.
In addition, the Corporate Area was able to benefit from cross-selling, such as investment banking services offered through our investment banking subsidiary (Banchile Asesoría Financiera). During 2021, revenues and net income from this subsidiary increased when compared to 2020, having executed 20 transactions. Also, the subsidiary maintained its leadership position in investment banking while being recognized as the “Best Investment Bank in Chile” by Global Finance for the third consecutive year.
The foreign trade business is also managed by our Corporate Area, although balances and results are allocated to different business areas depending on the customer who performs the transaction. It is worth mentioning that during 2021, the foreign trade business recorded a 31.5% increase in loan balances for the Bank as a whole and a 12.6% expansion in the Corporate Area in particular, mainly associated with Chilean peso trends in 2021 as well as the base effect of lower international trade in 2020 due to the COVID-19 pandemic.
Special Businesses Area
The Special Business Area provides tailored financial products and services to the real estate and construction industries, as well as family offices. Thus, in addition to traditional lending products, this area offers a wide range of non-lending services related to project finance, deal structuring associated with business acquisitions, cash management, custody services, deposits and funds administration, investment banking, derivative instruments, among others.
As of December 31, 2021, our Special Businesses Area had approximately 773 borrowers out of a total of 7,484 core customers (those holding either a current account or a loan with us). In addition, as of the same date, loans granted by this area accounted for Ch$2,617,921 million, which represented 7.6% of our total loans.
The following table displays the loan portfolio composition of the Special Businesses Area, in accordance with our internal reporting policies, as of December 31, 2021:
| As of December 31, 2021 | ||||||||
| (in millions of Ch$, except percentages) | ||||||||
| BANK’S INTERNAL REPORTING POLICIES: | ||||||||
| Commercial credits | Ch$ | 2,514,268 | 96.0 | % | ||||
| Leasing loans | 79,495 | 3.0 | ||||||
| Other loans | 24,158 | 0.9 | ||||||
| Total | Ch$ | 2,617,921 | 100.0 | % | ||||
62
During 2021 the Special Businesses Area focused on strengthening a comprehensive strategy intended to take advantage of opportunities that arise in the local market within the family office sub-segment. In this group of customers, relationships are crucial and, therefore, this area has concentrated on reinforcing the team’s capabilities while establishing a collaborative work relationship with our subsidiaries Banchile Administradora General de Fondos and Banchile Corredora de Bolsa (jointly, Banchile Inversiones) in order to put their wide range of wealth management services and products at the disposal of these customers. In addition, the Special Businesses Area recorded an annual increase of 20.6% in total loans during 2021, particularly concentrated in commercial credits.
Large Companies Area
Our Large Companies Area provides companies, with annual sales that range from approximately Ch$2,000 million to approximately Ch$90,000 million, with a broad range of financial products and services. Customers served by this area are those related to the commercial, manufacturing, agricultural, forestry, fishing and infrastructure sectors, among others.
In May 2021, some subsegments of the Corporate Area were migrated to the Large Companies Area.
As of December 31, 2021, we had 8,996 large company debtors out of a total of 18,280 core customers (those holding either a current account or a loan with us). Loans granted by the Large Companies Area amounted to Ch$5,152,046 million as of the same date, which represented 15.0% of our total loans.
The following table sets forth the loan portfolio composition of the Large Companies Area, in accordance with our internal reporting policies, as of December 31, 2021:
| As of December 31, 2021 | ||||||||
| (in millions of Ch$, except percentages) | ||||||||
| BANK’S INTERNAL REPORTING POLICIES: | ||||||||
| Commercial credits | Ch$ | 3,314,740 | 64.3 | % | ||||
| Leasing loans | 905,365 | 17.6 | ||||||
| Foreign trade loans | 698,611 | 13.6 | ||||||
| Factoring loans | 177,137 | 3.4 | ||||||
| Other loans | 56,193 | 1.1 | ||||||
| Total | Ch$ | 5,152,046 | 100.0 | % | ||||
Products and services offered by this area are mainly related to commercial loans, lines of credit, trade finance and foreign currency transactions, factoring services, leasing, non-residential mortgage loans, syndicated loans, investment banking and financial advisory services for mergers and acquisitions, debt restructuring assistance, payments and collections services, current accounts and related saving services, corporate credit cards, cash and investment management, derivative contracts to hedge against currency or interest rate fluctuations, insurance brokerage, among other traditional and tailored services.
The Large Companies Area aims to provide its customers with excellent service based on proactive financial support that enhances long term relationships with customers. Over time, the area has developed service models intended to take advantage of synergies arising from the interaction of account and specialized support executives responsible for ensuring comprehensive customer service. These models have enabled the Large Companies Area to strengthen customer relationships and product offerings.
In 2021, the Large Companies Area prioritized a customer centric approach in order to maintain a market-leading position in commercial loans. In the context of the economic slowdown prompted by the COVID-19 pandemic, the Large Companies Area had a crucial role in the implementation of the National Support Plan deployed in 2020 that involved government-guaranteed working capital loans, particularly by the FOGAPE Reactiva program that began in February 2021. This support plan largely explained the annual increase of 5.1%, or Ch$250,822 million, in year-end loan balances managed by this area, although lower than the 9.7% increment seen in 2020. At the product level, the area posted an increase of 44.9% on an annual basis in trade finance loan balances supported by Chilean peso trends and, as compared to the base effect due to the unusual behavior of international trade in 2020 due to the COVID-19 pandemic.
63
Our factoring business is part of the Large Companies Area. During 2021, we posted an annual increase of 9.0% in year-end balances of factoring loans on a consolidated basis.
Treasury and Money Market Operations
Our Treasury and Money Market Operations business segment provides a wide range of financial services to our customers, including currency intermediation, forward contracts, interest rate swaps, transactions under repurchase agreements and investment products based on bonds, mortgage finance bonds and deposits.
In addition, our Treasury and Money Market Operations business segment is focused on managing our currency, interest rate and maturity gaps, ensuring adequate liquidity levels, managing our investment portfolio and performing the intermediation of fixed-income instruments, currencies and derivatives. Interest rate gap management is aimed at generating an adequate funding structure, prioritizing our capitalization and asset and liability cost structure and funding source diversification.
The Treasury and Money Market Operations business segment is also responsible for: (i) the issuance of short- and long-term senior bonds, as well as long-term subordinated bonds, in Chile or abroad, (ii) monitoring compliance with regulatory deposit limits, technical reserves and maturity and rate matches/mismatches, (iii) monitoring our adherence to the security margins defined by regulatory limits, and risk limits for interest rate, currency and investment gaps. This segment continually monitors the Bank’s cost of funding by benchmarking with the rest of the local financial system and financing alternatives in Chile or abroad.
Regarding funding functions, during 2021, we continued to develop a funding diversification strategy by conducting important transactions in Chile and abroad. This strategy is aimed at maintaining a competitive cost of funding that supports the value offerings we provide to our wide customer base and improving our liquidity by issuing debt of longer maturities that match long-term assets. For that reason, we are continually seeking alternative sources, types of instruments and markets. We generally conduct international bond issuances only if the cost (including costs of interest rate swaps and other transactional expenses) is below the cost of raising funds locally and the currency or interest rate exposure is fully hedged via cross currency swaps.
We are constantly striving to diversify our liability structure in terms of sources, types of instruments and markets with the aim of maintaining a competitive cost of funding and improving our liquidity. In this context, in 2021 we were more active than in the previous year in terms of long-term debt placements in both local and overseas markets. The increase in debt issuance was largely a result of our mid-term funding strategy that aims to diversify our liability structure while financing long-term loan growth, which, in 2020, experienced an extraordinary surge in current account and other demand deposits. In 2021, we carried out the following debt placements:
| ● | Approximately Ch$277,910 million (denominated in UF) within the local market. These debt placements had maturities ranging from six to nine years, while bearing premium spreads over the relevant benchmark. |
| ● | We also carried out a debt placement in an international capital market by taking advantage of our superior credit rating within Chile and the Latin American region, which enabled us to benefit from liquidity and low interest rates in major capital markets, as follows: (i) Ch$36,097 million in Japan with a 10-year maturity, (ii) Ch$31,203 million in Australia with a 10-year maturity, (iii) Ch$115,483 million in Switzerland with a five-year maturity, (iv) Ch$82,543 million in Japan with a five-year maturity, and (v) Ch$419,345 million in the international capital markets through a Rule 144A/Regulation S issuance with a ten-year maturity. These placements were accompanied by cross currency swap hedge arrangements in order to offset any effects associated with changes in foreign exchange that could impact our cost of funding. |
| ● | Furthermore, we continued to utilize short-term funding associated with our commercial paper program, which provides us with premium funding for Trade Finance transactions. During 2021, we issued a total amount of approximately Ch$698,435 million. As of December 31, 2021, we had an outstanding balance of approximately Ch$348,445 million. |
64
The funding functions carried out by our Treasury area are complemented by our international area, namely International Financial Institutions (“IFI”), which manages relations with correspondent banks worldwide, facilitating international payments and obtaining foreign currency financing for us. As of December 31, 2021, we have established a network of approximately 600 foreign banks, among which we maintained credit relationships with approximately 130 correspondent banks, from which we maintained 17 account relationships. IFI played an important role in structuring international transactions aimed at diversifying our funding.
From the business perspective, our Treasury and Money Market segment recorded operating revenues of Ch$56,673 in 2021, which was lower than the Ch$68,547 recorded in 2020. This performance was based on a proactive management of our investment portfolio and financial gaps and also a very high basis for comparison represented by 2020 when sharp decreases in both local and foreign interest rates translated into remarkable mark-to-market gains in the Investment and Trading portfolios.
Regarding the management of our securities portfolio, as of December 31, 2021, the portfolio amounted to Ch$7,777,613 million and was composed of financial instruments measured at fair value through other comprehensive income that totaled Ch$3,061,174 million, securities held for trading amounting to Ch$3,876,695 million and financial instruments at amortized cost (held-to-maturity) totaling Ch$839,744 million. As for the type of instruments included in our securities portfolio, as of December 31, 2021, 87.4% consisted of securities issued by the Central Bank and the Chilean Government, 10.3% consisted of securities issued by local financial institutions, and 2.2% consisted of securities issued by non-financial Chilean corporate issuers, foreign issuers and other securities. Our investment strategy is designed to supplement our expected profitability, risks and economic variable projections while adhering to the regulatory guidelines and internal limits defined by our finance committee. In this regard, neither proprietary trading nor speculation on equity holdings are business goals for us and, therefore, equity instruments only represented 0.1% of our investment portfolio as of December 31, 2021.
Operations through Subsidiaries
We have made several strategic long-term investments in financial services companies that are engaged in activities complementary to our commercial banking activities. In making these investments our goal is to develop a comprehensive financial group capable of meeting the diverse financial needs of our current and potential clients by offering traditional banking products and specialized financial services through our different subsidiaries.
The following table sets forth information with respect to our financial services subsidiaries in accordance with our internal reporting policies as of December 31, 2021:
| Assets | Equity | Net Income | |||||||||
| (in millions of Ch$) | ||||||||||||
| BANK’S INTERNAL REPORTING POLICIES | ||||||||||||
| Banchile Corredores de Bolsa S.A. | Ch$ | 868,794 | Ch$ | 139,056 | Ch$ | 27,901 | ||||||
| Banchile Administradora General de Fondos S.A. | 55,729 | 37,571 | 25,241 | |||||||||
| Banchile Corredores de Seguros Ltda. | 25,139 | 10,222 | 6,909 | |||||||||
| Socofin S.A. | 9,594 | 1,511 | (93 | ) | ||||||||
| Banchile Asesoria Financiera S.A. | 3,908 | 3,291 | 2,112 | |||||||||
| Banchile Securitizadora S.A. (In process of liquidation) | 24 | 14 | (129 | ) | ||||||||
| Total | Ch$ | 963,188 | Ch$ | 191,665 | Ch$ | 61,941 | ||||||
The following table sets forth information with respect to our ownership interest in our financial services subsidiaries as of December 31, 2021:
| Ownership Interest | ||||||||||||
| Direct (%) | Indirect (%) | Total (%) | ||||||||||
| Banchile Administradora General de Fondos S.A. | 99.98 | % | 0.02 | % | 100.00 | % | ||||||
| Banchile Asesoría Financiera S.A. | 99.96 | — | 99.96 | |||||||||
| Banchile Corredores de Seguros Ltda. | 99.83 | 0.17 | 100.00 | |||||||||
| Banchile Corredores de Bolsa S.A. | 99.70 | 0.30 | 100.00 | |||||||||
| Banchile Securitizadora S.A. (In process of liquidation) | 99.01 | 0.99 | 100.00 | |||||||||
| Socofin S.A. | 99.00 | % | 1.00 | % | 100.00 | % | ||||||
65
Securities Brokerage Services
We provide securities brokerage services through Banchile Corredores de Bolsa S.A. is registered as a securities broker with the CMF, the regulator of Chilean publicly listed companies, and is a member of the Santiago Stock Exchange and the Chilean Electronic Stock Exchange. Since it was founded in 1989, Banchile Corredores de Bolsa S.A. has provided stock brokerage services, fixed income investments and foreign exchange products to individuals and companies through our branch network. In early 2009, Citibank Agencia de Valores S.A. merged with Banchile Corredores de Bolsa S.A.
During the year ended December 31, 2021, Banchile Corredores de Bolsa S.A. recorded an aggregate stock trading turnover on the Santiago Stock Exchange and the Chilean Electronic Stock Exchange that amounted to approximately Ch$9,156,530 million, which represented a 11.7% market share within the Chilean stock market.
Also, as of December 31, 2021, Banchile Corredores de Bolsa S.A. had equity amounting to Ch$139,056 million and, for the year ended December 31, 2021, recorded net income of Ch$27,901 million, which represented 3.5% of our consolidated net income for that period (under the bank’s internal reporting policies).
Mutual and Investment Fund Management
Since 1980, we have provided mutual fund management services through Banchile Administradora General de Fondos S.A. (formerly Banchile Administradora de Fondos Mutuos S.A.). As of December 31, 2021, according to data published by the Chilean Association of Mutual Funds, Banchile Administradora General de Fondos S.A. was the largest mutual fund manager in Chile, managing approximately 24.3% of all Chilean mutual funds’ assets. Also, as of December 31, 2021, Banchile Administradora General de Fondos S.A. operated 56 mutual funds and had Ch$9,916,505 million in assets under management owned by 373,277 corporate and individual investors. As of the same date, Banchile Administradora General de Fondos S.A. operated 40 public investment funds. Banchile managed Ch$1,407,801 million in net assets associated with these public investment funds on behalf of 1,582 participants. As of December 31, 2021, Banchile managed five private investment funds of Ch$47,891 million in net assets associated with these public investment funds on behalf of 95 participants. During 2021, Banchile Administradora General de Fondos S.A. created nine new mutual funds, nine new public investment funds and one private investment fund.
The mutual and investment funds mentioned above are managed by Banchile Administradora General de Fondos S.A., but neither the Bank nor Banchile Administradora General de Fondos S.A. have ownership of these funds and, accordingly, they are not booked in our audited consolidated financial statements.
66
The following table sets forth information regarding the various mutual funds managed by Banchile Administradora General de Fondos S.A. as of December 31, 2021:
| As of December 31, 2021 | ||||||||||
| Name of Fund | Type of Fund | Net Asset Value (in millions of Ch$) | Number of Investors | |||||||
| Alianza | Fixed income (medium/long term) | Ch$ | 11,566 | Ch$ | 3,542 | |||||
| Asia | Equity | 7,454 | 1,615 | |||||||
| Asiatico Accionario | Equity | 20,754 | 1,844 | |||||||
| Banchile Agresivo | Blend | 4,035 | 892 | |||||||
| Banchile Conservador | Blend | 429 | 216 | |||||||
| Banchile Moderado | Blend | 3,194 | 452 | |||||||
| Banchile Renta Lp | Blend | 136 | 116 | |||||||
| Banchile-Acciones | Equity | 17,021 | 5,431 | |||||||
| Best Coupon Emergente | Structured | 2,272 | 94 | |||||||
| Booster Clean Energy | Structured | 14,123 | 538 | |||||||
| Booster Innovation | Structured | 3,422 | 170 | |||||||
| Capital Efectivo | Fixed income (short term) | 319,893 | 7,434 | |||||||
| Capital Empresarial | Fixed income (short term) | 2,349,748 | 29,884 | |||||||
| Capital Financiero | Fixed income (short term) | 890,802 | 15,435 | |||||||
| Corporate Dollar | Fixed income (short term) | 1,360,747 | 32,159 | |||||||
| Crecimiento | Fixed income (medium/long term) | 88,491 | 15,105 | |||||||
| Deposito Xxi | Fixed income (medium/long term) | 129,413 | 13,044 | |||||||
| Deuda Dolar | Fixed income (medium/long term) | 183,858 | 3,729 | |||||||
| Deuda Estatal Uf 3-5 | Fixed income (medium/long term) | 1,668 | 483 | |||||||
| Disponible | Fixed income (short term) | 305,595 | 48,955 | |||||||
| Emerging | Equity | 11,029 | 2,050 | |||||||
| Emerging Market | Equity | 12,036 | 815 | |||||||
| Estrategia Agresiva | Blend | 10,612 | 1,289 | |||||||
| Estrategia Cons | Blend | 16,455 | 1,877 | |||||||
| Estrategia Moderada | Blend | 35,333 | 2,391 | |||||||
| Estrategico | Fixed income (medium/long term) | 280,324 | 15,347 | |||||||
| Europa Desarrollada | Equity | 22,240 | 2,586 | |||||||
| Fm Bch Pa Usd Mod | Blend | 100,774 | 2,490 | |||||||
| Fondo Mutuo Chile Blue Chip Index Fund | Equity | 2,825 | 361 | |||||||
| Fondo Mutuo Cobertura Deuda Global | Fixed income (medium/long term) | 6,686 | 192 | |||||||
| Global Dollar | Equity | 36,429 | 885 | |||||||
| Global High Yield | Fixed income (medium/long term) | 862 | 39 | |||||||
| Global Mid Cap | Equity | 16,008 | 1,555 | |||||||
| Horizonte | Fixed income (medium/long term) | 81,157 | 3,482 | |||||||
| Inversion Brasil | Equity | 4,457 | 770 | |||||||
| Inversion China | Equity | 9,744 | 1,292 | |||||||
| Inversion Usa | Equity | 115,819 | 5,921 | |||||||
| Inversiones Alternat | Blend | 158 | 160 | |||||||
| Inversionista I | Equity | 22,309 | 230 | |||||||
| Japón Accionario | Equity | 1,601 | 601 | |||||||
| Latam Corporate Investment Grade | Fixed income (medium/long term) | 36,072 | 1,350 | |||||||
| Latam Mid Cap | Equity | 6,689 | 2,253 | |||||||
| Liquidez 2000 | Fixed income (short term) | 379,827 | 41,467 | |||||||
| Mid Cap | Equity | 4,682 | 2,264 | |||||||
| Port Act Agresivo | Blend | 178,893 | 7,385 | |||||||
| Port Act Controlado | Blend | 307,809 | 14,004 | |||||||
| Port Act Equilibrado | Blend | 748,343 | 23,360 | |||||||
| Port Act Moderado | Blend | 928,962 | 25,557 | |||||||
| Port Act Potenciado | Blend | 426,041 | 13,416 | |||||||
| Portafolio Activo Dolar Agresivo | Blend | 3,034 | 110 | |||||||
| Portafolio Activo Dolar Conservador | Blend | 1,462 | 38 | |||||||
| Renta Futura | Fixed income (medium/long term) | 79,582 | 3,858 | |||||||
| Retorno L.P. Uf | Fixed income (medium/long term) | 27,186 | 1,776 | |||||||
| U.S. Dollar | Equity | 64,552 | 1,398 | |||||||
| Us Mid Cap | Equity | 35,022 | 2,489 | |||||||
| Utilidades | Fixed income (medium/long term) | 186,873 | 7,081 | |||||||
| Total | Ch$ | 9,916,505 | 373,277 | |||||||
67
The following table sets forth information regarding the investment funds managed by Banchile Administradora General de Fondos S.A. as of December 31, 2021:
| As of December 31, 2021 | ||||||||||||
| Name of Fund | Type of Fund | Net Asset Value (in millions of Ch$) | Number of Investors | |||||||||
| Rem. F.I. Small Cap | Public | 66,605 | 17 | |||||||||
| Rem. F.I.($) Latam Small Mid Cap | Public | 4,102 | 4 | |||||||||
| Rem. F.I. Banchile Rentas Inmobiliarias I | Public | 125,516 | 93 | |||||||||
| Rem. F.I. Latam Corp.High Yield | Public | 9,714 | 111 | |||||||||
| Rem F.I. ($) Renta Habitacionales | Public | 4,076 | 54 | |||||||||
| Remu F.I. ($) Deuda Chilena | Public | 233,608 | 245 | |||||||||
| Rem. F.I. Deuda Global | Public | 38,619 | 96 | |||||||||
| Rem Fi Inmobiliario VIII | Public | 1,988 | 4 | |||||||||
| Rem F.I. Market Plus Global | Public | 214,897 | 49 | |||||||||
| Rem F.I. Market Plus Eeuu | Public | 95,496 | 27 | |||||||||
| Remu F.I. Usa Equity | Public | 35,121 | 9 | |||||||||
| Remu F.I. Europe Equity | Public | 2,075 | 7 | |||||||||
| Remu F.I. Emerging Equity | Public | 13,272 | 1 | |||||||||
| Remu F.I. Deuda Alto Rendimiento | Public | 52,516 | 23 | |||||||||
| Remu Fi Desarr.Y Rtas.Resid. | Public | 10,505 | 281 | |||||||||
| Remu F.I Inver. Inmobiliario IX | Public | 18,106 | 300 | |||||||||
| Remu F.I Marketplus Europa | Public | 21,792 | 9 | |||||||||
| Remu F.I United States Propert | Public | 5,381 | 19 | |||||||||
| Remu Fi Marketplus Emergente | Public | 34,406 | 18 | |||||||||
| Remu Fi ($) Desarrollo Inmobiliario Peru-Colombia | Public | 26,570 | 14 | |||||||||
| Remu Fi European Value Partners II | Public | 2,921 | 3 | |||||||||
| Remu Fi Infraestructura Chile I | Public | 70,823 | 9 | |||||||||
| Remu Fi ($) Inmobiliario X | Public | 48,875 | 8 | |||||||||
| Remu Fi ($) Edr Fund Emerging Credit | Public | 7,036 | 4 | |||||||||
| Remu Fi (Us$) Privado F2 | Private | 7,992 | 6 | |||||||||
| Remu Fi ($) Banchile Oro | Public | 1,928 | 6 | |||||||||
| Remu Fi (Us$) Ag Direct Lendin | Public | 3,756 | 5 | |||||||||
| Remu Fi ($) Global Real Estate | Public | 38,658 | 12 | |||||||||
| Remu Fi ($) Marketplus Japón | Public | 2,312 | 3 | |||||||||
| Remu Fip (Us$) Allvp III | Private | 2,693 | 10 | |||||||||
| Remu Fip (Us$) Rentas Perú I | Private | 8,335 | 1 | |||||||||
| Remu Fi ($) Banchile Equity Tr | Public | 1,646 | 2 | |||||||||
| Remu Fi ($) Inmobiliario XI | Public | 23,826 | 18 | |||||||||
| Remu Fi (Us$) Energias Renovab | Public | 1,772 | 38 | |||||||||
| Remu Fi (Eur$) Axon Aurora I | Public | 2,159 | 43 | |||||||||
| Remu Fi (Us$) Banchile Ag Dl Iv | Public | 6,025 | 1 | |||||||||
| Remu Fi (Us$) Banchile Real Estate Usa I | Public | 55,742 | 2 | |||||||||
| Remu Fi ($) Banchile Deuda Dol | Public | 35,648 | 8 | |||||||||
| Remu Fi ($) Banchile Proyeccio | Public | 29,414 | 1 | |||||||||
| Remu Fi (Us$) Private Opportun | Public | 9,361 | 1 | |||||||||
| Remu Fi (Us$) Pe Secondary Deal I | Public | 7,085 | 4 | |||||||||
| Rem.($) F.I. Chile Blend | Public | 32,898 | 11 | |||||||||
| Rem.($)F.I.P. Inmob.Capitolio | Private | 18,897 | 29 | |||||||||
| Rem. (Us$) F.I.P. Rentas Inmob | Private | 9,974 | 49 | |||||||||
| Rem. F.I.($) Banch. Plusvalia Eficiente | Public | 11,549 | 22 | |||||||||
| Total | Ch$ | 1,455,692 | 1,677 | |||||||||
As of December 31, 2021, Banchile Administradora General de Fondos S.A. had equity of Ch$37,571 million and, for the year ended December 31, 2021, net income of Ch$25,241 million, which represented 3.2% of our 2021 consolidated net income (under the bank’s internal reporting policies).
68
Insurance Brokerage
We provide insurance brokerage services to our customers through Banchile Corredores de Seguros Limitada (Banchile Corredores de Seguros LTDA.). In 2000, we began to offer life insurance policies associated with consumer loans and non-credit related insurance to our individual customers and the general public. As of December 31, 2021, Banchile Corredores de Seguros Limitada had equity of Ch$10,222 million and, for the year ended December 31, 2021 it recorded net income of Ch$6,909 million, which represented 0.9% of our 2021 consolidated net income (under the bank’s internal reporting policies). According to data published by the CMF, as of December 31, 2021, Banchile Corredores de Seguros Limitada had a 5.0% market share in the total amount of life and casualty insurance policies (in Chilean pesos) sold by insurance brokerage companies in Chile, excluding life annuities.
Additionally, in January 2019 we signed a long-term partnership with Chubb Seguros Chile S.A. and Chubb Seguros de Vida Chile S.A., local subsidiaries of Chubb Limited, by which Chubb became our exclusive provider of life and non-life insurances to be distributed by our insurance brokerage subsidiary. For non-life products, the partnership became effective in June 2019, and for life products, it became effective in January 2020. The partnership does not include life and non-life insurance products that in accordance with local regulation must be publicly auctioned.
Financial Advisory Services
We provide financial advisory and other investment banking services to our customers through Banchile Asesoría Financiera S.A. The services offered by Banchile Asesoría Financiera S.A. are primarily targeted to our corporate customers and include advisory services concerning mergers and acquisitions, restructuring, project finance and strategic alliances. As of December 31, 2021, Banchile Asesoría Financiera S.A. had equity of Ch$3,291 million and, for the year ended December 31, 2021, recorded net income of Ch$2,112 million, which represented 0.3% of our 2021 consolidated net income (under the bank’s internal reporting policies).
Securitization Services
We used to offer investment products to meet the needs of institutional investors, such as private pension funds and insurance companies, through Banchile Securitizadora S.A. In the past, this subsidiary securitized financial assets and issued debt instruments with credit ratings that could be traded in the Chilean marketplace, backed by a bundle of revenue producing assets of the client company. On February 4, 2021, we began a voluntary and anticipated dissolution process for Banchile Securitizadora S.A. as approved by the subsidiary’s shareholders during the extraordinary meeting held on the same date. The dissolution was approved by the CMF and the process of liquidation is still in progress. As of December 31, 2021, Banchile Securitizadora S.A. had equity of Ch$14 million and, for the year ended December 31, 2021, the subsidiary reported a net loss of Ch$129 million (under bank’s internal reporting policies).
Collection Services
Socofin S.A. provides judicial and extra judicial loan collection services to the Bank. As of December 31, 2021, Socofin S.A. had equity of Ch$1,511 million and, for the year ended December 31, 2021, and recorded a net loss of Ch$93 million (under the bank’s internal reporting policies).
Distribution Channels and Electronic Banking
Our distribution network provides integrated financial services and products to our customers through a wide range of channels. The network includes ATMs, branches, internet-based banking platforms, mobile banking applications and call centers.
As of December 31, 2021, we had a network of 272 retail branches throughout Chile. Our branch system serves as a distribution network for all of the products and services offered to our customers. Our full-service branches accept deposits, cash withdrawals, offer the full range of our retail banking products, such as consumer loans, credit cards, mortgage loans and current accounts, and provide financial and non-financial information to current and potential customers. As of December 31, 2021, we had 1,761 ATMs that were part of a larger network of 7,553 ATMs operating in Chile, of which 4,775 ATMs operate under a network managed by Redbanc S.A.
69
We also offer electronic banking services to our customers 24 hours a day through our website, www.bancochile.cl, which has tailored homepages for the different segments we serve. Thus, by accessing our website, our individual customers may execute electronic money transfers, access their account balances, pay utilities bills, apply for loans, make time deposits, purchase insurance premiums, invest in mutual funds, and so on. On the other hand, our corporate homepage offers a broad range of services, including the payment of bills, electronic fund transfers, non-charge orders, as well as a wide variety of account inquiries. These services include our office banking service, Banconexion Web for Enterprises, which enables our corporate customers to perform all of their banking transactions from their offices. Our homepage also offers products with exclusive benefits provided by our customer loyalty marketing programs, which enhance our relationships with customers. Through the jointly administered website of Banchile Administration General de Fondos and Banchile Corredora de Bolsa, our mutual funds and securities brokerage subsidiaries, respectively, we also provide customers interested in investing and saving their funds with an internet-based platform on which they can trade stocks and currencies, make time deposits and take positions in mutual funds, foreign stock markets, investments funds and derivatives. Our foreign trade customers can rely on our international business homepage, www.bancochile.com, which enables them to inquire about the status of their foreign trade transactions and perform transactions, such as opening letters of credit, recording import collection and hedging on instructions and letters of credit.
Also, we provide our customers with access to a 24-hour phone-bank through which they can access account information and execute certain transactions. This service, through which we receive nearly 371,793 calls per month on average, has enabled us to develop customer loyalty campaigns, sell financial products and services, answer specialized inquiries and receive and resolve complaints by customers and non-customers.
Lastly, over the last years we have devoted efforts to enhance our mobile banking platforms by developing and launching diverse applications, including the mobile applications MiBanco, MiBanconexion, MiPago, and MiBeneficio. Similarly, we launched MiCuenta, MiPass, and MiSeguro. MiBanco is a mobile banking platform that enables our customers to perform most of the operations they can execute on our website, such as accessing their account balances, making bill payments and electronic money transfers, carrying out cash advances from credit cards to checking accounts. MiBanconexion is an application designed for treasury managers of companies or entrepreneurs, which allows our customers to make massive transfers, pay their use of credit lines and check movements in their demand account, among other functionalities. MiPago is a specialized mobile application that permits requests for reimbursements from other Banco de Chile’s customers and performs the transaction by generating and scanning a QR code, which reinforces the security standards for these types of operations. MiCuenta is a mobile application that enables users to make monthly payments associated with utility bills and other types of services. MiPass is a password-generating application that, among other features, allows users to set a list of money transfer recipients to make transfers without requiring another password-generating device. Also, we continued to expand our digital banking offerings by launching the new mobile application called MiInversion. This application serves as a portfolio management mobile platform for retail customers by enabling them to manage their investments in equity, fixed-income and mutual funds. Furthermore, we added new functionalities to these mobile applications by incorporating an on/off service for credit and debit cards in case of theft, misplacement or other security issues detected by the user, authorization of web transactions with MiPass, biometric access to MiBanco and MiBanconexion, through fingerprint, onsite payment in shops and commerce through MiPago, among other features. Likewise, we also added new functionalities by expanding our RedGiro service to permit our clients to perform transactions through their smartphones and added new functionalities to MiInversion, through which our customers are able to invest in time deposits while exchanging foreign currency. As of 2021, we have continued enhancing our mobile applications by improving existing functionalities.
The following table sets forth information regarding the evolution of the number of transactions carried out by customers and non-customers in our diverse distribution channels, as of December 31, 2019, 2020 and 2021:
| For the Year Ended December 31, | % Increase (Decrease) | ||||||||||||||||||
| 2019 | 2020 | 2021 | 2019/2020 | 2020/2021 | ||||||||||||||||
| (in millions of transactions) | ||||||||||||||||||||
| BANK’S MANAGEMENT INFORMATION SYSTEM | ||||||||||||||||||||
| Teller | 36.6 | 20.4 | 18.9 | (44.2 | )% | (7.3 | )% | |||||||||||||
| ATMs | 147.2 | 106.6 | 114.7 | (27.6 | ) | 7.6 | ||||||||||||||
| Website | ||||||||||||||||||||
| Monetary Transactions | 49.5 | 56.5 | 61.8 | 14.1 | 9.4 | |||||||||||||||
| Non-monetary transactions | 356.1 | 391.5 | 404.4 | 9.9 | 3.3 | |||||||||||||||
| Mobile Banking | 48.7 | 61.5 | 89.6 | 26.3 | 45.6 | |||||||||||||||
| Total | 638.2 | 636.6 | 689.5 | (0.3 | )% | 8.3 | % | |||||||||||||
70
Competition
Overview
The Chilean market for banking and other financial services is highly and increasingly competitive and consists of various market sectors. The most important sector is commercial banking with total loans (excluding operations of subsidiaries abroad) representing 85% of the Chilean GDP as of December 31, 2021. As of the same date, the Chilean banking industry consisted of 17 banks, 16 of which were private sector banks and one state-owned bank, namely, Banco del Estado. As of December 31, 2021, the six largest Chilean banks accounted for approximately 86.7% of all outstanding loans granted by Chilean financial institutions (excluding operations of subsidiaries abroad): Banco Santander—Chile (17.9%), Banco de Chile (16.7%), Banco de Crédito e Inversiones (“BCI”) (14.3%), Scotiabank Chile (14.1%), Banco del Estado (13.8%) and Itaú-Corpbanca (9.8%).
We face significant and increasing competition in all market segments in which we operate. As a comprehensive commercial bank that offers a wide range of services to all types of enterprises and individual customers, we deal with a variety of competitors, ranging from large private sector commercial banks to more specialized entities, such as “niche” banks. In addition, we face competition from other types of lenders, such as non-banking leasing, crowdfunding, factoring and automobile financing companies, especially in credit products, mutual funds, pension funds and insurance companies within the market for savings products and insurance companies in the market for mortgage loans. Likewise, other non-traditional providers of financial services have emerged over the last years, such as e-commerce, local and foreign fintech companies, Telecom companies, like internet and mobile phone providers, and more recently some marketplaces that may set and provide offerings, in the form of temporary financing, directly to their customers or providers. Furthermore, in recent years and given the outstanding credit rating held by the country, as well as the liquidity observed in overseas markets, local middle market, corporations and multinational branches in Chile have increasingly replaced loans rendered by local banks with off-shore long-term debt. In addition, we face competition from other types of competitors, such as leasing, factoring and automobile financing companies (especially in lending products), as well as mutual funds, pension funds and insurance companies, within the market for savings and mortgage loans. Nevertheless, banks continue to be the main suppliers of leasing, factoring and mutual funds, while the insurance brokerage business has become an important component of the value offerings provided by banks.
Within the local banking industry, our primary competitors are the main private sector commercial banks in Chile, namely, Banco Santander—Chile, BCI, Scotiabank Chile, and Itaú-Corpbanca. Nevertheless, we also face competition from Banco del Estado, a state-owned bank, which has a larger customer base than we do. Banco del Estado, which operates under the same regulatory regime as Chilean private sector banks, was the fifth largest bank in Chile as of December 31, 2021, with outstanding total loans of Ch$28,258,859 million, representing a 13.8% market share (excluding operations of subsidiaries abroad), according to data published by the CMF.
In the retail market, we compete with other private sector Chilean banks, as well as with Banco del Estado, which has a large individual customer base. Among private sector banks, we believe our strongest competitors in this market are Banco Santander—Chile, Scotiabank Chile and BCI, as these banks have developed diversified business strategies focused on both small and medium-sized companies and lower to middle income segments of the Chilean population. In addition, we believe our strongest competitors in the high-income individual segment are Banco Santander—Chile, Banco Bice and Banco Security, as these banks rely on specialized business models that provide wealth management and traditional banking services, as we do.
Historically, commercial banks in Chile have competed in the retail market against each other, and finance companies and department stores, with the latter two having traditionally been focused on consumer loans to low and middle-income segments. However, finance companies gradually disappeared between the 1990s and 2000s, as most of them merged into the largest commercial banks that dominate the Chilean banking industry today. Also, by the end of 1990s, the Chilean financial industry witnessed the rise of non-traditional banking competitors, such as large department stores. During the 2000s, these players gained increasing significance in the consumer lending sector, as they were permitted to issue financial products such as credit cards. Currently, there are two consumer-oriented banks affiliated with Chile’s largest department stores: Banco Falabella and Banco Ripley. Although these banks had a combined market share (excluding operations of subsidiaries abroad) of only 2.3% as of December 31, 2021, according to the CMF, the presence of these banks is likely to make consumer banking more competitive over the next few years, especially within the lower income segment. As of December 31, 2021, consumer loans granted by Banco Falabella and Banco Ripley represented 13.4% and 3.1%, respectively, of the total consumer loans rendered by the industry (excluding operations of subsidiaries abroad).
71
In the wholesale market, we believe our strongest competitors are also Banco Santander—Chile, BCI, Itaú-Corpbanca and Scotiabank Chile. Similarly, we believe these banks are our most significant competitors in the small and medium sized companies’ business segment.
We also compete, mainly through our subsidiaries, with companies that offer non-banking specialized financial services in the high-income individuals segment and the middle market and corporate segment such as Larrain Vial, BTG Pactual, Moneda Asset and CrediCorp (formerly IM Trust), whose core businesses are stock brokerage, financial advisory and wealth management services. Other Chilean commercial banks also compete in these markets of specialized financial services, but they are less focused on such businesses.
The Chilean banking industry has experienced increased levels of competition in recent years from domestic as well as foreign banks. This phenomenon has triggered a consolidation wave within the industry and the creation of more comprehensive banking entities that participate in most of our markets. Consequently, banks’ strategies have been increasingly focused on reducing costs and improving efficiency standards in order to compete effectively with the larger banks. Although we are making our best efforts in order to operate within this competitive environment, we acknowledge that our income may decrease as a result of increasing competition.
Mergers and Acquisitions
Regarding mergers and acquisitions events in the local banking industry, most of these transactions have involved international players seeking to participate in the local market.
In recent years, for example, in 2013 Corpbanca’s controlling shareholders announced their intention to sell part of their stake to a local or international player. On January 29, 2014, Corpgroup (the controlling shareholder of Corpbanca) accepted the bid of Brazil’s Itaú Unibanco, through which Itau merged its own Chilean and Colombian subsidiaries with Corpbanca. The merger was approved by the former SBIF in September 2015 and Banco Itaú Chile became Banco Itaú-Corpbanca. The merged company started operations on April 1, 2016. As of December 31, 2021, the merged bank, which adopted the brand name Banco Itaú Corpbanca, had a 9.8% market share, excluding operations of subsidiaries abroad.
In addition, consolidation and overseas expansion has emerged as a means of inorganic growth for local banks. For example, in 2012, Corpbanca, ranked fourth among Chilean private sector banks in terms of total loans as of December 31, 2011, acquired a former Santander Group’s subsidiary in Colombia and consolidated its balance sheet and results of operations beginning May 31, 2012. Also, by the end of 2012, Corpbanca made a bid for acquiring Helm Bank in Colombia. According to publicly available information, the bid process was completed and fully authorized by the former SBIF in July 2013 and Corpbanca started to consolidate the balance sheet of this new subsidiary beginning August 31, 2013. Given the merger between Banco Itaú Chile and Corpbanca in 2016, assets held by former Corpbanca subsidiaries in Colombia were integrated into the merged bank. Hence, as of December 31, 2021, loans associated with Banco Itaú-Corpbanca’s operations in Colombia amounted to Ch$4,773,752 million and represented 2.1% of the industry’s total loans.
Similarly, by the end of May 2013, BCI—the third largest private sector bank in Chile in terms of total loans as of December 31, 2021, with a 14.3% market share (excluding operations of subsidiaries abroad)—announced the acquisition of the City National Bank (CNB), headquartered in the United States. According to public information published by the former SBIF, the process was fully authorized and completed in October 2015. BCI started to consolidate the balance sheet on the same date. Furthermore, in December 2017, BCI—through CNB—announced its intention to acquire the 100% of Totalbank (based in the United States) shares from Banco Santander for an amount of approximately U.S.$530 million. This acquisition was formally completed in June 2018, resulting in BCI recording a notable increase in its international presence in terms of total loans. As of December 31, 2021, loans associated with BCI’s operation in the United States amounted to Ch$11,637,496 million and represented 5.3% of the industry’s total loans.
72
On December 5, 2017, it was publicly announced that BBVA formally accepted Scotiabank Chile’s bid to acquire 68.2% of BBVA Chile shares for an amount of approximately U.S.$2,200 million. In January 2018, Scotiabank requested the former SBIF’s authorization for this transaction, which was granted in March 2018. The merger was completed in September 2018 after receiving the approval of the former SBIF at the end of August 2018. As of December 31, 2021, the market share of the merged bank in terms of total loans was 14.1%, excluding foreign subsidiaries.
In addition, in recent years, some of our banking competitors have acquired the lending business of certain non-banking credit card issuers, primarily related to credit cards, as permitted by the Chilean regulator since 2018. For example, on December 19, 2017, BCI agreed to acquire Walmart Chile Servicios Financieros for an amount of approximately U.S.$148 million. Walmart Chile Servicios Financieros managed two types of credit cards and had approximately 1.4 million credit card holders. The former SBIF approved this acquisition in November 2018. Similarly, on May 31, 2018, Promotora CMR Falabella S.A. merged into Banco Falabella. By means of this acquisition, Banco Fallabella added approximately 1.2 million credit account holders. The former SBIF approved this transaction in October 2018 and the integration process was fully completed in December 2018. As a result, as of December 31, 2018, Banco Falabella became the largest bank in Chile in terms of issued credit cards.
On March 27, 2019 Banco Santander Chile announced that it had entered into an agreement with SKBergé Financiera S.A. to acquire a 49% of the ownership of Santander Consumer Chile S.A. for an amount of approximately Ch$59,063.5 million. Furthermore, on August 27, 2019, Banco Santander Chile’s controlling shareholders agreed at an extraordinary meeting to purchase an additional 2% of the ownership of Santander Consumer Chile S.A. for approximately Ch$3,100 million from Banco Santander S.A. (Spain), which is its parent company. Both transactions were approved by the CMF on November 15, 2019. The equity sale was completed on November 28, 2019. As a result of this transaction (51% equity shares of Santander Consumer Chile S.A), Banco Santander Chile entered into the auto-finance business and, since December 2019, has consolidated its balance sheet and results of operations into the bank. According to Banco Santander Chile, Ch$451 billion of consumer loans were added to its loan book as a result of this transaction.
In 2021, there were no changes in the industry’s composition.
Changes in Banking Players
During 2014 the Chilean banking industry witnessed the entry of new market players and changes in the ownership structure of certain competitors. By the end of August 2014, Banco International announced the intention of Inversiones la Construcción (“ILC”) to take control of the bank by acquiring a 50.1% stake from the controlling shareholder, “Baninter”. Banco Internacional is a small bank within the Chilean banking industry and is mostly focused on the wholesale banking segment. As of December 31, 2021, Banco Internacional’s loan book represented 1.1% of the total outstanding loans of the industry (excluding operations of subsidiaries abroad).
Furthermore, on May 30, 2014, the former SBIF authorized the existence and approved the bylaws of “Banco BTG Pactual Chile.” This bank, a Chilean subsidiary of Brazil-based bank BTG Pactual, was already operating in the Chilean financial industry since 2012, providing stock brokerage, mutual funds management and investment banking services. Banco BTG Pactual Chile received the final authorization to operate as a commercial bank on December 31, 2014 and officially started its commercial operations on January 23, 2015. As of December 31, 2021, the loan book of Banco BTG Pactual Chile represented only 0.7% of the total outstanding loans of the industry (excluding operations of subsidiaries abroad).
In 2016, Deutsche Bank Chile closed its operations in many Latin American countries including Chile. Deutsche Bank’s participation in the Chilean Banking industry accounted for 0.5% in terms of total assets as of December 31, 2015. Similarly, in 2018, the former SBIF approved Banco de la Nación Argentina’s request to close its business in Chile.
On the other hand, it is worth noting that since 2014 two Chinese banks have requested SBIF authorizations for starting operations in Chile. In May 2016, the China Construction Bank Corporation received final approval from the former SBIF to open a branch in Chile under the brand name “China Construction Bank, Agencia en Chile”. This was the first branch established by this bank in Latin America. Similarly, in November 2016, the Bank of China received provisional authorization and installation authorization from the former SBIF to open a branch in Chile under the brand name “Bank of China Limited”. Finally, on March 13, 2018 the former SBIF definitively authorized Bank of China to start operations in Chile under the brand name “Bank of China Limited”.
73
In March 2019, the Bank of Tokyo-Mitsubishi UFJ (“MUFG Bank, Ltd.”) informed the Chilean regulatory authorities that it would be ceasing its banking activities after 38 years of operation in Chile. According to the company, the decision was made for strategic reasons.
In December 2021, the CMF approved the termination of the banking license of Banco do Brasil S.A.’s business in Chile as requested by the bank in May 2021. Banco do Brasil S.A. had presence in the local banking industry since 1963, ending 58 years of operation in Chile.
We expect these trends of increasing competition and consolidation to continue, particularly in connection with the formation of new large financial groups and the creation of new niche banks. Although we believe that we are currently large enough to compete effectively in all of our target markets, any further consolidation in the Chilean financial services industry may adversely affect our competitive position. We are working on developing and enhancing our competitive strengths to ensure our sustainability.
Below there is a set of tables and figures for the years ended December 31, 2019, 2020 and 2021 that show our position within the Chilean financial industry. The market information is set forth under Chilean GAAP as published by the CMF and—unless otherwise indicated—excludes data related to operations of subsidiaries abroad.
Balance Sheet
The following table sets forth certain statistical information on the Chilean financial system as of December 31, 2021, according to information published by the CMF under Chilean GAAP:
| As of December 31, 2021 | ||||||||||||||||||||||||||||||||
| Assets | Loans(1)(2) | Deposits(2) | Equity(3) | |||||||||||||||||||||||||||||
| Amount | Share | Amount | Share | Amount | Share | Amount | Share | |||||||||||||||||||||||||
| (in millions of Ch$, except percentages) | ||||||||||||||||||||||||||||||||
| CHILEAN GAAP: | ||||||||||||||||||||||||||||||||
| Private sector banks | Ch$ | 307,867,306 | 85.2 | % | Ch$ | 176,439,887 | 86.2 | % | Ch$ | 128,501,487 | 79.9 | % | Ch$ | 22,549,027 | 91.0 | % | ||||||||||||||||
| Banco del Estado | 53,586,003 | 14.8 | 28,258,859 | 13.8 | 32,278,607 | 20.1 | 2,237,907 | 9.0 | ||||||||||||||||||||||||
| Total banking system | Ch$ | 361,453,309 | 100.0 | % | Ch$ | 204,698,746 | 100.0 | % | Ch$ | 160,780,094 | 100.0 | % | Ch$ | 24,786,934 | 100.0 | % | ||||||||||||||||
Source: CMF
| (1) | Loans to customers. Interbank loans are not included. |
| (2) | Excludes operations of subsidiaries abroad. |
| (3) | For purposes of this table, equity includes capital and reserves, net income for the period and provisions for minimum dividends. |
Loans and Deposits
| a. | Total Loans |
We had total loans of Ch$34,256,184 million as of December 31, 2021, according to information published by the CMF under Chilean GAAP. The following table sets forth our market share and the market share of our principal private sector competitors in terms of total loans, as of the dates indicated, according to information published by the CMF under Chilean GAAP:
Total Loans(1)(2) | ||||||||||||
| As of December 31, | ||||||||||||
| 2019 | 2020 | 2021 | ||||||||||
| CHILEAN GAAP: | ||||||||||||
| Banco Santander–Chile | 18.0 | % | 18.5 | % | 17.9 | % | ||||||
| Banco de Chile | 16.5 | 16.6 | 16.7 | |||||||||
| Banco de Crédito e Inversiones | 14.0 | 14.3 | 14.3 | |||||||||
| Scotiabank Chile | 14.0 | 13.7 | 14.1 | |||||||||
| Itaú-Corpbanca | 10.1 | 9.8 | 9.8 | |||||||||
| Total market share | 72.6 | % | 72.9 | % | 72.9 | % | ||||||
Source: CMF
| (1) | Allowances for loan losses not deducted. |
| (2) | Excludes operations of subsidiaries abroad. |
74
| b. | Total Deposits |
We had total deposits (including demand deposits and time deposits) of Ch$27,682,797 million as of December 31, 2021, according to information published by the CMF under Chilean GAAP. The following table sets forth the market shares in terms of total deposits for private banks as of December 31, 2019, 2020 and 2021 on a consolidated basis, according to information published by the CMF under Chilean GAAP:
Total Deposits(1) | ||||||||||||
| As of December 31, | ||||||||||||
| 2019 | 2020 | 2021 | ||||||||||
| CHILEAN GAAP: | ||||||||||||
| Banco Santander–Chile | 16.9 | % | 16.8 | % | 17.4 | % | ||||||
| Banco de Chile | 15.9 | 16.1 | 17.2 | |||||||||
| Banco de Crédito e Inversiones | 13.4 | 13.3 | 14.2 | |||||||||
| Scotiabank Chile | 11.5 | 10.5 | 10.4 | |||||||||
| Itaú-Corpbanca | 9.0 | 9.3 | 8.4 | |||||||||
| Total market share | 66.6 | % | 66.0 | % | 67.6 | % | ||||||
Source: CMF
| (1) | Excludes operations of subsidiaries abroad. |
| c. | Demand Deposits |
We had demand deposits of Ch$18,542,791 million as of December 31, 2021, according to information published by the CMF under Chilean GAAP. The following table sets forth the market shares in terms of demand deposits for private banks as of the dates indicated, on a consolidated basis, according to information published by the CMF under Chilean GAAP:
Demand Deposits(1) | ||||||||||||
| As of December 31, | ||||||||||||
| 2019 | 2020 | 2021 | ||||||||||
| CHILEAN GAAP: | ||||||||||||
| Banco de Chile | 22.6 | % | 20.8 | % | 21.6 | % | ||||||
| Banco Santander–Chile | 20.5 | 20.0 | 20.9 | |||||||||
| Banco de Crédito e Inversiones | 13.3 | 13.5 | 14.6 | |||||||||
| Scotiabank Chile | 9.7 | 9.3 | 8.4 | |||||||||
| Itaú-Corpbanca | 5.5 | 5.4 | 5.4 | |||||||||
| Total market share | 71.6 | % | 69.0 | % | 71.0 | % | ||||||
Source: CMF
| (1) | Excludes operations of subsidiaries abroad. |
| d. | Time Deposits |
We had time deposits of Ch$9,140,006 million as of December 31, 2021, according to information published by the CMF under Chilean GAAP. The following table sets forth the market shares in terms of time deposits for private banks as of the dates indicated, on a consolidated basis, according to information published by the CMF under Chilean GAAP:
Time Deposits(1) | ||||||||||||
| As of December 31, | ||||||||||||
| 2019 | 2020 | 2021 | ||||||||||
| CHILEAN GAAP: | ||||||||||||
| Banco de Crédito e Inversiones | 13.4 | % | 13.2 | % | 13.7 | % | ||||||
| Banco Santander–Chile | 14.8 | 13.8 | 13.5 | |||||||||
| Scotiabank Chile | 12.5 | 11.5 | 12.6 | |||||||||
| Banco de Chile | 12.2 | 11.6 | 12.2 | |||||||||
| Itaú-Corpbanca | 10.9 | 13.0 | 11.7 | |||||||||
| Total market share | 63.8 | % | 63.1 | % | 63.6 | % | ||||||
Source: CMF
| (1) | Excludes operations of subsidiaries abroad. |
75
Credit Quality and Risk Management
| a. | Risk Index |
The following table sets forth the ratio of allowances to total loans of the largest private banks in Chile and of the Chilean financial system as a whole (including such banks) as of December 31, 2019, 2020 and 2021, according to information published by the CMF under Chilean GAAP:
Allowances to Total Loans(1) | ||||||||||||
| As of December 31, | ||||||||||||
| 2019 | 2020 | 2021 | ||||||||||
| CHILEAN GAAP: | ||||||||||||
| Scotiabank Chile | 2.11 | % | 2.00 | % | 1.54 | % | ||||||
| Banco de Crédito e Inversiones | 1.97 | 2.22 | 1.84 | |||||||||
| Banco de Chile | 2.28 | 2.41 | 2.10 | |||||||||
| Banco Santander—Chile | 2.73 | 2.84 | 2.62 | |||||||||
| Itaú-Corpbanca | 3.36 | 3.99 | 3.22 | |||||||||
| Financial system | 2.58 | % | 2.73 | % | 2.39 | % | ||||||
Source: CMF
| (1) | Includes operations of subsidiaries abroad. |
| b. | Non-Performing Loans |
The following table sets forth the ratio of past-due loans (90 days or more) over total loans for the largest private banks in Chile as of December 31, 2019, 2020 and 2021 on an individual basis, according to information published by the CMF under Chilean GAAP:
Past-due loans to Total Loans(1) | ||||||||||||
| As of December 31, | ||||||||||||
| 2019 | 2020 | 2021 | ||||||||||
| CHILEAN GAAP: | ||||||||||||
| Banco de Crédito e Inversiones | 1.36 | % | 1.18 | % | 0.84 | % | ||||||
| Banco de Chile | 1.39 | 0.97 | 0.85 | |||||||||
| Scotiabank Chile | 1.90 | 1.47 | 0.95 | |||||||||
| Banco Santander-Chile | 2.05 | 1.41 | 1.23 | |||||||||
| Itaú-Corpbanca | 2.82 | 2.23 | 1.87 | |||||||||
| Financial system | 2.09 | % | 1.59 | % | 1.25 | % | ||||||
Source: CMF
| (1) | Past-due loans refer to loans 90 days or more past due, including installments that are overdue and the remaining amount of principal and interest. |
| c. | Additional Allowances |
The following table sets forth the amount of additional allowances established (under Chilean GAAP) by the largest private Chilean banks as of the dates indicated, according to information published by the CMF under Chilean GAAP:
Additional Allowances (1) | ||||||||||||
| As of December 31, | ||||||||||||
| 2019 | 2020 | 2021 | ||||||||||
| CHILEAN GAAP: | ||||||||||||
| Banco de Chile | Ch$ | 213,252 | Ch$ | 320,252 | Ch$ | 540,252 | ||||||
| Banco de Crédito e Inversiones | 16,692 | 160,176 | 350,143 | |||||||||
| Banco Santander–Chile | 16,000 | 126,000 | 258,000 | |||||||||
| Scotiabank Chile | 5,451 | 84,808 | 185,761 | |||||||||
| Itaú-Corpbanca | — | 137,848 | 133,323 | |||||||||
| Financial System | Ch$ | 799,664 | Ch$ | 1,480,042 | Ch$ | 2,273,943 | ||||||
Source: CMF
| (1) | Includes operations of subsidiaries abroad. |
76
Capital Adequacy
| a. | Capital and Reserves |
The following table sets forth year-end balances of capital and reserves for the largest private banks in Chile as of December 31, 2019, 2020 and 2021 according to information published by the CMF under Chilean GAAP:
Capital and Reserves(1)(2) | ||||||||||||
| As of December 31, | ||||||||||||
| 2019 | 2020 | 2021 | ||||||||||
| CHILEAN GAAP: | ||||||||||||
| Banco de Crédito e Inversiones | Ch$ | 3,510,669 | Ch$ | 3,672,487 | Ch$ | 4,137,202 | ||||||
| Banco de Chile | 3,235,676 | 3,483,431 | 3,753,989 | |||||||||
| Itaú-Corpbanca | 3,351,440 | 3,313,805 | 3,157,878 | |||||||||
| Banco Santander - Chile | 3,083,852 | 3,290,386 | 2,957,104 | |||||||||
| Scotiabank Chile | Ch$ | 1,965,959 | Ch$ | 2,312,753 | Ch$ | 2,504,054 | ||||||
Source: CMF
| (1) | Capital and Reserves equals to total equity before provisions for minimum dividends and net income for the period. |
| (2) | Includes operations of subsidiaries abroad. |
| b. | Average Equity |
The following table sets forth balances of average equity for the largest private banks in Chile as of the dates indicated, according to information published by the CMF under Chilean GAAP:
Average Equity (1)(2) | ||||||||||||
| As of December 31, | ||||||||||||
| 2019 | 2020 | 2021 | ||||||||||
| CHILEAN GAAP: | ||||||||||||
| Banco de Crédito e Inversiones | Ch$ | 3,609,822 | Ch$ | 3,950,221 | Ch$ | 4,131,897 | ||||||
| Banco de Chile | 3,388,347 | 3,615,816 | 3,940,116 | |||||||||
| Banco Santander - Chile | 3,346,831 | 3,645,803 | 3,490,776 | |||||||||
| Scotiabank Chile | 2,123,480 | 2,407,282 | 2,641,269 | |||||||||
| Itaú-Corpbanca | Ch$ | 3,600,192 | Ch$ | 2,919,658 | Ch$ | 2,553,162 | ||||||
Source: CMF
| (1) | Includes operations of subsidiaries abroad. |
| (2) | Average total equity for the year ended December 31, 2019, 2020 and 2021. |
| c. | Basel Ratio |
The following table sets forth the BIS ratios of the largest private Chilean banks as of the dates indicated, according to information published by the CMF:
BIS Ratios (1) | ||||||||||||
| Year Ended December 31, | ||||||||||||
| 2019 | 2020 | 2021 | ||||||||||
| CHILEAN GAAP: | ||||||||||||
| Banco de Chile | 14.1 | % | 16.0 | % | 17.3 | % | ||||||
| Itaú-Corpbanca | 13.1 | 13.6 | 16.2 | |||||||||
| Banco Santander–Chile | 12.9 | 15.4 | 15.9 | |||||||||
| Banco de Crédito e Inversiones | 12.0 | 13.4 | 13.5 | |||||||||
| Scotiabank Chile | 10.9 | 13.2 | 12.3 | |||||||||
| Financial system | 12.8 | % | 14.7 | % | 14.9 | % | ||||||
Source: CMF
| (1) | Total Capital or Regulatory Capital divided by Risk Weighted Assets (RWA). Figures for December 2020 consider a transition to Basel III as established by the CMF while figures for 2021 consider the first application of Basel III by considering risk weighted assets for credit, market and operational risk. |
77
| d. | CET1 Ratio |
The following table sets forth the CET1 ratios of the largest private Chilean banks as of the dates indicated, according to information published by the CMF under Chilean GAAP:
CET1 Ratios (1) | ||||||||||||
| Year Ended December 31, | ||||||||||||
| 2019 | 2020 | 2021 | ||||||||||
| CHILEAN GAAP: | ||||||||||||
| Banco de Chile | 10.9 | % | 12.2 | % | 13.0 | % | ||||||
| Itaú-Corpbanca | 13.4 | 8.4 | 11.5 | |||||||||
| Scotiabank Chile | 10.2 | 10.1 | 10.1 | |||||||||
| Banco de Crédito e Inversiones | 10.1 | 10.9 | 10.0 | |||||||||
| Banco Santander–Chile | 7.9 | 10.3 | 9.6 | |||||||||
| Financial system | 10.3 | % | 10.7 | % | 10.7 | % | ||||||
Source: CMF
| (1) | CET1 Capital divided by Risk Weighted Assets (RWA). Figures since December 2020 consider a transition to Basel III as established by the CMF, while figures for 2021 consider the first application of Basel III by considering risk weighted assets for credit, market and operational risk. |
Operating Revenue Generation
| a. | Net Income attributable to equity holders |
The following table sets forth the market shares in net income attributable to equity holders for private sector banks as of December 31, 2019, 2020 and 2021, according to information published by the CMF under Chilean GAAP:
Net Income(1) | ||||||||||||
| Year Ended December 31, | ||||||||||||
| 2019 | 2020 | 2021 | ||||||||||
| CHILEAN GAAP: | ||||||||||||
| Banco de Chile | 23.4 | % | 39.3 | % | 21.4 | % | ||||||
| Banco Santander—Chile | 21.8 | 43.9 | 20.9 | |||||||||
| Banco de Crédito e Inversiones | 15.9 | 26.9 | 14.1 | |||||||||
| Scotiabank Chile | 10.0 | 23.4 | 11.5 | |||||||||
| Itaú-Corpbanca | 5.0 | (78.5 | ) | 7.5 | ||||||||
| Total Market Share | 76.1 | % | 54.9 | % | 75.4 | % | ||||||
Source: CMF
| (1) | Includes operations of subsidiaries abroad. |
| b. | Operating Revenues |
The following table sets forth the market shares in terms of operating revenues for private banks as of December 31, 2019, 2020 and 2021, on a consolidated basis, according to information published by the CMF under Chilean GAAP:
Operating Revenues(1) | ||||||||||||
| Year Ended December 31, | ||||||||||||
| 2019 | 2020 | 2021 | ||||||||||
| CHILEAN GAAP: | ||||||||||||
| Banco Santander–Chile | 16.3 | % | 17.1 | % | 17.4 | % | ||||||
| Banco de Chile | 16.9 | 16.3 | 16.8 | |||||||||
| Banco de Crédito e Inversiones | 15.9 | 17.1 | 16.3 | |||||||||
| Scotiabank Chile | 10.6 | 10.8 | 10.3 | |||||||||
| Itaú-Corpbanca | 10.4 | 9.1 | 10.0 | |||||||||
| Total Market Share | 70.1 | % | 70.4 | % | 70.8 | % | ||||||
Source: CMF
| (1) | Includes operations of subsidiaries abroad. |
78
| c. | Fees and Commissions |
The following table sets forth the market shares in terms of revenues coming from fees and commissions for private banks as of the dates indicated, on a consolidated basis, according to information published by the CMF under Chilean GAAP:
Fees and Commissions (1) | ||||||||||||
| Year Ended December 31, | ||||||||||||
| 2019 | 2020 | 2021 | ||||||||||
| CHILEAN GAAP: | ||||||||||||
| Banco de Chile | 21.6 | % | 22.5 | % | 20.3 | % | ||||||
| Banco de Crédito e Inversiones | 16.6 | 17.0 | 15.4 | |||||||||
| Banco Santander–Chile | 13.6 | 13.5 | 14.8 | |||||||||
| Scotiabank Chile | 9.8 | 9.0 | 8.6 | |||||||||
| Itaú-Corpbanca | 8.2 | 7.1 | 6.8 | |||||||||
| Total Market Share | 69.9 | % | 69.2 | % | 65.9 | % | ||||||
Source: CMF
| (1) | Includes operations of subsidiaries abroad. |
| d. | Operating Margin |
The following table sets forth the operating margins for private banks as of December 31, 2019, 2020 and 2021, on a consolidated basis, according to information published by the CMF under Chilean GAAP:
Operating Margin(1)(2) | ||||||||||||
| Year Ended December 31, | ||||||||||||
| 2019 | 2020 | 2021 | ||||||||||
| CHILEAN GAAP: | ||||||||||||
| Banco de Chile | 5.7 | % | 5.6 | % | 5.3 | % | ||||||
| Banco Santander—Chile | 5.2 | 5.1 | 5.0 | |||||||||
| Itaú-Corpbanca | 2.6 | 3.8 | 4.6 | |||||||||
| Scotiabank Chile | 5.5 | 5.1 | 4.5 | |||||||||
| Banco de Crédito e Inversiones | 5.3 | 5.2 | 4.2 | |||||||||
| Financial System average | 5.2 | % | 5.1 | % | 4.8 | % | ||||||
Source: CMF
| (1) | Includes operations of subsidiaries abroad. |
| (2) | Operating income divided by average interest earning assets. |
Profitability Ratios
| a. | Return on Capital and Reserves (year-end balance) |
The following table sets forth our return attributable to equity holders on capital and reserves and the returns attributable to equity holders on capital and reserves of our principal private sector competitors and the Chilean banking industry as a whole, in each case as of December 31, 2019, 2020 and 2021, according to information published by the CMF under Chilean GAAP:
Return on Capital and Reserves(1)(2) | ||||||||||||
| Year Ended December 31, | ||||||||||||
| 2019 | 2020 | 2021 | ||||||||||
| CHILEAN GAAP: | ||||||||||||
| Banco Santander–Chile | 17.9 | % | 15.7 | % | 26.2 | % | ||||||
| Banco de Chile | 18.3 | 13.3 | 21.1 | |||||||||
| Scotiabank Chile | 12.9 | 11.9 | 16.9 | |||||||||
| Banco de Crédito e Inversiones | 11.5 | 8.6 | 12.6 | |||||||||
| Itaú-Corpbanca | 3.8 | (27.9 | ) | 8.8 | ||||||||
| Financial System average | 12.5 | % | 5.4 | % | 16.5 | % | ||||||
Source: CMF
| (1) | Corresponds to net income attributable to equity holders divided by the year-end balance of Capital and Reserves. |
| (2) | Includes operations of subsidiaries abroad. |
79
| b. | Return on Average Equity (ROAE) |
The following table sets forth our return on average equity and the returns on average equity of our principal private sector competitors and the Chilean banking industry as a whole, in each case as of the dates indicated, according to information published by the CMF under Chilean GAAP:
Return on Average Equity (1)(2) | ||||||||||||
| Year Ended December 31, | ||||||||||||
| 2019 | 2020 | 2021 | ||||||||||
| CHILEAN GAAP: | ||||||||||||
| Banco Santander–Chile | 16.5 | % | 14.2 | % | 22.2 | % | ||||||
| Banco de Chile | 17.5 | 12.8 | 20.1 | |||||||||
| Scotiabank Chile | 12.0 | 11.4 | 16.1 | |||||||||
| Banco de Crédito e Inversiones | 11.2 | 8.0 | 12.6 | |||||||||
| Itaú-Corpbanca | 3.5 | (31.7 | ) | 10.9 | ||||||||
| Financial System average | 11.9 | % | 5.3 | % | 16.1 | % | ||||||
Source: CMF
| (1) | Corresponds to net income attributable to equity holders divided by the average balance of Total Equity. |
| (2) | Includes operations of subsidiaries abroad. |
| c. | Return on Average Assets (ROAA) |
The following table sets forth our return on average assets and the returns on average assets of our principal private sector competitors and the Chilean banking industry as a whole, in each case as of the dates indicated, according to information published by the CMF under Chilean GAAP:
Return on Average Assets (1)(2) | ||||||||||||
| Year Ended December 31, | ||||||||||||
| 2019 | 2020 | 2021 | ||||||||||
| CHILEAN GAAP: | ||||||||||||
| Banco de Chile | 1.6 | % | 1.0 | % | 1.7 | % | ||||||
| Banco Santander–Chile | 1.3 | 0.9 | 1.3 | |||||||||
| Scotiabank Chile | 0.8 | 0.7 | 1.1 | |||||||||
| Banco de Crédito e Inversiones | 0.9 | 0.6 | 0.9 | |||||||||
| Itaú-Corpbanca | 0.4 | (2.5 | ) | 0.8 | ||||||||
| Financial System average | 1.0 | % | 0.4 | % | 1.1 | % | ||||||
Source: CMF
| (1) | Corresponds to net income attributable to equity holders divided by the average balance of Total Assets. |
| (2) | Includes operations of subsidiaries abroad. |
80
Operating Efficiency
| a. | Operating Expenses |
The following table sets forth the market shares in terms of operating expenses for private sector banks as of December 31, 2019, 2020 and 2021, on a consolidated basis, according to information published by the CMF under Chilean GAAP:
Operating Expenses(1) | ||||||||||||
| As of December 31, | ||||||||||||
| 2019 | 2020 | 2021 | ||||||||||
| CHILEAN GAAP: | ||||||||||||
| Scotiabank Chile | 11.0 | % | 8.7 | % | 10.1 | % | ||||||
| Itaú-Corpbanca | 12.8 | 24.0 | 11.8 | |||||||||
| Banco de Chile | 15.7 | 13.0 | 14.7 | |||||||||
| Banco Santander—Chile | 14.0 | 12.7 | 15.2 | |||||||||
| Banco de Crédito e Inversiones | 16.5 | 15.3 | 17.2 | |||||||||
| Total Market Share | 69.9 | % | 73.6 | % | 69.1 | % | ||||||
Source: CMF
| (1) | Includes operations of subsidiaries abroad. |
| b. | Efficiency Ratio (Cost-to-income) |
The following table sets forth the efficiency ratios of the largest private Chilean banks as of December 31, 2019, 2020 and 2021, according to information published by the CMF under Chilean GAAP:
Efficiency Ratio(1)(2) | ||||||||||||
| As of December 31, | ||||||||||||
| 2019 | 2020 | 2021 | ||||||||||
| CHILEAN GAAP: | ||||||||||||
| Banco Santander–Chile | 42.0 | % | 42.5 | % | 39.8 | % | ||||||
| Banco de Chile | 45.2 | 45.5 | 39.8 | |||||||||
| Scotiabank Chile | 50.5 | 46.4 | 44.5 | |||||||||
| Banco de Crédito e Inversiones | 50.6 | 51.0 | 48.2 | |||||||||
| Itaú-Corpbanca | 59.9 | 151.0 | 53.9 | |||||||||
| Financial System average | 48.8 | % | 57.2 | % | 45.5 | % | ||||||
Source: CMF
| (1) | Operating expenses divided by operating revenue. |
| (2) | Includes operations of subsidiaries abroad. |
81
REGULATION AND SUPERVISION
General
In Chile, only banks may maintain current accounts for their customers and, together with certain other specific non-banking financial institutions, may accept time deposits. The main authorities regulating financial institutions in Chile are the CMF and the Central Bank. Chilean banks are primarily subject to the General Banking Act and secondarily, to the extent not inconsistent with that law, the provisions of the Chilean Corporations Law governing publicly listed corporations, except for certain provisions that are expressly excluded. The Chilean banking regulatory system dates to 1925 and has been characterized by periods of substantial regulation and government intervention, as well as periods of deregulation. The most recent period of deregulation commenced in 1975 and culminated in the adoption of a series of amendments to the General Banking Act. In 2004, amendments to the General Banking Act granted additional powers to banks, including general underwriting powers for new issuances of certain debt and equity securities and the power to create subsidiaries to engage in activities related to banking, such as brokerage, investment advisory, mutual fund services, investment fund management, factoring, securitization products and financial leasing services. Prior to 2006, banks had the option of distributing less than 30% of their earnings as dividends in any given year, subject to approval of the holders of at least two-thirds of the bank’s common stock. In 2006, however, the General Banking Act was amended to eliminate this alternative. During the last years, several modifications to the General Banking Act were issued with the purpose of implementing the Basel III guidelines. For more information on recent modifications to the General Banking Act see “Item 4. Information on the Company—Regulation and Supervision—Modifications to the General Banking Act”.
Due to the integration and replacement of the SBIF into the CMF in June 2019, references herein that formerly applied to the SBIF will be mentioned hereinafter, interchangeably, as the “CMF”, “regulator”, “banking regulator” or “Chilean regulator”. For more information regarding the legal amendments that led to the replacement of the SBIF by the CMF, see both “Item 4. Information on the Company—Regulation and Supervision—The Financial Market Commission (CMF)” and “Item 4. Information on the Company—Regulation and Supervision—Modifications to the General Banking Act”.
The Central Bank
The Central Bank is an autonomous legal entity created under the framework of the Chilean Constitution. It is subject to its Ley Orgánica Constitucional (the “Organic Constitutional Law”) and the current Chilean Constitution. To the extent not inconsistent with its Organic Constitutional Law or the current Chilean Constitution, the Central Bank is also subject to general laws applicable to the private sector, but is not subject to the laws applicable to the public sector. The Central Bank is directed and administered by a board of directors composed of five members appointed by the President of Chile, subject to Senate approval.
The new Constitution, which is currently still being drafted and which will be subject to an exit referendum, is expected to address the role of the Central Bank at a constitutional level, per the drafting and discussions held by the Constitutional Convention as of the date of this annual report. As it stands, we do not expect that material changes in its autonomy and/or characteristics will be introduced in the new Constitution, although new objectives could be added to its current legal purpose. For more information on the constitutional process that is carried out by the Constitutional Convention, please see “Item 3. Key Information—Risk Factors—Risks Relating to Chile—Our business growth, asset quality and profitability may be affected by political, legal and economic uncertainty, as well as social developments and the drafting of a new constitution in Chile”.
The legal purpose of the Central Bank is to maintain the stability of the Chilean peso, control inflation and the orderly functioning of Chile’s internal and external payment systems. The Central Bank’s powers include setting reserve requirements, regulating the amount of money and credit in circulation, and establishing regulations and guidelines regarding financial companies, foreign exchange (including the Formal Exchange Market) and bank deposit-taking activities.
82
The Financial Market Commission (CMF)
In accordance with modifications introduced in January 2019 to the General Banking Law, the CMF took over the authority previously vested on the SBIF and replaced it as the Chilean banking regulator in June 2019. For more information on such replacement and further amendments introduced to the General Banking Act, see “Item 4. Information on the Company—Regulation and Supervision—Modifications to the General Banking Act”.
The CMF was established in January 2018, pursuant to Law No. 21,000 to replace the SVS and the SBIF. Specifically, the CMF must regulate, oversee, sanction and manage the operation, stability and development of the Chilean financial market by easing the participation of market agents while keeping public trust. In order to do so, the CMF must have an overall and systemic vision by protecting interests of investors and insured agents. The CMF also can impose sanctions on the supervised entities.
The CMF is a professional and technical institution, led by a board of five members whose chairman is appointed by the Chilean Government. The CMF framework includes a special financial prosecutor who is responsible for identifying, investigating, and prosecuting potential infringements of the rules that govern the markets and industries regulated by the CMF. In addition to the powers formerly vested on both the SBIF and the SVS, the CMF has additional powers that should improve the supervision of the Chilean financial markets while providing due process for regulated companies by incorporating new tools that promote the cooperation of companies purportedly involved with infringements of applicable rules.
Since the beginning of 2021, the CMF’s internal structure has been moving towards a “twin peaks” system, following recommendations from the International Monetary Fund. This means that the CMF’s structure since January 2021 is divided into two sections depending on the supervisory and regulatory objects. One of these sections exclusively addresses prudential/solvency regulation and supervision, while the other focuses on conduct regulation and supervision.
The CMF’s powers include the authority to require information of banking transactions of specific persons, even those subject to secrecy or confidentiality provisions; interception of all kind of communications and requesting telecommunication companies any communication transmitted or received by them, and order other public agencies to provide background information, even when such information is confidential or classified. These measures, among others, are subject to control and prior authorization of the Santiago Court of Appeal.
The CMF currently oversees the Chilean Financial Market (comprised of publicly traded companies, banks and financial institutions, insurance companies, insurance brokers, mutual funds and investment funds). As mentioned, based on several modifications to the General Banking Law, the CMF assumed the supervision and regulation of banking activities by replacing and assuming the powers of the SBIF.
Regarding the specific powers of the CMF related to banking regulation, this entity authorizes the creation of new banks and has broad powers to interpret and enforce legal and regulatory requirements applicable to banks and financial institutions. Furthermore, in cases of noncompliance with its legal and regulatory requirements, the CMF has the ability to impose sanctions. In extreme cases, it can appoint, with the prior approval of the board of directors of the Central Bank, a provisional administrator to manage a bank. It also has the mandate to approve any amendment to a bank’s bylaws or any increase in its capital.
The CMF examines all banks, usually at least once a year or more often if necessary under certain circumstances. Banks are required to submit unaudited financial statements to the CMF on a monthly basis and to publish their unaudited financial statements at least four times a year in a newspaper of national circulation. A bank’s financial statements as of December 31 of each year must be audited and submitted to the CMF together with the opinion of its independent auditors. Also, banks are required by the CMF to include in mid-year financial statements (as of June 30 of every fiscal year) an auditor’s review statement in accordance with Chilean GAAP). Likewise, under the new Compendium of Accounting Standards (“Compendio de Normas Contables Bancarias”), banks are required to accompany their interim financial statements by a management commentary starting in the first quarter of 2022. In addition, banks are required to provide extensive information regarding their operations at various periodic intervals to the CMF by means of specialized reports associated with business-related risk, products, transactions, distribution channels, among others.
83
Any person wishing to acquire, directly or indirectly, 10% or more of the share capital of a bank must obtain prior approval from the CMF. Without such approval, the holder will not have the right to vote such shares. The CMF may only refuse to grant its approval based on specific grounds set forth in the General Banking Act.
According to Article 35 of the General Banking Act, the prior authorization of the CMF is required for each of the following:
| ● | the merger of two or more banks; |
| ● | the acquisition of all or a substantial portion of a bank’s assets and liabilities by another bank; |
| ● | the control by the same person, or controlling group, of two or more banks; or |
| ● | a substantial increase in the share ownership of a bank by a controlling shareholder of that bank. |
Such prior authorization may be granted or rejected by the CMF, which is further authorized to set rules or specific requirements on that regard.
Pursuant to the regulations of the CMF, the following ownership disclosures are required:
| ● | banks must disclose to the CMF the identity of any person owning, directly or indirectly, 5% or more of its shares; |
| ● | holders of ADSs must disclose to the depositary the identity of beneficial owners of ADSs registered under such holders’ names; |
| ● | the depositary must disclose to the bank the identity of beneficial owners of ADSs which the depositary has registered, and the bank, in turn, must disclose to the CMF the identity of the beneficial owners of the ADSs representing 5% or more of such bank’s shares; and |
| ● | bank shareholders who individually hold 10% or more of a bank’s capital stock and who are controlling shareholders must periodically inform the CMF of their financial condition. |
All of our subsidiaries operating under the brand name Banchile are also supervised by the CMF.
Some of the amendments to the General Banking Act introduced in January 2019 are regulations still in the process of being implemented by the CMF and/or the Central Bank. For more information on the timeframe for such implementation see “Item 4. Information on the Company—Regulation and Supervision—Modifications to the General Banking Act.”
On December 20, 2019, the CMF published Circular No. 2,243, which updates the instructions to the Compendium of Accounting Standards. The changes pursued to achieve greater convergence with IFRS, as well as an improvement in the quality of financial information, to contribute to the financial stability and transparency of the banking system. The main changes introduced to the Compendium of Accounting Standards were related to: (i) the incorporation of IFRS 9 with the exception of the chapter on impairment of loans classified as “financial assets at amortized cost”, (ii) changes in the presentation of the financial statements due to the adoption of IFRS 9 in replacement of IAS 39, (iii) a new presentation for the Statement of Other Comprehensive Income, the Statement of Changes in Equity, and guidelines for presenting financing and investment activities in the Statement of Cash Flows, (iv) the incorporation of a “Management Commentary” in interim and annual financial statements in accordance with the IASB Practice Document No. 1, (v) modifications to some notes to the financial statements, (vi) changes in coding of accounts as well as in their description, (vii) changes to the criteria for suspending the accrual of interests when any credit or an installment become overdue 90 days or more, and (viii) the adaptation of limitations and precisions to the use of IFRS contained in Chapter A-2 of the Compendium of Accounting Standards.
84
All the new standards were to be applicable as of January 1, 2021, with a transition date on January 1, 2020, and the change of criteria for the suspension of the recognition of interest income on an accrual basis as provided in Chapter B-2 of the CNCB, were to be adopted no later than January 1, 2021. However, due to the COVID-19 pandemic, the CMF issued Circular No. 2,249 on April 20, 2020, by which these updates were to become applicable in January 2022 with a transition date on January 1, 2021, and the change of criteria for the suspension of the recognition of interest income on an accrual basis as provided in Chapter B-2 of the Compendium of Accounting Standards must be adopted no later than January 2022. The effects of the application of the suspension rule of interest and readjustments when any credit or one of its payments presents a default greater than 90 days did not have a significant impact on our results of operations or financial condition under Chilean GAAP.
On October 7, 2021, the CMF published some adjustments and updates to the Compendium of Accounting Standards, which became effective on January 1, 2022, and to the reporting system by which this information must be submitted to the CMF. Among other matters, this update includes the accounting information required to prepare Chilean banks’ financial statements consistent with Basel III guidelines. In addition, some of the instructions of the Compendium of Accounting Standards have been clarified, mainly regarding the application of the following IFRS rules: (i) IFRS 9, on the accounting treatment of instruments that may qualify as additional Tier 1 and Tier 2 capital, (ii) IFRS 8, on the mistakes associated with events of operational risk, and (iii) IFRS 37, on the determination of provisions due to operational risk. Chapter B-1 of the Compendium of Accounting Standards, on the aggregate exposure of commercial loans, has also been amended, though it will become effective on July 1, 2022.
As of the date of this annual report, we have deployed human and technical resources through diverse IT projects that aimed to address all the requirements associated with the adoption of the new Compendium of Accounting Standards by modifying our core accounting, transactional and reporting systems. Based on these efforts, as of the date of this annual report we are in full compliance with the guidelines established by the CMF through the new Compendium of Accounting Standards at the beginning January 1, 2022. In addition, we did not experience material impacts on our results of operations or financial condition due to the adoption of the new Compendium of Accounting Standards under Chilean GAAP.
Limitations on Types of Activities
Chilean banks can only conduct those activities expressly allowed by Article 69 of the General Banking Act, including among others, opening bank accounts, bond issuance, consumer and commercial (secured or unsecured) loan placements, consumer mortgages, engaging in financial derivatives, factoring and leasing activities, accepting deposits and, subject to certain limitations, making investments and performing financial services. Investments are restricted to real estate for the bank’s own use, gold, foreign exchange and debt securities. Through subsidiaries, banks may also engage in other specific financial service activities such as securities brokerage services, mutual fund management, investment fund management, foreign capital fund management, financial advisory, securitization and factoring activities. Subject to specific limitations and the prior approval of the CMF and the Central Bank, Chilean banks may own majority or non-controlling interests in foreign banks. The CMF and the Central Bank are allowed by the General Banking Act to dictate and issue ancillary regulation stating additional requirements for certain activities in which banks can engage.
Deposit Guarantee
According to the General Banking Act, local or foreign currency denominated deposits at banks or financial companies are insured as described below.
The Chilean Government guarantees up to 100% of the principal amount of the following deposits:
| ● | deposits in current accounts; |
| ● | deposits in savings accounts of demand deposits; |
| ● | other demand deposits; and |
| ● | deposits in savings accounts with unlimited withdrawals. |
The General Banking Act contemplates a current deposit guarantee for time deposits such that the principal amount of time deposits would be 100% guaranteed by the Chilean Government with a limit of UF 200 per person (approximately Ch$6.2 million or U.S.$7,270 as of December 31, 2021) in a single bank and UF 400 per person (approximately Ch$12.4 million or U.S.$14,539 as of December 31, 2021s) in the Chilean banking system as a whole.
85
Reserve Requirements
Deposits are subject to a reserve requirement of 9.0% for demand deposits and 3.6% for time deposits (with terms of less than one year). The Central Bank has statutory authority to increase these percentages to as much as 40% for demand deposits and as much as 20% for time deposits, to implement monetary policy.
In addition, Chilean banks must hold a certain amount of assets in cash or highly liquid instruments. This reserve requirement, also know as “technical reserve”, is equal to the amount by which the daily balance of demand deposits, net of clearing, exceeds 2.5 times the amount of the bank’s Total Capital or Regulatory Capital. Deposits payable on demand include the following:
| ● | deposits in current accounts; |
| ● | other demand deposits or obligations payable on demand and incurred in the ordinary course of business; |
| ● | saving deposits that allow unconditional withdrawals that bear a stated maturity; and |
| ● | other deposits unconditionally payable immediately. |
As of December 31, 2021, Banco de Chile fully complied with these reserve requirements.
In accordance with the General Banking Act, if a Chilean bank or a foreign bank operating in Chile is defined to be a domestic-systemically important bank by the new regulator, it may be subject to one or a combination of additional restrictions, including but not limited to, more restrictive reserve requirements associated with the “technical reserve”. In this regard, the new banking framework establishes that under certain conditions a systemically important bank may be required to hold assets in cash or highly liquid instruments for the amount by which the daily balance of deposits payable on demand, net of clearing, exceeds 1.5 times the amount of the bank’s Total Capital or Regulatory Capital, instead of 2.5 times as requested for any bank. On November 2, 2020, the CMF published the final regulation that establishes the methodology for determining systemically important banks in Chile under the Basel III framework. Requirements for systemically important banks could be imposed since March 2021 by the CMF based on the previously mentioned methodology and the guidelines defined by the General Banking Act. On March 31, 2021, the CMF announced that six local banks (including us) were designated as systemically important banks. Based on modifications to the adoption phase-in period generated by the COVID-19, the systemic buffer and related measures, if any, commenced at zero in December 2021 and will start to be effective in December 2022, based on the assessment of the CMF. On March 30, 2022 the CMF announced the systemic buffers for these six banks. The systemic buffer imposed on us is equivalent to 1.25%, as determined based on the prevailing methodology for this purpose. However, as of the date of this annual report, we have not received notice of the other requirements such as stricter technical reserve thresholds, which may be imposed on us due to our classification as a D-SIB.
For more information on this regulation and, further, the implementation of the systemic buffer see “Item 4. Information on the Company—Regulation and Supervision—Modifications to the General Banking Act.” and “Item 4. Information on the Company—Regulation and Supervision—Capital Adequacy Regulations.”
Minimum Capital
Under Article No. 50 of the General Banking Act, a bank must have a minimum paid in capital and reserves of UF 800,000 (Ch$24,793.4 million or U.S.$29.1 million as of December 31, 2021). If the paid-in capital and reserves decrease below that amount, that bank will be compelled to cover that deficit in a timeframe no longer than one year, which could be extended by the CMF under certain circumstances. If not addressed, the CMF could revoke such a bank’s authorization to operate.
86
In accordance with Article No. 51 of the General Banking Act, a bank may begin its operations with 50% of the previously mentioned amount, with no specific timeframe for the establishment of the remaining amount. However, as long as the bank does not reach the amount of minimum capital, it would be required to hold further Common Equity Tier 1 capital for an amount representing 2% of its risk-weighted assets in addition to the 4.5% required for all banks plus any capital buffer defined by the regulation. This additional amount of Common Equity Tier 1 capital will be reduced to 1% as a percentage of its risk-weighted assets when the bank’s paid in capital and reserves reach at least UF 600,000 (Ch$18,595.0 million or U.S.$21.8 million as of December 31, 2021).
As of December 31, 2021, Banco de Chile fully complied with such minimum capital requirements.
For more information of capital requirements for local banks see “Item 4. Information on the Company—Regulation and Supervision—Modifications to the General Banking Act.”
Modifications to the General Banking Act
In 2017, certain modifications to the General Banking Act were initiated by a bill sent to Congress by the Ministry of Finance. The bill was passed by Congress on October 3, 2018 and, following that, Law No. 21,130 (Modernization of Banking Legislation) was enacted on December 27, 2018 and published on January 12, 2019.
The legal framework incorporated by this amendment to the General Banking Act (Decreto con Fuerza de Ley No. 3) addresses four main topics on banking regulation and supervision, as follows:
| ● | Adoption of Basel III guidelines on capital adequacy. Under this modification, new minimum capital requirements levels in line with the main standards of Basel III Pillar 1 which must be fulfilled by Chilean banks, considering a phased-in transition from Basel I lasting four years after the specific regulatory framework is issued by the regulator. Likewise, the new legal framework establishes additional potential capital requirements associated with Pillar 2 of Basel III for those Banks having objective deficiencies in terms of coverage and management of banking-related risks. The phase-in period for the transition from Basel I to Basel III was expected to be completed in four years after the new specific banking framework was issued by the regulator, which was originally expected to start in December 2020, when capital requirements would be in place. However, in light of the COVID-19 pandemic in Chile, in March 2020 the CMF introduced modifications to the Basel III initial schedule by postponing Basel III requirements associated with risk-weighted assets from December 2020 to December 2021. Similarly, the phase-in periods for the systemic and conservation buffers were delayed by one year, and commenced in December 2021, with the systemic buffer commencing at zero in December 2021, which could gradually increase overtime with the exception of those banks that already had an additional capital requirement according to Article 35 of the General Banking Act. Also, adjustments to Total Capital or Regulatory Capital were postponed one year, now starting in December 2022. Given the changes made to the original schedule, no additional capital requirements were imposed on local banks before December 2021. |
According to the phase-in period set in the modifications, within the 18 months following the integration of the former SBIF into the CMF, specific regulation for the implementation of Basel III must be issued by the CMF. Since May 2019, the CMF began the publication for comment in respect of their rulemaking on a diverse and wide array of topics associated with Basel III. By December 2021, all the final rules had been issued by the CMF. The rules already in place are part of the Recopilación Actualizada de Normas (RAN) Compendium of the CMF, are related to:
| a. | The guidelines for calculation and composition of Total Capital or Regulatory Capital for banks (RAN 21-1), are as follows: |
| 1. | CET1 Capital: composed of (i) paid-in capital related to common shares, (ii) stock surplus (share premium) resulting from the issuance of instruments included in CET1, (iii) reserves whether they come from net income, depreciation or expiration of perpetual bonds or not, (iv) accumulated other comprehensive income related to financial instruments measured at fair-value, (v) retained earnings or losses, net of provisions for minimum dividends, appreciation of perpetual bonds or interests/dividends paid on financial instruments issued for capital adequacy purposes, and (vi) minority interest. The CET1, however, is subject to a set of adjustments that include: (i) minority interest, (ii) goodwill and intangible assets, (iii) deferred tax assets (not related to temporary differences), (iv) accumulated other comprehensive income related to cash flow hedge accounting derivatives, (v) insufficiency of credit risk allowances when using internal methodologies for risk weighted assets, (vi) earnings from the sale of securitized assets, (vii) accumulated gains or losses from changes in own issuer risk related to financial liabilities measured at fair value (such as debit value adjustment for derivatives), (viii) assets related to pension plans for staff, (ix) investments in own assets, (x) significant and not significant investments, and (xi) threshold adjustments in line with Basel III. CET1 Capital that (for compliance with minimum levels) must equal to at least 4.4% of risk-weighted assets; |
87
| 2. | AT1: comprised of perpetual bonds and preferred stocks that (for compliance with minimum levels) must be equal to at least 1.5% of risk-weighted assets, once the CET1 minimum requirements have been fulfilled. Instruments issued by banks’ subsidiaries do not get counted for these purposes; |
| 3. | Tier 1 Capital or T1: the sum of CET1 and AT1; |
| 4. | Tier 2 Capital: comprised of (i) subordinated bonds of up to 50% of CET1 Capital, excluding subordinated bonds issued by banks’ subsidiaries, and (ii) voluntary provisions of up to 1.25% of credit risk-weighted assets if computed by standardized method or 0.625% if computed by internal method. Tier 2 capital may be computed (for compliance of minimum levels) up to 2.0% of risk-weighted assets, once fulfilled the Tier 1 Capital minimum requirements; |
| b. | Conditions to be fulfilled for the issuance of financial instruments representing AT1Capital (RAN 21-2) as mentioned above, while permitting a temporary substitution of AT1 Capital with T2 Capital for the maximum portion of 1.5% of risk weighted assets starting December 1, 2020, decreasing by 0.5% per year until reaching zero; |
| c. | Conditions to be fulfilled for the issuance of financial instruments representing Tier 2 capital (RAN 21-3), to be computed as part of Total Capital or Regulatory Capital; |
| d. | A comprehensive framework for determination of credit risk-weighted assets for banks under both a standardized methodology and internal models (RAN 21-6); |
| e. | A standardized framework for determining market risk-weighted assets for the trading book (RAN 21-7), including risks not previously considered, such as stock market risk, commodity risk and issuer risk for fixed-income assets. Similarly, the framework does not consider internal models or fundamental review of the trading book, which would be analyzed by the CMF in the future; |
| f. | A standardized methodology for determining operational risk-weighted assets of banks (RAN 21-8), with no ability to apply internal models; |
| g. | Additional requirements of CET1 capital for banks (RAN 21-12), including both the conservation buffer equivalent to 2.5% of risk-weighted assets and the countercyclical buffer of up to 2.5% of risk-weighted assets. The methodology to activate or deactivate the countercyclical buffer, to be defined by the Central Bank and monitored by the CMF, is still pending; |
| h. | A methodology for determining systemically important banks or groups of banks (RAN 21-11), including a relationship between the qualifications obtained by means of the methodology and the corresponding capital requirement. This capital requirement could range from 1.0% to 3.5% of risk-weighted assets and it should be met with CET1, while imposed by the CMF in agreement with the Central Bank. The characteristic of systemically important bank could also translate into add-ons to the leverage ratio requirement and other restrictions, such as an increase in reserve requirements (from the excess of demand deposit balances over 2.5 times the Total Capital or Regulatory Capital to 1.5 times the Total Capital or Regulatory Capital) and a decrease in the portion of interbank loans that a systemically important bank can have (from 30% to 20%), among others; |
| i. | A framework for the calculation of leverage ratio (RAN 21-30), which considers a minimum level of 3.0% on total risk assets, although add-ons could be imposed by the CMF to systemically important banks for an amount of up to 50% of the systemic buffer imposed for CET1, T1 and Total Capital or Regulatory Capital indicators; |
88
| j. | The Pillar 2 framework (RAN 21-13 and amendments to the current RAN 1-13) for the regulatory review process, which establishes a set of requirements associated with the infrastructure, processes and governance that banks should comply with in order to ensure proper capital and risk management protocols. Pillar 2 includes other-than-Pillar-1 risks to be addressed by banks, such as interest rate risk of the banking book (IRRBB), concentration risk, strategic risk and reputational risk, among others, that the bank could consider relevant. Also, Pillar 2 incorporates the obligation for banks to carry out stress tests for relevant risk while incorporating their results for capital management purposes. Under Pillar 2, a bank will be subject to closer supervision as long as it is defined as an “atypical” bank, i.e. if its long-term IRRBB exceeds 15% of the Tier 1 capital. Also, Pillar 2 empowers the CMF to impose additional capital requirements of up to 4.0% of risk-weighted assets if it believes that a bank presents signs of a weak risk management approach or insufficient risk coverage; and |
| k. | Pillar 3 disclosure requirements related to information to be disclosed by banks in relation to their risk and capital management, which will be filed on a quarterly basis, in conjunction with financial statements, or separately. Although not associated with Pillar 3, the CMF has also reinforced its current information system, defining new reports on Basel III metrics, most of them staring July 2021. |
| l. | Limits to significant exposures (Article N°83 of General Banking Act). |
| ● | Changes to the governance of the banking regulator. According to these modifications and timeframe for implementation, the SBIF was abolished and all of its powers, authority and personnel were transferred to the CMF. The CMF oversees the local banking business since June 2019. This means that the local supervision model changed from a specific regulator to an integrated supervision model where the regulator’s oversight extends to the financial market as a whole, including the securities market, insurance companies and brokers and the banking industry. For further information on the description of this new banking regulator, see “Item 4. Information on the Company—Regulation and Supervision—The Financial Market Commission.” |
| ● | Establishment of a new banking resolution regime for the Chilean banks in the case of insolvency. The new banking framework outlines specific actions to be taken under scenarios of insolvency or signs of financial distress. In this regard, the General Banking Act, as modified, establishes the possibility of undertaking an early regularization plan in case of signs of financial weakness, capitalization in the form of loans to be granted by other banks or forced liquidation in case of insolvency. For each scenario, the appointment of a delegated inspector, a provisional administrator or a liquidator, among other elements, are introduced. For further information on the description of this new regime, see “Item 4. Information on the Company—Regulation and Supervision—Legal Provisions Regarding Banking Institutions with Economic Difficulties.” |
| ● | The modifications to the General Banking Act also address other matters such as increased deposit insurance for time deposits, stricter requirements for members of banks’ boards of directors, changes in relation to confidential information of bank customers, among others. With regards to confidentiality of customers, certain conditions of access to information subject to banking secrecy are required, upon special request of the Financial Analysis Unit (responsible for watching anti-money laundering activities) in the case of an investigation or prosecution. |
Capital Adequacy Regulations
Beginning December 1, 2021 all the requirements related to the adoption of Basel III framework became required for all Chilean banks, although considering the phase-in process for the adoption of diverse matters including: (i) adjustments to Common Equity Tier 1 Capital and risk-weighted assets, (ii) the requirement of buffers such as the conservation buffer and the systemic buffer, among other topics.
89
According to the General Banking Act, each bank should comply with the following capital requirements as a percentage of its risk-weighted assets, net of required allowances:
| ● | Common Equity Tier 1 Capital (CET1) above 4.5% of risk-weighted assets; |
| ● | Tier 1 Capital = CET1 Capital + Additional Tier 1 Capital (AT1) above 6.0% of risk-weighted assets; |
| ● | Tier 1 + Tier 2 above 8.0% of risk-weighted assets; |
| ● | Conservation Buffer of 2.5% of risk-weighted assets, to be fulfilled in a four-year period starting December 1, 2021 at 0.625% and increasing by the same amount on a yearly basis; |
| ● | Countercyclical Buffer of up to 2.5% of risk-weighted assets, to the extent applicable; |
| ● | Domestic-Systemically Important Banks (D-SIB) Buffer in the range of 1.0% to 3.5% of risk-weighted assets, to be fulfilled at 25% rate every year starting December 1, 2021, to the extent applicable; |
| ● | Pillar 2 Buffer of up to 4.0% of risk-weighted assets, to the extent applicable, to be fulfilled in a six-month timeframe. |
Banks should also comply with a leverage ratio, meaning CET1 Capital of at least 3% of their total risk assets, net of required allowances. If a bank is defined as a domestic-systemically important bank, the threshold for the leverage ratio could be subject to further requirement of up to 50% of the systemic buffer imposed over risk-weighted assets but over total risk assets.
These thresholds, with exception of Pillar 2, will be required to be fulfilled with CET1 capital. However, the Pillar 2 buffer, if any, could be met with CET1 capital, AT1 capital (perpetual bonds or preferred stocks) or Tier 2 Capital (subordinated bonds or disclosed reserves) according to the bank’s actual capital structure. The adoption of these regulatory thresholds was initially to be phased-in during a four-year period starting December 1, 2020. However, as a result of the COVID-19 pandemic, the phase-in period was postponed twelve months, starting December 1, 2021.
Furthermore, in accordance with the modifications to the General Banking Act, the authorization and/or report from the Central Bank will be necessary for the implementation of several Basel III capital adequacy guidelines set forth in these modifications, such as the systemic buffer (to be defined by the CMF once agreed with the Central Bank) and the countercyclical buffer, which will rely on a methodology defined by the Central Bank while its activation will be in agreement with the CMF. On the other hand, Pillar 2 buffers, if any, will be defined exclusively by the CMF with agreement of the council.
For more information on the composition of capital tiers and guidelines associated with calculation of risk-weighted assets and buffers, see “Item 4. Information on the Company—Regulation and Supervision—Modifications to the General Banking Act.”
In accordance with Article No. 35 bis of the General Banking Act, under the former capital regulation, some banks could be required to fulfill stricter thresholds in terms of capital adequacy. This was the case of Banco de Chile, which was subject to a Total Capital or Regulatory Capital (or Total Capital) ratio of at least 10% on risk-weighted assets, this is 2% over the 8% required for any bank. Given the transition to Basel III, this buffer will be replaced by the systemic buffer at which domestic-systemically important banks could be subject to. Therefore, this former requirement is due to expire at a rate of 25% per year starting December 1, 2021. On March 30, 2022 the CMF announced the systemic buffers for the six banks previously determined to be systemically important banks. Based on the methodology established by the CMF for this purpose, the Chilean regulator has imposed a systemic buffer equivalent to 1.25% on us, which will be gradually introduced over a four year period starting December 1, 2022, and continuing at an annual and cumulative rate of 25% every year, completing the 1.25% (if maintained unchanged) on December 1, 2025. During the phase-in process, we must comply with the aggregate amount of the new Basel III systemic buffer (in the portion defined by the gradual implementation) and the remaining Article 35 bis buffer until extinguished. As of the date of this annual report, we have not received notice of the other requirements such as stricter technical reserve thresholds, which may be imposed on us due to our classification as a D-SIB.
90
As of December 31, 2021 and as of the date of this annual report, Banco de Chile is in full compliance with all capital adequacy requirements.
Market Risk Regulations
As part of the new regulations associated with the implementation of Basel III, the standardized model for measuring the price risk of the trading book was modified by the CMF and began to be reported by banks for market risk and capital management purposes beginning in July 2021 while being utilized to measure risk-weighted assets for market risk starting December 1, 2021. The new guidelines, as appearing in RAN 21-7, introduced more definitions to precisely distinguish the trading and the banking book while the new standardized model incorporated certain methodological changes and revised treatments while adding further trading exposures when compared to the former model used since 2005. Thus, the new standardized model continues to determine general interest rate risk, foreign exchange or FX risk (taken in both their trading and banking books) and option risk, to the extent applicable, while adding specific interest rate risk for the fixed-income portfolio (issuer risk), commodity risk and stock market risk (including stocks, indices and funds). The outcome of the application of the new standardized model delivers the Exposure to Market Risk (EMR), which is multiplied by 12.5 to compute the market risk-weighted assets that are part of the total risk-weighted assets over which Chilean banks are required to maintain minimum amounts of CET1, Tier 1 Capital, and Total Capital as defined in “Item 4. Information on the Company—Regulation and Supervision—Capital Adequacy Requirements.”
According to the RAN 21-7, the trading book is composed of portfolios of debt and equity instruments that have a liquid secondary market and therefore their valuation is at market prices and the corresponding profit and losses impact is representative of market conditions. In addition, all derivative transactions, options, FX mismatches and positions in mutual funds, investment funds and stock indices are also part of the trading book, to the extent applicable. The accrual book comprises all of the asset and liability balance sheet items that are not part of the trading book.
As of December 31, 2021, the Exposure to Market Risk of our trading book totaled Ch$107,421 million, on a consolidated basis. Based on this amount, our market risk-weighted assets amounted to Ch$1,342,767 million as of the same date.
The interest rate risk of the banking book is measured against a self-imposed (internal) limit equal to the lesser of 12-month rolling net revenues and the Common Equity Tier 1 Capital. Since 2005, the CMF provides a standardized methodology to measure the interest rate risk of the banking book, although some behavioral models are allowed in order to treat some business topics. Aligned with the implementation of the Basel III, the CMF has proposed a revised standardized methodology for this purpose, which is contained in the RAN 21-13 as part of the Pillar 2 guidelines. As requested by the CMF, the current standardized model defined in the RAN 12-21 will be in place, at least, until June 30, 2022. In July 2022, the new standardized model will begin to be reported to the CMF and based on the outcome of the long-term interest rate risk of the banking book, the CMF will determine whether a bank should be subject to further supervision or additional capital requirements.
In June 2006, the banking regulator introduced new regulations relating to (i) the valuation process of debt instruments and (ii) the measurement and reporting of credit risk generated by derivative transactions. Prior to June 2006, the banking regulator allowed banks to classify debt instruments for accounting and business purposes as either “Trading” or “Held-to-Maturity” only. Starting in June 2006, a new alternative classification was added (“Available-for-Sale”). Given the new Compendium of Accounting Standards in effect since January 1, 2022, the former available for sale classification is known as Financial Assets measured at Fair Value through Other Comprehensive Income, although principles are the same as those for the former Available for Sale category. Likewise, former “Held-to-Maturity” classification is known as Financial Assets measured at Amortized Cost”. In both cases, the change was aligned with IFRS.
Credit risk for derivative transactions, for regulatory purposes, must be measured and reported as:
| Derivatives Credit risk | = | Current Mark-to-Market (if positive) | + | Credit Risk Factor (%) | * | Notional Amount |
91
The Current Mark-to-Market (“CMTM”) of the transaction, if positive, reflects the amount of money owed by the counterparty today, e.g. corresponding to the amount the counterparty would pay us if the transaction were unwound today. As we are interested in measuring the maximum amount of money that the customer would owe us within the life of the transaction, the maximum potential future value of the transaction is added to the CMTM. This potential value is measured as the Credit Risk Factor multiplied by the Notional Amount. Hence, the Credit Risk Factor reflects the potential value that the transaction may take in favor of the bank (under some confidence level) within its remaining tenor. The regulator determines the Credit Risk Factor by considering market factors (three categories: interest rates, FX rates or equity prices) involved in the respective transactions and the remaining tenor. In addition, banks usually develop their own Credit Risk Factors models to assess credit risk not only under regulatory guidelines. Netting and credit mitigation schemes, such as recouping, early termination, margins, etc. have been allowed by regulators so that banks can better manage their credit risk.
In 2018 amendments to Chapters 12-1 and 12-3 of Recopilación Actualizada de Normas (the Revised Compilation of Norms) were introduced by our regulator in order to set specific guidelines for calculation of risk-weighted assets associated with derivative instruments for capital adequacy purposes, specifically for those derivative contracts cleared and settled through a Central Counterparty Entity (CCP). Likewise, the amendments include general clarifications on the treatment of operations with intermediate settlement and the calculation of guarantees. In brief, the regulatory amendment establishes a risk-weighting of 2% over the amount of Derivatives Credit Risk, as defined above for regulatory purposes, for those derivative contracts cleared through a CCP. Also, due to the original interbank nature of the derivative instruments, exposures to CCPs are considered to be subject to the 30% limit on Total Capital or Regulatory Capital, as defined above.
Liquidity Risk Regulations
The guidelines for measuring liquidity risk are mainly focused on constructing an expected cash flow analysis for the following 30 and 90 days, broken down by currency. Net outflows may not exceed the amount of our Basic Capital (CET1 Capital) for the following 30 days or two times that amount for the following 90 days. Subject to approval of the CMF, the cash flow analysis may include behavioral run-off assumptions for some specific liability balance sheet items (demand deposits, time deposits, etc.) and behavioral roll-over assumptions for some asset items of the consolidated statement of financial position (loans, etc.). This guidance is also known as the C46 index, effective since 2015.
In March 2016, the Chilean regulator began to require C47 and C48 reports for informational purposes only (no limits were required at that point). The C47 report focuses on liabilities analysis from the concentration, maturity and renewal perspectives. On the other hand, the C48 report gauges LCR and NSFR, aligned with the Basel framework for these purposes. Also, on May 4, 2018 the Central Bank published for comment an amendment to Chapter III.B.2.1 of Compendio de Normas Financieras (the Compendium of Financial Norms) by which this regulator outlines the main guidelines for banks to follow in order to measure and control their liquidity position. This amendment was primarily focused on establishing a minimum requirement for the LCR, considering a phase-in period of five years, starting at 60% in 2019 and reaching the final limit of 100% in 2023 (with annual increments of 10% between 2019 and 2023).
Aligned with this new framework, on October 2, 2018 amendments to Chapter 12-20 of Recopilación Actualizada de Normas (which addresses the management and measurement of banks’ liquidity position) were published by the banking regulator for comment while establishing a new report on liquidity matters (C49) intended to refine the measurement of the LCR and the NFSR as defined by the current C48 report. Overall, the new framework: (i) introduced adjustments to the formulae used to compute high-quality-liquid-assets for the LCR, (ii) clarified the treatment of derivatives on the measurement of a bank’s liquidity position, (iii) widened the extent of some liability concentration metrics and (iv) specified that only accrued interest, rather than total interest, must be considered for the NSFR calculation, among other topics. On December 28, 2018 Circular No. 3,585 was endorsed by circular No. 3,644 by which the regulator established April 4, 2019 as the date that Chilean banks must start the submission of C49 report and comply with the LCR limit of 60% determined by the Central Bank. Even though the C49 report was expected to replace the C48 report in the short-term, they continued to be jointly submitted, as the regulator is still calibrating both reports. As of the date of this annual report, there is no certainty as to when the C48 report would be removed by the CMF.
92
On March 8, 2022, the Chilean Central Bank published the final ruling, previously shared for public comment, associated with the changes proposed for Chapter III.B.2.1 of the Compendium of Financial Norms, which adopted, among others, the following relevant changes: (i) the removal of regulatory limit for 30-day and 90-day cash flows mismatches in local currency as measured by C46 index while maintaining the limit for 30-day cash flows mismatches in foreign currency as measured by the C46 index, (ii) the anticipation of the increase of the LCR limit to 90% for the period between January and June 2022 and to 100% from June 2022 onwards, (iii) the incorporation of a regulatory limit for NSFR starting in 60% in June 2022 and increasing 10% in January 2023 to 70% and subsequently 10% per year until reaching 100% in January 2026, (iv) the introduction of specifications on the treatment of securities pledged as “technical reserve” in order to take them into account as high quality liquid assets and (v) confirmation on the submission of the ILAAP starting April 2023, among other topics.
Therefore, we are subject to the following liquidity regulatory limits:
| ● | For C46 index, mismatches between modeled cash inflows and cash outflows over 30-day period in foreign currency must not exceed one time the amount of Common Equity Tier 1 Capital). |
| ● | For the C47 report there is no regulatory limit, as it only characterizes the liability structure of banks. |
| ● | For C48 and C49 reports, the LCR must exceed the regulatory limit of 90% (from January to May 2022), which will increase to 100% in June 2022. |
| ● | For C48 and C49 reports, the NSFR must exceed the regulatory limit of 60%, commencing in June 2022, which will increase to 70% in January 2023 and then, 10% per year until reaching 100% in January 2026. |
As of December 31, 2021, the Bank fully complied with all minimum liquidity requirements.
Lending Limits
Under the General Banking Act, Chilean banks are subject to certain lending limits, including the following material limits:
| ● | A bank may not extend to any entity or individual, directly or indirectly, unsecured credit in an amount that exceeds 10% of the bank’s Total Capital or Regulatory Capital, or in an amount of up to 30% of its Total Capital or Regulatory Capital if the excess over 10% is secured by certain assets with a value equal to or higher than such excess. |
| ● | In the case of financing infrastructure projects built through the concession mechanism, the 10% ceiling for unsecured credits is raised to 15% of the bank’s Total Capital or Regulatory Capital if secured by a pledge over the concession, or if granted by two or more banks or financial companies which have executed a credit agreement with the builder or holder of the concession. |
| ● | A bank may not extend loans in an aggregate amount exceeding 30% of its Total Capital or Regulatory Capital to a group of persons or entities belonging to the same holding group (grupo empresarial) as defined in the Securities Market Act. |
| ● | A bank may not extend loans to another financial institution subject to the General Banking Act in an aggregate amount exceeding 30% of its Total Capital or Regulatory Capital. |
| ● | A bank may not extend to any individual or entity that is, directly or indirectly, related to the ownership or management of the bank, credit under more favorable terms with respect to repayment conditions, interest rates or collateral than those granted to third parties in similar transactions. The aggregate amount of such credits granted to related persons may not exceed 5% of the bank’s Total Capital or Regulatory Capital. The 5% unsecured ceiling is raised to 25% of the bank’s Total Capital or Regulatory Capital if the excess over 5% is secured by certain assets with a value equal to or higher than such excess. In any case, the aggregate amount of these credits granted by the bank may not exceed the bank’s Total Capital or Regulatory Capital. |
93
| ● | A bank may not directly or indirectly grant a loan, the purpose of which is to allow an individual or entity to acquire shares of the lender bank. |
| ● | A bank may not lend, directly or indirectly, to a director or any other person who has the power to act on behalf of the bank. |
| ● | A bank may not grant loans to related parties (including holders of more than 1% of its shares or 5% of its shares if these are actively traded stocks) on more favorable terms than those generally offered to non-related parties. Loans granted to related parties are subject to the limitations above. The aggregate amount of loans to related parties may not exceed a bank’s Total Capital or Regulatory Capital. |
As of December 31, 2021, the Bank fully complied with the lending limits established by the General Banking Act.
Classification of Banks
The CMF regularly examines and evaluates each bank’s solvency and credit management process, including its compliance with loan classification guidelines. On the basis of this evaluation, it classifies banks into various categories.
Solvency and Management
Banks are classified into categories “I” through “V” based upon their solvency and management ratings. This classification is confidential.
| Category I: | This category is reserved for financial institutions that have been rated level A in terms of solvency and management. |
| Category II: | This category is reserved for financial institutions that have been rated (i) level A in terms of solvency and level B in terms of management, (ii) level B in terms of solvency and level A in terms of management, or (iii) level B in terms of solvency and level B in terms of management. |
| Category III: | This category is reserved for financial institutions that have been rated (i) level B in terms of solvency and level B in terms of management for two or more consecutive review periods, (ii) level A in terms of solvency and level C in terms of management, or (iii) level B in terms of solvency and level C in terms of management. |
| Category IV: | This category is reserved for financial institutions that are rated level A or B in terms of solvency and have been rated level C in terms of management for two or more consecutive review periods. |
| Category V: | This category is reserved for financial institutions that have been rated level C in terms of solvency, irrespective of their rating level of management. |
A bank’s solvency may be classified in level A, B or C in accordance with the following:
| ● | Level A (solvency): when a bank’s Regulatory Capital (or Total Capital) to risk weighted assets ratio (including additional tier 1 Capital associated with conservation buffer) is equal to or greater than 10.5% and, when applicable, the additional requirements of systemic and countercyclical buffers and Pillar 2 buffer. Likewise, the common equity tier 1 to risk weighted assets ratio must be 7.0% or higher and, when applicable, the additional requirements of systemic and countercyclical buffers and Pillar 2 buffer. Finally, the ratio between the common equity tier 1 and total assets must be 3% or higher, and, when applicable, the domestic, systemic buffers. |
94
| ● | Level B (solvency): bank that meets requirements for common equity tier 1 capital and Regulatory Capital (or Total Capital), but does not meet the additional requirements stated for Level A (solvency). |
| ● | Level C (solvency): bank that meets neither Common Equity Tier 1 Capital nor Regulatory Capital (or Total Capital) requirements as required by the General Banking Act. |
With respect to a bank’s management rating, level A banks are those that are not rated as level B or C. Level B banks display some weakness in corporate governance, internal controls, IT security, information systems for decision making, timely follow-up of risks private risk rating or ability to manage contingency scenarios. Level C banks display significant deficiencies in the matters previously mentioned
The above-mentioned requirements are set forth in both the General Banking Act and the Chapter 1-13 of the Recopilación Actualizada de Normas of the CMF (the Revised Compilation of Norms). The latter further states an array of requirements, guidelines and good practices to be considered by banks in the management of business continuity risks, considering the volume and complexity of their operations. The corresponding adherence to these practices will be considered in the management evaluation “Solvency and Management Classification” carried out by the CMF.
Obligations Denominated in Foreign Currencies
Foreign currency-denominated obligations of Chilean banks are subject to two requirements:
| ● | a reserve requirement of 9% for demand deposits and 3.6% for time deposits (see “—Reserve Requirements”); and |
| ● | net foreign currency outflows may not exceed the amount of the Common Equity Tier 1 Capital for the next 30 days as measured by the C46 index. |
Capital Markets
Under the General Banking Act, banks in Chile may purchase, sell, place, underwrite and act as paying agents with respect to certain debt securities. Likewise, banks in Chile may place and underwrite certain equity securities. Bank subsidiaries may also engage in debt placement and dealing, equity issuance advice and securities brokerage, as well as mutual fund and investment fund administration, factoring, investment advisory services and merger and acquisition services. The CMF regulates these subsidiaries.
Legal Provisions Regarding Banking Institutions with Economic Difficulties
The General Banking Act provides that if specified adverse circumstances exist at any bank, it must promptly inform the CMF and must shortly present them an early regularization plan duly approved by its board of directors. If the plan is approved by the CMF, which may also require additional measures, the bank must report periodically to the regulator regarding the implementation of such plan. All the communications between a bank with economic difficulties and the CMF regarding this matter are reserved. If, among the measures addressed by the early regularization plan, a capital increase is required, the board of directors must call for an extraordinary shareholders meeting setting forth the conditions of such capital increase, which must be approved by the banking regulator. Another measure that may be included in the early regularization plan is that the bank may receive a loan of up to three-year term from other bank(s). The terms and conditions of such loan must be approved by the board of directors of both banks, as well as by the banking regulator, but need not be submitted to the borrowing bank’s shareholders for their approval. A creditor bank may not grant such interbank loans to an insolvent bank in an amount exceeding 25% of the creditor bank’s Regulatory Capital (or Total Capital). Such loan may only be repaid if the borrowing bank complies with certain capital requirements. If this loan is not repaid timely, the General Banking Law provides the possibility that such loan may be capitalized by the lending banks in the form of equity of the borrowing bank.
95
The CMF may further impose certain prohibitions to banks with economic difficulties such as prohibitions on granting loans to related parties, renewing any loan in excess of 180 days, releasing guarantees, acquiring or selling certain assets, granting unsecured loans, investing in any securities other than instruments issued by the Central Bank or by the Chilean Treasury, among others. Furthermore, if the bank with economic difficulties does not present an early regularization plan (or if it is unfulfilled or breached by this bank, among other reasons provided by the General Banking Act), the banking regulator may appoint a delegate inspector to oversee the bank’s operations or a provisional administrator (appointment to be approved by the Central Bank as well) who will take over the powers and authority of the bank’s board of director and chief executive officer; however, the provisional administrator authority is limited to the extent provided by the General Banking Act and should always be in line with the interests of depositors, creditors and those of the general public related to financial stability.
Dissolution and Liquidation of Banks
The banking regulator may establish that a bank should be liquidated for the benefit of its depositors or other creditors when the bank does not have the necessary solvency to continue its operations. In which case, the CMF must revoke the bank’s authorization to exist and order its mandatory liquidation, subject to the agreement of the Central Bank. The General Banking Act establishes certain criteria by which it will be deemed that a bank does not have the necessary solvency or that the safety of its depositors may be jeopardized, such as when it does not reach certain minimum or Regulatory Capital (or Total Capital) thresholds, upon aggregate and consecutive losses, when urgency credits with the Central Bank are due and when it has suspended the repayment of its obligations. The resolution of the banking regulator must state the reason for ordering the liquidation and must name a liquidator. When a liquidation is declared, all current accounts, other demand deposits received in the ordinary course of business, other deposits unconditionally payable immediately or that have a maturity of no more than 30 days, and any other deposits and receipts payable within 10 days of its maturity date, are required to be paid by using the bank’s existing funds, its deposits with the Central Bank, or its investments in instruments that represent its reserves. If these funds are insufficient to pay these obligations, the liquidator may seize the bank’s remaining assets, as needed. If necessary, and in specified circumstances, the Central Bank will lend the bank the funds necessary to pay these obligations. Any such loans are preferential to any claims of other creditors of the liquidated bank.
Investments in Foreign Securities
Under current Chilean banking regulations, banks in Chile may grant loans to foreign individuals and entities and invest in certain foreign currency securities. Chilean banks may only invest in equity securities of foreign banks and certain other foreign companies which may be affiliates of the bank or which would support the bank’s business if such companies were incorporated in Chile. Banks in Chile may also invest in debt securities traded in formal secondary markets. Such debt securities shall qualify as (i) securities issued or guaranteed by foreign sovereign states or their central banks or other foreign or international financial entities, and (ii) bonds issued by foreign companies. Such foreign currency securities must have a minimum rating as indicated in the table below and, if the investments in these securities and the loans referred to above exceed 70% of the Regulatory Capital (or Total Capital) of the bank, an allowance for 100% of the excess shall be established:
Rating Agency | Short Term | Long Term | ||
| Moody’s Investor Service (Moody’s) | P2 | Baa3 | ||
| Standard and Poor’s (S&P) | A2 | BBB– | ||
| Fitch Rating Service (Fitch) | F2 | BBB– | ||
| Dominion Bond Rating Service (DBRS) | R2 | BBB(low) |
A Chilean bank may invest in securities having a minimum rating as follows, provided that if the total amount of these investments and the loans referred to above exceed 20% (or 30% in certain cases) of the Regulatory Capital (or Total Capital) of the bank, an allowance of 100% of the excess shall be established by the bank:
Rating Agency | Short Term | Long Term | ||
| Moody’s Investor Service (Moody’s) | P2 | Ba3 | ||
| Standard and Poor’s (S&P) | A2 | BB– | ||
| Fitch Rating Service (Fitch) | F2 | BB– | ||
| Dominion Bond Rating Service (DBRS) | R2 | BB(low) |
96
However, a Chilean bank may invest in securities up to an additional amount of 70% of the bank’s Regulatory Capital (or Total Capital) without having to establish an additional allowance, if such securities have a minimum rating of:
Rating Agency | Short Term | Long Term | ||
| Moody’s Investor Service (Moody’s) | P1 | Aa3 | ||
| Standard and Poor’s (S&P) | A1+ | AA– | ||
| Fitch Rating Service (Fitch) | F1+ | AA– | ||
| Dominion Bond Rating Service (DBRS) | R1(high) | AA(low) |
Subject to specific conditions, a bank may grant loans in U.S. dollars to subsidiaries or branches of Chilean companies located abroad, to companies listed on foreign stock exchanges located in countries with an international risk rating no less than BB- or its equivalent and, in general, to individuals and entities residing or domiciled abroad.
Internationalization of the Chilean peso
In recent years, the Central Bank has enacted regulation with the purpose of internationalizing our local currency, the Chilean peso. Until recently, the Chilean peso was used only in the local market. These regulations include a rule issued in December 2020, by virtue of which certain offshore transactions denominated in Chilean pesos shall be allowed. For instance, since March 2021, Chilean banks may: (i) execute off-shore derivative transactions settled or paid in Chilean pesos; (ii) open and maintain Chilean peso denominated current accounts to non-Chilean residents and (iii) grant off-shore loans denominated in Chilean pesos to non-Chilean residents. Likewise, since September 2021, Chilean residents are permitted to make Chilean peso denominated foreign deposits or investments and to grant loans, make capital contributions and other investments abroad, all denominated in Chilean pesos.
Procedures for the Management of Information of Interest to the Market
In order to ensure compliance with the provisions of the Ley de Mercado de Valores No. 18,045 (the Chilean “Securities Market Law”) and further specific regulations, our board of directors has approved the Manual for the Management of Information of Interest to the Market (the “Manual”).
The Manual’s main objective is to provide timely disclosure of our policies and internal regulations in connection with the disclosure of information to the public and the systems that have been implemented by us.
In addition, these policies and internal regulations establish codes of conduct that our employees and other persons with access to certain information must comply with in order to protect information related to us.
The Manual is available to the general public on our web page at www.bancochile.cl.
Prevention of Money Laundering and the Financing of Terrorism
Law No. 19,913, enacted in 2003, created the Financial Analysis Unit and established specific regulation regarding money laundering. The CMF issues further regulations governing the requirements applicable to banks with respect to prevention of money laundering and terrorism financing. The regulations, as amended, are aimed at incorporating international AML and terrorism financing laws to the Chilean banking industry. Pursuant to these regulations, the CMF requires that banks implement an Anti-Money Laundering and Terrorism Financing system based mainly on the “know your customer” and source of wealth concepts. Moreover, these policies and procedures must be approved by the board of directors of each bank and must consider the volume and complexity of its operations and other related parties.
Based on these requirements, a Customer Identification Program (as part of the Anti-Money Laundering and Terrorism Financing system) is needed to enable a bank to establish the reasonable belief that it knows the true identity of its customers. In general, the program includes controls and procedures to:
| ● | properly identifying customers, including their background, source and amount of funds, country of origin and other risk factors; |
97
| ● | identifying and monitoring what the CMF has defined as politically exposed persons (“PEPs”) both within Chile and abroad; and |
| ● | ensuring a safe and suitable account opening process, with different documentation requirements needed for different types of accounts and products. |
The Anti-Money Laundering and Terrorism Financing system required by local regulations must also include the following components:
| ● | AML policies and procedures aimed at preventing a bank from being used as an intermediary to carry out money laundering operations; |
| ● | appointment of a compliance officer on a senior management level who is responsible for coordinating and monitoring day-to-day AML compliance; |
| ● | establishment of an AML Committee for the purposes of planning and coordinating compliance with AML policies and procedures; |
| ● | use of software tools to detect, monitor and report unusual operations related to transactions made by customers on different products; |
| ● | implementation of personnel selection policies and a training program, in order to prevent money laundering; |
| ● | establishment of a Code of Conduct in order to, among other things, guide employee behavior and prevent possible conflicts of interest; and |
| ● | independent testing by the compliance department, which must be conducted by a bank’s internal audit department. |
In 2015, further rules regarding the PEPs were issued by the banking regulator. Among others, they require banks to keep specific PEPs policy and procedures in place to grant certain loans to PEPs, as well as to carry out controls procedures associated with service providers when PEPs are involved therewith.
Legal Provisions for the Prevention, Detection and Prosecution of Corruption.
Law No. 21,121, which came into force on November 20, 2018, amends the Criminal Code, Law No. 20,393 on Criminal Liability of Legal Entities, and Law No. 19,913 that creates the Financial Analysis Unit and deals with Money Laundering, addresses business-to-business bribery and discretion abuse, increasing prison time and pecuniary penalties and criminalizing corruption and unfair administration affecting private individuals and companies, among other matters. For the first time, our legislation criminalizes the behavior of private businesses with the aim of regulating transparency between them, without the need for a public official to participate in the crime, and with a very wide range of alternatives that could configure the crime. Particularly, with respect to the crime of unfair administration, this law incorporates a penalty for anyone who, being responsible for the management of third party assets, commits abusive acts or omissions that damage the owner of those assets.
98
Consumer-Oriented Regulation
During the last decade, a wide array of legislation has been enacted with the purpose of enhancing consumer rights.
Among the latest relevant consumer legislation enacted in Chile, Law 21,081 came into force on March 14, 2019 and amended the Consumer Protection Law (Law No. 19,496). This amendment aims to strengthen consumer protection, granting new powers to SERNAC in matters of oversight. Likewise, fines are increased and the authority of SERNAC is reinforced in the scope of collective actions and collective voluntary procedures. The main reforms affecting banks as financial services providers are, among others:
| ● | SERNAC inspectors shall be empowered to request the assistance of public force to be granted by local courts, in the event that the provider does not provide access to its facilities to SERNAC. |
| ● | SERNAC is granted authority to initiate collective voluntary procedures. |
| ● | Fines for adhesion contract infringement and misleading advertising are increased to up to 1,500 UTM (Unidades Tributarias Mensuales) which, as of December 31, 2021, would amount to approximately Ch$81.3 million (approximately U.S.$95,300). |
| ● | For the determination of fines, within the framework of collective actions, mitigating and aggravating circumstances and the number of affected consumers will be weighted. In case of full and effective compensation damages for all consumers, a lump sum will be applied as a fine, which may not exceed 30% of the sales of the product or service line made in the period of the infringement, or double the economic benefit obtained as a result of it. In any case, the fine may not exceed 45,000 UTA (Unidades Tributarias Anuales) for each event, which as of December 31, 2022 amounted to approximately Ch$29,252.3 million (approximately U.S.$36.5 million). |
| ● | In collective lawsuits, in addition to the material damage, moral damage may be also sought, and the judge may establish a common minimum amount. |
| ● | The court is empowered to increase the amount of the compensation granted by 25% in case of aggravating circumstances, established in the Consumer Protection Law. |
During May 2020, Law 20,009 regarding liabilities of payment service providers (such as banks) and their customers, was modified, setting new standards in cases of fraudulent transactions carried out with credit or debit cards, including those by electronic means. It was established that funds charged to credit or debit cards for transactions that are not recognized by the customer, must be returned to the cardholder’s account. Specifically, this legislation provides that, if such unrecognized charged funds are up to an amount of UF 35 (equivalent to Ch$1.1 million as of December 31, 2022), the payment service provider are obligated to return these funds to the cardholder’s account within five business days. In case of unrecognized charges for amounts over the limit of UF 35, the payment service provider has an additional term of seven days to return the amounts in excess of UF 35. However, in this case, the payment service provider may retain such excess if it believes itself to have sufficient evidence to determine that the customer acted fraudulently or with gross negligence, in which case the payment service provider will be required to prove this to the applicable court. Also, this law prohibits payment service providers to offer fraud insurance for such cards. It further establishes obligations for the payment service provider to take adequate measures to protect the payment services in case of unlawful acts, holding them liable for damages caused by security and protection deficiencies in their technological systems through which such services are provided. Accordingly, this law establishes that certain fraudulent transactions with credit or debit cards and electronic payments (such as forgery of credit or debit cards, sale of forged or stolen cards and/or its data, impersonation of a card/accountholder, etc.) are constitutive of crimes subject to imprisonment penalties and fines up to threefold the amount of the fraudulent transaction. Further, it grants the Chilean Public Ministry (public prosecutors) broad powers to investigate these crimes when they are suspected to be related to organized crime. Some of the effects that this new regulation has caused since its publication are: (i) banks’ liabilities towards clients in cases of fraudulent transactions carried out with credit or debit cards, including those by electronic means, have increased; (ii) litigation and related costs have increased; (iii), thresholds and evidentiary standards were raised in litigation to determine the liability of the customer. For more information on this specific regulation and other bills currently being discussed in the Chilean Congress, and laws recently enacted, related to consumer protection, see “Item 3. Key Information—Risk Factors—Risks Relating to our Operations and the Chilean Banking Industry—Restrictions imposed by banking regulations may constrain our operations and thereby adversely affect our financial condition and results.”
In June 2020, the Chilean Congress passed a law known as “Financial Portability,” which aims to simplify the bank switching process for individual customers and SMEs of certain products, while also reducing the costs and time associated with the process. In summary, all banking customers holding: (i) a savings account, (ii) a demand account, (iii) electronic checks, (iv) a line of credit, (v) credit or debit cards, (vi) time deposits, (vii) mutual funds, (viii) consumer loans, (ix) auto-finance loans, (x) residential mortgage loans, or (xi) a combination of these products, are able to transfer such services to other financial service providers in order to improve the financial terms of any banking product or a group of products, such as interest rates, tenors and related benefits. The bank switching process is managed by the provider receiving the new customer.
99
Maximum Legal Interest Rates
Maximum interest rates are regulated by Law 20,715, enacted in 2013. This legislation affects all Chilean businesses that charge interests (including all banks, department stores and any other commerce or financial provider) on loans up to UF 200 (approximately Ch$6.2 million or U.S.$7,270 as of December 31, 2021), including installment loans, credit cards and credit lines related loans, as well as overdue loans. This regulation established among other things, a new methodology for calculating the maximum legal interest rate for loans –not indexed to inflation– longer than a 90-day term, which resulted in a reduction of the maximum legal interest rate applicable to such debtors.
We cannot rule out that new limits to the maximum interest rates may be imposed to local banks or foreign banks operating in Chile in the future. Furthermore, as of the date of this annual report, amendments to this legislation are under discussion in the Chilean Congress. For further information, see “Item 3. Key Information—Risk Factors—Risks Relating to our Operations and the Chilean Banking Industry—Restrictions imposed by banking regulations may constrain our operations and thereby adversely affect our financial condition and results.”
Credit Risk Provisioning
On July 6, 2018 the banking regulator published a set of amendments (Circular No. 3,638) to Chapter B-1 of Compendio de Normas Contables introducing changes to provisioning rules for commercial loans evaluated on a group basis. From the banking regulator’s point of view, these new rules are aimed at supplementing the changes introduced in 2014 (Circular No. 3,573 mentioned above) by establishing a standardized methodology to compute minimum acceptable level of loan loss allowances for commercial loans evaluated on a group basis that banks should recognize on their balance sheet. The new framework is composed of three methods depending on the type of loans, as follows: (i) leasing loan allowances will be set by taking into account delinquency the type of asset underlying the contract and the ratio of present value to book value, (ii) student loan allowances will be based on the type of loan (government-backed or not), if the loan is callable or not and delinquency, and (iii) other commercial loan allowances will be set based on delinquency, guarantees backing the loan and the loan to guarantee ratio. In addition, the new set of rules also addressed other topics related to loan provisioning, including (i) a minimum risk index of 0.5% for other-than-past-due loans that a bank must hold on an individual basis and on a consolidated basis considering both operations in Chile and abroad, (ii) the establishment that allowances for leasing residential loans must be in consistency with residential mortgage loans managed by the same bank, and (iii) that non-performing residential mortgage loans will drag into the same condition other credits owed by the same debtor for provisioning purposes. The new provisioning criteria became effective in July 2019 and had no material impact on our results of operations.
On April 27, 2021, to further align Chapter B-1 of the Compendium of Accounting Standards for Banks to the Basel III framework, the CMF published for comment some modifications to the Chapter B-1, such as those associated with loan provisioning guidelines by introducing the precise treatment for certain sub-segments of the group-based evaluated portfolio. The final ruling was published on August 19, 2021 with no major changes in comparison with the formerly proposed modifications. We do not foresee a material impact related to these modifications neither under Chilean GAAP nor IFRS.
For more information for the years ended December 31, 2013, 2014, 2015, 2016 and 2017, respectively, please refer to “Item 4—Information on the Company—Regulation and Supervision—Credit Risk Provisioning” in our annual report on Form 20-F for the year ended December 31, 2019 filed with the SEC on April 29, 2020.
Amendments to the Reform that Modified the Chilean Tax System
Since 2014, the tax system has been subject to relevant modifications and reforms. The 2014 tax reform (Law No. 20,780) aimed to gradually increased the first category tax or corporate tax rate between 2014 and 2018 while establishing two alternative tax regimes from 2017 onwards: (i) the Semi-Integrated Regime and (ii) the Attribution Regime.
100
Notwithstanding the above, in February 2016, a new tax law was enacted (Law No. 20,899), aiming to simplify the 2014 reform by limiting the possibility of choosing between the two alternative tax regimes. In fact, according to this amendment to the Chilean tax system, publicly traded companies are only subject to the Semi-Integrated Regime. Consequently, the statutory corporate tax rate for Banco de Chile was 25.5% in 2017 and 27.0% from 2018 onwards.
The tax reform also affects the taxes levied on dividends received by investors that hold shares of common stock or ADS from 2017 onwards. Under the Semi-Integrated Regime, holders of shares or ADS pay taxes on the dividends effectively received from the company (withholding tax of 35% for foreign investors and a general regime tax for local investors). Foreign investors from Double Taxation Avoidance Treaty (“DTAT”) countries are able to use 100% of the corporate tax paid by the company as a tax credit. However, local investors and holders from non-DTAT countries are permitted to use only 65% of the corporate tax paid by the company as a tax credit.
However, in order to provide evidence of their tax residence, foreign holders of our ADSs or of our shares of common stock must send to Banco de Chile a certificate of residence issued by their local tax authority. This certificate must be legalized or apostilled and valid at the moment of the distribution of dividends, otherwise the Tax credit will be 65%.
In addition, Law No. 20,899 permits investors to use 100% of the corporate tax paid by the company as a tax credit, if investors reside in countries that were part of DTAT before January 1, 2017, even though the DTAT was not in force from 2017 onwards. However, this special treatment only applied until December 31, 2019.
Consequently, Law No. 21,047 enacted on November 23, 2017 extended the previously mentioned exemption until December 31, 2021, with regard to DTAT signed through January 1, 2019 and pending to enter into force as of December 31, 2021. Finally, Law No. 21,210 published in February 2020, further extended this exemption to Double Taxation Treaties signed through January 1, 2020, including the treaty signed with the United States, until 2026.
Based on the above, the effective tax rate paid by local (individual) investors or foreign holders from non-DTAT countries would increase up to 44.45%. This would be the effect of adding together both taxes paid by the company on earnings before distributing dividends and taxes paid by this type of investor when receiving those dividends, given the inability to use 100% of the corporate tax expense as tax credit.
During 2018 the Chilean Government sent a bill to the Chilean congress, which was intended to modernize the Chilean tax system by introducing a set of technical adjustments in order to simplify the current tax system, while incorporating new regulations related to the integration of the whole tax system and introducing new taxes on digital services, among other topics. The bill, however, was not passed by the Chilean Congress. Moreover, following the social unrest which occurred in Chile during late 2019, the Ministry of Finance reformulated the former bill in order to address social demands, by increasing tax collection, while resigning to certain elements originally proposed by the Chilean Government, with the purpose of reaching an agreement in the Congress. As a result of the latter, Law No. 21,210, which modernizes the local tax system, was enacted and became law during February 2020. This new law mainly focuses on: (i) entrepreneurship promotion measures by providing SMEs with a special tax regime based on total integration and a statutory tax rate of 25%, as opposed to large companies and corporations, which will continue to be subject to a semi-integrated system while bearing a statutory corporate tax rate of 27%, (ii) initiatives promoting private investment by introducing instantaneous or accelerated depreciation for fixed-assets, reducing the time frame to receive reimbursements of VAT paid on fixed-assets, (iii) reductions or exemptions of property taxes paid by elderly people and low income pensioners; (iv) increasing taxes paid by high-income individuals by means of adding a new tax bracket of 40%, and raising taxes on properties that exceed U.S.$500,000 in assessed value, (v) incorporating a regional green tax of 1% levied on investment projects exceeding U.S.$10 million in capital expenditures that were subject to environmental approval, (vi) lowering tax benefits on capital gains obtained in stock markets, (vii) creating a Taxpayer Protection & Advisory Agency, which aims to be a counterpoint to the Chilean Internal Revenue Service on taxation matters, and (viii) introducing a digital approach, which considers both the compulsory use of electronic bill and invoices, aimed at reducing tax evasion, and the imposition of VAT on digital services. In addition, this law maintains Stock dividends (distributions of fully paid-in shares) free of tax for the shareholders at the moment of distribution. Nevertheless, capital gains associated with the sale of shares formerly received as stock dividends are subject to the general tax regime. Therefore, foreign investors will be subject to Chilean Withholding Tax on capital gains arising as a consequence of the sale of shares received as stock dividends. Law No. 21,210 established that shares will have no acquisition cost for tax purposes and will not be eligible for sale under Article 107 of the Chilean Income Tax Law, being the total amount of the sale price affected by the general tax regime.
101
On September 2, 2020, Law No 21,256 was enacted establishing additional tax measures as part of the emergency plan for economic reactivation following the COVID-19 pandemic. Among others, the main measures included in this law were: (i) temporary reduction of the statutory corporate tax rate to 10% for SMEs for the business years 2020, 2021 and 2022, (ii) refund of accumulated VAT for purchases and/or services acquired between January and May 2020 by SMEs, and (iii) a temporary additional accelerated depreciation for fixed assets newly and imported acquired between June 1, 2020 and December 31, 2022, for all types of companies.
In February 2022, Law No. 21,420 was enacted with the purpose of increasing tax collection by an amount equivalent to 0.7% of GDP in order to finance the universal guaranteed pension for individuals belonging to the bottom 80% of the population by income. The main tax measures included in this law are: (i) the extension of VAT to any service that was not formerly exempt for services provided after January 1, 2023, (ii) the establishment of the same treatment for financial and tax purposes for financial leasing agreements entered into on or after January 1, 2023, (iii) a 10% tax on capital gains produced by the sale of actively traded stocks (under definitions established by the Chilean Internal Revenue Service (“Chilean IRS”)) for sales performed on or after September 1, 2022, which will not apply to local or foreign institutional investors, (iv) an inheritance tax on profits from life insurance contracts agreed on or after February 4, 2022, (v) an increase in the wealth tax on real estate from 0.275% to 0.425% starting January 1, 2023, (vi) the elimination of the special VAT credit for construction companies targeting middle income homes starting January 1, 2025, (vii) the establishment of a 2.0% annual tax on luxury goods such as airplanes, helicopters, yachts and luxury vehicles, (viii) the reduction of tax benefits on middle income housing, namely, DFL No. 2 of 1959, by limiting the benefit to individuals only and for a maximum of two homes, regardless of the purchase date, starting January 1, 2023, (ix) the elimination of the tax credit on the purchase of fixed assets for large companies and (x) the increase of mining patents’ value.
For more information on current bills being discussed in the Chilean Congress addressing taxation, see “Item 3. Risk Factors—Risks Relating to our Operations and the Chilean Banking Industry— Restrictions imposed by regulations may constrain our operations and thereby adversely affect our financial condition and results” and for additional information in the Chilean Tax framework, see “Item 10. Additional Information—Taxation—Chilean Tax Considerations.”
Bankruptcy Law
Chilean Bankruptcy Law aims to promote agreements and avoid liquidations became effective. Among the main changes introduced by this law is Article 57, which is intended to protect debtors and provides that, during a 30-day term beginning on the date of the appointment of observers:
| (i) | the creditors of a debtor may not request its liquidation; |
| (ii) | no proceeding seeking the issuance of a warrant of attachment, execution or similar process may be initiated against a debtor; |
| (iii) | no proceeding seeking the restitution of leased assets may be initiated against a debtor; |
| (iv) | all proceedings referred to in (ii) and (iii) directly above will be suspended, as well as the term of the statute of limitations; |
| (v) | all the agreements entered into by a debtor will remain valid and effective and its payments terms and conditions will remain in force. Consequently, these agreements may not be early terminated without the consent of the debtor nor be enforced, even if the commencement of a reorganization proceeding under the Bankruptcy Law constitutes an event of default under such agreement. Thus, any guarantees granted to secure the obligations of the debtor may not be enforced; and |
| (vi) | if a debtor forms part of a public registry as a contractor or service provider, and it is in compliance with its obligations with the relevant principal, it cannot be excluded from such public registry and may not be prohibited from participating in any relevant bidding process. |
102
Reporting of Operational and Cybersecurity Incidents
According to Chapter 20-8 of Recopilación Actualizada de Normas, banks must report immediately to the SBIF certain types of significant operational incidents in order to keep the regulator properly informed. For purposes of the regulation, an operational incident is deemed significant if the event affects the business continuity, information security or reputation of the bank.
During 2018, the regulator introduced modifications to the regulation associated with the management of operational risk by supplementing Chapters 1-13 and 20-8 of Recopilación Actualizada de Normas with specific guidelines on cybersecurity matters. Under this amendment, the SBIF widens its scope of supervision by incorporating cybersecurity matters through the continuous assessment of banks’ critical technological infrastructure that exposes banks to risks of data integrity, data availability and confidentiality of clients’ information. Also, a dedicated digital platform was created, through which banks should report directly to the regulator within a 30-minute time frame the occurrence of an incident and requires the appointment of the bank’s representative to be in charge of the communication with the CMF for these purposes. Similarly, banks are required to timely inform customers and users about cybersecurity incidents affecting quality and continuity of services, as well as incidents that are publicly known. In addition, under these guidelines, banks are compelled to maintain an alert system at an industry level in order to share information about incidents and measures that should be taken in order to mitigate widespread impact.
Volcker Rule
The Volcker Rule became effective during 2015 in the United States as part of the Dodd–Frank Wall Street Reform and Consumer Protection Act. Among other topics, the Volcker Rule limits proprietary trading and positions taken by banks in covered funds by establishing specific conditions for carrying out these activities. Also, this regulation establishes specific corporate governance measures for conducting these businesses to avoid conflict of interest and high-risk trading strategies by banks.
Section No. 619 of the Volcker Rule is applicable to Citigroup. Since we and our subsidiaries are considered to be Citigroup’s subsidiaries for purposes of this rule, during 2015 we comprehensively revised our internal policies and procedures to establish, maintain, enforce, test and modify our Volcker Rule Compliance Program to enable Citigroup to comply with its regulatory requirements. The new requirements and amendments introduced to the Volcker Rule during 2019, to the extent applicable, have been implemented into our Volcker Rule Compliance Program within the required time periods.
103
ORGANIZATIONAL STRUCTURE
The following diagram presents our current corporate structure, including our subsidiaries and their respective direct ownership interests, as of April 20, 2022:

All of the subsidiaries presented above have their jurisdiction of incorporation in the Republic of Chile. See “—Business Overview—Principal Business Activities—Operations through Subsidiaries” for more information on our subsidiaries.
On February 4, 2021, we began a voluntary and anticipated dissolution process for Banchile Securitizadora S.A. as approved by the subsidiary’s shareholders during the extraordinary meeting held on the same date. The dissolution was approved by the CMF and the process of liquidation is still in progress.
104
PROPERTY, PLANT AND EQUIPMENT
We are based in Chile and own the building located at Paseo Ahumada 251, Santiago, Chile, that is approximately 77,500 square meters and serves as the headquarters for the Bank and its subsidiaries. In addition, we own both office and parking space in four other buildings located at Huerfanos 740, Agustinas 733, Andrés Bello 2687 and El Bosque 500, Santiago, Chile where the remainder of our executive offices are located. The total area we own in these buildings is equivalent to approximately 46,300 square meters.
As of December 31, 2021, we owned the properties on which 148 of our full-service branches and other points of sale are located (approximately 109,125 square meters of office space). Also, as of December 31, 2021, we had leased office space for 116 of our full-service branches with office space of approximately 39,021 square meters. Lastly, the 11 remaining branches and other points of sale were managed through a combined model by which part of the branch surface is owned and the remaining branch surface is under a leasing contract. Also, in some cases, we entered into special partnership agreements with the property’s owners.
We also own properties throughout Chile for back office and administrative operations, as well as for storage of documents and other purposes. We believe that our facilities are adequate for our present needs and suitable for their intended purposes.
As of December 31, 2021, we also owned approximately 134,250 square meters in mainly recreational physical facilities in Chile, which we use to assist our employees in maintaining a healthy work and life balance and which we use for incentive and integration activities.
Our 2022 infrastructure expenditures budget includes disbursements associated with general maintenance investments (34.0%), the consolidation of our branch network as a result of a new customer service model we continue to deploy in some of our locations (30.0%), renovation and restoration of our corporate buildings (20.9%), reconstitution of infrastructure related to contingency issues (12.0%) and other initiatives related to subsidiaries and security expenditures (3.1%).
105
SELECTED STATISTICAL INFORMATION
The following information is included for analytical purposes and should be read in conjunction with our audited consolidated financial statements as of and for the year ended December 31, 2021 appearing elsewhere in this annual report and “Item 5. Operating and Financial Review and Prospects.”
Average Balance Sheets, Interest Earned on Interest Earning Assets and Interest Paid on Interest Bearing Liabilities
The average balances for interest-earning assets and interest-bearing liabilities, including interest and readjustments received and paid, were calculated on the basis of our daily balances and on the basis of monthly balances for our subsidiaries. These average balances are presented in Chilean pesos (Ch$), in UF and in foreign currencies (principally the U.S. dollar). The UF is an inflation-indexed Chilean monetary unit of account with a value in Chilean pesos which is linked to, and which is adjusted daily to reflect changes in, the CPI of the Chilean National Institute of Statistics.
The nominal interest rate has been calculated by dividing the amount of interest and inflation adjustment gain or loss during the period by the related average balance, both amounts expressed in Chilean pesos.
Foreign exchange gains or losses on foreign currency-denominated assets and liabilities have not been included in interest revenue or expense. Interest received on past-due loans includes interest on such loans from the original maturity date. For our impaired portfolio and high risk loans, we apply a conservative approach of discontinuing accrual-basis recognition of interest revenue in the income statement and they are only recorded once received.
Included in cash and due from banks are current accounts maintained in the Central Bank and overseas banks. Such assets have a distorting effect on the average interest rate earned on total interest earning assets because of balances maintained in:
| ● | the Central Bank, only the portion that is legally required to be held for liquidity purposes earns interest; and |
| ● | overseas banks earn interest on certain accounts in certain countries. |
Consequently, the average interest earned on such assets is comparatively low. These deposits are maintained by us in these accounts to comply with statutory requirements and to facilitate international business, rather than to earn income.
106
The following tables set forth, by currency of denomination, average balances and, where applicable, interest amounts and nominal rate for our assets and liabilities under IFRS for the years ended December 31, 2019, 2020 and 2021:
| For the Year Ended December 31, | ||||||||||||||||||||||||||||||||||||
| 2019 | 2020 | 2021 | ||||||||||||||||||||||||||||||||||
| Average Balance | Interest | Average Nominal Rate | Average Balance | Interest | Average Nominal Rate | Average Balance | Interest | Average Nominal Rate | ||||||||||||||||||||||||||||
| (In millions of Ch$, except percentages) | ||||||||||||||||||||||||||||||||||||
| IFRS: | ||||||||||||||||||||||||||||||||||||
| Assets | ||||||||||||||||||||||||||||||||||||
| Interest earning assets | ||||||||||||||||||||||||||||||||||||
| Financial Investments | ||||||||||||||||||||||||||||||||||||
| Ch$ | Ch$ | 2,156,285 | Ch$ | 68,528 | 3.18 | % | Ch$ | 3,875,777 | Ch$ | 35,019 | 0.90 | % | Ch$ | 5,158,059 | Ch$ | 70,727 | 1.37 | % | ||||||||||||||||||
| UF | 537,993 | 20,010 | 3.72 | 470,582 | 17,011 | 3.61 | 619,017 | 55,976 | 9.04 | |||||||||||||||||||||||||||
| Foreign currency | 135,731 | 5,464 | 4.03 | 77,691 | 2,890 | 3.72 | 10,581 | 105 | 0.99 | |||||||||||||||||||||||||||
| Total | 2,830,009 | 94,002 | 3.32 | 4,424,050 | 54,920 | 1.24 | 5,787,657 | 126,808 | 2.19 | |||||||||||||||||||||||||||
| Loans in advance to Banks | ||||||||||||||||||||||||||||||||||||
| Ch$ | 823,533 | 17,187 | 2.09 | 1,677,319 | 6,826 | 0.41 | 2,766,249 | 17,353 | 0.63 | |||||||||||||||||||||||||||
| UF | — | — | — | — | — | — | — | — | — | |||||||||||||||||||||||||||
| Foreign currency | 363,308 | 10,270 | 2.83 | 297,226 | 4,983 | 1.68 | 271,134 | 1,960 | 0.72 | |||||||||||||||||||||||||||
| Total | 1,186,841 | 27,457 | 2.31 | 1,974,545 | 11,809 | 0.60 | 3,037,383 | 19,313 | 0.64 | |||||||||||||||||||||||||||
| Commercial loans | ||||||||||||||||||||||||||||||||||||
| Ch$ | 7,196,336 | 449,502 | 6.25 | 8,575,948 | 414,847 | 4.84 | 10,138,902 | 415,403 | 4.10 | |||||||||||||||||||||||||||
| UF | 6,017,552 | 296,653 | 4.93 | 6,275,327 | 279,478 | 4.45 | 6,234,862 | 455,601 | 7.31 | |||||||||||||||||||||||||||
| Foreign currency | 2,532,428 | 104,200 | 4.11 | 2,472,405 | 74,832 | 3.03 | 2,251,039 | 47,479 | 2.11 | |||||||||||||||||||||||||||
| Total | 15,746,316 | 850,355 | 5.40 | 17,323,680 | 769,157 | 4.44 | 18,624,803 | 918,483 | 4.93 | |||||||||||||||||||||||||||
| Consumer Loans | ||||||||||||||||||||||||||||||||||||
| Ch$ | 4,342,319 | 633,192 | 14.58 | 4,062,452 | 528,154 | 13.00 | 3,852,841 | 439,235 | 11.40 | |||||||||||||||||||||||||||
| UF | 61,777 | 5,006 | 8.10 | 86,638 | 5,113 | 5.90 | 68,802 | 7,373 | 10.72 | |||||||||||||||||||||||||||
| Foreign currency | 41,146 | — | — | 29,528 | — | — | 36,657 | — | — | |||||||||||||||||||||||||||
| Total | 4,445,242 | 638,198 | 14.36 | 4,178,618 | 533,267 | 12.76 | 3,958,300 | 446,608 | 11.28 | |||||||||||||||||||||||||||
| Residential mortgage loans | ||||||||||||||||||||||||||||||||||||
| Ch$ | 33,311 | 169 | 0.51 | 33,716 | 305 | 0.90 | 37,087 | 526 | 1.42 | |||||||||||||||||||||||||||
| UF | 8,528,134 | 531,840 | 6.24 | 9,186,710 | 519,966 | 5.66 | 9,818,906 | 917,926 | 9.35 | |||||||||||||||||||||||||||
| Foreign currency | — | — | — | — | — | — | — | — | — | |||||||||||||||||||||||||||
| Total | 8,561,445 | 532,009 | 6.21 | 9,220,426 | 520,271 | 5.64 | 9,855,993 | 918,452 | 9.32 | |||||||||||||||||||||||||||
| Repurchase agreements | ||||||||||||||||||||||||||||||||||||
| Ch$ | 81,901 | 2,480 | 3.03 | 51,467 | 1,406 | 2.73 | 71,515 | 1,756 | 2.46 | |||||||||||||||||||||||||||
| UF | — | — | — | — | — | — | — | — | — | |||||||||||||||||||||||||||
| Foreign currency | — | — | — | — | — | — | — | — | — | |||||||||||||||||||||||||||
| Total | 81,901 | 2,480 | 3.03 | 51,467 | 1,406 | 2.73 | 71,515 | 1,756 | 2.46 | |||||||||||||||||||||||||||
| Other assets | ||||||||||||||||||||||||||||||||||||
| Ch$ | 46,023 | 2,377 | 5.16 | 68,013 | 1,889 | 2.78 | 53,105 | 1,825 | 3.44 | |||||||||||||||||||||||||||
| UF | — | — | — | — | — | — | — | — | — | |||||||||||||||||||||||||||
| Foreign currency | 332,089 | 6,641 | 2.00 | 439,551 | 2,248 | 0.51 | 177,965 | 146 | 0.08 | |||||||||||||||||||||||||||
| Total | 378,112 | 9,018 | 2.39 | 507,564 | 4,137 | 0.82 | 231,070 | 1,971 | 0.85 | |||||||||||||||||||||||||||
| Total interest earning assets | ||||||||||||||||||||||||||||||||||||
| Ch$ | 14,679,708 | 1,173,435 | 7.99 | 18,344,692 | 988,446 | 5.39 | 22,077,758 | 946,825 | 4.29 | |||||||||||||||||||||||||||
| UF | 15,145,456 | 853,509 | 5.64 | 16,019,257 | 821,568 | 5.13 | 16,741,587 | 1,436,876 | 8.58 | |||||||||||||||||||||||||||
| Foreign currency | 3,404,702 | 126,575 | 3.72 | 3,316,401 | 84,953 | 2.56 | 2,747,376 | 49,690 | 1.81 | |||||||||||||||||||||||||||
| Total | Ch$ | 33,229,866 | Ch$ | 2,153,519 | 6.48 | % | Ch$ | 37,680,350 | Ch$ | 1,894,967 | 5.03 | % | Ch$ | 41,566,721 | Ch$ | 2,433,391 | 5.85 | % | ||||||||||||||||||
| (1) | Interest earned includes interest accrued on trading securities. |
107
| For the Year Ended December 31, | ||||||||||||||||||||||||||||||||||||
| 2019 | 2020 | 2021 | ||||||||||||||||||||||||||||||||||
| Average Balance | Interest Earned | Average Nominal Rate | Average Balance | Interest Earned | Average Nominal Rate | Average Balance | Interest Earned | Average Nominal Rate | ||||||||||||||||||||||||||||
| (In millions of Ch$, except percentages) | ||||||||||||||||||||||||||||||||||||
| IFRS: | ||||||||||||||||||||||||||||||||||||
| Assets | ||||||||||||||||||||||||||||||||||||
| Non-interest earning assets | ||||||||||||||||||||||||||||||||||||
| Cash and due from banks | ||||||||||||||||||||||||||||||||||||
| Ch$ | Ch$ | 1,025,004 | — | — | Ch$ | 1,197,286 | — | — | Ch$ | 1,242,870 | — | — | ||||||||||||||||||||||||
| UF | — | — | — | — | — | — | — | — | — | |||||||||||||||||||||||||||
| Foreign currency | 647,875 | — | — | 1,335,356 | — | — | 1,570,465 | — | — | |||||||||||||||||||||||||||
| Total | 1,672,879 | — | — | 2,532,642 | — | — | 2,813,335 | — | — | |||||||||||||||||||||||||||
| Transactions in the course of collection | ||||||||||||||||||||||||||||||||||||
| Ch$ | 480,975 | — | — | 332,797 | — | — | 336,610 | — | — | |||||||||||||||||||||||||||
| UF | — | — | — | — | — | — | — | — | — | |||||||||||||||||||||||||||
| Foreign currency | 298,180 | — | — | 241,992 | — | — | 250,925 | — | — | |||||||||||||||||||||||||||
| Total | 779,155 | — | — | 574,789 | — | — | 587,535 | — | — | |||||||||||||||||||||||||||
| Allowances for loan losses | ||||||||||||||||||||||||||||||||||||
| Ch$ | (595,058 | ) | — | — | (804,710 | ) | — | — | (660,051 | ) | — | — | ||||||||||||||||||||||||
| UF | — | — | — | — | — | — | — | — | — | |||||||||||||||||||||||||||
| Foreign currency | — | — | — | — | — | — | — | — | — | |||||||||||||||||||||||||||
| Total | (595,058 | ) | — | — | (804,710 | ) | — | — | (660,051 | ) | — | — | ||||||||||||||||||||||||
| Derivatives | ||||||||||||||||||||||||||||||||||||
| Ch$ | 1,747,644 | — | — | 3,124,051 | — | — | 2,072,621 | — | — | |||||||||||||||||||||||||||
| UF | — | — | — | — | — | — | — | — | — | |||||||||||||||||||||||||||
| Foreign currency | 143,005 | — | — | 351,611 | — | — | 216,836 | — | — | |||||||||||||||||||||||||||
| Total | 1,890,649 | — | — | 3,475,662 | — | — | 2,289,457 | — | — | |||||||||||||||||||||||||||
| Investments in Other Companies | ||||||||||||||||||||||||||||||||||||
| Ch$ | 51,214 | — | — | 56,909 | — | — | 46,570 | — | — | |||||||||||||||||||||||||||
| UF | — | — | — | — | — | — | — | — | — | |||||||||||||||||||||||||||
| Foreign currency | 90 | — | — | 101 | — | — | 52 | — | — | |||||||||||||||||||||||||||
| Total | 51,304 | — | — | 57,010 | — | — | 46,622 | — | — | |||||||||||||||||||||||||||
| Intangible assets | ||||||||||||||||||||||||||||||||||||
| Ch$ | 87,953 | — | — | 93,273 | — | — | 99,876 | — | — | |||||||||||||||||||||||||||
| UF | — | — | — | — | — | — | — | — | — | |||||||||||||||||||||||||||
| Foreign currency | — | — | — | — | — | — | — | — | — | |||||||||||||||||||||||||||
| Total | 87,953 | — | — | 93,273 | — | — | 99,876 | — | — | |||||||||||||||||||||||||||
| Fixed assets | ||||||||||||||||||||||||||||||||||||
| Ch$ | 219,901 | — | — | 221,724 | — | — | 223,100 | — | — | |||||||||||||||||||||||||||
| UF | — | — | — | — | — | — | — | — | — | |||||||||||||||||||||||||||
| Foreign currency | — | — | — | — | — | — | — | — | — | |||||||||||||||||||||||||||
| Total | 219,901 | — | — | 221,724 | — | — | 223,100 | — | — | |||||||||||||||||||||||||||
| Lease assets | ||||||||||||||||||||||||||||||||||||
| Ch$ | 142,807 | — | — | 137,606 | — | — | 111,126 | — | — | |||||||||||||||||||||||||||
| UF | — | — | — | — | — | — | — | — | — | |||||||||||||||||||||||||||
| Foreign currency | — | — | — | — | — | — | — | — | — | |||||||||||||||||||||||||||
| Total | 142,807 | — | — | 137,606 | — | — | 111,126 | — | — | |||||||||||||||||||||||||||
| Current tax assets | ||||||||||||||||||||||||||||||||||||
| Ch$ | 636 | — | — | — | — | — | — | — | — | |||||||||||||||||||||||||||
| UF | — | — | — | — | — | — | — | — | — | |||||||||||||||||||||||||||
| Foreign currency | — | — | — | — | — | — | — | — | — | |||||||||||||||||||||||||||
| Total | 636 | — | — | — | — | — | — | — | — | |||||||||||||||||||||||||||
| Deferred tax assets | ||||||||||||||||||||||||||||||||||||
| Ch$ | 209,297 | — | — | 260,193 | — | — | 211,210 | — | — | |||||||||||||||||||||||||||
| UF | — | — | — | — | — | — | — | — | — | |||||||||||||||||||||||||||
| Foreign currency | — | — | — | — | — | — | — | — | — | |||||||||||||||||||||||||||
| Total | 209,297 | — | — | 260,193 | — | — | 211,210 | — | — | |||||||||||||||||||||||||||
| Other assets | ||||||||||||||||||||||||||||||||||||
| Ch$ | 273,824 | — | — | 260,356 | — | — | 349,746 | — | — | |||||||||||||||||||||||||||
| UF | 39,412 | — | — | 23,721 | — | — | 13,792 | — | — | |||||||||||||||||||||||||||
| Foreign currency | 10,014 | — | — | 8,103 | — | — | 17,689 | — | — | |||||||||||||||||||||||||||
| Total | 323,250 | — | — | 292,180 | — | — | 381,227 | — | — | |||||||||||||||||||||||||||
| Total non-interest earning assets | ||||||||||||||||||||||||||||||||||||
| Ch$ | 3,644,197 | — | — | 4,879,485 | — | — | 4,033,678 | — | — | |||||||||||||||||||||||||||
| UF | 39,412 | — | — | 23,721 | — | — | 13,792 | — | — | |||||||||||||||||||||||||||
| Foreign currency | 1,099,164 | — | — | 1,937,163 | — | — | 2,055,967 | — | — | |||||||||||||||||||||||||||
| Total | 4,782,773 | — | — | 6,840,369 | — | — | 6,103,437 | — | — | |||||||||||||||||||||||||||
| Total Assets | ||||||||||||||||||||||||||||||||||||
| Ch$ | 18,323,905 | 1,173,435 | — | 23,224,177 | 988,446 | — | 26,111,436 | 946,825 | — | |||||||||||||||||||||||||||
| UF | 15,184,868 | 853,509 | — | 16,042,978 | 821,568 | — | 16,755,379 | 1,436,876 | — | |||||||||||||||||||||||||||
| Foreign currency | 4,503,866 | 126,575 | — | 5,253,564 | 84,953 | — | 4,803,343 | 49,690 | — | |||||||||||||||||||||||||||
| Total | Ch$ | 38,012,639 | Ch$ | 2,041,047 | — | Ch$ | 44,520,719 | Ch$ | 1,894,967 | — | Ch$ | 47,670,158 | Ch$ | 2,433,391 | — | |||||||||||||||||||||
108
| For the Year Ended December 31, | ||||||||||||||||||||||||||||||||||||
| 2019 | 2020 | 2021 | ||||||||||||||||||||||||||||||||||
| Average Balance | Interest paid | Average Nominal Rate | Average Balance | Interest paid | Average Nominal Rate | Average Balance | Interest paid | Average Nominal Rate | ||||||||||||||||||||||||||||
| (In millions of Ch$, except percentages) | ||||||||||||||||||||||||||||||||||||
| IFRS: | ||||||||||||||||||||||||||||||||||||
| Liabilities | ||||||||||||||||||||||||||||||||||||
| Interest bearing liabilities | ||||||||||||||||||||||||||||||||||||
| Savings accounts | ||||||||||||||||||||||||||||||||||||
| Ch$ | Ch$ | 8,041,040 | Ch$ | 199,309 | 2.48 | % | Ch$ | 7,378,261 | Ch$ | 65,163 | 0.88 | % | Ch$ | 6,064,623 | Ch$ | 41,415 | 0.68 | % | ||||||||||||||||||
| UF | 1,777,845 | 72,044 | 4.05 | 1,115,280 | 43,775 | 3.93 | 954,030 | 88,694 | 9.30 | |||||||||||||||||||||||||||
| Foreign currency | 1,105,488 | 30,309 | 2.74 | 1,363,824 | 13,204 | 0.97 | 1,448,855 | 1,643 | 0.11 | |||||||||||||||||||||||||||
| Total | 10,924,373 | 301,662 | 2.76 | 9,857,365 | 122,142 | 1.24 | 8,467,508 | 131,752 | 1.56 | |||||||||||||||||||||||||||
| Repurchase agreements | ||||||||||||||||||||||||||||||||||||
| Ch$ | 240,595 | 6,993 | 2.91 | 271,707 | 1,845 | 0.68 | 139,331 | 940 | 0.67 | |||||||||||||||||||||||||||
| UF | — | — | — | — | — | — | — | — | — | |||||||||||||||||||||||||||
| Foreign currency | 29,095 | 55 | 0.19 | 9,120 | 8 | 0.09 | 1,269 | — | — | |||||||||||||||||||||||||||
| Total | 269,690 | 7,048 | 2.61 | 280,827 | 1,853 | 0.66 | 140,600 | 940 | 0.67 | |||||||||||||||||||||||||||
| Borrowings from financial institutions | ||||||||||||||||||||||||||||||||||||
| Ch$ | 6,104 | 708 | 11.60 | 13,840 | 137 | 0.99 | 3,973 | 508 | 12.79 | |||||||||||||||||||||||||||
| UF | — | — | — | — | — | — | — | — | — | |||||||||||||||||||||||||||
| Foreign currency | 1,540,535 | 42,862 | 2.78 | 3,211,463 | 27,693 | 0.86 | 4,416,874 | 22,874 | 0.52 | |||||||||||||||||||||||||||
| Total | 1,546,639 | 43,570 | 2.82 | 3,225,303 | 27,830 | 0.86 | 4,420,847 | 23,382 | 0.53 | |||||||||||||||||||||||||||
| Debt issued | ||||||||||||||||||||||||||||||||||||
| Ch$ | 16,218 | 219 | 1.35 | 9,095 | 434 | 4.77 | — | — | — | |||||||||||||||||||||||||||
| UF | 6,420,438 | 344,801 | 5.37 | 7,181,164 | 363,013 | 5.06 | 7,021,429 | 618,355 | 8.81 | |||||||||||||||||||||||||||
| Foreign currency | 1,330,915 | 33,996 | 2.55 | 1,529,017 | 36,643 | 2.40 | 1,470,272 | 34,312 | 2.33 | |||||||||||||||||||||||||||
| Total | 7,767,571 | 379,016 | 4.88 | 8,719,276 | 400,090 | 4.59 | 8,491,701 | 652,667 | 7.69 | |||||||||||||||||||||||||||
| Commercial Papers | ||||||||||||||||||||||||||||||||||||
| Ch$ | — | — | — | — | — | — | — | — | — | |||||||||||||||||||||||||||
| UF | — | — | — | — | — | — | — | — | — | |||||||||||||||||||||||||||
| Foreign currency | 275,802 | 6,999 | 2.54 | 219,046 | 3,899 | 1.78 | 359,836 | 1,223 | 0.34 | |||||||||||||||||||||||||||
| Total | 275,802 | 6,999 | 2.54 | 219,046 | 3,899 | 1.78 | 359,836 | 1,223 | 0.34 | |||||||||||||||||||||||||||
| Lease Liabilities | ||||||||||||||||||||||||||||||||||||
| Ch$ | 140,331 | 2,574 | 1.83 | 133,514 | 2,532 | 1.90 | 107,048 | 1,978 | 1.85 | |||||||||||||||||||||||||||
| UF | — | — | — | — | — | — | — | — | — | |||||||||||||||||||||||||||
| Foreign currency | — | — | — | — | — | — | — | — | — | |||||||||||||||||||||||||||
| Total | 140,331 | 2,574 | 1.83 | 133,514 | 2,532 | 1.90 | 107,048 | 1,978 | 1.85 | |||||||||||||||||||||||||||
| Other financial obligations | ||||||||||||||||||||||||||||||||||||
| Ch$ | 160,160 | 1,301 | 0.81 | 104,056 | 1,640 | 1.58 | 39,298 | 2,254 | 5.74 | |||||||||||||||||||||||||||
| UF | 2,037 | 59 | 2.90 | 797 | 19 | 2.38 | 322 | 24 | 7.45 | |||||||||||||||||||||||||||
| Foreign currency | 34,520 | 41 | 0.12 | 52,199 | 2 | 0.00 | 105,253 | 228 | 0.22 | |||||||||||||||||||||||||||
| Total | 196,717 | 1,401 | 0.71 | 157,052 | 1,661 | 1.06 | 144,873 | 2,506 | 1.73 | |||||||||||||||||||||||||||
| Total interest bearing liabilities | ||||||||||||||||||||||||||||||||||||
| Ch$ | 8,604,448 | 211,104 | 2.45 | 7,910,473 | 71,751 | 0.91 | 6,354,273 | 47,095 | 0.74 | |||||||||||||||||||||||||||
| UF | 8,200,320 | 416,904 | 5.08 | 8,297,241 | 406,807 | 4.90 | 7,975,781 | 707,073 | 8.87 | |||||||||||||||||||||||||||
| Foreign currency | 4,316,355 | 114,262 | 2.65 | 6,384,669 | 81,449 | 1.28 | 7,802,359 | 60,280 | 0.77 | |||||||||||||||||||||||||||
| Total | Ch$ | 21,121,123 | Ch$ | 742,270 | 3.51 | % | Ch$ | 22,592,383 | Ch$ | 560,007 | 2.48 | % | Ch$ | 22,132,413 | Ch$ | 814,448 | 3.68 | % | ||||||||||||||||||
109
| For the Year Ended December 31, | ||||||||||||||||||||||||||||||||||||
| 2019 | 2020 | 2021 | ||||||||||||||||||||||||||||||||||
| Average Balance | Interest paid | Average Nominal Rate | Average Balance | Interest paid | Average Nominal Rate | Average Balance | Interest paid | Average Nominal Rate | ||||||||||||||||||||||||||||
| (In millions of Ch$, except percentages) | ||||||||||||||||||||||||||||||||||||
| IFRS: | ||||||||||||||||||||||||||||||||||||
| Liabilities | ||||||||||||||||||||||||||||||||||||
| Non-interest bearing liabilities | ||||||||||||||||||||||||||||||||||||
| Current account and demand deposits | ||||||||||||||||||||||||||||||||||||
| Ch$ | Ch$ | 8,006,151 | — | — | Ch$ | 10,709,744 | — | — | Ch$ | 14,181,137 | — | — | ||||||||||||||||||||||||
| UF | 482,662 | — | — | 376,918 | — | — | 455,067 | — | — | |||||||||||||||||||||||||||
| Foreign currency | 1,227,187 | — | — | 1,795,965 | — | — | 2,412,623 | — | — | |||||||||||||||||||||||||||
| Total | 9,716,000 | — | — | 12,882,627 | — | — | 17,048,827 | — | — | |||||||||||||||||||||||||||
| Transactions in the course of payment | ||||||||||||||||||||||||||||||||||||
| Ch$ | 411,127 | — | — | 533,216 | — | — | 531,175 | — | — | |||||||||||||||||||||||||||
| UF | — | — | — | — | — | — | — | — | — | |||||||||||||||||||||||||||
| Foreign currency | 220,457 | — | — | 210,173 | — | — | 211,664 | — | — | |||||||||||||||||||||||||||
| Total | 631,584 | — | — | 743,389 | — | — | 742,839 | — | — | |||||||||||||||||||||||||||
| Derivatives | ||||||||||||||||||||||||||||||||||||
| Ch$ | 1,798,429 | — | — | 3,147,528 | — | — | 2,079,304 | — | — | |||||||||||||||||||||||||||
| UF | — | — | — | — | — | — | — | — | — | |||||||||||||||||||||||||||
| Foreign currency | 166,811 | — | — | 405,774 | — | — | 240,301 | — | — | |||||||||||||||||||||||||||
| Total | 1,965,240 | — | — | 3,553,302 | — | — | 2,319,605 | — | — | |||||||||||||||||||||||||||
| Current tax liabilities | ||||||||||||||||||||||||||||||||||||
| Ch$ | — | — | — | 4,512 | — | — | 8,426 | — | — | |||||||||||||||||||||||||||
| UF | — | — | — | — | — | — | — | — | — | |||||||||||||||||||||||||||
| Foreign currency | — | — | — | — | — | — | — | — | — | |||||||||||||||||||||||||||
| Total | — | — | — | 4,512 | — | — | 8,426 | — | — | |||||||||||||||||||||||||||
| Deferred tax liabilities | ||||||||||||||||||||||||||||||||||||
| Ch$ | — | — | — | — | — | — | — | — | — | |||||||||||||||||||||||||||
| UF | — | — | — | — | — | — | — | — | — | |||||||||||||||||||||||||||
| Foreign currency | — | — | — | — | — | — | — | — | — | |||||||||||||||||||||||||||
| Total | — | — | — | — | — | — | — | — | — | |||||||||||||||||||||||||||
| Provisions | ||||||||||||||||||||||||||||||||||||
| Ch$ | 177,253 | — | — | 190,675 | — | — | 154,878 | — | — | |||||||||||||||||||||||||||
| UF | — | — | — | — | — | — | — | — | — | |||||||||||||||||||||||||||
| Foreign currency | — | — | — | — | — | — | — | — | — | |||||||||||||||||||||||||||
| Total | 177,253 | — | — | 190,675 | — | — | 154,878 | — | — | |||||||||||||||||||||||||||
| Other liabilities | ||||||||||||||||||||||||||||||||||||
| Ch$ | 376,059 | — | — | 497,653 | — | — | 589,222 | — | — | |||||||||||||||||||||||||||
| UF | 580 | — | — | 501 | — | — | 546 | — | — | |||||||||||||||||||||||||||
| Foreign currency | 39,570 | — | — | 79,452 | — | — | 93,953 | — | — | |||||||||||||||||||||||||||
| Total | 416,209 | — | — | 577,606 | — | — | 683,721 | — | — | |||||||||||||||||||||||||||
| Equity | ||||||||||||||||||||||||||||||||||||
| Ch$ | 3,985,230 | — | — | 3,976,225 | — | — | 4,579,449 | — | — | |||||||||||||||||||||||||||
| UF | — | — | — | — | — | — | — | — | — | |||||||||||||||||||||||||||
| Foreign currency | — | — | — | — | — | — | — | — | — | |||||||||||||||||||||||||||
| Total | 3,985,230 | — | — | 3,976,225 | — | — | 4,579,449 | — | — | |||||||||||||||||||||||||||
| Total non-interest bearing liabilities and equity | ||||||||||||||||||||||||||||||||||||
| Ch$ | 14,754,249 | — | — | 19,059,553 | — | — | 22,123,591 | — | — | |||||||||||||||||||||||||||
| UF | 483,242 | — | — | 377,419 | — | — | 455,613 | — | — | |||||||||||||||||||||||||||
| Foreign currency | 1,654,025 | — | — | 2,491,364 | — | — | 2,958,541 | — | — | |||||||||||||||||||||||||||
| Total | 16,891,516 | — | — | 21,928,336 | — | — | 25,537,745 | — | — | |||||||||||||||||||||||||||
| Total liabilities and equity | ||||||||||||||||||||||||||||||||||||
| Ch$ | 23,358,697 | 211,643 | — | 26,970,026 | 71,751 | — | 28,477,864 | 47,095 | — | |||||||||||||||||||||||||||
| UF | 8,683,562 | 416,904 | — | 8,674,660 | 406,807 | — | 8,431,394 | 707,073 | — | |||||||||||||||||||||||||||
| Foreign currency | 5,970,380 | 113,723 | — | 8,876,033 | 81,449 | — | 10,760,900 | 60,280 | — | |||||||||||||||||||||||||||
| Total | Ch$ | 38,012,639 | Ch$ | 742,270 | — | Ch$ | 44,520,719 | Ch$ | 560,007 | — | Ch$ | 47,670,158 | Ch$ | 814,448 | — | |||||||||||||||||||||
110
Interest Earning Assets and Net Interest Margin
The following table sets forth, by currency of denomination, the levels of our average interest earning assets and net interest, and illustrates the comparative margins obtained, for the years ended December 31, 2019, 2020 and 2021:
| For the Year Ended December 31, | ||||||||||||
| 2019 | 2020 | 2021 | ||||||||||
| (in millions of Ch$, except percentages) | ||||||||||||
| IFRS: | ||||||||||||
| Total average interest earning assets | ||||||||||||
| Ch$ | Ch$ | 14,679.708 | Ch$ | 18,344,692 | Ch$ | 22,077,758 | ||||||
| UF | 15,145,456 | 16,019,257 | 16,741,587 | |||||||||
| Foreign currency | 3,404,702 | 3,316,401 | 2,747,376 | |||||||||
| Total | 33,229,866 | 37,680,350 | 41,566,721 | |||||||||
| Net interest earned (including interest earned on trading securities)(1) | ||||||||||||
| Ch$ | 962,331 | 916,695 | 899,730 | |||||||||
| UF | 436,605 | 414,761 | 729,803 | |||||||||
| Foreign currency | 12,313 | 3,504 | (10,590 | ) | ||||||||
| Total | Ch$ | 1,411,249 | Ch$ | 1,334,960 | Ch$ | 1,618,943 | ||||||
| Net interest margin, nominal basis(2) | ||||||||||||
| Ch$ | 6.56 | % | 5.00 | % | 4.08 | % | ||||||
| UF | 2.88 | 2.59 | 4.36 | |||||||||
| Foreign currency | 0.36 | 0.11 | (0.39 | ) | ||||||||
| Total | 4.25 | % | 3.54 | % | 3.89 | % | ||||||
| (1) | Net interest earned is defined as interest revenue earned less interest expense incurred. |
| (2) | Net interest margin, nominal basis is defined as net interest earned divided by average interest earning assets. |
111
Changes in Net Interest Income—Volume and Rate Analysis
The following tables compare, by currency of denomination, changes in our net interest revenue between 2019 and 2020, as well as 2020 and 2021, caused by (i) changes in the average volume of interest earning assets and interest bearing liabilities and (ii) changes in their respective nominal interest rates. Volume and rate variances were calculated based on movements in average balances over the period and changes in nominal interest rate, average interest earning assets and average interest bearing liabilities. The net change attributable to changes in both volume and rate has been allocated proportionately to the change in volume and the change in rate.
| Increase (Decrease) from 2019 to 2020 due to changes in | Net Change from 2019 | Increase (Decrease) from 2020 to 2021 due to changes in | Net Change from 2020 | |||||||||||||||||||||
| Volume | Rate | to 2020 | Volume | Rate | to 2021 | |||||||||||||||||||
| (in millions of Ch$) | ||||||||||||||||||||||||
| IFRS: | ||||||||||||||||||||||||
| Assets | ||||||||||||||||||||||||
| Interest earning assets | ||||||||||||||||||||||||
| Financial investments | ||||||||||||||||||||||||
| Ch$ | Ch$ | 34,035 | Ch$ | (67,544 | ) | Ch$ | (33,509 | ) | Ch$ | 13,924 | Ch$ | 21,784 | Ch$ | 35,708 | ||||||||||
| UF | (2,450 | ) | (549 | ) | (2,999 | ) | 6,764 | 32,201 | 38,965 | |||||||||||||||
| Foreign currency | (2,186 | ) | (388 | ) | (2,574 | ) | (1,506 | ) | (1,279 | ) | (2,785 | ) | ||||||||||||
| Total | 29,399 | (68,481 | ) | (39,082 | ) | 19,182 | 52,706 | 71,888 | ||||||||||||||||
| Loans in advance to bank | ||||||||||||||||||||||||
| Ch$ | 9,744 | (20,105 | ) | (10,361 | ) | 5,740 | 4,787 | 10,527 | ||||||||||||||||
| UF | — | — | — | — | — | — | ||||||||||||||||||
| Foreign currency | (1,633 | ) | (3,654 | ) | (5,287 | ) | (404 | ) | (2,619 | ) | (3,023 | ) | ||||||||||||
| Total | 8,111 | (23,759 | ) | (15,648 | ) | 5,336 | 2,168 | 7,504 | ||||||||||||||||
| Commercial loans | ||||||||||||||||||||||||
| Ch$ | 77,244 | (111,899 | ) | (34,655 | ) | 69,316 | (68,760 | ) | 556 | |||||||||||||||
| UF | 12,331 | (29,506 | ) | (17,175 | ) | (1,814 | ) | 177,937 | 176,123 | |||||||||||||||
| Foreign currency | (2,416 | ) | (26,952 | ) | (29,368 | ) | (6,237 | ) | (21,117 | ) | (27,354 | ) | ||||||||||||
| Total | 87,159 | (168,357 | ) | (81,198 | ) | 61,265 | 88,060 | 149,325 | ||||||||||||||||
| Consumer loans | ||||||||||||||||||||||||
| Ch$ | (39,160 | ) | (65,878 | ) | (105,038 | ) | (26,260 | ) | (62,659 | ) | (88,919 | ) | ||||||||||||
| UF | 1,688 | (1,581 | ) | 107 | (1,226 | ) | 3,486 | 2,260 | ||||||||||||||||
| Foreign currency | — | — | — | — | — | — | ||||||||||||||||||
| Total | (37,472 | ) | (67,459 | ) | (104,931 | ) | (27,486 | ) | (59,173 | ) | (86,659 | ) | ||||||||||||
| Residential mortgage loans | ||||||||||||||||||||||||
| Ch$ | 2 | 134 | 136 | 33 | 188 | 221 | ||||||||||||||||||
| UF | 39,343 | (51,217 | ) | (11,874 | ) | 38,009 | 359,951 | 397,960 | ||||||||||||||||
| Foreign currency | — | — | — | — | — | — | ||||||||||||||||||
| Total | 39,345 | (51,083 | ) | (11,738 | ) | 38,042 | 360,139 | 398,181 | ||||||||||||||||
| Repurchase agreement | ||||||||||||||||||||||||
| Ch$ | (850 | ) | (224 | ) | (1,074 | ) | 504 | (154 | ) | 350 | ||||||||||||||
| UF | — | — | — | — | — | — | ||||||||||||||||||
| Foreign currency | — | — | — | — | — | — | ||||||||||||||||||
| Total | (850 | ) | (224 | ) | (1,074 | ) | 504 | (154 | ) | 350 | ||||||||||||||
| Other Assets | ||||||||||||||||||||||||
| Ch$ | 869 | (1,357 | ) | (488 | ) | (461 | ) | 397 | (64 | ) | ||||||||||||||
| UF | — | — | — | — | — | — | ||||||||||||||||||
| Foreign currency | 1,664 | (6,057 | ) | (4,393 | ) | (872 | ) | (1,229 | ) | (2,101 | ) | |||||||||||||
| Total | 2,533 | (7,414 | ) | (4,881 | ) | (1,333 | ) | (832 | ) | (2,165 | ) | |||||||||||||
| Total interest earning assets | ||||||||||||||||||||||||
| Ch$ | 81,884 | (266,873 | ) | (184,989 | ) | 62,796 | (104,417 | ) | (41,621 | ) | ||||||||||||||
| UF | 50,912 | (82,853 | ) | (31,941 | ) | 41,733 | 573,575 | 615,308 | ||||||||||||||||
| Foreign currency | (4,571 | ) | (37,051 | ) | (41,622 | ) | (9,019 | ) | (26,244 | ) | (35,263 | ) | ||||||||||||
| Total | Ch$ | 128,225 | Ch$ | (386,777 | ) | Ch$ | (258,552 | ) | Ch$ | 95,510 | Ch$ | 442,914 | Ch$ | 538,424 | ||||||||||
112
| Increase (Decrease) from 2019 to 2020 due to changes in | Net Change from 2019 to | Increase (Decrease) from 2020 to 2021 due to changes in | Net Change from 2020 to | |||||||||||||||||||||
| Volume | Rate | 2020 | Volume | Rate | 2021 | |||||||||||||||||||
| (in millions of Ch$) | ||||||||||||||||||||||||
| IFRS: | ||||||||||||||||||||||||
| Liabilities | ||||||||||||||||||||||||
| Interest bearing liabilities Savings accounts and time deposits | ||||||||||||||||||||||||
| Ch$ | Ch$ | (15,228 | ) | Ch$ | (118,918 | ) | Ch$ | (134,146 | ) | Ch$ | (10,445 | ) | Ch$ | (13,303 | ) | Ch$ | (23,748 | ) | ||||||
| UF | (26,071 | ) | (2,198 | ) | (28,269 | ) | (7,157 | ) | 52,076 | 44,919 | ||||||||||||||
| Foreign currency | 5,867 | (22,972 | ) | (17,105 | ) | 775 | (12,336 | ) | (11,561 | ) | ||||||||||||||
| Total | (35,432 | ) | (144,088 | ) | (179,520 | ) | (16,827 | ) | 26,437 | 9,610 | ||||||||||||||
| Repurchase agreements | ||||||||||||||||||||||||
| Ch$ | 804 | (5,952 | ) | (5,148 | ) | (893 | ) | (12 | ) | (905 | ) | |||||||||||||
| UF | — | — | — | — | — | — | ||||||||||||||||||
| Foreign currency | (26 | ) | (21 | ) | (47 | ) | (4 | ) | (4 | ) | (8 | ) | ||||||||||||
| Total | 778 | (5,973 | ) | (5,195 | ) | (897 | ) | (16 | ) | (913 | ) | |||||||||||||
| Borrowing from financial institutions | ||||||||||||||||||||||||
| Ch$ | 421 | (992 | ) | (571 | ) | (163 | ) | 534 | 371 | |||||||||||||||
| UF | — | — | — | — | — | — | ||||||||||||||||||
| Foreign currency | 26,882 | (42,050 | ) | (15,168 | ) | 8,383 | (13,202 | ) | (4,819 | ) | ||||||||||||||
| Total | 27,303 | (43,042 | ) | (15,739 | ) | 8,220 | (12,668 | ) | (4,448 | ) | ||||||||||||||
| Debt issued | ||||||||||||||||||||||||
| Ch$ | (132 | ) | 347 | 215 | (217 | ) | (217 | ) | (434 | ) | ||||||||||||||
| UF | 39,250 | (21,038 | ) | 18,212 | (8,249 | ) | 263,591 | 255,342 | ||||||||||||||||
| Foreign currency | 4,839 | (2,192 | ) | 2,647 | (1,386 | ) | (945 | ) | (2,331 | ) | ||||||||||||||
| Total | 43,957 | (22,883 | ) | 21,074 | (9,852 | ) | 262,429 | 252,577 | ||||||||||||||||
| Commercial Papers | ||||||||||||||||||||||||
| Ch$ | — | — | — | — | — | — | ||||||||||||||||||
| UF | — | — | — | — | — | — | ||||||||||||||||||
| Foreign currency | (1,265 | ) | (1,835 | ) | (3,100 | ) | 1,608 | (4,284 | ) | (2,676 | ) | |||||||||||||
| Total | (1,265 | ) | (1,835 | ) | (3,100 | ) | 1,608 | (4,284 | ) | (2,676 | ) | |||||||||||||
| Lease Liabilities | ||||||||||||||||||||||||
| Ch$ | (128 | ) | 85 | (43 | ) | (491 | ) | (63 | ) | (554 | ) | |||||||||||||
| UF | — | — | — | — | — | — | ||||||||||||||||||
| Foreign currency | — | — | — | — | — | — | ||||||||||||||||||
| Total | (128 | ) | 85 | (43 | ) | (491 | ) | (63 | ) | (554 | ) | |||||||||||||
| Other financial obligation | ||||||||||||||||||||||||
| Ch$ | (572 | ) | 911 | 339 | (1,535 | ) | 2,149 | 614 | ||||||||||||||||
| UF | (31 | ) | (9 | ) | (40 | ) | (17 | ) | 22 | 5 | ||||||||||||||
| Foreign currency | 14 | (53 | ) | (39 | ) | 4 | 222 | 226 | ||||||||||||||||
| Total | (589 | ) | 849 | 260 | (1,548 | ) | 2,393 | 845 | ||||||||||||||||
| Total interest bearing liabilities | ||||||||||||||||||||||||
| Ch$ | (14,835 | ) | (124,519 | ) | (139,354 | ) | (13,744 | ) | (10,912 | ) | (24,656 | ) | ||||||||||||
| UF | 13,148 | (23,245 | ) | (10,097 | ) | (15,423 | ) | 315,689 | 300,266 | |||||||||||||||
| Foreign currency | 36,311 | (69,123 | ) | (32,812 | ) | 9,380 | (30,549 | ) | (21,169 | ) | ||||||||||||||
| Total | Ch$ | 34,624 | Ch$ | (216,887 | ) | Ch$ | (182,263 | ) | Ch$ | (19,787 | ) | Ch$ | 274,228 | Ch$ | 254,441 | |||||||||
113
Financial Investments
Financial assets held for trading:
The following table sets forth a breakdown of instruments classified as financial assets held for trading, included in our investment portfolio:
| As of December 31, | Weighted Average | |||||||||||
| 2020 | 2021 | 2021 | ||||||||||
| (in millions of Ch$) | % | |||||||||||
| IFRS: | ||||||||||||
| Instruments issued by the Chilean Government and the Central Bank: | ||||||||||||
| Central Bank bonds | Ch$ | 3,186 | Ch$ | 1,145 | — | % | ||||||
| Central Bank promissory notes | 4,006,490 | 3,295,955 | 3.87 | |||||||||
| Other instruments issued by the Chilean Government and the Central Bank | 149,616 | 175,022 | 3.83 | |||||||||
| Other securities issued in Chile: | ||||||||||||
| Bonds from other Chilean companies | 5,396 | — | — | |||||||||
| Bonds from domestic banks | 5,494 | 51,484 | 2.49 | |||||||||
| Deposits in domestic banks | 93,905 | 214,336 | 3.59 | |||||||||
| Mortgage bonds from domestic banks | — | — | — | |||||||||
| Other instruments issued in Chile | 1,003 | 3,062 | — | |||||||||
| Instruments issued by foreign institutions: | ||||||||||||
| Instruments from foreign governments or central banks | — | — | — | |||||||||
| Other instruments issued abroad | 164 | — | — | |||||||||
| Mutual fund investments: | ||||||||||||
| Funds managed by related companies | 400,902 | 135,691 | 3.96 | |||||||||
| Total | Ch$ | 4,666,156 | Ch$ | 3,876,695 | 3.82 | % | ||||||
| (1) | Weighted Average Nominal Rate is calculated as the sum of total accrued interests for the type of security divided by the average balance for the same type of security during the reported period. |
“Other securities issued in Chile” includes instruments sold under repurchase agreements with customers and financial instruments, amounting to Ch$52,809 million as of December 31, 2020 and Ch$84,969 million as of December 31, 2021. Instruments issued by the Chilean Government and the Central Bank include instruments sold under agreements to repurchase to customers and financial institutions. For these instruments, the balance as of December 31, 2020 was Ch$217,614 million. As of December 31, 2021, there are no instruments sold with a repurchase agreement.
114
Investment Portfolio:
The detail of instruments classified as financial instruments measured at fair value through other comprehensive income and as financial assets held-to-maturity is as follows:
Financial Assets at Fair Value through Other Comprehensive Income
(Formerly Available-for-Sale Assets)
| As of December 31, | Weighted | |||||||||||
| 2020 | 2021 | 2021 | ||||||||||
| (in millions of Ch$) | % | |||||||||||
| IFRS: | ||||||||||||
| Debt instruments at fair value through OCI | ||||||||||||
| Instruments issued by the Chilean Government and the Central Bank: | ||||||||||||
| Bonds issued by the Chilean Government and the Central Bank | Ch$ | 109 | Ch$ | 102 | 3.65 | % | ||||||
| Promissory notes issued by the Chilean Government and the Central Bank | — | — | — | |||||||||
| Other instruments | 163,491 | 2,488,748 | 4.62 | |||||||||
| Other instruments issued in Chile: | ||||||||||||
| Mortgage bonds from domestic banks | 128,763 | 111,656 | 2.79 | |||||||||
| Bonds from domestic banks | 15,887 | 2,411 | 6.06 | |||||||||
| Deposits from domestic banks | 685,392 | 424,419 | 5.02 | |||||||||
| Bonds from other Chilean companies | 34,539 | 27,473 | 4.71 | |||||||||
| Other instruments | 32,342 | — | — | |||||||||
| Instruments issued by Foreign Institutions: | ||||||||||||
| Instruments from foreign governments or central banks | — | — | — | |||||||||
| Equity instruments at fair value through OCI | ||||||||||||
| Equity instruments issued in Chile | 6,869 | 5,499 | — | |||||||||
| Equity instruments issued by foreign institutions | 761 | 866 | — | |||||||||
| Total | Ch$ | 1,068,153 | Ch$ | 3,061,174 | 4.61 | % | ||||||
| (1) | Weighted Average Nominal Rate is calculated as the sum of total accrued interests for the type of security divided by the average balance for the same type of security during the reported period. |
The portfolio of financial assets available-for-sale included net unrealized gains of Ch$9,054 million and Ch$39,688 as of December 31, 2020 and 2021, respectively, in each case recorded in other comprehensive income within equity.
115
Financial Instruments at Amortized Cost
(Formerly Held-to-Maturity)
| As of December 31, | Weighted | |||||||||||
| 2020 | 2021 | 2021 | ||||||||||
| (in millions of Ch$) | % | |||||||||||
| IFRS: | ||||||||||||
| Financial Instruments at Amortized Cost | ||||||||||||
| Instruments issued by the Chilean Government and Central Bank of Chile: | ||||||||||||
| Bonds issued by the Central Bank | Ch$ | — | Ch$ | — | — | % | ||||||
| Promissory notes issued by the Chilean Government and the Central Bank | — | — | — | |||||||||
| Other instruments | — | 839,744 | 2.14 | |||||||||
| Other instruments issued in Chile: | ||||||||||||
| Deposit promissory notes from domestics banks | ||||||||||||
| Mortgage bonds from domestic banks | — | — | — | |||||||||
| Bonds from domestic banks | — | — | — | |||||||||
| Deposits from domestic banks | — | — | — | |||||||||
| Bonds from other Chilean companies | — | — | — | |||||||||
| Promissory notes issued by other Chilean companies | ||||||||||||
| Other instruments | — | — | — | |||||||||
| Instruments issued by Foreign Institutions: | ||||||||||||
| Instruments from foreign governments or central banks | — | — | — | |||||||||
| Total | Ch$ | — | Ch$ | 839,744 | 2.14 | % | ||||||
| (1) | Weighted Average Nominal Rate is calculated as the sum of total accrued interests for the type of security divided by the average balance for the same type of security during the reported period. |
116
Maturity of Financial Investments:
The maturities of financial assets held for trading and financial instruments measured at fair value through other comprehensive income as of December 31, 2020 and 2021 were as follows:
| As of December 31, 2020 | ||||||||||||||||||||||||||||||||||||
| Due within 1 year | Weighted | Due after 1 year but within 5 years | Weighted | Due after 5 year but within 10 years | Weighted | Due after 10 years | Weighted | Total | ||||||||||||||||||||||||||||
| (millions of Ch$, except percentages) | ||||||||||||||||||||||||||||||||||||
| Financial assets held for trading: | ||||||||||||||||||||||||||||||||||||
| Instruments issued by the Chilean Government and the Central Bank: | ||||||||||||||||||||||||||||||||||||
| Central Bank bonds | Ch$ | 3,186 | (2.07 | )% | Ch$ | — | — | % | Ch$ | — | — | % | Ch$ | — | — | % | Ch$ | 3,186 | ||||||||||||||||||
| Central Bank promissory notes | 4,006,490 | 0.16 | — | — | — | — | — | — | 4,006,490 | |||||||||||||||||||||||||||
| Other instruments issued by the Chilean Government and the Central Bank | 149,616 | 1.86 | — | — | — | — | — | — | 149,616 | |||||||||||||||||||||||||||
| Other securities issued in Chile: | ||||||||||||||||||||||||||||||||||||
| Bonds from other Chilean companies | 5,396 | 2.94 | — | — | — | — | — | — | 5,396 | |||||||||||||||||||||||||||
| Bonds from domestic banks | 5,494 | (1.04 | ) | — | — | — | — | — | — | 5,494 | ||||||||||||||||||||||||||
| Deposits in domestic banks | 93,905 | 0.62 | — | — | — | — | — | — | 93,905 | |||||||||||||||||||||||||||
| Mortgage bonds from domestic banks | — | — | — | — | — | — | — | — | ||||||||||||||||||||||||||||
| Other instruments issued in Chile | 1,003 | — | — | — | — | — | — | — | 1,003 | |||||||||||||||||||||||||||
| Instruments issued by foreign institutions: | ||||||||||||||||||||||||||||||||||||
| Instruments from foreign governments or central banks | — | — | — | — | — | — | — | — | — | |||||||||||||||||||||||||||
| Other instruments issued abroad | 164 | — | — | — | — | — | — | — | 164 | |||||||||||||||||||||||||||
| Mutual fund investments | ||||||||||||||||||||||||||||||||||||
| Funds managed by related companies | 400,902 | 0.24 | — | — | — | — | — | — | 400,902 | |||||||||||||||||||||||||||
| Total | Ch$ | 4,666,156 | 0.23 | % | Ch$ | — | — | % | Ch$ | — | % | Ch$ | — | — | % | Ch$ | 4,666,156 | |||||||||||||||||||
| (1) | Weighted Average Nominal Rate is calculated as the sum of total accrued interests for the type of security divided by the average balance for the same type of security during the reported period. |
117
| As of December 31, 2021 | ||||||||||||||||||||||||||||||||||||
| Due within 1 year | Weighted Average Nominal Rate(1) | Due after 1 year but within 5 years | Weighted Average Nominal Rate(1) | Due after 5 year but within 10 years | Weighted Average Nominal Rate(1) | Due after 10 years | Weighted Average Nominal Rate(1) | Total | ||||||||||||||||||||||||||||
| (millions of Ch$, except percentages) | ||||||||||||||||||||||||||||||||||||
| Financial assets held for trading: | ||||||||||||||||||||||||||||||||||||
| Instruments issued by the Chilean Government and the Central Bank: | ||||||||||||||||||||||||||||||||||||
| Central Bank bonds | Ch$ | 1,145 | — | % | Ch$ | — | — | % | Ch$ | — | — | % | Ch$ | — | — | % | Ch$ | 1,145 | ||||||||||||||||||
| Central Bank promissory notes | 3,295,955 | 3.87 | — | — | — | — | — | — | 3,295,955 | |||||||||||||||||||||||||||
| Other instruments issued by the Chilean Government and the Central Bank | 175,022 | 3.83 | — | — | — | — | — | — | 175,022 | |||||||||||||||||||||||||||
| Other securities issued in Chile: | ||||||||||||||||||||||||||||||||||||
| Bonds from other Chilean companies | — | — | — | — | — | — | — | — | — | |||||||||||||||||||||||||||
| Bonds from domestic banks | 51,484 | 2.49 | — | — | — | — | — | — | 51,484 | |||||||||||||||||||||||||||
| Deposits in domestic banks | 214,336 | 3.59 | — | — | — | — | — | — | 214,336 | |||||||||||||||||||||||||||
| Mortgage bonds from domestic banks | — | — | — | — | — | — | — | — | ||||||||||||||||||||||||||||
| Other instruments issued in Chile | 3,062 | — | — | — | — | — | — | — | 3,062 | |||||||||||||||||||||||||||
| Instruments issued by foreign institutions: | ||||||||||||||||||||||||||||||||||||
| Instruments from foreign governments or central banks | — | — | — | — | — | — | — | — | — | |||||||||||||||||||||||||||
| Other instruments issued abroad | — | — | — | — | — | — | — | — | — | |||||||||||||||||||||||||||
| Mutual fund investments | ||||||||||||||||||||||||||||||||||||
| Funds managed by related companies | 135,691 | 3.96 | — | — | — | — | — | — | 135,691 | |||||||||||||||||||||||||||
| Total | Ch$ | 3,876,695 | 3.82 | % | Ch$ | — | — | % | Ch$ | — | — | % | Ch$ | — | — | % | Ch$ | 3,876,695 | ||||||||||||||||||
| (1) | Weighted Average Nominal Rate is calculated as the sum of total accrued interests for the type of security divided by the average balance for the same type of security during the reported period. |
118
| As of December 31, 2020 | ||||||||||||||||||||||||||||||||||||
| Due within 1 year | Weighted | Due after 1 year but within 5 years | Weighted Average Nominal Rate(1) | Due after 5 year but within 10 years | Weighted | Due after 10 years | Weighted | Total | ||||||||||||||||||||||||||||
| (millions of Ch$, except percentages) | ||||||||||||||||||||||||||||||||||||
| Financial Assets at Fair Value through Other Comprehensive Income: | ||||||||||||||||||||||||||||||||||||
| Debt instruments at fair value through OCI | ||||||||||||||||||||||||||||||||||||
| Instruments issued by the Chilean Government and the Central Bank: | ||||||||||||||||||||||||||||||||||||
| Bonds issued by the Chilean Government and the Central Bank | Ch$ | — | — | % | Ch$ | 109 | 0.27 | % | Ch$ | — | — | % | Ch$ | — | — | % | Ch$ | 109 | ||||||||||||||||||
| Promissory notes issued by the Chilean Government and the Central Bank | — | — | — | — | — | — | — | — | — | |||||||||||||||||||||||||||
| Other instruments | 155,651 | 0.27 | 7,733 | 0.91 | 107 | 1.01 | — | — | 163,491 | |||||||||||||||||||||||||||
| Other instruments issued in Chile: | ||||||||||||||||||||||||||||||||||||
| Mortgage bonds from domestic banks | 45 | 1.90 | 15,099 | 2.44 | 35,789 | 2.24 | 77,920 | 2.51 | 128,763 | |||||||||||||||||||||||||||
| Bonds from domestic banks | 3,088 | 0.56 | 12,799 | 0.91 | — | — | — | — | 15,887 | |||||||||||||||||||||||||||
| Deposits from domestic banks | 546.838 | 0.21 | 138,554 | 0.64 | — | — | — | — | 685,392 | |||||||||||||||||||||||||||
| Bonds from other Chilean companies | — | — | 5,335 | 3.20 | 19,375 | 1.08 | 9,829 | 2.33 | 34,539 | |||||||||||||||||||||||||||
| Other instruments | — | — | — | — | 32,342 | 4.61 | — | — | — | |||||||||||||||||||||||||||
| Instruments issued by Foreign Institutions: | ||||||||||||||||||||||||||||||||||||
| Instruments from foreign governments or central banks | — | — | — | — | — | — | — | — | — | |||||||||||||||||||||||||||
| Subtotal | 705,622 | 0.22 | 179,539 | 0.80 | 87,613 | 2.62 | 87,749 | 2.23 | 1,060,523 | |||||||||||||||||||||||||||
| Equity instruments at fair value through OCI | ||||||||||||||||||||||||||||||||||||
| Equity instruments issued in Chile | — | — | — | — | — | — | 6,869 | — | 6,869 | |||||||||||||||||||||||||||
| Equity instruments issued by foreign institutions | — | — | — | — | — | — | 761 | — | 761 | |||||||||||||||||||||||||||
| Subtotal | — | — | — | — | — | — | 7,630 | — | 7,630 | |||||||||||||||||||||||||||
| Total | Ch$ | 705,622 | 0.22 | % | Ch$ | 179,539 | 0.80 | % | Ch$ | 87,613 | 2.62 | % | Ch$ | 95,379 | 2.23 | % | Ch$ | 1,068,153 | ||||||||||||||||||
| (1) | Weighted Average Nominal Rate is calculated as the sum of total accrued interests for the type of security divided by the average balance for the same type of security during the reported period. |
119
| As of December 31, 2021 | ||||||||||||||||||||||||||||||||||||
| Due within 1 year | Weighted | Due after 1 year but | Weighted | Due after 5 year but within 10 years | Weighted | Due after 10 years | Weighted | Total | ||||||||||||||||||||||||||||
| (millions of Ch$, except percentages) | ||||||||||||||||||||||||||||||||||||
| Financial Assets at Fair Value through Other Comprehensive Income: | ||||||||||||||||||||||||||||||||||||
| Debt instruments at fair value through OCI | ||||||||||||||||||||||||||||||||||||
| Instruments issued by the Chilean Government and the Central Bank: | ||||||||||||||||||||||||||||||||||||
| Bonds issued by the Chilean Government and the Central Bank | Ch$ | 102 | 3.65 | % | Ch$ | — | — | % | Ch$ | — | — | % | Ch$ | — | — | % | Ch$ | 102 | ||||||||||||||||||
| Promissory notes issued by the Chilean Government and the Central Bank | — | — | — | — | — | — | — | — | — | |||||||||||||||||||||||||||
| Other instruments | 1,154,380 | 4.35 | 937,917 | 5.65 | 396,451 | 2.92 | — | — | 2,488,748 | |||||||||||||||||||||||||||
| Other instruments issued in Chile: | ||||||||||||||||||||||||||||||||||||
| Mortgage bonds from domestic banks | 80 | 2.01 | 14.188 | 2.16 | 29,466 | 2.40 | 67,922 | 3.10 | 111,656 | |||||||||||||||||||||||||||
| Bonds from domestic banks | 2,411 | 6.06 | — | — | — | — | — | — | 2,411 | |||||||||||||||||||||||||||
| Deposits from domestic banks | 419,946 | 4.99 | 4,473 | 7.30 | — | — | — | — | 424,419 | |||||||||||||||||||||||||||
| Bonds from other Chilean companies | — | — | 4,682 | 6.85 | 18,972 | 4.12 | 3,819 | 5.00 | 27,473 | |||||||||||||||||||||||||||
| Other instruments | — | — | — | — | — | — | — | |||||||||||||||||||||||||||||
| Instruments issued by Foreign Institutions: | ||||||||||||||||||||||||||||||||||||
| Instruments from foreign governments or central banks | — | — | — | — | — | — | — | — | — | |||||||||||||||||||||||||||
| Subtotal | 1,576,919 | 4.53 | 961,260 | 5.58 | 444,889 | 2.76 | 71,141 | 2.93 | 3,054,809 | |||||||||||||||||||||||||||
| Equity instruments at fair value through OCI | ||||||||||||||||||||||||||||||||||||
| Equity instruments issued in Chile | — | — | — | — | — | — | 5,499 | — | 5,499 | |||||||||||||||||||||||||||
| Equity instruments issued by foreign institutions | — | — | — | — | — | — | 866 | — | 866 | |||||||||||||||||||||||||||
| Subtotal | — | — | — | — | — | — | 6.365 | — | 6.365 | |||||||||||||||||||||||||||
| Total | Ch$ | 1,576,919 | 4.53 | % | Ch$ | 961,260 | 5.58 | % | Ch$ | 444,889 | 2.76 | % | Ch$ | 78,106 | 2.93 | % | Ch$ | 3,061,174 | ||||||||||||||||||
| (1) | Weighted Average Nominal Rate is calculated as the sum of total accrued interests for the type of security divided by the average balance for the same type of security during the reported period. |
120
| As of December 31, 2020 | ||||||||||||||||||||||||||||||||||||
| Due within 1 year | Weighted Nominal | Due after 1 year but within 5 years | Weighted | Due after 5 year but within 10 years | Weighted | Due after 10 years | Weighted | Total | ||||||||||||||||||||||||||||
| (millions of Ch$, except percentages) | ||||||||||||||||||||||||||||||||||||
| Financial Instruments at Amortized Cost : | ||||||||||||||||||||||||||||||||||||
| Instruments issued by the Chilean Government and Central Bank of Chile: | ||||||||||||||||||||||||||||||||||||
| Bonds issued by the Central Bank | Ch$ | — | — | % | Ch$ | — | — | % | Ch$ | — | — | % | Ch$ | — | — | % | Ch$ | — | ||||||||||||||||||
| Promissory notes issued by the Chilean Government and the Central Bank | — | — | — | — | — | — | — | — | — | |||||||||||||||||||||||||||
| Other instruments | ||||||||||||||||||||||||||||||||||||
| Other instruments issued in Chile: | ||||||||||||||||||||||||||||||||||||
| Deposit promissory notes from domestics banks | — | — | — | — | — | — | — | — | — | |||||||||||||||||||||||||||
| Mortgage bonds from domestic banks | — | — | — | — | — | — | — | — | — | |||||||||||||||||||||||||||
| Bonds from domestic banks | — | — | — | — | — | — | — | — | — | |||||||||||||||||||||||||||
| Deposits from domestic banks | — | — | — | — | — | — | — | — | — | |||||||||||||||||||||||||||
| Bonds from other Chilean companies | — | — | — | — | — | — | — | — | — | |||||||||||||||||||||||||||
| Promissory notes issued by other Chilean companies | — | — | — | — | — | — | — | — | — | |||||||||||||||||||||||||||
| Other instruments | — | — | — | — | — | — | — | — | — | |||||||||||||||||||||||||||
| Instruments issued by Foreign Institutions: | ||||||||||||||||||||||||||||||||||||
| Instruments from foreign governments or central banks | — | — | — | — | — | — | — | — | — | |||||||||||||||||||||||||||
| Total | Ch$ | — | — | % | Ch$ | — | —% | Ch$ | — | — | % | Ch$ | — | — | % | Ch$ | — | |||||||||||||||||||
| (1) | Weighted Average Nominal Rate is calculated as the sum of total accrued interests for the type of security divided by the average balance for the same type of security during the reported period. |
121
| As of December 31, 2021 | ||||||||||||||||||||||||||||||||||||
| Due within 1 year | Weighted Average Nominal Rate(1) | Due after 1 year but within 5 years | Weighted Average Nominal Rate(1) | Due after 5 year but within 10 years | Weighted Average Nominal Rate(1) | Due after 10 years | Weighted Average Nominal Rate(1) | Total | ||||||||||||||||||||||||||||
| (millions of Ch$, except percentages) | ||||||||||||||||||||||||||||||||||||
| Financial Instruments at Amortized Cost: | ||||||||||||||||||||||||||||||||||||
| Instruments issued by the Chilean Government and Central Bank of Chile: | ||||||||||||||||||||||||||||||||||||
| Bonds issued by the Central Bank | Ch$ | — | — | % | Ch$ | — | — | % | Ch$ | — | — | % | Ch$ | — | — | % | Ch$ | — | ||||||||||||||||||
| Promissory notes issued by the Chilean Government and the Central Bank | — | — | — | — | — | — | — | — | — | |||||||||||||||||||||||||||
| Other instruments | — | — | 413,599 | 1.58 | 426,145 | 3.51 | — | — | 839,744 | |||||||||||||||||||||||||||
| Other instruments issued in Chile: | ||||||||||||||||||||||||||||||||||||
| Deposit promissory notes from domestics banks | ||||||||||||||||||||||||||||||||||||
| Mortgage bonds from domestic banks | — | — | — | — | — | — | — | — | — | |||||||||||||||||||||||||||
| Bonds from domestic banks | — | — | — | — | — | — | — | — | — | |||||||||||||||||||||||||||
| Deposits from domestic banks | — | — | — | — | — | — | — | — | — | |||||||||||||||||||||||||||
| Bonds from other Chilean companies | — | — | — | — | — | — | — | — | — | |||||||||||||||||||||||||||
| Promissory notes issued by other Chilean companies | — | — | — | — | — | — | — | — | — | |||||||||||||||||||||||||||
| Other instruments | — | — | — | — | — | — | — | |||||||||||||||||||||||||||||
| Instruments issued by Foreign Institutions: | ||||||||||||||||||||||||||||||||||||
| Instruments from foreign governments or central banks | — | — | — | — | — | �� | — | — | — | — | ||||||||||||||||||||||||||
| Total | Ch$ | — | — | % | Ch$ | 413,599 | 1.58 | % | Ch$ | 426,145 | 3.51 | % | Ch$ | — | — | % | Ch$ | 839,744 | ||||||||||||||||||
| (1) | Weighted Average Nominal Rate is calculated as the sum of total accrued interests for the type of security divided by the average balance for the same type of security during the reported period. |
122
Loan Portfolio
The following table sets forth our loans by type of loan and risk classification. All loan amounts stated below are before deduction of allowances for loan losses.
| As of December 31, | ||||||||
| 2020 | 2021 | |||||||
| (in millions of Ch$) | ||||||||
| IFRS: | ||||||||
| Commercial loans: | ||||||||
| Commercial loans | Ch$ | 14,398,446 | Ch$ | 15,986,168 | ||||
| Foreign trade loans | 967,646 | 1,271,705 | ||||||
| Current account debtors | 120,539 | 144,010 | ||||||
| Factoring transactions | 373,903 | 486,282 | ||||||
| Student loans | 57,552 | 58,018 | ||||||
| Commercial lease transactions | 1,592,905 | 1,612,776 | ||||||
| Other loans and accounts receivable | 90,606 | 113,373 | ||||||
| Subtotal | 17,601,597 | 19,672,332 | ||||||
| Mortgage loans: | ||||||||
| Mortgage bonds | 9,363 | 6,084 | ||||||
| Endorsable mortgage loans | 24,105 | 17,784 | ||||||
| Other residential real estate mortgage loans | 9,198,834 | 10,169,889 | ||||||
| Credits from ANAP | 2 | — | ||||||
| Other loans and accounts receivable | 155,068 | 152,771 | ||||||
| Subtotal | 9,387,372 | 10,346,528 | ||||||
| Consumer loans: | ||||||||
| Consumer loans in installments | 2,711,541 | 2,873,304 | ||||||
| Current account debtors | 158,756 | 172,623 | ||||||
| Credit card debtors | 1,077,445 | 1,199,407 | ||||||
| Consumer lease transactions | 302 | 509 | ||||||
| Other loans and accounts receivable | 677 | 1,170 | ||||||
| Subtotal | 3,948,721 | 4,247,013 | ||||||
| Total loans | Ch$ | 30,937,690 | Ch$ | 34,265,873 | ||||
The loan categories are as follows:
| ● | “Commercial Loans” are loans and accounts receivable from clients not included within the mortgage or consumer loans categories. | |
| ● | “Mortgage Loans” include mortgage loans granted to individuals to acquire, expand, repair or build a home, issued as mortgage bonds, endorsable mortgage loans or by other methods. It also includes supplementary loans for the same purposes and bridge loans granted before the mortgage loan has been settled. This subcategory also includes residential real estate lease transactions and other accounts receivable. | |
| ● | “Consumer Loans” are all loans granted to individuals to be used for purchasing goods or services. These include different types of loans (either installments or revolving), as well as balances from credit card transactions or overdrafts on current accounts belonging to individuals. Consumer loans also include consumer lease transactions and other accounts receivable. Consumer loans do not include loans granted to finance business activities that the debtor is developing or that it may develop. |
123
Maturity and Interest Rate Sensitivity of Loans as of December 31, 2021
The following table sets forth an analysis by type and time remaining to maturity of our loans as of December 31, 2021:
| Balances as of December 31, 2021 | Due within 1 month | Due after 1 month but within 6 months | Due after 6 months but within 12 months | Due after 1 year but within 3 years | Due after 3 years but within 5 years | Due after 5 years but within 15 years | Due after 15 years | |||||||||||||||||||||||||
| (in millions of Ch$) | ||||||||||||||||||||||||||||||||
| IFRS: | ||||||||||||||||||||||||||||||||
| Commercial Loans: | ||||||||||||||||||||||||||||||||
| Commercial loans | Ch$ | 15,986,168 | Ch$ | 1,183,133 | Ch$ | 3,434,085 | Ch$ | 2,360,795 | Ch$ | 4,435,836 | Ch$ | 1,950,956 | Ch$ | 2,380,269 | Ch$ | 241,094 | ||||||||||||||||
| Foreign trade loans | 1,271,705 | 309,853 | 860,069 | 96,941 | 3,624 | 1,052 | 166 | — | ||||||||||||||||||||||||
| Current account debtors | 144,010 | 144,010 | — | — | — | — | — | — | ||||||||||||||||||||||||
| Factoring loans | 486,282 | 262,408 | 211,342 | 11,224 | 1,308 | — | — | — | ||||||||||||||||||||||||
| Student loans | 58,018 | 1,850 | 7,442 | 5,704 | 14,066 | 11,526 | 17,193 | 237 | ||||||||||||||||||||||||
| Leasing loans | 1,612,776 | 46,777 | 208,768 | 218,551 | 582,154 | 254,471 | 299,135 | 2,920 | ||||||||||||||||||||||||
| Other loans | 113,373 | 113,370 | 3 | — | — | — | — | — | ||||||||||||||||||||||||
| Subtotal | 19,672,332 | 2,061,401 | 4,721,709 | 2,693,215 | 5,036,988 | 2,218,005 | 2,696,763 | 244,251 | ||||||||||||||||||||||||
| Mortgage Loans: | ||||||||||||||||||||||||||||||||
| Mortgage bonds | 6,084 | 247 | 824 | 1,004 | 2,655 | 691 | 663 | — | ||||||||||||||||||||||||
| Endorsable mortgage loans | 17,784 | 370 | 1,649 | 1,842 | 6,330 | 4,447 | 3,075 | 71 | ||||||||||||||||||||||||
| Residential mortgage loans | 10,169,889 | 57,530 | 256,883 | 310,849 | 1,263,110 | 1,271,001 | 5,337,172 | 1,673,344 | ||||||||||||||||||||||||
| Credits from ANAP | — | — | — | — | — | — | — | — | ||||||||||||||||||||||||
| Other loans | 152,771 | 2,825 | 6,207 | 1,689 | 3,480 | 5,980 | 68,839 | 63,751 | ||||||||||||||||||||||||
| Subtotal | 10,346,528 | 60,972 | 265,563 | 315,384 | 1,275,575 | 1,282,119 | 5,409,749 | 1,737,166 | ||||||||||||||||||||||||
| Consumer Loans: | ||||||||||||||||||||||||||||||||
| Consumer loans | 2,873,304 | 107,570 | 448,106 | 463,209 | 1,314,383 | 502,354 | 37,116 | 566 | ||||||||||||||||||||||||
| Current accounts debtors | 172,623 | 172,623 | — | — | — | — | — | — | ||||||||||||||||||||||||
| Credit card | 1,199,407 | 1,198,964 | 443 | — | — | — | — | — | ||||||||||||||||||||||||
| Consumer lease transactions | 509 | 22 | 72 | 93 | 261 | 61 | — | — | ||||||||||||||||||||||||
| Other loans | 1,170 | 1,170 | — | — | — | — | — | — | ||||||||||||||||||||||||
| Subtotal | 4,247,013 | 1,480,349 | 448,621 | 463,302 | 1,314,644 | 502,415 | 37,116 | 566 | ||||||||||||||||||||||||
| Total Loans | Ch$ | 34,265,873 | Ch$ | 3,602,722 | Ch$ | 5,435,893 | Ch$ | 3,471,901 | Ch$ | 7,627,207 | Ch$ | 4,002,539 | Ch$ | 8,143,628 | Ch$ | 1,981,983 | ||||||||||||||||
124
The following table sets forth a breakdown by variable and fixed rate of our outstanding loans due after one year as of December 31, 2021:
| As of December 31, 2021 | ||||
| (in millions of Ch$) | ||||
| IFRS: | ||||
| Variable rate | ||||
| Ch$ | Ch$ | 275,708 | ||
| UF | 585,774 | |||
| Foreign currency | 562,259 | |||
| Subtotal | 1,423,741 | |||
| Fixed rate | ||||
| Ch$ | 6,414,470 | |||
| UF | 13,811,680 | |||
| Foreign currency | 105,466 | |||
| Subtotal | 20,331,616 | |||
| Total | Ch$ | 21,755,357 | ||
Foreign Country Outstanding Loans
Our cross-border outstanding loans are principally trade-related. These loans include loans granted to foreign financial institutions and foreign corporations, some of which are guaranteed by their Chilean parent company. The table below lists under IFRS the total amounts outstanding to borrowers in certain foreign countries as of the dates indicated, and thus does not include foreign trade-related loans to domestic borrowers.
| As of December 31, | ||||||||
| 2020 | 2021 | |||||||
| (in millions of Ch$) | ||||||||
| IFRS: | ||||||||
| Argentina | Ch$ | — | Ch$ | — | ||||
| Brazil | — | — | ||||||
| Canada | — | — | ||||||
| China | — | — | ||||||
| Colombia | 1,071 | 1,282 | ||||||
| India | — | — | ||||||
| Mexico | — | — | ||||||
| Netherlands | — | — | ||||||
| Panama | — | — | ||||||
| Peru | 7,789 | 6,512 | ||||||
| Spain | 1,610 | 5,924 | ||||||
| Singapore | — | — | ||||||
| United Kingdom | — | — | ||||||
| United States | — | — | ||||||
| Total | Ch$ | 10,470 | Ch$ | 13,718 | ||||
As December 31, 2021 and as of the date of this annual report, we did not have exposures associated with cross-border loans or contingent loans either in Ukraine or in Russia.
Credit Review Process
Credit risk is the risk that we will incur a loss because our customers or counterparties do not comply with their contractual obligations.
This risk is managed using a global, unified and forward-looking strategy, which recognizes the current and projected economic environment of the markets and segments in which our different businesses are developing and grants appropriate credit treatment to each such market or segment by using risk limits that we are willing to accept from counterparties.
Managing credit risk is, therefore, inherent to our business and must be incorporated into each segment in which we do business. In this way, we may achieve an optimum balance between assumed risks and attained returns and properly allocate capital to each business line while complying with regulations and criteria defined by our board of directors in order to ensure that we have an appropriate capital base for potential losses that may arise from our credit exposure.
125
Counterparty limits are established by analyzing financial information, risk ratings, the nature of the exposure, documentation, guarantees, market conditions and the pertinent industry sector, among other factors. The process of monitoring credit quality also includes identifying in advance any possible changes in a counterparty’s payment capacity, which enables us to evaluate the potential loss from these risks and take corrective actions.
Approval Process
The Bank analyzes its loan portfolio on a segmented basis and the same approach is used for approval purposes by taking into account the characteristics of each particular targeted group of customers. Given the diversity of the bank’s loan book, we utilize different techniques in order to evaluate the credit quality, payment capacity and financial structure of every type of customer.
It is important to note that Banco de Chile organizes its lending business in two business segments, namely, retail banking and wholesale banking. Accordingly, for risk management purposes, Banco de Chile has specialized processes and knowledgeable teams for credit approval in each of these segments.
Retail Banking Segment
Credit risk assessment is carried out through automated models for personal banking and parametric models for SME banking. These models allow us to determine suitable levels of financial burden, payment capacity and desired exposure to credit risk. These are build-in models that depend on information associated with customers’ payment behavior, customers’ borrowings with other banks, similarity to the target market and income segment for personal banking. In the case of SME banking, we add information related to the customer’s main commercial activity and diverse financial information. Based on the accuracy we have achieved with these models over time, we are able to provide our commercial areas with timely responses to customer requests.
We have continued to work and focus on the improvement of our retail lending analytics process, covering several elements, such as: (i) data management and data governance, (ii) scoring and loan loss provisioning models, (iii) validation standards and procedures, and (iv) an ongoing monitoring of models and portfolios, among others. These efforts are aimed at enhancing our market-leading position in risk management matters, maintaining a competitive risk-return relationship while reinforcing our governance and regulatory compliance.
Wholesale Banking Segment
Within wholesale banking, credit risk assessment is executed by means of a case-by-case approach, which is based on subjective credit analysis supported by the judgement of specialized officers. This approach consists of a comprehensive individualized review that considers, among other factors, the credit exposure, the loan tenor, the type of loan, the customer’s financial soundness and collaterals that could be used to back the loan. All of these quantitative and objective factors are supplemented by a SWOT analysis of the customer and projections for the industry in which the company operates. This process is supported by a credit rating model that enables us to homogeneously evaluate each customer while establishing approval attributions depending on the credit exposure.
Although the Bank has dedicated monitoring teams within the loan approval areas, monitoring efforts are also carried out collectively by the credit risk and commercial areas, which track operations from application to collection, in order to avoid unexpected risks.
Also, we have set approval attributions that are limited by the total customer credit risk. We define total customer credit risk as the sum of the customer’s loans and other financial obligations in which the customer is the indebted party, the loans and other financial obligations from a third party that are guaranteed by the customer, the customer’s contingent loans and any of the customer’s credit facilities. Also, if the customer is part of an economic group, then the total customer credit risk will also include the total amount of the items described above corresponding to all the parties that make up the economic group.
126
Transactions in which the total customer credit risk is more than Ch$23,244 million require approval from a credit committee, composed of three members of the board of directors and our chief executive officer. Transactions in which the total customer credit risk is equal to or less than Ch$23.244 million may be approved by other risk officers, depending on the amount involved, as follows:
Approved by | Limit in Ch$ | |
| Credit committee, including members of the board of directors | up to legal limits | |
| Executive Committee (Chairman, General Manager and Wholesale Credit Risk Divisions Manager/Retail Credit Risk and Global Risk Control Division Manager) | up to Ch$23,244 million | |
| Senior Risk Committee (Chairman, General Manager and Wholesale Credit Risk Divisions Manager/Retail Credit Risk and Global Risk Control Division Manager). Approved by two of the three. | up to Ch$15,496 million | |
| Wholesale Credit Risk Divisions Manager, Manager of the Corporate Division/Commercial Division Manager. | up to Ch$12,397 million | |
| Corporate Credit Risk Area Manager and Corporate Division Manager | up to Ch$10,847 million | |
| Corporate Credit Risk Area Deputy Manager and Corporate Banking Area Manager | up to Ch$9,298 million | |
| Large Companies Risk Area Deputy Manager, Large Companies Area Manager | up to Ch$6,198 million | |
| Regional Risk Manager and Large Companies Group Manager | up to Ch$3,099 million | |
| Risk Officer, Large Companies Group Manager | up to Ch$1,860 million | |
| Risk Department Heads | up to Ch$1,240 million | |
| Zonal Managers | up to Ch$310 million |
In addition to reviewing the credit limit, the business segment extending the credit must review the terms of the loan, the interest rate and any security to be obtained.
Control and Follow-up
The ongoing control and follow-up of credit risk is the basis for portfolio management and enables us to recognize risk opportunely while detecting and avoiding potential write-offs in advance. In line with the guidelines we follow for credit assessment purposes, we also utilize control and follow-up procedures in accordance with our main business segments.
Retail Banking Segment
We control credit risk in this segment by continuously monitoring customers and market trends. This approach permits us to take corrective measures and implement necessary adjustments in order to keep credit risk aligned with desired levels. In order to achieve this goal, we generate a wide set of management reports addressing the evolution of portfolio expected loss, vintage analysis, past due at the level of product and segment, in addition to approval guidelines. Further, we have developed statistical models for this segment, which are intended to support the credit assessment process. These models are continuously monitored through back-testing, variable and segmentation stability, among other techniques. This approach enables us to assure the models’ predictive capability over time.
Wholesale Banking Segment
For wholesale banking segment, we control and monitor credit quality by means of a specialized unit, which has developed diverse methodologies and tools that enable us to carry out a centralized systematic monitoring of thresholds on financial ratios, behavior variables and credit ratings. Thus, for companies reporting risk alerts, we execute a focused follow-up that allows us to take corrective measures in advance.
In addition, portfolio follow-up responsibilities include monitoring of conditions established during the assessment process, such as covenants, collateral, specific restrictions for credit approval and borrowing caps, among others.
127
Analysis of Our Loan Classification
The following tables provide statistical data under IFRS regarding the classification of our loans as of the dates indicated. As discussed above, our risk analysis system requires that loans to all customers be classified.
| As of December 31, 2020 | ||||||||||||||||||||||||
| Bank’s Credit Rating: | Stage 1 | Stage 2 | Stage 3 | POCI | Total Loans | Classification percentage | ||||||||||||||||||
| (in millions of Ch$, except percentages) | ||||||||||||||||||||||||
| Commercial Loans | ||||||||||||||||||||||||
| Individual | ||||||||||||||||||||||||
| A1 | Ch$ | 10,099 | Ch$ | — | Ch$ | — | Ch$ | — | Ch$ | 10,099 | 0.08 | % | ||||||||||||
| A2 | 1,174,965 | — | — | — | 1,174,965 | 9.19 | ||||||||||||||||||
| A3 | 1,961,106 | 124,772 | — | — | 2,085,878 | 16.31 | ||||||||||||||||||
| A4 | 2,574,329 | 28,444 | — | — | 2,602,773 | 20.36 | ||||||||||||||||||
| A5 | 3,197,835 | 793,264 | 964 | — | 3,992,063 | 31.22 | ||||||||||||||||||
| A6 | — | 2,521,089 | — | — | 2,521,089 | 19.72 | ||||||||||||||||||
| Normal Portfolio | 8,918,334 | 3,467,569 | 964 | — | 12,386,867 | 96.88 | ||||||||||||||||||
| B1 | — | 133,770 | — | — | 133,770 | 1.05 | ||||||||||||||||||
| B2 | — | 22,276 | — | — | 22,276 | 0.17 | ||||||||||||||||||
| B3 | — | 34,669 | — | 1,609 | 36,278 | 0.28 | ||||||||||||||||||
| B4 | — | 3,527 | — | 18 | 3,545 | 0.03 | ||||||||||||||||||
| Substandard Portfolio | — | 194,242 | — | 1,627 | 195,869 | 1.53 | ||||||||||||||||||
| C1 | — | — | 47,333 | 40 | 47,373 | 0.37 | ||||||||||||||||||
| C2 | — | — | 13,875 | 29 | 13,904 | 0.11 | ||||||||||||||||||
| C3 | — | — | 15,245 | 26 | 15,271 | 0.12 | ||||||||||||||||||
| C4 | — | — | 29,943 | 1 | 29,944 | 0.23 | ||||||||||||||||||
| C5 | — | — | 48,164 | 1 | 48,165 | 0.38 | ||||||||||||||||||
| C6 | — | — | 48,925 | 64 | 48,989 | 0.38 | ||||||||||||||||||
| Non-Complying Portfolio | — | — | 203,485 | 161 | 203,646 | 1.59 | ||||||||||||||||||
| Subtotal individual loans | 8,918,334 | 3,661,811 | 204,449 | 1,788 | 12,786,382 | 100.00 | ||||||||||||||||||
| Group | ||||||||||||||||||||||||
| Normal portfolio | 4,291,198 | 199,810 | 613 | 42 | 4,491,663 | 93.28 | ||||||||||||||||||
| Non-complying portfolio | — | — | 321,511 | 2,041 | 323,552 | 6.72 | ||||||||||||||||||
| Subtotal group loans | 4,291,198 | 199,810 | 322,124 | 2,083 | 4,815,215 | 100.00 | ||||||||||||||||||
| Total Commercial Loans | 13,209,532 | 3,861,621 | 526,573 | 3,871 | 17,601,597 | |||||||||||||||||||
| Residential Mortgage Loans | ||||||||||||||||||||||||
| Group | ||||||||||||||||||||||||
| Normal portfolio | 8,664,761 | 401,997 | 1,078 | — | 9,067,836 | 96.60 | ||||||||||||||||||
| Non-complying portfolio | — | — | 319,122 | 414 | 319,536 | 3.40 | ||||||||||||||||||
| Subtotal group loans | 8,664,761 | 401,997 | 320,200 | 414 | 9,387,372 | 100.00 | ||||||||||||||||||
| Total Residential Mortgage Loans | 8,664,761 | 401,997 | 320,200 | 414 | 9,387,372 | |||||||||||||||||||
| Consumer Loans | ||||||||||||||||||||||||
| Group | ||||||||||||||||||||||||
| Normal portfolio | 3,295,502 | 324,440 | 2,419 | 28 | 3,622,389 | 91.74 | ||||||||||||||||||
| Non-complying portfolio | — | — | 324,683 | 1,649 | 326,332 | 8.26 | ||||||||||||||||||
| Subtotal group loans | 3,295,502 | 324,440 | 327,102 | 1,677 | 3,948,721 | 100.00 | ||||||||||||||||||
| Total Consumer Loans | 3,295,502 | 324,440 | 327,102 | 1,677 | 3,948,721 | |||||||||||||||||||
| Total Individual Loans | 8,918,334 | 3,661,811 | 204,449 | 1,788 | 12,786,382 | 41.33 | ||||||||||||||||||
| Total Group Loans | 16,251,461 | 926,247 | 969,426 | 4,174 | 18,151,308 | 58.67 | ||||||||||||||||||
| Total Loans | Ch$ | 25,169,795 | Ch$ | 4,588,058 | Ch$ | 1,173,875 | Ch$ | 5,962 | Ch$ | 30,937,690 | 100.00 | % | ||||||||||||
| Percentage Individual classified | 35.43 | % | 79.81 | % | 17.42 | % | 29.99 | % | 41.33 | % | ||||||||||||||
128
| As of December 31, 2021 | ||||||||||||||||||||||||
| Stage 1 | Stage 2 | Stage 3 | POCI | Total Loans | Classification percentage | |||||||||||||||||||
| Bank’s Credit Rating: | (in millions of Ch$, except percentages) | |||||||||||||||||||||||
| Commercial Loans | ||||||||||||||||||||||||
| Individual | ||||||||||||||||||||||||
| A1 | Ch$ | 6,605 | Ch$ | — | Ch$ | — | Ch$ | — | Ch$ | 6,605 | 0.05 | % | ||||||||||||
| A2 | 1,384,897 | 2,620 | — | — | 1,387,517 | 9.51 | ||||||||||||||||||
| A3 | 2,901,683 | 38 | — | — | 2,901,721 | 19.88 | ||||||||||||||||||
| A4 | 2,828,834 | 129,484 | — | — | 2,958,318 | 20.27 | ||||||||||||||||||
| A5 | 3,846,862 | 408,215 | 834 | — | 4,255,911 | 29.15 | ||||||||||||||||||
| A6 | — | 2,721,778 | — | — | 2,721,778 | 18.64 | ||||||||||||||||||
| Normal Portfolio | 10,968,881 | 3,262,135 | 834 | — | 14,231,850 | 97.50 | ||||||||||||||||||
| B1 | — | 123,332 | — | — | 123,332 | 0.84 | ||||||||||||||||||
| B2 | — | 29,164 | — | — | 29,164 | 0.20 | ||||||||||||||||||
| B3 | — | 37,516 | — | 3 | 37,519 | 0.26 | ||||||||||||||||||
| B4 | — | 7,568 | — | — | 7,568 | 0.05 | ||||||||||||||||||
| Substandard Portfolio | — | 197,580 | — | 3 | 197,583 | 1.35 | ||||||||||||||||||
| C1 | — | — | 36,132 | 196 | 36,328 | 0.25 | ||||||||||||||||||
| C2 | — | — | 16,036 | 75 | 16,111 | 0.11 | ||||||||||||||||||
| C3 | — | — | 19,001 | 17 | 19,018 | 0.13 | ||||||||||||||||||
| C4 | — | — | 12,960 | 9 | 12,969 | 0.09 | ||||||||||||||||||
| C5 | — | — | 41,617 | 86 | 41,703 | 0.29 | ||||||||||||||||||
| C6 | — | — | 41,053 | 185 | 41,238 | 0.28 | ||||||||||||||||||
| Non-Complying Portfolio | — | — | 166,799 | 568 | 167,367 | 1.15 | ||||||||||||||||||
| Subtotal individual loans | 10,968,881 | 3,459,715 | 167,633 | 571 | 14,596,800 | 100.00 | ||||||||||||||||||
| Group | ||||||||||||||||||||||||
| Normal portfolio | 4,579,194 | 214,276 | 893 | 199 | 4,794,562 | 94.46 | ||||||||||||||||||
| Non-complying portfolio | — | — | 279,420 | 1,550 | 280,970 | 5.54 | ||||||||||||||||||
| Subtotal group loans | 4,579,194 | 214,276 | 280,313 | 1,749 | 5,075,532 | 100.00 | ||||||||||||||||||
| Total Commercial Loans | 15,548,075 | 3,673,991 | 447,946 | 2,320 | 19,672,332 | |||||||||||||||||||
| Residential Mortgage Loans | ||||||||||||||||||||||||
| Group | ||||||||||||||||||||||||
| Normal portfolio | 9,608,872 | 449,804 | 2,675 | — | 10,061,351 | 97.24 | ||||||||||||||||||
| Non-complying portfolio | — | — | 285,143 | 34 | 285,177 | 2.76 | ||||||||||||||||||
| Subtotal group loans | 9,608,872 | 449,804 | 287,818 | 34 | 10,346,528 | 100.00 | ||||||||||||||||||
| Total Residential Mortgage Loans | 9,608,872 | 449,804 | 287,818 | 34 | 10,346,528 | |||||||||||||||||||
| Consumer Loans | ||||||||||||||||||||||||
| Group | ||||||||||||||||||||||||
| Normal portfolio | 3,739,887 | 287,814 | 4,367 | 64 | 4,032,132 | 94.94 | ||||||||||||||||||
| Non-complying portfolio | — | — | 213,662 | 1,219 | 214,881 | 5.06 | ||||||||||||||||||
| Subtotal group loans | 3,739,887 | 287,814 | 218,029 | 1,283 | 4,247,013 | 100.00 | ||||||||||||||||||
| Total Consumer Loans | 3,739,887 | 287,814 | 218,029 | 1,283 | 4,247,013 | |||||||||||||||||||
| Total Individual Loans | 10,968,881 | 3,459,715 | 167,633 | 571 | 14,596,800 | 42.60 | ||||||||||||||||||
| Total Group Loans | 17,927,953 | 951,894 | 786,160 | 3,066 | 19,669,073 | 57.40 | ||||||||||||||||||
| Total Loans | Ch$ | 28,896,834 | Ch$ | 4,411,609 | Ch$ | 953,793 | Ch$ | 3,637 | Ch$ | 34,265,873 | 100.00 | % | ||||||||||||
| Percentage Individual classified | 37.96 | % | 78.42 | % | 17.58 | % | 15.70 | % | 42.60 | % | — | |||||||||||||
129
Classification of Loan Portfolio
Information about the classification of our loan portfolio is presented in Note 11 to our audited consolidated financial statements as of and for the year ended December 31, 2021 appearing elsewhere in this annual report
Analysis of Substandard and Past-due loans
The following table analyzes our substandard loans, total past-due loans and allowances for loan losses existing at the dates indicated under IFRS.
| Year Ended December 31, | ||||||||||||
| 2019 | 2020 | 2021 | ||||||||||
| (in millions of Ch$, except percentages) | ||||||||||||
| IFRS: | ||||||||||||
| Total Loans | Ch$ | 30,033,272 | Ch$ | 30,937,690 | Ch$ | 34,265,873 | ||||||
| Impaired loans | 894,532 | 1,173,875 | 953,793 | |||||||||
| Impaired loans as a percentage of total loans | 2.98 | % | 3.79 | % | 2.78 | % | ||||||
| Total past-due loans | ||||||||||||
| To the extent secured(2) | 58,312 | 58,005 | 42,873 | |||||||||
| To the extent unsecured | 360,456 | 241,403 | 246,634 | |||||||||
| Total past-due loans | Ch$ | 418,768 | Ch$ | 299,408 | Ch$ | 289,507 | ||||||
| Total past-due loans as a percentage of total loans | ||||||||||||
| To the extent secured(2) | 0.19 | % | 0.19 | % | 0.13 | % | ||||||
| To the extent unsecured | 1.20 | 0.78 | 0.72 | |||||||||
| Total past-due loans as a percentage of total loans | 1.39 | % | 0.97 | % | 0.85 | % | ||||||
| Allowance for loan losses as a percentage of: | ||||||||||||
| Total loans | 2.16 | % | 2.70 | % | 1.97 | % | ||||||
| Past-due loans | 155.03 | 279.25 | 232.64 | |||||||||
| Unsecured past-due loans | 180.11 | % | 346.35 | % | 273.08 | % | ||||||
| (1) | All references to Total Past-due loans in the table above refer as to Total Past-due loans (90 days or more) including interests and principal. |
| (2) | Security generally consists of mortgages on real estate, pledges of marketable securities, letters of credit or cash. |
As of December 31, 2021, our past-due loans (loans 90-days or more past due) amounted to Ch$289,507 million, which represented a 3.3% annual decrease when compared to the Ch$299,408 million recorded in 2020. These figures translated into past-due ratios (loans 90-days or more past due over total loans) of 0.97% in 2020 and 0.85% in 2021. Various economic and business dynamics contributed to the decrease in both the amount of past-due loans and our past-due loans ratio in 2021 when compared to 2020, including: (i) improved business conditions for companies in 2021, when mobility restrictions began to be gradually lifted and commercial activity returned to almost normal pre-pandemic levels, benefiting companies’ turnover and results, which resulted in enhanced credit behavior of wholesale customers, and (ii) improved payment capacity of personal banking customers due to the excess of liquidity in the economy produced by three consecutive pension fund withdrawals and the government aid package to support individuals, which increased disposable income by the end of 2020 but particularly throughout 2021. For more information, see “Item 5. Operating Financial Review and Prospects— Results of Operations for the Years Ended December 31, 2019, 2020 and 2021—Provisions for Loan Losses” and “Item 3. Key Information—Risk Factors—Our exposure to certain segments of the retail market could lead to higher levels of total past-due loans and subsequent charge offs.”
130
Analysis of Allowances for Loan Losses
The following table analyzes our allowances for loan losses and changes in the allowances attributable to charge-offs, allowances established and allowances released:
| As of December 31, | ||||||||||||
| 2019 | 2020 | 2021 | ||||||||||
| (in millions of Ch$, except percentages) | ||||||||||||
| IFRS: | ||||||||||||
| Allowances for expected credit losses at the beginning of the period | Ch$ | 585,378 | Ch$ | 649,233 | Ch$ | 836,107 | ||||||
| Charge-offs | (313,200 | ) | (332,978 | ) | (241,221 | ) | ||||||
| Debt Exchange | — | — | — | |||||||||
| Loan portfolio acquisition | — | — | — | |||||||||
| Sale of loans | — | (107 | ) | (15,477 | ) | |||||||
| Allowances established | 377,055 | 519,959 | 94,087 | |||||||||
| Allowances for expected credit losses at the end of the period | Ch$ | 649,233 | Ch$ | 836,107 | Ch$ | 673,496 | ||||||
| Allowances for expected credit losses at the end of period as a percentage of total loans | 2.16 | % | 2.70 | % | 1.97 | % | ||||||
| Changes in provisions for expected credit losses as a percentage of average loans | 1.15 | 1.78 | 0.05 | |||||||||
| Nonaccrual loans as a percentage of total loans | 0.00 | 0.00 | 0.00 | |||||||||
| Allowance for expected credit losses as a percentage of nonaccrual loans | 66.67 | 11.11 | 0.00 | |||||||||
| Ratios of charge-offs to average balance: | ||||||||||||
| Commercial loans | 0.35 | 0.40 | 0.45 | |||||||||
| Mortgage loans | 0.09 | 0.15 | 0.11 | |||||||||
| Consumer loans | 5.62 | 5.99 | 3.70 | |||||||||
| Total loans | 1.09 | % | 1.08 | % | 0.74 | % | ||||||
In 2019, the Chilean economy began to show some signs of recovery during the first three quarters, mainly influenced by a rebound in private investment in the first half of the year and, to a lesser degree, by a low comparison base in the third quarter. However, protests and demonstrations that followed the social turmoil that started in October 2019 resulted in a GDP contraction of 2.4% during the fourth quarter, due to damage to private and public infrastructure, stagnation of certain economic sectors and deteriorated confidence indices. These factors affected private consumption, which increased by 0.7% in 2019 compared to the 3.8% increase in 2018. In addition, fixed capital formation rose 4.7% as compared to 6.5% growth in 2018. In this environment, our loan portfolio had an annual increase of 7.5%, primarily supported by a 14.8% annual expansion in residential mortgage loans, which was the result of interest rates at historically low levels and a strong housing demand. However, commercial loans and consumer loans grew by 5.5% and 2.2%, respectively, on an annual basis. These lending products were highly impacted by the economic landscape in relation to the slowdown in private investment during the second half of 2019, as well as the effect of social turmoil on the business sentiment. Consumer loans, in turn, were affected by the deceleration in private consumption coupled with a deterioration in consumer confidence. In regard to credit quality, our loan loss allowances increased by the end of 2019 in order to recognize the change in the macroeconomic environment and its impact on our customers’ payment capacity. Thus, our loan loss allowances increased by approximately Ch$63,855 million in 2019 as compared to 2018. This increase was the result of numerous factors including: (i) the expansion of our loan book explaining approximately Ch$33,443 million of the total increase in loan loss allowances, and (ii) the net credit quality deterioration in both the retail and wholesale banking segment, mainly associated with the October 2019 social turmoil. These effects were partially offset by a positive exchange rate effect on our U.S. dollar-denominated loan loss allowances, given a lower depreciation of the Chilean peso against the U.S. dollar in 2019 (8.4%) as compared to 2018 (12.7%). Based on these trends, our risk index increased from 2.10% in 2018 to 2.16% in 2019.
131
During 2020, the Chilean economy was affected by diverse factors. Although in the first quarter the economy experienced a moderate improvement after the social turmoil experienced during the last months of 2019, the first infections of COVID-19 in Chile (by early March) led to the cession of operations for most of the economic sectors that were intensive in social interaction, given sanitary measures taken in order to reduce viral contagion. Overall, these factors largely explained the 6.0% GDP contraction during 2020, in line with sharp decreases of 9.3% and 8.0% in investment and household spending, respectively. Consequently, our loan portfolio was greatly influenced by lower demand for loans and, therefore, posted a moderate increase of 3.0% in year-end balances. Most of this increase was related to the FOGAPE loan program, which boosted commercial loans by 8.0% at the end of the year. Similarly, residential mortgage loan balances increased by only 2.0% as real estate investment decisions were postponed in light of the current COVID-19 scenario. On the other hand, higher unemployment and the uncertain economic outlook for the coming quarters impacted the year-end balances of consumer loans that decreased 12.9%. In this context, taking into consideration the effects that the COVID-19 pandemic is expected to have on risk profiles of customers as a result of a decrease in disposable income, unemployment and weakened commercial activities for companies, our loan loss allowances increased from Ch$649,233 million in 2019 to Ch$836,107 in 2020, equivalent to an increase of Ch$186,874 million. This behavior was a result of the following drivers: (i) a net credit quality deterioration explained by worsened expectations of financial condition of our retail and wholesale banking customers due to nationwide quarantines due to COVID-19 and their impact on consumption and investment projects, which led us to adjust forecasting models for both Probabilities of Default and Loss Given Default in order to recognize more accurately and with more sensitivity the uncertainties generated by the COVID-19 pandemic and the expected impact on expected credit losses over the coming quarters and years, with a total effect of approximately Ch$151,700 million in higher provisions, and (ii) an annual increase in allowances for loan losses due to loan growth, mainly associated with the expansion of commercial loans in 2020 owing to the FOGAPE loan program, focused on SMEs. These effects were partially offset by a positive exchange rate effect on U.S. dollar-denominated loan loss allowances as a consequence of a 5.3% Chilean peso appreciation against the U.S. dollar in 2020 as compared to the 8.4% depreciation experienced in 2019. As a result, our risk index increased from 2.16% in 2019 to 2.70% at the end of 2020.
During 2021, the Chilean economy recovered significantly from the contraction which was experienced in 2020 as a result of the COVID-19 pandemic. This recovery was reflected in the improvement of many macroeconomic metrics, including GDP, which expanded 11.7% in 2021 due to a sharp annual increase of 20.3% in household consumption. This factor was largely driven by extraordinary support measures for individuals adopted by the Chilean Government, which provided direct money transfers, and by the Chilean Congress, which approved three withdrawals from pension funds, both of which resulted in higher liquidity and disposable income of individuals. In addition, following a successful vaccination process and a decrease in rates of infection, mobility restrictions were gradually lifted in 2021, prompting a recovery in the business activity of diverse industries. Similarly, capital expenditures also improved by growing 17.6% in 2021. Based on these drivers, our loan portfolio posted an annual increase of 10.8%, which was the result annual growths of 11.8%, 10.2% and 7.6% in commercial, residential mortgage and consumer loans, respectively. The increase in commercial loans was produced, for the most part, by the renewed government-guaranteed program for SME and middle market companies in 2021 (Fogape-Reactiva) and, to a lesser extent, by the reactivation of postponed investment projects as a consequence of the pandemic in 2020. From the residential mortgage loans perspective, growth was influenced by both inflation and a demand for housing that continued to be decoupled from the economic drivers. Demand for consumer loans, however, was overall negatively affected during most of 2021 due to the excess of liquidity in the economy, which instead benefited payment behavior, although it did begin to show signs of recovery in the fourth quarter of 2021. In terms of allowances for expected credit losses, the improved macroeconomic environment and enhanced payment behavior positively impacted our forward-looking provisioning models and resulted in an annual decrease of Ch$162,611 million, from Ch$836,107 million in 2020 to Ch$673,496 million in 2021. This decline was the consequence of: (i) a decline of approximately Ch$398,529 million in gross provisions established for expected credit losses, from Ch$210,205 million established in 2020 to approximately Ch$188,324 million in 2021, due to economic growth relating to lower mobility restrictions associated with COVID-19 pandemic in 2021 as compared to 2020, benefiting both the financial condition of companies and the risk profile of individuals, and (ii) the positive effect of non-recurrent events, such as the three pension fund withdrawals and the fiscal aid package deployed by the government to address the economic effects of the COVID-19 pandemic, on individuals’ income, resulting in enhanced payment capacity of individuals and lower delinquency. These factors translated into improved parameters used in our forward-looking provisioning models, based on which we released of approximately Ch$162,018 million during 2021. Likewise, we updated the models to accurately reflect the change in the economic outlook after the pandemic, which prompted an allowance release of approximately Ch$26,308 million in 2021. In addition, as a direct consequence of the improved payment behavior of both individuals and companies, charge-offs decreased Ch$91,767 million in 2021 when compared to 2020 while recoveries increased Ch$28,646 within the same period. Based on all of these factors, our risk index decreased from 2.70% in 2020 to 1.97% in 2021.
For allowances for loan losses associated with impaired loans and with non-impaired loans, see Note 11(b) to our audited consolidated financial statements as of and for the year ended December 31, 2021 appearing elsewhere in this annual report.
132
Loans are written-off when the collection efforts have been exhausted but not later than the maximum periods as follows:
| Type of Loan | Term | |
| Consumer loans with or without collateral | 6 months | |
| Other transactions without collateral | 24 months | |
| Commercial loans with collateral | 36 months | |
| Residential mortgage loans | 48 months | |
| Consumer leases | 6 months | |
| Other non-real estate lease transactions | 12 months | |
| Real estate leases (commercial or residential) | 36 months |
The following table presents the charge-offs breakdown by loan category:
| Year ended December 31, | ||||||||||||
| 2019 | 2020 | 2021 | ||||||||||
| (in millions of Ch$) | ||||||||||||
| IFRS: | ||||||||||||
| Commercial loans | Ch$ | 55,698 | Ch$ | 69,193 | Ch$ | 84,135 | ||||||
| Mortgage loans | 7,790 | 13,663 | 10,712 | |||||||||
| Consumer loans | 249,712 | 250,122 | 146,374 | |||||||||
| Total | Ch$ | 313,200 | Ch$ | 332,978 | Ch$ | 241,221 | ||||||
Loan recoveries by type of loan are shown in the table below:
| Year ended December 31, | ||||||||||||
| 2019 | 2020 | 2021 | ||||||||||
| (in millions of Ch$) | ||||||||||||
| IFRS: | ||||||||||||
| Commercial loans | Ch$ | 12,253 | Ch$ | 8,599 | Ch$ | 15,480 | ||||||
| Mortgage loans | 5,114 | 3,377 | 7,922 | |||||||||
| Consumer loans | 30,608 | 29,783 | 47,005 | |||||||||
| Subtotal | 47,975 | 41,759 | 70,407 | |||||||||
| Recoveries and sales of loan reacquired from the Central Bank | — | — | — | |||||||||
| Total | Ch$ | 47,975 | Ch$ | 41,759 | Ch$ | 70,407 | ||||||
| Total Recoveries as a percentage of average loans | 0.17 | % | 0.14 | % | 0.22 | % | ||||||
The following tables classify our loan portfolio based on the borrower’s payment performance for each of the last two years:
| Year ended December 31, 2020 | ||||||||||||||||
| Commercial Loans | Consumer Loans | Mortgage Loans | Total | |||||||||||||
| (in millions of Ch$) | ||||||||||||||||
| IFRS: | ||||||||||||||||
| Past-due loans - 90 days to 6 months | Ch$ | 24,855 | Ch$ | 43,113 | Ch$ | 4,883 | Ch$ | 72,851 | ||||||||
| Past-due loans - 6 months to 12 months | 41,402 | — | 8,482 | 49,884 | ||||||||||||
| Past-due loans - 12 months to 24 months | 87,847 | — | 32,802 | 120,655 | ||||||||||||
| Past-due loans - 24 months to 36 months | 26,888 | — | 17,869 | 44,757 | ||||||||||||
| Past-due loans - 36 months to 48 months | 133 | — | 11,128 | 11,261 | ||||||||||||
| Past-due loans | Ch$ | 181,125 | Ch$ | 43,113 | Ch$ | 75,170 | Ch$ | 299,408 | ||||||||
| Year ended December 31, 2021 | ||||||||||||||||
| Commercial Loans | Consumer Loans | Mortgage Loans | Total | |||||||||||||
| (in millions of Ch$) | ||||||||||||||||
| IFRS: | ||||||||||||||||
| Past-due loans - 90 days to 6 months | Ch$ | 34,961 | Ch$ | 35,775 | Ch$ | 14,987 | Ch$ | 85,723 | ||||||||
| Past-due loans - 6 months to 12 months | 63,492 | — | 15,182 | 78,674 | ||||||||||||
| Past-due loans - 12 months to 24 months | 64,979 | — | 12,340 | 77,319 | ||||||||||||
| Past-due loans - 24 months to 36 months | 18,972 | — | 17,304 | 36,276 | ||||||||||||
| Past-due loans - 36 months to 48 months | 61 | — | 11,454 | 11,515 | ||||||||||||
| Past-due loans | Ch$ | 182,465 | Ch$ | 35,775 | Ch$ | 71,267 | Ch$ | 289,507 | ||||||||
133
Allocation of Allowances for Loan Losses
The following tables set forth the proportions of our required allowances for loan losses attributable to our commercial, consumer and residential mortgage loans under IFRS as of the dates indicated.
As of December 31, 2020(1) | ||||||||||||||||
| Allowance amount | Allowance amount as a percentage of loans in category | Allowance amount as a percentage of total loans | Loans in | |||||||||||||
| (in millions of Ch$, except percentages) | ||||||||||||||||
| IFRS: | ||||||||||||||||
| Commercial loans | Ch$ | 481,390 | 2.73 | % | 1.56 | % | 56.90 | % | ||||||||
| Consumer loans | 320,065 | 8.11 | 1.03 | 12.76 | ||||||||||||
| Residential mortgage loans | 34,652 | 0.37 | 0.11 | 30.34 | ||||||||||||
| Total allocated allowances | Ch$ | 836,107 | 2.70 | % | 2.70 | % | 100.00 | % | ||||||||
| As of December 31, 2021 | ||||||||||||||||
| Allowance amount | Allowance amount as a percentage of loans in category | Allowance amount as a percentage of total loans | Loans in | |||||||||||||
| (in millions of Ch$, except percentages) | ||||||||||||||||
| IFRS: | ||||||||||||||||
| Commercial loans | Ch$ | 318,841 | 1.62 | % | 0.93 | % | 57.42 | % | ||||||||
| Consumer loans | 315,669 | 7.43 | 0.92 | 12.39 | ||||||||||||
| Residential mortgage loans | 38,986 | 0.38 | 0.11 | 30.19 | ||||||||||||
| Total allocated allowances | Ch$ | 673,496 | 1.97 | % | 1.97 | % | 100.00 | % | ||||||||
| (1) | Based on our loan classification |
The following table sets forth our charge-offs for 2019, 2020 and 2021 by major economic sector and provides further detail of charge-offs that have already been described in the previous discussion of allowances for loan losses:
| Year Ended December 31, | ||||||||||||
| 2019 | 2020 | 2021 | ||||||||||
| (in millions of Ch$) | ||||||||||||
| IFRS: | ||||||||||||
| Commercial: | ||||||||||||
| Agriculture | Ch$ | 2,759 | Ch$ | 5,630 | Ch$ | 11,316 | ||||||
| Mining | 656 | 687 | 658 | |||||||||
| Manufacturing | 6,094 | 4,361 | 14,392 | |||||||||
| Construction | 6,219 | 8,460 | 6,834 | |||||||||
| Commerce | 13,333 | 17,232 | 15,530 | |||||||||
| Transport | 4,839 | 4,142 | 4,350 | |||||||||
| Financial services | 15,899 | 21,488 | 21,544 | |||||||||
| Community | 5,899 | 7,193 | 9,511 | |||||||||
| Subtotal: | Ch$ | 55,698 | Ch$ | 69,193 | Ch$ | 84,135 | ||||||
| Consumer loans | 249,712 | 250,122 | 146,374 | |||||||||
| Mortgage loans | 7,790 | 13,663 | 10,712 | |||||||||
| Total | Ch$ | 313,200 | Ch$ | 332,978 | Ch$ | 241,221 | ||||||
134
Composition of Deposits and Other Commitments
The following table sets forth under IFRS the composition of our deposits and similar commitments as of the dates indicated. See “Item 4. Information on the Company––Selected Statistical Information––Average Balance Sheets, Interest Earned on Interest Earning Assets and Interest Paid on Interest Bearing Liabilities” for the average rate paid on each of the following deposit categories.
| As of December 31, | ||||||||
| 2020 | 2021 | |||||||
| (in millions of Ch$) | ||||||||
| IFRS: | ||||||||
| Current accounts | Ch$ | 12,477,719 | Ch$ | 15,349,224 | ||||
| Other demand deposits | 2,689,510 | 3,193,567 | ||||||
| Savings accounts | 342,550 | 448,257 | ||||||
| Time deposits | 8,442,536 | 8,319,165 | ||||||
| Other term balance payables | 114,455 | 372,584 | ||||||
| Total | Ch$ | 24,066,770 | Ch$ | 27,682,797 | ||||
Maturity of Deposits
The following table sets forth information regarding the currency and maturity of our deposits on December 31, 2021, expressed in percentages, under IFRS. UF-denominated deposits are similar to Chilean peso-denominated deposits in all aspects, except that the principal is readjusted periodically based on the value of the UF.
| As of December 31, 2021 | ||||||||||||||||
| Ch$ | UF | Foreign Currency | Total | |||||||||||||
| (in percentage) | ||||||||||||||||
| IFRS: | ||||||||||||||||
| Demand deposits | 68.95 | % | 26.81 | % | 68.85 | % | 66.98 | % | ||||||||
| Savings accounts | — | 35.09 | — | 1.62 | ||||||||||||
| Time deposits: | ||||||||||||||||
| Maturing within three months | 30.47 | 27.73 | 30.21 | 30.31 | ||||||||||||
| Maturing after three but within six months | 0.46 | 0.13 | 0.36 | 0.42 | ||||||||||||
| Maturing after six but within 12 months | 0.08 | 6.02 | 0.49 | 0.42 | ||||||||||||
| Maturing after 12 months | 0.04 | 4.22 | 0.09 | 0.25 | ||||||||||||
| Total time deposits | 31.06 | 38.10 | 31.15 | 31.40 | ||||||||||||
| Total deposits | 100.00 | % | 100.00 | % | 100.00 | % | 100.00 | % | ||||||||
The following table sets forth information regarding the currency and maturity of deposits in excess of U.S.$100,000 as of December 31, 2021, under IFRS.
| As of December 31, 2021 | ||||||||||||||||
| Ch$ | UF | Foreign Currency | Total | |||||||||||||
| (in millions of Ch$) | ||||||||||||||||
| IFRS: | ||||||||||||||||
| Demand deposits | Ch$ | 7,024,779 | Ch$ | 56,164 | Ch$ | 2,969,481 | Ch$ | 10,050,424 | ||||||||
| Savings accounts | — | 119,392 | — | 119,392 | ||||||||||||
| Time deposits: | ||||||||||||||||
| Maturing within three months | 3,588,660 | 217,349 | 1,275,570 | 5,081,579 | ||||||||||||
| Maturing after three but within six months | 83,342 | 919 | 14,026 | 98,287 | ||||||||||||
| Maturing after six but within 12 months | 11,241 | 53,657 | 22,761 | 87,659 | ||||||||||||
| Maturing after 12 months | 7,903 | 44,456 | 2,592 | 54,951 | ||||||||||||
| Total time deposits | 3,691,146 | 316,381 | 1,314,949 | 5,322,476 | ||||||||||||
| Total deposits | Ch$ | 10,715,925 | Ch$ | 491,937 | Ch$ | 4,284,430 | Ch$ | 15,492,292 | ||||||||
The concept of uninsured deposits does not exist under Chilean regulatory reporting requirements. However, the General Banking Act does contemplate a guarantee by the Chilean Government of time deposits up to a certain amount. For more information, see “Item 4. Information on the company––Regulation and Supervision––Deposit Insurance”.
135
Deposits in Foreign Countries
We also maintain deposits abroad, as needed to conduct our foreign trade transactions and manage liquidity. The table below lists the largest amounts of foreign deposits by country as of the dates indicated, under IFRS:
| As of December 31, | ||||||||
| 2020 | 2021 | |||||||
| (in millions of Ch$) | ||||||||
| IFRS: | ||||||||
| Australia | Ch$ | 1,588 | Ch$ | 2,414 | ||||
| Canada | 3,340 | 1,989 | ||||||
| China | 6 | 143 | ||||||
| Denmark | 629 | — | ||||||
| Finland | 326 | 776 | ||||||
| France | 3,463 | 1,592 | ||||||
| Germany | 15,053 | 12,128 | ||||||
| Japan. | 45,254 | 5,052 | ||||||
| Mexico | 686 | 1,757 | ||||||
| Netherlands | 7,804 | — | ||||||
| Norway | 407 | 2,327 | ||||||
| Peru | 75 | 175 | ||||||
| Sweden | 1,021 | 26,746 | ||||||
| United Kingdom | 49,687 | 10,790 | ||||||
| United States | 1,158,639 | 898,914 | ||||||
| Total | Ch$ | 1,287,978 | Ch$ | 964,803 | ||||
As of December 31, 2021, and as of the date of this annual report, we do not have exposures associated with deposits either in Ukraine or in Russia.
Short-Term Borrowings
The principal categories of our short-term borrowings are amounts borrowed under foreign trade lines of credit, domestic inter-bank loans and repurchase agreements. The table below presents the amounts outstanding and the weighted average nominal interest rate for each period indicated by type of short-term borrowing under IFRS.
| For the year ended December 31, | ||||||||||||||||||||||||
| 2019 | 2020 | 2021 | ||||||||||||||||||||||
| Year-End Balance | Weighted | Year-End Balance | Weighted | Year-End Balance | Weighted | |||||||||||||||||||
| (in millions of Ch$, except interest rate data) | ||||||||||||||||||||||||
| IFRS: | ||||||||||||||||||||||||
| Payables from repurchase agreements and security lending | Ch$ | 308,734 | 2.28 | % | Ch$ | 288,917 | 0.64 | % | Ch$ | 95,009 | 0.99 | % | ||||||||||||
| Borrowings from domestic financial institutions | 6,214 | 1.50 | 8,357 | 0.25 | — | — | ||||||||||||||||||
| Foreign borrowings | 1,462,756 | 2.75 | 550,658 | 3.11 | 453,705 | 0.58 | ||||||||||||||||||
| Commercial Papers | 292,573 | 2.03 | 106,060 | 0.95 | 348,445 | 0.32 | ||||||||||||||||||
| Other obligations | 148,375 | — | 191,506 | — | 274,528 | — | ||||||||||||||||||
| Total short-term borrowings | Ch$ | 2,218,652 | 2.40 | % | Ch$ | 1,145,498 | 1.75 | % | Ch$ | 1,171,687 | 0.40 | % | ||||||||||||
| (1) | Weighted Average Nominal Rate is calculated as the sum of total accrued interests for the type of security divided by the average balance for the same type of security during the reported period. |
136
The following table shows the average balance and the weighted average nominal rate for each short-term borrowing category during the periods indicated:
| For the year ended December 31, | ||||||||||||||||||||||||
| 2019 | 2020 | 2021 | ||||||||||||||||||||||
| Average Balance | Weighted Average Nominal Interest | Average Balance | Weighted Average Nominal Interest | Average Balance | Weighted Average Nominal Interest | |||||||||||||||||||
| (in millions of Ch$, except interest rate data) | ||||||||||||||||||||||||
| IFRS: | ||||||||||||||||||||||||
| Payables from repurchase agreements and security lending | Ch$ | 269,690 | 2.61 | % | Ch$ | 280,827 | 0.66 | % | Ch$ | 140,600 | 0.66 | % | ||||||||||||
| Central Bank borrowings | — | — | — | — | — | — | ||||||||||||||||||
| Borrowings from domestic financial institutions | 6,104 | 11.62 | 13,840 | 2.84 | 3,973 | 3.52 | ||||||||||||||||||
| Sub-total | 275,794 | 2.81 | 294,667 | 0.76 | 144,573 | 0.75 | ||||||||||||||||||
| Foreign borrowings | 1,434,810 | 2.99 | 3,092,454 | 0.55 | 4,302,785 | 0.10 | ||||||||||||||||||
| Foreign Commercial Paper | 275,802 | 2.54 | 219,046 | 1.78 | 359,836 | 0.34 | ||||||||||||||||||
| Sub-total | 1,710,612 | 2.91 | 3,311,500 | 0.64 | 4,662,621 | 0.11 | ||||||||||||||||||
| Total short-term borrowings | Ch$ | 1,986,406 | 2.90 | % | Ch$ | 3,606,167 | 0.65 | % | Ch$ | 4,807,194 | 0.13 | % | ||||||||||||
| (1) | Weighted Average Nominal Rate is calculated as the sum of total accrued interests for the type of security divided by the average balance for the same type of security during the reported period. |
The following table presents the maximum month-end balances of our principal sources of short-term borrowings during the periods indicated:
| Maximum 2019 month-end balance | Maximum 2020 month-end balance | Maximum 2021 month-end balance | ||||||||||
| (in millions of Ch$) | ||||||||||||
| IFRS: | ||||||||||||
| Investments sold under agreements to repurchase | Ch$ | 381,489 | Ch$ | 390,090 | Ch$ | 209,469 | ||||||
| Central Bank borrowings | — | 3,110,774 | 4,348,677 | |||||||||
| Borrowings from domestic financial institutions | 15,208 | 20,546 | 6,556 | |||||||||
| Foreign borrowings | Ch$ | 1,836,163 | Ch$ | 1,688,503 | Ch$ | 618,461 | ||||||
Minimum Capital Requirements
Pursuant to the general Banking Act, local banks must comply with minimum capital requirements in relation to both total assets and risk-weighted assets (considering credit, market and operational risk). CET1 Capital should be at least equal to 3.0% of total assets, based on the leverage requirements. Likewise banks’ Total Capital or Regulatory Capital, should be at least 8.0% of their risk weighted assets, Tier1 Capital should be at least 6.0% of their risk weighted assets and CET1 Capital should be at least 4.5% of their risk weighted assets. In addition to these requirements banks must comply with capital buffers, as mentioned in “Item 4. Information on the Company—Regulation and Supervision—Capital Adequacy Requirements”.
For more information on capital adequacy requirements, compliance and capital availability, see “Item 5. Operating and Financial Review and Prospects—Liquidity and Capital Resources—Capital Adequacy Requirements”.
Item 4A Unresolved Staff Comments
None.
137
Item 5 Operating and Financial Review and Prospects
OPERATING RESULTS
Introduction
The following discussion should be read in conjunction with, and is entirely qualified by reference to, our audited consolidated financial statements as of and for the year ended December 31, 2021 appearing elsewhere in this annual report and “Item 4. Information on the Company—Selected Statistical Information.” Certain amounts (including percentage amounts) that appear in this annual report may not total due to rounding.
Unless otherwise indicated, the financial information included in this annual report with respect to 2019, 2020 and 2021 has been derived from financial statements that have been prepared in accordance with IFRS as issued by the IASB. See Note 2(a) to our audited consolidated financial statements as of and for the year ended December 31, 2021 appearing elsewhere in this annual report. IFRS differs in certain significant respects from Chilean GAAP. As a result, our financial information presented under IFRS is not directly comparable to any of our financial information presented under Chilean GAAP. Accordingly, readers should avoid such comparison.
Overview
We are a leading bank within the Chilean financial system, providing a broad range of financial products and services to individual and corporate customers who are primarily located in Chile. Accordingly, our financial condition, results of operations and our ability to achieve our strategic business goals could be adversely affected by changes in Chile’s economic conditions and the resulting effects on macroeconomic indicators (such as interest rates, inflation and GDP growth, among others), modifications of non-economic policies implemented by the Chilean Government that can affect private sector activities, or other political and economic developments in Chile, as well as regulatory changes or administrative practices of Chilean authorities over which we have no control. See “Item 3. Key Information—Risk Factors—Risks Relating to Our Operations and the Chilean Banking Industry—The results of our operations are affected by interest rate volatility and inflation,” “Item 3. Key Information—Risk Factors—Risks Relating to Chile—Currency fluctuations could adversely affect the value of our ADSs and any distributions on the ADSs” and “Item 3. Key Information—Risk Factors—Risks Relating to Chile—Our growth and profitability depend on the level of economic activity in Chile.”
Chilean Economy
After a period of sustained GDP growth from 2010 to 2013, as illustrated by an average annual growth rate of 5.3%, Chilean economic growth decelerated between 2014 and 2017 by increasing below the long-term trend at an average annual growth rate of only 1.8%, driven by a persistent downward trend in fixed capital formation and uncertainty that lowered business sentiment and consumer confidence due to the weakened external environment and several reforms announced by the Chilean Government during that period.
In 2018, GDP seemed to have a recovery by growing 4.0% as compared to 2017, primarily due to improved confidence indices, the better economic performance of some key trade partners, and a strong recovery in private investment, which increased by 6.5% as compared to 2017, leading to favorable impact on the demand for commercial loans from corporations. The recovery of copper prices was a key driver of these positive figures, boosting machinery and equipment investment in the mining sector.
In 2019, the GDP expanded by only 0.8%, mainly due to the social unrest in Chile that occurred in October 2019. Prior to those events, although the Chilean economy was growing below its potential, the figures reported in the third quarter reflected an important recovery in comparison with the first two quarters. However, protests and demonstrations that followed the social turmoil resulted in a GDP contraction of 2.4% during the fourth quarter of 2019 on an annual basis, due to severe damage to private and public infrastructure, stagnation of certain economic sectors, such as commerce and entertainment, and deteriorated consumer confidence indices. These factors also affected household consumption which increased by 0.7% in 2019 in comparison with the 3.8% increase in 2018. In addition, fixed capital formation rose 4.7% as compared to 6.5% growth in 2018, mainly fostered by projects that were in pipeline.
138
Undoubtedly, 2020 was very challenging year in terms of economic growth. The effects of COVID-19 on the world economy were worse than expected. According to the IMF, GDP in developed markets decreased 4.5% in 2020, while the world economy contracted by 3.1% on an annual basis. Emerging markets were less impacted by the pandemic, although their economic output decreased 2.0% in 2020. For many countries, the impact of COVID-19 on its economic growth was aligned with and dependent on the effectiveness of measures taken by its authorities aimed at controlling the pandemic, including the duration of lockdowns, mobility restrictions and fiscal support packages, among others. Amid this global downturn, the Chilean economy was also severely affected by the evolution and spread of COVID-19, which led health authorities to establish total or partial lockdowns in many districts and entire cities. Thus, during the second quarter 2020, most of the economic activities that are highly dependent on social interaction, including services, retail, construction, nonessential manufacturing, restaurants, tourism and entertainment, were dramatically affected, translating into significant pressure on the labor market and investment projects. Overall, the local Chilean economy contracted 6.0% in 2020, as a consequence of a sharp decrease of 9.3% in investment (particularly investment in infrastructure, machinery and equipment) and an 8.0% decline in household spending. Despite these negative trends, these figures were better than originally expected due to the unprecedented fiscal and monetary packages as a result of diverse initiatives proposed by the Chilean Government, including: (i) direct money transfers to individuals as a way to mitigate the decrease in monthly income, (ii) a lending facility program implemented by the Central Bank to provide liquidity to local banks pursuing to preserve lending to individuals and SMEs while promoting the rescheduling of overdue installments of past-due loans, and (iii) the choice for companies to adopt a furlough scheme with workers financed through the unemployment insurance fund. These fiscal and monetary actions were supplemented by the effect of two consecutive pension fund withdrawals by individuals, as approved by the Chilean Congress during 2020 in order to face the economic aftermath of the pandemic. Furthermore, the annual contraction in investment and household consumption was partially offset by a trade balance that turned from negative in 2019 to positive in 2020 as a result of imports decreasing 12.7% while exports decreased only 1.1%. The latter was supported by an unexpected rally in copper price (Chile’s main export product), resulting from the rebound of the Chinese economy after the peak of the COVID-19 pandemic, and the pandemic-related supply/production restrictions, which together more than offset the decrease in exports associated with other products as a result of the pandemic.
In 2021, the Chilean economy showed a strong recovery, given both the low comparison base posed by 2020 and, more importantly, real economic growth, particularly driven by an increase in private consumption. According to figures reported by the Central Bank, GDP increased 11.7% in 2021 on an annual basis, which was primarily due to household spending increasing 20.3% as compared to 2020, principally as a result of extraordinary support measures for individuals adopted by both the Chilean Government, in the form of direct money transfers, and the Chilean Congress, which approved a total of three withdrawals from pension funds, two in 2020 and a third one in 2021, all of which had a significant impact on liquidity and disposable income of individuals. According to the Chilean Superintendency of Pensions, as of December 31, 2021, the Chilean Pension Funds managers had paid a total amount of U.S.$47,444 million to pension fund participants. The higher liquidity among individuals had a direct impact on the purchasing power of individuals. Also, throughout 2021, the long-lasting mobility restrictions were gradually lifted as a significant part of the population became fully vaccinated and the contagion rates decreased steadily, reactivating diverse industries, particularly those associated with retail, mass consumption and services. As for investment expenditures (gross capital formation, namely, investment in infrastructure, machinery and equipment), overall capital expenditures also improved as depicted by a 17.6% growth in gross fixed capital formation. Similarly, government spending increased 10.3% in 2021 when compared to 2020, which was primarily fostered by increasing social demands from the Chilean population and efforts deployed by the administration to deal with the effects of the COVID-19 pandemic on the many economic sectors and for companies ranging from SMEs to large companies, as well as individuals that witnessed a sudden reduction on their monthly income. On the other hand, given the dynamics that boosted household consumption and investment, constrained inventories led the Chilean balance of trade (defined as exports minus imports) to record a deficit in 2021. Based on these trends, in 2021, the Chilean economy surpassed its pre-pandemic GDP level.
Inflation
In the past, Chile has experienced high levels of inflation that affected private consumption, consumer sentiment, financial conditions and the results of various companies. Nevertheless, since the 1990s, inflation has been maintained under control through responsible monetary policy carried out by an independent Central Bank and the adoption of a successful inflation target policy. Thus, in Chile inflation is correlated to both local economic dynamics and external factors.
139
In 2017, due to weak economic growth and the impact on the exchange rate of the 8.2% appreciation of the Chilean peso against the U.S. dollar, the CPI recorded a slight increase of 2.3% year over year on both durable and non-durable goods, which is below the midpoint of the Central Bank’s long-term target inflation rate. In 2018, CPI rose 2.6%, partly as a result of the steep decline in oil prices and slower economic growth during the fourth quarter, which was partially offset by a sharp depreciation of the Chilean Peso against the U.S. dollar of 12.7% during the year. During 2019, inflation remained within the Central Bank’s target range, from 2.0% to 4.0%, increasing by 3.0% as measured by the CPI. Although inflation was in the range of 2.0% to 3.0% most of the year, the social unrest in Chile during the fourth quarter of 2019 produced certain inflationary pressures as some economic sectors experienced a constraint in their productive capacity. The depreciation of 8.4% of the Chilean peso against the U.S. dollar also contributed to the increase in inflation by affecting the prices of non-durable goods and fuel. In 2020, in spite of the significant impact of the COVID-19 pandemic on household spending and unemployment rates as a result of the lockdowns determined by Chilean health authorities, CPI recorded a 12-month increase of 3.0%, which was equivalent to the target defined by the Central Bank for long-term inflation. The deflationary pressures triggered by the COVID-19 pandemic coupled with an appreciation of the Chilean peso by the end of the year, all of which was more than offset by the temporary shortfall of certain products during the peak of the COVID-19 pandemic, as many economic sectors were restricted or suspended. In 2021, CPI increased 7.2% as a result of diverse inflationary pressures coming from both the local and external fronts. From the local perspective, a high demand for durable and non-durable goods was triggered due to excess of liquidity present in the whole economy as a consequence of the effect of the three pension fund withdrawals approved by the government plus one withdrawal from life annuities (rentas vitalicias) from life insurance companies, that injected a U.S.$47,444 million and U.S.$1,100 billion to the local economy. This excess of liquidity meant a significant improvement in individuals’ disposable income, which translated into higher than expected consumption that was not met by aggregate supply. Likewise, in 2021, the Chilean peso recorded an annual depreciation of 19.8% against the U.S. dollar, mainly attributable to the uncertainty caused by local economic events in the capital market, such as the aforesaid pension fund withdrawals, and political uncertainty associated with the presidential elections held in November and December 2021, all of contributed to significant spikes in the prices of imported goods. From the external perspective, the sharp increase in the price of oil and also the constraints experienced in the global supply chain contributed to an increase in overall prices in the economy. As of March 31, 2022, the CPI index has accumulated a year-to-date increase of 3.4% as pressures from the demand side have remained in the local economy.
An increase in inflation rates could adversely affect the Chilean economy and have an adverse effect on our business, financial condition and results of operations. Our results of operations reflect the effect of inflation in the following ways:
| ● | a substantial portion of our assets and liabilities are denominated in UFs, a unit that is indexed daily to reflect inflation recorded in the previous month, with the net gain or loss resulting from such indexation reflected in income; and |
| ● | the interest rates earned and paid on peso-denominated assets and liabilities to some degree reflect inflation and expectations regarding inflation. |
UF Denominated Assets and Liabilities. The UF is revalued in monthly cycles. On each day in the period beginning the tenth day of the current month through the ninth day of the next month, the nominal peso value of the UF is indexed up (or down in the event of deflation) in order to reflect each day a pro rata amount of the prior calendar month’s change in the CPI as published by the Chilean National Statistics Institute. One UF was equal to Ch$29,070.33 as of December 31, 2020 and Ch$30,991.74 as of December 31, 2021. The effect of any changes in the nominal peso value of our UF denominated assets and liabilities are reflected in our results of operations as an increase (or decrease, in the event of deflation) in interest revenue and expense. Our net interest income will be positively affected by inflation (and negatively affected by deflation) to the extent that our average UF denominated assets exceed our average UF denominated liabilities, while our net interest income will be negatively affected by inflation (and positively affected by deflation) when average UF denominated liabilities exceed our average UF denominated assets. Our average UF denominated assets exceeded our average UF denominated liabilities by Ch$7,368,318 million (U.S.$10,350.21 million) as of December 31, 2020 and Ch$8,323,985 million (U.S.$ 9,762.72 million) as of December 31, 2021. These figures exclude positions in derivatives. See “Item 4. Information on the Company—Selected Statistical Information.”
140
Peso-Denominated Assets and Liabilities. Interest rates in Chile tend to reflect the prevailing inflation rate and expectations regarding future inflation. The sensitivity of our peso denominated interest earning assets and interest bearing liabilities to the inflation rate may vary. See “Item 5. Operating and Financial Review and Prospects—Operating Results—Overview Interest Rates.” We maintain a substantial amount of non-interest bearing, peso denominated current accounts and other demand deposits. The ratio of such deposits to average interest bearing peso denominated liabilities was 135% during the year ended December 31, 2020 and 223% during the year ended December 31, 2021. Since a large part of such deposits are not indexed to inflation, even a slight decline in the rate of inflation may adversely affect our net interest margin on assets funded with such deposits and even a slight increase in the rate of inflation may increase the net interest margin on such assets. See “Item 4. Information on the Company—Selected Statistical Information—Interest Earning Assets and Net Interest Margin.”
Interest Rates
Interest rates earned and paid on our assets and liabilities reflect in part, inflation and expectations regarding future inflation, shifts in short-term interest rates related to the Central Bank’s monetary policies and movements in long-term real rates. The Central Bank manages short-term interest rates in order to achieve its long-term inflation target and provide the economy with financial stability.
Beginning in 2017, the Central Bank cut the reference rate by 25 basis points four times (in January, March, April and May) from the 3.5% level at which it had ended the previous year, to anchor inflation expectations within the Central Bank’s long-term target range and stimulate sluggish economic demand. Against such economic background and in line with Central Bank’s authority over macroeconomic balances, the monetary policy interest rate stood unchanged at 2.50% during 2017 and remained at the same level until October 2018, when the Central Bank began to withdraw the monetary stimulus on the grounds of reduced output gaps, which in its view could translate into inflationary pressures. As a result, the reference interest rate increased to 2.75% to anchor inflation expectations to the mid-term target range. The Central Bank maintained its view regarding inflation and expectation on economic growth, which translated into an additional 25 basis points hike in the monetary policy interest rate, reaching 3.00% in January 2019. This interest rate level remained until mid-year, when the Central Bank surprised the market by cutting the reference rate 50 basis points to 2.50% in June 2019, given an upward revision in the GDP potential growth and economic slack, both resulting in low inflationary pressures. At that point, inflation had remained in the lower boundary of the Central Banks’s target range (2.00%-4.00%). These trends persisted until the third quarter of 2019, which led the Central Bank to apply consecutive interest rate reductions of 50 basis points in September 2019 and 25 basis points in October 2019. Given the economic slowdown produced by the social turmoil that took place in Chile in October 2019, the Central Bank decided to maintain the monetary stimulus, in light of the tempered impact that social crisis had on inflation and the intervention it carried out in the local foreign exchange market in order to halt the depreciation of the Chilean peso. Consequently, the monetary policy interest rate stood at 1.75% as of December 31, 2019. The Central Bank’s view on the Chilean economy remained the same during the first two months of 2020. However, in a specially convened meeting, the Central Bank later decided to cut the monetary policy rate by 75 basis points to 1.00% on March 16, 2020, as both local and international economic activity was being negatively affected by the effects of the COVID-19 pandemic. Following the developments associated with COVID-19 and the expected effects on the local economy, the Central Bank applied a further cut of 50 basis points to the reference rate on March 31, 2020. By December 31, 2020, the reference interest rate continued to be 0.5% as a result of not only the Central Bank’s commitment to ensure liquidity in the local economy by providing low-cost funding to local banks in order to promote lending and household consumption, but also due to continued inflation within the Central Bank’s target range throughout the entire year. The monetary policy interest rate remained at the level of 0.5% during the first half of 2021 as well. However, in July 2021 the Chilean Central Bank implemented a 25 basis point increase, which was followed by a 0.75% increase in August 2021 and further increases of 1.25% in October 2021 and December 2021, taking the monetary policy interest rate to 4.00% by the end of 2021, in order to control the inflationary pressures that arose in the local economy as described earlier. In 2022, the Central Bank took the monetary policy interest rate to 5.50% in January while stating that additional hikes could be applied as long as inflation persists above the target range. As such, most recently, in March 2022, the monetary policy interest rate was increased by 150 basis points, ending the month at 7.0%. Accordingly, as of March 31, 2022, the monetary policy interest rate remains at 7.00%.
141
Since our liabilities generally re-price faster than our assets, changes in the rate of inflation or short-term interest rates are reflected in the nominal interest rates we pay on our liabilities before they are reflected in the nominal interest rates we earn on our assets. Accordingly, our net interest margin on assets and liabilities is usually adversely affected in the short-term by increases in short-term nominal interest rates and benefits in the short-term from decreases in short-term nominal interest rates, although the existence of non-interest bearing peso-denominated demand deposits tends to mitigate both effects. See “—Inflation—Peso-Denominated Assets and Liabilities.” In addition, because our peso-denominated liabilities have relatively short re-pricing periods, those liabilities generally are more sensitive to changes in inflation or short-term interest rates than our UF-denominated liabilities. As a result, during periods when current inflation exceeds the previous month’s inflation, customers often switch funds from peso-denominated deposits to more expensive UF-denominated deposits, thereby adversely affecting our net interest margin.
According to information published by the Central Bank, the average annual short term nominal interest rate, based on the rate paid by Chilean financial institutions for 90 to 360 days Chilean peso denominated deposits, was 2.72% in 2019, 0.86% in 2020 and 1.71% in 2021, following the trend seen in the monetary policy interest rate. For the same reason, the average interest rate paid by Chilean financial institutions for 90 to 360 days Chilean peso denominated deposits in the three-month period ended on March 31, 2022 was 6.59%.
The average annual long term nominal interest rate, based on the interest rate of the five year Chilean peso denominated bonds in the secondary market, issued by both the Central Bank and the Chilean Government, was 3.31% in 2019, 1.93% in 2020 and 3.51% in 2021. Local long-term interest rates recorded a sharp and persistent increase in 2021, mainly attributable to the effect of: (i) pension fund withdrawals on the pricing of fixed-income securities, as pension funds managers had to liquidate significant portfolios of fixed-income positions to deal with the payment process to the account holders, (ii) expectations of higher inflation in the near future, and (iii) the presidential election held in December 2021 that determined the administration that took office on March 11, 2022 and the potential consequences its results may have on the prevailing economic system. Based on this, the interest rate of five-year Chilean peso denominated bonds, issued by both the Central Bank and the Chilean Government, increased from 1.58% in December 2020 to 5.59% in December 2021 and to 6.76% in March 2022. In the three-month period ended on March 31, 2022, the interest rate for the same Central Bank and Chilean Government bonds averaged 6.20%.
Chilean Stock Market
During 2021, the S&P/CLX IPSA, a selective price index of shares composed of between 25 and 30 of the most traded Chilean stocks, was influenced by diverse and opposing factors. From the positive point of view, the Chilean stock market reflected the dynamism experienced by the Chilean economy that significantly recovered from the GDP contraction seen in 2020. Likewise, the gradual lift of almost all mobility restrictions fostered the reactivation of many economic sectors and industries highly dependent on social interaction, all of which resulted in improved valuations on equity instruments. On the contrary, the local stock market was impacted by high volatility produced by the potential future effect of specific events on capital markets, including the pension fund withdrawals approved by the Chilean Congress in 2021, which impacted the long-term savings rate of the economy and then future . The equity market was also affected by the uncertainty surrounding the result of the presidential election in December 2021 and expectations on how the new administration could modify essential pillars of the prevailing economic model. Altogether, the S&P/CLX IPSA posted a moderate annual increase. As of December 30, 2021 (last trading date), the S&P/CLX IPSA reached a level of 4,308.38 points, which represented an increase of 3.1% as compared to the 4,177.22 points recorded as of December 30, 2020 (last trading date), according to data provided by Bloomberg. During the first quarter of 2022, the S&P/CLX IPSA has shown an important recovery on the whole by advancing 14.6% year-to-date by reaching 4,936.97 points on March 31, 2022. The upward trend has been the consequence of an improved economic landscape resulting from the success of the vaccination process and the return to normal activity in many industries, particularly those depending on social interaction. These drivers had a direct positive effect on results of main companies that compose the S&P/CLX IPSA index, which has enhanced the outlook on stock valuations. Regardless of this recent improved performance, the first quarter of 2022 has also been marked by high volatility, primarily associated with both the expectations on the outcome of the Constitutional Convention that is drafting a new constitution and, more recently, the armed conflict in eastern Europe that jeopardizes the economic growth of key European developed economies and Chile’s trade partners.
142
Foreign Currency Exchange Rates
A portion of our assets and liabilities are denominated in foreign currencies, principally U.S. dollars. In the past, we have maintained and may continue to maintain gaps between the balances of such assets and liabilities. This gap includes assets and liabilities denominated in foreign currencies and assets and liabilities denominated in Chilean pesos that contain repayment terms linked to changes in foreign currency exchange rates. However, we generally offset this gap by taking hedging derivative positions. Because foreign currency denominated assets and liabilities, as well as interest earned or paid on such assets and liabilities and gains (losses) realized upon the sale of such assets, are translated into pesos in preparing our audited consolidated financial statements, our reported income is affected by changes in the value of the peso with respect to foreign currencies, primarily the U.S. dollar. Adjustments to U.S. dollar-indexed assets are reflected as adjustments in net interest earnings and offset results in our foreign exchange position. See “Item 3. Key Information—Risk Factors—Risks Relating to Chile—Currency fluctuations could adversely affect the value of our ADSs and any distributions on the ADSs.”
Impacts of COVID-19 in 2021
The outbreak of COVID-19 was first reported on December 31, 2019 in Wuhan, Hubei Province, China. From Wuhan, the disease spread rapidly to other parts of China, as well as other countries, including Chile and the United States, growing into a global pandemic, as declared by the World Health Organization. Since the outbreak began, countries have responded by taking various measures including imposing mass quarantines, shelter-in-place orders, and medical screenings, restricting or banning travel, limiting public gatherings, closing businesses and schools and suspending certain other economic activities. Although multiple COVID-19 vaccines have received regulatory approval and currently are being distributed to the population, many people remain unvaccinated. Additionally, variant strains of the COVID-19 virus have appeared, further complicating efforts of the medical community and governmental authorities in response to the pandemic, including the effectiveness of the mass vaccination efforts. Moreover, although in various countries some of the activity restrictions have been relaxed with progressive success, in some geographies, the number of individuals diagnosed with COVID-19 has again began to increase, causing certain governments to reverse or reinstitute activity restrictions. In addition, concerns related to COVID-19 lowered equity market valuations, decreased liquidity in fixed income markets and created significant volatility and disruption in global financial markets, particularly in the early months of the pandemic, resulting in the fall of stock prices (including the price of our stock). Also, there continue to be concerns related to the effects of the COVID-19 pandemic on international trade, travel, employee productivity, employee illness, increased unemployment levels, securities markets, and other economic activities that may continue to have an adverse effect on financial markets and economic activity, particularly for companies in the financial sector. Please refer to “Item 3. Key Information—Risks Relating to our ADSs—COVID-19 or any other pandemic disease and health events will affect both the global and the Chilean economy, our business or results of operations and could affect our financial condition” for a discussion of the ways COVID-19 may impact our business and the Chilean economy.
In terms of the direct effect on our results of operations and financial condition in 2021, our performance continued to reflect the dynamics experienced by the local economy and the local banking system, as a consequence of GDP expansion caused by the boosting household spending, mobility restrictions that began to be lifted as a result of improved sanitary conditions and unseen levels of liquidity among individuals. Therefore, the main drivers supporting our performance in 2021 were as follows:
| ● | Our loan portfolio began to gradually recover in 2021, in line with the improvements in the public health context, such as the end of total lockdowns and the reopening of diverse economic activities, particularly those involving social interaction. Nonetheless, most of the loan growth continued to be driven by low margin lending products, such as residential mortgage and commercial loans, while consumer loans started to display positive growth only beginning in the third quarter of 2021. Overall, our loan portfolio increased 10.8% on an annual basis. The expansion of our loan portfolio has been mainly supported by: (i) the 11.8% increase in commercial loans during 2021, which was caused by the combination of both the effect of the FOGAPE Reactiva program oriented to SMEs and also due to specific lending operations in the second half of the year in line with a moderate reactivation of investment expenditures postponed during the pandemic, (ii) a sustained upward trend in residential mortgage loans, which grew 10.2% in 2021, given the decoupling of this lending product from economic drivers due to a demand for housing that has remained strong, together with the effect of pension fund withdrawals on individuals’ disposable income that allowed them to finance the down payment for home purchasing and (iii) an annual growth of 7.6% in consumer loans in 2021, after the significant contraction experienced in 2020, reflecting a more dynamic demand for personal banking loans and easing offer conditions as economic activity rebounded. |
143
| ● | From the funding perspective, as nominal interest rates, particularly for short-term products, remained at low levels throughout 2021, the contribution of our non-interest bearing demand deposits to our cost of funds continued to be negatively affected, since a scenario of low interest rates reduces the competitive advantage associated with holding demand deposit balances. Our average balances of demand deposits increased 32.3% in 2021 on an annual basis. The increase in demand deposits was mainly attributable to the excess of liquidity due to non-recurrent factors, such as direct money transfers from the Chilean Government and the approval of three pension fund withdrawals since 2020. This trend in demand deposits was coupled with mid-term financing provided by the Central Bank bearing the monetary policy interest rate (0.5%). In 2020, we raised Ch$3,110,600 million from the Central Bank and we made an additional request for Ch$1,238,800 million in 2021 bearing the same rate. Thus, we replaced time deposits held by wholesale counterparties with liabilities with the Central Bank and non-interest bearing deposits, which became our main source of funding. Also, we reactivated long-term bond placements only by the end of 2021, principally in foreign markets, by taking advantage of our credit rating. As a matter of fact, during the second half of 2021, we placed Ch$277,910 million (approximately U.S.$326 million) UF-denominated bonds within the local market with maturities ranging from six to nine years. Likewise, we issued Ch$684,671 million (approximately U.S.$803 million) of bonds in in the international capital markets with tenors ranging from five to ten years. |
| ● | In terms of results, our net income was Ch$1,056,317 million, representing a 163.0% increase when compared to the Ch$401,630 million recorded in 2020. The main drivers of this change were improvements in both provisions for loan losses and net interest income. Provisions for loan losses recorded a sharp decrease of Ch$527,934 million or 96.5%, reflecting an overall improvement in the payment behavior of customers, particularly in the retail banking segment, as a result of the liquidity surplus observed in the Chilean economy. The lower risk expenses coupled with an increase of Ch$257,234 million or 19.5% in net interest income, which was primarily attributable to the positive effect of higher inflation to the contribution of our structural UF net asset exposure. However, this was, to some extent, offset by lower interest earned on our balance sheet due to interest rates remaining, for almost two years, at the lowest levels seen in the past decade, following the downturn caused by the COVID-19 pandemic, as well as lower income from consumer loans as this portfolio significantly decreased in 2020. These favorable results were supplemented by: (i) other income (loss) net increasing Ch$32,981 million in 2021, primarily due to the effect of higher depreciation of the Chilean peso and benefits from Counterparty Value Adjustment (“CVA”) for derivatives, (ii) a Ch$9,060 million increase in fee-based income, mainly attributable to higher fee income from transactional services, in light of an increasing volume of transactions in 2021, as mobility gradually returned to normal levels and higher fees from mutual funds management as investors began to move from fixed-income funds to equity funds, which allowed us to offset the effect of the recognition of most of the upfront fee received from our alliance with an international insurance company in 2020. All of these positive factors were, to some extent, offset by: (i) a Ch$172,746 million increase in income tax and (ii) a moderate increase of 0.8% in operating expenses on an annual basis, mainly attributable to the low comparison base in 2020, when mobility restrictions were in place and commercial activity was severely affected for that reason. |
| ● | From the capital adequacy perspective, we continued to maintain a sound equity base in 2021, as reflected by a CET1 ratio that increased from 12.2% to 13.0% and a BIS ratio that increased from 16.0% to 17.3% between December 2020 and December 2021. It is worth noting that in December 2021 Basel III guidelines became effective for purposes of measuring capital and risk-weighted assets, although this change did not have a significant impact on our capital adequacy. Therefore, the improvement in our capital ratios, under Chilean GAAP, was mainly the result of a bolstered capital base, as a result of: (i) the retention of Ch$242,837 million from the net distributable income recorded in 2020, (ii) higher net income in 2021 as compared to 2020, by Ch$226,188 million (after deducting the amount set aside for dividends), and (iii) an improvement in cumulative other comprehensive income of Ch$27,323 million in 2021 as compared to the same period in 2020, which stemmed from the effect of increasing local long-term interest rates during 2021 on the fair value adjustment of both derivatives held for hedge accounting purposes and financial instruments measured at fair value through other comprehensive income. Likewise, we bolstered Tier 2 capital by increasing our balances of additional allowances. These positive effects were to some extent offset by an annual increase of 6.6% in risk-weighted assets, prompted by balance sheet growth that was focused on low risk assets, which decreased the risk-weighted asset density in 2021 when compared to 2020. |
144
Likewise, as part of our commitment to our customers and Chile, in 2020 we implemented the National Support Plan (“Plan Nacional de Apoyo”) for Individuals and SME customers. This plan supported our customers by reducing their financial burden during a specific time period of three to six months by: (i) postponing monthly installments of both residential mortgage and consumer loans, (ii) giving our customers certain facilities to pay their monthly credit card bill, (iii) providing our SME customers with special financing in the form of credits, and (iv) keeping our firm commitment to our SME providers by settling their invoices before ten days. As of December 31, 2020, we had rescheduled Ch$562,073 million in installments of consumer, mortgage, commercial loans and credit card loans. Additionally, to continue aiding our customers we deployed the special support program for small, medium and large companies associated with the FOGAPE-COVID (government-guaranteed) loan program promoted by the Chilean Government, in order to assist these kinds of borrowers. During 2020, we granted Ch$1,888,856 million in these types of secured loans. In February 2021, the Chilean Government created a new support program named FOGAPE-Reactiva program, which was aimed at achieving a prompt economic recovery by promoting borrowing from banks to SMEs and middle market companies to finance working capital, investment projects and debt restructuring. As of December 31, 2021, we had granted Ch$1,234,501 million in loans related to this program while rescheduling mortgage installments for an amount of Ch$7,275 million to benefit some our customers that continued to be affected by the pandemic. Both the FOGAPE-Reactiva and our rescheduling program concluded in 2021. As of December 31, 2021 approximately an aggregate of 1.6% of the FOGAPE-COVID and FOGAPE-Reactiva loans and 7.2% of the rescheduled loans were in Stage–3 for purposes of determination of expected credit losses.
For more information regarding potential economic or regulatory factors that could affect our results of operations or financial condition, see “Item 3. Key Information—Risk Factors—COVID-19 or any other pandemic disease and health events will affect both the global and the Chilean economy, our business or results of operations and could affect our financial condition” and “Item 5. Operating and Financial Review and Prospects—Trend Information—Impact of COVID-19.”
Critical Accounting Policies
We prepare our audited consolidated financial statements in accordance with IFRS as issued by the IASB. Note 2 of our audited consolidated financial statements as of and for the year ended December 31, 2021, which are included in this annual report, contains a summary of our significant accounting policies.
The preparation of financial statements under IFRS requires management to make certain estimates and assumptions, as some of the amounts reported in the financial statements are related to matters that are inherently uncertain or require modeling. These estimates could change from period to period, which may have a material impact on our financial condition or results of operations. Actual results may differ if conditions or underlying circumstances were to change.
The following discussion describes those areas that require considerable management judgment or involve a higher degree of complexity in the application of the accounting policies that currently affect our financial situation and results of operations.
145
Allowances for Loan Losses
IFRS 9 establishes requirements for the classification and measurement of financial assets by introducing an approach based on both the business model used by the company or bank to manage financial assets and the characteristics of the assets’ contractual flows.
In terms of impairment, IFRS 9 establishes a single model to be applied to all financial instruments, which requires timely recognition of the expected credit losses (“ECLs”) by introducing a “prospective” analysis for their calculation.
For assets measured at either amortized cost or measured at fair value through other comprehensive income (“FVOCI”), including loan commitments and contingent loans, this approach requires a timely recognition of ECLs, which may be accounted as: (i) a loss allowance for assets measured at amortized cost, which is deducted from the actual balance of these assets, (ii) a liability provision for contingent loans, or (iii) a profit or loss in the income statement for financial assets that are measured at FVOCI.
IFRS 9 uses a dual approach for determining loan loss allowances depending on the stage at which the asset is classified in light of its credit risk or changes in credit risk. Thus, loan loss allowances based on ECLs may be measured by considering: (i) a 12-month time horizon or (ii) a lifetime horizon. For these purposes, assets are classified as follows:
| ● | Stage 1: Assets with no significant increase in risk. These are defined as financial assets that have not significantly deteriorated in terms of credit quality as compared to their credit risk evaluation when originated. In this case, ECLs are computed and recognized by considering a 12-month timeframe. This calculation also includes those assets that have been reclassified from Stage 2. |
| ● | Stage 2: Assets with significant increase in risk. These are defined as financial assets that show a significant increase in credit risk as compared to their credit risk evaluation when originated. In this case, ECLs are computed for the whole maturity of the financial instrument by considering lifetime expected loss. For these purposes, Stage 2 also includes those assets with credit risk improvements that have been reclassified from Stage 3. |
| ● | Stage 3: Assets objectively impaired. These are defined as financial assets that show objective evidence of impairment at the end of the reported period. In this case, ECLs are computed for the whole maturity of the financial instrument by considering lifetime expected loss. |
| ● | POCI: Purchased or Originated Credit Impaired. These are defined as financial assets that are credit impaired on initial recognition. POCI assets are recorded at fair value at original recognition and interest income is subsequently recognized based on a risk-adjusted Effective Interest Rate (“EIR”). ECLs are only recognized or released to the extent that there is a subsequent change in the expected credit losses. |
Expected Credit Losses
The expected credit loss is the probability-weighted estimate of credit losses, i.e., the present value of all cash losses. A cash loss is the difference between the cash flows that are due to an entity by contract and the cash flows that the entity expects to receive. The three main inputs used for the calculation of the expected credit loss are, as follows:
| ● | Probability of Default (PD): The PD is an estimate of the likelihood of a client or counterparty to fail in meeting its legal obligation of payment at a certain time horizon. The default event only occurs in the event that the asset belongs to the Bank and the counterparty has not complied with the payment of installments as agreed by contract. |
146
| ● | Loss Given Default (LGD): The LGD is the mathematical expectation of the percentage loss that would be incurred if an asset defaults and is referred to as a percentage of the exposure at the time of default. |
| ● | Exposure at Default (EAD): The EAD is an estimate of the exposure at the expected date of default, which takes into account expected changes in the exposure after the reporting date, including repayments of principal and interest, whether scheduled by contract or not, expected drawdowns on committed facilities, and accrued interest on unpaid installments. |
| ● | Credit Conversion Factor (CCF): The CCF is the percentage amount used to estimate the EAD related to off-balance sheet assets, such as contingent loans or credit commitments. |
Based on the effects of the COVID-19 pandemic on the global and local economy, we reviewed and updated the main estimates and assumptions related to the ECL models for both the group-based and individually-evaluated portfolios, with the aim of aligning them with the characteristics of the prevailing economic scenario. The impact of these changes on the ECL models resulted in a release of allowances for loan losses of Ch$26,308 million before taxes. For more information, see Note 4, 11 and 25 to our audited consolidated financial statements as of and for the year ended December 31, 2021 appearing elsewhere in this annual report.
Also, for a further description of our policy regarding allowances for loan losses, see Note 2(i)(vii)(2) to our audited consolidated financial statements as of and for the year ended December 31, 2021 appearing elsewhere in this annual report.
Fair Value Estimates for Financial Assets and Liabilities
IFRS 13 defines “fair value” as the price that would be received to sell an asset or paid to transfer a liability in an orderly transaction between market participants at the measurement date. IFRS 13 seeks to increase consistency and comparability in fair value measurements and related disclosures through a ‘fair value hierarchy’. The hierarchy categorizes the inputs used in valuation techniques into three levels. The hierarchy gives the highest priority to (unadjusted) quoted prices in active markets for identical assets or liabilities and the lowest priority to unobservable inputs. The Bank uses valuation techniques appropriate in the circumstances and for which sufficient data are available to measure fair value, maximizing the use of relevant observable inputs and minimizing the use of unobservable inputs.
The objective of using a valuation technique is to estimate the price at which an orderly transaction to sell the asset or to transfer the liability would take place between market participants and the measurement date under current market conditions. Three widely used valuation techniques are:
| ● | Market approach – uses prices and other relevant information generated by market transactions involving identical or comparable (similar) assets, liabilities, or a group of assets and liabilities (e.g. a business). |
| ● | Cost approach – reflects the amount that would be required currently to replace the service capacity of an asset (current replacement cost). |
| ● | Income approach – converts future amounts (cash flows or income and expenses) to a single current (discounted) amount, reflecting current market expectations about those future amounts. |
In some cases, a single valuation technique will be appropriate, whereas in others multiple valuation techniques will be appropriate. The objective of a fair value measurement is to estimate the price at which an orderly transaction to sell the asset or to transfer the liability would take place between market participants at the measurement date under current market conditions. A fair value measurement requires an entity to determine all of the following:
| ● | the particular asset or liability that is the subject of the measurement (consistently with its unit of account). |
147
| ● | the principal (or most advantageous) market for the asset or liability. |
| ● | the valuation technique(s) appropriate for the measurement, considering the availability of data with which to develop inputs that represent the assumptions that market participants would use when pricing the asset or liability and the level of the fair value hierarchy within which the inputs are categorized. For more information regarding the accounting principles associated with the valuation of financial assets and liabilities, see Note 2(h) to our audited consolidated financial statements as of and for the year ended December 31, 2021 appearing elsewhere in this annual report. Also, for a further description of our internal fair value classification, see Note 41 to our audited consolidated financial statements as of and for the year ended December 31, 2021 appearing elsewhere in this annual report. |
Deferred Tax Assets
The Bank records, when appropriate, deferred tax assets and liabilities for the estimated future tax effects attributable to differences between the carrying amount of assets and liabilities and their tax bases. The measurement of deferred tax assets and liabilities is based on the tax rate, in accordance with the applicable tax laws, using the tax rate that applies to the period when the deferred asset and liability will be settled. The future effects of changes in tax legislation or tax rates are recorded in deferred taxes beginning on the date on which the law is enacted or substantially enacted.
Modification of Financial Assets
Pursuant to our internal procedures, the accounting of modifications to financial assets depends on whether modifications were carried out for customers who had a deteriorated financial condition or due to commercial reasons, as follows:
| ● | Contractual modifications due to debtor’s financial difficulties. These modifications occur when the Bank changes originally agreed contract conditions in order to allow the customer to comply with their payment obligations. When the modification is significant, it is accounted as a write-off of the original asset and the new loan is measured at fair value, while the difference between the former and the latter asset is accounted in the profit and loss statement. Instead, when the modification is not significant, the former loan is not written off, although its amortized cost is adjusted by including the difference between the book value of the loan before the modification and the present value of the cash flows generated by the modified loan by using the effective interest rate of the former loan, which is recognized in the profit and loss statement. |
| ● | Contractual modifications due to commercial reasons. These modifications are associated with market conditions at the moment of the contract modification, with the purpose of retaining the customer or preserving the commercial relationship, which results in changes to the original interest rate, modifications to the contract tenor or a combination of them, in order to recognize the prevailing market conditions. These modifications are treated as a total or partial write-off of the original loan and the new loan is initially measured at fair value and at amortized cost afterwards. |
As part of the commercial measures adopted by us as a consequence of the COVID-19 pandemic, we proactively offered to our customers the possibility of applying for special plans of financial aid in light of the effects of the COVID-19 pandemic. This plan included holiday periods, rescheduling of three to six installments and changes to the interest rate of postponed installments. Specific behavior credit requisites were considered in order to allow customers to apply, such as commercial relationship and good payment behavior before the COVID-19 pandemic.
The accounting treatment of these loan modifications had a no material effect on our results or financial condition neither for the year ended December 31, 2020 nor the year ended December 31, 2021.
148
Amendments to Financial Reporting Standards in 2021
The accounting policies followed in 2021 are consistent with those prevailing in the previous financial year. The following amendments, corresponding to IFRS enhancements, did not have any impact on our accounting policies, financial position or results of operations.
| ● | Amendments to complement the changes issued during 2019 on the effects on the financial statements when a company replaces the former interest rate benchmark with an alternative benchmark rate, all in the context of the LIBOR transition, affecting: (i) “IFRS 9 Financial Instruments”, (ii) “IFRS 7 Financial Instruments: Disclosures”, (iii) “IAS 39 Financial Instruments: Recognition and Measurement”, (iv) “IFRS 4 Insurance Contracts”, and (v) “IFRS 16 Leases”, related to Interest Rate Benchmark Reform. |
Results of Operations for the Years Ended December 31, 2019, 2020 and 2021
The consolidated financial information presented in this section for the years ended December 31, 2019, 2020 and 2021 has been audited and prepared in accordance with IFRS. In addition, to the extent that it is available and because we believe it is useful in analyzing our results, we have included information classified by the business segments that we use for internal reporting purposes. As mentioned earlier, information about our business segments is reported under our internal reporting policies, which differ in significant respects from IFRS.
Net Income
The following table sets forth the principal components of our net income, as detailed in our audited consolidated financial statements for the years ended December 31, 2019, 2020 and 2021:
| For the Year Ended December 31, | % Increase (Decrease) | |||||||||||||||||||
| 2019 | 2020 | 2021 | 2019/2020 | 2020/2021 | ||||||||||||||||
| (in millions of Ch$, except percentages) | ||||||||||||||||||||
| IFRS: | ||||||||||||||||||||
| Net interest income | Ch$ | 1,371,278 | Ch$ | 1,316,788 | Ch$ | 1,574,022 | (4.0 | )% | 19.5 | % | ||||||||||
| Net fees and commissions income | 457,302 | 445,968 | 455,028 | (2.5 | ) | 2.0 | ||||||||||||||
| Other income (loss), net | 176,638 | 172,054 | 205,035 | (2.6 | ) | 19.2 | ||||||||||||||
| Provisions for expected credit losses | (331,601 | ) | (547,106 | ) | (19,172 | ) | 65.0 | (96.5 | ) | |||||||||||
| Operating expenses | (902,250 | ) | (877,752 | ) | (884,420 | ) | (2.7 | ) | 0.8 | |||||||||||
| Income attributable to associates | 6,039 | (5,099 | ) | 1,793 | — | — | ||||||||||||||
| Income before income taxes | 777,406 | 504,853 | 1,332,286 | (35.1 | ) | 163.9 | ||||||||||||||
| Income taxes | (173,661 | ) | (103,223 | ) | (275,969 | ) | (40.6 | ) | 167.4 | |||||||||||
| Net income | Ch$ | 603,745 | Ch$ | 401,630 | Ch$ | 1,056,317 | (33.5 | )% | 163.0 | % | ||||||||||
2020 and 2021. For the year ended December 31, 2021, our net income increased Ch$654,687, or 163.0%, from Ch$401,630 million in 2020 to the Ch$1,056,317 million recorded in 2021. This increase in net income was primarily attributable to the combined effect of lower provisions for expected credit losses and higher inflation as further discussed below. For information on the impacts of the COVID-19 pandemic on our results of operations for the year ended December 31, 2020 please see: “Item 5. Operating and Financial Review and Prospects—Operating Results—Overview—Impacts of COVID-19 in 2021” in this annual report. In summary, the annual increase in net income was mainly supported by:
| ● | An annual decrease of 96.5%, or Ch$527,934 million, in provisions for loan losses, from Ch$547,106 million in 2020 to Ch$19,172 million in 2021. This decline was primarily a result of improved economic dynamics given the significant decrease or removal of mobility restrictions in 2021 when compared to 2020, which benefited the financial condition of credit risk profiles of companies and individuals as economic activity began to return to near normal levels. Similarly, the excess of liquidity in the economy produced by pension fund withdrawals and the fiscal aid package improved the payment capacity of personal banking customers significantly as reflected by lower delinquency ratios. These factors had a positive effect on our forward-looking provisioning models that, in conjunction with updated models for both individually-evaluated and group-based evaluated portfolio resulted in an allowance release of approximately Ch$188,324 million in 2021 that compares to allowances for expected credit losses of Ch$210,205 million established in 2020 in the context of the COVID-19 pandemic. Lower charge-offs and increased recoveries within the same period also contributed, to a lesser extent, to this result. |
149
| ● | An increase of 19.5%, or Ch$257,234 million, in net interest income on an annual basis, from Ch$1,316,788 million in 2020 to Ch$1,574,022 million in 2021. This increase was primarily due to the impact of higher inflation during this year on our UF-denominated net asset exposure, as a result of an annual UF variation of 6.61% as of December 31, 2021, when compared to 2.69% as of December 31, 2020, which led to nearly Ch$310,775 million of the increase in net interest income. To a lesser extent, the contribution of demand deposits to our funding cost increased Ch$5,772 million in 2021 when compared to 2020 given the upward trend adopted by short-term and long-term interest rates, particularly during the second half of 2021, as a consequence of higher uncertainty, expectations on higher inflation, and the withdrawal of the monetary stimulus by the Central Bank that had led the reference rate to increase from 0.5% to 4.0% between July 2021 and December 2021. These effects were partially offset by: (i) lower income from loans (net of cost of funds) by approximately Ch$29,000 million in 2021 when compared to 2020, mainly due to a change in the mix toward products with lower lending spreads such as residential mortgage loans and commercial loans granted to SMEs and middle market companies in the context of the government guaranteed program, as well as consumer loans bearing higher lending spreads that only started to reactivate by the end of 2021, (ii) lower results from the carry (net of funding cost) of fixed-income securities measured at fair value through OCI and held-to-maturity by approximately Ch$15,460 million given the aforementioned trends in interest rates, and (iii) an annual decrease of approximately Ch$ 8,100 million from the management of interest rates mismatches and term gaps (asset and liability management). |
| ● | An increase of 19.2%, or Ch$32,981 million, in net other income (loss) in 2021 when compared to 2020, mostly due to higher income from derivatives, which benefited from both the positive impact of the sharp 19.8% depreciation of the Chilean peso against the U.S. dollar in 2021 as compared to the appreciation of 5.3% observed for the Chilean peso against the U.S. dollar in 2020 and increased net asset average exposure to exchange rate through trading derivatives in 2021. To a lesser extent, CVA adjustments for derivatives also positively contributed to these results, when compared to 2020. The increase in net other income (loss) was to some extent offset by a net decrease in income from foreign exchange transactions associated with on-balance liability positions in foreign currency, mostly due to the sharp increase in foreign exchange rates as of December 31, 2021 as compared to 2020, which coupled with lower results from marking-to-market on fixed-income portfolios as a result of higher interest rates on both securities held for trading and securities measured at fair value through other comprehensive income. |
| ● | An annual increase in fees and commissions of approximately Ch$9,060 million, or 2.0%, from Ch$445,968 million in 2020 to Ch$455,028 million in 2021. This annual increase was mostly explained by: (i) higher fees from mutual funds management due to increased assets under management and portfolio rebalancing towards equity funds bearing higher fees, and (ii) the effect that greater mobility and social interaction had on transactional services, explained by a subdued commercial activity in 2020 attributable to the COVID-19 pandemic. The magnitude of this increase was partially decreased due to the extraordinary upfront fee received by our insurance brokerage coming from our long-term partnership with an international insurance company in 2020, which increased the basis for comparison for 2021. |
| ● | An annual increase of Ch$6,892 million in income attributable to associates, from a net loss of Ch$5,099 million in 2020 to a net gain of Ch$1,793 million in 2021. This effect was mostly explained by: (i) a low comparison base in 2020 given impairments recognized in December 2020 in Nexus S.A., the company that provides us with credit card processing services, and (ii) higher income in 2021 from Transbank, the company that manages the payment operation of credit and debit cards for most of the local banks, due to the adjustment in client fees charged by Transbank in September 2021, as authorized by the Chilean Antitrust Court (Tribunal de Defensa de la Libre Competencia) to reflect alignment with operating costs. This decision came after fees were frozen by this court in 2020, which resulted in economic losses for Transbank for 2020 and most of 2021. |
150
These factors were partly offset by: (i) an annual increase of Ch$173,402 million in income tax, from Ch$103,223 million in 2020 to Ch$275,969 million in 2021, mostly explained by income before income taxes increasing 163.9% in 2021 when compared to 2020, and (ii) operating expenses increasing Ch$6,668 million on an annual basis, highly associated with an annual increase in IT expenses due to the implementation of both our digital transformation strategy and efficiency initiatives and higher marketing expenses in order to reinforce our brand value while supporting diverse social initiatives. These effects were partly offset by an annual decrease in personnel expenses due to decreased severance payments and decreased benefit expenses given organizational changes made during the year.
2019 and 2020. For the year ended December 31, 2020, our net income amounted to Ch$401,630 million, which denoted a decrease of 33.5% or Ch$202,115 million when compared to the Ch$603,745 million recorded in 2019. This trend in net income was primarily attributable to the effects of the COVID-19 pandemic on economic activity and business dynamics, as described in “Item 5. Operating and Financial Review and Prospects—Operating Results—Overview—Impacts of COVID-19 in 2020” in our annual report on Form 20-F for the year ended December 31, 2020 filed with the SEC on April 30, 2021. In summary, the annual decrease in net income was mainly related to:
| ● | An annual increase of 65.0% (or Ch$215,505 million) in provisions for loan losses. This trend reflects the effects of COVID-19 on economic activity and negative expectations regarding customers’ credit behavior in a context of higher unemployment and reduced monthly income in the case of individuals, as well as a deterioration on the financial condition of companies. Throughout the year, the effects were changing, consistent with the evolution of the COVID-19 pandemic and how the mobility restrictions were changing in terms of severity. Accordingly, the first three quarters were the most intensive in terms of loan loss provisions, given the impact of lockdowns on customers’ payment behavior. Instead, in the fourth quarter of 2021, monetary and fiscal aid packages, along with the effect of partial withdrawals from pension funds for individuals, alleviated the financial constraints of both individuals and companies, translating into a moderation of non-performing loans and improved, though still weak, payment capacity. Based on these trends, we reviewed our Expected Credit Losses (ECL) models by adjusting models for estimating and forecasting both Probabilities of Default and Loss Given Default in order to recognize the uncertainties regarding the economic outlook as a result of the COVID-19 pandemic with a forward-looking approach. The impact of these adjustments in ECL models resulted in higher provisions for loan losses of Ch$151,652 million before taxes. For more information, see Note 4 to our audited consolidated financial statements as of and for the year ended December 31, 2020 appearing elsewhere in this annual report. To a lesser extent, loan growth contributed to a moderate increase in provisions for loan losses. These factors were to some degree offset by an appreciation of 5.3% of the Chilean peso against the U.S. dollar in 2020, as compared to a depreciation of 8.4% in 2019, which contributed to a decrease in provisions for loans losses related to loans denominated in U.S. dollars. |
| ● | An annual decrease of approximately 4.0% (or Ch$54,490 million) in net interest income, from the Ch$1,371,278 recorded in 2019 to Ch$1,316,788 million in 2020. There were two main reasons behind this decrease. First, the effects of COVID-19 on economic activity, particularly in household consumption and investment, produced a sharp decrease of approximately Ch$34,730 million in income from loans (net of funding). This decrease was primarily the result of a 6.0% reduction in average balances of our most profitable lending product, consumer loans, during 2020, due to both a weakened demand for loans and also more restrictive conditions in lending amid a more complex scenario in terms of credit risk, and loan growth concentrated in low-margin products, such as SMEs loans as part of the government-guaranteed (FOGAPE) loan program and loans to large companies and corporations, all of which carried lower lending spreads. Second, there was a significant decline in the contribution from demand deposits to our funding cost by approximately Ch$50,100 million, caused primarily by the sharp decrease in local and foreign interest rates as a consequence of monetary actions carried out by central banks across the globe in order to face the downturn produced by the COVID-19 pandemic. These effects were partly counterbalanced by higher contribution of nearly Ch$9,630 million from our UF structural position, in terms of both higher exposure and also lower nominal interest rates funding part of this net asset position. |
| ● | An annual decrease in net fees and commissions of 2.5% (or Ch$11,334 million) in 2020, as compared to 2019. This decline was primarily caused by: (i) the impact of lockdowns and mobility restrictions set as a result of the pandemic, on household spending and, therefore, on transactionality at an industry level, which negatively affected income related to checking accounts, ATMs and credit cards, and (ii) the impact of increased market volatility and uncertainty that led investors to prefer liquidity and low risk investments over profitability, which had a negative effect on fees from mutual funds management. These factors were partly counterbalanced by higher fee income from insurance brokerage, primarily supported by the income from the alliance materialized in 2019 with an international insurance company for the distribution of life and non-life insurance products, which in turn enabled us to more than offset the decline in written policies sales, given a lower demand for insurance products as a consequence of lower disposable income among individuals due to the economic plunge they faced as a result of the COVID-19 pandemic. |
151
These factors were partly offset by: (i) lower income tax, by Ch$70,438 million, as a result of a decline of Ch$272,553 million in income before income tax, (ii) effective cost control protocols that we have been designing and implementing over the last two years, enabling us to reduce operating expenses by Ch$24,498 million in 2020 when compared to 2019, and (iii) other income (loss) net increasing 2.6%, or Ch$4,584 million, which was mainly explained by higher results from our Treasury business, which recorded an annual increase of approximately Ch$48,000 million in revenues as a result of the positive effect of decreasing interest rates in the fixed-income portfolio and lower CVA adjustments to derivative positions, which were to some extent offset by a decrease of Ch$22,400 million related to the net asset position in foreign currency that hedges our exposure to US-denominated allowances (credit and fee expenses) and lower net financial income recorded by our securities brokerage subsidiary by Ch$10,660 million, mainly due to the solid performance posted by such subsidiary in 2019.
Net Interest Income
The tables included under the headings “—Interest Revenue” and “—Interest Expense” set forth information regarding our consolidated interest revenue and expenses, average interest earning assets and average interest bearing liabilities for the years ended December 31, 2019, 2020 and 2021. This information is derived from tables included elsewhere in this annual report under “Item 4. Information on the Company—Selected Statistical Information” and is qualified in its entirety by reference to such information.
| For the Year Ended December 31, | % Increase (Decrease) | |||||||||||||||||||
| 2019 | 2020 | 2021 | 2019/2020 | 2020/2021 | ||||||||||||||||
| (in millions of Ch$, except percentages) | % | |||||||||||||||||||
| IFRS: | ||||||||||||||||||||
| Interest revenue | Ch$ | 2,113,548 | Ch$ | 1,876,795 | Ch$ | 2,388,470 | (11.2 | )% | 27.3 | % | ||||||||||
| Interest expense | (742,270 | ) | (560,007 | ) | (814,448 | ) | (24.6 | ) | 45.4 | |||||||||||
| Net interest income | Ch$ | 1,371,278 | Ch$ | 1,316,788 | Ch$ | 1,574,022 | (4.0 | )% | 19.5 | % | ||||||||||
| Net interest margin(1)(2) | 4.25 | % | 3.54 | % | 3.89 | % | ||||||||||||||
| (1) | Net interest income divided by average interest-earning assets. The average balances for interest-earning assets, including interest readjustments, were calculated on a daily basis for the Bank’s balances and on a monthly basis for our subsidiaries’ balances. |
| (2) | Net interest margin includes the interest earned on trading securities, which is accounted for under Other Income (Loss) Net. Similarly, it includes average balances of trading securities. |
152
2020 and 2021. For the year ended December 31, 2021 our net interest income was Ch$1,574,022 million which represents an annual increase of 19.5%, or Ch$257,234 million, as compared to the Ch$1,316,788 million recorded in 2020. The main drivers supporting the increase in net interest income were:
| ● | An annual increase of approximately Ch$310,775 million in the contribution of our UF-denominated net asset balance sheet exposure, including both on-balance and off-balance positions denominated in UF. This impact was the result of higher inflation (measured as UF variation) of 3.92%, from 2.69% in the year ended December 31, 2020 to 6.61% in the same period of 2021. |
| ● | An annual decrease of Ch$40,628 million in interest paid on saving accounts and time deposits during 2021 when compared to 2020. This behavior was mostly the consequence of: (i) a lower average interest rate paid on saving accounts and demand deposits, explaining approximately Ch$25,038 million of such decrease, and (ii) an annual decrease of approximately 14.1% in average balances in 2021 when compared to 2020, associated with lower funding needs due to the 32.3% annual increase in non-interest bearing current accounts and demand deposits prompted by excess liquidity in the economy and low interest rates, which explained Ch$15,590 million of the decrease in interest expenses paid on time deposits. |
| ● | An annual increase of Ch$11,988 million in interest earned on securities measured at fair value through OCI and on securities held-to-maturity fixed-income securities in 2021 when compared to 2020. This effect was mostly associated with an annual expansion of 30.8% in average balances (including the trading portfolio), which explained approximately Ch$20,040 million of the higher interest revenues. This effect was partially offset by lower average nominal and real interest rates carried by these instruments, explaining approximately Ch$8,052 million of the lower interest revenues, due to the low local interest rates for most of 2021 when compared to 2020 and the purchase of UF-denominated securities, which earn lower interest rates (excluding the effect of inflation). |
| ● | An annual decrease in interest paid on debt instruments (including commercial paper) by Ch$9,355 million in 2021 as compared to 2020. This behavior was primarily driven by an annual contraction in the average nominal and real interest rate paid on long-term debt instruments, explaining Ch$7,912 million of the lower interest expenses. To a lesser extent, an overall decrease of 1.0% in average balances of debt issued (including commercial paper), due to the previously mentioned annual increase in non-interest bearing current account and demand deposits, resulted in a Ch$1,443 million decrease in interest expenses. |
| ● | An annual decrease in interest paid on borrowings from financial institutions by Ch$4,448 million. This was mainly the consequence of the lower average nominal and real interest rates carried by these instruments given the impact of borrowings from the Central Bank in Chile associated with the Lending Facilities Conditional on Loan Growth (“FCIC” for its acronym in Spanish) that accrues a nominal interest rate of 0.5%, which prompted a decrease in the overall average interest paid on borrowings from financial institutions by approximately Ch$14,540 million, all things equal. This effect was to some extent offset by an increase of 37.2% in average balances, from Ch$2,200,874 million in 2020 to Ch$3,020,147 million in 2021, given additional borrowings from the Central Bank in 2021 (also raised from FCIC), which explained an annual increase of Ch$10,092 million in interest expenses due to higher balances, all things being otherwise equal. |
| ● | An annual increase in interest revenues on loans and advances to banks of Ch$3,727 million. This was largely associated with a 53.8% annual increase in average balances, which was mostly concentrated in short-term low interest-earning assets aimed at complying with “technical reserve” requirements arising from high levels of demand deposits. For more information on technical reserves, please see “Item 4. Information on the Company—Regulation and Supervision—Reserve Requirements”. |
These positive factors were partially offset by:
| ● | An annual decrease of Ch$113,635 million in interest revenues earned on loans to customers (excluding the effect of inflation), mainly influenced by: (i) lower interest earned on consumer loans, which decreased Ch$92,011 million in 2021 when compared to 2020 based on both lower average nominal interest rates and a decline of 5.3% in average balances due to lower demand for loans as a result of the excess of liquidity produced by the three pension fund withdrawals and government aid packages, and (ii) an annual decline of Ch$28,061 million in interest earned on commercial loans, particularly concentrated in commercial credits, due to lower average nominal and real interest rates (excluding inflation) associated with loan growth concentrated in the government-guaranteed loan program (FOGAPE and FOGAPE Reactiva) that carries low interest rates and in spite of a 7.5% increase in average balances. These effects were partly offset by slightly higher interest revenues on residential mortgage loans by Ch$6,419 million on an annual basis, driven by average loan balances increasing 6.9% in 2021. |
153
On the whole, the effect of higher inflation on our net asset position in UF, which is accounted for as interest income, more than offset the lower average nominal and real rates (excluding inflation effect) earned and paid on assets and liabilities, respectively, which resulted in an increase in our net interest margin from 3.54% in 2020 to 3.89% in 2021.
2019 and 2020. For the year ended December 31, 2020 our net interest income was Ch$1,316,788 million, which represents an annual decrease of 4.0% or Ch$54,490 million as compared to the Ch$1,371,278 million recorded in 2019. The annual decrease in net interest income was primarily attributable to:
| ● | An annual decrease of Ch$209,300 million in interest revenues earned on loans to customers, which was mainly associated with the annual decline of 6.0% recorded by average balances of consumer loans and loan growth concentrated in low margin products, such as commercial loans (10.0%) and residential mortgage loans (7.7%). The decrease in consumer loans was highly influenced by the economic downturn produced by the COVID-19 pandemic, which significantly affected demand for loans by individuals and more restrictive credit granting conditions in the context of increased unemployment, higher credit risk and customers’ deteriorated payment capacity. Furthermore, we were impacted by the fact that growth in commercial loans was primarily related to loans granted to SMEs as part of the government-guaranteed loans program bearing low interest rates. In addition, given the expected impact of COVID-19 on the economy, the Central Bank adopted an even more dovish approach than previously taken by lowering interest rates from 1.75% in January 2020 to 0.5% in March 2020. Overall, the annual decrease in interest revenues earned on loans was mainly influenced by: (i) lower interest earned on consumer loans (installment loans, credit cards and credit lines) decreasing Ch$101,345 million in 2020, (ii) a decline of Ch$83,800 million in interest revenues earned on commercial loans, particularly concentrated in commercial credits, trade finance and overdraft loans, and (iii) lower interest revenues on residential mortgage loans by Ch$24,520 million in 2020 as compared to 2019, primarily due to lower long-term interest rates. |
| ● | An annual decrease on interest earned on loans and advances to banks of Ch$16,660 million in 2020 when compared to 2019. The main reason behind this decrease was the sharp decline in nominal interest rates, as mentioned earlier, and an increase of 66.4% in average balances concentrated in short-term low interest-bearing loans. |
| ● | An annual decrease of Ch$7,700 million in interest earned on available for sale securities in 2020 when compared to 2019. This decline was largely attributable to the sustained decreases in both local (nominal and real) and foreign interest rates, which has translated into a decline in the interest carried by these types of securities. |
These negative factors were partially offset by:
| ● | An annual decrease of Ch$153,800 million in interests paid on time deposits during 2020 in comparison with 2019. This decline was the consequence of both: (i) the sharp decline in nominal interest rates to approximately 0.5% for tenors up to 730 days in 2020, from an average level of 2.5% in 2019, and (ii) a decrease of approximately 9.8% in average balances in 2020 as a consequence of both an important increase in average balances of demand deposits (32.6%) and the funding provided by the Central Bank to many local banks, at low cost with the purpose of mitigating the effects of the economic downturn caused by the COVID-19 pandemic. |
| ● | An annual decrease of Ch$15,740 million in interests paid on borrowings from financial institutions. This lower cost of funding was mainly the consequence of: (i) lower interest rates in Chile and abroad following the efforts by Central Banks across the globe to mitigate the effects of the COVID-19 pandemic on their economies, and (ii) the effect of the specific funding provided by the Central Bank to local banks, including us, in order to promote liquidity and lending within the local economy with the aim of mitigating the effects of the crisis produced by mobility restrictions. As of December 31, 2020, we had borrowed approximately Ch$3,100,000 million from the Central Bank, bearing a nominal interest rate of 0.5%. |
154
| ● | An annual increase of approximately Ch$9,630 million in the contribution from our UF-denominated net asset balance sheet exposure. Although UF variation was the same in 2019 and 2020 (2.7%), we benefited from an increase in our UF-denominated balance sheet exposure in 2020 as compared to 2019. |
Based on these factors, but particularly as a consequence of the decrease in average interest rates earned on assets, given the increase in low margin interest earning assets related to short-term securities used in order to comply with reserve requirements associated with demand deposits, our net interest margin decreased from 4.25% in 2019 to 3.55% in 2020.
Interest Revenue
The following table sets forth information regarding our interest revenue and average interest earning assets for the years ended December 31, 2019, 2020 and 2021:
| For the Year Ended December 31, | % Increase (Decrease) | |||||||||||||||||||
| 2019 | 2020 | 2021 | 2019/2020 | 2020/2021 | ||||||||||||||||
| (in millions of Ch$, except percentages) | % | |||||||||||||||||||
| IFRS: | ||||||||||||||||||||
| Interest revenue | Ch$ | 2,113,548 | Ch$ | 1,876,795 | Ch$ | 2,388,470 | (11.2 | )% | 27.3 | % | ||||||||||
| Average interest earning assets: | ||||||||||||||||||||
| Commercial loans | 15,746,316 | 17,323,680 | 18,624,803 | 10.0 | 7.5 | |||||||||||||||
| Residential mortgage loans | 8,561,445 | 9,220,426 | 9,855,993 | 7.7 | 6.9 | |||||||||||||||
| Consumer loans | 4,445,242 | 4,178,618 | 3,958,300 | (6.0 | ) | (5.3 | ) | |||||||||||||
| Total loans | 28,753,003 | 30,722,724 | 32,439,096 | 6.9 | 5.6 | |||||||||||||||
| Investment under resale agreements | 81,901 | 51,467 | 71,515 | (37.2 | ) | 39.0 | ||||||||||||||
| Other Assets | 378,112 | 507,564 | 231,070 | 34.2 | (54.5 | ) | ||||||||||||||
| Financial investments | 2,830,009 | 4,424,050 | 5,787,657 | 56.3 | 30.8 | |||||||||||||||
| Loans and advance to banks | 1,186,841 | 1,974,545 | 3,037,383 | 66.4 | 53.8 | |||||||||||||||
| Total | Ch$ | 33,229,866 | Ch$ | 37,680,350 | Ch$ | 41,566,721 | 13.4 | % | 10.3 | % | ||||||||||
| Average rates earned on total interest earning assets(1)(2): | ||||||||||||||||||||
| Average nominal rates | 6.36 | % | 4.98 | % | 5.75 | % | ||||||||||||||
| (1) | See “Item 4. Information on the Company—Selected Statistical Information—Average Balance Sheets, Interest Earned on Interest Earning Assets and Interest Paid on Interest Bearing Liabilities.” |
| (2) | Average rates earned on interest earning assets do not include the interest earned on trading securities, which is accounted for under Other Income (Loss) Net. However, it does include average balances of trading securities. |
2020 and 2021. For the year ended December 31, 2021, our interest revenue was Ch$2,388,470 million, representing a 27.3% increase when compared to the Ch$1,876,795 million recorded in 2020. The annual increase was primarily due to the effect of increased inflation, as reflected by an annual UF variation of 6.61% as of December 31, 2021, when compared to 2.69% as of December 31, 2020, which explained Ch$658,738 million of the higher interest revenues earned on inflation-indexed assets. The increase in inflation was associated with diverse drivers, including: (i) economic growth driven by higher household consumption in 2021, (ii) an increase in external prices due to the effects of the pandemic and disruptions in the international supply chain, (iii) the impact of higher than expected liquidity among individuals due to support programs and fiscal policies intended to assist them during the COVID-19 pandemic, including three pension fund withdrawals, (iv) a weaker currency given the sharp depreciation of the Chilean peso against the U.S. dollar as of December 31, 2021, and (v) lower unemployment, all of which translated into higher demand for durable and non-durable goods that pushed overall prices in the Chilean economy up. The aforementioned effect of higher inflation on interest revenues coupled with the effect of an annual increase of 10.3% in average balances of interest-earning assets, primarily due to increases in loans to customers, resulted in higher interest accrued on interest-earning assets by Ch$102,827 million in 2021 when compared to 2020.
155
These effects were partially offset by the impact of lower average nominal and real interest rates (excluding inflation) accrued on our interest-earning assets during the year ended December 31, 2021, as compared to the year ended December 31, 2020, resulting in an Ch$203,490 million decrease in interest revenues produced by interest rates that remained at historically low levels for the first three quarters of 2021, as the Central Bank had to deploy an aggressive expansionary monetary policy to mitigate the economic effects of the pandemic by reducing the reference interest rate, which remained at 0.5% between April 2020 and July 2021. Similarly, long-term interest rates were well below average throughout 2020, while returning to average levels by mid-2021. In addition, higher-interest rate lending products, such as consumer loans, suffered a significant decrease in average balances as a consequence of economic drivers prompted by the pandemic, which also caused a decline in the average interest rate earned on assets. To a lesser extent, the result of derivatives held for cash hedge accounting purposes decreased Ch$48,101 million in 2021 when compared to 2020, mostly related to the liability position of the hedging derivative denominated in UF given higher inflation.
Based on the above, the effect of higher inflation more than offset the lower average real and nominal interest rates, which resulted in an increase of the overall average interest rate earned on our assets from 4.98% for the year ended on December 31, 2020 to 5.75% for the year ended on December 31, 2021.
2019 and 2020. For the year ended December 31, 2020, our interest revenue was Ch$1,876,795 million, an 11.2% decrease when compared to the Ch$2,113,548 million recorded in 2019. The annual decline was primarily due to the decrease in nominal and real local interest rates, and also lower interest rates in foreign currency, explaining approximately Ch$356,200 million of the total decrease in interest revenues. This effect more than offset the positive impact of higher average balances of interest earning assets of approximately 13.3% on an annual basis, resulting in higher revenues of approximately Ch$134,100 million. The increase in average balances of interest earning assets was primarily concentrated in low interest rate assets, such as: (i) the Central Bank’s securities to afford reserve requirements related to the significant increase in demand deposits, and (ii) an increase of 10.0% and 7.7% in average balances of commercial and residential mortgage loans, respectively, where growth in commercial loans was principally fostered by government-guaranteed loans to SMEs as part of the recovery plan to face the COVID-19 pandemic. These factors were coupled with a decrease in high interest rate assets, such as the contraction of 6.0% in average balances of consumer loans. Given these trends, the average interest rate earned on assets recorded a decrease from 6.36% in 2019 to 4.98% in 2020.
Interest Expense
The following table sets forth information regarding our interest expense and average interest bearing liabilities for the years ended December 31, 2019, 2020 and 2021:
| For the Year Ended December 31, | % Increase (Decrease) | |||||||||||||||||||
| 2019 | 2020 | 2021 | 2019/2020 | 2020/2021 | ||||||||||||||||
| (in millions of Ch$, except percentages) | % | |||||||||||||||||||
| IFRS: | ||||||||||||||||||||
| Interest expense | Ch$ | 742,270 | Ch$ | 560,007 | Ch$ | 814,448 | (24.6 | )% | 45.4 | % | ||||||||||
| Average interest-bearing liabilities: | ||||||||||||||||||||
| Saving accounts and time deposits(1) | 10,924,373 | 9,857,365 | 8,467,508 | (9.8 | ) | (14.1 | ) | |||||||||||||
| Obligations under repurchase agreements | 269,690 | 280,827 | 140,600 | 4.1 | (49.9 | ) | ||||||||||||||
| Borrowings from financial institutions | 1,546,639 | 3,225,303 | 4,420,847 | 108.5 | 37.1 | |||||||||||||||
| Debt issued | 7,767,571 | 8,719,276 | 8,491,701 | 12.3 | (2.6 | ) | ||||||||||||||
| Commercial Papers | 275,802 | 219,046 | 359,836 | (20.6 | ) | 64.3 | ||||||||||||||
| Lease Liabilities | 140,331 | 133,514 | 107,048 | (4.9 | ) | (19.8 | ) | |||||||||||||
| Other financial obligations | 196,717 | 157,052 | 144,873 | 20.2 | (7.8 | ) | ||||||||||||||
| Total | Ch$ | 21,121,123 | Ch$ | 22,592,383 | Ch$ | 22,132,413 | 7.0 | % | (2.0 | )% | ||||||||||
| Average rates paid on total interest bearing liabilities(2): | ||||||||||||||||||||
| Average nominal rates | 3.51 | % | 2.48 | % | 3.68 | % | ||||||||||||||
| Average (Chilean peso-denominated) non-interest bearing current account and demand deposits | 9,716,000 | 12,882,627 | 17,048,827 | 32.6 | % | 32.3 | % | |||||||||||||
| (1) | Includes interest-bearing demand deposits. |
| (2) | See “Item 4. Information on the Company—Selected Statistical Information—Average Balance Sheets, Interest Earned on Interest Earning Assets and Interest Paid on Interest Bearing Liabilities.” |
156
2020 and 2021. Our interest expense increased 45.4%, or Ch$254,441 million, in 2021, from Ch$560,007 million for the year ended December 31, 2020 to Ch$814,448 million recorded for the year ended December 31, 2021. The annual increase in interest expense was mostly due to the impact of higher inflation, as reflected by an annual UF variation of 6.61% as of December 31, 2021, when compared to 2.69% as of December 31, 2020, which explains Ch$308,794 million of the higher interest expenses paid on our UF-denominated interest-bearing liabilities. The impact of higher UF variation was to some extent offset by lower average nominal and real interest rates (excluding inflation) accrued on our interest-bearing liabilities, particularly as a consequence of local and foreign short-term interest rates that remained at historically low levels for most of 2021, as a consequence of the monetary stimulus set by the Central Bank and other central banks abroad in 2020 in order to deal with the effects of the COVID-19 pandemic on the global economy, policies that remained for most of 2021. Overall, the lower average nominal and real interest (excluding inflation) accrued on interest-bearing liabilities resulted in a decrease of Ch$48,389 million in interest expenses in 2021, as compared to 2020. To a lesser extent, an annual decrease of 2.0% in average balances of interest-bearing liabilities explained a decrease of Ch$8,051 million in interest expenses (excluding inflation), primarily driven by the impact of an annual decrease of 14.1% in savings accounts and time deposits, which was partially explained by the 32.3% annual increase in non-interest bearing current account and demand deposits that reinforced our funding and reduced the needs for time deposits.
Based on the above, higher inflation resulted in an increase in the interest paid on liabilities by offsetting the effect of lower average nominal an interest rates, which increased the overall interest paid on interest bearing liabilities from 2.48% as of the year ended December 31, 2020 to 3.68% as of the year ended December 31, 2021.
2019 and 2020. Our interest expense decreased 24.6% or Ch$182,263 million in 2020 when compared to the Ch$742,270 million recorded in 2019. Similar to the effect observed in interest revenues, the annual decrease in interest expenses was mainly due to the effects of lower short-term and long-term interest rates on the interest paid on liabilities, explaining a decrease of approximately Ch$198,100 million. As mentioned, this was the result of dovish monetary actions taken by the Chilean and foreign central banks in an effort to contain the impact of the economic crisis produced by the spread of COVID-19. On the other hand, interest bearing liabilities increased by approximately 7.2% on an annual basis, which caused a volume effect of Ch$23,000 million that partly offset the impact of lower interest rates. Consequently, the average interest rate paid on liabilities decreased from 3.53% in 2019 to 2.48% in 2020.
Net Fees and Commissions Income
The following table sets forth certain components of our fees and commissions income (net of fees paid to third parties that provide support for those services) for the years ended December 31, 2019, 2020 and 2021:
| Year Ended December 31, | % Increase (Decrease) | |||||||||||||||||||
| 2019 | 2020 | 2021 | 2019/2020 | 2020/2021 | ||||||||||||||||
| (in millions of Ch$, except percentages) | % | |||||||||||||||||||
| IFRS: | ||||||||||||||||||||
| Mutual funds | Ch$ | 101,046 | Ch$ | 92,514 | Ch$ | 108,348 | (8.4 | )% | 17.1 | % | ||||||||||
| Insurance | 122,108 | 131,361 | 95,482 | 7.6 | (27.3 | ) | ||||||||||||||
| Current accounts, overdrafts, credit lines and credit cards | 69,640 | 63,923 | 72,541 | (8.2 | ) | 13.5 | ||||||||||||||
| Demand accounts and ATMs | 60,172 | 55,779 | 68,619 | (7.3 | ) | 23.0 | ||||||||||||||
| Stock brokerage | 11,544 | 12,462 | 13,632 | 8.0 | 9.4 | |||||||||||||||
| Cash management services | 4,700 | 3,769 | 5,484 | (19.8 | ) | 45.5 | ||||||||||||||
| Letters of credit, guarantees, collateral and other contingent loans | 26,100 | 27,825 | 30,130 | 6.6 | 8.3 | |||||||||||||||
| Custody and trust services | 8,725 | 8,565 | 9,403 | (1.8 | ) | 9.8 | ||||||||||||||
| Foreign trade and currency exchange | 2,089 | 2,319 | 2,426 | 11.0 | 4.6 | |||||||||||||||
| Financial advisory services | 4,393 | 4,487 | 4,948 | 2.1 | 10.3 | |||||||||||||||
| Credits and factoring | 6,271 | 4,003 | 4,421 | (36.2 | ) | 10.4 | ||||||||||||||
| Collection services | 23,808 | 16,984 | 16,159 | (28.7 | ) | (4.9 | ) | |||||||||||||
| Teller services expenses | (6,284 | ) | (4,927 | ) | (4,211 | ) | (21.6 | ) | (14.5 | ) | ||||||||||
| Credit pre-evaluation services | (404 | ) | (244 | ) | (229 | ) | (39.6 | ) | (6.1 | ) | ||||||||||
| Wire transfers and payment orders | 12,329 | 13,364 | 15,708 | 8.4 | 17.5 | |||||||||||||||
| Other | 11,066 | 13,784 | 12,167 | 24.6 | (11.7 | ) | ||||||||||||||
| Total | Ch$ | 457,302 | Ch$ | 445,968 | Ch$ | 455,028 | (2.5 | )% | 2.0 | % | ||||||||||
157
2020 and 2021. Our income from fees and commissions was Ch$455,028 million in 2021, which denotes a 2.0% annual increase when compared to the Ch$445,968 million recorded in 2020. This annual increase in fee-based income was primarily supported by:
| ● | An annual increase of 17.1%, or Ch$15,834 million, in fees and commissions from mutual funds management, from Ch$92,514 million in 2020 to Ch$108,348 million in 2021. This annual increase was mainly the result of: (i) an increase of 5.2% in the average balance of assets under management by our mutual funds management subsidiary, which recorded a market share of 24.3% as of December 31, 2021, and (ii) a change in the portfolio mix from fixed-income funds to local and international equity funds, with the latter bearing higher fees. Unlike trends seen in 2020, when fixed-income funds were highly preferred over riskier assets given the effect of the uncertainty on the outlook for local and global economies and the market volatility produced by the COVID-19 pandemic, during 2021, the change in the portfolio mix has been conducted by a shift in the investors’ preferences toward riskier investments given the negative effects of the steady upward trend observed in local long-term interest rates for most of 2021 on the market value of fixed-income securities throughout the year. |
| ● | An annual increase of 23.0% or Ch$12,840 million in net fees and commissions from demand accounts and ATMs, from Ch$55,779 million in 2020 to Ch$68,619 million in 2021. This increase was mostly the consequence of an annual increase in the number of transactions in the context of the economic rebound seen in 2021, as mobility restrictions began to be gradually lifted and social interaction converged to normalized levels as the vaccination process progressed, which resulted in higher use of both debit cards and ATMs. |
| ● | An annual increase of 13.5%, or Ch$8,618 million, in fees and commissions from transactional services (including current accounts, overdrafts, credit lines and credit cards) from Ch$63,923 million in 2020 to Ch$72,541 million in 2021. This increase was mainly due to an annual increase in the number of transactions in the context of the economic rebound seen in 2021 as many economic sectors and industries reopened during the year as decreased contagion rates led to greater mobility within the country. Thus, the increase was due to an annual increase in use of credit cards, as reflected by the amount of transactions increasing 24.6%, which is aligned with the recovery in economic activity, although the average amount per transaction slightly decreased 2.5% on an annual basis. Also, it is important to note that 2020 was certainly a subdued year in terms of fees coming from these services due to the negative impact that the COVID-19 pandemic had on employment, disposable income of individuals, household spending and, therefore, transactionality, posing a low basis for comparison. |
| ● | An annual increase of 17.5%, or Ch$2,344 million, in fees related to wire transfers and payment orders, from Ch$13,364 million in 2020 to Ch$15,708 million in 2021. This behavior was linked to high levels of liquidity among individuals during 2021 prompted by special measures taken by the government to assist them amid the COVID-19 pandemic, such as three withdrawals from pension funds, which led to increased cash management services and transactionality among companies and individuals. |
| ● | An annual increase of 8.3%, or Ch$2,305 million, in fees related to letters of credit guarantees, collateral and other contingent loans, from Ch$27,825 million in 2020 to Ch$30,130 million in 2021. This figure was mostly associated with: (i) a depreciation of the Chilean peso against the U.S. dollar in 2021 (19.8%) as compared to the appreciation of the Chilean peso against the U.S. dollar in 2020, given that a portion of the underlying loans is denominated in foreign currency, and (ii) a recovery in international trade during 2021, particularly associated a low comparison base in 2020 due to the COVID-19 pandemic. |
These increases were partially offset by an annual decline of 27.3%, or Ch$35,879 million, in fees related to the insurance brokerage business, from Ch$131,361 million in 2020 to Ch$95,482 million in 2021. This decrease was mostly influenced by the non-recurrent base effect of the higher amount recognized in 2020 in connection with the extraordinary upfront fee coming from our long-term partnership with an insurance company in 2020. This effect in fees coming from our insurance brokerage business was to some extent offset by a 12-month real increase of 4.2% in written premiums as of December 31, 2021, primarily due to increased lending activity over the second half of the year, particularly in the origination of consumer loans and residential mortgage loans that increased 35.0% and 33.7% in 2021 on an annual basis, respectively.
158
2019 and 2020. Our income from fees and commissions was Ch$445,968 million in 2020, which represents a 2.5% annual decrease when compared to the Ch$457,302 million recorded in 2019. This annual decrease in fee-based income was primarily caused by:
| ● | An annual decrease of 8.4%, or Ch$8,532 million, in fees and commissions from mutual funds management. This decrease was mainly influenced by the effect of the uncertainty on the outlook for local and worldwide economies and the market volatility produced by the spread of COVID-19, which resulted in a sharp correction of stock markets. As a result, investors, particularly retail investors, moved to less risky assets. Therefore, the portfolio managed by our mutual funds management subsidiary changed focus towards fixed-income securities, which carry lower margins. This negative factor was to some extent offset by a 17.0% annual increase in the average balance of assets managed by our mutual funds management subsidiary that enabled it to record an unprecedented 24.2% market share in 2020. |
| ● | An annual decrease of 8.2%, or Ch$5,717 million in fees and commissions from current accounts, overdrafts, credit lines and credit cards. This decrease was mainly the consequence of diverse sanitary measures implemented by health authorities with the aim of controlling the spread of COVID-19, including lockdowns, mobility restrictions and social distancing. These measures negatively impacted employment disposable income of individuals, household spending and, therefore, transactionality. The total amount of transactions made by our customers with credit cards, including purchases, cash withdrawals and bill payments decreased by 19.0% or 18.0 million transactions on an annual basis, which reflects the impact of reduced mobility during the peak of the COVID-19 pandemic and lower than average transactionality during the rest of the year. These drivers were to some degree softened by the positive impact of the two pension fund withdrawals as approved by the Chilean Congress as a measure to increase disposable income for individuals during the COVID-19 pandemic. As a matter of fact, the average ticket per transaction increased 12.5% on an annual basis, which partly mitigated the negative effect on number of transactions. |
| ● | An annual decrease of 28.6%, or Ch$6,695 million in fees and commissions from collection of overdue loans. The main drivers behind this decrease were: (i) the evolution of our loan portfolio and, particularly, the decrease of 6.0% in the average balance of consumer loans, (ii) our support program for individual customers that permitted them to reschedule part of their obligations, and (iii) the positive impact of the two withdrawals from pension funds approved by the Chilean Congress for individuals on past-due loans at an industry level. |
| ● | An annual decrease of 7.3% or Ch$4,393 million in net fees and commissions from demand accounts and ATMs. The decrease was primarily the consequence of: (i) an annual decrease of approximately Ch$18.7 million or 43.1% in the amount of cash withdrawal transactions from our countrywide network of ATMs during 2020 as compared to 2019, and (ii) an annual decrease of Ch$19.4 million or 10.5% in the amount of transactions made by our clients with debit cards. These drivers were partially offset by annual increases of 25.4% and 19.4% in the average ticket of cash withdrawals in ATMs and transactions made with debit cards, respectively. |
These factors were to some extent offset by: (i) an annual increase of 7.6% or Ch$9,253 million in fees and commissions from insurance brokerage, which was attributable to our strategic partnership with Chubb Limited, that resulted in additional fees accrued in 2020 with the beginning of the agreement for life insurance products that enabled us to more than offset the impact of the COVID-19 pandemic on the demand for insurance policies, particularly those linked to consumer loans, that observed an annual decrease of 9.3% in written premiums, (ii) an annual increase of 6.6% or Ch$1,725 million in fees related to letters of credit and contingent loans, partly explained by the evolution of the Chilean peso/U.S. dollar exchange rate throughout the year, and (iii) higher fees and commissions from securities brokerage of approximately 14.8%, or Ch$1,709 million, on an annual basis.
159
Other Income (Loss), Net
Other income (loss), net, consists of net gains and losses from financial operating income, net gains and losses from foreign exchange transactions and other operating income. Financial operating income results include gains and losses realized on the sale of securities, gains and losses from marking to market of securities and interest rate and currency derivatives at the end of the period. Net gains and losses from foreign exchange transactions include gains and losses realized upon the sale of foreign currency and foreign exchange derivatives and gains and losses arising from the period-end translation of foreign currency denominated assets and liabilities into pesos. Foreign exchange results also include net adjustments on U.S. dollar-indexed domestic currency transactions and existing interest rate differences in currency derivatives.
The following table sets forth certain components of our other income (loss), net, for the years ended December 31, 2019, 2020 and 2021:
| For the Year Ended December 31, | % Increase (Decrease) | |||||||||||||||||||
| 2019 | 2020 | 2021 | 2019/2020 | 2020/2021 | ||||||||||||||||
| (in millions of Ch$, except percentages) | % | |||||||||||||||||||
| IFRS: | ||||||||||||||||||||
| Income on trading securities | Ch$ | 44,274 | Ch$ | 24,715 | Ch$ | 48,940 | (44.2 | )% | 98.0 | % | ||||||||||
| Gains (losses) from mark to market and sales | 32,128 | 33,216 | (12,483 | ) | 3.4 | — | ||||||||||||||
| Financial Assets Held for Trading | 76,402 | 57,931 | 36,457 | (24.2 | ) | (37.1 | ) | |||||||||||||
| Sales of Available for Sale Instruments | 4,789 | 27,091 | 1,244 | 465.7 | (95.4 | ) | ||||||||||||||
| Net Gain (Loss) from other transactions | (145 | ) | 29 | 141 | (120.0 | ) | 386.2 | |||||||||||||
| Derivative Instruments | 32,391 | (96,369 | ) | 143,641 | (397.5 | ) | — | |||||||||||||
| Sales of Loan Portfolios | — | 39 | 5,458 | 100.0 | — | |||||||||||||||
| Total net financial operating (loss) income | 113,437 | (11,279 | ) | 186,941 | (100.9 | ) | — | |||||||||||||
| Foreign exchange transactions, net | 30,886 | 156,662 | (15,962 | ) | 407.2 | — | ||||||||||||||
| Other operating income, net | 32,315 | 26,671 | 34,056 | (17.5 | ) | 27.7 | ||||||||||||||
| Total other income (loss), net | Ch$ | 176,638 | Ch$ | 172,054 | Ch$ | 205,035 | (2.6 | )% | 19.2 | % | ||||||||||
2020 and 2021. Our other income (loss), net amounted to Ch$205,048 million in 2021, denoting a 19.2%, or Ch$32,994 million, annual increase as compared to the Ch$172,054 million recorded in 2020. This annual increase was primarily the result of:
| ● | An annual increase of Ch$240,010 million in income from derivatives, from a net loss of Ch$96,369 million in 2020 to a net gain of Ch$143,641 million in 2021. The reversal was mainly explained by: (i) an increase in results from foreign exchange adjustments to the average net asset position held in foreign currency derivatives by approximately Ch$216,780 million, from a negative result of nearly Ch$118,045 million in 2020 to a net gain of approximately Ch$98,730 million in 2021, which in turn was the combination of the end-of-period sharp depreciation of 19.8% of the Chilean peso against the U.S. dollar in 2021 as compared to the appreciation of 5.3% observed for the Chilean peso against the U.S. dollar in 2020, as well as an increase in the net asset average exposure to exchange rate through trading derivatives in 2021 as compared to 2020, and (ii) the positive combined effect of improved probabilities of default –given more certainties related to the COVID-19 pandemic than in 2020– and portfolio compression carried out during 2021 on CVA for derivatives by Ch$7,380 million from a net charge of Ch$3,241 million in 2020 to a net benefit of Ch$4,139 million in 2021. |
| ● | An annual increase of 27.7% or Ch$7,385 in other operating income in 2021 as compared to 2020, from Ch$26,671 million in 2020 to Ch$34,056 million in 2021. This increase was mainly the consequence of: (i) higher revenues associated with tax reimbursements, (ii) recovery of write-offs related to the new fraud law, which determines that banks must refund fraudulent amounts reported by customers and then obtain proof to revert those charges or, otherwise, write-off them, and (iii) higher income from assets received in lieu of payment. For more information on the new fraud law, please see “Item 4. Information on the company—Regulation and Supervision—Consumer Oriented Regulation”. |
160
The increases were partially offset by:
| ● | An annual decrease of 37.1%, or Ch$21,474 million, in income from financial assets held for trading, from Ch$57,931 million in 2020 to Ch$36,457 million in 2021. The annual decline was primarily the consequence of the sharp increase experienced by local long-term interest rates ranging from 300 to 400 basis points in the twelve-month period ended on December 31, 2021, which resulted as a second-round effect of pension fund withdrawals on the local capital market. This decrease was, in turn, to some extent offset by the positive effect of higher than expected inflation (2.69% in 2020 and 6.61% in 2021, measured as UF variation) on the carry of inflation-indexed securities. |
| ● | An annual decrease of Ch$172,624 million, in income from foreign exchange transactions, from a positive income of Ch$156,662 million in 2020 to a loss of Ch$15,962 million in 2021. This change was principally due to foreign exchange adjustments of Ch$406,750 million on our on-balance foreign exchange liability exposure, mostly composed of long-term debt denominated in foreign currency issued abroad, as a result of both: (i) the significant shift in the exchange rate ranging from an end-of-period appreciation of 5.3% of the Chilean peso against the U.S. dollar in 2020 to a depreciation of 19.8% of the Chilean peso against the U.S. dollar in 2021, and (ii) long-term debt placements abroad for an amount of Ch$684,671 million (U.S.$803 million) in 2021 as compared to almost no issuances in 2020. These factors were partly offset by: (i) an increase of Ch$216,360 million in foreign exchange adjustments on our off-balance foreign exchange net asset position in derivatives held for cash flow hedge accounting (mirroring part of the on-balance liability exposure to long-term debt denominated in foreign currency), as a result of the trends in exchange rates mentioned earlier, and (ii) an increase of nearly Ch$17,758 million in foreign exchange adjustments on assets denominated in local currency, but adjusted by the effect of changes in foreign exchange (primarily leasing loans), given the evolution mentioned above. |
| ● | An annual decrease of 95.4%, or Ch$25,847 million in the sale of financial assets measured at fair value through other comprehensive income, from revenues of Ch$27,091 million in 2020 to income of Ch$1,244 million in 2021. The annual variation was mainly explained by the steady increase in local long-term interest rates, ranging from 300 to 400 basis points throughout 2021. This effect was amplified by a high comparison base, given the sharp decreases in interest rates in 2020, amid the monetary policy actions taken by central banks around the world to cope with the effects of the pandemic, which enabled us to benefit from positive marking-to-market through sales of fixed income securities. |
2019 and 2020. Our other income (loss), net amounted to Ch$172,054 million in 2020, which denoted a 2.6%, or Ch$4,584 million, annual decrease as compared to the Ch$176,638 million recorded in 2019. This annual increase was primarily explained by:
| ● | An annual decrease of 397.5%, or Ch$128,760 million, in income from derivatives, from a net gain of Ch$32,391 million in 2019 to a net loss of Ch$96,369 million in 2020. This reversal was principally explained by: (i) lower results from foreign exchange adjustments to the average net asset position held in foreign currency derivatives by approximately Ch$143,043 million, from a positive result of nearly Ch$24,998 million in 2019 to a negative income of approximately Ch$118,045 million in 2020, which in turn was primarily due to the end-of-period appreciation of 5.3% observed for the Chilean peso against the U.S. dollar in 2020 as compared to the 8.4% end-of-period depreciation of the Chilean peso in 2019, and (ii) a decrease in the average exposure to exchange rate through derivatives for trading in 2020 as compared to 2019. These effects were partly counterbalanced by a positive effect of CVA for derivatives by Ch$8,530 million in 2020 as compared to 2019, mainly as a consequence of improved probabilities of default, particularly since the beginning of the second half of 2020, and the end-of-period appreciation of the Chilean peso against the U.S. dollar in 2020, as compared to the end-of-period depreciation observed in 2019. |
161
| ● | An annual decrease of 24.2%, or Ch$18,471 million, in income from financial assets held for trading, from Ch$76,402 million in 2019 to Ch$57,931 million in 2020. This decrease was mainly the result of lower carry on trading securities, which in turn was mainly as a result of the decrease in nominal and real interest rates for all maturities, but particularly short-term maturities. Shifts in exchange rates followed the monetary actions taken by the Central Bank, which, among others, included a decrease in the monetary policy interest rate from 1.75% in December 2019 to 0.5% in March 2020. This effect was amplified by increased positions in the Central Bank’s short-term notes, carrying low interest rates, that we took in order to meet reserve requirements that arose as a consequence of the increase in our demand deposit balances. |
The previous factors were to some degree offset by:
| ● | An annual increase of 407.2%, or Ch$125,776 million, in income from foreign exchange transactions from Ch$30,886 million in 2019 to Ch$156,662 million in 2020. This increase was mainly due to higher results from foreign exchange adjustments of Ch$265,241 million associated with our on-balance foreign exchange liability exposure, primarily composed of long-term debt issued denominated in foreign currency. Our on-balance liability position benefited from end-of-period appreciation of 5.3% of the Chilean peso against the U.S. dollar in 2020, as compared to the depreciation of 8.4% in 2019. This increase was to some extent offset by: (i) a decrease of Ch$130,530 million in foreign exchange adjustment results on our off-balance foreign exchange net asset position in derivatives held for cash flow hedge accounting, which mirrored part of the on-balance foreign exchange liability exposure, as a result of the aforementioned trends in exchange rates, and (ii) a decrease of Ch$8,935 million in foreign exchange adjustment results from assets that are denominated in local currency, but adjusted by the effect of changes in foreign exchange (primarily leasing loans), as a result primarily to the same trends in exchange rates. |
| ● | An annual increase of 465.7%, or Ch$22,302 million in the sale of available for sale securities, from Ch$4,789 million in 2019 to Ch$27,091 million in 2020. This increase was primarily the consequence of the sharp decrease in local and foreign interest rates for all maturities, which translated into a significant increase in fair value adjustments of our portfolio of available for sale securities. As a result, we materialized those fair value gains by selling a significant part of our portfolio denominated in both local and foreign currency. |
Provisions for Expected Credit Losses
We recognize allowances to cover possible credit losses in accordance with IFRS as issued by the IASB. For statistical information with respect to our substandard loans and allowances for loan losses, see “Item 4. Information on the Company—Selected Statistical Information” and Note 11(c) to our audited consolidated financial statements as of and for the year ended December 31, 2021. According to regulations applicable to such periods, the amount of provisions charged to income in any period consists of net provisions for possible loan losses.
162
The following table sets forth information with respect to our provisions and allowances for expected credit losses and charge-offs for each of the years ended December 31, 2019, 2020 and 2021:
| For the Year Ended December 31, | % Increase (Decrease) | |||||||||||||||||||
| 2019 | 2020 | 2021 | 2019/2020 | 2020/2021 | ||||||||||||||||
| (in millions of Ch$, except percentages) | ||||||||||||||||||||
| IFRS: | ||||||||||||||||||||
| Provisions: | ||||||||||||||||||||
| Gross provisions for expected credit losses(1) | Ch$ | 379,576 | 588,865 | 89,579 | 55.1 | % | (84.8 | )% | ||||||||||||
| Total loan loss recoveries | 47,975 | 41,759 | 70,407 | (13.0 | ) | 68.6 | ||||||||||||||
| Net provisions for expected credit losses(1) | 331,601 | 547,106 | 19,172 | 65.0 | (96.5 | ) | ||||||||||||||
| Charge-offs: | ||||||||||||||||||||
| Total charge-offs | 313,200 | 332,978 | 241,221 | 6.3 | (27.6 | ) | ||||||||||||||
| Net charge-offs | 265,225 | 291,219 | 170,814 | 9.8 | (41.3 | ) | ||||||||||||||
| Other asset quality data: | ||||||||||||||||||||
| Total loans | Ch$ | 30,033,272 | Ch$ | 30,937,690 | Ch$ | 34,265,873 | 3.0 | % | 10.8 | % | ||||||||||
| Average Loans | 28,753,003 | 30,722,724 | 32,439,096 | 6.9 | 5.6 | |||||||||||||||
| Allowances for loan losses | Ch$ | 649,233 | Ch$ | 836,107 | Ch$ | 673,496 | 28.8 | % | (19.4 | )% | ||||||||||
| Allowances for expected credit losses as a percentage of total loans | 2.16 | 2.70 | 1.97 | — | — | |||||||||||||||
| Net provisions for expected credit losses as a percentage of average loans | 1.15 | % | 1.78 | % | 0.06 | % | — | — | ||||||||||||
| (1) | This amount includes provisions for due from banks, loans to customers, contingent loan risks and allowances for debt instruments at fair value through OCI. |
2020 and 2021. Our provisions for loans losses posted an annual decrease of 96.5%, or Ch$527,934 million, from Ch$547,106 million in 2020 to Ch$19,172 million in 2021. The annual decrease in credit risk expenses was primarily the result of:
| ● | A decline of Ch$398,529 million in gross provisions for expected credit losses, from an establishment of Ch$210,205 million in 2020 to a release of approximately Ch$188,324 million in 2021. Whereas the increase in provisions for 2020 was based on the prevailing economic environment prompted by the spread of the COVID-19, the allowance release in 2021 was explained by: |
| ○ | Improved economic dynamics given the lifting of most of mobility restrictions associated with the COVID-19 pandemic in 2021, which had a direct positive impact on both the financial condition of companies, as business activity returned to almost normal levels, and the improved risk profile of individuals based on decreasing unemployment. These macroeconomic trends coupled with non-recurrent events, such as the three pension fund withdrawals by individuals by the end of 2020 and throughout 2021, and the fiscal aid package deployed by the government to address the economic effects of the COVID-19 pandemic, all resulting in enhanced payment capacity of personal banking customers, which in turn resulted in a significant decline in delinquency for the industry as a whole and for us in particular. In fact, our delinquency rate decreased from 0.97% in 2020 to 0.85% in 2021. As a result, the economic, business and behavioral parameters contained in our forward-looking provisioning models were modified in order to reflect the revised outlook, which resulted in a risk allowance release of approximately Ch$162,018 million during 2021. |
| ○ | To a lesser extent, in order to accurately reflect the change in the economic outlook after the worst of the COVID-19 pandemic, we updated our provisioning models for both the individually-evaluated and the group-based evaluated portfolios. This resulted in an allowance release of approximately Ch$26,308 million in 2021. |
| ● | The change in allowances for expected credit losses coupled with lower charge-offs of Ch$91,767 million in 2021 when compared to 2020 and an increase of Ch$28,646 in recoveries within the same period, all in line with and improved economic and business environment and excess of liquidity within the economy that benefited payment behavior. |
Based on these drivers, our ratio of provisions for expected credit losses to average loans decreased from 1.78% in 2020 to 0.06% in 2021.
163
Regarding delinquency, many factors resulted in an overall improvement in past-due loans (loans 90 days or more past-due), which decreased Ch$9,901 million or 3.3%, from Ch$299,408 million in 2020 to Ch$289,507 million. Accordingly, and given the increase of the total loan book, the past-due ratio (90 days or more past-due loans over total loans) declined from 0.97% in 2020 0.85% in 2021. The annual decrease in past-due loans was caused by the combination of declines in both the retail and the wholesale banking segment. In wholesale banking, past-due loans decreased Ch$4,992 million in 2021 when compared to 2020, which was concentrated in commercial loans. This was mainly the consequence of improved business conditions for companies in 2021, when mobility restrictions began to be gradually lifted and commercial activity returned to almost normal levels, benefiting companies’ turnover and results. Accordingly, the past-due loans ratio for the wholesale banking segment decreased from 0.84% in 2020 to 0.51% in 2021. Likewise, in retail banking past-due loans decreased Ch$4,909 million in 2021 when compared to 2020. This decrease was principally related to a decline in past-due in consumer loans and to a lesser extent by lower past-due mortgage loans, which was partially offset by an increase in past-due loans granted to SMEs. The trend shown by individuals’ payment capacity had mainly to do with the excess of liquidity in the economy produced by the three consecutive pension fund withdrawals and the aid package deployed by the government to support individuals, which significantly increased disposable income by the end of 2020 but particularly throughout 2021. These factors positively impacted the payment behavior in both consumer and mortgage loans. Instead, the moderate increase in past-due loans of SMEs was primarily caused by lagged effects of COVID-19 on SMEs’ financial condition. Based on these effects, the past-due loans ratio of the retail banking segment decreased from 1.21% in 2020 to 1.12% in 2021. As mentioned above, various extraordinary factors benefiting the customers’ payment capacity, particularly the excess of liquidity among personal banking customers, contributed to this behavior in past-due loans. Nonetheless, we recognize this trend is expected to converge to medium-term average levels in the range of 1.1% to 1.3% for us, to the extent the above-average liquidity levels begin to dissipate.
2019 and 2020. Our provisions for loans losses recorded an annual increase of 65.0%, or Ch$215,505 million, from Ch$331,601 million in 2019 to Ch$547,106 million in 2020. The increase in credit risk expenses was mainly the result of the dynamics witnessed in the local banking system in 2020, mostly due to the effects of the COVID-19 pandemic on the credit risk profile of our customers. The main trends in credit risk can be summarized, as follows:
| ● | Higher provisions for expected credit losses of Ch$216,825 million associated with credit risk deterioration due to the economic downturn produced by: |
| ○ | The negative effect the COVID-19 pandemic had on economic activity and credit behavior of both individuals and corporate customers. Throughout the year, the effects on provisions for loan losses were mixed and evolved consistent with the path followed by the COVID-19 pandemic and mobility restrictions. Given massive lockdowns established since the end of the first quarter until part of the third quarter of 2020, many companies reduced their working hours, which almost immediately translated into cost cutting actions in personnel expenses, which in turn resulted in higher unemployment. Also, the sharp decrease in household spending significantly reduced companies’ liquidity, particularly in the case SMEs, for a period of approximately four to six months, which affected their financial condition. These trends and their effects on the outlook for the Chilean economy and the main macroeconomic variables we usually utilize as inputs in our Expected Credit Losses (ECL) and provisioning models led us to adjust our forecasting models for both Probabilities of Default and Loss Given Default in order to recognize more accurately and more sensitively the uncertainties generated by the COVID-19 pandemic and the expected impact over the coming quarters and years. The impact of these adjustments in ECL models resulted in higher provisions for loan losses of Ch$151,652 million before taxes. For more information, see Note 4 to our audited consolidated financial statements as of and for the year ended December 31, 2020 appearing elsewhere in this annual report. |
| ○ | Also, notwithstanding the positive trend in non-performing loans, the forward-looking approach required by IFRS 9 recognized the effect of the weakened and riskier environment on higher probabilities of default, either in a 12-month period or lifetime depending on the stage of the loan, which resulted in higher provisions for loan losses, associated with both our group-based and the individually-evaluated portfolios. |
| ● | An annual increase of approximately Ch$23,300 million in provisions for loan losses due to loan growth. Average balances of total loans recorded an increase of 6.9% in 2020 as compared to 2019. This annual growth, however, was primarily concentrated in low risk lending products, such as commercial loans (growing 10.0%) and residential mortgage loans (growing 7.7%) in 2020. Consumer loans, on the other hand, posted an annual decrease of 6.0% in average balances during 2020. As a result, most of the loan growth effects in provisions for loan losses had to do with growth in commercial loans in SMEs, as well as larger companies. |
164
These negative effects were partly offset by:
| ● | The positive effect of exchange rate shifts on provisions for loan losses. In 2020, the Chilean peso appreciated by approximately 5.3% against the U.S. dollar at year-end, as compared to the 8.4% depreciation experienced at year-end in 2019. The net change (appreciation) of 13.7% on a year-on-year basis of the Chilean peso against the U.S. dollar resulted in lower allowances for loan losses of Ch$16,500 million related to the loan portfolio denominated in U.S. dollar. |
| ● | A net annual decrease of Ch$8,120 million in impairment of financial instruments measured at fair value through other comprehensive income, primarily a result of lower probabilities of default, and also due to the sale of part of our portfolio of instruments measured at fair value through other comprehensive income in order to materialize marking-to-market gains associated with the decrease interest rates during 2020. |
Based on these drivers, our ratio of provisions for loan losses to average loans increased from 1.15% in 2019 to 1.78% in 2020.
Regarding delinquency, in spite of a more complex scenario in terms of credit risk and uncertainty regarding the economic outlook, our past-due loans (loans 90 days or more past-due) recorded a decrease of 28.5%, or Ch$119,360 million, from Ch$418,768 million in 2019 to Ch$299,408 million in 2020. Accordingly, our past-due ratio (90 days or more past-due loans over total loans) declined from 1.39% in 2019 to 0.97% in 2020. This annual decrease was primarily explained by the retail banking segment, which recorded a decline of approximately Ch$121,750 million, including decreases in all lending products, but particularly in consumer loans that contributed with approximately Ch$65,500 million of the decrease in 2020. The decrease in delinquency in retail banking was the result of combined factors including: (i) a high comparison base since, in 2019, non-performing loans increased significantly by the end of the year due to the social unrest that took place in Chile, which reduced and negatively affected the payment capacity of some borrowers as a consequence of the economic aftermaths of demonstrations and riots, and (ii) exogenous factors appearing in 2020 as a result of the COVID-19 pandemic associated with monetary and fiscal aid packages implemented in Chile that coupled with two consecutive withdrawals from pension funds by individuals (as approved by the Chilean Congress), a wide array of loan re-schedule programs set by most local banks and a program of government-backed loans for companies through local banks with special focus on SMEs, all of which resulted in increased liquidity and temporary improvement in the customers’ payment behavior. For that reason, the past-due loans ratio (90 days or more past-due loans) for retail banking decreased from 1.89% in 2019 to 1.21% in 2020. Past-due loans (90 days or more past-due loans) in the wholesale banking segment remained almost flat on an annual basis, reaching Ch$58,763 million in 2020 as compared to the Ch$56,372 million in 2019. In this case, delinquency levels produced by the 2019 social crisis did not recover in 2020. Although companies also received some support from banks, fiscal policies were principally oriented to SMEs. Accordingly, the sharp reduction in revenues and liquidity due to the COVID-19 pandemic more than offset these kinds of packages, which resulted in a moderate increase of Ch$2,391 million in past-due loans (90 days or more past-due loans) for the wholesale banking segment. Overall, the past-due loans ratio increased from 0.53% in 2019 to 0.84% in 2020.
ECL Sensitivity Analysis
The following analysis contains a quantitative sensitivity assessment of the ECLs in relation to the main macroeconomic assumptions included in the models used for that purpose. The ECLs reflect an unbiased probability-weighted loss for a certain range of future economic scenarios. We determine the ECLs based on three economic scenarios : (i) base case (60%), (ii) upside case (20%), and (iii) downside case (20%).
165
The sensitivity of our model to potential changes in projections for key macroeconomics variables (“MEVs”) is determined as monetary amounts representing one-time impacts on ECLs for Stages 1 and 2, which are broken down by the Retail and the Wholesale Banking Segments. However, since MEVs are highly correlated, complementary analysis is usually suggested to address this challenge. As a consequence, we provide two kinds of analyses:
| i) | A single-factor analysis, which measures the isolated impact of shocks for each MEVs on ECLs, and |
| ii) | A scenario-based analysis, which takes into consideration the cross-correlation of the MEVs to determine a combined impact on ECLs. |
The following table sets forth the MEV we use for the single-factor analysis and the changes applied to each of them. A change is measured as one standard deviation from the historical mean for each MEV, considering a three-year period:
| Macroeconomic Variable | Shift | |||
| Real Sector MEVs | ||||
| GDP Growth Rate (“GDP”) | 1.74 | % | ||
| Unemployment rate (“U”) | 0.54 | |||
| Financial and Monetary Sector MEVs | ||||
| Central Bank Interest Rate (“IR”) | 0.84 | |||
| Consumer Price Index (“CPI”) | 1.05 | |||
| U.S. Consumer Price Index (“US CPI”) | 0.92 | |||
| Exchange Rate (“FX”) | 5.27 | % | ||
The following table sets forth the one-time impact on the ECLs, considering isolated upward changes on each MEV. Positive figures represent higher in ECLs while negative figures represent lower ECLs:
ECL Impact Ch$ million (1) | ||||||||
| Macroeconomic Variable | Retail Banking Segment | Wholesale Banking Segment | ||||||
| (in millions of Ch$) | ||||||||
| Real Sector MEVs | Ch$ | 948 | Ch$ | (1,846 | ) | |||
| Financial and Monetary Sector MEVs | Ch$ | 5,997 | Ch$ | (31,204 | ) | |||
| (1) | Cross effects are not computed. |
Nevertheless, given the existing correlation between most of the MEV, the analysis of isolated impacts may not represent the real effect of macroeconomic changes on the ECLs. In order to address this challenge, we define a scenario-based analysis by establishing six possible scenarios for the MEVs, as follows:
Real Sector MEVs
| i) | Scenario 1: Change on GDP growth rate |
| ii) | Scenario 2: Change on Unemployment Rate |
Financial and Monetary Sector MEVs
| iii) | Scenario 3: Change on Central Bank Interest Rate |
| iv) | Scenario 4: Change on Consumer Price Index |
| v) | Scenario 5: Change on U.S. Consumer Price Index |
| vi) | Scenario 6: Change on U.S. Dollar |
166
For the scenario-based analysis one MEVs is changed and the rest of them are related to that change by multiplying it with a related factor.
| MEV Scenarios | ||||||||||||||||||||||||
| MEV Sensitivity to MEV Scenarios | 1 | 2 | 3 | 4 | 5 | 6 | ||||||||||||||||||
| (in percentage) | ||||||||||||||||||||||||
| Real Sector Variable | ||||||||||||||||||||||||
| GDP growth rate | 1.74 | % | (0.74 | )% | 0.18 | % | 0.22 | % | 0.29 | % | (0.28 | )% | ||||||||||||
| Unemployment rate | (0.29 | ) | 0.54 | (0.32 | ) | (0.13 | ) | (0.14 | ) | (0.07 | ) | |||||||||||||
| Financial and Monetary Sector Variable | ||||||||||||||||||||||||
| Central Bank Interest Rate | 0.12 | (0.55 | ) | 0.84 | 0.49 | 0.22 | 0.21 | |||||||||||||||||
| Consumer Price Index | 0.18 | (0.27 | ) | 0.59 | 1.05 | 0.27 | 0.31 | |||||||||||||||||
| U.S Consumer Price Index (1) | 0.00 | 0.00 | 0.00 | 0.00 | 0.92 | 0.00 | ||||||||||||||||||
| Exchange rate | (1.14 | )% | (0.74 | )% | 1.24 | % | 1.53 | % | (2.36 | )% | 5.27 | % | ||||||||||||
| (1) | U.S. inflation is forced to be zero because there is no real impact of local MEVs on the U.S. Price Index variation. |
As depicted by the table above, MEVs scenarios show correlations between most of them. For instance, in the Scenario 4, a strong upward change in inflation leads to a strong increase in Central Bank’s monetary policy interest rate, which is the opposite of Scenario 2, where an increase in unemployment should lead to a decrease in the monetary policy interest rate. In addition, the Scenario 1 associated with positive GDP growth produces less unemployment.
The following table sets forth the combined impact of changes in all MEVs for each scenario on our ECLs (Positive figures represent higher ECLs while negative figures represent lower ECLs):
| Range of MEV Scenarios Impact on the ECL | ||||
| Macroeconomic Variable | Retail Banking Segment | Wholesale Banking Segment | ||
| (in millions of Ch$) | ||||
| Real Sector Scenarios | Ch$ (1,176) – (366) | Ch$ (3,311) – 3,663 | ||
| Financial and Monetary Sector Scenarios | Ch$ 2,103 – 3,868 | Ch$ (4,301) – (21,331) | ||
It is important to note that no lags of MEVs are taken into consideration when setting the ECL models. As the main portion of our portfolio is allocated to Stage 1, lagging MEVs might reduce the sensitivity of the ECLs to them, since the ECLs are calculated for a 12-month horizon.
Operating Expenses
The following table sets forth information regarding our operating expenses for the years ended December 31, 2019, 2020 and 2021:
| For the Year Ended December 31, | % Increase (Decrease) | |||||||||||||||||||
| 2019 | 2020 | 2021 | 2019/2020 | 2020/2021 | ||||||||||||||||
| (in millions of Ch$, except percentages) | % | |||||||||||||||||||
| IFRS: | ||||||||||||||||||||
| Personnel expenses | Ch$ | 475,59 | Ch$ | 457,176 | Ch$ | 450,952 | (3.9 | )% | (1.4 | )% | ||||||||||
| Administrative expenses: | ||||||||||||||||||||
| Advertising | 27,808 | 23,561 | 30,652 | (15.3 | ) | 30.1 | ||||||||||||||
| Building maintenance | 50,297 | 48,218 | 42,106 | (4.1 | ) | (12.7 | ) | |||||||||||||
| Rentals and insurance | 14,449 | 15,686 | 14,516 | 8.6 | (7.5 | ) | ||||||||||||||
| Office supplies | 9,366 | 11,094 | 8,093 | 18.4 | (27.1 | ) | ||||||||||||||
| Other expenses | 227,785 | 220,322 | 229,258 | (3.3 | ) | 4.1 | ||||||||||||||
| Total administrative expenses | 329,705 | 318,881 | 324,625 | (3.3 | ) | 1.8 | ||||||||||||||
| Depreciation and amortization | 70,541 | 73,357 | 76,798 | 4.0 | 4.7 | |||||||||||||||
| Impairments | 2,555 | 1,661 | 1,690 | (35.0 | ) | 1.7 | ||||||||||||||
| Other operating expenses | 23,850 | 26,677 | 30,355 | 11.9 | 13.8 | |||||||||||||||
| Total | Ch$ | 902,250 | Ch$ | 877,752 | Ch$ | 884,420 | (2.7 | )% | 0.8 | % | ||||||||||
167
2020 and 2021. Our total operating expenses increased 0.8% or Ch$6,668 million on an annual basis from Ch$877,752 million in 2020 to 884,420 million in 2021. The annual change in operating expenses was mainly attributable to:
| ● | An annual increase of 1.8%, or Ch$5,744 million, in administrative expenses, from Ch$318,881 million in 2020 to Ch$324,625 million in 2021. The main drivers explaining this annual increase were as follows: (i) an annual increase of 9.3% or Ch$9,263 million in IT and communication expenses mostly due to the implementation of both our digital transformation strategy and efficiency initiatives in order to enhance and adapt capabilities across the corporation, as well as cybersecurity related expenses in order to provide us with improved infrastructure, protocols and tools to ensure an industry-leading customer experience in times of increasing demand for remote settings and services, (ii) higher advertising and marketing expenses of nearly Ch$7,091 million or 30.1% on an annual basis, highly associated with our efforts to reinforce our brand value and appreciation among customers and non-customers while boosting new product and services, such as our FAN account, as well as ESG actions including media exposure to promote the Teleton fundraising campaign and initiatives related to entrepreneurship and women support, (iii) an annual increase of Ch$3,624 million or 24.7% in external advisory expenses related to the identification of efficiency opportunities across all of our businesses and support processes while designing action plans to overcome them in the short-term, (iv) higher taxes and contributions expenses by Ch$2,510 million or 14.3% on an annual basis due to a low comparison base as a result of the temporary exemption on the payment of credit cards stamp and seal taxes (between April and September of 2020) due to the impact of the COVID-19 pandemic, and (v) an annual increase in security and cash vault services of Ch$2,442 million or 22.6% explained by both the temporary effect of higher cash needs in the context of pension fund withdrawals and direct money transfers to individuals and a low comparison base given the subdued commercial activity in 2020 when mobility restrictions were fully in place and only a portion of our branch network was fully operating, behavior that was normalized during 2021 due to the reactivation of the economy. These factors were partially offset by: (i) an annual decline of approximately Ch$8,083 million or 19.5% in outsourced services, which was mainly related to the deployment of efficiency initiatives such as the internalization of credit pre-evaluation services, (ii) lower fixed-asset maintenance expenses of Ch$6,112 million or 12.7%, mostly due to higher expenses in 2020 related to repairs made as a consequence of the social upheaval that occurred in Chile in October 2019, services incurred in order to deal with the impact of the COVID-19 pandemic and the first steps of the implementation of our dual branch network in the context of our new service model, (iii) an annual contraction of Ch$3,001 million or 27.1% in office supplies expenses as a result of the non-recurring effect of higher expenses in sanitation materials recorded in 2020 due to increased local and international prices amid the worst effects of the COVID-19 pandemic, and (iv) lower costs in energy, heating and other services by Ch$1,111 or 20.0% on an annual basis, explained by our focus on sustainability, which allowed us to reduce our total energy consumption. |
| ● | An annual increase of 13.8%, or Ch$3,678 million, in other operating expenses on an annual basis, which was principally explained by higher operational write-offs in 2021, which was to some extent offset by lower expenses associated with assets received in lieu of payment. |
| ● | An annual increase of 4.7%, or Ch$3,441 million, in depreciation and amortization of intangible assets, from Ch$73,357 million in 2020 to Ch$76,798 million in 2021. This figure was related to the implementation of diverse IT projects related to cybersecurity and our digital transformation strategy that led to higher software amortization, which coupled with temporary effects related to modifications in rental agreements in 2020 prompted by the sanitary contingency and the social unrest that kept unused several ATMs across the country. |
The increase in operating expenses was partially offset by an annual decrease of approximately Ch$6,224 million or 1.4% in personnel expenses from Ch$457,176 million in 2020 to Ch$450,952 million in 2021, mainly due to: (i) an annual decline of Ch$6,772 million, or 29.5%, in severance payments, principally associated with higher charges made at the end of 2020 in order to address upcoming organizational changes in order to pursue higher operating efficiency, aligned with an annual contraction of 6.5% in headcount as of December 31, 2021, and (ii) other benefits decreasing Ch$4,942 million, aligned with the annual decrease in headcount. The decrease in personnel expenses was in turn partially offset by: (i) an annual increase of Ch$3,015 million or 1.2% in salaries, mostly associated with the recognition of higher inflation in salaries despite the steady decrease in headcount mentioned above, and (ii) bonuses and other compensation expenses increasing Ch$2,252 million in 2021, mostly related to higher bonuses for a total amount of Ch$10,768 million in 2021 when compared to 2020, mostly associated with a special bonus granted to our staff in September 2021 to recognize the effort and commitment of our employees in these difficult times and higher provisions for performance bonuses, due to the upsurge in commercial activity in 2021. The increase in salaries and other compensation were also in turn partially offset by an annual decrease of Ch$6,311 million associated with the negotiation of collective bargaining processes, and an annual decrease of Ch$1,748 million in bonuses and variable compensation mostly due to a lower headcount.
168
2019 and 2020. Our total operating expenses decreased by approximately 2.7% or Ch$24,498 million on an annual basis from Ch$902,250 million in 2019 to Ch$877,752 million in 2020. The annual decrease in operating expenses was primarily explained by:
| ● | An annual decrease of 3.9%, or Ch$18,423 million, in personnel expenses from Ch$475,599 million in 2019 to Ch$457,176 million in 2020, mainly due to: (i) an annual decline of Ch$12,354 million in bonuses and other benefits to the staff, mainly related to a decline in business activity during 2020, including lower loan origination and a decrease in financial performance bonuses, and (ii) lower severance payments of Ch$12,106 million in 2020 as compared to 2019, largely explained by the organizational restructuring we started by the end of 2019. These effects were to some extent offset by a slight increase of approximately 1.6%, or Ch$4,033 million, in salaries, which reflects the effect of inflation recognition on salaries (3.0%), which was partially offset by the annual decrease in headcount following our efficiency program. |
| ● | An annual decrease of 3.3%, or Ch$10,824 million, in administrative expenses, from Ch$329,705 million in 2019 to Ch$318,881 million in 2020. The main drivers explaining this annual decrease were as follows: (i) an annual decrease of Ch$8,235 million in outsourced services, primarily attributable to the internalization of core IT developments and sales services aimed at improving our productivity and efficiency, (ii) lower expenses in external advisory of Ch$6,450 million in 2020, as compared to 2019, mainly explained by a high comparison base as in 2019 we deployed the first steps of our efficiency program and also the development of a new service model for branches, (iii) an annual decrease of Ch$4,247 million in advertising and marketing expenses due to cost effective campaigns implemented in 2020, and also the decline in business activity because of the COVID-19 pandemic, and (iv) lower expenses associated with fixed-assets maintenance and repairs by Ch$4,979 million in 2020 as compared to 2019, principally explained by a high comparison base since, in 2019, we faced the repair of many branches and ATMs as a result of the social unrest that occurred in Chile in October 2019. These factors were partly offset by: (i) higher costs related to IT developments addressed internally during 2020 by Ch$7,500 million, such as the launch of our new FAN account, improvements to customers’ websites, mobile apps and the development of certain cybersecurity projects, and (ii) the effect of higher expenses by Ch$6,400 million linked to sanitization protocols and materials needed for safe on-site operation of branches and headquarters during the COVID-19 pandemic. |
These factors were partly offset by an annual increase of approximately 11.9% or Ch$2,827 million in other operating expenses, mainly explained by lower expenses associated with assets received in lieu of payment.
Income Tax
The Chilean tax system contains differences in the tax treatment for monetary correction (effect of inflation on equity), as well as provisions on individual loans and for charge-offs related to past-due loans, all of which has an impact on our effective tax rate through deferred taxes. Also, until 2014 all real estate taxes paid on properties that are leased to customers were deductible from our taxable income as a tax credit. However, in light of the tax reform approved in 2014, for the year ended December 31, 2015 only 50% of these taxes can be deducted from our taxable income. Since 2016, no tax credits have been allowed from taxes paid on leased properties, with the exception of properties used in agricultural activities. For more information, see “Item 10. Additional Information—Taxation—Chilean Tax Considerations—Tax Reform Law No. 20,780.”
In September 2014, the Chilean Congress approved a law reforming the Chilean tax system. This tax reform (Law No. 20,780) gradually increases the first category tax or corporate tax rate between 2014 and 2018 while establishing two alternative tax regimes from 2017 onwards: (i) the Semi-Integrated Regime and (ii) the Attribution Regime. The tax reform increases the statutory corporate tax rate from 20.0% in 2013 to 21.0% in 2014, 22.5% in 2015 and 24.0% in 2016. From 2017 onwards, the statutory corporate tax rate will depend on the tax regime chosen by the owners of the taxpayer (the company). If the Semi-Integrated Regime is selected, the company will be subject to a statutory corporate tax rate of 25.5% in 2017 and 27.0% from 2018 onwards. If, instead, the Attribution Regime is selected, the company will be subject to a statutory corporate tax rate of 25.0% from 2017 onwards. Notwithstanding the above, in February 2016, a new tax law was enacted (Law No. 20,899), which subjects publicly-traded companies only to the Semi-Integrated Regime. Accordingly, the statutory corporate tax rate for Banco de Chile was 25.5% in 2017 and will be 27.0% from 2018 onwards.
169
On August 23, 2018 the Chilean Government presented a bill intended to modernize the Chilean tax system. The proposed bill considers a return to the integrated system by permitting that 100% of the income tax borne by corporations be used as a tax credit by the final taxpayer (individuals). In addition, the bill incorporates a series of modifications to the tax system, including, among others: (i) the establishment of a new taxation regime levied on services rendered digitally, which will be subject to a 10% rate, where banks and credit card issuers will be in charge of withholding and paying the collected tax income from users of these digital services, (ii) the introduction of some tax benefits for SMEs, such as instantaneous depreciation of assets and reduced tax rates while simplifying the annual income tax return process for SMEs, (iii) the simplification of requisites to recognize expenses that may be deducted from the taxable income, (iv) an update to the Chilean Internal Revenue Service procedures intended to reduce terms while limiting exclusive powers of the Chilean Internal Revenue Service Director, and (v) the creation of a Taxpayer Protection & Advisory agency, which pursues to be a counterpoint to the Chilean Internal Revenue Service on taxation matters such as interpretation of tax regulation while assisting taxpayers on overall taxation matters.
Following the social crisis that took place in Chile in the fourth quarter of 2019, the Chilean Government reformulated the proposed bill, which at that point had not been approved by the Chilean Congress yet, in order to address new social demands by means of increasing tax collection, while giving up certain elements with the purpose of achieving an agreement. Thus, Law No. 21,210 was passed by the Chilean Congress on January 29, 2020 and enacted by the Chilean Government on February 24, 2020, to modernize the local tax system. The law mainly focused on: (i) promoting entrepreneurship measures by providing SMEs with a special tax regime based on total integration and a statutory tax rate of 25%, as opposed to large companies and corporations whom will continue to be subject to a semi-integrated system, while bearing a statutory corporate tax rate of 27%, (ii) implementing initiatives to promote private investment by introducing instantaneous or accelerated depreciation for fixed-assets, reducing the timeframe to receive reimbursements of VAT paid on fixed-assets, while reducing or eliminating property taxes paid by elderly people, (iii) increasing taxes paid by high-income individuals by means of adding a new tax bracket of 40%, (iv) raising taxes on properties exceeding U.S.$500,000 in assessed value, (v) incorporating a regional green tax of 1% levied on investment projects exceeding U.S.$10 million in capital expenditures that were subject to environmental approval, (vi) lowering tax benefits on capital gains obtained in stock markets, (vii) creating a Taxpayer Protection & Advisory Agency, which aims to be a counterpoint to the Chilean Internal Revenue Service on taxation matters, and (viii) introducing a digital approach, which considers both the compulsory use of electronic bill and invoices, aimed at reducing tax evasion, and the imposition of VAT on digital services rendered from foreign countries. This law did not represent a significant change for us in terms of a statutory corporate tax rate of 27%, or the semi-integrated system that currently applies to us. Nonetheless, it requires us to withhold the VAT levied on digital services paid through our credit or debit cards, which translates into additional IT and processing costs.
In February 2022, Law No. 21,420 was enacted with the purpose of reducing or removing diverse tax exemptions by introducing the following measures: (i) the extension of VAT to any service that was not formerly exempt for services provided after January 1, 2023, (ii) the establishment of the same treatment for financial and tax purposes for financial leasing agreements entered into on or after January 1, 2023, (iii) a 10% tax on capital gains produced by the sale of actively traded stocks (under definitions established by the Chilean Internal Revenue Service (“Chilean IRS”)) for sales performed on or after September 1, 2022, which will not apply to local or foreign institutional investors, (iv) an inheritance tax on profits from life insurance contracts agreed on or after February 4, 2022, (v) an increase in the wealth tax on real estate from 0.275% to 0.425% starting January 1, 2023, (vi) the elimination of the special VAT credit for construction companies targeting middle income homes starting January 1, 2025, (vii) the establishment of a 2.0% annual tax on luxury goods such as airplanes, helicopters, yachts and luxury vehicles, (viii) the reduction of tax benefits on middle income housing, namely, DFL No. 2 of 1959, by limiting the benefit to individuals only and for a maximum of two homes, regardless of the purchase date, starting January 1, 2023, (ix) the elimination of the tax credit on the purchase of fixed assets for large companies and (x) the increase of mining patents’ value.
170
These changes could have a direct or indirect effect on our operations to an extent that is currently difficult to predict, although we do not expect a material impact on our results of operations or financial condition. For more information, see “Item 3. Key Information—Risk Factors—Risks Relating to our Operations and the Chilean Banking Industry—Restrictions imposed by regulations may constrain our operations and thereby adversely affect our financial condition and results of operations”. “Item 4. Regulation and Supervision—Amendments to the Reform that Modified the Chilean Tax System” and “Item 10. Additional Information—Taxation—Chilean Tax Considerations.”
2020 and 2021. Our income tax expense was Ch$275,969 million in 2021, which represented an annual increase of 167.4%, or Ch$172,746 million, from the Ch$103,223 million recorded in 2020. Despite this increase in income tax, the effective tax rate only increased from 20.5% in 2020 to 20.7% in 2021. The income tax increase was primarily the result of: (i) an annual increase in income before income taxes by Ch$827,433 million in 2021 when compared to 2020, mostly due to changes in provisioning models that led to a decrease in provisions for expected credit losses, higher inflation that benefited net interest income and a low comparison base in 2020 due to the effects of the COVID-19 pandemic on our business, effects that jointly represented an annual increase of Ch$223,407 million in income tax when considering the statutory corporate tax rate of 27.0%. This factor was partly offset by an annual increase of Ch$44,392 million in other deductions related to the effect of inflation revaluation on equity accounts, which provides an income tax benefit that is deductible from taxable income under Chilean tax laws.
2019 and 2020. Our income tax expense was Ch$103,223 million in 2020, which represented an annual decrease of 40.6%, or $70,438 million, from the Ch$$173,661 million recorded in 2019. Based on this result, the effective tax rate decreased from 22.3% in 2019 to 20.5% in 2020. The income tax decrease was mainly explained by an annual decrease in income before income taxes by Ch$272,553 million or 35.1% in 2020 as compared to 2019, given the lower business activity due to the impact of COVID-19 on almost all business segments, which translated into Ch$73,591 million in income tax at the statutory corporate tax rate of 27.0%. This factor was to some extent offset by an increase in other tax charges by Ch$2,736 million, mainly associated with higher non-tax deductible expenses in 2020.
Business Segments
To the extent that it is available and because we believe it is useful in analyzing our results, we have included information on a consolidated basis by business segments, disclosed under our internal reporting policies. A summary of differences between IFRS and our internal reporting policies is presented under “Item 5. Operating and Financial Review and Prospects—Operating Results—Summary of Differences between Internal Reporting Policies and IFRS.”
For management purposes, we have organized our operations and commercial strategies into four business segments, which are defined according to the type of products and services offered to target customers. These business segments are:
Retail Banking: This segment is focused on individuals and small and medium-sized companies whose annual sales do not exceed Ch$2,200 million (or UF 70,000). The segment’s value proposition is primarily focused on consumer loans, commercial loans, current accounts, credit cards, credit lines and residential mortgage loans.
Wholesale Banking: This segment is focused on corporate clients and large companies whose annual sales exceed approximately Ch$2,200 million (or UF 70,000). This segment offers products and services focused on commercial loans, current accounts, cash management services, debt instruments, foreign trade, derivative contracts and leases, as well as corporate finance transactions.
Treasury and Money Market: The revenue generated by this segment relates to the management of our liquidity and net positions subject to market risks. This segment also includes the results of our securities portfolio, our derivatives positions and currency trading.
171
Operations through subsidiaries: This segment includes all companies controlled by us whose results are obtained individually by the respective company. As of December 31, 2021, this business segment consisted of:
| ● | Banchile Administradora General de Fondos S.A.; |
| ● | Banchile Asesoría Financiera S.A.; |
| ● | Banchile Corredores de Seguros Ltda.; |
| ● | Banchile Corredores de Bolsa S.A.; |
| ● | Banchile Securitizadora S.A.; and |
| ● | Socofin S.A. |
On February 4, 2021, we began a voluntary and anticipated dissolution process for Banchile Securitizadora S.A. as approved by the subsidiary’s shareholders during the extraordinary meeting held on the same date. The dissolution was approved by the CMF and the process of liquidation is still in progress.
The accounting policies described in the summary of accounting principles in “Item 5. Operating and Financial Review and Prospects—Operating Results—Critical Accounting Policies” apply to all business segments. Matters such as the evaluation of segment performance and decision-making processes regarding goals and allocation of resources for each segment are based on a cost-benefit analysis and are aligned with our overall strategic goals.
In order to measure each segment’s financial performance, we use a business segment-based profitability system, which allows us to obtain information for each business segment relative to income, balances, revenues and expenses, among other indicators. This system has been internally developed in order to serve our specific requirements and we continuously work to improve it. In addition, business segment information is subject to general internal auditing procedures to ensure its integrity and usefulness for management decision-making.
The financial information used to measure the performance of our business segments is not necessarily comparable with similar information from other financial institutions because it is based on our internal reporting policies. The accounting policies used to prepare our operating segment information are similar to those described in Note 2(ab) to our audited consolidated financial statements as of and for the year ended December 31, 2021 appearing elsewhere in this annual report, except as noted below:
| ● | The net interest margin of loans and deposits is measured on an individual transaction basis, due to the difference between the effective individual transaction rate and our related fund transfer price in terms of maturity, re-pricing and currency. |
| ● | The results associated with gap management (interest rate and currency mismatches) are allocated to the business segments in proportion to the loans and demand deposits managed by each segment. |
| ● | For purposes of allocating the effect of funding through capital and reserves, the internal performance profitability system considers capital allocation in each segment in accordance with Basel guidelines. |
| ● | In addition to direct costs (consisting mainly of labor and administrative expenses of the business segments), we allocate all of our direct and indirect operating costs of back office and support units to each business segment by utilizing the most relevant business driver to assign such costs to a specific segment. |
| ● | We apply Chilean GAAP, as required by the CMF, when measuring and recording allowances for loan losses, assets received in lieu of payments, minimum dividend allowances and other minor items for internal reporting purposes. These accounting principles differ in certain respects from IFRS. A description of these differences is presented below under “Item 5. Operating and Financial Review and Prospects—Operating Results—Summary of Differences between Internal Reporting Policies and IFRS.” |
172
Net Income by Business Segment
The following table sets forth income before income tax by business segment in accordance with our internal reporting policies for each of the years ended December 31, 2019, 2020 and 2021:
| For the Year Ended December 31, | % Increase (Decrease) | |||||||||||||||||||
| 2019 | 2020 | 2021 | 2019/2020 | 2020/2021 | ||||||||||||||||
| (in millions of Ch$, except percentages) | ||||||||||||||||||||
| BANK’S INTERNAL REPORTING POLICIES: | ||||||||||||||||||||
| Retail banking | Ch$ | 351,086 | Ch$ | 272,700 | Ch$ | 492,043 | (22.3 | )% | 80.4 | % | ||||||||||
| Wholesale banking | 306,374 | 185,142 | 345,244 | (39.6 | ) | 86.5 | ||||||||||||||
| Treasury and Money Market | 22,539 | 65,795 | 52,854 | 191.9 | (19.7 | ) | ||||||||||||||
| Subsidiaries | 82,693 | 65,434 | 81,332 | (20.9 | ) | 24.3 | ||||||||||||||
| Other | — | — | — | — | — | |||||||||||||||
| Income before Income tax | Ch$ | 762,692 | Ch$ | 589,071 | Ch$ | 971,473 | (22.8 | )% | 64.9 | % | ||||||||||
Retail Banking
2020 and 2021. Our retail banking segment recorded income before income tax of Ch$492,043 million in 2021, which represented an annual increase of 80.4% or approximately Ch$219,343 million when compared to the Ch$272,700 million recorded in 2020.
This annual increase in income before income tax was mainly the consequence of:
| ● | An annual increase of Ch$144,116 million or 15.3% in net interest income as compared to 2020, primarily as a result of: (i) a higher contribution of the portion of our UF net asset exposure that is partly attributable to this segment, driven by both an annual increase in inflation as represented by a UF variation of 2.79% in 2020 that increased to 6.61% in 2021, and a larger inflation-indexed exposure, and (ii) higher contribution of demand deposit accounts managed by this segment as a consequence of average balances that increased by 42.9% on an annual basis. These effects were to some extent offset by: (i) lower income from loans by approximately Ch$33,900 million, due primarily to lower income from consumer loans due to weakened demand for this kind of credit in the context of above average levels of liquidity among personal banking customers in light of the fiscal policies to deal with the pandemic that resulted in direct transfers and pension fund withdrawals. |
| ● | An annual decrease of Ch$66,623 million or 20.4% in provisions for loan losses in 2021 as compared to 2020. The positive performance in terms of credit risk was largely attributable to a significant improvement in asset quality, at an industry level, that was mainly attributable to the above average liquidity among personal banking customers that translated into a temporary improved payment capacity and a transitory decrease in non-performing loans. This effect resulted in lower provisioning as asset quality is a key driver when establishing allowances for loan losses. In addition, the temporary positive trend in asset quality more than offset the impact of higher additional allowances by Ch$113,000 million on an annual basis, for this segment, to anticipate potential second-round effects of the pandemic on customers’ continued payment capacity. |
| ● | An annual increase of Ch$14,256 million or 537.6% in net financial operating and foreign exchange transactions in 2021 when compared to 2020, which was mainly due to the positive effect of exchange rate changes on the U.S.$-indexed asset position to hedge the impact on U.S.$-indexed expenses, given the 19.8% depreciation of the Chilean peso in 2021 as compared to 5.3% appreciation in 2020. |
The increase in income before income tax was partially offset by lower income from fees and commissions of Ch$14,868 million or 5.6% on an annual basis, mainly as a result of lower fee income from insurance brokerage, primarily driven by the non-recurrent base of effect associated with the upfront fee received from the alliance with an international insurer that was mainly recognized in 2019 and 2020 and was not present in 2021. This effect was to some extent offset by the recovery of fee income related to transactional services such as credit cards, debit cards and checking account supported by improved economic dynamism, particularly linked to household consumption.
173
2019 and 2020. Our retail banking segment recorded income before income tax of Ch$272,700 million in 2020, which represented an annual decrease of 22.3% or Ch$78,386 million when compared to the Ch$351,086 million recorded in 2019.
This annual decrease was primarily caused by an annual decrease in operating revenues of 7.1%, or Ch$94,272 million, which in turn was explained by:
| ● | An annual decrease of approximately 9.0% or Ch$64,120 million in income from loans, largely attributable to the sharp decrease of 6.4% in average balances of consumer loans explaining approximately 80%, or nearly Ch$51,500 million, of the overall decrease in income from loans. The decrease in consumer loans was primarily the consequence of the business dynamics fostered by the COVID-19 pandemic, which translated into an economic downturn, increased unemployment and customers’ deteriorated payment capacity, all of which resulted in a weakened demand for loans and more restrictive credit conditions on lending, across the industry. In addition, income from residential mortgage loans decreased by approximately Ch$15,500 million or 10.8% on an annual basis, mostly due to lending spreads that converged to normal levels from the ones seen in 2019, which more than offset an 8.0% increase in average mortgage loan balances managed by the segment. |
| ● | An annual decrease of approximately 14.3%, or Ch$21,200 million, in income demand deposits managed by the segment. This annual decrease was mainly the result of the local and global economic downturn caused by COVID-19, which led central banks to take a dovish monetary approach that translated into a sharp decrease in reference interest rates to historical lows of 0.5%, in the case of Chile, and 0.25%, in the case of the United States. Long-term interest rates also followed this trend, while reflecting the weakened economic outlook ahead. The effect of lower interest rates was to some extent offset by a significant annual increase of 41.1% in average demand deposit balances. |
| ● | An annual decrease of 1.1%, or Ch$3,007 million, in fees and commissions income. Our commissions fee-based income was negatively impacted by the sharp decrease in transactionality a result of the lockdowns and mobility restrictions imposed due to the COVID-19 pandemic. However, this was partially offset by the positive effect of approximately Ch$28,600 million in higher fees received from our partnership with Chubb Limited for life and non-life insurance business associated with the annual accrual of the upfront fee received as a result of the distribution and brokerage agreement. |
The annual decrease in operating revenues was partially offset by:
| ● | An annual decrease of 3.2%, or Ch$20,405 million, in operating expenses, largely attributable to lower personnel expenses of approximately Ch$23,600 million on an annual basis, which in turn was supported by: (i) lower severance payments as a consequence of a high comparison base associated with the organizational restructuring process started in 2019, (ii) salaries increasing below inflation as a result of lower headcount, and (iii) a decrease in bonuses and benefits in line with a deteriorated financial performance produced by the weakened economic backdrop and due to a high comparison base in light of the special bonus granted to the staff in 2019 in recognition of their commitment during the social unrest in Chile in October 2019. |
| ● | An annual decrease in provisions for loan losses of 2.1%, or Ch$6,981 million, in 2020 as compared to 2019. In spite of increasing provisions during the peak of the COVID-19 pandemic, a combination of several effects resulted in a net annual decrease in provisions for loan losses for the segment. Factors producing a decrease in provisions for loan losses were: (i) a high comparison base as a result of further provisioning in 2019 due to the social unrest that translated into a non-recurrent hike in total past-due loans (loans past-due by more than 90 days) and, accordingly, higher provisions, as well as the effect observed by the end of 2020 in total past-due loans (loans past-due by more than 90 days) that decreased significantly as a result of the one-time effect of increasing disposable income among customers due to factors such as the two withdrawals from pension funds authorized by the Chilean Congress and additional income generated by fiscal aid packages, and (ii) the annual decrease in consumer loans balances by approximately 6.0%. These effects were partly offset by: (i) a one-time impact of Ch$71,000 million in higher loan loss provisions associated with the recalibration of probabilities of default for our provisioning models for the group-based evaluated portfolios, in order to properly reflect the deteriorated economic environment as a consequence of the COVID-19 pandemic, and (ii) further deterioration linked to the effects of the COVID-19 pandemic on certain lending products. |
174
Wholesale Banking
2020 and 2021. Our wholesale banking segment recorded an 86.5%, or Ch$160,102 million, annual increase in income before tax, from Ch$185,142 million in 2020 to Ch$345,244 million in 2021.
This annual increase was mainly attributable to:
| ● | An annual increase of Ch$101,493, or 26.9%, in net interest income, which was mainly the result of: (i) a higher contribution of the portion of our UF net asset exposure that is attributable to this segment, driven by both an annual increase in inflation as represented by a UF variation of 2.79% in 2020 that increased to 6.61% in 2021, and a larger inflation-indexed exposure, and (ii) higher income from loans by approximately Ch$9,570 million (including loans and contingent loans), which was primarily the result of a 4.3% increase in average loan balances and stable lending spreads in 2021 when compared to 2020. These factors were partly offset by a decrease of approximately Ch$10,770 million, or 11.8%, in the contribution of demand deposits managed by this segment to our cost of funds, primarily as a consequence of lower interest rates. |
| ● | An annual increase of Ch$32,698 million, or 93.5%, in net financial operating and foreign exchange transactions in 2021 when compared to 2020, which was the result of: (i) the positive effect of exchange rate changes on the U.S.$-indexed asset position to hedge the impact on U.S.$-indexed expenses, principally credit risk expenses associated with U.S.$-denominated loans managed by this segment, given the 19.8% depreciation of the Chilean peso in 2021 as compared to the 5.3% appreciation in 2020, and (ii) higher results associated with foreign exchange spot/forward transactions and derivatives transactions carried out by wholesale customers in a context of high market volatility in order to manage exposure to market risks. |
| ● | An annual decrease of Ch$22,149 million, or 16.2%, in provisions for loan losses in 2021 when compared to 2020, mainly due to improved payment capacity of wholesale customers in light of recovered dynamism produced by the gradual lifting of mobility restrictions that reactivated many economic sectors, particularly those that strongly depend on social interaction, all of which translated into lower provisioning for individually-evaluated wholesale customers. These factors enabled us to more than offset: (i) the impact of unfavorable trends in exchange rate for provisioning of U.S.$-denominated loans managed by the segment, given the trends followed by exchange rate mentioned above, and (ii) higher additional allowances by Ch$113,000 million set in 2021 when compared to 2020 in order to anticipate potential lagged effects of the pandemic in payment behavior, which is partly allocated to this segment. |
| ● | An annual increase of Ch$6,072 million, or 10.9%, in income from fees and commissions in 2021 when compared to 2020, mainly associated with enhanced lending, trade finance and cash management activity, in line with better economic conditions and reactivation of commercial activity. |
The annual increase in wholesale banking income before tax was partly offset by a moderate increase in other operating expenses of Ch$2,781 million or 1.7% in 2021 as compared to 2020, mainly associated with the negative effect of the 19.8% depreciation of the Chilean peso in 2021 when compared to a 5.3% appreciation of the Chilean peso in 2020 on the provisioning of cross border loans denominated in foreign currency.
175
2019 and 2020. Our wholesale banking segment recorded a 39.6%, or Ch$121,232 million, annual decrease in income before income tax, from Ch$306,374 million in 2019 to Ch$185,142 million in 2020.
This decrease was mainly due to the impact of COVID-19 on business dynamics, particularly in terms of credit risk, which resulted in a significant annual increase of Ch$122,073 million in loan loss provisions. The increase in credit risk expansion was mainly due to:
| ● | Ch$42,000 in additional allowances set in 2020 as compared to no allowances established in 2019, mainly as a consequence of expected deterioration in the credit condition of certain economic sectors that could affect part of our individually-evaluated loan portfolio (large companies and corporations) amid an uncertain economic outlook given potential risks related to the evolution of the COVID-19 pandemic. |
| ● | Higher provisions for loan losses associated with specific wholesale customers, mainly as a result of uncertainty regarding potential negative impacts on their financial condition and payment capacity due to the effect of the COVID-19 pandemic on their income generating capacity and long-term sustainability. |
| ● | These effects were partly counterbalanced by a positive exchange rate effect of approximately Ch$15,000 million on an annual basis, which was associated with the year-end appreciation of 5.3% of the Chilean peso against the U.S. -dollar in 2020 as compared to a year-end depreciation of 8.4% of the Chilean peso against the U.S. dollar in 2019. These opposite trends resulted in a positive impact on loan loss allowances linked to U.S.-denominated loans. |
The negative impact of provisions for loan losses was partly offset by an increase of Ch$2,793 million in operating revenues, mainly explained by higher net interest income as a result of higher income from loans fostered by the loan portfolio expansion, to some extent explained by FOGAPE loans, which was itself partially offset by a lower contribution from demand deposits managed by the segment due to the sharp decrease in interest rates.
Treasury and Money Market
2020 and 2021. Our Treasury and Money Market segment posted a decrease of Ch$12,941 million, or 19.7% million, on an annual basis income before tax, from Ch$65,795 million in 2020 to Ch$52,854 million in 2021.
The decrease was mainly attributable to an annual decline of Ch$12,899 million, or 18.5%, in operating revenues, which in turn was primarily caused by a decrease of approximately Ch$26,600 million in net revenues from the management of our investment portfolio as result of the high comparison base represented by 2020, when we benefited from the positive effect of the sharp decrease in local and foreign interest rates on fixed-income securities, which compares to the sharp increase evidenced by local long-term interest rates in 2021 following the financial effects of pension fund withdrawals on the yield curves.
This decline in revenues was partially offset by higher income from the management of our trading portfolio of approximately Ch$10,600 million in 2021 when compared to 2020, mainly due to: (i) increased benefits from CVA’s for derivatives by approximately Ch$7,400 million on an annual basis, which was the consequence of improved probabilities of default of our counterparties in 2021 when compared to 2020, given lower uncertainties associated with the pandemic and the economic recovery observed in 2021, and (ii) an increase of approximately Ch$8,700 million in the fair value adjustment of derivative positions explained by favorable shifts in mid-term local interest rates. These positive effects on income before income tax were in turn partially offset by a decrease of approximately Ch$5,100 million in income explained by lower marking-to-market gains in trading securities given the significant increase in long-term local interest rates in 2021 for the reason mentioned above in comparison with the sharp decrease in interest rates in 2020 following monetary actions taken by central banks around the world in response to the pandemic.
2019 and 2020. Our Treasury and Money Market segment posted income before income tax of Ch$65,795 million in 2020, representing a 191.9% or Ch$43,256 million annual increase when compared to the Ch$22,539 million recorded in 2019.
176
The annual increase in income before income tax was mainly to do an annual increase of 167.1%, or Ch$43,913 million, in operating revenues, mainly attributable to:
| ● | An annual increase of approximately Ch$29,800 million in income and marking-to-market gains materialized from the positive effect of the sharp decrease in local and foreign interest rates on the fixed income portfolio managed by our Treasury. Between the second quarter and the end of the year, we sold a significant part of our AFS portfolio denominated in local and foreign currency in order to recognize the accumulated marking-to-market generated by lower interest rates. We also benefited in the short-term from securities held for trading as a result of the volatility caused by the COVID-19 pandemic on bond markets. |
| ● | An annual increase of approximately Ch$12,000 million in revenues associated with: (i) lower CVA charges on derivative positions of approximately Ch$8,500 million on an annual basis, and (ii) higher revenues from the management of derivative and foreign exchange positions of approximately Ch$3,400 million on an annual basis, given favorable shifts in interest rates in the short-term and also volatility in currency markets. |
Operations through Subsidiaries
2020 and 2021. Our subsidiaries recorded income before income tax of Ch$81,332 million for the year ended December 31, 2021, representing a 24.3%, or Ch$15,898 million, increase when compared to the Ch$65,434 million reached in 2020. This annual increase in income before income tax is mainly attributable to:
| ● | An annual increase of Ch$8,778 million or 35.0% in income before income tax in our mutual funds subsidiary. The main reason behind this increase was related to higher income from fees and commissions of Ch$11,617 million, or 25.8%, recorded by this subsidiary primarily as a result of: (i) a change in investors’ preferences from fixed-income funds to equity and blended funds, that bear higher fees, and (ii) an annual expansion of 5.2% in assets under management of this subsidiary partly due to the increase of disposable income of retail investors due to pension fund withdrawals. The increase in fee income was to some extent offset by an annual increase of Ch$2,759 million, or 8.2%, in operating expenses, primarily explained by higher personnel and administrative expenses in line with higher commercial activity in 2021 when compared to 2020, which represents a low comparison base as a consequence of the COVID-19 pandemic. |
| ● | An annual increase of Ch$4,090 million, or 80.2%, in income before income tax in our insurance brokerage subsidiary on an annual basis. This increase was largely explained by (i) an annual increase of Ch$3,491 million, or 16.2%, in income from fees and commissions, which in turn was attributable to the recovery in lending activity, particularly due to the gradual recovery in the origination of consumer loans by the end of 2021 as compared to the decline experienced in 2020 and (ii), to a lesser extent, by a Ch$0.5 million, or 2.7%, decrease in operating expenses, principally linked to administrative expenses. |
| ● | An annual increase of Ch$1,932 million, or 5.8%, in income before income tax of our securities brokerage subsidiary. This annual increase was primarily due to an annual increase of Ch$4,537 million, or 6.2%, in fee-based income, which in turn is the result of: (i) an annual recovery of 13.9% in the stock trading turnover as investors returned to the equity market in 2021 in pursuit of more profitable investments than fixed-income securities and an improved economic context associated with the lifting of COVID-19 pandemic mobility restrictions and the reactivation of economic activity, (ii) an annual expansion of 46.0% in currency trading in view of the volatility seen in the foreign currency market driven by diverse economic and political issues in the local market and (iii) higher fee-income as well as the increase of Ch$1,036 million in net interest income related to the fixed-income portfolio managed by the subsidiary. These positive factors were partially offset by higher operating expenses of Ch$3,271 million, or 8.2%, on an annual basis, largely explained by higher personnel expenses as a consequence of a low comparison base effect to 2020 associated with weakened commercial activity due to the COVID-19 pandemic. |
177
2019 and 2020. Our subsidiaries recorded a 20.9%, or Ch$17,258 million, annual decrease in income before income tax from the Ch$82,693 million reached in 2019 to Ch$65,434 million. The main factors explaining this annual decrease were, as follows:
| ● | An annual decrease of 20.8%, or Ch$8,821 million, in income before income tax recorded by our securities brokerage subsidiary. This decrease was primarily the consequence of (i) lower net financial income of Ch$10,660 million in 2020 as compared to 2019, which had mainly to do with a high comparison base in 2019 given an excellent performance in the management of the fixed-income trading portfolio due to changes in nominal and real interest rates in 2019, and (ii) lower fees and commissions income of Ch$2,556 million on an annual basis, primarily related to the effects of the economic downturn on equity transactionality in light of market volatility and uncertainty, particularly among retail investors. These effects in revenues were to some degree offset by a decrease of Ch$4,400 million in operating expenses, principally driven by the impact of the business backdrop on variable compensation (resulting in lower personnel expenses). |
| ● | An annual decrease of Ch$6,920 million, or 21.6%, in income before income tax of our mutual funds management subsidiary. Although the subsidiary recorded an annual expansion of 17.0% in assets under management, fees and commissions income decreased by Ch$6,241 million in 2020 as compared to 2019. This annual change was mostly explained by business trends seen in 2020 as a result of the COVID-19 pandemic that led investors to seek haven from high market volatility and sharp stock markets corrections, preferring fixed-income mutual funds rather than equity funds, with the former carrying lower commissions. |
| ● | An annual decrease of 16.1%, or Ch$979 million, in income before income taxes recorded by our insurance brokerage subsidiary. This decrease was primarily driven by a decrease of Ch$683 million in fees and commissions income, which in turn reflected the dynamics seen in 2020 as a result of lower loan origination in the Bank (particularly in consumer loans) and a decline in the overall demand for insurance products, in each case due to the economic downturn. |
Summary of Differences between Internal Reporting Policies and IFRS
We prepare our business segments’ financial information in accordance with our internal reporting policies, which differ in certain significant aspects from IFRS. The following table sets forth net income and equity for the years ended December 31, 2019, 2020 and 2021 in accordance with our internal reporting policies and under IFRS:
| Year Ended | ||||||||||||
| December 31, 2019 | December 31, 2020 | December 31, 2021 | ||||||||||
| (in millions of Ch$) | ||||||||||||
| Income before income tax (Internal Reporting Policies) | Ch$ | 762,692 | Ch$ | 589,071 | Ch$ | 971,473 | ||||||
| Reconciliation to IFRS | 14,714 | (84,218 | ) | 360,813 | ||||||||
| Income before income tax (IFRS) | 777,406 | 504,853 | 1,332,286 | |||||||||
| Net income (Internal Reporting Policies) | 593,009 | 463,109 | 792,923 | |||||||||
| Reconciliation to IFRS | 10,736 | (61,479 | ) | 263,394 | ||||||||
| Net income (IFRS) | 603,745 | 401,630 | 1,056,317 | |||||||||
| Equity (Internal Reporting Policies) | 3,528,223 | 3,726,268 | 4,223,014 | |||||||||
| Reconciliation to IFRS | 377,538 | 270,813 | 595,958 | |||||||||
| Equity (IFRS) | Ch$ | 3,905,761 | Ch$ | 3,997,081 | Ch$ | 4,818,972 | ||||||
Some differences exist between our net income and equity as determined in accordance with our internal reporting policies, which are used for management reporting purposes, as presented in the segment information, and our net income and equity as determined under IFRS, as presented in our audited consolidated financial statements.
178
The main differences that should be considered are the following:
| ● | Loan loss allowances |
The main difference between Chilean GAAP and IFRS 9 regarding loan loss allowances is that loan loss allowances under Chilean GAAP are calculated using expected loss models based on specific guidelines set by the CMF, which in turn are based on an expected losses approach. Additionally, with board approval, a bank would be allowed to establish additional provisions to protect itself from the risk of non-predictable economical fluctuations that could affect the macro-economic environment or a specific economic sector. Under IFRS 9 “Financial instruments,” allowances for loan losses are calculated based on the “expected credit loss” model. The CMF has not yet adopted IFRS 9 for banks and therefore the Bank has adjusted the financial statements to fully comply with IFRS standards. The most significant impact of IFRS 9 on the Bank’s financial statements arises from the new impairment requirements. As a result of these accounting policies differences, our net income under IFRS was Ch$11,567 million higher, Ch$14,171 million lower and Ch$353,357 million higher than our internally (or under Chilean GAAP) reported net income in 2019, 2020 and 2021, respectively. The impact on equity was Ch$242,349 million, Ch$228,178 million and Ch$581,535 million higher than our internally (or under Chilean GAAP) reported equity in 2019, 2020 and 2021, respectively.
| ● | Provisions for country risk and for contingent loan risk |
Under Chilean GAAP, the Bank provisions for country risk cover the risk taken when holding or committing resources in any foreign country. These allowances are established according to country risk classifications established by the CMF and therefore are not in accordance with IFRS as issued by the IASB. The Bank has adjusted its financial statements accordingly.
Under Chilean GAAP, the Bank has established allowances related to the undrawn available credit lines and contingent loans in accordance with the CMF. With the adoption of IFRS 9, provisions for contingent loans are calculated based on expected credit loss. As a result of these accounting policies differences, our net income under IFRS was Ch$1,557 million higher than our internally (or under Chilean GAAP) reported net income in 2019 and Ch$54,061 million and Ch$2,452 million lower than our internally (or under Chilean GAAP) reported net income in 2020 and 2021, respectively. The impact on equity was Ch$32,071 million higher than our internally reported equity in 2019 and Ch$21,990 million and Ch$24,442 million lower than our internally (or under Chilean GAAP) reported equity in 2020 and 2021, respectively.
Other differences that do not materially impact our financial statements:
| ● | Business Combination |
Under internal reporting policies, our merger with Citibank Chile was accounted for under the pooling of interest method, while under IFRS, and for external financial reporting purposes, the merger of the two banks was accounted for as a business combination in which we were the acquirer as required by IFRS 3 “Business Combinations”. Under IFRS 3, we recognized all acquired net assets at fair value as determined at the acquisition date, as well as the goodwill resulting from the purchase price consideration in excess of net assets recognized. There is no amount for this accounting policy difference for 2019, 2020 and 2021, the impact on equity was Ch$33,410 million in 2019, 2020 and 2021.
| ● | Provision for mandatory dividends |
Chilean banks are required to distribute at least 30% of their net income to shareholders unless the shareholders unanimously approve the retention of profits. A bank may, however, be prohibited from distributing to shareholders even this 30% of its net income if such distribution would cause the bank to violate certain statutory capital requirements. In accordance with internal reporting policies, we record a minimum dividend allowance of at least 60% of the period’s net distributable income, as permitted by the CMF. Under IFRS, only the portion of dividends that is required to be distributed by Chilean Law must be recorded, i.e., 30% as required by Chilean Corporations Law. This accounting difference does not lead to differences in net income. Given this adjustment, the equity under IFRS was Ch$122,559 million, Ch$81,339 million and Ch$86,020 million higher than our internally (or under Chilean GAAP) reported equity in 2019, 2020 and 2021, respectively.
179
| ● | Assets Received in Lieu of Payment |
The Compendium of Accounting Standards requires that the assets received in lieu of payments are measured at historical cost or fair value, less cost to sell, if lower, on a portfolio basis and written off if not sold after a certain period of time in accordance with specific guidelines established by the CMF. Under IFRS, these assets are deemed non-current assets held for sale and their accounting treatment is set by IFRS 5 “Non-Current Assets Held for Sale and Discontinued Operations.” In accordance with IFRS 5 these assets are measured at historical cost or fair value, less cost to sell, if lower. Accordingly, under IFRS these assets are not written off unless they were impaired. As a result of this accounting policy difference, our net income was Ch$915 million, Ch$4,424 million and Ch$568 lower than our internally (or under Chilean GAAP) reported net income in 2019, 2020 and 2021, respectively. The impact on equity was a decrease of Ch$5,053 million, Ch$629 million and Ch$61 million in 2019, 2020 and 2021, respectively.
| ● | Suspension of Income Recognition on Accrual Basis |
In accordance with the Compendium of Accounting Standards, financial institutions must suspend recognition of income on an accrual basis in their statements of income for certain loans included in the impaired portfolio. IFRS 9 and IAS 39 did not allow the suspension of accrual of interest on financial assets for which an impairment loss has been determined. As of January 1, 2018, the Bank adopted IFRS 9. Under IFRS 9, interest income is calculated by applying the effective interest rate to the gross carrying amount of financial assets, except for financial assets that have subsequently become credit-impaired (or “Stage 3”), for which interest revenue is calculated by applying the effective interest rate to their amortized cost (i.e., net of expected credit losses provision). Off-balance interests are recorded as interest income only if the Bank receives the related payments. This difference does not materially impact our financial statements.
| ● | Deferred taxes |
The Bank records, when appropriate, deferred tax assets and liabilities for the estimated future tax effects attributable to differences between the carrying amount of assets and liabilities and their tax bases. All of the aforementioned differences had an impact on deferred taxes, which resulted in net income under IFRS that was Ch$3,978 million higher, Ch$22,739 million lower and Ch$97,419 million higher than our internally (or under Chilean GAAP) reported net income in 2019, 2020 and 2021, respectively. The impact on equity was an increase of Ch$86,629 million, a decrease of Ch$63,339 million and an increase of Ch$161,421 million in 2019, 2020 and 2021, respectively.
180
LIQUIDITY AND CAPITAL RESOURCES
Liquidity Management
A sound liquidity strategy must be focused on ensuring that funds are available to honor our financial commitments when they are due and also to take advantage of attractive business opportunities. To accomplish this, we monitor funding liquidity (i.e., the ability to raise funds when they are needed without incurring abnormal costs) and trading liquidity (i.e., the ability to easily decrease debt instruments held in our portfolios and/or offset price risk positions generated by derivative transactions).
Liquidity risk can be broken down into two types of risks: trading liquidity risk and funding liquidity risk. Trading liquidity risk deals with the inability to decrease cash positions (bonds, loans, etc.) and/or offset price risks generated by derivatives transactions and funding liquidity risk is related to our inability to raise funds. Both risks can lead to potentially adverse scenarios that might make the Bank unable to meet its payment obligations and/or potential payment obligations when they become due.
These two risks are jointly managed but by utilizing different tools, as detailed below.
Trading Liquidity Risk Management
Holding a stake of debt instruments with deep secondary markets ensures trading liquidity. Central Bank and government instruments and short-term banks’ time deposits show these characteristics. These kinds of instruments are held in our trading portfolio while comprising a portion of our portfolio of financial instruments measured at fair value through other comprehensive income as well. In addition, mortgage bonds issued by banks resident in Chile, as well as corporate bonds are also part of our portfolio of financial instruments measured at fair value through other comprehensive income.
Even though mortgage and corporate bonds show much less trading liquidity than Central Bank and government instruments, the former may be sold to the Central Bank under repurchase agreements. Government instruments and short-term banks’ time deposits can also be sold to the Central Bank under repurchase agreements.
Funding Liquidity Risk Management
Diversifying funding sources and avoiding a concentration of large fund providers or funding maturity dates are means to ensure funding liquidity. We diversify through the establishment of triggers that monitor concentrations of funding sources, maturities, currencies, etc. The aggregation of significant fund providers by currency is monitored as a percentage of our current liabilities.
In particular, our funding strategy aims to satisfy our customers’ needs and to enhance our product base offering while maintaining a prudent product diversification profile, currencies and maturities. We are focused on broadening the current core and diversified funding obtained through the retail banking business. In addition, we are continuously issuing either senior or subordinated bonds in order to match both the liquidity and the interest rate risk generated by our long-term loans.
In addition to our own metrics in place to monitor liquidity, the Central Bank and the CMF have established regulations regarding liquidity, which include minimum reserve requirements for demand and time deposits, minimum “technical” reserve requirements for demand deposits and maximum expected outflows for the following 30 and 90 days.
181
The Central Bank has established a minimum reserve requirement of 9.0% for demand deposits and 3.6% for time deposits. The reserve requirement must be complied with separately by currency (Chilean Peso and foreign currencies).
In addition, we are subject to a “technical” reserve requirement for demand deposits applicable to all banks that operate in Chile. The daily balance of deposits and obligations payable on demand, except for obligations with other banks, may not exceed 2.5 times the amount of the bank’s Regulatory Capital (or Total Capital). Following the implementation of Basel III in Chile, banks defined as systemically important banks could bear stricter requirements in terms of “technical” reserves, since the threshold could decrease to 1.5 times the bank’s Regulatory Capital (or Total Capital). For more information, see “Item 3. Key Information—Risk Factors—Modifications to reserve requirements may affect our growth capacity and margins” and “Item 4. Information on the Company—Regulation and Supervision—Reserve Requirements.”
Deposits and obligations payable on demand include:
| ● | deposits in current accounts; |
| ● | other demand deposits or obligations payable on demand and incurred in the ordinary course of business; |
| ● | savings deposits that allow unconditional withdrawals that bear a stated maturity; and |
| ● | other deposits unconditionally payable immediately. |
Chilean banks are not required, however, to maintain the minimum reserves referred to above for deposits and obligations subject to this “technical” reserve.
Financing Plan Guidelines
Every year financing needs arising from operating activities are projected in order to gauge the Bank’s ability to timely and effectively raise funds in local and foreign markets. For these purposes, the Bank evaluates core commercial banking balances, namely, loans to customers and demand deposits, from which an in-depth analysis of potential sources of funding are assessed based on public information, interest rate trends and debt issuance programs in place in Chile and abroad.
The following are the key drivers our Treasury evaluates in order to determine our ability to meet our cash requirements for the next fiscal year:
| ● | Balance sheet growth expected in the business plan for the next fiscal period, which is mainly associated with growth in loans to customers, loans and advances to banks and positions to be take in securities held for trading, securities measured at fair value through other comprehensive income, held to maturity securities and any purchase or investment in fixed assets or affiliates. |
| ● | Expected growth of demand deposits for the next fiscal period, including the amount of reserves and technical reserves, if any, that may be required. |
| ● | Expected growth of time deposits for the next fiscal period, including reserve requirements. |
| ● | Maximum participation that local pension funds could be expected to invest in Banco de Chile’s long-term bonds, based on their historical highest participation in Banco de Chile’s securities and the regulatory limits that pension funds managers are subject to per type of fund, considering fund C, D, E of the pension fund system, which are more oriented to fixed-income securities. |
| ● | Maximum participation that local mutual funds have reached in Banco de Chile’s long-term bonds. |
| ● | The unused amount of long-term debt programs in Chile or abroad by which we are able to raise funding effectively and on a timely basis. |
For more information on our ability to obtain adequate amounts of cash to meet our funding requirements and plans for cash in the short- and long-term, see “Item 5. Liquidity And Capital Resources—Borrowings, Off-Balance Sheet Arrangements and Tabular Disclosure of Contractual Obligations” below.
182
Regulatory Liquidity Requirements
Chilean regulations also require that the expected outflows within the following 30 days not exceed the amount of a bank’s Basic Capital (or CET1 capital) and the expected outflows within the following 90 days not exceed twice the amount of a bank’s Basic Capital. Expected outflows may include behavioral assumptions and they have to be computed separately by currency. This report is called the C46 index.
Furthermore, in March 2016 the Chilean regulator began to require C47 and C48 reports. The C47 report focuses on liabilities analysis from a concentration, maturity and renewal perspectives. On the other hand, the C48 report gauges LCR and NSFR. In October 2018, the CMF established a new report on liquidity matters (C49) intended to refine the measurement of LCR and NSFR as defined by the current C48 report. The C49 report began to be submitted in parallel with the C48 report on April 4, 2019. Although the C49 report is expected to replace the C48 report, there is no certainty as to when it may happen.
For the year ended December 31, 2021, there was a regulatory limit of 80% for LCR, which will increase ten percentage points per year until reaching 100% in 2023. No regulatory limit has been defined for NSFR.
For more information on liquidity risk regulations, see “Item 4. Information on the Company—Regulation and Supervision—Liquidity Risk Regulations.” Also, for recent measures adopted by the Central Bank in view of the COVID-19, impacting liquidity risk management of banks, see “Item 5. Operating and Financial Review and Prospects—Operating Results—Impacts of COVID-19 in 2021” and “Item 5. Operating and Financial Review and Prospects—Trend Information.”
In November 2021, the Chilean Central Bank published a modification to liquidity requirements for comment. Among other topics, this proposal included: (i) the anticipation of the 100% requirement for LCR staring January 1, 2022 instead of January 1, 2023 as originally requested, (ii) the establishment of a regulatory limit for the NSFR ratio equivalent to 100%, starting January 1, 2022 at 60% and increasing ten percentage points each year until reaching 100% on January 1, 2026, (iii) changes to the liquidity reporting requirements through the incorporation of NSFR, (iv) the incorporation of financial instruments pledged for technical reserve (arising from demand deposits levels) as high quality liquid assets when determining LCR, (v) the softening of requisites for using behavioral models for C46 index, (vi) the removal of regulatory limits for C46 index in local currency, (vii) the introduction of contingency measures for breaches of regulatory limits for both the C46 index in foreign currency and the NSFR ratio, and (viii) the softening of measures for regulatory limits in case of local contingencies. Also, the Central Bank established that banks will be required to carry out an annual ILAAP, which will go into effect in April 2023, although the possibility of imposing additional HQLA requirements based on the information disclosed in the ILAAP will be in effect only in April 2025. On March 8, 2022, the Chilean Central Bank published the final ruling associated with the changes proposed for Chapter III.B.2.1 of the Compendium of Financial Norms, which adopted the following changes: (i) the removal of regulatory limit for 30-day and 90-day cash flows mismatches in local currency as measured by C46 index while maintaining the limit for 30-day cash flows mismatches in foreign currency as measured by the C46 index, (ii) the anticipation of the increase of the LCR limit to 90% for the period between January and June 2022 and to 100% from June 2022 onwards, (iii) the incorporation of a regulatory limit for NSFR starting in 60% in June 2022 and increasing 10% in January 2023 to 70% and subsequently 10% per year until reaching 100% in January 2026, (iv) the introduction of specifications on the treatment of securities pledged as technical reserves in order to take them into account as high quality liquid assets and (v) confirmation on the submission of the ILAAP starting April 2023, among other topics.
As of December 31, 2021 our LCR and NSFR were 228.3% and 113.2%, respectively, on a consolidated basis. As such, we were fully in compliance with the prevailing regulatory requirements.
We supplement regulatory reports and metrics with internally-developed reports that are aimed at providing us with a broader perspective on liquidity matters. The market access report, the liquidity duffer, intraday liquidity and liquidity ratios, are the main internal reports we use in order to monitor liquidity while establishing internal alerts and triggers for decision making. For more information see Note 43(3) to our audited consolidated financial statements.
Mandatory metrics requested by the CMF and internal metrics developed by us utilizing internal models are prepared on a daily basis by the Financial Control & Treasury Area, which reports to the CFO. These reports are submitted on a daily basis to the Market Risk Area and the Treasury Division, which are in charge of overseeing and managing our liquidity, respectively. The Finance, International and Market Risk Committee also monitors these metrics on a monthly basis.
Given our internal metrics and policies, we believe that our working capital is sufficient to meet our present needs.
183
Cash Flows
The tables below set forth our principal sources of cash. Our subsidiaries are not an important source of cash for us and therefore do not significantly affect our ability to meet our cash obligations. No legal, contractual or economic restrictions exist on the ability of our subsidiaries to transfer funds to us in the form of loans or cash dividends as long as they abide by the regulations in the Chilean Corporations Law regarding loans to related parties and minimum dividend payments.
For the Year Ended December 31, | ||||||||||||
| 2019 | 2020 | 2021 | ||||||||||
| (in millions of Ch$) | ||||||||||||
| IFRS: | ||||||||||||
| Net cash provided by (used in) operating activities | Ch$ | 1,388,971 | Ch$ | (2,472,360) | Ch$ | 3,005,640 | ||||||
2020 and 2021. Net cash provided by operating activities recorded a reversal in 2021 from a net outflow of Ch$2,472,360 million in 2020 to a net inflow of Ch$3,005,640 million in 2021. The annual change of Ch$5,478,000 million was mainly the result of: (i) a net decrease of approximately Ch$3,448,642 million in cash outflow associated with the purchase of financial assets held for trading, primarily related to reserve requirements associated with demand deposit balances, which remained at stable high levels, from which purchases were oriented to renew the balance of instruments that expired, (ii) an increase of approximately Ch$2,135,062 million in inflow from funding with savings accounts and demand deposits, based on the increase experienced by short-term interest rates by the end of the year following the policy tightening carried out by the Central Bank to control inflation, and (iii) a decrease of approximately Ch$1,435,294 million in the cash outflow associated with lower loans granted to customers and banks, mainly explained by lower amount of loans and advances to banks, particularly associated with lower balances held in the Central Bank in 2021. These factors were to some degree offset by: (i) an increase of approximately Ch$645,968 million in the outflow associated with other assets and liabilities, and (ii) a decrease of approximately Ch$473,358 million in the net inflow from demand deposits, based on a moderate deceleration in the growth of demand deposit balances, particularly by the end of 2021 when short-term interest rates began to increase in connection with actions taken by the Central Bank.
2019 and 2020. Net cash provided by operating activities recorded a reversal in 2020 from a from a net inflow of Ch$1,388,971 million in 2019 to a net outflow of Ch$2,472,360 million in 2020. The annual net change of Ch$3,861,331 million was mainly the result of: (i) a net increase of approximately Ch$2,943,093 million in cash outflow associated with the purchase of financial assets held for trading, primarily related to Central Bank’s short-term notes in order to meet reserve requirements associated with the percentage share increase in demand deposit balances, (ii) a decrease of approximately Ch$2,085,960 in the inflow from time deposits, as a consequence of both higher demand deposits balances as part of liquidity facilities provided to customers in the context of the COVID-19 pandemic as well as higher liquidity maintained by corporate clients, all of which enabled us to reduce the funding with deposits held by institutional investors, and (iii) an annual increase of approximately Ch$952,974 million in the cash outflow associated with lower loans granted to customers and banks. These factors were to some extent offset by an increase of approximately Ch$2,104,305 million in the cash inflow related to demand deposits and current account balances demonstrated through a 33.9% increase in year-end balances.
For the Year Ended December 31, | ||||||||||||
| 2019 | 2020 | 2021 | ||||||||||
| (in millions of Ch$) | ||||||||||||
| IFRS: | ||||||||||||
| Net cash provided by (used in) investing activities | Ch$ | (396,741) | Ch$ | 210,306 | Ch$ | (2,987,305) | ||||||
2020 and 2021. We experienced a reversal in our cash flows provided by investing activities from a net inflow of Ch$210,306 million in 2020 to a net outflow of Ch$2,987,305 million in 2021. This net use in investing activities was primarily due to: (i) a net annual increase in the outflow associated with purchases of fixed-income securities measured at fair value through other comprehensive income from an inflow of Ch$285,558 in 2020 to a net outflow of Ch$2,070,906 million in 2021, which was primarily explained by higher positions taken in securities with mid-term maturities during 2021 to benefit from both the accrual at higher interest rates and positive marking-to-market in the long-run while covering reserve requirements produced by persistent high levels of demand deposits in 2021, and (ii) positions taken in held-to-maturity financial instruments for an amount of Ch$813,477 million in 2021 in comparison with no investments in 2020, due to the same reasons underlying the investment in securities measured at fair value through other comprehensive income.
184
2019 and 2020. We experienced a reversal in our investing cash flows from a net outflow of Ch$396,741 million in 2019 to a net inflow of Ch$210,306 million in 2020. This reversal of Ch$607,047 million was principally associated with a net annual decrease of approximately Ch$586,733 million in the outflow related to purchases of financial assets measured at fair value through other comprehensive income. Given the prevailing interest rate scenario at historical lows following the monetary actions taken by the Chilean and global Central Banks, we sold most of the instruments we held before the COVID-19 pandemic in order to take advantage of the sharp decrease in interest rates. Low interest rates also reduced the possibility of obtaining marking-to-market gains, which led us to purchase lower volumes of fixed-income securities during the year, resulting in a decrease in the outflow associated with investing activities.
For the Year Ended December 31, | ||||||||||||
| 2019 | 2020 | 2021 | ||||||||||
| (in millions of Ch$) | ||||||||||||
| IFRS: | ||||||||||||
| Net cash provided by (used in) financing activities | Ch$ | 802,439 | Ch$ | 1,461,584 | Ch$ | 1,376,414 | ||||||
2020 and 2021. The net cash provided by financing activities decreased Ch$85,170 million from a net inflow of Ch$1,461,584 million in 2020 to a net inflow of Ch$1,376,414 million in 2021. This moderate decrease was mainly the result of a decrease in the inflow related to borrowings from the Central Bank by Ch$1,872,786 million from Ch$3,110,600 million in 2020 to Ch$1,237,814 million in 2021, which was primarily associated with the lower funding raised from the Central Bank through FCIC. This factor was to some degree offset by: (i) a net increase in the inflow associated with borrowings from foreign financial institutions by Ch$954,504 million linked to the reactivation of trade finance loans in a context of a low comparison base prompted by the COVID-19 pandemic in 2020, (ii) an increase of approximately Ch$708,398 million in proceeds from bond issuances, based on consecutive placements in Chile and abroad in 2021 to diversify our funding structure while optimizing our cost of funds and (iii) a decrease of Ch$130,267 million in dividends paid to shareholders from Ch$350,538 million in 2020 (associated with net distributable income for 2019) to Ch$220,271 in 2021 (associated with net distributable income for 2020) as a result of lower net distributable income in 2020 when compared to 2019 due to the effects of the COVID-19 pandemic on the banking business and, to a lesser extent, a higher pay-out ratio in 2020 (70%) in comparison with 2021 (60%).
2019 and 2020. The net cash provided by financing activities increased by Ch$659,145 million from a net inflow of Ch$802,439 million in 2019 to a net inflow of Ch$1,461,584 million in 2020. This annual increase in cash provided by financing activities was mainly the consequence of: (i) an increase of Ch$3,110,600 million in the inflow linked to borrowings from the Central Bank, associated with the special facility program deployed by the Central Bank in order to ensure liquidity within the local financial system while promoting lending for individuals and SMEs by providing local banks with medium-term funding at low interest rates (0.5%) based on the increase in loan balances, and (ii) a decrease of approximately Ch$325,546 million in the outflow related to redemption of bond issuances. These factors were to some degree offset by: (i) a decrease of approximately Ch$1,736,041 million in the inflow related to proceeds from both bond and commercial paper issuances, and (ii) a decrease of approximately Ch$1,044,680 million in borrowings from foreign banks. These trends in lower funding needs from bonds, banks and commercial paper had mainly to do with the moderate increase in our loan portfolio, a higher than normal annual increase in demand deposit balances primarily due to both uncertainty and interest rates at historical lows, as well as the funding we obtained through borrowings from the Central Bank.
185
Asset and Liability Management
Our asset and liability management policy is to maximize net interest income, return on assets and average equity in light of interest rate, liquidity and foreign exchange risks, within the limits of Chilean banking regulations and our internal risk management policies. Subject to these constraints, we may from time to time take mismatched positions as to interest rates or, in certain limited circumstances, foreign currencies when justified, in our view, by market conditions and prospects, and subject to our asset and liability management policies. Our board of directors determines our asset and liability policies. See Note 43 to our audited consolidated financial statements as of and for the year ended December 31, 2021 appearing elsewhere in this annual report.
Borrowings by Type of Liability and Terms
The following table presents the maturities of each borrowing category for the indicated year.
| As of December 31, 2020 | As of December 31, 2021 | |||||||||||||||||||||||
| Long-term | Short-term | Total | Long-term | Short-term | Total | |||||||||||||||||||
| (in millions of Ch$) | ||||||||||||||||||||||||
| IFRS: | ||||||||||||||||||||||||
| Borrowings from financial institutions: | ||||||||||||||||||||||||
| Central Bank credit lines for renegotiation of loans | Ch$ | — | Ch$ | — | Ch$ | — | Ch$ | — | Ch$ | — | Ch$ | — | ||||||||||||
| Other borrowings from the Central Bank | 3,110,600 | – | 3,110,600 | 3,328,446 | 1,020,014 | 4,348,460 | ||||||||||||||||||
| Borrowings from domestic financial institutions | — | 8,357 | 8,357 | — | — | — | ||||||||||||||||||
| Borrowings from foreign institutions | 138 | 550,658 | 550,796 | 59,700 | 453,705 | 513,405 | ||||||||||||||||||
| Debt issued: | ||||||||||||||||||||||||
| Bonds | 6,474,526 | 1,119,816 | 7,594,342 | 7,193,949 | 1,014,885 | 8,208,834 | ||||||||||||||||||
| Commercial papers | – | 106,060 | 106,060 | – | 348,445 | 348,445 | ||||||||||||||||||
| Subordinated bonds | 768,243 | 118,164 | 886,407 | 799,034 | 118,476 | 917,510 | ||||||||||||||||||
| Mortgage finance bonds | 3,472 | 3,314 | 6,786 | 1,977 | 2,139 | 4,116 | ||||||||||||||||||
| Other financial obligations | 207 | 191,506 | 191,713 | 90 | 274,528 | 274,618 | ||||||||||||||||||
| Total other interest bearing liabilities | Ch$ | 10,357,186 | Ch$ | 2,097,875 | Ch$ | 12,455,061 | Ch$ | 11,383,196 | Ch$ | 3,232,192 | Ch$ | 14,615,388 | ||||||||||||
The Bank was in material compliance with all of its debt instruments during 2020 and 2021.
186
Central Bank Borrowings
Central Bank borrowings include credit lines for the renegotiation of loans and other borrowings. Historically, the Central Bank provided credit lines for the renegotiation of mortgage loans due to the need to refinance debts as a result of the economic recession and crisis of the Chilean banking system from 1982 to 1985. These credit lines were linked to the UF index and carry real interest rates.
Currently, in the context of the COVID-19 pandemic, the Central Bank provided lending facilities for all banks holding commercial or consumer loans on their balance sheet, conditional on the increase in loan balances (FCIC). For more information see “Item 5. Operating and Financial Review and Prospects—Trend Information”. As of December 31, 2021, the amount borrowed to the Central Bank, associated with the FCIC facility was equivalent to Ch$4,348,460 million, denominated in Chilean pesos and bearing at a nominal interest rate of 0.5%. The maturities of the outstanding balances were, as follows:
| As of December 31, 2021 | ||||
| (in millions of Ch$) | ||||
| IFRS: | ||||
| Due within 1 year | Ch$ | 1,020,014 | ||
| Due after 1 year but within 2 years | — | |||
| Due after 2 years but within 3 years | 3,328,446 | |||
| Due after 3 years but within 4 years | — | |||
| Due after 4 years but within 5 years | — | |||
| Due after 5 years | — | |||
| Total Central Bank borrowings | Ch$ | 4,348,460 | ||
Borrowings from Domestic Financial Institutions
Borrowings from domestic financial institutions are generally used to fund our general operations. As of December 31, 2021, we had no borrowings from domestic financial institutions. As of the same date, borrowings from domestic financial institutions had the following maturity profile:
As of | ||||
| (in millions of Ch$) | ||||
| IFRS: | ||||
| Due within 1 year | Ch$ | — | ||
| Due after 1 year but within 2 years | — | |||
| Due after 2 years but within 3 years | — | |||
| Due after 3 years but within 4 years | — | |||
| Due after 4 years but within 5 years | — | |||
| Due after 5 years | — | |||
| Total domestic borrowings | Ch$ | — | ||
Borrowings from Foreign Financial Institutions
We have short- and long-term borrowings from foreign banks. These loans are denominated in foreign currency and are used to fund our foreign trade loans and carried an average nominal interest rate of 0.56% in the year ended December 31, 2021. The outstanding maturities of these borrowings as of December 31, 2021 were, as follows:
| As of December 31, 2021 | ||||
| (in millions of Ch$) | ||||
| IFRS: | ||||
| Due within 1 year | Ch$ | 453,705 | ||
| Due after 1 year but within 2 years | 59,700 | |||
| Due after 2 years but within 3 years | — | |||
| Due after 3 years but within 4 years | — | |||
| Due after 4 years but within 5 years | — | |||
| Due after 5 years | — | |||
| Total foreign borrowings | Ch$ | 513,405 | ||
187
Senior Long-Term Bonds
Our bonds are primarily denominated in local currency, mainly in UF, and, to a lesser extent, in foreign currencies, including Swiss francs (CHF), Hong Kong dollar (HKD), Japanese Yen (JPY), U.S. Dollar (USD), Euros (EUR), Peruvian sol (PEN), Norwegian krone (NOK) and Australian dollar (AUD).
As of December 31, 2021, bonds denominated in local currency, with semi-annual interest and principal, accounted for Ch$6,116,418 million, all denominated in UF, with a weighted average annual interest rate of 2.25%. As of the same date, bonds denominated in foreign currency, most of them with annual interest and principal payments, amounted to Ch$2,092,416 million and carried an average annual interest rate of 2.25% (excluding the effect of exchange rate adjustments). In general, long-term bonds, denominated in both local and foreign currency, are intended to finance loans that had a maturity of more than one year.
The maturities of bonds denominated in local currency (Ch$ or UF) as of December 31, 2021 were:
| As of December 31, 2021 | ||||
| (in millions of Ch$) | ||||
| IFRS: | ||||
| Due within 1 year | Ch$ | 842,424 | ||
| Due after 1 year but within 2 years | 881,718 | |||
| Due after 2 years but within 3 years | 726,387 | |||
| Due after 3 years but within 4 years | 726,832 | |||
| Due after 4 years but within 5 years | 945,359 | |||
| Due after 5 years | 1,993,698 | |||
| Total bonds | Ch$ | 6,116,418 | ||
During 2021, we issued bonds denominated in UF for an amount equivalent to Ch$277,910 million at a weighted average real interest rate of 3.66% and tenors in the range of six to nine years.
We did not carry out any issuance of long-term bonds denominated in Chilean pesos during 2021.
The maturities of bonds denominated in foreign currency as of December 31, 2021 were:
| As of December 31, 2021 | ||||
| (in millions of Ch$) | ||||
| IFRS: | ||||
| Due within 1 year | Ch$ | 172,461 | ||
| Due after 1 year but within 2 years | 184,660 | |||
| Due after 2 years but within 3 years | 140,519 | |||
| Due after 3 years but within 4 years | 112,415 | |||
| Due after 4 years but within 5 years | — | |||
| Due after 5 years | 1,482,361 | |||
| Total bonds | Ch$ | 2,092,416 | ||
During 2021 we issued bonds denominated in foreign currency for an amount equivalent to Ch$684,671 million at a weighted average interest rate of 1.56% and tenors in the range of five to ten years.
Commercial paper
Our commercial paper is denominated in U.S. dollars and carried an average annual interest rate of 0.35% as of December 31, 2021. This average rate does not include the effect of exchange rate adjustments.
188
The maturities of our commercial paper as of December 31, 2021 were:
As of | ||||
(in millions of Ch$) | ||||
| IFRS: | ||||
| Due within 1 year | Ch$ | 348,445 | ||
| Due after 1 year but within 2 years | — | |||
| Due after 2 years but within 3 years | — | |||
| Due after 3 years but within 4 years | — | |||
| Due after 4 years but within 5 years | — | |||
| Due after 5 years | — | |||
| Total bonds | Ch$ | 348,445 | ||
During 2021 we issued commercial paper in an amount of Ch$698,435 million, bearing an average interest rate of approximately 0.27%.
Subordinated Bonds
As of December 31, 2021, our outstanding subordinated bonds were denominated in UF. Payments of interests and principal are generally due on a semiannual basis and the discount on the issuance is amortized over the life of the bond. As of December 31, 2021, we had an outstanding balance of Ch$917,510 million in subordinated bonds, bearing an effective weighted average real interest rate of 3.24% taking into consideration the discount at issuance.
Subordinated bonds are also intended to finance loans having a maturity of more than one year. As of December 31, 2021, the maturities of subordinated bonds were:
| As of December 31, 2021 | ||||
| (in millions of Ch$) | ||||
| IFRS: | ||||
| Due within 1 year | Ch$ | 118,476 | ||
| Due after 1 year but within 2 years | 11,313 | |||
| Due after 2 years but within 3 years | 8,666 | |||
| Due after 3 years but within 4 years | 9,125 | |||
| Due after 4 years but within 5 years | 6,729 | |||
| Due after 5 years | 763,201 | |||
| Total subordinated bonds | Ch$ | 917,510 | ||
During 2021, there were no subordinated bonds issuances.
Mortgage Finance Bonds
Mortgage finance bonds are used to finance the granting of mortgage loans. The outstanding principal amounts of the bonds are amortized on a quarterly basis. The range of maturities of these bonds is between five and 30 years. The bonds are linked to the UF index and carried a weighted average annual interest rate of 3.53% as of December 31, 2021.
189
The maturities of mortgage finance bonds as of December 31, 2021 were:
| As of December 31, 2021 | ||||
| (in millions of Ch$) | ||||
| IFRS: | ||||
| Due within 1 year | Ch$ | 2,139 | ||
| Due after 1 year but within 2 years | 792 | |||
| Due after 2 years but within 3 years | 632 | |||
| Due after 3 years but within 4 years | 185 | |||
| Due after 4 years but within 5 years | — | |||
| Due after 5 years | 368 | |||
| Total mortgage finance bonds | Ch$ | 4,116 | ||
During 2021, we did not carry out any issuance of mortgage finance bonds.
Other Financial Obligations
The maturities of other financial obligations as of December 31, 2021 were as follows:
| As of December 31, 2021 | ||||
| (in millions of Ch$) | ||||
| IFRS: | ||||
| Other long-term obligations: | ||||
| Obligations with Chilean Government | Ch$ | 90 | ||
| Total other long-term obligations | 90 | |||
| Other short-term obligations | 274,528 | |||
| Total other obligations | Ch$ | 274,618 | ||
As of December 31, 2021, other financial obligations had the following maturities:
| As of December 31, 2021 | ||||
| (in millions of Ch$) | ||||
| IFRS: | ||||
| Due within 1 year | Ch$ | 274,528 | ||
| Due after 1 year but within 2 years | 70 | |||
| Due after 2 years but within 3 years | 20 | |||
| Due after 3 years but within 4 years | — | |||
| Due after 4 years but within 5 years | — | |||
| Due after 5 years | — | |||
| Total other obligations | Ch$ | 274,618 | ||
190
Funding by Type of Liability and Average Rates
The following table sets forth our average daily balance of liabilities for the years ended December 31, 2020 and 2021 in each case together with the related average nominal interest rates paid thereon:
| Year Ended December 31, | ||||||||||||||||||||||||
| 2020 | 2021 | |||||||||||||||||||||||
| Average Balance | % of Total Liabilities | Average Nominal Rate | Average Balance | % of Total Liabilities | Average Nominal Rate | |||||||||||||||||||
| (in millions of Ch$, except percentages) | ||||||||||||||||||||||||
| IFRS: | ||||||||||||||||||||||||
| Current accounts and demand deposits | Ch$ | 12,882,627 | 31.8 | % | — | % | Ch$ | 17,048,827 | 39.6 | % | — | % | ||||||||||||
| Savings accounts and time deposits | 9,857,365 | 24.3 | 1.24 | 8,467,508 | 19.7 | 1.56 | ||||||||||||||||||
| Borrowings from financial institutions | 3,225,303 | 8.0 | 0.86 | 4,420,847 | 10.3 | 0.53 | ||||||||||||||||||
| Debt issued | 8,719,276 | 21.5 | 4.59 | 8,491,701 | 19.7 | 7.69 | ||||||||||||||||||
| Commercial Paper | 219,046 | 0.5 | 1.78 | 359,836 | 0.8 | 0.34 | ||||||||||||||||||
| Other financial obligations | 157,052 | 0.4 | 1.06 | 144,873 | 0.3 | 1.73 | ||||||||||||||||||
| Lease Liabilities | 133,514 | 0.3 | 1.90 | 107,048 | 0.2 | 1.85 | ||||||||||||||||||
| Other interest bearing liabilities | 280,827 | 0.7 | 0.66 | 140,600 | 0.3 | 0.67 | ||||||||||||||||||
| Other non-interest bearing liabilities | 5,069,484 | 12.5 | — | 3,909,469 | 9.1 | — | ||||||||||||||||||
| Total liabilities | Ch$ | 40,544,494 | 100.0 | % | 1.38 | % | Ch$ | 43,090,709 | 100.00 | % | 1.89 | % | ||||||||||||
Our most important sources of funding are customer deposits, which primarily consist of peso-denominated, non-interest bearing current accounts and demand deposits and both Chilean Peso and UF-denominated interest bearing time deposits and savings accounts. Current accounts and demand deposits represented 31.8% and 39.6% of our average total liabilities in 2020 and 2021, respectively. These kinds of liabilities are our least-cost source of funding. On the other hand, savings accounts and time deposits represented 24.3% and 19.7% of our average liabilities in 2020 and 2021, respectively. Lastly, debt issued represented 21.5% and 19.7% of our average liabilities in 2020 and 2021, respectively.
191
TABULAR DISCLOSURE OF CONTRACTUAL OBLIGATIONS
The following tables set forth our contractual obligations and commercial commitments by residual maturity. As of December 31, 2021, the scheduled maturities of our contractual obligations, including accrued interest, were as follows:
| Due within 1 year | Due after 1 year but within 3 years | Due after 3 years but within 5 years | Due after 5 years | Total | Estimated Interest Payment | |||||||||||||||||||
| (in millions of constant Ch$ as of December 31, 2021) | ||||||||||||||||||||||||
| IFRS: | ||||||||||||||||||||||||
| Contractual Obligations | ||||||||||||||||||||||||
| Currents accounts and other demand deposits | Ch$ | 18,542,791 | Ch$ | — | Ch$ | — | Ch$ | — | Ch$ | 18,542,791 | Ch$ | — | ||||||||||||
| Transaction in the course of payment | 210,479 | — | — | — | 210,479 | — | ||||||||||||||||||
| Saving accounts and time deposits | 8,623,839 | 513,809 | 1,906 | 452 | 9,140,006 | — | ||||||||||||||||||
| Bonds issued | ||||||||||||||||||||||||
| Mortgage finance bonds | 2,139 | 1,424 | 185 | 368 | 4,116 | 409 | ||||||||||||||||||
| Bonds | 1,182,760 | 1,933,284 | 1,784,606 | 3,476,059 | 8,376,709 | 975,194 | ||||||||||||||||||
| Commercial Bonds | 180,570 | — | — | — | 180,570 | 21,021 | ||||||||||||||||||
| Subordinated Bonds | 118,476 | 19,979 | 15,854 | 763,201 | 917,510 | 351,304 | ||||||||||||||||||
| Hedged Instrument | ||||||||||||||||||||||||
| Inflows | ||||||||||||||||||||||||
| Corporate Bond EUR | (1,626 | ) | (3,252 | ) | (47,854 | ) | (56,380 | ) | (109,112 | ) | — | |||||||||||||
| Corporate Bond HKD | (15,897 | ) | (105,828 | ) | (91,271 | ) | (309,896 | ) | (522,892 | ) | — | |||||||||||||
| Corporate Bond PEN | (1,682 | ) | (3,366 | ) | (3,366 | ) | (43,383 | ) | (51,797 | ) | — | |||||||||||||
| Corporate Bond CHF | (1,022 | ) | (249,008 | ) | (764 | ) | (121,521 | ) | (372,315 | ) | — | |||||||||||||
| Corporate Bond USD | (1,814 | ) | (3,629 | ) | (3,629 | ) | (46,260 | ) | (55,332 | ) | — | |||||||||||||
| Obligation USD | (427 | ) | (60,047 | ) | — | — | (60,474 | ) | — | |||||||||||||||
| Corporate Bond JPY | (39,338 | ) | (4,249 | ) | (4,249 | ) | (242,020 | ) | (289,856 | ) | — | |||||||||||||
| Corporate Bond AUD | (6,014 | ) | (12,024 | ) | (12,023 | ) | (264,901 | ) | (294,962 | ) | — | |||||||||||||
| Corporate Bond NOK | (2,646 | ) | (5,292 | ) | (5,292 | ) | (80,515 | ) | (93,745 | ) | — | |||||||||||||
| Outflows | ||||||||||||||||||||||||
| Cross currency swap EUR | 1,626 | 3,252 | 47,854 | 56,380 | 109,112 | — | ||||||||||||||||||
| Cross currency swap HKD | 15,897 | 105,828 | 91,271 | 309,896 | 522,892 | — | ||||||||||||||||||
| Cross Currency Swap PEN | 1,682 | 3,366 | 3,366 | 43,383 | 51,797 | — | ||||||||||||||||||
| Cross currency swap CHF | 1,022 | 249,008 | 764 | 121,521 | 372,315 | — | ||||||||||||||||||
| Cross currency swap USD | 1,814 | 3,629 | 3,629 | 46,260 | 55,332 | — | ||||||||||||||||||
| Cross currency swap USD | 427 | 60,047 | — | — | 60,474 | — | ||||||||||||||||||
| Cross currency swap JPY | 39,338 | 4,249 | 4,249 | 242,020 | 289,856 | — | ||||||||||||||||||
| Cross Currency Swap AUD | 6,014 | 12,024 | 12,023 | 264,901 | 294,962 | — | ||||||||||||||||||
| Cross Currency Swap NOK | 2,646 | 5,292 | 5,292 | 80,515 | 93,745 | — | ||||||||||||||||||
| Borrowings from financial institutions | 1,473,719 | 3,388,146 | — | — | 4,861,865 | — | ||||||||||||||||||
| Other obligations | 274,528 | 90 | — | — | 274,618 | — | ||||||||||||||||||
| Lease contracts | 26,400 | 29,056 | 16,449 | 23,765 | 95,670 | — | ||||||||||||||||||
| Services contracts | 16,288 | 1,424 | 12 | — | 17,724 | — | ||||||||||||||||||
| Obligations under repurchase agreements | 95,009 | — | — | — | 95,009 | — | ||||||||||||||||||
| Total | Ch$ | 30,746,998 | Ch$ | 5,887,212 | Ch$ | 1,819,012 | Ch$ | �� 4,263,845 | Ch$ | 42,717,067 | Ch$ | 1,347,928 | ||||||||||||
Capital Management
We managed our capital adequacy as efficiently as we can since we realize capital is a scarce resource provided by our shareholders and generated by us through the capitalization of both part of our net distributable earnings and the effect of inflation on our shareholders’ equity. In this regard, our senior management and board of directors consider capital management to be a crucial input for the definition, implementation and achievement of our strategic goals, as well as the way in which we can cover all the business-related risks.
Thus, through our capital management policy, the Bank seeks to:
| ● | Ensure our capital adequacy and the quality of our capital, on a consolidated basis, based on the management of business-related risks; |
| ● | Establish sufficient capital levels, through the definition of internal capital targets, in order to both support the achievement of our business strategy and face stress scenarios; |
| ● | Ensure compliance with the internal capital objectives in the short- and medium-term while complying with the requirements set by the regulator; |
| ● | Determine a suitable reporting regime to meet the internal and regulatory requirements; |
| ● | Provide corporate governance, in addition to specific roles and responsibilities for capital and risk management purposes. |
192
Capital Adequacy Requirements
Beginning December 1, 2021 all the requirements related to the adoption of Basel III framework became in place for all Chilean banks, although considering the phase-in process for the adoption of diverse matters including: (i) adjustments to Common Equity Tier 1 Capital and risk-weighted assets, (ii) the requirement of buffers such as the conservation buffer and the systemic buffer, among others.
According to the General Banking Act, each bank must comply with the following capital requirements as a percentage of its risk-weighted assets, net of required allowances:
| ● | Common Equity Tier 1 Capital (CET1) above 4.5% of risk-weighted assets; |
| ● | Tier 1 Capital = CET1 Capital + Additional Tier 1 Capital (AT1) above 6.0% of risk-weighted assets; |
| ● | Tier 1 + Tier 2 above 8.0% of risk-weighted assets; |
| ● | Conservation Buffer of 2.5% of risk-weighted assets, to be fulfilled in a four-year period starting December 1, 2021 at 0.625% and increasing by the same amount on a yearly basis; |
| ● | Countercyclical Buffer of up to 2.5% of risk-weighted assets, to the extent applicable; |
| ● | Domestic-Systemically Important Banks (D-SIB) Buffer in the range of 1.0% to 3.5% of risk-weighted assets, to be fulfilled at 25% rate every year starting December 1, 2021, to the extent applicable; |
| ● | Pillar 2 Buffer of up to 4.0% of risk-weighted assets, to the extent applicable, to be fulfilled in a six-month timeframe. |
Banks should also comply with a leverage ratio, meaning CET1 Capital of at least 3% of their total risk assets, net of required allowances. If a bank is defined as a domestic-systemically important bank, the threshold for the leverage ratio could be subject to further requirement of up to 50% of the systemic buffer imposed over risk-weighted assets but over total risk assets.
For more information on capital requirements, capital tiers and guidelines associated with calculation of risk-weighted assets and buffers, see “Item 4. Information on the Company—Regulation and Supervision—Modifications to the General Banking Act.”
As of December 31, 2021, Banco de Chile fully complied with capital adequacy requirements by holding:
| As of December 31, 2021 | ||||||||
| Actual Ratio | Regulatory Limit | |||||||
| Common Equity Tier 1 | 12.97 | % | 6.625 | % | ||||
| Tier 1 Ratio | 13.97 | 8.125 | ||||||
| Total Capital Ratio | 17.30 | 10.125 | ||||||
| Leverage Ratio | 7.96 | % | 3.000 | % | ||||
193
The following table sets forth our minimum capital requirements and capital availability for Banco de Chile for the years ended December 31, 2020 and 2021, based on the requirements set by the CMF:
| ● | CET1 Capital over Total Risk Assets |
| As of December 31, | ||||||||
2020(1) | 2021(2) | |||||||
| (in millions of Ch$) | ||||||||
| CHILEAN GAAP: | ||||||||
| CET1 Capital | Ch$ | (1,462,634 | ) | Ch$ | (1,591,564 | ) | ||
| Excess over minimum CET1 Capital required | Ch$ | 2,263,634 | Ch$ | 2,631,452 | ||||
| (1) | Based on total risk assets and CET1 Capital measured under Basel I. |
| (2) | Based on total risk assets and CET1 Capital measured under Basel III. |
| ● | CET1 Capital over Risk Weighted Assets |
| As of December 31, | ||||||||
2020(1) | 2021(2) | |||||||
| (in millions of Ch$) | ||||||||
| CHILEAN GAAP: | ||||||||
| CET1 Capital | N/A | Ch$ | (2,158,425 | ) | ||||
| Excess over minimum CET1 Capital required | N/A | Ch$ | 2,064,591 | |||||
| (1) | Not required under Basel I. |
| (2) | Based on total risk-weighted assets and CET1 Capital measured under Basel III. |
| ● | Tier 1 Capital over Risk Weighted Assets |
| As of December 31, | ||||||||
2020(1) | 2021(2) | |||||||
| (in millions of Ch$) | ||||||||
| CHILEAN GAAP: | ||||||||
| Tier 1 Capital | N/A | Ch$ | (2,647,125 | ) | ||||
| Excess over minimum Tier 1 Capital required | N/A | Ch$ | 1,575,891 | |||||
| (1) | Not required under Basel I. |
| (2) | Based on total risk-weighted assets and Tier1 Capital measured under Basel III. |
| ● | Total Capital or Regulatory Capital over Risk Weighted Assets |
| As of December 31, | ||||||||
2020(1) | 2021(2) | |||||||
| (in millions of Ch$) | ||||||||
| CHILEAN GAAP: | ||||||||
| Total Capital or Regulatory Capital | Ch$ | (3,056,657 | ) | Ch$ | (3,298,725 | ) | ||
| Excess over minimum Total Capital or Regulatory Capital required | Ch$ | 1,821,843 | Ch$ | 2,335,621 | ||||
| (1) | Based on total risk-weighted assets and Total Capital or Regulatory Capital measured under Basel I. |
| (2) | Based on total risk-weighted assets and Total Capital or Regulatory Capital measured under Basel III. |
Capital Expenditures
For information on our capital expenditures, see “Item 4. Information on the Company—History and Development of the Bank—Capital Expenditures.”
RECENT DEVELOPMENTS
As of the date of this annual report, there are no recent developments to report.
TREND INFORMATION
The following trends may have an impact on the Chilean economy and the economic growth of its trade partners, and could therefore affect the Chilean banking industry, and thus, could affect our business, operating results or financial condition:
194
Impact of COVID-19
Since the worldwide outbreak of COVID-19 began in early 2020, countries have responded by taking various measures aimed at, among other things, restricting mobility to avoid the spread of the virus. As of the date of this annual report, concerns about the effects of COVID-19 on worldwide economy continue to be present as new variant strains of varying degrees of severity appear from time to time. As such, the pandemic may continue to have a destabilizing effect on financial markets and economic activity, particularly for companies in the financial sector, such as us, as long as vaccine efficacy and the the global vaccination process do not perform or advance as expected. During 2021, the vaccination process in Chile was internationally recognized as having been successful. As such, the Chilean Government has gradually adjusted its “step-by-step” restriction program, which has been in effect since March 2020. The program includes five stages ranging from total restriction (lockdown) to advanced opening, depending on various factors, including the number of new cases per capita in a specific area, the size of the vulnerable population and its access to health services. In the first months of 2022, following the appearance of the Omicron variant, there was an increase in contagion rates across the country. Nevertheless, the local sanitary authorities were able to contain the new wave of COVID-19 in Chile and the need of imposing stricter mobility restrictions, such as lockdowns, by modifying the “step-by-step” status for specific neighborhoods, as needed, for certain periods of time. As of the date of this annual report, most of the Chilean communities are in an advanced stage of re-opening, which has permitted the reactivation of many economic sectors. As of the date of this annual report, approximately 93.5% of the Chilean population have received at least one dose of the vaccine, approximately 91.0% have received the total vaccination scheme and approximately 84.3% have received a booster dose.
From a macroeconomic point of view, the slow of the spread has also contributed to the reactivation of the Chilean economy throughout 2021, as reflected by the GDP expansion of 11.7%. This was a result of both the lifting of almost all mobility restrictions following mass vaccination, as well as of the extraordinary measures adopted by the Chilean Government and the Congress to assist people, which included three pension fund withdrawals and direct money transfers to face the sanitary contingency, all resulting in a boost in household consumption. Given the rebound in economic activity, the expectation for 2022 is a moderate GDP expansion in the range of 1.5% to 2.5%, according to the Chilean Central Bank. However, one of the consequences of the pandemic for the local economy is expected to be the higher inflation caused by the extraordinary aid measures deployed in 2020 and 2021, which could signify that CPI variation will stand at or above the upper boundary of the mid-term target range (2% - 4%), as defined by the Central Bank in 2022. As a consequence, the Central Bank is also expected to continue restricting the monetary supply by applying additional hikes to the monetary policy interest rate during 2022 from the 7.0% level as of the date of this annual report. These trends could lead to a reduced demand for loans from both individuals and companies while increasing the cost of funds for banks, which could impact our income generating capacity.
If the current COVID-19 outbreak evolves negatively, or if new variant strains of the COVID-19 virus, which have appeared in other countries, spread quickly and become difficult to control, financial institutions may face increased credit risk, market risk, strategic risk, operational risk, and compliance risk. This could also translate into lowered economic performance, liquidity constraints, reduced access to funding, and longstanding contingency plans in order to address the emergency. Likewise, given the way in which local and international financial markets and economic indicators, such as exchange rates, interest rates, credit spreads and commodity prices experienced increased volatility at the beginning of the COVID-19 outbreak, any shocks or unexpected movements in these market factors due to new variant strains could result in financial losses associated with our trading portfolio or financial assets measured at fair value through other comprehensive income.
For a discussion of the impact of COVID-2019 on our business in 2020 and related government measures, see “Item 5. Trend Information—Impact of COVID-19” in the Form 20-F for the year ended December 31, 2020 filed with the SEC on April 30, 2021.
Other Relevant Trends
We believe we have developed strong competitive advantages that will allow us to remain a relevant participant within the Chilean banking industry. We are continuously seeking additional improvements in matters such as operating efficiency, productivity, profitability and service quality by developing new customer oriented service models, launching new financial products and services and implementing high quality information technologies. Our business environment is increasingly competitive and an active market for mergers and acquisitions tends to encourage large financial groups. In addition, competition from non-banking companies, mainly those involved in the retail industry, has encouraged us to develop improved value propositions to satisfy our customers’ needs.
195
Unfavorable developments on the U.S.-China “trade-war” or the effects of Brexit could negatively affect global economic growth and adversely impact Chilean economic growth as a result of external forces affecting copper prices, the growth trends of Chile’s main trade partners or global trade. Any impact on the local economy would certainly affect the dynamics of the banking industry.
Political or diplomatic developments. Various political events are taking place around world, including administrations recently appointed or the upcoming elections in certain of the principal developed countries and various countries in Latin America, a redefinition of political and economic alliances and the emergence of radicalized political movements in other parts of the world. In addition, the latent threat of armed conflicts or terrorism in the Middle East and Asia, the ongoing tensions between the U.S. and Iran, the recent armed conflict between Russia and Ukraine in eastern Europe that threatens to become global, have contributed to global migration crises and political instability that have been managed in dramatically different ways by developed countries. Any negative development in these matters could result in the adoption of protectionist policies, immigration bans, restrictions on foreign trade or prohibitions on business with specific investors in particular countries or within certain countries. If any of these risks materialize, they could result in increased uncertainty and volatility in the international markets.
The Chilean economy and the Chilean financial system are also exposed to political, social and economic developments occurring in the country. In this regard, the current Constitutional Convention that is in charge of drafting a new constitution for Chile could introduce changes to the current political system and the economic model prevailing in Chile over the last 40 years. Accordingly, uncertainty regarding the final outcome could result in deteriorated business sentiment and consumer confidence, which could result in further slowdown of the Chilean economy by affecting both overall capital expenditures and household consumption.
We believe that Chile and its financial industry have demonstrated success in facing worldwide financial contingencies because of the strict fiscal policy, forward-looking and independent monetary policy, as well as strong regulation and supervision related to the financial industry.
In addition, the recent international trend of improved protection of consumers’ financial rights has become increasingly significant in Chile. If this trend leads to several and/or dramatic changes in the Chilean financial regulation, the banking industry could be adversely affected and, therefore, we could experience a negative impact on our future operating results.
For more information regarding the potential economic or regulatory factors that could affect our results of operations or financial condition, see “Item 3. Key Information—Risk Factors—COVID-19 or any other pandemic disease and health events will affect both the global and the Chilean economy, our business or results of operations and could affect our financial condition.”
196
OFF-BALANCE SHEET ARRANGEMENTS
In the normal course of business, we are party to a number of off-balance sheet arrangements that present credit, market and operational risks that are not reflected in our audited consolidated financial statements. These activities include commitments to extend credit not otherwise accounted for as contingent loans, such as overdrafts and credit card lines of credit, and long-term contractual obligations under operating leases or service contracts.
We provide customers with off balance sheet credit support through loan commitments. Such commitments are agreements to lend to a customer at a future date, subject to compliance with contractual terms. Since substantial portions of these commitments are expected to expire without us having to make any loans, total commitment amounts do not necessarily represent our actual future cash requirements. The amounts of these loan commitments were Ch$7,650,382 million as of December 31, 2020 and Ch$8,651,193 million as of December 31, 2021 and. See Note 28 to our audited consolidated financial statements as of and for the year ended December 31, 2021 appearing elsewhere in this annual report. The amounts of subscribed leasing contracts were Ch$120,556 million as of December 31, 2020 and Ch$147,861 million as of December 31, 2021.
Interest rate and cross-currency swaps, which are entered into in order to hedge our foreign investment portfolio, are recorded at their estimated fair market values. See Note 9 to our audited consolidated financial statements as of and for the year ended December 31, 2021 appearing elsewhere in this annual report.
The credit risk of both on and off-balance sheet financial instruments depends on many factors, including the value of collateral held and other security arrangements. To mitigate credit risk, we generally determine the need for specific covenant, guarantee and collateral requirements on a case-by-case basis, depending on the nature of the financial instrument and the customer’s creditworthiness. The amount and type of collateral held to reduce credit risk varies, but may include real estate, machinery, equipment, inventory and accounts receivable, as well as cash on deposit, stocks, bonds and other marketable securities that are generally held in our possession or at another appropriate custodian or depository. This collateral is valued and inspected on a regular basis to ensure both its existence and adequacy. Additional collateral is requested when appropriate. For further information, see Note 28 to our audited consolidated financial statements as of and for the year ended December 31, 2021 appearing elsewhere in this annual report.
Financial Guarantees
The following is a summary of the nominal value of instruments that are considered financial guarantees, and which are accounted for in off-balance sheet accounts:
| As of December 31, 2021 | ||||
| (in millions of Ch$) | ||||
| Performance bonds | Ch$ | 2,366,953 | ||
| Foreign office guarantees and standby letters of credit | 439,669 | |||
| Total | Ch$ | 2,806,622 | ||
Guarantees in the form of performance bonds, standby letters of credit and foreign office guarantees are issued in connection with agreements made by customers to counterparties. If the customer fails to comply with the agreement, the counterparty may enforce the performance bonds, standby letters of credit or foreign office guarantees as a remedy. Credit risk arises from the possibility that the customer may not be able to repay us for these guarantees.
As of December 31, 2021, the expiration of guarantees per period was as follows:
| Due within 1 year | Due after 1 year but within 3 years | Due after 3 years but within 5 years | Due after 5 years | Total | ||||||||||||||||
| (in millions of Ch$) | ||||||||||||||||||||
| Performance bonds | Ch$ | 1,539,049 | Ch$ | 727,280 | Ch$ | 91,089 | Ch$ | 9,535 | Ch$ | 2,366,953 | ||||||||||
| Foreign office guarantees and standby letters of credit | 388,065 | 46,459 | 21 | 5,124 | 439,669 | |||||||||||||||
| Total | Ch$ | 1,927,114 | Ch$ | 773,739 | Ch$ | 91,110 | Ch$ | 14,659 | Ch$ | 2,806,622 | ||||||||||
197
Item 6 Directors, Senior Management and Employees
DIRECTORS AND SENIOR MANAGEMENT
Directors
Our administration is conducted by our board of directors, which, in accordance with our bylaws (estatutos), consists of 11 directors and two alternate directors. The entire board of directors is elected every three years. Our current board of directors was elected in March 2020 and its term expires in March 2023.
Cumulative voting is permitted for the election of directors. Our chairman and our chief executive officer are appointed by our board of directors and hold their offices at its discretion. Scheduled meetings of our board of directors are held at least twice a month. Extraordinary board of directors meetings may be called by the chairman, when requested by a majority of the directors, or, in limited circumstances, when requested by a single director.
Our current directors are as follows:
| Director | Position | Committee Memberships | Age | |||||||
| Pablo Granifo L. | Chairman | 8 | 63 | |||||||
| Andrónico Luksic C. | Vice Chairman | 1 | 68 | |||||||
| Julio Figueroa | Vice Chairman | 2 | 50 | |||||||
| Alfredo Ergas S. | Director | 4 | 55 | |||||||
| Andrés Ergas H. | Director | 2 | 55 | |||||||
| Jean Paul Luksic F. | Director | 1 | 57 | |||||||
| Raul A. Anaya Elizalde | Director | 4 | 67 | |||||||
| Samuel Libnic | Director | 1 | 56 | |||||||
| Hernán Büchi Buc | Director | 2 | 73 | |||||||
| Francisco Pérez M. | Director | 4 | 64 | |||||||
| Jaime Estévez V. | Director | 4 | 75 | |||||||
| Paul Fürst G. | Alternate Director | 3 | 55 | |||||||
| Sandra Guazzotti | Alternate Director | 2 | 55 | |||||||
Pablo Granifo L. was re-elected as the chairman of our board of directors in 2020, a position which he has held since 2007. He was our Chief Executive Officer from 2001 to 2007, and previously, Chief Executive Officer of Banco A. Edwards from 2000 to 2001, commercial manager at Banco Santiago from 1995 to 1999 and corporate manager at Banco Santiago from 1999 to 2000. Mr. Granifo is also chairman of the board of directors of Banchile Administradora General de Fondos S.A., Banchile Asesoría Financiera S.A., Socofin S.A., a member of the executive committee of Banchile Corredores de Seguros Limitada. He is also chairman of Viña San PedroTarapacá S.A., and a member of the board of directors of Quiñenco S.A., Compañía Cervecerías Unidas S.A., Empresa Nacional de Energía Enex S.A., Embotelladoras Chilenas Unidas S.A. and Cervecera CCU Chile. Mr. Granifo is also a member of the Chilean Bank Association. He holds a degree in business administration from the Pontificia Universidad Católica de Chile.
Andrónico Luksic C. has been a director and the vice chairman of our board of directors since 2002 and was re-elected in 2020. Mr. Luksic is also chairman of LQ Inversiones Financieras S.A., Quiñenco S.A. and Compañía Cervecerías Unidas S.A., vice chairman of Compañía Sud Americana de Vapores S.A. (CSAV S.A.) and a member of the board of directors of Antofagasta plc (United Kingdom), Antofagasta Minerals,, Nexans S.A. and Invexans S.A. In addition to his corporate roles, Mr. Luksic is a founding member of the Advisory Board of the Panama Canal Authority and a member of the International Advisory Council of the Brookings Institution, the Chairman’s International Advisory Council of the Americas Society/Council of the Americas, the International Business Leaders’ Advisory Council for the Mayor of Shanghai, and the International Advisory Council of the China Investment Corporation. Mr. Luksic is also a founding member of the Harvard Global Advisory Council, and the Columbia University World Projects Advisory Council. He is a member of the Harvard Business School Latin American Advisory Board, the Dean’s Council of the Harvard Kennedy School, the Americas Executive Board of the MIT Sloan School of Management, the International Advisory Board of the Blavatnik School of Government at the University of Oxford, and the International Advisory Boards of Tsinghua University School of Economics and Management and the Fudan University School of Management. Mr. Luksic attended Babson College in the U.S., where he is an Emeritus member of the Board of Trustees. Andrónico Luksic and Jean Paul Luksic are brothers.
198
Julio Figueroa. has been a member of our board of directors since December 27, 2018, and was most recently re-elected as director and appointed vice chairman of the board in March 2020. He is Chief Executive Officer at Citi Latin America South –LAS– (Argentina, Chile, Colombia, Peru, Paraguay, Peru, Uruguay and Venezuela) based in Buenos Aires, Argentina. In addition to this role, he is also Head of Corporate & Investment Banking (CIB) for LAS Cluster. Mr. Figueroa joined Citi in Buenos Aires in 1994 in CIB after working for IBM Argentina in the finance division. Since then, from 1994-2001 he has held several roles in CIB Argentina as a senior banker covering Argentine clients in different industries. He moved to the Citi Latin America Regional Office in Miami, U.S.A. in 2001, as a senior corporate finance transactor in CIB, covering corporate clients in Latin America, and to Citi New York, United States, in 2004 as managing director, responsible for Financial Sponsors & Private Equity Clients for CIB Latin America. In 2010, Mr. Figueroa returned to Buenos Aires as CIB Head for Citi Argentina, a position he held until May 2014, when he was appointed Chief Executive Officer for Citi Peru and Vice President of the board of directors of Citibank del Peru S.A., responsible for the wholesale and the consumer businesses. In November 2015, Mr. Figueroa was named Chief Executive Officer for Citi in Argentina, where he led a significant transformation of the franchise, both in the wholesale and consumer businesses. In January 2017, in addition to his role as Chief Executive Officer of Citi Argentina, he became head of Southern Cone (Argentina, Uruguay and Paraguay) and CIB Head for Southern Cone. In January 2020, he expanded his responsibility and became head of Latin America South LAS (Argentina, Chile, Colombia, Ecuador, Peru, Paraguay, Uruguay and Venezuela). Mr. Figueroa received his MBA finance degree from the CEMA University in Buenos Aires, a B.A. in business administration and a B.A. in accounting, both from Universidad Católica Argentina (U.C.A.) in Buenos Aires. He is a member of the Asociación Empresaria Argentina (AEA), Consejo Empresarial de América Latina (CEAL) in Argentina, Young President Organization (YPO) in Argentina, and Instituto para el Desarrollo Empresarial en Argentina (IDEA).
Raul A. Anaya Elizalde. was a member of our board of directors from 2008 to 2013, and was re-elected to our board of directors in September 2020. Mr. Anaya is currently Chairman of the Board of Directors of Citibanamex Seguros S.A. de C.V. and Citibanamex Pensiones S.A. de C.V. in Mexico. Mr. Anaya worked at Citi for 32 years until his retirement in June 2019. Before retiring, he was the Corporate Head of In-Business AML (KYC) for Citibanamex, subsidiary of Citigroup in Mexico, from July 2017 to June 2019. From July 2015 to June 2017, Raul Anaya was the Corporate Head of Transformation for Citibanamex in Mexico. Before his role in Citibanamex, from July 2012 to July 2015, Mr. Anaya was the Citi CEO for Latin America Consumer and Commercial Banking. Prior to this, Mr. Anaya served as Head of Global Retail Banking immediately following his position as the COO of Citigroup’s Global Consumer Banking Council, which commenced in April 2010. He also served as CEO of Citigroup's businesses in Central America and the Caribbean starting in July 2008. From December 2005 to July 2008, Mr. Anaya was the CEO of Latin America’s (except Brazil and Mexico) Consumer Group. He was responsible for retail banking, credit cards, and consumer finance, after serving as Retail Head for Latin America since February 2005. From August 2003 to January 2005, he was Executive Director of Consumer Assets at Banamex in Mexico, responsible for mortgages, personal loans and vehicle financing. Prior to this position, Mr. Anaya served as Division Director for the Central Metropolitan Retail Banking Division at Banamex. From May 1999 to January 2002, he was Chairman and CEO of Banco Bansud S.A. (formerly a subsidiary of Banamex) in Argentina. Mr. Anaya joined Citibank at Banamex’s New York Agency in October 1987 and later became General Manager of the Banamex Agency in Los Angeles, Executive Vice-President of the Corporate Banking and International Division at California Commerce Bank, General Manager of the Banamex Agency in Houston and General Manager of the Banamex Agency in New York, in charge of its offices in the United States and Canada. Mr. Anaya Chaired the Board of Directors of most of Citi’s financial and subsidiary entities across all of Central America.
Alfredo Ergas S. has been a member of our board of directors since March 2017 and was re-elected in March 2020. Mr. Ergas is an independent director and was elected with the vote of the administrators of the Chilean pension funds. Mr. Ergas is chairman of the board of directors of Transportadora de Gas del Perú S.A. (Peru), and member of the board of directors of Grupo Costanera SpA and Transelec S.A. He is also a member of the board directors of non-profits, Corporation InBest and chairman of the Advisory Committee of the Faculty of Business and Economics of the Universidad de Chile. Previously, he acted as the Regional Chief Financial Officer of Enersis, where he also served in business development and as Controller. Previously, he was the Chief Financial Officer of Endesa Chile and Smartcom, a telecommunications subsidiary of Endesa Spain. He has also been Head of the Money Market Desk of Santiago S.A. Corredores de Bolsa. Mr. Ergas is a professor of finance at Universidad de Chile and holds a degree in business administration from Universidad de Chile and an MBA from Trium Global Executive, jointly issued by NYU, LSE and HEC.
199
Andrés Ergas H. was appointed member of our board of directors in 2017 and was re-elected in March 2020. Previously, he was an advisor to the board of directors since August 2014 until his appointment as director. Currently, he is chairman of the board of Nomads of the Seas, Todo Moda and Inersa 1 and Shmates. Previously, he was chairman and Chief Executive Officer of Banco HNS, chairman of the board of directors of Compañía General de Leasing and vice chairman of Factoring Finersa. He has also served on the boards of Banco de A. Edwards, Hotel Plaza San Francisco Kempinsky, BMW Chile, Inmobiliaria Paidahue, Mitsubishi Motors and Dina Trucks Co. Mr. Ergas was President and Founder of the Factoring Companies Association. He holds a degree in business administration from the Universidad Diego Portales.
Jean Paul Luksic F. was appointed member of our board of directors in April 2013 and was re-elected in March 2020. Mr. Luksic is vice chairman of Quiñenco S.A. and Sociedad Matriz SAAM S.A. Mr. Luksic has also been chairman of the board of directors of Antofagasta plc (United Kingdom) since 2004 and of Antofagasta Minerals S.A. Mr. Luksic was appointed to the board of directors of Antofagasta plc in 1990 and was the Chief Executive Officer of Antofagasta Minerals until his appointment as chairman of Antofagasta plc in 2004. He is also a member of the Consejo Minero, the industry body representing the largest mining companies in Chile. Mr. Luksic holds a B.Sc. degree in management and science from the London School of Economics and Political Science. Jean Paul Luksic is the brother of Andrónico Luksic.
Samuel Libnic has been member of our board of directors since April 2015 and was re-elected in March 2020. He has been the General Counsel for Citigroup Inc.’s operations in Latin America since 2007. In April 2010, he became a member of Citigroup Inc.’s Legal Management Committee and in January 2012, he was appointed to the Office of Vice President by the board of directors of Citibank, N.A. and as Senior Vice President of Citibank, N.A. in October 2019. In September 2013, the legal department of Banamex, Citigroup Inc.’s Mexican banking subsidiary, also began reporting to Mr. Libnic. Mr. Libnic’s current responsibilities include overseeing legal coverage for all Citibank’s products and businesses throughout Latin America and Mexico. Prior to becoming General Counsel for the Latin America region, Mr. Libnic held a number of positions since joining the company in 1996 as General Counsel of the Global Corporate and Investment Bank for Citibank Mexico, Grupo Financiero Citibank. In 2001, he was named Deputy General Counsel for Latin America, a position he held until he assumed his current role. From November 2010 until June 2013, Mr. Libnic also acted as head of the Legal Department for Citi Brazil (in addition to his regional role). Before joining Citigroup Inc., Mr. Libnic worked at Shearman & Sterling LLP in New York and with Basham, Ringe and Correa in Mexico. He holds a law degree with honors from the Anahuac University in Mexico, as well as an L.L.M. from Georgetown Law School, and is licensed to practice law in both Mexico and New York.
Hernán Büchi Buc was elected a member of our board in August 2019 and re-elected in March 2020. Previously, he served as an advisor to our board since 2008, and during 2007 he was a member of our board of directors. He is the founder and advisor of the Instituto Libertad y Desarrollo, and president of the Directive Council of Universidad del Desarrollo. Mr. Büchi is also a board member of Quiñenco S.A., and Falabella S.A. Between 1985 and 1989, Mr. Büchi served as the Minister of Finance, and prior to this, he served as the Superintendent of Banks from 1984-1985, Minister of Planning from 1983-1984, and Vice-Secretary of Health from 1980-1983. Mr. Büchi holds a degree in civil mining engineering from the University of Chile and a Master’s Degree from Columbia University.
Francisco Pérez M. has been a member of our board of directors since 2001 and was re-elected in March 2020. Since 1998, Mr. Perez has also served as the Chief Executive Officer of Quiñenco S.A. Mr. Pérez is also chairman of the board of directors of Compañía Sud Americana de Vapores S.A., Empresa Nacional de Energía Enex S.A., Invexans S.A., Hidrosur S.A. and Tech Pack S.A. He was formerly the Chief Executive Officer of Compañía Cervecerías Unidas S.A., of which he is still a director. Mr. Perez is a member of the board of directors of LQ Inversiones Financieras S.A., Embotelladoras Chilenas Unidas S.A., Cía. Cervecerías Unidas Argentina S.A., Cía. Pisquera de Chile S.A., Cervecera CCU Chile Limitada, Viña San Pedro Tarapacá S.A., Inversiones y Rentas S.A., Nexans (France), Sociedad Matriz SAAM S.A., Hapag-Lloyd A.G. (Germany) and member of the executive committee of Banchile Corredores de Seguros Limitada. Prior to 1991, Mr. Perez was Chief Executive Officer of Citicorp Chile and also was Vice President of Bankers Trust in Chile. Mr. Perez holds a degree in business administration from the Pontificia Universidad Católica de Chile and an MBA from the University of Chicago.
200
Jaime Estévez V. has been a member of our board of directors since 2007 and was re-elected in March 2020. He is also currently a member of the board of directors of Cruzados SADP. Previously, Mr. Estévez was chairman of the board of directors of Banco Estado, a Chilean state-owned bank. Additionally, he has served as a director of AFP Provida and AFP Protección, two Chilean pension fund investment companies, and as director of Endesa Chile S.A. Mr. Estévez was the Minister of Public Works from January 2005 to March 2006, and simultaneously, the Minister of Transportation and Telecommunications. He was also a congressman from March 1990 to March 1998 and President of the Lower Chamber of the Chilean Congress from March 1995 to November 1996. Mr. Estévez holds a degree in economics from the Universidad de Chile.
Paul Fürst G. has been a member of our board since November 2019 and was re-elected as first alternate director in March 2020. From 1998 to date, he has been a member of the board and partner at Grupo Plaza S.A., where he was also a member of the audit committee for two years, until April 2019. In addition, since 2009 he has been a partner and director of the mining company Ventana Minerals, since 2005 a partner and director of the mining and hydrogeology drilling company Terraservice, member of the board and partner of the goat products company Caprilac, and member of the board and partner of the agricultural company Comaihue. Previously, he was partner and member of the board at Parque Arauco S.A. for eleven years and director at the General Fund Manager WEG for two years. Mr. Fürst Gwinner is a commercial engineer from the Universidad de Las Condes. In addition, Mr. Fürst pursued the Senior Management Program (PADE) of the ESE Business School at the Universidad de los Andes.
Sandra Guazzotti has been a member of our board of directors since June 2019 and was re-elected as second alternate director in March 2020. Ms. Guazzotti is Head of Multi Country Region of Latin America at Google Cloud since November 2021 and has more than 20 years of global experience in IT and finance. Previously, Ms. Guazzotti led MCR Oracle between 2019 and 2021, and was General Manager of Oracle Chile twice, firstly between 2011-2014, and later in 2018. During her career at Oracle, she held the positions of Vice President of Investment Solutions and Financing for Asia – Pacific, based in Singapore, and Vice President of Corporate Sales in Japan. Prior to joining Oracle in 1999, she held various positions in the financial services industry, both in Japan and Argentina. Ms. Guazzotti holds degrees in International Relations from the University of Tsukuba, Japan and Senior Management (PADE) from Universidad de los Andes, Chile. Additionally, she has the Diploma of Directors of the Institute of Directors (IoD), United Kingdom. Ms. Guazzotti was distinguished as one of the “100 Women Leaders in Chile” by the organization Mujeres Empresarias and the newspaper El Mercurio (2011, 2018 and 2019). She is also the former President and member of the Board of Directors of the Chilean-American Chamber of Commerce (AmCham Chile). Ms. Guazzotti is also a member of Women Corporate Directors (WCD).
201
Senior Management
Our current executive officers are as follows:
Executive Officers | Position | Age | ||
| Eduardo Ebensperger O. | Chief Executive Officer | 57 | ||
| Rolando Arias S. | Chief Financial Officer | 57 | ||
| Alfredo Villegas Montes | General Legal Counsel and Secretary of the Board | 51 | ||
| Cristián Lagos C. | Manager — People and Organization Division | 56 | ||
| José Luis Vizcarra Villalobos. | Manager — Commercial Division | 63 | ||
| Felipe Echaiz B. | Manager — Global Compliance Division | 54 | ||
| Axel Fahrenkrog Romero. | Manager — Corporate Banking Division | 51 | ||
| Sergio Karlezi Aboitiz | Manager — Treasury Division | 56 | ||
| Oscar Mehech C. | Manager — Internal Audit Division | 57 | ||
| Paola Alam Auad | Manager — Wholesale Credit Risk Division | 59 | ||
| Julio Cubillo Navarro | Manager — Retail Credit & Global Risk Control Division | 46 | ||
| Claudia Herrera G | Manager — Marketing and Digital Banking Division | 51 | ||
| Esteban Kemp De La Hoz | Manager — Operations and Technology Division | 42 | ||
| Salvador Danel H. | Manager — Cyber Security Division | 48 | ||
| Nicolás Burr G. | Manager — Efficiency and Productivity Division | 46 |
Eduardo Ebensperger O. has been our Chief Executive Officer since May 2016. He has held several positions at Banco de Chile including manager of the Commercial Division from 2014 to 2016, manager of the Wholesale, Large Companies and Real Estate Division between 2008 and 2014 and manager of the Large Companies Division between 2005 and 2007. Between 2002 and 2005, he was the Chief Executive Officer of Banchile Factoring S.A. He originally joined Banco de A. Edwards in 1989, where he was appointed as the regional branch manager in 1997 until 1999 when he was appointed as manager of the Medium Sized Companies Division until 2001. He has also been the president of the board of directors of Artikos S.A. and a member of the board of directors of Banchile Securitizadora S.A. Currently, he serves on the boards of directors of Banchile Asesoría Financiera S.A., Banchile Administradora General de Fondos S.A., Banchile Corredores de Seguros Limitada and Socofin S.A. He is also member of the Advisory Council of the Faculty of Economics and Administration of the University of Chile. Mr. Ebensperger holds a degree in business administration from the Universidad de Chile.
Rolando Arias S. has been our Chief Financial Officer since June 2014. Prior to this position, Mr. Arias was manager of the Research and Planning Area. He served as manager of the Financial Control Area of Banco de Chile after its merger with Banco de A. Edwards from 2002 to 2006. Before this merger, Mr. Arias was in charge of the Planning Area of Banco de A. Edwards from 1997 to 2001. Mr. Arias joined Banco de A. Edwards in 1987 and until 1997 he held various positions related to controlling and planning. Mr. Arias holds a degree in business administration from Pontificia Universidad Católica de Chile.
Alfredo Villegas Montes. has been our General Counsel and Secretary of our board of directors since December 2019. Previously, he served as deputy general counsel since 2017. Before, he was head legal counsel for the Commercial Division since 2008. He joined Banco de Chile in 2002 as a result of its merger with Banco de A. Edwards, having joined the latter in 1994. Since January 2021, he has been the vice president of the legal affairs committee of the Chilean Banks Association. Mr. Villegas is an attorney and holds a law degree from the Universidad de Chile.
Cristián Lagos C. has been our People and Organization Division manager since May 2012. From 2008 to March 2012 he was the Corporate Human Resources and Reputational manager of Compañía General de Electricidad S.A. He was the Human Resources manager of Chilesat S.A. and corporate manager of Telmex S.A after those two companies merged. Previously, he was the Planning and Human Resources Division manager at Banco Sudaméricano, and later Scotiabank following the merger of these two banks. Currently, he is also member of the board of directors of Guillermo Subercaseaux Banking Studies Institute. Mr. Lagos holds a degree in psychology from the Universidad Diego Portales.
202
José Luis Vizcarra V. has been our Commercial Division Manager since January 2020. Mr. Vizcarra joined Banco de Chile in September 1977. As of the date of his most recent appointment, he was the Metropolitan Regional Manager, a position he held since 2017. Previously, he served as regional area manager and zone manager in different locations throughout Chile, among other roles. Currently, he is a member of the boards of directors of Banchile Administradora General de Fondos S.A., Banchile Corredora de Seguros S.A. and Socofin S.A. Mr. Vizcarra has a technical degree in finance from Instituto de Estudios Bancarios Guillermo Subercaseaux, a graduate degree in corporate management from Universidad del Desarrollo, and a diploma in finance from Universidad de Buenos Aires.
Felipe Echaiz B. has been manager of our Global Compliance Division since January 2008. Mr. Echaiz previously worked for Citibank for ten years. Between 2004 and 2005 he was vice-president and Multinationals Cluster Group Head, and then served as Country Compliance Officer for Citigroup Chile between 2006 and 2007. In 2003 Mr. Echaiz was deputy director of the Anti-Money Laundering and Organized Crime Unit at the Public Prosecutor’s Office. At present, Mr. Echaiz is a member of the Compliance Committee of the Chilean Association of Banks. Mr. Echaiz is an attorney and holds a law degree from the Pontificia Universidad Católica de Chile and holds a master’s degree in finance and economics from the Universidad de Chile.
Axel Fahrenkrog Romero. has been the Head of Corporate Banking Division since July 2020. Prior to that, he was the multinational head since June 2016 at Banco de Chile. Before this position, he worked as the Multinational Unit Head at Citibank Chile since 2007, a position which he held in Banco de Chile upon the merger of Citibank and Banco de Chile. From 1995 to 2005, Mr. Fahrenkrog covered different positions within main local banks as the multinational and corporate relationship manager, and also as the group unit head in commercial banking. Currently, he is also a member of the board of directors of Banchile Asesoría Financiera S.A. Mr. Fahrenkrog holds a degree in Business Administration at Universidad de Valparaiso and an MBA from The University of Queensland, Brisbane, Australia.
Sergio Karlezi Aboitiz. has been the Manager of Treasury Division since December 2011. Previously, he was the Manager of Treasury between October 2009 and November 2011. From June 2006 to December 2008, Mr. Karlezi served as Head Trader of Citibank Chile, holding the same position at Banco de Chile until September 2009. Since 2000, he worked for six years as Executive Director of Santander Investment New York. Before that, Mr. Karlezi held positions as Head Trader in Chase Manhattan Bank (now J.P. Morgan) and Santander Investment Chile. Mr. Karlezi holds a degree in Industrial Civil Engineering from the Universidad de Santiago de Chile.
Oscar Mehech C. has been manager of our Internal Audit Division since July 2008. Before that, he was our Regulatory Policies Division manager in 2008, Global Compliance Division manager from 2006 until 2007 and deputy general counsel between 2004 and 2006. Prior to joining the Bank in 2002, he was deputy general counsel at Banco de A. Edwards, an institution that he joined in 1991. Mr. Mehech is also the vice chairman of the surveillance committee at Depósito Central de Valores S.A. He holds a law degree from Universidad de Chile and an MBA from Pontificia Universidad Católica de Chile.
Paola Alam A. has been manager of our Wholesale Credit Risk Division since September 2018. Before, she served as the acting Corporate Credit Risk Division Manager since August 2018. Previously, since 2006, she was manager of Banco de Chile’s Business Risk Area. Mrs. Alam initially joined the Risk Area of Banco de A. Edwards in 1994, where she served in several positions. She has experience in risk taking in all sectors from SME to corporations, and in the last few years she has served in charge of the Large Companies Area. Previously, she worked at Price Waterhouse. Mrs. Alam holds a degree in business administration from Universidad de Santiago de Chile.
Julio César Cubillo N. has been manager of our Retail Credit Risk Division since October 2018 and, since July 2020, has also been manager of our Global Risk Control Division. Previously, between May 2017 and July 2018, he was head of Credit Risk at BBVA Chile. Likewise, Mr. Cubillo was Global Head of Credit Risk for Consumer Finance line of business at BBVA Holding (Spain) and before that he was Global Head of Retail Credit Risk Tools at BBVA Holding (Spain), in which he continued serving between years 2011 and 2017. He started his career at Bankinter in Madrid developing several functions in the risk areas and segments during 11 years. Currently, he also is member of the board of directors of Socofin S.A. Mr. Cubillo is an economist from the Universidad Carlos III de Madrid (Spain), having also completed an executive development program at IESE Business School (Spain).
203
Claudia Herrera G. has been our Marketing and Digital Banking Division Manager since October 2019. Previously, she was the Division Manager in charge of Digital Transformation, a strategic program that she continues to lead. She joined Banco de A. Edwards in 2000, and in 2009, she assumed the position of Area Manager for Regional Large Businesses. In 2010 she became the Area Manager for Large Metro Businesses, Factoring and Comex, a position she held until June 2019 when she was named Division Manager of Large Metro Business, Factoring and Comex. Mrs. Herrera is also a member of the board of directors of Banchile Securitizadora S.A. She holds a degree in business administration from the Adolfo Ibáñez University.
Esteban Kemp D. has been manager of our Operations and Technology Division since August 2018. Before, he served as our acting manager of our Global Risk Control Division in March 2018. Prior to that, he had been the manager of the operational risk area since 2016. Mr. Kemp joined Banco de Chile in July 2016, after serving as senior manager at EY Chile. He had his first managerial position as a manager at Everis, in 2011. Mr. Kemp holds a civil engineer degree in computer science from the Universidad Austral de Chile and holds an MBA from the Universidad Adolfo Ibáñez.
Salvador Danel H. has been manager of our Cybersecurity Division since January 2019. During 2016 he was Cybersecurity Architect at Microsoft, responsible as a cybersecurity advisor for several organizations, cybersecurity assessments, compromise recovery activities and cloud planning. During 2015 he was Senior Security Manager at Accenture, responsible for the evaluation, planning and implementation of plans and processes related to cybersecurity for different industries. Between 2008 and 2014 he held the position of Senior Manager of Enterprise Risk Services at Deloitte, responsible for various areas, including, among others, cybersecurity practices to improve technology solutions, consulting services and business management, cybersecurity projects, define and develop corporate cybersecurity strategies. In addition, Mr. Danel is co-founder of Secure Information Technologies Consulting, responsible for, among other, defining the processes of the cybersecurity business (risk, threat and vulnerability management, incident management, hardening of infrastructure, forensic analysis, data classification, destruction of data and others), and IT and security assessment. Mr. Danel holds a bachelor’s degree in Information Technology Engineering from the Anahuac University (Mexico).
Nicolás Burr Garcia de la Huerta. has been manager of the Efficiency and Productivity Division since December 2020. Between 2015 and 2020, Mr. Burr served as Chief Financial Officer, member of the Executive Board of Hapag-Lloyd and supervisory board member of United Arab Shipping Company (UASC) in Hamburg, Germany. Previously, between 2009 and 2012, Mr. Burr was Chief Financial Officer of Madeco S.A. and member of the board of directors of Madeco Mills and Indalum SA. In 2012, Mr. Burr was appointed Chief Financial Officer of Compañía Sudamericana de Valopres (CSAV), a position he held until the beginning of 2015. Between 2000 and 2009, Mr. Burr served in diverse executive positions in Arauco in both Chile and Argentina. He is an Industrial Civil Engineer from Pontificia Universidad Católica de Chile (Santiago, Chile). Mr. Burr holds an MBA from the MIT Sloan School of Management and a Master of Public Administration from the London School of Economics.
204
COMPENSATION
The table below presents the amount of compensation, as established by our shareholders, to the members of our board of directors for the year ended December 31, 2021. These amounts include remuneration for services, fees for attendance at meetings of our board of directors, meetings of committees of our board of directors and meetings of board of directors of our subsidiaries, consulting services and travel expenses.
Name of Director | Remuneration | Fees for Attending Meetings of our Board of Directors | Fees for Attending Meetings of Committees of our Board of Directors and Meetings of the Board of Directors of our Subsidiaries(1) | Consulting | Total | |||||||||||||||
| (in millions of Ch$) | ||||||||||||||||||||
| Pablo Granifo Lavín | Ch$ | 618 | (2) | Ch$ | 55 | Ch$ | 370 | Ch$ | - | Ch$ | 1,043 | |||||||||
| Andrónico Luksic Craig | 179 | 15 | - | - | 194 | |||||||||||||||
| Raul A. Anaya Elizalde | 60 | 29 | 86 | - | 175 | |||||||||||||||
| Hernán Büchi Buc | 60 | 29 | 75 | - | 164 | |||||||||||||||
| Jaime Estévez Valencia | 60 | 29 | 113 | - | 202 | |||||||||||||||
| Sandra Guazzotti | 60 | 29 | 71 | - | 160 | |||||||||||||||
| Francisco Pérez Mackenna | 60 | 30 | 102 | - | 192 | |||||||||||||||
| Jean-Paul Luksic Fontbona | 60 | 20 | - | - | 80 | |||||||||||||||
| Alfredo Ergas Segal | 60 | 29 | 139 | - | 228 | |||||||||||||||
| Andrés Ergas Heymann | 60 | 26 | 86 | - | 172 | |||||||||||||||
| Samuel Libnic | - | - | - | - | - | |||||||||||||||
| Julio Figueroa | - | - | - | - | - | |||||||||||||||
| Paul Fürst Gwinner | 60 | 29 | 69 | - | 158 | |||||||||||||||
| Other Subsidiary Directors | - | - | 115 | 6 | 121 | |||||||||||||||
| Total | Ch$ | 1,337 | Ch$ | 320 | Ch$ | 1,226 | Ch$ | 6 | Ch$ | 2,889 | ||||||||||
| (1) | Includes fees paid to members of the Advisory Committee of Banchile Corredores de Seguros Ltda. of Ch$14 million. |
| (2) | Includes a provision of Ch$439 million, to account for an incentive which will be paid depending on the Bank’s results. |
For the year ended December 31, 2021 there were no fees paid for advisory services to the board of directors, while travel and other related expenses amounted to Ch$10 million.
Consistent with Chilean law, we do not disclose to our shareholders, or otherwise make public, information regarding the compensation of our executive officers. For the year ended December 31, 2021, the aggregate amount of compensation paid to our executive officers, including the executive officers of our subsidiaries, was Ch$4,233 million. Pursuant to the Chilean Corporations Law, our directors/audit committee must approve compensation plans, but we are not required to have a compensation committee. For the year ended December 31, 2021, no amounts were set aside or accrued by us to provide pension, retirement or similar benefits for our directors and officers. None of our directors is a party to any agreement with us or any of our subsidiaries that provides for benefits upon termination of his appointment as a director.
205
BOARD PRACTICES
Governance Practices
The board of directors delegates certain functions and activities to our committees to research, evaluate and report to the board of directors regarding specific matters which may affect our businesses.
The Directors/Audit Committee
The directors/audit committee’s primary objectives are to seek the efficiency, maintenance, application and functioning of our internal control systems and compliance with applicable rules and procedures governing our business; to identify and understand our business risks; to supervise the activities of Internal Audit, ensuring their independence from management; to serve as mediator and coordinator of tasks between the internal audit work and our independent auditors; to act as a communication channel between our internal audit team, our independent auditors and our board of directors; and to ensure the compliance with the duties set forth in Article 50 bis of the Chilean Corporations Law.
Our directors/audit committee is composed of three members appointed by the board of directors. The directors/audit committee is currently composed of the following individuals:
| ● | Alfredo Ergas S. (financial expert); |
| ● | Jaime Estévez V.; and |
| ● | Raúl Anaya E. |
Mr. Ergas was appointed to the directors/audit committee by our board of directors at the meeting held on March 23, 2017. Mr. Estevez was appointed as member of the directors/audit committee by our board of directors at the meeting held on April 12, 2007. Mr. Anaya was appointed to the directors/audit committee by our board of directors at the meeting held on April 8, 2021. Messrs Estevez and Ergas satisfy the independence requirements of both Chilean law and Rule 10A-3 under the Exchange Act and are full voting members of our directors/audit committee.
Mr. Anaya is exempt from the independence requirements of Rule 10A-3 of the Exchange Act pursuant to the exemption under Rule 10A-3(b)(1)(iv)(D). Pursuant to that exemption, Mr. Anaya is a non-voting member of our directors/audit committee with respect to all matters required to be addressed by our directors/audit committee under U.S. federal securities laws.
The directors/audit committee met 16 times (12 ordinary and 4 extraordinary meetings) during 2021. The budget of the directors/audit committee is approved annually at the ordinary annual shareholders’ meeting. The directors/audit committee satisfies the applicable requirements of the CMF and operates pursuant to a charter document. The CMF recommends that at least one of the members of the directors/audit committee be experienced with respect to the accounting procedures and financial aspects of banking operations. The directors/audit committee submits a report regarding its activities to our board of directors after each directors/audit committee meeting and presents an annual report at our ordinary annual shareholder’s meeting. As established in the directors/audit committee’s charter, the chief executive officer, the general counsel and the manager of our Internal Audit Division, or their respective deputies, shall also attend this committee’s meetings. The directors/audit committee may also invite other persons to attend meetings. The directors/audit committee may appoint independent personnel to carry out specific duties.
206
The directors/audit committee’s specific objectives include, among others:
| ● | Seeking efficiency, maintenance, application and functioning of our internal control systems, and compliance with rules and procedures; |
| ● | Supervising compliance with rules and procedures governing the banking business and identifying the business risks of our and our subsidiaries’ activities; |
| ● | Supervising the activities of our Internal Audit Division and ensuring its independence from management; |
| ● | Serving as an intermediator and coordinator of tasks between our internal audit work and our independent auditors, and acting as a communication channel between these teams and our board of directors; |
| ● | Proposing to the board of directors the independent auditors and the credit rating agencies to be proposed at the shareholders meeting; |
| ● | Analyzing the reports, content, procedures and scope of the revisions by our independent auditors and credit rating agencies; |
| ● | Analyzing the reports of internal audits and revisions and analyzing and reviewing the annual audit program; |
| ● | Analyzing the interim and annual financial statements; |
| ● | Analyzing our financial statements included in the Form 20-F; |
| ● | Gathering information on accounting changes occurring during the year and their effects; |
| ● | Reviewing issues affecting the internal control systems; |
| ● | Analyzing the remuneration systems and compensation plans for managers and executive officers; |
| ● | Analyzing the annual performance self-evaluation process; |
| ● | Analyzing related party transactions pursuant to Title XVI of the Chilean Corporations Law; |
| ● | Analyzing policies relating to operational risk and progress in the risk-management process and SOX self-evaluation; |
| ● | Analyzing and informing on matters related to the Global Compliance Division, principally regarding the revision of policies for detecting and sanctioning money laundering transactions; and |
| ● | Reviewing customer claims filed with the CMF and the Customer Defense Division of the Chilean Association of Banks and Financial Institutions. |
Portfolio Risk Committee
The portfolio risk committee is continuously informed regarding the composition, concentration and risk of our loan portfolio, from a global, sector-specific and line of business perspective.
Among several matters, the portfolio risk committee is responsible for:
| ● | Closely reviewing the performance of our principal debtors, past-due loan ratios, past-due loan indicators, write-offs and allowances for loan losses; |
| ● | Analyzing proposals for discussion with, and approval by, our board of directors with respect to credit policies; |
| ● | Reviewing and approving different methodologies to assess each portfolio; |
207
| ● | Calculating allowances for loan-losses and determining additional and anticyclical allowances and methodologies related to the Bank’s capital management; |
| ● | Reviewing and approving both the integral risks measurement and the credit risk appetite framework. |
The portfolio risk committee meets on a monthly basis and is composed of the chairman of our board of directors, two additional members of our board of directors, our chief executive officer; the manager of our Wholesale Credit Risk Division, the manager of our Retail Credit and Global Control Risk Division, the manager of our Commercial Division and the manager of our Risk Control and Information Management Area.
Credit Committees
Our governance structure relating to our credit evaluation process is based on our business segments and on the total requested. All credit committees are represented by qualified members with sufficient authority over credit approval limits.
Credit decisions are mostly made by different credit committees, the highest of which, in terms of lending limits, is the board loan committee. The Wholesale Credit Risk Division and the Retail Credit & Global Control Risk Division participate independently and autonomously, from the business divisions. The board loan committee meets on a weekly basis and reviews all transactions exceeding UF 750,000, as well as those transactions potential reputational risk for us, such as loans for education, not-for-profits entities, PEPs, etc. This committee is chaired by our Chairman and is comprised by all of our board members, our chief executive officer and the manager of our Wholesale Credit Risk Division or the Retail Credit and Global Control Risk Division, depending on the business’ segment requesting credit approval.
Additionally, for retail banking, we have loan committees that in exceptional cases review individual customers when they do not meet our customer profile policies, payment behavior requirements or maximum financing amounts.
Finance, International and Market Risk Committee
The main objectives of the finance, international and market risk committee are to continuously review and follow-up on the Bank’s capital basis, liquidity (funding and instruments negotiation), main financial positions and results, and to assess price and liquidity risks thereof. Thus, this committee oversees compliance with applicable regulations, procedures and our policies, also recommending and implementing finance guidelines and appropriate actions to address any contingencies. Likewise, it monitors the Bank’s balance sheet and any change it may suffer in accordance with applicable accounting and financial standards.
The finance, international and market risk committee meets at least monthly. Its permanent members are the chairman of the board of directors, four other members of the board of directors, the chief executive officer, the chief financial officer, the manager of our Treasury Division, the manager of our Wholesale Credit Risk Division and the manager of the market risk area.
The finance, international and market risk committee covers the following topics, among others:
| ● | Design, develop and continuous review of policies and procedures related to limits and alerts of financial positions and exposures, ensuring adequate control and disclosure to the board of directors; |
| ● | Review of the Bank’s annual Liquidity Plan and Price Risk limits framework; |
| ● | Ensure the compliance with the Bank’s Market Risk Management Policy, Liquidity Policy and Fair Value Policy; |
208
| ● | Prior to the board’s approval, review the risk appetite framework, the finance plans and the price risk plan; |
| ● | Continuously monitor financial exposures and market/liquidity risks, ensuring compliance with the board’s risk framework; |
| ● | Review methodologies, main assumptions and results of stress tests, ensuring coherence with the economic environment and financial markets, and to develop action plans to address such results if necessary; |
| ● | Monitor actual results of the different financial exposures, including the accuracy of our predictions and their impact on our positions; and |
| ● | Review the liability profile, including long-term funding provided by foreign investors, and the main credit exposures generated by the derivatives portfolio. |
Money Laundering and Financing of Terrorism Prevention Committee
The money laundering and financing of terrorism prevention committee was set up in April 2006 with the purpose of defining the policies and procedures that would comprise the asset laundering and financing of terrorism prevention system, as well as evaluating compliance and deciding on all matters related to these subjects.
This committee is composed of three board members, two of which must be independent. Additionally, the committee includes our chief executive officer, our general counsel and the chief executive officer of Banchile Administradora General de Fondos S.A., the manager of our Operations and Technology Division, the manager of our Internal Audit Division, the manager of our Global Compliance Division and the manager of our Anti Money Laundering Area as non-voting members.
The asset laundering and financing of terrorism prevention committee meets quarterly and among other functions as determined by our board has the following functions:
| ● | To approve the policies and procedures concerning the gathering of information on customers and their activities and the acceptance and monitoring of their accounts, products and operations; |
| ● | To approve policies and procedures concerning unusual transaction detection systems; formal channels of information to senior management; and monitoring, analysis and reporting mechanisms; |
| ● | To approve policies and procedures concerning surveillance methods and relations with correspondent banks; |
| ● | To approve policies and procedures concerning staff selection, training programs and codes of conduct; |
| ● | To approve the policies and procedures concerning money laundering and terrorism financing prevention; |
| ● | To approve policies and procedures relating to client segmentation, products and high risk areas and their treatment, including special guidelines related to monitoring and controlling transactions associated with PEPs; |
| ● | To approve policies and procedures relating to sanctions applied by the Office of Foreign Assets Controls (OFAC) to persons or countries listed under it; |
| ● | To designate persons related to the Unidad de Análisis Financiera (UAF) according to law 19.913; |
209
| ● | To review and analyze results to verify compliance with current policies and procedures; |
| ● | To be informed and aware of decisions relating to the number of suspicious transaction reports sent to the UAF; |
| ● | To consider activities developed to train staff in money laundering and terrorism financing prevention; |
| ● | To be informed and aware of technological and other types of projects relevant to the Global Compliance Division; and |
| ● | To inform our board of directors of regulatory changes related to the prevention of money laundering and financing of terrorism. |
Upper Operational Risk Committee
The Upper Operational Risk Committee addresses and validates any necessary change in the procedures, controls and IT systems that uphold our Bank’s operations, with the purpose of mitigating operational risks thereof, ensuring that the Bank, overall as well as its respective divisions and areas, properly manage and control these risks.
Among other matters, this committee is responsible for:
| ● | Approving our operational risk management model, ensuring the implementation of policies, rules, methodologies and associated procedures; |
| ● | Approving plans and initiatives for the development of the operational risk management model and monitoring it; |
| ● | Reviewing and approving operational risks within our integral risk measurement, also ensuring its review and validation by the Capital Management Committee and its approval by the board of directors; |
| ● | Reviewing and approving the operational risk appetite framework, defining metrics of acceptable levels of tolerance and appetite for operational risk and maintaining a permanent control over their compliance; |
| ● | Tracking the main incidents and operational events, their root causes, impacts and corrective measures; |
| ● | Ensuring the progress of the main action plans associated with incidents, events and operational risk assessments; |
| ● | Acknowledging and being permanently informed about the level of our exposure to operational risk and the main risks to which it is exposed; |
| ● | Understanding the main strategies to mitigate our most significant operational risks, whether they have materialized or not, and following up on the implementation of these strategies; |
| ● | Ensuring the long term solvency of the organization by avoiding those risk factors that may jeopardize the continuity of the Bank; |
| ● | Ensuring that the policies of operational risk, information security, business continuity and outsourcing services are aligned with the objectives and strategies of the Bank; |
210
| ● | Determining the development of new products and services, process changes or outsourcing, in those cases of greater complexity or impact; |
| ● | Informing our board of directors about the comprehensive operational risk management model and level exposure for the Bank´s operational risk, the main risks, events and action plans in this respect; |
| ● | Acknowledging the results of critical suppliers’ yearly evaluation and following up on any measures defined therein. |
This committee meets on a monthly basis, and is composed of the chairman and three additional members of our board of directors, our Chief Executive Officer, the manager of our Retail Credit and Global Control Risk Division, the manager of our Operations and Technology Division, the manager of our Commercial Division, the manager of our Cybersecurity Division and the manager of our Marketing and Digital Banking Division.
Capital Management Committee
The main function and objective of this committee is to evaluate, monitor and review the Bank’s capital adequacy under the principles set by the Bank’s Capital Management Policy and applicable risk appetite frame, safeguard that capital resources are adequately managed, that the principles set by the CMF in this respect are complied with, and the sustainability of the Bank’s business in the medium-term horizon.
Among other matters, the Capital Management Committee is responsible for:
| ● | Reviewing and updating, at least on an annual basis, the Capital Management Policy; |
| ● | Ensuring that the Bank counts with sufficient capital as may be required to properly manage its necessities in normal and stressed scenarios, in a three-year horizon. |
| ● | Reviewing the results of stress tests, the Bank’s risk appetite framework related to business and capital and the Bank’s Regulatory Capital (or Total Capital) self-evaluation report. |
| ● | Briefing the board of directors on the compliance of the Bank’s capital plan, the Banks’s risk appetite framework related to business and capital, and any variable affecting such parameters. |
This committee meets on a quarterly basis and is composed of two members of our board, the Chief Executive Officer, the Chief Financial Officer, the manager of our Wholesale Credit Risk Division, the manager of our Retail Credit and Global Control Risk Division and by the manager of our Financial Control of Treasury & Capital Area.
Leasing Committee
The main function of the Leasing Committee is to review the monthly evolution and results of our Leasing Area by means of a report that consolidates the management of the business divisions of the Bank.
This committee meets on a monthly basis and is composed of one or more directors appointed by the board of directors and our Chief Executive Officer as voting members. Other managers from business areas are appointed from time to time by this committee as non-voting members.
Factoring Committee
The Factoring Committee was set up in 2013, after the merger of Banchile Factoring S.A. with us. Its purpose is to analyze the evolution and results of our Factoring Area in terms of volume, prices, margins, provisions and expenses and analyze the factoring product for each business area of the Bank.
211
This committee meets on a monthly basis and is composed of one or more directors appointed by the board of directors and our Chief Executive Officer as voting members. Other managers from business areas are appointed from time to time by this committee as non-voting members.
Banchile Corredores de Seguros Executive Committee
The main purpose of the Banchile Corredores de Seguros Executive Committee is to analyze the growth and results of our insurance brokerage subsidiary.
This committee is composed of the chairman of our board of directors, one other member of our board of directors, our chief executive officer, the manager of our Commercial Division and the chief executive officer of Banchile Corredores de Seguros Ltda.
Committees composed of Banco de Chile’s senior management
The main committees composed of Banco de Chile’s senior management executives are:
Management Committee
The management committee, the highest coordinating body of our management, is chaired by our chief executive officer and composed by the managers of each of our divisions; its principal function is to discuss main strategic guidelines and to analyze the market and the banking industry.
This committee meets every two months and resolves issues relating to our internal policies and analyzes our performance. In this committee, numerous divisions exchange their points of view as to our business and prioritize joint initiatives. Each year, this committee outlines the foundations for our annual plan. After the individual annual plan for each business area is agreed upon by our chief executive officer and each division manager, under the coordination of our chief financial officer, the overall plan is submitted to our board of directors for approval. This committee also reviews progress and budgets for approved plans on a regular basis.
Disclosure Committee
In May 2003, we established the disclosure committee to ensure accurate market disclosure of our and our subsidiaries’ consolidated financial information. The members of the disclosure committee include our chief financial officer, our chief accountant, our chief legal counsel for international, financial and investment banking matters, the manager of our Wholesale Credit Risk division, the manager of our Retail Credit and Global Control Risk division, the manager of our Research and Planning Area, the manager of our Financial Control of Treasury & Capital Area and the manager of our Risk Follow-up Area. The manager of our Internal Audit Division may participate in this committee as well.
This committee meets quarterly, and its members are required to review annual, mid-year and quarterly financial reports and in general all financial information disclosed by us prior to each disclosure.
Ethics Committee
The Ethics Committee was established in 2005 to define, promote and regulate behavior of professional and personal excellence consistent with our philosophy and values to be followed by all our staff in order to meet the expectations of our customers.
To meet these goals and promote a culture of ethical behavior, the Ethics Committee sets policies on ethics and ensures their compliance, develops training plans related to ethics in our business, and reinforces positive behavior among our staff. The Ethics Committee also acts as a forum to address, discuss and resolve any conduct by our staff that is inconsistent with our values. This committee meets every four months and additionally, when necessary, upon receiving internal reports or complaints. It is chaired by the manager of our People and Organization Division and includes our general counsel, the manager of our Internal Audit Division, the manager of our Global Compliance Division, the manager of our Commercial Division, and the manager of our Operational and Technology Division.
212
Operational Risk Committee
The operational risk committee, at a management level, is responsible for initiating any necessary change in the procedures, controls and IT systems that uphold the Bank’s operations, with the purpose of mitigating operational risks thereof, ensuring that the Bank overall as well as its respective divisions and areas, properly manage and control these risks. Most of the responsibilities of our Upper Operational Risk Committee are also addressed, at a management level and as first instance, by the Operational Risk Committee.
This committee meets on a monthly basis, and is chaired by the manager of our Retail Credit and Global Control Risk Division, and includes our chief financial officer, the manager of our Cybersecurity Division, the manager of our Operational Risk Area, the manager of our Technological Risk Area, the manager of our Business Continuity, the manager of our Planning and PMO Area, the manager of our Large Companies Area, the manager of the Corporate Audit Area, the manager of our Operations Area, the manager of our Clients Area, the Head of the Legal Department and the sub-manager of our Operational Risk Management Area.
Quality Committee
This main objective of this committee is to generate strategic guidelines for decision-making on issues related to the attention of customers, through all channels available at the bank, by means of the analysis of customer perception and relevant competition. In addition, this committee supervises projects and initiatives aimed at increasing the permanence and referrals of our clients.
This committee meets every two months and is chaired by our chief executive officer, the manager of our Commercial Division, the manager of our Corporate Division, the manager of our Operations and Technology Division, the manager of our Marketing and Customers Division, the manager of our Clients and Phone-banking Area and the manager of the Consumer Business Area. The chairman of our board of directors and the deputy manager of our Consumer Experience Area also attend and participate in the meetings as permanent attendants.
Technical Committee for Internal Models Supervision and Development
This committee sets methodic guidelines to develop, follow-up and document diverse statistical models used throughout our Bank’s products focused on massive segments in order to assess their credit risk. It also safeguards the coherence between models and compliance of minimum satisfaction standards as required. Every model that must be approved by the Portfolio Risk Committee and by our board of directors must previously pass through a recommendation from this committee.
This committee meets on a monthly basis and is composed by the manager of our Retail Credit and Global Control Risk Division, the manager of the Risk Follow-up Area, the manager of the Research and Management Area, the manager of our Retail Business Development Area, the manager of our Risk Models Area, the deputy manager of our Retail and Model Follow-up Area, the deputy manager of our Big-Data and Regulatory Systems Area, the deputy manager of our Pre-approved Admissions Area, the deputy manager of our Regulatory Models Area, the deputy manager of our Infrastructure and Management Area, the deputy manager of our Risk Modeling Validation Area and our Retail Risk Department Chief.
Investment and Expenditures Committee
The main objectives of the Investment and Expenditures Committee are to review investment or expenditures related initiatives or projects amounting to more than UF12,500; to ensure that these investments or expenditures are consistent with our strategic plans; and to evaluate these new projects from an economic perspective, among others. Notwithstanding the foregoing, if a project involves the incremental disbursement of resources for more than UF25,000, this committee must request the approval of our board of directors.
213
This committee meets only in extraordinary sessions, on the dates determined by its chair. It is composed of our chief executive officer, our chief financial officer, the manager of the Administrative Area and the Manager of the Expenditure Control Area. If any technological project is to be approved, the manager of the Operations and Technology Division, the manager of the Technology and Infrastructure Area and the manager of the Planning and Project Management Office Area also participate.
Project Approval Committee
The main objectives of this committee are to approve technology initiatives or projects, whether investments or expenditures; to ensure that these investments or expenditures are consistent with our strategic plans; and to economically evaluate new projects, among others. Notwithstanding the latter, if a project involves the incremental disbursement of resources of more than UF12,500, this committee requires the approval of the Investment and Expenditures Committee.
This committee meets on a weekly basis or as extraordinary determined by its chair. Its members are the manager of the Operations and Technology Division (chairing this committee), the manager of the Administrative Area, the manager of the Expenditures Control Area and the manager of the Planning and Project Management Office Area.
Policies and Procedures
Our board of directors has approved policies and procedures addressing several matters. In addition, the Merger Agreement between us and Citibank Chile provided that as a general rule our board of directors would approve and implement certain policies and procedures relating to the operation of the joint entity. These policies are reviewed annually and updated as necessary.
As of the date of this annual report, our board of directors or, when applicable, our senior management, have approved policies and/or procedures regarding the following issues, among others:
● Anti-Money Laundering and Anti- Terrorism Finance Policy;
● Anti-Bribery and Foreign Corrupt Practices Act;
● Office of Foreign Assets Control;
● Insider Trading and Personal Investment Management Policy; Information Barriers;
● Regulation K—Debts Previously Contracted;
● Regulation K—Equity Activity;
● Regulation W (23 A/B);
● Code of Conduct;
● Fair Lending Policy;
● Loans to Directors and Senior Management; | ● Capital Management Policy
● Capital Expenditure Policy;
● Expense Management Policy;
● Accounting Policies and Procedures;
● Complex Products and Services Policy;
● Tax Standards for Tax Sensitive Transactions Policy;
● Tax Policy and Procedures;
● Fiduciary Policy;
● Mergers and Acquisitions Policy;
● Records Management Policy;
● Electronic Transportable Media Policy;
● Volcker Rule Policy; |
214
● Independent Research Policy;
● Related Parties Regular Transactions Policy;
● Charitable Donations Policy;
● Internal Audit Policy;
● Non-Discriminatory Access to Credit Product for Natural Persons Policy;
● Information Security and Cybersecurity Policy;
● Anti-Tying Policy;
● Mandatory Absence Policy;
● Compliance Policy/Program;
● Legal Entity Management Policy;
● Fraud Management Policy;
● Anti-Boycott Policy;
● Issue Tracking, Management and Escalation Process;
● Operational Risk Management Policy;
● Credit Risk Policy;
● Vendor Selection and Management Process;
● Web Site Standards Policy;
● Information Technology;
● Service Outsourcing Policy; | ● Market Risk Policy;
● Liquidity Risk Policy;
● Crime Prevention Model Policy;
● FATCA Policy;
● Fair Value Policy;
● Capital Management Policy;
● Compliance Program for Antitrust Regulation;
● Manual for Handling Information of Interest to the Market;
● PEPs Policy;
● Business Continuity (COB);
● Citi Information Security Standards;
● General Ledger Maintenance Policy;
● Quality Policy;
● Environmental Sustainability Policy;
● Sustainability Policy;
● Inclusion, Non-Discrimination and Diversity Policy;
● Anti-Trust Policy; and
● Conflict of Interest Management Policy |
215
EMPLOYEES
The following table shows a breakdown of our full-time, permanent employees at the dates indicated:
As of December 31, | ||||||||||||
2019 | 2020 | 2021 | ||||||||||
| Banco de Chile | 11,140 | 10,876 | 10,288 | |||||||||
| Subsidiaries | 2,422 | 2,258 | 1,996 | |||||||||
| Total | 13,562 | 13,134 | 12,284 | |||||||||
As of December 31, 2021, we had 12,284 employees (on a consolidated basis), of whom 8,997 (including Banco de Chile and subsidiaries) were unionized, representing 73.2% of the total employees of the Bank and its subsidiaries. As of the same date, all management positions were held by non-unionized employees.
Banco de Chile currently has 11 unions that collectively negotiate their bargaining agreements. Two of those unions are associated with our subsidiaries, Banchile Administradora General de Fondos, Banchile Corredores de Bolsa and Socofin. In the case of Banchile Administradora General de Fondos and Banchile Corredores de Bolsa (“Banchile”), there is only one union representing workers of both (“Banchile union”). The remaining nine unions represent the Bank’s employees and five of them negotiate as a single union (Federación de Sindicatos de Banco de Chile).
During 2016 we renegotiated existing collective bargaining agreements with the unions of three of our subsidiaries, Socofin and Banchile union. In the case of Socofin, we reached a four-year agreement, which expired in 2020. On December 31, 2016, our former credit pre-evaluation subsidiary (Promarket S.A.) was merged into the Bank. As a result, Promarket’s union was integrated into the Bank. Based on the last collective bargaining agreement signed by Promarket and its union in 2014, a new collective bargaining process between the Bank and the former Promarket union took place in November 2017. Following that negotiation, we reached a three-year agreement that expired in 2020.
In addition, during the first quarter of 2018, we renegotiated the collective bargaining agreement signed with the union associated with former employees of Citibank (before the merger between Citibank and Banco de Chile) and reached a three-year agreement expiring in December 2020. Also, it is worth mentioning that based on formerly signed contracts, during the second quarter of 2018 we renegotiated the collective bargaining agreement with the remaining unions representing the Bank’s employees, including Sindicato BAE and Federación de Sindicatos de Banco de Chile. As of December 2021, both unions represented 31.2% and 6.0% of our employees (on a consolidated basis), respectively.
During 2019, we carried out a collective bargaining process with Banchile’s union, reaching a three-year agreement, which is due to expire in 2022.
In 2020, we renegotiated the collective bargaining agreements with two of the Bank’s unions, particularly with those composed of former employees of Citibank and Promarket. We reached a three-year agreement expiring in November 2023. We believe that these agreements were a significant milestone in the relationship with our unions considering the current, challenging scenario and the uncertain social, economic and political context for the next few years. In addition, in March 2021 we successfully completed collective bargaining processes with Sindicato BAE, Federación de Sindicatos de Banco de Chile and Sindicato Banco de Chile, reaching a three-year agreement. As of December 2021, these three unions jointly represented 54.4% of our employees on a consolidated basis.
216
We believe all of these agreements reflect the satisfactory relationships between the Bank and its employees, while reinforcing our commitment to their career development. In this regard, we would like to emphasize our employees’ high level of commitment to the Bank and our customers during the challenging months that followed the social turmoil of October 2019 and after the COVID-19 outbreak in Chile. To reward these efforts, during December 2019 we granted a one-time bonus of Ch$500,000 to part of the staff, and introduced additional benefits to address transport problems due to the significant disruption we observed during the unrest. Additionally, we have taken care of our employees by promoting working remotely from home offices for those collaborators who do not need to stay at our headquarters or branches. In order to do that, we have acquired a significant number of laptops, which have been installed with world-class cybersecurity measures. Also, we have set up our contingency sites with proven health measures in order to avoid overcrowding, while utilizing other locations in order to provide our employees with even more space to carry out their tasks. Furthermore, due to the increase in our consolidated net income for the year ended 2021, as compared to 2020, during 2021 we granted a special performance bonus to our staff in order to recognize the effort and commitment of our employees in the context of the COVID-19 pandemic, with a big portion of our staff working from home.
See “Item 8—Financial Information—Legal Proceedings—Setting of Minimum Services and Emergency Teams in Case of a Strike,” for information on the setting of the Bank’s minimum services and emergency teams in case of a strike by our labor unions.
We have comprehensive personnel training and development programs that include internal courses on operational, technical and commercial matters, as well as participation in external seminars and conferences. In 2021, the total cost of training programs was approximately 0.2% of our consolidated personnel expenses. These expenses were associated with 1,911 training courses that were attended by 166,813 attendees. In addition, for the year ended December 31, 2021 the Bank granted 163 scholarships to staff members for specialization purposes.
We do not maintain any pension or retirement programs for the vast majority of our employees. We do, however, pay certain long-serving key employees a severance payment upon retirement. Although we have provided productivity bonuses to individual employees on a discretionary basis, we do not maintain a formal profit-sharing plan.
217
SHARE OWNERSHIP
Mr. Andronico Luksic and Mr. Jean Paul Luksic, members of our board of directors since March 2002 and April 2013, respectively, together with members of their family, control Quiñenco S.A. (“Quiñenco”). As of April 20, 2022, Quiñenco directly and indirectly owns 50% of LQIF, which in turns owns directly 46.34% of our outstanding shares and 4.81% through Inversiones LQ-SM Ltda. (“LQ-SM”). Quiñenco also directly holds 0.11% of our total common stock.
LQIF and LQ-SM are investment vehicles incorporated under Chilean law through which Quiñenco and Citigroup hold their ownership interests in Banco de Chile. As part of the strategic partnership between Citigroup and Quiñenco, they entered into a framework agreement which was included in our 6-K filed on July 20, 2007. Pursuant to this agreement and following the merger of Citibank Chile into Banco de Chile, Quiñenco and Citigroup became the shareholders of LQIF, the parent corporation of Banco de Chile, among other companies. LQ-SM is an investment vehicle whose major shareholder LQIF owns 99.99% of its shares.
As of April 20, 2022, Citigroup is the owner of 50% of LQIF and Quiñenco, directly and indirectly, owns 50% of LQIF. Regardless of any increase in participation by Citigroup, however, the framework agreement provides that Quiñenco will remain in control of LQIF and the corporations that are directly or indirectly controlled by LQIF. Accordingly, Quiñenco will maintain the power to elect the majority of the directors of LQIF and Banco de Chile.
None of our directors or senior management directly owns 1% or more of our outstanding common stock. Further, none of our directors (including Mr. Andronico Luksic and Mr. Jean Paul Luksic) or senior management have different or preferential voting rights with respect to the shares they own.
We do not have any arrangements for involving employees in our capital, including any arrangements that involve the issue or grant of options of our shares or securities.
In view of the cash dividend approved at our annual shareholders’ meeting held on March 28, 2019, SAOS repaid the Central Bank subordinated debt on April 30, 2019. See “Item 4. Information on the Company—History and Development of the Bank—The 1982-1983 Economic Crisis and the Central Bank Subordinated Debt.” As a consequence of such full payment, Sociedad Matriz del Banco de Chile S.A. (“SM-Chile”) is in the process of being liquidated and its shareholders, LQ Inversiones Financieras S.A. and Inversiones LQ SM Ltda., increased their direct shareholdings in our ordinary shares. Similarly, other shareholders of SM-Chile became our direct shareholders, which significantly increased the public float of our stock. As a result of the repayment SAOS was dissolved.
218
Item 7 Major Shareholders and Related Party Transactions
MAJOR SHAREHOLDERS
Ownership Structure
As described in “Item 4. Information on the Company—History and Development of the Bank—History—The 1982–1983 Economic Crisis and the Central Bank Subordinated Debt,” the Chilean banking system, including us, experienced significant instability during that time that required the Central Bank and the Chilean Government to provide financial assistance to most Chilean private sector banks which resulted, pursuant to Law No. 18,818 enacted in 1989, in the repurchase by us of our portfolio of non-performing loans from the Central Bank and the assumption of the Central Bank’s subordinated debt relating to our non-performing loans.
In November 1996, pursuant to Law No. 19,396, our shareholders approved a reorganization by which the former Banco de Chile was converted into a holding company named Sociedad Matriz del Banco de Chile S.A (“SM-Chile”). In turn, SM-Chile organized a new wholly owned banking subsidiary named Banco de Chile, to which the former contributed all of its assets and liabilities, other than the Central Bank subordinated debt. In addition, SM-Chile incorporated Sociedad Administradora de la Obligación Subordinada S.A. (“SAOS”), a wholly-owned subsidiary and special purpose legal vehicle created pursuant Law 19,396, whose only business purpose is to repay indebtedness to the Central Bank. In exchange for assuming the Central Bank debt, SAOS received from SM-Chile a certain portion of our shares as collateral, which as of April 30, 2019 represented 28.31% of our shares. Pursuant to applicable law and the bylaws of both SAOS and SM-Chile, the economic rights of our shares held by SAOS belonged to the Central Bank; however, their voting rights were exercised by the shareholders of SM-Chile at Banco de Chile’s shareholders’ meetings. On April 30, 2019, SAOS fully repaid the Central Bank subordinated debt. As a consequence, SAOS was dissolved. SM-Chile is currently in the process of being liquidated, and SM-Chile’s shareholders became our direct shareholders, which significantly increased our public float.
As a result, shares of Banco de Chile owned by SAOS and SM-Chile were distributed as follows:
| a) | the shares of Banco de Chile, owned by SAOS, and the proceeds obtained from the liquidation of any assets owned by SAOS at the time of their liquidation, were distributed among series A, B and D shareholders of SM-Chile pro rata based on the participation of each series in the total amount of series A, B and D shares. |
| b) | the shares of Banco de Chile owned by SM–Chile were distributed in the following proportions: |
| ● | Series A shareholders received one Banco de Chile share for each share they have in SM–Chile. |
| ● | Series D shareholders received one Banco de Chile share for each share they have in SM–Chile. |
| ● | Series E shareholders received one Banco de Chile share for each share they have in SM–Chile. |
| ● | The remaining shares of the Banco de Chile were distributed among the Series B shareholders. |
| c) | The proceeds of the liquidation of any other asset, after the full payment of any debt of SM-Chile on the date of its dissolution, will be distributed among all the shareholders of SM–Chile, on a pro-rata basis. |
As a consequence of the distribution of Banco de Chile shares among SM-Chile shareholders, LQ Inversiones Financieras S.A. and Inversiones LQ SM Ltda. increased their direct shareholdings in our ordinary shares from their prior direct shareholdings of 27.18% and 0.29%, respectively, to 46.344% and 4.806% in each case. LQIF and Inversiones LQ-SM Ltda. are vehicles incorporated under Chilean law through which Quiñenco S.A. and Citigroup hold their ownership interests in Banco de Chile. Additionally, Quiñenco S.A. has a direct shareholding of 0.1097% of our total common stock.
219
Major Shareholders
The following table sets forth certain information regarding the ownership of outstanding shares as of April 20, 2022 for the following:
| ● | each person or entity who is known by us to own beneficially more than 5% of our outstanding shares and LQIF. |
| ● | our directors and members of our executive management group, as a group. |
Ownership in Banco de Chile
(As of April 20, 2022)
Name | Amount Owned | Percentage | ||||||
| LQIF and LQ-SM(1) | 51,670,277,343 | 51.15 | % | |||||
| Directors and executive officers as a group(2) | 5,989,716,815 | 5.93 | % | |||||
| (1) | LQIF and LQ-SM hold 46.34% and 4.81%, respectively, of our shares. In connection with the framework agreement executed between Citigroup, Inc. and Quiñenco S.A. in July 2007 and following the merger of Citibank Chile into Banco de Chile, Citigroup became a shareholder of LQIF. As of April 20, 2022, Citigroup is the owner of 50% of LQIF, and Quiñenco directly and indirectly owns 50% of LQIF. Regardless of any increase in participation by Citigroup, however, the agreement provides that Quiñenco will remain in control of LQIF and the corporations that are directly or indirectly controlled by LQIF. Accordingly, Quiñenco will maintain the right to elect the majority of the directors of LQIF and Banco de Chile. As of December 31, 2021, members of the Luksic family or their affiliates beneficially owned 82.9% of the common shares of Quiñenco S.A. Mr. Andrónico Luksic and Mr. Jean Paul Luksic are members of our board of directors. |
| (2) | Percentage reflects direct and indirect share ownership, excluding the share ownership of Mr. Andronico Luksic and Mr. Jean Paul Luksic, members of our board of directors, whose direct and indirect ownership is reflected and discussed under the share ownership of LQIF and LQ-SM above. |
220
RELATED PARTY TRANSACTIONS
In the ordinary course of our business, we engage in a variety of transactions with certain of our affiliates and related parties. Financial information concerning these transactions is set forth in Note 40 to our audited consolidated financial statements as of and for the year ended December 31, 2021, appearing elsewhere in this annual report. In accordance with the Chilean Corporations Law, related party transactions in publicly held corporations and its affiliates are defined as every negotiation, act, contract or operation in which the corporation deals with any of the following persons: (i) one or more persons related to the corporation, in accordance with the Chilean Securities Law No. 18,045; (ii) a director, manager, administrator, main executive or liquidator of the corporation, acting on its own behalf or on behalf of third parties, or their respective husband or wife or any other person to which such director, manager, administrator, main executive or liquidator has a second degree relationship with (either by consanguinity or affinity); (iii) companies or corporations in which the persons mentioned in the previous item are owners, directly or through other juridical or natural persons, of 10% or more of its capital, or directors, managers, administrators or main executives; (iv) those established in the bylaws of the corporation or those identified by the directors committee on a well-founded basis, as the case may be, even in the event of those set out at the final paragraph of article 147; or (v) any person who has acted as a director, manager, administrator, main executive or liquidator of the corporation within 18 months of the relevant transaction.
We may only enter into transactions with related parties if (i) the purpose of the transaction is in our best interest, (ii) the transaction reflects prevailing market prices, terms, and conditions and (iii) the transaction complies with the requirements and procedures specified in the Chilean Corporations Law, which requires our board of directors to approve the relevant transaction based upon the criteria mentioned in items (i) and (ii) of this paragraph. In order for our board of directors to approve any such transactions, the related party involved in or negotiating the transaction must give prior notice to our board of directors.
A violation of these provisions shall not affect the transaction’s validity, but shall grant us, our shareholders or third parties an indemnification right to claim damages for the benefit of the company. The amount of damages claimed shall be equal to the sum of the benefits improperly obtained by the related party as a result of the relevant transaction. All board resolutions approving such related party transactions must be reported to our shareholders at the following ordinary annual shareholders’ meeting. Violations of this provision may result in administrative or criminal sanctions and civil liability to shareholders or third parties who suffer losses as a result of such violation.
The following transactions with related parties may be executed without complying with the requirements previously mentioned, subject to the prior approval of our board of directors: (i) transactions that are not considered material (for this purpose, an act or contract is deemed material if (1) it exceeds 1% of our paid-in capital and reserves and it also exceeds UF 2,000 or (2) it exceeds UF 20,000; and there is a presumption that all contracts celebrated within a period of 12 months constitute one single transaction, irrespective of whether they are executed in one or more separate transactions during such period of time); (ii) transactions that, according to a general policy of customary transactions adopted by the board of directors of the corporation, are considered customary in connection with our corporate purpose; and (iii) transactions among corporations in which we own, directly or indirectly, at least 95% of the stake of the counterparty.
In connection with number (ii) above, on December 29, 2009, our board of directors established the following general policy which permits us to carry out certain transactions with related parties without the requirements and procedures set forth in the Chilean Corporations Law. The general policy adopted by our board of directors permits, among other things, transactions in the ordinary course of our business, such as opening current accounts, making deposits, extending loans or credit lines with or without collateral, factoring transactions, the sale and transfer of commercial paper, collections, payments and funds transfers, foreign exchange transactions and issuing letters of credit. This general policy has also been extended to our affiliates. Recent amendments to the Chilean Corporations Law enacted in mid-April 2021 established additional requirements to this general policy, as follows: (i) it must be previously assessed by the Directors/Audit Committee; (ii) it must comply with certain minimum requirements set forth by the CMF; and (iii) it may not authorize entering into agreements involving more than 10% of the assets of the company. In connection with number (ii), such minimum requirements have not yet been issued by the CMF as of the date of this annual report.
221
We believe that we have complied with the applicable requirements of the Chilean Corporations Law in all transactions with related parties and affirm that we will continue to comply with such requirements.
On July 19, 2007, Quiñenco, Citigroup Inc. and Citibank Overseas Investment Corporation entered into a Master Joint Venture Agreement (the “Framework Agreement”) that set forth the parameters of a partnership between Quiñenco and Citigroup Inc., including the eventual merger of Citibank Chile into us. The Framework Agreement provided that Citigroup Inc. would initially acquire a 32.96% equity interest in LQIF, our controlling shareholder, and would be entitled to increase its stake in LQIF to either 41.4778% or 50% through the exercise of several options. Citigroup Inc. could also be required to increase its stake in LQIF to 50% if Quiñenco exercised a put option under the Framework Agreement. The acquisition by Citigroup Inc. of its initial interest in LQIF occurred, with effect on January 1, 2008, under the terms of the Framework Agreement and the corresponding Merger Agreement between us and Citibank Chile dated December 26, 2007. For purposes of the Merger Agreement, the operations and businesses of Citibank Chile that were effectively contributed to us were deemed to represent 10.497% of the post-merger entity and, together with other assets and businesses contributed by Citigroup Inc. to LQIF, were the basis for the issuance by LQIF of the 32.96% equity interest in LQIF transferred to Citigroup Inc. As consideration for the merger, we issued and conveyed to LQIF (and indirectly, the holders of Citibank Chile shares) 8,443,861,140 no-par value “Banco de Chile-S” series shares (which, as of the date hereof, were converted into ordinary shares, by means of the amendment of the Bank’s bylaws).
Under the Framework Agreement, Quiñenco remains as the controlling shareholder of LQIF and therefore of us, while Citigroup Inc. is granted certain governance and other shareholder rights in LQIF. With respect to the governance rights in us, Citigroup Inc. had the right to name two directors to our 11-member board of directors (later amended as explained below), while Quiñenco maintained the right to appoint a majority of our board of directors. Citigroup Inc. also has the power to propose the appointment of certain of our executive officers (including our chief financial officer) and at least one representative on our directors/audit committees. Under this agreement, Citigroup Inc. was also granted certain veto rights over certain “fundamental strategic decisions” (as defined in the Framework Agreement), such as the delisting of our ADSs from the New York Stock Exchange or the delisting of our shares from the Santiago Stock Exchange and the Bolsa Electrónica de Chile, entry into new lines of business or large acquisitions, approval of related party transactions and changes to our bylaws or organizational documents. Furthermore, Citigroup Inc. agreed to purchase substantially all of the assets of our North American (i.e., Miami and New York) branches for U.S.$130 million. The Framework Agreement also sets forth a series of ancillary agreements proposed to be entered into by the parties to the Framework Agreement and some of their affiliates.
On December 31, 2007, we entered into an Asset Purchase Agreement with Citibank, N.A. (the “Asset Purchase Agreement”), whereby we sold substantially all of the assets and operations of our banking businesses in Miami and New York to Citibank, N.A. and Citibank, N.A. agreed to offer employment to substantially all of the employees in those branches and to assume substantially all of the liabilities related to such assets and operations. In consideration for this sale, we were paid an aggregate purchase price of U.S. $130 million, in addition to the assumption of liabilities. Following the completion of the sale, the Miami and New York branches were placed in voluntary liquidation in January 2008. In March 2008, the banking licenses for both branches were surrendered to the appropriate banking regulator.
On December 19, 2008, Quiñenco, Citigroup Inc. and Citibank Overseas Investment Corporation amended the Framework Agreement (the “2008 Amendment”), and through it the Shareholders’ Agreement mentioned below. The 2008 Amendment provided that if Citigroup Inc. did not acquire 8.52% of LQIF’s shares (to hold at least a 41.4778% ownership interest in LQIF) as a consequence of the actions and decisions of any relevant authority in the United States, Quiñenco shall have the right to compensation as provided in the 2008 Amendment, and Citigroup Inc. shall have the option of acquiring either a 41.4778% or a 50% interest in LQIF. Furthermore, the 2008 Amendment provided that if for any reason Citigroup Inc. did not exercise any of the call options mentioned in the previous sentence, Quiñenco or its affiliates, as applicable, shall be entitled to require Citigroup Inc. to sell to them a number of shares of LQIF such that, after such sale, Quiñenco shall directly or through its affiliates own an 80.1% ownership interest in LQIF. If this had occurred, Citigroup Inc.’s governance and other shareholder rights mentioned in the preceding paragraph should have been those provided in Clause Six of the Shareholders’ Agreement referred to below. Notwithstanding these provisions, on January 29, 2010, Citigroup Inc. exercised a call option to acquire 8.52% of LQIF’s shares and, on March 15, 2010, Citigroup Inc. exercised another call option to acquire an additional 8.52% of LQIF’s shares. Consequently, since April 30, 2010 Citigroup Inc. and Citigroup Overseas Investment Corporation indirectly own 50% of LQIF. As a result, since April 30, 2010, Citigroup Inc. has been granted certain corporate governance rights over us, as described above.
222
Effective January 9, 2014, Quiñenco Citigroup Inc. and Citibank Overseas Investment Corporation entered into an amendment to the Framework Agreement, and additionally Quiñenco, Citigroup Chile S.A. and other shareholders of LQIF entered into an amendment to the Shareholders’ Agreement (as defined below) (collectively, the “2014 Amendments”), to, among other things, reduce LQ Inversiones Financieras S.A.’s minimum shareholding in Banco de Chile (direct and indirect) from 58.33% to 51%. Prior to the 2014 Amendments, Citigroup had the right to appoint five of the permanent members of our board of directors, provided that the number of directors Citigroup had the right to appoint was reduced by the number of directors appointed by minority shareholders, subject to a minimum of one permanent director appointed by Citigroup. Pursuant to the 2014 Amendments, Citigroup maintains its right to appoint five of the permanent members of our board of directors, except that in the event our minority shareholders appoint five permanent directors and thus no person proposed by Citigroup can be appointed as a permanent director, then Citigroup shall have the right to appoint two alternate directors.
On December 27, 2007, Quiñenco, Citigroup Chile S.A. and the minority shareholders of LQIF entered into a shareholders’ agreement (the “Shareholders’ Agreement”) that formalized the rights of Citigroup Inc. with respect to the governance rights in us as set forth in the Framework Agreement (and as discussed in the preceding paragraphs). The Shareholders Agreement, as amended, became effective on January 1, 2008.
On December 27, 2007, we entered into the Global Connectivity Agreement with Citigroup Inc. The Global Connectivity Agreement enables us and our clients to become part of Citigroup’s global network and provides a framework for us and Citigroup Inc. to direct new business to both companies. The agreement sets forth the terms upon which we, Citigroup Inc. and our respective affiliates will develop a relationship with respect to cross-border business and certain related services (such as corporate and investment banking services, international personal banking services and global transactions services, among others). The parties agreed on the following principles with respect to implementing the terms of the agreement: (i) the promotion of global connectivity products among Chilean customers, (ii) the setup of a technology platform, (iii) the training of employees and officers and (iv) the construction of international support networks to carry out the transactions contemplated by the agreement. This agreement was replaced by the new Global Connectivity Agreement dated October 22, 2015, as mentioned below.
On December 27, 2007, we entered into a Cooperation Agreement with Citigroup Inc. with the purpose of providing a framework for the integration of Citibank Chile with us following the merger and ensuring a successful relationship between us and Citigroup Inc. In particular, the Cooperation Agreement establishes a communication mechanism between us and Citigroup Inc. to enhance the exchange of ideas and information related to the integration of our business with that of Citibank Chile and provides for certain specific areas of collaboration going forward (such as with respect to our hedging and derivatives strategies). This agreement was replaced by the new Cooperation Agreement dated October 22, 2015, as mentioned below.
On December 27, 2007, we also entered into a Trademark License Agreement with Citigroup Inc. in which Citigroup Inc. granted us a non-exclusive paid-up and royalty-free license to use certain of Citigroup Inc.’s trademarks in Chilean territory. In addition, Citigroup Inc. granted us a license to use its domain name solely in connection with marketing and promoting authorized services in Chilean territory. This agreement was replaced by the new Trademark License Agreement dated October 22, 2015 and, later, by the Amended and Restated Trademark License Agreement dated November 29, 2019, as mentioned below.
On September 25, 2009, we entered into a Master Services Agreement with Citigroup Inc. This agreement regulates and supplements certain reciprocal services that, before the merger between us and Citibank Chile, had been provided pursuant to the terms of certain service agreements then in effect between Citigroup Inc. (and certain of its affiliates) and Citibank Chile, which were assumed, after the merger, by us as legal successor to Citibank Chile. Furthermore, this agreement seeks to foster global connectivity with respect to the banking and financial services referred to in the Global Connectivity Agreement and in the other agreements executed with Citigroup Inc. mentioned above. This agreement has been restated and amended as further explained below.
223
On October 22, 2015 and effective January 1, 2016, we entered into a new Global Connectivity Agreement, a new Cooperation Agreement, and a new Trademark License Agreement with Citigroup Inc., replacing the original agreements mentioned above (the “2015 Global Connectivity Agreement”, “2015 Cooperation Agreement” and “2015 Trademark License Agreement”, respectively). Later, the 2015 Global Connectivity Agreement was amended on April 26, 2021 and August 31, 2021. As for the 2015 Trademark License Agreement, it was replaced by the Amended and Restated Trademark License Agreement dated November 29, 2019, for the same term as the 2015 Cooperation Agreement (the “2019 Amended and Restated Trademark License Agreement”).
On January 26, 2017, we entered into a new Master Services Agreement with Citigroup Inc. replacing the original agreement dated September 25, 2009, which expired on January 1, 2017. This agreement was retroactively effective on January 1, 2017 and has the same duration of the 2015 Cooperation Agreement as mentioned above. The new Master Services Agreement regulated certain reciprocal services to be provided by the parties and seeks to foster global connectivity with respect to the banking and financial services referred to in the 2015 Global Connectivity Agreement and in the other agreements executed with Citigroup Inc. This agreement was restated and amended on November 29, 2019 (the “2019 Amended and Restated Master Services Agreement”), and then again in 2021 as explained below.
The 2015 Global Connectivity Agreement, the 2015 Cooperation Agreement and the 2019 Amended and Restated Trademark License Agreement each have a duration period of two years and have been extended several times. The last time such agreements were extended was on August 31, 2021, when the parties agreed to extend their terms from January 1, 2022 to January 1, 2024. However, the parties may convene before August 31, 2023 to agree on an extension to these agreements for a new period of two years commencing on January 1, 2024 until January 1, 2026. In the event that the parties do not agree to an extension, these agreements will be automatically extended once for a period of one year starting January 1, 2024 until January 1, 2025, the date on which they shall terminate without any formality. If the parties agree to the two-year extension mentioned above, the same renewal procedure may be used by the parties to extend the agreements in the future, as many times as they agree. Likewise, on August 31, 2021, the parties entered into an Amended and Restated Master Services Agreement for the same term as the agreements mentioned above in this paragraph, which replaced the 2019 Amended and Restated Master Services Agreement.
On December 19, 2016, by means of a public deed signed before the Public Notary Mr. René Benavente Cash, Banco de Chile acquired all of the shares of Promarket S.A. (our subsidiary) held by our subsidiary Banchile Asesoría Financiera S.A. Pursuant to the Chilean Corporations Law Article 103 N° 2, after a period of ten days starting from the date of acquisition, Promarket S.A. was dissolved, and Banco de Chile became its legal successor.
On December 14, 2018, Banco de Chile and its affiliate Banchile Corredores de Seguros Limitada have entered with Banchile Seguros de Vida S.A. into two agreements, specifically, the Collective Debtor’s Life Insurance Agreement (“Contrato de Seguro Colectivo de Desgravamen”) and the Collective Debtor’s Life Total and Permanent Disability 2/3 Insurance Agreement (“Contrato de Seguro Colectivo de Desgravamen e Invalidez Total y Permanente 2/3”) both for mortgage loans. The aforementioned agreements were entered into pursuant to Article 40 of DFL 251 of 1931, General Regulation number 330 of the CMF and Order number 3,530 of the SBIF, both dated on March 21, 2012, according to which, the public bid for the Collective Policy for Life Insurances and Total and Permanent Disability 2/3 Insurance Agreement was awarded to Banchile Seguros de Vida S.A., who offered in both cases the lowest rates at 0.0101% per month and 0.0103% per month, respectively, including a 14.00% fee for the insurance broker, Banchile Corredores de Seguros Limitada. Similar agreements were subscribed previously with these affiliates on December 12, 2016. For further information see “Item 7. Major Shareholders and Related Party Transactions” in our annual report on Form 20-F for the year ended December 31, 2019 filed with the SEC on April 29, 2020.
On November 29, 2021, Banco de Chile (holder of a 29.63% share ownership) and all of the other shareholders of Operadora de Tarjetas de Crédito Nexus S.A. (“Nexus”), a company whose purpose is to provide credit card processing services, agreed to sell 100% of their shares in Nexus to a third party. The transaction is subject to the fulfillment of a series of conditions, including the authorization of the CMF and the approval of the Fiscalía Nacional Económica (Chilean Antitrust Prosecution Office).
224
In addition to the aforementioned regulation set forth in the Chilean Corporations Law, the CMF provides certain rules on related party transactions in Chapter 12-4 of the Recopilación Actualizada de Normas for purpose of regulatory lending limits. To some extent, such regulation differs from the Chilean Corporations Law in the treatment and definition of related party transactions. Further, in accordance with CMF’s Compendium of Accounting Standards, a note addressing our transactions with related parties must be included in our audited consolidated financial statements. Such note has to comply with the aforementioned CMF rules on related parties and must be prepared in accordance with Chilean GAAP as issued by the CMF.
For more information on our transactions with related parties, see Note 40 to our audited consolidated financial statements as of and for the year ended December 31, 2021, appearing elsewhere in this annual report.
Loans to Related Parties
As disclosed in Note 40(c) to our audited consolidated financial statements as of and for the year ended December 31, 2021 appearing elsewhere in this annual report, we incurred an aggregate of Ch$205,666 million in expenses and recorded Ch$224,814 million in income from transactions with related parties in 2021, other than loans.
As authorized by the General Banking Act, and within the regulatory lending limits, we hold several outstanding loans owed to us by related parties. All such loans:
| (i) | were made in the ordinary course of business; |
| (ii) | were made on terms, including interest rates and collateral, substantially the same as those prevailing at the time for comparable transactions with other persons; and |
| (iii) | did not involve more than the normal risk of collectability or present other unfavorable features. |
We held an aggregate of Ch$560,456 million in loans (before deducting allowances for loan losses) to related parties, including Ch$255,578 million in collateral pledged by related parties, as of December 31, 2021. See Note 40(a) to our audited consolidated financial statements as of and for the year ended December 31, 2021 appearing elsewhere in this annual report for details concerning on these transactions.
225
Item 8 Financial Information
CONSOLIDATED STATEMENTS AND OTHER FINANCIAL INFORMATION
Audited Consolidated Financial Statements
Please refer to “Item 18. Financial Statements.”
Legal Proceedings
We and our subsidiaries are subject to claims and are parties to legal proceedings in the normal course of business. A summary of certain current legal proceedings is below.
Charges brought under Securities Market Law
On October 30, 2014, the SVS (the former capital market regulator before its replacement by the CMF) imposed a fine of UF 50,000 (approximately U.S.$2 million as of December 31, 2014) on Banchile Corredores de Bolsa S.A. (“Banchile Corredores”), based on alleged infringement of Article 53 second paragraph of Law No. 18,045 for a specific transaction of SQM-A’s shares intermediated by Banchile in 2011. In this regard, Article 53 second paragraph of Law No. 18,045 provides that “…no person may engage in transactions or induce or attempt to induce the purchase or sale of securities, whether or not governed by this Act, by means of any misleading or deceptive act, practice, mechanism or artifice…” Banchile filed a claim against that fine with the Santiago Civil Courts requesting to void the fine.
On January 16, 2019, Banchile Corredores filed an inapplicability request with the Constitutional Court challenging the enforcement of the then applicable Article 29 of the Decree Law N° 3,538 and requested this court to render such provision as inapplicable in this process, on the grounds that it breaches the Chilean Constitution. On November 14, 2019, the Constitutional Court ruled in favor of Banchile Corredores rendering such provision as inapplicable.
On December 2019, the 22nd Santiago Civil Court issued its judgment on Banchile Corredores’ claim, reducing the fine to an amount of UF 7,500, approximately U.S.$275,000, as of December 2019. Both parties in these proceedings – Banchile Corredores and Consejo de Defensa del Estado (Chilean State Defense Board) – challenged this judgment through the procedures of appeal and nullity, both of which are currently pending in the Santiago Court of Appeals.
Banchile Corredores de Bolsa’s attorneys in charge of the claim believe that there are solid grounds to obtain a judgment in favor of Banchile Corredores de Bolsa S.A.
As of the date of this annual report, there are no new developments on this case.
Consumer Protection Claim
In March 2022, we were notified of a lawsuit filed by SERNAC on the grounds that: 1) the Bank allegedly charges certain expenses and judicial collection fees that, under SERNAC’s view, should be charged within applicable limits; and 2) certain contractual clauses should be declared as abusive. In the lawsuit, SERNAC requests the court to order the Bank to reimburse the purportedly overcharged expenses and fees and to apply the maximum legal fines. The Bank has contested this lawsuit, seeking its full dismissal in accordance with the terms and defenses set out in the Bank’s court filing, which was filed in April 2022. As of the date of this annual report, it is not possible to estimate the monetary amounts involved in this claim or to determine whether it could have a material impact on our results of operations.
226
Spanish Court’s Request to Chilean Judicial Authorities
Please refer to “Item 8. Financial Information–Legal Proceedings–Request from Spanish Court to Chilean Authorities” of the Bank’s Form 20-F for the year ended December 31, 2013, as filed with the U.S. Securities and Exchange Commission on April 25, 2014. As described therein, the applicable Spanish court sent a rogatory letter to the applicable Chilean judicial authorities in order to notify them that a lawsuit pending before the Spanish Court had been amended to add causes of action concerning concealment of assets and money laundering against our chairman and the former manager of our former New York branch and against us, Banchile Corredores de Bolsa S.A. and Banchile Administradora General de Fondos S.A., the latter three facing subsidiary civil liability only. The rogatory letter, among other items, requested a joint guarantee from the defendants in the amount of U.S. $77,348,374 and, if the aforementioned parties were not to grant such a joint guarantee, requested the attachment of assets of up to U.S. $103,131,165. In April 2012, the Spanish court temporarily dismissed such lawsuit on the grounds that Chilean judicial authorities were investigating the same matters and, therefore, should take lead on said investigation. Likewise, the Chilean judicial investigation, where no charges were filed against us or our related parties, was temporarily dismissed in January 2014. However, the Spanish investigation was reopened in 2021. As such, we hereby provide an update of the current status.
In January 2021, the Criminal Chamber of the National Audience of Spain, sustaining a petition from the plaintiff, ordered the reopening of this investigation and later the Spanish court requested that a new rogatory letter be sent to the Chilean judicial authorities, requesting that we, our subsidiaries, Banchile Corredores de Bolsa S.A. and Banchile Administradora General de Fondos S.A., and our Chairman be given notice of the reopening of this investigation.
In August 2021, the Chilean Supreme Court admitted this new rogatory letter, deciding that the information sent merely exhibits a dismissal and reopening of the investigation, and that it does not contain any substantive pronouncement that could affect the jurisdiction of the Chilean courts or Chile’s sovereignty. It is worth noting that the notice of the reopening of this investigation does not in any way make the persons so notified parties to the Spanish proceeding, nor does it imply the formulation of charges against them. Further, the competence and jurisdiction to hear the above-mentioned facts corresponds exclusively to the Chilean courts.
In January 2022, the Chilean Supreme Court received a rogatory letter from the applicable Spanish court, which as of this date is currently in process. This rogatory letter intends to notify the Chilean Supreme Court of the same lawsuit filed in that court, in relation to concealment of assets and money laundering against us, Banchile Corredores de Bolsa S.A., Banchile Administradora General de Fondos S.A. and our chairman, as described above.
Public Prosecutor Investigation Against Former Commander in Chief
In August 2021, the Chilean Public Prosecutor requested us to provide background information of our compliance with the crime prevention models set forth in local legislation and their implementation in relation to certain transactions carried out by the former Commander in Chief of the Chilean Army, Mr. Juan Miguel Fuente-Alba and his spouse. We also received supplementary requirements after the initial request.
These requests from the Chilean Public Prosecutor’s Office are due to an investigation of the purported criminal liability of legal entities or natural persons, other than Mr. Fuente-Alba and his spouse, who are currently defendants in criminal proceedings. Further, this investigation includes banks or financial institutions, and some related parties, who may have been involved in money laundering in connection with the criminal proceedings against Mr. Fuente-Alba.
We are cooperating fully in the investigation and providing the necessary documentation to the Chilean Public Prosecutor.
227
Dividends
General
We currently have a single series of common shares and the dividends on our shares are proposed by our board of directors and are approved by our shareholders at the ordinary annual shareholders’ meeting following the year with respect to which the dividends are proposed. Our ordinary annual shareholders’ meeting is required to be held in the first three months of each year. Following shareholder approval, the dividends are declared and paid. Dividends are paid to shareholders of record on the fifth business day preceding the date set for payment of the dividend. The applicable record dates for the payment of dividends to holders of our ADSs are, to the extent practicable, the same. Under the Chilean Corporations Law and regulations issued thereunder, Chilean publicly held corporations are generally required to distribute at least 30% of their consolidated annual earnings as dividends, except to the extent they have accumulated losses. Under the General Banking Act, a Chilean bank may pay dividends upon approval of its shareholders from (i) net earnings of previous fiscal years (i.e., interim dividends are not permitted), (ii) the reserve kept for that purpose or (iii) other funds permitted under Chilean law. In addition, in accordance with the modifications to the General Banking Act introduced in 2019, the amount of the dividends that may be paid by Chilean banks are limited if mandatory additional capital requirements, and/or additional counter-cyclical buffer capital that may be requested by the Central Bank, are not met. For more information on the modifications to the General Banking Act introduced in 2019 and the specific regulations issued by the CMF, see “Item 4. Information on the Company—Regulation and Supervision—Modifications to the General Banking Act.”
Cash Dividends
In March 2019, our shareholders at the ordinary annual shareholders meeting agreed to the distribution and payment of dividend No. 207 in the amount of Ch$3.52723589646 per ordinary share, with a corresponding charge to our 2018 net distributable income.
In March 2020, our shareholders at the ordinary annual shareholders meeting agreed to the distribution and payment of dividend No. 208 in the amount of Ch$3.47008338564 per ordinary share, with a corresponding charge to our 2019 net distributable income.
In March 2021, our shareholders at the ordinary annual shareholders meeting agreed to the distribution and payment of dividend No. 209 in the amount of Ch$2.18053623438 per ordinary share, with a corresponding charge to our 2020 net distributable income.
In March 2022, our shareholders at the ordinary annual shareholders meeting agreed to the distribution and payment of dividend No. 210 in the amount of Ch$5.34393608948 per ordinary share, with a corresponding charge to our 2021 net distributable income.
The following table sets forth the cash dividends declared per common share during the years ended December 2019, 2020 and 2021:
| As of and for the Year Ended December 31, | |||||||||||||||||||
| 2019 | 2020 | 2021 | 2021 | ||||||||||||||||
| (in Ch$, except percentages) | (in U.S.$) | ||||||||||||||||||
| Chile GAAP: | |||||||||||||||||||
| Dividend payout ratio(1) | 59.90 | % | 59.11 | % | 47.56 | % | ‒ | ||||||||||||
| Dividend per Common Share(2)–for shares not pledged to the Central Bank | Ch$ | 3.70 | Ch$ | 3.47 | Ch$ | 2.18 | U.S.$ | 0.0003 | |||||||||||
| Dividend per Common Share(2)–for shares pledged to the Central Bank(3) | 3.11 | ‒ | ‒ | ‒ | |||||||||||||||
| Average Dividend per Common Share | Ch$ | 3.53 | Ch$ | 3.47 | Ch$ | 2.18 | U.S.$ | 0.0003 | |||||||||||
| (1) | Dividends per share are calculated by dividing the amount of the dividend paid during each year by the previous year’s number of shares outstanding. |
| (2) | The Central Bank subordinated debt was fully paid on April 30, 2019. For more information, see both “Item 4 Information on the Company History and Development of the Bank The 1982-1983 Economic Crisis and the Central Bank Subordinated Debt” and “Item 7. Major Shareholders and Related Party Transactions—Ownership Structure.” |
| (3) | On April 30, 2019, the last installment of the subordinated debt was paid to the Central Bank. |
Whether future dividends will be paid will depend upon our earnings, financial condition, capital requirements, governmental regulations and policies and other factors. Accordingly, there can be no assurance that dividends in future years will be paid at a rate similar to dividends paid in past years.
228
On January 28, 2016, our Board of Directors decided to establish a provision for minimum dividends equivalent to 60% of the distributable net income generated each fiscal year, beginning January 2016 and onwards. On March 14, 2019, our Board of Directors resolved to establish a provision for minimum dividends equivalent to 60% of the distributable net income generated during the course of the year. For that purpose, the distributable net income was defined as the amount resulting from the net income for the relevant period minus the inflation effect (or inflation adjustment) on our paid-in capital and reserves, based on the Consumer Price Index variation between the previous month of calculation and the month of November of the previous year. Lastly, on March 12, 2020, our Board of Directors decided it would, for 2020 and onwards, maintain this net income calculation method to distribute as dividends for 2020, while agreeing to provision a 60% over the net income balance so calculated.
Stock Dividends
During 2019, no stock dividends, in the form of fully paid-in shares, were distributed to our shareholders.
During 2020, no stock dividends, in the form of fully paid-in shares, were distributed to our shareholders.
During 2021, no stock dividends, in the form of fully paid-in shares, were distributed to our shareholders.
Capital Increases
During 2019, no stock dividends, in the form of fully paid-in shares, were paid to our shareholders.
During 2020, no stock dividends, in the form of fully paid-in shares, were distributed to our shareholders.
During 2021, no stock dividends, in the form of fully paid-in shares, were distributed to our shareholders.
ADR Holders
Dividends payable to holders of our ADSs are net of conversion expenses of the depositary and are subject to Chilean Withholding Tax, currently set at the rate of 35%, subject to certain credits and ISFUT regime. For further information on these taxes and ISFUT see “Item 5. Operating and Financial Review and Prospects—Operating Results—Income Tax and Item 10. Additional Information—Taxation—Chilean Tax Considerations”. Owners of our ADSs are not charged any fees by us with respect to cash or stock dividends.
Pursuant to current Chilean foreign exchange regulations, a shareholder who is not a resident of Chile does not need to be authorized as a foreign investor in order to receive dividends, sale proceeds or other amounts with respect to its shares remitted outside Chile, but the investor must inform the Central Bank about any such transactions and must remit foreign currency through the Formal Exchange Market. See “Item 10. Additional Information—Exchange Controls” for additional information on how ADS holders may remit currency outside Chile.
SIGNIFICANT CHANGES
No significant changes in our financial condition have occurred since the date of the most recent audited consolidated financial statements included in this annual report.
229
Item 9 The Offer and Listing
Nature of Trading Market
Shares of our common stock are traded on all Chilean stock exchanges. Our shares have been listed on the Santiago Stock Exchange since 1894 and on the Electronic Stock Exchange since 1989. The Santiago Stock Exchange is the main trading market for our shares.
The Chilean securities markets are substantially smaller, less liquid and more volatile than major securities markets in the United States. The Santiago Stock Exchange, which is Chile’s main exchange, had a market capitalization of approximately U.S.$152,029 million as of December 31, 2021. As of the same date, the total annual trading turnover was approximately U.S$47,161 million while the average monthly trading turnover was approximately U.S.$3,930 million. The Santiago Stock Exchange was established in 1893 and is a private company whose equity consists of 48 million shares owned by 70 shareholders as of December 31, 2021. As of the same date, 194 companies by means of 209 series of stocks were listed on the Santiago Stock Exchange.
In addition, as reported by the Santiago Stock Exchange, the ten largest companies in terms of market capitalization represented approximately 49.3% of the Santiago Stock Exchange’s aggregate market capitalization as of December 31, 2021. As of the same date, the ten most traded companies accounted for approximately 64.2% of the Santiago Stock Exchange’s equity trading. During 2021 approximately 41% of the companies listed on the Santiago Stock Exchange had their shares traded on an average of 70% or more of the exchange’s trading days.
Our ADSs, each representing 200 shares of common stock, without nominal (par) value, have been listed on the NYSE since January 2, 2002 under the symbol “BCH”. JPMorgan Chase Bank is our depositary for purposes of the ADSs. As of December 31, 2021, a maximum of 5,316,195 ADSs were outstanding (equivalent to 1,063,239,000 shares of common stock or 1.05% of the total number of issued shares of common stock as of the same date). Since certain of our ADSs are held by brokers or other nominees, the number of record holders in the United States may not be fully indicative of the number of direct beneficial owners in the United States or of where the beneficial owners of such shares are resident.
On October 23, 2018 we announced a ratio change to our ADR program from one ADS per 600 of our common shares into one ADS per 200 of our common shares. This modification became effective on November 23, 2018, upon which ADR holders received two additional ADSs for each ADS held as of the record date of November 15, 2018. Additionally, the existing ADRs, continued to be valid as of the effective date and were not exchanged for new ones. In 2002 we listed our shares of common stock on Latibex. Trading of these shares started on October 8, 2002 under the code “XBCH,” grouped in trading units of 600 shares. Effective October 18, 2013, we voluntarily delisted our trading units from Latibex.
In addition, on December 20, 2002, we listed our trading units on the London Stock Exchange. Nevertheless, on December 22, 2015 we voluntary delisted our trading units from such exchange.
230
The table below shows, for the periods indicated, the annual, quarterly and monthly high and low closing prices (in nominal Chilean pesos) of the traded shares of our securities, labeled “Chile” series, on the Santiago Stock Exchange and the Electronic Stock Exchange:
| Santiago Stock Exchange | Electronic Stock Exchange | |||||||||||||||
| Period | High | Low | High | Low | ||||||||||||
| (Ch$ per share of our common stock)(1) | ||||||||||||||||
| Annual Price History | ||||||||||||||||
| 2016 | 79.3 | 68.6 | 80.0 | 68.7 | ||||||||||||
| 2017 | 100.4 | 76.9 | 104.0 | 75.0 | ||||||||||||
| 2018 | 105.3 | 94.6 | 105.0 | 99.0 | ||||||||||||
| 2019 | 105.5 | 79.0 | 106.0 | 79.0 | ||||||||||||
| 2020 | 88.5 | �� | 57.0 | 87.6 | 58.8 | |||||||||||
| 2021 | 89.8 | 66.4 | 89.8 | 66.5 | ||||||||||||
| 2022 (through April 20) | 90.0 | 68.8 | 87.9 | 68.6 | ||||||||||||
| Quarterly Price History | ||||||||||||||||
| 2016 | ||||||||||||||||
| 1st Quarter 2016 | 76.3 | 68.6 | 76.4 | 68.7 | ||||||||||||
| 2nd Quarter 2016 | 72.5 | 69.6 | 73.6 | 69.5 | ||||||||||||
| 3rd Quarter 2016 | 75.7 | 70.1 | 75.8 | 70.1 | ||||||||||||
| 4th Quarter 2016 | 79.3 | 73.7 | 80.0 | 73.4 | ||||||||||||
| 2017 | ||||||||||||||||
| 1st Quarter 2017 | 83.0 | 76.9 | 83.0 | 75.0 | ||||||||||||
| 2nd Quarter 2017 | 87.6 | 80.1 | 88.0 | 79.5 | ||||||||||||
| 3rd Quarter 2017 | 97.6 | 86.9 | 97.9 | 86.1 | ||||||||||||
| 4th Quarter 2017 | 100.4 | 87.8 | 104.0 | 87.5 | ||||||||||||
| 2018 | ||||||||||||||||
| 1st Quarter 2018 | 105.3 | 99.0 | 105.0 | 99.0 | ||||||||||||
| 2nd Quarter 2018 | 102.0 | 97.4 | 101.9 | 97.5 | ||||||||||||
| 3rd Quarter 2018 | 103.1 | 96.6 | 104.0 | 96.2 | ||||||||||||
| 4th Quarter 2018 | 101.3 | 94.6 | 100.9 | 95.5 | ||||||||||||
| 2019 | ||||||||||||||||
| 1st Quarter 2019 | 105.5 | 99.2 | 106.0 | 98.8 | ||||||||||||
| 2nd Quarter 2019 | 101.9 | 96.8 | 101.9 | 96.8 | ||||||||||||
| 3rd Quarter 2019 | 105.0 | 99.0 | 104.6 | 99.7 | ||||||||||||
| 4th Quarter 2019 | 103.0 | 79.0 | 103.0 | 79.0 | ||||||||||||
| 2020 | ||||||||||||||||
| 1st Quarter 2020 | 88.5 | 57.0 | 87.6 | 59.2 | ||||||||||||
| 2nd Quarter 2020 | 78.3 | 66.5 | 77.8 | 66.7 | ||||||||||||
| 3rd Quarter 2020 | 79.0 | 58.8 | 79.0 | 58.8 | ||||||||||||
| 4th Quarter 2020 | 75.0 | 59.2 | 76.5 | 59.4 | ||||||||||||
| 2021 | ||||||||||||||||
| 1st Quarter 2021 | 89.8 | 73.2 | 89.8 | 72.5 | ||||||||||||
| 2nd Quarter 2021 | 86.5 | 66.9 | 86.5 | 66.8 | ||||||||||||
| 3rd Quarter 2021 | 78.0 | 66.4 | 77.7 | 66.5 | ||||||||||||
| 4th Quarter 2021 | 83.5 | 66.6 | 83.1 | 67.5 | ||||||||||||
| 2022 | ||||||||||||||||
| 1st Quarter 2022 | 90.0 | 68.8 | 87.9 | 68.6 | ||||||||||||
| 2nd Quarter 2022 (through April 20) | 89.5 | 84.0 | 86.8 | 83.6 | ||||||||||||
| Monthly Price History | ||||||||||||||||
| November 2021 | 83.5 | 72.3 | 83.1 | 71.0 | ||||||||||||
| December 2021 | 78.5 | 66.6 | 79.3 | 67.6 | ||||||||||||
| January 2022 | 80.5 | 68.8 | 81.1 | 68.5 | ||||||||||||
| February 2022 | 86.5 | 79.2 | 85.9 | 79.6 | ||||||||||||
| March 2022 | 90.0 | 81.5 | 88.3 | 81.1 | ||||||||||||
| April 2022 (through April 20) | 89.5 | 84.0 | 86.8 | 83.6 | ||||||||||||
Sources: Santiago Stock Exchange and the Electronic Stock Exchange—Official Quotation Bulletins and Bloomberg.
| (1) | Pesos per share reflect nominal price at trade date. |
231
The table below shows the annual, quarterly and monthly high and low closing prices, as reported by the NYSE:
| New York Stock Exchange | ||||||||
| Period | High | Low | ||||||
| (U.S.$ per ADS)(1) | ||||||||
| Annual Price History | ||||||||
| 2016 | 72.48 | 56.27 | ||||||
| 2017 | 98.14 | 69.91 | ||||||
| 2018 | 105.50 | 27.88 | ||||||
| 2019 | 32.48 | 19.78 | ||||||
| 2020 | 22.40 | 13.62 | ||||||
| 2021 | 24.98 | 15.71 | ||||||
| 2022 (through April 20) | 22.62 | 16.26 | ||||||
| Quarterly Price History | ||||||||
| 2016 | ||||||||
| 1st Quarter 2016 | 65.35 | 56.27 | ||||||
| 2nd Quarter 2016 | 65.86 | 60.20 | ||||||
| 3rd Quarter 2016 | 69.30 | 63.31 | ||||||
| 4th Quarter 2016 | 72.48 | 66.32 | ||||||
| 2017 | ||||||||
| 1st Quarter 2017 | 74.95 | 69.91 | ||||||
| 2nd Quarter 2017 | 79.04 | 72.70 | ||||||
| 3rd Quarter 2017 | 92.99 | 77.89 | ||||||
| 4th Quarter 2017 | 98.14 | 80.64 | ||||||
| 2018 | ||||||||
| 1st Quarter 2018 | 105.50 | 98.75 | ||||||
| 2nd Quarter 2018 | 102.16 | 92.10 | ||||||
| 3rd Quarter 2018 | 95.00 | 84.54 | ||||||
| 4th Quarter 2018 | 91.41 | 27.88 | ||||||
| 2019 | ||||||||
| 1st Quarter 2019 | 32.48 | 28.74 | ||||||
| 2nd Quarter 2019 | 30.08 | 27.76 | ||||||
| 3rd Quarter 2019 | 29.60 | 27.46 | ||||||
| 4th Quarter 2019 | 28.84 | 19.78 | ||||||
| 2020 | ||||||||
| 1st Quarter 2020 | 22.40 | 13.62 | ||||||
| 2nd Quarter 2020 | 20.52 | 15.78 | ||||||
| 3rd Quarter 2020 | 19.91 | 14.91 | ||||||
| 4th Quarter 2020 | 20.82 | 14.95 | ||||||
| 2021 | ||||||||
| 1st Quarter 2021 | 24.98 | 20.12 | ||||||
| 2nd Quarter 2021 | 24.73 | 18.59 | ||||||
| 3rd Quarter 2021 | 19.84 | 17.15 | ||||||
| 4th Quarter 2021 | 20.25 | 15.71 | ||||||
| 2022 | ||||||||
| 1st Quarter 2022 | 22.62 | 16.26 | ||||||
| 2nd Quarter 2022 (through April 20) | 21.91 | 20.78 | ||||||
| Monthly Price History | ||||||||
| November 2021 | 20.25 | 17.65 | ||||||
| December 2021 | 18.68 | 15.71 | ||||||
| January 2022 | 20.07 | 16.26 | ||||||
| February 2022 | 21.68 | 19.48 | ||||||
| March 2022 | 22.62 | 20.68 | ||||||
| April 2022 (through April 20) | 21.91 | 20.78 | ||||||
Source: Bloomberg.
| (1) | One ADS represents 200 shares of common stock since November 23, 2018. Before that date, one ADS represented 600 shares of common stock. | |
| (2) | One Trading Unit represents 600 shares of common stock. |
232
Item 10 Additional Information
MEMORANDUM AND ARTICLES OF ASSOCIATION
Set forth below is a brief summary of the significant provisions of our estatutos (bylaws) and Chilean law. This description contains all material information concerning our shares, but does not purport to be complete and is qualified in its entirety by reference to our estatutos (a copy of which is filed as Exhibit 1.1 to this annual report), the General Banking Act, the Chilean Corporations Law and the Securities Market Law.
We are an open stock corporation and are registered with the Chilean Public Registry of Commerce of Santiago under Page 23,859 Number 18,638 of the year 1996, and authorized to operate as a bank by the CMF. The Chilean Corporations Law, the Securities Market Law and the General Banking Act set forth the rules and requirements for establishing, and operating banks in Chile, as well as shareholder rights in a Chilean bank. Additionally, the operation and the shareholder’s rights are also governed by the bank’s estatutos, which effectively serve as both the articles of incorporation and the bylaws of a company incorporated in the United States. Legal provisions in Chile take precedence over any contrary provision set forth in a corporation’s estatutos. Both the Chilean Corporations Law and our estatutos provide that legal actions by shareholders against us (or our officers or directors) to enforce their rights as shareholders or by one shareholder against another in their capacity as such are to be brought in Chile in arbitration proceedings.
The Chilean securities markets are principally regulated by the CMF under the Securities Market Law and the Chilean Corporations Law. In the case of banks, compliance with these laws is also supervised by the CMF.
Purpose
Our corporate purpose is to undertake all acts, contracts, business and transactions as the General Banking Act allows banking institutions to undertake, without prejudice to expanding or restricting our scope of action consistent with current legal precepts or such as may be established in the future.
Capitalization
As of April 20, 2022, there are 101,017,081,114 Banco de Chile shares outstanding of our capital stock. All of such shares are fully paid.
Our shares are no par value and full voting rights. There are no legal restrictions on the payment of dividends from our net income, except that we may only pay a single dividend per year (i.e., interim dividends are not permitted). Under the Chilean Corporations Law and regulations issued thereunder, Chilean public corporations are generally required to distribute at least 30% of their consolidated annual earnings as dividends, except to the extent they have accumulated losses. Under the General Banking Act, a Chilean bank may pay dividends upon approval of its shareholders from (i) net earnings of previous fiscal years (i.e., interim dividends are not permitted), (ii) the reserve kept for that purpose or (iii) other funds permitted under Chilean law. In addition, according to the General Banking Act the amount of dividends that may be paid by Chilean banks is limited if mandatory additional capital requirements, and/or additional counter-cyclical buffer capital requirements that may be requested by the Central Bank, are not met. For more information on the Chilean banking legislation, see “Item 4. Information on the Company—Regulation and Supervision—Modifications to the General Banking Act.”
Under Chilean law, the shareholders of a company, acting at an extraordinary shareholders’ meeting, have the power to authorize an increase in the company’s capital. When an investor subscribes for issued shares, the shares are registered in such investor’s name, even if not paid for, and the investor is treated as a shareholder for all purposes, except with regard to receipt of dividends and the return of capital. The investor becomes eligible to receive dividends or the return of capital once it has paid for the shares; if it has paid for only a portion of such shares, it is entitled to reserve a corresponding pro rata portion of the dividends declared with respect to such shares unless the company’s bylaws provide otherwise. If an investor does not pay for shares for which it has subscribed on or prior to the date agreed upon for payment, the company is entitled under Chilean law to auction the shares on a stock exchange and collect the difference, if any, between the subscription price and the auction proceeds. However, until such shares are sold, the subscriber continues to exercise all the rights of a shareholder (except the right to receive dividends or the return of capital). In the case of banks, authorized shares and issued shares that have not been paid for within the period fixed for their payment by the CMF are cancelled and are no longer available for issuance by the company.
233
The Chilean Corporations Law provides that the purchaser of shares of a company implicitly accepts its bylaws and any agreements adopted at shareholders’ meetings.
Directors
For a description of the provisions of our estatutos relating to our board of directors and our directors/audit committee, see “Item 6. Directors, Senior Management and Employees—Board Practices.”
Ownership Restrictions
Under the Securities Market Law and the regulations of the CMF, shareholders of open stock corporations are required to report the following to the CMF and the Chilean stock exchanges:
| ● | any direct or indirect acquisition or sale of shares that results in the holder’s acquiring or disposing of, directly or indirectly, 10% or more of an open stock corporation’s share capital; and |
| ● | any direct or indirect acquisition or sale of shares or options to buy or sell shares, in any amount, if made by a holder of 10% or more of an open stock corporation’s capital or if made by a director, liquidator, main officer, general manager or manager of such corporation. |
The foregoing requirements also apply to the acquisition or sale of securities or agreements which price or return depends or is conditioned (all or in a significant part) upon changes or movements in the price of such shares. The report shall be made the day following the execution of the transaction.
In addition, any person who acquires 10% or more of our shares must include in the report whether the purpose of the acquisition is to acquire control of the company or if the acquisition is just a financial investment. A beneficial owner of ADSs representing 10% or more of our share capital will be subject to these reporting requirements under Chilean law.
According to the regulations of the CMF, Chilean banks that issue ADSs are required to inform the CMF if any person, directly or beneficially, acquires ADSs representing 5% or more of the total amount of shares of capital stock issued by such bank.
Under the Securities Market Law and the regulations of the CMF, persons or entities intending to acquire control, directly or indirectly, of an open stock corporation, regardless of the acquisition vehicle or procedure, and including acquisitions made through direct subscriptions or private transactions, are also required to inform the public of such intention at least 10 business days before the date on which the transaction is to be completed, but, in any case, as soon as negotiations regarding the change of control begin or as soon as confidential information and documents concerning the target are delivered to the potential acquirer such delivery can occur through a filing with the CMF, the stock exchanges where its securities are traded, companies controlled by and that control the target and through a notice published in two Chilean newspapers, which notice must disclose, among other information, the person or entity purchasing or selling, the price and the material conditions of any negotiations.
Prior to such publication, a written communication to such effect must be sent to the target corporation, to the controlling corporation, to the corporations controlled by the target corporation, to the CMF and to the Chilean stock exchanges. Title XV of the Securities Market Law provides the definition of a controlling power, direct holding and related party.
In addition to the foregoing, Article 54A of the Chilean Securities Market Law requires that within two business days of the completion of the transactions pursuant to which a person has acquired control of a publicly traded company, a notice shall be published in the same newspapers in which the notice referred to above was published and notices shall be sent to the same persons mentioned in the preceding paragraphs, as well as posted on their websites, if any.
234
The provisions of the aforementioned articles do not apply when the acquisition is being made through a tender or exchange offer.
Title XXV of the Chilean Securities Market Law on tender offers and the regulations of the CMF provide that the following transactions must be carried out through a tender offer:
| ● | an offer which allows a person to take control of a publicly traded company, unless (i) the shares are being sold by a controlling shareholder of such company at a price in cash which is not substantially higher than the market price and the shares of such company are actively traded on a stock exchange and (ii) those shares are acquired (a) through a capital increase, (b) as a consequence of a merger, (c) by inheritance or (d) through a forced sale; |
| ● | an offer for a controlling percentage of the shares of a listed company if such person intends to take control of the parent company (whether listed or not) of such listed company, to the extent that the listed company represents 75% or more of the consolidated net worth of the parent company; and |
| ● | whenever a controlling shareholder acquires two-thirds of the voting shares of a listed company, such controlling shareholder must offer to purchase the remaining shares from the minority shareholders in a tender offer, unless (i) the controlling shareholder has reached two thirds of the voting shares through a tender offer for all of the shares of the company, or (ii) it reaches such percentage as a result of a reduction of the capital of the company by operation of law. |
Article 200 of the Chilean Securities Market Law prohibits any shareholder that has taken control of a publicly traded company from acquiring, for a period of 12 months from the date of the transaction in which it gained control of the publicly traded company, a number of shares equal to or greater than 3% of the outstanding issued shares of the target without making a tender offer at a price per share not lower than the price paid at the time of taking control. Should the acquisition from the other shareholders of the company be made on a stock exchange and on a pro rata basis, the controlling shareholder may purchase a higher percentage of shares, if so permitted by the regulations of the stock exchange.
Title XV of the Chilean Securities Market Law sets forth the basis to determine what constitutes a controlling power, a direct holding and a related party. The Chilean Securities Market Law defines control as the power of a person or group of persons acting (either directly or through other entities or persons) pursuant to a joint action agreement to direct the majority of the votes at the shareholders’ meetings of the corporation and to elect the majority of members of its board of directors, or to influence the management of the corporation significantly. Significant influence is deemed to exist in respect of the person or group of persons with an agreement to act jointly that holds, directly or indirectly, at least 25% of the voting share capital, unless:
| ● | another person or group of persons acting pursuant to joint action agreement, directly or indirectly, controls a stake equal to or greater than the percentage controlled by such person; |
| ● | the person or group does not control, directly or indirectly, more than 40.0% of the voting share capital and the percentage controlled is lower than the sum of the shares held by other shareholders holding more than 5% of the share capital (either directly or pursuant to a joint action agreement); or |
| ● | in cases where the CMF has ruled otherwise, based on the distribution or atomization of the overall shareholding. |
235
According to the Chilean Securities Market Law, a joint action agreement is an agreement among two or more parties which, directly or indirectly, own shares in a corporation at the same time and whereby they agree to participate with the same interest in the management of the corporation or in taking control of the same. The law presumes that such an agreement exists between:
| ● | a principal and its agents; |
| ● | spouses and relatives within certain degrees of kinship; |
| ● | entities within the same business group; and |
| ● | an entity and its controller or any of the members of the controller. |
Likewise, the CMF may determine that a joint action agreement exists between two or more entities considering, among other things, the number of companies in which they participate and the frequency with which they vote identically in the election of directors, appointment of managers and other resolutions passed at extraordinary shareholders’ meetings.
According to Article 96 of the Chilean Securities Market Law, a business group is a group of entities with such ties in their ownership, management or credit liabilities that it may be assumed that the economic and financial action of such members is directed by, or subordinated to, the joint interests of the group, or that there are common credit risks in the credits granted to, or in the acquisition of securities issued by, them. According to the Chilean Securities Market Law, the following entities are part of the same business group:
| ● | a company and its controller; |
| ● | all the companies with a common controller together with that controller; and |
| ● | all the entities that the CMF declares to be part of the business group due to one or more of the following reasons: |
| ○ | a substantial part of the assets of the company is involved in the business group, whether as investments in securities, equity rights, loans or guaranties; |
| ○ | the company has a significant level of indebtedness and the business group has a material participation as a lender or guarantor of such indebtedness; |
| ○ | the company is a member of a controlling group of any company of those mentioned in the first two bullets above and there are reasons grounded in ties in the ownership, management or credit liabilities to include it in the business group; or |
| ○ | the company is controlled by a member of the controller of any of the entities of the business group if the latter is formed by more than one entity and if there is more than one group of controlling entities and there are reasons grounded in ties in the ownership, management or credit liabilities to include it in the business group. |
The General Banking Act provides that, as a matter of public policy, no person or company may acquire, directly or indirectly, more than 10% of the shares of a bank without the prior authorization of the CMF, which may not be unreasonably withheld. The prohibition also applies to beneficial owners of ADSs. In the absence of such authorization, any person or group of persons acting in concert would not be permitted to exercise voting rights with respect to the shares or ADSs acquired. In determining whether or not to issue such an authorization, the CMF considers factors given by the General Banking Act.
The General Banking Act also requires the prior authorization of the CMF for the following transactions:
| ● | the merger of two or more banks; |
| ● | the acquisition of all or a substantial portion of a bank’s assets and liabilities by another bank; |
236
| ● | the control by the same person or controlling group of two or more banks; or |
| ● | a substantial increase in the share ownership by a controlling shareholder of a bank. |
Such prior authorization may be granted or rejected by the CMF, which is further authorized to set rules or specific requirements in that regard. For further information, see “Item 4. Information on the Company—Regulation and Supervision— Financial Market Commission.”
According to the General Banking Act, a bank may not grant loans to related parties on terms more favorable than those generally offered to non-related parties. Article 84 No. 2 of the General Banking Act and the regulations issued by the CMF provides that a natural person will not be considered related to the bank by the mere fact of owning up to 1% of the shares of such bank. Likewise, a legal person will not be considered to be related to the bank by the mere fact of owning directly, indirectly or jointly with other companies with which it forms a unit of economic interest, up to a 1% of the bank’s shares. The foregoing percentages shall be 5% in the case of shareholders, whether natural or legal persons, of a bank whose shares are traded on a stock exchange. Additionally, the General Banking Act imposes certain restrictions on the amounts and terms of loans made by banks to related parties. These provisions would also apply to beneficial owners of ADSs representing more than 1% or 5%, as applicable, of the shares. For further information, see “Item 4. Information on the Company—Regulation and Supervision—Lending Limits.”
Article 16 bis of the General Banking Act provides that the individuals or legal entities that, individually or with other people, directly control a bank and who individually own more than 10% of its shares must send to the CMF reliable information on their financial situation in the form and in the opportunity set forth in Resolution No. 3,156 of the CMF.
There are no limitations for non-resident or foreign shareholders to hold or exercise voting rights on the securities of a bank.
Preemptive Rights and Increases of Share Capital
The Chilean Corporations Law provides that whenever a Chilean company issues new shares for cash, it must offer its existing shareholders the right to purchase a number of shares sufficient to maintain their existing ownership percentages in the company. Pursuant to this requirement, preemptive rights in connection with any future issue of shares will be offered by us to the depositary as the registered owner of the shares underlying the ADSs. However, the depositary will not be able to make such preemptive rights available to holders of ADSs unless a registration statement under the Securities Act is effective with respect to the underlying shares or an exemption from the registration requirements thereunder is available.
We intend to evaluate, at the time of any preemptive rights offering, the practicality under Chilean law and Central Bank regulations in effect at the time of making such rights available to our ADS holders, as well as the costs and potential liabilities associated with registration of such rights and the related shares of common stock under the Securities Act, and the indirect benefits to us of thereby enabling the exercise by all or certain holders of ADSs of their preemptive rights and any other factors we consider appropriate at the time, and then to make a decision as to whether to file such registration statement. There can be no assurance that any registration statement would be filed. If we do not file a registration statement and no exemption from the registration requirements under the Securities Act is available, the depositary will sell such holders’ preemptive rights and distribute the proceeds thereof if a premium can be recognized over the cost of such sale. In the event that the depositary is not able, or determines that it is not feasible, to sell such rights at a premium over the cost of any such sale, all or certain holders of ADSs may receive no value for such rights. Non-U.S. holders of ADSs may be able to exercise their preemptive rights regardless of whether a registration statement is filed. The inability of all or certain holders of ADSs to exercise preemptive rights in respect of shares of common stock underlying such ADSs could result in such holders not maintaining their percentage ownership of the common stock following such preemptive rights offering unless such holder made additional market purchases of ADSs or shares of common stock.
237
Under Chilean law, preemptive rights are exercisable or freely transferable by shareholders during a period that cannot be less than 30 days following the grant of such rights. During such period, and for an additional 30-day period thereafter, a Chilean corporation is not permitted to offer any unsubscribed shares for sale to third parties on terms which are more favorable than those offered to its shareholders. At the end of such additional 30-day period, a Chilean open stock corporation is authorized to sell unsubscribed shares to third parties on any terms, provided they are sold on a Chilean stock exchange. Unsubscribed shares that are not sold on a Chilean stock exchange can be sold to third parties only on terms no more favorable for the purchaser than those offered to shareholders.
Shareholders’ Meetings and Voting Rights
An ordinary annual shareholders’ meeting is held within the first four months of each year. The ordinary annual shareholders’ meeting is the corporate body that approves the annual financial statements, approves all dividends in accordance with the dividend policy determined by our board of directors, elects the members of our board of directors and approves any other matter that does not require an extraordinary shareholders’ meeting. Extraordinary meetings may be called by our board of directors when deemed appropriate, and ordinary or extraordinary meetings must be called by our board of directors when requested by shareholders representing at least 10% of the issued voting shares or by the CMF.
Notice to convene the ordinary annual meeting or an extraordinary meeting is given by means of three notices which must be published in a newspaper of our corporate domicile (currently Santiago, Chile) previously determined by our shareholders at the ordinary annual meeting or, in the event an agreement is not reached in the previous ordinary annual meeting or the newspaper ceases to exist or has its distribution suspended for whatever reason, in the Official Gazette in a prescribed manner, and the first notice must be published not less than 15 calendar days nor more than 20 calendar days in advance of the scheduled meeting. Notice must also be given to the CMF, the Santiago Stock Exchange and the Chilean Electronic Stock Exchange. Currently, we publish our official notices in the El Mercurio newspaper of Santiago.
In the case of an ordinary annual shareholders’ meeting, shareholders holding a prescribed minimum ownership interest in us must be sent an annual report of our activities that includes audited consolidated financial statements. Shareholders who do not fall into this category but who request it must also be sent a copy of our annual report. In addition to these requirements, we regularly provide, and management currently intends to continue to provide, together with the notice of ordinary annual shareholders’ meeting, a proposal for the final annual dividend.
The quorum for a shareholders’ meeting is established by the presence, in person or by proxy, of shareholders representing at least an absolute majority of the issued shares. If a quorum is not present at the first meeting on first call, the meeting can be reconvened (in accordance with the procedures described in the previous paragraphs) and, upon the meeting being reconvened, shareholders present at the reconvened meeting are deemed to constitute a quorum regardless of the percentage of the shares represented.
The shareholders’ meetings pass resolutions by the affirmative vote of an absolute majority of those voting shares present or represented at the meeting. Approval by a two-thirds majority of the issued shares, however, is required at any shareholders’ meeting to approve any of the following actions:
| ● | a change in corporate form, merger or spin-off; |
| ● | an amendment to our term of existence, if any, or our early dissolution; |
| ● | a change in corporate domicile; |
| ● | a decrease of corporate capital previously approved by the CMF, provided it is not reduced below the minimum legal capital; |
| ● | the approval of capital contributions and appraisal of properties other than cash, in those cases where it is permitted by the General Banking Act; |
238
| ● | a modification of the powers of shareholders or limitations on the powers of our board of directors; |
| ● | a reduction in the number of members of our board of directors; |
| ● | the transfer of 50% or more of the corporate assets or the implementation or amendment of any business plan that contemplates the transfer of more than 50% of our corporate assets or the transfer of 50% or more of the assets of a subsidiary if such subsidiary represents at least 20% of our total corporate assets, as well as transfer of shares of such subsidiary which would make it lose such status; |
| ● | any non-cash distribution in respect of the shares; |
| ● | a change in the manner of distribution of profits established in our bylaws; |
| ● | the granting of guarantees to secure third-party obligations in excess of 50% of our corporate assets, unless granted to a subsidiary; |
| ● | the repurchase of our shares under the conditions set forth in Articles 27A and 27B of the Chilean Corporations Law; |
| ● | the correction of nullity caused by formal defects of any amendments to our bylaws; |
| ● | approval or confirmation of transactions with related parties, as set forth in Articles 44 and 147 of the Chilean Corporations Law; or |
| ● | certain other matters set forth in our bylaws. |
Shareholders may accumulate their votes for the election of directors and cast all of their votes in favor of one person.
In general, Chilean law does not require a Chilean open stock corporation to provide the level and type of information that U.S. securities laws require a reporting company to provide to its shareholders in connection with a solicitation of proxies. However, shareholders are entitled to examine the books of a company and its subsidiaries within the 15-day period before any ordinary annual shareholders’ meeting.
The Chilean Corporations Law provides that a Chilean company’s annual report must include, in addition to the materials provided by the board of directors to shareholders, the comments and proposals made by the directors’ committee, and, whenever shareholders representing 10% or more of the issued voting shares so request, such shareholders’ comments and proposals in relation to the company’s affairs. Similarly, the Chilean Corporations Law provides that whenever the board of directors of an open stock corporation convenes an ordinary annual shareholders’ meeting and solicits proxies for that meeting, or distributes information supporting its decisions or other similar material, it is obligated to include as an annex to its annual report any pertinent comments and proposals that may have been made by the directors’ committee and shareholders owning 10% or more of the company’s voting shares who have requested that such comments and proposals be so included.
Only shareholders registered as such with us on the fifth business day prior to the date of a meeting are entitled to attend and vote their shares. A shareholder may appoint another individual (who need not be a shareholder) as his proxy to attend and vote on his behalf. Every shareholder entitled to attend and vote at a shareholders’ meeting has one vote for every share subscribed, as we do not have special classes of shares with different voting rights.
239
Our shareholders’ meeting held in 2019 were:
| ● | The ordinary annual shareholders’ meeting held on March 28, 2019, where our shareholders agreed to the distribution and payment of dividend No. 207, in the amount of Ch$3.52723589646 per Banco de Chile common share, with a charge to 2018 net distributable income of Banco de Chile. |
Our shareholders’ meetings held in 2020 were:
| ● | The ordinary annual shareholders’ meeting held on March 26, 2020, where our shareholders agreed to the distribution and payment of dividend No. 208, in the amount of Ch$3.47008338564 per Banco de Chile common share, with a charge to 2019 net distributable income of Banco de Chile. |
Our shareholders’ meetings held in 2021 were:
| ● | The ordinary annual shareholders’ meeting held on March 25, 2021, where our shareholders agreed to the distribution and payment of dividend No. 210, in the amount of Ch$2.18053623438 per Banco de Chile common share, with a charge to 2020 net distributable income of Banco de Chile. |
As of April 20, 2022, the following shareholders’ meeting had been held:
| ● | The ordinary annual shareholders’ meeting held on March 17, 2022, where our shareholders agreed to the distribution and payment of dividend No. 211, in the amount of Ch$5.34393608948 per Banco de Chile common share, with a charge to 2021 net distributable income of Banco de Chile. |
Dividend, Liquidation and Appraisal Rights
For a description of the provisions of our estatutos related to our dividends, see “Item 8. Financial Information—Consolidated Statements and Other Financial Information—Dividends.”
Dividends that are declared but not paid by the date set for payment at the time of declaration are adjusted from the date set for payment to the date such dividends are actually paid, and interest is accrued thereon. The right to receive a dividend lapses if it is not claimed within five years from the date the dividend is payable, and the funds may be claimed by the Chilean treasury.
We may declare a dividend in cash or in shares. When a share dividend is declared above the legal minimum (which minimum must be paid in cash), our shareholders must be given the option to elect to receive cash. A holder of our ADSs may, in the absence of an effective registration statement under the Securities Act or an available exemption from the registration requirement thereunder, effectively be required to receive a dividend in cash. See “Item 10. Additional Information—Memorandum and Articles of Association—Preemptive Rights and Increases of Share Capital.”
In the event of our liquidation, the holders of our fully paid shares would participate equally and ratably, in proportion to the number of paid-in shares held by them, in our assets available after payment of all our creditors. The holders of fully paid shares would not be required to contribute additional capital to us in the event of our liquidation.
In accordance with the General Banking Act, our shareholders do not have appraisal rights in the event of a business combination or otherwise.
Approval of Financial Statements
Our board of directors is required to submit our audited consolidated financial statements to the shareholders annually for their approval. The approval or rejection of the audited consolidated financial statements is entirely within our shareholders’ discretion. If our shareholders reject our audited consolidated financial statements, our board of directors must submit new audited consolidated financial statements no later than 60 calendar days from the date of rejection. If our shareholders reject our new audited consolidated financial statements, our entire board of directors is deemed removed from office and a new board of directors shall be elected at the same meeting. Directors who individually approved our audited consolidated financial statements are disqualified from running for re-election for the ensuing period.
Registrations and Transfers
We act as our own registrar and transfer agent, as is customary among Chilean companies. In the case of jointly owned shares, an attorney-in-fact must be appointed to represent the joint owners in dealings with us.
240
MATERIAL CONTRACTS
See “Item 7. Major Shareholders and Related Party Transactions—Related Party Transactions.”
EXCHANGE CONTROLS
The Central Bank is responsible for maintaining the stability of the Chilean peso and the normal functioning of internal and external payments. The authority of the Central Bank for these purposes includes regulation of the amount of currency and credit in circulation, the performance of credit transactions and foreign exchange transactions and the issuance of regulatory provisions regarding monetary, credit, financing and foreign exchange matters.
Under the Basic Constitutional Act of the Central Bank, Law No. 18,840, foreign exchange transactions can be carried out in Chile by any person, subject to the limitations and restrictions established by the Central Bank. Foreign exchange transactions include buying and selling foreign currency and, in general, any act or agreement that may have the effect of creating, amending, or extinguishing an obligation payable in foreign currency, even if no transfer of funds or drafts to or from Chile is actually involved. Foreign exchange transactions also include transfers of or transactions with respect to gold or instruments representing gold.
The Central Bank can impose the following limitations on foreign exchange transactions:
| ● | The Central Bank can require that the transaction of specified foreign exchange operations, such as foreign investments and foreign credits, be reported to it; and |
| ● | The Central Bank can require that the execution of certain foreign exchange operations, such as money transfers to and from Chile, be made only in the Formal Exchange Market. The Formal Exchange Market consists of banks and other entities authorized by the Central Bank. |
Also, the Central Bank has the authority to establish certain restrictions on foreign exchange transactions with respect to the Formal Exchange Market. These restrictions may include the following: the obligation to return to Chile in Chilean pesos the value obtained in the export of goods, services, and other payments to foreign persons or entities that have a right of residency in Chile; that a reserve be maintained for credits, deposits and investments in foreign currency from or to a foreign country; and the obligation to obtain approval for payment or remittance of foreign exchange transactions, among others.
These restrictions may only be imposed by resolution adopted by the majority of board members of the Central Bank if required for the stability of the currency or the financing of the balance of payments of the country. Additionally, these restrictions may only be imposed for a predetermined period, which, at the most, may extend to a year. The resolution may be subject to veto by the Minister of Finance, in which case the restriction may only be adopted pursuant to a favorable vote of all the board members. The restriction, once the predetermined period has expired, may be renewed subject to the preceding rules.
On April 16, 2001, the Central Bank eliminated the prior foreign exchange restrictions, replaced the former Compendium of Foreign Exchange Regulations (“Compendium”) by a new one, and eliminated Chapter XXVI of the old Compendium, which regulated the establishment of an ADR facility by a Chilean company. Notwithstanding such replacement, the special regime of Chapter XXVI continued in force for Banco de Chile’s ADS program until March 7, 2011, when the Central Bank, JPMorgan Chase Bank N.A., as depositary bank, and Banco de Chile executed an agreement that terminated the Convención Cambiaria (“Exchange Convention”). As a consequence of such termination, the special exchange regime established in the Exchange Convention is no longer applicable. Thus, the Deposit Agreement, as amended from time to time, and Banco de Chile’s ADS program are subject to the exchange regulations of general applicability of Chapter XIV of the Compendium or such new regulations that may be issued in the future. Copies of amendments to the Deposit Agreement can be found as Exhibits to this annual report.
241
The ADS facility is governed by Chapter XIV of the Compendium on “Regulations applicable to Credits, Deposits, Investments and Capital Contributions from Abroad.” According to Chapter XIV, the establishment of an ADS facility is regarded as an ordinary foreign investment, subject to the above mentioned limitations, and it is not necessary to seek the Central Bank’s prior approval in order to establish an ADS facility. The establishment of an ADS facility only requires that the Central Bank be informed of the transaction, and that the transaction be conducted through the Formal Exchange Market.
In Chile, until December 2015, foreign investments could also be made through the Foreign Investment Committee under Decree Law No. 600 of 1974, Foreign Investment Statute, which was an optional mechanism to invest capital in Chile that required, among other items, a foreign investment contract with the State of Chile. However, on September 29, 2014, Law No. 20,780 was published, which repealed Decree 600 effective January 1, 2016. However, this repeal does not apply retroactively. Therefore, foreign investment agreements entered into under Decree Law 600, before its repeal, will continue to be governed by Decree Law 600.
Investment in Our Shares and ADSs
With regard to exchange controls, investments made in shares of our common stock are subject to the following requirements:
| ● | any foreign investor acquiring shares of our common stock who brought funds into Chile for that purpose must bring those funds through an entity participating in the Formal Exchange Market; |
| ● | any foreign investor acquiring shares of our common stock to be converted into ADSs or deposited into an ADR facility who brought funds into Chile for that purpose must bring those funds through an entity participating in the Formal Exchange Market; |
| ● | in both cases, the entity of the Formal Exchange Market through which the funds are brought into Chile must report such investment to the Central Bank; |
| ● | all remittances of funds from Chile to the foreign investor upon the sale of the acquired shares of our common stock or from dividends or other distributions made in connection therewith must be made through the Formal Exchange Market; |
| ● | all remittances of funds from Chile to the foreign investor upon the sale of shares underlying ADSs or from dividends or other distributions made in connection therewith must be made through the Formal Exchange Market; and |
| ● | all remittances of funds made to the foreign investor must be reported to the Central Bank by the intervening entity of the Formal Exchange Market. |
When funds are brought into Chile for a purpose other than to acquire shares to convert them into ADSs or deposit them into an ADR facility and subsequently such funds are used to acquire shares to be converted into ADSs or deposited into an ADR facility, such investment must be reported to the Central Bank by the custodian within ten days following the end of each month within which the custodian is obligated to deliver periodic reports to the Central Bank.
When funds to acquire shares of our common stock or to acquire shares to convert them into ADSs or deposit them into an ADR facility are received by us abroad (i.e., outside of Chile), such investment must be reported to the Central Bank directly by the foreign investor or by an entity participating in the Formal Exchange Market within ten days following the end of the month in which the investment was made.
All payments in foreign currency in connection with our shares of common stock or ADSs made from Chile through the Formal Exchange Market must be reported to the Central Bank by the entity participating in the transaction. In the event there are payments made outside of Chile, the foreign investor must provide the relevant information to the Central Bank directly or through an entity of the Formal Exchange Market within the first ten calendar days of the month following the date on which the payment was made.
There can be no assurance that additional Chilean restrictions applicable to the holders of ADSs, the disposition of shares of our common shares underlying ADSs or the conversion or repatriation of the proceeds from such disposition will not be imposed in the future, nor can we assess the duration or impact of such restrictions if imposed.
This summary does not purport to be complete and is qualified by reference to Chapter XIV of the Central Bank Foreign Exchange Regulations, a copy of which is available in Spanish at the Central Bank’s website at www.bcentral.cl.
242
TAXATION
Chilean Tax Considerations
The following discussion is based on income tax laws and other applicable regulations and rulings issued by the Chilean Internal Revenue Service (Servicio de Impuestos Internos) that have been enacted in Chile. The discussion summarizes the main Chilean income tax consequences for investments in ADSs or shares of common stock held by individuals without domicile or residence in Chile or legal entities that are neither incorporated under the laws of Chile nor permanently located in Chile. We refer to these investors as “foreign holders” hereafter.
For Chilean tax law purposes, under Law No. 21,210 published on February 24, 2020, an individual holder resides in Chile if the individual has resided in Chile for more than 183 days within the last 12 months. On its turn, for Chilean tax law purposes an individual holder is domiciled in Chile if he or she resides in Chile with the real or supposed purpose of staying in the country. Domicile is defined as residence in a place with the intention of staying there. The intention is proved through facts and circumstances. Accordingly, the Chilean Internal Revenue Service has interpreted that an individual without residence in Chile may, nonetheless, be considered as domiciled in Chile since the day of entry into the country if he or she intends to stay in Chile and such intention is evidenced, for example, by circumstances such as the acceptance of a job position in Chile or the relocation of his or her family to the country, among other considerations. Recently, the Chilean Internal Revenue Service has also interpreted that an individual may lose residence when he or she is absent from Chile for more than 184 days in 12 consecutive months and that he or she may lose his or her domicile when he or she no longer has the main seat of his business in Chile. Chilean Internal Revenue Service established affidavits for those who express their intention to acquire or lose domicile in Chile which will be considered together with other circumstances to define the quality of domiciled in the country.
Under the current constitution, taxes in Chile are governed by the principle of legality, which precludes the creation, suppression, modification, reduction or waiving of taxes, its essential elements, their form of computation, their collection or their form, proportionality or progression by any means other than a law. Chilean tax authorities, however, have the power to interpret tax laws by issuing rulings and regulations of either general or specific application.
Chile and the United States have subscribed an income and capital tax treaty for the avoidance of double taxation and the prevention of fiscal evasion, but its effectiveness is contingent upon its ratification by the United States Senate, which is still pending and whose approval date is uncertain.
In September 2014, the Chilean Government enacted a law reforming the Chilean tax system. This tax reform (Law No. 20,780) gradually increases the first category tax or corporate tax rate between 2014 and 2018 while establishing two alternative tax regimes from 2017 onwards: (i) the Semi-Integrated Regime and (ii) the Attribution Regime. Nevertheless, following this reform in the Chilean taxation system, in February 2016, a new tax law was enacted (Law No. 20,899), which simplified the previously mentioned reform (Law No. 20,780) by limiting the possibility of choosing between the two alternative tax regimes. According to this new law, publicly-traded companies, like Banco de Chile, will only be subject to a Semi-Integrated Regime. The Chilean IRS has provided instructions regarding these regulations by means of Circular Letter No 49/2016.
In August 2018, the Government proposed a new bill to the Chilean Congress seeking to modernize Chilean tax legislation. After almost two years of legislative discussion, Law No. 21,210, which modernizes the local tax system, was passed by the Chilean Congress and enacted by the Chilean Government on February 24, 2020. This law entered into force retroactively on January 1, 2020. The Chilean IRS has provided instructions regarding these regulations by means of Circular Letter No 73/2020. The new law mainly focuses on: (i) entrepreneurship promotion measures by providing SMEs with a special tax regime based on total integration and a statutory tax rate of 25%, as opposed to large companies and corporations whom will continue to be subject to a semi-integrated system while bearing a statutory corporate tax rate of 27%, (ii) initiatives to promote private investment by introducing instantaneous or accelerated depreciation for fixed-assets, reducing the time frame to receive reimbursements of VAT paid on fixed-assets while reducing or eliminating property taxes paid by elderly people, (iii) increasing taxes paid by high-income individuals by means of adding a new tax bracket of 40%, raising taxes on properties that exceed U.S.$500,000 in assessed value, incorporating a regional green tax of 1% levied on investment projects exceeding U.S.$10 million in capital expenditures that were subject to environmental approval, and lowering tax benefits on capital gains obtained in stock markets, (iv) the creation of a Taxpayer Protection & Advisory Agency, which aims to be a counterpoint to the Chilean Internal Revenue Service on taxation matters, and (v) the introduction of a digital approach, which considers both the compulsory use of electronic bill and invoices, aimed at reducing tax evasion, and the imposition of VAT on digital services rendered from foreign countries.
243
In September 2020, Law No 21,256 was enacted establishing additional tax measures as part of the emergency plan for economic reactivation following the COVID-19 pandemic. Among others, the main measures included in this law were: (i) a temporary reduction of the statutory corporate tax rate to 10% for SMEs for the fiscal years 2020, 2021 and 2022, (ii) a refund of accumulated VAT for purchases and/or services acquired between January and May 2020 by SMEs, and (iii) a temporary additional accelerated depreciation for fixed assets newly and imported acquired between June 1, 2020 and December 31, 2022, for all types of companies.
In February 2022, Law 21,420 was published, reducing or eliminating a series of tax exemptions. As a result: (i) the taxation of services with VAT was extended to any service that is not exempt provided that it is a service performed after January 1, 2023; (ii) financial leasing agreements entered into on or after January 1, 2023, will have the same treatment for tax and financial purposes; (iii) a single tax of 10% is applied to the capital gains produced by the sale of actively traded stocks (under definitions established by the Chilean IRS) provided that the requirements established by Article N° 107 of the Chilean Income Tax Law apply to sales on or after September 1, 2022 and local or foreign institutional investors are excluded; (iv) profits from life insurance contracts entered into on or after February 4, 2022 will pay inheritance tax; (v) the rate of the upper bracket of the wealth tax on real estate is increased from 0.275% to 0.425%, effective January 1, 2023; (vi) the special VAT credit is eliminated for construction companies that build affordable homes for sales from 1 January 2025 onwards; (vii) 2% annual tax on expensive aircraft, helicopters, yachts and vehicles is implemented; (viii) tax benefits of affordable housing under DFL No. 2 of 1959 are reduced only to individuals and maximum for two homes, regardless of the date of acquisition form January 1, 2023; (ix) credit for the purchase of fixed assets is eliminated for large companies; (x) the value of mining patents is increased.
This discussion is not intended as tax advice to any particular investor. Such advice would require a complete understanding of an investor’s particular tax situation.
Cash Dividends and Other Distributions
Cash dividends distributed by us to foreign holders of our ADSs or shares of common stock are subject to a 35.0% withholding tax, which is withheld, declared and paid to the Chilean Treasury by us (the “Chilean Withholding Tax” hereafter). A tax credit associated with the corporate income tax or the first category tax (the “Corporate Tax” hereafter) actually paid by the company and registered in the Credit Registry may be deducted from the Chilean Withholding Tax levied on cash dividends, up to the amounts registered in the Credit Registry. Finally, distribution of non-taxable income is relieved from Chilean Withholding Tax.
For purposes of applying the Chilean Withholding Tax, cash dividends are grossed-up in the amount the Corporate Tax paid by the company, in the proportion corresponding to the ADS holder.
All dividends will be attached with a provisional Corporate Tax credit (applying the rate of the first category in effect) that should be confirmed by the company’s taxable income as of December 31 of the year in which the dividend was paid. If such provisional credit is determined to be totally or partially not applicable at the end of the year because retained taxable profits were not enough to cover the distribution, the company will have to pay on behalf of the foreign holders such balance, along with its annual tax return to be filed on April of the following year. Foreign holders shall reimburse the company the excess resulting from the tax difference originated by the provisional credit.
244
Notwithstanding the above, as of January 1, 2017 onwards Banco de Chile has been subject to a semi-integrated system (current general tax regime) by which personal or withholding taxes are only triggered upon distribution of taxable profits to the company’s owners or shareholders, with a tax credit of only 65% of the paid Corporate Tax, unless the owner or shareholder is resident in a country party to a Double Taxation Avoidance Treaty with Chile, in which case a tax credit up to 100% of the corporate tax paid by the company can be used against withholding taxes1.
However, in order to provide evidence of their tax residence, foreign holders of our ADSs or of our shares of common stock must send to Banco de Chile a certificate of residence issued by their local tax authority.
Law No. 21,210 established a legal rule whereby, in the absence of proof to the contrary, the residence of the non-resident shareholders is accredited in the calendar business year by the issuance of a certificate of residence by the tax authority of the respective country of residence. This certificate must be legalized or apostilled and valid at the moment of the distribution of dividends, otherwise the Tax credit will be 65%. In December 2020, the Chilean Internal Revenue Service issued the Exempt Resolution No. 151, which sets the validity of the certificate of residence which will be as defined in the certificate and, in cases where it is not specified in the certificate, it will be valid according to the rules of the country in which it was issued, and in the absence of background information to establish the validity of the certificate, it will be deemed to be valid only until the last day of the issuance year. If the Chilean Internal Revenue Service can validate the certificate with the foreign tax authority by internet or other technological means, it will not be necessary to legalize or apostille the certificate.
Transitional Article 25 of Law No. 21,210 enacted on February 24, 2020, established an optional and temporary tax regime that allows corporate taxpayers to apply the Substitute Tax for Final Taxes (ISFUT), including Chilean withholding tax, as applicable, on taxable profits generated by companies before December 31, 2016 instead of the marginal tax rate applicable for shareholders. In addition, corporate taxes formerly paid by the companies on profits generated before December 31, 2016 can be considered as a tax credit to be discounted from the 30% associated with the ISFUT. According to the Ordinary Official Letter No. 2,762 issued by the Chilean IRS on October 13, 2021, from a taxation perspective, there is no issue with Chilean companies discounting (and withholding) the ISFUT from distributed dividends. For non-resident shareholders, who are subject to a 35% Chilean withholding tax, after choosing ISFUT, dividend distribution by companies will not affect tax withholding, as they have already paid all taxes in Chile.
Capital Gains
Capital gains realized on the sale, exchange or other disposition by a foreign holder of ADSs (or ADRs evidencing ADSs) will not be subject to Chilean taxation, provided that such disposition occurs outside Chile or that it is performed under the rules of Title XXIV of the Chilean Securities Market Law. The deposit and withdrawal of shares of common stock in exchange for ADRs will not be subject to any Chilean taxes.
Capital gains recognized on the sale or exchange of shares of common stock (as distinguished from sales or exchanges of ADSs representing such shares of common stock) by a foreign holder will be subject to both Corporate Tax and the Chilean Withholding Tax (Corporate Tax being creditable against the latter) if the seller is a taxpayer who obtains other income effectively taxed as first category. If the transaction does not meet this condition, capital gains will be taxed at the Chilean Withholding Tax of 35.0%, unless the special exemption described in the next paragraph applies.
Finally, an exemption regime is available for capital gains produced by the sale of actively traded stocks (under definitions established by the Chilean IRS) provided that the following requirements established by Article N° 107 of the Chilean Income Tax Law are met:
| a) | The seller must have acquired the shares: (i) on a Chilean stock exchange authorized by the CMF; or (ii) pursuant to a regulated tender offer carried out according to Title XXV of the Chilean Securities Market Law; or (iii) at the time of incorporation of the corporation or pursuant to a capital increase; or (iv) pursuant to the exchange of public traded securities convertible in shares (in this case the acquisition cost of the shares corresponds to the exchange price); or (v) in a redemption of securities from mutual funds. |
| 1 | In cases where a Double Taxation Avoidance Treaty has only been signed but not yet ratified, Law No. 20.899, enacted on February 8, 2016, established a temporary extension of the use of 100% of corporate tax credit up to 2019. Subsequently, Law No. 21,047 enacted on November 23, 2017 extended the previously mentioned exemption until December 31, 2021. And, finally, Law No. 21,210 further extended this benefit up to 2026, with regard to Double Taxation Treaties signed through January 1, 2020, which is the case with the United States. |
245
In regards to shares acquired in a capital increase process (as mentioned in (iii) above) before the company was publicly listed, only the greatest amount between the portion which exceeds the price of the offering on the stock exchange (closing price on the first day of transactions for the IRS) and the book value on the prior day will be exempted;
| b) | The shares must be sold: (i) on a stock exchange authorized by the CMF; (ii) pursuant to a regulated tender offer; or (iii) in a contribution of securities on mutual funds; and |
| c) | The exemption under analysis also applies if the sale or transfer of shares is executed within 90 days following the day on which they were no longer considered as actively traded. In such case, the profits exempted from Chilean taxes will correspond to the average price of said shares within the last 90 days in which they were actively traded. Any profits above the average price will be subject to the general tax regime applicable to the transfer of shares. |
This exemption regime will only be in force until August 31, 2022, given that, as explained under “Chilean Tax Considerations” above, Law 21,420 established a single 10% tax on the capital gain produced by the sale of actively traded stocks. In any case, the acquirer or the stockbroker must withhold the tax and if they do not know the amount of the capital gain they will apply a provisional withholding of 1% of the sale price of the shares.
Regarding ADSs, the acquisition value of the shares of common stock received in exchange for them will represent the tax basis of such shares. The acquisition value is determined by the parties in the relevant deposit agreement, and generally corresponds to the highest price at which they are traded on Chilean stock exchanges on the date when the exchange takes place. Consequently, the conversion of ADSs into shares of common stock and the sale of such shares of common stock for the value established under the deposit agreement will not generate a capital gain subject to taxation in Chile in case the sale of shares is made at the same tax basis as of the time of the conversion.
However, as the exchange is generally registered two days after it took place, if the price of the shares goes down, a gain would arise. In order to overcome this situation, on October 1, 1999, the Chilean Internal Revenue Service issued Ruling No. 3,708, allowing Chilean issuers of ADSs to amend the deposit agreements by including a clause stating that when exchanged shares are sold by the ADSs’ holders on a Chilean stock exchange, either on the same day in which the exchange is recorded in the shareholders’ registry of the issuer or within two business days prior to such date, the acquisition price of those exchanged shares will be the price recorded in the invoice issued by the stock broker that participated in the sale. Consequently, if this clause were included in the deposit agreement, the capital gain that may arise if the exchange date was different from the date in which the shares received in exchange for ADSs were sold will not be subject to taxation. Sale of shares at a higher value of the invoice of the broker will be subject to taxes in Chile.
The distribution and exercise of preemptive rights relating to the shares of common stock will not be subject to Chilean taxation. Amounts received in exchange for the shares or assignment of preemptive rights relating to the shares will be subject to both Corporate Tax and Chilean Withholding Tax (the former being creditable against the latter to the extent described above).
Stock dividends
Stock dividends (distributions of fully paid-in shares) are free of tax at the moment they are received by the shareholder.
Until 2019, capital gains obtained on the sale of shares received as stock dividends could be eligible for treatment under the art. 107 regime. Nevertheless, since 2020 capital gains associated with the sale of shares obtained as stock dividends are subject to the general tax regime. Therefore, foreign investors will be subject to Chilean Withholding Tax on capital gains arising as a consequence of the sale of shares received as stock dividends. Law No. 21,210 established that the shares will have no acquisition cost for tax purposes and will not be eligible for sale under Article 107 of the Chilean Income Tax Law, being the total amount of the sale price affected by the general tax regime.
246
Mutual Funds and Investment Funds
Law No. 20,712, also known as the “Unitary Funds Act”, regulates all aspects related to mutual funds and investment funds, both public and private (creation, accepted investments, administration, forbidden activities, profit taxation, among others), as well as the activity of administrating third-party funds and individual portfolio management.
(1) The main aspects concerning taxation of foreign investments made in mutual and public funds are the following:
| a) | In general, foreign investors are subject to a 10% Sole Tax over dividends and other forms of payment of taxable income originated from the Fund’s investments which would generally be subject to Chilean Withholding Tax, except if they are attributed to non-taxable income or income exempted from Chilean Withholding Tax. |
| b) | The rescue of Fund quotas (capital investments) is not subject to Chilean taxes, only to the extent that the fund has been liquidated, only with respect to the capital invested plus its readjustment by inflation. |
| c) | The capital gains arising from the sale or redemption of Fund’s quotas for reasons other than the Fund’s termination is subject to a 10% Sole Tax. |
(2) In the case of Funds that have at least 80% of their investment portfolio invested in certain foreign assets during at least 330 continuous or discontinuous days within the financial year, the foreign investments are taxed according to the following rules:
| a) | Dividends attributed to income proceeding from the Fund’s investments in foreign assets (80% or more) are not subject to taxes in Chile. Dividends attributed to income proceeding from the Fund’s investments in Chilean assets (20% or less) are subject to a 10% Sole Tax, except for those who correspond to non-taxable o exempted income. |
| b) | The capital gains produced by the sale or redemption of fund quotas for reasons other than the Fund’s termination are exempted from Chilean taxes. |
| c) | Interests attributed to income proceeding from the Fund’s investments in foreign assets (80% or more) are not subject to taxes in Chile. Interests attributed to income proceeding from the Fund’s investments in certain Chilean assets (20% or less) and other specific kinds of investments are subject to a 4% Sole Tax, except for those who correspond to non-taxable o exempted income. No tax credits available. |
| d) | Whatever the percentage of the investment portfolio of the Fund is invested in foreign assets, dividends and interest payments will be subject to the general tax regime (Corporate Tax plus Chilean Withholding Tax with a credit for paid Corporate Tax) if any individual or entity with domicile or residence in Chile holds an interest, or is entitled to benefits, of 5% or more in one of the foreign holders, excluding foreign individuals and institutional investors. |
This special tax treatment also requires that the internal investment policy of the Fund:
| (a) | be in line with such percentage being invested specific foreign assets during the referred period of time; and |
247
| (b) | mandate that all other income proceeding from the remaining percentage of their portfolio investment (local assets) and not exempted from Chilean Withholding Tax be completely distributed among its participants during that year of their perception or during the 180 day-period following such financial year’s closing. |
Fixed Income (in force according to the Unitary Funds Act)
There are special tax regulations for bonds issued in Chile in a public offering which fulfill specific conditions established in the Chilean Income Tax Law (“104 Bonds”).
In February 2017, Law 20,956 came into effect, according to which the Chilean Withholding Tax on interest accrued by Chilean bonds, as a general rule, must be withheld by the issuer.
However, if the bond issuance agreement provides so, the Chilean Withholding Tax of 4% shall be withheld by the local custodian that is acting as the local tax agent for the foreign investor.
Regarding bonds issued by the Central Bank or by the Chilean Treasury, the withholding tax will always be borne by the issuer.
Finally, with regard to bonds whose issuance agreement was executed prior to the effectiveness of Law 20,956, local custodians must withhold the applicable tax unless the issuer adheres to said law by giving notice to the bondholders and to the Chilean Internal Revenue Service.
Capital gain produced in the sale of 104 Bonds should be exempted from Chilean taxes regardless of whether they are traded on a Chilean stock exchange in a continuous auction system, or over the counter.
The governmental bonds included in a list made by the Treasury Department qualify as 104 Bonds (even if some of the requirements mentioned above are not met) and are suitable for a tax exemption, regardless of its trading system, by virtue of Supreme Decree N° 471 of March 25, 2014.
According to the Chilean Income Tax Law, bonds and other debt instruments issued in Chile by Chilean companies are deemed to be located in Chile and therefore, sourced in Chile for income tax purposes. Therefore, the capital gains arising from their sale is subject to Chilean taxes, even if the seller is a non- resident. Also, interests arising from debt securities issued through offshore permanent establishments are deemed to be sourced in Chile.
Capital Gains Tax Regime for Foreign Institutional Investors
The Unitary Funds Act contains an exemption rule for capital gains obtained by foreign institutional investors in the sale of debt securities and the sale of shares subject to Article 107 of the Chilean Income tax Law.
According to this rule, capital gains obtained by foreign institutional investors in the sale of debt securities (public offerings not covered by the regime established in the Article 104 of the Chilean Income Tax Law) are exempted from income tax provided they have been issued prior to May 1, 2014 by companies incorporated in Chile and that the investor meets requirements set by the law.
The exemption shall be applicable for securities purchased before the entry in force of Unitary Funds Act (May 1, 2014), provided that the seller complies with the requirements listed in the repealed article 106, even in the case where the transfer of shares has not been made under any of the modalities set out in Article 107 (as described above).
Amendments to Law No. 21,420 to Article 107 of the Income Tax Act do not affect the capital gain of foreign institutional investors, who will remain exempt from this tax.
248
Other Chilean Taxes
There are no Chilean inheritance, gift or succession taxes applicable to the transfer or disposition of the ADSs by a foreign holder; however, according to the Chilean Internal Revenue Service’s criteria, such taxes will generally apply to the transfer at death or by a gift of shares of common stock by a foreign holder. No Chilean stamp, issue, registration or similar taxes or duties apply to foreign holders of ADSs or shares of common stock.
Stamp duties are applied only to documented money credit operations. The tax rate varies depending on the transaction: (i) 0.332% flat fee for operations on demand and (ii) 0.066% per month with a 0.8% cap for operations subject to a maturity date.
Other Relevant Aspects
Law No. 21,210 mainly focuses on: (i) entrepreneurship promotion measures by providing SMEs with a special tax regime based on total integration and a statutory tax rate of 25%, as opposed to the general tax regime applicable for large companies and corporations, which will continue to be subject to a semi-integrated system with a statutory corporate tax rate of 27%, (ii) initiatives to promote private investment by introducing instantaneous or accelerated depreciation for fixed-assets, reducing the time frame to receive reimbursements of VAT paid on fixed-assets while reducing or eliminating property taxes paid by elderly people, (iii) raising taxes on properties that exceed U.S.$500,000 in assessed value, incorporating a regional green tax of 1% levied on investment projects exceeding U.S.$10 million in capital expenditures that were subject to environmental approval, and lowering tax benefits on capital gains obtained in stock markets, (iv) the creation of a Taxpayer Protection & Advisory Agency, which aims to be a counterpoint to the Chilean Internal Revenue Service on taxation matters, and (v) the introduction of a digital approach, which considers both the compulsory use of electronic bill and invoices, aimed at reducing tax evasion, and the imposition of VAT on digital services rendered from foreign countries.
Aside from the changes that have been mentioned previously, the new law increased personal taxes for Chilean residents. In fact, a new tax bracket of 40% was added for higher-income individuals, maintaining a bracket of 35% for the immediately lower segment. This modification became effective on January 1, 2020 and will levied on annual personal income exceeding UTA 310 (approximately U.S.$266,900).
Also, starting January 1, 2016, the Stamp Tax rate increased from 0.4% to 0.8%, which mainly affects loans and financing. On April 2, 2020, however, the Chilean Government enacted Law No. 21,225 with the purpose of arranging an Emergency Plan in order to mitigate the effects of COVID-19 on the local economy. This plan is composed of various economic and tax measures to ensure liquidity in the local financial system and financing to SMEs and corporations. One of these measures was a temporary reduction of the Stamp Tax to 0% for all lending operations between April and September 2020. In addition, Law 21,307 was published on February 3, 2021, which established a stamp tax exemption for credits granted to small and medium-sized enterprises with a state guarantee until December 31, 2021.
United States Federal Income Tax Considerations
The following discussion is a summary of certain U.S. federal income tax considerations that may be relevant to the acquisition, ownership and disposition of shares of our common stock, as well as the ownership and disposition of ADSs received pursuant to a deposit into the ADR facility of shares of our common stock, by a beneficial owner that is: (i) an individual who is a citizen or resident of the United States; (ii) a corporation (or other entity treated as a corporation for U.S. federal income tax purposes) created or organized under the laws of the United States, any state thereof or the District of Columbia; (iii) an estate the income of which is subject to U.S. federal income tax regardless of its source; or (iv) a trust if a court within the United States is able to exercise primary supervision over its administration and one or more U.S. persons have the authority to control all substantial decisions of the trust (or otherwise if the trust has a valid election in effect under current U.S. Treasury regulations to be treated as a U.S. person). For purposes of this discussion, we refer to these owners of ADSs or shares of our common stock as “U.S. Holders.” If a partnership (or any entity or arrangement treated as a partnership for U.S. federal income tax purposes) holds ADSs or shares of our common stock, the tax treatment of a partner generally will depend upon the status of the partner and upon the activities of the partnership. A prospective investor that is a partnership or a partner in a partnership holding ADSs or shares of our common stock should consult its own tax advisors.
249
This summary is not a comprehensive discussion of all of the tax considerations that may be relevant to a U.S. Holder’s decision to acquire ADSs or shares of our common stock. In particular, this discussion is directed only to U.S. Holders that will hold ADSs or shares of our common stock as capital assets (generally, property held for investment) and it does not address the Medicare tax on net investment income or any special U.S. federal income tax consequences that may be applicable to U.S. Holders that are subject to special treatment under the Internal Revenue Code of 1986, as amended (“U.S. Code”), such as banks, brokers or dealers in securities or currencies, traders in securities electing the mark-to-market method of accounting, financial institutions, insurance companies, tax-exempt entities, regulated investment companies, real estate investment trusts, partnerships, holders that own or are treated as owning 10% or more of our stock (by vote or by value), persons holding ADSs or shares of our common stock as part of a hedging, conversion or other integrated transaction or a straddle, persons subject to the alternative minimum tax or U.S. Holders whose functional currency is not the U.S. dollar. Prospective investors are advised to satisfy themselves as to the overall U.S. federal, state and local tax consequences of their ownership of ADSs or shares of our common stock by consulting their own tax advisors.
Except where specifically described below, this discussion assumes that we are not a passive foreign investment company (“PFIC”), for U.S. federal income tax purposes. Please see the discussion under “—Passive Foreign Investment Companies” below.
The statements of U.S. federal income tax laws set out below are based on the laws in force as of the date of this annual report and may be subject to changes in U.S. federal income tax law occurring after that date, including changes that may have retroactive effect.
ADRs
A U.S. Holder who deposits shares of our common stock into the ADR facility, receiving ADSs in return, will be treated for U.S. federal income tax purposes as the beneficial owner of the underlying shares of our common stock represented by those ADSs and evidenced by ADRs. Deposits and withdrawals of shares of our common stock by U.S. Holders in exchange for ADSs will not result in the realization of gain or loss for U.S. federal income tax purposes.
Taxation of Dividends
Subject to the discussion below under “—Passive Foreign Investment Companies,” distributions of cash or property (other than shares of our common stock, if any, distributed pro rata to all of our shareholders, including holders of ADSs) paid out of our current or accumulated earnings and profits (as determined for U.S. federal income tax purposes) with respect to ADSs or shares of our common stock, including the net amount of the Chilean income tax withheld on the distribution (after taking into account the credit for the first category tax as described in Taxation—Chilean Tax Considerations—Cash Dividends and Other Distributions), will be includible in gross income as ordinary income on the date on which the U.S. Holder receives the distribution, in the case of shares of our common stock, or the date the depositary receives the distribution, in the case of ADSs. To the extent that the amount of any distribution exceeds our current and accumulated earnings and profits as determined for U.S. federal income tax purposes, such excess amounts will be treated first as a non-taxable return of capital to the extent of such U.S. Holder’s tax basis in the shares of our common stock and, thereafter, as capital gain. As used below, the term “dividend” means a distribution that constitutes a dividend for U.S. federal income tax purposes. Dividends paid in Chilean pesos generally will be includible in gross income in a U.S. dollar amount calculated by reference to the spot market exchange rate in effect on the date the U.S. Holder receives the dividends, in the case of shares of our common stock, or the date the depositary receives the dividends, in the case of ADSs, regardless of whether the payment is in fact converted into U.S. dollars. U.S. Holders should consult their own tax advisors regarding the treatment of foreign currency gain or loss, if any, on any Chilean pesos received which are converted into U.S. dollars after they are received.
250
Dividends paid to corporate U.S. Holders with respect to ADSs or shares of our common stock will not be eligible for the dividends received deduction allowed to corporations under the U.S. Code. Under current law, dividends received by certain non-corporate U.S. Holders (including individuals) with respect to ADSs will be subject to U.S. federal income tax at preferential rates if the dividends constitute “qualified dividend income” for U.S. federal income tax purposes. Dividends paid on the ADSs will be treated as qualified dividend income if:
| ● | the ADSs are readily tradable on an established securities market in the United States; and |
| ● | we were not, in the year prior to the year in which the dividend was paid, and are not, in the year in which the dividend is paid, a PFIC. |
The ADSs are listed on the NYSE and will qualify as readily tradable on an established securities market in the United States so long as they are so listed. Moreover, as discussed below under “—Passive Foreign Investment Companies,” we believe that we will not be treated as a PFIC for U.S. federal income tax purposes with respect to our 2021 and current taxable year, and based on our current expectations regarding the value and nature of our assets, the sources and nature of our income, relevant market and shareholder data and our current business plans, we do not anticipate becoming a PFIC in the future. However, there can be no assurance in this regard because the PFIC determination is made annually and is based on the portion of our assets (including goodwill) and income that is characterized as passive under the PFIC rules and our continued qualification for an exception to the PFIC rules for certain foreign banks.
Based on existing guidance, we do not expect that dividends paid on shares of our common stock will be qualified as dividends because shares of our common stock are not readily tradable on an established securities market in the United States and, although a comprehensive income tax treaty between Chile and the United States has been signed, such treaty is not currently in force.
Subject to generally applicable limitations and conditions under the U.S. Code (including a minimum holding period requirement), Chilean income tax withheld from dividends (after taking into account the credit for the first category tax, when it is available) may be treated as a foreign income tax eligible for credit against a U.S. Holder’s U.S. federal income tax liability. If the amount of Chilean income tax initially withheld from a dividend is determined to be in excess of a U.S. Holder’s Chilean tax liability, thereby permitting a U.S. Holder to obtain a refund in respect of such excess tax, such excess tax may not be creditable. Dividends paid on the ADSs or shares of our common stock generally will constitute foreign source income, and for purposes of calculating the foreign tax credit, as “passive category income,” for most U.S. Holders. U.S. Holders are not allowed foreign tax credits for income taxes withheld in respect of certain short-term or hedged positions in securities and may not be allowed foreign tax credits in respect of arrangements in which their expected economic profit is insubstantial. Alternatively, a U.S. Holder may be able to deduct Chilean income taxes paid with respect to dividends on our shares of common stock against its taxable income, assuming such U.S. Holder does not take a credit for any foreign income taxes paid or accrued during the taxable year and certain other conditions are met. U.S. Holders should consult their own advisors concerning the implications of these rules in light of their particular circumstances.
Taxation of Capital Gains or Losses
Subject to the discussion below under “—Passive Foreign Investment Companies,” gain or loss realized by a U.S. Holder on the sale, exchange or other taxable disposition of ADSs or shares of our common stock generally will be capital gain or loss and generally will be long-term capital gain or loss if the shares of our common stock have been held for more than one year. The amount of gain or loss realized will be the difference between (i) the amount realized on the sale, exchange or other taxable disposition of ADSs or shares of our common stock over (ii) the U.S. Holder’s adjusted tax basis in such ADSs or shares of our common stock. Long-term capital gain realized by certain U.S. Holders (including individuals) generally is eligible for favorable rates of U.S. federal income tax. The deductibility of capital losses is subject to significant limitations under the U.S. Code.
251
The initial tax basis of shares of our common stock purchased by a U.S. Holder generally will be the U.S. dollar value of the Chilean pesos denominated purchase price determined on the date of purchase. If shares of our common stock are treated as being traded on an “established securities market,” a cash basis U.S. Holder, or, if it elects, an accrual basis U.S. Holder, will determine the U.S. dollar value of the cost of such shares by translating the amount paid at the spot rate of exchange on the settlement date of the purchase. Such an election by an accrual basis U.S. Holder must be applied consistently from year to year and cannot be revoked without the consent of the U.S. Internal Revenue Service (the “U.S. IRS”). If a U.S. Holder converts U.S. dollars to Chilean pesos and immediately uses the currency to purchase shares of our common stock, such conversion generally will not result in taxable gain or loss to the U.S. Holder.
With respect to the sale, exchange or other taxable disposition of shares of our common stock, the amount realized by a U.S. Holder generally will be the U.S. dollar value of the payment received determined on (1) the date of receipt of payment in the case of a cash basis U.S. Holder or (2) the date of disposition in the case of an accrual basis U.S. Holder. If shares of our common stock are treated as being traded on an “established securities market,” a cash basis U.S. Holder, or, if it elects, an accrual basis U.S. Holder, will determine the U.S. dollar value of the amount realized by translating the amount received at the spot rate of exchange on the settlement date of the sale.
Any gain or loss realized by a U.S. Holder on such a sale, exchange or other taxable disposition of shares of our common stock generally will be treated as U.S. source income or loss for U.S. foreign tax credit purposes. If Chilean income tax is withheld on such sale, exchange or other taxable disposition (see “Item 10. Additional Information—Taxation—Chilean Tax Considerations—Capital Gains”), a U.S. Holder’s ability to utilize foreign tax credits in respect of such Chilean income tax may be limited. Alternatively, a U.S. Holder may be able to deduct Chilean income taxes paid with respect to a disposition of shares of our common stock against its taxable income, assuming such U.S. Holder does not take a credit for any foreign income taxes paid or accrued during the taxable year and certain other conditions are met. U.S. Holders should consult their own tax advisors regarding the application of the foreign tax credit limitation rules to their investment in, and disposition of, the shares of our common stock.
Passive Foreign Investment Companies
Special U.S. federal income tax rules apply to U.S. persons owning ADSs or common shares of a PFIC. A foreign corporation generally will be classified as a PFIC for U.S. federal income tax purposes in any taxable year in which, after applying relevant look through rules with respect to the income and assets of subsidiaries, either:
| ● | at least 75% of its gross income is “passive income”; or |
| ● | on average at least 50% of the gross value of its assets is attributable to assets that produce passive income or are held for the production of passive income. |
For this purpose, passive income generally includes, among other things, dividends, interest, rents, royalties, gains from the disposition of passive assets and gains from commodities and securities transactions. In determining whether a foreign corporation is a PFIC, a pro rata portion of the income and assets of each corporation in which it owns, directly or indirectly, at least a 25% interest (by value) is taken into account.
Banks generally derive a substantial part of their income from assets that are interest bearing or that otherwise could be considered passive under the PFIC rules. An exception, however, is provided for income derived in the active conduct of a banking business (the “Active Bank Exception”). The application of the Active Bank Exception to banks is unclear under present U.S. federal income tax law. The U.S. IRS has issued a notice and has proposed U.S. Treasury regulations which have different requirements for qualifying as a foreign bank and for determining the banking income that may be excluded from passive income under the Active Bank Exception. Based on our current estimates of our gross income and gross assets, the nature of our business and our interpretation of the proposed U.S. Treasury regulations and notice relating to the Active Bank Exception, we do not expect to be classified as a PFIC for our current taxable year (although the determination cannot be made until the end of such taxable year), and we intend to continue our operations in such a manner that we do not expect to be classified as a PFIC in the foreseeable future. There can be no assurances in this regard, however, because the application of the relevant rules is complex and involves some uncertainty. The PFIC determination is made annually and is based on the portion of our assets (including goodwill) and income that is characterized as passive under the PFIC rules. In addition, the relevant U.S. Treasury regulations addressing the Active Bank Exception may not be finalized in their current form, and our PFIC status may be impacted if and when these U.S. Treasury regulations are finalized. Moreover, our business plans may change, which may affect the PFIC determination in future years.
252
If we are treated as a PFIC for any year, U.S. Holders may be subject to adverse tax consequences upon a sale, exchange or other disposition of ADSs or shares of our common stock, or upon the receipt of certain “excess distributions” (generally distributions in excess of 125% of the average distribution over the shorter of a three-year period or the U.S. Holder’s holding period for shares of our common stock) from us. In this event, unless a U.S. Holder elects to be taxed annually on a mark-to-market basis with respect to ADSs or shares of our common stock, as described below, any gain realized on a sale or other taxable disposition of ADSs or shares of our common stock or excess distributions would be treated as realized ratably over the U.S. Holder’s holding period for such ADSs or shares of our common stock, and amounts allocated to prior years during which we were a PFIC would be taxed at the highest tax rate in effect for each such year. An additional interest charge may apply to the portion of the U.S. federal income tax liability on such gain or distribution treated under the PFIC rules as having been deferred by the U.S. Holder. Amounts allocated to the taxable year in which the sale or excess distribution occurs and to any year before we became a PFIC would be taxed as ordinary income in the taxable year in which the sale or excess distribution occurs. If we were a PFIC, certain subsidiaries and other entities in which we have a direct or indirect interest may also be PFICs (“Lower-tier PFICs”). Under attribution rules, U.S. Holders would be deemed to own their proportionate shares of Lower-tier PFICs and would be subject to U.S. federal income tax according to the rules described above on (i) certain distributions by a Lower-tier PFIC and (ii) a disposition of shares of a Lower-tier PFIC, in each case as if the U.S. Holder held such shares directly, even though such U.S. Holder had not received the proceeds of those distributions or dispositions.
If we are treated as a PFIC, the rules described in the foregoing paragraph can be avoided by a U.S. Holder that makes a “mark-to-market” election. A U.S. Holder may make a mark-to-market election for ADSs or shares of our common stock (but not for the shares of any Lower-tier PFIC) if such ADSs or shares of our common stock constitute “marketable stock” as defined in the U.S. Treasury regulations. ADSs and shares of our common stock will be marketable stock if they are regularly traded on a “qualified exchange or other market” within the meaning of the U.S. Treasury regulations. The ADSs are listed on the NYSE and will qualify as regularly traded on an established securities market so long as they are so listed. No assurance can be given, however, that our common stock will be considered regularly traded on an established securities market. In particular, it is unclear whether the Santiago Stock Exchange and the Bolsa Electrónica de Chile would meet the requirements for a “qualified exchange or other market.” A U.S. Holder electing the mark-to-market regime generally would compute gain or loss at the end of each taxable year as if the ADSs or shares of our common stock had been sold at fair market value. Any gain recognized by the U.S. Holder under mark-to-market treatment, or on an actual sale, would be treated as ordinary income, and the U.S. Holder would be allowed an ordinary deduction for any decrease in the value of its ADSs or shares of our common stock as of the end of any taxable year, and for any loss recognized on an actual sale, but only to the extent, in each case, of previously included mark-to-market income not offset by previously deducted decreases in value. Any loss on an actual sale of ADSs or shares of our common stock would be a capital loss to the extent in excess of previously included mark-to-market income not offset by previously deducted decreases in value. A U.S. Holder’s adjusted tax basis in its ADSs or shares of our common stock will be increased by the amount of income inclusion and decreased by the amount of deductions under the mark-to-market rules. U.S. Holders should be aware, however, that if we are determined to be a PFIC, the interest charge regime described above could be applied to indirect distributions or gains deemed to be attributable to U.S. Holders in respect of any of our Lower-tier PFICs, and the mark-to-market election generally would not be effective for such Lower-tier PFICs.
The rules described in the second preceding paragraph can also be avoided by a U.S. Holder that elects to treat us as a “qualified electing fund.” However, this option generally will not be available to U.S. Holders because we do not intend to provide the information necessary for U.S. Holders to make such election.
A U.S. Holder that owns ADSs or shares of our common stock during any taxable year that we are treated as a PFIC generally would be required to file U.S. IRS Form 8621. U.S. Holders should consult their own tax advisors regarding the application of the PFIC rules to ADSs or shares of our common stock, the availability and advisability of making an election to avoid the adverse tax consequences of the PFIC rules should we be considered a PFIC for any taxable year and the application of the reporting requirements on U.S. IRS Form 8621 to their particular situation.
253
Backup Withholding and Information Reporting
Dividends paid on, and proceeds from the sale or other disposition of, ADSs or shares of our common stock to a U.S. Holder generally will be subject to the information reporting requirements of the U.S. Code and may be subject to backup withholding unless the U.S. Holder provides an accurate taxpayer identification number and makes any other required certification or otherwise establishes an exemption. Backup withholding is not an additional tax. The amount of any backup withholding from a payment to a U.S. Holder will be allowed as a credit against the U.S. Holder’s U.S. federal income tax liability and may entitle the U.S. Holder to a refund, provided that certain required information is timely furnished to the U.S. IRS.
In addition, U.S. Holders may be required to comply with certain reporting requirements, including filing a U.S. IRS Form 8938, Statement of Foreign Financial Assets, with respect to the holding of certain foreign financial assets, including stock of foreign issuers, either directly or through certain foreign financial institutions, if the aggregate value of all such assets exceeds U.S.$50,000. U.S. Holders should consult their own tax advisors regarding the application of the information reporting rules to ADSs or shares of our common stock and the application of these reporting requirements to their particular situations.
HOLDERS OF ADSs OR SHARES OF OUR COMMON STOCK SHOULD CONSULT THEIR OWN TAX ADVISORS AS TO THE CHILEAN, U.S. FEDERAL INCOME AND OTHER TAX CONSEQUENCES OF THE ACQUISITION, OWNERSHIP AND DISPOSITION OF ADSs OR SHARES OF OUR COMMON STOCK, INCLUDING, IN PARTICULAR, THE EFFECT OF ANY NON-U.S., STATE OR LOCAL TAX LAWS.
WHERE TO FIND ADDITIONAL INFORMATION
The materials included in this annual report on Form 20-F may be downloaded at the SEC’s website: http://www.sec.gov at http://www.sec.gov. Additional reports and information about us can be downloaded at the SEC’s website.
254
Item 11 Quantitative and Qualitative Disclosures About Market Risk
For quantitative and qualitative information related to market risk, see Note 43 to our audited consolidated financial statements as of and for the year ended December 31, 2021 appearing elsewhere in this annual report.
Item 12 Description of Securities Other Than Equity Securities
Item 12A Debt Securities
Not Applicable.
Item 12B Warrants and Rights
Not Applicable.
Item 12C Other Securities
Not Applicable.
Item 12D American Depositary Shares
JPMorgan Chase Bank, N.A. (the “Depositary”) serves as the depositary for our ADSs. ADS holders are required to pay various fees to the Depositary, and the Depositary may refuse to provide any service for which a fee is assessed until the applicable fee has been paid.
ADS holders are required to pay the Depositary amounts in respect of expenses incurred by the Depositary or its agents on behalf of ADS holders, including expenses arising from compliance with applicable law, taxes or other governmental charges, facsimile transmission or conversion of foreign currency into U.S. dollars.
ADS holders are also required to pay additional fees for certain services provided by the Depositary, as set forth in the table below.
Depositary service | Fee payable by ADS holders | |
| (a) Issuance and delivery of ADRs against deposits of shares, including deposits in respect of share distributions, rights and other distributions | Up to U.S.$5.00 per 100 ADSs (or portion thereof) | |
| (b) Distribution of dividends | U.S.$0.02 or less per ADS | |
| (c) Withdrawal of shares underlying ADSs | Up to U.S.$5.00 per 100 ADSs (or portion thereof) | |
| (d) Transfer, combination and split-up of ADRs | U.S.$1.50 per ADS |
The Depositary may sell (by public or private sale) sufficient securities and property received in respect of share distributions, rights and other distributions prior to the deposit of shares to pay the charges described in (a) and (c) of the table above. In addition, the Depositary may deduct from any distributions on or in respect of deposited securities, or may sell by public or private sale for the account of a holder, any part or all of such deposited securities (after attempting by reasonable means to notify the holder prior to such sale), and may apply such deduction or the proceeds of any such sale in payment of any tax or other governmental charge that may become payable by or on behalf of a custodian or the Depositary with respect to any ADR, any deposited securities represented by ADSs or any distribution thereon.
ADS Split
On October 23, 2018 we announced a ratio change to our ADR program from one ADS per 600 of our common shares into one ADS per 200 of our common shares. This modification became effective on November 23, 2018, upon which ADR holders received two additional ADSs for each ADS held as of the record date of November 15, 2018. Additionally, the existing ADRs, as of the effective date continued to be valid and were not exchanged for new ones.
Payments by the Depositary
The Depositary has agreed to reimburse us for certain reasonable expenses related to the ADS program, subject to a cap agreed between the Depositary and us. These reimbursable expenses currently include, but are not limited to, legal fees, NYSE listing fees, investor relations servicing, investor related presentations, ADR-related advertising and public relations in those jurisdictions in which the ADRs may be listed or otherwise quoted for trading, and accountants’ fees in relation to our regulatory filings. During the year ended December 31, 2021, we received gross reimbursements from the depositary for an amount of U.S.$146,727.
Please refer to Exhibits 2.1, 2.2 2.3 and 2.4 to this annual report for the remaining information relating to our American Depositary Shares required by Item 12 of Form 20-F.
255
Part II
Item 13 Defaults, Dividend Arrearages and Delinquencies
None.
Item 14 Material Modifications to the Rights of Security Holders and Use of Proceeds
None.
Item 15 Controls and Procedures
(a) Disclosure Controls and Procedures
We have evaluated, with the participation of our chief executive officer and chief financial officer, the effectiveness of our disclosure controls and procedures as of December 31, 2021.
There are inherent limitations to the effectiveness of any system of disclosure controls and procedures, including the possibility of human error and the circumvention or overriding of the controls and procedures. Accordingly, even effective disclosure controls and procedures can only provide reasonable assurance of achieving their control objectives. Based upon our evaluation, our chief executive officer and chief financial officer concluded that our disclosure controls and procedures were effective to provide reasonable assurance that information required to be disclosed by us in the reports that we file or submit under the Exchange Act is recorded, processed, summarized and reported, within the time periods specified in the applicable rules and forms, and that it is accumulated and communicated to our management, including our chief executive officer and chief financial officer, as appropriate to allow timely decisions regarding required disclosure.
(b) Management’s Annual Report on Internal Control Over Financial Reporting
Our management is responsible for establishing and maintaining adequate internal control over financial reporting as defined in Rules 13a-15(f) and 15d-15(f) under the Exchange Act. The company’s internal control over financial reporting is designed to provide reasonable assurance regarding the reliability of financial reporting and the preparation of financial statements for external purposes in accordance with generally accepted accounting principles. The company’s internal control over financial reporting includes those policies and procedures that:
(i) pertain to the maintenance of records that, in reasonable detail, accurately and fairly reflect the transactions and dispositions of the assets of the company;
(ii) provide reasonable assurance that transactions are recorded as necessary to permit preparation of financial statements in accordance with generally accepted accounting principles, and that receipts and expenditures of the company are being made only in accordance with authorizations of management and directors of the company; and
(iii) provide reasonable assurance regarding prevention or timely detection of unauthorized acquisition, use or disposition of the company’s assets that could have a material effect on the financial statements.
Because of its inherent limitations, internal control over financial reporting may not prevent or detect misstatements. Also, projections of any evaluation of effectiveness to future periods are subject to the risk that controls may become inadequate because of changes in conditions, or that the degree of compliance with the policies or procedures may deteriorate.
Management assessed the effectiveness of the company’s internal control over financial reporting as of December 31, 2021. In making this assessment, management used the criteria set forth by the Committee of Sponsoring Organizations of the Treadway Commission (COSO – 2013 framework) in Internal Control-Integrated Framework.
256
Based on our assessment and those criteria, management believes that the company maintained effective internal control over financial reporting as of December 31, 2021.
(c) Report of Independent Registered Public Accounting Firm on Internal Controls
Ernst & Young Servicios Profesionales de Auditoría y Asesorías SpA (“EY Audit SpA”), the independent registered public accounting firm that has audited our financial statements, has issued an attestation report on our internal control over financial reporting as of December 31, 2021. This attestation report appears on page F-5 of our audited consolidated financial statements as of and for the year ended December 31, 2021.
(d) Changes in Internal Control over Financial Reporting
There has been no change in our internal control over financial reporting during 2021 that has materially affected, or is reasonably likely to materially affect, our internal control over financial reporting.
Item 16A Audit Committee Financial Expert
Our board of directors has determined that Mr. Alfredo Ergas, a member of our directors/audit committee who satisfies the independence requirements of both Chilean law and Rule 10A-3 under the Exchange Act, qualifies as an “audit committee financial expert” pursuant to the Instruction to paragraph (a) of this Item 16A. Mr. Ergas possesses vast financial experience evidenced by the fact that he was the Regional Chief Financial Officer and Controller at Enersis, Chief Financial Officer at Endesa Chile and Smartcom and Head of the Money Desk at Santiago S.A. Corredores de Bolsa. He is also chairman at Transportadora de Gas del Peru and member of the board of directors at Grupo Costanera S.A. and Transelec. Further, Mr. Ergas is chairman of the Advisory Committee of the Faculty of Business and Economics at Universidad Chile, where he is also a professor of finance. He holds a business administration degree from Universidad de Chile and an MBA from Trium Global Executive, jointly issued by New York University, the London School of Economics and Political Science and the HEC Paris School of Management.
Item 16B Code of Ethics
In 2008, we adopted a new Code of Ethics, as defined in Item 16B of Form 20-F under the Exchange Act, which we frequently revise and update, and which was last updated in July 2021. The Code of Ethics applies to directors and consultants of our Board, to our chief executive officer, chief financial officer, principal accounting officer and persons performing similar functions, and to all other employees without exception. A current copy of the Code of Ethics, also referred herein as the Code of Professional Ethics, or Code of Conduct is filed as Exhibit 11.1 to this annual report.
The Code of Ethics is available to the general public on our web page at www.bancochile.cl. This URL is intended to be an inactive textual reference only. It is not intended to be an active hyperlink to our website. The information on our website, which might be accessible through a hyperlink resulting from this URL, is not and shall not be deemed to be incorporated into this annual report on Form 20-F.
257
Item 16C Principal Accountant Fees and Services
Audit and Non-Audit Fees
The following table sets forth the fees billed to us by our independent auditors, EY Audit SpA, during the fiscal years ended December 31, 2019, 2020 and 2021:
| Year ended December 31, | ||||||||||||
| 2019 | 2020 | 2021 | ||||||||||
| (in millions of Ch$) | ||||||||||||
| Audit fees | Ch$ | 817 | Ch$ | 772 | Ch$ | 702 | ||||||
| Audit-related fees | — | — | — | |||||||||
| Tax fees | 21 | 22 | 25 | |||||||||
| Other fees | 182 | — | 129 | |||||||||
| Total fees | Ch$ | 1,020 | Ch$ | 794 | Ch$ | 856 | ||||||
“Audit fees” in the above table are the aggregate fees billed by EY Audit SpA in connection with the audit of our annual financial statements. This line item includes: (i) the audit of our statutory accounts, and the audit of the consolidated financial statements required by Item 18 of Form 20-F and limited reviews of financial statements, (ii) reviews and issuances of comfort letters and (iii) other local attestation reports required by local regulators.
“Audit-related fees” in the above table are the aggregate fees billed by EY Audit SpA for assurance and related services that are reasonably related to the performance of the audit or review of the Bank’s financial statements and are not reported under “audit fees.” Services such as (i) attestation reports not required by statute or regulations and (ii) merger and acquisition due diligence are included in this line item. During 2019, 2020 and 2021, there were no such services rendered.
“Tax fees” in the above table are the aggregate fees billed by EY Audit SpA for permitted tax advisory and tax compliance services.
“All Other fees” in the above table are fees incurred in 2019, 2020 and 2021 related to certain consulting services such as: (i) operational risk assessment, (ii) foreign regulations compliance, and (iii) advisory services.
Directors/Audit Committee Pre-Approval Policies and Procedures
Auditors are pre-approved by our directors/audit committee, whose main duties are disclosed in “Item 6. Directors, Senior Management and Employees—Board Practices.” Furthermore, the selection of external auditors is subject to approval by our shareholders at the ordinary annual shareholders’ meeting. All proposed services carried out by our external auditors as well as corresponding fees related to audit and non-audit services, have been presented to our directors/audit committee, which has determined they are reasonable and consistent with our policies.
Item 16D Exemptions from the Listing Standards for Audit Committees
Mr. Raúl Anaya E. serves on our directors/audit committee in reliance upon the exemption from the independence requirements contained in Rule 10A-3(b)(1)(iv)(D). We do not believe that such reliance would materially adversely affect the ability of the directors/audit committee to act independently and to satisfy the other requirements of Rule 10A-3.
Item 16E Purchases of Equity Securities by the Issuer and Affiliated Purchasers
We did not make any purchases of our previously issued shares during the fiscal year ended December 31, 2021.
258
Item 16F Change in Registrant’s Certifying Accountant
Not Applicable.
Item 16G Corporate Governance
Pursuant to Section 303A.11 of the Listed Company Manual of the NYSE, we are required to provide a summary of the significant ways in which our corporate governance practices differ from those required for U.S. companies under the NYSE listing standards. We are a Chilean bank with shares listed on the Santiago Stock Exchange, the Chilean Electronic Stock Exchange and ADSs listed on the New York Stock Exchange. Our corporate governance practices are governed by our bylaws, the General Banking Act, the Chilean Corporations Law, the Securities Market Law, and the regulations issued by the CMF. Therefore, you may not have the same protections afforded to shareholders of U.S. companies under the NYSE listing standards.
The table below discloses the significant differences between our corporate governance practices and the NYSE standards.
NYSE Standards | Our Corporate Governance Practice | |
| Director Independence. Majority of board of directors must be independent. “Controlled companies,” which would include our company if it were a U.S. issuer, are exempt from this requirement. §303A.01 | Pursuant to the General Banking Act, we are not required to make a determination as to the independence of our directors. However, pursuant to the Chilean Corporations Law, under certain circumstances provided in Article 50b is of such law, we are required to appoint at least one independent director. | |
| The definition of independence applicable to us pursuant to the Chilean Corporations Law differs in certain aspects from the definition applicable to U.S. issuers under the NYSE rules. | ||
| Under the Chilean Corporations Law, there are several factors that must be observed in order to determine whether a director is deemed to be independent. These factors are included in Article 50 bis of the Chilean Corporations Law. In addition, under the regulations of the CMF, members of the directors/audit committee must satisfy international independence criteria set forth by our board of directors. | ||
| Executive Sessions. Non-management directors must meet regularly in executive sessions without management. Independent directors should meet alone in an executive session at least once a year. §303A.03 | There is no similar requirement under our bylaws or under applicable Chilean law. | |
| Audit committee. Audit committee must satisfy the independence and other requirements of Rule 10A-3 under the Exchange Act, and the more stringent requirements under the NYSE standards is required. §§303A.06, 303A.07. | We are in compliance with Rule 10A-3. The members of our directors/audit committee are not required to satisfy the NYSE independence and other audit committee standards that are not prescribed by Rule 10A-3. | |
| Nominating/corporate governance committee. Nominating/corporate governance committee of independent directors is required. The committee must have a charter specifying the purpose, duties and evaluation procedures of the committee. “Controlled companies,” which would include our company if it were a U.S. issuer, are exempt from these requirements. §303A.04 | We are not required to have, and do not have, a nominating/corporate governance committee. |
259
NYSE Standards | Our Corporate Governance Practice | |
| Compensation committee. Compensation committee of independent directors is required, which must approve executive officer compensation. The committee must have a charter specifying the purpose, duties and evaluation procedures of the committee. “Controlled companies,” which would include our company if it were a U.S. issuer, are exempt from this requirement. §303A.05 | We are not required to have a compensation committee. Pursuant to the Chilean Corporations Law, our directors/audit committee must approve compensation plans. | |
| Equity compensation plans. Equity compensation plans require shareholder approval, subject to limited exemptions. | Equity compensation plans require shareholder approval, subject to limited exemptions. | |
| Code of Ethics. Corporate governance guidelines and a code of business conduct and ethics is required, with disclosure of any waiver for directors or executive officers. §303A.10 | We have adopted a code of ethics, also referred herein as Code of Professional Ethics or Code of Conduct, applicable to all of our executive officers, employees, directors and advisors to our board of directors, a version of which is filed as an exhibit to this Form 20-F. We are required by Item 16B of Form 20-F to disclose any waivers granted to our chief executive officer, chief financial officer, principal accounting officer and persons performing similar functions. Our Code of Ethics sets forth the principles and values that govern personnel conduct as well as other issues such as conflicts of interests, usage of privileged information, internal controls for fraud prevention and labor responsibility, among others. |
Item 16H Mine Safety Disclosure
Not applicable.
Item 16I Disclosure Regarding Foreign Jurisdictions that Prevent Inspections
Not applicable.
260
Part III
Item 17 Financial Statements
Not applicable.
Item 18 Financial Statements
Our audited consolidated financial statements are included in this annual report beginning at page F-1. Our financial statements have been prepared in accordance with International Financial Reporting Standards as issued by the International Accounting Standards Board.
261
Consolidated Financial Statements
BANCO DE CHILE AND SUBSIDIARIES
December 31, 2020 and 2021
| Ch$ or CLP | = | Chilean pesos |
| MCh$ | = | Millions of Chilean pesos |
| US$ or USD | = | U.S. dollars |
| ThUS$ | = | Thousands of U.S. dollars |
| JPY | = | Japanese yen |
| EUR | = | Euro |
| HKD | = | Hong Kong dollars |
| CHF | = | Swiss franc |
| PEN | = | Peruvian sol |
| AUD | = | Australian dollar |
| NOK | = | Norwegian krone |
| UF or CLF | = | Unidad de fomento |
| (The unidad de fomento is an inflation-indexed, Chilean peso denominated monetary unit set daily in advance on the basis of the previous month’s inflation rate). |
F-1
Index
F-2
 | EY Chile Avda. Presidente Riesco 5435, piso 4, Las Condes, Santiago | Tel: +56 (2) 2676 1000 www.eychile.cl |
Report of Independent Registered Public Accounting Firm
To the Shareholders and the Board of Directors of Banco de Chile
Opinion on the Consolidated Financial Statements
We have audited the accompanying consolidated statements of financial position of Banco de Chile and subsidiaries (the “Bank”) as of December 31, 2021 and 2020, the related consolidated statements of comprehensive income, changes in equity and cash flows for each of the three years in the period ended December 31, 2021, and the related notes (collectively referred to as the “consolidated financial statements“). In our opinion, the consolidated financial statements present fairly, in all material respects, the consolidated financial position of the Bank as of December 31, 2021 and 2020, and the consolidated results of its operations and its cash flows for each of the three years in the period ended December 31, 2021, in conformity with International Financial Reporting Standards as issued by the International Accounting Standards Board.
We also have audited, in accordance with the standards of the Public Company Accounting Oversight Board (United States) (PCAOB), the Bank's internal control over financial reporting as of December 31, 2021, based on criteria established in Internal Control-Integrated Framework issued by the Committee of Sponsoring Organizations of the Treadway Commission (2013 framework) and our report dated April 28, 2022 expressed an unqualified opinion thereon.
Basis for Opinion
These consolidated financial statements are the responsibility of the Bank‘s management. Our responsibility is to express an opinion on the Bank‘s consolidated financial statements based on our audits. We are a public accounting firm registered with the PCAOB and are required to be independent with respect to the Bank in accordance with the U.S. federal securities laws and the applicable rules and regulations of the Securities and Exchange Commission and the PCAOB.
We conducted our audits in accordance with the standards of the PCAOB. Those standards require that we plan and perform the audit to obtain reasonable assurance about whether the consolidated financial statements are free of material misstatement, whether due to error or fraud. Our audits included performing procedures to assess the risks of material misstatement of the consolidated financial statements, whether due to error or fraud, and performing procedures that respond to those risks. Such procedures include examining, on a test basis, evidence regarding the amounts and disclosures in the consolidated financial statements. Our audits also included evaluating the accounting principles used and significant estimates made by management, as well as evaluating the overall presentation of the consolidated financial statements. We believe that our audits provide a reasonable basis for our opinion.
Critical audit matter
The critical audit matter communicated below is a matter arising from the current period audit of the financial statements that was communicated or required to be communicated to the audit committee and that: (1) relate to accounts or disclosures that are material to the financial statements and (2) involved our especially challenging, subjective, or complex judgments. The communication of the critical audit matter does not alter in any way our opinion on the consolidated financial statements, taken as a whole, and we are not, by communicating the critical audit matter below, providing a separate opinion on the critical audit matter or on the accounts or disclosures to which they relate.
F-3
Allowance for loan losses
Description of the matter
At December 31, 2021, the Bank’s allowance for individual, grouped loan losses and contingent loan risk (ALL) was Ch$ 181,255 million, Ch$ 492,322 million and Ch$ 93,049 million, respectively. As discussed in Note 2 (i) (vii) to the consolidated financial statements, the allowance is calculated using an expected credit loss model (ECL). This allowance represents a probability-weighted amount, which is determined by evaluating a range of possible outcomes and reasonable and supportable information about past events, current and forecasts of market and economic conditions (Forward looking information – FLI). The allowance is based on the ECL associated with the probability of default in the next twelve months unless there has been a significant increase in credit risk (SICR) since origination or there is objective evidence of impairment. In those cases, the allowance is based on the change in the ECL over the life of the financial instrument.
Auditing the allowance for loan losses involves increased complexity and significant auditor judgement, as the process for the assessment of indicators of impairment includes multiple variables, estimates and involves significant judgment. Significant assumptions and judgments with respect to the estimation of the allowance for credit losses include the probability of default, loss given default and forward-looking information, as well as the application of management’s expert credit risk knowledge and judgment.
How we addressed the matter in our audit
We obtained an understanding, evaluated the design and tested the operating effectiveness of the Bank’s controls, including those related to information systems used in the determination of the allowance for credit losses. For example, we tested controls over the identification of indicators of impairment, controls over changes in credit risk-rating, the governance and oversight controls over the review of the overall ECL, management’s review and approval of models used to calculate the ALL, including the data inputs and outputs of those models.
To test the ALL for individual, grouped, and contingent loans, our audit procedures included, among others, involving our credit risk modelling specialists to assist in assessing the methodology, models and assumptions used to estimate ECL, and comparing management’s forward-looking information to publicly available information from independent sources; performing independent recalculations. In addition, we assessed significant changes in credit risk rating triggers and testing the completeness and accuracy of underlying data used in the measurement of the ECL. We also assessed the adequacy of the related financial statements’ disclosures.
/s/ EY Audit SpA
We have served as the Bank’s auditor since 2002.
Santiago, Chile
April 28, 2022
F-4
| EY Chile Avda. Presidente Riesco 5435, piso 4, Las Condes, Santiago | Tel: +56 (2) 2676 1000 www.eychile.cl |
Report of Independent Registered Public Accounting Firm
To the Shareholders and the Board of Directors of Banco de Chile
Opinion on Internal Control Over Financial Reporting
We have audited Banco de Chile and subsidiaries’ internal control over financial reporting as of December 31, 2021, based on criteria established in Internal Control — Integrated Framework issued by the Committee of Sponsoring Organizations of the Treadway Commission (2013 framework) (the COSO criteria). In our opinion, Banco de Chile and subsidiaries (the “Bank”) maintained, in all material respects, effective internal control over financial reporting as of December 31, 2021, based on the COSO criteria.
We also have audited, in accordance with the standards of the Public Company Accounting Oversight Board (United States) (PCAOB), the consolidated statements of financial position of the Bank as of December 31, 2021 and 2020, the related consolidated statements of comprehensive income, changes in equity and cash flows, for each of the three years in the period ended December 31, 2021, and the related notes and our report dated April 28, 2022 expressed an unqualified opinion thereon.
Basis for Opinion
The Bank’s management is responsible for maintaining effective internal control over financial reporting and for its assessment of the effectiveness of internal control over financial reporting included in the accompanying Management’s Report on Internal Control Over Financial Reporting. Our responsibility is to express an opinion on the Bank’s internal control over financial reporting based on our audit. We are a public accounting firm registered with the PCAOB and are required to be independent with respect to the Bank in accordance with the U.S. federal securities laws and the applicable rules and regulations of the Securities and Exchange Commission and the PCAOB.
We conducted our audit in accordance with the standards of the PCAOB. Those standards require that we plan and perform the audit to obtain reasonable assurance about whether effective internal control over financial reporting was maintained in all material respects.
Our audit included obtaining an understanding of internal control over financial reporting, assessing the risk that a material weakness exists, testing and evaluating the design and operating effectiveness of internal control based on the assessed risk, and performing such other procedures as we considered necessary in the circumstances. We believe that our audit provides a reasonable basis for our opinion.
F-5
Definition and Limitations of Internal Control Over Financial Reporting
A company’s internal control over financial reporting is a process designed to provide reasonable assurance regarding the reliability of financial reporting and the preparation of financial statements for external purposes in accordance with generally accepted accounting principles. A company’s internal control over financial reporting includes those policies and procedures that (1) pertain to the maintenance of records that, in reasonable detail, accurately and fairly reflect the transactions and dispositions of the assets of the company; (2) provide reasonable assurance that transactions are recorded as necessary to permit preparation of financial statements in accordance with generally accepted accounting principles, and that receipts and expenditures of the company are being made only in accordance with authorizations of management and directors of the company; and (3) provide reasonable assurance regarding prevention or timely detection of unauthorized acquisition, use, or disposition of the company’s assets that could have a material effect on the financial statements.
Because of its inherent limitations, internal control over financial reporting may not prevent or detect misstatements. Also, projections of any evaluation of effectiveness to future periods are subject to the risk that controls may become inadequate because of changes in conditions, or that the degree of compliance with the policies or procedures may deteriorate.
/s/ EY Audit SpA.
Santiago, Chile
April 28, 2022
F-6
BANCO DE CHILE AND SUBSIDIARIES
CONSOLIDATED STATEMENTS OF FINANCIAL POSITION
As of December 31, 2020 and 2021
(Expressed in millions of Chilean pesos unless otherwise specified)
| 2020 | 2021 | 2021 | ||||||||||||
| ASSETS | Notes | MCh$ | MCh$ | ThUS$ | ||||||||||
| Cash and due from banks | 6 | 2,560,216 | 3,713,734 | 4,355,622 | ||||||||||
| Transactions in the course of collection | 6 | 163,252 | 326,446 | 382,870 | ||||||||||
| Financial assets held-for-trading | 7 | 4,666,156 | 3,876,695 | 4,546,750 | ||||||||||
| Investment under resale agreements | 8 | 76,407 | 64,365 | 75,490 | ||||||||||
| Derivative instruments | 9 | 2,618,004 | 2,983,298 | 3,498,936 | ||||||||||
| Loans and advances to banks | 10 | 2,939,198 | 1,529,751 | 1,794,156 | ||||||||||
| Loans to customers at amortized cost | 11 | 30,101,583 | 33,592,377 | 39,398,540 | ||||||||||
| Financial assets at fair value through other comprehensive income | 12 | 1,068,153 | 3,061,174 | 3,590,272 | ||||||||||
| Financial instruments at amortized cost | 13 | — | 839,744 | 984,887 | ||||||||||
| Investments in other companies | 14 | 42,338 | 46,923 | 55,033 | ||||||||||
| Intangible assets | 15 | 94,111 | 105,942 | 124,253 | ||||||||||
| Property and equipment | 16 | 217,928 | 222,320 | 260,746 | ||||||||||
| Leased assets | 16 | 118,829 | 100,188 | 117,505 | ||||||||||
| Investments properties | 17 | 12,833 | 12,476 | 14,632 | ||||||||||
| Current tax assets | 18 | 22,949 | — | — | ||||||||||
| Deferred tax assets, net | 18 | 292,517 | 276,400 | 324,173 | ||||||||||
| Other assets | 19 | 556,486 | 674,115 | 790,630 | ||||||||||
| TOTAL ASSETS | 45,550,960 | 51,425,948 | 60,314,495 | |||||||||||
| LIABILITIES | ||||||||||||||
| Current accounts and other demand deposits | 20 | 15,167,229 | 18,542,791 | 21,747,758 | ||||||||||
| Transactions in the course of payments | 6 | 882,944 | 210,479 | 246,859 | ||||||||||
| Obligations under repurchase agreements | 8 | 288,917 | 95,009 | 111,431 | ||||||||||
| Saving accounts and time deposits | 21 | 8,899,541 | 9,140,006 | 10,719,780 | ||||||||||
| Derivative instruments | 9 | 2,841,653 | 2,773,476 | 3,252,848 | ||||||||||
| Borrowings from financial institutions | 22 | 3,669,753 | 4,861,865 | 5,702,198 | ||||||||||
| Debt issued | 23 | 8,593,595 | 9,478,905 | 11,117,255 | ||||||||||
| Other financial obligations | 24 | 191,713 | 274,618 | 322,084 | ||||||||||
| Lease liabilities | 16 | 115,017 | 95,670 | 112,206 | ||||||||||
| Current tax liabilities | 18 | 311 | 112,283 | 131,690 | ||||||||||
| Provisions | 25 | 237,620 | 331,884 | 389,247 | ||||||||||
| Employee benefits | 26 | 111,243 | 106,963 | 125,451 | ||||||||||
| Other liabilities | 27 | 554,343 | 583,027 | 683,798 | ||||||||||
| TOTAL LIABILITIES | 41,553,879 | 46,606,976 | 54,662,605 | |||||||||||
| EQUITY | ||||||||||||||
| Attributable to equity holders of the parent: | ||||||||||||||
| Capital | 2,418,833 | 2,418,833 | 2,836,908 | |||||||||||
| Reserves | 965,140 | 904,059 | 1,060,318 | |||||||||||
| Other comprehensive income | (42,776 | ) | 41,617 | 48,810 | ||||||||||
| Retained earnings: | ||||||||||||||
| Retained earnings from previous periods | 393,186 | 636,023 | 745,954 | |||||||||||
| Income for the year | 401,629 | 1,056,316 | 1,238,891 | |||||||||||
| Less: | ||||||||||||||
| Provisions for minimum dividend | (138,932 | ) | (237,877 | ) | (278,992 | ) | ||||||||
| SUBTOTAL EQUITY | 3,997,080 | 4,818,971 | 5,651,889 | |||||||||||
| Non-controlling interest | 1 | 1 | 1 | |||||||||||
| TOTAL EQUITY | 29 | 3,997,081 | 4,818,972 | 5,651,890 | ||||||||||
| TOTAL LIABILITIES AND EQUITY | 45,550,960 | 51,425,948 | 60,314,495 | |||||||||||
The accompanying notes 1 to 45 are an
integral part of these consolidated financial statements
F-7
BANCO DE CHILE AND SUBSIDIARIES
CONSOLIDATED STATEMENTS OF INCOME
As of December 31, 2019, 2020 and 2021
(Expressed in millions of Chilean pesos unless otherwise specified)
| 2019 | 2020 | 2021 | 2021 | |||||||||||||||
| Notes | MCh$ | MCh$ | MCh$ | ThUS$ | ||||||||||||||
| Interest revenue | 30 | 2,113,548 | 1,876,795 | 2,388,470 | 2,801,297 | |||||||||||||
| Interest expense | 30 | (742,270 | ) | (560,007 | ) | (814,448 | ) | (955,219 | ) | |||||||||
| Net interest income | 1,371,278 | 1,316,788 | 1,574,022 | 1,846,078 | ||||||||||||||
| Income from fees and commissions | 31 | 589,172 | 562,146 | 584,321 | 685,316 | |||||||||||||
| Expense from fees and commissions | 31 | (131,870 | ) | (116,178 | ) | (129,293 | ) | (151,640 | ) | |||||||||
| Net fees and commissions income | 457,302 | 445,968 | 455,028 | 533,676 | ||||||||||||||
| Net financial operating income | 32 | 113,437 | (11,279 | ) | 186,941 | 219,252 | ||||||||||||
| Foreign exchange transactions, net | 33 | 30,886 | 156,662 | (15,962 | ) | (18,721 | ) | |||||||||||
| Other operating income | 38 | 32,315 | 26,671 | 34,056 | 39,942 | |||||||||||||
| Total operating revenues | 2,005,218 | 1,934,810 | 2,234,085 | 2,620,227 | ||||||||||||||
| Provision for Expected Credit losses | 34 | (331,601 | ) | (547,106 | ) | (19,172 | ) | (22,486 | ) | |||||||||
| OPERATING REVENUES, NET OF PROVISIONS FOR LOAN LOSSES | 1,673,617 | 1,387,704 | 2,214,913 | 2,597,741 | ||||||||||||||
| Personnel expenses | 35 | (475,599 | ) | (457,176 | ) | (450,952 | ) | (528,895 | ) | |||||||||
| Administrative expenses | 36 | (329,705 | ) | (318,881 | ) | (324,625 | ) | (380,734 | ) | |||||||||
| Depreciation and amortization | 37 | (70,541 | ) | (73,357 | ) | (76,798 | ) | (90,072 | ) | |||||||||
| Impairment property and equipment | 37 | (2,555 | ) | (1,661 | ) | (1,690 | ) | (1,982 | ) | |||||||||
| Other operating expenses | 39 | (23,850 | ) | (26,677 | ) | (30,355 | ) | (35,601 | ) | |||||||||
| TOTAL OPERATING EXPENSES | (902,250 | ) | (877,752 | ) | (884,420 | ) | (1,037,284 | ) | ||||||||||
| NET OPERATING INCOME | 771,367 | 509,952 | 1,330,493 | 1,560,457 | ||||||||||||||
| Income attributable to associates | 14 | 6,039 | (5,099 | ) | 1,793 | 2,103 | ||||||||||||
| Income before income taxes | 777,406 | 504,853 | 1,332,286 | 1,562,560 | ||||||||||||||
| Income taxes | 18 | (173,661 | ) | (103,223 | ) | (275,969 | ) | (323,668 | ) | |||||||||
| NET INCOME FOR THE YEAR | 603,745 | 401,630 | 1,056,317 | 1,238,892 | ||||||||||||||
| Attributable to: | ||||||||||||||||||
| Equity holders of the parent | 603,744 | 401,629 | 1,056,316 | 1,238,891 | ||||||||||||||
| Non-controlling interest | 1 | 1 | 1 | 1 | ||||||||||||||
| Net income per share from continued operations attributable to equity holders of the parent: | 29 | Ch$ | Ch$ | Ch$ | US$ | |||||||||||||
| Basic net income per share | 5.98 | 3.98 | 10.46 | 0.01 | ||||||||||||||
| Diluted net income per share | 5.98 | 3.98 | 10.46 | 0.01 | ||||||||||||||
The accompanying notes 1 to 45 are an
integral part of these consolidated financial statements
F-8
BANCO DE CHILE AND SUBSIDIARIES
CONSOLIDATED STATEMENTS OF COMPREHENSIVE INCOME
As of December 31, 2019, 2020 and 2021
(Expressed in millions of Chilean pesos unless otherwise specified)
| 2019 | 2020 | 2021 | 2021 | |||||||||||||||
| Notes | MCh$ | MCh$ | MCh$ | ThUS$ | ||||||||||||||
| NET INCOME FOR THE YEAR | 603,745 | 401,630 | 1,056,317 | 1,238,892 | ||||||||||||||
| Other comprehensive income that will be reclassified subsequently to profit or loss | ||||||||||||||||||
| Net unrealized gains (losses): | ||||||||||||||||||
| Net change in unrealized gains (losses) on financial instruments at fair value through OCI | 12 | 15,969 | (8,540 | ) | (52,913 | ) | (62,059 | ) | ||||||||||
| Gains and losses on derivatives held as cash flow hedges | 9 | (37,546 | ) | 10,358 | 182,376 | 213,898 | ||||||||||||
| Cumulative translation adjustment | — | — | — | — | ||||||||||||||
| Subtotal Other comprehensive income before income taxes | (21,577 | ) | 1,818 | 129,463 | 151,839 | |||||||||||||
| Income tax | 5,810 | (493 | ) | (45,070 | ) | (52,860 | ) | |||||||||||
| Total other comprehensive income items that will be reclassified subsequently to profit or loss | (15,767 | ) | 1,325 | 84,393 | 98,979 | |||||||||||||
| Other comprehensive income that will not be reclassified subsequently to profit or loss | ||||||||||||||||||
| Actuarial gains (losses) | (247 | ) | (91 | ) | 523 | 613 | ||||||||||||
| Subtotal other comprehensive income before income taxes | (247 | ) | (91 | ) | 523 | 613 | ||||||||||||
| Income taxes | 66 | 25 | (125 | ) | (147 | ) | ||||||||||||
| Total other comprehensive income items that will not be reclassified subsequently to profit or loss | (181 | ) | (66 | ) | 398 | 466 | ||||||||||||
| Subtotal other comprehensive income | (15,948 | ) | 1,259 | 84,791 | 99,445 | |||||||||||||
| TOTAL CONSOLIDATED COMPREHENSIVE INCOME | 587,797 | 402,889 | 1,141,108 | 1,338,337 | ||||||||||||||
| Attributable to: | ||||||||||||||||||
| Equity holders of the parent | 587,796 | 402,888 | 1,141,107 | 1,338,336 | ||||||||||||||
| Non-controlling interest | 1 | 1 | 1 | 1 | ||||||||||||||
The accompanying notes 1 to 45 are an
integral part of these consolidated financial statements
F-9
BANCO DE CHILE AND SUBSIDIARIES
CONSOLIDATED STATEMENTS OF CHANGES IN EQUITY
for the years ended December 31, 2019, 2020 and 2021
(Expressed in millions of Chilean pesos unless otherwise specified)
| Reserves | Other comprehensive income | Retained earnings | ||||||||||||||||||||||||||||||||||||||||||||||||
| Paid-in capital | Other reserves | Reserves from earnings | Unrealized gains (losses) on financial assets at FV through OCI | Cumulative translation adjustment | Cash flow hedge adjustment | Retained earnings from previous periods | Income for the year | Provision for minimum dividends | Attributable to equity holders of the parent | Non- controlling interest | Total equity | |||||||||||||||||||||||||||||||||||||||
| Notes | MCh$ | MCh$ | MCh$ | MCh$ | MCh$ | MCh$ | MCh$ | MCh$ | MCh$ | MCh$ | MCh$ | MCh$ | ||||||||||||||||||||||||||||||||||||||
| Balances as of January 1, 2019 | 2,418,833 | 99,001 | 761,033 | 3,649 | — | (31,983 | ) | (1,989 | ) | 603,633 | (178,462 | ) | 3,673,715 | 1 | 3,673,716 | |||||||||||||||||||||||||||||||||||
| Retention of earnings | — | — | — | — | — | — | 152,705 | (152,705 | ) | — | — | — | — | |||||||||||||||||||||||||||||||||||||
| Other retention (release) earnings | — | — | 94,617 | — | — | — | — | (94,617 | ) | — | — | — | — | |||||||||||||||||||||||||||||||||||||
| Defined benefit plans adjustment | 29 | — | (181 | ) | — | — | — | — | — | — | — | (181 | ) | — | (181 | ) | ||||||||||||||||||||||||||||||||||
| Dividends distributions and paid | — | — | — | — | — | — | — | (356,311 | ) | 178,462 | (177,849 | ) | (1 | ) | (177,850 | ) | ||||||||||||||||||||||||||||||||||
| Valuation adjustment on financial assets at FV through OCI (net) | 29 | — | — | — | 11,641 | — | — | — | — | — | 11,641 | — | 11,641 | |||||||||||||||||||||||||||||||||||||
| Cash flow hedge adjustment, net | 29 | — | — | — | — | — | (27,408 | ) | — | — | — | (27,408 | ) | — | (27,408 | ) | ||||||||||||||||||||||||||||||||||
| Income for the year | 29 | — | — | — | — | — | — | — | 603,744 | — | 603,744 | 1 | 603,745 | |||||||||||||||||||||||||||||||||||||
| Provision for minimum dividends | 29 | — | — | — | — | — | — | — | — | (177,902 | ) | (177,902 | ) | — | (177,902 | ) | ||||||||||||||||||||||||||||||||||
| Balances as of December 31, 2019 | 2,418,833 | 98,820 | 855,650 | 15,290 | — | (59,391 | ) | 150,716 | 603,744 | (177,902 | ) | 3,905,760 | 1 | 3,905,761 | ||||||||||||||||||||||||||||||||||||
| Balances as of January 1, 2020 | 2,418,833 | 98,820 | 855,650 | 15,290 | — | (59,391 | ) | 150,716 | 603,744 | (177,902 | ) | 3,905,760 | 1 | 3,905,761 | ||||||||||||||||||||||||||||||||||||
| Retention of earnings | 29 | — | — | — | — | — | — | 242,470 | (242,470 | ) | — | — | — | — | ||||||||||||||||||||||||||||||||||||
| Other retention (release) earnings | — | — | 10,736 | — | — | — | — | (10,736 | ) | — | — | — | — | |||||||||||||||||||||||||||||||||||||
| Defined benefit plans adjustment | 29 | — | (66 | ) | — | — | — | — | — | — | — | (66 | ) | — | (66 | ) | ||||||||||||||||||||||||||||||||||
| Dividends distributions and paid | 29 | — | — | — | — | — | — | — | (350,538 | ) | 177,902 | (172,636 | ) | (1 | ) | (172,637 | ) | |||||||||||||||||||||||||||||||||
| Valuation adjustment on financial assets at FV through OCI (net) | 29 | — | — | — | (6,236 | ) | — | — | — | — | — | (6,236 | ) | — | (6,236 | ) | ||||||||||||||||||||||||||||||||||
| Cash flow hedge adjustment, net | 29 | — | — | — | — | — | 7,561 | — | — | — | 7,561 | — | 7,561 | |||||||||||||||||||||||||||||||||||||
| Income for the year | 29 | — | — | — | — | — | — | — | 401,629 | — | 401,629 | 1 | 401, 630 | |||||||||||||||||||||||||||||||||||||
| Provision for minimum dividends | 29 | — | — | — | — | — | — | — | — | (138,932 | ) | (138,932 | ) | — | (138,932 | ) | ||||||||||||||||||||||||||||||||||
| Balances as of December 31, 2020 | 2,418,833 | 98,754 | 866,386 | 9,054 | — | (51,830 | ) | 393,186 | 401,629 | (138,932 | ) | 3,997,080 | 1 | 3,997,081 | ||||||||||||||||||||||||||||||||||||
| Balances as of January 1, 2021 | 2,418,833 | 98,754 | 866,386 | 9,054 | — | (51,830 | ) | 393,186 | 401,629 | (138,932 | ) | 3,997,080 | 1 | 3,997,081 | ||||||||||||||||||||||||||||||||||||
| Retention of earnings | 29 | — | — | — | — | — | — | 242,837 | (242,837 | ) | — | — | — | — | ||||||||||||||||||||||||||||||||||||
| Other retention (release) earnings | — | — | (61,479 | ) | — | — | — | — | 61,479 | — | — | — | — | |||||||||||||||||||||||||||||||||||||
| Defined benefit plans adjustment | 29 | — | 398 | — | — | — | — | — | — | — | 398 | — | 398 | |||||||||||||||||||||||||||||||||||||
| Dividends distributions and paid | 29 | — | — | — | — | — | — | — | (220,271 | ) | 138,932 | (81,339 | ) | (1 | ) | (81,340 | ) | |||||||||||||||||||||||||||||||||
| Valuation adjustment on financial assets at FV through OCI (net) | 29 | — | — | — | (48,742 | ) | — | — | — | — | — | (48,742 | ) | — | (48,742 | ) | ||||||||||||||||||||||||||||||||||
| Cash flow hedge adjustment, net | 29 | — | — | — | — | — | 133,135 | — | — | — | 133,135 | — | 133,135 | |||||||||||||||||||||||||||||||||||||
| Income for the year | 29 | — | — | — | — | — | — | — | 1,056,316 | — | 1,056,316 | 1 | 1,056,317 | |||||||||||||||||||||||||||||||||||||
| Provision for minimum dividends | 29 | — | — | — | — | — | — | — | — | (237,877 | ) | (237,877 | ) | — | (237,877 | ) | ||||||||||||||||||||||||||||||||||
| Balances as of December 31, 2021 | 2,418,833 | 99,152 | 804,907 | (39,688 | ) | — | 81,305 | 636,023 | 1,056,316 | (237,877 | ) | 4,818,971 | 1 | 4,818,972 | ||||||||||||||||||||||||||||||||||||
The accompanying notes 1 to 45 are an
integral part of these consolidated financial statements
F-10
BANCO DE CHILE AND SUBSIDIARIES
CONSOLIDATED STATEMENTS OF CASH FLOWS
for the years ended December 31, 2019, 2020 and 2021
(Expressed in millions of Chilean pesos unless otherwise specified)
| 2019 | 2020 | 2021 | 2021 | |||||||||||||||
| Notes | MCh$ | MCh$ | MCh$ | ThUS$ | ||||||||||||||
| CASH FLOWS FROM OPERATING ACTIVITIES: | ||||||||||||||||||
| Net income for the year | 603,745 | 401,630 | 1,056,317 | 1,238,892 | ||||||||||||||
| Items that do not represent cash flows: | ||||||||||||||||||
| Depreciation and amortization | 37 | 70,541 | 73,357 | 76,798 | 90,072 | |||||||||||||
| Impairment property and equipment | 37 | 2,555 | 1,661 | 1,690 | 1,982 | |||||||||||||
| Provision for Expected Credit losses | 34 | 376,153 | 520,307 | 93,710 | 109,907 | |||||||||||||
| Provisions for contingent loan risks | 34 | (45 | ) | 73,210 | (5,132 | ) | (6,019 | ) | ||||||||||
| Fair value adjustment of financial assets held-for-trading | 294 | (909 | ) | 6,122 | 7,180 | |||||||||||||
| Provision for deferred income taxes | 18 | (58,733 | ) | (58,895 | ) | 20,163 | 23,648 | |||||||||||
| Income attributable to associates | 14 | (6,039 | ) | 5,099 | (1,793 | ) | (2,103 | ) | ||||||||||
| Net gain on sales of assets received in lieu of payment | 38 | (2,560 | ) | (3 | ) | (1,837 | ) | (2,155 | ) | |||||||||
| Net gain loss on sales of property and equipment | (90 | ) | (30 | ) | (214 | ) | (251 | ) | ||||||||||
| Charge-offs of assets received in lieu of payment | — | — | 418 | 490 | ||||||||||||||
| Other charges (credits) to income that do not represent cash flows | 9,477 | 27,110 | 13,508 | 15,843 | ||||||||||||||
| Net changes in exchange rate, interest and fees accrued on assets and liabilities | 146,774 | (7,117 | ) | (500,215 | ) | (586,673 | ) | |||||||||||
| Changes in assets and liabilities that affect operating cash flows: | ||||||||||||||||||
| (Increase) decrease in loans and advances to banks, net | 354,308 | (1,800,134 | ) | 1,409,687 | 1,653,340 | |||||||||||||
| (Increase) decrease in loans to customers at amortized cost | (2,342,112 | ) | (1,140,644 | ) | (2,915,171 | ) | (3,419,034 | ) | ||||||||||
| (Increase) decrease in financial assets held-for-trading, net | 149,292 | (2,793,801 | ) | 654,841 | 768,025 | |||||||||||||
| (Increase) decrease in other assets and liabilities | 129,119 | 304,426 | (341,542 | ) | (400,575 | ) | ||||||||||||
| Increase (decrease) in current accounts and other demand deposits | 1,738,840 | 3,843,145 | 3,369,787 | 3,952,227 | ||||||||||||||
| Increase (decrease) in transactions from reverse repurchase agreements | 1,711 | (33,488 | ) | (176,369 | ) | (206,853 | ) | |||||||||||
| Increase (decrease) in saving accounts and time deposits | 184,946 | (1,901,014 | ) | 234,048 | 274,501 | |||||||||||||
| Proceeds from sale of assets received in lieu of payment | 30,795 | 13,730 | 10,824 | 12,695 | ||||||||||||||
| Total cash flows from operating activities | 1,388,971 | (2,472,360 | ) | 3,005,640 | 3,525,139 | |||||||||||||
| CASH FLOWS FROM INVESTING ACTIVITIES: | ||||||||||||||||||
| (Increase) decrease in financial assets at fair value through other comprehensive income | (301,175 | ) | 285,558 | (2,070,906 | ) | (2,428,845 | ) | |||||||||||
| (Increase) decrease in financial instruments at amortized cost | 13 | — | — | (813,477 | ) | (954,080 | ) | |||||||||||
| Payments for lease agreements | 16 | (29,374 | ) | (28,705 | ) | (30,585 | ) | (35,871 | ) | |||||||||
| Net changes in leased assets | 16 | (1,725 | ) | (847 | ) | (1,386 | ) | (1,626 | ) | |||||||||
| Purchases of property and equipment | 16 | (43,512 | ) | (28,471 | ) | (34,193 | ) | (40,103 | ) | |||||||||
| Proceeds from sales of property and equipment | 92 | 401 | 214 | 251 | ||||||||||||||
| Purchases of intangible assets | 15 | (20,928 | ) | (18,631 | ) | (30,222 | ) | (35,446 | ) | |||||||||
| Investments in other companies | 14 | (671 | ) | — | (7,847 | ) | (9,203 | ) | ||||||||||
| Dividends received from investments in other companies | 14 | 552 | 1,001 | 1,097 | 1,287 | |||||||||||||
| Total cash flows from investing activities | (396,741 | ) | 210,306 | (2,987,305 | ) | (3,503,636 | ) | |||||||||||
| CASH FLOWS FROM FINANCING ACTIVITIES: | ||||||||||||||||||
| Repayment of mortgage financial bonds | (3,268 | ) | (2,382 | ) | (1,633 | ) | (1,915 | ) | ||||||||||
| Proceeds from bond issuances | 23 | 2,625,176 | 889,135 | 1,661,016 | 1,948,109 | |||||||||||||
| Redemption from bond issuances | (1,546,572 | ) | (1,221,026 | ) | (1,338,021 | ) | (1,569,287 | ) | ||||||||||
| Dividends paid | 29 | (356,311 | ) | (350,538 | ) | (220,271 | ) | (258,343 | ) | |||||||||
| Increase (decrease) in borrowings from foreign financial institutions | 44,755 | (999,925 | ) | (45,421 | ) | (53,272 | ) | |||||||||||
| Increase (decrease) in other financial obligations | 42,664 | 52,683 | 83,137 | 97,507 | ||||||||||||||
| Increase (decrease) in borrowings from Central Bank of Chile | — | 3,110,600 | 1,237,814 | 1,451,760 | ||||||||||||||
| Other long-term borrowings | — | — | — | — | ||||||||||||||
| Payment of other long-term borrowings | (4,005 | ) | (16,963 | ) | (207 | ) | (243 | ) | ||||||||||
| Total cash flows from financing activities | 802,439 | 1,461,584 | 1,376,414 | 1,614,316 | ||||||||||||||
| TOTAL NET POSITIVE (NEGATIVE) CASH FLOWS FOR THE YEAR | 1,794,669 | (800,470 | ) | 1,394,749 | 1,635,819 | |||||||||||||
| Net effect of exchange rate changes on cash and cash equivalents | 34,299 | (34,366 | ) | 324,965 | 381,133 | |||||||||||||
| Cash and cash equivalents at beginning of year | 1,281,278 | 3,110,246 | 2,275,410 | 2,668,696 | ||||||||||||||
| Cash and cash equivalents at end of year | 6 | 3,110,246 | 2,275,410 | 3,995,124 | 4,685,648 | |||||||||||||
| Supplemental disclosure of cash flow information: | ||||||||||||||||||
| Cash received (paid ) during the year for: | ||||||||||||||||||
| Income taxes (paid) received | (6,514 | ) | (70,686 | ) | 29,163 | 34,204 | ||||||||||||
| Interest received | 2,010,563 | 1,777,086 | 1,656,189 | 1,942,447 | ||||||||||||||
| Interest paid | (460,115 | ) | (505,557 | ) | (262,894 | ) | (308,333 | ) | ||||||||||
The accompanying notes 1 to 45 are an
integral part of these consolidated financial statements
F-11
NOTES TO THE CONSOLIDATED FINANCIAL STATEMENTS
| 1. | Company Information: |
Banco de Chile, resulting from the merger of Banco Nacional de Chile, Banco Agrícola and Banco de Valparaíso, was formed on October 28, 1893 in the city of Santiago, in the presence of the Notary Eduardo Reyes Lavalle.
Banco de Chile (“Banco de Chile” or the “Bank”) is a Corporation organized under the laws of the Republic of Chile, regulated by the Commission for Financial Market (“CMF”). Banco de Chile also complies with the regulations published by the United States Securities and Exchange Commission (“SEC”) from which the Bank is also subject to its supervision since 2001, due to its registration in the New York Stock Exchange (“NYSE”) through its American Depositary Receipt (“ADR”) program.
Banco de Chile offers a broad range of banking services to its customers, ranging from individuals to large corporations. Additionally, the Bank offers international as well as treasury banking services. The Bank’s subsidiaries provide other services including securities brokerage, mutual fund management, factoring, insurance brokerage and financial advisory services.
Banco de Chile’s legal address is Ahumada 251, Santiago, Chile and its website is www.bancochile.cl.
The consolidated financial statements of the Bank for the year ended December 31, 2021 were authorized for issuance in accordance with the directors’ resolution on April 28, 2022.
| 2. | Summary of Significant Accounting Policies: |
| (a) | Basis of preparation: |
The Bank’s consolidated financial statements for the years 2019, 2020 and 2021 have been prepared in accordance with International Financial Reporting Standards (“IFRS”) as issued by the International Accounting Standards Board (“IASB”).
The Bank presents its statement of financial position broadly in order of liquidity. An analysis regarding recovery or settlement is presented in Note No. 42.
The consolidated financial statements comprise the consolidated statement of comprehensive income and the consolidated statements of financial position, changes in equity, cash flows and the related notes. The consolidated financial statements have been prepared under the historical cost convention, except for financial assets at fair value through other comprehensive income, financial assets held for trading measured at fair value through profit or loss and derivative contracts, which have been measured at fair value.
The consolidated statement of cash flows shows the changes in cash and cash equivalents arising from operating activities, investing activities and financing activities during the period.
F-12
NOTES TO THE CONSOLIDATED FINANCIAL STATEMENTS, continued
| 2. | Summary of Significant Accounting Policies, continued: |
| (b) | Basis of consolidation: |
The Financial Statements of Banco de Chile as of and for the years ended December 31, 2020 and 2021 have been consolidated with those of its subsidiaries. The financial statements of the Bank’s subsidiaries are prepared for the same reporting year as for Banco de Chile, using consistent accounting policies.
| (i) | Subsidiaries |
Consolidated Financial Statements as of December 31, 2020 and 2021 incorporate financial statements of the Bank and its subsidiaries. According IFRS 10 –“Consolidated Financial Statements”, control requires exposure or rights to variable returns and the ability to affect those returns through power over an investee. Specifically the Bank has power over the investee when it has existing rights that give it the ability to direct the relevant activities of the investee.
When the Bank has less than a majority of the voting rights of an investee, but these voting rights are enough to have the ability to direct the relevant activities unilaterally, then the Bank has control. The Bank considers all factors and relevant circumstances to evaluate if its voting rights are enough to obtain control, which includes:
| ● | The amount of voting rights that the Bank has, related to the amount of voting rights of the other stakeholders. | |
| ● | Potential voting rights maintained by the Bank, other holders of voting rights or other parties. | |
| ● | Rights that emanated from other contractual arrangements. | |
| ● | Any additional circumstance that indicate that the Bank has or does not have the ability to manage the relevant activities when decisions need to be made, including voting behavior patterns in previous shareholders meetings. |
The Financial Statements of the subsidiaries are included in the consolidated Financial Statements from the date control is obtained until the loss of such control. The Financial Statements have been prepared using uniform accounting policies for similar transactions and other events under equivalent circumstances.
The following table details the entities in which the Bank, directly or indirectly – owns a controlling interest and that are therefore consolidated in these financial statements:
| Interest Owned | |||||||||||||||||||||||||||||||||||
| RUT | Subsidiaries | Country | Functional Currency | Direct | Indirect | Total | |||||||||||||||||||||||||||||
| 2020 | 2021 | 2020 | 2021 | 2020 | 2021 | ||||||||||||||||||||||||||||||
| % | % | % | % | % | % | ||||||||||||||||||||||||||||||
| 96,767,630-6 | Banchile Administradora General de Fondos S.A. | Chile | Ch$ | 99.98 | 99.98 | 0.02 | 0.02 | 100.00 | 100.00 | ||||||||||||||||||||||||||
| 96,543,250-7 | Banchile Asesoría Financiera S.A. | Chile | Ch$ | 99.96 | 99.96 | — | — | 99.96 | 99.96 | ||||||||||||||||||||||||||
| 77,191,070-K | Banchile Corredores de Seguros Ltda. | Chile | Ch$ | 99.83 | 99.83 | 0.17 | 0.17 | 100.00 | 100.00 | ||||||||||||||||||||||||||
| 96,571,220-8 | Banchile Corredores de Bolsa S.A. | Chile | Ch$ | 99.70 | 99.70 | 0.30 | 0.30 | 100.00 | 100.00 | ||||||||||||||||||||||||||
| 96,932,010-K | Banchile Securitizadora S.A. en Liquidación (*) | Chile | Ch$ | 99.01 | 99.01 | 0.99 | 0.99 | 100.00 | 100.00 | ||||||||||||||||||||||||||
| 96,645,790-2 | Socofin S.A. | Chile | Ch$ | 99.00 | 99.00 | 1.00 | 1.00 | 100.00 | 100.00 | ||||||||||||||||||||||||||
(*) Company in the process of dissolution
Intercompany transactions and balances between the Bank and its subsidiaries and among its subsidiaries have been eliminated for consolidation purposes. Any non-controlling interest is recognized as a separate item within the Bank’s consolidated equity.
F-13
NOTES TO THE CONSOLIDATED FINANCIAL STATEMENTS, continued
| 2. | Summary of Significant Accounting Policies, continued: |
| (b) | Basis of consolidation, continued: |
| (ii) | Investment in Associates and Joint Ventures |
Associates
An associate is an entity over which the Bank has significant influence on its operating and financial management policy decisions, without having control over the associate. Significant influence is generally presumed when the Bank holds between 20% and 50% of the voting rights. Other factors considered when determining whether the Bank has significant influence over another entity are the representation on the Board of Directors and the existence of material intercompany transactions. The existence of these factors could determine the existence of significant influence over an entity despite the Bank holding a participation of less than 20% of the entity’s voting rights.
According to the equity method, the Bank’s investments in an associate are initially recorded at cost, and subsequently increased (or decreased) to reflect both the Bank’s pro rata share of the post-acquisition net income (or loss) of the associate and other movements directly recognized in the associate’s equity. Goodwill arising from the acquisition of an associate is included in the carrying value of the investment (net of any accumulated impairment loss). Since goodwill is not reported separately, an associate is not tested individually for impairment. Rather, the entire investment is tested for impairment as described below.
After the application of the equity method, the Bank determines whether it is necessary to recognize impairment loss on the Bank’s investment in an associate. The Bank determines at each reporting date whether there is objective evidence, considering information from internal and external sources, that the investment in the associate is impaired. If this is the case, the Bank calculates the amount of impairment as the difference between the recoverable amount of the associate and its carrying value and recognizes the amount in its income statement under the line “Income attributable to associates”.
Joint Ventures
Joint Ventures are joint arrangements whereby the parties to the agreement that have joint control over the arrangement have rights to the net assets covered by the arrangement. Joint control exists only when decisions about the relevant activities covered by the arrangement require the unanimous consent of the parties sharing control in the agreement.
According to IFRS 11, an entity shall determine the type of joint arrangement: “Joint Operation” or “Joint Venture”.
For investments defined as a “Joint Operation”, the assets, liabilities, income and expenses are recognized by the participation in the joint operation.
Investments defined as a “Joint Venture” will be registered according to the equity method.
Investments in other companies that, for their characteristics, are defined as “Joint Ventures” include the following:
| ● | Artikos Chile S.A. | |
| ● | Servipag Ltda. |
F-14
NOTES TO THE CONSOLIDATED FINANCIAL STATEMENTS, continued
| 2. | Summary of Significant Accounting Policies, continued: |
| (b) | Basis of consolidation, continued: |
| (iii) | Structured entities |
Special purpose entities (“SPEs”) are generally created to comply with a specific and well-defined objective, such as securitizing specific assets or carrying out a specific loan transaction. An SPE is consolidated if, based on an assessment of its relationship with the Bank and the risks and benefits over the SPE, the Bank concludes that it has control of the SPE.
As of December 31, 2020 and 2021, the Bank does not control and therefore does not consolidate any SPEs.
| (iv) | Asset management services investments and mutual funds |
The Bank, through its subsidiary Banchile Administradora General de Fondos S.A., manages assets through investment and mutual funds and other investment products on behalf of investors.
According to IFRS 10, for consolidation purposes, it is necessary to evaluate the role of the Bank and its subsidiaries in the funds that it manages, determining its role of Agent or Principal. When assessing whether an investor controls an investee, an investor with decision-making rights must determine whether it acts as a Principal or as an Agent for other parties. A number of factors are considered in making this assessment, including the following:
| ● | Scope to make decision over the investee. | |
| ● | Rights held by other parties. | |
| ● | Remuneration according to compensation arrangements. | |
| ● | Exposition of the decision maker to the variability of returns from other interests that keeps the investee. |
The Bank and its subsidiaries manage investments and mutual funds on behalf and for the benefit of investors, acting only as an Agent in this relationship. Under this category, and as per the aforementioned rule, these funds are not controlled and therefore not consolidated by the Bank or its subsidiaries.
| (c) | Non-controlling interest: |
Non-controlling interest represents the share of losses, income and net assets that the Bank does not control, either directly or indirectly. It is presented as a separate item in the Consolidated Statement of Comprehensive Income and the Consolidated Statement of Financial Position.
| (d) | Going Concern: |
The Bank’s management has made an assessment of its ability to continue as a going concern and is satisfied that it has the resources to continue in business for the foreseeable future. Furthermore, management is not aware of any material uncertainties that may cast significant doubt upon the Bank’s ability to continue as a going concern. Therefore, the Financial Statements continue to be prepared on the going concern basis.
F-15
NOTES TO THE CONSOLIDATED FINANCIAL STATEMENTS, continued
| 2. | Summary of Significant Accounting Policies, continued: |
| (e) | Presentation and functional currency: |
The items included in the Financial Statements of each of the entities of Banco de Chile and its subsidiaries are valued using the currency of the primary economic environment in which it operates (functional currency). The functional currency of Banco de Chile is the Chilean peso, which is also the currency used to present the entity’s consolidated financial statements.
| (f) | Transactions in foreign currency: |
Transactions in currencies other than the functional currency are considered to be in foreign currency and are initially recorded at the exchange rate of the functional currency on the transaction date. Monetary assets and liabilities denominated in foreign currencies are converted using the exchange rate of the functional currency as of the date of the Statement of Financial Position, for profit or loss the exchange rate corresponding to each month-end is applied. All differences are recorded as a charge or credit to income.
Assets and liabilities in foreign currencies are shown at their equivalent value in Chilean pesos, calculated using the following exchange rates as of December 31, 2020 and 2021: Ch$711.90 and Ch$852.63 to US$1, Ch$7.40 and Ch$6.91 per JPY1, Ch$965 and Ch$843.31 per EUR1.
The loss of MCh$15,962 (net gain of MCh$156,662 in 2020) for net foreign exchange income shown in the Consolidated Statement of Income includes recognition of the effects of exchange rates variations on assets and liabilities in foreign currency or indexed to exchange rates, and the result of foreign exchange transactions conducted by the Bank and its subsidiaries.
| (g) | Use of estimates and judgment: |
Preparing Consolidated Financial Statements requires Management to make judgments, estimations and assumptions that affect the application of accounting policies and the valuation of assets, liabilities, income and expenses presented. Actual results could differ from these estimated amounts.
Relevant estimates and assumptions are reviewed regularly by senior management in order to quantify certain assets, liabilities, income, expenses and uncertainties. Revisions to accounting estimates are recognized in the year in which the estimate is revised and for any future period that is affected.
Some accounting matters particularly involve uncertainties and therefore require a considerable degree of estimation and critical judgment when applying accounting policies. Details on the use of estimates and judgment and their effect on the amounts recognized in the Financial Statements are included in the following notes:
| - | Impairment of loans (Notes No. 10, No. 11 and No. 34) | |
| - | Impairment of instruments at fair value through OCI (Notes No. 12 and No. 34) | |
| - | Impairment of Financial instruments at amortized cost (Notes No. 13 and No. 34) | |
| - | Impairment of contingent loan risks (Notes No. 25 and No. 34) | |
| - | Useful lives of intangible assets, property and equipment and leased assets and lease liabilities and investment properties (Notes No. 15, No. 16 and No. 17) | |
| - | Goodwill valuation (Note No. 15) | |
| - | Deferred taxes and income taxes (Note No. 18) | |
| - | Provisions (Note No. 25) | |
| - | Employee benefits (Note No. 26) | |
| - | Contingencies and commitments (Note No. 28) | |
| - | Fair value of financial assets and liabilities (Note No. 41) |
F-16
NOTES TO THE CONSOLIDATED FINANCIAL STATEMENTS, continued
| 2. | Summary of Significant Accounting Policies, continued: |
| (h) | Financial asset and liability valuation criteria: |
Measurement is the process of determining the monetary amounts at which the elements of the Financial Statements are to be recognized and carried in the Consolidated Statement of Financial Position and the Consolidated Statement of Other Comprehensive Income. This involves selecting the particular basis or method of measurement.
These bases or methods include the following:
| (i) | Initial recognition |
The Bank and its subsidiaries recognize loans to customers, trading and investment securities, deposits, debt issued and subordinated liabilities on the date they originated. Purchases and sales of financial assets performed on a regular basis are recognized as of the trade date on which the Bank committed to purchase or sell the asset. All other assets and liabilities (including assets and liabilities at fair value through profit or loss) are initially recognized as of the trade date on which the Bank becomes a party to the contractual provisions of the instrument.
Financial assets or liabilities are initially recognized at fair value plus transaction costs directly attributable to their purchase or issuance, except in the case of financial assets and financial liabilities recorded at fair value through profit or loss (FVPL).
| (ii) | Derecognition of financial assets and liabilities |
The Bank and its subsidiaries derecognize a financial asset (or where applicable, part of a financial asset) from its Statement of Financial Position when the contractual rights to the cash flows of the financial asset have expired or when the contractual rights to receive the cash flows of the financial asset are transferred during a transaction in which all ownership risks and rewards of the financial asset are transferred. Any portion of transferred financial assets that is created or retained by the Bank is recognized as a separate asset or liability.
When the Bank transfers a financial asset, it assesses to what extent it has retained the risks and rewards of ownership. In this case:
| (a) | If substantially all risks and rewards of ownership of the financial asset have been transferred, it is derecognized and any rights or obligations created or retained upon transfer are recognized separately as assets or liabilities. |
| (b) | If substantially all risks and rewards of ownership of the financial asset have been retained, the Bank continues to recognize it. |
| (c) | If substantially all risks and rewards of ownership of the financial asset are neither transferred nor retained, the Bank will determine if it has retained control of the financial asset. In this case: |
| (c.i) | If it has not retained control, the financial asset will be derecognized and any rights or obligations created or retained upon transfer will be recognized separately as assets or liabilities. |
| (c.ii) | If the entity has retained control, it will continue to recognize the financial asset to the extent of its continuing involvement in the financial asset. |
A financial liability is derecognized when the obligation under the liability is discharged or canceled or expires.
F-17
NOTES TO THE CONSOLIDATED FINANCIAL STATEMENTS, continued
| 2. | Summary of Significant Accounting Policies, continued: |
| (h) | Financial asset and liability valuation criteria, continued: |
| (ii) | Derecognition of financial assets and liabilities, continued: |
If an existing financial liability is replaced by another from the same lender on substantially different terms, or the terms of the existing liability are substantially modified, such an exchange or modification is treated as a derecognition of the original liability and the recognition of a new liability, and the difference in the respective carrying amounts is recognized in the income statement.
| (iii) | Offsetting |
Financial assets and liabilities are offset and the net amount is reported in the Statement of Financial Position if, and only if, the Bank has the legally enforceable right to set off the recognized amounts and there is an intention to settle on a net basis or to realize an asset and settle the liability simultaneously.
Income and expenses are shown net only if accounting standards allow such treatment, or in the case of gains and losses arising from a group of similar transactions, such as the Bank’s trading activities.
| (iv) | Measurement categories of financial assets and liabilities |
The Bank classifies all of its financial assets based on the business model for managing these assets and each asset’s contractual terms, measured at either amortized cost, fair value through other comprehensive income (FVOCI) or fair value through profit or loss (FVPL).
The Bank classifies and measures its trading portfolio at FVPL as explained in Note No. 2 (i) (ii). The Bank may designate financial instruments at FVPL, if such designation eliminates or significantly reduces measurement or recognition inconsistencies.
Financial liabilities, other than loan commitments and financial guarantees, are measured at amortized cost or at FVPL when they are held for trading and derivative instruments or the fair value designation is applied.
Fair value measurements
The fair value of a financial instrument is the price that would be received to sell an asset or that would be paid to transfer a liability in an orderly transaction between participants in a main market (or more advantageous) at the measurement date under current market conditions, regardless of whether that price is directly observable or estimated using another valuation technique. The most objective and common fair value is the price that you would pay on an active, transparent and deep market (“quoted price” or “market price”).
When available, the Bank estimates the fair value of an instrument using quoted prices in an active market for that instrument. A market is considered active if quoted prices are readily and regularly available and represent actual and regularly occurring market transactions on an arm’s length basis.
If a market for a financial instrument is not active, the Bank establishes fair value using a valuation technique. These valuation techniques include the use of recent market transactions between interested and duly informed parties that act in mutual independence conditions, if available, as well as references to the fair value of other instruments that are substantially the same, discounted cash flows (“DCF”) and options pricing models.
F-18
NOTES TO THE CONSOLIDATED FINANCIAL STATEMENTS, continued
| 2. | Summary of Significant Accounting Policies, continued: |
| (h) | Financial asset and liability valuation criteria, continued: |
| (iv) | Measurement categories of financial assets and liabilities, continued: |
The chosen valuation technique uses the maximum observable market data, relies as little as possible on estimates performed by the Bank, incorporates factors that market participants would consider in setting a price and is consistent with accepted economic methodologies for pricing financial instruments. Inputs into the valuation technique reasonably represent market expectations and include risk and return factors that are inherent in the financial instrument. Periodically, the Bank calibrates the valuation techniques and tests them for validity using prices from observable current market transactions in the same instrument or based on any available observable market data.
The best evidence of the fair value of a financial instrument at initial recognition is the transaction price (i.e., the fair value of the consideration given or received) unless the fair value of that instrument is evidenced by a comparison with other observable current market transactions in the same instrument (i.e., without modification or repackaging) or based on a valuation technique whose variables include only data from observable markets.
When the transaction price provides the best evidence of fair value at initial recognition, the financial instrument is initially measured at the transaction price and any difference between this price and the value initially obtained from a valuation model is subsequently recognized in incomes.
Fair value estimates obtained from models are adjusted for any other factors, such as model uncertainties, to the extent that the Bank believes that a third-party market participant would take them into account in pricing a transaction.
The Bank’s fair value disclosures are included in Note No. 41.
| (i) | Financial assets and liabilities per financial statement line items: |
| (i) | Due from banks, Loans to customers, Financial investments at amortized cost |
The Bank measure due from banks, loans to customers and other financial investments at amortized cost as long as the following conditions are met:
| - | The financial asset is held within a business model whose objective is to hold financial assets in order to collect contractual cash flows from them. | |
| - | The contractual terms of the financial asset give rise on specified dates on which cash flows are to be received and such cash flows are solely payments of principal and interest (SPPI) on the principal amount outstanding. |
For classification process, the Bank performs the SPPI test, which assesses the contractual terms of the financial asset to identify whether they meet the SPPI criterion.
‘Principal’ for the purpose of this test is defined as the fair value of the financial asset at initial recognition and may change over the life of the financial asset (for example, if there are repayments of principal or amortization of the premium/discount).
The most significant elements of interest within a lending arrangement are typically the consideration for the time value of money and credit risk. To make the SPPI assessment, the Bank applies judgement and considers relevant factors, such as the currency in which the financial asset is denominated, and the period for which the interest rate is set.
F-19
NOTES TO THE CONSOLIDATED FINANCIAL STATEMENTS, continued
| 2. | Summary of Significant Accounting Policies, continued: |
| (i) | Financial asset and liability per financial statement line items, continued: |
| (i) | Due from banks, Loans to customers, Financial investments at amortized cost, continued |
In contrast, contractual terms that introduce a more than de minimis exposure to risks or volatility in the
contractual cash flows that are unrelated to a basic lending arrangement do not give rise to contractual cash flows that are solely payments of principal and interest on the amount outstanding. In such cases, the financial asset is required to be measured at FVPL.
| (ii) | Financial assets held-for-trading |
Financial assets held-for-trading are securities acquired in order to generate profits from short-term price fluctuations or as a result of brokerage activities, or which are part of a portfolio on which a short-term profit-generating pattern exists. This item includes mainly Central Bank bonds and deposits from domestic banks and mutual fund investments.
Financial assets held-for-trading are stated at their fair value. Accrued interest, gains or losses from their fair market value adjustments, as well as gains or losses from trading activities, are included in “Net financial operating income” in the Consolidated Statement of Comprehensive Income. Dividends, interest and indexations are reported as “Net financial operating income” in the Consolidated Statement of Comprehensive Income.
All purchases and sales of financial assets held-for-trading that must be executed within the period established by market regulations or conventions are recorded using the trade date, which is the date on which the purchase or sale of the asset is committed. Any other purchase or sale is treated as a derivative (forward) until settlement occurs.
| (iii) | Financial assets at FVOCI |
| (iii.1) | Debt instruments at FVOCI |
The Bank applies the new category under IFRS 9 of debt instruments measured through FVOCI when both of the following conditions are met:
| - | The instrument is held within a business model whose, objective is to collect contractual cash flows and sell financial assets. |
| - | The contractual terms of the financial asset meet the SPPI test. |
FVOCI debt instruments are measured at fair value with gains and losses arising due to changes in fair value are recognized in Other Comprehensive Income (OCI). Interest income and foreign exchange gains and losses are recognized in profit or loss. The Expected Credit Losses (ECL), which are measured and recorded pursuant to the IFRS 9 adoption, recorded for debt instruments measured at FVOCI does not reduce the carrying amounts of these financial assets, as these remain at fair value in the statement of financial position, but instead, an amount equal to the allowance that would result from the impairment is recognized in OCI, with a corresponding charge to profit or loss. The accumulated loss recognized in OCI is recycled to profit or loss upon derecognition of the asset.
Where the Bank holds more than one investment in the same security, they are deemed to be disposed of on a first–in first–out basis. On derecognition, cumulative gains or losses previously recognized in OCI are reclassified from OCI to profit or loss.
F-20
NOTES TO THE CONSOLIDATED FINANCIAL STATEMENTS, continued
| 2. | Summary of Significant Accounting Policies, continued: |
| (i) | Financial asset and liability per financial statement line items, continued: |
| (iii) | Financial assets at FVOCI, continued: |
| (iii.2) | Equity instruments at FVOCI |
Upon initial recognition, the Bank occasionally elects to classify irrevocably some of its equity investments as equity instruments at FVOCI when they meet the definition of Equity under IAS 32 “Financial Instruments: Presentation” and are not held for trading. Such classification is determined on an instrument-by instrument basis.
Gains and losses on these equity instruments are never recycled to profit or loss. Dividends are recognized in profit or loss as other operating income. Equity instruments at FVOCI are not subject to an impairment assessment.
| (iv) | Lease contracts |
Accounts receivable relating to leasing contracts, included under the caption “Loans to customers”, correspond to periodic rent installments of contracts, which meet the definition to be classified as financial leases and are presented at their nominal value net of unearned interest as of each year-end.
| (v) | Factoring transactions |
They are valued for the amounts disbursed by the Bank in exchange for invoices or other commercial instruments representative of credit, with or without responsibility of the grantor, received in discount. Price differences between the amounts disbursed and the nominal value of the credits are recorded in the result as interest income, through the effective interest method, during the financing period.
In those cases where the transfer of these instruments was made without responsibility of the grantor, it is the Bank who assumes the insolvency risks of those required to pay.
| (vi) | Financial guarantees: |
In its ordinary course of business, the Bank gives financial guarantees consisting of letters of credit, guarantees and acceptances. Financial guarantees are initially recognized in the Financial Statements at fair value being the premium received. Subsequent to initial recognition, the Bank’s liability is measured at the higher of the amount originally recognized less, when appropriate, cumulative amortization recognized in the income statement and the best estimate of expenditure required settling the financial obligation arising as the result of the guarantee. The premium received is recognized in the income statement in “Income from Fees and Commissions” on a straight line basis over the guarantee period.
F-21
NOTES TO THE CONSOLIDATED FINANCIAL STATEMENTS, continued
| 2. | Summary of Significant Accounting Policies, continued: |
| (i) | Financial asset and liability per financial statement line items, continued: |
| (vii) | Impairment of loans: |
(vii.1) Overview of the principles of Expected Credit Loss (ECL)
The Bank records an allowance for expected credit loss for all loans and other debt financial assets not held at FVPL, together with loan commitments and financial guarantee contracts, all referred to as ‘financial instruments’. Equity instruments are not subject to impairment under IFRS 9.
In this context, and specifically within the scope of the impairment methodology required by IFRS 9, the following key elements are identified among others:
| ● | Estimate of expected loss based on a scenario analysis. | |
| ● | Calculation based on three stages, each as described below. | |
| ● | Forward looking analysis of macroeconomic factors and their impact in risk parameters, such as Gross Domestic Product (“GDP”) growth, unemployment rates and Central Banks interest rates. |
(vii.2) Expected Credit Loss (ECL)
The expected credit loss reflects the weighted average, across multiple scenarios; for that purpose three scenarios are estimated, for some given probabilities optimistic, central and pessimistic scenarios. Pricing and loan loss provisions should be aligned to those estimates to ensure profitability management of the portfolio.
IFRS9 requires that a provision be recognized on the date a loan is originated based on its expected credit loss.
IFRS9 proposes to calculate the expected credit loss based on the classification of operations in stages:
Stage 1: No significant increase in risk
Financial assets whose credit quality is not significantly deteriorated with respect to their credit risk evaluation at the time of their origination. Twelve months expected losses are recognized. This stage also includes those credits which have been reclassified from stage 2.
Stage 2: With a significant increase in risk
Financial assets that are not in default, however, present a significant increase in risk with respect to the levels anticipated at the time of origination. Stage 2 operations are provisioned considering the financial instrument lifetime; for the discount of the expected losses, the effective rate at the time of origination is used, calculated on the gross amount in the Bank’s books. This stage also includes those credits which have been reclassified from stage 3.
Stage 3: Objective impairment evidence
For financial assets that present evidence of impairment at the closing date of financial statements, the expected credit losses will consider a lifetime approach. The cash flows discount rate used for this stage corresponds to that of the effective interest rate (EIR) applied at the origination of the credit.
F-22
NOTES TO THE CONSOLIDATED FINANCIAL STATEMENTS, continued
| 2. | Summary of Significant Accounting Policies, continued: |
| (i) | Financial asset and liability per financial statement line items, continued: |
| (vii) | Impairment of loans, continued: |
(vii.2) Expected Credit Loss (ECL), continued:
POCI: Purchased or Originated Credit Impaired
Purchased or originated credit impaired (POCI) assets are financial assets that are credit impaired on initial recognition. POCI assets are recorded at fair value at original recognition and interest income is subsequently recognized based on a credit-adjusted EIR. ECLs are only recognized or released to the extent that there is a subsequent change in their expected credit losses.
The classification of the assets is of special relevance due to the different time horizons considered in the calculation of the provision for customers classified in stage 1 and those classified in stage 2.
Therefore, the concept of significant risk increase (SRI) is relevant since the amount of provision depends on the interpretation of this concept.
Individual classified loans
An individual analysis of debtors is applied to individuals and companies that are of such significance with respect to size, complexity or level of exposure to the Bank that they must be analyzed in detail.
The Bank classifies the debtors and their operations related to loans into one of three categories of loan portfolio: Normal, Substandard and Non-complying Loans. This internal rating considers the quantitative variables used to determine the significant risk increase (SRI) in order to establish the appropriate provisions.
| i. | Normal Loans: |
Normal loans correspond to borrowers who are up to date on their payment obligations and no sign of impairment in their credit quality are shown. This situation is reflected in the internal rating that varies from A1 to A6. All exposures rated as A1 to A4 are classified as stage 1 in IFRS9; exposures rated A5 or A6 are also classified as stage 1 whenever they are not issued with a higher rating; in that case, they are classified as stage 2.
| ii. | Substandard Loans: |
Substandard loans include all borrowers with a significant increase in risk and insufficient payment capacity or significant deterioration of payment capacity that it may be reasonably expected that they will not comply with all principal and interest payments obligations set forth in the credit agreement.
This category also includes all loans that have been non-performing for more than 30 days.
This situation is reflected in the internal rating that varies from B1 to B4. All exposures rated at these levels are classified as stage 2.
F-23
NOTES TO THE CONSOLIDATED FINANCIAL STATEMENTS, continued
| 2. | Summary of Significant Accounting Policies, continued: |
| (i) | Financial asset and liability per financial statement line items, continued: |
| (vii) | Impairment of loans, continued: |
(vii.2) Expected Credit Loss (ECL), continued:
| iii. | Non-complying Loans: |
Non-complying loans correspond to borrowers whose payment capacity is seriously at risk and who have a high likelihood of filing for bankruptcy or are renegotiating credit terms to avoid bankruptcy. This category comprises all loans outstanding from debtors that have at least one installment payment of interest or principal overdue for 90 days or more.
This situation is reflected in the internal rating that varies from C1 to C6. All obligors rated at these levels are classified as stage 3.
Group classified loans
The group analysis is used to analyze a large number of loans whose individual amounts are homogenous and not significant. For this analysis, the Bank uses models based on attributes of the debtors and their loans, and on the behavior of a group of loans. The categories used to classify the debtors correspond to “Normal loans” and “Non-complying loans”.
Loans to customers include originated and purchased non-derivative financial assets with fixed or determinable payments that are not quoted on an active market and which the Bank does not intend to sell immediately or in the short-term.
(vii.3) Significant risk increase (SRI) (quantitative criteria):
Significant increase in risk is determined on a quantitative manner, based on changes in Lifetime Probability of Default (LPD). A loan is impaired whenever LPD at calculation date is significantly greater than LPD estimated at the loan origination date. In order to estimate current LPD, macroeconomic factors and their projections are taken into account. In addition, negative behavior records (delinquency over 60 days, default (considering a 4 month probation period) or written off balances) at the public bureau (reporting entities only, banks under supervision of the local regulator) trigger a transition to stage 2.
(vii.4) Default events
In addition to the quantitative criteria described in the previous section, other aspects are considered as indicators of SRI, for which the following entry conditions to the different stages are considered:
A default event is due whenever payments are past due for more than 90 days or a renegotiated loan is originated after the preceding loan has been past due for more than 60 days.
Default events are identified on a borrower basis, therefore a default event in any exposure triggers a default across any other exposure but not on residential mortgages. Instead, residential mortgages do trigger a default event on every other exposure.
In these cases loans are classified as stage 3.
F-24
NOTES TO THE CONSOLIDATED FINANCIAL STATEMENTS, continued
| 2. | Summary of Significant Accounting Policies, continued: |
| (i) | Financial asset and liability per financial statement line items, continued: |
| (vii) | Impairment of loans, continued: |
(vii.5) Probation period
Probation periods have been set in order to regulate transitions from stage 3 to stage 2, and from stage 2 to stage 1 as well. Transitions from stage 3 to stage 1 are not allowed. Transitions are determined on a monthly basis.
| ● | Transitions from stage 2 to stage 1: In order to be upgraded, exposures in stage 2 should not have had a “significant increase in risk” for the last 4 months previous to the reporting date. “Significant increase in risk” is defined in a different manner for Retail exposures (including SMEs) and Wholesale exposures. |
Wholesale exposures: an exposure will be considered to have a significant increase in risk if any of the following are true:
| - | The client is rated in one of the two last grades of stage 1, having been downgraded during the last 12 months. | |
| - | The client is currently rated in the last grade of stage 1 (even in the case of not having been downgraded). | |
| - | Any of the client’s obligations are past due 60 days or more. | |
| - | Renegotiated loans that have been past due between 30 and 59 days. |
Retail exposures: an exposure will be considered to have a significant increase in risk if any of the following are true:
| - | The client has rescheduled a loan while it was past due 60 days or more. | |
| - | The exposure is past due 30 days or more. | |
| - | The exposure shows an increase in its default risk, quantitatively defined as follows: | |
Lifetime PD – PD at inception > Average PD
| ● | Transitions from stage 3 to stage 2: Probation period is aligned with local statutory accounting, therefore it should accomplish the following criteria: |
| - | No obligation of the debtor shows a delay in its payment of more than 30 calendar days. | |
| - | Have not been granted new refinancing to pay the obligations. | |
| - | At least one of the payments made includes capital amortization. | |
| - | If the debtor has some credit with partial payments in periods of less than six months, at least two payments have been made. | |
| - | If the debtor must pay monthly instalments for one or more credits, at least four consecutive instalments have been paid. | |
| - | All debtor obligations across the Chilean financial system are current, except for insignificant amounts. |
F-25
NOTES TO THE CONSOLIDATED FINANCIAL STATEMENTS, continued
| 2. | Summary of Significant Accounting Policies, continued: |
| (i) | Financial asset and liability per financial statement line items, continued: |
| (vii) | Impairment of loans, continued: |
(vii.6) The ECL calculation
The Bank calculates the ECL based on probability-weighted scenarios to measure the expected credit losses discounted at its effective interest rate (EIR). Losses are defined as the difference between the cash flows expected to be received by the Bank versus the contractual cash flows.
For the calculation of the ECL, the following key parameters should be considered:
| ● | Probability of Default (PD) |
The PD parameter is an estimate of the probability with which a client will fall into the non-performing portfolio within a certain time horizon. Point in time estimates are used. Depending on the stage on which the exposure is classified, the time horizon may vary from one year (for stage 1) to lifetime (for stage 2). Naturally, stage 3 exposures carry a PD = 1.
| ● | Exposure at Default (EAD) and Credit Conversion Factor (CCF) |
The exposure at default (EAD) parameter represents an estimate of the outstanding loan at the time of a customer’s default. This exposure can be either an asset or a contingent exposure. The latter includes unused limits on revolving facilities such as credit cards, lines of credit, Letters of Credit, etc.; in such cases unused limits are weighted by their CCF, which is an estimate of further utilization before default time.
| ● | Loss Given Default (LGD) |
The Loss Given the Default (LGD) parameter is defined as the expected value of the losses that an operation would have in case of default. It is expressed as a percentage of the EAD. Inflows (payments) and outflows are considered in calculating LGD.
| (viii) | Loans write-off |
Criteria under which loans are written-off when collection efforts have been exhausted, but not later than the following maximum periods:
Type of Loan | Term | |
| Consumer loans – secured and unsecured | 6 months | |
| Other transactions – unsecured | 24 months | |
| Commercial loans – secured | 36 months | |
| Residential mortgage loans | 48 months | |
| Consumer leases | 6 months | |
| Other non-real estate lease transactions | 12 months | |
| Real estate leases (commercial or residential) | 36 months |
The term represents the time elapsed by a loan from the date on which the unpaid collection or portion is in default.
Cash recoveries on written-off loans are recorded directly through the income statement.
F-26
NOTES TO THE CONSOLIDATED FINANCIAL STATEMENTS, continued
| 2. | Summary of Significant Accounting Policies, continued: |
| (i) | Financial asset and liability per financial statement line items, continued: |
| (ix) | Renegotiated loans: |
The Bank attempts to restructure loans rather than to take possession of collateral when economically convenient. This may involve extending the payment arrangements and the agreement of new loan conditions. After having renegotiated the terms, any impairment is measured using the original effective interest rate as calculated before the modification of terms and the loan is no longer considered past due. Renegotiated loans are continuously reviewed by management to ensure that all criteria are met and that future payments are likely to occur. The loans continue to be subject to an individual or collective impairment assessment, calculated using the loan’s original effective interest rate.
| (x) | Collateral valuation: |
The Bank seeks to use collateral, where possible, to mitigate its risks on financial assets. The collateral comes in various forms such as mortgages, pledges, securities, other non-financial assets and credit enhancements. The fair value of collateral is generally assessed, at a minimum, at inception through a certified appraiser, considering factors such as location, collateral type, and observable market value, among others. Additionally, the settlement costs, the time required to sell off the assets and the potential adverse market conditions are considered as well. However, some types of collateral, such as securities, are valued daily. To the extent possible, the Bank uses active market data for valuing financial assets held as collateral. (See Note No. 43 for further analysis of collateral).
For impairment of loans estimates, Collateral is not accounted as an EAD mitigation factor, but as an LGD driver instead.
| (xi) | Modified loans: |
When the contractual cash flows of a debt financial instrument are renegotiated or modified, the Bank distinguishes the modifications that originate in financial difficulties of the debtor, from those that are of a commercial nature.
| ● | Contractual modifications due to financial difficulties of the debtor: These occur when the Bank modifies the contractual conditions originally agreed so that the debtor can comply with its payment obligations. When the modification is substantial, it is recorded as a derecognition and the new loan is valued at fair value, and when the modification is not substantial, the loan is not derecognized, and its amortized cost must be adjusted based on the difference between the book value before the modification and the present value of the flows of the modified operation using the effective interest rate (EIR) of the original credit. |
| ● | Contractual modifications for other commercial reasons: These operations normally respond to general market situations at the time of the modification. Such modifications are treated as a total or partial cancellation of the original operation and the recording of a new operation at fair value. |
| (j) | Financial and operating leases: |
The determination of whether an arrangement is a lease, or it contains a lease, is based on the substance of the arrangement and requires an assessment of whether the fulfillment of the arrangement is dependent on the use of a specific asset or assets and the arrangement conveys a right to use the asset.
F-27
NOTES TO THE CONSOLIDATED FINANCIAL STATEMENTS, continued
| 2. | Summary of Significant Accounting Policies, continued: |
| (j) | Financial and operating leases, continued: |
(i) The Bank acting as lessor
Assets leased to customers under agreements which transfer substantially all the risks and rewards of ownership, with or without ultimate legal title, are classified as financial leases. When assets held are subject to a financial lease, the leased assets are derecognized and a receivable is recognized which is equal to the present value of the minimum lease payments, discounted at the interest rate implicit in the lease. Initial direct costs incurred in negotiating and arranging a financial lease are incorporated into the receivable through the discount rate applied to the lease. Financial lease income is recognized over the lease term based on a pattern reflecting a constant periodic rate of return on the net investment in the financial lease.
Assets leased to customers under agreements which do not transfer substantially all the risks and rewards of ownership are classified as operating leases. The leased assets are included within premises and equipment on the Group’s statement of financial position and depreciation is provided on the depreciable amount of these assets on a systematic basis over their estimated useful economic lives. Rental income is recognized on a straight-line basis over the period of the lease. Initial direct costs incurred in negotiating and arranging an operating lease are added to the carrying amount of the leased asset and recognized as an expense on a straight-line basis over the lease term.
(ii) The Bank acting as lessee
A contract is, or contains a lease, if one party has the right to control the use of an identified asset for a period of time in exchange for a regular payment. On the start date of a lease, a right-to-use assets leased is determined at cost, which includes the amount of the initial measurement of the lease liability plus other disbursements made. The amount of the lease liability is measured at the present value of future lease payments that have not been paid on that date, which are discounted using the Bank’s incremental financing interest rate.
The right-of-use asset is measured using the cost model, less accumulated depreciation and accumulated losses due to impairment of value, depreciation of the right-of-use asset, is recognized in the Income Statement based on the linear depreciation method from the start date and until the end of the lease term.
After the start date, the lease liability is measured by decreasing the carrying amount to reflect the lease payments made and the modifications to the lease.
According to IFRS 16 “Leases” the bank does not apply this rule to contracts whose duration are 12 months or less and those that contain an underlying asset of low value. In these cases, payments are recognized as a lease expense.
| (k) | Interest revenue and expense: |
Interest revenue and expenses are recognized in the Consolidated Income Statement using the effective interest rate method. The effective interest rate is the rate which exactly discounts estimated future cash payments or receipts through the expected life of the financial instrument or a shorter period, where appropriate, to the net carrying amount of the financial asset or financial liability. To calculate the effective interest rate, the Bank determines cash flows by taking into account all contractual conditions of the financial instrument, excluding future credit losses.
The effective interest rate calculation includes all fees and other amounts paid or received that form part of the effective interest rate. Transaction costs include incremental costs that are directly attributable to the purchase or issuance of a financial asset or liability.
F-28
NOTES TO THE CONSOLIDATED FINANCIAL STATEMENTS, continued
| 2. | Summary of Significant Accounting Policies, continued: |
| (l) | Fees and commissions: |
Revenue and expenses from fees are recognized in the Consolidated Income Statement using the criteria established in IFRS 15 “Revenue from contracts with customers”.
Under IFRS 15, revenues are recognized considering the terms of the contract with customers. Revenue is recognized when, or as the performance obligation is satisfied by transferring the goods or services committed to the customer.
Under IFRS 15, revenues are recognized using different criteria depending on their nature. The most significant are:
| − | Those that correspond to a singular act, when the act that originates them takes place. | |
| − | Those that originate in transactions or services that are extended over time, during the life of such transactions or services. | |
| − | Commissions on loan commitments and other fees related to credit operations are deferred (together with the incremental costs directly related to the placement) and recognized as an adjustment to the effective interest rate of the placement. In the case of loan commitments, when there is no certainty of the date of effective placement, the commissions are recognized on a linear basis in the duration period of the commitment. |
The fees registered by the Bank correspond mainly to:
| − | Commissions for lines of credit and overdrafts: these commissions are accrued in the period in which the lines of credit and overdrafts are granted. The Bank revenues are recognized at a point in time when performance obligation is satisfied. | |
| − | Commissions for guarantees and letters of credit: these commissions are accrued in the period in which the payment guarantees for real or contingent obligations of third parties are granted. The Bank revenues are recognized over time when performance obligation is satisfied. | |
| − | Commissions for card services: correspond to commissions earned and accrued during the period, related to the use of credit, debit and other cards. The Bank revenues are recognized at a point in time when performance obligation is satisfied. | |
| − | Commissions for account management: includes commissions for the maintenance of current accounts and other deposit accounts. The Bank revenues are recognized over time when performance obligation is satisfied. | |
| − | Commissions for collections, collections and payments: correspond to, collection and payments services provided by the Bank. The Bank revenues are recognized at a point in time when performance obligation is satisfied. | |
| − | Commissions for intermediation and management of securities: correspond to income from brokerage service, placements, administration and custody of securities. The Bank revenues are recognized at a point in time when performance obligation is satisfied. | |
| − | Remuneration for insurance commercialization: corresponds to income from the sale of insurance. The Bank revenues are recognized over time when performance obligation is satisfied. | |
| − | Commissions for investments in mutual funds and others: corresponds to commissions originated in the administration of mutual funds. The Bank revenues are recognized at a point in time when performance obligation is satisfied. | |
| − | Other commissions earned: Income generated by currency exchanges, financial advice, use of distribution channels, use of trademark agreement and placement of financial products and cash transfers and recognition of payments associated with commercial alliances, among others, are included. The Bank revenues are recognized at a point in time when performance obligation is satisfied. |
F-29
NOTES TO THE CONSOLIDATED FINANCIAL STATEMENTS, continued
| 2. | Summary of Significant Accounting Policies, continued: |
| (l) | Fees and commissions, continued: |
The expense commissions registered by the Bank correspond mainly to:
| − | Remuneration for card operations: corresponds to commissions paid for the operation of credit and debit cards. | |
| − | Inter-bank transactions: corresponds to commissions paid to the automatic clearing house for transactions carried out. | |
| − | Commissions for operations with securities: corresponds to commissions for deposit and custody of securities and brokerage of securities are included. | |
| − | Other commissions: corresponds to commissions for collection, payments and other online services are included. |
| (m) | Property and equipment: |
Property and equipment is stated at cost excluding servicing cost, less accumulated depreciation and accumulated impairment. Changes in the expected useful life are accounted for by changing the depreciation period or method, as appropriate, and treated as changes in accounting estimates.
This cost includes expenses that have been directly attributed to the asset’s acquisition.
Depreciation is recognized the Consolidated Statements of Income on a straight-line basis over the estimated useful lives of each part of an item of property and equipment.
Estimated useful lives for 2020 and 2021 are as follows:
| Buildings | 50 years |
| Installations (in general) | 10 years |
| Equipment | 5 years |
| Office furniture | 5 years |
Property and equipment is derecognized on disposal or when no future economic benefits are expected from its use. Any gain or loss arising on derecognition of the asset (calculated as the difference between the net disposal proceeds and the carrying amount of the asset) is recognized in “Impairments” in the income statement in the year the asset is derecognized.
F-30
NOTES TO THE CONSOLIDATED FINANCIAL STATEMENTS, continued
| 2. | Summary of Significant Accounting Policies, continued: |
| (n) | Intangible assets: |
Intangible assets are identified as non-monetary assets (separated from other assets) without physical substance that arise as the result of a legal transaction or that are developed internally by the consolidated entities. They are assets whose cost can be reliably estimated and for which the consolidated entities consider that it is probable that future economic benefits will be recognized.
| (i) | Goodwill |
Goodwill arises on the acquisition of subsidiaries and associates representing the excess of the fair value of the purchase consideration over the net fair value of the Bank’s share of the identifiable assets acquired and the liabilities and contingent liabilities assumed on the date of the acquisition.
For the purpose of calculating goodwill, fair values of acquired assets, liabilities and contingent liabilities are determined by reference to market values or by discounting expected future cash flows to present value. This discounting is either performed using market rates or by using risk-free rates and risk-adjusted expected future cash flows.
Goodwill originating from the acquisition of subsidiaries is capitalized and reviewed for impairment annually or more frequently if there are indications that impairment may have occurred. Impairment is determined by comparing the present value of expected future cash flows from each cash generating unit with the carrying value of its net assets, including attributable goodwill. Goodwill is allocated to cash generating units for the purpose of impairment testing considering the business level at which goodwill is monitored for internal management purposes.
Impairment losses on goodwill are not reversed. Gains and losses on the disposal of an entity include the carrying amount of goodwill relating to the entity sold.
| (ii) | Software and computer programs |
Computer software purchased by the Bank and its subsidiaries is accounted for at cost less accumulated amortization and impairment losses.
The subsequent expense in software assets is capitalized only when it increases the future economic benefit for the specific asset. All other expenses are capitalized as an expense as incurred.
Amortization is recorded in income using the straight-line amortization method based on the estimated useful life of the software, from the date on which it is available for use. The estimated useful life of software is a maximum of 6 years.
Expense for internally developed software is recorded in income for each year.
F-31
NOTES TO THE CONSOLIDATED FINANCIAL STATEMENTS, continued
| 2. | Summary of Significant Accounting Policies, continued: |
| (o) | Collateral repossessed (assets received in lieu of payment): |
Assets received in lieu of payment are classified under “Other Assets” and they are recorded at the lower of carrying amount and fair value, less cost to sell. Assets that are determined better to be sold are immediately transferred to assets held-for-sale at their fair value at the repossession date in line with the Bank’s policy.
| (p) | Investment Properties: |
Investment properties are real estate assets held to earn rental income or for capital appreciation or both, but are not held-for-sale in the ordinary course of business or used for administrative purposes. Investment properties are initially measured at cost, including transaction costs. Subsequent to initial recognition, they are carried at cost less accumulated depreciation and impairments using the same accounting policies as property and equipment.
| (q) | Deferred taxes and income taxes: |
The income tax provision of the Bank and its subsidiaries has been determined in conformity with current legal provisions.
The Bank and its subsidiaries recognize, when appropriate, deferred tax assets and liabilities for future estimates of tax effects attributable to temporary differences between the book and tax values of assets and liabilities. Deferred tax assets and liabilities are measured based on the tax rate expected to be applied, in accordance with current tax law, in the year that deferred tax assets are realized or liabilities are settled. The effects of future changes in tax legislation or tax rates are recognized in deferred taxes starting on the date of publication of the law approving such changes.
Deferred tax assets and liabilities are recorded at their book value as of the date the deferred taxes are measured. Deferred tax assets are recognized only when it is likely that future tax profits will be sufficient to recover deductions for temporary differences.
| (r) | Debt issued and other financial liabilities: |
Financial instruments issued by the Bank are classified under “Debt issued”, where the substance of the contractual arrangement results in the Bank having an obligation either to deliver cash or another financial asset to the holder, or to satisfy the obligation other than by the exchange of a fixed amount of cash or another financial asset for a fixed number of equity shares.
After initial measurement, debt issued is subsequently measured at amortized cost using the effective interest rate. Amortized cost is calculated by taking into account any discount or premium on the issue and costs that are an integral part of the effective interest rate.
The Bank applies the same accounting policies for its other financial liabilities.
F-32
NOTES TO THE CONSOLIDATED FINANCIAL STATEMENTS, continued
| 2. | Summary of Significant Accounting Policies, continued: |
| (s) | Derivative instruments: |
A “Financial Derivative” is a financial instrument whose value changes in response to changes in an observable market variable (such as an interest rate, exchange rate, the price of a financial instrument or a market index, including credit ratings), whose initial investment is very small in relation to other financial instruments with a similar response to changes in market conditions and which is generally settled at a future date.
Derivative instruments, which include foreign currency and UF forwards, interest rate forwards, currency and interest rate swaps, currency and interest rate options and other financial derivative instruments, are recorded in the Statement of Financial Position at fair value regardless of whether they are held-for-trading or for non-trading purposes.
The fair value is obtained from market quotes, DCF models and options valuation models, as and where applicable. Derivative contracts are reported as an asset when their fair value is positive and as a liability when negative under the item “Derivative Instruments”.
At inception, a derivative contract must be designated by the Bank as a derivative instrument for trading or hedging purposes.
Changes in the fair value of derivative contracts held for trading purposes are recorded in “Net financial operating income”, in the Consolidated Statement of Comprehensive Income.
If a derivative instrument is classified as a hedging instrument, it can be:
| (1) | A hedge of the fair value of existing assets or liabilities or firm commitments, or | |
| (2) | A hedge of cash flows related to existing assets or liabilities or forecasted transactions. |
A hedge relationship for hedge accounting purposes must comply with all of the following conditions:
| (a) | at its inception, the hedge relationship has been formally documented; | |
| (b) | it is expected that the hedge will be highly effective; | |
| (c) | the effectiveness of the hedge can be measured in a reasonable manner; and | |
| (d) | the hedge is highly effective with respect to the hedged risk on an ongoing basis and throughout the entire hedge relationship. |
Certain derivatives transactions that do not qualify for hedge accounting are treated and reported as derivatives for trading purposes even though they provide an effective hedge on the risk of net positions.
Changes in the fair value of derivative contracts that qualify for hedge accounting are recorded, as follows:
| ● | If derivative contracts qualify for hedge accounting of changes in the fair value of assets, liabilities or unrecognized firm commitments (Fair Value Hedge), changes in the fair value of both the hedged asset (or liability) and the hedging derivative are recognized in the income statement under “Interest revenue and expenses” and/or “Foreign Exchange Transactions, Net”, depending on the risk being hedged. On the other hand, any ineffective portion of the Fair Value Hedge is recognized in the income statement under “Net Financial Operating Income.” |
F-33
NOTES TO THE CONSOLIDATED FINANCIAL STATEMENTS, continued
| 2. | Summary of Significant Accounting Policies, continued: |
| (s) | Derivative instruments, continued: |
| ● | If derivative contracts qualify for hedge accounting of the variability of future cash flows from highly probable future transactions and/or floating rate assets or liabilities (Cash Flow Hedge), the changes in fair value are recorded in Equity under “Other Comprehensive Income”, to the extent that the hedge is effective. Changes in the fair value of the Cash Flow Hedge are subsequently reclassified to the income statement when and where the hedged item affects the Bank’s results (e.g. to Interest Revenues and Expenses and/or Foreign Exchange Transactions when the hedged instrument affects the income statement because of interest rate risk, or exchange rate risk, respectively). On the other hand, any ineffective portion of the Cash Flow Hedge is recognized in the comprehensive statement of income under the “Net Financial Operating Income” line item. |
Finally, if the hedging instrument does not continue qualifying for hedge accounting and/or it is terminated, sold, suspended or executed, the hedge accounting is discontinued prospectively. In this case, gains/losses already accrued will remain in Equity until the expected transactions occur. In that moment, gains/losses will be recorded in the Income Statement (under “Interest Revenues or Expenses” and/or “Foreign Exchange Transactions” depending on the risk being hedged) as long as transactions occur. Otherwise, if transactions are expected to fail, the changes in fair value are immediately recognized in the Income Statement (under “Interest Revenues or Expenses” and/or “Foreign Exchange Transactions” depending on the risk that was used to be hedged).”
| (t) | Operations under resale and repurchase agreements: |
The Bank carries out operations under resale agreements as a form of investment. The securities purchased under these agreements are not recognized on the Bank’s Consolidated Statement of Financial Position. The consideration paid is recognized under “Investments under resale agreements” reflecting the transaction’s economic substance as a loan granted by the Bank. The difference between the purchase and the resale price is recorded in “Net Interest Income” and is accrued over the duration of the agreement using its effective interest rate. This treatment reflects the economic substance as a loan to the Bank.
The Bank also carries out operations under repurchase agreements as a form of financing. The securities sold under a repurchase agreement at a specific date in the future are not derecognized from the Consolidated Statement of Financial Position because the Bank retains all the risks and rewards of the ownership of the securities. The corresponding cash received is recognized in the balance sheet as an asset, and the corresponding obligation to return the cash, including any accrued interest, is recognized as a liability under “Obligations under repurchase agreements”. The difference between the sale and the repurchase price is treated as “Interest Expense” and is accrued over the duration of the agreement using the effective interest rate.
The treatment of secured lending and financing transactions follows the principles laid out above. As of December 31, 2021 and 2020, there were no operations corresponding to securities lending.
| (u) | Customer loyalty programs: |
The Bank maintains a loyalty program to provide incentives to its customers, which allows acquiring goods and/or services, based on the exchange of prize points (“Dolares-Premio”), which are granted based on the purchases made with Bank’s credit cards and the compliance of certain conditions established in said program. The consideration for the prizes is made by a third party. In accordance with IFRS 15, these associated benefit plans have the necessary provisions to meet the delivery of committed future performance obligations.
F-34
NOTES TO THE CONSOLIDATED FINANCIAL STATEMENTS, continued
| 2. | Summary of Significant Accounting Policies, continued: |
| (v) | Provisions and contingent liabilities: |
Provisions are liabilities that are characterized by uncertainty in either their amount or maturity. Provisions are recorded in the Statement of Financial Position when the following requirements are jointly met:
| (i) | a present obligation has arisen from a past event, |
| (ii) | as of the date of the Financial Statements it is likely that the Bank or its subsidiaries have to disburse resources to settle the obligation and, |
| (iii) | the amount can be reliably measured. |
A contingent asset or liability is any right or obligation that arises from past events whose existence will be confirmed by one or more uncertain future events which are not within the control of the Bank. Contingent assets and liabilities are not recognized in the Statement of Financial Position according to the above mentioned requirements.
Contingent credits are understood as operations or commitments in which the Bank assumes a credit risk by committing itself to third parties, in the event of a future event, to make a payment or disbursement that must be recovered from its clients.
The following are classified as contingent credits in the complementary information:
| (i) | Guarantees and sureties: Comprises guarantees, sureties and standby letters of credit. In addition it includes payment guarantees for purchases in factoring transactions. |
| (ii) | Confirmed foreign letters of credit: Corresponds to letters of credit confirmed by the Bank. |
| (iii) | Documentary letters of credit: Includes documentary letters of credit issued by the Bank, which have not yet been negotiated. |
| (iv) | Documented guarantee with promissory notes. |
| (v) | Undrawn credit lines: The unused amount of credit lines that allow customers to draw without prior approval by the Bank (for example, using credit cards or overdrafts in checking accounts). |
| (vi) | Other credit commitments: Amounts not yet lent under committed loans, which must be disbursed at an agreed future date when events contractually agreed upon with the customer occur, such as in the case of irrevocable lines of credit linked to the progress of projects, or credits for higher studies referred to in Law No. 20,027. |
| (vii) | Other contingent loans: Includes any other kind of commitment by the Bank which may exist and give rise to lending when certain future events occur. In general, this includes unusual transactions, such as pledges made to secure the payment of loans among third parties or derivative contracts made by third parties that may result in a payment obligation and are not covered by deposits. |
F-35
NOTES TO THE CONSOLIDATED FINANCIAL STATEMENTS, continued
| 2. | Summary of Significant Accounting Policies, continued: |
| (w) | Provisions for minimum dividends: |
The Bank records within liabilities the portion of net income for the year that should be distributed to comply with the Corporations Law. For these purposes, the Bank establishes a provision in a complementary equity account within retained earnings.
Distributable net income is considered for the purpose of calculating a minimum dividends provision, which in accordance with the Bank’s bylaws is defined as that which results from reducing or adding to net income the value of price-level restatement for the concept of restatement or adjustment of paid-in capital and reserves for the year.
| (x) | Employee benefits: |
| (i) | Staff accrued vacations |
The annual costs of vacations and staff benefits are recognized on an accrual basis.
| (ii) | Short-term benefits |
The Bank has a yearly bonus plan for its employees based on their ability to meet objectives and their individual contribution to the Company’s results, consisting of a given number or portion of monthly salaries. It is provisioned for based on the estimated amount to be distributed.
| (iii) | Staff severance indemnities |
Banco de Chile has recorded a liability for long-term severance indemnities in accordance with employment contracts it has with certain employees. The liability, which is payable to specified retiring employees with over 30 years of service, is recorded at the present value of the accrued benefits, which are calculated by applying a real discount rate to the benefit accrued as of year-end over the estimated average remaining service period.
Obligations for this defined benefits plan are valued according to the projected unit credit actuarial valuation method, using inputs such as staff turnover rates, expected salary growth in wages and probability that this benefit will be used, discounted at current long-term rates (2.31% as of December 31, 2020 and 5.70% as of December 31, 2021).
The discount rate used corresponds to the rate of 10-year Bonds in pesos of the Central Bank of Chile (BCP).
Actuarial gains and losses are recognized as Other Comprehensive Income at the end of each reporting period. There is no past service costs that would have to be recognized by the Bank.
F-36
NOTES TO THE CONSOLIDATED FINANCIAL STATEMENTS, continued
| 2. | Summary of Significant Accounting Policies, continued: |
| (y) | Equity reserves: |
The equity reserves recorded in the Bank’s Statement of Financial Position include:
Reserves from Earnings:
This item includes all the reserves that were originated from earnings and that by legal or statutory dispositions, or agreements of the shareholders’ meeting, will not be distributed in the form of future dividends.
Other reserves:
This item includes all the reserves that do not come from earnings and that do not correspond to those indicated in previous items.
Unrealized gains (losses) on financial assets at fair value through other comprehensive income:
This item comprises changes in the fair value of these instruments.
| (z) | Earnings per share: |
The basic earnings per share is determined by dividing the net income attributed to the Bank’s owners in a period and the weighted average number of shares outstanding during that period.
Diluted earnings per share are determined similarly to basic earnings, but the weighted average number of outstanding shares is adjusted to take into account the potential dilutive effect of the options on shares, warrants and convertible debt. As of December 31, 2020 and 2021, there are no dilutive items on basic earnings per share.
| (aa) | Cash and cash equivalents: |
The Consolidated Statement of Cash Flows shows the changes in cash and cash equivalents derived from operating activities, investment and financing activities during the year. The indirect method has been used in the preparation of this statement of cash flows.
For the preparation of Consolidated Financial Statements of Cash Flow the following concepts have been considered:
Cash flows: Inflows and outflows of cash and cash equivalents, such as deposits with the Central Bank of Chile, deposits in domestic banks, and deposits in foreign banks.
| (i) | Operating activities: corresponds to normal activities of the Bank, as well as other activities that cannot classify, like investing or financing activities. | |
| (ii) | Investing activities: correspond to the acquisition, sale or disposition other forms, of long-term assets and other investments that not include in cash and cash equivalent. | |
| (iii) | Financing activities: corresponds to the activities that produce changes in the amount and composition of the equity and the liabilities that are not included in the operating or investing activities. |
F-37
NOTES TO THE CONSOLIDATED FINANCIAL STATEMENTS, continued
| 2. | Summary of Significant Accounting Policies, continued: |
| (ab) | Segment reporting: |
The Bank discloses information by segment in accordance with IFRS 8. The Bank’s operating segments are defined based on its different business units, considering the following factors:
| (i) | That it develops business activities from which income is obtained and expenses are incurred (including income and expenses relating to transactions with other components of the same entity); |
| (ii) | That its operating results are reviewed regularly by the entity’s highest decision-making authority for operating decisions, to determine resource allocation for the segment and evaluate its performance; and |
| (iii) | That separate financial information is available. |
| (ac) | Fiduciary activities: |
The Bank provides trust and other fiduciary services that result in the holding or investing of assets on behalf of the clients. Assets held in a fiduciary capacity are not reported in the financial statements, as they are not the assets of the Bank.
| (ad) | Identifying and measuring impairment on non-financial assets |
The Bank assesses at each reporting date and on an ongoing basis whether there is an indication that an asset may be impaired. If any indication exists, or if annual impairment testing for an asset is required, the Bank estimates the asset’s recoverable amount. An asset’s recoverable amount is the higher of an asset’s or cash-generating unit’s (“CGU”) fair value less costs to sell and its value in use. Where the carrying amount of an asset or CGU exceeds its recoverable amount, the asset is considered impaired and is written down to its recoverable amount. In assessing value in use, the estimated cash flows are discounted to their present value using a pre-tax discount rate that reflects the current market assessments of the time value of money and risks specific to the asset. In determining fair value less costs to sell, an appropriate valuation model is used. These calculations are corroborated by valuation multiples, share prices and other available fair value indicators.
For assets, excluding goodwill, impairment losses recognized in prior years are assessed at each reporting date in case there are any indications that the loss has decreased or disappeared. A previously recognized impairment is reversed only if there has been a change in the assumptions used to determine the asset’s recoverable amount since the last impairment was recognized. An impairment loss is reversed only to the extent that the book value of the asset does not exceed the carrying amount that would have been determined, net of depreciation or amortization, if no impairment loss had been recognized. Such reversal is recognized in the income statement.
Impairment losses relating to goodwill cannot be reversed in future periods.
F-38
NOTES TO THE CONSOLIDATED FINANCIAL STATEMENTS, continued
| 3. | New and Amended Standards and Interpretations: |
Amendments that resulted from improvements to IFRS to the following standards did not have any significant impact on the accounting policies, financial position or performance of the Bank:
IFRS 9 Financial Instruments, IFRS 7 Financial Instruments: Disclosures and IAS 39 Financial Instruments: Recognition and Measurement IFRS 4 Insurance Contracts and IFRS 16 Leases. Interest Rate Benchmark Reform. The amendments complement the changes issued during 2019 and focus on the effects on the financial statements when a company replaces the old interest rate benchmark with an alternative benchmark rate.
Amendment to IFRS 16 Leases: The amendment provided lessees with an exemption from assessing whether a COVID-19-related rent concession is a lease modification. The amendment was intended to apply until June 30, 2021, but as the impact of the COVID-19 pandemic is continuing, on March 31, 2021, the IASB extended the period of application of the practical expedient to June 30, 2022.
| 4. | Changes in Accounting policies, Estimates and Disclosures: |
During the year ended December 31, 2021, there have been no accounting changes that may significantly affect these consolidated financial statements.
F-39
NOTES TO THE CONSOLIDATED FINANCIAL STATEMENTS, continued
| 5. | Segment Reporting: |
For management purposes, the Bank has organized its operations and commercial strategies into 4 business segments, which are defined in accordance with the type of products and services offered to target customers. These business segments are currently defined as follows:
| Retail: | This segment focuses on individuals and small and medium-sized companies (SMEs) with annual sales up to UF 70,000, where the product offering focuses primarily on consumer loans, commercial loans, checking accounts, credit cards, credit lines and mortgage loans. |
| Wholesale: | This segment focused on corporate clients and large companies, whose annual revenue exceed UF 70,000, where the product offering focuses primarily on commercial loans, checking accounts and liquidity management services, debt instruments, foreign trade, derivative contracts and leases. |
| Treasury: | This segment includes the associated revenues to the management of the investment portfolio and the business of financial transactions and currency trading. |
Transactions with customers carried out by the Treasury are reflected in the respective aforementioned segments. These products are highly transaction-focused and include foreign exchange transactions, derivatives and financial instruments in general, among others.
| Subsidiaries: | Corresponds to the businesses generated by the companies controlled by the Bank, which carry out activities complementary to the bank business. The companies that comprise this segment are: |
| ● | Banchile Administradora General de Fondos S.A. | |
| ● | Banchile Asesoría Financiera S.A. | |
| ● | Banchile Corredores de Seguros Ltda. | |
| ● | Banchile Corredores de Bolsa S.A. | |
| ● | Banchile Securitizadora S.A. en Liquidación | |
| ● | Socofin S.A. |
F-40
NOTES TO THE CONSOLIDATED FINANCIAL STATEMENTS, continued
| 5. | Segment Reporting, continued: |
The financial information used to measure the performance of the Bank’s business segments is not necessarily comparable with similar information from other financial institutions because it is based on internal reporting policies. The Bank obtains the majority of its income from: interest, UF indexation and fees and financial operations and changes, discounting provisions for credit risk and operating expenses. Management is mainly focused on these concepts in its evaluation of segment performance and decision-making regarding goals and allocation of resources for each unit individually. Although the results of the segments reconcile with those of the Bank at total level, this is not necessarily the case for all concepts on an individual basis, since the management is measured and controlled in individual form and additionally applies the following criteria:
| ● | The net interest margin of loans and deposits is obtained aggregating the net financial margins of each individual operation of credit and uptake made by the Bank. For these purposes, the volume of each operation and its contribution margin are considered, which in turn corresponds to the difference between the effective rate of the customer and the internal transfer price established according to the term and currency of each operation. Additionally, the net margin includes the result of interest and indexation from the accounting hedges. |
| ● | Provisions for credit risk are determined at the customer level based on the characteristics of each of their operations. |
| ● | The capital and financial impacts on outcome have been assigned to each segment based on the risk-weighted assets. |
| ● | Operational expenses are reflected at the level of the different functional areas of the Bank. The allocation of expenses from functional areas to business segments is done using different allocation criteria, at the level of the different concepts and expense items. |
The Bank did not enter into transactions with any particular customer or third party that collectively generated more than 10% of the Bank’s total income in 2020 and 2021.
Taxes are managed at the consolidated level and are not allocated to business segments.
F-41
NOTES TO THE CONSOLIDATED FINANCIAL STATEMENTS, continued
| 5. | Segment Reporting, continued: |
| As of December 31, 2019 | ||||||||||||||||||||||||||||||
| Retail | Wholesale | Treasury | Subsidiaries | Subtotal | Reclassifications and adjustments to conform IFRS | Total | ||||||||||||||||||||||||
| MCh$ | MCh$ | MCh$ | MCh$ | MCh$ | MCh$ | Note | MCh$ | |||||||||||||||||||||||
| Net interest income | 1,020,346 | 366,638 | (13,511 | ) | (7,650 | ) | 1,365,823 | 5,455 | 1,371,278 | |||||||||||||||||||||
| Net fees and commissions income | 268,345 | 49,492 | (2,917 | ) | 153,330 | 468,250 | (10,948 | ) | 457,302 | |||||||||||||||||||||
| Other operating income | 37,225 | 62,153 | 42,087 | 53,931 | 195,396 | (18,758 | ) | 176,638 | ||||||||||||||||||||||
| Total operating revenue | 1,325,916 | 478,283 | 25,659 | 199,611 | 2,029,469 | (24,251 | ) | (1) | 2,005,218 | |||||||||||||||||||||
| Provisions for Expected Credit losses | (332,833 | ) | (14,375 | ) | — | (66 | ) | (347,274 | ) | 15,673 | (2) | (331,601 | ) | |||||||||||||||||
| Depreciation and amortization | (57,826 | ) | (6,605 | ) | (264 | ) | (5,846 | ) | (70,541 | ) | — | (70,541 | ) | |||||||||||||||||
| Other operating expenses | (588,997 | ) | (151,949 | ) | (2,967 | ) | (111,499 | ) | (855,412 | ) | 23,703 | (3) | (831,709 | ) | ||||||||||||||||
| Income attributable to associates | 4,826 | 1,020 | 111 | 493 | 6,450 | (411 | ) | 6,039 | ||||||||||||||||||||||
| Income before income taxes | 351,086 | 306,374 | 22,539 | 82,693 | 762,692 | 14,714 | 777,406 | |||||||||||||||||||||||
| Income taxes | (169,683 | ) | (3,978 | ) | (4) | (173,661 | ) | |||||||||||||||||||||||
| Income after income taxes | 593,009 | 10,736 | 603,745 | |||||||||||||||||||||||||||
| Assets | 18,215,859 | 10,765,728 | 11,351,141 | 964,695 | 41,297,423 | (515,199 | ) | 40,782,224 | ||||||||||||||||||||||
| Current and deferred taxes | 321,305 | (89,655 | ) | 231,650 | ||||||||||||||||||||||||||
| Total assets | 41,618,728 | (604,854 | ) | (5) | 41,013,874 | |||||||||||||||||||||||||
| Liabilities | 10,735,252 | 9,160,441 | 17,337,471 | 781,052 | 38,014,216 | (982,392 | ) | 37,031,824 | ||||||||||||||||||||||
| Current and deferred taxes | 76,289 | — | 76,289 | |||||||||||||||||||||||||||
| Total liabilities | 38,090,505 | (982,392 | ) | (6) | 37,108,113 | |||||||||||||||||||||||||
F-42
NOTES TO THE CONSOLIDATED FINANCIAL STATEMENTS, continued
| 5. | Segment Reporting, continued: |
Reclassifications and adjustments to conform IFRS
| (1) | The total effect due to the elimination adjustments to conform the total operating revenue is MCh$(14,949). In addition the total effect of IFRS adjustments is MCh$(9,302) which mainly stems from the reclassification of interest on repurchase agreements and suspended interest recognition. |
| (2) | The total effect relates to IFRS adjustments of MCh$15,673, which mainly stems from differences in the calculation of allowances for ECL. |
| (3) | The total effect due to the elimination adjustments to conform other operating expenses is MCh$14,949. In addition the total effect of IFRS adjustments is MCh$8,754, which mainly represents reversal of write-offs of assets received in lieu of payments. |
| (4) | The total effect relates to IFRS adjustments of MCh$(3,978), which stems from deferred taxes. |
| (5) | The total effect due to the elimination adjustments to conform the consolidated financial position data in assets is MCh$(345,395). In addition the total effect of IFRS adjustments in assets is MCh$(259,459), which mainly stems from differences in the calculation of allowances for loan losses, the acquisition of Citibank Chile and deferred taxes effects and settlement of transactions in the course of collection. |
| (6) | The total effect due to the elimination adjustments to conform the consolidated financial position data in liabilities is MCh$(345,395). In addition the total effect of IFRS adjustments in liabilities is MCh$(636,997), which mainly stems from provision for minimum dividends and differences in the calculation of allowances for ECL. |
F-43
NOTES TO THE CONSOLIDATED FINANCIAL STATEMENTS, continued
| 5. | Segment Reporting, continued: |
| As of December 31, 2020 | ||||||||||||||||||||||||||||||
| Retail | Wholesale | Treasury | Subsidiaries | Subtotal | Reclassifications and adjustments to conform IFRS | Total | ||||||||||||||||||||||||
| MCh$ | MCh$ | MCh$ | MCh$ | MCh$ | MCh$ | Note | MCh$ | |||||||||||||||||||||||
| Net interest income | 940,075 | 377,314 | (3,603 | ) | (1,923 | ) | 1,311,863 | 4,925 | 1,316,788 | |||||||||||||||||||||
| Net fees and commissions income | 265,338 | 55,599 | (1,969 | ) | 143,863 | 462,831 | (16,863 | ) | 445,968 | |||||||||||||||||||||
| Other operating income | 26,231 | 48,163 | 75,144 | 35,991 | 185,529 | (13,475 | ) | 172,054 | ||||||||||||||||||||||
| Total operating revenue | 1,231,644 | 481,076 | 69,572 | 177,931 | 1,960,223 | (25,413 | ) | (1) | 1,934,810 | |||||||||||||||||||||
| Provisions for Expected Credit losses | (325,852 | ) | (136,448 | ) | — | (380 | ) | (462,680 | ) | (84,426 | ) | (2) | (547,106 | ) | ||||||||||||||||
| Depreciation and amortization | (59,730 | ) | (7,317 | ) | (312 | ) | (5,998 | ) | (73,357 | ) | — | (73,357 | ) | |||||||||||||||||
| Other operating expenses | (566,688 | ) | (153,717 | ) | (3,458 | ) | (106,591 | ) | (830,454 | ) | 26,059 | (3) | (804,395 | ) | ||||||||||||||||
| Income attributable to associates | (6,674 | ) | 1,548 | (7 | ) | 472 | (4,661 | ) | (438 | ) | (5,099 | ) | ||||||||||||||||||
| Income before income taxes | 272,700 | 185,142 | 65,795 | 65,434 | 589,071 | (84,218 | ) | 504,853 | ||||||||||||||||||||||
| Income taxes | (125,962 | ) | 22,739 | (4) | (103,223 | ) | ||||||||||||||||||||||||
| Income after income taxes | 463,109 | (61,479 | ) | 401,630 | ||||||||||||||||||||||||||
| Assets | 18,800,918 | 10,811,000 | 15,400,139 | 830,910 | 45,842,967 | (607,473 | ) | 45,235,494 | ||||||||||||||||||||||
| Current and deferred taxes | 380,894 | (65,428 | ) | 315,466 | ||||||||||||||||||||||||||
| Total assets | 46,223,861 | (672,901 | ) | (5) | 45,550,960 | |||||||||||||||||||||||||
| Liabilities | 13,848,124 | 10,143,939 | 17,844,350 | 660,869 | 42,497,282 | (943,714 | ) | 41,553,568 | ||||||||||||||||||||||
| Current and deferred taxes | 311 | — | 311 | |||||||||||||||||||||||||||
| Total liabilities | 42,497,593 | (943,714 | ) | (6) | 41,553,879 | |||||||||||||||||||||||||
F-44
NOTES TO THE CONSOLIDATED FINANCIAL STATEMENTS, continued
| 5. | Segment Reporting, continued: |
Reclassifications and adjustments to conform IFRS
| (1) | The total effect due to the elimination adjustments to conform the total operating revenue is MCh$(21,480). In addition the total effect of IFRS adjustments is MCh$(3,933) which mainly stems from the reclassification of interest on repurchase agreements and suspended interest recognition. |
| (2) | The total effect relates to IFRS adjustments of MCh$(84,426), which mainly stems from differences in the calculation of allowances for ECL. |
| (3) | The total effect due to the elimination adjustments to conform other operating expenses is MCh$21,480. In addition the total effect of IFRS adjustments is MCh$4,579, which mainly represents reversal of write-offs of assets received in lieu of payments. |
| (4) | The total effect relates to IFRS adjustments of MCh$22,739, which stems from deferred taxes. |
| (5) | The total effect due to the elimination adjustments to conform the consolidated financial position data in assets is MCh$(128,730). In addition the total effect of IFRS adjustments in assets is MCh$(544,171), which mainly stems from differences in the calculation of allowances for loan losses, the acquisition of Citibank Chile and deferred taxes effects and settlement of transactions in the course of collection. |
| (6) | The total effect due to the elimination adjustments to conform the consolidated financial position data in liabilities is MCh$(128,730). In addition the total effect of IFRS adjustments in liabilities is MCh$(814,984), which mainly stems from provision for minimum dividends and differences in the calculation of allowances for ECL. |
F-45
NOTES TO THE CONSOLIDATED FINANCIAL STATEMENTS, continued
| 5. | Segment Reporting, continued: |
| As of December 31, 2021 | ||||||||||||||||||||||||||||||
| Retail | Wholesale | Treasury | Subsidiaries | Subtotal | Reclassifications and adjustments to conform IFRS | Total | ||||||||||||||||||||||||
| MCh$ | MCh$ | MCh$ | MCh$ | MCh$ | MCh$ | Note | MCh$ | |||||||||||||||||||||||
| Net interest income | 1,084,191 | 478,807 | 6,479 | (1,198 | ) | 1,568,279 | 5,743 | 1,574,022 | ||||||||||||||||||||||
| Net fees and commissions income | 250,470 | 61,671 | (1,864 | ) | 160,507 | 470,784 | (15,756 | ) | 455,028 | |||||||||||||||||||||
| Other operating income | 42,160 | 80,994 | 52,058 | 36,839 | 212,051 | (7,016 | ) | 205,035 | ||||||||||||||||||||||
| Total operating revenue | 1,376,821 | 621,472 | 56,673 | 196,148 | 2,251,114 | (17,029 | ) | (1) | 2,234,085 | |||||||||||||||||||||
| Provisions for Expected Credit losses | (259,229 | ) | (114,299 | ) | — | 268 | (373,260 | ) | 354,088 | (2) | (19,172 | ) | ||||||||||||||||||
| Depreciation and amortization | (62,721 | ) | (8,114 | ) | (365 | ) | (5,598 | ) | (76,798 | ) | — | (76,798 | ) | |||||||||||||||||
| Other operating expenses | (562,599 | ) | (155,701 | ) | (3,538 | ) | (109,985 | ) | (831,823 | ) | 24,201 | (3) | (807,622 | ) | ||||||||||||||||
| Income attributable to associates | (229 | ) | 1,886 | 84 | 499 | 2,240 | (447 | ) | 1,793 | |||||||||||||||||||||
| Income before income taxes | 492,043 | 345,244 | 52,854 | 81,332 | 971,473 | 360,813 | 1,332,286 | |||||||||||||||||||||||
| Income taxes | (178,550 | ) | (97,419 | ) | (4) | (275,969 | ) | |||||||||||||||||||||||
| Income after income taxes | 792,923 | 263,394 | 1,056,317 | |||||||||||||||||||||||||||
| Assets | 20,458,338 | 12,806,598 | 17,412,053 | 954,858 | 51,631,847 | (482,299 | ) | 51,149,548 | ||||||||||||||||||||||
| Current and deferred taxes | 440,040 | (163,640 | ) | 276,400 | ||||||||||||||||||||||||||
| Total assets | 52,071,887 | (645,939 | ) | (5) | 51,425,948 | |||||||||||||||||||||||||
| Liabilities | 16,794,546 | 10,530,749 | 19,640,221 | 770,228 | 47,735,744 | (1,241,051 | ) | 46,494,693 | ||||||||||||||||||||||
| Current and deferred taxes | 113,129 | (846 | ) | 112,283 | ||||||||||||||||||||||||||
| Total liabilities | 47,848,873 | (1,241,897 | ) | (6) | 46,606,976 | |||||||||||||||||||||||||
F-46
NOTES TO THE CONSOLIDATED FINANCIAL STATEMENTS, continued
| 5. | Segment Reporting, continued: |
Reclassifications and adjustments to conform IFRS
| (1) | The total effect due to the elimination adjustments to conform the total operating revenue is MCh$(20,857). In addition the total effect of IFRS adjustments is MCh$3,828, which mainly stems from the reclassification of interest on repurchase agreements and suspended interest recognition. |
| (2) | The total effect relates to IFRS adjustments of MCh$354,088, which mainly stems from differences in the calculation of allowances for ECL. |
| (3) | The total effect due to the elimination adjustments to conform other operating expenses is MCh$20,857. In addition the total effect of IFRS adjustments is MCh$3,344, which mainly represents reversal of write-offs of assets received in lieu of payments. |
| (4) | The total effect relates to IFRS adjustments of MCh$(97,419), which stems from deferred taxes. |
| (5) | The total effect due to the elimination adjustments to conform the consolidated financial position data in assets is MCh$(369,448). In addition the total effect of IFRS adjustments in assets is MCh$(276,491), which mainly stems from differences in the calculation of allowances for loan losses, the acquisition of Citibank Chile and deferred taxes effects and settlement of transactions in the course of collection. |
| (6) | The total effect due to the elimination adjustments to conform the consolidated financial position data in liabilities is MCh$(369,448). In addition the total effect of IFRS adjustments in liabilities is MCh$(872,449), which mainly stems from provision for minimum dividends and differences in the calculation of allowances for ECL. |
F-47
NOTES TO THE CONSOLIDATED FINANCIAL STATEMENTS, continued
| 6. | Cash and Cash Equivalents: |
| (a) | Details of cash and cash equivalents and its reconciliation to the Statement of Cash Flows at each year-end are as follows: |
| 2020 | 2021 | |||||||
| MCh$ | MCh$ | |||||||
| Cash and due from banks: | ||||||||
| Cash (*) | 615,842 | 1,073,601 | ||||||
| Current account with the Central Bank (*) | 641,890 | 1,545,472 | ||||||
| Deposits in other domestic banks | 14,506 | 129,858 | ||||||
| Deposits abroad | 1,287,978 | 964,803 | ||||||
| Subtotal - Cash and due from banks | 2,560,216 | 3,713,734 | ||||||
| Transactions in the course of collection | (719,692 | ) | 115,967 | |||||
| Highly liquid financial instruments (**) | 400,014 | 125,054 | ||||||
| Repurchase agreements | 34,872 | 40,369 | ||||||
| Total cash and cash equivalents | 2,275,410 | 3,995,124 | ||||||
(*) Amounts in cash and Central Bank deposits are mandatory reserve deposits for which the Bank must maintain a minimum specified monthly average balance.
(**) It corresponds to negotiation instruments and investment instruments, whose terms do not exceed three months from the date of acquisition.
| (b) | Transactions in the course of collection: |
Transactions in the course of collection are transactions for which the only remaining step is settlement, which will increase or decrease the funds in the Central Bank or in foreign banks, normally occurring within 24 to 48 business hours and are detailed as follows:
| 2020 | 2021 | |||||||
| MCh$ | MCh$ | |||||||
| Assets | ||||||||
| Documents drawn on other banks (clearing) | 123,267 | 123,051 | ||||||
| Funds receivable | 39,985 | 203,395 | ||||||
| Subtotal transactions in the course of collection | 163,252 | 326,446 | ||||||
| Liabilities | ||||||||
| Funds payable | (882,944 | ) | (210,479 | ) | ||||
| Subtotal transactions in the course of payment | (882,944 | ) | (210,479 | ) | ||||
| Total transactions in the course of collection | (719,692 | ) | 115,967 | |||||
F-48
NOTES TO THE CONSOLIDATED FINANCIAL STATEMENTS, continued
| 7. | Financial Assets Held-for-Trading: |
The details of financial instruments classified as held-for-trading at each period are as follows:
| 2020 | 2021 | |||||||
| MCh$ | MCh$ | |||||||
| Instruments issued by the Chilean Government and Central Bank: | ||||||||
| Central Bank bonds | 3,186 | 1,145 | ||||||
| Central Bank promissory notes | 4,006,490 | 3,295,955 | ||||||
| Other instruments issued by the Chilean Government and Central Bank | 149,616 | 175,022 | ||||||
| Other instruments issued in Chile | ||||||||
| Bonds from other domestic companies | 5,396 | — | ||||||
| Bonds from domestic banks | 5,494 | 51,484 | ||||||
| Deposits in domestic banks | 93,905 | 214,336 | ||||||
| Other instruments issued in Chile | 1,003 | 3,062 | ||||||
| Instruments issued by foreign institutions | ||||||||
| Other instruments issued abroad | 164 | — | ||||||
| Mutual fund investments | ||||||||
| Funds managed by related companies | 400,902 | 135,691 | ||||||
| Funds managed by third-party | — | — | ||||||
| Total | 4,666,156 | 3,876,695 | ||||||
Under “Instruments issued by the Chilean Government and Central Bank of Chile” some instruments are classified as sold under resale agreements to customers and financial institutions, by an amount of Ch$217,614 million as of December 31, 2020. As of December 31, 2021, there are no instruments sold with a repurchase agreement. Repurchase agreements had a 4 days average expiration at the end of year 2020. Additionally, under this line are maintained instruments to comply with the requirements for the constitution of the technical reserve for an amount equivalent to Ch$3,288,800 million (Ch$2,986,000 million in December 2020).
“Other instruments issued in Chile” includes instruments sold under repurchase agreements with customers and financial institutions amounting to Ch$84,969 million as of December 31, 2021 (Ch$52,809 million as of December 31, 2020). The repurchase agreements have an average maturity of 12 days at the end of year 2021 (9 days in December 2020).
Additionally, the Bank holds financial investments in mortgage financial bonds issued by itself in the amount of Ch$3,832 million as of December 31, 2021 (Ch$5,156 million as of December 31, 2020), which are presented as a reduction of the liability line item “Debt issued”.
F-49
NOTES TO THE CONSOLIDATED FINANCIAL STATEMENTS, continued
| 8. | Investments under Resale Agreements and Obligations under Repurchase Agreements: |
| (a) | Rights arising from resale agreements: The Bank provides financing to its customers through resale agreements and securities lending, in which the financial instrument serves as collateral. As of December 31, 2020 and 2021, the Bank has the following receivables resulting from such transactions: |
| Up to 1 month | Over 1 month and up to 3 months | Over 3 months and up to 12 months | Over 1 year and up to 3 years | Over 3 years and up to 5 years | Over 5 years | Total | ||||||||||||||||||||||||||||||||||||||||||||||||||
| 2020 | 2021 | 2020 | 2021 | 2020 | 2021 | 2020 | 2021 | 2020 | 2021 | 2020 | 2021 | 2020 | 2021 | |||||||||||||||||||||||||||||||||||||||||||
| MCh$ | MCh$ | MCh$ | MCh$ | MCh$ | MCh$ | MCh$ | MCh$ | MCh$ | MCh$ | MCh$ | MCh$ | MCh$ | MCh$ | |||||||||||||||||||||||||||||||||||||||||||
| Instruments issued by the Chilean Governments and Central Bank of Chile | ||||||||||||||||||||||||||||||||||||||||||||||||||||||||
| Central Bank bonds | — | — | — | — | — | — | — | — | — | — | — | — | — | — | ||||||||||||||||||||||||||||||||||||||||||
| Central Bank promissory notes | — | — | — | — | — | — | — | — | — | — | — | — | — | — | ||||||||||||||||||||||||||||||||||||||||||
| Other instruments issued by the Chilean Government and Central Bank | 10,006 | — | — | — | — | — | — | — | — | — | — | — | 10,006 | — | ||||||||||||||||||||||||||||||||||||||||||
| Subtotal | 10,006 | — | — | — | — | — | — | — | — | — | — | — | 10,006 | — | ||||||||||||||||||||||||||||||||||||||||||
| Other Instruments issued in Chile | ||||||||||||||||||||||||||||||||||||||||||||||||||||||||
| Deposit promissory notes from domestic banks | — | — | — | — | — | — | — | — | — | — | — | — | — | — | ||||||||||||||||||||||||||||||||||||||||||
| Mortgage bonds from domestic banks | — | — | — | — | — | — | — | — | — | — | — | — | — | — | ||||||||||||||||||||||||||||||||||||||||||
| Bonds from domestic banks | — | — | — | — | — | — | — | — | — | — | — | — | — | — | ||||||||||||||||||||||||||||||||||||||||||
| Deposits in domestic banks | — | — | — | — | — | — | — | — | — | — | — | — | — | — | ||||||||||||||||||||||||||||||||||||||||||
| Bonds from other Chilean companies | — | — | — | — | — | — | — | — | — | — | — | — | — | — | ||||||||||||||||||||||||||||||||||||||||||
| Other instruments issued in Chile | 29,089 | 37,763 | 20,591 | 14,013 | 16,721 | 12,589 | — | — | — | — | — | — | 66,401 | 64,365 | ||||||||||||||||||||||||||||||||||||||||||
| Subtotal | 29,089 | 37,763 | 20,591 | 14,013 | 16,721 | 12,589 | — | — | — | — | — | — | 66,401 | 64,365 | ||||||||||||||||||||||||||||||||||||||||||
| Instruments issued by foreign institutions | ||||||||||||||||||||||||||||||||||||||||||||||||||||||||
| Instruments from foreign governments or Central Bank | — | — | — | — | — | — | — | — | — | — | — | — | — | — | ||||||||||||||||||||||||||||||||||||||||||
| Other instruments | — | — | — | — | — | — | — | — | — | — | — | — | — | — | ||||||||||||||||||||||||||||||||||||||||||
| Subtotal | — | — | — | — | — | — | — | — | — | — | — | — | — | — | ||||||||||||||||||||||||||||||||||||||||||
| Total | 39,095 | 37,763 | 20,591 | 14,013 | 16,721 | 12,589 | — | — | — | — | — | — | 76,407 | 64,365 | ||||||||||||||||||||||||||||||||||||||||||
Securities received:
As part of investments under resale agreements the Bank has received securities that it is allowed to sell or give as collateral in case the owner of these instruments enters into default or in bankruptcy. As of December 31, 2021 the Bank held securities with a fair value of Ch$65,531 million (Ch$82,585 million in 2020).
F-50
NOTES TO THE CONSOLIDATED FINANCIAL STATEMENTS, continued
| 8. | Investments under Resale Agreements and Obligations under Repurchase Agreements, continued: |
| (b) | Obligations arising from repurchase agreements: The Bank obtains financing by selling financial instruments and agreeing to repurchase them in the future, plus interest at a prefixed rate. As of December 31, 2020 and 2021, the repurchase agreements are the following: |
| Up to 1 month | Over 1 month and up to 3 months | Over 3 months and up to 12 months | Over 1 year and up to 3 years | Over 3 years and up to 5 years | Over 5 years | Total | ||||||||||||||||||||||||||||||||||||||||||||||||||
| 2020 | 2021 | 2020 | 2021 | 2020 | 2021 | 2020 | 2021 | 2020 | 2021 | 2020 | 2021 | 2020 | 2021 | |||||||||||||||||||||||||||||||||||||||||||
| MCh$ | MCh$ | MCh$ | MCh$ | MCh$ | MCh$ | MCh$ | MCh$ | MCh$ | MCh$ | MCh$ | MCh$ | MCh$ | MCh$ | |||||||||||||||||||||||||||||||||||||||||||
| Instruments issued by the Chilean Governments and Central Bank of Chile | ||||||||||||||||||||||||||||||||||||||||||||||||||||||||
| Central Bank bonds | — | — | — | — | — | — | — | — | — | — | — | — | — | — | ||||||||||||||||||||||||||||||||||||||||||
| Central Bank promissory notes | 183,083 | — | — | — | — | — | — | — | — | — | — | — | 183,083 | — | ||||||||||||||||||||||||||||||||||||||||||
| Other instruments issued by the Chilean Government and Central Bank | 47,763 | 351 | — | — | — | — | — | — | — | — | — | — | 47,763 | 351 | ||||||||||||||||||||||||||||||||||||||||||
| Subtotal | 230,846 | 351 | — | — | — | — | — | — | — | — | — | — | 230,846 | 351 | ||||||||||||||||||||||||||||||||||||||||||
| Other Instruments issued in Chile | ||||||||||||||||||||||||||||||||||||||||||||||||||||||||
| Deposit promissory notes from domestic banks | — | — | — | — | — | — | — | — | — | — | — | — | — | — | ||||||||||||||||||||||||||||||||||||||||||
| Mortgage bonds from domestic banks | — | — | — | — | — | — | — | — | — | — | — | — | — | — | ||||||||||||||||||||||||||||||||||||||||||
| Bonds from domestic banks | — | — | — | — | — | — | — | — | — | — | — | — | — | — | ||||||||||||||||||||||||||||||||||||||||||
| Deposits in domestic banks | 57,648 | 84,996 | 43 | — | — | 52 | — | — | — | — | — | — | 57,691 | 85,048 | ||||||||||||||||||||||||||||||||||||||||||
| Bonds from other Chilean companies | — | — | — | — | — | — | — | — | — | — | — | — | — | — | ||||||||||||||||||||||||||||||||||||||||||
| Other instruments issued in Chile | 380 | 2,320 | — | 4 | — | — | — | — | — | — | — | — | 380 | 2,324 | ||||||||||||||||||||||||||||||||||||||||||
| Subtotal | 58,028 | 87,316 | 43 | 4 | — | 52 | — | — | — | — | — | — | 58,071 | 87,372 | ||||||||||||||||||||||||||||||||||||||||||
| Instruments issued by foreign institutions | ||||||||||||||||||||||||||||||||||||||||||||||||||||||||
| Instruments from foreign governments or central bank | — | — | — | — | — | — | — | — | — | — | — | — | — | — | ||||||||||||||||||||||||||||||||||||||||||
| Other instruments issued by foreign | — | — | — | — | — | 7,286 | — | — | — | — | — | — | — | 7,286 | ||||||||||||||||||||||||||||||||||||||||||
| Subtotal | — | — | — | — | — | 7,286 | — | — | — | — | — | — | — | 7,286 | ||||||||||||||||||||||||||||||||||||||||||
| Total | 288,874 | 87,667 | 43 | 4 | — | 7,338 | — | — | — | — | — | — | 288,917 | 95,009 | ||||||||||||||||||||||||||||||||||||||||||
Securities sold:
The fair value of the financial instruments delivered as collateral by the Bank and its subsidiaries, in sales transactions with repurchase agreements and securities lending as of December 31, 2021 amounts to Ch$85,322 million (Ch$288,523 million in December 2020). In the event that the Bank and its subsidiaries enter into default or bankruptcy, the counterparty is authorized to sell or deliver these investments as collateral.
F-51
NOTES TO THE CONSOLIDATED FINANCIAL STATEMENTS, continued
| 9. | Derivative Instruments and Accounting Hedges: |
| (a) | As of December 31, 2020 and 2021, the Bank’s portfolio of derivative instruments is detailed as follows: |
| As of December 31, 2020 | ||||||||||||
| Fair value | ||||||||||||
| Notional amount contract | Asset | Liability | ||||||||||
| MCh$ | MCh$ | MCh$ | ||||||||||
| Derivatives held for hedging of fair value | ||||||||||||
| Cross currency swap | 5,031 | — | 1,646 | |||||||||
| Interest rate swap | 29,508 | — | 4,873 | |||||||||
| Total derivatives held for hedging purposes | 34,539 | — | 6,519 | |||||||||
| Derivatives held as cash flow hedges | ||||||||||||
| Interest rate swap and cross currency swap | 1,217,457 | 51,062 | 65,172 | |||||||||
| Total Derivatives held as cash flow hedges | 1,217,457 | 51,062 | 65,172 | |||||||||
| Derivatives held-for-trading purposes | ||||||||||||
| Currency forward | 21,751,181 | 551,964 | 637,164 | |||||||||
| Interest rate swap | 44,189,444 | 1,167,416 | 1,189,828 | |||||||||
| Cross currency swap and interest rate swap | 18,893,219 | 845,831 | 940,565 | |||||||||
| Call currency options | 71,914 | 269 | 306 | |||||||||
| Put currency options | 57,395 | 1,462 | 2,099 | |||||||||
| Total derivatives held-for-trading purposes | 84,963,153 | 2,566,942 | 2,769,962 | |||||||||
| Total | 86,215,149 | 2,618,004 | 2,841,653 | |||||||||
| As of December 31, 2021 | ||||||||||||
| Fair value | ||||||||||||
| Notional amount contract | Asset | Liability | ||||||||||
| MCh$ | MCh$ | MCh$ | ||||||||||
| Derivatives held for hedging of fair value | ||||||||||||
| Cross currency swap | 1,788 | — | 608 | |||||||||
| Interest rate swap | — | — | — | |||||||||
| Total derivatives held for hedging purposes | 1,788 | — | 608 | |||||||||
| Derivatives held as cash flow hedges | ||||||||||||
| Currency forward | 3,099 | — | 88 | |||||||||
| Interest rate swap and cross currency swap | 1,362,671 | 277,803 | — | |||||||||
| Total Derivatives held as cash flow hedges | 1,365,770 | 277,803 | 88 | |||||||||
| Derivatives held-for-trading purposes | ||||||||||||
| Currency forward | 21,676,356 | 742,545 | 505,463 | |||||||||
| Interest rate swap | 44,811,310 | 825,525 | 831,338 | |||||||||
| Cross currency swap and interest rate swap | 18,798,439 | 1,132,717 | 1,432,794 | |||||||||
| Call currency options | 117,001 | 4,509 | 2,726 | |||||||||
| Put currency options | 93,433 | 199 | 459 | |||||||||
| Total derivatives held-for-trading purposes | 85,496,539 | 2,705,495 | 2,772,780 | |||||||||
| Total | 86,864,097 | 2,983,298 | 2,773,476 | |||||||||
F-52
NOTES TO THE CONSOLIDATED FINANCIAL STATEMENTS, continued
| 9. | Derivative Instruments and Accounting Hedges, continued: |
| (b) | Fair Value Hedges (notional): |
The Bank uses cross-currency swaps and interest rate swaps to hedge its exposure to changes in the fair value of the hedged elements attributable to interest rates. The aforementioned hedge instruments change the effective cost of long-term issuances from a fixed interest rate to a variable interest rate, decreasing the duration and modifying the sensitivity to the shortest segments of the curve.
Below is a detail of the hedged elements and hedge instruments under fair value hedges as of December 31, 2020 and 2021:
| As of December 31, | ||||||||
| 2020 | 2021 | |||||||
| MCh$ | MCh$ | |||||||
| Notional Amounts | ||||||||
| Hedged element | ||||||||
| Commercial loans | 5,031 | 1,788 | ||||||
| Corporate bonds | 29,508 | — | ||||||
| Hedge instrument | ||||||||
| Cross currency swap | 5,031 | 1,788 | ||||||
| Interest rate swap | 29,508 | — | ||||||
| (c) | Cash flow Hedges: |
(c.1) The Bank uses cross currency swaps to hedge the risk from variability of cash flows attributable to changes in the interest rates and foreign exchange of borrowings from banks and bonds issued abroad in US Dollars, Hong Kong dollars, Swiss Franc, Japanese Yens, Peruvian Sol, Australian Dollars, Euros and Norwegian kroner. The cash flows of the cross currency swaps equal the cash flows of the hedged items, which modify uncertain cash flows to known cash flows derived from a fixed interest rate.
Additionally, these cross currency swap contracts used to hedge the risk from variability of the Unidad de Fomento (“CLF”) in assets flows denominated in CLF until a nominal amount equal to the portion notional of the hedging instrument CLF, whose readjustment daily impact the item “Interest Revenue” of the Income Financial Statements.
F-53
NOTES TO THE CONSOLIDATED FINANCIAL STATEMENTS, continued
| 9. | Derivative Instruments and Accounting Hedges, continued: |
| (c) | Cash flow Hedges, continued: |
(c.2) Below are the cash flows of borrowings from banks and bonds issued abroad objects of these hedges and the cash flows of the asset part of the derivative:
| Up to 1 month | Over 1 month and up to 3 months | Over 3 months and up to 12 months | Over 1 year and up to 3 years | Over 3 years and up to 5 years | Over 5 years | Total | ||||||||||||||||||||||||||||||||||||||||||||||||||
| 2020 | 2021 | 2020 | 2021 | 2020 | 2021 | 2020 | 2021 | 2020 | 2021 | 2020 | 2021 | 2020 | 2021 | |||||||||||||||||||||||||||||||||||||||||||
| MCh$ | MCh$ | MCh$ | MCh$ | MCh$ | MCh$ | MCh$ | MCh$ | MCh$ | MCh$ | MCh$ | MCh$ | MCh$ | MCh$ | |||||||||||||||||||||||||||||||||||||||||||
| Hedge element | ||||||||||||||||||||||||||||||||||||||||||||||||||||||||
| Outflows: | ||||||||||||||||||||||||||||||||||||||||||||||||||||||||
| Corporate Bond EUR | — | — | — | — | (1,473 | ) | (1,626 | ) | (2,946 | ) | (3,252 | ) | (44,037 | ) | (47,854 | ) | (51,871 | ) | (56,380 | ) | (100,327 | ) | (109,112 | ) | ||||||||||||||||||||||||||||||||
| Corporate Bond HKD | — | — | — | — | (13,352 | ) | (15,897 | ) | (90,988 | ) | (105,828 | ) | (78,369 | ) | (91,271 | ) | (269,894 | ) | (309,896 | ) | (452,603 | ) | (522,892 | ) | ||||||||||||||||||||||||||||||||
| Corporate Bond PEN | — | — | (775 | ) | (841 | ) | (775 | ) | (841 | ) | (3,098 | ) | (3,366 | ) | (3,098 | ) | (3,366 | ) | (41,484 | ) | (43,383 | ) | (49,230 | ) | (51,797 | ) | ||||||||||||||||||||||||||||||
| Corporate Bond CHF | — | (64 | ) | — | — | (829 | ) | (958 | ) | (94,332 | ) | (249,008 | ) | (121,182 | ) | (764 | ) | — | (121,521 | ) | (216,343 | ) | (372,315 | ) | ||||||||||||||||||||||||||||||||
| Corporate Bond USD | — | — | — | — | (1,515 | ) | (1,814 | ) | (3,030 | ) | (3,629 | ) | (3,030 | ) | (3,629 | ) | (40,140 | ) | (46,260 | ) | (47,715 | ) | (55,332 | ) | ||||||||||||||||||||||||||||||||
| Obligation USD | (202 | ) | — | (76 | ) | — | (157,455 | ) | (427 | ) | — | (60,047 | ) | — | — | — | — | (157,733 | ) | (60,474 | ) | |||||||||||||||||||||||||||||||||||
| Corporate Bond JPY | — | — | — | (130 | ) | (2,115 | ) | (39,208 | ) | (38,110 | ) | (4,249 | ) | (3,472 | ) | (4,249 | ) | (191,351 | ) | (242,020 | ) | (235,048 | ) | (289,856 | ) | |||||||||||||||||||||||||||||||
| Corporate Bond AUD | — | — | (970 | ) | (1,220 | ) | (3,928 | ) | (4,794 | ) | (9,796 | ) | (12,024 | ) | (9,799 | ) | (12,023 | ) | (206,991 | ) | (264,901 | ) | (231,484 | ) | (294,962 | ) | ||||||||||||||||||||||||||||||
| Corporate Bond NOK | — | — | — | — | (2,275 | ) | (2,646 | ) | (4,550 | ) | (5,292 | ) | (4,550 | ) | (5,292 | ) | (71,491 | ) | (80,515 | ) | (82,866 | ) | (93,745 | ) | ||||||||||||||||||||||||||||||||
| Hedge instrument | ||||||||||||||||||||||||||||||||||||||||||||||||||||||||
| Inflows: | ||||||||||||||||||||||||||||||||||||||||||||||||||||||||
| Cross Currency Swap EUR | — | — | — | — | 1,473 | 1,626 | 2,946 | 3,252 | 44,037 | 47,854 | 51,871 | 56,380 | 100,327 | 109,112 | ||||||||||||||||||||||||||||||||||||||||||
| Cross Currency Swap HKD | — | — | — | — | 13,352 | 15,897 | 90,988 | 105,828 | 78,369 | 91,271 | 269,894 | 309,896 | 452,603 | 522,892 | ||||||||||||||||||||||||||||||||||||||||||
| Cross Currency Swap PEN | — | — | 775 | 841 | 775 | 841 | 3,098 | 3,366 | 3,098 | 3,366 | 41,484 | 43,383 | 49,230 | 51,797 | ||||||||||||||||||||||||||||||||||||||||||
| Cross Currency Swap CHF | — | 64 | — | — | 829 | 958 | 94,332 | 249,008 | 121,182 | 764 | — | 121,521 | 216,343 | 372,315 | ||||||||||||||||||||||||||||||||||||||||||
| Cross Currency Swap USD | — | — | — | — | 1,515 | 1,814 | 3,030 | 3,629 | 3,030 | 3,629 | 40,140 | 46,260 | 47,715 | 55,332 | ||||||||||||||||||||||||||||||||||||||||||
| Cross Currency Swap USD | 202 | — | 76 | — | 157,455 | 427 | — | 60,047 | — | — | — | — | 157,733 | 60,474 | ||||||||||||||||||||||||||||||||||||||||||
| Cross Currency Swap JPY | — | — | — | 130 | 2,115 | 39,208 | 38,110 | 4,249 | 3,472 | 4,249 | 191,351 | 242,020 | 235,048 | 289,856 | ||||||||||||||||||||||||||||||||||||||||||
| Cross Currency Swap AUD | — | — | 970 | 1,220 | 3,928 | 4,794 | 9,796 | 12,024 | 9,799 | 12,023 | 206,991 | 264,901 | 231,484 | 294,962 | ||||||||||||||||||||||||||||||||||||||||||
| Cross Currency Swap NOK | — | — | — | — | 2,275 | 2,646 | 4,550 | 5,292 | 4,550 | 5,292 | 71,491 | 80,515 | 82,866 | 93,745 | ||||||||||||||||||||||||||||||||||||||||||
| Net cash flows | — | — | — | — | — | — | — | — | — | — | — | — | — | — | ||||||||||||||||||||||||||||||||||||||||||
F-54
NOTES TO THE CONSOLIDATED FINANCIAL STATEMENTS, continued
| 9. | Derivative Instruments and Accounting Hedges, continued: |
| (c) | Cash flow Hedges, continued: |
(c.2) Below are the cash flows of the underlying assets portfolio and the cash flow of the liability part of the derivatives:
| Up to 1 month | Over 1 month and up to 3 months | Over 3 months and up to 12 months | Over 1 year and up to 3 years | Over 3 years and up to 5 years | Over 5 years | Total | ||||||||||||||||||||||||||||||||||||||||||||||||||
| 2020 | 2021 | 2020 | 2021 | 2020 | 2021 | 2020 | 2021 | 2020 | 2021 | 2020 | 2021 | 2020 | 2021 | |||||||||||||||||||||||||||||||||||||||||||
| MCh$ | MCh$ | MCh$ | MCh$ | MCh$ | MCh$ | MCh$ | MCh$ | MCh$ | MCh$ | MCh$ | MCh$ | MCh$ | MCh$ | |||||||||||||||||||||||||||||||||||||||||||
| Hedge element | ||||||||||||||||||||||||||||||||||||||||||||||||||||||||
| Inflows: | ||||||||||||||||||||||||||||||||||||||||||||||||||||||||
| Cash flows in CLF | 160 | 537 | 280 | 4,031 | 186,116 | 59,853 | 213,673 | 370,886 | 246,244 | 144,432 | 741,654 | 968,900 | 1,388,127 | 1,548,639 | ||||||||||||||||||||||||||||||||||||||||||
| Hedge instrument | ||||||||||||||||||||||||||||||||||||||||||||||||||||||||
| Outflows: | ||||||||||||||||||||||||||||||||||||||||||||||||||||||||
| Cross Currency Swap HKD | (160 | ) | (171 | ) | — | — | (9,035 | ) | (9,630 | ) | (72,728 | ) | (75,575 | ) | (76,073 | ) | (79,358 | ) | (206,514 | ) | (214,067 | ) | (364,510 | ) | (378,801 | ) | ||||||||||||||||||||||||||||||
| Cross Currency Swap PEN | — | — | (48 | ) | (51 | ) | (49 | ) | (52 | ) | (194 | ) | (207 | ) | (194 | ) | (206 | ) | (31,965 | ) | (33,974 | ) | (32,450 | ) | (34,490 | ) | ||||||||||||||||||||||||||||||
| Cross Currency Swap JPY | — | — | — | (341 | ) | (4,195 | ) | (40,029 | ) | (40,526 | ) | (8,388 | ) | (6,596 | ) | (8,376 | ) | (201,852 | ) | (252,362 | ) | (253,169 | ) | (309,496 | ) | |||||||||||||||||||||||||||||||
| Cross Currency Swap USD | — | — | — | — | (165,634 | ) | (1,104 | ) | (1,311 | ) | (57,936 | ) | (1,317 | ) | (1,402 | ) | (37,584 | ) | (39,368 | ) | (205,846 | ) | (99,810 | ) | ||||||||||||||||||||||||||||||||
| Cross Currency Swap CHF | — | (366 | ) | — | — | (3,929 | ) | (5,281 | ) | (91,923 | ) | (220,166 | ) | (114,409 | ) | (4,387 | ) | — | (115,104 | ) | (210,261 | ) | (345,304 | ) | ||||||||||||||||||||||||||||||||
| Cross Currency Swap EUR | — | — | — | — | (1,912 | ) | (2,028 | ) | (3,805 | ) | (4,070 | ) | (44,464 | ) | (46,165 | ) | (45,439 | ) | (47,638 | ) | (95,620 | ) | (99,901 | ) | ||||||||||||||||||||||||||||||||
| Cross Currency Swap AUD | — | — | (232 | ) | (540 | ) | (738 | ) | (1,064 | ) | (1,939 | ) | (3,212 | ) | (1,942 | ) | (3,208 | ) | (152,709 | ) | (197,125 | ) | (157,560 | ) | (205,149 | ) | ||||||||||||||||||||||||||||||
| Cross Currency Swap NOK | — | — | — | — | (624 | ) | (665 | ) | (1,247 | ) | (1,332 | ) | (1,249 | ) | (1,330 | ) | (65,591 | ) | (69,262 | ) | (68,711 | ) | (72,589 | ) | ||||||||||||||||||||||||||||||||
| Forward UF | — | — | — | (3,099 | ) | — | — | — | — | — | — | — | — | — | (3,099 | ) | ||||||||||||||||||||||||||||||||||||||||
| Net cash flows | — | — | — | — | — | — | — | — | — | — | — | — | — | — | ||||||||||||||||||||||||||||||||||||||||||
F-55
NOTES TO THE CONSOLIDATED FINANCIAL STATEMENTS, continued
| 9. | Derivative Instruments and Accounting Hedges, continued: |
| (c) | Cash flow Hedges, continued: |
With respect to CLF assets hedged, these are revalued monthly according to the variation of the UF, which is equivalent to monthly reinvestment of the assets until maturity of the relationship hedging.
| (c.3) | The unrealized results generated during the year 2021 by those derivative contracts that conform the hedging instruments in this cash flow hedging strategy have been recorded with credit to equity in an amount totaling Ch$182,376 million (a credit to equity for Ch$10,358 million and a debit for Ch$37,546 million as of December 31, 2020 and 2019, respectively). The net effect of tax credit to equity amounts for Ch$133,135 million in 2021 (a credit to equity for Ch$7,561 million and a debit to equity for Ch$27,408 million as of December 31, 2020 and 2019, respectively). |
The accumulated balance for this concept net of income tax as of December 31, 2021 corresponds to a credit to equity amounting to Ch$81,305 million (a debit to equity amounting to Ch$51,830 million and Ch$59,391 million as of December 31, 2020 and 2019, respectively).
| (c.4) | The effect of the cash flow hedging derivatives that offset the result of the hedged instruments corresponds to a credit to income of Ch$123,100 million in 2021 (a debit to income for Ch$39,449 million in 2020 and a credit to income for Ch$84,684 million in 2019). |
| (c.5) | As of December 31, 2021 and 2020, there was no inefficiency in the Bank’s cash flow hedge, because as both the hedge item and hedge instruments are mirrors of the other, all variation of value attributable to rate and revaluation components are almost entirely netted. |
| (c.6) | As of December 31, 2021 and 2020, the Bank had no hedges of net investments in foreign businesses. |
F-56
NOTES TO THE CONSOLIDATED FINANCIAL STATEMENTS, continued
| 10. | Loans and Advances to Banks, net: |
| (a) | As of December 31, 2020 and 2021, loans and advance to banks, net are detailed as follows: |
| 2020 | 2021 | |||||||
| MCh$ | MCh$ | |||||||
| Domestic Banks | ||||||||
| Interbank loans | 260,002 | 160,018 | ||||||
| Other credits with domestic banks | — | — | ||||||
| Provisions for loans to domestic banks | (214 | ) | (31 | ) | ||||
| Subtotal | 259,788 | 159,987 | ||||||
| Foreign Banks | ||||||||
| Loans to foreign banks | 185,858 | 158,308 | ||||||
| Credits with third countries | 167 | 498 | ||||||
| Chilean export trade banks | 113,596 | 121,008 | ||||||
| Provisions for loans to foreign banks | (244 | ) | (50 | ) | ||||
| Subtotal | 299,377 | 279,764 | ||||||
| Central Bank of Chile | ||||||||
| Central Bank deposits | 2,380,033 | 1,090,000 | ||||||
| Other Central Bank credits | — | — | ||||||
| Subtotal | 2,380,033 | 1,090,000 | ||||||
| Total | 2,939,198 | 1,529,751 | ||||||
| (b) | Impairment allowance for due from banks: |
| i. | The credit quality and the maximum exposure to credit risk based on the Bank’s internal credit rating system and year-end stage classification as of December 31, 2020 and 2021, is as follows: |
| 2020 | 2021 | |||||||||||||||||||||||||||||||
| Stage 1 Individual | Stage 2 Individual | Stage 3 Individual | Total | Stage 1 Individual | Stage 2 Individual | Stage 3 Individual | Total | |||||||||||||||||||||||||
| MCh$ | MCh$ | MCh$ | MCh$ | MCh$ | MCh$ | MCh$ | MCh$ | |||||||||||||||||||||||||
| Domestic Banks | ||||||||||||||||||||||||||||||||
| Normal | 260,002 | — | — | 260,002 | 160,018 | — | — | 160,018 | ||||||||||||||||||||||||
| Substandard | — | — | — | — | — | — | — | — | ||||||||||||||||||||||||
| Non-complying | — | — | — | — | — | — | — | — | ||||||||||||||||||||||||
| Subtotal | 260,002 | — | — | 260,002 | 160,018 | — | — | 160,018 | ||||||||||||||||||||||||
| Foreign Banks | ||||||||||||||||||||||||||||||||
| Normal | 299,621 | — | — | 299,621 | 279,814 | — | — | 279,814 | ||||||||||||||||||||||||
| Substandard | — | — | — | — | — | — | — | — | ||||||||||||||||||||||||
| Non-complying | — | — | — | — | — | — | — | — | ||||||||||||||||||||||||
| Subtotal | 299,621 | — | — | 299,621 | 279,814 | — | — | 279,814 | ||||||||||||||||||||||||
| Central Bank of Chile | ||||||||||||||||||||||||||||||||
| Normal | 2,380,033 | — | — | 2,380,033 | 1,090,000 | — | — | 1,090,000 | ||||||||||||||||||||||||
| Substandard | — | — | — | — | — | — | — | — | ||||||||||||||||||||||||
| Non-complying | — | — | — | — | — | — | — | — | ||||||||||||||||||||||||
| Subtotal | 2,380,033 | — | — | 2,380,033 | 1,090,000 | — | — | 1,090,000 | ||||||||||||||||||||||||
| Total | 2,939,656 | — | — | 2,939,656 | 1,529,832 | — | — | 1,529,832 | ||||||||||||||||||||||||
F-57
NOTES TO THE CONSOLIDATED FINANCIAL STATEMENTS, continued
| 10. | Loans and Advances to Banks, net, continued: |
| (b) | Impairment allowance for due from banks, continued: |
| ii. | Changes in gross carrying amount and corresponding allowance for ECL by stage as of December 31, 2020 and 2021, is as follows: |
| Changes as of December 31, 2020 | ||||||||||||||||||||||||||||||||
| Stage 1 Individual | Stage 2 Individual | Stage 3 Individual | Total | |||||||||||||||||||||||||||||
| Gross carrying amount MCh$ | ECL MCh$ | Gross carrying amount MCh$ | ECL MCh$ | Gross carrying amount MCh$ | ECL MCh$ | Gross carrying amount MCh$ | ECL MCh$ | |||||||||||||||||||||||||
| ECL allowances as of January 1, 2020 | 1,018,551 | 84 | 121,640 | 26 | — | — | 1,140,191 | 110 | ||||||||||||||||||||||||
| Net change on Balance * | 1,845,572 | (84 | ) | (45,547 | ) | (26 | ) | — | — | 1,800,025 | (110 | ) | ||||||||||||||||||||
| Transfer to Stage 1 | 86,986 | — | (86,986 | ) | — | — | — | — | — | |||||||||||||||||||||||
| Transfer to Stage 2 | — | — | — | — | — | — | — | — | ||||||||||||||||||||||||
| Transfer to Stage 3 | — | — | — | — | — | — | — | — | ||||||||||||||||||||||||
| Impact on year-end ECL of exposures transferred between stages during the year ** | — | — | — | — | — | — | — | — | ||||||||||||||||||||||||
| Refinements to models used for calculation | — | 458 | — | — | — | — | — | 458 | ||||||||||||||||||||||||
| Amounts written off | — | — | — | — | — | — | — | — | ||||||||||||||||||||||||
| Foreign exchange adjustments | (11,453 | ) | — | 10,893 | — | — | — | (560 | ) | — | ||||||||||||||||||||||
| Total | 2,939,656 | 458 | — | — | — | — | 2,939,656 | 458 | ||||||||||||||||||||||||
| Changes as of December 31, 2021 | ||||||||||||||||||||||||||||||||
| Stage 1 Individual | Stage 2 Individual | Stage 3 Individual | Total | |||||||||||||||||||||||||||||
| Gross carrying amount MCh$ | ECL MCh$ | Gross carrying amount MCh$ | ECL MCh$ | Gross carrying amount MCh$ | ECL MCh$ | Gross carrying amount MCh$ | ECL MCh$ | |||||||||||||||||||||||||
| ECL allowances as of January 1, 2021 | 2,939,656 | 458 | — | — | — | — | 2,939,656 | 458 | ||||||||||||||||||||||||
| Net change on Balance * | (1,446,442 | ) | (389 | ) | — | — | — | — | (1,446,442 | ) | (389 | ) | ||||||||||||||||||||
| Transfer to Stage 1 | — | — | — | — | — | — | — | — | ||||||||||||||||||||||||
| Transfer to Stage 2 | — | — | — | — | — | — | — | — | ||||||||||||||||||||||||
| Transfer to Stage 3 | — | — | — | — | — | — | — | — | ||||||||||||||||||||||||
| Impact on year-end ECL of exposures transferred between stages during the year ** | — | — | — | — | — | — | — | — | ||||||||||||||||||||||||
| Refinements to models used for calculation | — | — | — | — | — | — | — | — | ||||||||||||||||||||||||
| Amounts written off | — | — | — | — | — | — | — | — | ||||||||||||||||||||||||
| Foreign exchange adjustments | 36,618 | 12 | — | — | — | — | 36,618 | 12 | ||||||||||||||||||||||||
| Total | 1,529,832 | 81 | — | — | — | — | 1,529,832 | 81 | ||||||||||||||||||||||||
| * | Net change between assets originated and assets repaid, excluding write offs. |
| ** | Represents the change in the year-end ECLs of exposures that were transferred from one stage to another during the year. |
F-58
NOTES TO THE CONSOLIDATED FINANCIAL STATEMENTS, continued
| 11. | Loans to Customers at amortized cost: |
| (a) | Loans to Customers: |
As of December 31, 2020 and 2021, the composition of our portfolio of loans is the following:
| As of December 31, 2020 | As of December 31, 2021 | |||||||||||||||||||||||
| Assets before Allowances | Allowances established (3) | Net assets | Assets before Allowances | Allowances established (3) | Net assets | |||||||||||||||||||
| MCh$ | MCh$ | MCh$ | MCh$ | MCh$ | MCh$ | |||||||||||||||||||
| Commercial loans (2) | ||||||||||||||||||||||||
| Commercial loans | 14,398,446 | (381,243 | ) | 14,017,203 | 15,986,168 | (256,653 | ) | 15,729,515 | ||||||||||||||||
| Foreign trade loans | 967,646 | (18,341 | ) | 949,305 | 1,271,705 | (15,080 | ) | 1,256,625 | ||||||||||||||||
| Current account debtors | 120,539 | (6,293 | ) | 114,246 | 144,010 | (2,522 | ) | 141,488 | ||||||||||||||||
| Factoring transactions | 373,903 | (5,673 | ) | 368,230 | 486,282 | (2,658 | ) | 483,624 | ||||||||||||||||
| Student loans | 57,552 | (2,390 | ) | 55,162 | 58,018 | (3,437 | ) | 54,581 | ||||||||||||||||
| Commercial lease transactions (1) | 1,592,905 | (51,175 | ) | 1,541,730 | 1,612,776 | (24,802 | ) | 1,587,974 | ||||||||||||||||
| Other loans and accounts receivable | 90,606 | (16,275 | ) | 74,331 | 113,373 | (13,689 | ) | 99,684 | ||||||||||||||||
| Subtotal | 17,601,597 | (481,390 | ) | 17,120,207 | 19,672,332 | (318,841 | ) | 19,353,491 | ||||||||||||||||
| Mortgage loans | ||||||||||||||||||||||||
| Mortgage bonds | 9,363 | (57 | ) | 9,306 | 6,084 | (27 | ) | 6,057 | ||||||||||||||||
| Transferable mortgage loans | 24,105 | (76 | ) | 24,029 | 17,784 | (66 | ) | 17,718 | ||||||||||||||||
| Other residential real estate mortgage loans | 9,198,834 | (33,501 | ) | 9,165,333 | 10,169,889 | (37,085 | ) | 10,132,804 | ||||||||||||||||
| Credits from ANAP | 2 | — | 2 | — | — | — | ||||||||||||||||||
| Other loans and accounts receivable | 155,068 | (1,018 | ) | 154,050 | 152,771 | (1,808 | ) | 150,963 | ||||||||||||||||
| Subtotal | 9,387,372 | (34,652 | ) | 9,352,720 | 10,346,528 | (38,986 | ) | 10,307,542 | ||||||||||||||||
| Consumer loans | ||||||||||||||||||||||||
| Consumer loans in installments | 2,711,541 | (257,574 | ) | 2,453,967 | 2,873,304 | (267,826 | ) | 2,605,478 | ||||||||||||||||
| Current account debtors | 158,756 | (6,441 | ) | 152,315 | 172,623 | (6,490 | ) | 166,133 | ||||||||||||||||
| Credit card debtors | 1,077,445 | (55,625 | ) | 1,021,820 | 1,199,407 | (40,317 | ) | 1,159,090 | ||||||||||||||||
| Consumer lease transactions (1) | 302 | (2 | ) | 300 | 509 | (33 | ) | 476 | ||||||||||||||||
| Other loans and accounts receivable | 677 | (423 | ) | 254 | 1,170 | (1,003 | ) | 167 | ||||||||||||||||
| Subtotal | 3,948,721 | (320,065 | ) | 3,628,656 | 4,247,013 | (315,669 | ) | 3,931,344 | ||||||||||||||||
| Total | 30,937,690 | (836,107 | ) | 30,101,583 | 34,265,873 | (673,496 | ) | 33,592,377 | ||||||||||||||||
| (1) | In this item, the Bank finances its clients’ purchases of assets, including real estate and other personal property, through financial lease agreements. As of December 31, 2021, Ch$810,969 million corresponds to financial leases for real estate (Ch$803,238 million in December 31, 2020) and Ch$802,316 million corresponds to financial leases for other assets (Ch$789,969 million in December 31, 2020). |
| (2) | As of December 31, 2021, the Commercial Loans category includes loan operations that guarantee obligations maintained with the Central Bank of Chile as part of the Loan Increase Conditional Credit Facility program (FCIC by its Spanish initials) for an approximate amount of Ch$3,024,118 million (Ch$2,021,688 million in December 31, 2020). |
| (3) | Include an additional overlay related to the measures associated with the COVID-19 contingency. See Note No. 42(2)(l). |
F-59
NOTES TO THE CONSOLIDATED FINANCIAL STATEMENTS, continued
| 11. | Loans to Customers at amortized cost, continued: |
| (b) | Impairment allowance for loans to customers: |
| i. | The credit quality and the maximum exposure to credit risk based on the Bank’s internal credit rating system and year-end stage classification as of December 31, 2020 and 2021, are as follows: |
| 2020 | ||||||||||||||||||||||||||||||||
| Stage 1 | Stage 2 | Stage 3 | ||||||||||||||||||||||||||||||
| Individual | Group | Individual | Group | Individual | Group | POCI | Total | |||||||||||||||||||||||||
| MCh$ | MCh$ | MCh$ | MCh$ | MCh$ | MCh$ | MCh$ | MCh$ | |||||||||||||||||||||||||
| Commercial loans | ||||||||||||||||||||||||||||||||
| Normal | 8,918,334 | 4,291,198 | 3,467,569 | 199,810 | 964 | 613 | 42 | 16,878,530 | ||||||||||||||||||||||||
| Substandard | — | — | 194,242 | — | — | — | 1,627 | 195,869 | ||||||||||||||||||||||||
| Non-complying | — | — | — | — | 203,485 | 321,511 | 2,202 | 527,198 | ||||||||||||||||||||||||
| Subtotal | 8,918,334 | 4,291,198 | 3,661,811 | 199,810 | 204,449 | 322,124 | 3,871 | 17,601,597 | ||||||||||||||||||||||||
| Mortgage loans | ||||||||||||||||||||||||||||||||
| Normal | — | 8,664,761 | — | 401,997 | — | 1,078 | — | 9,067,836 | ||||||||||||||||||||||||
| Non-complying | — | — | — | — | — | 319,122 | 414 | 319,536 | ||||||||||||||||||||||||
| Subtotal | — | 8,664,761 | — | 401,997 | — | 320,200 | 414 | 9,387,372 | ||||||||||||||||||||||||
| Consumer loans | ||||||||||||||||||||||||||||||||
| Normal | — | 3,295,502 | — | 324,440 | — | 2,419 | 28 | 3,622,389 | ||||||||||||||||||||||||
| Non-complying | — | — | — | — | — | 324,683 | 1,649 | 326,332 | ||||||||||||||||||||||||
| Subtotal | — | 3,295,502 | — | 324,440 | — | 327,102 | 1,677 | 3,948,721 | ||||||||||||||||||||||||
| Total | 8,918,334 | 16,251,461 | 3,661,811 | 926,247 | 204,449 | 969,426 | 5,962 | 30,937,690 | ||||||||||||||||||||||||
| 2021 | ||||||||||||||||||||||||||||||||
| Stage 1 | Stage 2 | Stage 3 | ||||||||||||||||||||||||||||||
| Individual | Group | Individual | Group | Individual | Group | POCI | Total | |||||||||||||||||||||||||
| MCh$ | MCh$ | MCh$ | MCh$ | MCh$ | MCh$ | MCh$ | MCh$ | |||||||||||||||||||||||||
| Commercial loans | ||||||||||||||||||||||||||||||||
| Normal | 10,968,881 | 4,579,194 | 3,262,135 | 214,276 | 834 | 893 | 199 | 19,026,412 | ||||||||||||||||||||||||
| Substandard | — | — | 197,580 | — | — | — | 3 | 197,583 | ||||||||||||||||||||||||
| Non-complying | — | — | — | — | 166,799 | 279,420 | 2,118 | 448,337 | ||||||||||||||||||||||||
| Subtotal | 10,968,881 | 4,579,194 | 3,459,715 | 214,276 | 167,633 | 280,313 | 2,320 | 19,672,332 | ||||||||||||||||||||||||
| Mortgage loans | ||||||||||||||||||||||||||||||||
| Normal | — | 9,608,872 | — | 449,804 | — | 2,675 | — | 10,061,351 | ||||||||||||||||||||||||
| Non-complying | — | — | — | — | — | 285,143 | 34 | 285,177 | ||||||||||||||||||||||||
| Subtotal | — | 9,608,872 | — | 449,804 | — | 287,818 | 34 | 10,346,528 | ||||||||||||||||||||||||
| Consumer loans | ||||||||||||||||||||||||||||||||
| Normal | — | 3,739,887 | — | 287,814 | — | 4,367 | 64 | 4,032,132 | ||||||||||||||||||||||||
| Non-complying | — | — | — | — | — | 213,662 | 1,219 | 214,881 | ||||||||||||||||||||||||
| Subtotal | — | 3,739,887 | — | 287,814 | — | 218,029 | 1,283 | 4,247,013 | ||||||||||||||||||||||||
| Total | 10,968,881 | 17,927,953 | 3,459,715 | 951,894 | 167,633 | 786,160 | 3,637 | 34,265,873 | ||||||||||||||||||||||||
F-60
NOTES TO THE CONSOLIDATED FINANCIAL STATEMENTS, continued
| 11. | Loans to Customers at amortized cost, continued: |
| (b) | Impairment allowance for loans to customers, continued: |
| ii. | Changes in gross carrying amount and corresponding allowance for ECL by stage as of December 31, 2020 and 2021, is as follows: |
| Changes as of December 31, 2020 | ||||||||||||||||||||||||||||||||||||||||||||||||||||||||||||||||
| Stage 1 | Stage 2 | Stage 3 | ||||||||||||||||||||||||||||||||||||||||||||||||||||||||||||||
| Individual | Group | Individual | Group | Individual | Group | POCI | Total | |||||||||||||||||||||||||||||||||||||||||||||||||||||||||
Gross carrying amount MCh$ | ECL MCh$ | Gross carrying amount MCh$ | ECL MCh$ | Gross carrying amount MCh$ | ECL MCh$ | Gross carrying amount MCh$ | ECL MCh$ | Gross carrying amount MCh$ | ECL MCh$ | Gross carrying amount MCh$ | ECL MCh$ | Gross carrying amount MCh$ | ECL MCh$ | Gross carrying amount MCh$ | ECL MCh$ | |||||||||||||||||||||||||||||||||||||||||||||||||
| Commercial loans | ||||||||||||||||||||||||||||||||||||||||||||||||||||||||||||||||
| Balance as of January 1, 2020 | 9,880,799 | 8,945 | 3,369,494 | 17,743 | 2,059,481 | 42,406 | 561,831 | 31,527 | 152,972 | 47,296 | 267,999 | 106,609 | 1,636 | 275 | 16,294,212 | 254,801 | ||||||||||||||||||||||||||||||||||||||||||||||||
| Net change on Balance * | 786,574 | 26,720 | 551,556 | 26,706 | 17,987 | 110,560 | 114,618 | 12,959 | (26,075 | ) | 7,313 | 13,863 | 41,847 | 2,527 | 1,328 | 1,461,050 | 227,433 | |||||||||||||||||||||||||||||||||||||||||||||||
| Transfer to Stage 1 | 501,608 | 3,278 | 1,640,602 | 76,242 | (501,608 | ) | (3,278 | ) | (1,636,469 | ) | (75,140 | ) | — | — | (4,133 | ) | (1,102 | ) | — | — | — | — | ||||||||||||||||||||||||||||||||||||||||||
| Transfer to Stage 2 | (2,224,652 | ) | (6,538 | ) | (1,236,055 | ) | (16,158 | ) | 2,232,210 | 7,431 | 1,308,926 | 32,656 | (7,558 | ) | (893 | ) | (72,871 | ) | (16,498 | ) | — | — | — | — | ||||||||||||||||||||||||||||||||||||||||
| Transfer to Stage 3 | (5,865 | ) | (17 | ) | (32,996 | ) | (1,000 | ) | (84,410 | ) | (15,037 | ) | (146,784 | ) | (14,807 | ) | 90,275 | 15,054 | 179,780 | 15,807 | — | — | — | — | ||||||||||||||||||||||||||||||||||||||||
| Impact on year-end ECL of exposures transferred between stages during the year** | — | (2,031 | ) | — | (55,735 | ) | — | 35,905 | — | 31,119 | — | 12,246 | — | 21,137 | — | — | — | 42,641 | ||||||||||||||||||||||||||||||||||||||||||||||
| Refinements to models used for calculation | — | 15,097 | — | 36,476 | — | (8,106 | ) | — | (2,555 | ) | — | 11,812 | — | (22,816 | ) | — | (27 | ) | — | 29,881 | ||||||||||||||||||||||||||||||||||||||||||||
| Amounts written off | — | — | (77 | ) | (77 | ) | (1,561 | ) | (1,561 | ) | (3,710 | ) | (3,710 | ) | (1,446 | ) | (1,446 | ) | (62,107 | ) | (62,107 | ) | (292 | ) | (292 | ) | (69,193 | ) | (69,193 | ) | ||||||||||||||||||||||||||||||||||
| Foreign exchange adjustments | (20,130 | ) | (82 | ) | (1,326 | ) | (42 | ) | (60,288 | ) | (2,131 | ) | 1,398 | 54 | (3,719 | ) | (1,671 | ) | (407 | ) | (301 | ) | — | — | (84,472 | ) | (4,173 | ) | ||||||||||||||||||||||||||||||||||||
| Subtotal Commercial loans | 8,918,334 | 45,372 | 4,291,198 | 84,155 | 3,661,811 | 166,189 | 199,810 | 12,103 | 204,449 | 89,711 | 322,124 | 82,576 | 3,871 | 1,284 | 17,601,597 | 481,390 | ||||||||||||||||||||||||||||||||||||||||||||||||
| Mortgage loans | ||||||||||||||||||||||||||||||||||||||||||||||||||||||||||||||||
| Balance as of January 1, 2020 | — | — | 8,209,100 | 1,411 | — | — | 822,524 | 29,363 | — | — | 175,103 | 12,934 | — | — | 9,206,727 | 43,708 | ||||||||||||||||||||||||||||||||||||||||||||||||
| Net change on Balance * | — | — | 302,255 | (317 | ) | — | — | (81,433 | ) | (7,192 | ) | — | — | (26,928 | ) | 11,593 | 414 | 37 | 194,308 | 4,121 | ||||||||||||||||||||||||||||||||||||||||||||
| Transfer to Stage 1 | — | — | 1,456,154 | 29,878 | — | — | (1,455,965 | ) | (29,859 | ) | — | — | (189 | ) | (19 | ) | — | — | — | — | ||||||||||||||||||||||||||||||||||||||||||||
| Transfer to Stage 2 | — | — | (1,231,376 | ) | (1,244 | ) | — | — | 1,274,646 | 4,951 | — | — | (43,270 | ) | (3,707 | ) | — | — | — | — | ||||||||||||||||||||||||||||||||||||||||||||
| Transfer to Stage 3 | — | — | (71,361 | ) | (243 | ) | — | — | (153,543 | ) | (7,104 | ) | — | — | 224,904 | 7,347 | — | — | — | — | ||||||||||||||||||||||||||||||||||||||||||||
| Impact on year-end ECL of exposures transferred between stages during the year** | — | — | — | (28,455 | ) | — | — | — | 20,805 | — | — | — | 9,804 | — | — | — | 2,154 | |||||||||||||||||||||||||||||||||||||||||||||||
| Refinements to models used for calculation | — | — | — | 6,638 | — | — | — | (511 | ) | — | — | — | (7,788 | ) | — | (7 | ) | — | (1,668 | ) | ||||||||||||||||||||||||||||||||||||||||||||
| Amounts written off | — | — | (11 | ) | (11 | ) | — | — | (4,232 | ) | (4,232 | ) | — | — | (9,420 | ) | (9,420 | ) | — | — | (13,663 | ) | (13,663 | ) | ||||||||||||||||||||||||||||||||||||||||
| Foreign exchange adjustments | — | — | — | — | — | — | — | — | — | — | — | — | — | — | — | — | ||||||||||||||||||||||||||||||||||||||||||||||||
| Subtotal Mortgage loans | — | — | 8,664,761 | 7,657 | — | — | 401,997 | 6,221 | — | — | 320,200 | 20,744 | 414 | 30 | 9,387,372 | 34,652 | ||||||||||||||||||||||||||||||||||||||||||||||||
| Consumer loans | ||||||||||||||||||||||||||||||||||||||||||||||||||||||||||||||||
| Balance as of January 1, 2020 | — | — | 3,860,973 | 98,536 | — | — | 372,814 | 75,235 | — | — | 298,458 | 176,909 | 88 | 44 | 4,532,333 | 350,724 | ||||||||||||||||||||||||||||||||||||||||||||||||
| Net change on Balance * | — | — | (243,577 | ) | (15,947 | ) | — | — | (126,358 | ) | (34,347 | ) | — | — | 34,201 | 113,480 | 1,614 | 650 | (334,120 | ) | 63,836 | |||||||||||||||||||||||||||||||||||||||||||
| Transfer to Stage 1 | — | — | 963,136 | 189,887 | — | — | (957,243 | ) | (187,255 | ) | — | — | (5,893 | ) | (2,632 | ) | — | — | — | — | ||||||||||||||||||||||||||||||||||||||||||||
| Transfer to Stage 2 | — | — | (1,216,941 | ) | (78,494 | ) | — | — | 1,302,454 | 117,252 | — | — | (85,513 | ) | (38,758 | ) | — | — | — | — | ||||||||||||||||||||||||||||||||||||||||||||
| Transfer to Stage 3 | — | — | (68,493 | ) | (6,780 | ) | — | — | (264,083 | ) | (68,958 | ) | — | — | 332,576 | 75,738 | — | — | — | — | ||||||||||||||||||||||||||||||||||||||||||||
| Impact on year-end ECL of exposures transferred between stages during the year** | — | — | — | (134,853 | ) | — | — | — | 141,034 | — | — | — | 83,947 | — | — | — | 90,128 | |||||||||||||||||||||||||||||||||||||||||||||||
| Refinements to models used for calculation | — | — | — | 93,176 | — | — | — | 10,048 | — | — | — | (37,619 | ) | — | (149 | ) | — | 65,456 | ||||||||||||||||||||||||||||||||||||||||||||||
| Amounts written off | — | — | (122 | ) | (122 | ) | — | — | (3,272 | ) | (3,272 | ) | — | — | (246,703 | ) | (246,703 | ) | (25 | ) | (25 | ) | (250,122 | ) | (250,122 | ) | ||||||||||||||||||||||||||||||||||||||
| Foreign exchange adjustments | — | — | 526 | (4 | ) | — | — | 128 | 52 | — | — | (24 | ) | (5 | ) | — | — | 630 | 43 | |||||||||||||||||||||||||||||||||||||||||||||
| Subtotal Consumer loans | — | — | 3,295,502 | 145,399 | — | — | 324,440 | 49,789 | — | — | 327,102 | 124,357 | 1,677 | 520 | 3,948,721 | 320,065 | ||||||||||||||||||||||||||||||||||||||||||||||||
| Total | 8,918,334 | 45,372 | 16,251,461 | 237,211 | 3,661,811 | 166,189 | 926,247 | 68,113 | 204,449 | 89,711 | 969,426 | 227,677 | 5,962 | 1,834 | 30,937,690 | 836,107 | ||||||||||||||||||||||||||||||||||||||||||||||||
| * | Net change between assets originated and assets repaid excluding write offs. |
| ** | Represents the change in the year-end ECLs of exposures that were transferred from one stage to another during the year. |
F-61
NOTES TO THE CONSOLIDATED FINANCIAL STATEMENTS, continued
| 11. | Loans to Customers at amortized cost, continued: |
| (b) | Impairment allowance for loans to customers, continued: |
| Changes as of December 31, 2021 | |||||||||||||||||||||||||||||||||||||||||||||||||||||||||||||||
| Stage 1 | Stage 2 | Stage 3 | |||||||||||||||||||||||||||||||||||||||||||||||||||||||||||||
| Individual | Group | Individual | Group | Individual | Group | POCI | Total | ||||||||||||||||||||||||||||||||||||||||||||||||||||||||
Gross carrying amount MCh$ | ECL MCh$ | Gross carrying amount MCh$ | ECL MCh$ | Gross carrying amount MCh$ | ECL MCh$ | Gross carrying amount MCh$ | ECL MCh$ | Gross carrying amount MCh$ | ECL MCh$ | Gross carrying amount MCh$ | ECL MCh$ | Gross carrying amount MCh$ | ECL MCh$ | Gross carrying amount MCh$ | ECL MCh$ | ||||||||||||||||||||||||||||||||||||||||||||||||
| Commercial loans | |||||||||||||||||||||||||||||||||||||||||||||||||||||||||||||||
| Balance as of January 1, 2021 | 8,918,334 | 45,372 | 4,291,198 | 84,155 | 3,661,811 | 166,189 | 199,810 | 12,103 | 204,449 | 89,711 | 322,124 | 82,576 | 3,871 | 1,284 | 17,601,597 | 481,390 | |||||||||||||||||||||||||||||||||||||||||||||||
| Net change on Balance * | 1,750,645 | (13,624 | ) | 390,327 | 9,809 | (209,088 | ) | (70,947 | ) | (51,073 | ) | (220 | ) | (44,630 | ) | (24,393 | ) | (29,657 | ) | 40,040 | (467 | ) | 458 | 1,806,057 | (58,877 | ) | |||||||||||||||||||||||||||||||||||||
| Transfer to Stage 1 | 797,576 | 5,149 | 767,931 | 40,313 | (797,576 | ) | (5,149 | ) | (767,917 | ) | (40,307 | ) | — | — | (14 | ) | (6 | ) | — | — | — | — | |||||||||||||||||||||||||||||||||||||||||
| Transfer to Stage 2 | (721,413 | ) | (3,268 | ) | (858,851 | ) | (16,615 | ) | 732,462 | 4,870 | 921,908 | 26,896 | (11,049 | ) | (1,602 | ) | (63,057 | ) | (10,281 | ) | �� | — | — | — | — | ||||||||||||||||||||||||||||||||||||||
| Transfer to Stage 3 | (2,720 | ) | (12 | ) | (19,103 | ) | (892 | ) | (32,441 | ) | (5,785 | ) | (88,525 | ) | (12,720 | ) | 35,162 | 5,797 | 107,627 | 13,612 | — | — | — | — | |||||||||||||||||||||||||||||||||||||||
| Impact on year-end ECL of exposures transferred between stages during the year** | — | (2,627 | ) | — | (28,741 | ) | — | 9,793 | — | 26,879 | — | 7,344 | — | 6,553 | — | — | — | 19,201 | |||||||||||||||||||||||||||||||||||||||||||||
| Refinements to models used for calculation | — | (995 | ) | — | (30,368 | ) | — | (7,357 | ) | — | (4,188 | ) | — | 2,415 | — | (4,912 | ) | — | 144 | — | (45,261 | ) | |||||||||||||||||||||||||||||||||||||||||
| Amounts written off | — | — | (27 | ) | (27 | ) | — | — | (156 | ) | (156 | ) | (25,470 | ) | (25,470 | ) | (57,398 | ) | (57,398 | ) | (1,084 | ) | (1,084 | ) | (84,135 | ) | (84,135 | ) | |||||||||||||||||||||||||||||||||||
| Foreign exchange adjustments | 226,459 | 686 | 7,719 | 331 | 104,547 | 2,725 | 229 | 19 | 9,171 | 2,352 | 688 | 410 | — | — | 348,813 | 6,523 | |||||||||||||||||||||||||||||||||||||||||||||||
| Subtotal Commercial loans | 10,968,881 | 30,681 | 4,579,194 | 57,965 | 3,459,715 | 94,339 | 214,276 | 8,306 | 167,633 | 56,154 | 280,313 | 70,594 | 2,320 | 802 | 19,672,332 | 318,841 | |||||||||||||||||||||||||||||||||||||||||||||||
| Mortgage loans | |||||||||||||||||||||||||||||||||||||||||||||||||||||||||||||||
| Balance as of January 1, 2021 | — | — | 8,664,761 | 7,657 | — | — | 401,997 | 6,221 | — | — | 320,200 | 20,744 | 414 | 30 | 9,387,372 | 34,652 | |||||||||||||||||||||||||||||||||||||||||||||||
| Net change on Balance * | — | — | 1,011,262 | (1,521 | ) | — | — | (11,005 | ) | 1,118 | — | — | (30,009 | ) | 6,758 | (380 | ) | (28 | ) | 969,868 | 6,327 | ||||||||||||||||||||||||||||||||||||||||||
| Transfer to Stage 1 | — | — | 1,221,879 | 18,069 | — | — | (1,221,879 | ) | (18,069 | ) | — | — | — | — | — | — | — | — | |||||||||||||||||||||||||||||||||||||||||||||
| Transfer to Stage 2 | — | — | (1,281,402 | ) | (2,077 | ) | — | — | 1,332,093 | 4,084 | — | — | (50,691 | ) | (2,007 | ) | — | — | — | — | |||||||||||||||||||||||||||||||||||||||||||
| Transfer to Stage 3 | — | — | (7,604 | ) | (53 | ) | — | — | (51,395 | ) | (4,240 | ) | — | — | 58,999 | 4,293 | — | — | — | — | |||||||||||||||||||||||||||||||||||||||||||
| Impact on year-end ECL of exposures transferred between stages during the year** | — | — | — | (15,782 | ) | — | — | — | 19,309 | — | — | — | (1,159 | ) | — | — | — | 2,368 | |||||||||||||||||||||||||||||||||||||||||||||
| Refinements to models used for calculation | — | — | — | 1,997 | — | — | — | 3,699 | — | — | — | 653 | — | 2 | — | 6,351 | |||||||||||||||||||||||||||||||||||||||||||||||
| Amounts written off | — | — | (24 | ) | (24 | ) | — | — | (7 | ) | (7 | ) | — | — | (10,681 | ) | (10,681 | ) | — | — | (10,712 | ) | (10,712 | ) | |||||||||||||||||||||||||||||||||||||||
| Foreign exchange adjustments | — | — | — | — | — | — | — | — | — | — | — | — | — | — | — | — | |||||||||||||||||||||||||||||||||||||||||||||||
| Subtotal Mortgage loans | — | — | 9,608,872 | 8,266 | — | — | 449,804 | 12,115 | — | — | 287,818 | 18,601 | 34 | 4 | 10,346,528 | 38,986 | |||||||||||||||||||||||||||||||||||||||||||||||
| Consumer loans | |||||||||||||||||||||||||||||||||||||||||||||||||||||||||||||||
| Balance as of January 1, 2021 | — | — | 3,295,502 | 145,399 | — | — | 324,440 | 49,789 | — | — | 327,102 | 124,357 | 1,677 | 520 | 3,948,721 | 320,065 | |||||||||||||||||||||||||||||||||||||||||||||||
| Net change on Balance * | — | — | 543,272 | 36,335 | — | — | (67,751 | ) | (6,166 | ) | — | — | (36,418 | ) | 71,045 | (381 | ) | (83 | ) | 438,722 | 101,131 | ||||||||||||||||||||||||||||||||||||||||||
| Transfer to Stage 1 | — | — | 787,325 | 117,574 | — | — | (787,325 | ) | (117,574 | ) | — | — | — | — | — | — | — | — | |||||||||||||||||||||||||||||||||||||||||||||
| Transfer to Stage 2 | — | — | (879,653 | ) | (57,076 | ) | — | — | 943,398 | 79,524 | — | — | (63,745 | ) | (22,448 | ) | — | — | — | — | |||||||||||||||||||||||||||||||||||||||||||
| Transfer to Stage 3 | — | — | (12,205 | ) | (1,485 | ) | — | — | (124,873 | ) | (46,739 | ) | — | — | 137,078 | 48,224 | — | — | — | — | |||||||||||||||||||||||||||||||||||||||||||
| Impact on year-end ECL of exposures transferred between stages during the year** | — | — | — | (76,550 | ) | — | — | — | 91,107 | — | — | — | 12,985 | — | — | — | 27,542 | ||||||||||||||||||||||||||||||||||||||||||||||
| Refinements to models used for calculation | — | — | — | (10,338 | ) | — | — | — | (561 | ) | — | — | — | 23,657 | — | 338 | — | 13,096 | |||||||||||||||||||||||||||||||||||||||||||||
| Amounts written off | — | — | (46 | ) | (46 | ) | — | — | (291 | ) | (291 | ) | — | — | (146,024 | ) | (146,024 | ) | (13 | ) | (13 | ) | (146,374 | ) | (146,374 | ) | |||||||||||||||||||||||||||||||||||||
| Foreign exchange adjustments | — | — | 5,692 | 181 | — | — | 216 | 20 | — | — | 36 | 8 | — | — | 5,944 | 209 | |||||||||||||||||||||||||||||||||||||||||||||||
| Subtotal Consumer loans | — | — | 3,739,887 | 153,994 | — | — | 287,814 | 49,109 | — | — | 218,029 | 111,804 | 1,283 | 762 | 4,247,013 | 315,669 | |||||||||||||||||||||||||||||||||||||||||||||||
| Total | 10,968,881 | 30,681 | 17,927,953 | 220,225 | 3,459,715 | 94,339 | 951,894 | 69,530 | 167,633 | 56,154 | 786,160 | 200,999 | 3,637 | 1,568 | 34,265,873 | 673,496 | |||||||||||||||||||||||||||||||||||||||||||||||
| * | Net change between assets originated and assets repaid excluding write offs. |
| ** | Represents the change in the year-end ECLs of exposures that were transferred from one stage to another during the year. |
F-62
NOTES TO THE CONSOLIDATED FINANCIAL STATEMENTS, continued
| 11. | Loans to Customers at amortized cost, continued: |
| (c) | Allowances for loan losses: |
Changes in allowances for loan losses during 2020 and 2021 are as follows:
| Commercial | Mortgage | Consumer | Total | |||||||||||||
| MCh$ | MCh$ | MCh$ | MCh$ | |||||||||||||
| Balance as of January 1, 2020 | 254,801 | 43,708 | 350,724 | 649,233 | ||||||||||||
| Charge-offs | (69,193 | ) | (13,663 | ) | (250,122 | ) | (332,978 | ) | ||||||||
| Sales or transfers of credits | (107 | ) | — | — | (107 | ) | ||||||||||
| Allowances (released) established, net (*) | 295,889 | 4,607 | 219,463 | 519,959 | ||||||||||||
| Balance as of December 31, 2020 | 481,390 | 34,652 | 320,065 | 836,107 | ||||||||||||
| Charge-offs | (84,135 | ) | (10,712 | ) | (146,374 | ) | (241,221 | ) | ||||||||
| Sales or transfers of credits | (15,477 | ) | — | — | (15,477 | ) | ||||||||||
| Allowances (released) established, net (*) | (62,937 | ) | 15,046 | 141,978 | 94,087 | |||||||||||
| Balance as of December 31, 2021 | 318,841 | 38,986 | 315,669 | 673,496 | ||||||||||||
| (*) | The Bank’s Management has been frequently reviewing the estimates and assumptions related to the ECL models for the retail and wholesale portfolios, with the aim of keeping them accurate and ensuring that the models used continue to reflect the risks inherent across the businesses. The impact of refinements to ECL models and assumptions resulted in a decrease in allowances of Ch$25,814 million before taxes in 2021 (an increase of Ch$93,669 million before taxes in 2020). |
| (d) | Financial Lease Contracts: |
As of December 31, 2020 and 2021, the Bank’s scheduled cash flows to be received from financial leasing contracts have the following maturities as follows:
| Total receivable | Unearned income | Net lease receivable (*) | ||||||||||||||||||||||
| 2020 | 2021 | 2020 | 2021 | 2020 | 2021 | |||||||||||||||||||
| MCh$ | MCh$ | MCh$ | MCh$ | MCh$ | MCh$ | |||||||||||||||||||
| Due within one year | 521,445 | 525,720 | (52,438 | ) | (53,312 | ) | 469,007 | 472,408 | ||||||||||||||||
| Due after 1 year but within 2 years | 373,304 | 385,118 | (37,958 | ) | (38,653 | ) | 335,346 | 346,465 | ||||||||||||||||
| Due after 2 years but within 3 years | 245,667 | 260,002 | (25,084 | ) | (25,228 | ) | 220,583 | 234,774 | ||||||||||||||||
| Due after 3 years but within 4 years | 161,492 | 166,416 | (17,433 | ) | (17,015 | ) | �� | 144,059 | 149,401 | |||||||||||||||
| Due after 4 years but within 5 years | 110,743 | 116,650 | (12,841 | ) | (12,038 | ) | 97,902 | 104,612 | ||||||||||||||||
| Due after 5 years | 350,679 | 327,071 | (28,994 | ) | (25,624 | ) | 321,685 | 301,447 | ||||||||||||||||
| Total | 1,763,330 | 1,780,977 | (174,748 | ) | (171,870 | ) | 1,588,582 | 1,609,107 | ||||||||||||||||
| (*) | The net balance receivable does not include the total overdue portfolio totaling Ch$4,625 million and Ch$4,178 million as of December 31, 2020 and 2021, respectively. This overdue portfolio only reflects the past due portion without considering the remaining outstanding principal and interest. |
The leasing contracts are related to real estate, industrial machinery, vehicles and transport equipment. The leasing contracts have an average life of between 2 and 15 years.
F-63
NOTES TO THE CONSOLIDATED FINANCIAL STATEMENTS, continued
| 11. | Loans to Customers at amortized cost, continued: |
| (e) | Loans by industry sector: |
The following table details the Bank’s loan portfolio (before allowances for loans losses) as of December 31, 2020 and 2021 by the customer’s industry sector and their respective economic activity:
| Location | ||||||||||||||||||||||||||||||||
| Chile | Abroad | Total | ||||||||||||||||||||||||||||||
| 2020 | 2021 | 2020 | 2021 | 2020 | % of Loan | 2021 | % of Loan | |||||||||||||||||||||||||
| MCh$ | MCh$ | MCh$ | MCh$ | MCh$ | Portfolio | MCh$ | Portfolio | |||||||||||||||||||||||||
| Agriculture, Livestock, Forestry, Agribusiness, Fishing: | ||||||||||||||||||||||||||||||||
| Agriculture and livestock | 642,941 | 647,731 | — | — | 642,941 | 2.08 | 647,731 | 1.89 | ||||||||||||||||||||||||
| Fruit | 849,625 | 979,632 | — | — | 849,625 | 2.75 | 979,632 | 2.86 | ||||||||||||||||||||||||
| Forestry and wood extraction | 154,661 | 143,520 | — | — | 154,661 | 0.50 | 143,520 | 0.42 | ||||||||||||||||||||||||
| Fishing | 135,487 | 144,809 | — | — | 135,487 | 0.44 | 144,809 | 0.42 | ||||||||||||||||||||||||
| Mining and Petroleum: | ||||||||||||||||||||||||||||||||
| Mining and quarries | 470,607 | 400,413 | — | — | 470,607 | 1.52 | 400,413 | 1.17 | ||||||||||||||||||||||||
| Natural gas and crude oil extraction | — | — | — | — | — | — | — | — | ||||||||||||||||||||||||
| Manufacturing: | ||||||||||||||||||||||||||||||||
| Tobacco, food and beverages | 539,144 | 680,460 | — | — | 539,144 | 1.74 | 680,460 | 1.99 | ||||||||||||||||||||||||
| Textiles, clothing and leather goods | 40,344 | 49,758 | — | — | 40,344 | 0.13 | 49,758 | 0.15 | ||||||||||||||||||||||||
| Wood and wood products | 68,892 | 71,031 | — | — | 68,892 | 0.22 | 71,031 | 0.21 | ||||||||||||||||||||||||
| Paper, printing and publishing | 42,988 | 51,588 | — | — | 42,988 | 0.14 | 51,588 | 0.15 | ||||||||||||||||||||||||
| Oil refining, carbon and rubber | 86,358 | 84,848 | — | — | 86,358 | 0.28 | 84,848 | 0.25 | ||||||||||||||||||||||||
| Production of basic metal, non-mineral, machine and equipment | 403,924 | 526,601 | — | — | 403,924 | 1.31 | 526,601 | 1.54 | ||||||||||||||||||||||||
| Other manufacturing industries | 166,118 | 287,165 | — | — | 166,118 | 0.54 | 287,165 | 0.84 | ||||||||||||||||||||||||
| Electricity, Gas and Water: | ||||||||||||||||||||||||||||||||
| Electricity, gas and water | 395,598 | 340,618 | — | — | 395,598 | 1.28 | 340,618 | 0.99 | ||||||||||||||||||||||||
| Construction: | ||||||||||||||||||||||||||||||||
| Residential buildings | 2,328,498 | 2,367,450 | — | — | 2,328,498 | 7.53 | 2,367,450 | 6.91 | ||||||||||||||||||||||||
| Other constructions | 125,081 | 126,252 | — | — | 125,081 | 0.40 | 126,252 | 0.37 | ||||||||||||||||||||||||
| Commerce: | ||||||||||||||||||||||||||||||||
| Wholesale | 1,137,766 | 1,290,157 | — | — | 1,137,766 | 3.68 | 1,290,157 | 3.77 | ||||||||||||||||||||||||
| Retail, restaurants and hotels | 1,399,039 | 1,319,864 | 7,341 | 7,793 | 1,406,380 | 4.55 | 1,327,657 | 3.87 | ||||||||||||||||||||||||
| Transport, Storage and Communications: | ||||||||||||||||||||||||||||||||
| Transport and storage | 1,239,443 | 1,622,345 | — | — | 1,239,443 | 4.01 | 1,622,345 | 4.73 | ||||||||||||||||||||||||
| Communications | 214,961 | 212,279 | — | — | 214,961 | 0.69 | 212,279 | 0.62 | ||||||||||||||||||||||||
| Financial Services: | ||||||||||||||||||||||||||||||||
| Financial and insurance companies | 2,019,017 | 2,656,312 | — | — | 2,019,017 | 6.53 | 2,656,312 | 7.75 | ||||||||||||||||||||||||
| Real estate and other financial services | 330,868 | 396,680 | 1,448 | 1,723 | 332,316 | 1.07 | 398,403 | 1.16 | ||||||||||||||||||||||||
| Community, Social and Personal Services: | ||||||||||||||||||||||||||||||||
| Community, social and personal services | 3,052,513 | 3,179,900 | 1,681 | 4,202 | 3,054,194 | 9.87 | 3,184,102 | 9.29 | ||||||||||||||||||||||||
| Others | 1,747,254 | 2,079,201 | — | — | 1,747,254 | 5.67 | 2,079,201 | 6.07 | ||||||||||||||||||||||||
| Consumer Loans | 3,948,721 | 4,247,013 | — | — | 3,948,721 | 12.76 | 4,247,013 | 12.39 | ||||||||||||||||||||||||
| Residential Mortgage Loans | 9,387,372 | 10,346,528 | — | — | 9,387,372 | 30.33 | 10,346,528 | 30.19 | ||||||||||||||||||||||||
| Total | 30,927,220 | 34,252,155 | 10,470 | 13,718 | 30,937,690 | 100.00 | 34,265,873 | 100.00 | ||||||||||||||||||||||||
F-64
NOTES TO THE CONSOLIDATED FINANCIAL STATEMENTS, continued
| 11. | Loans to Customers at amortized cost, continued: |
| (f) | Purchase of loan portfolio |
During the year ended December 31, 2020 and 2021 the Bank did not acquire portfolio loans.
| (g) | Sale or transfer of credits from the loans to customers: |
During 2019, 2020 and 2021 the Bank has carried out transactions of sale or transfer of the loan portfolio according to the following:
| As of December 31, 2019 | ||||||||||||||||
| Carrying amount | Allowances released | Sale price | Effect on income (loss) gain (*) | |||||||||||||
| MCh$ | MCh$ | MCh$ | MCh$ | |||||||||||||
| Sale of outstanding loans | 12,420 | — | 12,420 | — | ||||||||||||
| Sale of write-off loans | — | — | — | — | ||||||||||||
| Total | 12,420 | — | 12,420 | — | ||||||||||||
| As of December 31, 2020 | ||||||||||||||||
| Carrying amount | Allowances released | Sale price | Effect on income (loss) gain (*) | |||||||||||||
| MCh$ | MCh$ | MCh$ | MCh$ | |||||||||||||
| Sale of outstanding loans | 43,957 | (107 | ) | 43,889 | 39 | |||||||||||
| Sale of write-off loans | — | — | — | — | ||||||||||||
| Total | 43,957 | (107 | ) | 43,889 | 39 | |||||||||||
| As of December 31, 2021 | ||||||||||||||||
| Carrying amount | Allowances released | Sale price | Effect on income (loss) gain (*) | |||||||||||||
| MCh$ | MCh$ | MCh$ | MCh$ | |||||||||||||
| Sale of outstanding loans | 24,023 | (15,477 | ) | 13,992 | 5,446 | |||||||||||
| Sale of write-off loans | — | — | 12 | 12 | ||||||||||||
| Total | 24,023 | (15,477 | ) | 14,004 | 5,458 | |||||||||||
| (*) | See Note No. 31 |
| (h) | Own assets securitizations: |
During 2020 and 2021 the Bank did not execute securitization transactions involving its own assets.
F-65
NOTES TO THE CONSOLIDATED FINANCIAL STATEMENTS, continued
| 12. | Financial Assets at Fair Value through Other Comprehensive Income: |
As of December 31, 2020 and 2021, financial assets are detailed as follows:
| 2020 | 2021 | |||||||
| MCh$ | MCh$ | |||||||
| Debt instruments at fair value through OCI | 1,060,523 | 3,054,809 | ||||||
| Equity instruments valued at fair value through OCI | 7,630 | 6,365 | ||||||
| Total | 1,068,153 | 3,061,174 | ||||||
| (a) | Debt instruments at fair value through OCI: |
| (a.1) | The breakdown of the balance under the heading “Debt instruments at fair value through OCI” as of December 31, 2020 and 2021 is, as follows: |
| 2020 | 2021 | |||||||
| MCh$ | MCh$ | |||||||
| Instruments issued by the Chilean Government and the Central Bank of Chile: | ||||||||
| Bonds issued by the Chilean Government and the Central Bank of Chile | 109 | 102 | ||||||
| Promissory notes issued by the Chilean Government and the Central Bank of Chile | — | — | ||||||
| Other instruments | 163,491 | 2,488,748 | ||||||
| Other instruments issued in Chile: | ||||||||
| Mortgage bonds from domestic banks | 128,763 | 111,656 | ||||||
| Bonds from domestic banks | 15,887 | 2,411 | ||||||
| Deposits from domestic banks | 685,392 | 424,419 | ||||||
| Bonds from other Chilean companies | 34,539 | 27,473 | ||||||
| Other instruments | 32,342 | — | ||||||
| Instruments issued by foreign institutions: | ||||||||
| Other instruments | — | — | ||||||
| Total | 1,060,523 | 3,054,809 | ||||||
Instruments of the Government and the Central Bank of Chile include instruments sold under repurchase agreements to clients and financial institutions for an amount of Ch$351 million in December 2021 (Ch$13,268 million in December 2020). The repurchase agreements have an average maturity of 4 days in December 2021 (5 days in December 2020). As part of the FCIC program, instruments delivered as collateral are classified for an approximate amount of Ch$456,057 million as of December 31, 2021. Additionally, under this item, instruments are maintained to comply with the requirements for the constitution of a technical reserve for an amount equivalent to Ch$2,336,780 million as of December 31, 2021 (Ch$64,000 million in December 2020).
Under the instruments issued abroad mainly include bonds of local companies issued abroad.
As of December 31, 2021, the portfolio of financial assets at FVOCI includes a net unrealized loss of Ch$39,688 million, recorded in other comprehensive income within equity (a net unrealized gain of Ch$9,054 million as of December 31, 2020).
As of December 31, 2021 the impairment for debt instruments at Fair Value through OCI was Ch$4,085 million (Ch$3,084 million as of December 31, 2020).
F-66
NOTES TO THE CONSOLIDATED FINANCIAL STATEMENTS, continued
| 12. | Financial Assets at Fair Value through Other Comprehensive Income, continued: |
| (a) | Debt instruments at fair value through OCI, continued: |
| (a.2) | The credit ratings of the issuers of debt instruments as of December 31, 2020 and 2021, are as follows: |
| As of December 31, 2020 | As of December 31, 2021 | |||||||||||||||||||||||||||||||
Stage 1 Individual | Stage 2 Individual | Stage 3 Individual | Total Individual | Stage 1 Individual | Stage 2 Individual | Stage 3 Individual | Total Individual | |||||||||||||||||||||||||
| MCh$ | MCh$ | MCh$ | MCh$ | MCh$ | MCh$ | MCh$ | MCh$ | |||||||||||||||||||||||||
| Debt Instrument | ||||||||||||||||||||||||||||||||
| Investment grade | 1,027,965 | 216 | — | 1,028,181 | 3,054,795 | 14 | — | 3,054,809 | ||||||||||||||||||||||||
| Non-investment grade | — | — | — | — | — | — | — | — | ||||||||||||||||||||||||
| Without rating | 32,342 | — | — | 32,342 | — | — | — | — | ||||||||||||||||||||||||
| Total | 1,060,307 | 216 | — | 1,060,523 | 3,054,795 | 14 | — | 3,054,809 | ||||||||||||||||||||||||
| (a.3) | Analysis of changes in the fair value and corresponding allowance for ECL by stage for debt instruments measured at FVOCI as of December 31, 2020 and 2021, is as follows: |
Stage 1 Individual | Stage 2 Individual | Stage 3 Individual | Total | |||||||||||||||||||||||||||||
Fair value MCh$ | ECL MCh$ | Fair value MCh$ | ECL MCh$ | Fair value MCh$ | ECL MCh$ | Fair value MCh$ | ECL MCh$ | |||||||||||||||||||||||||
| Balance as of January 1, 2020 | 1,357,846 | 7,736 | — | — | — | — | 1,357,846 | 7,736 | ||||||||||||||||||||||||
| Net change on Balance * | (306,649 | ) | 1,519 | (255 | ) | (7 | ) | — | — | (306,904 | ) | 1,512 | ||||||||||||||||||||
| Change in fair value | 14,217 | — | (6 | ) | — | — | — | 14,211 | — | |||||||||||||||||||||||
| Transfer to Stage 1 | — | — | — | — | — | — | — | — | ||||||||||||||||||||||||
| Transfer to Stage 2 | (477 | ) | (12 | ) | 477 | 12 | — | — | — | — | ||||||||||||||||||||||
| Transfer to Stage 3 | — | — | — | — | — | — | — | — | ||||||||||||||||||||||||
| Impact on year-end ECL of exposures transferred between stages during the year ** | — | — | — | 1 | — | — | — | 1 | ||||||||||||||||||||||||
| Impact of net re-measurement of year-end ECL | — | (6,120 | ) | — | — | — | — | — | (6,120 | ) | ||||||||||||||||||||||
| Amounts written off | — | — | — | — | — | — | — | — | ||||||||||||||||||||||||
| Foreign exchange adjustments | (4,630 | ) | (45 | ) | — | — | — | — | (4,630 | ) | (45 | ) | ||||||||||||||||||||
| Balance as of December 31, 2020 | 1,060,307 | 3,078 | 216 | 6 | — | — | 1,060,523 | 3,084 | ||||||||||||||||||||||||
| Balance as of January 1, 2021 | 1,060,307 | 3,078 | 216 | 6 | — | — | 1,060,523 | 3,084 | ||||||||||||||||||||||||
| Net change on Balance * | 2,096,637 | (4,265 | ) | (276 | ) | (8 | ) | — | — | 2,096,361 | (4,273 | ) | ||||||||||||||||||||
| Change in fair value | (103,047 | ) | — | (60 | ) | — | — | — | (103,107 | ) | — | |||||||||||||||||||||
| Transfer to Stage 1 | — | — | — | — | — | — | — | — | ||||||||||||||||||||||||
| Transfer to Stage 2 | (134 | ) | (4 | ) | 134 | 4 | — | — | — | — | ||||||||||||||||||||||
| Transfer to Stage 3 | — | — | — | — | — | — | — | — | ||||||||||||||||||||||||
| Impact on year-end ECL of exposures transferred between stages during the year ** | — | — | — | — | — | — | — | — | ||||||||||||||||||||||||
| Impact of net re-measurement of year-end ECL | — | 5,270 | — | (2 | ) | — | — | — | 5,268 | |||||||||||||||||||||||
| Amounts written off | — | — | — | — | — | — | — | — | ||||||||||||||||||||||||
| Foreign exchange adjustments | 1,032 | 6 | — | — | — | — | 1,032 | 6 | ||||||||||||||||||||||||
| Balance as of December 31, 2021 | 3,054,795 | 4,085 | 14 | — | — | — | 3,054,809 | 4,085 | ||||||||||||||||||||||||
| * | Net change between assets purchased and assets derecognized excluding write offs. |
| ** | Represents the change in the year-end ECLs of exposures that were transferred from one stage to another during the year. |
F-67
NOTES TO THE CONSOLIDATED FINANCIAL STATEMENTS, continued
| 12. | Financial Assets at Fair Value through Other Comprehensive Income, continued: |
| (b) | Equity instruments at fair value through OCI: |
The breakdown of the balance under the heading “Equity instruments at fair value through OCI” as of December 31, 2020 and 2021 is as follows:
| 2020 | 2021 | |||||||
| MCh$ | MCh$ | |||||||
| Equity instruments issued in Chile | 6,869 | 5,499 | ||||||
| Equity instruments issued by foreign institutions | 761 | 866 | ||||||
| Total | 7,630 | 6,365 | ||||||
The equity investments issued by foreign institutions represent shares of currency exchange offices and servicing companies that the Bank is obliged to hold in order to benefit from these services. Shares that do not have an active market and their value cannot be reliably measured are presented at cost, the difference between cost and fair value is not expected to be significant.
| (c) | Realized and unrealized profits: |
Realized profits and losses are calculated as the proceeds from sales less the cost (specific identification method) of the investments identified as for sale and fair value through OCI. In addition, any unrealized profit or loss previously recorded in other comprehensive income for these investments is reclassified when recorded in the income statements.
The gross gains (losses) realized in sale of financial instruments, as of December 31, 2019, 2020 and 2021, is recorded in the item “Net financial operating income” (Note No. 32).
Change in profits and losses unrealized on the sale of debt instruments for the periods ended December 31, 2019, 2020 and 2021 are as follows:
| 2019 | 2020 | 2021 | ||||||||||
| MCh$ | MCh$ | MCh$ | ||||||||||
| Net gain (loss) on financial assets before income tax (1) | 15,969 | (8,540 | ) | (52,913 | ) | |||||||
| Tax (expense) benefit | (4,328 | ) | 2,304 | 4,171 | ||||||||
| Net of tax amount (2) | 11,641 | (6,236 | ) | (48,742 | ) | |||||||
| (1) | As of December 31, 2019, 2020 and 2021, realized gains reclassified to the income statement line item “Net financial operating income” amounted to Ch$4,716 million, Ch$22,735 million and Ch$442 million, respectively. |
| (2) | This amount corresponds to the unrealized gain or loss, net of deferred tax and which are included in “Consolidated Statement of Changes in Equity”. |
F-68
NOTES TO THE CONSOLIDATED FINANCIAL STATEMENTS, continued
| 13. | Financial Instruments at Amortized Cost: |
As of December 31, 2020 and 2021, financial assets at amortized cost are detailed as follows:
| 2020 | 2021 | |||||||
| MCh$ | MCh$ | |||||||
| Instruments issued by the Chilean Government and Central Bank of Chile | ||||||||
| Bonds issued by the Central Bank of Chile | — | — | ||||||
| Promissory notes issued by the Central Bank of Chile | — | — | ||||||
| Other instruments of the Chilean Government and the Central Bank of Chile | — | 839,744 | ||||||
| Other instruments issued in Chile | ||||||||
| Deposit promissory notes from domestics banks | — | — | ||||||
| Mortgage bonds from domestic banks | — | — | ||||||
| Bonds from domestic banks | — | — | ||||||
| Deposits from domestic banks | — | — | ||||||
| Bonds from other Chilean companies | — | — | ||||||
| Promissory notes issued by other Chilean companies | — | — | ||||||
| Other instruments issued in Chile | — | — | ||||||
| Instruments issued Abroad | ||||||||
| Instruments from foreign governments or Central Banks | — | — | ||||||
| Other instruments | — | — | ||||||
| Total | — | 839,744 | ||||||
| (a.1) | The credit ratings of the issuers of instruments assets at amortized cost as of December 31, 2021, are as follows: |
| As of December 31, 2020 | As of December 31, 2021 | |||||||||||||||||||||||||||||||
Stage 1 Individual | Stage 2 Individual | Stage 3 Individual | Total Individual | Stage 1 Individual | Stage 2 Individual | Stage 3 Individual | Total Individual | |||||||||||||||||||||||||
| MCh$ | MCh$ | MCh$ | MCh$ | MCh$ | MCh$ | MCh$ | MCh$ | |||||||||||||||||||||||||
| Debt Instrument | ||||||||||||||||||||||||||||||||
| Investment grade | — | — | — | — | 839,744 | — | — | 839,744 | ||||||||||||||||||||||||
| Non-investment grade | — | — | — | — | — | — | — | — | ||||||||||||||||||||||||
| Without rating | — | — | — | — | — | — | — | — | ||||||||||||||||||||||||
| Total | — | — | — | — | 839,744 | — | — | 839,744 | ||||||||||||||||||||||||
F-69
NOTES TO THE CONSOLIDATED FINANCIAL STATEMENTS, continued
| 13. | Financial Instruments at Amortized Cost, continued: |
| (a.2) | Analysis of changes in gross carrying amount and corresponding allowance for ECL by stage for financial instruments measured at amortized cost as of December 31, 2021, is as follows: |
Stage 1 Individual | Stage 2 Individual | Stage 3 Individual | Total | |||||||||||||||||||||||||||||
Fair value MCh$ | ECL MCh$ | Fair value MCh$ | ECL MCh$ | Fair value MCh$ | ECL MCh$ | Fair value MCh$ | ECL MCh$ | |||||||||||||||||||||||||
| Balance as of January 1, 2021 | — | — | — | — | — | — | — | — | ||||||||||||||||||||||||
| Net change on Balance * | 839,744 | — | — | — | — | — | 839,744 | — | ||||||||||||||||||||||||
| Change in fair value | — | — | — | — | — | — | — | — | ||||||||||||||||||||||||
| Transfer to Stage 1 | — | — | — | — | — | — | — | — | ||||||||||||||||||||||||
| Transfer to Stage 2 | — | — | — | — | ||||||||||||||||||||||||||||
| Transfer to Stage 3 | — | — | — | — | — | — | — | — | ||||||||||||||||||||||||
| Impact on year-end ECL of exposures transferred between stages during the year ** | — | — | — | — | — | — | — | — | ||||||||||||||||||||||||
| Impact of net re-measurement of year-end ECL | — | — | — | — | — | — | — | — | ||||||||||||||||||||||||
| Amounts written off | — | — | — | — | — | — | — | — | ||||||||||||||||||||||||
| Foreign exchange adjustments | — | — | — | — | — | — | — | — | ||||||||||||||||||||||||
| Balance as of December 31, 2021 | 839,744 | — | — | — | — | — | 839,744 | — | ||||||||||||||||||||||||
| * | Net change between assets purchased and assets derecognized excluding write offs. |
| ** | Represents the change in the year-end ECLs of exposures that were transferred from one stage to another during the year. |
F-70
NOTES TO THE CONSOLIDATED FINANCIAL STATEMENTS, continued
| 14. | Investments in Other Companies: |
| (a) | This item includes investments in other companies for an amount of Ch$42,338 million and Ch$46,923 million as of December 31, 2020 and 2021, respectively, detailed as follows: |
| Investment | ||||||||||||||||||||||||||||||||||||||
| Ownership Interest | Equity | Assets | Income | |||||||||||||||||||||||||||||||||||
| 2020 | 2021 | 2020 | 2021 | 2020 | 2021 | 2019 | 2020 | 2021 | ||||||||||||||||||||||||||||||
| Company | Shareholder | % | % | MCh$ | MCh$ | MCh$ | MCh$ | MCh$ | MCh$ | MCh$ | ||||||||||||||||||||||||||||
| Associates | ||||||||||||||||||||||||||||||||||||||
| Transbank S.A. (*) | Banco de Chile | 26.16 | 26.16 | 67,337 | 84,898 | 17,613 | 22,207 | 3,505 | (4,360 | ) | (3,254 | ) | ||||||||||||||||||||||||||
| Administrador Financiero del Transantiago S.A. | Banco de Chile | 20.00 | 20.00 | 19,171 | 19,158 | 3,951 | 3,947 | 390 | 389 | 385 | ||||||||||||||||||||||||||||
| Redbanc S.A. | Banco de Chile | 38.13 | 38.13 | 8,663 | 9,935 | 3,307 | 3,842 | 330 | (242 | ) | 539 | |||||||||||||||||||||||||||
| Centro de Compensación Automatizado S.A. | Banco de Chile | 33.33 | 33.33 | 8,182 | 10,728 | 2,787 | 3,663 | 294 | 603 | 876 | ||||||||||||||||||||||||||||
| Sociedad Interbancaria de Depósitos de Valores S.A. | Banco de Chile | 26.81 | 26.81 | 5,526 | 6,317 | 1,564 | 1,788 | 231 | 276 | 315 | ||||||||||||||||||||||||||||
| Servicios de Infraestructura de Mercado OTC S.A. | Banco de Chile | 12.33 | 12.33 | 12,248 | 12,609 | 1,510 | 1,541 | 59 | (24 | ) | 32 | |||||||||||||||||||||||||||
| Sociedad Operadora de la Cámara de Compensación de Pagos de Alto Valor S.A. | Banco de Chile | 15.00 | 15.00 | 6,436 | 6,638 | 980 | 1,025 | 29 | 29 | 58 | ||||||||||||||||||||||||||||
| Sociedad Operadora de Tarjetas de Crédito Nexus S.A. (**) | Banco de Chile | 29.63 | 29.63 | 8,626 | — | 2,556 | — | 5 | (2,682 | ) | 1,405 | |||||||||||||||||||||||||||
| Subtotal | 136,189 | 150,283 | 34,268 | 38,013 | 4,843 | (6,011 | ) | 356 | ||||||||||||||||||||||||||||||
| Joint Venture | ||||||||||||||||||||||||||||||||||||||
| Servipag Ltda. | Banco de Chile | 50.00 | 50.00 | 13,268 | 14,930 | 6,631 | 7,465 | 572 | 359 | 831 | ||||||||||||||||||||||||||||
| Artikos Chile S.A. | Banco de Chile | 50.00 | 50.00 | 2,547 | 2,527 | 1,439 | 1,445 | 624 | 553 | 606 | ||||||||||||||||||||||||||||
| Subtotal | 15,815 | 17,457 | 8,070 | 8,910 | 1,196 | 912 | 1,437 | |||||||||||||||||||||||||||||||
| Total | 152,004 | 167,740 | 42,338 | 46,923 | 6,039 | (5,099 | ) | 1,793 | ||||||||||||||||||||||||||||||
| (*) | On April 22, 2021, the Extraordinary Shareholders’ Meeting of the company unanimously approved a capital increase for Ch$30,000 million through the issuance of 152,905,194 payment shares. As of December 31, 2021, Banco de Chile has subscribed and full payment of 39,994,508 shares equivalent to Ch$7,847 million. |
| (**) | As of December 31, 2021, the investment is presented in the item “Other Assets” under the concept “Non-current assets held for sale”. |
F-71
NOTES TO THE CONSOLIDATED FINANCIAL STATEMENTS, continued
| 14. | Investments in Other Companies, continued: |
| (b) | The total carrying amount of the Bank’s associates as of December 31, 2020 and 2021 is explained as follows: |
| 2020 | ||||||||||||||||||||||||||||||||||||
| Associate’s statement of financial position | Centro de Compensación Automatizado S.A. | Sociedad Operadora de la Cámara de Compensación de Pagos de Alto Valor S.A. | Sociedad Operadora de Tarjetas de Crédito Nexus S.A. | Sociedad Interbancaria de Depósitos de Valores S.A. | Redbanc S.A. | Transbank S.A. | Administrador Financiero del Transantiago S.A. | Sociedad Imerc OTC S.A. | Total | |||||||||||||||||||||||||||
| MCh$ | MCh$ | MCh$ | MCh$ | MCh$ | MCh$ | MCh$ | MCh$ | MCh$ | ||||||||||||||||||||||||||||
| Current assets | 5,087 | 6,019 | 9,586 | 113 | 7,047 | 1,118,388 | 54,120 | 21,585 | 1,221,945 | |||||||||||||||||||||||||||
| Non-current assets | 3,463 | 1,353 | 21,561 | 4,961 | 16,366 | 99,060 | 592 | 8,216 | 155,572 | |||||||||||||||||||||||||||
| Total Assets | 8,550 | 7,372 | 31,147 | 5,074 | 23,413 | 1,217,448 | 54,712 | 29,801 | 1,377,517 | |||||||||||||||||||||||||||
| Current liabilities | 1,947 | 769 | 7,951 | 263 | 7,688 | 1,130,800 | 34,234 | 16,789 | 1,200,441 | |||||||||||||||||||||||||||
| Non-current liabilities | 139 | 313 | 5,521 | — | 6,504 | 3,981 | 1,304 | 533 | 18,295 | |||||||||||||||||||||||||||
| Total Liabilities | 2,086 | 1,082 | 13,472 | 263 | 14,192 | 1,134,781 | 35,538 | 17,322 | 1,218,736 | |||||||||||||||||||||||||||
| Equity | 6,464 | 6,290 | 17,675 | 4,811 | 9,221 | 82,667 | 19,174 | 12,470 | 158,772 | |||||||||||||||||||||||||||
| Minority interest | — | — | — | — | — | — | — | 9 | 9 | |||||||||||||||||||||||||||
| Total Liabilities and Equity | 8,550 | 7,372 | 31,147 | 5,074 | 23,413 | 1,217,448 | 54,712 | 29,801 | 1,377,517 | |||||||||||||||||||||||||||
| Associate’s revenue and profit | ||||||||||||||||||||||||||||||||||||
| Operating income | 3,384 | 3,386 | 49,944 | 15 | 38,024 | 222,912 | 3,707 | 6,291 | 327,663 | |||||||||||||||||||||||||||
| Operating expenses | (2,229 | ) | (3,348 | ) | (49,699 | ) | (57 | ) | (36,693 | ) | (133,128 | ) | (2,224 | ) | (5,725 | ) | (233,103 | ) | ||||||||||||||||||
| Other income (expenses) | (13 | ) | 159 | (304 | ) | 903 | (195 | ) | (72,143 | ) | 979 | 179 | (70,435 | ) | ||||||||||||||||||||||
| Gain before tax | 1,142 | 197 | (59 | ) | 861 | 1,136 | 17,641 | 2,462 | 745 | 24,125 | ||||||||||||||||||||||||||
| Income tax | (261 | ) | (4 | ) | 75 | — | (270 | ) | (4,239 | ) | (514 | ) | (267 | ) | (5,480 | ) | ||||||||||||||||||||
| Gain for the year | 881 | 193 | 16 | 861 | 866 | 13,402 | 1,948 | 478 | 18,645 | |||||||||||||||||||||||||||
F-72
NOTES TO THE CONSOLIDATED FINANCIAL STATEMENTS, continued
| 14. | Investments in Other Companies, continued: |
| 2021 | ||||||||||||||||||||||||||||||||
| Associate’s statement of financial position | Centro de Compensación Automatizado S.A. | Sociedad Operadora de la Cámara de Compensación de Pagos de Alto Valor S.A. | Sociedad Interbancaria de Depósitos de Valores S.A. | Redbanc S.A. | Transbank S.A. | Administrador Financiero del Transantiago S.A. | Sociedad Imerc OTC S.A. | Total | ||||||||||||||||||||||||
| MCh$ | MCh$ | MCh$ | MCh$ | MCh$ | MCh$ | MCh$ | MCh$ | |||||||||||||||||||||||||
| Current assets | 10,501 | 5,259 | 108 | 12,006 | 1,197,305 | 53,741 | 27,628 | 1,306,548 | ||||||||||||||||||||||||
| Non-current assets | 2,746 | 2,310 | 6,567 | 16,404 | 120,282 | 696 | 8,013 | 157,018 | ||||||||||||||||||||||||
| Total Assets | 13,247 | 7,569 | 6,675 | 28,410 | 1,317,587 | 54,437 | 35,641 | 1,463,566 | ||||||||||||||||||||||||
| Current liabilities | 2,126 | 836 | 358 | 9,490 | 1,230,002 | 35,189 | 21,179 | 1,299,180 | ||||||||||||||||||||||||
| Non-current liabilities | 393 | 95 | — | 8,985 | 2,687 | 90 | 1,844 | 14,094 | ||||||||||||||||||||||||
| Total Liabilities | 2,519 | 931 | 358 | 18,475 | 1,232,689 | 35,279 | 23,023 | 1,313,274 | ||||||||||||||||||||||||
| Equity | 10,728 | 6,638 | 6,317 | 9,935 | 84,898 | 19,158 | 12,609 | 150,283 | ||||||||||||||||||||||||
| Minority interest | — | — | — | — | — | — | 9 | 9 | ||||||||||||||||||||||||
| Total Liabilities and Equity | 13,247 | 7,569 | 6,675 | 28,410 | 1,317,587 | 54,437 | 35,641 | 1,463,566 | ||||||||||||||||||||||||
| Associate’s revenue and profit | ||||||||||||||||||||||||||||||||
| Operating income | 5,675 | 3,898 | 10 | 43,192 | 821,362 | 4,033 | 7,210 | 885,380 | ||||||||||||||||||||||||
| Operating expenses | (2,377 | ) | (3,653 | ) | (43 | ) | (41,066 | ) | (757,773 | ) | (2,182 | ) | (6,864 | ) | (813,958 | ) | ||||||||||||||||
| Other income (expenses) | 87 | 134 | 1,208 | (338 | ) | (83,001 | ) | 296 | (5 | ) | (81,619 | ) | ||||||||||||||||||||
| Gain before tax | 3,385 | 379 | 1,175 | 1,788 | (19,412 | ) | 2,147 | 341 | (10,197 | ) | ||||||||||||||||||||||
| Income tax | (757 | ) | 13 | — | (375 | ) | 6,973 | (222 | ) | 31 | 5,663 | |||||||||||||||||||||
| Gain for the year | 2,628 | 392 | 1,175 | 1,413 | (12,439 | ) | 1,925 | 372 | (4,534 | ) | ||||||||||||||||||||||
F-73
NOTES TO THE CONSOLIDATED FINANCIAL STATEMENTS, continued
14. | Investments in Other Companies, continued: |
| (c) | Joint Ventures: |
The Bank has a 50% interest in Servipag Ltda. and a 50% interest in Artikos Chile S.A., two jointly controlled entities. The Bank’s interest in both entities is accounted for using the equity method in the consolidated financial statements.
The table below presents summarized financial information as of December 31, 2020 and 2021 of the entities the Bank controls jointly:
| Artikos Chile S.A. | Servipag Ltda. | |||||||||||||||
| 2020 | 2021 | 2020 | 2021 | |||||||||||||
| MCh$ | MCh$ | MCh$ | MCh$ | |||||||||||||
| Current assets | 1,856 | 2,067 | 71,711 | 65,128 | ||||||||||||
| Non-current assets | 1,799 | 2,278 | 16,102 | 15,721 | ||||||||||||
| Total Assets | 3,655 | 4,345 | 87,813 | 80,849 | ||||||||||||
| Current liabilities | 1,108 | 1,167 | 70,887 | 61,079 | ||||||||||||
| Non-current liabilities | — | 651 | 3,658 | 4,840 | ||||||||||||
| Total Liabilities | 1,108 | 1,818 | 74,545 | 65,919 | ||||||||||||
| Equity | 2,547 | 2,527 | 13,268 | 14,930 | ||||||||||||
| Total Liabilities and Equity | 3,655 | 4,345 | 87,813 | 80,849 | ||||||||||||
| Operating income | 3,632 | 3,977 | 40,138 | 39,309 | ||||||||||||
| Operating expenses | (2,534 | ) | (2,631 | ) | (38,841 | ) | (37,047 | ) | ||||||||
| Other income (expenses) | 4 | 7 | (31 | ) | (231 | ) | ||||||||||
| Profit before tax | 1,102 | 1,353 | 1,266 | 2,031 | ||||||||||||
| Income tax | 3 | (142 | ) | (290 | ) | (369 | ) | |||||||||
| Profit for the year | 1,105 | 1,211 | 976 | 1,662 | ||||||||||||
| (d) | The reconciliation between opening and ending balance of investments in other companies that are not consolidated in 2019, 2020 and 2021 is detailed as follows: |
| 2019 | 2020 | 2021 | ||||||||||
| MCh$ | MCh$ | MCh$ | ||||||||||
| Balance as of January 1, | 42,252 | 48,442 | 42,338 | |||||||||
| Capital increase | 671 | — | 7,847 | |||||||||
| Participation in net income | 6,039 | (5,099 | ) | 1,793 | ||||||||
| Dividends received | (552 | ) | (1,001 | ) | (1,097 | ) | ||||||
| Non-current assets Nexus | — | — | (3,961 | ) | ||||||||
| Other | 32 | (4 | ) | 3 | ||||||||
| Balance as of December 31, | 48,442 | 42,338 | 46,923 | |||||||||
| (e) | During the year ended as of December 31, 2020 and 2021 no impairment has incurred in these investments. |
F-74
NOTES TO THE CONSOLIDATED FINANCIAL STATEMENTS, continued
| 15. | Intangible Assets: |
| (a) | As of December 31, 2020 and 2021 intangible assets are detailed as follows: |
| Useful Life | Average remaining amortization | Gross balance | Accumulated Amortization | Net balance | ||||||||||||||||||||||||||||||||||||
| 2020 | 2021 | 2020 | 2021 | 2020 | 2021 | 2020 | 2021 | 2020 | 2021 | |||||||||||||||||||||||||||||||
| Years | Years | Years | Years | MCh$ | MCh$ | MCh$ | MCh$ | MCh$ | MCh$ | |||||||||||||||||||||||||||||||
| Other Intangible Assets: | ||||||||||||||||||||||||||||||||||||||||
| Goodwill | — | — | — | — | 16,714 | 16,714 | — | — | 16,714 | 16,714 | ||||||||||||||||||||||||||||||
| Intangible assets arising from business combinations | — | — | — | — | 56,249 | 56,249 | (39,553 | ) | (39,553 | ) | 16,696 | 16,696 | ||||||||||||||||||||||||||||
| Software or computer programs | 6 | 6 | 4 | 4 | 180,695 | 209,458 | (119,994 | ) | (136,926 | ) | 60,701 | 72,532 | ||||||||||||||||||||||||||||
| Total | 253,658 | 282,421 | (159,547 | ) | (176,479 | ) | 94,111 | 105,942 | ||||||||||||||||||||||||||||||||
F-75
NOTES TO THE CONSOLIDATED FINANCIAL STATEMENTS, continued
| 15. | Intangible Assets, continued: |
| (b) | Changes in intangible assets during the 2020 and 2021 periods are as follows: |
| Goodwill (1) | Intangible assets arising from business combinations (2) | Software or computer programs | Total | |||||||||||||
| MCh$ | MCh$ | MCh$ | MCh$ | |||||||||||||
| Gross Balance | ||||||||||||||||
| Balance as of January 1, 2020 | 16,714 | 56,249 | 163,511 | 236,474 | ||||||||||||
| Acquisitions | — | — | 18,631 | 18,631 | ||||||||||||
| Disposals/write-downs | — | — | (387 | ) | (387 | ) | ||||||||||
| Reclassification | — | — | (16 | ) | (16 | ) | ||||||||||
| Impairment (*) (**) | — | — | (1,044 | ) | (1,044 | ) | ||||||||||
| Balance as of December 31, 2020 | 16,714 | 56,249 | 180,695 | 253,658 | ||||||||||||
| Acquisitions | — | — | 30,222 | 30,222 | ||||||||||||
| Disposals/write-downs | — | — | (352 | ) | (352 | ) | ||||||||||
| Reclassification | — | — | (89 | ) | (89 | ) | ||||||||||
| Impairment (*) (**) | — | — | (1,018 | ) | (1,018 | ) | ||||||||||
| Balance as of December 31, 2021 | 16,714 | 56,249 | 209,458 | 282,421 | ||||||||||||
| Accumulated Amortization | ||||||||||||||||
| Balance as of January 1, 2020 | — | (39,553 | ) | (105,204 | ) | (144,757 | ) | |||||||||
| Amortization for the year (**) | — | — | (15,865 | ) | (15,865 | ) | ||||||||||
| Disposals/write-downs | — | — | 660 | 660 | ||||||||||||
| Reclassification | — | — | — | — | ||||||||||||
| Impairment (*) (**) | — | — | 415 | 415 | ||||||||||||
| Balance as of December 31, 2020 | — | (39,553 | ) | (119,994 | ) | (159,547 | ) | |||||||||
| Amortization for the year (**) | — | — | (17,831 | ) | (17,831 | ) | ||||||||||
| Disposals/write-downs | — | — | 352 | 352 | ||||||||||||
| Reclassification | — | — | (2 | ) | (2 | ) | ||||||||||
| Impairment (*) (**) | — | — | 549 | 549 | ||||||||||||
| Balance as of December 31, 2021 | — | (39,553 | ) | (136,926 | ) | (176,479 | ) | |||||||||
| Net balance as of December 31, 2020 | 16,714 | 16,696 | 60,701 | 94,111 | ||||||||||||
| Net balance as of December 31, 2021 | 16,714 | 16,696 | 72,532 | 105,942 | ||||||||||||
| (1) | Goodwill corresponds mainly to business combination with Citibank Chile whose amount is of MCh$12,576 that represents the value of synergies to be generated in the combination process and the acquisition of know-how. |
| (2) | Intangible assets arising from business combinations include assets with indefinite useful lives acquired in the business combination with Citibank Chile. |
| (*) | Does not include write-offs of Intangible assets for $1,178 million as of December 31, 2021. |
| (**) | See Note No. 37 Depreciation, Amortization and Impairment. |
F-76
NOTES TO THE CONSOLIDATED FINANCIAL STATEMENTS, continued
| 15. | Intangible Assets, continued: |
As of December 31, 2020 and 2021, the Bank had made the following commitments for technological developments:
| Amount of Commitment | ||||||||
| 2020 | 2021 | |||||||
| MCh$ | MCh$ | |||||||
| Software and licenses | 3,830 | 7,097 | ||||||
| (c) | Impairment testing of Goodwill |
For goodwill impairment purposes, testing is carried out at the level of business segments described above and in Note No. 5 to the financial statements. This methodology is in line with IAS 36, where business segments represent the lowest level within the entity at which the goodwill is monitored for internal management purposes.
Accordingly, for impairment testing purposes, goodwill acquired through business combinations has been allocated to four individual business segments, as follows:
| 2020 | 2021 | |||||||
| Business Segments | MCh$ | MCh$ | ||||||
| Retail | 5,928 | 5,928 | ||||||
| Wholesale | 2,135 | 2,135 | ||||||
| Treasury and money market operations | 4,513 | 4,513 | ||||||
| Subsidiaries | 4,138 | 4,138 | ||||||
| Total | 16,714 | 16,714 | ||||||
Below are the key assumptions used for determining the value in use for impairment testing purposes:
| ● | The Bank determines the recoverable amount of its business segments on the basis of value in use and employs a DCF valuation model. The DCF model determines the present value of the estimated future earnings that would be distributed to shareholders, once the respective regulatory capital requirements are satisfied. |
| ● | For purposes of the goodwill impairment testing, the DCF model uses earnings projections for a ten-year period. A ten-year period is deemed as the Bank assumes that over that period it is possible to achieve the goals set in the long-term business strategy. |
| ● | Earnings projections result from business growth, particularly associated with projected expansion rates for the local economy, the industry’s loan book and the Bank’s strategic goals. Then, based on historical data and a linear regression analysis, the Bank determines a multiplier of loan expansion (real terms) over GDP growth for the local economy. Given the impact of the COVID-19 pandemic, the multiplier for 2022 has been defined at 0.90 times. However, this multiplier is expected to return to normal levels from 2023 onwards (average of approximately 1.52 times between 2023 and 2031) although it is expected to decrease overtime as long as banking penetration increases across the diverse business segments. |
| ● | Following the estimated growth rates for the Chilean economy (measured as GDP) and the banking industry in terms of loans to customers, expansion rates of the Bank’s loan book are determined by considering the achievement of the Bank’s long-term strategic goals. Therefore, real growth rates are considered to be slightly higher than the industry rates within the ten-year period, assuming that a market share of 17.0% is achieved at year three and remains flat onwards. |
F-77
NOTES TO THE CONSOLIDATED FINANCIAL STATEMENTS, continued
| 15. | Intangible Assets, continued: |
| (c) | Impairment testing of Goodwill, continued: |
| ● | For purposes of business segments valuation, the DCF model considers discount rates that are determined by carrying out a linear regression analysis based on historical data of daily stock returns for the Bank and the market portfolio or overall stock index (IGPA index in Chile). In order to do this, an index linear model is applied, which is widely used in finance for these purposes. After estimating the model parameters (alpha and beta), the Capital Asset Pricing Model (“CAPM”) is utilized in order to determine the cost of equity or discount rate for shareholders’ cash flows. When using CAPM, a 6.7% discount rate is computed by assuming long-term scenarios for market risk premium and the latest available data (December 2021) for both inflation and long-term risk free rate. We also use alternative methods, such as historical return-on-market-equity (net income over market capitalization) and implied return-on-equity from price-to-earnings ratios projected by market analysts. Based on these methods, the Bank is able to reach a discount rate of 7.5% by using the return-on-market-equity and 9.8% by means of the projected price-to-earnings ratio. By using such evidence, the Bank determined a cost of equity of 9.0% as a baseline scenario for discount rates used for valuation purposes. The Bank also carries out a sensitivity analysis by setting discounts rates of 8.0% and 10.0%. |
| (d) | Annual goodwill impairment test: |
The annual goodwill impairment tests for the years ended December 31, 2020 and 2021 did not result in an impairment loss on the goodwill of the Bank’s business segments as their economic values were higher than their carrying amounts.
| (e) | Restrictions: |
Banco de Chile and its subsidiaries have no restrictions on intangible assets as of December 31, 2020 and 2021. Additionally, no intangible assets have been pledged as collateral to secure the fulfillment of any financial obligation. Moreover, there are no amounts owed by the Bank on intangible assets as of the aforementioned dates.
F-78
NOTES TO THE CONSOLIDATED FINANCIAL STATEMENTS, continued
| 16. | Property and Equipment and Leased Assets and Lease Liabilities: |
| (a) | The properties and equipment as of December 31, 2020 and 2021 are composed as follows: |
| Useful Life | Average remaining depreciation | Gross balance | Accumulated Depreciation | Net balance | ||||||||||||||||||||||||||||||||||||
| 2020 | 2021 | 2020 | 2021 | 2020 | 2021 | 2020 | 2021 | 2020 | 2021 | |||||||||||||||||||||||||||||||
| Years | Years | Years | Years | MCh$ | MCh$ | MCh$ | MCh$ | MCh$ | MCh$ | |||||||||||||||||||||||||||||||
Type of property and equipment: | ||||||||||||||||||||||||||||||||||||||||
| Land and Buildings | 26 | 26 | 20 | 19 | 304,951 | 311,279 | (142,543 | ) | (148,645 | ) | 162,408 | 162,634 | ||||||||||||||||||||||||||||
| Equipment | 5 | 5 | 4 | 3 | 222,624 | 243,757 | (175,141 | ) | (191,334 | ) | 47,483 | 52,423 | ||||||||||||||||||||||||||||
| Others | 7 | 7 | 4 | 4 | 55,898 | 56,582 | (47,861 | ) | (49,319 | ) | 8,037 | 7,263 | ||||||||||||||||||||||||||||
| Total | 583,473 | 611,618 | (365,545 | ) | (389,298 | ) | 217,928 | 222,320 | ||||||||||||||||||||||||||||||||
F-79
NOTES TO THE CONSOLIDATED FINANCIAL STATEMENTS, continued
| 16. | Property and Equipment and Leased Assets and Lease Liabilities, continued: |
| (b) | As of December 31, 2020 and 2021, this account and its changes are detailed as follows: |
| Land and Buildings | Equipment | Other | Total | |||||||||||||
| MCh$ | MCh$ | MCh$ | MCh$ | |||||||||||||
| (a.1) Gross Balance | ||||||||||||||||
| Balance as of January 1, 2020 | 301,619 | 207,605 | 55,519 | 564,743 | ||||||||||||
| Additions | 6,303 | 20,658 | 1,510 | 28,471 | ||||||||||||
| Write-down and sales of the year | (2,903 | ) | (5,606 | ) | (1,105 | ) | (9,614 | ) | ||||||||
| Impairment loss (*) (***) | (68 | ) | (33 | ) | (26 | ) | (127 | ) | ||||||||
| Balance as of December 31, 2020 | 304,951 | 222,624 | 55,898 | 583,473 | ||||||||||||
| Balance as of January 1, 2021 | 304,951 | 222,624 | 55,898 | 583,473 | ||||||||||||
| Additions | 9,477 | 22,367 | 2,349 | 34,193 | ||||||||||||
| Write-down and sales of the year | (3,132 | ) | (1,232 | ) | (1,628 | ) | (5,992 | ) | ||||||||
| Impairment loss (*) | (17 | ) | (2 | ) | (37 | ) | (56 | ) | ||||||||
| Balance as of December 31, 2021 | 311,279 | 243,757 | 56,582 | 611,618 | ||||||||||||
| (a.2) Accumulated Depreciation | ||||||||||||||||
| Balance as of January 1, 2020 | (136,394 | ) | (162,560 | ) | (45,527 | ) | (344,481 | ) | ||||||||
| Depreciation charges of the year (*) (**) | (8,844 | ) | (17,273 | ) | (3,371 | ) | (29,488 | ) | ||||||||
| Write-down and sales of the year | 2,695 | 4,692 | 1,025 | 8,412 | ||||||||||||
| Impairment (*) (***) | — | — | 12 | 12 | ||||||||||||
| Accumulated Depreciation as of December 31, 2020 | (142,543 | ) | (175,141 | ) | (47,861 | ) | (365,545 | ) | ||||||||
| Balance as of January 1, 2021 | (142,543 | ) | (175,141 | ) | (47,861 | ) | (365,545 | ) | ||||||||
| Reclassification | — | — | 16 | 16 | ||||||||||||
| Depreciation charges of the year (*) (**) | (8,895 | ) | (17,409 | ) | (3,107 | ) | (29,411 | ) | ||||||||
| Write-down and sales of the year | 2,793 | 1,216 | 1,620 | 5,629 | ||||||||||||
| Impairment (*) | — | — | 13 | 13 | ||||||||||||
| Accumulated Depreciation as of December 31, 2021 | (148,645 | ) | (191,334 | ) | (49,319 | ) | (389,298 | ) | ||||||||
| (*) | See Note No. 37 about Depreciation, Amortization and Impairment. |
| (**) | It does not include depreciation for the year for Investment Properties, which it registered under the item “Investment Properties” for an amount of Ch$357 million (Ch$357 million in 2020). |
| (***) | This amount does not include charge-offs of Property and Equipment of Ch$916 million as of December 2020. |
F-80
NOTES TO THE CONSOLIDATED FINANCIAL STATEMENTS, continued
| 16. | Property and Equipment and Leased Assets and Lease Liabilities, continued: |
| (c) | The composition of the rights over leased assets as of December 31, 2020 and 2021 is as follows: |
Gross | Accumulated Depreciation | Net | ||||||||||||||||||||||
| December | December | December | December | December | December | |||||||||||||||||||
| 2020 | 2021 | 2020 | 2021 | 2020 | 2021 | |||||||||||||||||||
| MCh$ | MCh$ | MCh$ | MCh$ | MCh$ | MCh$ | |||||||||||||||||||
| Categories | ||||||||||||||||||||||||
| Buildings | 123,215 | 124,978 | (33,560 | ) | (46,743 | ) | 89,655 | 78,235 | ||||||||||||||||
| Floor space for ATMs | 40,445 | 42,051 | (16,496 | ) | (25,566 | ) | 23,949 | 16,485 | ||||||||||||||||
| Improvements to leased properties | 26,579 | 26,066 | (21,354 | ) | (20,598 | ) | 5,225 | 5,468 | ||||||||||||||||
| Total | 190,239 | 193,095 | (71,410 | ) | (92,907 | ) | 118,829 | 100,188 | ||||||||||||||||
| (d) | The changes of the rights over leased assets as of December 31, 2020 and 2021 is as follows: |
| 2020 | ||||||||||||||||
Buildings |
Floor space | Improvements to leased properties |
Total | |||||||||||||
| MCh$ | MCh$ | MCh$ | MCh$ | |||||||||||||
| Gross Balance | ||||||||||||||||
| Balance as of January 1, 2020 | 130,853 | 41,960 | 27,254 | 200,067 | ||||||||||||
| Additions | 7,907 | 1,319 | 847 | 10,073 | ||||||||||||
| Write-downs | (15,538 | ) | (1,197 | ) | (1,522 | ) | (18,257 | ) | ||||||||
| Remeasurement | (7 | ) | (1,637 | ) | — | (1,644 | ) | |||||||||
| Total | 123,215 | 40,445 | 26,579 | 190,239 | ||||||||||||
| Accumulated Depreciation | ||||||||||||||||
| Balance as of January 1, 2020 | (18,722 | ) | (9,091 | ) | (21,589 | ) | (49,402 | ) | ||||||||
| Depreciation of the year (*) | (18,867 | ) | (7,774 | ) | (1,006 | ) | (27,647 | ) | ||||||||
| Write-downs | 4,029 | 369 | 1,241 | 5,639 | ||||||||||||
| Total | (33,560 | ) | (16,496 | ) | (21,354 | ) | (71,410 | ) | ||||||||
| Balance as of December 31, 2020 | 89,655 | 23,949 | 5,225 | 118,829 | ||||||||||||
| (*) | See Note No.37 Depreciation, Amortization and Impairment. Does not include provision for impairment of Ch$1 million. |
F-81
NOTES TO THE CONSOLIDATED FINANCIAL STATEMENTS, continued
| 16. | Property and Equipment and Leased Assets and Lease Liabilities, continued: |
| 2021 | ||||||||||||||||
Buildings |
Floor space | Improvements to leased properties |
Total | |||||||||||||
| MCh$ | MCh$ | MCh$ | MCh$ | |||||||||||||
| Gross Balance | ||||||||||||||||
| Balance as of January 1, 2021 | 123,215 | 40,445 | 26,579 | 190,239 | ||||||||||||
| Additions | 12,123 | 2,867 | 1,386 | 16,376 | ||||||||||||
| Write-downs | (10,468 | ) | (1,055 | ) | (1,899 | ) | (13,422 | ) | ||||||||
| Remeasurement | — | (206 | ) | — | (206 | ) | ||||||||||
| Others | 108 | — | — | 108 | ||||||||||||
| Total | 124,978 | 42,051 | 26,066 | 193,095 | ||||||||||||
| Accumulated Depreciation | ||||||||||||||||
| Balance as of January 1, 2021 | (33,560 | ) | (16,496 | ) | (21,354 | ) | (71,410 | ) | ||||||||
| Depreciation of the year (*) | (18,244 | ) | (10,095 | ) | (860 | ) | (29,199 | ) | ||||||||
| Write-downs | 5,064 | 1,025 | 1,616 | 7,705 | ||||||||||||
| Others | (3 | ) | — | — | (3 | ) | ||||||||||
| Total | (46,743 | ) | (25,566 | ) | (20,598 | ) | (92,907 | ) | ||||||||
| Balance as of December 31, 2021 | 78,235 | 16,485 | 5,468 | 100,188 | ||||||||||||
| (*) | See Note No.37 Depreciation, Amortization and Impairment. |
| (e) | The following are the future maturities of the lease liabilities as of December 31, 2020 and 2021: |
| December 2020 | ||||||||||||||||||||||||||||
Up to 1 month | Over 1 month and up to 3 months | Over 3 months and up to 12 months | Over 1 year and up to 3 years | Over 3 years and up to 5 years |
Over |
Total | ||||||||||||||||||||||
| MCh$ | MCh$ | MCh$ | MCh$ | MCh$ | MCh$ | MCh$ | ||||||||||||||||||||||
| Lease associated with: | ||||||||||||||||||||||||||||
| Buildings | 1,646 | 3,371 | 14,501 | 28,663 | 20,869 | 30,865 | 99,915 | |||||||||||||||||||||
| ATMs | 824 | 1,644 | 7,229 | 14,467 | 419 | 483 | 25,066 | |||||||||||||||||||||
| Total | 2,470 | 5,015 | 21,730 | 43,130 | 21,288 | 31,348 | 124,981 | |||||||||||||||||||||
| December 2021 | ||||||||||||||||||||||||||||
Up to | Over 1 month and up to 3 months | Over 3 months and up to 12 months | Over 1 year and up to 3 years | Over 3 years and up to 5 years |
Over |
Total | ||||||||||||||||||||||
| MCh$ | MCh$ | MCh$ | MCh$ | MCh$ | MCh$ | MCh$ | ||||||||||||||||||||||
| Lease associated with: | ||||||||||||||||||||||||||||
| Buildings | 1,785 | 3,555 | 13,516 | 28,025 | 21,530 | 27,733 | 96,144 | |||||||||||||||||||||
| ATMs | 962 | 1,921 | 8,221 | 6,114 | 116 | 108 | 17,442 | |||||||||||||||||||||
| Total | 2,747 | 5,476 | 21,737 | 34,139 | 21,646 | 27,841 | 113,586 | |||||||||||||||||||||
F-82
NOTES TO THE CONSOLIDATED FINANCIAL STATEMENTS, continued
| 16. | Property and Equipment and Leased Assets and Lease Liabilities, continued: |
The Bank and its subsidiaries maintain contracts with certain renewal options and for which there is reasonable certainty that said option shall be carried out. In such cases, the lease period used to measure the liability and assets corresponds to an estimate of future renewals.
The changes of the obligations for lease liabilities and the flows for the years 2021 and 2020 are as follows:
Total cash flow | ||||
| MCh$ | ||||
| Lease liability | ||||
| Balances as of January 1, 2020 | 146,013 | |||
| Liabilities for new lease agreements | 5,768 | |||
| Interest expenses | 2,532 | |||
| Payments of capital and interests | (28,705 | ) | ||
| Remeasurement | (1,644 | ) | ||
| Derecognized contracts | (12,337 | ) | ||
| Others | 3,390 | |||
| Balances as of December 31, 2020 | 115,017 | |||
| Balances as of January 1, 2021 | 115,017 | |||
| Liabilities for new lease agreements | 8,283 | |||
| Interest expenses | 1,978 | |||
| Payments of capital and interests | (30,585 | ) | ||
| Remeasurement | (206 | ) | ||
| Derecognized contracts | (5,524 | ) | ||
| Others | 6,707 | |||
| Balances as of December 31, 2021 | 95,670 | |||
| (f) | The future cash flows related to short-term lease agreements in effect as of December 31, 2021 correspond to Ch$5,569 million (Ch$6,814 million as of December 31, 2020). |
F-83
NOTES TO THE CONSOLIDATED FINANCIAL STATEMENTS, continued
| 17. | Investment Properties: |
| 2019 | 2020 | 2021 | ||||||||||
| MCh$ | MCh$ | MCh$ | ||||||||||
| Net Balance as of January 1, | 13,938 | 13,190 | 12,833 | |||||||||
| Additions resulting from business combinations | — | — | — | |||||||||
| Reclassifications | (389 | ) | — | — | ||||||||
| Disposals | — | — | — | |||||||||
| Depreciation charges in the period | (359 | ) | (357 | ) | (357 | ) | ||||||
| Impairment | — | — | — | |||||||||
| Net Balance as of December 31, | 13,190 | 12,833 | 12,476 | |||||||||
Estimated useful lives applied by the Bank are presented in Note No. 2(m) Property and equipment.
As of December 31, 2021, the fair value of the investment properties held by the Bank is Ch$51,808 million (Ch$47,370 million as of December 31, 2020).
In 2021, the Bank earned income of Ch$3,372 million (Ch$4,546 million in 2020) renting out its investment properties. In the same period the Bank incurred corresponding expenses of Ch$2,944 million and Ch$1,843 million per year in 2020 and 2021.
| 18. | Current Taxes and Deferred Taxes: |
| (a) | Current Tax: |
The Bank and its subsidiaries at the end of each year, have constituted a First Category Income Tax Provision, which was determined based on current tax regulations, and has been reflected in the statement of financial position net of taxes to be recovered or payable, as applicable, as of December 31, 2020 and 2021, according to the following detail:
| 2020 | 2021 | |||||||
| MCh$ | MCh$ | |||||||
| Income taxes | 153,084 | 299,396 | ||||||
| Less: | ||||||||
| Monthly prepaid taxes (PPM) | (172,683 | ) | (182,903 | ) | ||||
| Credit for training expenses | (1,900 | ) | (2,000 | ) | ||||
| Other | (1,139 | ) | (2,210 | ) | ||||
| Total tax (receivable) payable, net | (22,638 | ) | 112,283 | |||||
| 2020 | 2021 | |||||||
| MCh$ | MCh$ | |||||||
| Current tax assets | 22,949 | — | ||||||
| Current tax liabilities | (311 | ) | (112,283 | ) | ||||
| Total tax receivable (payable), net | 22,638 | (112,283 | ) | |||||
F-84
NOTES TO THE CONSOLIDATED FINANCIAL STATEMENTS, continued
| 18. | Current Taxes and Deferred Taxes, continued: |
| (b) | Income Tax: |
The Bank’s tax expense recorded for the years ended December 31, 2019, 2020 and 2021 is detailed as follows:
| 2019 | 2020 | 2021 | ||||||||||
| MCh$ | MCh$ | MCh$ | ||||||||||
| Income tax expense: | ||||||||||||
| Current year taxes | 232,404 | 161,869 | 250,155 | |||||||||
| Tax from previous period | (331 | ) | 813 | 3,014 | ||||||||
| Subtotal | 232,073 | 162,682 | 253,169 | |||||||||
| (Credit) charge for deferred taxes: | ||||||||||||
| Origin and reversal of temporary differences | (58,733 | ) | (58,895 | ) | 20,163 | |||||||
| Effect of changes in tax rate | — | — | — | |||||||||
| Subtotal | (58,733 | ) | (58,895 | ) | 20,163 | |||||||
| Other | 321 | (564 | ) | 2,637 | ||||||||
| Net charge to income for income taxes | 173,661 | 103,223 | 275,969 | |||||||||
| Tax Rate | 27.00 | % | 27.00 | % | 27.00 | % | ||||||
| (c) | Reconciliation of effective tax rate: |
The following table reconciles the income tax rate to the effective rate applied to determine the Bank’s income tax expense as of December 31, 2019, 2020 and 2021:
| 2019 | 2020 | 2021 | ||||||||||||||||||||||
| Tax rate % | MCh$ | Tax rate % | MCh$ | Tax rate % | MCh$ | |||||||||||||||||||
| Income tax calculated on net income before tax | 27.00 | 209,901 | 27.00 | 136,310 | 27.00 | 359,717 | ||||||||||||||||||
| Additions or deductions (*) | (5.10 | ) | (39,612 | ) | (7.76 | ) | (39,195 | ) | (6.27 | ) | (83,587 | ) | ||||||||||||
| Effect of changes in tax rate | — | — | — | — | — | — | ||||||||||||||||||
| Other | 0.43 | 3,372 | 1.21 | 6,108 | (0.01 | ) | (161 | ) | ||||||||||||||||
| Effective rate and income tax expense | 22.33 | 173,661 | 20.45 | 103,223 | 20.72 | 275,969 | ||||||||||||||||||
| (*) | The deductions of the tax rate for 2019, 2020 and 2021 mainly relate to permanent differences between tax and financial accounting rules. |
F-85
NOTES TO THE CONSOLIDATED FINANCIAL STATEMENTS, continued
| 18. | Current Taxes and Deferred Taxes, continued: |
| (d) | Effect of deferred taxes on income and equity: |
The effects of deferred taxes on assets, liabilities and income accounts are detailed as follows:
| Balance as of January 1, | Effect | Balance as of December 31, | Effect | Balance as of December 31, | ||||||||||||||||||||||||
2020 | Income | Equity | 2020 | Income | Equity | 2021 | ||||||||||||||||||||||
| MCh$ | MCh$ | MCh$ | MCh$ | MCh$ | MCh$ | MCh$ | ||||||||||||||||||||||
| Debit differences: | ||||||||||||||||||||||||||||
| Allowances for loan losses | 151,481 | 65,880 | — | 217,361 | (47,150 | ) | — | 170,211 | ||||||||||||||||||||
| Personnel provisions | 16,997 | (481 | ) | — | 16,516 | (1,929 | ) | — | 14,587 | |||||||||||||||||||
| Staff vacations | 7,444 | 1,720 | — | 9,164 | 829 | — | 9,993 | |||||||||||||||||||||
| Accrued interest and indexation adjustments from past due loans | 3,674 | 896 | — | 4,570 | 503 | — | 5,073 | |||||||||||||||||||||
| Staff severance indemnities provision | 1,491 | (95 | ) | 25 | 1,421 | (67 | ) | (125 | ) | 1,229 | ||||||||||||||||||
| Provisions of credit card expenses | 8,221 | (262 | ) | — | 7,959 | 1,815 | — | 9,774 | ||||||||||||||||||||
| Provisions of accrued expenses | 10,564 | 3,519 | — | 14,083 | (1,768 | ) | — | 12,315 | ||||||||||||||||||||
| Derivative instruments adjustments | 1,470 | (109 | ) | — | 1,361 | 102 | — | 1,463 | ||||||||||||||||||||
| Adjustment for valuation and impairment of financial assets at fair value through OCI | — | — | — | — | 270 | 2,774 | 3,044 | |||||||||||||||||||||
| Leasing | 41,792 | (12,957 | ) | — | 28,835 | 23,184 | — | 52,019 | ||||||||||||||||||||
| Other adjustments | 36,523 | 965 | — | 37,488 | 11,401 | — | 48,889 | |||||||||||||||||||||
| Total debit differences | 279,657 | 59,076 | 25 | 338,758 | (12,810 | ) | 2,649 | 328,597 | ||||||||||||||||||||
| Credit differences: | ||||||||||||||||||||||||||||
| Depreciation of property and equipment and investment properties | 15,524 | 1,732 | — | 17,256 | (810 | ) | — | 16,446 | ||||||||||||||||||||
| Adjustment for valuation and impairment of financial assets at fair value through OCI | 2,445 | 1,256 | (2,304 | ) | 1,397 | — | (1,397 | ) | — | |||||||||||||||||||
| Transitory assets | 8,329 | (1,796 | ) | — | 6,533 | 1,580 | — | 8,113 | ||||||||||||||||||||
| Derivative instruments adjustments | — | — | — | — | — | — | — | |||||||||||||||||||||
| Accrued interest to effective rate | 1,381 | 1,393 | — | 2,774 | (342 | ) | — | 2,432 | ||||||||||||||||||||
| Advance payment of lump-sum under union contracts | 3,334 | (1,100 | ) | — | 2,234 | 3,434 | — | 5,668 | ||||||||||||||||||||
| Intangible assets amortization | 5,503 | — | — | 5,503 | — | — | 5,503 | |||||||||||||||||||||
| Other adjustments | 11,848 | (1,304 | ) | — | 10,544 | 3,491 | — | 14,035 | ||||||||||||||||||||
| Total credit differences | 48,364 | 181 | (2,304 | ) | 46,241 | 7,353 | (1,397 | ) | 52,197 | |||||||||||||||||||
| Total Assets (Liabilities), net | 231,293 | 58,895 | 2,329 | 292,517 | (20,163 | ) | 4,046 | 276,400 | ||||||||||||||||||||
F-86
NOTES TO THE CONSOLIDATED FINANCIAL STATEMENTS, continued
| 19. | Other Assets: |
As of December 31, 2020 and 2021, other assets are detailed as follows:
| 2020 | 2021 | |||||||
| MCh$ | MCh$ | |||||||
| Assets held for leasing (*) | 85,626 | 94,460 | ||||||
| Assets received or awarded as payment (**): | ||||||||
| Assets awarded at judicial sale | 5,571 | 11,629 | ||||||
| Assets received in lieu of payment | 1,182 | 1,955 | ||||||
| Provisions for assets received in lieu of payment | (506 | ) | (1,019 | ) | ||||
| Subtotal | 6,247 | 12,565 | ||||||
| Other Assets | ||||||||
| Deposit by derivatives margin | 232,732 | 293,378 | ||||||
| Documents intermediated (***) | 84,993 | 79,064 | ||||||
| Recoverable income taxes | 8,691 | 65,302 | ||||||
| Prepaid expenses | 29,654 | 45,731 | ||||||
| Other accounts and notes receivable | 64,029 | 34,373 | ||||||
| Commissions receivable | 11,810 | 9,482 | ||||||
| Non-current assets held for sale (****) | — | 3,961 | ||||||
| Other | 32,704 | 35,799 | ||||||
| Subtotal | 464,613 | 567,090 | ||||||
| Total | 556,486 | 674,115 | ||||||
| (*) | These assets correspond to property and equipment to be given under a financial lease. |
| (**) | Assets received in lieu of payment are valued at fair value, which is calculated considering the lesser between appraised value and value of award, less cost of sell. |
| (***) | Documents intermediated refers to securities lending agreements managed by the Bank’s subsidiary Banchile Corredores de Bolsa S.A. |
| (****) | This item corresponds to the participation in Sociedad Operadora de Tarjeta de Crédito Nexus S.A., which has been reclassified as non-current assets. |
F-87
NOTES TO THE CONSOLIDATED FINANCIAL STATEMENTS, continued
| 20. | Current Accounts and Other Demand Deposits: |
As of December 31, 2020 and 2021, current accounts and other demand deposits are detailed as follows:
| 2020 | 2021 | |||||||
| MCh$ | MCh$ | |||||||
| Current accounts | 12,477,719 | 15,349,224 | ||||||
| Other deposits and accounts | 1,257,606 | 1,641,287 | ||||||
| Other demand deposits | 1,431,904 | 1,552,280 | ||||||
| Total | 15,167,229 | 18,542,791 | ||||||
| 21. | Saving Accounts and Time Deposits: |
As of December 31, 2020 and 2021, saving accounts and time deposits are detailed as follows:
| 2020 | 2021 | |||||||
| MCh$ | MCh$ | |||||||
| Time deposits | 8,442,536 | 8,319,165 | ||||||
| Term savings accounts | 342,550 | 448,257 | ||||||
| Other term balances payable | 114,455 | 372,584 | ||||||
| Total | 8,899,541 | 9,140,006 | ||||||
F-88
NOTES TO THE CONSOLIDATED FINANCIAL STATEMENTS, continued
| 22. | Borrowings from Financial Institutions: |
As of December 31, 2020 and 2021, borrowings from financial institutions are detailed as follows:
| 2020 | 2021 | |||||||
| MCh$ | MCh$ | |||||||
| Domestic banks | ||||||||
| Banco do Brasil | 7,100 | — | ||||||
| Banco Scotiabank | 1,257 | — | ||||||
| Subtotal domestic banks | 8,357 | — | ||||||
| Foreign banks | ||||||||
| Foreign trade financing | ||||||||
| Wells Fargo Bank | 85,734 | 145,070 | ||||||
| Citibank N.A. United State | 114,525 | 70,590 | ||||||
| Bank of America | 20,475 | 43,925 | ||||||
| Sumitomo Mitsui Banking | 11,394 | 42,641 | ||||||
| Bank of New York Mellon | 21,389 | 17,055 | ||||||
| Standard Chartered Bank | 715 | 4,990 | ||||||
| Commerzbank AG | 21,687 | 1,782 | ||||||
| Bank of Tokyo | 40 | 412 | ||||||
| The Bank of Nova Scotia | 121,085 | — | ||||||
| Zürcher Kantonalbank | 39,116 | — | ||||||
| Borrowings and other obligations | ||||||||
| Wells Fargo Bank | 106,965 | 133,692 | ||||||
| Citibank N.A. United Kingdom | 233 | 48,120 | ||||||
| Citibank N.A. United States | — | 4,173 | ||||||
| Commerzbank AG | — | 568 | ||||||
| Standard Chartered Bank | — | 211 | ||||||
| Deutsche Bank Trust Company Americas | 7,333 | — | ||||||
| Others | 105 | 176 | ||||||
| Subtotal foreign banks | 550,796 | 513,405 | ||||||
| Central Bank of Chile (*) | 3,110,600 | 4,348,460 | ||||||
| Total | 3,669,753 | 4,861,865 | ||||||
| (*) | Financing provided by the Central Bank of Chile to deliver liquidity to the economy and support the flow of credit to households and companies, among which are the Loan Increase Conditional Credit Facility program (FCIC by its Spanish initials) and the Liquidity Credit Line (LCL). |
As of December 31, 2021, the Bank has made use of these financing facilities for an amount of Ch$4,348,460 million (Ch$3,110,600 million as of December 31, 2020). To access the FCIC, the Bank has established guarantees in favor of the Central Bank of Chile for a total amount of approximately Ch$3,665,592 million, corresponding to commercial placements of the individual portfolio of high credit quality for Ch$3,024,118 million, and fixed income securities for an approximate amount of Ch$641,474 million. In the case of the LCL, the guarantee provided corresponds to the reserve held by the Bank.
F-89
NOTES TO THE CONSOLIDATED FINANCIAL STATEMENTS, continued
| 23. | Debt Issued: |
As of December 31, 2020 and 2021, Debt issued is detailed as follows:
| 2020 | 2021 | |||||||
| MCh$ | MCh$ | |||||||
| Mortgage bonds | 6,786 | 4,116 | ||||||
| Bonds | 7,700,402 | 8,557,279 | ||||||
| Subordinated bonds | 886,407 | 917,510 | ||||||
| Total | 8,593,595 | 9,478,905 | ||||||
During the year 2020, the Bank issued bonds in the amount of Ch$889,135 million, of which Ch$634,952 million were Short-Term Bonds and Ch$254,183 million were Current Bonds, according to the following details:
Short-term Bonds
Counterparty | Currency | Amount MCh$ | Annual interest rate % | Issued date | Maturity date | |||||||||
| Citibank N.A. | USD | 23,078 | 2.00 | 07/01/2020 | 07/07/2020 | |||||||||
| Citibank N.A. | USD | 38,371 | 1.95 | 09/01/2020 | 09/04/2020 | |||||||||
| Citibank N.A. | USD | 34,886 | 1.91 | 13/01/2020 | 13/04/2020 | |||||||||
| Citibank N.A. | USD | 11,629 | 1.87 | 14/01/2020 | 14/04/2020 | |||||||||
| Citibank N.A. | USD | 31,667 | 1.91 | 29/01/2020 | 31/07/2020 | |||||||||
| Citibank N.A. | USD | 7,917 | 1.91 | 29/01/2020 | 31/07/2020 | |||||||||
| Citibank N.A. | USD | 27,709 | 1.86 | 29/01/2020 | 29/05/2020 | |||||||||
| Citibank N.A. | USD | 10,350 | 1.85 | 30/01/2020 | 01/06/2020 | |||||||||
| Citibank N.A. | USD | 19,720 | 1.85 | 03/02/2020 | 03/06/2020 | |||||||||
| Citibank N.A. | USD | 31,391 | 1.55 | 08/04/2020 | 05/06/2020 | |||||||||
| Citibank N.A. | USD | 21,262 | 1.30 | 13/04/2020 | 12/05/2020 | |||||||||
| Citibank N.A. | USD | 12,758 | 1.30 | 13/04/2020 | 13/05/2020 | |||||||||
| Citibank N.A. | USD | 34,020 | 1.30 | 13/04/2020 | 13/05/2020 | |||||||||
| Citibank N.A. | USD | 25,593 | 1.55 | 16/04/2020 | 16/06/2020 | |||||||||
| Citibank N.A. | USD | 25,593 | 1.55 | 16/04/2020 | 18/06/2020 | |||||||||
| Citibank N.A. | USD | 34,158 | 1.61 | 17/04/2020 | 21/08/2020 | |||||||||
| Wells Fargo Bank | USD | 42,697 | 1.60 | 17/04/2020 | 21/08/2020 | |||||||||
| Wells Fargo Bank | USD | 42,858 | 1.50 | 22/04/2020 | 14/08/2020 | |||||||||
| Wells Fargo Bank | USD | 42,943 | 1.45 | 24/04/2020 | 29/01/2021 | |||||||||
| Wells Fargo Bank | USD | 4,175 | 1.30 | 29/04/2020 | 29/10/2020 | |||||||||
| Citibank N.A. | USD | 32,834 | 0.45 | 18/05/2020 | 20/07/2020 | |||||||||
| Citibank N.A. | USD | 5,089 | 0.45 | 18/05/2020 | 20/07/2020 | |||||||||
| Wells Fargo Bank | USD | 74,254 | 0.45 | 07/12/2020 | 06/12/2021 | |||||||||
| Total as of December 31, 2020 | 634,952 | |||||||||||||
Current Bonds Long-Term
Series | Currency | Amount MCh$ | Terms Years | Annual issue rate % | Issue date | Maturity date | ||||||||||||
| BCHIEM0817 | UF | 93,096 | 7 | 0.80 | 06/01/2020 | 06/01/2027 | ||||||||||||
| BCHIEL0717 | UF | 123,957 | 8 | 0.72 | 04/02/2020 | 04/02/2028 | ||||||||||||
| Subtotal UF | 217,053 | |||||||||||||||||
| BONO AUD | AUD | 37,130 | 15 | 2.65 | 02/03/2020 | 02/03/2035 | ||||||||||||
| Subtotal Others currency | 37,130 | |||||||||||||||||
| Total as of December 31, 2020 | 254,183 | |||||||||||||||||
Subordinated bonds
During the year ended December 31, 2020, the Bank did not issue any subordinated bonds.
F-90
NOTES TO THE CONSOLIDATED FINANCIAL STATEMENTS, continued
| 23. | Debt Issued, continued: |
During the year 2021, the Bank issued bonds in the amount of Ch$1,661,016 million, of which Ch$698,435 million were Short-Term Bonds and Ch$962,581 million were Current Bonds, according to the following details:
Short-term Bonds
Counterparty | Currency | Amount MCh$ | Annual interest rate % | Issued date | Maturity date | |||||||||
| Wells Fargo Bank | USD | 72,240 | 0.23 | 20/01/2021 | 20/04/2021 | |||||||||
| Wells Fargo Bank | USD | 36,736 | 0.38 | 09/02/2021 | 04/02/2022 | |||||||||
| Citibank N.A. | USD | 36,736 | 0.28 | 09/02/2021 | 02/08/2021 | |||||||||
| Wells Fargo Bank | USD | 35,700 | 0.26 | 25/02/2021 | 24/08/2021 | |||||||||
| Citibank N.A. | USD | 71,400 | 0.23 | 25/02/2021 | 01/06/2021 | |||||||||
| Wells Fargo Bank | USD | 35,700 | 0.26 | 25/02/2021 | 26/08/2021 | |||||||||
| Citibank N.A. | USD | 36,295 | 0.34 | 04/03/2021 | 03/09/2021 | |||||||||
| Citibank N.A. | USD | 72,589 | 0.34 | 04/03/2021 | 07/09/2021 | |||||||||
| Wells Fargo Bank | USD | 18,147 | 0.25 | 04/03/2021 | 01/06/2021 | |||||||||
| Wells Fargo Bank | USD | 78,814 | 0.25 | 08/09/2021 | 01/06/2022 | |||||||||
| Citibank N.A. | USD | 78,873 | 0.23 | 10/09/2021 | 10/03/2022 | |||||||||
| Wells Fargo Bank | USD | 39,436 | 0.25 | 10/09/2021 | 08/06/2022 | |||||||||
| Citibank N.A. | USD | 78,413 | 0.23 | 13/09/2021 | 17/03/2022 | |||||||||
| Wells Fargo Bank | USD | 4,283 | 0.28 | 15/09/2021 | 14/09/2022 | |||||||||
| Citibank N.A. | USD | 3,073 | 0.28 | 22/09/2021 | 16/09/2022 | |||||||||
| Total as of December 31, 2021 | 698,435 | |||||||||||||
Current Bonds Long-Term
Series | Currency | Amount MCh$ | Terms Years | Annual issue rate % | Issue date | Maturity date | ||||||||||||
| BCHIER1117 | UF | 109,889 | 6 | 3.68 | 22/10/2021 | 22/10/2027 | ||||||||||||
| BCHICD0815 | UF | 58,658 | 9 | 3.59 | 25/10/2021 | 25/10/2030 | ||||||||||||
| BCHIEU0917 | UF | 109,363 | 7 | 3.70 | 25/10/2021 | 25/10/2028 | ||||||||||||
| Subtotal UF | 277,910 | |||||||||||||||||
| BONO JPY | JPY | 36,097 | 10 | 0.70 | 17/08/2021 | 17/08/2031 | ||||||||||||
| BONO AUD | AUD | 31,203 | 10 | Rate BBSW+1.38 pb | 12/08/2021 | 12/08/2031 | ||||||||||||
| BONO CHF | CHF | 115,483 | 5 | 0.32 | 14/10/2021 | 14/10/2026 | ||||||||||||
| BONO USD | USD | 82,543 | 5 | 2.22 | 17/11/2021 | 17/11/2026 | ||||||||||||
| BONO USD | USD | 419,345 | 10 | 2.99 | 07/12/2021 | 07/12/2031 | ||||||||||||
| Subtotal Others currency | 684,671 | |||||||||||||||||
| Total as of December 31, 2021 | 962,581 | |||||||||||||||||
Subordinated bonds
During the year ended December 31, 2021, the Bank did not issue any subordinated bonds.
As of December 31, 2020 and 2021, the Bank was not in default in the payment of principal or interest on its debt instruments. Likewise, there have been no breaches of covenants and other commitments associated with the debt instruments issued.
F-91
NOTES TO THE CONSOLIDATED FINANCIAL STATEMENTS, continued
| 24. | Other Financial Obligations: |
As of December 31, 2020 and 2021, other financial institutions are detailed as follows:
| 2020 | 2021 | |||||||
| MCh$ | MCh$ | |||||||
| Other Chilean obligations | 191,258 | 274,395 | ||||||
| Public sector obligations | 455 | 223 | ||||||
| Total | 191,713 | 274,618 | ||||||
| 25. | Provisions: |
| (a) | As of December 31, 2020 and 2021, provisions are detailed as follows: |
| 2020 | 2021 | |||||||
| MCh$ | MCh$ | |||||||
| Provision for minimum dividends | 138,932 | 237,877 | ||||||
| Provisions for contingent loan risks | 98,181 | 93,049 | ||||||
| Provisions for other contingencies | 507 | 958 | ||||||
| Total | 237,620 | 331,884 | ||||||
| (b) | The following table details the changes in provisions during 2020 and 2021: |
Minimum dividends | Contingent loan risks |
Other |
Total | |||||||||||||
| MCh$ | MCh$ | MCh$ | MCh$ | |||||||||||||
| Balances as of January 1, 2020 | 177,902 | 24,971 | 501 | 203,374 | ||||||||||||
| Provisions established | 138,932 | 73,210 | 6 | 212,148 | ||||||||||||
| Provisions used | (177,902 | ) | — | — | (177,902 | ) | ||||||||||
| Provisions released | — | — | — | — | ||||||||||||
| Balances as of December 31, 2020 | 138,932 | 98,181 | 507 | 237,620 | ||||||||||||
| Balances as of January 1, 2021 | 138,932 | 98,181 | 507 | 237,620 | ||||||||||||
| Provisions established | 237,877 | — | 537 | 238,414 | ||||||||||||
| Provisions used | (138,932 | ) | (5,132 | ) | (86 | ) | (144,150 | ) | ||||||||
| Provisions released | — | — | — | — | ||||||||||||
| Balances as of December 31, 2021 | 237,877 | 93,049 | 958 | 331,884 | ||||||||||||
| (c) | Impairment losses on contingent loan risks: |
Provisions for contingent loan risks are detailed as follows:
| Outstanding exposure | ECL | |||||||||||||||
2020 | 2021 | 2020 | 2021 | |||||||||||||
| MCh$ | MCh$ | MCh$ | MCh$ | |||||||||||||
| Warranty by endorsement and sureties | 224,079 | 439,669 | 6,068 | 3,754 | ||||||||||||
| Confirmed foreign letters of credit | 58,299 | 91,270 | 10 | 3 | ||||||||||||
| Issued foreign letters of credit | 343,663 | 358,755 | 235 | 200 | ||||||||||||
| Performance guarantees | 2,214,370 | 2,366,953 | 13,124 | 7,029 | ||||||||||||
| Undrawn credit lines | 7,650,382 | 8,651,193 | 78,744 | 82,033 | ||||||||||||
| Other commitments | 107,707 | 78,951 | — | 30 | ||||||||||||
| Total | 10,598,500 | 11,986,791 | 98,181 | 93,049 | ||||||||||||
F-92
NOTES TO THE CONSOLIDATED FINANCIAL STATEMENTS, continued
| 25. | Provisions, continued: |
| (c) | Impairment losses on contingent loan risks, continued: |
An analysis of changes in the gross carrying amount and the corresponding allowance for impairment losses in relation to each contingent loan risk is as follow:
| a. | Warranty by endorsement and sureties: |
The table below shows the credit quality and the maximum exposure to credit risk based on the Bank’s internal credit rating system and year-end stage classification as of December 31, 2020 and 2021.
| As of December 31, 2020 | As of December 31, 2021 | |||||||||||||||||||||||||||||||||||||||||||||||||||||||
| Stage 1 | Stage 2 | Stage 3 | Stage 1 | Stage 2 | Stage 3 | |||||||||||||||||||||||||||||||||||||||||||||||||||
| Individual | Group | Individual | Group | Individual | Group | Total | Individual | Group | Individual | Group | Individual | Group | Total | |||||||||||||||||||||||||||||||||||||||||||
| MCh$ | MCh$ | MCh$ | MCh$ | MCh$ | MCh$ | MCh$ | MCh$ | MCh$ | MCh$ | MCh$ | MCh$ | MCh$ | MCh$ | |||||||||||||||||||||||||||||||||||||||||||
| Normal | 186,051 | 131 | 31,911 | — | — | — | 218,093 | 403,479 | 567 | 28,453 | — | — | — | 432,499 | ||||||||||||||||||||||||||||||||||||||||||
| Substandard | — | — | 356 | — | — | — | 356 | — | — | 7,170 | — | — | — | 7,170 | ||||||||||||||||||||||||||||||||||||||||||
| Non-complying | — | — | — | — | 5,630 | — | 5,630 | — | — | — | — | — | — | — | ||||||||||||||||||||||||||||||||||||||||||
| Total | 186,051 | 131 | 32,267 | — | 5,630 | — | 224,079 | 403,479 | 567 | 35,623 | — | — | — | 439,669 | ||||||||||||||||||||||||||||||||||||||||||
F-93
NOTES TO THE CONSOLIDATED FINANCIAL STATEMENTS, continued
| 25. | Provisions, continued: |
| (c) | Impairment losses on contingent loan risks, continued: |
An analysis of changes in the gross carrying amount and the corresponding allowance for impairment losses in relation to each contingent loan risk is as follow:
| a. | Warranty by endorsement and sureties: continued: |
An analysis of changes in the outstanding exposures and corresponding allowance for ECL during the 2020 and 2021 periods are as follows:
| Stage 1 | Stage 2 | Stage 3 | ||||||||||||||||||||||||||||||||||||||||||||||||||||||
| Individual | Group | Individual | Group | Individual | Group | Total | ||||||||||||||||||||||||||||||||||||||||||||||||||
| Gross carrying amount | ECL | Gross carrying amount | ECL | Gross carrying amount | ECL | Gross carrying amount | �� | ECL | Gross carrying amount | ECL | Gross carrying amount | ECL | Gross carrying amount | ECL | ||||||||||||||||||||||||||||||||||||||||||
| MCh$ | MCh$ | MCh$ | MCh$ | MCh$ | MCh$ | MCh$ | MCh$ | MCh$ | MCh$ | MCh$ | MCh$ | MCh$ | MCh$ | |||||||||||||||||||||||||||||||||||||||||||
| Outstanding exposure as of January 1, 2020 | 249,306 | 41 | 395 | — | 31,137 | 22 | — | — | — | — | — | — | 280,838 | 63 | ||||||||||||||||||||||||||||||||||||||||||
| Net change on exposures | (31,759 | ) | (19 | ) | (231 | ) | — | (19,038 | ) | 2,838 | (62 | ) | — | — | — | — | — | (51,090 | ) | 2,819 | ||||||||||||||||||||||||||||||||||||
| Transfer to Stage 1 | 29,099 | 1 | — | — | (29,099 | ) | (1 | ) | — | — | — | — | — | — | — | — | ||||||||||||||||||||||||||||||||||||||||
| Transfer to Stage 2 | (55,270 | ) | (18 | ) | (65 | ) | — | 55,270 | 18 | 65 | — | — | — | — | — | — | — | |||||||||||||||||||||||||||||||||||||||
| Transfer to Stage 3 | — | — | — | — | (6,069 | ) | (3,034 | ) | — | — | 6,069 | 3,034 | — | — | — | — | ||||||||||||||||||||||||||||||||||||||||
| Impact on year-end ECL of exposures transferred between stages during the year** | — | — | — | — | — | 159 | — | — | — | 2,815 | — | — | — | 2,974 | ||||||||||||||||||||||||||||||||||||||||||
| Refinements to models used for calculation | — | 167 | — | — | — | 226 | — | — | — | — | — | — | — | 393 | ||||||||||||||||||||||||||||||||||||||||||
| Foreign exchange adjustments | (5,325 | ) | 2 | 32 | — | 66 | 36 | (3 | ) | — | (439 | ) | (219 | ) | — | — | (5,669 | ) | (181 | ) | ||||||||||||||||||||||||||||||||||||
| Total | 186,051 | 174 | 131 | — | 32,267 | 264 | — | — | 5,630 | 5,630 | — | — | 224,079 | 6,068 | ||||||||||||||||||||||||||||||||||||||||||
| Outstanding exposure as of January 1, 2021 | 186,051 | 174 | 131 | — | 32,267 | 264 | — | — | 5,630 | 5,630 | — | — | 224,079 | 6,068 | ||||||||||||||||||||||||||||||||||||||||||
| Net change on exposures | 168,112 | 26 | 369 | 1 | (6,416 | ) | (153 | ) | — | — | — | — | — | — | 162,065 | (126 | ) | |||||||||||||||||||||||||||||||||||||||
| Transfer to Stage 1 | 3,870 | 8 | 320 | — | (3,870 | ) | (8 | ) | (320 | ) | — | — | — | — | — | — | — | |||||||||||||||||||||||||||||||||||||||
| Transfer to Stage 2 | (2,300 | ) | (2 | ) | (313 | ) | — | 8,859 | 6,561 | 313 | — | (6,559 | ) | (6,559 | ) | — | — | — | — | |||||||||||||||||||||||||||||||||||||
| Transfer to Stage 3 | — | — | — | — | — | — | — | — | — | — | — | — | — | — | ||||||||||||||||||||||||||||||||||||||||||
| Impact on year-end ECL of exposures transferred between stages during the year** | — | (2 | ) | — | — | — | (3,367 | ) | — | — | — | — | — | — | — | (3,369 | ) | |||||||||||||||||||||||||||||||||||||||
| Refinements to models used for calculation | — | — | — | 1 | — | — | — | — | — | — | — | — | — | 1 | ||||||||||||||||||||||||||||||||||||||||||
| Foreign exchange adjustments | 47,746 | 35 | 60 | — | 4,783 | 216 | 7 | — | 929 | 929 | — | — | 53,525 | 1,180 | ||||||||||||||||||||||||||||||||||||||||||
| Total | 403,479 | 239 | 567 | 2 | 35,623 | 3,513 | — | — | — | — | — | — | 439,669 | 3,754 | ||||||||||||||||||||||||||||||||||||||||||
F-94
NOTES TO THE CONSOLIDATED FINANCIAL STATEMENTS, continued
| 25. | Provisions, continued: |
| (c) | Impairment losses on contingent loan risks, continued: |
| b. | Confirmed foreign letters of credit: |
The table below shows the credit quality and the maximum exposure to credit risk based on the Bank’s internal credit rating system and year-end stage classification as of December 31, 2020 and 2021.
| As of December 31, 2020 | As of December 31, 2021 | |||||||||||||||||||||||||||||||||||||||||||||||||||||||
| Stage 1 | Stage 2 | Stage 3 | Stage 1 | Stage 2 | Stage 3 | |||||||||||||||||||||||||||||||||||||||||||||||||||
| Individual | Group | Individual | Group | Individual | Group | Total | Individual | Group | Individual | Group | Individual | Group | Total | |||||||||||||||||||||||||||||||||||||||||||
| MCh$ | MCh$ | MCh$ | MCh$ | MCh$ | MCh$ | MCh$ | MCh$ | MCh$ | MCh$ | MCh$ | MCh$ | MCh$ | MCh$ | |||||||||||||||||||||||||||||||||||||||||||
| Normal | 58,063 | 236 | — | — | — | — | 58,299 | 91,270 | — | — | — | — | — | 91,270 | ||||||||||||||||||||||||||||||||||||||||||
| Substandard | — | — | — | — | — | — | — | — | — | — | — | — | — | — | ||||||||||||||||||||||||||||||||||||||||||
| Non-complying | — | — | — | — | — | — | — | — | — | — | — | — | — | — | ||||||||||||||||||||||||||||||||||||||||||
| Total | 58,063 | 236 | — | — | — | — | 58,299 | 91,270 | — | — | — | — | — | 91,270 | ||||||||||||||||||||||||||||||||||||||||||
F-95
NOTES TO THE CONSOLIDATED FINANCIAL STATEMENTS, continued
| 25. | Provisions, continued: |
| (c) | Impairment losses on contingent loan risks, continued: |
| b. | Confirmed foreign letters of credit: continued: |
An analysis of changes in the outstanding exposures and corresponding allowance for ECL during the 2020 and 2021 periods are as follows:
| Stage 1 | Stage 2 | Stage 3 | ||||||||||||||||||||||||||||||||||||||||||||||||||||||
| Individual | Group | Individual | Group | Individual | Group | Total | ||||||||||||||||||||||||||||||||||||||||||||||||||
Gross carrying amount | ECL | Gross carrying amount | ECL | Gross carrying amount | ECL | Gross carrying amount | ECL | Gross carrying amount | ECL | Gross carrying amount | ECL | Gross carrying amount | ECL | |||||||||||||||||||||||||||||||||||||||||||
| MCh$ | MCh$ | MCh$ | MCh$ | MCh$ | MCh$ | MCh$ | MCh$ | MCh$ | MCh$ | MCh$ | MCh$ | MCh$ | MCh$ | |||||||||||||||||||||||||||||||||||||||||||
| Outstanding exposure as of January 1, 2020 | 94,673 | 4 | — | — | — | — | — | — | — | — | — | — | 94,673 | 4 | ||||||||||||||||||||||||||||||||||||||||||
| Net change on exposures | (34,528 | ) | — | 236 | — | — | — | — | — | — | — | — | — | (34,292 | ) | — | ||||||||||||||||||||||||||||||||||||||||
| Transfer to Stage 1 | — | — | — | — | — | — | — | — | — | — | — | — | — | — | ||||||||||||||||||||||||||||||||||||||||||
| Transfer to Stage 2 | — | — | — | — | — | — | — | — | — | — | — | — | — | — | ||||||||||||||||||||||||||||||||||||||||||
| Transfer to Stage 3 | — | — | — | — | — | — | — | — | — | — | — | — | — | — | ||||||||||||||||||||||||||||||||||||||||||
| Impact on year-end ECL of exposures transferred between stages during the year** | — | — | — | — | — | — | — | — | — | — | — | — | — | — | ||||||||||||||||||||||||||||||||||||||||||
| Refinements to models used for calculation | — | 7 | — | — | — | — | — | — | — | — | — | — | — | 7 | ||||||||||||||||||||||||||||||||||||||||||
| Foreign exchange adjustments | (2,082 | ) | (1 | ) | — | — | — | — | — | — | — | — | — | — | (2,082 | ) | (1 | ) | ||||||||||||||||||||||||||||||||||||||
| Total | 58,063 | 10 | 236 | — | — | — | — | — | — | — | — | — | 58,299 | 10 | ||||||||||||||||||||||||||||||||||||||||||
| Outstanding exposure as of January 1, 2021 | 58,063 | 10 | 236 | — | — | — | — | — | — | — | — | — | 58,299 | 10 | ||||||||||||||||||||||||||||||||||||||||||
| Net change on exposures | 18,244 | (8 | ) | (239 | ) | — | — | — | — | — | — | — | — | — | 18,005 | (8 | ) | |||||||||||||||||||||||||||||||||||||||
| Transfer to Stage 1 | — | — | — | — | — | — | — | — | — | — | — | — | — | — | ||||||||||||||||||||||||||||||||||||||||||
| Transfer to Stage 2 | — | — | — | — | — | — | — | — | — | — | — | — | — | — | ||||||||||||||||||||||||||||||||||||||||||
| Transfer to Stage 3 | — | — | — | — | — | — | — | — | — | — | — | — | — | — | ||||||||||||||||||||||||||||||||||||||||||
| Impact on year-end ECL of exposures transferred between stages during the year** | — | — | — | — | — | — | — | — | — | — | — | — | — | — | ||||||||||||||||||||||||||||||||||||||||||
| Refinements to models used for calculation | — | — | — | — | — | — | — | — | — | — | — | — | — | — | ||||||||||||||||||||||||||||||||||||||||||
| Foreign exchange adjustments | 14,963 | 1 | 3 | — | — | — | — | — | — | — | — | — | 14,966 | 1 | ||||||||||||||||||||||||||||||||||||||||||
| Total | 91,270 | 3 | — | — | — | — | — | — | — | — | — | — | 91,270 | 3 | ||||||||||||||||||||||||||||||||||||||||||
F-96
NOTES TO THE CONSOLIDATED FINANCIAL STATEMENTS, continued
| 25. | Provisions, continued: |
| (c) | Impairment losses on contingent loan risks, continued: |
| c. | Issued foreign letters of credit: |
The table below shows the credit quality and the maximum exposure to credit risk based on the Bank’s internal credit rating system and year-end stage classification as of December 31, 2020 and 2021.
| As of December 31, 2020 | As of December 31, 2021 | |||||||||||||||||||||||||||||||||||||||||||||||||||||||
| Stage 1 | Stage 2 | Stage 3 | Stage 1 | Stage 2 | Stage 3 | |||||||||||||||||||||||||||||||||||||||||||||||||||
| Individual | Group | Individual | Group | Individual | Group | Total | Individual | Group | Individual | Group | Individual | Group | Total | |||||||||||||||||||||||||||||||||||||||||||
| MCh$ | MCh$ | MCh$ | MCh$ | MCh$ | MCh$ | MCh$ | MCh$ | MCh$ | MCh$ | MCh$ | MCh$ | MCh$ | MCh$ | |||||||||||||||||||||||||||||||||||||||||||
| Normal | 298,841 | 1,881 | 42,927 | — | — | — | 343,649 | 277,639 | 1,578 | 79,392 | 26 | — | — | 358,635 | ||||||||||||||||||||||||||||||||||||||||||
| Substandard | — | — | 14 | — | — | — | 14 | — | — | 120 | — | — | — | 120 | ||||||||||||||||||||||||||||||||||||||||||
| Non-complying | — | — | — | — | — | — | — | — | — | — | — | — | — | — | ||||||||||||||||||||||||||||||||||||||||||
| Total | 298,841 | 1,881 | 42,941 | — | — | — | 343,663 | 277,639 | 1,578 | 79,512 | 26 | — | — | 358,755 | ||||||||||||||||||||||||||||||||||||||||||
F-97
NOTES TO THE CONSOLIDATED FINANCIAL STATEMENTS, continued
| 25. | Provisions, continued: |
| (c) | Impairment losses on contingent loan risks, continued: |
| c. | Issued foreign letters of credit: continued: |
An analysis of changes in the outstanding exposures and corresponding allowance for ECL during the 2020 and 2021 periods are as follows:
| Stage 1 | Stage 2 | Stage 3 | ||||||||||||||||||||||||||||||||||||||||||||||||||||||
| Individual | Group | Individual | Group | Individual | Group | Total | ||||||||||||||||||||||||||||||||||||||||||||||||||
Gross carrying amount | ECL | Gross carrying amount | ECL | Gross carrying amount | ECL | Gross carrying amount | ECL | Gross carrying amount | ECL | Gross carrying amount | ECL | Gross carrying amount | ECL | |||||||||||||||||||||||||||||||||||||||||||
| MCh$ | MCh$ | MCh$ | MCh$ | MCh$ | MCh$ | MCh$ | MCh$ | MCh$ | MCh$ | MCh$ | MCh$ | MCh$ | MCh$ | |||||||||||||||||||||||||||||||||||||||||||
| Outstanding exposure as of January 1, 2020 | 149,753 | 20 | 1,308 | 1 | 165,538 | 11 | 317 | 19 | — | — | — | — | 316,916 | 51 | ||||||||||||||||||||||||||||||||||||||||||
| Net change on exposures | 53,462 | 7 | 830 | 3 | (20,836 | ) | (13 | ) | (530 | ) | (19 | ) | — | (1 | ) | — | — | 32,926 | (23 | ) | ||||||||||||||||||||||||||||||||||||
| Transfer to Stage 1 | 136,838 | 2 | 866 | — | (136,838 | ) | (2 | ) | (866 | ) | — | — | — | — | — | — | — | |||||||||||||||||||||||||||||||||||||||
| Transfer to Stage 2 | (37,319 | ) | (10 | ) | (1,048 | ) | (4 | ) | 37,319 | 10 | 1,048 | 4 | — | — | — | — | — | — | ||||||||||||||||||||||||||||||||||||||
| Transfer to Stage 3 | — | — | — | — | — | — | — | — | — | — | — | — | — | — | ||||||||||||||||||||||||||||||||||||||||||
| Impact on year-end ECL of exposures transferred between stages during the year** | — | 1 | — | — | — | 10 | — | (4 | ) | — | — | — | — | — | 7 | |||||||||||||||||||||||||||||||||||||||||
| Refinements to models used for calculation | — | 111 | — | — | — | 92 | — | — | — | 1 | — | — | — | 204 | ||||||||||||||||||||||||||||||||||||||||||
| Foreign exchange adjustments | (3,893 | ) | (2 | ) | (75 | ) | — | (2,242 | ) | (2 | ) | 31 | — | — | — | — | — | (6,179 | ) | (4 | ) | |||||||||||||||||||||||||||||||||||
| Total | 298,841 | 129 | 1,881 | — | 42,941 | 106 | — | — | — | — | — | — | 343,663 | 235 | ||||||||||||||||||||||||||||||||||||||||||
| Outstanding exposure as of January 1, 2021 | 298,841 | 129 | 1,881 | — | 42,941 | 106 | — | — | — | — | — | — | 343,663 | 235 | ||||||||||||||||||||||||||||||||||||||||||
| Net change on exposures | (59,551 | ) | (32 | ) | (503 | ) | 13 | 45,249 | (36 | ) | (1 | ) | — | — | — | — | — | (14,806 | ) | (55 | ) | |||||||||||||||||||||||||||||||||||
| Transfer to Stage 1 | 19,728 | 14 | — | — | (19,728 | ) | (14 | ) | — | — | — | — | — | — | — | — | ||||||||||||||||||||||||||||||||||||||||
| Transfer to Stage 2 | (788 | ) | (1 | ) | (25 | ) | — | 788 | 1 | 25 | — | — | — | — | — | — | — | |||||||||||||||||||||||||||||||||||||||
| Transfer to Stage 3 | — | — | — | — | — | — | — | — | — | — | — | — | — | — | ||||||||||||||||||||||||||||||||||||||||||
| Impact on year-end ECL of exposures transferred between stages during the year** | — | (1 | ) | — | — | — | — | — | — | — | — | — | — | — | (1 | ) | ||||||||||||||||||||||||||||||||||||||||
| Refinements to models used for calculation | — | — | — | (11 | ) | — | — | — | — | — | — | — | — | — | (11 | ) | ||||||||||||||||||||||||||||||||||||||||
| Foreign exchange adjustments | 19,409 | 12 | 225 | 2 | 10,262 | 18 | 2 | — | — | — | — | — | 29,898 | 32 | ||||||||||||||||||||||||||||||||||||||||||
| Total | 277,639 | 121 | 1,578 | 4 | 79,512 | 75 | 26 | — | — | — | — | — | 358,755 | 200 | ||||||||||||||||||||||||||||||||||||||||||
F-98
NOTES TO THE CONSOLIDATED FINANCIAL STATEMENTS, continued
| 25. | Provisions, continued: |
| (c) | Impairment losses on contingent loan risks, continued: |
| d. | Performance guarantees: |
The table below shows the credit quality and the maximum exposure to credit risk based on the Bank’s internal credit rating system and year-end stage classification as of December 31, 2020 and 2021.
| As of December 31, 2020 | As of December 31, 2021 | |||||||||||||||||||||||||||||||||||||||||||||||||||||||
| Stage 1 | Stage 2 | Stage 3 | Stage 1 | Stage 2 | Stage 3 | |||||||||||||||||||||||||||||||||||||||||||||||||||
| Individual | Group | Individual | Group | Individual | Group | Total | Individual | Group | Individual | Group | Individual | Group | Total | |||||||||||||||||||||||||||||||||||||||||||
| MCh$ | MCh$ | MCh$ | MCh$ | MCh$ | MCh$ | MCh$ | MCh$ | MCh$ | MCh$ | MCh$ | MCh$ | MCh$ | MCh$ | |||||||||||||||||||||||||||||||||||||||||||
| Normal | 1,573,058 | 46,523 | 568,005 | 615 | — | — | 2,188,201 | 1,718,639 | 45,140 | 572,081 | 307 | — | — | 2,336,167 | ||||||||||||||||||||||||||||||||||||||||||
| Substandard | — | — | 21,833 | — | — | — | 21,833 | — | — | 28,697 | — | — | — | 28,697 | ||||||||||||||||||||||||||||||||||||||||||
| Non-complying | — | — | — | — | 3,851 | 485 | 4,336 | — | — | — | — | 1,728 | 361 | 2,089 | ||||||||||||||||||||||||||||||||||||||||||
| Total | 1,573,058 | 46,523 | 589,838 | 615 | 3,851 | 485 | 2,214,370 | 1,718,639 | 45,140 | 600,778 | 307 | 1,728 | 361 | 2,366,953 | ||||||||||||||||||||||||||||||||||||||||||
F-99
NOTES TO THE CONSOLIDATED FINANCIAL STATEMENTS, continued
| 25. | Provisions, continued: |
| (c) | Impairment losses on contingent loan risks, continued: |
| d. | Performance guarantees: continued: |
An analysis of changes in the outstanding exposures and corresponding allowance for ECL during the 2020 and 2021 periods are as follows:
| Stage 1 | Stage 2 | Stage 3 | ||||||||||||||||||||||||||||||||||||||||||||||||||||||
| Individual | Group | Individual | Group | Individual | Group | Total | ||||||||||||||||||||||||||||||||||||||||||||||||||
Gross carrying amount | ECL | Gross carrying amount | ECL | Gross carrying amount | ECL | Gross carrying amount | ECL | Gross carrying amount | ECL | Gross carrying amount | ECL | Gross carrying amount | ECL | |||||||||||||||||||||||||||||||||||||||||||
| MCh$ | MCh$ | MCh$ | MCh$ | MCh$ | MCh$ | MCh$ | MCh$ | MCh$ | MCh$ | MCh$ | MCh$ | MCh$ | MCh$ | |||||||||||||||||||||||||||||||||||||||||||
| Outstanding exposure as of January 1, 2020 | 1,804,374 | 601 | 44,325 | 277 | 420,427 | 1,440 | 10,970 | 754 | 2,194 | 491 | 1,100 | 474 | 2,283,390 | 4,037 | ||||||||||||||||||||||||||||||||||||||||||
| Net change on exposures | (33,951 | ) | 359 | (8,832 | ) | (160 | ) | (6,254 | ) | 6,341 | 1,305 | (674 | ) | (5,241 | ) | (8,647 | ) | (1,226 | ) | (454 | ) | (54,199 | ) | (3,235 | ) | |||||||||||||||||||||||||||||||
| Transfer to Stage 1 | 128,944 | 48 | 29,217 | 78 | (128,944 | ) | (48 | ) | (29,180 | ) | (68 | ) | — | — | (37 | ) | (10 | ) | — | — | ||||||||||||||||||||||||||||||||||||
| Transfer to Stage 2 | (314,572 | ) | (222 | ) | (17,839 | ) | (169 | ) | 314,683 | 237 | 18,347 | 179 | (111 | ) | (15 | ) | (508 | ) | (10 | ) | — | — | ||||||||||||||||||||||||||||||||||
| Transfer to Stage 3 | (459 | ) | — | (326 | ) | (2 | ) | (6,511 | ) | (4,038 | ) | (826 | ) | (6 | ) | 6,970 | 4,038 | 1,152 | 8 | — | — | |||||||||||||||||||||||||||||||||||
| Impact on year-end ECL of exposures transferred between stages during the year** | — | 2 | — | 235 | — | 362 | — | (172 | ) | — | 6,261 | — | (8 | ) | — | 6,680 | ||||||||||||||||||||||||||||||||||||||||
| Refinements to models used for calculation | — | 2,002 | — | 658 | — | 2,138 | — | (10 | ) | — | 851 | — | — | — | 5,639 | |||||||||||||||||||||||||||||||||||||||||
| Foreign exchange adjustments | (11,278 | ) | — | (22 | ) | — | (3,563 | ) | (10 | ) | (1 | ) | — | 39 | 13 | 4 | — | (14,821 | ) | 3 | ||||||||||||||||||||||||||||||||||||
| Total | 1,573,058 | 2,790 | 46,523 | 917 | 589,838 | 6,422 | 615 | 3 | 3,851 | 2,992 | 485 | — | 2,214,370 | 13,124 | ||||||||||||||||||||||||||||||||||||||||||
| Outstanding exposure as of January 1, 2021 | 1,573,058 | 2,790 | 46,523 | 917 | 589,838 | 6,422 | 615 | 3 | 3,851 | 2,992 | 485 | — | 2,214,370 | 13,124 | ||||||||||||||||||||||||||||||||||||||||||
| Net change on exposures | 72,215 | (1,284 | ) | (716 | ) | 16 | 21,365 | (2,636 | ) | (882 | ) | (47 | ) | (1,870 | ) | (1,491 | ) | (344 | ) | — | 89,768 | (5,442 | ) | |||||||||||||||||||||||||||||||||
| Transfer to Stage 1 | 166,106 | 247 | 3,381 | 84 | (166,106 | ) | (247 | ) | (3,381 | ) | (84 | ) | — | — | — | — | — | — | ||||||||||||||||||||||||||||||||||||||
| Transfer to Stage 2 | (149,250 | ) | (277 | ) | (3,911 | ) | (77 | ) | 150,330 | 1,131 | 3,998 | 77 | (1,080 | ) | (854 | ) | (87 | ) | — | — | — | |||||||||||||||||||||||||||||||||||
| Transfer to Stage 3 | (62 | ) | — | (260 | ) | (5 | ) | (765 | ) | (79 | ) | (47 | ) | (5 | ) | 827 | 79 | 307 | 10 | — | — | |||||||||||||||||||||||||||||||||||
| Impact on year-end ECL of exposures transferred between stages during the year** | — | (58 | ) | — | (27 | ) | — | (362 | ) | — | 67 | — | 374 | — | (11 | ) | — | (17 | ) | |||||||||||||||||||||||||||||||||||||
| Refinements to models used for calculation | — | (2 | ) | — | (716 | ) | — | (4 | ) | — | (8 | ) | — | 11 | — | — | — | (719 | ) | |||||||||||||||||||||||||||||||||||||
| Foreign exchange adjustments | 56,572 | 52 | 123 | 3 | 6,116 | 28 | 4 | — | — | — | — | — | 62,815 | 83 | ||||||||||||||||||||||||||||||||||||||||||
| Total | 1,718,639 | 1,468 | 45,140 | 195 | 600,778 | 4,253 | 307 | 3 | 1,728 | 1,111 | 361 | (1 | ) | 2,366,953 | 7,029 | |||||||||||||||||||||||||||||||||||||||||
F-100
NOTES TO THE CONSOLIDATED FINANCIAL STATEMENTS, continued
| 25. | Provisions, continued: |
| (c) | Impairment losses on contingent loan risks, continued: |
| e. | Undrawn credit lines: |
The table below shows the credit quality and the maximum exposure to credit risk based on the Bank’s internal credit rating system and year-end stage classification as of December 31, 2020 and 2021.
| As of December 31, 2020 | As of December 31, 2021 | |||||||||||||||||||||||||||||||||||||||||||||||||||||||
| Stage 1 | Stage 2 | Stage 3 | Stage 1 | Stage 2 | Stage 3 | |||||||||||||||||||||||||||||||||||||||||||||||||||
| Individual | Group | Individual | Group | Individual | Group | Total | Individual | Group | Individual | Group | Individual | Group | Total | |||||||||||||||||||||||||||||||||||||||||||
| MCh$ | MCh$ | MCh$ | MCh$ | MCh$ | MCh$ | MCh$ | MCh$ | MCh$ | MCh$ | MCh$ | MCh$ | MCh$ | MCh$ | |||||||||||||||||||||||||||||||||||||||||||
| Normal | 1,055,119 | 6,244,331 | 138,432 | 182,812 | 20 | — | 7,620,714 | 1,178,448 | 7,130,566 | 133,391 | 180,023 | 13 | — | 8,622,441 | ||||||||||||||||||||||||||||||||||||||||||
| Substandard | — | — | 3,896 | — | — | — | 3,896 | — | — | 4,421 | — | — | — | 4,421 | ||||||||||||||||||||||||||||||||||||||||||
| Non-complying | — | — | — | — | 837 | 24,935 | 25,772 | — | — | — | — | 719 | 23,612 | 24,331 | ||||||||||||||||||||||||||||||||||||||||||
| Total | 1,055,119 | 6,244,331 | 142,328 | 182,812 | 857 | 24,935 | 7,650,382 | 1,178,448 | 7,130,566 | 137,812 | 180,023 | 732 | 23,612 | 8,651,193 | ||||||||||||||||||||||||||||||||||||||||||
F-101
NOTES TO THE CONSOLIDATED FINANCIAL STATEMENTS, continued
| 25. | Provisions, continued: |
| (c) | Impairment losses on contingent loan risks, continued: |
| e. | Undrawn credit lines: continued: |
An analysis of changes in the outstanding exposures and corresponding allowance for ECL during the 2020 and 2021 periods are as follows:
| Stage 1 | Stage 2 | Stage 3 | ||||||||||||||||||||||||||||||||||||||||||||||||||||||
| Individual | Group | Individual | Group | Individual | Group | Total | ||||||||||||||||||||||||||||||||||||||||||||||||||
Gross carrying amount | ECL | Gross carrying amount | ECL | Gross carrying amount | ECL | Gross carrying amount | ECL | Gross carrying amount | ECL | Gross carrying amount | ECL | Gross carrying amount | ECL | |||||||||||||||||||||||||||||||||||||||||||
| MCh$ | MCh$ | MCh$ | MCh$ | MCh$ | MCh$ | MCh$ | MCh$ | MCh$ | MCh$ | MCh$ | MCh$ | MCh$ | MCh$ | |||||||||||||||||||||||||||||||||||||||||||
| Outstanding exposure as of January 1, 2020 | 1,135,118 | 234 | 6,434,148 | 13,135 | 83,458 | 185 | 207,646 | 2,644 | 359 | 78 | 9,531 | 4,540 | 7,870,260 | 20,816 | ||||||||||||||||||||||||||||||||||||||||||
| Net change on exposures | (28,109 | ) | 181 | 20,484 | (1,726 | ) | 11,628 | 502 | (102,141 | ) | (1,262 | ) | (568 | ) | (174 | ) | (7,903 | ) | (1,004 | ) | (106,609 | ) | (3,483 | ) | ||||||||||||||||||||||||||||||||
| Transfer to Stage 1 | 80,990 | 19 | 516,008 | 7,348 | (80,990 | ) | (19 | ) | (515,854 | ) | (7,301 | ) | — | — | (154 | ) | (47 | ) | — | — | ||||||||||||||||||||||||||||||||||||
| Transfer to Stage 2 | (129,707 | ) | (93 | ) | (597,956 | ) | (5,942 | ) | 129,751 | 101 | 606,469 | 9,664 | (44 | ) | (8 | ) | (8,513 | ) | (3,722 | ) | — | — | ||||||||||||||||||||||||||||||||||
| Transfer to Stage 3 | (183 | ) | — | (18,407 | ) | (317 | ) | (949 | ) | (67 | ) | (14,838 | ) | (766 | ) | 1,132 | 67 | 33,245 | 1,083 | — | — | |||||||||||||||||||||||||||||||||||
| Impact on year-end ECL of exposures transferred between stages during the year** | — | (1 | ) | — | (293 | ) | — | 77 | — | (1,035 | ) | — | 349 | — | 8,479 | — | 7,576 | |||||||||||||||||||||||||||||||||||||||
| Refinements to models used for calculation | — | 899 | — | 53,001 | — | 267 | — | 1,294 | — | 116 | — | (1,429 | ) | — | 54,148 | |||||||||||||||||||||||||||||||||||||||||
| Foreign exchange adjustments | (2,990 | ) | (3 | ) | (109,946 | ) | (128 | ) | (570 | ) | (8 | ) | 1,530 | 30 | (22 | ) | (8 | ) | (1,271 | ) | (196 | ) | (113,269 | ) | (313 | ) | ||||||||||||||||||||||||||||||
| Total | 1,055,119 | 1,236 | 6,244,331 | 65,078 | 142,328 | 1,038 | 182,812 | 3,268 | 857 | 420 | 24,935 | 7,704 | 7,650,382 | 78,744 | ||||||||||||||||||||||||||||||||||||||||||
| Outstanding exposure as of January 1, 2021 | 1,055,119 | 1,236 | 6,244,331 | 65,078 | 142,328 | 1,038 | 182,812 | 3,268 | 857 | 420 | 24,935 | 7,704 | 7,650,382 | 78,744 | ||||||||||||||||||||||||||||||||||||||||||
| Net change on exposures | 110,630 | (647 | ) | 493,150 | 4,207 | (5,814 | ) | (598 | ) | (32,854 | ) | (1,345 | ) | (446 | ) | (219 | ) | (4,328 | ) | (125 | ) | 560,338 | 1,273 | |||||||||||||||||||||||||||||||||
| Transfer to Stage 1 | 21,447 | 28 | 547,431 | 6,216 | (21,447 | ) | (28 | ) | (547,431 | ) | (6,216 | ) | — | — | — | — | — | — | ||||||||||||||||||||||||||||||||||||||
| Transfer to Stage 2 | (20,684 | ) | (48 | ) | (562,964 | ) | (6,833 | ) | 20,850 | 159 | 568,515 | 8,760 | (166 | ) | (111 | ) | (5,551 | ) | (1,927 | ) | — | — | ||||||||||||||||||||||||||||||||||
| Transfer to Stage 3 | (62 | ) | — | (4,738 | ) | (68 | ) | (386 | ) | (28 | ) | (2,046 | ) | (33 | ) | 448 | 28 | 6,784 | 101 | — | — | |||||||||||||||||||||||||||||||||||
| Impact on year-end ECL of exposures transferred between stages during the year** | — | (2 | ) | — | 370 | — | (73 | ) | — | (3,159 | ) | — | 192 | — | 1,306 | — | (1,366 | ) | ||||||||||||||||||||||||||||||||||||||
| Refinements to models used for calculation | — | — | — | (1,574 | ) | — | — | — | (224 | ) | — | 1 | — | 2,032 | — | 235 | ||||||||||||||||||||||||||||||||||||||||
| Foreign exchange adjustments | 11,998 | 8 | 413,356 | 2,594 | 2,281 | 15 | 11,027 | 79 | 39 | 21 | 1,772 | 430 | 440,473 | 3,147 | ||||||||||||||||||||||||||||||||||||||||||
| Total | 1,178,448 | 575 | 7,130,566 | 69,990 | 137,812 | 485 | 180,023 | 1,130 | 732 | 332 | 23,612 | 9,521 | 8,651,193 | 82,033 | ||||||||||||||||||||||||||||||||||||||||||
F-102
NOTES TO THE CONSOLIDATED FINANCIAL STATEMENTS, continued
| 25. | Provisions, continued: |
| (c) | Impairment losses on contingent loan risks, continued: |
| f. | Other commitments: |
The table below shows the credit quality and the maximum exposure to credit risk based on the Bank’s internal credit rating system and year-end stage classification as of December 31, 2020 and 2021.
| As of December 31, 2020 | As of December 31, 2021 | |||||||||||||||||||||||||||||||||||||||||||||||||||||||
| Stage 1 | Stage 2 | Stage 3 | Stage 1 | Stage 2 | Stage 3 | |||||||||||||||||||||||||||||||||||||||||||||||||||
| Individual | Group | Individual | Group | Individual | Group | Total | Individual | Group | Individual | Group | Individual | Group | Total | |||||||||||||||||||||||||||||||||||||||||||
| MCh$ | MCh$ | MCh$ | MCh$ | MCh$ | MCh$ | MCh$ | MCh$ | MCh$ | MCh$ | MCh$ | MCh$ | MCh$ | MCh$ | |||||||||||||||||||||||||||||||||||||||||||
| Normal | 107,707 | — | — | — | — | — | 107,707 | 78,951 | — | — | — | — | — | 78,951 | ||||||||||||||||||||||||||||||||||||||||||
| Substandard | — | — | — | — | — | — | — | — | — | — | — | — | — | — | ||||||||||||||||||||||||||||||||||||||||||
| Non-complying | — | — | — | — | — | — | — | — | — | — | — | — | — | — | ||||||||||||||||||||||||||||||||||||||||||
| Total | 107,707 | — | — | — | — | — | 107,707 | 78,951 | — | — | — | — | — | 78,951 | ||||||||||||||||||||||||||||||||||||||||||
F-103
NOTES TO THE CONSOLIDATED FINANCIAL STATEMENTS, continued
| 25. | Provisions, continued: |
| (c) | Impairment losses on contingent loan risks, continued: |
| f. | Other commitments: continued: |
An analysis of changes in the outstanding exposures and corresponding allowance for ECL during the 2020 and 2021 periods are as follows:
| Stage 1 | Stage 2 | Stage 3 | ||||||||||||||||||||||||||||||||||||||||||||||||||||||
| Individual | Group | Individual | Group | Individual | Group | Total | ||||||||||||||||||||||||||||||||||||||||||||||||||
Gross carrying amount | ECL | Gross carrying amount | ECL | Gross carrying amount | ECL | Gross carrying amount | ECL | Gross carrying amount | ECL | Gross carrying amount | ECL | Gross carrying amount | ECL | |||||||||||||||||||||||||||||||||||||||||||
| MCh$ | MCh$ | MCh$ | MCh$ | MCh$ | MCh$ | MCh$ | MCh$ | MCh$ | MCh$ | MCh$ | MCh$ | MCh$ | MCh$ | |||||||||||||||||||||||||||||||||||||||||||
| Outstanding exposure as of January 1, 2020 | 155,163 | — | — | — | — | — | — | — | — | — | — | — | 155,163 | — | ||||||||||||||||||||||||||||||||||||||||||
| Net change on exposures | (47,456 | ) | — | — | — | — | — | — | — | — | — | — | — | (47,456 | ) | — | ||||||||||||||||||||||||||||||||||||||||
| Transfer to Stage 1 | — | — | — | — | — | — | — | — | — | — | — | — | — | — | ||||||||||||||||||||||||||||||||||||||||||
| Transfer to Stage 2 | — | — | — | — | — | — | — | — | — | — | — | — | — | — | ||||||||||||||||||||||||||||||||||||||||||
| Transfer to Stage 3 | — | — | — | — | — | — | — | — | — | — | — | — | — | — | ||||||||||||||||||||||||||||||||||||||||||
| Impact on year-end ECL of exposures transferred between stages during the year** | — | — | — | — | — | — | — | — | — | — | — | — | — | — | ||||||||||||||||||||||||||||||||||||||||||
| Refinements to models used for calculation | — | — | — | — | — | — | — | — | — | — | — | — | — | — | ||||||||||||||||||||||||||||||||||||||||||
| Foreign exchange adjustments | — | — | — | — | — | — | — | — | — | — | — | — | — | — | ||||||||||||||||||||||||||||||||||||||||||
| Total | 107,707 | — | — | — | — | — | — | — | — | — | — | — | 107,707 | — | ||||||||||||||||||||||||||||||||||||||||||
| Outstanding exposure as of January 1, 2021 | 107,707 | — | — | — | — | — | — | — | — | — | — | — | 107,707 | — | ||||||||||||||||||||||||||||||||||||||||||
| Net change on exposures | (28,756 | ) | 30 | — | — | — | — | — | — | — | — | — | — | (28,756 | ) | 30 | ||||||||||||||||||||||||||||||||||||||||
| Transfer to Stage 1 | — | — | — | — | — | — | — | — | — | — | — | — | — | — | ||||||||||||||||||||||||||||||||||||||||||
| Transfer to Stage 2 | — | — | — | — | — | — | — | — | — | — | — | — | — | — | ||||||||||||||||||||||||||||||||||||||||||
| Transfer to Stage 3 | — | — | — | — | — | — | — | — | — | — | — | — | — | — | ||||||||||||||||||||||||||||||||||||||||||
| Impact on year-end ECL of exposures transferred between stages during the year** | — | — | — | — | — | — | — | — | — | — | — | — | — | — | ||||||||||||||||||||||||||||||||||||||||||
| Refinements to models used for calculation | — | — | — | — | — | — | — | — | — | — | — | — | — | — | ||||||||||||||||||||||||||||||||||||||||||
| Foreign exchange adjustments | — | — | — | — | — | — | — | — | — | — | — | — | — | — | ||||||||||||||||||||||||||||||||||||||||||
| Total | 78,951 | 30 | — | — | — | — | — | — | — | — | — | — | 78,951 | 30 | ||||||||||||||||||||||||||||||||||||||||||
F-104
NOTES TO THE CONSOLIDATED FINANCIAL STATEMENTS, continued
| 26. | Employee Benefits: |
| (a) | Provisions for personnel benefits and payroll: |
| 2020 | 2021 | |||||||
| MCh$ | MCh$ | |||||||
| Short-term personnel benefits (a.2) | 43,941 | 53,069 | ||||||
| Vacation accrual (a.3) | 33,993 | 37,010 | ||||||
| Other Benefits | 25,728 | 10,438 | ||||||
| Employee defined benefit plan (a.1)(*) | 7,581 | 6,446 | ||||||
| Total | 111,243 | 106,963 | ||||||
| (*) | See Note No. 2 (x) (iii). |
| (a.1) | Employee defined benefit plan: |
| 2020 | 2021 | |||||||
| MCh$ | MCh$ | |||||||
| Current service cost | 367 | 226 | ||||||
| Interest cost on benefit obligation | 160 | 364 | ||||||
| Actuarial gains and losses | 91 | (523 | ) | |||||
| Net benefit expense | 618 | 67 | ||||||
The net benefit expense is recognized under “Personnel Expenses” (Note No. 35).
The principal assumptions used in determining pension obligations for the Bank’s plan are shown below:
| December 31, | December 31, | |||||||
| 2020 | 2021 | |||||||
| % | % | |||||||
| Discount rate | 2.31 | 5.70 | ||||||
| Annual salary increase | 4.04 | 3.94 | ||||||
| Payment probability | 99.99 | 99.99 | ||||||
The most recent actuarial valuation of the staff severance indemnities provision was carried out during December 2021.
F-105
NOTES TO THE CONSOLIDATED FINANCIAL STATEMENTS, continued
| 26. | Employee Benefits, continued: |
Changes in the present value of the defined benefit obligation are as follows:
| 2020 | 2021 | |||||||
| MCh$ | MCh$ | |||||||
| Opening defined benefit obligation, January 1, | 7,566 | 7,581 | ||||||
| Increase in provision | 527 | 590 | ||||||
| Benefits paid | (603 | ) | (1,202 | ) | ||||
| Actuarial gains and losses | 91 | (523 | ) | |||||
| Closing defined benefit obligation | 7,581 | 6,446 | ||||||
(a.2) The following table details the changes in provisions for incentive plans during 2020 and 2021:
| 2020 | 2021 | |||||||
| MCh$ | MCh$ | |||||||
| Balances as of January 1, | 51,051 | 43,941 | ||||||
| Provisions established | 34,138 | 49,652 | ||||||
| Provisions used | (41,248 | ) | (40,524 | ) | ||||
| Provisions released | — | — | ||||||
| Balances as of December 31, | 43,941 | 53,069 | ||||||
(a.3) The following table details the changes in provisions for vacation during 2020 and 2021:
| 2020 | 2021 | |||||||
| MCh$ | MCh$ | |||||||
| Balances as of January 1, | 27,609 | 33,993 | ||||||
| Provisions established | 11,512 | 11,294 | ||||||
| Provisions used | (5,128 | ) | (8,277 | ) | ||||
| Provisions released | — | — | ||||||
| Balances as of December 31, | 33,993 | 37,010 | ||||||
| (b) | Provisions for share-based employee benefits: |
As of December 31, 2020 and 2021, the Bank and its subsidiaries did not have stock-based compensation plans.
F-106
NOTES TO THE CONSOLIDATED FINANCIAL STATEMENTS, continued
| 27. | Other Liabilities: |
As of December 31, 2020 and 2021, other liabilities are detailed as follows:
| 2020 | 2021 | |||||||
| MCh$ | MCh$ | |||||||
| Accounts and notes payable | 273,143 | 220,422 | ||||||
| Documents intermediated (**) | 137,546 | 159,592 | ||||||
| Income received in advance (*) | 76,228 | 68,691 | ||||||
| Securities unliquidated | 2,725 | 61,238 | ||||||
| Cobranding | 29,213 | 35,937 | ||||||
| VAT payable | 5,742 | 5,442 | ||||||
| Outstanding transactions | 725 | 4,792 | ||||||
| Insurance payments | 1,802 | 397 | ||||||
| Others | 27,219 | 26,516 | ||||||
| Total | 554,343 | 583,027 | ||||||
| (*) | In relation to the Strategic Alliance Framework Agreement, on June 4, 2019, Banco de Chile received the payment from the insurance companies for an amount of Ch$149,061 million, which was recorded according to IFRS 15. The related income is recognized over time, depending on compliance with the associated performance obligation. |
| (**) | This item mainly includes financing of simultaneous operations performed by subsidiary Banchile Corredores de Bolsa S.A. |
F-107
NOTES TO THE CONSOLIDATED FINANCIAL STATEMENTS, continued
| 28. | Contingencies and Commitments: |
| (a) | Commitments accounted for in off-balance-sheet accounts: |
In order to satisfy its customers’ needs, the Bank entered into several irrevocable commitments and contingent obligations. Although these obligations are not recognized in the Statement of Financial Position, they entail credit risks and, therefore, form part of the Bank’s overall risk.
| 2020 | 2021 | |||||||
| MCh$ | MCh$ | |||||||
| Off-balance-sheet accounts | ||||||||
| Warranty by endorsement and sureties | 224,079 | 439,669 | ||||||
| Confirmed foreign letters of credit | 58,299 | 91,270 | ||||||
| Issued foreign letters of credit | 343,663 | 358,755 | ||||||
| Performance guarantees | 2,214,370 | 2,366,953 | ||||||
| Undrawn credit lines | 7,650,382 | 8,651,193 | ||||||
| Other commitments | 107,707 | 78,951 | ||||||
| Transactions on behalf of third parties | ||||||||
| Collections | 157,671 | 152,297 | ||||||
| Third-party resources managed by the Bank: | ||||||||
| Financial assets managed on behalf of third parties | 16,024 | 9,676 | ||||||
| Other assets managed on behalf of third parties | — | — | ||||||
| Financial assets acquired on its own behalf | 80,788 | 107,210 | ||||||
| Fiduciary activities | ||||||||
| Securities held in safe custody in the Bank | 2,023,313 | 2,459,854 | ||||||
| Securities held in safe custody in other entities | 18,467,801 | 17,833,361 | ||||||
| Total | 31,344,097 | 32,549,189 | ||||||
| (b) | Lawsuits and legal proceedings: |
(b.1) Legal contingencies within the ordinary course of business:
At the date of issuance of these consolidated financial statements, there are legal actions filed against the Bank and its subsidiaries in the ordinary course of business. As of December 31, 2021, the Bank and its subsidiaries maintain provisions for legal contingencies amounting to Ch$474 million (Ch$244 million as of December 31, 2020), which are part of the item “Provisions” in the Statement of Financial Position.
The following table presents the estimated date of completion of the respective litigation:
| As of December 31, 2021 | ||||||||||||||||||||||||
| 2022 | 2023 | 2024 | 2025 | 2026 | Total | |||||||||||||||||||
| MCh$ | MCh$ | MCh$ | MCh$ | MCh$ | MCh$ | |||||||||||||||||||
| Legal contingencies | 29 | 295 | 150 | — | — | 474 | ||||||||||||||||||
(b.2) Contingencies for significant lawsuits:
As of December 31, 2020 and 2021, there are not significant lawsuits that affect or may affect these Consolidated Financial Statements.
F-108
NOTES TO THE CONSOLIDATED FINANCIAL STATEMENTS, continued
| 28. | Contingencies and Commitments, continued: |
| (c) | Guarantees granted: |
| (i) | In subsidiary Banchile Administradora General de Fondos S.A.: |
In compliance with article 12 of Law No. 20,712, Banchile Administradora General de Fondos S.A., has designated Banco de Chile as the representative of the beneficiaries of the guarantees it has established and in that character the Bank has issued bank guarantees totaling UF 4,149,200, maturing January 7, 2022 (UF 3,778,100, maturing on January 8, 2021 as of December 2020). The subsidiary took a policy with Mapfre Seguros Generales S.A. for the Real State Funds by a guaranteed amount of UF 839,700.
As of December 31, 2020 and 2021 the Bank had no guaranteed mutual funds.
| (ii) | In subsidiary Banchile Corredores de Bolsa S.A.: |
For the purposes of ensuring correct and complete compliance with all of its obligations as a broker-dealer entity, in conformity with the provisions of article 30 and subsequent articles of Law No. 18,045 on Securities Markets, the subsidiary established a guarantee in an insurance policy for UF 20,000, insured by Mapfre Seguros Generales S.A., that matures on April 22, 2022, whereby the Securities Exchange of the Santiago Stock Exchange was appointed as the subsidiary’s creditors representative.
| 2020 | 2021 | |||||||
| MCh$ | MCh$ | |||||||
| Guarantees: | ||||||||
| Shares delivered to cover simultaneous forward sales transactions: | ||||||||
| Santiago Securities Exchange, Stock Exchange | 47,684 | 38,279 | ||||||
| Electronic Chilean Securities Exchange, Stock Exchange | 20,227 | 12,839 | ||||||
| Fixed income securities to guarantee CCLV system: | ||||||||
| Santiago Securities Exchange, Stock Exchange | 10,000 | 9,990 | ||||||
| Fixed income securities to guarantee equity lending: | ||||||||
| Santiago Securities Exchange, Stock Exchange | — | 2,344 | ||||||
| Shares delivered to guarantee equity lending and short-selling: | ||||||||
| Santiago Securities Exchange, Stock Exchange | 2,858 | — | ||||||
| Total | 80,769 | 63,452 | ||||||
F-109
NOTES TO THE CONSOLIDATED FINANCIAL STATEMENTS, continued
| 28. | Contingencies and Commitments, continued: |
| (c) | Guarantees granted, continued: |
| (ii) | In subsidiary Banchile Corredores de Bolsa S.A., continued: |
In conformity with the internal regulation of the stock exchange in which this subsidiary participates, and for the purpose of securing the broker’s correct performance, the Company established a pledge over 1,000,000 shares of the Santiago Stock Exchange, in favor of that institution, as stated in the Public Deed dated September 13, 1990 before the notary of Santiago Mr. Raul Perry Pefaur, and over 100,000 shares of the Electronic Chilean Stock Exchange, in favor of that Institution, as stated in a contract signed between both entities dated May 16, 1990.
Banchile Corredores de Bolsa S.A. keeps an insurance policy current with Chubb Seguros Chile S.A. that expires May 2, 2022, this considers matters of employee fidelity, physical losses, falsification or adulteration, and currency fraud with a coverage amount equivalent to US$20,000,000.
It also provided a bank guarantee in the amount of UF 286,600 for the benefits of investors in portfolio management contracts. This bank guarantee is revaluated in UF to fixed term, non-endorsable and has a maturity date of January 7, 2022.
It also provided a cash guarantee in the amount of US$122,494.32 for the purpose of complying with the obligations to Pershing, for any operations conducted through that broker.
The Company has issued a guarantee ticket No. 722852-3 corresponding to UF 500, to guarantee of its commitment to the offer presented in the fixed income bidding process. Beneficiary: Security Mutual of the Chilean Chamber of Construction Rut.70.285.100-9, valid until March 15, 2022.
| (iii) | In subsidiary Banchile Corredores de Seguros Ltda. |
According to established in article 58, letter D of D.F.L. 251, as of December 31, 2021 the entity maintains two insurance policies with effect from April 15, 2021 to April 14, 2022 which protect it against of potential damages caused by infractions of the law, regulations and complementary rules that regulate insurance brokers, especially when the non-compliance comes from acts, errors or omissions of the broker, its representatives, agents or dependents that participate in the intermediation.
The policies contracted are the following:
| Matter insured | Amount Insured (UF) | |||
| Errors and omissions liability policy | 60,000 | |||
| Civil responsibility policy | 500 | |||
| (d) | By Exempt Resolution No. 270 dated October 30, 2014, the Superintendency of Securities and Insurance (current Commission for the Financial Market) imposed a fine of UF 50,000 to Banchile Corredores de Bolsa S.A. for violations of the second paragraph of article 53 of the Securities Market Law, said company filed a claim with the competent Civil Court requesting the annulment of the fine. On December 10, 2019, a judgement in the case was issued reducing the fine to the amount of UF 7,500. The judgment indicated has been subject to cassation appeals filed by both parties, which are pending before the Illustrious Court of Appeals of Santiago. |
The company has not made provisions considering that the Bank’s legal advisors in charge of the procedure estimate that there are solid grounds that the claim filed by Banchile Corredores de Bolsa S.A. can be accepted.
F-110
NOTES TO THE CONSOLIDATED FINANCIAL STATEMENTS, continued
| 29. | Equity: |
| (a) | Authorized, subscribed and paid shares: |
As of December 31, 2021, the paid-in capital of Banco de Chile is represented by 101,017,081,114 registered shares (101,017,081,114 in 2020), with no par value, subscribed and fully paid.
| (b) | Shares: |
The following table shows the share movements from December 31, 2019 to December 31, 2021:
Total Shares | ||||
| Total shares as of December 31, 2019 | 101,017,081,114 | |||
| Total shares as of December 31, 2020 | 101,017,081,114 | |||
| Total shares as of December 31, 2021 | 101,017,081,114 | |||
| (c) | Shareholders’ composition: |
As of December 31, 2020, the shareholder composition was as follows:
| Corporate Name or Shareholder’s Name | Shares | % of Equity Holding | ||||||
| LQ Inversiones Financieras S.A. | 46,815,289,329 | 46.34 | ||||||
| Banchile Corredores de Bolsa S.A. | 6,119,467,747 | 6.06 | ||||||
| Inversiones LQ-SM Limitada | 4,854,988,014 | 4.81 | ||||||
| Other minority shareholders | 43,227,336,024 | 42.79 | ||||||
| Total | 101,017,081,114 | 100.00 | ||||||
As of December 31, 2021, the shareholder composition was as follows:
| Corporate Name or Shareholder’s Name | Shares | % of Equity Holding | ||||||
| LQ Inversiones Financieras S.A. | 46,815,289,329 | 46.34 | ||||||
| Banchile Corredores de Bolsa S.A. | 5,745,082,033 | 5.69 | ||||||
| Inversiones LQ-SM Limitada | 4,854,988,014 | 4.81 | ||||||
| Other minority shareholders | 43,601,721,738 | 43.16 | ||||||
| Total | 101,017,081,114 | 100.00 | ||||||
F-111
NOTES TO THE CONSOLIDATED FINANCIAL STATEMENTS, continued
| 29. | Equity, continued: |
| (d) | Approval and payment of dividends: |
At the Bank Ordinary Shareholders’ Meeting held on March 25, 2021, the distribution and payment of dividend No. 209 of Ch$2.18053623438 per share of the Banco de Chile was approved, with charge to the net distributable income for the year ended as of December 31, 2020. The dividends paid in the year 2021 amounted to Ch$220,271 million.
At the Bank Ordinary Shareholders’ Meeting held on March 26, 2020, the distribution and payment of dividend No. 208 of Ch$3.47008338564 per share of the Banco de Chile was approved, with charge to the net distributable income for the year ended as of December 31, 2019. The dividends paid in the year 2020 amounted to Ch$350,538 million.
The following dividends were declared and paid by the Bank for the year ended as of December 31, 2019, 2020 and 2021:
| 2019 | 2020 | 2021 | ||||||||||
| Dividends on ordinary shares MCh$ : | 356,311 | 350,538 | 220,271 | |||||||||
| Dividends per ordinary share Ch$ (*): | 3.53 | 3.47 | 2.18 | |||||||||
| (*) | Dividends per share are calculated by dividing the amount of the dividend paid during each year by the previous year’s number of shares outstanding. |
| (e) | Provision for minimum dividends: |
The Chilean Corporations Law mandates a minimum distribution of 30% of distributable income. Accordingly, the Bank recorded a liability under the line item “Provisions” for an amount of Ch$237,877 million (Ch$138,932 million in December 31, 2020) against “Retained earnings”.
| (f) | Other comprehensive income: |
In accordance with Note No. 2(i) (iii), the fair market value adjustment for financial assets at fair value through other comprehensive income is generated by fluctuations in the fair value of that portfolio, with a charge or credit to equity, net of deferred taxes (see Note No. 12). For the year ended 2021, there was a net charge to equity in an amount of Ch$48,742 million (a net charge to equity for Ch$6,236 million in 2020).
Cash flow hedge adjustment consists of the portion of income of hedge instruments registered in equity produced in a cash flow hedge. For the year ended December 31, 2021, there was a net credit to equity in an amount of Ch$133,135 million (a net credit to equity for Ch$7,561 million for the period 2020).
| (g) | Retained earnings from previous years: |
During the year 2021, the Ordinary Shareholders Meeting of Banco de Chile agreed to deduct and withhold from the 2020 liquid income, an amount equivalent to the value effect of the monetary unit of paid capital and reserves according to the variation in the Consumer Price Index, which occurred between November 2019 and November 2020, amounting to Ch$95,989 million. Additionally, the Board determined to withhold 30% of the remaining liquid income, which was equivalent to Ch$146,848 million.
| (h) | Earnings per share: |
Earnings per share is calculated by dividing the net profit for the year attributable to the ordinary equity holders of the Bank by the weighted average number of ordinary shares outstanding during the year.
The following table shows the income and share data used in the calculation of EPS:
| As of December 31, | ||||||||||||
| 2019 | 2020 | 2021 | ||||||||||
| Basic and diluted earnings per share: | ||||||||||||
| Net profits attributable to ordinary equity holders of the Bank (MCh$) | 603,744 | 401,629 | 1,056,316 | |||||||||
| Weighted average number of ordinary shares | 101,017,081,114 | 101,017,081,114 | 101,017,081,114 | |||||||||
| Earnings per share (Ch$) | 5.98 | 3.98 | 10.46 | |||||||||
During the periods presented the Bank did not have any instruments that could lead to a dilution of its ordinary shares.
There have been no transactions involving ordinary shares or potential ordinary shares between the reporting date and the date of the completion of these financial statements.
F-112
NOTES TO THE CONSOLIDATED FINANCIAL STATEMENTS, continued
| 30. | Interest Revenue and Expenses: |
| (a) | As of each year-end below, interest revenue is detailed as follows: |
| 2019 | 2020 | 2021 | ||||||||||
| MCh$ | MCh$ | MCh$ | ||||||||||
| Commercial loans | 910,229 | 826,440 | 1,028,638 | |||||||||
| Consumer loans | 638,198 | 533,267 | 446,608 | |||||||||
| Residential mortgage loans | 532,009 | 520,271 | 918,452 | |||||||||
| Financial investments | 45,294 | 36,748 | 81,887 | |||||||||
| Repurchase agreements | 2,480 | 1,406 | 1,756 | |||||||||
| Loans and advances to banks | 27,457 | 10,797 | 14,524 | |||||||||
| Gain (loss) from accounting hedges | (59,874 | ) | (62,826 | ) | (110,927 | ) | ||||||
| Other interest revenue | 17,755 | 10,692 | 7,532 | |||||||||
| Total | 2,113,548 | 1,876,795 | 2,388,470 | |||||||||
The amount of interest recognized on a received basis for impaired portfolio in 2021 amounts to Ch$5,408 million (Ch$3,811 million as of December 31, 2020).
| (b) | As of each year-end below, interest expenses are detailed as follows: |
| 2019 | 2020 | 2021 | ||||||||||
| MCh$ | MCh$ | MCh$ | ||||||||||
| Savings accounts and time deposits | 313,142 | 142,623 | 133,338 | |||||||||
| Debt issued | 386,015 | 403,989 | 653,890 | |||||||||
| Other financial obligations | 918 | 413 | 31 | |||||||||
| Repurchase agreements | 7,048 | 1,853 | 940 | |||||||||
| Borrowings from financial institutions | 43,570 | 27,830 | 23,382 | |||||||||
| (Gain) loss from accounting hedges | (25,888 | ) | (32,040 | ) | (29,953 | ) | ||||||
| Demand deposits | 14,408 | 11,559 | 28,367 | |||||||||
| Lease liabilities | 2,574 | 2,532 | 1,978 | |||||||||
| Other interest expenses | 483 | 1,248 | 2,475 | |||||||||
| Total | 742,270 | 560,007 | 814,448 | |||||||||
| (c) | As of each year-end below, loss from accounting hedge is the following: |
| 2019 | 2020 | 2021 | ||||||||||
| MCh$ | MCh$ | MCh$ | ||||||||||
| Cash Flow hedge | (28,690 | ) | (22,293 | ) | (76,108 | ) | ||||||
| Fair value hedge | (5,296 | ) | (8,493 | ) | (4,866 | ) | ||||||
| Total | (33,986 | ) | (30,786 | ) | (80,974 | ) | ||||||
F-113
NOTES TO THE CONSOLIDATED FINANCIAL STATEMENTS, continued
| 31. | Income and Expenses from Fees and Commissions: |
The income and expenses for fees and commissions shown in the Consolidated Statement of Comprehensive Income for the years ended December 31, 2019, 2020 and 2021 refer to the following items:
| 2019 | 2020 | 2021 | ||||||||||
| MCh$ | MCh$ | MCh$ | ||||||||||
| Income from fees and commissions | ||||||||||||
| Debit and credit card services | 185,878 | 156,786 | 183,292 | |||||||||
| Investments in mutual funds and others | 101,046 | 92,514 | 108,348 | |||||||||
| Collections and payments | 56,389 | 64,475 | 74,273 | |||||||||
| Portfolio management | 47,816 | 50,272 | 50,793 | |||||||||
| Fees for insurance transactions | 37,035 | 33,049 | 38,057 | |||||||||
| Use of distribution channel and access to customers | 65,243 | 75,074 | 30,518 | |||||||||
| Guarantees and letter of credit | 26,101 | 27,824 | 30,131 | |||||||||
| Trading and securities management | 21,878 | 21,226 | 23,334 | |||||||||
| Brand use agreement | 16,494 | 19,835 | 22,616 | |||||||||
| Financial advisory services | 4,393 | 4,487 | 4,948 | |||||||||
| Lines of credit and overdrafts | 4,716 | 4,568 | 4,396 | |||||||||
| Other fees earned | 22,183 | 12,036 | 13,615 | |||||||||
| Total income from fees and commissions | 589,172 | 562,146 | 584,321 | |||||||||
| Expenses from fees and commissions | ||||||||||||
| Credit card transactions | (97,823 | ) | (79,893 | ) | (87,256 | ) | ||||||
| Interbank transactions | (20,133 | ) | (24,843 | ) | (31,368 | ) | ||||||
| Securities transactions | (5,943 | ) | (4,411 | ) | (4,759 | ) | ||||||
| Collections and payments | (6,284 | ) | (4,927 | ) | (4,211 | ) | ||||||
| Sales force | (404 | ) | (244 | ) | (229 | ) | ||||||
| Other fees | (1,283 | ) | (1,860 | ) | (1,470 | ) | ||||||
| Total expenses from fees and commissions | (131,870 | ) | (116,178 | ) | (129,293 | ) | ||||||
F-114
NOTES TO THE CONSOLIDATED FINANCIAL STATEMENTS, continued
| 32. | Net Financial Operating Income: |
The gain (losses) from trading and brokerage activities for the years ended December 31, 2019, 2020 and 2021 is detailed as follows:
| 2019 | 2020 | 2021 | ||||||||||
| MCh$ | MCh$ | MCh$ | ||||||||||
| Net income on financial assets held-for-trading | 44,274 | 24,715 | 48,940 | |||||||||
| Gain (loss) from mark to market | 32,128 | 33,216 | (12,483 | ) | ||||||||
| Financial assets held-for-trading | 76,402 | 57,931 | 36,457 | |||||||||
| Derivative instruments | 32,391 | (96,369 | ) | 143,641 | ||||||||
| Sale of loan portfolio | — | 39 | 5,458 | |||||||||
| Sale of financial assets at fair value through other comprehensive income | 4,789 | 27,091 | 1,244 | |||||||||
| Net (loss) gain of other transactions | (145 | ) | 29 | 141 | ||||||||
| Total | 113,437 | (11,279 | ) | 186,941 | ||||||||
| 33. | Foreign Exchange Transactions, net: |
The detail of foreign exchange transactions for the years ended December 31, 2019, 2020 and 2021 is the following:
| 2019 | 2020 | 2021 | ||||||||||
| MCh$ | MCh$ | MCh$ | ||||||||||
| Gain (loss) from accounting hedges | 113,374 | (17,156 | ) | 199,208 | ||||||||
| Exchange difference, net | 6,284 | (2,651 | ) | 15,107 | ||||||||
| Indexed foreign currency | (88,772 | ) | 176,469 | (230,277 | ) | |||||||
| Total | 30,886 | 156,662 | (15,962 | ) | ||||||||
F-115
NOTES TO THE CONSOLIDATED FINANCIAL STATEMENTS, continued
| 34. | Provisions for Expected Credit Losses: |
The changes in provisions for expected credit losses during 2019, 2020 and 2021 are the following:
| Loans and | Loans to customers as of December 31, 2019 | Debt instruments at fair value | ||||||||||||||||||||||||||||||
| advance to banks | Commercial loans | Mortgage loans | Consumer loans | Subtotal | through OCI | Contingent loan risks | Total | |||||||||||||||||||||||||
| MCh$ | MCh$ | MCh$ | MCh$ | MCh$ | MCh$ | MCh$ | MCh$ | |||||||||||||||||||||||||
| Provisions established: | ||||||||||||||||||||||||||||||||
| Individual provisions | — | (17,143 | ) | — | — | (17,143 | ) | (3,468 | ) | — | (20,611 | ) | ||||||||||||||||||||
| Group provisions | — | (64,492 | ) | (17,168 | ) | (278,252 | ) | (359,912 | ) | — | (2,707 | ) | (362,619 | ) | ||||||||||||||||||
| Provisions established net | — | (81,635 | ) | (17,168 | ) | (278,252 | ) | (377,055 | ) | (3,468 | ) | (2,707 | ) | (383,230 | ) | |||||||||||||||||
| Provisions released: | ||||||||||||||||||||||||||||||||
| Individual provisions | 902 | — | — | — | — | — | 2,752 | 3,654 | ||||||||||||||||||||||||
| Group provisions | — | — | — | — | — | — | — | — | ||||||||||||||||||||||||
| Provisions released net | 902 | — | — | — | — | — | 2,752 | 3,654 | ||||||||||||||||||||||||
| Recovery of written-off assets | — | 12,253 | 5,114 | 30,608 | 47,975 | — | — | 47,975 | ||||||||||||||||||||||||
| Provisions net allowances for credit risk | 902 | (69,382 | ) | (12,054 | ) | (247,644 | ) | (329,080 | ) | (3,468 | ) | 45 | (331,601 | ) | ||||||||||||||||||
F-116
NOTES TO THE CONSOLIDATED FINANCIAL STATEMENTS, continued
| 34. | Provisions for Expected Credit Losses, continued: |
| Loans and | Loans to customers as of December 31, 2020 | Debt instruments at fair value | ||||||||||||||||||||||||||||||
| advance to banks | Commercial loans | Mortgage loans | Consumer loans | Subtotal | through OCI | Contingent loan risks | Total | |||||||||||||||||||||||||
| MCh$ | MCh$ | MCh$ | MCh$ | MCh$ | MCh$ | MCh$ | MCh$ | |||||||||||||||||||||||||
| Provisions established: | ||||||||||||||||||||||||||||||||
| Individual provisions | (348 | ) | (207,611 | ) | — | — | (207,611 | ) | — | (18,084 | ) | (226,043 | ) | |||||||||||||||||||
| Group provisions | — | (88,278 | ) | (4,607 | ) | (219,463 | ) | (312,348 | ) | — | (55,126 | ) | (367,474 | ) | ||||||||||||||||||
| Provisions established net | (348 | ) | (295,889 | ) | (4,607 | ) | (219,463 | ) | (519,959 | ) | — | (73,210 | ) | (593,517 | ) | |||||||||||||||||
| Provisions released: | ||||||||||||||||||||||||||||||||
| Individual provisions | — | — | — | — | — | 4,652 | — | 4,652 | ||||||||||||||||||||||||
| Group provisions | — | — | — | — | — | — | — | — | ||||||||||||||||||||||||
| Provisions released net | — | — | — | — | — | 4,652 | — | 4,652 | ||||||||||||||||||||||||
| Recovery of written-off assets | — | 8,599 | 3,377 | 29,783 | 41,759 | — | — | 41,759 | ||||||||||||||||||||||||
| Provisions net allowances for credit risk | (348 | ) | (287,290 | ) | (1,230 | ) | (189,680 | ) | (478,200 | ) | 4,652 | (73,210 | ) | (547,106 | ) | |||||||||||||||||
F-117
NOTES TO THE CONSOLIDATED FINANCIAL STATEMENTS, continued
| 34. | Provisions for Expected Credit Losses, continued: |
| Loans and | Loans to customers as of December 31, 2021 | Debt instruments at fair value | ||||||||||||||||||||||||||||||
| advance to banks | Commercial loans | Mortgage loans | Consumer loans | Subtotal | through OCI | Contingent loan risks | Total | |||||||||||||||||||||||||
| MCh$ | MCh$ | MCh$ | MCh$ | MCh$ | MCh$ | MCh$ | MCh$ | |||||||||||||||||||||||||
| Provisions established: | ||||||||||||||||||||||||||||||||
| Individual provisions | — | — | — | — | — | (1,001 | ) | — | (1,001 | ) | ||||||||||||||||||||||
| Group provisions | — | (32,551 | ) | (15,046 | ) | (141,978 | ) | (189,575 | ) | — | (3,874 | ) | (193,449 | ) | ||||||||||||||||||
| Provisions established net | — | (32,551 | ) | (15,046 | ) | (141,978 | ) | (189,575 | ) | (1,001 | ) | (3,874 | ) | (194,450 | ) | |||||||||||||||||
| Provisions released: | ||||||||||||||||||||||||||||||||
| Individual provisions | 377 | 95,488 | — | — | 95,488 | — | 9,006 | 104,871 | ||||||||||||||||||||||||
| Group provisions | — | — | — | — | — | — | — | — | ||||||||||||||||||||||||
| Provisions released net | 377 | 95,488 | — | — | 95,488 | — | 9,006 | 104,871 | ||||||||||||||||||||||||
| Recovery of written-off assets | — | 15,480 | 7,922 | 47,005 | 70,407 | — | — | 70,407 | ||||||||||||||||||||||||
| Provisions net allowances for credit risk | 377 | 78,417 | (7,124 | ) | (94,973 | ) | (23,680 | ) | (1,001 | ) | 5,132 | (19,172 | ) | |||||||||||||||||||
F-118
NOTES TO THE CONSOLIDATED FINANCIAL STATEMENTS, continued
| 35. | Personnel Expenses: |
Personnel expenses for the year ended December 31, 2019, 2020 and 2021 are detailed as follows:
| 2019 | 2020 | 2021 | ||||||||||
| MCh$ | MCh$ | MCh$ | ||||||||||
| Remuneration | 254,886 | 258,918 | 261,933 | |||||||||
| Bonuses, incentives and variable compensation | 108,309 | 95,677 | 96,358 | |||||||||
| Gratifications | 27,889 | 28,167 | 29,738 | |||||||||
| Lunch and health benefits | 27,618 | 27,388 | 24,893 | |||||||||
| Staff severance indemnities | 35,100 | 22,994 | 16,222 | |||||||||
| Training expenses | 3,626 | 1,832 | 2,055 | |||||||||
| Other personnel expenses | 18,171 | 22,200 | 19,753 | |||||||||
| Total | 475,599 | 457,176 | 450,952 | |||||||||
F-119
NOTES TO THE CONSOLIDATED FINANCIAL STATEMENTS, continued
| 36. | Administrative Expenses: |
For the year ended December 31, 2019, 2020 and 2021, administrative expenses are detailed as follows:
| 2019 | 2020 | 2021 | ||||||||||
| MCh$ | MCh$ | MCh$ | ||||||||||
| General administrative expenses | ||||||||||||
| Information technology and communications | 92,264 | 99,763 | 109,026 | |||||||||
| Maintenance and repair of property and equipment | 50,297 | 48,218 | 42,106 | |||||||||
| External advisory services and professional services fees | 21,099 | 14,650 | 18,274 | |||||||||
| Surveillance and securities transport services | 11,533 | 10,787 | 13,229 | |||||||||
| Office supplies | 9,366 | 11,094 | 8,093 | |||||||||
| Insurance premiums | 5,851 | 8,273 | 7,621 | |||||||||
| External service of financial information | 5,461 | 5,912 | 6,297 | |||||||||
| Postal box, mail, postage and home delivery services | 5,131 | 4,218 | 4,718 | |||||||||
| Energy, heating and other utilities | 5,697 | 5,556 | 4,445 | |||||||||
| Legal and notary expenses | 3,996 | 4,182 | 4,432 | |||||||||
| Expenses for short-term leases and low value | 5,801 | 4,729 | 3,825 | |||||||||
| Donations | 2,238 | 2,818 | 3,199 | |||||||||
| External service of custody of documentation | 3,315 | 3,359 | 3,094 | |||||||||
| Other expenses of obligations for lease agreements | 2,797 | 2,684 | 3,070 | |||||||||
| Representation and travel expenses | 3,657 | 2,780 | 2,703 | |||||||||
| Other general administrative expenses | 5,227 | 4,495 | 3,538 | |||||||||
| Subtotal | 233,730 | 233,518 | 237,670 | |||||||||
| Outsource services | ||||||||||||
| External technological developments expenses | 9,459 | 11,371 | 10,164 | |||||||||
| Data processing | 10,129 | 9,333 | 9,407 | |||||||||
| Certification and technology testing | 7,460 | 6,062 | 7,362 | |||||||||
| Credit pre-evaluation | 19,159 | 12,241 | 4,958 | |||||||||
| Other | 3,470 | 2,435 | 1,468 | |||||||||
| Subtotal | 49,677 | 41,442 | 33,359 | |||||||||
| Board expenses | ||||||||||||
| Board of Directors Compensation | 2,509 | 2,795 | 2,889 | |||||||||
| Other Board expenses | 194 | 30 | 10 | |||||||||
| Subtotal | 2,703 | 2,825 | 2,899 | |||||||||
| Marketing expenses | ||||||||||||
| Advertising | 27,808 | 23,561 | 30,652 | |||||||||
| Subtotal | 27,808 | 23,561 | 30,652 | |||||||||
| Taxes, payroll taxes and contributions | ||||||||||||
| Contribution to the banking regulator | 10,285 | 11,408 | 11,968 | |||||||||
| Real estate contributions | 2,856 | 4,054 | 4,852 | |||||||||
| Patents | 1,209 | 1,284 | 1,440 | |||||||||
| Other taxes | 1,437 | 789 | 1,785 | |||||||||
| Subtotal | 15,787 | 17,535 | 20,045 | |||||||||
| Total | 329,705 | 318,881 | 324,625 | |||||||||
F-120
NOTES TO THE CONSOLIDATED FINANCIAL STATEMENTS, continued
| 37. | Depreciation, Amortization and Impairment: |
| (a) | Amounts charged to income for depreciation and amortization during the year ended December 31, 2019, 2020 and 2021 are detailed as follows: |
| 2019 | 2020 | 2021 | ||||||||||
| MCh$ | MCh$ | MCh$ | ||||||||||
| Depreciation and amortization | ||||||||||||
| Depreciation of property and equipment (Note No.16(b) and Note No. 16) | 29,194 | 29,845 | 29,768 | |||||||||
| Depreciation of rights over leased assets (Note No. 16(d)) | 28,472 | 27,647 | 29,199 | |||||||||
| Amortization of intangibles assets (Note No.15 (b)) | 12,875 | 15,865 | 17,831 | |||||||||
| Total | 70,541 | 73,357 | 76,798 | |||||||||
| (b) | As of December 31, 2019, 2020 and 2021, the impairment loss is detailed as follows: |
| 2019 | 2020 | 2021 | ||||||||||
| MCh$ | MCh$ | MCh$ | ||||||||||
| Impairment loss | ||||||||||||
| Impairment loss on intangibles assets (Note No.15(b)) | 350 | 629 | 1,647 | |||||||||
| Impairment loss on property and equipment (Note No.16(b)) | 2,018 | 1,031 | 43 | |||||||||
| Impairment of rights over leased assets (Note No. 16(d)) | 187 | 1 | — | |||||||||
| Total | 2,555 | 1,661 | 1,690 | |||||||||
F-121
NOTES TO THE CONSOLIDATED FINANCIAL STATEMENTS, continued
| 38. | Other Operating Income: |
During the year ended December 31, 2019, 2020 and 2021, the Bank and its subsidiaries presented the following under other operating income:
| 2019 | 2020 | 2021 | ||||||||||
| MCh$ | MCh$ | MCh$ | ||||||||||
| Income for assets received in lieu of payment | ||||||||||||
| Income from sale of assets received in lieu of payment | 2,560 | 3 | 1,837 | |||||||||
| Other income | 40 | 87 | 231 | |||||||||
| Subtotal | 2,600 | 90 | 2,068 | |||||||||
| Release of provisions for contingencies | ||||||||||||
| Other provisions for contingencies | — | — | — | |||||||||
| Subtotal | — | — | — | |||||||||
| Other income | ||||||||||||
| Release of provisions and expense recovery | 9,002 | 6,497 | 9,690 | |||||||||
| Rental investment properties | 8,387 | 5,748 | 5,965 | |||||||||
| Revaluation of prepaid monthly payments | 1,731 | 1,569 | 5,183 | |||||||||
| Tax management income | — | 1,565 | 3,117 | |||||||||
| Recovery from correspondent banks | 2,816 | 2,841 | 2,800 | |||||||||
| Income from sale leased assets | 1,166 | 1,956 | 1,214 | |||||||||
| Reimbursements for insurance policies | 349 | 4,414 | 161 | |||||||||
| Credit card income | 4,037 | 459 | 346 | |||||||||
| Others | 2,227 | 1,532 | 3,512 | |||||||||
| Subtotal | 29,715 | 26,581 | 31,988 | |||||||||
| Total | 32,315 | 26,671 | 34,056 | |||||||||
F-122
NOTES TO THE CONSOLIDATED FINANCIAL STATEMENTS, continued
| 39. | Other Operating Expenses: |
During the year ended December 31, 2019, 2020 and 2021, the Bank and its subsidiaries incurred the following other operating expenses:
| 2019 | 2020 | 2021 | ||||||||||
| MCh$ | MCh$ | MCh$ | ||||||||||
| Provisions and expenses for assets received in lieu of payment | ||||||||||||
| Charge-off assets received in lieu of payment | — | — | 418 | |||||||||
| Expenses to maintain assets received in lieu of payment | 1,225 | 1,021 | 813 | |||||||||
| Provisions for assets received in lieu of payment | 3,246 | 1,539 | 205 | |||||||||
| Subtotal | 4,471 | 2,560 | 1,436 | |||||||||
| Provisions for contingencies | ||||||||||||
| Country risk provisions | — | — | — | |||||||||
| Other provisions | 33 | 7 | 398 | |||||||||
| Subtotal | 33 | 7 | 398 | |||||||||
| Other expenses | ||||||||||||
| Write-offs for operating risks | 5,586 | 10,625 | 13,957 | |||||||||
| Leasings operational expenses | 5,111 | 5,430 | 5,346 | |||||||||
| Correspondent banks | 1,569 | 1,804 | 2,614 | |||||||||
| Card administration | 2,490 | 2,599 | 2,098 | |||||||||
| Expenses for charge-off leased assets recoveries | 1,072 | 597 | 1,038 | |||||||||
| Others | 3,518 | 3,055 | 3,468 | |||||||||
| Subtotal | 19,346 | 24,110 | 28,521 | |||||||||
| Total | 23,850 | 26,677 | 30,355 | |||||||||
| 40. | Related Party Transactions: |
Related parties are considered to be those natural or legal persons who are in positions to directly or indirectly have significant influence through their ownership or management of the Bank and its subsidiaries.
According to the above, the Bank has considered as related parties those natural or legal persons who have a direct participation or through third parties on bank ownership, where such participation exceeds 5% of the shares, and also people who, regardless of ownership, have authority and responsibility for planning, management and control of the activities of the entity or its subsidiaries. There also are considered as related the companies in which the parties related by ownership or management of the Bank have a share which reaches or exceeds 5%, or has the position of director, general manager or equivalent.
F-123
NOTES TO THE CONSOLIDATED FINANCIAL STATEMENTS, continued
| 40. | Related Party Transactions, continued: |
| (a) | Loans with related parties: |
The following table details loans and accounts receivable and contingent loans, corresponding to related entities as of December 31, 2020 and 2021.
| Productive and Services Companies (*) | Investment Companies (**) | Individuals (***) | Total | |||||||||||||||||||||||||||||
| 2020 | 2021 | 2020 | 2021 | 2020 | 2021 | 2020 | 2021 | |||||||||||||||||||||||||
| MCh$ | MCh$ | MCh$ | MCh$ | MCh$ | MCh$ | MCh$ | MCh$ | |||||||||||||||||||||||||
| Loans and accounts receivable: | ||||||||||||||||||||||||||||||||
| Commercial loans | 122,716 | 356,282 | 164,213 | 114,306 | 12,445 | 13,571 | 299,374 | 484,159 | ||||||||||||||||||||||||
| Residential mortgage loans | — | — | — | — | 61,131 | 65,637 | 61,131 | 65,637 | ||||||||||||||||||||||||
| Consumer loans | — | — | — | — | 8,743 | 10,660 | 8,743 | 10,660 | ||||||||||||||||||||||||
| Gross loans | 122,716 | 356,282 | 164,213 | 114,306 | 82,319 | 89,868 | 369,248 | 560,456 | ||||||||||||||||||||||||
| Allowance for loan losses | (1,264 | ) | (3,224 | ) | (802 | ) | (571 | ) | (390 | ) | (432 | ) | (2,456 | ) | (4,227 | ) | ||||||||||||||||
| Net loans | 121,452 | 353,058 | 163,411 | 113,735 | 81,929 | 89,436 | 366,792 | 556,229 | ||||||||||||||||||||||||
| Contingent loans: | ||||||||||||||||||||||||||||||||
| Guarantees and sureties | 7,277 | 8,619 | 9,469 | 12,253 | — | — | 16,746 | 20,872 | ||||||||||||||||||||||||
| Letters of credits | 2,885 | 87 | — | — | — | — | 2,885 | 87 | ||||||||||||||||||||||||
| Banks guarantees | 25,129 | 26,872 | 35,733 | 21,852 | — | — | 60,862 | 48,724 | ||||||||||||||||||||||||
| Undrawn credit lines | 46,887 | 77,965 | 14,308 | 14,398 | 20,306 | 21,831 | 81,501 | 114,194 | ||||||||||||||||||||||||
| Other contingencies loans | — | — | — | — | — | — | — | — | ||||||||||||||||||||||||
| Total contingent loans | 82,178 | 113,543 | 59,510 | 48,503 | 20,306 | 21,831 | 161,994 | 183,877 | ||||||||||||||||||||||||
| Provision for contingencies loans | (218 | ) | (274 | ) | (55 | ) | (52 | ) | (51 | ) | (22 | ) | (324 | ) | (348 | ) | ||||||||||||||||
| Contingent loans, net | 81,960 | 113,269 | 59,455 | 48,451 | 20,255 | 21,809 | 161,670 | 183,529 | ||||||||||||||||||||||||
| Amount covered by guarantee: | ||||||||||||||||||||||||||||||||
| Mortgage | 15,575 | 14,093 | 54,891 | 50,650 | 82,777 | 139,378 | 153,243 | 204,121 | ||||||||||||||||||||||||
| Warrant | — | — | — | — | — | — | — | — | ||||||||||||||||||||||||
| Pledge | — | — | — | — | — | — | — | — | ||||||||||||||||||||||||
| Others (****) | 33,474 | 27,785 | 12,117 | 17,366 | 6,582 | 6,306 | 52,173 | 51,457 | ||||||||||||||||||||||||
| Total collateral | 49,049 | 41,878 | 67,008 | 68,016 | 89,359 | 145,684 | 205,416 | 255,578 | ||||||||||||||||||||||||
| (*) | For these effects are considered productive companies, those that meet the following conditions: |
| (i) | They engage in operating activities and generate a separable flow of income; |
| (ii) | Less than 50% of their assets are trading securities or investments. |
Service companies are considered entities whose main purpose is oriented to rendering services to third parties.
| (**) | Investment companies include those legal entities that do not comply with the conditions for operating companies and are profit-oriented. |
| (***) | Individuals include key members of the management and correspond to those who directly or indirectly have authority and responsibility for planning, administrating and controlling the activities of the organization, including directors. This category also includes their family members who influence or are influenced by such individuals in their interactions with the organization. |
| (****) | These guarantees correspond mainly to warranty by endorsement and sureties, state guarantees and other financial guarantees. |
F-124
NOTES TO THE CONSOLIDATED FINANCIAL STATEMENTS, continued
| 40. | Related Party Transactions, continued: |
| (b) | Other assets and liabilities with related parties as of December 31, 2020 and 2021: |
| 2020 | 2021 | |||||||
| MCh$ | MCh$ | |||||||
| Assets | ||||||||
| Cash and due from banks | 261,386 | 288,798 | ||||||
| Transactions in the course of collection | 35,833 | 76,772 | ||||||
| Financial assets held-for-trading | 96 | 16 | ||||||
| Derivative instruments | 252,748 | 319,120 | ||||||
| Investment instruments | 31,548 | 15,045 | ||||||
| Other assets | 96,362 | 29,248 | ||||||
| Total | 677,973 | 728,999 | ||||||
| Liabilities | ||||||||
| Demand deposits | 239,139 | 224,675 | ||||||
| Transactions in the course of payment | 37,799 | 75,142 | ||||||
| Obligations under repurchase agreements | 24,500 | 531 | ||||||
| Savings accounts and time deposits | 338,732 | �� | 238,407 | |||||
| Derivative instruments | 355,099 | 313,354 | ||||||
| Borrowings from financial institutions | 114,758 | 122,883 | ||||||
| Lease liabilities | 10,354 | 10,256 | ||||||
| Other liabilities | 14,699 | 56,196 | ||||||
| Total | 1,135,080 | 1,041,444 | ||||||
| (c) | Income and expenses from related party transactions during the year ended December 31, 2019, 2020 and 2021: |
| 2019 | 2020 | 2021 | ||||||||||||||||||||||
| Income | Expense | Income | Expense | Income | Expense | |||||||||||||||||||
| Type of income or expense recognized | MCh$ | MCh$ | MCh$ | MCh$ | MCh$ | MCh$ | ||||||||||||||||||
| Interest and revenue expenses | 19,039 | 2,619 | 15,790 | 258 | 19,421 | 492 | ||||||||||||||||||
| Fees and commission income | 72,931 | 65,383 | 93,994 | 39,988 | 98,915 | 29,280 | ||||||||||||||||||
| Net financial operating income | ||||||||||||||||||||||||
| Derivative instruments (*) | 124,967 | 73,252 | 12,219 | 46,593 | 105,964 | 56,189 | ||||||||||||||||||
| Other financial operations | 87 | 119 | 40 | — | 48 | 23 | ||||||||||||||||||
| Release or established of provision for credit risk |
— | 106 | — | 1,226 | — | 1,733 | ||||||||||||||||||
| Operating expenses | — | 120,559 | — | 119,259 | — | 117,912 | ||||||||||||||||||
| Other income and expenses | 542 | 26 | 469 | 4 | 466 | 37 | ||||||||||||||||||
| (*) | The outcome of derivative operations is presented net at each related counterparty level. Additionally, this line includes operations with local counterpart banks (unrelated) which have been novated by Comder Contraparte Central S.A. (Related entity) for centralized clearing purposes, which generated a net gain of Ch$29,956 million as of December 31, 2021 (net gain of Ch$4,997 million as of December 31, 2020 and net gain of Ch$123,461 million as of December 31, 2019). |
F-125
NOTES TO THE CONSOLIDATED FINANCIAL STATEMENTS, continued
| 40. | Related Party Transactions, continued: |
| (d) | Directors’ expenses and remunerations and payments to key management personnel: |
| 2019 | 2020 | 2021 | ||||||||||
| MCh$ | MCh$ | MCh$ | ||||||||||
| Personnel remunerations | 4,148 | 3,918 | 4,233 | |||||||||
| Short-term benefits | 3,255 | 3,642 | 3,534 | |||||||||
| Severance pay | 1,264 | 1,550 | 314 | |||||||||
| Directors’ remunerations and fees (*) | 2,509 | 2,795 | 2,889 | |||||||||
| Total | 11,176 | 11,905 | 10,970 | |||||||||
| (*) | It includes fees paid to members of the Advisory Committee of Banchile Corredores de Seguros Ltda, of Ch$14 million (Ch$14 million in December 2020 and Ch$13 million in December 2019). |
No fees were paid to the advisors of the Board of Directors during the 2020 and 2021 (Ch$90 million in 2019). Travel and other related expenses amount to Ch$10 million in 2021 (Ch$30 million in 2020 and Ch$104 million in 2019).
Composition of key personnel:
| N° of executives | ||||||||
| Position | 2020 | 2021 | ||||||
| CEO | 1 | 1 | ||||||
| CEOs of subsidiaries | 6 | 5 | ||||||
| Division Managers | 14 | 14 | ||||||
| Directors Bank and subsidiaries | 19 | 18 | ||||||
| Total | 40 | 38 | ||||||
F-126
NOTES TO THE CONSOLIDATED FINANCIAL STATEMENTS, continued
| 41. | Fair Value of Financial Assets and Liabilities: |
Banco de Chile and its subsidiaries have defined a corporate framework for valuation and control related with the process to the fair value measurement.
Within the established framework includes the Product Control Unit (PCU), which is independent of the business areas and reports to the Financial Management and Control Division Manager. This function befalls on the Financial Control and Treasury Manager, through the Financial Risk Information and Control Section is responsible for independent verification of price and results of trading (including derivatives) and investment operations and all fair value measurements.
To achieve the appropriate measurements and controls, the Bank and its subsidiaries, take into account at least the following aspects:
| (i) | Industry standard valuation. |
To value financial instruments, Banco de Chile uses industry standard modeling; quota value, share price, DCF and valuation of options through Black-Scholes-Merton, according to the case. The input parameters for the valuation correspond to rates, prices and levels of volatility for different terms and market factors that are traded in the national and international market and that are provided by the main sources of the market.
| (ii) | Quoted prices in active markets. |
The fair value for instruments with quoted prices in active markets is determined using daily quotes from electronic systems information (such as Bolsa de Comercio de Santiago, Bloomberg, LVA and Risk America, etc.). This quote represents the price at which these instruments are regularly traded in the financial markets.
| (iii) | Valuation techniques. |
If no specific quotes are available for the instrument to be valued, valuation techniques will be used to determine the fair value.
Due to the fact that, in general, the valuation models require a set of market parameters as inputs, the aim is to maximize information based on observable or prices-related quotations for similar instruments in active markets. To the extent there is no information available in direct from the markets, data from external suppliers of information, prices of similar instruments and historical information are used to validate the valuation parameters.
F-127
NOTES TO THE CONSOLIDATED FINANCIAL STATEMENTS, continued
| 41. | Fair Value of Financial Assets and Liabilities, continued: |
| (iv) | Fair value adjustments. |
Part of the fair value process considers two adjustments to the market value of each instrument calculated based on the market parameters. The Bid/offer adjustment represents the impact on the valuation of an instrument depending on whether the position corresponds to a long (bought) or a short (sold). To calculate this adjustment is used the direct quotes from active markets or indicative prices or derivatives of similar assets depending on the instrument, considering the Bid, Mid and Offer, respectively. Finally, the adjustment made for CVA and DVA for derivatives corresponds to the credit risk recognition of the issuer, either of the counterparty (CVA) or of Banco de Chile (DVA).
| (v) | Fair value control. |
A process of independent verification of prices and interest rates is executed daily, in order to control that the market parameters used by Banco de Chile in the valuation of the financial instruments relating to the current state of the market and from them the best estimate derived of the fair value. The objective of this process is to control that the official market parameters provided by the respective business areas, before being entered into the valuation, are within acceptable ranges of differences when compared to the same set of parameters prepared independently by the Financial Risk Information and Control Section. As a result, value differences are obtained at the level of currency, product and portfolio. In the event significant differences exist, these differences are scaled according to the amount of individual materiality of each market factor and aggregated at the portfolio level, according to the grouping levels within previously defined ranges. These ranges are approved by the Finance, International and Financial Risk Committee.
Complementary and in parallel, the Financial Risk Information and Control Section generates and reports on a daily basis Profit and Loss (“P&L”) and Exposure to Market Risks, which allow for proper control and consistency of the parameters used in the valuation.
F-128
NOTES TO THE CONSOLIDATED FINANCIAL STATEMENTS, continued
| 41. | Fair Value of Financial Assets and Liabilities, continued: |
| (vi) | Judgmental analysis and information to Management. |
In particular cases, where there are no market quotations for the instrument to be valued and there are no prices for similar transactions instruments or indicative parameters, a specific controls and reasoned analysis must be carried out in order to estimate the fair value of the operation. Within the valuation framework described in the Reasonable Value Policy (and its procedure) approved by the Board of Directors of Banco de Chile, a required level of approval is set in order to carry out transactions where market information is not available or it is not possible to infer prices or rates from it.
| (a) | Fair value hierarchy |
Banco de Chile and its subsidiaries, classify all the financial instruments among the following levels:
| Level 1: | These are financial instruments whose fair value is calculated at quoted prices (unadjusted) in extracted from liquid and deep markets. For these instruments there are quotes or prices (return internal rates, quote value, price) the observable market, so that assumptions are not required to determine the value. |
In this level, the following instruments are considered: currency futures, debt instruments issued by the Treasury and the Central Bank of Chile, which belong to benchmarks, mutual fund investments and equity shares.
For the instruments of the Central Bank of Chile and the General Treasury of the Republic, all those mnemonics belonging to a Benchmark, in other words corresponding to one of the following categories published by the Santiago Stock Exchange, will be considered as Level 1: Pesos-02, Pesos-03, Pesos-04, Pesos-05, Pesos-07, Pesos-10, UF-02, UF-04, UF-05, UF-07, UF-10, UF-20, UF-30. A Benchmark corresponds to a group of mnemonics that are similar in duration and are traded in an equivalent way, i.e., the price (return internal rates in this case) obtained is the same for all the instruments that make up a Benchmark. This feature defines a greater depth of market, with daily quotations that allow classifying these instruments as Level 1.
In the case of debt issued by the Chilean Government, the internal rate of return of the market is used to discount all flows to present value. In the case of mutual funds and equity shares, the current market price per share, which multiplied by the number of instruments results in the fair value.
The preceding described valuation methodology is equivalent to the one used by the Bolsa de Comercio de Santiago (Santiago Stock Exchange) and corresponds with the standard methodology used in the market and is in accordance with standards used in IFRS.
F-129
NOTES TO THE CONSOLIDATED FINANCIAL STATEMENTS, continued
| 41. | Fair Value of Financial Assets and Liabilities, continued: |
| Level 2: | They are financial instruments whose fair value is calculated based on prices other than in quoted in Level 1 that are observable for the asset or liability, directly (that is, as prices or internal rates of return) or indirectly (that is, derived from prices or internal rates of return from similar instruments). These categories include: |
| a) | Quoted prices for similar assets or liabilities in active markets. |
| b) | Quoted prices for identical or similar assets or liabilities in markets that are not active. |
| c) | Inputs data other than quoted prices that are observable for the asset or liability. |
| d) | Inputs data corroborated by the market. |
At this level there are mainly derivatives instruments, debt issued by banks, debt issued by Chilean and foreign companies, issued in Chile or abroad, mortgage claims, financial brokerage instruments and some issuances by the Central Bank of Chile and the General Treasury of the Republic, which do not belong to benchmarks.
To value derivatives, depends on whether they are impacted by volatility as a relevant market factor in standard valuation methodologies; for options the Black-Scholes-Merton formula is used; for the rest of the derivatives, forwards and swaps, DCF method is used.
For the remaining instruments at this level, as for debt issues of level 1, the valuation is done through cash flows model by using an internal rate of return that can be derived or estimated from internal rates of return of similar securities as mentioned above.
In the event that there is no observable price for an instrument in a specific term, the price will be inferred from the interpolation between periods that have observable quoted price in active markets. These models incorporate various market variables, including the credit quality of counterparties, exchange rates and interest rate curves.
F-130
NOTES TO THE CONSOLIDATED FINANCIAL STATEMENTS, continued
| 41. | Fair Value of Financial Assets and Liabilities, continued: |
Valuation Techniques and Inputs for Level 2 Instrument:
Type of Financial Instrument | Valuation Method | Description: Inputs and Sources |
Local Bank and Corporate Bonds | Discounted cash flows model | Prices (internal rates of return) are provided by third party price providers that are widely used in the Chilean market.
Model is based on a Base Yield (Central Bank Bonds) and issuer spread.
The model is based on daily prices and risk/maturity similarities between Instruments. |
Offshore Bank and Corporate Bonds | Prices (internal rates of return) are provided by third party price providers that are widely used in the Chilean market.
Model is based on daily prices. | |
Local Central Bank and Treasury Bonds | Prices (internal rates of return) are provided by third party price providers that are widely used in the Chilean market.
Model is based on daily prices. | |
Mortgage Notes | Prices (internal rates of return) are provided by third party price providers that are widely used in the Chilean market.
Model is based on a Base Yield (Central Bank Bonds) and issuer spread.
The model takes into consideration daily prices and risk/maturity similarities between instruments. | |
Time Deposits | Prices are provided by third party price providers that are widely used in the Chilean market.
Model is based on daily prices and considers risk/maturity similarities between instruments. | |
Cross Currency Swaps, Interest Rate Swaps, FX Forwards, Inflation Forwards | Forward Points, Inflation forecast and local swap rates are provided by market brokers that are widely used in the Chilean market
Offshore rates and spreads are obtained from third party price providers that are widely used in the Chilean market.
Zero Coupon rates are calculated by using the bootstrapping method over swap rates. | |
| FX Options | Black-Scholes Model | Prices for volatility surface estimates are obtained from market brokers that are widely used in the Chilean market. |
F-131
NOTES TO THE CONSOLIDATED FINANCIAL STATEMENTS, continued
| 41. | Fair Value of Financial Assets and Liabilities, continued: |
| Level 3: | These are financial instruments whose fair value is determined using non-observable inputs data neither for the assets or liabilities under analysis nor for similar instruments. An adjustment to an input that is significant to the entire measurement can result in a fair value measurement classified within Level 3 of the fair value hierarchy, if the adjustment uses significant non-observable data entry. |
The instruments likely to be classified as Level 3 are mainly Corporate Debt by Chilean and foreign companies, issued both in Chile and abroad.
Valuation Techniques and Inputs for Level 3 Instrument:
Type of Financial Instrument | Valuation Method | Description: Inputs and Sources |
| Local Bank and Corporate Bonds | Discounted cash flows model | Since inputs for these types of securities are not observable by the market, we model interest rate of returns for them based on a Base Yield (Central Bank Bonds) and issuer spread. These inputs (base yield and issuer spread) are provided on a daily basis by third party price providers that are widely used in the Chilean market. |
| Offshore Bank and Corporate Bonds | Discounted cash flows model | Since inputs for these types of securities are not observable by the market, we model interest rate of returns for them based on a Base Yield (US-Libor) and issuer spread. These inputs (base yield and issuer spread) are provided on a weekly basis by third party price providers that are widely used in the Chilean market. |
F-132
NOTES TO THE CONSOLIDATED FINANCIAL STATEMENTS, continued
| 41. | Fair Value of Financial Assets and Liabilities, continued: |
| (b) | Level hierarchy classification and figures: |
The following table shows the figures by hierarchy, for instruments recorded at fair value in the statement of financial position as of December 31, 2020 and 2021.
| Level 1 | Level 2 | Level 3 | Total | |||||||||||||||||||||||||||||
| 2020 | 2021 | 2020 | 2021 | 2020 | 2021 | 2020 | 2021 | |||||||||||||||||||||||||
| MCh$ | MCh$ | MCh$ | MCh$ | MCh$ | MCh$ | MCh$ | MCh$ | |||||||||||||||||||||||||
| Financial Assets | ||||||||||||||||||||||||||||||||
| Financial assets held-for-trading | ||||||||||||||||||||||||||||||||
| From the Chilean government and Central Bank | 75,701 | 169,067 | 4,083,591 | 3,303,055 | ― | ― | 4,159,292 | 3,472,122 | ||||||||||||||||||||||||
| Other instruments issued in Chile | 1,002 | 3,061 | 99,302 | 214,337 | 5,494 | 51,484 | 105,798 | 268,882 | ||||||||||||||||||||||||
| Instruments issued abroad | 164 | ― | — | — | ― | ― | 164 | ― | ||||||||||||||||||||||||
| Mutual fund investments | 400,902 | 135,691 | — | — | ― | ― | 400,902 | 135,691 | ||||||||||||||||||||||||
| Total | 477,769 | 307,819 | 4,182,893 | 3,517,392 | 5,494 | 51,484 | 4,666,156 | 3,876,695 | ||||||||||||||||||||||||
| Derivative Instruments | ||||||||||||||||||||||||||||||||
| Derivative contracts for trading purposes | ||||||||||||||||||||||||||||||||
| Forwards | ― | ― | 551,964 | 742,545 | ― | ― | 551,964 | 742,545 | ||||||||||||||||||||||||
| Swaps | ― | ― | 2,013,247 | 1,958,242 | ― | ― | 2,013,247 | 1,958,242 | ||||||||||||||||||||||||
| Call options | ― | ― | 269 | 4,509 | ― | ― | 269 | 4,509 | ||||||||||||||||||||||||
| Put options | ― | ― | 1,462 | 199 | ― | ― | 1,462 | 199 | ||||||||||||||||||||||||
| Futures | ― | ― | — | — | ― | ― | — | — | ||||||||||||||||||||||||
| Subtotal | ― | ― | 2,566,942 | 2,705,495 | ― | ― | 2,566,942 | 2,705,495 | ||||||||||||||||||||||||
| Hedge derivative contracts | ||||||||||||||||||||||||||||||||
| Fair value hedge (Swaps) | ― | ― | ― | ― | ― | ― | — | — | ||||||||||||||||||||||||
| Cash flow hedge (Swaps) | ― | ― | 51,062 | 277,803 | ― | ― | 51,062 | 277,803 | ||||||||||||||||||||||||
| Subtotal | ― | ― | 51,062 | 277,803 | ― | ― | 51,062 | 277,803 | ||||||||||||||||||||||||
| Total | ― | ― | 2,618,004 | 2,983,298 | ― | ― | 2,618,004 | 2,983,298 | ||||||||||||||||||||||||
| Financial assets at fair value through other comprehensive income | ||||||||||||||||||||||||||||||||
| Debt instruments (1): | ||||||||||||||||||||||||||||||||
| From the Chilean government and Central Bank | ― | 507,368 | 163,600 | 1,981,482 | ― | ― | 163,600 | 2,488,850 | ||||||||||||||||||||||||
| Instruments issued in Chile | ― | ― | 860,327 | 540,756 | 36,596 | 25,203 | 896,923 | 565,959 | ||||||||||||||||||||||||
| Instruments issued abroad | ― | ― | ― | ― | ― | ― | — | — | ||||||||||||||||||||||||
| Subtotal | ― | 507,368 | 1,023,927 | 2,522,238 | 36,596 | 25,203 | 1,060,523 | 3,054,809 | ||||||||||||||||||||||||
| Equity instruments: | ||||||||||||||||||||||||||||||||
| Instruments issued in Chile | ― | ― | 6,869 | 5,499 | ― | ― | 6,869 | 5,499 | ||||||||||||||||||||||||
| Instruments issued abroad | 670 | 841 | ― | ― | 91 | 25 | 761 | 866 | ||||||||||||||||||||||||
| Subtotal | 670 | 841 | 6,869 | 5,499 | 91 | 25 | 7,630 | 6,365 | ||||||||||||||||||||||||
| Total | 670 | 508,209 | 1,030,796 | 2,527,737 | 36,687 | 25,228 | 1,068,153 | 3,061,174 | ||||||||||||||||||||||||
| Total Financial Assets | 478,439 | 816,028 | 7,831,693 | 9,028,427 | 42,181 | 76,712 | 8,352,313 | 9,921,167 | ||||||||||||||||||||||||
| Financial liabilities | ||||||||||||||||||||||||||||||||
| Derivative contracts for trading purposes | ||||||||||||||||||||||||||||||||
| Forwards | ― | ― | 637,164 | 505,463 | ― | ― | 637,164 | 505,463 | ||||||||||||||||||||||||
| Swaps | ― | ― | 2,130,393 | 2,264,132 | ― | ― | 2,130,393 | 2,264,132 | ||||||||||||||||||||||||
| Call options | ― | ― | 306 | 2,726 | ― | ― | 306 | 2,726 | ||||||||||||||||||||||||
| Put options | ― | ― | 2,099 | 459 | ― | ― | 2,099 | 459 | ||||||||||||||||||||||||
| Futures | ― | ― | ― | ― | ― | ― | ― | ― | ||||||||||||||||||||||||
| Subtotal | ― | ― | 2,769,962 | 2,772,780 | ― | ― | 2,769,962 | 2,772,780 | ||||||||||||||||||||||||
| Hedge derivative contracts | ||||||||||||||||||||||||||||||||
| Cash flow hedge (Forwards) | ― | ― | ― | 88 | ― | ― | 88 | |||||||||||||||||||||||||
| Fair value hedge (Swaps) | ― | ― | 6,519 | 608 | ― | ― | 6,519 | 608 | ||||||||||||||||||||||||
| Cash flow hedge (Swaps) | ― | ― | 65,172 | ― | ― | ― | 65,172 | ― | ||||||||||||||||||||||||
| Subtotal | ― | ― | 71,691 | 696 | ― | ― | 71,691 | 696 | ||||||||||||||||||||||||
| Total Financial liabilities | ― | ― | 2,841,653 | 2,773,476 | ― | ― | 2,841,653 | 2,773,476 | ||||||||||||||||||||||||
| (1) | As of December 31, 2021, 100% of instruments of level 3 have denomination “Investment Grade”. Also, 100% of total of these financial instruments correspond to domestic issuers. |
F-133
NOTES TO THE CONSOLIDATED FINANCIAL STATEMENTS, continued
| 41. | Fair Value of Financial Assets and Liabilities, continued: |
| (c) | Level 3 Reconciliation |
The following tables show the reconciliation between the beginning and ending balances of instruments classified as Level 3, whose fair value is reflected in the Financial Statements.
| 2020 | ||||||||||||||||||||||||||||||||
| Balance as of January 1, 2020 | Gain (Loss) Recognized in Income (1) | Gain (Loss) Recognized in Equity (2) | Purchases | Sales | Transfer from Level 1 and 2 | Transfer to Level 1 and 2 | Balance as of December 31, 2020 | |||||||||||||||||||||||||
| MCh$ | MCh$ | MCh$ | MCh$ | MCh$ | MCh$ | MCh$ | MCh$ | |||||||||||||||||||||||||
| Financial Assets | ||||||||||||||||||||||||||||||||
| Financial assets held-for-trading: | ||||||||||||||||||||||||||||||||
| Other instruments issued in Chile | 55,094 | (708 | ) | — | 49,424 | (98,316 | ) | — | — | 5,494 | ||||||||||||||||||||||
| Subtotal | 55,094 | (708 | ) | — | 49,424 | (98,316 | ) | — | — | 5,494 | ||||||||||||||||||||||
| Financial assets at fair value through OCI: | ||||||||||||||||||||||||||||||||
| Debt instruments: | ||||||||||||||||||||||||||||||||
| Other instruments issued in Chile | 7,069 | 323 | (647 | ) | 71,539 | (70,897 | ) | 29,209 | — | 36,596 | ||||||||||||||||||||||
| Equity instruments: | ||||||||||||||||||||||||||||||||
| Instruments issued abroad | 96 | — | (5 | ) | — | — | — | — | 91 | |||||||||||||||||||||||
| Subtotal | 7,165 | 323 | (652 | ) | 71,539 | (70,897 | ) | 29,209 | — | 36,687 | ||||||||||||||||||||||
| Total | 62,259 | (385 | ) | (652 | ) | 120,963 | (169,213 | ) | 29,209 | — | 42,181 | |||||||||||||||||||||
F-134
NOTES TO THE CONSOLIDATED FINANCIAL STATEMENTS, continued
| 41. | Fair Value of Financial Assets and Liabilities, continued: |
| 2021 | ||||||||||||||||||||||||||||||||
| Balance as of January 1, 2021 | Gain (Loss) Recognized in Income (1) | Gain (Loss) Recognized in Equity (2) | Purchases | Sales | Transfer from Level 1 and 2 | Transfer to Level 1 and 2 | Balance as of December 31, 2021 | |||||||||||||||||||||||||
| MCh$ | MCh$ | MCh$ | MCh$ | MCh$ | MCh$ | MCh$ | MCh$ | |||||||||||||||||||||||||
| Financial Assets | ||||||||||||||||||||||||||||||||
| Financial assets held-for-trading: | ||||||||||||||||||||||||||||||||
| Other instruments issued in Chile | 5,494 | (503 | ) | — | 42,484 | (3,160 | ) | 7,169 | — | 51,484 | ||||||||||||||||||||||
| Subtotal | 5,494 | (503 | ) | — | 42,484 | (3,160 | ) | 7,169 | — | 51,484 | ||||||||||||||||||||||
| Financial assets at fair value through OCI: | ||||||||||||||||||||||||||||||||
| Debt instruments: | ||||||||||||||||||||||||||||||||
| Other instruments issued in Chile | 36,596 | 1,084 | (3,168 | ) | 10,212 | (20,453 | ) | 6,399 | (5,467 | ) | 25,203 | |||||||||||||||||||||
| Equity instruments: | ||||||||||||||||||||||||||||||||
| Instruments issued abroad | 91 | — | (66 | ) | — | — | — | — | 25 | |||||||||||||||||||||||
| Subtotal | 36,687 | 1,084 | (3,234 | ) | 10,212 | (20,453 | ) | 6,399 | (5,467 | ) | 25,228 | |||||||||||||||||||||
| Total | 42,181 | 581 | (3,234 | ) | 52,696 | (23,613 | ) | 13,568 | (5,467 | ) | 76,712 | |||||||||||||||||||||
| (1) | It is recorded in the income statement under “Net financial operating income” |
| (2) | It is recorded in Equity under “Other Comprehensive Income” |
F-135
NOTES TO THE CONSOLIDATED FINANCIAL STATEMENTS, continued
| 41. | Fair Value of Financial Assets and Liabilities, continued: |
| (d) | Transfers between levels: |
The following tables show transfers between levels for financial assets and liabilities whose fair value is recorded in the consolidated financial statements:
| Transfers from level 1 to level 2 | ||||
| 2020 | ||||
| Financial assets | MCh$ | |||
| Financial assets held-for-trading instruments | ||||
| From the Chilean Government and Central Bank | 425 | |||
| Instruments issued abroad | ||||
| From the Chilean Government and Central Bank | ― | |||
| Transfers from level 2 to level 1 | ||||
| 2020 | ||||
| Financial assets | MCh$ | |||
| Financial assets held-for-trading instruments | ||||
| From the Chilean Government and Central Bank | 109 | |||
| Instruments issued abroad | ||||
| From the Chilean Government and Central Bank | ― | |||
| Transfers from level 1 to level 2 | ||||
| 2021 | ||||
| Financial assets | MCh$ | |||
| Financial assets held-for-trading instruments | ||||
| From the Chilean Government and Central Bank | 933 | |||
| Financial assets at fair value through OCI | ||||
| From the Chilean Government and Central Bank | ― | |||
| Transfers from level 2 to level 1 | ||||
| 2021 | ||||
| Financial assets | MCh$ | |||
| Financial assets held-for-trading instruments | ||||
| From the Chilean Government and Central Bank | ― | |||
| Financial assets at fair value through OCI | ||||
| From the Chilean Government and Central Bank | ― | |||
F-136
NOTES TO THE CONSOLIDATED FINANCIAL STATEMENTS, continued
| 41. | Fair Value of Financial Assets and Liabilities, continued: |
| (e) | Sensitivity of level 3 instruments to changes in key assumptions of the input parameters for the valuation model: |
The following table shows the impact on the fair value of Level 3 financial instruments using alternative assumptions that are reasonably possible.
It is believed that the positive and negative impacts are similar:
| As of December 31, 2020 | As of December 31, 2021 | |||||||||||||||
| Level 3 | Sensitivity to changes in key assumptions of models | Level 3 | Sensitivity to changes in key assumptions of models | |||||||||||||
| MCh$ | MCh$ | MCh$ | MCh$ | |||||||||||||
| Financial Assets | ||||||||||||||||
| Financial assets held-for-trading | ||||||||||||||||
| Other instruments issued in Chile | 5,494 | (8 | ) | 51,484 | (506 | ) | ||||||||||
| Subtotal | 5,494 | (8 | ) | 51,484 | (506 | ) | ||||||||||
| Financial assets at fair value through OCI | ||||||||||||||||
| Debt instrument: | ||||||||||||||||
| Other instruments issued in Chile | 36,596 | (525 | ) | 25,203 | (782 | ) | ||||||||||
| Equity instrument: | ||||||||||||||||
| Instruments issued abroad | 91 | — | 25 | — | ||||||||||||
| Subtotal | 36,687 | (525 | ) | 25,228 | (782 | ) | ||||||||||
| Total | 42,181 | (533 | ) | 76,712 | (1,288 | ) | ||||||||||
With the purpose of determining the sensitivity of the financial investments to changes in significant market factors, the Bank has made alternative calculations at fair value, changing those key parameters for the valuation and which are not directly observable in screens. In the case of the financial assets listed in the table above, which correspond to Bank Bonds and Corporate Bonds, it was considered that, since there are no current observables prices, the input prices will be based on brokers’ quotes. The prices are usually calculated as a base rate plus a spread. For Local Bonds it was determined to apply a 10% impact on the price, while for the Off Shore Bonds (associated with Chilean domestic issuers as of December 31, 2020 and 2021) it was determined to apply a 10% impact only on the spread, since the base rate is covered by interest rate swaps instruments in the so-called accounting hedges. The 10% impact is considered reasonable, taking into account the market performance of these instruments and comparing it against the bid / offer adjustment that is provisioned by these instruments.
F-137
NOTES TO THE CONSOLIDATED FINANCIAL STATEMENTS, continued
| 41. | Fair Value of Financial Assets and Liabilities, continued: |
| (f) | Other assets and liabilities not measured at fair value: |
The following table summarizes the fair values of the Bank’s main financial assets and liabilities that are not recorded at fair value in the Statement of Financial Position. The values shown in this note do not attempt to estimate the value of the Bank’s income-generating assets, nor forecast their future behavior. The estimated fair value is as follows:
| Book Value | Fair Value | |||||||||||||||
| 2020 | 2021 | 2020 | 2021 | |||||||||||||
| MCh$ | MCh$ | MCh$ | MCh$ | |||||||||||||
| Assets | ||||||||||||||||
| Cash and due from banks | 2,560,216 | 3,713,734 | 2,560,216 | 3,713,734 | ||||||||||||
| Transactions in the course of collection | 163,252 | 326,446 | 163,252 | 326,446 | ||||||||||||
| Investments under resale agreements | 76,407 | 64,365 | 76,407 | 64,365 | ||||||||||||
| Subtotal | 2,799,875 | 4,104,545 | 2,799,875 | 4,104,545 | ||||||||||||
| Loans and advances to banks | ||||||||||||||||
| Domestic banks | 259,788 | 159,987 | 259,788 | 159,987 | ||||||||||||
| Central Bank of Chile | 2,380,033 | 1,090,000 | 2,380,033 | 1,090,000 | ||||||||||||
| Foreign banks | 299,377 | 279,764 | 297,778 | 278,813 | ||||||||||||
| Subtotal | 2,939,198 | 1,529,751 | 2,937,599 | 1,528,800 | ||||||||||||
| Loans to Customers at amortized cost | ||||||||||||||||
| Commercial loans | 17,120,207 | 19,353,491 | 16,968,143 | 18,449,013 | ||||||||||||
| Residential mortgage loans | 9,352,720 | 10,307,542 | 10,075,011 | 9,753,455 | ||||||||||||
| Consumer loans | 3,628,656 | 3,931,344 | 3,711,582 | 3,899,940 | ||||||||||||
| Subtotal | 30,101,583 | 33,592,377 | 30,754,736 | 32,102,408 | ||||||||||||
| Financial instruments at amortized cost | — | 839,744 | — | 764,528 | ||||||||||||
| Total | 35,840,656 | 40,066,417 | 36,492,210 | 38,500,281 | ||||||||||||
| Liabilities | ||||||||||||||||
| Current accounts and other demand deposits | 15,167,229 | 18,542,791 | 15,167,229 | 18,542,791 | ||||||||||||
| Transactions in the course of payment | 882,944 | 210,479 | 882,944 | 210,479 | ||||||||||||
| Obligations under repurchase agreements | 288,917 | 95,009 | 288,917 | 95,009 | ||||||||||||
| Saving accounts and time deposits | 8,899,541 | 9,140,006 | 8,885,015 | 9,145,192 | ||||||||||||
| Borrowings from financial institutions | 3,669,753 | 4,861,865 | 3,415,959 | 4,325,869 | ||||||||||||
| Other financial obligations | 191,713 | 274,618 | 217,311 | 299,452 | ||||||||||||
| Subtotal | 29,100,097 | 33,124,768 | 28,857,375 | 32,618,792 | ||||||||||||
| Debt issued | ||||||||||||||||
| Letters of credit for residential purposes | 6,532 | 4,011 | 7,201 | 4,214 | ||||||||||||
| Letters of credit for general purposes | 254 | 105 | 280 | 110 | ||||||||||||
| Bonds | 7,700,402 | 8,557,279 | 8,390,594 | 8,397,835 | ||||||||||||
| Subordinated bonds | 886,407 | 917,510 | 1,004,196 | 869,364 | ||||||||||||
| Subtotal | 8,593,595 | 9,478,905 | 9,402,271 | 9,271,523 | ||||||||||||
| Total | 37,693,692 | 42,603,673 | 38,259,646 | 41,890,315 | ||||||||||||
Other financial assets and liabilities not measured at their fair value, but for which a fair value is estimated, even if not managed based on such value, include assets and liabilities such as placements, deposits and other time deposits, debt issued, and other financial assets and obligations with different maturities and characteristics. The fair value of these assets and liabilities is calculated using the DCF model and the use of various data sources such as yield curves, credit risk spreads, etc. In addition, as some of these assets and liabilities are not traded on the market, periodic reviews and analyses are required to determine the suitability of the inputs and determined fair values.
F-138
NOTES TO THE CONSOLIDATED FINANCIAL STATEMENTS, continued
| 41. | Fair Value of Financial Assets and Liabilities, continued: |
| (g) | Levels of other assets and liabilities: |
The table below sets forth the fair value of Financial Assets/Liabilities not measured at fair value on the balance sheet, for the years ended December 31, 2020 and 2021:
| Level 1 | Level 2 | Level 3 | Total | |||||||||||||||||||||||||||||
| Estimated Fair Value | Estimated Fair Value | Estimated Fair Value | Estimated Fair Value | |||||||||||||||||||||||||||||
| 2020 | 2021 | 2020 | 2021 | 2020 | 2021 | 2020 | 2021 | |||||||||||||||||||||||||
| MCh$ | MCh$ | MCh$ | MCh$ | MCh$ | MCh$ | MCh$ | MCh$ | |||||||||||||||||||||||||
| Assets | ||||||||||||||||||||||||||||||||
| Cash and due from banks | 2,560,216 | 3,713,734 | — | — | — | — | 2,560,216 | 3,713,734 | ||||||||||||||||||||||||
| Transactions in the course of collection | 163,252 | 326,446 | — | — | — | — | 163,252 | 326,446 | ||||||||||||||||||||||||
| Investments under resale agreements | 76,407 | 64,365 | — | — | — | — | 76,407 | 64,365 | ||||||||||||||||||||||||
| Subtotal | 2,799,875 | 4,104,545 | — | — | — | — | 2,799,875 | 4,104,545 | ||||||||||||||||||||||||
| Loans and advances to banks | ||||||||||||||||||||||||||||||||
| Domestic banks | 259,788 | 159,987 | — | — | — | — | 259,788 | 159,987 | ||||||||||||||||||||||||
| Central Bank of Chile | 2,380,033 | 1,090,000 | — | — | — | — | 2,380,033 | 1,090,000 | ||||||||||||||||||||||||
| Foreign banks | — | — | — | — | 297,778 | 278,813 | 297,778 | 278,813 | ||||||||||||||||||||||||
| Subtotal | 2,639,821 | 1,249,987 | — | — | 297,778 | 278,813 | 2,937,599 | 1,528,800 | ||||||||||||||||||||||||
| Loans to Customers at amortized cost | ||||||||||||||||||||||||||||||||
| Commercial loans | — | — | — | — | 16,968,143 | 18,449,013 | 16,968,143 | 18,449,013 | ||||||||||||||||||||||||
| Residential mortgage loans | — | — | — | — | 10,075,011 | 9,753,455 | 10,075,011 | 9,753,455 | ||||||||||||||||||||||||
| Consumer loans | — | — | — | — | 3,711,582 | 3,899,940 | 3,711,582 | 3,899,940 | ||||||||||||||||||||||||
| Subtotal | — | — | — | — | 30,754,736 | 32,102,408 | 30,754,736 | 32,102,408 | ||||||||||||||||||||||||
| Financial instruments at amortized cost | — | 764,528 | — | — | — | — | — | 764,528 | ||||||||||||||||||||||||
| Total | 5,439,696 | 6,119,060 | — | — | 31,052,514 | 32,381,221 | 36,492,210 | 38,500,281 | ||||||||||||||||||||||||
| Liabilities | ||||||||||||||||||||||||||||||||
| Current accounts and other demand deposits | 15,167,229 | 18,542,791 | — | — | — | — | 15,167,229 | 18,542,791 | ||||||||||||||||||||||||
| Transactions in the course of payment | 882,944 | 210,479 | — | — | — | — | 882,944 | 210,479 | ||||||||||||||||||||||||
| Obligations under repurchase agreements | 288,917 | 95,009 | — | — | — | — | 288,917 | 95,009 | ||||||||||||||||||||||||
| Savings accounts and time deposits | — | — | — | — | 8,885,015 | 9,145,192 | 8,885,015 | 9,145,192 | ||||||||||||||||||||||||
| Borrowings from financial institutions | — | — | — | — | 3,415,959 | 4,325,869 | 3,415,959 | 4,325,869 | ||||||||||||||||||||||||
| Other financial obligations | — | — | — | — | 217,311 | 299,452 | 217,311 | 299,452 | ||||||||||||||||||||||||
| Subtotal | 16,339,090 | 18,848,279 | — | — | 12,518,285 | 13,770,513 | 28,857,375 | 32,618,792 | ||||||||||||||||||||||||
| Debt Issued | ||||||||||||||||||||||||||||||||
| Letters of credit for residential purposes | — | — | 7,201 | 4,214 | — | — | 7,201 | 4,214 | ||||||||||||||||||||||||
| Letters of credit for general purposes | — | — | 280 | 110 | — | — | 280 | 110 | ||||||||||||||||||||||||
| Bonds | — | — | 8,390,594 | 8,397,835 | — | — | 8,390,594 | 8,397,835 | ||||||||||||||||||||||||
| Subordinate bonds | — | — | — | — | 1,004,196 | 869,364 | 1,004,196 | 869,364 | ||||||||||||||||||||||||
| Subtotal | — | — | 8,398,075 | 8,402,159 | 1,004,196 | 869,364 | 9,402,271 | 9,271,523 | ||||||||||||||||||||||||
| Total | 16,339,090 | 18,848,279 | 8,398,075 | 8,402,159 | 13,522,481 | 14,639,877 | 38,259,646 | 41,890,315 | ||||||||||||||||||||||||
F-139
NOTES TO THE CONSOLIDATED FINANCIAL STATEMENTS, continued
| 41. | Fair Value of Financial Assets and Liabilities, continued: |
| (g) | Levels of other assets and liabilities, continued: |
| We | estimate fair values for these assets/liabilities, as follows: |
| ● | Short-term assets and liabilities: For assets and liabilities with short-term maturity, it is assumed that the book values approximate to their fair value. This assumption is applied to the following assets and liabilities: |
Assets | Liabilities | |
| - Cash and due from banks | - Current accounts and other demand deposits | |
| - Transactions in the course of collection | - Transactions in the course of payments | |
| - Investment under resale agreements | - Obligations under repurchase agreements | |
| - Loans and advance to domestic banks |
| ● | Loans to Customers and Advances to foreign banks: Fair value is determined by using the DCF model and internally generated discount rates, based on internal transfer rates derived from our internal transfer price process. Once the present value is determined, we deduct the related loan loss allowances in order to incorporate the credit risk associated with each contract or loan. As we use internally generated parameters for valuation purposes, we categorize these instruments in Level 3. |
| ● | Investment Instruments Until Maturity: The fair value is calculated with the methodology of the Stock Exchange, using the IRR observed in the market. Because the instruments that are in this category correspond to Treasury Bonds that are Benchmark, they are classified in Level 1. |
| ● | Letters of Credit and Bonds: In order to determine the present value of contractual cash flows, we apply the DCF model by using market interest rates that are available in the market, either for the instruments under valuation or instruments with similar features that fit valuation needs in terms of currency, maturities and liquidity. The market interest rates are obtained from third party price providers widely used by the market. As a result of the valuation technique and the quality of inputs (observable) used for valuation, we categorize these financial liabilities in Level 2. |
| ● | Saving Accounts, Time Deposits, Borrowings from Financial Institutions, Subordinated Bonds and Other borrowings financial: The DCF model is used to obtain the present value of committed cash flows by applying a bucket approach and average adjusted discount rates that derived from both market rates for instruments with similar features and our internal transfer price process. As we use internally generated parameters and/or apply significant judgmental analysis for valuation purposes, we categorize these financial liabilities in Level 3. |
F-140
NOTES TO THE CONSOLIDATED FINANCIAL STATEMENTS, continued
| 41. | Fair Value of Financial Assets and Liabilities, continued: |
| (h) | Offsetting of financial assets and liabilities: |
The Bank trades financial derivatives with foreign counterparties using ISDA Master Agreement (International Swaps and Derivatives Association, Inc.), under the laws of the City of New York – USA or London – United Kingdom. The legal framework in these jurisdictions, along with documentation mentioned, allows Banco de Chile the right to anticipate the maturity of the transaction and then, offset the net value of those transactions in case of default of counterparty. Additionally, the Bank has negotiated with these counterparties an additional annex (CSA Credit Support Annex), that includes other credit mitigating factors, such as entering margins on a certain amount of net value of transactions, early termination (optional or mandatory) of transactions at certain dates in the future, coupon adjustment of transaction in exchange for payment of the debtor counterpart over a certain threshold amount, etc.
| Effect of offsetting on balance sheet | Related amount not offset | |||||||||||||||||||||||
| Gross amount | Amounts offset | Net amounts reported on the balance sheet | Financial Instruments | Financial Collateral | Net amount | |||||||||||||||||||
| MCh$ | MCh$ | MCh$ | MCh$ | MCh$ | MCh$ | |||||||||||||||||||
| As of December 31, 2020 | ||||||||||||||||||||||||
| Derivative financial assets | 2,618,004 | — | 2,618,004 | (2,258,554 | ) | (85,614 | ) | 273,836 | ||||||||||||||||
| Derivative financial liabilities | 2,841,653 | — | 2,841,653 | (2,258,554 | ) | (218,329 | ) | 364,770 | ||||||||||||||||
| Effect of offsetting on balance sheet | Related amount not offset | |||||||||||||||||||||||
| Gross amount | Amounts offset | Net amounts reported on the balance sheet | Financial Instruments | Financial Collateral | Net amount | |||||||||||||||||||
MCh$ | MCh$ | MCh$ | MCh$ | MCh$ | MCh$ | |||||||||||||||||||
| As of December 31, 2021 | ||||||||||||||||||||||||
| Derivative financial assets | 2,983,298 | — | 2,983,298 | (2,042,009 | ) | (327,840 | ) | 613,449 | ||||||||||||||||
| Derivative financial liabilities | 2,773,476 | — | 2,773,476 | (2,042,009 | ) | (275,191 | ) | 456,276 | ||||||||||||||||
F-141
NOTES TO THE CONSOLIDATED FINANCIAL STATEMENTS, continued
| 42. | Maturity of Assets and Liabilities: |
The table below shows the classification of assets and liabilities as current and non-current as the balance sheet is presented in the order of liquidity without indicating this information:
| 2020 | ||||||||||||||||||||||||||||||||||||||||
| Demand | Up to 1 month | Over 1 month and up to 3 months | Over 3 month and up to 12 months | Subtotal up to 1 year | Over 1 year and up to 3 years | Over 3 year and up to 5 years | Over 5 years | Subtotal over 1 year | Total | |||||||||||||||||||||||||||||||
| MM$ | MM$ | MM$ | MM$ | MM$ | MM$ | MM$ | MM$ | MM$ | MM$ | |||||||||||||||||||||||||||||||
| Assets | ||||||||||||||||||||||||||||||||||||||||
| Cash and due from banks | 2,560,216 | — | — | — | 2,560,216 | — | — | — | — | 2,560,216 | ||||||||||||||||||||||||||||||
| Transactions in the course of collection | — | 163,252 | — | — | 163,252 | — | — | — | — | 163,252 | ||||||||||||||||||||||||||||||
| Financial Assets held-for-trading | — | 4,666,156 | — | — | 4,666,156 | — | — | — | — | 4,666,156 | ||||||||||||||||||||||||||||||
| Investments under resale agreements | — | 39,095 | 20,591 | 16,721 | 76,407 | — | — | — | — | 76,407 | ||||||||||||||||||||||||||||||
| Derivative instruments | — | 131,978 | 211,871 | 423,431 | 767,280 | 593,691 | 405,153 | 851,880 | 1,850,724 | 2,618,004 | ||||||||||||||||||||||||||||||
| Loans and advances to banks (*) | — | 2,743,134 | 71,401 | 125,121 | 2,939,656 | — | — | — | — | 2,939,656 | ||||||||||||||||||||||||||||||
| Loans to customers at amortized cost (*) | — | 3,135,874 | 2,173,685 | 5,791,178 | 11,100,737 | 6,876,058 | 3,711,756 | 9,249,139 | 19,836,953 | 30,937,690 | ||||||||||||||||||||||||||||||
| Financial Assets at Fair Value through Other Comprehensive Income | — | 78,180 | 140,367 | 487,075 | 705,622 | 162,683 | 16,856 | 182,992 | 362,531 | 1,068,153 | ||||||||||||||||||||||||||||||
| Financial instruments at amortized cost | — | — | — | — | — | — | — | — | — | — | ||||||||||||||||||||||||||||||
| Total financial assets | 2,560,216 | 10,957,669 | 2,617,915 | 6,843,526 | 22,979,326 | 7,632,432 | 4,133,765 | 10,284,011 | 22,050,208 | 45,029,534 | ||||||||||||||||||||||||||||||
F-142
NOTES TO THE CONSOLIDATED FINANCIAL STATEMENTS, continued
| 42. | Maturity of Assets and Liabilities, continued: |
| 2021 | ||||||||||||||||||||||||||||||||||||||||
| Demand | Up to 1 month | Over 1 month and up to 3 months | Over 3 month and up to 12 months | Subtotal up to 1 year | Over 1 year and up to 3 years | Over 3 year and up to 5 years | Over 5 years | Subtotal over 1 year | Total | |||||||||||||||||||||||||||||||
| MM$ | MM$ | MM$ | MM$ | MM$ | MM$ | MM$ | MM$ | MM$ | MM$ | |||||||||||||||||||||||||||||||
| Assets | ||||||||||||||||||||||||||||||||||||||||
| Cash and due from banks | 3,713,734 | — | — | — | 3,713,734 | — | — | — | — | 3,713,734 | ||||||||||||||||||||||||||||||
| Transactions in the course of collection | — | 326,446 | — | — | 326,446 | — | — | — | — | 326,446 | ||||||||||||||||||||||||||||||
| Financial Assets held-for-trading | — | 3,876,695 | — | — | 3,876,695 | — | — | — | — | 3,876,695 | ||||||||||||||||||||||||||||||
| Investments under resale agreements | — | 37,763 | 14,013 | 12,589 | 64,365 | — | — | — | — | 64,365 | ||||||||||||||||||||||||||||||
| Derivative instruments | — | 81,336 | 235,071 | 703,543 | 1,019,950 | 651,610 | 400,466 | 911,272 | 1,963,348 | 2,983,298 | ||||||||||||||||||||||||||||||
| Loans and advances to banks (*) | — | 1,366,332 | 81,053 | 81,457 | 1,528,842 | 990 | — | — | 990 | 1,529,832 | ||||||||||||||||||||||||||||||
| Loans to customers at amortized cost (*) | — | 3,602,722 | 2,492,113 | 6,415,681 | 12,510,516 | 7,627,207 | 4,002,539 | 10,125,611 | 21,755,357 | 34,265,873 | ||||||||||||||||||||||||||||||
| Financial Assets at Fair Value through Other Comprehensive Income | — | 92,654 | 475,406 | 1,008,858 | 1,576,918 | 836,880 | 124,380 | 522,996 | 1,484,256 | 3,061,174 | ||||||||||||||||||||||||||||||
| Financial instruments at amortized cost | — | — | — | — | — | — | 413,599 | 426,145 | 839,744 | 839,744 | ||||||||||||||||||||||||||||||
| Total financial assets | 3,713,734 | 9,383,948 | 3,297,656 | 8,222,128 | 24,617,466 | 9,116,687 | 4,940,984 | 11,986,024 | 26,043,695 | 50,661,161 | ||||||||||||||||||||||||||||||
| (*) | The respective provisions, which amount to Ch$836,107 million and Ch$673,496 million in 2020 and 2021, respectively, for loans to customers and Ch$458 million and Ch$81 million for loans and advances to banks, have not been deducted from these balances. |
F-143
NOTES TO THE CONSOLIDATED FINANCIAL STATEMENTS, continued
| 42. | Maturity of Assets and Liabilities, continued: |
| 2020 | ||||||||||||||||||||||||||||||||||||||||
| Demand | Up to 1 month | Over 1 month and up to 3 months | Over 3 month and up to 12 months | Subtotal up to 1 year | Over 1 year and up to 3 years | Over 3 year and up to 5 years | Over 5 years | Subtotal over 1 year | Total | |||||||||||||||||||||||||||||||
| MM$ | MM$ | MM$ | MM$ | MM$ | MM$ | MM$ | MM$ | MM$ | MM$ | |||||||||||||||||||||||||||||||
| Liabilities | ||||||||||||||||||||||||||||||||||||||||
| Current accounts and other demand deposits | 15,167,229 | — | — | — | 15,167,229 | — | — | — | — | 15,167,229 | ||||||||||||||||||||||||||||||
| Transactions in the course of payment | — | 882,944 | — | — | 882,944 | — | — | — | — | 882,944 | ||||||||||||||||||||||||||||||
| Obligations under repurchase agreements | — | 288,874 | 43 | — | 288,917 | — | — | — | — | 288,917 | ||||||||||||||||||||||||||||||
| Savings accounts and time deposits (**) | — | 5,909,865 | 1,945,177 | 642,125 | 8,497,167 | 58,441 | 1,232 | 151 | 59,824 | 8,556,991 | ||||||||||||||||||||||||||||||
| Derivative instruments | — | 185,093 | 243,096 | 442,551 | 870,740 | 666,493 | 427,190 | 877,230 | 1,970,913 | 2,841,653 | ||||||||||||||||||||||||||||||
| Borrowings from financial institutions | — | 76,018 | 141,809 | 341,188 | 559,015 | 1,020,138 | 2,090,600 | — | 3,110,738 | 3,669,753 | ||||||||||||||||||||||||||||||
| Debt issued: | ||||||||||||||||||||||||||||||||||||||||
| Mortgage bonds | — | 806 | 793 | 1,714 | 3,313 | 2,321 | 838 | 314 | 3,473 | 6,786 | ||||||||||||||||||||||||||||||
| Bonds | — | 220,455 | 113,448 | 891,973 | 1,225,876 | 1,704,497 | 1,586,221 | 3,183,808 | 6,474,526 | 7,700,402 | ||||||||||||||||||||||||||||||
| Subordinate bonds | — | 3,547 | 1,221 | 113,397 | 118,165 | 29,354 | 16,688 | 722,200 | 768,242 | 886,407 | ||||||||||||||||||||||||||||||
| Other financial obligations | — | 191,303 | 40 | 163 | 191,506 | 189 | 18 | — | 207 | 191,713 | ||||||||||||||||||||||||||||||
| Lease liabilities | — | 2,271 | 4,621 | 20,025 | 26,917 | 39,697 | 19,424 | 28,979 | 88,100 | 115,017 | ||||||||||||||||||||||||||||||
| Total financial liabilities | 15,167,229 | 7,761,176 | 2,450,248 | 2,453,136 | 27,831,789 | 3,521,130 | 4,142,211 | 4,812,682 | 12,476,023 | 40,307,812 | ||||||||||||||||||||||||||||||
F-144
NOTES TO THE CONSOLIDATED FINANCIAL STATEMENTS, continued
| 42. | Maturity of Assets and Liabilities, continued: |
| 2021 | ||||||||||||||||||||||||||||||||||||||||
| Demand | Up to 1 month | Over 1 month and up to 3 months | Over 3 month and up to 12 months | Subtotal up to 1 year | Over 1 year and up to 3 years | Over 3 year and up to 5 years | Over 5 years | Subtotal over 1 year | Total | |||||||||||||||||||||||||||||||
| MM$ | MM$ | MM$ | MM$ | MM$ | MM$ | MM$ | MM$ | MM$ | MM$ | |||||||||||||||||||||||||||||||
| Liabilities | ||||||||||||||||||||||||||||||||||||||||
| Current accounts and other demand deposits | 18,542,791 | — | — | — | 18,542,791 | — | — | — | — | 18,542,791 | ||||||||||||||||||||||||||||||
| Transactions in the course of payment | — | 210,479 | — | — | 210,479 | — | — | — | — | 210,479 | ||||||||||||||||||||||||||||||
| Obligations under repurchase agreements | — | 87,667 | 4 | 7,338 | 95,009 | — | — | — | — | 95,009 | ||||||||||||||||||||||||||||||
| Savings accounts and time deposits (**) | — | 6,640,986 | 1,748,178 | 234,675 | 8,623,839 | 65,552 | 1,906 | 452 | 67,910 | 8,691,749 | ||||||||||||||||||||||||||||||
| Derivative instruments | — | 34,931 | 226,057 | 713,279 | 974,267 | 644,452 | 399,499 | 755,258 | 1,799,209 | 2,773,476 | ||||||||||||||||||||||||||||||
| Borrowings from financial institutions | — | 196,093 | 1,259,282 | 18,344 | 1,473,719 | 3,388,146 | — | — | 3,388,146 | 4,861,865 | ||||||||||||||||||||||||||||||
| Debt issued: | ||||||||||||||||||||||||||||||||||||||||
| Mortgage bonds | 528 | 544 | 1,066 | — | 2,138 | 1,425 | 185 | 368 | 1,978 | 4,116 | ||||||||||||||||||||||||||||||
| Bonds | 139,874 | 374,532 | 848,924 | — | 1,363,330 | 1,933,284 | 1,784,606 | 3,476,059 | 7,193,949 | 8,557,279 | ||||||||||||||||||||||||||||||
| Subordinate bonds | 4,227 | 1,390 | 112,859 | — | 118,476 | 19,979 | 15,854 | 763,201 | 799,034 | 917,510 | ||||||||||||||||||||||||||||||
| Other financial obligations | — | 274,413 | 25 | 90 | 274,528 | 90 | — | — | 90 | 274,618 | ||||||||||||||||||||||||||||||
| Lease liabilities | 2,312 | 6,586 | 17,502 | — | 26,400 | 29,056 | 16,449 | 23,765 | 69,270 | 95,670 | ||||||||||||||||||||||||||||||
| Total financial liabilities | 18,689,732 | 7,827,621 | 4,213,897 | 973,726 | 31,704,976 | 6,081,984 | 2,218,499 | 5,019,103 | 13,319,586 | 45,024,562 | ||||||||||||||||||||||||||||||
| (**) | Excludes term saving accounts, which amount to Ch$448,257 million (Ch$342,550 million in December 2020 |
F-145
NOTES TO THE CONSOLIDATED FINANCIAL STATEMENTS, continued
| 43. | Risk Management: |
| (1) | Introduction |
Banco de Chile seeks to maintain a risk profile that support the sustainable growth of its activity and that is aligned with its strategic objectives, in order to maximize value creation and guarantee its long-term solvency.
Our risk management policies are established in order to identify and analyze the risks faced by the Bank, set appropriate risk limits, alerts and controls, monitor risks and compliance with limits and alerts in order to carry out the necessary action plans. Through its administration policies and procedures, the Bank develops a disciplined and constructive control environment. Policies as well as risk management standards, procedures and systems are regularly reviewed.
For this, the Bank has teams with extensive experience and knowledge in each area associated with risks, ensuring comprehensive and consolidated management of the same, including the Bank and its subsidiaries.
| (a) | Risk Management Structure |
Credit, Market and Operational Risk Management are in place at all levels of the Organization, with a Corporate Governance structure that recognizes the relevance of the different risk areas that exist.
The Board of Directors of Banco de Chile is responsible for establishing the policies, the risk appetite framework, the guidelines for the development, validation and monitoring of models. Similarly, it approves the provision models and pronounces annually on the sufficient provisions. For its part, the Administration is responsible both for the establishment of standards and associated procedures as well as for the control and compliance with the decisions of the Board of Directors.
The Bank’s Corporate Governance considers the active participation of the Board, either directly or through different committees made up of Directors and Senior Management. It is permanently informed of the evolution of the different risk areas, participating through its Finance, International and Financial Risk, Credit, Portfolio Risk Committee and Higher Operational Risk Committee, in which the status of credit, market and operational risks are reviewed. These committees are described in the next paragraphs.
The Wholesale Credit Risk Division, the Retail Credit Risk and Global Risk Control Division and the Cybersecurity Division develop risk Management jointly, which constitute the corporate risk governance structure, which, by having highly experienced and specialized teams, together with a robust regulatory framework, allow optimal and effective management of the matters they address.
The Wholesale Credit Risk Division and the Retail Credit Risk and Global Risk Control Division are responsible for credit risk in the admission, monitoring and recovery phases for the different business segments. Additionally, the Wholesale Credit Risk Division has a Market Risk Area that performs the function of measuring, limiting, controlling and reporting said risk together with the definition of valuation and management standards for the Bank’s assets and liabilities.
In turn, in the Retail Credit Risk and Global Risk Control Division, the Admissions Area, among its functions, develops the regulatory framework in matters of credit risk, and the Risk Models Area, which develops the different methodologies related to credit risk. Likewise, in this Division, the monitoring and validation of models are carried out by the respective areas that deal with these matters, ensuring the independence of the function across the organization.
F-146
NOTES TO THE CONSOLIDATED FINANCIAL STATEMENTS, continued
| 43. | Risk Management, continued: |
| (1) | Introduction, continued: |
| (a) | Risk Management Structure, continued: |
This Division also has the Operational Risk and Business Continuity Areas, in charge of managing and supervising the application of the policies, rules and procedures in each of these areas within the Bank and Subsidiaries. The Operational Risk Area is in charge of guaranteeing the identification and efficient management of operational risks and promoting a culture in terms of risks to prevent financial losses and improve the quality of our processes, as well as proposing continuous improvements to risk management, aligned with business objectives. In addition to the above, the Business Continuity Area aims to manage the strategy and control of business continuity in the operational and technological field for the Bank, maintaining alternative operation plans and controlled tests to reduce the impact of disruptive events that may affect the organization. Both in Operational Risk and in Business Continuity, its methodologies, controls and scope are applied at the Banco de Chile level and are replicated in the subsidiaries, guaranteeing their consistency to the Bank’s global management model.
For its part, the Cybersecurity Division is responsible for defining, implementing and reporting the progress of the Strategic Cybersecurity Plan in line with the Bank’s business strategy, one of its main focuses being to protect internal information, that of its customers and collaborators.
This Division is made up of the Cybersecurity, Cyberdefense and Technological Risk Engineering Management Teams, as well as the Strategic Management and Assurance Deputy Manager.
The Cyber Defense Management is responsible for safeguarding information assets by detecting, responding to, and containing threats. The Engineering Management is in charge of defining, implementing and maximizing existing protection technologies against cyber threats, and defining and maintaining the security architecture. The Technological Risk Management is responsible for identifying, evaluating, treating and report information security risks, technological and cybersecurity, this includes the management of technological risks in the Bank’s projects. The Strategic Management Deputy Manager is responsible for defining and managing the Cybersecurity Project Plan in line with the Bank’s Strategic Plan, guaranteeing the effective and efficient use of resources, and imparting and controlling the Cybersecurity guidelines to suppliers. Finally, the Assurance Deputy Manager is responsible for reviewing compliance with the Strategic Plan, the policies, procedures and the regulatory framework regarding, as well as to develop and implement the Cybersecurity Awareness Program.
| (i) | Finance, International and Financial Risk Committee |
This committee functions are to design policies and procedures related to price and liquidity risk; design a structure of limits and alerts of financial exposures, review the proposal to the Board of Directors of the Risk Appetite Framework, and ensure a correct and timely measurement, control and reporting thereof; track exposures and financial risks; analyze impacts on the valuation of operations and / or results due to potential adverse movements in the values of market variables or liquidity narrowness; review the stress test assumptions and establish action plans where appropriate ; ensure the existence of independent units that value financial positions, and analyze the results of financial positions; review and approve the Comprehensive Risk Measurement in the area of market and liquidity risk; track the international financial exposure of liabilities; review the main credit exposures of Treasury products (derivatives, bonds); ensure that the management guidelines for price and liquidity risks in subsidiaries are consistent with those of the Bank, and be aware of the evolution of their main financial risks.
The Finance, International and Financial Risk Committee’s monthly session is comprised of the Chairman of the Board, four Directors or Advisors to the Board, General Manager, Financial Management and Control Division Manager, Wholesale Credit Risk Division Manager, Treasury Division Manager and Market Risk Area Manager. If deemed appropriate, the Committee may invite certain persons to participate, on a permanent or occasional basis, in one or more sessions.
F-147
NOTES TO THE CONSOLIDATED FINANCIAL STATEMENTS, continued
| 43. | Risk Management, continued: |
| (1) | Introduction, continued: |
| (a) | Risk Management Structure, continued: |
| (ii) | Credit Committees |
The credit approval process is done mainly through various credit committees, which are composed of qualified professionals and with the sufficient attributions to take the required decisions.
Each committee is responsible for defining the terms and conditions under which the Bank accepts counterparty risks and the Wholesale Credit Risk and Retail Credit Risk Divisions and Global Risk Control participate independently and autonomously of the commercial areas. They are constituted according to the commercial segments and the amounts to approve and have different meeting periodicities.
Within the risk management structure of the Bank, the maximum approval instance is the Credit Committee of Directors. Sessions are held weekly and are comprised of the Chairman of the Board, regular and alternate directors, General Manager and the Wholesale Credit Risk Division Manager. This Committee is responsible for knowing, analyzing and resolving all credit operations associated with clients and / or economic groups whose total amount subject for approval is equal to or greater than UF 750,000. It also has to know, analyze and resolve all those credit operations that, in accordance with the established in the Bank’s internal rules, must be approved by this Committee, with the exception of the special powers delegated by the Board to the Administration.
| (iii) | Portfolio Risk Committee |
The main function is to know the evolution of the composition, concentration and risk of the loan portfolio of the different banks and segments, covering the complete cycle of credit risk management with the processes of admission, monitoring and recovery of the credits granted. Review the main debtors and the different risk indicators of the portfolio, proposing differentiated management strategies. Approves and proposes to the Board the different credit risk policies. It is responsible for reviewing, approving and recommending to the Board of Directors, for its final approval, the different portfolio evaluation methodologies and provision models. It is also responsible for reviewing, analyzing the adequacy of provisions for the different banks and segments, as well as reviewing the guidelines and methodological advances for the development of internal models of credit risk, together with monitoring the concentration by sectors and segments according to the sectoral limits policy. This committee reviews and approves both the Comprehensive Risk Measurement (CRM) and the Credit Risk Appetite Framework (RAF) in the area of credit risk, ensuring their due approval by the Board of Directors, defines the metrics that are part of the Risk Appetite Framework and their acceptable levels and verifies the consistency of the credit risk policies of the subsidiaries in relation to those of the Bank, controls them globally and becomes aware of the credit risk management carried out by the subsidiaries. In general, this committee is responsible for knowing and analyzing any relevant aspect in matters of Credit Risk in the portfolio of Banco de Chile.
The Portfolio Risk Committee meets monthly and is comprised of the Chairman of the Board, two regular and alternate Directors, General Manager, Wholesale Credit Risk Division Manager, Retail Credit Risk Division Manager and Global Risk Control, Commercial Division Manager, Risk Management and Information Control Manager.
F-148
NOTES TO THE CONSOLIDATED FINANCIAL STATEMENTS, continued
| 43. | Risk Management, continued: |
| (1) | Introduction, continued: |
| (a) | Risk Management Structure, continued: |
| (iv) | Technical Committee for the Supervision of Internal Models |
The main function of the Committee is to provide a framework of methodological guidelines for the development, follow-up and documentation of the mathematical models that are used in the massive segments for credit risk management, such as Management Models (Admission, Follow-up, Collection and Rating, among others) and the regulatory models (Capital and Provisions, specific for credit risk or additional, under local or international regulations), among others. The Committee may exceptionally evaluate additional methodologies, other than those related to credit risk, at the request of its Chairman.
The Committee has the functions of defining the main criteria and guidelines to be used for the construction of new models; reviewing and approving methodologies associated with non-regulatory models (eg admission, collection), which must be submitted for the consideration of the Portfolio Risk Committee, so that it can rule on their ratification; In the case of regulatory models, the Technical Committee is limited to their review, leaving approval in the hands of the Portfolio Risk Committee and the Board of Directors; establishing minimum standards to monitor the quality of internal models; and establishing the minimum standards to document the different areas related to the development, construction, monitoring, and operation of the models.
In terms of its composition, it is comprised of the manager of the Retail Credit Risk and Global Risk Control Division, the managers of the Risk Monitoring, Studies and Management, People Business Development, Risk Models Areas, by the Deputy Managers of Retail Monitoring and Models, of Big Data and Regulatory Systems, of Validation of Risk Models, of Pre-approved Admission, of Regulatory Models, of Management and Infrastructure Models and of the Head of the Personnel Risk Department. The Committee meets monthly.
| (v) | Capital Management Committee |
This committee meets quarterly and is comprised of two members of the Board of Directors; the General Manager; the Financial Management and Control Division Manager; the Wholesale Credit Risk Division Manager; the Retail Credit Risk and Global Risk Control Division Manager; and the Treasury and Capital Financial Control Area Manager. The President of the Committee is a member of the Board of Directors. In case of absence of the Chairman, other members of the Board of Directors may act in his place.
The Capital Management Committee’s main function is to monitor and supervise the capital management of the Bank and its subsidiaries, and ensure its compliance in accordance with the Corporate Capital Management Policy and related regulations, being responsible for: (i) reviewing and updating the Corporate Capital Management Policy, at least annually, (ii) reviewing and updating the complementary documentation associated with capital management, at least annually, (iii) ensuring that the Bank has sufficient capital to meet both its current needs and those arising from stress scenarios, over a three-year horizon, (iv) reviewing and validating, on an annual basis, the Capital Plan and propose an Internal Regulatory Capital Objective for approval by the Board of Directors, (v) reviewing the results of the Stress Tests, the Risk Appetite Framework (“MAR”) and the Self-Assessment Report of Capital Stock, (vi) periodically monitoring the different metrics defined for the Bank’s capital management, as well as the variables that affect those parameters, (vii) keeping the Board of Directors informed of compliance with the capital plan, the Business and Capital MAR, as well as the evolution of the variables that affect capital management, (viii) proposing the activation and supervising the execution of the Contingency Plans associated with possible breaches of the Business and Capital MAR, prior to its approval by the Board of Directors, as well as annually reviewing updates to them, (ix) reviewing the results of the validation of the models associated with capital management and quarterly monitoring the status of the observations generated from the validations, and (x) being aware of the results of the internal control evaluation of the Capital Self-Assessment Process, prior to the issuance of the Regulatory Capital Self-Assessment Report.
F-149
NOTES TO THE CONSOLIDATED FINANCIAL STATEMENTS, continued
| 43. | Risk Management, continued: |
| (1) | Introduction, continued: |
| (b) | Measurement Methodology |
Regarding Credit Risk, provision levels and portfolio expenses are the basic measures for determining the credit quality of our portfolio.
Banco de Chile permanently evaluates its loan portfolio, timely recognizing the associated level of risk of the loan portfolio. For this, there are specific guidelines for the development of provision models under local regulations in accordance with the instructions issued by the CMF, as well as under IFRS 9 and stress tests; these guidelines and the models developed are approved by the Board of Directors.
As a result of this evaluation, on both wholesale and retail portfolios, the level of provisions that the bank should constitute is determined, in the event of customers payment default.
The wholesale portfolio encompases companies that due to their size, complexity or indebtedness, require a more detailed level of knowledge and a case-by-case analysis. Each debtor is assigned one of the 16 risk categories, in order to establish the provisions in a timely and appropriate manner. The review of the portfolio risk classifications is carried out permanently considering the financial situation, payment behavior and the environment of each client.
The retail portfolio encompases natural persons and smaller companies. These assessments are carried out monthly through statistical models that allow estimating the appropriate level of provisions necessary to cover the portfolio risk. The consistency of the models is analyzed through an independent validation of the unit that develops them and, subsequently, through the analysis of retrospective tests that allow to compare the real losses with the expected ones.
During 2021, the Bank continued to monitor the performance of its models and made adjustments when it was deemed necesary. As a result, the Bank foresees lower short-term PDs that will converge to its long-term level in the short run, higher levels of LoC and Credit Card utilization in the medium term, and more severe LGDs in the long term,
Each year, the Board of Directors is presented with the results of a sufficiency test for allowances for loan losses. This test shows whether the Bank’s existing level of allowances for loan losses, both for the wholesale and retail portfolios, is sufficient, based on historic losses or impairment experienced by the portfolio. The Board of Directors must issue a formal opinion on its sufficiency. The sufficiency test of the Chilean GAAP allowance and the related review by the Board of Directors has not resulted in supplementary provisions for our Chilean GAAP allowance. Due to the fact that our IFRS impairment model leverages our existing Chilean GAAP models, any adjustment to the latter would have an impact on our allowances, which has not happened.
The monitoring and control of risks are carried out mainly based on limits established by the Board of Directors. These limits reflect the Bank’s business and market strategy, as well as the level of risk that it is willing to accept, with additional emphasis on the selected industries.
F-150
NOTES TO THE CONSOLIDATED FINANCIAL STATEMENTS, continued
| 43. | Risk Management, continued: |
| (2) | Credit Risk: |
Credit risk considers the likelihood that the counterparty in the credit operation will not be able to fulfill its contractual obligation due to incapacity or financial insolvency, and this leads to a potential credit loss.
The Bank seeks an adequate risk-return relation and an appropriate balance of the risks assumed, through a permanent credit risk management considering the processes of admission, monitoring and recovery of the loans granted. Likewise, it continuously manages risk knowledge, from a comprehensive approach, in order to contribute to the business and anticipate threats that could damage the solvency, quality of the portfolio, cultivating a unique risk culture in the Corporation.
The foregoing has the permanent challenge of establishing a risk management framework for the different business segments served by the Bank, responding to regulatory requirements and commercial dynamism, being part of the digital transformation, and contributing from the perspective of risks to the various businesses addressed, through a vision of the portfolio that allows managing, resolving and controlling the business approval process efficiently and proactively.
In the business segments, the application of additional management processes is taken into consideration, to the extent required, for those financing requests that that will have a greater exposure to environmental and/or social risks.
In this respect, the Bank integrates the socio-environmental criteria in its evaluations for the granting of financing destined to the development of projects, whether national or regional and that can generate an impact of this type, where they are executed. For the financing of projects, they must have the corresponding permits, authorizations, patents and studies, according to the impact they generate. In addition, the Bank has specialized units for serving large clients, through which the financing of project development is concentrated, including those of Public Works concessions that contemplate the construction of infrastructure, mining, electrical, real estate developments that can generate an environmental impact.
Credit policies and processes materialize in the following management principles, which are addressed with a specialized approach according to the characteristics of the different markets and segments served, recognizing the singularities of each one of them:
| 1. | Apply a rigorous evaluation in the admission process, based on established credit policies, standards and procedures, together with the availability of sufficient and accurate information. Thus, it corresponds to analyze the generation of flows and solvency of the client to meet their payment commitments and, when the characteristics of the operation merit it, must constitute adequate collateral that allow mitigating the risk incurred with the client. |
| 2. | Have permanent and robust portfolio tracking processes, through systems that alert both the potential signs of impairment of clients, with respect to the conditions of origin, as well as with respect to possible business opportunities with those that present a better payments quality and behavior. |
| 3. | Develop credit risk modeling guidelines, both in regulatory aspects (provisions, capital, stress tests) and management (admission, management, collection), for efficient decision-making at different stages of the credit process. |
| 4. | Have a collection structure with timely, agile and effective processes that allow management to be carried out in accordance with the different types of clients and the types of breaches that arise, always in strict adherence to the regulatory framework and the Bank’s reputational definitions. |
| 5. | Maintain an efficient administration in the organization of work, tools and availability of information that allow an optimal credit risk management. |
Based on these management principles, the credit risk divisions contribute to the business and anticipate threats that may affect the solvency and quality of the portfolio. In particular, during the years 2020 and 2021 the solidity of these principles and the role of credit risk have made it possible to respond adequately to the challenges derived from the pandemic, providing timely responses to clients while maintaining the solid fundamentals that characterize the Bank’s portfolio in its different segments and products.
F-151
NOTES TO THE CONSOLIDATED FINANCIAL STATEMENTS, continued
| 43. | Risk Management, continued: |
| (2) | Credit Risk, continued: |
In continuity with the previous year, various measures to support clients have been implemented, such as participation in the loan program associated with the Fogape Fund - Reactivation, Law No. 21,299 on the postponement of mortgage loan installments and relaxation of collection, among others, with the aim of temporarily making payment conditions more flexible and supporting clients with new facilities to cover their needs arising from the existing health contingency.
Within the framework of risk management, during this year, a permanent and focused monitoring of the portfolios and the results of the temporary measures implemented has continued.
In the interest of the developing and strengthening a risk culture in the Bank, the training and education of executives has been promoted in 2021, diffusing risk knowledge from a comprehensive perspective. Training has thus been carried out for commercial and risk company executives in matters of environmental and social risks in order to further ensure that these factors and their impacts are taken into account in the credit analysis and evaluation processes. Specifically, employees from various areas were trained in the Socio-environmental Risk Analysis course taught by the United Nations Environment Programme Finance Initiative (UNEP FI).
| (a) | Retail Segment |
In these segments, admission management is carried out mainly through a risk evaluation that uses scoring tools and an adequate credit attribution model to approve each operation. These evaluations take into consideration the level of indebtedness, payment capacity and the maximum acceptable exposure for the client.
For these segments, the Bank’s risk functions are segregated and distributed in the following areas:
| − | Retail Admission and Regulatory Area, performs the evaluation of operations and clients, with specialization by products and segments. It also maintains a framework of policies and standards that ensure the quality of the portfolio according to the desired risk, defining guidelines for the admission of clients and their respective establishment of parameters in the evaluation systems. These definitions are released to commercial and risk areas through programs and continuous training, and their application is monitored through credit review processes. |
| − | Model Area, is responsible for developing, maintaining and updating credit risk models, whether for regulatory or management uses, in accordance with local and international regulations, determining the most appropriate functional specifications and statistical techniques for the development of the required models. These models are validated by the Model Validation Area and presented to the corresponding government bodies, such as the “Technical Committee for the Supervision and Development of Internal Models”, the Portfolio Risk Committee or the Board of Directors, as appropriate. |
| − | Retail Tracking and Models Area, is in charge of measuring the behavior of portfolios especially through the monitoring of the main indicators of the aggregate portfolio and the analysis of layers, reported in management reports, generating relevant information for decision-making in different instances defined. Also, special follow-ups are generated according to relevant events in the environment. |
This Area also ensures that the different strategies executed meet the risk quality objectives that determined their implementation. Additionally, through the model monitoring function, they monitor the risk models, ensuring compliance with the defined standards to ensure their predictive and discriminating power, identifying the possible associated risks.
F-152
NOTES TO THE CONSOLIDATED FINANCIAL STATEMENTS, continued
| 43. | Risk Management, continued: |
| (2) | Credit Risk, continued: |
| (a) | Retail Segment, continued: |
| − | Models Validation Area, is responsible for performing an independent review of the credit and treasury risk models, both in the construction and implementation stages. It considers the validation of compliance with the guidelines established by the Board of Directors, addressing aspects such as governance, data quality, modeling and implementation techniques, and documentation. The results of the review are presented and placed in consideration of the respective Committees, as appropriate. |
| − | Collection Area performs a cross-collection management in the Bank and centralizes recovery management in retail segments through Socofin, Bank’s subsidiary. Define refinancing criteria and payment agreements with customers, maintaining an adequate risk-return ratio, together with the incorporation of robust tools for a differentiated collection management according to the institutional policies. |
| (b) | Wholesale Segment |
In these segments, admission management is carried out through an individual evaluation of the client and the relationship of the rest of the group with the Bank is also considered if it belongs to a group of companies. This individual evaluation - and group if applicable - considers, among others, generation capacity, financial capacity with emphasis on equity solvency, exposure levels, industry variables, evaluation of partners and management, and aspects of the operation such as financing structure, term, products and possible collaterals.
A rating model that allows greater homogeneity in the evaluation of the client and the group supports the indicated evaluation. This evaluation also includes specialized areas in some segments that by their nature require expert knowledge, such as real estate, construction, agriculture, financial, international, among others.
In a centralized manner, a permanent monitoring of the portfolio is carried at the individual level of business segments and economic sectors, based on periodically updated information from both the client and the industry. Through this process, alerts are generated that ensure the correct and timely recognition of the risk of the individual portfolio and that the special conditions established in the admission stage are monitored, such as controls of financial covenants, coverage of certain collaterals and conditions imposed at the time of approval.
Additionally, within the Admission areas, joint monitoring tasks are carried out that allow monitoring the development of operations from their gestation to their recovery, with the aim of ensuring the correct and timely identification of portfolio risks, and to manage in advance those cases with higher risk levels.
Upon detection of clients that show signs of impairment or default with any condition, the commercial area to which the client belongs, together with the Wholesale Credit Risk Division, establish action plans for their regularization. In those more complex cases where specialized management is required, the Special Assets Management area, belonging to the Wholesale Credit Risk Division, is directly in charge of collection management, establishing action plans and negotiations based on the particular characteristics of each client.
F-153
NOTES TO THE CONSOLIDATED FINANCIAL STATEMENTS, continued
| 43. | Risk Management, continued: |
| (2) | Credit Risk, continued |
| (c) | Derivative Transactions |
We produce own models which are used for credit risk management purposes, known as the pre-settlement exposure (PSE). Generally, the PSE is computed as follows:
PSE = Maximum (CMTM + CEF * Notional, 0)
CMTM: Current Mark-to-Market of the transaction
Notional: Transaction notional amount
CEF: Credit Exposure Factor, which reflects the peak exposure within the life of the transaction, under 95% of confidence level.
The portfolio approach is taken into account when computing exposures of several transactions closed with one single counterpart.
Credit mitigating conditions for derivative transactions have become popular in the local financial markets. There are financial institutions that have accepted early termination clauses, and netting is also possible with corporations when appropriate documentation under a regular Master Agreement is signed.
Collateral agreements have been requested by certain banks for inter-banking transactions within other financial institutions, but its effective application under Chilean Law make advisable not to include it in the exposure measurement.
Derivative transactions closed with counterparts residing abroad (mostly global banks) are documented utilizing ISDA and CSA. Netting and cash collateral above a certain threshold level are the typical credit mitigations schemes in place for this kind of transactions.
This metric is used for measuring, limiting, controlling and reporting credit exposures by counterparty.
| (d) | Portfolio Concentration: |
The maximum exposure to credit risk, by client or counterparty, without taking into account guarantees or other credit enhancements as of December 31, 2020 and 2021, does not exceed 10% of the Bank’s regulatory capital.
F-154
NOTES TO THE CONSOLIDATED FINANCIAL STATEMENTS, continued
| 43. | Risk Management, continued: |
| (2) | Credit Risk, continued: |
| (d) | Portfolio Concentration, continued:: |
The following tables show credit risk exposure per balance sheet item, including derivatives, detailed by both geographic region and industry sector as of December 31, 2020:
| Chile | United States | Brazil | Other | Total | ||||||||||||||||
| MCh$ | MCh$ | MCh$ | MCh$ | MCh$ | ||||||||||||||||
| Financial Assets | ||||||||||||||||||||
| Cash and Due from Banks | 1,272,238 | 1,158,637 | — | 129,341 | 2,560,216 | |||||||||||||||
| Financial Assets held-for-trading | ||||||||||||||||||||
| From the Chilean Government and Central Bank of Chile | 4,159,292 | — | — | — | 4,159,292 | |||||||||||||||
| Other instruments issued in Chile | 105,798 | — | — | — | 105,798 | |||||||||||||||
| Instruments issued abroad | — | 164 | — | — | 164 | |||||||||||||||
| Mutual fund investments | 400,902 | — | — | — | 400,902 | |||||||||||||||
| Subtotal | 4,665,992 | 164 | — | — | 4,666,156 | |||||||||||||||
| Investments under resale agreements | 76,407 | — | — | — | 76,407 | |||||||||||||||
| Derivative Contracts for Trading Purposes | ||||||||||||||||||||
| Forwards | 415,349 | 73,805 | — | 62,810 | 551,964 | |||||||||||||||
| Swaps | 1,184,563 | 83,776 | — | 744,908 | 2,013,247 | |||||||||||||||
| Call Options | 269 | — | — | — | 269 | |||||||||||||||
| Put Options | 1,462 | — | — | — | 1,462 | |||||||||||||||
| Futures | — | — | — | — | — | |||||||||||||||
| Subtotal | 1,601,643 | 157,581 | — | 807,718 | 2,566,942 | |||||||||||||||
| Hedge Derivative Contracts | ||||||||||||||||||||
| Forwards | — | — | — | — | — | |||||||||||||||
| Swaps | 1,511 | 18,964 | — | 30,587 | 51,062 | |||||||||||||||
| Call Options | — | — | — | — | — | |||||||||||||||
| Put Options | — | — | — | — | — | |||||||||||||||
| Futures | — | — | — | — | — | |||||||||||||||
| Subtotal | 1,511 | 18,964 | — | 30,587 | 51,062 | |||||||||||||||
| Loans and advances to Banks (before allowances) | ||||||||||||||||||||
| Central Bank of Chile | 2,380,033 | — | — | — | 2,380,033 | |||||||||||||||
| Domestic banks | 260,002 | — | — | — | 260,002 | |||||||||||||||
| Foreign banks | — | — | 150,230 | 149,391 | 299,621 | |||||||||||||||
| Subtotal | 2,640,035 | — | 150,230 | 149,391 | 2,939,656 | |||||||||||||||
| Loans to Customers at amortized cost (before allowances) | ||||||||||||||||||||
| Commercial loans | 17,591,127 | — | — | 10,470 | 17,601,597 | |||||||||||||||
| Residential mortgage loans | 9,387,372 | — | — | — | 9,387,372 | |||||||||||||||
| Consumer loans | 3,948,721 | — | — | — | 3,948,721 | |||||||||||||||
| Subtotal | 30,927,220 | — | — | 10,470 | 30,937,690 | |||||||||||||||
| Financial assets available-for-sale | ||||||||||||||||||||
| Debt Instruments: | ||||||||||||||||||||
| From the Chilean government and Central Bank of Chile | 163,600 | — | — | — | 163,600 | |||||||||||||||
| Other instruments issued in Chile | 896,923 | — | — | — | 896,923 | |||||||||||||||
| Instruments issued abroad | — | — | — | — | — | |||||||||||||||
| Subtotal | 1,060,523 | — | — | — | 1,060,523 | |||||||||||||||
| Equity Instruments: | ||||||||||||||||||||
| Instruments issued in Chile | 6,869 | — | — | — | 6,869 | |||||||||||||||
| Instruments issued abroad | — | — | — | 761 | 761 | |||||||||||||||
| Subtotal | 6,869 | — | — | 761 | 7,630 | |||||||||||||||
| Total | 1,067,392 | — | — | 761 | 1,068,153 | |||||||||||||||
| Financial instruments at amortized cost | — | — | — | — | — | |||||||||||||||
F-155
NOTES TO THE CONSOLIDATED FINANCIAL STATEMENTS, continued
| 43. | Risk Management, continued: |
| (2) | Credit Risk, continued: |
| (d) | Portfolio Concentration, continued: |
| Central Bank of Chile | Government | Retail (Individuals) | Financial Services | Trade | Manufacturing | Mining | Electricity, Gas and Water | Agriculture and Livestock | Fishing | Transportation and Telecom | Construction | Services | Other | Total | ||||||||||||||||||||||||||||||||||||||||||||||
| MCh$ | MCh$ | MCh$ | MCh$ | MCh$ | MCh$ | MCh$ | MCh$ | MCh$ | MCh$ | MCh$ | MCh$ | MCh$ | MCh$ | MCh$ | ||||||||||||||||||||||||||||||||||||||||||||||
| Financial Assets | ||||||||||||||||||||||||||||||||||||||||||||||||||||||||||||
| Cash and Due from Banks | 641,890 | — | 1,918,326 | — | — | — | — | — | — | — | — | — | — | — | 2,560,216 | |||||||||||||||||||||||||||||||||||||||||||||
| Financial Assets held-for-trading | ||||||||||||||||||||||||||||||||||||||||||||||||||||||||||||
| From the Chilean Government and Central Bank of Chile | 4,009,676 | 149,616 | — | — | — | — | — | — | — | — | — | — | — | — | 4,159,292 | |||||||||||||||||||||||||||||||||||||||||||||
| Other instruments issued in Chile | — | — | — | 105,798 | — | — | — | — | — | — | — | — | — | — | 105,798 | |||||||||||||||||||||||||||||||||||||||||||||
| Instruments issued abroad | — | — | — | 164 | — | — | — | — | — | — | — | — | — | — | 164 | |||||||||||||||||||||||||||||||||||||||||||||
| Mutual fund investment | — | — | — | 400,902 | — | — | — | — | — | — | — | — | — | — | 400,902 | |||||||||||||||||||||||||||||||||||||||||||||
| Subtotal | 4,009,676 | 149,616 | 506,864 | — | — | — | — | — | — | — | — | — | — | 4,666,156 | ||||||||||||||||||||||||||||||||||||||||||||||
| Investments under resale agreements | — | 10,006 | 950 | 64,554 | 130 | — | — | — | — | — | — | 146 | — | 621 | 76,407 | |||||||||||||||||||||||||||||||||||||||||||||
| Derivative Contracts for Trading Purposes | ||||||||||||||||||||||||||||||||||||||||||||||||||||||||||||
| Forwards | — | — | — | 351,833 | 17,280 | 16,078 | 4,456 | 6,253 | 1,071 | 30 | 2,269 | 265 | — | 152,429 | 551,964 | |||||||||||||||||||||||||||||||||||||||||||||
| Swaps | — | — | — | 1,943,033 | 4,579 | 4,031 | 18 | 17,637 | 10,237 | 913 | 21,163 | 662 | — | 10,974 | 2,013,247 | |||||||||||||||||||||||||||||||||||||||||||||
| Call Options | — | — | — | 13 | 205 | — | — | — | 40 | — | — | 11 | — | — | 269 | |||||||||||||||||||||||||||||||||||||||||||||
| Put Options | — | — | — | 148 | 1,314 | — | — | — | — | — | — | — | — | — | 1,462 | |||||||||||||||||||||||||||||||||||||||||||||
| Futures | — | — | — | — | — | — | — | — | — | — | — | — | — | — | — | |||||||||||||||||||||||||||||||||||||||||||||
| Subtotal | — | — | — | 2,295,027 | 23,378 | 20,109 | 4,474 | 23,890 | 11,348 | 943 | 23,432 | 938 | — | 163,403 | 2,566,942 | |||||||||||||||||||||||||||||||||||||||||||||
| Hedge Derivative Contracts | ||||||||||||||||||||||||||||||||||||||||||||||||||||||||||||
| Forwards | ||||||||||||||||||||||||||||||||||||||||||||||||||||||||||||
| Swaps | — | — | — | — | — | — | — | — | — | — | — | — | — | — | — | |||||||||||||||||||||||||||||||||||||||||||||
| Call Options | — | — | — | 51,062 | — | — | — | — | — | — | — | — | — | — | 51,062 | |||||||||||||||||||||||||||||||||||||||||||||
| Put Options | — | — | — | — | — | — | — | — | — | — | — | — | — | — | — | |||||||||||||||||||||||||||||||||||||||||||||
| Futures | — | — | — | — | — | — | — | — | — | — | — | — | — | — | — | |||||||||||||||||||||||||||||||||||||||||||||
| Subtotal | — | — | — | 51,062 | — | — | — | — | — | — | — | — | — | — | 51,062 | |||||||||||||||||||||||||||||||||||||||||||||
| Loans and advances to Banks | ||||||||||||||||||||||||||||||||||||||||||||||||||||||||||||
| Central Bank of Chile | 2,380,033 | — | — | — | — | — | — | — | — | — | — | — | — | — | 2,380,033 | |||||||||||||||||||||||||||||||||||||||||||||
| Domestic banks | — | — | — | 260,002 | — | — | — | — | — | — | — | — | — | — | 260,002 | |||||||||||||||||||||||||||||||||||||||||||||
| Foreign banks | — | — | — | 299,621 | — | — | — | — | — | — | — | — | — | — | 299,621 | |||||||||||||||||||||||||||||||||||||||||||||
| Subtotal | 2,380,033 | — | — | 559,623 | — | — | — | — | — | — | — | — | — | — | 2,939,656 | |||||||||||||||||||||||||||||||||||||||||||||
| Loans to Customers at amortized cost | ||||||||||||||||||||||||||||||||||||||||||||||||||||||||||||
| Commercial loans | — | — | — | 2,351,333 | 2,544,146 | 1,347,770 | 470,607 | 395,598 | 1,647,226 | 135,488 | 1,454,404 | 2,453,579 | 3,054,194 | 1,747,252 | 17,601,597 | |||||||||||||||||||||||||||||||||||||||||||||
| Residential mortgage loans | — | — | 9,387,372 | — | — | — | — | — | — | — | — | — | — | — | 9,387,372 | |||||||||||||||||||||||||||||||||||||||||||||
| Consumer loans | — | — | 3,948,721 | — | — | — | — | — | — | — | — | — | — | — | 3,948,721 | |||||||||||||||||||||||||||||||||||||||||||||
| Subtotal | — | — | 13,336,093 | 2,351,333 | 2,544,146 | 1,347,770 | 470,607 | 395,598 | 1,647,226 | 135,488 | 1,454,404 | 2,453,579 | 3,054,194 | 1,747,252 | 30,937,690 | |||||||||||||||||||||||||||||||||||||||||||||
| Financial Assets at Fair Value through OCI | ||||||||||||||||||||||||||||||||||||||||||||||||||||||||||||
| Debt Instruments: | ||||||||||||||||||||||||||||||||||||||||||||||||||||||||||||
| From the Chilean Government and Central Bank of Chile | 109 | 163,491 | — | — | — | — | — | — | — | — | — | — | — | — | 163,600 | |||||||||||||||||||||||||||||||||||||||||||||
| Other instruments issued in Chile | — | — | — | 851,468 | — | 4,465 | — | 8,089 | — | — | 5,334 | — | — | 27,567 | 896,923 | |||||||||||||||||||||||||||||||||||||||||||||
| Instruments issued abroad | — | — | — | — | — | — | — | — | — | — | — | — | — | — | — | |||||||||||||||||||||||||||||||||||||||||||||
| Subtotal | 109 | 163,491 | — | 851,468 | — | 4,465 | — | 8,089 | — | — | 5,334 | — | — | 27,567 | 1,060,523 | |||||||||||||||||||||||||||||||||||||||||||||
| Equity Instruments: | ||||||||||||||||||||||||||||||||||||||||||||||||||||||||||||
| Instruments issued in Chile | — | — | — | 6,869 | — | — | — | — | — | — | — | — | — | — | 6,869 | |||||||||||||||||||||||||||||||||||||||||||||
| Instruments issued abroad | — | — | — | 761 | — | — | — | — | — | — | — | — | — | — | 761 | |||||||||||||||||||||||||||||||||||||||||||||
| Subtotal | — | — | — | 7,630 | — | — | — | — | — | — | — | — | — | — | 7,630 | |||||||||||||||||||||||||||||||||||||||||||||
| Total | 109 | 163,491 | — | 859,098 | — | 4,465 | — | 8,089 | — | — | 5,334 | — | — | 27,567 | 1,068,153 | |||||||||||||||||||||||||||||||||||||||||||||
| Financial instruments at amortized cost | — | — | — | — | — | — | — | — | — | — | — | — | — | — | — | |||||||||||||||||||||||||||||||||||||||||||||
F-156
NOTES TO THE CONSOLIDATED FINANCIAL STATEMENTS, continued
| 43. | Risk Management, continued: |
| (2) | Credit Risk, continued: |
| (d) | Portfolio Concentration, continued: |
The following tables show credit risk exposure per balance sheet item, including derivatives, detailed by both geographic region and industry sector as of December 31, 2021:
| Chile | United States | Brazil | Others | Total | ||||||||||||||||
| MCh$ | MCh$ | MCh$ | MCh$ | MCh$ | ||||||||||||||||
| Financial Assets | ||||||||||||||||||||
| Cash and Due from Banks | 2,748,930 | 897,881 | 8 | 66,915 | 3,713,734 | |||||||||||||||
| Financial Assets held-for-trading | ||||||||||||||||||||
| From the Chilean Government and Central Bank of Chile | 3,472,122 | — | — | — | 3,472,122 | |||||||||||||||
| Other instruments issued in Chile | 268,882 | — | — | — | 268,882 | |||||||||||||||
| Instruments issued abroad | — | — | — | — | — | |||||||||||||||
| Mutual fund investments | 135,691 | — | — | — | 135,691 | |||||||||||||||
| Subtotal | 3,876,695 | — | — | — | 3,876,695 | |||||||||||||||
| Investments under resale agreements | 64,365 | — | — | — | 64,365 | |||||||||||||||
| Derivative Contracts for Trading Purposes | ||||||||||||||||||||
| Forwards | 585,463 | 90,461 | — | 66,621 | 742,545 | |||||||||||||||
| Swaps | 1,113,135 | 256,829 | — | 588,278 | 1,958,242 | |||||||||||||||
| Call Options | 4,509 | — | — | — | 4,509 | |||||||||||||||
| Put Options | 199 | — | — | — | 199 | |||||||||||||||
| Futures | — | — | — | — | — | |||||||||||||||
| Subtotal | 1,703,306 | 347,290 | — | 654,899 | 2,705,495 | |||||||||||||||
| Hedge Derivative Contracts | ||||||||||||||||||||
| Forwards | — | — | — | — | — | |||||||||||||||
| Swaps | 16,375 | 79,904 | — | 181,524 | 277,803 | |||||||||||||||
| Call Options | — | — | — | — | — | |||||||||||||||
| Put Options | — | — | — | — | — | |||||||||||||||
| Futures | — | — | — | — | — | |||||||||||||||
| Subtotal | 16,375 | 79,904 | — | 181,524 | 277,803 | |||||||||||||||
| Loans and advances to Banks | ||||||||||||||||||||
| Central Bank of Chile | 1,090,000 | — | — | — | 1,090,000 | |||||||||||||||
| Domestic banks | 160,018 | — | — | — | 160,018 | |||||||||||||||
| Foreign banks | — | — | 141,249 | 138,565 | 279,814 | |||||||||||||||
| Subtotal | 1,250,018 | — | 141,249 | 138,565 | 1,529,832 | |||||||||||||||
| Loans to Customers, Net | ||||||||||||||||||||
| Commercial loans | 19,658,614 | — | — | 13,718 | 19,672,332 | |||||||||||||||
| Residential mortgage loans | 10,346,528 | — | — | — | 10,346,528 | |||||||||||||||
| Consumer loans | 4,247,013 | — | — | — | 4,247,013 | |||||||||||||||
| Subtotal | 34,252,155 | — | — | 13,718 | 34,265,873 | |||||||||||||||
| Financial Assets Available-for-Sale | ||||||||||||||||||||
| from the Chilean Government and Central Bank of Chile | 2,488,850 | — | — | — | 2,488,850 | |||||||||||||||
| Other instruments issued in Chile | 565,959 | — | — | — | 565,959 | |||||||||||||||
| Instruments issued abroad | — | — | — | — | — | |||||||||||||||
| Subtotal | 3,054,809 | — | — | — | 3,054,809 | |||||||||||||||
| Equity Instruments: | ||||||||||||||||||||
| Instruments issued in Chile | 5,499 | — | — | — | 5,499 | |||||||||||||||
| Instruments issued abroad | — | — | — | 866 | 866 | |||||||||||||||
| Subtotal | 5,499 | — | — | 866 | 6,365 | |||||||||||||||
| Total | 3,060,308 | 866 | 3,061,174 | |||||||||||||||||
| Financial instruments at amortized cost | 839,744 | — | — | — | 839,744 | |||||||||||||||
F-157
NOTES TO THE CONSOLIDATED FINANCIAL STATEMENTS, continued
| 43. | Risk Management, continued: |
| (2) | Credit Risk, continued: |
| (d) | Portfolio Concentration, continued: |
| Central Bank of Chile | Government | Retail (Individuals) | Financial Services | Trade | Manufacturing | Mining | Electricity, Gas and Water | Agriculture and Livestock | Fishing | Transportation and | Construction | Services | Others | Total | ||||||||||||||||||||||||||||||||||||||||||||
| MCh$ | MCh$ | MCh$ | MCh$ | MCh$ | MCh$ | MCh$ | MCh$ | MCh$ | MCh$ | MCh$ | MCh$ | MCh$ | MCh$ | MCh$ | ||||||||||||||||||||||||||||||||||||||||||||
| Financial Assets | ||||||||||||||||||||||||||||||||||||||||||||||||||||||||||
| Cash and Due from Banks | 1,545,472 | — | — | 2,168,262 | — | — | — | — | — | — | — | — | — | — | 3,713,734 | |||||||||||||||||||||||||||||||||||||||||||
| Financial Assets held-for-trading | ||||||||||||||||||||||||||||||||||||||||||||||||||||||||||
| From the Chilean Government and Central Bank of Chile | 3,287,111 | 162,433 | — | 22,578 | — | — | — | — | — | — | — | — | — | — | 3,472,122 | |||||||||||||||||||||||||||||||||||||||||||
| Other instruments issued in Chile | — | — | — | 268,882 | — | — | — | — | — | — | — | — | — | — | 268,882 | |||||||||||||||||||||||||||||||||||||||||||
| Instruments issued abroad | — | — | — | — | — | — | — | — | — | — | — | — | — | — | — | |||||||||||||||||||||||||||||||||||||||||||
| Mutual fund investments | — | — | — | 135,691 | — | — | — | — | — | — | — | — | — | — | 135,691 | |||||||||||||||||||||||||||||||||||||||||||
| Subtotal | 3,287,111 | 162,433 | — | 427,151 | — | — | — | — | — | — | — | — | — | — | 3,876,695 | |||||||||||||||||||||||||||||||||||||||||||
| Investments under resale agreements | — | — | 232 | 62,030 | 1,327 | — | — | — | — | — | — | 13 | — | 763 | 64,365 | |||||||||||||||||||||||||||||||||||||||||||
| Derivative Contracts for Trading Purposes | ||||||||||||||||||||||||||||||||||||||||||||||||||||||||||
| Forwards | — | — | — | 521,735 | 3,685 | 18,806 | 1,343 | 12,623 | 4,873 | — | — | 247 | — | 179,233 | 742,545 | |||||||||||||||||||||||||||||||||||||||||||
| Swaps | — | — | — | 1,870,974 | 342 | 3,444 | 2 | 8,129 | 17,815 | 5,409 | 11,516 | 3,098 | — | 37,513 | 1,958,242 | |||||||||||||||||||||||||||||||||||||||||||
| Call Options | — | — | — | 251 | 3,595 | 474 | — | — | 80 | 109 | — | — | — | — | 4,509 | |||||||||||||||||||||||||||||||||||||||||||
| Put Options | — | — | — | 21 | 178 | — | — | — | — | — | — | — | — | — | 199 | |||||||||||||||||||||||||||||||||||||||||||
| Futures | — | — | — | — | — | — | — | — | — | — | — | — | — | — | — | |||||||||||||||||||||||||||||||||||||||||||
| Subtotal | — | — | — | 2,392,981 | 7,800 | 22,724 | 1,345 | 20,752 | 22,768 | 5,518 | 11,516 | 3,345 | — | 216,746 | 2,705,495 | |||||||||||||||||||||||||||||||||||||||||||
| Hedge Derivative Contracts | ||||||||||||||||||||||||||||||||||||||||||||||||||||||||||
| Forwards | — | — | — | — | — | — | — | — | — | — | — | — | — | — | — | |||||||||||||||||||||||||||||||||||||||||||
| Swaps | — | — | — | 277,803 | — | — | — | — | — | — | — | — | — | — | 277,803 | |||||||||||||||||||||||||||||||||||||||||||
| Call Options | — | — | — | — | — | — | — | — | — | — | — | — | — | — | — | |||||||||||||||||||||||||||||||||||||||||||
| Put Options | — | — | — | — | — | — | — | — | — | — | — | — | — | — | — | |||||||||||||||||||||||||||||||||||||||||||
| Futures | — | — | — | — | — | — | — | — | — | — | — | — | — | — | — | |||||||||||||||||||||||||||||||||||||||||||
| Subtotal | — | — | — | 277,803 | — | — | — | — | — | — | — | — | — | — | 277,803 | |||||||||||||||||||||||||||||||||||||||||||
| Loans and advances to Banks | ||||||||||||||||||||||||||||||||||||||||||||||||||||||||||
| Central Bank of Chile | 1,090,000 | — | — | — | — | — | — | — | — | — | — | — | — | — | 1,090,000 | |||||||||||||||||||||||||||||||||||||||||||
| Domestic banks | — | — | — | 160,018 | — | — | — | — | — | — | — | — | — | — | 160,018 | |||||||||||||||||||||||||||||||||||||||||||
| Foreign banks | — | — | — | 279,814 | — | — | — | — | — | — | — | — | — | — | 279,814 | |||||||||||||||||||||||||||||||||||||||||||
| Subtotal | 1,090,000 | — | — | 439,832 | — | — | — | — | — | — | — | — | — | — | 1,529,832 | |||||||||||||||||||||||||||||||||||||||||||
| Loans to Customers, Net | ||||||||||||||||||||||||||||||||||||||||||||||||||||||||||
| Commercial loans | — | — | — | 3,054,715 | 2,617,814 | 1,751,451 | 400,413 | 340,618 | 1,770,883 | 144,809 | 1,834,624 | 2,493,702 | 3,184,102 | 2,079,201 | 19,672,332 | |||||||||||||||||||||||||||||||||||||||||||
| Residential mortgage loans | — | — | 10,346,528 | — | — | — | — | — | — | — | — | — | — | — | 10,346,528 | |||||||||||||||||||||||||||||||||||||||||||
| Consumer loans | — | — | 4,247,013 | — | — | — | — | — | — | — | — | — | — | — | 4,247,013 | |||||||||||||||||||||||||||||||||||||||||||
| Subtotal | — | — | 14,593,541 | 3,054,715 | 2,617,814 | 1,751,451 | 400,413 | 340,618 | 1,770,883 | 144,809 | 1,834,624 | 2,493,702 | 3,184,102 | 2,079,201 | 34,265,873 | |||||||||||||||||||||||||||||||||||||||||||
| Financial Assets Available-for-Sale | ||||||||||||||||||||||||||||||||||||||||||||||||||||||||||
| from the Chilean Government and Central Bank of Chile | 102 | 2,488,748 | — | — | — | — | — | — | — | — | — | — | — | — | 2,488,850 | |||||||||||||||||||||||||||||||||||||||||||
| Other instruments issued in Chile | — | — | — | 537,036 | — | — | — | 5,254 | — | — | 5,321 | 4,609 | — | 13,739 | 565,959 | |||||||||||||||||||||||||||||||||||||||||||
| Instruments issued abroad | — | — | — | — | — | — | — | — | — | — | — | — | — | — | — | |||||||||||||||||||||||||||||||||||||||||||
| Subtotal | 102 | 2,488,748 | — | 537,036 | — | — | — | 5,254 | — | — | 5,321 | 4,609 | — | 13,739 | 3,054,809 | |||||||||||||||||||||||||||||||||||||||||||
| Equity Instruments: | ||||||||||||||||||||||||||||||||||||||||||||||||||||||||||
| Instruments issued in Chile | — | — | — | 5,499 | — | — | — | — | — | — | — | — | — | — | 5,499 | |||||||||||||||||||||||||||||||||||||||||||
| Instruments issued abroad | — | — | — | 866 | — | — | — | — | — | — | — | — | — | — | 866 | |||||||||||||||||||||||||||||||||||||||||||
| Subtotal | — | — | — | 6,365 | — | — | — | — | — | — | — | — | — | — | 6,365 | |||||||||||||||||||||||||||||||||||||||||||
| Total | 102 | 2,488,748 | — | 543,401 | — | — | — | 5,254 | — | — | 5,321 | 4,609 | — | 13,739 | 3,061,174 | |||||||||||||||||||||||||||||||||||||||||||
| Financial instruments at amortized cost | — | 839,744 | — | — | — | — | — | — | — | — | — | — | — | — | 839,744 | |||||||||||||||||||||||||||||||||||||||||||
F-158
NOTES TO THE CONSOLIDATED FINANCIAL STATEMENTS, Continued
| 43. | Risk Management, continued: |
| (2) | Credit Risk, continued: |
| (d) | Collateral and Other Credit Enhancements |
The amount and type of collateral required depends on the counterparty’s credit risk assessment.
The Bank has guidelines regarding the acceptability of types of collateral and valuation parameters.
The main types of collateral obtained are:
| - | For commercial loans: Residential and non-residential real estate, liens and inventory. |
| - | For retail loans: Mortgages loans on residential property. |
The Bank also obtains collateral from parent companies for loans granted to their subsidiaries.
Management makes sure its collateral is acceptable according to both external standards and internal policies guidelines and parameters. The Bank has approximately 242,870 collateral assets (240,087 in December 2020), the majority of which consist of real estate.
The following table contains guarantees values as of December 31, 2020 and 2021:
| Fair value of collateral and credit enhancements held as of December 31, 2020 | ||||||||||||||||||||||||||||
| Maximum exposure to credit risk | Mortgages | Pledge (*) | Securities | Warrants | Net collateral | Net exposure | ||||||||||||||||||||||
| Loans to customers: | MCh$ | MCh$ | MCh$ | MCh$ | MCh$ | MCh$ | MCh$ | |||||||||||||||||||||
| Corporate lending | 12,810,975 | 3,091,284 | 128,366 | 565,761 | 2,842 | 3,788,253 | 9,022,722 | |||||||||||||||||||||
| Small business lending | 4,790,622 | 3,178,176 | 28,832 | 14,242 | — | 3,221,250 | 1,569,372 | |||||||||||||||||||||
| Consumer lending | 3,948,721 | 333,191 | 795 | 2,518 | — | 336,504 | 3,612,217 | |||||||||||||||||||||
| Mortgage lending | 9,387,372 | 8,499,584 | 113 | 87 | — | 8,499,784 | 887,588 | |||||||||||||||||||||
| Total | 30,937,690 | 15,102,235 | 158,106 | 582,608 | 2,842 | 15,845,791 | 15,091,899 | |||||||||||||||||||||
| Fair value of collateral and credit enhancements held as of December 31, 2021 | ||||||||||||||||||||||||||||
| Maximum exposure to credit risk | Mortgages | Pledge (*) | Securities | Warrants | Net collateral | Net exposure | ||||||||||||||||||||||
| Loans to customers: | MCh$ | MCh$ | MCh$ | MCh$ | MCh$ | MCh$ | MCh$ | |||||||||||||||||||||
| Corporate lending | 14,633,419 | 3,392,760 | 149,892 | 508,711 | 4,451 | 4,055,814 | 10,577,605 | |||||||||||||||||||||
| Small business lending | 5,038,913 | 3,124,172 | 26,310 | 12,898 | — | 3,163,380 | 1,875,533 | |||||||||||||||||||||
| Consumer lending | 4,247,013 | 317,215 | 622 | 2,498 | — | 320,335 | 3,926,678 | |||||||||||||||||||||
| Mortgage lending | 10,346,528 | 8,730,747 | 96 | 196 | — | 8,731,039 | 1,615,489 | |||||||||||||||||||||
| Total | 34,265,873 | 15,564,894 | 176,920 | 524,303 | 4,451 | 16,270,568 | 17,995,305 | |||||||||||||||||||||
| (*) | Includes agricultural and industrial pledges, and pledges without conveyance. |
F-159
NOTES TO THE CONSOLIDATED FINANCIAL STATEMENTS, Continued
| 43. | Risk Management, continued: |
| (2) | Credit Risk, continued: |
| (d) | Collateral and Other Credit Enhancements, continued: |
The Bank also uses mitigating tactics for credit risk on derivative transactions. To date, the following mitigating tactics are used:
| ● | Accelerating transactions and net payment using market values at the date of default of one of the parties. | |
| ● | Option for both parties to terminate early any transactions with a counterparty at a given date, using market values as of the respective date. | |
| ● | Margins established with time deposits by customers that close FX forwards with subsidiary Banchile Corredores de Bolsa S.A. |
The value of the guarantees that the Bank maintains related to the loans individually classified as impaired as of December 31, 2020 and 2021 is Ch$98,653 million and Ch$28,189 million, respectively.
The value of the guarantees that the Bank maintains related to non-impaired loans as of December 31, 2020 and 2021 totaled Ch$133,949 million and Ch$177,169 million, respectively.
| (e) | Credit Quality by Asset Class: |
The Bank determines the credit quality of financial assets using internal credit ratings. The rating process is linked to the Bank’s approval and monitoring processes and is carried out in accordance with risk categories established by current standards. Credit quality is continuously updated based on any favorable or unfavorable developments to customers or their environments, considering aspects such as commercial and payment behavior as well as financial information.
The Bank also conducts reviews of companies in certain industry sectors that are affected by macroeconomic or sector-specific variables. Such reviews allow the Bank to timely establish any necessary allowance loan losses that are sufficient to cover losses for potentially uncollectable loans.
F-160
NOTES TO THE CONSOLIDATED FINANCIAL STATEMENTS, Continued
| 43. | Risk Management, continued: |
| (2) | Credit Risk, continued: |
| (e) | Credit Quality by Asset Class, continued: |
Analysis of age of portfolio loan, over-due loans by financial asset class. Additionally to the overdue portion, the amounts detailed include remaining balance of the past due credits are featured below:
As of December 31, 2020:
| Default | ||||||||||||
| 1 to 29 days | 30 to 59 days | 60 to 89 days | ||||||||||
| MCh$ | MCh$ | MCh$ | ||||||||||
| Loans and advances to banks | 14,454 | — | — | |||||||||
| Subtotal past-due loans and advances to banks | 14,454 | — | — | |||||||||
| Commercial loans | 133,625 | 29,240 | 13,039 | |||||||||
| Import-export financing | 5,246 | 71 | 223 | |||||||||
| Factoring transactions | 16,255 | 1,464 | 157 | |||||||||
| Commercial lease transactions | 17,889 | 3,904 | 979 | |||||||||
| Other loans and receivables | 1,449 | 135 | 162 | |||||||||
| Residential mortgage loans | 90,462 | 24,875 | 9,795 | |||||||||
| Consumer loans | 136,147 | 53,786 | 22,764 | |||||||||
| Subtotal past-due loans to customers | 401,073 | 113,475 | 47,119 | |||||||||
| Total | 415,527 | 113,475 | 47,119 | |||||||||
As of December 31, 2021:
| Default | ||||||||||||
| 1 to 29 days | 30 to 59 days | 60 to 89 days | ||||||||||
| MCh$ | MCh$ | MCh$ | ||||||||||
| Loans and advances to banks | 116,307 | — | — | |||||||||
| Subtotal past-due loans and advances to banks | 116,307 | — | — | |||||||||
| Commercial loans | 182,781 | 62,020 | 14,680 | |||||||||
| Import-export financing | 7,874 | 189 | 2,666 | |||||||||
| Factoring transactions | 17,255 | 1,790 | 332 | |||||||||
| Commercial lease transactions | 17,056 | 4,758 | 1,736 | |||||||||
| Other loans and receivables | 1,367 | 309 | 356 | |||||||||
| Residential mortgage loans | 113,040 | 35,687 | 19,095 | |||||||||
| Consumer loans | 124,422 | 52,105 | 21,308 | |||||||||
| Subtotal past-due loans to customers | 463,795 | 156,858 | 60,173 | |||||||||
| Total | 580,102 | 156,858 | 60,173 | |||||||||
F-161
NOTES TO THE CONSOLIDATED FINANCIAL STATEMENTS, Continued
| 43. | Risk Management, continued: |
| (2) | Credit Risk, continued: |
| (e) | Credit Quality by Asset Class, continued: |
As of December 31, the aging analysis of loans is as follows:
| Past due but not impaired(*) | ||||||||||||||||||||||||
| Neither past due nor impaired | Up to 30 days | Over 30 days and up to 60 days | Over 60 days and up to 90 days | Over 90 days | Total | |||||||||||||||||||
| As of December 31, | MCh$ | MCh$ | MCh$ | MCh$ | MCh$ | MCh$ | ||||||||||||||||||
| 2020 | 29,425,612 | 272,409 | 51,812 | 13,531 | 451 | 29,763,815 | ||||||||||||||||||
| 2021 | 32,836,252 | 409,338 | 51,001 | 15,402 | 87 | 33,312,080 | ||||||||||||||||||
| (*) | These amounts include installments that are overdue, plus the remaining balance of principal and interest on such loans. |
| (f) | Assets Received in Lieu of Payment: |
The Bank has received assets in lieu of payment totaling Ch$6,753 million and Ch$13,584 as of December 31, 2020 and 2021, respectively, the majority of which are properties. All of these assets are managed for sale.
| (g) | Renegotiated Assets: |
The impaired loans are considered to be renegotiated when the corresponding financial commitments are restructured and the Bank assesses the probability of recovery as sufficiently high.
The following table details the book value of loans with renegotiated terms per financial asset class:
| 2020 | 2021 | |||||||
| Financial assets | MCh$ | MCh$ | ||||||
| Loans and advances to banks | ||||||||
| Domestic banks | — | — | ||||||
| Foreign banks | — | — | ||||||
| Subtotal | — | — | ||||||
| Loans to Customers at amortized cost | ||||||||
| Commercial loans | 288,094 | 331,127 | ||||||
| Residential mortgage loans | 253,907 | 243,684 | ||||||
| Consumer loans | 532,420 | 361,015 | ||||||
| Subtotal | 1,074,421 | 935,826 | ||||||
| Total renegotiated financial assets | 1,074,421 | 935,826 | ||||||
F-162
NOTES TO THE CONSOLIDATED FINANCIAL STATEMENTS, Continued
| 43. | Risk Management, continued: |
| (2) | Credit Risk, continued: |
| (g) | Renegotiated Assets, continued: |
This has resulted in a strong increase in the stock of renegotiated consumer and mortgage loans. Basically, these actions consisted of the postponement of installments or dividends at the end of their respective payment schedule.
The Bank calculates ECLs either on a group or an individual basis, which are described in more detail in Note 2(i)(vii).
The renegotiated portfolio of Banco de Chile represents 2.73% of the total loans.
The most common type of modification is to extend the term of the loan. For payment extensions, depending on the characteristics of each credit, the Bank can agree with the client changes in the initial conditions in terms of interest rate and payment schedule. With regard to the forgiveness of the principal, the Bank normally does not give this benefit. The Board of Directors might on rare occasions approve debt forgiveness for a portion of principal on certain credit-operations that have been impaired and provisioned previously. Only those borrowers which are considered viable are renegotiated. If the debtor is not considered to be financially viable, the Bank proceeds to the legal collection of debts.
The table below includes Stage 2 and 3 assets that were modified and, therefore, treated as forborne during the 2021 period, with the related modification loss suffered by the Bank.
| 2021 | ||||
MCh$ | ||||
| Amortized costs of financial assets modified during the period | 122,014 | |||
| Net modification loss | 24,594 | |||
Although the Bank does not have systematized information related to the balance of modified loans by type of concession, it continuously monitors its impaired portfolio as defined in note 2 (i) vii). Also, for internal purposes the renegotiated loan portfolio is analyzed and reviewed as part of the impaired portfolio. Therefore, for management and regulatory (local and IFRS) reporting purposes the Bank does not frequently use information on loans modified by types of concession.
The table below shows the gross carrying amount of previously modified financial assets for which loss allowances has changed to 12 month Expected Credit Losses (12mECL) measurement during the 2021 period:
December 31, 2021 | ||||||||||||||||
Post modification | Pre-modification | |||||||||||||||
Gross carrying amount | Corresponding ECL | Gross carrying amount | Corresponding ECL | |||||||||||||
| MCh$ | MCh$ | MCh$ | MCh$ | |||||||||||||
| Facilities that have cured since modification and are now measured using 12mECLs (Stage 1) | 13,552 | 1,400 | 13,682 | 2,036 | ||||||||||||
| Facilities that reverted to (Stage 2/3) lifetime ECLs having once cured | 8,154 | 2,108 | 8,122 | 1,336 | ||||||||||||
F-163
NOTES TO THE CONSOLIDATED FINANCIAL STATEMENTS, Continued
| 43. | Risk Management, continued: |
| (2) | Credit Risk, continued: |
| (h) | Renegotiated Assets: |
The Bank determines the appropriate amount of allowance for loan losses as follows:
The commercial loan renegotiations are always evaluated and approved individually by the credit committee with all the background and history of previous approvals, including financial records, delinquencies or other previous renegotiations of the debtor. In this step of renegotiation approval, a reevaluation of the provision level is always carried out for each debtor.
Among the variables that the credit committee considers in establishing the level of provisions for the individual portfolio are payment behavior, payment capacity and collateral coverage are mainly considered.
On the other hand, for the portfolio evaluated for provisioning purposes as a group, the models contain past behavior variables, incorporating delinquencies and default prior to renegotiation for six months, recognizing the increased risk and generating a higher level of provisions. The provision can only be decreased if the renegotiated client has good payment behavior (an overdue period of less than 30 days), in a period of over seven months.
In both segments, the approvals of the renegotiation operations are submitted to specialized credit committees, whose members have attributions adjusted to this risk.
Moreover, an operation identified as renegotiation never leaves this classification for purposes of monitoring and provisioning.
| (i) | Impairment Testing |
The main tools used to test loan impairment include an analysis of whether principal or interest payments are more than 90 days past due or if the counterparty is experiencing any known cash flow problems, reductions in credit ratings or default of the original contractual terms.
| (j) | Off balance sheet accounts |
In order to meet our customers’ financial needs, the Bank has extended several irrevocable commitments and contingent obligations. Even though these obligations are not recognized in the balance sheet, they involve credit risk and thus form part of the Bank’s general risk exposure.
Credit risk exposure generated by contingent obligations is disclosed in Note No. 28.
F-164
NOTES TO THE CONSOLIDATED FINANCIAL STATEMENTS, Continued
| 43. | Risk Management, continued: |
| (2) | Credit Risk, continued: |
| (k) | Measures associated with the COVID-19 Contingency: |
Due to the health emergency caused by the COVID-19 pandemic, the Bank implemented measures that sought to make payments more flexible on a temporary basis and provided financing that allows to sustain working capital during this period, having in the first case credit refinancing (mortgage, commercial, consumer) and in the second case and by order of the Chilean Government, through the Ministry of Finance, Central Bank of Chile and the Commission for the Financial Market, measures to facilitate the granting of loans with state guarantee (FOGAPE-COVID) with the aim of being used as working capital or reactivating the activities of companies that demonstrate having been affected by the COVID-19 pandemic.
The objective of the FOGAPE-COVID initiative was to facilitate access to working capital loans for individuals and legal entities with annual sales of less than UF 1,000,000 affected by the COVID-19 pandemic. The guarantee coverage of these loans — differentiated according to sales tranche— is between 60% and 85% of financing, after applying a deductible that does not exceed 5% of the guaranteed amount. The Administration rules applicable to the COVID-19 guarantee lines, considered the option of refinancing any principal amortization of preexisting commercial loans that mature in the 6 months following the moment of granting the financing with the COVID-19 Guarantee
In order to cover the Bank’s exposure to potential losses associated with granting these state-guaranteed loans, a provision equivalent to 100% of each operation’s deductible amount is set. The total allowance related to state-guaranteed loans amounted to Ch$70,352 million as of December 31, 2021 (Ch$49,848 million as of December 31, 2020) and was registered under the line-item “Loans to customers at amortized cost” as ECL provision.
The payment behavior of these loans (COVID refinancing and FOGAPE-COVID) in both cases have a similar behavior to the rest of the Bank’s loan portfolio.
| (l) | Management overlays |
As indicated in Note No. 4, during 2021 the Bank carried out a review of the Probability of Default projection models used in the calculation of the ECL of its loan portfolio. These models incorporate upward adjustment elements (dichotomous variables) when certain adverse macroeconomic conditions are met, which were estimated based on a previous crisis. Those adjustment elements aim to reflect the non-linear nature of the ECL more accurately.
Notwithstanding the foregoing, for certain market segments such as Private Banking, Preferential Banking and Micro Entrepreneurs, the forecasted scenarios do not meet the conditions set forth in the models because the current context has no comparable historical precedents. In those cases, the loading associated to those dichotomous variables were included, despite the fact that those conditions are not met. As of the date of these financial statements, those adjustments remain in place.
This effect has been recognized as an overlay for an amount equivalent to Ch$30,980 million as of December 31, 2021 (Ch$24,370 million as of December 31, 2020) and was registered under the asset item line “Loans to customers at amortized cost” as ECL provision.
| (m) | Modificated financial assets: |
When the bank modifies the contractual conditions originally agreed so that the debtor can fulfill its payment obligations, it is evaluated considering the following:
| - | In the event that the modification is substantial due to financial difficulties of the debtor, it is recorded as derecognition and the new loan is valued at fair value. | |
| - | In the event that the modification is not substantial, the loan is not written off and its amortized cost must be adjusted based on the difference between the book value before the modification and the present value of the flows of the modified operation using the effective interest rate (EIR) of the original loan. |
The resulting amount for adjusting the amortized cost of the financial asset when the modification does not result in derecognition and was registered under the line item “Provision for Expected Credit losses”. For the year 2021 the impact due this effect was not material.
F-165
NOTES TO THE CONSOLIDATED FINANCIAL STATEMENTS, Continued
| 43. | Risk Management, continued: |
| (3) | Market Risk: |
Market Risk refers to the loss that the Bank could face due to a liquidity shortage to honor the payments, or to close financial transactions in a timely manner (Liquidity Risk), or due to adverse movements in the values of market variables (Risk Price).
| (a) | Liquidity Risk: |
Liquidity Risk Measurement and Limits
The Bank manages the Liquidity Risk separately for each sub-category: Trading Liquidity Risk and Funding Liquidity Risk.
Trading Liquidity Risk is the inability to close, at current market prices, the financial positions opened mainly from the Trading Book (which is daily valued at market prices and the value differences instantly reflected in the Income Statement). This risk is controlled by establishing limits on the positions amounts of the Trading Book in accordance with what is estimated to be closed in a short time period. Additionally, the Bank incorporates a negative impact on the Income Statement whenever it considers that the size of a certain position in the Trading Book exceeds the reasonable amount, negotiated in the secondary markets, which would allow the exposure to be offset without altering market prices.
Funding Liquidity Risk refers to the Bank’s inability to obtain sufficient cash to meet its immediate obligations. This risk is managed by a minimum amount of highly liquid assets called liquidity buffer, and establishing limits and controls of internal metrics, among which the Market Access Report (“MAR”) stands out, which estimates the amount of funding that the Bank would need from wholesale financial counterparties, for the next 30 and 90 days in each of the relevant currencies of the balance sheet, to face a cash need as a result of the operation under business as usual conditions.
The use of MAR within year 2021 is illustrated below (LCCY = local currency; FCCY = foreign currency):
| MAR LCCY + FCCY | MAR FCCY | ||||||||||||
MMM$ | MMUS$ | ||||||||||||
| 1 – 30 days | 1 – 90 days | 1 – 30 days | 1 – 90 days | ||||||||||
| Maximum | 1,290 | 3,765 | 1,550 | 2,712 | |||||||||
| Minimum | -1,530 | 647 | -866 | 238 | |||||||||
| Average | 130 | 2,330 | 208 | 1,271 | |||||||||
The Bank also monitors the amount of assets denominated in local currency that is funded by liabilities denominated in foreign currency, including all tenors and the cash flows generated by full delivery derivatives payments. This metric is referred to as Cross Currency Funding. The Bank oversees and limits this amount in order to take precautions against not only Banco de Chile’s event but also against a systemic adverse environment generated by a country risk event that might trigger lack of foreign currency funding.
F-166
NOTES TO THE CONSOLIDATED FINANCIAL STATEMENTS, Continued
| 43. | Risk Management, continued: |
| (3) | Market Risk, continued: |
| (a) | Liquidity Risk, continued: |
The use of Cross Currency Funding within year 2021 is illustrated below:
Cross Currency Funding | ||||
| MMUS$ | ||||
| Maximum | 3,637 | |||
| Minimum | 1,446 | |||
| Average | 2,582 | |||
The Bank establishes thresholds that alert behaviors outside the expected ranges at a normal or prudent level of operation, in order to protect other dimensions of liquidity risk such as, for example, maturities concentration of fund providers, the diversification of sources of funds either by type of counterparty or type of product, among others.
The evolution over time of the Bank’s financial ratios that can detect structural changes in its balance sheet characteristics is monitored, such as those presented in the following table and whose relevant use values during the year 2021 are shown below:
Liquid Assets/ Net Funding <30 days | Liabilities>1 year/ Assets >1 year | Deposits/ Loans | ||||||||||
| Maximum | 216 | % | 106 | % | 72 | % | ||||||
| Minimum | 161 | % | 92 | % | 65 | % | ||||||
| Average | 192 | % | 97 | % | 68 | % | ||||||
Additionally, some market index, prices and monetary decisions taken by the Central Bank of Chile are monitored to detect structural changes in market conditions that can trigger a liquidity shortage or even a financial crisis.
Furthermore, the Liquidity Risk Management Policy performs stress tests periodically which are controlled against potentially accessible action plans in each modeled scenario, according with the guidelines established in the Liquidity Contingency Plan. This process is essential in determining the liquidity risk appetite framework of the institution.
The Bank measures and controls the mismatch of cash flows under regulatory standards with the C46 index report, which represents the net cash flows expected over time as a result of the contractual maturity of almost all assets and liabilities. Additionally, the Commission for the Financial Market (hereinafter, “CMF”) authorized Banco de Chile, among others, to report the adjusted C46 index. This allows the Bank to report, in addition to the regular C46 index, outflow behavior assumptions of certain specific elements of the liability, such as demand deposits and time deposits. In addition, the regulator also requires some rollover assumptions for the loan portfolio.
F-167
NOTES TO THE CONSOLIDATED FINANCIAL STATEMENTS, Continued
| 43. | Risk Management, continued: |
| (3) | Market Risk, continued: |
| (a) | Liquidity Risk, continued: |
The CMF establish the following limits for the C46:
Foreign Currency balance sheet items: 1-30 days C46 index < 1 x Tier-1 Capital
All Currencies balance sheet items: 1-30 days C46 index < 1 x Tier-1 Capital
All Currencies balance sheet items: 1-90 days C46 index < 2 x Tier-1 Capital
The use of this index in year 2021 is illustrated below:
Adjusted C46 All CCYs as part of Tier-1 Capital | Adjusted C46 FCCY as part of Tier-1 Capital | |||||||||
| 1 – 30 days | 1 – 90 days | 1 – 30 days | ||||||||
| Maximum | 0.17 | 0.14 | 0.36 | |||||||
| Minimum | (0.22) | (0.23) | 0.08 | |||||||
| Average | (0.02) | (0.02) | 0.22 | |||||||
| Regulatory Limit | 1.0 | 2.0 | 1.0 | |||||||
Additionally, the regulatory entities have introduced other metrics that the Bank uses in its management, such as the Liquidity Coverage Ratio (“LCR”) and Net Stable Financing Ratio (“NSFR”), using assumptions similar to those used in the international banking. Only for the first one, a limit implementation calendar has been established and that during the year 2021 was with a minimum level of 80%. The evolution of the LCR and NSFR metrics during the year 2021 are shown below:
| LCR | NSFR | |||||||
| Maximum | 2.46 | 1.13 | ||||||
| Minimum | 1.78 | 1.07 | ||||||
| Average | 2.09 | 1.10 | ||||||
| Regulatory Limit | 0.8 | (*) | N/A | |||||
| (*) | This is the current minimum value for the year 2021 and that increases 0.1 annually until reaching 1.0 in the year 2023. |
F-168
NOTES TO THE CONSOLIDATED FINANCIAL STATEMENTS, Continued
| 43. | Risk Management, continued: |
| (3) | Market Risk, continued: |
| (a) | Liquidity Risk, continued: |
The contractual maturity profile of the financial liabilities of Banco de Chile and its subsidiaries (consolidated basis), as of 2020 and 2021 end-of-year, is illustrated below:
| Up to 1 month | 1 to 3 months | 3 to 12 months | 1 to 3 years | 3 to 5 years | Over 5 years | Total | ||||||||||||||||||||||
| MCh$ | MCh$ | MCh$ | MCh$ | MCh$ | MCh$ | MCh$ | ||||||||||||||||||||||
| Liabilities as of December 31, 2021 | ||||||||||||||||||||||||||||
| Current accounts and other demand deposits | 18,542,791 | — | — | — | — | — | 18,542,791 | |||||||||||||||||||||
| Transactions in the course of payment | 210,479 | — | — | — | — | — | 210,479 | |||||||||||||||||||||
| Reverse repurchase agreements and securities lending | 88,433 | — | 52 | — | — | — | 88,485 | |||||||||||||||||||||
| Savings accounts and time deposits | 7,103,640 | 1,774,627 | 240,912 | 66,492 | 1,619 | — | 9,187,290 | |||||||||||||||||||||
| Full delivery derivative transactions | 434,113 | 469,349 | 2,603,467 | 1,645,489 | 968,078 | 1,761,581 | 7,882,077 | |||||||||||||||||||||
| Borrowings from financial institutions | 67,813 | 1,259,167 | 18,344 | 3,515,979 | — | — | 4,861,303 | |||||||||||||||||||||
| Other financial obligations | 273,394 | 50 | 183 | 183 | — | — | 273,810 | |||||||||||||||||||||
| Debt instruments issued in foreign currency other than USD | 17,154 | 369,988 | 1,083,540 | 2,358,966 | 2,104,219 | 4,839,310 | 10,773,177 | |||||||||||||||||||||
| Total (excluding non-delivery derivative transactions) | 26,737,817 | 3,873,181 | 3,946,498 | 7,587,109 | 3,073,916 | 6,600,891 | 51,819,412 | |||||||||||||||||||||
| Non-delivery derivative transactions | 271,193 | 586,231 | 2,602,915 | 1,030,628 | 669,796 | 2,145,008 | 7,305,771 | |||||||||||||||||||||
F-169
NOTES TO THE CONSOLIDATED FINANCIAL STATEMENTS, Continued
| 43. | Risk Management, continued: |
| (3) | Market Risk, continued: |
| (a) | Liquidity Risk, continued: |
| Up to 1 month | 1 to 3 months | 3 to 12 months | 1 to 3 years | 3 to 5 years | Over 5 years | Total | ||||||||||||||||||||||
| MCh$ | MCh$ | MCh$ | MCh$ | MCh$ | MCh$ | MCh$ | ||||||||||||||||||||||
| Liabilities as of December 31, 2020 | ||||||||||||||||||||||||||||
| Current accounts and other demand deposits | 15,167,229 | — | — | — | — | — | 15,167,229 | |||||||||||||||||||||
| Transactions in the course of payment | 882,944 | — | — | — | — | — | 882,944 | |||||||||||||||||||||
| Reverse repurchase agreements and securities lending | 289,777 | 43 | — | — | — | 289,820 | ||||||||||||||||||||||
| Savings accounts and time deposits | 6,243,204 | 1,964,350 | 648,974 | 59,038 | 1,222 | 156 | 8,916,944 | |||||||||||||||||||||
| Full delivery derivative transactions | 396,599 | 364,793 | 1,305,210 | 1,088,925 | 549,777 | 934,097 | 4,639,401 | |||||||||||||||||||||
| Borrowings from financial institutions | 74,424 | 140,455 | 340,532 | 1,020,126 | 2,090,600 | — | 3,666,137 | |||||||||||||||||||||
| Other financial obligations | 189,003 | 80 | 334 | 386 | 37 | — | 189,840 | |||||||||||||||||||||
| Debt instruments issued in foreign currency other than USD | 53,438 | 90,285 | 1,082,282 | 2,194,406 | 1,886,936 | 4,452,831 | 9,760,178 | |||||||||||||||||||||
| Total (excluding non-delivery derivative transactions) | 23,296,618 | 2,560,006 | 3,377,332 | 4,362,881 | 4,528,572 | 5,387,084 | 43,512,493 | |||||||||||||||||||||
| Non-delivery derivative transactions | 401,144 | 570,084 | 929,211 | 787,866 | 644,420 | 1,542,088 | 4,874,813 | |||||||||||||||||||||
F-170
NOTES TO THE CONSOLIDATED FINANCIAL STATEMENTS, Continued
| 43. | Risk Management, continued: |
| (3) | Market Risk, continued: |
| (b) | Price Risk: |
Price Risk Measurement and Limits
The measurement and management of Price Risk are carried out through the use of several metrics developed internally by the Bank, both for the Trading Book and for the Accrual Book (the Accrual Book includes all balance sheet items, even those of the Trading book but in such case these are reported at an interest rate adjustment period of one day, thus not generating accrual interest rate risk). In addition, the Bank reports metrics to regulatory entities according to the models defined by them.
The bank has established internal limits for the exposures of the Trading Book. In fact, FX positions (FX delta), interest rate sensitivities generated by the derivatives and debt securities portfolios (DV01 or also referred as to rho) and the FX options volatility sensitivity (vega) are measured, reported and controlled against their limits. Limits are established on an aggregate basis but also for some specific tenor points. The use of these limits is daily monitored, controlled and reported by independent control functions to the senior management of the bank. The internal governance framework also establishes that these limits must be approved by the board and reviewed at least annually.
The Bank measures and controls the risk for the Trading Book portfolios using the Value-at-Risk (VaR). The model uses a 99% confidence level and the most recent one-year observed rates, prices and yields data.
The use of VaR within year 2021 is illustrated below:
Value-at-Risk 99% one-day confidence level | ||||
| MCh$ | ||||
| Maximum | 1,606 | |||
| Minimum | 425 | |||
| Average | 971 | |||
Additionally, the Bank performs measuring, limiting, controlling and reporting interest rate exposures and risks for the Accrual Book using internally developed methodologies based on the differences in the amounts of assets and liabilities considering the interest rate repricing dates. Exposures are measured according to the Interest Rate Exposure or IRE metric and their corresponding risks using the Earnings-at-Risk or EaR metric.
F-171
NOTES TO THE CONSOLIDATED FINANCIAL STATEMENTS, Continued
| 43. | Risk Management, continued: |
| (3) | Market Risk, continued: |
| (b) | Price Risk, continued: |
The use of EaR within year 2021 is illustrated below:
12- months Earnings-at-Risk 99% confidence level 3 months defeasance period | ||||
| MCh$ | ||||
| Maximum | 155,073 | |||
| Minimum | 102,504 | |||
| Average | 119,551 | |||
The regulatory risk measurement for the Trading Book (C41 report, replaced in December 2021 by the APRM report, from the spanish Activos Ponderados por Riesgo Mercado) is produced by utilizing guidelines provided by the Central Bank of Chile (hereinafter, “BCCh”) and the CMF, which are adopted based on standardized BIS methodologies. The referred methodologies estimate the potential loss that the bank may incur considering standardized fluctuations of the value of market factors such as FX rates, interest rates and volatilities that may adversely impact the value of FX spot positions, interest rate exposures, and volatility exposures, respectively. In addition, correlation factors are included to represent non-parallel changes in the yield curve.
The risk measurement for the Banking Book, according to normative guidelines (C40 report), as a result of interest rate fluctuations is carried out through the use of standardized methodologies provided by regulatory entities (BCCh and CMF). The report includes models for reporting interest rate gaps and standardized adverse interest rate fluctuations. In addition to this, the regulatory entity has requested banks to establish internal limits for this regulatory risk measurement. Limits must be established separately for short-term and long-term balance. The short-term risk limit should be expressed as a percentage of the Net Interest Margin or NIM plus the revenue collected from commissions that depend on the level of the interest rate; the long-term risk limit cannot exceed a specific percentage of the amount of regulatory capital.
In addition to the above, the Market Risk Policy of Banco de Chile enforces to perform daily stress tests for the Trading Book and monthly for the Accrual Book, additionally a stress test for the AFS (available for sale) portfolio is included, which is reported daily. The output of the stress testing process is monitored against corresponding trigger levels: in the case those triggers are breached, the senior management is notified in order to implement further actions, if necessary. In addition, the results during the month for the trading activities are controlled against defined loss levels and in case such levels are exceeded, senior management is also notified.
F-172
NOTES TO THE CONSOLIDATED FINANCIAL STATEMENTS, Continued
| 43. | Risk Management, continued: |
| (3) | Market Risk, continued: |
| (b) | Price Risk, continued: |
The following table illustrates the interest rate cash-flows of the Banking Book, considering the interest rate repricing dates on an individual basis, as of December 31, 2020 and 2021:
| Up to 1 month | Between 1 and 3 months | Between 3 and 12 months | Between 1 and 3 years | Between 3 and 5 years | More than 5 years | Total | ||||||||||||||||||||||
| MCh$ | MCh$ | MCh$ | MCh$ | MCh$ | MCh$ | MCh$ | ||||||||||||||||||||||
| Assets as of December 31, 2020 | ||||||||||||||||||||||||||||
| Cash and due from banks | 2,496,891 | — | — | — | — | — | 2,496,891 | |||||||||||||||||||||
| Transactions in the course of collection | 96,444 | — | — | — | — | — | 96,444 | |||||||||||||||||||||
| Investment under resale agreements | 10,007 | — | — | — | — | — | 10,007 | |||||||||||||||||||||
| Derivative instruments under hedge-accounting treatment | 260 | 1,800 | 182,709 | 250,612 | 282,219 | 995,168 | 1,712,768 | |||||||||||||||||||||
| Inter-banking loans | 2,743,250 | 71,543 | 125,574 | — | — | — | 2,940,367 | |||||||||||||||||||||
| Customer loans | 3,180,598 | 2,339,929 | 6,504,393 | 8,134,601 | 4,437,666 | 10,877,247 | 35,474,434 | |||||||||||||||||||||
| Financial Assets at Fair Value through OCI | 94,086 | 145,272 | 456,613 | 185,995 | 31,465 | 145,987 | 1,059,418 | |||||||||||||||||||||
| Financial instruments at amortized cost | — | — | — | — | — | — | — | |||||||||||||||||||||
| Total assets | 8,621,536 | 2,558,544 | 7,269,289 | 8,571,208 | 4,751,350 | 12,018,402 | 43,790,329 | |||||||||||||||||||||
| Assets as of December 31, 2021 | ||||||||||||||||||||||||||||
| Cash and due from banks | 3,579,634 | — | — | — | — | — | 3,579,634 | |||||||||||||||||||||
| Transactions in the course of collection | 196,592 | — | — | — | — | — | 196,592 | |||||||||||||||||||||
| Investment under resale agreements | — | — | — | — | — | — | — | |||||||||||||||||||||
| Derivative instruments under hedge-accounting treatment | 64 | 2,163 | 69,192 | 500,218 | 198,926 | 1,669,980 | 2,440,543 | |||||||||||||||||||||
| Inter-banking loans | 1,366,378 | 81,164 | 81,800 | — | — | — | 1,529,342 | |||||||||||||||||||||
| Customer loans | 2,529,601 | 2,676,130 | 7,226,224 | 9,018,799 | 4,798,188 | 11,955,962 | 38,204,904 | |||||||||||||||||||||
| Financial Assets at Fair Value through OCI | 95,585 | 488,919 | 1,479,321 | 619,044 | 169,289 | 208,507 | 3,060,665 | |||||||||||||||||||||
| Financial instruments at amortized cost | — | 8,334 | 10,740 | 38,148 | 431,285 | 450,200 | 938,707 | |||||||||||||||||||||
| Total assets | 7,767,854 | 3,256,710 | 8,867,277 | 10,176,209 | 5,597,688 | 14,284,649 | 49,950,387 | |||||||||||||||||||||
F-173
NOTES TO THE CONSOLIDATED FINANCIAL STATEMENTS, Continued
| 43. | Risk Management, continued: |
| (3) | Market Risk, continued: |
| (b) | Price Risk, continued: |
| Up to 1 month | Between 1 and 3 months | Between 3 and 12 months | Between 1 and 3 years | Between 3 and 5 years | More than 5 years | Total | ||||||||||||||||||||||
| MCh$ | MCh$ | MCh$ | MCh$ | MCh$ | MCh$ | MCh$ | ||||||||||||||||||||||
| Liabilities as of December 31, 2020 | ||||||||||||||||||||||||||||
| Current accounts and demand deposits | 15,245,137 | — | — | — | — | — | 15,245,137 | |||||||||||||||||||||
| Transactions in the course of payment | 816,294 | — | — | — | — | — | 816,294 | |||||||||||||||||||||
| Obligations under repurchase agreements | 13,255 | — | — | — | — | — | 13,255 | |||||||||||||||||||||
| Savings accounts and interest-bearing deposits | 6,243,204 | 1,964,350 | 648,974 | 59,038 | 1,222 | 156 | 8,916,944 | |||||||||||||||||||||
| Derivative hedging instruments | 160 | 291 | 192,625 | 230,742 | 280,421 | 1,057,369 | 1,761,608 | |||||||||||||||||||||
| Inter-banking borrowings | 72,935 | 140,455 | 340,532 | 1,020,126 | 2,090,600 | — | 3,664,648 | |||||||||||||||||||||
| Debt instruments issued (*) | 53,438 | 90,285 | 1,082,282 | 2,194,406 | 1,886,936 | 4,452,831 | 9,760,178 | |||||||||||||||||||||
| Other liabilities | 189,003 | 80 | 334 | 386 | 37 | — | 189,840 | |||||||||||||||||||||
| Total liabilities | 22,633,426 | 2,195,461 | 2,264,747 | 3,504,698 | 4,259,216 | 5,510,356 | 40,367,904 | |||||||||||||||||||||
| Liabilities as of December 31, 2021 | ||||||||||||||||||||||||||||
| Current accounts and demand deposits | 18,611,880 | — | — | — | — | — | 18,611,880 | |||||||||||||||||||||
| Transactions in the course of payment | 83,420 | — | — | — | — | — | 83,420 | |||||||||||||||||||||
| Obligations under repurchase agreements | 351 | — | — | — | — | — | 351 | |||||||||||||||||||||
| Savings accounts and interest-bearing deposits | 7,103,640 | 1,774,627 | 240,912 | 66,492 | 1,619 | — | 9,187,290 | |||||||||||||||||||||
| Derivative hedging instruments | 538 | 979 | 62,220 | 407,960 | 167,805 | 1,401,836 | 2,041,338 | |||||||||||||||||||||
| Inter-banking borrowings | 63,611 | 1,259,167 | 18,344 | 3,515,979 | — | — | 4,857,101 | |||||||||||||||||||||
| Debt instruments issued (*) | 17,154 | 369,988 | 1,083,540 | 2,358,966 | 2,104,219 | 4,839,310 | 10,773,177 | |||||||||||||||||||||
| Other liabilities | 273,394 | 50 | 183 | 183 | — | — | 273,810 | |||||||||||||||||||||
| Total liabilities | 26,153,988 | 3,404,811 | 1,405,199 | 6,349,580 | 2,273,643 | 6,241,146 | 45,828,367 | |||||||||||||||||||||
| (*) | Amounts shown here are different from those reported in the liabilities report which is part of the liquidity analysis, due to differences in the treatment of mortgage bonds issued by the Bank in both reports. |
F-174
NOTES TO THE CONSOLIDATED FINANCIAL STATEMENTS, Continued
| 43. | Risk Management, continued: |
| (3) | Market Risk, continued: |
| (b) | Price Risk, continued: |
Price Risk Sensitivity Analysis
The Bank uses stress tests as the main sensitivity analysis tool for Price Risk. The analysis is implemented for the Trading Book, Accrual Book and the AFS portfolio separately. The Bank has adopted this tool as it is considered more useful than fluctuations in business as usual scenario, such as VaR or EaR, given that:
| (i) | The financial crisis show market factors fluctuations that are materially larger than those used in the VaR with 99% of confidence level or EaR with 99% of confidence level. |
| (ii) | The financial crisis also show that correlations between these fluctuations are materially different from those used in the VaR computation, since a crisis precisely indicates severe disconnections between the behaviors of market factors fluctuations respect to the patterns observed under normal conditions. |
| (iii) | Trading liquidity dramatically diminishes during financial distress and especially in emerging markets. Therefore, the overnight VaR number might not be representative of the loss for trading portfolios in such environment since closing exposures period may exceed one business day. This may also happen when calculating EaR, even considering three months as the closing period. |
The impacts are determined by mathematical simulations of fluctuations in the values of market factors, and also, estimating the changes of the economic and /or accounting value of the financial positions.
In order to comply with IFRS 7.40, the following exercise was included illustrating an estimation of the impact of extreme but reasonable fluctuations of interest rates, swaps yields, FX rates and exchange volatility, which are used for valuing Trading Book, Accrual Book and the AFS portfolios. Given that the Bank’s portfolio includes positions denominated in nominal and real interest rates, these fluctuations must be aligned with extreme but realistic Chilean inflation changes forecasts.
The exercise is implemented by multiplying the sensitivities by the fluctuations obtained as the results of mathematical simulations over a two-week time horizon and using the maximum historical volatility, within a significant period of time, in each of the market factors present in the Trading Book, in the case of the AFS portfolio a four-week time horizon is used due to liquidity constrains; Accrual Book impacts are estimated by multiplying cumulative gaps by forward interest rates fluctuations modeled over a three-month time horizon and using the maximum historical volatility of interest fluctuations but limited by maximum fluctuations and / or levels observed within a significant period of time. It is relevant to note that the methodology might ignore some portion of the interest rates convexity, since it is not captured properly when large fluctuations are modeled. In any case, given the magnitude of the changes, the methodology may be reasonable enough for the purposes and scope of the analysis.
F-175
NOTES TO THE CONSOLIDATED FINANCIAL STATEMENTS, Continued
| 43. | Risk Management, continued: |
| (3) | Market Risk, continued: |
| (b) | Price Risk, continued: |
The following table illustrates the fluctuations resulting from the main market factors in the maximum stress test exercise, or more adverse, for the Trading Book.
The directions or signs of these fluctuations are those that correspond to those that generate the most adverse impact at the aggregate level.
Average Fluctuations of Market Factors for Maximum Stress Scenario Trading Book | ||||||||||||||||||||||||
| CLP Derivatives (bps) | CLP Bonds (bps) | CLF Derivatives (bps) | CLF Bonds (bps) | USD Offshore Libor Derivatives (bps) | Spread USD On/Off Derivatives (bps) | |||||||||||||||||||
| Less than 1 year | (28 | ) | 110 | 18 | 147 | (8 | ) | 1 | ||||||||||||||||
| Greater than 1 year | (12 | ) | 81 | 61 | 149 | (16 | ) | 8 | ||||||||||||||||
bps = basis points
The worst impact on the Bank’s Trading Book as of December 31, 2021, as a result of the simulation process described above, is as follows:
| Most Adverse Stress Scenario P&L Impact Trading Book (MCh$) | ||||||||
| CLP Interest Rate | (2,365 | ) | ||||||
| Derivatives | (432 | ) | ||||||
| Debt instruments | (1,933 | ) | ||||||
| CLF Interest Rate | (11,313 | ) | ||||||
| Derivatives | 118 | |||||||
| Debt instruments | (11,431 | ) | ||||||
| Interest rate USD offshore | (64 | ) | ||||||
| Domestic/offshore interest rate spread USD | (48 | ) | ||||||
| Banking spread | (389 | ) | ||||||
| Total Interest rates | (14,179 | ) | ||||||
| Total FX and FX Options | 137 | |||||||
| Total | (14,042 | ) | ||||||
The modeled scenario would generate losses in the Trading Book for approximately MCh$14,042. In any case, such fluctuations would not result in material losses compared to regulatory capital or to the P&L estimate for the next 12-months.
F-176
NOTES TO THE CONSOLIDATED FINANCIAL STATEMENTS, Continued
| 43. | Risk Management, continued: |
| (3) | Market Risk, continued: |
| (b) | Price Risk, continued: |
The impact on the Accrual Book for the next 12 months as of December 31, 2021, which does not necessarily mean a net loss(gain) but a greater(lower) net income from funds generation (resulting net interest rate generation), is illustrated below:
Most Adverse Stress Scenario 12-Month Revenue Accrual Book (MCh$) | ||||
| Impact by Base Interest Rate shocks | (391,392 | ) | ||
| Impact due to Spreads Shocks | (16,255 | ) | ||
| Higher / (Lower) Net revenues | (407,647 | ) | ||
The impact on the AFS portfolio is shown in the following tables. First are the main fluctuations in the market factors, due to the scenarios provided for the stress test meltdown (more adverse), for this portfolio.
The sign of the fluctuation below, correspond to the ones that generate the most adverse impact.
Average Fluctuations of Market Factors for Maximum Stress Scenario AFS Portfolio | ||||||||||||||||
| CLP Bonds (bps) | CLF Bonds (bps) | USD Offshore Libor Derivatives (bps) | Spread USD On/Off Derivatives (bps) | |||||||||||||
| Less than 1 year | 306 | 306 | (15 | ) | (22 | ) | ||||||||||
| Greater than 1 year | 278 | 309 | (6 | ) | 2 | |||||||||||
bps = basis points
The worst impact on the Bank’s AFS portfolio as of December 31, 2021, as a result of the simulation process described above, is as follows:
Most Adverse Stress Scenario P&L Impact AFS portfolio (MCh$) | ||||
| CLP Debt Instrument | (77,209 | ) | ||
| CLF Debt Instrument | (84,858 | ) | ||
| Interest rate USD offshore | — | |||
| Domestic/offshore interest rate spread USD | — | |||
| Banking spread | (405 | ) | ||
| Corporative spread | 220 | |||
| Total | (162,252 | ) | ||
The modeled scenario would generate losses in the AFS portfolio for approximately MCh$162,252, which would potentially be reflected in Other Comprehensive Income accounts.
The main negative impact on the Trading Book would occur as a result of an increase in local interest rates, especially for the Debt instruments, the same applies to the AFS portfolio. The lowest potential income in the next 12 months in the Accrual Book would occur in a scenario of a sharp inflation price fall. In any case, the impacts would be less than the annual budgeted profits of the Bank.
F-177
NOTES TO THE CONSOLIDATED FINANCIAL STATEMENTS, Continued
| 43. | Risk Management, continued: |
| (4) | Requirements and Capital Management: |
The main objectives of the Bank’s capital management are to ensure the adequacy and quality of its capital, at a consolidated level, based on managing the risks it faces in its operations, establishing sufficient capital levels, through the definition of an internal objective, which supports both the business strategy and stress scenarios in the short and medium terms, thus ensuring compliance with regulatory requirements, a solid credit rating and adequate capital levels. During 2021, the Bank has comfortably met the required capital requirements.
As part of its Capital Management Policy, the Bank has established capital adequacy alerts and limits, which are monitored by the governance structures that the Bank has established for these purposes, including the Capital Management Committee. During 2021, none of the internal alerts defined by the Bank were activated as part of the Capital Risk Appetite Framework.
The Bank manages capital based on its strategic objectives, its risk profile and its ability to generate cash flows, as well as the economic and business context in which it operates. Consequently, the Bank may modify the amount of payment of dividends to its shareholders or issue basic capital, additional tier 1 capital or tier 2 capital instruments. The Bank’s capital adequacy is monitored using, among other measures, the indices and rules established by the CMF, as well as the alerts and internal limits that the capital management committee and board of directors have defined for such purposes.
Capital Requirements
In accordance with the General Banking Law, the total capital or regulatory capital of a bank may not be less than 8% of its risk-weighted assets (RWA), net of required provisions. Additionally, it establishes that the Common Equity Tier 1 (CET1) Capital may not be less than 4.5% of its RWA or 3% of its total assets. Also, Tier 1 Capital, corresponding to the sum of CET1 and Additional Tier 1 Capital (AT1 = Perpetual Bonds + Preferred Stocks), may not be less than 6% of RWA, net of required provisions. Likewise, banks must comply with additional requirements associated with capital buffers, such as the conservation buffer, the domestic systemically-important banks buffer, the countercyclical buffer and/or pillar 2 capital requirements.
Adoption of the Basel III standard
In 2019, the CMF began the regulatory process for the implementation of Basel III standards in Chile, as established in Law No. 21,130 that Modernizes Banking Regulation. During the years 2020 and 2021, the CMF published the specific regulations for compliance with the Basel III framework for the local banking industry, which became applicable as of December 1, 2021. The regulation includes the standard methodologies to determine, among others, Credit, Operational and Market Risk-Weighted Assets, total or regulatory capital, the leverage ratio and domestic systemically-important banks. Additionally, the regulations describe requirements and conditions for: (i) the application of internal models for the calculation of certain risk-weighted assets, (ii) the issuance of hybrid capital instruments (AT1), (iii) the principles for determining capital buffers (countercyclical and conservation), (iv) additional requirements for banks defined as systemically-important banks, (v) the criteria to determine capital requirements for banks with risk management deficiencies identified in the supervisory process (Pillar 2), and (vi) market disclosure requirements (Pillar 3), among others.
F-178
NOTES TO THE CONSOLIDATED FINANCIAL STATEMENTS, Continued
| 43. | Risk Management, continued: |
| (4) | Requirements and Capital Management, continued: |
The aforementioned Basel III banking adequacy standards consider a series of transitory regulations. These measures include: i) the gradual adoption of the conservation buffer and requirements for systemic banks, ii) the gradual application of adjustments to regulatory capital, iii) the temporary substitution of additional tier 1 capital (AT1) for tier 2 capital instruments, that is, subordinated bonds and additional provisions and iv) gradualness to continue recognizing subordinated bonds issued by banking subsidiaries as regulatory capital.
Below are indicators and indices applicable as of December 1, 2021:
| Total assets, risk-weighted assets and Regulatory Capital Components | Overall consolidated | Local consolidated | ||||||||
| according to Basel III | Dec-2021 | Dec-2021 | ||||||||
| Item No. | Item description | MCh$ | MCh$ | |||||||
| 1 | Total assets according to the statement of financial position | 51,702,439 | 51,702,439 | |||||||
| 2 | Non-consolidated investment in subsidiaries | — | — | |||||||
| 3 | Assets discounted from regulatory capital, other than item 2 | 61,953 | 61,953 | |||||||
| 4 | Derivative credit equivalents | 1,782,784 | 1,782,784 | |||||||
| 4.1 | Financial derivative contracts | 2,983,298 | 2,983,298 | |||||||
| 5 | Contingent loans | 2,612,170 | 2,612,170 | |||||||
| 6 | Assets generated by the intermediation of financial instruments | — | — | |||||||
| 7 | = (1-2-3+4-4.1+5-6) Total assets for regulatory purposes | 53,052,142 | 53,052,142 | |||||||
| 8.a | Credit risk-weighted assets, estimated according to the standard methodology (CRWA) | 28,280,644 | 28,280,644 | |||||||
| 8.b | Credit risk-weighted assets, estimated according to internal methodologies (CRWA) | — | — | |||||||
| 9 | Market risk-weighted assets (MRWA) | 1,342,767 | 1,342,767 | |||||||
| 10 | Operational risk-weighted assets (ORWA) | 2,956,592 | 2,956,592 | |||||||
| 11.a | = (8.a/8.b+9+10) Risk-weighted assets (RWA) | 32,580,003 | 32,580,003 | |||||||
| 11.b | = (8.a/8.b+9+10) Risk-weighted assets, after application of the output floor (RWA) | 32,580,003 | 32,580,003 | |||||||
| 12 | Owner’s equity | 4,223,013 | 4,223,013 | |||||||
| 13 | Non-controlling interest | 1 | 1 | |||||||
| 14 | Goodwill | — | — | |||||||
| 15 | Excess minority investments | — | — | |||||||
| 16 | = (12+13-14-15) Common Equity Tier 1 Capital (CET1) | 4,223,014 | 4,223,014 | |||||||
| 17 | Additional deductions to Common Equity Tier 1 Capital, other than item 2 | — | — | |||||||
| 18 | = (16-17-2) Common Equity Tier 1 Capital (CET1) | 4,223,014 | 4,223,014 | |||||||
| 19 | Voluntary provisions (additional) computed as additional Tier 1 capital (AT1) | 325,800 | 325,800 | |||||||
| 20 | Subordinated bonds computed as additional tier 1 capital (AT1) | — | — | |||||||
| 21 | Preferred shares allocated to additional tier 1 capital (AT1) | — | — | |||||||
| 22 | Bonds without a fixed term of maturity imputed to additional tier 1 capital (AT1) | — | — | |||||||
| 23 | Discounts applied to AT1 | — | — | |||||||
| 24 | = (19+20+21+22-23) Additional Tier 1 Capital (AT1) | 325,800 | 325,800 | |||||||
| 25 | = (18+24) Tier 1 Capital | 4,548,814 | 4,548,814 | |||||||
| 26 | Voluntary provisions (additional) computed as Tier 2 capital (T2) | 214,452 | 214,452 | |||||||
| 27 | Subordinated bonds computed as Tier 2 capital (T2) | 871,079 | 871,079 | |||||||
| 28 | = (26+27) Equivalent tier 2 capital (T2) | 1,085,531 | 1,085,531 | |||||||
| 29 | Discounts applied to T2 | — | — | |||||||
| 30 | = (28-29) Tier 2 capital (T2) | 1,085,531 | 1,085,531 | |||||||
| 31 | = (25+30) Total or Regulatory Capital | 5,634,345 | 5,634,345 | |||||||
| 32 | Additional CET 1 Capital required for the constitution of the conservation buffer | 0 | 0 | |||||||
| 33 | Additional CET 1 Capital required to set up the countercyclical buffer | 0 | 0 | |||||||
| 34 | Additional CET 1 Capital required for banks qualified as systemic | 0 | 0 | |||||||
| 35 | Additional capital required for the evaluation of the adequacy of Total or Regulatory Capital (Pillar 2) | 0 | 0 | |||||||
F-179
NOTES TO THE CONSOLIDATED FINANCIAL STATEMENTS, Continued
| 43. | Risk Management, continued: |
| (4) | Requirements and Capital Management, continued: |
| Capital Adequacy Ratios and Regulatory Compliance According to Basel III | Overall consolidated Dec-2021 | Local consolidated Dec-2021 | ||||||
| % | % | |||||||
| Leverage Ratio ( I18/ I7) | 7.96 | % | 7.96 | % | ||||
| Common Equity Tier 1 (CET1) Capital Ratio ( I18 / I11.b) | 12.96 | % | 12.96 | % | ||||
| Tier 1 capital Ratio ( I25 / I11.b) | 13.96 | % | 13.96 | % | ||||
| Total or Regulatory Capital Ratio ( I31/ I11.b) | 17.29 | % | 17.29 | % | ||||
| Credit rating | A | A | ||||||
| Regulatory Compliance for Capital Adequacy | ||||||||
| Additional provisions computed as Tier 2 capital (T2) in relation to Credit RWA | 0.76 | % | 0.76 | % | ||||
| Subordinated bonds computed as Tier 2 capital (T2) in relation to CET 1 Capital | 20.63 | % | 20.63 | % | ||||
| Additional Tier 1 Capital (AT1) in relation to CET 1 Capital | 7.71 | % | 7.71 | % | ||||
| Voluntary (additional) provisions and subordinated bonds computed as AT1 in relation to RWAs | 1.00 | % | 1.00 | % |
Below, for comparative purposes, the amounts and ratios determined using the standards in effect up to November 30, 2021 are:
| As of December 31, | ||||||||
| 2020 | 2021 (*) | |||||||
| MCh$ | MCh$ | |||||||
| Basic capital | 3,726,267 | 4,223,013 | ||||||
| Regulatory capital | 4,878,500 | 5,522,703 | ||||||
| Total consolidated assets | 48,754,455 | 55,261,371 | ||||||
| Total consolidated credit risk-weighted assets | 30,566,571 | 34,288,733 | ||||||
| Ratio | ||||||||
| As of December 31, | ||||||||
| 2020 | 2021 (*) | |||||||
| % | % | |||||||
| Basic capital / consolidated assets | 7.64 | 7.64 | ||||||
| Regulatory capital / consolidated risk-weighted assets | 15.96 | 16.11 | ||||||
| (*) | Information for comparative purposes based on standards contained in Chapter 12-1 of the RAN. |
F-180
NOTES TO THE CONSOLIDATED FINANCIAL STATEMENTS, Continued
| 44. | New Accounting Pronouncements: |
The following is a summary of new standards, interpretations and improvements to the International Financial Reporting Standards issued by the International Accounting Standards Board (IASB) that are not yet effective as of December 31, 2021:
IAS 28 — Investments in Associates and Joint Venture, and IFRS 10 — Consolidated Financial Statements.
In September 2014, the IASB published this modification, which clarifies the scope of the profits and losses recognized in a transaction that involves an associate or joint venture, and that this depends on whether the asset sold or contribution constitutes a business. Therefore, the IASB concluded that all gains or losses should be recognized against loss of control of a business. Likewise, the gains or losses that result from the sale or contribution of a subsidiary that does not constitute a business (definition of IFRS 3) to an associate or joint venture should be recognized only to the extent of unrelated interests in the associate or joint venture.
During December 2015, the IASB agreed to set the effective date of this modification in the future, allowing its immediate application.
Banco de Chile and its subsidiaries will have no impact on the Consolidated Financial Statements as a result of the application of this amendment.
Limited Scope Amendments and Annual Improvements 2018-2020.
In May 2020, the IASB published a package of amendments of limited scope, as well as the 2018-2020 Annual Improvements, whose changes clarify the wording or correct minor consequences, omissions or conflicts between the requirements of the Standards.
Among other modifications, it contains amendments to IAS 37 Provisions, Contingent Liabilities and Contingent Assets which specify the costs that an entity should include when evaluating whether a contract will cause losses. These costs include those that are directly related to the contract and may be costs incremental to the performance of that contract (for example, direct labor and materials), or an allocation of other costs that are directly related to the performance of contracts (for example, the allocation of the depreciation charge for an item of property, plant and equipment used to fulfill the contract).
These amendments will be effective as of January 1, 2022 and it is estimated that Banco de Chile and its subsidiaries will not have significant impacts on the Consolidated Financial Statements as a result of the application of these amendments.
IAS 1 Presentation of Financial Statements and IFRS Practice Statement No. 2 Accounting Policy Disclosures.
In February 2021, the IASB published amendments to IAS 1 to require companies to disclose material information on accounting policies, the foregoing in order to improve the disclosures of their accounting policies and provide useful information to investors and other users of financial statements.
To help entities apply the amendments to IAS 1, the Board also amended IFRS Practice Statement No. 2 to illustrate how an entity can judge whether accounting policy information is material to its financial statements.
The amendments to IAS 1 will be effective for Financial Statement presentation periods beginning on or after January 1, 2023. Early application is permitted. If an entity applies those amendments to prior periods, it must disclose that fact.
The application of this amendment will not generate material impacts on the disclosure of accounting policies in the Consolidated Financial Statements of Banco de Chile and its subsidiaries.
F-181
NOTES TO THE CONSOLIDATED FINANCIAL STATEMENTS, Continued
| 44. | New Accounting Pronouncements, continued: |
IAS 8 Accounting Policies, Changes in Accounting Estimates and Errors. Definition of Accounting Estimate.
In February 2021, the IASB incorporated changes to the definition of accounting estimates contained in IAS 8, the amendments to IAS are intended to help entities distinguish changes in accounting estimates from changes in accounting policies.
The amendments to IAS 8 will be effective for Financial Statement presentation periods beginning on or after January 1, 2023. Early application is permitted.
The application of this amendment will not have an impact on the Consolidated Financial Statements of Banco de Chile and its subsidiaries.
IAS 12 Income Tax.
In May 2021 the IASB published amendments to IAS 12, to specify how companies should account for deferred taxes on transactions such as leases and decommissioning obligations.
IAS 12 Income Tax specifies how a company accounts for income tax, including deferred tax, which represents tax to be paid or recovered in the future. In certain circumstances, companies are exempt from recognizing deferred taxes when they first recognize assets or liabilities. Prior to the amendment, there was some uncertainty as to whether the exemption applied to transactions such as leases and decommissioning obligations, transactions for which companies recognize both an asset and a liability.
The amendments clarify that the exemption does not apply and that companies are required to recognize deferred taxes on such transactions. The purpose of the amendments is to reduce the differences in reporting deferred tax on leases and decommissioning obligations.
F-182
NOTES TO THE CONSOLIDATED FINANCIAL STATEMENTS, Continued
| 45. | Subsequent Events: |
| (a) | On January 27, 2022, the Board of Directors of Banco de Chile agreed to convene an Ordinary Shareholders Meeting on March 17, 2022 in order to propose, among other matters, the following: |
| 1. | The following distribution of profits for the year ended on December 31, 2021: |
| a. | Deduct and withhold from the net income of the year, an amount equivalent to the effect of inflation of the paid capital and reserves according to the variation of the Consumer Price Index that occurred between November 2020 and November 2021, amounting to Ch$253,093,655,744 which will be added to retained earnings from previous periods. |
| b. | Distribute in the form of a dividend the remaining liquid profit, corresponding to a dividend of Ch$5.34393608948 to each of the 101,017,081,114 shares of the Bank. |
Consequently, the distribution as dividend of 68.1% of the profits for the year ending December 31, 2021, will be proposed.
| 2. | The shareholders who choose to, may at their option apply all or part of their dividend to the optional and transitory taxation regime that contemplates a substitute tax payment for the final taxes, called ISFUT (for its Spanish initials), in accordance with the transitory article 25 of Law No. 21,210. The form and period in which this option can be exercised will be informed in a timely manner. |
| 3. | The dividend, if approved by the Meeting, will be paid on March 31, 2022. |
| (b) | On March 17, 2022, Banco de Chile reported that at its Ordinary Shareholders’ Meeting, shareholders approved the payment of dividend No. 210 for Ch$5.34393608948 per share, charged to net income corresponding to fiscal year 2021. Following this, shareholders could, at their option apply all or part of their dividend to the optional and transitory taxation regime that contemplates a substitute tax payment for the final taxes, called ISFUT (for its Spanish initials), in accordance with the transitory article 25 of Law No. 21,210. The term to exercise the option expired at 1:00 p.m. on March 29 (Santiago de Chile time). Shareholders who chose the ISFUT option had 11.12877% of the dividend withheld per share chosen for the aforementioned option. The amount withheld will be used to pay the ISFUT. Those shareholders registered in the respective registry at midnight on March 25, 2022 were entitled to receive the dividend. The dividend was paid to all shareholders entitled to it as of March 31, 2022 at any Banco de Chile branch. |
In Management’s opinion, there are no other significant subsequent events that affect or could affect the Consolidated Financial Statements of Banco de Chile and its subsidiaries between December 31, 2021 and the date of issuance of these Consolidated Financial Statements.
F-183
Item 19 Exhibits
LIST OF EXHIBITS
262
| * | Filed herewith. |
Omitted from the exhibits filed with this annual report are certain instruments and agreements with respect to our long-term debt, none of which authorizes securities in a total amount that exceeds 10% of our total assets. We hereby agree to furnish to the SEC copies of any such omitted instruments or agreements as the SEC requests.
263
SIGNATURE
The registrant, Banco de Chile, hereby certifies that it meets all of the requirements for filing on Form 20-F and that it has duly caused and authorized the undersigned to sign this annual report on its behalf.
Date: April 29, 2022
| BANCO DE CHILE | ||
| By | /s/ Eduardo Ebensperger O. | |
| Name: | Eduardo Ebensperger O. | |
| Title: | Chief Executive Officer | |
264