FORM 6-K
SECURITIES AND EXCHANGE COMMISSION
Washington, D.C. 20549
Report of Foreign Private Issuer
Pursuant to Rule 13a-16 or 15d-16
of the Securities Exchange Act of 1934
For the month of October, 2006
Commission File Number 001-15266
BANK OF CHILE
(Translation of registrant's name into English)
Ahumada 251
Santiago, Chile
(Address of principal executive offices)
Indicate by check mark whether the registrant files or will file annual reports under cover Form 20-F or Form 40-F.
Form 20-F___X___ Form 40-F
Indicate by check mark if the registrant is submitting the Form 6-K in paper as permitted
by Regulation S-T Rule 101(b)(1): ____
Indicate by check mark if the registrant is submitting the Form 6-K in paper as permitted
by Regulation S-T Rule 101(b)(7): ____
Indicate by check mark whether by furnishing the information contained in this Form, the
registrant is also thereby furnishing the information to the Commission pursuant to Rule
12g3-2(b) under the Securities Exchange Act of 1934.
Yes____ No___X___
If "Yes" is marked, indicate below the file number assigned to the registrant in
connection with Rule 12g3-2(b): 82- ________
BANCO DE CHILE
REPORT ON FORM 6-K
Attached is a Press Release issued by Banco de Chile (“the Bank”) on October 30, 2006, regarding its financial statements for the nine months ended September 30, 2006.

| 2006 Third Quarter Results | ||
FINANCIAL HIGHLIGHTS | ||
| Santiago, Chile, October 30, 2006 Banco de Chile (NYSE: BCH), a full service Chilean financial institution, market leader in a wide variety of credit and non credit products and services across all segments of the Chilean financial market, today announced its results for the third quarter ended September 30, 2006. |
| |
| Selected Financial Data (in constant Ch$ as of September 30, 2006, except for percentages) | 3Q05 | 2Q06 | 3Q06 | % Change 3Q06/3Q05 | ||||
| Income Statement(Millions of Chilean pesos) | ||||||||
| Net financial income(1) | 100,645 | 117,385 | 116,365 | 15.6% | ||||
| Fees and income from services | 36,042 | 32,907 | 31,779 | (11.8)% | ||||
| Gains (Losses) on financial instruments & | ||||||||
| non-forwards derivatives , net | 1,275 | (3,929) | 1,983 | 55.5% | ||||
| Operating revenues | 137,962 | 146,363 | 150,127 | 8.8% | ||||
| Provisions for loan losses | (4,783) | (7,185) | (9,204) | 92.4% | ||||
| Operating expenses | (72,074) | (76,309) | (76,432) | 6.0% | ||||
| Net income | 50,140 | 56,061 | 52,447 | 4.6% | ||||
| Earnings per Share(Chilean pesos) | ||||||||
| Earnings per share | 0.74 | 0.81 | 0.77 | 4.1% | ||||
| Book value per share | 11.14 | 10.79 | 11.67 | 4.8% | ||||
| Balance Sheet(Millions of Chilean pesos) | ||||||||
| Total loans | 7,929,728 | 8,906,551 | 9,151,257 | 15.4% | ||||
| Total assets | 10,699,286 | 11,661,819 | 11,889,520 | 11.1% | ||||
| Shareholders' equity | 758,259 | 744,507 | 794,824 | 4.8% | ||||
| Ratios | ||||||||
| Profitability | ||||||||
| Return on average as sets (ROAA) | 1.86% | 1.93% | 1.79% | |||||
| Return on average shareholders ' equity (ROAE) | 28.2% | 31.2% | 26.9% | |||||
| Net financial margin(2) | 4.3% | 4.6% | 4.5% | |||||
| Efficiency ratio (operat. expenses/operat. revenues) | 52.2% | 52.1% | 50.9% | |||||
| Credit Quality | ||||||||
| Past due loans / Total loans | 0.99% | 0.75% | 0.72% | |||||
| Allowances for loan losses / Total loans | 1.80% | 1.62% | 1.54% | |||||
| Allowances for loan losses / Past due loans | 181.2% | 215.4% | 214.9% | |||||
| Capital Adequacy | ||||||||
| Total capital / Risk adjusted assets | 12.0% | 11.7% | 11.5% | |||||
| 1 | Net interest revenue, foreign exchange transactions and gains from forwards derivatives instruments, net. |
| 2 | Net financial income divided by average interest earning assets. |

2006 Third Quarter Results | |
Third Quarter 2006 Highlights
The Bank |
- Solid Operating Income.The Bank registered an 8.8% growth in operating revenues between the third quarter of 2006 and the year earlier quarter, as a result of a strong loan expansion and a higher contribution of demand deposits to the net financial income.
- The Bank strengthens its internationalpresence through its representative office inChina. Banco de Chile opened its representative office in Beijing last September.
This office will promote a variety of financial services focused on supporting our customer base in a context of increased opportunities emerging from the recently signed Free Trade Agreement between Chile and China. As such, this office expects to be a key business platform for both Chinese and Chilean companies. - Banco de Chile issued UF denominatedbonds worth the equivalent of US$171million.Last September, Banco de Chile placed a total amount of UF5 million (US$171 million) in 5-year bonds on the local market with an interest yield of 3.69%. These instruments were previously rated AA+ by the local risk agencies Feller Rate and Fitch Chile.
- Banco de Chile received important awardsduring 3Q06.The Bank was distinguished as the"Best Bank in Chile"for 2006 by Euromoney in its annual Awards of Excellence nomination.
This award defines banking excellence in global categories across 110 individual countries. Banco de Chile was distinguished for its global performance, distribution network, market share, product innovation and service quality, amongst others.
In addition, Banco de Chile was selected as the “Best Foreign Exchange Bank in Chile” by bothGlobal Finance MagazineandEuromoney.
Regarding our subsidiaries, Banchile Insurance Brokerage was once again recognized for its working environment, ranking second in the 2006 survey conducted by the Great Place to Work Institute.
- Neos Plan.During the third quarter of 2006, the Bank rolled out the first stage in the implementation of its new teller system named “Genesis”. This milestone is part of Neos, the Bank’s leading project plan and will allow to increasing its efficiency level through higher service quality standards.
- The Financial Advisory subsidiarymaterialized important businesses.During the third quarter of 2006, the firm represented the sell side in an important acquisition of a supermarket chain, while arranging together with other banks an important syndicated loan for over US$100 million granted to a retail company
- Commercial campaigns.During the currently reported quarter, the Bank launched different promotional campaigns oriented to the retail segment in order to expand its client base and strengthen clients’ loyalty. New and more flexible mortgage alternatives, auto loans, insurance and checking accounts were fostered through several marketing initiatives. In addition, new innovative mutual funds were recently launched by the Mutual Funds Subsidiary.
- Client base expansion.The Bank’s customer base continued to grow in line with the Bank’s sale force efforts and distribution network expansion. Accordingly, the number of debtors increased by 15% in twelve months, to 582.390 in September 2006. The Bank has also benefited from a large and stable low cost deposit base. The number of current accounts increased by 9.3% during the last twelve months reaching 458,125 accounts in 3Q06. As a result, the Bank’s market share on average demand deposits increased by 19 basis points during the same period.
- Distribution Network.The Bank has opened 167 new automatic teller machines and 8 new branches during 3Q06, in order to expand its business in high potential spots within the metropolitan area and throughout the country.
Page 2 of 16 |
2006 Third Quarter Results | |
Financial System Highlights |
- The Chilean Financial Systemreported solid results in the third quarter of 2006 with a net income of Ch$242,446 million, reflecting an increase of 14.4% as compared to the same figure in 3Q05. This increase was largely a result of the 14.8% annual expansion of the loan portfolio, net of interbank loans, however, improvements in the efficiency of the system also explained the positive results of the quarter. The Return on Average Equity (ROAE) for 3Q06 was of 18.1% as compared to 17.0% for 3Q05 and 18.0% in 2Q06.
Total loans, net of interbank loans, as of September 30, 2006, totaled US$92,637million, with year-on-year and quarterly expansions of 14.8% and 1.8%, respectively. The twelve month growth was fostered by the retail sector mainly in consumer and mortgage loans which increased by 21.8% and 10.8% during the last twelve months. The wholesale sector has also proved a solid performance with significant growth in commercial loans.
Page 3 of 16 |
2006 Third Quarter Results | |
Banco de Chile 2006 Third-Quarter Consolidated Results
NET INCOME |
The Bank’s consolidated net income totaled Ch$52,447 million during 3Q06, which signified a 4.6% increase as compared to 3Q05. This better performance reflected the stronger net financial income driven by the loan portfolio growth and by higher benefits arising from demand deposits. To a lesser extent, higher non-operating income as well as a recovery in the results of its foreign branches also contributed to this expansion. These positive factors more than compensated lower fee incomes, higher provisions for loan losses and higher operating expenses.
In 3Q06, the Bank reached an annualized return on average assets(ROAA) and annualized return on average shareholders’ equity(ROAE) of 1.79% and 26.92%, respectively, slightly below the figures posted in 3Q05 but far above the financial system’s comparable figures for the quarter of 1.39% and 18.1% .
As a whole, the net income of subsidiaries decreased by 14.9% during 3Q06 as compared to 3Q05, primarily as a consequence of lower fee income accounted by Banchile Corredores de Bolsa (the securities brokerage subsidiary) and, to a lesser extent, to lower results of the Mutual Funds subsidiary. However, those effects were partially offset by higher net income posted by the rest of the subsidiaries, mainly by the Financial Advisory and the Insurance Brokerage companies. During 3Q06, the Financial Advisory subsidiary participated in two important business transactions, while the Insurance Brokerage firm continued to demonstrate strong commercial activities, thus increasing its contribution to the Bank’s net income.
Regarding the improved results of the Bank’s foreign branches, they were mainly attributable to an important drop in the New York branch’s operating expenses. These expenses were mostly related to advisories incurred upon as part of the additional risk control activities taken in order to adjust to compliance regulations.
Bank, Subsidiaries and Foreign Branches' Net Income | ||||||||
| (in millions of Chilean pesos) | 3Q05 | 2Q06 | 3Q06 | % C ha nge 3Q06/3Q05 | ||||
| Bank | 46,537 | 55,242 | 47,209 | 1.4% | ||||
| Foreign Branches | (2,869) | (3,671) | (270) | (90.6)% | ||||
| Securities Brokerage | 2,650 | 1,025 | 1,313 | (50.5)% | ||||
| Mutual Funds | 2,586 | 2,150 | 2,384 | (7.8)% | ||||
| Insurance Brokerage | 179 | 520 | 442 | 146.9% | ||||
| Financial Advisory | 105 | 107 | 345 | 228.6% | ||||
| Factoring | 586 | 264 | 623 | 6.3% | ||||
| Securitization | 27 | (21) | (22) | (181.5)% | ||||
| Promarket (sales force) | 23 | 25 | 27 | 17.4% | ||||
| Socofin (collection) | 261 | 373 | 339 | 29.9% | ||||
| Trade Services | 55 | 47 | 57 | 3.6% | ||||
| Total Net Income | 50,140 | 56,061 | 52,447 | 4.6% | ||||
Total net income decreased by 6.4% in 3Q06 as compared to the previous record figure of Ch$56,061 million registered in 2Q06. This decline was mainly a result of a lower result in other income and expenses and higher provisions for loan losses, which together offset the increase registered in operating revenues. It is worth noting that during 2Q06, other income and expenses line was positively impacted by a release of excess tax provisions from previous years, being a one time effect at the non-operating income level of approximately Ch$3,350 million.
However, the net income of the 3Q06 compared to the previous quarter was positively impacted by better results registered by the foreign branches, and by the net income growth registered by the Bank’s subsidiaries.
Overall, the net income of subsidiaries amounted to Ch$5,508 million in 3Q06, contributing 10.5% to consolidated net income up from 8.0% in the previous quarter. This increase was mostly explained by better results attained by the Securities Brokerage, the Mutual Funds and the Financial Advisory subsidiaries, as well as by higher recoveries posted by the Factoring subsidiary.
Page 4 of 16 |
2006 Third Quarter Results | |
NET FINANCIAL INCOME |
The net financial income increased to Ch$116,365 million in 3Q06 compared to Ch$100,645 million in 3Q05, mainly as a result of a 9.7% growth in average interest earning assets and, to a lesser extent, to an increase of 23 basis points in the net financial margin from 4.25% in 3Q05 to 4.48% in 3Q06.
| Net Interest Revenue | ||||||||
| (in millions of Chilean pesos) | 3Q05 | 2Q06 | 3Q06 | % Change 3Q06/3Q05 | ||||
| Interest revenue | 191,244 | 227,966 | 234,268 | 22.5% | ||||
| Interest expense | (90,125) | (113,035) | (123,112) | 36.6% | ||||
| Foreign Exchange transactions, net | 15,901 | (7,380) | 783 | (95.1)% | ||||
| Gains (losses) from forwards derivatives | ||||||||
| contracts | (16,375) | 9,834 | 4,426 | - | ||||
| Net Financial Income(1) | 100,645 | 117,385 | 116,365 | 15.6% | ||||
| Avg. Int. earning assets | 9,462,844 | 10,212,455 | 10,381,775 | 9.7% | ||||
| Net Financial Margin (2) | 4.3% | 4.6% | 4.5% | - | ||||
The increase in average interest earning assets between 3Q06 and 3Q05 was mainly caused by a 15% growth in the average loan portfolio principally driven by commercial, contingent and consumer loans, which more than offset the 10% decrease in average investments between the same periods.
The increase in the net financial margin during 3Q06 was mainly due to:
- A higher contribution from non-interest bearing liabilities, principally demand deposits, as a result of the increase of nominal interest rates (average short-term interest rate was 5.21% in 3Q06 and 3.66% in 3Q05).
- A lower negative repricing effect in 3Q06 compared to 3Q05 derived from a lower increase in short-term interest rates (as the Bank’s liabilities reprice faster than its assets). The Chilean Central Bank increased the monetary policy interest rate by only 25 basis points at the beginning of 3Q06, and maintained this rate stable for the rest of the quarter, while during 3Q05 this rate was increased by 75 basis points.
- A slight increase in the inflation rate, measured by the fluctuation of the UF of 1.38% during 3Q06, compared to 1.31% in 3Q05, which implied that during 3Q06, the Bank earned higher interest income on the portion of UF denominated interest earning assets financed by nominal interest bearing liabilities and by non-interest bearing liabilities.
These factors which positively affected the net financial income were partially offset by a less favorable funding structure (the ratio of interest bearing liabilities to interest earning assets increased to 73.6% in 3Q06 from 71.9% in 3Q05) and lower spreads derived from increased competition.
Net financial income for 3Q06 compared to 2Q06 decreased slightly by 0.9% mainly as a result of a drop in the net financial margin, partially offset by the 1.7% expansion in average interest earning assets. The decline in the net financial income was mainly explained by:
- The impact of the flattening in the slope of the yield curve during 3Q06, which reduced the quarterly net financial margin (the difference between the short-term and 5 year interest rates were 135 basis points in June 2006 and only 58 basis points in September 2006).
- Lower lending spreads.
- The implementation of the new accounting standards which implied the recognition of approximately Ch$230 million in results during 2Q06, which were accounted for in the Gains from forwards derivatives instruments line.
| 1 | Net interest revenue, foreign exchange transactions and gains from forwards derivative contracts, net. |
| 2 | Net financial income divided by average interest earning assets. |
Page 5 of 16 |
2006 Third Quarter Results | |
FEES AND INCOME FROM SERVICES, NET |
Fees and Income from Services, net, by Company | ||||||||
| (in millions of Chilean pesos) | 3Q05 | 2Q06 | 3Q06 | % Change | ||||
| 3Q06 / 3Q05 | ||||||||
| Bank | 19,416 | 17,741 | 16,308 | (16.0)% | ||||
| Mutual Funds | 6,696 | 6,777 | 6,593 | (1.5)% | ||||
| Financial Advisory | 300 | 242 | 575 | 91.7% | ||||
| Insurance Brokerage | 1,804 | 2,447 | 2,478 | 37.4% | ||||
| Securities Brokerage | 4,530 | 2,144 | 2,446 | (46.0)% | ||||
| Factoring | 194 | 206 | 212 | 9.3% | ||||
| Socofin | 2,212 | 2,664 | 2,659 | 20.2% | ||||
| Securization | 93 | 24 | 23 | (75.3)% | ||||
| Promarket | 0 | 0 | 0 | - | ||||
| Foreign Branches | 739 | 602 | 406 | (45.1)% | ||||
| Trade Services | 58 | 60 | 79 | 36.2% | ||||
| Total Fees and | ||||||||
| Income from Services | 36,042 | 32,907 | 31,779 | (11.8)% | ||||
| Fees, net | 36,678 | 34,934 | 34,425 | (6.1)% | ||||
| Other Services, net | (636) | (2,027) | (2,646) | 316.0% | ||||
Total fees and income from services decreased by 11.8% amounting to Ch$31,779 million in 3Q06 down from Ch$36,042 million in 3Q05. This decline mainly responded to lower fee income accounted for by the Securities Brokerage subsidiary, to higher cobranding and sales force expenses and lower income related to assets received in lieu of payment (the three of them are registered by the Bank as other services expenses). Regarding fees derived from our core business, they performed well during the quarter, showing an improvement mainly in those related to credit cards, current accounts, debit cards, ATMs and cash management. This increase was principally fueled by enhanced customer base and product usage in the retail segment.
Lower fee income recorded by the Securities Brokerage company was largely the result of higher fees accounted for in 3Q05 related to its participation in stock offerings and to higher corporate advisory incomes derived from the investment banking unit. The decrease in these fees was partially offset by higher fee income attained by the Insurance Brokerage, Socofin and the Financial Advisory subsidiaries. Overall, the Bank’s subsidiaries accounted for 47.4% of total consolidated fees and income from services in 3Q06, a rise compared to the 44.1% reported in 3Q05.
As compared to the previous quarter, fees and income from services declined by 3.4% as a consequence of higher sales force and cobranding expenses, lower fee income associated to credits, lease contracts, foreign branches and mutual funds. On the other hand, the fee income registered by the Financial Advisory subsidiary showed a significant increase during 3Q06 which more than doubled the figure of the previous quarter. The Securities Brokerage company also posted an increase in fee income during 3Q06 principally related to stock transactions and asset management. In addition, fee income derived from credit cards and ATMs increased by 5.7% and 7.7%, respectively, during the current quarter.
GAINS (LOSSES) ON FINANCIAL INSTRUMENTS & NON-FORWARD DERIVATIVES, NET |
| (in millions of Chilean pesos) | 3Q05 | 2Q06 | 3Q06 | % Change | ||||
| 3Q06/3Q05 | ||||||||
| Gains (losses) on financial instruments, net | 63 | (4,854) | 5,400 | - | ||||
| Gains (losses) from non-forward derivatives contracts | 1,212 | 925 | (3,417) | |||||
| Subtotal | 1,275 | (3,929) | 1,983 | 55.5% | ||||
| Gains (losses) from forward contracts | (16,375) | 9,834 | 4,426 | - | ||||
| Gains from trading activities and derivatives | ||||||||
| instruments, net | (15,100) | 5,905 | 6,409 | - | ||||
Results on financial instruments and non-forward foreign currency derivatives contracts for 3Q06 amounted to Ch$1,983 million, above the Ch$1,275 million reported in 3Q05 and the losses of Ch$3,929 million registered in 2Q06. The positive results attained during 3Q06 were mainly attributed to the decrease of approximately 30 basis points on both local and foreign long-term interest rates during the quarter, which positively affected the market value of Latin American sovereign bonds, Chilean Central Bank securities and mortgage finance bonds maintained by the Bank. On the contrary, during 3Q05 and 2Q06, the long-term interest rate raise adversely impacted on the value of the Bank’s investment portfolio during such quarters.
Page 6 of 16 |
2006 Third Quarter Results | |
PROVISIONS FOR LOAN LOSSES |
Provisions for loan losses amounted to Ch$9,204 million in 3Q06 above the Ch$7,185 million in 2Q06 and the Ch$4,783 million in 3Q05. This upward trend is consistent with the Bank’s loan portfolio expansion in higher-margin and higher risk portfolios and also with a less dynamic economic environment. As a result, provisions for loan losses have mainly increased in commercial and consumer loans. Accordingly, the Bank’s ratio of provisions for loan losses to average loans increased to 0.41% in 3Q06 compared to 0.33% in 2Q06 and 0.24% in 3Q05. However this figure remains below the system’s average of 0.83% for the current quarter.
As a result of better macroeconomic conditions prevailing since 2004, the Bank’s loan loss recoveries fell by 7.4% between 3Q06 and 3Q05, thus implying a drop in the ratio of recoveries to average loans ratio to 0.34% in 3Q06 from 0.42% posted in last year’s same quarter.
| Allowances and Provisions | ||||||||
| (in millions of Chilean pesos) | 3Q05 | 2Q06 | 3Q06 | % Change | ||||
| 3Q06/3Q05 | ||||||||
| Allowances | ||||||||
| Allow ances at the beginning of each period | 146,396 | 144,476 | 144,421 | (1.3)% | ||||
| Price-level restatement | (2,099) | (2,091) | (2,002) | (4.6)% | ||||
| Charge-off | (14,466) | (13,096) | (18,400) | 27.2% | ||||
| Provisions for loan losses established, net | 12,994 | 15,132 | 16,808 | 29.4% | ||||
| Allowances at the end of each period | 142,825 | 144,421 | 140,827 | (1.4)% | ||||
| Provisions for loan losses | ||||||||
| Provisions for loan losses established | (12,994) | (15,132) | (16,808) | 29.4% | ||||
| Loan loss recoveries | 8,211 | 7,947 | 7,604 | (7.4)% | ||||
| Provisions for loan losses | (4,783) | (7,185) | (9,204) | 92.4% | ||||
| Ratios | ||||||||
| Allowances for loan losses/ Total loans | 1.80% | 1.62% | 1.54% | |||||
| Provisions for loan losses / Avg. Loans | 0.24% | 0.33% | 0.41% | |||||
| Charge-offs / Avg. Loans | 0.74% | 0.60% | 0.81% | |||||
| Recoveries / Avg. Loans | 0.42% | 0.36% | 0.34% | |||||
OTHER INCOME AND EXPENSES |
Total Other Income and Expenses amounted to Ch$1,198 million during 3Q06 as compared to a negative Ch$1,202 in 3Q05. This change was due to a higher income from the sale of assets received in lieu of payment previously charged off and, to a lesser extent, to non-recurring earnings associated to credit cards and higher earnings participation in equity investment during 3Q06.
The drop in the other income and expenses line during 3Q06 as compared to the previous quarter, was mainly due to: (i) a non-recurring tax release in 2Q06 of approximately Ch$3,350 million originated from the recognition of a differential between the effective tax paid and what had been provisioned for during prior periods and (ii) higher provisions and lower income from the sale of assets received in lieu of payments previously charged off during 3Q06.
OPERATING EXPENSES |
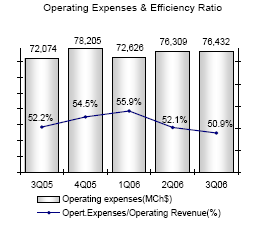
Total operating expenses in 3Q06 stood at Ch$76,432 million, an increase of 6.0% as compared to 3Q05. This higher level of operating expenses was directly related to the Bank’s commercial expansion which implied:
Page 7 of 16 |
2006 Third Quarter Results | |
- An increase in the number of employees, most of them related to the new branches and commercial positions in the Bank’s Head quarters, which in turn, implied higher level of personnel salaries and expenses.
- Higher marketing and advertising expenses (which covers around 76% of the increase in administrative expenses) principally supporting new promotional campaigns and initiatives towards increasing market share in the retail segment.
- The strengthening of the Bank’s distribution network such as new branches and ATMs, thus increasing rental and depreciation expenses.
- Increase and improvement in the Bank’s transactional and operating capacity involving higher expenses mainly related to computers systems, software and new processes implementation and advisory services.
The Bank registered an improvement in operating leverage during 3Q06 as operating revenues growth of 8.8% exceeded operating expenses growth of 6.0%, resulting in a decrease of 130 basis points in the efficiency ratio from 52.2% in 3Q05 to 50.9% in 3Q06.
Operating expenses remained almost flat during 3Q06 as compared to the previous quarter, as higher expenses accounted for mainly by the Bank and, to a lesser extent, by its subsidiaries, were compensated for with lower advisory expenses in the Bank’s foreign branches. Higher operating expenses from the Bank and its subsidiaries were closely related to higher personnel salaries and expenses arising from the opening of new branches and, to some extent, from additional severance payments.
| Operating Expenses | ||||||||
| (in millions of Chilean pesos) | 3Q05 | 2Q06 | 3Q06 | % Change | ||||
| 3Q06/3Q05 | ||||||||
| Personnel salaries and expenses | (37,219) | (38,933) | (39,391) | 5.8% | ||||
| Administrative and other expenses | (30,310) | (32,530) | (31,841) | 5.1% | ||||
| Depreciation and amortization | (4,545) | (4,846) | (5,200) | 14.4% | ||||
| Total operating expenses | (72,074) | (76,309) | (76,432) | 6.0% | ||||
| Efficiency Ratio* | 52.2% | 52.1% | 50.9% | - | ||||
| * Operating expenses/Operating revenues | ||||||||
LOSS (GAINS) FROM PRICE- LEVEL RESTATEMENT |
Gains from price-level restatement increased to Ch$6,086 million in 3Q06 as compared to Ch$4,961 million during 3Q05, mainly as a consequence of: (i) a higher inflation rate used for adjustment purposes (1.4% in 3Q06 compared to 1.3% in 3Q05) and (ii) an increase in non-monetary liabilities, net, as a result of the partial capitalization of the 2005 net income.
INCOME TAX |
In 3Q06, the Bank recorded a tax expense of Ch$7,156 million as compared to Ch$4,802 million in 3Q05, reflecting effective tax rates of 12.0% and 8.7%, in the respective periods. It is worth mentioning that tax expenses during 3Q06 included Ch$1,046 million of allowances to cover the impact of the treatment of derivatives as according to the new accounting regulations implemented in June 2006 in this line.
LOAN PORTFOLIO |
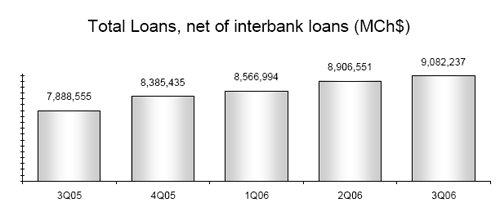
As of September 30, 2006, the Bank’s loan portfolio, net of interbank loans, totaled Ch$9,082,237 million, posting an annual expansion of 15.1% and a quarterly growth of 2.0% . The annual growth has been a consequence of multiple factors such as: adjustments implemented to the commercial organizational structure, distribution network expansion, strengthening of the sales force, product and technology innovation, as well as effective advertising campaigns. In turn, both the retail and wholesale segments grew by approximately 16% during the last twelve-month period. Moreover, the lower-end consumer segment of Credichile and the small-medium companies have grown at a more rapid pace of 17.2% and 19.8%, respectively. In terms of number of debtors, during the last twelve months the Bank has experienced an increase of 15.4% totaling 582,390 as of September 2006.
The annual loan portfolio expansion was mainly driven by commercial, other outstanding, contingent and consumer loans. Commercial and contingent loans have been driven by the wholesale segment, the latter largely, concentrated in the financial services and construction sectors. The other outstanding loans increase was principally related to mortgage loans financed by the Bank’s general borrowings (which in turn more than compensated
Page 8 of 16 |
2006 Third Quarter Results | |
the drop in mortgage loans financed with mortgage bonds) and, to a lesser extent, by the growth of factoring contracts. The consumer loans growth was attributable to an annual increase of 28% in credit cards, 21% in lines of credit and 17% in installment loans.
The quarterly loan growth was largely the result of loan expansion in the retail sector which grew by approximately 4.7% as compared to a 1.6% in the wholesale segment. In terms of types of loans, this expansion was principally driven by mortgage loans financed by the Bank’s general borrowings, consumer and commercial loans. It is worth mentioning that during the current quarter the Bank launched aggressive campaigns offering new mortgage and consumer loans with different maturity terms tailored to the customers’ needs. In addition, the Bank continued with its expansion efforts in higher yield products such as factoring and lease contracts which once again increased during the quarter by around 2%. These increases were partially lessened by the contraction experienced by contingent loans mainly related to the financial services sector and by mortgage loans financed by mortgage bonds.
| Loan Portfolio | |||||
| (in millions of Chilean pesos) | Sep-05 | June-06 | Sep-06 | % Change 12 - months | % Change 3Q06/2Q06 |
| Commercial Loans | 3,317,465 | 3,716,237 | 3,798,837 | 14.5% | 2.2% |
| Mortgage Loans1 | 714,537 | 631,957 | 616,570 | (13.7)% | (2.4)% |
| Consumer Loans | 824,182 | 969,897 | 1,019,870 | 23.7% | 5.2% |
| Foreign trade Loans | 647,746 | 687,363 | 702,435 | 8.4% | 2.2% |
| Contingent Loans | 635,830 | 907,813 | 851,089 | 33.9% | (6.2)% |
| Others Outstanding Loans2 | 1,233,477 | 1,441,200 | 1,532,951 | 24.3% | 6.4% |
| Leasing Contracts | 436,476 | 485,027 | 494,938 | 13.4% | 2.0% |
| Past-due Loans | 78,842 | 67,057 | 65,547 | (16.9)% | (2.3)% |
| Total Loans, net | 7,888,555 | 8,906,551 | 9,082,237 | 15.1% | 2.0% |
| Interbank Loans | 41,173 | 0 | 69,020 | 67.6% | - |
| Total Loans | 7,929,728 | 8,906,551 | 9,151,257 | 15.4% | 2.7% |
| 1Mortgage loans financed by mortgage bonds. | |||||
| 2Includes mortgage loans financed by the Bank’s general borrowings and factoring contracts. | |||||
| Past Due Loans | |||||
| (in millions o f Chilean pesos) | Sep-05 | June-06 | Sep-06 | % Change 12 - months | % Change 2Q06 / 1Q06 |
| Commercial loans | 61,204 | 51,883 | 50,038 | (18.2)% | (3.6)% |
| Consumer loans | 3,702 | 4,233 | 5,019 | 35.6% | 18.6% |
| Residential mortgage loans | 13,936 | 10,941 | 10,490 | (24.7)% | (4.1)% |
| Total Past Due Loans | 78,842 | 67,057 | 65,547 | (16.9)% | (2.3)% |
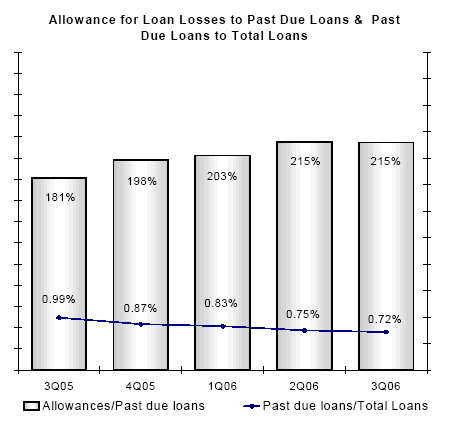
Past due loans amounted to Ch$65,547 million as of September 30, 2006, showing once again a quarterly decline, mainly driven by commercial and residential mortgage loans. Consequently, the past due loan to total loan ratio improved to 0.72% in 3Q06 from 0.75% in 2Q06 and 0.99% in 3Q05, while allowances for loan losses to past due loans remained stable at 215%.
The quarterly decrease in past due loans was mainly related to payments and charged-off of certain commercial loans associated to the financial sector.
Page 9 of 16
2006 Third Quarter Results | |
| FUNDING |
Total liabilities totaled Ch$11,094,695 million as of September 2006, an 11.6% increase compared to a year ago, as a consequence of a 13.7% expansion in interest bearing liabilities and a 7.2% growth in non-interest bearing liabilities.
Other liabilities, mainly related to contingent liabilities (stand by letters of credit) and current accounts were the main drivers of the annual increase in non-interest bearing liabilities. Current accounts continued to increase, despite the rise in the monetary policy short-term reference interest rate during the last year, as a consequence of the Bank’s focus on continually expanding this source of funding. In turn, current account holders have grown by 9.3% during the last twelve months. The increases in these line items of non-interest bearing liabilities more than offset the decline in bankers drafts and other deposits. As we have mentioned in previous releases, the decline in bankers drafts were mainly related to the new on-line high value payment clearing system which became operational in 4Q05 through the new Combanc affiliate (Sociedad Operadora de la Cámara de Pagos de Alto Valor S.A.), thus implying a decrease in the balance of bankers drafts and at the same time a decrease in the cash item in process of collection on the asset side.
The annual growth of 13.7% in the interest bearing liabilities was mostly caused by a significant increase in time deposits and, to a lesser extent, by an increase in subordinated and other bonds. During 2Q06 the Bank issued subordinated bonds, in the international market for U$200 million, while in the current quarter the Bank issued other bonds for a total amount of UF5 million (US$171 million) in the local market. These increases more than offset the decline in foreign borrowings, borrowings from domestic financial institutions and mortgage finance bonds, in line with the contraction of mortgage loans. The decrease in foreign borrowings mainly responded to the prepayment of a syndicated loan made by the Bank during 2Q06 and to the substitution of these liabilities for less expensive funds such as time deposits which are later linked to foreign currency through the use of derivatives instruments.
The 1.6% quarterly increase in total liabilities mainly reflected the aforementioned increases in current accounts, contingent liabilities, time deposits and other bonds.
| Funding | |||||
| (in millions of Chilean pesos) | Sep-05 | June-06 | Sep-06 | % Change 12 - months | % Change 3Q06 / 2Q06 |
| Non-interest Bearing Liabilities | |||||
| Current Accounts | 1,480,406 | 1,596,628 | 1,657,597 | 12.0% | 3.8% |
| Bankers drafts and other deposits | 689,531 | 501,917 | 491,754 | (28.7)% | (2.0)% |
| Derivatives intruments | 31,429 | 65,223 | 55,983 | 78.1% | (14.2)% |
| Other Liabilities | 1,004,140 | 1,156,953 | 1,232,293 | 22.7% | 6.5% |
| Total | 3,205,506 | 3,320,721 | 3,437,627 | 7.2% | 3.5% |
| Interest Bearing Liabilities | |||||
| Savings & Time Deposits | 4,369,842 | 5,410,857 | 5,591,799 | 28.0% | 3.3% |
| Central Bank Borrow ings | 1,597 | 1,272 | 949 | (40.6)% | (25.4)% |
| Repurchase agreements | 250,913 | 268,436 | 234,456 | (6.6)% | (12.7)% |
| Mortgage Finance Bonds | 613,757 | 521,838 | 504,994 | (17.7)% | (3.2)% |
| Subordinated Bonds | 316,213 | 414,790 | 413,967 | 30.9% | (0.2)% |
| Other Bonds | 330,271 | 330,594 | 455,983 | 38.1% | 37.9% |
| Borrow ings from Domestic Financ. Inst. | 154,435 | 124,114 | 58,739 | (62.0)% | (52.7)% |
| Foreign Borrow ings | 646,611 | 479,112 | 340,229 | (47.4)% | (29.0)% |
| Other Obligations | 51,881 | 45,577 | 55,952 | 7.8% | 22.8% |
| Total | 6,735,520 | 7,596,590 | 7,657,068 | 13.7% | 0.8% |
| Total Liabilities | 9,941,026 | 10,917,311 | 11,094,695 | 11.6% | 1.6% |
Page 10 of 16
2006 Third Quarter Results | |
| FINANCIAL INVESTMENTS |
As of September 30, 2006, the Bank’s financial investments totaled Ch$1,278,299 million, a 2.4% and 0.6% annual and quarterly increase, respectively. The Investment portfolio slightly grew as compared to June 2006, in response to an increase of short-term investments in Fed Funds accounted for by the Bank’s foreign branches as trading securities. As of September 2006, the Bank continued to have 97% of its investment portfolio classified as trading securities out of which 48% are central bank securities, 24% investments in foreign countries and 17% investments in local financial institutions.
On September 30, 2006, the investment portfolio was allocated as follows:

| SHAREHOLDERS’ EQUITY |
As of September 30, 2006, the Bank’s Shareholders’ Equity totaled Ch$794,824 million (US$1,477 million), growing 4.8% as compared to 3Q05, mainly due to an increase in capital and reserves and, to a lesser extent, to a 4.2% expansion in the accumulated net income.
The growth in capital and reserves was related to both the capitalization of Ch$30,984 million of the 2005 net income; and, to the application of the new accounting rules which implied an increase of Ch$960 million additional reserves during 2Q06.
As of September 30, 2006, on a consolidated basis, Basic Capital to Total Assets stood at 5.35% while Total Capital to Risk-Adjusted Assets (BIS ratio) posted 11.4%, both ratios above the minimum requirements applicable to Banco de Chile of 3% and 10%, respectively.
Page 11 of 16
2006 Third Quarter Results | |
| BANCO DE CHILE CONSOLIDATED STATEMENTS OF INCOME (Under Chilean GAAP) (Expressed in millions of constant Chilean pesos (MCh$) as of September 30, 2006 and millions of US dollars (MUS$)) |
| Quarters | % Change | Year ended | % Change | ||||||||||
| 3Q05 | 2Q06 | 3Q06 | 3Q06 | 3Q06-3Q05 | 3Q06-2Q06 | Sep.05 | Dec.05 | Sep.06 | Sep.06 | Sep.06-Sep.05 | |||
| MCh$ | MCh$ | MCh$ | MUS$ | MCh$ | MCh$ | MCh$ | MUS$ | ||||||
| Interest revenue and expense | |||||||||||||
| Interest revenue | 191,244 | 227,966 | 234,268 | 435.3 | 22.5 % | 2.8 % | 496,789 | 700,519 | 605,630 | 1,125.2 | 21.9 % | ||
| Interest expense | (90,125) | (113,035) | (123,112) | (228.7) | 36.6 % | 8.9 % | (218,994) | (317,917) | (293,083) | (544.5) | 33.8 % | ||
| Net interest revenue | 101,119 | 114,931 | 111,156 | 206.6 | 9.9 % | (3.3) % | 277,795 | 382,602 | 312,547 | 580.7 | 12.5 % | ||
| Income from services, net | |||||||||||||
| Income from fees and other services | 48,700 | 47,560 | 46,877 | 87.1 | (3.7) % | (1.4) % | 137,313 | 188,413 | 138,674 | 257.7 | 1.0 % | ||
| Other services expenses | (12,658) | (14,653) | (15,098) | (28.1) | 19.3 % | 3.0 % | (33,708) | (47,569) | (42,481) | (78.9) | 26.0 % | ||
| Income from services, net | 36,042 | 32,907 | 31,779 | 59.0 | (11.8) % | (3.4) % | 103,605 | 140,844 | 96,193 | 178.8 | (7.2) % | ||
| Other operating income, net | |||||||||||||
| Gains from trading activities and derivatives instruments, net | (15,100) | 5,905 | 6,409 | 11.9 | n/a | 8.5 % | (1,172) | (16,283) | 25,079 | 46.6 | n/a | ||
| Foreign exchange transactions, net | 15,901 | (7,380) | 783 | 1.5 | (95.1) % | n/a | 12,679 | 24,249 | (13,059) | (24.3) | n/a | ||
| Total other operating income, net | 801 | (1,475) | 7,192 | 13.4 | 797.9 % | n/a | 11,507 | 7,966 | 12,020 | 22.3 | 4.5 % | ||
| Operating Revenues | 137,962 | 146,363 | 150,127 | 279.0 | 8.8 % | 2.6 % | 392,907 | 531,412 | 420,760 | 781.8 | 7.1 % | ||
| Provisions for loan losses | (4,783) | (7,185) | (9,204) | (17.1) | 92.4 % | 28.1 % | (12,344) | (22,579) | (22,923) | (42.6) | 85.7 % | ||
| Other income and expenses | |||||||||||||
| Non-operating income | 2,043 | 7,538 | 4,154 | 7.7 | 103.3 % | (44.9) % | 5,451 | 8,055 | 13,901 | 25.7 | 155.0 % | ||
| Non-operating expenses | (3,319) | (2,851) | (3,215) | (6.0) | (3.1) % | 12.8 % | (9,000) | (15,307) | (8,847) | (16.4) | (1.7) % | ||
| Participation in earnings of equity investments | 74 | 478 | 259 | 0.5 | 250.0 % | (45.8) % | 512 | 698 | 977 | 1.8 | 90.8 % | ||
| Total other income and expenses | (1,202) | 5,165 | 1,198 | 2.2 | n/a | (76.8) % | (3,037) | (6,554) | 6,031 | 11.1 | n/a | ||
| Operating expenses | |||||||||||||
| Personnel salaries and expenses | (37,219) | (38,933) | (39,391) | (73.2) | 5.8 % | 1.2 % | (113,590) | (154,381) | (116,053) | (215.6) | 2.2 % | ||
| Administrative and other expenses | (30,310) | (32,530) | (31,841) | (59.2) | 5.1 % | (2.1) % | (81,004) | (111,649) | (91,869) | (170.7) | 13.4 % | ||
| Depreciation and amortization | (4,545) | (4,846) | (5,200) | (9.7) | 14.4 % | 7.3 % | (13,178) | (17,345) | (14,344) | (26.7) | 8.8 % | ||
| Total operating expenses | (72,074) | (76,309) | (76,432) | (142.1) | 6.0 % | 0.2 % | (207,772) | (283,375) | (222,266) | (413.0) | 7.0 % | ||
| Loss from price-level restatement | (4,961) | (6,022) | (6,086) | (11.3) | 22.7 % | 1.1 % | (7,064) | (11,736) | (10,359) | (19.2) | 46.6 % | ||
| Income before income taxes | 54,942 | 62,012 | 59,603 | 110.7 | 8.5 % | (3.9) % | 162,690 | 207,168 | 171,243 | 318.1 | 5.3 % | ||
| Income taxes | (4,802) | (5,951) | (7,156) | (13.3) | 49.0 % | 20.2 % | (15,916) | (21,926) | (18,374) | (34.1) | 15.4 % | ||
| Net income | 50,140 | 56,061 | 52,447 | 97.4 | 4.6 % | (6.4) % | 146,774 | 185,242 | 152,869 | 284.0 | 4.2 % | ||
These results have been prepared in accordance with Chilean GAAP on an unaudited, consolidated basis. All figures are expressed in constant Chilean pesos as of September 30, 2006, unless otherwise stated. Therefore, all growth rates are in real terms. All figures expressed in US dollars (except earnings per ADR) were converted using the exchange rate of Ch$538.22 for US$1.00 as of September 30, 2006. Earnings per ADR were calculated considering the nominal net income and, the exchange rate and the number of shares existing at the end of each period.
Page 12 of 16
2006 Third Quarter Results | |
| BANCO DE CHILE CONSOLIDATED BALANCE SHEETS (Under Chilean GAAP) (Expressed in millions of constant Chilean pesos (MCh$) as of September 30, 2006 and millions of U S dollars (MUS$)) |
| ASSET S | Dec 04 MCh$ | Sep 05 MCh$ | Dec 05 MCh$ | Jun 06 MCh$ | Sep 06 MCh$ | Sep 06 MUS$ | % Change | ||||
| Sep 06-Sep 05 | Sep 06-Dec 05 | Sep 06-Jun 06 | |||||||||
| Cash and due from banks | |||||||||||
| Non-interest bearing | 573,041 | 920,820 | 654,569 | 913,300 | 734,362 | 1,364.4 | (20.2% ) | 12.2% | (19.6% ) | ||
| Interbank deposits-interest bearing | 372,705 | 89,468 | 21,222 | 103,216 | 201,264 | 373.9 | 125.0% | 848.4% | 95.0% | ||
| Total cash and due from banks | 945,746 | 1,010,288 | 675,791 | 1,016,516 | 935,626 | 1,738.3 | (7.4%) | 38.4% | (8.0%) | ||
| Investments purchased under agreements to resell | 27,939 | 52,246 | 47,862 | 64,878 | 31,923 | 59.3 | (38.9%) | (33.3%) | (50.8%) | ||
| Financial investments | |||||||||||
| Trading securities | 1,625,450 | 1,210,140 | 1,373,948 | 1,228,058 | 1,238,416 | 2,300.9 | 2.3% | (9.9% ) | 0.8% | ||
| Available for sale | 29,008 | 21,911 | 24,126 | 26,611 | 23,968 | 44.5 | 9.4% | (0.7% ) | (9.9% ) | ||
| Held to maturity | 17,858 | 16,458 | 15,800 | 16,628 | 15,915 | 29.6 | (3.3% ) | 0.7% | (4.3% ) | ||
| Total financial investments | 1,672,316 | 1,248,509 | 1,413,874 | 1,271,297 | 1,278,299 | 2,375.0 | 2.4% | (9.6%) | 0.6% | ||
| Loans, Net | |||||||||||
| Commercial loans | 3,044,773 | 3,317,465 | 3,598,675 | 3,716,237 | 3,798,837 | 7,058.1 | 14.5% | 5.6% | 2.2% | ||
| Consumer loans | 734,677 | 824,182 | 885,748 | 969,897 | 1,019,870 | 1,894.9 | 23.7% | 15.1% | 5.2% | ||
| Mortgage loans | 870,633 | 714,537 | 687,106 | 631,957 | 616,570 | 1,145.6 | (13.7% ) | (10.3% ) | (2.4% ) | ||
| Foreign trade loans | 636,132 | 647,746 | 564,539 | 687,363 | 702,435 | 1,305.1 | 8.4% | 24.4% | 2.2% | ||
| Interbank loans | 16,139 | 41,173 | 25,637 | 0 | 69,020 | 128.2 | 67.6% | 169.2% | n/a | ||
| Lease contracts | 365,138 | 436,476 | 466,175 | 485,027 | 494,938 | 919.6 | 13.4% | 6.2% | 2.0% | ||
| Other outstanding loans | 994,195 | 1,233,477 | 1,368,396 | 1,441,200 | 1,532,951 | 2,848.2 | 24.3% | 12.0% | 6.4% | ||
| Past due loans | 89,927 | 78,842 | 73,133 | 67,057 | 65,547 | 121.8 | (16.9% ) | (10.4% ) | (2.3% ) | ||
| Contingent loans | 563,764 | 635,830 | 741,663 | 907,813 | 851,089 | 1,581.3 | 33.9% | 14.8% | (6.2% ) | ||
| Total loans | 7,315,378 | 7,929,728 | 8,411,072 | 8,906,551 | 9,151,257 | 17,002.8 | 15.4% | 8.8% | 2.7% | ||
| Allow ance | (163,301) | (142,825) | (144,837) | (144,421) | (140,827) | (261.7) | (1.4% ) | (2.8% ) | (2.5% ) | ||
| Total loans, net | 7,152,077 | 7,786,903 | 8,266,235 | 8,762,130 | 9,010,430 | 16,741.1 | 15.7% | 9.0% | 2.8% | ||
| Derivative instruments | 0 | 0 | 0 | 59,966 | 46,250 | 85.9 | n/a | n/a | n/a | ||
| Other assets | |||||||||||
| Assets received in lieu of pay ment, net | 17,128 | 13,659 | 10,711 | 9,229 | 12,197 | 22.7 | (10.7% ) | 13.9% | 32.2% | ||
| Bank premises and equipment | 140,882 | 143,397 | 146,011 | 147,906 | 150,714 | 280.0 | 5.1% | 3.2% | 1.9% | ||
| Investments in other companies | 5,747 | 7,402 | 7,339 | 7,530 | 7,736 | 14.4 | 4.5% | 5.4% | 2.7% | ||
| Other | 284,653 | 436,882 | 392,257 | 322,367 | 416,345 | 773.6 | (4.7% ) | 6.1% | 29.2% | ||
| Total other assets | 448,410 | 601,340 | 556,318 | 487,032 | 586,992 | 1,090.7 | (2.4%) | 5.5% | 20.5% | ||
| Total assets | 10,246,488 | 10,699,286 | 10,960,080 | 11,661,819 | 11,889,520 | 22,090.3 | 11.1% | 8.5% | 2.0% | ||
Page 13 of 16
2006 Third Quarter Results | |
| BANCO DE CHILE CONSOLIDATED BALANCE SHEETS (Under Chilean GAAP) (Expressed in millions of constant Chilean pesos (MCh$) as of September 30, 2006 and millions of US dollars (MUS$)) |
| LIABILIT IES & SHAREHOLDERS' EQUIT Y | Dec 04 MCh$ | Sep 05 MCh$ | Dec 05 MCh$ | Jun 06 MCh$ | Sep 06 MCh$ | Sep-06 MUS$ | % Change | ||||
| Sep 06-Sep 05 | Sep 06-Dec 05 | Sep 06-Jun 06 | |||||||||
| Deposits | |||||||||||
| Current accounts | 1,512,750 | 1,480,406 | 1,554,124 | 1,596,628 | 1,657,597 | 3,079.8 | 12.0% | 6.7% | 3.8% | ||
| Bankers drafts and other deposits | 741,054 | 689,531 | 496,629 | 501,917 | 491,754 | 913.7 | (28.7% ) | (1.0% ) | (2.0% ) | ||
| Saving accounts and time deposits | 3,890,464 | 4,369,842 | 4,728,584 | 5,410,857 | 5,591,799 | 10,389.4 | 28.0% | 18.3% | 3.3% | ||
| Total deposits | 6,144,268 | 6,539,779 | 6,779,337 | 7,509,402 | 7,741,150 | 14,382.9 | 18.4% | 14.2% | 3.1% | ||
| Borrowings | |||||||||||
| Central Bank borrow ings | 116,355 | 1,597 | 1,442 | 1,272 | 949 | 1.8 | (40.6% ) | (34.2% ) | (25.4% ) | ||
| Securities sold under agreements to repurchase | 370,694 | 250,913 | 277,519 | 268,436 | 234,456 | 435.6 | (6.6% ) | (15.5% ) | (12.7% ) | ||
| Mortgage finance bonds | 837,720 | 613,757 | 570,417 | 521,838 | 504,994 | 938.3 | (17.7% ) | (11.5% ) | (3.2% ) | ||
| Other bonds | 192,751 | 330,271 | 332,822 | 330,594 | 455,983 | 847.2 | 38.1% | 37.0% | 37.9% | ||
| Subordinated bonds | 282,788 | 316,213 | 312,916 | 414,790 | 413,967 | 769.1 | 30.9% | 32.3% | (0.2% ) | ||
| Borrowings from domestic financial institutions | 28,033 | 154,435 | 92,414 | 124,114 | 58,739 | 109.1 | (62.0% ) | (36.4% ) | (52.7% ) | ||
| Foreign borrow ings | 632,412 | 646,611 | 678,030 | 479,112 | 340,229 | 632.1 | (47.4% ) | (49.8% ) | (29.0% ) | ||
| Other obligations | 47,623 | 51,881 | 34,587 | 45,577 | 55,952 | 104.0 | 7.8% | 61.8% | 22.8% | ||
| Total borrowings | 2,508,376 | 2,365,678 | 2,300,147 | 2,185,733 | 2,065,269 | 3,837.2 | (12.7%) | (10.2%) | (5.5%) | ||
| Derivative instruments | 47,340 | 31,429 | 61,517 | 65,223 | 55,983 | 104.0 | 78.1% | (9.0%) | (14.2%) | ||
| Other liabilities | |||||||||||
| Contingent liabilities | 565,113 | 635,867 | 742,005 | 909,508 | 850,859 | 1,580.9 | 33.8% | 14.7% | (6.4% ) | ||
| Other | 265,103 | 368,273 | 282,588 | 247,445 | 381,434 | 708.6 | 3.6% | 35.0% | 54.1% | ||
| Total other liabilities | 830,216 | 1,004,140 | 1,024,593 | 1,156,953 | 1,232,293 | 2,289.5 | 22.7% | 20.3% | 6.5% | ||
| Minority interest in consolidated subsidiaries | 1 | 1 | 1 | 1 | 1 | 0.0 | 0.0% | 0.0% | 0.0% | ||
| Shareholders' equity | |||||||||||
| Capital and Reserves | 554,211 | 611,485 | 609,243 | 642,679 | 641,955 | 1,192.7 | 5.0% | 5.4% | (0.1% ) | ||
| Net income for the year | 162,076 | 146,774 | 185,242 | 101,828 | 152,869 | 284.0 | 4.2% | (17.5% ) | 50.1% | ||
| Total shareholders' equity | 716,287 | 758,259 | 794,485 | 744,507 | 794,824 | 1,476.7 | 4.8% | 0.0% | 6.8% | ||
| Total liabilities & shareholders' equity | 10,246,488 | 10,699,286 | 10,960,080 | 11,661,819 | 11,889,520 | 22,090.3 | 11.1% | 8.5% | 2.0% | ||
Page 14 of 16
2006 Third Quarter Results | |
| BANCO DE CHILE SELECTED CONSOLIDATED FINANCIAL INFORMATION |
| Quarters | Year ended | ||||||
| 3Q05 | 2Q06 | 3Q06 | Sep.05 | Dec.05 | Sep.06 | ||
| Earnings per Share | |||||||
| Net income per Share (Ch$)(1) | 0.74 | 0.81 | 0.77 | 2.16 | 2.72 | 2.25 | |
| Net income per ADS (Ch$)(1) | 441.89 | 487.22 | 462.23 | 1,293.55 | 1,632.57 | 1,347.26 | |
| Net income per ADS (US$)(2) | 0.83 | 0.89 | 0.86 | 2.42 | 3.17 | 2.50 | |
| Book v alue per Share (Ch$)(1) | 11.14 | 10.79 | 11.67 | 11.14 | 11.67 | 11.67 | |
| Shares outstanding (Millions) | 68,080 | 69,038 | 68,080 | 68,080 | 68,080 | 68,080 | |
| Profitability Ratios(3)(4) | |||||||
| Net Interest Margin | 4.27% | 4.50% | 4.28% | 3.95% | 4.10% | 4.15% | |
| Net Financial Margin | 4.25% | 4.60% | 4.48% | 4.01% | 4.15% | 4.28% | |
| Fees / Av g. Interest Earnings Assets | 1.52% | 1.29% | 1.22% | 1.47% | 1.51% | 1.28% | |
| Other Operating Rev enues / Av g. Interest Earnings Assets | 0.03% | -0.06% | 0.28% | 0.16% | 0.09% | 0.16% | |
| Operating Rev enues / Av g. Interest Earnings Assets | 5.83% | 5.73% | 5.78% | 5.59% | 5.69% | 5.59% | |
| Return on Av erage Total Assets | 1.86% | 1.93% | 1.79% | 1.85% | 1.75% | 1.80% | |
| Return on Av erage Shareholders' Equity | 28.16% | 31.16% | 26.92% | 29.06% | 26.66% | 26.83% | |
| Capital Ratios | |||||||
| Shareholders Equity / Total Assets | 7.09% | 6.38% | 6.69% | 7.09% | 7.25% | 6.69% | |
| Basic capital / total assets | 5.68% | 5.46% | 5.35% | 5.68% | 5.52% | 5.35% | |
| Basic Capital / Risk-Adjusted Assets | 7.98% | 7.41% | 7.24% | 7.98% | 7.49% | 7.24% | |
| Total Capital / Risk-Adjusted Assets | 11.97% | 11.71% | 11.45% | 11.97% | 11.23% | 11.45% | |
| Credit Quality Ratios | |||||||
| Past Due Loans / Total Loans | 0.99% | 0.75% | 0.72% | 0.99% | 0.87% | 0.72% | |
| Allow ance for loan losses / past due loans | 181.15% | 215.37% | 214.85% | 181.15% | 198.05% | 214.85% | |
| Allow ance for Loans Losses / Total Loans | 1.80% | 1.62% | 1.54% | 1.80% | 1.72% | 1.54% | |
| Prov ision for Loan Losses / Av g.Loans(4) | 0.24% | 0.33% | 0.41% | 0.22% | 0.29% | 0.35% | |
| Operating and Productivity Ratios | |||||||
| Operating Ex penses / Operating Rev enue | 52.24% | 52.14% | 50.91% | 52.88% | 53.32% | 52.82% | |
| Operating Ex penses / Av erage Total Assets(3) | 2.67% | 2.63% | 2.60% | 2.62% | 2.68% | 2.61% | |
| Loans per employ ee (million Ch$)(1) | 801 | 839 | 834 | 801 | 828 | 834 | |
| Average Balance Sheet Data(1)(3) | |||||||
| Av g. Interest Earnings Assets (million Ch$) | 9,462,844 | 10,212,455 | 10,381,775 | 9,367,010 | 9,341,248 | 10,033,591 | |
| Av g. Assets (million Ch$) | 10,801,845 | 11,594,102 | 11,743,250 | 10,570,284 | 10,583,657 | 11,340,914 | |
| Av g. Shareholders Equity (million Ch$) | 712,189 | 719,647 | 779,274 | 673,472 | 694,722 | 759,642 | |
| Av g. Loans (million Ch$) | 7,863,497 | 8,776,095 | 9,040,322 | 7,651,972 | 7,708,502 | 8,683,156 | |
| Av g. Interest Bearing Liabilities (million Ch$) | 6,800,585 | 7,552,603 | 7,643,622 | 6,625,035 | 6,643,925 | 7,352,406 | |
| Other Data | |||||||
| Inflation Rate | 1.91% | 1.48% | 0.83% | 3.76% | 3.66% | 2.91% | |
| Ex change rate (Ch$) | 533.69 | 547.31 | 538.22 | 533.69 | 514.21 | 538.22 | |
| Employ ees | 9,896 | 10,618 | 10,978 | 9,896 | 10,159 | 10,978 | |
Notes
| (1) | These figures w ere ex pressed in constant Chilean pesos as of September 30, 2006. |
| (2) | These figures w ere calculated considering the nominal net income, the shares outstanding and the ex change rates ex isting at the end of each period. |
| (3) | The ratios w ere calculated as an av erage of daily balances. |
| (4) | Annualized data. |
Page 15 of 16
2006 Third Quarter Results | |
| CONTACTS: | Jacqueline Barrio |
| (56-2) 653 2938 | |
| jbarrio@bancochile.cl | |
| Rolando Arias | |
| (56-2) 653 3535 | |
| rarias@bancochile.cl | |
FORWARD-LOOKING INFORMATION
The information contained herein incorporates by reference statements which constitute ‘‘forward-looking statements,’’ in that they include statements regarding the intent, belief or current expectations of our directors and officers with respect to our future operating performance. Such statements include any forecasts, projections and descriptions of anticipated cost savings or other synergies. You should be aware that any such forward-looking statements are not guarantees of future performance and may involve risks and uncertainties, and that actual results may differ from those set forth in the forward-looking statements as a result of various factors (including, without limitations, the actions of competitors, future global economic conditions, market conditions, foreign exchange rates, and operating and financial risks related to managing growth and integrating acquired businesses), many of which are beyond our control. The occurrence of any such factors not currently expected by us would significantly alter the results set forth in these statements.
Factors that could cause actual results to differ materially and adversely include, but are not limited to:
- changes in general economic, business or political or other conditions in Chile or changes in general economic or business conditions in Latin America;
- changes in capital markets in general that may affect policies or attitudes toward lending to Chile or Chilean companies;
- unexpected developments in certain existing litigation;
- increased costs;
- unanticipated increases in financing and other costs or the inability to obtain additional debt or equity financing on attractive terms; and
Undue reliance should not be placed on such statements, which speak only as of the date that they were made. Our independent public accountants have not examined or compiled the forward-looking statements and, accordingly, do not provide any assurance with respect to such statements. These cautionary statements should be considered in connection with any written or oral forward-looking statements that we may issue in the future. We do not undertake any obligation to release publicly any revisions to such forward-looking statements after completion of this offering to reflect later events or circumstances or to reflect the occurrence of unanticipated events.
Page 16 of 16
| Banco de Chile | ||
/S/ Julio Guzman H. | ||
By: Julio Guzman H. Acting General Manager | ||