Exhibit 99.2
|
| |
| Sunoco Logistics Partners L.P. |
| |
| |
 |
| |
| Second Quarter 2003 Earnings Conference Call |
| July 24, 2003 |
| |
|
| Forward-Looking Statements |
|
| |
You should review this slide presentation in conjunction with the second quarter 2003 earnings conference call for Sunoco Logistics Partners L.P., held on July 24, 2003 at 10:00 a.m. [EDT]. You may listen to the audio portion of the conference call on this website. An audio recording also will be available after the call’s completion by dialing 1-800-925-0261. During the call, those statements we make that are not historical facts are forward-looking statements. We believe the assumptions underlying these statements are reasonable, but caution you that such forward-looking statements involve risks that may affect our business prospects and performance, causing actual results to differ from those discussed during the conference call. Such risks include, among other things: general business and economic conditions; increased competition; changes in the demand both for crude oil we buy and sell, as well as for crude oil and refined products that we store and distribute; loss of a major customer; changes in our tariff rates, implemented by federal and/or state regulators; changes in throughput of third-party pipelines that connect to our refined product pipelines and terminals; changes in the condition of debt and equity capital markets in the United States; the amount of our indebtedness and restrictive covenants in our or Sunoco, Inc.’s credit agreements; our ability to control costs and manage growth; the effects of changes in accounting principles; changes in operating conditions and costs; changes in the level of environmental remediation spending; potential equipment malfunction; potential labor relations problems; the legislative or regulatory environment; plant construction/repair delays; and political and economic conditions, including the impact of potential terrorist acts and international hostilities. These and other applicable risks and uncertainties are described more fully in our December 31, 2002 Annual Report on Form 10-K, filed with the Securities and Exchange Commission on March 7, 2003. We undertake no obligation to update publicly any forward-looking statements whether as a result of new information or future events. |
| |
|
| 2 |
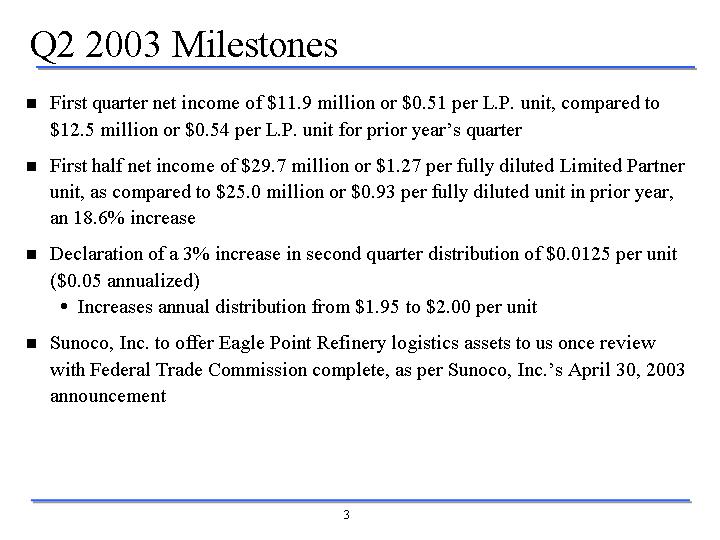
Q2 2003 Milestones
| | • | | First quarter net income of $11.9 million or $0.51 per L.P. unit, compared to $12.5 million or $0.54 per L.P. unit for prior year’s quarter |
| | • | | First half net income of $29.7 million or $1.27 per fully diluted Limited Partner unit, as compared to $25.0 million or $0.93 per fully diluted unit in prior year, an 18.6% increase |
| | • | | Declaration of a3% increase in second quarter distribution of $0.0125 per unit ($0.05 annualized) |
| | — | | Increases annual distribution from $1.95 to $2.00 per unit |
| | • | | Sunoco, Inc. to offer Eagle Point Refinery logistics assets to us once review with Federal Trade Commission complete, as per Sunoco, Inc.’s April 30, 2003 announcement |
3
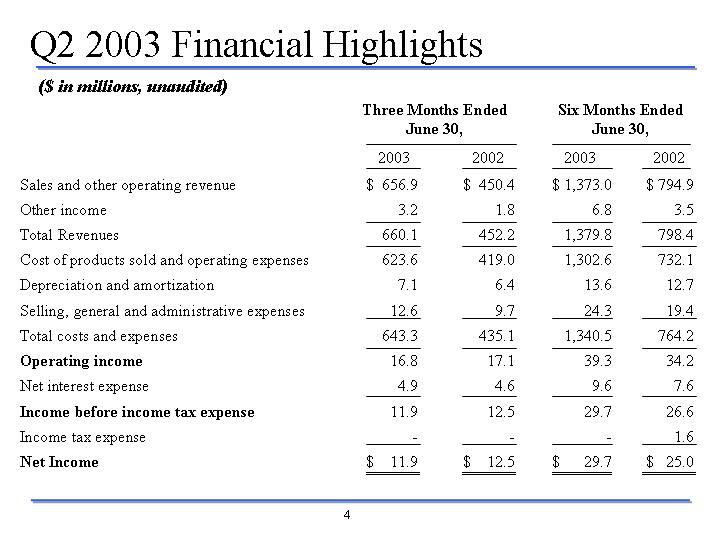
Q2 2003 Financial Highlights
($ in millions, unaudited)
| | | Three Months
Ended June 30,
| | Six Months Ended June 30,
|
| | | 2003
| | 2002
| | 2003
| | 2002
|
Sales and other operating revenue | | $ | 656.9 | | $ | 450.4 | | $ | 1,373.0 | | $ | 794.9 |
Other income | | | 3.2 | | | 1.8 | | | 6.8 | | | 3.5 |
| | |
|
| |
|
| |
|
| |
|
|
Total Revenues | | | 660.1 | | | 452.2 | | | 1,379.8 | | | 798.4 |
| | |
|
| |
|
| |
|
| |
|
|
Cost of products sold and operating expenses | | | 623.6 | | | 419.0 | | | 1,302.6 | | | 732.1 |
Depreciation and amortization | | | 7.1 | | | 6.4 | | | 13.6 | | | 12.7 |
Selling, general and administrative expenses | | | 12.6 | | | 9.7 | | | 24.3 | | | 19.4 |
| | |
|
| |
|
| |
|
| |
|
|
Total costs and expenses | | | 643.3 | | | 435.1 | | | 1,340.5 | | | 764.2 |
| | |
|
| |
|
| |
|
| |
|
|
Operating income | | | 16.8 | | | 17.1 | | | 39.3 | | | 34.2 |
Net interest expense | | | 4.9 | | | 4.6 | | | 9.6 | | | 7.6 |
| | |
|
| |
|
| |
|
| |
|
|
Income before income tax expense | | | 11.9 | | | 12.5 | | | 29.7 | | | 26.6 |
Income tax expense | | | — | | | — | | | — | | | 1.6 |
| | |
|
| |
|
| |
|
| |
|
|
Net Income | | $ | 11.9 | | $ | 12.5 | | $ | 29.7 | | $ | 25.0 |
| | |
|
| |
|
| |
|
| |
|
|
4
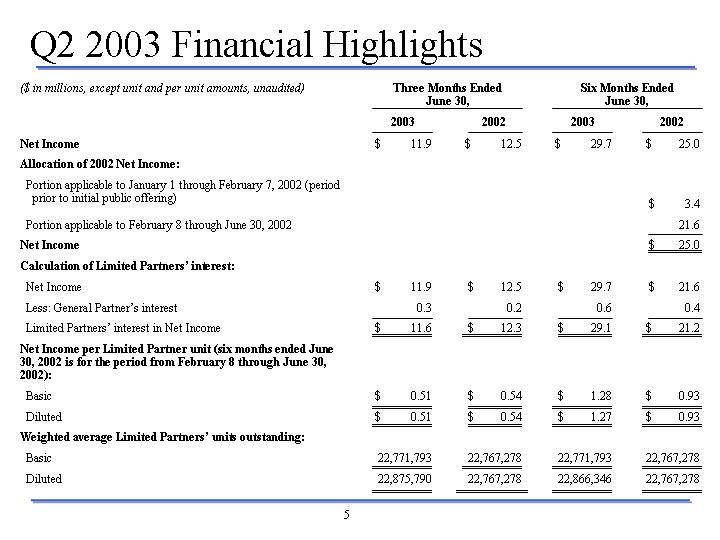
Q2 2003 Financial Highlights
($ in millions, except unit and per unit amounts, unaudited)
| | | Three Months Ended June 30,
| | Six Months Ended June 30,
|
| | | 2003
| | 2002
| | 2003
| | 2002
|
Net Income | | $ | 11.9 | | $ | 12.5 | | $ | 29.7 | | $ | 25.0 |
Allocation of 2002 Net Income: | | | | | | | | | | | | |
Portion applicable to January 1 through February 7, 2002 (period prior to initial public offering) | | | | | | | | | | | $ | 3.4 |
Portion applicable to February 8 through June 30, 2002 | | | | | | | | | | | | 21.6 |
| | | | | | | | | | | |
|
|
Net Income | | | | | | | | | | | $ | 25.0 |
| | | | | | | | | | | |
|
|
Calculation of Limited Partners’ interest: | | | | | | | | | | | | |
Net Income | | $ | 11.9 | | $ | 12.5 | | $ | 29.7 | | $ | 21.6 |
Less: General Partner’s interest | | | 0.3 | | | 0.2 | | | 0.6 | | | 0.4 |
| | |
|
| |
|
| |
|
| |
|
|
Limited Partners’ interest in Net Income | | $ | 11.6 | | $ | 12.3 | | $ | 29.1 | | $ | 21.2 |
| | |
|
| |
|
| |
|
| |
|
|
Net Income per Limited Partner unit (six months ended June 30, 2002 is for the period from February 8 through June 30, 2002): | | | | | | | | | | | | |
Basic | | $ | 0.51 | | $ | 0.54 | | $ | 1.28 | | $ | 0.93 |
| | |
|
| |
|
| |
|
| |
|
|
Diluted | | $ | 0.51 | | $ | 0.54 | | $ | 1.27 | | $ | 0.93 |
| | |
|
| |
|
| |
|
| |
|
|
Weighted average Limited Partners’ units outstanding: | | | | | | | | | | | | |
Basic | | | 22,771,793 | | | 22,767,278 | | | 22,771,793 | | | 22,767,278 |
| | |
|
| |
|
| |
|
| |
|
|
Diluted | | | 22,875,790 | | | 22,767,278 | | | 22,866,346 | | | 22,767,278 |
| | |
|
| |
|
| |
|
| |
|
|
5
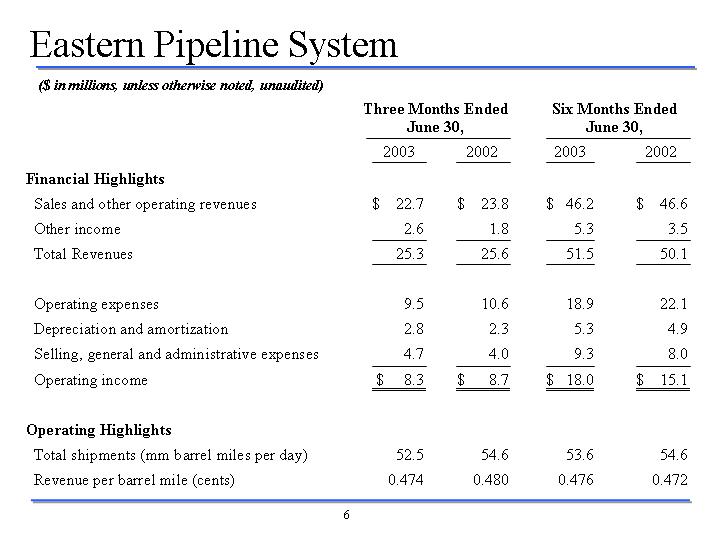
Eastern Pipeline System
($ in millions, unless otherwise noted, unaudited)
| | | Three Months
Ended June 30,
| | Six Months Ended June 30,
|
| | | 2003
| | 2002
| | 2003
| | 2002
|
Financial Highlights | | | | | | | | | | | | |
Sales and other operating revenues | | $ | 22.7 | | $ | 23.8 | | $ | 46.2 | | $ | 46.6 |
Other income | | | 2.6 | | | 1.8 | | | 5.3 | | | 3.5 |
| | |
|
| |
|
| |
|
| |
|
|
Total Revenues | | | 25.3 | | | 25.6 | | | 51.5 | | | 50.1 |
| | |
|
| |
|
| |
|
| |
|
|
Operating expenses | | | 9.5 | | | 10.6 | | | 18.9 | | | 22.1 |
Depreciation and amortization | | | 2.8 | | | 2.3 | | | 5.3 | | | 4.9 |
Selling, general and administrative expenses | | | 4.7 | | | 4.0 | | | 9.3 | | | 8.0 |
| | |
|
| |
|
| |
|
| |
|
|
Operating income | | $ | 8.3 | | $ | 8.7 | | $ | 18.0 | | $ | 15.1 |
| | |
|
| |
|
| |
|
| |
|
|
Operating Highlights | | | | | | | | | | | | |
Total shipments (mm barrel miles per day) | | | 52.5 | | | 54.6 | | | 53.6 | | | 54.6 |
Revenue per barrel mile (cents) | | | 0.474 | | | 0.480 | | | 0.476 | | | 0.472 |
6
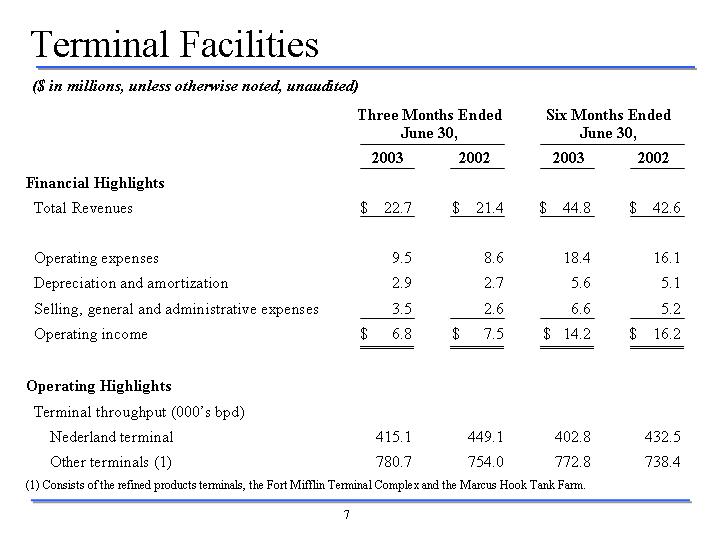
Terminal Facilities
($ in millions, unless otherwise noted, unaudited)
| | | Three Months
Ended June 30,
| | Six Months Ended June 30,
|
| | | 2003
| | 2002
| | 2003
| | 2002
|
Financial Highlights | | | | | | | | | | | | |
Total Revenues | | $ | 22.7 | | $ | 21.4 | | $ | 44.8 | | $ | 42.6 |
| | |
|
| |
|
| |
|
| |
|
|
Operating expenses | | | 9.5 | | | 8.6 | | | 18.4 | | | 16.1 |
Depreciation and amortization | | | 2.9 | | | 2.7 | | | 5.6 | | | 5.1 |
Selling, general and administrative expenses | | | 3.5 | | | 2.6 | | | 6.6 | | | 5.2 |
| | |
|
| |
|
| |
|
| |
|
|
Operating income | | $ | 6.8 | | $ | 7.5 | | $ | 14.2 | | $ | 16.2 |
| | |
|
| |
|
| |
|
| |
|
|
Operating Highlights | | | | | | | | | | | | |
Terminal throughput (000’s bpd) | | | | | | | | | | | | |
Nederland terminal | | | 415.1 | | | 449.1 | | | 402.8 | | | 432.5 |
Other terminals (1) | | | 780.7 | | | 754.0 | | | 772.8 | | | 738.4 |
| (1) | | Consists of the refined products terminals, the Fort Mifflin Terminal Complex and the Marcus Hook Tank Farm. |
7
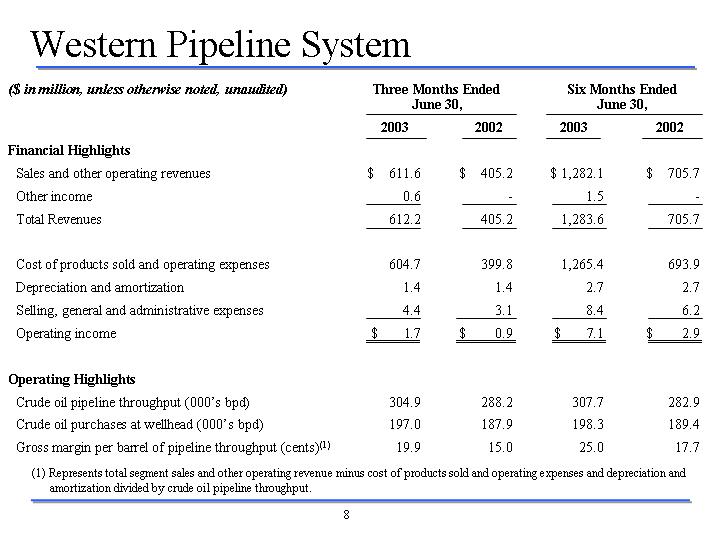
Western Pipeline System
$ in million, unless otherwise noted, unaudited)
| | | Three Months
Ended June 30,
| | Six Months Ended June 30,
|
| | | 2003
| | 2002
| | 2003
| | 2002
|
Financial Highlights | | | | | | | | | | | | |
Sales and other operating revenues | | $ | 611.6 | | $ | 405.2 | | $ | 1,282.1 | | $ | 705.7 |
Other income | | | 0.6 | | | — | | | 1.5 | | | — |
| | |
|
| |
|
| |
|
| |
|
|
Total Revenues | | | 612.2 | | | 405.2 | | | 1,283.6 | | | 705.7 |
| | |
|
| |
|
| |
|
| |
|
|
Cost of products sold and operating expenses | | | 604.7 | | | 399.8 | | | 1,265.4 | | | 693.9 |
Depreciation and amortization | | | 1.4 | | | 1.4 | | | 2.7 | | | 2.7 |
Selling, general and administrative expenses | | | 4.4 | | | 3.1 | | | 8.4 | | | 6.2 |
| | |
|
| |
|
| |
|
| |
|
|
Operating income | | $ | 1.7 | | $ | 0.9 | | $ | 7.1 | | $ | 2.9 |
| | |
|
| |
|
| |
|
| |
|
|
Operating Highlights | | | | | | | | | | | | |
Crude oil pipeline throughput (000’s bpd) | | | 304.9 | | | 288.2 | | | 307.7 | | | 282.9 |
Crude oil purchases at wellhead (000’s bpd) | | | 197.0 | | | 187.9 | | | 198.3 | | | 189.4 |
Gross margin per barrel of pipeline throughput (cents)(1) | | | 19.9 | | | 15.0 | | | 25.0 | | | 17.7 |
| (1) | | Represents total segment sales and other operating revenue minus cost of products sold and operating expenses and depreciation and amortization divided by crude oil pipeline throughput. |
8