Exhibit 99.2
Sunoco Logistics Partners L.P.
First Quarter 2005 Earnings Conference Call April 26, 2005
Forward-Looking Statement
You should review this slide presentation in conjunction with the first quarter 2005 earnings conference call for Sunoco Logistics Partners L.P., held on April 26, 2005 at 9:00 a.m. EDT. You may listen to the audio portion of the conference call on www.sunocologistics.com . An audio recording also will be available after the call’s completion by dialing 1-800-642-1687. International callers should dial 1-706-645-9291. Please enter Conference ID #4978530.
During the call, those statements we make that are not historical facts are forward-looking statements. Although we believe the assumptions underlying these statements are reasonable, investors are cautioned that such forward-looking statements involve risks that may affect our business prospects and performance, causing actual results to differ from those discussed during the conference call. Such risks and uncertainties include, among other things: our ability to successfully consummate announced acquisitions and integrate them into existing business operations; the ability of announced acquisitions to be cash-flow accretive; increased competition; changes in the demand both for crude oil that we buy and sell, as well as for crude oil and refined products that we store and distribute; the loss of a major customer; changes in our tariff rates; changes in throughput of third-party pipelines that connect to our pipelines and terminals; changes in operating conditions and costs; changes in the level of environmental remediation spending; potential equipment malfunction; potential labor relations problems; the legislative or regulatory environment; plant construction/repair delays; and political and economic conditions, including the impact of potential terrorist acts and international hostilities.
These and other applicable risks and uncertainties are described more fully in our December 31, 2004 Annual Report on Form 10-K, filed with the Securities and Exchange Commission on March 4, 2005. We undertake no obligation to update publicly any forward-looking statements whether as a result of new information or future events.
2
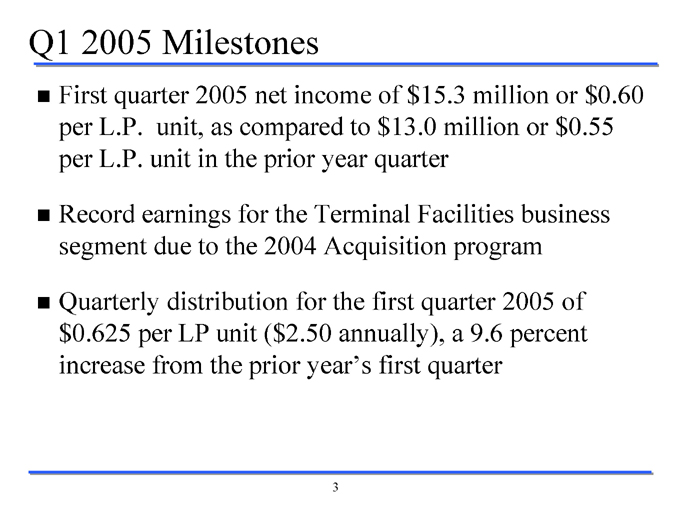
Q1 2005 Milestones
First quarter 2005 net income of $15.3 million or $0.60 per L.P. unit, as compared to $13.0 million or $0.55 per L.P. unit in the prior year quarter
Record earnings for the Terminal Facilities business segment due to the 2004 Acquisition program
Quarterly distribution for the first quarter 2005 of $0.625 per LP unit ($2.50 annually), a 9.6 percent increase from the prior year’s first quarter
3
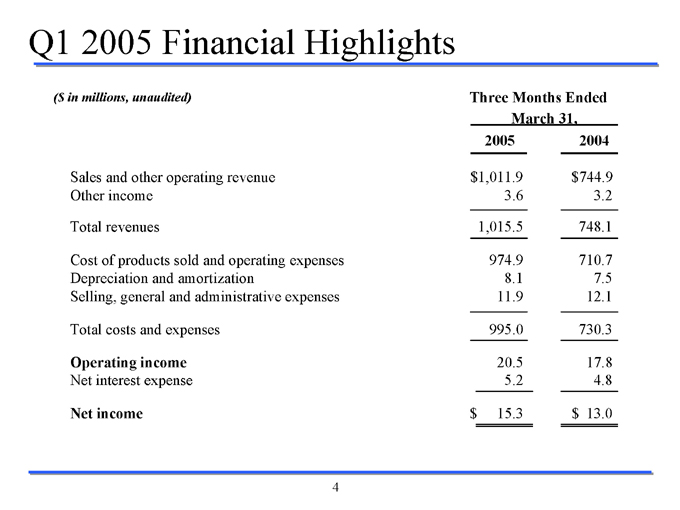
Q1 2005 Financial Highlights
($ in millions, unaudited) Three Months Ended
March 31,
2005 2004
Sales and other operating revenue $1,011.9 $744.9
Other income 3.6 3.2
Total revenues 1,015.5 748.1
Cost of products sold and operating expenses 974.9 710.7
Depreciation and amortization 8.1 7.5
Selling, general and administrative expenses 11.9 12.1
Total costs and expenses 995.0 730.3
Operating income 20.5 17.8
Net interest expense 5.2 4.8
Net income $15.3 $13.0
4
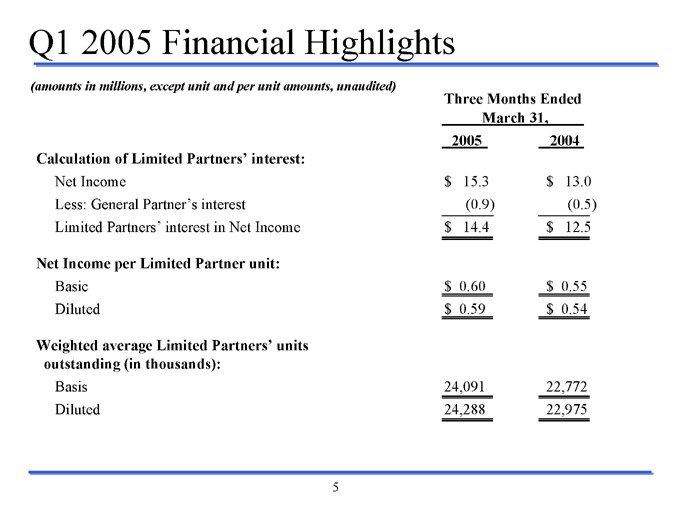
Q1 2005 Financial Highlights
(amounts in millions, except unit and per unit amounts, unaudited)
Three Months Ended
March 31,
2005 2004
Calculation of Limited Partners’ interest:
Net Income $15.3 $13.0
Less: General Partner’s interest (0.9) (0.5)
Limited Partners’ interest in Net Income $14.4 $12.5
Net Income per Limited Partner unit:
Basic $0.60 $0.55
Diluted $0.59 $0.54
Weighted average Limited Partners’ units
outstanding (in thousands):
Basis 24,091 22,772
Diluted 24,288 22,975
5
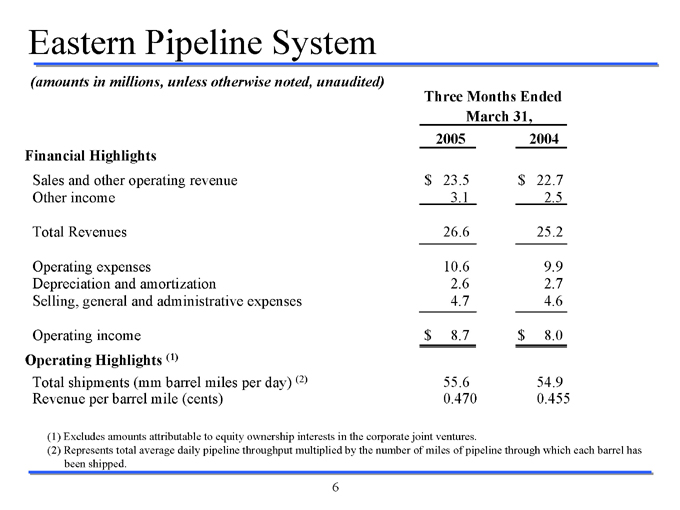
Eastern Pipeline System
(amounts in millions, unless otherwise noted, unaudited)
Three Months Ended
March 31,
2005 2004
Financial Highlights
Sales and other operating revenue $23.5 $22.7
Other income 3.1 2.5
Total Revenues 26.6 25.2
Operating expenses 10.6 9.9
Depreciation and amortization 2.6 2.7
Selling, general and administrative expenses 4.7 4.6
Operating income $8.7 $8.0
Operating Highlights (1)
Total shipments (mm barrel miles per day) (2) 55.6 54.9
Revenue per barrel mile (cents) 0.470 0.455
(1) Excludes amounts attributable to equity ownership interests in the corporate joint ventures.
(2) Represents total average daily pipeline throughput multiplied by the number of miles of pipeline through which each barrel has been shipped.
6
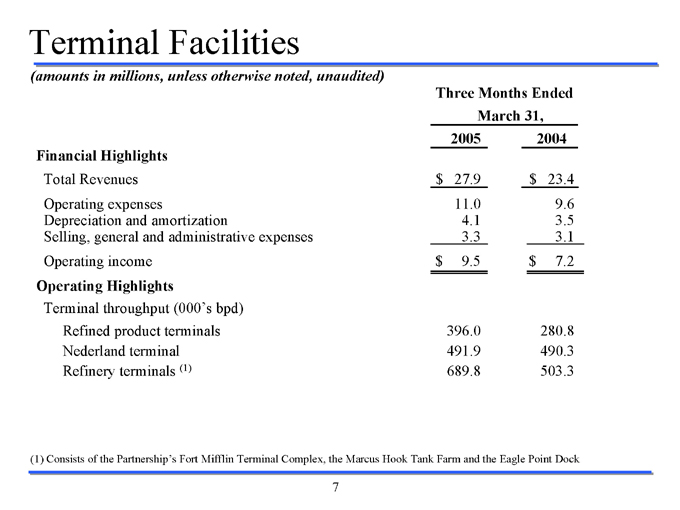
Terminal Facilities
(amounts in millions, unless otherwise noted, unaudited)
Three Months Ended
March 31,
2005 2004
Financial Highlights
Total Revenues $27.9 $23.4
Operating expenses 11.0 9.6
Depreciation and amortization 4.1 3.5
Selling, general and administrative expenses 3.3 3.1
Operating income $9.5 $7.2
Operating Highlights
Terminal throughput (000’s bpd)
Refined product terminals 396.0 280.8
Nederland terminal 491.9 490.3
Refinery terminals (1) 689.8 503.3
(1) Consists of the Partnership’s Fort Mifflin Terminal Complex, the Marcus Hook Tank Farm and the Eagle Point Dock
7
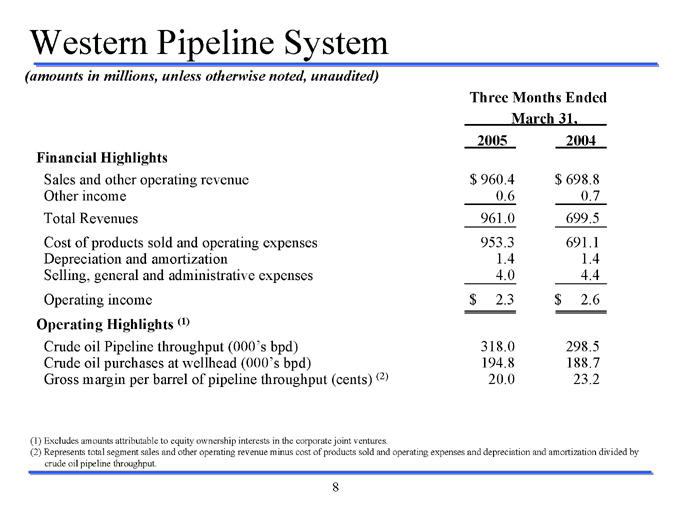
Western Pipeline System
(amounts in millions, unless otherwise noted, unaudited)
Three Months Ended
March 31,
2005 2004
Financial Highlights
Sales and other operating revenue $960.4 $698.8
Other income 0.6 0.7
Total Revenues 961.0 699.5
Cost of products sold and operating expenses 953.3 691.1
Depreciation and amortization 1.4 1.4
Selling, general and administrative expenses 4.0 4.4
Operating income $2.3 $2.6
Operating Highlights (1)
Crude oil Pipeline throughput (000’s bpd) 318.0 298.5
Crude oil purchases at wellhead (000’s bpd) 194.8 188.7
Gross margin per barrel of pipeline throughput (cents) (2) 20.0 23.2
(1) Excludes amounts attributable to equity ownership interests in the corporate joint ventures.
(2) Represents total segment sales and other operating revenue minus cost of products sold and operating expenses and depreciation and amortization divided by crude oil pipeline throughput.
8
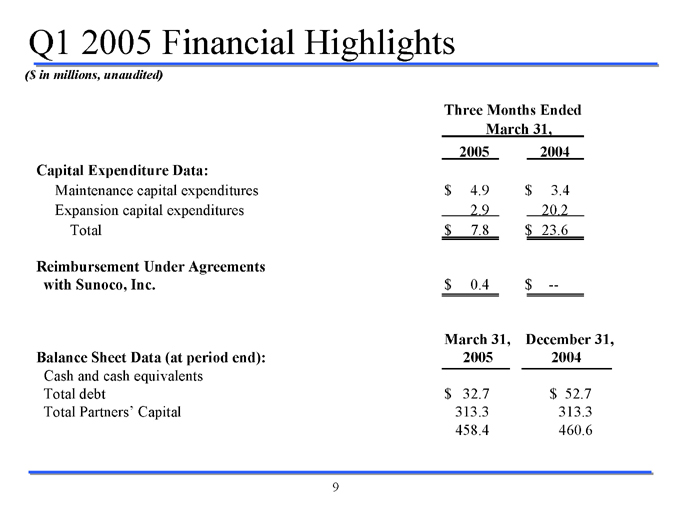
Q1 2005 Financial Highlights
($ in millions, unaudited)
Three Months Ended
March 31,
2005 2004
Capital Expenditure Data:
Maintenance capital expenditures $4.9 $3.4
Expansion capital expenditures 2.9 20.2
Total $7.8 $23.6
Reimbursement Under Agreements
with Sunoco, Inc. $0.4 $—
March 31, December 31,
Balance Sheet Data (at period end): 2005 2004
Cash and cash equivalents
Total debt $32.7 $52.7
Total Partners’ Capital 313.3 313.3
458.4 460.6
9