Use these links to rapidly review the document
TABLE OF CONTENTS1
TABLE OF CONTENTS 2
TABLE OF CONTENTS3
Table of Contents
UNITED STATES
SECURITIES AND EXCHANGE COMMISSION
WASHINGTON, D.C. 20549
FORM 20-F
| | |
| (Mark One) | | |
o |
|
REGISTRATION STATEMENT PURSUANT TO SECTION 12(b) OR (g) OF THE SECURITIES EXCHANGE ACT OF 1934 |
OR |
ý |
|
ANNUAL REPORT PURSUANT TO SECTION 13 OR 15(d) OF THE SECURITIES EXCHANGE ACT OF 1934 |
|
|
For the fiscal year ended December 31, 2014 |
OR |
o |
|
TRANSITION REPORT PURSUANT TO SECTION 13 OR 15(d) OF THE SECURITIES EXCHANGE ACT OF 1934 |
OR |
o |
|
SHELL COMPANY REPORT PURSUANT TO SECTION 13 OR 15(d) OF THE SECURITIES EXCHANGE ACT OF 1934 |
|
|
Date of event requiring this shell company report |
|
|
For the transition period from to . |
Commission file number: 001-36125
ABENGOA, S.A.
(Exact name of Registrant as specified in its charter)
Not applicable
(Translation of Registrant's name into English)
Kingdom of Spain
(Jurisdiction of incorporation or organization)
Campus Palmas Altas
C/ Energía Solar 1
41014, Seville, Spain
Tel: + 34 954 93 71 11
(Address of principal executive offices)
Securities registered or to be registered pursuant to Section 12(b) of the Act.
| | |
| Title of each class | | Name of each exchange on which registered |
|---|
Class B Shares, par value €0.01 per share
American Depositary Shares, each representing Five Class B Shares | | NASDAQ Global Select Market
NASDAQ Global Select Market |
Securities registered or to be registered pursuant to Section 12(g) of the Act.
None
Securities for which there is a reporting obligation pursuant to Section 15(d) of the Act.
None
Indicate the number of outstanding shares of each of the issuer's classes of capital or common stock as of the close of the period covered by the annual report: 755,526,080 Class B shares.
Indicate by check mark if the registrant is a well-known seasoned issuer, as defined in Rule 405 of the Securities Act. o Yes ý No
If this report is an annual or transaction report, indicate by check mark if the registrant is not required to file reports pursuant to Section 13 or 15(d) of the Securities Exchange Act of 1934. o Yes ý No
Indicate by check mark whether the registrant (1) has filed all reports required to be filed by Section 13 or 15(d) of the Securities Exchange Act of 1934 during the preceding 12 months (or for such shorter period that the registrant was required to file such reports), and (2) has been subject to such filing requirements for the past 90 days. ý Yes o No
Indicate by check mark whether the registrant has submitted electronically and posted on its corporate Web site, if any, every Interactive Data File required to be submitted and posted pursuant to Rule 405 of Regulation S-T (§232.405 of this chapter) during the preceding 12 months (or for such shorter period that the registrant was required to submit and post such files). o Yes o No
Indicate by check mark whether the registrant is a large accelerated filer, an accelerated filer, or a non-accelerated filer.
| | | | |
| Large accelerated filer ý | | Accelerated filer o | | Non-accelerated filer o |
Indicate by check mark which basis of accounting the registrant has used to prepare the financial statements included in this filing:
U.S. GAAPo International Financial Reporting Standards as issued by the International Accounting Standards Board ý Other o
If "Other" has been checked in response to the previous question indicate by check mark which financial statement item the registrant has elected to follow. o Item 17 o Item 18
If this is an annual report, indicate by check mark whether the registrant is a shell company (as defined in Rule 12b-2 of the Exchange Act). o Yes ý No
Table of Contents
ABENGOA, S.A.
TABLE OF CONTENTS
| | |
CAUTIONARY STATEMENTS REGARDING FORWARD-LOOKING STATEMENTS | | 3 |
CURRENCY PRESENTATION AND DEFINITIONS | | 4 |
PRESENTATION OF FINANCIAL INFORMATION | | 6 |
PART I | | 14 |
Item 1. Identity of Directors, Senior Management and Advisors | | 14 |
Item 2. Offer Statistics and Expected Timetable | | 14 |
Item 3. Key Information | | 14 |
A. Selected Financial Data | | 14 |
B. Capitalization and Indebtedness | | 21 |
C. Reasons for the Offer and Use of Proceeds | | 21 |
D. Risk Factors | | 21 |
Item 4. Information on the Company | | 55 |
A. History and Development of the Company | | 55 |
B. Business Overview | | 59 |
C. Organizational Structure | | 124 |
D. Property, Plant and Equipment | | 125 |
Item 4A. Unresolved Staff Comments | | 125 |
Item 5. Operating and Financial Review and Prospects | | 125 |
A. Operating Results | | 125 |
B. Liquidity and Capital Resources | | 178 |
C. Research and Development | | 210 |
D. Trend Information | | 212 |
E. Off-Balance Sheet Arrangements | | 212 |
F. Tabular Disclosure of Contractual Obligations | | 213 |
G. Safe harbor | | 215 |
Item 6. Directors, Senior Management and Employees | | 216 |
A. Directors and Senior Management | | 216 |
B. Compensation | | 223 |
C. Board Practices | | 225 |
D. Employees | | 227 |
E. Share Ownership | | 228 |
Item 7. Major Shareholders and Related Party Transactions | | 229 |
A. Major Shareholders | | 229 |
B. Related Party Transactions | | 229 |
C. Interests of Experts and Counsel | | 231 |
Item 8. Financial Information | | 231 |
A. Consolidated Statements and Other Financial Information | | 231 |
B. Significant Changes | | 233 |
Item 9. The Offering and Listing | | 234 |
A. Offer and Listing Details | | 234 |
B. Plan of Distribution | | 235 |
C. Markets | | 236 |
D. Selling Shareholders | | 236 |
E. Dilution | | 236 |
F. Expenses of the Issue | | 236 |
Item 10. Additional Information | | 236 |
A. Share Capital | | 236 |
B. Memorandum and Articles of Association | | 236 |
1
Table of Contents
| | |
C. Material Contracts | | 255 |
D. Exchange Controls | | 255 |
E. Taxation | | 255 |
F. Dividends and Paying Agents | | 261 |
G. Statements by Experts | | 261 |
H. Documents on Display | | 261 |
I. Subsidiary Information | | 262 |
Item 11. Quantitative and Qualitative Disclosures About Market Risk | | 262 |
Item 12. Description of Securities Other Than Equity Securities | | 269 |
A. Debt Securities | | 269 |
B. Warrants and Rights | | 269 |
C. Other Securities | | 269 |
D. American Depositary Shares | | 269 |
Part II | | 270 |
Item 13. Defaults, Dividend Arrearages and Delinquencies | | 270 |
Item 14. Material Modifications to the Rights of Security Holders and Use of Proceeds | | 270 |
Item 15. Controls and Procedures | | 270 |
Item 16. [Reserved] | | |
Item 16A. Audit Committee Financial Expert | | 271 |
Item 16B. Code of Ethics | | 271 |
Item 16C. Principal Accountant Fees and Services | | 272 |
Item 16D. Exemptions from the Listing Standards for Audit Committees | | 273 |
Item 16E. Purchases of Equity Securities by the Issuer and Affiliated Purchasers | | 273 |
Item 16F. Change in Registrant's Certifying Accountant | | 275 |
Item 16G. Corporate Governance | | 275 |
Part III | | 276 |
Item 17. Financial Statements | | 276 |
Item 18. Financial Statements | | 276 |
Item 19. Exhibits | | 276 |
2
Table of Contents
CAUTIONARY STATEMENTS REGARDING FORWARD-LOOKING STATEMENTS
This annual report includes forward-looking statements. These forward-looking statements include, but are not limited to, all statements other than statements of historical facts contained in this annual report, including, without limitation, those regarding our future financial position and results of operations, our strategy, plans, objectives, goals and targets, future developments in the markets in which we operate or are seeking to operate or anticipated regulatory changes in the markets in which we operate or intend to operate. In some cases, you can identify forward-looking statements by terminology such as "aim," "anticipate," "believe," "continue," "could," "estimate," "expect," "forecast," "guidance," "intend," "may," "plan," "potential," "predict," "projected," "should" or "will" or the negative of such terms or other comparable terminology.
By their nature, forward-looking statements involve risks and uncertainties because they relate to events and depend on circumstances that may or may not occur in the future. Forward-looking statements are not guarantees of future performance and are based on numerous assumptions. Our actual results of operations, financial condition and the development of events may differ materially from (and be more negative than) those made in, or suggested by, the forward-looking statements. Investors should read the section entitled "Item 3.D—Risk Factors" and the description of our segments in the section entitled "Item 4.B—Business" for a more complete discussion of the factors that could affect us. Important risks, uncertainties and other factors that could cause these differences include, but are not limited to:
- •
- Failure to consummate a transaction with a third-party intended to facilitate transition to an asset-light business model;
- •
- Failure to reduce our shareholding in our publicly-traded affiliate;
- •
- Failure to complete the sale of certain concessional assets to our publicly-traded affiliate;
- •
- Changes in general economic, political, governmental and business conditions globally and in the countries in which Abengoa does business;
- •
- Difficult conditions in the global economy and in the global markets; changes in interest rates;
- •
- Changes in inflation rates; changes in prices, including increases in the cost of energy and oil and other operating costs;
- •
- Decreases in government expenditure budgets and reductions in government subsidies;
- •
- Changes to national and international laws and policies that support renewable energy sources;
- •
- Inability to improve competitiveness of our renewable energy services and products;
- •
- Decline in public acceptance of renewable energy sources;
- •
- Changes to regulations, subsidies and incentives that support renewable energy sources;
- •
- Extensive governmental regulation in a number of different jurisdictions, including stringent environmental regulation;
- •
- Our substantial capital expenditure and research and development requirements;
- •
- Management of exposure to credit, interest rate, exchange rate, supply and commodity price risks;
- •
- The termination or revocation of our operations conducted pursuant to concessions;
- •
- Reliance on third party contractors and suppliers;
- •
- Acquisitions or investments in joint ventures with third parties;
- •
- Unexpected adjustments and cancellations of our backlog of unfilled orders;
3
Table of Contents
- •
- Management of our economic, political and other risks inherent in operating in emerging markets;
- •
- Failure to comply with laws and regulations, including anti-bribery laws;
- •
- Inability to obtain new sites and expand existing ones;
- •
- Failure to maintain safe work environments; effects of catastrophes, natural disasters, adverse weather conditions, unexpected geological or other physical conditions, or criminal or terrorist acts at one or more of our plants;
- •
- Insufficient insurance coverage and increases in insurance cost;
- •
- Loss of senior management and key personnel; unauthorized use of our intellectual property and claims of infringement by us of others intellectual property and legal proceedings;
- •
- Our substantial indebtedness;
- •
- Our ability to generate cash to service our indebtedness changes in business strategy;
- •
- Adverse conditions in financial markets, including related to decisions on spending by the U.S. government; and
- •
- Various other factors, including those factors discussed under "Item 3.D—Risk Factors" herein.
The forward-looking statements made in this annual report relate only to events or information as of the date on which the statements are made in this annual report. Except as required by law, we undertake no obligation to update or revise publicly any forward-looking statements, whether as a result of new information, future events or otherwise, after the date on which the statements are made or to reflect the occurrence of unanticipated events. You should read this annual report and the documents that we reference in this annual report and have filed as exhibits to this annual report, completely and with the understanding that our actual future results or performance may be materially different from what we expect.
CURRENCY PRESENTATION AND DEFINITIONS
In this annual report, all references to "euro" or "€" are to the single currency of the participating member states of the European and Monetary Union of the Treaty Establishing the European Community, as amended from time to time, and all references to "U.S. Dollar", "US$" and "$" are to the lawful currency of the United States.
Definitions
Unless otherwise specified or the context requires otherwise in this annual report:
- •
- references to "Abengoa," "Group," "we," "us", "the Company" and "our" refer to Abengoa, S.A., together with its subsidiaries unless the context otherwise requires;
- •
- references to "Consolidated Financial Statements" refer to the audited Consolidated Financial Statements of Abengoa and its subsidiaries as of December 31, 2014 and 2013 and for each of the years ended December 31, 2014, 2013 and 2012, including the related notes thereto, prepared in accordance with IFRS as issued by the IASB (as such terms are defined herein);
- •
- references to "backlog" refer principally to projects, operations and services for which we have signed contracts and in respect of which we have received non-binding commitments from customers or other operations within our Group, where the related revenues are not eliminated in consolidation. Commitments may be in the form of written contracts for specific projects, purchase orders, subscriptions or indications of the amount of time and materials we need to make available for customers' projects. Our backlog includes expected revenue based on engineering and design specifications that may not be final and could be revised over time, and also includes expected revenue
4
Table of Contents
for government and maintenance contracts that may not specify actual monetary amounts for the work to be performed. For these contracts, our backlog is based on an estimate of work to be performed, which is based on our knowledge of our customers' stated intentions or our historical experience. We do not include in backlog expected future sales from our concession activities, such as energy sales, transmission and water sales or commodity sales. Our definition of backlog may not necessarily be the same as that used by other companies engaged in activities similar to ours. As a result, the amount of our backlog may not be comparable to the backlog reported by such other companies;
- •
- references to the "Befesa Sale" refer to Abengoa's sale of 100% of Abengoa's shares in its subsidiary, Befesa Medio Ambiente, S.L.U. ("Befesa"), to funds advised by Triton Partners;
- •
- references to the "Cemig Sales" refer to (i) the sale by Abengoa of 100% of the shareholding of NTE Nordeste Transmissora de Energia S.A. ("NTE") and 50% of the shareholding of União de Transmissoras de Energia Elétrica Holding S.A. ("UNISA") to Transmissão Aliança de Energia Elétrica S.A. ("TAESA"), an affiliate of Companhia Energetica de Minas Gerais, S.A. ("Cemig"), which occurred on November 30, 2011 (the "First Cemig Sale") and (ii) the sale of our remaining 50% interest in UNISA, which occurred on June 30, 2012 (the "Second Cemig Sale"), which are described in more detail in Note 6 to our Consolidated Financial Statements;
- •
- references to "Concession-Type Infrastructure" or "Concession-Type Infrastructure activity" refer to the operation by us of assets under long-term arrangements, such as "take or pay" contracts, feed-in and ad hoc tariffs or power or water purchase agreements;
- •
- references to "Deposit Agreement" refer to the deposit agreement entered into on October 16, 2013 between Citibank, N.A., as depositary, us and all owners and holders from time to time of the ADSs issued thereunder. The rights of the holders of ADSs are governed by the Deposit Agreement;
- •
- references to "Engineering and Construction" or our "Engineering and Construction activity" refer to our traditional engineering activities in the energy and water sectors, with more than 70 years of experience in the market and development of thermo-solar technology. Abengoa is specialized in carrying out complex turn-key projects for thermo-solar plants, solar-gas hybrid plants, conventional generation plants, biofuels plants and water infrastructures, as well as large-scale desalination plants and transmission lines, among others;
- •
- references to "IFRIC 12" refer to International Financial Reporting Interpretations Committee's Interpretation 12—Service Concessions Arrangements;
- •
- references to "IFRS as issued by the IASB" refer to International Financial Reporting Standards as issued by the International Accounting Standards Board;
- •
- references to "Industrial Production" or our "Industrial Production activity" refer to our traditional activity in the development and production of biofuels and, only until the Befesa Sale, providing a variety of recycling services to industrial customers;
- •
- references to "January 2014 Plan" refer to the variable pay scheme for the senior management approved by the Board of Directors of Abengoa in January 2014;
- •
- references to "July 2014 Plan" refer to the variable pay scheme for the senior management approved by the Board of Directors of Abengoa in July 2014;
- •
- references to "Project Debt" (previously categorized as "Non-Recourse Debt") refer to liabilities related to certain of our projects and significant investments, including capital expenditures typically relating to concessions or fixed tariff take-or-pay agreements, primarily under loan agreements and related documents which require the loans to be repaid solely from the revenue of the project being financed thereby and provide that the repayment of the loans (and interest thereon) is secured solely by the
5
Table of Contents
shares, physical assets, contracts and cash flow of that project company. Project Debt also includes certain obligations guaranteed by Abengoa, S.A. or its subsidiaries (other than non-recourse subsidiaries) in favor of our project companies and categorized as "bridge loan" (previously categorized as "non-recourse debt in process"), whereby Abengoa, S.A. and/or its subsidiaries (other than non-recourse subsidiaries) guarantee obligations in order to act as sponsors for the period prior to such project companies securing long-term project financing (typically periods of less than 2-3 years). Bridge loans will typically relate to bank financing arrangements, but may also include capital markets debt if such indebtedness is, or is expected to be, recorded as "project finance" in our consolidated annual accounts. Although our classification of bridge loans as Project Debt is in compliance with IFRS guidelines, we have discretion, within applicable IFRS guidelines, to reclassify this type of indebtedness. See Note 19 of our Consolidated Financial Statements for further details. See "Item 5—Liquidity and Capital Resources—Project Debt" for a full description;
- •
- references to "non-recourse subsidiaries" refer to our subsidiaries through which we engage in projects involving the design, construction, financing, operation and maintenance of large scale, complex operational assets or infrastructures, which are either owned by such subsidiaries or held under concession for a period of time. The projects undertaken by these non-recourse subsidiaries are initially financed through bridge loans and later by Project Debt. The assets and liabilities, results of operations, and cash flows of our non-recourse subsidiaries are consolidated in our Consolidated Financial Statements;
- •
- references to "OECD" refer to the Organization of Economic Co-operation and Development, an international organization of 34 member countries consisting of advanced economies;
- •
- references to "R&D&i" refer to our research and development and innovation;
- •
- references to "t" and "tons" are to metric tons (one metric ton being equal to 1,000 kilograms or 2,205 pounds);
- •
- references to "total net fixed assets" refer to the sum of intangible assets and property, plant and equipment, and fixed assets and projects, net of depreciation, amortization and provisions for impairment charges;
- •
- references to the "2005 Credit Facility" refer to the €600 million commercial credit facility granted to us by a syndicate of lenders under an agreement executed on July 20, 2005 which matured and was repaid and extinguished on July 20, 2012; and
- •
- references to the "2006 Credit Facility" refer to the €600 million commercial credit facility granted to us by a syndicate of lenders under an agreement executed on June 29, 2006 which matured and was repaid and extinguished on July 20, 2012.
PRESENTATION OF FINANCIAL INFORMATION
The selected financial information as of December 31, 2014 and 2013 and for the years ended December 31, 2014, 2013 and 2012 is derived from, and qualified in its entirety by reference to our Consolidated Financial Statements, which are included elsewhere in this annual report, which are prepared in accordance with IFRS as issued by the IASB. The selected financial information as of December 31, 2012 and as of and for the years ended December 31, 2011 and 2010 is derived from, and qualified in its entirety by reference to our consolidated financial statements and related notes for the years ended December 31, 2012, 2011 and 2010.
Certain numerical figures set out in this annual report, including financial data presented in millions or thousands and percentages describing market shares, have been subject to rounding adjustments, and, as a result, the totals of the data in this annual report may vary slightly from the actual arithmetic totals of such information. Percentages and amounts reflecting changes over time periods relating to financial and other
6
Table of Contents
data set forth in "Operating and Financial Review and Prospects" are calculated using the numerical data in our Consolidated Financial Statements or the tabular presentation of other data (subject to rounding) contained in this annual report, as applicable, and not using the numerical data in the narrative description thereof.
Since the beginning of 2014, our Engineering and Construction activity consists of one operating segment, Engineering and Construction. Previously, the Technology and other segment was also included in this activity. Since 2014, the Technology and other segment has been included in the Engineering and Construction operating segment, in accordance with IFRS 8,Operating Segments.
Geographic Reporting
We report our results in accordance with the following six geographic regions:
- •
- Spain;
- •
- North America;
- •
- Europe (excluding Spain);
- •
- South America (excluding Brazil);
- •
- Brazil; and
- •
- Other (remaining overseas markets).
During 2013 and 2012 we reported results from Mexico as part of South America (excluding Brazil) (formerly Latin America (excluding Brazil)). In the year ended December 31, 2014, in order to better reflect the geographical segmentation of our business we included results from Mexico in the North America segment (formerly the United States segment). The information by geographic areas for the years ended December 31, 2013 and 2012 has been presented according to the new geographic segmentation.
Partial Divestment of Abengoa Yield
On June 18, 2014, we completed an initial public offering (the "Abengoa Yield IPO") of 28,577,500 ordinary shares of Abengoa Yield plc ("Abengoa Yield"), including the exercise in full of the underwriters' over-allotment option, at a price of $29.00 per share for total gross proceeds of $828.7 million (€611.0 million) before fees and expenses. Abengoa Yield is a dividend growth-oriented company formed by us that groups together renewable energy, conventional power, electric transmission lines and other contracted, revenue-generating assets previously reported in different operating segments within the Concession-Type Infrastructure activity. As a result of a second transfer of assets announced on February 9, 2015, Abengoa Yield is now present in the water infrastructure segment, has expanded its geographic presence to the north of Africa and is expected to expand its geographic presence to the United Arab Emirates. As such, Abengoa Yield became a new operating segment within the Concession-Type Infrastructure activity after the Abengoa Yield IPO and we reported that segment's results in our quarterly financial information for the quarters ended June 30, 2014 and September 30, 2014.
Immediately following the Abengoa Yield IPO, we held 64% of the ordinary share capital of Abengoa Yield. On December 15, 2014, our Board of Directors approved a plan to reduce our shareholding in Abengoa Yield to below 50% during 2015, subject to market conditions. On January 22, 2015, we completed an initial divestment of 13% through the sale in an underwritten public offering of 10,580,000 ordinary shares in Abengoa Yield (including 1,380,000 shares sold pursuant to the exercise in full of the underwriters' option to purchase additional shares) at a price of US$31 per share which brought our shareholding in Abengoa Yield to 51%. On February 9, 2015, we announced our intention to reduce our shareholding in Abengoa Yield to below 50% by the end of the first half of 2015, with the objective of maintaining a long-term stake in the range of 40-49%. We have also indicated our intention to reinforce the role of independent directors at
7
Table of Contents
Abengoa Yield in order to effectively transfer control once we reduce our shareholding in Abengoa Yield below 50%.
Taking into account that Abengoa Yield was an operating segment within our Concession-Type Infrastructure activity during part of 2014 and the significance that those activities carried out by Abengoa Yield have for Abengoa, our shareholding in Abengoa Yield during 2014 was treated as a discontinued operation in accordance with the stipulations and requirements of IFRS 5,Non-Current Assets Held for Sale and Discontinued Operations. The treatment of Abengoa Yield as discontinued operations also resulted in the removal of the Abengoa Yield operating segment from our Concession-Type Infrastructure activity.
In accordance with this standard, the assets and liabilities of Abengoa Yield have been reclassified as assets and liabilities held for sale in our consolidated statement of financial position included within our consolidated financial statements as of and for the year ended December 31, 2014. Likewise, our consolidated income statements for the years ended December 31, 2014, 2013, 2012, 2011 and 2010 also include the results of Abengoa Yield under a single heading, "Profit (loss) from discontinued operations, net of tax".
Sale of Additional Assets to Abengoa Yield
Our plan to accelerate the sale of assets to Abengoa Yield through a right of first offer ("ROFO") agreement started at the end of 2014 with our approval of a divestment plan that includes several companies owning concessional projects for water desalination plants in Algeria (Skikda and Honnaine), power transmission lines in Peru (ATN2) and thermo-solar plants in Abu Dhabi (Shams) and Spain (Helioenergy 1/2).
On February 9, 2015, we announced our agreement entered into with Abengoa Yield for a second transfer of assets, including: ATN 2, a transmission power line in Peru (40% stake); Shams, a 100-MW solar power asset in the United Arab Emirates (20% stake); rights of usufruct over Helioenergy 1/2, a 100-MW solar power asset in Spain (29.6% stake); and Honaine and Skikda, two water desalination plants in Algeria with an aggregate capacity of 10.5 Mft3/day (25.5% and 34.17% stakes, respectively) for total proceeds of approximately $142 million. The sale of Honaine and Skikda was closed on February 15, 2015, while the acquisition of the remaining assets is still pending. Regarding Honaine and Skikda, we have entered into a two-year call and put option agreement with Abengoa Yield under which they have put option rights to require us to purchase back these assets at the same price paid by them and we have call option rights to require them to sell back these assets if certain indemnities and guarantees provided by us reach a certain threshold. In addition, discussions between us and Abengoa Yield have already commenced regarding a potential third dropdown for a total equity value in the range of $200 to $250 million. This potential third acquisition falls within the $100 million call option agreement announced between us and Abengoa Yield in December 2014 at a 12% yield. The third dropdown divestment is expected to close by the end of the year.
Given that as of December 31, 2014, the companies holding the above-mentioned companies were available for immediate sale and that we consider the sales to be highly probable, we classified the associated assets and liabilities as held for sale in the consolidated statement of financial position as of December 31, 2014. Until the closing of the respective sale transactions, the assets, other than Helioenergy 1/2, will be reported as held for sale in accordance with the stipulations and requirements of IFRS 5,Non-Current Assets Held For Sale and Discontinued Operations.
Potential Disposition of Greenfield Projects to APW1
On December 23, 2014, we entered into a letter agreement to negotiate exclusively with the energy infrastructure investor EIG Global Energy Partners ("EIG") until March 31, 2015 an investment by EIG-managed investment funds, alongside Abengoa, in a portfolio of greenfield projects currently owned by Abengoa, on the basis of the terms set forth in the term sheet attached to the letter agreement. On February 2, 2015, EIG confirmed to us in writing that its due diligence to date had not revealed facts or circumstances that would cause EIG not to recommend the proposed transaction for approval by the EIG
8
Table of Contents
investment committees overseeing investments by EIG-managed investment funds. On February 9, 2015, we announced that we and EIG were in an advanced stage of documentation and due diligence regarding the proposed transaction.
As part of the transaction, Abengoa is expected to contribute to a newly formed company, Abengoa Projects Warehouse 1 ("APW1"), a portfolio of selected Abengoa projects under construction, including renewable and conventional power generation, power transmission and water management assets in different geographies including, among others, the United States, Mexico, Brazil and Chile. Based on the current status of the negotiations, the total investment in the projects expected to be contributed is approximately $9.2 billion once these projects are fully invested in the coming years, of which approximately $2.5 billion is expected to be equity. Of the total equity estimated to be committed, based on the current status of the negotiations, we expect that a majority stake (approximately 55%) in APW1 will be held by EIG, with the remainder held by Abengoa. Our current estimate of the total amount of EIG's investment, based on the current status of the negotiations, is approximately $1.4 billion over four years based on the projects expected to be contributed.
Once APW1 is created and the initial projects contributed to the vehicle, EIG will make an initial payment to us of less than half of their total expected $1.4 billion contribution to purchase 55% of the equity that Abengoa has already invested in the projects that have been contributed to APW1. Abengoa is expecting to receive these cash proceeds before March 31, 2015. The remaining projects are expected to be contributed by us to APW1 over time. The remaining equity expected to be required in order to develop the entire portfolio of projects is expected to be contributed over a period of four years both by Abengoa and EIG pro-rata to their shareholding in APW1 following the construction schedule of the projects in the vehicle as they are contributed to the vehicle, which is expected to take several months.
We expect that the definitive transaction agreements related to the investment by EIG will be entered into by March 31, 2015. Once we have entered into the definitive transaction agreements and the projects have been transferred to APW1, Abengoa will no longer have a controlling interest in these assets. Given that as of December 31, 2014, the companies expected to be transferred to APW1 are available for immediate sale and we consider the sale to be highly probable, we have classified the associated assets and liabilities as held for sale in the consolidated statement of financial position as of December 31, 2014. Until entry into definitive documentation and closing of the sale transaction, the assets will be reported as held for sale in accordance with the stipulations and requirements of IFRS 5,Non-Current Assets Held for Sale and Discontinued Operations. The expectations set forth herein regarding a potential transaction with EIG, the projects to be contributed and related investment amounts are based on the current status of negotiations with EIG and are subject to change as negotiation of definitive transaction agreements progresses, and any such change may be material. We cannot guarantee that we will be successful in consummating the transaction with EIG on the terms described above, on other terms acceptable to us, or at all.
Application of IFRS 10 and 11
IFRS 10 and 11 came into effect on January 1, 2013 under IFRS as issued by the IASB and were initially applied in our interim consolidated financial statements as of and for the six months ended June 30, 2013 included in the final prospectus for our initial public offering in the United States as filed with the SEC on October 17, 2013. The main impacts of the application of the new standards relate to the de-consolidation of companies that do not fulfill the conditions of effective control during the construction phase, now recorded under the equity method, and to the elimination of the proportional consolidation of joint ventures, with the equity method being obligatory for recording our interest in the relevant entities. According to the terms and requirements established in IAS 8 'Accounting policies, changes in accounting estimates and errors', the above standards and amendments were retrospectively applied, recasting the comparative information presented for the year 2012. The above standards and amendments have already been applied in the Consolidated Financial statements as of and for the year ended December 31, 2012, presented in the final prospectus for our initial public offering in the United States. Financial information as of and for the years
9
Table of Contents
ended December, 31, 2011 and 2010 have not been recasted according to the transition guidance of IFRS 10. Consequently, the comparative information presented for the years 2011 and 2010 is not comparable with the more recent periods presented.
Befesa Sale
On June 13, 2013, we entered into a share purchase agreement for the sale of 100% of our shares in our subsidiary Befesa (the "Befesa Sale") to funds advised by Triton Partners (the "Triton Funds"). After customary net debt adjustments and subject to certain other adjustments, total consideration to us amounted to €620 million which was comprised of €348 million total cash, of which a payment of €331 million was received at closing and deferred compensation of €17 million (including €15 million in escrow pending resolution of ongoing litigation and a €2 million long-term receivable from a Befesa customer), a €48 million subordinated vendor note with a five-year maturity and a €225 million (par value) subordinated convertible instrument with a 15-year maturity (subject to two five-year extensions) accruing interest of 6 month Euribor in effect at closing date plus a 6% spread and which, upon the occurrence of certain triggering events including, but not limited to, Befesa's failure to meet certain financial targets or the exit of the Triton Funds from Befesa, may be converted into approximately 14% of the shares of Befesa (subject to certain adjustments). The share purchase agreement contains a two-year non-compete provision concerning Befesa's activities. On February 4, 2015, we sold the €48 million subordinated vendor note to Triton Partners (see Note 7.3 to our Consolidated Financial Statements).
On July 15, 2013, we received €331 million of cash proceeds corresponding to the price agreed for the shares and the sale of the transaction was closed. The gain on the sale amounted to €0.4 million and is included in "Results for the year from discontinued operations, net of taxes" in the Consolidated Income Statement.
Taking into account the significance of the activities carried out between Befesa and Abengoa, the sale of this shareholding is considered as a discontinued operation in accordance with IFRS 5,Non-Current Assets Held For Sale and Discontinued Operations. In accordance with this standard, the results of Befesa until the closing of the sale and the result of this sale are included under a single heading, "Profit (loss) for the year from discontinued operations, net of tax" in our Consolidated Financial Statements. Likewise, the consolidated income statements for the years ended December 31, 2013, 2012, 2011, and 2010 also include the results of Befesa under a single heading. The Befesa Sale also resulted in the removal of the Industrial Recycling segment from our Industrial Production activity.
Sale of Brazilian Transmission Line Assets
We sold, in two portions pursuant to three share purchase agreements, 100% of certain Brazilian transmission line assets to TAESA, an affiliate of Cemig.
Over the course of 2011 and 2012, Abengoa Concessões Brasil Holding S.A. ("Abengoa Concessões") entered into the Cemig Sales with TAESA which comprised the following: (i) on June 2, 2011, we sold 50% of our interest in four project companies: STE—Sul Transmissora de Energia S.A. ("STE"), ATE Transmissora de Energia S.A. ("ATE"), ATE II Transmissora de Energia S.A. ("ATE II") and ATE III Transmissora de Energia S.A. ("ATE III"); (ii) also on June 2, 2011 we sold 100% of the share capital of NTE Nordeste Transmissora de Energia S.A. and; (iii) on March 16, 2012, we signed an additional share purchase agreement to sell our remaining 50% interest in project companies STE, ATE, ATE II and ATE III.
On June 30, 2012, all the conditions necessary to close the transaction were fulfilled, and on July 2, we received €354 million of cash proceeds corresponding to the total price agreed for the shares. The gain from the Second Cemig Sale of €4.5 million is reflected in the "Other operating income" line item in our consolidated income statement for the year ended December 31, 2012. The Second Cemig Sale includes a post-closing adjustment mechanism similar to that described above relating to the First Cemig Sale, and no significant post-closing adjustment was required to be paid.
10
Table of Contents
In our consolidated income statement for the year ended December 31, 2012 included in the Consolidated Financial Statements, the profits and losses of the four project companies we contributed to UNISA (STE, ATE, ATE II and ATE III) are recorded under the equity method as a result of the retrospective application of IFRS 11 from January 1, 2012 until June 30, 2012, when the Second Cemig Sale closed.
Simplification of Engineering and Construction Activity
Prior to 2014, our Engineering and Construction activity was comprised of two operating segments: Engineering and Construction, and Technology and Other. Beginning in 2014, we began including the Technology and Other segment with the Engineering and Construction segment in accordance with IFRS 8, Operating Segments. As a result, our Engineering and Construction activity is now comprised of a single operating segment, Engineering and Construction, and the information by activities for the years ended December 31, 2013 and 2012 has been presented according to the new segmentation.
Commencement of Operations of Projects
The comparability of our results of operations is significantly influenced by the volume of projects that become operational during a particular year. The number of projects becoming operational and the length of projects under construction significantly impact our revenue and operating profit, as well as our consolidated profit after tax during a particular period, which makes the comparison of periods difficult.
The following table sets forth the current principal projects that commenced operations during each of the years ended December 31, 2014, 2013 and 2012, including the quarter in which operations began.
| | | | | | | | |
| Segment | | Project | | 2012 | | 2013 | | 2014 |
|---|
Transmission | | Manaus (Brazil) | | | | 1st quarter | | |
| | Norte Brazil (Brazil) | | | | | | 3rd quarter |
Biofuels | | Salamanca (Spain)—Waste to Biofuels plant | | | | 2nd quarter | | |
| | Hugoton (USA) | | | | | | 4th quarter |
Water | | Qingdao (China)(3) | | | | 1st quarter | | |
| | Tenes (Algeria) | | | | | | 4th quarter |
Solar | | Helioenergy 2 (Spain)(1) | | 1st quarter | | | | |
| | Helios 1 (Spain) | | 2nd quarter | | | | |
| | Helios 2 (Spain) | | 3rd quarter | | | | |
| | Shams (UAE)(1) | | | | 1st quarter | | |
| | Solaben 1-6 (Spain) | | | | 4th quarter | | |
Abengoa Yield(2) | | Solacor 1 (Spain) | | 1st quarter | | | | |
(as discontinued operations) | | Solacor 2 (Spain) | | 1st quarter | | | | |
| | Solaben 2 (Spain) | | 4th quarter | | | | |
| | Solaben 3 (Spain) | | 2nd quarter | | | | |
| | ACT (Mexico) | | | | 2nd quarter | | |
| | Solana (USA) | | | | 4th quarter | | |
| | ATS (Peru) | | | | | | 1st quarter |
| | Quadra 2 (Chile) | | | | | | 1st quarter |
| | Quadra 1 (Chile) | | | | | | 2nd quarter |
| | Palmatir (Uruguay) | | | | | | 2nd quarter |
| | Mojave (USA) | | | | | | 4th quarter |
| | Cadonal (Uruguay) | | | | | | 4th quarter |
- (1)
- Assets announced to be transferred to Abengoa Yield.
11
Table of Contents
- (2)
- As of December 31, 2014, we held 64% of the ordinary share capital of Abengoa Yield. On December 15, 2014, our Board of Directors approved a plan to reduce our shareholding in Abengoa Yield to below 50% during 2015, subject to market conditions. On January 22, 2015, we completed an initial divestment of 13% which brought our shareholding in Abengoa Yield to 51%. On February 9, 2015, we announced our intention to reduce our shareholding in Abengoa Yield to below 50% by the end of the first half of 2015, with the objective of maintaining a long-term stake in the range of 40-49%.
- (3)
- Sold in the last quarter of 2014.
Non-GAAP Financial Measures
This annual report contains non-GAAP financial measures and ratios, including Consolidated EBITDA, Corporate EBITDA, Gross Corporate Debt, Net Corporate Debt and constant currency presentation, that are not required by, or presented in accordance with, IFRS as issued by the IASB.
- •
- Consolidated EBITDA is calculated as profit for the year, after adding back income tax expense/(benefit), share of (loss)/profit of associates, finance expense net and depreciation, amortization and impairment charges of Abengoa, S.A. and its subsidiaries.
- •
- Corporate EBITDA is calculated as profit for the year from continuing operations, after adding back income tax expense/(benefit), share of (loss)/profits of associates, finance expense net, depreciation, amortization and impairment charges of Abengoa, S.A. and its subsidiaries less EBITDA from non-recourse activities net of eliminations.
- •
- Gross Corporate Debt consists of our (i) long-term debt (debt with a maturity of greater than one year) incurred with credit institutions, plus (ii) short-term debt (debt with a maturity of one year or less) incurred with credit institutions, plus (iii) notes, obligations, promissory notes, financial leases and any other such obligations or liabilities, the purpose of which is to provide finance and which generate a financial cost for us, plus (iv) obligations relating to guarantees of third-party obligations (other than intra-Group guarantees), but excluding any Project Debt.
- •
- Net Corporate Debt consists of Gross Corporate Debt, excluding obligations relating to guarantees of third parties (other than intragroup guarantees), less total cash and cash equivalents (excluding project cash and cash equivalents), and short-term financial investments at the end of each period (excluding project short-term financial investments).
We present non-GAAP financial measures because we believe that they and other similar measures are widely used by certain investors, securities analysts and other interested parties as supplemental measures of performance and liquidity. The non-GAAP financial measures may not be comparable to other similarly titled measures of other companies and have limitations as analytical tools and should not be considered in isolation or as a substitute for analysis of our operating results as reported under IFRS as issued by the IASB. Non-GAAP financial measures and ratios are not measurements of our performance or liquidity under IFRS as issued by the IASB and should not be considered as alternatives to operating profit or profit for the year or any other performance measures derived in accordance with IFRS as issued by the IASB or any other generally accepted accounting principles or as alternatives to cash flow from operating, investing or financing activities.
Some of the limitations of these non-GAAP measures and ratios are:
- •
- they do not reflect our cash expenditures or future requirements for capital expenditures or contractual commitments;
- •
- they do not reflect changes in, or cash requirements for, our working capital needs;
- •
- they do not reflect the significant interest expense, or the cash requirements necessary, to service interest or principal payments, on our debts;
- •
- although depreciation and amortization are non-cash charges, the assets being depreciated and amortized will often need to be replaced in the future and Consolidated EBITDA and Corporate EBITDA do not reflect any cash requirements that would be required for such replacements;
12
Table of Contents
- •
- some of the exceptional items that we eliminate in calculating Consolidated EBITDA and Corporate EBITDA reflect cash payments that were made, or will be made in the future; and
- •
- the fact that other companies in our industry may calculate Consolidated EBITDA, Corporate EBITDA, Gross Corporate Debt and Net Corporate Debt differently than we do, which limits their usefulness as comparative measures.
In our discussion of operating results, we have included foreign exchange impacts in our revenue by providing constant currency revenue growth. The constant currency presentation is a non-GAAP financial measure, which excludes the impact of fluctuations in foreign currency exchange rates. We believe providing constant currency information provides valuable supplemental information regarding our results of operations. We calculate constant currency amounts by converting our current period local currency revenue using the prior period foreign currency average exchange rates and comparing these adjusted amounts to our prior period reported results. This calculation may differ from similarly titled measures used by others and, accordingly, the constant currency presentation is not meant to substitute for recorded amounts presented in conformity with IFRS as issued by the IASB nor should such amounts be considered in isolation.
13
Table of Contents
PART I.
ITEM 1. IDENTITY OF DIRECTORS, SENIOR MANAGEMENT AND ADVISERS
Not applicable.
ITEM 2. OFFER STATISTICS AND EXPECTED TIMETABLE
Not applicable.
ITEM 3. KEY INFORMATION
A. Selected Consolidated and Other Financial and Operating Data
The following tables present selected consolidated financial and business level information for Abengoa, S.A. as of and for each of the years ended December 31, 2014, 2013, 2012, 2011 and 2010.
The selected financial information as of December 31, 2014 and 2013 and for the years ended December 31, 2014, 2013 and 2012 is derived from, and qualified in its entirety by reference to, our Consolidated Financial Statements and related notes, prepared in accordance with IFRS as issued by the IASB, which are included elsewhere in this annual report. The selected financial information as of December 31, 2012 and as of and for the years ended December 31, 2011 and 2010 is derived from, and qualified in its entirety by reference to our consolidated financial statements and related notes for the years ended December 31, 2012, 2011 and 2010.
The selected consolidated financial information as of and for the years ended December 31, 2014, 2013, 2012, 2011 and 2010 is not intended to be an indicator of our financial condition or results of operations in the future. You should review such selected consolidated financial information together with our Consolidated Financial Statements and notes thereto, included elsewhere in this annual report.
14
Table of Contents
The following tables should be read in conjunction with "Item 5.A—Operating Results", and our Consolidated Financial Statements and related notes included elsewhere in this annual report.
| | | | | | | | | | | | | | | | |
| | Year ended December 31, | |
|---|
| | 2014(1) | | 2013(1)(3) | | 2012(1)(2)(3) | | 2011(1)(3)(4) | | 2010(1)(3)(4) | |
|---|
| | (€ in millions)
| |
|---|
Consolidated Income Statement Data | | | | | | | | | | | | | | | | |
Revenue | | | 7,150.6 | | | 7,245.1 | | | 6,285.6 | | | 6,682.1 | | | 4,359.4 | |
Changes in inventories of finished goods and work in progress | | | 1.1 | | | 7.7 | | | 19.7 | | | 64.1 | | | 24.1 | |
Other operating income | | | 188.3 | | | 441.4 | | | 481.9 | | | 598.2 | | | 751.5 | |
Raw materials and consumables used | | | (4,083.1 | ) | | (4,469.9 | ) | | (4,244.7 | ) | | (4,655.7 | ) | | (3,257.0 | ) |
Employee benefit expense | | | (871.9 | ) | | (755.4 | ) | | (708.0 | ) | | (609.6 | ) | | (507.6 | ) |
Depreciation, amortization and impairment charges | | | (474.9 | ) | | (516.4 | ) | | (406.3 | ) | | (226.3 | ) | | (228.7 | ) |
Other operating expenses | | | (976.9 | ) | | (1,201.5 | ) | | (907.6 | ) | | (917.3 | ) | | (661.4 | ) |
| | | | | | | | | | | | | | | | | |
Operating profit | | | 933.2 | | | 751.0 | | | 520.6 | | | 935.6 | | | 480.4 | |
| | | | | | | | | | | | | | | | | |
| | | | | | | | | | | | | | | | | |
| | | | | | | | | | | | | | | | | |
Finance income | | | 62.1 | | | 67.0 | | | 87,5 | | | 105.3 | | | 79.4 | |
Finance expense | | | (745.4 | ) | | (583.2 | ) | | (532.2 | ) | | (569.7 | ) | | (366.8 | ) |
Net exchange differences | | | 5.0 | | | (3.5 | ) | | (36.1 | ) | | (28.3 | ) | | (20.3 | ) |
Other financial income/(expense) net | | | (176.5 | ) | | (119.2 | ) | | (157.9 | ) | | (170.1 | ) | | (18.1 | ) |
| | | | | | | | | | | | | | | | | |
Finance expense, net | | | (854.8 | ) | | (638.9 | ) | | (638.7 | ) | | (662.9 | ) | | (325.8 | ) |
| | | | | | | | | | | | | | | | | |
| | | | | | | | | | | | | | | | | |
| | | | | | | | | | | | | | | | | |
Share of (loss)/profit of associates | | | 7.0 | | | (5.2 | ) | | 17.9 | | | 4.0 | | | 8.5 | |
| | | | | | | | | | | | | | | | | |
Profit (loss) before income tax | | | 85.4 | | | 106.9 | | | (100.2 | ) | | 276.7 | | | 163.1 | |
| | | | | | | | | | | | | | | | | |
| | | | | | | | | | | | | | | | | |
| | | | | | | | | | | | | | | | | |
Income tax benefit/(expense) | | | 58.7 | | | 26.2 | | | 174.1 | | | (2.2 | ) | | 18.0 | |
| | | | | | | | | | | | | | | | | |
Profit for the year from continued operations | | | 144.1 | | | 133.1 | | | 73.8 | | | 274.5 | | | 181.0 | |
| | | | | | | | | | | | | | | | | |
| | | | | | | | | | | | | | | | | |
| | | | | | | | | | | | | | | | | |
Profit (loss) for the year from discontinued operations, net of tax | | | (22.2 | ) | | (22.7 | ) | | 20.2 | | | 121.0 | | | 82.3 | |
| | | | | | | | | | | | | | | | | |
Profit for the year | | | 121.9 | | | 110.3 | | | 94.0 | | | 395.5 | | | 263.3 | |
| | | | | | | | | | | | | | | | | |
| | | | | | | | | | | | | | | | | |
| | | | | | | | | | | | | | | | | |
Profit attributable to non-controlling interest from continued operations | | | 3.6 | | | (7.7 | ) | | (38.2 | ) | | (18.6 | ) | | (53.5 | ) |
Profit attributable to non-controlling interest from discontinued operations | | | (0.2 | ) | | (1.2 | ) | | (0.4 | ) | | (2.8 | ) | | (2.7 | ) |
| | | | | | | | | | | | | | | | | |
Profit for the year attributable to the parent company | | | 125.3 | | | 101.4 | | | 55.4 | | | 374.1 | | | 207.2 | |
Weighted average number of ordinary shares outstanding (thousands)(5) | | | 835,371 | | | 595,905 | | | 538,063 | | | 466,634 | | | 452,348 | |
Basic earnings per Share from continued operations (€ per share) | | | 0.18 | | | 0.21 | | | 0.06 | | | 0.55 | | | 0.28 | |
Basic earnings per Share from discontinued operations (€ per share) | | | (0.03 | ) | | (0.04 | ) | | 0.04 | | | 0.25 | | | 0.18 | |
Basic earnings per share attributable to the parent company (€ per share) | | | 0.15 | | | 0.17 | | | 0.1 | | | 0.8 | | | 0.46 | |
Weighted average number of ordinary shares outstanding (thousands)(5) | | | 835,371 | | | 595,905 | | | 538,063 | | | 466,634 | | | 452,348 | |
Warrants adjustments (average weighted number of shares outstanding since issue)(5) | | | 20.039 | | | 19.995 | | | 20,021 | | | 3,340 | | | — | |
Diluted earnings per Share from continued operations (€ per share) | | | 0.17 | | | 0.20 | | | 0.06 | | | 0.55 | | | n/a(* | ) |
Diluted earnings per Share from discontinued operations (€ per share) | | | (0.02 | ) | | (0.04 | ) | | 0.04 | | | 0.25 | | | n/a(* | ) |
Diluted earnings per share attributable to the parent company (€ per share) | | | 0.15 | | | 0.16 | | | 0.10 | | | 0.8 | | | n/a(* | ) |
Dividend paid per share (€ per share)(6) | | | 0.111 | | | 0.072 | | | 0.070 | | | 0.040 | | | n/a(* | ) |
- *
- Diluted earnings per share equals basic earnings per share for this period.
15
Table of Contents
| | | | | | | | | | | | | | | | |
| | As of December 31, | |
|---|
| | 2014(1) | | 2013 | | 2012(2) | | 2011 | | 2010 | |
|---|
| | (€ in millions)
| |
|---|
Consolidated Statement of Financial Position Data | | | | | | | | | | | | | | | | |
Non-current assets: | | | | | | | | | | | | | | | | |
Intangible assets | | | 1,568.4 | | | 842.1 | | | 1,556.7 | | | 1,290.5 | | | 1,793.5 | |
Property, plant and equipment | | | 1,287.3 | | | 1,273.6 | | | 1,431.6 | | | 1,502.9 | | | 1,640.3 | |
Fixed assets in projects | | | 6,188.4 | | | 9,914.3 | | | 7,786.0 | | | 7,782.5 | | | 5,744.8 | |
Investments in associates carried under the equity method | | | 311.3 | | | 835.7 | | | 920.1 | | | 51.3 | | | 48.6 | |
Financial investments | | | 686.5 | | | 761.2 | | | 479.8 | | | 405.3 | | | 437.8 | |
Deferred tax Assets | | | 1,503.6 | | | 1,281.1 | | | 1,148.3 | | | 939.7 | | | 885.7 | |
| | | | | | | | | | | | | | | | | |
Total non-current assets | | | 11,545.4 | | | 14,908.0 | | | 13,322.6 | | | 11,972.2 | | | 10,550.6 | |
| | | | | | | | | | | | | | | | | |
| | | | | | | | | | | | | | | | | |
| | | | | | | | | | | | | | | | | |
Current assets: | | | | | | | | | | | | | | | | |
Inventories | | | 294.8 | | | 331.0 | | | 426.8 | | | 384.9 | | | 385.0 | |
Clients and other receivables | | | 2,156.9 | | | 1,870.0 | | | 2,271.3 | | | 1,806.3 | | | 2,141.4 | |
Financial investments | | | 1,048.6 | | | 925.8 | | | 900.0 | | | 1,013.9 | | | 913.6 | |
Cash and cash equivalents | | | 1,810.8 | | | 2,951.7 | | | 2,413.2 | | | 3,738.1 | | | 2,983.2 | |
Assets held for sale (discontinued operations) | | | 8,390.1 | | | 166.4 | | | — | | | — | | | — | |
| | | | | | | | | | | | | | | | | |
Total current assets | | | 13,701.2 | | | 6,244.9 | | | 6,011.3 | | | 6,943.2 | | | 6,423.3 | |
| | | | | | | | | | | | | | | | | |
| | | | | | | | | | | | | | | | | |
| | | | | | | | | | | | | | | | | |
Total assets | | | 25,246.6 | | | 21,152.8 | | | 19,333.9 | | | 18,915.4 | | | 16,973.9 | |
| | | | | | | | | | | | | | | | | |
| | | | | | | | | | | | | | | | | |
| | | | | | | | | | | | | | | | | |
Total equity | | | 2,646.2 | | | 1,893.0 | | | 1,860.4 | | | 1,848.0 | | | 1,630.3 | |
Non-current liabilities: | | |
| | |
| | |
| | |
| | |
| |
Long-term project debt | | | 4,158.9 | | | 5,736.2 | | | 4,679.0 | | | 4,983.0 | | | 3,557.9 | |
Long-term corporate financing | | | 3,748.7 | | | 4,735.1 | | | 4,356.4 | | | 4,149.9 | | | 4,441.7 | |
Other liabilities | | | 851.5 | | | 1,348.1 | | | 1,067.4 | | | 1,028.2 | | | 952.2 | |
| | | | | | | | | | | | | | | | | |
Total non-current liabilities | | | 8,759.1 | | | 11,819.4 | | | 10,102.8 | | | 10,161.1 | | | 8,951.8 | |
| | | | | | | | | | | | | | | | | |
| | | | | | | | | | | | | | | | | |
| | | | | | | | | | | | | | | | | |
Current liabilities: | | | | | | | | | | | | | | | | |
Short-term project debt | | | 799.2 | | | 584.8 | | | 577.8 | | | 407.1 | | | 492.1 | |
Short-term corporate financing | | | 1,576.7 | | | 919.3 | | | 590.4 | | | 918.8 | | | 719.9 | |
Other liabilities | | | 5,984.9 | | | 5,815.0 | | | 6,202.6 | | | 5,580.5 | | | 5,179.7 | |
Liabilities held for sale (discontinued operations) | | | 5,480.5 | | | 121.3 | | | — | | | — | | | — | |
| | | | | | | | | | | | | | | | | |
Total current liabilities | | | 13,841.4 | | | 7,440.4 | | | 7,370.7 | | | 6,906.4 | | | 6,391.7 | |
| | | | | | | | | | | | | | | | | |
| | | | | | | | | | | | | | | | | |
| | | | | | | | | | | | | | | | | |
Total Liabilities | | | 22,600.4 | | | 19,259.8 | | | 17,473.6 | | | 17,067.5 | | | 15,343.5 | |
| | | | | | | | | | | | | | | | | |
| | | | | | | | | | | | | | | | | |
| | | | | | | | | | | | | | | | | |
16
Table of Contents
Consolidated Cash Flow Statements
| | | | | | | | | | | | | | | | |
| | Year ended December 31, | |
|---|
| | 2014(1) | | 2013(1)(3) | | 2012(1)(2)(3) | | 2011(1)(3)(4) | | 2010(1)(3)(4) | |
|---|
| | (€ in millions)
| |
|---|
Consolidated Cash Flow Statement Data | | | | | | | | | | | | | | | | |
Gross cash flows from operating activities | | | | | | | | | | | | | | | | |
Profit fot the period from continuing operations | | | 144.1 | | | 133.1 | | | 73.8 | | | 274.5 | | | 181.0 | |
Adjustments to reconcile consolidated after-tax profit to net cash generated by operating activities | | | 1,038.6 | | | 797.7 | | | 679.4 | | | 543.3 | | | 339.0 | |
Variations in working capital and other items | | | (1,164.1 | ) | | (218.3 | ) | | (165.9 | ) | | 563.2 | | | 298.9 | |
| | | | | | | | | | | | | | | | | |
Total net cash flow generated by (used in) operating activities | | | 18.6 | | | 712.5 | | | 587.3 | | | 1,381.0 | | | 818.9 | |
| | | | | | | | | | | | | | | | | |
| | | | | | | | | | | | | | | | | |
| | | | | | | | | | | | | | | | | |
Net cash flows from investment activities | | | | | | | | | | | | | | | | |
Investments | | | (2,634.1 | ) | | (1,877.1 | ) | | (2,216.1 | ) | | (1,979.3 | ) | | (1,640.7 | ) |
Disposals | | | 134.4 | | | 512.7 | | | 410.4 | | | 1,064.0 | | | 175.7 | |
| | | | | | | | | | | | | | | | | |
Total net cash flows used in investment activities | | | (2,499.7 | ) | | (1,364.4 | ) | | (1,805.7 | ) | | (915.3 | ) | | (1,465.0 | ) |
| | | | | | | | | | | | | | | | | |
| | | | | | | | | | | | | | | | | |
| | | | | | | | | | | | | | | | | |
Net cash flows generated by finance activities | | | 1,590.6 | | | 1,197.5 | | | 5.6 | | | 478.6 | | | 1,946.4 | |
| | | | | | | | | | | | | | | | | |
| | | | | | | | | | | | | | | | | |
| | | | | | | | | | | | | | | | | |
Net increase/(decrease) in cash and cash equivalents | | | (890.5 | ) | | 545.6 | | | (1,212.8 | ) | | 944.3 | | | 1,300.3 | |
Cash and cash equivalents at the beginning of the year | | | 2,951.7 | | | 2,413.2 | | | 3,723.2 | | | 2,983.2 | | | 1,546.4 | |
Discontinued operations/Assets held for sale | | | (281.7 | ) | | (112.1 | ) | | (31.3 | ) | | (193.0 | ) | | 89.0 | |
Currency translation difference on cash and cash equivalents | | | 31.3 | | | 105.0 | | | (66.0 | ) | | 3.6 | | | 47.5 | |
| | | | | | | | | | | | | | | | | |
Cash and cash equivalents at the end of the year | | | 1,810.8 | | | 2,951.7 | | | 2,413.2 | | | 3,738.1 | | | 2,983.2 | |
| | | | | | | | | | | | | | | | | |
| | | | | | | | | | | | | | | | | |
| | | | | | | | | | | | | | | | | |
Business and Geographic Activity Data
| | | | | | | | | | |
| | Year ended December 31, | |
|---|
| | 2014(1) | | 2013(1)(3) | | 2012(1)(2)(3) | |
|---|
| | (€ in millions)
| |
|---|
Consolidated Revenue by Activity | | | | | | | | | | |
Engineering and Construction | | | 4,514.5 | | | 4,831.7 | | | 3,789.2 | |
| | | | | | | | | | | |
Engineering and Construction | | | 4,514.5 | | | 4,831.7 | | | 3,789.2 | |
Concession-Type Infrastructure | | | 499.4 | | | 384.3 | | | 358.2 | |
| | | | | | | | | | | |
Solar | | | 335.2 | | | 258.7 | | | 259.8 | |
Transmission | | | 91.4 | | | 47.5 | | | 24.4 | |
Water | | | 40.8 | | | 40.2 | | | 20.7 | |
Co-generation and other | | | 32.0 | | | 38.0 | | | 53.2 | |
Industrial Production | | | 2,136.7 | | | 2,029.1 | | | 2,138.2 | |
| | | | | | | | | | | |
Biofuels | | | 2,136.7 | | | 2,029.7 | | | 2,138.2 | |
| | | | | | | | | | | |
Total revenue | | | 7,150.6 | | | 7,245.1 | | | 6,285.6 | |
| | | | | | | | | | | |
| | | | | | | | | | | |
| | | | | | | | | | | |
17
Table of Contents
| | | | | | | | | | |
| | Year ended December 31, | |
|---|
| | 2014(1) | | 2013(1)(3) | | 2012(1)(2)(3) | |
|---|
| | (€ in millions)
| |
|---|
Consolidated Revenue by Geography | | | | | | | | | | |
Spain | | | 889.1 | | | 1,129.3 | | | 925.0 | |
North America | | | 2,253.6 | | | 2,670.4 | | | 2,569.3 | |
Europe (excluding Spain) | | | 892.9 | | | 863.3 | | | 877.8 | |
Brazil | | | 874.7 | | | 726.0 | | | 986.6 | |
South America (excluding Brazil) | | | 1,301.8 | | | 689.6 | | | 522.3 | |
Other regions | | | 938.5 | | | 1,166.5 | | | 404.6 | |
| | | | | | | | | | | |
Total revenue | | | 7,150.6 | | | 7,245.1 | | | 6,285.6 | |
| | | | | | | | | | | |
| | | | | | | | | | | |
| | | | | | | | | | | |
Non-GAAP Financial Data
| | | | | | | | | | |
| | Year ended December 31, | |
|---|
| | 2014(1) | | 2013(1)(3) | | 2012(1)(2)(3) | |
|---|
| | (€ in millions)
| |
|---|
Consolidated EBITDA by Activity | | | | | | | | | | |
Engineering and Construction | | | 806.0 | | | 806.5 | | | 623.9 | |
| | | | | | | | | | | |
Engineering and Construction | | | 806.0 | | | 806.5 | | | 623.9 | |
Concession-Type Infrastructures | | | 330.6 | | | 220.0 | | | 211.9 | |
| | | | | | | | | | | |
Solar | | | 235.9 | | | 156.8 | | | 190.4 | |
Transmission | | | 64.3 | | | 27.7 | | | 6.9 | |
Water | | | 26.5 | | | 28.1 | | | 11.6 | |
Co-generation and other | | | 3.9 | | | 7.3 | | | 2.9 | |
Industrial Production | | | 271.4 | | | 240.9 | | | 91.1 | |
| | | | | | | | | | | |
Biofuels | | | 271.4 | | | 240.9 | | | 91.1 | |
| | | | | | | | | | | |
Consolidated EBITDA(7) | | | 1,408.0 | | | 1,267.4 | | | 926.9 | |
| | | | | | | | | | | |
| | | | | | | | | | | |
| | | | | | | | | | | |
The following table sets forth a reconciliation of Consolidated EBITDA to our consolidated profit for the year:
| | | | | | | | | | |
| | Year ended December 31, | |
|---|
| | 2014(1) | | 2013(1)(3) | | 2012(1)(2)(3) | |
|---|
| | (€ in millions)
| |
|---|
Reconciliation of profit for the year to Consolidated EBITDA | | | | | | | | | | |
Profit for the year | | | 121.9 | | | 110.3 | | | 94.0 | |
Profit (loss) for the year from discontinued operations, net of tax | | | 22.2 | | | 22.7 | | | (20.2 | ) |
Income tax expenses/(benefits) | | | (58.7 | ) | | (26.2 | ) | | (174.1 | ) |
Share of loss/(profit) of associated companies | | | (7.0 | ) | | 5.2 | | | (17.9 | ) |
Net finance expenses | | | 854.8 | | | 638.9 | | | 638.7 | |
| | | | | | | | | | | |
Operating profit | | | 933.2 | | | 751.0 | | | 520.6 | |
| | | | | | | | | | | |
| | | | | | | | | | | |
| | | | | | | | | | | |
Depreciation, amortization and impairment changes | | | 474.9 | | | 516.4 | | | 406.3 | |
| | | | | | | | | | | |
Consolidated EBITDA(7) | | | 1,408.0 | | | 1,267.4 | | | 926.9 | |
| | | | | | | | | | | |
| | | | | | | | | | | |
| | | | | | | | | | | |
18
Table of Contents
The following table sets forth a reconciliation of Consolidated EBITDA to our Net cash generated by operating activities:
| | | | | | | | | | |
| | Year ended December 31, | |
|---|
| | 2014(1) | | 2013(1)(3) | | 2012(1)(2)(3) | |
|---|
| | (€ in millions)
| |
|---|
Reconciliation of Consolidated EBITDA to Net cash generated or used from operating activities | | | | | | | | | | |
Consolidated EBITDA | | | 1,408.0 | | | 1,267.4 | | | 926.9 | |
(Profit)/loss from sale of subsidiaries and property, plant and equipment | | | | | | | | | | |
Other cash finance costs and other | | | (225.3 | ) | | (336.5 | ) | | (173.7 | ) |
Variations in working capital | | | (523.6 | ) | | 221.2 | | | 149.5 | |
Income tax (paid) | | | 8.6 | | | (12.1 | ) | | (35.5 | ) |
Interests (paid)/received | | | (772.3 | ) | | (508.9 | ) | | (397.0 | ) |
Discontinued operations | | | 123.2 | | | 81.5 | | | 117.0 | |
| | | | | | | | | | | |
Net cash generated or used from operating activities | | | 18.6 | | | 712.5 | | | 587.3 | |
| | | | | | | | | | | |
| | | | | | | | | | | |
| | | | | | | | | | | |
- (1)
- On December 15, 2014, our Board of Directors approved a plan to further improve our financial structure through three main initiatives which contemplated the sale of certain companies, including Abengoa Yield. Given that as of December 31, 2014, those certain companies were available for immediate sale and we considered the sale to be highly probable, we have classified their associated assets and liabilities as held for sale in our annual consolidated financial statements as of December 31, 2014, prepared in accordance with IFRS as issued by the IASB, which are included elsewhere in this annual report. Until the closing of the sale of those certain companies, the assets will be reported as held for sale in accordance with the stipulations and requirements of IFRS 5,Non-Current Assets Held For Sale and Discontinued Operations. Furthermore, during June 2014, we completed the initial public offering of Abengoa Yield, which grouped assets previously reported in different operating segments within the Concession-Type Infrastructure activity. As such, Abengoa Yield became a new operating segment within the Concession-Type Infrastructure activity after the Abengoa Yield IPO. Consequently, it has been reported as a separate segment in our quarterly financial information for the quarters ended June 30, 2014 and September 30, 2014. Taking into account that Abengoa Yield was an operating segment within our Concession-Type Infrastructure activity during part of 2014 and the significance that those activities carried out by Abengoa Yield have for Abengoa, our shareholding in Abengoa Yield during 2014 was treated as a discontinued operation in accordance with the stipulations and requirements of IFRS 5,Non-Current Assets Held for Sale and Discontinued Operations. The treatment of Abengoa Yield as discontinued operations also resulted in the removal of the Abengoa Yield operating segment from our Concession-Type Infrastructure activity. In accordance with this standard, the assets and liabilities of Abengoa Yield have been reclassified as assets and liabilities held for sale in our consolidated statement of financial position included within our consolidated financial statements as of and for the year ended December 31, 2014. Likewise, our consolidated income statements for the years ended December 31, 2014 and 2013 also include the results of Abengoa Yield under a single heading, "Profit (loss) from discontinued operations, net of tax".
- (2)
- In the consolidated financial statements of Abengoa and its subsidiaries as of December 31, 2013, prepared in accordance with IFRS as issued by the IASB, the Group applied IFRS 10 and 11 that came into effect on January 1, 2013 under IFRS-IASB. According to the terms and requirements established in IAS 8 "Accounting Policies, Changes in Accounting Estimates and Errors" and to the specific transition guidance of the new standards, we recasted the financial information as of and for the year ended December 31, 2012 and the recasted financial information is included herein. Financial information for prior periods was not recasted therein or herein for IFRS 10 and 11 according to the transition guidance and consequently is not comparable with other periods presented. See "Presentation of Financial Information".
- (3)
- On July 15, 2013, we closed the sale of 100% of our shares in our subsidiary Befesa. On that date, we received €331 million of cash proceeds. Taking into account the significance of the activities carried out by Befesa to Abengoa, the sale of this shareholding is considered as a discontinued operation to in accordance with IFRS 5,Non-Current Assets Held for Sale and Discontinued Operations. In accordance with this standard, the results of Befesa until the closing of the sale and the result of this sale are included under a single heading, "Profit (loss) for the year from discontinued operations, net of tax" in our Consolidated Financial Statements and under separate line items in the consolidated cash-flow statement for the year ended December 31, 2013. The consolidated income statement for the years ended December 31, 2012, 2011 and 2010 also includes the results of Befesa under a single heading. See "Presentation of Financial Information". The Befesa Sale also resulted in the removal of the Industrial Recycling segment from our Industrial Production activity.
- (4)
- As of December 31, 2010 and during part of the year 2011, we held a 40% shareholding in Telvent GIT, S.A. ("Telvent"). Despite partially reducing our share ownership in Telvent during 2009, we remained the largest shareholder and our 40% shareholding,
19
Table of Contents
along with our control of certain treasury shares held by Telvent, permitted us to exercise de facto control over Telvent. Therefore Telvent's financial information was fully consolidated with our consolidated financial statements for the year ended December 31, 2010 and the period of 2011 in which we held control over Telvent. On June 1, 2011, we announced the sale of our investment in Telvent to Schneider Electric S.A. ("SE") and on September 5, 2011 the transaction was completed. As a result and taking into account the significance of Telvent to us, Telvent was treated as discontinued operations in accordance with IFRS 5,Non-Current Assets Held for Sale and Discontinued Operations. The results obtained from this sale are included under a single heading in the consolidated income statement and under separate line items in the consolidated cash flow statement for the year 2011 and the consolidated income statement for 2010 has been recasted to present Telvent as discontinued operations.
- (5)
- Number of shares considered in all periods is after the increase in Class B shares distributed for no consideration approved by the Extraordinary General Shareholders' Meeting on September 30, 2012 and considered effective on October 2, 2012, equivalent to a split of shares, as described in Note 18 to our Consolidated Financial Statements.
- (6)
- Dividends paid per share have been calculated considering the post-split number of shares, restating prior periods in order to be consistent with the earnings per share calculation. Dividends paid in 2014, 2013, 2012 (in April, July and April, respectively) were €0.111 per share in the aggregate (US$0.153), €0.072 per share in the aggregate (US$0.094) and €0.070 per share in the aggregate (US$0.088), respectively.
- (7)
- Consolidated EBITDA is calculated as profit for the year, after adding back income tax expense/(benefit), share of (loss)/profit of associates, finance expense net and depreciation, amortization and impairment charges of Abengoa, S.A. Consolidated EBITDA is not a measurement of performance under IFRS as issued by the IASB and you should not consider Consolidated EBITDA as an alternative to operating income or consolidated profits as a measure of our operating performance, cash flows from operating, investing and financing activities as a measure of our ability to meet our cash needs or any other measures of performance under generally accepted accounting principles. We believe that Consolidated EBITDA is a useful indicator of our ability to incur and service our indebtedness and can assist securities analysts, investors and other parties to evaluate us. Consolidated EBITDA and similar measures are used by different companies for different purposes and are often calculated in ways that reflect the circumstances of those companies. Consolidated EBITDA may not be indicative of our historical operating results, nor are meant to be predictive of potential future results. See "Presentation of Financial Information—Non-GAAP Financial Measures."
Exchange Rate Information
The following table sets forth, for the periods indicated, the Noon Buying Rate certified by the Federal Reserve Bank of New York expressed in U.S. Dollar per €1.00. The Noon Buying Rate refers to the exchange for euro, expressed in U.S. Dollars per euro, in the City of New York for cable transfers payable in foreign currencies as certified by the Federal Reserve Bank of New York for customs purposes. The rates may differ from the actual rates used in the preparation of the Consolidated Financial Statements and other financial information appearing in this annual report. We do not represent that the U.S. Dollar amounts referred to below could be or could have been converted into euro at any particular rate indicated or any other rate.
The average rate of the Noon Buying Rate means the average rates for the euro on the last day reported of each month during the relevant period.
20
Table of Contents
The Federal Reserve Bank of New York Noon Buying Rate of the euro on February 13, 2015 was $1.1408 per €1.00.
| | | | | | | | | | | | | |
| | U.S. Dollar per €1.00 | |
|---|
| | High | | Low | | Average | | Period End | |
|---|
Year | | | | | | | | | | | | | |
2010 | | | 1.4536 | | | 1.1959 | | | 1.3218 | | | 1.3269 | |
2011 | | | 1.4875 | | | 1.2926 | | | 1.4002 | | | 1.2973 | |
2012 | | | 1.3463 | | | 1.2062 | | | 1.2909 | | | 1.3186 | |
2013 | | | 1.3816 | | | 1.2774 | | | 1.3303 | | | 1.3779 | |
2014 | | | 1.3927 | | | 1.2101 | | | 1.3297 | | | 1.2101 | |
Month | | | | | | | | | | | | | |
August 2014 | | | 1.3436 | | | 1.3150 | | | 1.3315 | | | 1.3150 | |
September 2014 | | | 1.3126 | | | 1.2628 | | | 1.2889 | | | 1.2628 | |
October 2014 | | | 1.2812 | | | 1.2517 | | | 1.2677 | | | 1.2530 | |
November 2014 | | | 1.2554 | | | 1.2394 | | | 1.2472 | | | 1.2438 | |
December 2014 | | | 1.2504 | | | 1.2101 | | | 1.2329 | | | 1.2101 | |
January 2015 | | | 1.2015 | | | 1.1279 | | | 1.1615 | | | 1.1290 | |
February 2015 (through February 13, 2015 | | | 1.1462 | | | 1.1300 | | | 1.1373 | | | 1.1408 | |
B. Capitalization and Indebtedness
Not applicable.
C. Reasons for the Offer and Use of Proceeds
Not applicable.
D. Risk Factors
An investment in our securities involves significant risks. You should carefully consider the risks described below, together with all of the other information contained in this annual report, including our Consolidated Financial Statements and related notes included elsewhere in this annual report, before you decide to purchase our securities. The risks described below may not be the only risks we face. We have only described those risks that we currently consider to be material and there may be additional risks that we do not currently consider to be material or of which we are not currently aware. If any of these risks actually occurs, our business, prospects, financial condition or results of operations could be materially and adversely affected, the trading price and value of our securities could decline and you could lose all or part of your investment.
Risks Related to Our Business and the Markets in Which We Operate
We may not be successful in consummating a transaction with EIG on the terms publicly disclosed or otherwise on the terms that are acceptable to us or at all, which would slow our progress toward implementing our plan to migrate to an asset-light business model
On December 23, 2014, we entered into a letter agreement to negotiate exclusively EIG until March 31, 2015 an investment by EIG-managed investment funds, alongside Abengoa, in a portfolio of greenfield projects currently owned by Abengoa, on the basis of the terms set forth in the term sheet attached to the letter agreement. On February 2, 2015, EIG confirmed to us in writing that its due diligence to date had not revealed facts or circumstances that would cause EIG not to recommend the proposed transaction for approval by the EIG investment committees overseeing investments by EIG-managed investment funds. On
21
Table of Contents
February 9, 2015, we announced that we and EIG were in an advanced stage of documentation and due diligence regarding the proposed transaction.
As part of the transaction, Abengoa is expected to contribute to a newly formed company, Abengoa Projects Warehouse 1 ("APW1"), a portfolio of selected Abengoa projects under construction, including renewable and conventional power generation, power transmission and water management assets in different geographies including, among others, the United States, Mexico, Brazil and Chile. Based on the current status of the negotiations, the total investment in the projects expected to be contributed is approximately $9.2 billion once these projects are fully invested in the coming years, of which approximately $2.5 billion is expected to be equity. Of the total equity estimated to be committed, based on the current status of the negotiations, we expect that a majority stake (approximately 55%) in APW1 will be held by EIG, with the remainder held by Abengoa. Our current estimate of the total amount of EIG's investment, based on the current status of the negotiations, is approximately $1.4 billion over four years based on the projects expected to be contributed.
Once APW1 is created and the initial projects contributed to the vehicle, EIG will make an initial payment to us of less than half of their total expected $1.4 billion contribution to purchase 55% of the equity that Abengoa has already invested in the projects that have been contributed to APW1. Abengoa is expecting to receive these cash proceeds before March 31, 2015. The remaining projects are expected to be contributed by us to APW1 over time. The remaining equity expected to be required in order to develop the entire portfolio of projects is expected to be contributed over a period of four years both by Abengoa and EIG pro-rata to their shareholding in APW1 following the construction schedule of the projects in the vehicle as they are contributed to the vehicle, which is expected to take several months.
Consummation of the transaction with EIG is subject to a number of customary conditions precedent, including, among others:
- •
- completion of ongoing negotiation and execution of mutually satisfactory definitive transaction agreements as reflected in the December 23, 2014 term sheet;
- •
- absence of any material adverse change affecting the business, operations, properties, assets, liabilities or condition (financial or otherwise) of any material participant involved in the transaction or any of the projects to be contributed by Abengoa;
- •
- absence of any material adverse change in any country, financial market, commodities market, regulatory environment or other market material to the financing or operation of the projects to be contributed by Abengoa to APW1;
- •
- receipt of all necessary governmental consents and permits;
- •
- EIG's completion of the final stages of its due diligence investigation;
- •
- feasibility of financial closing for the projects to be contributed by Abengoa; and
- •
- final approval by EIG's Investment Committee.
Assuming that we are successful in consummating the transaction with EIG, our ability to realize the strategic and financial benefits outlined in our February 9, 2015 market update will depend on a number of factors, including:
- •
- achievement by EIG of its target returns on its investment in APW1 and the projects initially acquired by APW1 from us;
- •
- availability of long-term project financing to refinance short-term bridge loans incurred during development of the projects and finance construction of the projects;
- •
- Abengoa entering into power purchase agreements and other offtake agreements on terms that enable APW1 to meet EIG's minimum return criteria;
22
Table of Contents
- •
- Abengoa Yield's ability to raise financing to purchase any assets to be acquired from APW1 pursuant to the ROFO agreement to be entered into between APW1 and Abengoa Yield; and
- •
- once the projects initially contributed by Abengoa to APW1 have been sold, the availability of new projects in development that meet EIG's investment criteria for recycling equity.
The expectations set forth herein regarding a potential transaction with EIG, the projects to be contributed and related investment amounts are based on the current status of negotiations with EIG and are subject to change as negotiation of definitive transaction agreements progresses, and any such change may be material.
We cannot guarantee that we will be successful in consummating a transaction with EIG on the terms publicly disclosed or otherwise on the terms that are acceptable to us or at all, or that we will receive the cash proceeds from EIG's initial investment in APW1 before March 31, 2015. Nor can we guarantee that we will realize the strategic and financial benefits from the EIG transaction outlined in our February 9, 2015 market update. Our inability to successfully consummate such transaction or to realize such benefits would slow our progress toward implementing our plan to migrate to an asset-light business model, and would have a material adverse impact on our business, financial condition and results of operations.
We may not be able to reduce our shareholding in Abengoa Yield to below 50% by the end of the first half of 2015
On December 15, 2014, our Board of Directors approved a plan to reduce our shareholding in Abengoa Yield to below 50% during 2015, subject to market conditions. On January 22, 2015, we completed an initial divestment of 13% through the sale in an underwritten public offering of 10,580,000 ordinary shares in Abengoa Yield (including 1,380,000 shares sold pursuant to the exercise in full of the underwriters' option to purchase additional shares) at a price of US$31 per share which brought our shareholding in Abengoa Yield to 51%. On February 9, 2015, we announced our intention to reduce our shareholding in Abengoa Yield to below 50% by the end of the first half of 2015, with the objective of maintaining a long-term stake in the range of 40-49%. We have also indicated our intention to reinforce the role of independent directors at Abengoa Yield in order to effectively transfer control once we reduce our shareholding in Abengoa Yield below 50%. In the Consolidated Financial Statements appearing elsewhere in this annual report, Abengoa Yield is considered as a discontinued operation in accordance with the stipulations and requirements of IFRS 5,Non-Current Assets Held for Sale and Discontinued Operations.
Our ability to carry out our plan to reduce our shareholding in Abengoa Yield to below 50% by the end of the first half of 2015 is subject to a number of risks and uncertainties:
- •
- The lenders under those of our credit facilities that require lender consent to the disposition of assets may not provide their consent to the reduction of our shareholding in Abengoa Yield below 50% timely or on terms that are acceptable to us;
- •
- A reduction in our shareholding in Abengoa Yield below 50% may trigger a requirement for Abengoa Yield to seek waivers, authorizations or approvals from agencies, governments, financing providers, concession contract counterparties or other relevant contract counterparties that may not provide their consent to the reduction in a timely manner or on terms that are acceptable to Abengoa Yield or at all; and
- •
- If conditions in the equity capital markets generally are not favorable, we may not be able to sell at prices that are attractive an amount of our ordinary shares in Abengoa Yield sufficient to reduce our shareholding to below 50% by the end of the first half of 2015.
We are currently seeking to obtain the necessary consents that will allow us to reduce our shareholding without triggering adverse consequences under the current financing agreements. We cannot guarantee that we will be successful in reducing our shareholding in Abengoa Yield to below 50% by the end of the first
23
Table of Contents
half of 2015 or at prices that are favourable to us. Our inability to carry out our plan to reduce our shareholding in Abengoa Yield to below 50% during 2015 may require us to reclassify Abengoa Yield from discontinued operation to continuing operations, which may have a material adverse impact on our business, financial position and results of operations.
Difficult conditions in the global economy and in the global capital markets have caused, and may continue to cause, a sharp reduction in worldwide demand for our products and services, and negatively impact our access to the levels of financing necessary for the successful development of our existing and future projects and the successful refinancing of our corporate indebtedness
Our results of operations have been, and continue to be, materially affected by conditions in the global economy and in the global capital markets. Concerns over inflation, energy costs, geopolitical issues, the availability and cost of credit, sovereign debt and the instability of the euro have contributed to increased volatility and diminished expectations for the economy and global capital markets going forward. These factors, combined with volatile oil prices, declining global business and consumer confidence and rising unemployment, have precipitated an economic slowdown and have led to a recession and weak economic growth in many of the markets in which we operate. The economic instability and uncertainty may affect the willingness of companies to make capital expenditures and investment in the markets in which we operate. These events and continuing disruptions in the global economy and in the global capital markets may, therefore, have a material adverse effect on our business, financial condition and results of operations. Moreover, even in the absence of a market downturn, we are exposed to substantial risk of loss due to market volatility with certain factors, including consumer spending, business investment, government spending, the volatility and strength of capital markets, inflation affecting the business and economic environment and, ultimately, the volume and profitability of our business.
Generalized or localized downturns or inflationary pressures in our key geographical areas could also have a material adverse effect on the performance of our business. A significant portion of our business activity is concentrated in Spain, Brazil and the United States, and we are significantly affected by the general economic conditions in these countries. Spain experienced negative economic conditions in the last years, including high unemployment and significant government debt which we believe could adversely affect our operations in the near future. General elections are expected in Spain by the end of 2015 that could bring changes similar to those that may result from the Greek elections in January 2015, which could in turn raise concerns over the economic outlook in Spain.
We are a Spanish company and our share capital is denominated in euro. The effects on the European and global economy of any exit of one or more member states (each a "Member State") from the Eurozone, such as Greece, the dissolution of the euro and the possible redenomination of our share capital, financial instruments or other contractual obligations from euro into a different currency, or the perception that any of these events are imminent, are inherently difficult to predict and could give rise to operational disruptions or other risks of contagion to our business and have a material, adverse effect on our business, financial condition and results of operation. In addition, to the extent uncertainty regarding the European economic recovery continues to negatively impact government or regional budgets or demand for our environmental services, our business and results of operations could be materially adversely affected. Various European left-wing parties that question the EU's recent austerity policies are becoming more prominent, adding some political instability to the Eurozone. Moreover, many of our customers are continually seeking to implement measures aimed at greater cost savings. These and other factors could therefore result in our customers reducing their budgets for spending on our products and services.
The global capital and credit markets have experienced periods of extreme volatility and disruption since the last half of 2008. Continued disruptions, uncertainty or volatility in the global capital and credit markets may limit our access to additional capital required to operate or grow our business, including our access to Project Debt which we use to fund many of our projects, even in cases where such capital has already been committed. Such market conditions may limit our ability to replace, in a timely manner or at all, maturing
24
Table of Contents
liabilities and access the capital necessary to grow our business, or replace financing previously committed for a project that ceases to be available to it. As a result, we may be forced to delay raising capital, issue shorter-term securities than we prefer, or bear a higher cost of capital which could decrease our profitability and significantly reduce our financial flexibility. In the event that we are required to replace previously committed financing to certain projects that subsequently becomes unavailable, we may have to postpone or cancel planned capital expenditures or construction projects.
Decreases in government budgets, reductions in government subsidies and adverse changes in law may adversely affect our business and the development of existing and new projects
Economic instability and difficult economic conditions in Spain have resulted in a decline in tax revenue obtained by our public administration customers at a time of rising public sector deficits. For example, reductions in government infrastructure budgets have had a significant impact on our results of operations as a substantial percentage of our revenue is derived from services we provide as a contractor or subcontractor on various projects with governmental entities, including state-owned companies.
Poor economic conditions have affected, and continue to affect, government budgets and threaten the continuation of government subsidies such as regulated revenues, cash grants, U.S. federal income tax benefits and other similar subsidies that benefit our business, particularly with respect to renewable energy. Such conditions may also lead to adverse changes in laws. For example, in the United States, due to the failure of the U.S. Congress to enact a plan by February 28, 2013 to reduce the federal budget deficit by $1.2 trillion, $85 billion of automatic budget cuts (known as "sequestration") went into effect on March 1, 2013 reducing discretionary spending by all agencies of the federal government for the remainder of the federal fiscal year ending September 30, 2013. These cuts affected, among others, the U.S. Department of the Treasury's, or the U.S. Treasury, program providing for cash grants in lieu of investment tax credits ("ITCs"). The Bipartisan Budget Act of 2013 was approved in December 2013. This budget agreement replaces $63 billion in sequester cuts over two years split evenly between defense and non-defense programs. Both defense and non-defense programs received approximately $22.4 billion more in the government fiscal year ending September 30, 2014 than would otherwise have been allocated under the sequestration scenario. While this budget agreement provides some near-term relief, sequestration, reduction in government spending in lieu of sequestration and fiscal issues raised by negotiations over the federal debt ceiling remain a long-term concern. See "Item 4.B—Regulation—United States Regulations—Solar Regulation—Renewal Energy Tax Incentives in the United States—Section 1603 Treasury Grant Program."
On December 16, 2014, President Obama signed into law the Consolidated and Further Continuing Appropriations Act of 2015 making appropriations for all federal departments and agencies, except for the Department of Homeland Security, through the end of the U.S. government fiscal year 2015 which runs through September 30, 2015. As such, federal discretionary spending levels and priorities are set through the end of fiscal year 2015. Nonetheless, there are several decision-making points during the remainder of the 2015 fiscal year in which tensions between President Obama and the new majority Republican Congress could jeopardize current year funding. For example, on March 15, 2016, the current agreement to allow the federal debt ceiling to rise to meet federal obligations will expire, and without a new agreement the federal government could face default. Furthermore, at the end of May 2015, funding for federal infrastructure programs through the highway trust fund will run out, causing a precipitous drop in construction projects nationwide absent an agreement on a reauthorization of these programs between Republican Congressional Leaders and the President. In addition, a number of states and municipal authorities are experiencing severe fiscal pressures as they seek to address mounting budget deficits. The reduction or elimination of such subsidies or adverse changes in law could have a material adverse effect on the profitability of our existing projects and the lack of availability of new projects undertaken in reliance on the continuation of such subsidies could adversely affect our growth plan.
25
Table of Contents
The revenue from the wind, solar and biofuel projects that we undertake in our Concession-Type Infrastructure and Industrial Production activities, respectively, may be adversely affected if there is a decline in public acceptance and support of renewable energy
Certain persons, associations and groups of people could oppose renewable energy projects, citing, for example, misuse of water resources, landscape degradation, land use, food scarcity or price increase and harm to the environment. Moreover, regulation may restrict the development of renewable energy plants in certain areas. In order to develop a renewable energy project, a wind farm, a solar power plant, or other infrastructure project, we are typically required to obtain, among other things, environmental impact permits or other authorizations and building permits, which in turn require environmental impact studies to be undertaken and public hearings and comment periods to be held during which any person, association or group may oppose a project. Any such opposition may be taken into account by government officials responsible for granting the relevant permits, which could result in the permits being delayed or not being granted or being granted solely on the condition that we carry out certain corrective measures to the proposed project.
As a result, we cannot guarantee that all of the renewable energy plants or infrastructure that we currently plan to develop or, to the extent applicable, are developing will ultimately be authorized or accepted by the local authorities or the local population. For example, the local population could oppose the construction of a renewable energy plant or infrastructure at the local government level, which could in turn lead to the imposition of more restrictive requirements.
In certain jurisdictions, if a significant portion of the local population were to mobilize against the construction of a renewable energy plant or infrastructure, it may become difficult, or impossible, for us to obtain or retain the required building permits and authorizations. Moreover, such challenges could result in the cancellation of existing building permits or even, in extreme cases, the dismantling of, or the retroactive imposition of changes in the design of, existing renewable energy plants or infrastructure.
A decrease in acceptance of renewable energy plants or infrastructure by local populations, an increase in the number of legal challenges, or an unfavorable outcome of such legal challenges could have a material adverse effect on our business, financial condition and results of operations.
We rely on certain regulations, subsidies and tax incentives that may be changed or legally challenged
We rely in a significant part on environmental and other regulation of industrial and local government activities, including regulations mandating, among other things, reductions in carbon or other greenhouse gas emissions and minimum biofuel content in fuel or use of energy from renewable sources. If the businesses to which such regulations relate were deregulated or if such regulations were materially changed or weakened, the profitability of our current and future projects could suffer, which could in turn have a material adverse effect on our business, financial condition and results of operations. In addition, uncertainty regarding possible changes to any such regulations has adversely affected in the past, and may adversely affect in the future, our ability to finance or refinance a project or to satisfy other financing needs.
Subsidy regimes for renewable energy generation have been challenged in the past on constitutional and other grounds (including that such regimes constitute impermissible European Union state aid) in certain jurisdictions. In addition, certain loan guarantee programs in the United States, including those which have enabled the U.S. Department of Energy (the "DOE") to provide loan guarantees to support our Solana, Mojave and Hugoton projects, have been challenged on grounds of failure by the appropriate authorities to comply with applicable U.S. federal administrative and energy law. If all or part of the subsidy and incentive regimes for renewable energy generation in any jurisdiction in which we operate were found to be unlawful and, therefore, reduced or discontinued, we may be unable to compete effectively with conventional and other renewable forms of energy or we may be unable to complete certain ongoing projects. For more
26
Table of Contents
information regarding recent adverse regulatory developments in Spain, see "Item 4.B—Regulation—Spain—Solar Regulatory Framework—Royal Decree Law 9/2013."
The production from our renewable energy facilities is the subject of various tax relief measures or tax incentives in the jurisdictions in which they operate. These tax relief and tax incentive measures play an important role in the profitability of our projects. In the future, it is possible that some or all of these tax incentives will be suspended, curtailed, not renewed or revoked. For example, our Mojave project is reliant on the ITC cash grant program to repay a significant portion of its external debt financing and the failure to receive anticipated funds, or any funds at all, pursuant to the ITC cash grant would have an adverse effect on our ability to receive distributions from our Mojave project. The occurrence of any of the above could adversely affect the profitability of our current plants and our ability to refinance projects, which could in turn have a material adverse effect on our business, financial condition, results of operations and cash flows.
We are subject to extensive governmental regulation in a number of different jurisdictions, and our inability to comply with existing regulations or requirements or changes in applicable regulations or requirements may have a negative impact on our business, results of operations or financial condition
We are subject to extensive regulation of our business in the United States, Mexico, Spain, Peru, Brazil and in each of the other countries in which we operate. Such laws and regulations require licenses, permits and other approvals to be obtained in connection with the operations of our activities. This regulatory framework imposes significant actual, day-to-day compliance burdens, costs and risks on us. In particular, the power plants and transmission lines that we operate in our Concession-Type Infrastructure and Industrial Production activities are subject to strict international, national, state and local regulations relating to their development, construction and operation (including, among other things, land acquisition, leasing and use of land, and the corresponding building permits, landscape conservation, noise regulation, environmental protection and environmental permits and energy power transmission and distribution network congestion regulations). Non-compliance with such regulations could result in the revocation of permits, sanctions, fines or even criminal penalties. Compliance with regulatory requirements, which may in the future include increased exposure to capital markets regulations, may result in substantial costs to our operations that may not be recovered. In addition, we cannot predict the timing or form of any future regulatory or law enforcement initiatives. Changes in existing energy, environmental and administrative laws and regulations may materially and adversely affect our business, margins and investments. Our business may also be affected by additional taxes imposed on our activities, reduction of regulated tariffs and other cuts or measures. For example, in late 2012 and throughout 2013, the Spanish government established new taxes on electricity production, eliminated certain premiums previously payable on renewable power generation, reduced adjustments for changes in the consumer price index and took other measures, which materially adversely affected our thermo-solar electricity generation activity in Spain. See "Item 4.B—Regulation—Spain—Solar Regulatory Framework" for further information.
Further, similar changes in laws and regulations could increase the size and number of claims and damages asserted against us or subject us to enforcement actions, fines and even criminal penalties. In addition, changes in laws and regulations may, in certain cases, have retroactive effect and may cause our results of operations to be lower than expected. In particular, our activities in the energy sector are subject to regulations applicable to the economic regime of generation of electricity from renewable sources and to subsidies or public support for the production of biofuels from renewable energy sources, which vary by jurisdiction, and are subject to modifications that may be more restrictive or unfavorable to us.
Our business is subject to stringent environmental regulation
We are subject to significant environmental regulation, which, among other things, requires us to perform environmental impact studies on future projects or changes to projects, obtain regulatory licenses,
27
Table of Contents
permits and other approvals and comply with the requirements of such licenses, permits and other approvals. There can be no assurance that:
- •
- governmental authorities will approve these environmental impact studies;
- •
- public opposition will not result in delays, modifications to or cancellation of any proposed project or license; or
- •
- laws or regulations will not change or be interpreted in a manner that increases our costs of compliance or materially or adversely affects our operations or plants or our plans for the companies in which we have an investment or to which we provide our services.
We believe that we are currently in material compliance with all applicable regulations, including those governing the environment. While we employ robust policies with regard to environmental regulation compliance, there are occasions where regulations are breached. On occasion, we have been found not to be in compliance with certain environmental regulations, and have incurred fines and penalties associated with such violations which to date have not been material in amount. We can give no assurance, however, that we will continue to be in compliance or avoid material fines, penalties, sanctions and expenses associated with compliance issues in the future. Violation of such regulations may give rise to significant liability, including fines, damages, fees and expenses, and site closures. Generally, relevant governmental authorities are empowered to clean up and remediate releases of environmental damage and to charge the costs of such remediation and cleanup to the owners or occupiers of the property, the persons responsible for the release and environmental damage, the producer of the contaminant and other parties, or to direct the responsible parties to take such action. These governmental authorities may also impose a tax or other liens on the responsible parties to secure the parties' reimbursement obligations.
In Brazil, environmental liability applies to any individual or legal entity (whether public or private) that directly or indirectly causes, by action or omission, any damage to the environment. A sole fact may result in liability of three types (civil, administrative and criminal) independently or cumulatively. Brazilian courts may even pierce the corporate veil in circumstances where a company is found to evade an obligation to indemnify environmental damage. When the veil of the corporation is pierced, the shareholders, rather than Abengoa itself, may be personally liable to redress the damage.
Environmental regulation has changed rapidly in recent years, and it is possible that we will be subject to even more stringent environmental standards in the future. For example, our activities are likely to be covered by increasingly strict national and international standards relating to climate change and related costs, and may be subject to potential risks associated with climate change, which may have a material adverse effect on our business, financial condition or results of operations. We cannot predict the amounts of any increased capital expenditures or any increases in operating costs or other expenses that we may incur to comply with applicable environmental, or other regulatory, requirements, or whether these costs can be passed on to customers through product price increases.
New regulations related to "conflict minerals" may force us to incur additional expenses, may make our supply chain more complex and may result in damage to our reputation with customers
On August 22, 2012, under the Dodd-Frank Wall Street Reform and Consumer Protection Act of 2010, or the Dodd-Frank Act, the SEC adopted new requirements for listed companies that use certain minerals and metals, known as conflict minerals, in their products, whether or not these products are manufactured by third parties. The term "conflict minerals" encompasses tantalum, tin, tungsten (and their ores) and gold. These requirements, which became applicable in May 2014, require companies to conduct due diligence and disclose whether or not such minerals originate from the Democratic Republic of Congo and adjoining countries. We have assessed whether conflict minerals are necessary to the functionality or production of any of our products or services. We could incur additional costs to comply with the disclosure requirements compared to previous periods, including costs related to determining the source of any of the relevant
28
Table of Contents
minerals and metals used in our products or services. So far, we have not detected conflict minerals and metals whose origin is the Democratic Republic of Congo or adjoining countries in the production of any of our products or services. Since our supply chain is complex, we may not be able to sufficiently verify the origins for these minerals and metals used in our products or services through the due diligence procedures that we have implemented, which may harm our reputation. In such event, we may also face difficulties in satisfying customers who could require that all of the components of our products are conflict mineral-free.
We face pressure to improve the competitiveness of our renewable energy services and products
To ensure our long-term future, we must be able to compete on a non-subsidized basis with conventional and other renewable energy sources. The current levels of government support for renewable energy are generally intended to grant the industry a "grace period" to reduce the cost per kilowatt-hour of electricity or per gasoline gallon equivalent generated through technological advances, cost reductions and process improvements. Consequently, and as generation or production costs decrease, this level of government support is likely to be gradually phased out for many critical projects in the future, although existing and commissioned projects are expected to continue to benefit from feed-in tariffs or similar government incentives as already set. In the medium-to long-term, a gradual but significant reduction of the tariffs, premiums and incentives for renewable energy is likely. If these reductions continue and/or increase, market participants, including ourselves, may need to reduce prices to remain competitive against other alternatives. If cost reductions and product innovations do not occur, or occur at a slower pace than is required to achieve the necessary price reductions, this could have a material adverse effect on our business, financial condition and results of operations.
We also face significant competition from other renewable energy providers. With regard to the solar industry, we believe it may see significantly increased competition, as a result of new market entrants and/or substitute renewable energy sources due to increased demand for renewable energy sources. Other contributing factors to this increased competition are lower barriers to entry in these markets due to the increased standardization of technologies, improved funding opportunities and increased governmental support. Although we endeavor to maintain our competitiveness, no assurance can be given that we will succeed. Our failure to compete successfully would negatively impact our ability to grow our business and generate revenue, which could have a material adverse effect on our business, financial condition and results of operations.
Increases in the cost of energy and gas could significantly increase our operating costs
Some of our activities require significant consumption of energy and gas, and we are vulnerable to material fluctuations in their prices. Although our energy and gas purchase contracts generally include indexing mechanisms, we cannot guarantee that these mechanisms will cover all of the additional costs generated by an increase in energy and gas prices, particularly for long-term contracts, and some of the contracts entered into by us do not include any indexing provisions. Significant increases in the cost of energy or gas, or shortages of the supply of energy and/or gas, could have a material adverse effect on our business, financial condition and results of operations.
Our business has substantial capital expenditure requirements which requires us to have access to the global capital markets for financing
We have significant capital expenditure requirements which necessitates continued access to the global capital markets, as well as R&D&i costs and extensive construction costs for power transmission lines, solar power plants and installations, co-generation power plants, infrastructure for the production of ethanol and desalination plants. Our capital expenditure and R&D&i requirements depend on the number and type of projects we undertake in the future. Under concessions and other agreements, we have committed to certain future capital expenditures (see "Item 5.A—Operating Results—Factors Affecting Our Results of Operations—Capital Expenditures"). Any recovery of our capital expenditures and R&D&i requirements,
29
Table of Contents
especially those made in respect of our concessions, will occur over a substantial period of time. Moreover, we may be unable to recoup our investments in these projects due to delays, cost overruns and general timing issues as to when revenue can be derived from these projects.
We must also continue to make significant expenditures on R&D&i in order to maintain and improve our competitive position. Furthermore, certain of our competitors may have substantially greater financial resources than we do. Any failure by us to react quickly and effectively to technological changes, or to obtain necessary financing to conduct appropriate R&D&i activities, could have a material adverse effect on our business, financial condition and results of operations.
Transactions with counterparties exposes us to credit risk which we must effectively manage to mitigate the effect of counterparty defaults
We are exposed to the credit risk implied by default on the part of a counterparty (a customer, provider, partner or financial entity), which could impact our business, financial condition and results of operations. Although we actively manage this credit risk through the use of non-recourse factoring contracts, which involves banks and third parties assuming a counterparty's credit risk, and credit insurance, our risk management strategy may not be successful in limiting our exposure to credit risk, which could adversely affect our business, financial condition and results of operations.
We may be subject to increased finance expenses if we do not effectively manage our exposure to interest rate and foreign currency exchange rate risks
We are exposed to various types of market risk in the normal course of business, including the impact of interest rate changes and foreign currency exchange rate fluctuations. Some of our indebtedness bears interest at variable rates, generally linked to market benchmarks such as EURIBOR and LIBOR. Any increase in interest rates would increase our finance expenses relating to our variable rate indebtedness and increase the costs of refinancing our existing indebtedness and issuing new debt (see "Item 5.A—Operating Results—Factors Affecting Our Results of Operations—Interest Rates"). In addition, we conduct our business and incur costs in the local currency of the countries in which we operate. As we continue expanding our business into existing markets such as North America and South America, and into new markets such as the Middle East, Africa, India, China and Australia, we expect that a large and increasing percentage of our revenue and cost of sales will be denominated in currencies other than our reporting currency, the euro. As a result, we will become subject to increasing currency translation risk, whereby changes in exchange rates between the euro and the other currencies in which we do business could result in foreign exchange losses.
We seek to actively manage these risks by entering into interest rate options and swaps to hedge against interest rate risk and future currency sale and purchase contracts and foreign exchange rate swaps to hedge against foreign exchange rate risk. If our risk management strategies are not successful in limiting our exposure to changes in interest rates and foreign currency exchange rates, our business, financial condition and results of operations could be materially and adversely affected.
Our competitive position could be adversely affected by changes in technology, prices, industry standards and other factors
The markets in which our activities operate change rapidly because of technological innovations and changes in prices, industry standards, product instructions, customer requirements and the economic environment. New technology or changes in industry and customer requirements may render existing products or services obsolete, excessively costly or otherwise unmarketable. As a result, we must continuously enhance the efficiency and reliability of our existing technologies and seek to develop new technologies in order to remain at the forefront of industry standards and customer requirements. If we are unable to introduce and integrate new technologies into our products and services in a timely and cost-effective manner, our competitive position will suffer and our prospects for growth will be impaired.
30
Table of Contents
The delivery of our products and services to our customers and our performance under our contracts with our customers may be adversely affected by problems related to our reliance on third-party contractors and suppliers
Some of our contracts require services, equipment or software which we subcontract to subcontractors, and some of our key products and services use items from third-party suppliers. The delivery of products or services which are not in compliance with the requirements of the subcontract, or the late supply of products and services, can cause us to be in default under our contracts with our customers. To the extent we are not able to transfer all of the risk or be fully indemnified by third-party contractors and suppliers, we may be subject to a claim by our customers as a result of a problem caused by a third-party that could have a material adverse effect on our reputation, business, results of operations and financial condition.
We may be adversely affected by risks associated with acquisitions or investments in joint ventures with third parties
If we decide to make certain acquisitions or financial investments in order to expand or diversify our business, we may take on additional debt to pay for such acquisitions. Moreover, we cannot guarantee that we will be able to complete all, or any, such external expansion or diversification transactions that we might contemplate in the future. To the extent we do, such transactions expose us to risks inherent in integrating acquired businesses and personnel, such as the inability to achieve projected synergies; difficulties in maintaining uniform standards, controls, policies and procedures; recognition of unexpected liabilities or costs; and regulatory complications arising from such transactions. Furthermore, the terms and conditions of financing for such acquisitions or financial investments could restrict the manner in which we conduct our business, particularly if we were to use debt financing. These risks could have a material adverse effect on our business, financial condition and results of operations.
In addition, we have made significant investments in certain strategic development projects with third parties, including governmental entities and private entities. In certain cases, these projects are developed pursuant to joint venture agreements over which we only have partial or joint control. Investments in projects over which we have partial or joint control are subject to the risk that the other shareholders of the joint venture, who may have different business or investment strategies than us or with whom we may have a disagreement or dispute, may have the ability to block business, financial or management decisions, such as the decision to distribute dividends or appoint members of management, which may be crucial to the success of the project or our investment in the project, or otherwise implement initiatives which may be contrary to our interests. Our partners may be unable, or unwilling, to fulfill their obligations under the relevant joint venture agreements and shareholder agreements or may experience financial or other difficulties that may adversely impact our investment in a particular joint venture. In certain of our joint ventures, we may also be reliant on the particular expertise of our partners and, as a result, any failure to perform our obligations in a diligent manner could also adversely impact the joint venture. If, for example, we fail to complete our expected joint venture with EIG, it could adversely impact our ability to develop our current portfolio of projects. If any of the foregoing were to occur, our business, financial condition and results of operations could be materially and adversely affected.
Our backlog of unfilled orders is subject to unexpected adjustments and cancellations and is, therefore, not a fully accurate indicator of our future revenue or earnings
At December 31, 2014, our backlog was €7,953 million. Our backlog represents management's estimate of the amount of contract awards that we expect to result in future revenue. A project for which the related contract has been signed is included in the calculation of the project portfolio value. A signed contract represents a legally binding agreement, meaning a secure revenue source in the future. The sole exception is concentrated solar power ("CSP") plants for engineering, construction and construction ("EPC") projects, which are considered in the amount of our backlog despite not having a contract signed, as they have been granted a feed-in tariff. Furthermore, we do not include in backlog predicted sales from our concession
31
Table of Contents
activities, such as energy sales, power transmission and water sales or commodity sales, or our industrial production activities, such as biofuel sales. Our backlog does include expected revenue based on engineering and design specifications that may not be final and could be revised over time, and also includes expected revenue for government and maintenance contracts that may not specify actual monetary amounts for the work to be performed. For these contracts, our backlog is based on an estimate of work to be performed, which is based on our knowledge of our customers' stated intentions. See "Item 5.A—Operating Results—Factors Affecting Our Results of Operations—Backlog and Concessions" and "Item 4.B—Business Overview" for more information. Furthermore, our ability to execute our backlog is dependent on our ability to meet our operational and financing needs, and if we are unable to meet such needs, our ability to execute our backlog could be adversely affected, which could materially affect our business, financial condition and results of operations.
There can be no assurance that the revenue projected in our backlog will be realized or, if realized, will result in profit. Because of project terminations or suspensions and changes in project scope and schedule, we cannot predict with certainty when, or if, our backlog will be actualized. We can provide no assurance that we will not receive additional cancellations, and, even where a project proceeds as scheduled, it is possible that the customer may default and fail to pay amounts owed to us. Material delays, cancellations or payment defaults could materially affect our business, financial condition and results of operations.
Our definition of backlog may not necessarily be the same as that used by other companies engaged in activities similar to ours. As a result, the amount of our backlog may not be comparable to the backlog reported by such other companies.
We have international operations, including in emerging markets, that could be subject to economic, social and political uncertainties
We operate our activities in a range of international locations, including Africa, Australia, China, India, the Middle East, North America and South America (including Brazil), and expect to expand our operations into new locations in the future. Accordingly, we face a number of risks associated with operating in different countries that may have a material adverse impact on our business, financial condition and results of operations. These risks include, but are not limited to, adapting to the regulatory requirements of such countries, compliance with changes in laws and regulations applicable to foreign corporations, the uncertainty of judicial processes, and the absence, loss or non-renewal of favorable treaties, or similar agreements, with local authorities or political, social and economic instability, all of which can place disproportionate demands on our management, as well as significant demands on our operational and financial personnel and business. As a result, we can provide no assurance that our future international operations will remain successful.
In addition, we conduct business in various emerging countries worldwide. Our activities in these countries involve a number of risks that are more prevalent than in developed markets, such as economic and governmental instability, the possibility of significant amendments to, or changes in, the application of governmental regulations, the nationalization and expropriation of private property, payment collection difficulties, social problems, substantial fluctuations in interest and exchange rates, changes in the tax framework or the unpredictability of enforcement of contractual provisions, currency control measures limits on the repatriation of funds and other unfavorable interventions or restrictions imposed by public authorities. For example, certain of our contracts in countries such as Peru or Mexico, are payable in local currency at the exchange rate of the payment date. In the event of a rapid devaluation or implementation of exchange or currency controls, we may not be able to exchange the local currency for the agreed dollar amount, which could affect our liquidity position. Governments in South American frequently intervene in the economies of their respective countries and occasionally make significant changes in policy and regulations. Governmental actions in certain South American countries to control inflation and other policies and regulations have often involved, among other measures, price controls, currency devaluations, capital controls and limits on imports. In addition, in recent years, political upheaval, civil unrest and, in some cases, regime change and armed
32
Table of Contents
conflict, have occurred in certain countries in the Middle East and Africa, including Egypt, Iraq, Syria, Libya and Tunisia. Such events have increased political instability and economic uncertainty in certain countries in the Middle East and Africa where we currently operate or may seek to operate. Although our activities in emerging markets are not concentrated in any specific country (other than Brazil), the occurrence of one or more of these risks in a country or region in which we operate could have a material adverse effect on our business, financial condition and results of operations.
We could be adversely affected by violations of the U.S. Foreign Corrupt Practices Act and similar worldwide anti-bribery laws
The U.S. Foreign Corrupt Practices Act, the U.K. Bribery Act of 2010 and similar anti-bribery laws in other jurisdictions generally prohibit companies and their intermediaries from making improper payments to officials or others for the purpose of obtaining or retaining business. Our policies mandate compliance with these anti-bribery laws. We operate in many parts of the world that have experienced governmental corruption to some degree and, in certain circumstances, strict compliance with anti-bribery laws may conflict with local customs and practices. We train our personnel concerning anti-bribery laws and issues, and we also inform our partners, subcontractors, suppliers, agents and others who work for us or on our behalf that they must comply with anti-bribery law requirements. We also have procedures and controls in place to monitor compliance. We cannot assure that our internal controls and procedures always will protect us from the possible reckless or criminal acts committed by our employees or agents. If we are found to be liable for anti-bribery law violations (either due to our own acts or our inadvertence, or due to the acts or inadvertence of others including our partners, agents, subcontractors or suppliers), we could suffer from criminal or civil penalties or other sanctions, including contract cancellations or debarment, and loss of reputation, any of which could have a material adverse effect on our business. Litigation or investigations relating to alleged or suspected violations of anti-bribery laws, even if ultimately such litigation or investigations demonstrate that we did not violate anti-bribery laws, could be costly and could divert management's attention away from other aspects of our business.
Our growth may be limited by our inability to obtain new sites and expand existing ones
Our ability to maintain our competitive position and meet our growth objectives for our operations and, in particular, our Industrial Production activity and Co-generation and other segment of our Concession-Type Infrastructure activity depend on our ability to upgrade existing sites or acquire or lease additional sites in strategically located areas. Our ability to obtain new sites and expand existing sites is limited by regulation and geographic considerations. Government restrictions, including environmental, public health and technical restrictions, limit where our facilities and plants can be located. The process of obtaining planning permission and licenses or permits to build, operate or expand our facilities and plants involve extended hearings and compliance with planning, environmental and other regulatory requirements. We may not be successful in obtaining the planning permissions, licenses or permits we require or such planning permissions, license or permits may contain onerous terms and conditions, which could have a material adverse effect on our business, financial condition and results of operations. Furthermore, objections from the public are capable of delaying, and even preventing, the proposed construction of a new or expanded facility or plant and the operation of a facility or plant. As a result, we may not be able to obtain extra site capacity where it is required. In some instances, it is also necessary for us to negotiate separate agreements with local authorities and third parties, such as landowners, who can make demands for additional obligations.
Our solar power plants can only be constructed in locations with suitable weather conditions, sufficient levels of solar radiation, access to water and suitable topographic features. Accordingly, the number of feasible sites available for solar power plants is limited in many countries, including Spain and the United States, particularly as growth in the number of installed solar plants can restrict the number of sites available for additional plants. Recent growth in the number of solar energy operators has increased competition for available sites. Moreover, although we undertake extensive studies before investing in the development of
33
Table of Contents
any particular site, the sites we choose to develop might not perform to our expectations. If these constraints on the establishment of solar power plants were to intensify, or if the sites we ultimately choose to develop do not perform as expected, this could have a material adverse effect on our business, financial condition and results of operations.
The construction projects in our Engineering and Construction activity and the facilities we operate in our Concession-Type Infrastructure and Industrial Production activities are inherently dangerous workplaces at which hazardous materials are handled. If we fail to maintain safe work environments or cause any damage, we can be exposed to significant financial losses, as well as civil and criminal liabilities
The construction projects we undertake in our Engineering and Construction activity and the facilities we operate in our Concession-Type Infrastructure and Industrial Production activity often put our employees and others in close proximity with large pieces of mechanized equipment, moving vehicles, manufacturing or industrial processes, heat or liquids stored under pressure and highly regulated materials. On most projects and at most facilities, we are responsible for safety and, accordingly, must implement safe practices and safety procedures. If we fail to design and implement such practices and procedures or if the practices and procedures we implement are ineffective, our employees and others may become injured and our and others property may become damaged. Unsafe work sites also have the potential to increase employee turnover, increase the cost of a project to our customers or the operation of a facility, and raise our operating costs. Any of the foregoing could result in financial losses, which could have a material adverse impact on our business, financial condition and results of operations.
In addition, our projects and the operation of our facilities can involve the handling of hazardous and other highly regulated materials, which, if improperly handled or disposed of, could subject us to civil and criminal liabilities. We are also subject to regulations dealing with occupational health and safety. Although we maintain functional groups whose primary purpose is to ensure we implement effective health, safety, and environmental work procedures throughout our organization, including construction sites and maintenance sites, the failure to comply with such regulations could subject us to liability. In addition, we may incur liability based on allegations of illness or disease resulting from exposure of employees or other persons to hazardous materials that we handle or are present in our workplaces.
Our safety record is critical to our reputation. Many of our customers require that we meet certain safety criteria to be eligible to bid for contracts, and many contracts provide for automatic termination or forfeiture of some, or all, of its contract fees or profit in the event we fail to meet certain measures. As a result, our failure to maintain adequate safety standards could result in reduced profitability or the loss of projects or clients, and could have a material adverse impact on our business, financial condition and results of operations.
Our business may be adversely affected by catastrophes, natural disasters, adverse weather conditions, unexpected geological or other physical conditions, or criminal or terrorist acts at one or more of our plants, facilities and construction sites
If one or more of our plants, facilities or construction sites were to be subject in the future to fire, flood or a natural disaster, adverse weather conditions, terrorism, power loss or other catastrophe, or if unexpected geological or other adverse physical conditions were to develop at any of our plants, facilities or construction sites, we may not be able to carry out our business activities at that location or such operations could be significantly reduced. This could result in lost revenue at these sites during the period of disruption and costly remediation, which could have a material adverse effect on our business, financial condition and results of operations. In addition, despite security measures taken by us, it is possible that our sites relating to our Concession-Type Infrastructure and Industrial Production activities or other sites, could be affected by criminal or terrorist acts. Any such acts could have a material adverse effect on our business, financial condition and results of operations.
34
Table of Contents
Our insurance may be insufficient to cover relevant risks and the cost of our insurance may increase
Our business is exposed to the inherent risks in the markets in which we operate. Although we seek to obtain appropriate insurance coverage in relation to the principal risks associated with our business, we cannot guarantee that such insurance coverage is, or will be, sufficient to cover all of the possible losses we may face in the future. If we were to incur a serious uninsured loss or a loss that significantly exceeded the coverage limits established in our insurance policies, the resulting costs could have a material adverse effect on our business, financial condition and results of operations.
In addition, our insurance policies are subject to review by our insurers. If the level of premiums were to increase in the future, or certain types of insurance coverage were to become unavailable, we might not be able to maintain insurance coverage comparable to those that are currently in effect at comparable cost, or at all. If we were unable to pass any increase in insurance premiums on to our customers, such additional costs could have a material adverse effect on our business, financial condition and results of operations.
We are subject to litigation and other legal proceedings
We are subject to the risk of legal claims and proceedings and regulatory enforcement actions in the ordinary course of our business and otherwise. For example, in November 2014, Abengoa and its Board of Directors, along with the CNMV and our auditors, Deloitte S.L., were named as defendants in a criminal action filed on behalf of a private party (namedPartido de Perjudicados por las Preferentes) with theJuzgado Central de Instrucción of the Audiencia Nacional, the investigating arm of the criminal court. The complaint alleges that we misrepresented the amount of our corporate financing in our financial statements and violated various provisions of the Spanish criminal code. To date, we have not been notified by the investigating judge whether it intends to bring any criminal charges against any of the defendants. The results of legal and regulatory proceedings cannot be predicted with certainty. We cannot guarantee that the results of current or future legal or regulatory proceedings or actions will not materially harm our business, financial condition and results of operations nor can we guarantee that we will not incur losses in connection with current or future legal or regulatory proceedings or actions that exceed any provisions we may have set aside in respect of such proceedings or actions or that exceed any available insurance coverage, which may have a material adverse effect on our business, financial condition or results of operations. We are currently subject to various claims, proceedings, actions and investigations, including relating to possible anti-competitive practices, which could have a material adverse effect on our business, financial condition and results of operations. See "Item 8.A—Legal Proceedings."
Unauthorized use of our proprietary technology by third parties may reduce the value of our products, services and brand, and impair our ability to compete effectively
We rely across our business on a combination of trade secret and intellectual property laws, non-disclosure and other contractual agreements and technical measures to protect our proprietary rights. These measures may not be sufficient to protect our technology from third-party infringement and, notwithstanding any remedies available, could subject us to increased competition or cause us to lose market share. In addition, these measures may not protect us from the claims of employees and other third parties. We also face risks with respect to the protection of our proprietary technology because the markets where our products are sold include jurisdictions that provide less protection for intellectual property than is provided under the laws of the United States or the European Union. Unauthorized use of our intellectual property could weaken our competitive position, reduce the value of our products, services and brand, and harm our business, financial condition and results of operations.
35
Table of Contents
Our business may suffer if we are sued for infringing upon the intellectual property rights of third parties
We are subject to the risk of adverse claims and litigation alleging our infringement of the intellectual property rights of others. In the future, third parties may assert infringement claims, alleging infringement by our current, or future, services or solutions. These claims may result in protracted and costly litigation, may subject us to liability if we are found to have infringed upon third parties' intellectual property rights, and, regardless of the merits or ultimate outcome, may divert management's attention from the operation of our business.
Our business will suffer if we do not retain our senior management and key employees or if we do not attract and retain other highly skilled employees
Our future success depends significantly on the full involvement of our senior management and key employees, who have valuable expertise in all areas of our business. Our ability to retain and motivate our senior management and key employees and attract highly skilled employees will significantly affect our ability to run our business successfully and to expand our operations in the future. If we were to lose one or more of our senior management or, for example, valuable local managers with significant experience in the markets in which we operate, we might encounter difficulty in appointing replacements. This could have an adverse impact on our business, financial condition and results of operations.
The analysis of whether IFRIC 12 applies to certain contracts and activities, and the determination of the proper accounting treatment at each period end if it is determined that IFRIC 12 is to be applied, involves various complex factors and is significantly affected by legal and accounting interpretations
We account for certain of our Concession-Type Infrastructure assets as service concession agreements in accordance with the provisions of IFRIC 12. The infrastructures accounted for by us as service concessions under IFRIC 12 are mainly related to the activities concerning power transmission lines, desalination plants and thermo-solar electricity generation plants outside of Spain and (with prospective application from January 1, 2011) in Spain.
The analysis of whether IFRIC 12 applies to certain contracts and activities involves various complex factors and it is significantly affected by legal interpretation of certain contractual agreements or other terms and conditions with public sector entities. In particular, the application of IFRIC 12 requires a determination that the grantor of the concession governs what services the operator must provide using the infrastructure, to whom and at what price and also controls any significant residual interest in the infrastructure at the end of the term of the arrangement. When the operator of the infrastructure is also responsible for the engineering, procurement and construction of such asset, IFRIC 12 requires the separate accounting for the revenue and margins associated with the construction activities, which is not eliminated in consolidation even between companies within the same consolidated group, and for the subsequent operation and maintenance of the infrastructure. In such cases, the investment in the infrastructure used in the concession arrangement cannot be classified as property, plant and equipment of the operator, but rather must be classified as a financial asset or an intangible asset, depending on the nature of the payment rights established under the contract.
Therefore, the application of IFRIC 12 requires extensive judgment in relation to, among other factors, (i) the identification of certain infrastructures and contractual agreements in the scope of IFRIC 12, (ii) the understanding of the nature of the payments in order to determine the classification of the infrastructure as a financial asset or as an intangible asset and (iii) the timing and recognition of the revenue from construction and concessionary activity.
Changes in one or more of the factors described above may significantly affect our conclusions as to the appropriateness of the application of IFRIC 12 and, therefore, our results of operations or our financial position. As a result, if we determined that those assets were no longer within the scope of IFRIC 12, the
36
Table of Contents
revenue and associated margins realized by us during the construction phase of the affected assets would no longer be recognized in accordance with IFRIC 12 but rather would be eliminated in consolidation, resulting in a decrease in revenue and profits in our consolidated income statement for the period reported, and a reclassification from intangible assets to property, plant and equipment on the consolidated balance sheet. As such, a determination that those assets ceased to be within the scope of IFRIC 12 would affect the comparability of our results of operations and our financial condition for the periods, and as of the dates, before and after the date on which we made that determination.
For more information about the application of IFRIC 12, see "Item 5.—A. Operating Results—Critical Accounting Policies and Estimates—Revenue from construction contracts" and Note 2.5 to our Consolidated Financial Statements.
Market perceptions concerning the instability of the euro, the potential re-introduction of individual currencies within the Eurozone, or the potential dissolution of the euro entirely, could adversely affect our business or financial position
As a result of the credit crisis in Europe, in particular in Greece, Italy, Ireland, Portugal and Spain, the European Commission created the European Financial Stability Facility (the "EFSF") and the European Financial Stability Mechanism (the "EFSM") to provide funding to Eurozone countries in financial difficulties that seek such support. Throughout 2011, the EFSF and EFSM undertook a series of interventions to provide direct financing or other credit support to European governments. In March 2011, the European Council agreed on the need for Eurozone countries to establish a permanent stability mechanism, the European Stability Mechanism, which will be activated by mutual agreement, to assume the role of the EFSF and the EFSM in providing external financial assistance to Eurozone countries after June 2013. In July 2011, the European Council agreed to enlarge the EFSF capital guarantee from €440 billion to €780 billion, a decision which was ratified by all relevant national legislatures in October 2011. In October 2011, the European Council agreed to increase the ability of the EFSF to intervene in sovereign debt markets by granting it the ability to offer insurance to third parties purchasing Eurozone sovereign debt. Throughout 2012, certain Eurozone states announced austerity programs and other cost cutting initiatives, and the EFSF was permitted to further expand its powers to provide direct loans to certain Eurozone financial institutions, including certain such institutions in Spain. Further, the ECB indicated its willingness to take further actions to support the euro if necessary. In January 2015, the ECB unveiled quantitative easing measures expected to last until September 2016, which are intended to boost the Eurozone's flagging economy and to ward off the specter of deflation. These measures and indications helped, or are expected to help, stabilize the euro through the end of 2012, 2013, 2014 and 2015. There can be no assurance that the recent market disruptions in Europe related to sovereign debt will not reoccur, nor can there be any assurance that future assistance packages will be available or, even if provided, will be sufficient to stabilize any affected countries and markets in Europe or elsewhere.
Uncertainty persists regarding the debt burden of certain Eurozone countries and regional governments and the solvency of certain European financial institutions and their respective ability to meet future financial obligations. The protracted adverse market conditions have created doubts as to the overall stability of the euro and the suitability of the euro as a single currency given the diverse economic and political circumstances in individual Member States. These and other concerns could lead to the re-introduction of individual currencies in one or more Member States, such as Greece in light of elections held there in January 2015 and recent debt negotiations with its various European creditors, or, in more extreme circumstances, the possible dissolution of the euro entirely. Should the euro dissolve entirely, the legal and contractual consequences for holders of euro denominated obligations would be determined by laws in effect at such time. These potential developments, or market perceptions concerning these and related issues, could adversely affect our business or our financial position, as a significant principal amount of our outstanding debt securities is denominated in euro.
37
Table of Contents
The recoverability of our deferred tax assets depends on our future taxable income, which depends on management estimates that are uncertain
Our management assesses the recoverability of deferred tax assets on the basis of estimates of future taxable profit. These estimates are derived from the projections included in our five- and ten-year strategic plans, which are prepared on a yearly basis and reviewed twice a year for the accuracy of the assumptions used. As of December 31, 2014, a significant portion of our deferred tax assets are tax credits, which include mostly tax loss carryforwards in Brazil, the United States, the Netherlands and Spain and tax credits relating to tax incentives principally generated in Spain from our investments in R&D&i and export activities, whose recoverability depends mostly on our capacity to generate future taxable income in such countries. Based on our current estimates we expect to generate sufficient future taxable income to achieve the realization of our current tax credits and tax loss carryforwards, supported by our historical trend of business performance. However, our current and deferred income taxes may be impacted by events and transactions arising in the normal course of business as well as by special non-recurring items. Changes in the assumptions and estimates made by management may result in the de-recognition of these deferred tax assets on our balance sheet if we consider that it is not probable that taxable profit will be available against which the deductible temporary difference can be utilized, with a corresponding charge to income tax expense in the consolidated income statement, although there would be no impact on cash flows.
Our actual operating results may differ significantly from the guidance for 2015 provided by our management in our February 9, 2015 update
From time to time we release guidance in our quarterly earnings releases, quarterly earnings conference call, or otherwise, regarding our future performance that represent our management's estimates as of the date of release. We issued guidance in our February 9, 2015 market update concerning our projected revenues, EBITDA, corporate EBITDA, net income, certain leverage ratios and corporate free cash flow for 2015. This guidance, which includes forward-looking statements, is based on projections prepared by our management. Neither our independent registered public accountants nor any other independent expert or outside party compiles or examines the projections and, accordingly, no such person expresses any opinion or any other form of assurance with respect thereto.
Projections are based upon a number of assumptions and estimates that, while presented with numerical specificity, are inherently subject to significant business, economic and competitive uncertainties and contingencies, many of which are beyond our control and are based upon specific assumptions with respect to future business decisions, some of which will change. We generally state possible outcomes as high and low ranges which are intended to provide a sensitivity analysis as variables are changed but are not intended to represent that actual results could not fall outside of the suggested ranges. The principal reason that we release guidance is to provide a basis for our management to discuss our business outlook with analysts and investors. We do not accept any responsibility for any projections or reports that may be published by analysts.
Guidance is necessarily speculative in nature, and it can be expected that some or all of the assumptions of the guidance furnished by us will not materialize or will vary significantly from actual results. Accordingly, our guidance is only an estimate of what management believes is realizable as of the date of release. If the estimates of what management believes is realizable change significantly from the guidance expressed earlier in the year, our guidance for the year is adjusted as appropriate. For example, on November 12, 2014, we revised downward the €7.9–8.0 billion estimate of 2014 revenues that we provided on February 20, 2014 to €7.4–7.5 billion, while increasing our 2014 Corporate EBITDA guidance from €860–885 million to €885–900 million and reaffirming the remainder of our 2014 guidance. Actual results may vary from our guidance and the variations may be material. In light of the foregoing, investors are urged not to rely upon, or otherwise consider, our guidance in making an investment decision in respect of our Class A shares, Class B shares or ADSs. Any failure to successfully implement our operating strategy could result in the actual operating results being different from our guidance, and such differences may be adverse and material.
38
Table of Contents
Risks Related to the Engineering and Construction Activity
Our current and future fixed-price contracts may result in significant losses if costs are greater than anticipated
Many of our EPC contracts are fixed-price contracts which contain inherent risks because we agree to the selling price of the project at the time we enter into the contract. The selling price is based on estimates of the ultimate cost of the contract and we assume substantially all of the risks associated with completing the project, as well as the post-completion warranty obligations. Most EPC contracts are fixed-price turnkey projects where we are responsible for all aspects of the work, from engineering through construction, as well as commissioning, all for a fixed selling price.
In addition, we assume a project's technical risk and associated warranty obligations on all of our projects, meaning that we must tailor products and systems to satisfy the technical requirements of a project even though, at the time the project is awarded, we may not have previously produced such a product or system. Warranty obligations can range from re-performance of engineering services to modification or replacement of equipment. We also assume the risks related to revenue, cost and gross profit realized on such contracts that can vary, sometimes substantially, from the original projections due to changes in a variety of other factors, including but not limited to:
- •
- engineering design changes;
- •
- unanticipated technical problems with the equipment being supplied or developed by us, which may require that we spend our own money to remedy the problem;
- •
- changes in the cost of components, materials or labor;
- •
- difficulties in obtaining required governmental permits or approvals;
- •
- changes in local laws and regulations;
- •
- changes in local labor conditions;
- •
- project modifications creating unanticipated costs;
- •
- delays caused by adverse weather conditions; and
- •
- project owners', suppliers' or subcontractors' failure to perform.
These risks may be exacerbated by the length of time between signing a contract and completing the project because most of the projects that we execute are long-term. In addition, we sometimes bear the risk of delays caused by unexpected conditions or events. We may be subject to penalties if portions of the long-term, fixed-priced projects are not completed in accordance with agreed-upon time limits.
Failure by us to successfully defend against claims made against us by customers, suppliers or subcontractors, or failure by us to recover adequately on claims made against customers, suppliers or subcontractors, could materially adversely affect our business, financial condition and results of operations
Our projects generally involve complex engineering, procurement of supplies and construction management. We may encounter difficulties in the engineering, equipment delivery, schedule changes and other factors, some of which are beyond our control, that affect our ability to complete the project in accordance with the original delivery schedule or to meet the contractual performance obligations. In addition, we rely on third-party partners, equipment manufacturers and subcontractors to assist us with the completion of our contracts. As such, claims involving customers, suppliers and subcontractors may be brought against us, and by us, in connection with our project contracts. Claims brought against us include back charges for alleged defective or incomplete work, breaches of warranty and/or late completion of the project and claims for cancelled projects. The claims and back charges can involve actual damages, as well as
39
Table of Contents
contractually agreed upon liquidated sums. Claims brought by us against customers include claims for additional costs incurred in excess of current contract provisions arising out of project delays and changes in the previously agreed scope of work. Claims between us and our suppliers, subcontractors and vendors include claims like any of those described above. These project claims, if not resolved through negotiation, are often subject to lengthy and expensive litigation or arbitration proceedings. Charges associated with claims could materially adversely affect our business, financial condition and results of operations.
The performance of our Engineering and Construction activity is substantially dependent on the growth of our Concession-Type Infrastructure activity
Our Engineering and Construction activity is our largest activity by revenue. A significant component of the revenue of our Engineering and Construction activity relates to works on owned assets and the construction of new infrastructure assets used in the Concession-Type Infrastructure activity, primarily power plants, power transmission lines and water infrastructure. As a result, revenue and profits from our Engineering and Construction activity are substantially dependent on global demand for new power plants, power transmission lines and water infrastructure, and the ability of our Concession-Type Infrastructure activity to win concession-type arrangements associated with such infrastructure. If we are unsuccessful in growing our Concession-Type Infrastructure activity and obtaining new concession-type arrangements, whether due to the reductions in capital expenditures we plan to make on owned assets over the next several years following significant expenditures in recent years, declines in global demand for new power plants, power transmission lines and water infrastructure or otherwise, revenue and profits from our Engineering and Construction activity will decline, which could materially adversely affect our business, results of operations and financial condition.
The nature of our Engineering and Construction activity exposes us to potential liability claims and contract disputes which may reduce our profits
Our Engineering and Construction activity engages in operations where failures in design, construction or systems can result in substantial injury or damage to third parties. In addition, the nature of our Engineering and Construction activity results in customers, subcontractors and vendors occasionally presenting claims against us for recovery of cost they incurred in excess of what they expected to incur, or for which they believe they are not contractually liable. We have been, and may in the future, be named as a defendant in legal proceedings where parties may make a claim for damages or other remedies with respect to our projects or other matters. These claims generally arise in the normal course of our business. When it is determined that we have liability, we may not be covered by insurance or, if covered, the financial amount of these liabilities may exceed our policy limits.
Risks Related to the Concession-Type Infrastructure Activity
We may not be able to complete the sale before the end of 2015 of a number of concessional assets already in operation as disclosed in our February 9, 2015 market update
In our February 9, 2015 market update, we announced our intention to sell, to third-parties or to Abengoa Yield, our equity in certain concessionary assets already in operation before the end of 2015. These assets consist of the Solaben 1 and 6, Solnova 1, 3 and 4 and Helios 1 and 2 thermo-solar plants in Spain and five photovoltaic projects aggregating 12 MW, as well as other concessional assets. In that market update, we disclosed the cash proceeds that we expect to generate from such sales and the amount by which we expect to reduce our Project Debt as a result of those sales. In the Consolidated Financial Statements appearing elsewhere in this annual report, these assets are considered as assets held for sale in accordance with the stipulations and requirements of IFRS 5,Non-Current Assets Held for Sale and Discontinued Operations.
40
Table of Contents
Our ability to carry out our plan to sell these assets during 2015 is subject to a number of risks and uncertainties:
- •
- The governmental authorities that have granted the concessions or other relevant contractual counterparties may not provide their consent to the transfer of the concession or long-term power purchase agreement timely or on terms that are acceptable to us or the buyer of the asset;
- •
- The lenders under the project debt facilities associated with the assets to be sold may not provide their consent to the sale of those assets timely or on terms that are acceptable to us; and
- •
- Our investment partners in the project companies associated with the assets to be sold may not provide their consent to the sale of those assets timely or on terms that are acceptable to us.
We cannot guarantee that we will be successful in selling all of the above-described operating concessional assets by the end of 2015 and at prices that are favourable to us or at all. Our inability to carry out our plan to sell all of these assets during 2015 may preclude us from continuing to classify any asset that is not sold as held for sale and require us to consolidate such asset and could lead us to reduce Project Debt by less than expected, which could have a material adverse impact on our consolidated financial position.
Development, construction and operation of new projects may be adversely affected by factors commonly associated with such projects
The development, construction and operation of conventional power plants, renewable energy facilities, water infrastructure plants, power transmission lines and a number of our other projects can be time-consuming and highly complex. In connection with their development and financing, we must generally obtain government permits and approvals and sufficient financing, as well as enter into land purchase or leasing agreements, equipment procurement and construction contracts, operation and maintenance agreements, fuel supply and transportation agreements and any off-take arrangements. Factors that may affect our ability to construct new projects include, among others:
- •
- delays in obtaining regulatory approvals, including environmental permits;
- •
- shortages or changes in the price of equipment, materials or labor and related budget overruns;
- •
- adverse changes in the political and/or regulatory environment in the jurisdictions in which we operate;
- •
- adverse weather conditions or natural disasters, accidents or other unforeseen events; and
- •
- the inability to obtain financing on satisfactory terms or at all.
Any of these factors may cause delays in commencement or completion of our projects and may increase the cost of projects. If we are unable to complete contemplated projects, the costs incurred in connection with such projects may not be recoverable, which may have an adverse effect on our business, financial condition and results of operations.
The concession agreements under which we conduct some of our operations are subject to revocation or termination
Certain of our operations are conducted pursuant to concessions granted by various governmental bodies. Generally, these concessions give us rights to provide services for a limited period of time, subject to various governmental regulations. The governmental bodies responsible for regulating these services often have broad powers to monitor our compliance with the applicable concession contracts and can require us to supply them with technical, administrative and financial information. Among other obligations, we may be required to comply with investment commitments and efficiency and safety standards established in the concession. Such commitments and standards may be amended in certain cases by the governmental bodies. Our failure to comply with the concession agreements or other regulatory requirements may result in
41
Table of Contents
concessions not being granted, upheld or renewed in our favor, or, if granted, upheld or renewed, may not be done on as favorable terms as currently applicable. This could have a material adverse effect on our business, financial condition and results of operations. For more information, see "Item 5.A—Operating Results—Factors Affecting our Results of Operations—Backlog and Concessions".
Revenue from our Concession-Type Infrastructure activity is significantly dependent on regulated tariffs or other long-term fixed rate arrangements that restrict our ability to increase revenue from these operations
The revenue that we generate from our Concession-Type Infrastructure activity is significantly dependent on regulated tariffs or other long-term fixed rate arrangements. Under most of our concession agreements, a tariff structure is established in such agreements, and we have limited, or no possibility to independently raise tariffs beyond the established rates. Similarly, under a long-term power purchase agreement, we are required to deliver power at a fixed rate for the contract period, with limited escalation rights. In addition, we may be unable to adjust our tariffs or rates as a result of fluctuations in prices of raw materials, exchange rates, labor and subcontractor costs during the construction phase and the operating phase of these projects, or any other variations in the conditions of specific jurisdictions in which our concession-type infrastructure projects are located, which may reduce our revenue. Moreover, in some cases, if we fail to comply with certain pre-established conditions, the government or customer (as applicable) may reduce the tariffs or rates payable to us. In addition, during the life of a concession, the relevant government authority may unilaterally impose additional restrictions on our tariff rates, subject to the regulatory frameworks applicable in each jurisdiction. Governments may also postpone annual tariff increases until a new tariff structure is approved without compensating us for lost revenue. Furthermore, changes in laws and regulations may, in certain cases, have retroactive effect and expose us to additional compliance costs or interfere with our existing financial and business planning. In the case that any one or more of these events occur, this could have a material adverse effect on our business, financial condition and results of operations.
Our Water segment depends significantly on public spending on infrastructure-related water projects and services, and reduced government spending could adversely affect our business, financial condition and results of operations
During 2012, 2013 and 2014, the majority of the revenue from the Water segment of our Concession-Type Infrastructure activity was generated from contracts with governmental entities. Many of these public entities with which we do business are municipalities with limited budgets that are susceptible to annual fluctuations from year to year. The budgets of such municipalities are often dependent on the collection of local taxes or national government grants. As a result, resources that may be available to municipalities for infrastructure-related projects and services may become limited, with little or no notice. In addition, measures aimed at correcting the current economic environment have increased budget deficits of many of the national, regional and local governments and public administrations with which we do business, and no assurance can be given that funding for infrastructure-related projects and services will remain available at previous levels. Furthermore, the competition from competitors for publicly funded works has become increasingly intense, which may affect our margins in the future. Our dependence on public spending, coupled with increasing competition, may lead to reductions in our water concession revenue, which could have an adverse effect on our business, financial condition and results of operations.
Revenue from our power generation facilities is partially exposed to market electricity prices
In addition to regulated incentives, revenue from certain of our projects partially depends on market prices for sales of electricity. Market prices may be volatile and are affected by various factors, including the cost of raw materials, user demand, and if applicable, the price of greenhouse gas emission rights.
In several of the jurisdictions in which we operate, we are exposed to remuneration schemes which contain both regulated incentive and market price components. In such jurisdictions, the regulated incentive
42
Table of Contents
component may not compensate for fluctuations in the market price component, and, consequently, total remuneration may be volatile.
There can be no assurance that market prices will remain at levels which enable us to maintain profit margins and desired rates of return on investment. A decline in market prices below anticipated levels could have a material adverse effect on our business, financial condition and results of operations.
Our solar projects will be negatively affected if there are adverse changes to national and international laws and policies that support renewable energy sources
Recently, certain countries, such as the United States, a market that has become our principal market, have enacted policies of active support for renewable energy. These policies have included feed-in tariffs and renewable energy purchase obligations, mandatory quotas and/or portfolio standards imposed on utilities and certain tax incentives (such as the Investment Tax Credit ("ITC") in the United States). See "Item 4.B—Regulation."
Although support for renewable energy sources by governments and regulatory authorities in the jurisdictions in which we operate has historically been strong, and European authorities, along with the United States government, have reaffirmed their intention to continue such support, certain policies currently in place may expire, be suspended or be phased out over time, cease upon exhaustion of the allocated funding or be subject to cancellation or non-renewal. Accordingly, we cannot guarantee that such government support will be maintained in full, in part or at all. In Spain, after years of strong support, the Spanish government has adopted a series of measures (including measures with retroactive effect) that have significantly and adversely affected the prospects of renewable energy in Spain. See "Item 4.B—Regulation—Spain—Solar Regulatory Framework."
In the United States, the temporary 30% ITC for solar energy projects will expire on December 31, 2016 and thereafter will revert to a permanent 10% ITC. In order to qualify for the 30% ITC, an eligible project must be placed in service by the end of 2016. Efforts to change the qualification criteria to require instead the commencement of construction by the end of 2016 have been unsuccessful thus far. The U.S. loan guarantee program has approximately $4 billion left in funding for renewable energy projects, including solar power generation. It is unlikely that new spending authority will be added to this program, at least in the next two years. The U.S. Treasury's program providing for cash grants in lieu of an ITC has expired for new projects, but the pending awards are subject to an automatic budget cut, which in fiscal year 2014 is 7.3% of the grant award. See "Item 3.D—Risk Factors—Risks Related to Our Business and the Markets in Which We Operate—Decreases in government budgets, reductions in government subsidies and adverse changes in law may adversely affect our business and the development of existing and new projects."
If the governments and regulatory authorities in the jurisdictions in which we operate were to further decrease or abandon their support for development of solar energy due to, for example, competing funding priorities, political considerations or a desire to favor other energy sources, renewable or otherwise, the power plants we plan to develop in the future could become less profitable or cease to be economically viable. Such an outcome could have a material adverse effect on our business, financial condition and results of operations.
Lack of power transmission capacity availability, potential upgrade costs to the power transmission grid, and other systems constraints could significantly impact our ability to build photovoltaic ("PV") and CSP plants and generate solar electricity power sales
In order to deliver electricity from our PV and CSP plants to our customers, our projects need to connect to the power transmission grid. The lack of available capacity on the power transmission grid could substantially impact our projects and cause reductions in project size, delays in project implementation, increases in costs from power transmission upgrades, and potential forfeitures of any deposit we have made with respect to a given project. These power transmission issues, as well as issues relating to the availability of
43
Table of Contents
large systems such as transformers and switch gear, could significantly impact our ability to build PV and CSP plants and generate solar electricity sales.
Risks Related to Our Industrial Production Activity
The ability of our Industrial Production activity to operate at a profit is largely dependent on managing the spread between the prices of inputs (grain, sugarcane, natural gas and others) and outputs (ethanol, sugar, DGS and others), the prices of which are subject to significant volatility and uncertainty
The results of the Biofuels segment of our Industrial Production activity are highly impacted by commodity prices, including the spread between the cost of inputs that we must purchase and the price of outputs that we sell. Prices and supplies are subject to, and determined by, market forces over which we have no control, such as weather, domestic and global demand, shortages, export prices, and various governmental policies in the United States, Europe, Brazil and around the world. As a result of price volatility for these commodities, the operating results of the Biofuels segment of our Industrial Production activity may fluctuate substantially. Increases in input or decreases in output prices may make it unprofitable to operate our plants. In the last quarter of 2011 and in 2012 and 2013, our Biofuels segment was adversely affected by rising raw materials costs of grains and sugar resulting from drought conditions in the United States and heavy rainfall in Brazil, respectively, as well as low gasoline demand that depressed ethanol prices. Currently, ethanol prices are under pressure in Europe due to low gasoline demand. No assurance can be given that we will be able to purchase corn and natural gas at, or near, favorable prices and that we will be able to sell ethanol, sugar or distillers grains at, or near, favorable prices. Consequently, our results of operations and financial position may be adversely affected by increases in the price of inputs or decreases in the price of outputs.
Our revenue may decrease, and operating costs may increase, if we do not effectively manage our exposure to commodity prices and supply risks through our hedging arrangements and other strategies
We are exposed to fluctuations in the price and supply of commodities in the Biofuels segment of our Industrial Production activity. The Biofuels segment of our Industrial Production activity competes with the food market for the supply of grain, such as wheat, barley, corn, sorghum, and sugar. Consequently, any increases in the cost of grains increase our costs of ethanol production. We use hedging arrangements, including future sale and purchase contracts and options listed on organized markets, as well as over-the-counter contracts, to mitigate these risks. Such arrangements, however, do not fully eliminate our exposure to commodity prices and supply risk, which could materially and adversely affect our business, financial condition and results of operations.
The price of ethanol from sugarcane is directly correlated to the price of sugar and is becoming closely positively correlated to the price of oil, so that a decline in the price of sugar will adversely affect our revenue from the sale of ethanol and a decline in the price of oil may adversely affect our revenue from the sale of ethanol
The price of ethanol, generally, is closely associated with the price of sugar, and, to some degree, is increasingly correlated to the price of oil. A significant portion of our ethanol production in Brazil is produced at sugarcane mills that produce both ethanol and sugar. Because sugarcane millers are able to alter their product mix in response to the relative prices of ethanol and sugar, this results in the prices of both products being directly correlated, and the correlation between ethanol and sugar may increase over time. In addition, sugar prices in Brazil are determined by prices in the global market, so that there is a strong correlation between Brazilian ethanol prices and global sugar prices.
Because flex-fuel vehicles allow consumers to choose between gasoline and ethanol at the fuel pump, ethanol prices are now becoming increasingly positively correlated to gasoline prices and, consequently, oil
44
Table of Contents
prices. We believe that the positive correlation between these products will increase over time. Accordingly, a decline in sugar prices will have an adverse effect on the financial performance of our ethanol and sugar businesses, and the current decline in oil prices may have a material adverse effect on our business, financial condition and results of operations. However, biofuels are not the only alternative fuel for the transportation sector currently under development in the market. Future demand for fuel will depend on the relative attractiveness of other technologies, such as electric vehicles, synthetic fuels and other fossil fuels such as methane or liquid petroleum gas. Certain of these technological initiatives receive public support from governments. If biofuels do not remain an attractive alternative fuel competitive with gasoline and other emerging technologies, such occurrence may have an adverse effect on our business, financial condition and results of operations.
We rely on third-party distribution agreements for our products which we may not be able to maintain
We currently have several long-term contracts for the distribution of ethanol and biodiesel for a number of our plants. If these long-term contracts were not renewed, or were renewed on terms less favorable to us, it may have an adverse effect on our business, financial condition and results of operations.
The Biofuels segment of our Industrial Production activity may be adversely affected due to a change in the public opinion regarding the use of grain and sugar for the production of ethanol
We may face adverse public opinion to the use of grain and sugar for the production of ethanol. Governments responding to public pressure may put in place measures to divert the supply of grain and sugar away from ethanol production and towards the food market, thereby inhibiting our current ethanol production activities or our plans for future expansion, which could have a material adverse effect on our business, financial condition and results of operations.
Our revenue from the Biofuels segment of our Industrial Production activity may be affected by adverse weather conditions, disease, government programs, competition, government regulation and various factors beyond our control
Adverse weather conditions, disease, plantings, government programs and policies, competition and changes in global demand are factors that have historically caused damage to, and affected related prices in, grain and sugar cane crops, reducing our pool of supply for ethanol production, which may have a material adverse effect on our business, financial condition and results of operations. In addition, government regulation of biofuels, including the elimination of existing subsidies for biofuels in some of the markets in which we operate, may have the result of changing consumer preferences or the prices by which we produce and market such biofuels.
Our Industrial Production activity is subject to an increasingly demanding level of governmental regulations and environmental legislation
Our Industrial Production activity is subject to an increasingly demanding level of governmental regulations. Among other things, these laws and regulations impose comprehensive local, state, municipal, foreign and supranational statutory and regulatory requirements concerning, among other matters, the treatment, acceptance, identification, storage, handling, transportation and disposal of industrial by-products, hazardous and solid waste materials, air emissions and soil contamination. In addition, environmental liability in Brazil is strict and joint. As a result, we may be held liable for damages caused to the environment by third parties hired by us for waste disposal and other services. There can be no assurance that potential liabilities, expenditures, fines and penalties associated with environmental laws and regulations will not be imposed on us in the future or that such liabilities, expenditures, fines or penalties will not have a material adverse effect on our business, financial condition and results of operations.
45
Table of Contents
Risks Related to Our Indebtedness
We operate with a high amount of indebtedness and we may incur significant additional debt
Our operations are capital intensive and we operate with a significant amount of indebtedness, which, as of December 31, 2014, totaled €10,283.5 million, of which €5,325.4 million was Gross Corporate Debt and €4,958.1 million was Project Debt, approximately €1,946.4 million of which was bridge loans as described below. Additionally, we have additional corporate borrowing capacity of €386 million which we may incur without triggering a breach of our financial covenants. Our indebtedness may increase, from time to time, in the future for various reasons, including fluctuations in operating results, capital expenditures and potential acquisitions or joint ventures. In addition to our significant indebtedness, we had substantial off-balance sheet arrangements with third-party guarantors, which totaled €7,462.1 million as of December 31, 2014.
Our shareholding in Abengoa Yield during 2014 was treated as a discontinued operation in accordance with the stipulations and requirements of IFRS 5,Non-Current Assets Held for Sale and Discontinued Operations. In accordance with this standard, the assets and liabilities of Abengoa Yield are included under a single heading in our consolidated statement of financial position as of December 31, 2014. In addition, given that as of December 31, 2014, the companies expected to be transferred to APW1 are available for immediate sale and we consider the sale to be highly probable, we have classified the associated assets and liabilities as held for sale in the consolidated statement of financial position as of December 31, 2014 in accordance with the stipulations and requirements of IFRS 5,Non-Current Assets Held for Sale and Discontinued Operations. In the event that we do not, before the end of 2015, reduce our shareholding in Abengoa Yield below 50% or consummate the sale to APW1 of the assets expected to be transferred to it, these assets and liabilities would be fully consolidated again, with corresponding increases in our indebtedness.
Moreover, as a result of our implementation of the new accounting standards set forth in IFRS 10, which came into effect on January 1, 2012, for purposes of the Consolidated Financial Statements, we have de consolidated companies that do not fulfill the conditions of effective control of the interest during the construction phase in terms of decision making and have included them in our financial statements according to the equity method. However, it is expected that these projects will be fully consolidated again once they enter into operation and we gain control over them, with corresponding significant increases in our long term Project Debt, among others.
Our substantial indebtedness could have important consequences to you. For example, it could:
- •
- make it more difficult for us to successfully refinance upcoming maturities;
- •
- make it more difficult for us to satisfy our obligations with respect to our outstanding debt obligations;
- •
- increase our vulnerability to general adverse economic and industry conditions;
- •
- require us to dedicate a substantial portion of our cash flow from operations to payments on our indebtedness, thereby reducing the availability of our cash flow to fund working capital, capital expenditures, R&D&i and other general corporate purposes;
- •
- restrict our ability to make certain distributions with respect to our shares and the ability of our subsidiaries to make certain distributions to us, in light of restricted payment and other financial covenants in our financing agreements;
- •
- limit our flexibility in planning for, or reacting to, changes in our business and the market in which we operate;
- •
- place us at a competitive disadvantage compared to our competitors that have less debt; and
- •
- limit our ability to borrow additional funds.
46
Table of Contents
If operating cash flows and other resources (for example, any available debt or equity funding or the proceeds of asset sales or short-term financing lines) are not sufficient to repay obligations as they mature or fund liquidity needs, we may be forced to do one or more of the following:
- •
- delay or reduce capital expenditures;
- •
- forego business opportunities, including acquisitions; or
- •
- restructure or refinance all, or a portion, of our debt on or before maturity,
any or all of which could have a material adverse effect on our business, financial condition and results of operations and, therefore, on the ability of the obligors under that debt to perform their respective obligations in respect of our debt.
If we were to fail to satisfy any of our debt service obligations or to breach any related financial or operating covenants, the holders of that debt could declare the full amount of the indebtedness to be immediately due and payable and could foreclose on any assets pledged as collateral. Further, certain of our financing arrangements contain cross-default provisions such that a default under one particular financing arrangement could automatically trigger defaults under other financing arrangements. Certain of such arrangements also contain cross-default provisions related to the financing arrangements of other sponsors unrelated to us. Such cross-default provisions could, therefore, magnify the effect of an individual default. As a result, any default under any indebtedness to which we or any such other party are a party could result in a substantial loss to us or could otherwise have a material adverse effect on our and our subsidiaries' ability to perform our and their respective obligations in respect of any of our debt obligations.
Despite our significant current leverage, the terms of the indentures and other agreements governing our outstanding indebtedness will permit us and our subsidiaries, joint ventures and associates to incur substantial additional debt, including secured debt, in the future. Furthermore, the terms of our indebtedness and other agreements does not limit the amount of Project Debt we may issue including Project Debt in the form of bridge loans guaranteed by Abengoa, S.A. and/or its subsidiaries, as described below, and such Project Debt may be secured. If we incur additional debt, the related risks we now face could intensify.
Of the €4,958.1 million of Project Debt that we had as of December 31, 2014, approximately €1,946.4 million were bridge loans, whereby Abengoa, S.A. and/or its subsidiaries (other than non-recourse subsidiaries) guarantee obligations in order to act as sponsors for the period prior to project companies securing long-term project financing (typically periods of less than 2-3 years). In the event of default under these obligations, creditors would have recourse to Abengoa, S.A. and any subsidiary that had guaranteed such obligations. If we believe there is a risk of non-compliance with the debt repayment schedule of bridge loans, such financing would be reclassified on our consolidated statement of financial position as a type of recourse financing, depending upon the nature of the arrangement. See Note 19 to our Consolidated Financial Statements for further details.
Furthermore, we rely to a significant extent on short-term financing lines to finance our working capital requirements. If these lines are withdrawn, reduced or otherwise not available to us, we could be required to seek other sources of financing which could involve incurring substantial additional debt, including secured debt, in the future, if available. We are also increasingly reliant on the Euro commercial paper market to manage our working capital requirements. If short-term financing or the Euro commercial paper market are not available to us, and we are not able to replace such sources of financing with other sources of financing on a timely basis, or at all, this would have a material adverse effect on our liquidity position.
Our operating and financial flexibility may be reduced by restrictive covenants in the agreements governing our indebtedness and other financial obligations
The agreements governing our indebtedness and other financial obligations applicable to us and certain of our subsidiaries contain various negative and affirmative covenants, including the requirement to maintain
47
Table of Contents
certain specified financial ratios. Depending on the agreement, these covenants reduce our operating flexibility as they limit our and certain of our subsidiaries' ability to, among other things: incur additional indebtedness; make distributions, loans, and other types of restricted payments; liquidate or dissolve the applicable companies; enter into any spin-off, transformation, merger, or acquisition, subject to certain exceptions set forth in the applicable agreement; and change the nature or scope of the lines of business. The extent of the restrictions on our subsidiaries' ability to transfer assets to us through loans, advances or cash dividends without the consent of third parties is significant, requiring us to include condensed financial information regarding Abengoa, S.A. as part of our Consolidated Financial Statements. Furthermore, some of our subsidiaries have restrictions on their ability to pay dividends or make other distributions to us, including restrictions under the terms of the agreements governing project-level financing, or restrictions applicable in the various jurisdictions in which we operate, such as exchange controls or similar matters. Our project-level financing agreements generally prohibit distributions to us unless certain specific conditions are met, including the satisfaction of financial ratios. If we or any of our applicable subsidiaries violate any of these covenants, a default may result, which, if not cured or waived, could result in the acceleration of our debt and could limit the ability of our subsidiaries to make distributions to us.
To service our indebtedness, we will require a significant amount of cash. We have generated significant negative cash outflows in the last three fiscal years and our liabilities at the end of each of those years have exceeded our tangible assets. Our ability to generate cash depends on many factors beyond our control.
As a result of the investments we have made in our activities in the years ended December 31, 2014, 2013 and 2012, which totaled €2,883.3 million, €2,257.1 million and €2,731.5 million, respectively, in capital expenditures, we have generated a significant amount of negative cash outflows during each of those periods, and our liabilities at each respective period end have exceeded our tangible assets.
Our ability to make payments on, and to refinance, our indebtedness and fund planned capital expenditures and R&D&i initiatives will depend on our ability to generate cash in the future. In addition, a substantial part of the Project Debt of our project companies is fully amortized over the term of such debt, and we rely on cash flows from such project companies to meet our payment obligations thereunder. Our cash flow, to a certain extent, is subject to general economic, financial, competitive, legislative, regulatory and other factors that are beyond our control. Based on our current level of operations, we believe our cash flow from operations, available cash and available borrowings under our credit facilities will be adequate to meet our future liquidity needs for at least twelve months. We cannot assure you, however, that our business will generate sufficient cash flow from operations; that ongoing cost savings and operating improvements will be realized on schedule; that we will be able to maintain the same terms for our payments and collections and therefore maintain our negative working capital balance; or that future borrowings will be available to us under our credit facilities in an amount sufficient to enable us to pay our indebtedness or to fund our other liquidity needs or to enable us to pursue our uncommitted capital expenditure plan (see "Item 5.B—Liquidity and Capital Resources"). We may need to refinance all, or a portion, of our indebtedness on or before maturity. We cannot assure you that we will be able to refinance any of our indebtedness on commercially reasonable terms, or at all.
We may not be able to raise the funds necessary to finance a mandatory prepayment of amounts outstanding under certain of our credit facilities in the event of a change of control if so required by a majority of the lenders or a change of control offer required by the indentures governing our outstanding debt securities
Under the terms of certain of our credit facilities, the majority of the lenders (as defined in each such facility) under each such facility have the right to require early repayment of all outstanding borrowings under such facility, together with accrued interest and all accrued commissions and expenses, upon a person or entity other than our current controlling shareholder gaining control of us. Under the terms of our
48
Table of Contents
outstanding debt securities, we are required to offer to repurchase such debt securities if we experience a change of control as defined in the indentures governing such debt securities. We may be unable to raise sufficient funds at the time of a change of control to make such mandatory repayment of all outstanding borrowings under those credit facilities or repurchase such debt securities.
Existing and potential future defaults by subsidiaries, joint ventures or associates pursuant to Project Debt could adversely affect us
We attempt to finance certain of our projects and significant investments, including capital expenditures typically relating to concessions or fixed tariff take-or-pay agreements, primarily under loan agreements and related documents which, except as noted below, require the loans to be repaid solely from the revenue of the project being financed thereby, and provide that the repayment of the loans (and interest thereon) is secured solely by the shares, physical assets, contracts and cash flow of that project company. This type of financing is usually referred to herein as "Project Debt", "bridge loans" or "project financing." As of December 31, 2014, we had €10,283.5 million outstanding indebtedness on a consolidated basis, of which €4,958.1 million was Project Debt of which approximately €1,946.4 million were bridge loans, whereby Abengoa, S.A. and/or its subsidiaries (other than non-recourse subsidiaries) guarantee obligations in order to act as sponsors for the period prior to project companies securing long-term project financing (typically periods of less than 2-3 years). In the event of default under these obligations, creditors would have recourse to Abengoa, S.A. and any subsidiary that had guaranteed such obligations. If we determine there is a risk of non-compliance with the debt repayment schedule of bridge loans, such financing would be reclassified on the consolidated statement of financial position as a type of corporate finance, depending upon the nature of the arrangement. See Note 19 to our Consolidated Financial Statements for further details.
While the lenders under the remainder of our Project Debt other than bridge loans do not have direct recourse to us or our subsidiaries (other than the project borrowers under those financings), defaults by the project borrowers under such financings can still have important consequences for us and our subsidiaries, including, without limitation:
- •
- reducing our receipt of dividends, fees, interest payments, loans and other sources of cash, since the project company will typically be prohibited from distributing cash to us and our subsidiaries during the pendency of any default;
- •
- causing us to record a loss in the event the lender forecloses on the assets of the project company; and
- •
- the loss or impairment of investors' and project finance lenders' confidence in us.
Any of these events could have a material adverse impact on our financial condition and results of operations.
Any future credit rating downgrade may impair our ability to obtain financing and may significantly increase our cost of indebtedness
Credit ratings affect the cost and other terms upon which we are able to obtain financing (or refinancing). Rating agencies regularly evaluate us and their ratings of our default rate and existing capital markets debt are based on a number of factors, including the credit rating of the Kingdom of Spain, where we are incorporated. On April 26, 2012, Standard & Poor's Rating Services ("S&P") downgraded the debt of Spain from "A" to "BBB+", citing concerns related to the negative economic growth and the capital adequacy of certain Spanish financial institutions. This was followed by rating downgrades by Fitch Ratings, Inc. ("Fitch") on November 1, 2013, which lowered Spain's rating from "A" to "BBB" with a stable outlook, and Moody's Investors Service, Inc. ("Moody's") on June 13, 2012, which likewise lowered Spain's rating from "A3" to "Baa3." Moody's upgraded its rating to "Baa2" on February 24, 2014, with a positive outlook. Fitch subsequently raised its rating to "BBB+". S&P announced on October 10, 2012 that it had further lowered its long-term sovereign credit rating of the Kingdom of Spain to "BBB-" from "BBB+" and the short-term
49
Table of Contents
sovereign credit rating to A-3 from A-2, with a negative outlook on the long-term rating; the outlook was changed to stable on November 29, 2013.
Partially as a result of the downgrade of Spain, where we are incorporated, on July 17, 2012, Moody's downgraded our corporate family and probability of default ratings from "Ba3" to "B1" with a stable outlook. Concurrently, Moody's downgraded the rating on certain of our existing high- yield notes from "Ba3" to "B1." On November 30, 2012 Moody's changed to negative from stable the outlook on the B1 rating of our corporate family and such high-yield notes and downgraded them on March 20, 2013 from B1 to B2 with a stable outlook. On December 27, 2012, S&P changed the perspective of the B+ rating from stable to watch negative of our corporate family and such high yield notes and S&P downgraded them on April 3, 2013 to "B" with negative outlook.
On March 19, 2014, S&P reaffirmed our corporate family probability of default ratings of "B" but with a positive outlook and on February 10, 2015, S&P reaffirmed the rating of the corporate family and of our high-yield notes. On October 21, 2014, Fitch reaffirmed our corporate family rating and probability of default rating from "B+" but with a negative outlook. In addition, Moody´s has maintained its 'B2' rating with a stable outlook during 2014, reaffirming it on November 24, 2014.
Any future downgrade of the Kingdom of Spain, our corporate family or of our outstanding nonconvertible debt securities may impede our ability to obtain financing on commercially acceptable terms, or on any terms at all, significantly increase our cost of borrowing or interfere with our ability to implement our corporate strategy. There can be no assurance that further credit ratings downgrades, either of Spain or our Group, will not occur. The occurrence of any of these events could have a material adverse effect on our business, financial condition and results of operations.
Risks Related to Ownership of the ADSs and Class B shares
The trading price of our ADSs and dividends paid on our ADSs may be materially adversely affected by fluctuations in the exchange rate for converting euros into U.S. Dollars
Market prices for our ADSs may fall if the value of euros declines against the U.S. Dollar. The U.S. Dollar amount of cash dividends and other cash payments made to holders of our ADSs would be reduced if the value of euros declines against the U.S. Dollar.
Holders of our ADSs may not be able to exercise their voting rights due to delays in notification to and by the depositary
The rights of shareholders under Spanish law to take actions such as voting their shares, receiving dividends and distributions, bringing derivative actions, examining our accounting books and records and exercising appraisal rights are available only to shareholders of record. Because the depositary, through its custodian, will be the record holder of the Class B shares underlying the ADSs, a holder of ADSs will not be entitled to the same rights as a shareholder. In its capacity as an ADS holder, an investor in the Company's ADSs will not able to vote, bring a derivative action, examine our accounting books and records or exercise appraisal rights, except through the depositary.
The depositary for our ADSs may not receive voting materials for our Class B shares represented by our ADSs in time to ensure that holders of our ADSs can instruct the depositary to vote their shares. In addition, the depositary's liability to holders of our ADSs for failing to carry out voting instructions or for the manner of carrying out voting instructions is limited by the Deposit Agreement governing our ADR facility. As a result, holders of our ADSs may not be able to exercise their right to vote and may have limited recourse against the depositary or us, if their shares are not voted according to their request. Although holders or owners of ADSs who withdraw Class B shares from the depositary may vote those Class B shares directly, such holders or owners of the ADSs may not receive sufficient advance notice of shareholder meetings to enable them to withdraw the shares and vote at such meetings.
50
Table of Contents
Holders of our ADSs will have limited recourse if we or the depositary fail to meet our respective obligations under the Deposit Agreement
The Deposit Agreement expressly limits our obligations and liability and those of the depositary. Neither we nor the depositary will be liable if either:
- •
- is prevented from or delayed in performing any obligation by circumstances beyond our/their control;
- •
- exercises or fails to exercise discretion under the Deposit Agreement; or
- •
- takes any action based upon the advice of, or information from, legal counsel, accountants, any person presenting ordinary shares for deposit, any holder or owner of our ADSs or any other person believed by us or the depositary in good faith to be competent to give such advice or information. In addition, the depositary has the obligation to participate in any action, suit or other proceeding with respect to our ADSs which may involve it in expense or liability only if it is indemnified. These provisions of the Deposit Agreement will limit the ability of holders of our ADSs to obtain recourse if we or the depositary fails to meet their obligations under the Deposit Agreement or if they wish to involve us or the depositary in a legal proceeding.
Because Inversión Corporativa IC, S.A., as the direct and indirect holder of 58.815% of our Class A shares issued, controls the majority of the voting power of our outstanding share capital, other shareholders will be unable to affect the outcome of shareholder votes with respect to most events.
Our Class A shares have 100 votes per share and our Class B shares have one vote per share. Inversión Corporativa IC, S.A. beneficially owns, either directly or indirectly through Finarpisa, S.A., 49,548,068 of our Class A shares and 219,841,737 of our Class B shares and 56.369% of the total combined voting power of our Class A shares and Class B shares outstanding as of December 31, 2014. In the event that all holders of Class A shares other than Inversión Corporativa IC, S.A. were to convert their Class A shares to Class B shares, Inversión Corporativa IC, S.A. would as of December 31, 2014 hold 88.514% of the total combined voting power of our aggregate issued and outstanding Class A and Class B shares (subject to its agreement entered into on August 27, 2012 with us not to exercise voting rights in excess of 55.93% of the voting power in the Company unless its economic rights in us exceed such amount). Accordingly, Inversión Corporativa IC, S.A. has and is expected to maintain the ability to determine the outcome of shareholder votes with respect to most events that may require shareholder approval, including:
- •
- mergers, consolidations and other business combinations;
- •
- election or non-election of directors;
- •
- removal of directors; and
- •
- certain amendments to our Bylaws.
As a result, Inversión Corporativa IC, S.A. may be able to effectively approve or prevent a merger, consolidation or other business combination, elect or not elect directors, approve or prevent the removal of a director and approve or prevent amendments to our Bylaws. Inversión Corporativa IC, S.A.'s interests in any of these matters may be contrary to the interests of the rest of the holders of our Class B shares.
On September 30, 2012, the Extraordinary General Shareholders' Meeting approved a modification of our Bylaws to include certain minority protection rights for holders of Class B shares afforded by Spanish corporate laws to holders of shares representing specified percentages of a company's share capital, including among others the right to request the calling of an extraordinary general meeting of shareholders, to add items to the agenda of any ordinary general shareholders meeting and to challenge resolutions passed by the Board of Directors. Notwithstanding this, holders of Class B shares will not, in practice, be able to appoint
51
Table of Contents
directors by virtue of the proportional representation mechanism (representación proporcional), which is only available to holders of at least 5% of our share capital.
For more information regarding the shareholdings of Inversión Corporativa IC, S.A., see "Item 7.A—Major Shareholders."
Our dual-class share structure with different voting rights could discourage others from pursuing any change of control transactions that holders of our Class B shares and ADSs may view as beneficial
We have two classes of voting shares. Holders of Class A shares are entitled to 100 votes per share, while holders of Class B shares are entitled to one vote per share. Inversión Corporativa IC, S.A. beneficially owns, either directly or indirectly through Finarpisa, S.A., 49,548,068 of our Class A shares and 219,841,737 of our Class B shares and 56.369% of the total combined voting power of our Class A shares and Class B shares outstanding as of December 31, 2014 (subject to its agreement entered into on August 27, 2012 with us not to exercise voting rights in excess of 55.93% of the voting power in the Company unless its economic rights in us exceed such amount).
Due to the disparate voting rights attached to our Class A and Class B shares, holders of our Class A shares and, in particular, Inversión Corporativa IC, S.A. will have significant voting power over matters requiring shareholder approval, including election of directors and significant corporate transactions, such as a merger or sale of our company or our assets. Because this concentrated control could discourage others from pursuing any potential merger, takeover or other change of control transactions that holders of Class B shares and ADSs may view as beneficial, the market price of our Class B shares and ADSs could be adversely affected.
In addition, holders of ADSs and Class B shares may not have the same protections as the Class A shares in the event of a takeover bid by a third-party offeror for all of the outstanding voting shares of Abengoa. Under Spanish tender offer legislation, it is not clear whether in such event the offeror would be obligated to offer to holders of Class B shares the same price per share that it offers to holders of our Class A shares. Our Bylaws provide holders of Class B shares with the right to have their shares redeemed under certain circumstances for consideration equal to the price per share offered to holders of the Class A shares in a takeover bid launched for 100% of the voting shares not providing the same treatment for holders of Class A shares and of Class B shares. Because the inclusion of such redemption right in our Bylaws may discourage others from pursuing a voluntary takeover bid that holders of our Class B shares and ADSs may view as beneficial, the market price of our Class B shares and ADSs could be adversely affected.
While our Class B shares and ADSs have similar economic rights to our Class A shares, they may trade at different prices from our Class A shares
While our Class B shares have different voting rights from our Class A shares, the two classes of shares are similar in terms of the economic rights that attach to them. In particular, each Class B share grants its holder, among other things, the rights to receive the same dividend, the same payment on liquidation, the same restitution of contributions in the event of any capital reduction, the same distribution of reserves of any kind or of the issue premium and any other allocations as the Class A shares. Moreover, in the event of any capital increase, holders of the Class A shares and Class B shares are both entitled to pre-emptive subscription rights allowing them, upon exercise of such rights, to maintain their respective percentage ownership interest in the share capital of Abengoa.
Despite having similar economic rights, however, the Class A shares and the Class B shares have traded in the past at different prices from each other. We cannot provide you with any assurance that the trading price of the Class B shares and ADSs will be correlated with the trading price of the Class A shares in the future.
52
Table of Contents
Our ability to redeem the Class B shares upon the occurrence of certain tender offers for our voting shares may conflict with applicable restrictions under our debt instruments
Under our Bylaws, in the event that a tender offer is made for the acquisition of all of our voting shares, following which the offeror, together with any persons acting in concert with the offeror, (i) directly or indirectly holds 30% or more of our voting rights (except where another person, individually or together with other persons acting in concert with it, already held a percentage of voting rights equal to or greater than that held by the offeror after such tender offer), or (ii) becoming the holder of a shareholding below 30%, appoints a number of directors to our Board of Directors that, either by themselves or collectively with those already appointed previously (as the case may be), constitute more than 50% of our Board of Directors, each holder of Class B shares shall be entitled to have all of its Class B shares redeemed by us in a manner in accordance with Spanish law except where the holders of Class B shares had the right to participate in such tender offer in the same manner and on the same terms and conditions and, in any event, for the same consideration, as the holders of Class A shares (each such event under clauses (i) and (ii) above, a "Redemption Event").
The credit agreements, indentures and other debt instruments governing our existing indebtedness contain restrictions on our ability to repurchase or redeem our outstanding shares. We may be required by our Bylaws to redeem the Class B shares (including any Class A shares converted into Class B shares pursuant to the terms thereof) even in circumstances where such payment would contravene covenants in our indebtedness, which could result in an acceleration of the related indebtedness. In such circumstances, we may be unable to meet or refinance such payment obligations under conditions satisfactory to us or at all, in which case our business, results of operations and financial condition and the market price of our Class B shares and ADSs could be materially adversely affected.
Holders of our ADSs in the United States may not be able to participate in offerings of rights, warrants or similar securities to holders of our ordinary shares on the same terms and conditions as holders of our ordinary shares
In the event that we offer rights, warrants or similar securities to the holders of our ordinary shares or distribute dividends payable, in whole or in part, in securities, the Deposit Agreement provides that the depositary (after consultation with us) shall have discretion as to the procedure to be followed in making such rights or other securities available to ADS holders including disposing of such rights or other securities and distributing the net proceeds in U.S. Dollars to ADS holders. We generally would be required to register with the SEC any public offering of rights, warrants or other securities made to our ADS holders unless an exemption from the registration requirements of the U.S. securities laws is available. Registering such an offering with the SEC can be a lengthy process which may be inconsistent with the timetable for a global capital raising operation. Consequently, we may in the future elect not to make such an offer in the United States, including to our ADS holders in the United States and rather only conduct such an offering in an "offshore" transaction in accordance with Regulation S under the Securities Act, as amended. Therefore, there can be no assurance that our ADS holders will be able to participate in such an offering in the same manner as our ordinary shareholders. In such event, the percentage ownership interest and voting power of the Class B shareholders would decline relative to the percentage ownership interest and voting power of the Class A shareholders and, in particular, Inversión Corporativa IC, S.A.
As a "foreign private issuer" in the United States, we are exempt from certain rules under the U.S. securities laws and are permitted to file less information with the SEC than U.S. companies
As a "foreign private issuer," we are exempt from certain rules under the U.S. Securities Exchange Act of 1934, as amended (the "Exchange Act"), that impose certain disclosure obligations and procedural requirements for proxy solicitations under Section 14 of the Exchange Act. In addition, our officers, directors and principal shareholders are exempt from the reporting and "short-swing" profit recovery provisions of Section 16 of the Exchange Act and the rules under the Exchange Act with respect to their purchases and
53
Table of Contents
sales of our ordinary shares and ADSs. Moreover, we are not required to file periodic reports and financial statements with the SEC as frequently or as promptly as U.S. companies whose securities are registered under the Exchange Act. In addition, we are not required to comply with Regulation FD, which restricts the selective disclosure of material information. Although we must comply with Spanish listing rules on insider reporting of share ownership and on protection of inside information, there may be less publicly available information concerning us than there is for U.S. public companies.
Judgments of U.S. courts may not be enforceable against us
Judgment of U.S. courts, including those predicated on the civil liability provisions of the federal securities laws of the U.S. may not be enforceable in courts in Spain. As a result, our shareholders who obtain a judgment against us in the U.S. may not be able to require us to pay the amount of the judgment.
There are limitations on enforceability of civil liabilities under U.S. federal securities laws
We are a Spanish company. Most of our officers and directors are residents of Spain and not the United States. It may be difficult or impossible to serve legal process on persons located outside the United States and to force them to appear in a U.S. court. It may also be difficult or impossible to enforce a judgment of a U.S. court against persons outside the United States, or to enforce a judgment of a foreign court against such persons in the United States. We believe that there may be doubt as to the enforceability against persons in Spain, whether in original actions or in actions for the enforcement of judgments of U.S. courts, of civil liabilities predicated solely upon the laws of the United States, including its federal securities laws. Because we are a foreign private issuer, our directors and officers will not be subject to rules under the Exchange Act that under certain circumstances would require directors and officers to forfeit to us any "short-swing" profits realized from purchases and sales, as determined under the Exchange Act and the rules thereunder, of our equity securities. However, under Spanish listing rules, our directors must not deal in any of our securities on considerations of a short-term nature.
Individual shareholders who hold at least 3% of the capital stock of a Spanish company (including U.S. persons) have the right under Spanish law to bring lawsuits against our directors for breach of their duties on behalf of the company in which they are a shareholder, and on their own behalf against the company.
Future sales of the Class A shares, Class B shares and/or the ADSs and/or equity related securities in the public market could adversely affect the trading price of the Class A shares, Class B shares and the ADSs and our ability to raise funds in new stock offerings
Future sales of substantial amounts of the Class A shares, Class B shares and/or the ADSs and/or equity related securities in the public market, or the perception that such sales could occur, could adversely affect prevailing trading prices of our Class B shares and the ADSs and could impair our ability to raise capital through future offerings of equity or equity related securities. No prediction can be made as to the effect, if any, that future sales of the Class A shares, Class B shares and/or the ADSs or the availability of the Class A shares, Class B shares and/or the ADSs and/or equity related securities for future sale will have on the trading price of our Class B shares and the ADSs.
The price of the Class B shares and the ADSs could be depressed by investors' anticipation of the potential sale in the market of substantial additional amounts of Class B shares and ADSs. Disposals of the Class B shares and/or the ADSs would increase their offer in the market and depress their price.
The trading market for securities such as the Class B shares and the ADSs may be volatile and may be adversely impacted by many events
Market volatility may affect the price of our Class B shares and/or the ADSs. The market price of our Class B shares or the ADSs may be adversely affected if our public image or reputation were to be damaged as a result of adverse publicity, poor financial or operating performance, changes in financial condition or otherwise. For example, on November 13 and 14, 2014, our share and bond prices significantly declined
54
Table of Contents
following the release of our nine month results for the period ended September 30, 2014 and questions raised regarding our reporting of non-recourse debt and non-recourse debt in process, which adversely affected our working capital at the end of 2014 and led to our recategorization of non-recourse debt as "Project Debt" and our non-recourse finance in process as "bridge loans" in this annual report and in our Consolidated Financial Statements. Any perceived concerns regarding our financial reporting practices, or perceived or real financial or operating or other difficulties experienced by us would have an adverse effect on the price of our Class B shares or the ADSs or otherwise materially adversely affect our business, financial condition and results of operations.
Additionally, the market for securities issued by issuers like us, such as the Class B shares and the ADSs, is influenced by economic and market conditions and, to varying degrees, market conditions, interest rates, currency exchange rates and inflation rates in other European and other industrialized countries. There can be no assurance that events in Spain, Europe, the United States or elsewhere will not cause market volatility or that such volatility will not adversely affect the price of the Class B shares or the ADSs or that economic and market conditions will not have any other adverse effect. Fluctuations in interest rates may give rise to arbitrage opportunities based upon changes in the relative value of the Class B shares or the ADSs. Any trading by arbitrageurs could, in turn, affect the trading prices of the Class B shares or ADSs.
ITEM 4. INFORMATION ON THE COMPANY
A. History and Development of the Company
Abengoa was incorporated under the laws of the Kingdom of Spain in Seville on January 4, 1941 as a limited liability company (sociedad de responsabilidad limitada) and was subsequently changed to a limited company (sociedad anónima) on March 20, 1952. We were originally founded as Sociedad Abengoa, S.L. in Seville by Javier Benjumea Puigcerver and José Manuel Abaurre and devoted to the manufacturing of mono phase meters for measurement of electric currents. However, we changed course due to supply problems and, soon after, we began offering engineering consultancy services, carrying out technical studies and completing construction works within the energy sector. Our registered office and our headquarters are located at Campus Palmas Altas, Calle Energía Solar, No. 1, 41014 Seville, Spain. The telephone number for our headquarters is +34 954 93 71 11.
Abengoa expanded throughout Spain in the 1950s and started its international expansion in the 1960s, first to South America, then to the United States and Canada, rest of Europe, Africa, Asia and other parts of the world. Today, Abengoa operates in more than 50 countries with offices and projects in more than 35 of them, with North America being its main location, accounting for 31.5% of total revenues during 2014, and Spain accounting for 12.4% of total revenues the same period. Abengoa is the parent company of the Group, which as of December 31, 2014 was made up of 653 companies, being the parent company itself, 607 subsidiaries, 17 associates and 28 joint ventures, in addition to certain companies of the Group being involved in 244 temporary joint ventures. Additionally, the Group has a number of shareholdings of less than 20% in various further entities.
We currently conduct our traditional engineering and industrial construction business through our subsidiary Abeinsa Ingeniería y Construcción Industrial S.A.
Until September 5, 2011, we conducted our information technology business through Telvent. We first entered this business when we acquired Sainco, a traffic automation company, in the late 1960s. As Sainco grew and broadened its spectrum of solutions and geographical reach, Abengoa decided to take the company public to finance its growth. As part of the reorganization undertaken prior to going public in 2004, the brand name of Telvent was adopted. In 2008, we acquired DTN Holding Company Inc., a leader in delivering real time business information to key decision makers in the agriculture, energy and environmental industries. As of December 31, 2009, 2010 and during part of the year 2011, we held a 40% shareholding in Telvent. On June 1, 2011, we announced the sale of our investment in Telvent to Schneider Electric S.A. and on September 5, 2011 the transaction was completed.
55
Table of Contents
We entered the environmental services business in the 1980s with our participation in water infrastructure projects in Spain. With the acquisition of Befesa in 2000, a company specializing in industrial waste management, we reorganized our environmental activities under Befesa. In 2006, Befesa acquired BUS Group AB, the founder of the original Befesa and the largest European recycler of steel dust, which acquisition made Befesa a European leader in industrial waste recycling. On June 13, 2013, we entered into a share purchase agreement for the sale of Befesa to funds advised by Triton Partners. On July 15, 2013, the sale transaction was closed.
We entered the bioenergy business in the 1990s. In late 1990s, we identified the need for a renewable energy alternative for the transport sector. We had a clear vision to achieve a critical mass in first generation bioethanol (or "cereal" bioethanol) and to make second generation bioethanol (or "biomass" bioethanol) commercially available through investments in R&D&i. We built our first two plants in Spain and in 2001 we acquired High Plains Corporation in the United States, a bioethanol producer with three plants. This new business line was organized as Abengoa Bioenergía. In 2007, we acquired Dedini Agro and entered the Brazilian bioenergy market.
Abengoa began its solar power activity in 1984 when the Company was one of the participants in the construction of the Solar Platform in Almería, Spain. Since then, multiple R&D&i projects have been carried out to develop different types of receivers for tower plants and parabolic trough technology, which were partially supported by the European Union Framework Programmes. These first steps were taken in Abengoa's Engineering and Construction and Industrial Production business units. In 2007, with the inauguration of the first tower technology commercial plant, PS10 (11 MW), as well as the world's largest low-concentration photovoltaic plant, Sevilla PV, with 1.2 MW of power output capacity, Abengoa Solar was incorporated as a business unit.
On July 27, 2010, Abengoa Concessões Brasil Holding, S.A., a subsidiary in the Concession-Type Infrastructure segment, concluded an agreement with the company State Grid International to sell its 25% shareholding in the companies ETEE (Expansión Transmisora de Energía Eléctrica, S.A.) and ETIM (Expansión Transmissora Itumbiara Marimbondo), which are responsible for the concession of the 794 kilometers of transmission lines that joins the power stations of the city of Itumbiara, in Soiás, Brazil, and Marimbondo, in the state of Minas Gerais, Brazil.
On June 2, 2011, Abengoa Concessões entered into an agreement with TAESA to sell 50% of its shareholding in a newly formed entity, named UNISA, to which Abengoa Concessões contributed 100% of its interests in four project companies that it controlled and that hold power transmission line concessions in Brazil. These four project companies are STE, ATE, ATE II and ATE III. In addition, on June 2, 2011, Abengoa Concessões and Abengoa Construção Brasil Ltda. entered into an agreement with TAESA to sell 100% of the share capital of NTE, another project company that holds a power transmission line concession in Brazil. We subsequently signed an agreement with TAESA on March 16, 2012 to sell our remaining 50% interest in UNISA, thereby completing the divestment of certain Brazilian transmission line concession assets (STE, ATE, ATE II and ATE III). See "Item 5.A—Operating Results—Factors Affecting the Comparability of our Results of Operations—Divestments and Business Combinations—Sale of Brazilian Transmission Line Assets."
In October 2011, we issued 17,142,858 Class B shares and warrants to purchase an additional 4,020,124 Class B shares to First Reserve as part of their €300 million investment in Abengoa. As a result of the First Reserve investment, First Reserve acquired approximately 0.2% of the voting rights of our share capital. For further information on First Reserve, see "Item 7.A—Major Shareholders."
In October 17, 2013, we carried out a capital increase of 250,000,000 Class B shares and, on October 29, 2013, we issued 37,500,000 additional Class B shares as a result of the exercise by the underwriters of the capital increase of their option to purchase additional shares to cover over- allotments. The shares were offered at a price of €1.80 per share, for total gross proceeds, including shares sold pursuant to the option, of €517.5 million. The new Class B shares are listed on the Madrid and Barcelona stock exchanges and, in the form of American Depositary Shares (with each American Depositary Share representing five Class B shares), on the NASDAQ Global Select Market. The shares were offered globally, including in the United States pursuant to a registration statement filed with the SEC.
56
Table of Contents
On June 18, 2014, we completed the Abengoa Yield IPO for total gross proceeds of $828.7 million (€611.0 million) before fees and expenses. Abengoa Yield is a dividend growth-oriented company formed by us that groups together renewable energy, conventional power, electric transmission lines and other contracted, revenue-generating assets previously reported in different operating segments within the Concession-Type Infrastructure activity. As a result of a second transfer of assets announced on February 9, 2015, Abengoa Yield is now present in the water infrastructure segment, has expanded its geographic presence to the north of Africa and is expected to expand its geographic presence to the United Arab Emirates. As such, Abengoa Yield became a new operating segment within the Concession-Type Infrastructure activity after the Abengoa Yield IPO and we reported that segment's results in our quarterly financial information for the quarters ended June 30, 2014 and September 30, 2014. Immediately following the Abengoa Yield IPO, we held 64% of the ordinary share capital of Abengoa Yield.
In September 2014, we announced our objective to transition to an "asset-light" business model in support of our "Abengoa 3.0" strategy. Leveraging the reduction in our long-term cost of capital achieved through the carve-out and IPO of Abengoa Yield, this strategy envisions, among other things, the creation of a vehicle to secure funding from external partners to provide bridge equity and bridge loans for new, greenfield, projects thereby allowing us to accelerate the timing of completion, bid on more projects and increase the return on equity investment.
On December 15, 2014, we updated our plan to further improve our financial structure through three main initiatives:
- •
- reducing our stake in Abengoa Yield;
- •
- accelerating the sale of assets to Abengoa Yield; and
- •
- the creation of a joint venture with external equity partners to invest in a portfolio of contracted assets under construction as well as in new contracted assets under development.
On December 15, 2014, our Board of Directors approved a plan to reduce our shareholding in Abengoa Yield to below 50% during 2015, subject to market conditions. On January 22, 2015, we completed an initial divestment of 13% through the sale in an underwritten public offering of 10,580,000 ordinary shares in Abengoa Yield (including 1,380,000 shares sold pursuant to the exercise in full of the underwriters' option to purchase additional shares) at a price of US$31 per share which brought our shareholding in Abengoa Yield to 51%. On February 9, 2015, we announced our intention to reduce our shareholding in Abengoa Yield to below 50% by the end of the first half of 2015, with the objective of maintaining a long-term stake in the range of 40-49%. We have also indicated our intention to reinforce the role of independent directors at Abengoa Yield in order to effectively transfer control once we reduce our shareholding in Abengoa Yield below 50%. Taking into account that Abengoa Yield was an operating segment within our Concession-Type Infrastructure activity during part of 2014 and the significance that those activities carried out by Abengoa Yield have for Abengoa, our shareholding in Abengoa Yield during 2014 was treated as a discontinued operation in accordance with the stipulations and requirements of IFRS 5,Non-Current Assets Held for Sale and Discontinued Operations. The treatment of Abengoa Yield as discontinued operations also resulted in the removal of the Abengoa Yield operating segment from our Concession-Type Infrastructure activity.
In accordance with this standard, the assets and liabilities of Abengoa Yield have been reclassified as assets and liabilities held for sale in our consolidated statement of financial position included within our consolidated financial statements as of and for the year ended December 31, 2014. Likewise, our consolidated income statements for the years ended December 31, 2014, 2013, 2012, 2011 and 2010 also include the results of Abengoa Yield under a single heading, "Profit (loss) from discontinued operations, net of tax".
57
Table of Contents
Our plan to accelerate the sale of assets to Abengoa Yield through the ROFO agreement started at the end of 2014 with our approval of a divestment plan that includes several companies owning concessional projects for water desalination plants in Algeria (Skikda and Honnaine), power transmission lines in Peru (ATN2) and thermo-solar plants in Abu Dhabi (Shams).
On February 9, 2015, we announced our agreement entered into with Abengoa Yield for a second transfer of assets, including: ATN 2, a transmission power line in Peru (40% stake); Shams, a 100-MW solar power asset in the United Arab Emirates (20% stake); rights of usufruct over Helioenergy 1/2, a 100-MW solar power asset in Spain (29.6% stake); and Honaine and Skikda, two water desalination plants in Algeria with an aggregate capacity of 10.5 Mft3/day (25.5% and 34.17% stakes, respectively) for total proceeds of approximately $142 million. The sale of Honaine and Skikda was closed on February 15, 2015, while the acquisition of the remaining assets is still pending. Regarding Honaine and Skikda, we have entered into a two-year call and put option agreement with Abengoa Yield under which they have put option rights to require us to purchase back these assets at the same price paid by them and we have call option rights to require them to sell back these assets if certain indemnities and guarantees provided by us reach a certain threshold. In addition, discussions between us and Abengoa Yield have already commenced regarding a potential third dropdown for a total equity value in the range of $200 to $250 million. This potential third acquisition falls within the $100 million call option agreement announced between us and Abengoa Yield in December 2014 at a 12% yield. The third dropdown divestment is expected to close by the end of the year.
Given that as of December 31, 2014, the companies holding the above-mentioned companies were available for immediate sale and that we consider the sales to be highly probable, we classified the associated assets and liabilities as held for sale in the consolidated statement of financial position as of December 31, 2014. Until the closing of the respective sale transactions, the assets, other than Helioenergy 1/2, will be reported as held for sale in accordance with the stipulations and requirements of IFRS 5,Non-Current Assets Held for Sale and Discontinued Operations.
On December 23, 2014, we entered into a letter agreement to negotiate exclusively EIG until March 31, 2015 an investment by EIG-managed investment funds, alongside Abengoa, in a portfolio of greenfield projects currently owned by Abengoa, on the basis of the terms set forth in the term sheet attached to the letter agreement. On February 2, 2015, EIG confirmed to us in writing that its due diligence to date had not revealed facts or circumstances that would cause EIG not to recommend the proposed transaction for approval by the EIG investment committees overseeing investments by EIG-managed investment funds. On February 9, 2015, we announced that we and EIG were in an advanced stage of documentation and due diligence regarding the proposed transaction.
As part of the transaction, Abengoa is expected to contribute to a newly formed company, APW1, a portfolio of selected Abengoa projects under construction, including renewable and conventional power generation, power transmission and water management assets in different geographies including, among others, the United States, Mexico, Brazil and Chile. Based on the current status of the negotiations, the total investment in the projects expected to be contributed is approximately $9.2 billion, of which approximately $2.5 billion once these projects are fully invested in the coming years, is expected to be equity. Of the total equity estimated to be committed, based on the current status of the negotiations, we expect that a majority stake (approximately 55%) in APW1 will be held by EIG, with the remainder held by Abengoa. Our current estimate of the total amount of EIG's investment, based on the current status of the negotiations, is approximately $1.4 billion over four years based on the projects expected to be contributed.
Once APW1 is created and the projects contributed to the vehicle, EIG will make an initial payment to us of less than half of their total expected $1.4 billion contribution to purchase 55% of the equity that Abengoa has already invested in the projects that have been contributed to APW1. Abengoa is expecting to receive
58
Table of Contents
these cash proceeds before March 31, 2015. The remaining projects are expected to be contributed by us to APW1 over time. The remaining equity expected to be required in order to develop the entire portfolio of projects is expected to be contributed over a period of four years both by Abengoa and EIG pro-rata to their shareholding in APW1 following the construction schedule of the projects in the vehicle as they are contributed to the vehicle, which is expected to take several months.
As part of the transaction with EIG, Abengoa and APW1 will sign a new right of first offer agreement to allow APW1 to acquire at cost Abengoa's present and future infrastructure assets in renewable energy, conventional power, electric transmission and water not already in operation. The financing of those new projects will be sourced either from new equity contribution, or from the reinvestment of the initial invested equity once the projects initially contributed by Abengoa are completed and sold, or by a combination of both. The objective of APW1 is to reinvest 100% of the initial equity in a second set of projects in the future, which if achieved would extend APW1's activity over approximately the next eight years. Distributions from APW1 are expected to be made in accordance with a waterfall to be agreed between the parties.
We expect that the definitive transaction agreements related to the investment by EIG will be entered into by March 31, 2015. Once we have entered into the definitive transaction agreements and the projects have been transferred to APW1, Abengoa will no longer have a controlling interest in these assets. Given that as of December 31, 2014, the companies expected to be transferred to APW1 are available for immediate sale and we consider the sale to be highly probable, we have classified the associated assets and liabilities as held for sale in the consolidated statement of financial position as of December 31, 2014. Until entry into definitive documentation and closing of the sale transaction, the assets will be reported as held for sale in accordance with the stipulations and requirements of IFRS 5,Non-Current Assets Held for Sale and Discontinued Operations. The expectations set forth herein regarding a potential transaction with EIG, the projects to be contributed and related investment amounts are based on the current status of negotiations with EIG and are subject to change as negotiation of definitive transaction agreements progresses, and any such change may be material. We cannot guarantee that we will be successful in consummating the transaction with EIG on the terms described above, on other terms acceptable to us, or at all.
B. Business overview
Overview
We are a leading engineering and clean technology company with operations in more than 50 countries worldwide that provides innovative solutions for a diverse range of customers in the energy and environmental sectors. Over the course of our 70-year history, we have developed a unique and integrated business model that applies our accumulated engineering expertise to promoting sustainable development solutions, including delivering new methods for generating power from the sun, developing biofuels, producing potable water from seawater, efficiently transporting electricity. A cornerstone of our business model has been investment in proprietary technologies, particularly in areas with relatively high barriers to entry. We organize our business into the following three activities: Engineering and Construction, Concession-Type Infrastructure and Industrial Production, as follows:
- •
- Our Engineering and Construction activity provides sophisticated turnkey engineering, procurement and construction ("EPC") services from design to implementation for infrastructure projects within the energy and water sectors and engages in other related activities with a high technology component.
- •
- Our Concession-Type Infrastructure activity operates, manages and maintains infrastructure assets, usually pursuant to long term concession agreements under Build, Own, Operate and Transfer ("BOOT") schemes, within four operating segments (Solar, Transmission, Water, and Co-generation and other).
- •
- Our Industrial Production activity produces a variety of biofuels (ethanol and biodiesel).
59
Table of Contents
For the year ended on December 31, 2014, our average number of employees was 27,181 people worldwide across our three business activities and, according to industry publications, we are among the market leaders in the majority of our areas of operation.
Our three activities are focused in the energy and environmental industries, and integrate operations throughout the value chain, including Research and Development and Innovation ("R&D&i"), project development, engineering and construction, and the operation and maintenance of our own assets and those of third parties. Our activities are organized to capitalize on our global presence and scale, as well as to leverage our engineering and technological expertise in order to strengthen our leadership positions.
We have successfully grown our business, with a compound annual growth rate of our Consolidated EBITDA of 19% from the year ended December 31, 2002 to the year ended December 31, 2014. We have also maintained double-digit growth in our consolidated revenue and Consolidated EBITDA on a compound annual growth basis since our 1996 initial public offering on the Madrid and Barcelona stock exchanges. As of December 31, 2014, we had a market capitalization of approximately €1.6 billion. As of December 31, 2014, our backlog was €7,953 million.
Our revenue, Consolidated EBITDA and net fixed assets of the Group and by segment as of and for the years ended December 31, 2014 and 2013 are set forth in the following tables.
| | | | | | | |
| | For the year ended
December 31, | |
|---|
| | 2014(1)(2) | | 2013(2) | |
|---|
| | (€ in millions)
| |
|---|
Revenue (total) | | | 7,150.6 | | | 7,245.1 | |
| | | | | | | | |
Engineering and Construction | | | 4,514.5 | | | 4,831.7 | |
| | | | | | | | |
Engineering and Construction | | | 4,514.5 | | | 4,831.7 | |
Concession-Type Infrastructure | | | 499.4 | | | 384.3 | |
| | | | | | | | |
Solar | | | 335.2 | | | 258.7 | |
Transmission | | | 91.4 | | | 47.5 | |
Water | | | 40.8 | | | 40.2 | |
Co-generation and other | | | 32.0 | | | 38.0 | |
Industrial Production | | | 2,136.7 | | | 2,029.1 | |
| | | | | | | | |
Biofuels | | | 2,136.7 | | | 2,029.1 | |
| | | | | | | | |
Consolidated EBITDA (total) (unaudited) | | | 1,408.0 | | | 1,267.4 | |
| | | | | | | | |
Engineering and Construction | | | 806.0 | | | 806.5 | |
| | | | | | | | |
Engineering and Construction | | | 806.0 | | | 806.5 | |
Concession-Type Infrastructure | | | 330.6 | | | 220.0 | |
| | | | | | | | |
Solar | | | 235.9 | | | 156.8 | |
Transmission | | | 64.3 | | | 27.7 | |
Water | | | 26.5 | | | 28.1 | |
Co-generation and other | | | 3.9 | | | 7.3 | |
Industrial Production | | | 271.4 | | | 240.9 | |
| | | | | | | | |
Biofuels | | | 271.4 | | | 240.9 | |
60
Table of Contents
| | | | | | | |
| | As of December 31, | |
|---|
| | 2014(1) | | 2013 | |
|---|
| | (€ in millions)
| |
|---|
Net Fixed Assets (total) | | | 9,044.1 | | | 12,030.0 | |
| | | | | | | | |
Engineering and Construction | | | 672.3 | | | 611.4 | |
| | | | | | | | |
Engineering and Construction | | | 672.3 | | | 611.4 | |
Concession-Type Infrastructure | | | 5,226.0 | | | 8,964.3 | |
| | | | | | | | |
Solar | | | 2,135.0 | | | 4,737.0 | |
Transmission | | | 2,273.1 | | | 2,749.9 | |
Water | | | 495.9 | | | 452.6 | |
Co-generation and other | | | 322.0 | | | 1,024.8 | |
Industrial Production | | | 3,145.8 | | | 2,454.3 | |
| | | | | | | | |
Biofuels | | | 3,145.8 | | | 2,454.3 | |
- (1)
- On December 15, 2014, our Board of Directors approved a plan to further improve our financial structure through three main initiatives which contemplated the sale of certain companies, including Abengoa Yield. Given that as of December 31, 2014, those certain companies were available for immediate sale and we considered the sale to be highly probable, we have classified their associated assets and liabilities as held for sale in our annual consolidated financial statements as of December 31, 2014, prepared in accordance with IFRS as issued by the IASB, which are included elsewhere in this annual report. Until the closing of the sale of those certain companies, the assets will be reported as held for sale in accordance with the stipulations and requirements of IFRS 5,Non-Current Assets Held for Sale and Discontinued Operations. Furthermore, during June 2014, we completed the initial public offering of Abengoa Yield, which grouped assets previously reported in different operating segments within the Concession-Type Infrastructure activity. As such, Abengoa Yield became a new operating segment within the Concession-Type Infrastructure activity after the Abengoa Yield IPO. Consequently, it has been reported as a separate segment in our quarterly financial information for the quarters ended June 30, 2014 and September 30, 2014. Taking into account that Abengoa Yield was an operating segment within our Concession-Type Infrastructure activity during part of 2014 and the significance that those activities carried out by Abengoa Yield have for Abengoa, our shareholding in Abengoa Yield during 2014 was treated as a discontinued operation in accordance with the stipulations and requirements of IFRS 5,Non-Current Assets Held for Sale and Discontinued Operations. The treatment of Abengoa Yield as discontinued operations also resulted in the removal of the Abengoa Yield operating segment from our Concession-Type Infrastructure activity. In accordance with this standard, the assets and liabilities of Abengoa Yield have been reclassified as assets and liabilities held for sale in our consolidated statement of financial position included within our consolidated financial statements as of and for the year ended December 31, 2014. Likewise, our consolidated income statements for the years ended December 31, 2014 and 2013 also include the results of Abengoa Yield under a single heading, "Profit (loss) from discontinued operations, net of tax".
- (2)
- On July 15, 2013, we closed the sale of 100% of our shares in our subsidiary Befesa. On that date, we received €331 million of cash proceeds. Taking into account the significance of the activities carried out by Befesa to Abengoa, the sale of this shareholding is considered as a discontinued operation to in accordance with IFRS 5,Non-Current Assets Held for Sale and Discontinued Operations. In accordance with this standard, the results of Befesa until the closing of the sale and the result of this sale are included under a single heading, "Profit (loss) for the year from discontinued operations, net of tax" in our Consolidated Financial Statements and under separate line items in the consolidated cash-flow statement for the year 2013. The consolidated income statement for the years ended December 31, 2012, 2011 and 2010 also includes the results of Befesa under a single heading. See "Presentation of Financial Information". The Befesa Sale also resulted in the removal of the Industrial Recycling segment from our Industrial Production activity.
Our three activities are as follows:
- •
- Engineering and Construction
Our Engineering and Construction activity includes one operating segment: Engineering and Construction
We have over 70 years of experience in the Engineering and Construction activity in the energy and water sectors. We are responsible for all phases of the engineering and construction cycle, including project identification and development, basic and detailed engineering, construction and operation and maintenance.
61
Table of Contents
In the energy sector, we are dedicated primarily to renewable energy (wind, solar, biofuel and biomass), as well as conventional (co-generation and combined-cycle) power plants and power transmission lines. In 2014, we were recognized byENR Magazine as the leading international contractor in power transmission and distribution ("T&D") of electricity in terms of revenues, the leading international contractor in solar in terms of revenues and the second leading international contractor in co-generation and in water in terms of revenues (source: ENR).
Within the environmental sector, we build water infrastructure, desalination and water treatment plants in Europe, the Americas, Africa and Asia. We are among the market leaders in the construction of water desalination plants through our projects in Algeria, China, India, Ghana, and Spain.
- •
- Concession-Type Infrastructure
By leveraging the expertise we have gained over the years in our Engineering and Construction activity and by selectively developing proprietary technologies, we have developed a portfolio of investments in concession-type infrastructures in the energy and environmental sectors where we seek to achieve attractive returns. Many such concessions are held pursuant to long-term agreements in which we operate and maintain assets that we initially constructed under BOOT or Build, Own and Operate ("BOO") schemes. There is limited or no demand risk as a result of arrangements such as feed-in and ad hoc tariff regimes, take-or-pay contracts and power or water purchase agreements, which are long-term contracts with utilities or other offtakers for the purchase and sale of the output of our concession assets. We believe our level of revenue visibility in this business to be very high given the nature of our assets, the long-term arrangements under which they are operated, and the number of projects under construction where off-take remuneration is already in place.
Our Concession-Type Infrastructure activity includes four operating segments: Solar, Transmission, Water, and Co-generation and other, which operate, respectively, our assets in power transmission, wind and solar power generation (mostly in concentrated solar power technology ("CSP")), water desalination, and co-generation. In each instance, we typically partner with leading international or local businesses or parastatals, such as E.ON AG ("E.ON"), Total S.A., Abu Dhabi Future Energy Company ("Masdar"), Centrais Eléctricas Brasileiras S.A. ("Eletrobrás"), General Electric Company ("General Electric"), Cemig, JGC Corporation, Itochu Corporation and Algérienne des Eaux (Algerian Water Authority). In a typical partnership, we make an equity contribution with our partners and then typically finance the infrastructure through Project Debt.
Following its IPO, Abengoa Yield was considered an additional operating segment within the Concession-Type Infrastructure activity. However, on December 15, 2014, our Board of Directors approved a plan to reduce our shareholding in Abengoa Yield to below 50% during 2015, subject to market conditions. On January 22, 2015, we completed an initial divestment of 13% through the sale in an underwritten public offering of 10,580,000 ordinary shares in Abengoa Yield (including 1,380,000 shares sold pursuant to the exercise in full of the underwriters' option to purchase additional shares) at a price of US$31 per share which brought our shareholding in Abengoa Yield to 51%. On February 9, 2015, we announced our intention to reduce our shareholding in Abengoa Yield to below 50% by the end of the first half of 2015, with the objective of maintaining a long-term stake in the range of 40-49%. We have also indicated our intention to reinforce the role of independent directors at Abengoa Yield in order to effectively transfer control once we reduce our shareholding in Abengoa Yield below 50%. Our shareholding in Abengoa Yield is considered as a discontinued operation in accordance with the stipulations and requirements of IFRS 5,Non-Current Assets Held for Sale and Discontinued Operations, and in accordance with this standard, the assets and liabilities of Abengoa Yield have been reclassified as assets and liabilities held for sale in our consolidated statement of financial position included within our consolidated financial statements as of and for the year ended December 31, 2014. Likewise, our consolidated income statements for the years ended
62
Table of Contents
December 31, 2014, 2013, 2012, 2011 and 2010 also include the results of Abengoa Yield under a single heading, "Profit (loss) from discontinued operations, net of tax".
As of December 31, 2014, the average remaining duration of operation of our concession contract portfolio was 25 years. The capacity of our solar, co-generation and water desalination plants and the scale of our power transmission line networks are each expected to approximately double as projects currently under construction are expected to be completed between 2015 and 2019.
We manage concession assets on five continents as diverse as power transmission lines in Brazil, Chile and Peru, wind farms in Uruguay, thermo-solar plants in the United States, Spain, South Africa and the United Arab Emirates, desalination plants in India, China, the Middle East and Africa and co-generation plants in Spain and Mexico. We pursue a flexible asset rotation strategy through which we may divest certain assets from time to time on an opportunistic basis, including to Abengoa Yield, to maximize our overall investment returns.
On February 9, 2015, we announced our agreement entered into with Abengoa Yield for a second transfer of assets, including: ATN 2, a transmission power line in Peru (40% stake); Shams, a 100-MW solar power asset in the United Arab Emirates (20% stake); rights of usufruct over Helioenergy 1/2, a 100-MW solar power asset in Spain (29.6% stake); and Honaine and Skikda, two water desalination plants in Algeria with an aggregate capacity of 10.5 Mft3/day (25.5% and 34.17% stakes, respectively) for total proceeds of approximately $142 million. The sale of Honaine and Skikda was closed on February 15, 2015, while the acquisition of the remaining assets is still pending. Regarding Honaine and Skikda, we have entered into a two-year call and put option agreement with Abengoa Yield under which they have put option rights to require us to purchase back these assets at the same price paid by them and we have call option rights to require them to sell back these assets if certain indemnities and guarantees provided by us reach a certain threshold. In addition, discussions between us and Abengoa Yield have already commenced regarding a potential third dropdown for a total equity value in the range of $200 to $250 million. This potential third acquisition falls within the $100 million call option agreement announced between us and Abengoa Yield in December 2014 at a 12% yield. The third dropdown divestment is expected to close by the end of the year.
- •
- Industrial Production
Our Industrial Production activity includes one operating segment: Biofuels, in which we develop and produce biofuels. These operations are conducted using our own assets and are focused on high growth markets. According to industry publications and our own estimates, we enjoy a leadership position in many of the markets in which we operate.
In terms of capacity, according toEthanol Producer Magazine and the European Renewable Ethanol Association, our Biofuels segment is currently the European market leader in ethanol production and is one of the top ten producers in the United States (source: Ethanol Producer Magazine, ePure and FO Lichts). We are the only operator with a significant presence in all of the three key biofuel markets: the United States, Europe and Brazil. We are also diversified in terms of revenue sources.
We believe we have identified a significant market opportunity in second-generation biofuels, which utilize biomass rather than cereal and other food crops as the primary raw material. We have invested continually in R&D&i over the past decade in this business and have developed our own proprietary processes and enzymes. Our pilot plant has been in operation in York (Nebraska, United States) since 2007 and a demonstration plant in Salamanca (Spain) since 2009. We commenced construction of our first second-generation commercial plant in Hugoton (Kansas, United States) in 2011, for which we have been awarded a total of $132 million in loan guarantee financing and $97 million in grants from the U.S. Department of Energy since 2007. This plant started operations in October 2014 and increased the number of opportunities for us to license our biomass technology to third parties. In addition, we believe that the plant will position our business for potential entry into the biomaterials
63
Table of Contents
Industry and Market Opportunity
Over the last decade, global investment in the renewable energy and environmental sectors has witnessed significant growth. Moreover, energy scarcity, the focus on reduction of carbon emissions, and the potential increased costs of building and operating nuclear plants are expected to continue to drive renewable technology. We expect this to continue both in the short and long term and expect that this will support demand for our products and services. According to the World Energy Outlook 2014, global energy demand is expected to grow 37% by 2040, compared to 2012 levels reaching 18.293 Mtoe. 97% of the growth in demand is expected to come from non-OECD countries, of which the developing Asian countries—led by China—is expected to account for 65%. These trends shift the dynamics of global energy consumption decisively away from the Americas and Europe towards Asia and, to a lesser extent, the Middle East and Africa. Oil is expected to remain the single largest energy source throughout 2040, though its share of total demand is expected to fall from 31% in 2012 to 26% in 2040—just ahead of coal and natural gas. Demand growth is expected to slow gradually, from 0.9% per year until 2020 to 0.3% per year in the 2030s (Source: World Energy Outlook 2014).
The share of renewables in world primary energy demand is expected to reach 15% in 2040, compared with 8% in 2012. The power sector is expected to contribute most to this increase: the share of renewables in total generation is expected to increase from 21% in 2012 to 33% by 2040. Around half of this increase would be due to solar and wind power, generation from the two sources together growing at a combined rate of almost 8% per year on average. (Source: World Energy Outlook 2014). Cumulative investment of $7,377 billion would be required in renewable energy technologies from 2014 to 2040. (Source: World Energy Outlook 2014).
The use of biofuel is expected to also expand substantially over the same period, from 1.3 million barrels per day to 4.6 mb/d, with an increasing contribution coming from advanced biofuels after 2020. The consumption of biofuels is expected to remain concentrated in the Unites States, European Union and Brazil, though their combined share of global consumption drops, from nearly 90% in 2012 to 70% in 2040, largely as a result of growing consumption in China and other Asian countries (Source: World Energy Outlook 2014).
Significant opportunities are expected in one of Abengoa's core areas of expertise, the transmission and distribution sectors, where a total investment of 8,686 billion dollars is estimated by 2040. More than two-thirds of this investment is expected to occur is in non-OECD countries, reflecting the need to expand the networks to meet the higher electricity demand growth. Globally, 56% of T&D investment would be needed to expand capacity to meet the projected increase in demand, while refurbishment and replacement of existing assets is expected to account for 40% and network integration of renewables for the remaining 4%. (Source: World Energy Outlook 2014).
Other macroeconomic trends such as continuous global population growth and increasing water scarcity are expected to result in trends that favor the expertise and focus of our business. According to Global Water Intelligence estimates, the 2014 global water market is worth $556.8 billion and is expected to grow at a rate of around 3.9% per year through 2018. In particular, worldwide installed desalination capacity (industrial and municipal) in 2012 was 75 million m3/d, which corresponds to a water desalination market value of $3.9 billion, and is expected to grow to $15.2 by 2018 (Source: Global Water Market 2014).
In addition, increasing environmental consciousness, reducing carbon and greenhouse gas emissions, increasing focus on security of energy supply in many developed countries, and the related tightening of environmental regulation are important factors that we expect to bolster global demand and provide an impetus to our sustainable development focus.
64
Table of Contents
Our Growth Strategy
Our objective is to create long-term value for our shareholders by becoming the leading global engineering and clean technology company providing innovative solutions for sustainability in the energy and environmental sectors. Key elements of our strategy for achieving this objective are as follows:
Maintain focus on operational excellence and technological development
Given the importance of our technological leadership to our competitive advantage, we maintain this strength through significant investment in R&D&i which is undertaken by over approximately 800 employees. We intend to maintain this effort to retain or enhance our market positions and cost competitiveness.
Maintain the mix of our business operations to operate a diversified business model
We have been careful to expand our business in a balanced manner, seeking to ensure that we are not over-reliant on any particular product or service, geography or technology.
Take advantage of opportunities for organic cash flow generation in our growth markets
We look to establish ourselves early in growth markets so that we can garner leadership positions in our businesses. We have significant experience in expanding into new and diverse markets with different regulatory regimes that allows us to adapt and to become familiar with new markets and technologies more quickly and helps us capitalize on future expansion opportunities in new markets.
Our business is positioned for growth through the development of both existing operations and new investments. We have strict "return on investment" criteria that attempt to ensure that our growth plans generate long-term, sustainable cash flows for our business. In addition, we maintain strict discipline towards the deployment of new non-committed capital expenditures, committing to such investments only when long-term funding has been secured.
Maintain our competitive position
We believe that we enjoy competitive advantages in many of our businesses due to factors such as our technological leadership position, know-how and scale, as well as the relatively high barriers to entry in certain key areas. We believe these are important factors in protecting our cash flows and profitability. We intend to continue to focus on efficiency measures and technology investments to seek to maintain our competitive advantages.
Continue unlocking value and enhance our Engineering and Construction business through asset rotation
It is part of our strategy to unlock value through asset rotations, when we think that conditions are appropriate, in order to increase equity returns. We have a successful track record of monetizing certain of our investments. For example:
- •
- over the course of 2011 and 2012, we completed the Telvent Disposal, which generated cash proceeds of €391 million and the Cemig Sales, which resulted in the equivalent of €833 million of net cash proceeds in Brazilian reais;
- •
- in 2013, we completed the sale of our subsidiary Befesa to funds advised by Triton Partners, which generated €331 million in cash proceeds corresponding to the agreed price for the shares (and deferred compensation and other compensation totaling €289 million); we also closed the sale of our Brazilian subsidiary, Bargoa, for a total sales price of $80 million, which resulted in approximately $50 million of cash proceeds;
65
Table of Contents
- •
- in the second quarter of 2014, we completed the Abengoa Yield IPO for total gross proceeds of $828.7 million (€611.0 million) before fees and expenses;
- •
- in November and December 2014, we completed the sale to Abengoa Yield of our Solacor 1/2 thermo-solar plants through a 30-year usufruct rights contract over the related shares (which includes an option to purchase such shares for one euro during a four-year term), our PS10 and PS20 thermo-solar plants and the Cadonal windfarm (subject to a put option right that allows Abengoa Yield to sell the asset back to us under certain circumstances), for aggregate consideration of $312 million;
- •
- on December 11, 2014, we and Abengoa Yield announced that we had entered into a call option agreement for the purchase by Abengoa Yield of up to $100 million in contracted assets at a 12% yield during the year 2015, subject to certain conditions;
- •
- on December 23, 2014, we entered into a letter agreement to negotiate exclusively with EIG until March 31, 2015 an investment by EIG-managed investment funds, alongside Abengoa, in a portfolio of greenfield projects currently owned by Abengoa, on the basis of the terms set forth in the term sheet attached to the letter agreement. On February 9, 2015, we announced that we and EIG were in an advanced stage of documentation and due diligence regarding the proposed transaction. The total amount of EIG's investment is expected to be approximately $1.4 billion over a period of four years. Of the total equity expected to be committed, we expect that a majority stake (approximately 55%) in APW1 will be held by EIG, with the remainder held by Abengoa; and
- •
- On February 9, 2015, we announced our agreement entered into with Abengoa Yield for a second transfer of assets, including: ATN 2, a transmission power line in Peru (40% stake); Shams, a 100-MW solar power asset in the United Arab Emirates (20% stake); rights of usufruct over Helioenergy 1/2, a 100-MW solar power asset in Spain (29.6% stake); and Honaine and Skikda, two water desalination plants in Algeria with an aggregate capacity of 10.5 Mft3/day (25.5% and 34.17% stakes, respectively) for total proceeds of approximately $142 million. The sale of Honaine and Skikda was closed on February 15, 2015, while the acquisition of the remaining assets is still pending. Regarding Honaine and Skikda, we have entered into a two-year call and put option agreement with Abengoa Yield under which they have put option rights to require us to purchase back these assets at the same price paid by them and we have call option rights to require them to sell back these assets if certain indemnities and guarantees provided by us reach a certain threshold. In addition, discussions between us and Abengoa Yield have already commenced regarding a potential third dropdown for a total equity value in the range of $200 to $250 million. This potential third acquisition falls within the $100 million call option agreement announced between us and Abengoa Yield in December 2014 at a 12% yield. The third dropdown divestment is expected to close by the end of the year.
We intend to continue to actively follow an asset rotation strategy whereby we periodically sell assets or businesses in order to seek to optimize investment returns and free up capital for new investments or debt reduction. We intend to follow an opportunistic approach, whereby we consider to sell assets or businesses when we deem market conditions are attractive to us. Sales of assets or businesses may be material and may happen at any time.
Going forward, Abengoa Yield constitutes a vehicle through which we expect to execute most of our asset rotations, representing a long-term, recurrent, equity-recycling vehicle to crystallize value in concessions and facilitating the divestment process in concessional assets, because Abengoa Yield is a natural buyer of the assets we are building and benefits from a significantly lower cost of capital than us. In addition, APW1 is expected to become our partner during the construction period of the assets, providing a significant part of the equity required for the roll-over of our capex plan over the next seven to eight years.
These opportunities relate to our power transmission business, our renewable and conventional power assets, waste water treatment facilities and other assets.Our asset rotation plans constitute forward-looking information and are subject to risks and uncertainties that could cause actual results to
66
Table of Contents
differ materially from the results forecasted, including, but not limited to, our performance, industry performance, the availability of buyers for our assets at the prices we seek, general business and economic conditions, competition, adverse changes in applicable laws, regulations or rules, and the various risks set forth in this annual report. See "Cautionary Statements Regarding Forward-Looking Statements".
Strengthen and diversify our capital structure and gain financial flexibility
We are committed to maintaining a sound capital structure and a strong liquidity position. As such, we intend to extend the debt maturities of our existing corporate financing, prefund our cash needs and avoid committing to new projects unless we have first secured long-term financing. We aim to continue to access the global capital markets from time to time, as appropriate and subject to market conditions, in order to further diversify our funding sources.
Our Business
Our operations are conducted through three operating segments: Engineering and Construction, Concession-Type Infrastructure and Industrial Production.
Engineering and Construction
Overview
Our Engineering and Construction activity is dedicated to the engineering and construction of electrical, mechanical and instrumental infrastructures in the energy, industrial, water management and services sectors, as well as the development of innovative technology for our businesses. Our Engineering and Construction activity works mainly on an EPC work basis, with a strong technology and R&D&I component. Through our Engineering and Construction activity, we provide services throughout Europe, North America, South America, the Middle East, Africa and Asia-Pacific.
Our Engineering and Construction activity had revenue of €4,514.5 million and Consolidated EBITDA of €806.0 million for the year ended December 31, 2014. In addition, our Engineering and Construction activity had total net fixed assets of €672.3 million as of December 31, 2014.
Operations
Our core areas of operation are the development, design and construction on an EPC basis of renewable energy (solar, wind, ethanol, biodiesel and biomass) plants; power transmission lines; conventional energy (co-generation and combined cycle) plants; water treatment, desalination plants, other hydraulic infrastructures and industrial installations.
Solar Energy
Within the field of solar energy, our Engineering and Construction activity has significant experience in designing and constructing some of the largest and most complex facilities. Our Engineering and Construction activity's work for the Solar segment of our Concession Type Infrastructure activity includes the construction of 13 solar 50 MW trough power plants in Spain, three of which became operational during 2010, eight of which became operational during 2011 and 2012 and a further two which became operational at the end of the third quarter of 2013. We also brought into operation a 280 MW solar thermal project with 6 hours of molten salt storage in Solana, Arizona, which sells electricity to the Arizona Public Service Company and another 280 MW solar thermal project in Mojave, California, which sells electricity to the Pacific Gas and Electric Company. As of December 31, 2014, the Solana and Mojave projects are included within Abengoa Yield and are thus classified as discontinued operation in accordance with the stipulations and requirements of IFRS 5,Non-Current Assets Held For Sale and Discontinued Operations. In South Africa,
67
Table of Contents
we are building three solar thermal projects, two solar thermal plants with 100 MW of capacity each with parabolic trough technology, and a 50 MW tower solar thermal technology power plant, all of which will sell electricity to the local national grid for 20 years. Additionally, we have built the Shams facility in Abu Dhabi (United Arab Emirates), with a power capacity of 100 MW. Our Engineering and Construction activity's work for other entities in the solar energy field includes the construction of the world's first integrated solar combined cycle ("ISCC") plant with 150 MW in Hassi R'Mel (Algeria), as well as the construction of a 470 MW power plant located in Ain Beni Mathar (Morocco), for the Office National de I'Electricité ("ONE"), the Moroccan power utility, both of which have recently entered into operation. Both plants, in Algeria and Morocco, will use combined cycle technology integrated with a solar field of parabolic trough collectors.
Transmission
Our Engineering and Construction activity has built more than 26,000 km of power transmission lines in the last ten years for internal and external customers, with a proven global expertise in both EPC and Operation and Maintenance. As of December 31, 2014, the Engineering and Construction activity had 5,143 km of high voltage power transmission lines in operation for proprietary use (of which 1,611 km are owned by Abengoa Yield, which we have classified as discontinued operation in accordance with the stipulations and requirements of IFRS 5,Non-Current Assets Held for Sale and Discontinued Operations) and 6,820 km of such lines under construction. As of December 31, 2014, of the total backlog of €7,953 million in the Engineering and Construction activity, approximately 32% was related to power transmission projects.
In January 2014, we participated in an auction organized by the Brazilian National Electricity Agency ("ANEEL") in which we were awarded two additional projects for a total of 380 km of new transmission lines. In November 2013, we were chosen by ANEEL to carry out a new 367 km electricity transmission project. In August 2013 we were selected by Ukrenergo, the national energy company of Ukraine, to develop an electricity transmission project that includes construction of a 187 kilometer line that will connect the Zaporizhia nuclear power plant with the substation in Kakhovska. In March 2013 we were selected by Mexico's Federal Electricity Commission (CFE) to develop a new electricity transmission project in Mexico. The contract includes the engineering, construction and startup of a 201 km transmission line and two substations. In 2013, we were also chosen by the Kenya Electricity Transmission Company of the Kenyan Ministry of Energy for an electricity transmission project that includes construction of a 132 km transmission line and extension of an existing substation in Kenya. In December 2012, we were chosen by ANEEL to carry out three new power transmission lines in Brazil, for a total of more than 2,400 km. During the previous year, our Engineering and Construction activity was awarded a contract by the state owned Power Grid Corporation of India Limited to construct a 170 km power transmission line in Karnataka (India), connecting various localities in the environs of the city of Bangalore.
Biofuels
In the biofuels sector, we have constructed several plants for our Industrial Production activity on a turnkey construction basis. These include an ethanol plant in Rotterdam (The Netherlands), with capacity to produce up to 480 million liters of ethanol from corn or wheat, and two ethanol plants in Indiana and Illinois (both in the United States), each with a capacity of 340 million liters. These three plants came into operation in 2010.
We have constructed one of the first and few commercial-scale second generation bioethanol production plants in Kansas, United States, which started operation in October 2014. This plant, with a 95 million liter capacity, is able to convert cellulosic biomass, mainly agricultural waste products, into ethanol.
On November 2014, we were selected by the electricity and gas company, Belgian Eco Energy, to develop the largest waste-to-energy commercial plant in the world in Ghent (Belgium), which will produce 215 MW of electricity, using only biomass (wood chips and agro-residues) as the raw materials for energy production. The total cost of the project will exceed €315 million.
68
Table of Contents
Power Plants
We have significant expertise in the design and construction of conventional power plants. In January 2015, we were selected by Mexico's Federal Electricity Commission to develop the Norte III project, a 924 MW combined cycle project in Ciudad Juarez. In June 2013 we were selected by the U.S. power company, Portland General Electric (PGE) to develop a 440 megawatt (MW) combined cycle power plant to supply electrical energy to half the population of Portland, Oregon (USA). We will be responsible for the engineering, design and construction of the combined cycle power plant under the engineering, procurement and construction (EPC) "turnkey" system. The estimated time for the project is 36 months. In April 2012, we were selected by Elektrociepłownia Stalowa Wola S.A., Poland's partially state owned energy and gas distribution company, to undertake the engineering and construction of a 450 MW combined cycle plant in Poland, the largest such power plant to be in Poland. In December 2011, we were awarded a contract to construct a 640 MW combined cycled electricity power plant for Mexico's Federal Electricity Commission, which is part of the Morelos Integral Project, an initiative to develop central Mexico's infrastructure. In December 2010, our Engineering and Construction activity announced plans to develop a 300 MW co-generation plant in the Abengoa Cogeneración Tabasco facility ("ACT") in Mexico, in partnership with General Electric Energy Financial Services. The plant, which entered into operation at the beginning of 2013, supplies the Nuevo Pemex gas processing complex with power and steam. We have also built five co-generation plants with over 250 MW in Spain and two co-generation plants, which use biomass as fuel, in Brazil with 70 MW of capacity each adjacent to our bioenergy plants.
Water Infrastructure
We have extensive experience bidding on and executing EPC projects in the water infrastructure sector globally. Our Engineering and Construction activity specializes in the design and construction of large desalination plants, particularly those using reverse osmosis technologies. Reverse osmosis is a common method of desalination consisting of the separation of the various components of a liquid solution through the forces applied to a semi- permeable membrane. In addition to reverse osmosis desalination plants, our Engineering and Construction activity designs and constructs waste water treatment stations and plants and designs, constructs and overhauls hydroelectric plants, irrigation lines and piping lines (including repairing, improving, reconstructing aqueducts, tunnels, drains, service roads and bridges, and installing monitoring and automation equipment). Since 2000, our Engineering and Construction activity has constructed seven desalination plants with capacity totaling 660,000 m3/day and it is currently constructing two additional plants with capacity totaling 260,000 m3/day. In January 2013, we were awarded a water project in Chile worth $65 million to supply water to the mining industry in the Copiapó valley from the desalination plant in Caldera, in the Atacama region. In July 2012, we were chosen by ACWA Power International to develop a desalination plant using reverse osmosis technology in Barka, Oman. The project will have the capacity to supply more than 225,000 people with a capacity to desalinate 45,000 m3/day. We will be responsible for the design, engineering and construction of the plant as well as its subsequent operation and maintenance support. In October 2011, we were awarded a contract by Conagua, the Mexican water commission, to perform construction, equipping and maintenance works for a 139 km aqueduct project to supply potable water to 1.5 million people. In May 2014, we were chosen by the Moroccan National Electricity and Drinking Water Office to construct a new desalination plant in Agadir, Morocco. The plant, which uses proprietary reverse osmosis technology, will produce 100,000 m3 of drinking water per day and will supply around 800,000 people. In July 2014, we were selected to deliver 50,000 acre feet per year of water to the city of San Antonio, Texas. We will lead a team of local sub-contractors and consultants within the Vista Ridge Consortium to design, build, finance and operate the infrastructure needed to deliver the water. In January 2015, we were selected by Advanced Water Technology to jointly develop the world's first large-scale desalination plant to be powered by solar energy, in Saudi Arabia. We are currently bidding on multiple new EPC projects and considering new opportunities in various countries and regions, including China, India, South America, the Middle East, Africa and the United States.
69
Table of Contents
In December 2014, we signed a memorandum of understanding with the South Korean company Daelim Industrial Co. Ltd to develop large water projects all over the world.
Other Selected Expertise
Our Engineering and Construction activity also designs, supplies, manufactures, assembles and tests mechanical systems associated with hydroelectric power plants, thermal plants, combined-cycle plants, co-generation plants, gas plants, and the chemical and petrochemical industry. In addition, our Engineering and Construction activity provides thermal and acoustic insulation and supplies and installs refractory material, fire protection systems and smoke sectoring curtains. Examples of such projects include repair and insulation works for Repsol, BP plc ("BP") andCompañía Española de Petróleos, S.A.'s ("CEPSA") refineries in Spain. Our Engineering and Construction activity also provides installation and infrastructure services in chemical and gas production plants, nuclear and thermal power plants, and individual buildings.
Our Engineering and Construction activity includes EPC activities related to the engineering and installation of electrical, mechanical and instrumental infrastructure for the energy, industrial, transportation and services sectors. Our Engineering and Construction activity also provides electrical installations for thermal and combined-cycle power plants, substations and transformation centers, airport infrastructure, industrial infrastructure, individual buildings and maritime and railway transportation. Projects include providing the electrical installation for the electric substations of theAlta Velocidad Española ("AVE") high speed train line running between Madrid and Valencia, Spain, commissioned in 2010.
Our Engineering and Construction activity provides engineering and integration services on an EPC basis for telecommunications networks. Its main telecommunications customer isTelefónica de España, S.A.U., for which it provides construction and maintenance services. We also provide products and services for the deployment and installation of telecommunication networks.
Maintenance and Service
Our Engineering and Construction activity provides operation and maintenance services for conventional and renewable energy power plants. The operation and maintenance services for power plants include preventive, scheduled and corrective maintenance of equipment and systems and the operation thereof to ensure that the facility operates reliably and meets its technical specifications with a view to minimizing fuel consumption and greenhouse gas emissions while maximizing production. In January 2015, together with the EPC contract, we were awarded a 25-year operation and maintenance contract for a new 924 MW combined cycle plant for Mexico's Federal Electricity Commission in Ciudad Juarez. Our Engineering and Construction activity also provides various operation and maintenance services in chemical and gas production plants and nuclear and thermal power plants. Such work includes services provided for maintenance and instrumentation, operation and loading, and modifications for both the Almaraz and Trillo nuclear power plants in Spain.
Industry and Competition
The prevailing economic and financial climate is having a mixed impact on the industrial engineering and construction industry in developed markets. Investment and current projects under negotiation or in progress have slowed significantly, competition is robust, customers are facing significant difficulties in acquiring funding and their insolvency risk is high. However, there have been indications of increased public spending in infrastructure in the mid-term and growth in renewable energies. Other developments in this industry include increased international demand in both established and emerging markets for sustainable and renewable energy infrastructure. In addition, the strong growth in emerging markets in the last few years resulted in significant investment in energy infrastructure to meet increased demands resulting from the rapid industrialization of these economies. This investment is also to an extent, strategically driven, as local governments seek to stimulate their economies through infrastructure spending.
70
Table of Contents
Our Engineering and Construction activity also performs significant work for our Concession-Type Infrastructure and Industrial Production activities. As a result, this activity is impacted by factors relevant to the industries in which those two activities operate.
According to the International Monetary Fund's latest World Economy Outlook, global activity in 2015 is expected to strengthen moderately but the risks to the forecast remain to the downside. The strength is projected to come from the advanced economies, where output is expected to expand at a pace of about 2.5% in 2015, about half of a percentage point more than in 2014. Drivers of the projected uptick are a stronger U.S. economy, further monetary policy easing in the euro area and Japan, and a boost in exports resulting from the depreciation of the euro and yen relative to the U.S. Dollar. Growth in the euro area will be held back by weak investment prospects and inflation expectations. Emerging market and developing economies are projected to expand by about 4.3% in 2015, at approximately the same rate as in the previous year, as lower growth in China and downward revisions to potential growth in commodity exporters are expected. The precipitous decline in oil prices in U.S. Dollars in the last quarter of 2014, and whether oil prices will stabilize at their current levels or rebound, will be a primary influence on the global economic picture in 2015. Improving economic conditions, especially in some of our key markets such as the U.S. and some emerging markets, should continue to support Abengoa's growth in those geographies.
Our Engineering and Construction activity faces a different set of competitors depending on the type of project. Some of our key competitors in certain markets are: Técnicas Reunidas, Mitsubishi and Korean Electric Power Corporation ("KEPCO") in conventional energy; Actividades de Construcción y Servicios, S.A. ("ACS") and Acciona, S.A. ("Acciona") in solar power; Colombian grid operator ("ISA"), Eletrobrás and Cemig in power transmission in South America; and Elecnor, S.A., ACS, Acciona and Duro Felguera, S.A. in Spain. In the water area, our principal competitors in Spain are Obrascón Huarte Lain, S.A., Acciona, S.A. and Sacyr Vallehermoso, S.A. and internationally include Asociación de Empresas Constructoras de Ámbito Nacional ("SEOPAN"), Veolia Environnement S.A., Hyflux Ltd., Doosan Ltd., Suez Environnement S.A., GE Water and Process Technologies, Ltd., Fisia Italimpianti S.p.A and Aquatech, Ltd.
Customers and Contracts
Our Engineering and Construction activity's customer base includes public administrations and large corporations such asComisión Federal de Electricidad andPetróleos Mexicanos ("Pemex") in Mexico, ONE in Morocco,Agência Nacional de Energia Elétrica ("ANEEL") (the Brazilian Electricity Regulatory Agency) in Brazil, Abu Dhabi Transmission & Despatch Company in the United Arab Emirates,Agencia de Promoción de la Inversión Privada ("Proinversion") in Peru and Power Grid Corporation of India Limited ("PowerGrid") in India. Our customer base also includes our own Concession-Type Infrastructure and Industrial Production activities. No individual customer represented more than approximately 10% of consolidated revenue of our Engineering and Construction activity.
In the water area of our Engineering and Construction activity, a limited number of EPC customers, many of which are government entities, currently account for a substantial portion of our revenue.
Revenue from the solar area of our Engineering and Construction activity comes from selling plants, equipment, technology and industrial heating installations. We sell solar plant equipment and technology to solar developers. In the industrial heat market, our clients are industrial players who engage us for the construction and operation of installations and for maintenance or heating services.
Our Engineering and Construction activity has different types of contracts depending on the nature of the work to be performed. Usually, for EPC projects, contracts are fixed price or cost-plus contracts, usually running for a short period of time of up to 36 months and end after completion and startup. For water projects, we perform turnkey EPC projects for the design and construction of infrastructures and plants, which we usually undertake at non-revisable fixed prices.
71
Table of Contents
Suppliers
The principal products used by the Engineering and Construction activity include structural steel, metal plate, concrete, cable and various electrical and mechanical components such as turbines and boilers. These products and components are subject to raw material (aluminum, copper, nickel, iron ore, etc.) availability and commodity price fluctuations, which the Engineering and Construction activity monitors on a regular basis. Our Engineering and Construction activity has access to numerous global supply sources and we do not foresee any supply constraints that might have a material adverse effect on our business in the near term. However, the availability of these products, components and raw materials may vary significantly from year to year due to factors including customer demand, producer capacity, market conditions and specific material shortages.
Although water infrastructure plants utilize essential equipment, such as pumps or membranes, we procure such equipment in mature markets where we generally use a large number of suppliers and are not dependent on any single supplier.
We own interests in companies that produce and supply key components for the construction of CSP plants, such as Rioglass Solar, S.A. ("Rioglass Solar"), Construcciones Métalicas Mexicanas Comemsa, S.A. de C.V. ("Comemsa") and Europea de Construcciones Métalicas, S.A. ("Eucomsa"). Rioglass Solar specializes in the manufacture of parabolic-shaped mirrors, which are one of the key components for parabolic trough plants. Both Eucomsa and Comemsa focus on the manufacture of galvanized reticulated metal structures, such as steel towers for power transmission and structures for parabolic troughs and heliostats. Both Eucomsa and Comemsa undertake R&D&i activities in order to develop robust and reliable structures at lower costs. The Engineering and Construction activity also owns an interest in Sol3g, S.L., a company that designs and sells high-concentration PV modules.
Concession-Type Infrastructure
Overview
Our Concession-Type Infrastructure activity oversees the construction, operation and maintenance of power transmission infrastructure, conventional (co-generation) and renewable energy (solar and wind) plants, and water generation, transportation and management facilities (including desalination, treatment and water purification plants and water pipelines). Within this activity we have grouped four segments: Solar, Transmission, Water, and Co-generation and other. Abengoa Yield was considered an additional operating segment in the Concession-Type Infrastructure activity. However, on December 15, 2014, our Board of Directors approved a plan to reduce our shareholding in Abengoa Yield to below 50% during 2015, subject to market conditions. On January 22, 2015, we completed an initial divestment of 13% through the sale in an underwritten public offering of 10,580,000 ordinary shares in Abengoa Yield (including 1,380,000 shares sold pursuant to the exercise in full of the underwriters' option to purchase additional shares) at a price of US$31 per share which brought our shareholding in Abengoa Yield to 51%. On February 9, 2015, we announced our intention to reduce our shareholding in Abengoa Yield to below 50% by the end of the first half of 2015, with the objective of maintaining a long-term stake in the range of 40-49%. We have also indicated our intention to reinforce the role of independent directors at Abengoa Yield in order to effectively transfer control once we reduce our shareholding in Abengoa Yield below 50%. Our shareholding in Abengoa Yield is considered as a discontinued operation in accordance with the stipulations and requirements of IFRS 5,Non-Current Assets Held For Sale and Discontinued Operations, and in accordance with this standard, the assets and liabilities of Abengoa Yield have been reclassified as assets and liabilities held for sale in our consolidated statement of financial position included within our consolidated financial statements as of and for the year ended December 31, 2014. Likewise, our consolidated income statements for the years ended December 31, 2014, 2013, 2012, 2011 and 2010 also include the results of Abengoa Yield under a single heading, "Profit (loss) from discontinued operations, net of tax". We engage our Engineering and Construction activity for a significant portion of our Concession-Type Infrastructure activity's
72
Table of Contents
projects. We undertake these activities through our own asset owned operations and through concession based arrangements. These arrangements are governed by long term sales arrangements such as take or pay contracts, feed in tariff arrangements and power or water purchase agreements, with limited demand risk. In our Concession-Type Infrastructure activity, we participate in public tenders for the construction and operation of certain infrastructure assets.
Our work in concessions generally has four functions: building, operating, owning and transferring of infrastructure. Typically, the concessionaire agrees to construct an infrastructure project for the owner (usually a public administration in the case of public infrastructure projects), procures the necessary financing and operates it for a fixed or variable period of time and at the end of which the concession returns to the owner. During the term of the concession, the concessionaire has ownership of the infrastructure.
Our Concession-Type Infrastructure activity had revenue of €499.4 million and Consolidated EBITDA of €330.6 million for the year ended December 31, 2014. In addition, our Concession-Type Infrastructure activity had total net fixed assets of €5,226.0 million as of December 31, 2014.
Solar
The Solar segment had revenue of €335.2 million and Consolidated EBITDA of €235.9 million for the year ended December 31, 2014. In addition, our Solar segment had total net fixed assets of €2,135.0 million as of December 31, 2014.
Within our Concession-Type Infrastructure activity, our Solar segment designs, develops, oversees the engineering and construction of and operates solar power plants and installations. Our Solar segment operates in Europe, the United States, South America, the Middle East, Africa, India, China and Australia. Our Solar segment has invested in solar power plants and has developed expertise in the three core solar technologies—solar towers, parabolic troughs and photovoltaics. We are also working to develop more efficient solar technologies.
73
Table of Contents
Our Solar segment had a portfolio of approximately 712 MW of plants in operation, 780 MW of plants under construction as of December 31, 2014. The tables below provide breakdowns of our thermo-solar and photovoltaic plants, respectively, as of December 31, 2014.
| | | | | | | | | | | |
Location | | Abengoa
Stake | | Operational Name | | Production
Capacity | | Concessionaire | | Status |
|---|
CSP Spain(1) | | | | | | | | | | | |
Solúcar Platform, Seville | | | 100 | % | Solnova 1 | | 50 MW | | Spain | | In operation |
| | | 100 | % | Solnova 3 & 4 | | 50 MW each | | Spain | | In operation |
Écija Platform, Seville | | | 50 | % | Helioenergy 1 & 2(2) | | 50 MW each | | Spain | | In operation |
Extremadura Platform, Cáceres | | | 100 | % | Solaben 1 & 6 | | 50 MW each | | Spain | | In operation |
Ciudad Real Platform, Castilla-La Mancha | | | 100 | % | Helios 1 | | 50 MW | | Spain | | In operation |
| | | 100 | % | Helios 2 | | 50 MW | | Spain | | In operation |
Chile | | | 100 | % | Atacama I(3) | | 210 MW | | Chile | | Under construction (Q2 2016/
Q2 2017) |
| | | 100 | % | Atacama II(3) | | 210 MW | | Chile | | Under construction (Q3 2018) |
Abu Dhabi | | | 40 | % | Shams(2) | | 100 MW | | Adwel | | In operation |
Algeria | | | 51 | % | Hassi-R'Mel | | 150 MW | | Sonatrach | | In operation |
South Africa | | | 51 | % | Kaxu Solar One | | 100 MW | | ESKOM | | Under construction (Q1 2015) |
| | | 51 | % | Khi Solar One | | 50 MW | | ESKOM | | Under construction (Q4 2015) |
| | | 41 | % | Xina Solar One | | 100MW | | ESKOM | | Under construction (Q3 2017) |
Israel | | | 50 | % | Ashalim(1) | | 110 MW | | Israel | | Under construction (Q2 2018) |
| | | | | | | | | | | |
Location | | Abengoa
Stake | | Operational
Name | | Production
Capacity | | Concessionaire | | Status |
|---|
PV Spain(1) | | | | | | | | | | | |
Solúcar Platform, Seville | | | 80 | % | Seville PV | | 1.2 MW | | Spain | | In operation |
Solúcar Platform, Seville | | | 100 | % | Casaquemada | | 1.9 MW | | Spain | | In operation |
Jaén | | | 100 | % | Linares | | 1.9 MW | | Spain | | In operation |
Seville | | | 100 | % | Las Cabezas | | 5.7 MW | | Spain | | In operation |
Seville | | | 50 | % | Copero | | 1.0 MW | | Spain | | In operation |
- (1)
- Feed-in-tariff regime.
- (2)
- Assets expected to be transferred to Abengoa Yield in 2015 and 2016.
- (3)
- Projects expected to be transferred to APW1.
Solar Power Plants under construction and development
Our Solar segment oversees the engineering and construction of our solar power plants. As of the date of this annual report, we oversee the engineering and construction of four solar power plants with a total installed capacity of 570 MW, 420 MW in Chile and 150 MW in South Africa. We have also 110 MW in Israel and 100 MW in South Africa in Pre-Construction.
In the international market, during 2014, we continued construction of the following plants: a 100 MW CSP plant, with three hours of molten salt storage, and a 50 MW Solar Tower technology CSP plant, with two hours of molten salt storage, both located in Upington, South Africa and two solar plants in Chile, a 110 MW concentrated solar power tower and a 100 MW photovoltaic plant. During the fourth quarter of 2014, we completed the construction of Mojave, a 280 MW parabolic trough solar plant in California.
74
Table of Contents
The process of constructing a CSP solar power plant takes approximately 18 to 36 months, depending on the size of the plant and whether it will have capacity to store solar energy. The process of constructing a PV plant is generally much shorter, typically six months or less. The construction of a plant is performed by a contractor pursuant to a turnkey construction contract entered into based on market rates. Our Engineering and Construction activity is the principal contractor for our Concession-Type Infrastructure activity to construct its CSP and PV projects. On occasion, we enter into turnkey construction contracts with temporary business associations (unión temporal de empresas) in which our Engineering and Construction activity or other companies may participate. We undertake a large part of the basic and sophisticated engineering work in the plants using our own solar technologies.
We are involved in the development of solar power plants from the initial stage. These activities principally involve site selection, securing land rights, assessment of solar resources, administrative processing and obtaining relevant authorizations and connections to the required power grid and related infrastructure. These activities average between one and three years for CSP and PV plants but can vary significantly between regions and countries. Once a potential site has been located and the relevant land rights have been secured, we proceed to present the project to the appropriate authorities with respect to both the generation facilities and evacuation infrastructure. During the administrative process, we are required to submit extensive documentation to the relevant authorities for each site in order to obtain the necessary permits, licenses and authorizations. Depending on the jurisdiction, this process may involve simply an application to the competent public authority or, in addition, a submission of the project for public consultation, such as is generally the case in the United States.
In 2007, we started developing solar power plants in Spain. As a result, we currently have a portfolio of 450 MW which have been filed with the power register (Registro de Potencia) of the Spanish Ministry of Industry, Tourism and Trade, and therefore have the licenses required to commence construction. Solar power plants in Spain work under regulated schemes, establishing a remuneration for all the energy produced. This scheme has been recently implemented after the latest sector reform, as described in the "Item 4.B—Regulation" section. In Spain, we have partnered with a number of companies, including E.ON, Itochu Corporation and JGC Corporation, to construct and operate CSP plants.
In July 2011, we launched the first hybrid solar-gas plant in Hassi-R' Mel (Algeria), with 150 MW capacity that will generate electricity using both natural gas and solar energy. This combination of conventional and sustainable technologies enables energy to be produced from the sun without compromising the functionality and stability of the power grid.
In December 2011, the South African Department of Energy selected us to construct and operate a 100 MW parabolic-trough solar plant and a 50 MW superheated steam tower technology solar plant together with our joint venture partner, Industrial Development Corporation. We own a 51% interest in such joint venture. These plants obtained project finance throughout 2012 and are under construction at the date of this annual report. In August 2013, Abengoa achieved an important milestone in the department of these projects with the announcement of the completion of the construction of the Khi Solar One tower.
In June 2012, we were selected to construct and operate a 200 MW photovoltaic plant in Imperial Valley, California (United States). The construction of this plant started during the second half of 2012.
In March 2013, we signed an agreement with BrightSource Energy Inc., a leading concentrating solar thermal technology company, to jointly develop, build and operate the 500 MW Palen Solar Electric Generating System in California. On March 5, 2014, we announced our intention to become the sole developer of the Palen project, which is currently being re-assessed. Additionally, due to permitting delays, the development of this project is being delayed.
In June 2013 a joint company created by Abengoa and Shikun & Binui, an Israeli based global infrastructure group, was selected to build, own and operate a 110 MW solar trough plant with storage
75
Table of Contents
located in the Negev desert. Construction is expected to start in 2014 in the Ashalim area of the Negev Desert once the power purchase agreement and the project financing are closed.
In October 2013, the South African Department of Energy selected us to construct and operate a 100 MW parabolic trough solar plant with 5 hours of thermal energy storage. Xina Solar One will belong to a consortium, 40% of which is controlled by Abengoa. Other constituents of the consortium are the Industrial Development Corporation (IDC), the Public Investment Corporation (PIC), and the KaXu Community Trust. This project, together with the 100 MW photovoltaic plant, constitute the Atacama I project.
In January 2014, the Ministry of Energy of the Chilean Government and Corfo (Corporación de Fomento de la Producción) selected us to develop a 110 MW solar plant using tower technology with 17.5 hours of thermal energy storage using molten salts. The project will be located in the Atacama Desert, the region with the highest solar radiation concentrations in the world. It will be the first solar thermal plant for direct electricity production in South America.
In December 2014, we were awarded 950 GWh/year in the Distribution Companies Supply tender (Tender Process SIC 2013/03-2º Llamado) held by the National Energy Commission of the Chilean government. The company will generate the power from a combination of solar-thermal and photovoltaic plants.
Solar Power Plants in Operation
Plants in operation include the production and sale of electricity as well as the operation and maintenance of solar power plants. Once a CSP or PV solar power plant enters into operation, it generates revenue by selling the electricity generated. The production level and price are two factors that directly affect the amount of revenue generated. Electricity sales are therefore critical to maximize income from electricity generation. The mechanisms used to determine the sale price of electricity vary from jurisdiction and include regimes based on regulated tariffs to those where an ad hoc tariff is negotiated and agreed for each project. Once the plant is operational, we also provide all materials, tools and labor and cover all costs of staffing in connection with the plants preventive and scheduled maintenance.
In CSP, we have brought nineteen commercial plants into operation totaling 1,491 MW. The first to become operational was PS10, an 11 MW solar tower power plant that commenced operations in 2007. Two years later, PS20, a 20 MW solar power plant, started up, also located in the Solúcar Platform. In 2008, a solar trough plant was installed at PS10, the first commercial operating solar trough plant in Spain and representing part of our continuing efforts to increase our familiarity with the latest technologies. In 2010, three 50 MW trough technology plants commenced operations, making for a total of 181 MW of CSP in operation. In 2011, 2012, and as of the date of this annual report, twelve plants commenced operations: ten 50 MW plants, all in Spain (Helioenergy 1/2, Solacor 1/2, Solaben 2/3, Helios 1 and 2, Solaben 1 and 6), a 150 MW hybrid solar gas plant in Hassi R' Mel (Algeria) and the first large scale concentrating solar power plant in the Middle East, Abu Dhabi (United Arab Emirates), with 100 MW of power output capacity. In October 2013, we successfully brought into operation Solana with a generation capacity of 280 MW, six hours of molten salt heat storage, and the ability to supply power to 70,000 homes. In June 2014, we transferred our rights of usufruct over Solaben 2/3, Solana and Mojave to Abengoa Yield. On November 18, 2014, we completed the transfer to Abengoa Yield of Solacor 1/2 through a 30-year usufruct rights contract over the related shares (which includes an option for Abengoa Yield to purchase such shares for one euro during a four-year term). On December 4, 2014, we completed the transfer to Abengoa Yield of PS10/20, and on December 29, 2014, we completed the transfer of Cadonal, subject to a put option right that allows Abengoa Yield to sell the asset back to us under certain circumstances. In February 2015, we entered into an agreement to sell to Abengoa Yield usufruct rights over 30% of Helioenergy 1/2. The projects expected to be transferred to Abengoa Yield, other than Helioenergy 1/2, are classified as discontinued operations in accordance with the stipulations and requirements of IFRS 5,Non-Current Assets Held for Sale and Discontinued Operations.
76
Table of Contents
In the field of PV energy, our first 1.2 MW PV plant, located in Seville (Spain), has now completed its seventh year of commercial production, thereby demonstrating the commercial viability of the low concentration technology it utilizes. The 1 MW Copero plant in Seville (Spain) is also in operation, as well as the 1.9 MW Casaquemada PV plant in Sanlucar la Mayor, Seville (Spain), the 1.9 MW Linares PV plant in Linares (Spain) and the 5.7 MW Las Cabezas PV plant in Las Cabezas de San Juan, Seville (Spain), all of which have reached expected levels of production.
In California, we completed construction on December 1, 2014 of the Mojave power plant equipped with parabolic trough technology in the Mojave Desert and benefitting from a power purchase agreement ("PPA") signed in 2009 with the electric utility Pacific Gas and Electric Company. This project obtained a $1,202 million loan guarantee from the DOE in order to support its construction and startup of the Mojave Solar power plant. Mojave Solar, with a gross generation capacity of 280 MW, is able to supply power to 90,000 households. Mojave was transferred to Abengoa Yield as part of the Abengoa Yield IPO.
Transmission
The Transmission segment had revenue of €91.4 million and Consolidated EBITDA of €64.3 million for the year ended December 31, 2014. In addition, our Transmission segment had total net fixed assets of €2,273.1 as of December 31, 2014.
Within our Concession-Type Infrastructure activity, the Transmission segment operates power transmission lines for a certain period of time after construction is completed. The power transmission lines are constructed by our Engineering and Construction activity. During the period of operation, our Concession-Type Infrastructure activity generates revenue by charging the electrical grid an annual fee for operating the power transmission lines. The prices of the service, fixed at the award of the project and regulated in the concession contract, are invoiced monthly to the companies that use the infrastructure. The amount the Engineering and Construction activity is able to charge is usually set in the concession contract as is normally an availability payment. As of December 31, 2014, the Concession-Type Infrastructure activity managed approximately 5,143 km of high voltage power transmission lines in operation (of which 3,532 km are owned by Abengoa Yield, which we have classified as discontinued operation in accordance with the stipulations and requirements of IFRS 5,Non-Current Assets Held for Sale and Discontinued Operations) and a further 6,820 km of high voltage power transmission lines under construction that will come under the Concession-Type Infrastructure activity's operation upon their completion. In Brazil, Peru and India, the Concession-Type Infrastructure activity has 19 projects totaling 10,552 km of power transmission concessions.
| | | | | | | |
Country | | Number of
Projects(1) | | Total km of
Power
Transmission
Concessions(1) | |
|---|
Brazil | | | 16 | | | 9,750 | |
Peru(2) | | | 2 | | | 487 | |
India | | | 1 | | | 115 | |
| | | | | | | | |
Total | | | 19 | | | 10,552 | |
| | | | | | | | |
| | | | | | | | |
| | | | | | | | |
- (1)
- Includes greenfield projects, projects under construction and projects in operation.
- (2)
- Includes ATN 2, which is expected to be transferred to Abengoa Yield in 2015.
Over the course of 2011 and 2012, we completed the Cemig Sales which comprised the following: (i) on June 2, 2011, we sold 50% of our interest in four project companies: STE—Sul Transmissora de Energia S.A. ("STE"), ATE Transmissora de Energia S.A. ("ATE"), ATE II Transmissora de Energia S.A. ("ATE II") and ATE III Transmissora de Energia S.A. ("ATE III"); (ii) also on June 2, 2011 we sold 100% of the share capital of NTE Nordeste Transmissora de Energia S.A. and; (iii) on March 16, 2012, we signed an additional share purchase
77
Table of Contents
agreement to sell our remaining 50% interest in project companies STE, ATE, ATE II and ATE III (on June 30, 2012, all closing conditions were fulfilled). See "Item 5.A—Operating Results—Factors Affecting the Comparability of Our Results of Operations—Divestments and Business Combinations—Sale of Brazilian Transmission Line Assets" for further discussion.
In June 2012, we were awarded the construction, operation and maintenance of an 80 km power transmission line by Sierra Gorda Sociedad Contractual Minera, known as the "Sierra Gorda" project, to cross the Atacama Desert from North to South, linking various mining centers in Northern Chile. The concession is for a period of 20 years and portions of the line are expected to begin operation in 2013.
In December 2012, we were awarded by ANEEL the construction, operation and maintenance of three 500 kV AC power transmission lines, which will cover a total of 2,472 km across 8 states in Brazil.
The projects began in March 2013 and are expected to come into operation in the same month in 2016. The first concession comprises four transmission lines covering 1,816 km and two electricity stations in the states of Tocantins, Piauí, Bahía and Maranhao; while the second concession involves the construction of a 286 km transmission line and two substations in the states of Ceará, Paraíba and Río Grande do Norte. The third and final concession won by Abengoa consists of a single transmission line of 370 km between the Estreito and Itabirito 2 stations in the state of Minas Gerais.
In February 2013, we were selected by the Peruvian Ministry of Energy and Mining through the private investment promotion agency Pro Inversion, the construction, operation and maintenance of three power transmission lines covering a total distance of 354 km in Peru.
In May 2013, we were chosen by ANEEL to carry out the engineering, design, construction, maintenance and commission of three new electricity concessions in Brazil which will cover 2,920 km. The first concession comprises a transmission line covering 615 km in the states of Pernambuco, Piauí and Ceará. The second concession involves the construction of a 544 km transmission line in the states of Maranhao, Piauí and Ceará. The third concession consists of various transmission lines with a combined length of 1,761 km, construction of a new substation and extending a further three substations, all located in the states of Pará and Tocantins. A further transmission line covering 367 km was awarded by ANEEL in November 2013.
In July 2014, we were awarded our first concessions project for two electricity transmission lines in Asia, specifically in India, representing our first Asian contract. We will be responsible for engineering, designing and constructing two transmission lines totaling 134 km. The first concession is a 400 kV line covering 113.7 km, of which 4.4 km are underground, which will connect Dahej with the city of Vadodara. The second line will have a 220 kV capacity and be 20.62 km long, running between the district of Bhestan and the city of Navsari. Both lines are located in the state of Gujarat and will provide the Vadodara and Navsari districts with a quality energy supply under this concession. The project is expected to benefit around ten million people.
In November 2014, we were selected by the National Power and Drinking Water Office (ONEE) for a new electricity transmission project in Morocco of 210 km.
In December 2014, we were selected by Endesa to develop five new electric transmission lines in southern Chile that will connect the Hydro Los Cóndores plant with Ancoa substation. We were also selected by the Oman Electricity Transmission Company for a new power transmission project in Oman. The project consists of an electrical substation and transmission line of 24 km. In addition, we were commissioned by the Talas del Maciel II wind farm, Cadonal, for its second project of this type in Uruguay. Located in the Flores department, the wind farm consists of 25 wind turbines producing a total of 50 MW that will be supplied to Uruguay's national power grid. Cadonal was transferred in the last quarter 2014 to Abengoa Yield, subject to a put option right that allows Abengoa Yield to sell the asset back to us under certain circumstances.
78
Table of Contents
A complete list of our power transmission line concessions as of December 31, 2014 is set out below:
| | | | | | | | | | | | | | |
| | Project | | Kilometers | | Abengoa
Stake | | Concession-Type
Contract | | Concessionaire | | Status
(Operational
Start Date) |
|---|
Brazil | | ATE IV (São Mateus) | | | 85 | | | 100 | % | BOOT | | ANEEL | | Operating (Sept-10) |
| | ATE V (Londrina) | | | 132 | | | 100 | % | BOOT | | ANEEL | | Operating (Oct-10) |
| | ATE VI (Campos Novos) | | | 131 | | | 100 | % | BOOT | | ANEEL | | Operating (Jan-10) |
| | ATE VII (Foz do Iguaçu) | | | 115 | | | 100 | % | BOOT | | ANEEL | | Operating (Aug-09) |
| | Manaus | | | 586 | | | 50.5 | % | BOOT | | ANEEL | | Operating (Mar-2013) |
| | Norte Brasil | | | 2,375 | | | 51 | % | BOOT | | ANEEL | | Operating (Nov-2014) |
| | ATE VIII | | | 108 | | | 50 | % | BOOT | | ANEEL | | Operating (Feb-14) |
| | ATE XVI | | | 1,816 | | | 100 | % | BOOT | | ANEEL | | Pre-Construction (Q3 2016) |
| | ATE XVII | | | 286 | | | 100 | % | BOOT | | ANEEL | | Pre-Construction (Q2 2016) |
| | ATE XVIII | | | 383 | | | 100 | % | BOOT | | ANEEL | | Pre-Construction (Q1 2016) |
| | ATE XIX | | | 630 | | | 100 | % | BOOT | | ANEEL | | Pre-Construction (Q3 2016) |
| | ATE XX | | | 541 | | | 100 | % | BOOT | | ANEEL | | Pre-Construction (Q3 2016) |
| | ATE XXI | | | 1,760 | | | 100 | % | BOOT | | ANEEL | | Pre-Construction (Q3 2016) |
| | ATE XXII | | | 367 | | | 100 | % | BOOT | | ANEEL | | Pre-Construction (Q1 2017) |
| | ATE XXIII | | | 240 | | | 100 | % | BOOT | | ANEEL | | Pre-Construction (Q3 2018) |
| | ATE XXIV | | | 195 | | | 100 | % | BOOT | | ANEEL | | Pre-Construction (Q2 2017) |
| | | | | | | | | | | | | | | |
Total | | | | | 9,750 | | | | | | | | | |
Peru | | ATN 2(1) | | | 132 | | | 40 | % | BOOT | | MEM | | Construction (Q2 2015) |
| | ATN 3(2) | | | 355 | | | 100 | % | BOOT | | MEM | | Construction (Q3 2016) |
Total | | | | | 487 | | | | | | | | | |
India | | Dgen | | | 115 | | | 51 | % | BOOT | | India | | Construction (Q3 2017) |
Total | | | | | 115 | | | | | | | | | |
| | | | | | | | | | | | | | | |
Total Power Transmission Lines | | | | | 10,552 | | | | | | | | | |
| | | | | | | | | | | | | | | |
| | | | | | | | | | | | | | | |
| | | | | | | | | | | | | | | |
"BOOT" means Build, Own, Operate and Transfer.
"MEM" means the Ministerio de Energía y Minas.
- (1)
- Assets expected to be transferred to Abengoa Yield in 2015.
- (2)
- Projects expected to be transferred to APW1.
Water Infrastructure
The Water segment had revenue of €40.8 million and Consolidated EBITDA of €26.5 million for the year ended December 31, 2014. In addition, our Water segment had total net fixed assets of €495.9 million as of December 31, 2014.
Within our Concession-Type Infrastructure activity, our Water segment constructs and operates water generation, transportation and management facilities, including desalination, treatment and water purification plants and water pipelines pursuant to long-term concession agreements. In recent years, the number of partnerships between the public and the private sectors to manage and execute water infrastructure projects on a concession basis has grown significantly. The form of a particular concession may vary significantly depending on the type of project, the country involved, the individual public-private negotiations and the specific purpose of the concession.
We currently have a portfolio of 12 operational concession projects. We are in the process of constructing two additional concessions in Tenes (Algeria) (200,000 m3/day) and a desalination plant in Nungua (Ghana) (60,000 m3/day). These projects are scheduled to be in operation in 2015. In addition, we have also several plants in pre-construction.
We have been chosen by the Moroccan National Electricity and Drinking Water Office (ONEE) to construct a new desalination plant in Agadir, Morocco and to operate it for 20 years. The project will draw on Abengoa's technological capabilities, based on a desalination method using a water ultrafiltration pretreatment that will optimize the advanced reverse osmosis process. It will be Morocco's largest capacity
79
Table of Contents
desalination plant (100,000 m3/day). We have also been selected to deliver 175,000 m3 per day of water to the city of San Antonio, Texas. We will lead a team of local sub-contractors and consultants within the Vista Ridge Consortium to design, build, finance and operate the infrastructure needed to deliver the water. The water will be delivered from Burleson County and contracted for a period of 30 years.
The table below shows certain information regarding our current concessions in our Water segment as of December 31, 2014. All such concessions were awarded under BOOT schemes.
| | | | | | | | | | | | | | |
Project Name | | Location | | Type of
Plant | | Year or
Expected Year of
Commencement | | Duration | | Capacity | | Abengoa
Equity
Interest | |
|---|
Iniciativas Hidroeléctricas de Aragón y Cataluña, S.A | | Huesca and Lerida, Spain | | Hydroelectric plant | | 1997 | | 50 years | | 12 GWh/year | | | 95 | % |
Iniciativas Hidroeléctricas, S.A | | Seville, Spain | | Hydroelectric plant | | 2003 | | 35 years | | 10 GWh/year | | | 50 | % |
Almeria | | Almeria, Spain | | Seawater desalination plant | | 2005 | | 15 years | | 50,000 m3/day | | | 50 | % |
Canal de Navarra | | Navarre, Spain | | Irrigation systems | | 2006 | | 35 years | | 14 sectors including 2,611 Ha | | | 10 | % |
Cartagena | | Murcia, Spain | | Seawater desalination plant | | 2006 | | 15 years | | 65,000 m3/day | | | 37.5 | % |
Bajo Almanzora | | Almería, Spain | | Seawater desalination plant | | 2007 | | 15 years | | 45,000 m3/day | | | 40 | % |
Skikda(1) | | Skikda, Algeria | | Seawater desalination plant | | 2009 | | 25 years | | 100,000 m3/day | | | 34.17 | % |
Chennai | | Chennai, India | | Seawater desalination plant | | 2010 | | 25 years | | 100,000 m3/day | | | 25 | % |
Honaine(1) | | Honaine, Algeria | | Seawater desalination plant | | 2011 | | 30 years | | 200,000 m3/day | | | 25.5 | % |
Tenes | | Tenes, Algeria | | Seawater desalination plant | | 2014 | | 25 years | | 200,000 m3/day | | | 49 | % |
Nungua | | Nungua, Ghana | | Seawater desalination plant | | 2015 | | 25 years | | 60,000 m3/day | | | 51 | % |
Agadir | | Agadir, Moroco | | Seawater desalination plant | | 2017 | | 20 years | | 100,000 m3/day | | | 51 | % |
Zapotillo | | Jalisco, Mexico | | Aqueduct | | 2017 | | 25 years | | 3.8m3/sec | | | 100 | % |
San Antonio Water Systems (SAWS) | | Texas, USA | | Brackish water treatment plant | | 2019 | | 30 years | | 168,970 m3/day | | | 51 | % |
- (1)
- On February 3, 2015, Abengoa Yield completed the acquisition from us of a 25.5% stake in Honaine and a 34.17% stake in Skikda.
Co-generation and other Power Plants
The Co-generation and other segment had revenue of €32.0 million and Consolidated EBITDA of €3.9 million for the year ended December 31, 2014. In addition, our Co-generation and other segment had total net fixed assets of €322.0 million as of December 31, 2014.
Within our Concession-Type Infrastructure activity, our Co-generation and other segment participates in public tenders for the development and operation of combined heat and power plants under concession schemes. We also seek opportunities in the private sector.
In November 2014, we were selected to construct a 20 MW hydroelectric power plant in the Mamacocha River in Arequipa (Peru) for the owner, Hidroelectrica Laguna Azul. The plant will have a total installed capacity of 20 MW and the generated power will be equivalent to the consumption of 10,000 households.
In December 2014, we signed a memorandum of understanding with the South Korean company Hyundai Engineering & Construction to work together developing power plant projects.
We are currently developing two additional co-generation units of 240 MW (A3T) and 600 MW (A4T) adjacent to Abengoa Yield's ACT facility in Mexico.
We also have significant experience in the development, construction and operation of wind farms in Uruguay. We are currently constructing Nicefield, a 70 MW wind farm in Uruguay that also manages two other wind farms (Cadonal and Palmatir) with a total capacity of 100 MW, currently owned by Abengoa Yield (which we have classified as discontinued operation in accordance with the stipulations and requirements of IFRS 5,Non-Current Assets Held For Sale and Discontinued Operations).
80
Table of Contents
Abengoa Yield
The impact on our revenue and Consolidated EBITDA due to the classification of Abengoa Yield as discontinued operations was €225 million and €226 million, respectively, for the year ended December 31, 2014.
The portfolio of Abengoa Yield consists of the following assets:
- •
- Renewable energy: renewable energy assets include (i) two concentrated solar power (CSP) plants in the United States, Solana and Mojave, each with an aggregate gross capacity of 280 MW; (ii) two onshore wind farms in Uruguay, Palmatir and Cadonal, with an aggregate gross capacity of 100 MW; (iii) three CSP plants in Spain, Solaben 2/3, Solacor 1/2, and PS 10/20, with an aggregate gross capacity of 231 MW; and (iv) a 34.17% stake and a 25.5% stake in Skikda and Honaine, respectively, two water desalination plants in Algeria, with an aggregate gross capacity of 10.5 Mft3/day.
- •
- Conventional power: the conventional power asset consists of ACT, a 300 MW co-generation plant in Mexico.
- •
- Electric transmission lines: the electric transmission line assets include (i) two lines in Peru, ATN and ATS, spanning a total of 931 miles; and (ii) three lines in Chile, Quadra 1, Quadra 2, and Palmucho, spanning a total of 87 miles.
In addition, Abengoa Yield owns a preferred equity investment in Abengoa Concessões Brasil Holding ("ACBH"), a subsidiary holding company of Abengoa that is engaged in the development, construction, investment and management of contracted concessions in Brazil, consisting mostly of electric transmission lines.
This preferred equity investment grants Abengoa Yield the following rights:
- •
- During the five year period commencing on July 1, 2014, Abengoa Yield has the right to receive, in four quarterly installments, a preferred dividend of $18.4 million per year. Pursuant to the terms of a parent support agreement entered into on December 9, 2014 by and among Abengoa Yield, ACBH and us, we guaranteed such dividend for the initial five-year period and in the event that, at any point in time, the amount deposited in New York City in U.S. Dollars is lower than the preferred dividend payments that Abengoa Yield has the right to receive as of such time, Abengoa Yield will be able to retain all payments due to us and any of our affiliates, including dividends payable on its shares and payments related to all agreements entered into between Abengoa Yield and/or its subsidiaries and us and/or our affiliates, without affecting their respective obligations to continue performing under the relevant contract. In addition, we have agreed to forego our right to certain dividends from Abengoa Yield if such preferred dividend is not received by it.
- •
- Following the initial five-year period, Abengoa Yield will have the option to (i) remain as preferred equity holder receiving the first $18.4 million in dividends per year that ACBH is able to distribute or (ii) exchange the preferred equity for ordinary shares of specific project companies owned by ACBH.
81
Table of Contents
The table below provides an overview of Abengoa Yield's current assets (excluding the exchangeable preferred equity investment in Abengoa Concessões Brasil Holding):
| | | | | | | | | | | | | | | |
Assets | | Type | | Ownership | | Location | | Capacity
(Gross) | | COD | | Contract
Years Left | |
|---|
Solana | | Renewable (CSP) | | | 100 | %(1) | Arizona (USA) | | 280 MW | | Q4 2013 | | | 29 | |
Mojave | | Renewable (CSP) | | | 100 | % | California (USA) | | 280 MW | | Q4 2014 | | | 25 | |
ACT | | Conventional Power | | | 100 | % | Mexico | | 300 MW | | Q2 2013 | | | 19 | |
ATN | | Transmission line | | | 100 | % | Peru | | 362 miles | | Q1 2011 | | | 27 | |
ATS | | Transmission line | | | 100 | % | Peru | | 569 miles | | Q1 2014 | | | 30 | |
Quadra 1 & Quadra 2 | | Transmission line | | | 100 | % | Chile | | 81 miles | | Q2 2014 & Q1 2014 | | | 21 | |
Palmucho | | Transmission line | | | 100 | % | Chile | | 6 miles | | Q4 2007 | | | 23 | |
Palmatir | | Renewable (Wind) | | | 100 | % | Uruguay | | 50 MW | | Q2 2014 | | | 20 | |
Solaben 2 & Solaben 3 | | Renewable (CSP) | | | 70% | (2) | Spain | | 2x50 MW | | Q2 2012 & Q4 2012 | | | 24 | |
Cadonal | | Renewable (Wind) | | | 100% | (3) | Uruguay | | 50MW | | Q4 2014 | | | 20 | |
Solacor 1 & Solacor 2 | | Renewable (CSP) | | | 74% | (4) | Spain | | 100MW | | Q2 2012 & Q4 2012 | | | 24 | |
PS10/20 | | Renewable (CSP) | | | 100 | % | Spain | | 31MW | | Q1 2007 & Q2 2009 | | | 20 | |
Honaine | | Water desalination | | | 25.5% | (5) | Algeria | | 200 Km3/d | | Q3 2014 | | | 27 | |
Skikda | | Water desalination | | | 34.17% | (5) | Algeria | | 100 Km3/d | | Q1 2009 | | | 19 | |
- (1)
- On September 30, 2013, we entered into an agreement with Liberty Interactive Corporation pursuant to which Liberty agreed to invest $300 million in Class A membership interests of ASO Holdings Company LLC, the parent of Arizona Solar, in exchange for a share of the dividends and the taxable loss generated by the project. Abengoa Yield indirectly owns 100% of the Class B membership interests in ASO Holdings Company LLC.
- (2)
- Itochu Corporation, a Japanese trading company, holds 30% of the shares in each of Solaben 2 and Solaben 3. Abengoa Yield holds a 30-year right of usufruct over the remaining shares of Solaben 2 and Solaben 3 and a call option to purchase such shares for one euro during a four-year term.
- (3)
- Under the terms of a put option agreement entered into with Abengoa Yield in the context of its acquisition of Cadonal, Abengoa Yield has a put right to sell the asset back to us for the same price for which Abengoa Yield acquired it if certain waiver conditions related to the Cadonal financing arrangements are not satisfied by the end of March 2015.
- (4)
- JGC Corporation, a Japanese engineering company, holds 26% of the shares in each of Solacor 1 and Solacor 2. Abengoa Yield holds a 30-year right of usufruct over the remaining shares of Solacor 1 and Solacor 2 and a call option to purchase such shares for one euro during a four-year term.
- (5)
- We sold a 25.5% stake in Honaine and a 34.17% stake in Skikda to Abengoa Yield on February 3, 2015.
In February 2015, Abengoa Yield announced it has reached an agreement with us for the second asset drop-down from Abengoa, the closing of which would be subject to customary conditions, including approvals from financing institutions and, in some cases, from partners. The assets include:
- •
- A 40% equity interest in ATN 2, an 81-mile transmission line in Peru;
- •
- A 20% stake in Shams, a 100-MW solar power asset in the United Arab Emirates and usufruct rights over a 29.6% stake in Helioenergy 1/2 in Helioenergy 1/2, a 100-MW solar power asset in Spain; and
- •
- A 25.5% stake and a 34.17% stake, respectively, in Honaine and Skikda, two water desalination plants in Algeria with an aggregate capacity of 10.5 Mft3/day.
On February 3, 2015, we completed the sale of a 25.5% equity stake in Honaine and a 34.17% equity stake in Skikda and entered into a simultaneous call and put option agreement by which Abengoa Yield has put option rights to require Abengoa to purchase back the assets at the same price paid by it and Abengoa has call option rights to require Abengoa Yield to sell back the assets under certain circumstances during a two-year period.
The acquisition of the 40% equity interest in ATN2, the usufruct rights over the 29.6% stake in Helioenergy 1/2 and the 20% equity stake in Shams has not been consummated as of the date of this annual report, and is subject to entering into definitive documentation and obtaining certain approvals, including
82
Table of Contents
approvals from financing institutions and, in some cases, from partners in joint ventures. In the case of ATN 2, the acquisition is also subject to the beginning of the generation of revenues by the project.
Industry and Competition
Over the past 36 months, the energy landscape has changed significantly in part due to: political upheaval and civil unrest in certain countries in the Middle East and Africa; the incident at the Fukushima Daiichi nuclear plant in Japan; new moratoria on shale gas drilling in the Canadian province of Quebec and France; expectations regarding economic growth in China; and uncertainty surrounding global agreements regarding greenhouse gas emissions including Canada's withdrawal from the Kyoto Protocol.
Despite these changes and the uncertain economic environment, world energy demand is expected to increase due principally to demand growth experienced by many large non OECD economies such as China and India (44% and 123% growth, respectively, in energy demand from 2012 to 2040 according to World Energy Outlook 2014) and renewable energy is expected to play a more important role in satisfying energy demands which may lead to more projects available under BOOT schemes.
According to the International Energy Agency ("IEA"), global energy demand is expected to gradually increase to 18,293 Mtoe by 2040, a 37% increase from 2012. In the same period, demand for renewable energy (wind, solar, geothermal, marine, biomass and hydro) is expected almost double from 1,802 Mtoe in 2012 to 3,455 Mtoe in 2040, and the share of renewables in the electricity generation market is expected to increase from 20.6% in 2012 to 36.8% in 2040 (Source: World Energy Outlook 2014, IEA).
In order to meet growing energy demand, significant investment must be made in the power sector in order to increase installed production capacity and to expand and improve T&D infrastructure. The IEA estimates a total investment of $20.8 billion for the 2014-2040 period, or an average of $800 billion per year as follows:
- •
- total investment in new power plants estimated at $12,150 billion, out of which $7,577 billion or 61% corresponds to renewables, led by hydro, wind and solar PV;
- •
- total investment in power transmission infrastructure estimated at $8,686 billion globally, of which two thirds takes place in non-OECD countries; and
- •
- total investment in biofuels of $400 billion.
(Source: World Energy Outlook 2014)
We face several different competitors in our Concession-Type Infrastructure activity. In the Transmission segment, our principal competitors are Eletrobrás, Cemig and ISA. In the Water segment, our principal competitors are Veolia Environnement S.A., Hyflux Ltd., Doosan Ltd., Suez Environnement, S.A, Fisia Italimpianti S.p.A. and Aquatech, Ltd. The principal competitors of our Solar segment along the CSP value chain are Spanish companies ACS, SENER Ingeniería y Sistemas, S.A. ("SENER") and Acciona, and the American companies Florida Power Corporation and The Light Group LLC in the promotion and operation activities, and BrightSource Energy Inc., Ausra/Areva, and SkyFuel Inc. in technology. In PV, there are multiple competitors in both promotion and technology. In the Co-generation and other segment, we have numerous international and regional competitors, including utilities. Our principal competitors in the Spanish co-generation market are Iberdrola Cogeneración, S.R.L.U., Endesa Cogeneración y Renovables, S.A.U., Sacyr Vallehermoso, S.A., Gas Natural SDG, S.A. (Gas Natural Fenosa), DETISA and Dragados, S.A. In the international co-generation market, our competitors include ACS, Iberdrola Ingeniería y Construcción, S.A.U., Cobra Instalaciones y Servicios, S.A., Grupo Isolux Corsán, S.A., Samsung Group and Itochu Corporation.
83
Table of Contents
Customers and Contracts
Revenue from our Concession-Type Infrastructure activity comes from selling water, electricity, and power transmission line capacity. Our customers vary from governments in countries where feed-in-tariffs are in place (in the case of Spain, utilities are the electricity offtakes; but a government agency pays the tariff and premium), to electrical and water utilities, with which we would typically sign power purchase agreements.
Our Concession-Type Infrastructure activity primarily utilizes concession contracts, which include the operation and maintenance of the asset for a significant period of time, typically 20 to 30 years. There are several forms of concession contracts, but the most frequently used are BOO and BOOT.
Industrial Production
Overview
Our Industrial Production activity develops and produces biofuels for transportation which are used as components of gasoline or for direct blending with gasoline or diesel. We also produce DGS, sugar from our production plants in Brazil, electricity and carbon dioxide as by-products of the ethanol production process for sale to third parties. This activity includes the segment of Biofuels. Our Biofuels segment is located in Spain, France, The Netherlands, the United States and Brazil.
Our Biofuel segment had revenue of €2,136.7 million and Consolidated EBITDA of €271.4 million for the year ended December 31, 2014. In addition, our Industrial Production activity had total net fixed assets of €3,145.8 million as of December 31, 2014.
The Biofuels segment is dedicated to the production and development of biofuels, primarily ethanol for transport that employs cereal and sugarcane as raw materials. Our ethanol production facilities in Europe, the United States and Brazil have a combined production capacity of 3,045 million liters ("Ml") in operation. We also have a biodiesel plant in Spain, with a capacity of 225 Ml per year. We are the only company with a significant presence in Europe, the United States and Brazil, the three largest biofuel markets in the world.
Ethanol is used for Ethyl Butyl Ether ("ETBE") production, as a component of all gasoline or for direct blending with gasoline. Biodiesel is used for direct blending with diesel or in a pure form as a substitute for diesel. We also produce by-products from our biofuel production, including DGS, sugar, electricity and carbon dioxide, which are sold to third parties.
We are Europe's largest bioethanol producer with an annual production capacity of 1,275 Ml. We operate three ethanol plants in Spain in Cartagena, Murcia; Teixeiro, La Coruña; and Babilafuente, Salamanca. These three ethanol plants have a combined annual production capacity of 545 Ml. In addition we operate a fourth plant in Lacq (France), which has an annual production capacity of 250 Ml; a 480 Ml ethanol production capacity plant in Rotterdam (The Netherlands) commenced operation in September 2010 and is Europe's largest ethanol plant by production capacity.
We also produce biodiesel at a production plant in San Roque, Cádiz (Spain), which began supplying biodiesel in March 2009 and produces 225 Ml of biodiesel annually. This plant is located on the premises of a CEPSA refinery; CEPSA is also the customer for a significant portion of the facility's output.
We are one of the largest ethanol producers in the United States, with an annual production capacity of over 1,535 Ml. Most of the ethanol produced in the United States is marketed in the form of e10 (90% gasoline and 10% ethanol), although sales of e85 (a mixture of 15% gasoline and 85% ethanol) have been increasing steadily. In 2010, construction work was completed on two 340 Ml production capacity plants located in Madison, Illinois, and Mount Vernon, Indiana; both plants became fully operational in early 2010. In October 2014, the first commercial scale biorefinery facility to produce renewable ethanol fuel from cellulosic plant fiber in Hugoton, Kansas entered into operation.
We are a significant producer of ethanol and sugar in Brazil, operating three sugarcane ethanol plants which have a crush consumption capacity of 6.2 million tons of sugarcane for the production of
84
Table of Contents
approximately 235 Ml of ethanol and a sugar production capacity of 520,000 tons per year. Brazil is one of the world's largest markets for ethanol and ethanol production and is expected to continue as such, due to the success of flex-fuel vehicles that can run on either gasoline or ethanol. Flex-fuel vehicles currently account for nearly 90% of the vehicles sold in Brazil. In 2010, we finished the construction of two energy co-generation units at our sugarcane ethanol plants, each with an installed capacity of 91 MW and one of which can be upgraded to 144 MW. The plants use sugarcane "bagasse" as the raw material to fuel their boilers, which produce the steam to generate electricity and heat for production processes. These plants became operational in August and September 2010, and their excess output is fully connected to the power grid operated by Eletrobrás, a major Brazilian power utility.
We believe there is a significant market opportunity for us in the second-generation biofuels industry, which utilize biomass rather than cereal and other food crops as the primary raw material. We have invested continually in R&D&i over the past decade and have developed our own proprietary process and enzymes. We have been operating a pilot plant in York, Nebraska (United States) since 2007 and a demonstration plant in Salamanca, Spain since 2009. We completed the construction of our first second-generation commercial plant in Hugoton, Kansas (United States), for which we were awarded $132 million loan guarantee financing from DOE and $88 million in grants since 2007 from the DOE. This plant started operations in October 2014 and will result in significant cost saving, while also providing opportunities to license its biomass technology to third parties. In addition, the plant will position us well to potentially enter the industries of biomaterials and bioproducts.
In April 2013, we began operating the first demonstration plant using waste-to-biofuels technology. The demonstration plant in Babilafuente (Salamanca, Spain) has the capacity to treat 25,000 tons of municipal solid waste from which up to 1.5 million liters of bioethanol will be produced for use as fuel.
A list of our biofuel production facilities as of December 31, 2014 is set out below:
| | | | | | | | |
Region | | Plant | | Ethanol Capacity
(million liters
per year) | | Status | |
|---|
Europe | | Murcia, Spain | | 150 | | | Operating since 1999 | |
| | La Coruña, Spain | | 195 | | | Operating since November 2003 | |
| | Salamanca, Spain | | 200 | | | Operating since April 2006 | |
| | Lacq, France | | 250 | | | Operating since June 2007 | |
| | Rotterdam, The Netherlands | | 480 | | | Operating since September 2010 | |
| | San Roque, Spain | | 225 (biodiesel) | | | Operating since February 2009 | |
United States | | York, Nebraska | | 208 | | | Acquired in November 2001 | |
| | Colwich, Kansas | | 95 | | | Acquired in November 2001 | |
| | Portales, New Mexico | | 114 | | | Acquired in November 2001 | |
| | Ravenna, Nebraska | | 341 | | | Operating since September 2007 | |
| | Evansville, Indiana | | 341 | | | Operating since Q1 2010 | |
| | Tricity, Illinois | | 341 | | | Operating since Q1 2010 | |
| | Hugoton, Kansas | | 95 | | | Operating since Q4 2014 | |
Brazil | | São Luis, São Paulo | | 3 million tons crushed capacity,
91 Ml of ethanol,
275 thousand tons of sugar | | | Acquired in September 2007 | |
| | São João, São Paulo | | 3.1 million tons crushed capacity,
144 Ml of ethanol,
360 thousand tons of sugar | | | Acquired in September 2007 | |
| | Santo Antonio de Posse, São Paulo | | 3.1 million tons crushed capacity;
245 thousand tons of sugar | | | Under leasing agreement | |
All of the above plants (other than those in York, Nebraska; Colwich, Kansas; Portales, New Mexico—all in the United States—and those in Brazil) were constructed by our Engineering and Construction segment.
Operations
The operations of our Industrial Production activity's Biofuels segment represents a single integrated process that includes production; raw materials procurement; ethanol origination; and the trading of ethanol, DGS and sugar.
85
Table of Contents
Production
We produce ethanol at our facilities in Europe, the United States and Brazil from cereal grains and sugarcane by means of biochemical processes and treatments. One of our European production facilities also generates biodiesel. In the process of producing ethanol and biodiesel, we generate various secondary byproducts, including DGS, sugar, electricity and carbon dioxide, which are collected and sold to third parties.
Procurement of Raw Materials
Raw materials account for approximately 60% to 70% of the production costs of biofuels. The most important typically for production are corn, wheat, barley and sorghum. The production of biodiesel relies on various oils, including soybean and palm. Since operations began, the Biofuels segment of our Industrial Production activity has built up experience in the supply and logistics of commodities. We have also established direct supply agreements with farmers and traders to secure the necessary volume of raw materials for our plants.
In Brazil, we grow sugarcane while preserving sustainable rural development, biodiversity and regional economic growth. Our production plants are supplied through agreements with landowners, performing the required tasks for use of the land, and by providing the necessary resources and advice to farmers in order to start production.
Ethanol, DGS and Sugar Trading
We trade in ethanol, DGS and sugar to manage our demands for these products. We have established offices in key markets for global ethanol trading, including Rotterdam (The Netherlands); St. Louis, Missouri (United States); and São Paulo (Brazil). Market fluctuations, political conditions in different geographical areas and other factors affecting our business, both in terms of acquisition of raw materials and in the production of marketed products, are analyzed globally to obtain a better view of international markets.
As a result, our trading activities are designed to optimize our operations, grain procurement, hedging and risk. As a risk mitigation element, we set daily limits or "stop losses" for each strategy, depending on the markets in which it operates, the financial instruments purchased and the risks defined in the transaction.
The term trading includes "buy sell transactions" that we use for a variety of cases and which are used in the ordinary course of our business: (1) short or long positions: we may enter into a buy sell transaction to cover a long or short production position, (2) logistical swaps: we may enter into a buy sell transaction in order to increase margins based on logistics, and (3) market and economic opportunities: our trading department seeks market and economic opportunities that arise. An example is a business opportunity with a third-party to enter into a transaction for a buy sell transaction that is a fully negotiated deal. In the ordinary course of business, we use the same financing policies applicable to the rest of the Group, such as factoring and confirming and other sources of financing, to manage our liquidity position.
Products
We produce ethanol at our facilities in Europe and the United States from cereal grains, and in Brazil from sugarcane. Ethanol is obtained to produce either ETBE or for direct blending with gasoline as e85, e25 and e10. In addition to its renewable origin and being biodegradable, distilled ethanol has many advantages over fossil fuels, it contributes to the reduction of greenhouse gas emissions, increases energy autonomy and diversification, reduces fossil fuel dependence, stimulates growth in local economies, creates jobs in rural areas, and creates cleaner fuels that produce less sulfur dioxide and fewer particles.
86
Table of Contents
Biodiesel is a renewable fuel formed by long-chain fatty acid methyl or ethyl esters. It is obtained through the chemical reaction of methanol (or ethanol) with vegetable oils (rape, sunflower, soy or palm). Biodiesel does not contain sulfur and, when compared with diesel derived from oil, produces lower emissions of greenhouse gas (including carbon dioxide), carbon monoxide and particles and other polluting products.
DGS, a high protein compound used as feedstock for cattle, is obtained as a secondary product from the extraction of starch from cereal grains. In Europe and the United States, DGS is subject to strict quality controls that guarantee that its nutritional properties and products derived therefrom meet relevant food safety legislation. In Europe, Bureau Veritas certifies that our DGS is in compliance with the standards set by the relevant European food quality and safety requirements. Work is also being conducted to obtain a European specification for the product. In the United States, our DGS product fulfills the specifications required by the Association of American Feed Control Officials, which is responsible for developing and implementing uniform and equitable laws, regulations, standards and enforcement policies for regulating the manufacture, distribution and sale of animal foods.
In Brazil, we produce sugar from sugarcane grinding. Liquid is separated from bagasse during grinding and undergoes the necessary filtration and chemical processes to neutralize its pH. Currently, we have an estimated 520,000 tons of crystal sugar production, of which most is exported, taking advantage of the optimal location of our plants near ports.
Some of our biofuel process plants contain co-generation units to produce the necessary steam and electricity to run the ethanol production process. Excess electricity generated is sold to public utilities such as Eletrobrás in Brazil. Each of our plants in Spain and our facility in Rotterdam (The Netherlands) has a gas turbine co-generation plant. Our facilities in Brazil generate steam and heat from the combustion of bagasse obtained after the sugarcane milling process for use in the biofuel production process and in generating electricity. The aggregate amount of capacity from co-generation units was 286 MW as of December 31, 2014. Out of these co-generation units, units with a capacity of 234 MW are operated under long-term contracts, such as feed-in-tariffs or PPAs. However, these are not included in our Concession-Type Infrastructure activity as these are bioethanol assets.
At some of our plants, the carbon dioxide emissions from the production of ethanol are captured and sold to third parties. At our facilities in York, Nebraska and Colwich, Kansas (both the United States); captured carbon dioxide is sold to third parties who process the gas and sell it for use in the beverage and flash freezing industries. For our 480 MI ethanol plant in Rotterdam (The Netherlands), we have been carrying out studies regarding the possibility of supplying the carbon dioxide emissions from the plant's production to greenhouses.
Competition
Our main competitors in the global biofuel market are The Archer Daniels Midland Company, Cosan Limited, CropEnergies AG, Green Plains Renewable Energy, Grupo São Martinho, The Andersons Inc., Verbio, Ensus, Poet Bio Refining and Valero.
87
Table of Contents
Customers and Contracts
Our customer base is mainly comprised of oil companies, including Repsol, CEPSA, Total S.A and BP, and traders, including Cargill, Incorporated.
We have long-term supply contracts for the delivery of ethanol from two of our Spanish facilities and for the delivery of biodiesel from our biodiesel plant. For the remaining facilities, the production is sold under supply contracts ranging in duration from one to six months. To monitor and converse profit margins, we purchase raw materials according to the same time horizon in which we set ethanol production.
Suppliers
In our European operations, we consolidate the purchasing of raw materials (cereal grains, oleaginous seeds and vegetable oils) necessary for the operation of our European ethanol and biodiesel plants with the marketing of associated co-products through a single entity: our fully owned subsidiary Ecoagrícola, S.A. For the past ten years, Ecoagrícola, S.A. has sourced its materials by means of two well-differentiated mechanisms: purchasing on the free market and direct contracting with farmers.
We also centralize the critical functions of grain procurement, ethanol and DGS co-product marketing, and hedging and risk management for all commodities, including energy needs for our U.S. operations. The concentration of these functions into one specialized entity for our biofuel business in the United States is critical to achieve our goals of consistency, efficiency, and identification as one common brand.
With respect to our Brazilian operations, we have reached agreements with local farmers for the supply of sugarcane that satisfies the feedstock requirements for our production facilities in Brazil.
Intellectual Property
Given the progress that we have made in our technology development, in particular in CSP and bioproducts technologies, we have created the office of patents and technological surveillance as a fundamental tool for protecting our intellectual property. The office of patents and technological surveillance determines whether or not to file patents in relation to the knowledge, products and technology that we produce. Currently, we have filed 312 patents, of which 146 have been granted.
The office of patents and technological surveillance has implemented intellectual property ("IP") protection policies and procedures throughout our businesses. These IP protection policies and procedures are applied to all knowledge that has, or might have, commercial value whether or not it is capable of being patented, including R&D&i and know-how, and any documentation (in printed or electronic format) that contains any confidential proprietary information.
The measures that we take to protect our IP include the entry into confidentiality, non-disclosure and/or non-compete agreements with employees, service providers and counterparties, as appropriate, and the dissemination throughout the Group of an internal security code and internal security protocol.
In addition, we take steps to protect the trademarks, business names and distinctive designs used in connection with our activities, products and services, although not all of these have been registered in the jurisdictions in which we operate.
Although we take measures to protect our intellectual property, we do not consider that our business is dependent on any single patent or license, new manufacturing process or other types of intellectual property.
Information Technology
We use information technology developed in-house and also provided by third parties for processing plant maintenance, construction management and operational management. Our systems integrate data and generate stock, orders and efficient sourcing and delivery routes. We are presently implementing a group-wide data warehouse and business intelligence system and a global sourcing (purchasing and
88
Table of Contents
procurement) system across all of our businesses. We utilize software and other information technology licensed from third parties to manage communications with our suppliers and customers.
We believe that our information technology systems infrastructure that supports our various business operations is secure and robust. Our critical system servers are housed offsite in data centers. The remaining system servers are housed in secure, temperature-controlled internal data rooms. We have back-up and disaster recovery plans in place which are reviewed on a periodic basis.
Environmental Matters
Our activities are subject to significant environmental regulation. This requires, among other things, that we commission environmental impact studies for future projects and that we obtain licenses, permits and other authorizations required to construct and operate relevant projects. In recent years, there has been a significant increase in environmental regulation in Spain, the European Union and other jurisdictions in which we operate. These include regulations in relation to carbon dioxide emissions and limitations on polluting emissions from large plants and facilities. See "Item 4.B—Regulation." See also "Item 3.D—Risk Factors—Risks Related to Our Business and the Markets in Which We Operate—Our business is subject to stringent environmental regulation."
We have specifically established within our management regulations, applicable to all of our activities, the obligation to implement environmental management systems certified under the ISO 14001 standard of the International Organization for Standardization. As of December 31, 2014, 85.47% of Group companies, in terms of sales volume, had environmental management systems certified under the ISO 14001 standard and 89.88% held valid ISO 9001 standard certificates for their quality management systems.
Insurance
We maintain the types and amounts of insurance coverage that we believe are consistent with customary industry practices in the jurisdictions in which we operate, and consider our insurance coverage to be adequate for our business. Our insurance policies cover employee-related accidents and injuries, property damage, machinery breakdowns, fixed assets, facilities and liability deriving from our activities or products, including environmental liability. We maintain business interruption insurance for interruptions resulting from incidents covered by insurance policies. Our insurance policies also cover directors' and officers' liability and third-party insurance. We have not had any material claims under our insurance policies that would either invalidate our insurance policies or cause a material increase to our insurance premiums. We can provide no assurance, however, that our insurance coverage will adequately protect us from all risks that may arise or in amounts sufficient to prevent any material loss. See "Item 3.D—Risk Factors—Risks Related to Our Business and the Markets in which We Operate—Our insurance may be insufficient to cover relevant risks and the cost of our insurance may increase."
Risk Management and Internal Control
Our risk management system comprises two distinct systems that collectively manage risk at all levels of our Group: our shared management systems, which aim to mitigate business risks and our internal control systems which are organized to permit compliance with Section 404 of the Sarbanes-Oxley Act of 2002 ("SOX") to mitigate risks related to the reliability of financial information. The system operates live and undergoes continual modification to remain up to date with our business and with employees also being issued a risk management manual. In addition, we have internal auditing to ensure the compliance with and the proper functioning of our risk management system.
The risk management system includes the identification, evaluation, response, monitoring and reporting of risks and is fully integrated into our strategic planning process, our business objectives and our daily operations.
We have implemented common management systems in order to coordinate and streamline our worldwide operations across our activities. Our systems are based on two key pillars of: (i) the definition of a set of management standards for the Group's activities; and (ii) monitoring of project and business performance in real time in order to take appropriate corrective measures, if required.
89
Table of Contents
The mission of our shared management systems is based on the following specific objectives:
- •
- Unification of actions: To establish a single criterion for the carrying out of actions in all our businesses and geographies.
- •
- Reinforcement of corporate identity: To achieve a strong corporate identity recognizable by key stakeholders.
- •
- Control and reduction of risks: To manage risks in a uniform manner and thus mitigate them.
- •
- Optimization of management: To be efficient and effective in the management of the Company both within businesses and geographically.
- •
- Value creation for stakeholders: To differentiate and individualize the management of the main stakeholders in order to provide the greatest value- add to each one.
- •
- Profitability: To contribute to financial performance through active management.
Our risk management system uses a systematic approach to identify events and to evaluate, prioritize, monitor and respond to any risks which may prevent the successful execution of our strategy, business objectives and daily operations.
The main objectives sought through the risk management system are the following:
- •
- To understand and control the risks to which the Group is exposed.
- •
- To establish a system which optimizes the evaluation of risk management by the entire Group, allowing us to successfully assume and manage a greater number of risks and better understand each risk in order that we can adopt more efficient control.
- •
- To achieve a closer alignment between our strategy and our identified risks and controls by the Group.
- •
- To increase senior management assurance with each decision-making process to better achieve the business objectives of the Group.
- •
- To increase transparency of risk management and relations with stakeholders through more precise risk evaluation methods.
- •
- To ensure compliance with all applicable risk management regulations and best market practices.
- •
- To establish clear roles and responsibilities in the Group in order to focus on fundamental aspects of management.
- •
- To reduce profit volatility and avoid unwanted outcomes for the Group.
We also have a model that is aimed at identifying the potential risks in our business. This model considers four key areas that are subdivided into 20 further categories of risks, which contemplate more than 130 potential risk scenarios for the Group. The four key areas are the following:
- •
- Strategic risks: Corporate governance, strategic and R&D&i projects, mergers, acquisitions and divestments, planning and assignment of resources, market dynamics, communication and relations with investors.
- •
- Operational risks: Human resources, information technologies, physical assets, sales, supply chain, threats or catastrophes.
- •
- Financial risks: Cash flow and credit, markets, taxation, capital structure, accounting and reporting.
- •
- Compliance risks: Regulations, laws and codes of ethics and conduct.
We were among the first European companies to have undertaken to voluntarily comply with the SOX requirements regarding auditor attestations as to the effectiveness of our internal controls over financial
90
Table of Contents
reporting. Since 2007 voluntarily and from 2014 compulsorily, Abengoa has performed internal control compliance audits in line with the Public Company Accounting Oversight Board ("PCAOB") standards, pursuant to the requirements set forth in Section 404 of SOX. The independent registered public accounting firm's report dated February 23, 2015 for the year ended December 31, 2014, included elsewhere in this annual report, expresses an unqualified opinion on our internal control over financial reporting in relation to our consolidated financial statements as of and for the year ended December 31, 2014. The SOX audits are used to mitigate the risks related to the reliability of financial information, through a combined system of control procedures and activities in key areas of the Company.
We have a commitment to transparency and good governance practices; our annual report now includes six independent verification reports carried out by external auditors covering the following areas: annual accounts, our SOX internal control system according to the PCAOB standards, corporate social responsibility reporting, greenhouse gas emissions inventory, corporate governance reporting and designing risk management systems according to the principles and guidelines established in ISO 31000.
Regulation
Overview
We operate in a significant number of regulated markets. Our Engineering and Construction and Industrial Production activities and the Solar segment of our Concession-Type Infrastructure activity are, in particular, subject to extensive regulation by governmental agencies in a number of the countries in which we operate. The degree of regulation to which our activities are subject varies by country. In a number of the countries in which we operate, regulation is carried out by national regulatory authorities. In some countries, such as the United States and, to a certain degree, Spain, there are various additional layers of regulation at the state, regional and/or local levels. In countries such as these, the scope, nature and extent of regulation may differ among the various states, regions and/or localities.
While we believe the requisite authorizations, permits and approvals for our existing activities have been obtained and that our activities are operated in substantial compliance with applicable laws and regulations, we remain subject to a varied and complex body of laws and regulations that both public officials and private parties may seek to enforce. The following is a description of the primary industry-related regulations applicable to our activities and currently in force in certain of the principal markets in which we operate.
European Union
Bioenergy Regulation
Directive 2003/30/EC of the European Parliament and the Council, of May 8, 2003, on the promotion of the use of biofuels or other renewable fuels for transport ("Directive 2003/30/EC") set Member States national indicative targets by December 31, 2010 of 5.75% of biofuel in the content of petrol or diesel sold for transport purposes in each Member State.
This legislation was superseded by two directives that resulted from the European Council of June 2008, in which the Council furthered its aim to develop and fulfill effective sustainability criteria for biofuels and to ensure commercial availability of second-generation biofuels, and underlined the need to assess the possible impacts of biofuel production on agricultural food products and to take action, if necessary, to address shortcomings. As a consequence, in 2009, the following new legislation was adopted:
- •
- Directive 2009/28/EC (the "2009 Renewable Energy Directive") on the promotion of the use of energy from renewable sources, which sets a minimum mandatory target of 20% renewable energy consumption in the European Union by 2020 and a minimum mandatory target of 10% renewable energy in the consumption of transport fuel for all Member States by 2020.
91
Table of Contents
- •
- Directive 2009/30/EC establishes a mandatory minimum 6% reduction in the greenhouse gas emissions of road transport in the European Union between 2011 and 2020. It also increases the percentage of ethanol and ETBE that can be used in mixtures with gasoline to operate motor vehicles.
The Directives also implement a certification system to ensure the compliance of biofuels sold in the European Union with the regulated criteria of sustainability, including a minimum reduction of 35% in the emission of greenhouse gases during their life cycle compared with average emissions from petrol and diesel (increased to 50% from January 2017).
The Directives are presently under review in order to address concerns regarding indirect land use change arising from the promotion of biofuels.
Following the adoption of the Directives, the European Union has adopted a series of regulations in order to correctly implement its policy on the importation of biofuels. For instance, Commission Implementing Regulation (EU) No. 211/2012 classifies a blend of 70% ethanol and 30% petrol as denatured ethanol in the Combined Nomenclature. Council Implementing Regulation (EU) No. 157/2013 of February 18, 2013 imposes a definitive antidumping duty on imports of bioethanol originated in the United States. Similar trade defense actions have been undertaken to protect the European biodiesel market.
Solar Regulation
The Kyoto Protocol, ratified by the European Union and its Member States on May 31, 2002, imposed on the European Union a target of reducing its emissions of greenhouse gases by 8%.
On November 26, 1997, the European Union published a report, or White Paper, which outlined a strategy and a community-wide action plan aimed at doubling energy production from renewable energy sources in the European Union from 6% in 1996 to 12% by 2010. The White Paper proposed a number of measures to promote the use of renewable energy sources, including measures designed to provide renewable energy sources better access to the electricity market. The Kyoto Protocol, ratified by the EU and its Member States on May 31, 2002, imposed a target of reducing EU emissions of greenhouse gases by 8%. Currently, the Doha Amendment of the Kyoto Protocol extending the commitment period until December 31, 2020 is in the process of being ratified by the parties.
Directive 2009/28/EC on the Promotion of the Use of Energy from Renewable Sources of the European Parliament and of the Council of the European Union, or the 2009 Renewable Energy Directive, set mandatory national overall targets for each Member State consistent with at least 20% of EU total energy consumption coming from renewable energy sources by 2020.
Spain
Bioenergy Regulation
Spanish law on bioenergy either transposes European Directives (see above) or responds to national goals and requirements.
An example of the former, is Royal Decree 1088/2010, which transposes the specification of petrol in Directive 2009/30/EC to allow for higher blends of ethanol and ETBE in petrol.
Another example is, Royal Decree 1597/2011 that transposes the biofuel and bioliquid sustainability criteria, and the double counting of some biofuels in Directive 2009/28/EC.
The primary bioenergy law in Spain is its minimum obligation of biofuel consumption in diesel and petrol. This obligation is reviewed and adjusted frequently. In 2013, the last time it was adjusted (Royal Law Decree 4/2013), the overall obligation was reduced from 6.5% to 4.1%, with concomitant reductions for specific targets in diesel (from 7.0% to 4.1%) and in petrol (from 4.1% to 3.9%).
92
Table of Contents
In the case of biodiesel, the obligation is filled by the Spanish Government by assigning a specific production quota to individual plants in Spain and in the rest of Europe (Resolution of 24 January, 2014 of the Secretary of State for Energy). The supply of bioethanol to the market, on the other hand, is left unregulated at present.
Water Regulatory Framework
Spain is currently the only country within the European Union in which we operate our Water segment. The Spanish water regulatory framework, which primarily regulates the desalination process and the water concessions needed for the operation of our thermo-solar plants, is included in the Water Law as approved by Royal Legislative Decree 1/2001, of July 20 (the "Water Law"), and developed by the Royal Decree 849/1986, of April 11, which approves the regulation of public water.
The Water Law regulates the use of hydraulic public property, in addition to authorizations and public concessions necessary in accordance with Law 22/1988, of July 28, on coasts, and other applicable regulations. The Water Law also regulates hydraulic infrastructures, which are defined as the construction of infrastructure for collection, extraction, desalination, storage, regulation, piping, control and use of water, including its drainage and purification, processing and reuse. In addition, Law 26/2007, of October 23, on environmental responsibility (slightly modified in July 2014 by Law 11/2014) establishes a preventive and reparative administrative responsibility framework, applicable to water operators whose activities impact on the environment.
The innovations and additions introduced by the Law 11/2014 are essentially:
- 1.
- Wider responsibility for the damages caused by the operators in the ecological status of the sea water.
- 2.
- A new article which allows the Spanish government to initiate the environmental responsibility procedure and to demand all the prevention measures.
- 3.
- Innovation in the mandatory financial guarantee: From now, operators are the ones who have to determinate the minimum amount that will be guaranteed according to the intensity or extension of the potential damage caused. The creation of such guarantee shall be communicated to the competent authority.
- 4.
- Elimination of the use of the Environmental Damages Compensation Fund (created by the Insurance Compensation Consortium) in the event of insurance companies' insolvency.
- 5
- Procedural amendments: For instance, new previous proceeding in the event of an environmental responsibility procedure initiated by an interested third party.
- 6.
- Modification of other laws: (i) Law 34/2007, on Air Quality and Atmospheric Protection and (ii) Law 10/2001, on Spain's National Hydrological Plan.
Solar Regulation
Overview
The 2009 Renewable Energy Directive set mandatory national overall targets for each Member State consistent with at least 20% of EU total energy consumption coming from renewable energy sources by 2020. In order to comply with these mandatory renewable energy targets, all EU Member States, including Spain, were required to develop a national action plan, called a National Renewable Energy Action Plan, or NREAP. Spain's NREAP was issued on June 30, 2010 and sent to the European Commission.
In its NREAP, Spain set a target of 22.7% for primary energy consumption to be supplied by renewable energy sources and a target of 42.3% of total electricity consumption to be supplied by renewable energy sources by 2020.
93
Table of Contents
In 2011, a new Renewable Energies Plan, referred to as REP 2011-2020, was developed by the European Parliament and the Council of the European Union under the 2009 Renewable Energy Directive that added a new target to the 2009 Renewable Energy Directive, a minimum of 10% of transportation energy consumption to be supplied from renewable energy sources in each Member State by 2020.
In Spain, these targets mean that energy from renewable sources should represent at least 20% of total energy consumption by 2020, consistent with the EU target, with a minimum of 10% of transportation consumption to be derived from renewable sources by that same year.
Article 3.3.(a) of the 2009 Renewable Energy Directive states that in order to reach the targets set for 2020, Member States may apply support schemes and incentives for renewable energy. These support systems or incentives are different in each country, but the most common are:
- •
- Green certificates. Producers of renewable energy receive a "green certificate" for each Mwh they generate and suppliers of energy have an obligation to purchase part of the energy that they supply from renewable sources.
- •
- Investment grants and direct subsidies. These help defray the costs of installing renewable energy generation plants.
- •
- Tax exemptions or relief. These include ITCs, cash grants in lieu of tax credits and accelerated depreciation, among others.
- •
- System of direct support of prices. These include regulated tariffs and premiums and involve a regulatory guarantee to purchase energy generated by a renewable energy plant for an allotted period of time at a fixed tariff per kWh, for a maximum annual number of hours, so that the producer is ensured of a reasonable return on its investment.
Solar Regulatory Framework
The applicable legal framework for Solar Power plants already in operation is set out in four primary legal instruments:
- •
- Royal Decree-law 9/2013, of July 12, containing emergency measures to guarantee the financial stability of the electricity system, referred to as Royal Decree-law 9/2013;
- •
- Law 24/2013, of December 26, the Electricity Sector Act, referred to as the Electricity Act;
- •
- Royal Decree 413/2014, of June 6, regulating electricity production from renewable energy sources, combined heat and power and waste, referred to as Royal Decree 413/2014; and
- •
- Ministerial Order IET/1045/2014 of June 16, published on June 20, 2014, approving the remuneration parameters for standard facilities, applicable to certain electricity production facilities based on renewable energy, cogeneration and waste, referred to as Revenue Order.
Primary Rights and Obligations under the Electricity Act
The Electricity Act eliminates a previously existing distinction between ordinary electricity producers and those using renewable energy sources in their production of electricity, though it continues to recognize the following rights for producers with facilities that use renewable energy sources:
- •
- Priority off-take. Producers of electricity from renewable sources will have priority over conventional generators in transmitting to off-takers the energy they produce over conventional generators under equal market conditions, subject to the secure operation of the national electricity system and based on transparent and non-discriminatory criteria.
- •
- Priority of access and connection to transmission and distribution networks. Producers of electricity from renewable energy sources will have priority in obtaining access and connecting to the grid,
94
Table of Contents
The significant obligations of the renewable energy electricity producers under the Electricity Act include a requirement to:
- •
- Offer to sell the energy they produce through the market operator even when they have not entered into a contract and so are excluded from the bidding system managed by the market operator.
- •
- Maintain the plant's planned production capacity. Power lines, which include connections with the transmission or distribution network and transformers, are considered part of the production facility.
- •
- Contract and pay the corresponding fees, whether directly or through their representatives, to the transmission or distribution companies to which the renewable energy facilities are connected in order for their power to be fed into the grid.
Registration on Public Registers
The Electricity Act and Royal Decree 413/2014 require electricity generation facilities to be entered on the official register of electricity production plants maintained by the Ministry of Industry, Energy and Tourism.
The autonomous regions may keep their own registers of electricity generation plants they have authorized if such plants have a capacity of 50 MW or less. The registration details of these plants must be provided to the Ministry of Industry, Energy and Tourism electronically.
To receive their facility-specific reimbursement, renewable energy facilities are required under the Electricity Act and Royal Decree 413/2014 to be listed on a new register entitled the Specific Payment System Register, Registro de Regimen Retributivo Especifico. Unregistered plants will only receive the pool price.
The first transitional provision of Royal Decree 413/2014 states that power plants based on renewable sources recognized under the previous economic regime have been automatically included in the Specific Payment System Register.
Change of Compensation System Applicable to Concentrating Solar Power Plants
Royal Decree-law 9/2013 introduced a change in the payment system applicable to existing electricity production facilities using renewable energy sources to guarantee the financial stability of the electric system. The purpose of Royal Decree-law 9/2013, which entered into force on July 14, 2013, was to adopt a series of measures to ensure the sustainability of the electric system and to combat the shortfalls between electricity system revenues and costs, referred to as the tariff deficit.
The measures adopted were focused primarily on the following areas: (i) the legal and financial regime for existing electricity production facilities using renewable energy sources, co-generation and residual waste; (ii) the remuneration regime for transport and distribution activities; (iii) Spain's guarantee of the Securitization Fund to cover the tariff deficit; and (iv) certain aspects related to capacity payments, assumption of the cost of the subsidized tariff and a review of access charges.
Royal Decree-law 9/2013 established an entirely new remuneration system, abolishing the remuneration system based on a regulated tariff applicable to electricity production facilities using renewable energy sources (including facilities in operation at the time that Royal Decree-law 9/2013 entered into force).
95
Table of Contents
Prior to the adoption of Royal Decree-law 9/2013, electricity production facilities using renewable energy sources received revenues tied to their electricity produced according to their power output. This involved receiving feed-in tariffs, in €/kWh, that were split into two components: (i) the pool price of electricity and (ii) an equivalent premium, consisting of the difference between the pool price and the set feed-in tariff for each type of plant (feed in tariff = pool price + equivalent premium). This revenue was received for a maximum annual number of hours and for a pre-determined number of years, depending on the technology used in each case. For any additional hours produced, producers received the pool price.
The repealed economic scheme was applied on a transitional basis until new provisions were approved to fully implement the new remuneration system. Settlements made after July 14, 2013 were made in accordance with the previous regime until the new implementing regulations have been adopted. However, following the implementation of these new regulations, payments made during this interim period will be recalculated in accordance with the new regulations. The difference between the amounts received under the prior regime and those calculated under the new regime will be deducted from the first six settlements that follow the approval of the new implementing regulations.
New System
According to Royal Decree-law 413/2014, producers now receive: (i) the pool price for the power they produce and (ii) a payment based on the standard investment cost for each kind of plant (without any relation whatsoever to the amount of power they generate). This payment based on investment (in €/MW of installed capacity) is supplemented (in cases of technologies with running costs in excess of the pool price) with an "operating payment" (in €/MWh produced).
The principle driving the new economic regime imposed by Royal Decree-law 413/2014 is that the incentives that an electricity producer receives should be equivalent to the costs that they are unable to recover on the electricity market where they compete with non-renewable technologies. The new economic regime seeks to allow a "well-run and efficient enterprise" to recover the costs of building and running a plant, plus a reasonable return on investment (project internal rate of return).
According to Royal Decree 413/2014, the remuneration for investment in respect of plants that were already in operation during the first statutory period (from July 14, 2013 to December 31, 2019) is calculated as follows:
- •
- The "standard per-MW investment value" is added to the "standard per-MW operating cost" (both updated from July 2013 with a 7.398% rate of return); i.e., what it would have cost a well-run and efficient enterprise to build, maintain and run the facility from its start-up until the time Royal Decree-law 9/2013 came into force.
- •
- From the resulting total, the "standard per-MW total revenue valued at the electricity pool price," earned by each type of plant from its start-up through entry into force of Royal Decree-law 9/2013, also updated applying the 7.398% rate of return is subtracted.
- •
- The result (the standard per-MW investment value plus standard per-MW operating cost minus standard per-MW total revenue) is the "net investment value," i.e., the costs unrecovered by the plant owner as of July 14, 2013.
- •
- Payments for investment to be made after Royal Decree-law 9/2013 came into force and during every year of a plant's remaining statutory useful life are calculated by (a) adding the net investment value (calculated as explained above) to the "expected operating costs until the end of the asset's statutory useful life;" and (b) deducting the "expected revenue on the market up to that same point in time" (in both cases, the amount would be discounted to July 2013 by applying the 7.398% rate of return). The annual amount to be received would be calculated so that it would be the same amount every year until the end of the statutory useful life.
96
Table of Contents
Accordingly, under Royal Decree 413/2014, the returns received by the owners of plants in excess of 7.398%, from start-up until Royal Decree-law 9/2013 took effect, would serve to reduce the unrecovered net investment value as of July 14, 2013.
Operating payments will only be available for those facilities whose costs exceed the estimated average pool price. However, the Ministry of Industry, Energy and Tourism can cap operating payments at a maximum number of hours.
Payment Factors for Concentrating Solar Power Plants
The payment system applicable for each plant is based on various criteria considered by the Ministry of Industry, Energy and Tourism and includes the specific technology used, amount of power produced relative to operating costs, age of the facility and any other differentiating factor deemed necessary to consider in applications of the payment system.
Revenue Order recognizes six types of solar thermal plants: (i) parabolic trough collectors without a storage system, (ii) parabolic trough collectors with a storage system, (iii) central or tower receivers without a storage system, (iv) central or tower receivers with a storage system, (v) linear collectors and (vi) solar-biomass hybrids.
To determine the payment system applicable to each plant, the following factors are considered:
- •
- Net investment value. This consists of a standard amount per MW for each type of plant, calculated by the method set out in Royal Decree 413/2014, which is the amount invested in the plant and not depreciated as of July 14, 2013.
- •
- Useful life of the plant. For solar thermal plants this is 25 years.
- •
- Return on investment. Considering the net asset value determined on the basis of a standard cost per MW built, an amount is set per unit of power, which enables investment costs that cannot be recovered through the pool price to be recouped over the useful life of the plant.
- •
- Operating remuneration. An amount is set per unit of power and hour that, added to the pool price, enables the producer to recoup all the plant's operating and maintenance costs. Operating expenses include the cost of land, electricity, gas and water bills, management, security, corrective and preventive maintenance, representation costs, the Spanish tax on special immovable properties, insurance, applicable generation charges and a generation tax which is equal to 7% of total revenue.
- •
- Maximum number of operating hours. A maximum number of hours is set for which each plant type can receive the operating subsidy.
- •
- Operating threshold. Plants must operate for more than a set number of hours per year to receive the return on investment and operating subsidy.
- •
- Minimum operating hours. Plants that cross the operating threshold but operate for fewer hours than the annual minimum hours receive a lower subsidy.
Regulatory Periods
Payment criteria are based on prevailing economic conditions in Spain, demand for electricity and reasonable profits for electricity generation activities and can be revised every six years. The first regulatory period commenced on July 14, 2013, the date on which Royal Decree-law 9/2013 came into force, and will end on December 31, 2019.
The definitions and values of all payment criteria can be changed at the end of each regulatory period, except for a plant's useful life and the value of a plant's initial investment that is recouped through the specific return on investment.
97
Table of Contents
Unless reviewed, payment criteria will be considered to be extended for the subsequent regulatory period.
Reasonable Rate of Return
Article 14 of the Electricity Act provides that a reasonable return on investment is calculated on the basis of the average pre-tax yield of Spanish government 10-year bonds on the secondary market.
For plants that are already in operation, the reasonable return over the regulatory life of the plants is based on the average pre-tax yield on Spanish government 10-year bonds on the secondary market for the preceding 10 years, plus 300 basis points.
Annex III of the Revenue Order specifies that the 10-year average yield for the 10-year bond is 4.398%, which, increased by 300 bps, results in 7.398% per annum.
Under no circumstances will amounts received by producers for electricity generated before July 14, 2013 be required to be returned or reimbursed under the new system.
Before the start of a new regulatory period, a revised reasonable return can be established for each plant type, calculated as the average yield on Spanish government 10-year bonds on the secondary market in the 24 months through the month of May preceding the new regulatory period, plus a spread.
This spread is based on the following criteria:
- •
- Appropriate profit for this specific type of renewable electricity generation and electricity generation as a whole, considering the financial condition of the Spanish electricity system and Spanish prevailing economic conditions; and
- •
- Borrowing costs for electricity generation companies using renewable energy sources with regulated payment systems, which are efficient and well run, within Europe.
The next regulatory period will begin on January 1, 2020.
Funding the Tariff Deficit
The Electricity Act also states that from January 1, 2014, tariff deficit amounts would no longer be paid for, as they had been previously, by the five major Spanish utilities. Instead, they will be paid by the companies that receive "regulated payments," including distributors, transportation companies, producers of electricity from renewable plants, companies receiving capacity payments and others. Each of these entities will temporarily fund the tariff deficit in proportion to the costs that they represent for the electricity system in a given year and can recover these contributions in the following five years, plus interest at a market rate.
According to the Electricity Act, tariff deficit cannot exceed 2% of the estimated system revenues for each year. Furthermore, the accumulated debt due to previous years' deficit cannot exceed 5% of the estimated system revenues for that period. If these thresholds are exceeded, the Spanish government is forced to review the access fees so that the system revenues increase accordingly.
Access Fee
Royal Decree-law 14/2010 was passed in order to eliminate the shortfalls between electricity system revenues and costs, referred to as the tariff deficit in the electricity sector.
The First Transitional Provision of Royal Decree-law 14/2010 provided that the owners of electricity production facilities pay a fee for access to the grid to the transmission and distribution companies (this access previously having been provided at no cost) from January 1, 2011. During the interim period, the access fee payable is: (i) calculated at €0.5 per MWh delivered to the network or (ii) any other amount that the Ministry of Industry, Energy and Tourism establishes.
98
Table of Contents
Royal Decree 1544/2011 implemented the First Transitional Provision of Royal Decree-law 14/2010 and confirmed the interim access fee imposed on electricity producers (€0.5 per MWh), subject to the adoption of a final method for calculating the access fee.
Calculation methodology for power attributable to fuels
On October 16, 2014, Ministerial Order IET/1882/2014 of October 14 was published, which established the methodology for the calculation of power attributable to the use of fuels in thermoelectric solar plants.
Electricity Sales Tax
On December 27, 2012, the Spanish Parliament approved Law 15/2012, which became effective on January 1, 2013, or Law 15/2012. The aim of Law 15/2012 is to try to combat the problem of the so-called tariff deficit, which reached approximately €28 billion as of December 2013.
Law 15/2012 provides for an electricity sales tax which is levied on activities related to electricity production. The tax is triggered by the sale of electricity and affects ordinary energy producers and those generating power from renewable sources. The tax, a flat rate of 7%, is levied on the total income received from the power produced at each of the installations, which means that every calendar year, Concentrating Solar Power plants will be required to pay 7% of the total amount which they are entitled to receive for production and incorporation into the electricity system of electric power, measured as the net output generated.
Tax Incentive of Accelerated Depreciation of New Assets
Tax-free depreciation was permitted on investments in new material assets and investment properties used for economic activities acquired between January 1, 2009 and March 31, 2012.
In accordance with Law 27/2014, of November 27 of corporate income tax ("LIS"), taxpayers who made investments from January 1, 2009 to March 31, 2012 in new material assets and investment properties used for economic activities and have amounts pending application, are permitted to keep taking free depreciation for those assets.
However, for fiscal periods commencing in 2015, the following limitations apply:
- •
- Investments made in accordance with 11th Aditional Disposition of Legislative Royal Decree 4/2004 of March 5 (in the wording provided by Royal Decree-Law 6/2010): 40% of the tax base before the depreciation, the integration of article 11.12 LIS and the offset of tax losses.
- •
- Investments made in accordance with 11th Aditional Disposition of Legislative Royal Decree 4/2004 of March 5 (in the wording provided by Royal Decree-Law 13/2010): 20% of the tax base before the depreciation, the integration of article 11.12 LIS and the offset of tax losses.
These limitations do not apply in respect of companies that meet the requirements set forth in article 108.1 of Royal Decree 4/2004 of March 5 related to the special rules for enterprises of a reduced size.
Most of the investment in Solaben 1/2/3/6, Helioenergy 1/2, Solacor 1/2, Solnova 1/3/4, Helios 1/2 and Solar Processes, S.A. was undertaken within the regime that applied between January 1, 2009 and March 31, 2012.
Tax deductions for research, development and innovation
The tax deduction for R&D&i is regulated in Article 35 of LIS. For purposes of the deduction, the definitions of each of the concepts of research, development and technological innovation in Article 35 of the LIS are of significant importance, which differentiates between research and development and the concept of technological innovation. Article 35 of LIS states explicitly that certain specific activities are considered
99
Table of Contents
research and development for purposes of the deduction. Expenses relating to the qualifying R&D activities are entitled to a 25% deduction for the period in which they were incurred (or 42% for those expenses that exceed the average expenditure over the preceding two years for this purpose), provided that such expenses were incurred in accordance with cost accounting and were specifically undertaken in connection with identified projects. In addition, investments in tangible fixed assets and intangible assets made in connection with R&D are entitled to a deduction of 8% and expenditures corresponding to qualified personnel exclusively engaged with the R&D are entitled to a deduction of 17%.
Expenditures associated with technological innovation activities are entitled to a deduction of 12% for the period in which they were incurred, provided that such expenses were incurred in accordance with cost accounting and were specifically undertaken in connection with identified projects. These deductions may be applied in assessments of tax periods that end in the 18 years subsequent to the tax period in which they were generated, provided that the other requirements of the corporate income tax regulations are complied with.
At the discretion of the tax payer, under certain circumstances, upon a 20% reduction of the R&D&i tax deduction, this deduction will not be subject to the ordinary limitations in the application of tax deductions and in case of lack of tax quota in the period in which to apply this tax deduction, it will be refundable in cash. The maximum R&D&i joint tax deduction either applicable or refundable is €3 million per year for R&D activities and €1 million per year for technological innovation.
United States Regulations
Our operations within the Biofuels segment of our Industrial Production activity and the Solar segment of our Concession-Type Infrastructure activity are subject to significant regulation in the United States.
Bioenergy Regulation
Federal Renewable Fuel Standard ("RFS")
The Energy Policy Act of 2005 ("EPACT 2005") set the first United States renewable fuel volume mandate. The renewable fuel program established by the Environmental Protection Agency ("EPA") under EPACT 2005 required that 4 Bgal of renewable fuels be blended into gasoline for 2006, a volume mandate that increased to 7.5 Bgal for 2012. The Energy Independence and Security Act of 2007 ("EISA") modified and expanded the RFS in a number of respects: increased the renewable fuel volume mandate to 9 Bgal for 2008 and set increasing volume mandates through 2022, when the volume mandate will reach 36 Bgal of total renewable fuels. EISA also sets complementary annual volume mandates for "advanced biofuel" as well as two specific kinds of renewable fuels, cellulosic biofuel and biomass-based diesel. Of particular note, EISA defines advanced biofuel, cellulosic biofuel, and biomass-based diesel as having at least 50% less "lifecycle greenhouse gases ("GHG") emissions"—"the aggregate quantity of greenhouse gas emissions (including direct emissions and significant indirect emissions such as significant emissions from land use changes). . . related to the full fuel life cycle, including all stages of fuel and feedstock production and distribution. . . "—than the gasoline or diesel the renewable fuels are replacing. Specifically, EISA defines "advanced biofuel" as "renewable fuel, other than ethanol derived from corn starch that has life cycle greenhouse gas emissions. . . that are at least 50% less than baseline life cycle greenhouse gas emissions" as determined by EPA. EISA defines "cellulosic biofuel" as "renewable fuel derived from any cellulose, hemi-cellulose, or lignin that is derived from renewable biomass and that has life cycle gas emissions. . . that are at least 60% less than baseline life cycle greenhouse gas emissions" as determined by EPA." The EPA announced in May 2012 its determination that ethanol produced from grain sorghum (or milo) at facilities that use biogas digesters in combination heat and power technology meets the 50% GHG emissions reduction threshold requirement for an advanced biofuel. Further, EISA defines "biomass-based diesel" as renewable fuel defined as "biodiesel" under the Energy Policy Act of 1992 and which has life cycle GHG emissions which EPA determines to be at least 50% less than baseline lifecycle GHG emissions.
100
Table of Contents
In addition, EISA requires that any renewable fuel which is to be counted towards the RFS and is produced at a facility which commences construction after December 19, 2007, achieve at least a 20% reduction in life cycle GHG emissions compared to baseline life cycle GHG emissions. (This life cycle GHG emissions reduction requirement, coupled with EPA's inclusion in the implementing regulations of an analysis of indirect emissions from international land use changes related to biofuel production, may serve to exclude some biofuels from counting towards the RFS.) In May 2012, the EPA announced that ethanol produced from grain sorghum (or milo) at facilities that use natural gas meets the minimum 20% GHG emissions reduction threshold for renewable fuels. Under the Clean Air Act (the "CAA"), as amended by EISA and EPACT 2005, EPA possesses the authority to waive or adjust downward RFS requirements if the EPA Administrator, in consultation with the Secretary of Energy and the Secretary of Agriculture, determines that an RFS requirement or requirements would severely harm the economy or the environment, or if there is an inadequate domestic supply of a renewable fuel or fuels. The EPA is specifically required to review the availability of cellulosic biofuel and, if necessary, to downwardly adjust the annual volume mandate for cellulosic ethanol. After determining that limited production of cellulosic biofuel is occurring, EPA reduced the annual volume mandate for that fuel each of 2011 and 2012. However, EPA did not reduce or modify the advanced biofuel or total renewable fuel annual volume mandates. A number of lawsuits were filed challenging EPA's cellulosic biofuel and certain other mandates as being too high, and based upon those lawsuits, the 2011 and 2012 volumes for cellulosic biofuels were eliminated. The EPA Administrator also has authority under the CAA, in certain circumstances, to revise upwardly or downwardly the GHG reduction percentages required of renewable fuel, advanced biofuel, cellulosic biofuel, and/or biomass-based diesel.
As implemented under EPA's March 2010 regulations, the RFS requires producers and importers of gasoline and diesel to meet the various volume mandates for total renewable fuel and the various renewable fuel types. Producers and importers of gasoline and diesel must purchase renewable fuel (or renewable fuel credits, called "renewable identification numbers") in an amount equal to or greater than a certain percentage, set by EPA, of their gasoline or diesel production and/or importation. EPA sets the percentages so that, if producers and importers produce and import gasoline and diesel in the volumes EPA projects, and if each producer and importer meets its obligations under the RPS, then total renewable fuel, advanced biofuel, cellulosic biofuel, and biomass-based diesel will be produced in the amounts required by EISA (or downwardly adjusted by EPA pursuant to its authority under EISA). Additionally, renewable fuel producers face recordkeeping and reporting obligations. The EPA has finalized standards for 2013, reducing cellulosic volumes, but not other volumes.
In November 2013, the EPA proposed a draft volume requirement for 2014 which would reduce both cellulosic and advanced biofuels, as well as total biofuels requirements from the very aggressive statutory requirements. After receiving hundreds of thousands of comments on the proposal, the EPA elected to withdraw their proposal and is now giving the matter further consideration. The EPA has indicated that they will release a multiple-year rule in the summer of 2015 that will finalize volume requirements for the years 2014-2016. The ethanol industry is lobbying for the EPA to change not just the numbers that it originally proposed, but also the methodology behind the EPA's proposal, arguing that the law does not give the EPA authority to reduce statutory volumes for any reason related to infrastructure, but only for lack of supply. Regardless of the final numbers proposed by the EPA, the RFS is still a major market driver for ethanol and other renewable biofuels, and is expected to remain so through the sunset of the law in 2022.
Grants and Loan Guarantees from Department of Agriculture and Department of Energy
The Food, Conservation, and Energy Act of 2008 ("Farm Bill") authorized a number of United States Department of Agriculture ("USDA") programs that promote the development and expansion of bio-energy production. The USDA Biorefinery Assistance Program under Farm Bill Section 9003 provides to eligible entities both grants to construct demonstration "advanced biofuel" refineries and loan guarantees for the development, construction, and retrofitting of commercial-scale bio-refineries that produce "advanced biofuels." As under the RFS, "advanced biofuel" is defined as fuel derived from renewable biomass other than
101
Table of Contents
corn kernel starch. Under Farm Bill Section 9003, loan guarantees are capped at $250 million and grant funding is capped at a percentage of the project cost. The USDA Bioenergy Program for Advanced Biofuels under Farm Bill Section 9005 provides payments to eligible producers of advanced biofuels to support expanded production. Payments are based on: the amount of funding available; the number of producers participating in the program; the amount of advanced biofuel being produced; the duration of production by the eligible producer; and, the net nonrenewable energy content of the advanced biofuel, if sufficient data is available. The bioenergy program for advanced biofuels will provide no more than 5% of total available funds to producers with an annual refining capacity of 150,000,000 gallons or more of advanced biofuel. Mandatory funding is available under both the Biorefinery Assistance Program and the Program for Advanced Biofuels through fiscal year 2012 but mandatory funding was not included for the year 2013. The Biomass Research and Development Initiative, a collaboration of the USDA and the DOE created under Farm Bill Section 9008, provides grant funding and other financial assistance to eligible projects addressing the research, development, and demonstration of biofuels and bio-based projects and the methods, practices, and technologies for their production. The initiative is geared towards addressing three main areas: feedstock development, biofuels and bio-based products development, and biofuels development analysis. The USDA Repowering Assistance Program under Farm Bill Section 9004 provides payments to eligible bio-refineries to encourage the use of renewable biomass as a replacement fuel source for fossil fuels used to provide process heat or power in their operation.
While the 2008 Farm Bill expired in 2013, most of these programs were renewed in new Farm Bill legislation that was passed by Congress and signed into law on February 7, 2014. This law is officially titled the "Agricultural Act of 2014", and provides a five year extension of the Energy Title programs referenced above $881 million in mandatory funding for those programs and an extension of many of the programs to also include production of biochemicals and bioproducts (in addition to just biofuels).
The USDA published in the Federal Register in April 2010 proposed rules implementing the Bioenergy Program for Advanced Biofuels (Farm Bill Section 9005) and Repowering Assistance Program (Farm Bill Section 9004) that would have served to exclude from the program most foreign entities, as well as subsidiaries of most foreign entities. USDA similarly published in the Federal Register in April 2010 a proposed rule implementing the Biorefinery Assistance Program (Farm Bill Section 9003) that would have made most foreign entities, as well as subsidiaries of most foreign entities, ineligible for loan guarantees from the program. Interim final rules published by the USDA in February 2011 eliminated the provisions limiting foreign entity participation in the three programs.
The DOE, acting pursuant to Section 1705 of EPACT 2005 (as amended by the American Reinvestment and Recovery Act ("ARRA")), guaranteed loans to certain eligible projects, including "[l]eading edge biofuel projects that will use technologies performing at the pilot or demonstration scale that the Secretary determines are likely to become commercial technologies and will produce transportation fuels that substantially reduce life-cycle greenhouse gas emissions compared to other transportation fuels." In order to have qualified for a guarantee under the Section 1705 Program, physical construction must have commenced at the primary site of the project on or before September 30, 2011. National Environmental Policy Act ("NEPA") review must have been completed prior to the issuance of a loan guarantee. Loan guarantees under Section 1705 were limited to projects meeting the prevailing wage requirements set forth in the Davis-Bacon Act of 1931. The DOE loan guarantees were issued to bio-refineries located in Hugoton, Kansas (Abengoa) and Emmetsburg, Iowa. A number of industry associations representing bioenergy producers asked the government to make changes to the loan guarantee program, including stipulating that the existence of the RFS suffices to show that there is a reasonable prospect that advanced biofuel makers will be able to repay loans, extending the September 2011 construction commencement deadline, and carving out loan guarantee funds that would be dedicated to bio-energy projects. Additionally, the DOE announced in mid-2014 two new loan guarantee program solicitations that have substantial funding available for loans that could be relevant to the biofuels space. The largest program is the Advanced Technology Vehicles Manufacturing (ATVM) program, which is intended to provide loans for the development of vehicles (or fuels)
102
Table of Contents
that improve vehicle fuel economy. Additionally, DOE's Renewable Energy and Efficient Energy Projects program was granted funding to promote the development of clean energy technologies that avoid, reduce, or sequester air pollutants or anthropogenic emissions of greenhouse gases. Both of these programs could provide incentives to biofuel producers (including Abengoa) who are developing new technologies in areas such as "waste to biofuels," efficiency improvements, or drop in biofuels.
The USDA's Business and Industry Loan Guarantee program and Rural Energy for America Program ("REAP") are other potential sources of loan guarantees or grant money for eligible bio-energy producers. Both EISA and the ARRA authorized the DOE to make grants related to biofuel. DOE in the past made a number of grants to fund biomass research and development. EPACT 2005 Section 932 authorized federal funding of eligible cellulosic bio-refinery demonstration projects. The USDA Biomass Crop Assistance Program provides eligible growers of renewable crops in certain areas with payments for growing the crops as well as payments to sellers of eligible biomass materials to qualified biomass conversion facilities. The USDA disburses value-added producer grants to incentivize eligible independent agricultural producers to engage in activities such as biofuels production.
In December 2012, EPA approved a pathway to allow grain sorghum to be used as a feedstock for both conventional biofuels and for advanced biofuels under the RFS. Per the EPA analysis, sorghum based ethanol produced at dry mill facilities that use natural gas has a smaller GHG footprint than corn based ethanol (30% reduction compared to baseline gasoline versus 20% for corn). We have two plants that historically use 100% sorghum (Colwich and Portales), though neither of these have been in operation since January 2012.
Other Federal Programs and Requirements Impacting Bioenergy Producers
A number of other programs and requirements exist to promote bio-energy production and development. The Energy Policy Act 1992 set a number of alternative fuel use and other requirements applicable to certain vehicles in federal and state government fleets. The Federal Highway Administration Surface Transportation Research, Development, and Deployment program provides some funding of bio-based research.
The EPA possesses authority under the CAA to regulate fuels and fuel additives, and the EPA until October 13, 2010 limited gasoline composition to 10% ethanol for most vehicles. In 2010 and 2011, the EPA announced their approval of increased ethanol blends in gasoline up to 15% (E15) for use in 2001 and newer model year vehicles. However, there were still some hurdles to overcome before E15 could actually be blended and sold. During 2012, the EPA satisfied all of these final technical federal requirements (including approval of health effects testing data and a formal Misfueling Mitigation Plan) which allowed the first gallons of E15 blend gasoline to be sold in approximately 10 states in 2013. Other states have followed and now E15 can be legally used in approximately 80% of the vehicles on the road in the US today. Additionally, millions of those vehicles are specifically designated as Flex Fuel Vehicles (FFVs) and can use an 85% ethanol fuel known as E85. This positive actions by the EPA continue to help open up more ethanol demand and should ultimately have a positive effect on ethanol prices.
Ethanol imported into the United States faces an ad valorem tariff of 2.5%; a secondary tariff of $0.54/gallon expired on December 31, 2011.
State and Local Incentives for and Programs Concerning Bioenergy Production
In addition to federal government support, many states have enacted laws or programs incentivizing or impacting bio-energy production. Programs and incentives come in the form of grants, loans, tax exemptions, job training programs, direct payments and mandates requiring the use of biofuels or low carbon fuels.
The most significant piece of state legislation for the ethanol industry continues to be the ongoing implementation by California of its Low Carbon Fuel Standard ("LCFS") Legislation. On April 23, 2009 California adopted its draft plan to reduce emissions under a LCFS which is being implemented pursuant to a 2007 Executive Order and supporting state legislation. The goal of this law is to reduce emissions from California's transportation fuels by at least 10% by 2020.
103
Table of Contents
California, like the EPA in its proposed rules implementing the Federal RFS, acknowledges that most ethanol use results in a reduction of lifecycle greenhouse gas ("GHG") emissions when compared to gasoline. However, attribution of an impact factor for Indirect Land Use Change ("ILUC") emissions under California's current rule resulted in the conclusion that ethanol's total GHG emissions are only marginally better than gasoline, and in some specific cases could be worse.
The ethanol industry continues to negotiate with and offer technical support to California to establish that California has improperly attributed these ILUC emissions to ethanol alone and that indirect effects are not calculated or attributed to gasoline or any other fuels. In fact, The California Air Resources Board ("CARB") appointed an Expert Working Group ("EWG") to continue to evaluate these carbon intensity numbers, and that group has made a formal recommendation that CARB significantly reduce the ILUC emissions attributed to ethanol fuels. However, CARB has not yet made any voluntary decision regarding modifications to the rules despite the volume of evidence submitted questioning their initial conclusions.
A lawsuit filed against the state of California by the ethanol and petroleum industries has now been resolved in favor of California, and the state is proceeding to implement the LCFS, although it is still evaluating the industry's request for reduction of the ILUC penalty in its analyses.
LCFS programs have the potential to be extremely beneficial for the ethanol industry as they recognize ethanol's significant benefits in reducing direct GHG emissions when compared to conventional petroleum based fuels. However, if the California LCFS is implemented as currently proposed, the impact on Abengoa Bioenergy will be both negative (in that the California fuel market will be more difficult to access for most Midwestern grain ethanol), and also positive (in that Abengoa Bioenergy produces a lower carbon ethanol than some other ethanol manufacturers, and an extremely low carbon cellulosic ethanol from its new Hugoton, KS facility, which could give the Company an advantage over other Midwestern ethanol in the California market).
In addition to California, other states in both the Northwest and the Northeast have made substantial progress towards the potential implementation of similar LCFS programs. The strongest of these programs currently is being initiated by the state of Oregon. In January 2015, the Oregon Environmental Quality Commission approved phase 2 of the Oregon Clean Fuels Program, putting their LCFS program on course to go into effect on February 1, 2015. The Oregon legislature must now act to remove the sunset date of the program. If this sunset date is not removed, the program will expire at the end of 2015, before phase 2 can begin.
The Oregon program is similar to California's LCFS, but perhaps more favorable for ethanol producers in the way it estimates carbon intensity. Specifically, the Oregon rule:
- •
- establishes clean fuel standards to reduce greenhouse gas emissions ("GHG") from Oregon's transportation fuels by 10% from the baseline in 2015. Compliance will be 2016 through 2025;
- •
- requires importers of transportation fuels to reduce the average carbon intensity of fuels they provide in Oregon;
- •
- allows providers of clean fuels to generate and sell clean fuel credits for the fuels they provide in Oregon; and
- •
- creates fuel supply and price deferrals to contain the program's cost.
This approval is a positive step in an individual state's attempt to reduce GHG emissions in its fuel supply, and if implemented should result in the creation of another good market for ethanol fuels.
In Kansas, a newly constructed biomass-to-energy facility is exempted from state property taxes for up to 10 taxable years immediately following the taxable year in which construction or installation is completed. To fall within the exemption, we would need to establish that the plant meets the definition of a biomass-to-energy facility, which requires the use of biomass to produce at least 500,000 gallons of cellulosic
104
Table of Contents
alcohol fuel, liquid or gaseous fuel, or other sources of energy in a quantity with energy content at least equal to that of 500,000 gallons of cellulosic alcohol fuel.
Environmental Permitting and Compliance
Bio-energy facilities face numerous potential permitting, licensing, and land use requirements and are subject to various federal, state, and local environmental laws, including laws governing: the discharge of materials into the air, water, and ground; the use, handling, storage, generation, transportation and disposal of hazardous materials, access to and use of water resources; and, employee health and safety. These environmental laws can require the installation of pollution control equipment or operational changes for the purpose of limiting potential or actual environmental impacts. Violations of these laws or permit conditions may result in significant fines, the revocation of permits (including the potential for facility shutdown), criminal sanctions, and/or natural resources damage claims. Prior to development, permitting authorities may require that bio-energy projects consider and address, among other things, the impact on water resources and water quality, endangered species and other biological resources, existing land uses and zoning, agricultural resources, archaeological, paleontological, recreational and cultural considerations, and the impact on the landscape. Project approvals may be conditioned upon the project being modified, including to involve mitigation measures.
Potentially applicable federal permits might be required under the CAA, the Endangered Species Act ("ESA"), the Clean Water Act ("CWA"), the National Historic Preservation Act, and the National Wilderness Preservation Act, among other federal laws. Depending upon a number of factors (including facility location and potential to emit), the CAA may require bioenergy facilities to obtain preconstruction and operating permits, model potential emission impacts, install control technology to mitigate emission impacts, and purchase offsets to cover remaining emission impacts. In many instances, EPA has delegated its CAA authority to state or local authorities, who are then primarily responsible for issuing air emission permits. Some bioenergy facilities emit various pollutants regulated under the CAA, including volatile organic compounds ("VOCs"), oxides of nitrogen ("NOx"), carbon dioxide ("CO2"), particulate matter ("PM") and hazardous air pollutants ("HAPs"). A number of CAA standards, are potentially applicable to a facility if it exceeds certain emission thresholds (such as for pollutants regulated as "hazardous") or contains certain pieces of equipment (such as boilers, heaters, or liquid storage tanks of a certain size). EPA has recently taken steps to regulate GHG emissions under the CAA. As such, bioenergy facility operation or expansion may face regulatory requirements relating to GHG emissions reporting and reduction. The ESA is intended to protect endangered species by prohibiting the take of listed animals without a permit. The ESA makes it unlawful to harm a listed animal either directly or by significantly modifying its habitat in a way that interferes with the animal's breeding, feeding, or sheltering patterns. The CWA makes it unlawful to fill wetlands or other waters without a permit, or to make point source discharges into navigable waters or their tributaries without a permit. The Emergency Planning and Community Right-to-Know Act and Sections 112(r)(1) and 112(r)(7) of the CAA may impose certain risk management planning, inventory reporting, release reporting, and other requirements upon biofuel facilities storing substances regulated under these acts in excess of certain quantities. Permits from other federal agencies may be required if federal lands, federally regulated natural resources, military zones, or other areas of federal competence are involved or may be impacted by the construction or operation of a renewable energy facility. The Comprehensive Environmental, Response, Compensation, and Liability Act of 1980 may subject bioenergy producers who arrange for the disposal of hazardous wastes to investigation or clean-up costs related to disposal sites.
Projects involving discretionary federal action must normally comply with NEPA, which requires assessment of the project's environmental impacts and includes public review and involvement. If a project does not fall under a categorical exclusion or exemption, then an environmental assessment ("EA") or an environmental impact statement ("EIS") must be prepared. An EA is the less rigorous assessment, can take approximately six months to complete, and will result in either a "finding of no significant impact" ("FONSI") or a finding that significant impacts are likely. If a FONSI is issued, NEPA review is complete. If, on the other
105
Table of Contents
hand, the EA finds significant impacts to be likely, an EIS must be prepared (which can take a year or longer) describing the environmental impact of the project and possible alternatives.
Various states have also implemented environmental laws and regulations that impact renewable energy projects. State or local approvals might be needed: to obtain air emission permits; to address impacts upon historic resources, state endangered species act considerations, considerations under state corollaries to the CWA, traffic, GHG emissions, or urban encroachment; to remove agricultural preservation restrictions; for wastewater and storm water discharges, water rights permits, water supply assessments, lake and streambed alterations, a utility license, or various land use approvals, among other reasons. As one example, California released in November 2011 air quality guidance addressing stationary and mobile source emissions associated with bio-refineries that could result in stricter air pollution control requirements than have previously been imposed. Certain state environmental laws require the preparation of an environmental impact report similar to the federal impact statement, while some states require a meeting to be held to solicit comments from affected local landowners and local authorities.
Litigation or third party appeals challenging or seeking to delay permits for bio-energy facilities could delay or prevent the construction or operation of these facilities.
Federal Tax Incentives
The federal tax credits available to producers of biofuel vary according to the type of biofuel produced and the feedstock used to produce that fuel. Producers of blended fuel mixtures were eligible for an excise or income tax credit of $0.45 per gallon of ethanol (regardless of feedstock) that was blended with gasoline and sold or used as fuel in a trade or business, but these credits expired on December 31, 2011. Producers of cellulosic biofuel, such as ethanol produced from wood chips and plant wastes, were eligible for a maximum $1.01 per gallon tax credit, which has been renewed from year to year by Congress, but which most recently expired on December 31, 2014. Blenders of biodiesel and renewable diesel fuel were eligible for a tax credit of $1.00 per gallon blended into motor fuels, but these credits also expired on December 31, 2014.
Accelerated Depreciation
Owners of eligible biofuel property may also benefit from accelerated depreciation of the property over a five-year period under the Modified Accelerated Cost Recovery System ("MACRS") under the United States Internal Revenue Code of 1986, as amended. In addition, some property used in biofuel projects may qualify for bonus depreciation for equipment placed in service before January 1, 2015. Under the same statute a deduction of 50% of the cost of qualifying property is permitted in the first year for property placed in service in 2014. Bonus depreciation under this statute has also been renewed annually for several years, and most recently expired on December 31, 2014.
Solar Regulation
Federal, state and local energy laws and regulations apply to the development, ownership, business organization and operation of power generation facilities in the United States. The United States federal government regulates the sale of electricity at wholesale and certain environmental matters, and state and local governments regulate the construction of power generation facilities, the sale of electricity at retail, and certain other environmental and permitting matters.
United States Federal Regulation of the Electricity Industry
The United States federal government regulates the wholesale sale of electric power and the transmission of electricity in interstate commerce through the Federal Energy Regulatory Commission ("FERC"), which draws its jurisdiction from the Federal Power Act ("FPA"), as amended, and from other federal legislation such as the Public Utility Regulatory Policies Act of 1978 ("PURPA"), the Energy Policy Act of 1992 ("EPACT 1992") and the Energy Policy Act of 2005 ("EPACT 2005"). EPACT 2005 repealed the Public
106
Table of Contents
Utility Holding Company Act of 1935 and replaced it with the Public Utility Holding Company Act of 2005 ("PUHCA").
The FPA provides FERC with exclusive ratemaking jurisdiction over all "public utilities" that engage in wholesale sales of electricity and/or the transmission of electricity in interstate commerce. The owners of renewable energy facilities selling at wholesale are therefore generally subject to FERC's ratemaking jurisdiction. FERC may authorize a public utility to make wholesale sales of electric energy and related products at negotiated or "market-based" rates if the public utility can demonstrate that it does not have, or that it has adequately mitigated, horizontal and vertical market power and that it cannot otherwise erect barriers to market entry. Entities granted market-based rate approval face ongoing filing and compliance requirements. In granting market-based rate approval to a wholesale generator, FERC also typically grants blanket authorizations under Section 204 of the FPA and FERC's regulations for the issuance of securities and the assumption of debt liabilities.
If the criteria for market-based rate authority are not met, FERC has the authority to impose conditions on the exercise of market rate authority that are designed to mitigate market power or to withhold or rescind market-based rate authority altogether and require sales to be made based on cost-of- service rates, which could in either case result in a reduction in rates. FERC also has the authority to assess substantial civil penalties (up to $1.0 million per day per violation) for failure to comply with tariff provisions or the requirements of the FPA.
FERC approval under the FPA may be required prior to a change in ownership or control of a 10% or greater voting interest, directly or through one or more subsidiaries, in any public utility (including one of our U.S. project companies) or any public utility assets. FERC approval may also be required for individuals to serve as common officers or directors of public utilities or of a public utility and certain other companies that provide financing or equipment to public utilities.
FERC also implements the requirements of PUHCA applicable to "holding companies" having direct or indirect voting interests of 10% or more in companies that (among other activities) own or operate facilities used for the generation of electricity for sale, which includes renewable energy facilities. PUHCA imposes certain record-keeping, reporting and accounting obligations on such holding companies and certain of their affiliates. However, holding companies that own only exempt wholesale generators ("EWGs"), foreign utility companies, and certain qualifying facilities under PURPA are exempt from the federal access to books and records provisions of PUHCA. EWGs are owners or operators of electric generation facilities (including producers of renewable energy, such as solar projects) that are engaged exclusively in the business of owning and/or operating generating facilities and selling electricity at wholesale. An EWG cannot make retail sales of electricity, may only own or operate the limited interconnection facilities necessary to connect its generating facility to the grid, and faces restrictions in transacting business with affiliated regulated utilities.
Regulation of Electricity Sales
Electricity transactions in the United States may be bilateral in nature, whereby two parties contract for the sale and purchase of electricity subject to various governmental approval processes or guidelines that may apply to the contract, or they may take place within a single, centralized clearing market for purchases and sales of energy, electric generating capacity and ancillary services. Given the limited interconnections between power transmission systems in the United States and differences among market rules, regional markets have formed as part of the power transmission systems operated by regional transmission organizations (known as "RTOs" or independent system operators ("ISOs")) in places such as California, the Midwest, New York, Texas, the Mid-Atlantic region and New England.
107
Table of Contents
Reliability Standards
EPACT 2005 amended the FPA to grant FERC jurisdiction over all users, owners, and operators of the bulk power system for the purpose of enforcing compliance with certain standards for the reliable operation of the bulk power system. Pursuant to its authority under the FPA, FERC certified the North American Electric Reliability Corporation ("NERC") as the entity responsible for developing reliability standards, submitting them to FERC for approval, and overseeing and enforcing compliance with them, subject in each case to FERC review. NERC, in turn, has delegated certain monitoring and enforcement powers to regional reliability organizations. Users, owners, and operators of the bulk power system meeting certain materiality thresholds are required to register with the NERC compliance registry and comply with FERC-approved reliability standards.
State Regulation of the Electricity Industry in the United States
State regulatory agencies in the United States have jurisdiction over the rates and terms of electricity service to retail customers. Regulated investor-owned utilities often must obtain state approval for the contracts through which they purchase electricity, including renewable energy, if they seek to pass along the costs of these contracts to their retail ratepayers. Different states apply different standards for determining acceptable prices for utility procurement contracts, including contracts for the purchase of renewable energy. In some states, electricity generation is deregulated and electricity supply is provided by retail or wholesale third party suppliers, as determined in that state's regulatory scheme. Several states hold auctions for the wholesale supply of power to be sold through utilities to retail customers that do not choose a third party competitive electric supplier.
In certain states, approval of the construction of new power generation facilities, including solar power plants, is obtained from a state agency, with only limited regulatory approvals required from other state agencies and local governments. However, in many states the permitting process for power plants, including solar power plants, is also subject to land-use and similar regulations established at the county and municipal government level. In other cases, state and local authorizations may involve a more extensive approval process, possibly including an environmental impact evaluation and opposition by interested parties or utilities.
Renewable Energy Tax Incentives in the United States
The United States provides various federal, state and local tax incentives to stimulate investment in renewable energy generation capacity, including solar power. These tax incentives are subject to change and, possibly, elimination in the future. Certain U.S. federal income tax incentives are described below.
Owners of eligible solar energy property (which includes most kinds of solar energy generation equipment) that is placed in service before January 1, 2017 generally may claim a one-time federal income investment tax credit ("ITC") equal to 30% of the tax basis of the eligible property. An owner of eligible solar energy property who claims the ITC must reduce the tax basis of the eligible property by an amount equal to one half of the credit. The ITC is subject to recapture (in declining amounts) if the owner sells or ceases use of the property during the five-year period following the placed-in- service date. Once the 30% ITC expires at the end of 2016, the permanent 10% ITC shall remain in effect.
In lieu of claiming certain U.S. federal income tax credits (in particular, the ITC), owners of eligible solar energy property may be eligible to receive a cash payment (a "Cash Grant") from the United States Department of the Treasury ("Treasury") equal to 30% of tax basis of the eligible property. Among other requirements, to be eligible for a Cash Grant, the eligible property must have been placed in service in 2009,
108
Table of Contents
2010 or 2011 or, for property not placed in service during that period, the construction of the specified energy property must have begun after December 31, 2008 and before January 1, 2012. In addition, eligible solar energy property must be placed in service by January 1, 2017. Certain persons, "disqualified persons," are ineligible to receive the Cash Grant and are prohibited from owning a direct or indirect interest in otherwise Cash Grant-eligible solar energy property, unless the indirect interest is held through an entity taxable as a C corporation for U.S. federal income tax purposes. Cash Grants are subject to recapture during the five-year period beginning on the date the eligible solar energy property is placed in service. The amount of the Cash Grant subject to recapture decreases ratably over the five-year recapture period. Among other events, failure of the eligible property to be used for its intended purpose and the direct or indirect transfer to a disqualified person (as described above) will cause recapture of the Cash Grant.
Certain legislation required a mandatory sequestration of discretionary spending if U.S. Congress failed to reach an agreement on a deficit-reducing budget by March 1, 2013. Because U.S. Congress did not approve the requisite budget by that deadline, President Obama signed a sequestration order. Under the current sequestration rules, every final decision by Treasury in respect of a Cash Grant, evidenced by an award letter that is delivered to a cash grant applicant on or after October 1 2013 through September 30, 2014, will reflect a 7.2% reduction in the Cash Grant award amount. For cash grant award letters issued on or after October 1, 2014 through September 30, 2015, the Office of Management and Budget has estimated that the sequestration reduction will be 7.3%. This reduction applies regardless of the date on which the application for a Cash Grant was received by Treasury.
Owners of eligible solar energy property also benefit from accelerated depreciation of the property over a five-year period under the Modified Accelerated Cost Recovery System ("MACRS") under the United States Internal Revenue Code of 1986, as amended. Most of the equipment used in CSP and PV projects qualifies for five-year depreciation under MACRS. In addition, some equipment used in CSP and PV projects may qualify for bonus depreciation for equipment placed in service.
The DOE, in an effort to promote the rapid deployment of renewable energy and electric power transmission projects, is authorized to grant guarantees with respect to certain loans to renewable energy projects and related manufacturing facilities and electric power transmission projects under Sections 1703 and 1705 of EPACT 2005. The ARRA amended the EPACT 2005 to include Section 1705. In order to have qualified for the Section 1705 Program, physical construction must have commenced at the primary site of the project on or before September 30, 2011. NEPA review must have been completed prior to the issuance of a loan guarantee. In May 2011, the Section 1705 Program expired by statute, and DOE announced that it would no longer accept new applications under that program. On September 30, 2011 the Section 1705 loan guarantee program closed with no further loan guarantees to be issued.
Loan guarantees under Section 1703 continue to be available for solar. However, eligibility is limited. The applicant must be located in the United States and may include foreign ownership so long as the project is located in one of the fifty states, the District of Columbia or a U.S. territory. The project must employ a new or significantly improved technology that is not a commercial technology. A commercial technology is defined as in general use in the commercial marketplace in the United States at the time the term sheet is issued by the Department of Energy. A technology is considered to be in commercial use if it has been installed in and is being used in three or more commercial projects in the United States and has been in operation in each such commercial project for at least five years. The project must also pay prevailing wages under the Davis-Bacon Act.
109
Table of Contents
DOE Research Grants, State Energy Funding, Workforce Training, and Other Initiatives under the ARRA
The DOE received funding under the ARRA, which it has disbursed or is in the process of disbursing to increase solar power production. Some funds were allocated as grants to support research, development, demonstration, and deployment projects. Funds were awarded to states on the basis of their electric consumption to fund energy efficiency, renewable energy, and other energy programs. ARRA funds were allocated with the purpose of providing workforce training with respect to renewable energy and energy efficiency. A number of initiatives were funded by the DOE with ARRA monies, including initiatives addressing solar market transformation, the integration of PV generation into the distribution system, and base load CSP generation.
In addition to federal legislation, many states have enacted legislation, principally in the form of renewable portfolio standards ("RPS"), which generally require electric utilities to generate or purchase a certain percentage of their electricity supplied to consumers from renewable resources. In certain states, it is not only mandatory to meet these percentages from renewable resources, which in general are on the increase, but also electric utilities may be required to generate or purchase a percentage of their electricity supplied to consumers from specific renewable energy technologies, including solar technology. Depending upon the state, various certifications, permits, contracts and approvals may be required in order for a project to qualify for particular RPS programs. Some states, for example, require that only renewable energy generated in-state counts towards the RPS. According to the Database of State Incentives for Renewable Energy, as of August 2014, 49 states and U.S. territories have adopted some type of RPS standards. Although there is currently no federal RPS program, there have been proposals to create a federal RPS standard for renewable energy.
Renewable Energy Certificates ("RECs") are typically used in conjunction with RPS programs as tradable certificates demonstrating that a certain number of kWh have been generated from renewable resources. Under many RPS programs, a utility may generally demonstrate, through its ownership of RECs, that it has supported an amount of renewable energy generation equal to its state-mandated RPS percentage. The sale of RECs can represent a significant additional revenue stream for renewable energy generators. In RPS states where a liquid REC market does not exist, renewable energy can be bought or sold through "bundled" power purchase agreements, where the power purchase agreement price includes the price for renewable energy attributes. Some states require that RECs and the associated electricity be purchased together in order to count towards the RPS. In states that do not have RPS requirements, certain entities buy RECs voluntarily. These RECs generally have lower prices than RECs that are used to meet RPS obligations. The price of RECs can vary significantly, depending on their availability, which in turn depends upon the amount of renewable generation that has been put in service in a state that has implemented RPS requirements. In some states, the number of successful projects has generated more RECs than required to meet the applicable RPS requirements for a given year or years, leading to steep drops in the market price for RECs. Additionally, demand for RECs can be driven by requirements (such as those imposed under the California Environmental Quality Act) that development projects mitigate potential significant GHG impacts identified in connection with environmental clearances.
Effective December 10, 2011, California enacted legislation that increases its existing RPS to 25% by 2016 and 33% by 2020, and expands the program to cover publicly-owned utilities, in addition to investor-owned utilities ("IOUs"). In addition, the California Solar Initiative ("CSI") sets a goal of 1,940 MW of solar capacity by the end of 2016. The CSI provides monetary incentives for solar installation between 1 kW and 5 MW in size as well as grants for research, development, and demonstration. California's feed-in tariff program obligates IOUs to purchase solar generation at a standard price until a purchase threshold is crossed. Colorado set an RPS of 30% by 2020 for IOUs, permits the trading of RECs, and requires that 3% of the RPS be met by distributed generation in 2020 for IOUs. Arizona set an RPS of 15% by 2025, with 30% of the RPS
110
Table of Contents
to be met from distributed generation. A Texas law signed in August 2005 requires that 5,880 MW of new renewable generation be built by 2015. The law also set a target of having 10,000 MW of renewable generation capacity by 2025. Additionally, Texas law establishes a minimum of 500 MW of non-wind renewable generation, and doubles the RPS compliance value provided by non-wind generation.
Other incentives that states and localities have adopted to encourage the development of renewable resources include property and state tax exemptions and abatements, state grants, and rebate programs. In addition, a number of states collect electricity surcharges on residential and commercial users and through public benefit funds reinvest some of these funds in renewable energy projects. California offers a property tax incentive for certain solar energy systems installed between January 1, 1999 and December 31, 2016. The Arizona Department of Revenue provides a corporate tax credit based on production for solar, wind, or biomass systems that are 5 MW or larger and are installed on or after December 31, 2010 and before January 1, 2021.
Solar generation may also be incentivized by state GHG emission reduction measures, such as California's cap and trade scheme, which caps and reduces GHG emissions. The California cap and trade program went into effect with respect to the electricity and other sectors starting in 2013.
Environmental Permitting and Compliance
Construction and operation of solar power plants and the generation and power transmission of renewable energy is subject to environmental regulation by United States federal, state and local authorities. Typically, environmental laws and regulations require a lengthy and complex process for obtaining licenses, permits and approvals prior to construction, operation or modification of a generation project or power transmission facilities. Prior to development, permitting authorities may require that project developers consider and address, among other things, the impact on water resources and water quality, endangered species and other biological resources, existing land uses and zoning, agricultural resources, archaeological, paleontological, recreational and cultural considerations, and impact on landscape. Potentially applicable federal permits might be required under the National Environmental Policy Act ("NEPA"), the Endangered Species Act ("ESA"), the Clean Water Act ("CWA"), the National Historic Preservation Act, and the National Wilderness Preservation Act, among other federal laws. The Federal Land Policy and Management Act ("FLPMA") provides the Bureau of Land Management ("BLM") with discretion to provide rights-of-way for power plants and electric power transmission facilities on federal lands, and BLM has developed detailed regulations for the management of its lands. Additional approvals would be needed if projects or power transmission lines were to be located on Forest Service or tribal lands. Project approvals may be conditioned upon the project being modified, including to involve mitigation measures.
A project that is located on federal land (as well as other projects involving federal agency action) must comply with NEPA, which requires assessment of the project's environmental impacts and includes public review and involvement. If a project does not fall under a categorical exclusion or exemption, then an environmental assessment ("EA") or an environmental impact statement ("EIS") must be prepared. An EA is the less rigorous assessment, can take approximately six months to complete, and will result in either a finding of no significant impact ("FONSI") or a finding that significant impacts are likely. If a FONSI is issued, NEPA review is complete. If, on the other hand, the EA finds significant impacts to be likely, an EIS must be prepared (which can take a year or longer) describing the environmental impact of the project and possible alternatives. The DOE and the BLM jointly prepared a solar energy programmatic environmental impact statement ("Solar PEIS") in order to facilitate the permitting and sponsoring of large scale solar electric power plants on public lands in the Western United States. The DOE and BLM released a draft Solar PEIS in December 2010, a supplement to the draft Solar PEIS on October 27, 2011, the final Solar PEIS on July 24, 2012 and the Record of Decision for the Solar PEIS on October 12, 2012. The Solar PEIS is intended to serve as a roadmap for solar energy development by establishing solar energy zones, totaling about 285,000 acres of public lands, characterized by significant solar resources, good energy transmission potential, and relatively low conflict with biological, cultural and historic resources. Within these zones, the Solar PEIS has the goal of
111
Table of Contents
providing incentives for development, including faster and simpler permitting, improved mitigation strategies, and other economic incentives.
On October 12, 2012, the Secretary of the Interior signed the Record of Decision to establish a comprehensive Solar Energy Program to administer the development of utility-scale solar resources on BLM-administered public lands in six southwestern states. The Solar Energy Program decisions will guide the processing of all new utility-scale solar energy applications on BLM- administered lands. The BLM's Solar Energy Program would only apply to projects capable of generating 20 MW or more. Decisions on projects that are on non BLM-administered land and on projects capable of generating less than 20 MW will be made in accordance with existing land use requirements, current applicable policy, and individual site-specific NEPA analyses.
Permits from other federal agencies may be required if federal lands, federally regulated natural resources, endangered species, military zones, or other areas of federal jurisdiction are involved or may be impacted by the construction or operation of a renewable energy facility. The ESA is intended to protect endangered species by prohibiting the take of listed animals without a permit. The ESA makes it unlawful to harm a listed animal either directly or by significantly modifying its habitat in a way that interferes with the animal's breeding, feeding, or sheltering patterns. The CWA makes it unlawful to fill wetlands or other waters without a permit, or to make point source discharges into navigable waters or their tributaries without a permit.
Various states have also implemented environmental laws and regulations that impact renewable energy projects. State or local approvals might be needed to obtain air emission permits, to address impacts upon historic resources, to remove agricultural preservation restrictions, to address state endangered species act considerations, for wastewater and storm water discharges, for water rights permits, a utility license, or various land use approvals, among other reasons. Certain state environmental laws require the preparation of an environmental impact report similar to the federal impact statement, while some states require a meeting to be held to solicit comments from affected local landowners and local authorities. Utility scale solar power plant technologies require access to water resources, potentially triggering permitting scrutiny (as well as necessitating the navigation of water rights regulations that vary from state to state).
Litigation or third party appeals challenging or seeking to delay permits for renewable energy facilities and associated power transmission infrastructure could delay or prevent the construction or operation of renewable energy facilities and result in financial penalties for failure to complete or operate the facilities.
The California Energy Commission, the California Department of Fish and Wildlife, the BLM and United States Fish and Wildlife Service are working to develop a streamlined permitting process for renewable generation facilities including a plan for the development of solar generation and the protection of environmental resources in the Mojave and Colorado deserts. These agencies are drafting the Desert Renewable Energy Conservation Plan ("DRECP") to address how entities with jurisdiction over renewable energy and transmission projects and related facilities in the desert of California should conserve natural communities and species pursuant to the California Natural Community Conservation Planning Act (NCCP Act), the ESA, and the Federal Land Policy and Management Act ("FLPMA") while also facilitating the permitting of renewable energy projects in accordance with California's RPS and the federal government's goal of increasing renewable energy generation on public land. The agencies are preparing a joint Environmental Impact Report ("EIR") for the DRECP and for a possible amendment to the California Desert Conservation Area (CDCA) Plan of 1980, as amended, and released a scoping report for the EIR/EIS in December 2011.
Regulation of Solar Storage
Solar storage is a nascent industry in the United States. Energy storage solutions are being explored for solar and other renewable and distributed generation of electricity, and some support has been available from the federal government from agencies such as the Department of Energy, in the form of grants and loans.
112
Table of Contents
Additional support or encouragement can be found in a number of states. However, no concerted legal or regulatory effort has been made to develop a framework that would make energy storage an attractive alternative for the supply of electricity to end users of power. To date, energy storage has been considered to be generally too expensive to be viable for the supply of electricity.
Several issues have stood in the way. There is no federal energy policy that supports a national renewable portfolio standard. Further, the existing system of ISOs and RTOs that manage the bulk transmission grids and wholesale markets for pricing electricity frequently establish low prices for electricity sold in off hours, making it difficult to recoup the cost of stored power sold into the grid at that time. At present, most states do not have regulations that specifically address issues related to stored power, including interconnection to the grid, nor does the federal government. However, as stored electricity becomes more common some such regulation is likely. In July 2013, the FERC issued Order 784, which created regulations that, inter alia, are intended to facilitate the adoption of energy storage technologies. The California Public Utilities Commission ("CPUC") initiated a docket (CPUC Energy Storage Proceeding R.10 12 007) on December 16, 2010 to review issues related to energy storage and develop regulations. On October 17, 2013, the CPUC issued a decision concerning the adoption of procurement targets for viable and cost-effective storage systems. It established a target of 1,325 MW of energy storage to be procured by Pacific Gas & Electric Company, Southern California Edison Company and San Diego Gas & Electric Company by 2020, with installations required no later than the end of 2024, and set a schedule for procurement of energy storage. Notwithstanding those developments, in general, the lack of defined regulation creates uncertainty. In addition, whether power that is stored and later injected into the grid will qualify for RPS programs and how the amount that is eligible for RECs will be computed is unknown. For example, it is uncertain whether RECs will apply to the amount of power generated by the renewable generation or to the amount taken from storage after line losses.
Brazil
Our operations within the power transmission-lines portions of our Engineering and Construction and Concession-Type Infrastructure activities and the Biofuels segment of our Industrial Production activity are subject to significant regulation in Brazil.
Industrial Engineering and Construction Regulation
The Governmental Policy and Legislative Framework for the Electricity Sector
The electricity sector has undergone two major institutional reforms in the last decades which resulted in its current form: the first in the 1990s and another in 2003, which aimed at modifying the rules applying to the National Interconnected System ("SIN") and resulted in its current form. The first change in the sector occurred after the enactment of Law No. 8,987 of 1995, as amended, which established the system for the concessions and permissions for rendering public services (the "Concessions' General Act"), and with the enactment of Law No. 9,074 of 1995, as amended, which sets forth specific rules for the concession of electricity public services. This law,inter alia: (i) established the granting, duration and extension of concessions and permissions; (ii) set forth the free access principle for the power transmission and distribution systems; (iii) released free consumers (as defined below) from the commercial monopoly of distribution concessionaires, allowing them to choose their supplier; and (iv) introduced the independent power producer ("IPP") and the self-producer agents.
Law No. 9,427 of 1996, as amended,inter alia, created the National Electric Energy Agency ("ANEEL"), the regulatory agency concerned with supervising the production, power transmission, distribution and trading of electricity, and it is regulated by Decree No. 2,335 of 1997. Such law granted ANEEL the authority,inter alia, to run public tenders for concessions and permissions, as well as to execute and manage the agreements for delivering public services and to grant certain authorizations. Law No. 9,478 of 1997, as amended, created the National Committee on Energy Policy ("CNPE"), chaired by the Minister of Mining and
113
Table of Contents
Energy ("MME"), with the duty of advising the President of the Republic on the national policies in this domain.
The first phase of the reform was concluded with the enactment in May 1998 of Law No. 9,648, later amended, which regulates competition in the electricity sector. Among many other provisions, it sets forth rules for: (i) the trading, import and export of power; (ii) the division, into separate agreements, of the purchase and sale of energy, and the free access to the power transmission and distribution systems; (iii) the creation of the Electric System National Operator ("ONS"), a legal entity organized under the private law, in charge of the coordination and operational control of the facilities for the generation and power transmission of interconnected electric systems in Brazil; and (iv) the free negotiation of energy, within the scope of the Wholesale Market of Electricity ("MAE"), to be created by a market agreement.
The second phase of the reform redefined the sector's institutional model, mainly concerning the energy market, by setting forth as chief goals the need for the system's expansion while keeping tariffs low and competition present in power generation.
The new institutional framework was established by Law No. 10,848 of 2004 in an effort to restructure the electricity industry to better provide consumers with a secure electricity supply combined with low tariffs by expanding electricity generation and services.
Law No. 10,848 created two co-existing energy markets: a regulated market, for the protection of customers, and a free market to encourage consumers which are able to buy directly from producers on a competitive basis ("free consumers"). Law No. 10,848 has authorized the creation of the Chamber of Electric Energy Trading ("CCEE"), a non-profit private entity, functioning under the supervision of ANEEL to manage the agreements for the purchase and sale of energy in the regulated contracting environment ("ACR") and the ascertainment and settlement of contractual differences in the free contracting environment ("ACL"), which took over the responsibilities previously performed by MAE. This law further authorized the creation of the Committee on the Monitoring of the Electricity Sector ("CMSE"), under the aegis of the government, to monitor the supply conditions of the electricity market and the advising of preventive actions for guaranteeing this supply.
On May 28, 2009, Provisional Measure No. 450 of 2008 became Law No. 11,943, of 2009, as amended, which authorizes the Federal Government to participate in the Guarantee Fund for Electric Energy Enterprises (Fundo de Garantia a Empreendimentos de Energia Elétrica). Such fund aims to provide financial guarantees proportional to the participation, direct or indirect, of federal or state companies of the electric industry in special purpose companies, created for the development of electric related projects in connection with the Growth Acceleration Program (Programa de Aceleração do Crescimento—PAC) and other strategic programs appointed by act of the Executive Branch.
More recently, the government passed Provisional Measure No. 577 of 2012, converted into Law No. 12,767 of 2012, which establishes specific rules for the termination of concessions in the event of bankruptcy or forfeiture and for intervention by the granting authority, acting through ANEEL, in the management of concessionaires in order to ensure the adequate rendering of services and compliance with contractual, regulatory and legal provisions. The goal of this Law is to ensure the continuation of the service and its rules on administrative intervention are stricter than the ones of the Concessions' General Act. Law No. 12,767, of 2012, expressly sets forth that the possibility of resorting to the judicial or extrajudicial reorganization procedure under Law No. 11,101, of 2005 (Law on Corporate Reorganization and Bankruptcy) shall not apply to the electricity concessionaires which exploit public services while the concession is in force.
In addition, the government issued Provisional Measure No. 579 of 2012, later converted into Law No. 12,783 of 2013, which establishes that concession agreements expiring between 2015 and 2017 may be extended once, in 2013, thus before their expiration date, for a period of up to 30 years. This Provisional Measure came as a response of the government to problems related to the high costs of the tariffs and also to
114
Table of Contents
the expiration of many concession agreements between 2015 and 2017. The concessionaires had until October 15, 2012 to express their interest in renewing their concessions. The deadline was later extended to December 4, 2012. The main goal of the anticipation of the renewal process was to ensure that the concessionaires would abide with the government promises of reducing the tariffs. Hence, since its edition until its conversion into law, the Provisional Measure has been in the center of heated debates among the many stakeholders. In general lines, the main issue lays in the fact that after the renewal, concessionaires would be remunerated only for investments in the operation and maintenance of its equipment, failing to receive higher revenues, which include the compensation of non-amortized investments on assets. The government indemnified the concessionaires for these other costs, but the companies have argued about the calculation of the compensation amount. As a partial response to the problem, the government issued Provisional Measure No. 591 on November 29, 2012, establishing that assets belonging to transmission concessionaires prior to May 31, 2000 and which have not yet been fully amortized shall also be compensated. This Provisional Measure is no longer in force. However, this rule has been incorporated in Law No. 12,783 of 2013 and is still applicable. The effort has paid off and, unlikely to what happened with the renewal of generation concession agreements, in December 4, 2012, all 9 (nine) transmission concessionaires whose concession agreements would expire between 2015 and 2017 have agreed to enter into new concession agreements or amendments to the existing ones to extend the concession period.
The Transmission Sector
The transmission of electricity over long distances is undertaken through a basic power transmission network comprised of power transmission lines and respective substations with a tension equal or superior to 230kV. The objective of the basic power transmission network is to enable the integration between remote power plants and load centers represented by terminal substations, so as to serve the distributors, or large clients directly. The power transmission lines in Brazil are generally extensive as the majority of the important hydroelectric plants are located away from the electricity consumers. Currently, the Brazilian territory is almost totally interconnected.
The basic power transmission network is a large and complex system, which allows the electrical integration between different regions of Brazil, thus enabling constant interchanges of energy with the aim of optimizing the operating costs of the generation matrix (operating with a complement of thermal energy).
In addition, the basic power transmission network permits access by the interested users , who are subject to the payment of a tariff for the use of this network, known as the TUST (Tarifa de Uso do Sistema de Transmissão), which is fixed at differentiated values, depending on the point of the system accessed by the interested user.
Although the vast majority of electricity transmission takes place in Brazil through the basic power transmission network, there are some locations, mainly in the Amazon region, which are not covered by such network. This area is served by an isolated system grid. The isolated system grids must comply with several specific ANEEL Resolutions. Planning and monitoring of the systems' operation in the North Region is undertaken by the North Region's Operational Technical Group, created by Ordinance MINFRA No. 895 of 1990. Law No. 12,111 of 2009, regulated by Decree No. 7,246 of 2010, aims to encourage the competitiveness of power suppliers in the isolated systems and establishes the provisions for the interconnection of part of an isolated system to the SIN and determines quality and safety standards similar to those set forth in the SIN. It also redefines the distribution criteria of the CCC—the Fossil Fuel Compensation Account, created by Law No. 5,899 of 1973—which is an account whose revenues are used to cover the costs of fossil fuels (diesel, for example) for thermoelectric generation in the isolated and interconnected systems. These account`s revenues come from a fee paid by the final consumers, through the distribution concessionaires.
115
Table of Contents
Brazilian Regulatory Authorities
The CNPE, is a council created in August 1997 aimed at advising the Brazilian President with respect to the creation and development of a national energy policy. The Minister of Mines and Energy is the person responsible for the presidency of the CNPE. The majority of its members are ministers of the Brazilian government. The CNPE was created to optimize the use of Brazil's energy resources and to ensure the supply of energy to the country.
The MME is the primary authority of the Brazilian energy sector, having as its main role the definition of policies, guidelines and regulatory framework of the sector. Since the enactment of Law No. 10,848 of 2004, the Federal Government, through the MME, has taken over from ANEEL responsibilities such as the creation of regulations governing the granting of concessions and the definition of rules for public tender offers for concessions of public services and electric energy facilities.
ANEEL is the agency in charge of regulating and supervising the generation, transmission, distribution and commercialization of electricity in Brazil. It is an independent federal regulatory agency. ANEEL's primary responsibility is to regulate and monitor the electricity sector. ANEEL's current responsibilities include, among others, (i) managing concessions for electric power generation, transmission and distribution, including the approval of electricity tariffs, (ii) proposing and enacting regulations for the electricity sector, (iii) implementing and regulating the exploitation of various energy sources, including the use of hydroelectric energy, (iv) promoting public tender offers for the granting of new concessions, (v) settling administrative disputes between producers and purchasers of electricity and (vi) defining the criteria and methodology for the determination of power transmission and distribution tariffs.
The ONS was created in 1998 as a non-profit private entity comprised of free consumers and players engaged in generation, transmission and distribution of electric power, in addition to importers and exporters of electricity. The main role of the ONS is to coordinate and control the power generation and transmission operations in the SIN, in accordance with ANEEL's regulation and supervision. The principal objectives and responsibilities of the ONS comprise,inter alia, (i) operational planning for the generation sector; (ii) organizing the use of the SIN and international interconnections; (iii) guaranteeing that all players of the sector have access to the power transmission network in a non-discriminatory manner; (iv) planning for the expansion of the electric energy system; (v) proposing plans to the MME for extensions of the basic grid; and (vi) proposing and submitting new rules for the operation of the power transmission system for ANEEL's approval.
The CCEE was created by Law No. 10,848 of 2004 and established by Decree No. 5,177 of 2004 and took over the responsibilities previously performed by MAE (Wholesale Electricity Market) as well as its organizational and operational structures. The CCEE is responsible for,inter alia: (i) preparing and performing electricity auctions within the ACR by delegation of ANEEL; (ii) registering all the power purchase agreements in the ACR, Contratos de Comercialização de Energia no Ambiente Regulado ("CCEAR"); (iii) registering the agreements resulting from market adjustments and the volume of power contracted in the free market; and (iv) accounting for and clearing of short-term transactions.
116
Table of Contents
The EPE was created by Law No. 10,847 of 2004 and established by Decree No. 5,184 of 2004. The main purpose of the EPE is to carry out studies and research in order to acquire and provide background information to Brazilian energy sector planning activities. Its primary responsibilities include, among others: (i) the performance of studies and projections with respect to the Brazilian energy matrix; (ii) the execution of research to support integrated planning of energy resources; (iii) the development of studies to support generation and power transmission expansion; (iv) the performance of feasibility studies for electricity generation, including technical-economic and social-environmental aspects; and (v) the coordination of efforts to obtain pre-construction environmental licenses for hydro power plants and power transmission lines.
The CMSE is an advisory board under direct coordination of the MME. Its primary objective is to monitor and evaluate the continuity of electricity supply and its safety throughout Brazil. Its main attributions include, among others, (i) monitoring the generation, power transmission, distribution, commercialization, import and export of electricity; and (ii) assessment of electricity supply and service conditions.
Concessions of Electricity Utilities—Transmission
Companies or consortia that wish to build and operate electric power transmission facilities pertaining to the basic grid have to participate in a public auction since they are to render a public service. These concessions are granted by ANEEL, acting as representative of the granting authority, and the winner is the bidder who is able to render the service with the lowest annual permitted revenue (Receita Anual Permitida—"RAP"). The agreements define the regulatory regime under which the rendering of public services will be carried out, as set forth by the Concessions' General Act. The concession agreements grant rights to use certain electricity installations during a period of usually 30 (thirty) years.
The Concessions' General Act and the concession agreements establish,inter alia, the requirements that a concessionaire must comply with when rendering public services, the rights of the consumers, as well as the obligations of the concessionaire and the granting authority. Furthermore, the concessionaire must comply with regulations governing the energy sector. The main provisions of both the Concessions' General Act and the concession agreements are summarized as follows:
- •
- Adequate Service: The concessionaire must render adequate services in terms of regularity, continuity, efficiency, safety and accessibility;
- •
- Use of Land: The concessionaire may use public land or request the granting authority to expropriate necessary private land for the benefit of the concessionaire. In this case, the concessionaire must compensate the affected private landowners;
- •
- Strict Liability: The concessionaire is strictly liable for all damages arising from the provision of its services. See "—Penalties";
- •
- Full Performance Guarantee: The winner of the public auction shall grant a full compliance guarantee on behalf of ANEEL in order to ensure the compliance with the obligations established under the concession. Such guarantees may be replaced by lesser-value guarantees when ANEEL verifies the gradual execution of milestones in the implementation landmarks' schedule (and, in such cases, the reduction shall be proportional to the implementation);
- •
- Changes in Controlling Interest: ANEEL must previously approve any change in the concessionaire's indirect and direct controlling interest;
- •
- Agreements with Related Parties: ANEEL provides for specific rules on the transactions between agents of the electricity sector and related parties, especially concerning technology transfer, technical
117
Table of Contents
assistance, infrastructure sharing and provision of services. According to ANEEL's Resolution No. 334, of 2008, some agreements shall be previously submitted to the Agency for approval;
- •
- Financing: ANEEL's Resolution No. 532, of 2013, establishes limits that shall be observed by the concessionaire to offer to third parties the rights emerging from the concession, assets and future revenues related to the concession as guarantee in financing agreements. Notwithstanding the general rule that the grant of a security interest on concession rights requires ANEEL's prior approval, such approval will not be required, for example, in the following situations: (a) project finance guarantee packages for new transmission projects; and (b) regulated auctions for new projects that require a guarantee;
- •
- Intervention by the Granting Authority: As set forth in Federal Law No. 12,767, of 2012, the granting authority, through ANEEL, may intervene in the concession, by means of an act, to ensure the adequate performance of services, as well as the full compliance with applicable contractual, regulatory and legal provisions. Within 30 days of the act date, ANEEL is required to begin an administrative proceeding to establish the causes and to determine liability, in which the concessionaire is entitled to contest the intervention. The shareholders of the concessionaire under intervention will have 60 (sixty) days from the act date to submit to ANEEL a recovery plan and correction of errors and transgressions which gave rise to intervention. During the term of the administrative proceeding, a person appointed by the granting authority (interventor) becomes responsible for carrying on the concession and the terms of office for officers and members of the supervisory board (Conselho Fiscal) shall be suspended during the intervention. The interventor will be paid with funds from the concessionaire. The intervention term shall be up to one year, renewable at the discretion of ANEEL;
- •
- Early Termination of the Concession: The termination of the concession agreement may be accelerated by means of expropriation and/or forfeiture. Expropriation results in the early termination of a concession due to the public interest, which must be expressly declared by law. Forfeiture must be declared by the granting authority after the issuance of a final administrative ruling by ANEEL attesting that the concessionaire, among others: (i) has failed to render adequate service or to comply with applicable law or regulation; (ii) no longer has the technical, financial or economic capacity to provide adequate service; or (iii) has not complied with penalties assessed by the granting authority. The concessionaire may contest any expropriation or forfeiture in the court. The concessionaire is entitled to indemnification for its investments in expropriated assets that have not been fully amortized or depreciated, after the deduction of any amount that must be paid by the concessionaire as penalty;
- •
- Expiration: When the concession expires, all assets, rights and privileges that are materially related to the rendering of the services revert to the Brazilian government. Following the expiration, the concessionaire is entitled to indemnification for its investments in assets that have not been fully amortized or depreciated on the expiration date;
- •
- Remuneration: Transmission concessionaires are remunerated on the basis of compensation authorized under the concession agreement, the RAP. Rather than relating to the volume of electricity transmitted, these payments are set by the granting authority upon the granting of each concession. Under the relevant Agreement for the Rendering of Transmission Services (as defined below) and based on the annual permitted revenues, ONS is responsible for calculating the amounts owed to power transmission concessionaires on a monthly basis. Based on this calculation, and depending on the agreements executed individually with ONS, power transmission system users make direct monthly payments to the concessionaires;
- •
- Revisions Under Concessions' General Act and the concession agreements: There are two types of annual revisions—related to investments in transmission facilities and substations previously agreed upon with the granting authority, and special revisions—related to changes in the tax regime, regulatory tariffs, compensation for certain investments made by the concessionaires for which prior
118
Table of Contents
approval by ANEEL is not legally required, or other unforeseen events that, at the discretion of the granting authority, affect the economic and financial balance of the concession agreement. Depending on the nature of the event, the granting authority may conduct a revision unilaterally or at the request of the interested concessionaire; and
- •
- Affordable Pricing: Client's right to obtain the rendering of the services continuously and with maximum efficiency for the lowest possible tariffs.
Under the Agreement for the Rendering of Transmission Services (as defined below) and under the concession agreements, the reduction of the revenues can occur based on the following terms:
- •
- by a variable amount equivalent to a maximum of 12.5% of the RAP amount, in the event of an operating unavailability of the grid and substations of a power transmission concessionaire;
- •
- if the operating unavailability occurs following a reduction at the maximum percentage of 12.5%, the concessionaire will be subject to an additional penalty equivalent to a maximum of 2% of the RAP amount for the preceding 12 month period.
- •
- the variable reduction and the additional penalty shall similarly not be applied to events of operating unavailability resulting from force majeure, interruptions authorized or requested by the ONS or events of unavailability as a result of the inefficiency of ONS, among others; or
- •
- if the unavailability continues for more than 30 consecutive days, the granting authority may initiate legal proceedings to terminate the concession.
ANEEL may also reduce the RAP at any time if the concessionaire starts receiving revenues from other activities.
Regulation of Electricity Utilities—Transmission
The governmental or administrative authorizations required for the construction and operation of power transmission networks
After the auction for the concession of power transmission lines, a concession agreement is signed by and between the concessionaire and the federal government, represented by ANEEL. Next, the Basic Project for Power Transmission Facilities relating to the concession shall be submitted and duly approved. For environmental compliance, the concessionaire must prepare environmental impact studies to be approved by the competent environmental authority for the granting of the previous license (licença prévia), which is granted in the initial phase of the project and approves its concept and location, certifying its environmental feasibility. After the fulfillment of the conditions of the previous license, the concessionaire shall obtain the environmental installation license (licença de instalação), authorizing the actual implementation and construction. Some other permits and licenses may also be required during the installation, such as the Declaration of Public Interest from ANEEL, authorization for suppression of vegetation, among others. Lastly, the concessionaire must obtain the respective environmental operation license (licença de operação) and the release certificate issued by ONS to start operating.
The regulation in force sets forth that the rendering of transmission services shall be preceded by the execution of Transmission Agreements and of Agreements for the Rendering of Supplementary Services (Contratos de Prestação de Serviços Ancilares). There are three different types of Transmission Agreements: (i) Agreement for the Rendering of Transmission Services ("CPST"), (ii) Agreement for the Use of the Transmission Networks ("CUST"); and (iii) Connection Agreement. The CPST is executed between the ONS and the concessionaires. The CUST is executed among the ONS, the concessionaires, represented by the ONS, and the users of the transmission network. These users may be: (i) agents holding a concession or a permission for distribution of electricity; (ii) power generation agents directly connected to the basic grid or
119
Table of Contents
not connected to the basic grid but operating centrally, whether concessionaires or authorized companies; (iii) consumers connected to the basic grid; and (iv) importers and exporters of electricity directly connected to the basic grid.
There are three types of Connection Agreements: (i) Agreement for the Connection to the Transmission Network (Contrato de Conexão ao Sistema de Transmissão), (ii) Agreement for Facilities' Sharing (Contrato de Compartilhamento de Instalações); and (iii) Agreement for the Connection to the Transmission Network—Adjustment Term (Contrato de Conexão ao Sistema de Transmissão—Termo de Ajuste). These agreements are executed between the transmission concessionaires and the connecting agents, while the ONS is an interested third-party to such agreements.
There is also the Financial Guarantee Agreement (Contrato de Constituição de Garantia), which is an agreement between the ONS, acting on its own behalf and on behalf of the transmission concessionaires, and the custodian bank which provides ONS with access to funds available in user-designated bank accounts in the event the latter fails to satisfy payments owed to the transmission concessionaires and to the ONS under the corresponding CUST.
There are special credit lines available to entrepreneurs from the National Bank for Economic and Social Development (Banco Nacional de Desenvolvimento Econômico e Social—BNDES). Also, Law No. 11,488 of 2007, as amended, created the Special Incentive Regimen for the Development of Infrastructure (Regime Especial de Incentivos para o Desenvolvimento da Infraestrutura—REIDI), a general tax incentive to infrastructure projects, which directly applies to the expansion of the power transmission grids.
A recent innovation regarding the granting of the REIDI was established after the edition of Mines and Energy Ministerial Ordinance No. 274 of 2013, which stipulate all the data required in order to apply for this incentive, including, among other requirements, the description of the project, technical and legal information, and the perspective of investment in equipment, materials and machines. All required information must be compiled in a specific petition and filed with ANEEL.
Power Transmission companies are remunerated through the RAP, for the availability of their facilities to the ONS and for the rendering of transmission services to the users.
The Electricity Services Inspection Fee (Taxa de Fiscalização de Serviços de Energia Elétrica—TFSEE), was created by Law No. 9,427 of 1996, as amended, and regulated by Decree No. 2,410 of 1997.TFSEE is an annual fee payable directly to ANEEL in 12 monthly payments, and is calculated based on the type of service rendered by the concessionaire and on the size of the concession. It is equivalent to 0.4% of the annual economic benefit earned by the concessionaire. Electricity transmission concessionaires also must invest each year a minimum of 1% (one percent) of their net operating revenues in electricity research and development.
The regulation issued by ANEEL governs the imposition of sanctions against the participants of the energy sector and classifies the appropriate penalties based on the nature and importance of the breach (including warnings, fines, temporary suspension from the right to participate in public auctions for new concessions, licenses or authorizations and forfeiture). For each breach, the fine may be up to 2% of the concessionaire revenues (net of value-added tax and services tax) in the 12 months period prior to the assessment notice. In addition, electricity generation, distribution and transmission concessionaires are strictly liable for any direct or consequential damages caused to third parties as a result of inappropriate
120
Table of Contents
provision of electricity services at their facilities. In case ONS is incapable of determining the liability of a particular concessionaire, permissionaire or authorized agent, or if the damages are caused by ONS, liability is proportionately allocated to the power transmission, distribution and generation agents in accordance with the voting rights of each category under the ONS bylaws.
The granting authority may unilaterally amend the concession agreements, including in the event of alterations to the project or previously unforeseen specifications (such as a requirement to strengthen or to improve the current power transmission facilities). A concessionaire is entitled to the economic and financial balance of the concession agreement and, therefore, receives additional revenues by way of amortization of its investments in the implementation of these reinforcements or improvements.
Until May of 2005, a concessionaire's obligation to implement strengthening actions ("Reinforcements") was subject to specific prior authorization from ANEEL, which would then set the corresponding additional revenues. Any improvements action ("Improvements") would not require prior authorization or additional revenues. The then existing regulation, however, failed to clearly define reinforcement and improvement. Thus, on May 23, 2005, ANEEL issued Resolution No. 158, distinguishing the projects and installations that would be considered as Reinforcements and those deemed to be classified as Improvements. In July 2011, Resolution No. 158 was replaced by Resolution No. 443, as amended by Resolution No. 643 of 2014.
Improvements are defined as any installation, replacement or remodeling of equipment in order to ensure adequate electricity transmission services, pursuant to the relevant concession agreement. Depending on the type of Improvement, the costs incurred may be taken into account in a subsequent revision of the RAP or be established by Resolution.
Reinforcements are defined as the implementation of new electricity transmission facilities, or the replacement or adjustment of existing facilities in order to increase the electricity transmission capacity, the reliability of the SIN, the useful life or to connect users. Some Reinforcements are subject to prior authorization by ANEEL and certain types of Reinforcements may also be implemented by transmission concessionaires directly, without prior authorization by ANEEL, provided that they are the result of a request by ONS aiming at expanding power transmission capacity or the reliability of the SIN. In this case, however, ANEEL will not have previously established the additional revenues to which the concessionaire would be entitled for the implementation of such Reinforcement. These revenues, therefore, are included in the revision procedure of the RAP.
Bioenergy Regulatory Framework
Pursuant to Law No. 9,074 of 1995, Decree No. 2,003 of 1996 and ANEEL Resolution No. 389 of 2009, a company or a consortium that is interested in producing electric power and trading, in part or all, the production at its own risk shall be granted a concession or authorization from ANEEL to become an IPP. The implementation of thermoelectric power plants (except nuclear) exceeding 5MW to be explored by an IPP only requires an authorization. Thermoelectric power plants produce electricity from a wide range of sources, including alternative sources such as biomass.
The interested company shall submit to ANEEL a formal request and meet the requirements set out in ANEEL Resolution No. 390 of 2009, such as the compliance with tax, social security, FGTS (employee's dismissal fund), and local, state and federal obligations.
Upon confirmation by ANEEL that the requirements were met, the agency first issues an order, which allows the interested company: (i) to request information from the distribution concessionaries and from ONS regarding the access to the installations; (ii) to obtain the environmental license and authorizations from federal, state or local public authorities; and (iii) to initiate the construction of the power plant, at its own risk.
121
Table of Contents
Following the issuance of the corresponding order, the interested party shall submit the documents listed in the Appendix of the Resolution and ANEEL will examine: (i) the availability of the fuel, when applicable; (ii) installed capacity to be produced by the plant; and (iii) access to the transmission and distribution grids. ANEEL also verifies the historical record of the company and its economic group and our economic group, and the existence of any prior penalties. Once the prerequisites are accomplished, ANEEL grants an authorization and the corresponding IPP is then allowed to produce and trade the energy at its own risk.
The authorized company shall keep in its files and at ANEEL's disposal: (i) the environmental impact assessment and environmental impact report or related reports and studies; (ii) project documents; and (iii) commissioned studies and reports.
An IPP has the right to access the power transmission and distribution grids, connecting its system, through payment of the power transmission and distribution tariffs, calculated on the basis of the criteria established by ANEEL (the "TUST" and the "TUSD", respectively).
For this purpose, the corresponding IPP executes agreements for the use of the power transmission and distribution systems (the "CUSTs" and the "CUSDs", respectively) and agreements for the connection to the power transmission and distribution systems (the "CCT" and "CCD", respectively). According to ONS procedures, certain of our project companies have been exempted from executing the "CUSTs."
The energy from alternative sources can be traded not only in the regulated contracting environment ("ACR") but also in the free contracting environment ("ACL")—where the terms and conditions are freely negotiated by the parties, by the execution of a power purchase agreements of alternative energy ("CCEI").
In the ACL, an IPP with an installed capacity of up to 30 MW can sell energy from biomass sources (and other renewable sources as well) to: (i) other generation agents; and (ii) consumers able to buy directly from the generators on a competitive basis ("Free Consumers") or small consumers, usually with a small business, with an installed load of between 500 kW and 3 MW ("Special Consumers").
In the ACR, the trade of energy is preceded by a public auction, where the price and conditions of the power purchase agreements are previously established by ANEEL.
The enactment of Law No. 10,438 of 2002, as amended, led to the development of a policy fostering alternative energy sources and also to co-generation, which formulated several strategies.
One of them is the reduction of the TUST or TUSD, as applicable, to plants with an installed power of up to 30 MW, on a percentage not inferior to 50%.
Another initiative in this area is the Program for Fostering Alternative Sources of Electricity ("PROINFA"), whereby Eletrobras undertakes to purchase energy generated from wind power, small hydroelectric power plants and biomass projects in the SIN. The cost of energy is divided among the final consumers. BNDES has opened a credit line for investments in PROINFA projects. The same law created the Energy Development Account, the funds of which may be used for the payment of the difference between the economic value corresponding to the specific technology of each source' and the 'value corresponding to the generation of competitive energy' from plants that do not take part in PROINFA.
In the isolated systems, Law No. 9,648 of 1998, as amended, establishes, as incentives for the use of renewable alternative energy sources to replace the oil-based thermoelectric generation, benefits in the sharing of the amounts deposited in the Fuel Consumption Account ("CCC").
122
Table of Contents
Law No. 11,488 of 2007, as amended, establishes a special tax regime related to the improvement of Brazilian infrastructure (REIDI) and an IPP can benefit from such special regime during the installation of its power plant.
In Brazil, the legislation for ethanol production is the same when the product is 1G or 2G (cellulosic ethanol). There are no incentives or prizes for production.
Mainly derived from sugarcane, Brazilian ethanol has been commercially produced for more than 70 years, when its addition to gasoline became compulsory. The current legal percentage of ethanol to this blend is 25%. Nonetheless, there are ongoing discussions with the government to increase this percentage to 27% and, if approved, such new percentage probably will enter into force between February and March 2015.
There are favorable tax treatments to ethanol transactions available under the following taxes: Contribution for the Financing of Social Security ("COFINS"), Social Integration Program ("PIS"), the Manufactured Goods Tax ("IPI"), the State VAT ("ICMS"), Contribution for Intervention in Economic Domain ("CIDE") and the Import Duty.
According to Law No. 10,833 of 2003, COFINS will not be levied on export transactions. The same rule applies to PIS, in accordance with Law No. 10,637 of 2002, as amended.
For import transactions, the current rates of COFINS and PIS are zero until December 2016. Previously, the rates were 120 Brazilian reais per cubic meter, which was comprised of a 48 Brazilian reais per cubic meter rate charged to mills and a 72 Brazilian reais per cubic meter rate charged to distributors.
Export transactions are also exempt from IPI in accordance with Decree No. 7,212 of 2010 and ICMS in the state of São Paulo, as established by Item V of Article 7 of Book 1 of São Paulo Estate Decree No. 45,490 of 2000.
In São Paulo State, the ICMS rate levied on internal transactions with mineral diesel is 12% as stated by Item VI, of Article 54, of São Paulo Estate Decree No. 45,490 of 2000.
The CIDE Contribution rate levied on import and commercial transactions was reduced to zero as determined by Decree No. 5,060 of 2004. Recently, there was a tax increase enforced by Decree No. 8,395 of 2015 but ethanol remained unaltered.
The import tax rate levied on ethanol import transactions is set at 20%. However, in April 2010 the Foreign Trade Chamber ("CAMEX"), of the Ministry of Development, Industry and Foreign Trade enacted the CAMEX Regulation No. 21 of 2010 reducing this rate to zero.
As mentioned above, in January 2005 the Brazilian government enacted Law No. 11,097, later amended, to insert biodiesel on the list of the Brazilian energy matrix. The idea behind the National Biodiesel Production and Use Program, launched in 2004, was to gradually replace the use of petroleum-based fuels with clean and renewable fuels.
To achieve this, it has been mandatory since January 2008 to add a minimum percentage of biodiesel to mineral diesel sold to end consumers nationwide. Pursuant to Law No. 13,033, of 2014, currently, the minimum percentage required for the addition of biodiesel to mineral diesel sold in the country is 7%.
The Decree No. 5,297 of 2004 establishes reducing coefficients to PIS and COFINS Contributions according to the nature of the raw material, producer and region of production.
123
Table of Contents
As stated by Decree No. 6,006 of 2006, the IPI rate levied on transactions with biodiesel under the Standard Classification of Goods No. 3824.90.29 is reduced to zero. (It is important to note that the Brazilian government can increase this rate without enacting a specific law, due to the lawfulness principle). This Decree was later revoked and replaced by Decree No. 7,660 of 2011 and the IPI rate is now set at 10%.
Like ethanol, there are no taxes levied on export transactions.
ICMS Covenant No. 113 of 2006 (amended by ICMS Covenant No. 27 of 2011) reduces the ICMS rate levied on interstate transactions with biodiesel resulting from the industrialization of grains, suet, seeds and palm.
C. Organizational Structure
We are a leading engineering and clean technology company, and the head of a group of companies, which at the end of 2014 comprised the following:
- –
- The holding parent company itself.
- –
- 607 subsidiaries.
- –
- 17 associates and 28 joint businesses as well as certain companies of the Group being involved in 244 temporary joint ventures. Furthermore, the Group's companies have shareholdings of less than 20% in other entities.
The following diagram illustrates our corporate operating structure as of the date of this annual report:
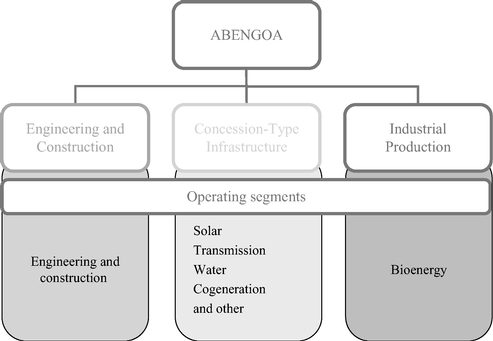
Our Chief Operating Decision Maker ("CODM") assesses the performance and assignment of resources according to the above identified segments. The CODM in Abengoa considers the revenues as a measure of the activity and the EBITDA (Earnings before interest, tax, depreciation and amortization) as measure of the performance of each segment. In order to assess the performance of the business, the CODM receives reports of each reportable segment using revenues and EBITDA. Net interest expense evolution is assessed on a consolidated basis given that the majority of the corporate financing is incurred at the holding level and that most of the related assets are held at project companies which are financed through Project Debt. The depreciation, amortization and impairment charges are assessed on a consolidated basis in order to analyze
124
Table of Contents
the evolution of net income and to determine the dividend pay-out ratio. These charges are not taken into consideration by CODM for the allocation of resources.
The process to allocate resources by the CODM takes place prior to the award of a new project. Prior to presenting a bid, the Company must ensure that the Project Debt for the new project has been obtained. These efforts are taken on a project by project basis. Once the project has been awarded, its evolution is monitored at a lower level and the CODM receives periodic information (revenues and EBITDA) on each operating segment's performance.
D. Property, Plant and Equipment
See "Item 4.B—Business Overview."
ITEM 4A. UNRESOLVED STAFF COMMENTS
Not applicable.
ITEM 5. OPERATING AND FINANCIAL REVIEW AND PROSPECTS
You should read the following discussion and analysis of financial condition and results of operations in conjunction with the section entitled "Selected Consolidated and Other Financial and Operating Data" and the financial statements and related notes included elsewhere in this annual report. This discussion contains forward-looking statements that involve risks and uncertainties. Our actual results and the timing of selected events could differ materially from those anticipated in these forward-looking statements as a result of various factors, including those set forth under "Item 3.D—Risk Factors" and elsewhere in this annual report.
A. Operating Results
Overview
We are a leading engineering and clean technology company with operations in more than 50 countries worldwide that provides innovative solutions for a diverse range of customers in the energy and environmental sectors. Over the course of our more than 70-year history, we have developed a unique and integrated business model that applies our accumulated engineering expertise to promoting sustainable development solutions, including delivering new methods for generating power from the sun, developing biofuels, producing drinking water from seawater and efficiently transporting electricity. A cornerstone of our business model has been investment in proprietary technologies, particularly in areas with relatively high barriers to entry. Our Engineering and Construction activity provides sophisticated turnkey engineering, procurement and construction ("EPC") services from design to implementation for infrastructure projects within the energy and water sectors and engages in other related activities with a high technology component. Our Concession-Type Infrastructure activity operates, manages and maintains infrastructure assets, usually pursuant to long-term concession agreements under Build, Own, Operate and Transfer ("BOOT") schemes, within four operating segments (Solar, Transmission, Water and Co-generation and other). Finally, our Industrial Production activity produces a variety of biofuels (ethanol and biodiesel). For the year 2014, our average number of employees was 27,181 people worldwide across our three business activities and, according to industry publications; we are among the market leaders in the majority of our areas of operation.
In order to focus our attention on our key markets, we organized our business into three activities: Engineering and Construction, Concession-Type Infrastructure and Industrial Production. Each activity is further broken into the following reporting segments: Engineering and Construction within the Engineering and Construction activity; Solar, Transmission, Water and Co-generation and other segments within the Concession-Type Infrastructure activity; and Biofuels within the Industrial Production activity. Previously, we
125
Table of Contents
organized our business according to five reporting segments: Engineering; Bioenergy; Information Technologies; Environmental Services; and Solar.
Our three activities are focused in the energy and environmental industries, and integrate operations throughout the value chain, including R&D, project development, engineering and construction, and the operation and maintenance of our own assets and those of third parties. Our activities are organized to capitalize on our global presence and scale, as well as to leverage our engineering and technological expertise in order to strengthen our leadership positions.
We have successfully grown our business, with a compound annual growth rate of our Consolidated EBITDA of 11.1% during the last ten years ended December 31, 2014. We have also maintained double digit growth in our consolidated revenue and Consolidated EBITDA on a compound annual growth basis since our 1996 initial public offering on the Madrid and Barcelona stock exchanges. As of December 31, 2014, we had a market capitalization of approximately €1.6 billion. As of December 31, 2014, our backlog was €7,953 million.
Our revenue, Consolidated EBITDA and net fixed assets of the Group and by segment as of and for the years ended December 31, 2014 and 2013 are set forth in the following tables.
| | | | | | | |
| | For the year ended
December 31, | |
|---|
| | 2014(1) | | 2013(1)(2) | |
|---|
| | (€ in millions)
| |
|---|
Revenue (total) | | | 7,150.6 | | | 7,245.1 | |
| | | | | | | | |
Engineering and Construction | | | 4,514.5 | | | 4,831.7 | |
| | | | | | | | |
Engineering and Construction | | | 4,514.5 | | | 4,831.7 | |
Concession-Type Infrastructure | | | 499.4 | | | 384.3 | |
| | | | | | | | |
Solar | | | 335.2 | | | 258.7 | |
Transmission | | | 91.4 | | | 47.5 | |
Water | | | 40.8 | | | 40.2 | |
Co-generation and other | | | 32.0 | | | 38.0 | |
Industrial Production | | | 2,136.7 | | | 2,029.1 | |
| | | | | | | | |
Biofuels | | | 2,136.7 | | | 2,029.1 | |
| | | | | | | | |
Consolidated EBITDA (total) (unaudited) | | | 1,408.0 | | | 1,267.4 | |
| | | | | | | | |
Engineering and Construction | | | 806.0 | | | 806.5 | |
| | | | | | | | |
Engineering and Construction | | | 806.0 | | | 806.5 | |
Concession-Type Infrastructure | | | 330.6 | | | 220.0 | |
| | | | | | | | |
Solar | | | 235.9 | | | 156.8 | |
Transmission | | | 64.3 | | | 27.7 | |
Water | | | 26.5 | | | 28.1 | |
Co-generation and other | | | 3.9 | | | 7.3 | |
Industrial Production | | | 271.4 | | | 240.9 | |
| | | | | | | | |
Biofuels | | | 271.4 | | | 240.9 | |
126
Table of Contents
| | | | | | | |
| | As of December 31, | |
|---|
| | 2014(1) | | 2013 | |
|---|
| | (€ in millions)
| |
|---|
Net Fixed Assets (total) | | | 9,044.1 | | | 12,030.0 | |
| | | | | | | | |
Engineering and Construction | | | 672.3 | | | 611.4 | |
| | | | | | | | |
Engineering and Construction | | | 672.3 | | | 611.4 | |
Concession-Type Infrastructure | | | 5,226.0 | | | 8,964.3 | |
| | | | | | | | |
Solar | | | 2,135.0 | | | 4,737.0 | |
Transmission | | | 2,273.1 | | | 2,749.9 | |
Water | | | 495.9 | | | 452.6 | |
Co-generation and other | | | 322.0 | | | 1,024.8 | |
Industrial Production | | | 3,145.8 | | | 2,454.3 | |
| | | | | | | | |
Biofuels | | | 3,145.8 | | | 2,454.3 | |
- (1)
- On December 15, 2014, our Board of Directors approved a plan to further improve our financial structure through three main initiatives which contemplated the sale of certain companies, including Abengoa Yield. Given that as of December 31, 2014, those certain companies were available for immediate sale and we considered the sale to be highly probable, we have classified their associated assets and liabilities as held for sale in our annual consolidated financial statements as of December 31, 2014, prepared in accordance with IFRS as issued by the IASB, which are included elsewhere in this annual report. Until the closing of the sale of those certain companies, the assets will be reported as held for sale in accordance with the stipulations and requirements of IFRS 5,Non-Current Assets Held for Sale and Discontinued Operations. Furthermore, during June 2014, we completed the initial public offering of Abengoa Yield, which grouped assets previously reported in different operating segments within the Concession-Type Infrastructure activity. As such, Abengoa Yield became a new operating segment within the Concession-Type Infrastructure activity after the Abengoa Yield IPO. Consequently, it has been reported as a separate segment in our quarterly financial information for the quarters ended June 30, 2014 and September 30, 2014. Taking into account that Abengoa Yield was an operating segment within our Concession-Type Infrastructure activity during part of 2014 and the significance that those activities carried out by Abengoa Yield have for Abengoa, our shareholding in Abengoa Yield during 2014 was treated as a discontinued operation in accordance with the stipulations and requirements of IFRS 5,Non-Current Assets Held for Sale and Discontinued Operations. The treatment of Abengoa Yield as discontinued operations also resulted in the removal of the Abengoa Yield operating segment from our Concession-Type Infrastructure activity. In accordance with this standard, the assets and liabilities of Abengoa Yield have been reclassified as assets and liabilities held for sale in our consolidated statement of financial position included within our consolidated financial statements as of and for the year ended December 31, 2014. Likewise, our consolidated income statements for the years ended December 31, 2014 and 2013 also include the results of Abengoa Yield under a single heading, "Profit (loss) from discontinued operations, net of tax".
- (2)
- On July 15, 2013, we closed the sale of 100% of our shares in our subsidiary Befesa. On that date, we received €331 million of cash proceeds. Taking into account the significance of the activities carried out by Befesa to Abengoa, the sale of this shareholding is considered as a discontinued operation to in accordance with IFRS 5, Non Current Assets Held for Sale and Discontinued Operations. In accordance with this standard, the results of Befesa until the closing of the sale and the result of this sale are included under a single heading, "Profit (loss) for the year from discontinued operations, net of tax" in our Consolidated Financial Statements and under separate line items in the consolidated cash flow statement for the year 2013. The consolidated income statement for the years ended December 31, 2012, 2011 and 2010 also includes the results of Befesa under a single heading. See "Presentation of Financial Information". The Befesa Sale also resulted in the removal of the Industrial Recycling segment from our Industrial Production activity.
Factors Affecting the Comparability of Our Results of Operations
IFRS 10 and 11
In preparing the Consolidated Financial Statements, the Group applied IFRS 10 and 11 that came into effect on January 1, 2013 under IFRS IASB.
The main impacts of the application of the new standards IFRS 10 and 11, as well as the amendments to IAS 27 and 28, in relation to what was systematically applied previously, relate to:
- (i)
- The de-consolidation of companies that do not fulfill the conditions of effective control of the interest during the construction phase in terms of decision making for their integration in the
127
Table of Contents
Consolidated Financial Statements according to the equity method. It is expected that these projects will be fully consolidated again once they enter into operation and we gain control over them, with corresponding significant increases in fixed assets in projects and long-term project finance, among others.
- (ii)
- The elimination of the proportional consolidation of the joint ventures, with the equity method being obligatory for recording its interest in the Company.
According to the terms and requirements established in IAS 8 'Accounting policies, changes in accounting estimates and errors', the above standards and amendments were retrospectively applied, recasting the comparative information presented for the year 2012. The above standards and amendments have already been applied in the consolidated financial statements as of and for the year ended December 31, 2012, presented in the final prospectus for our initial public offering in the United States filed with the SEC pursuant to Rule 424(b) of the Securities Act of 1933 on October 17, 2013, and the recasted information is included herein. Consolidated financial statements as of and for the years ended December, 31, 2011 and 2010 have not been recasted according to the transition guidance of IFRS 10 and consequently is not comparable with other periods presented.
The effect of the de-consolidation of the affected companies and their integration according to the equity method on the consolidated statements of financial position as of December 31, 2012 and January 1, 2012 is shown below:
| | | | | | | |
Concept | | Balance as of
December 31, 2012 | | Balance as of
January 1, 2012 | |
|---|
| | (€ in thousands)
| |
|---|
Assets | | | | | | | |
Intangible assets and Property, Plant & Equipment | | | (25,212 | ) | | 2,198 | |
Fixed assets in projects (project finance) | | | (2,341,152 | ) | | (1,501,341 | ) |
Investments in associates carried under the equity method | | | 855,627 | | | 647,945 | |
Financial investments | | | 31,775 | | | 30,679 | |
Deferred tax assets | | | (18,976 | ) | | (7,283 | ) |
Current assets | | | 237,834 | | | (15,239 | ) |
| | | | | | | | |
Total assets | | | (1,260,104 | ) | | (843,041 | ) |
| | | | | | | | |
| | | | | | | | |
| | | | | | | | |
Equity and liabilities | | | | | | | |
Equity | | | (19,959 | ) | | 20,584 | |
Long-term project debt | | | (1,707,460 | ) | | (876,168 | ) |
Long-term corporate financing | | | (40 | ) | | 6,884 | |
Other non-current liabilities | | | (189,989 | ) | | (92,164 | ) |
Current liabilities | | | 657,344 | | | 97,823 | |
| | | | | | | | |
Total equity and liabilities | | | (1,260,104 | ) | | (843,041 | ) |
| | | | | | | | |
| | | | | | | | |
| | | | | | | | |
128
Table of Contents
In addition, the effect of this de-consolidation on the consolidated income statement for the year ended 2012 is shown below:
| | | | |
Concept | | For the Year ended
December 31, 2012 | |
|---|
| | (€ in thousands)
| |
|---|
Revenue | | | (57,235 | ) |
Other operating income | | | (64,756 | ) |
Operating expenses | | | 62,745 | |
Operating profit | | | (59,246 | ) |
Financial expense, net | | | 27,487 | |
Share of profit/(loss) of associates carried under the equity method | | | 19,477 | |
Profit before income tax | | | (12,282 | ) |
Income tax benefit | | | 7,823 | |
Profit for the period from continuing operations | | | (4,459 | ) |
Profit/(loss) attributable to non-controlling interests | | | 4,459 | |
Profit for the period attributable to the parent company | | | — | |
Some of our assets that were deconsolidated have been consolidated again (such as Mojave), although consequently reclassified as discontinued operations. See Note 6 to our Consolidated Financial Statements for further detail.
Divestments and Business Combinations
As discussed in Notes 6.2, 6.3, 6.4 and 7 to our Consolidated Financial Statements, certain divestments and business combinations impacted our scope of consolidation and, therefore, our results of operations, including principally the following transactions.
Partial Divestment of Abengoa Yield
On June 18, 2014, we completed the Abengoa Yield IPO for total gross proceeds of $828.7 million (€611.0 million) before fees and expenses. Abengoa Yield is a dividend growth-oriented company formed by us that groups together renewable energy, conventional power, electric transmission lines and other contracted, revenue-generating assets previously reported in different operating segments within the Concession-Type Infrastructure activity. As a result of a second transfer of assets announced on February 9, 2015, Abengoa Yield is now present in the water infrastructure segment and has expanded its geographic presence to the north of Africa and is expected to expand its geographic presence to the United Arab Emirates. As such, Abengoa Yield became a new operating segment within the Concession-Type Infrastructure activity after the Abengoa Yield IPO and we reported that segment's results in our quarterly financial information for the quarters ended June 30, 2014 and September 30, 2014.
Immediately following the Abengoa Yield IPO, we held 64% of the ordinary share capital of Abengoa Yield. On December 15, 2014, our Board of Directors approved a plan to reduce our shareholding in Abengoa Yield to below 50% during 2015, subject to market conditions. On January 22, 2015, we completed an initial divestment of 13% through the sale in an underwritten public offering of 10,580,000 ordinary shares in Abengoa Yield (including 1,380,000 shares sold pursuant to the exercise in full of the underwriters' option to purchase additional shares) at a price of US$31 per share which brought our shareholding in Abengoa Yield to 51%. On February 9, 2015, we announced our intention to reduce our shareholding in Abengoa Yield to below 50% by the end of the first half of 2015, with the objective of maintaining a long-term stake in the range of 40-49%. We have also indicated our intention to reinforce the role of independent directors at Abengoa Yield in order to effectively transfer control once we reduce our shareholding in Abengoa Yield below 50%.
129
Table of Contents
Taking into account that Abengoa Yield was an operating segment within our Concession-Type Infrastructure activity during part of 2014 and the significance that those activities carried out by Abengoa Yield have for Abengoa, our shareholding in Abengoa Yield during 2014 was treated as a discontinued operation in accordance with the stipulations and requirements of IFRS 5,Non-Current Assets Held for Sale and Discontinued Operations. The treatment of Abengoa Yield as discontinued operations also resulted in the removal of the Abengoa Yield operating segment from our Concession-Type Infrastructure activity.
In accordance with this standard, the assets and liabilities of Abengoa Yield have been reclassified as assets and liabilities held for sale in our consolidated statement of financial position included within our consolidated financial statements as of and for the year ended December 31, 2014. Likewise, our consolidated income statements for the years ended December 31, 2014, 2013, 2012, 2011 and 2010 also include the results of Abengoa Yield under a single heading, "Profit (loss) from discontinued operations, net of tax".
Potential Disposition of Greenfield Projects to APW1
On December 23, 2014, we entered into a letter agreement to negotiate exclusively EIG until March 31, 2015 an investment by EIG-managed investment funds, alongside Abengoa, in a portfolio of greenfield projects currently owned by Abengoa, on the basis of the terms set forth in the term sheet attached to the letter agreement. On February 2, 2015, EIG confirmed to us in writing that its due diligence to date had not revealed facts or circumstances that would cause EIG not to recommend the proposed transaction for approval by the EIG investment committees overseeing investments by EIG-managed investment funds. On February 9, 2015, we announced that we and EIG were in an advanced stage of documentation and due diligence regarding the proposed transaction.
As part of the transaction, Abengoa is expected to contribute to a newly formed company, APW1, a portfolio of selected Abengoa projects under construction, including renewable and conventional power generation, power transmission and water management assets in different geographies including, among others, the United States, Mexico, Brazil and Chile. Based on the current status of the negotiations, the total investment in the projects expected to be contributed is approximately $9.2 billion, of which approximately $2.5 billion once these projects are fully invested in the coming years, is expected to be equity. Of the total equity estimated to be committed, based on the current status of the negotiations, we expect that a majority stake (approximately 55%) in APW1 will be held by EIG, with the remainder held by Abengoa. Our current estimate of the total amount of EIG's investment, based on the current status of the negotiations, is approximately $1.4 billion over four years based on the projects expected to be contributed.
Once APW1 is created and the projects contributed to the vehicle, EIG will make an initial payment to us of less than half of their total expected $1.4 billion contribution to purchase 55% of the equity that Abengoa has already invested in the projects that have been contributed to APW1. Abengoa is expecting to receive these cash proceeds before March 31, 2015. The remaining projects are expected to be contributed by us to APW1 over time. The remaining equity expected to be required in order to develop the entire portfolio of projects is expected to be contributed over a period of four years both by Abengoa and EIG pro-rata to their shareholding in APW1 following the construction schedule of the projects in the vehicle as they are contributed to the vehicle, which is expected to take several months.
We expect that the definitive transaction agreements related to the investment by EIG will be entered into by March 31, 2015. Once we have entered into the definitive transaction agreements and the projects have been transferred to APW1, Abengoa will no longer have a controlling interest in these assets. Given that as of December 31, 2014, the companies expected to be transferred to APW1 are available for immediate sale and we consider the sale to be highly probable, we have classified the associated assets and liabilities as held for sale in the consolidated statement of financial position as of December 31, 2014. Until entry into definitive documentation and closing of the sale transaction, the assets will be reported as held for sale in accordance with the stipulations and requirements of IFRS 5,Non-Current Assets Held for Sale and
130
Table of Contents
Discontinued Operations. The expectations set forth herein regarding a potential transaction with EIG, the projects to be contributed and related investment amounts are based on the current status of negotiations with EIG and are subject to change as negotiation of definitive transaction agreements progresses, and any such change may be material. We cannot guarantee that we will be successful in consummating the transaction with EIG on the terms described above, on other terms acceptable to us, or at all.
Certain Business Combinations and Divestments
Full consolidation of Abengoa Bioenergy Biomass of Kansas, LLC, the company that owns the assets and liabilities of the second-generation biofuels plant in Hugoton, USA, previously accounted for via the equity method, began in December 2014 once control over this company was obtained. Consequently, all of this company's assets and liabilities have been integrated according to IFRS 3,Business Combinations, with no significant differences arising between the book value in Abengoa's consolidation and its fair value.
Full consolidation of Mojave Solar, LLC, the company that owns the assets and liabilities of the thermo-solar plant in Mojave, USA, previously accounted for via the equity method, began in December 2014 once control over this company was obtained. At the end of 2014, this company is included in the Abengoa Yield consolidation group and classified as discontinued operation in accordance with the requirements of IFRS 5,Non-Current Assets Held for Sale and Discontinued Operations. Therefore, Abengoa's consolidated financial statements as of December 31, 2014 include this company's assets and liabilities under a single heading in Assets held for sale and liabilities held for sale within the consolidated statements of financial position.
Full consolidation of Arizona Solar One, LLC, the company that owns the assets and liabilities of the thermo-solar plant in Arizona, USA, previously accounted for via the equity method, began in October 2013 once control over this company was obtained. Consequently, all of this company's assets and liabilities have been consolidated according to IFRS 3,Business Combinations, with no significant differences arising between the book value in Abengoa's consolidation and its fair value. At the end of 2014, this company is included in the Abengoa Yield consolidation group and classified as discontinued operation in accordance with the requirements of IFRS 5,Non-Current Assets Held for Sale and Discontinued Operations. Therefore, Abengoa's consolidated financial statements as of December 31, 2014 include this company's assets and liabilities under a single heading in assets held for sale and liabilities held for sale within the consolidated statements of financial position.
Change in Geographic Segmentation
During 2013 we reported results from Mexico as part of South America (excluding Brazil) (formerly Latin America (excluding Brazil)). In the year ended December 31, 2014, in order to better reflect the geographical segmentation of our business we included results from Mexico in the North America segment (formerly United States). The information by geographic areas for the year ended December 31, 2013 has been presented according to the new geographic segmentation.
Sale of Befesa
On June 13, 2013, we entered into a share purchase agreement for the sale of 100% of our shares in our subsidiary Befesa to funds advised by the Triton Funds. After customary net debt adjustments and subject to certain other adjustments, total consideration to us amounted to €620 million which was comprised of €348 million total cash, of which a payment of €331 million was received at closing and deferred compensation of €17 million (including €15 million in escrow pending resolution of ongoing litigation and a €2 million long term receivable from a Befesa customer), a €48 million subordinated vendor note with a five year maturity and a €225 million (par value) subordinated convertible instrument with a 15 year maturity (subject to two five year extensions) accruing interest of 6 month Euribor in effect at closing date plus a 6% spread and which, upon the occurrence of certain triggering events including, but not limited to, Befesa's failure to meet certain financial targets or the exit of the Triton Funds from Befesa, may be converted into
131
Table of Contents
approximately 14% of the shares of Befesa (subject to certain adjustments). The share purchase agreement contains a two year non-compete provision concerning Befesa's activities. On February 4, 2015, we sold the €48 million subordinated vendor note to Triton Partners (see Note 7.3 to our Consolidated Financial Statements).
On July 15, 2013, we received €331 million of cash proceeds corresponding to the price agreed for the shares and the sale of the transaction was closed. The gain on the sale amounted to €0.4 million and is included in "Results for the year from discontinued operations, net of taxes" in the Consolidated Income Statement.
Taking into account the significance of the activities carried out between Befesa and Abengoa, the sale of this shareholding is considered as a discontinued operation in accordance with IFRS 5,Non Current Assets Held for Sale and Discontinued Operations. In accordance with this standard, the results of Befesa until the closing of the sale and the result of this sale are included under a single heading, "Profit (loss) for the year from discontinued operations, net of tax" in our Consolidated Financial Statements. Likewise, the consolidated income statements for the years ended December 31, 2013, 2012, 2011, and 2010 also include the results of Befesa under a single heading. The Befesa Sale also resulted in the removal of the Industrial Recycling segment from our Industrial Production activity.
Sale of Brazilian Transmission Line Assets
We sold, in two portions pursuant to three share purchase agreements, 100% of certain Brazilian transmission line assets to TAESA, an affiliate of Cemig.
Over the course of 2011 and 2012, Abengoa Concessões Brasil Holding S.A. ("Abengoa Concessões") entered into the Cemig Sales with TAESA which comprised the following: (i) on June 2, 2011, we sold 50% of our interest in four project companies: STE—Sul Transmissora de Energia S.A. ("STE"), ATE Transmissora de Energia S.A. ("ATE"), ATE II Transmissora de Energia S.A. ("ATE II") and ATE III Transmissora de Energia S.A. ("ATE III"); (ii) also on June 2, 2011 we sold 100% of the share capital of NTE Nordeste Transmissora de Energia S.A. and; (iii) on March 16, 2012, we signed an additional share purchase agreement to sell our remaining 50% interest in project companies STE, ATE, ATE II and ATE III.
On June 30, 2012, all the conditions necessary to close the transaction were fulfilled, and on July 2, we received €354 million of cash proceeds corresponding to the total price agreed for the shares. The gain from the Second Cemig Sale of €4.5 million is reflected in the "Other operating income" line item in our consolidated income statement for the year ended December 31, 2012. The Second Cemig Sale includes a post-closing adjustment mechanism similar to that described above relating to the First Cemig Sale, and no significant post-closing adjustment was required to be paid.
In the consolidated income statement for the year ended December 31, 2012 the profits and losses of the four project companies we contributed to UNISA (STE, ATE, ATE II and ATE III) are recorded under the equity method as a result of the retrospective application of IFRS 11 from January 1, 2012 until June 30, 2012, when the Second Cemig Sale closed.
Business combination of the Rioglass Group
Rioglass Group ("Rioglass") was incorporated in 2006 as a joint venture between us and its former shareholders. Rioglass manufactures and sells parabolic trough mirrors for solar thermal plants, using an exclusive technology developed internally.
Since the incorporation of Rioglass, solar-thermal energy has experienced a strong development worldwide. Global installed capacity has reached 1,560 MW in operation, mainly in Spain and the United States. Recently, we experienced a significant international expansion in other geographies, with plants in construction in the Middle East, Africa and India and with ambitious plans to develop new solar thermal plants in several countries such as South Africa, Australia, China, India, Saudi Arabia and Chile.
132
Table of Contents
On January 16, 2012 Abengoa Solar, S.A. signed an agreement with Rioglass Laminar, S.L. to acquire an additional share of Rioglass Holding, S.A. With this acquisition, and once the agreement's closing conditions were fulfilled, we became the majority shareholder of Rioglass and obtained control of the management of the group, a business which is key to our strategy of international expansion. As a result, Rioglass, which was integrated proportionally, has started to be fully consolidated as of January 1, 2012.
Since the business combination was achieved in stages according to IFRS 3, we have re-measured our previously held equity interest in the acquiree at our acquisition-date fair value, which consists primarily in the value of committed sales from Rioglass for the use of technology and mirrors, linked to relations and contracts existing with clients in the construction of solar thermal plants in Spain, the United States, South Africa, Mexico and India. This valuation has represented a gain of €85.2 million. The difference between the fair value of the stake acquired in Rioglass group and the fair value of the identifiable assets and liabilities acquired, amounting to €38.9 million, has been recorded as goodwill.
Additionally, according to IFRS 3, we have finalized the evaluation of the identifiable assets and liabilities acquired in order to perform the purchase price allocation, considering all identifiable fixed and intangible assets, liabilities and contingent liabilities to the extent they are subject to recognition according to IFRS. Among the assets identified, higher values have been assigned to technology and customer relationships. See Note 6.3 to our Consolidated Financial Statements included elsewhere in this annual report.
Simplification of Engineering and Construction Activity
Prior to 2014, our Engineering and Construction activity was comprised of two operating segments: Engineering and Construction, and Technology and Other. Beginning in 2014, we began including the Technology and Other segment with the Engineering and Construction segment in accordance with IFRS 8, Operating Segments. As a result, our Engineering and Construction activity is now comprised of a single operating segment, Engineering and Construction, and the information by activities for the years ended December 31, 2013 and 2012 has been presented according to the new segmentation.
Commencement of Operations of Projects
The comparability of our results of operations is significantly influenced by the volume of projects that become operational during a particular year. The number of projects becoming operational and the length of projects under construction significantly impact our revenue and operating profit, as well as our consolidated profit after tax during a particular period, which makes the comparison of periods difficult.
133
Table of Contents
The following table sets forth the principal current projects that commenced operations during each of the years ended December 31, 2014, 2013 and 2012 including the quarter in which operations began.
| | | | | | | | |
| Segment | | Project | | 2012 | | 2013 | | 2014 |
|---|
Transmission | | Manaus (Brazil) | | | | 1st quarter | | |
| | Norte Brazil (Brazil) | | | | | | 3rd quarter |
Biofuels | | Salamanca (Spain)—Waste to Biofuels plant | | | | 2nd quarter | | |
| | Hugoton (USA) | | | | | | 4th quarter |
Water | | Qingdao (China)(3) | | | | 1st quarter | | |
| | Tenes (Algeria) | | | | | | 4th quarter |
Solar | | Helioenergy 2 (Spain)(1) | | 1st quarter | | | | |
| | Helios 1 (Spain) | | 2nd quarter | | | | |
| | Helios 2 (Spain) | | 3rd quarter | | | | |
| | Shams (UAE)(1) | | | | 1st quarter | | |
| | Solaben 1-6 (Spain) | | | | 4th quarter | | |
Abengoa Yield(2) | | Solacor 1 (Spain) | | 1st quarter | | | | |
(as discontinued operations) | | Solacor 2 (Spain) | | 1st quarter | | | | |
| | Solaben 2 (Spain) | | 4th quarter | | | | |
| | Solaben 3 (Spain) | | 2nd quarter | | | | |
| | ACT (Mexico) | | | | 2nd quarter | | |
| | Solana (USA) | | | | 4th quarter | | |
| | ATS (Peru) | | | | | | 1st quarter |
| | Quadra 2 (Chile) | | | | | | 1st quarter |
| | Quadra 1 (Chile) | | | | | | 2nd quarter |
| | Palmatir (Uruguay) | | | | | | 2nd quarter |
| | Mojave (USA) | | | | | | 4th quarter |
| | Cadonal (Uruguay) | | | | | | 4th quarter |
- (1)
- Assets announced to be transferred to Abengoa Yield.
- (2)
- As of December 31, 2014, we held 64% of the ordinary share capital of Abengoa Yield. On December 15, 2014, our Board of Directors approved a plan to reduce our shareholding in Abengoa Yield to below 50% during 2015, subject to market conditions. On January 22, 2015, we completed an initial divestment of 13% which brought our shareholding in Abengoa Yield to 51%. On February 9, 2015, we announced our intention to reduce our shareholding in Abengoa Yield to below 50% by the end of the first half of 2015, with the objective of maintaining a long-term stake in the range of 40-49%.
- (3)
- Sold in the last quarter of 2014.
Factors Affecting Our Results of Operations
Commodity Prices
Our Industrial Production activity is particularly sensitive to commodity price changes. The Biofuels segment of our Industrial Production activity is affected by the availability of supply of grains such as wheat, barley, corn and sorghum as well as sugar. We acquire grain and sugar as raw materials to produce ethanol and distillers, grains and solubles ("DGS"). Consequently, any increase in the cost of such grains increases our cost of ethanol production. Our Biofuels segment is exposed to, among other factors, fluctuations in the cost of grain caused by meteorological conditions, such as droughts or excessive rainfall. Furthermore, the output price of ethanol is exposed to regional changes in price. Ethanol prices fluctuate in response to domestic and international prices, competition, governmental policies and regulations, meteorological conditions, market demand for gasoline and market demand for ethanol as an alternative or additive to gasoline. To mitigate
134
Table of Contents
these effects, when acquiring raw materials for the production of ethanol, we engage in commodity hedging transactions so as to ensure that there is a sufficient margin between the costs of our raw materials and the price of ethanol sold, which is known in the industry as a "crush margin." Furthermore, in Brazil, we also grow our own sugarcane, which partially insulates us against any extreme price fluctuations in Brazil and allows our ethanol production plants to remain properly supplied.
In addition, our Engineering and Construction and Industrial Production activities and the Solar segment of our Concession-Type Infrastructure activity require significant consumption of energy, predominantly electricity and natural gas, and we are, therefore, exposed to fluctuations in their price. Although our energy consumption costs account for a relatively small portion of our total operating expenses, the price of energy is volatile and shortages can occur leading to unexpected price increases. To mitigate this risk, some of our energy and gas contracts include mechanisms to limit price increases such as caps, indexing any cost increase to an increase in output price or permitting a pass-through of the cost increase to the customer. Significant increases in energy or oil costs or shortages in supply can have an adverse effect on our business. However, we also benefit from increases in energy prices through our Biofuels segment and our Engineering and Construction activity when plants are not subject to the fixed tariff regime. As the Solar segment of our Concession-Type Infrastructure activity generates revenue from the sale of electricity produced, increases in energy prices may increase our revenue generated by our solar power plants and, in the Biofuels segment of our Industrial Production activity, our biofuel process plants in Europe and Brazil contain co-generation units that produce excess electricity which is sold to public utilities such as Eletrobrás in Brazil.
To mitigate certain risks of variation in market prices of commodities, we seek to hedge our exposure through the use of forward sale and purchase contracts and options listed on organized markets, as well as over-the- counter contracts with financial entities. Nevertheless, our actions may not be successful and such arrangements expose us to the credit risk of our counterparties.
Regulation
We operate in a significant number of regulated markets and our Engineering and Construction and Industrial Production activities and the Solar segment of our Concession-Type Infrastructure activity are, in particular, subject to extensive regulation by governmental agencies in a number of the countries in which they operate. The degree of regulation that each one of our operating segments is subject to varies according to country. In a number of the countries in which we operate, regulation is carried out by national regulatory authorities. In some countries, such as the United States, Brazil and, to a certain degree, Spain, there are various additional layers of regulation at the state, regional and/or local level. In countries such as these, the degree of state, regional and/or local regulation may also be materially different for operating segments within the particular country, if the operating segments are located in different states and/or localities.
Renewable Energies
Demand for a number of our products and services from our operations including our Engineering and Construction and Industrial Production activities and the Solar segment of our Concession-Type Infrastructure activity, depends significantly on government legislation, regulation, incentives and subsidies aimed at promoting greater use of renewable energies and sustainable products and services. This governmental action has been driven by political change largely precipitated from public perception of climate change and desired action from government, particularly in the United States and Europe.
In our Solar segment, various key jurisdictions, including the United States and Europe, have introduced or bolstered regulation concerning the use of solar and other renewable energies. The United States unveiled legislative changes, and the European Union passed the new Renewable Energies Directive ("RED") and the Fuel Quality Directive ("FQD") in April 2009, both of which, among other things, impose renewable energy targets for 2020. The RED covers energy consumption as a whole, including for heating and cooling, and lays down legally binding rather than indicative national targets such that the EU, as a whole, achieves a 20%
135
Table of Contents
share of renewable energy by 2020. The FQD establishes a 10% renewable energy in transport target by 2020. In our Biofuels segment, we have benefited from regulation which has facilitated the development of new technologies and enabled biofuel producers to operate profitably.
Spain, after many years of strong support for solar and other renewable energies, has recently enacted several new laws introducing regulatory changes which adversely affect the solar industry, including our solar activities in Spain. These regulatory changes include a new law adopted on December 27, 2012 which imposes a 7% levy on revenue received from power generation, including the revenue we generate from thermos-solar plants, and excludes from the feed in tariff the power produced by thermos-solar installations using gas (going forward, payment for this energy will be at market price). A new law adopted on February 1, 2013 limiting remuneration schemes for renewable energy produced by eliminating pool plus premium pricing and changing the applicable adjustment for changes in the consumer price index. In July 2013, the Spanish government passed a new law related to the electric sector in Spain, the goal of which is to achieve financial stability in the sector by approving a new legal and remuneration special regime for facilities producing electricity from renewable energy sources, among other things. Royal Decree Law 9/2013, of July 12, on the adoption of urgent measures to guarantee the financial stability of the electric system entered into force on July 15, 2013 (as amended as the case may be pursuant to Act 24/2013, of December 26, of the Electricity Sector, "RDL 9/2013"). According to the provisions of RDL 9/2013, the new remunerative regime enables renewable energy facilities to obtain reasonable profitability in relation to a standard facility applicable in each case. Reasonable profitability shall be calculated, before taxes, on the average yield of Spanish government 10 year bonds on the secondary market, applying the appropriate differential. Nevertheless, for those special regime facilities that, on the date of entry into force of RDL 9/2013, were entitled to premium based remuneration, reasonable profitability will be set, before tax, on the average yield of Spanish government 10 year bonds on the secondary market in the preceding 10 years plus 300 basis points, which in any event will be reviewed every six years. See "Item 4.B—Regulation—Spain—Solar Regulatory Framework—Law 15/2012 on Tax Measures for Energy Sustainability."
Taken by themselves, these regulatory changes adversely affect our thermo-solar electricity generation activity in Spain, and therefore the results of our Solar segment. However, based on the bilateral legal relationship established between us and the Spanish government in the individual rulings that we obtained in early 2011 from the Ministry of Industry, we believe that we have legal recourse to bring claims for the impact on the profitability of our plants caused by the Spanish government's nonperformance, although those rulings do not guarantee that we would be successful in any claim brought by us against the Spanish government. In this regard, in June 2013, we commenced a private-law action against the Spanish government in the lower civil court (juzgado de primera instancia) in Seville for breach of contract based on the administrative ruling issued in respect of our Helios I thermo-solar plant. In that action, we are seeking performance by the Spanish government in accordance with the terms of that administrative ruling or, in the alternative, money damages in an amount equivalent to the difference between the profit we would have obtained under the administrating ruling and the profit that we will obtain under the Spanish government's special-regime tariff. The lower civil court has dismissed our complaint on the procedural ground that we must first exhaust our administrative remedies before the Ministry of Industry. We believe the dismissal was improper under applicable case-law and have appealed the lower court's decision to the appellate court (audiencia provincial) in Seville. Also in June 2013, our subsidiary CSP Equity Investment S.a.r.l. submitted a demand for arbitration against the Spanish government as a signatory to the Energy Charter Treaty. This demand for arbitration is limited to the equity investments made in Helioenergy 1/2, Solaben 2/3 and Solacor 1/2 thermo-solar plants, and alleges that the Spanish government's regulatory reforms of the electricity sector have breached CSP Equity Investment's legitimate expectations under the administrative rulings issued in respect of those facilities and constitute expropriation. Further, this demand is seeking compensation through money damages. The arbitral proceeding is conducted in The Hague in accordance with the rules of the Arbitration Institute of the Stockholm Chamber of Commerce before a panel of three arbitrators. In July 2014 our demand for arbitration was actualized on the remuneration parameters for standard facilities, applicable to facilities under Ministerial Order IET/1045/2014, of June 16, 2014. In
136
Table of Contents
September, 2014, our fifteen Solar Power Plants in Spain, commenced a public law action in the Supreme Court (Tribunal Supremo) against the parameters for standard facilities, applicable to our Solar Power Plants in Spain under Ministerial Order IET/1045/2014, of June 16, 2014, in order to obtain the annulment or vacation of those parameters. In December 2014, the arbitral tribunal granted the European Commission leave to intervene as "amicus curiae". Such actions are not intended to claim for damages.
Also, in September 2014, the bioenergy companies, Ecocarburantes Españoles, S.A., Bioetanol Galicia, S.A., and Biocarburantes Castilla y León S.A., have brought a public law action against R.D. 413/2014 and OM IET/1045/2014, enacted by Spanish authorities, in the Supreme Court (Tribunal Supremo), to declare their annulment.
Certain government policies may expire or be phased out over time, cease due to lack of funding or upon exhaustion of the allocated funding or be subject to cancellation or non-renewal by the applicable authority, including in Spain as a result of austerity measures introduced in recent years. See "Item 4.B—Regulation—Spain—Solar Regulatory Framework—Law 15/2012 on Tax Measures for Energy Sustainability." As we cannot guarantee that such government support will be maintained in full, in part or at all, the market for our products and services and our corresponding results of operations could be materially adversely affected.
Research, Development and Innovation
Under Spanish law, our expenditures associated with technological innovation activities are entitled, among other things, to a deduction in corporate tax between 8% and 42% (between 12% and 42% for fiscal periods commencing after the entry into force of Law 2/2011, March 4, 2011 on Sustainable Economy), according to the technological level of the project, for the fiscal year in which they were incurred, provided that such expenditures were incurred in accordance with cost accounting and were specifically undertaken in connection with identified projects. These deductions may be applied in assessments of tax periods that end in the 18 years subsequent to the tax period in which they were generated, provided that the other requirements of the corporate income tax regulations are complied with. The amount of deferred tax assets corresponding to R&D tax deductions amounted to €73 million as of December 31, 2014. (Pursuant to Law 14/2013 of September 27 to support entrepreneurs and their internationalization, for fiscal years initiated as from January 1, 2013 and at the discretion of the tax payer, under certain circumstances, upon a 20% reduction of the R&D&i tax deduction, this deduction will not be subject to the ordinary limitations in the application of tax deductions and in case of lack of tax quota of the period in which to apply this tax deduction, it will be refundable in cash. The maximum R&D tax deduction either applicable or refundable is €3 million per year and €1 million for technological innovation.) In addition to these deductions, which can be generated during the period of creation of an intangible asset, Spanish law allows the application of another tax incentive during the period of utilization of certain intangible assets. Pursuant to Article 23 of the Revised Text of the Spanish Income Tax Act, we may apply for tax incentives for the transfer of use of intangible assets. Such incentives consist in a 50% exemption of the revenue generated by the transfer of use of such intangible assets which is applied directly to the taxable income (i.e., licensing revenue or royalties). (Pursuant to Law 14/2013 of September 27 to support entrepreneurs and their internationalization, this tax incentive has been modified with effects as from September 28, 2013. For the transfer of use of intangible assets carried out as from such date, this tax incentive will consist in a 60% reduction of the profit generated by the transfer of use of such intangible assets.) This incentive is expected to be recurring over the coming years. As it is not a deduction to be applied to the income tax payable, it is not carried forward and does not generate a deferred tax asset as is the case with R&D tax deductions.
In the United States, we participate in loan guarantee programs with the DOE that are aimed at promoting the rapid deployment of renewable energy and electric power transmission projects. The programs provide loan guarantees to renewable energy projects, related manufacturing facilities and electric power transmission projects. As part of these programs, in June 2011, the DOE offered us a conditional commitment for a $1,202 million loan guarantee to support the construction and start-up of the Mojave solar
137
Table of Contents
project, a 280 MW CSP solar plant in the Mojave Desert, California. Previously, on December 21, 2010, the DOE announced a final commitment for a $1,450 million loan guarantee to support the construction and start-up of one of the largest CSP power plants in the world (Solana). As of December 31, 2014, Mojave and Solana are included in the Abengoa Yield consolidation group and classified as discontinued operations in accordance with the requirements of IFRS 5,Non-Current Assets Held for Sale and Discontinued Operations.Furthermore, our Solar and Biofuels segments have also received DOE research grants of $145.8 million and in 2010, our Biofuels segment signed a four-year $35.5 million contract to develop technology for advanced biorefining of distillers, grain and corn blends.
Environmental
Our business is subject to significant environmental regulation, which, among other things, requires us to perform environmental impact studies on future projects, obtain regulatory licenses, permits and other approvals and to comply with the requirements of such licenses, permits and approvals. Over recent years, environmental regulation has increased and changed rapidly and has caused a corresponding increase in our cost of compliance and has impacted our financial condition. Furthermore, if we fail to be in compliance, we may become subject to significant liability, including fines, penalties, damages, fees and expenses and closures.
Spanish Export Tax Credit
Through our increasing international presence and a corresponding increase in our overseas investments and exports, we have claimed tax benefits provided under Article 37, Export Tax Credit (Deducción por actividades de exportación, "DAEX") of the Spanish Corporate Income Tax law, in connection with our overseas investments and exports of goods and services from Spain. Export tax credits provided in connection with overseas investments is calculated as a percentage of investments through the acquisition of interest in foreign companies or the incorporation of subsidiaries established abroad. This percentage, which was initially set at 25%, has been progressively reduced since 2007 to reach 3% in 2010 and 0% in 2011. The amount of deferred tax assets recognized for this credit totaled €242.9 million as of December 31, 2014.
Spanish Export Tax Incentive
International projects involving the export of goods and services from Spain receive special treatment in Spain, generating a tax incentive applicable to the taxable income base for the year, which exempts any profits from abroad. These are not deductions to be applied to the income tax payable amount, but rather incentives that are applied directly to reduce the taxable income of the current year. Therefore, they are recognized directly in the income statement as a lower tax expense, and they do not result in the capitalization of any deferred tax asset.
Spanish Tax System
Under Article 29 and the Transitional Provision 34 (DT 34) of the Law 27/2014 governing reforms to the Spanish tax system, the general tax rate in Spain will be reduced to 28% in 2015 and to 25% in 2016 (from 30% in 2014).
Backlog and Concessions
We believe that our backlog is a significant indicator of the growth of our Engineering and Construction ("E&C") business and provides useful trend information and revenue visibility based on our activities over the previous two years. Backlog serves to measure the total euro value of work to be performed on contracts awarded, in progress and customer subscriptions, but does not include estimated revenue streams from the operating phase of any of our concession based projects, which are reported in a different operating segment. Backlog consists principally of projects, operations and services for which we have signed contracts
138
Table of Contents
and in respect of which we have received non-binding commitments from customers or other operations within our Group, where the related revenues are not eliminated upon consolidation. Commitments may be in the form of written contracts for specific projects, purchase orders, or indications of the amount of time and materials we need to make available for customers' anticipated projects. The volume and timing of executing the work in our backlog is important to us in anticipating our operational and financing needs and our ability to execute our backlog is dependent on our ability to meet such operational and financing needs. Our work to be performed in our backlog is typically completed within 12 to 24 months. Backlog is provided on a net basis after accounting for intra group eliminations. As December 31, 2014, 2013, 2012, 2011 and 2010, our backlog (excluding intra group sales) was approximately €7,953 million €6,796 million, €6,679 million, €7,535 million and €6,253 million, respectively.
In the last year, our backlog has grown across our activities and we expect that our backlog will drive our results of operations in the near term as we undertake projects and operations. While our backlog has increased recently, it has fluctuated on a quarter to quarter basis due to the signing of new contracts, more of which have historically tended to be executed as the year progresses as customers make purchases under their capital budgets, as well as the pace of execution of existing contracts. As a result of the changes in our backlog, whether due to the signing of new contracts or commitments, the pace of execution of our contracts or otherwise, our results of operations for certain of the financial periods discussed in this annual report may not be directly comparable with our results of operations for other financial periods discussed herein or future financial periods. See "Item 3.D—Risk Factors—Risks Related to Our Business and the Markets in Which We Operate—Our backlog of unfilled orders is subject to unexpected adjustments and cancellations and is, therefore, not a fully accurate indicator of our future revenue or earnings."
As of December 31, 2014, the average remaining life of our concessions and concession-type agreements was approximately 25 years. We believe that the average life of our concessions and concession-type agreements is a significant indicator of our forecasted revenue streams and the growth of our business. Concessions consist of long-term projects awarded to, and undertaken by us (in conjunction with other companies or on an exclusive basis) typically over a term of 20 to 30 years. Such projects typically include the construction phase, as well as future provisions associated with the operation and maintenance services provided during the concession period. In order to maintain or grow our business, we must obtain extensions to our current concessions and concession-type agreements or secure new concessions to replace our concessions as they expire. Furthermore, the revenue that we generate from our concession projects is significantly dependent on regulated tariffs. Under most of our concession agreements, there is an established tariff structure that provides us with limited or no possibility to adjust our tariffs as a result of fluctuations in prices of raw materials, exchange rates, labor and subcontractor costs or any other variations in the conditions of specific jurisdictions in which our concessions are located.
Capital Expenditures
Our business has significant capital expenditure requirements, including construction as well as R&D&i costs. Our capital expenditure requirements include asset and concession construction costs of power transmission lines, solar power plants and co-generation power plants, as well as infrastructure for the production of ethanol and desalination plants. We finance these capital projects primarily through Project Debt issued by a project finance company, along with debt incurred at the corporate level. Consequently, a significant part of our business is capital-intensive and our new assets under construction are highly leveraged. Over the last few years, the costs associated with our requirements have increased significantly, largely due to our increased business activity. See "Item 5.B—Liquidity and Capital Resources—Capital Expenditures." As a result, these increases have resulted in an increase of our Project Debt and related increased service costs, resulting in significantly reduced available cash flow from our project finance companies. As of December 31, 2014, our Gross Corporate Debt was €5,325.4 million and our total Project Debt was €4,958.1 million of which approximately €1,946.4 million were bridge loans.
139
Table of Contents
Interest Rates
We incur significant indebtedness during the course of our operations. The interest rate risk arises mainly from indebtedness with variable interest rates. To mitigate the interest rate risk, we primarily use interest rate swaps and interest rate options which, in exchange for a fee, offer protection against a rise in interest rates. Our results of operations can be affected by changes in interest rates with respect to the unhedged portion of our indebtedness that bears interest at floating rates, which typically bears a spread over EURIBOR, LIBOR andTaxa de Juros de Longo Prazo ("TJLP"), for our Brazilian operations.
In the event that EURIBOR had risen by 25 basis points as of December 31, 2014, with the rest of the variables remaining constant, the effect in the consolidated income statement for the year ended December 31, 2014 would have been a profit of €9,182 thousand (a profit of €13,669 thousand in 2013) mainly due to the increase in time value of hedge interest rate options (caps and collars) and an increase of €35,591 thousand in other reserves (an increase of €48,050 thousand in 2013) mainly due to the increase in value of hedging interest derivatives (swaps, caps and collars).
A significant increase in interest rates could also reduce the profitability of our projects in the development stage for which we have not yet secured financing and make it more costly for us to submit bids for concessions or third-party construction contracts. In addition, while the financing costs of our subsidiaries tend to be high during the early years of a relevant concession or construction contract, during which the cash flows from the assets support a significant amount of debt in relation to relatively low revenue, we may have opportunities to refinance such debt as such concessions or construction contracts become more mature and their revenue, cash flow and debt coverage ratios improve.
Exchange Rates
Our functional currency is the euro, but our revenue and expenses are denominated in the local currency of the jurisdictions in which we operate. As we have globally expanded our business, a large and increasing percentage of our revenue is now derived from countries outside of the Eurozone.
As a result, fluctuations in the value of foreign currencies relative to the euro impact our operating results. Impacts associated with fluctuations in foreign currency are discussed in more detail under "—Quantitative and Qualitative Disclosure About Market Risk—Foreign Exchange Rate Risk." In countries with currencies other than the euro, assets and liabilities are translated into euro using end-of-period exchange rates; revenue, expenses and cash flows are translated using average rates of exchange. The following tables illustrate the average rates of exchange used.
| | | | |
Period | | U.S. Dollar average
per euro | |
|---|
Year ended December 31, 2014 | | | 1.2153 | |
Year ended December 31, 2013 | | | 1.3764 | |
Year ended December 31, 2012 | | | 1.3190 | |
We are exposed to foreign exchange rate fluctuations principally between the euro and our U.S. Dollar denominated debt. In order to mitigate these exchange risks, we enter into forward exchange contracts and currency options which hedge the fair value of our future cash flows.
In the event that the exchange rate of the U.S. Dollar had risen by 10% against the euro as of December 31, 2014, with the rest of the variables remaining constant, the effect in the consolidated income statement for the year ended December 31, 2014 would have been a loss of €1,103 thousand (a loss of €8,496 thousand in 2013) mainly due to the U.S. Dollar net liability position of the Group in companies with euro functional currency and an increase of €36,315 thousand (a decrease of €1,192 thousand in 2013) in other reserves as a result of the cash flow hedging effects on highly probable future transactions.
140
Table of Contents
In addition, we are generally exposed to foreign currency exchange translation risk with respect to our subsidiaries whose reporting currency is other than the euro. The contribution of these subsidiaries to our Consolidated Financial Statements is significantly affected by the fluctuations in exchange rate between their reporting currency and the euro. Our primary foreign exchange translation risk results from our Brazilian and U.S. subsidiaries.
In our discussion of operating results, we have included foreign exchange impacts in our revenue by providing constant currency revenue growth. The constant currency presentation is a non-GAAP financial measure, which excludes the impact of fluctuations in foreign currency exchange rates. We believe providing constant currency information provides valuable supplemental information regarding our results of operations. We calculate constant currency amounts by converting our current period local currency revenue using the prior period foreign currency average exchange rates and comparing these adjusted amounts to our prior period reported results. This calculation may differ from similarly titled measures used by others and, accordingly, the constant currency presentation is not meant to substitute for recorded amounts presented in conformity with GAAP nor should such amounts be considered in isolation.
Key Performance Indicators
In addition to the factors described above, we closely monitor the following key drivers of our businesses' operating performance to plan for our current needs, and to adjust our expectations, financial budgets and forecasts appropriately.
| | | | | | | | | | |
| | As of December 31, | |
|---|
| | 2014 | | 2013 | | 2012 | |
|---|
| | (unaudited)
| |
|---|
| | (€ in millions)
| |
|---|
Key Performance Indicator | | | | | | | | | | |
Engineering and Construction Backlog | | | 7,953 | | | 6,796 | | | 6,679 | |
Concession-Type Infrastructure | | | | | | | | | | |
Solar | | | | | | | | | | |
MW under development | | | 0 | | | 210 | | | 0 | |
MW under construction | | | 780 | | | 430 | | | 910 | |
MW in operation | | | 712 | | | 1,223 | | | 743 | |
| | | | | | | | | | | |
Total MW | | | 1,492 | | | 1,863 | | | 1,653 | |
Transmission | | | | | | | | | | |
Km of transmission under development | | | 115 | | | — | | | — | |
Km of transmission under construction | | | 6,270 | | | 9,373 | | | 5,217 | |
Km of transmission in operation | | | 3,532 | | | 2,660 | | | 1,476 | |
| | | | | | | | | | | |
Total Km | | | 9,917 | | | 12,400 | | | 6,693 | |
Co-generation and other | | | | | | | | | | |
MW of co-generation and other under construction | | | 692 | | | 0 | | | 300 | |
MW of co-generation and other in operation | | | 393 | | | 693 | | | 393 | |
| | | | | | | | | | | |
Total MW | | | 1,085 | | | 693 | | | 693 | |
Water | | | | | | | | | | |
Capacity of desalination in operation (m3/day) | | | 760,000 | | | 560,000 | | | 560,000 | |
Capacity of desalination Construction (m3/day) | | | 60,000 | | | 260,000 | | | 260,000 | |
| | | | | | | | | | | |
Total m3/day | | | 820,000 | | | 820,000 | | | 820,000 | |
The Global Economy
Our results of operations have been and continue to be affected by conditions in the global economy. Concerns over inflation, energy costs, geopolitical issues, sovereign debt and government austerity programs and the availability and cost of credit have contributed to increased volatility and diminished expectations for
141
Table of Contents
the economy going forward. These factors, combined with volatile oil prices, declining global business and consumer confidence and increased unemployment, have precipitated an economic slowdown which has been followed by inconsistent signs of growth. For example, in our Engineering and Construction activity, the global downturn resulted in a significant decline in investment and current projects under negotiation or in progress slowed down significantly. These declines were largely driven by reduced spending by governments, public administrations and utility companies and a resultant increase in competition for remaining projects.
Notwithstanding conditions in the global economy generally, some operations within our segments have experienced positive effects due to increased government spending in certain sectors as part of stimulus measures to combat weak economic conditions. For example, there has been recent increased public spending in infrastructure, renewable energies and the water desalination sectors which are all currently experiencing significantly increased growth in certain countries. In addition, a significant part of our business is regulated or benefits from long-term offtake contracts, which provide some protection from the global economic downturn.
Engineering and Construction
The revenue and profitability of our Engineering and Construction activity is determined by the demand for our services with respect to new infrastructure, mainly in the energy sector. We primarily monitor the amount of our backlog as a significant indicator of our forecasted revenue streams and the growth of that activity. The margins we are able to achieve with respect to the services we provide in our Engineering and Construction activity drive that activity's revenue and profitability.
Concession-Type Infrastructure
The revenue of our Concession-Type Infrastructure activity is determined by the amount of MW capacity under operation in our thermo solar and co-generation plants, the number of kilometers available and operating in our power transmission lines and the volume (in cubic meters) of water treated in our desalination plants. We are currently making significant investments in the development of such assets (as of December 31, 2014 we had €8,964.2 million of net fixed assets and are continuously looking for new opportunities in the area of public private concession agreements (examples include the new power transmission lines in Brazil and Peru and the new co-generation plants near the ACT facility (Mexico), which are all in the pre-construction or construction phases) that will contribute to our Concession-Type Infrastructure activity's revenue in the future.
Industrial Production
The profitability of our Industrial Production activity is mainly affected by the volume (in ML) of bioethanol produced, crush margin, which is determined by the commodity input price (mainly for corn, sugarcane and natural gas) and output prices (mainly prices for ethanol and sugar), and prices for the byproducts sold, such as electricity or DGS.
Critical Accounting Policies and Estimates
The preparation of our Consolidated Financial Statements in conformity with IFRS requires us to make estimates and judgments that affect the reported amounts of assets, liabilities, revenues and expenses. We base our estimates on historical experience and on various other assumptions we believe to be reasonable under the specific circumstances, the results of which form the basis for making judgments about the carrying values of assets and liabilities that are not readily apparent from other sources. Actual results may differ from these estimates under different assumptions or conditions.
An understanding of the accounting policies for these items is important to understand the Consolidated Financial Statements. The following discussion provides more information regarding the
142
Table of Contents
estimates and assumptions used for these items in accordance with IFRS and should be considered in conjunction with our Consolidated Financial Statements.
The most critical accounting policies, which reflect significant management estimates and judgment to determine amounts in our Consolidated Financial Statements, are as follows:
- •
- Impairment of intangible assets and goodwill.
- •
- Revenue from construction contracts.
- •
- Income taxes and recoverable amount of deferred tax assets.
- •
- Derivative financial instruments.
- •
- Concession agreements.
Some of these accounting policies require the application of significant judgment by management to select the appropriate assumptions to determine these estimates. These assumptions and estimates are based on our historical experience, advice from experienced consultants, forecasts and other circumstances and expectations as of the close of the financial period. The assessment is considered in relation to the global economic situation of the industries and regions where the Group operates, taking into account future development of our businesses. By their nature, these judgments are subject to an inherent degree of uncertainty; therefore, actual results could materially differ from the estimates and assumptions used. In such cases, the carrying values of assets and liabilities are adjusted.
As of the date of preparation of our Consolidated Financial Statements, no relevant changes in the estimates made are anticipated and, therefore, no significant changes in the value of the assets and liabilities recognized at December 31, 2014 are expected.
Although these estimates and assumptions are being made using all available facts and circumstances, it is possible that future events may require management to amend such estimates and assumptions in future periods. Changes in accounting estimates are recognized prospectively, in accordance with IAS 8, in the consolidated income statement of the year in which the change occurs. The Group significant accounting policies are more fully described in Note 2 to the Consolidated Financial Statements for the year ended December 31, 2014, presented elsewhere in this annual report.
Impairment of intangible assets and goodwill
Goodwill and intangible assets which have not yet come into operation or that have an indefinite useful life are not amortized and are tested for impairment on an annual basis or whenever there is an impairment indicator. Goodwill is tested for impairment within the cash-generating unit to which it belongs. Other intangible assets are tested individually, unless they do not generate cash flows independently from other assets, in which case they are tested within the cash-generating unit to which they belong.
For those cash generating units with high potential growth, the Group uses cash flow projections for a period of 10 years based on the cash flows identified in the Group's strategic plans, which are reviewed and approved every six months by the management of the Group. The residual value is calculated based on the cash flows of the latest year projected using a steady or nil growth rate. The use of a 10-year period is based on the consideration that this is the minimum period that needs to be used in order to appropriately reflect all the potential growth of these cash generating units. In addition, 10-year projections are prepared based on the historical experience within the Group in preparing long-term strategic plans, which are considered reliable and are prepared on the basis of the Group's internal control system. These cash flows are considered reliable since they can easily adapt to the changes of the market and of the business segment to which cash generating units belong, based on the Group's past experience on cash flows and margins and on future expectations.
143
Table of Contents
For other cash generating units the Group uses cash flows projections based on a period of 5 years, calculating the residual value based on the cash flows of the latest year projected, using a zero growth rate.
Projected cash flows are discounted using the weighted average cost of capital ("WACC") (see Note 2.8 to our Consolidated Financial Statements), adjusted for the specific risks associated to the business unit to which the cash generating unit belongs.
Based on values in use calculated in accordance with the assumptions and hypotheses described above and in Note 8 to our Consolidated Financial Statements, the recoverable amount of the cash generating units to which goodwill was assigned is higher than their carrying amount. Detailed sensitivity analysis has been carried out and we believe that the carrying amount of the cash generating units will be recovered in full. Main variables considered in sensitivity analysis are growth rates, discount rates based in WACC and the main variables of each business.
During the years 2014 and 2013 there were no intangible assets with indefinite useful life or there were no significant intangible assets not yet in use that were impaired.
Revenue from construction contracts
Revenue from construction contracts is recognized using the percentage-of-completion method for contracts whose outcome can be reliably estimated and whose profitability is probable. When the outcome of a construction contract cannot be reliably estimated, revenue is recognized only to the extent it is probable that contract costs incurred will be recoverable.
As described in Note 2.24.b to our Consolidated Financial Statements, the percentage of completion is determined at the date of every Consolidated Statement of Financial Position based on the actual costs incurred as a percentage of total estimated costs for the entire contract.
Revenue recognition using the percentage-of-completion method involves the use of estimates of certain key elements of the construction contracts, such as total estimated contract costs, allowances or provisions related to the contract, period of execution of the contract and recoverability of the claims. We have established, over the years, a robust project management and control system, with periodic monitoring of each project. This system is based on the long-track experience of the Group in constructing complex infrastructures and installations. As far as practicable, the Group applies past experience in estimating the main elements of construction contracts and relies on objective data such as physical inspections or third parties confirmations. Nevertheless, given the highly tailored characteristics of the construction contracts, most of the estimates are unique to the specific facts and circumstances of each contract.
Although estimates on construction contracts are periodically reviewed on an individual basis, we exercise significant judgments and not all possible risks can be specifically quantified.
It is important to point out that, as stated in Note 2.4 to our Consolidated Financial Statements on the measurement of property, plant and equipment, in the internal asset construction projects outside the scope of IFRIC 12 on Service Concession Arrangements (see Note 2.5 to our Consolidated Financial Statements), the totality of the revenues and profits between group companies is eliminated, meaning those assets are shown at their acquisition cost.
Income taxes and recoverable amount of deferred tax assets
The current income tax provision is calculated on the basis of relevant tax laws in force at the date of our Consolidated Financial Statements in the countries in which the subsidiaries and associates operate and generate taxable income. Subsidiaries which are not included in the consolidated income tax returns filed in Spain file income tax returns in numerous tax jurisdictions around the world.
Determining income tax payable requires judgment in assessing the timing and the amount of deductible and taxable items, as well as the interpretation and application of tax laws in different jurisdictions. Due to this fact, contingencies or additional tax expenses could arise as a result of tax inspections or different interpretations of certain tax laws by the corresponding tax authorities.
144
Table of Contents
We recognize deferred tax assets for all deductible temporary differences and all unused tax losses and tax credits to the extent that it is probable that future taxable profit will be available against which they can be utilized.
We consider it probable that we will have sufficient taxable profit available in the future to enable a deferred tax asset to be recovered when:
- •
- there are sufficient taxable temporary differences relating to the same tax authority, and the same taxable entity is expected to reverse either in the same period as the expected reversal of the deductible temporary difference or in periods into which a tax loss arising from the deferred tax asset can be carried back or forward;
- •
- it is probable that the taxable entity will have sufficient taxable profit, relating to the same tax authority and the same taxable entity, in the same period as the reversal of the deductible temporary difference (or in the periods into which a tax loss arising from the deferred tax asset can be carried back or forward); or
- •
- tax planning opportunities are available to the entity that will create taxable profit in appropriate periods.
As of December 31, 2014, our deferred tax assets corresponded mainly to tax loss carryforwards in Brazil, Spain, the Netherlands and the United States, and to tax credits for export activities and other tax deductions generated in Spain, as shown in the following table:
| | | | |
| | As of
December 31,
2014 | |
|---|
| | (€ in millions)
| |
|---|
Tax credits for Tax Loss Carryforwards: | | | | |
Spain | | | 70 | |
Brazil | | | 177 | |
United States | | | 141 | |
Netherlands | | | 56 | |
Other | | | 43 | |
| | | | | |
| | | 487 | |
| | | | | |
| | | | | |
| | | | | |
Tax credits for deductions to be applied in future periods: | | | | |
Spanish Export Tax Credit (DAEX) | | | 243 | |
R&D&i Tax Credits in Spain | | | 73 | |
Tax Credits for deduction on reinvestment of certain benefits in Spain | | | 50 | |
Tax Credits for environmental investments in Spain | | | 12 | |
Tax Credits for double taxation (mainly in Spain) | | | 82 | |
Tax Credits for donations and other (mainly in Spain) | | | 21 | |
| | | | | |
| | | 481 | |
| | | | | |
| | | | | |
| | | | | |
The jurisdictions where we have tax credits and where we have also recorded tax losses are Brazil, the Netherlands (mainly coming from the bioenergy business in the three nations), the United States and Spain. The subsidiaries in these jurisdictions, which include companies in our biofuels, engineering and construction, solar and water segments, are expected to generate taxable profit in the upcoming years, as described in more detail below.
We have credits for tax loss carryforwards in Brazil of €177 million as of December 31, 2014. Tax credits for tax loss carryforwards in Brazil were mainly generated in recent years with very poor weather conditions
145
Table of Contents
which affected our sugar cane production. Since 2011, we have implemented a series of plans to improve the quality of our biological assets and to increase the milling capacity of the facilities, as well as in the co-generation plant in order to increase the profitability of the assets. The tax loss carryforwards are expected to offset future taxable income in Brazil, as there is no time limit under Brazilian tax legislation for their application. In addition, at the end of 2012 an internal restructuring was carried out in Brazil in order to obtain additional benefits from certain intangible assets related to our bioenergy business. During 2014, we participated in a tax reform program offered by the Brazilian government that allowed us to offset our tax credits to pay off other existing tax debts. As a result, some of our tax credits were compensated during 2014. We expect to generate taxable income that will help to use the tax credits we have in this jurisdiction. We also operate in Brazil through our Engineering and Construction activity. In the last three tax returns submitted in this jurisdiction, we generated taxable losses amounting to €65 million in 2013, €38 million in 2012 and €28 million in 2011.
Tax credits for tax loss carryforwards in the United States amount to approximately €141 million and expire in 20 years. In order to utilize these tax loss carryforwards, we would need to generate future taxable income of approximately €392 million. During the last years the taxable losses generated by the Company in the United States have been driven mainly by specific tax advantages like bonus depreciations and the application of specific Modified Accelerated Cost Recovery System ("MACRS"), and due to non-ordinary losses. During the year 2013, we undertook a restructuring of our subsidiaries in the United States, for business purposes. After the restructuring, most of our U.S. subsidiaries in our Biofuels, Engineering and Construction, Water and Solar segments are subsidiaries of Abengoa US, LLC, which is in turn a subsidiary of newly incorporated entities corresponding to each of the four operating segments mentioned above. This structure permits to calculate our income tax in the United States on an aggregated basis for these companies.
In Engineering and Construction, we forecast growth in the three markets in which we operate in the U.S. (Engineering, procurement and construction of large projects in the water and energy sectors, electric transmission projects and other services like ancillary manufacturing, logistics and supplies, and project management). We expect to generate taxable income in all our Engineering and construction subsidiaries in the upcoming years.
In 2013, biofuels prices and margins recovered from the exceptionally negative prior year in terms of margins and results. This was mainly due to better harvests and to an increase in the price of ethanol because of the reduction of inventory levels in the industry. In 2014, the margin recovery trend continued and high margin levels were reached. The margin recovery has been mainly driven by low corn prices that have remained steady throughout the year. These low corn prices resulted in a slight decrease in the price of ethanol. Competitive ethanol prices resulted in a significant increase in ethanol exports which, coupled with stable internal demand. increases our total sales volume.
As a consequence of the crush spread recovery, our Bioenergy companies have generated operational taxable income during 2014. Our ability to keep generating future taxable income in our Biofuels segment in the United States depends on managing the spread between the prices of inputs (grain, natural gas and others) and outputs (ethanol, DGS and others), which are subject to significant volatility and uncertainty, as we disclose in "Item 3.D—Risk Factors—Risks Related to Our Industrial Production Activity."
In our last three U.S. tax returns submitted, considering all our segments, we generated taxable losses amounting to €153 million in 2013, €30 million in 2012 and €24 million in 2011.
Tax credits for tax loss carryforwards in the Netherlands, amounting to €56 million approximately expire in nine years. In order to utilize these tax loss carryforwards, we would need to generate future taxable
146
Table of Contents
income of approximately €217 million. At the beginning of 2013, our bioethanol plant in the Netherlands was shut down for a period of three months as a result of safety measurements that we voluntarily wanted to undertake, which resulted in non-recurring losses. In 2014, our Dutch bioethanol plant operated at full capacity, generating taxable income for this year. A slight increase in consumption in the European biofuels market is expected based on regulatory decisions introduced by the European Union with the goal of reducing imports of bioethanol. We expect these measures will increase the demand in our plant in the Netherlands. In addition, growth in ethanol production is expected until 2020 based on continued low cereal prices, but will remain significantly below the peak growth experienced in 2010 and 2012. We expect our subsidiary to generate enough taxable income in for foreseeable future to offset the tax loss carryforwards. In the last three tax returns submitted in this jurisdiction, we generated taxable losses amounting to €72 million in 2013, €56 million in 2012 and €47 million in 2011.
Tax loss carryforwards in Spain were mainly generated from applying certain tax incentives, such as Spanish Export Tax Incentive. In Spain, we have over €534 million in tax credits on deductions and on tax loss carryforwards, of which €70 million are credits for tax loss carryforwards. These tax credits expire over a period ranging from 15 to18 years. There is no time limit under Spanish tax regulations for the application of the tax loss carryforwards, and their recoverability is based on our ability to generate taxable income of €3.6 billion from our Spanish subsidiaries over this time period. We expect to generate this taxable income from our Engineering and Construction business, which has been growing consistently year-after-year based on the construction of new infrastructure projects, from our Spanish solar business, where we have brought new assets into operation at profitable margins, and from the contribution of our recurring Spanish biofuels businesses. In connection with our ability to generate taxable income from our Spanish solar business, Spain has experienced negative economic conditions, including high unemployment and significant government debt, which may adversely affect investment by customers in new projects. See "Item 3.D—Risk Factors—Risks Related to Our Business and the Markets in Which We Operate—Decreases in government budgets, reductions in government subsidies and adverse changes in law may adversely affect our business and the development of existing and new projects." In addition, our ability to generate taxable income in Spain may be affected by the performance of our thermos-solar segment, which is subject to changes in regulation (see "Item 3.D—Risk Factors—Risks Related to the Concession-Type Infrastructure Activity—Our solar projects will be negatively affected if there are adverse changes to national and international laws and policies that support renewable energy sources. In the last three tax returns submitted, in Spain, we generated taxable losses amounting to €143 million in 2013, and taxable income amounting to €194 million in 2012 and €224 million in 2011.
Our management assesses the recoverability of deferred tax assets on the basis of estimates of future taxable profit. These estimates are derived from the projections included in our five- and ten-year strategic plans, which are prepared on a yearly basis and reviewed twice a year for the accuracy of the assumptions used. Based on our current estimates we expect to generate sufficient future taxable income to achieve the realization of our current tax credits and tax loss carryforwards, supported by our historical trend of business performance.
Our current and deferred income taxes may be impacted by events and transactions arising in the normal course of business as well as by special non-recurring items. Assessment of the appropriate amount and classification of income taxes is dependent on several factors, including estimates of the timing and realization of deferred tax assets and the timing of income tax payments.
Actual collections and payments may materially differ from these estimates as a result of changes in tax laws as well as unforeseen future transactions impacting the income tax balances.
147
Table of Contents
Derivatives and hedging
Derivatives are recorded at fair value. The Company applies hedge accounting to all hedging derivatives that qualify to be accounted for as hedges under IFRS.
When hedge accounting is applied, hedging strategy and risk management objectives are documented at inception, as well as the relationship between hedging instruments and hedged items. Effectiveness of the hedging relationship needs to be assessed on an ongoing basis. Effectiveness tests are performed prospectively and retrospectively at inception and at each reporting date, following the dollar offset method or the regression method, depending on the type of derivatives.
We have three types of hedges:
- •
- Fair value hedge for recognized assets and liabilities
The effective portion of changes in fair value of derivatives designated as cash flow hedges are recorded temporarily in equity and are subsequently reclassified from equity to profit or loss in the same period or periods during which the hedged item affects profit or loss. Any ineffective portion of the hedged transaction is recorded in the consolidated income statement as it occurs.
When options are designated as hedging instruments (such as interest rate options described in Note 14 to our Consolidated Financial Statements), the intrinsic value and time value of the financial hedge instrument are separated. Changes in intrinsic value which are highly effective are recorded in equity and subsequently reclassified from equity to profit or loss in the same period or periods during which the hedged item affects profit or loss. Changes in time value are recorded in the consolidated income statement, together with any ineffectiveness.
When the hedged forecasted transaction results in the recognition of a non-financial asset or liability, gains and losses previously recorded in equity are included in the initial cost of the asset or liability.
When the hedging instrument matures or is sold, or when it no longer meets the requirements to apply hedge accounting, accumulated gains and losses recorded in equity remain as such until the forecast transaction is ultimately recognized in the consolidated income statement. However, if it becomes unlikely that the forecast transaction will actually take place, the accumulated gains and losses in equity are recognized immediately in the consolidated income statement.
- •
- Net investment hedges in foreign operation
Hedges of a net investment in a foreign operation, including the hedging of a monetary item considered part of a net investment, are recognized in a similar way to cash flow hedges. The foreign currency transaction gain or loss on the non-derivative hedging instrument that is designated as, and is effective as, an economic hedge of the net investment in a foreign operation is reported in the same manner as a translation adjustment. That is, reported in the cumulative translation adjustment section of equity to the extent it is effective as a hedge, as long as the following conditions are met: the notional amount of the non-derivative instrument matches the portion of the net investment designated as being hedged and the non-derivative instrument is denominated in the functional currency of the hedged net investment. In that circumstance, no hedge ineffectiveness would be recognized in earnings.
Amounts recorded in equity are reclassified to the consolidated income statement when the foreign operation is sold or otherwise disposed of.
148
Table of Contents
Contracts held for the purposes of receiving or making payment of non-financial elements in accordance with expected purchases, sales or use of goods ("own-use contracts") of the Group are not recognized as derivative instruments, but as executory contracts. In the event that such contracts include embedded derivatives, they are recognized separately from the host contract, if the economic characteristics of the embedded derivative are not closely related to the economic characteristics of the host contract. The options contracted for the purchase or sale of non-financial elements which may be cancelled through cash outflows are not considered to be own-use contracts.
Changes in fair value of derivative instruments which do not qualify for hedge accounting are recognized immediately in the consolidated income statement. Trading derivatives are classified as current assets or liabilities.
In addition, during 2013, 2010 and 2009 the Group issued convertible bonds to qualified investors and institutions with an outstanding amount of € 750.1 million, maturing between one (1) and six (6) years. In accordance with the terms and conditions of the issuances, the bonds qualify as hybrid instruments which are bifurcated into a debt component and an embedded derivative. Embedded derivatives are recognized initially at fair value and at each closing date they are re-measured at fair value, with the change in fair value being recorded in the consolidated income statement (see Note 20.3 to our Consolidated Financial Statements).
The inputs used to calculate fair value of our derivatives are based on prices observable on not quoted markets, through the application of valuation models (Level 2). The valuation techniques used to calculate fair value of our derivatives include discounting estimated future cash flows, using assumptions based on market conditions at the date of valuation or using market prices of similar comparable instruments, amongst others. The valuation of derivatives and the identification and valuation of embedded derivatives and own-use contracts requires the use of considerable professional judgment. These determinations were based on available market information and appropriate valuation methodologies. The use of different market assumptions and/or estimation methodologies may have a material effect on the estimated fair value amounts.
Concession agreements
Service concession agreements are recorded in accordance with the provisions of IFRIC 12. IFRIC 12 is applicable to public-to-private service concession arrangements where the grantor of the concession governs what services the operator must provide using the infrastructure, to whom and at what price and also controls any significant residual interest in the infrastructure at the end of the term of the arrangement. When the operator of the infrastructure is also responsible for the engineering, procurement and construction of such asset, IFRIC 12 requires the separate accounting for the revenue and margins associated with the construction activities, which is not eliminated in consolidation even between companies within the same consolidated group, and for the subsequent operation and maintenance of the infrastructure. In such cases, the investment in the infrastructure used in the concession arrangement cannot be classified as property, plant and equipment of the operator, but rather must be classified as a financial asset or an intangible asset, depending on the nature of the payment rights established under the contract. The infrastructures accounted for by us as service concessions under IFRIC 12 are mainly related to the activities concerning power transmission lines, desalination plants and thermo-solar electricity generation plants outside of Spain and, with effect from January 1, 2011, in Spain.
Any analysis regarding whether the IFRIC 12 applies to certain contracts and activities involves various complex factors. It is significantly affected by legal interpretation of certain contractual agreements or other terms and conditions with public sector entities.
Therefore, the application of IFRIC 12 requires extensive judgment in relation with, amongst other factors: (i) the identification of certain infrastructures (and not contractual agreements) in the scope of IFRIC 12; (ii) the understanding of the nature of the payments in order to determine the classification of the
149
Table of Contents
infrastructure as a financial asset or as an intangible asset; and (iii) the recognition of the revenue from construction and concessionary activity.
Changes in one or more of the factors described above may significantly affect the conclusions as to the appropriateness of the application of IFRIC 12 and, therefore, the results of operations or our financial position (see Note 10.1 to our Consolidated Financial Statements).
Explanation of Income Statement Items
Revenue
Revenue consists of the fair value of consideration received for the sale of goods or services excluding any related charges resulting from operations, before any discounts or returns and excluding intra-group transactions. Revenue from the sale of goods is recognized when we deliver the goods to the client, the client accepts them and it is reasonably certain that the related receivables will be collectible. Revenue from the sale of services is recognized in the period in which the service is provided, using the percentage of completion method based on the specific contractual terms and conditions of each service agreement, when the revenue of the service contract and the associated costs, as well as the percentage of completion, can be estimated reliably and when it is reasonably certain that the related receivables will be collectible. When one or more of such elements of the service contract cannot be estimated reliably, ordinary income from the sale of service is recognized only to the extent of the expenses recognized that are recoverable. In addition, revenue is generated by the construction and operation of our concession projects is recognized in accordance with IFRIC 12 as described under "—Critical Accounting Policies and Estimates—Concession Agreements." Revenue in each of our business activities is generated as follows:
Engineering and Construction. Revenue is generated primarily from infrastructure construction contracts, engineering services and maintenance services of electrical, mechanical and industrial infrastructures.
Concession-Type Infrastructure. Revenue is generated primarily from the management and operation of our infrastructure related to power transmission lines, thermo-solar plants, water treatment plants, and co-generation plants which are all regulated through long-term sale agreements.
Industrial Production. Revenue is generated primarily from the production and sale of biofuel products including ethanol, sugar, biodiesel, distillers, grains and solubles, and electricity from co-generation plants.
Changes in inventories of finished goods and work in progress
Changes in inventories include the result of changes in inventories of finished products and work in progress during the year.
Other operating income
Other operating income includes income from government grants, income from work performed on our own assets, and capitalized and all other income not captured within any other income line item, including income for various services, as well as profit from the sale of subsidiaries. In addition, from time to time, other operating income may include income from litigation and arbitration awards.
Raw materials and consumables used
Raw materials consumed include the purchase and consumption of raw materials and changes in inventories of raw materials and other inventories. Primary raw materials include energy in all businesses, wheat, barley, corn, sorghum and sugarcane in our Biofuels segment and steel and iron in our Engineering and Construction activity.
150
Table of Contents
Employee benefit expenses
Employee benefit expenses include wages and salaries, social security costs and costs associated with our employee stock option plans, along with other employee retributions.
Depreciation, amortization and impairment charges
This line item includes the depreciation of tangible assets, amortization of intangible assets with a finite useful life, charges for the impairment of assets related to the value of goodwill, tangible and intangible assets and accounts receivable, which have been reduced at period end in the event that their book value is lower than their recoverable amount.
Other operating expenses
Other operating expenses include external services, including expenses for leases, repairs and maintenance, research and development costs, expenses for independent professional services, such as accounting, banking, consultancy, legal and other advisory fees and commissions, expenses for transportation and supplies, taxes for external services and other management and general expenses.
Operating profit
Operating profit consists of revenue, changes in inventories, other operating income, raw materials consumed, employee benefit expenses, depreciation, amortization and impairment charges, research and development costs and other operating expenses.
Finance income
Finance income includes income earned from cash deposited with financial institutions and changes in the fair value of some interest rate derivative financial instruments.
Finance expenses
Finance expenses includes expenses due to interest and similar expenses, including interest on our outstanding corporate and non-recourse indebtedness and changes in the fair value of some interest rate derivative financial instruments.
Net exchange differences
Net exchange differences include gains and losses originating from exchange differences related to assets and liabilities denominated in foreign currencies and changes in the fair value of exchange rate derivatives.
Other net finance income/expenses
Other net finance income/expenses includes changes in the fair value of the embedded derivative component of our existing convertible bonds, dividend income from equity instruments, impairment of financial investments, disposals and changes in the fair value of financial investments and changes in the fair value of some commodity derivatives.
Finance expense net
Finance expense net represents the total of financial income, financial expenses, net exchange differences and other financial income/expenses.
151
Table of Contents
Share of (loss)/profit of associates
Share of (loss)/profit of associates includes the results of companies accounted for using the equity method over which we exercise a significant influence but which are neither subsidiaries nor jointly controlled entities.
Profit before income tax
Profit before income tax represents our profit before the payment of corporate income tax.
Income tax benefit/expense
Income tax benefit/expense includes all current and deferred taxes, as calculated in accordance with the relevant tax laws in force in the jurisdictions in which we operate.
Profit for the year from continuing operations
Profit for the year from continuing operations represents the profit before income taxes after the deduction of corporate income tax, generated by the continuing operations of the Group.
Profit (loss) from discontinued operations, net of tax
Profit (loss) from discontinued operations, net of tax represents the profit before income taxes after the deduction of corporate income tax generated by the discontinued operations of the Group plus any gain or loss, net of tax, from the disposal of discontinued operations of the Group.
Profit for the year
Profit for the year represents the total of profit for the year from continuing operations plus profit (loss) from discontinued operations, net of tax.
Profit attributable to non-controlling interest
Profit attributable to non-controlling interest represents profit for the year from continuing operations that is allocated to non-controlling interests in accordance with their percentage of the ownership of the affected subsidiaries.
Profit for the year attributable to the Parent Company
Profit for the year attributable to the Parent Company represents profit for the year after the deduction of corporate income tax and profit attributable to non-controlling interests.
152
Table of Contents
Results of Operations
The tables below illustrate our results of operations for the years ended December 31, 2014, 2013 and 2012.
| | | | | | | | | | |
| | For the Twelve months ended
December 31, | |
|---|
| | 2014(1) | | 2013(1)(2) | | 2012(1)(2)(3) | |
|---|
| | (€ in millions)
| |
|---|
Consolidated Income Statement Data | | | | | | | | | | |
Revenue | | | 7,150.6 | | | 7,245.1 | | | 6,285.6 | |
Changes in inventories of finished goods and work in progress | | | 1.1 | | | 7.7 | | | 19.7 | |
Other operating income | | | 188.3 | | | 441.4 | | | 481.9 | |
Raw materials and consumables used | | | (4,083.1 | ) | | (4,469.9 | ) | | (4,244.7 | ) |
Employee benefit expense | | | (871.9 | ) | | (755.4 | ) | | (708.0 | ) |
Depreciation, amortization and impairment charges | | | (474.9 | ) | | (516.4 | ) | | (406.3 | ) |
Other operating expenses | | | (976.9 | ) | | (1,201.5 | ) | | (907.6 | ) |
| | | | | | | | | | | |
Operating profit | | | 933.2 | | | 751.0 | | | 520.6 | |
| | | | | | | | | | | |
| | | | | | | | | | | |
| | | | | | | | | | | |
Finance income | | | 62.1 | | | 67.0 | | | 87.5 | |
Finance expense | | | (745.4 | ) | | (583.2 | ) | | (532.2 | ) |
Net exchange differences | | | 5.0 | | | (3.5 | ) | | (36.1 | ) |
Other financial income/(expense) net | | | (176.5 | ) | | (119.2 | ) | | (157.9 | ) |
| | | | | | | | | | | |
Finance expense, net | | | (854.8 | ) | | (638.9 | ) | | (638.7 | ) |
| | | | | | | | | | | |
| | | | | | | | | | | |
| | | | | | | | | | | |
Share of profit/(loss) of associates | | | 7.0 | | | (5.2 | ) | | 17.9 | |
| | | | | | | | | | | |
Profit (loss) before income tax | | | 85.4 | | | 106.9 | | | (100.2 | ) |
| | | | | | | | | | | |
| | | | | | | | | | | |
| | | | | | | | | | | |
Income tax benefit/(expense) | | | 58.7 | | | 26.2 | | | 174.1 | |
| | | | | | | | | | | |
Profit for the year from continued operations | | | 144.1 | | | 133.1 | | | 73.8 | |
| | | | | | | | | | | |
| | | | | | | | | | | |
| | | | | | | | | | | |
Profit (loss) for the year from discontinued operations, net of tax | | | (22.2 | ) | | (22.7 | ) | | 20.2 | |
| | | | | | | | | | | |
Profit for the year | | | 121.9 | | | 110.3 | | | 94.0 | |
| | | | | | | | | | | |
| | | | | | | | | | | |
| | | | | | | | | | | |
Profit attributable to non-controlling interests | | | 3.6 | | | (7.7 | ) | | (38.2 | ) |
Profit from discontinued operations attributable to non-controlling interests | | | (0.2 | ) | | (1.2 | ) | | (0.4 | ) |
| | | | | | | | | | | |
Profit for the year attributable to the parent company | | | 125.3 | | | 101.4 | | | 55.4 | |
| | | | | | | | | | | |
| | | | | | | | | | | |
| | | | | | | | | | | |
- (1)
- On December 15, 2014, our Board of Directors approved a plan to further improve our financial structure through three main initiatives which contemplated the sale of certain companies, including Abengoa Yield. Given that as of December 31, 2014, those certain companies were available for immediate sale and we considered the sale to be highly probable, we have classified their associated assets and liabilities as held for sale in our annual consolidated financial statements as of December 31, 2014, prepared in accordance with IFRS as issued by the IASB, which are included elsewhere in this annual report. Until the closing of the sale of those certain companies, the assets will be reported as held for sale in accordance with the stipulations and requirements of IFRS 5,Non-Current Assets Held for Sale and Discontinued Operations. Furthermore, during June 2014, we completed the initial public offering of Abengoa Yield, which grouped assets previously reported in different operating segments within the Concession-Type Infrastructure activity. As such, Abengoa Yield became a new operating segment within the Concession-Type Infrastructure activity after the Abengoa Yield IPO. Consequently, it has been reported as a separate segment in our quarterly financial information for the quarters ended June 30, 2014 and September 30, 2014. Taking into account that Abengoa Yield was an operating segment within our Concession-Type Infrastructure activity during part of 2014 and the significance that those activities carried out by Abengoa Yield have for Abengoa, our shareholding in Abengoa Yield during 2014 was treated as a discontinued operation in accordance with the stipulations and requirements of IFRS 5,Non-Current Assets Held for Sale and Discontinued Operations. The treatment of Abengoa Yield as discontinued operations also resulted in the removal of the Abengoa Yield operating segment from
153
Table of Contents
our Concession-Type Infrastructure activity. In accordance with this standard, the assets and liabilities of Abengoa Yield have been reclassified as assets and liabilities held for sale in our consolidated statement of financial position included within our consolidated financial statements as of and for the year ended December 31, 2014. Likewise, our consolidated income statements for the years ended December 31, 2014 and 2013 also include the results of Abengoa Yield under a single heading, "Profit (loss) from discontinued operations, net of tax".
- (2)
- On July 15, 2013, we closed the sale of 100% of our shares in our subsidiary Befesa. On that date, we received €331 million of cash proceeds. Taking into account the significance of the activities carried out by Befesa to Abengoa, the sale of this shareholding is considered as a discontinued operation to in accordance with IFRS 5,Non-Current Assets Held For Sale and Discontinued Operations. In accordance with this standard, the results of Befesa until the closing of the sale and the result of this sale are included under a single heading, "Profit (loss) for the year from discontinued operations, net of tax" in our Consolidated Financial Statements and under separate line items in the consolidated cash-flow statement for the year 2013. The consolidated income statement for the years ended December 31, 2012, 2011 and 2010 also includes the results of Befesa under a single heading. See "Presentation of Financial Information". The Befesa Sale also resulted in the removal of the Industrial Recycling segment from our Industrial Production activity.
- (3)
- In the consolidated financial statements of Abengoa and its subsidiaries as of December 31, 2013, prepared in accordance with IFRS as issued by the IASB, the Group applied IFRS 10 and 11 that came into effect on January 1, 2013 under IFRS-IASB. According to the terms and requirements established in IAS 8 "Accounting Policies, Changes in Accounting Estimates and Errors" and to the specific transition guidance of the new standards, we recasted the financial information as of and for the year ended December 31, 2012 and the recasted financial information is included herein. Financial information for prior periods was not recasted therein or herein for IFRS 10 and 11 and consequently is not comparable with other periods presented. See "Presentation of Financial Information".
Geographic Reporting
We report our results in accordance with the following six geographic regions:
- •
- Spain;
- •
- North America;
- •
- Europe (excluding Spain);
- •
- South America (excluding Brazil);
- •
- Brazil; and
- •
- Other (remaining overseas markets).
During 2013 and 2012 we reported results from Mexico as part of South America (excluding Brazil) (formerly Latin America (excluding Brazil)). In the year ended December 31, 2014, in order to better reflect the geographical segmentation of our business we included results from Mexico in the North America segment (formerly the United States segment). The information by geographic areas for the years ended December 31, 2013 and 2012 has been presented according to the new geographic segmentation.
Comparison of Years Ended December 31, 2014 and December 31, 2013
Revenue
Revenue decreased by 1.3% to €7,150.6 million for the year ended December 31, 2014 from €7,245.1 million in the year ended December 31, 2013. On a constant currency basis, revenue for the year ended December 31, 2014 would have been €7,304.8 million, representing an increase of €59.7 million, or 0.8%, compared to the previous year. The decrease in consolidated revenues was due to the decrease in revenue contribution from our Engineering and Construction segment, partially offset by an increase in our Concessions-Type Infrastructure and Industrial Production activities in 2014 compared to 2013.
Within our Engineering and Construction activity, revenues decreased by 6.6% to €4,514.5 million for the year ended December 31, 2014 from €4,831.7 million for the year ended December 31, 2013. The decrease in revenues was primarily attributable to the lower activity of construction resulting from the completion of the 280 MW Solana plant in Arizona (€224 million decrease year-over-year) and the 280 MW
154
Table of Contents
Mojave thermo-solar plant in California (€312 million decrease year-over-year), the completion of the Solaben 1 and Solaben 6 thermo-solar plants in Spain (€280 million decrease year-over-year), the completion of the Palmatir wind farm in Uruguay (€64 million decrease year-over-year), lower construction activity on the Kaxu and Khi thermo-solar plants in South Africa (€189 million decrease year-over-year), and lower construction activity on the transmission lines in Brazil (€235 million decrease year-over-year). This effect was partially offset by higher construction activity related to the Atacama thermo-solar plants in Chile (€757 million increase year-over year) and the co-generation plants in Mexico (€226 million increase year-over year). Consistent with IFRS 5,Non-Current Assets Held for Sale and Discontinued Operations, when accounting for transactions with our discontinued subsidiaries, services provided to Abengoa Yield are recorded as revenues given that Abengoa Yield is classified as discontinued operations in both years, and a corresponding elimination in the same amount is recorded in the heading "Profit (loss) from discontinued operations, net of tax."
Our Concession-Type Infrastructures activity has also continued its growth path, showing a 30.0% increase in the year ended December 31, 2014 compared to the prior year, which was due to the entry into operation of new assets and the strong performance of assets already in operation. In 2014, we brought two assets into operation, which have contributed to the expansion of this segment. Revenue from our Solar segment increased by 29.6% to €335.2 million for the year ended December 31, 2014, from €258.7 million for year ended December 31, 2013. The increase was mainly attributable to the larger contribution from solar plants that entered into operation in Spain in the fourth quarter of 2013 (Solaben 1 and 6) and improved performance of the Spanish solar plants previously in operation. Revenue from our Transmission segment increased by 92.3% to €91.4 million for the year ended December 31, 2014, from €47.5 million for the year ended December 31, 2013. The increase was primarily attributable to the entry into operation of the Norte Brazil power transmission line (Brazil), which covers 2,375 km, as well as the larger contribution from the power transmission line in Manaus (Brazil), which covers 586 km. Revenue in our Water segment has remained relatively stable at €40.8 million for the year ended December 31, 2014 compared with €40.2 million for the year ended December 31, 2013. Revenue in our Co-generation and other segment decreased by 15.6% to €32.0 million for the year ended December 31, 2014, from €38.0 million for the year ended December 31, 2013. This decrease was mainly due to the Spanish government's regulatory reforms of the electricity sector, given that after the reform a greater portion of the income is a fixed remuneration that was lower than the amount received in the previous year.
Revenue from our Industrial Production activity increased by 5.3% to €2,136.7 million for the year ended December 31, 2014, from €2,029.1 million for the year ended December 31, 2013. The increase was mainly due to an increase in volume of ethanol sold in Europe and in the United States and due to an increase in volume of sugar sold in Brazil.
155
Table of Contents
Revenue by geographic regions
The following table sets forth our revenue for the years ended December 31, 2014 and 2013 by geographic region.
| | | | | | | | | | | | | |
| | For the Years ended December 31, | |
|---|
| | 2014 | | 2013 | |
|---|
| |
| | % of
revenues | |
| | % of
revenues | |
|---|
| | (€ in millions)
| |
| | (€ in millions)
| |
| |
|---|
Consolidated Revenue by Geography | | | | | | | | | | | | | |
Spain | | | 889.1 | | | 12.4 | | | 1,129.3 | | | 15.6 | |
North America | | | 2,253.6 | | | 31.5 | | | 2,670.4 | | | 36.9 | |
Europe (excluding Spain) | | | 892.9 | | | 12.5 | | | 863.3 | | | 11.9 | |
Brazil | | | 874.7 | | | 12.2 | | | 726.0 | | | 10.0 | |
South America (excluding Brazil) | | | 1,301.8 | | | 18.3 | | | 689.6 | | | 9.5 | |
Other countries | | | 938.5 | | | 13.1 | | | 1,166.5 | | | 16.1 | |
| | | | | | | | | | | | | | |
Total | | | 7,150.6 | | | 100.0 | | | 7,245.1 | | | 100.0 | |
| | | | | | | | | | | | | | |
| | | | | | | | | | | | | | |
| | | | | | | | | | | | | | |
Revenue from our international operations (all activities outside of Spain) increased by 2.4% to €6,261.5 million for the year ended December 31, 2014, compared to €6,115.8 million for the previous year. Our international operations accounted for 87.6% of our total revenue, with the Americas (South America, Brazil and North America) representing 62.0% of our total revenue and North America representing the largest geographic region with 31.5% of our total revenue.
Spain. Revenue decreased by 21.3% to €889.1 million for year ended December 31, 2014, from €1,129.3 million for the year ended December 31, 2013. This decline was primarily attributable to the decrease in revenues from the completion of the construction of solar plants in Spain (Solaben 1 and 6). This effect was partially offset by the entry into operation of solar plants during the fourth quarter of 2013 and by the increase in our Biofuels segment due to higher volumes of ethanol sold.
North America. Revenue decreased by 15.6% to €2,253.6 million for the year ended December 31, 2014, from €2,670.4 million for the year ended December 31, 2013. The decrease in revenue was primarily attributable to lower construction activity in the United States due to the completion of the Solana and Mojave plants. The decrease was partially offset by higher construction activity in our co-generation plant in Mexico and the year-over-year increase in our Biofuels segment in North America due to the increase in the volume of ethanol sold.
Europe (excluding Spain). Revenue increased by 3.4% to €892.9 million for the year ended December 31, 2014, from €863.3 million for the year ended December 31, 2013. The increase in revenue was primarily attributable to higher volumes of biofuels sold in 2014 compared to the previous year, since our ethanol plant in Rotterdam was closed during the first quarter of 2013.
Brazil. Revenue increased by 20.5% to €874.7 for the year ended December 31, 2014, from €726.0 million for the year ended December 31, 2013. This increase was mainly due to higher activity in the construction of new transmission lines in Brazil, partially offset by the completion of large projects such as Norte Brazil and Manaus in 2014 and 2013, respectively, and higher sugar sales from our Industrial Production activity.
South America (excluding Brazil). Revenue increased by 88.8% to €1,301.8 million for the year ended December 31, 2014, from €689.6 million for the year ended December 31, 2013. The increase in revenue was primarily attributable to the construction of Atacama thermo-solar plants in Chile.
156
Table of Contents
Other (remaining overseas markets). Revenue decreased by 19.5% to €938.5 million for the year ended December 31, 2014, from €1,166.5 million for the year ended December 31, 2013. The decrease in revenue was primarily attributable to the lower construction activity at our two thermo-solar plants in South Africa.
Other operating income
The following table below sets forth our other operating income for the years ended December 31, 2014 and 2013.
| | | | | | | |
| | For the
Years ended
December 31, | |
|---|
| | 2014 | | 2013 | |
|---|
| | (€ in millions)
| |
|---|
Other operating income | | | | | | | |
Work performed by the entity and capitalized, and other | | | 76.0 | | | 322.3 | |
Grants | | | 16.7 | | | 17.8 | |
Income from various services | | | 95.5 | | | 101.3 | |
| | | | | | | | |
Total | | | 188.3 | | | 441.4 | |
| | | | | | | | |
| | | | | | | | |
| | | | | | | | |
Other operating income decreased by 57.3% to €188.3 million for the year ended December 31, 2014, from €441.4 million for the year ended December 31, 2013. This decrease is mainly due to the non-recurrence of the gain obtained in 2013 from the sale of our Brazilian subsidiary, Bargoa, S.A., which amounted to €34.2 million before taxes, and income in 2013 of €141.8 million, corresponding to a favorable award in arbitrations against Adriano Gianetti Dedini Ometto and Adriano Ometto Agrícola, Ltda. See "Item 8.A—Legal Proceedings." The income from this award was recorded in 2013 under the heading "Work performed by the entity and capitalized and other". Additionally, the decrease in other operating income was due to a lower capitalized amount in the construction of our own assets.
Raw materials consumed
Raw materials consumed decreased by 8.7% to €4,083.1 million for the year ended December 31, 2014, from €4,469.9 million for the year ended December 31, 2013, due to the decrease in revenue in our Engineering and Construction activity. Raw materials consumed decreased as a percentage of revenue to 57.1% in 2014 from 61.7% in the previous year. This decrease was mainly due to a lower contribution to the revenue mix from construction, an activity which is intensive in raw materials, and to a higher contribution to the revenue mix from our Concession-Type Infrastructure activity.
Employee benefits expenses
Employee benefits expenses increased by 15.4% to €871.9 million for the year ended December 31, 2014, from €755.4 million for the year ended December 31, 2013. This increase was attributable to growth in our employee headcount during the period, mainly in our engineering and construction operations due to the fact that we carried out less work through subcontractors. Also, as result of this shift, our independent professional services expenses, which are accounted for under other operating expenses, decreased as a percentage of revenues.
Depreciation, amortization and impairment charges
Depreciation, amortization and impairment charges decreased by 8.0% to €474.9 million for the year ended December 31, 2014, from €516.4 million for the year ended December 31, 2013. The decrease is mainly due to the depreciation of the Brazilian real average exchange rate in 2014 and higher receivables
157
Table of Contents
impairment recorded in 2013 compared to 2014, partially offset by the entry into operation of new assets in our Solar segment in the fourth quarter of 2013 (Solaben 1 and 6).
Other operating expenses
The following table below sets forth our other operating expenses for the years ended December 31, 2014 and 2013.
| | | | | | | | | | | | | |
| | For the Years ended December 31 | |
|---|
| | 2014 | | 2013 | |
|---|
| |
| | % of
revenue | |
| | % of
revenue | |
|---|
| | (€ in millions)
| |
| | (€ in millions)
| |
| |
|---|
Other operating expenses | | | | | | | | | | | | | |
Research and development costs | | | 8.7 | | | 0.1 | | | 6.5 | | | 0.1 | |
Leases and fees | | | 122.5 | | | 1.7 | | | 110.8 | | | 1.5 | |
Repairs and maintenance | | | 71.2 | | | 1.0 | | | 64.7 | | | 0.9 | |
Independent professional services | | | 265.8 | | | 3.7 | | | 488.7 | | | 6.7 | |
Transportation | | | 78.7 | | | 1.1 | | | 75.4 | | | 1.0 | |
Supplies | | | 115.5 | | | 1.6 | | | 123.7 | | | 1.7 | |
Other external services | | | 167.4 | | | 2.3 | | | 157.3 | | | 2.2 | |
Taxes | | | 85.5 | | | 1.2 | | | 71.0 | | | 1.0 | |
Other management expenses | | | 61.6 | | | 0.9 | | | 103.4 | | | 1.4 | |
| | | | | | | | | | | | | | |
Total | | | 976.9 | | | 13.6 | | | 1,201.5 | | | 16.5 | |
| | | | | | | | | | | | | | |
| | | | | | | | | | | | | | |
| | | | | | | | | | | | | | |
Other operating expenses decreased by 18.7% to €976.9 million for the year ended December 31, 2014, from €1,201.5 million for the year ended December 31, 2013. This decrease is due to a decrease in independent professional services caused mainly by the fact we carried out less work through subcontractors in our Engineering and Construction activity.
Operating profit
Operating profit increased by 24.3% to €933.2 million for the year ended December 31, 2014, from €751.0 million for the year ended December 31, 2013. Operating profit also increased as a percentage of revenues, to 13.1% during the year ended December 31, 2014 from 10.4% during the year ended December 31, 2013, mainly due to the reduction in the raw materials and consumables used and the decline in other operating expenses as a percentage of revenues, as explained above.
Finance income
The following table below sets forth our finance income for the years ended December 31, 2014 and 2013.
| | | | | | | |
| | For the
Years ended
December 31, | |
|---|
| | 2014 | | 2013 | |
|---|
| | (€ in millions)
| |
|---|
Finance income | | | | | | | |
Income from loans and debts | | | 45.2 | | | 38.1 | |
Gains from interest-rate derivatives: cash flow hedges | | | 15.7 | | | 28.4 | |
Gains from interest-rate derivatives: non-hedging | | | 1.2 | | | 0.5 | |
| | | | | | | | |
Total | | | 62.1 | | | 67.0 | |
| | | | | | | | |
| | | | | | | | |
| | | | | | | | |
158
Table of Contents
Finance income decreased by 7.4% to €62.1 million for the year ended December 31, 2014, from €67.0 million for the year ended December 31, 2013. The decrease is primarily due to lower income from our cash flow hedge interest-rate derivatives, mainly due to a higher fair value in 2013 of our interest rate options resulting from a decrease in expected future interest rates, partially offset by an increase in income from loans and debts from our term deposits in Brazil.
Finance expenses
The following table below sets forth our finance expenses for the years ended December 31, 2014 and 2013.
| | | | | | | |
| | For the
Years ended
December 31, | |
|---|
| | 2014 | | 2013 | |
|---|
| | (€ in millions)
| |
|---|
Finance expenses | | | | | | | |
Expenses due to interest: | | | | | | | |
—Loans from credit entities | | | 257.0 | | | 229.4 | |
—Other debts | | | 376.5 | | | 269.9 | |
Losses from interest-rate derivatives: cash flow hedges | | | 92.3 | | | 83.9 | |
Losses from interest-rate derivatives: non-hedging | | | 19.6 | | | — | |
| | | | | | | | |
Total | | | 745.4 | | | 583.2 | |
| | | | | | | | |
| | | | | | | | |
| | | | | | | | |
Finance expenses increased by 27.8% to €745.4 million for the year ended December 31, 2014, from €583.2 million for the year ended December 31, 2013. The increase was mainly due to higher interest expense from loans and borrowings as a result of the completion of various projects under construction (interest expense is capitalized when a project is under construction). The interest expense from other debts increased mainly due to new notes issued in the last quarter of 2013 and the first quarter of 2014, and the negative impact of interest rate derivatives classified as non-hedging.
Net exchange differences
The following table below sets forth our exchange differences for the years ended December 31, 2014 and 2013.
| | | | | | | |
| | For the
Years ended
December 31, | |
|---|
| | 2014 | | 2013 | |
|---|
| | (€ in millions)
| |
|---|
Net exchange differences | | | | | | | |
Gains and losses from foreign exchange transactions | | | (6.5 | ) | | 0.3 | |
Gains and losses from foreign exchange contracts: cash flow hedges | | | 11.2 | | | (4.2 | ) |
Gains and losses from foreign exchange contracts: non-hedging | | | 0.3 | | | 0.3 | |
| | | | | | | | |
Total | | | 5.0 | | | (3.5 | ) |
| | | | | | | | |
| | | | | | | | |
| | | | | | | | |
Net exchange differences remained relatively stable period-over-period at low levels, representing 0.1% of revenues for the year ended December 31, 2014 and 0.05% of for the year ended December 31, 2013. In general, we use exchange rate derivatives to hedge our foreign exchange operations. As a result, and due to the application of hedge accounting, most of our exchange rate differences are offset by the effect of our cash flow hedge derivatives. The increase in net exchange differences for the year ended December 31, 2014
159
Table of Contents
was mainly due to different hedges in several subsidiaries that have not been offset perfectly with the differences generated by the hedged item.
Other net finance income/expenses
| | | | | | | |
| | For the
Years ended
December 31. | |
|---|
| | 2014 | | 2013 | |
|---|
| | (€ in millions)
| |
|---|
Other finance income | | | | | | | |
Profits from the sale of financial assets | | | 0.4 | | | 0.1 | |
Income on financial assets | | | 1.7 | | | 0.6 | |
Other finance income | | | 13.1 | | | 18.4 | |
Changes in the fair value of the derivatives embedded in the convertible bonds and options over shares | | | — | | | 75.6 | |
Hedging derivatives gains: Cash flow hedge | | | — | | | 0.2 | |
Gains from commodities forward contracts: non-hedging | | | — | | | — | |
Total | | | 15.2 | | | 94.9 | |
| | | | | | | | |
Other finance expenses | | | | | | | |
Losses from sale of financial assets | | | (11.3 | ) | | (0.4 | ) |
Outsourcing of payables | | | (84.8 | ) | | (81.2 | ) |
Other finance expenses | | | (81.1 | ) | | (110.7 | ) |
Changes in the fair value of derivatives embedded in the convertible bonds and options over shares | | | (9.6 | ) | | — | |
Losses from partial repayment of the convertible notes due 2014 | | | — | | | (12.0 | ) |
Commodity derivative losses: cash flow hedges | | | — | | | — | |
Loss from commodities forward contracts: non-hedging | | | (4.9 | ) | | (9.9 | ) |
Total | | | (191.7 | ) | | (214.2 | ) |
| | | | | | | | |
Other net finance income/expenses | | | (176.5 | ) | | (119.2 | ) |
| | | | | | | | |
| | | | | | | | |
| | | | | | | | |
Other net finance expense increased to €176.5 million for the year ended December 31, 2014, from €119.2 million for the year ended December 31, 2013.
For the year ended December 31, 2014, total other finance income decreased by 84.0% to €15.2 million, from €94.9 in the previous year. This decrease is mainly due to the change in fair value of embedded derivatives of convertible bonds, net of the change in the fair value of the call options over our own shares that hedge the embedded derivatives, which amounted to a €9.6 million loss recorded under the heading "Other finance expenses" for the year ended December 31, 2014, as compared to a profit of €75.6 million in the period year.
Total other finance expenses decreased by 10.5% to €191.7 million for the year ended December 31, 2014 compared to €214.2 million for the year ended December 31, 2013. The decrease is mainly due to lower banking fees and commissions, the change in fair value of the derivative embedded in the convertible loan received as part of the consideration for the sale of the shareholding in Befesa, and losses from changes in the fair value of the embedded derivatives in our convertible bonds due 2017 and call options as discussed above, partially offset by losses incurred in 2013 by the partial repurchase of our convertible bonds due 2014 and financial losses due to a higher volume of uncollectible financial accounts with partners projects in South America recorded in 2013.
Finance expense net
Finance expense net increased by 33.8% to €854.8 million for the year ended December 31, 2014, from €638.9 million for the year ended December 31, 2013. The increase in finance expense net was attributable to the aforementioned changes in Finance income, Finance expenses, Net exchange differences and Other net finance income/expenses.
160
Table of Contents
Profit (loss) before income tax
Profit before income tax decreased to €85.4 million for year ended December 31, 2014, from €106.9 million for the year ended December 31, 2013. This decrease was attributable to the aforementioned results of the year.
Income tax benefit/expense
We had an income tax benefit of €58.7 million for the year ended December 31, 2014, compared to an income tax benefit of €26.2 million for the year ended December 31, 2013, although we actually received income tax for an amount of €8.6 million in 2014 and we paid €12.1 million in 2013. The subsidiaries within the consolidated group that generate profits usually generate income tax expenses and pay taxes, whereas companies with negative taxable income recognize income tax benefit but they do not obtain a tax refund; instead, they generate tax loss carryforwards that can be offset in future periods. Different types of tax credits generate an income in the income tax expense calculation but they do not reduce the amount of income tax paid in the current period. Rather, they reduce the amount payable in the future.
For the year ended December 31, 2014, Income tax benefit corresponded primarily to the recognition of certain Spanish export tax incentives generated in the period related to the export of goods and services from Spain (a positive impact of €201 million) and tax benefits that we generated in the period from the application of a tax incentive for the transfer of the use of intangible assets, as specified in Article 23 of the repealed Spanish Corporate Income Tax Act (a positive impact of €5 million). This benefit results in a direct deduction from taxable income of 50% of the revenue generated from granting the use of the related intangible assets (i.e. licensing revenue, etc.). In addition, in 2014, net operating losses have been generated but they have not been recorded considering that their future recoverability is not sufficiently assured and part of the net operating losses recognized in prior years have been reversed (a negative impact of €56 million). Because of the entry into force in Spain of the modification of the general tax rate to 28% in 2015 and to 25% in 2016 onwards (the tax rate applicable in 2014 was 30%), the negative impact was €49 million. There were differences in foreign tax rates related to companies based in jurisdictions with statutory tax rates different from Spanish statutory tax rate (a positive impact of €13 million). Finally, we have recorded other non-taxable income and expense which include, among other things, permanent differences arising in different jurisdictions (a negative impact of €5 million).
Profit (loss) from discontinued operations, net of tax
In the years ended December 31, 2014 and 2013 and according to IFRS 5,Non-Current Assets Held For Sale and Discontinued Operations, we recorded the results from Abengoa Yield, amounting to a €22.2 million loss net of tax, and a €22.1 million loss, net of tax, respectively as discontinued operations.
For the year ended December 31, 2013, and according to IFRS 5,Non-Current Assets Held For Sale and Discontinued Operations, we recorded the results from the Befesa Sale, amounting to a €0.6 million loss net of tax as discontinued operations.
Profit attributable to non-controlling interests
Profit attributable to non-controlling interests increased to €3.4 million for the year ended December 31, 2014, from a loss of €8.9 million for the year ended December 31, 2013. The increase is mainly due to lower from Rioglass Group, Procesos Ecológicos Vilches, S.A. and our construction activities in Brazil and South Africa.
161
Table of Contents
Profit attributable to the parent company
Profit attributable to the parent company increased by 23.5% to €125.3 million for the year ended December 31, 2014, compared to €101.4 million for the year ended December 31, 2013. This increase was attributable to the results explained above.
Total comprehensive income
Total comprehensive income was €58.0 million for the year ended December 31, 2014, compared to total comprehensive loss of €253.3 million for the year ended December 31, 2013, due to the increases in Profit for the year and Other comprehensive income as explained above.
Other comprehensive loss was €63.9 million for the year ended December 31, 2014, compared to other comprehensive loss of €363.7 million for the year ended December 31, 2013. The increase was mainly due to translation differences in equity, which corresponds mainly to an increase in 2014 from our subsidiaries with the U.S. Dollar as their functional currency, which experienced an appreciation against the euro during the period, and a decrease in 2013 from our subsidiaries with the Brazilian real as their functional currency, which experienced a depreciation against the euro during the year. The increase was partially offset by the increase in fair value of cash flow hedges recorded directly in equity which correspond mainly to interest rate derivatives. These losses are principally related to long-term swaps maturing in 2020 and subsequent years, which are very sensitive to changes in interest rates and which have fixed rates payable that are higher than the expected variable interest rate receivable. Additionally, €21.4 million corresponds to the amounts related to cash flow hedges transferred to income statements during 2104 compared to €62.2 million in 2013.
In year ended December 31, 2013, we recorded €89.9 million directly in equity corresponding to the change in fair value of cash flow hedges, mostly corresponding to interest rate derivatives. The impact was mainly due to long-term swaps maturing in 2020 and subsequent years. This effect was offset by negative translation differences recorded in equity for an amount of €483.8 million which corresponds mainly to our subsidiaries with the Brazilian real as their functional currency, which experienced a depreciation against the euro during the period.
Comparison of Years Ended December 31, 2013 and December 31, 2012
Revenue
Revenue increased by 15.3%, to €7,245.1 million for the year ended December 31, 2013, from €6,285.6 million for the year ended December 31, 2012. On a constant currency basis, revenue for the year ended December 31, 2013 would have been €7,522.2 million, representing an increase of €1,236.6 million, or 19.7%, compared to the previous year. The increase in consolidated revenues was due to the increased revenue contribution from most of our operating segments for the year 2013 versus the previous year, and was mostly attributable to the Engineering and Construction business.
Within Engineering and Construction, revenues increased by €1,042.5 million due to the ongoing construction of the two thermo-solar plants in South Africa (a 100 MW CSP plant and a 50 MW Solar tower technology CSP plant, causing a €434.5 million increase year-over-year), of the 200 MW PV plant in Imperial Valley, California (€236 million increase year-over-year), of the Mojave thermo-solar plant in the United States (the 280 MW solar plant in California, causing a €126.7 million increase year-over-year), of the co-generation plants in Mexico (a €106.6 million increase year-over-year), of the 450 MW combined cycle plant in Poland (a €100.0 million increase year-over-year) and of the wind farms in Uruguay (a €78.2 million increase year-over-year).These effects were partially offset by a lower contribution of the Solana 280 MW solar plant in Arizona (a €415 million decrease year-over-year) and a lower activity of construction of transmission lines in Brazil, given that 2012 was a year of very high execution with large projects such as Norte Brazil and Manaus (a €9.7 million decrease year-over-year).
162
Table of Contents
Our Concession-Type Infrastructures activity continued its growth path showing a 7.3% increase in the year 2013 with respect to the prior year, which was due to a solid performance in our four segments. In 2013, we brought into operation two assets which have contributed to the expansion of this segment. Revenues from our Solar segment decreased 0.4%, mainly due to lower income from our Spanish solar plants due to adverse government energy reforms in Spain, as well as poor weather conditions registered during the first quarter of 2013, partially offset by higher revenues from the solar plants that entered into operation in the fourth quarter of 2013 (Solaben 1 and Solaben 6 in Spain) and to the larger contribution of solar plants that entered into operation in 2012 (Helios 1 and Helios 2). Revenues in our Transmission segment increased by 93.9% up to €47.5 million for the year 2013 from €24.4 million for the previous year. This increase is mainly attributable to the entry into operation during the first quarter of 2013 of the power transmission line in Manaus which covers 586 km.
Our Water segment also increased by 94.2%, achieving growth of €19.5 million year-over-year, mostly due to the entry into operation in the first quarter of 2013 of the desalination plant in Qingdao (China). Finally, revenues in our Co-generation segment decreased by €15.2 million, to €38.0 million in the year 2013, compared to the previous year due to adverse government energy reforms in Spain.
Revenue from our Industrial Production activity decreased during the year 2013 when compared to the previous year by 5.1%. Revenues decreased mainly due to the decrease in volumes sold in Europe and the decrease in ethanol prices in Europe, partially offset by the increase in ethanol prices in the United States. In Brazil, revenues have remained stable year-over-year.
Revenue by geographic regions
The following table sets forth our revenue for the years ended December 31, 2013 and 2012 by geographic region.
| | | | | | | | | | | | | |
| | For the Years ended December 31, | |
|---|
| | 2013 | | 2012 | |
|---|
| |
| | % of
revenues | |
| | % of
revenues | |
|---|
| | (€ in millions)
| |
| | (€ in millions)
| |
| |
|---|
Consolidated Revenue by Geography | | | | | | | | | | | | | |
Spain | | | 1,129.3 | | | 15.6 | | | 925.0 | | | 14.7 | |
North America | | | 2,670.4 | | | 36.9 | | | 2,569.3 | | | 40.9 | |
Europe (excluding Spain) | | | 863.3 | | | 11.9 | | | 877.8 | | | 14.0 | |
Brazil | | | 726.0 | | | 10.0 | | | 986.6 | | | 15.7 | |
South America (excluding Brazil) | | | 689.6 | | | 9.5 | | | 522.3 | | | 8.3 | |
Other countries | | | 1,166.5 | | | 16.1 | | | 404.6 | | | 6.4 | |
| | | | | | | | | | | | | | |
Total | | | 7,245.1 | | | 100.0 | | | 6,285.6 | | | 100.0 | |
| | | | | | | | | | | | | | |
| | | | | | | | | | | | | | |
| | | | | | | | | | | | | | |
Revenue from our international operations (all activities outside of Spain) increased by 14.1% to €7,245.1 million for the year ended December 31, 2013 compared to the previous year. Our international operations accounted for 84.4% of revenue with the Americas (South America, Brazil and North America) representing 56.4% of total revenue and North America representing the largest geographic region with 36.9% of revenue.
Spain. Revenue increased by 22.1% to €1,129.3 million for the year ended December 31, 2013, from €925.0 million for the year ended December 31, 2012. The increase in revenues was primarily attributable to the solar plants that entered into operation in the fourth quarter of 2013 (Solaben 1 and Solaben 6), to the larger contribution of solar plants that entered into operation in 2012 (Helios 1, Helios 2, Solaben 2 and Solaben 3) and to the increase in ethanol volumes sold in the Biofuels segment. This increase was partially
163
Table of Contents
offset by adverse government energy reforms in Spain, as well as poor weather conditions registered during the first quarter of 2013.
North America. Revenue increased by 3.9% to €2,670.4 million for the year ended December 31, 2013 from €2,569.3 for the year ended December 31, 2012. The decrease in revenue was primarily attributable to the lower contribution of the construction of the Solana solar plant in Arizona which entered into operation in the last quarter of 2013. This effect was partially offset by the construction of the 200MW PV plant in the Imperial Valley of California, which resulted in an increase of €236 million year-over-year, the construction of the Mojave solar power plant, which resulted in a €126.7 million increase year-over-year and the increase in sales of solar components, such as technology and mirrors used in the construction of the mentioned U.S. solar plants. Revenues also increased in our biofuels segment in North America year-over-year.
Europe (excluding Spain). Revenue decreased by 1.6% to €863.3 million for the year ended December 31, 2013, from €877.8 million for the year ended December 31, 2012. The decrease was primarily attributable to the decrease in revenues in our Biofuels segment due to lower volumes sold and to the decrease in ethanol prices. This effect was partially offset by the construction of the 450 MW combined cycle plant in Poland.
South America (excluding Brazil). Revenue increased by 32.0% to €689.6 million for the year ended December 31, 2013, from €522.3 million for the year ended December 31, 2012. The increase in revenue was primarily attributable to revenue from the wind farms in Uruguay and the transmission lines in Peru and Chile.
Brazil. Revenue decreased by 26.4% to €726.0 million for the year ended December 31, 2013, from €986.6 million for the year ended December 31, 2012. The decrease in revenue was due to a lower activity of construction of transmission lines in Brazil, given that 2012 was a year of very high execution, with large projects such as Norte Brazil and Manaus. This decrease has been partially offset by the increase in revenues caused by the entry in operation of the Manaus transmission line. In addition, we have signed several new transmission line projects in the region that are expected to contribute to future years' revenues.
Other (remaining overseas markets). Revenue increased by 188.3% to €1,166.5 million for the year ended December 31, 2013, from €404.6 million for the year ended December 31, 2012. The increase in revenue was primarily attributable to the construction of the two thermos-solar plants in South Africa, a 100 MW CSP plant and a 50 MW Solar tower technology CSP plant, causing a €434.5 million increase year-over-year, and to the entry into operation in the first quarter of 2013 of the desalination plant in Qingdao (China) of 100,000 m3/day.
Other operating income
| | | | | | | |
| | For the Years
ended
December 31. | |
|---|
| | 2013 | | 2012 | |
|---|
| | (€ in millions)
| |
|---|
Other operating income | | | | | | | |
Work performed by the entity and capitalized and other | | | 322.3 | | | 367.8 | |
Grants | | | 17.8 | | | 13.8 | |
Income from various services | | | 101.3 | | | 100.3 | |
| | | | | | | | |
Total | | | 441.4 | | | 481.9 | |
| | | | | | | | |
| | | | | | | | |
| | | | | | | | |
Other operating income decreased by 8.4% to €441.4 million for the year ended December 31, 2013, from €481.9 million for the year ended December 31, 2012. The heading 'Work performed by the entity and
164
Table of Contents
capitalized and other' in 2013 includes income of €141.8 million corresponding to a favorable award in arbitrations against Adriano Gianetti Dedini Ometto and Adriano Ometto Agrícola, Ltda. See "Item 8.A.—Legal Proceedings." In the year 2012, this heading also included income of €26 million recorded by Abengoa Bioenergy U.S. Holding in the last quarter of 2012, corresponding to a collection from Chicago Title Insurance Company after a favorable jury verdict in litigation against that company. The decrease in 2013 in Other operating income when compared to 2012 was mainly due to a lower amount capitalized in the construction of our own assets and to the fact that in 2012 we recorded a €85 million gain arising from the business combination of Rioglass Group. Additionally, Income from various services for the year 2013 primarily includes the gain obtained in the sale of our Brazilian subsidiary Bargoa, S.A. amounting to €33.2 million.
Raw materials consumed
Raw materials consumed increased by 5.3% to €4,469.9 million for the year ended December 31, 2013, from €4,244.7 million for the year ended December 31, 2012, due to the increase in revenue in our activities. Raw materials consumed decreased as a percentage of revenue to 61.7% for the year ended December 31, 2013 from 67.5% for the year ended December 31. 2012. This decrease was mainly due to a lower contribution to the revenue mix from the construction, an activity which is intensive in raw materials, and to a higher contribution to the revenue mix from our Concession-Type Infrastructures activity.
Employee benefits expenses
Employee benefit expenses increased by 6.7% to €755.4 million for the year ended December 31, 2013, from €708.0 million for the year ended December 31. 2012. This was due to an increase in employee headcount in the period (excluding the effect of the sale of Befesa), mainly due to a net increase in our construction operations. In addition, the commencement of operations of the new solar plants in Spain that came into operation during 2013 have also increased our employee benefits expenses in our Solar segment.
Employee benefit expenses have decreased as a percentage of revenue, standing at 10.4% for the year ended December 31, 2013, compared to 11.3% in 2012.
Depreciation, amortization and impairment charges
Depreciation. amortization and impairment charges increased by 27.1% to €516.4 million for the year ended December 31, 2013, from €406.3 million for the year ended December 31, 2012. Depreciation and amortization charges also increased as a percentage of revenue to 7.1% in 2013 from 6.5% in 2012. The increase is mainly due to an increase in the depreciation and amortization in our Solar segment, as a result of the beginning of the amortization of the solar plants that entered into operation in the fourth quarter of 2013 (Solaben 1, Solaben 6) and to the larger contribution of solar plant that entered into operation in the first half of 2012 (Helios 1) and in the second half of 2012 (Helios 2). Depreciation and amortization also increased in Transmission lines mainly due to the Manaus transmission line in Brazil, which entered into operations in the first quarter of 2013. Additionally, in 2013, we recorded receivables impairments of €31.9 million that mostly correspond to public clients in Spain and abroad, against whom the corresponding claims have been made for the amounts owing from various construction projects, supported by the Company's formal procedures where possible. Given the uncertainty in relation to the future recoverability of these receivables, due to various factors but most of which are beyond the Company's control, we have decided to make the corresponding provision.
165
Table of Contents
Other operating expenses
The following table below sets forth our other operating expenses for the years ended December 31, 2013 and 2012.
| | | | | | | | | | | | | |
| | For the Years ended December 31 | |
|---|
| | 2013 | | 2012 | |
|---|
| |
| | % of
revenue | |
| | % of
revenue | |
|---|
| | (€ in millions)
| |
| | (€ in millions)
| |
| |
|---|
Other operating expenses | | | | | | | | | | | | | |
Research and development costs | | | 6.5 | | | 0.1 | | | 6.4 | | | 0.1 | |
Leases and fees | | | 110.8 | | | 1.5 | | | 99.8 | | | 1.4 | |
Repairs and maintenance | | | 64.7 | | | 0.9 | | | 66.1 | | | 0.9 | |
Independent professional services | | | 488.7 | | | 6.8 | | | 283.9 | | | 3.9 | |
Transportation | | | 75.4 | | | 1.1 | | | 77.5 | | | 1.1 | |
Supplies | | | 123.7 | | | 1.7 | | | 101.6 | | | 1.4 | |
Other external services | | | 157.3 | | | 2.2 | | | 138.7 | | | 1.9 | |
Taxes | | | 71.0 | | | 1.0 | | | 53.4 | | | 0.7 | |
Other management expenses | | | 103.4 | | | 1.4 | | | 80.2 | | | 1.1 | |
| | | | | | | | | | | | | | |
Total | | | 1,201.5 | | | 16.7 | | | 907.6 | | | 12.5 | |
| | | | | | | | | | | | | | |
Other operating expenses increased by 32.4% to €1,201.5 million for the year ended December 31, 2013, from €907.6 million for the year ended December 31, 2012, which is primarily due to an increase in independent professional services because of increases in operations across all of our activities, especially in the construction activity in the United States.
Operating profit
Operating profit increased by 44.3% to €751.0 million for the year ended December 31, 2013, from €520.6 million for the year ended December 31, 2012. Operating profit has increased as a percentage of revenues, to 10.4% during the year ended December 31, 2013 from 8.3% during the year ended December 31, 2012. The increase in operating profit for the year 2013, compared to 2012, was mainly due to a 15.3% increase in revenue and to a smaller increase in our operating expenses.
Finance income
The following table below sets forth our finance income for the years ended December 31, 2013 and 2012.
| | | | | | | |
| | For the
Years ended
December 31. | |
|---|
| | 2013 | | 2012 | |
|---|
| | (€ in millions)
| |
|---|
Finance income | | | | | | | |
Income from loans and debts | | | 38.1 | | | 77.3 | |
Gains from interest-rate derivatives: cash flow hedges | | | 28.4 | | | 10.2 | |
Gains from interest-rate derivatives: non-hedging | | | 0.5 | | | 0.0 | |
| | | | | | | | |
Total | | | 67.0 | | | 87.5 | |
| | | | | | | | |
| | | | | | | | |
| | | | | | | | |
Finance income decreased by 23.4% for the year ended December 31, 2013, to €67.0 million for the year ended December 31, 2013 from €87.5 million for the year ended December 31, 2012. The decrease was
166
Table of Contents
primarily due to lower income from loans and debts from our short-term deposits in Brazil, and was partially offset by higher gains on cash-flow hedge interest-rate derivatives, mainly due to the increase in the time value of our interest rate options resulting from an increase in the expected future interest rates.
Finance expenses
The following table below sets forth our finance expenses for the years ended December 31, 2013 and 2012.
| | | | | | | |
| | For the
Years ended
December 31. | |
|---|
| | 2013 | | 2012 | |
|---|
| | (€ in millions)
| |
|---|
Finance expenses | | | | | | | |
Expenses due to interest: | | | | | | | |
—Loans from credit entities | | | 229.4 | | | 208.8 | |
—Other debts | | | 269.9 | | | 219.9 | |
Losses from interest-rate derivatives: cash flow hedges | | | 83.9 | | | 99.2 | |
Losses from interest-rate derivatives: non-hedging | | | — | | | 4.3 | |
| | | | | | | | |
Total | | | 583.2 | | | 532.2 | |
| | | | | | | | |
| | | | | | | | |
| | | | | | | | |
�� Finance expenses increased by 9.6% to €583.2 million for the year ended December 31, 2013, from €532.2 million for the year ended December 31, 2012.
Finance expenses increased in 2013 when compared to 2012 as the result of an increase in interest expenses from loans with credit entities, mainly due to the lower capitalization of interest expenses, as several projects came into operation during 2013 (interest expense is capitalized when a project is under construction). Additionally, interest from other debts increased due to the convertible bonds and ordinary bonds issued during 2013.
Losses from cash flow hedge interest-rate derivatives for the year ended December 31, 2013 and 2012 are mainly due to interest rate swaps where the fixed rate payable is currently higher than the variable interest rate receivable referenced to Euribor. These swaps have an impact in our income statement when interest accrued in the hedged loan is recorded in the consolidated income statement.
Net exchange differences
The following table below sets forth our exchange differences for the years ended December 31, 2013 and 2012.
| | | | | | | |
| | For the
Years ended
December 31. | |
|---|
| | 2013 | | 2012 | |
|---|
| | (€ in millions)
| |
|---|
Net exchange differences | | | | | | | |
Gains and losses from foreign exchange transactions | | | 0.3 | | | 6.8 | |
Gains and losses from foreign exchange contracts: cash flow hedges | | | (4.2 | ) | | (22.9 | ) |
Gains and losses from foreign exchange contracts: non-hedging | | | 0.3 | | | (20.0 | ) |
| | | | | | | | |
Total | | | (3.5 | ) | | (36.1 | ) |
| | | | | | | | |
| | | | | | | | |
| | | | | | | | |
Negative net exchange differences decreased to a net foreign exchange loss of €3.5 million for the year ended December 31, 2013, from a net foreign exchange loss of €36.1 million for the year ended
167
Table of Contents
December 31, 2012. In general, we use exchange rate derivatives to hedge our foreign exchange operations. As a result, most of our exchange rate differences are offset by the effect of our cash-flow hedge derivatives.
Net exchange differences that subsist for the year ended December 31, 2012 are primarily due to a loss from exchange rate derivatives recorded as a result of discontinuing a hedge relationship when the hedged transaction is no longer expected to occur and to inefficiencies in different hedges generating exchange rate differences that have not been perfectly offset with the differences generated by the hedged item.
Other net finance income/expenses
| | | | | | | |
| | For the
Years ended
December 31. | |
|---|
| | 2013 | | 2012 | |
|---|
| | (€ in millions)
| |
|---|
Other finance income | | | | | | | |
Profits from the sale of financial assets | | | 0.1 | | | 1.0 | |
Income on financial assets | | | 0.6 | | | 0.3 | |
Other finance income | | | 18.4 | | | 15.9 | |
Changes in the fair value of the derivatives embedded in the convertible bonds and options over shares | | | 75.6 | | | 9.2 | |
Hedging derivatives gains: Cash flow hedge | | | 0.2 | | | — | |
Hedging derivatives gains: Fair flow hedge | | | — | | | — | |
Total | | | 94.9 | | | 26.4 | |
| | | | | | | | |
| | | | | | | | |
| | | | | | | | |
Other finance expenses | | | | | | | |
Losses from sale of financial assets | | | (0.4 | ) | | — | |
Outsourcing of payables | | | (81.2 | ) | | (88.5 | ) |
Other finance expenses | | | (110.7 | ) | | (75.5 | ) |
Changes in the fair value of the derivatives embedded in the convertible bonds and options over shares | | | — | | | — | |
Losses from partial repayment of the convertible notes due 2014 | | | (12.0 | ) | | — | |
Commodity derivative losses: cash flow hedge | | | — | | | — | |
Loss from commodities forward contracts: non-hedging | | | (9.9 | ) | | (20.3 | ) |
Total | | | (214.2 | ) | | (184.3 | ) |
| | | | | | | | |
Other net finance income/expenses | | | (119.2 | ) | | (157.9 | ) |
| | | | | | | | |
| | | | | | | | |
| | | | | | | | |
Other net finance expense decreased to €119.3 million for the year ended December 31, 2013, from €157.9 million for the year ended December 31, 2012.
In the year ended December 31, 2013, Total other finance income increased to €94.9 million from €26.4 million mainly due to the change in fair value of embedded derivatives of our convertible bonds, net of change in fair value of the call options over our own shares, which hedge the embedded derivatives partially, amounting to a net gain of €75.6 million versus a net gain of €9.2 million in 2012.
Other finance expense increased to €119.3 million for the year ended December 31, 2013 from €184.3 million for the year ended December 31, 2012. This increase was mainly due to the increase in other financial losses due to a higher volume of uncollectible financial accounts with partners in projects in South America, according to the current situation of negotiations, and the impairment of financial investments associated with thermo-solar projects in the United States due to permitting delays. In addition, other financial expenses also increased due to losses from partial repayment of the convertible notes due in 2014. These expenses were partially offset by lower costs of outsourcing supplier payments and lower commodity derivatives losses corresponding to the interruption of the hedging relationship, when the transaction hedged is no longer expected to occur. Additionally, Other finance losses include finance expenses mainly
168
Table of Contents
related to financial guarantees and letters of credit, wire transfers and other bank fees, losses on available for sale financial assets, and other minor finance expenses.
Finance expense net
Finance expense net remained stable at a loss of €638.9 million for the year ended December 31, 2013, compared with a loss of €638.7 million for the year ended December 31, 2012. The change in finance expense net was attributable to the aforementioned change in Finance income, Finance expense, Net exchange differences and Other net finance income/expenses.
Profit (loss) before income tax
Profit before income tax increased to a gain of €106.9 million for the year ended December 31, 2013, compared to a loss of €100.2 million for the year ended December 31, 2012. This increase was attributable to the aforementioned results of the period.
Income tax benefit/expense
We had an income tax benefit of €26.2 million for the year ended December 31, 2013, compared to an income tax benefit of €174.1 million for the year ended December 31, 2012, although we actually paid income tax for an amount of €12.1 million in 2013 and €35.5 million in 2012.
For the year ended December 31, 2013, Income tax benefit corresponded primarily to the recognition of certain Spanish export tax incentives generated in the period related to the export of goods and services from Spain (a positive impact of €80.3 million) and tax benefits that the Company generated in the period from the application of a tax incentive for the transfer of the use of intangible assets, as specified in Article 23 of the Revised Text of the Spanish Corporate Income Tax Act (a positive benefit of €16.0 million). This benefit results in a direct deduction from taxable income of 50% of the revenue generated from granting the use of the related intangible assets (i.e. licensing revenue, etc.). In addition, there were differences in foreign tax rates related to companies based in jurisdictions with statutory tax rates different from Spanish statutory tax rate (a positive impact of €9.0 million). Finally, we have recorded other non-taxable income and expense which include, among other things, tax credits which it has not capitalized and permanent differences arising in other jurisdictions (a negative impact of €37.0 million).
Profit (loss) from discontinued operations net of tax
For the year ended December 31, 2013 and according to IFRS 5,Non-Current Assets Held for Sale and Discontinued Operations, we include the results from Abengoa Yield, amounting to a €22.1 million loss, net of tax, and Befesa, amounting to a €0.6 million loss net of tax as discontinued operations. In the previous year, and according to IFRS 5,Non-Current Assets Held for Sale and Discontinued Operations, we include the results from Abengoa Yield, amounting to a €12.9 million loss, net of tax, and Befesa, amounting to a €32.5 million profit net of tax as discontinued operations.
Profit attributable to non-controlling interests
Profit attributable to non-controlling interests increased to €8.9 million loss for the year ended December 31, 2013, from €38.6 million for the year ended December 31, 2012. The decrease is mainly due to the lower results from Rioglass Group and our construction activities in Brazil.
Profit attributable to the parent company
Profit attributable to the parent company increased by 83.2% to €101.4 million for the year ended December 31, 2013, compared to €55.4 million for the year ended December 31, 2012. This increase was attributable to the results explained above.
169
Table of Contents
Total comprehensive income
Total comprehensive income increased to €(253.4) million for the year ended December 31, 2013, compared to €(263.3) million for the year ended December 31, 2012 due to the increase of profit attributable to the parent company explained above, partially offset by the decrease in Other comprehensive income.
Other comprehensive income decreased by 1.8% to €(363.7) million for the year ended December 31, 2013, compared to €(357.3) million for the year ended December 31, 2012. These amounts are significantly lower than profit attributable to the parent company for each period, mainly due to the impact of change in fair value of cash flow hedges and currency translation differences recognized directly in equity in both periods, as disclosed in our Consolidated Financial Statements.
In the year ended December 31, 2013, we recorded €(483.8) million of translation differences in equity, which corresponds mainly to our subsidiaries with Brazilian real as their functional currency, which experienced a depreciation of 17% against the euro during the year. This effect has been partially offset by the change in fair value of cash flow hedges recorded directly in equity for an amount of €89.9 million. Of this amount, €78.3 million corresponds to interest rate derivatives, mainly interest rate swaps. These profits are principally related to long-term swaps maturing in 2020 and subsequent years, which are very sensitive to changes in interest rates and which have fixed rates payable that are lower than expected variable interest rate receivable. Additionally, €88.9 million corresponds to the amounts transferred to income statements during the period once the hedged items impact the income statement (see Note 14 to our Consolidated Financial Statements and "—Liquidity and Capital Resources—Quantitative and Qualitative Disclosure About Market Risk" for further information on hedging and derivatives).
In the year ended December 31, 2012 we recorded €(237.8) million directly in equity corresponding to change in fair value of cash flow hedges. Of this amount, €(183.1) million corresponds to interest rate derivatives, mainly interest rate swaps. These losses are principally related to long-term swaps maturing in 2020 and subsequent years, which are very sensitive to changes in interest rates and which have fixed rates payable that are higher than current variable interest rate receivable. The rest of the impact of cash flow hedges recorded in equity corresponds mainly to derivatives on commodities for an amount of €(46.2) million during the period, mostly related to derivatives on grain in our Biofuels segment. For both types of derivatives, these effects have been partially offset by the amounts transferred to income statements during the period once the hedged items impact the income statement for a total amount of €96.2 million (see Note 14 to our Consolidated Financial Statements and "—Liquidity and Capital Resources—Quantitative and Qualitative Disclosure About Market Risk" for further information on hedging and derivatives). In addition. during the year 2012 we have also recorded €(256.3) million of translation differences in equity, corresponding mainly to our subsidiaries with Brazilian real as their functional currency, which experienced a depreciation of 11% against the euro during the year.
Segment Reporting
We organize our business into the following three activities—Engineering and Construction, Concession-Type Infrastructures and Industrial Production, which in turn comprise six operating segments:
- •
- Engineering and Construction: relates to our traditional engineering activities in the energy and water sectors, with more than 70 years of experience in the market as well as the development of solar technology. Prior to 2014, our Engineering and Construction activity was comprised of two operating segments: Engineering and Construction, and Technology and Other. Beginning in 2014, we began including the Technology and Other segment with the Engineering and Construction segment in accordance with IFRS 8,Operating Segments. As a result, our Engineering and Construction activity is now comprised of a single operating segment: Engineering and Construction.
170
Table of Contents
This activity is comprised of one operating segment:
- •
- Engineering and Construction—Abengoa is specialized in carrying out complex turn-key projects for thermos-solar plants, solar-gas hybrid plants, conventional generation plants, biofuels plants and water infrastructures, as well as large-scale desalination plants and transmission lines, among others.
- •
- Concession-Type Infrastructure: groups together the Company's proprietary concession assets that generate revenues governed by long term sales agreements, such as take-or-pay contracts, tariff contracts or power purchase agreements. This activity includes the operation of electric (solar, water, co-generation or wind) energy generation plants, desalination plants and transmission lines. These assets generate low demand risk and we focus on operating them as efficiently as possible.
This activity is currently composed of four operating segments:
- •
- Solar—Operation and maintenance of solar energy plants, mainly using solar-thermal technology;
- •
- Transmission—Operation and maintenance of high-voltage transmission power line infrastructures;
- •
- Water—Operation and maintenance of facilities aimed at generating, transporting, treating and managing potable water, including desalination and water treatment and purification plants; and
- •
- Co-generation and other—Operation and maintenance of conventional electricity plants.
On June 18, 2014, we completed the Abengoa Yield IPO. Abengoa Yield groups together assets previously reported in different operating segments within the Concession-Type Infrastructure activity. As such, Abengoa Yield became a new operating segment within the Concession-Type Infrastructure activity after the Abengoa Yield IPO. Consequently, it has been reported in our quarterly financial information. Taking into account that Abengoa Yield was an operating segment within our Concession-Type Infrastructure activity during part of 2014 and the significance that those activities carried out by Abengoa Yield have for Abengoa, our shareholding in Abengoa Yield during 2014 was treated as a discontinued operation in accordance with the stipulations and requirements of IFRS 5,Non-Current Assets Held for Sale and Discontinued Operations. The treatment of Abengoa Yield as discontinued operations also resulted in the removal of the Abengoa Yield operating segment from our Concession-Type Infrastructure activity. In accordance with this standard, the assets and liabilities of Abengoa Yield have been reclassified as assets and liabilities held for sale in our consolidated statement of financial position included within our Consolidated Financial Statements as of and for the year ended December 31, 2014. Likewise, our consolidated income statements for the years ended December 31, 2014, 2013, 2012, 2011 and 2010 also include the results of Abengoa Yield under a single heading, "Profit (loss) from discontinued operations, net of tax".
- •
- Industrial Production: covers Abengoa's businesses with a high commodity component, our biofuels business. The company holds an important leadership position in this activity in the geographical markets in which it operates. In biofuels, we are engaged in the production and development of biofuels, mainly bioethanol for transport, which uses cereals, sugar cane and oil seeds (soya, rape and palm) as raw materials.
171
Table of Contents
Comparison of Years Ended December 31, 2014 and December 31, 2013
Revenue by activity
The following table sets forth our revenue for the years ended December 31, 2014 and 2013 by our three activities and six segments.
| | | | | | | | | | | | | |
| | For the Years ended December 31, | |
|---|
| | 2014 | | 2013 | |
|---|
| |
| | % of
revenue | |
| | % of
revenue | |
|---|
| | (€ in millions)
| |
| | (€ in millions)
| |
| |
|---|
Revenue | | | | | | | | | | | | | |
Engineering and Construction | | | 4,514.5 | | | 63.1 | | | 4,831.7 | | | 66.7 | |
| | | | | | | | | | | | | | |
Engineering and Construction | | | 4,514.5 | | | 63.1 | | | 4,831.7 | | | 66.7 | |
Concession-Type Infrastructures | | | 499.4 | | | 7.0 | | | 384.3 | | | 5.3 | |
| | | | | | | | | | | | | | |
Solar | | | 335.2 | | | 4.7 | | | 258.7 | | | 3.6 | |
Transmission | | | 91.4 | | | 1.3 | | | 47.5 | | | 0.7 | |
Water | | | 40.8 | | | 0.6 | | | 40.2 | | | 0.6 | |
Co-generation and other | | | 32.0 | | | 0.4 | | | 38.0 | | | 0.5 | |
Industrial Production | | | 2,136.7 | | | 29.9 | | | 2,029.1 | | | 28.0 | |
| | | | | | | | | | | | | | |
Biofuels | | | 2,136.7 | | | 29.9 | | | 2,029.1 | | | 28.0 | |
Total | | | 7,150.6 | | | 100.0 | | | 7,245.1 | | | 100.0 | |
| | | | | | | | | | | | | | |
| | | | | | | | | | | | | | |
| | | | | | | | | | | | | | |
Engineering and Construction. Revenue decreased by 6.6% to €4,514.5 million for the year ended December 31, 2014 from €4,831.7 million for the year ended December 31, 2013. The decrease in revenue was primarily attributable to the lower activity of construction resulting from the completion of the 280 MW Solana plant in Arizona (€224 million decrease year-over-year) and the 280 MW Mojave thermo-solar plant in California (€312 million decrease year-over-year), the completion of the Solaben 1 and Solaben 6 thermo-solar plants in Spain (€280 million decrease year-over-year), the completion of the Palmatir wind farm in Uruguay (€64 million decrease year-over-year), lower construction activity on the Kaxu and Khi thermo-solar plants in South Africa (€189 million decrease year-over-year), and lower construction activity on the transmission lines in Brazil (€235 million decrease year-over-year). This effect was partially offset by higher construction activity related to the Atacama thermo-solar plants in Chile (€757 million increase year-over year) and the co-generation plants in Mexico (€ 226 million increase year-over year).
Concession-Type Infrastructure. Revenue increased by 30.0% to €499.4 million for the year ended December 31, 2014, from €384.3 for the year ended December 31, 2013. The increase in revenue was primarily attributable to the entry into operation of new assets and the larger contribution from assets already in operation. In 2014, we brought two assets into operation, which have contributed to the expansion of this segment.
- •
- Solar: Revenue increased by 29.6% to €335.2 million for the year ended December 31, 2014, from €258.7 million for year ended December 31, 2013. The increase was mainly attributable to the larger contribution from solar plants that entered into operation in Spain in the fourth quarter of 2013 (Solaben 1 and 6), and by better performance of our Spanish solar plants in operation.
- •
- Transmission: Revenue increased by 92.3% to €91.4 million for the year ended December 31, 2014, from €47.5 million for the year ended December 31, 2013. The increase was primarily attributable to the entry into operation in the fourth quarter of 2014 of our Norte Brazil power transmission line (Brazil), which covers 2,375 km, as well as the larger contribution from our power transmission line in Manaus (Brazil), which covers 586 km.
172
Table of Contents
- •
- Water: Revenue remained stable at €40.8 million for the year ended December 31, 2014, from €40.2 million for the year ended December 31, 2013.
- •
- Co-generation and other: Revenue decreased by 15.6% to €32.0 million for the year ended December 31, 2014, from € 38.0 million for the year ended December 31, 2013. This decrease was mainly due to the Spanish government's regulatory reforms of the electricity sector, given that after the reform a greater portion of the income is a fixed remuneration, which in turn, represents lower than the amount received in the previous year.
Industrial Production:
- •
- Biofuels: Revenue increased by 5.3% to €2,136.7 million for the year ended December 31, 2014, from €2,029.1 million for the year ended December 31, 2013. The increase was mainly due to an increase in volume of ethanol sold in Europe and in the United States and an increase in the volume of sugar sold in Brazil.
Consolidated EBITDA by activity
The following table sets forth our Consolidated EBITDA for the years ended December 31, 2014 and 2013 by our three activities and six segments.
| | | | | | | |
| | For the years ended
December 31, | |
|---|
| | 2014 | | 2013 | |
|---|
| | (€ in millions)
| |
|---|
Consolidated EBITDA | | | | | | | |
Engineering and Construction | | | 806.0 | | | 806.5 | |
| | | | | | | | |
Engineering and Construction | | | 806.0 | | | 806.5 | |
Concession-Type Infrastructure | | | 330.6 | | | 220.0 | |
| | | | | | | | |
Solar | | | 235.9 | | | 156.8 | |
Transmission | | | 64.3 | | | 27.7 | |
Water | | | 26.5 | | | 28.1 | |
Co-generation and other | | | 3.9 | | | 7.3 | |
Industrial Production | | | 271.4 | | | 240.9 | |
| | | | | | | | |
Biofuels | | | 271.4 | | | 240.9 | |
| | | | | | | | |
Total | | | 1,408.0 | | | 1,267.4 | |
| | | | | | | | |
| | | | | | | | |
| | | | | | | | |
Engineering and Construction. Consolidated EBITDA decreased by 0.1% to €806.0 million for the year ended December 31, 2014, from €806.5 million for the year ended December 31, 2013. Consolidated EBITDA margin (Consolidated EBITDA as a percentage of revenue) increased to 17.9% for 2014, compared to 16.7% in 2013. The increase in margins in 2014 is related to projects with higher contribution of technology where we manufacture many of the components needed for the construction of an asset (such as transmission power lines and solar plants).
Concession-Type Infrastructure. Consolidated EBITDA increased by 50.3% to €330.6 million for the year ended December 31, 2014, from €220.0 million for the year ended December 31, 2013. Consolidated EBITDA margin in this activity increased to 66.2% for 2014, compared to 57.2% in 2013.
- •
- Solar: Consolidated EBITDA increased by 50.4% to €235.9 million for the year ended December 31, 2014, from €156.8 million for 2013. The increase in Consolidated EBITDA was primarily attributable to the solar plants in Spain that entered into operation in the fourth quarter of 2013 (Solaben 1 and 6), as a result, the average capacity in terms of installed MW available throughout the period increased by
173
Table of Contents
100 MW. This increase in average capacity, together with better weather conditions registered during 2014 compared to the previous year and the solid performance of the plants, resulted in higher net electricity production for the year ended December 31, 2014 compared with the previous year.
- •
- Transmission: Consolidated EBITDA increased by 132.1% to €64.3 million for the year ended December 31, 2014, from €27.7 million for the year ended December 31, 2013. The increase was primarily attributable to the entry into operation of the Norte Brazil power transmission line (Brazil), which covers 2,375 km, and to the larger contribution of the Manaus power transmission line in Brazil, which entered into operation in the first quarter of 2013 and covers 586 km.
- •
- Water: Consolidated EBITDA decreased by 5.7% to €26.5 million for the year ended December 31, 2014, from €28.1 million for the year ended December 31, 2013. This decrease was primarily attributable to lower activity of the desalination plant Aguas de Skikda.
- •
- Co-generation and other: Consolidated EBITDA decreased by 46.6% to €3.9 million for the year ended December 31, 2014, from €7.3 million for the year ended December 31, 2013. This decrease was mainly due to the Spanish government's regulatory reforms of the electricity sector.
Industrial Production.
- •
- Biofuels: Consolidated EBITDA increased by 12.7% to €271.4 million for the year ended December 31, 2014, from €240.9 million for the year ended December 31, 2013, mainly driven by higher margins on ethanol in the United States and sugar in Brazil, and partially offset by lower margins on ethanol in Europe due to the decrease in average ethanol prices in Europe.
The following table provides reconciliations of Consolidated EBITDA to line items in our Consolidated Financial Statements for the years ended December 31, 2014 and 2013.
| | | | | | | |
| | Years ended
December 31, | |
|---|
| | 2014 | | 2013 | |
|---|
| | (€ in millions)
| |
|---|
Reconciliation of profit for the year to Consolidated EBITDA | | | | | | | |
Profit for the year | | | 144.1 | | | 133.1 | |
Income tax expenses/(benefits) | | | (58.7 | ) | | (26.2 | ) |
Share of loss/(profit) of associated companies | | | (7.0 | ) | | 5.2 | |
Net finance expenses | | | 854.8 | | | 638.9 | |
| | | | | | | | |
Operating profit | | | 933.2 | | | 751.0 | |
| | | | | | | | |
| | | | | | | | |
| | | | | | | | |
Depreciation, amortization and impairment changes | | | 474.9 | | | 516.4 | |
| | | | | | | | |
Consolidated EBITDA (unaudited) | | | 1,408.0 | | | 1,267.4 | |
| | | | | | | | |
| | | | | | | | |
| | | | | | | | |
174
Table of Contents
Comparison of Years Ended December 31, 2013 and December 31, 2012
Revenue by activity
The following table sets forth our revenue for the years ended December 31, 2013 and 2012 by our three activities and six segments.
| | | | | | | | | | | | | |
| | For the Years ended December 31, | |
|---|
| | 2013 | | 2012 | |
|---|
| |
| | % of
revenue | |
| | % of
revenue | |
|---|
| | (€ in millions)
| |
| | (€ in millions)
| |
| |
|---|
Revenue | | | | | | | | | | | | | |
Engineering and Construction | | | 4,831.7 | | | 66.7 | | | 3,789.2 | | | 60.3 | |
| | | | | | | | | | | | | | |
Engineering and Construction | | | 4,831.7 | | | 66.7 | | | 3,789.2 | | | 60.3 | |
Concession-Type Infrastructure | | | 384.3 | | | 5.3 | | | 358.2 | | | 4.9 | |
| | | | | | | | | | | | | | |
Solar | | | 258.7 | | | 3.6 | | | 259.8 | | | 3.6 | |
Transmission | | | 47.5 | | | 0.7 | | | 24.4 | | | 0.3 | |
Water | | | 40.2 | | | 0.6 | | | 20.7 | | | 0.3 | |
Co-generation and other | | | 38.0 | | | 0.5 | | | 53.2 | | | 0.7 | |
Industrial Production | | | 2,029.1 | | | 28.0 | | | 2,138.2 | | | 34.0 | |
| | | | | | | | | | | | | | |
Biofuels | | | 2,029.1 | | | 28.0 | | | 2,138.2 | | | 34.0 | |
Total | | | 7,245.1 | | | 100.0 | | | 6,285.6 | | | 100.0 | |
| | | | | | | | | | | | | | |
| | | | | | | | | | | | | | |
| | | | | | | | | | | | | | |
Engineering and Construction. Revenues increased by 27.5% to €4,831.7 million for the year ended December 31, 2013, from €3,789.2 million for the year ended December 31, 2012. This increase in revenues was primarily attributable to the ongoing construction of our two thermo-solar plants in South Africa (a 100 MW CSP plant and a 50 MW Solar tower technology CSP plant, causing a €434.5 million increase year-over-year), of the 200 MW PV plant in Imperial Valley, California (€236 million increase year-over-year), of the Mojave thermo-solar plant in the United States (a 280 MW solar plant in California, causing a €126.7 million increase year-over-year), of the co-generation plants in Mexico (a €106.6 million increase year-over-year), of the 450 MW combined cycle plant in Poland (a €100.0 million increase year-over-year) and of the wind farms in Uruguay (a €78.2 million increase year-over-year).These effects were partially offset by a lower contribution of the Solana 280 MW solar plant in Arizona (a €415 million decrease year-over-year due to Solana commencing operations in October 2013) and a lower activity of construction of transmission lines in Brazil, given that 2012 was a year of very high execution with large projects such as Norte Brazil and Manaus (a €9.7 million decrease year-over-year).
Concession-Type Infrastructure. Revenue increased by 7.3% to €384.3 million for the year ended December 31, 2013, from €358.2 million for the year ended December 31, 2012. Our concession business has continued its growth due to new assets entering into operation and a strong performance of assets already in operation.
- •
- Solar: Revenue decreased by 0.4% to €258.7 million for the year ended December 31, 2013, from 259.8 million for the year ended December 31, 2012. The decrease was mainly due to lower income from our Spanish solar plants due to adverse government energy reforms in Spain, as well as poor weather conditions registered during the first quarter of 2013, partially offset by higher revenues from the solar plants that entered into operation during the fourth quarter of 2013 (Solaben 1 and Solaben 6 in Spain) and to the larger contribution of solar plants that entered into operation in 2012 (Helios 1 and Helios 2).
- •
- Transmission: Revenue increased by 93.9% to €47.5 million for the year ended December 31, 2013, from 24.4 million for the year ended December 31, 2012. The increase was primarily attributable to
175
Table of Contents
the entry into operation in the first quarter of 2013 of the power transmission lines in Manaus, which cover 586 km.
During both years, we were able to maintain levels of availability (a determining factor for the Transmission segment's revenue generation) above 99%, in line with availability levels for previous years.
- •
- Water: Revenue increased by 94.2% to €40.2 million for the year ended December 31, 2013, from €20.7 million for the year ended December 31, 2012. This increase was mainly due the entry into operation in the first quarter of 2013 of the 100,000 m3/day desalination plant in Qingdao (China).
- •
- Co-generation and Other: Revenue decreased by 28.6% to €38.0 million for the year ended December 31, 2013, from €53.2 million for the year ended December 31, 2012. This decrease was mainly due to adverse government energy reforms in Spain.
Industrial Production:
- •
- Biofuels: Revenue decreased by 5.1% to €2,029.1 million for the year ended December 31, 2013, from €2,138.2 million for the year ended December 31, 2012. This decrease was mainly due to the reduction of volumes sold of ethanol in Europe to 902.3 Ml, compared to 1,037.8 Ml in the previous year, with a total negative impact on revenues of €84.9 million. In addition, the decrease in ethanol prices in Europe, partially offset by the increase in ethanol prices in the United States and Brazil, resulted in a net negative impact on revenues of €40.0 million in 2013. The business recorded during the year an average plant utilization of 80% compared to 84% during the year 2012.
Sugar sales, an important part of the Brazilian business, recorded an increase as the harvest campaign started approximately one month earlier than in the previous year, with 451.1 ktn sold during 2013 compared to 411.9 ktn sold during the previous year and with a positive impact on revenues in the amount of €11.3 million. This positive effect was partially offset by the reduction of the average sugar prices, which declined from 22 $/lb for the year 2012 to 18 $/lb for the year 2013.
Consolidated EBITDA by activity
The following table sets forth our Consolidated EBITDA for the years ended December 31, 2013 and 2012 by our three activities and six segments.
| | | | | | | |
| | For the years
ended
December 31, | |
|---|
| | 2013 | | 2012 | |
|---|
| | (€ in millions)
| |
|---|
Consolidated EBITDA | | | | | | | |
Engineering and Construction | | | 806.5 | | | 623.9 | |
| | | | | | | | |
Engineering and Construction | | | 806.5 | | | 623.9 | |
Concession-Type Infrastructure | | | 220.0 | | | 211.9 | |
| | | | | | | | |
Solar | | | 156.8 | | | 190.4 | |
Transmission | | | 27.7 | | | 6.9 | |
Water | | | 28.1 | | | 11.6 | |
Co-generation and other | | | 7.3 | | | 2.9 | |
Industrial Production | | | 240.9 | | | 91.1 | |
| | | | | | | | |
Biofuels | | | 240.9 | | | 91.1 | |
| | | | | | | | |
Total | | | 1,267.4 | | | 926.9 | |
| | | | | | | | |
| | | | | | | | |
| | | | | | | | |
176
Table of Contents
Engineering and Construction. Consolidated EBITDA increased by 29.3% to €806.5 million for the year ended December 31, 2013, from €623.9 million for the year ended December 31, 2012. The consolidated EBITDA margin increased slightly to 16.7% for the year ended December 31, 2013, compared to 16.5% in 2012. The increase in margins in 2013 is related to projects with higher contribution of technology and where we manufacture many of the components needed for the construction of an asset, mainly solar components used in the construction of solar plants in the United States and South Africa, together with water technology components used in the construction of the desalinations plants in Tenes (Algeria) and in Nungua (Ghana).
Concession-Type Infrastructure. Consolidated EBITDA increased by 3.9% to €220.0 million for the year ended December 31, 2013, from €211.9 million for the year ended December 31, 2012. Consolidated EBITDA margin in these activities decreased to 57.2% for the year ended December 31, 2013, compared to 59.1% in the same period of 2012.
- •
- Solar: Consolidated EBITDA decreased by 17.6% to €156.8 million for the year ended December 31, 2013, from €190.4 million for the year ended December 31, 2012. This decrease in the consolidated EBITDA was primarily attributable to adverse measures adopted by the Spanish government related to the electricity system, such as the elimination of the remuneration option of receiving the production market price (pool price) plus a premium or the new tax on electricity production, which imposed a 7% levy on revenue received from power generation, together with worse weather conditions especially during the first quarter of 2013, all of which resulted in lower margins for the Spanish solar plants. These negative effects were partially offset by the solar plants that entered into operation in 2013 (Solaben 1 and Solaben 6 in Spain) and to the larger contribution of solar plants that entered into operation in 2012 (Helios 1 and Helios 2).
- •
- Transmission: Consolidated EBITDA increased by 301.4% to €27.7 million for the year ended December 31, 2013, from €6.9 million for the year ended December 31, 2012, mainly due to the entry into operation in the first quarter of 2013 of the Brazilian transmission lines in Manaus which have higher operating margins than the average for the segment. Inflation did not have a relevant impact on operating margins, as contracts are indexed to inflation.
- •
- Water: Consolidated EBITDA increased by 142.2% to €28.1 million for the year ended December 31, 2013, from €11.6 million for the year ended December 31, 2012. The increase was primarily attributable to the entry into operation in the first quarter of 2013 of a 100,000 m3/day desalination plant in Qingdao (China). The cost of electricity, the main component of the cost structure of the segment, did not have a meaningful impact, as it is passed through to the final client through the tariff.
- •
- Co-generation and other: Consolidated EBITDA increased by 151.7% to €7.3 million for the year ended December 31, 2013, from €2.9 million for the year ended December 31, 2012, mainly due to income related to an insurance claim, partially offset by the adverse government energy reforms in Spain.
Industrial Production.
- •
- Biofuels: Consolidated EBITDA increased by 164.4% to €240.9 million for the year ended December 31, 2013, from €91.1 million for the year ended December 31, 2012. Biofuels EBITDA in 2013 includes the impact for €141.8 million of a positive arbitration resolution in relation to a breach of contract in our Brazilian business. In 2012, Consolidated EBITDA also included the impact of a positive arbitration amounting to €26 million. Excluding these impacts, Consolidated EBITDA grew by 53%. Although the first half of 2013 was affected by weak margins, Consolidated EBITDA in 2013 showed recovery across the whole segment. The increase in Consolidated EBITDA was primarily attributable to a favorable evolution of the average crush spread in the United States. As ethanol prices increased and grain prices decreased (the main cost component of the crush formula), the
177
Table of Contents
average crush spread for the business in the United States saw a positive evolution for the year 2013 compared with the previous year. The average market crush spread in the United States increased to $0.63/gal during the year 2013, compared to an average of $0.42/gal for the year 2012. Market crush spread in Europe remained stable in 2013 in compared to the year 2012.
The following tables provide reconciliations of Consolidated EBITDA to line items in our Consolidated Condensed Financial Statements for the years ended December 31, 2013 and 2012.
| | | | | | | |
| | Years ended
December 31, | |
|---|
| | 2013 | | 2012 | |
|---|
| | (€ in millions)
| |
|---|
Reconciliation of profit for the year to Consolidated EBITDA | | | | | | | |
Profit for the year | | | 133.1 | | | 73.8 | |
Income tax expenses/(benefits) | | | (26.2 | ) | | (174.1 | ) |
Share of loss/(profit) of associated companies | | | 5.2 | | | (17.9 | ) |
Net finance expenses | | | 638.9 | | | 638.7 | |
| | | | | | | | |
Operating profit | | | 751.0 | | | 520.6 | |
| | | | | | | | |
| | | | | | | | |
| | | | | | | | |
Depreciation, amortization and impairment changes | | | 516.4 | | | 406.3 | |
| | | | | | | | |
Consolidated EBITDA | | | 1,267.4 | | | 926.9 | |
| | | | | | | | |
| | | | | | | | |
| | | | | | | | |
B. Liquidity and Capital Resources
The liquidity and capital resources discussion which follows contains certain estimates as of the date of this annual report of our estimated future sources and uses of liquidity (including estimated future capital resources and capital expenditures) and future financial and operating results. Our management has prepared the prospective financial information set forth below to present the future capital resources, future capital expenditures and future financial and operating results, for the years 2015 through 2017, in the context of our Liquidity and Capital Resources discussion. The accompanying prospective financial information was not primarily prepared with a view toward public disclosure or with a view toward complying with the guidelines established by the American Institute of Certified Public Accountants with respect to prospective financial information, but, in the view of our management, was prepared on a reasonable basis, reflects the best currently available estimates and judgments, and presents, to the best of management's knowledge and belief, the expected course of action and the expected future financial performance of the Company. However, this information is not fact and should not be relied upon as being necessarily indicative of future results, and readers of this annual report are cautioned not to place undue reliance on the prospective financial information.
Neither our independent auditors, nor any other independent accountants, have compiled, examined, or performed any procedures with respect to the prospective financial information contained herein, nor have they expressed any opinion or any other form of assurance on such information or its achievability, and assume no responsibility for, and disclaim any association with, the prospective financial information.
The assumptions and estimates underlying the prospective financial information are inherently uncertain and, though considered reasonable by our management as of the date of their preparation, are subject to a wide variety of significant business, economic, and competitive risks and uncertainties that could cause actual results to differ materially from those contained in the prospective financial information, including, among others, risks and uncertainties. See "Cautionary Statements Regarding Forward-Looking Language" and "Item 3.D—Risk Factors." Accordingly, there can be no assurance that the prospective results are indicative of our future performance or that actual results will not differ materially from those presented in the prospective financial information. Inclusion of the prospective financial information in this annual report should not be
178
Table of Contents
regarded as a representation by any person that the results contained in the prospective financial information will be achieved.
We do not generally publish our business plans and strategies or make external disclosures of our anticipated financial position or results of operations. Accordingly, we do not intend to update or otherwise revise the prospective financial information to reflect circumstances existing since its preparation or to reflect the occurrence of unanticipated events, even in the event that any or all of the underlying assumptions are shown to be in error. Furthermore, we do not intend to update or revise the prospective financial information to reflect changes in general economic or industry conditions. See "Item 3.D—Risk Factors" for a discussion of various factors that could materially affect our financial condition, results of operations, business, prospects and securities.
We believe that our existing liquidity and cash flow will be sufficient to meet our requirements and commitments for the foreseeable future.
We utilize a combination of corporate financing and Project Debt to finance our cash needs and the growth of our business. Our primary source of liquidity has historically been cash generated from our operations and financing activities.
Cash generated by operations includes mostly the EBITDA generated in the period as well as cash flow generated from working capital. We use different tools that have allowed the Company to generate cash flows from working capital in the past: (i) we outsource payment to suppliers through financial institutions that process payments 180 days after approval of invoices, (ii) we use non-recourse factoring for many of our receivables (see "Item 11—Quantitative and Qualitative Disclosure About Market Risk—Credit Risk") and (iii) we attempt to negotiate advances from customers related to construction works we perform in our Engineering and Construction segment. The use of these tools allows many of our projects to be cash flow positive throughout their life. Non-recourse factoring allows us to collect on invoices as soon as they are certified by our customers (based on percentage of completion milestones agreed to in our contracts). Our outsourcing of payables implies suppliers are paid through a financial institution 180 days after the invoices are internally approved (which requires us in certain cases to maintain significant cash deposits within the relevant financial institutions or otherwise on a restrictive basis), having the option to collect in advance with a discount. Therefore, in quarters of high execution and invoicing, we can generate significant cash flows from collections, whereas payments on work performed are generally made in the subsequent two quarters. This causes certain seasonality in our cash flows, with cash typically generated towards the end of the year, and payments made in the first half of the year.
As of December 31, 2014 we had €5,325.4 million of Gross Corporate Debt and €2,850.0 million of cash and cash equivalents and short-term financial investments, excluding non-recourse subsidiaries, compared to €5,654.4 million and €3,407 million as of December 31, 2013, respectively. As of December 31, 2014, we had €1,576.6 million of short-term Gross Corporate Debt, representing 30% of our total Gross Corporate Debt. Such debt includes €36.2 million under the ICO loan, €173.5 million under the Export Credit Agreements, €234.6million of other corporate financing, €300 million under the 2015 Bond, €244.4 million under our 2017 Convertible Bond, €464.1 million of euro commercial paper and €43.5 million of commercial paper in Abengoa Mexico. See "—Financing arrangements" below for an explanation of the evolution of cash and cash equivalents during 2014.
We have historically refinanced or renewed our bilateral credit agreements and other indebtedness coming due at or prior to maturity, and in 2014 we refinanced the remaining amounts due under our 2012 Forward Start Facility Agreement with the signing on September 30, 2014 of a new syndicated loan facility agreement with a group of lenders (the "2014 Syndicated Loan Facility Agreement"). The 2014 Syndicated Loan Facility Agreement provides for borrowings up to €1,402.9 million, divided into Tranche A and Tranche B amounting to €701.45 million and €701.45 million, respectively. As of December 31, 2014, €180.2 million was outstanding under Tranche A of the 2014 Syndicated Loan Facility Agreement and Tranche B was fully drawn.
179
Table of Contents
Credit ratings affect the cost and other terms upon which we are able to obtain liquidity through financing (or refinancing). Currently, our corporate family and probability of default ratings are "B2" with a stable outlook from Moody's, "B" with a positive outlook from S&P and "B+" with a negative outlook from Fitch.
Any future downgrade or negative outlook of our corporate family or of our outstanding securities may adversely affect our ability to obtain financing on commercially acceptable terms, or at all, and therefore materially adversely affect our liquidity position (including our ability to repay our outstanding indebtedness) and our ability to implement our corporate strategy.
Our principal liquidity and capital requirements consist of the following:
- •
- capital expenditures for existing and new plants and operations;
- •
- debt service requirements on our existing and future debt;
- •
- costs and expenses relating to the operation of our businesses; and
- •
- acquisitions of new companies to expand our existing product and service lines and geographic presence.
We proactively manage our cash needs by preparing an annual financial plan, which is approved by the Board of Directors, and continually monitoring the provisions of our liquidity reserve (which includes credit facilities and cash and cash equivalents), based on expected cash flows. We fund in advance disbursements for major cash requirements, such as capital expenditures and debt repayments. In addition, as a general rule, we do not commit our own equity in projects until the associated long-term financing is obtained.
As of December 31, 2014, our Gross Corporate Debt and Project Debt were €5,325.4 million and €4,958.1 million (which includes €1,946.4 million of bridge loans), respectively. For further discussion of our contractual obligations, see "—Project Debt" and "—Corporate Debt."
In addition, as of December 31, 2014, our estimated total capital expenditures for 2015 through 2019 broken down between our Concession-Type Infrastructure activities (we do not have any capital expenditures in our Engineering and Construction activity) amount to approximately €3,383 million.
To finance our total capital expenditures plan, we have secured commitments for the provision of €2,458 million of Project Debt and obtained commitments from our partners in these projects for €249 million, with the remaining €676 million to be contributed by us as equity. We intend to finance our equity contribution to these projects through cash on hand, cash flows generated from operating activities and cash from the corporate financing arrangements we have in place. The table that follows breaks down the amounts estimated to be raised from these sources of capital by year for the years 2015 through 2019:
| | | | |
| | Total
2015–2019 | |
|---|
| | (unaudited and estimated)
| |
|---|
| | (€ in millions)
| |
|---|
Source of Capital | | | | |
Equity from Abengoa | | | 676 | |
Partners | | | 249 | |
Project Debt | | | 2,458 | |
| | | | | |
Total | | | 3,383 | |
| | | | | |
| | | | | |
| | | | | |
Additionally, we plan to incur additional disbursements for the completion of certain projects that have been awarded to us where we hold or expect to hold a minority equity stake. The expected equity from Abengoa required for these projects amounts to €413 million.
180
Table of Contents
In the last three years, due to the increase in capital expenditures incurred to develop our portfolio of segments in power transmission, solar plants, biofuels and water desalination plants, we have invested €2,883 million, €2,257 million and €2,732 million in 2014, 2013 and 2012, respectively, which has resulted in negative cash flow. These projects are developed over long periods of time, many of which are over 12-month periods. As these projects become operational, between 2015 and 2019, they will start contributing to the operating result under our Concession-Type Infrastructure activity and therefore will generate cash flow from operations.
The amount of total assets under the scope of IFRS 10 which were under construction as of December 31, 2014 was approximately €1,226 million. See "Item 5.A—Operating Results—Factors Affecting the Comparability of Our Results of Operations—IFRS 10 and 11."
The expected start-up date of the most significant assets under construction as of December 31, 2014 are as follows:
| | | | | | | | | | | | |
Description of assets | | Location | | Capacity | | Abengoa
(Equity
Ownership %) | | Expected
start up | |
|---|
Solar | | | | | | | | | | | | |
South Africa Trough* | | South Africa | | | 100 MW | | | 51 | % | | Q1 2015 | |
South Africa Tower* | | South Africa | | | 50 MW | | | 51 | % | | Q1 2016 | |
Atacama I (PV, CSP)(1) | | Chile | | | 210 MW | | | 50 | % | | Q2 2016, Q2 2017 | |
Atacama II (PV, CSP)(1) | | Chile | | | 210 MW | | | 100 | % | | Q3 2018 | |
Ashalim(1) | | Israel | | | 110 MW | | | 50 | % | | Q2 2018 | |
Xina | | South Africa | | | 100 MW | | | 40 | % | | Q3 2017 | |
Water | | | | | | | | | | | | |
Ghana | | Ghana | | | 60 ML/day | | | 56 | % | | Q1 2015 | |
Zapotillo | | Mexico | | | 3.8 m3/sec | | | 100 | % | | Q4 2017 | |
SAWS(1) | | EEUU | | | 168,970 m3/day | | | 51 | % | | Q4 2019 | |
Agadir | | Morocco | | | 100,000 m3/day | | | 51 | % | | Q4 2016 | |
Co-generation and other | | | | | | | | | | | | |
Nicefield(1) | | Uruguay | | | 70 MW | | | 50 | % | | Q3 2016 | |
A3T | | Mexico | | | 22 MWe | | | 100 | % | | Q1 2017 | |
A4T | | Mexico | | | 600 MW | | | 100 | % | | Q1 2018 | |
Transmission | | | | | | | | | | | | |
ATN 2(2) | | Peru | | | 132 km | | | 40 | % | | Q2 2015 | |
ATN 3(1) | | Peru | | | 355 km | | | 100 | % | | Q3 2016 | |
New Brazilian T&D Lines | | Brazil | | | 6,163 km | | | 50 | % | | 2016-2018 | |
Dgen | | India | | | 115 km | | | 51 | % | | Q3 2017 | |
- *
- Project falling under the scope of IFRS 10 and is therefore consolidated through the equity method until entry into operation. See "Item 5.A—Operating Results—Factors Affecting the Comparability of Our Results of Operations—IFRS 10 and 11."
- (1)
- Expected to be transferred to APW1.
- (2)
- Announced to be transferred to Abengoa Yield.
As of December 31, 2014, our cash and cash equivalents were €1,810.8 million and short-term financial investments were €1,048.6 million. We also had other current assets (clients and other receivables and inventories) amounting to €2,451.7 million. Our undrawn corporate credit lines amounted to €300 million.
We aim to maintain our strong liquidity position, extend the debt maturities of our existing corporate loans and bonds, continue to access the capital markets from time to time, as appropriate, and further diversify our funding sources.
181
Table of Contents
Our debt maturities as of December 31, 2014 for the following twelve months amount to €2,375.9 million, out of which €799.2 million relate to Project Debt to be repaid with cash flows to be generated from the projects in respect of which that financing was incurred and €1,576.7 million relate to corporate financing maturities. Additionally, we estimate capital expenditures commitments for the next 3 to 4 years of approximately €3,383 million, out of which €2,458 million are expected to be financed with Project Debt already committed but not yet drawn upon, €249 million with committed contributions from partners and €676 million with corporate funds from Abengoa. Additionally, we plan to have additional disbursements for the completion of certain projects that have been awarded to us where we hold or expect to hold a minority equity stake. The expected equity from us required for these projects amounts to €413 million. We also have as of December 31, 2014 other current liabilities (trade payables, tax liabilities, derivative financial liabilities and provisions) for a total amount of €5,984.9 million. Some of these payables benefit from required cash deposits, recorded under short term financial investments and Cash and cash equivalents that may only be used specifically to pay confirmed suppliers through financial institutions. As of December 31, 2014 this amount stands at approximately €1,226 million.
We intend to follow an opportunistic approach, whereby we consider to sell assets or businesses when we deem market conditions are attractive to us. Sales of assets or businesses may be material and may happen at any time. We expect to continue with our asset rotation strategy through the rest of 2015.
On June 18, 2014, we completed the Abengoa Yield IPO for total gross proceeds of $828.7 million (€611.0 million) before fees and expenses. Abengoa Yield is a dividend growth-oriented company formed by us that groups together renewable energy, conventional power, electric transmission lines and other contracted, revenue-generating assets previously reported in different operating segments within the Concession-Type Infrastructure activity. As a result of a second transfer of assets announced on February 9, 2015, Abengoa Yield is now present in the water infrastructure segment, has expanded its geographic presence to the north of Africa and is expected to expand its geographic presence to the United Arab Emirates. As such, Abengoa Yield became a new operating segment within the Concession-Type Infrastructure activity after the Abengoa Yield IPO and we reported that segment's results in our quarterly financial information for the quarters ended June 30, 2014 and September 30, 2014.
Immediately following the Abengoa Yield IPO, we held 64% of the ordinary share capital of Abengoa Yield. On December 15, 2014, our Board of Directors approved a plan to reduce our shareholding in Abengoa Yield to below 50% during 2015, subject to market conditions. On January 22, 2015, we completed an initial divestment of 13% through the sale in an underwritten public offering of 10,580,000 ordinary shares in Abengoa Yield (including 1,380,000 shares sold pursuant to the exercise in full of the underwriters' option to purchase additional shares) at a price of US$31 per share which brought our shareholding in Abengoa Yield to 51%. On February 9, 2015, we announced our intention to reduce our shareholding in Abengoa Yield to below 50% by the end of the first half of 2015, with the objective of maintaining a long-term stake in the range of 40-49%. We have also indicated our intention to reinforce the role of independent directors at Abengoa Yield in order to effectively transfer control once we reduce our shareholding in Abengoa Yield below 50%.
Abengoa Yield constitutes a vehicle through which we plan to execute most of our asset rotations, representing a long-term, recurrent, equity-recycling vehicle to crystallize value in concessions, facilitating the divestment process in concessional assets, as Abengoa Yield is a natural buyer of the assets we are building that benefits from a significantly lower cost of capital than we do.
On December 11, 2014, we and Abengoa Yield announced that we had entered into a call option agreement for the purchase by Abengoa Yield of up to $100 million in contracted assets at a 12% yield during the year 2015, subject to certain conditions.
On February 9, 2015, we announced our agreement entered into with Abengoa Yield for a second transfer of assets, including: ATN 2, a transmission power line in Peru (40% stake); Shams, a 100-MW solar power asset in the United Arab Emirates (20% stake); rights of usufruct over Helioenergy 1/2, a 100-MW
182
Table of Contents
solar power asset in Spain (29.6% stake); and Honaine and Skikda, two water desalination plants in Algeria with an aggregate capacity of 10.5 Mft3/day (25.5% and 34.17% stakes, respectively) for total proceeds of approximately $142 million. The sale of Honaine and Skikda was closed on February 15, 2015, while the acquisition of the remaining assets is still pending. Regarding Honaine and Skikda, we have entered into a two-year call and put option agreement with Abengoa Yield under which they have put option rights to require us to purchase back these assets at the same price paid by them and we have call option rights to require them to sell back these assets if certain indemnities and guarantees provided by us reach a certain threshold. In addition, discussions between us and Abengoa Yield have already commenced regarding a potential third dropdown for a total equity value in the range of $200 to $250 million. This potential third acquisition falls within the $100 million call option agreement announced between us and Abengoa Yield in December 2014 at a 12% yield. The third dropdown divestment is expected to close by the end of the year.
Additionally, we executed sales of some of our assets or businesses prior to the constitution of Abengoa Yield. In the first quarter of 2014, we announced our agreement to sell our desalination plant in Qingdao, China for total cash proceeds of approximately €53 million, which closed in December 2014. In July 2013, we received €331 million of cash proceeds corresponding to the price agreed for the sale of our subsidiary Befesa, together with a deferred compensation of €17 million (including €15 million in escrow pending resolution of ongoing litigation and a €2 million long term receivable from a Befesa customer), a €48 million subordinated vendor note with a five year maturity and a €225 million (par value) subordinated convertible instrument with a 15 year maturity. In May 2013, we closed the sale of Bargoa, which manufactures telecommunication components, to the U.S. company Corning Incorporated for a total amount of $80 million, which resulted in $50 million of cash proceeds. On February 4, 2015, we sold the €48 million subordinated vendor note to Triton Partners (see Note 7.3 to our Consolidated Financial Statements).
Our liquidity plans are subject to a number of risks and uncertainties, some of which are outside of our control. Macro-economic conditions could limit our ability to successfully execute our business and liquidity plans. See "Cautionary Statements Regarding Forward-Looking Statements."
183
Table of Contents
Cash Flow
The following table sets forth consolidated cash flow data each of the three years ended December 31, 2014, 2013 and 2012.
| | | | | | | | | | |
| | Year ended December 31, | |
|---|
| | 2014 | | 2013(1) | | 2012(1) | |
|---|
| | (€ in millions)
| |
|---|
Consolidated Cash Flow Statement Data | | | | | | | | | | |
Gross cash flows from operating activities | | | | | | | | | | |
Profit for the year from continued operations | | | 144.1 | | | 133.1 | | | 73.8 | |
Adjustments to reconcile consolidated after-tax profit to net cash generated by operating activities | | | 1,038.6 | | | 797.7 | | | 679.4 | |
Variations in working capital and other items | | | (1,164.1 | ) | | (218.3 | ) | | (165.9 | ) |
| | | | | | | | | | | |
Total net cash flow generated by (used in) operating activities | | | 18.6 | | | 712.5 | | | 587.3 | |
| | | | | | | | | | | |
| | | | | | | | | | | |
| | | | | | | | | | | |
Net cash flows from investment activities | | | | | | | | | | |
Investments | | | (2,634.1 | ) | | (1,877.1 | ) | | (2,216.1 | ) |
Disposals | | | 134.4 | | | 512.7 | | | 410.4 | |
| | | | | | | | | | | |
Total net cash flows used in investment activities | | | (2,499.7 | ) | | (1,364.4 | ) | | (1,805.7 | ) |
| | | | | | | | | | | |
| | | | | | | | | | | |
| | | | | | | | | | | |
Net cash flows generated by finance activities | | | 1,590.6 | | | 1,197.5 | | | 5.6 | |
| | | | | | | | | | | |
| | | | | | | | | | | |
| | | | | | | | | | | |
Net increase/(decrease) in cash and cash equivalents | | | (890.5 | ) | | 545.6 | | | (1,212.8 | ) |
Cash and cash equivalents at the beginning of the year | | | 2,951.7 | | | 2,413.2 | | | 3,723.2 | |
Discontinued operations / Assets held for sale | | | (281.7 | ) | | (112.1 | ) | | (31.2 | ) |
Currency translation difference on cash and cash equivalents | | | 31.3 | | | 105.0 | | | (66.0 | ) |
| | | | | | | | | | | |
Cash and cash equivalents at the end of the year | | | 1,810.8 | | | 2,951.7 | | | 2,413.2 | |
| | | | | | | | | | | |
| | | | | | | | | | | |
| | | | | | | | | | | |
- (1)
- Amounts recasted (see "Presentation of Financial Information" and Note 2 to our Consolidated Financial Statements).
Net Cash Flows from Operating Activities
For the year ended December 31, 2014, we generated €18.6 million of net cash flows from operating activities compared to €712.5 million during the same period last year, mostly due to greater consumption of working capital (€523.6 million in 2014 compared to the generation of €221.2 million in 2013), which was offset by higher profit for the period from continuing operations adjusted by non-monetary items (€1,182.7 million in 2014 compared to €930.8 million in 2013). The net cash used in working capital in 2014 was mainly due to reduced execution of several projects compared to the prior year as some of our current projects under execution are still in a ramp-up phase, and to larger amounts paid to our suppliers, especially in our Engineering and Construction activity, which have been partially offset by stronger execution in the fourth quarter. This execution related to projects performed on our assets which have not yet reached the milestone for invoicing resulting in an increase of receivables outstanding as of year end. As a result of our working capital financing policies, whereby we pay suppliers 180 days from the date of invoice, much of the strong execution performed in the last quarter of 2013 to bring several solar and bioenergy assets into operation was paid out to suppliers during 2014. This resulted in large cash outflows during this year, which were paid, in part, with existing cash on the balance sheet, with cash generated from operations during the period before the payment of interest and taxes, and by using funds from corporate financing. Finally, net interest and taxes paid, net of discontinued operations were higher in 2014 than in 2013 (€640.4 million compared to €439.4 million, respectively) mainly due to new bonds issued during 2014.
For the year ended December 31, 2013, we generated €712.5 million of net cash flows from operating activities compared to €587.3 million during the previous year mostly due to higher profit for the period from
184
Table of Contents
continuing operations adjusted by non-monetary items (€930.8 million in the year 2013 compared to €753.2 million in the year 2012, thanks to an increase in our three activities) and increased generation of working capital (€221.2 million in the year 2013 compared to €149.5 million in the previous year, mainly derived from the variation in tax liabilities and short term financial investments), which was partially offset by larger net interest and taxes paid, net of discontinued operations (€439.4 million in the year 2013 compared to €315.4 million in the previous year).
For the year ended December 31, 2012, we generated net cash in our operating activities of €587.3 million, compared to net cash generated from operating activities of €1,381.0 million for the year ended December 31, 2011. The decrease in net cash flow from operating activities was mainly due to a positive contribution to operating cash from working capital of €924.0 million during the year ended December 31, 2011 versus €149.5 million during the same period of 2012. The reduced generation of cash from working capital in 2012 was mainly due to larger amounts paid to our suppliers, especially in our Engineering and Construction activity, as well as to the low margins in our Biofuels segment during 2012. As a result of our working capital financing policies, whereby we pay suppliers 180 days from date of invoice, a lot of the strong execution performed in the last quarter of 2011 to bring several solar assets into operation was paid out to suppliers during 2012. This resulted in large cash outflows during this period, which was paid, in part, with existing cash on the balance sheet, with cash generated from operations during the period before the payment of interest and taxes, and by temporarily using funds from corporate financing. Finally, interest paid was lower for the year ended December 31, 2012 compared with the prior year (€464.3 million vs €471.4 million), while interest received was also lower (€67.4 million (2012) vs. €91.3 million (2011)), all resulting in a significantly lower cash generated by operations period over period.
Net Cash Used in Investing Activities
For the year ended December 31, 2014, net cash used in investing activities was €2,499.7 million compared to €1,364.4 million in the year ended December 31, 2013. The increase in net cash used in investing activities corresponds to the execution of our capital expenditure plan, which was more intense during 2014 compared to 2013. Our main expenditures during 2014 have been the construction of co-generation projects in Mexico, various transmission lines in Brazil and Peru, the thermo-solar and PV plants in Chile, Hospital de Manaus in Brazil and Hugoton in the United States.
For the year ended December 31, 2013, net cash used in investing activities was €1,364.4 million compared to €1,805.7 million for the year ended December 31, 2012. The decrease in net cash used in investing corresponds to the execution of our capital expenditure plan, which was less intensive during 2013 compared to 2012. Our main expenditures during 2013 have been the construction of power transmission lines in Brazil and Peru, the construction of 11 solar plants in Spain, the construction of the second generation biofuels commercial plant in Hugoton (United States), the construction of the solar plan of Mojave in California, the construction of projects in Mexico, the construction of wind farms in Uruguay and the construction of desalination plants in Ghana and Algeria. Our contributions into these investments amounted to approximately €729 million (mostly related to Abengoa's equity funding of the solar plant of Mojave in California, and the second generation biofuels commercial plant in Hugoton, Kansas, and transmission lines in Brazil), which were primarily funded with cash and cash equivalents on balance sheet.
For the year ended December 31, 2012, net cash used in investing activities was €1,805.7 million compared to €915.3 million for the year ended December 31, 2011. The increase in net cash used in investing activities corresponds to the execution of our capital expenditure plan, which was more intense during 2012 compared to 2011. Our main expenditures during 2012 have been the construction of 11 solar plants in Spain, the construction of power transmission lines in Brazil and Peru, the construction of a second generation biofuels commercial plant in Hugoton, Kansas (United States), the construction of a co-generation plant in ACT (Mexico) and the construction of a desalination plant in Ghana. Our contributions into these investments amounted to approximately €1,189 million (mostly related to our equity funding of solar plants
185
Table of Contents
in Spain and United States, transmission lines in Brazil and a co-generation plant in Mexico), which were primarily funded with cash and cash equivalents on balance sheet.
Net Cash Generated from Financing Activities
For the year ended December 31, 2014, net cash flow from financing activities was €1,590.6 million compared to €1,197.5 million in the year ended December 31, 2013. The net cash generated from financing activities during 2014 related to the proceeds from loans and borrowings of €5,038.9 million, which was offset by a repayment of loans and borrowings of €4,108.5 million and dividends paid to shareholders totaling €39.1 million. The proceeds from loans and borrowings are mainly due to the issuance during 2014 of the Notes due 2021, the Notes due 2019, the Euro Commercial Paper program, the increase in our 2014 Syndicated Loan Facility Agreement, and also to the increase in Project Debt related to projects under construction. Additionally, on June 18, 2014, we received €611.0 million from the Abengoa Yield IPO before fees and expenses. After deducting underwriting fees and expenses, we received €575.0 million.
For the year ended December 31, 2013, net cash flow from financing activities was €1,197.5 million compared to €5.6 million in the previous year. The net cash generated from financing activities in 2013 related to proceeds from loans and borrowings of €3,281.5 million, which was partially offset by a repayment of loans and borrowings of €1,802.0 million, the acquisition of treasury shares totalling €89.6 million, dividends paid to shareholders totalling €38.8 million and the effect of discontinued operations of €721.1 million. The proceeds from loans and borrowings are mainly due to increase in Project Debt related to projects under construction. We also had proceeds from corporate financing, consisting mainly of the issuance of the 2019 Convertible Notes, the Senior Unsecured Notes due 2018 and the Senior Unsecured Notes due 2020 for an amount of €400 million, €550 million and $450 million, respectively. Additionally, in October 2013, a capital increase was carried out and we received proceeds for an amount of €517.5 million.
For the year ended December 31, 2012, net cash flow from financing activities was €5.6 million, compared to €478.6 million for the year ended December 31, 2011. The net cash generated from financing activities during 2012 corresponds to proceeds from loans and borrowings of €757.1 million, repayments of loans and borrowings of €229.7 million, dividends paid to shareholders of €36.6 million, other finance activities of €6.1 million and the effect of discontinued operations of €479.1 million. The proceeds from loans and borrowings relates mostly to new Project Debt of €242 million obtained for our solar plants under construction (the thermal solar plants Solacor and Helios in Spain) and to an extent to transmission lines in Brazil, for €432 million (Manaus, Linha Verde), the co-generation plant for Pemex in Mexico and the construction of a wind farm in Uruguay for €84 million.
Clients and other receivable accounts
| | | | | | | |
| | As of December 31, | |
|---|
| | 2014 | | 2013 | |
|---|
| | (€ in millions)
| |
|---|
Clients and other receivable accounts: | | | | | | | |
Trade receivables | | | 592.6 | | | 566.9 | |
Unbilled revenues | | | 913.1 | | | 488.9 | |
Bad debt provisions | | | (82.2 | ) | | (64.0 | ) |
Tax receivables | | | 595.8 | | | 640.6 | |
Other debtors | | | 137.6 | | | 237.6 | |
| | | | | | | | |
Total | | | 2,156.9 | | | 1,870.0 | |
| | | | | | | | |
| | | | | | | | |
| | | | | | | | |
As of December 31, 2014, clients and other receivable accounts increased by €286.9 million, or 15.3%, compared to December 31, 2013. This increase was primarily due to the increase in unbilled revenues in most of our Engineering and Construction companies during 2014, which was, in turn, due to especially large
186
Table of Contents
projects under construction that will be billed in the next few months. As a general rule, we aim to bill amounts under unbilled revenues within the three months following completion of the work being performed on the project. Nevertheless, given the highly-tailored characteristics of some construction contracts, some projects may take longer to be billed due to specific billing milestones in the contracts. These balances do not include any receivables relating to customer claims being supported by contracts signed with such customers.
Of the total amount of unbilled revenues outstanding as of December 31, 2013, 10% has been carried forward to December 31, 2014. The unbilled balance that has not been billed as of December 31, 2014 will be billed in the upcoming months according to the milestones of each specific project, which means approximately 10% per month, except for those projects that will be billed at the end of the construction, so that the total amount is realizable. These balances do not include any receivables relating to customer claims being supported by contracts signed with such customers.
Concessions
As of December 31, 2014, the average remaining life of our concessions was approximately 25 years. Concessions consist of long-term projects awarded to, and undertaken by, Group entities (in conjunction with other companies or on an exclusive basis), typically over a term of 20 to 30 years. For further information on our backlog and concessions, see "Item 5.A—Operating Results—Factors Affecting our Results of Operations—Backlog and Concessions."
Financing Arrangements
We utilize two main sources of financing to meet our financial commitments: corporate financing and Project Debt. We use our corporate financing to finance our investments (including in joint ventures and financing at the project company level) and for general corporate purposes. Our corporate financing is used by all of our activities and is primarily incurred by the Company with upstream guarantees from our main operating subsidiaries. Project Debt refers to non recourse loans obtained by certain Group entities dedicated to long term projects for the development of integrated products. Project Debt also includes bridge loans, which relates to certain operations which are financed in a similar manner to non-recourse projects, generally by financial entities, and which are earmarked to be future development projects which typically will be eventually financed through project finance schemes. Such funding typically relates to transitional financing phases of a project (typically periods of less than 2-3 years) during the launch and construction phase of goods/projects, which once completed and ready for operation, become financed under the project finance model. In these situations Abengoa, S.A. and/or its subsidiaries (other than non-recourse subsidiaries) provide, from time to time, guarantees of obligations whereby Abengoa, S.A. and/or its subsidiaries (other than non-recourse subsidiaries) act as sponsors for the period prior to such project companies securing long-term project financing for their projects. However, if during such transitory period we believe there is a risk of non-compliance with the debt repayment schedule necessary in order to obtain project finance (or of construction, which will ultimately require financing), such financing would be reclassified on the consolidated statement of financial position as a type of corporate financing, depending upon the nature of the arrangements, typically being loans with financial entities. For more detailed information on Project Debt refer to Note 19 to our Consolidated Financial Statements. As of December 31, 2014 we had approximately €1,946.4 million of borrowings classified as bridge loans. The classification of this debt as Project Debt may differ from the classification made by other companies and we have discretion, within applicable IFRS guidelines, to reclassify this type of indebtedness. We generally finance the construction of our own operations by means of Project Debt at the project company level. Project Debt is the principal means of financing for project construction in our Engineering and Construction activity, our Concession- Type Infrastructure activity and our Industrial Production activity.
We are subject to one single financial covenant under the majority of the corporate facilities consisting of the maintenance of a Corporate Net Finance Debt to Consolidated EBITDA (as such terms are defined therein) lower than 3.00x until December 30, 2014 and lower than 2.50x thereafter. As of December 31, 2014 this ratio stood at 2.11x which means that the Company has an additional €386 million corporate borrow capacity without incurring a breach of covenants, considering the last twelve month consolidated EBITDA (as defined therein) of €970 million.
187
Table of Contents
As of December 31, 2014, we had a total net debt (including other loans and borrowings) as calculated below of €7,424.1 million outstanding, the majority of which is long-term financing. Our borrowings consist principally of corporate financing and Project Debt and loans received from public organizations in connection with certain of our projects. As of December 31, 2014, we had €5,325.4 million of indebtedness at the corporate level, €4,958.1 million of Project Debt (of which approximately €1,946.4 million were bridge loans) and €2,859.4 million of cash and cash equivalents and short-term financial investments, resulting in total net debt (including other loans and borrowings) of €7,424.1 million. The decrease in cash and cash equivalents in 2014 is primarily due to the repayment of our previous syndicated loan for an amount of €500 million with the proceeds received from Tranche A of our 2014 Syndicated Loan Facility Agreement, and to our subsequent repayment of Tranche A of our 2014 Syndicated Loan Facility Agreement for an amount of €500 million.
The table below sets forth our total net debt (excluding other loans and borrowings) as of December 31, 2014 and 2013.
| | | | | | | |
| | As of December 31, | |
|---|
| | 2014 | | 2013 | |
|---|
| | (€ in millions)
| |
|---|
Corporate financing: | | | | | | | |
Long-term and short-term bank loans | | | (1,316.0 | ) | | (2,596.1 | ) |
Long-term and short-term notes and bonds | | | (3,853.0 | ) | | (2,894.5 | ) |
Long-term and short-term finance lease liabilities | | | (35.0 | ) | | (40.0 | ) |
Long-term and short-term other loans and borrowings | | | (121.4 | ) | | (123.8 | ) |
| | | | | | | | |
Total corporate financing | | | (5,325.4 | ) | | (5,654.4 | ) |
| | | | | | | | |
Project Debt: | | | | | | | |
Long-term project debt | | | (4,158.9 | ) | | (5,736.2 | ) |
Short-term project debt | | | (799.2 | ) | | (584.8 | ) |
| | | | | | | | |
Total project debt | | | (4,958.1 | ) | | (6,320.9 | ) |
| | | | | | | | |
Total indebtedness | | | (10,283.5 | ) | | (11,975.4 | ) |
| | | | | | | | |
Short-term financial investment | | | 1,048.6 | | | 925.8 | |
Cash and cash equivalents(1) | | | 1,810.8 | | | 2,951.7 | |
| | | | | | | | |
Total net debt (including other loans and borrowings) | | | (7,424.1 | ) | | (8,097.9 | ) |
Less: Long-term and short-term other loans and borrowings | | | 121.4 | | | 123.8 | |
Total net debt (excluding other loans and borrowings) | | | (7,302.7 | ) | | (7,974.1 | ) |
- (1)
- The decrease in cash and cash equivalents in 2014 is primarily due to the repayment of our previous syndicated loan for an amount of €500 million with the proceeds received from Tranche A of our 2014 Syndicated Loan Facility Agreement, and to our subsequent repayment of Tranche A of our 2014 Syndicated Loan Facility Agreement for an amount of €500 million.
Corporate Financing
As of December 31, 2014, we had €5,325.4 million of corporate financing outstanding. Our bank loan financings and bond financings (other than Project Debt) as of December 31, 2014 primarily consist of the following:
2014 Syndicated Loan Facility Agreement
Overview
On September 30, 2014, we entered into a syndicated loan facility agreement (the "2014 Syndicated Loan Facility Agreement") with a group of lenders raising the total aggregate amount to €1,402.9 million. The 2014 Syndicated Loan Facility Agreement provides, among other things, for borrowings comprising of up
188
Table of Contents
to €701.45 million by way of a revolving credit facility ("Tranche A") designed to amortize the previous syndicated loan and an additional €701.45 million by way of a further revolving credit facility ("Tranche B") to finance the promotion, development and construction of concession projects. The 2014 Syndicated Loan Facility Agreement is governed by Spanish law. As of December 31, 2014, €180.2 million was outstanding under Tranche A of the 2014 Syndicated Loan Facility Agreement and Tranche B is fully drawn.
Purpose
All funds drawn under Tranche A were used for the full repayment of our 2012 Forward Start Credit Facility, which was paid in October 2014. All funds drawn under Tranche B" are being used exclusively for the promotion, development and construction of our new concessional projects on a revolving basis.
Borrowers
Abengoa is the borrower for Tranche A and Abengoa Greenbridge, S.A. is the borrower for Tranche B under the 2014 Syndicated Loan Facility Agreement.
Guarantees
The 2014 Syndicated Loan Facility Agreement is guaranteed on a senior basis by the following guarantors: Abeinsa Ingeniería y Construcción Industrial S.A., Abencor Suministros S.A., Abener Energía S.A., Abengoa Bioenergía S.A., Abengoa Bioenergy Company, LLC, Abengoa Bioenergy New Technologies, LLC, Abengoa Bioenergy of Nebraska, LLC, Abengoa Bioenergy Trading Europe, B.V., Abengoa Solar, S.A., Abengoa México S.A. de C.V., Abengoa Solar España, S.A., Abentel Telecomunicaciones S.A., Abentey Gerenciamento de Projectos de Engenharia e Construções, Ltda, ASA Investment Brasil ltda, Abeinsa Infraestructuras de Medio Ambiente, S.A., ASA Desulfuración S.A., Bioetanol Galicia, S.A., Construcciones Metálicas Mexicanas COMEMSA, S.A. de C.V., Ecoagrícola S.A., Europea de Construcciones Metálicas, S.A:, Inabensa Rio ltda, Instalaciones Inabensa S.A., Negocios Industriales y Comerciales S.A., Nicsamex, S.A. de C.V., Teyma Gestión de Contratos de Construcción e Ingeniería, S.A., Teyma Internacional, S.A., Teyma USA & Abener Engineering and Construction Services General Partnership, Abener Teyma Hugoton General Partnership, Abener Teyma Mojave General Partnership, Abengoa Solar New Technologies, S.A., Centro Morelos 264 S.A. de C.V., Teyma Uruguay ZF S.A., Abengoa Construção Brasil LTDA, Abeima Teyma Zapotillo S. de R.L. de C.V. Abengoa Concessions Investments Limited, Siema Technologies, S.L., Abengoa Water, S.L.U., Abeinsa Inversiones Latam, S.L., Abengoa Concessions, S.L., and Abeinsa Asset Management, S.L. The guarantors jointly with the borrowers will represent at least 75% of the total consolidated assets and 75% of the consolidated EBITDA.
Guarantor Coverage Test
The 2014 Syndicated Loan Facility Agreement requires that the total consolidated assets and the aggregate EBITDA of the 2014 Syndicated Loan Facility Agreement Guarantors jointly with Abengoa and Abengoa Greenbridge, S.A. represent at least 75% of total consolidated assets and 75% of Consolidated EBITDA, respectively. In calculating consolidated assets and Consolidated EBITDA, the following items are excluded: (i) Group companies created for the sole purpose of undertaking projects under a system of long-term financing without recourse against another Group member; (ii) acquisitions made without recourse financing; and (iii) Group companies in respect of which a legal restriction exists on the guaranteeing thereby of amounts payable by the Borrowers pursuant to the 2014 Syndicated Loan Facility Agreement (but only insofar as the said restrictions affect the whole of the said amounts and they shall consequently be under an obligation to guarantee those amounts in respect of which there are no restrictions).
Security
The obligations under the 2014 Syndicated Loan Facility Agreement are not secured.
189
Table of Contents
Amount and Repayment of Borrowings
Both Tranche A and Tranche B are revolving credit facilities. The date of final maturity of Tranche A is July 20, 2019. The total availability of funds under Tranche A will be reduced on certain dates in an amount equal to:
| | | | |
| | Tranche A | |
|---|
07/20/2018 | | | 60 | % |
07/20/2019 | | | 40 | % |
| | | | | |
Total | | | 100 | % |
| | | | | |
| | | | | |
| | | | | |
The date of final maturity of Tranche B is September 30, 2018. Upon request of the Borrowers made during the first year of the term of the 2014 Syndicated Loan Facility Agreement, each of the lenders may agree to individually extend, with respect to their participation at that time in Tranche B, the final maturity date of Tranche B for a further year.
The interest payable under the 2014 Syndicated Loan Facility Agreement shall be paid at each successive interest period, which shall be one, three or six months, as selected by us at the time of drawdown through certain procedures, as defined therein.
As of December 31, 2014, €180.2 million was outstanding under Tranche A of the 2014 Syndicated Loan Facility Agreement and Tranche B was fully drawn.
Mandatory Prepayment
In the event of a sale of assets corresponding to Discontinued Activities (as defined therein), 30% of the net cash proceeds must be put towards mandatory prepayment to each of the Tranches. In the event of sale of a participation in the share capital of certain Group companies, 30% of the net cash proceeds that exceeds the nominal amount of such share capital and the proportional debt of the relevant sold company will be put towards mandatory prepayment. In the event of sale of other assets exceeding €10 million, 30% of net cash proceeds that exceeds the book value of such assets, once discounted for their replacement value, as applicable, must be put towards mandatory prepayment. In each case, provided however, the amounts put towards mandatory prepayment shall not exceed €90 million per fiscal year and/or transaction related to the same business of the Group within 12 months, or €400 million for the life of the 2014 Syndicated Loan Facility Agreement.
Interest Rates and Fees
The annual interest rate on borrowings is calculated based on EURIBOR, plus a margin. From the date of the first drawdown to the date on which the first anniversary of the date of signature occurs, the margin (on a yearly basis) will come to 3%.
As from the date on which the first anniversary of the date of signature occurs, the margin (on a yearly basis) will be determined depending on our credit rating published by Moody's or S&P, taking as a reference for these effects the higher of the credit ratings published from time to time:
| | | | |
Rating (S&P/Moody's) | | Applicable Margin
(on a yearly basis) | |
|---|
Lower than or equal to B/B2 | | | 3.00 | % |
B+/B1 | | | 2.75 | % |
Equal to or higher than BB-/Ba3 | | | 2.25 | % |
We are also obligated to pay a commitment fee on undrawn amounts under Tranche A and B. Other fees are also payable, including an agency commission, structuring commission, loyalty commission and certain mandatory costs.
190
Table of Contents
Covenants
Availability of amounts under the 2014 Syndicated Loan Facility Agreement is subject to compliance with a financial maintenance covenant. At the end of each annual and semi-annual consolidated financial statement period, the ratio of Net Finance Debt to Consolidated EBITDA (as such terms are defined therein) shall maintain a level equal to or less than (i) 3.00x until December 30, 2014, inclusive, and (ii) 2.50x from December 31, 2014 forward, inclusive. Subject in each case to certain exceptions, the 2014 Syndicated Loan Facility Agreement also contains negative covenants and restrictions, including, among other things, restrictions on the granting of security, restrictions on the provision of loans and guarantees, restrictions on the disposal of assets and restrictions on a change of business. Furthermore, we must retain certain ownership levels of the guarantors (at least 50% of the share capital). The 2014 Syndicated Loan Facility Agreement also contains affirmative covenants such as for the mandatory periodic reporting of financial and other information and for notification upon the occurrence of any default and certain other events.
Under the 2014 Syndicated Loan Facility Agreement , we are obligated to not permit the Net Financial Debt (as defined therein) of the subsidiaries who are not 2014 Syndicated Loan Facility Agreement Guarantors (excluding the indebtedness of project companies and certain acquisitions without recourse) at any time to exceed €150 million.
Change of Control
The Majority of the Lenders (as defined in the 2014 Syndicated Loan Facility Agreement) have the ability to require early repayment of all outstanding borrowings under the 2012 Forward Start Facility Agreement, together with accrued interest and all accrued commissions and expenses, upon a person or entity gaining control of us. Control of the borrower is described as either: (i) the ownership of more than 50% of our capital; or (ii) the ability and power to: (a) control 50% or more of our voting shares; (b) appoint or remove 50% or more of the members of our management; or (c) create directives regarding our operating and financial policies.
Events of Default
The 2014 Syndicated Loan Facility Agreement contains provisions governing certain events of default, including the failure to make payment of the amounts due, defaults under other agreements evidencing indebtedness over a certain threshold, failure to comply with covenants or other obligations, material misrepresentations, events which have a material adverse effect on us, certain bankruptcy events, a cessation of business and the loss of control over any guarantor or Abengoa Solar except in compliance with the 2014 Syndicated Loan Facility Agreement. The occurrence of an event of default could result in the acceleration of payment obligations under the 2014 Syndicated Loan Facility Agreement.
Bilateral Facilities Loan with Official Credit Institute 2007 due July 2016
Overview
On July 18, 2007, we entered into a €150.0 million facility agreement (the "Official Credit Institute Loan") with the Instituto de Crédito Oficial which was amended and restated on July 11, 2012. Repayment of principal under the loan shall be made on July 18, 2016. The Official Credit Institute Loan is governed by Spanish law. As of December 31, 2014, €36 million were outstanding under the Official Credit Institute Loan.
Purpose
All funds drawn down under the Official Credit Institute Loan must be used for financing our plan of international expansion.
Borrowers
Abengoa is the original borrower under the Official Credit Institute Loan.
191
Table of Contents
Guarantees
The guarantors are the same as those in the 2014 Syndicated Loan Facility Agreement.
The guarantor coverage test is substantially similar to the provision contained in the 2014 Facility Agreement.
Security
The obligations under the Official Credit Institute Loan are not secured.
Amount and Repayment of Borrowings
The principal drawn down under the Official Credit Institute Loan is repayable in successive installments on the dates and in the amounts below:
- •
- July 18, 2014: €50 million;
- •
- July 18, 2015: €50 million; and
- •
- July 18, 2016: €50 million.
We are obligated to prepay the facility with the proceeds obtained from any initial public offering of the shares of Befesa Medio Ambiente, S.L., Abengoa Bioenergía, S.A. and/or Abengoa Solar, S.A. held by us directly or indirectly so that the Leverage Ratio (as defined in the Official Credit Institute Loan) calculated pro forma on the basis of the last audited consolidated financial statements available is equal to or below 2.0 at the end of the period referred to by such audited consolidated financial statements. In the event of sale of assets corresponding to Discontinued Activities (as defined therein), 30% of the net cash proceeds must be put towards mandatory prepayment of the Official Credit Institute Loan. In the event of sale of a participation in the share capital of certain Group companies (excluding any public offering of the shares of Befesa Medio Ambiente S.L., Abengoa Bioenergía S.A. and/or Abengoa Solar, S.A.), 30% of the net cash proceeds that exceeds the nominal amount of such share capital and the proportional debt of the relevant sold company will be put towards mandatory prepayment. In the event of sale of other assets exceeding € 10 million, 30% of net cash proceeds that exceeds the book value of such assets, once discounted for their replacement value, as applicable, must be put towards mandatory prepayment. In each case, provided however, the amounts put towards mandatory prepayment shall not exceed €33,75 million per fiscal year and/or transaction related to the same business of the Group within 12 months, or €150 million for the life of the Official Credit Institute Loan.
This obligatory early repayment shall not exceed €100 million with respect to the proceeds of such sale of shares in Befesa, €50 million with respect to the proceeds of such sale of shares in Abengoa Bioenergía and €100 million with respect to the proceeds of such sale of shares in Abengoa Solar. Such obligatory early repayment is limited to the principal amount pending repayment at the date of the repayment.
The interest under the Official Credit Institute Loan must be paid at the end of each successive Interest Period (as defined in the Official Credit Institute Loan), which must be of one, three or six months, as selected by us at the time of drawdown.
All amounts outstanding under the Official Credit Institute Loan must be repaid in full on July 18, 2016.
Interest Rates and Fees
The annual interest rate on borrowings is calculated based on EURIBOR, plus a margin. The margin is currently 4.75%.
Any unpaid due amounts drawn down under the Official Credit Institute Loan will accrue default interest equal to the application of the applicable interest rate indicated above, calculated based on EURIBOR for
192
Table of Contents
one-month deposits (as calculated in the Official Credit Institute Loan) and increased by 2%. Due and unpaid interest will be capitalized, the foregoing default interest rate being therefore applicable to such amount once capitalized.
Covenants
We are subject to compliance with a financial covenant. Our Net Debt to Consolidated EBITDA Ratio (as defined in the Official Credit Institute Loan) should be lower than 3.00 to 1.00 until December 30, 2014, following which the ratio should be lower than 2.50 to 1.00.
Subject in each case to certain exceptions, the Official Credit Institute Loan contains negative covenants and restrictions, including among others: restrictions on the granting of security, on the provision of loans and guarantees on the disposal of assets, on a change of business and on the incurrence of certain type of debt by certain subsidiaries. Furthermore, subject to certain exceptions, we must not sell or dispose of significant stakes of the share capital of our subsidiaries and must retain directly or indirectly at least 50% of the share capital of Befesa Medio Ambiente, S.L, Abengoa Bioenergía, S.A., and Abengoa Solar. Consequently, the Befesa Sale required the consent of the lenders and such consent was obtained. Non- recourse subsidiaries are not subject to certain of the negative covenants. The Credit Facility Agreement also contains other affirmative covenants such as for the mandatory periodic reporting of financial and other information and for notification upon the occurrence of any event of default.
Change of Control
The change of control provision is substantially similar to the provision contained in the 2014 Facility Agreement.
Events of Default
The events of default are substantially similar to the provision contained in the 2014 Facility Agreement.
Swedish Export Buyer Credit Agreement
Overview
On March 2, 2010, Instalaciones Inabensa S.A. entered into a Swedish export buyer credit agreement (the "Swedish Credit Agreement") with a group of lenders. The Swedish Credit Agreement provides, among other things, for borrowings of up to €247,730,631. The commitments under the Swedish Credit Agreement mature on October 31, 2020. On December 10, 2010, the Swedish Credit Agreement was increased in the amount of €128,759,382. The Swedish Credit Agreement is governed by Swedish law. As of December 31, 2014, €249 million was outstanding under the Swedish Credit Agreement.
Purpose
All amounts borrowed by Instalaciones Inabensa S.A. under the Swedish Credit Facility Agreement shall be applied to finance 100% of the EKN Premium (as defined in the Swedish Credit Facility Agreement) up to a maximum of €13,030,631, 100% of the costs of Eligible Goods and Services, as defined in the Swedish Credit Agreement, consisting primarily of rectifier and inverter stations up to a maximum aggregate amount of €222.7 million and 100% of the interest incurred under the Swedish Credit Agreement up to a maximum of €12 million.
Borrower
The original borrower under the Swedish Credit Agreement is Instalaciones Inabensa S.A.
Guarantee
The Swedish Credit Agreement is guaranteed on a senior basis by Abengoa.
193
Table of Contents
Security
The obligations under the Swedish Credit Agreement are not secured.
Amount and Repayment of Borrowings
The borrower shall repay the loans made to it under the Swedish Credit Agreement in seventeen equal semi-annual installments. Any amount outstanding on October 31, 2020 shall be repaid in full on that date.
Interest Rates and Fees
The annual interest rate on borrowings is EURIBOR plus a margin. The annual interest rate on borrowings is calculated based on EURIBOR, plus a margin. The all-in cost is EURIBOR plus 2.85%. Interest payments on each loan made under the Swedish Credit Agreement shall be made on the last day of the six-month period following the utilization date for that loan and every other successive interest period for that loan shall have a six month duration.
Covenants
Availability of amounts under the Swedish Credit Agreement is subject to compliance with a financial covenant. As of the end of each financial year, the Debt Ratio (as such term is defined in the Swedish Credit Agreement) should not exceed 3.00. Net Financial Debt and EBITDA (which are components of the Debt Ratio) shall be calculated and interpreted on a consolidated basis in accordance with the GAAP applicable to our audited consolidated financial statements which shall be expressed in euros.
Subject in each case to certain exceptions, the Swedish Credit Agreement also contains negative covenants and restrictions, including, among other things, restrictions on the granting of security, restrictions on the provision of loans and guarantees, restrictions on the disposal of assets and restrictions on a change of business. The Swedish Credit Agreement also contains affirmative covenants such as for the mandatory periodic reporting of financial and other information and for notification upon the occurrence of any default and certain other events.
Change of Control
The Guarantor may not sell, lease, transfer or otherwise dispose of any shares or capital shares representing the capital or the Borrower unless such disposition does not result in a Change of Control (as defined in the Swedish Credit Agreement). Any disposal by means of granting security, granting an option or similar arrangements which may if realized and/or exercised result in a Change of Control shall not be permitted.
Events of Default
The Swedish Credit Agreement contains provisions governing certain events of default, including a failure to make payment of the amounts due, defaults under other agreements evidencing indebtedness over a certain threshold, failure to comply with covenants or other obligations, material misrepresentations, events which have a material adverse effect on us, certain bankruptcy events, a cessation of business and the loss of control over any Guarantor except in compliance with the Swedish Credit Agreement. The occurrence of an event of default could result in the acceleration of payment obligations under the Swedish Credit Agreement.
Second Swedish Credit Agreement
Overview
On August 11, 2010, our subsidiary Abener Energía S.A. entered into a Second Swedish Credit Agreement (the "Second Swedish Credit Agreement") which was amended on October 19, 2010, May 4, 2011 and January 25, 2012. The Facility Framework Agreement provides, among other things, for borrowings of up to €299,253,894. Sixteen individual loan agreements have been borrowed under the Second Swedish Credit Agreement amounting to €269,365,984 maturing between 2018 and 2022. The Second Swedish Credit Agreement is governed by English law. As of December, 31, 2014, €166 million was outstanding under the Second Swedish Credit Agreement.
194
Table of Contents
Purpose
All amounts borrowed by Abener Energía S.A. under the Second Swedish Credit Agreement shall be applied to 100% of the EKN Premium (as defined in the Second Swedish Credit Agreement), 100% of the costs of Eligible Goods and Services (as defined in the Second Swedish Credit Agreement), 100% of the local costs and up to a maximum of 30% of imported costs.
Guarantee
We guarantee the Second Swedish Credit Agreement on a senior basis.
Amount and Repayment of Borrowings
The borrower shall repay the loans made to it under the Second Swedish Credit Agreement in seventeen equal semi-annual installments. Any amount outstanding on the Final Maturity Date (as defined in the Second Swedish Credit Agreement) shall be repaid in full on that date.
Interest Rates and Fees
The annual interest rate on borrowings is calculated based on EURIBOR, plus a margin. The all-in cost is EURIBOR plus 2.85%. Interest payments on each loan made under the Second Swedish Credit Agreement shall be made on the last day of the six-month period following the utilization date for that loan and every other successive interest period for that loan shall have six-month duration.
Covenants
Availability of amounts under the Second Swedish Credit Agreement is subject to compliance with a financial covenant. The Debt Ratio (as such term is defined in the Second Swedish Credit Agreement) should be equal to or less than 3.00, as of the end of each annual and semi-annual Consolidated Financial Statement period. Net Financial Debt and Consolidated EBITDA shall be calculated and interpreted on a consolidated basis in accordance with the GAAP applicable to our audited consolidated financial statements which shall be expressed in euros.
Subject in each case to certain exceptions, the Second Swedish Credit Agreement also contains negative covenants and restrictions, including, among other things, restrictions on the granting of security, restrictions on the provision of loans and guarantees, restrictions on the disposal of assets and restrictions on a change of business. The Second Swedish Credit Agreement also contains affirmative covenants such as for the mandatory periodic reporting of financial and other information and for notification upon the occurrence of any default and certain other events.
Change of Control
The Guarantor may not sell, lease, transfer or otherwise dispose of any shares or capital shares representing the capital or the Borrower unless such disposition does not result in a Change of Control (as defined in the Second Swedish Credit Agreement). Any disposal by means of granting security, granting an option or similar arrangements which may if realized and/or exercised result in a Change of Control shall not be permitted.
Events of Default
The Second Swedish Credit Agreement contains provisions governing certain events of default, including a failure to make payment of the amounts due, defaults under other agreements evidencing indebtedness over a certain threshold, failure to comply with covenants or other obligations, material misrepresentations, events which have a material adverse effect on us, certain bankruptcy events, a cessation of business and the loss of control over any Guarantor or Abengoa Solar except in compliance with the
195
Table of Contents
Second Swedish Credit Agreement. The occurrence of an event of default could result in the acceleration of payment obligations under the Second Swedish Credit Agreement.
Convertible Notes due 2017
Overview
On February 3, 2010, the Company issued €250 million aggregate principal amount of 4.5% notes due 2017 (the "2017 Convertible Notes"). Deutsche Bank AG, London Branch acted as fiscal agent and principal paying agent and Deutsche Bank, S.A.E. acted as commissioner. The 2017 Convertible Notes are governed by English law. The terms and conditions of the 2017 Convertible Notes were amended in December 2012.
On February 3, 2015, holders of the 2017 Convertible Notes exercised their right to require Abengoa to redeem the 2017 Convertible Notes at the principal amount together with accrued and unpaid interest to such date. Currently, €5.6 million was outstanding under the Convertible Notes due 2017.
Ranking
The 2017 Convertible Notes are direct, unconditional, unsubordinated and unsecured obligations of Abengoa, rankingpari passu and ratably, without any preference among themselves, and equally with all our other existing and future unsecured and unsubordinated indebtedness, but, in the event of winding up, save for such obligations that may be preferred by provisions of law that are mandatory and of general application.
Guarantees
The obligations under the 2017 Convertible Notes are not guaranteed.
Interest Rates, Payment Dates and Maturity
The 2017 Convertible Notes bear interest at 4.5% per annum. Interest on the 2017 Convertible Notes is payable semi-annually in arrears in equal installments on February 3 and August 3 of each year, commencing on August 3, 2010. The 2017 Convertible Notes will mature on February 3, 2017.
Conversion
The 2017 Convertible Notes are convertible into fully paid Class A shares or Class B shares of Abengoa credited in the number determined by dividing the aggregate nominal amount of the Notes by the applicable conversion price and adjusted upon the occurrence of certain events, including, among others, the change in our share capital or the issuance of certain securities by us. The conversion price was initially set at €30.27 per ordinary share of Abengoa and adjusted upon the occurrence of certain events, including, among others, the change in our share capital or the issuance by us of certain securities. In July 2012, the conversion price was adjusted to €29.87 per ordinary share of the Company following a dividend payment (€0.35 per share) in excess of the dividend threshold permitted without adjustment in the conversion price (€0.21 per share). The conversion price was adjusted to €5.97 per share of Abengoa due to the distribution of Class B shares as approved by the Extraordinary General Shareholders' Meeting of Abengoa held on September 30, 2012. Moreover, the conversion price was adjusted to €5.45 per Class B share of Abengoa as a result of a capital increase. The conversion price was further adjusted to €5.35 per Class B share of Abengoa after the dividend payment approved by General Shareholders' meeting of Abengoa held on April 6, 2014.
The 2017 Convertible Notes are only convertible during the conversion period beginning on and including March 16, 2010 and ending on and including January 23, 2017, subject to certain adjustments. However, should we redeem the 2017 Convertible Notes the conversion period will end on the ninth Trading Day (as defined therein) before the date fixed for redemption.
196
Table of Contents
Optional Redemption by Abengoa
We may redeem all the 2017 Convertible Notes in whole, but not in part, at the principal amount, together with accrued and unpaid interest to such date, in the following circumstances:
- •
- if, at any time after February 24, 2013, the value of the principal amount of €50,000 of the 2017 Convertible Notes exceeds €65,000 according to a certain method of valuation described therein; or
- •
- if, at any time, holders of the 2017 Convertible Notes constituting 85% of the nominal amount of the 2017 Convertible Notes originally issued have been exercised and/or purchased and/or redeemed; or
- •
- at any time between 60 and 150 days after the occurrence of either: (i) a tender offer made in accordance with Spanish law and regulations to our shareholders (other than the offeror or persons acting with the offeror) to acquire all or any of our Class A shares or Class B shares where the offeror will obtain control (as defined therein) of Abengoa immediately following the tender offer (the "2017 Convertible Notes Tender Offer Triggering Event"); or (ii) the acquisition of 80% of our voting shares by Inversión Corporativa IC, S.A. and/or any person or persons controlled by Inversión Corporativa IC, S.A.
Optional Redemption by the Noteholders
The holders of the 2017 Convertible Notes will have the right to require us to redeem the 2017 Convertible Notes upon the occurrence of a 2017 Convertible Notes Tender Offer Triggering Event or if Inversión Corporativa IC, S.A. acquires 80% of our voting shares.
On February 3, 2015, holders of the 2017 Convertible Notes obtained the right to require Abengoa to redeem the 2017 Convertible Notes at the principal amount together with accrued and unpaid interest to such date.
Covenants
We are restricted from taking certain actions while the conversion right attached to the 2017 Convertible Notes remains exercisable, including, among others, the issuance of certain securities, the modification of certain rights attached to our shares, the reduction of our share capital and the creation of certain liens, mortgages, pledges or security interests.
We are also obligated to undertake certain actions while the conversion right attached to the 2017 Convertible Notes remains exercisable, including, among others, to reasonably endeavor to have the 2017 Convertible Notes and the shares issued upon conversion of the 2017 Convertible Notes admitted to listing and to trading on the relevant stock exchanges.
Events of Default
The 2017 Convertible Notes contain provisions governing certain events of default, including, among others, failure to make payment of principal, premium or interest on the 2017 Convertible Notes, certain failures to perform or to observe any other obligation under the 2017 Convertible Notes, certain other indebtedness of ours or a Material Subsidiary (as defined therein) becoming due and payable prior to its stated maturity otherwise than at our option or that of a Material Subsidiary, the failure to pay certain indebtedness or judgments and our bankruptcy or insolvency or that of a Material Subsidiary. The occurrence of any of the events of default in the 2017 Convertible Notes would permit the acceleration of all obligations outstanding under the 2017 Convertible Notes.
197
Table of Contents
Notes due 2015
Overview
On December 1, 2009, we issued €300 million aggregate principal amount of 9.625% Notes due 2015 (the "2015 Notes"). Deutsche Bank AG, London Branch acted as fiscal agent and principal paying agent and Deutsche Bank, S.A.E. acted as commissioner. The 2015 Notes are governed by English law.
Ranking
The 2015 Notes are direct, unconditional, unsubordinated and unsecured obligations ranking at least equally, without any preference among themselves, with all of our other present and future unsecured and unsubordinated obligations, save for such obligations that may be preferred by provisions of law that are mandatory and of general application.
Interest Rates, Payment Dates and Maturity
The 2015 Notes bear interest at 9.625% per annum. Interest on the 2015 Notes is payable semi-annually in arrears in equal installments on June 1 and December 1 of each year. The 2015 Notes will mature on February 25, 2015.
Guarantees
The payment of all sums payable by us under the 2015 Notes are unconditionally and irrevocably guaranteed on a joint and several basis by us and certain subsidiaries (collectively, the "2015 Notes Guarantors") which are, Abeinsa Ingeniería y Construcción Industrial S.A., Abencor Suministros S.A., Abener Energía S.A., Abengoa Bioenergía S.A., Abengoa Bioenergy Company, LLC, Abengoa Bioenergy New Technologies, LLC, Abengoa Bioenergy of Nebraska, LLC, Abengoa Bioenergy Trading Europe, B.V., Abengoa Solar, S.A., Abengoa México S.A. de C.V., Abengoa Solar España, S.A., Abentel Telecomunicaciones S.A., Abentey Gerenciamento de Projectos de Engenharia e Construções, Ltda, ASA Investment Brasil ltda, Abeinsa Infraestructuras de Medio Ambiente, S.A., ASA Desulfuración S.A., Bioetanol Galicia, S.A., Construcciones Metálicas Mexicanas COMEMSA, S.A. de C.V., Ecoagrícola S.A., Europea de Construcciones Metálicas, S.A:, Inabensa Rio ltda, Instalaciones Inabensa S.A., Negocios Industriales y Comerciales S.A., Nicsamex, S.A. de C.V., Teyma Gestión de Contratos de Construcción e Ingeniería, S.A., Teyma Internacional, S.A., Teyma USA & Abener Engineering and Construction Services General Partnership, Abener Teyma Hugoton General Partnership, Abener Teyma Mojave General Partnership, Abengoa Solar New Technologies, S.A., Centro Morelos 264 S.A. de C.V., Teyma Uruguay ZF S.A., Abengoa Construção Brasil LTDA, Abeima Teyma Zapotillo S. de R.L. de C.V. and Abengoa Concessions Investments Limited. The obligations of each 2015 Notes Guarantor under its guarantee constitute (or will constitute) direct, unconditional, unsubordinated and unsecured obligations of such 2015 Notes Guarantor ranking at least equally with all other present and future unsecured and unsubordinated obligations of such 2015 Notes Guarantor.
If two rating agencies assign the 2015 Notes an Investment Grade Rating, as defined therein (the "2015 Notes Rating Release Event"), and no event of default under the 2015 Notes has occurred and is continuing, each of the 2015 Notes Guarantors will be released from its obligations under its guarantee. If certain other events constituting a release event occur with respect to a 2015 Notes Guarantor and no event of default has occurred and is continuing, the relevant 2015 Notes Guarantor will be released from its obligations under its guarantee.
Optional Redemption by the Noteholders
Upon the occurrence of certain Change of Control events (as defined therein), each holder of the 2015 Notes may require us to redeem or purchase the Notes, in whole or in part, at 101% of their principal amount, plus accrued and unpaid interest up to the date of such redemption or purchase.
198
Table of Contents
Covenants
The 2015 Notes contain covenants that, among other things, limit our ability and the ability of certain of our subsidiaries to:
- •
- incur additional indebtedness;
- •
- make restricted payments, including dividends or other distributions;
- •
- create certain liens; and
- •
- sell assets.
These covenants are subject to important exceptions and qualifications. If a Rating Release Event occurs (as defined therein), we and our subsidiaries will be released from their respective obligations under certain of these covenants.
Events of Default
The 2015 Notes have the same events of default provisions as the 2014 Convertible Notes.
Notes due 2016
Overview
On March 31, 2010, we issued €500 million aggregate principal amount of 8.50% Notes due 2016 (the "2016 Notes"). Deutsche Bank AG, London Branch acted as fiscal agent and principal paying agent and Deutsche Bank, S.A.E. acted as commissioner. The 2016 Notes are governed by English law.
Ranking
The 2016 Notes are our direct, unconditional, unsubordinated and unsecured obligations ranking at least equally, without any preference among themselves, with all our other present and future unconditional unsubordinated and unsecured obligations, save for such obligations that may be preferred by provisions of law that are mandatory and of general application.
Interest Rates, Payment Dates and Maturity
The 2016 Notes bear interest at 8.50% per annum. Interest on the 2016 Notes is payable semi-annually in arrears on March 31 and September 30 of each year. The 2016 Notes will mature on March 31, 2016.
Guarantees
The 2016 Notes have the same guarantee provisions as the 2015 Notes.
Optional Redemption by Abengoa
We may redeem the 2016 Notes in whole or in part at any time, at a redemption price equal to the principal amount of such 2016 Notes plus accrued and unpaid interest up to the date for such redemption plus a premium amount equal to the greater of: (i) 1% of the principal amount of such notes; or (ii) the excess, if any, of the present value at such redemption date of the redemption price of such 2016 Notes at March 31, 2016 (excluding accrued but unpaid interest to such redemption date), discounted with the Benchmark Yield (as defined therein) plus 75 basis points, over the principal amount of such 2016 Notes on such redemption date.
In addition, in the event that we become obligated to pay additional amounts (as defined therein) to holders of the 2016 Notes as a result of changes affecting withholding taxes applicable to payments on the
199
Table of Contents
2016 Notes, we may redeem the 2016 Notes in whole but not in part at any time at the principal amount of the 2016 Notes plus accrued interest to the redemption date.
Optional Redemption by the Noteholders
The 2016 Notes have the same optional redemption by the noteholder provision as the 2015 Notes.
Covenants
The 2016 Notes have the same covenants as the 2015 Notes.
Events of Default
The 2016 Notes have the same events of default provisions as the 2015 Notes.
Notes due 2017
Overview
On October 28, 2010, our direct wholly owned subsidiary Abengoa Finance, S.A.U. issued $650 million aggregate principal amount of 8.875% Senior Notes due 2017 (the "2017 Notes"). Deutsche Trustee Company Limited acted as trustee and Deutsche Bank Trust Company Americas acted as paying agent, transfer agent and registrar. The 2017 Notes are governed by New York law.
Ranking
The 2017 Notes are senior obligations of Abengoa Finance, S.A.U. ranking at least equally, without any preference among themselves, with all the other present and future unsecured and unsubordinated obligations of Abengoa Finance, S.A.U., save for such obligations that may be preferred by provisions of law that are mandatory and of general application.
Interest Rates, Payment Dates and Maturity
The 2017 Notes bear interest at 8.875% per annum. Interest on the 2017 Notes is payable semi-annually in arrears on May 1 and November 1 of each year. The 2017 Notes will mature on November 1, 2017.
Guarantees
The 2017 Notes contain the same guarantee provisions, and are guaranteed by the same guarantors, as the 2015 Notes.
Optional Redemption by Abengoa
Abengoa Finance, S.A.U. may redeem the 2017 Notes in whole or in part at any time, at a redemption price equal to the principal amount of such 2017 Notes plus accrued and unpaid interest up to the date for such redemption plus a premium amount equal to the greater of: (i) 1% of the principal amount of such notes; or (ii) the excess, if any, of the present value at such redemption date of the redemption price of such 2017 Notes at November 1, 2017 (excluding accrued but unpaid interest to such redemption date), discounted with the Treasury Rate (as defined therein) plus 50 basis points, over the principal amount of such 2017 Notes on such redemption date.
In addition, in the event that Abengoa Finance, S.A.U. becomes obligated to pay additional amounts (as defined therein) to holders of the 2017 Notes as a result of changes affecting withholding taxes applicable to payments on the 2017 Notes, Abengoa Finance, S.A.U. may redeem the 2017 Notes in whole but not in part at any time at the principal amount of the 2017 Notes plus accrued interest to the redemption date.
200
Table of Contents
Optional Redemption by the Noteholders
The 2017 Notes have the same optional redemption by the noteholder provision as the 2015 Notes.
Covenants
The 2017 Notes covenants which are similar to the covenants in the 2015 Notes.
Events of Default
The 2017 Notes have the same events of default provisions as the 2015 Notes.
Convertible Notes due 2019
Overview
On January 17, 2013, the Company issued €400 million aggregate principal amount of 6.25% notes due 2019 (the "2019 Convertible Notes"). Deutsche Bank AG, London Branch acted as fiscal agent and principal paying agent and Deutsche Bank, S.A.E. acted as commissioner. The 2019 Convertible Notes are governed by English law.
At the beginning of 2014, our Board of Directors expressly and irrevocably resolved, with binding effect, that in relation to the right conferred on the Company to choose the type of payment, the Company shall not exercise the cash settlement option in the event that bondholders decide to exercise their conversion right during the early period granted for that effect.
Ranking
The 2019 Convertible Notes have the same ranking as the 2017 Convertible Notes.
Guarantees
The obligations under the 2019 Convertible Notes are not guaranteed.
Interest Rates, Payment Dates and Maturity
The 2019 Convertible Notes bear interest at 6.25% per annum. Interest on the 2019 Convertible Notes is payable semi-annually in arrears in equal installments on January 17 and July 17 in each year, commencing on July 17, 2013. The 2019 Convertible Notes will mature on January 17, 2019.
Conversion
The 2019 Convertible Notes are convertible into fully paid Class B shares of the Company credited in the number determined by dividing the aggregate nominal amount of the Notes by the applicable conversion price. The conversion price was adjusted to €3.04 per share of Abengoa as a result of the capital increase. The conversion price was further adjusted to €2.98 per Class B share of Abengoa after the dividend payment approved by General Shareholders' Meeting of Abengoa held on April 6, 2014.
Optional Redemption by the Issuer
Following the occurrence of a Tender Offer Triggering Event, the holder of each 2019 Convertible Note will have the right to require the Issuer to redeem that 2019 Convertible Note on the Put Date at the Put Price (each as defined in the terms and conditions of the 2019 Convertible Notes), together with accrued interest to (but excluding) the Put Date.
201
Table of Contents
Following the occurrence of a Relevant Person Triggering Event, the holder of each 2019 Convertible Note will have the right to require the Issuer to redeem that 2019 Convertible Note on the Put Date at its principal amount together with accrued interest to (but excluding) the Put Date.
Covenants
The 2019 Convertible Notes have substantially the same covenants as the 2017 Convertible Notes.
Events of Default
The 2019 Convertible Notes have the same events of default provisions as the 2017 Convertible Notes.
Notes due 2018
On February 5, 2013, our direct wholly owned subsidiary Abengoa Finance, S.A.U. issued €250 million aggregate principal amount of 8.875% Senior Notes due 2018 (the "Senior Unsecured Notes due 2018"). On October 3, 2013 and November 5, 2013, Abengoa Finance, S.A.U. issued €250 million and €50 million, respectively, of additional notes (together with the Senior Unsecured Notes due 2013, the "2018 Notes"). Deutsche Trustee Company Limited acted as trustee, Deutsche Bank AG, London Branch, acted as paying agent and Deutsche Bank Luxembourg S.A., acted as transfer agent and registrar. The 2018 Notes are governed by New York law.
Ranking
The 2018 Notes are senior obligations of Abengoa Finance, S.A.U. ranking at least equally, without any preference among themselves, with all the other present and future unsecured and unsubordinated obligations of Abengoa Finance, S.A.U., save for such obligations that may be preferred by provisions of law that are mandatory and of general application.
Interest Rates, Payment Dates and Maturity
The 2018 Notes bear interest at 8.875% per annum. Interest on the 2018 Notes is payable semi-annually in arrears on February 5 and August 5 of each year. The 2018 Notes will mature on February 5, 2018.
Guarantees
The 2018 Notes contain the same guarantee provisions, and are guaranteed by the same guarantors, as the 2015 Notes.
Optional Redemption by Abengoa
Abengoa Finance, S.A.U. may redeem all or part of the 2018 Notes at any time at a redemption price equal to 100% of the principal amount of the 2018 Notes redeemed, plus the applicable redemption premium, plus accrued and unpaid interest, if any, and additional amounts, if any.
Optional Redemption by the Noteholders
The 2018 Notes have the same optional redemption by the noteholder provision as the 2017 Notes.
Covenants
The 2018 Notes covenants are similar to the covenants in the 2017 Notes.
202
Table of Contents
Events of Default
The 2018 Notes contain provisions governing certain events of default, including, among others, failure to make payment of principal, premium or interest on the 2018 Notes, certain failures to perform or to observe any other obligation under the 2018 Notes, certain other indebtedness of the Material Subsidiary (as defined therein) becoming due and payable prior to its stated maturity otherwise than at our option or that of a Material Subsidiary, the failure to pay certain indebtedness or judgments and our bankruptcy or insolvency or that of a Material Subsidiary. The occurrence of any of the events of default in the 2018 Notes would permit the acceleration of all obligations outstanding under the 2018 Notes.
Notes due 2020
Overview
On December 13, 2013, our direct wholly owned subsidiary Abengoa Finance, S.A.U. issued $450 million aggregate principal amount of 7.75% Senior Notes due 2020 (the "2020 Notes"). Deutsche Trustee Company Limited acted as trustee and Deutsche Bank Trust Company Americas acted as paying agent,transfer agent and registrar. The 2020 Notes are governed by New York law.
Ranking
The 2020 Notes are senior obligations of Abengoa Finance, S.A.U. ranking at least equally, without any preference among themselves, with all the other present and future unsecured and unsubordinated obligations of Abengoa Finance, S.A.U., save for such obligations that may be preferred by provisions of law that are mandatory and of general application.
Interest Rates, Payment Dates and Maturity
The 2020 Notes bear interest at 7.75% per annum. Interest on the 2020 Notes is payable semi-annually in arrears on August 1 and February 1 of each year. The 2020 Notes will mature on February 1, 2020.
Guarantees
The 2020 Notes have the same guarantee provisions as the 2017 Notes.
Optional Redemption by Abengoa
Abengoa Finance, S.A.U. may redeem the 2020 Notes in whole or in part at any time, at a redemption price equal to the principal amount of such 2020 Notes plus accrued and unpaid interest up to the date for such redemption plus a premium amount equal to the greater of: (i) 1% of the principal amount of such notes; or (ii) the excess, if any, of the present value at such redemption date of the redemption price of such 2020 Notes at February 1, 2020 (excluding accrued but unpaid interest to such redemption date), discounted with the Bund rate (as defined therein) plus 50 basis points, over the principal amount of such 2020 Notes on such redemption date.
In addition, in the event that Abengoa Finance, S.A.U. becomes obligated to pay additional amounts (as defined therein) to holders of the 2020 Notes as a result of changes affecting withholding taxes applicable to payments on the 2020 Notes, Abengoa Finance, S.A.U. may redeem the 2020 Notes in whole but not in part at any time at the principal amount of the 2020 Notes plus accrued interest to the redemption date.
Optional Redemption by the Noteholders
The 2020 Notes have the same optional redemption by the noteholder provision as the 2017 Notes.
203
Table of Contents
Covenants
The 2020 Notes contain covenants which are similar to the covenants in the 2015 Notes.
Events of Default
The 2020 Notes have the same events of default provisions as the 2015 Notes.
Notes due 2021
Overview
On March 21, 2014, our direct wholly owned subsidiary, Abengoa Finance, S.A.U., issued €500 million aggregate principal amount of 6.00% Senior Notes due 2021 (the "2021 Notes"). Deutsche Trustee Company Limited acted as trustee, Deutsche Bank AG, London Branch acted as paying agent and Deutsche Bank Luxembourg S.A. acted as listing agent, transfer agent and registrar. The 2021 Notes are governed by New York law. We expect to apply the net proceeds of the 2021 Notes to repay the outstanding €300 million principal amount of the 2015 Notes by their February 25, 2015 maturity date, with the balance of net proceeds of the 2021 Notes being used to prepay a portion of the 2012 Forward Start Facility by September 30, 2014.
Ranking
The 2021 Notes are senior obligations of Abengoa Finance, S.A.U. ranking at least equally, without any preference among themselves, with all the other present and future unsecured and unsubordinated obligations of Abengoa Finance, S.A.U., save for such obligations that may be preferred by provisions of law that are mandatory and of general application.
Interest Rates, Payment Dates and Maturity
The 2021 Notes bear interest at 6.00% per annum. Interest on the 2021 Notes is payable semi-annually in arrears on March 15 and September 15 of each year. The 2021 Notes will mature on March 31, 2021.
Guarantees
The 2021 Notes contain the same guarantee provisions, and are guaranteed by the same guarantors, as the 2015 Notes.
Optional Redemption by Abengoa
Abengoa Finance, S.A.U. may redeem the 2021 Notes in whole or in part at any time, at a redemption price equal to the principal amount of such 2021 Notes plus accrued and unpaid interest up to the date for such redemption plus a premium amount equal to the greater of: (i) 1% of the principal amount of such notes; and (ii) the present value at such redemption date of: (x) 100% of the aggregate principal amount of such Note to be redeemed; plus (y) all required interest payments that would otherwise be due to be paid on such Note through March 31, 2021 (excluding accrued but unpaid interest to the redemption date), computed using a discount rate equal to the Bund Rate at such redemption date plus 50 basis points; over (ii) the outstanding principal amount of the Note.
In addition, in the event that Abengoa Finance, S.A.U. becomes obligated to pay additional amounts (as defined therein) to holders of the 2021 Notes as a result of changes affecting withholding taxes applicable to payments on the 2021 Notes, Abengoa Finance, S.A.U. may redeem the 2021 Notes in whole but not in part at any time at the principal amount of the 2021 Notes plus accrued interest to the redemption date.
204
Table of Contents
Optional Redemption by the Noteholders
The 2021 Notes have the same optional redemption by the noteholder provision as the 2015 Notes.
Covenants
The 2021 Notes contain covenants which are similar to the covenants in the 2015 Notes.
Events of Default
The 2021 Notes have the same events of default provisions as the 2015 Notes.
Repayment Schedule
The repayment schedule of our corporate financing with respect to the bank finance portion thereof, as of December 31, 2014, is as follows:
| | | | | | | | | | | | | | | | |
| | One Year
or Less | | Between
One and
Two Years | | Between
Two and
Three Years | | Between
Three and
Four Years | | Subsequent | |
|---|
| | (€ in millions)
| |
|---|
2014 Syndicated Loan Facility Agreement | | | — | | | — | | | — | | | — | | | 180.2 | |
Loan with Official Credit Institute | | | 36.2 | | | — | | | — | | | — | | | — | |
Instalaciones Inabensa, S.A. Financing | | | 68.9 | | | 64.7 | | | 66.6 | | | 51.8 | | | 52.1 | |
Abener Energía S.A. Financing | | | 104.7 | | | 60.6 | | | 37.8 | | | 50.8 | | | 90.5 | |
Other loans | | | 234.6 | | | 40.2 | | | 43.6 | | | 19.8 | | | 112.9 | |
| | | | | | | | | | | | | | | | | |
Total | | | 444.4 | | | 165.5 | | | 148.0 | | | 122.4 | | | 435.7 | |
| | | | | | | | | | | | | | | | | |
| | | | | | | | | | | | | | | | | |
| | | | | | | | | | | | | | | | | |
The repayment schedule of our corporate financing with respect to the capital markets portion thereof, as of December 31, 2014, is as follows:
| | | | | | | | | | | | | | | | |
| | One Year
or Less | | Between
One and
Two Years | | Between
Two and
Three Years | | Between
Three and
Four Years | | Subsequent | |
|---|
| | (€ in millions)
| |
|---|
2017 Convertible Notes(1) | | | 244.4 | | | — | | | 5.6 | | | — | | | — | |
2019 Convertible Notes | | | — | | | — | | | — | | | — | | | 400.0 | |
2015 Notes | | | 300.0 | | | — | | | — | | | — | | | — | |
2016 Notes | | | — | | | 500.0 | | | — | | | — | | | — | |
2017 Notes | | | — | | | — | | | 534.8 | | | — | | | — | |
2018 Notes | | | — | | | — | | | — | | | 550.0 | | | — | |
2020 Notes | | | — | | | — | | | — | | | — | | | 370.3 | |
2021 Notes | | | — | | | — | | | — | | | — | | | 500.0 | |
Euro Commercial Paper Program (ECP) | | | 464.1 | | | — | | | — | | | — | | | — | |
Commercial Paper—Abengoa Mexico | | | 43.5 | | | — | | | — | | | — | | | — | |
| | | | | | | | | | | | | | | | | |
Total | | | 1,052.0 | | | 500.0 | | | 540.4 | | | 550.0 | | | 1,270.3 | |
| | | | | | | | | | | | | | | | | |
| | | | | | | | | | | | | | | | | |
| | | | | | | | | | | | | | | | | |
- (1)
- As of February 3, 2015, €5.6 million was outstanding under the 2017 Convertible Notes.
The debt referenced in the table above is subject to fixed and floating interest rate payments, as described in the facilities or instruments thereto.
At the corporate level we also incur purchase obligations for the purchase of goods or services that are enforceable and legally binding on us. These contractual commitments specify all significant terms, including
205
Table of Contents
fixed or minimum quantities to be purchased, fixed, minimum or variable price provisions and the appropriate timing of the transactions.
Project Debt
Compared to corporate financing, Project Debt has certain key advantages, including a clearly defined risk profile, lower funding costs, generally longer terms and its ability to enable higher leverage on a project company basis.
We incur Project Debt either through special-purpose project companies that are established to finance multiple projects or businesses and in certain instances, special-purpose project companies established for a single project. In each case, the project company enters into the financing agreement directly with the relevant lender for a specific project. The basis of the financing agreement between the project company and lender details the allocation of the cash flows generated by the project and the amortization schedule of payments owed under the financing agreement. Under such arrangements, any claims against the assets of the project company are subordinated to those of the lender or lenders, if multiple projects have been financed through the project company, until the financing is repaid in full, but the lender or lenders only have recourse to the project company's assets and not to the shareholder of the project company or the sponsor of the project. Consequently, the cross-default provisions of Abengoa's borrowings do not apply to defaults of project companies, thus safeguarding the non-recourse nature of the project financings. We also incur Project Debt as corporate debt of a subsidiary of Abengoa, S.A. under which the holders of such debt do not have recourse to Abengoa, S.A. or any of its other subsidiaries.
Project Debt refers to non recourse loans obtained by certain Group entities dedicated to long term projects for the development of integrated products. Project Debt also includes bridge loans, which relates to certain operations which are financed in a similar manner to non-recourse projects, generally by financial entities, and which are earmarked to be future development projects which typically will be eventually financed through project finance schemes. Such funding typically relates to transitional financing phases of a project (typically periods of less than 2-3 years) during the launch and construction phase of goods/projects, which once completed and ready for operation, become financed under the project finance model. In these situations Abengoa, S.A. and/or its subsidiaries (other than non-recourse subsidiaries) provide, from time to time, guarantees of obligations whereby Abengoa, S.A. and/or its subsidiaries (other than non-recourse subsidiaries) act as sponsors for the period prior to such project companies securing long-term project financing for their projects. However, if during such transitory period we believe there is a risk of non-compliance with the debt repayment schedule necessary in order to obtain project finance (or of construction, which will ultimately require financing), such financing would be reclassified on the consolidated statement of financial position as a type of corporate financing, depending upon the nature of the arrangements, typically being loans with financial entities. For more detailed information on Project Debt refer to Note 19 to our Consolidated Financial Statements.
Our Project Debt contains customary financial covenants, including maintaining or exceeding certain financial ratios, and limitations on capital expenditures and additional debt. Project Debt also includes certain obligations guaranteed by Abengoa, S.A. and/or its subsidiaries (other than non-recourse subsidiaries) in favor of our project companies and categorized as bridge loans, whereby Abengoa, S.A. and/or its subsidiaries (other than non-recourse subsidiaries) guarantee obligations in order to act as sponsors for the period prior to such project companies securing long-term project financing. As of December 31, 2014 we had €1,946.4 million of borrowings classified as bridge loans (see Note 19.2 to our Consolidated Financial Statements for details).
Our activities, in particular our Engineering and Construction activity, regularly operate as contractors or service providers to the project company to either construct or maintain the project for third-party owner or sponsor of the project and may also undertake certain obligations for the project company. Although we are usually required to provide credit and other support to the project company in relation to its trading activities
206
Table of Contents
(by way of performance bonds, guarantees or other commitments), we do not provide, with certain limited exceptions, any credit support for the repayment of the project company's debt obligations. We have, from time to time, provided guarantees of obligations of certain project companies incurred under working capital facilities of such project companies, other contingent obligations, and letters of credit or guarantees replacing amounts withdrawn by us from debt service reserve accounts held by project companies. These guarantees, letters of credit and other contingent liabilities have been incurred from time to time for reasons relating to the unique circumstances of the relevant project company or the history of its acquisition or development.
The below table shows our Project Debt as of December 31, 2014. Project Debt of projects under construction which were deconsolidated upon the application of IFRS 10 until their entry into operation is not included below. See "Item 5.A—Operating Results—Factors Affecting the Comparability of Our Results of Operations—IFRS 10 and 11":
| | | | |
| | As of
December 31,
2014 | |
|---|
| | (€ in millions)
| |
|---|
Project Debt | | | | |
Long-Term | | | 4,158.9 | |
Short-Term | | | 799.2 | |
| | | | | |
Total | | | 4,958.1 | |
| | | | | |
| | | | | |
| | | | | |
Our main bridge financing arrangements consist of the following:
October 2014 Notes Program
Overview
In October 1, 2014, we entered into a five-year senior unsecured notes program with a group of lenders for an initial maximum available amount of €125 million, which may be increased up to €425 million (the "October 2014 Notes Program"). As of December 31, 2014, €80.8 million in notes have been issued.
Purpose
Proceeds from the October 2014 Notes Program are to be used for financing the development of our projects until long-term external funds associated with such projects can be secured.
Ranking
The October 2014 Notes Program is guaranteed by us on a senior basis. In the event of our insolvency (unless we qualify as a subordinated claim pursuant to article 92 of Law 22/2003 (Ley Concursal) of July 9 or equivalent legal provisions which replace it in the future, and subject to any applicable legal and statutory exemptions) the notes issued under the October 2014 Notes Program will rankpari passu and ratably without any preference among themselves and at leastpari passu with all other present and future unsecured and unsubordinated indebtedness of Abengoa, S.A.
Interest Rates, Payment Dates and Maturity
The notional weighted average interest rate of the notes issued under the October 2014 Notes Program is 6.92% per annum. Interest on the notes issued under the October 2014 Notes Program is payable quarterly. Notes issued under the October 2014 Notes Program feature a variety of original maturity dates between 33 and 62 months from the date of issuance.
207
Table of Contents
Guarantees
Abengoa, S.A. and Abengoa Greenbridge, S.A.U. are the specified issuers under the October 2014 Notes Program. Abengoa, S.A. acts as the guarantor when Abengoa Greenbridge, S.A.U. is the issuer of a series of notes.
Redemption Events
In the event of an amendment in Spanish tax law which prevents an issuer from making their next payment of principal or interest without paying additional amounts, noteholders have the right to require the issuer to redeem their October 2014 Notes Program notes at a redemption price equal to 100% of the principal amount of the October 2014 Notes Program notes redeemed, together with any interest accrued to, but excluding the date of, redemption (the "Early Adoption Amount"). If in the event of an amendment in Spanish law prevents an issuer from making their next payment of principal or interest altogether, the issuer will be required to redeem a noteholder's October 2014 Notes Program notes for the Early Adoption Amount.
If in the event of a Succession Failure Event or a Credit Event Mandatory Redemption Event (as defined therein), the issuer will be required to redeem the October 2014 Notes Program notes at a redemption price equal to the Early Redemption Amount.
If in the event of a Illegality Event (as defined therein), noteholders have the right to require the issuer to redeem their October 2014 Notes Program notes at a redemption price equal to the Early Redemption Amount.
Covenants
We are restricted from taking certain actions during the term of October 2014 Notes Program including, among others, ensuring the noteholders' initial creditor position in the event of liquidation and the payment of all additional tax payments or fees in connection with the October 2014 Notes Program.
Events of Default
The October 2014 Notes Program contains provisions governing certain events of default, including a failure to make payment of the amounts due, certain other indebtedness of ours becoming due and payable prior to its stated maturity otherwise than at our option, failure to pay any amount payable when due under any present or future guarantee over a certain threshold, failure to comply with covenants or other obligations, a cessation of business and certain bankruptcy events. The occurrence of any of the events of default in the October 2014 Notes Program would permit the acceleration of all obligations outstanding under the October 2014 Notes Program.
Notes due 2019
Overview
On September 30, 2014, our direct wholly owned subsidiary, Abengoa Greenfield, S.A., issued €265 million aggregate principal amount of 5.50% Euro Senior Notes due 2019 and $300 million aggregate principal amount of 6.50% U.S. Dollar Senior Notes due 2019 (the "2019 Notes"). Deutsche Trustee Company Limited acted as trustee, Deutsche Bank AG, London Branch acted as paying agent for the Euro Senior Notes, Deutsche Bank Trust Company Americas acted as paying agent for the U.S. Dollar Senior Notes and Deutsche Bank Luxembourg S.A. acted as listing agent, transfer agent and registrar. The 2019 Notes are governed by New York law. We expect to apply the net proceeds of the 2019 Notes to finance, in whole or in part, Eligible Green Projects (as defined therein) until the long-term funds associated with those projects are obtained.
208
Table of Contents
Ranking
The 2019 Notes are senior obligations of Abengoa Greenfield, S.A. ranking at least equally, without any preference among themselves, with all the other present and future unsecured and unsubordinated obligations of Abengoa Greenfield S.A, save for such obligations that may be preferred by provisions of law that are mandatory and of general application.
Interest Rates, Payment Dates and Maturity
The 2019 Euro Notes bear interest at 5.50% per annum and the 2019 U.S. Dollar Notes bear interest at 6.50% per annum. Interest on the 2019 Notes is payable semi-annually in arrears on April 1 and October 1 of each year. The 2019 Notes will mature on October 1, 2019.
Guarantees
The 2019 Notes contain the same guarantee provisions, and are guaranteed by the same guarantors, as the 2015 Notes.
Optional Redemption by Abengoa
Abengoa Greenfield, S.A. may redeem the 2019 Notes in whole or in part at any time, at a redemption price equal to the principal amount of such 2019 Notes plus accrued and unpaid interest up to the date for such redemption plus a premium amount equal to the greater of: (i) 1% of the principal amount of such notes; and (ii) the present value at such redemption date of: (x) 100% of the aggregate principal amount of such Note to be redeemed; plus (y) all required interest payments that would otherwise be due to be paid on such Note through October 1, 2019 (excluding accrued but unpaid interest to the redemption date), computed using a discount rate equal to the Bund Rate at such redemption date plus 50 basis points; over (ii) the outstanding principal amount of the Note.
In addition, in the event that Abengoa Greenfield, S.A. becomes obligated to pay additional amounts (as defined therein) to holders of the 2019 Notes as a result of changes affecting withholding taxes applicable to payments on the 2019 Notes, Abengoa Greenfield, S.A. may redeem the 2019 Notes in whole but not in part at any time at the principal amount of the 2019 Notes plus accrued interest to the redemption date.
Optional Redemption by the Noteholders
The 2019 Notes have the same optional redemption by the noteholder provision as the 2015 Notes.
Covenants
The 2019 Notes contain covenants which are similar to the covenants in the 2015 Notes.
Events of Default
The 2019 Notes have the same events of default provisions as the 2015 Notes.
The repayment schedule of our Project Debt, as of December 31, 2014, is as follows, and is generally in accordance with the projected cash flows of the related projects.
| | | | | | | | | | | | | |
Total | | Less than
One Year | | Between
One and
Three Years | | Between
Three and
Five Years | | More than
Five Years | |
|---|
| | (€ in millions)
| |
|---|
4,958.1 | | | 799.2 | | | 895.4 | | | 1,575.9 | | | 1,687.6 | |
209
Table of Contents
C. Research and Development
R&D&i involves activities which continuously improve our processes and products, but also generating new future options with breakthrough technologies. R&D&i is undertaken by our activities in furtherance of the demands of our respective markets to provide the necessary competitive capacities for us on an ongoing basis. The goal of our R&D&i program is to provide innovative solutions for sustainability, create value over the long-term and continue to provide us with a competitive edge by focusing on reducing costs in our current technologies.
We have continued to increase our efforts in R&D&i (despite the prolonging of the global financial crisis during this period), based on our strong belief that to improve current results and achieve real future benefits, such investment requires continuous input which should not be adversely affected by economic cycles.
We have strengthened our presence, and in certain cases, our technological leadership, in various institutions, public forums and private forums in which cooperation is encouraged among large technology companies, and where the short- and long-term future of R&D&i is decided.
We have undertaken R&D&i in accordance with the requirements identified for our markets. The majority of our projects are aligned with the research and development objectives of the public administrations of Spain (the Ministry of Industry and Energy), of Europe (under research and development framework programs) and of the United States (the DOE).
We collaborate with some of the most reputable research centers in the world, such as the National Renewable Energy Laboratory in the United States,Deutsche Zentrum für Luft und Raumfahrt in Germany andCentro de Investigaciones Energéticas, Medioambientales y Tecnológicas in Spain. In addition, we have received substantial economic support from government entities such as the DOE and the European Union.
During this period, we have made strategic investments in pioneering companies in the United States and Canada, developing and owning technologies which are defined as "high priority," such as new CSP plants, second generation biofuels, biorefineries and water treatment technologies, with the objective of enabling internationalization and the generation of value through these technologies in key emerging markets.
In the years ended December 31, 2014, 2013 and 2012, our investment in R&D&i totaled €99.7 million, €107.4 million and €91 million, respectively, including investments in our recycling segment sold in June 2013. Of our investment in R&D&i, amounts expensed represented €8.7 million, €6.5 million and €6.4 million, respectively and amounts capitalized represented €91 million, €101 million and €84 million, respectively. Taking into account the investment in Atacama 1, Khi Solar One, Hugoton and the rest of our activities expensed or capitalized, total investment in R&D during 2014 amounted to €597.8 million. As of December 31, 2014, we have approximately 880 people engaged in R&D&i activities in different centers, mainly in Seville (Spain), Madrid (Spain), St. Louis, Missouri (United States) and Denver, Colorado (United States) and Montevideo (Uruguay).
In solar-thermal technology, construction has continued in South Africa on Khi Solar One, the world's first commercial plant using tower technology and superheated steam. The 50 MW plant is expected to come into operation in 2015. Abengoa is also developing the first solar-thermal molten salt tower plant in Latin America, totaling 110 MW and in combination with a 100 MW photovoltaic plant. The solar-thermal tower plant includes a 17.5 hours energy storage system using molten salts, allowing it to be able to offer electricity 24 hours a day. In the biofuels area, we have finished the construction of the commercial bio-refinery plant in Hugoton, which came into operation in October 2014. The technology used in this plant has been developed and proven by us over the last ten years at our second-generation demonstration plant in Salamanca, Spain. A waste-to-biofuels demonstration plant has also been operated at the same complex, which is capable of obtaining second-generation biofuels from recovered municipal solid waste. In addition to this progress, we continue to develop various processes to obtain high value-added bio-products from biomass, such as a catalyst that has been patented that enables biobutanol to be produced from ethanol using a catalytic
210
Table of Contents
process. This technology offers us an additional advantage since it can be applied at our existing conventional biofuels facilities.
Abengoa Research
Abengoa Research, created in February 2011, is engaged in technological research and development activities within the fields of energy and sustainable development. This research center, a forerunner in private research in Spain, is intended as a top-rank science and technology center, valorizing our accumulated knowledge by developing existing and future real applications. By engaging in R&D, Abengoa Research seeks to expand upon existing knowledge while generating new approaches, rooted in our scientific knowledge of the state of the art and the multidisciplinary skill sets of our human team.
The company's specific objectives are akin to those of a research center but are tailored to Abengoa's strategy and geared towards the present and future business needs and interests of the Company. This includes generating and exploiting patents and other intellectual and industrial property and conducting studies, preparing reports and performing scientific-technical projects.
Projects to date have focused on the areas of research in which Abengoa is currently interested: solar power, bioenergy, water, waste, hydrogen, marine power, and so on. The center has also been working on an Abengoa-specific strategic technology agenda for the coming years in relation to the areas described above.
Engineering and Construction
R&D&i is a strategic area in our Engineering and Construction activity for future planning. R&D&i activities are undertaken by a number of different Group entities through the investigation, development and application of new technologies which focus on combating climate change and contribute to sustainable development, including,inter alia:
- •
- reducing carbon dioxide and other greenhouse gas emissions in the construction sector;
- •
- developing hydrogen technology with pioneering R&D&i projects in the area of clean electricity generation through hydrogen batteries;
- •
- improving energy efficiency through the development of new technologies;
- •
- developing electrical storage systems to improve grids dispatchability reducing transport loses; and
- •
- investigating and innovating in the field of new renewable energy sources.
Concession-Type Infrastructure
Our R&D&i in our Concession-Type Infrastructure activity is undertaken in partnership with numerous research institutes and universities in Spain and elsewhere.
At our two research centers in Spain and the United States, the R&D&i team of our Concession-Type Infrastructure activity's Solar segment is involved in the research of high-temperature concentration of solar power and photovoltaic research. Our Solar segment has undertaken various R&D&i projects with the backing of the DOE, while also continuing to work on different projects within the Seventh Framework Program of the European Union, including the Solugas Consortium in collaboration with theDeutsche Zentrum für Luft und Raumfahrt andNew Algerian Company, among others, and on the Innpacto projects against the backdrop of theCentro de Investigaciones Energéticas, Medioambientales y Tecnológicas programs in Spain. Our Solar segment R&D&i team also collaborates with leading research centers worldwide, including universities and technological institutes. The independent research centers with which the Solar segment's R&D&i team has worked include the National Renewable Energy Laboratory in the United States,Centro de Investigaciones Energéticas, Medioambientales y Tecnológicas in Spain and the Aerospace Centre in Germany. In addition to the Solúcar Platform, considered one of the world's leading centers in solar
211
Table of Contents
energy research, our Solar segment has increased its R&D&i capabilities with the inauguration of the Soland R&D center, with more than 3,500 m2 of labs. Our Solar segment's main R&D&i programs are focused on: increasing the efficiency of its CSP tower technology; reducing the components cost of its CSP through technology and high concentrated photovoltaic (HCPV); and increasing the dispatchability of our thermal storage technology.
Our R&D&i in the Water segment is structured into three areas: desalination, water treatment and water cycle sustainability. The desalination area focuses on improving the efficiency of the reverse osmosis process and lowering our investment, operation and maintenance costs and is also engaged in the validation and conceptual design of a new and cost-effective remineralization process for desalination plants. The water treatment area seeks to optimize membrane-based water treatment processes so as to save energy and produce less sludge, develop sludge treatment and elimination technologies as supercritical oxidation. The water cycle sustainability area seeks to optimize energy use in water infrastructure, develop hydro power and marine energy capabilities, create sustainable water management models, and develop and apply sustainability criteria in the design of the water area's solutions. In addition, our Water segment's R&D&i team also collaborates with leading universities, institutes, and public bodies including Foundation Euskoiker, the School of Industrial Engineering in Bilbao (Spain), the Spanish Ministry of Industry, Tourism and Trade, the Ministry of Innovation and Science and the Center for Industrial Technological Development.
D. Trend Information
Other than as disclosed elsewhere in this annual report, we are not aware of any trends, uncertainties, demands, commitments or events for the year ended December 31, 2014 that are reasonably likely to have a material adverse effect on our revenues, income, profitability, liquidity or capital resources, or that caused the disclosed financial information to be not necessarily indicative of future operating results or financial conditions.
E. Off-Balance Sheet Arrangements
The total value of off-balance sheet arrangements and third-party guarantees decreased by approximately €48.4 million, from €7,510.5 million as of December 31, 2013 to €7,462.1 million as of December 31, 2014. Such figure comprises (i) guarantees provided by financial institutions (bank bonds and surety insurance) for the benefit of third parties and (ii) the overall value of guarantees undertaken by the Group for the benefit of third parties.
With respect to guarantees provided by financial institutions for the benefit of third parties, this subset comprises bank bonds and surety insurance directly deposited by such Group companies with financial institutions and those deposited by us to any company in the Group as guarantee to third parties (clients, financial entities, public entities and other third parties). Such commitments totaled €1,672.8 million as of December 31, 2014 compared to €1,323.3 million in December 31, 2013.
With respect to guarantees provided by Group companies for the benefit of third parties, this subset comprises a range of declarations of intent and commitments undertaken by Group companies and us regarding group companies in support of their operations with third parties. Such guarantees totaled €5,789.2 million as of December 31, 2014 compared to €6,187.3 million as of December 31, 2013.
For further discussion, see Note 23.1 to our Consolidated Financial Statements included elsewhere in this annual report.
212
Table of Contents
F. Tabular Disclosure of Contractual Obligations
The following table summarizes our contractual obligations as of December 31, 2014.
| | | | | | | | | | | | | | | | |
| | Total | | Less than
1 year | | Between
1 and 3 years | | Between
3 and 5 years | | More than
5 years | |
|---|
| | (Amounts in millions of euros)
| |
|---|
Project Debt | | | 4,958.1 | | | 799.2 | | | 895.4 | | | 1,575.9 | | | 1,687.6 | |
Borrowings | | | 1,316.0 | | | 444.4 | | | 313.5 | | | 424.5 | | | 133.6 | |
Notes and Bonds | | | 3,853.0 | | | 1,097.0 | | | 1,029.9 | | | 867.3 | | | 858.8 | |
Financial Leases | | | 35.0 | | | 10.9 | | | 12.8 | | | 3.7 | | | 7.6 | |
Other loans and borrowings | | | 121.4 | | | 24.4 | | | 71.3 | | | 21.2 | | | 4.5 | |
Lease obligations | | | 13.8 | | | 3.9 | | | 5.5 | | | 3.0 | | | 1.4 | |
Purchase Obligations | | | 1,072.8 | | | 933.1 | | | 123.1 | | | 5.5 | | | 11.1 | |
Derivative financial instruments | | | 248.5 | | | 39.7 | | | 48.5 | | | 18.6 | | | 141.7 | |
Accrued Interest Estimate during the Useful Life of Loans | | | 2,599.1 | | | 589.4 | | | 908.7 | | | 500.0 | | | 601.0 | |
We have contractual obligations to make future payments in connection with bank debt, notes and bonds and lease agreements. In addition, during the normal course of business, we enter into agreements where we commit to future purchases of goods and services from third parties.
Project Debt refers to non recourse loans obtained by certain Group entities dedicated to long term projects for the development of integrated products. Project Debt also includes bridge loans, which relates to certain operations which are financed in a similar manner to non-recourse projects, generally by financial entities, and which are earmarked to be future development projects which typically will be eventually financed through project finance schemes. Such funding typically relates to transitional financing phases of a project (typically periods of less than 2-3 years) during the launch and construction phase of goods/projects, which once completed and ready for operation, become financed under the project finance model. In these situations Abengoa, S.A. and/or its subsidiaries (other than non-recourse subsidiaries) provide, from time to time, guarantees of obligations whereby Abengoa, S.A. and/or its subsidiaries (other than non-recourse subsidiaries) act as sponsors for the period prior to such project companies securing long-term project financing for their projects. However, if during such transitory period we believe there is a risk of non-compliance with the debt repayment schedule necessary in order to obtain project finance (or of construction, which will ultimately require financing), such financing would be reclassified on the consolidated statement of financial position as a type of corporate financing, depending upon the nature of the arrangements, typically being loans with financial entities. For more detailed information on Project Debt refer to Note 19 to our Consolidated Financial Statements.
Borrowings include our long-term and short-term amounts outstanding, mainly under our syndicated loan agreement for €180.2 million. These obligations are more fully discussed in Note 20 to our Consolidated Financial Statements and in "—Liquidity and Capital Resources".
Notes and Bonds refer to the carrying value of issuances made during 2009, 2010, 2013 and 2014, which are described in detail in "—Liquidity and Capital Resources" and in Note 20 to our Consolidated Financial Statements.
Financial Leases includes obligations owed to third parties in connection with technical installations, machinery and other tangible assets acquired under finance lease agreements. The amount shown in the table above corresponds to the minimum lease payments.
Other Loans and Borrowings represent interest-free loans and other loans obtained from governmental entities in connection with research and development projects as well as obligations for certain sale and lease back agreements included in Note 20 to our Consolidated Financial Statements.
213
Table of Contents
Lease Obligations represent the amount of future minimum lease payments for both structural and renting contracts that certain Group companies have entered into, mainly in connection with buildings and equipment.
Purchase Obligations include agreements for the purchase of goods or services that are enforceable and legally binding on the Group and that specify all significant terms, including fixed or minimum quantities to be purchased, fixed, minimum or variable price provisions and the appropriate timing of the transactions.
Derivatives include interest rate swaps, collars, foreign exchange forward contracts and commodities derivates used to mitigate our financial risks. See Notes 4 and 14 of our Consolidated Financial Statements.
Accrued Interest Estimate during the useful life of loans represents the estimation for the total amount of interest estimated to be paid or accumulated over the useful life of loans, notes and bonds.
Capital Expenditures
Our business has significant capital expenditure requirements, including construction of concession-type infrastructure and other industrial facilities, as well as R&D&i costs. Our capital expenditure requirements include construction costs of power transmission lines, solar power plants, co-generation power plants, infrastructure for the production of ethanol, and desalination plants. While we generally seek to maintain a balance of Project Debt and corporate financing to encourage financial discipline, the majority of our capital expenditures are financed by Project Debt (including funding by us through bridge loans) and funding, when applicable, from partners in a particular project. We incur corporate financing to finance our investments, acquisitions and general purpose requirements. Our corporate financing has the benefit of upstream guarantees from our operating subsidiaries which are subject to debt/EBITDA ratios as discussed above. The funding of our corporate capital expenditure is covered by existing cash and corporate EBITDA generation. We incur Project Debt on a project-by-project basis.
The table below sets forth our historic capital expenditures by our three activities for the years ended December 31, 2014, 2013 and 2012.
| | | | | | | | | | |
| | Year ended December 31, | |
|---|
| | 2014 | | 2013 | | 2012 | |
|---|
| | (€ in millions)
| |
|---|
Engineering and Construction | | | 133.6 | | | 131.8 | | | 111.3 | |
Concession-Type Infrastructure | | | 2,469.1 | | | 1,930.7 | | | 2,311.5 | |
Industrial Production | | | 280.1 | | | 194.6 | | | 308.7 | |
| | | | | | | | | | | |
Total | | | 2,883.3 | | | 2,257.1 | | | 2,731.5 | |
| | | | | | | | | | | |
| | | | | | | | | | | |
| | | | | | | | | | | |
As of December 31, 2014, we had total capital expenditures of €3,383 million, of which €676 million is expected to be undertaken by subsidiaries in our corporate group and financed through corporate financing or equity contributions and €249 million from our equity partners. The remaining €2,458 million consists of commitments that are expected to be undertaken by our project companies and will be financed primarily through Project Debt and funding from partners at project companies. Corporate entities also engage in regular maintenance capital expenditures as necessary in order to ensure the adequate performance of our existing facilities.
Additionally, we plan to incur additional disbursements for the completion of certain projects that have been awarded to us where we hold or expect to hold a minority equity stake. The expected equity from Abengoa required for these projects amounts to €413 million.
The following table represents management's estimate, as of December 31, 2014, of the costs to complete our total capital expenditures. The estimates presented in the table below may differ significantly from the actual costs which are incurred in connection with these expenditures. See "Item 3.D—Risk
214
Table of Contents
Factors—Risks Related to Our Business and the Markets in Which We Operate—Our business has substantial capital expenditure requirements which requires us to have access to the global capital markets for financing" and "Item 5.B—Liquidity and Capital Resources." See also "Cautionary Statements Regarding Forward-Looking Statements."
| | | | | | | |
Activity | | Pending
Capex Total(1) | | Capex Expected to be
Financed from the
Corporate Group(1) | |
|---|
| | (€ in millions)
| |
|---|
Concession-Type Infrastructure | | | 3,383 | | | 676 | |
| | | | | | | | |
Total(2) | | | 3,383 | | | 676 | |
| | | | | | | | |
| | | | | | | | |
| | | | | | | | |
- (1)
- Figures refer in both cases to capital expenditures pending execution.
- (2)
- As of the date of this annual report, the total capital expenditures of our Engineering and Construction and Industrial Production activities were de minimis.
Additionally, we plan to incur additional disbursements for the completion of certain projects that have been awarded to us where we hold or expect to hold a minority equity stake. The expected equity from Abengoa required for these projects amounts to €413 million.
Additionally, we have a pipeline of projects in the development stage for which we are either in the process of tendering or negotiating.
G. Safe harbor
This annual report contains forward-looking statements within the meaning of Section 27A of the Securities Act and Section 21E of the Exchange Act and as defined in the Private Securities Litigation Reform Act of 1995. See "Cautionary Statements Regarding Forward-Looking Statements."
215
Table of Contents
ITEM 6. DIRECTORS, SENIOR MANAGEMENT AND EMPLOYEES
A. Directors and Senior Management
Board of Directors of Abengoa, S.A.
The Board of Directors of Abengoa comprises the following 16 members:
| | | | | | | | | |
Name | | Position | | Date of
Appointment | | Age | |
|---|
Felipe Benjumea Llorente(1) | | Executive Chairman | | | 06/25/1983 | | | 57 | |
Manuel Sánchez Ortega(1) | | First Vice-Chairman, CEO | | | 10/25/2010 | | | 51 | |
Antonio Fornieles Melero(3) | | Second Vice-Chairman, Lead Director | | | 01/19/2015 | | | 55 | |
José Joaquín Abaurre Llorente(2) | | Director | | | 06/25/1988 | | | 64 | |
José Luis Aya Abaurre(2) | | Director | | | 06/25/1983 | | | 66 | |
José Borrell Fontellés(3) | | Director | | | 07/27/2009 | | | 67 | |
María Teresa Benjumea Llorente(2) | | Director | | | 04/15/2007 | | | 65 | |
Javier Benjumea Llorente(1) | | Executive Director | | | 06/25/1983 | | | 62 | |
Mercedes Gracia Díez(3) | | Director | | | 12/12/2005 | | | 58 | |
Ricardo Martínez Rico(3) | | Director | | | 10/24/2011 | | | 50 | |
Claudi Santiago Ponsa(2) | | Director | | | 02/23/2012 | | | 58 | |
Ignacio Solís Guardiola(2) | | Director | | | 04/15/2007 | | | 63 | |
Fernando Solís Martínez-Campos(2) | | Director | | | 04/15/2007 | | | 58 | |
Carlos Sundheim Losada(2) | | Director | | | 04/15/2007 | | | 63 | |
Alicia Velarde Valiente(3) | | Director | | | 04/06/2008 | | | 50 | |
Ricardo Hausmann(3) | | Director | | | 04/06/2014 | | | 58 | |
- (1)
- Executive director (director with executive functions in Abengoa).
- (2)
- Proprietary director (director with significant shareholding, or who has been designated by a shareholder).
- (3)
- Independent director (designated in view of his or her personal or professional conditions, who carries out his or her function without being conditioned by relationships with the Company, its significant shareholders or officers; and proposed specifically by the Appointments and Remuneration Committee).
The business address of the members of the Board of Directors of Abengoa is Campus Palmas Altas, Calle Energía Solar, No. 1, 41014 Seville, Spain.
Felipe Benjumea Llorente, Javier Benjumea Llorente and María Teresa Benjumea Llorente are siblings. José Joaquín Abaurre Llorente and José Luis Aya Abaurre are cousins. José Joaquín Abaurre Llorente is the cousin of Felipe Benjumea Llorente, Javier Benjumea Llorente and María Teresa Benjumea Llorente. Ignacio Solís Guardiola and Fernando Solís Martínez Campos are cousins.
There are no potential conflicts of interest between the private interests or other duties of the members of the Board of Directors listed above and their duties to Abengoa.
The following is the biographical information of members of our Board of Directors.
Felipe Benjumea Llorente
Mr. Benjumea obtained a Degree in Law at the Universidad de Deusto.
He joined Abengoa in 1983 as a member of the Board of Directors, and in 1989 he was appointed Managing Director. He has been the Chairman of the Board of Directors since 1991. Since 2002, he has been the Chairman of the Focus-Abengoa Foundation.
He is also Chairman of Inversión Corporativa IC, S.A. since July 2008, the University Cooporation Society of Loyola Andalucía and the Technology and Science Advisory Board of the Spanish Ministry of Education and
216
Table of Contents
Science. He is also a member of the Boards of Directors of the U.S.—Spain Council, Council of the Universidad Pontificia de Salamanca, Loyola Andalucía University Foundation, the Sacred Family of Vocational Schools Foundation and theConfederación Española de Directivos y Ejecutivos.
He has been a member of the Boards of Directors of Sociedad General de Cablevisión (1993-1996), La Papelera Española (1987-1995), Thyssen Industrie (1989-1993), Hispano Inmobiliaria de Gestión (1989-1998), Banco Santander Central Hispano (1990-2002), Iberia Líneas Aéreas de España (2007-2010), the Operating Company of the Spanish Electricity Market ("OMEL") (1998-2011), Garanair (2011) and Iberia, LAE, Sociedad Anonima Operadora (2011-2012).
Manuel Sánchez Ortega
Mr. Sánchez holds a degree in Industrial Electrical Engineering from the ICAI in Madrid and has a master's degree in Business Administration from theInstituto Panamericano de Alta Dirección de Empresas (IPADE), Mexico. Mr. Sánchez joined our Information Technologies business in 1989 as a software engineer. He later went on to perform duties as project director and sales director within our Information Technologies business. In 1995, he was named Executive Vice President in Mexico, where he lived for five years. In 2000, upon his return to Spain, he was named Executive Vice President of the Energy and Environment subsidiary of our Information Technologies business. In 2001 Mr. Sánchez was named general manager of our Information Technologies business, of which he was appointed the Chief Executive Officer in 2002 and Chairman in 2004, serving in that capacity until he was appointed as Chief Executive Officer of Abengoa. He has been a member of Bioenergy's Board of Directors since 2007. Since October 25, 2010, Mr. Sánchez has served as Abengoa's Chief Executive Officer. He has served as First Vice-Chairman since January 2015.
Antonio Fornieles Melero
Mr. Fornieles serves as Second Vice-Chairman, lead director and a member of the Audit Committee and the Appointments and Remuneration Committee of Abengoa since January 2015. He joined Abengoa having spent almost his entire career in the audit sector. He joined the Spanish Institute of Chartered Accountants in 1987 and was made a partner in KPMG in 1994. He was subsequently appointed to the board of the firm, responsible for the audit function of KPMG Spain and COO of the audit function globally. Prior to joining Abengoa, Mr. Fornieles was responsible for the middle market program for all KPMG offices in Spain. He graduated with a degree in economics and business studies from Universidad Complutense de Madrid and completed a senior management diploma in business management from the Instituto Internacional San Telmo business school. He has been a lecturer in the faculty of economics and business studies at the University of Cádiz, and a regular speaker and lecturer in various universities and corporations about issues related to financial reporting, business management and corporate governance and ethics.
José Joaquín Abaurre Llorente
Mr. Abaurre serves as a member of the Board of Directors of Abengoa. He has held this post since June 25, 1988. He is also a member of the Strategy and Technology Committee. Mr. Abaurre is an expert in audiovisual activities.
José Luis Aya Abaurre
Mr. Aya serves as a member of the Board of Directors of Abengoa. He has held this post since June 25, 1983. He also is a member of the Strategy and Technology Committee. Moreover, he serves as a member of the Board of Directors of Inversión Corporativa IC, S.A. Mr. Aya trained as a Technical Agricultural Engineer.
José Borrell Fontellés
Mr. Borrell is Professor of Introduction to Economic Analysis at Madrid's Universidad Complutense and Chairman of the European University Institute in Florence. He studied aeronautic engineering at the
217
Table of Contents
Universidad Politécnica in Madrid, and also holds a doctorate in Economic Sciences, a master's degree in Operations Research from Stanford University and a master's degree from Paris' Institut Français du Pétrole. He worked as an engineer at Compañía Española de Petróleos (1972 1981), and, between 1982 and 1996, he served successively as Spanish Secretary General for Budget, Secretary of State for Finance and Minister for Public Works, Telecommunications, Transport and the Environment. He was President of the European Parliament for the first half of the 2004 2009 legislative term and President of the Development Assistance Committee for the second half. Mr. Borrell is a member of the Audit Committee, was appointed chairman of the Appointments and Remuneration Committee on July 23, 2012 and chairman of the Strategy and Technology Committee on January 19, 2015.
María Teresa Benjumea Llorente
Ms. Benjumea serves as a member of the Board of Directors of Abengoa. She has held this position since April 14, 2007. She developed her professional experience in the sector of decoration.
Javier Benjumea Llorente
Mr. Benjumea graduated with a degree in Business Administration and also earned a master's in Senior Company Management. He joined Abengoa in 1980 as Deputy Chairman. In 1986, he was appointed Managing Director and was Co- Chairman from 1995 to 2007. He is also a director of Inversión Corporativa IC, S.A., Vice-Chairman of Sevillana-Endesa and a member of the Board of Directors of, among others, Telefónica de Argentina, S.A., the newspaper ABC, Estudios de Política Exterior, S.A., and the Association for Managerial Progress. He is also Chairman of the Board of Trustees of the Sagrada Familia Professional Schools Foundation. Additionally, he has served as a member of the Board of Trustees of the Focus-Abengoa Foundation, a member of the Governing Body and the Board of Trustees of the Comillas-ICAI University Foundation, Permanent Academician of the Andalusian Academy of Social Sciences and the Environment, a member of the Board of Trustees of the Royal Palace of Seville and of the Andalusian Association of Foundations, and a member of the Board of Trustees of the Forja XXI Foundation.
Mercedes Gracia Díez
Ms. Gracia is a Professor of Econometrics at Madrid's Universidad Complutense and atCentro Universitario de Estudios Financieros. She serves as an Independent Director of the Board of Directors of Abengoa. She is the chairman of the Audit Committee and a member of the Appointments and Remuneration Committee. Her academic papers have been published in theJournal of Business and Economic Statistics, Review of Labor Economics and Industrial Relations, Applied Economics and the Journal of Systems and Information Technology. She also served as Director of Balance Sheet Management at Caja Madrid (1996-1999). Additionally, she served as Head of the Economics and Law Division of the Agencia Nacional de Evaluación y Prospectiva.
Ricardo Martínez Rico
Mr. Martínez studied at the Universidad de Zaragoza, obtaining a first class bachelor's degree in Business Administration. He joined Abengoa on October 24, 2011 as a director and is a member of the Strategy and Technology Committee. He is the founding partner and current president and chief executive officer of Equipo Económico, a Madrid based consulting firm. In addition, Mr. Martínez is a member of the advisory board to the President of the U.S. Chamber of Commerce of the United States. Previously he was head of Spain's Economic and Commercial Office in Washington, D.C. (2006) and in 2003 he was appointed Deputy Finance Minister of the Spanish government (2003-2004). Mr. Martínez was also Spain's spokesman on the European Budgetary Council and European Council for Regional Policy.
218
Table of Contents
Claudi Santiago Ponsa
Mr. Santiago studied at Georgetown University and he also earned a master's degree in Computer Science from the Universitat Autònoma de Barcelona as well as completing further postgraduate studies at INSEAD in France. He previously spent 31 years with General Electric (1980 to 2011), serving as President and Chief Executive Officer of GE Oil & Gas from 1999 to 2011. He has been a member of the Board of Directors of Abengoa since February 23, 2012.
Ignacio Solís Guardiola
Mr. Solís graduated from the Universidad de Seville with a specialty in private law. He currently serves as a Regional Director for private banking of Lloyds Bank, which he joined in 1989. He has been a member of the Board of Directors of Abengoa since 2007.
Fernando Solís Martínez-Campos
Mr. Solís is a law graduate with postgraduate studies at the Instituto de Empresa, Spain, the University of Colorado and Harvard University. He is currently a member of the Boards of Directors of Concesur and Cabimar. He has been a member of the Board of Directors of Abengoa since 2007.
Carlos Sundheim Losada
Mr. Sundheim holds a degree in Industrial Engineering from theEscuela Técnica Superior de Ingenieros in Seville. He has been employed at different departments of Banco Urquijo-Hispano Americano LMTD, London, and as manager of production and maintenance of Minas de Herrerías, S.A., Huelva, commercial deputy director in export of Rio Tinto Minera, S.A., Madrid, manager of Algebra, S.L., Seville and general manager of Abecomsa, S.A., Seville.
Alicia Velarde Valiente
Ms. Velarde graduated magna cum laude from theInstituto Católico de Enseñanza, Colegio Pablo VI. She also holds a degree in Law from the Universidad San Pablo. In 1990, Ms. Velarde passed the notary examination and became a notary public. During the 1994-1995 academic year she taught civil law at the Universidad Francisco de Vitoria, where she remained until 1999. She is still affiliated with this university, where, from 1999, she teaches canon law. Ms. Velarde is a member of the Audit Committee and the Appointments and Remuneration Committee.
Ricardo Hausmann
Professor Hausmann, a Venezuelan economist and academic, is the current director of the Centre for International Development and a Professor at Harvard University. He was formerly Chief Economist at the Inter-American Development Bank, where he created the Research Department. He has also held positions such as the Minister of Planning for Venezuela, as a member of the board of the Central Bank of Venezuela. He was a lecturer of economics at the Instituto de Estudios Superiores de Administración in Caracas, where he founded the Centre for Public Policies.
219
Table of Contents
Senior Management of Abengoa, S.A.
The senior management of Abengoa is made up of the following members:
| | |
Name | | Position |
|---|
Felipe Benjumea Llorente | | Executive Chairman |
Manuel Sánchez Ortega | | First Vice-Chairman and CEO |
José Domínguez Abascal | | Technical General Secretary |
Jesús Ángel García-Quilez Gómez | | Chief Financial Officer |
Ignacio Garcia Alvear | | Co-Chief Financial Officer, responsible for Investor Relations & Capital Markets |
Javier Garoz Neira | | Biofuels Executive VP |
Alfonso González Domínguez | | Engineering and Construction and South America Executive VP |
Santiago Seage Medela | | Concessions Executive VP & CEO Abengoa Yield |
Armando Zuluaga Zilbermann | | Solar Executive VP |
Carlos Cosín Fernández | | Water Executive VP |
Álvaro Polo Guerrero | | Human Resources Director |
Luis Fernández Mateo | | Director of Organization, Quality and Budgets |
Juan Carlos Jiménez Lora | | Director of Planning and Control |
Germán Bejarano García | | Assistant CEO, International Institutional Relations Director |
Daniel Alaminos Echarri | | General Secretary |
Luis Enrique Pizarro Maqueda | | Chief Audit Officer |
Enrique Borrajo Lovera | | Consolidation and Reporting Officer |
Miguel Ángel Jiménez-Velasco Mazarío | | Compliance Officer |
Enrique Aroca Moreno | | Chief Information Officer |
Manuel Doblaré Castellano | | Abengoa Research General Director |
The business address of the members of the senior management of Abengoa is Campus Palmas Altas, Calle Energía Solar, No. 1, 41014 Seville, Spain.
There are no potential conflicts of interest between the private interests or other duties of the members of the senior management of Abengoa listed above and their duties to Abengoa. There is no family relationship between any of the Company's directors and members of our senior management.
Below are the biographies of those members of the senior management of Abengoa which do not also serve on our Board of Directors.
José Domínguez Abascal
Prof. Domínguez is currently the Technical General Secretary of Abengoa. He was previously the Technical General Secretary of Abengoa since 2008. Previously, he was the General Secretary of Universities, Investigation and Technology of the Junta de Andalucía (2004 to 2008). Prof. Domínguez has been Professor of engineering at the Universidad de Las Palmas de Gran Canarias and Universidad de Sevilla. He holds a doctorate in Industrial Engineering from the Universidad de Sevilla.
Jesús Ángel García-Quilez Gómez
Mr. García-Quílez has been the Chief Financial Officer of Abengoa since May 2013. He previously served in the Control, Treasury and Financial Departments, and as Head of Corporate Finance since 2002. He holds a degree in Business Administration from Seville University, an Executive MBA from San Telmo Business School and a certificate in Corporate Performance from the Harvard Business School.
220
Table of Contents
Ignacio García Alvear
Mr. García has been the Co-Chief Financial Officer, responsible for Investor Relations and Capital Markets since January 2015. From January 2004 to January 2015, he served as the Chief Financial Officer of Abengoa Bioenergy. He also previously served as Director of Corporate Finance of Abengoa, S.A., Chief Financial Officer for Telvent and Abengoa Mexico. Mr. García holds a degree in Economics and Management and is a graduate of an Executive Management Program from Ipade Business School in Mexico.
Javier Garoz Neira
Mr. Garoz is currently the Biofuels Executive Vice President. Since he joined Abengoa back in 2000 and prior to the sale of Telvent, he served in a number of positions within Telvent, the latest as its Chief Operating Officer and Head of Strategy. He also served as Abengoa's Strategy Development Officer. During his career, he has developed a broad managerial experience in numerous positions within several companies. He holds a degree in Business Administration with a specialization in Marketing and Business Development and a master in B.A. from the IESE Business School.
Alfonso González Domínguez
Mr. González has been Engineering and Construction (Transmission and Co-generation) Executive Vice President and South America VP since 2006. He joined Abengoa in 1990. Since then, he has held several management positions, including Managing Director of Sainsel and Divisional Manager of Water within our environmental services sector. He was also the Managing Director of Inabensa and the director of our engineering activities. Previously, he worked for five years as Project Engineer in different Spanish nuclear plants and for five years as Program CN234 Director for Construcciones Aeronáuticas S.A., a company subsequently acquired by Airbus Military Company S.A.S.
Santiago Seage Medela
Mr. Seage is currently the Concessions Executive Vice President & CEO of Abengoa Yield. He was previously the Solar Executive Vice President since 2006. Previously, he had been responsible for Abengoa's Strategy and Corporate Development. Before joining Abengoa, he was a partner with McKinsey & Company. He holds a degree in Business Management from ICADE University in Madrid.
Armando Zuluaga Zilbermann
Mr. Zuluaga is currently the Solar Executive Vice President of Abengoa. He has also been the Chief Executive Officer of Abengoa Solar since January 2014. He was the general manager of Abengoa Solar in the United States from 2012 to 2014, and was previously Assistant General Secretary of Abengoa and General Secretary of Abengoa Solar from 2009 to 2013, and General Counsel of Abengoa from 2007 to 2009. He holds a law degree from the University of Granada, a master's degree in EU law from the Universidad Carlos III in Madrid and an Executive MBA from the San Telmo business school.
Carlos Cosín Fernández
Mr. Cosín is currently the Water Executive Vice President of Abengoa, since December 2011. He has been working for Abengoa since 2005, first as International Division Manager in Abeinsa Infraestructuras de Medio Ambiente, S.A., and since the beginning of 2011, as the head of the Water business area. He has been in charge of developing water activities worldwide under EPC or BOOT models. Before that, he held several high-level positions in Veolia or USfilter, among which stands out the ownership of his private company. He holds a degree in Engineering from the Universidad Politécnica de Madrid.
221
Table of Contents
Álvaro Polo Guerrero
Mr. Polo has been the Human Resources Director of Abengoa since 2000. He holds a degree in Law from the Universidad de Sevilla, a master's degree in general management from the IESE Business School at the Universidad de Navarra, and a certificate in Executive Human Resources Education from the University of Michigan Ross School of Business.
Luis Fernández Mateo
Mr. Mateo has been Director of Organization, Quality and Budgets since 2007. He holds a degree in Economic Sciences and Business from Universidad Pontificia Comillas and also obtained a degree in Business Administration from the Instituto de Estudios Superiores de la Empresa.
Juan Carlos Jiménez Lora
Mr. Jiménez has been the Planning and Control Director of Abengoa since 2011. From 1996 to 2010 he was Head of Investor Relations. Previously, he served as the Group Financial Controller for five years. He holds a degree in Business Administration.
Germán Bejarano García
Mr. Bejarano has been Assistant CEO and Chairman's Adviser and International Institutional Relations Director since 2008. He holds a degree in Economics and Business Administration from the Universidad Autónoma de Madrid, aDiplôme d'Études Approfondies from Université de Nancy II and aDiplôme d'Études Supérieures Européennes, Centre Universitaire Européen de Nancy. He held various positions in the Spanish Civil Service since 1988 when he joined the Ministry of Economy and Finance as a Senior Economist and Trade Specialist working at the General Technical Secretariat and the Treasury. He was also the representative of the Spanish government at the Inter-American Development Bank, where he was appointed as Executive Director and Alternate Executive Director (1992-1998). In addition, he served as Vice-Secretary General for Economic and Budgetary Matters at the Ministry of Economy and Finance of the Spanish government in 1999 and Director General for Economic International Relations at the Ministry of Foreign Affairs (2000-2004). He also served as Spain's ambassador to Malaysia (2004-2007) and Brunei Darussalam (2005-2007).
Daniel Alaminos Echarri
Mr. Alaminos is currently the General Secretary of Abengoa and Secretary of its Board of Directors. He has been a state attorney since 1996 and he has held various previous positions, including General Counsel of SEPI, the Spanish holding group for state-owned companies. Prior to joining Abengoa in 2014, Daniel was a partner in the capital markets group of the law firm Ramón y Cajal Abogados. He also has experience of restructuring savings banks, capital increases and restructuring major real estate and industrial groups, as well as advising on a wide range of issues, especially financial, technological and industrial matters. He holds a law degree specializing in business law from Universidad San Pablo CEU.
Luis Enrique Pizarro Maqueda
Mr. Pizarro has been the Chief Audit Officer of Abengoa since 2005. Previously, he worked as an Internal Audit manager for the savings bank Caja San Fernando and at Arthur Andersen as a financial auditor. He holds a degree in Business Administration from Seville University, a degree in Law magna cum laude from the University Pablo de Olavide, and an Executive MBA from the IESE Business School at Navarra University, and is licensed as a certified public accountant in Spain.
222
Table of Contents
Enrique Borrajo Lovera
Mr. Borrajo has been the Consolidation and Reporting Officer of Abengoa since 2007. He joined Abengoa in 2000 in its internal audit department. He holds a degree in Business Administration from the University of Córdoba and an Executive MBA from the Fundation San Telmo.
Miguel Ángel Jiménez-Velasco Mazarío
Mr. Jiménez Velasco is currently the Compliance Officer of Abengoa. He was the General Secretary of Abengoa between 2003 and June 2014. He holds a degree in Law from the Universitat de Barcelona and a master's degree in Senior Business Management and Finance from the Instituto Internacional de Empresas at the Universidad de Deusto. Since 2003, he has served as General Counsel of Abengoa and was appointed Secretary and Advisory Lawyer of the Board of Directors of Abengoa.
Enrique Aroca Moreno
Mr. Aroca has been our Chief Information Officer since 2005. Prior to 2005, he held other managerial positions in Telvent and Abengoa. Mr. Aroca is a qualified Telecommunications Engineer fromUniversidad Politécnica de Madrid and has completed an Executive Master in Business Administration at the IE Business School in Madrid. He holds the CISA and CISM security certifications from Isaca.
Manuel Doblaré Castellano
Prof. Doblaré has been the General Director of Abengoa Research since its creation in October 2011. He is a full professor and previously taught at the Universities of Zaragoza and Seville, and the Polytechnique University of Madrid. He was also a visiting professor at the University of Southampton, New York University and Stanford University. He holds a degree in Industrial (Electrtical and Mechanical) Engineering from Seville University and a PhD from the Polytechnique University of Madrid. Prof. Doblaré has received several national and international recognitions and is member of the Royal Academy of Engineering of Spain.
B. Compensation
Compensation of Board of Directors
The salary (both fixed and variable) and allowances paid to the members of the Board of Abengoa, S.A. in 2014 were €15,833 thousand (€15,421 thousand in 2013 and €13,887 thousand in 2012).
223
Table of Contents
Details on individual salaries and benefits in 2014 paid to the Board of Directors are as follows (in thousands of euros):
| | | | | | | | | | | | | | | | | | | | | | | | | |
Name | | Salary | | Fixed
remuneration | | Daily
allowance | | Short term
variable
remuneration | | Compensation
as member of
Board
Committee | | Compensation
as officer of
other Group
companies | | Other
concepts | | Total
2014 | |
|---|
Felipe Benjumea Llorente | | | 1,086 | | | — | | | 93 | | | 3,304 | | | — | | | — | | | 1 | | | 4,484 | |
José B. Terceiro Lomba(1) | | | — | | | 202 | | | 93 | | | 2,804 | | | — | | | — | | | — | | | 3,099 | |
Manuel Sánchez Ortega | | | 1,086 | | | — | | | 93 | | | 3,304 | | | — | | | — | | | 1 | | | 4,484 | |
Javier Benjumea Llorente | | | 450 | | | — | | | 93 | | | 1,307 | | | 200 | | | 52 | | | | | | 2,102 | |
José Borrell Fontelles | | | — | | | — | | | 160 | | | — | | | 140 | | | — | | | — | | | 300 | |
Mercedes Gracia Díez | | | — | | | — | | | 160 | | | — | | | 40 | | | — | | | — | | | 200 | |
Ricardo Martínez Rico | | | — | | | — | | | 110 | | | — | | | 20 | | | — | | | — | | | 130 | |
Alicia Velarde Valiente | | | — | | | — | | | 110 | | | — | | | 40 | | | — | | | — | | | 150 | |
Ricardo Hausmann(2) | | | _ | | | _ | | | 178 | | | — | | | — | | | | | | | | | 178 | |
José Joaquín Abaurre Llorente | | | — | | | — | | | 110 | | | — | | | 40 | | | — | | | — | | | 150 | |
José Luis Aya Abaurre | | | — | | | — | | | 110 | | | — | | | 40 | | | — | | | — | | | 150 | |
María Teresa Benjumea Llorente | | | — | | | — | | | 78 | | | — | | | — | | | 24 | | | — | | | 102 | |
Claudio Santiago Ponsa | | | — | | | — | | | 70 | | | — | | | — | | | — | | | — | | | 70 | |
Ignacio Solís Guardiola | | | — | | | — | | | 78 | | | — | | | — | | | — | | | — | | | 78 | |
Fernando Solís Martínez-Campos | | | — | | | — | | | 78 | | | — | | | — | | | — | | | — | | | 78 | |
Carlos Sundhein Losada | | | — | | | — | | | 78 | | | — | | | — | | | — | | | — | | | 78 | |
| | | | | | | | | | | | | | | | | | | | | | | | | | |
Total | | | 2,622 | | | 202 | | | 1,692 | | | 10,595 | | | 520 | | | 76 | | | 2 | | | 15,833 | |
| | | | | | | | | | | | | | | | | | | | | | | | | | |
| | | | | | | | | | | | | | | | | | | | | | | | | | |
| | | | | | | | | | | | | | | | | | | | | | | | | | |
- (1)
- Representative of Aplidig, S.L. (formerly Aplicaciones Digitales, S.L.)
- (2)
- Since April 6, 2014
Additionally, in 2014, overall remuneration for our key management (senior management who are not executive directors), including both fixed and variable components, amounted to €11,351 thousand (€14,656 thousand in 2013 and €13,574 thousand in 2012).
Other Remuneration for Directors and Senior Management
Extraordinary Variable Compensation Plan
There are currently two extraordinary long-term variable remuneration plans for executive directors and officers.
Extraordinary Variable Remuneration Plan for Executive Directors and Officers—January 2014
January 2014, the Board of Directors, at the proposal of the Appointments and Remuneration Committee, unanimously approved a four-year variable remuneration plan (the "January 2014 Plan"), which replaces and cancels the extraordinary plan previously approved in February 2011.
The January 2014 Plan expires on December 31, 2017 and is designed to help achieve the objectives set forth in our strategic plans at an individual level. The January 2014 Plan requires beneficiaries to remain with the Company for the corresponding period and for the average price of Abengoa's Class B shares during the last three months of 2017 to be higher than a specific value. At the end of 2014, the January 2014 Plan included 345 participants.
224
Table of Contents
Extraordinary Variable Remuneration Plan for Managers—July 2014
In July 2014, the Board of Directors, at the proposal of the Appointments and Remuneration Committee, unanimously approved a five-year variable remuneration plan (the "July 2014 Plan").
The July 2014 Plan expires on December 31, 2018 and accrues 20% annually. Its purpose is to incentivize certain executive directors and officers to stay with the Company or to achieve specific personal objectives. The plan requires the beneficiary to be employed by the Company for the corresponding period and for the average price of Abengoa's Class B shares during the last three months of 2018 to be higher than a specific value. At the end of 2014, the July 2014 Plan included 359 participants.
C. Board Practices
Under Spanish law, the Board of Directors of a Spanish company is responsible for management, administration and representation in all matters concerning our business, subject to the provisions of our bylaws and resolutions adopted at general shareholders' meetings by a majority vote of the shareholders. Six of our sixteen current directors (Messrs. Borrell, Martínez, Hausmann and Fornieles, and Mmes. Gracia and Velarde) are independent under applicable NASDAQ listing standards.
Directors are elected by our shareholders to serve four-year terms. A director may be re-elected to serve for one or more four-year terms. If a director does not serve out his or her entire term, the Board of Directors may fill the vacancy by appointing a new director as a replacement director to serve until the next general shareholders' meeting or, if it has already been called, until the one after that when the appointment may be ratified or a new director to fill the vacancy is elected or replaced. A director may resign or be removed (with or without cause) from office by a majority vote of the shareholders at a general shareholders' meeting. As a result of these four-year terms, not all of our directors will be elected each year. Information about when our directors were appointed is set forth in Section 6.A. above.
Under Spanish law, the Board of Directors may delegate its powers to an executive committee or other delegated committee or to one or more executive officers, unless the shareholders, through a meeting, have specifically delegated certain powers belonging to the shareholders' meeting to the board and have not approved the possibility for the board's sub-delegation to others. Since they were appointed, the independent directors on our Board of Directors have held meetings in conjunction with the regular meetings of the Board of Directors. Spanish corporate law provides that resolutions appointing an executive committee or any executive officer or authorizing the permanent delegation of all, or part of, the board's power require a two-thirds majority of the members of the Board of Directors and will not have any effect until its registration with the relevant Mercantile Registry. Certain powers provided in Spanish corporate law may not be delegated, including the drafting of the financial statements and the proposal for its approval by the shareholders at their annual meeting, disapproval of which would prohibit the filing of the Company's annual financial statements in the Mercantile Registry of Seville.
Audit Committee
The Audit Committee of Abengoa comprises the following four members plus the Secretary to the Audit Committee:
| | |
Name | | Position |
|---|
Mercedes Gracia Díez(1) | | Chairman |
José Borrell Fontellés(1) | | Member |
Antonio Fornieles Melero(1) | | Member |
Alicia Velarde Valiente(1) | | Member |
Daniel Alaminos Echarri | | Secretary, Non-Member |
225
Table of Contents
The duties and functions of our Audit Committee include, among others, to report information on the annual financial statements, as well as on our quarterly and semiannual financial statements that must be presented to the regulatory or supervisory bodies of the securities markets on which the Company is listed. In addition, our Audit Committee proposes the appointment of the external independent auditors to the Board of Directors, and oversees our internal audit services, our financial information reporting process and our internal control systems. The Audit Committee meets as often as necessary in order to discharge its functions, and at least once every quarter.
Mr. Alaminos, the Secretary to the Board of Directors of the Company, serves as Secretary to the Audit Committee in accordance with the Audit Committee Charter and is the Secretary of the Appointments and Remuneration Committee.
Appointments and Remuneration Committee
The Appointments and Remuneration Committee of Abengoa comprises the following four members plus the Secretary to the Appointments and Remuneration Committee:
| | |
Name | | Position |
|---|
José Borrell Fontellés(1) | | Chairman |
Mercedes Gracia Díez(1) | | Member |
Antonio Fornieles Melero(1) | | Member |
Alicia Velarde Valiente(1) | | Member |
Juan Carlos Jiménez Lora | | Secretary, Non-Member |
The duties and functions of our Appointments and Remuneration Committee include, among others, the duty to propose the appointments of independent directors and inform our Board of Directors of appointments, re-elections, terminations and remuneration of the Board and its members, as well as upon general remuneration and incentives policy for the Board and senior management. The Appointments and Remuneration Committee meets as often as necessary in order to perform its functions, and at least once every six months.
Strategy and Technology Committee
The Strategy and Technology Committee of Abengoa comprises the following four members plus the Secretary to the Strategy and Technology Committee:
| | |
Name | | Position |
|---|
José Borrell Fontellés(1) | | Chairman |
José Luis Aya Abaurre | | Member |
José Joaquín Abaurre Llorente | | Member |
Ricardo Martinez Rico(1) | | Member |
Juan Carlos Jiménez Lora | | Secretary, Non-Member |
The duties and functions of our Strategy and Technology Committee include, among others, analyzing basic matters relating to technology and strategy that can affect Abengoa, including the preparation or assignment of studies on products and services that constitute Abengoa's portfolio. The Committee also informs the Board of Directors, or its Chairman, about any of these matters that may relate to our strategic and technological development. The Strategy and Technology Committee meets as often as necessary in order to perform its functions.
226
Table of Contents
Benefits upon Termination of Employment
Neither we nor our subsidiaries maintain any directors' service contracts providing for benefits upon termination of service.
D. Employees
During 2014, 2013 and 2012, on a consolidated basis, the average number of employees was 27,181, 26,818 and 26,654, respectively, including locally hired staff in our foreign offices but excluding temporary employees. We believe our relations with our employees are good and we have not experienced any significant labor disputes or work stoppages. Certain businesses are participating in a series of share based incentive schemes for directors and employees. Such programs are linked to the achievement of certain agreed upon management objectives.
The following tables show the average number of our full-time employees during 2014 on a consolidated basis broken down based on business segment and geographical location:
| | | | |
Employee Numbers by Segment Group | | Average Number of
Employees | |
|---|
Engineering and Construction | | | 20,732 | |
Concession-Type Infrastructure | | | 454 | |
Industrial Production | | | 5,995 | |
| | | | | |
Total | | | 27,181 | |
| | | | | |
| | | | | |
| | | | | |
| | | | |
Employee Numbers by Location | | Average Number of
Employees | |
|---|
Spain | | | 6,740 | |
North America | | | 3,867 | |
Europe (excluding Spain) | | | 489 | |
South America (excluding Brazil) | | | 8,472 | |
Brazil | | | 6,067 | |
Other regions | | | 1,546 | |
| | | | | |
Total | | | 27,181 | |
| | | | | |
| | | | | |
| | | | | |
227
Table of Contents
E. Share Ownership
The following table shows the number of our Class A shares and Class B shares beneficially owned by our directors and senior management as of December 31, 2014:
| | | | | | | |
Directors and senior management: | | Number of
Class A shares
beneficially owned | | Number of
Class B shares
beneficially owned | |
|---|
Felipe Benjumea Llorente(1)(3) | | | 0 | | | 4,715,075 | |
Manuel Sánchez Ortega | | | 0 | | | 913,167 | |
Antonio Fornieles Melero | | | 0 | | | 0 | |
José Joaquín Abaurre Llorente(3) | | | 0 | | | 9,870 | |
José Luis Aya Abaurre(3) | | | 1,210 | | | 344,301 | |
José Borrell Fontellés | | | 0 | | | 471,695 | |
María Teresa Benjumea Llorente(3) | | | 12,390 | | | 49,560 | |
Javier Benjumea Llorente(3) | | | 3,888 | | | 15,552 | |
Mercedes Gracia Díez | | | 0 | | | 2,500 | |
Ricardo Martínez Rico | | | 0 | | | 2,565 | |
Claudi Santiago Ponsa | | | 200 | | | 800 | |
Ignacio Solís Guardiola | | | 17,000 | | | 68,000 | |
Fernando Solís Martínez-Campos(2) | | | 85,272 | | | 341,088 | |
Carlos Sundheim Losada | | | 0 | | | 247,118 | |
Alicia Velarde Valiente | | | 400 | | | 1,600 | |
Ricardo Hausmann | | | 0 | | | 0 | |
Germán Bejarano García | | | 0 | | | 0 | |
Carlos Cosín Fernández | | | 0 | | | 0 | |
Armando Zuluaga Zilbermann | | | 0 | | | 0 | |
Santiago Seage Medela | | | 0 | | | 135,000 | |
Javier Garoz Neira | | | 1,684 | | | 6,736 | |
Alfonso González Domínguez | | | 0 | | | 146,668 | |
Juan Carlos Jiménez Lora | | | 3,897 | | | 25,963 | |
Miguel Ángel Jiménez-Velasco Mazarío | | | 40 | | | 160 | |
Luis Fernández Mateo | | | 5,635 | | | 22,569 | |
José Domínguez Abascal | | | 6,000 | | | 36,000 | |
Álvaro Polo Guerrero | | | 12,100 | | | 48,400 | |
Jesús Ángel García-Quilez Gómez | | | 3,000 | | | 43,000 | |
Daniel Alaminos Echarri | | | 0 | | | 0 | |
Luis Enrique Pizarro Maqueda | | | 0 | | | 91,606 | |
Enrique Borrajo Lovera | | | 0 | | | 0 | |
Enrique Aroca Moreno | | | 0 | | | 0 | |
Manuel Doblaré Castellano | | | 0 | | | 0 | |
Ignacio García Alvear | | | 6,862 | | | 27,448 | |
- (1)
- Held indirectly through Ardachon, S.L.
- (2)
- Of such 85,272 Class A shares and 341,088 Class B shares, 34,440 and 137,760, respectively, are held indirectly through Dehesa del Mesto, S.A.
- (3)
- Does not include shares of Abengoa owned indirectly through Inversión Corporativa IC, S.A. See "—Control of the Company."
None of our directors or members of our senior management is the owner of more than one percent of our ordinary shares, and no director or member of our senior management has voting rights with respect to our ordinary shares that are different from any other holder of our ordinary shares.
228
Table of Contents
ITEM 7. MAJOR SHAREHOLDERS AND RELATED PARTY TRANSACTIONS
A. Major Shareholders
Our major shareholders as of December 31, 2014 are as follows:
| | | | | | | | | | | | | | | | |
Name: | | Number of
Class A shares
beneficially held | | Percentage of
Class A
shares issued | | Number of
Class B shares
beneficially held | | Percentage of
Class B
shares issued | | Combined
voting power | |
|---|
Inversión Corporativa IC, S.A. | | | 44,082,885 | | | 52.32 | % | | 197,981,005 | | | 26.20 | % | | 50.178 | % |
Finarpisa, S.A.(1) | | | 5,465,183 | | | 6.49 | % | | 21,860,732 | | | 2.89 | % | | 6.192 | % |
- (1)
- Finarpisa is a wholly owned subsidiary of Inversión Corporativa.
Shareholders in the United States
Because some of our ordinary shares are held by brokers and other nominees, the number of shares held by and the number of beneficial holders with addresses in the United States is not fully ascertainable. As of December 31, 2014, to the best of an knowledge, there were holders of our Class A and Class B shares with addresses in the United States, whose shareholdings represented approximately 20.49% of our outstanding shares.
Control of the Company
Inversión Corporativa IC, S.A. beneficially owns, either directly or indirectly through Finarpisa, S.A., as of December 31, 2014, 49,548,068 of our Class A shares and 219,841,737 of our Class B shares and 56.369% of the total combined voting power of our Class A shares and Class B shares outstanding (subject to its agreement entered into on August 27, 2012 with us not to exercise voting rights in excess of 55.93% of the voting power in the Company unless its economic rights in us exceed such amount).
Inversión Corporativa IC, S.A. is beneficially owned by more than 300 shareholders, including, directly or indirectly, various members of the founding families of Abengoa, including our directors Felipe Benjumea Llorente, Javier Benjumea Llorente, María Teresa Benjumea Llorente, José Joaquín Abaurre Llorente and José Luis Aya Abaurre.
Arrangements for Change in Control of the Company
We are not aware of any arrangements the operation of which may at a later time result in a change of control.
B. Related Party Transactions
In the ordinary course of our business, we carry out transactions with related parties in accordance with established market practice and specific legal requirements. In particular, these related party transactions include the supply of business, administrative and financial services. All transactions between Abengoa, S.A. and our subsidiaries and related companies for the years ended December 31, 2014, 2013 and 2012 occurred within the ordinary course of our business.
For a summary of our revenue and expenses and receivables and payables with related parties, please see Note 33 of our Consolidated Financial Statements.
The account held by Abengoa with Inversión Corporativa I.C., S.A., as of the years ending 2014 and 2013 has a nil balance. Dividends distributed to related parties during 2014 amounted to €31,601 thousand (€17,212 thousand in 2013 and €17,212 thousand in 2012).
229
Table of Contents
During the last three years, the only transactions associated with related parties were the following:
- •
- On January 9, 2013, we entered into certain stock loan agreements with Inversión Corporativa IC, S.A. for a total amount of 11,047,468 Class B shares to facilitate stock borrow liquidity to investors in the 2019 Convertible Notes. This loan was cancelled on July 8, 2013. The total compensation that we paid to Inversión Corporativa IC, S.A. was fifty two thousand euros.
- •
- On February 27, 2013, we signed a service provision agreement between Centro Tecnológico Palmas Altas, S.A. and Ms. Blanca de Porres Guardiola, which involved consideration of €72 thousand.
- •
- In 2014, a service provision agreement was entered by and between our subsidiary, Centro Tecnológico Palmas Altas, S.A., and Ms. Blanca de Porres Guardiola, which involved consideration of €72 thousand.
- •
- In 2014, a service provision agreement was signed by and among Equipo Económico, S.L. (a company related to one of our directors, Mr. Ricardo Martínez Rico) and Abengoa,��S.A., Abengoa Concessions, S.L., Abeinsa Ingeniería y Construcción Industrial, S.A., which involved consideration of €355 thousand.
- •
- As indicated in Note 18.1 of our Consolidated Financial Statements, Inversión Corporativa IC, S.A. is Abengoa's main shareholder, and issues its own separate consolidated financial statements.
- •
- On June 13, 2014, we entered into a Right of First Offer Agreement with Abengoa Yield, as amended and restated on December 9, 2014, under which we, along with our affiliates, granted Abengoa Yield and its affiliates a right of first offer on any proposed sale, transfer or other disposition of any of our contracted renewable energy, conventional power, electric transmission or water assets that are in operation, and any other renewable energy, conventional power, electric transmission or water asset that is expected to generate contracted revenue and that we have transferred to an investment vehicle located in our certain geographies. The initial term of this agreement is five years from the date of consummation of Abengoa Yield's initial public offering. We will receive a fee equal to 1% of the equity purchase price of any assets acquired by Abengoa Yield as a result of this agreement.
- •
- On June 13, 2014, we entered in to an Executive Services Agreement with Abengoa Yield, under which some of our key executives will provide their services to Abengoa Yield while they remain our employees and continue to provide services to us. Abengoa Yield may terminate this agreement immediately upon notice on or after June 2015 without cause, or at any time upon 30 days' notice with cause. We are unable to unilaterally terminate this agreement. We receive consideration of $500 thousand per quarter under the agreement.
- •
- On June 13, 2014, we entered into a Financial Support Agreement with Abengoa Yield, under which (i) we have provided Abengoa Yield with a $50 million revolving credit line and (ii) we agreed to maintain any outstanding guarantees or letters of credit that were outstanding on the date of the consummation of Abengoa Yield's IPO. The term of this agreement is five years. If at any time we cease to own, either directly or indirectly, at least 20% of the outstanding shares of Abengoa Yield, we shall be entitled to terminate this agreement not earlier than June 13, 2017, upon 180 days' prior written notice.
- •
- On June 13, 2014, we entered into a Support Services Agreement with Abengoa Yield, under which we agreed to provide or arrange for other service providers to provide management and administration services to Abengoa Yield, excluding executive or senior management services. This agreement does not have a fixed term, however each party is able to terminate the agreement upon 180 days' prior written notice, subject to certain restrictions. We receive consideration of approximately $650 thousand per quarter, subject to certain adjustments.
- •
- On June 13, 2014, we entered into a Trademark License Agreement with Abengoa Yield, under which we granted Abengoa Yield a non-exclusive, royalty-free license to use the name "Abengoa" and the
230
Table of Contents
Abengoa logo, among other trademarks of ours, and the exclusive right to use the "Abengoa Yield" name and logo. We are entitled to terminate this agreement upon 90 days' prior written notice upon the occurrence of certain events. If at any time we cease to own, either directly or indirectly, at least 20% of the outstanding shares of Abengoa Yield, we shall be entitled to terminate this agreement two years thereafter upon written notice.
- •
- On September 22, 2014, we announced our entry into an asset transfer agreement with Abengoa Yield for the sale of Solacor 1/2 and PS10/20, concentrating solar power assets located in Spain with a combined capacity of 131 MW, and Cadonal, a 50 MW wind farm located in Uruguay, for a total purchase price of $312 million, subject to a put option right that allows Abengoa Yield to sell the asset back to us under certain circumstances. We closed the sale of Solacor 1/2 and PS10/20 on December 4, 2014 and we closed the sale of Cadonal on December 24, 2014.
- •
- On December 11, 2014, we and Abengoa Yield announced that we had entered into a call option agreement for the purchase by Abengoa Yield of up to $100 million in contracted assets at a 12% yield during the year 2015, subject to certain conditions.
- •
- On February 9, 2015, we announced our agreement entered into with Abengoa Yield for a second transfer of assets, including: ATN 2, a transmission power line in Peru (40% stake); Shams, a 100-MW solar power asset in the United Arab Emirates (20% stake); rights of usufruct over Helioenergy 1/2, a 100-MW solar power asset in Spain (29.6% stake); and Honaine and Skikda, two water desalination plants in Algeria with an aggregate capacity of 10.5 Mft3/day (25.5% and 34.17% stakes, respectively) for total proceeds of approximately $142 million. The sale of Honaine and Skikda was closed on February 15, 2015, while the acquisition of the remaining assets is still pending. Regarding Honaine and Skikda, we have entered into a two-year call and put option agreement with Abengoa Yield under which they have put option rights to require us to purchase back these assets at the same price paid by them and we have call option rights to require them to sell back these assets if certain indemnities and guarantees provided by us reach a certain threshold. In addition, discussions between us and Abengoa Yield have already commenced regarding a potential third dropdown for a total equity value in the range of $200 to $250 million. This potential third acquisition falls within the $100 million call option agreement announced between us and Abengoa Yield in December 2014 at a 12% yield. The third dropdown divestment is expected to close by the end of the year.
See "Item 5.A—Operating Results—Factors Affecting the Comparability of Our Results of Operations."
All related party transactions are, and were, subject to verification by our Audit Committee and the consideration paid for the different transactions was determined by third parties.
C. Interests of Experts and Counsel
Not applicable.
ITEM 8. FINANCIAL INFORMATION
A. Consolidated statements and other financial information.
We have included the Consolidated Financial Statements as part of this annual report. See Item 18, "Financial Statements."
Legal Proceedings
We are involved in a number of legal, governmental, fiscal and arbitration proceedings and investigations in connection with our operations in the normal course of business. These may include actions by regulatory authorities, tax authorities, suppliers and customers, employment-related claims, contractual disputes, claims for personal injury or property damage that occur in connection with our products or services
231
Table of Contents
performed in relation to projects or construction sites, tax assessments, environmental claims and other matters. We establish reserves for litigation and other contingent liabilities where we consider it probable that a claim will be resolved unfavorably and where we can reasonably estimate the potential loss involved. As of December 31, 2014, we have established a reserve amounting to €33.0 million allocated to cover liabilities for litigation and other claims where Group companies are defendants. While we do not expect these proceedings, either individually or in the aggregate, to have a material adverse effect on our financial position or results of operations, because of the nature of these proceedings, we are not able to predict their ultimate outcomes, some of which may be unfavorable to us and, if so, such proceedings could adversely affect our financial position or results of operations.
We have briefly summarized below the most significant of these proceedings.
- •
- In May 2000, Abengoa Puerto Rico S.E., a subsidiary of Abengoa, S.A, brought a lawsuit against the Electricity Power Authority (Autoridad de Energía Eléctrica, "AEE") of Puerto Rico and terminated the agreement that both parties had entered into in relation to an EPC project for the construction of an electricity power station in Puerto Rico. The referred lawsuit contained different claims such as, inter alia, withholding payments, defaulted invoices, loss of future profits, damages and several other costs, which tentatively amounted to $40 million. In response to the lawsuit brought by Abengoa Puerto Rico, S.E., the AEE brought a counterclaim premised upon unlawful termination and consequential damages relating to the agreement with Abengoa Puerto Rico, S.E. and, at the same time, brought an additional lawsuit for the same amount against Abengoa and its insurer, American International Insurance Co. of Puerto Rico. The amount claimed by the AEE is approximately $450 million.
- •
- In December 2011, two related arbitration proceedings before the International Court of Arbitration of the International Chamber of Commerce with seat in New York, United States were concluded in which our subsidiary ASA Bioenergy Holding A.G. ("ASA") filed various claims for certain breaches of contract by Mr. Adriano Gianetti Dedini Ometto and Adriano Ometto Agrícola Ltda. (the "Adriano Defendants") relating to a share purchase agreement with respect to the shares of Adriano Ometto Participações Ltda. Both arbitration proceedings were decided in ASA's favor, in the approximate amounts of $13.0 million and $110.6 million, respectively. The awards are final and not subject to further appeal in the United States. We have started the necessary actions to recognize the awards in Brazil.
- •
- On April 29, 2013, the European Commission decided to initiate an inspection on us, along with all the companies directly or indirectly under our control, regarding our possible participation in anticompetitive agreements or actions which were allegedly aimed at manipulating the results of Platt's Market on Close ("MOC") price assessment as well as denying the access of one or more companies to participation in the MOC price assessment process. According to such European Commission's decision, the suspected anticompetitive conduct, agreements and/or mutually coordinated concrete actions have allegedly existed since 2002 and would likely involve various markets for which the Platts MOC process is used to report prices, including markets for biofuels. The investigation is still in a preliminary phase, and the European Commission has not initiated formal proceedings. We believe that we and the relevant companies within the Group have at all times complied with the applicable competition laws. We are actively cooperating with the European Commission in its investigation. Nevertheless, we cannot predict the final outcome of any judicial proceedings that could be instigated in relation to the subject matter of the investigation. Should the European Commission or any subsequent judicial proceedings find that the Group has participated in anticompetitive practices, it could potentially entail (i) the imposition of fines calculated on the basis of the revenue in the affected markets, which in no case, however, may exceed 10% of the Group's total revenue in the year immediately preceding the imposition of the fine; and (ii) the filing of civil law claims for losses and damages by injured third parties. The imposition of fines, the cost of losses and damages and the resulting negative publicity could have a material adverse effect on the business, financial condition and results of operations of the Group.
232
Table of Contents
- •
- On February 11, 2010, a temporary joint venture (unión temporal de empresas, or "UTE") formed by our subsidiary, Befesa Construcción y Tecnología, S.A. and Construcciones Alpi, S.A., brought a lawsuit against the Comunidad de Regantes de las Marismas del Guadalquivir ("CRMG") regarding a project for the modernization of the Guadalquivir marshes irrigation area in Spain. The referred lawsuit contained different claims including, inter alia, unlawful termination of the contract by CRMG, penalties for delay, and a request to terminate the contract based on CRMG's breaches. The UTE requested a liquidation balance, which included unpaid construction and works certificates, amounting to €34.5 million and an additional €1.1 million based on different grounds. CRMG answered UTE's suit on November 4, 2010 and requested dismissal of UTE's claims. On December 12, 2014, our subsidiary, Abeinsa Infraestructuras Medio Ambiente, S.A. ("Abeinsa", formerly Befesa Construccion y Tecnología Ambiental, S.A.), was served with a counterclaim brought by the CRMG against the UTE and its current members (Abeinsa and Construcciones Alpi, S.A.) on the basis of the same dispute, project and factual issues of the aforementioned proceedings. CRMG is seeking €120.4 million in total damages, including approximately €14.9 million for damages related to poorly-executed work, extra costs, alleged damages, €120.7 million for loss of profits and €84.7 million in delay penalties. CRMG's lawsuit has been answered by the members of UTE.
Dividend Policy
Our dividend policy with respect to our Class A shares and Class B shares is subject to investment requirements and capital expenditures, possible future acquisitions, expected future results of operations, cash flows, debt limits and other factors. Our Class B shares carry the same economic rights as our Class A common shares.
Under the terms of our debt instruments, we are subject to certain restrictions on the distribution of dividends. The dividend protection clause existing in our outstanding convertible bonds permits us, with respect to the dividends that may be paid in respect of each year through the year 2017, to increase the dividend per share paid in respect of each such year by €0.002 per share over the prior year, without triggering any adjustment to the conversion price. Non-convertible bonds restrict the payment of dividends in excess of the sum of (i) 50% of consolidated net income for the year plus (ii) the amount of payments received by taxable capital increases through ordinary shares. Exceptions on these restrictions are available to us for situations including, but not limited to, buybacks, the repurchase of management-owned shares under our incentive plans, payment of dividends from the proceeds from a sale, and a maximum distribution of €20 million per year for allowed distributions related to (i) and (ii) above.
On February 20, 2014, a scrip dividend of €0.111 per Class A and Class B share, which represents a payout ratio of 90.3%, which is calculated as the total amount distributed as a dividend by the profit for the year attributed to the parent company for the year 2013, was approved by our General Shareholders' Meeting. The scrip dividend consisted of the assignment of free allotment rights with an irrevocable purchase commitment by us, and a subsequent capital increase by means of the issue of new shares to fulfill said allotments. The total amount of the dividend in 2014 was €92 million, of which €39 million was paid in cash and the remainder in Class B shares.
On April 9, 2013, a dividend of €0.072 per Class A and Class B share, which represents a payout ratio of 70.0%, which is calculated as the total amount distributed as a dividend by the profit for the year attributed to the parent company for the year 2012, was approved by our General Shareholders' Meeting. In addition, a cash amount equivalent to the dividends on the warrants issued under our Class B shares was also approved. The total amount of the dividend in 2013 was €40 million.
B. Significant Changes
There have been no significant changes since the date of the Consolidated Financial Statements included in this annual report.
233
Table of Contents
ITEM 9. THE OFFER AND LISTING.
A. Offering and listing details.
The following table sets forth, for the periods indicated, the high and low trading prices, and average daily trading volume for our ordinary shares since the year ended December 31, 2010, and for our Class A shares and Class B shares from October 25, 2012, on the Automated Quotation System of the Madrid and Barcelona stock exchanges, and for our American Depositary Shares representing our Class B shares ("ADSs"), with each ADS representing five Class B shares, from October 17, 2013 on the NASDAQ Global Select Market.
| | | | | | | | | | |
| | Price per Share | | Average Daily
Trading
(in number of
shares or ADSs) | |
|---|
(Amounts in Euros for Class A and B Shares and U.S. Dollars for ADSs) | | High | | Low | |
|---|
2010 | | | 24.04 | | | 13.37 | | | 518,718 | |
2011 | | | 24.00 | | | 14.80 | | | 584,219 | |
2012 | | | | | | | | | | |
Class A shares | | | 3.59 | | | 1.83 | | | 2,623,446 | |
Class B shares | | | 2.74 | | | 1.77 | | | 1,674,680 | |
2013 | | | | | | | | | | |
Class A shares | | | 3.59 | | | 1.83 | | | 2,623,446 | |
Class B shares | | | 2.74 | | | 1.77 | | | 1,674,680 | |
ADSs (from October 17, 2013) | | | 15,43 | | | 10.04 | | | 89,119 | |
2012 | | | | | | | | | | |
First quarter | | | 3.44 | | | 2.74 | | | 2,983,107 | |
Second quarter | | | 2.58 | | | 1.83 | | | 3,842,081 | |
Third quarter | | | 3.14 | | | 1.84 | | | 2,750,008 | |
Fourth quarter | | | | | | | | | | |
Class A shares | | | 3.59 | | | 1.91 | | | 918,586 | |
Class B shares | | | 2.74 | | | 1.77 | | | 1,674,680 | |
2013 | | | | | | | | | | |
First quarter | | | | | | | | | | |
Class A shares | | | 2.68 | | | 1.90 | | | 462,041 | |
Class B shares | | | 2.59 | | | 1.67 | | | 1,852,561 | |
Second quarter | | | | | | | | | | |
Class A shares | | | 2.25 | | | 1.68 | | | 266,485 | |
Class B shares | | | 1.93 | | | 1.54 | | | 1,360,292 | |
Third quarter | | | | | | | | | | |
Class A shares | | | 2.70 | | | 1.58 | | | 326,906 | |
Class B shares | | | 2.29 | | | 1.26 | | | 1,419,585 | |
Fourth quarter | | | | | | | | | | |
Class A shares | | | 2.78 | | | 2.05 | | | 538,115 | |
Class B shares | | | 2.25 | | | 1.47 | | | 5,269,009 | |
ADSs (from October 17, 2013) | | | 15.43 | | | 10.04 | | | 89,119 | |
234
Table of Contents
| | | | | | | | | | |
| | Price per Share | | Average Daily
Trading
(in number of
shares or ADSs) | |
|---|
(Amounts in Euros for Class A and B Shares and U.S. Dollars for ADSs) | | High | | Low | |
|---|
2014 | | | | | | | | | | |
First quarter | | | | | | | | | | |
Class A shares | | | 4.31 | | | 2.37 | | | 719,925 | |
Class B shares | | | 3.51 | | | 2.12 | | | 8,783,454 | |
ADSs | | | 24.44 | | | 14.42 | | | 13,707 | |
Second quarter | | | | | | | | | | |
Class A shares | | | 4.96 | | | 3.55 | | | 993,567 | |
Class B shares | | | 4.30 | | | 2.86 | | | 10,912,392 | |
ADSs | | | 29.27 | | | 19.86 | | | 17,990 | |
Third quarter | | | | | | | | | | |
Class A shares | | | 4.90 | | | 3.74 | | | 517,689 | |
Class B shares | | | 4.69 | | | 3.59 | | | 11,230,327 | |
ADSs | | | 30.16 | | | 23.73 | | | 12,481 | |
Fourth quarter | | | | | | | | | | |
Class A shares | | | 4.30 | | | 1.92 | | | 977,007 | |
Class B shares | | | 4.05 | | | 1.50 | | | 24,612,592 | |
ADSs | | | 25.53 | | | 9.14 | | | 218,021 | |
Most recent six months | | | | | | | | | | |
September 2014 | | | | | | | | | | |
Class A shares | | | 4.90 | | | 4.40 | | | 471,026 | |
Class B shares | | | 4.69 | | | 4.09 | | | 12,220,936 | |
ADSs | | | 30.16 | | | 26.21 | | | 19,003 | |
October 2014 | | | | | | | | | | |
Class A shares | | | 4.30 | | | 3.09 | | | 774,154 | |
Class B shares | | | 4.05 | | | 2.79 | | | 19,836,924 | |
ADSs | | | 25.53 | | | 17.97 | | | 38,777 | |
November 2014 | | | | | | | | | | |
Class A shares | | | 3.66 | | | 1.92 | | | 1,628,713 | |
Class B shares | | | 3.48 | | | 1.50 | | | 45,165,364 | |
ADSs | | | 22.03 | | | 9.14 | | | 591,515 | |
December 2014 | | | | | | | | | | |
Class A shares | | | 3.21 | | | 1.92 | | | 1,108,859 | |
Class B shares | | | 2.99 | | | 1.50 | | | 27,766,147 | |
ADSs | | | 18.82 | | | 9.14 | | | 328,800 | |
January 2015 | | | | | | | | | | |
Class A shares | | | 3.18 | | | 2.12 | | | 686,419 | |
Class B shares | | | 2.93 | | | 1.83 | | | 17,742,011 | |
ADSs | | | 16.76 | | | 10.88 | | | 69,931 | |
February 2015 (through February 20, 2015) | | | | | | | | | | |
Class A shares | | | 3.25 | | | 2.87 | | | 454,152 | |
Class B shares | | | 3.05 | | | 2.57 | | | 14,907,660 | |
ADSs | | | 17.53 | | | 14.61 | | | 103,226 | |
B. Plan of Distribution
Not applicable.
235
Table of Contents
C. Markets
Our Class A shares and Class B shares are traded on the Madrid and Barcelona stock exchanges and traded through the Automated Quotation System of such stock exchanges under the symbols "ABG" and "ABG.P", respectively. American Depositary Shares representing our Class B shares are traded on the NASDAQ Global Select Market under the symbol "ABGB".
D. Selling Shareholders
Not applicable.
E. Dilution
Not applicable.
F. Expenses of the Issue
Not applicable.
ITEM 10. ADDITIONAL INFORMATION.
A. Share capital
Not applicable.
B. Memorandum and Articles of Association
The Company is currently in the process of amending its corporate governance regulations (bylaws, regulations of the general shareholders' meetings, regulations of the Board of Directors) in order to conform them with the new requirements set forth under Law 31/2014, of December 3, 2014, amending the Spanish Companies Act to improve corporate governance ("Law 31/2014").
Corporate Objectives
Article 3 of Title one of our memorandum and articles of association sets out our objectives:
- •
- to engage in and carry on business in connection with projects for and the construction, manufacture, import-export, acquisition, repair, installation, assembly, contracting, sale and supply of all manner of electrical, electronic, mechanical and gas equipment or appliances for any application and all ancillary material used in this branch of industry, civil engineering works associated with such installations and ancillary material for all related businesses, including electricity generating power stations—nuclear, hydroelectric, thermal, solar and wind power plants and transformer and rectifier substations; design and manufacture of command and control consoles, low-, medium- and high-voltage cubicles, switchboards and equipment for nuclear power stations, bar conductors, rectifier equipment, motor control centers, low-voltage distribution boards, power boards and transformer centers; distribution networks, electrification of industrial facilities, mining installations and commercial and residential buildings, hydraulic pumping stations, water regulation and control systems, irrigation systems, water treatment systems; river management, water distribution operation; urban and industrial waste treatment, covering solid, liquid and gaseous waste, automatic hydrological information systems, seawater desalination plants, road tunnel ventilation and control systems, electrical, beacon, lighting and control installations at airports and ports, oil platform installations, heating and cooling systems, fire protection systems, studies and works for health service facilities, residential estates, urban landscaping and street furniture, industrial, artistic, monument, sports and street lighting, control and automation, security, manufacture, development, commercialization and maintenance of security equipment, particularly the installation and maintenance of physical, electronic, visual and acoustic devices or instruments for surveillance, monitoring and protection systems, especially with connection to alarm reception centers, consultancy, design, construction, maintenance and planning of security
236
Table of Contents
systems, naval electric power, traffic and road signs, power lines, electric traction, electrification and signaling for all types of railways, fixed installations for rolling stock, including railways and tracks, telephony, telematics, telecommunications and radio communications in general, computer hardware and software for all types of installations and buildings and for all types of applications and the maintenance, servicing and repair of such products.
- •
- to study, develop and execute all types of private and public civil engineering construction, rehabilitation, improvement and conservation works, including all manner of industrial construction works, civil engineering works, infrastructures, land urbanization and the construction of dwellings and buildings of all kinds.
- •
- to carry out activities related to the acquisition, holding, administration, disposal and sale of any movable or immovable property, intangible rights, securities, except for activities governed by special laws, equity securities, fixed-interest securities and stocks and shares in any listed or unlisted company or any other interest in any corporation, commercial company, entity or body whether public or private, national or foreign, at the time of incorporation or at a later date, irrespective of its activities or the rights and interests inherent in it.
Appointment of Directors
The general meeting of shareholders—or, where appropriate, the Board of Directors exercising the power legally conferred on it to fill vacancies arising from time to time caused by the resignation or removal of a director during a term—shall appoint the members of the Board of Directors in accordance with the applicable laws. Abengoa's directors are elected for terms of four years. They may be re-elected for one or further four-year terms.
Under Spanish corporate law, shareholders of voting shares who voluntarily aggregate their shares so that the capital stock so aggregated is equal to or greater than the result of dividing the total capital stock by the number of directors have the right, provided there are vacancies on the Board of Directors, to appoint a corresponding proportion of the members of the Board of Directors (disregarding fractions). Shareholders who exercise this right (in person or by proxy) may not vote on the appointment of other directors.
Vacancies occurring in the period between re-elections may be filled by any person appointed by the Board of Directors until the following annual general meeting is held. In case the general shareholders' meeting has already been called when the vacancy occurs, the director will remain in its position until the following general meeting after the general meeting that has been already called. A director appointed in the manner aforesaid shall be subject to retirement at the same time as if he had become a director on the day on which the director in whose place he is appointed was last elected a director.
Directors shall vacate their office on expiration of the appointment (when, having expired the period for which they were appointed, the general shareholders' meeting has already taken place or the period for celebration of the general shareholders' meeting deciding on the approval of the financial statements has already expired), death or resignation and by resolution of the general meeting in the case of incapacity or removal.
In addition to compliance with all legal and statutory requirements as to eligibility, directors appointed to the Board shall also be solvent and possess the knowledge, standing, expertise and professional experience required to fulfill the duties of a director.
In conducting the business of Abengoa, directors shall discharge their duties in good faith with no personal interest, with enough information and following a suitable decision-making process. Directors must adequately dedicate themselves to their office and have the right and the obligation to request from the Company any necessary information to discharge their duties. They may be held liable by Abengoa, the shareholders and third parties for damages when they act contrary to the provisions of the Spanish corporate law or the Bylaws.
237
Table of Contents
In such cases, all the members of the Board who carried out the detrimental act or who adopted the detrimental resolution shall be jointly and severally liable, except those who can prove that they played no part in any such action and were either unaware of it, did all in their power to prevent any damage or, at least, expressed their objection to it.
Likewise and by virtue of their office, directors are bound, among others and in particular, to:
- (a)
- Not to exercise their powers for purposes other than those for which they were granted;
- (b)
- Avoid conflicts of interest and report any potential conflicts to the Board of Directors, through the Secretary to the Board of Directors;
- (c)
- Refrain from holding offices in competing companies or in companies belonging to the group of a competitor of Abengoa. Therefore, directors shall not hold any office, either directly or through an intermediary, in rival companies or undertakings or in the groups of such companies or undertakings, nor shall they provide representation or consultation services to them unless the general shareholders' meeting authorizes them;
- (d)
- Refrain from using non-public information pertaining to Abengoa;
- (e)
- Refrain from making use of our assets and from using their position in Abengoa for personal gain without the corresponding consideration unless the general shareholders' meeting or, if applicable, the Board of Directors authorizes them, provided, however, that the independence of the members of the Board of Directors granting the authorization in respect of the affected director is duly guaranteed ensuring that the transaction is neutral for the wealth of the Company or, as the case may be, is carried out on an arm's length basis and with transparency in the process;
- (f)
- Refrain from using business opportunities for their own benefit unless the general shareholders' meeting or the Board of Directors authorizes them provided however that the independence of the members of the Board of Directors granting the authorization in respect of the affected director is duly guaranteed ensuring that the transaction is neutral for the wealth of the Company or, as the case may be, is carried out on an arm's length basis;
- (g)
- Refrain from participating in the deliberation and vote of resolutions in which they or a related party have a direct or indirect conflict of interest. However, directors will not be prevented from voting on proposals affecting them in their condition as directors such as their appointment or removal for positions on the Board of Directors or similar positions;
- (h)
- Inform the Board of Directors of any securities or derivatives they hold, whether directly or indirectly, in the Company;
- (i)
- Discharge their duties following principles of personal liability with freedom of criteria and independence from instructions of third parties;
- (j)
- Refrain from carrying out activities in their own name and behalf or in the name and on behalf of a third party, which may entail an effective competence, either actual or potential, with the Company or putting themselves in a permanent conflict of interest in any other way, unless the general shareholders' meeting expressly and separately authorizes them. However, such an authorization from the general shareholders' meeting can only be granted in case no damage is caused to the Company or if it is, such a damage is compensated by the benefits that the Company will obtain from such authorization; and
- (k)
- In general, avoid any conflict of interest with the Company and, in particular, situations reflected in article 229 of the Spanish Companies Act.
In compliance with the duty of loyalty to Abengoa by which they are bound, directors shall not authorize and, should the case arise, shall report, any operations carried out by members of their own family or by companies in which they hold an executive office or a significant ownership interest, when they are not subject to the conditions and controls referred to above.
238
Table of Contents
The duty to act as loyal representatives requires directors to inform Abengoa of any shares, options on shares or equity derivatives that it holds in the Company either directly or through companies in which they have a significant shareholding, in accordance with the internal Code of Market Conduct.
Directors may take part in deliberations and votes relating to proposals affecting their condition as directors, such as their appointment or removal.
Currently, the Board of Directors of Abengoa is composed of 16 directors.
�� The Board of Directors shall meet when it is in the interest of Abengoa to do so, at the discretion of the chairman or the vice-chairman, as the case may be, at the request of one-third of its members or at the request of at least one independent director, at the registered office of the Company or elsewhere. It shall meet at least once every two months. Meetings shall be summoned by the secretary on the instructions of the chairman or the vice-chairman, as the case may be, or, in his absence or incapacity, on the instructions of the director taking his place, at the request of one-third of its members of at the request of the lead independent director. The notice, which shall state the agenda, place, day and hour of the meeting, shall be delivered to the members of the Board in writing no less than ten days prior to the meeting. However, notice requirements may be dispensed with if all the members of the Board are present or give their written consent to such a meeting. Decisions can be taken by voting in writing provided that all members so agree.
No business may be transacted at a meeting of the Board of Directors unless half plus one of the directors are present in person or by proxy, except in the event that a meeting is held without notice, in which case all the members of the Board of Directors must be present.
Directors may appoint another director as their proxy. There is no restriction on the number of instruments of proxy that any one director may hold for a specific meeting. Proxies may be granted in any written form, including telegram, telex or telefax, and shall be addressed to the chairman of the Board.
Resolutions shall be carried by a majority vote of those present at the meeting in person or by proxy. In the event of an equality of votes, the chairman of the Board of Directors shall have the casting vote.
The Board of Directors of Abengoa has made available, from the year 1998, the regulations that govern its operation and the operation of its Committees. The existence of regulations that govern the structure and functions of the general shareholders' meetings and the Board of Directors and its supervision and control is obligatory for all companies listed on a Spanish stock exchange.
Share Capital
The Company's share capital is divided into three classes: Class A shares, Class B shares and Class C shares. As of December 31, 2014, we had 84,243,640 Class A shares outstanding, 755,526,080 Class B shares outstanding and no Class C shares outstanding.
Class A Shares
Class A shares, with a par value of one (1) euro as endow their owners with the following rights established under Spanish law and in our Bylaws:
Each Class A share carries one hundred (100) voting rights.
Except in the case of inexistence or exclusion of pre-emptive rights or of rights to free assignment or any similar pre-emptive rights, successive capital increases or successive issues of convertible or exchangeable bonds or any other security or instrument which could give rise to subscription for, conversion into, exchange for or acquisition of or in any other way grants the right to receive Company shares, shall be carried out by the Company with one of the following structures: (i) in the case of capital increases, the simultaneous issue of
239
Table of Contents
Class A shares, Class B shares and Class C shares (if previously issued) in the proportion that the number of shares of each class bears to the total number of shares of all classes already issued into which our share capital is divided at the time of the issuance triggering such pre-emptive rights; or (ii) in the case of the issue of other securities which could give rise to subscription for, conversion into, exchange for or acquisition of or in any other way grants the right to receive Company shares, holders of Class A shares, Class B shares and Class C shares shall have pre-emptive rights to subscribe for such security in the proportion indicated under (i) above.
With full observance of the principle of proportionality previously referred to, based on the proportion that the number of shares of each class bears to the total number of shares of all classes already issued into which our share capital is divided at the time of the issuance triggering such pre-emptive rights, the pre-emptive rights, rights to free assignment of shares and any other similar pre-emptive right of holders of Class A shares shall be exercised only over Class A shares (or convertible or exchangeable bonds, warrants or other securities and instruments granting rights to subscription or acquisition of the same).
In the case of capital increases effected using reserves or premiums obtained from prior issuances of shares to increase the par value of the issued and outstanding shares, the Class A shares as a class shall be entitled to a par value increase in the proportion that the aggregate par value of the issued and outstanding Class A shares at the time of the execution of the resolution respecting such capital increase bears to the Company's share capital represented by the Class A shares, Class B shares and Class C shares issued and outstanding at such time.
Notwithstanding the above, the General Shareholders' Meeting shall be entitled to increase the share capital by charge to reserves through the issue of new Class A shares only, provided that a favorable vote of the majority of the shares of each Class then outstanding is separately obtained, and otherwise at all times respecting an equal treatment between all classes of shares.
Each Class A share confers on its holder a right to obtain its conversion into a Class B share, exercisable up until December 31, 2017.
The conversion right shall be exercised by its holder by providing the Company (or, alternatively, the nominee entity appointed for such purpose, through the participating entity in Sociedad de Gestión de los Sistemas de Registro, Compensación y Liquidación de Valores, S.A.U. (Iberclear), by any means allowing to establish receipt, of a notice, deemed to be issued on a firm, irrevocable and unconditional basis, in which the holder shall express the total number of Class A shares it holds and the exact number of Class A shares over which it wishes to exercise its conversion right, so that the Company may carry out the necessary acts and pass the necessary resolutions to effect said conversion and may duly report this to the Spanish Securities and Exchange Commission ("CNMV") by publishing the relevant regulatory communication (hecho relevante).
The above described notice shall be accompanied by the relevant certificate attesting to the legitimate ownership of the relevant Class A shares, issued by an entity participating in the systems managed by Iberclear, or by an intermediary or custodian financial entity, or a managing entity of the shares, on the terms provided in the rules on representation of securities in book entry form or through any other means of evidence to which the Company accords sufficient validity for the purposes hereof.
Upon the Class A shareholder exercising its conversion right, the share capital of the Company shall be deemed reduced in the amount of the difference between the par value of the Class A shares on which the right is exercised and the par value of the same number of Class B shares, which amount shall increase the restricted reserve which, for these purposes and pursuant to Spanish Corporate law, the Company shall have established in advance.
It shall be the Board of Directors' duty, with express power of substitution in favor of the Chairman or the Chief Executive Officer, to determine the term, frequency and procedures to exercise the conversion right, including where appropriate, the assessment of the adequacy of the equivalent means of evidence referred to
240
Table of Contents
above, as well as any other aspects as may be necessary for the effective exercise of said right, all of which shall be duly reported through the disclosure of the relevant regulatory communication (hecho relevante).
Without prejudice to the provisions described under "—Pre-Emptive Rights and Rights to Free Assignment of New Shares" above, each Class A share confers upon its holder the remaining rights, including the financial rights recognized under Spanish law and the Bylaws, to which shareholders are entitled as shareholders in the Company.
Class B Shares
Class B shares carry the following rights established under Spanish law and in the Bylaws:
Each Class B share, with a par value of one cent euro (€0.01), carries the right to one vote.
With full observance of the principle of proportionality previously referred to based on the proportion that the number of shares of each class bears to the total number of shares of all classes already issued into which our share capital is divided at the time of the issuance triggering such pre-emptive rights, the pre-emptive rights, rights to free assignment of shares and any other similar pre-emptive right of holders of Class B shares shall be exercised only over Class B shares (or convertible or exchangeable bonds, warrants or other securities and instruments granting rights to subscription or acquisition of the same).
In the case of capital increases effected using reserves or premiums obtained from prior issuances of shares to increase the par value of the issued and outstanding shares, the Class B shares as a class shall be entitled to a par value increase in the proportion that the aggregate par value of the issued and outstanding Class B shares at the time of the execution of the resolution respecting such capital increase bears to the Company's share capital represented by the Class A shares, Class B shares and Class C shares issued and outstanding at such time.
Notwithstanding the above, the General Shareholders' Meeting shall be entitled to increase the share capital by charge to reserves through the issue of new Class B shares only, provided that a favorable vote of the majority of the shares of each Class then outstanding is separately obtained, and otherwise at all times respecting an equal treatment between all classes of shares.
Except as described under "—Voting Rights" and "—Pre-Emptive Rights and Rights to Free Assignment of New Shares" above and to the regulations in force, and notwithstanding the Class B shares having a lower par value per share, each Class B share confers the same rights, including financial rights, as a Class A share, and we shall grant Class B shareholders the same treatment recognized for Class A shareholders insofar as it does not contradict the stipulations of the regulations in force. In particular, each Class B share grants its holder the right to receive the same dividend, the same liquidation quota, the same restitution of contributions in the event of capital reduction, distribution of reserves of any kind (including, as the case may be, premiums for attendance at a general shareholders' meeting), issuing premiums and any other allocations as a holder of Class A shares shall receive, all the aforesaid in the same terms as are applied to Class A shares.
In the event of a capital reduction due to losses through the reduction of the par value of the shares, Class A and Class B shares shall be affected in proportion to their respective par values.
241
Table of Contents
Separate Voting in the Event of Modifications of the Bylaws or Resolutions and Other Transactions that May Negatively Affect Class B Shares
Bylaws or resolution amendments that may directly or indirectly prejudice or adversely affect the pre-emptive rights or privileges of Class B shares (including any amendment of the provisions of the Bylaws relating to Class B shares or to any resolution that may prejudice or adversely affect Class B shares relative to the Class A shares or that may benefit or favorably affect Class A shares relative to Class B shares) shall require, in addition to being approved pursuant to the provisions of the Bylaws, the approval by holders of a majority of the then issued and outstanding Class B shares. By way of explanation but without limiting the generality of the foregoing, such separate class voting right shall apply to the following: (i) the elimination or modification of the principle of proportionality among the Class A shares, the Class B shares and the Class C shares (if previously issued) relative to the total number of the Company's issued and outstanding shares in connection with the issuance of new shares or securities or instruments that may give rise to subscription for, conversion into, exchange for or acquisition of, or in any other way grants the right to receive, the Company's shares; (ii) the partial or total exclusion, applied in an unequal manner, of the pre-emptive and other analogous rights that may be attached under Spanish law and the Bylaws to Class A shares, Class B shares and Class C shares (as the case may be); (iii) the repurchase or acquisition of the Company's own shares in a manner that may affect Class A shares, Class B shares and Class C shares (as the case may be) unequally, whether in the applicable terms and conditions, the purchase price or in any other manner, and which may exceed that which is produced under the framework of ordinary operation of treasury stock or which may give rise to amortization of shares or to the reduction of capital in an unequal manner for Class A shares, Class B shares or Class C shares (as the case may be); (iv) the approval of a structural modification to the Company that results in unequal treatment of Class A shares and Class B shares in any aspect; (v) the exclusion of the shares of the Company from trading on any secondary stock exchange or securities market except through the launching of a delisting public tender offer that provides for the payment of the same consideration to holders of the Class A shares, Class B shares and Class C shares (as the case may be); and (vi) the issuance of Class C shares or of any other class of preferred or privileged shares that may be created in the future.
Notwithstanding the foregoing, separate class voting is not required to approve any resolution authorizing a partial or total exclusion of pre-emptive rights and other analogous rights that may be applicable under Spanish law and the Bylaws in relation to Class A shares, Class B shares and Class C shares (as the case may be) where such exclusion applies in an equal manner across all such share classes.
In the event that a tender offer is made for the acquisition of all of the voting shares of the Company, following which the offeror, together with any persons acting in concert with the offeror, (i) directly or indirectly holds 30% or more of the voting rights of the Company (except where another person, individually or together with other persons acting in concert with it, already held a percentage of voting rights equal to or greater than that held by the offeror after such tender offer), or (ii) becoming the holder of a shareholding below 30%, appoints a number of directors to the Company's Board of Directors that, either by themselves or collectively with those already appointed previously (as the case may be), constitute more than 50% of the Company's Board of Directors, each holder of Class B shares shall be entitled to have all of its Class B shares redeemed by the Company under Spanish law except where the holders of Class B shares had the right to participate in such tender offer in the same manner and on the same terms and conditions and, in any events, for the same consideration, as the holders of Class A shares (each such event under clauses (i) and (ii) above, a "Redemption Event"). In the event that the total nominal share capital represented by the Class B shares that are presented for redemption exceeds 25% of the nominal share capital of the Company, the number of shares that each holder will be allowed to have redeemed will be determined on a pro rata basis. As of this date, all of the Class B shares would be entitled to redemption, as the total sum of their nominal value is below such 25% limit.
242
Table of Contents
The credit agreements, indentures and other debt instruments governing our existing indebtedness contain restrictions on our ability to repurchase or redeem our outstanding shares. We may be required by our Bylaws to redeem the Class B shares (including any Class A shares converted into Class B shares pursuant to the terms thereof) even in circumstances where such payment would contravene covenants in our indebtedness, which could result in an acceleration of the related indebtedness.
Upon a Redemption Event, for the purpose of information and within seven calendar days from the date of either the settlement of the tender offer or the offeror's appointment of directors to the Company's Board of Directors who, either by themselves or collectively with those already appointed (as the case may be), constitute more than 50% of our Board of Directors, we shall publish an announcement informing holders of Class B shares of the procedure for exercising their redemption rights in relation to such Redemption Event in the Commercial Registry Official Gazette, in the Spanish Stock Exchange Listing Bulletin, on our website and in a national newspaper of general circulation.
Each holder of Class B shares may exercise its redemption rights within two months from the date of the last of the announcements mentioned in the paragraph above, by notifying us. We shall ensure that said notice for the exercise of the redemption rights may be issued through the systems established by Iberclear.
The redemption price that the Company shall promptly pay for each Class B share surrendered by a holder for redemption shall be equal to the consideration paid by the offeror in the tender offer to holders of Class A shares giving rise to the Redemption Event, as increased by interest accruing at the legal interest rate on the aforementioned amount from the date of issuance of the notice of the exercise of redemption rights by such holder until the date payment is actually made to such holder. The Company's directors shall be authorized to execute such resolutions and take such actions as may be necessary or appropriate to ensure that the Company fully complies with its obligation to pay the redemption price for any Class B shares as to which the redemption rights are exercised.
Upon payment of the redemption price, the share capital of the Company shall be deemed reduced in the amount of the par value of the redeemed shares. The amount of the reduction of share capital must not exceed one quarter of the total share capital of the Company. The corporate resolutions approving the issuance shall establish the terms for the exercise of the redemption rights. We will place priority on the redemption requests placed by those shareholders who exclusively hold Class B shares and by those who, holding both Class A and Class B shares, provide evidence that they refused to accept, either totally or partially, the takeover bid that triggered the Redemption Event. In this case, the Company will reduce its share capital by meeting all such priority redemption requests in proportion to the number of Class B shares held by each shareholder.
As to any non-monetary consideration paid in the offer, it shall be valued at its market value as of the initial settlement date of the offer, which valuation must be accompanied by a report issued by an independent expert appointed by the Company, selected from among audit firms of international renown.
From the moment the tender offer is commenced until the payment in full of the redemption price (including any accrued interest thereon) in respect of any Class B shares as to which redemption rights have been exercised, the Company may not pay any dividend, distribution or other similar payment whatsoever to its shareholders, regardless of whether such dividend, distribution or other similar payments are paid in cash, securities of the Company or any of its subsidiaries or in the form of any other securities, assets or rights.
243
Table of Contents
Class C Shares
Class C shares with a par value of one cent (0.01) of euro carry the following rights established under Spanish law and in the Bylaws:
Class C shares do not carry voting rights.
Each Class C share confers on its holder the right to receive an annual minimum preferential dividend charged against ordinary distributable profits for each fiscal year at the end of which such Class C share is outstanding, of one euro cent (€0.01) per Class C share (the "Preferential Dividend").
The Company is required to declare and pay the Preferential Dividend before paying out any dividend whatsoever to holders of voting shares that is charged against the ordinary distributable profits earned by the Company in each fiscal year.
The Preferential Dividend in respect of Class C shares must be paid within nine months after the end of the fiscal year in respect of which it is due. Under our Bylaws, the aggregate amount of the Preferential Dividend paid on the outstanding Class C shares in respect of any fiscal year shall not exceed the sum of distributable profits earned by the Company in such fiscal year.
In the event that the Company does not earn sufficient distributable profits in any fiscal year to pay the Preferential Dividend on all Class C shares existing at the close of such fiscal year, the Preferential Dividend shall not be paid out and the part of the aggregate sum of said Preferential Dividend exceeding the distributable profits earned by the Company in such year shall not accumulate as a dividend to be paid out in the future.
The total or partial failure to pay out the Preferential Dividend in respect of any fiscal year due to failure to earn sufficient distributable profits for full payment of the Preferential Dividend in such fiscal year shall not confer any voting rights on the Class C shares.
Each Class C share confers the right of the holder to receive, in addition to the Preferential Dividend, the same dividend, the same liquidation quota, the same restitution of contributions in the event of share capital reduction, distribution of reserves of all kinds or the issuance premium and whatsoever other allocations and distributions as our voting shares, all in the same terms and conditions that correspond to voting shares.
Each Class C share confers on its holder the right to receive, in the event the Company is wound up and liquidated, an amount (the "Preferential Liquidation Quota") equivalent to the paid up value of Class C shares.
The Company shall pay out the Preferential Liquidation Quota for Class C shares before paying any liquidation quota whatsoever to holders of voting shares. Regarding the rest of the liquidation quota that may correspond to them, they shall be entitled to the same rights as voting shares.
In the event that a tender offer for all or part of the shares of the Company is made and wholly or partially settled, each holder of Class C shares shall be entitled to have its Class C shares redeemed pursuant to the procedure established for the redemption of Class B shares,provided that such redemption right shall not be available if the holder of Class C shares had the right to participate in such tender offer in the same manner and on the same terms and conditions and, in any events, for the same consideration, as the holders of Class A shares (each such tender offer, a "Class C Shares Redemption Event").
244
Table of Contents
Notwithstanding the above, the number of Class C shares redeemed as a consequence of a Class C Shares Redemption Event may not represent a percentage of the total number of Class C shares issued and outstanding at the date of the Class C Shares Redemption Event that is greater than the proportion that (a) the sum of Class A shares and Class B shares (as the case may be) (i) held by persons to whom the tender offer giving rise to the Class C Shares Redemption Event is made, (ii) held by the offeror in said tender and (iii) held by persons acting in concert with such offeror or persons who signed agreements with the offeror in relation to the offer, bears to (b) all of the Class A shares and Class B shares (as the case may be) issued and outstanding on the date of the tender offer giving rise to the Class C Shares Redemption Event.
Notwithstanding the above, the General Shareholders' Meeting is entitled to increase the share capital by charge to reserves through the issue of new Class C shares only, provided that a favorable vote of the majority of the shares of each Class then outstanding is separately obtained, and otherwise at all times respecting an equal treatment between all classes of shares.
With full observance of the principle of proportionality based on the proportion that the number of shares of each share class bears to the total number of shares of all classes already issued into which our share capital is divided at the time of the issuance triggering such pre-emptive rights, the pre-emptive rights, rights to free assignment of shares and any other similar pre-emptive right of holders of Class C shares shall be exercised only over Class C shares (or convertible or exchangeable bonds, warrants or other securities and instruments granting rights to subscription or acquisition of the same).
In the case of capital increases effected using reserves or premiums obtained from prior issuances of shares to increase the par value of the issued and outstanding shares, the Class C shares as a class shall be entitled to a par value increase in the proportion that the aggregate par value of the issued and outstanding Class C shares at the time of the execution of the resolution approving such capital increase bears to the Company's share capital represented by the Class A shares, Class B shares and Class C shares issued and outstanding at such time.
Notwithstanding the above, the General Meeting shall be entitled to increase the share capital by charge to reserves through the issue of only new Class C shares, provided always that a favorable vote is separately obtained by the majority of the shares in each of the various classes of shares outstanding, and at all times respecting an equal treatment between all classes of shares.
Separate Voting in the Event of Modifications of the Bylaws or Agreements and Other Operations that May Negatively Affect Class C Shares
Notwithstanding Article 103 of the Spanish Companies Act, the Bylaws or any resolution amendments that may directly or indirectly prejudice or adversely affect the pre-emptive rights or privileges of Class C shares (including any amendment of the provisions of the Bylaws relating to Class C shares or to any resolution that may prejudice or adversely affect Class C shares relative to the Class A shares and/or Class B shares or that may benefit or favorably affect Class A shares and/or Class B shares relative to Class C shares) shall require, in addition to being approved pursuant to the provisions of the Bylaws, the approval by holders of a majority of the then issued and outstanding Class C shares. By way of explanation but without limiting the generality of the foregoing, such separate class voting right shall apply to the following: (i) the elimination or modification of the principle of proportionality among the Class A shares, the Class B shares and the Class C shares relative to the total number of the Company's issued and outstanding shares in connection with the issuance of new shares or securities or instruments that may give rise to subscription for, conversion into, exchange for or acquisition of, or in any other way grants the right to receive, the Company's shares; (ii) the partial or total exclusion, applied in an unequal manner, of the pre-emptive and other analogous rights that may be attached under Spanish law and the Bylaws to Class A shares and/or Class B shares and Class C shares (as the case may be); (iii) the repurchase or acquisition of the Company's own shares in a manner that may affect Class A shares and/or Class B shares relative to Class C shares unequally, whether in the applicable
245
Table of Contents
terms and conditions, the purchase price or in any other manner, and which may exceed that which is produced under the framework of ordinary operation of treasury stock or which may give rise to amortization of shares or to the reduction of capital in an unequal manner for Class A shares, Class B shares or Class C shares (as the case may be); (iv) the approval of a structural modification to the Company that results in unequal treatment of Class A shares Class B shares (as the case may be) relative to Class C shares in any aspect; (v) the exclusion of the shares of the Company from trading on any secondary stock exchange or securities market except through the launching of a delisting tender offer that provides for the payment of the same consideration to holders of the Class A shares, Class B shares and Class C shares (as the case may be); and (vi) the issuance of any other class of preferred or privileged shares that may be created in the future.
Notwithstanding the provisions of Article 293 of the Spanish Companies Act, any agreement by us to increase capital by any method and under any formula whatsoever entailing the first issue of Class C shares shall also require approval, in addition to the approval in compliance with the applicable law and the provisions of Article 30 of the Bylaws, of the majority of Class B shares then issued and outstanding.
The general meeting of shareholders or the Board of Directors by delegation may from time to time make calls upon the shareholders in respect of any amounts unpaid on their shares. Each shareholder shall pay the specified amount at the established time or times. If an amount called in respect of a share by the general meeting of shareholder is not paid before or on the day appointed for payment, Abengoa may, at its discretion, adopt any of the following decisions:
(a) institute legal proceedings to enforce compliance with the obligation to pay the amount called on the shares plus legal interest and to seek damages sustained as a result of non-payment;
(b) take enforced collection action against the shareholder, seizing his or her property to satisfy the amount called on the shares plus interest. The enforcement order can be issued on the basis of certification by Abengoa accrediting that the debtor is a shareholder and the resolution adopted by the Board of Directors to issue a call on shares; or
(c) execute the transfer of the shares before a notary public and replace the original share certificate with a duplicate. All expenses incurred in this respect shall be for the account of the defaulting member. If, for any reason, the shares cannot be sold, Abengoa has the right to terminate the contract with the defaulting member and cancel the shares in question, with the corresponding reduction of capital. Any amounts already paid on the shares shall revert to Abengoa.
The transferee of shares that are not fully paid up shall be jointly and severally liable with all previous transferors, as the directors may determine, for the payment of sums due on shares. The liability of the transferor shall expire three years from the date of the transfer. All shares shall be freely transferable, there being no restrictions or limitations in this respect.
The Bylaws do not contain any provision relating to sinking funds or potential liability of shareholders to further capital calls.
Pre-emptive Rights
Pursuant to the Spanish Companies Act, shareholders have pre-emptive rights to subscribe for any new shares, and bonds convertible into shares issued by Abengoa. However, the pre-emptive rights of holders of shares may not be available under special circumstances if they are excluded by a resolution passed at a general meeting in accordance with the Spanish Companies Act or by the Board of Directors pursuant to the authority to do so conferred to it by a shareholders' resolution in the best interest of the Company.
Further, pre-emptive rights are not available in the event of an increase in capital in connection with (i) the conversion of convertible bonds into shares in accordance with their terms, (ii) a merger or a public exchange offer in which shares are issued as consideration; (iii) an acquisition of assets from another company
246
Table of Contents
in which shares are issued as consideration; or (iv) in the case of capital increases with non-monetary contributions or by way of capitalization of credits held vis à vis the Company.
Pre-emptive rights are transferable on the same conditions as the shares from which they derive, may be traded on the Spanish Automated Quotation System and may be of value to existing shareholders because new shares may be offered for subscription at prices lower than prevailing market prices.
Shareholder Suits
Shareholders holding at least 0.1% of the share capital stock of the Company may bring actions challenging resolutions adopted at general shareholders' meetings or by the Board of Directors. The venue for shareholder suits will be the court of the Company's corporate domicile.
Under the Spanish Companies Act, directors are liable to the company and the shareholders and creditors of the company for acts and omissions contrary to Spanish law or the company's Bylaws and for failure to carry out the duties and obligations required of directors, provided that they acted intentionally or with negligence. Directors have such liability even if the transaction in connection with which the acts or omissions occurred is approved or ratified by the shareholders.
The liability of the directors is joint and several, except to the extent any director can demonstrate that he or she did not participate in decision making relating to the transaction at issue, was unaware of its existence or being aware of it, did all that was possible to mitigate any damages or expressly disagreed with the decision making relating to the transaction.
Directors' liability will also extend tode facto directors this meaning any person that in the normal course of a company's business discharges, without a valid title, the duties of directors as well as any such person under whose instructions the directors discharge their duties.
General Meetings
General meetings of shareholders may be at the Annual General Shareholders' Meeting and extraordinary general meetings. The Annual General Shareholders' Meeting is held within the first six months of each fiscal year in order to review, among other things, the management of the Company, and to approve, if applicable, the annual financial statements for the previous fiscal year. Extraordinary general meetings of shareholders are those meetings that are not ordinary. The requirements mentioned below concerning the constitution and adoption of resolutions are applicable to both categories of general meetings.
The Annual General Shareholders' Meeting of Abengoa is held in Seville, during the first six months of each year on a date fixed by the Board of Directors. General shareholders' meetings may be called by the Board of Directors whenever deemed appropriate or, in accordance with the Spanish Companies Act, at the request of shareholders representing at least 3% of Abengoa's share capital or 3% of the voting shares. Notices of all general meetings are published in the Commercial Registry's Official Gazette (Boletín Oficial del Registro Mercantil) or in a local newspaper of wide circulation in Spain, on the CNMV's website (www.cnmv.es) and on the Company's website (www.abengoa.com) at least one month prior to the meeting. In accordance with the Spanish Companies Act, at ordinary general meetings, shareholders representing at least 3% of Abengoa's share capital or 3% of the voting shares have the right to request the publication of an amended notice including one or more additional agenda items provided, however, that such additional agenda items are duly justified or, as the case may be, accompanied by a duly justified resolution proposal . Shareholders representing at least 3% of Abengoa's share capital or 3% of the voting shares will also be entitled to make duly justified proposals of resolutions of items already included in the agenda or to be included in the agenda. However, dismissal of directors can be considered even if not included in the agenda of any general meeting.
A holder of a minimum of three hundred and seventy-five (375) shares, whether they are Class A shares or Class B shares, shall have the right to attend the general meeting,provided that the shareholder registers prior to the date on which the meeting is to be held and presents an attendance card issued in his name and
247
Table of Contents
stating the number, class and series of shares and the number of votes to which such holder is entitled. The card shall be issued by the entity responsible for book-entry registration to those shareholders who present proof of shares entered in the register five days prior to the scheduled date of the meeting.
Any shareholder entitled to attend a general meeting shall have the right to be represented at the general meeting by any person. If the proxy holder is also a shareholder and eligible to attend the meeting in his own right, a private written instrument of proxy issued specifically for the relevant meeting should suffice to document the proxy.
Legal persons, minors and persons under civil disqualification may be represented at meetings by their legal representatives, who shall present evidence of their powers of attorney to the chair of the general meeting.
General Meetings shall be held in Seville on the day designated in the notice calling them. Sessions however may be extended during one or more consecutive days. Said extensions may be agreed upon request by the Board of Directors or by shareholders holding at least 25% of the equity present or represented at the relevant meeting or 25% of the voting shares.
Action is taken at the Annual General Shareholders' Meeting on, among others, the following matters: the approval of the management of the Company by the directors during the previous fiscal year; the approval of the annual accounts from the previous fiscal year; and the application of the previous fiscal year's income or loss the acquisition, transfer or contribution to another company of essential assets of the Company and the approval of directors' remuneration policy.. All other matters can be considered at either the Annual General Shareholders' Meeting or an extraordinary general meeting if the matter is within the authority of the meeting and is included on the agenda.
Shareholders representing 1% of the share capital or 1% of voting shares are entitled to request the presence of a Notary Public to record the minutes of the general meeting.
Shareholders representing 3% of the share capital or 3% of the voting shares of the Company are entitled to call a General Meeting to resolve on a corporate action claiming liability against directors, and to bring, even in the absence of a resolution of the General Meeting or despite the existence of a contrary resolution of the General Meeting, a corporate action claiming liability of directors, as well as to challenge, settle or waive such action.
The quorum required for business to be transacted at a general meeting (either the Annual General Shareholders' Meeting or an extraordinary general meeting) shall be the holders present in person or by proxy of at least 25% of the issued voting share capital. In the event that a meeting stands adjourned because the quorum requirement is not met, there shall be no minimum quorum required at the adjourned meeting.
Under the Spanish Companies Act, the rights of shareholders may only be changed by an amendment to the Bylaws that complies with the quorum requirements explained below, plus the affirmative vote of the majority of the shares of the class that will be affected by the amendment. As noted above, holders of Class B shares and holders of Class C shares (if any) are entitled to vote as separate classes in the event of any modification of the Bylaws or resolution for transaction that may adversely affect such Class B and Class C shares.
However, certain resolutions, specifically those relating to the issue of bonds, the increase or reduction of capital, a change of corporate form, the merger, demerger, global assignment of assets and liabilities, cancellation or restriction of pre-emptive rights, or the transfer of the registered office abroad of Abengoa and, in general, any amendment to the Bylaws, can only be taken at General Shareholders' Meetings when the holders of at least 50% of the issued voting share capital are present in person or by proxy at first call. In this case, the resolution may be adopted by an absolute majority.
In the event that a meeting stands adjourned because the quorum requirement is not met, such decisions can be taken at the adjourned meeting when holders of at least 25% of the issued voting share capital are present in person or by proxy. The interval between the first and second call for a shareholders'
248
Table of Contents
meeting must be at least 24 hours. However, when less than 50% of the voting share capital is present at the meeting in person or by proxy, a reinforced majority of two thirds of the voting share capital present in person or by proxy is required for the adoption of the aforementioned resolutions (merger, demerger, increase or reduction of capital, etc.).
Abengoa's shareholders may, at any time, request certifications of resolutions adopted by the general meeting.
A resolution passed in a shareholders' meeting is binding on to all shareholders, unless such resolution is: (i) contrary to Spanish law or our Bylaws; or (ii) prejudicial to our interests and beneficial to one or more shareholders or third parties. In the case of resolutions contrary to Spanish law, the right to contest is extended to all shareholders holding at least 0.1% of the share capital, directors and interested third parties. In the case of resolutions prejudicial to our interests, prejudicial to the interests of minority shareholders without justification or contrary to our Bylaws, such right is extended to shareholders who attended the shareholders' meeting and recorded their opposition in the minutes of the meeting, to shareholders who were absent and to those unlawfully prevented from casting their vote as well as to members of the Board of Directors. In certain circumstances (such as a modification of corporate purpose or change of the corporate form, transfer of domicile to a foreign country, intra-European Union merger with transfer of domicile to another European Union country or incorporation of a limited liability European holding company if the dissenting shareholder is a partner of the promoter companies), Spanish corporate law gives dissenting or absent shareholders the right to withdraw from the Company. If this right were exercised, we would be obliged to purchase the relevant shareholding(s) at prices determined in accordance with established formula or criteria relating to the average price of the shares within certain periods of time.
The regulations that govern the general meeting were approved by resolution of the Board of Directors on February 24, 2003 and by resolution of the general meeting of shareholders on June 29, 2003, and were amended by resolution of the Extraordinary General Shareholders Meeting on September 30, 2012. The existence of such regulations is obligatory for all corporations listed on a Spanish stock exchange following the adoption of Law 26/2003. However, these regulations are in the process of being amended to adapt them to Law 31/2014 and such amendment will be proposed for approval in the following general shareholders' meeting to be held in the first half of 2015.
Restrictions on Investments in Spanish Companies
The Madrid and Barcelona stock exchanges and other securities markets are open to foreign investors.
Under Abengoa's Bylaws, all the shares forming part of the share capital of the Company are transferable to foreign investors, provided all statutory and legal requirements are met.
Pursuant to Law 18/1992, of July 1, and Royal Decree 664/1999, of April 23, foreign investors may freely invest in shares of Spanish companies (as well as transfer invested capital, capital gains and dividends out of Spain without limitation, subject to applicable taxes and exchange controls) and need only notify the Spanish Ministry of Economy of their investment after it has been made and for administrative, economic and statistical purposes, for the purposes of its registration with the Spanish Registry of Foreign Investments. The shares underlying the ADSs are so registered.
In addition, if a foreign investor is an individual or entity resident in designated tax havens, this investor is also required to file a prior notification of investment with the Spanish Ministry of Economy as well as after consummating the transaction. This prior notification is not necessary when the investment is made in transferable securities (whether or not trading on the official secondary market) or when the foreign holding in the Spanish target company does not exceed 50%.
Law 19/2003 of July 4, which has as its purpose the establishment of a regulatory regime relating to capital flows to and from legal or natural persons abroad and the prevention of money laundering, generally provides for the liberalization of the regulatory environment with respect to acts, businesses, transactions and other operations between Spanish residents and non-residents of Spain in respect of which charges or
249
Table of Contents
payments abroad will occur, as well as money transfers, variations in accounts or financial debit or credits abroad. These operations must be reported to the Ministry of the Economy and the Bank of Spain only for informational and statistical purposes.
The most important developments resulting from Law 19/2003 are the obligations on financial intermediaries to provide to the Spanish Ministry of Economy and the Bank of Spain information corresponding to client transactions.
Tender Offers
In Spain, tender offers are governed by the Spanish Securities Act, as amended by Law 6/2007 of April 12, and Royal Decree 1066/2007, of July 27, which have implemented Directive 2004/25/EC of the European Parliament and of the Council of April 21, 2004.
Tender offers in Spain may qualify as either mandatory or voluntary offers.
Mandatory public tender offers must be launched for all the shares of the target company or other securities that might directly or indirectly give the right to subscription thereto or acquisition thereof (including convertible and exchangeable bonds) directed to all holders at an equitable price when any person acquires control of a Spanish company listed on the Spanish stock exchanges, whether such control is obtained:
- •
- by means of the acquisition of shares or other securities that directly or indirectly give voting rights in such company;
- •
- through agreements with shareholders or other holders of said securities; or
- •
- as a result of other situations of equivalent effect as provided in the regulations (i.e., indirect control acquired through mergers, share capital decreases, target's treasury stock variations or securities exchange or conversion, etc.).
A person is deemed to have obtained the control of a target company, individually or jointly with concerted parties, whenever:
- •
- it acquires directly or indirectly a percentage of voting rights equal to or greater than 30%; or
- •
- it has acquired a percentage of less than 30% of the voting rights and appoints, in the 24 months following the date of acquisition of said percentage, a number of directors that, together with those already appointed, by such person if any, represent more than one half of the members of the target company's Board of Directors. Regulations also set forth certain situations where directors are deemed to have been appointed by the bidder or persons acting in concert therewith unless evidence to the contrary is provided.
Notwithstanding the above, Spanish regulations establish certain exceptional situations where control is obtained but no mandatory tender offer is required, including, among others:
- •
- subject to the CNMV's approval:
- •
- acquisitions or other transactions resulting from the conversion or capitalization of credits into shares of listed companies, the financial feasibility of which is subject to serious and imminent danger, even if the company is not undergoing bankruptcy proceedings, provided that such transactions are intended to ensure the company's financial recovery in the long term; or
- •
- in the event of a merger, provided that those acquiring control did not vote in favor of the merger at the relevant general meeting of shareholders of the offeree company and provided also that it can be shown that the primary purpose of the transaction is not the takeover but an industrial or corporate purpose; and
250
Table of Contents
- •
- when control has been obtained after a voluntary bid for all of the securities, if either the bid has been made at an equitable price or has been accepted by holders of securities representing at least 50% of the voting rights to which the bid was directed.
For the purposes of calculating the percentages of voting rights acquired, the regulations establish the following rules:
- •
- percentages of voting rights corresponding to (i) companies belonging to the same group as the bidder; (ii) members of the Board of Directors of the bidder or of companies of its group; (iii) persons acting in concert with or for the account of the bidder (a concert party shall be deemed to exist when two or more persons collaborate under an agreement, be it express or implied, oral or written, in order to obtain control of the offeree company); (iv) voting rights exercised freely and over an extended period by the bidder under proxy granted by the actual holders or owners of such rights, in the absence of specific instructions with respect thereto; and (v) shares held by a nominee, such nominee being understood as a third party whom the bidder totally or partially covers against the risks inherent in acquisitions or transfers of the shares or the possession thereof, will be deemed to be held by the bidder (including the voting rights attaching to shares that constitute the underlying asset or the subject matter of financial contracts or swaps when such contracts or swaps cover, in whole or in part, against the risks inherent in ownership of the securities and have, as a result, an effect similar to that of holding shares through a nominee);
- •
- both the voting rights arising from the ownership of shares and those enjoyed under a usufruct or pledge or upon any other title of a contractual nature will be counted towards establishing the number of voting rights held;
- •
- the percentage of voting rights shall be calculated based on the entire number of shares carrying voting rights, even if the exercise of such rights has been suspended; treasury shares held directly or indirectly by the target company as per the information available on the date of calculation of the percentage of voting rights shall be excluded; and non-voting shares shall be taken into consideration only when they carry voting rights pursuant to applicable law; and
- •
- acquisitions of securities or other financial instruments giving the right to the subscription, conversion, exchange or acquisition of shares which carry voting rights will not result in the obligation to launch a tender offer until any such subscription, conversion, exchange or acquisition occurs.
- •
- there will be no obligation to launch a tender offer when the acquisitions or transactions entail a mere redistribution of voting rights when they remain under control of the same person.
Notwithstanding the foregoing, upon the terms established in the regulations, the CNMV will conditionally dispense with the obligation to launch a mandatory bid when another person or entity, individually or jointly in concert, directly or indirectly holds an equal or greater voting percentage than the potential bidder in the target company.
The price of the mandatory tender offer is deemed equitable when it is at least equal to the highest price paid or agreed by the bidder or by any person acting in concert therewith for the same securities during the 12 months prior to the announcement of the tender offer. When the mandatory tender offer must be made without the bidder having previously acquired the shares over the above-mentioned 12-month period, the equitable price shall not be less than the price calculated in accordance with other rules set forth in the regulations. Other rules to calculate such equitable price are set forth in the regulations. However, the CNMV may change the price so calculated in certain circumstances (extraordinary events affecting the price, evidence of market manipulation, etc.).
Mandatory offers must be launched within one month from the acquisition of the control of the target company.
251
Table of Contents
Voluntary tender offers may be launched when a mandatory offer is not required. Voluntary offers are subject to the same rules established for mandatory offers except for the following:
- •
- they might be subject to certain conditions (such as amendments to the bylaws or adoption of certain resolutions by the target company, acceptance of the offer by a minimum number of securities, approval of the offer by the shareholders' meeting of the bidder; and any other deemed by the CNMV to be in accordance with law), provided that such conditions can be met before the end of the acceptance period of the offer; and
- •
- they shall not be launched at an equitable price. However, if they are not launched at an equitable price and upon settlement of the tender offer shares representing at least 50% of the voting rights are tendered in the offer (excluding voting rights already held by the offeror and those belonging to shareholders who entered into an agreement with the offeror regarding the tender offer), the offeror may become obliged to launch a mandatory tender offer.
In any case, by virtue of an amendment to the Spanish Securities Act operated by Law 1/2012, of June 22, the price in a voluntary tender offer must be the higher of (i) the equitable price and (ii) the price resulting from an independent valuation report, and must at least consist of cash as an alternative if certain circumstances have occurred during the two years prior to the announcement of the offer (basically, the trading price for the shares being affected by price manipulation practices, market or share prices being affected by natural disasters, force majeure, or other exceptional events, or the target company being subject to expropriation or confiscation resulting in significant impair of the company's real value).
Spanish regulations on tender offers set forth further provisions, including:
- •
- subject to shareholder approval within 18 months from the date of announcement of the tender offer, the Board of Directors of a target company will be exempt from the rule prohibiting frustrating action against a foreign bidder whose Board of Directors is not subject to an equivalent passivity rule;
- •
- defensive measures included in a listed company's bylaws and transfer and voting restrictions included in agreements among a listed company's shareholders will remain in place whenever the company is the target of a tender offer, unless the shareholders resolve otherwise (in which case any shareholders whose rights are diluted or otherwise adversely affected will be entitled to compensation at the target company's expense); and
- •
- squeeze-out and sell-out rights will apply provided that following a mandatory tender offer (or as a result of a voluntary offer for all the target's share capital) the bidder holds securities representing at least 90% of the target company's voting capital and the tender offer has been accepted by the holders of securities representing at least 90% of the voting rights other than those held by the bidder previously to the offer.
Reporting Requirements
Acquisition of Shares
Spanish law requires any person or group, which as a result of an acquisition or transfer of shares, reaches, increases its ownership above or decreases its ownership below 3%, 5%, 10%, 15%, 20%, 25%, 30%, 35%, 40%, 45%, 50%, 60%, 70%, 75%, 80% or 90% of the capital stock of a company listed on a Spanish stock exchange, to report such acquisition or transfer to (i) the company whose securities are being acquired and (ii) the CNMV.
The individual or legal entity obliged to carry out the notification must serve it by means of the standard form approved by the CNMV within four business days from the date on which the transaction is or should have been acknowledged (Royal Decree 1362/2007 deems a transaction to be acknowledged within two business days from the date on which such transaction is entered into).
252
Table of Contents
In certain circumstances established by Royal Decree 1362/2007, the notification requirements on the acquisition or transfer of shares also apply to any person or legal entity that, independently of the ownership of the shares, may acquire, transmit or exercise the voting rights granted by those shares, provided that the proportion of voting rights reaches, increases above or decreases below, the percentages set forth by Spanish law.
The ownership thresholds that trigger these reporting obligations are reduced to 1% and any multiple of 1% for purchasers residing in designated tax havens or jurisdictions where such ownership is not taxable or where no effective mechanisms exist for the exchange of tax information, pursuant to current regulation. Furthermore, any person or legal entity must similarly report any acquisition or transfer, regardless of size, of equity securities of a company listed on a Spanish stock exchange if such person or legal entity is a member of the Board of Directors of such company.
All directors must report to us and the CNMV the percentage and number of voting rights held by them at the time of becoming or ceasing to be a member of the Board of Directors. Additionally, in accordance with Royal Decree 1333/2005 members of the Board of Directors of Abengoa and certain members of our senior management (as defined in the Royal Decree) must notify us and the CNMV about all transactions carried out by them or by any person or entity to whom they have a direct relationship regarding shares or financial instruments which carry a right to acquire or dispose of shares attaching voting rights of Abengoa or regarding derivatives or other financial instruments linked to said shares.
Moreover, pursuant to article 30.6 of Royal Decree 1362/2007, in the context of a takeover bid, the following transactions should be notified to the CNMV: (i) any acquisition reaching or exceeding 1% of the voting rights of the Company, and (ii) any increase or decrease in the percentage of voting rights held by holders of 3% or more of the voting rights in the Company. The CNMV will immediately make public this information.
Disclosure of Net Short Positions
Net short positions on shares listed on the Madrid and Barcelona stock exchanges equal to, or in excess of, 0.2% of the relevant issuer's share capital and any increases or reductions thereof by 0.1% are required to be disclosed to the CNMV by no later than the first trading day following the transaction. If the net short position reaches 0.5%, and also at every 0.1% above that, the CNMV will disclose the net short position to the public.
Acquisition of Own Shares
In application of the law, the maximum percentage permitted in relation to the own shares held by Abengoa is 10% of its share capital. If an acquisition or series of acquisitions of shares of Abengoa reaches or exceeds or causes Abengoa's and its affiliates holdings to reach or exceed 1% of Abengoa's voting shares, Abengoa must notify its final holding of treasury stock to the CNMV. If such threshold is reached as a result of a series of acquisitions, such reporting obligation will only arise after the closing of the acquisition which, taken together with all acquisitions made since the last of any such notifications, causes Abengoa's and its affiliates holdings to exceed, 1% of Abengoa's voting shares. Sales and other dispositions of Abengoa's treasury stock will not be deducted in the calculation of such threshold. This requirement also applies if the stock is acquired by a majority-owned subsidiary of Abengoa.
Disclosure of Shareholder agreements affecting the Company
Under Spanish law, any party to certain types of shareholders' agreements affecting companies listed on any Spanish stock exchange must disclose to us and the CNMV the execution, amendment or extension of such agreements, including the registration with the appropriate commercial registry (Seville in our case).
In particular, any agreement concerning the exercise of voting rights at a general shareholders' meeting or containing restrictions or conditions on the free transferability of shares or bonds that are convertible or
253
Table of Contents
exchangeable into shares must be disclosed. Such a shareholders' agreement has effect upon the time of deposit and publication. Failure to comply with these disclosure obligations renders any such shareholders' agreement unenforceable and constitutes a violation under Spanish law.
Upon request by the interested parties of such agreements, the CNMV may temporarily waive the requirement to report, deposit and publish the relevant agreement when such disclosure may adversely affect the company.
Currently, Abengoa is aware of the existence of the following agreements between shareholders:
Agreement between Inversión Corporativa IC, S.A., Finarpisa, S.A. and First Reserve Corporation
According to the terms and conditions provided in the investment agreement (the "Investment Agreement") between Abengoa and First Reserve Fund XII, L.P., which subsequently assigned its contractual rights and obligations thereunder to First Reserve Alfajor Holding, S.à.r.l. (the "Investor"), Inversión Corporativa and Finarpisa, S.A., shareholders of Abengoa, entered into an agreement on October 3, 2011, which regulates the exercise of their respective rights to vote in Abengoa's general meetings in relation with the proposal, appointment, ratification, reelection or substitution of a director in representation of the Investor.
Inversión Corporativa and Finarpisa, S.A. jointly and severally have undertaken, subject to the terms and conditions stated in the Investment Agreement, as applicable:
- (i)
- through their respective dominical directors ("consejeros dominicales") at the Board of Directors of Abengoa to vote in favor of (x) the appointment to such Board of the Investor's nominee for the Director designated by the Investor pursuant to thecooptación procedure provided under the Spanish Companies Act, and (y) the proposal to recommend to Abengoa's shareholders the election of any replacement director designated by the Investor to the Board of Directors at Abengoa's annual general meeting of shareholders;
- (ii)
- to vote, at the corresponding annual general meeting of shareholders of Abengoa, in favor of the appointment of the Investor's nominee for the Designated Investor Director to be appointed to the Board of Directors; and
- (iii)
- so long as the Investor or any of its permitted transferees owns any Class B shares or any other security convertible into, or exchangeable for, Class B shares issued pursuant to the Investment Agreement or any other transaction document, not to propose, or request to the Board of Directors to recommend, to the shareholders any amendment to the Abengoa's organizational documents that would adversely modify the equal rights of Class B shares and Class A shares in relation to dividends or other distributions as currently set forth in the organizational documents and, if proposed by any shareholder or by the Board of Directors, to vote against such amendment.
Shareholders Agreement between Inversión Corporativa IC, S.A., and Abengoa, S.A.
Inversión Corporativa IC, S.A. has entered into a shareholders' agreement with Abengoa, whereby the first undertakes, directly or indirectly through its subsidiary Finarpisa S.A., among other things, (i) to exercise their voting rights up to a maximum of 56.369% of the total voting rights in the Company in the event that, as a result of the exercise of the right of holders of Class A shares to convert such shares into Class B shares, the total percentage of voting rights it holds increases in relation to the total voting rights in the Company, and (ii) that their voting rights shall not be higher than four times their economic rights from the total rights of the Company and that, if so occurred, it will sell or transfer Class A shares or Class B shares in the amount required to maintain that ratio.
254
Table of Contents
Registration Rights Agreement between Abengoa, S.A. and FR Alfajor Holdings S.à. r.l.
On November 4, 2011, we entered into an agreement with FR Alfajor Holdings S.à. r.l. ("FRAH"), an affiliate of First Reserve, relating to certain registration rights granted in connection with the purchase of our Class B shares by First Reserve in October 2011. Under the registration rights agreement, we are responsible, subject to certain exceptions, for the expenses of any offering of our common shares held by FRAH other than underwriting discounts and selling commissions. The registration rights agreement contains customary indemnification provisions.
Demand Registration Rights
Under the registration rights agreement, subject to certain exceptions, FRAH may require us to effect a registration under the Securities Act for the sale of their Class B shares of our company. However, we are not obliged to effect any such registration when (1) the request for registration does not cover that number of shares with an anticipated gross offering price of at least €60.0 million, or (2) we elect to only issue Class B shares on the Madrid and Barcelona stock exchanges and not also ADSs on the NASDAQ Global Select Market.
Piggyback Registration Rights
Under the registration rights agreement, if we propose to register the offer and sale of any of our securities under the Securities Act, in connection with the public offering of such securities, FRAH will be entitled to certain "piggyback" registration rights allowing them to include their shares in such registration, subject to certain marketing and other limitations.
F-3 Registration Rights
Under the registration rights agreement, and at such time as we are eligible to do so, FRAH may make a written request that we file a Registration Statement on Form F-3 for an offering of FRAH's Class B shares. In addition, during such time when we have an effective Registration Statement on Form F-3, FRAH may make a written request to register the offer and sale of their shares on a shelf registration statement on Form F-3, so long as the request covers at least that number of shares with an anticipated aggregate offering price of at least €60.0 million.
Termination
The rights of FRAH under the registration rights agreement terminate on the date upon which FRAH ceases to hold any of our Class B shares.
C. Material Contracts
See "Item 4.B—Business Overview."
D. Exchange Controls
See "Item 5.A—Operating Results—Factors Affecting Our Results of Operations—Regulation."
E. Taxation
The following is a summary of the material Spanish and U.S. federal income tax consequences to U.S. Holders (as defined below) of the ownership and disposition of Class B shares or ADSs. This summary is based upon Spanish tax laws as referred to below and U.S. tax laws (including the U.S. Internal Revenue Code of 1986, as amended (the "Code"), final, temporary and proposed Treasury regulations, rulings, judicial decisions and administrative pronouncements), and the Convention Between the United States of America and the Kingdom of Spain for the Avoidance of Double Taxation and the Prevention of Fiscal Evasion with Respect to Taxes on Income, signed February 22, 1990, (the "Treaty"), all in effect as of the date hereof and all
255
Table of Contents
of which are subject to changes in wording or administrative or judicial interpretation occurring after the date hereof, possibly with retroactive effect. In addition, the summary is based in part on representations of the Depositary and assumes that each obligation provided for in or otherwise contemplated by the Deposit Agreement or any other related agreements will be performed in accordance with its terms.
As used herein, the term "U.S. Holder" means a beneficial owner of one or more Class B shares or ADSs:
- (a)
- that is, for U.S. federal income tax purposes, one of the following:
- (i)
- a citizen or resident of the United States;
- (ii)
- a corporation (or other entity taxable as a corporation) created or organized in or under the laws of the United States or any political subdivision thereof; or
- (iii)
- an estate or trust the income of which is subject to U.S. federal income taxation regardless of its source;
- (b)
- that holds the Class B shares or ADSs as capital assets for U.S. federal income tax purposes;
- (c)
- that owns, directly, indirectly or by attribution, less than 10% of the share capital or voting stock of Abengoa; and
- (d)
- whose holding is not effectively connected with a permanent establishment in Spain.
This summary does not address all of the tax considerations that may apply to holders that are subject to special tax rules, such as U.S. expatriates, insurance companies, tax-exempt organizations, certain financial institutions, persons subject to the alternative minimum tax, dealers and certain traders in securities, persons holding Class B shares or ADSs as part of a straddle, hedging, conversion or other integrated transaction, persons who acquired their Class B shares or ADSs pursuant to the exercise of employee stock options or otherwise as compensation, partnerships or other entities classified as partnerships for U.S. federal income tax purposes or persons whose functional currency is not the U.S. Dollar. Such holders may be subject to U.S. federal income tax consequences different from those set forth below.
In addition, this summary does not address all the Spanish tax consequences that may apply to holders that are subject to special tax rules, such as "look through" entities (such as trusts or estates) that may be subject to the tax regime applicable to such non Spanish tax resident entities under the Spanish NRIT.
If a partnership holds Class B shares or ADSs, the tax treatment of a partner generally will depend upon the status of the partner and the activities of the partnership. A partnership, or partner in a partnership, that holds Class B shares or ADSs is urged to consult its own tax advisor regarding the specific tax consequences of owning and disposing of the Class B shares or ADSs.
The U.S. Treasury has expressed concerns that parties to whom American depositary shares are released before shares are delivered to the depositary ("pre-release"), or intermediaries in the chain of ownership between holders and the issuer of the security underlying the American depositary shares, may be taking actions that are inconsistent with the claiming of foreign tax credits by U.S. Holders of American depositary shares. Such actions would also be inconsistent with the claiming of the reduced rate of tax applicable to dividends received by certain non-corporate U.S. Holders. Accordingly, the availability of foreign tax credits to U.S. Holders of ADSs and the reduced tax rate for dividends received by certain non-corporate U.S. Holders of ADSs, each as described below, could be affected by actions taken by such parties or intermediaries.
For purposes of the Treaty and U.S. federal income tax, U.S. Holders of ADSs will generally be treated as owners of the underlying Class B shares represented by such ADSs. Accordingly, for U.S. federal income tax purposes, no gain or loss will be recognized if a U.S. Holder exchanges ADSs for the underlying Class B shares represented by those ADSs.
This discussion assumes that Abengoa is not, and will not become, a passive foreign investment company ("PFIC"), for U.S. federal income tax purposes, as discussed below under "—U.S. Federal Income Tax Considerations—Passive foreign investment company rules."
256
Table of Contents
U.S. Holder of Class B shares or ADSs should consult their own tax advisors concerning the specific Spanish and U.S. federal, state and local tax consequences of the ownership and disposition of Class B shares or ADSs in light of their particular situations as well as any consequences arising under the laws of any other taxing jurisdiction. In particular, U.S. Holders investors are urged to consult their own tax advisors concerning whether they are eligible for benefits under the Treaty.
On January 14, 2013, the U.S. Ambassador to Spain and the Spanish Minister of Finance and Public Administration signed a new Protocol amending the Treaty (the "2013 Protocol"). Among other things, the 2013 Protocol amends the articles of the Treaty related to dividends, capital gains, interest and limitation on benefits. The 2013 Protocol will enter into force three months after the United States and Spain notify each other that their required internal procedures have been complied with. If the 2013 Protocol goes into effect, the capital gains on disposal of the Class B shares and ADSs will not be taxable in Spain regardless of the size of the U.S. Holder's stake in our capital. Potential investors are urged to consult their own tax advisors concerning whether the 2013 Protocol has been entered into force and, if so, the tax implications thereof and the applicability of the Treaty under the amended limitation on benefits clause.
Spanish Tax Considerations
This information has been prepared in accordance with the following Spanish tax legislation in force at the date of this annual report, including the Royal Legislative Decree 5/2004, of March 5, promulgating the Consolidated Text of the NRIT Law along with Law 19/1991, dated June 6, 1991 on Wealth Tax, as amended by Law 4/2008, of December 23, which abolishes Wealth Tax, provides for a monthly Value Added Tax refund system and introduces other amendments to Spanish legislation and by Royal Decree law 13/2011, of September 16, and the Law 36/2014, of December 26, which reestablish temporarily Wealth Tax, and Royal Decree 1776/2004, of July 30, promulgating the NRIT Regulations and Law 29/1987, of December 18, on Inheritance and Gift Tax.
The acquisition and transfer of the Class B shares will be exempt from indirect taxes in Spain, i.e., exempt from Transfer Tax and Stamp Duty, and exempt from Value Added Tax, in accordance with article 108 of the Spanish Securities Act and related regulations.
Spanish tax considerations concerning the Class B shares and ADSs
Ownership of the Class B shares or ADSs by U.S. Holders will not in itself create the existence of a permanent establishment in Spain.
Taxation of dividends
Under Spanish law, dividends paid by Abengoa to U.S. Holders of Class B shares or ADSs are subject to Spanish NRIT, withheld at source on the gross amount of dividends, currently at a 20% (19% in 2016 onwards) tax rate. For these purposes, upon distribution of the dividend, Abengoa or its paying agent will withhold an amount equal to the tax due according to the rules set forth above (i.e., applying the current withholding tax rate of 20%).
If the depositary (as defined for Spanish law purposes) of the U.S. Holder is resident, domiciled or represented in Spain and it provides timely evidence (i.e. a certificate from the U.S. Internal Revenue Service ("IRS") stating that, to the best knowledge of the IRS, the U.S. Holder is resident of the United States within the meaning of the Treaty and entitled to its benefits (currently, IRS Form 6166)) of the U.S. Holder's right to obtain the Treaty- reduced rate (currently 15%), it will immediately receive the excess amount withheld. For these purposes, the relevant certificate of residence must be provided before the tenth day following the end of the month in which the dividends were paid. The tax residence certificate is valid only for a period of one year from the date of issuance.
If the certificate referred to in the above paragraph is not provided within said term but you qualify for the reduced tax rate provided for in the Treaty, you may afterwards obtain a refund of the amount withheld in
257
Table of Contents
excess of the rate provided for in the Treaty from the Spanish tax authorities following the refund procedure described below under "—Spanish refund procedure".
According to Spanish Regulations on NRIT (Royal Decree 1776/2004, dated July 30, and an Order dated December 17, 2010), a refund for the amount withheld in excess of the Treaty reduced rate can be obtained from the relevant Spanish tax authorities.
U.S. Holders may claim the amount withheld from the Spanish Treasury within the first four years by filing with the Spanish tax authorities beginning in February of the following year in which the amount has been withheld (i) the relevant Spanish tax form (210 form) along with, (ii) a certificate of residency issued by the IRS, among other documents.
U.S. Holders are urged to consult their own tax advisors regarding refund procedures and any U.S. tax implications thereof.
Taxation of capital gains
The rate applicable to capital gains derived from the transfer of Class B shares or ADSs of U.S. Holders is currently 20% (moving to 19% in 2016 onwards) under Spanish law.
However, under the Treaty, capital gains realized by U.S. Holders arising from the disposition of Class B shares or ADSs will not be taxed in Spain, provided that the seller has not maintained a direct or indirect holding of 25% or more in our capital during the 12 months preceding the disposition of the Class B shares or ADSs. U.S. Holders will be required to establish that they are entitled to the exemption from tax under the Treaty by providing to the relevant Spanish tax authorities a Spanish tax form (Form 210) together with a certificate of tax residence issued by the IRS stating that to the best knowledge of the IRS, such U.S. Holder is a U.S. resident within the meaning of the Treaty (currently, IRS Form 6166). This certificate is generally valid for a period of one year from the date of issuance.
Additionally, capital gains derived from the transfer of Class B shares in an official Spanish secondary stock market by a U.S. Holder will be exempt from taxation in Spain. For purposes of this exemption, a certificate of tax residence shall be provided in the terms described in the previous paragraph.
Wealth Tax
In accordance with Royal Decree Law 13/2011, dated September 16, 2011 (as amended by Law 36/2014 dated December 26, 2014) and Law 19/1991, dated June 6, 1991, U.S. tax resident individuals who held Class B shares or ADSs on December 31, 2013 are subject to Spanish Wealth Tax (Impuesto sobre el Patrimonio) at a rate varying from 0.2% and 2.5% of the average market value of Class B shares or ADSs during the last quarter of the year.
U.S. Holders that are entities are not subject to Wealth Tax.
Notwithstanding the foregoing, Spanish Regulations on Wealth Tax provides for an exemption of first €700,000 of taxable base.
As of January 1, 2016 a 100% tax allowance has been approved by Law 36/2014 dated December 26, 2014. Therefore, in practice no taxation will derive from this tax.
U.S. Holders who are individuals holding Class B shares or ADSs should consult their own tax advisors with respect to the applicability of the Spanish Wealth Tax.
Inheritance and Gift Tax
Transfers of Class B shares or ADSs on death and by gift to individuals are subject to Spanish inheritance and gift taxes (Impuesto sobre Sucesiones y Donaciones), regardless of the residence of the heir or
258
Table of Contents
beneficiary. The effective tax rate, after applying relevant personal, family and wealth factors ranges from between 0% and 81.6%. While inheritance and gift taxes are generally state taxes, certain autonomous communities have the right to establish their own tax rates and deductions and to control the management and settlement of such taxes.
Gifts granted to corporations non-resident in Spain for tax purposes are subject to NRIT currently at a 20% (19% in 2016 onwards) tax rate on the fair market value of the Class B shares or ADSs. If the donee is a United States tax resident corporation, the exemptions available under the Treaty will be applicable.
U.S. Holders holding Class B shares or ADSs should consult their own tax advisors with respect to the specific Spanish tax consequences of the disposition or acquisition of our Class B shares or ADSs by gift or bequest upon death.
U.S. Federal Income Tax Considerations
Taxation of dividends from the Class B shares or ADSs
Distributions received by a U.S. Holder on Class B shares or ADSs, including the amount of any Spanish taxes withheld, other than certainpro rata distributions of Class B shares to all shareholders (including ADS holders), will constitute foreign-source dividend income to the extent paid out of Abengoa's current or accumulated earnings and profits (as determined for U.S. federal income tax purposes). Because Abengoa does not maintain calculations of its earnings and profits under U.S. federal income tax principles it is expected that distributions will be reported to U.S. Holders as dividends. The amount of the dividend a U.S. Holder will be required to include in income will equal the U.S. Dollar value of the euros received, calculated by reference to the exchange rate in effect on the date the payment is received by the Depositary (in the case of ADSs) or by the U.S. Holder (in the case of Class B shares), regardless of whether the payment is converted into U.S. Dollars on the date of receipt. If the dividend is converted to U.S. Dollars on the date of receipt, a U.S. Holder should not be required to recognize foreign currency gain or loss in respect of the dividend income. A U.S. Holder may have foreign currency gain or loss if the dividend is converted into U.S. Dollars after the date of its receipt. If a U.S. Holder realizes gain or loss on a sale or other disposition of euros, it will be U.S.-source ordinary income or loss. Corporate U.S. Holders will not be entitled to claim the dividends-received deduction with respect to dividends paid by Abengoa. Subject to certain exceptions for short-term and hedged positions and the discussion above regarding concerns expressed by the U.S. Treasury, the U.S. Dollar amount of dividends received by certain non-corporate U.S. Holders of Class B shares or ADSs will be subject to taxation at rates lower than those applicable to other ordinary income if the dividends are "qualified dividends." Distributions received by a U.S. Holder on Class B shares or ADSs will be qualified dividends if (i) Abengoa is eligible for the benefits of a comprehensive income tax treaty with the United States that the IRS has approved for purposes of the qualified dividend rules and (ii) Abengoa was not, for the year prior to the year in which the dividends are paid, and is not, for the year in which the dividends are paid, a PFIC. Abengoa expects to be eligible for the benefits of the comprehensive income tax treaty between the United States and Spain, which has been approved by the IRS for the purposes of the qualified dividend rules. Further, Abengoa believes that it was not a PFIC for U.S. federal income tax purposes with respect to its most recent taxable year, it does not expect to be a PFIC for its current taxable year, and it does not anticipate becoming a PFIC in the foreseeable future. See "—Passive foreign investment company rules" below. Non-corporate U.S. Holders should consult their own tax advisors to determine whether they are subject to any special rules that limit their ability to be taxed at these favorable rates.
Certainpro rata distributions of Class B shares to all shareholders (including ADS holders) are not generally subject to tax.
Spanish income taxes withheld from dividends on Class B shares or ADSs at a rate not exceeding the applicable rate under the Treaty will be creditable against a U.S. Holder's U.S. federal income tax liability, subject to applicable restrictions and limitations that may vary depending upon the U.S. Holder's circumstances and the discussion above regarding concerns expressed by the U.S. Treasury. Spanish taxes that are refundable or withheld in excess of the rate applicable under the Treaty will not be eligible for credit
259
Table of Contents
against a U.S. Holder's federal income tax liability. See "—Spanish Tax Considerations—Spanish tax considerations concerning the Class B shares and ADSs—Taxation of dividends" above for a discussion of how to obtain the applicable Treaty rate. Instead of claiming a credit, a U.S. Holder may elect to deduct foreign taxes (including the Spanish taxes) in computing its taxable income, subject to generally applicable limitations. An election to deduct foreign taxes (instead of claiming foreign tax credits) applies to all taxes paid or accrued in the taxable year to foreign countries and possessions of the United States. The limitations on foreign taxes eligible for credit are calculated separately with respect to specific classes of income. The rules governing foreign tax credits are complex. Therefore, U.S. Holders should consult their own tax advisors regarding the availability of foreign tax credits in their particular circumstances.
Taxation upon sale or other disposition of Class B shares or ADSs
A U.S. Holder will generally recognize U.S.-source capital gain or loss on the sale or other disposition of Class B shares or ADSs, which will be long- term capital gain or loss if the U.S. Holder has held such Class B shares or ADSs for more than one year. The amount of the U.S. Holder's gain or loss will be equal to the difference between such U.S. Holder's tax basis in the Class B shares or ADSs sold or otherwise disposed of and the amount realized on the sale or other disposition, in each case as determined in U.S. Dollars. Net long-term capital gain recognized by certain non-corporate U.S. Holders will be taxed at a lower rate than the rate applicable to ordinary income. The deductibility of capital losses is subject to limitations.
As discussed under "—Spanish Tax Considerations—Spanish tax considerations concerning the Class B shares and ADSs—Taxation of capital gains" above, gain realized by a U.S. Holder on the sale or other disposition of Class B shares or ADSs will be exempt from Spanish tax on capital gains under the Treaty, after the coming into force of the 2013 Protocol, and under certain circumstances prior to the coming into force of the 2013 Protocol. If a U.S. Holder is eligible for the exemption from Spanish tax on capital gains but does not follow appropriate procedures for obtaining the exemption, it will not be entitled to credit the amount of Spanish tax on capital gains paid against its U.S. federal income tax liability.
Passive foreign investment company rules
Abengoa believes that it was not a PFIC in its most recent taxable year and will not be a PFIC for U.S. federal income tax purposes for its current taxable year, and Abengoa does not expect to become a PFIC in the foreseeable future. However, because PFIC status depends upon the composition of a company's income and assets and the market value of its assets (including, among others, less than 25% owned equity investments) from time to time, there can be no assurance that Abengoa will not be considered a PFIC for any taxable year. If Abengoa were treated as a PFIC for any taxable year during which a U.S. Holder held a Class B share or ADS, certain adverse tax consequences could apply to the U.S. Holder.
If Abengoa were treated as a PFIC for any taxable year during which a U.S. Holder held a Class B share or ADS, gain recognized by a U.S. Holder on a sale or other disposition of the Class B share or ADS would be allocated ratably over the U.S. Holder's holding period for the Class B share or ADS. The amounts allocated to the taxable year of the sale or other disposition and to any year before Abengoa became a PFIC would be taxed as ordinary income. The amount allocated to each other taxable year would be subject to tax at the highest rate in effect in that year for individuals or corporations, as appropriate, and an interest charge would be imposed on the resulting tax liability. The same treatment would apply to any distribution in respect of Class B shares or ADSs to the extent it exceeds 125% of the average of the annual distributions on Class B shares or ADSs received by the U.S. Holder during the preceding three years or the U.S. Holder's holding period, whichever is shorter. Certain elections may be available that would result in alternative treatments (such as mark-to-market treatment) of the Class B shares or ADSs.
In addition, if Abengoa were treated as a PFIC in a taxable year in which it pays a dividend or in the prior taxable year, the favorable dividend rate discussed above with respect to dividends paid to certain non-corporate U.S. Holders would not apply.
260
Table of Contents
Medicare Tax
Certain U.S. Holders, including individuals, estates and certain trusts, are subject to an additional 3.8% Medicare tax on, among other things, dividends and capital gains from the sale or other disposition of equity interests. For individuals, the additional Medicare tax applies to the lesser of (i) "net investment income" or (ii) the excess of modified adjusted gross income over $200,000 ($250,000 if married and filing jointly or $125,000 if married and filing separately). "Net investment income" includes the taxpayer's gross investment income reduced by deductions that are allocable to such income. Potential investors should consult their tax advisors regarding the implications of the additional Medicare tax resulting from their ownership and disposition of Class B shares or ADSs.
Information reporting and backup withholding
Payments of dividends and sales proceeds that are made within the United States or through certain U.S.-related financial intermediaries generally are subject to information reporting and to backup withholding unless the U.S. Holder is a corporation or other exempt recipient or, in the case of backup withholding, the U.S. Holder provides a correct taxpayer identification number and certifies that it is not subject to backup withholding. The amount of any backup withholding from a payment to a U.S. Holder will be allowed as a credit against the U.S. Holder's U.S. federal income tax liability and may entitle such U.S. Holder to a refund, provided that the required information is timely furnished to the IRS.
Certain U.S. Holders who are individuals may be required to report information relating to their ownership of an interest in certain foreign financial assets, including stock and securities of a non-U.S. person, subject to exceptions (including an exception for stock and securities held through a U.S. financial institution). Other U.S. Holders may be subject to similar rules in the future. U.S. Holders should consult their tax advisers regarding their reporting obligations with respect to the Class B shares or ADSs.
F. Dividends and Paying Agents
Not applicable.
G. Statement by Experts.
Not applicable.
H. Documents on Display
We previously filed with the SEC our registration statement on Form F-1.
We have filed this annual report on Form 20-F with the SEC under the Securities Exchange Act of 1934, as amended. Statements made in this annual report as to the contents of any document referred to are not necessarily complete. With respect to each such document filed as an exhibit to this annual report, reference is made to the exhibit for a more complete description of the matter involved, and each such statement shall be deemed qualified in its entirety by such reference.
We are subject to the informational requirements of the Exchange Act and file reports and other information with the SEC. Reports and other information which we filed with the SEC, including this annual report on Form 20-F, may be inspected and copied at the public reference room of the SEC at 450 Fifth Street N.W. Washington D.C. 20549.
You can also obtain copies of this annual report on Form 20-F by mail from the Public Reference Section of the Securities and Exchange Commission, 450 Fifth Street, N.W., Washington D.C. 20549, at prescribed rates. Additionally, copies of this material may be obtained from the SEC's Internet site at http://www.sec.gov. The Commission's telephone number is 1-800- SEC-0330.
261
Table of Contents
I. Subsidiaries Information
Not applicable.
ITEM 11. QUANTITATIVE AND QUALITATIVE DISCLOSURES ABOUT MARKET RISK.
Our activities are undertaken through our segments and are exposed to market risk, credit risk, liquidity risk and capital risk. Risk management is the responsibility of our corporate finance department in accordance with mandatory internal management rules. The internal management rules provide written policies for the management of overall risk, as well as for specific areas, such as exchange rate risk, credit risk, interest rate risk, liquidity risk, use of hedging instruments and derivatives, and the investment of excess cash.
Market Risk
We are exposed to market risk, such as movement in foreign exchange rates, interest rates, changes in the prices of assets and commodities purchased (principally zinc, aluminium, grain, ethanol, sugar and gas). All of these market risks arise in the normal course of business and we do not carry out speculative operations. For the purpose of managing these risks, we use a series of forward sale contracts, swaps and options on exchange rates, interest rates and raw materials. None of the derivative contracts signed has an unlimited lose exposure.
Foreign Exchange Rate Risk
Foreign exchange risks arise (i) from commercial transactions to be settled in the future, for which assets and liabilities are not denominated in the functional currency of the entity and (ii) from financial liabilities denominated in a different currency from the functional currency of the subsidiary.
Risks from commercial transactions: To manage foreign exchange risks arising from commercial transactions, we purchase forward purchase/sale contracts. Such contracts provide protection related to the fair value of future cash flow. Most projected transactions which are not denominated in our functional currency qualify as highly probable forecast transactions for hedge accounting purposes. The main exchange rate exposures relate to the U.S. Dollar and the euro. Our foreign exchange risks mainly relate to our operations in connection with purchases and sales in a currency other than the functional currency, mostly affecting the U.S. Dollar against the euro. These purchases and sales, other than in the functional currency, are hedged through our purchase of future currency sale/purchase contracts. Specifically, an appreciation of the U.S. Dollar against the euro would result in a decrease/increase of our purchase costs/sale price in the profit and loss account, which would be compensated by the derivatives purchased, to the extent that the transactions have been hedged. We would recognize a net gain or loss in the income statement from the net assets or liabilities that remain unhedged.
262
Table of Contents
The total notional amount of the financial instruments relating to amounts receivable and payable outstanding in foreign currencies for each of the years ended December 31, 2014, 2013 and 2012 was as follows:
| | | | | | | | | | | | | | | | | | | |
| | Collections Hedging | | Payments Hedging | |
|---|
Exchange Rate | | 2014 | | 2013 | | 2012 | | 2014 | | 2013 | | 2012 | |
|---|
| | (€ in thousands)
| |
|---|
Krona (Sweden | | | — | | | — | | | — | | | 3,737 | | | 1,653 | | | 880 | |
Dirhams (UAE) | | | 8,754 | | | 13,222 | | | 15,344 | | | 8,161 | | | 7,683 | | | 7,325 | |
Dirhams (Morocco) | | | — | | | 533 | | | — | | | — | | | — | | | 6 | |
Dollar (Australia) | | | — | | | — | | | — | | | 194 | | | 1,939 | | | 29 | |
Dollar (Canada) | | | — | | | — | | | — | | | — | | | — | | | 144 | |
Dollar (USA) | | | 105,804 | | | 328,421 | | | 76,765 | | | 473,218 | | | 226,943 | | | 209,104 | |
Euro | | | — | | | — | | | 20,093 | | | — | | | 4,978 | | | 50,480 | |
Shilling (Kenya) | | | 5,944 | | | — | | | — | | | 1,963 | | | — | | | — | |
Franc (Switzerland) | | | — | | | — | | | — | | | 2,495 | | | — | | | 2,881 | |
Pound Sterling (UK) | | | — | | | — | | | — | | | 24 | | | 68 | | | 32 | |
Mexican Peso (Mexico) | | | 7 | | | — | | | 98 | | | 15 | | | 8 | | | 10 | |
Yen (Japan) | | | 12 | | | — | | | — | | | 31 | | | 15 | | | — | |
Rand (South Africa) | | | — | | | — | | | 52,094 | | | — | | | — | | | 10,707 | |
Rupee (Indian) | | | — | | | — | | | — | | | 183 | | | — | | | — | |
Shekel (Israel) | | | — | | | — | | | — | | | 5,330 | | | — | | | — | |
Peso (Uruguay) | | | 244 | | | — | | | — | | | — | | | — | | | — | |
Zloty (Poland) | | | 83,308 | | | 137,363 | | | 199,081 | | | 27,594 | | | 65,647 | | | 76,928 | |
Total | | |
204,073 | | |
479,539 | | |
363,475 | | |
522,762 | | |
308,934 | | |
358,526 | |
At the end of 2014, the fair value of the exchange rate derivatives was:
| | | | | | | | | | | | | | | | | | | |
| | Collections
Hedging 2014 | | Collections
Hedging 2013 | | Collections
Hedging 2012 | | Payments
Hedging 2014 | | Payments
Hedging 2013 | | Payments
Hedging 2012 | |
|---|
| | (€ in thousands)
| |
|---|
Exchange Rate | | | | | | | | | | | | | | | | | | | |
Krona (Sweden) | | | — | | | — | | | — | | | (254 | ) | | 2 | | | (6 | ) |
Dirhams (UAE) | | | (677 | ) | | 430 | | | 167 | | | 639 | | | (289 | ) | | (148 | ) |
Dirhams (Morocco) | | | — | | | 4 | | | — | | | — | | | — | | | — | |
Dollar (Australia) | | | — | | | — | | | — | | | 1 | | | (102 | ) | | (1 | ) |
Dollar (Canada) | | | — | | | — | | | — | | | — | | | — | | | 8 | |
Dollar (USA) | | | (3,746 | ) | | 12,499 | | | 307 | | | 2,915 | | | (14,378 | ) | | (6,714 | ) |
Euro | | | — | | | — | | | 551 | | | — | | | 1 | | | (936 | ) |
Shilling (Kenya) | | | (88 | ) | | — | | | — | | | (2 | ) | | — | | | — | |
Franc (Switzerland) | | | — | | | — | | | — | | | 27 | | | — | | | 17 | |
Pound Sterling (UK) | | | — | | | — | | | — | | | — | | | 2 | | | — | |
Peso (Mexico) | | | — | | | — | | | — | | | (1 | ) | | — | | | — | |
Yen (Japan) | | | 1 | | | — | | | — | | | (2 | ) | | (1 | ) | | — | |
Shekel (Israel) | | | — | | | — | | | — | | | 105 | | | — | | | — | |
Peso (Uruguay) | | | (13 | ) | | — | | | — | | | — | | | — | | | — | |
Rand (South Africa) | | | — | | | — | | | (1,029 | ) | | — | | | — | | | 179 | |
Zloty (Poland) | | | (7,176 | ) | | (8,555 | ) | | (18,267 | ) | | 1,125 | | | 2,896 | | | 8,267 | |
Total | | | (11,699 | ) | | 4,378 | | | (18,271 | ) | | 4,553 | | | (11,869 | ) | | 666 | |
| | | | | | | | | | | | | | | | | | | | |
| | | | | | | | | | | | | | | | | | | | |
| | | | | | | | | | | | | | | | | | | | |
In the event that the exchange rate of the U.S. Dollar had risen (/decreased) by 10% against the euro on December 31, 2014, with the rest of the variables remaining constant, the effect in the profit and loss accounts would have been a decrease in profit (/loss) of €1.1 million, mainly due to our U.S. Dollar unhedged
263
Table of Contents
net liability position in companies with euro functional currency and an increase in other reserves of €36.3 million, respectively, as a result of the cash flow hedging effects on highly probable future transactions.
Interest Rate Risk
Interest rate risks arise mainly from our financial liabilities at variable interest rate. To mitigate interest rate risk, we use interest rate swaps and interest rate options (caps and collars).
As a result, the notional amounts hedged, strikes contracted and maturities, depending on the characteristics of the debt on which the interest rate risk is being hedged, are very diverse, including the following:
- a)
- Corporate financing: between 78% and 100% of the notional amount, with maturities up to 2022 and average guaranteed interest rates of between 0.5% and 4.75% for loans referenced to the 1-month, 3-month and 6-month EURIBOR rates; and
- b)
- Project Debt:
- 1)
- Project Debt in euro: between 80% and 100% of the notional amount, maturities until 2032 and average guaranteed interest rates of between 0.55% and 4.88%; and
- 2)
- Project Debt in U.S. Dollars: between 75% and 100% of the notional amount, maturities until 2032 average guaranteed interest rates of between 0.59% and 3.54%.
In connection with our interest rate derivative positions, the most significant impact on our Consolidated Financial Statements are derived from the changes in EURIBOR, which represents the reference interest rate for the majority of our corporate and Project Debt.
In relation to our interest rate swaps positions, an increase in EURIBOR above the contracted fixed interest rate would create an increase in our financial expense which would be positively mitigated by our hedges, reducing our financial expenses to our contracted fixed interest rate. However, an increase in EURIBOR that does not exceed the contracted fixed interest rate would not be offset by our derivative position and would result in a net financial loss recognized in our consolidated income statement. Conversely, a decrease in EURIBOR below the contracted fixed interest rate would result in lower interest expense on our variable rate debt, which would be offset by a negative impact from the mark-to-market of our hedges, increasing our financial expenses up to our contracted fixed interest rate, thus resulting in a likely neutral effect.
In relation to our interest rate options positions, an increase in EURIBOR above the strike price would result in higher interest expenses which would be positively mitigated by our hedges, reducing our financial expenses to our capped interest rate, whereas a decrease of EURIBOR below the strike price would result in lower interest expenses.
In addition to the above, our results of operations can be affected by changes in interest rates with respect to the unhedged portion of our indebtedness that bears interest at floating rates.
In the event that EURIBOR interest rates had risen by 25 basis points on December 31, 2014, with the rest of the variables remaining constant, the effect in the income statement would have been a profit of €9.18 million, mainly due to the fair value increase due to the time value of the interest rate options (caps and collars) designated as hedges and an increase of €35.59 million in other reserves as a result of the fair value increase of interest rate swaps, caps and collars designated as hedges.
Commodity Risk
The risk of commodity price changes through both the sale of products and services as well as the purchase of commodities for production processes. In general, we use forward purchase contracts and
264
Table of Contents
options that are listed on organized markets, as well as over-the-counter ("OTC") contracts with financial institutions, to mitigate the risk of market price fluctuations.
The most significant impacts on our Consolidated Financial Statements derived from commodity risks are related to the price and supply of grains such as wheat, barley, corn and sorghum, sugar, ethanol, gas and aluminium. Prior to the Befesa Sale, our commodity risks also included the prices of zinc and steel.
In relation to our bioethanol production, prices of inputs (grain, sugarcane, natural gas and others) and prices of outputs (ethanol, sugar, DGS and others) are affected by market forces that are independent from each other. Consequently, an increase in the cost of grains or other inputs would increase our production costs for ethanol, sugar, DGS and other products. These increases may be compensated by hedges in place to cover highly probable future purchases that have been contracted to fix the purchase price of inputs, which could neutralize some input price volatility on a transaction-by-transaction basis.
In addition, an increase in ethanol, sugar, DGS and other production costs cannot be directly converted into higher selling prices, since the prices of these outputs are referenced to market trading prices. We seek to mitigate the volatility in the output prices by purchasing OTC derivatives.
These hedging strategies are implemented in order to manage the spread between the prices of inputs and outputs by securing the production costs of each transaction where the output prices are fixed by contract. As a result of the combination of these two strategies, increases or decreases in market prices of ethanol and/or grains affect the spread that can be secured for each transaction, but do not eliminate volatility in net income, since the spread fluctuates in each transaction.
Gas hedging strategies are carried out together with other commodities, as described above, in order to manage our exposure to changes in energy prices. Therefore, depending on forward production sales and on the types of contracts, we may hedge the cost of our natural gas consumption. These hedging transactions are usually OTC natural gas swaps that are only traded with investment-grade counterparties and are recorded as financial derivatives for cash flow hedging. As of December 31, 2014, we have only traded natural gas hedging swaps in the United States, and have no hedging in place in Europe, although our ethanol sale contracts with Repsol YPF, S.A. ("Repsol") enable us to pass on this cost. We do not have any energy contracts that could generate material losses to our Consolidated Financial Statements if the corresponding energy prices were to decrease.
In addition, certain of our subsidiaries have engaged in purchase and sale transactions in the grain and ethanol markets, in accordance with management trading policy. These operations reflect the implementation of management- approved strategies for the purchase and sale of forward and swap contracts, mainly for grain and ethanol, which are controlled and reported on daily following the procedures established under our trading policy. As a risk- mitigation element, we set daily limits or "stop losses" for each strategy and, depending on the market in which we are operating, the financial instruments purchased and the risks defined in the transaction.
In relation to the cost of aluminium, which is purchased and then sold, an increase in the price of aluminium would result in an increase in both our cost (from the purchase transactions) and our revenue (from sale transactions) resulting in a natural hedge.
265
Table of Contents
The table below shows a breakdown of the maturities of notional amounts for the commodity price derivatives designated as cash flow hedges for each of the years ended December 31, 2014, 2013 and 2012, including zinc and aluminium derivatives obtained prior to the completion of the Befesa Sale:
| | | | | | | | | | | | | | | | |
2014 | | Ethanol | | Gas | | Grain | | Zinc | | Aluminium | |
|---|
| | (Gallons)
| | (MMBTU)
| | (Bushels)
| | (Tons)
| | (Tons)
| |
|---|
Year 2015 | | | 50,610,000 | | | 2,015,989 | | | 104,750,000 | | | | | | 115,522 | |
Subsequent | | | — | | | — | | | — | | | — | | | — | |
| | | | | | | | | | | | | | | | | |
Total | | | 50,610,000 | | | 2,015,989 | | | 104,750,000 | | | — | | | 115,522 | |
| | | | | | | | | | | | | | | | | |
| | | | | | | | | | | | | | | | | |
| | | | | | | | | | | | | | | | | |
| | | | | | | | | | | | | | | | |
2013 | | Ethanol | | Gas | | Grain | | Zinc | | Aluminium | |
|---|
| | (Gallons)
| | (MMBTU)
| | (Bushels)
| | (Tons)
| | (Tons)
| |
|---|
Year 2014 | | | 94,752,000 | | | 2,814,591 | | | 41,735,000 | | | — | | | 120,642 | |
Subsequent | | | — | | | — | | | — | | | — | | | — | |
| | | | | | | | | | | | | | | | | |
Total | | | 94,752,000 | | | 2,814,591 | | | 41,735,000 | | | — | | | 120,642 | |
| | | | | | | | | | | | | | | | | |
| | | | | | | | | | | | | | | | | |
| | | | | | | | | | | | | | | | | |
| | | | | | | | | | | | | | | | |
2012 | | Ethanol | | Gas | | Grain | | Zinc | | Aluminium | |
|---|
| | (Gallons)
| | (MMBTU)
| | (Bushels)
| | (Tons)
| | (Tons)
| |
|---|
Year 2013 | | | 14,987,300 | | | 5,202,000 | | | 32,090,000 | | | 67,920 | | | 800 | |
Subsequent | | | — | | | — | | | — | | | 36,000 | | | — | |
| | | | | | | | | | | | | | | | | |
Total | | | 14,987,300 | | | 5,202,000 | | | 32,090,000 | | | 103,920 | | | 800 | |
| | | | | | | | | | | | | | | | | |
| | | | | | | | | | | | | | | | | |
| | | | | | | | | | | | | | | | | |
The table below shows a breakdown of the maturities of the fair value of commodity price derivatives designated as cash flow hedges at the years ended December 31, 2014, 2013 and 2012, including zinc and aluminium derivatives obtained prior to the completion of the Befesa Sale:
| | | | | | | | | | | | | | | | |
2014 | | Ethanol | | Gas | | Grain | | Zinc | | Aluminium | |
|---|
| | (€ in thousands)
| |
|---|
Year 2015 | | | (2,733 | ) | | (1,386 | ) | | 10,364 | | | — | | | (29,418 | ) |
Following | | | — | | | — | | | — | | | — | | | — | |
| | | | | | | | | | | | | | | | | |
Total | | | (2,733 | ) | | (1,386 | ) | | 10,364 | | | — | | | (29,418 | ) |
| | | | | | | | | | | | | | | | | |
| | | | | | | | | | | | | | | | | |
| | | | | | | | | | | | | | | | | |
| | | | | | | | | | | | | | | | |
2013 | | Ethanol | | Gas | | Grain | | Zinc | | Aluminium | |
|---|
| | (€ in thousands)
| |
|---|
Year 2014 | | | 4,587 | | | 755 | | | 2,715 | | | — | | | (14,759 | ) |
Following | | | — | | | — | | | — | | | — | | | — | |
| | | | | | | | | | | | | | | | | |
Total | | | 4,587 | | | 755 | | | 2,715 | | | — | | | (14,759 | ) |
| | | | | | | | | | | | | | | | | |
| | | | | | | | | | | | | | | | | |
| | | | | | | | | | | | | | | | | |
| | | | | | | | | | | | | | | | |
2012 | | Ethanol | | Gas | | Grain | | Zinc | | Aluminium | |
|---|
| | (€ in thousands)
| |
|---|
Year 2013 | | | (387 | ) | | (369 | ) | | (368 | ) | | 6,818 | | | 135 | |
Following | | | — | | | — | | | — | | | (4,164 | ) | | — | |
| | | | | | | | | | | | | | | | | |
Total | | | (387 | ) | | (369 | ) | | (368 | ) | | 2,654 | | | 135 | |
| | ��� | | | | | | | | | | | | | | | |
| | | | | | | | | | | | | | | | | |
| | | | | | | | | | | | | | | | | |
There were no commodity price derivatives not designated as hedges as of December 31, 2014, 2013 and 2012.
At December 31, 2014, if the price of grain had increased by 10%, with all other variables remaining constant, the effect in the consolidated income statement would have been null and an increase in other reserves of €49,086 thousand due to open derivative contracts primarily grain purchases held by the Group.
266
Table of Contents
At December 31, 2014, if the price of ethanol had increased by 10%, with all other variables remaining constant, the effect in the consolidated income statement would have been null and an increase in other reserves of €8,673 thousand due to open derivative contracts primarily ethanol purchases held by the Group.
For additional information about our financial instrument and hedging activity refer to Note 4, Note 12 and Note 14 of our Consolidated Financial Statements included elsewhere in this annual report.
Credit Risk
Trade and other receivables, current financial investments and cash are the main financial assets of the Company and present the greatest exposure to credit risk in the event that a third-party does not comply with its obligations.
Most of our receivables relate to our customers who operate in a range of industries and countries with contracts that require ongoing payments as the project advances, the service is rendered or upon delivery of the product. It is common practice for us to reserve the right to cancel the work in the event of a material breach, especially non-payment. In addition, we rely on written confirmation for the non-recourse purchase of accounts receivable (factoring). In these arrangements, we pay a bank fee to assume the credit risk as well as interest charges for the financing component.
In this regard, derecognizing of factored accounts receivable is taken only when all the requirements of IAS 39,Financial instruments; Recognition and Measurement are met. Therefore, we consider whether or not the risks and rewards inherent in the ownership of the asset have been transferred, including a comparison of our risk before and after the transfer, considering the amounts and timing of net cash payments to be received. Once the risk to the grantor company has been eliminated or is considered to be substantially reduced, it is considered that the financial asset in fact has been transferred.
In general, our greatest risk is the risk of not collecting a trade account receivable. This is our greatest risk because it may be of significant value in the development of a project or in the provision of a service and it is not within our control. However, for those contracts in which there is a possibility of customer payment delay, with no commercial justification, could theoretically be identified as a risk associated to the financial asset, and so we establish that, not only should the risk of legal insolvency (bankruptcy, etc.) be covered, but also that ofde facto or evident insolvency (arising from the client's management of its own cash, even though there is no "general moratorium").
As indicated, it is our policy to transfer the credit risk associated with our customers and other accounts receivable through the use of non-recourse factoring. As such, with regard to considering risks inherent with debtors and other accounts receivable on the statement of financial position, amounts can be excluded that relate to works completed and awaiting certification for which factoring contracts are in place, as well as amounts which could be factored which are outstanding to be submitted to the financial entity providing the factoring, and also those debtors included which are covered by an insurance policy.
The following table shows the maturity detail of trade receivables for each of the years ended December 31, 2014, 2013 and 2012:
| | | | | | | | | | |
| | Balance as of December 31, | |
|---|
| | 2014 | | 2013 | | 2012 | |
|---|
| | (€ in thousands)
| |
|---|
Maturity | | | | | | | | | | |
Up to 3 months | | | 405,137 | | | 409,744 | | | 941,048 | |
Between 3 and 6 months | | | 50,928 | | | 43,305 | | | 49,271 | |
Over 6 months | | | 136,563 | | | 113,881 | | | 74,519 | |
| | | | | | | | | | | |
Total | | | 592,628 | | | 566,930 | | | 1,064,838 | |
| | | | | | | | | | | |
| | | | | | | | | | | |
| | | | | | | | | | | |
267
Table of Contents
Liquidity Risk
The objective of our financing and liquidity policy is to ensure that we maintain sufficient funds to meet our financial obligations as they fall due.
To ensure there are sufficient funds available for debt repayment in relation to its cash-generating capacity, the Corporate Financial Department annually prepares and the Board of Directors reviews a Financial Plan that details all the financing needs and how such financing will be provided. We fund in advance disbursements for major cash requirements, such as capital expenditures, debt repayments and working capital requirements. In addition, as a general rule, we do not commit our own equity in projects until the associated long-term financing is obtained.
During 2013 and 2014, we covered our financing needs through the following financial transactions:
- •
- During 2013, we successfully extended the maturity profile of our debt maturities through access to capital markets.
- •
- During 2013, we issued €400 million convertible bonds due in 2019, and €550 million ordinary bonds due in 2018.
- •
- In October 2013, we completed a capital increase for a total amount of €517.5 million.
- •
- In December 2013, we issued $450 million ordinary notes due in 2020.
- •
- During 2014, we refinanced the syndicated loans whereupon Abengoa, S.A. signed a long term revolving financing agreement, as well as new financing transactions in subsidiaries which have the support of export credit agencies. See Note 20.2 of our Consolidated Financial Statements for further details.
- •
- Initial public offering of Abengoa Yield in June 2014. This company completed the capital increase for a total amount of €611 million. See Note 6.2 of our Consolidated Financial Statements for further details.
- •
- The financial closing of some project finance during 2014. See Note 19 of our Consolidated Financial Statements for further details).
- •
- During 2014, ordinary notes were issued for a total equivalent amount of €1,000 million. See Notes 19 and 20 of our Consolidated Financial Statements for further details.
We aim to maintain our strong liquidity position, extend the debt maturities of our existing corporate loans and bonds, continue to access the capital markets from time to time, as appropriate, and further diversify our funding sources. We aim to continue to raise equity funding at the project company level through partnerships.
In accordance with the above, we have a policy to diversify our sources of finance in order to prevent concentration of financing sources that may limit our working capital liquidity risk.
Capital risk
We manage capital risk to ensure the continuity of the activities of our subsidiaries from an equity standpoint by maximizing the return for the shareholders and optimizing the structure of equity and debt in the respective companies or projects.
The leverage objective of the activities of the Company is not measured based on the level of debt on own resources, but on the nature of the activities:
- •
- For activities financed through Project Debt, each project is assigned a leverage objective based on the cash and cash flow generating capacity, generally, of contracts that provide these projects with highly recurrent and predictable levels of cash flow generation.
268
Table of Contents
- •
- For activities financed with Corporate Financing, the objective is to maintain reasonable leverage, defined as 2.0 times corporate EBITDA over Net Corporate Debt (excluding the EBITDA and Project Debt) in 2014.
ITEM 12. DESCRIPTION OF SECURITIES OTHER THAN EQUITY SECURITIES.
A. Debt Securities
Not applicable.
B. Warrants and Rights
Not applicable.
C. Other Securities
Not applicable.
D. American Depositary Shares
As an ADS holder, you will be required to pay the following service fees to the depositary bank:
| | | | |
Service | | Fees |
|---|
• | | Issuance of ADSs | | Up to $0.05 per ADS issued |
• | | Cancellation of ADSs | | Up to $0.05 per ADS cancelled |
• | | Distribution of cash dividends or other cash
distributions | | Up to $0.05 per ADS held |
• | | Distribution of ADSs pursuant to stock
dividends, free stock distributions or exercise of rights | | Up to $0.05 per ADS held |
• | | Distribution of securities other than ADSs or
rights to purchase additional ADSs | | Up to $0.05 per ADS held |
• | | Depositary Services | | Up to $0.05 per ADS held on the applicable record date(s) established by the depositary bank |
As an ADS holder you will also be responsible to pay certain fees and expenses incurred by the depositary bank and certain taxes and governmental charges such as:
- •
- fees for the transfer and registration of Class B shares charged by the registrar and transfer agent for the Class B shares in Spain (i.e., upon deposit and withdrawal of Class B shares);
- •
- expenses incurred for converting foreign currency into U.S. Dollars;
- •
- expenses for cable, telex and fax transmissions and for delivery of securities;
- •
- taxes and duties upon the transfer of securities (i.e., when Class B shares are deposited or withdrawn from deposit); and
- •
- fees and expenses incurred in connection with the delivery or servicing of Class B shares on deposit.
Depositary fees payable upon the issuance and cancellation of ADSs are typically paid to the depositary bank by the brokers (on behalf of their clients) receiving the newly issued ADSs from the depositary bank and by the brokers (on behalf of their clients) delivering the ADSs to the depositary bank for cancellation. The brokers in turn charge these fees to their clients. Depositary fees payable in connection with distributions of
269
Table of Contents
cash or securities to ADS holders and the depositary services fee are charged by the depositary bank to the holders of record of ADSs as of the applicable ADS record date.
The Depositary fees payable for cash distributions are generally deducted from the cash being distributed. In the case of distributions other than cash (i.e., stock dividend, rights), the depositary bank charges the applicable fee to the ADS record date holders concurrent with the distribution. In the case of ADSs registered in the name of the investor (whether certificated or uncertificated in direct registration), the depositary bank sends invoices to the applicable record date ADS holders. In the case of ADSs held in brokerage and custodian accounts (via DTC), the depositary bank generally collects its fees through the systems provided by DTC (whose nominee is the registered holder of the ADSs held in DTC) from the brokers and custodians holding ADSs in their DTC accounts. The brokers and custodians who hold their clients' ADSs in DTC accounts in turn charge their clients' accounts the amount of the fees paid to the depositary banks.
In the event of refusal to pay the depositary fees, the depositary bank may, under the terms of the Deposit Agreement, refuse the requested service until payment is received or may set off the amount of the depositary fees from any distribution to be made to the ADS holder.
Note that the fees and charges you may be required to pay may vary over time and may be changed by us and by the depositary bank. You will receive prior notice of such changes. The depositary bank may reimburse us for certain expenses incurred by us in respect of the ADR program established pursuant to the Deposit Agreement, by making available a portion of the Depositary fees charged in respect of the ADR program or otherwise, upon such terms and conditions as the Company and the Depositary may agree from time to time. As of December 31, 2013, the Depositary had not reimbursed us for expenses incurred by us in 2013.
PART II.
ITEM 13. DEFAULTS, DIVIDEND ARREARAGES AND DELINQUENCIES.
None of these events occurred in any of the years ended December 31, 2014, 2013 and 2012.
ITEM 14. MATERIAL MODIFICATIONS TO THE RIGHTS OF SECURITY HOLDERS AND USE OF PROCEEDS.
Not applicable.
ITEM 15. CONTROLS AND PROCEDURES.
Evaluation of Disclosure Controls and Procedures
(a) Evaluation of Disclosure Controls and Procedures
Abengoa, under the supervision and with the participation of its management, including our chief executive officer, chief consolidation officer and chief financial officer, performed an evaluation of the effectiveness of the design and operation of its disclosure controls and procedures (as defined in Rule 13a-15 (e) under the Exchange Act) as of December 31, 2014. There are inherent limitations to the effectiveness of any control system, including disclosure controls and procedures. Accordingly, even effective disclosure controls and procedures can provide only reasonable assurance of achieving their control objectives.
Based upon their evaluation, Abengoa's chief executive officer, chief accounting officer and chief financial officer concluded, that Abengoa's disclosure controls and procedures are effective in providing reasonable assurance that information relating to Abengoa, including its consolidated subsidiaries, required to be disclosed in reports that it files under the Exchange Act is (1) recorded, processed, summarized and reported within the time periods specified in the SEC's rules and forms, and (2) accumulated and communicated to the management, including principal financial officers, as appropriate to allow timely decisions regarding required disclosure.
270
Table of Contents
(b) Management's Report on Internal Control over Financial Reporting
The management of Abengoa is responsible for establishing and maintaining effective internal control over financial reporting. This system is designed to provide reasonable assurance regarding the reliability of financial reporting and the preparation of financial statements for external purposes in accordance with generally accepted accounting principles.
Because of its inherent limitations, internal control over financial reporting may not prevent or detect all misstatements. Also, projections of any evaluation of effectiveness to future periods are subject to the risk that controls may become inadequate because of changes in conditions, or that the degree of compliance with the policies or procedures may deteriorate.
Abengoa's management assessed the effectiveness of the Company's internal control over financial reporting as of December 31, 2014, based on the framework set forth by the Committee of Sponsoring Organizations of the Treadway Commission ("COSO") inInternal Control—Integrated Framework (2013). Based on this assessment, management concluded that, as of December 31, 2014, its internal control over financial reporting was effective based on those criteria.
Our internal control over financial reporting as of December 31, 2014 has been audited by Deloitte S.L., an independent registered public accounting firm, as stated in their report which follows below.
(c) Attestation report of the registered public accounting firm
The report of Deloitte, S.L., our Independent Auditor, on our internal control over financial reporting is included herein at page F-3 of our Consolidated Financial Statements.
(d) Changes in internal controls over financial reporting
There was no change in our internal control over financial reporting that occurred during the period covered by this annual report that has materially affected, or is reasonably likely to materially affect, our internal control over financial reporting.
ITEM 16A. AUDIT COMMITTEE FINANCIAL EXPERT.
See "Item 6.C—Board Practices—Audit Committee." Our Board of Directors has determined that Mercedes Gracia Díez qualifies as an "audit committee financial expert" under applicable SEC rules.
ITEM 16B. CODE OF ETHICS.
Our Board of Directors has adopted a code of conduct for our employees, officers and directors to govern their relations with current and potential customers, fellow employees, competitors, government and self-regulatory agencies, the media, and anyone else with whom Abengoa has contact. Our code of conduct is publicly available on our website at www.abengoa.es.
271
Table of Contents
ITEM 16C. PRINCIPAL ACCOUNTANT FEES AND SERVICES.
The following table provides information on the aggregate fees billed by our principal accountants, Deloitte, S.L. or by other firms to Abengoa, classified by type of service rendered for the periods indicated, in thousands of euros:
| | | | | | | | | | | | | | | | | | | |
| | 2014 | | 2013 | |
|---|
| | Deloitte | | Other
Auditors | | Total | | Deloitte | | Other
Auditors | | Total | |
|---|
| | (€ in thousands)
| |
|---|
Audit Fees | | | 5,221 | | | 315 | | | 5,536 | | | 3,541 | | | 270 | | | 3,810 | |
Audit-Related Fees | | | 2,100 | | | 143 | | | 2,243 | | | 1,131 | | | 248 | | | 1,379 | |
Tax Fees | | | 183 | | | 4,388 | | | 4,521 | | | 636 | | | 3,934 | | | 4,571 | |
All Other Fees | | | 410 | | | 3,436 | | | 3,846 | | | 680 | | | 2,137 | | | 2,817 | |
| | | | | | | | | | | | | | | | | | | | |
Total | | | 7,914 | | | 8,282 | | | 16,196 | | | 5,988 | | | 6,589 | | | 12,577 | |
| | | | | | | | | | | | | | | | | | | | |
| | | | | | | | | | | | | | | | | | | | |
| | | | | | | | | | | | | | | | | | | | |
Audit Fees are the aggregate fees billed for professional services in connection with the audit of our consolidated annual financial statements, quarterly review of our interim financial statements and statutory audits of our subsidiaries' financial statements under the rules of Spain and the countries in which our subsidiaries are organized. Also included are services that can only be provided by our auditor, such as audits of non-recurring transactions, consents, comfort letters, attestation services and any audit services required for SEC or other regulatory filings.
Audit-Related Fees are fees charged for assurance and related services that are reasonably related to the performance of the audit or review of our financial statements, and are not restricted to those that can only be provided by the auditor signing the audit report. This category comprises fees billed for consultation concerning financial accounting and reporting standards, advisory services associated with our financial reporting process, and assistance with training of personnel in financial related subjects.
The Audit Committee approved all of the services provided by Deloitte, S.L. and by other member firms of Deloitte.
Tax Fees are fees billed for tax compliance, tax review and tax advice on actual or contemplated transactions.
All Other Fees comprises fees billed in relation to financial advisory services, internal control advisory, issuance of comfort letters in connection with capital markets transactions and other services which cannot be comprised under other categories.
Audit Committee's Policy on Pre-Approval of Audit and Permissible Non-Audit Services of the Independent Auditor
Subject to shareholder approval of the independent auditor in accordance with Spanish law, the Audit Committee has the sole authority to appoint, retain or replace the independent auditor. The Audit Committee is also directly responsible for the compensation and oversight of the work of the independent auditor. These policies generally provide that we will not engage our independent auditors to render audit or non-audit services unless the service is specifically approved in advance by the Audit Committee. The Audit Committee's pre-approval policy, which covers audit and non-audit services provided to us or to any of our subsidiaries, is as follows:
- •
- The Audit Committee shall review and approve in advance the annual plan and scope of work of the independent external auditor, including staffing of the audit, and shall (i) review with the independent external auditor any audit-related concerns and management's response and (ii) confirm that any examination is performed in accordance with the relevant accounting standards.
272
Table of Contents
- •
- The Audit Committee shall pre-approve all audit services and all permitted non-audit services (including the fees and terms thereof) to be performed for us by the independent auditors, to the extent required by law. The Audit Committee may delegate to one or more Committee members the authority to grant pre-approvals for audit and permitted non-audit services to be performed for us by the independent auditor, provided that decisions of such members to grant pre-approvals shall be presented to the full Audit Committee at its next regularly scheduled meeting.
- •
- The list of audit services and all permitted non-audit services (including the fees and terms thereof) to be performed for us by the independent auditors pre-approved by the Audit Committee, considering that these services clearly allowed from the point of independence is the following:
- •
- Audit services, including audit of financial statements, limited reviews, comfort letters, other verification works requested by regulator or supervisors.
- •
- Audit-Related services, including due diligence services, verification of corporate social responsibility report, accounting or internal control advisory and preparation courses on these topics.
- •
- Tax services
- •
- Other specific services: evaluation of the design, implementation and operation of a financial information system or control over financial reporting; and courses or seminars.
Only for information purpose, all audit and non-audit services will be reported to the Audit Committee on a quarterly basis.
Any other service shall be pre-approved by the Audit Committee.
However, when for reasons of urgency, it is necessary to start the provision of services prior to the next meeting of the Audit Committee, the Chairman of the committee is authorized to provide such approval which shall be shall be communicated to the Audit Committee subsequently.
In accordance with the above pre-approval policy, all audit and permitted non-audit services performed for us by our principal accountants, or any of its affiliates, were approved by the Audit Committee of our Board of Directors, who concluded that the provision of such services by the independent accountants was compatible with the maintenance of that firm's independence in the conduct of its auditing functions: an auditor may not function in the role of management; an auditor may not audit his or her own work; and an auditor may not serve in an advocacy role for his or her client.
The Audit Committee approved 100% of the services provided by Deloitte and 82% of Audit-related fees considering all Audit-related services provided to us by all audit firms and 24% of all Other Fees for the year 2013.
ITEM 16D. EXEMPTIONS FROM THE LISTING STANDARDS FOR AUDIT COMMITTEES.
Not applicable.
ITEM 16E. PURCHASES OF EQUITY SECURITIES BY THE ISSUER AND AFFILIATED PURCHASERS.
The number of shares of treasury stock at December 31, 2014, amounted to 5,550,532 Class A Shares and 36,073,733 Class B, compared to 5,382,896 Class A Shares and 34,629,460 Class B Shares at December 31, 2013. These treasury shares are directly owned by Abengoa, S.A.
273
Table of Contents
Class A Shares
| | | | | | | | | | | | | |
| | Year Ended December 31, 2014 | |
|---|
Period of Fiscal Year | | Total Number
of Shares
Purchased | | Average Price
Paid per
Share
(Euro) | | Total Number of
Shares (or Units)
Purchased as Part
of Publicly
Announced Plans or
Programs | | Maximum Number
(or Approximate
Dollar Value) of
Shares (or Units)
that May Yet be
Purchased Under
the Plans or
Programs(1) | |
|---|
January 1 to January 31 | | | 994,826 | | | 2.84 | | | | | | | |
February 1 to February 28 | | | 1,128,050 | | | 3.53 | | | | | | | |
March 1 to March 31 | | | 1,246,779 | | | 4.05 | | | | | | | |
April 1 to April 30 | | | 1,468,753 | | | 3.81 | | | | | | | |
May 1 to May 31 | | | 889,157 | | | 3.88 | | | | | | | |
June 1 to June 30 | | | 1,191,541 | | | 4.65 | | | | | | | |
July 1 to July 31 | | | 655,478 | | | 4.45 | | | | | | | |
August 1 to August 30 | | | 770,050 | | | 4.16 | | | | | | | |
September 1 to September 30 | | | 960,890 | | | 4.59 | | | | | | | |
October 1 to October 31 | | | 1,467,007 | | | 3.55 | | | | | | | |
November 1 to November 30 | | | 1,969,794 | | | 2.69 | | | | | | | |
December 1 to December 31 | | | 1,494,693 | | | 2.24 | | | | | | | |
| | | | | | | | | | | | | | |
Total | | | 14,237,018 | | | | | | | | | | |
| | | | | | | | | | | | | | |
| | | | | | | | | | | | | | |
| | | | | | | | | | | | | | |
Class B Shares
| | | | | | | | | | | | | |
| | Year Ended December 31, 2014 | |
|---|
Period of Fiscal Year | | Total Number
of Shares
Purchased | | Average Price
Paid per
Share
(Euro) | | Total Number of
Shares (or Units)
Purchased as Part
of Publicly
Announced Plans or
Programs | | Maximum Number
(or Approximate
Dollar Value) of
Shares (or Units)
that May Yet be
Purchased Under
the Plans or
Programs(1) | |
|---|
January 1 to January 31 | | | 7,823,510 | | | 2.44 | | | | | | | |
February 1 to February 28 | | | 11,065,560 | | | 2.99 | | | | | | | |
March 1 to March 31 | | | 8,420,799 | | | 3.33 | | | | | | | |
April 1 to April 30 | | | 10,223,487 | | | 3.12 | | | | | | | |
May 1 to May 31 | | | 7,525,883 | | | 3.14 | | | | | | | |
June 1 to June 30 | | | 12,086,914 | | | 3.96 | | | | | | | |
July 1 to July 31 | | | 7,849,994 | | | 3.93 | | | | | | | |
August 1 to August 30 | | | 13,043,536 | | | 3.95 | | | | | | | |
September 1 to September 30 | | | 13,881,022 | | | 4.33 | | | | | | | |
October 1 to October 31 | | | 25,165,020 | | | 3.30 | | | | | | | |
November 1 to November 30 | | | 32,200,000 | | | 2.41 | | | | | | | |
December 1 to December 31 | | | 19,840,538 | | | 2.00 | | | | | | | |
| | | | | | | | | | | | | | |
Total | | | 169,126,263 | | | | | | | | | | |
| | | | | | | | | | | | | | |
| | | | | | | | | | | | | | |
| | | | | | | | | | | | | | |
- (1)
- For a more detailed description of our plans and programs, see "Item 6.B—Compensation—Stock Option Plans and Other Remuneration for Directors and Senior Management—Abengoa Share Purchase Plan."
274
Table of Contents
ITEM 16F. CHANGE IN REGISTRANT'S CERTIFYING ACCOUNTANT.
Not applicable.
ITEM 16G. CORPORATE GOVERNANCE.
We are a Spanish corporation and qualify as a foreign private issuer listed on the NASDAQ Global Select Market. Under NASDAQ's applicable corporate governance rules, foreign private issuers are permitted to follow home country corporate governance practices in certain circumstances in lieu of NASDAQ's corporate governance rules. We base our corporate governance procedures on the Conthe Code, published in May 2006. Publicly-listed Spanish companies are required by law to publish an annual report on Corporate Governance, which provides a detailed explanation of our corporate governance procedures and explains the role and duties of our Board of Directors and Board Committees. Our annual report on Corporate Governance and other corporate governance information is available on our website at www.abengoa.com. None of the information contained on our website is incorporated in this annual report. Set forth below is a summary of the significant differences between the corporate governance practices we follow under Spanish law and those followed by NASDAQ-listed U.S. domestic issuers.
Under NASDAQ's corporate governance rules, the Board of Directors of a U.S. domestic issuer must have a majority of independent members. As a foreign private issuer, we are permitted to follow Spanish corporate governance requirements for the number of independent directors on our Board of Directors. As of the date of this annual report, we had 15 directors, out of which four have been deemed independent by our Board of Directors. We assess the independence of our directors by evaluating, among other things, (i) the contractual, employment and commercial relations between directors, our shareholders and us, (ii) other Board of Directors positions held by our directors, and (iii) the presence of material business dealings with us or any other company in our Group. The classification of our directors as independent is reviewed annually by our Board of Directors and is reported in our annual corporate governance report filed in accordance with Spanish corporate law.
Under NASDAQ's corporate governance rules, only independent directors may be members of the compensation committees of the boards of directors of U.S. domestic issuers. We have an Appointments and Remuneration Committee, which is our equivalent to a compensation committee. Under Spanish corporate governance codes, all of the members of a compensation committee of a publicly-listed Spanish company must be external directors and a majority of those directors must be independent. Our Appointments and Remuneration Committee bases its corporate governance procedures and functions on these published codes and is currently in compliance with their requirements, including those related to committee membership, executive compensation, and director nominations.
Under NASDAQ's corporate governance rules, U.S. domestic issuers are required to provide a quorum as specified in its bylaws for any meeting of the holders of common stock, provided, however, that such quorum is not permitted to be less than 331/3% of the outstanding shares of common voting stock. Our articles of association provide that, on the first call of our general shareholders' meeting, a duly constituted meeting requires a quorum of at least 25% of our subscribed share capital, and, if a quorum was not obtained on the first call, a meeting is validly convened on the second call regardless of the share capital in attendance. However, certain major corporate actions (such as issuing additional ordinary shares, increasing or decreasing our share capital, issuing debt securities, amending our bylaws or approving merger transactions) require shareholder approval by an absolute majority at a meeting at which at least 50% of our subscribed share capital is present or represented on the first call or at least 25% of the our share capital present or represented on the second call. However, when the number of shareholders attending a meeting represents less than 50% of our subscribed share capital, resolutions on any of these major corporate actions must be adopted by the affirmative vote of at least two-thirds of the share capital present or represented at such meeting.
Under NASDAQ's corporate governance rules, U.S. domestic issuers are required to solicit proxies, provide proxy statements for all shareholder meetings and provide copies of such proxy materials to
275
Table of Contents
NASDAQ. As a foreign private issuer, we are generally exempt from the SEC's rules governing the solicitation of shareholder proxies. However, under Spanish law we are required to publish a "calling of the meeting" one month in advance of the meeting setting forth the matters to be voted upon with respect to a shareholder meeting in our corporate website, in the website of the CNMV (the Spanish securities markets regulator) and in either a Spanish widely-read newspaper or the BORME. We distribute a copy of the calling of the meeting and a form of proxy to our U.S. shareholders and also make these materials available through our website in advance of such meeting.
Under NASDAQ's corporate governance rules, shareholders of U.S. domestic issuers must be given the opportunity to vote on equity compensation plans and material revisions thereto, with limited exceptions set forth in the NASDAQ Marketplace Rules, including an exception for foreign private issuers who follow the laws of their home country. Under Spanish law, equity compensation plans involving the issuance of our securities require prior shareholder approval. Additionally, equity compensation plans in which our officers and employees participate can be approved by our board of directors without shareholder approval. However, the establishment of equity compensation plans in which members of our Board of Directors participate must be authorized in our articles of association. Our articles of association currently do not include this type of provision and would have to be amended by our shareholders before any such plan could be adopted.
Under NASDAQ's corporate governance rules, shareholders of U.S. domestic issuers must approve the issuance of our securities when such issuance would result in a change in control of such issuer. Under Spanish law, any issuance of our securities, regardless of whether such issuance would result in a change of control, requires prior shareholder approval.
PART III.
ITEM 17. FINANCIAL STATEMENTS.
We have elected to provide financial statements pursuant to Item 18.
ITEM 18. FINANCIAL STATEMENTS.
Our Consolidated Financial Statements are included at the end of this annual report.
ITEM 19. EXHIBITS.
The following exhibits are filed as part of this annual report:
| | | |
Exhibit
No. | | Description |
|---|
| | 1.1 | | Memorandum and Articles of Association of Abengoa, S.A. (English translation) |
|
2.1 |
|
Specimen certificate evidencing American Depositary Receipt(1) |
|
4.1 |
|
Extraordinary Variable Remuneration Plan for Managers—January 2014 |
|
4.2 |
|
Extraordinary Variable Remuneration Plan for Managers—July 2014 |
|
4.3 |
|
Registration Rights Agreement, dated as of November 4, 2011, between Abengoa, S.A. and FR Alfajor Holdings S.à. r.l.(1) |
|
4.4 |
|
Shareholders' Agreement between Abengoa, S.A. and Inversión Corporativa, I.C., S.A., dated as of August 27, 2012(1) |
|
4.5 |
|
Form of Deposit Agreement between Abengoa, S.A., the depositary, and all registered holders and beneficial owners of the American Depositary Shares(1) |
276
Table of Contents
| | | |
Exhibit
No. | | Description |
|---|
| | 8.1 | | Subsidiaries of Abengoa, S.A. (incorporated by reference to Appendix I to the Consolidated Financial Statements included with this annual report) |
|
12.1 |
|
Certification of Manuel Sánchez Ortega, Chief Executive Officer of Abengoa, S.A., pursuant to Section 302 of the Sarbanes-Oxley Act of 2002 |
|
12.2 |
|
Certification of Jesús García-Quilez Gómez, Chief Financial Officer of Abengoa, S.A., pursuant to Section 302 of the Sarbanes-Oxley Act of 2002 |
|
13.1 |
|
Certification pursuant to 18 U.S.C. Section 1350, as adopted pursuant to Section 906 of the Sarbanes-Oxley Act of 2002 |
- (1)
- Incorporated by reference to the registrant's Registration Statement on Form F-1 (File No. 333-191575) filed on October 4, 2013.
277
Table of Contents
SIGNATURE
The registrant hereby certifies that it meets all of the requirements for filing on Form 20-F and that it has duly caused and authorized the undersigned to sign this annual report on its behalf.
Date: February 23, 2015
| | | | |
| | | ABENGOA, S.A. |
|
|
By: |
|
/s/ MANUEL SÁNCHEZ ORTEGA
|
| | | Name: | | Manuel Sánchez Ortega |
| | | Title: | | Chief Executive Officer |
278
Table of Contents
ABENGOA, S.A.
AUDITED CONSOLIDATED FINANCIAL STATEMENTS
| | | | |
Consolidated Financial Statements as of December 31, 2014 and 2013 and for each of the years ended December 31, 2014, 2013 and 2012 | | | | |
Report of Independent Registered Public Accounting Firm on Consolidated Financial Statements as of December 31, 2014 and 2013 and for the three-year ended December 31, 2014 | | | F-2 | |
Report of Independent Registered Public Accounting Firm on Internal Control over Financial Reporting for the year ended December 31, 2014 | | | F-3 | |
Consolidated Statements of Financial Position as of December 31, 2014 and 2013 | | | F-5 | |
Consolidated Income Statements for the years 2014, 2013 and 2012 | | | F-7 | |
Consolidated Statements of Comprehensive Income (Loss) for the years 2014, 2013 and 2012 | | | F-8 | |
Consolidated Statements of Changes in Equity for the years ended December 31, 2014, 2013 and 2012 | | | F-9 | |
Consolidated Cash Flow Statements for the years 2014, 2013 and 2012 | | | F-10 | |
Notes to the Consolidated Financial Statements | | | F-12 | |
Appendices to the Consolidated Financial Statements | | | F-142 | |
F-1
Table of Contents

REPORT OF INDEPENDENT REGISTERED PUBLIC ACCOUNTING FIRM
To the Board of Directors and Shareholders of Abengoa, S.A.:
We have audited the accompanying consolidated statements of financial position of Abengoa, S.A. and subsidiaries (the "Company") as of December 31, 2014 and 2013, and the related consolidated income statements, the consolidated statements of comprehensive income (loss), the consolidated statements of changes in equity and the consolidated cash flow statements for each of the three years in the period ended December 31, 2014. These consolidated financial statements are the responsibility of Company's management. Our responsibility is to express an opinion on these consolidated financial statements based on our audits.
We conducted our audits in accordance with the standards of the Public Company Accounting Oversight Board (United States of America). Those standards require that we plan and perform the audit to obtain reasonable assurance about whether the financial statements are free of material misstatement. An audit includes examining, on a test basis, evidence supporting the amounts and disclosures in the financial statements. An audit also includes assessing the accounting principles used and significant estimates made by management, as well as evaluating the overall financial statements presentation. We believe that our audits provide a reasonable basis for our opinion.
In our opinion, such consolidated financial statements present fairly, in all material respects, the financial position of Abengoa, S.A . and subsidiaries as of December 31, 2014 and 2013, and the results of their operations and their cash flows for each of the three years in the period ended December 31, 2014, in conformity with International Financial Reporting Standards, as issued by the International Accounting Standards Board ("IFRS-IASB").
We have also audited, in accordance with the standards of the Public Company Accounting Oversight Board (United States of America), the Company's internal control over financial reporting as of December 31, 2014, based on the criteria established inInternal Control—Integrated Framework (2013) issued by the Committee of Sponsoring Organizations of the Treadway Commission and our report dated February 23, 2015, expressed an unqualified opinion on the Company's internal control over financial reporting.
Seville, Spain
February 23, 2015
F-2
Table of Contents
REPORT OF INDEPENDENT REGISTERED PUBLIC ACCOUNTING FIRM
To the Board of Directors and Shareholders of Abengoa, S.A.:
We have audited the internal control over financial reporting of Abengoa, S.A. and subsidiaries (the "Company") as of December 31, 2014, based on criteria established inInternal Control—Integrated Framework (2013) issued by the Committee of Sponsoring Organizations of the Treadway Commission. The Company's management is responsible for maintaining effective internal control over financial reporting and for its assessment of the effectiveness of internal control over financial reporting, included in the accompanyingManagement's Report on Internal Control over Financial Reporting. Our responsibility is to express an opinion on the Company's internal control over financial reporting based on our audit.
We conducted our audit in accordance with the standards of the Public Company Accounting Oversight Board (United States of America). Those standards require that we plan and perform the audit to obtain reasonable assurance about whether effective internal control over financial reporting was maintained in all material respects. Our audit included obtaining an understanding of internal control over financial reporting, assessing the risk that a material weakness exists, testing and evaluating the design and operating effectiveness of internal control based on the assessed risk, and performing such other procedures as we considered necessary in the circumstances. We believe that our audit provides a reasonable basis for our opinion.
A company's internal control over financial reporting is a process designed by, or under the supervision of, the company's principal executive and principal financial officers, or persons performing similar functions, and effected by the company's board of directors, management, and other personnel to provide reasonable assurance regarding the reliability of financial reporting and the preparation of financial statements for external purposes in accordance with generally accepted accounting principles. A company's internal control over financial reporting includes those policies and procedures that (1) pertain to the maintenance of records that, in reasonable detail, accurately and fairly reflect the transactions and dispositions of the assets of the company; (2) provide reasonable assurance that transactions are recorded as necessary to permit preparation of financial statements in accordance with generally accepted accounting principles, and that receipts and expenditures of the company are being made only in accordance with authorizations of management and directors of the company; and (3) provide reasonable assurance regarding prevention or timely detection of unauthorized acquisition, use, or disposition of the company's assets that could have a material effect on the financial statements.
Because of the inherent limitations of internal control over financial reporting, including the possibility of collusion or improper management override of controls, material misstatements due to error or fraud may not be prevented or detected on a timely basis. Also, projections of any evaluation of the effectiveness of the internal control over financial reporting to future periods are subject to the risk that the controls may become inadequate because of changes in conditions, or that the degree of compliance with the policies or procedures may deteriorate.
F-3
Table of Contents
In our opinion, the Company maintained, in all material respects, effective internal control over financial reporting as of December 31, 2014, based on the criteria established inInternal Control—Integrated Framework (2013) issued by the Committee of Sponsoring Organizations of the Treadway Commission.
We have also audited, in accordance with the standards of the Public Company Accounting Oversight Board (United States of America), the consolidated financial statements as of and for the year ended December 31, 2014 of the Company and our report dated February 23, 2015, expressed an unqualified opinion on those consolidated financial statements.
Seville, Spain
February 23, 2015
F-4
Table of Contents
ABENGOA
Consolidated financial statements
Consolidated statements of financial position as of December 31, 2014 and 2013
– Amounts in thousands of euros –
| | | | | | | | | | |
Assets | | Note(1) | | 12/31/2014 | | 12/31/2013 | |
|---|
Non-current assets | | | | | | | | | | |
Goodwill | | | | | | 487,645 | | | 476,059 | |
Other intangible assets | | | | | | 1,080,729 | | | 366,052 | |
| | | | | | | | | | | |
Intangible assets | | | 8 | | | 1,568,374 | | | 842,111 | |
| | | | | | | | | | | |
Property, plant & equipment | | | 9 | | | 1,287,313 | | | 1,273,589 | |
| | | | | | | | | | | |
Concession assets in projects | | | | | | 4,942,189 | | | 8,573,243 | |
Other assets in projects | | | | | | 1,246,176 | | | 1,341,030 | |
| | | | | | | | | | | |
Fixed assets in projects (project finance) | | | 10 | | | 6,188,365 | | | 9,914,273 | |
| | | | | | | | | | | |
Investments in associates carried under the equity method | | | 11 | | | 311,261 | | | 835,682 | |
| | | | | | | | | | | |
Available for sale financial assets | | | 13 | | | 39,466 | | | 40,700 | |
Other receivable accounts | | | 15 | | | 641,024 | | | 674,183 | |
Derivative assets | | | 14 | | | 5,997 | | | 46,347 | |
| | | | | | | | | | | |
Financial investments | | | | | | 686,487 | | | 761,230 | |
| | | | | | | | | | | |
Deferred tax assets | | | 24 | | | 1,503,609 | | | 1,281,092 | |
| | | | | | | | | | | �� |
Total non-current assets | | | | | | 11,545,409 | | | 14,907,977 | |
| | | | | | | | | | | |
Current assets | | | | | | | | | | |
Inventories | | | 16 | | | 294,789 | | | 330,981 | |
| | | | | | | | | | | |
Trade receivables | | | | | | 1,477,711 | | | 958,544 | |
Credits and other receivables | | | | | | 679,205 | | | 911,428 | |
| | | | | | | | | | | |
Clients and other receivables | | | 15 | | | 2,156,916 | | | 1,869,972 | |
| | | | | | | | | | | |
Available for sale financial assets | | | 13 | | | 7,183 | | | 9,507 | |
Other receivable accounts | | | 15 | | | 1,026,528 | | | 901,118 | |
Derivative assets | | | 14 | | | 14,842 | | | 15,204 | |
| | | | | | | | | | | |
Financial investments | | | | | | 1,048,553 | | | 925,829 | |
| | | | | | | | | | | |
Cash and cash equivalents | | | 17 | | | 1,810,813 | | | 2,951,683 | |
| | | | | | | | | | | |
| | | | | | 5,311,071 | | | 6,078,465 | |
| | | | | | | | | | | |
Assets held for sale | | | 7 | | | 8,390,115 | | | 166,403 | |
| | | | | | | | | | | |
Total current assets | | | | | | 13,701,186 | | | 6,244,868 | |
| | | | | | | | | | | |
Total assets | | | | | | 25,246,595 | | | 21,152,845 | |
| | | | | | | | | | | |
- (1)
- Notes 1 to 33 are an integral part of these Consolidated Financial Statements
F-5
Table of Contents
ABENGOA
Consolidated financial statements
Consolidated statements of financial position as of December 31, 2014 and 2013
– Amounts in thousands of euros –
| | | | | | | | | | |
Equity and liabilities | | Note(1) | | 12/31/2014 | | 12/31/2013 | |
|---|
Equity attributable to owners of the Parent Share capital | | | 18 | | | 91,799 | | | 91,857 | |
| | | | | | | | | | | |
Parent company reserves | | | 18 | | | 1,334,286 | | | 1,119,910 | |
| | | | | | | | | | | |
Other reserves | | | 18 | | | (289,583 | ) | | (160,456 | ) |
| | | | | | | | | | | |
Fully or proportionally consolidated entities | | | | | | (523,465 | ) | | (545,950 | ) |
Associates | | | | | | (5,866 | ) | | (36,885 | ) |
| | | | | | | | | | | |
Accumulated currency translation differences | | | 18 | | | (529,331 | ) | | (582,835 | ) |
| | | | | | | | | | | |
Retained earnings | | | 18 | | | 838,099 | | | 852,378 | |
| | | | | | | | | | | |
Non-controlling Interest | | | | | | 1,200,902 | | | 572,149 | |
| | | | | | | | | | | |
Total equity | | | | | | 2,646,172 | | | 1,893,003 | |
| | | | | | | | | | | |
Non-current liabilities | | |
| | |
| | |
| |
Project debt | | | 19 | | | 4,158,904 | | | 5,736,151 | |
| | | | | | | | | | | |
Borrowings | | | | | | 871,613 | | | 1,959,339 | |
Notes and bonds | | | | | | 2,755,993 | | | 2,638,083 | |
Financial lease liabilities | | | | | | 24,064 | | | 27,093 | |
Other loans and borrowings | | | | | | 97,029 | | | 110,630 | |
| | | | | | | | | | | |
Corporate financing | | | 20 | | | 3,748,699 | | | 4,735,145 | |
| | | | | | | | | | | |
Grants and other liabilities | | | 21 | | | 212,606 | | | 646,188 | |
| | | | | | | | | | | |
Provisions and contingencies | | | 22 | | | 75,117 | | | 78,044 | |
| | | | | | | | | | | |
Derivative liabilities | | | 14 | | | 225,298 | | | 266,802 | |
| | | | | | | | | | | |
Deferred tax liabilities | | | 24 | | | 281,797 | | | 327,304 | |
| | | | | | | | | | | |
Personnel liabilities | | | 33 | | | 56,659 | | | 29,789 | |
| | | | | | | | | | | |
Total non-current liabilities | | | | | | 8,759,080 | | | 11,819,423 | |
| | | | | | | | | | | |
Current liabilities | | | | | | | | | | |
Project debt | | | 19 | | | 799,210 | | | 584,799 | |
| | | | | | | | | | | |
Borrowings | | | | | | 444,386 | | | 636,733 | |
Notes and bonds | | | | | | 1,096,965 | | | 256,443 | |
Financial lease liabilities | | | | | | 10,927 | | | 12,945 | |
Other loans and borrowings | | | | | | 24,373 | | | 13,143 | |
| | | | | | | | | | | |
Corporate financing | | | 20 | | | 1,576,651 | | | 919,264 | |
| | | | | | | | | | | |
Trade payables and other current liabilities | | | 25 | | | 5,555,168 | | | 5,514,186 | |
| | | | | | | | | | | |
Income and other tax payables | | | | | | 337,297 | | | 247,015 | |
| | | | | | | | | | | |
Derivative liabilities | | | 14 | | | 79,737 | | | 44,380 | |
| | | | | | | | | | | |
Provisions for other liabilities and charges | | | | | | 12,762 | | | 9,506 | |
| | | | | | | | | | | |
| | | | | | 8,360,825 | | | 7,319,150 | |
| | | | | | | | | | | |
Liabilities held for sale | | | 7 | | | 5,480,518 | | | 121,269 | |
| | | | | | | | | | | |
Total current liabilities | | | | | | 13,841,343 | | | 7,440,419 | |
| | | | | | | | | | | |
Equity and liabilities | | | | | | 25,246,595 | | | 21,152,845 | |
| | | | | | | | | | | |
- (1)
- Notes 1 to 33 are an integral part of these Consolidated Financial Statements
F-6
Table of Contents
ABENGOA
Consolidated financial statements
Consolidated income statements for the years 2014, 2013 and 2012
– Amounts in thousands of euros –
| | | | | | | | | | | | | |
| | Note(1) | | 2014 | | 2013(2) | | 2012(2) | |
|---|
Revenue | | | 27 | | | 7,150,567 | | | 7,245,131 | | | 6,285,555 | |
Changes in inventories of finished goods and work in progress | | | | | | 1,143 | | | 7,679 | | | 19,722 | |
Other operating income | | | 28 | | | 188,277 | | | 441,401 | | | 481,912 | |
Raw materials and consumables used | | | | | | (4,083,125 | ) | | (4,469,936 | ) | | (4,244,737 | ) |
Employee benefit expenses | | | 29 | | | (871,883 | ) | | (755,438 | ) | | (708,024 | ) |
Depreciation, amortization and impairment charges | | | | | | (474,864 | ) | | (516,368 | ) | | (406,276 | ) |
Other operating expenses | | | 8 & 28 | | | (976,957 | ) | | (1,201,463 | ) | | (907,564 | ) |
| | | | | | | | | | | | | | |
Operating profit | | | | | | 933,158 | | | 751,006 | | | 520,588 | |
| | | | | | | | | | | | | | |
Financial income | | | 30 | | | 62,118 | | | 67,046 | | | 87,474 | |
Financial expense | | | 30 | | | (745,392 | ) | | (583,184 | ) | | (532,198 | ) |
Net exchange differences | | | 30 | | | 5,035 | | | (3,557 | ) | | (36,103 | ) |
Other financial income/(expense), net | | | 30 | | | (176,503 | ) | | (119,253 | ) | | (157,874 | ) |
| | | | | | | | | | | | | | |
Financial expense, net | | | | | | (854,742 | ) | | (638,948 | ) | | (638,701 | ) |
| | | | | | | | | | | | | | |
Share of profit (loss) of associates carried under the equity method | | | 11 | | | 7,018 | | | (5,175 | ) | | 17,875 | |
| | | | | | | | | | | | | | |
Profit (loss) before income tax | | | | | | 85,434 | | | 106,883 | | | (100,238 | ) |
| | | | | | | | | | | | | | |
Income tax benefit | | | 31 | | | 58,646 | | | 26,183 | | | 174,082 | |
| | | | | | | | | | | | | | |
Profit for the year from continuing operations | | | | | | 144,080 | | | 133,066 | | | 73,844 | |
| | | | | | | | | | | | | | |
Profit (loss) from discontinued operations, net of tax | | | 7 | | | (22,203 | ) | | (22,742 | ) | | 20,176 | |
| | | | | | | | | | | | | | |
Profit for the year | | | | | | 121,877 | | | 110,324 | | | 94,020 | |
| | | | | | | | | | | | | | |
Profit attributable to non-controlling interests | | | 18 | | | 3,628 | | | (7,705 | ) | | (38,234 | ) |
Profit attributable to non-controlling interests discontinued operations | | | 18 | | | (213 | ) | | (1,174 | ) | | (416 | ) |
| | | | | | | | | | | | | | |
Profit for the year attributable to the parent company | | | | | | 125,292 | | | 101,445 | | | 55,370 | |
| | | | | | | | | | | | | | |
Weighted average number of ordinary shares outstanding (thousands) | | | 32 | | | 835,371 | | | 595,905 | | | 538,063 | |
Basic earnings per share from continuing operations (€ per share) | | | 32 | | | 0.18 | | | 0.21 | | | 0.06 | |
Basic earnings per share from discontinued operations (€ per share) | | | 32 | | | (0.03 | ) | | (0.04 | ) | | 0.04 | |
| | | | | | | | | | | | | | |
Basic earnings per share attributable to the parent company (€ per share) | | | | | | 0.15 | | | 0.17 | | | 0.10 | |
| | | | | | | | | | | | | | |
Weighted average number of ordinary shares affecting the diluted earnings per share (thousands) | | | 32 | | | 855,410 | | | 615,900 | | | 558,084 | |
Diluted earnings per share from continuing operations (€ per share) | | | 32 | | | 0.17 | | | 0.20 | | | 0.06 | |
Diluted earnings per share from discontinued operations (€ per share) | | | 32 | | | (0.02 | ) | | (0.04 | ) | | 0.04 | |
| | | | | | | | | | | | | | |
Diluted earnings per share attributable to the parent company (€ per share) | | | | | | 0.15 | | | 0.16 | | | 0.10 | |
| | | | | | | | | | | | | | |
- (1)
- Notes 1 to 33 are an integral part of these Consolidated Financial Statements
- (2)
- Figures recasted, see Note 7 Assets held for sale and discontinued operations of these Consolidated Financial Statements
F-7
Table of Contents
ABENGOA
Consolidated financial statements
Consolidated statements of comprehensive income (loss) for the years 2014, 2013 and 2012
– Amounts in thousands euros –
| | | | | | | | | | | | | |
| | Note(1) | | 2014 | | 2013(2) | | 2012(2) | |
|---|
Profit for the period | | | | | | 121,877 | | | 110,324 | | | 94,020 | |
| | | | | | | | | | | | | | |
Items that may be subject to transfer to income statement: | | | | | | | | | | | | | |
Change in fair value of available for sale financial assets | | | | | |
(1,414 |
) | |
(568 |
) | |
1,390 | |
Change in fair value of cash flow hedges | | | | | | (223,219 | ) | | 89,925 | | | (237,802 | ) |
Currency translation differences | | | | | | 83,724 | | | (483,826 | ) | | (256,257 | ) |
Tax effect | | | | | | 55,657 | | | (25,152 | ) | | 68,100 | |
Other movements | | | | | | — | | | (6,292 | ) | | (91 | ) |
| | | | | | | | | | | | | | |
Net income / (expenses) recognized directly in equity | | | | | | (85,252 | ) | | (425,913 | ) | | (424,660 | ) |
| | | | | | | | | | | | | | |
Cash flow hedges | | | | | | 29,720 | | | 88,924 | | | 96,172 | |
Tax effect | | | | | | (8,322 | ) | | (26,677 | ) | | (28,852 | ) |
| | | | | | | | | | | | | | |
Transfers to income statement for the period | | | | | | 21,398 | | | 62,247 | | | 67,320 | |
| | | | | | | | | | | | | | |
Other comprehensive income (loss) | | | | | | (63,854 | ) | | (363,666 | ) | | (357,340 | ) |
| | | | | | | | | | | | | | |
Total comprehensive income (loss) for the period | | | | | | 58,023 | | | (253,342 | ) | | (263,320 | ) |
| | | | | | | | | | | | | | |
Total comprehensive income (loss) attributable to non-controlling interest | | | | | | (8,354 | ) | | 59,142 | | | 9,080 | |
Total comprehensive income (loss) attributable to the parent company | | | | | | 49,669 | | | (194,200 | ) | | (254,240 | ) |
Total comprehensive income (loss) attributable to the parent company from continuining operations | | | | | | 63,980 | | | (170,696 | ) | | (252,553 | ) |
Total comprehensive income (loss) attributable to the parent company from discontinued operations | | | | | | (14,311 | ) | | (23,504 | ) | | (1,687 | ) |
- (1)
- Notes 1 to 33 are an integral part of these Consolidated Financial Statements
- (2)
- Figures recasted, see Note 7 Assets held for sale and discontinued operations of these Consolidated Financial Statements.
F-8
Table of Contents
ABENGOA
Consolidated financial statements
Consolidated statements of changes in equity for years ended December 31, 2014,
2013 and 2012
– Amounts in thousands euros –
| | | | | | | | | | | | | | | | | | | | | | |
| | Attributable to the owners of the Company | |
| |
| |
|---|
| | Share
capital | | Parent
company
and other
reserves | | Accumulated
currency
translation
differences | | Retained
earnings | | Total | | Non-controlling
interest | | Total
equity | |
|---|
Balance at January 1, 2012 | | | 90,641 | | | 419,826 | | | 41,353 | | | 882,578 | | | 1,434,398 | | | 434,220 | | | 1,868,618 | |
| | | | | | | | | | | | | | | | | | | | | | | |
Profit for the year after taxes | | | — | | | — | | | — | | | 55,370 | | | 55,370 | | | 38,650 | | | 94,020 | |
Other comprehensive income (loss) | | | — | | | (100,876 | ) | | (208,733 | ) | | — | | | (309,609 | ) | | (47,730 | ) | | (357,339 | ) |
Total comprehensive income (loss) | | | — | | | (100,876 | ) | | (208,733 | ) | | 55,370 | | | (254,239 | ) | | (9,080 | ) | | (263,319 | ) |
Treasury shares | | | — | | | 69 | | | — | | | — | | | 69 | | | — | | | 69 | |
Capital increase | | | 4,305 | | | (4,305 | ) | | — | | | | | | — | | | — | | | — | |
Capital decrease | | | (4,802 | ) | | 4,802 | | | — | | | | | | — | | | — | | | — | |
Distribution of 2011 profit | | | — | | | 33,735 | | | — | | | (71,399 | ) | | (37,664 | ) | | — | | | (37,664 | ) |
Transactions with owners | | | (497 | ) | | 34,301 | | | — | | | (71,399 | ) | | (37,595 | ) | | — | | | (37,595 | ) |
Acquisitions | | | — | | | — | | | — | | | (1,125 | ) | | (1,125 | ) | | 46,328 | | | 45,203 | |
Capital increase in subsidiaries with non-controlling interest | | | — | | | — | | | — | | | — | | | — | | | 272,012 | | | 272,012 | |
Scope variations and other movements | | | — | | | (5,111 | ) | | — | | | (18,173 | ) | | (23,284 | ) | | (1,272 | ) | | (24,556 | ) |
Scope variations, acquisitions and other movements | | | — | | | (5,111 | ) | | — | | | (19,298 | ) | | (24,409 | ) | | 317,068 | | | 292,659 | |
| | | | | | | | | | | | | | | | | | | | | | | |
Balance at December 31, 2012 | | | 90,144 | | | 348,140 | | | (167,380 | ) | | 847,251 | | | 1,118,155 | | | 742,208 | | | 1,860,363 | |
| | | | | | | | | | | | | | | | | | | | | | | |
Profit for the year after taxes | | | — | | | — | | | — | | | 101,445 | | | 101,445 | | | 8,879 | | | 110,324 | |
Other comprehensive income (loss) | | | — | | | 119,810 | | | (415,455 | ) | | — | | | (295,645 | ) | | (68,021 | ) | | (363,666 | ) |
Total comprehensive income (loss) | | | — | | | 119,810 | | | (415,455 | ) | | 101,445 | | | (194,200 | ) | | (59,142 | ) | | (253,342 | ) |
Treasury shares | | | — | | | (84,173 | ) | | — | | | — | | | (84,173 | ) | | — | | | (84,173 | ) |
Capital increase | | | 2,875 | | | 514,625 | | | — | | | — | | | 517,500 | | | — | | | 517,500 | |
Capital decrease | | | (1,162 | ) | | 1,162 | | | — | | | — | | | — | | | — | | | — | |
Distribution of 2012 profit | | | — | | | 76,755 | | | — | | | (115,496 | ) | | (38,741 | ) | | — | | | (38,741 | ) |
Transactions with owners | | | 1,713 | | | 508,369 | | | — | | | (115,496 | ) | | 394,586 | | | — | | | 394,586 | |
Acquisitions | | | — | | | — | | | — | | | 3,029 | | | 3,029 | | | (7,480 | ) | | (4,451 | ) |
Capital increase in subsidiaries with non-controlling interest | | | — | | | — | | | — | | | — | | | — | | | 39,936 | | | 39,936 | |
Scope variations and other movements | | | — | | | (16,865 | ) | | — | | | 16,149 | | | (716 | ) | | (143,373 | ) | | (144,089 | ) |
Scope variations, acquisitions and other movements | | | — | | | (16,865 | ) | | — | | | 19,178 | | | 2,313 | | | (110,917 | ) | | (108,604 | ) |
| | | | | | | | | | | | | | | | | | | | | | | |
Balance at December 31, 2013 | | | 91,857 | | | 959,454 | | | (582,835 | ) | | 852,378 | | | 1,320,854 | | | 572,149 | | | 1,893,003 | |
| | | | | | | | | | | | | | | | | | | | | | | |
Profit for the year after taxes | | | — | | | — | | | — | | | 125,292 | | | 125,292 | | | (3,415 | ) | | 121,877 | |
Other comprehensive income (loss) | | | — | | | (129,127 | ) | | 53,504 | | | — | | | (75,623 | ) | | 11,769 | | | (63,854 | ) |
Total comprehensive income (loss) | | | — | | | (129,127 | ) | | 53,504 | | | 125,292 | | | 49,669 | | | 8,354 | | | 58,023 | |
Treasury shares | | | — | | | (2,217 | ) | | — | | | — | | | (2,217 | ) | | — | | | (2,217 | ) |
Capital increase | | | — | | | — | | | — | | | — | | | — | | | — | | | — | |
Capital decrease | | | (1,003 | ) | | 1,003 | | | — | | | — | | | — | | | — | | | — | |
Distribution of 2013 profit | | | 945 | | | 154,018 | | | — | | | (194,020 | ) | | (39,057 | ) | | — | | | (39,057 | ) |
Transactions with owners | | | (58 | ) | | 152,804 | | | — | | | (194,020 | ) | | (41,274 | ) | | — | | | (41,274 | ) |
Acquisitions | | | — | | | — | | | — | | | (29,318 | ) | | (29,318 | ) | | — | | | (29,318 | ) |
Capital increase in subsidiaries with non-controlling interest | | | — | | | — | | | — | | | 86,070 | | | 86,070 | | | 630,681 | | | 716,751 | |
Change in conditions of conversion option in convertible note | | | — | | | 62,894 | | | — | | | — | | | 62,894 | | | — | | | 62,894 | |
Scope variations and other movements | | | — | | | (1,322 | ) | | — | | | (2,303 | ) | | (3,625 | ) | | (10,282 | ) | | (13,907 | ) |
Scope variations, acquisitions and other movements | | | — | | | 61,572 | | | — | | | 54,449 | | | 116,021 | | | 620,399 | | | 736,420 | |
| | | | | | | | | | | | | | | | | | | | | | | |
Balance at December 31, 2014 | | | 91,799 | | | 1,044,703 | | | (529,331 | ) | | 838,099 | | | 1,445,270 | | | 1,200,902 | | | 2,646,172 | |
| | | | | | | | | | | | | | | | | | | | | | | |
Notes 1 to 33 are an integral part of these Consolidated Financial Statements
F-9
Table of Contents
ABENGOA
Consolidated financial statements
Consolidated cash flow statements for the years 2014, 2013 and 2012
– Amounts in thousands of euros –
| | | | | | | | | | | | | |
| | Note(1) | | 2014 | | 2013(2) | | 2012(2) | |
|---|
I. Profit for the year from continuing operations | | | | | | 144,080 | | | 133,066 | | | 73,844 | |
| | | | | | | | | | | | | | |
| | | | | | | | | | | | | | |
| | | | | | | | | | | | | | |
Non-monetary adjustments | | | | | | | | | | | | | |
Depreciation, amortization and impairment charges | | | 5 | | | 474,864 | | | 516,368 | | | 406,276 | |
Finance (income)/expenses | | | | | | 648,346 | | | 461,159 | | | 351,363 | |
Fair value gains on derivative financial instruments | | | 30 | | | 35,145 | | | (87,742 | ) | | 74,354 | |
Shares of (profits)/losses from associates | | | 11 | | | (7,018 | ) | | 5,175 | | | (17,875 | ) |
Income tax | | | 31 | | | (58,646 | ) | | (26,183 | ) | | (174,082 | ) |
Changes in consolidation and other non-monetary items | | | | | | (54,078 | ) | | (71,074 | ) | | 39,317 | |
| | | | | | | | | | | | | | |
II. Profit for the year from continuing operations adjusted by
non monetary items | | | | | | 1,182,693 | | | 930,769 | | | 753,197 | |
| | | | | | | | | | | | | | |
| | | | | | | | | | | | | | |
| | | | | | | | | | | | | | |
Variations in working capital and discontinued operations | | | | | | | | | | | | | |
Inventories | | | | | | 67,116 | | | 7,900 | | | (56,989 | ) |
Clients and other receivables | | | | | | (654,732 | ) | | (8,442 | ) | | (402,415 | ) |
Trade payables and other current liabilities | | | | | | 246,317 | | | (47,014 | ) | | 636,523 | |
Financial investments and other current assets/liabilities | | | | | | (158,075 | ) | | 196,646 | | | (66,736 | ) |
Discontinued operations | | | | | | (24,245 | ) | | 72,148 | | | 39,111 | |
| | | | | | | | | | | | | | |
III. Variations in working capital and discontinued operations | | | | | | (523,619 | ) | | 221,238 | | | 149,494 | |
| | | | | | | | | | | | | | |
| | | | | | | | | | | | | | |
| | | | | | | | | | | | | | |
Income tax paid | | | | | | 8,642 | | | (12,105 | ) | | (35,477 | ) |
Interest paid | | | | | | (806,196 | ) | | (545,801 | ) | | (464,325 | ) |
Interest received | | | | | | 33,899 | | | 36,869 | | | 67,358 | |
Discontinued operations | | | | | | 123,167 | | | 81,503 | | | 117,041 | |
| | | | | | | | | | | | | | |
A. Net cash provided by operating activities | | | | | | 18,586 | | | 712,473 | | | 587,288 | |
| | | | | | | | | | | | | | |
Acquisition of subsidiaries | | | 11 | | | (303,744 | ) | | (372,736 | ) | | (517,002 | ) |
Investment in property, plant & equipment | | | 9 & 10 | | | (142,265 | ) | | (101,429 | ) | | (234,441 | ) |
Investment in intangible assets | | | 8 & 10 | | | (2,437,292 | ) | | (1,782,953 | ) | | (1,980,010 | ) |
Other non-current assets/liabilities | | | | | | (34,816 | ) | | (116,895 | ) | | (215,174 | ) |
Non-controlling interest | | | | | | — | | | (35,939 | ) | | — | |
Discontinued operations | | | 7 | | | 284,019 | | | 532,883 | | | 730,488 | |
| | | | | | | | | | | | | | |
I. Investments | | | | | | (2,634,098 | ) | | (1,877,069 | ) | | (2,216,139 | ) |
| | | | | | | | | | �� | | | | |
| | | | | | | | | | | | | | |
| | | | | | | | | | | | | | |
Disposal of subsidiaries | | | | | | 11,707 | | | 43,496 | | | 9,456 | |
Sale of property, plant & equipment | | | 9 & 10 | | | 14,142 | | | 3,313 | | | 1,399 | |
Sale of intangible assets | | | 8 & 10 | | | 10,552 | | | 665 | | | 60 | |
Other non-current assets/liabilities | | | | | | 97,993 | | | 361,208 | | | 354,270 | |
Proceeds from contribution of partners to investments in projects | | | | | | — | | | 139,262 | | | 297,443 | |
Discontinued operations | | | 7 | | | — | | | (35,240 | ) | | (252,151 | ) |
| | | | | | | | | | | | | | |
II. Disposals | | | | | | 134,394 | | | 512,704 | | | 410,477 | |
| | | | | | | | | | | | | | |
B. Net cash used in investing activities | | | | | | (2,499,704 | ) | | (1,364,365 | ) | | (1,805,662 | ) |
| | | | | | | | | | | | | | |
Proceeds from loans and borrowings | | | | | | 5,038,869 | | | 3,281,532 | | | 757,057 | |
Repayment of loans and borrowings | | | | | | (4,108,544 | ) | | (1,801,968 | ) | | (229,656 | ) |
Dividends paid to company´s shareholders | | | | | | (39,057 | ) | | (38,741 | ) | | (36,632 | ) |
Initial Public Offering of subsidiaries | | | | | | 611,039 | | | — | | | — | |
Other finance activities | | | | | | 338,818 | | | 477,746 | | | (6,075 | ) |
Discontinued operations | | | 7 | | | (250,507 | ) | | (721,088 | ) | | (479,074 | ) |
| | | | | | | | | | | | | | |
C. Net cash provided by financing activities | | | | | | 1,590,618 | | | 1,197,481 | | | 5,620 | |
| | | | | | | | | | | | | | |
Net increase/(decrease) in cash and cash equivalents | | | | | | (890,500 | ) | | 545,589 | | | (1,212,754 | ) |
| | | | | | | | | | | | | | |
Cash, cash equivalents and bank overdrafts at beginning of the year | | | 17 | | | 2,951,683 | | | 2,413,184 | | | 3,723,204 | |
Translation differences cash or cash equivalent | | | | | | 31,276 | | | 104,964 | | | (66,058 | ) |
Assets held for sale | | | | | | (21,792 | ) | | — | | | — | |
Discontinued operations | | | | | | (259,854 | ) | | (112,054 | ) | | (31,208 | ) |
| | | | | | | | | | | | | | |
Cash and cash equivalents at end of the year | | | | | | 1,810,813 | | | 2,951,683 | | | 2,413,184 | |
| | | | | | | | | | | | | | |
- (1)
- Notes 1 to 33 are an integral part of these Consolidated Financial Statements
- (2)
- Figures recasted, see Note 7 Assets held for sale and discontinued operations of these Consolidated Financial Statements
F-10
Table of Contents
ABENGOA
Consolidated financial statements
Contents
F-11
Table of Contents
ABENGOA
Consolidated financial statements
Notes to the consolidated financial statements
Note 1. — General information
Abengoa, S.A. is the parent company of the Abengoa Group (referred to hereinafter as 'Abengoa', 'the Group' or 'the Company'), which at the end of 2014, was made up of 653 companies: the parent company itself, 607 subsidiaries, 17 associates and 28 joint ventures. Additionally, as of the end of 2014, certain subsidiaries were participating in 244 temporary joint operations (UTE) and, furthermore, the Group held a number of interests, of less than 20%, in several other entities.
Abengoa, S.A. was incorporated in Seville, Spain on January 4, 1941 as a Limited Liability Company and was subsequently transformed into a Limited Liability Corporation ('S.A.' in Spain) on March 20, 1952. Its registered office is Campus Palmas Altas, C/ Energía Solar nº 1, 41014 Seville.
The Group's corporate purpose is set out in Article 3 of its Bylaws. It covers a wide range of activities, although Abengoa is principally an applied engineering and equipment manufacturer, providing integrated project solutions to customers in the following sectors: energy, telecommunications, transport, water utilities, environmental, industrial and service.
Abengoa's shares are represented by class A and B shares which are listed on the Madrid and Barcelona stock exchanges and on the Spanish Stock Exchange Electronic Trading System (Electronic Market) and Class B shares are included in the IBEX 35. Class A shares have been listed since November 29, 1996 and class B shares since October 25, 2012. Additionally, Class B shares are also listed on the NASDAQ Global Select Market in the form of American Depositary Shares from October 29, 2013 following the capital increase carried out on October 17, 2013. The Company presents mandatory financial information quarterly and semiannually.
Following the initial public offering of our subsidiary Abengoa Yield (see Note 6.2), of which Abengoa held a 64.28% interest as of December 31, 2014, Abengoa Yield's shares are also listed in the NASDAQ Global Select Market from June 13, 2014.
Abengoa is an international company that applies innovative technology solutions for sustainability in the energy and environment sectors, generating electricity from renewable resources, converting biomass into biofuels and producing drinking water from sea water. The Company supplies engineering projects under the 'turnkey' contract modality and operates assets that generate renewable energy, produce biofuel, manage water resources, desalinate sea water and treat sewage.
Abengoa`s business and the internal and external management information are organized under the following three activities:
- •
- Engineering and construction: includes the traditional engineering activities in the energy and water sectors, with more than 70 years of experience in the market and the development of solar technology. Abengoa is specialized in carrying out complex turn-key projects for thermo-solar plants, solar-gas hybrid plants, conventional generation plants, biofuels plants and water infrastructures, as well as large-scale desalination plants and transmission lines, among others.
- •
- Concession-type infrastructures: groups together the company's extensive portfolio of proprietary concession assets that generate revenues governed by long term sales agreements, such as take-or-pay contracts, tariff contracts or power purchase agreements. This activity includes, the operation of electric (solar, cogeneration or wind) energy generation plants and transmission lines. These assets generate low demand risk and the Company focuses on operating them as efficiently as possible.
F-12
Table of Contents
ABENGOA
Consolidated financial statements
- •
- Industrial production: covers Abengoa's businesses with a high technological component, such as development of biofuels technology. The Company holds an important leadership position in these activities in the geographical markets in which it operates.
These Consolidated Financial Statements were approved by the Chiel Executive Officer on February 23, 2015.
All public documents of Abengoa may be viewed at www.abengoa.com.
Note 2. — Significant accounting policies
The significant accounting policies adopted in the preparation of the accompanying Consolidated Financial Statements are set forth below:
- 2.1.
- Basis of presentation
The Consolidated Financial Statements as of December 31, 2014 and 2013, and for the three years ended December 31, 2014, 2013 and 2012 have been prepared in accordance with International Financial Reporting Standards Board as issued by the International Accounting Standards Board (IFRS-IASB) and, they present the Group's consolidated statements of financial position as of December 31, 2014 and 2013 and the consolidated income statements, consolidated statements of comprehensive income, consolidated statements of change in equity and the consolidated cash flows statements for the years ended December 31, 2014, 2013 and 2012.
Unless otherwise stated, the accounting policies set out below have been applied consistently throughout all periods presented within these Consolidated Financial Statements.
The Consolidated Financial Statements have been prepared under the historical cost convention, modified by the revaluation of certain available-for-sale non-current financial assets under IFRS 1 and with the exception of those situations where IFRS requires that financial assets and financial liabilities are measured at fair value.
The preparation of the Consolidated Financial Statements under IFRS requires the use of certain critical accounting estimates. It also requires that Management exercises its judgment in the process of applying Abengoa's accounting policies. Note 3 provides further information on those areas which involve a higher degree of judgment or areas of complexity for which the assumptions or estimates made are significant to the financial statements.
The amounts included within the Consolidated Financial Statements (Consolidated Statement of Financial Position, Consolidated Income Statement, Consolidated Statement of Comprehensive Income, Consolidated Statement of Changes in Equity, Consolidated Cash Flow Statement and notes herein) are, unless otherwise stated, all expressed in thousands of Euros (€).
Any presented percentage of interest in subsidiaries, joint ventures (including temporary joint operations) and associates includes both direct and indirect ownership.
- 2.1.1.
- Application of new accounting standards
- a)
- Standards, interpretations and amendments published by the IASB effective from January 1, 2014, applied by the Group:
- •
- IAS 32 (Amendment) 'Offsetting of financial assets and financial liabilities'.
- •
- IAS 36 (Amendment) 'Recoverable Amount Disclosures for Non-Financial Assets'.
F-13
Table of Contents
ABENGOA
Consolidated financial statements
- •
- IAS 39 (Amendment) 'Novation of Derivatives and Continuation of Hedge Accounting'.
- •
- IFRIC 21 (Interpretation) 'Levies'.
- 2.1.2.
- IFRIC 12—Service concession arrangements
As stated in the consolidated financial statements for 2011 and as a result of IFRIC 12 'Service Concession Arrangements' that came into effect in 2010, the Company carried out an analysis of other agreements in the Group and identified further infrastructures, specifically thermo-solar plants in Spain included under the special arrangements of RD 661/2007 and recorded in the pre-assignment register in November 2009, which could potentially be classified as service concession arrangements.
F-14
Table of Contents
ABENGOA
Consolidated financial statements
At the end of 2010, the company decided that it needed to carry out a more in-depth analysis of the issue since the reasons that justified the accounting application of the interpretation had not been sufficiently proven based on the information available at that date.
During 2010 and 2011, the Spanish government issued several laws and resolutions that regulate the market for renewable energy in Spain in general, and thermo-solar activities in particular. In early 2011, when Abengoa received a set of individual rulings from the Spanish Ministry of Industry for each of its thermo-solar assets,the Company returned to work on the analysis of applying IFRIC 12 to its thermo-solar plants in Spain. In September 2011 the Company concluded that it was required to start applying IFRIC 12 to its thermo-solar plants in Spain included under the special scheme of Royal Decree 661/2007 and recorded in the pre-assignment register in November 2009, just as it was doing for its other concession assets, based on all available information and the newly acquired knowledge from the analysis performed.
As explained in the preceding paragraphs, it was not possible to allow application on January 1, 2010 of IFRIC 12 to those thermo-solar plants and, as indicated in Paragraph 52 of IAS 8 on Accounting Policy and Changes to Accounting Estimates, the application became prospective as from September 1, 2011.
At the time of application of IFRIC 12, the Company reclassified all capitalized costs under the heading of 'other assets in projects' relating to thermo-solar plants into 'concession assets in projects' for an amount of €1.6 billion. Similarly, from September 1, 2011, all revenues and costs related to the construction of these plants were recorded based on the percentage of completion method in accordance with IAS 11, from the date of the prospective application of IFRIC 12 to the end of the construction of these assets which were estimated for completion in 2013. This treatment deferred recognition of the costs, margins and revenues generated up to that date and previously eliminated in consolidation prospectively, pro rata, over the term of the remaining construction period.
During 2013, the Company re-evaluated the assumptions made in 2011 that justified the application of IFRIC 12 to thermo-solar plants in Spain as described above. On June 30, 2013 and based on the provisions of IAS 8.14, the Directors deemed it necessary to change the accounting policy applied to these plants. It is believed that financial statements will provide more reliable and comparable information about the application of IFRIC 12 to thermo-solar plants in Spain. The accounting change modified the method in which we initially applied IFRIC 12, as well as the date on which IFRIC 12 was applied (January 1, 2011 instead of September 1, 2011).
The revised accounting treatment consisted in applying IFRIC 12 prospectively from January 1, 2011 by derecognizing, our thermo-solar plant assets previously recognized at cost as "Property, Plant and Equipment in Projects" and recognizing those thermo-solar plant assets at fair value as "Concession Assets in Projects". The difference of €165 million was recorded in that moment in "Other Operating Income" on the consolidated income statement. From January 1, 2011, only the remaining contract revenue, costs and margins generated after such date for the ongoing construction of the plants began to be recognized based on the "percentage of completion" accounting method in accordance with IAS 11. In addition, the revenue and operating profit that were previously deferred upon original adoption of IFRIC 12 and recognized prospectively during fiscal years 2011 and 2012 were eliminated. The change in application date resulted in the recognition of revenues and costs associated with the
F-15
Table of Contents
ABENGOA
Consolidated financial statements
construction activities that occurred between January 1, 2011 and September 1, 2011, that were previously eliminated.
This change in accounting policy for the application of IFRIC 12 to the thermo-solar plants in Spain, reflects the spirit of Paragraph 45 of IAS 1 which justifies changes in the presentation (in addition to the classification) of annual accounts. As a result of the change, there is an improved presentation of the financial statements. They better reflect the plant construction operations underway in each financial year, without altering the trend of the group's earnings. They also facilitate comparisons between periods.
- 2.2.
- Principles of consolidation
In order to provide information on a consistent basis, the same principles and standards applied to the parent company have been applied to all other consolidated entities.
All subsidiaries, associates and joint ventures included in the consolidated group for the years 2014 (2013 and 2012) that form the basis of these Consolidated Financial Statements are set out in Appendices I (XII and XVII), II (XIII and XVIII) and III (XIV and XIX), respectively.
Note 6 of these Consolidated Financial Statements reflects the information on the changes in the composition of the Group.
- a)
- Subsidiaries
The Company reassesses whether or not it controls an investee when facts and circumstances indicate that there are changes to one or more of the three elements of control listed above.
The Company operates an integrated business model in which it provides complete services form initial design, construction and engineering to operation and maintenance of infrastructure assets. In order to evaluate the existence of control, we need to distinguish two independent stages in these projects in terms of decision making process: the construction phase and the operation phase. In some of these projects (such as Solana and Mojave thermo-solar plants in the United States, Hugoton second generation biofuels plant in the United States and solar plants currently under construction in South Africa), all the relevant decisions during the construction phase are subject to the approval and control of a third party. As a result, Abengoa does not have control over these assets during this period and records these companies as associates under the equity method. Once the project is in operation, Abengoa gains control over these companies which are then fully consolidated.
When the Company has less than a majority of the voting rights of an investee, it has power over the investee when the voting rights are sufficient to give it the practical ability to direct the relevant activities of the investee unilaterally. The Company considers all relevant facts and
F-16
Table of Contents
ABENGOA
Consolidated financial statements
circumstances in assessing whether or not the Company's voting rights in an investee are sufficient to give it power, including:
- •
- the size of the Company's holding of voting rights relative to the size and dispersion of holdings of the other vote holders;
- •
- potential voting rights held by the Company, other vote holders or other parties;
- •
- rights arising from other contractual arrangements; and
- •
- any additional facts and circumstances that indicate that the Company has, or does not have, the current ability to direct the relevant activities at the time that decisions need to be made, including voting patterns at previous shareholders' meetings.
Consolidation of a subsidiary begins when the Company obtains control over the subsidiary and ceases when the Company loses control of the subsidiary.
The Group uses the acquisition method to account for business combinations. According to this method, the consideration transferred for the acquisition of a subsidiary corresponds to the fair value of the assets transferred, the liabilities incurred and the equity interests issued by the Group and includes the fair value of any asset or liability resulting from a contingent consideration arrangement. Any contingent consideration is recognized at fair value at the acquisition date and subsequent changes in its fair value are recognized in accordance with IAS 39 either in profit or loss or as a change to other comprehensive income. Acquisition related costs are expensed as incurred. Identifiable assets acquired, liabilities and contingent liabilities assumed in a business combination are measured initially at their fair values at the acquisition date. The Group recognizes any non controlling interest in the acquiree either at the non controlling interest's proportionate share of the acquirer's net assets on an acquisition basis.
The value of non controlling interest in equity and the consolidated results are shown, respectively, under 'Non controlling interests' of the Consolidated Statements of Financial Position and 'Profit attributable to non controlling interests' in the Consolidated Income Statements.
Profit for the period and each component of other comprehensive income are attributed to the owners of the Company and to the non controlling interests. Total comprehensive income of subsidiaries is attributed to the owners of the Company and to the non controlling interests even if this results in the non controlling interests having a total negative balance.
When necessary, adjustments are made to the financial statements of subsidiaries to bring their accounting policies in line with the Group's accounting policies.
All intragroup assets and liabilities, equity, income, expenses and cash flows relating to transactions between members of the Group are eliminated in full on consolidation.
In compliance with Article 155 of Spanish Corporate Law (Ley de Sociedades de Capital), the parent company has notified all these companies that, either by itself or through another subsidiary, it owns more than 10 per 100 shares of their capital. Appendix IX lists the Companies external to the Group which have a share equal to or greater than 10% of a subsidiary of the parent company under consolidation scope.
F-17
Table of Contents
ABENGOA
Consolidated financial statements
- b)
- Associates and joint ventures
An associate is an entity over which the Group has significant influence. Significant influence is the power to participate in the financial and operating policy decisions of the investee but is not control or joint control over those policies.
A joint venture, as opposed to a joint operation described in section c) below, is a joint arrangement whereby the parties that have joint control of the arrangement have rights to the net assets of the joint arrangement. Joint control is the contractually agreed sharing of control of an arrangement, which exists only when decisions about the relevant activities require unanimous consent of the parties sharing control.
The results and assets and liabilities of associates or joint ventures are incorporated in these Consolidated Financial Statements using the equity method of accounting. Under the equity method, an investment in an associate or a joint venture is initially recognized in the consolidated statement of financial position at cost and adjusted thereafter to recognize the Group's share of the profit or loss and other comprehensive income of the associate or joint venture. When the Group's share of losses of an associate or a joint venture exceeds the Group's interest in that associate or joint venture, the Group discontinues recognizing its share of further losses. Additional losses are recognized only to the extent that the Group has incurred legal or constructive obligations or made payments on behalf of the associate or joint venture.
An investment in an associate or a joint venture is accounted for using the equity method from the date on which the investee becomes an associate or a joint venture.
Profits and losses resulting from the transactions of the Company with the associate or joint venture are recognized in the Group's Consolidated Financial Statements only to the extent of interests in the associate or joint venture that are not related to the Group.
In compliance with Article 155 of Spanish Corporate Law (Ley de Sociedades de Capital), the parent company has notified all these companies that, either by itself or through another subsidiary, it owns more than 10 per 100 shares of their capital.
As of December 31, 2014 and 2013 there are no significant contingent liabilities in the Group's interests in associeates and joint ventures.
- c)
- Interest in joint operations and temporary joint operations (UTE)
A joint operation is a joint arrangement whereby the parties that have joint control of the arrangement have rights to the assets, and obligations for the liabilities, relating to the arrangement. Joint control is the contractually agreed sharing of control of an arrangement, which exists only when decisions about the relevant activities require unanimous consent of the parties sharing control.
When a group entity undertakes its activities under joint operations, the Group as a joint operator recognises in relation to its interest in a joint operation:
- •
- Its assets, including its share of any assets held jointly.
- •
- Its liabilities, including its share of any liabilities incurred jointly.
- •
- Its share of the revenue from the sale of the output by the joint operation.
- •
- Its expenses, including its share of any expenses incurred jointly.
F-18
Table of Contents
ABENGOA
Consolidated financial statements
When a group entity transacts with a joint operation in which a group entity is a joint operator (such as a purchase of assets), the Group does not recognize its share of the gains and losses until it resells those assets to a third party.
'Unión Temporal de Empresas' (UTE) are temporary joint operations generally formed to execute specific commercial and/or industrial projects in a wide variety of areas and particularly in the fields of engineering and construction and infrastructure projects. They are normally used to combine the characteristics and qualifications of the UTE's partners into a single proposal in order to obtain the most favorable technical assessment possible. UTE are normally limited as standalone entities with limited action, since, although they may enter into commitments in their own name, such commitments are generally undertaken by their partners, in proportion to each investor's share in the UTE.
The partners' shares in the UTE normally depend on their contributions (quantitative or qualitative) to the project, are limited to their own tasks and are intended solely to generate their own specific results. Each partner is responsible for executing its own tasks and does so in its own interests.
The fact that one of the UTE's partners acts as project manager does not affect its position or share in the UTE. The UTE's partners are collectively responsible for technical issues, although there are strict pari passu clauses that assign the specific consequences of each investor's correct or incorrect actions.
UTE are not variable interest or special purpose entities. UTE do not usually own assets or liabilities on a standalone basis. Their activity is conducted for a specific period of time that is normally limited to the execution of the project. The UTE may own certain fixed assets used in carrying out its activity, although in this case they are generally acquired and used jointly by all the UTE's investors, for a period similar to the project's duration, or prior agreements are signed by the partners on the assignment or disposal of the UTE's assets upon completion of the project.
UTE in which the Company participates are operated through a management committee comprised of equal representation from each of the temporary joint operation partners, and such committee makes all the decisions about the temporary joint operation's activities that have a significant effect on its success. All the decisions require consent of each of the parties sharing power, so that all the parties together have the power to direct the activities of the UTE. Each partner has rights to the assets and obligations relating to the arrangement. As a result, these temporary joint operations are consolidated proportionally.
The proportional part of the UTE's Consolidated Statement of Financial Position and Consolidated Income Statement is integrated into the Consolidated Statement of Financial Position and the Consolidated Income Statement of the Company in proportion to its interest in the UTE on a line by line basis.
As of December 31, 2014 and 2013 there are no significant material contingent liabilities in relation to the Group's shareholdings in the UTE, additional to those described in Note 22.2.
- d)
- Transactions with non-controlling interests
Transactions with non-controlling interests are accounted for as transactions with equity owners of the group. When the Group acquires non-controlling interests, the difference between any consideration paid and the carrying value of the proportionate share of net assets
F-19
Table of Contents
ABENGOA
Consolidated financial statements
acquired is recorded in equity. Gains or losses on disposals of non-controlling interests are also recorded in equity.
When the group ceases to have control or significant influence, any retained interest in the entity is remeasured to its fair value, and any difference between fair value and its carrying amount is recognized in profit or loss. In addition, any amount previously recognized in other comprehensive income in respect of that entity is accounted for as if the group had directly disposed of the related assets or liabilities.
Companies and entities which are third parties the Group and which hold a share equal to or larger than 10% in the share capital of any company included in the consolidation group are disclosed in Appendix VIII.
- 2.3.
- Intangible assets
- a)
- Goodwill
Goodwill is recognized as the excess between (A) and (B), where (A) is the sum of the considerations transferred, the amount of any non-controlling interest in the acquiree and in the case of a business combination achieved in stages, the fair value on the acquisition date of the previously held interest in the acquiree and (B) the net value, at the acquisition date, of the identifiable assets acquired, the liabilities and contingent liabilities assumed, measured at fair value. If the resulting amount is negative, in the case of a bargain purchase, the difference is recognized as income directly in the Consolidated Income Statement.
Goodwill relating to the acquisition of subsidiaries is included in intangible assets, while goodwill relating to associates is included in investments in associates.
Goodwill is carried at initial value less accumulated impairment losses (see Note 2.8). Goodwill is allocated to Cash Generating Units (CGU) for the purposes of impairment testing, these CGU's being the units which are expected to benefit from the business combination that generated the goodwill.
- b)
- Computer programs
Costs paid for licenses for computer programs are capitalized, including preparation and installation costs directly associated with the software. Such costs are amortized over their estimated useful life. Maintenance costs are expensed in the period in which they are incurred.
Costs directly related with the production of identifiable computer programs are recognized as intangible assets when they are likely to generate future economic benefit for a period of one or more years and they fulfill the following conditions:
- •
- it is technically possible to complete the production of the intangible asset;
- •
- management intends to complete the intangible asset;
- •
- the Company is able to use or sell the intangible asset;
- •
- there are technical, financial and other resources available to complete the development of the intangible asset; and
- •
- disbursements attributed to the intangible asset during its development may be reliably measured.
F-20
Table of Contents
ABENGOA
Consolidated financial statements
Costs that do not meet the criteria above are recognized as expenses in the Consolidated Income Statement when incurred.
- c)
- Research and development cost
Research costs are recognized as an expense when they are incurred.
Development costs (relating to the design and testing of new and improved products) are recognized as an intangible asset when all the following criteria are met:
- •
- it is probable that the project will be successful, taking into account its technical and commercial feasibility, so that the project will be available for its use or sale;
- •
- it is probable that the project generates future economic benefits;
- •
- management intends to complete the project;
- •
- the Company is able to use or sell the intangible asset;
- •
- there are appropriate technical, financial or other resources available to complete the development and to use or sell the intangible asset; and
- •
- the costs of the project/product can be measured reliably.
Once the product is in the market, capitalized costs are amortized on a straight-line basis over the period for which the product is expected to generate economic benefits, which is normally 5 years, except for development assets related to the thermo-solar plant using tower technology and the second-generation biofuels plant, which are amortized according to its useful life.
Development costs that do not meet the criteria above are recognized as expenses in the Consolidated Income Statement when incurred.
Grants or subsidized loans obtained to finance research and development projects are recognized as income in the Consolidated Income Statement consistently with the expenses they are financing (following the rules described above).
- 2.4.
- Property, plant and equipment
Property, plant and equipment includes property, plant and equipment of companies or project companies which have been self-financed or financed through external financing with recourse facilities or through non-recourse project financing.
In general, property, plant and equipment is measured at historical cost, including all expenses directly attributable to the acquisition, less depreciation and impairment losses, with the exception of land, which is presented net of any impairment losses.
Subsequent costs are capitalized when it is probable that future economic benefits associated with that asset can be separately and reliably identified.
Work carried out by a company on its own property, plant and equipment is valued at production cost. In construction projects of the Company's owned assets carried out by its Engineering and Construction segment which are not under the scope of IFRIC 12 on Service Concession Arrangements (see Note 2.5), internal margins are eliminated. The corresponding costs are recognized in the individual expense line item in the accompanying income statements. The recognition of an income for the sum of such costs through the line item 'Other income- Work performed by the entity and capitalized and other' results in these costs having no impact in net operating profit. The
F-21
Table of Contents
ABENGOA
Consolidated financial statements
corresponding assets are capitalized and included in property, plant and equipment in the accompanying balance sheets.
All other repair and maintenance costs are charged to the Consolidated Income Statement in the period in which they are incurred.
Costs incurred during the construction period may also include gains or losses from foreign-currency cash-flow hedging instruments for the acquisition of property, plant and equipment in foreign currency, transferred from equity.
With regard to investments in property, plant and equipment located on land belonging to third parties, an initial estimate of the costs of dismantling the asset and restoring the site to its original condition is also included in the carrying amount of the asset. Such costs are recorded at their net present value in accordance with IAS 37.
The annual depreciation rates of property, plant and equipment (including property, plant and equipment in projects) are as follows:
| | | |
| | Items | | % of depreciation |
|---|
| | Lands and buildings | | |
| | Buildings | | 2% – 3% |
| | Technical installations and machinery | | |
| | Installations | | 3% – 4% – 12% – 20% |
| | Machinery | | 12% |
| | Other fixed assets | | |
| | Data processing equipment | | 25% |
| | Tools and equipment | | 15% – 30% |
| | Furniture | | 10% – 15% |
| | Works equipment | | 30% |
| | Transport elements | | 8% – 20% |
The assets' residual values and useful economic lives are reviewed, and adjusted if necessary, at the end of the accounting period of the company which owns the asset.
When the carrying amount of an asset is higher than its recoverable amount, the carrying amount is reduced immediately to reflect the lower recoverable amount.
- 2.5.
- Fixed assets in projects
This category includes property, plant and equipment, intangible assets and financial assets of consolidated companies which are financed through project debt (see Note 19), that are raised specifically and solely to finance individual projects as detailed in the terms of the loan agreement.
These assets financed through project debt are generally the result of projects which consist of the design, construction, financing, application and maintenance of large-scale complex operational assets or infrastructures, which are owned by the company or are held under a concession agreement for a period of time. The projects are initially financed through medium-term bridge loans (non-recourse project financing in process) and later by a long-term project finance.
In this respect, the basis of the financing agreement between the Company and the bank lies in the allocation of the cash flows generated by the project to the repayment of the principal amount and interest expenses, excluding or limiting the amount secured by other assets, in such a way that the bank recovers the investment solely through the cash flows generated by the project financed, any other debt being subordinated to the debt arising from the non-recourse financing applied to projects
F-22
Table of Contents
ABENGOA
Consolidated financial statements
until the project debt has been fully repaid. For this reason, fixed assets in projects are separately reported on the face of the Consolidated Statement of Financial Position, as is the related project debt (project finance and bridge loan) in the liability section of the same statement.
Non-recourse project financing (project finance) typically includes the following guarantees:
- •
- Shares of the project developers are pledged.
- •
- Assignment of collection rights.
- •
- Limitations on the availability of assets relating to the project.
- •
- Compliance with debt coverage ratios.
- •
- Subordination of the payment of interest and dividends to meet loan financial ratios.
Once the project finance has been repaid and the project debt and related guarantees fully extinguished, any remaining net book value reported under this category is reclassified to the Property, Plant and Equipment or Intangible Assets line items, as applicable, in the Consolidated Statement of Financial Position.
Assets in the 'fixed assets in projects' line item of the Consolidated Statement of Financial Position are sub-classified under the following two headings, depending upon their nature and their accounting treatment:
- 2.5.1.
- Concession assets in projects
This heading includes fixed assets financed through project debt related to Service Concession Arrangements recorded in accordance with IFRIC 12. IFRIC 12 states that service concession arrangements are public-to-private arrangements in which the public sector controls or regulates the services to be provided using the infrastructure and their prices, and is contractually guaranteed to gain, at a future time, ownership of the infrastructure through which the service is provided. The infrastructures accounted for by the Group as concessions are mainly related to the activities concerning power transmission lines, desalination plants and generation plants (both renewable as conventional). The infrastructure used in a concession can be classified as an intangible asset or a financial asset, depending on the nature of the payment entitlements established in the agreement.
- a)
- Intangible asset
The Group recognizes an intangible asset when the demand risk to the extent that it has a right to charge final customers for the use of the infrastructure. This intangible asset is subject to the provisions of IAS 38 and is amortized linearly, taking into account the estimated period of commercial operation of infrastructure which generally coincides with the concession period.
The Group recognizes and measures revenue, costs and margin for providing construction services during the period of construction of the infrastructure in accordance with IAS 11 'Construction Contracts'. As indicated in Note 2.7, the interest costs derived from financing the project incurred during construction are capitalized during the period of time required to complete and prepare the asset for its predetermined used.
F-23
Table of Contents
ABENGOA
Consolidated financial statements
- 2.6.
- Current and non-current classification
Assets are classified as current assets if they are expected to be realized in less than 12 months after the date of the Consolidated Statements of Financial Position. Otherwise, they are classified as non-current assets.
Liabilities are classified as current liabilities unless an unconditional right exists to defer their repayment by at least 12 months following the date of the Consolidated Statement of Financial Position.
- 2.7.
- Borrowing costs
Interest costs incurred in the construction of any qualifying asset are capitalized over the period required to complete and prepare the asset for its intended use. A qualifying asset is an asset that
F-24
Table of Contents
ABENGOA
Consolidated financial statements
necessarily takes a substantial period of time to get ready for its internal use or sale, which in Abengoa is considered to be more than one year.
Costs incurred relating to non-recourse factoring are expensed when the factoring transaction is completed with the financial institution.
Remaining borrowing costs are expensed in the period in which they are incurred.
- 2.8.
- Impairment of non-financial assets
Annually, Abengoa perfoms an analysis of impairment losses of goodwill to determine the recoverable amount.
In addition, Abengoa reviews its property, plant and equipment, fixed assets in projects and intangible assets with finite and indefinite useful life to identify any indicators of impairment. The periodicity of this review is annually or when an event involving as indication of impairment is detected.
If there are indications of impairment, Abengoa calculates the recoverable amount of an asset as the higher of its fair value less costs to sell and its value in use, defined as the present value of the estimated future cash flows to be generated by the asset. In the event that the asset does not generate cash flows independently of other assets, Abengoa calculates the recoverable amount of the Cash-Generating Unit to which the asset belongs.
When the carrying amount of the Cash Generating Unit to which these assets belong is lower than its recoverable amount assets are impaired.
Assumptions used to calculate value in use include a discount rate, growth rates and projected changes in both selling prices and costs. The discount rate is estimated by Management, to reflect both changes in the value of money over time and the risks associated with the specific Cash-Generating Unit. Growth rates and changes in prices and costs are projected based upon internal and industry projections and management experience respectively. Financial projections range between 5 and 10 years depending on the growth potential of each Cash Generating Unit.
To calculate the value in use of the major goodwill balances, the following assumptions were made:
- •
- 10-year financial projections were used for those Cash-Generating Units (CGUs) that have high growth potential based on cash flows taken into account in the strategic plans for each business unit, considering a residual value based on the cash flow in the final year of the projection.
The use of these 10-year financial projections was based on the assumption that it is the minimum period necessary for the discounted cash flow model to reflect all potential growth in the CGUs in each business segment showing significant investments.
The aforementioned estimated cash flows were considered to be reliable due to their capacity to adapt to the real market and/or business situation faced by the CGU in accordance with the business's margin and cash-flow experience and future expectations.
These cash flows are reviewed and approved every six months by Senior Management so that the estimates are continually updated to ensure consistency with the actual results obtained.
In these cases, given that the period used is reasonably long, the Group then applies a zero growth rate for the cash flows subsequent to the period covered by the strategic plan.
- •
- For concession assets with a defined useful life and with a project debt, cash flow projections until the end of the project are considered and no terminal value is assumed.
F-25
Table of Contents
ABENGOA
Consolidated financial statements
Concession assets have a contractual structure that permit the Company to estimate quite accurately the costs of the project (both in the construction and in the operations periods) and revenue during the life of the project.
Projections take into account real data based on the contract terms and fundamental assumptions based on specific reports prepared by experts, assumptions on demand and assumptions on production. Additionally, assumptions on macro-economic conditions are taken into account, such as inflation rates, future interest rates, etc.
- •
- 5-year cash flow projections are used for all other CGUs, considering the residual value to be the cash flow in the final year projected.
- •
- Cash flow projections of CGUs located in other countries are calculated in the functional currency of those CGUs and are discounted using rates that take into consideration the risk corresponding to each specific country and currency. Present values obtained with this method are then converted to Euros at the year-end exchange rate of each currency.
- •
- Taking into account that in most CGUs the specific financial structure is linked to the financial structure of the projects that are part of those CGUs, the discount rate used to calculate the present value of cash-flow projections is based on the weighted average cost of capital (WACC) for the type of asset, adjusted, if necessary, in accordance with the business of the specific activity and with the risk associated with the country where the project is performed.
- •
- In any case, sensitivity analyses are performed, especially in relation with the discount rate used, residual value and fair value changes in the main business variables, in order to ensure that possible changes in the estimates of these items do not impact the possible recovery of recognized assets.
- •
- Accordingly, the following table provides a summary of the discount rates used (WACC) and growth rates to calculate the recoverable amount for Cash-Generating Units with the operating segment to which it pertains:
| | | | | |
| | Operating segment | | Discount rate | | Growth Rate |
|---|
| | Engineering and construction | | | | |
| | Engineering and construction | | 7% – 9% | | 0% |
| | Concession-type infrastructure | | | | |
| | Solar | | 4% – 6% | | 0% |
| | Water | | 5% – 7% | | 0% |
| | Transmission lines | | 8% – 12% | | 0% |
| | Cogeneration and other | | 8% – 10% | | 0% |
| | Industrial production | | | | |
| | Biofuels | | 5% – 10% | | 0% |
In the event that the recoverable amount of an asset is lower than its carrying amount, an impairment charge for the difference is recorded in the Consolidated Income Statement under the item 'Depreciation, amortization and impairment charges'. With the exception of goodwill, impairment losses recognized in prior periods which are later deemed to have been recovered are credited to the same income statement heading.
F-26
Table of Contents
ABENGOA
Consolidated financial statements
- 2.9.
- Financial Investments (current and non-current)
Financial investments are classified into the following categories, based primarily on the purpose for which they were acquired:
- a)
- financial assets at fair value through profit and loss;
- b)
- loans and accounts receivable; and
- c)
- available for sale financial assets.
Classification of each financial asset is determinated by management upon initial recognition, and is reviewed at each year end.
- a)
- Financial assets at fair value through profit and loss
This category includes the financial assets acquired for trading and those initially designated at fair value through profit and loss. A financial asset is classified in this category if it is acquired mainly for the purpose of sale in the short term or if it is so designated by Management. Financial derivatives are also classified at fair value through profit and loss when they do not meet the accounting requirements to be designated as hedging instruments.
These financial assets are recognized initially at fair value, without including transaction costs. Subsequent changes in fair value are recognized under 'Gains or losses from financial assets at fair value' within the 'Finance income or expense' line of the Consolidated Income Statement for the period.
- b)
- Loans and accounts receivable
Loans and accounts receivable are non-derivative financial assets with fixed or determinable payments, not listed on an active market.
In accordance with IFRIC 12, certain assets under concessions qualify as financial receivables (see Note 2.5).
Loans and accounts receivable are initially recognized at fair value plus transaction costs and are subsequently measured at amortized cost in accordance with the effective interest rate method. Interest calculated using the effective interest rate method is recognized under 'Interest income from loans and credits' within the 'Finance income' line of the Consolidated Income Statement.
- c)
- Available for sale financial assets
This category includes non-derivative financial assets which do not fall within any of the previously mentioned categories. For Abengoa, they primarily comprise shares in companies that, pursuant to the regulations in force, have not been included in the scope of consolidation for the years ended December 31, 2014 and 2013 and in which the Company's stake is greater than 5% and lower than 20%.
Financial assets available for sale are initially recognized at fair value plus transaction costs and subsequently measured at fair value, with changes in fair value recognized directly in equity, with the exception of translation differences of monetary assets, which are charged to the Consolidated Income Statement. Dividends from available-for-sale financial assets are recognized under 'Other finance income' within the 'Other net finance income/expense' line of the Consolidated Income Statement when the right to receive the dividend is established.
F-27
Table of Contents
ABENGOA
Consolidated financial statements
When available for sale financial assets are sold or impaired, the accumulated amount recorded in equity is transferred to the Consolidated Income Statement. To establish whether the assets have been impaired, it is necessary to consider whether the reduction in their fair value is significantly below cost and whether it will be for a prolonged period of time. The cumulative gain or loss reclassified from equity to profit or loss when the financial assets are impaired is the difference between their acquisition cost (net of any principal repayment and amortization) and current fair value, less any impairment loss on that financial asset previously recognized in profit or loss. Impairment losses recognized in the Consolidated Income Statement are not subsequently reversed through the Consolidated Income Statement.
Acquisitions and disposals of financial assets are recognized on the trading date, i.e. the date upon which there is a commitment to purchase or sell the asset. Available for sale financial assets are derecognized when the right to receive cash flows from the investment has expired or has been transferred and all the risks and rewards derived from owning the asset have likewise been substantially transferred.
At the date of each Consolidated Statement of Financial Position, the Group evaluates if there is any objective evidence that the value of any financial asset or any group of financial assets has been impaired. This process requires significant judgment. To make this judgment, the Group assesses, among other factors, for how long and to what extent the fair value of an investment will be below its cost, considering the financial health and short-term prospects of the company issuing the securities, including factors such as the industry and sector return, changes in the technology and cash flows from operating and financing activities.
- 2.10.
- Derivative financial instruments and hedging activities
Derivatives are recorded at fair value. The Company applies hedge accounting to all hedging derivatives that qualify to be accounted for as hedges under IFRS.
When hedge accounting is applied, hedging strategy and risk management objectives are documented at inception, as well as the relationship between hedging instruments and hedged items. Effectiveness of the hedging relationship needs to be assessed on an ongoing basis. Effectiveness tests are performed prospectively and retrospectively at inception and at each reporting date, following the dollar offset method or the regression method, depending on the type of derivatives.
The Company has three types of hedges:
- a)
- Fair value hedge for recognized assets and liabilities
The effective portion of changes in fair value of derivatives designated as cash flow hedges are recorded temporarily in equity and are subsequently reclassified from equity to profit or loss in the same period or periods during which the hedged item affects profit or loss. Any ineffective portion of the hedged transaction is recorded in the Consolidated Income Statement as it occurs.
When options are designated as hedging instruments (such as interest rate options described in Note 14), the intrinsic value and time value of the financial hedge instrument are separated. Changes in intrinsic value which are highly effective are recorded in equity and subsequently reclassified from equity to profit or loss in the same period or periods during which the hedged
F-28
Table of Contents
ABENGOA
Consolidated financial statements
item affects profit or loss. Changes in time value are recorded in the Consolidated Income Statement, together with any ineffectiveness.
When the hedged forecasted transaction results in the recognition of a non-financial asset or liability, gains and losses previously recorded in equity are included in the initial cost of the asset or liability.
When the hedging instrument matures or is sold, or when it no longer meets the requirements to apply hedge accounting, accumulated gains and losses recorded in equity remain as such until the forecast transaction is ultimately recognized in the Consolidated Income Statement. However, if it becomes unlikely that the forecasted transaction will actually take place, the accumulated gains and losses in equity are recognized immediately in the Consolidated Income Statement.
- c)
- Net investment hedges in foreign operation
Hedges of a net investment in a foreign operation, including the hedging of a monetary item considered part of a net investment, are recognized in a similar way to cash flow hedges. The foreign currency transaction gain or loss on the non-derivative hedging instrument that is designated as, and is effective as, an economic hedge of the net investment in a foreign operation shall be reported in the same manner as a translation adjustment. That is, such foreign currency transaction gain or loss shall be reported in the cumulative translation adjustment section of equity to the extent it is effective as a hedge, as long as the following conditions are met: the notional amount of the non-derivative instrument matches the portion of the net investment designated as being hedged and the non-derivative instrument is denominated in the functional currency of the hedged net investment. In that circumstance, no hedge ineffectiveness would be recognized in earnings.
Amounts recorded in equity will be reclassified to the Consolidated Income Statement when the foreign operation is sold or otherwise disposed of.
Contracts held for the purposes of receiving or making payment of non-financial elements in accordance with expected purchases, sales or use of goods ('own-use contracts') of the Group are not recognized as derivative instruments, but as executory contracts. In the event that such contracts include embedded derivatives, they are recognized separately from the host contract, if the economic characteristics of the embedded derivative are not closely related to the economic characteristics of the host contract. The options contracted for the purchase or sale of non-financial elements which may be cancelled through cash outflows are not considered to be own-use contracts.
Changes in fair value of derivative instruments which do not qualify for hedge accounting are recognized immediately in the Consolidated Income Statement. Trading derivatives are classified as a current assets or liabilities.
- 2.11.
- Fair value estimates
Financial instruments measured at fair value are presented in accordance with the following level classification based on the nature of the inputs used for the calculation of fair value:
- •
- Level 1: Inputs are quoted prices in active markets for identical assets or liabilities.
- •
- Level 2: Fair value is measured based on inputs other than quoted prices included within Level 1 that are observable for the asset or liability, either directly (i.e. as prices) or indirectly (i.e. derived from prices).
F-29
Table of Contents
ABENGOA
Consolidated financial statements
- •
- Level 3: Fair value is measured based on unobservable inputs for the asset or liability.
In the event that prices cannot be observed, the management shall make its best estimate of the price that the market would otherwise establish based on proprietary internal models which, in the majority of cases, use data based on observable market parameters as significant inputs (Level 2) but occasionally use market data that is not observed as significant inputs (Level 3). Different techniques can be used to make this estimate, including extrapolation of observable market data. The best indication of the initial fair value of a financial instrument is the price of the transaction, except when the value of the instrument can be obtained from other transactions carried out in the market with the same or similar instruments, or valued using a valuation technique in which the variables used only include observable market data, mainly interest rates. According to current legislation (IFRS-EU), differences between the transaction price and the fair value based on valuation techniques that use data that is not observed in the market, are not initially recognized in the income statement.
- a)
- Level 2 valuation
The majority of Abengoa's portfolio comprises financial derivatives designated as cash flow hedges, is classified as level 2 and corresponds mainly to the interest rate swaps (see Note 14).
Credit risk effect on the valuation of derivatives is calculated for each of the instruments in the portfolio of derivatives classified within level 2, using the own risk of the Abengoa companies and financial counterparty risk.
Description of the valuation method
- •
- Interest rate swaps
Interest rate swap valuations are made by valuing the swap component of the contract and valuing the credit risk.
The most common methodology used by the market and applied by Abengoa to value interest rate swaps is to discount the expected future cash flows according to the parameters of the contract. Variable interest rates, which are needed to estimate future cash flows, are calculated using the curve for the corresponding currency and extracting the implicit rates for each of the reference dates in the contract. These estimated flows are discounted with the swap zero curve for the reference period of the contract 1, 3 or 6 months.
The effect of the credit risk on the valuation of the interest rate swaps depends on its settlement. If the settlement is favorable for the Company, the counterparty credit spread will be incorporated to quantify the probability of default at maturity. If the expected settlement is negative for the company, its own credit risk will be applied to the final settlement.
Classic models for valuing interest rate swaps use deterministic valuation of variable rates, based on future outlooks. When quantifying credit risk, this model is limited by considering only the risk for the current paying party, ignoring the fact that the derivative could change sign at maturity. A payer and receiver swaption model is used for these cases. This enables the associated risk in each swap position to be reflected. Thus, the model shows each agent's exposure, on each payment date, as the value of entering into the 'tail' of the swap, i.e. the live part of the swap.
F-30
Table of Contents
ABENGOA
Consolidated financial statements
- •
- Interest rate Caps and Floors
Interest rate caps and floors are valued by separating the derivative in the successive caplets/floorlets that comprise the transaction. Each caplet or floorlet is valued as a call or put option, respectively, on the reference interest rate, for which the Black-Scholes approach is used for European-type options (exercise at maturity) with minor adaptations and following the Black-76 model.
- •
- Forward foreign exchange transactions
The embedded derivatives in convertible bonds consist of an option to convert the bond into shares in favor of the bondholder; call options for the issuer to repurchase the bonds at a specific price on specific dates; and put options for the bondholder to redeem the bonds at a specific price and on specific dates. Since these are Bermuda-type options (multiple exercise dates), they are valued using the Longstaff-Schwartz model and the Monte Carlo method.
Variables (Inputs)
Interest rate derivative valuation models use the corresponding interest rate curves for the relevant currency and underlying reference in order to estimate the future cash flows and to discount them. Market prices for deposits, futures contracts and interest rate swaps are used to construct these curves. Interest rate options (caps and floors) also use the volatility of the reference interest rate curve.
Exchange rate derivatives are valued using the interest rate curves of the underlying currencies in the derivative, as well as the corresponding spot exchange rates.
The inputs in equity models include the interest rate curves of the corresponding currency, the price of the underlying asset, as well as the implicit volatility and any expected future dividends.
To estimate the credit risk of the counterparty, the credit default swap (CDS) spreads curve is obtained in the market for important individual issuers. For less liquid issuers, the spreads curve is estimated using comparable CDSs or based on the country curve. To estimate proprietary credit risk, prices of debt issues in the market and CDSs for the sector and geographic location are used.
F-31
Table of Contents
ABENGOA
Consolidated financial statements
The fair value of the financial instruments that results from the aforementioned internal models, takes into account, among other factors, the terms and conditions of the contracts and observable market data, such as interest rates, credit risk, exchange rates, commodities and share prices, and volatility. The valuation models do not include significant levels of subjectivity, since these methodologies can be adjusted and calibrated, as appropriate, using the internal calculation of fair value and subsequently compared to the corresponding actively traded price. However, valuation adjustments may be necessary when the listed market prices are not available for comparison purposes.
- b)
- Level 3 valuation
Level 3 includes available for sale financial assets, as well as derivative financial instruments whose fair value is calculated based on models that use non observable or illiquid market data as inputs.
Fair value within these elements was calculated by taking as the main reference the value of the investment the company's cash flow generation based on its current business plan, discounted at a rate appropriate for the sector in which each of the companies is operating. Valuations were obtained from internal models. These valuations could vary where other models and assumptions made on the principle variables had been used, however the fair value of the assets and liabilities, as well as the results generated by these financial instruments are considered reasonable.
Detailed information on fair values is included in Note 12.
- 2.12.
- Inventories
Inventories are valued at the lower of cost or net realizable value. In general, cost is determined by using the first-in-first-out (FIFO) method. The cost of finished goods and work in progress includes design costs, raw materials, direct labor, other direct costs and general manufacturing costs (assuming normal operating capacity). Borrowing costs are not included. The net realizable value is the estimated sales value in the normal course of business, less applicable variable selling costs.
Cost of inventories includes the transfer from equity of gains and losses on qualifying cash-flow hedging instruments related with the purchase of raw materials or with foreign exchange contracts.
- 2.13.
- Biological assets
Abengoa recognizes sugar cane in production as biological assets. The production period of sugar cane covers the period from preparation of the land and sowing the seedlings until the plant is ready for first production and harvesting. Biological assets are classified as property, plant and equipment in the Consolidated Statement of Financial Position. Biological assets are recognized at fair value, calculated as the market value less estimated harvesting and transport costs.
Agricultural products harvested from biological assets, which in the case of Abengoa are cut sugar cane, are classified as inventories and measured at fair value less estimated sale costs at the point of sale or harvesting.
Fair value of biological assets is calculated using as a reference the forecasted market price of sugarcane, which is estimated using public information and estimates on future prices of sugar and ethanol. Fair value of agricultural products is calculated using as a reference the price of sugar cane made public on a monthly basis by the Cane, Sugar and Alcohol Producers Board (Consecana).
Gains or losses arising as a result of changes in the fair value of such assets are recorded within 'Operating profit' in the Consolidated Income Statement.
F-32
Table of Contents
ABENGOA
Consolidated financial statements
To obtain the fair value of the sugar cane while growing, a number of assumptions and estimates have been made in relation to the area of land sown, the estimated TRS (Total Recoverable Sugar contained within the cane) per ton to be harvested and the average degree of growth of the agricultural product in the different areas sown.
- 2.14.
- Clients and other receivables
Clients and other receivables relate to amounts due from customers for sales of goods and services rendered in the normal course of operation.
Clients and other receivables are recognized initially at fair value and are subsequently measured at amortized cost using the effective interest rate method, less provision for impairment. Trade receivables due in less than one year are carried at their face value at both initial recognition and subsequent measurement, provided that the effect of not discounting flows is not significant.
A provision for impairment of trade receivables is recorded when there is objective evidence that the Group will not be able to recover all amounts due as per the original terms of the receivables. The existence of significant financial difficulties, the probability that the debtor is in bankruptcy or financial reorganization and the lack or delay in payments are considered evidence that the receivable is impaired.
The amount of the provision is the difference between the asset's carrying amount and the present value of estimated future cash flows discounted at the effective interest rate. When a trade receivable is uncollectable, it is written off against the bad debt provision.
Clients and other receivables which have been factored with financial entities are derecognized and hence removed from assets on the Consolidated Statement of Financial Position only if all risks and rewards of ownership of the related financial assets have been transferred, comparing the Company's exposure, before and after the transfer, to the variability in the amounts and the calendar of net cash flows from the transferred asset. Once the Company's exposure to this variability has been eliminated or substantially reduced, the financial asset has been transferred, and is derecognized from the Consolidated Statement of Financial Position (See Note 4.b).
- 2.15.
- Cash and cash equivalents
Cash and cash equivalents include cash on hand, cash in bank and other highly-liquid current investments with an original maturity of three months or less which are held for the purpose of meeting short-term cash commitments.
In the Consolidated Statement of Financial Position, bank overdrafts are classified as borrowings within current liabilities.
- 2.16.
- Share capital
Parent company shares are classified as equity. Transaction costs directly attributable to new shares are presented in equity as a reduction, net of taxes, to the consideration received from the issue.
Treasury shares are classified in Equity-Parent company reserves. Any amounts received from the sale of treasury shares, net of transaction costs, are classified as equity.
- 2.17.
- Government grants
Non-refundable capital grants are recognized at fair value when it is considered that there is a reasonable assurance that the grant will be received and that the necessary qualifying conditions, as agreed with the entity assigning the grant, will be adequately met.
F-33
Table of Contents
ABENGOA
Consolidated financial statements
Grants related to income are recorded as liabilities in the Consolidated Statement of Financial Position and are recognized in 'Other operating income' in the Consolidated Income Statement based on the period necessary to match them with the costs they intend to compensate.
Grants related to fixed assets are recorded as non-current liabilities in the Consolidated Statement of Financial Position and are recognized in 'Other operating income' in the Consolidated Income Statement on a straight-line basis over the estimated useful economic life of the assets.
- 2.18.
- Loans and borrowings
External resources are classified in the following categories:
- a)
- project debt (see note 19);
- b)
- corporate financing (see Note 20).
Loans and borrowings are initially recognized at fair value, net of transaction costs incurred. Borrowings are subsequently measured at amortized cost and any difference between the proceeds initially received (net of transaction costs incurred in obtaining such proceeds) and the repayment value is recognized in the Consolidated Income Statement over the duration of the borrowing using the effective interest rate method.
Interest free loans and loans with interest rates below market rates, mainly granted for research and development projects, are initially recognized at fair value in liabilities in the Consolidated Statement of Financial Position. The difference between proceeds received from the loan and its fair value is initially recorded within 'Grants and Other liabilities' in the Consolidated Statement of Financial Position, and subsequently recorded in 'Other operating income- Grants' in the Consolidated income statement when the costs financed with the loan are expensed. In the case of interest free loans received for development projects where the Company record an intangible asset, income from the grant will be recognized according to the useful life of the asset, at the same rate as we record its amortization.
Commissions paid for obtaining credit lines are recognized as transaction costs if it is probable that part or all of the credit line will be drawn down. If this is the case, commissions are deferred until the credit line is drawn down. If it is not probable that all or part of the credit line will be drawn down, commission costs are expensed in the period.
- 2.18.1.
- Convertible notes
Pursuant to the Terms and Conditions of each of the convertible notes issued except for the 2019 notes, when investors exercise their conversion right, the Company may decide whether to deliver shares of the company, cash, or a combination of cash and shares (see Note 20.3 for further information).
In accordance with IAS 32 and 39, since Abengoa has a contractual right to choose the type of payment and one of these possibilities is paying through a variable number of shares and cash, the conversion option qualifies as an embedded derivative. Thus, the convertible bond is considered a hybrid instrument, which includes a component of debt and an embedded derivative for the conversion option held by the bondholder.
The Company initially measures the embedded derivative at fair value and classifies it under the derivative financial instruments liability heading. At the end of each period, the embedded derivative is re-measured and changes in fair value are recognized under 'Other net finance income or expense' within the 'Finance expense net' line of the Consolidated Income Statement. The debt component of the bond is initially recorded as the difference between the
F-34
Table of Contents
ABENGOA
Consolidated financial statements
proceeds received for the notes and the fair value of the aforementioned embedded derivative. Subsequently, the debt component is measured at amortized cost until it is settled upon conversion or maturity. Debt issuance costs are recognized as a deduction in the value of the debt in the Consolidated Statement of Financial Position and included as part of its amortized cost.
In relation to the convertible bonds maturing in 2019, at the beginning of 2014, the Board of Directors expressly and irrevocably stated, with binding effect, that in relation to the right conferred on Abengoa to choose the type of payment, the Company shall not exercise the cash settlement option in the event that bondholders decide to exercise their conversion right early during the period granted for that effect and Abengoa, S.A. shall therefore only settle this conversion right in a fixed number of shares. Accordingly, the fair value at the beginning of the year of the derivative liability embedded in the convertible bond was reclassified as equity since after that date the conversion option meets the definition of an equity instrument.
- 2.18.2.
- Ordinary notes
The company initially recognizes ordinary notes at fair value, net of issuance costs incurred. Subsequently, notes are measured at amortized cost until settlement upon maturity. Any other difference between the proceeds obtained (net of transaction costs) and the redemption value is recognized in the Consolidated Income Statement over the term of the debt using the effective interest rate method.
- 2.19.
- Current and deferred income taxes
Income tax expense for the period comprises current and deferred income tax. Income tax is recognized in the Consolidated Income Statement, except to the extent that it relates to items recognized directly in equity. In these cases, income tax is also recognized directly in equity.
Current income tax expense is calculated on the basis of the tax laws in force or about to enter into force as of the date of the Consolidated Statement of Financial Position in the countries in which the subsidiaries and associates operate and generate taxable income.
Deferred income tax is calculated in accordance with the Consolidated Statement of Financial Position liability method, based upon the temporary differences arising between the carrying amount of assets and liabilities and their tax base. However, deferred income tax is not recognized if it arises from initial recognition of an asset or liability in a transaction other than a business combination that, at the time of the transaction, affects neither the accounting nor the taxable profit or loss. Deferred income tax is determined using tax rates and regulations which are enacted or substantially enacted at the date of the Consolidated Statement of Financial Position and are expected to apply and/or be in force at the time when the deferred income tax asset is realized or the deferred income tax liability is settled.
Deferred tax assets are recognized only when it is probable that sufficient future taxable profit will be available to use deferred tax assets.
Deferred taxes are recognized on temporary differences arising on investments in subsidiaries and associates, except where the timing of the reversal of the temporary differences is controlled by the Group and it is not probable that temporary differences will reverse in the foreseeable future.
- 2.20.
- Employee benefits
F-35
Table of Contents
ABENGOA
Consolidated financial statements
The Group records the amount annually accrued in accordance with the percentage of compliance with the plan's established objectives as personnel expense in the Consolidated Income Statement
Expenses incurred from employee benefits are disclosed in Note 29
- 2.21.
- Provisions and contingencies
Provisions are initially measured at the present value of the expected outflows required to settle the obligation and subsequently valued at amortized cost following the effective interest method.
Contingent liabilities are possible obligations, existing obligations with low probability of a future outflow of economic resources and existing obligations where the future outflow cannot be reliably estimated. Contingences are not recognized in the Consolidated Statements of Financial Position unless they have been acquired in a business combination.
- 2.22.
- Trade payables and other liabilities
Trade payables and other liabilities are obligations arising from the purchase of goods or services in the ordinary course of business and are recognized initially at fair value and are subsequently measured at their amortized cost using the effective interest method.
Other liabilities are obligations not arising from the purchase of goods or services in the normal course of business and which are not treated as financing transactions.
Advances received from customers are recognized as 'Trade payables and other current liabilities'
- 2.23.
- Foreign currency transactions
- a)
- Functional currency
Financial statements of each subsidiary within the Group are measured and reported in the currency of the principal economic environment in which the subsidiary operates (subsidiary's functional currency). The Consolidated Financial Statements are presented in euro, which is Abengoa's functional and reporting currency.
- b)
- Transactions and balances
Transactions denominated in a currency different from the subsidiary's functional currency are translated into the subsidiary's functional currency applying the exchange rates in force at the time of the transactions. Foreign currency gains and losses that result from the settlement of these transactions and the translation of monetary assets and liabilities denominated in foreign currency at the year-end rates are recognized in the Consolidated Income Statement, unless they are deferred in equity, as occurs with cash-flow hedges and net investment in foreign operations hedges.
- c)
- Translation of the financial statements of foreign companies within the Group
F-36
Table of Contents
ABENGOA
Consolidated financial statements
Results of companies carried under the equity method are translated at the average annual exchange rate calculated described in (2) above.
Goodwill arising on the acquisition of a foreign company is treated as an asset of the foreign company and is translated at the year-end exchange rate.
- 2.24.
- Revenue recognition
- a)
- Ordinary income
Ordinary income comprises the fair value of sales of goods or services, excluding VAT or similar taxes, any discounts or returns and excluding sales between Group entities.
Ordinary income is recognized as follows:
- •
- Income from the sale of goods is recognized when the Group delivers the goods to the client, the client accepts them and it is reasonably certain that the related receivables will be collectible.
- •
- Income from the sale of services is recognized in the period in which the service is provided.
- •
- Interest income is recognized using the effective interest rate method. When a receivable is considered impaired, the carrying amount is reduced to its recoverable amount, discounting the estimated future cash flows at the original effective interest rate of the instrument and recording the discount as a reduction in interest income. Income from interest on loans that have been impaired is recognized when the cash is collected or on the basis of the recovery of the cost when the conditions are guaranteed.
- •
- Dividend income is recognized when the right to receive payment is established.
- b)
- Construction contracts
F-37
Table of Contents
ABENGOA
Consolidated financial statements
When the outcome of a construction contract can be reliably estimated and it is probable that it will be profitable, revenue from the contract is recognized over the term of the contract. When it is probable that the costs of the project will be greater than its revenue, expected loss is recognized immediately as an expense. To determine the appropriate amount of revenue to be recognized in any period, the percentage of completion method is applied. The percentage of completion method considers, at the date of the Statement of Financial Position, the actual costs incurred as a percentage of total estimated costs for the entire contract.
Partial billing that has not yet been settled by the clients and withholdings are included under the Trade and other receivables heading.
Gross amounts owed by clients for ongoing works in which the costs incurred plus recognized profits (minus recognized losses) exceed partial billing are presented as assets under the heading of 'Unbilled Revenue' within 'Clients and other receivables' heading of the Statement of Financial Position.
On the other hand, amounts outstanding from customers for work in progress for which the billing to date is greater than the costs incurred plus recognized profits (less recognized losses) are shown as liabilities within the line item 'Advance payments from clients' in the Trade payables and other current liabilities caption of the Consolidated Statement of Financial Position.
Lastly, as stated in point 2.4 on the measurement of property, plant and equipment in internal asset construction projects outside the scope of IFRIC 12 on Service Concession Arrangements (see Note 2.5), revenues and profits between group companies are eliminated, meaning that such assets are shown at their acquisition cost.
- c)
- Concession contracts
Concession contracts are public services agreements for periods usually between 20 and 30 years including both the construction of infrastructure and future services associated with the operation and maintenance of assets in the concession period which are under the scope of IFRIC 12. Revenue recognition, as well as, the main characteristics of these contracts are detailed in Note 2.5.
- 2.25.
- Leases
Lease contracts of fixed assets in which a Group company is the lessee and substantially retains all the risks and rewards associated with the ownership of the assets are classified as finance leases.
Finance leases are recognized at inception of the lease at the lower of the fair value of the leased asset and the present value of the minimum lease payments over the contract term. Each lease payment is distributed between debt and financing costs, in a way which establishes a constant interest rate on the outstanding debt. The amounts to be paid over the lease term, net of financing costs, are recognized as non-current and current payables, as appropriate. The interest portion of the financing costs is charged to the Consolidated Income Statement over the period of the lease agreement, in order to obtain a constant periodic interest rate on the balance of the outstanding debt in each period. Assets acquired under finance lease agreements are depreciated over the shorter of the useful life of the asset and the lease term.
Lease agreements undertaken by the Group in which the entity entering into the agreement does not substantially retain all the risks and rewards associated with the ownership of the asset are classified as operating leases. Payments made under operating leases are charged to the Consolidated Income Statement (net of any incentives received from the lessor) on a straight-line basis over the lease term.
F-38
Table of Contents
ABENGOA
Consolidated financial statements
- 2.26.
- Segment reporting
Information on the Group's operating segments is presented in accordance with internal information provided to the Group's Chief Operating Decision Maker (CODM). The CODM, responsible for assigning resources and evaluating the performance of the operating segments, has been identified as the CEO and the Chairman.
As described in Note 5, the CODM reviews the business by 6 operating segments which are in turn grouped, for business purposes, into three activities: Engineering & Construction, Concession-type Infrastructures and Industrial Production.
Geographically, the Group reports financial information by 6 regions which are Spain (home market), North America, South America (except Brazil), Brazil, Europe (except Spain) and other (the remaining overseas markets).
For detailed information on segment reporting, see Note 5.
- 2.27.
- Environmental assets
Equipment, installations and systems used to eliminate, reduce or control possible environmental impacts are recognized applying the same criteria used for other similar assets.
Provisions made for environmental restoration, costs of restructuring and litigations are recognized when the company has a legal or constructive obligation as a result of past events, it becomes probable that an outflow of resources will be necessary to settle the obligation and the outflow can be reliably estimated.
Note 33.6 gives additional information on the Group's environmental policies.
- 2.28.
- Severance payments
Severance payments are made to employees in the event that the company terminates their employment contract prior to the normal retirement age or when the employee voluntarily accepts redundancy in the terms offered by the employer. The Group recognizes severance payments when it is demonstrably committed to third parties to provide indemnities for leaving the company or to dismiss the current workers in accordance with a detailed formal plan, with no possibility of retracting.
- 2.29.
- Assets held for sale and discontinued operations
The Group classifies property, plant and equipment, intangible assets and disposal groups (groups of assets that are to be sold together with their directly associated liabilities) as non-current assets held for sale when, at the date of the Consolidated Statement of Financial Position, an active program to sell them has been initiated by Management and the sale is foreseen to take place within the following twelve months.
The Group includes in discontinued operations those business lines which have been sold or otherwise disposed of or those that meet the conditions to be classified as held-for-sale. Discontinued operations also include those assets which are included in the same sale program together with the business line. Entities which are acquired exclusively with a view for resale are also classified as discontinued operations.
Assets held for sale or disposal groups are measured at the lower of their carrying value or fair value less estimated costs necessary to sell them. They are no longer amortized or depreciated from the moment they are classified as non-current assets held for sale.
F-39
Table of Contents
ABENGOA
Consolidated financial statements
Assets held for sale and the components of disposal groups are presented in the Consolidated Statement of Financial Position grouped under a single heading as 'Assets held for sale'. Liabilities are also grouped under a single heading as 'Liabilities held for sale'.
The after-tax profit or loss on discontinued operations is presented in a single line within the Consolidated Income Statement under the heading 'Profit (loss) from discontinued operations, net of tax'.
As indicated in IFRS 5, the elimination of intragroup transactions with companies classified as discontinued operations are performed in continuing operations or in the line of discontinued operations, depending on how they reflect more appropriately the business' continuity or not in each case.
Further information is provided on Non-current assets held for sale and discontinued operations in Note 7.
Note 3. — Critical accounting policies
The preparation of the Consolidated Financial Statements in conformity with IFRS requires to make estimates and judgments that affect the reported amounts of assets, liabilities, revenues and expenses. Actual results may differ from these estimates under different assumptions or conditions. The most critical accounting policies, which reflect significant management estimates and judgment to determine amounts in the Consolidated Financial Statements are:
- •
- Impairment of intangible assets and goodwill.
- •
- Revenue from construction contracts.
- •
- Concession agreements.
- •
- Income taxes and recoverable amount of deferred tax assets.
- •
- Derivative financial instruments and hedging.
Some of these accounting policies require the application of significant judgment by management to select the appropriate assumptions to determine these estimates. These assumptions and estimates are based on Company's historical experience, advice from experienced consultants, forecasts and other circumstances and expectations as of the close of the financial period. The assessment is considered in relation to the global economic situation of the industries and regions where the Group operates, taking into account future development of the businesses. By their nature, these judgments are subject to an inherent degree of uncertainty; therefore, actual results could materially differ from the estimates and assumptions used. In such cases, the carrying values of assets and liabilities are adjusted.
As of the date of preparation of these Consolidated Financial Statements, no relevant changes in the estimates made are anticipated and, therefore, no significant changes in the value of the assets and liabilities recognized at December 31, 2014 are expected.
Although these estimates and assumptions are being made using all available facts and circumstances, it is possible that future events may require management to amend such estimates and assumptions in future periods. Changes in accounting estimates are recognized prospectively, in accordance with IAS 8, in the Consolidated Income Statement of the year in which the change occurs. The Group significant accounting policies have been fully described in Note 2.
F-40
Table of Contents
ABENGOA
Consolidated financial statements
Impairment of intangible assets and goodwill
Goodwill and Intangible assets which have not yet come into operation or that have an indefinite useful life are not amortized and are tested for impairment on an annual basis or whenever there is an impairment indicator. Goodwill is tested for impairment within the Cash-Generating Unit to which it belongs. Other intangible assets are tested individually, unless they do not generate cash flows independently from other assets, in which case they are tested within the Cash-Generating Unit to which they belong.
For those cash generating units with high potential growth, the Group uses cash flow projections for a period of 10 years based on the cash flows identified in the Group's strategic plans, which are reviewed and approved every six months by the Management of the Group. The residual value is calculated based on the cash flows of the latest year projected using a steady or nil growth rate. The use of a 10 year period is based on the consideration that this is the minimum period that needs to be used in order to appropriately reflect all the potential growth of these cash generating units. In addition, 10 year projections are prepared based on the historical experience within the Group in preparing long-term strategic plans, which are considered reliable and are prepared on the basis of the Group's internal control system. These cash flows are considered reliable since they can easily adapt to the changes of the market and of the business segment to which cash generating units belong, based on the Group's past experience on cash flows and margins and on future expectations.
For other cash generating units the Group uses cash flows projections based on a period of 5 years, calculating the residual value based on the cash flows of the latest year projected, using a growth rate 'using a zero growth rate'.
Projected cash flows are discounted using the Weighted Average Cost of Capital (see Note 2.8), adjusted for the specific risks associated to the business unit to which the cash generating unit belongs.
Based on values in use calculated in accordance with the assumptions and hypotheses described above and in Note 8 for the years 2014, 2013 and 2012, the recoverable amount of the cash generating units to which goodwill was assigned is higher than their carrying amount. Detailed sensitivity analysis has been carried out and the Management is confident that the carrying amount of the cash generating units will be recovered in full. Main variables considered in sensitivity analysis are growth rates, discount rates based in weighted average cost of capital (WACC) and the main variables of each business.
During the years 2014, 2013 and 2012 there were no intangible assets with indefinite useful life and there were no significant intangible assets not yet in use that were impaired.
Revenue from construction contracts
Revenue from construction contracts is recognized using the percentage-of-completion method for contracts whose outcome can be reliably estimated and it is probable that they will be profitable. When the outcome of a construction contract cannot be reliably estimated, revenue is recognized only to the extent it is probable that contract costs incurred will be recoverable.
As described in Note 2.24.b), the percentage of completion is determined at the date of every Consolidated Statement of Financial Position based on the actual costs incurred as a percentage of total estimated costs for the entire contract.
Revenue recognition using the percentage-of-completion method involves the use of estimates of certain key elements of the construction contracts, such as total estimated contract costs, allowances or provisions related to the contract, period of execution of the contract and recoverability of the claims. The Company has established, over the years, a robust project management and control system, with periodic monitoring of each project. This system is based on the long-track record of the Group in constructing
F-41
Table of Contents
ABENGOA
Consolidated financial statements
complex infrastructures and installations. As far as practicable, the Group applies past experience in estimating the main elements of construction contracts and relies on objective data such as physical inspections or third parties confirmations. Nevertheless, given the highly tailored characteristics of the construction contracts, most of the estimates are unique to the specific facts and circumstances of each contract.
Although estimates on construction contracts are periodically reviewed on an individual basis, we exercise significant judgments and not all possible risks can be specifically quantified.
It is important to point out that, as stated in Note 2.4 on the measurement of property, plant and equipment, in the internal asset construction projects outside the scope of IFRIC 12 on Service Concession Arrangements (see Note 2.5), the totality of the revenues and profits between group companies is eliminated, meaning that said assets are shown at their acquisition cost.
Concession Agreements
The analysis on whether the IFRIC 12 applies to certain contracts and activities involves various complex factors and it is significantly affected by legal interpretation of certain contractual agreements or other terms and conditions with public sector entities.
Therefore, the application of IFRIC 12 requires extensive judgment in relation with, amongst other factors, (i) the identification of certain infrastructures (and not contractual agreements) in the scope of IFRIC 12, (ii) the understanding of the nature of the payments in order to determine the classification of the infrastructure as a financial asset or as an intangible asset and (iii) the recognition of the revenue from construction and concessionary activity.
Changes in one or more of the factors described above may significantly affect the conclusions as to the appropriateness of the application of IFRIC 12 and, therefore, the results of operations or our financial position (see Note 10.1).
Income taxes and recoverable amount of deferred tax assets
Determining income tax expense requires judgment in assessing the timing and the amount of deductible and taxable items, as well as the interpretation and application of tax laws in different jurisdictions. Due to this fact, contingencies or additional tax expenses could arise as a result of tax inspections or different interpretations of certain tax laws by the corresponding tax authorities.
Group Management assesses the recoverability of deferred tax assets on the basis of estimates of the future taxable profit. In making this assessment, Management considers the foreseen reversal of deferred tax liabilities, projected taxable profit and tax planning strategies. This assessment is carried out on the basis of internal projections, which are updated to reflect the Group's most recent operating trends.
The Group's current and deferred income taxes may be impacted by events and transactions arising in the normal course of business as well as by special non-recurring circumstances. Assessment of the appropriate amount and classification of income taxes is dependent on several factors, including estimates of the timing and realization of deferred tax assets and the timing of income tax payments.
Actual collections and payments may materially differ from these estimates as a result of changes in tax laws as well as unforeseen future transactions impacting the income tax balances.
Derivatives financial instruments and hedging
The Group uses derivatives in order to mitigate risks arising from foreign exchange, interest rates and changes in the prices of assets and commodities purchased (principally aluminum, grain, ethanol, sugar and
F-42
Table of Contents
ABENGOA
Consolidated financial statements
gas). Derivatives are initially recognized at fair value on the date that the derivative contract is entered into, and are subsequently re-measured at fair value at each reporting date (see Notes 2.10 and 2.11 for a full description of the accounting policy for derivatives).
Contracts held for the purposes of receiving or making payment of non-financial elements in accordance with expected purchases, sales or use of goods (own-use contracts) of the Group are not recognized as financial derivative instruments, but as executory contracts. In the event that such contracts include embedded derivatives, those derivatives are recorded separately from the original contract, if the economic characteristics of the embedded derivative are not closely related to the economic characteristics of the original host contract. Options contracted for the purchase or sale of non-financial elements which may be cancelled through cash outflows are not considered to be 'own-use contracts'.
The inputs used to calculate fair value of our derivatives are based on prices observable on not quoted markets, through the application of valuation models (Level 2). The valuation techniques used to calculate fair value of our derivatives include discounting estimated future cash flows, using assumptions based on market conditions at the date of valuation or using market prices of similar comparable instruments, amongst others. The valuation of derivatives and the identification and valuation of embedded derivatives and own-use contracts requires the use of considerable professional judgment. These determinations were based on available market information and appropriate valuation methodologies. The use of different market assumptions and/or estimation methodologies may have a material effect on the estimated fair value amounts.
Note 4. — Financial risk management
Abengoa's activities are undertaken through its operating segments and are exposed to various financial risks: market risk (including currency risk, interest rate risk and price risk), credit risk, liquidity risk and capital risk.
The risk management model attempts to minimize the potential adverse impact of such risks upon the Group's financial performance. Risk is managed by the Group's Corporate Finance Department, which is responsible for identifying and evaluating financial risks in conjunction with the Group's operating segments, quantifying them by project, region and company.
Written internal risk management policies exist for global risk management, as well as for specific areas of risk, such as foreign exchange risk, credit risk, interest rate risk, liquidity risk, the use of hedging instruments and derivatives and the investment of cash surpluses.
In addition, there are official written management regulations regarding key controls and control procedures for each company and the implementation of these controls is monitored through Internal Audit procedures.
The Group is affected by the following financial risks:
Market risk arises when group activities are exposed fundamentally to financial risk derived from changes in foreign exchange rates, interest rates and changes in the fair values of certain raw materials.
To hedge such exposure, Abengoa uses currency forward contracts, options and interest rate swaps as well as future contracts for commodities. The Group does not generally use derivatives for speculative purposes.
F-43
Table of Contents
ABENGOA
Consolidated financial statements
- •
- Foreign exchange rate risk: the international activity of the Group generates exposure to foreign exchange rate risk. Foreign exchange rate risk arises when future commercial transactions and assets and liabilities recognized are not denominated in the functional currency of the group company that undertakes the transaction or records the asset or liability. The main exchange rate exposure for the Group relates to the US Dollar against the Euro.
To control foreign exchange risk, the Group purchases forward exchange contracts. Such contracts are designated as fair-value or cash-flow hedges, as appropriate.
In the event that the exchange rate of the US Dollar had risen by 10% against the Euro as of December 31, 2014, with the rest of the variables remaining constant, the effect in the Consolidated Income Statement would have been a loss of €1,103 thousand (loss of €8,496 thousand in 2013 and loss of €10,602 thousand in 2012) mainly due to the US Dollar net liability position of the Group in companies with Euro functional currency and an increase of € 36,315 thousand (increase of €1,192 in 2013 and decrease of €2,440 in 2012) in other reserves as a result of the cash flow hedging effects on highly probable future transactions.
Details of the financial hedging instruments and foreign currency payments as of December 31, 2014 and 2013 are included in Note 14 of these Notes to these Consolidated Financial Statements.
- •
- Interest rate risk: arises mainly from financial liabilities at variable interest rates.
Abengoa actively manages its risks exposure to variations in interest rates associated with its variable interest debt.
In project debt (see Note 19), as a general rule, the Company enters into hedging arrangements for at least 80% of the amount and the timeframe of the relevant financing.
In corporate financing (see Note 20), as a general rule, 80% of the debt is covered throughout the term of the debt; in addition, in 2009, 2010, 2013 and 2014, Abengoa issued notes at a fixed interest rate.
The main interest rate exposure for the Group relates to the variable interest rate with reference to the Euribor.
To control the interest rate risk, the Group primarily uses interest rate swaps and interest rate options (caps and collars), which, in exchange for a fee, offer protection against an increase in interest rates.
In the event that Euribor had risen by 25 basic points as of December 31, 2014, with the rest of the variables remaining constant, the effect in the Consolidated Income Statement would have been a profit of €9,182 thousand (profit of €13,669 thousand in 2013 and profit of €4,004 thousand in 2012) mainly due to the increase in time value of hedge interest rate options (caps and collars) and an increase of € 35,591 thousand in other reserves (increase of €48,050 thousand in 2013 and increase of €52,163 thousand in 2012) mainly due to the increase in value of hedging interest derivatives (swaps, caps and collars).
A breakdown of the interest rate derivatives as of December 31, 2014 and 2013 is provided in Note 14 of these Notes to the Consolidated Financial Statements.
F-44
Table of Contents
ABENGOA
Consolidated financial statements
- •
- Risk of change in commodities prices: arises both through the sale of the Group's products and the purchase of commodities for production processes. The main risk of change in commodities prices for the Group is related to the price of grain, ethanol, sugar, gas, and steel.
In general, the Group uses futures and options listed on organized markets, as well as OTC (over-the-counter) contracts with financial institutions, to mitigate the risk of market price fluctuations.
At December 31, 2014, if the price of grain had increased by 10%, with the rest of the variables remaining constant, the effect in the Consolidated Income Statement would have been null (null in 2013 and loss of €35,092 thousand in 2012) and an increase in other reserves of € 49,086 thousand (increase of €4,567 thousand in 2013 and decrease of €16,391 thousand in 2012) due to open derivative contracts primarily on grain purchases held by the Group.
At December 31, 2014, if the price of ethanol had increased by 10%, with the rest of the variables remaining constant, the effect in the Consolidated Income Statement would have been null (null in 2013 and profit of €11,035 thousand in 2012) and an increase in other reserves of € 8,673 thousand (increase of €60,040 in 2013 and null in 2012) due to open derivative contracts primarily on ethanol purchases held by the Group.
A breakdown of the commodity derivative instruments as of December 31, 2014 ad 2013 is included in Note 14 to these Consolidated Financial Statements.
In addition, certain Bioenergy Business Group companies engage in purchase and sale transactions in the grain and ethanol markets, in accordance with a management policy for trading transactions.
Management has approved and supplemented trading strategies to control the purchase and sale of forward and swap contracts, mainly for sugar, grain and ethanol, which are reported on a daily basis, following the internal procedures established in the Transactions Policy. As a risk-mitigation element, the company sets daily limits or 'stop losses' for each strategy, depending on the markets in which it operates, the financial instruments purchased and the risks defined in the transaction.
These transactions are measured monthly at fair value through the Consolidated Income Statement. In 2014, Abengoa recorded a profit of €3,992 thousand (profit of €15 thousand in 2013 and profit of €11,768 thousand in 2012), corresponding to settled transactions in all years.
- b)
- Credit risk
F-45
Table of Contents
ABENGOA
Consolidated financial statements
is a common practice for the company to reserve the right to cancel the work in the event of a material breach, especially non-payment.
In general, and to mitigate the credit risk, prior to any commercial contract or business agreement, the company generally holds a firm commitment from a leading financial institution to purchase the receivables through a non-recourse factoring arrangement. Under these agreements, the company pays the bank for assuming the credit risk and also pays interest for the discounted amounts. The company always assumes the responsibility that the receivables are valid.
Abengoa derecognizes the factored receivables from the Consolidated Statement of Financial Position when all the conditions of IAS 39 for derecognition of assets are met. In other words, an analysis is made to determine whether all risks and rewards of the financial assets have been transferred, comparing the company's exposure, before and after the transfer, to the variability in the amounts and the calendar of net cash flows from the transferred asset. Once the company's exposure to this variability has been eliminated or substantially reduced, the financial asset is transferred.
In general, Abengoa considers that the most significant risk related to Clients and other receivables is the risk of non-collection, since: a) trade receivables may be quantitatively significant during the progress of work performed for a project or service rendered; b) it is not under the company's control. However, the risk of delays in payment typically relates to technical problems, i.e., associated with the technical risk of the service provided and, therefore, within the company's control.
If the company concludes that the risk associated to the contract has been transferred to the financial institution, the receivable is derecognized in the Consolidated Statement of Financial Position at the time it is transferred, in accordance with IAS 39.20.
An aging of trade receivables as of December 31, 2014 and 2013 is included in Note 15 'Clients and other receivable accounts'. The same note also discloses the credit quality of the clients as well as the movement on provisions for receivables for the years ended December 31, 2014 and 2013.
- •
- Financial investments: to control credit risk in financial investments, the Group has established corporate criteria which require that counterparties are always highly rated financial entities and government debt, as well as establishing investing limits with periodic reviews.
- c)
- Liquidity risk
F-46
Table of Contents
ABENGOA
Consolidated financial statements
and maturities, which mitigates the liquidity risk significantly. Despite having a commitment from a financial institution during the awarding phase of the project and since the financing is usually completed in the latter stages of a construction project—mainly because these projects require a significant amount of technical and legal documentation to be prepared and delivered that is specific to the project (licenses, authorizations, etc.)—a bridge loan (Non-recourse project financing in process) needs to be available at the start of the construction period in order to begin construction activities as soon as possible and to be able to meet the deadlines specified in the concession agreements (see Note 19.2).
- •
- Corporate Financing, used to finance the activities of the remaining companies which are not financed under the aforementioned financing model. This means of financing is managed through Abengoa S.A., which pools cash held by the rest of the companies so as to be able to re-distribute funds in accordance with the needs of the Group (see Notes 2.18 and 20) and to ensure that the necessary resources are obtained from the bank and capital markets.
To ensure there are sufficient funds available for debt repayment in relation to its cash-generating capacity, the Financial Management Group annually prepares and the Board of Directors reviews a Financial Plan that details all the financing needs and how such financing will be provided. We fund in advance disbursements for major cash requirements, such as capital expenditures, debt repayments and working capital requirements. In addition, as a general rule, we do not commit our own equity in projects until the associated long term financing is feasible.
During 2014, Abengoa covered its financing needs through the following financial transactions:
- •
- The refinancing of its syndicated loans. Abengoa, S.A. signed a long term revolving financing agreement, as well as new financing transactions in subsidiaries which have the support of export credit agencies (see Note 20.2)
- •
- Initial Public Offering of Abenga Yield Plc., in June 2014. This company completed the capital increase for a total amount of €611 million (see Note 6.2).
- •
- Financing of certain projects through project debt (see Note 19).
- •
- Ordinary notes issue for a total amount of €1,000 million (see Notes 19 and 20).
Abengoa aims to maintain its strong liquidity position, extend the debt maturities of its existing corporate loans and bonds, continue to access the capital markets from time to time, as appropriate, and further diversify its funding sources. The Company aims to continue to raise equity funding at the project company level through partnerships.
In accordance with the foregoing, the sources of financing are diversified, in an attempt to prevent concentrations that may affect our liquidity risk.
F-47
Table of Contents
ABENGOA
Consolidated financial statements
| | | |
| | Current and non-current | | Notes to the consolidated financial statements |
|---|
| | Financial debt | | Note 19 Project debt and
Note 20 Corporate financing |
| | Lease-back | | Note 20 Corporate financing |
| | Finance lease | | Note 20 Corporate financing |
| | Borrowings and other loans | | Note 20 Corporate financing |
| | Trade and other accounts payable | | Note 25 Trade payables and other current liabilities |
| | Derivatives and hedging instruments | | Note 14 Financial derivatives instruments |
| | Other liabilities | | Note 21 Grants and other liabilities |
The Group manages capital risk to ensure the continuity of the activities of its subsidiaries from an equity standpoint by maximizing the return for the shareholders and optimizing the structure of equity and debt in the respective companies or projects.
Since the admission of its shares to trade on the stock market, the company has grown in the following ways:
- •
- cash flows generated by conventional businesses;
- •
- financing of new investments through project debt (project finance and bridge loan), which also generates business for conventional businesses;
- •
- corporate financing, either through banks or capital markets;
- •
- issuance of new shares of subsidiaries through organized markets;
- •
- asset rotation or divestitures, such as divestiture of Befesa, the sale of mature concessional assets, the sale of a transmission line concession activity in Brazil and a water concession activity in China (for details see Note 6.3.b and 7.2);
- •
- capital increases carried out for €300 million in 2011 and for €517.5 million in 2013 (see Note 18.1).
The leverage objective of the activities of the company is not measured based on the level of debt on its own resources, but on the nature of the activities:
- •
- for activities financed through project debt, each project is assigned a leverage objective based on the cash and cash flow generating capacity, generally, of contracts that provide these projects with highly recurrent and predictable levels of cash flow generation;
- •
- for activities financed with Corporate Financing, the objective is to maintain reasonable leverage, defined as 2.0 times corporate Ebitda over Net Corporate Debt in 2014.
F-48
Table of Contents
ABENGOA
Consolidated financial statements
Note 5. — Financial information by segment
- 5.1.
- Information by business segment
As indicated in Note 1, Abengoa's activity is grouped under the following three activities which are in turn composed of six operating segments:
- •
- Engineering and construction; includes the traditional engineering business in the energy and water sectors, with more than 70 years of experience in the market. Since the beginning of 2014, this activity comprises one operating segment Engineering and Construction (previously it also included the operating segment of 'Technology and Other' that is included in the operating segment of Engineering and Construction since the beginning of 2014, in accordance with IFRS8 'Operating Segment').
Abengoa specializes in carrying out complex turn-key projects for thermo-solar plants, solar-gas hybrid plants, conventional generation plants, biofuels plants and water infrastructures, as well as large-scale desalination plants and transmission lines, among others. In addition, this segment includes activities related to the development of thermo-solar technology, water management technology and innovative technology businesses such as hydrogen energy or the management of energy crops.
- •
- Concession-type infrastructures; groups together the company's proprietary concession assets that generate revenues governed by long term sales agreements, such as take-or-pay contracts or power purchase agreements. This activity includes the operation of electric (solar, cogeneration or wind) energy generation plants, desalination plants and transmission lines. These assets generate low demand risk and the Company focus on operating them as efficiently as possible.
During June 2014, the Company's subsidiary, Abengoa Yield Plc. completed an initial public offering in the US, raising capital of €611 million, and listed its shares on Nasdaq (ABY). ABY grouped ten assets previously reported in different operating segments within the Concession-type infrastructures activity. As such, ABY became a new operating segment within the activity of Concessions-Type Infrastructures after its IPO and has been reported as such in the Company's quarterly financial information since the IPO.
At the end of 2014 the operating segment Abengoa Yield was considered as discontinued operations (see Note 7). As a result, the Concession-type infrastructures activity again comprises four operating segments as it was reported through until the end of 2013:
- •
- Solar—Operation and maintenance of solar energy plants, mainly using thermo-solar technology.
- •
- Transmission—Operation and maintenance of high-voltage transmission power line infrastructures.
- •
- Water—Operation and maintenance of facilities aimed at generating, transporting, treating and managing water, including desalination and water treatment and purification plants.
- •
- Cogeneration and other—Operation and maintenance of conventional cogeneration electricity plants.
- •
- Industrial production; covers Abengoa's businesses with a high technological component, such as development of biofuels technology. The company holds an important leadership position in these activities in the geographical markets in which it operates.
F-49
Table of Contents
ABENGOA
Consolidated financial statements
Abengoa's Chief Operating Decision Maker ('CODM') assesses the performance and assignment of resources according to the above identified segments. The CODM in Abengoa considers the revenues as a measure of the activity and the EBITDA (Earnings before interest, tax, depreciation and amortization) as measure of the performance of each segment. In order to assess performance of the business, the CODM receives reports of each reportable segment using revenues and EBITDA. Net interest expense evolution is assessed on a consolidated basis given that the majority of the corporate financing is incurred at the holding level and that most investemnts in assets are held at project companies which are financed through project debt. The depreciation, amortization and impairment charges are assessed on a consolidated basis in order to analyze the evolution of net income and to determine the dividend pay-out ratio. These charges are not taken into consideration by CODM for the allocation of resources because they are non-cash charges.
The process to allocate resources by the CODM takes place prior to the award of a new project. Prior to presenting a bid, the company must ensure that the project debt for the new project has been obtained. These efforts are taken on a project by project basis. Once the project has been awarded, its evolution is monitored at a lower level and the CODM receives periodic information (revenues and EBITDA) on each operating segment's performance.
- a)
- The following table shows the Segment Revenues and EBITDA for the years 2014, 2013 and 2012:
| | | | | | | | | | | | | | | | | | | | |
| |
| | Revenue | | Ebitda | |
|---|
| | Item | | 2014 | | 2013 | | 2012 | | 2014 | | 2013 | | 2012 | |
|---|
| | Engineering and construction | | | | | | | | | | | | | | | | |
| | Engineering and construction | | | 4,514,496 | | | 4,831,676 | | | 3,789,156 | | | 805,951 | | | 806,486 | | | 623,902 | |
| | | | | | | | | | | | | | | | | | | | | |
| | Total | | | 4,514,496 | | | 4,831,676 | | | 3,789,156 | | | 805,951 | | | 806,486 | | | 623,902 | |
| | | | | | | | | | | | | | | | | | | | | |
| | Concession-type infraestructure | | | | | | | | | | | | | | | | | | | |
| | Solar | | | 335,188 | | | 258,702 | | | 259,842 | | | 235,939 | | | 156,845 | | | 190,411 | |
| | Transmission lines | | | 91,347 | | | 47,497 | | | 24,415 | | | 64,289 | | | 27,657 | | | 6,927 | |
| | Water | | | 40,840 | | | 40,194 | | | 20,679 | | | 26,463 | | | 28,135 | | | 11,625 | |
| | Cogeneration and other | | | 32,036 | | | 37,951 | | | 53,243 | | | 3,941 | | | 7,344 | | | 2,896 | |
| | | | | | | | | | | | | | | | | | | | | |
| | Total | | | 499,411 | | | 384,344 | | | 358,179 | | | 330,632 | | | 219,981 | | | 211,859 | |
| | | | | | | | | | | | | | | | | | | | | |
| | Industrial production | | | | | | | | | | | | | | | | | | | |
| | Biofuels | | | 2,136,660 | | | 2,029,111 | | | 2,138,220 | | | 271,439 | | | 240,907 | | | 91,103 | |
| | | | | | | | | | | | | | | | | | | | | |
| | Total | | | 2,136,660 | | | 2,029,111 | | | 2,138,220 | | | 271,439 | | | 240,907 | | | 91,103 | |
| | | | | | | | | | | | | | | | | | | | | |
| | Total | | | 7,150,567 | | | 7,245,131 | | | 6,285,555 | | | 1,408,022 | | | 1,267,374 | | | 926,864 | |
| | | | | | | | | | | | | | | | | | | | | |
F-50
Table of Contents
ABENGOA
Consolidated financial statements
The reconciliation of segment EBITDA with the profit attributable to owners of the parent is as follows:
| | | | | | | | | | | |
| | Line | | 2014 | | 2013 | | 2012 | |
|---|
| | Total segment EBITDA | | | 1,408,022 | | | 1,267,374 | | | 926,864 | |
| | Amortization and depreciation | | | (474,864 | ) | | (516,368 | ) | | (406,276 | ) |
| | Financial expenses net | | | (854,742 | ) | | (638,948 | ) | | (638,701 | ) |
| | Share in profits/ (losses) of associates | | | 7,018 | | | (5,175 | ) | | 17,875 | |
| | Income tax expense | | | 58,646 | | | 26,183 | | | 174,082 | |
| | Profit (loss) from discontinued operations, net of tax | | | (22,203 | ) | | (22,742 | ) | | 20,176 | |
| | Profit attributable to non-controlling interests | | | 3,415 | | | (8,879 | ) | | (38,650 | ) |
| | Profit attributable to the parent company | | | 125,292 | | | 101,445 | | | 55,370 | |
- b)
- The long term assets and liabilities by Segment at the end of 2014 and 2013 are as follows:
| | | | | | | | | | | | | | | | | | | | | | | |
| |
| | Engineering
and
construction | | Concession-type infrastructure | | Industrial
prod. | |
| |
|---|
| | Item | | Eng. and
const. | | Solar | | Trans. | | Water | | Cog. and
other | | Biofuels | | Balance as of
12.31.14 | |
|---|
| | Assets allocated | | | | | | | | | | | | | | | | | | | | | | |
| | Intangible assets | | | 396,309 | | | 276 | | | — | | | 6,775 | | | 915 | | | 1,164,099 | | | 1,568,374 | |
| | Property plant and equipment | | | 275,952 | | | 23,113 | | | — | | | 4,761 | | | — | | | 983,487 | | | 1,287,313 | |
| | Fixed assets in projects | | | — | | | 2,111,631 | | | 2,273,131 | | | 484,317 | | | 321,102 | | | 998,184 | | | 6,188,365 | |
| | Current financial investments | | | 711,312 | | | 87,237 | | | 30,694 | | | 9,403 | | | 8,775 | | | 201,132 | | | 1,048,553 | |
| | Cash and cash equivalents | | | 498,629 | | | 339,434 | | | 119,428 | | | 36,585 | | | 34,143 | | | 782,594 | | | 1,810,813 | |
| | | | | | | | | | | | | | | | | | | | | | | | |
| | Subtotal allocated | | | 1,882,202 | | | 2,561,691 | | | 2,423,253 | | | 541,841 | | | 364,935 | | | 4,129,496 | | | 11,903,418 | |
| | | | | | | | | | | | | | | | | | | | | | | | |
| | Unallocated assets | | | | | | | | | | | | | | | | | | | | | | |
| | Non-current and associated financ. invest. | | | — | | | — | | | — | | | — | | | — | | | — | | | 997,748 | |
| | Deferred tax assets | | | — | | | — | | | — | | | — | | | — | | | — | | | 1,503,609 | |
| | Other current assets | | | — | | | — | | | — | | | — | | | — | | | — | | | 2,451,705 | |
| | Assets held for sale | | | — | | | — | | | — | | | — | | | — | | | — | | | 8,390,115 | |
| | Subtotal unallocated | | | — | | | — | | | — | | | — | | | — | | | — | | | 13,343,177 | |
| | | | | | | | | | | | | | | | | | | | | | | | |
| | Total Assets | | | — | | | — | | | — | | | — | | | — | | | — | | | 25,246,595 | |
| | | | | | | | | | | | | | | | | | | | | | | | |
| | | | | | | | | | | | | | | | | | | | | | | |
| |
| | Engineering
and
construction | | Concession-type infrastructure | | Industrial
prod. | |
| |
|---|
| | Item | | Eng. and
const. | | Solar | | Trans. | | Water | | Cog. and
other | | Biofuels | | Balance as of
12.31.14 | |
|---|
| | Liabilities allocated | | | | | | | | | | | | | | | | | | | | | | |
| | L-T and S-T corpor. financing | | | 1,351,648 | | | 983,267 | | | 362,154 | | | 105,978 | | | 98,904 | | | 2,267,006 | | | 5,168,957 | |
| | L-T and S-T project debt | | | 6,082 | | | 1,722,176 | | | 1,770,138 | | | 517,975 | | | 465,041 | | | 476,702 | | | 4,958,114 | |
| | L-T and S-T lease liabilities | | | 14,494 | | | — | | | — | | | — | | | — | | | 20,497 | | | 34,991 | |
| | | | | | | | | | | | | | | | | | | | | | | | |
| | Subtotal allocated | | | 1,372,224 | | | 2,705,443 | | | 2,132,292 | | | 623,953 | | | 563,945 | | | 2,764,205 | | | 10,162,062 | |
| | | | | | | | | | | | | | | | | | | | | | | | |
| | Unallocated liabilities | | | | | | | | | | | | | | | | | | | | | | |
| | L-T Other loans and borrowings | | | — | | | — | | | — | | | — | | | — | | | — | | | 121,402 | |
| | L-T grants and other liabilities | | | — | | | — | | | — | | | — | | | — | | | — | | | 212,606 | |
| | L-T and S-T provisions and contingencies | | | — | | | — | | | — | | | — | | | — | | | — | | | 87,879 | |
| | L-T derivative financial instruments | | | — | | | — | | | — | | | — | | | — | | | — | | | 225,298 | |
| | Deferred tax liabilities | | | — | | | — | | | — | | | — | | | — | | | — | | | 281,797 | |
| | L-T personnel liabilities | | | — | | | — | | | — | | | — | | | — | | | — | | | 56,659 | |
| | Other current liabilities | | | — | | | — | | | — | | | — | | | — | | | — | | | 5,972,202 | |
| | Liabilities held for sale | | | — | | | — | | | — | | | — | | | — | | | — | | | 5,480,518 | |
| | | | | | | | | | | | | | | | | | | | | | | | |
| | Subtotal unallocated | | | — | | | — | | | — | | | — | | | — | | | — | | | 12,438,361 | |
| | | | | | | | | | | | | | | | | | | | | | | | |
| | Total liabilities | | | — | | | — | | | — | | | — | | | — | | | — | | | 22,600,423 | |
| | | | | | | | | | | | | | | | | | | | | | | | |
| | Equity unallocated | | | — | | | — | | | — | | | — | | | — | | | — | | | 2,646,172 | |
| | | | | | | | | | | | | | | | | | | | | | | | |
| | Total liabilities and equity unallocated | | | — | | | — | | | — | | | — | | | — | | | — | | | 15,084,533 | |
| | | | | | | | | | | | | | | | | | | | | | | | |
| | Total liabilities and equity | | | — | | | — | | | — | | | — | | | — | | | — | | | 25,246,595 | |
| | | | | | | | | | | | | | | | | | | | | | | | |
F-51
Table of Contents
ABENGOA
Consolidated financial statements
| | | | | | | | | | | | | | | | | | | | | | | |
| |
| | Engineering
and
construction | | Concession-type infrastructure | | Industrial
prod. | |
| |
|---|
| | Item | | Eng. and
const. | | Solar | | Trans. | | Water | | Cog. and
other | | Biofuels | | Balance as of
12.31.13 | |
|---|
| | Assets allocated | | | | | | | | | | | | | | | | | | | | | | |
| | Intangible assets | | | 378,464 | | | 496 | | | — | | | 5,078 | | | 2,451 | | | 455,622 | | | 842,111 | |
| | Property plant and equipment | | | 230,198 | | | 31,756 | | | — | | | — | | | 10,941 | | | 1,000,694 | | | 1,273,589 | |
| | Fixed assets in projects | | | 2,757 | | | 4,704,728 | | | 2,749,837 | | | 447,531 | | | 1,011,429 | | | 997,991 | | | 9,914,273 | |
| | Current financial investments | | | 574,399 | | | 106,508 | | | 101,745 | | | 9,923 | | | 55,915 | | | 77,339 | | | 925,829 | |
| | Cash and cash equivalents | | | 1,537,418 | | | 258,519 | | | 109,566 | | | 35,369 | | | 143,557 | | | 867,254 | | | 2,951,683 | |
| | | | | | | | | | | | | | | | | | | | | | | | |
| | Subtotal allocated | | | 2,723,236 | | | 5,102,007 | | | 2,961,148 | | | 497,901 | | | 1,224,293 | | | 3,398,900 | | | 15,907,485 | |
| | | | | | | | | | | | | | | | | | | | | | | | |
| | Unallocated assets | | | | | | | | | | | | | | | | | | | | | | |
| | Non-current and associated financ. invest. | | | — | | | — | | | — | | | — | | | — | | | — | | | 1,596,912 | |
| | Deferred tax assets | | | — | | | — | | | — | | | — | | | — | | | — | | | 1,281,092 | |
| | Other current assets | | | — | | | — | | | — | | | — | | | — | | | — | | | 2,200,953 | |
| | Assets held for sale | | | — | | | — | | | — | | | — | | | — | | | — | | | 166,403 | |
| | | | | | | | | | | | | | | | | | | | | | | | |
| | Subtotal unallocated | | | — | | | — | | | — | | | — | | | — | | | — | | | 5,245,360 | |
| | | | | | | | | | | | | | | | | | | | | | | | |
| | Total Assets | | | — | | | — | | | — | | | — | | | — | | | — | | | 21,152,845 | |
| | | | | | | | | | | | | | | | | | | | | | | | |
| | | | | | | | | | | | | | | | | | | | | | | |
| |
| | Engineering
and
construction | | Concession-type infrastructure | | Industrial
prod. | |
| |
|---|
| | Item | | Eng. and
const. | | Solar | | Trans. | | Water | | Cog. and
other | | Biofuels | | Balance as of 12.31.13 | |
|---|
| | Liabilities allocated | | | | | | | | | | | | | | | | | | | | | | |
| | L-T and S-T corpor. financing | | | 1,588,500 | | | 1,137,763 | | | 112,812 | | | — | | | 2,536 | | | 2,648,987 | | | 5,490,598 | |
| | L-T and S-T project debt | | | 160,463 | | | 3,028,960 | | | 1,616,216 | | | 218,302 | | | 829,657 | | | 467,352 | | | 6,320,950 | |
| | L-T and S-T lease liabilities | | | 19,247 | | | — | | | — | | | — | | | — | | | 20,791 | | | 40,038 | |
| | | | | | | | | | | | | | | | | | | | | | | | |
| | Subtotal allocated | | | 1,768,210 | | | 4,166,723 | | | 1,729,028 | | | 218,302 | | | 832,193 | | | 3,137,130 | | | 11,851,586 | |
| | | | | | | | | | | | | | | | | | | | | | | | |
| | Unallocated liabilities | | | | | | | | | | | | | | | | | | | | | | |
| | L-T Other loans and borrowings | | | — | | | — | | | — | | | — | | | — | | | — | | | 123,773 | |
| | L-T grants and other liabilities | | | — | | | — | | | — | | | — | | | — | | | — | | | 646,188 | |
| | L-T and S-T provisions and contingencies | | | — | | | — | | | — | | | — | | | — | | | — | | | 87,550 | |
| | L-T derivative financial instruments | | | — | | | — | | | — | | | — | | | — | | | — | | | 266,802 | |
| | Deferred tax liabilities | | | — | | | — | | | — | | | — | | | — | | | — | | | 327,304 | |
| | L-T personnel liabilities | | | — | | | — | | | — | | | — | | | — | | | — | | | 29,789 | |
| | Other current liabilities | | | — | | | — | | | — | | | — | | | — | | | — | | | 5,805,581 | |
| | Liabilities held for sale | | | — | | | — | | | — | | | — | | | — | | | — | | | 121,269 | |
| | | | | | | | | | | | | | | | | | | | | | | | |
| | Subtotal unallocated | | | — | | | — | | | — | | | — | | | — | | | — | | | 7,408,256 | |
| | | | | | | | | | | | | | | | | | | | | | | | |
| | Total liabilities | | | — | | | — | | | — | | | — | | | — | | | — | | | 19,259,842 | |
| | | | | | | | | | | | | | | | | | | | | | | | |
| | Equity unallocated | | | — | | | — | | | — | | | — | | | — | | | — | | | 1,893,003 | |
| | | | | | | | | | | | | | | | | | | | | | | | |
| | Total liabilities and equity unallocated | | | — | | | — | | | — | | | — | | | — | | | — | | | 9,301,259 | |
| | | | | | | | | | | | | | | | | | | | | | | | |
| | Total liabilities and equity | | | — | | | — | | | — | | | — | | | — | | | — | | | 21,152,845 | |
| | | | | | | | | | | | | | | | | | | | | | | | |
F-52
Table of Contents
ABENGOA
Consolidated financial statements
- c)
- Net Debt by segment as of December 31, 2014 and 2013 is as follows:
| | | | | | | | | | | | | | | | | | | | | | | |
| |
| | Engineering and construction | |
| |
| |
| |
| |
| |
| |
|---|
| |
| | Concession-type infrastructure | | Industrial prod. | |
| |
|---|
| |
| | Balance as of 12.31.14 | |
|---|
| | Item | | Eng. and const. | | Solar | | Trans. | | Water | | Cog. and other | | Biofuels | |
|---|
| | Bank debt and current/non-curr. bond | | | 1,351,648 | | | 983,267 | | | 362,154 | | | 105,978 | | | 98,904 | | | 2,267,006 | | | 5,168,957 | |
| | L-T and S-T project debt | | | 6,082 | | | 1,722,176 | | | 1,770,138 | | | 517,975 | | | 465,041 | | | 476,702 | | | 4,958,114 | |
| | Obligat. under curr./non-curr. financial lease | | | 14,494 | | | — | | | — | | | — | | | — | | | 20,497 | | | 34,991 | |
| | Current financial investments | | | (711,312 | ) | | (87,237 | ) | | (30,694 | ) | | (9,403 | ) | | (8,775 | ) | | (201,132 | ) | | (1,048,553 | ) |
| | Cash and cash equivalents | | | (498,629 | ) | | (339,434 | ) | | (119,428 | ) | | (36,585 | ) | | (34,143 | ) | | (782,594 | ) | | (1,810,813 | ) |
| | | | | | | | | | | | | | | | | | | | | | | | |
| | Total net debt (cash) | | | 162,283 | | | 2,278,772 | | | 1,982,170 | | | 577,965 | | | 521,027 | | | 1,780,479 | | | 7,302,696 | |
| | | | | | | | | | | | | | | | | | | | | | | | |
| | | | | | | | | | | | | | | | | | | | | | | |
| |
| | Engineering and construction | |
| |
| |
| |
| | Industrial production | |
| |
|---|
| |
| | Concession-type infrastructure | |
| |
|---|
| |
| | Balance as of 12.31.13 | |
|---|
| | Item | | Eng. and const. | | Solar | | Trans. | | Water | | Cog. and other | | Biofuels | |
|---|
| | Bank debt and current/non-curr. bond | | | 1,588,500 | | | 1,137,763 | | | 112,812 | | | — | | | 2,536 | | | 2,648,987 | | | 5,490,598 | |
| | L-T and S-T project debt | | | 160,463 | | | 3,028,960 | | | 1,616,216 | | | 218,302 | | | 829,657 | | | 467,352 | | | 6,320,950 | |
| | Obligat. under curr./non-curr. financial lease | | | 19,247 | | | — | | | — | | | — | | | — | | | 20,791 | | | 40,038 | |
| | Current financial investments | | | (574,399 | ) | | (106,508 | ) | | (101,745 | ) | | (9,923 | ) | | (55,915 | ) | | (77,339 | ) | | (925,829 | ) |
| | Cash and cash equivalents | | | (1,537,418 | ) | | (258,519 | ) | | (109,566 | ) | | (35,369 | ) | | (143,558 | ) | | (867,254 | ) | | (2,951,684 | ) |
| | | | | | | | | | | | | | | | | | | | | | | | |
| | Total net debt (cash) | | | (343,607 | ) | | 3,801,696 | | | 1,517,717 | | | 173,010 | | | 632,720 | | | 2,192,537 | | | 7,974,073 | |
| | | | | | | | | | | | | | | | | | | | | | | | |
F-53
Table of Contents
ABENGOA
Consolidated financial statements
- d)
- The invetments in intangible assets and property, plant and equipment by segments for the years ended December 31, 2014, 2013 and 2012 is as follows:
| | | | | | | | | | | |
| | Item | | 2014 | | 2013 | | 2012 | |
|---|
| | Engineering and construction | | | | | | | | | | |
| | Engineering and construction | | | 133,630 | | | 131,834 | | | 111,253 | |
| | | | | | | | | | | | |
| | Total | | | 133,630 | | | 131,834 | | | 111,253 | |
| | | | | | | | | | | | |
| | Concession-type infraestructure | | | | | | | | | | |
| | Solar | | | 811,637 | | | 346,500 | | | 737,784 | |
| | Transmission lines | | | 487,887 | | | 594,527 | | | 689,441 | |
| | Water | | | 99,356 | | | 242,131 | | | 53,361 | |
| | Cogeneration and other | | | 612,726 | | | 230,661 | | | 60,312 | |
| | | | | | | | | | | | |
| | Total | | | 2,011,606 | | | 1,413,819 | | | 1,540,898 | |
| | | | | | | | | | | | |
| | Industrial production | | | | | | | | | | |
| | Biofuels | | | 127,228 | | | 57,395 | | | 152,174 | |
| | | | | | | | | | | | |
| | Total | | | 127,228 | | | 57,395 | | | 152,174 | |
| | | | | | | | | | | | |
| | Discontinued operations | | | 307,093 | | | 281,334 | | | 410,128 | |
| | | | | | | | | | | | |
| | Total | | | 2,579,557 | | | 1,884,382 | | | 2,214,453 | |
| | | | | | | | | | | | |
- e)
- The distribution of depreciation, amortization and impairment charges by segments for the years 2014, 2013 and 2012 is as follows:
| | | | | | | | | | | |
| | Item | | 2014 | | 2013 | | 2012 | |
|---|
| | Engineering and construction | | | | | | | | | | |
| | Engineering and construction | | | 138,145 | | | 210,750 | | | (143,360 | ) |
| | | | | | | | | | | | |
| | Total | | | 138,145 | | | 210,750 | | | (143,360 | ) |
| | | | | | | | | | | | |
| | Concession-type infraestructure | | | | | | | | | | |
| | Solar | | | 90,230 | | | 89,106 | | | (76,974 | ) |
| | Transmission lines | | | 34,838 | | | 24,105 | | | (7,883 | ) |
| | Water | | | 3,996 | | | 8,746 | | | (4,017 | ) |
| | Cogeneration and other | | | 10,906 | | | 11,125 | | | (3,026 | ) |
| | | | | | | | | | | | |
| | Total | | | 139,970 | | | 133,082 | | | (91,900 | ) |
| | | | | | | | | | | | |
| | Industrial production | | | | | | | | | | |
| | Biofuels | | | 196,749 | | | 172,536 | | | (171,016 | ) |
| | | | | | | | | | | | |
| | Total | | | 196,749 | | | 172,536 | | | (171,016 | ) |
| | | | | | | | | | | | |
| | Total | | | 474,864 | | | 516,368 | | | (406,276 | ) |
| | | | | | | | | | | | |
F-54
Table of Contents
ABENGOA
Consolidated financial statements
- 5.2.
- Information by geographic areas
- a)
- The revenue distribution by geographical region for the years 2014, 2013 and 2012 is as follows:
| | | | | | | | | | | | | | | | | | | | |
| | Geographical region | | 2014 | | % | | 2013 | | % | | 2012 | | % | |
|---|
| | —North America | | | 2,253,624 | | | 31.5 | | | 2,670,411 | | | 36.9 | | | 2,569,313 | | | 40.9 | |
| | —South America (except Brazil) | | | 1,301,816 | | | 18.3 | | | 689,554 | | | 9.5 | | | 522,343 | | | 8.3 | |
| | —Brazil | | | 874,687 | | | 12.2 | | | 726,019 | | | 10.0 | | | 986,563 | | | 15.7 | |
| | —Europe (except Spain) | | | 892,872 | | | 12.5 | | | 863,329 | | | 11.9 | | | 877,758 | | | 14.0 | |
| | —Other regions | | | 938,517 | | | 13.1 | | | 1,166,510 | | | 16.1 | | | 404,599 | | | 6.4 | |
| | —Spain | | | 889,051 | | | 12.4 | | | 1,129,308 | | | 15.6 | | | 924,979 | | | 14.7 | |
| | | | | | | | | | | | | | | | | | | | | |
| | Consolidated Total | | | 7,150,567 | | | 100 | | | 7,245,131 | | | 100 | | | 6,285,555 | | | 100 | |
| | | | | | | | | | | | | | | | | | | | | |
| | Outside Spain amount | | | 6,261,516 | | | 87.6 | | | 6,115,823 | | | 84.4 | | | 5,360,576 | | | 85.3 | |
| | | | | | | | | | | | | | | | | | | | | |
| | Spain amount | | | 889,051 | | | 12.4 | | | 1,129,308 | | | 15.6 | | | 924,979 | | | 14.7 | |
| | | | | | | | | | | | | | | | | | | | | |
During 2013 we reported results from Mexico as part of South America. In the year ended December 31, 2014, in order to better reflect the geographical segmentation of our business we included amounts from Mexico in the North America segment. The information by geographic areas for the year ended December 31, 2013 has been presented according to the new geographic segmentation.
- b)
- The net book value of Intangible assets and Property, plant and equipment by geographical region as of December 31, 2014 and 2013 is as follows:
| | | | | | | | |
| | Geographic region | | Balance as of
12.31.14 | | Balance as of
12.31.13 | |
|---|
| | Spain | | | 825,364 | | | 831,529 | |
| | | | | | | | | |
| | —North America | | | 1,076,259 | | | 334,651 | |
| | —South America (except Brazil) | | | 34,243 | | | 25,766 | |
| | —Brazil | | | 380,905 | | | 381,894 | |
| | —Europe (except Spain) | | | 508,712 | | | 520,541 | |
| | —Other regions | | | 30,204 | | | 21,319 | |
| | | | | | | | | |
| | Foreign market | | | 2,030,323 | | | 1,284,171 | |
| | | | | | | | | |
| | Total | | | 2,855,687 | | | 2,115,700 | |
| | | | | | | | | |
- c)
- The net book value of Fixed assets in projects by geographic region as of December 31, 2014 and 2013 is as follows:
| | | | | | | | |
| | Geographic region | | Balance as of
12.31.14 | | Balance as of
12.31.13 | |
|---|
| | Spain | | | 1,643,547 | | | 2,987,456 | |
| | | | | | | | | |
| | —North America | | | 578,763 | | | 2,658,753 | |
| | —South America (except Brazil) | | | 2,350 | | | 813,098 | |
| | —Brazil | | | 3,289,310 | | | 2,757,365 | |
| | —Europe (except Spain) | | | 145,633 | | | 153,442 | |
| | —Other regions | | | 528,762 | | | 544,159 | |
| | | | | | | | | |
| | Foreign market | | | 4,544,818 | | | 6,926,817 | |
| | | | | | | | | |
| | Total | | | 6,188,365 | | | 9,914,273 | |
| | | | | | | | | |
F-55
Table of Contents
ABENGOA
Consolidated financial statements
Note 6. — Changes in the composition of the group
- 6.1.
- Changes in the consolidation group
- a)
- In 2014 a total of 84 subsidiaries (56 in 2013 and 79 in 2012), 3 associates (2 in 2013 and 5 in 2012) and 5 joint ventures (3 in 2013 and 9 in 2012), were included in the consolidation group, which are identified in Appendices I, II, III, XII, XIII and XIV of these Consolidated Financial Statements.
These changes did not have a significant impact on the overall consolidated amounts in 2014, 2013 and 2012.
In addition, during 2014, 19 Temporary joint operations (UTE), (22 in 2013 and 14 in 2012) 5 of them with partners which do not being to the Group, have commenced their activity or have started to undertake a significant level of activity and were included in the consolidation group.
The amounts set out below represent the Group's proportional interest in the assets, liabilities, revenues and profits of the UTE with partners non Group shareholding, which have been included in the Consolidated Financial Statements in 2014 and 2013 (and revenues and profits of the UTE with partners non Group shareholding which have been included in the Consolidated Financial Statements in 2012):
| | | | | | | | |
| |
| | 2014 | | 2013 | |
|---|
| | Non-current assets | | | 8,354 | | | 7,498 | |
| | Current assets | | | 124,096 | | | 152,974 | |
| | Non-current liabilities | | | 7,421 | | | 5,534 | |
| | Current liabilities | | | 119,248 | | | 152,871 | |
| | | | | | | | | | | |
| |
| | 2014 | | 2013 | | 2012 | |
|---|
| | Revenue | | | 40,510 | | | 58,112 | | | 66,419 | |
| | Expenses | | | (36,148 | ) | | (61,032 | ) | | (76,795 | ) |
| | Profit/ (loss) after taxes | | | 4,362 | | | (2,920 | ) | | (10,376 | ) |
- b)
- In 2014 a total of 14 subsidiaries were no longer included in the consolidation group (88 in 2013 and 46 in 2012), 2 associates (4 in 2013 and 5 in 2012) and 1 joint ventures (9 in 2013 and 7 in 2012), which are identified in Appendix IV, V and VI and which did not have any material impact in the Consolidated Income Statement, except for disposals mentioned in Note 6.3b).
During 2014, 2 UTE, (17 in 2013 and 33 in 2012), which do not belong to the Group, were excluded from the consolidated group because they had ceased their activities or had become insignificant in relation to overall group activity levels. The proportional consolidated revenues of these UTE in 2014 were null (€53 thousand in 2013 and €271 thousand in 2012).
- c)
- In December 2014, full consolidation of Abengoa Bioenergy Biomass of Kansas, LLC and Mojave Solar, LLC, previously accounted for under the equity method, began after we gained control of these entities (see Note 6.4). At the end of 2014, this last company is included in the Abengoa Yield consolidation group and classified as discontinued operations at the end of 2014 (see Note7).
On October 13, 2013, Arizona Solar One, LLC, which was recorded under the equity method, started to be fully consolidated after we gained control over the entity (see Note 6.4). At the
F-56
Table of Contents
ABENGOA
Consolidated financial statements
end of 2014 this company is included in the Abengoa Yield consolidation group and classified as discontinued operations in accordance with the requirements of IFRS 5 (see Note 7).
During 2012, Rioglass group, which was consolidated proportionally until December 31, 2011, started to be fully consolidated due to the business combination conducted in this period (see Note 6.4).
- 6.2.
- Initial Public Offering of Abengoa Yield Plc.
On June 18, 2014 Abengoa Yield Plc. ('Abengoa Yield' o 'ABY'), a wholly-owned subsidiary of Abengoa, closed its initial public offering of 28,577,500 ordinary shares, including the exercise in full of underwriters' over-allotment option ('greenshoe option'). These shares were offered at a price of USD 29 per share for total gross proceeds of USD 828.7 million (€611.0 million) before underwriter discounts and offering expenses.
Abengoa Yield's shares began trading on the NASDAQ Global Select Market under the symbol 'ABY' on June 13, 2014.
Abengoa Yield is a dividend growth-oriented company formed to serve as the primary vehicle through which Abengoa will own, manage and acquire renewable energy, conventional power and electric transmission lines and other contracted revenue-generating assets, initially focused in North America and South America, as well as Europe.
Abengoa Yield Limited was incorporated on December 17, 2013. On March 17, 2014, the General Shareholders Meeting approved its conversion to Plc, with effect on March 19, 2014.
Prior to the closing of the offering, Abengoa contributed to Abengoa Yield ten concessional assets, certain holding companies and a preferred equity investment in Abengoa Concessoes Brasil Holding (a subsidiary of Abengoa engaged in the development, construction and management of transmission lines in Brazil). As consideration for this asset transfer, Abengoa received a 64.28% interest in Abengoa Yield and USD 779.8 million (€575 million) in cash, corresponding to the net proceeds of the initial public offering after underwriter discounts and offering expenses.
As a result of the Initial Public Offering, Abengoa recorded Non-controlling interest amounting to €488.9 million, corresponding to the book value of the 35.72% stake in Abengoa Yield sold in the initial public offering and a positive impact in Equity amounting to €86 million, for the difference between the net proceeds and the book value of the net assets transferred.
At the end of 2014, and following the start of the implementation of the Company's plan to reduce the participation of Abengoa Yield Plc which will result in a loss of control, we proceeded to account for ABY as a discontinued operation based on the requirements of IFRS 5 (see Note 7).
- 6.3.
- Main acquisitions and disposals
- a)
- Acquisitions
- •
- There were no significant acquisitions during the year 2014, 2013 and 2012.
- b)
- Disposals
- •
- On December, 2014, Abengoa Yield closed the acquisition of Solacor 1 and Solacor 2 and PS10 and PS 20 (thermo-solar assets with a combined capacity of 131 MW located in Spain) and Cadonal (wind farm of 50 MW, located in Uruguay). The first acquisition of assets has been completed for a total amount of 312 million US dollars and it was
F-57
Table of Contents
ABENGOA
Consolidated financial statements
- 6.4.
- Business combinations
Full consolidation of Abengoa Bioenergy Biomass of Kansas, LLC, the company that owns the assets and liabilities of the second-generation biofuels plant in Hugoton, USA, previously accounted through the equity method, began in December 2014 once control over this company was obtained as it entered a stage in which relevant decisions are no longer subject to the control and approval of the Administration. This change of control of the company and consequently its full consolidation means that all its assets and liabilities have been integrated according to IFRS 3 ('Business combinations') with no significant differences arising between the book value in Abengoa's consolidation and its fair value.
The amount of assets and liabilities related to Abengoa Bioenergy Biomass of Kansas, LLC consolidated as of December 31, 2014 is shown in the following table:
| | | | | |
| |
| | As of
December 31,
2014 | |
|---|
| | Non-current assets | | | 686,253 | |
| | Current assets | | | 16,229 | |
| | Non-current and current liabilities | | | (151,446 | ) |
| | Equity | | | (551,036 | ) |
Additionally, full consolidation of Mojave Solar, LLC, the company that owns the assets and liabilities of the thermo-solar plant in Mojave, USA, previously accounted through the equity method, began in December 2014 once control over this company was obtained as it entered a stage in which relevant decisions are no longer subject to the control and approval of the Administration. This change of control of the company and consequently its full consolidation means that all its assets and liabilities
F-58
Table of Contents
ABENGOA
Consolidated financial statements
have been integrated according to IFRS 3 ('Business combinations') with no significant differences arising between the book value in Abengoa's consolidation and its fair value.
At the end of 2014, Mojave Solar, LLC is included in the Abengoa Yield consolidation group and classified as discontinued operations in accordance with the requirements of IFRS 5 (see Note 7). Therefore, Abengoa's Consolidated Financial Statements as of December 31, 2014 include Mojave Solar, LLC's assets and liabilities under a single heading in Assets held for sale and liabilities held for sale within the Consolidated statements of financial position.
Full consolidation of Arizona Solar One, LLC, the company that owns the assets and liabilities of the thermo-solar plant in Arizona, USA, previously accounted through the equity method, began in October 2013 once control over this company was obtained as it entered a stage in which relevant decisions are no longer subject to the control and approval of the Administration. This change of control of the company and consequently its full consolation means that all its assets and liabilities have been integrated according to IFRS 3 ('Business combinations') with no significant differences arising between the book value in Abengoa's consolidation and its fair value.
At the end of 2014, this company is included in the Abengoa Yield consolidation group and classified as discontinued operation in accordance with the requirements of IFRS 5 (see Note 7). Therefore, Abengoa's Consolidated financial statements as of December 31, 2014 include its assets and liabilities under a single heading in Assets held for sale and liabilities held for sale within the Consolidated statements of financial position.
In 2012 the Group carried out the business combination of Rioglass Group. Rioglass Group was incorporated in 2006 as a joint venture between Abengoa and its former shareholders. The group manufactures and sells parabolic trough mirrors for thermo-solar plants.
Since the incorporation of Rioglass Group, thermo-solar energy has experienced a very high development worldwide, mainly in Spain and the United States. Recently, we can appreciate a significant international expansion in other geographies, with plants in construction in the Middle East, Africa and India and with ambitious plans to develop new thermo-solar plants in several countries such as South Africa, Australia, China, India, Saudi Arabia and Chile.
On January 16, 2012, Abengoa Solar, S.A. closed an agreement with Rioglass Laminar, S.L. to acquire an additional share of Rioglass Holding, S.A. With this acquisition and once the conditions for the closing were fulfilled, Abengoa Solar, S.A. became the majority shareholder of Rioglass Holding, S.L. and obtained control of the management of the group, a business which is key in its strategy of international expansion. As a result, Rioglass group, which was integrated proportionally, started to be fully consolidated.
Since the business combination was achieved in stages, according to IFRS 3, the Company has remeasured its previously held equity interest in the acquiree at its acquisition-date fair value, which has consisted basically in the value of committed sales from Rioglass Group for the use of technology and mirrors, linked to relations and contracts existing with clients in the construction of thermo-solar plants in Spain, the United States, South Africa, Mexico and India. This valuation has represented a gain of € 85,247 thousand.
The difference between the fair value of the stake acquired in Rioglass group and the fair value of the identifiable assets and liabilities acquired, amounting to € 38,919 thousand, was recorded as Goodwill.
F-59
Table of Contents
ABENGOA
Consolidated financial statements
Additionally, according to IFRS 3, the purchase price allocation, was as follows:
| | | | | | | | |
| |
| | Book value | | Fair value | |
|---|
| | Non-current assets | | | 66,141 | | | 187,157 | |
| | Current assets | | | 64,856 | | | 73,564 | |
| | Non-current and current liabilities | | | (73,082 | ) | | (110,148 | ) |
| | Book value of share capital of acquired net assets | | | 28,958 | | | — | |
| | | | | | | | | |
| | Fair value of acquired net assets | | | — | | | 150,573 | |
| | | | | | | | | |
| | Stake in fair value of acquired net assets (I) | | | — | | | 75,287 | |
| | | | | | | | | |
| | Fair value of the stake acquired (II) | | | — | | | 114,206 | |
| | | | | | | | | |
| | Goodwill (Difference II – I) | | | — | | | 38,919 | |
| | | | | | | | | |
| | | | | | | | | |
| | | | | | | | | |
Note 7. — Assets held for sale and discontinued operations
- 7.1.
- Plan to further optimize Abengoa Financial Structure
On December 15, 2014, Abengoa's Board of Directors approved the plan to further improve its financial structure through three main initiatives:
- •
- Reduce its stake in Abengoa Yield
- •
- Accelerate the sale of assets to Abengoa Yield
- •
- The creation of a joint venture with external equity partners that will invest in a portfolio of contracted assets under construction as well as in new contracted assets under development.
The impacts of these initiatives and their main effects in relation to the reclassification to heading 'Assets held for sale and discontinued operations' as of December 31, 2014 are described below.
Reduce its stake in Abengoa Yield
The plan to reduce the stake in Abengoa Yield was initiated at year end 2014 with the approval of the Abengoas's Board of Directors and is expected to be completed within one year, through the completion of following steps:
- •
- An initial stage to divest a 13% stake ended on January 16, 2015, via the sale in an underwritten public offering of 10,580,000 ordinary shares in Abengoa Yield (including 1,380,000 shares sold pursuant to the exercise in full of the underwritters' over-allotment option) at a price of USD 31 per share, bringing the holding in Abengoa Yield to 51%. This sale generated USD 328 million for Abengoa, before fees.
- •
- The second step will consist of the divestment of an additional shareholding in Abengoa Yield and the strengthening of the Right Of First Offer (ROFO) agreement between the two companies, as well as a review of the corporate governance of Abengoa Yield to reinforce the role of the independent directors so that control is effectively transferred when the second sale takes place.
Taking into account that Abengoa Yield was presented as an operating segment within the Concession-Type Infrastructures activity during part of the year 2014 and due to the significance that the activities carried out by Abengoa Yield have for Abengoa, the sale of this shareholding is considered as a discontinued operation in accordance with the stipulations and requirements of IFRS 5, 'Non-Current Assets Held for Sale and Discontinued Operations'.
F-60
Table of Contents
ABENGOA
Consolidated financial statements
In accordance with this standard, the results of Abengoa Yield for the year 2014 are included under a single heading in Abengoa's Consolidated Financial Statements for the year ended December 31, 2014.
Likewise, the Consolidated Income Statement for the year, 2013, which is included for comparison purposes in Abengoa's Consolidated Financial Statements for the year ended December 31, 2014 also includes the results generated by Abengoa Yield recorded under a single heading ('Profit (loss) from discontinued operations, net of tax'), for the activities which are now considered discontinued.
As of December 31, 2014, the breakdown of the assets and liabilities included in the Consolidated Statements of Financial Position related to Abengoa Yield and reclassified to assets and liabilities held for sale in accordance with IFRS 5, is as follows:
| | | | | |
| |
| | Balance as of
12.31.14 | |
|---|
| | Fixed assets in projects | | | 5,574,324 | |
| | Investments in associates | | | 4,136 | |
| | Financial investments | | | 43,623 | |
| | Deferred tax assets | | | 58,465 | |
| | Current assets | | | 580,441 | |
| | Project debt | | | (3,457,156 | ) |
| | Other non-current liabilities | | | (1,263,060 | ) |
| | Other current liabilities | | | (102,539 | ) |
| | | | | | |
| | Total net assets and liabilities held for sale | | | 1,438,234 | |
| | | | | | |
| | | | | | |
| | | | | | |
Additionally, for the years ended December 31, 2014 and 2013, the impact of the discontinuity of the Abengoa Yield's Income Statements, is as follows:
| | | | | | | | | | | |
| |
| | 2014 | | 2013 | | 2012 | |
|---|
| | Revenue | | | 224,563 | | | 111,339 | | | 26,397 | |
| | Other operating income | | | 18,206 | | | 5,627 | | | 3,316 | |
| | Operating expenses | | | (112,046 | ) | | (74,006 | ) | | (23,705 | ) |
| | I. Operating profit | | | 130,723 | | | 42,960 | | | 6,008 | |
| | II. Financial expense, net | | | (148,935 | ) | | (82,867 | ) | | (15,892 | ) |
| | III. Share of profit/(loss) of associates carried under the equity method | | | (581 | ) | | 10 | | | (314 | ) |
| | IV. Profit before income tax | | | (18,793 | ) | | (39,897 | ) | | (10,198 | ) |
| | V. Income tax benefit | | | (3,410 | ) | | 17,750 | | | (2,169 | ) |
| | VI. Profit for the period from continuing operations | | | (22,203 | ) | | (22,147 | ) | | (12,367 | ) |
| | | | | | | | | | | | |
| | VIII. Profit for the period attributable to the Parent Company | | | (22,203 | ) | | (22,147 | ) | | (12,367 | ) |
| | | | | | | | | | | | |
| | | | | | | | | | | | |
| | | | | | | | | | | | |
F-61
Table of Contents
ABENGOA
Consolidated financial statements
Furthermore for the years ended December 31, 2014 and 2013, the breakdown of the Consolidated Cash Flows Statements of Abengoa Yield is as follows:
| | | | | | | | | | | |
| |
| | 2014 | | 2013 | | 2012 | |
|---|
| | Profit for the year from continuing operations | | | (22,203 | ) | | (22,147 | ) | | (12,367 | ) |
| | I. Profit for the year from continuing operations adjusted by non monetary items | | | 123,575 | | | 68,184 | | | 17,874 | |
| | II. Variations in working capital | | | 24,245 | | | 6,937 | | | 28,065 | |
| | III. Interest and income tax received / paid | | | (123,167 | ) | | (46,964 | ) | | (31,554 | ) |
| | A. Net cash provided by operating activities | | | 24,653 | | | 28,157 | | | 14,385 | |
| | I. Investments/Disposals | | | (284,019 | ) | | (523,118 | ) | | (832,979 | ) |
| | B. Net cash used in investing activities | | | (284,019 | ) | | (523,118 | ) | | (832,979 | ) |
| | I. Proceeds from loans and borrowings | | | 1,100,954 | | | 858,352 | | | 257,430 | |
| | II. Repayment of loans and borrowings | | | (1,359,938 | ) | | (502,947 | ) | | (46,718 | ) |
| | III. Other finance activities | | | 509,491 | | | 333,638 | | | 628,749 | |
| | C. Net cash provided by financing activities | | | 250,507 | | | 689,043 | | | 839,461 | |
| | Net increase/(decrease) in cash and cash equivalents | | | (8,859 | ) | | 194,082 | | | 20,867 | |
| | Cash, cash equivalents and bank overdrafts at beginning of the year | | | 259,854 | | | 73,919 | | | 53,438 | |
| | Translation differences cash or cash equivalent | | | 40,418 | | | (8,147 | ) | | (386 | ) |
| | Cash and cash equivalents at end of the year | | | 291,413 | | | 259,854 | | | 73,919 | |
Finally for the year ended December 31, 2014, the amount of expenses recognized directly in equity related to Abengoa Yield amounts to €14,311 thousand.
Accelerate the sale of assets to Abengoa Yield
The plan to accelerate the sale of assets to Abengoa Yield under the Right of First Offer (ROFO) agreement was launched at the start of 2014 with the approval of Abengoa's board of directors, with the aim of divesting certain concession project companies that own desalination plants in Algeria (Skikda and Honnaine), transmission lines in Peru (ATN2) and an STE plant in Abu Dhabi (Shams). Given that as of December 31, 2014, the previous companies are available for immediate sale and the sale is highly probable, the Company has classified the associated assets and liabilities as held for sale in the Consolidated Statement of Financial Position as of December 31, 2014. Until closing of the sale transaction, the assets will be classified as held for sale in accordance with the stipulations and requirements of IFRS 5, 'Non-Current Assets Held for Sale and Discontinued Operations'.
F-62
Table of Contents
ABENGOA
Consolidated financial statements
As of December 31, 2014, the breakdown of the assets and liabilities included in the Consolidated Statements of Financial Position related to these companies and reclassified to assets and liabilities held for sale, is as follows:
| | | | | |
| |
| | Balance as of
12.31.14 | |
|---|
| | Fixed assets in projects | | | 142,213 | |
| | Investments in associates | | | 37,901 | |
| | Financial investments | | | 297 | |
| | Current assets | | | 35,463 | |
| | Project debt | | | (126,170 | ) |
| | Other non-current liabilities | | | (491 | ) |
| | Other current liabilities | | | (2,210 | ) |
| | | | | | |
| | Total net assets and liabilities held for sale | | | 87,003 | |
| | | | | | |
| | | | | | |
| | | | | | |
A definitive agreement was reached with Abengoa Yield on February 3, 2015 for a total of USD 142 million following approval by Abengoa's board of directors. It includes the divestment of the aforementioned assets (classified as assets held for sale at the end of 2014) and 29.6% of the stake held in Helioenergy 1 and 2 (a thermo-solar assets in Spain) at the end of the year. Since the agreement to divest Helioenergy 1 and 2 was performed during January 2015, such assets have not been classified as assets held for sale. Related to desalination plants in Algeria, Abengoa also entered into a two year call and put option agreement with Abengoa Yield by which they have put option rights to require Abengoa to purchase back these assets at the same price paid by them and Abengoa has call option rights to require them to sell back these assets if certain indemnities and guarantees provided by Abengoa related to past circumstances reach a certain threshold.
The creation of a joint venture with external equity partners that will invest in a portfolio of contracted assets under construction and development.
On December 11, 2014, the company reached a non-binding agreement with the infrastructure fund EIG Global Energy Partners to jointly invest in a new company (Newco) to which Abengoa will contribute its shareholdings in a series of companies. These project companies own concessions for conventional generation and renewable energy assets and transmission lines in different regions, including the USA, Mexico, Brazil and Chile. The new company will be jointly managed, although EIG will hold a majority stake in the new company. Once the agreement has been completed and the projects have been transferred to Newco, Abengoa will no longer have a controlling interest in these assets. Given that as of December 31, 2014, the companies associated with previous projects are available for immediate sale and the sale is highly probable, the Company has classified the associated assets and liabilities as held for sale in the Consolidated Statement of Financial Position as of December 31, 2014. Until closing of the sale transaction, the assets will be reported as held for sale in accordance with the stipulations and requirements of IFRS 5, 'Non-Current Assets Held for Sale and Discontinued Operations'.
F-63
Table of Contents
ABENGOA
Consolidated financial statements
As of December 31, 2014, the breakdown of the assets and liabilities included in the Consolidated Statements of Financial Position related to companies to be transferred to the new company and reclassified to assets and liabilities held for sale, is as follows:
| | | | | |
| |
| | Balance as of
12.31.14 | |
|---|
| | Fixed assets in projects | | | 1,710,429 | |
| | Financial investments | | | 44 | |
| | Deferred tax assets | | | 47 | |
| | Current assets | | | 33,348 | |
| | Project debt | | | (252,784 | ) |
| | Other non-current liabilities | | | (13,646 | ) |
| | Other current liabilities | | | (115,346 | ) |
| | | | | | |
| | Total net assets and liabilities held for sale | | | 1,362,092 | |
| | | | | | |
| | | | | | |
| | | | | | |
- 7.2.
- Assets held for sale (shares in Linha Verde Transmissora de Energía, S.A.)
The Company has signed with Centrais Elétricas do Norte do Brasil S.A (Eletronorte) a share purchase agreement to sell its 51% stake in Linha Verde Transmissora de Energía S.A. ('Linha Verde'), a company with a concession of an electric transmission line in Brazil which is currently in pre-operational stage. As of December 31, 2014, the sale is subject to the closing conditions customary for the sale of these types of assets.
Given that as of that date the subsidiary is available for immediate sale and the sale is highly probable, the Company has classified the assets and liabilities of Linha Verde as held for sale in the Consolidated Statement of Financial Position as of December 31, 2014. Until closing of the sale transaction, the assets will be classified as held for sale in accordance with the stipulations and requirements of IFRS 5, 'Non-Current Assets Held for Sale and Discontinued Operations'.
The expected cash proceeds will be approximately 40 million Brazilian Real (approximately €12.4 million).
As of December 31, 2014, the breakdown of the assets and liabilities included in the Consolidated Statements of Financial Position related to Linha Verde and reclassified to assets and liabilities held for sale, are as follows:
| | | | | |
| |
| | Balance as of 12.31.14 | |
|---|
| | Fixed assets in projects | | | 163,529 | |
| | Deferred tax assets | | | 834 | |
| | Current assets | | | 5,022 | |
| | Project debt | | | (116,398 | ) |
| | Other current liabilities | | | (30,719 | ) |
| | | | | | |
| | Total net assets and liabilities held for sale | | | 22,268 | |
| | | | | | |
| | | | | | |
| | | | | | |
F-64
Table of Contents
ABENGOA
Consolidated financial statements
- 7.3.
- Sale of shares in Befesa Medio Ambiente, S.L.U.
On June 13, 2013 the Company reached an exclusive agreement with certain investment funds managed by Triton Partners to wholly transfer Abengoa's shareholding in Befesa Medio Ambiente, S.L.U. The agreed sale price was €1,075 million (considering the net debt adjustments, total consideration to Abengoa amounted to €620 million). The sale of this shareholding involved a cash deposit of €331 million. The balance of the agreed payment, to complete the aforementioned figure of €620 million, consisted of a deferred payment of €17 million (€15 million held as a deposit until ongoing litigations are resolved and two million Euros in long-term receivables from a client of Befesa Medioambiente), a credit note of €48 million to mature in five years and a deferred payment of €225 million through a convertible loan with 15 years maturity and subject to two extension options of five years each at the discretion of the venture capital fund. The loan's principal was settled with a single repayment at maturity and accrues interest at the 6-month Euribor, plus a 6% spread, with an option for the fund to capitalize or pay interest at the end of each accrual period. Certain triggering events, which include Befesa's insolvency, a maximum net debt/EBITDA ratio of 8.0 throughout the life of the convertible loan, and failure to meet certain financial objectives in the last three years of the 15-year loan (minimum expected operating cash flow, minimum cash coverage ratio of 1.3) resulted in the automatic conversion of the loan into 14.06% of Befesa's shares.
The convertible loan is a hybrid instrument including a loan receivable and multiple embedded derivatives. According to IAS 39, derivatives which are not closely related with the host contract (the loan receivable) should be accounted for separately. In our case, the value of all the options which are not closely related with the host contract is mainly based in the performance of Befesa and in consequence they are considered as a single derivative instrument.
The convertible loan is included in "Other Receivable Accounts" in non-current assets and the derivative is included in non-current 'Derivative liabilities' in the Consolidated Statements of Financial Position.
On February 4, 2015, the Company signed an agreement with Triton Partners to sell credit note in the nominal amount of €48 million, which was part of the consideration agreed for the sale of Befesa.
The sale transaction generated a gain of €0.4 million in the 'Results for the year from discontinued operations, net of taxes' in the Consolidated Income Statement for the year 2013.
Taking into account the significance that the activities carried out by Befesa had for Abengoa, the sale of this shareholding was considered as a discontinued operation in accordance with the stipulations and requirements of IFRS 5, 'Non-Current Assets Held for Sale and Discontinued Operations'.
In accordance with this standard, the Consolidated Income Statement for the year ended December 31, 2013 and 2012, which are included for comparison purposes in Abengoa's Consolidated Financial Statements for the year ended December 31, 2014 include the results generated by Befesa under a single heading, for the activities which are now considered discontinued.
F-65
Table of Contents
ABENGOA
Consolidated financial statements
Below is the breakdown of the Consolidated Income Statements related to Befesa up to the date of sale (June 13, 2013 and 2012):
| | | | | | | | |
| |
| | 2013 | | 2012 | |
|---|
| | Revenue | | | 317,517 | | | 605,597 | |
| | Other operating income | | | 4,670 | | | 15,373 | |
| | Operating expenses | | | (317,132 | ) | | (536,565 | ) |
| | I. Operating profit | | | 5,055 | | | 84,405 | |
| | II. Financial expense, net | | | (18,623 | ) | | (46,624 | ) |
| | III. Share of profit/(loss) of associates carried under the equity method | | | 138 | | | 4,931 | |
| | IV. Profit before income tax | | | (13,430 | ) | | 42,712 | |
| | V. Income tax benefit | | | 12,454 | �� | | (10,169 | ) |
| | VI. Profit for the period from continuing operations | | | (976 | ) | | 32,543 | |
| | VII. Profit attributable to non-controlling interests | | | — | | | (1,345 | ) |
| | | | | | | | | |
| | VIII. Profit for the period attributable to the Parent Company | | | (976 | ) | | 31,198 | |
| | | | | | | | | |
| | | | | | | | | |
| | | | | | | | | |
Additionally, below is the composition of the heading 'Profit (loss) from discontinued operations, net of tax' included in the Consolidated Income Statements for year 2013:
| | | | | |
| |
| | 2013 | |
|---|
| | Gain on the sale of Befesa | | | 381 | |
| | % result of Befesa integration | | | (976 | ) |
| | | | | | |
| | Profit from discontinued operations, net of tax | | | (595 | ) |
| | | | | | |
| | | | | | |
| | | | | | |
- 7.4.
- Assets held for sale (shares in BCTA Qingdao, S.L.)
As of December 31, 2013, the Company started a process of negotiations to sell its 92.6% interest in Qingdao BCTA Desalination Co., Ltd., ('Qingdao') a desalination plant in China. Given that as of that date the subsidiary was available for inmediate sale and the sale is highly probable, the Company classified the assets and liabilities of Qingdao as held for sale in the Consolidated Statement of Financial Position as of December 31, 2013. Until closing of the sale transaction, the assets have been reported as held for sale in accordance with the stipulations and requirements of IFRS 5, Non-Current Assets Held for Sale and Discontinued Operations.
As of December 31, 2013, the breakdown of the assets and liabilities classified as Held for Sale, are as follows:
| | | | | |
| |
| | Balance as of
12.31.13 | |
|---|
| | Fixed assets in projects | | | 138,067 | |
| | Financial investments | | | 16 | |
| | Deferred tax assets | | | 432 | |
| | Current assets | | | 27,888 | |
| | Project debt | | | (95,460 | ) |
| | Other current liabilities | | | (25,809 | ) |
| | | | | | |
| | Total net assets and liabilities held for sale | | | 45,134 | |
| | | | | | |
| | | | | | |
| | | | | | |
F-66
Table of Contents
ABENGOA
Consolidated financial statements
On December 5, 2014, all the conditions necessary to close the sale of this company were fulfilled. The transaction price was set at 440 million chinese yuan. This sale brought Abengoa a cash inflow of €49.7 million and generated an after-tax profit of €5.1 million.
Note 8. — Intangible assets
- 8.1.
- The following table sets out the movement of intangible assets in 2014:
| | | | | | | | | | | | | | |
| | Cost | | Goodwill | | Development
assets | | Other | | Total | |
|---|
| | Total cost as of December 31, 2013 | | | 476,059 | | | 311,444 | | | 273,285 | | | 1,060,788 | |
| | Additions | | | — | | | 91,020 | | | 36,236 | | | 127,256 | |
| | Disposals and decreases | | | — | | | (1,886 | ) | | (3,254 | ) | | (5,140 | ) |
| | Translation differences | | | 11,586 | | | 5,463 | | | 4,444 | | | 21,493 | |
| | Change in consolidation | | | — | | | 676,846 | | | — | | | 676,846 | |
| | Reclassifications | | | — | | | (19,482 | ) | | 647 | | | (18,835 | ) |
| | Transfer to assets held for sale | | | — | | | — | | | (15,880 | ) | | (15,880 | ) |
| | | | | | | | | | | | | | | |
| | Total cost as of December 31, 2014 | | | 487,645 | | | 1,063,405 | | | 295,478 | | | 1,846,528 | |
| | | | | | | | | | | | | | | |
| | | | | | | | | | | | | | | |
| | | | | | | | | | | | | | | |
| | | | | | | | | | | | | | |
| | Accumulated depreciation | | Goodwill | | Development
assets | | Other | | Total | |
|---|
| | Total amort. as of December 31, 2013 | | | — | | | (146,651 | ) | | (72,026 | ) | | (218,677 | ) |
| | Additions | | | — | | | (42,985 | ) | | (34,492 | ) | | (77,477 | ) |
| | Disposals | | | — | | | — | | | 21,059 | | | 21,059 | |
| | Translation differences | | | — | | | (2,322 | ) | | (796 | ) | | (3,118 | ) |
| | Reclassifications | | | — | | | (629 | ) | | 688 | | | 59 | |
| | | | | | | | | | | | | | | |
| | Total amort. as of December 31, 2014 | | | — | | | (192,587 | ) | | (85,567 | ) | | (278,154 | ) |
| | | | | | | | | | | | | | | |
| | Net balance at December 31, 2014 | | | 487,645 | | | 870,818 | | | 209,911 | | | 1,568,374 | |
| | | | | | | | | | | | | | | |
| | | | | | | | | | | | | | | |
| | | | | | | | | | | | | | | |
The increase in goodwill is due to the translation differences caused by the appreciation of the US Dollar and the Brazilian real against the Euro.
The increased cost of intangible assets is primarily due to investment in research and development projects (see Note 8.4) and to the change in the consolidation scope following the start-up and control of the Hugoton second generation biofuels plant in the United States, which is owned by Abengoa Bioenergy Biomass of Kansas, LLC (See Note 6.4) and it has been classified as development assets (see Note 8.4).
During 2014 no significant losses from impairment of intangible assets were recorded.
F-67
Table of Contents
ABENGOA
Consolidated financial statements
- 8.2.
- The following table sets out the movement of intangible assets in 2013:
| | | | | | | | | | | | | | |
| | Cost | | Goodwill | | Development
assets | | Other | | Total | |
|---|
| | Total cost as of December 31, 2012 | | | 1,115,275 | | | 223,751 | | | 392,450 | | | 1,731,476 | |
| | Additions | | | — | | | 100,888 | | | 386,775 | | | 487,663 | |
| | Disposals and decreases | | | — | | | (4,691 | ) | | — | | | (4,691 | ) |
| | Translation differences | | | (77,681 | ) | | (1,640 | ) | | (1,859 | ) | | (81,180 | ) |
| | Change in consolidation | | | (561,535 | ) | | (6,864 | ) | | (5,828 | ) | | (574,227 | ) |
| | Reclassifications | | | — | | | — | | | (498,253 | ) | | (498,253 | ) |
| | | | | | | | | | | | | | | |
| | Total cost as of December 31, 2013 | | | 476,059 | | | 311,444 | | | 273,285 | | | 1,060,788 | |
| | | | | | | | | | | | | | | |
| | | | | | | | | | | | | | | |
| | | | | | | | | | | | | | | |
| | | | | | | | | | | | | | |
| | Accumulated depreciation | | Goodwill | | Development
assets | | Other | | Total | |
|---|
| | Total amort. as of December 31, 2012 | | | — | | | (116,823 | ) | | (57,908 | ) | | (174,731 | ) |
| | Additions | | | — | | | (31,510 | ) | | (20,463 | ) | | (51,973 | ) |
| | Translation differences | | | — | | | 604 | | | 519 | | | 1,123 | |
| | Change in consolidation | | | — | | | 1,078 | | | 5,826 | | | 6,904 | |
| | | | | | | | | | | | | | | |
| | Total amort. as of December 31, 2013 | | | — | | | (146,651 | ) | | (72,026 | ) | | (218,677 | ) |
| | | | | | | | | | | | | | | |
| | Net balance at December 31, 2013 | | | 476,059 | | | 164,793 | | | 201,259 | | | 842,111 | |
| | | | | | | | | | | | | | | |
| | | | | | | | | | | | | | | |
| | | | | | | | | | | | | | | |
The decrease in goodwill was mainly due to the exclusion of Befesa from the consolidation scope (see Note 7) and due to the negative effect of the depreciation of the Brazilian real with respect to the Euro.
The cost of intangible assets increased principally due to the investment effort in research and development projects (see Note 8.3) offset by the reclassification of the fixed assets related to the Solaben 1 and 6 thermo-solar plants as Fixed assets in projects, once the project debt for these projects had been obtained (see Note 10.1).
During 2013 no significant losses for impairment of intangible assets were recorded.
- 8.3.
- Total amortización expense of intangible assets for the year 2012 was €68,466.
- 8.4.
- Development assets
During 2014, Abengoa made significant Research, Development and Innovation (R&D&i) investment efforts, investing a total of €597,784 thousand (€426,358 thousand in 2013 and €91,260 thousand in 2012) through the development of new technologies in different areas of business (solar technology, biotechnology, desalination, water treatment and reuse, hydrogen, energy storage and new renewable energies).
F-68
Table of Contents
ABENGOA
Consolidated financial statements
| | | | | | | | | | | | | | | | | |
| |
| | Assets as of
12.31.13 | | Investment
during the
fiscal year | | Other
movements | | Transfer to
assets
held for
sale | | Assets as of
12.31.14 | |
|---|
| | Development assets (Note 8.1) | | | 311,444 | | | 91,020 | | | 660,941 | | | — | | | 1,063,405 | |
| | Development assets in projects (Note 10.1) | | | 71,204 | | | 304,392 | | | — | | | (375,596 | ) | | — | |
| | Development assets in investments in associates (Note 11.2) | | | 474,239 | | | 193,658 | | | (549,093 | ) | | — | | | 118,804 | |
| | Technological development research 2014 | | | — | | | 8,714 | | | (8,714 | ) | | — | | | — | |
| | | | | | | | | | | | | | | | | | |
| | Total in the 2014 fiscal year | | | 856,887 | | | 597,784 | | | 103,134 | | | (375,596 | ) | | 1,182,209 | |
| | | | | | | | | | | | | | | | | | |
| | | | | | | | | | | | | | | | | | |
| | | | | | | | | | | | | | | | | | |
| | | | | | | | | | | | | | | | | |
| |
| | Assets as of
12.31.12 | | Investment
during the
fiscal year | | Other
movements | | Transfer to
assets
held for
sale | | Assets as of
12.31.13 | |
|---|
| | Development assets (Note 8.2) | | | 223,751 | | | 100,888 | | | (13,195 | ) | | — | | | 311,444 | |
| | Development assets in projects (Note 10.1) | | | 73,424 | | | — | | | (2,220 | ) | | — | | | 71,204 | |
| | Development assets in investments in associates (Note 11.2) | | | 155,301 | | | 318,938 | | | — | | | — | | | 474,239 | |
| | Technological development research 2013 | | | — | | | 6,532 | | | (6,532 | ) | | — | | | — | |
| | | | | | | | | | | | | | | | | | |
| | Total in the 2013 fiscal year | | | 452,476 | | | 426,358 | | | (21,947 | ) | | — | | | 856,887 | |
| | | | | | | | | | | | | | | | | | |
| | | | | | | | | | | | | | | | | | |
| | | | | | | | | | | | | | | | | | |
In 2014 Abengoa continued its strategy of developing proprietary technology to give it a competitive advantage and as a vector for growing its business. Thanks to this commitment to R&D and innovation, the Abengoa Research laboratories at Campus Palmas Altas became fully operational during the year with facilities for the different technology areas of Abengoa's business segments:
- •
- Biological laboratory
- •
- Electrical laboratory
- •
- Materials laboratory
- •
- Thermal fluids laboratory
- •
- Chemistry laboratory
- •
- Biomolecular and biochemistry laboratory
The main development assets are based on technologies that enable Abengoa's strategic R&D areas to continue progressing, such as technologies for solar-thermal plants, energy storage systems, bio-refining, treating municipal solid waste for energy production, and plants for treating and reusing water.
F-69
Table of Contents
ABENGOA
Consolidated financial statements
In solar-thermal technology it is worth noting the construction of Khi Solar One, the world's first commercial plant using tower technology and superheated steam, in South Africa. The 5O MW plant is expected to come into operation in 2015.
Additionally, in the field of solar-thermal power, it is worth noting the construction of the solar plant project in the Atacama Desert (Chile), which combines tower technology based on molten salts (110 MW) and photovoltaics (100 MW) with energy storage systems that use molten salts and batteries. This plant will enable renewable power to be continually produced 24 hours a day, supplying demand from the network at any given time.
The R&D and innovation carried out by Abengoa also resulted in the enzymatic cocktail that converts non-food organic material into biofuels, which led to the opening of Abengoa's first 2G bioethanol plant located in Hugoton (USA) in October 2014, where up to 95 million liters of bioethanol are produced annually from 350,000 tons of biomass approximately, specifically agricultural waste. In Brazil the company is developing second-generation ethanol production from sugar cane straw and bagasse, while one of the world's largest commercial biomass plants that will generate 215 MW of power will be constructed in Gante.
Work also continues on developing the Waste to Biofuels (W2B) project in Salamanca (Spain), to produce biofuels from municipal solid waste (MSW), solving the issue of how to manage this waste while generating a high value added product.
In the field of R&D+i for integral water management, nanotechnology is being developed for water treatment processes. Projects include a desalination plant being developed in Ténes (Algeria) using reverse osmosis technology to desalinate 200,000 m3 of water per day, while in the city of San Antonio, Texas (USA) a drinking water treatment and water supply project is underway that will supply 168,970 m3 of water per day and includes an agreement to manage the plant for a 30 year period.
As a technology company, Abengoa is committed to using R&D to develop new businesses that enable it to grow. Additionally, it has made an investment effort to the development of the company's emerging businesses related to hydrogen and energy.
The expenses for Technological development research for the year 2012 was €6,404 thousand.
- 8.5.
- Goodwill
The table below shows the breakdown of Goodwill as of December 31, 2014 and 2013:
| | | | | | | | |
| | Goodwill / Operating segment | | Balance as of
12.31.14 | | Balance as of
12.31.13 | |
|---|
| | Abener Eng. and Const. Services, LLC (Enginneering and construction) | | | 26,658 | | | 25,663 | |
| | Abengoa Bioenergía Brasil (Biofuels) | | | 354,437 | | | 351,280 | |
| | Abengoa Bioenergy USA (Biofuels) | | | 36,621 | | | 32,334 | |
| | Rioglass Solar (Enginneering and construction) | | | 38,914 | | | 38,919 | |
| | Other | | | 31,015 | | | 27,863 | |
| | | | | | | | | |
| | Total | | | 487,645 | | | 476,059 | |
| | | | | | | | | |
| | | | | | | | | |
| | | | | | | | | |
F-70
Table of Contents
ABENGOA
Consolidated financial statements
Based on the values in use calculated in accordance with the assumptions and hypothesis described in Notes 2.8 and 3, in 2014 and 2013 the recoverable amount of the cash generating units to which goodwill was assigned is higher than their carrying amount.
For each goodwill, sensitivity analysis have been performed, especially in relation to discount rates, terminal values and changes in the main business key variables, to ensure that potential changes in valuation do not make cash generating units fair value lower than its book value.
- 8.6.
- There are no intangible assets with indefinite useful life other than goodwill. There are no intangible assets with restricted ownerships or that may be under pledge as liabilities guarantee.
Note 9. — Property, plant and equipment
- 9.1.
- The table below shows the movement on the different categories of Property, plant and equipment (PP&E) for 2014:
| | | | | | | | | | | | | | | | | |
| | Cost | | Lands and
buildings | | Technical
installations
and
machinery | | Advances and
fixed assets
in progress | | Other fixed
assets | | Total | |
|---|
| | Total balance as of December 31, 2013 | | | 494,174 | | | 1,240,458 | | | 49,601 | | | 87,841 | | | 1,872,074 | |
| | Additions | | | 8,873 | | | 43,221 | | | 24,596 | | | 15,919 | | | 92,609 | |
| | Disposals and decreases | | | (2,132 | ) | | (5,886 | ) | | (1,008 | ) | | (2,625 | ) | | (11,651 | ) |
| | Translation differences | | | 6,781 | | | 36,832 | | | 2,536 | | | 1,403 | | | 47,552 | |
| | Reclassifications | | | 5,407 | | | (11,428 | ) | | (16,284 | ) | | 854 | | | (21,451 | ) |
| | | | | | | | | | | | | | | | | | |
| | Total Balance as of December 31, 2014 | | | 513,103 | | | 1,303,197 | | | 59,441 | | | 103,392 | | | 1,979,133 | |
| | | | | | | | | | | | | | | | | | |
| | | | | | | | | | | | | | | | | | |
| | | | | | | | | | | | | | | | | | |
| | | | | | | | | | | | | | | | | |
| | Accumulated depreciation | | Buildings | | Technical
installations
and
machinery | | Advances and
fixed assets
in progress | | Other fixed
assets | | Total | |
|---|
| | Total accum. deprec. as of December 31, 2013 | | | (109,286 | ) | | (418,111 | ) | | — | | | (71,088 | ) | | (598,485 | ) |
| | Additions | | | (17,326 | ) | | (63,328 | ) | | — | | | (12,980 | ) | | (93,634 | ) |
| | Disposals and decreases | | | 1,054 | | | 2,053 | | | — | | | 2,611 | | | 5,718 | |
| | Translation differences | | | (1,901 | ) | | (17,047 | ) | | — | | | (756 | ) | | (19,704 | ) |
| | Reclassifications | | | 9,567 | | | (18,774 | ) | | — | | | 23,492 | | | 14,285 | |
| | | | | | | | | | | | | | | | | | |
| | Total accum. deprec. as of December 31, 2014 | | | (117,892 | ) | | (515,207 | ) | | — | | | (58,721 | ) | | (691,820 | ) |
| | | | | | | | | | | | | | | | | | |
| | Net balance at December 31, 2014 | | | 395,211 | | | 787,990 | | | 59,441 | | | 44,671 | | | 1,287,313 | |
| | | | | | | | | | | | | | | | | | |
| | | | | | | | | | | | | | | | | | |
| | | | | | | | | | | | | | | | | | |
The increase in Property, plant and equipment in 2014 was primarily due to improvements in the technical facilities of the Rotterdam plant, fitting out a research laboratory in Spain and a new warehouse in Spain, construction equipment purchases for projects in Peru, Uruguay and Chile, and the new offices in India.
During 2014 no significant losses from impairment of PP&E were recorded.
F-71
Table of Contents
ABENGOA
Consolidated financial statements
- 9.2.
- The table below shows the movement on the different categories of Property, plant and equipment (PP&E) for 2013:
| | | | | | | | | | | | | | | | | |
| | Cost | | Lands and
buildings | | Technical
installations
and
machinery | | Advances and
fixed assets
in progress | | Other fixed
assets | | Total | |
|---|
| | Total balance as of December 31, 2012 | | | 523,679 | | | 1,306,824 | | | 95,498 | | | 107,883 | | | 2,033,884 | |
| | Additions | | | 9,155 | | | 42,206 | | | 23,859 | | | 71 | | | 75,291 | |
| | Disposals and decreases | | | (209 | ) | | (1,251 | ) | | (34,064 | ) | | (1,121 | ) | | (36,645 | ) |
| | Translation differences | | | (8,980 | ) | | (16,906 | ) | | (1,850 | ) | | (2,522 | ) | | (30,258 | ) |
| | Change in consolidation | | | (52,050 | ) | | (91,251 | ) | | (31,887 | ) | | (15,991 | ) | | (191,179 | ) |
| | Reclassifications | | | 22,579 | | | 836 | | | (1,955 | ) | | (479 | ) | | 20,981 | |
| | | | | | | | | | | | | | | | | | |
| | Total Balance as of December 31, 2013 | | | 494,174 | | | 1,240,458 | | | 49,601 | | | 87,841 | | | 1,872,074 | |
| | | | | | | | | | | | | | | | | | |
| | | | | | | | | | | | | | | | | | |
| | | | | | | | | | | | | | | | | | |
| | | | | | | | | | | | | | | | | |
| | Accumulated depreciation | | Buildings | | Technical
installations
and
machinery | | Advances and
fixed assets
in progress | | Other fixed
assets | | Total | |
|---|
| | Total accum. deprec. as of December 31, 2012 | | | (109,014 | ) | | (436,385 | ) | | — | | | (56,886 | ) | | (602,285 | ) |
| | Additions | | | (15,043 | ) | | (49,481 | ) | | — | | | (32,249 | ) | | (96,773 | ) |
| | Disposals and decreases | | | 166 | | | 1,198 | | | — | | | 794 | | | 2,158 | |
| | Translation differences | | | 1,403 | | | 7,382 | | | — | | | 1,771 | | | 10,556 | |
| | Change in consolidation | | | 12,645 | | | 58,782 | | | — | | | 14,896 | | | 86,323 | |
| | Reclassifications | | | 557 | | | 393 | | | — | | | 586 | | | 1,536 | |
| | | | | | | | | | | | | | | | | | |
| | Total accum. deprec. as of December 31, 2013 | | | (109,286 | ) | | (418,111 | ) | | — | | | (71,088 | ) | | (598,485 | ) |
| | | | | | | | | | | | | | | | | | |
| | Net balance at December 31, 2013 | | | 384,888 | | | 822,347 | | | 49,601 | | | 16,753 | | | 1,273,589 | |
| | | | | | | | | | | | | | | | | | |
| | | | | | | | | | | | | | | | | | |
| | | | | | | | | | | | | | | | | | |
In 2013, the decrease in Property, plant and equipment was mainly due to the exclusion of Befesa Medio Ambiente, S.L.U. (see Note 7) and Bargoa, S.A. (see Note 6.3.b) from the consolidation scope following the sales of their shareholdings (–€105 million). However, there was an increase due to construction of a new metal structures manufacturing plant in India; the construction and equipping of a research laboratory in Spain; and the acquisition of machinery for projects in Peru.
During 2014, no significant losses from impairment of PP&E were recorded.
- 9.3.
- The depreciation expense of Property, plant equipment for the year 2012 was €109, 483 thousand.
- 9.4.
- Property, plant and equipment not assigned to operating activities at the year-end is not significant.
- 9.5.
- The companies' policy is to contract all insurance policies deemed necessary to ensure that all Property, plant and equipment is covered against possible risks that might affect it.
- 9.6.
- The amount of capitalized interest costs included in PP&E at December 31, 2014 was €1,447 thousand (€1,846 thousand in 2013 and €2,051 thousand in 2012).
F-72
Table of Contents
ABENGOA
Consolidated financial statements
- 9.7.
- At the end of 2014 and 2013, Property, Plant and Equipment include the following amounts where the group is a lessee under a finance lease:
| | | | | | | | |
| |
| | Balance as of
12.31.14 | | Balance as of
12.31.13 | |
|---|
| | Capitalized finance-lease cost | | | 22,336 | | | 21,304 | |
| | Accumulated depreciation | | | (2,785 | ) | | (2,635 | ) |
| | | | | | | | | |
| | Net carrying amount | | | 19,551 | | | 18,669 | |
| | | | | | | | | |
| | | | | | | | | |
| | | | | | | | | |
- 9.8.
- The cost of lands included in the lands and building subcategory amounted to €85,063 thousand at December 31, 2014 (€82,205 thousand in 2013).
- 9.9.
- The table below sets out the information related to those assets constructed by the Group during 2014 and 2013 classified under the heading Property, plant and equipment of the Consolidated Statement of Financial Position):
| | | | | | | | |
| |
| | 12.31.14 | | 12.31.13 | |
|---|
| | Property, plant and equipment constructed by the Group (accumulated) | | | 941,652 | | | 931,422 | |
| | Revenue generated by property, plant and equipment constructed by the Group | | | 742,520 | | | 746,745 | |
| | Operating result of property, plant and equipment constructed by the Group | | | (10,831 | ) | | (50,966 | ) |
Note 10. — Fixed assets in projects
As indicated in Note 2.5 included in the Group are several companies which engage in the development of projects including the design, construction, financing, operation and maintenance of owned assets or assets under concession-type agreements which are financed through project debt.
This note provides a breakdown of fixed assets within such companies. Project debt details related to such companies are disclosed in Note 19 of these Notes to the Consolidated Financial Statements.
- 10.1.
- Concession assets in projects
- a)
- The following table shows the movements of 'Concession assets in projects' for 2014:
| | | | | | | | | | | |
| | Cost | | Intangible
and financial
assets | | Development
assets | | Total | |
|---|
| | Total as of December 31, 2013 | | | 8,819,361 | | | 71,204 | | | 8,890,565 | |
| | Additions | | | 2,005,644 | | | 304,392 | | | 2,310,036 | |
| | Disposals and decreases | | | (5,412 | ) | | — | | | (5,412 | ) |
| | Translation differences | | | 487,359 | | | — | | | 487,359 | |
| | Change in consolidation | | | 1,255,988 | | | — | | | 1,255,988 | |
| | Transfer to assets held for sale | | | (7,337,767 | ) | | (375,596 | ) | | (7,713,363 | ) |
| | | | | | | | | | | | |
| | Total as of December 31, 2014 | | | 5,225,173 | | | — | | | 5,225,173 | |
| | | | | | | | | | | | |
| | | | | | | | | | | | |
| | | | | | | | | | | | |
F-73
Table of Contents
ABENGOA
Consolidated financial statements
| | | | | | | | | | | |
| | Accumulated amortization | | Intangible
and financial
assets | | Development
assets | | Total | |
|---|
| | Total accum. amort. as of December 31, 2013 | | | (299,488 | ) | | (17,834 | ) | | (317,322 | ) |
| | Additions | | | (210,440 | ) | | (3,060 | ) | | (213,500 | ) |
| | Disposals and decreases | | | 9 | | | — | | | 9 | |
| | Translation differences | | | (10,846 | ) | | — | | | (10,846 | ) |
| | Reclassifications | | | 10,632 | | | — | | | 10,632 | |
| | Transfer to assets held for sale | | | 227,149 | | | 20,894 | | | 248,043 | |
| | | | | | | | | | | | |
| | Total accum amort. as of December 31, 2014 | | | (282,984 | ) | | — | | | (282,984 | ) |
| | | | | | | | | | | | |
| | Net balance at December 31, 2014 | | | 4,942,189 | | | — | | | 4,942,189 | |
| | | | | | | | | | | | |
| | | | | | | | | | | | |
| | | | | | | | | | | | |
The increase in concession assets during 2014 was primarily due to progress in constructing various transmission lines in Brazil and Peru (€487 million), water and generation projects in Mexico (€556 million) the thermo-solar plants in Chile (€796 million), the construction project of a hospital in Brazil (€103 million), the Palmatir and Cadonal wind farms in Uruguay (€55 million) and the desalination plants in Ghana, Algeria and USA (€57 million). Similarly, the change in the scope of consolidation also caused a significant increase following the start-up and control of the company Mojave Solar, LLC (see Note 6.4) and the appreciation of the US Dollar and the Brazilian real against the Euro.
The increase in 2014 was partially offset by the classification of various assets as held for sale, for a total net amount of €7,465 million (see Note 7.1). These included the Abengoa Yield assets, the concession assets of the desalination plants in Algeria (Skikda and Honnaine), transmission lines in Peru (ATN2) and a thermo-solar plant in Abu Dhabi (Shams), and the assets relating to the non-binding agreement with the EIG Global Energy Partners (EIG) infrastructures fund that will form part of a joint venture (conventional and renewable energy power plants as well as transmission lines in different countries such as USA, Mexico, Brazil and Chile).
No significant losses from impairment of 'Concession assets in projects' were recorded during 2014.
As of December 31, 2014, the corresponding cost to financial assets amounts to €284,201 thousand (€729,611 thousand as of December 31, 2013).
- b)
- The following table shows the movements of intangible assets included in the heading 'Concession assets in projects' for 2013:
| | | | | | | | | | | |
| | Cost | | Intangible
and financial
assets | | Development
assets | | Total | |
|---|
| | Total as of December 31, 2012 | | | 6,109,689 | | | 73,424 | | | 6,183,113 | |
| | Additions | | | 1,295,290 | | | — | | | 1,295,290 | |
| | Disposals and decreases | | | (2,741 | ) | | — | | | (2,741 | ) |
| | Translation differences | | | (414,484 | ) | | — | | | (414,484 | ) |
| | Change in consolidation | | | 1,469,234 | | | (2,220 | ) | | 1,467,014 | |
| | Reclassifications | | | 362,373 | | | — | | | 362,373 | |
| | | | | | | | | | | | |
| | Total as of December 31, 2013 | | | 8,819,361 | | | 71,204 | | | 8,890,565 | |
| | | | | | | | | | | | |
| | | | | | | | | | | | |
| | | | | | | | | | | | |
F-74
Table of Contents
ABENGOA
Consolidated financial statements
| | | | | | | | | | | |
| | Accumulated amortization | | Intangible
and financial
assets | | Development
assets | | Total | |
|---|
| | Total accum. amort. as of December 31, 2012 | | | (166,053 | ) | | (15,353 | ) | | (181,406 | ) |
| | Additions | | | (153,803 | ) | | (2,878 | ) | | (156,681 | ) |
| | Disposals and decreases | | | 177 | | | — | | | 177 | |
| | Translation differences | | | 9,271 | | | — | | | 9,271 | |
| | Change in consolidation | | | (3,017 | ) | | 397 | | | (2,620 | ) |
| | Reclassifications | | | 13,937 | | | — | | | 13,937 | |
| | | | | | | | | | | | |
| | Total accum amort. as of December 31, 2013 | | | (299,488 | ) | | (17,834 | ) | | (317,322 | ) |
| | | | | | | | | | | | |
| | Net balance at December 31, 2013 | | | 8,519,873 | | | 53,370 | | | 8,573,243 | |
| | | | | | | | | | | | |
| | | | | | | | | | | | |
| | | | | | | | | | | | |
The increase in the cost of concession assets was primarily due to progress in developing infrastructure concessions projects, mainly various transmission lines in Brazil and Peru (€727 million); projects in México (€381 million); the Palmatir and Cadonal wind farms in Uruguay (€114 million) and the desalination plants in Ghana and Algeria (€83 million).
Additionally, the increase was caused by the reclassification due to transfer of the fixed assets related to the Solaben 1 and 6 thermo-solar plants in Spain from PP&E (see Note 8.2); and the change in the consolidation scope following the entry into operation and control of the company Arizona Solar One, LLC (see Note 6.4), partially offset by the reclassification of the assets of the Quingdao desalination plant under Assets Held for Sale (–€142 million), see Note 6.3.b, and the depreciation of the Brazilian real and the US dollar with respect to the Euro.
No significant losses from impairment of 'Concession assets in projects' were recorded during 2013.
- c)
- Amotization expense of Concession assets in projects for the year 2012 was €86,847 thousand.
- d)
- As part of the ongoing regulatory reform of the electricity sector developed in the Royal Decree 413/2014 approved on June 6, 2014, the Order IET/1045/2014 of June 16 was published on June 20 by the Government in the Official State Gazette (BOE), which defines the new payment system for certain electricity power plants based on renewable, cogeneration, and waste energies. The new regulations define the investment and operating reference values for thermo-solar plants (with tower technology and parabolic trough), photovoltaic and cogeneration plants. As a consequence, and after analyzing their potential impacts that could have such measures, Management has concluded that these modifications will have no negative impact on the information reflected.
- e)
- Capitalized interest cost for the year ended December 31, 2014 amounts to €88,665 thousand (€115,113 thousand in 2013 and €172,854 thousand in 2012)
- f)
- There are no intangible assets with indefinite useful lives. There are no intangible assets restricted for use or pledged as security for liabilities.
- g)
- Appendix VII to these Consolidated Financial Statements includes certain information on project companies included within the scope of IFRIC 12.
F-75
Table of Contents
ABENGOA
Consolidated financial statements
- 10.2.
- Other assets in projects
- a)
- The table below shows the movement in 'Other assets in projects' for 2014:
| | | | | | | | | | | | | | | | | | | | |
| | Cost | | Land and
buildings | | Technical
installations
and
machinery | | Advances and
fixed assets
in progress | | Other
PP&E | | Software
and other
intangibles | | Total | |
|---|
| | Total as of December 31, 2013 | | | 284,552 | | | 1,058,459 | | | 24,187 | | | 376,450 | | | 73,861 | | | 1,817,509 | |
| | Additions | | | 13,829 | | | 11,322 | | | 1,299 | | | 19,287 | | | 3,919 | | | 49,656 | |
| | Disposals and decreases | | | — | | | (1,404 | ) | | (229 | ) | | (513 | ) | | (345 | ) | | (2,491 | ) |
| | Translation differences | | | 10,605 | | | 52,197 | | | (422 | ) | | 4,103 | | | 601 | | | 67,084 | |
| | Reclassifications | | | 4,550 | | | 3,605 | | | (2,444 | ) | | (24,360 | ) | | 951 | | | (17,698 | ) |
| | Transfer to assets held for sale | | | (7,949 | ) | | (126,905 | ) | | — | | | (2,797 | ) | | — | | | (137,651 | ) |
| | | | | | | | | | | | | | | | | | | | | |
| | Total as of December 31, 2014 | | | 305,587 | | | 997,274 | | | 22,391 | | | 372,170 | | | 78,987 | | | 1,776,409 | |
| | | | | | | | | | | | | | | | | | | | | |
| | | | | | | | | | | | | | | | | | | | | |
| | | | | | | | | | | | | | | | | | | | | |
| | | | | | | | | | | | | | | | | | | | |
| | Accumulated
depreciation | | Buildings | | Technical
installations
and
machinery | | Advances and
fixed assets
in progress | | Other
PP&E | | Software
and other
intangibles | | Total | |
|---|
| | Total accum. deprec. as of December 31, 2013 | | | (84,166 | ) | | (231,517 | ) | | — | | | (139,101 | ) | | (21,695 | ) | | (476,479 | ) |
| | Additions | | | (11,437 | ) | | (52,800 | ) | | — | | | (16,528 | ) | | (4,778 | ) | | (85,543 | ) |
| | Disposals and decreases | | | 9 | | | 676 | | | — | | | 223 | | | 4 | | | 912 | |
| | Translation differences | | | (1,828 | ) | | (12,237 | ) | | — | | | (1,677 | ) | | (244 | ) | | (15,986 | ) |
| | Reclassifications | | | 4,585 | | | (10,744 | ) | | — | | | 24,667 | | | — | | | 18,508 | |
| | Transfer to assets held for sale | | | 25,246 | | | 2,595 | | | — | | | 514 | | | — | | | 28,355 | |
| | | | | | | | | | | | | | | | | | | | | |
| | Total accum. deprec. as of December 31, 2014 | | | (67,591 | ) | | (304,027 | ) | | — | | | (131,902 | ) | | (26,713 | ) | | (530,233 | ) |
| | | | | | | | | | | | | | | | | | | | | |
| | Net balance at December 31, 2014 | | | 237,996 | | | 693,247 | | | 22,391 | | | 240,268 | | | 52,274 | | | 1,246,176 | |
| | | | | | | | | | | | | | | | | | | | | |
| | | | | | | | | | | | | | | | | | | | | |
| | | | | | | | | | | | | | | | | | | | | |
The net increase in Other assets in projects was mainly due to investments to improve other production assets of the bioenergy business in Brazil (€20 million), the acquisition of a plot of land adjoining Campus Palmas Altas (€5 million) as well as other plot of land for generation projects in Mexico (€4 million) and the appreciation of the US Dollar and the Brazilian real
F-76
Table of Contents
ABENGOA
Consolidated financial statements
against the Euro. This increase in 2014 was partially offset by the classification of Abengoa Yield's assets as assets held for sale totaling €109 million (see Note 7.1).
No significant losses from impairment of 'Other assets in projects' were recorded during 2014.
- b)
- The table below shows the movement in 'Other assets in projects' for 2013:
| | | | | | | | | | | | | | | | | | | | |
| | Cost | | Land and
buildings | | Technical
installations
and
machinery | | Advances and
fixed assets
in progress | | Other
PP&E | | Software
and other
intangibles | | Total | |
|---|
| | Total as of December 31, 2012 | | | 424,847 | | | 1,447,136 | | | 137,143 | | | 351,979 | | | 91,228 | | | 2,452,333 | |
| | Additions | | | 2,183 | | | 3,645 | | | 1,675 | | | 18,635 | | | — | | | 26,138 | |
| | Disposals and decreases | | | — | | | (8,421 | ) | | (218 | ) | | (155 | ) | | — | | | (8,794 | ) |
| | Translation differences | | | (12,642 | ) | | (83,320 | ) | | (2,023 | ) | | (68,642 | ) | | (4,071 | ) | | (170,698 | ) |
| | Change in consolidation | | | (119,326 | ) | | (298,276 | ) | | (81,863 | ) | | (14,412 | ) | | (9,007 | ) | | (522,884 | ) |
| | Reclassifications | | | (10,510 | ) | | (2,305 | ) | | (30,527 | ) | | 89,045 | | | (4,289 | ) | | 41,414 | |
| | | | | | | | | | | | | | | | | | | | | |
| | Total as of December 31, 2013 | | | 284,552 | | | 1,058,459 | | | 24,187 | | | 376,450 | | | 73,861 | | | 1,817,509 | |
| | | | | | | | | | | | | | | | | | | | | |
| | | | | | | | | | | | | | | | | | | | | |
| | | | | | | | | | | | | | | | | | | | | |
| | | | | | | | | | | | | | | | | | | | |
| | Accumulated
depreciation | | Buildings | | Technical
installations
and
machinery | | Advances and
fixed assets
in progress | | Other
PP&E | | Software
and other
intangibles | | Total | |
|---|
| | Total accum. deprec. as of December 31, 2012 | | | (105,131 | ) | | (416,435 | ) | | — | | | (122,846 | ) | | (23,623 | ) | | (668,035 | ) |
| | Additions | | | (19,091 | ) | | (32,214 | ) | | — | | | (49,851 | ) | | (2,066 | ) | | (103,222 | ) |
| | Disposals and decreases | | | — | | | 4,926 | | | — | | | 125 | | | — | | | 5,051 | |
| | Translation differences | | | 2,655 | | | 26,453 | | | — | | | 24,528 | | | 984 | | | 54,620 | |
| | Change in consolidation | | | 33,370 | | | 184,348 | | | — | | | 9,770 | | | 3,010 | | | 230,498 | |
| | Reclassifications | | | 4,031 | | | 1,405 | | | — | | | (827 | ) | | — | | | 4,609 | |
| | | | | | | | | | | | | | | | | | | | | |
| | Total accum. deprec. as of December 31, 2013 | | | (84,166 | ) | | (231,517 | ) | | — | | | (139,101 | ) | | (21,695 | ) | | (476,479 | ) |
| | | | | | | | | | | | | | | | | | | | | |
| | Net balance at December 31, 2013 | | | 200,386 | | | 826,942 | | | 24,187 | | | 237,349 | | | 52,166 | | | 1,341,030 | |
| | | | | | | | | | | | | | | | | | | | | |
| | | | | | | | | | | | | | | | | | | | | |
| | | | | | | | | | | | | | | | | | | | | |
F-77
Table of Contents
ABENGOA
Consolidated financial statements
(–€290 million), see Note 7, as well as the negative effect of the depreciation of the Brazilian real with respect to the Euro.
During 2013, no significant losses from impairment of 'Other assets in projects' were recorded.
- c)
- Amotization/depreciation expense of Other assets in projects for the year 2012 was €127,816 thousand
- d)
- Borrowing costs capitalized for the years ended December 31, 2014 were null (€1,635 thousand as of December 31, 2013).
- e)
- The fixed assets in projects have no mortgage warranty additional to the ones assigned to its project debt (see Note 19).
- f)
- It is the policy of the Group to enter into a number of insurance policies to cover risks relating to property, plant and equipment.
- g)
- In cases of property plant and equipment over third party land, the company has estimated the dismantling costs of affected items, as well as the rehabilitation costs of the place where they are settled (see Note 22.1).
- 10.3.
- Assets constructed by group
The table below sets out the information related to those assets constructed by the Group during 2014 and 2013 classified under the heading Fixed assets in projects of the Consolidated Statement of Financial Position (concessions and other assets in projects):
| | | | | | | | |
| | Item | | 12.31.14 | | 12.31.13 | |
|---|
| | Fixed assets in projects constructed by the Group (accumulated) | | | 5,899,869 | | | 9,747,611 | |
| | Revenue generated by fixed assets in project constructed by the Group | | | 1,167,402 | | | 1,362,642 | |
| | Operating result of fixed assets in project constructed by the Group | | | 289,675 | | | 156,184 | |
Note 11. — Investments in associates
- 11.1.
- The table below shows the breakdown and the movement of the investments held in associates for 2014 and 2013:
| | | | | | | | |
| | Investment in associates | | Balance as of
12.31.14 | | Balance as of
12.31.13 | |
|---|
| | Initial balance | | | 835,682 | | | 920,140 | |
| | Translation differences | | | 2,047 | | | (27,536 | ) |
| | Equity contributions | | | 303,744 | | | 372,736 | |
| | Changes in consolidation | | | (787,236 | ) | | (412,577 | ) |
| | Reclassification to assets held for sale | | | (42,037 | ) | | — | |
| | Distribution of dividends | | | (7,957 | ) | | (11,916 | ) |
| | Share of (loss)/profit | | | 7,018 | | | (5,165 | ) |
| | | | | | | | | |
| | Final balance | | | 311,261 | | | 835,682 | |
| | | | | | | | | |
| | | | | | | | | |
| | | | | | | | | |
F-78
Table of Contents
ABENGOA
Consolidated financial statements
- 11.2.
- The tables below shows a breakdown of assets, revenues and operating profit as well as other information of interest for the years 2014, 2013 and 2012 of the associated companies:
| | | | | | | | | | | | | | |
| | Company | | % shares | | Assets | | Revenues | | Operating
profit
2014 | |
|---|
| | Agroenergía de Campillos, S.L. | | | 25.00 | | | — | | | — | | | — | |
| | Agua y Gestión de Servicios Ambientales, S.A. | | | 41.54 | | | 89,586 | | | 25,002 | | | (510 | ) |
| | Al Osais-Inabensa Co., Ltd | | | 50.00 | | | 4,584 | | | (1,503 | ) | | (6,687 | ) |
| | Ashalim Thermo Solar Management, Ltd. | | | 50.00 | | | — | | | — | | | — | |
| | ATE VIII Transmissora de Energía, S.A. | | | 50.00 | | | 30,018 | | | 2,014 | | | 658 | |
| | Basor México, S.A.P.I. de C.V. | | | 50.00 | | | 755 | | | 391 | | | (162 | ) |
| | Chennai O&M, JV Private Limited | | | 50.00 | | | — | | | — | | | — | |
| | Chennai Water Desalination Limited | | | 25.00 | | | 88,139 | | | 23,379 | | | 514 | |
| | Coaben, S.A. de C.V. | | | 50.00 | | | 9,330 | | | 496 | | | (407 | ) |
| | Cogeneración Motril, S.A. | | | 19.00 | | | 15,952 | | | (1,725 | ) | | (1,725 | ) |
| | Concecutex, S.A. de C.V. | | | 50.00 | | | 71,135 | | | 4,928 | | | 2,347 | |
| | Concesionaria Costa del Sol S.A. | | | 50.00 | | | 26,730 | | | 350 | | | (3,549 | ) |
| | Concesionaria Hospital del Tajo, S.A. | | | 20.00 | | | 62,519 | | | 8,061 | | | 2,074 | |
| | Consorcio Teyma M y C, Ltda. | | | 50.00 | | | 59 | | | — | | | — | |
| | Evacuación Valdecaballeros, S.L. | | | 57.14 | | | 21,768 | | | — | | | (744 | ) |
| | Evacuación Villanueva del Rey, S.L. | | | 45.13 | | | 3,485 | | | — | | | (17 | ) |
| | Explotaciones Varias, S.L. | | | 50.00 | | | 44,296 | | | 634 | | | 205 | |
| | Explotadora Hospital del Tajo, S.L. | | | 20.00 | | | 1,197 | | | 3,557 | | | 7 | |
| | Geida Tlemcen, S.L. | | | 50.00 | | | 21,770 | | | — | | | 4,344 | |
| | Ghenova Ingeniería S.L. | | | 20.00 | | | 3,353 | | | 255 | | | 255 | |
| | Green Visión Holding, BV | | | 24.00 | | | 18,004 | | | 3,055 | | | 277 | |
| | Greentech Water Engineering Company | | | 25.00 | | | 26,160 | | | 13,137 | | | 1,196 | |
| | Helioenergy Electricidad Dos, S.A. | | | 50.00 | | | 278,319 | | | 28,813 | | | 537 | |
| | Helioenergy Electricidad Uno, S.A. | | | 50.00 | | | 277,328 | | | 28,800 | | | 795 | |
| | HZN Manutenção Hospitalar Ltda. | | | 33.00 | | | 1,192 | | | 1,232 | | | 195 | |
| | Inabensa Green Energy Co., Ltd. | | | 50.00 | | | 1,227 | | | 2,440 | | | (76 | ) |
| | Inapreu, S.A. | | | 50.00 | | | 11,204 | | | 1,308 | | | 1 | |
| | Kaxu Solar One (Pty) Ltd. | | | 51.00 | | | 505,111 | | | — | | | (306 | ) |
| | Khi Solar One (Pty) Ltd.(1) | | | 51.00 | | | 268,159 | | | — | | | (89 | ) |
| | Ledincor, S.A. | | | 49.00 | | | 7,341 | | | 3,265 | | | 338 | |
| | Lidelir, S.A. | | | 49.00 | | | 12,069 | | | 5,401 | | | 1,882 | |
| | Micronet Porous Fibers, S.L. | | | 50.00 | | | 7,125 | | | — | | | 76 | |
| | Myah Bahr Honaine, S.P.A.(2) | | | 25.50 | | | 202,192 | | | 46,847 | | | 20,382 | |
| | Negev Energy—Ashalim Thermo-Solar, Ltd.(2) | | | 50.00 | | | 149 | | | — | | | — | |
| | Negev Energy Ashalim Operation and Mantainance, Ltd. | | | 50.00 | | | — | | | — | | | — | |
| | Negev Energy Finance, Ltd. | | | 50.00 | | | — | | | — | | | — | |
| | Residuos Sólidos Urbanos de Ceuta, S.L. | | | 50.00 | | | 5,168 | | | — | | | 210 | |
| | Servicios Culturales Mexiquenses, S.A. de C.V. | | | 50.00 | | | 1,495 | | | 4,107 | | | 186 | |
| | Shams Power Company PJSC | | | 40.00 | | | 635,290 | | | 70,516 | | | 10,895 | |
| | SolelAben EPC Ashalim, L.P. | | | 50.20 | | | — | | | — | | | — | |
| | SRC Nanomaterials, S.A | | | 50.00 | | | 331 | | | — | | | 125 | |
| | Total Abengoa Solar Emirates Investment Company, B.V.(2) | | | 50.00 | | | 49,647 | | | — | | | (104 | ) |
| | Total Abengoa Solar Emirates O&M Company, B.V. | | | 50.00 | | | 348 | | | 1,345 | | | 165 | |
| | TSMC Ingeniería y Contrucción, Ltda. | | | 33.30 | | | 60 | | | — | | | — | |
| | Xina Solar One (Rf) (Pty), Ltd. | | | 80.00 | | | 33,160 | | | — | | | 337 | |
| | | | | | | | | | | | | | | |
| | Total 2014 | | | | | | 2,835,755 | | | 276,105 | | | 33,625 | |
| | | | | | | | | | | | | | | |
| | | | | | | | | | | | | | | |
| | | | | | | | | | | | | | | |
- (1)
- The assets heading includes assets certified as development related to the solar-thermal power plant that uses tower technology and concentrated solar power in South Africa, totaling €118,804 thousand, applying the shareholding that the Company holds. See Note 8.4 for more details of assets under development.
- (2)
- Companies classified as assets held for sale (see Note 7).
F-79
Table of Contents
ABENGOA
Consolidated financial statements
| | | | | | | | | | | | | | |
| | Company | | % shares | | Assets | | Revenues | | Operating
profit
2013 | |
|---|
| | Abengoa Bioenergy Biomass of Kansas, LLC(3) | | | 100.00 | | | 407,071 | | | — | | | (330 | ) |
| | Agua y Gestión de Servicios Ambientales, S.A. | | | 41.54 | | | 89,586 | | | 4,198 | | | (5,954 | ) |
| | Al Oasis-Inabensa Co. Ltd | | | 50.00 | | | 12,570 | | | 30,463 | | | (15,836 | ) |
| | ATE VIII Transmissora de Energía, S.A. | | | 50.00 | | | 30,012 | | | — | | | (67 | ) |
| | Basor México, S.A.P.I. de C.V. | | | 50.00 | | | 612 | | | 128 | | | (130 | ) |
| | Central Eólica São Tomé Ltda. | | | 9.00 | | | 2 | | | — | | | (2 | ) |
| | Chennai Water Desalination Limited | | | 25.00 | | | 76,088 | | | 22,241 | | | 664 | |
| | Coaben SA de CV | | | 50.00 | | | 14,103 | | | — | | | 1,406 | |
| | Cogeneración Motril, S.A. | | | 19.00 | | | 22,047 | | | 42,952 | | | 2,069 | |
| | Concecutex, S.A. de C.V. | | | 50.00 | | | 69,963 | | | 4,887 | | | 562 | |
| | Concesionaria Costa del Sol S.A. | | | 50.00 | | | 25,888 | | | 358 | | | (1,283 | ) |
| | Concesionaria Hospital del Tajo, S.A. | | | 20.00 | | | 63,512 | | | 8,656 | | | 1,925 | |
| | Consorcio Teyma M y C Ingeniería | | | 50.00 | | | 59 | | | — | | | — | |
| | Evacuación Valdecaballeros, S.A. | | | 57.14 | | | 22,027 | | | — | | | (751 | ) |
| | Evacuación Villanueva del Rey, S.L. | | | 45.13 | | | 3,709 | | | — | | | — | |
| | Explotaciones Varias, S.L. | | | 50.00 | | | 44,140 | | | 401 | | | (89 | ) |
| | Explotadora Hospital del Tajo, S.L. | | | 20.00 | | | 1,430 | | | 3,739 | | | — | |
| | Geida Tlemcen, S.L. | | | 50.00 | | | 31,939 | | | — | | | (627 | ) |
| | Ghenova Ingeniería S.L. | | | 20.00 | | | 1,340 | | | — | | | (3,250 | ) |
| | Green Visión Holding BV | | | 24.00 | | | 13,889 | | | 5,696 | | | 937 | |
| | Helioenergy Electricidad Dos, S.A. | | | 50.00 | | | 282,686 | | | 25,414 | | | (2,777 | ) |
| | Helioenergy Electricidad Uno, S.A. | | | 50.00 | | | 282,794 | | | 25,547 | | | (2,325 | ) |
| | Íbice Participações e Consultoria em Energia S.A. | | | 50.00 | | | 951 | | | — | | | 30 | |
| | Inabensa Green Energy Co., Ltd. | | | 50.00 | | | 396 | | | — | | | — | |
| | Inapreu, S.A. | | | 50.00 | | | 10,979 | | | 1,291 | | | 16 | |
| | Kaxu Solar One (Pty) Ltd. | | | 51.00 | | | 416,669 | | | — | | | (89 | ) |
| | Khi Solar One (Pty) Ltd.(3) | | | 51.00 | | | 252,262 | | | — | | | (60 | ) |
| | Ledincor S.A. | | | 49.00 | | | 6,341 | | | 942 | | | 541 | |
| | Lidelir S.A. | | | 49.00 | | | 8,864 | | | 878 | | | 164 | |
| | Micronet Porous Fibers, S.L. | | | 50.00 | | | 6,501 | | | 4 | | | 160 | |
| | Mojave Solar LLC | | | 100.00 | | | 1,038,986 | | | — | | | 10 | |
| | Myah Bahr Honaine, S.P.A. | | | 25.50 | | | 211,783 | | | 31,142 | | | 9,975 | |
| | Negev Energy—Ashalim Thermo-Solar Ltd. | | | 50.00 | | | — | | | — | | | — | |
| | Palen Solar Holdings, LLC | | | 42.97 | | | 48,909 | | | — | | | — | |
| | Parque Eólico Cristalândia Ltda. | | | 20.00 | | | 22 | | | — | | | (4 | ) |
| | Resurce, Resid. Urbanos de Ceuta, S.L. | | | 50.00 | | | 6,210 | | | 503 | | | 506 | |
| | Servicios Culturales Mexiquenses, S.A. de C.V. | | | 50.00 | | | 1,892 | | | 4,072 | | | 179 | |
| | Shams Power Company PJSC | | | 40.00 | | | 591,373 | | | 18,997 | | | 7,229 | |
| | SRC Nanomaterials, S.A | | | 50.00 | | | 547 | | | — | | | 195 | |
| | Tendogenix (RF) (Pty) Ltd. | | | 40.00 | | | — | | | — | | | — | |
| | Total Abengoa Solar Emirates Investment Company, B.V. | | | 50.00 | | | 45,581 | | | — | | | (268 | ) |
| | Total Abengoa Solar Emirates O&M Company, B.V. | | | 50.00 | | | 1,420 | | | 1,955 | | | 790 | |
| | TSMC Ingeniería y Contrucción, Ltda. | | | 33.30 | | | 70 | | | — | | | — | |
| | | | | | | | | | | | | | | |
| | Total 2013 | | | | | | 4,145,223 | | | 234,464 | | | (6,484 | ) |
| | | | | | | | | | | | | | | |
| | | | | | | | | | | | | | | |
| | | | | | | | | | | | | | | |
- (3)
- The assets heading includes assets certified as development related to the ethanol production plant in Kansas (USA), which uses biomass and second-generation technology, totaling €369,882 thousand in 2013, and the solar-thermal power plant that uses tower technology and concentrated solar power in South Africa, totaling €104,357 thousand in 2013 applying the shareholding that the Company holds. See Note 8.4 for more details of assets under development.
F-80
Table of Contents
ABENGOA
Consolidated financial statements
| | | | | | | | | | | | | | |
| | Company | | % shares | | Assets | | Revenues | | Operating
profit
2012 | |
|---|
| | Abengoa Bioenergy Biomass of Kansas, LLC (ABBK) | | | 100.00 | | | 602,738 | | | — | | | (153 | ) |
| | Agua y Gestión de Servicios Ambientales, S.A. | | | 41.54 | | | 96,966 | | | 25,165 | | | (1,821 | ) |
| | Al Oasis-Inabensa Co. Ltd | | | 50.00 | | | 26,922 | | | 45,602 | | | (691 | ) |
| | Arizona Solar One, LLC | | | 100.00 | | | 1,344,573 | | | — | | | (39 | ) |
| | ATE VIII Transmissora de Energía S.A. | | | 50.00 | | | 23,940 | | | — | | | (7 | ) |
| | Betearte | | | 33.33 | | | 19,367 | | | 2,642 | | | (7 | ) |
| | Central Eólica São Tomé Ltda. | | | 18.00 | | | 2 | | | — | | | (1 | ) |
| | Chennai Water Desalination Limited | | | 25.00 | | | 94,179 | | | 23,792 | | | 529 | |
| | Coaben SA de CV | | | 50.00 | | | 15,904 | | | 1,204 | | | (1,790 | ) |
| | Cogeneración Motril, S.A. | | | 19.00 | | | 26,796 | | | 43,687 | | | 6,195 | |
| | Concecutex SA de C.V. | | | 50.00 | | | 75,990 | | | 4,676 | | | 1,091 | |
| | Concesionaria Costa del Sol S.A. | | | 50.00 | | | 32,628 | | | 1,008 | | | (691 | ) |
| | Concesionaria Hospital del Tajo, S.A. | | | 20.00 | | | 62,172 | | | 8,737 | | | 1,879 | |
| | Consorcio Teyma M&C | | | 49.90 | | | 67 | | | — | | | — | |
| | Ecología Canaria, S.A. | | | 45.00 | | | 5,166 | | | 4,948 | | | 402 | |
| | Explotaciones Varias, S.A. | | | 50.00 | | | 44,150 | | | 276 | | | (64 | ) |
| | Explotadora Hospital del Tajo, S.L. | | | 20.00 | | | 1,182 | | | 4,243 | | | 1 | |
| | Geida Tlemcen, S.L. | | | 50.00 | | | 44,034 | | | — | | | (84 | ) |
| | Ghenova Ingeniería S.L. | | | 20.00 | | | 2,270 | | | — | | | (3,113 | ) |
| | Green Visión Holding BV | | | 24.00 | | | 13,072 | | | 7,216 | | | 1,798 | |
| | Hankook R&M Co., Ltd. | | | 25.00 | | | 47,260 | | | — | | | (1,841 | ) |
| | Helio Energy Electricidad Dos, S.A. | | | 50.00 | | | 291,480 | | | 31,754 | | | 310 | |
| | Helio Energy Electricidad Uno, S.A. | | | 50.00 | | | 290,712 | | | 33,452 | | | 570 | |
| | Íbice Participações e Consultoria em Energia S.A. | | | 50.00 | | | 1,098 | | | — | | | (5 | ) |
| | Inapreu | | | 50.00 | | | 10,948 | | | 1,246 | | | (29 | ) |
| | Kaxu Solar One | | | 51.00 | | | 214,180 | | | — | | | (4 | ) |
| | Khi Solar One | | | 51.00 | | | 158,368 | | | — | | | (56 | ) |
| | Ledincor S.A. | | | 49.00 | | | 5,050 | | | — | | | (23 | ) |
| | Lidelir S.A. | | | 49.00 | | | 9,360 | | | — | | | (12 | ) |
| | Mojave Solar LLC | | | 100.00 | | | 884,032 | | | — | | | (275 | ) |
| | Myah Bahr Honaine, S.P.A. | | | 50.00 | | | 222,595 | | | 37,618 | | | 4,701 | |
| | Parque Eólico Cristalândia Ltda. | | | 20.00 | | | 19 | | | — | | | — | |
| | Recytech, S.A. | | | 50.00 | | | 18,958 | | | 30,714 | | | | |
| | Red Eléctrica del Sur, S.A. (Redesur) | | | 23.75 | | | 39,745 | | | 11,490 | | | 3,865 | |
| | Shams Power Company PJSC | | | 20.00 | | | 501,580 | | | — | | | — | |
| | Total Abengoa Solar Emirates Investment | | | 50.00 | | | 37,598 | | | — | | | (51 | ) |
| | TSMC Ing. Y Contrucción | | | 33.30 | | | 70 | | | — | | | — | |
| | | | | | | | | | | | | | | |
| | Total 2012 | | | | | | 5,265,171 | | | 319,470 | | | 10,584 | |
| | | | | | | | | | | | | | | |
| | | | | | | | | | | | | | | |
| | | | | | | | | | | | | | | |
- 11.3.
- The shareholding percentages in associates does not differ from the voting rights percentage on them. The accumulated other comprehensive income as of December 31, 2014 related to investments in associates amounts to €–47,510 thousand (€–53,534 thousand as of December 31, 2013).
F-81
Table of Contents
ABENGOA
Consolidated financial statements
Note 12. — Financial instruments by category
The Group's financial instruments are primarily deposits, clients and other receivables, derivatives and loans. Financial instruments by category (current and non-current), reconciled with the Statement of Financial Position, are as follows:
| | | | | | | | | | | | | | | | | | | |
Category | | Notes | | Loans and
receivables /
payables | | Non-hedging
derivatives | | Hedging
derivatives | | Available
for sale | | Balance as of
12.31.14 | |
|---|
Available-for-sale financial assets | | | 13 | | | — | | | — | | | — | | | 46,649 | | | 46,649 | |
Derivative financial instruments | | | 14 | | | — | | | 745 | | | 20,094 | | | — | | | 20,839 | |
Financial accounts receivables | | | 15 | | | 1,667,552 | | | — | | | — | | | — | | | 1,667,552 | |
Clients and other receivables | | | 15 | | | 2,156,916 | | | — | | | — | | | — | | | 2,156,916 | |
Cash and cash equivalents | | | 17 | | | 1,810,813 | | | — | | | — | | | — | | | 1,810,813 | |
| | | | | | | | | | | | | | | | | | | | |
Total Financial assets | | | | | | 5,635,281 | | | 745 | | | 20,094 | | | 46,649 | | | 5,702,769 | |
| | | | | | | | | | | | | | | | | | | | |
| | | | | | | | | | | | | | | | | | | | |
| | | | | | | | | | | | | | | | | | | | |
Project debt | | | 19 | | | 4,958,114 | | | — | | | — | | | — | | | 4,958,114 | |
Corporate financing | | | 20 | | | 5,325,350 | | | — | | | — | | | — | | | 5,325,350 | |
Trade and other current liabilities | | | 25 | | | 5,555,168 | | | — | | | — | | | — | | | 5,555,168 | |
Derivative financial instruments | | | 14 | | | — | | | 45,682 | | | 259,353 | | | — | | | 305,035 | |
| | | | | | | | | | | | | | | | | | | | |
Total Financial liabilities | | | | | | 15,838,632 | | | 45,682 | | | 259,353 | | | — | | | 16,143,667 | |
| | | | | | | | | | | | | | | | | | | | |
| | | | | | | | | | | | | | | | | | | | |
| | | | | | | | | | | | | | | | | | | | |
| | | | | | | | | | | | | | | | | | | |
Category | | Notes | | Loans and
receivables /
payables | | Non-hedging
derivatives | | Hedging
derivatives | | Available
for sale | | Balance as of
12.31.13 | |
|---|
Available-for-sale financial assets | | | 13 | | | — | | | — | | | — | | | 50,207 | | | 50,207 | |
Derivative financial instruments | | | 14 | | | — | | | 2,686 | | | 58,865 | | | — | | | 61,551 | |
Financial accounts receivables | | | 15 | | | 1,575,301 | | | — | | | — | | | — | | | 1,575,301 | |
Clients and other receivables | | | 15 | | | 1,869,972 | | | — | | | — | | | — | | | 1,869,972 | |
Cash and cash equivalents | | | 17 | | | 2,951,683 | | | — | | | — | | | — | | | 2,951,683 | |
| | | | | | | | | | | | | | | | | | | | |
Total Financial assets | | | | | | 6,396,956 | | | 2,686 | | | 58,865 | | | 50,207 | | | 6,508,714 | |
| | | | | | | | | | | | | | | | | | | | |
| | | | | | | | | | | | | | | | | | | | |
| | | | | | | | | | | | | | | | | | | | |
Project debt | | | 19 | | | 6,320,950 | | | — | | | — | | | — | | | 6,320,950 | |
Corporate financing | | | 20 | | | 5,654,409 | | | — | | | — | | | — | | | 5,654,409 | |
Trade and other current liabilities | | | 25 | | | 5,514,186 | | | — | | | — | | | — | | | 5,514,186 | |
Derivative financial instruments | | | 14 | | | — | | | 81,530 | | | 229,652 | | | — | | | 311,182 | |
| | | | | | | | | | | | | | | | | | | | |
Total Financial liabilities | | | | | | 17,489,545 | | | 81,530 | | | 229,652 | | | — | | | 17,800,727 | |
| | | | | | | | | | | | | | | | | | | | |
| | | | | | | | | | | | | | | | | | | | |
| | | | | | | | | | | | | | | | | | | | |
The information on the financial instruments measured at fair value, is presented in accordance with the following level classification:
- •
- Level 1: Quoted prices in active markets for identical assets or liabilities.
- •
- Level 2: Measured on inputs other than quoted prices included within Level 1 that are observable for the asset or liability, either directly (i.e. as prices) or indirectly (i.e. derived from prices).
- •
- Level 3: Measured on inputs for the asset or liability that are not based on observable market data (unobservable inputs).
The following is a breakdown of the Group's assets and liabilities measured at fair value as of December 31, 2014 and 2013 (except assets and liabilities with a carrying amount close to their fair value,
F-82
Table of Contents
ABENGOA
Consolidated financial statements
non-quoted equity instruments measured at cost and contracts with components that cannot be measured reliably):
| | | | | | | | | | | | | |
Category | | Level 1 | | Level 2 | | Level 3 | | Balance as of
12.31.14 | |
|---|
Non-hedging derivatives | | | — | | | (44,937 | ) | | — | | | (44,937 | ) |
Hedging derivatives | | | — | | | (239,259 | ) | | — | | | (239,259 | ) |
Available-for-sale | | | 33 | | | — | | | 46,616 | | | 46,649 | |
| | | | | | | | | | | | | | |
Total | | | 33 | | | (284,196 | ) | | 46,616 | | | (237,547 | ) |
| | | | | | | | | | | | | | |
| | | | | | | | | | | | | | |
| | | | | | | | | | | | | | |
| | | | | | | | | | | | | |
Category | | Level 1 | | Level 2 | | Level 3 | | Balance as of
12.31.13 | |
|---|
Non-hedging derivatives | | | — | | | (78,844 | ) | | — | | | (78,844 | ) |
Hedging derivatives | | | — | | | (170,787 | ) | | — | | | (170,787 | ) |
Available-for-sale | | | 4,449 | | | — | | | 45,758 | | | 50,207 | |
| | | | | | | | | | | | | | |
Total | | | 4,449 | | | (249,631 | ) | | 45,758 | | | (199,424 | ) |
| | | | | | | | | | | | | | |
| | | | | | | | | | | | | | |
| | | | | | | | | | | | | | |
The financial instruments at fair value, determined from prices published in active markets (Level 1), consist of shares.
The majority of Abengoa's portfolio comprises financial derivatives designated as cash flow hedges, is classified as level 2 and corresponds mainly to the interest rate swaps (see Note 14).
The caption Non-hedging derivatives accounting includes the fair value of the derivatives embedded in the convertible notes except for the 2019 notes, the fair value of the call options over Abengoa's own shares, as well as those derivatives purchased with the purpose of hedging a market risk (interest rate, foreign exchange or commodities) that do not fulfil all the requirements, according to IAS 39 to be recorded as hedges from an accounting point of view.
Level 3 corresponds mainly to the 3% interest held by Abengoa, S.A. in Yoigo, S.A., a Spanish telecom operator, recorded at fair value of €32,997 thousand and held through the ownership of Siema Investments, S.L. (a holding company owned 100% by Abengoa, S.A.).
The valuation method used to calculate the fair value was discounting cash flows based on business plan of such instrument, using as discount rate a weighted average cost of capital (WACC) of market, 10%. A sensitivity analysis has also been performed considering different discount rates and deviations of the business plan in order to ensure that potential valuation changes do not worsen in any case the fair value.
Additionally, the embedded derivative of the convertible loan received as part of the consideration for the sale of Befesa (See Note 7.3), is classified within Level 3. As of December 31, 2014, the embedded derivative has a negative fair value of €8,498 thousands (€–36 thousands in 2013).
If the equity value of Befesa had increased by 10%, assuming that the average horizon of permanence of the financial fund before the sale of Befesa did not change compared with respect to the hypotheses considered in assessing, the fair value of the embedded derivative would have increased € 537 thousand (€20 thousand in 2013).
F-83
Table of Contents
ABENGOA
Consolidated financial statements
The following table shows the changes in the fair value of level 3 assets for the years ended December 31, 2014 and 2013:
| | | | |
Movements | | Amount | |
|---|
Beginning balance as of December 31, 2012 | | | 45,704 | |
Gains and losses recognized in Equity (see Note 13.1) | | | (568 | ) |
Change in consolidation, reclassifications and translation differences | | | 622 | |
| | | | | |
Total as of December 31, 2013 | | | 45,758 | |
| | | | | |
| | | | | |
| | | | | |
Gains and losses recognized in Equity (see Note 13.1) | | | (1,414 | ) |
Change in consolidation, reclassifications and translation differences | | | 2,272 | |
| | | | | |
Total as of December 31, 2014 | | | 46,616 | |
| | | | | |
| | | | | |
| | | | | |
During the periods ended December 31, 2014 and 2013, there have not been any reclassifications amongst the three levels presented above.
There were no losses recognized in the Consolidated Income Statement for the year 2012.
Note 13. — Available-for-sale financial assets
- 13.1.
- The following table shows the detail and the movement on available-for-sale financial assets during 2014 and 2013:
| | | | | |
| | Available for sale financial assets | | Balance | |
|---|
| | At January 1, 2012 | | | 49,695 | |
| | Additions | | | 3,802 | |
| | Gain/Losses transferred to equity | | | (568 | ) |
| | Derecognitions | | | (2,722 | ) |
| | | | | | |
| | At December 31 , 2013 | | | 50,207 | |
| | | | | | |
| | | | | | |
| | | | | | |
| | Additions | | | 1,626 | |
| | Gain/Losses transferred to equity | | | (1,414 | ) |
| | Derecognitions | | | (3,770 | ) |
| | | | | | |
| | At December 31 , 2014 | | | 46,649 | |
| | | | | | |
| | | | | | |
| | | | | | |
| | Less: Non-current portion | | | 39,466 | |
| | Current portion | | | 7,183 | |
F-84
Table of Contents
ABENGOA
Consolidated financial statements
- 13.2.
- The following table shows those entities which, in accordance with the then current legislation, were not consolidated in the years 2014 and 2013 and in which the parent company's direct and indirect shareholding is higher than 5% and lower than 20%. The net carrying amount of these holdings is €7,962 thousand at December 31, 2014 (€8,159 thousand in 2013).
| | | | | | | | |
| | Non-current financial assets | | 2014
% Holding | | 2013
% Holding | |
|---|
| | Dyadic Investment | | | 7.00 | | | 7.00 | |
| | Fundación Soland | | | 16.67 | | | 16.67 | |
| | Norpost | | | 10.00 | | | 10.00 | |
| | Proxima Ltd. (Nexttel) | | | 10.00 | | | 10.00 | |
| | Soc. Con. Canal Navarra | | | 10.00 | | | 10.00 | |
| | Sociedad Andaluza de Valoración Biomasa | | | 6.00 | | | 6.00 | |
| | Viryanet, Ltd. | | | — | | | 7.86 | |
| | | | | | | | |
| | Current financial assets | | 2014
% Holding | | 2013
% Holding | |
|---|
| | BC International Corp. | | | — | | | 9.00 | |
| | Comeesa | | | 5.31 | | | 5.31 | |
| | Chekin | | | 14.28 | | | 14.28 | |
| | Medgrid, SAS | | | 5.45 | | | 5.00 | |
| | Mediación Bursátil, S.V.B., S.A. | | | 8.00 | | | 8.00 | |
| | Operador Mercado Ibérico (OMIP) | | | 5.00 | | | 5.00 | |
- 13.3.
- All necessary notifications have been made to the companies in which the Group holds an interest of over 10%, as required under Article 155 of Spanish Corporate Law (Ley de Sociedades de Capital).
- 13.4.
- There are no circumstances which have a material impact on the financial assets on the Group's portfolio, such as litigations, pledges, etc.
- 13.5.
- There are no firm agreements in place regarding the sale or purchase of these investments which could be considered material in relation to the Group's Financial Statements.
- 13.6.
- The amount of interest accrued but not yet collected is not material.
- 13.7.
- There are no fixed-yield securities in arrears. The average rate of return on fixed-yield securities is in line with the market.
- 13.8.
- As of December 31, 2014 and 2013, Abengoa, S.A. held a 3% interest in Yoigo, S.A, a Spanish telecom operator, recorded at fair value of €32,997 thousand and held in the Group through the ownership of Siema Investments, S.L. (a holding company owned 100% by Abengoa, S.A.). Additionally the shareholders of Yoigo have granted this company several 'participative' loans in accordance with a pre-established plan, which involved a total disbursement of €21,030 thousand (as of December 31, 2014 and 2013), equivalent to 3% of the total loan made to the company by its shareholders in said years.
To value this holding, as in prior periods, once Yoigo's activities had commenced, the principal reference point taken is the company's future cash-flow generation on the basis of its current Business Plan, discounted at a rate appropriate to the sector in which this company operates (See Note 12).
As a result of the purchase of its holding in Yoigo, Siema Investment, S.L. became responsible, for furnishing guarantees to the Spanish Administration as security for compliance with the commitments relating to investment, commercialization, employment and network development acquired by Yoigo,
F-85
Table of Contents
ABENGOA
Consolidated financial statements
together with other guarantees relating to the Radioelectronic Spectrum Rate, which the Group is required to counter-guarantee, for a total amount of €3,387 thousand (as of December 31, 2014 and 2013).
- 13.9.
- As a result of the analysis of impairtment of available-for sale financial assets, no significant losses from impairment were recorded.
Note 14. — Derivative financial instruments
- 14.1.
- The fair value of derivative financial instruments (see Note 12) as of December 31, 2014 and 2013 is as follows:
| | | | | | | | | | | | | | | | | |
| |
| |
| | 12.31.14 | | 12.31.13 | |
|---|
| |
| | Note | | Assets | | Liabilities | | Assets | | Liabilities | |
|---|
| | Exchange rate derivatives—cash flow hedge | | | 14.2.a | | | 6,017 | | | 13,163 | | | 6,028 | | | 13,519 | |
| | Interest rate derivatives—cash flow hedge | | | 14.3.a | | | 5,271 | | | 215,308 | | | 43,889 | | | 200,483 | |
| | Interest rate derivatives—non-hedge accounting | | | 14.3.c | | | — | | | 33,163 | | | — | | | 14,765 | |
| | Commodity derivatives—cash flow hedge | | | 14.4.a | | | 8,806 | | | 30,882 | | | 8,948 | | | 15,650 | |
| | Embedded derivatives of convertible bonds and shares options | | | 20.3 | | | 745 | | | 12,519 | | | 2,686 | | | 66,765 | |
| | | | | | | | | | | | | | | | | | |
| | Total | | | | | | 20,839 | | | 305,035 | | | 61,551 | | | 311,182 | |
| | | | | | | | | | | | | | | | | | |
| | | | | | | | | | | | | | | | | | |
| | | | | | | | | | | | | | | | | | |
| | Non-current part | | | | | | 5,997 | | | 225,298 | | | 46,347 | | | 266,802 | |
| | Current part | | | | | | 14,842 | | | 79,737 | | | 15,204 | | | 44,380 | |
Information about the valuation techniques of derivative financial instruments is described in Notes 2.11 and 12.
Derivatives classified as non-hedge accounting are those derivative financial instruments which, although obtained for the purpose of hedging certain market risks (interest rates, exchange rates, commodity prices and fair value class B share Abengoa), do not meet the specific requirements established by IAS 39 to be designated as hedging instruments from an accounting point of view (since, at the inception of the hedge, there was no designation or formal documentation relating to the hedge or the risk management strategy that it was intended to implement) or, having complied with all of the requirements to be designated a hedging instrument, the underlying has been sold or the hedging designation has been interrupted.
Fair value of derivative assets decreased during 2014 mainly due to the unfavorable evolution of hedging interest rate derivatives, as well as, the decrease for classifying derivative financial instruments of Abengoa Yield as financial assets held for sale.
Fair value of derivative liabilities decreased during 2014 due to the reclassification to equity of the fair value of the embedded derivative of the convertible note due in 2019 because in 2014, conversion option meets the definition of equity instrument (see Note 20.3). Additionally, there has been a decrease for classifying derivative financial instruments of Abengoa Yield as financial assets held for sale. These decreases have been partially offset by an increase due to the unfavourable evolution of hedging interest rate derivatives, mainly due to a decrease in the fair value of swaps resulting from the decrease in the future interes rates.
F-86
Table of Contents
ABENGOA
Consolidated financial statements
The fair value amount recognized in the Consolidated Income Statement of the 2014 fiscal year for the financial instruments derivatives designated as hedging instruments is a loss of €29,720 thousand (loss of €88,924 thousand in 2013).
Included in the following sections are detailed fair value presentations of each of the categories of derivative financial instruments presented in the table above. The net position of assets and liabilities for each line item of the summary table above reconciles with the net amount of the fair values of collections and payments for exchange rate derivatives, the net amount of the fair values of caps and swaps for interest rates hedges and the net amount of the fair values of commodity price derivatives, respectively.
- 14.2.
- Exchange rate hedges
The terms 'Collection hedges' and 'Payment hedges' refer to foreign currency derivatives designated as hedging instruments of future cash inflows and outflows associated to highly probable forecasted sales and purchase, respectively, denominated in a foreign currency.
The following table shows a breakdown of the notional amounts of the financial instruments relating to amounts receivable and payable in foreign currencies as of December 31, 2014 and 2013:
| | | | | | | | | | | | | | |
| |
| | Collection hedges | | Payment hedges | |
|---|
| | Exchange Rates | | 2014 | | 2013 | | 2014 | | 2013 | |
|---|
| | Krona (Sweden) | | | — | | | — | | | 3,737 | | | 1,653 | |
| | Dirhams (UAE) | | | 8,754 | | | 13,222 | | | 8,161 | | | 7,683 | |
| | Dirhams (Morocco) | | | — | | | 533 | | | — | | | — | |
| | Dollar (Australia) | | | — | | | — | | | 194 | | | 1,939 | |
| | Dollar (USA) | | | 105,804 | | | 328,421 | | | 473,218 | | | 226,943 | |
| | Euro | | | — | | | — | | | — | | | 4,978 | |
| | Shilling (Kenya) | | | 5,944 | | | — | | | 1,963 | | | — | |
| | Franc (Switzerland) | | | — | | | — | | | 2,495 | | | — | |
| | Pound Sterling (UK) | | | — | | | — | | | 24 | | | 68 | |
| | Mexican Peso (Mexico) | | | 7 | | | — | | | 15 | | | 8 | |
| | Yen (Japan) | | | 12 | | | — | | | 31 | | | 15 | |
| | Shekel (Israel) | | | — | | | — | | | 5,330 | | | — | |
| | Peso (Uruguay) | | | 244 | | | — | | | — | | | — | |
| | Zloty (Poland) | | | 83,308 | | | 137,363 | | | 27,594 | | | 65,647 | |
| | | | | | | | | | | | | | | |
| | Total | | | 204,073 | | | 479,539 | | | 522,762 | | | 308,934 | |
| | | | | | | | | | | | | | | |
| | | | | | | | | | | | | | | |
| | | | | | | | | | | | | | | |
F-87
Table of Contents
ABENGOA
Consolidated financial statements
The following table shows a breakdown of the fair values of exchange rate derivatives relating to amounts receivable and payable in foreign currencies as of December 31, 2014 and 2013:
| | | | | | | | | | | | | | |
| |
| | Collection hedges | | Payment hedges | |
|---|
| | Exchange Rates | | 2014 | | 2013 | | 2014 | | 2013 | |
|---|
| | Krona (Sweden) | | | — | | | — | | | (254 | ) | | 2 | |
| | Dirhams (UAE) | | | (677 | ) | | 430 | | | 639 | | | (289 | ) |
| | Dirhams (Morocco) | | | — | | | 4 | | | — | | | — | |
| | Dollar (Australia) | | | — | | | — | | | 1 | | | (102 | ) |
| | Dollar (USA) | | | (3,746 | ) | | 12,499 | | | 2,915 | | | (14,378 | ) |
| | Euro | | | — | | | — | | | — | | | 1 | |
| | Shilling (Kenya) | | | (88 | ) | | — | | | (2 | ) | | — | |
| | Franc (Switzerland) | | | | | | — | | | 27 | | | — | |
| | Pound Sterling (UK) | | | — | | | — | | | — | | | 2 | |
| | Peso (Mexico) | | | — | | | — | | | (1 | ) | | — | |
| | Yen (Japan) | | | 1 | | | — | | | (2 | ) | | (1 | ) |
| | Shekel (Israel) | | | — | | | — | | | 105 | | | — | |
| | Peso (Uruguay) | | | (13 | ) | | — | | | — | | | — | |
| | Zloty (Poland) | | | (7,176 | ) | | (8,555 | ) | | 1,125 | | | 2,896 | |
| | | | | | | | | | | | | | | |
| | Total | | | (11,699 | ) | | 4,378 | | | 4,553 | | | (11,869 | ) |
| | | | | | | | | | | | | | | |
| | | | | | | | | | | | | | | |
| | | | | | | | | | | | | | | |
| | | | | | | | | | | | | | |
| |
| | 12.31.14 | | 12.31.13 | |
|---|
| | Notionals | | Collections | | Payments | | Collections | | Payments | |
|---|
| | Up to 1 year | | | 162,596 | | | 516,763 | | | 404,477 | | | 290,853 | |
| | Between 1 and 2 years | | | 41,477 | | | 5,999 | | | 45,579 | | | 17,616 | |
| | Between 2 and 3 years | | | — | | | — | | | 29,483 | | | 465 | |
| | | | | | | | | | | | | | | |
| | Total | | | 204,073 | | | 522,762 | | | 479,539 | | | 308,934 | |
| | | | | | | | | | | | | | | |
| | | | | | | | | | | | | | | |
| | | | | | | | | | | | | | | |
| | | | | | | | | | | | | | |
| |
| | 12.31.14 | | 12.31.13 | |
|---|
| | Fair value | | Collections | | Payments | | Collections | | Payments | |
|---|
| | Up to 1 year | | | (9,151 | ) | | 4,602 | | | 8,714 | | | (11,880 | ) |
| | Between 1 and 2 years | | | (2,548 | ) | | (49 | ) | | (2,988 | ) | | 36 | |
| | Between 2 and 3 years | | | — | | | — | | | (1,348 | ) | | (25 | ) |
| | | | | | | | | | | | | | | |
| | Total | | | (11,699 | ) | | 4,553 | | | 4,378 | | | (11,869 | ) |
| | | | | | | | | | | | | | | |
| | | | | | | | | | | | | | | |
| | | | | | | | | | | | | | | |
The net amount of the fair value of exchange rate derivatives designated as cash flow hedges transferred to the Consolidated Income Statement in 2014, 2013 and 2012 has been of €10,443 thousand, €–5,211 thousand and €1,033, respectively (see Note 18.3).
F-88
Table of Contents
ABENGOA
Consolidated financial statements
The ineffective amount recognized in the Consolidated Income Statement for the years 2014, 2013 and 2012 with respect to exchange rate derivatives designated as cash flow hedges amounts to €801 thousand, €1,040 thousand and €–17,193 thousand, respectively.
The after-tax gains/losses accumulated in equity in connection with exchange rate derivatives designated as cash flow hedges at December 31, 2014 amounted to € –14,317 thousand (€–4,362 thousand in 2013 and €–17,395 thousand in 2012). See note 18.3.
- b)
- Fair value hedges
The group does not have any exchange rate derivatives designated as fair value hedges at the end of 2014, 2013 and 2012.
- c)
- Non-hedge accounting derivatives
At the end of 2014 and 2013 the Group does not hold any exchange rate non-hedge accounting derivatives instruments.
The net amount of the fair value of exchange rate derivatives charged directly to the Consolidated Income Statement as a result of not meeting all the requirements of IAS 39 to be designated as hedges represented an impact of €266 thousand (€283 thousand in 2013 and €–19,947 thousan in 2012). (see Note 30.2).
- 14.3.
- Interest rate hedges
As stated in Note 4 to these Consolidated Financial Statements, the general hedging policy for interest rates is to purchase call options in exchange of a premium to fix the maximum interest rate cost. Additionally, under certain circumstances, the company also uses floating to fixed interest rate swaps.
As a result, the notional amounts hedged, strikes contracted and maturities, depending on the characteristics of the debt on which the interest rate risk is being hedged, can be diverse:
- •
- Corporate Financing: we hedge between 75% and 100% of the notional amount, with maturities up to 2022 and average guaranteed interest rates of between 0.50% and 4.75% for loans referenced to the 1-month, 3-months and 6 months Euribor rates.
- •
- Project debt:
- •
- Project debt in Euros: we hedge between 80% and 100% of the notional amount, maturities until 2032 and average guaranteed interest rates of between 0.55% and 4.88%.
- •
- Project debt in US Dollars: we hedge between 70% and 100% of the notional amount, including maturities until 2032 and average guaranteed interest rates of between 0.59% and 3.54%.
F-89
Table of Contents
ABENGOA
Consolidated financial statements
| | | | | | | | | | | | | | |
| |
| | 12.31.14 | | 12.31.13 | |
|---|
| | Notionals | | Cap / Collar | | Swap | | Cap / Collar | | Swap | |
|---|
| | Up to 1 year | | | 3,028,195 | | | 15,699 | | | 3,029,715 | | | 231,932 | |
| | Between 1 and 2 years | | | 2,734,645 | | | 17,120 | | | 3,033,757 | | | 37,190 | |
| | Between 2 and 3 years | | | 2,842,634 | | | 18,164 | | | 2,756,511 | | | 39,962 | |
| | Subsequent years | | | 3,236,461 | | | 321,656 | | | 4,764,796 | | | 821,217 | |
| | | | | | | | | | | | | | | |
| | Total | | | 11,841,935 | | | 372,639 | | | 13,584,779 | | | 1,130,301 | |
| | | | | | | | | | | | | | | |
| | | | | | | | | | | | | | | |
| | | | | | | | | | | | | | | |
| | | | | | | | | | | | | | |
| |
| | 12.31.14 | | 12.31.13 | |
|---|
| | Fair value | | Cap / Collar | | Swap | | Cap / Collar | | Swap | |
|---|
| | Up to 1 year | | | (24,762 | ) | | (5,407 | ) | | (14,910 | ) | | (13,219 | ) |
| | Between 1 and 2 years | | | (11,841 | ) | | (5,880 | ) | | (15,705 | ) | | 87 | |
| | Between 2 and 3 years | | | (3,568 | ) | | (6,295 | ) | | (1,157 | ) | | 90 | |
| | Subsequent years | | | 2,734 | | | (155,018 | ) | | 36,227 | | | (148,007 | ) |
| | | | | | | | | | | | | | | |
| | Total | | | (37,437 | ) | | (172,600 | ) | | 4,455 | | | (161,049 | ) |
| | | | | | | | | | | | | | | |
| | | | | | | | | | | | | | | |
| | | | | | | | | | | | | | | |
The net amount of the fair value of interest rate derivatives designated as cash flow hedges transferred to the Consolidated Income Statement in 2014, 2013 and 2012 has been of €–84,567 thousand, €–94,226 thousand and €–75,664, respectively (see Note 18.3).
The after-tax gains/losses accumulated in equity in connection with derivatives designated as cash flow hedges at the end of 2014, 2013 and 2012 amount to €–253,783 thousand, €–151,733 thousand and €–273,966, respectively (see Note 18.3).
The net amount of the time value component of the cash flow derivatives fair value recognized in the Consolidated Income Statement for the years 2014, 2013 and 2012 has been €–17,559 thousand, €21,734 thousand and €–24,221 thousand, respectively.
- b)
- Fair value hedges
The Group does not have any interest rate derivatives designated as fair value hedges at the end of 2014 and 2013.
F-90
Table of Contents
ABENGOA
Consolidated financial statements
| | | | | | | | |
| |
| | 12.31.14 | | 12.31.13 | |
|---|
| | Notionals | | Floor | | Floor | |
|---|
| | Up to 1 year | | | 630,000 | | | — | |
| | Between 1 and 2 years | | | 300,000 | | | 630,000 | |
| | Between 2 and 3 years | | | 1,500,000 | | | 300,000 | |
| | Subsequent years | | | 315,000 | | | 1,815,000 | |
| | | | | | | | | |
| | Total | | | 2,745,000 | | | 2,745,000 | |
| | | | | | | | | |
| | | | | | | | | |
| | | | | | | | | |
| | | | | | | | |
| |
| | 12.31.14 | | 12.31.13 | |
|---|
| | Fair value | | Floor | | Floor | |
|---|
| | Up to 1 year | | | (9,082 | ) | | — | |
| | Between 1 and 2 years | | | (4,358 | ) | | (6,497 | ) |
| | Between 2 and 3 years | | | (15,484 | ) | | (1,993 | ) |
| | Subsequent years | | | (4,239 | ) | | (6,275 | ) |
| | | | | | | | | |
| | Total | | | (33,163 | ) | | (14,765 | ) |
| | | | | | | | | |
| | | | | | | | | |
| | | | | | | | | |
At the end of 2014, 2013 and 2012, the net amount of the fair value of interest rate derivatives charged directly to the Consolidated Income Statement as a result of not meeting all the requirements of IAS 39 to be designated as hedges represented an impact of €–18,401 thousand, €533 thousand and €–4,305 thousand, respectively (see Note 30.1).
- 14.4.
- Commodity price hedges
In relation to hedges of commodity prices, as stated in Note 2.10 of the Consolidated Financial Statements of Abengoa for the year ended on December 31, 2014, the different activities carried on by Abengoa through its different segments (Biofuels and Engineering and construction) expose the group to risks derived from the fair value of certain commodity prices (aluminum, grain, ethanol and gas).
To hedge these risks, Abengoa uses derivative contracts and OTC derivatives for commodity prices.
- a)
- Cash flow hedges
The table below shows a breakdown of the maturities of notional amounts for the commodity price derivatives designated as cash flow hedges at the 2014 and 2013 year end:
| | | | | | | | | | | | | | |
| | 2014 | | Ethanol (Gallons) | | Gas (MMbtu) | | Grain (Bushels) | | Aluminum (Tons) | |
|---|
| | Up to 1 year | | | 50,610,000 | | | 2,015,989 | | | 104,750,000 | | | 115,522 | |
| | | | | | | | | | | | | | | |
| | Total | | | 50,610,000 | | | 2,015,989 | | | 104,750,000 | | | 115,522 | |
| | | | | | | | | | | | | | | |
| | | | | | | | | | | | | | | |
| | | | | | | | | | | | | | | |
F-91
Table of Contents
ABENGOA
Consolidated financial statements
| | | | | | | | | | | | | | |
| | 2013 | | Ethanol (Gallons) | | MMbtu (MWh) | | Grain (Bushels) | | Aluminum (Tons) | |
|---|
| | Up to 1 year | | | 94,752,000 | | | 2,814,591 | | | 41,735,000 | | | 120,642 | |
| | | | | | | | | | | | | | | |
| | Total | | | 94,752,000 | | | 2,814,591 | | | 41,735,000 | | | 120,642 | |
| | | | | | | | | | | | | | | |
| | | | | | | | | | | | | | | |
| | | | | | | | | | | | | | | |
| | | | | | | | | | | | | | |
| | 2014 | | Ethanol | | Gas | | Grain | | Aluminum | |
|---|
| |
| | (€ thousands)
| |
|---|
| | Up to 1 year | | | (2,733 | ) | | (1,386 | ) | | 10,364 | | | (29,418 | ) |
| | | | | | | | | | | | | | | |
| | Total | | | (2,733 | ) | | (1,386 | ) | | 10,364 | | | (29,418 | ) |
| | | | | | | | | | | | | | | |
| | | | | | | | | | | | | | | |
| | | | | | | | | | | | | | | |
| | | | | | | | | | | | | | |
| | 2013 | | Ethanol | | Gas | | Grain | | Aluminum | |
|---|
| |
| | (€ thousands)
| |
|---|
| | Up to 1 year | | | 4,587 | | | 755 | | | 2,715 | | | (14,759 | ) |
| | | | | | | | | | | | | | | |
| | Total | | | 4,587 | | | 755 | | | 2,715 | | | (14,759 | ) |
| | | | | | | | | | | | | | | |
| | | | | | | | | | | | | | | |
| | | | | | | | | | | | | | | |
The net amount of the fair value of commodity price derivatives designated as cash flow hedges transferred to the Income statement in 2014, 2013 and 2012 has been of €44,404 thousand, €10,513 thousand and €–21,541 thousand, respectively (see Note 18.3).
The after-tax gains/losses accumulated in equity in connection with derivatives designated as cash flow hedges at December 31, 2014 amounted to €–21,288 thousand (€–7,674 thousand in 2013 and €8,761 thousand in 2012), see Note 18.3.
- b)
- Non-hedge accounting derivatives
At the end of 2014 and 2013, the Group does not hold non-hedge accounting derivative financial instruments of commodity prices.
The net amount of the fair value of commodity prices derivatives charged directly to the Consolidated Income Statement as a result of not meeting all the requirements of IAS 39 to be designed as hedges represented losses of €4,808 thousand (losses of €9,837 thousand in 2013 and losses of €20,428 in 2012) (see Note 30.3).
Note 15. — Clients and other receivable accounts
- 15.1.
- The breakdown of Clients and Other Receivable Accounts as of December 31, 2014 and 2013 is as follows:
| | | | | | | | |
| | Item | | Balance as of 12.31.14 | | Balance as of 12.31.13 | |
|---|
| | Trade receivables | | | 592,628 | | | 566,930 | |
| | Unbilled revenues | | | 913,122 | | | 488,883 | |
| | Bad debt provisions | | | (82,209 | ) | | (64,047 | ) |
| | Tax receivables | | | 595,784 | | | 640,567 | |
| | Other debtors | | | 137,591 | | | 237,639 | |
| | | | | | | | | |
| | Total | | | 2,156,916 | | | 1,869,972 | |
| | | | | | | | | |
| | | | | | | | | |
| | | | | | | | | |
F-92
Table of Contents
ABENGOA
Consolidated financial statements
As a general rule, 'Unbilled revenues' are billed within the three months following completion of the work being performed on the project. Nevertheless, given the highly-tailored characteristics of some construction contracts, some projects may take longer to be billed due to specific billing milestones in the contracts. The total outstanding balances as of December 31, 2014 and 2013 are supported by contracts signed with such customers and do not include any receivables relating to customer claims.
At the end of 2014 and the 2013 there were no balances with related parties (see Note 33.2).
- 15.2.
- The fair value of Clients and other receivable accounts does not differ significantly from its carrying value.
- 15.3.
- The list of Clients and Other Accounts Receivable according to foreign currency as at December 31, 2014 and 2013 are as follows:
| | | | | | | | |
| | Currency | | Balance as of
12.31.14 | | Balance as of
12.31.13 | |
|---|
| | Algerian dinar | | | 5,842 | | | 11,219 | |
| | Dirhams (Morocco) | | | 23,267 | | | 16,926 | |
| | American dollar | | | 672,632 | | | 259,751 | |
| | New peruvian sol | | | 61,476 | | | 25,883 | |
| | Argentinian peso | | | 36,632 | | | 9,988 | |
| | Chilean peso | | | 20,419 | | | 38,217 | |
| | Mexican peso | | | 52,174 | | | 78,155 | |
| | Uruguayan peso | | | 27,085 | | | 17,125 | |
| | South African rand | | | 158,840 | | | — | |
| | Brazilian real | | | 57,460 | | | 56,344 | |
| | Indian rupee | | | 34,669 | | | 8,546 | |
| | Chinese yuan | | | 2,898 | | | 28,904 | |
| | Polish zloty | | | 56,815 | | | 13,685 | |
| | Others | | | 73,127 | | | 65,631 | |
| | | | | | | | | |
| | Total | | | 1,283,336 | | | 630,374 | |
| | | | | | | | | |
| | | | | | | | | |
| | | | | | | | | |
- 15.4.
- The following table shows the maturity detail of trade receivables as of December 31, 2014 and 2013:
| | | | | | | | |
| | Maturity | | Balance as of
12.31.14 | | Balance as of
12.31.13 | |
|---|
| | Up to 3 months | | | 405,137 | | | 409,744 | |
| | Between 3 and 6 months | | | 50,928 | | | 43,305 | |
| | Over 6 months | | | 136,563 | | | 113,881 | |
| | | | | | | | | |
| | Total | | | 592,628 | | | 566,930 | |
| | | | | | | | | |
| | | | | | | | | |
| | | | | | | | | |
F-93
Table of Contents
ABENGOA
Consolidated financial statements
- 15.5.
- The credit quality of outstanding Trade receivables, that are neither past due nor impaired, may be assessed under the following categories
| | | | | | | | |
| | Categories | | Balance as of
12.31.14 | | Balance as of
12.31.13 | |
|---|
| | Trade receivables subjet to non-recourse factoring by the bank | | | 154,425 | | | 217,318 | |
| | Trade receivables subject to recourse factoring by the bank | | | 9,349 | | | — | |
| | Trade receivables covered by credit insurance | | | 1,940 | | | 2,276 | |
| | Trade receivables in cash or by transfer | | | 289,891 | | | 208,996 | |
| | Trade receivables UTE/Public Entities/Other accounts | | | 137,023 | | | 138,340 | |
| | | | | | | | | |
| | Total trade receivables | | | 592,628 | | | 566,930 | |
| | | | | | | | | |
| | | | | | | | | |
| | | | | | | | | |
- 15.6.
- The movement in the bad debt provision for 2014 and 2013 is the following::
| | | | | | | | |
| |
| | Balance as of
12.31.14 | | Balance as of
12.31.13 | |
|---|
| | Initial Balance | | | (64,047 | ) | | (46,086 | ) |
| | Provision for receivables impairment | | | (13,511 | ) | | (31,680 | ) |
| | Receivables written off during the year as uncollectible | | | 506 | | | 533 | |
| | Reversal of unused amounts | | | 4,067 | | | 7,235 | |
| | Change in consolidation | | | — | | | 2,218 | |
| | Reclassifications and other movements | | | (9,224 | ) | | 3,733 | |
| | | | | | | | | |
| | Total | | | (82,209 | ) | | (64,047 | ) |
| | | | | | | | | |
| | | | | | | | | |
| | | | | | | | | |
The most significant variations in 2014 and 2013 were primarily due to recognition of doubtful trade loans with debtor balances that mostly correspond to public clients in Spain and abroad, against whom the corresponding claims were made for the amounts owed from various construction projects, supported by the company's formal procedures, depending on each case. Given the uncertainty in relation to the future recoverability of these loans, due to various factors but most of which are beyond the company's control, it was decided to make the corresponding provision. Once the process is definitively resolved, and in the event that it is favorable for the company, the corresponding provision will be reversed against the 'Reversal of unused amounts' heading.
Total provision for receivables impairment and reversal of unused amounts recognized in the Consolidated Income Statement for the year 2012 were €-22,301 thousan and €6,506 thousand, respectively.
- 15.7.
- The Company maintains a number of non-recourse factoring lines of credit. The Company enters into these factoring agreements with certain financial institution by selling the Company's credit rights in certain commercial contracts. The factoring agreements are entered into on a non-recourse basis, meaning that the financial institutions undertake the credit risk associated with the Company's customers. The Company is responsible for the existence and legitimacy of the credit rights being sold to the financial institutions. Credit rights from recurring customers or with terms of up to one year are supported by annual revolving factoring lines of credit. Credit rights from non-recurring customers or with terms longer than a year are supported with global transfer agreements commencing on the date when the underlying commercial contract comes into force and expiring when the contracted works are completed
At the end of the 2014 financial year, approximately €205 million (€285 million in 2013 and €360 million in 2012) were factored.
F-94
Table of Contents
ABENGOA
Consolidated financial statements
The finance cost in the 2014 fiscal year derived from factoring operations amounted to €16 million (€17 million in 2013 and €24 million in 2012).
- 15.8.
- Furthermore, as of December 31, 2014 collections amounted to €351 million (€298 million in 2013 and €196 million in 2012), related to a construction contract for a combined cycle plant in Mexico with a transfer agreement of the non-recourse collection rights signed with a financial institution under the 'Pidiregas' deferred financing scheme, in which a financial institution provides the funds required to construct the project until the provisional handover of the plant, when the amount of the contract is paid directly by the client to the financial institution. Consequently, Abengoa is being paid as the construction milestones are completed. The financial expense associated with this scheme in 2014 amounted to €11 million (€12 million in 2013 and €20 million in 2012).
- 15.9.
- The breakdown of Tax receivables as of December 31, 2014 and 2013 is as follows:
| | | | | | | | |
| | Item | | Balance as of
12.31.14 | | Balance as of
12.31.13 | |
|---|
| | Income and other taxes receivable | | | 333,492 | | | 387,924 | |
| | Social Security debtors | | | 365 | | | 436 | |
| | VAT charged | | | 187,170 | | | 171,047 | |
| | Witholdings tax and income tax advance | | | 74,757 | | | 81,160 | |
| | | | | | | | | |
| | Total tax receivables | | | 595,784 | | | 640,567 | |
| | | | | | | | | |
| | | | | | | | | |
| | | | | | | | | |
- 15.10.
- The following table shows a breakdown of financial accounts receivable as of December 31, 2014 and 2013:
| | | | | | | | |
| | Description | | Balance as of
12.31.14 | | Balance as of
12.31.13 | |
|---|
| | Loans | | | 601,875 | | | 570,321 | |
| | Fixed-term deposits and down payments and lease deposits | | | 28,580 | | | 97,934 | |
| | Other financial assets | | | 10,569 | | | 5,928 | |
| | | | | | | | | |
| | Total non-current portion | | | 641,024 | | | 674,183 | |
| | | | | | | | | |
| | | | | | | | | |
| | | | | | | | | |
| | Loans | | | 118,308 | | | 159,513 | |
| | Fixed-term deposits and down payments and lease deposits | | | 908,220 | | | 741,605 | |
| | | | | | | | | |
| | Total current portion | | | 1,026,528 | | | 901,118 | |
| | | | | | | | | |
| | | | | | | | | |
| | | | | | | | | |
This heading includes the loans, deposits and other accounts receivable considered as non-derivative financial assets not listed in an active market, with a maturity period of less than twelve months (current assets) or exceeding that period (non-current assets).
The market value of these assets does not differ significantly from their carrying amount.
Current and non-current loans for an amount of €720 million in 2014 (€730 million in 2013), mainly includes the convertible loan received in the sale of Befesa (see Note 7.3) of €176 million (€225 million of nominal amount), an account receivable of €141.8 million resulting from a favorable resolution from the Court of Arbitration of the International Chamber of Commerce in relation with the arbitration against Adriano Gianetti Dedini Ometto and Adriano Ometto Agrícola Ltda. (see Note 15.11), loans with associates amounting to €180 million, as well as credits with local administrations.
F-95
Table of Contents
ABENGOA
Consolidated financial statements
Current and non-current fixed-term and deposits for an amount of €937million (€840 million in 2013) includes primarily restricted investments in fixed-income securities and bank deposits.
Other financial assets include other receivable amounts considered as non-derivative financial assets not listed in an active market, which are not classified in any of the other categories.
- 15.11.
- In November 2011, the Arbitral Tribunal appointed by the International Court of Arbitration of the International Chamber of Commerce with seat in New York, United States, issued two arbitral awards in favor of our subsidiary ASA Bioenergy Holding A.G. ('ASA'), in relation to several claims for certain breaches of contract by Adriano Gianetti Dedini Ometto and Adriano Ometto Agrícola Ltda. (the 'Adriano' Defendants). In each of the proceedings, Adriano Defendants filed various counterclaims. Both arbitration proceedings were decided in ASA's favor, in the approximate total amount of USD 118.3 million plus accrued interest. In October 2012 Adriano Defendants presented motions to vacate such arbitral awards in the ordinary courts of New York City, which were in turn decided in our favor in first instance and in the Court of Appeals of the Second Circuit. In March 2014, Adriano Defendants filed a petition for a writ of Certiorari with the Supreme Court of the United States. In June 2014 the Supreme Court denied the petition for Certiorari. The awards are final and not subject to further appeal in United States. In addition, the Company has started the actions for the recognition of the awards in Brazil. Based on the foregoing, the company continues to provide evidence of the existence of a collection right and as a result an account receivable is still recorded for an amount of €142 million as of December 31, 2014.
Note 16. — Inventories
- 16.1.
- Inventories as of December 31, 2014 and 2013 were as follows::
| | | | | | | | |
| | Item | | Balance as of
12.31.14 | | Balance as of
12.31.13 | |
|---|
| | Goods for sale | | | 8,992 | | | 15,817 | |
| | Raw materials and other supplies | | | 116,714 | | | 112,657 | |
| | Work in progress and semi-finished products | | | 1,135 | | | 1,160 | |
| | Projects in progress | | | 40,712 | | | 58,588 | |
| | Finished products | | | 73,101 | | | 64,582 | |
| | Advance Payments to suppliers | | | 54,135 | | | 78,177 | |
| | | | | | | | | |
| | Total | | | 294,789 | | | 330,981 | |
| | | | | | | | | |
| | | | | | | | | |
| | | | | | | | | |
Inventories for entities located outside Spain were €196,570 thousand (€219,447 thousand in 2013).
- 16.2.
- There are no restrictions on the availability of inventories, with the exception of guarantees provided for construction projects in the normal course of business, which are released as the contractual milestones of the project are achieved.
Note 17. — Cash and cash equivalents
The following table sets out the detail of Cash and cash equivalents at December 31, 2014 and 2013:
| | | | | | | | |
| | Item | | Balance as of
12.31.14 | | Balance as of
12.31.13 | |
|---|
| | Cash at bank and on hand | | | 980,990 | | | 1,630,597 | |
| | Bank deposit | | | 829,823 | | | 1,321,086 | |
| | | | | | | | | |
| | Total | | | 1,810,813 | | | 2,951,683 | |
| | | | | | | | | |
| | | | | | | | | |
| | | | | | | | | |
F-96
Table of Contents
ABENGOA
Consolidated financial statements
The following breakdown shows the main currencies in which cash and cash equivalent balances are denominated:
| | | | | | | | | | | | | | |
| |
| | 12.31.14 | | 12.31.13 | |
|---|
| | Currency | | Domestic companies | | Non-domestic companies | | Domestic companies | | Non-domestic companies | |
|---|
| | Euro | | | 464,635 | | | 71,117 | | | 934,785 | | | 220,265 | |
| | US dollar | | | 172,073 | | | 425,777 | | | 641,729 | | | 767,361 | |
| | Swiss franc | | | 755 | | | 57 | | | 592 | | | 59 | |
| | Peso (Chile) | | | — | | | 18,031 | | | — | | | 2,589 | |
| | Dirhams (UAE) | | | 4,058 | | | — | | | 423 | | | — | |
| | Rupee (Indian) | | | 5,973 | | | 1,007 | | | 1,853 | | | 9,389 | |
| | Argentinian peso | | | — | | | 4,104 | | | — | | | 9,061 | |
| | Peruvian sol | | | 753 | | | 7,686 | | | 7 | | | 58,380 | |
| | Algerian dinar | | | 1,778 | | | 31,607 | | | 525 | | | 42,026 | |
| | Brazilian real | | | — | | | 554,599 | | | — | | | 222,167 | |
| | South african rand | | | 1 | | | 24,807 | | | 37 | | | 27,583 | |
| | Others | | | 5,579 | | | 16,416 | | | 4,727 | | | 8,125 | |
| | | | | | | | | | | | | | | |
| | Total | | | 655,605 | | | 1,155,208 | | | 1,584,678 | | | 1,367,005 | |
| | | | | | | | | | | | | | | |
| | | | | | | | | | | | | | | |
| | | | | | | | | | | | | | | |
As of December 31, 2014, the amount not drawn down of the syndicated loan (tranch A) in the form or revolving amounts to €519.8 million (see Note 20.2).
Note 18. — Shareholders' equity
- 18.1.
- Share capital
As of December 31, 2014 the share capital amounts to €91,798,901 corresponding to 839,769,720 shares completely subscribed and disbursed, divided into two distinct classes, as follows:
- •
- 84,243,640 class A shares with a nominal value of 1 Euro each, all in the same class and series, each of which grants the holder a total of 100 voting rights ('Class A Shares').
- •
- 755,526,080 class B shares with a nominal value of 0.01 Euros each, all in the same class and series, each of which grants One (1) voting right and which affords its holder economic rights identical to the economic rights of Class A shares as stated in article 8 of the Company's by laws ('Class B Shares' and, together with class A shares, 'Shares with Voting Rights').
Class A and B shares are listed on the Madrid and Barcelona stock exchange and on the Spanish Stock Exchange Electronic Trading System (Electronic Market). Class A shares have been listed since November 29, 1996 and class B shares since October 25, 2012. The Company presents mandatory financial information on a quarterly and semiannual basis.
On October 17, 2013, we carried out a capital increase of 250,000,000 Class B shares and on October 29, 2013 we issued, as a result of the exercise in full by the underweriters of the option to purchase additional shares to cover over-allotments, 37,500,000 additional Class B shares ('greenshoe' option). The shares were offered at a price of €1.80 per share, for total gross proceeds, including shares sold pursuant to the greenshoe option, of €517.5 million
Moreover, the controlling shareholder, Inversión Corporativa IC, S.A., subscribed 35,000,000 shares with an investment of €63 million, so that following the capital increase the Inversión Corporativa group holds a 57.79% shareholding. As part of the capital increase, the company and Inversión
F-97
Table of Contents
ABENGOA
Consolidated financial statements
Corporativa IC, S.A. agreed to a lock-up clause for a period of 180 days under the standard terms for these types of transactions, which ended on April 24, 2014.
The new class B shares issued in the capital increased in 2013, are also listed on the NASDAQ Global Select Market in the form of American Depositary Shares (with five Class B shares exchangeable for one American Depositary Share).
In accordance with notifications received by the company and in compliance with reporting requirements to communicate shareholding percentages (voting rights) and the information received from relevant parties, shareholders with a significant holding as of December 31, 2014 are as follows:
| | | | | |
| | Shareholders | | Share % | |
|---|
| | Inversión Corporativa IC, S.A. (*) | | | 50.178 | |
| | Finarpisa, S.A. (*) | | | 6.192 | |
- (*)
- Inversión Corporativa Group.
On September 30, 2012, the Extraordinary General Shareholders' Meeting approved a capital increase of 430,450,152 class B shares with a nominal value of €0.01per share, charged to our freely available reserves, which have been distributed for no consideration to all existing shareholders on the basis of four class B shares for each class A share or class B share which they held. This Extraordinary General Shareholders' Meeting approved a right of voluntary conversion for the class A shareholders to convert their class A shares with a nominal value of 1 Euro into class B shares with a nominal value of 0.01 Euros during pre-set windows until December 31, 2017. Following the exercise of this right, after each conversion window, a capital reduction has taken place and will take place, by reducing the par value of the number of converted class A shares to by 0.99 Euros per share, with a credit to restricted reserves.
During 2014 four capital conversions took place, through which 1,012,661 Class A shares were converted into class B shares, which has resulted in a reduction of capital of €1,003 thousand.
After such capital conversions the share capital as of January 28, 2015 after the end of the twelfth conversion period amounts to €91,717,022 corresponding to 836,769,720 shares completely subscribed and disbursed, and divided into two distinct classes of shares: 84,160,934 class A shares and 755,608,786 class B shares.
The General Shareholders' meeting held on April 6, 2014 approved a dividend of €0.111 per share, which totals €91,637 thousand, compared to €38,741 thousand in the previous year. On April 6, 2014, the Ordinary General Shareholders' Meeting approved the paid-up capital increase with the purpose of implementing the payment of the dividend for the fiscal year 2013 means of a 'scrip dividend'.
On April 23, 2014 the period for trading the free allotment rights corresponding to the aforementioned capital increase ended. During the period established for such purpose, the holders of 351,867,124 free allotment rights (52,193,313 of which corresponding to Class A shares and 299,673,811 corresponding to Class B shares) entitled to accept the irrevocable commitment to purchase the referred rights made by Abengoa did so. As such, on April 22, 2014, Abengoa proceed to acquire such rights in the total gross amount of € 39,057 thousand. The capital increase was carried out on April 23, 2014 with the issue of 810,582 Class A shares and 13,396,448 Class B shares, at their respective par values, in other words 1 euro for the Class A shares and 0.01 euro for the Class B shares. The total amount of the increase was therefore €944,546.48, of which €810,582 corresponded to the Class A shares issued and €133,964.48 to the Class B shares.
F-98
Table of Contents
ABENGOA
Consolidated financial statements
- 18.2.
- Parent company reserves
The following table shows the amounts and movements of the Parent Company Reserves in 2014, 2013 and 2012:
| | | | | | | | | | | | | | | | | |
| |
| | Balance as of
12.31.13 | | Distribution of
2013 profits | | Capital
increase | | Other
movements | | Balance as of
12.31.14 | |
|---|
| | Share premium | | | 903,377 | | | — | | | — | | | — | | | 903,377 | |
| | Revaluation reserve | | | 3,679 | | | — | | | — | | | — | | | 3,679 | |
| | Other reserves of the parent company: | | | | | | | | | | | | | | | | |
| | —Unrestricted reserves | | | 188,778 | | | 153,675 | | | (1,322 | ) | | (2,217 | ) | | 338,914 | |
| | —Legal reserves | | | 24,076 | | | 343 | | | 1,003 | | | 62,894 | | | 88,316 | |
| | | | | | | | | | | | | | | | | | |
| | Total | | | 1,119,910 | | | 154,018 | | | (319 | ) | | 60,677 | | | 1,334,286 | |
| | | | | | | | | | | | | | | | | | |
| | | | | | | | | | | | | | | | | | |
| | | | | | | | | | | | | | | | | | |
| | | | | | | | | | | | | | | | | |
| |
| | Balance as of
12.31.12 | | Distribution of
2012 profits | | Capital
increase | | Other
movements | | Balance as of
12.31.13 | |
|---|
| | Share premium | | | 388,752 | | | — | | | 514,625 | | | — | | | 903,377 | |
| | Revaluation reserve | | | 3,679 | | | — | | | — | | | — | | | 3,679 | |
| | Other reserves of the parent company: | | | | | | | | | | | | | | | | |
| | —Unrestricted reserves | | | 219,426 | | | 70,390 | | | (16,865 | ) | | (84,173 | ) | | 188,778 | |
| | —Legal reserves | | | 16,549 | | | 6,365 | | | 1,162 | | | — | | | 24,076 | |
| | | | | | | | | | | | | | | | | | |
| | Total | | | 628,406 | | | 76,755 | | | 498,922 | | | (84,173 | ) | | 1,119,910 | |
| | | | | | | | | | | | | | | | | | |
| | | | | | | | | | | | | | | | | | |
| | | | | | | | | | | | | | | | | | |
| | | | | | | | | | | | | | | | | |
| |
| | Balance as of
12.31.11 | | Distribution of
2011 profits | | Capital
increase | | Other
movements | | Balance as of
12.31.12 | |
|---|
| | Share premium | | | 388,752 | | | — | | | — | | | — | | | 388,752 | |
| | Revaluation reserve | | | 3,679 | | | — | | | — | | | — | | | 3,679 | |
| | Other reserves of the parent company: | | | | | | | | | | | | | | | | |
| | —Unrestricted reserves | | | 202,178 | | | 26,595 | | | (4,305 | ) | | (5,042 | ) | | 219,426 | |
| | —Legal reserves | | | 4,607 | | | 7,140 | | | 4,802 | | | — | | | 16,549 | |
| | | | | | | | | | | | | | | | | | |
| | Total | | | 599,216 | | | 33,735 | | | 497 | | | (5,042 | ) | | 628,406 | |
| | | | | | | | | | | | | | | | | | |
| | | | | | | | | | | | | | | | | | |
| | | | | | | | | | | | | | | | | | |
The amount corresponding to 'Other movements' for 2014, 2013 and 2012 is mainly part of operations carried out with treasury shares and the reclassification to equity of the fair value of the embedded derivative of the convertible note due in 2019 because in 2014, conversion option meets the definition of equity instruments (see Note 20.3).
The Legal Reserve is created in accordance with Article 274 the Spanish Corporate Law (Ley de Sociedades de Capital), which states that in all cases an amount of at least 10% of the earnings for the period will be allocated to this reserve until at least 20% of the share capital is achieved and maintained. The Legal Reserve may not be distributed and, if used to compensate losses in the event that there are no other reserves available to do so, it should be replenished from future profits.
On November 19, 2007, the company entered into a liquidity agreement on class A shares with Santander Investment Bolsa, S.V. Replacing this liquidity agreement, on January 8, 2013, the company entered into a liquidity agreement on class A shares with Santander Investment Bolsa, S.V. in
F-99
Table of Contents
ABENGOA
Consolidated financial statements
compliance with the conditions set forth in CNMV Circular 3/2007 of December 19. On November 8, 2012, the company entered into a liquidity agreement on class B shares with Santander Investment Bolsa, S.V. in compliance with the conditions set forth in CNMV Circular 3/2007 of December 19.
As of December 31, 2014 treasury stock amounted to 41,624,265 shares (40,009,307 shares in 2013 and 14,681,667 shares in 2012), which 5,550,532 are class A shares and 36,073,733 are class B shares.
Regarding the operations carried out during the year, the number of treasury stock purchased amounted to 14,237,018 class A shares and 169,126,263 class B shares and treasury stock transferred amounted to 14,069,382 class A shares and 167,678,941 class B shares, with a net result of €–2,217 thousand recognized in equity (€–89,612 thousand in 2013 and €–961 thousand in 2012).
The proposed distribution of 2014 profits of the Parent Company:
| | | | | |
| | Distribution | | Balance as of
12.31.14 | |
|---|
| | Legal reserve | | | — | |
| | Unrestricted reserves | | | 104,705 | |
| | Dividends | | | 94,894 | |
| | | | | | |
| | Total | | | 199,599 | |
| | | | | | |
| | | | | | |
| | | | | | |
- 18.3.
- Other reserves
Other reserves include the impact of the valuation of derivative instruments and available for sale investments at the end of the year.
The following table shows the balances and movements of Other reserves by item for 2014, 2013 and 2012:
| | | | | | | | | | | |
| |
| | Hedging
reserves | | Available-for-sale
financial assets reserves | | Total | |
|---|
| | Balance as of December 31, 2013 | | | (163,769 | ) | | 3,313 | | | (160,456 | ) |
| | —Gains/ (losses) on fair value for the year | | | (197,605 | ) | | (1,440 | ) | | (199,045 | ) |
| | —Transfer to the Consolidated Income Statement | | | 29,720 | | | — | | | 29,720 | |
| | —Tax effect | | | 42,266 | | | (2,068 | ) | | 40,198 | |
| | | | | | | | | | | | |
| | Balance as of December 31, 2014 | | | (289,388 | ) | | (195 | ) | | (289,583 | ) |
| | | | | | | | | | | | |
| | | | | | | | | | | | |
| | | | | | | | | | | | |
F-100
Table of Contents
ABENGOA
Consolidated financial statements
| | | | | | | | | | | |
| |
| | Hedging
reserves | | Available-for-sale
financial assets reserves | | Total | |
|---|
| | Balance as of December 31, 2012 | | | (282,600 | ) | | 2,334 | | | (280,266 | ) |
| | —Gains/ (losses) on fair value for the year | | | 89,584 | | | (616 | ) | | 88,968 | |
| | —Transfer to the Consolidated Income Statement | | | 88,924 | | | — | | | 88,924 | |
| | —Tax effect | | | (53,385 | ) | | 1,595 | | | (51,790 | ) |
| | —Transfers between other reserves and retained earnings | | | (6,292 | ) | | — | | | (6,292 | ) |
| | | | | | | | | | | | |
| | Balance as of December 31, 2013 | | | (163,769 | ) | | 3,313 | | | (160,456 | ) |
| | | | | | | | | | | | |
| | | | | | | | | | | | |
| | | | | | | | | | | | |
| | | | | | | | | | | |
| |
| | Hedging
reserves | | Available-for-sale
financial assets reserves | | Total | |
|---|
| | Balance as of December 31, 2011 | | | (180,034 | ) | | 644 | | | (179,390 | ) |
| | —Gains/ (losses) on fair value for the year | | | (237,614 | ) | | 1,440 | | | (236,174 | ) |
| | —Transfer to the Consolidated Income Statement | | | 96,172 | | | — | | | 96,172 | |
| | —Tax effect | | | 38,876 | | | 341 | | | 39,217 | |
| | —Transfers between other reserves and retained earnings | | | — | | | (91 | ) | | (91 | ) |
| | | | | | | | | | | | |
| | Balance as of December 31, 2012 | | | (282,600 | ) | | 2,334 | | | (280,266 | ) |
| | | | | | | | | | | | |
| | | | | | | | | | | | |
| | | | | | | | | | | | |
For further information on hedging activities, see Note 14.
- 18.4.
- Accumulated currency translation differences
The amount of accumulated currency translation differences for fully and proportionally consolidated companies and associates at the end of 2014, 2013 and 2012 is as follows:
| | | | | | | | | | | |
| |
| | Balance as of
12.31.14 | | Balance as of
12.31.13 | | Balance as of
12.31.12 | |
|---|
| | Currency translation differences: | | | | | | | | | | |
| | —Fully and proportionally consolidated companies | | | (523,465 | ) | | (545,950 | ) | | (153,246 | ) |
| | —Associates | | | (5,866 | ) | | (36,885 | ) | | (14,134 | ) |
| | | | | | | | | | | | |
| | Total | | | (529,331 | ) | | (582,835 | ) | | (167,380 | ) |
| | | | | | | | | | | | |
| | | | | | | | | | | | |
| | | | | | | | | | | | |
In 2014, the increase in the accumulated currency translation differences is mainly due to the appreciation of the US Dollar with respect to the euro.
For the year 2013, the decrease in the accumulated currency translation differences is mainly due to the depreciation of the Brazilian real against the Euro.
F-101
Table of Contents
ABENGOA
Consolidated financial statements
- 18.5.
- Retained earnings
The breakdown and movement of Retained earnings during the 2014, 2013 and 2012 fiscal years are as follows:
| | | | | | | | | | | | | | | | | |
| |
| | Balance as of 12.31.13 | | Dist. of 2013 profit | | 2014 profit | | Other movements | | Balance as of 12.31.14 | |
|---|
| | Reserves in full & proportionate consolidated entities | | | 735,425 | | | (87,410 | ) | | — | | | 60,951 | | | 708,966 | |
| | Reserves in equity method investments | | | 15,508 | | | (5,165 | ) | | — | | | (6,502 | ) | | 3,841 | |
| | Parent company dividends and reserves | | | — | | | 194,020 | | | — | | | (194,020 | ) | | — | |
| | | | | | | | | | | | | | | | | | |
| | Total reserves | | | 750,933 | | | 101,445 | | | — | | | (139,571 | ) | | 712,807 | |
| | | | | | | | | | | | | | | | | | |
| | Consolidated profits for the year | | | 110,324 | | | (110,324 | ) | | 121,877 | | | — | | | 121,877 | |
| | Profit attributable to non-controlling interest | | | (8,879 | ) | | 8,879 | | | 3,415 | | | — | | | 3,415 | |
| | | | | | | | | | | | | | | | | | |
| | Profit attributable to the parent company | | | 101,445 | | | (101,445 | ) | | 125,292 | | | — | | | 125,292 | |
| | | | | | | | | | | | | | | | | | |
| | Total retained earnings | | | 852,378 | | | — | | | 125,292 | | | (139,571 | ) | | 838,099 | |
| | | | | | | | | | | | | | | | | | |
| | | | | | | | | | | | | | | | | | |
| | | | | | | | | | | | | | | | | | |
| | | | | | | | | | | | | | | | | |
| |
| | Balance as of 12.31.12 | | Dist. of 2012 profit | | 2013 profit | | Other movements | | Balance as of 12.31.13 | |
|---|
| | Reserves in full & proportionate consolidated entities | | | 772,943 | | | (77,687 | ) | | — | | | 40,169 | | | 735,425 | |
| | Reserves in equity method investments | | | 18,938 | | | 17,561 | | | — | | | (20,991 | ) | | 15,508 | |
| | Parent company dividends and reserves | | | — | | | 115,496 | | | — | | | (115,496 | ) | | — | |
| | | | | | | | | | | | | | | | | | |
| | Total reserves | | | 791,881 | | | 55,370 | | | — | | | (96,318 | ) | | 750,933 | |
| | | | | | | | | | | | | | | | | | |
| | | | | | | | | | | | | | | | | | |
| | | | | | | | | | | | | | | | | | |
| | Consolidated profits for the year | | | 94,020 | | | (94,020 | ) | | 110,324 | | | — | | | 110,324 | |
| | Profit attributable to non-controlling interest | | | (38,650 | ) | | 38,650 | | | (8,879 | ) | | — | | | (8,879 | ) |
| | | | | | | | | | | | | | | | | | |
| | Profit attributable to the parent company | | | 55,370 | | | (55,370 | ) | | 101,445 | | | — | | | 101,445 | |
| | | | | | | | | | | | | | | | | | |
| | Total retained earnings | | | 847,251 | | | — | | | 101,445 | | | (96,318 | ) | | 852,378 | |
| | | | | | | | | | | | | | | | | | |
| | | | | | | | | | | | | | | | | | |
| | | | | | | | | | | | | | | | | | |
F-102
Table of Contents
ABENGOA
Consolidated financial statements
| | | | | | | | | | | | | | | | | |
| |
| | Balance as of 12.31.11 | | Dist. of 2011 profit | | 2012 profit | | Other movements | | Balance as of 12.31.12 | |
|---|
| | Reserves in full & proportionate consolidated entities | | | 491,110 | | | 298,771 | | | — | | | (16,938 | ) | | 772,943 | |
| | Reserves in equity method investments | | | 17,323 | | | 3,975 | | | — | | | (2,360 | ) | | 18,938 | |
| | Parent company dividends and reserves | | | — | �� | | 71,399 | | | — | | | (71,399 | ) | | — | |
| | | | | | | | | | | | | | | | | | |
| | Total reserves | | | 508,433 | | | 374,145 | | | — | | | (90,697 | ) | | 791,881 | |
| | | | | | | | | | | | | | | | | | |
| | Consolidated profits for the year | | | 395,482 | | | (395,482 | ) | | 94,020 | | | — | | | 94,020 | |
| | Profit attributable to non-controlling interest | | | (21,337 | ) | | 21,337 | | | (38,650 | ) | | — | | | (38,650 | ) |
| | | | | | | | | | | | | | | | | | |
| | Profit attributable to the parent company | | | 374,145 | | | (374,145 | ) | | 55,370 | | | — | | | 55,370 | |
| | | | | | | | | | | | | | | | | | |
| | Total retained earnings | | | 882,578 | | | — | | | 55,370 | | | (90,697 | ) | | 847,251 | |
| | | | | | | | | | | | | | | | | | |
| | | | | | | | | | | | | | | | | | |
| | | | | | | | | | | | | | | | | | |
Amounts included under 'Other movements' mainly refer to the acquisition of various non-controlling interests, the effects of which is recorded in net equity as required by the revised IFRS 3, as well as, to the impact of stake in Abengoa Yield sold in 2014, corresponding to the difference between the net proceeds and the book value of the net assets transferred.
The Reserves in full and proportionate consolidated entities and equity method investments are as follows:
| | | | | | | | | | | | | | | | | | | | |
| |
| | Balance as of 12.31.14 | | Balance as of 12.31.13 | | Balance as of 12.31.12 | |
|---|
| | Business unit | | F.C/P.C | | E.M. | | F.C/P.C | | E.M. | | F.C/P.C | | E.M. | |
|---|
| | Engineering and construction | | | 852,870 | | | 2,412 | | | 727,792 | | | 9,164 | | | 571,151 | | | 46,366 | |
| | Concession-type infraestructure | | | 161,039 | | | 1,429 | | | 173,800 | | | 6,976 | | | 128,205 | | | (33,378 | ) |
| | Industrial production | | | (304,943 | ) | | — | | | (166,167 | ) | | (632 | ) | | 73,587 | | | 5,950 | |
| | | | | | | | | | | | | | | | | | | | | |
| | Total | | | 708,966 | | | 3,841 | | | 735,425 | | | 15,508 | | | 772,943 | | | 18,938 | |
| | | | | | | | | | | | | | | | | | | | | |
| | | | | | | | | | | | | | | | | | | | | |
| | | | | | | | | | | | | | | | | | | | | |
- 18.6.
- Non-controlling interest
Non-controlling interest increased during 2014, mainly due to the initial public offering Abengoa Yield's ordinary shares, which was closed on June 18, 2014 (see Note 6.2), as well as, capital increases carried out in certain Brazilian subsidiaries with non-controlling interests.
Note 19. — Project debt
As indicated in Note 2.2 of this report, the Consolidation Group includes interests in various companies that, in general, have been created to develop an integrated product that consists of designing, constructing, financing, operating and maintaining a specific infrastructure (usually a large-scale asset such as a power transmission line). These may be owned outright or under a concession arrangement for a specific period of time and they are financed with non-recourse project financing (project finance).
Project finance (non-recourse financing) is generally used as a means of constructing an asset, using the assets and cash flows of the company (or group of companies) that will perform the activity associated
F-103
Table of Contents
ABENGOA
Consolidated financial statements
with the project being financed as collateral. In most cases the assets and/or contracts are used as a guarantee against repayment of the financing.
Compared to corporate financing, the project finance has certain key benefits, which include a longer borrowing period (due to the profile of the cash flows generated by the project) and a clearly defined risk profile.
Despite having a commitment from a financial institution during the awarding phase of the project and since the financing is usually completed in the latter stages of a construction project—mainly because these projects require a significant amount of technical and legal documentation to be prepared and delivered that is specific to the project (licenses, authorizations, etc.)—bridge loan (Non-recourse finance in process) needs to be available at the start of the construction period in order to begin construction activities as soon as possible and to be able to meet the deadlines specified in the concession agreements (see Note 19.2).
Obtaining this financing is considered as a temporary funding transaction and is equivalent to the advances that clients traditionally make during the different execution phases of a construction project or works.
Bridge loan has specific characteristics compared to traditional advances from clients. For example the funds are usually advanced by a financial institution (usually for terms of less than 2-3 years), although there are similarities in the implicit risk that mainly relates to the capacity of the company that is going to own the project to construct it correctly in time and form.
The specific funding requirements that usually accompany bridge financing agreements include the following:
- •
- The funds that are drawn down as the project is executed can only be used for developing the project to construct the asset, and
- •
- The obligation to use the project finance to repay the bridge loan.
This means that conversion of the bridge loan in a long-term project finance arrangement has a very high degree of security from the start of the project because there is a comfort letter or support from the institutions that are going to participate in the long-term financing. As we recently pointed out to our shareholders and investors, Abengoa has managed to substitute this bridge loan with the project finance in all of the projects (more than 110 during the company's history) that it has developed. This enables it to offer a high degree of certainty and confidence regarding the financing of these projects, and to our minority shareholders involved in them (when they exist), as well as to the institutions that have committed the project finance.
In terms of guarantees, both the bridge loan and the project finance have the same technical guarantees from the contractor in relation to price, deadlines and performance.
The difference is that the bridge loan also has corporate guarantee from the project's sponsor in order to cover the possibility of a delay in the financial closing of project finance.
Both guarantees (contractor and sponsor) are intended to underwrite the future cash flows from the project in the event that technical risks give rise to variations in them (failure to comply with the construction schedule or with the deadlines for finalizing the project finance).
This latter risk is particularly remote since there is a very high degree of security from the start with regards to conversion of the bridge loan into the project finance, as we have said.
F-104
Table of Contents
ABENGOA
Consolidated financial statements
Therefore the bridge loan and the project finance are—from a contractual perspective—independent loan transactions, although they are linked in terms of their overall aim (for example, with the exception of the aforementioned guarantees, both share the same risks; their sole purpose is for financing projects; they are generally repaid with funds from the project itself; and they are separate from the company's other cash sources) and commercially (the financial institution itself has an interest in favorably resolving the continuity of both transactions). These two types of financing are therefore considered to be similar in terms of managing the company's business.
Consequently, the internal criteria for classifying a financial liability in the Consolidated Statement of Financial Position as project debt is based on the characteristics and use of that financing and not on the guarantees provided, since the security and predictability of the substitution process (based on past guarantees) means that this guarantee is more theoretical or hypothetical with regards to its use (such a guarantee has never been used by the nominal beneficiaries).
In relation to the return on the project, it has always been more beneficial to obtain bridge loan via the special purpose entity responsible for operating and maintaining the asset to be constructed. However, during the last year the cheaper cost of financing obtained at a corporate level has enabled projects to be financed centrally, generating important competitive advantages as well as reducing start times for project construction. Consequently, a total of €1,058,880 thousand in financing was issued in 2014 with a corporate guarantee, structured in a similar way to the bridge loans used previously in terms of their purpose (project financing) and repayment (from project cash flows). This financing is therefore also considered to be similar to the project finance in terms of managing the business and the company's risk and it is therefore classified under the same heading.
The details of project debt applied to projects, for both non-current and current liabilities, as at December 31, 2014 and 2013 is as follows:
| | | | | | | |
Project debt | | Balance as of 12.31.14 | | Balance as of 12.31.13 | |
|---|
Project finance (Non-recourse project financing) | | | 3,011,702 | | | 5,744,413 | |
Project bridge loan (Non-recourse project financing in process) | | | 1,946,412 | | | 576,537 | |
| | | | | | | | |
Total project debt | | | 4,958,114 | | | 6,320,950 | |
| | | | | | | | |
| | | | | | | | |
| | | | | | | | |
Non current | | | 4,158,904 | | | 5,736,151 | |
Current | | | 799,210 | | | 584,799 | |
- 19.1.
- The balances and movements for 2014 of project debt are set out in the table below:
| | | | | | | | | | | |
| |
| | Project debt—
long term | | Project debt—
short term | | Total | |
|---|
| | Balance as of 12.31.13 | | | 5,736,151 | | | 584,799 | | | 6,320,950 | |
| | Increases | | | 1,871,770 | | | 860,813 | | | 2,732,583 | |
| | Decreases (reimbursement) | | | (185,809 | ) | | (921,401 | ) | | (1,107,210 | ) |
| | Currency translation differences | | | 60,198 | | | 15,430 | | | 75,628 | |
| | Changes in consolidation and reclassifications | | | (286,272 | ) | | 324,780 | | | 38,508 | |
| | Transfer to liabilites held for sale | | | (3,037,134 | ) | | (65,211 | ) | | (3,102,345 | ) |
| | | | | | | | | | | | |
| | Balance as of 12.31.14 | | | 4,158,904 | | | 799,210 | | | 4,958,114 | |
| | | | | | | | | | | | |
| | | | | | | | | | | | |
| | | | | | | | | | | | |
During the nine month period ended September 30, 2014 project debt increased due to the bridge loan issued on September, 2014 (€500 million), the new bridge loan obtained by Abengoa Greenbridge through the Tranche B of the syndicated refinancing amounting to €700 million (see
F-105
Table of Contents
ABENGOA
Consolidated financial statements
note 20) to the ordinary notes issurance and the credit facility signed by Abengoa Yield (€285 million), the new bridge loan obtained for the Zapotillo aqueduct project in Mexico (€262 million), the new bridge loan obtained for the Solar project in Chile (€238 million), the new bridge loan obtained for the cogeneration project in Mexico (€137 million), the new project finance for the Bioethanol project in Brazil (€129 million), the new project finance for smaller amounts for desalination, solar, bioenergy and transmission line projects (€482 million), and to a lesser extend to the incorporation of the debt Hugoton project (€39 million) and due to the exchange differences mainly as a result of the US dollar and Brazilian real appreciation against the euro (€76 million). Most significant decreases are the classification as liabilities held for sale of project finance or bridge loans corresponding to companies classified as held for sale (€–3,102 million). The repayment of the Solana project finance (€–324 million), the repayment of the bridge loan of the Bioethanol project in Brazil (€–167 million), the repayment of bridge loan of certain transmission line projects in Brazil (€–316 million), the repayment of the bridge loan of the cogeneration project in Mexico (€–137 million) and the repayment of project finance for smaller amounst for various projects (€–163 million).
Ordinary notes Greenfield, S.A.
With respect to the non-recourse debt in process (bridge loan) related to the issuance of ordinary notes, note that on September 30, 2014 Abengoa Greenfield, S.A., subsidiary of Abengoa, S.A., completed the placement to qualified institutional investors of an ordinary note ('Green Bonds') for a nominal value equivalent to €500 million and with the following terms and conditions:
- a)
- The placement was for a nominal amount equivalent to €500 million, split into two tranches, one for €265 million and a second tranche for USD 300 million, and maturing in 5 years.
- b)
- The notes accrue a fixed interest, payable every six months, with a rate of 5.5% for the Euro tranche and 6.5% for the U.S. dollar tranche.
- c)
- The notes are jointly guaranteed by certain group subsidiaries and have the same guarantees than ordinary notes issued by Abengoa Finance S.A.U. and described in Note 20.3.
- d)
- The proceeds will be used to finance in whole or in part the development of renewable projects until the moment when long term third party project financing is obtained.
- e)
- The proceeds do not apply to project finance as mentioned in the previous point should be classified in cash or other liquid financial instruments.
Ordinary notes Abengoa Yield Plc
With respect to the project debt related to the ordinary notes issuance, note that on November 17, 2014 our subsidiary Abengoa Yield Plc. issued Ordinary Notes to qualified and institutional investors for an amount of USD 255 million and maturing in 2019 and an interest rate of 7% payable every six months. The offer is guaranteed by Abengoa Yield and some of its subsidiaries.
Abengoa Yield used the proceeds for the acquisition of three assets from Abengoa, S.A. for an amount of USD 312 million: the solar concentration plants Solacor 1 and Solacor 2 and PS10 and PS20 located in Spain with the combined capacity of 131 MW and the wind from Cadonal located in Uruguay and with the capacity of 50 MW. At the end of 2014, Abengoa Yield is classified as discontinued operation in accordance with the requirements of IFRS 5 (see Note 7) and the Company has reclassified this debt to the heading liabilities held for sale within the Consolidated Statements of Financial Position.
F-106
Table of Contents
ABENGOA
Consolidated financial statements
Credit Facility Abengoa Yield, Plc
With respect to the project debt related to Abengoa Yield's credit facility, on December 4, 2014 Abengoa Yield entered into a credit facility which consists of a four year bullet facility in the amount of USD 125 million. It was signed with a syndicate of five banks comprised by HSBC, Bank of America Merrill Lynch, Citi, RBC and Santander. It bears interest at Libor + 275 basis points. The Credit Facility is guaranteed by Abengoa Yield and some of its subsidiaries. At the end of 2014, Abengoa Yield is classified as discontinued operations in accordance with the requirements of IFRS 5 (see Note 7) and the Company has reclassified this debt to the heading liabilities held for sale within the Consolidated statements of financial position.
The balances and movements for 2013 of project debt are set out in the table below:
| | | | | | | | | | | |
| |
| | Project debt—
long term | | Project debt—
short term | | Total | |
|---|
| | Balance as of 12.31.12 | | | 4,678,993 | | | 577,779 | | | 5,256,772 | |
| | Increases | | | 1,666,324 | | | 164,506 | | | 1,830,830 | |
| | Decreases (reimbursement) | | | (477,684 | ) | | (476,417 | ) | | (954,101 | ) |
| | Currency translation differences | | | (285,264 | ) | | (63,015 | ) | | (348,279 | ) |
| | Changes in consolidation and reclassifications | | | 153,782 | | | 381,946 | | | 535,728 | |
| | | | | | | | | | | | |
| | Balance as of 12.31.13 | | | 5,736,151 | | | 584,799 | | | 6,320,950 | |
| | | | | | | | | | | | |
| | | | | | | | | | | | |
| | | | | | | | | | | | |
The increase in 2013 was mainly due to the consolidation of Arizona Solar One (see Note 6.4) by € 809 million and to new drawnings related to transmission lines projects (€ 605 million). In addition, the Company obtained new financing for the cogeneration plant in Tabasco, Mexico (€566 million). There were also new drawnings for thermo-solar projects (€ 366 million), mainly Solaben 1 and 6 (€ 200 million).
Additionally, the Company repaid (€–377 million) corresponding to the existing debt of the cogeneration plant in Tabasco, Mexico, which was replaced by a new financing as referred to above. Furthermore, there were repayments of debt related to thermo-solar projects (–€ 175 million) and transmission lines (–€ 122 million). Project debt also decreased due to the sale of Befesa (–€369 million), to the classification of Qingdao as held for sale (–€ 106 million) and to translation differences (–€348 million) mainly caused by the depreciation of Brazilian real with respect to the euro.
Project finance entered into in 2014 (in million of Euros) is as follows:
| | | | | | | | | | | |
| | Project | | Year | | Country | | Amount
committed | | Amount
drawn |
|---|
| | Société d'Eau Déssalée d'Agadir (SEDA) | | | 2014 | | Marruecos | | | 63 | | — |
| | Concesionaria del Acueducto el Zapotillo, S.A. de C.V. | | | 2014 | | México | | | 131 | | — |
| | | | | | | | | | | | |
| | Total year 2014 | | | | | | | | 194 | | |
| | | | | | | | | | | | |
| | | | | | | | | | | | |
| | | | | | | | | | | | |
F-107
Table of Contents
ABENGOA
Consolidated financial statements
- 19.2.
- The table below lists projects with bridge loan in progress (bridge loan) as of December 31, 2014 (amount in thousands of Euros):
| | | | | | | | | | | | | | | | | | | | | |
| |
| | LAT Brasil(1) | | Hospital Manaus | | Acueducto Zapotillo | | Abent T3 | | ACC4T | | CSP Atacama I | | CSP Atacama II | | PV Atacama I | | San Antonio Water | | Total |
|---|
| | Construction start date | | Mar-13 / Ago-14 | | Apr-13 | | Oct-11 | | Sep-13 | | Sep-14 | | Apr-14 | | Dec-14 | | Dec-14 | | Dec-14 | | — |
| | Estimated end date | | Feb-16 / Jul-18 | | Aug-15 | | Sep-17 | | Jan-17 | | Jan-18 | | Feb-17 | | Oct-17 | | Apr-16 | | Oct-19 | | — |
| | Estimated amount of the contract (EPC) | | 2,390,209 | | 146,557 | | 459,834 | | 936,448 | | 541,614 | | 1,079,661 | | 721,501 | | 199,951 | | 529,600 | | 7,005,375 |
| | Bridge loan start date | | Mar-13/
Sep-14 | | Dec-13 | | Aug-14 | | Sep-14 | | Dec-14 | | Aug-14 | | Dec-14 | | Dec-14 | | Dec-14 | | — |
| | Bridge loan maturity date | | Jul-15/
Sep-19(2) | | Abr-15 | | Feb-15 | | Sep-19(2) | | Dec-19 | | Oct-17 | | Dec-19 | | Jul-19(2) | | Jul-19(2) | | — |
| | Anticipated LT financing start date | | Jul-15/
Sep-17 | | Abr-15 | | Feb-15 | | Sep-15/
Sep-19 | | Sep-15 | | Sep-15 | | Dec-15 | | Sep-15 | | May-16 | | — |
| | LT financing duration | | Up to 15,5 years | | Up to 12 years | | Up to 20 years | | Up to 18 years | | Up to 18 years | | Up to 18 years | | Up to 19 years | | Up to 20 years | | Up to 30 years | | — |
| | LT financing expected amount committed | | 1,485,632 | | 103,218 | | 400,737 | | 682,959 | | 502,967 | | 755,780 | | 629,030 | | 190,027 | | 627,065 | | 4,813,125 |
| | Bridge loan amount drawn(3) | | 1,047,434 | | 34,866 | | 262,091 | | 250,000 | | 64,000 | | 160,621 | | 27,400 | | 50,000 | | 50,000 | | 1,946,412 |
| | Guarantee type(4) | | Contractor and Sponsor / Corporate | | Contractor and Sponsor | | Contractor and Sponsor | | Contractor and Sponsor / Corporate | | Corporate | | Contractor and Sponsor / Corporate | | Corporate | | Contractor and Sponsor / Corporate | | Corporate | | — |
- (1)
- Includes the transmission line projects in Brazil relating to ATE XVI Transmissora de Energía, S.A. (Miracema), ATE XVII Transmissora de Energía, S.A. (Milagres), ATE XVIII Transmissora de Energía, S.A. (Estreito), ATE XIX Transmissora de Energía, S.A. (Luiz Gonzaga), ATE XX Transmissora de Energía, S.A. (Teresina), ATE XXI Transmissora de Energía, S.A. (Parauapebas), ATE XXII Transmissora de Energía, S.A., ATE XXIII Transmissora de Energía, S.A. and ATE XXIV Transmissora de Energía, S.A.
- (2)
- Once the long-term funding associated with the projects has been obtained, the issuer will use the funds from the Green Bond to finance other Green Projects, selected according to the "Use of Funds" requirements specified in the Offering Memorandum. Additionally, for funds tranch B (see Note 20), after long-term funds obtained can be allocated to developing new projects after fulfilling the requirements specified in the financing agreement.
- (3)
- Excludes amounts withdrawn from the bridge loans, which have been issued by the projects with Contractor and Sponsor guarantee, amounting to €252,783 thousands and which have been transferred to liabilities held for sale (see Note 7).
- (4)
- The guarantee references "Contractor and sponsor" refer to corporate guarantees related to the bridge financing of the projects. The references to "Corporate" guarantees refer to corporate guarantees mainly related to the Green Bonds. These guarantees cover all of the indicated bridge financing.
- 19.3.
- Within the assets on the Consolidated Statement of Financial Position and under the Cash and Cash equivalent and Financial Receivables headings, there are debt service reserve accounts in the amount of €94 million relating to project finance in 2014 (€156 million in 2013).
- 19.4.
- Appendix IX of this consolidated report details the Project companies as of the end of 2014 which are financed by project debt.
- 19.5.
- The repayment schedule for project debt, at the end of 2014 is as follows and is consistent the projected cash flows of the related projects:
| | | | | | | | | | | | | | | | | | |
| | 2015 | | 2016 | | 2017 | | 2018 | | 2019 | | Subsequents years | |
|---|
| | | 799,210 | | | 669,407 | | | 225,971 | | | 851,524 | | | 724,341 | | | 1,687,661 | |
Included within the amounts repayable there are balances relating to operations financed through bridge loans which will be repaid upon the project finance.
F-108
Table of Contents
ABENGOA
Consolidated financial statements
- 19.6.
- Current and non-current loans with credit entities include amounts in foreign currencies for the total of €2,436,633 thousand (€3,958,597 thousand in 2013).
The equivalent in Euros of the most significant foreign-currency-denominated debts held by the Group is as follows:
| | | | | | | | | | | | | | |
| |
| | 12.31.14 | | 12.31.13 | |
|---|
| | Currency | | Non-domestic
companies | | Domestic
companies | | Non-domestic
companies | | Domestic
companies | |
|---|
| | Dinar (Algeria) | | | 345,351 | | | — | | | 390,089 | | | — | |
| | Dollar (USA) | | | 664,707 | | | 356,738 | | | 2,111,663 | | | 67,875 | |
| | Peso (Chile) | | | — | | | — | | | 4,767 | | | — | |
| | Real (Brazil) | | | 1,069,837 | | | — | | | 1,384,203 | | | — | |
| | | | | | | | | | | | | | | |
| | Total | | | 2,079,895 | | | 356,738 | | | 3,890,722 | | | 67,875 | |
| | | | | | | | | | | | | | | |
| | | | | | | | | | | | | | | |
| | | | | | | | | | | | | | | |
- 19.7.
- The balance of interest payable is €15,518 thousand as of December 31, 2014 (€46,717 thousand as of December 31, 2013) and is included under current 'Project debt'.
Note 20. — Corporate financing
As indicated in Note 4, corporate financing is used to finance the activities of the remaining companies which are not financed under project debt and is guaranteed by Abengoa, S.A. and, in some cases, jointly guaranteed by certain group subsidiaries.
- 20.1.
- The breakdown of the corporate financing as of December 31, 2014 and 2013 is as follows:
| | | | | | | | |
| | Non-current | | Balance as of
12.31.14 | | Balance as of
12.31.13 | |
|---|
| | Credit facilities with financial entities | | | 871,613 | | | 1,959,339 | |
| | Notes and bonds | | | 2,755,993 | | | 2,638,083 | |
| | Finance lease liabilities | | | 24,064 | | | 27,093 | |
| | Other loans and borrowings | | | 97,029 | | | 110,630 | |
| | | | | | | | | |
| | Total non-current | | | 3,748,699 | | | 4,735,145 | |
| | | | | | | | | |
| | | | | | | | | |
| | | | | | | | | |
| | | | | | | | |
| | Current | | Balance as of 12.31.14 | | Balance as of 12.31.13 | |
|---|
| | Credit facilities with financial entities | | | 444,386 | | | 636,733 | |
| | Notes and bonds | | | 1,096,965 | | | 256,443 | |
| | Finance lease liabilities | | | 10,927 | | | 12,945 | |
| | Other loans and borrowings | | | 24,373 | | | 13,143 | |
| | | | | | | | | |
| | Total current | | | 1,576,651 | | | 919,264 | |
| | | | | | | | | |
| | | | | | | | | |
| | | | | | | | | |
| | Total corporate financing | | | 5,325,350 | | | 5,654,409 | |
| | | | | | | | | |
| | | | | | | | | |
| | | | | | | | | |
- 20.2.
- Credit facilities with financial entities
- a)
- The amount of current and non-current credit facilities with financial entities as of December 31, 2014 includes debts denominated in foreign currencies in the amount of €356,324 thousand (€278,511 thousand in 2013).
F-109
Table of Contents
ABENGOA
Consolidated financial statements
| | | | | | | | | | | | | | |
| |
| | 12.31.14 | | 12.31.13 | |
|---|
| | Currency | | Non-domestic
companies | | Domestic
companies | | Non-domestic
companies | | Domestic
companies | |
|---|
| | Dollar (USA) | | | 173,796 | | | 145,537 | | | 104,602 | | | 112,609 | |
| | Peso (Argentina) | | | 3 | | | — | | | — | | | — | |
| | Peso (Chile) | | | 978 | | | — | | | — | | | — | |
| | Peso (Colombia) | | | 2,537 | | | — | | | — | | | — | |
| | Peso (Mexico) | | | 12,964 | | | — | | | 15,642 | | | — | |
| | Real (Brazil) | | | 6,356 | | | — | | | 178 | | | — | |
| | Rand (South Africa) | | | — | | | — | | | 34,509 | | | — | |
| | Rupee (Indian) | | | 13,859 | | | — | | | 9,640 | | | — | |
| | Sol (Peru) | | | — | | | — | | | 793 | | | — | |
| | Yuan (China) | | | 294 | | | — | | | 538 | | | — | |
| | | | | | | | | | | | | | | |
| | Total | | | 210,787 | | | 145,537 | | | 165,902 | | | 112,609 | |
| | | | | | | | | | | | | | | |
| | | | | | | | | | | | | | | |
| | | | | | | | | | | | | | | |
- b)
- The following table shows a list of credit facilities with financial entities:
| | | | | | | | | | | | | | |
| | Loan details | | Year granted | | Granted amount | | Outstanding | | Expiry | |
|---|
| | Syndicated loan | | | 2014 | | | 700,000 | | | 180,214 | | | jul-19 | |
| | ICO financing | | | 2007 | | | 151,389 | | | 36,189 | | | jul-15 | |
| | Instalaciones Inabensa SA financing | | | 2010 – 2013 | | | 440,296 | | | 304,032 | | | 2014 – 2020 | |
| | Abener Energia SA financing | | | 2010 – 2013 | | | 496,572 | | | 344,415 | | | 2014 – 2024 | |
| | Remaining loans | | | Varios | | | 463,360 | | | 451,149 | | | Varios | |
| | | | | | | | | | | | | | | |
| | Total | | | | | | 2,251,617 | | | 1,315,999 | | | | |
| | | | | | | | | | | | | | | |
| | | | | | | | | | | | | | | |
| | | | | | | | | | | | | | | |
With the aim of minimizing the volatility in interest rates of financial operations, specific contracts are signed to hedge the possible variations that may occur (See Note 14).
The long-term syndicated financing loan was signed for the purposes of financing investments and general financing requirements of Abengoa, S.A. and all the companies of the group without project debt.
On September 30, 2014 Abengoa, S.A. closed the previous syndicated loan upon a long term revolving financing signed for an amount of approximately €1,400 million and maturing in the end of 2019 split in two tranches:
- •
- Tranch A, of corporate financing for an amount of €700 million, to extend the maturity of the existing syndicated loan, and
- •
- Tranch B, of bridge loan (non-recourse financing in process) for an amount of €700 million to fund the promotion, development and construction of concession projects until obtaining long term financing related to these projects (see Note 19).
Both tranches are guaranteed by Abengoa, S.A. and jointly by certain Group subsidiaries.
The new financing extends the maturity of the existing debt to more than four years and reduces the financial cost (with the possibility of further improvements in case of a company
F-110
Table of Contents
ABENGOA
Consolidated financial statements
rating increase by the agencies). The interest until the end of the year will be approximately 3.01%.
In addition, the loan with the Official Credit Institute (ICO) is aimed at financing specific investment programs, more notably overseas programs.
Furthermore, some subsidiaries of Abengoa S.A. undersigned long-term loans with various entities with the support of various Export Credit Agencies, including two financing agreements signed with a group of financing entities backed by an EKN (Swedish Export Credit Agency) guarantee to finance industrial machinery in various projects:
To ensure that the Company has sufficient funds to repay the debt with respect to its capacity to generate cash flow, Abengoa has to comply with a Corporate Net Debt Corporate/EBITDA financial ratio with the financial institutions.
According to the financing agreements, the maximum limit of this ratio was 3.0 for the years 2012, 2013 and until December 30, 2014 and 2.5 starting December 31, 2014. As of December 31, 2014 and 2013, Corporate Net Debt/EBITDA financial ratio was 2.11 and 1.69 respectively, according to the conditions of the financing agreements.
- c)
- As of December 31, 2014 the debt repayment calendar was as set out in the following table:
| | | | | | | | | | | | | | | | | | | | | | | |
| |
| | 2015 | | 2016 | | 2017 | | 2018 | | 2019 | | Subsequent
years | | Total | |
|---|
| | Syndicated loan (*) | | | — | | | — | | | — | | | — | | | 180,214 | | | — | | | 180,214 | |
| | ICO financing | | | 36,189 | | | — | | | — | | | — | | | — | | | — | | | 36,189 | |
| | Instalaciones Inabensa SA financing | | | 68,887 | | | 64,719 | | | 66,574 | | | 51,777 | | | 45,819 | | | 6,256 | | | 304,032 | |
| | Abener Energia SA financing | | | 104,665 | | | 60,645 | | | 37,838 | | | 50,787 | | | 29,578 | | | 60,902 | | | 344,415 | |
| | Remaining loans | | | 234,645 | | | 40,174 | | | 43,556 | | | 19,831 | | | 46,497 | | | 66,446 | | | 451,149 | |
| | | | | | | | | | | | | | | | | | | | | | | | |
| | Total | | | 444,386 | | | 165,538 | | | 147,968 | | | 122,395 | | | 302,108 | | | 133,604 | | | 1,315,999 | |
| | | | | | | | | | | | | | | | | | | | | | | | |
| | | | | | | | | | | | | | | | | | | | | | | | |
| | | | | | | | | | | | | | | | | | | | | | | | |
- (*)
- In case the whole facility is withdrawn, €480 million will mature in 2018 and €220 million in 2019.
The exposure of the Group to movements in interest rates and the dates at which prices are revised is specified in Note 4 on the management of financial risks. Corporate financing is mainly based in variable interest rates, as such its fair value is close to its book value. The fair value is based on discounted cash flows, applying a discount rate being that of the third-party loan.
- d)
- The balance of interest payable is €8,833 thousand as of December 31, 2014 (€39,664 thousand in 2013) and is included under 'Short-term borrowings'.
- e)
- Real estate pledged against mortgages corporate financing as of December 31, 2014 is not significant.
- f)
- The average interest rates associated with the debt facilities reflect normal levels in each of the regions and areas in which the facility was agreed upon.
- g)
- The average cost of total financing during 2014 was 7.1%.
F-111
Table of Contents
ABENGOA
Consolidated financial statements
- 20.3.
- Notes and bonds
The table below shows the maturities of the existing notes as of December 31, 2014:
| | | | | | | | | | | | | | | | | | | | | | | |
| |
| | 2015 | | 2016 | | 2017 | | 2018 | | 2019 | | 2020 | | 2021 | |
|---|
| | Convertible notes Abengoa | | | 244,400 | | | — | | | 5,600 | | | — | | | 400,000 | | | — | | | — | |
| | Ordinary notes Abengoa | | | 300,000 | | | 500,000 | | | 534,847 | | | 550,000 | | | — | | | 370,279 | | | 500,000 | |
| | Commercial paper Abengoa Mexico | | | 43,502 | | | — | | | — | | | — | | | — | | | — | | | — | |
| | Euro-Commercial Paper Programme (ECP) (*) | | | 464,141 | | | — | | | — | | | — | | | — | | | — | | | — | |
| | | | | | | | | | | | | | | | | | | | | | | | |
| | Total | | | 1,052,043 | | | 500,000 | | | 540,447 | | | 550,000 | | | 400,000 | | | 370,279 | | | 500,000 | |
| | | | | | | | | | | | | | | | | | | | | | | | |
| | | | | | | | | | | | | | | | | | | | | | | | |
| | | | | | | | | | | | | | | | | | | | | | | | |
- (*)
- With possibility of renewal
Convertible notes 2014
On July 24, 2009, Abengoa, S.A. issued Convertible Notes, convertible into ordinary shares, to qualified investors and institutions in Europe for the amount of €200 million. On January 17, 2013, Abengoa, S.A. repurchased a nominal amount of €99.9 for a purchase price of €108.8 million. The terms and conditions of the issuance were currently as follows:
- a)
- The nominal amount of the notes was one hundred million and one hundred thousand Euros (€100.1 million) with maturity set at 5 years.
- b)
- The Notes accrued a fixed annual interest of 6.875% payable semiannually.
- c)
- The 2014 Convertible Notes were convertible into fully paid class A shares or class B shares of Abengoa, subject to certain liquidity conditions, credited in the number determined by dividing the aggregate nominal amount of the Notes by the applicable conversion price. The conversion price was initially set at €21.12 per ordinary share of Abengoa and was adjusted to €20.84 per share in July 2012 following a dividend payment (€0.35 per share) in excess of the dividend threshold permitted without adjustment in the conversion price (€0.21 per share). In October 2012, the conversion price was adjusted to €4.17 per share of Abengoa due to the distribution of class B shares as approved by the Extraordinary General Shareholders' Meeting held on September 30, 2012. Additionally, the conversion price was adjusted to €3.81 per share of Abengoa as a result of the Capital Increase completed on October 29, 2013.
- d)
- Pursuant to the Terms and Conditions, in the event that investors decided to exercise their right of conversion, the Company might decide to settle the issuance entirely in shares, in cash or in a combination of shares and cash.
- e)
- The notes were jointly guaranteed by certain group subsidiaries.
As described in Note 2.18.1 Significant accounting policies, in accordance with IAS 32 and 39 and the Terms and Conditions of the issuance, since Abengoa has a contractual right to choose the type of settlement and one of these possibilities is paying through a variable number of shares and cash, the conversion option qualifies as an embedded derivative. Thus, the convertible bonds are considered a hybrid instrument, which includes a component of debt and an embedded derivative for the conversion option held by the bondholder. This happens with 2014 and 2017 convertible bonds.
F-112
Table of Contents
ABENGOA
Consolidated financial statements
On July 24, 2014, the convertible bonds matured, being cancelled in cash, according to its terms and conditions. The carrying value amount of the liability component of this note at December 31, 2013 amounted to 96,183 thousand.
At December 31, 2013, the fair value of the derivative liability embedded in the convertible bond was €984 thousand. The income recognized in 'Other net finance income/expense' in the Consolidated Income Statement for the year ended December 31, 2014 was €984 thousand (an income of €9,672 thousand in 2013) due to changes in fair value until its settlement date, see Note 30.3.
The key data for the valuation model was the share price, the estimated profitability of the dividend, an envisaged option maturity life, an interest rate and underlying volatility as set out in the table below:
| | | | | |
| |
| | 12.31.2013 | |
|---|
| | 'Spot Abengoa ' Price (Euros) | | | 2.18 | |
| | 'Strike ' Price (Euros) | | | 3.81 | |
| | Maturity | | | 07/24/2014 | |
| | Volatility | | | 40% | |
| | Number of shares | | | 26,272,966 | |
Furthermore, in order to partially hedge the derivatives embedded in the notes convertible, during the years 2011 and 2010 the Company purchased two call options over 7,000,000 Abengoa's own shares with a strike price of €21.125 per share, maturing on July 24, 2014 (over 35,000,000 Abengoa's shares with a strike price of €4.22 after the distribution of class B. shares approved by the Extraordinary General Meeting held on September 30, 2012).
The fair value of such call options as of December 31, 2013 was €419 thousand. The expense recognized in 'Other net finance income/expense' in the Consolidated Income Statement for the year ended December 31, 2014 was €419 thousand (an expense of €4,295 thousand in 2013 and an expense of €17,139 thousand in 2012), due to change in fair value until its liquidation, see Note 30.3.
The key data for the valuation model included the share price, the estimated profitability of the dividend, the envisaged life of maturity, an interest rate and underlying volatility as set forth in the table below:
| | | | | |
| |
| | 12.31.2013 | |
|---|
| | 'Spot Abengoa ' Price (Euros) | | | 2.18 | |
| | 'Strike ' Price (Euros) | | | 4.22 | |
| | Maturity | | | 07/24/2014 | |
| | Volatility | | | 47% | |
| | Number of shares | | | 35,000,000 | |
Convertible notes 2017
On February 3, 2010, Abengoa, S.A. issued Convertible Notes, convertible into ordinary shares, to qualified investors and institutions for the amount of €250 million. The terms and conditions of the issuance are currently as follows:
- a)
- The Notes were issued for two hundred million Euros (€250 million) with maturity set at 7 years.
- b)
- The Notes accrue a fixed annual interest of 4.5% payable semiannually.
F-113
Table of Contents
ABENGOA
Consolidated financial statements
- c)
- The 2017 Convertible Notes are convertible into fully paid class A shares or class B shares of Abengoa, subject to certain liquidity conditions, credited in the number determined by dividing the aggregate nominal amount of the Notes by the applicable conversion price. The conversion price was initially set at €30.27 per ordinary share of Abengoa and was adjusted to €29.87 per share in July 2012 following a dividend payment (€0.35 per share) in excess of the dividend threshold permitted without adjustment in the conversion price (€0.21 per share). In October 2012, the conversion price was adjusted to €5.97 per share of Abengoa due to the distribution of class B shares as approved by the Extraordinary General Shareholders' Meeting held on September 30, 2012. Additionally, the conversion price was adjusted to €5.45 per share of Abengoa as a result of the Capital Increase completed on October 29, 2013 and in April 2014, the conversion price was again adjusted to €5.35 per chare of Abengoa following a dividend payment in excess or the dividen threshold permitted without adjunstment in the conversion price.
- d)
- On February 3, 2015, holders of the 2017 Convertible Notes had the right to require Abengoa to redeem the 2017 Convertible Notes at the principal amount together with accrued and unpaid interest to such date.
On February 3, 2015, certain bondholders exercised the conversion option amounting to €244,400 thousand, corresponding to principal plus interest accrued and unpaid to date. The remaining bondholders, amounting to €5,600 thousand, preferred not to exercise its option and wait until the maturity in 2017.
- e)
- Pursuant to the Terms and Conditions, in the event that investors decide to exercise their right of conversion, the Company may decide to settle the issuance entirely in shares, in cash or in a combination of shares and cash.
- f)
- The notes are jointly guaranteed by certain group subsidiaries.
The carrying value amount of the liability component of this bond at December 31, 2014 amounted to €216,768 thousand (€203,422 thousand at December 31, 2013).
Additionally, at December 31, 2014, the fair value of the derivative liability embedded in the convertible bond is €4,021 thousand, while its fair value as of December 31, 2013 amounted to €2,887 thousand. The decrease in fair value has been recorded as an expense amounting to €1,134 thousand in 'Other net finance income/expense' in the Consolidated Income Statement for the year ended December 31, 2014 (an income of €36,419 thousand in 2013 and an income of €16.885 thousand in 2012), see Note 30.3.
The key data for the valuation model included the share price, the estimated profitability of the dividend, an envisaged option maturity life, an interest rate and underlying volatility as set forth in the table below:
| | | | | | | | |
| |
| | 12.31.2014 | | 12.31.2013 | |
|---|
| | 'Spot Abengoa ' Price (Euros) | | | 1.83 | | | 2.18 | |
| | 'Strike ' Price (Euros) | | | 5.35 | | | 5.45 | |
| | Maturity | | | 03/02/2017 | | | 02/03/2017 | |
| | Volatility | | | 56% | | | 39% | |
| | Number of shares | | | 46,728,972 | | | 45,871,560 | |
Furthermore, in order to partially hedge the derivatives embedded in the notes convertible, during the years 2011 and 2010 the Company purchased two call options over 7,100,000 Abengoa's own shares with a strike price of €30.27 per share, maturing on February 3, 2017 (over 35,500,000 Abengoa's
F-114
Table of Contents
ABENGOA
Consolidated financial statements
own shares with a strike price of €6.05 after the distribution of class B shares approved by the Extraordinary General Meeting held on September 30, 2012).
These options hedge around 76% of the notes in the event of conversion.
The fair value of the options at December 31, 2013, calculated using the Black-Scholes model, was €2,322 thousand, while the fair value was €750 thousand at December 31, 2014. The decrease in fair value has been recorded as a finance expense amounting to €1,572 thousand recorded in 'Other net finance income/expense' in the Consolidated Income Statement (an expense of €1,743 thousand in 2013 and an expense of €17,139 thousand in 2012), see Note 30.3. As of December 31, 2014 the listed price of these bonds was 99,38%.
The key data for the valuation model included the share price, the estimated profitability of the dividend an envisaged option maturity life, an interest rate and underlying volatility as set forth in the table below:
| | | | | | | | |
| |
| | 12.31.2014 | | 12.31.2013 | |
|---|
| | 'Spot Abengoa ' Price (Euros) | | | 1.83 | | | 2.18 | |
| | 'Strike ' Price (Euros) | | | 6.05 | | | 6.05 | |
| | Maturity | | | 03/02/2017 | | | 02/03/2017 | |
| | Volatility | | | 43% | | | 43% | |
| | Number of shares | | | 35,500,000 | | | 35,500,000 | |
Convertible notes 2019
On January 17, 2013, Abengoa, S.A. issued €400 million aggregate principal amount among qualified and institutional investors of convertible notes due 2019 (the '2019 Convertible Notes'). The notes are convertible into class B shares. In summary, the final terms and conditions of the issuance are as follows:
- a)
- The Notes were issued for four hundred million Euros (€400 million) with maturity set at 6 years.
- b)
- The Notes accrue a fixed annual interest of 6.25% payable semiannually.
- c)
- The Notes are convertible, at the option of noteholders into fully paid class B shares.
- d)
- In the event that investors decide to exercise their right of conversion, the Company may decide to repay the notes in shares, cash or a combination of cash and shares.
- e)
- The 2019 Convertible Notes are convertible into class B shares of the Parent Guarantor credited in the number determined by dividing the aggregate nominal amount of the Notes by the applicable conversion price. The initial conversion price is €3.27 for each class B share of the Company. The conversion price has been adjusted to €3.04 per share of Abengoa as a result of the Capital Increase completed on October 29, 2013 and in April 2014, the conversion price was again adjusted to €2.98 per share of Abengoa following a dividend payment in excess of the dividend threshold permitted without adjustment in the conversion price.
- f)
- The notes are jointly guaranteed by certain group subsidiaries.
At the beginning of 2014, the Board of Directors expressly and irrevocably stated, with binding effect, that in relation to the right conferred by Clause 6 (j) (Settlement in cash) of the Terms and Conditions of this convertible bond, which grants Abengoa the right to choose the type of payment, the Company shall not exercise the cash settlement option in the event that bondholders decide to exercise their conversion right early during the period granted for that effect and Abengoa, S.A. shall
F-115
Table of Contents
ABENGOA
Consolidated financial statements
therefore only settle this conversion right in shares. Accordingly, the fair value at the beginning of the year of the derivative liability embedded in the convertible bond, which totaled €62,894 thousand, was reclassified as equity since after that date the conversion option meets the definition of an equity instrument.
The carrying value of the liability component of the notes at December 31, 2014 amounts to €323,209 thousand (€309,249 thousand in 2013).
Ordinary notes Abengoa 2015
On December 1, 2009, Abengoa S.A. issued ordinary Notes for the amount of €300 million. In summary, the final terms and conditions of the issuance are as follows:
- a)
- The Notes were issued for three hundred million Euros (€300 million) with maturity set at 5 years.
- b)
- These Notes will accrue a fixed annual interest of 9.625% payable semiannually.
- c)
- These Notes are jointly guaranteed by some subsidiaries of the group.
As of December 31, 2014 the listed price of these bonds was 100.44%.
Ordinary notes Abengoa 2016
On March 31, 2010, Abengoa S.A. issued ordinary Notes to qualified investors and institutions in Europe for the amount of €500 million. In summary, the final terms and conditions of the issuance are as follows:
- a)
- The Notes were issued for five hundred million Euros (€500 million) with maturity set at 6 years.
- b)
- The fixed annual payable twice-yearly interest on the Notes is 8.50% annually.
- c)
- The Notes are guaranteed jointly by certain subsidiaries of the group.
As of December 31, 2014 the listed price of these bonds was 100.00%.
Ordinary notes Abengoa 2017
On October 19, 2010, Abengoa Finance, S.A.U., a subsidiary of Abengoa, S.A., issued an ordinary bonds for USD 650 million among qualified and institutional investors in accordance with Rule 144A of the Securities Act of 1933 and subsequent amendments thereto. In summary, the terms and conditions of the issue that were established definitively are:
- a)
- The Notes issue is for an amount of six hundred and fifty million United States dollars (USD 650 million) and matures at 7 years.
- b)
- The Notes will accrue fixed annual interest of 8.875%, payable every six months.
- c)
- The Notes are jointly and severally guaranteed by Abengoa, S.A. and certain group subsidiaries.
As of December 31, 2014 the listed price of these bonds was 96.88%.
Ordinary notes Abengoa 2018
On February 5, 2013, Abengoa Finance, S.A.U., a subsidiary of Abengoa, S.A., issued Ordinary Notes to qualified and institutional investors for €250 million. On October 3, 2013, Abengoa Finance, S.A.U. issued €250 million of additional and fungible notes, at a price of 100.25%, which is equivalent to a yield of 8.799%. Furthermore, on November 5, 2013, Abengoa Finance, S.A.U. issued €50 million of
F-116
Table of Contents
ABENGOA
Consolidated financial statements
additional and fungible notes, at a price of 105.25%, which is equivalent to a yield of 7.408%. The terms and conditions of the issuance are as follows:
- a)
- The aggregate nominal amount of the Notes is five hundred and fifty million Euros (€550 million) with maturity set at 5 years.
- b)
- The Notes accrue a fixed annual interest of 8.875% payable semiannually.
- c)
- The Notes are jointly guaranteed by Abengoa, S.A. and certain subsidiaries of the group.
As of December 31, 2014 the listed price of these bonds was 95.88%.
Ordinary notes Abengoa 2020
On December 13, 2013, Abengoa Finance, S.A. Unipersonal, a subsidiary of Abengoa, S.A., issued an ordinary bond for USD 450 million among qualified and institutional investors. In summary, the terms and conditions of the issuance are:
- a)
- The Notes was issued for an amount of USD 450 million and matures in 6 years.
- b)
- The Notes accrue fixed annual interest of 7.75%, payable every six months.
- c)
- The Notes are jointly guaranteed by Abengoa, S.A. and certain group subsidiaries.
As of December 31, 2014 the listed price of these bonds was 89.25%.
Ordinary notes Abengoa 2021
On March 27, 2014, Abengoa Finance, S.A.U., a subsidiary of Abengoa, S.A., issued an ordinary bond for €500 million among qualified and institutional investors. In summary, the terms and conditions of the issue that were established definitively are:
- a)
- The Notes was issued for an amount of €500 million and matures in 7 years.
- b)
- The Notes will accrue fixed annual interest of 6.00%, payable every six months, on March 15 and September 15.
- c)
- The Notes are jointly and severally guaranteed by Abengoa, S.A. and certain group subsidiaries.
As of December 31, 2014 the listed price of these bonds was 85.69%.
Euro-Commercial Paper Programme
On January 29, 2013, Abengoa, S.A. carried out a Euro Commercial Paper (ECP) program for a maximum of €500 million with one-year maturity. Through this program, the company was able to issue notes between one and twelve months maturity, diversifying its financing options in the capital markets.
On June 10, 2014, the maximum amount of the program was increased to €750 million.
On December 22, 2014, the program was renewed for one more year and for the same amount. At the end of 2014, the program had a balance of €464,141 thousand.
Commercial Paper Abengoa México
On June 30, 2014 Abengoa Mexico S.A.de C.V. signed the short-term revolving exchange traded certificate program for an amount up to 3,000 million Mexican pesos equivalent to €43,502 million as of December 31, 2014).
The certificates will accrue a variable interest rate calculated based in the Tasa de interés interbancaria de equilibrio ('TIIE') plus a margin to be determined in the moment of each use.
F-117
Table of Contents
ABENGOA
Consolidated financial statements
- 20.4.
- The balance of interest payable related to notes and bonds is €77,628 thousand as of December 31, 2014 (€55,349 thousand as of December 31, 2013) and is included under current 'Bonds and Notes'.
- 20.5.
- Finance lease liabilities
| | | | | | | | |
| | Finance lease | | Balance as of
12.31.14 | | Balance as of
12.31.13 | |
|---|
| | Present values of future payments for finance lease | | | 34,991 | | | 40,038 | |
| | Liabilities: minimum payments for finance lease: | | | | | | | |
| | Less than 1 year | | | 11,879 | | | 15,031 | |
| | From 1 to 5 years | | | 19,439 | | | 22,339 | |
| | More than 5 years | | | 7,108 | | | 8,139 | |
| | Net book value: | | | | | | | |
| | Technical installations and machinery | | | 27,865 | | | 24,997 | |
| | Information processing equipment | | | 3,045 | | | 2,515 | |
| | Other tangible assets | | | 17,705 | | | 22,606 | |
- 20.6.
- Other loans and borrowings
The following table sets out the movement of Other loans and borrowings at the 2014 and 2013 year end:
| | | | | | | | |
| |
| | Balance as of
12.31.14 | | Balance as of
12.31.13 | |
|---|
| | Sale and lease back | | | 12,211 | | | — | |
| | Derivative premiums payable | | | 65,010 | | | 76,518 | |
| | Low interest loans | | | 6,775 | | | 6,732 | |
| | Loans with public institutions and others | | | 37,406 | | | 40,523 | |
| | | | | | | | | |
| | Total | | | 121,402 | | | 123,773 | |
| | | | | | | | | |
| | | | | | | | | |
| | | | | | | | | |
Note 21. — Grants and other liabilities
Grants and Other Liabilities as of December 31, 2014 and 2013 are shown in the following table
| | | | | | | | |
| |
| | Balance as of
12.31.14 | | Balance as of
12.31.13 | |
|---|
| | Grants | | | 146,684 | | | 374,345 | |
| | Suppliers of non-current assets | | | 2,488 | | | 2,239 | |
| | Long-term trade payables | | | 63,434 | | | 269,604 | |
| | | | | | | | | |
| | Grants and other non-current liabilities | | | 212,606 | | | 646,188 | |
| | | | | | | | | |
| | | | | | | | | |
| | | | | | | | | |
The decrease in Grants was mainly due to the classification as liabilities held for sale of grants and other liabilities corresponding to the companies in Abengoa Yield segment, partially offset by a cash grant awarded by the United States Department of the treasury for Hugoton second generation biofuels plant, as a result of the full consolidation of Abengoa Bioenergy Biomass of Kansas, LLC, once control over this company was obtained (see Note 6.4).
F-118
Table of Contents
ABENGOA
Consolidated financial statements
Note 22. — Provisions and contingencies
- 22.1.
- Provisions for other liabilities and charge
The following table shows the movement of the non-current heading of 'Provisions for other liabilities and charges' for the years 2014 and 2013:
| | | | | | | | | | | | | | |
| | Item | | Taxes | | Liabilities | | Dismantling | | Total | |
|---|
| | Balance as of 12.31.12 | | | 33,334 | | | 42,492 | | | 42,451 | | | 118,277 | |
| | Net increase/ (decrease) with impact in profit and loss | | | 99 | | | (678 | ) | | 855 | | | 276 | |
| | Translation differences | | | (37 | ) | | (459 | ) | | (419 | ) | | (915 | ) |
| | Changes in consolidation | | | (14,275 | ) | | (13,981 | ) | | (10,991 | ) | | (39,247 | ) |
| | Reclassifications and other movements | | | (3,906 | ) | | 2,277 | | | 1,282 | | | (347 | ) |
| | | | | | | | | | | | | | | |
| | Balance as of 12.31.13 | | | 15,215 | | | 29,651 | | | 33,178 | | | 78,044 | |
| | | | | | | | | | | | | | | |
| | | | | | | | | | | | | | | |
| | | | | | | | | | | | | | | |
| | Net increase/ (decrease) with impact in profit and loss | | | 389 | | | 2,611 | | | 1,469 | | | 4,469 | |
| | Translation differences | | | 17 | | | 763 | | | 1,173 | | | 1,953 | |
| | Transfer to liabilities held for sale | | | — | | | (19 | ) | | (9,330 | ) | | (9,349 | ) |
| | | | | | | | | | | | | | | |
| | Balance as of 12.31.14 | | | 15,621 | | | 33,006 | | | 26,490 | | | 75,117 | |
| | | | | | | | | | | | | | | |
| | | | | | | | | | | | | | | |
| | | | | | | | | | | | | | | |
The decrease of total provisions in 2014 is mainly due to the classification of dismantling provisions of Abengoa Yield as liabilities held for sale.
The decrease of total provisions in 2013 was mainly due to the exclusión of Befesa from the consolidation scope following the sale of its shareholding.
Provision for tax and legal contingencies
This provision represents the Group's best estimates in connection with risks relating to tax contingencies arising during the normal course of the Group's business, fundamentally in Latin America, when it is considered probable that there will be an outflow of resources in the medium or long term, which has been estimated being comprised in a period between 2 to 5 years, although the development of the contingencies and the new facts and circumstances that may arise overtime could change such estimated settlement period.
There are also provisions recorded by Group companies in relation with court rulings and unfavorable tax inspections that are under appeal but have not been resolved yet. For these tax disputes the Group considers that it is probable that there will be an outflow of resources in the medium term (between 2 and 5 years).
Provision for liabilities
This provision includes the Group's best estimates of probable cash outflows in connection with litigation, arbitration and claims in progress in which the various group companies are defendants as a result of the activities they carry out. Management considers that these liabilities will likely be settled in the medium or long term, which has been estimated being comprised in a period between 2 to 5 years.
Dismantling provision
This provision is intended to cover future expenditures related to the dismantlement of the solar plants and it will be likely to be settled with an outflow of resources in the long term (over 5 years).
F-119
Table of Contents
ABENGOA
Consolidated financial statements
- 22.2.
- Contingent liabilities
As of December 31, 2014 Abengoa and its Group of companies are involved in certain claims and litigations both against and in their favor. Such matters arise during the Group's normal course of business and represent the technical and economic claims that the contractual parties typically invoke.
We have briefly summarized below the most significant proceedings, which in the Management's opinion are not expected to have a material adverse effect in the Consolidated Financial Statements, individually or as a whole, or for which the future outcome cannot be reliably estimated.
- •
- In May 2000, Abengoa Puerto Rico S.E., a subsidiary of Abengoa S.A, brought a lawsuit against the Electricity Power Authority (Autoridad de Energía Eléctrica, 'AEE') of Puerto Rico and terminated the agreement that both parties had entered into in relation to an EPC project for the construction of an electricity power station in Puerto Rico, in which the AEE was the Principal Contractor. The referred lawsuit contained different claims such as, inter alia, withholding payments, defaulted invoices, loss of future profits damages and several other costs, which tentatively amounted to USD 40 million.
In response to the lawsuit brought by Abengoa Puerto Rico, S.E., the AEE brought a counterclaim premised upon unlawful termination and consequential damages relating to the agreement with Abengoa Puerto Rico, S.E. and, at the same time, brought an additional lawsuit for the same amount against Abengoa and its insurer, American International Insurance Co. of Puerto Rico. The amount claimed by the AEE is approximately USD 450 million. Currently the lawsuit is under hearing phase.
- •
- On April 29, 2013, the European Commission decided to initiate an inspection on the Parent Guarantor, along with all the companies directly or indirectly under its control, including Abengoa Bioenergy Trading Europe B.V., regarding its possible participation in anticompetitive agreements or actions which were allegedly aimed at manipulating the results of Platt's Market on Close (MOC) price assessment as well as denying the access of one or more companies to participation in the MOC price assessment process. According to such European Commission's decision, the suspected anticompetitive conduct, agreements and/or mutually coordinated concrete actions have allegedly existed since 2002 and would likely involve various markets for which the Platts MOC process is used to report prices, including markets for biofuels.The investigation is still in a preliminary phase, and the European Commission has not initiated formal proceedings. Directors believe that it and the relevant companies within the Group (including Abengoa Bioenergy Trading Europe B.V.) have at all times complied with the applicable competition laws. We are actively cooperating with the European Commission in its investigation.
- •
- On February 11, 2010, the temporary joint venture (Unión Temporal de Empresas) formed by Befesa Construcción y Tecnología Ambiental, S.L. and Construcciones Alpi, S.A. (the 'UTE') took legal action against the Comunidad de Regantes de las Marismas del Guadalquivir (CRMG) regarding the project for the modernization of the Guadalquivir Marshes irrigation área (Proyecto de Modernización de la Zona Regable de las Marismas del Guadalquivir). The UTE asked for the following main claims: a) the declaration of the unlawful (i) termination of contract performed by the CRMG, (ii) application of penalties for delay; and (iii) other damages requested; and b) the termination of the agreement due to CRMG's breaches of contract, requesting a liquidation balance amounting to €32,454 thousand and additional €1,096 thousand based on different grounds. The CRMG answered the claim on November 4, 2010, requesting generically the dismissal of the UTE's claim.
F-120
Table of Contents
ABENGOA
Consolidated financial statements
On December 12, 2014, Abeinsa Infraestructuras Medio Ambiente, S.A. (Abeima, formerly Befesa Construcción y Tecnología Ambiental, S.L.) has been served with the claim brought by the CRMG against the UTE and its members (Abeima and Construcciones Alpi, S.A.), on the basis of the same dispute, project and factual issues of the aforementioned proceedings. The CRMG claims €120,353 thousand (approximately broken down as follows: €14,896 thousand for damages—works poorly executed, extra costs, alleged damages, etc. –€20,718 thousand for loss of profit and €84,682 thousand for penalties for delay). As at the date of these Consolidated Financial Statements the claim has been answered by the members of UTE.
- 22.3.
- Contingent assets
As of December 31, 2014 Abengoa and its Group of companies do not have significant contingent assets.
Note 23. — Third-party guarantees and commitments
- 23.1.
- Third-party guarantees
At the close of 2014 the overall sum of Bank Bond and Surety Insurance directly deposited by the group companies and all that the parent company deposited to any company in the group as guarantee to third parties (clients, financial entities, Public Entities and other third parties) amounted to €1,672,837 thousand (€1,323,267 thousand in 2013) out of which €8,092 thousand (€2,229 thousand in 2013) are attributed to operations of financial nature and €1,664,745 thousand (€1,321,038 thousand in 2013) to those of technical nature.
In addition, the declarations of intent and commitments undertaken by the Group companies and what the parent company undertook to any company in the group as guarantee to third parties (clients, financial entities, Public Entities and other third parties) amounted to €5,789,243 thousand (€6,187,269 thousand in 2013) out of which €39,939 thousand (€32,480 thousand in 2013) are attributed to operations of financial nature and €5,749,304 thousand (€6,154,789 thousand in 2013) to those of technical nature.
Also bridge loan (non-recourse financing in process) is guaranteed by Abengoa, S.A. and in some cases, jointly by certain group subsidiaries (see Note 19).
Finally, as indicated in Note 20, the corporate financing is guaranteed by Abengoa, S.A. and in same cases, jointly by certain group subsidiaries.
F-121
Table of Contents
ABENGOA
Consolidated financial statements
- 23.2.
- Contractual obligations
The following table shows the breakdown of the third-party commitments and contractual obligations as of December 31, 2014 and 2013 (in thousands of Euros):
| | | | | | | | | | | | | | | | | |
| | 2014 | | Total | | Up to
one year | | Between one
and three years | | Between three
and five years | | Subsequent | |
|---|
| | Loans with credit institutions | | | 6,274,113 | | | 1,243,596 | | | 1,208,884 | | | 2,000,368 | | | 1,821,265 | |
| | Notes and bonds | | | 3,852,958 | | | 1,096,965 | | | 1,029,873 | | | 867,288 | | | 858,832 | |
| | Liabilities due to financial leases | | | 34,991 | | | 10,927 | | | 12,796 | | | 3,668 | | | 7,600 | |
| | Other loans and borrowings | | | 121,402 | | | 24,373 | | | 71,327 | | | 21,206 | | | 4,496 | |
| | Obligations under operating Leases | | | 13,826 | | | 3,867 | | | 5,537 | | | 3,035 | | | 1,387 | |
| | Purchase commitments | | | 1,072,848 | | | 933,071 | | | 123,123 | | | 5,517 | | | 11,137 | |
| | Accrued interest estimate during the useful life of loans | | | 2,599,142 | | | 589,443 | | | 908,675 | | | 500,009 | | | 601,015 | |
| | | | | | | | | | | | | | | | | |
| | 2013 | | Total | | Up to
one year | | Between one
and three years | | Between three
and five years | | Subsequent | |
|---|
| | Loans with credit institutions | | | 8,917,022 | | | 1,221,532 | | | 2,837,961 | | | 938,084 | | | 3,919,445 | |
| | Notes and bonds | | | 2,894,526 | | | 256,443 | | | 795,159 | | | 1,210,960 | | | 631,964 | |
| | Liabilities due to financial leases | | | 40,038 | | | 12,945 | | | 12,348 | | | 1,588 | | | 13,157 | |
| | Other loans and borrowings | | | 123,773 | | | 13,143 | | | 62,835 | | | 39,394 | | | 8,401 | |
| | Obligations under operating Leases | | | 17,147 | | | 12,804 | | | 1,610 | | | 1,277 | | | 1,456 | |
| | Purchase commitments | | | 1,172,565 | | | 1,033,952 | | | 117,829 | | | 1,278 | | | 19,506 | |
| | Accrued interest estimate during the useful life of loans | | | 3,534,516 | | | 664,610 | | | 955,679 | | | 658,304 | | | 1,255,923 | |
Note 24. — Tax situation
- 24.1.
- Application of rules and tax groups in 2014
Abengoa, S.A. and 222, 242 and 256 consolidated subsidiaries in 2014, 2013 and 2012, respectively (see Appendixes XI, XVI and XXI of these Consolidated Financial Statements) have filed its 2014, 2013 and 2012 income taxes following the rules for tax consolidation in Spain under the 'Special Regime for Tax Consolidation' Number 2/97.
All the other Spanish and foreign companies included in the Consolidation group file income taxes according to the tax regulations in force in each country on an individual basis or under consolidation tax regulations. The fiscal policy of the company is based on compliance with the regulations in force in the countries where it operates.
F-122
Table of Contents
ABENGOA
Consolidated financial statements
In order to calculate the taxable income of the consolidated tax Group and the consolidated entities individually, the accounting profit is adjusted for temporary and permanent differences, recording the corresponding deferred tax assets and liabilities. At each Consolidated Income Statement date, a current tax asset or liability is recorded, representing income taxes currently refundable or payable. Deferred income taxes reflect the net tax effects of temporary differences between the carrying amount of assets and liabilities for financial statement and income tax purposes, as determined under enacted tax laws and rates.
Income tax payable is the result of applying the applicable tax rate in force to each tax-paying entity, in accordance with the tax laws in force in the territory and/or country in which the entity is registered. Additionally, tax deductions and credits are available to certain entities, primarily relating to inter-company trades and tax treaties between various countries to prevent double taxation.
Abengoa, S.A., as the dominant company of the tax group with registered number 02/97, has been informed of the start of inspection proceedings regarding the following concepts and periods:
| | | | | |
| | Corporate income tax | | 2009 – 2011 | |
|---|
| | Value added tax | | | 03/2010 – 12/2011 | |
| | Withholdings and on-account payments for personal income tax for residents and non-residents | | | 03/2010 – 12/2011 | |
This inspection remains open as at the closing date of the financial statements, although no tax adjustments have been proposed. The directors believe that although potential interpretations of prevailing tax legislation could give rise to additional liabilities as a result of this inspection, these would not have a significant impact on the financial statements. This opinion is based on the best available information and the situation as at December 31, 2014, although the results of the inspection cannot be known with certainty.
- 24.2.
- Deferred tax assets and liabilities
At the end of 2014 and 2013 the analysis of deferred tax assets and deferred tax liabilities is as follows:
| | | | | | | | |
| |
| | Balance as of
12.31.14 | | Balance as of
12.31.13 | |
|---|
| | Tax credits for tax loss carryforwards | | | 487,278 | | | 378,229 | |
| | Tax credits for deductions pending application | | | | | | | |
| | Tax credits for export activities | | | 242,872 | | | 242,872 | |
| | Tax credits for R+D+i | | | 72,981 | | | 72,525 | |
| | Other deductions | | | 165,201 | | | 168,180 | |
| | Temporary differences | | | | | | | |
| | Provisions | | | 128,951 | | | 48,462 | |
| | Impairment | | | 29,313 | | | 16,274 | |
| | Remuneration plans | | | 19,386 | | | 18,550 | |
| | Derivatives financial instruments | | | 104,936 | | | 119,211 | |
| | Non deductible expenses (Art. 20 TRLIS, Art. 7 Ley 16/2012) | | | 131,666 | | | 80,726 | |
| | Consolidation adjustments, homogenization adjustments and other | | | 121,025 | | | 136,063 | |
| | | | | | | | | |
| | Total deferred tax assets | | | 1,503,609 | | | 1,281,092 | |
| | | | | | | | | |
| | | | | | | | | |
| | | | | | | | | |
F-123
Table of Contents
ABENGOA
Consolidated financial statements
| | | | | | | | |
| |
| | Balance as of
12.31.14 | | Balance as of
12.31.13 | |
|---|
| | Accelerated tax amortization | | | 69,701 | | | 32,272 | |
| | Business combination | | | 44,971 | | | 39,852 | |
| | Consolidation adjustments, homogenization adjustments and other | | | 167,125 | | | 255,180 | |
| | | | | | | | | |
| | Total deferred tax liabilities | | | 281,797 | | | 327,304 | |
| | | | | | | | | |
| | | | | | | | | |
| | | | | | | | | |
Article 29 and the Thirty-Fourth Transitional Provision of Law 27/2014 published in the official state gazette (BOE), on November 28, 2014, introduces changes of the Spanish tax system which include changing the general tax rate to 28% in 2015 and to 25% in 2016 (from 30% in 2014), among other measures. The reclassification of certain deferred tax assets and liabilities at the new tax rates has resulted in an expense of €49.4 million in the income statement and €17.9 million under equity for the company.
Most of the tax credits for net operating loss carryforwards correspond to Brazil (€177 million), the United States (€141 million), Spain (€70 million) and the Netherlands (€56 million).
Tax loss carryforwards in Brazil have been generated in years with poor meteorological conditions which have negatively affected sugarcane production. From 2011 a series of plans are carrying out to improve the quality of biological assets, to increase milling capacity and cogeneration plant capacity, with the ultimate purpose of increasing assets profitability. Tax loss carryforwards in the United States correspond mainly to projects in an initial stage of development or operation, the application of tax incentives and to other non-recurring losses. Tax loss carryforwards in Spain correspond mainly to the application of tax incentives.
Tax credits for deductions have been generated mainly in Spain. Among these tax credits the larger amount corresponds to deduction on export activities (DAEX), which is calculated as a percentage over investments effectively made for the acquisition of foreign companies or capital increases in foreign companies. This percentage, which was initially 25% was been gradually reduced since 2007 to reach 3% in 2010, disappearing the deduction on 2011. To benefit from this deduction, among other requirements, the acquisition or incorporation of companies should be directly related to the export of goods and services from Spain.
From the year 2012, the Company has not recorded any income in relation to this deduction, as it had been recorded entirely as of December 31, 2011.
In addition, efforts in research, development and innovation activities (R&D&i) that Abengoa has been carrying out during the last years have resulted in the generation of important tax deductions, some of which are recorded as deferred tax assets for an amount of €73 million as of December 31, 2014.
'Other deductions', which have been generated mainly in Spain, correspond primarily to deductions for double taxation (€75 million), environmental deductions (€12 million), deduction for reinvestment of extraordinary benefits (€ 51 million) and deductions for donations to non-profit organizations (€19 million).
In relation to tax loss carryforwards and deductions pending of application recorded as deferred tax assets, the Company evaluates its recoverability projecting forecasted taxable income for the upcoming years and taking into account the Company tax planning strategy. Deferred tax liabilities reversals are also considered in these projections, as well as any limitation established by tax regulations in force in each tax jurisdiction.
On the other hand, the Company has certain tax credits as of December 31, 2014 which it has not capitalized, as it determined that recoverability of such assets is not probable. These tax credits consist
F-124
Table of Contents
ABENGOA
Consolidated financial statements
mainly of tax loss carryforwards related to our US subsidiaries amounting to €35 million (€35 million in 2013 and €28.2 million in 2012), with expiration dates between 2029 and 2032; to our South African subsidiaries amounting to €37 million with expiration date in 2016, to our Spanish subsidiaries amounting to €89 million and to our Brazilian subsidiaries amounting to €8 million, without expiration date in the last two jurisdictions; and R&D&i and environmental tax credits in Spain amounting to €89 million (€75 million in 2013 and €50.3 million in 2012), with expiration dates between 2022 and 2032.
The movements in deferred tax assets and liabilities during 2014 and 2013 were as follows:
| | | | | |
| | Deferred tax assets | | Amount | |
|---|
| | As of December 31, 2012 | | | 1,148,324 | |
| | Increase / Decrease through the consolidated income statement | | | 159,703 | |
| | Increase / Decrease through other comprehensive income (equity) | | | (40,703 | ) |
| | Change in consolidation, various reclassifications and translation diff. | | | 13,768 | |
| | | | | | |
| | As of December 31, 2013 | | | 1,281,092 | |
| | | | | | |
| | | | | | |
| | | | | | |
| | Increase / Decrease through the consolidated income statement | | | 217,693 | |
| | Increase / Decrease through other comprehensive income (equity) | | | 52,651 | |
| | Increase / Decrease through the consolidated income statement for change in tax rate | | | (83,683 | ) |
| | Increase / Decrease through other comprehensive income (equity) for change in tax rate | | | (17,925 | ) |
| | Transfer to assets held for sale | | | (58,465 | ) |
| | Change in consolidation, various reclassifications and translation diff. | | | 112,246 | |
| | | | | | |
| | As of December 31, 2014 | | | 1,503,609 | |
| | | | | | |
| | | | | | |
| | | | | | |
| | | | | |
| | Deferred tax liabilities | | Amount | |
|---|
| | As of December 31, 2012 | | | 276,550 | |
| | Increase / Decrease through the consolidated income statement | | | 87,163 | |
| | Increase / Decrease through other comprehensive income (equity) | | | 11,126 | |
| | Change in consolidation, various reclassifications and translation diff. | | | (47,535 | ) |
| | | | | | |
| | As of December 31, 2013 | | | 327,304 | |
| | | | | | |
| | | | | | |
| | | | | | |
| | Increase / Decrease through the consolidated income statement | | | 46,286 | |
| | Increase / Decrease through other comprehensive income (equity) | | | (12,563 | ) |
| | Increase / Decrease through the consolidated income statement for change in tax rate | | | (34,244 | ) |
| | Increase / Decrease through other comprehensive income (equity) for change in tax rate | | | (46 | ) |
| | Transfers to liabilities held for sale | | | (7,634 | ) |
| | Change in consolidation, various reclassifications and translation diff. | | | (37,306 | ) |
| | | | | | |
| | As of December 31, 2014 | | | 281,797 | |
| | | | | | |
| | | | | | |
| | | | | | |
F-125
Table of Contents
ABENGOA
Consolidated financial statements
Note 25. — Trade payables and other current liabilities
- 25.1.
- Trade payable and other current liabilities as of the close of 2014 and 2013 are shown in the following table:
| | | | | | | | |
| | Item | | Balance as of
12.31.14 | | Balance as of
12.31.13 | |
|---|
| | Trade payables for purchases of goods | | | 4,034,367 | | | 3,707,470 | |
| | Trade payables for services | | | 1,061,871 | | | 1,121,466 | |
| | Billings in excess and advance payments from clients | | | 245,970 | | | 429,462 | |
| | Remunerations payable to employees | | | 52,211 | | | 37,017 | |
| | Suppliers of intangible assets current | | | 12,522 | | | 14,748 | |
| | Other accounts payables | | | 148,227 | | | 204,023 | |
| | | | | | | | | |
| | Total | | | 5,555,168 | | | 5,514,186 | |
| | | | | | | | | |
| | | | | | | | | |
| | | | | | �� | | | |
- 25.2.
- Nominal values of Trade payables and other current liabilities are considered to approximate fair values and the effect of discounting them is not significant.
- 25.3.
- The table above includes amounts payable through 'Confirming without recourse' for an amount of €2,250 million at December 31, 2014 (€2,377 million in 2013) relating to various agreements entered into with a number of financial entities. There are deposits and cash and cash equivalents of the Consolidated Statement of Financial Position linked to the payment of such 'confirming without recourse' for an amount of €1,226 million (€1,337 million in 2013).
Note 26. — Construction contracts
Further to the information set out in Note 2.24.b) relating to the accounting treatment of construction contracts, the table below includes aggregated information on outstanding construction contracts to which IAS 11 was applied at the end of the years 2014, 2013 and 2012:
| | | | |
2014 | | Construction
contracts | |
|---|
Operating revenues | | | 4,696,358 | |
Billings in excess and advance payments received | | | 1,364,078 | |
Payment withholdings | | | 13,577 | |
Account receivables | | | 3,926,009 | |
Account payables | | | 3,851,257 | |
| | | | |
2013 | | Construction
contracts | |
|---|
Operating revenues | | | 5,110,959 | |
Billings in excess and advance payments received | | | 619,678 | |
Payment withholdings | | | 24,363 | |
Account receivables | | | 2,536,586 | |
Account payables | | | 3,959,876 | |
F-126
Table of Contents
ABENGOA
Consolidated financial statements
| | | | |
2012 | | Construction
contracts | |
|---|
Operating revenues | | | 3,946,966 | |
Billings in excess and advance payments received | | | 1,245,514 | |
Payment withholdings | | | 28,797 | |
Account receivables | | | 2,284,938 | |
Account payables | | | 4,108,388 | |
The amount of unbilled revenue by the end of the years 2014, 2013 and 2012 is €913,122, €488,883 and €393,200 thousand, respectively.
The aggregated total amount of the costs incurred and the aggregated total profits (less the related losses) recognized since origin for all the ongoing contracts at December 31, 2014 amount to €10,908,371 thousand and €1,462,619 thousand respectively (€11,869,900 thousand and €995,928 thousand in 2013).
Note 27. — Revenues
The breakdown of Revenues for the years 2014, 2013 and 2012 is as follows:
| | | | | | | | | | |
| | 2014 | | 2013 | | 2012 | |
|---|
Product sales | | | 2,424,084 | | | 2,302,224 | | | 2,495,552 | |
Rendering of services and construction contracts | | | 4,726,483 | | | 4,942,907 | | | 3,790,003 | |
| | | | | | | | | | | |
Total revenue | | | 7,150,567 | | | 7,245,131 | | | 6,285,555 | |
| | | | | | | | | | | |
| | | | | | | | | | | |
| | | | | | | | | | | |
Note 28. — Other operating income and expenses
The table below shows the detail of Other Operating Income and Expenses for the years 2014, 2013 and 2012:
| | | | | | | | | | |
Other operating income | | 2014 | | 2013 | | 2012 | |
|---|
Work performed by the entity and capitalized and other | | | 76,035 | | | 322,308 | | | 367,798 | |
Grants | | | 16,732 | | | 17,764 | | | 13,826 | |
Income from various services | | | 95,510 | | | 101,329 | | | 100,288 | |
| | | | | | | | | | | |
Total | | | 188,277 | | | 441,401 | | | 481,912 | |
| | | | | | | | | | | |
| | | | | | | | | | | |
| | | | | | | | | | | |
| | | | | | | | | | |
Other operating expenses | | 2014 | | 2013 | | 2012 | |
|---|
Research and development cost | | | (8,714 | ) | | (6,532 | ) | | (6,404 | ) |
Leases and fees | | | (122,497 | ) | | (110,814 | ) | | (99,761 | ) |
Repairs and maintenance | | | (71,181 | ) | | (64,741 | ) | | (66,051 | ) |
Independent professional services | | | (265,829 | ) | | (488,683 | ) | | (283,932 | ) |
Transportation | | | (78,746 | ) | | (75,410 | ) | | (77,464 | ) |
Supplies | | | (115,543 | ) | | (123,689 | ) | | (101,628 | ) |
Other external services | | | (167,442 | ) | | (157,273 | ) | | (138,742 | ) |
Taxes | | | (85,514 | ) | | (71,018 | ) | | (53,414 | ) |
Other minor management expenses | | | (61,491 | ) | | (103,303 | ) | | (80,168 | ) |
| | | | | | | | | | | |
Total | | | (976,957 | ) | | (1,201,463 | ) | | (907,564 | ) |
| | | | | | | | | | | |
| | | | | | | | | | | |
| | | | | | | | | | | |
F-127
Table of Contents
ABENGOA
Consolidated financial statements
Work performed by the entity and capitalized and other corresponds to income from capitalized costs, including mainly the capitalization of costs associated with the construction of our own assets (except for concession assets for which IFRIC 12 is applied). The corresponding costs are recognized in the individual expense line item in the accompanying income statements. The recognition of an income for the sum of such costs through the line item 'work performed by the entity and capitalized costs and other' results in these costs having no impact in net operating profit. The corresponding assets are capitalized and included in property, plant and equipment in the accompanying balance sheets.
For the year ended December 31, 2014, there has been a decrease in work performed by the entity for its own assets and additionally, other income primarily included in 2013 an income of €141.8 million corresponding to a favorable jury verdict in a litigation process against Adriano Gianetti Dedini Ometto and Adriano Ometto Agrícola, Ltda. and other non-recurring minor income.
In 2012, other income primarily corresponds to the gain amounting to €85 million arising from the business combination of Rioglass Group, where we achieved control by increasing our ownership in stages well as an income of €26 million recorded by Abengoa Bioenergy U.S. Holding in the last quarter of 2012, corresponding to a collection from Chicago Title Insurance Company after a favorable jury verdict in a litigation process against that company. Finally, this heading includes income arising from the fair value adjustment of our biological assets in Brazil, to sales of property plant and equipment and to other minor income.
Grants include government grants related to R&D activities and to loans at a rate below interest rates which are considered as subsidized loans (see Note 2.17).
Income from various services in 2014 primarily includes profits generated by the sale of Qingdao BCTA Desalination Co., amounting to €9 million, as weel as, income from collections related to claims with third and other income by minor services higher than the previous year. Additionally, during 2013, profits generated by the sale of the Brazilian subsidiary, Bargoa, S.A. amounting to €33.2 million, were recorded. In 2012 primarily includes profits generated by the sale of the second 50% of the shareholding of STE, ATE, ATE II an ATE III amounting to €45 million.
The decrease in other operating expenses for the year ended December 31, 2014 is due to a decrese in independent professional services caused mainly by the fact the Company carried out less work through subcontractors in our Engineering and Construcion activity.
'Leases and fees' mainly includes leases of buildings, offices, machinery and construction equipment required in the ordinary course of operating activities of companies.
Under 'Other external services' are mainly recorded trips and per diem expenses.
Note 29. — Employee benefit expenses
The breakdown of Employee Benefit Expense for 2014, 2013 and 2012 is as follows:
| | | | | | | | | | |
Item | | 2014 | | 2013 | | 2012 | |
|---|
Wages | | | 700,818 | | | 621,857 | | | 576,610 | |
Social security costs | | | 141,650 | | | 118,582 | | | 110,887 | |
Stock plans and other employee benefits | | | 29,415 | | | 14,999 | | | 20,527 | |
| | | | | | | | | | | |
Total | | | 871,883 | | | 755,438 | | | 708,024 | |
| | | | | | | | | | | |
| | | | | | | | | | | |
| | | | | | | | | | | |
F-128
Table of Contents
ABENGOA
Consolidated financial statements
Variable remuneration plans for managers
There are currently two extraordinary long-term variable remuneration plans for managers.
- 1)
- Extraordinary Variable Remuneration Plan for Managers—January 2014
This plan, which replaces and cancels the extraordinary plan previously approved in February 2011, was agreed by the Company's board of directors in January 2014 following a proposal by the Appointments and Remuneration Committee.
The plan expires on December 31, 2017 and is designed to help achieve the objectives set in the Strategic Plan at an individual level. The plan also requires beneficiaries to remain with the company for the corresponding period and for Abengoa's average share price during the last three months of 2017 to be higher than a specific value. At the end of 2014, there were 345 participants and the plan was worth a total of €85,703 thousand.
- 2)
- Extraordinary Variable Remuneration Plan for Managers—July 2014
On July 21, 2014, the board of directors, at the proposal of the Appointments and Remuneration Committee, unanimously approved a five-year variable remuneration plan (2014-2018).
The plan expires on December 31, 2018 and accrues 20% annually. Its purpose is to incentivize certain managers to stay with the company or to achieve specific personal objectives. The plan requires the beneficiary to be employed by the company for the corresponding period and for the average price of Abengoa's Class B shares during the last three months of 2018 to be higher than a specific value. At the end of 2014, there were 359 participants and the plan was worth a total of €67,720 thousand.
The cost recognized through the variable remuneration plans in 2014 was €29,415 thousand, the accumulated cost being €49,849 thousand. The cost of Plan corresponding to senior Management of the Company recognized in 2014 amounts to €5,895 thousand.
Note 30. — Finance income and expenses
- 30.1.
- Finance income and expenses
The following table sets forth our Finance income and expenses for the years ended 2014, 2013 and 2012:
| | | | | | | | | | | |
| | Finance income | | 2014 | | 2013 | | 2012 | |
|---|
| | Interest income from loans and credits | | | 45,294 | | | 38,113 | | | 77,272 | |
| | Interest rates benefits derivatives: cash flow hedges | | | 15,668 | | | 28,387 | | | 10,185 | |
| | Interest rates benefits derivatives: non-hedging | | | 1,156 | | | 546 | | | 17 | |
| | | | | | | | | | | | |
| | Total | | | 62,118 | | | 67,046 | | | 87,474 | |
| | | | | | | | | | | | |
| | | | | | | | | | | | |
| | | | | | | | | | | | |
| | | | | | | | | | | |
| | Finance expenses | | 2014 | | 2013 | | 2012 | |
|---|
| | Expenses due to interest: | | | | | | | | | | |
| | —Loans from credit entities | | | (256,995 | ) | | (229,436 | ) | | (208,816 | ) |
| | —Other debts | | | (376,580 | ) | | (269,832 | ) | | (219,818 | ) |
| | Interest rates losses derivatives: cash flow hedges | | | (92,260 | ) | | (83,903 | ) | | (99,242 | ) |
| | Interest rates losses derivatives: non-hedging | | | (19,557 | ) | | (13 | ) | | (4,322 | ) |
| | | | | | | | | | | | |
| | Total | | | (745,392 | ) | | (583,184 | ) | | (532,198 | ) |
| | | | | | | | | | | | |
| | | | | | | | | | | | |
| | | | | | | | | | | | |
| | Net financial loss | | | (683,274 | ) | | (516,138 | ) | | (444,724 | ) |
| | | | | | | | | | | | |
| | | | | | | | | | | | |
| | | | | | | | | | | | |
F-129
Table of Contents
ABENGOA
Consolidated financial statements
In 2014, finance income has decreased due to lower interest rates benefits derivatives as a result of expense for the time value of interest rate options classified in Finance expenses, that in the previous year was an income, partially offset by higher interest income from loans and credits in Brazil.
Interest expenses from loans with credit entities increased in 2014 mainly due to the higher interest accrued on other debts due to the new notes issued in the last quarter of 2013 and in the first quarter of 2014 (see Note 20.3), the increase in interest expenses from loans with credit entities because of the lower capitalization of interest expense financing projects under construction, due to various projects coming into operation, as well as, the negative effect on the valuation of interest rate derivatives.
In 2013, finance income has decreased due to lower interest income from loans and credits in Brazil, partially offset by higher interest rates benefits derivatives as a result of income for the time value of interest rate options that in the previous year was a loss classified in Finance expenses.
Interest expenses from loans with credit entities increased in 2013 mainly due to the lower capitalization of interest expenses for financing projects under construction, thanks to various projects coming into operation. The interest accrued on other debt increased, mainly due to the new notes issued during 2013 (see Note 20.3).
The net financial expenses for companies which are financed through project debt is €–181,989 thousand (€–174,065 thousand in 2013 and €–99,974 thousand in 2012).
- 30.2.
- Net exchange differences
The following table sets out the exchange rate differences for the years 2014, 2013 and 2012:
| | | | | | | | | | | |
| | Net exchange differences | | 2014 | | 2013 | | 2012 | |
|---|
| | Gains and losses from foreign exchange transactions | | | (6,475 | ) | | 331 | | | 6,780 | |
| | Gains and losses from foreign exchange contracts: cash flow hedges | | | 11,244 | | | (4,171 | ) | | (22,936 | ) |
| | Gains and losses from foreign exchange contracts: non-hedging | | | 266 | | | 283 | | | (19,947 | ) |
| | | | | | | | | | | | |
| | Total | | | 5,035 | | | (3,557 | ) | | (36,103 | ) |
| | | | | | | | | | | | |
| | | | | | | | | | | | |
| | | | | | | | | | | | |
The most significant amounts in net exchange differences during 2014 and 2013 corresponded to the Consolidated Income Statement and to different hedges in several subsidiaries that have not been offset perfectly with the differences generated by de hedged item.
The most significant amounts in net exchange differences during 2012 correspond to a loss from exchange rate derivatives recognized as a result of the interruption of the hedging relationship, when the transaction hedge is no longer expected to occur, to the negative impact of the accumulated translation differences transferred to the Consolidated Income Statement, to the termination of foreign exchange derivatives signed to hedge certain Brazilian transmission line concessions sold (see Note 6.3) and to different hedges in several subsidiaries that have not been offset perfectly with the differences generated by the hedged item.
Net exchange rate differences in 2014 for companies which are financed through project debt amounts to €–29,712 thousand (€–3,998 thousand in 2013 and €–27,632 thousand in 2012).
F-130
Table of Contents
ABENGOA
Consolidated financial statements
- 30.3.
- Other net finance income and expenses
The following table sets out 'Other net finance income and expenses' in 2014, 2013 and 2012:
| | | | | | | | | | | |
| | Other finance income | | 2014 | | 2013 | | 2012 | |
|---|
| | Profits from the sale of financial assets | | | 394 | | | 70 | | | 1,017 | |
| | Income on financial assets | | | 1,676 | | | 649 | | | 282 | |
| | Other finance income | | | 13,085 | | | 18,402 | | | 15,957 | |
| | Changes in the fair value of the derivatives embedded in the convertible bonds and options over shares | | | — | | | 75,614 | | | 9,214 | |
| | Commodity derivatives gains: Cash flow hedge | | | — | | | 154 | | | — | |
| | Commodity derivatives gains: non hedge | | | 45 | | | — | | | — | |
| | | | | | | | | | | | |
| | Total | | | 15,200 | | | 94,889 | | | 26,470 | |
| | | | | | | | | | | | |
| | | | | | | | | | | | |
| | | | | | | | | | | | |
| | | | | | | | | | | |
| | Other finance expenses | | 2014 | | 2013 | | 2012 | |
|---|
| | Loss from sale of financial assets | | | (11,337 | ) | | (335 | ) | | — | |
| | Losses from partial repayment of the convertible notes due 2014 | | | — | | | (12,026 | ) | | — | |
| | Outsourcing of payables | | | (84,770 | ) | | (81,238 | ) | | (88,457 | ) |
| | Other financial losses | | | (81,112 | ) | | (110,706 | ) | | (75,459 | ) |
| | Changes in the fair value of the derivatives embedded in the convertible bonds and options over shares | | | (9,631 | ) | | — | | | — | |
| | Commodity derivatives losses: non hedge | | | (4,853 | ) | | (9,837 | ) | | (20,428 | ) |
| | | | | | | | | | | | |
| | Total | | | (191,703 | ) | | (214,142 | ) | | (184,344 | ) |
| | | | | | | | | | | | |
| | | | | | | | | | | | |
| | | | | | | | | | | | |
| | Other net finance income/expenses | | | (176,503 | ) | | (119,253 | ) | | (157,874 | ) |
| | | | | | | | | | | | |
| | | | | | | | | | | | |
| | | | | | | | | | | | |
For the year ended December 31, 2014 the heading 'Other finance income' has decreased when compared to the previous year, mainly due to the change in fair value of embedded derivatives of the convertible notes, net of change in fair value of the call options over Abengoa's own share, which hedge the embedded derivatives partially, amounting to a net gain of €75,614 thousand for the year ended December, 2013 (a loss of €1,180 thousand for the year ended December 31, 2014).
The heading 'Other finance expenses' has decreased for the year ended December 31, 2014 compared to the previous year mainly due to the decrease in the heading 'Other financial losses', which include commissions to wire transfers and other bank fees and other minor finance expenses. Additionally, for the year ended December 31, 2013 was recorded the impairment of uncollectible financial accounts. This heading has also decreased by losses from partial repayment of the convertible notes due in 2014 recorded for the year ended December 31, 2013. These decreases has been partially offset by the change in fair value of embedded derivatives of the convertible notes, net of change in fair value of the call options over Abengoa's own share, as mentioned above, as well as, the negative impact of the valuation of the embedded derivative of convertible loan received as part of the consideration for the sale of the shareholding in Befesa (see Note 7.3).
For the year ended December 31, 2013 the heading 'Other finance income' has increased when compared to the previous year, mainly due to the change in fair value of embedded derivatives of the convertible bonds, net of change in fair value of the call options over Abengoa's own share, which hedge the embedded derivatives partially, amounting to a net gain of €75,614 thousand, see Note 20.3 (€9,214 thousand for the year ended December 31, 2012).
F-131
Table of Contents
ABENGOA
Consolidated financial statements
The heading 'Other finance expenses' has increased for the year ended December 31, 2013 compared to the previous year mainly due to losses from partial repayment of the convertible notes due in 2014 (see Note 20.3), the increase in other financial losses due to a higher volume of uncollectible financial accounts with related parties, according to the current situation of negotiations with them in developing projects in Latin America; and the impairment of financial investments associated with thermosolar projects in the USA, partially offset by lower costs of outsourcing supplier payments and lower commodity derivatives losses corresponding to the interruption of the hedging relationship, when the transaction hedged is no longer expected to occur. Additionally, 'Other finance losses' include finance expenses mainly related to financial guarantees and letters of credit, to wire transfers and other bank fees, losses on available for sale financial assets and other minor finance expenses.
The net of 'Other incomes and financial expenses' for companies which are financed through project debt is €–45,112 thousand (€–46,396 thousand in 2013 and €–33.473 thousand in 2012).
- 30.4.
- Non-monetary items of derivative financial instruments
The table below provides a breakdown of the line item 'Fair value gains on derivative financial instruments' included in the Consolidated Cash Flow Statement for the years 2014, 2013 and 2012:
| | | | | | | | | | | |
| | Fair value gains on derivative financial instruments | | 2014 | | 2013 | | 2012 | |
|---|
| | Change in fair value of the embedded derivative of convertible debt and shares options | | | (9,631 | ) | | 75,614 | | | 9,214 | |
| | Non-cash profit/(losses) from cash flow hedges | | | (3,087 | ) | | 20,230 | | | (29,547 | ) |
| | Non-cash profit/(losses) from derivatives—non-hedge accounting | | | (22,988 | ) | | (8,866 | ) | | (44,243 | ) |
| | Other non-cash gains/losses on derivative instruments | | | 561 | | | 764 | | | (9,778 | ) |
| | Fair value gains (losses) on derivative financial instruments (non cash items) | | | (35,145 | ) | | 87,742 | | | (74,354 | ) |
| | | | | | | | | | | | |
| | Cash gains (losses) on derivative financial instruments (monetary effect) | | | (74,287 | ) | | (76,794 | ) | | (30,222 | ) |
| | | | | | | | | | | | |
| | Total fair value gains / (loss) on derivative financial instruments (Notes 30.1 & 30.3) | | | (109,432 | ) | | 10,948 | | | (104.576 | ) |
| | | | | | | | | | | | |
| | | | | | | | | | | | |
| | | | | | | | | | | | |
Note 31. — Income tax
Details regarding income tax for the years 2014, 2013 and 2012 are as follows:
| | | | | | | | | | |
Item | | 2014 | | 2013 | | 2012 | |
|---|
Current tax | | | (63,322 | ) | | (27,960 | ) | | (30,676 | ) |
Deferred tax | | | 121,968 | | | 54,143 | | | 204,758 | |
| | | | | | | | | | | |
Total income tax benefit/(expense) | | | 58,646 | | | 26,183 | | | 174,082 | |
| | | | | | | | | | | |
| | | | | | | | | | | |
| | | | | | | | | | | |
F-132
Table of Contents
ABENGOA
Consolidated financial statements
The reconciliation between the theoretical income tax resulting from applying statutory tax rate in Spain to income before income tax and the actual income tax expense recognized in the Consolidated Income Statement for the years 2014, 2013 and 2012 is as follows:
| | | | | | | | | | |
| | 2014 | | 2013 | | 2012 | |
|---|
Consolidated profit before taxes | | | 85,434 | | | 106,883 | | | (100,238 | ) |
Regulatory tax rate | | | 30 | % | | 30 | % | | 30 | % |
| | | | | | | | | | | |
Corporate income tax at regulatory tax rate | | | (25,630 | ) | | (32,065 | ) | | 30,071 | |
| | | | | | | | | | | |
| | | | | | | | | | | |
| | | | | | | | | | | |
Income tax of associates, net | | | 2,105 | | | (1,549 | ) | | (222 | ) |
Differences in foreign tax rates | | | 12,507 | | | 8,899 | | | 12,099 | |
Incentives, deductions and tax losses carryforwards | | | 124,460 | | | 88,367 | | | 61,181 | |
Effect in consolidated income statement for change in Spanish companies tax rate | | | (49,439 | ) | | — | | | — | |
Non-taxable gain | | | — | | | — | | | 25,573 | |
Other non-taxable income/(expense) | | | (5,357 | ) | | (37,469 | ) | | 45,381 | |
| | | | | | | | | | | |
Corporate income tax | | | 58,646 | | | 26,183 | | | 174,082 | |
| | | | | | | | | | | |
| | | | | | | | | | | |
| | | | | | | | | | | |
Note 32. — Earnings per share
As explained in Note 18, on September 30, 2012, the General Shareholders' Meeting approved a capital increase in class B shares, charged to our freely available reserves, which were distributed for no consideration to all existing shareholders on the basis of four (4) class B shares for each class A share or class B share which they hold. Therefore, no dilution or further concentration with respect to our share capital occurred.
According to IAS 33, when ordinary shares are issued to existing shareholders for no additional consideration, the transaction is equivalent to a share split. In this case, the number of ordinary shares outstanding before the event is adjusted for the proportionate change in the number of ordinary shares outstanding as if the event had occurred at the beginning of the earliest period presented.
In addition, the average number of shares outstanding in 2013 has been calculated taking into account the capital increase carried out in October 2013 (see Note 18).
F-133
Table of Contents
ABENGOA
Consolidated financial statements
- 32.1.
- Basic earnings per share
Basic earnings per share are calculated by dividing the profit attributable to equity holders of the company by the weighted average number of ordinary shares outstanding during the period.
| | | | | | | | | | | |
| | Item | | 2014 | | 2013 | | 2012 | |
|---|
| | Profit from continuing operations attributable to equity holders of the company | | | 147,708 | | | 125,361 | | | 35,610 | |
| | Profit from discontinuing operations attributable to equity holders of the company | | | (22,416 | ) | | (23,916 | ) | | 19,760 | |
| | | | | | | | | | | | |
| | Average number of ordinary shares outstanding (thousands) | | | 835,371 | | | 595,905 | | | 538,063 | |
| | | | | | | | | | | | |
| | | | | | | | | | | | |
| | | | | | | | | | | | |
| | Earnings per share from continuing operations (€ per share) | | | 0.18 | | | 0.21 | | | 0.06 | |
| | Earnings per share from discontinuing operations (€ per share) | | | (0.03 | ) | | (0.04 | ) | | 0.04 | |
| | | | | | | | | | | | |
| | Earnings per share from profit for the year (€ per share) | | | 0.15 | | | 0.17 | | | 0.10 | |
| | | | | | | | | | | | |
| | | | | | | | | | | | |
| | | | | | | | | | | | |
- 32.2.
- Diluted earnings per share
To calculate the diluted earnings per share, the average weighted number of ordinary shares issued and outstanding is adjusted to reflect the conversion of all the potential diluting ordinary shares.
The potential diluting ordinary shares held by the group correspond to the warrants on Class B shares issued in November 2011. The assumption is that all warrants will be exercised and a calculation is made to determine the number of shares that may have been acquired at fair value based on the monetary value of the subscription rights of the warrants still to be exercised. The difference between
F-134
Table of Contents
ABENGOA
Consolidated financial statements
the number of shares issued assuming the exercise of the warrants, and the number of shares calculated based on the above, is included in the calculation of the income per diluted share.
| | | | | | | | | | | |
| |
| | 2014 | | 2013 | | 2012 | |
|---|
| | Profit for the year | | | | | | | | | | |
| | —Profit from continuing operations attributable to equity holders of the company | | | 147,708 | | | 125,361 | | | 35,610 | |
| | —Profit from discontinuing operations attributable to equity holders of the company | | | (22,416 | ) | | (23,916 | ) | | 19,760 | |
| | —Adjustments to attributable profit | | | — | | | — | | | | |
| | | | | | | | | | | | |
| | Profit used to determine the diluted earnings per share | | | 125,292 | | | 101,445 | | | 55,370 | |
| | | | | | | | | | | | |
| | | | | | | | | | | | |
| | | | | | | | | | | | |
| | Average weighted number of ordinary shares outstanding (thousands) | | | 835,371 | | | 595,905 | | | 538,063 | |
| | —Warrants adjustments (average weighted number of shares in outstanding since issue) | | | 20,039 | | | 19,995 | | | 20,021 | |
| | | | | | | | | | | | |
| | Average weighted number of ordinary shares affecting the diluted earnings per share (thousands) | | | 855,410 | | | 615,900 | | | 558,084 | |
| | | | | | | | | | | | |
| | | | | | | | | | | | |
| | | | | | | | | | | | |
| | Diluted earnings per share from continuing operations (€ per share) | | | 0.17 | | | 0.20 | | | 0.06 | |
| | Diluted earnings per share from discontinuing operations (€ per share) | | | (0.02 | ) | | (0.04 | ) | | 0.04 | |
| | | | | | | | | | | | |
| | Diluted earnings per share to the profit for the year (€ per share) | | | 0.15 | | | 0.16 | | | 0.10 | |
| | | | | | | | | | | | |
| | | | | | | | | | | | |
| | | | | | | | | | | | |
Note 33. — Other information
- 33.1.
- Employees
The average number of employees classified by category during 2014, 2013 and 2012 was:
| | | | | | | | | | | | | | | | | | | | | | | | | | | | | |
| |
| | Average number of employees in 2014 | |
| | Average number of employees in 2013 | |
| | Average number of employees in 2012 | |
| |
|---|
| | Categories | | Female | | Male | | %
Total | | Female | | Male | | %
Total | | Female | | Male | | %
Total | |
|---|
| | Directors | | | 65 | | | 503 | | | 2.1 | | | 73 | | | 536 | | | 2.3 | | | 76 | | | 583 | | | 2.5 | |
| | Management | | | 435 | | | 1,517 | | | 7.2 | | | 426 | | | 1,512 | | | 7.2 | | | 391 | | | 1,724 | | | 7.9 | |
| | Engineers | | | 1,362 | | | 3,375 | | | 17.4 | | | 1,278 | | | 3,268 | | | 17.0 | | | 1,108 | | | 2,485 | | | 13.5 | |
| | Assistants and professionals | | | 1,108 | | | 1,480 | | | 9.5 | | | 1,128 | | | 1,507 | | | 9.8 | | | 1,255 | | | 1,904 | | | 11.9 | |
| | Operators | | | 865 | | | 15,893 | | | 61.6 | | | 925 | | | 15,648 | | | 61.8 | | | 975 | | | 15,640 | | | 62.3 | |
| | Interns | | | 242 | | | 336 | | | 2.2 | | | 230 | | | 287 | | | 1.9 | | | 214 | | | 299 | | | 1.9 | |
| | | | | | | | | | | | | | | | | | | | | | | | | | | | | | |
| | Total | | | 4,077 | | | 23,104 | | | 100 | | | 4,060 | | | 22,758 | | | 100 | | | 4,019 | | | 22,635 | | | 100 | |
| | | | | | | | | | | | | | | | | | | | | | | | | | | | | | |
| | | | | | | | | | | | | | | | | | | | | | | | | | | | | | |
| | | | | | | | | | | | | | | | | | | | | | | | | | | | | | |
The average number of employees is 25% in Spain (27% in 2013 and 29% in 2012) and 75% abroad (73% in 2013 and 71% in 2012).
The average number of employees during the year with disabilities above or equal to 33% is 126 (107 in 2013 and 115 in 2012).
F-135
Table of Contents
ABENGOA
Consolidated financial statements
The total number of people employees classified by category as of December 31, 2014, 2013 and 2012 was:
| | | | | | | | | | | | | | | | | | | | | | | | | | | | | |
| |
| | 12.31.14 | |
| | 12.31.13 | |
| | 12.31.12 | |
| |
|---|
| | Categories | | Female | | Male | | %
Total | | Female | | Male | | %
Total | | Female | | Male | | %
Total | |
|---|
| | Board of Directors | | | 3 | | | 13 | | | 0.1 | | | 3 | | | 12 | | | 0.1 | | | 3 | | | 12 | | | 0.1 | |
| | Directors | | | 62 | | | 507 | | | 2.3 | | | 74 | | | 506 | | | 2.3 | | | 76 | | | 597 | | | 2.5 | |
| | Management | | | 466 | | | 1,668 | | | 8.8 | | | 415 | | | 1,382 | | | 7.3 | | | 400 | | | 1,714 | | | 8.0 | |
| | Engineers | | | 1,392 | | | 3,120 | | | 18.6 | | | 1,311 | | | 3,460 | | | 19.3 | | | 1,271 | | | 2,733 | | | 15.2 | |
| | Assistants and professionals | | | 1,111 | | | 1,531 | | | 10.9 | | | 1,079 | | | 1,407 | | | 10.0 | | | 1,170 | | | 1,552 | | | 10.3 | |
| | Operators | | | 791 | | | 13,045 | | | 56.8 | | | 772 | | | 13,844 | | | 59.0 | | | 883 | | | 15,503 | | | 62.0 | |
| | Interns | | | 247 | | | 366 | | | 2.5 | | | 230 | | | 268 | | | 2.0 | | | 221 | | | 282 | | | 1.9 | |
| | | | | | | | | | | | | | | | | | | | | | | | | | | | | | |
| | Total | | | 4,072 | | | 20,250 | | | 100 | | | 3,884 | | | 20,879 | | | 100 | | | 4,024 | | | 22,393 | | | 100 | |
| | | | | | | | | | | | | | | | | | | | | | | | | | | | | | |
| | | | | | | | | | | | | | | | | | | | | | | | | | | | | | |
| | | | | | | | | | | | | | | | | | | | | | | | | | | | | | |
- 33.2.
- Related parties
The account held by Abengoa with Inversión Corporativa I.C., S.A., as of year-end 2014 and 2013 has a nil balance.
Dividends distributed to related parties during 2014 amounted to €31,601 thousand (€17,182 thousand in 2013 and €17,212 thousand in 2012).
During 2014 the only transactions associated with related parties were the following:
- •
- Service provision agreement signed between Centro Tecnológico Palmas Altas, S.A. and Ms. Blanca de Porres Guardiola, which involved a consideration of €72 thousand.
- •
- Service agreement signed between Equipo Económico, S.L. (company related to D. Ricardo Martínez Rico, member of Board of Directors) and Abengoa, S.A., Abengoa Concessions, S.L.,Abeinsa Ingeniería and Construcción Industrial, S.A. for a total amount of €355 thousand.
As indicated in Note 18.1, Inversión Corporativa is Abengoa's main shareholder, and issues its own separate Consolidated Financial Statements.
These operations were subject to review by the Abengoa Audit Committee and third parties.
- 33.3.
- Employee remuneration and other benefits
Directors are remunerated as established in article 39 of the Bylaws. The remuneration of Directors is made up of a fixed amount as agreed upon at the General Shareholders' Meeting, and is not necessarily equal for all directors. Additionally, they may participate in profit sharing programs, for a percentage between 5% and 10% (maximum) of the net income of the Company after the declaration of the dividends for the year. Travel expenses related to work undertaken by the board are reimbursed to Directors.
Salary (both fixed and variable) and allowances paid to the members of the Board of Abengoa S.A. in 2014 were €15,833 thousand (€15,421 thousand in 2013 and €13,887 in 2012).
F-136
Table of Contents
ABENGOA
Consolidated financial statements
Detail on individual salaries and benefits in 2014 paid to the Board of Directors are as follows (in thousands of Euros):
| | | | | | | | | | | | | | | | | | | | | | | | | | |
| | Name | | Salary | | Fixed
remuneration | | Daily
allowance | | Short term
variable
remuneration | | Compensation
as member of
Board
Committee | | Compensation
as officer of
other Group
companies | | Other
concepts | | Total
2014 | |
|---|
| | Felipe Benjumea Llorente | | | 1,086 | | | — | | | 93 | | | 3,304 | | | — | | | — | | | 1 | | | 4,484 | |
| | Aplidig, S.L.(1) | | | — | | | 202 | | | 93 | | | 2,804 | | | — | | | — | | | — | | | 3,099 | |
| | Manuel Sánchez Ortega | | | 1,086 | | | — | | | 93 | | | 3,304 | | | — | | | — | | | 1 | | | 4,484 | |
| | Javier Benjumea Llorente | | | 450 | | | — | | | 93 | | | 1,307 | | | 200 | | | 52 | | | — | | | 2,102 | |
| | José Borrell Fontelles | | | — | | | — | | | 160 | | | — | | | 140 | | | — | | | — | | | 300 | |
| | Mercedes Gracia Díez | | | — | | | — | | | 160 | | | — | | | 40 | | | — | | | — | | | 200 | |
| | Ricardo Martínez Rico | | | — | | | — | | | 110 | | | — | | | 20 | | | — | | | — | | | 130 | |
| | Alicia Velarde Valiente | | | — | | | — | | | 110 | | | — | | | 40 | | | — | | | — | | | 150 | |
| | Ricardo Hausmann(2) | | | — | | | — | | | 178 | | | — | | | — | | | — | | | — | | | 178 | |
| | José Joaquín Abaurre Llorente | | | — | | | — | | | 110 | | | — | | | 40 | | | — | | | — | | | 150 | |
| | José Luis Aya Abaurre | | | — | | | — | | | 110 | | | — | | | 40 | | | — | | | — | | | 150 | |
| | María Teresa Benjumea Llorente | | | — | | | — | | | 78 | | | — | | | — | | | 24 | | | — | | | 102 | |
| | Claudi Santiago Ponsa | | | — | | | — | | | 70 | | | — | | | — | | | — | | | — | | | 70 | |
| | Ignacio Solís Guardiola | | | — | | | — | | | 78 | | | — | | | — | | | — | | | — | | | 78 | |
| | Fernando Solís Martínez-Campos | | | — | | | — | | | 78 | | | — | | | — | | | — | | | — | | | 78 | |
| | Carlos Sundheim Losada | | | — | | | — | | | 78 | | | — | | | — | | | — | | | — | | | 78 | |
| | | | | | | | | | | | | | | | | | | | | | | | | | | |
| | Total | | | 2,622 | | | 202 | | | 1,692 | | | 10,719 | | | 520 | | | 76 | | | 2 | | | 15,833 | |
| | | | | | | | | | | | | | | | | | | | | | | | | | | |
| | | | | | | | | | | | | | | | | | | | | | | | | | | |
| | | | | | | | | | | | | | | | | | | | | | | | | | | |
- Note
- (1): Represented by Mr. José B. Terceiro Lomba until 01.19.2015
- Note
- (2): From 06.02.2014
Detail on individual salaries and benefits in 2013 paid to the Board of Directors is as follows (in thousand of Euros):
| | | | | | | | | | | | | | | | | | | | | | | | | | |
| | Name | | Salary | | Fixed
remuneration | | Daily
allowance | | Short term
variable
remuneration | | Compensation
as member of
Board
Committee | | Compensation
as officer of
other Group
companies | | Other
concepts | | Total
2013 | |
|---|
| | Felipe Benjumea Llorente | | | 1,086 | | | — | | | 93 | | | 3,304 | | | — | | | — | | | 1 | | | 4,484 | |
| | Aplidig, S.L.(1) | | | — | | | 202 | | | 93 | | | 2,804 | | | — | | | — | | | — | | | 3,099 | |
| | Manuel Sánchez Ortega | | | 1,086 | | | — | | | 93 | | | 3,304 | | | — | | | — | | | 1 | | | 4,484 | |
| | Javier Benjumea Llorente | | | 263 | | | — | | | 78 | | | 1,183 | | | 200 | | | 38 | | | 108 | | | 1,870 | |
| | José Borrell Fontelles | | | — | | | — | | | 176 | | | — | | | 124 | | | — | | | — | | | 300 | |
| | Mercedes Gracia Díez | | | — | | | — | | | 160 | | | — | | | 40 | | | — | | | — | | | 200 | |
| | Ricardo Martínez Rico | | | — | | | — | | | 121 | | | — | | | 15 | | | — | | | — | | | 136 | |
| | Alicia Velarde Valiente | | | — | | | — | | | 110 | | | — | | | 40 | | | — | | | — | | | 150 | |
| | José Joaquín Abaurre Llorente | | | — | | | — | | | 110 | | | — | | | 40 | | | — | | | — | | | 150 | |
| | José Luis Aya Abaurre | | | — | | | — | | | 110 | | | — | | | 40 | | | — | | | — | | | 150 | |
| | María Teresa Benjumea Llorente | | | — | | | — | | | 78 | | | — | | | — | | | 24 | | | — | | | 102 | |
| | Claudio Santiago Ponsa | | | — | | | — | | | 62 | | | — | | | — | | | — | | | — | | | 62 | |
| | Ignacio Solís Guardiola | | | — | | | — | | | 78 | | | — | | | — | | | — | | | — | | | 78 | |
| | Fernando Solís Martínez-Campos | | | — | | | — | | | 78 | | | — | | | — | | | — | | | — | | | 78 | |
| | Carlos Sundhein Losada | | | — | | | — | | | 78 | | | — | | | — | | | — | | | — | | | 78 | |
| | | | | | | | | | | | | | | | | | | | | | | | | | | |
| | Total | | | 2,435 | | | 202 | | | 1,518 | | | 10,595 | | | 499 | | | 62 | | | 110 | | | 15,421 | |
| | | | | | | | | | | | | | | | | | | | | | | | | | | |
| | | | | | | | | | | | | | | | | | | | | | | | | | | |
| | | | | | | | | | | | | | | | | | | | | | | | | | | |
- Note
- (1): Represented by Mr. José B. Terceiro Lomba
F-137
Table of Contents
ABENGOA
Consolidated financial statements
Detail on individual salaries and benefits in 2012 paid to the Board of Directors is as follows (in thousand of Euros):
| | | | | | | | | | | | | | | | | | | | |
| | Name | | Daily expenses for
attendance and
other remun. as
officer | | Compensation as
member of Board
Committee | | Compensation as
officer of other
Group
companies | | Compensation for
Sr. Mgmt.—
Executive Officer
Duties | | Other
remunerations | | Total
2012 | |
|---|
| | Felipe Benjumea Llorente | | | 93 | | | — | | | — | | | 4,390 | | | — | | | 4,483 | |
| | Aplidig, S.L.(1) | | | 295 | | | — | | | — | | | 2,804 | | | — | | | 3,099 | |
| | Manuel Sánchez Ortega | | | 93 | | | — | | | — | | | 4,390 | | | — | | | 4,483 | |
| | Carlos Sebastián Gascón(2) | | | 33 | | | 28 | | | — | | | — | | | — | | | 61 | |
| | Mercedes Gracia Díez | | | 160 | | | 40 | | | — | | | — | | | — | | | 200 | |
| | Alicia Velarde Valiente | | | 110 | | | 40 | | | — | | | — | | | — | | | 150 | |
| | José Borrell Fontelles | | | 200 | | | 100 | | | — | | | — | | | — | | | 300 | |
| | Ricardo Martínez Rico | | | 107 | | | 10 | | | 13 | | | — | | | — | | | 130 | |
| | Claudio Santiago Ponsa(3) | | | 55 | | | — | | | — | | | — | | | — | | | 55 | |
| | José Luis Aya Abaurre | | | 110 | | | 40 | | | — | | | — | | | — | | | 150 | |
| | José Joaquín Abaurre Llorente | | | 110 | | | 40 | | | — | | | — | | | — | | | 150 | |
| | María Teresa Benjumea Llorente | | | 78 | | | — | | | 24 | | | — | | | — | | | 102 | |
| | Javier Benjumea Llorente | | | 78 | | | — | | | — | | | — | | | 220 | | | 298 | |
| | Ignacio Solís Guardiola | | | 78 | | | — | | | — | | | — | | | — | | | 78 | |
| | Fernando Solís Martínez-Campos | | | 78 | | | — | | | — | | | — | | | — | | | 78 | |
| | Carlos Sundhein Losada | | | 70 | | | — | | | — | | | — | | | — | | | 70 | |
| | | | | | | | | | | | | | | | | | | | | |
| | Total | | | 1,748 | | | 298 | | | 37 | | | 11,584 | | | 220 | | | 13,887 | |
| | | | | | | | | | | | | | | | | | | | | |
| | | | | | | | | | | | | | | | | | | | | |
| | | | | | | | | | | | | | | | | | | | | |
- Note
- (1): Represented by Mr. José B. Terceiro Lomba
- Note
- (2) To 23.02.12
- Note
- (3) From 24.02.12
Additionally, in 2014 overall remuneration for key management of the Company (Senior Management which are not executive directors), including both fixed and variable components, amounted to €11,351 thousand (€14,656 thousand in 2013 and €13,574 thousand in 2012).
No advanced payments or credits are granted to members of the Board, nor are any guarantees or obligations granted in their favor.
As of December 31, 2014 there existed €56,659 thousand in non-current personnel compensation obligations (€29,789 thousand in 2013 and €70,599 thousand in 2012).
- 33.4.
- In compliance with Royal Decree 1/2010 of July 2, that approves the Capital Corporations Law, the Company reports that no member of the Board of Directors of Abengoa, S.A. and, to its knowledge, none of the individuals related parties as referred to by article 231 in the Capital Corporations Law Act maintains any direct to indirect share in the capital of companies with the same, analogous or complementary kind of activity that the parent company's corporate purpose, nor has any position in any company with the same, analogous or complementary kind of activity that the parent company's corporate purpose. In addition, no member of the Board of Directors has accomplished any activity with the same, analogous or complementary kind of activity that the parent company's corporate purpose.
F-138
Table of Contents
ABENGOA
Consolidated financial statements
As of December 31, 2014, members of the Board of Directors who are in turn Directors or Management in other subsidiaries included in the consolidation group are:
| | | | | |
| | Name | | Company | | Charge |
|---|
| | Prof. D. José B. Terceiro | | Bioetanol Galicia, S.A. | | President |
|
D. Javier Benjumea Llorente |
|
Abengoa Bioenergía, S.A. |
|
President |
|
|
|
Abengoa Solar, S.A. |
|
President |
|
Dña. María Teresa Benjumea Llorente |
|
Sociedad Inversora en Energía y Medio Ambiente, S.A. |
|
Member of Board of Directors |
|
D. Manuel Sánchez Ortega |
|
Abengoa Bioenergía, S.A. |
|
Member of Board of Directors |
|
|
|
Abengoa Solar, S.A. |
|
Member of Board of Directors |
|
|
|
Gestión Integral de Recursos Humanos, S.A |
|
President |
|
|
|
Abengoa Yield, Plc |
|
President |
In accordance with the record of significant holding in the Company, and as required by the 'Internal Rules and Regulations for Conduct involving Stock Exchange Matters', the shares and the holding percentages of the Company Directors as of December 31, 2014 are:
| | | | | | | | | | | | | | | | | |
| |
| | No. of direct
class A shares | | No. of indirect
class A shares | | No. of direct
class B shares | | No. of indirect
class B shares | | % Total | |
|---|
| | Felipe Benjumea Llorente | | | — | | | — | | | 414,170 | | | 4,300,905 | | | 0.0513 | |
| | Aplidig, S.L. | | | — | | | — | | | 4,737,756 | | | — | | | 0.0516 | |
| | Manuel Sánchez Ortega | | | — | | | — | | | 913,167 | | | — | | | 0.0099 | |
| | José Joaquín Abaurre Llorente | | | — | | | — | | | 9,870 | | | — | | | 0.0001 | |
| | José Luis Aya Abaurre | | | 1,210 | | | — | | | 344,301 | | | — | | | 0.0050 | |
| | Mª Teresa Benjumea Llorente | | | 12,390 | | | — | | | 49,560 | | | — | | | 0.0140 | |
| | Javier Benjumea Llorente | | | 3,888 | | | — | | | 15,552 | | | — | | | 0.0044 | |
| | José Borrell Fontelles | | | — | | | — | | | 71,695 | | | — | | | 0.0008 | |
| | Mercedes Gracia Díez | | | — | | | — | | | 2,500 | | | — | | | — | |
| | Ricardo Hausmann | | | — | | | — | | | — | | | — | | | — | |
| | Ricardo Martínez Rico | | | — | | | — | | | 2,565 | | | — | | | — | |
| | Claudi Santiago Ponsa | | | 200 | | | — | | | 800 | | | — | | | 0.0002 | |
| | Ignacio Solís Guardiola | | | 17,000 | | | — | | | 68,000 | | | — | | | 0.0192 | |
| | Fernando Solís Martínez-Campos | | | 50,832 | | | 34,440 | | | 203,328 | | | 137,760 | | | 0.0966 | |
| | Carlos Sundheim Losada | | | — | | | — | | | 247,118 | | | — | | | 0.0026 | |
| | Alicia Velarde Valiente | | | 400 | | | — | | | 1,600 | | | — | | | 0.0005 | |
Throughout out 2014 and 2013 there was no evidence of any direct or indirect conflict of interest situation, in accordance with what is envisaged in Article 229 of the Capital Corporation Law.
F-139
Table of Contents
ABENGOA
Consolidated financial statements
- 33.5.
- Audit fees
The fees and costs obtained by Deloitte, S.L. and other auditors are the following:
| | | | | | | | | | | | | | | | | | | | | | | | | | | | | |
| |
| | 2014 | | 2013 | | 2012 | |
|---|
| |
| | Deloitte | | Other
auditors | | Total | | Deloitte | | Other
auditors | | Total | | Deloitte | | Other
auditors | | Total | |
|---|
| | Audit fees | | | 5,221 | | | 315 | | | 5,536 | | | 3,541 | | | 270 | | | 3,811 | | | 3,622 | | | 549 | | | 4,171 | |
| | Other verification services | | | 297 | | | 12 | | | 309 | | | 245 | | | 1 | | | 246 | | | 305 | | | 1 | | | 306 | |
| | Tax fees | | | 183 | | | 4,388 | | | 4,571 | | | 636 | | | 3,934 | | | 4,570 | | | 1,488 | | | 2.674 | (*) | | 4,162 | |
| | Other audit complementary services | | | 1,803 | | | 131 | | | 1,934 | | | 886 | | | 246 | | | 1,132 | | | 544 | | | 840 | | | 1,384 | |
| | Other services | | | 410 | | | 3,436 | | | 3,846 | | | 680 | | | 2,137 | | | 2,817 | | | 219 | | | 2,272 | | | 2,491 | |
| | | | | | | | | | | | | | | | | | | | | | | | | | | | | | |
| | Total | | | 7,914 | | | 8,282 | | | 16,196 | | | 5,988 | | | 6,588 | | | 12,576 | | | 6,178 | | | 6,336 | | | 12,514 | |
| | | | | | | | | | | | | | | | | | | | | | | | | | | | | | |
| | | | | | | | | | | | | | | | | | | | | | | | | | | | | | |
| | | | | | | | | | | | | | | | | | | | | | | | | | | | | | |
- (*)
- From this amount, €845 thousand correspond to tax advisory services provided by Deloitte, S.L. prior to their appointment as Group auditors.
- 33.6.
- Environmental information
The principles of the environmental policies of Abengoa are based on compliance with the current legal regulations applicable, preventing or minimizing damaging or negative environmental consequences, reducing the consumption of energy and natural resources, and achieving ongoing improvement in environmental conduct.
In response to this commitment to the sustainable use of energy and natural resources, Abengoa, in its Management Rules and Guidelines for the entire Group, explicitly establishes the obligation to implement and certify environmental management systems in accordance with the ISO 14001 International Standard.
Consequently, by year-end 2014, the percentage of Companies with Environment Management Systems certified according to the ISO 14001 Standard per sales volume is 89.56% (92.92% in 2013).
The table below lists the percentage of distribution of the Companies with Certified Environmental Management Systems, broken down by business unit:
| | | | | |
| | Business unit | | ISO 14001-certified
companies
(% of revenue) | |
|---|
| | Engineering and Construction | | | 92.35 | % |
| | Industrial Production | | | 89.53 | % |
| | Concession-type Infraestructure | | | 66.31 | % |
- 33.7.
- Restricted net assets
Abengoa considers that its traditional engineering activity represents no more than a valuable tool through which it can construct a more sustainable world, and it applies this philosophy in all its activities such that from concession type infrastructures, industrial production and engineering and construction, Abengoa applies innovative technology solutions for sustainable development.
Certain of our consolidated subsidiaries are restricted from remitting certain funds to us in the form of dividends or loans by a variety of regulations, contractual or statutory requirements. These restrictions are related to debt covenants that require the maintenance of debt coverage ratios and net assets ratios which restrict the amount of cash that can be paid to the parent. Also for certain project finance
F-140
Table of Contents
ABENGOA
Consolidated financial statements
entities that are in construction, no dividends may be distributed until activity commences or, after construction completion, be subject to cash waterfall provision. At December 31, 2014, the accumulated amount of the restrictions for the whole restricted term of these affiliates was €991 million. Even though the Company currently does not require any such dividends, loans or advances for working capital and other funding purposes, the Company may in the future require additional cash resources from the subsidiaries due to changes in business conditions, to fund future acquisitions and development, or merely to declare and pay dividends to make distributions to shareholders. Despite these restrictions, subsidiaries in operations have been distributing dividends up to the amount allowed by covenant ratios.
The Company performed a test on the restricted net assets of consolidated subsidiaries in accordance with Securities and Exchange Commission Regulation S X Rule 4 08 (e) (3) 'General Notes to Financial Statements' and rule 5 04 (c) 'what schedules are to be filed' and concluded the restricted net assets exceed 25% of the consolidated net assets of the Company as of December 31, 2014. Therefore the separate condensed financial statements of the Company should be presented (see Appendix XXIII for details).
At December 31, 2014, the amount of consolidated retained earnings which represents undistributed earnings of 50 percent or less owned entities is €9,973 thousand.
- 33.8.
- Subsequent events
Since December 31, 2014, apart from what is detailed above, no other events have occurred that might significantly influence the information reflected in the Consolidated Financial Statements, nor has there been any event of significance to the Group as a whole.
F-141
Table of Contents
Appendices
Appendix I
Subsidiary companies included in the 2014 consolidation perimeter using
the global integration method
| | | | | | | | | | | | | | | | | | | |
| |
| | Shareholding | |
| |
| |
| |
| |
|---|
Company Name | | Registered
Address | | Amount
in thousands
of € | | % of Nominal Capital | | Parent Company | | (*) | | Activity
(see
Page 5) | | Auditor | |
|---|
A3T Holdco España, S.A | | Seville (ES) | | | 60 | | | 100.00 | | Abener Energía, S.A./ Negocios Industriales y Comerciales, S.A. (Nicsa) | | (*) | | | (1 | ) | | — | |
AB Bioenergy Hannover, GmbH | | Hannover (DE) | | | 98 | | | 100.00 | | Abengoa Bioenergía, S.A. | | — | | | (6 | ) | | — | |
Abacus Project Management of Arizona, LLC. | | Arizona (US) | | | 1 | | | 100.00 | | Teyma Construction USA, LLC. | | — | | | (1 | ) | | — | |
Abacus Project Management, Inc. | | Arizona (US) | | | 3,824 | | | 100.00 | | Teyma Construction USA, LLC | | — | | | (1 | ) | | — | |
Abeanza Brasil, S.A. | | R. de Janeiro (BR) | | | 1,330 | | | 100.00 | | Asa Investment, AG ZUG/Sociedad Inversora Lineas de Brasil, S.L. (ETVE) | | — | | | (1 | ) | | — | |
Abeima Agua Internacional, S.L. | | Seville (ES) | | | 3 | | | 100.00 | | Abeinsa Infraestructuras Medio Ambiente/Construcciones y Depuraciones, S.A.(Codesa) | | — | | | (1 | ) | | — | |
Abeima India, Pvt. Ltd. | | Chennai (IN) | | | 7,602 | | | 100.00 | | Abeinsa Infraestructuras Medio Ambiente, S.A. | | — | | | (1 | ) | | D | |
Abeima Teyma Barka LLC. | | Ruwi (OM) | | | 332 | | | 70.00 | | Abeinsa Infraestructuras Medio Ambiente, S.A./Teyma Gest. Ctos. de Const. e Ing., S.A. | | — | | | (1 | ) | | B | |
Abeima Teyma Infraestructure Ghana Limited | | Accra (GH) | | | 38 | | | 100.00 | | Abeinsa Infraestructuras Medio Ambiente, S.A./Teyma Gest. Ctos. de Const. e Ing., S.A. | | — | | | (1 | ) | | B | |
Abeima Teyma Zapotillo, S.R.L. de C.V. | | Mexico City (MX) | | | — | | | 100.00 | | Abeinsa Infraestructuras Medio Ambiente, S.A./Teyma Gest. Ctos. de Const. e Ing., S.A. | | — | | | (1 | ) | | B | |
Abeima USA, LLC. | | Delaware (US) | | | 1 | | | 100.00 | | Abeinsa Business Development, LLC | | — | | | (1 | ) | | — | |
Abeinsa Abeima Teyma General Partnership | | Arizona (US) | | | 4 | | | 100.00 | | Abeima USA, LLC./Teyma Construction USA, LLC./ Abeinsa EPC, LLC. | | — | | | (1 | ) | | — | |
Abeinsa Abener Teyma General Partnership | | Arizona (US) | | | 4 | | | 100.00 | | Teyma Construction USA LLC./Abener Eng. Const. Serv., LLC/Abeinsa EPC Inc. | | — | | | (1 | ) | | — | |
Abeinsa Asset Management, S.L. | | Seville (ES) | | | 22,861 | | | 100.00 | | Abener Energía, S.A./Negocios Industriales y Comerciales, S.A. | | — | | | (1 | ) | | — | |
Abeinsa BD Asia Pacific Pte. Ltd. | | Singapore (SG) | | | 66 | | | 100.00 | | Abeinsa Business Development, S.A. | | — | | | (1 | ) | | B | |
Abeinsa Business Development (Pty) Ltd. | | Johannesburg (ZA) | | | — | | | 100.00 | | Abeinsa Business Development, S.A. | | (*) | | | (1 | ) | | — | |
Abeinsa Business Development Corp. | | Toronto (CA) | | | — | | | 100.00 | | Abeinsa Business Development, S.A. | | — | | | (1 | ) | | — | |
Abeinsa Business Development GmbH | | Berlin (DE) | | | 25 | | | 100.00 | | Abeinsa Business Development, S.A. | | (*) | | | (1 | ) | | — | |
Abeinsa Business Development Private Limited | | Bombay (IN) | | | 3,261 | | | 100.00 | | Abeinsa Business Development, S.A. /Negocios lndustriales y Comerciales, S.A. | | — | | | (1 | ) | | B | |
Abeinsa Business Development Representaçoes, Energía e Água, Ltda. | | R. de Janeiro (BR) | | | 1 | | | 100.00 | | Abeinsa Business Development, S.A./Negocios Industriales y Comerciales, S.A. | | — | | | (1 | ) | | — | |
Abeinsa Business Development S.A.C. | | Lima (PE) | | | — | | | 100.00 | | Abeinsa Business Development, S.A./Negocios Industriales y Comerciales, S.A. | | — | | | (1 | ) | | — | |
Abeinsa Business Development S.a.R.L./A.U | | Casablanca (MA) | | | — | | | 100.00 | | Abeinsa Business Development, S.A. | | (*) | | | (1 | ) | | — | |
Abeinsa Business Development, LLC | | Missouri (US) | | | 80,975 | | | 100.00 | | Abeinsa, LLC. | | — | | | (1 | ) | | B | |
Abeinsa Business Development, Ltd. | | Seoul (KR) | | | 70 | | | 100.00 | | Abeinsa Business Development, S.A. | | — | | | (1 | ) | | — | |
Abeinsa Business Development, Pty. Ltd. | | Sydney (AU) | | | — | | | 100.00 | | Abeinsa Business Development, S.A. | | — | | | (1 | ) | | — | |
Abeinsa Business Development, S.A. | | Seville (ES) | | | 501,735 | | | 100.00 | | Abeinsa Ingeniería y Construcción Industrial, S.A./ Negocios Industriales y Comerciales, S.A. | | — | | | (1 | ) | | B | |
Abeinsa Business Development, Sp.z.o.o. | | Gliwice (PL) | | | 1 | | | 100.00 | | Abeinsa Business Development, S.A. | | — | | | (1 | ) | | D | |
Abeinsa Business Development, Spa. | | Santiago de Chile (CL) | | | 1 | | | 100.00 | | Abeinsa Business Development, S.A. | | — | | | (1 | ) | | — | |
Abeinsa Business Developmet México, S.A. de C.V. | | Mexico City (MX) | | | 3 | | | 100.00 | | Abeinsa Business Development, S.A./Negocios Industriales y Comerciales, S.A. | | — | | | (1 | ) | | B | |
Abeinsa Engineering Private Limited | | Mumbai (IN) | | | 270 | | | 100.00 | | Abeinsa Engineering, S.L./Abener Energía, S.A. | | — | | | (1 | ) | | B | |
Abeinsa Engineering, Inc. | | Arizona (US) | | | 37 | | | 100.00 | | Abeinsa Engineering, S.L. | | — | | | (1 | ) | | B | |
Abeinsa Engineering, S.A. de CV. | | Mexico City (MX) | | | 3 | | | 100.00 | | Abeinsa Engineering, S.L./Abeinsa Asset Management, S.L. | | — | | | (1 | ) | | B | |
Abeinsa Engineering, S.L. | | Seville (ES) | | | 5,542 | | | 100.00 | | Abener Energía, S.A. | | — | | | (1 | ) | | B | |
Abeinsa EPC Kaxu Pty Ltd. | | Johannesburg (ZA) | | | — | | | 92.00 | | Abener Energía, S.A./Teyma Gestión de Contratos de Construcción e Ingeniería, S.A. | | — | | | (1 | ) | | B | |
Abeinsa EPC Khi Pty Ltd. | | Johannesburg (ZA) | | | — | | | 92.00 | | Abener Energía, S.A./Teyma Gestión de Contratos de Construcción e Ingeniería, S.A. | | — | | | (1 | ) | | B | |
Abeinsa EPC México, S.A de C.V | | Mexico City (MX) | | | 1 | | | 100.00 | | Abeinsa Ingeniería y Construcción Industrial S.A./ ASA Iberoamérica, S.L. | | — | | | (1 | ) | | B | |
Abeinsa EPC South Africa (Pty) Ltd. | | Cape Town (ZA) | | | — | | | 100.00 | | Abeinsa, Ingeniería y Construcción Industrial, S.A. | | (*) | | | (1 | ) | | — | |
F-142
Table of Contents
Appendices
Appendix I
Subsidiary companies included in the 2014 consolidation perimeter using
the global integration method (Continuation)
| | | | | | | | | | | | | | | | | | | |
| |
| | Shareholding | |
| |
| |
| |
| |
|---|
Company Name | | Registered
Address | | Amount
in thousands
of € | | % of Nominal Capital | | Parent Company | | (*) | | Activity
(see
Page 5) | | Auditor | |
|---|
Abeinsa EPC Xina (Pty) Ltd. | | Cape Town (ZA) | | | — | | | 92.00 | | Teyma, Gestión de Contratos de Construcción e Ingeniería, S.A./Abener Energía, S.A. | | (*) | | | (1 | ) | | — | |
Abeinsa EPC, LLC. | | Arizona (US) | | | — | | | 100.00 | | Abeinsa, LLC. | | — | | | (1 | ) | | B | |
Abeinsa EPC, S.A. | | Seville (ES) | | | 60 | | | 100.00 | | Abeinsa Ingeniería y Construcción Industrial S.A./Teyma Gest. Ctos. de Const. e Ing., S.A. | | — | | | (1 | ) | | B | |
Abeinsa Holding, Inc. | | Delaware (US) | | | — | | | 100.00 | | Abengoa US Holding, LLC. | | — | | | (1 | ) | | — | |
Abeinsa Infraestructuras Medio Ambiente, S.A. | | Seville (ES) | | | 447,151 | | | 100.00 | | Abeinsa, Ingeniería y Construcción Industrial, S.L./Negocios Industriales y Comerciales, S.A | | — | | | (1 | ) | | B | |
Abeinsa Inversiones Latam, S.L. | | Seville (ES) | | | 245,333 | | | 100.00 | | Asa Iberoamérica, S.L./Abeinsa Ingeniería y Construcción Industrial, S.A. | | — | | | (1 | ) | | B | |
Abeinsa Is Gelistirme Limited Sirketi | | Ankara (TR) | | | 5 | | | 100.00 | | Abeinsa Business Development, S.A. | | — | | | (1 | ) | | B | |
Abeinsa Monterrey VI, S.A. de C.V. | | Mexico City (MX) | | | 3 | | | 100.00 | | Abengoa México, S.A. de CV/ Abener Energía, S.A. | | (*) | | | (1 | ) | | — | |
Abeinsa Norte III, S.A. de C.V. | | Mexico City (MX) | | | 3 | | | 100.00 | | Abeinsa, Ingeniería y Construcción Industrial, S.A./Abener México, S.A. de C.V. | | — | | | (1 | ) | | — | |
Abeinsa Operation and Maintenance, S.A. | | Seville (ES) | | | 60 | | | 100.00 | | Abeinsa Ing. y Const. Industrial, S.A./Negocios Industriales y de Construcción, S.A. | | — | | | (1 | ) | | — | |
Abeinsa, LLC. | | Delaware (US) | | | 82,696 | | | 100.00 | | Abengoa US Operations, LLC | | — | | | (1 | ) | | — | |
Abeinsa, Ingeniería y Construcción Industrial, S.A. | | Seville (ES) | | | 90,642 | | | 100.00 | | Abengoa, S.A./Siema | | — | | | (1 | ) | | B | |
Abelec, S.A. | | Santiago de Chile (CL) | | | 2 | | | 99.99 | | Abengoa Chile, S.A. | | — | | | (2 | ) | | — | |
Abema Ltda | | Santiago de Chile (CL) | | | 2 | | | 100.00 | | Abengoa Chile, S.A./Abeinsa Infraestructuras Medio Ambiente, S.A. | | — | | | (1 | ) | | — | |
Abencor Brasil Ltda. | | R. de Janeiro (BR) | | | — | | | 100.00 | | Abencor Suministros, S.A./Abengoa Construção Brasil Ltda. | | — | | | (1 | ) | | — | |
Abencor Colombia, S.A.S. | | Bogota (CO) | | | — | | | 100.00 | | Abencor Suministros S.A. | | (*) | | | (1 | ) | | — | |
Abencor México, S.A. de C.V | | Mexico City (MX) | | | 3 | | | 100.00 | | Abencor Suministros, S.A./Abengoa México, S.A. de C.V. | | — | | | (1 | ) | | — | |
Abencor Perú, S.A. | | Lima (PE) | | | 1 | | | 99.99 | | Abencor Suministros S.A. | | — | | | (1 | ) | | — | |
Abencor South Africa Pty Ltd | | Upington (ZA) | | | — | | | 100.00 | | Abencor Suministros, S.A. | | — | | | (1 | ) | | — | |
Abencor Suministros Chile, S.A. | | Santiago de Chile (CL) | | | 1 | | | 100.00 | | Abengoa Chile S.A./Abencor Suministros, S.A. | | — | | | (1 | ) | | B | |
Abencor Suministros S.A. | | Seville (ES) | | | 4,133 | | | 100.00 | | Negocios Industriales y Comerciales, S.A./Abeinsa Ingeniería y Construcción Industrial, S.A. | | — | | | (1 | ) | | B | |
Abencor USA LLC | | Arizona (US) | | | 1 | | | 100.00 | | Abeinsa, LLC | | — | | | (1 | ) | | — | |
Abener Argelia, S.L. | | Seville (ES) | | | 4 | | | 100.00 | | Abener Energía, S.A./Abeinsa Ingeniería y Construcción Industrial, S.A. | | — | | | (1 | ) | | — | |
Abener Construction Services, LLC. | | Missouri (US) | | | 113,887 | | | 100.00 | | Abeinsa Business Development, LLC | | — | | | (1 | ) | | B | |
Abener Energía, S.A. | | Seville (ES) | | | 454,523 | | | 100.00 | | Abeinsa, Ing. y Const., S.A./Abeinsa Business Development, S.A./Negocios Ind. y Com., S.A. | | — | | | (1 | ) | | B | |
Abener Energie, S.A.R.L. | | Oudja (MA) | | | 3 | | | 100.00 | | Abener Energía, S.A. | | — | | | (1 | ) | | — | |
Abener México, S.A. De C.V. | | Mexico City (MX) | | | 4 | | | 100.00 | | Abengoa México, S.A. de C.V./Abeinsa Business Development México, S.A. de C.V. | | — | | | (1 | ) | | B | |
Abener North America Construction Services, Inc. | | Delaware (US) | | | 16 | | | 100.00 | | Abener Engineering & Construction Services, LLC. | | — | | | (1 | ) | | — | |
Abener North America Construction, L.P. | | Missouri (US) | | | 28 | | | 100.00 | | Abener Construction Service, LLC /Abener North America Construction Services, Inc. | | — | | | (1 | ) | | — | |
Abener Teyma Hugoton General Partnership | | Missouri (US) | | | 8 | | | 100.00 | | Teyma Construction USA LLC/Abener Construction Services, LLC. | | — | | | (1 | ) | | B | |
Abener Teyma Mojave General Partnership | | Missouri (US) | | | 4 | | | 100.00 | | Teyma Construction USA, LLC/Abener North America Construction Services, L.P. | | — | | | (1 | ) | | B | |
Abener Teyma Termocolón II, S.A. | | Panamá (PA) | | | — | | | 100.00 | | Teyma, Gestión de Contratos de Construcción e Ingeniería, S.A./ Abener Energía, S.A. | | (*) | | | (1 | ) | | — | |
Abener, Abeinsa, Power and Water Construction Saudi Limited | | Riyadh (SA) | | | 196 | | | 100.00 | | Abener Energía, S.A./ Abeinsa Infraestructuras Medio Ambiente, S.A. | | (*) | | | (1 | ) | | — | |
Abengoa Australia Pty. Ltd. | | Sidney (AU) | | | 3,489 | | | 100.00 | | Instalaciones Inabensa, S.A. | | — | | | (1 | ) | | B | |
F-143
Table of Contents
Appendices
Appendix I
Subsidiary companies included in the 2014 consolidation perimeter using
the global integration method (Continuation)
| | | | | | | | | | | | | | | | | | | |
| |
| | Shareholding | |
| |
| |
| |
| |
|---|
Company Name | | Registered
Address | | Amount
in thousands
of € | | % of Nominal Capital | | Parent Company | | (*) | | Activity
(see
Page 5) | | Auditor | |
|---|
Abengoa Bioenergia Agroindustria Trading US Inc. | | Delaware (US) | | | — | | | 100.00 | | Abengoa Bioenergia Agroindústria Ltda. | | — | | | (6 | ) | | — | |
Abengoa Bioenergía Agroindustria, Ltda. | | Sao Paulo (BR) | | | 297,256 | | | 100.00 | | Abengoa Bioenergía Brasil, S.A./Abengoa Bioenergia Santa Fe, Ltda. | | — | | | (6 | ) | | B | |
Abengoa Bioenergía Biodiesel, S.A. | | Seville (ES) | | | 60 | | | 100.00 | | Abengoa Bioenergía Inversiones, S.A./Ecoagrícola, S.A. | | — | | | (6 | ) | | — | |
Abengoa Bioenergia Biomasse France, SAS | | Arance (FR) | | | 3 | | | 100.00 | | Abengoa Bioenergía Inversiones, S.A. | | — | | | (6 | ) | | — | |
Abengoa Bioenergía Brasil, S.A. | | Sao Paulo (BR) | | | 705,752 | | | 99.99 | | Asa Bioenergy Holding AG./Abengoa Bioenergia, S.A. | | — | | | (6 | ) | | B | |
Abengoa Bioenergia Inovações Ltda. | | Sao Paulo (BR) | | | 314,036 | | | 100.00 | | ASA Bioenergy Holding, AG/ Abengoa Bioenergía Santa Fe, Ltda. | | — | | | (6 | ) | | — | |
Abengoa Bioenergía Inversiones, S.A. | | Seville (ES) | | | 743,069 | | | 100.00 | | Abengoa Bioenergía, S.A./Abengoa Bioenergía Nuevas Tecnologías, S.A. | | — | | | (6 | ) | | B | |
Abengoa Bioenergía Nuevas Tecnologías, S.A. | | Seville (ES) | | | 386 | | | 100.00 | | Abengoa Bioenergía, S.L./Instalaciones Inabensa, S.A. | | — | | | (6 | ) | | B | |
Abengoa Bioenergía Outsourcing, LLC | | Missouri (US) | | | — | | | 100.00 | | Abengoa Bioenergy Operation, LLC. | | — | | | (6 | ) | | — | |
Abengoa Bioenergía San Roque, S.A. | | Cadiz (ES) | | | 21,990 | | | 100.00 | | Abengoa Bioenergía Inversiones, S.A./Ecoagrícola, S.A. | | — | | | (6 | ) | | B | |
Abengoa Bioenergía Santa Fe, Ltda. | | Sao Paulo (BR) | | | 373 | | | 100.00 | | Abengoa Bioenergía Brasil, S.A./Abengoa Bioenergia Trading Brasil Ltda. | | — | | | (6 | ) | | — | |
Abengoa Bioenergia Trading Brasil, Ltda. | | Sao Paulo (BR) | | | — | | | 100.00 | | Abengoa Bioenergia Brasil, S.A./Abengoa Bioenergia Agroindústria, Ltda. | | — | | | (6 | ) | | — | |
Abengoa Bioenergía, S.A. | | Seville (ES) | | | 147,093 | | | 98.05 | | Abengoa, S.A./Sociedad Inversora Energía y Medio Ambiente, S.A. | | — | | | (6 | ) | | B | |
Abengoa Bioenergy Biomass Funding, LLC | | Kansas (US) | | | — | | | 100.00 | | Abengoa Bioenergy Technology Holding, LLC | | — | | | (6 | ) | | — | |
Abengoa Bioenergy Biomass of Kansas, LLC. | | Kansas (US) | | | 518,241 | | | 100.00 | | Abengoa Bioenergy Hybrid of Kansas, LLC. | | — | | | (6 | ) | | B | |
Abengoa Bioenergy Company, LLC. | | Kansas (US) | | | 66,268 | | | 100.00 | | Abengoa Bioenergy Operations, LLC. | | — | | | (6 | ) | | B | |
Abengoa Bioenergy Developments, LLC | | Missouri (US) | | | 1 | | | 100.00 | | Abengoa Bioenergy US Holding, LLC. | | — | | | (6 | ) | | — | |
Abengoa Bioenergy Engineering & Construction, LLC | | Missouri (US) | | | — | | | 100.00 | | Abengoa Bioenergy Operations, LLC. | | — | | | (6 | ) | | — | |
Abengoa Bioenergy France, S.A. | | Montardon (FR) | | | 108,353 | | | 74.79 | | Abengoa Bioenergía Inversiones, S.A. | | — | | | (6 | ) | | B | |
Abengoa Bioenergy Funding, LLC. | | Missouri (US) | | | 254,650 | | | 100.00 | | Abengoa Bioenergy Meramec Renewable, LLC. | | — | | | (6 | ) | | B | |
Abengoa Bioenergy Germany, GmbH | | Rostock (DE) | | | 11,859 | | | 100.00 | | Abengoa Bioenergía Inversiones, S.A. | | — | | | (6 | ) | | — | |
Abengoa Bioenergy Holdco, Inc. | | Delaware (US) | | | 783,421 | | | 100.00 | | Abengoa US Holding, LLC/ASA Bioenergy Holding, AG | | — | | | (6 | ) | | — | |
Abengoa Bioenergy Hybrid of Kansas, LLC. | | Kansas (US) | | | 511,268 | | | 100.00 | | Abengoa Bioenergy Technology Holding, Inc. | | — | | | (6 | ) | | — | |
Abengoa Bioenergy Investments, LLC | | Missouri (US) | | | — | | | 100.00 | | Abengoa Bioenergy US Holding, LLC. | | — | | | (6 | ) | | — | |
Abengoa Bioenergy Maple, LLC. | | Missouri (US) | | | 254,650 | | | 100.00 | | Abengoa Bioenergy Funding LLC. | | — | | | (6 | ) | | B | |
Abengoa Bioenergy Meramec Holding, Inc. | | Delaware (US) | | | 34,660 | | | 51.00 | | Abengoa Bioenergy Holdco, Inc. | | (*) | | | (6 | ) | | — | |
Abengoa Bioenergy Meramec Renewable, LLC. | | Missouri (US) | | | 333,679 | | | 100.00 | | Abengoa Bioenergy Meramec Holding, Inc./ Abengoa Bioenergy Operations, LLC | | — | | | (6 | ) | | B | |
Abengoa Bioenergy Netherlands, B.V. | | Rotterdam (NL) | | | 644,710 | | | 100.00 | | Abengoa Bioenergía Inversiones, S.A. | | — | | | (6 | ) | | B | |
Abengoa Bioenergy New Technologies, LLC. | | Missouri (US) | | | 656 | | | 100.00 | | Abengoa Bioenergy Technology Holding, LLC. | | — | | | (6 | ) | | B | |
Abengoa Bioenergy of Illinois, LLC | | Missouri (US) | | | 190,527 | | | 100.00 | | Abengoa Bioenergy Maple, LLC | | — | | | (6 | ) | | — | |
Abengoa Bioenergy of Indiana, LLC | | Missouri (US) | | | 159,447 | | | 100.00 | | Abengoa Bioenergy Maple, LLC. | | — | | | (6 | ) | | — | |
Abengoa Bioenergy of Kansas, LLC | | Missouri (US) | | | 199 | | | 100.00 | | Abengoa Bioenergy Operations,LLC | | — | | | (6 | ) | | — | |
Abengoa Bioenergy of Nebraska, LLC. | | Nebraska (US) | | | 43,624 | | | 100.00 | | Abengoa Bioenergy Operations, LLC | | — | | | (6 | ) | | B | |
Abengoa Bioenergy of Texas, LLC | | Delaware (US) | | | — | | | 100.00 | | Abengoa Bioenergy Operations, LLC | | (*) | | | (6 | ) | | — | |
Abengoa Bioenergy Operations, LLC | | Missouri (US) | | | 382,189 | | | 100.00 | | Abengoa Bioenergy US Holding, LLC. | | — | | | (6 | ) | | B | |
Abengoa Bioenergy Ranewable Power US, LLC. | | Missouri (US) | | | 341 | | | 100.00 | | Abengoa Bioenergy Operations, LLC. | | — | | | (6 | ) | | — | |
Abengoa Bioenergy Technology Holding, LLC | | Missouri (US) | | | 511,267 | | | 100.00 | | Abengoa Bioenergy US Holding, LLC. | | — | | | (6 | ) | | — | |
Abengoa Bioenergy Trading Europe, B.V. | | Rotterdam (NL) | | | 18 | | | 100.00 | | Abengoa Bioenergía Inversiones, S.A. | | — | | | (6 | ) | | B | |
Abengoa Bioenergy Trading US, LLC | | Missouri (US) | | | — | | | 100.00 | | Abengoa Bioenergy Operations, LLC | | — | | | (6 | ) | | B | |
Abengoa Bioenergy UK Limited | | Cardiff (UK) | | | 14,503 | | | 100.00 | | Abengoa Bioenergía Inversiones, S.A. | | — | | | (6 | ) | | — | |
Abengoa Bioenergy US Holding, LLC | | Missouri (US) | | | 711,498 | | | 100.00 | | Abengoa US, LLC | | — | | | (6 | ) | | B | |
Abengoa Biotechnology Research, S.A. | | Seville (ES) | | | 60 | | | 100.00 | | Abengoa Bioenergía Nuevas Tecnologías, S.A./Abengoa Research, S.A. | | — | | | (6 | ) | | — | |
Abengoa Biotechnology, LLC | | Delaware (US) | | | — | | | 100.00 | | Abengoa Bioenergy US Holding, LLC | | (*) | | | (6 | ) | | — | |
Abengoa Brasil Logística, Ltda. | | R. de Janeiro (BR) | | | 187 | | | 100.00 | | Abengoa Brasil, S.A./Inabensa Río Ltda. | | — | | | (1 | ) | | B | |
Abengoa Chile, S.A. | | Santiago de Chile (CL) | | | 47,847 | | | 100.00 | | Asa Investment, AG ZUG/Teyma Abengoa, S.A. | | — | | | (1 | ) | | B | |
F-144
Table of Contents
Appendices
Appendix I
Subsidiary companies included in the 2014 consolidation perimeter using
the global integration method (Continuation)
| | | | | | | | | | | | | | | | | | | |
| |
| | Shareholding | |
| |
| |
| |
| |
|---|
Company Name | | Registered
Address | | Amount
in thousands
of € | | % of Nominal Capital | | Parent Company | | (*) | | Activity
(see
Page 5) | | Auditor | |
|---|
Abengoa Cogeneraçao de Energía, S.A. | | R. de Janeiro (BR) | | | — | | | 100.00 | | Abengoa Brasil, S.A./Abengoa Concesssoes Brasil Holding, S.A. | | — | | | (2 | ) | | — | |
Abengoa Cogeneraçao de Energía II, S.A. | | R. de Janeiro (BR) | | | — | | | 100.00 | | Abengoa Brasil, S.A./Abengoa Concesssoes Brasil Holding, S.A. | | — | | | (2 | ) | | — | |
Abengoa Cogeneración Tabasco, S. de R.L. de C.V. | | Mexico City (MX) | | | 27,449 | | | 100.00 | | ACT Holdings, S.A. de C.V. | | — | | | (** | ) | | B | |
Abengoa Colombia, S.A.S. | | Bogota (CO) | | | 215 | | | 100.00 | | Abengoa Perú, S.A./Abener Energía, S.A./Abeinsa Infraestructuras Medio Ambiente, S.A. | | — | | | (1 | ) | | — | |
Abengoa Concessions Infrastructure, S.L. | | Seville (ES) | | | 299,001 | | | 100.00 | | Abengoa Yield Plc./ Sociedad Inversora en Energía y Medioambiente, S.A. (Siema) | | (*) | | | (** | ) | | — | |
Abengoa Concessions Investments Ltd. | | Leeds (GB) | | | 800,935 | | | 100.00 | | Abengoa Concessions, S.L./ Abengoa Solar, S.A. | | — | | | (1 | ) | | B | |
Abengoa Concessions Investments, S.à.r.l. | | Luxembourg (LU) | | | 13 | | | 100.00 | | Abengoa Concessions, S.L. | | — | | | (1 | ) | | — | |
Abengoa Concessions Perú, S.A. | | Lima (PE) | | | 212,947 | | | 100.00 | | Abengoa Yield Plc./Abengoa Perú, S.A. | | (*) | | | (** | ) | | B | |
Abengoa Concessions, S.L. | | Seville (ES) | | | 3 | | | 100.00 | | Abengoa, S.A./Siema | | — | | | (1 | ) | | B | |
Abengoa Concessões Brasil Holding, S.A. | | R. de Janeiro (BR) | | | 742,029 | | | 100.00 | | Abengoa Brasil, S.A./ Sociedad Inversora de Líneas de Brasil, S.L. | | — | | | (2 | ) | | B | |
Abengoa Construçao Brasil, Ltda. | | R. de Janeiro (BR) | | | 943,968 | | | 100.00 | | Abeanza Brasil, S.A./Sociedad Inversora de Líneas de Brasil, S.L. | | — | | | (1 | ) | | B | |
Abengoa Desalination Pilot Plants, Ltd. | | Masdar (AE) | | | 30 | | | 100.00 | | Abengoa, S.A. | | (*) | | | (1 | ) | | — | |
Abengoa Energy Crops Biomass USA, LLC | | Florida (US) | | | 211 | | | 100.00 | | Abengoa Energy Crops USA, LLC | | (*) | | | (1 | ) | | — | |
Abengoa Energy Crops Biomassa, S.A. | | R. de Janeiro (BR) | | | — | | | 99.80 | | Abengoa Energy Crops, S.A. | | (*) | | | (1 | ) | | — | |
Abengoa Energy Crops Pellet 1 USA, LLC | | Florida (US) | | | — | | | 100.00 | | Abengoa Energy Crops Biomass USA, LLC | | (*) | | | (1 | ) | | — | |
Abengoa Energy Crops USA, LLC | | Florida (US) | | | 213 | | | 100.00 | | Abengoa Energy Crops, S.A. | | (*) | | | (1 | ) | | — | |
Abengoa Energy Crops, S.A. | | Seville (ES) | | | 60 | | | 100.00 | | Abengoa, S.A./ Sociedad Inversora en Energía y Medioambiente, S.A. (Siema) | | (*) | | | (1 | ) | | B | |
Abengoa Energy Trading Chile, SpA | | Santiago de Chile (CL) | | | 14 | | | 100.00 | | Abengoa Chile, S.A. | | (*) | | | (1 | ) | | — | |
Abengoa Finance, S.A. | | Seville (ES) | | | 60 | | | 100.00 | | Abengoa, S.A. | | — | | | (1 | ) | | B | |
Abengoa Greenbridge, S.A.U. | | Seville (ES) | | | 60 | | | 100.00 | | Abengoa, S.A. | | (*) | | | (1 | ) | | B | |
Abengoa Greenfield Brasil Holding, S.A. | | R. de Janeiro (BR) | | | 844,929 | | | 100.00 | | Abengoa Construçao Brasil, Ltda. | | (*) | | | (1 | ) | | B | |
Abengoa Greenfield España, S.L. | | Seville (ES) | | | 3 | | | 100.00 | | Abengoa Greenbridge, S.A.U. | | (*) | | | (1 | ) | | — | |
Abengoa Greenfield Perú, S.A. | | Lima (PE) | | | — | | | 99.80 | | Abengoa Perú, S.A. | | (*) | | �� | (1 | ) | | — | |
Abengoa Greenfield PLC | | London (GB) | | | 65 | | | 100.00 | | Abengoa, S.A. | | (*) | | | (1 | ) | | — | |
Abengoa Greenfield S.A.U. | | Seville (ES) | | | 60 | | | 100.00 | | Abengoa, S.A. | | (*) | | | (1 | ) | | B | |
Abengoa Hellas Solar, Ltd. | | Atenas (GR) | | | 30 | | | 100.00 | | Abengoa Solar, S.A./Abengoa Solar España, S.A. | | — | | | (3 | ) | | — | |
Abengoa Hidrógeno, S.A. | | Seville (ES) | | | 912 | | | 100.00 | | Abeinsa Ingeniería y Construcción Industrial, S.A./ Instalaciones Inabensa, S.A. | | — | | | (1 | ) | | B | |
Abengoa México O&M, S.A. de C.V. | | Mexico City (MX) | | | 3 | | | 100.00 | | Abeinsa Operation and Maintenance, S.A./ Abengoa México, S.A. de CV | | (*) | | | (1 | ) | | — | |
Abengoa México, S.A. de CV | | Mexico City (MX) | | | 153,326 | | | 100.00 | | Asa lnvestment, AG ZUG /Asa Iberoamérica, S.L. | | — | | | (1 | ) | | B | |
Abengoa Perú, S.A. | | Lima (PE) | | | 128,830 | | | 99.90 | | Asa lnvestment, AG ZUG | | — | | | (1 | ) | | B | |
Abengoa Puerto Rico, S.E. | | San Juan (PR) | | | 8 | | | 100.00 | | Siema Investment, S.L./Abencor Suministros, S.A. | | — | | | (1 | ) | | — | |
Abengoa Research, Corp. | | Missouri (US) | | | — | | | 100.00 | | Abengoa Research, S.L. | | (*) | | | (1 | ) | | — | |
Abengoa Research, S.L. | | Seville (ES) | | | 9,053 | | | 100.00 | | Abeinsa, Ingeniería y Construcción Industrial, S.A./Instalaciones Inabensa, S.A. | | — | | | (1 | ) | | D | |
Abengoa SeaPower, S.A. | | Seville (ES) | | | 60 | | | 100.00 | | Abeinsa Ingeniería y Construcción Industrial, S.A./Instalaciones Inabensa, S.A. | | — | | | (1 | ) | | B | |
Abengoa Servicios Industriales, S.A. de C.V. | | Mexico City (MX) | | | 1,825 | | | 100.00 | | Abengoa México, S.A. de C.V./Asa Iberoamérica, S.L. | | — | | | (1 | ) | | B | |
Abengoa Servicios, S.A. De C.V. | | Mexico City (MX) | | | 159 | | | 100.00 | | Abengoa México, S.A. de C.V./Servicios Aux. de Admon., S.A | | — | | | (1 | ) | | B | |
Abengoa Solar Power Australia Pty Limited | | Brisbane (AU) | | | 458 | | | 100.00 | | Abengoa Solar Internacional, S.A. | | — | | | (3 | ) | | — | |
Abengoa Solar Brasil Desenvolvimientos Solares Ltda. | | R. de Janeiro (BR) | | | 962 | | | 100.00 | | Abengoa Solar Internacional, S.A./Abengoa Solar España, S.A. | | — | | | (1 | ) | | — | |
Abengoa Solar Chile, S.A. | | Santiago de Chile (CL) | | | 1 | | | 100.00 | | Abengoa Solar Internacional S.A./Abengoa Chile, S.A. | | — | | | (3 | ) | | B | |
Abengoa Solar Chile, SpA | | Santiago de Chile (CL) | | | 2 | | | 100.00 | | Abengoa Solar Internacional, S.A. | | (*) | | | (1 | ) | | — | |
F-145
Table of Contents
Appendices
Appendix I
Subsidiary companies included in the 2014 consolidation perimeter using
the global integration method (Continuation)
| | | | | | | | | | | | | | | | | | | |
| |
| | Shareholding | |
| |
| |
| |
| |
|---|
Company Name | | Registered
Address | | Amount
in thousands
of € | | % of Nominal Capital | | Parent Company | | (*) | | Activity
(see
Page 5) | | Auditor | |
|---|
Abengoa Solar Engeneering (Beijing), Co. Ltd. | | Beijing (CN) | | | 103 | | | 100.00 | | Abengoa Solar, S.A. | | — | | | (3 | ) | | B | |
Abengoa Solar España, S.A. | | Seville (ES) | | | 53,846 | | | 100.00 | | Abengoa Solar, S.A./Abengoa Solar New Technologies, S.A. | | — | | | (1 | ) | | B | |
Abengoa Solar Extremadura, S.A. | | Caceres (ES) | | | 60 | | | 100.00 | | Abengoa Solar España, S.A./Abengoa Solar New Technologies, S.A. | | — | | | (3 | ) | | — | |
Abengoa Solar GmbH | | Berlin (DE) | | | 160 | | | 100.00 | | Abengoa Solar Internacional, S.A. | | — | | | (3 | ) | | B | |
Abengoa Solar Holdings Inc. | | Washington (US) | | | 174,669 | | | 100.00 | | Abengoa US Holding, LLC | | (*) | | | (1 | ) | | — | |
Abengoa Solar Holdings USA Inc. | | Colorado (US) | | | 312,839 | | | 100.00 | | Abengoa Yield Plc. | | (*) | | | (** | ) | | — | |
Abengoa Solar India Private Limited | | Maharashtra (IN) | | | 1,544 | | | 100.00 | | Abengoa Solar Internacional, S.A./ Abengoa Solar, S.A. | | — | | | (1 | ) | | B | |
Abengoa Solar Industrial Systems, LLC | | Colorado (US) | | | 5,063 | | | 100.00 | | Abengoa Solar, LLC. | | — | | | (1 | ) | | B | |
Abengoa Solar Internacional, S.A. | | Seville (ES) | | | 12,501 | | | 100.00 | | Abengoa Solar, S.A./ Abengoa Solar España, S.A. | | — | | | (1 | ) | | B | |
Abengoa Solar Italia, S.R.L. | | Rome (IT) | | | 3,456 | | | 100.00 | | Abengoa Solar Internacional, S.A./Abengoa Solar, S.A. | | — | | | (1 | ) | | B | |
Abengoa Solar Japan K.K. | | Tokyo (JP) | | | 68 | | | 100.00 | | Abengoa Solar Internacional, S.A. | | (*) | | | (1 | ) | | B | |
Abengoa Solar México S.A. de C.V. | | Mexico City (MX) | | | 416 | | | 100.00 | | Abengoa Solar Internacional, S.A./Abengoa Solar España, S.A. | | — | | | (1 | ) | | B | |
Abengoa Solar New Technologies, S.A. | | Seville (ES) | | | 10,748 | | | 100.00 | | Abengoa Solar, S.A./ Abengoa Solar España, S.A. | | — | | | (1 | ) | | B | |
Abengoa Solar Power DMCC, LLC | | Dubai (AE) | | | 1 | | | 100.00 | | Abengoa Solar Ventures S.A | | (*) | | | (1 | ) | | — | |
Abengoa Solar Power South Africa (Pty) Ltd. | | Gauteng (ZA) | | | 1,242 | | | 100.00 | | Abengoa Solar Internacional, S.A. | | — | | | (3 | ) | | B | |
Abengoa Solar Power, S.A. | | Seville (ES) | | | 250 | | | 100.00 | | Abengoa Solar, S.A./Abengoa Solar España, S.A. | | — | | | (3 | ) | | — | |
Abengoa Solar Research, S.A. | | Seville (ES) | | | 60 | | | 100.00 | | Abengoa Solar New Technologies, S.A./ Abengoa Research, S.L. | | — | | | (1 | ) | | — | |
Abengoa Solar South Africa (Pty) Ltd. | | Gauteng (ZA) | | | 5,994 | | | 100.00 | | South Africa Solar Investments, S.L. | | — | | | (1 | ) | | B | |
Abengoa Solar US Holdings Inc. | | Colorado (US) | | | 261,623 | | | 100.00 | | Abengoa Yield Plc. | | — | | | | | | — | |
Abengoa Solar Ventures S.A | | Seville (ES) | | | 26,660 | | | 100.00 | | Abengoa Solar, S.A./ Abengoa Solar España, S.A. | | — | | | (1 | ) | | B | |
Abengoa Solar, LLC | | New York (US) | | | 188,738 | | | 100.00 | | Abengoa US Operations, LLC | | — | | | (1 | ) | | B | |
Abengoa Solar, S.A. | | Seville (ES) | | | 68,060 | | | 100.00 | | Abengoa, S.A./Abengoa Solar España, S.A. | | — | | | (1 | ) | | B | |
Abengoa SP Holdings, LLC | | California (US) | | | 22,845 | | | 100.00 | | Abengoa Solar, LLC. | | — | | | (1 | ) | | — | |
Abengoa Transmisión Norte, S.A. | | Lima (PE) | | | 175,234 | | | 100.00 | | Abengoa Concessions Perú, S.A./ Abengoa Concessions Infrastructure, S.L. | | — | | | (** | ) | | B | |
Abengoa Transmisión Sur, S.A. | | Lima (PE) | | | 68,205 | | | 100.00 | | Abengoa Concessions Perú, S.A./Abengoa Transmisión Norte, S.A. | | — | | | (** | ) | | B | |
Abengoa Transmission & Infrastructure ULC | | Vancouver (CA) | | | — | | | 100.00 | | Abengoa Transmission & Infrastructure, LLC | | (*) | | | (1 | ) | | — | |
Abengoa Transmission & Infrastructure, LLC | | Delaware (US) | | | 821 | | | 100.00 | | Abeinsa, LLC. | | — | | | (1 | ) | | B | |
Abengoa Transmission Holdings, LLC | | Arizona (US) | | | — | | | 100.00 | | Abengoa Transmission & Infrastructure, LLC | | (*) | | | (1 | ) | | — | |
Abengoa US Holding, LLC | | Washington (US) | | | 1,303,172 | | | 100.00 | | Abengoa Bioenergía, S.A./ Abengoa Solar, S.A./Abeinsa, S.A./Abengoa Water, S.L.U. | | — | | | (1 | ) | | B | |
Abengoa US Operations, LLC | | Washington (US) | | | 1,130,691 | | | 100.00 | | Abengoa US, LLC | | — | | | (1 | ) | | — | |
Abengoa US, LLC | | Washington (US) | | | 1,039,725 | | | 100.00 | | Abengoa Bioenergy Holdco, Inc./ Abengoa Solar Holdings Inc../ Abengoa Water Holding | | — | | | (1 | ) | | — | |
| | | | | | | | | | USA, Inc./ Abener Energia, S.A./ Abacus Project Management, Inc./ Abeinsa Holding, Inc. | | | | | | | | | |
Abengoa Vista Ridge, LLC. | | Texas (US) | | | — | | | 100.00 | | Abengoa Water USA, LLC. | | (*) | | | (4 | ) | | — | |
Abengoa Water Agadir, S.L.U. | | Seville (ES) | | | 3 | | | 100.00 | | Abengoa Water, S.L. | | — | | | (1 | ) | | B | |
Abengoa Water Beijing Co., Ltd | | Beijing (CN) | | | 65 | | | 100.00 | | Abengoa Water, S.L. | | — | | | (4 | ) | | D | |
Abengoa Water Chile, Limitada | | Santiago de Chile (CL) | | | — | | | 100.00 | | Abengoa Water, S.L. | | — | | | (4 | ) | | — | |
Abengoa Water Dalian, S.L.U. | | Seville (ES) | | | 33 | | | 100.00 | | Abengoa Water, S.L. | | — | | | (1 | ) | | — | |
Abengoa Water Holding USA, Inc. | | Delaware (US) | | | 5,072 | | | 100.00 | | Abengoa US Holding, LLC | | — | | | (4 | ) | | — | |
Abengoa Water Hong Kong, Co. Limited | | Hong-Kong (CN) | | | — | | | 100.00 | | Abengoa Water, S.L. | | (*) | | | (1 | ) | | — | |
Abengoa Water Internacional, S.L.U. | | Seville (ES) | | | 3 | | | 100.00 | | Abengoa Water, S.L. | | — | | | (1 | ) | | — | |
Abengoa Water Investments Ghana, BV | | Amsterdam (NL) | | | 3,637 | | | 100.00 | | Abengoa Water Nungua, S.L.U. | | — | | | (1 | ) | | — | |
Abengoa Water Investments Takoradi, Bv | | Amsterdam (NL) | | | — | | | 100.00 | | Abengoa Water Takoradi, S.L.U. | | (*) | | | (1 | ) | | — | |
Abengoa Water Nungua, S.L.U. | | Seville (ES) | | | 3,412 | | | 100.00 | | Abengoa Water, S.L.U. | | — | | | (1 | ) | | — | |
Abengoa Water Taiwan, S.L.U. | | Seville (ES) | | | 16 | | | 100.00 | | Abengoa Water, S.L. | | (*) | | | (1 | ) | | — | |
Abengoa Water Takoradi, S.L.U. | | Seville (ES) | | | 13 | | | 100.00 | | Abengoa Water, S.L. | | — | | | (1 | ) | | — | |
F-146
Table of Contents
Appendices
Appendix I
Subsidiary companies included in the 2014 consolidation perimeter using
the global integration method (Continuation)
| | | | | | | | | | | | | | | | | | | |
| |
| | Shareholding | |
| |
| |
| |
| |
|---|
Company Name | | Registered
Address | | Amount
in thousands
of € | | % of Nominal Capital | | Parent Company | | (*) | | Activity
(see
Page 5) | | Auditor | |
|---|
Abengoa Water USA, LLC. | | Texas (US) | | | 3,091 | | | 100.00 | | Abengoa US Operations, LLC. | | — | | | (1 | ) | | D | |
Abengoa Water, S.L. | | Seville (ES) | | | 10,860 | | | 100.00 | | Abengoa, S.A./ Sociedad Inversora en Energía y Medioambiente, S.A. (Siema) | | — | | | (1 | ) | | B | |
Abengoa Yield Plc. | | Leeds (GB) | | | 889,956 | | | 64.27 | | Abengoa Concessions Investments Ltd. | | — | | | (** | ) | | B | |
Abengoa Yield, S.à.r.l. | | Luxembourg (LU) | | | 13 | | | 100.00 | | Abengoa Concessions Investments, S.à.r.l. | | — | | | (1 | ) | | — | |
Abent 3T, S.A.P.I. de C.V. | | Mexico City (MX) | | | 231,865 | | | 100.00 | | A3T Holdco España, S.A/ Abener Energía, S.A. | | — | | | (5 | ) | | B | |
Abenta Concessões Brasil, S.A. | | R. de Janeiro (BR) | | | 3 | | | 95.84 | | Abengoa Concessões Brasil Holding, S.A. | | — | | | (2 | ) | | — | |
Abenta Construçao Brasil, Ltda | | R. de Janeiro (BR) | | | 16,167 | | | 100.00 | | Inabensa Rio, Ltda./Abengoa Brasil Ltda. | | — | | | (1 | ) | | B | |
Abentel Telecomunicaciones, S.A. | | Seville (ES) | | | 5,530 | | | 100.00 | | Abener Energía, S.A./Abeinsa Ingeniería y Construcción Industrial, S.A. | | — | | | (1 | ) | | B | |
Abentey Gerenciamiento de Projectos de Engenharia e Construçao, Ltda. | | Pirassununga (BR) | | | — | | | 100.00 | | Abener Energía, S.A./Teyma Internacional, S.A. | | — | | | (1 | ) | | — | |
Aboadze Desalination Developments, Limited | | Accra (GH) | | | — | | | 90.00 | | Abengoa Water Investments Takoradi, Bv | | (*) | | | (4 | ) | | — | |
Abratey Construção, Ltda. | | R. de Janeiro (BR) | | | — | | | 100.00 | | Abengoa Construçao Brasil, Ltda. / Teyma Internacional S.A. | | — | | | (1 | ) | | B | |
ACC 4T, S.A.P.I. de C.V. | | Mexico City (MX) | | | 3 | | | 100.00 | | Abengoa México, S.A. de CV/ Servicios Auxiliares de Administración, S.A. de C.V. | | (*) | | | (5 | ) | | — | |
ACT Holdings, S.A. de C.V. | | Mexico City (MX) | | | 59,323 | | | 100.00 | | Abengoa Yield Plc./Servicios Auxiliares de Administración, S.A. de C.V. | | — | | | (** | ) | | — | |
Advanced Feedstocks of Kansas, LLC | | Kansas (US) | | | 42 | | | 51.00 | | Abengoa Bioenergy Trading US, LLC | | — | | | (6 | ) | | B | |
Aguas de Skikda, S.P.A. | | Argel (DZ) | | | 10,811 | | | 51.00 | | Geida Skikda, S.L. | | — | | | (4 | ) | | D | |
Aprovechamientos Energéticos Furesa, S.A. | | Murcia (ES) | | | 2,211 | | | 98.00 | | Abeinsa Asset Management, S.L. | | — | | | (5 | ) | | — | |
Arao Enerxías Eólica, S.L. | | A Coruña (ES) | | | 7 | | | 70.00 | | Instalaciones Inabensa, S.A. | | — | | | (5 | ) | | — | |
Arizona Solar One, LLC | | Colorado (US) | | | 464,303 | | | 100.00 | | ASO Holdings Company, LLC | | — | | | (** | ) | | B | |
Asa Bioenergy Holding, AG | | Zug (SZ) | | | 430,749 | | | 99.98 | | Abengoa Bioenergía, S.A. | | — | | | (6 | ) | | B | |
Asa Desulfuración, S.A. | | Barakaldo (ES) | | | 44,611 | | | 100.00 | | Siema Investment, S.L.U. | | — | | | (1 | ) | | B | |
Asa E.& E.H., AG | | Zug (SZ) | | | 81 | | | 100.00 | | Sociedad Inversora Energía y Medio Ambiente, S.A. | | — | | | (1 | ) | | B | |
Asa Iberoamérica, S.L. | | Seville (ES) | | | 48,522 | | | 100.00 | | Soc. Inv. Energía y Medio Ambiente, S.A./Abeinsa Ingeniería y Construcción Industrial, S.A. | | — | | | (1 | ) | | B | |
Asa Inmobiliaria Chile, S.A. | | Santiago de Chile (CL) | | | 521 | | | 100.00 | | Asa Investment AG, ZUG/ Teyma Abengoa, S.A. | | (*) | | | (1 | ) | | — | |
Asa Investment AG, ZUG | | Zug (SZ) | | | 69,950 | | | 100.00 | | Abeinsa Inversiones Latam, S.L. | | — | | | (1 | ) | | — | |
ASA Investment Brasil Ltda | | R. de Janeiro (BR) | | | 993 | | | 100.00 | | Abeanza Brasil, S.A./Abengoa Brasil, S.A. | | — | | | (1 | ) | | B | |
ASI Operations LLC | | Delaware (US) | | | 2 | | | 100.00 | | Abengoa Solar, LLC. | | — | | | (1 | ) | | — | |
ASO Holdings Company, LLC | | Colorado (US) | | | 227,893 | | | (*** | ) | Abengoa Solar US Holdings Inc. | | — | | | (** | ) | | B | |
ATE VI Campos Novos Transmissora de Energía, S.A | | R. de Janeiro (BR) | | | 41,580 | | | 100.00 | | Abengoa Concessoes Brasil Holding, S.A./Abengoa Brasil Ltda. | | — | | | (2 | ) | | B | |
ATE VII- Foz do Iguacú Transmissora de Energía, S.A. | | R. de Janeiro (BR) | | | 26,309 | | | 100.00 | | Abengoa Concessoes Brasil Holding, S.A./Abengoa Brasil Ltda. | | — | | | (2 | ) | | B | |
ATE X Abengoa Brasil Administraçao Predial Ltda | | R. de Janeiro (BR) | | | 6,327 | | | 100.00 | | Abengoa Brasil, S.A./Abengoa Concesssoes Brasil Holding, S.A. | | — | | | (1 | ) | | B | |
ATE XI, Manaus Transmissora de Energía | | R. de Janeiro (BR) | | | 194,847 | | | 50.50 | | Abengoa Concessoes Brasil Holding, S.A. | | — | | | (2 | ) | | B | |
ATE XIII, Norte Brasil Transmissora de Energía S.A | | R. de Janeiro (BR) | | | 267,543 | | | 51.00 | | Abengoa Concessoes Brasil Holding, S.A. | | — | | | (2 | ) | | B | |
ATE XVI Transmissora de Energia S.A. | | R. de Janeiro (BR) | | | 297,942 | | | 100.00 | | Abengoa Concessões Brasil Holding S.A./ Abengoa Greenfield Brasil Holding, S.A. | | — | | | (2 | ) | | B | |
ATE XVII Transmissora de Energia S.A. | | R. de Janeiro (BR) | | | 84,785 | | | 100.00 | | Abengoa Concessões Brasil Holding S.A./ Abengoa Greenfield Brasil Holding, S.A. | | — | | | (2 | ) | | B | |
ATE XVIII Transmissora de Energia S.A. | | R. de Janeiro (BR) | | | 49,481 | | | 100.00 | | Abengoa Concessões Brasil Holding S.A./Abengoa Construção Brasil Ltda. | | — | | | (2 | ) | | B | |
ATE XIX Transmissora de Energia S.A. | | R. de Janeiro (BR) | | | 86,712 | | | 100.00 | | Abengoa Concessões Brasil Holding S.A./ Abengoa Greenfield Brasil Holding, S.A. | | — | | | (2 | ) | | B | |
ATE XX Transmissora de Energia S.A. | | R. de Janeiro (BR) | | | 70,452 | | | 100.00 | | Abengoa Concessões Brasil Holding S.A./ Abengoa Greenfield Brasil Holding, S.A. | | — | | | (2 | ) | | B | |
ATE XXI Transmissora de Energia S.A. | | R. de Janeiro (BR) | | | 289,314 | | | 100.00 | | Abengoa Concessões Brasil Holding S.A./ Abengoa Greenfield Brasil Holding, S.A. | | — | | | (2 | ) | | B | |
F-147
Table of Contents
Appendices
Appendix I
Subsidiary companies included in the 2014 consolidation perimeter using
the global integration method (Continuation)
| | | | | | | | | | | | | | | | | | | |
| |
| | Shareholding | |
| |
| |
| |
| |
|---|
Company Name | | Registered
Address | | Amount
in thousands
of € | | % of Nominal Capital | | Parent Company | | (*) | | Activity
(see
Page 5) | | Auditor | |
|---|
ATE XXII Transmissora de Energia S.A. | | R. de Janeiro (BR) | | | 89,125 | | | 100.00 | | Abengoa Concessões Brasil Holding S.A./ Abengoa Greenfield Brasil Holding, S.A. | | — | | | (2 | ) | | — | |
ATE XXIII Transmissora de Energia S.A. | | R. de Janeiro (BR) | | | 136,053 | | | 100.00 | | Abengoa Construçao Brasil, Ltda./ Abengoa Greenfield Brasil Holding, S.A. | | — | | | (2 | ) | | B | |
ATE XXIV Transmissora de Energia, S.A. | | R. de Janeiro (BR) | | | 73,716 | | | 100.00 | | Abengoa Construçao Brasil, Ltda./Abengoa Greenfield Brasil Holding, S.A. | | (*) | | | (2 | ) | | B | |
ATE XXVI Transmissora de Energia S.A. | | R. de Janeiro (BR) | | | — | | | 100.00 | | Abengoa Construçao Brasil, Ltda./ Abengoa Greenfield Brasil Holding, S.A. | | (*) | | | (2 | ) | | — | |
ATE XXVII Transmissora de Energia, S.A. | | R. de Janeiro (BR) | | | — | | | 100.00 | | Abengoa Construçao Brasil, Ltda./ Abengoa Greenfield Brasil Holding, S.A. | | (*) | | | (2 | ) | | — | |
ATN 1, S.A. | | Lima (PE) | | | 55 | | | 100.00 | | Abengoa Perú, S.A. | | — | | | (2 | ) | | B | |
ATN 2, S.A. | | Lima (PE) | | | 4,183 | | | 40.00 | | Abengoa Perú, S.A. | | — | | | (2 | ) | | B | |
ATN 3, S.A. | | Lima (PE) | | | 3,697 | | | 100.00 | | Abengoa Perú, S.A./ Asa Iberoamérica, S.L. | | — | | | (2 | ) | | B | |
Aurorex, S.A. | | Buenos Aires (AR) | | | 337 | | | 100.00 | | Balofix, S.A. | | — | | | (1 | ) | | — | |
Aznalcóllar Solar, S.A. | | Seville (ES) | | | 60 | | | 100.00 | | Abengoa Solar España, S.A./Abengoa Solar, S.A. | | — | | | (3 | ) | | — | |
Balofix, S.A. | | Montevideo (UY) | | | 1,428 | | | 100.00 | | Abengoa Energy Crops, S.A. | | — | | | (1 | ) | | B | |
Befesa Agua Tenes S.L. | | Seville (ES) | | | 16,143 | | | 100.00 | | Abengoa Water S.L. | | — | | | (4 | ) | | — | |
Befesa Apa, S.R.L | | Bucarest (RO) | | | — | | | 100.00 | | Abeima Agua Internacional, S.L. | | — | | | (1 | ) | | — | |
Befesa CTA Qingdao, S.L.U | | Madrid (ES) | | | 35,163 | | | 100.00 | | Abengoa Water, S.L. | | — | | | (4 | ) | | B | |
Befesa Desalination Developments Ghana Limited | | Accra (GH) | | | 5,491 | | | 56.00 | | Abengoa Water Investment Ghana BV | | — | | | (4 | ) | | B | |
Beijing Abeinsa Management Consulting Co., Ltd. | | Beijing (CN) | | | 150 | | | 100.00 | | Abeinsa Business Development, S.A. | | — | | | (1 | ) | | D | |
Biocarburantes de Castilla y León, S.A. | | Salamanca (ES) | | | 66,679 | | | 100.00 | | Abengoa Bioenergía Inversiones, S.A./Ecoagrícola, S.A. | | — | | | (6 | ) | | B | |
Bioetanol Galicia, S.A. | | A Coruña (ES) | | | 7,448 | | | 100.00 | | Abengoa Bioenergía Inversiones, S.A./Ecoagrícola, S.A. | | — | | | (6 | ) | | B | |
Cadonal, S.A. | | Montevideo (UY) | | | 28,267 | | | 100.00 | | Holding Energía Eólica, S.A | | — | | | (** | ) | | B | |
Captación Solar, S.A. | | Seville (ES) | | | 205 | | | 100.00 | | Abeinsa Asset Management, S.L./Abener Energía, S.A. | | — | | | (1 | ) | | — | |
Captasol Fotovoltaica 1, S.L. | | Seville (ES) | | | 57 | | | 100.00 | | Abengoa Solar España, S.A./Casaquemada Fotovoltaica, S.L. | | — | | | (3 | ) | | — | |
Captasol Fotovoltaica 2, S.L. | | Seville (ES) | | | 3 | | | 100.00 | | Abengoa Solar España, S.A./Casaquemada Fotovoltaica, S.L. | | — | | | (3 | ) | | — | |
Captasol Fotovoltaica 3, S.L. | | Seville (ES) | | | 3 | | | 100.00 | | Abengoa Solar España, S.A./Casaquemada Fotovoltaica, S.L. | | — | | | (3 | ) | | — | |
Captasol Fotovoltaica 4, S.L. | | Seville (ES) | | | 3 | | | 100.00 | | Abengoa Solar España, S.A./Casaquemada Fotovoltaica, S.L. | | — | | | (3 | ) | | — | |
Captasol Fotovoltaica 5, S.L. | | Seville (ES) | | | 3 | | | 100.00 | | Abengoa Solar España, S.A./Casaquemada Fotovoltaica, S.L. | | — | | | (3 | ) | | — | |
Captasol Fotovoltaica 6, S.L. | | Seville (ES) | | | 3 | | | 100.00 | | Abengoa Solar España, S.A./Casaquemada Fotovoltaica, S.L. | | — | | | (3 | ) | | — | |
Captasol Fotovoltaica 7, S.L. | | Seville (ES) | | | 3 | | | 100.00 | | Abengoa Solar España, S.A./Casaquemada Fotovoltaica, S.L. | | — | | | (3 | ) | | — | |
Captasol Fotovoltaica 8, S.L. | | Seville (ES) | | | 3 | | | 100.00 | | Abengoa Solar España, S.A./Casaquemada Fotovoltaica, S.L. | | — | | | (3 | ) | | — | |
Captasol Fotovoltaica 9, S.L. | | Seville (ES) | | | 3 | | | 100.00 | | Abengoa Solar España, S.A./Casaquemada Fotovoltaica, S.L. | | — | | | (3 | ) | | — | |
Captasol Fotovoltaica 10, S.L. | | Seville (ES) | | | 3 | | | 100.00 | | Abengoa Solar España, S.A./Casaquemada Fotovoltaica, S.L. | | — | | | (3 | ) | | — | |
Captasol Fotovoltaica 11, S.L. | | Seville (ES) | | | 3 | | | 100.00 | | Abengoa Solar España, S.A./Casaquemada Fotovoltaica, S.L. | | — | | | (3 | ) | | — | |
Captasol Fotovoltaica 12, S.L. | | Seville (ES) | | | 3 | | | 100.00 | | Abengoa Solar España, S.A./Casaquemada Fotovoltaica, S.L. | | — | | | (3 | ) | | — | |
Captasol Fotovoltaica 13, S.L. | | Seville (ES) | | | 3 | | | 100.00 | | Abengoa Solar España, S.A./Casaquemada Fotovoltaica, S.L. | | — | | | (3 | ) | | — | |
Captasol Fotovoltaica 14, S.L. | | Seville (ES) | | | 3 | | | 100.00 | | Abengoa Solar España, S.A./Casaquemada Fotovoltaica, S.L. | | — | | | (3 | ) | | — | |
Captasol Fotovoltaica 15, S.L. | | Seville (ES) | | | 3 | | | 100.00 | | Abengoa Solar España, S.A./Casaquemada Fotovoltaica, S.L. | | — | | | (3 | ) | | — | |
F-148
Table of Contents
Appendices
Appendix I
Subsidiary companies included in the 2014 consolidation perimeter using
the global integration method (Continuation)
| | | | | | | | | | | | | | | | | | | |
| |
| | Shareholding | |
| |
| |
| |
| |
|---|
Company Name | | Registered
Address | | Amount
in thousands
of € | | % of Nominal Capital | | Parent Company | | (*) | | Activity
(see
Page 5) | | Auditor | |
|---|
Captasol Fotovoltaica 16, S.L. | | Seville (ES) | | | 3 | | | 100.00 | | Abengoa Solar España, S.A./Casaquemada Fotovoltaica, S.L. | | — | | | (3 | ) | | — | |
Captasol Fotovoltaica 17, S.L. | | Seville (ES) | | | 3 | | | 100.00 | | Abengoa Solar España, S.A./Casaquemada Fotovoltaica, S.L. | | — | | | (3 | ) | | — | |
Captasol Fotovoltaica 18, S.L. | | Seville (ES) | | | 3 | | | 100.00 | | Abengoa Solar España, S.A./Casaquemada Fotovoltaica, S.L. | | — | | | (3 | ) | | — | |
Captasol Fotovoltaica 19, S.L. | | Seville (ES) | | | 3 | | | 100.00 | | Abengoa Solar España, S.A./Casaquemada Fotovoltaica, S.L. | | — | | | (3 | ) | | — | |
Captasol Fotovoltaica 20, S.L. | | Seville (ES) | | | 1,144 | | | 100.00 | | Abengoa Solar España, S.A./Linares Fotovoltaica, S.L. | | — | | | (3 | ) | | — | |
Captasol Fotovoltaica 21, S.L. | | Seville (ES) | | | — | | | 100.00 | | Abengoa Solar España, S.A./Linares Fotovoltaica, S.L. | | — | | | (3 | ) | | — | |
Captasol Fotovoltaica 22, S.L. | | Seville (ES) | | | — | | | 100.00 | | Abengoa Solar España, S.A./Linares Fotovoltaica, S.L. | | — | | | (3 | ) | | — | |
Captasol Fotovoltaica 23, S.L. | | Seville (ES) | | | — | | | 100.00 | | Abengoa Solar España, S.A./Linares Fotovoltaica, S.L. | | — | | | (3 | ) | | — | |
Captasol Fotovoltaica 24, S.L. | | Seville (ES) | | | — | | | 100.00 | | Abengoa Solar España, S.A./Linares Fotovoltaica, S.L. | | — | | | (3 | ) | | — | |
Captasol Fotovoltaica 25, S.L. | | Seville (ES) | | | — | | | 100.00 | | Abengoa Solar España, S.A./Linares Fotovoltaica, S.L. | | — | | | (3 | ) | | — | |
Captasol Fotovoltaica 26, S.L. | | Seville (ES) | | | — | | | 100.00 | | Abengoa Solar España, S.A./Linares Fotovoltaica, S.L. | | — | | | (3 | ) | | — | |
Captasol Fotovoltaica 27, S.L. | | Seville (ES) | | | — | | | 100.00 | | Abengoa Solar España, S.A./Linares Fotovoltaica, S.L. | | — | | | (3 | ) | | — | |
Captasol Fotovoltaica 28, S.L. | | Seville (ES) | | | — | | | 100.00 | | Abengoa Solar España, S.A./Linares Fotovoltaica, S.L. | | — | | | (3 | ) | | — | |
Captasol Fotovoltaica 29, S.L. | | Seville (ES) | | | — | | | 100.00 | | Abengoa Solar España, S.A./Linares Fotovoltaica, S.L. | | — | | | (3 | ) | | — | |
Captasol Fotovoltaica 30, S.L. | | Seville (ES) | | | — | | | 100.00 | | Abengoa Solar España, S.A./Linares Fotovoltaica, S.L. | | — | | | (3 | ) | | — | |
Captasol Fotovoltaica 31, S.L. | | Seville (ES) | | | — | | | 100.00 | | Abengoa Solar España, S.A./Linares Fotovoltaica, S.L. | | — | | | (3 | ) | | — | |
Captasol Fotovoltaica 32, S.L. | | Seville (ES) | | | — | | | 100.00 | | Abengoa Solar España, S.A./Linares Fotovoltaica, S.L. | | — | | | (3 | ) | | — | |
Captasol Fotovoltaica 33, S.L. | | Seville (ES) | | | — | | | 100.00 | | Abengoa Solar España, S.A./Linares Fotovoltaica, S.L. | | — | | | (3 | ) | | — | |
Captasol Fotovoltaica 34, S.L. | | Seville (ES) | | | — | | | 100.00 | | Abengoa Solar España, S.A./Linares Fotovoltaica, S.L. | | — | | | (3 | ) | | — | |
Captasol Fotovoltaica 35, S.L. | | Seville (ES) | | | — | | | 100.00 | | Abengoa Solar España, S.A./Linares Fotovoltaica, S.L. | | — | | | (3 | ) | | — | |
Captasol Fotovoltaica 36, S.L. | | Seville (ES) | | | — | | | 100.00 | | Abengoa Solar España, S.A./Linares Fotovoltaica, S.L. | | — | | | (3 | ) | | — | |
Captasol Fotovoltaica 37, S.L. | | Seville (ES) | | | — | | | 100.00 | | Abengoa Solar España, S.A./Linares Fotovoltaica, S.L. | | — | | | (3 | ) | | — | |
Captasol Fotovoltaica 38, S.L. | | Seville (ES) | | | — | | | 100.00 | | Abengoa Solar España, S.A./Linares Fotovoltaica, S.L. | | — | | | (3 | ) | | — | |
Captasol Fotovoltaica 52 S.L. | | Seville (ES) | | | 3 | | | 100.00 | | Abengoa Solar, S.A./Abengoa Solar España, S.A. | | — | | | (3 | ) | | — | |
Carpio Solar Inversiones, S.A. | | Seville (ES) | | | 52,364 | | | 100.00 | | CSP Equity Investment, S.A.R.L./Abengoa Solar New Technologies S.A. | | — | | | (** | ) | | B | |
Casaquemada Fotovoltaica, S.L. | | Seville (ES) | | | 2,936 | | | 100.00 | | Abengoa Solar España, S.A./Abengoa Solar, S.A. | | — | | | (3 | ) | | B | |
Cedisolar, S.A. | | Ourense (ES) | | | 4,992 | | | 57.50 | | Rioglass Solar Holding, S.A. | | — | | | (3 | ) | | — | |
Centinela Power Plant S.A.P.I. de C.V. | | Mexico City (MX) | | | 1 | | | 90.00 | | Abengoa México, S.A. de CV | | (*) | | | (1 | ) | | — | |
Centro Industrial y Logístico Torrecuellar, S.A. | | Seville (ES) | | | 60 | | | 100.00 | | Instalaciones Inabensa, S.A./Abeinsa Ingeniería y Construcción Industrial, S.A. | | — | | | (1 | ) | | — | |
Centro Morelos 264, S.A. de C.V | | Mexico City (MX) | | | 3 | | | 100.00 | | Abener Energía, S.A./Inst. Inabensa, S.A./Servicios Auxiliares de Administración, S.A. | | — | | | (1 | ) | | B | |
Centro Tecnológico Palmas Altas, S.A. | | Seville (ES) | | | 12,899 | | | 100.00 | | Abengoa, S.A./Abeinsa Ingeniería y Construcción Industrial, S.A. | | — | | | (1 | ) | | B | |
Cogeneración Villaricos, S.A. | | Seville (ES) | | | 5,951 | | | 99.22 | | Abeinsa Asset Management, S.L. | | — | | | (5 | ) | | — | |
F-149
Table of Contents
Appendices
Appendix I
Subsidiary companies included in the 2014 consolidation perimeter using
the global integration method (Continuation)
| | | | | | | | | | | | | | | | | | | |
| |
| | Shareholding | |
| |
| |
| |
| |
|---|
Company Name | | Registered
Address | | Amount
in thousands
of € | | % of Nominal Capital | | Parent Company | | (*) | | Activity
(see
Page 5) | | Auditor | |
|---|
Concesionaria del Acueducto el Zapotillo, S.A. de C.V. | | Mexico City (MX) | | | 3 | | | 100.00 | | Abengoa México, S.A.C.V./Abeinsa Infraestructuras MedioAmbiente, S.A./Abeinsa, S.A. | | — | | | (4 | ) | | B | |
Construcciones Metalicas Mexicanas, S.A. de C.V. (Comemsa) | | Queretaro (MX) | | | 20,322 | | | 100.00 | | Europea Const. Metálicas, S.A./Abengoa México, S.A. de C.V. | | — | | | (1 | ) | | B | |
Construcciones y Depuraciones, S.A. | | Seville (ES) | | | 7,771 | | | 100.00 | | Abeinsa Infraestructuras Medio Ambiente, S.A. | | — | | | (1 | ) | | B | |
Construtora Integração, Ltda. | | R. de Janeiro (BR) | | | — | | | 51.00 | | Abengoa Brasil, S.A. | | — | | | (1 | ) | | B | |
Consultora de Servicios y Proyectos Centro Norte, S.A. de C.V. | | Guadalajara (MX) | | | 3 | | | 100.00 | | Servicios Auxiliares de Administración, S.A. de C.V./ Abengoa México, S.A. de CV | | (*) | | | (1 | ) | | — | |
Copero Solar Huerta Uno, S.A. | | Seville (ES) | | | 96 | | | 50.00 | | Abengoa Solar España, S.A. | | — | | | (3 | ) | | B | |
Copero Solar Huerta Dos, S.A. | | Seville (ES) | | | 92 | | | 50.00 | | Abengoa Solar España, S.A. | | — | | | (3 | ) | | B | |
Copero Solar Huerta Tres, S.A | | Seville (ES) | | | 94 | | | 50.00 | | Abengoa Solar España, S.A. | | — | | | (3 | ) | | B | |
Copero Solar Huerta Cuatro, S.A. | | Seville (ES) | | | 88 | | | 50.00 | | Abengoa Solar España, S.A. | | — | | | (3 | ) | | B | |
Copero Solar Huerta Cinco, S.A. | | Seville (ES) | | | 87 | | | 50.00 | | Abengoa Solar España, S.A. | | — | | | (3 | ) | | B | |
Copero Solar Huerta Seis, S.A. | | Seville (ES) | | | 83 | | | 50.00 | | Abengoa Solar España, S.A. | | — | | | (3 | ) | | B | |
Copero Solar Huerta Siete, S.A. | | Seville (ES) | | | 83 | | | 50.00 | | Abengoa Solar España, S.A. | | — | | | (3 | ) | | B | |
Copero Solar Huerta Ocho, S.A. | | Seville (ES) | | | 81 | | | 50.00 | | Abengoa Solar España, S.A. | | — | | | (3 | ) | | B | |
Copero Solar Huerta Nueve, S.A. | | Seville (ES) | | | 42 | | | 50.00 | | Abengoa Solar España, S.A. | | — | | | (3 | ) | | B | |
Copero Solar Huerta Diez, S.A. | | Seville (ES) | | | 32 | | | 50.00 | | Abengoa Solar España, S.A. | | — | | | (3 | ) | | B | |
CSP Atacama Dos, S.A | | Santiago de Chile (CL) | | | 2 | | | 100.00 | | CSP Atacama Inversiones Dos, SpA/ Abengoa Solar Chile, SpA | | (*) | | | (3 | ) | | — | |
CSP Atacama Inversiones Uno, SpA | | Santiago de Chile (CL) | | | 2 | | | 100.00 | | Abengoa Solar Chile, SpA | | (*) | | | (1 | ) | | — | |
CSP Atacama Inversiones Dos, SpA | | Santiago de Chile (CL) | | | 2 | | | 100.00 | | Abengoa Solar Chile, SpA | | (*) | | | (1 | ) | | — | |
CSP Equity Investment, S.a.r.l. | | Luxembourg (LU) | | | 86,346 | | | 100.00 | | Abengoa Solar España, S.A. | | — | | | (1 | ) | | — | |
Cycon Solar, LTD | | Nicosia (CY) | | | 1 | | | 100.00 | | Abengoa Solar Internacional, S.A. | | — | | | (3 | ) | | B | |
Dalian Xizhong Island Desalination Co., Ltd | | Dalian (CN) | | | 34 | | | 51.00 | | Abengoa Water Dalian, S.L.U. | | — | | | (4 | ) | | — | |
Denizli Water Treatment Limited Sirketi | | Ankara (TR) | | | 1 | | | 100.00 | | Teyma, Gestión de Contratosde Construcción e Ingeniería, S.A./ Abeinsa Infraestructuras Medio Ambiente, S.A./ Abengoa Perú, S.A. | | (*) | | | (1 | ) | | — | |
Desarrolladora de Energía Renovable, S.A.P.I. de C.V | | Mexico City (MX) | | | — | | | 100.00 | | Abengoa México, S.A. de C.V. /Servicios Auxiliares de Administración, S.A. De C.V. | | — | | | (1 | ) | | — | |
Development NEA, Ltd. | | Tel Aviv (IL) | | | — | | | 100.00 | | NEA Solar Development, S.A. | | (*) | | | (1 | ) | | — | |
Écija Solar Inversiones, S.A | | Seville (ES) | | | 85,886 | | | 100.00 | | CSP Equity Investment S.A.R.L./Abengoa Solar, S.A. | | — | | | (1 | ) | | B | |
Ecoagricola, S.A. | | Murcia (ES) | | | 586 | | | 100.00 | | Abengoa Bioenergía Inversiones, S.A./Ecocarburantes, S.A. | | — | | | (6 | ) | | B | |
Ecocarburantes Españoles, S.A. | | Murcia (ES) | | | 3,798 | | | 95.10 | | Abengoa Bioenergía Inversiones, S.A. | | — | | | (6 | ) | | B | |
Energoprojekt-Gliwice, S.A. | | Gliwice (PL) | | | 9,895 | | | 100.00 | | Abener Energía, S.A. | | — | | | (1 | ) | | D | |
Enernova Ayamonte S.A. | | Huelva (ES) | | | 2,281 | | | 91.00 | | Abeinsa Asset Management, S.L. | | — | | | (5 | ) | | — | |
Enertey, S.A. | | Montevideo (UY) | | | 3,568 | | | 100.00 | | Teyma Uruguay Holding S.A. | | — | | | (1 | ) | | — | |
Enicar Chile, SA | | Santiago de Chile (CL) | | | 3 | | | 100.00 | | Abengoa Chile, S.A. | | — | | | (2 | ) | | — | |
Etarey, S.A. | | Montevideo (UY) | | | 3 | | | 100.00 | | Abeinsa, Ingeniería y Construcción Industrial, S.A. | | (*) | | | (1 | ) | | — | |
Europa Desenvolvimentos Solares Ltda. | | R. de Janeiro (BR) | | | 3 | | | 100.00 | | Abengoa Solar Brasil Desenvolvimientos Solares Ltda./ Abengoa Solar Internacional, S.A. | | — | | | (3 | ) | | — | |
Europea de Construcciones Metálicas, S.A. (Eucomsa) | | Seville (ES) | | | 7,124 | | | 100.00 | | Abeinsa Ingeniería y Construcción Industrial, S.A./Abengoa Solar, S.A. | | — | | | (1 | ) | | B | |
Extremadura Equity Investments Sárl. | | Luxembourg (LU) | | | 327,707 | | | 100.00 | | Logrosán Equity Investments Sárl. | | — | | | (1 | ) | | — | |
Faritel, S.A. | | Montevideo (UY) | | | 14 | | | 100.00 | | Teyma Forestal, S.A. | | — | | | (1 | ) | | — | |
Financiera Soteland, S.A. | | Montevideo (UY) | | | 42 | | | 100.00 | | Asa Investment, AG ZUG | | — | | | (1 | ) | | — | |
Fotovoltaica Solar Sevilla, S.A. | | Seville (ES) | | | 800 | | | 80.00 | | Abengoa Solar España, S.A. | | — | | | (3 | ) | | B | |
Geida Skikda, S.L. | | Madrid (ES) | | | 7,577 | | | 67.00 | | Abengoa Water S.L. | | — | | | (4 | ) | | — | |
GES Investment C.V. | | Amsterdam (NL) | | | — | | | 92.00 | | Asa Investment, AG ZUG | | — | | | (1 | ) | | — | |
Gestión Integral de Recursos Humanos, S.A. | | Seville (ES) | | | 165 | | | 100.00 | | Siema Technologies, S.L | | — | | | (1 | ) | | B | |
Giomper, S.A. | | Montevideo (UY) | | | 3 | | | 100.00 | | Instalaciones Inabensa, S.A./ Enertey, S.A. | | (*) | | | (1 | ) | | — | |
F-150
Table of Contents
Appendices
Appendix I
Subsidiary companies included in the 2014 consolidation perimeter using
the global integration method (Continuation)
| | | | | | | | | | | | | | | | | | | |
| |
| | Shareholding | |
| |
| |
| |
| |
|---|
Company Name | | Registered
Address | | Amount
in thousands
of € | | % of Nominal Capital | | Parent Company | | (*) | | Activity
(see
Page 5) | | Auditor | |
|---|
Girhmex, S.A. De C.V. | | Mexico City (MX) | | | — | | | 100.00 | | Gestión Integral de Recursos Humanos, S.A./Abengoa México, S.A. de C.V. | | — | | | (1 | ) | | — | |
Global Engineering Services, LLC. | | Delaware (US) | | | 2 | | | 100.00 | | GES Investment C.V. | | | | | | | | | |
Helioenergy Electricidad Tres, S.A. | | Seville (ES) | | | 5,127 | | | 100.00 | | Abengoa Solar España, S.A./Abengoa Solar NT, S.A. | | — | | | (3 | ) | | — | |
Helioenergy Electricidad Cuatro, S.A. | | Seville (ES) | | | 60 | | | 100.00 | | Abengoa Solar España, S.A./Abengoa Solar NT, S.A. | | — | | | (3 | ) | | — | |
Helioenergy Electricidad Cinco, S.A. | | Seville (ES) | | | 60 | | | 100.00 | | Abengoa Solar España, S.A./Abengoa Solar NT, S.A. | | — | | | (3 | ) | | — | |
Helioenergy Electricidad Once, S.A. | | Seville (ES) | | | 60 | | | 100.00 | | Abengoa Solar España, S.A./Abengoa Solar NT, S.A. | | — | | | (3 | ) | | — | |
Helioenergy Electricidad Trece, S.A. | | Seville (ES) | | | 60 | | | 100.00 | | Abengoa Solar España, S.A./Abengoa Solar NT, S.A. | | — | | | (3 | ) | | — | |
Helioenergy Electricidad Veintiuno, S.A | | Seville (ES) | | | 60 | | | 100.00 | | Abengoa Solar España, S.A. /Abengoa Solar New Technologies, S.A. | | — | | | (3 | ) | | — | |
Helioenergy Electricidad Veintidos, S.A | | Seville (ES) | | | 60 | | | 100.00 | | Abengoa Solar España, S.A. /Abengoa Solar New Technologies, S.A. | | — | | | (3 | ) | | — | |
Helioenergy Electricidad Veintitres, S.A | | Seville (ES) | | | 60 | | | 100.00 | | Abengoa Solar España, S.A. /Abengoa Solar New Technologies, S.A. | | — | | | (3 | ) | | — | |
Helioenergy Electricidad Veinticuatro, S.A | | Seville (ES) | | | 60 | | | 100.00 | | Abengoa Solar España, S.A. /Abengoa Solar New Technologies, S.A. | | — | | | (3 | ) | | — | |
Helios I Hyperion Energy Investments, S.L. | | Seville (ES) | | | 120,739 | | | 100.00 | | Hypesol Energy Holding, S.L./Abengoa Solar New Technologies, S.A. | | — | | | (3 | ) | | B | |
Helios II Hyperion Energy Investments, S.L. | | Madrid (ES) | | | 113,181 | | | 100.00 | | Hypesol Energy Holding, S.L./Abengoa Solar New Technologies, S.A. | | — | | | (3 | ) | | B | |
Holding de Energía Eólica, S.A. | | Montevideo (UY) | | | 36,666 | | | 100.00 | | Abengoa Concessions Infrastructure, S.L. | | — | | | (** | ) | | — | |
Hypesol Energy Holding, S.L. | | Seville (ES) | | | 236,067 | | | 100.00 | | Abengoa Solar España, S.A./Abengoa Solar New Technologies S.A. | | — | | | (1 | ) | | B | |
Inabensa Bharat Private Limited | | New Delhi (IN) | | | 8,389 | | | 100.00 | | Europea Const. Metálicas, S.A./Instalaciones Inabensa, S.A./Abener Energía, S.A. | | — | | | (1 | ) | | A | |
Inabensa Electrical (Tianjin) Co., Ltd. | | Tianjin (CN) | | | 190 | | | 100.00 | | Instalaciones Inabensa, S.A./Abeinsa Ingeniería y Construcción Industrial, S.A. | | — | | | (1 | ) | | D | |
Inabensa Fotovoltaica, S.L. | | Seville (ES) | | | 3 | | | 100.00 | | Instalaciones Inabensa, S.A./C.I.L. Torrecuéllar, S.A. | | — | | | (1 | ) | | — | |
Inabensa France, S.A. | | Pierrelate (FR) | | | 550 | | | 100.00 | | Instalaciones Inabensa, S.A. | | — | | | (1 | ) | | B | |
Inabensa Limited | | Leeds (GB) | | | — | | | 100.00 | | Instalaciones Inabensa, S.A. | | — | | | (1 | ) | | — | |
Inabensa Maroc, S.A.R.L. | | Tanger (MA) | | | 2,373 | | | 100.00 | | Instalaciones Inabensa, S.A. | | — | | | (1 | ) | | A | |
Inabensa Pty Ltd | | Sandton (SUD) | | | — | | | 100.00 | | Instalaciones Inabensa, S.A. | | — | | | (1 | ) | | D | |
Inabensa Rio Ltda | | R. de Janeiro (BR) | | | 16,225 | | | 100.00 | | Abeanza Brasil, S.A./Abengoa Brasil, S.A. | | — | | | (1 | ) | | B | |
Inabensa Saudi Company Limited | | Dammam (SA) | | | 93 | | | 100.00 | | Instalaciones Inabensa, S.A./Abeinsa Ingeniería y Construcción Industrial, S.A. | | — | | | (1 | ) | | B | |
Inabensa Ukraine, LLC | | Kiev (UA) | | | 15 | | | 100.00 | | Instalaciones Inabensa, S.A. | | (*) | | | (1 | ) | | — | |
Inabensa USA, LLC | | Arizona (US) | | | 41 | | | 100.00 | | Abeinsa, LLC. | | — | | | (1 | ) | | — | |
Inabensa, LLC | | Ruwi (OM) | | | 366 | | | 70.00 | | Instalaciones Inabensa, S.A. | | — | | | (1 | ) | | B | |
Iniciativas Hidroeléctricas de Aragón y Cataluña, S.L. | | Huesca (ES) | | | 4,007 | | | 95.00 | | Abeinsa Infraestructuras Medio Ambiente, S.A. | | — | | | (4 | ) | | — | |
Iniciativas Hidroeléctricas, S.A. | | Seville (ES) | | | 1,226 | | | 50.00 | | Abeinsa Infraestructuras Medio Ambiente, S.A. | | — | | | (4 | ) | | B | |
Insolation 17, S.R.L | | Rome (IT) | | | 2,075 | | | 100.00 | | Abengoa Solar Italia S.r.l./Abengoa Solar Internacional, S.A. | | — | | | (1 | ) | | B | |
Insolation 18, S.R.L | | Rome (IT) | | | 12 | | | 100.00 | | Abengoa Solar Italia S.r.l./Abengoa Solar Internacional, S.A. | | — | | | (3 | ) | | — | |
Insolation Sic 6, S.R.L | | Rome (IT) | | | 11 | | | 100.00 | | Abengoa Solar Italia S.r.l./Abengoa Solar Internacional, S.A. | | — | | | (3 | ) | | — | |
Insolation Sic 9, S.R.L | | Rome (IT) | | | 11 | | | 100.00 | | Abengoa Solar Italia S.r.l./Abengoa Solar Internacional, S.A. | | — | | | (3 | ) | | — | |
Insolation Sic 10, S.R.L | | Palermo (IT) | | | 11 | | | 100.00 | | Abengoa Solar Italia, S.R.L./ Abengoa Solar, S.A. | | (*) | | | (3 | ) | | — | |
Insolation Sic 11, S.R.L | | Palermo (IT) | | | 13 | | | 100.00 | | Abengoa Solar Italia, S.R.L./ Abengoa Solar, S.A. | | (*) | | | (3 | ) | | — | |
Insolation Sic 12, S.R.L | | Palermo (IT) | | | 12 | | | 100.00 | | Abengoa Solar Italia, S.R.L./ Abengoa Solar, S.A. | | (*) | | | (3 | ) | | — | |
F-151
Table of Contents
Appendices
Appendix I
Subsidiary companies included in the 2014 consolidation perimeter using
the global integration method (Continuation)
| | | | | | | | | | | | | | | | | | | |
| |
| | Shareholding | |
| |
| |
| |
| |
|---|
Company Name | | Registered
Address | | Amount
in thousands
of € | | % of Nominal Capital | | Parent Company | | (*) | | Activity
(see
Page 5) | | Auditor | |
|---|
Insolation Sic 13, S.R.L | | Rome (IT) | | | 22 | | | 100.00 | | Abengoa Solar Italia, S.R.L./ Abengoa Solar, S.A. | | (*) | | | (3 | ) | | — | |
Insolation Sic 14, S.R.L | | Rome (IT) | | | 13 | | | 100.00 | | Abengoa Solar Italia, S.R.L./ Abengoa Solar, S.A. | | (*) | | | (3 | ) | | — | |
Insolation Sic 15, S.R.L | | Rome (IT) | | | 14 | | | 100.00 | | Abengoa Solar Italia, S.R.L./ Abengoa Solar, S.A. | | (*) | | | (3 | ) | | — | |
Instalaciones Fotovoltaicas Torrecuéllar, 1 S.L. | | Seville (ES) | | | — | | | 100.00 | | Inabensa Fotovoltaica, S.L./Instalaciones Inabensa, S.A. | | — | | | (1 | ) | | — | |
Instalaciones Fotovoltaicas Torrecuéllar, 2 S.L. | | Seville (ES) | | | — | | | 100.00 | | Inabensa Fotovoltaica, S.L./Instalaciones Inabensa, S.A. | | — | | | (1 | ) | | — | |
Instalaciones Fotovoltaicas Torrecuéllar, 3 S.L. | | Seville (ES) | | | — | | | 100.00 | | Inabensa Fotovoltaica, S.L./Instalaciones Inabensa, S.A. | | — | | | (1 | ) | | — | |
Instalaciones Inabensa Contracting, LLC | | Abu-Dhabi (AE) | | | — | | | 49.00 | | Instalaciones Inabensa, S.A. | | (*) | | | (1 | ) | | — | |
Instalaciones Inabensa Insaat Enerji Sanayi ve Tícaret Ltd Sirketi | | Ankara (TR) | | | 58 | | | 100.00 | | Abeinsa, Ingeniería y Construcción Industrial, S.A./ Instalaciones Inabensa, S.A. | | — | | | (1 | ) | | B | |
Instalaciones Inabensa, Ltda. | | R. de Janeiro (BR) | | | 2,884 | | | 100.00 | | Zeroemissions Technologies, S.A./Zeroemissions Carbon Trust, S.A./ Instalaciones Inabensa, S.A. | | — | | | (1 | ) | | — | |
Instalaciones Inabensa, S.A. | | Seville (ES) | | | 17,307 | | | 100.00 | | Nicsa/Abener Energía, S.A./Abeinsa Ingeniería y Construcción Industrial, S.A. | | — | | | (1 | ) | | B | |
Inversora Enicar S.A. | | Santiago de Chile (CL) | | | 1,841 | | | 100.00 | | Abengoa Chile, S.A. | | — | | | (2 | ) | | — | |
Japan PV Ventures, S.A. | | Seville (ES) | | | 61 | | | 100.00 | | Abengoa Solar, S.A /Abengoa Solar España, S.A. | | — | | | (1 | ) | | — | |
Junertil S.A. | | Montevideo (UY) | | | 3 | | | 100.00 | | Enertey, S.A. | | — | | | (1 | ) | | — | |
Kaxu CSP O&M Company (Pty) Limited | | Gauteng (ZA) | | | — | | | 92.00 | | Abengoa Solar Power South Africa (Pty) Ltd. | | — | | | (3 | ) | | B | |
Kaxu CSP South Africa (Pty) Limited | | Gauteng (ZA) | | | 1,269 | | | 51.00 | | Abengoa Solar South Africa (Pty) Ltd. | | — | | | (3 | ) | | B | |
Khi CSP O&M Company (Pty) Limited | | Gauteng (ZA) | | | — | | | 92.00 | | Abengoa Solar Power South Africa (Pty) Ltd. | | — | | | (3 | ) | | B | |
Khi CSP South Africa (Pty) Limited | | Gauteng (ZA) | | | 762 | | | 51.00 | | Abengoa Solar South Africa (Pty) Ltd. | | — | | | (3 | ) | | B | |
Klitten, S.A. | | Montevideo (UY) | | | 15 | | | 100.00 | | Teyma Uruguay, S.A. | | — | | | (1 | ) | | — | |
Las Cabezas Fotovoltaica, S.L. | | Seville (ES) | | | 8,164 | | | 100.00 | | Abengoa Solar España, S.A./Abengoa Solar, S.A. | | — | | | (3 | ) | | B | |
Latifox, S.A. | | Buenos Aires (AR) | | | 31 | | | 100.00 | | Balofix, S.A. | | — | | | (1 | ) | | — | |
Linares Fotovoltaica, S.L. | | Seville (ES) | | | 3,271 | | | 100.00 | | Abengoa Solar España, S.A./Abengoa Solar, S.A. | | — | | | (3 | ) | | B | |
Linha Verde Transmisora de Energia, S.A | | Brasilia (BR) | | | 12,196 | | | 51.00 | | Abengoa Concessoes Brasil Holding S.A. | | — | | | (2 | ) | | B | |
Logrosán Equity Investments Sárl. | | Luxembourg (LU) | | | 327,707 | | | 100.00 | | Logrosán Solar Inversiones Dos, S.L. | | — | | | (1 | ) | | — | |
Logrosán Solar Inversiones Dos, S.L. | | Seville (ES) | | | 327,723 | | | 100.00 | | Abengoa Solar España S.A./Abengoa Solar S.A. | | — | | | (1 | ) | | — | |
Logrosán Solar Inversiones, S.A. | | Seville (ES) | | | 132,225 | | | 100.00 | | CSP Equity Investment, S.A.R.L./Abengoa Solar New Technologies S.A. | | — | | | (** | ) | | B | |
Londrina Transmissora De Energía, S.A. | | R. de Janeiro (BR) | | | 40,019 | | | 100.00 | | Abengoa Concessoes Brasil Holding, S.A./Abengoa Brasil Ltda. | | — | | | (2 | ) | | B | |
Mallorca Desenvolvimentos Solares Ltda. | | R. de Janeiro (BR) | | | 3 | | | 100.00 | | Abengoa Solar Brasil Desenvolvimientos Solares Ltda./ Abengoa Solar Internacional, S.A. | | — | | | (3 | ) | | — | |
Manaus Constructora, Ltda. | | R. de Janeiro (BR) | | | — | | | 50.50 | | Abengoa Brasil, Ltda. | | — | | | (1 | ) | | B | |
Marismas PV A1, S.L. | | Seville (ES) | | | 6,998 | | | 100.00 | | Las Cabezas Fotovoltaica, S.L./Abengoa Solar España, S.A. | | — | | | (3 | ) | | — | |
Marismas PV A2, S.L. | | Seville (ES) | | | — | | | 100.00 | | Las Cabezas Fotovoltaica, S.L./Abengoa Solar España, S.A. | | — | | | (3 | ) | | — | |
Marismas PV A3, S.L. | | Seville (ES) | | | — | | | 100.00 | | Las Cabezas Fotovoltaica, S.L./Abengoa Solar España, S.A. | | — | | | (3 | ) | | — | |
Marismas PV A4, S.L. | | Seville (ES) | | | — | | | 100.00 | | Las Cabezas Fotovoltaica, S.L./Abengoa Solar España, S.A. | | — | | | (3 | ) | | — | |
Marismas PV A5, S.L. | | Seville (ES) | | | — | | | 100.00 | | Las Cabezas Fotovoltaica, S.L./Abengoa Solar España, S.A. | | — | | | (3 | ) | | — | |
Marismas PV A6, S.L. | | Seville (ES) | | | — | | | 100.00 | | Las Cabezas Fotovoltaica, S.L./Abengoa Solar España, S.A. | | — | | | (3 | ) | | — | |
Marismas PV A7, S.L. | | Seville (ES) | | | — | | | 100.00 | | Las Cabezas Fotovoltaica, S.L./Abengoa Solar España, S.A. | | — | | | (3 | ) | | — | |
Marismas PV A8, S.L. | | Seville (ES) | | | — | | | 100.00 | | Las Cabezas Fotovoltaica, S.L./Abengoa Solar España, S.A. | | — | | | (3 | ) | | — | |
F-152
Table of Contents
Appendices
Appendix I
Subsidiary companies included in the 2014 consolidation perimeter using
the global integration method (Continuation)
| | | | | | | | | | | | | | | | | | | |
| |
| | Shareholding | |
| |
| |
| |
| |
|---|
Company Name | | Registered
Address | | Amount
in thousands
of € | | % of Nominal Capital | | Parent Company | | (*) | | Activity
(see
Page 5) | | Auditor | |
|---|
Marismas PV A9, S.L. | | Seville (ES) | | | — | | | 100.00 | | Las Cabezas Fotovoltaica, S.L./Abengoa Solar España, S.A. | | — | | | (3 | ) | | — | |
Marismas PV A10, S.L. | | Seville (ES) | | | — | | | 100.00 | | Las Cabezas Fotovoltaica, S.L./Abengoa Solar España, S.A. | | — | | | (3 | ) | | — | |
Marismas PV A11, S.L. | | Seville (ES) | | | — | | | 100.00 | | Las Cabezas Fotovoltaica, S.L./Abengoa Solar España, S.A. | | — | | | (3 | ) | | — | |
Marismas PV A12, S.L. | | Seville (ES) | | | — | | | 100.00 | | Las Cabezas Fotovoltaica, S.L./Abengoa Solar España, S.A. | | — | | | (3 | ) | | — | |
Marismas PV A13, S.L. | | Seville (ES) | | | — | | | 100.00 | | Las Cabezas Fotovoltaica, S.L./Abengoa Solar España, S.A. | | — | | | (3 | ) | | — | |
Marismas PV A14, S.L. | | Seville (ES) | | | — | | | 100.00 | | Las Cabezas Fotovoltaica, S.L./Abengoa Solar España, S.A. | | — | | | (3 | ) | | — | |
Marismas PV A15, S.L. | | Seville (ES) | | | — | | | 100.00 | | Las Cabezas Fotovoltaica, S.L./Abengoa Solar España, S.A. | | — | | | (3 | ) | | — | |
Marismas PV A16, S.L. | | Seville (ES) | | | — | | | 100.00 | | Las Cabezas Fotovoltaica, S.L./Abengoa Solar España, S.A. | | — | | | (3 | ) | | — | |
Marismas PV A17, S.L. | | Seville (ES) | | | — | | | 100.00 | | Las Cabezas Fotovoltaica, S.L./Abengoa Solar España, S.A. | | — | | | (3 | ) | | — | |
Marismas PV A18, S.L. | | Seville (ES) | | | — | | | 100.00 | | Las Cabezas Fotovoltaica, S.L./Abengoa Solar España, S.A. | | — | | | (3 | ) | | — | |
Marismas PV B1, S.L. | | Seville (ES) | | | — | | | 100.00 | | Las Cabezas Fotovoltaica, S.L./Abengoa Solar España, S.A. | | — | | | (3 | ) | | — | |
Marismas PV B2, S.L. | | Seville (ES) | | | — | | | 100.00 | | Las Cabezas Fotovoltaica, S.L./Abengoa Solar España, S.A. | | — | | | (3 | ) | | — | |
Marismas PV B3, S.L. | | Seville (ES) | | | — | | | 100.00 | | Las Cabezas Fotovoltaica, S.L./Abengoa Solar España, S.A. | | — | | | (3 | ) | | — | |
Marismas PV B4, S.L. | | Seville (ES) | | | — | | | 100.00 | | Las Cabezas Fotovoltaica, S.L./Abengoa Solar España, S.A. | | — | | | (3 | ) | | — | |
Marismas PV B5, S.L. | | Seville (ES) | | | — | | | 100.00 | | Las Cabezas Fotovoltaica, S.L./Abengoa Solar España, S.A. | | — | | | (3 | ) | | — | |
Marismas PV B6, S.L. | | Seville (ES) | | | — | | | 100.00 | | Las Cabezas Fotovoltaica, S.L./Abengoa Solar España, S.A. | | — | | | (3 | ) | | — | |
Marismas PV B7, S.L. | | Seville (ES) | | | — | | | 100.00 | | Las Cabezas Fotovoltaica, S.L./Abengoa Solar España, S.A. | | — | | | (3 | ) | | — | |
Marismas PV B8, S.L. | | Seville (ES) | | | — | | | 100.00 | | Las Cabezas Fotovoltaica, S.L./Abengoa Solar España, S.A. | | — | | | (3 | ) | | — | |
Marismas PV B9, S.L. | | Seville (ES) | | | — | | | 100.00 | | Las Cabezas Fotovoltaica, S.L./Abengoa Solar España, S.A. | | — | | | (3 | ) | | — | |
Marismas PV B10, S.L. | | Seville (ES) | | | — | | | 100.00 | | Las Cabezas Fotovoltaica, S.L./Abengoa Solar España, S.A. | | — | | | (3 | ) | | — | |
Marismas PV B11, S.L. | | Seville (ES) | | | — | | | 100.00 | | Las Cabezas Fotovoltaica, S.L./Abengoa Solar España, S.A. | | — | | | (3 | ) | | — | |
Marismas PV B12, S.L. | | Seville (ES) | | | — | | | 100.00 | | Las Cabezas Fotovoltaica, S.L./Abengoa Solar España, S.A. | | — | | | (3 | ) | | — | |
Marismas PV B13, S.L. | | Seville (ES) | | | — | | | 100.00 | | Las Cabezas Fotovoltaica, S.L./Abengoa Solar España, S.A. | | — | | | (3 | ) | | — | |
Marismas PV B14, S.L. | | Seville (ES) | | | — | | | 100.00 | | Las Cabezas Fotovoltaica, S.L./Abengoa Solar España, S.A. | | — | | | (3 | ) | | — | |
Marismas PV B15, S.L. | | Seville (ES) | | | — | | | 100.00 | | Las Cabezas Fotovoltaica, S.L./Abengoa Solar España, S.A. | | — | | | (3 | ) | | — | |
Marismas PV B16, S.L. | | Seville (ES) | | | — | | | 100.00 | | Las Cabezas Fotovoltaica, S.L./Abengoa Solar España, S.A. | | — | | | (3 | ) | | — | |
Marismas PV B17, S.L. | | Seville (ES) | | | — | | | 100.00 | | Las Cabezas Fotovoltaica, S.L./Abengoa Solar España, S.A. | | — | | | (3 | ) | | — | |
Marismas PV B18, S.L. | | Seville (ES) | | | — | | | 100.00 | | Las Cabezas Fotovoltaica, S.L./Abengoa Solar España, S.A. | | — | | | (3 | ) | | — | |
Marismas PV C1, S.L. | | Seville (ES) | | | — | | | 100.00 | | Las Cabezas Fotovoltaica, S.L./Abengoa Solar España, S.A. | | — | | | (3 | ) | | — | |
Marismas PV C2, S.L. | | Seville (ES) | | | — | | | 100.00 | | Las Cabezas Fotovoltaica, S.L./Abengoa Solar España, S.A. | | — | | | (3 | ) | | — | |
Marismas PV C3, S.L. | | Seville (ES) | | | — | | | 100.00 | | Las Cabezas Fotovoltaica, S.L./Abengoa Solar España, S.A. | | — | | | (3 | ) | | — | |
F-153
Table of Contents
Appendices
Appendix I
Subsidiary companies included in the 2014 consolidation perimeter using
the global integration method (Continuation)
| | | | | | | | | | | | | | | | | | | |
| |
| | Shareholding | |
| |
| |
| |
| |
|---|
Company Name | | Registered
Address | | Amount
in thousands
of € | | % of Nominal Capital | | Parent Company | | (*) | | Activity
(see
Page 5) | | Auditor | |
|---|
Marismas PV C4, S.L. | | Seville (ES) | | | — | | | 100.00 | | Las Cabezas Fotovoltaica, S.L./Abengoa Solar España, S.A. | | — | | | (3 | ) | | — | |
Marismas PV C5, S.L. | | Seville (ES) | | | — | | | 100.00 | | Las Cabezas Fotovoltaica, S.L./Abengoa Solar España, S.A. | | — | | | (3 | ) | | — | |
Marismas PV C6, S.L. | | Seville (ES) | | | — | | | 100.00 | | Las Cabezas Fotovoltaica, S.L./Abengoa Solar España, S.A. | | — | | | (3 | ) | | — | |
Marismas PV C7, S.L. | | Seville (ES) | | | — | | | 100.00 | | Las Cabezas Fotovoltaica, S.L./Abengoa Solar España, S.A. | | — | | | (3 | ) | | — | |
Marismas PV C8, S.L. | | Seville (ES) | | | — | | | 100.00 | | Las Cabezas Fotovoltaica, S.L./Abengoa Solar España, S.A. | | — | | | (3 | ) | | — | |
Marismas PV C9, S.L. | | Seville (ES) | | | — | | | 100.00 | | Las Cabezas Fotovoltaica, S.L./Abengoa Solar España, S.A. | | — | | | (3 | ) | | — | |
Marismas PV C10, S.L. | | Seville (ES) | | | — | | | 100.00 | | Las Cabezas Fotovoltaica, S.L./Abengoa Solar España, S.A. | | — | | | (3 | ) | | — | |
Marismas PV C11, S.L. | | Seville (ES) | | | — | | | 100.00 | | Las Cabezas Fotovoltaica, S.L./Abengoa Solar España, S.A. | | — | | | (3 | ) | | — | |
Marismas PV C12, S.L. | | Seville (ES) | | | — | | | 100.00 | | Las Cabezas Fotovoltaica, S.L./Abengoa Solar España, S.A. | | — | | | (3 | ) | | — | |
Marismas PV C13, S.L. | | Seville (ES) | | | — | | | 100.00 | | Las Cabezas Fotovoltaica, S.L./Abengoa Solar España, S.A. | | — | | | (3 | ) | | — | |
Marismas PV C14, S.L. | | Seville (ES) | | | — | | | 100.00 | | Las Cabezas Fotovoltaica, S.L./Abengoa Solar España, S.A. | | — | | | (3 | ) | | — | |
Marismas PV C15, S.L. | | Seville (ES) | | | — | | | 100.00 | | Las Cabezas Fotovoltaica, S.L./Abengoa Solar España, S.A. | | — | | | (3 | ) | | — | |
Marismas PV C16, S.L. | | Seville (ES) | | | — | | | 100.00 | | Las Cabezas Fotovoltaica, S.L./Abengoa Solar España, S.A. | | — | | | (3 | ) | | — | |
Marismas PV C17, S.L. | | Seville (ES) | | | — | | | 100.00 | | Las Cabezas Fotovoltaica, S.L./Abengoa Solar España, S.A. | | — | | | (3 | ) | | — | |
Marismas PV C18, S.L. | | Seville (ES) | | | — | | | 100.00 | | Las Cabezas Fotovoltaica, S.L./Abengoa Solar España, S.A. | | — | | | (3 | ) | | — | |
Marismas PV E1, S.L. | | Seville (ES) | | | — | | | 100.00 | | Las Cabezas Fotovoltaica, S.L./Abengoa Solar España, S.A. | | — | | | (3 | ) | | — | |
Marismas PV E2, S.L. | | Seville (ES) | | | — | | | 100.00 | | Las Cabezas Fotovoltaica, S.L./Abengoa Solar España, S.A. | | — | | | (3 | ) | | — | |
Marismas PV E3, S.L. | | Seville (ES) | | | — | | | 100.00 | | Las Cabezas Fotovoltaica, S.L./Abengoa Solar España, S.A. | | — | | | (3 | ) | | — | |
Marudhara Akshay Urja Private Limited | | Maharashtra (IN) | | | 33 | | | 100.00 | | Abengoa Solar India Private Limited/Abengoa Solar Internacional. S.A. | | — | | | (3 | ) | | B | |
Marusthal Green Power Private Limited | | Maharashtra (IN) | | | 33 | | | 100.00 | | Abengoa Solar India Private Limited/Abengoa Solar Internacional, S.A. | | — | | | (3 | ) | | B | |
Mojave Solar Holding, LLC. | | Delaware (US) | | | 303,917 | | | 100.00 | | Abengoa Solar Holdings USA Inc. | | — | | | (** | ) | | B | |
Mojave Solar LLC | | Colorado (US) | | | 303,920 | | | 100.00 | | Mojave Solar Holding, LLC. | | — | | | (** | ) | | B | |
NEA Solar O&M, S.A. | | Seville (ES) | | | 61 | | | 100.00 | | Abengoa Solar, S.A /Abengoa Solar España, S.A. | | — | | | (1 | ) | | — | |
NEA Solar Investments, LLC. | | Delaware (US) | | | 480 | | | 100.00 | | Abengoa Solar LLC. | | — | | | (1 | ) | | — | |
NEA Solar O&M Holdings, LLC. | | Delaware (US) | | | — | | | 100.00 | | Abengoa Solar, LLC | | (*) | | | (1 | ) | | — | |
NEA Solar Operation and Manteinance, Ltd | | Tel Aviv (IL) | | | — | | | 100.00 | | NEA Solar O&M Holdings, LLC. | | (*) | | | (1 | ) | | — | |
NEA Solar Power, Ltd. | | Ashalim (IL) | | | — | | | 100.00 | | NEA Solar Investments, LLC | | — | | | (1 | ) | | B | |
NEA Solar Power, S.A. | | Seville (ES) | | | 61 | | | 100.00 | | Abengoa Solar, S.A /Abengoa Solar España, S.A. | | — | | | (1 | ) | | — | |
Negocios Industriales y Comerciales, S.A. (Nicsa) | | Madrid (ES) | | | 1,791 | | | 100.00 | | Abencor, S.A./Abeinsa Ingeniería y Construcción Industrial, S.A. | | — | | | (1 | ) | | B | |
Nicefield S.A | | Uruguay (UY) | | | 12 | | | 100.00 | | Giomper, S.A. | | — | | | (5 | ) | | — | |
Nicsa Asia Pacific Private Limited | | Singapore (SG) | | | — | | | 100.00 | | Negocios Industriales y Comerciales, S.A. | | — | | | (1 | ) | | B | |
Nicsa Colombia, SAS | | Bogota (CO) | | | — | | | 100.00 | | Negocios Industriales y Comerciales, S.A. (Nicsa) | | (*) | | | (1 | ) | | — | |
Nicsa Fornecimiento de Materiais Eléctricos, Ltda. | | R. de Janeiro (BR) | | | 5,152 | | | 100.00 | | Abeinsa Ingeniería y Construcción Industrial, S.A./Negocios Industriales y Comerciales, S.A. | | — | | | (1 | ) | | — | |
F-154
Table of Contents
Appendices
Appendix I
Subsidiary companies included in the 2014 consolidation perimeter using
the global integration method (Continuation)
| | | | | | | | | | | | | | | | | | | |
| |
| | Shareholding | |
| |
| |
| |
| |
|---|
Company Name | | Registered
Address | | Amount
in thousands
of € | | % of Nominal Capital | | Parent Company | | (*) | | Activity
(see
Page 5) | | Auditor | |
|---|
Nicsa Industrial Supplies South Africa (Pty) Ltd. | | Upington (ZA) | | | — | | | 100.00 | | Negocios Industriales y Comerciales, S.A. (Nicsa) | | — | | | (1 | ) | | D | |
Nicsa Industrial Supplies, LLC. | | Texas (US) | | | 857 | | | 100.00 | | Abeinsa, LLC. | | — | | | (1 | ) | | D | |
Nicsa Middle East, FZE | | Sharjah (AE) | | | — | | | 100.00 | | Negocios Industriales y Comerciales, S.A | | — | | | (1 | ) | | B | |
Nicsa Perú, S.A. | | Lima (PE) | | | 561 | | | 100.00 | | Negocios Industriales y Comerciales, S.A./Abeinsa Ingeniería y Construcción Industrial, S.A. | | — | | | (1 | ) | | — | |
Nicsamex, S.A. de C.V. | | Mexico City (MX) | | | 4 | | | 100.00 | | Negocios Industriales y Comerciales, S.A./Abengoa México, S.A. de C.V. | | — | | | (1 | ) | | B | |
Norventus Atlántico, S.L. | | A Coruña (ES) | | | 7 | | | 70.00 | | Instalaciones Inabensa, S.A. | | — | | | (5 | ) | | — | |
Omega Chile SpA | | Santiago de Chile (CL) | | | 2 | | | 100.00 | | Omega Sudamérica, S.L. | | — | | | (1 | ) | | — | |
OMEGA Operação e Manutenção de Linhas de Transmissão, S.A. | | R. de Janeiro (BR) | | | 175 | | | 100.00 | | Instalaciones Inabesa S.A./Abengoa Brasil, S.A. | | — | | | (1 | ) | | — | |
Omega Perú Operación y Mantenimiento S.A. | | Lima (PE) | | | — | | | 100.00 | | Omega Sudamérica S.L./Abengoa Perú S.A. | | — | | | (1 | ) | | B | |
Omega Sudamérica, S.L | | Seville (ES) | | | 3 | | | 100.00 | | Instalaciones Inabensa, S.A./ASA Iberoamérica S.A. | | — | | | (1 | ) | | — | |
Operación y Mantenimiento Uruguay, S.A. | | Montevideo (UY) | | | 2 | | | 100.00 | | Omega Sudamérica, S.L | | — | | | (5 | ) | | — | |
Palen Solar Holdings, LLC | | California (US) | | | 25,346 | | | 100.00 | | Abengoa SP Holdings, LLC | | — | | | (3 | ) | | — | |
Palmatir, S.A. | | Montevideo (UY) | | | 37,408 | | | 100.00 | | Abengoa Concessions Infrastructure, S.L. | | — | | | (** | ) | | B | |
Palmucho, S.A. | | Santiago de Chile (CL) | | | 2 | | | 100.00 | | Abengoa Concessions Infrastructure, S.L./ Abengoa Yield Plc. | | — | | | (** | ) | | B | |
Pectonex (RF) (Pty) Limited | | Cape Town (ZA) | | | — | | | 100.00 | | Kaxu Solar One (Pty) Ltd. | | (*) | | | (1 | ) | | — | |
Power & Railway Solutions, S.L. | | Seville (ES) | | | 3 | | | 100.00 | | Instalaciones Inabensa, S.A. | | (*) | | | (1 | ) | | — | |
Power Structures, Inc. | | Delaware (US) | | | — | | | 100.00 | | Abeinsa, LLC. | | — | | | (1 | ) | | — | |
Presentel, S.A. | | Montevideo (UY) | | | — | | | 100.00 | | Abencor Suministros, S.A. | | — | | | (1 | ) | | — | |
Procesos Ecológicos Carmona 1, S.A. | | Seville (ES) | | | 63 | | | 100.00 | | Abeinsa Infraestructuras Medio Ambiente, S.A./Procesos Ecológicos, S.A. | | — | | | (1 | ) | | — | |
Procesos Ecológicos Carmona 2, S.A. | | Seville (ES) | | | 90 | | | 100.00 | | Abeinsa Infraestructuras Medio Ambiente, S.A./Procesos Ecológicos, S.A. | | — | | | (1 | ) | | — | |
Procesos Ecológicos Carmona 3, S.A. | | Seville (ES) | | | 60 | | | 100.00 | | Abeinsa Infraestructuras Medio Ambiente, S.A./Procesos Ecológicos, S.A. | | — | | | (1 | ) | | — | |
Procesos Ecológicos Lorca 1, S.A. | | Seville (ES) | | | 180 | | | 100.00 | | Abeinsa Infraestructuras Medio Ambiente, S.A./Procesos Ecológicos, S.A. | | — | | | (1 | ) | | — | |
Procesos Ecológicos Vilches, S.A. | | Seville (ES) | | | 1,299 | | | 100.00 | | Abeinsa Infraestructuras Medio Ambiente, S.A./Procesos Ecológicos, S.A. | | — | | | (5 | ) | | B | |
Procesos Ecológicos, S.A. | | Seville (ES) | | | 657 | | | 50.00 | | Abeinsa Infraestructuras Medio Ambiente, S.A. | | — | | | (1 | ) | | — | |
Promotora Serabén de Servicios Corporativos, S.A. de C.V. | | Mexico City (MX) | | | 3 | | | 100.00 | | Abener Mexico S.A. de C.V./Abengoa Mexico S.A. de C.V. | | — | | | (1 | ) | | B | |
Puerto Real Cogeneración, S.A. | | Seville (ES) | | | 176 | | | 99.10 | | Abeinsa Asset Management, S.L. | | — | | | (5 | ) | | B | |
PV Atacama Uno, S.A. | | Santiago de Chile (CL) | | | 2 | | | 100.00 | | PV Atacama Inversiones Uno, SpA/ Abengoa Solar Chile, SpA | | (*) | | | (3 | ) | | — | |
PV Atacama Dos, S.A | | Santiago de Chile (CL) | | | — | | | 100.00 | | PV Atacama Inversiones Dos, SpA/ Abengoa Solar Chile, SpA | | (*) | | | (3 | ) | | — | |
PV Atacama Inversiones Uno, SpA | | Santiago de Chile (CL) | | | 2 | | | 100.00 | | Abengoa Solar Chile, SpA | | (*) | | | (1 | ) | | — | |
PV Atacama Inversiones Dos, SpA | | Santiago de Chile (CL) | | | 2 | | | 100.00 | | Abengoa Solar Chile, SpA | | (*) | | | (1 | ) | | — | |
Qingdao Befesa Agua Co., Ltd | | Qingdao (CH) | | | 1,609 | | | 100.00 | | Abeinsa Infraestructuras Medio Ambiente, S.A./Codesa, S.A. | | — | | | (1 | ) | | B | |
Rajasthan Photon Energy Pvt Ltd | | Maharashtra (IN) | | | 33 | | | 100.00 | | Abengoa Solar India Private Limited/Abengoa Solar Internacional, S.A. | | — | | | (3 | ) | | B | |
Rioglass Solar Chile, S.A. | | Santiago de Chile (CL) | | | — | | | 100.00 | | Rioglass Solar Holding, S.A | | (*) | | | (1 | ) | | — | |
Rioglass Solar Dos, S.A. | | Asturias (ES) | | | 60 | | | 100.00 | | Rioglass Solar Holding, S.A. | | — | | | (1 | ) | | B | |
Rioglass Solar Holding, S.A | | Asturias (ES) | | | 502 | | | 50.00 | | Abengoa Solar, S.A. | | — | | | (1 | ) | | B | |
Rioglass Solar Inc. | | Delaware (US) | | | 9,391 | | | 100.00 | | Rioglass Solar Holding, S.A. | | — | | | (1 | ) | | B | |
Rioglass Solar Internacional | | Brussels (BE) | | | 62 | | | 100.00 | | Rioglass Solar Holding, S.A./Rioglass Solar, S.A. | | — | | | (1 | ) | | — | |
Rioglass Solar Systems, Ltd. | | Tel Aviv (IL) | | | — | | | 100.00 | | Rioglass Solar Holding, S.A. | | — | | | (1 | ) | | — | |
Rioglass Solar, S.A | | Asturias (ES) | | | 6,906 | | | 100.00 | | Rioglass Solar Holding, S.A. | | — | | | (1 | ) | | B | |
Rioglass South Africa (Lty) Ltd. | | Upington (ZA) | | | 60 | | | 100.00 | | Rioglass Solar Holding, S.A. | | — | | | (1 | ) | | B | |
Royalla PV Pty Ltd. | | Brisbane (AU) | | | 22 | | | 100.00 | | Abengoa Solar Internacional, S.A. | | — | | | (3 | ) | | — | |
Sanlúcar Solar, S.A. | | Seville (ES) | | | 29,359 | | | 100.00 | | Abengoa Concessions Infrastructure, S.L. | | — | | | (** | ) | | B | |
Sao Mateus Transmissora de Energía, Ltda. | | R. de Janeiro (BR) | | | 58,863 | | | 76.00 | | Abengoa Concessoes Brasil Holding, S.A./Abengoa Brasil Ltda. | | — | | | (2 | ) | | B | |
F-155
Table of Contents
Appendices
Appendix I
Subsidiary companies included in the 2014 consolidation perimeter using
the global integration method (Continuation)
| | | | | | | | | | | | | | | | | | | |
| |
| | Shareholding | |
| |
| |
| |
| |
|---|
Company Name | | Registered
Address | | Amount
in thousands
of € | | % of Nominal Capital | | Parent Company | | (*) | | Activity
(see
Page 5) | | Auditor | |
|---|
Servicios Administrativos Tabasco, S.A. de C.V. | | Tabasco (MX) | | | — | | | 100.00 | | Servicios Auxiliares de Administración, S.A. de C.V./ Abengoa México, S.A. de CV | | (*) | | | (1 | ) | | — | |
Servicios Auxiliares de Administración, S.A. de C.V. | | Mexico City (MX) | | | 3 | | | 100.00 | | Abengoa México, S.A. de C.V./Abengoa, S.A. | | — | | | (1 | ) | | B | |
Servicios de Ingenieria IMA, S.A. | | Santiago de Chile (CL) | | | 4,822 | | | 94.08 | | Abengoa Chile, S.A. | | — | | | (1 | ) | | B | |
Servicios Integrales de Mantenimiento y Operación, S.A. (Simosa) | | Seville (ES) | | | 1,185 | | | 100.00 | | Negocios Industriales y Comerciales, S.A./Abengoa, S.A. | | — | | | (1 | ) | | D | |
Siema AG | | Zug (SZ) | | | 8,757 | | | 100.00 | | Sociedad Inversora Energía y Medio Ambiente, S.A. | | — | | | (1 | ) | | D | |
Siema Factory Holding, AG | | Zug (SZ) | | | 9,353 | | | 100.00 | | Siema Investment, S.L. | | — | | | (1 | ) | | D | |
Siema Investment, S.L.U. | | Madrid (ES) | | | 7,000 | | | 100.00 | | Siema Technologies, S.L | | — | | | (1 | ) | | — | |
Siema Technologies, S.L. | | Madrid (ES) | | | 24,297 | | | 100.00 | | Abengoa, S.A./Siema AG | | — | | | (1 | ) | | B | |
Simosa Brasil, S.A. | | R. de Janeiro (BR) | | | — | | | 100.00 | | Abengoa Construçao Brasil, Ltda./Inabensa Rio Ltda | | (*) | | | (1 | ) | | — | |
Simosa I.T., S.A | | Seville (ES) | | | 61 | | | 100.00 | | Abengoa, S.A./Simosa, S.A. | | — | | | (1 | ) | | B | |
Simosa IT Uruguay, S.A. | | Montevideo (UY) | | | 2 | | | 100.00 | | Simosa IT, S.A. | | — | | | (1 | ) | | B | |
Simosa IT US, LLC | | Missouri (US) | | | — | | | 100.00 | | Simosa IT, S.A. | | — | | | (1 | ) | | D | |
Sinalan, S.A. | | Montevideo (UY) | | | 4 | | | 100.00 | | Teyma Forestal, S.A. | | — | | | (1 | ) | | — | |
Sistemas de Desarrollo Sustentables S.A. De C.V. | | Mexico City (MX) | | | 4,496 | | | 65.00 | | Abengoa Servicios Industriales, S.A./Abengoa México, S.A. de CV | | — | | | (1 | ) | | B | |
Sociedad Inversora en Energía y Medioambiente, S.A. (Siema) | | Seville (ES) | | | 93,008 | | | 100.00 | | Abengoa, S.A./Negocios Industriales y Comerciales, S.A. | | — | | | (1 | ) | | B | |
Sociedad Inversora Lineas de Brasil, S.L. (ETVE) | | Seville (ES) | | | 12,798 | | | 100.00 | | Asa Iberoamérica, S.L. | | — | | | (1 | ) | | B | |
Sociétéd'Eau Déssalée d'Agadir (SEDA) | | Agadir (MA) | | | 2,710 | | | 50.94 | | Abengoa Water Agadir, S.L.U. | | (*) | | | (4 | ) | | — | |
Solaben Electricidad Uno, S.A. | | Caceres (ES) | | | 164,915 | | | 100.00 | | Extremadura Equity Investments Sárl. | | — | | | (3 | ) | | B | |
Solaben Electricidad Dos, S.A. | | Caceres (ES) | | | 62,688 | | | 70.00 | | Abengoa Solar España, S.A./ Logrosán Solar Inversiones, S.A. | | — | | | (** | ) | | B | |
Solaben Electricidad Tres, S.A. | | Caceres (ES) | | | 62,401 | | | 70.00 | | Abengoa Solar España, S.A./ Logrosán Solar Inversiones, S.A. | | — | | | (** | ) | | B | |
Solaben Electricidad Seis, S.A. | | Badajoz (ES) | | | 162,793 | | | 100.00 | | Extremadura Equity Investments Sárl. | | — | | | (3 | ) | | B | |
Solaben Electricidad Diez, S.A. | | Caceres (ES) | | | 60 | | | 100.00 | | Abengoa Solar España, S.A./Abengoa Solar NT, S.A. | | — | | | (3 | ) | | — | |
Solacor Electricidad Uno, S.A. | | Seville (ES) | | | 57,902 | | | 74.00 | | Carpio Solar Inversiones, S.A. | | — | | | (** | ) | | B | |
Solacor Electricidad Dos, S.A. | | Seville (ES) | | | 58,477 | | | 74.00 | | Carpio Solar Inversiones, S.A. | | — | | | (** | ) | | B | |
Solar de Receptores de Andalucía, S.A. | | Seville (ES) | | | 60 | | | 100.00 | | Abengoa Yield Plc./ Abengoa Concessions Infrastructure, S.L. | | — | | | (** | ) | | — | |
Solar Power Plant One | | Argel (DZ) | | | 42,111 | | | 51.00 | | Abener Energía, S.A. | | — | | | (3 | ) | | D | |
Solar Power PV South Africa (Pty) Ltd. | | Gauteng (ZA) | | | 173 | | | 100.00 | | Abengoa Solar South Africa (Pty) Ltd. | | — | | | (3 | ) | | B | |
Solar Processes, S.A. | | Seville (ES) | | | 32,080 | | | 100.00 | | Abengoa Concessions Infrastructure, S.L. | | — | | | (** | ) | | B | |
Solargate Electricidad Tres, S.A. | | Seville (ES) | | | 60 | | | 100.00 | | Abengoa Solar España, S.A./Abengoa Solar NT, S.A. | | — | | | (3 | ) | | — | |
Solargate Electricidad Cuatro, S.A. | | Seville (ES) | | | 60 | | | 100.00 | | Abengoa Solar España, S.A./Abengoa Solar NT, S.A. | | — | | | (3 | ) | | — | |
Solargate Electricidad Cinco, S.A. | | Seville (ES) | | | 60 | | | 100.00 | | Abengoa Solar España, S.A./Abengoa Solar NT, S.A. | | — | | | (3 | ) | | — | |
Solnova Electricidad, S.A. | | Seville (ES) | | | 30,986 | | | 100.00 | | Solnova Solar Inversiones, S.A./Instalaciones Inabensa, S.A. | | — | | | (3 | ) | | B | |
Solnova Electricidad Dos, S.A. | | Seville (ES) | | | 4,960 | | | 100.00 | | Abengoa Solar España, S.A./Abengoa Solar, S.A. | | — | | | (3 | ) | | — | |
Solnova Electricidad Tres, S.A. | | Seville (ES) | | | 30,110 | | | 100.00 | | Solnova Solar Inversiones, S.A./Instalaciones Inabensa, S.A. | | — | | | (3 | ) | | B | |
Solnova Electricidad Cuatro, S.A. | | Seville (ES) | | | 28,964 | | | 100.00 | | Solnova Solar Inversiones, S.A /Instalaciones Inabensa, S.A. | | — | | | (3 | ) | | B | |
Solnova Electricidad Cinco, S.A. | | Seville (ES) | | | 3,965 | | | 100.00 | | Abengoa Solar España, S.A./Abengoa Solar, S.A. | | — | | | (3 | ) | | — | |
Solnova Electricidad Seis, S.A. | | Seville (ES) | | | 60 | | | 100.00 | | Abengoa Solar España, S.A./Abengoa Solar NT, S.A. | | — | | | (3 | ) | | — | |
Solnova Solar Inversiones, S.A | | Seville (ES) | | | 60 | | | 100.00 | | Abengoa Solar España, S.A./ Abengoa Solar New Technologies, S.A. | | — | | | (1 | ) | | B | |
F-156
Table of Contents
Appendices
Appendix I
Subsidiary companies included in the 2014 consolidation perimeter using
the global integration method (Continuation)
| | | | | | | | | | | | | | | | | | | |
| |
| | Shareholding | |
| |
| |
| |
| |
|---|
Company Name | | Registered
Address | | Amount
in thousands
of € | | % of Nominal Capital | | Parent Company | | (*) | | Activity
(see
Page 5) | | Auditor | |
|---|
Solúcar Andalucía FV2, S.A | | Seville (ES) | | | 58 | | | 100.00 | | Abengoa Solar España, S.A./ Abengoa Solar New Technologies, S.A. | | (*) | | | (3 | ) | | — | |
Son Rivieren (Pty) Limited | | Gauteng (ZA) | | | 549 | | | 100.00 | | South Africa Solar Investment, S.L. | | — | | | (1 | ) | | B | |
South Africa PV Investments, S.L. | | Seville (ES) | | | 99 | | | 100.00 | | Abengoa Solar Internacional, S.A./Abengoa Solar Ventures, S.A | | — | | | (1 | ) | | — | |
South Africa Solar Investments, S.L. | | Seville (ES) | | | 150,713 | | | 100.00 | | Abengoa Solar Internacional, S.A./ Abengoa Solar, S.A. | | — | | | (1 | ) | | B | |
South Africa Solar Ventures, S.L. | | Seville (ES) | | | 50 | | | 100.00 | | Abengoa Solar Internacional, S.A./Abengoa Solar Ventures, S.A | | — | | | (1 | ) | | — | |
Subestaciones 611 Baja California, S.A. De C.V. | | Mexico City (MX) | | | 3 | | | 100.00 | | Abengoa México, S.A. de C.V./Abengoa, S.A | | — | | | (1 | ) | | B | |
Tairol, S.A. | | Montevideo (UY) | | | — | | | 100.00 | | Talentir, S.A. | | (*) | | | (1 | ) | | — | |
Talentir, S.A. | | Montevideo (UY) | | | 1 | | | 100.00 | | Enertey, S.A./ Instalaciones Inabensa, S.A. | | (*) | | | (1 | ) | | — | |
Tarefix, S.A | | Delaware (US) | | | 1 | | | 92.00 | | Asa Investment, AG ZUG | | — | | | (1 | ) | | — | |
TenesLylmyah | | Argel (DZ) | | | 19,803 | | | 51.00 | | Befesa Aguas Tenes, S.L. | | — | | | (4 | ) | | D | |
Teyma Abengoa, S.A. | | Buenos Aires (AR) | | | 51,858 | | | 100.00 | | Asa Investment, AG ZUG/Asa Iberoamérica, S.L./Abengoa, S.A. | | — | | | (1 | ) | | B | |
Teyma Construction USA, LLC. | | Arizona (US) | | | 1 | | | 100.00 | | Abeinsa, LLC. | | — | | | (1 | ) | | — | |
Teyma Forestal, S.A. | | Montevideo (UY) | | | 1,100 | | | 100.00 | | Balofix, S.A. | | — | | | (1 | ) | | B | |
Teyma Gestión Ambiental, S.A | | Montevideo (UY) | | | 18 | | | 100.00 | | Teyma Medioambiente, S.A. | | — | | | (1 | ) | | — | |
Teyma India Private Limited | | Mumbai (IN) | | | 1,525 | | | 100.00 | | Teyma Gestión de Contratos de Construcción e Ingeniería, S.A. | | — | | | (1 | ) | | — | |
Teyma Internacional, S.A. | | Montevideo (UY) | | | 19 | | | 100.00 | | Teyma Uruguay Holding, S.A. | | — | | | (1 | ) | | B | |
Teyma Medio Ambiente, S.A. | | Montevideo (UY) | | | 19 | | | 100.00 | | Teyma Uruguay Holding, S.A. | | — | | | (1 | ) | | B | |
Teyma Middle East, S.L. | | Seville (ES) | | | 3 | | | 100.00 | | Teyma, S.A. /Teyma Int., S.A. /Ábacus Project Management Inc./Teyma Uruguay, S.A. | | — | | | (1 | ) | | B | |
Teyma Paraguay, SA. | | Asuncion (PY) | | | — | | | 100.00 | | Teyma Internacional, S.A. | | — | | | (1 | ) | | — | |
Teyma Sociedad de Inversión, S.A. | | Montevideo (UY) | | | 15,833 | | | 92.00 | | Abeinsa Inversiones Latam, S.L. | | — | | | (1 | ) | | B | |
Teyma South Africa (Pty) Ltd. | | Upington (ZA) | | | 80 | | | 100.00 | | Teyma Gestión de Contratos de Construcción e Ingeniería, S.A. | | — | | | (1 | ) | | — | |
Teyma Uruguay ZF, S.A. | | Montevideo (UY) | | | 3,809 | | | 100.00 | | Teyma Uruguay, S.A. | | — | | | (1 | ) | | B | |
Teyma Uruguay, S.A. | | Montevideo (UY) | | | 5,007 | | | 97.00 | | Teyma Sociedad de Inversión, S.A. | | — | | | (1 | ) | | B | |
Teyma USA & Abener Engineering and Construction Services Partnership | | Missouri (US) | | | 16,763 | | | 100.00 | | Teyma Construction USA, LLC/Abener Construction Services, LLC. | | — | | | (1 | ) | | — | |
Teyma, Gestión de Contratos de Construcción e Ingeniería, S.A. | | Seville (ES) | | | 55 | | | 92.00 | | Abeinsa Ingeniería y Construcción Industrial, S.A. | | — | | | (1 | ) | | B | |
Transmisora Baquedano, S.A. | | Santiago de Chile (CL) | | | 11,659 | | | 100.00 | | Abengoa Concessions Infrastructure, S.L./ Abengoa Yield Plc. | | — | | | (** | ) | | B | |
Transmisora Mejillones, S.A. | | Santiago de Chile (CL) | | | 8,071 | | | 100.00 | | Abengoa Concessions Infrastructure, S.L./ Abengoa Yield Plc. | | — | | | (** | ) | | B | |
Transportadora Bahía Blanca S.A. | | Buenos Aires (AR) | | | 2 | | | 100.00 | | Abengoa S.A./Teyma Abengoa S.A. | | — | | | (2 | ) | | — | |
Transportadora Cuyana, S.A. | | Buenos Aires (AR) | | | 3 | | | 100.00 | | Teyma Abengoa, S.A./Abengoa, S.A. | | — | | | (1 | ) | | B | |
Transportadora del Norte, S.A. | | Buenos Aires (AR) | | | — | | | 100.00 | | Abengoa, S.A./Teyma Abengoa, S.A. | | — | | | (1 | ) | | B | |
Transportadora Mar del Plata S.A. | | Buenos Aires (AR) | | | 5 | | | 70.00 | | Teyma Abengoa, S.A./ Abengoa, S.A. | | (*) | | | (1 | ) | | B | |
Transportadora Río Coronda, S.A. | | Buenos Aires (AR) | | | — | | | 100.00 | | Teyma Abengoa, S.A./Abengoa, S.A. | | — | | | (1 | ) | | B | |
Transportadora Rio de la Plata, S.A. | | Buenos Aires (AR) | | | — | | | 100.00 | | Teyma Argentina, S.A./Abengoa, S.A. | | — | | | (1 | ) | | D | |
Turbogenerador Madero 7, S.A. de C.V. | | Mexico City (MX) | | | 3 | | | 100.00 | | Abener Energ., S.A./ Teyma, Gest. Cont. Const. e Ing., S.A./Abengoa México, S.A. de C.V. | | — | | | (1 | ) | | — | |
Unidad Punta de Rieles, S.A. | | Montevideo (UY) | | | 21 | | | 85.00 | | Teyma Uruguay, S.A./ Instalaciones Inabensa, S.A. | | (*) | | | (5 | ) | | B | |
Vista Ridge Regional Water Supply Corporation | | Texas (US) | | | — | | | 100.00 | | Abengoa Vista Ridge, LLC. | | (*) | | | (4 | ) | | — | |
Waste to Energy Suppliers San Jose, S.A. | | Costa Rica (CR) | | | — | | | 100.00 | | Abeinsa Inf. de Medio Ambiente, S.A./Teyma, Gestión de Contratos e Ingeniería, S.A. | | — | | | (1 | ) | | — | |
XiNa CSP South Africa (Pty) Ltd. | | Gauteng (ZA) | | | 3,786 | | | 100.00 | | South Africa Solar Investments, S.L. | | — | | | (1 | ) | | B | |
XiNa Operations and Maintenance Company (Pty) Ltd | | Cape Town (ZA) | | | — | | | 92.00 | | Abengoa Solar Power South Africa (Pty) Ltd. | | (*) | | | (1 | ) | | — | |
Zero Emissions Technologies, S.A. (Zeroemissions) | | Seville (ES) | | | 60 | | | 100.00 | | Abeinsa Ingeniería y Construcción Industrial, S.A./Abengoa Hidrógeno, S.A. | | — | | | (1 | ) | | B | |
F-157
Table of Contents
Appendices
Appendix I
Subsidiary companies included in the 2014 consolidation perimeter using
the global integration method (Continuation)
| | | | | | | | | | | | | | | | | | | |
| |
| | Shareholding | |
| |
| |
| |
| |
|---|
Company Name | | Registered
Address | | Amount
in thousands
of € | | % of Nominal Capital | | Parent Company | | (*) | | Activity
(see
Page 5) | | Auditor | |
|---|
Zeroemissions (Beijing) Technology Consulting Service, Co. Ltd | | Beijing (CN) | | | 100 | | | 100.00 | | Zero Emissions Technologies, S.A./Zeroemissions Carbon Trust, S.A. | | — | | | (1 | ) | | — | |
Zeroemissions Carbon Trust, S.A | | Seville (ES) | | | 125 | | | 100.00 | | Zeroemissions Technologies, S.A./Abeinsa Ingeniería y Construcción Industrial, S.A. | | — | | | (1 | ) | | B | |
Zona Norte Engenharia, Manutenção e Gestão De Serviços, S.A. Spe. | | Manaus (BR) | | | 33,578 | | | 60.00 | | Abengoa Concessões Brasil Holding, S.A. | | — | | | (5 | ) | | B | |
Shareholding capital cost is calculated using the current closing year exchange rate
- (*)
- Companies incorporated or acquired and consolidated for the first time in the year.
- (**)
- Discontinued operation
- (***)
- Abengoa 100% class B (control), Liberty 100% class A.
- (1)
- Operating segment activities area: Engineering and Construction.
- (2)
- Operating segment activities area: Transmission.
- (3)
- Operating segment activities area: Solar.
- (4)
- Operating segment activities area: Water.
- (5)
- Operating segment activities areae: Cogeneration and others.
- (6)
- Operating segment activities area: Bioenergy.
- A
- Audited by PricewaterhouseCoopers Auditores.
- B
- Audited by Deloitte (for legal purposes).
- C
- Audited by Auditoría y Consulta (for legal purposes).
- D
- Audited by others auditors (for legal purposes).
F-158
Table of Contents
Appendices
Appendix II
Associated companies and Joint Ventures included in the
2014 consolidation perimeter using the participation method
| | | | | | | | | | | | | | | | |
| |
| | Shareholding | |
| |
| |
| |
|
|---|
Company Name | | Registered
Address | | Amount in
thousands
of € | | % of
Nominal
Capital | | Parent Company | | (*) | | Activity | | Auditor |
|---|
Agroenergía de Campillos, S.L. | | Seville (ES) | | | — | | | 25.00 | | Instalaciones Inabensa, S.A. | | (*) | | (1) | | — |
Agua y Gestión de Servicios Ambientales, S.A. | | Seville (ES) | | | 3,562 | | | 41.54 | | Abengoa Water, S.L. | | — | | (4) | | — |
Al Osais-Inabensa Co., Ltd | | Dammam (SA) | | | 438 | | | 50.00 | | Inabensa Saudi Arabia, LLC | | — | | (1) | | B |
Ashalim Thermo Solar Management, Ltd. | | Tel Aviv (IL) | | | — | | | 50.00 | | Abener Energía, S.A./ Teyma, Gestión de Contratos de Construcción e Ingeniería, S.A. | | (*) | | (1) | | — |
ATE VIII Transmissora de Energía, S.A. | | R. de Janeiro (BR) | | | 9,794 | | | 50.00 | | Abengoa Concessoes Brasil Holding, S.A. | | — | | (2) | | B |
Basor México, S.A.P.I. de C.V. | | Mexico City (MX) | | | 108 | | | 50.00 | | Nicsamex, S.A. de C.V. | | — | | (1) | | — |
Chennai O&M, JV Private Limited | | Chennai (India) | | | — | | | 50.00 | | Abengoa Water, S.L. | | (*) | | (1) | | — |
Chennai Water Desalination Limited | | Chennai (IN) | | | 7,086 | | | 25.00 | | Abengoa Water, S.L. | | — | | (4) | | — |
Coaben, S.A. de C.V. | | Mexico City (MX) | | | 1 | | | 50.00 | | Abengoa México S.A. de C.V./Instalaciones Inabensa, S.A. | | — | | (1) | | B |
Cogeneración Motril, S.A. | | Granada (ES) | | | 1,913 | | | 19.00 | | Abeinsa Asset Management, S.L. | | — | | (5) | | — |
Concecutex, S.A. de C.V. | | Toluca (MX) | | | 6,992 | | | 50.00 | | Abengoa México, S.A. de C.V. | | — | | (5) | | B |
Concesionaria Costa del Sol S.A. | | Malaga (ES) | | | 4,585 | | | 50.00 | | Instalaciones Inabensa, S.A. | | — | | (5) | | B |
Concesionaria Hospital del Tajo, S.A. | | Madrid (ES) | | | 944 | | | 20.00 | | Instalaciones Inabensa, S.A. | | — | | (5) | | D |
Consorcio Teyma M y C, Ltda. | | Santiago de Chile (CL) | | | 10 | | | 49.90 | | Abengoa Chile, S.A. | | — | | (1) | | — |
Evacuación Valdecaballeros, S.L. | | Madrid (ES) | | | 8,984 | | | 57.14 | | Solaben Electricidad Uno, Dos, Tres y Seis, S.A. | | — | | (3) | | — |
Evacuación Villanueva del Rey, S.L. | | Seville (ES) | | | 2 | | | 45.13 | | Helioenergy Electricidad Uno, Dos y Tres, S.A. | | — | | (3) | | — |
Explotaciones Varias, S.L. | | Seville (ES) | | | 2,301 | | | 50.00 | | Abengoa, S.A. | | — | | (1) | | — |
Explotadora Hospital del Tajo, S.L. | | Madrid (ES) | | | 1 | | | 20.00 | | Instalaciones Inabensa, S.A. | | — | | (5) | | — |
Geida Tlemcen, S.L. | | Madrid (ES) | | | 13,584 | | | 50.00 | | Abengoa Water, S.L. | | — | | (4) | | — |
Ghenova Ingeniería S.L. | | Seville (ES) | | | 1,323 | | | 20.00 | | Abener Energía, S.A. | | — | | (1) | | — |
Green Visión Holding, BV | | Arnhem (NL) | | | 3,000 | | | 24.00 | | Abengoa Hidrógeno, S.A. | | — | | (1) | | — |
Greentech Water Engineering Company | | Pekín (CN) | | | 5,967 | | | 25.00 | | Abengoa Water Hong Kong, Co. Limited | | (*) | | (1) | | — |
Helioenergy Electricidad Uno, S.A. | | Seville (ES) | | | 43,600 | | | 50.00 | | Écija Solar Inversiones, S.A. | | — | | (3) | | B |
Helioenergy Electricidad Dos, S.A. | | Seville (ES) | | | 42,718 | | | 50.00 | | Écija Solar Inversiones, S.A. | | — | | (3) | | B |
HZN ManutenÇão Hospitalar Ltda. | | Manaus (BR) | | | — | | | 33.00 | | Simosa Brasil, S.A. | | (*) | | (1) | | — |
Inabensa Green Energy Co., Ltd. | | Japan (JP) | | | 198 | | | 50.00 | | Instalaciones Inabensa S.A. | | — | | (1) | | — |
Inapreu, S.A. | | Barcelona (ES) | | | 2,318 | | | 50.00 | | Instalaciones Inabensa, S.A. | | — | | (5) | | B |
Kaxu Solar One (Pty) Ltd. | | Gauteng (ZA) | | | 16,430 | | | 51.00 | | Abengoa Solar South Africa (Pty) Ltd. | | — | | (3) | | B |
Khi Solar One (Pty) Ltd. | | Gauteng (ZA) | | | 11,526 | | | 51.00 | | Son Rivieren (Pty) Limited | | — | | (3) | | B |
Ledincor, S.A. | | Montevideo (UY) | | | 661 | | | 49.00 | | Teyma Forestal, S.A. | | — | | (1) | | — |
Lidelir, S.A. | | Montevideo (UY) | | | 1,068 | | | 49.00 | | Teyma Forestal, S.A. | | — | | (1) | | — |
Micronet Porous Fibers, S.L. | | Vizcaya (ES) | | | 3,162 | | | 50.00 | | Abengoa Water, S.L. | | — | | (1) | | — |
Myah Bahr Honaine, S.P.A. | | Argel (DZ) | | | 21,433 | | | 25.50 | | Geida Tlemcen, S.L. | | — | | (4) | | D |
Negev Energy—Ashalim Thermo-Solar, Ltd. | | Tel Aviv (IL) | | | — | | | 50.00 | | NEA Solar Power, Ltd. | | — | | (3) | | B |
Negev Energy Ashalim Operation and Mantainance, Ltd. | | Tel Aviv (IL) | | | — | | | 50.00 | | NEA Solar Operation and Manteinance, Ltd | | (*) | | (1) | | — |
Negev Energy Finance, Ltd. | | Tel Aviv (IL) | | | — | | | 50.00 | | NEA Solar Power, Ltd. | | (*) | | (1) | | — |
Residuos Sólidos Urbanos de Ceuta, S.L. | | Seville (ES) | | | 2,030 | | | 50.00 | | Abengoa, S.A. | | — | | (1) | | — |
Servicios Culturales Mexiquenses, S.A. de C.V. | | Toluca (MX) | | | 1 | | | 50.00 | | Abengoa México, S.A. de C.V./ Instalaciones Inabensa, S.A. | | — | | (1) | | B |
Shams Power Company PJSC | | Abu-Dhabi (AE) | | | 183 | | | 40.00 | | Total Abengoa Solar Emirates Investment Company, BV | | — | | (3) | | — |
SolelAben EPC Ashalim, L.P. | | Tel Aviv (IL) | | | — | | | 50.20 | | Abener Energía, S.A./ Teyma, Gestión de Contratos de Construcción e Ingeniería, S.A. | | (*) | | (1) | | — |
SRC Nanomaterials, S.A | | Asturias (ES) | | | 500 | | | 50.00 | | Rioglass Solar, S.A. | | — | | (3) | | — |
Total Abengoa Solar Emirates Investment Company, B.V. | | Amsterdam (NL) | | | 23,262 | | | 50.00 | | Abengoa Solar Ventures, S. A | | — | | (1) | | B |
Total Abengoa Solar Emirates O&M Company, B.V. | | Amsterdam (NL) | | | 165 | | | 50.00 | | Abengoa Solar Ventures, S.A. | | — | | (3) | | B |
TSMC Ingeniería y Contrucción, Ltda. | | Santiago de Chile (CL) | | | 12 | | | 33.30 | | Abengoa Chile, S.A. | | — | | (1) | | — |
Xina Solar One (Rf) (Pty), Ltd. | | Gauteng (ZA) | | | — | | | 80.00 | | Xina CSP South Africa (Pty) Ltd | | — | | (3) | | — |
Shareholding- capital cost is calculated using the current closing year exchange rate
- (*)
- Companies incorporated or acquired and consolidated for the first time in the year.
- (1)
- Operating segment activities area: Engineering and Construction.
- (2)
- Operating segment activities area: Transmission.
- (3)
- Operating segment activities area: Solar.
- (4)
- Operating segment activities area: Water.
- (5)
- Operating segment activities areae: Cogeneration and others.
- (6)
- Operating segment activities area: Bioenergy.
- A
- Audited by PricewaterhouseCoopers Auditores.
- B
- Audited by Deloitte (for legal purposes).
- C
- Audited by Auditoría y Consulta (for legal purposes).
- D
- Audited by others auditors (for legal purposes).
F-159
Table of Contents
Appendices
Appendix III
Temporary Joint Ventures included in the 2014 Consolidation Perimeter
using the proportional integration method
| | | | | | | | | | | | | | | | |
| |
| | Shareholding | |
| |
| |
| |
|
|---|
Company Name | | Registered
Address | | Amount in
thousands
of € | | % of
Nominal
Capital | | Parent Company | | (*) | | Activity
(see Page 2) | | Auditor |
|---|
Acceso Avda Pais Valencia | | Alicante (ES) | | | 3.00 | | | 50.00 | % | Instalaciones Inabensa, S.A. | | | | (1) | | — |
ACE L5 | | Setubal (PT) | | | — | | | 44.80 | % | Instalaciones Inabensa, S.A. | | (*) | | (1) | | — |
Adis Segovia Valdestrilla | | Madrid (ES) | | | — | | | 7.00 | % | Instalaciones Inabensa, S.A. | | | | (1) | | — |
Agencia Andaluza de Energía | | Seville (ES) | | | 6.00 | | | 35.00 | % | Instalaciones Inabensa, S.A. | | | | (1) | | — |
Albalac | | Madrid (ES) | | | 2.04 | | | 33.34 | % | Instalaciones Inabensa, S.A. | | | | (1) | | — |
Almanjayar | | Madrid (ES) | | | 1.50 | | | 25.00 | % | Instalaciones Inabensa, S.A. | | | | (1) | | — |
Almería | | Almeria (ES) | | | 1.50 | | | 50.00 | % | Abengoa Water S.L. | | | | (4) | | — |
Aparcamiento L`Ordana | | Alicante (ES) | | | 4.50 | | | 90.00 | % | Instalaciones Inabensa, S.A. | | | | (1) | | — |
APCA Inabensa-Abengoa Lote 1 | | Seville (ES) | | | 6.00 | | | 50.00 | % | Instalaciones Inabensa, S.A. | | | | (1) | | — |
APCA Inabensa-Abengoa Lote 2 | | Seville (ES) | | | 6.00 | | | 50.00 | % | Instalaciones Inabensa, S.A. | | | | (1) | | — |
Argelia | | Madrid (ES) | | | 3.00 | | | 50.00 | % | Instalaciones Inabensa, S.A. | | | | (1) | | — |
Armilla | | Seville (ES) | | | 3.00 | | | 50.00 | % | Instalaciones Inabensa, S.A. | | | | (1) | | — |
Asimel | | Madrid (ES) | | | 1.30 | | | 25.00 | % | Instalaciones Inabensa, S.A. | | | | (1) | | — |
Badaia | | Vitoria (ES) | | | 3.00 | | | 30.00 | % | Instalaciones Inabensa, S.A. | | | | (1) | | — |
Baja California | | Seville (ES) | | | — | | | 100.00 | % | Inabensa, S.A. /Abener Energía, S.A. /Abeinsa, Ing y Const. Ind., S.A./Serv. Aux. de Admon., S.A. de C.V. | | | | (1) | | B |
Barras Parada | | Madrid (ES) | | | 3.00 | | | 50.00 | % | Instalaciones Inabensa, S.A. | | | | (1) | | — |
CARE Córdoba | | Seville (ES) | | | 12.00 | | | 25.00 | % | Instalaciones Inabensa, S.A. | | | | (1) | | — |
Cartagena | | Murcia (ES) | | | 1.13 | | | 37.50 | % | Abengoa Water S.L. | | | | (4) | | — |
CEI Huesca | | Zaragoza (ES) | | | 0.60 | | | 20.00 | % | Instalaciones Inabensa, S.A. | | | | (1) | | — |
Cercanias Tren (Camas-Salteras) | | Madrid (ES) | | | 1.00 | | | 35.00 | % | Instalaciones Inabensa, S.A. | | | | (1) | | — |
CGS-ABENGOA | | Zaragoza (ES) | | | 2.40 | | | 20.00 | % | Instalaciones Inabensa, S.A. | | (*) | | (1) | | — |
Circulo Mercantil e Industrial de Sevilla | | Seville (ES) | | | 3.00 | | | 50.00 | % | Instalaciones Inabensa, S.A. | | | | (1) | | — |
Ciudad de la Justicia | | Madrid (ES) | | | 1.00 | | | 20.00 | % | Instalaciones Inabensa, S.A. | | | | (1) | | — |
Consistorio | | Madrid (ES) | | | 6.00 | | | 30.00 | % | Instalaciones Inabensa, S.A. | | | | (1) | | — |
Consorcio Abengoa Colombia | | Bogotá (CO) | | | — | | | 100.00 | % | Abeinsa Infraestructuras Medio Ambiente, S.A./Abener Energía, S.A./ Abengoa Perú S,A. | | (*) | | (1) | | — |
Consorcio Abengoa Kipreos Limitada | | Santiago (CL) | | | 8.00 | | | 50.00 | % | Abengoa Chile, S.A. | | | | (1) | | — |
Consorcio Ambiental de la Plata | | Montevideo (UY) | | | 0.67 | | | 100.00 | % | Teyma Uruguay, S.A./Teyma Medioambiente S.A. | | | | (1) | | — |
Consorcio Constructor Alto Cayma | | Lima (PE) | | | — | | | 25.00 | % | Abengoa Perú, S.A. | | | | (1) | | — |
Consorcio La Gloria | | Lima (PE) | | | — | | | 50.00 | % | Abengoa Perú, S.A. | | | | (1) | | — |
Consorcio Pachacutec | | Lima (PE) | | | — | | | 50.00 | % | Abengoa Perú, S.A. | | | | (1) | | — |
CPD Solares UTE | | Madrid (ES) | | | 10.00 | | | 35.00 | % | Instalaciones Inabensa, S.A. | | | | (1) | | — |
Edificio ETEA | | Zaragoza (ES) | | | — | | | 40.00 | % | Instalaciones Inabensa, S.A. | | | | (1) | | — |
Edificio ITA | | Zaragoza (ES) | | | 3.00 | | | 30.00 | % | Instalaciones Inabensa, S.A. | | | | (1) | | — |
Edificio PICA | | Seville (ES) | | | 5.00 | | | 50.00 | % | Instalaciones Inabensa, S.A. | | | | (1) | | — |
Electrificación Burgos | | Madrid (ES) | | | 2.00 | | | 33.34 | % | Instalaciones Inabensa, S.A. | | | | (1) | | — |
Electrificación Granollers | | Madrid (ES) | | | 6.00 | | | 20.00 | % | Instalaciones Inabensa, S.A. | | | | (1) | | — |
Electrificación L-3 | | Madrid (ES) | | | 1.20 | | | 50.00 | % | Instalaciones Inabensa, S.A. | | | | (1) | | — |
Emergencia NAT Barcelona | | Barcelona (ES) | | | 9.00 | | | 33.33 | % | Instalaciones Inabensa, S.A. | | | | (1) | | — |
Emvisesa Palacio Exposiciones | | Seville (ES) | | | 1.50 | | | 25.00 | % | Instalaciones Inabensa, S.A. | | | | (1) | | — |
Energía Línea 9 | | Barcelona (ES) | | | 1.20 | | | 20.00 | % | Instalaciones Inabensa, S.A. | | | | (1) | | — |
Energía Noroeste | | Seville (ES) | | | 6.00 | | | 50.00 | % | Instalaciones Inabensa, S.A. | | | | (1) | | — |
Equipamiento Solar Caballería | | Madrid (ES) | | | 1.20 | | | 20.00 | % | Instalaciones Inabensa, S.A. | | | | (1) | | — |
Facultades | | Madrid (ES) | | | 1.00 | | | 15.00 | % | Instalaciones Inabensa, S.A. | | | | (1) | | — |
Ferial Badajoz | | Madrid (ES) | | | — | | | 25.00 | % | Instalaciones Inabensa, S.A. | | | | (1) | | — |
Ferrovial-Agroman Teyma (FAT) | | Montevideo (UY) | | | — | | | 40.00 | % | Teyma Uruguay, S.A | | — | | (1) | | — |
Fotovoltaica Expo | | Zaragoza (ES) | | | 7.00 | | | 70.00 | % | Instalaciones Inabensa, S.A. | | | | (1) | | — |
Gallur Castejon | | Madrid (ES) | | | 2.00 | | | 33.33 | % | Instalaciones Inabensa, S.A. | | | | (1) | | — |
Guardería La Nucia | | Alicante (ES) | | | 4.50 | | | 45.00 | % | Instalaciones Inabensa, S.A. | | | | (1) | | — |
H. Campus de la Salud | | Seville (ES) | | | 2.40 | | | 20.00 | % | Instalaciones Inabensa, S.A. | | | | (1) | | — |
Hospital Costa del Sol | | Malaga (ES) | | | 10.00 | | | 50.00 | % | Instalaciones Inabensa, S.A. | | | | (1) | | — |
IB INABENSA (JV) G15 | | India (IN) | | | — | | | 100.00 | % | Inabensa Bharat Private Limited/ Instalaciones Inabensa, S.A. | | (*) | | (1) | | — |
IB INABENSA (JV) G24 | | India (IN) | | | — | | | 100.00 | % | Inabensa Bharat Private Limited/ Instalaciones Inabensa, S.A. | | (*) | | (1) | | — |
IB INABENSA (JV) GR177 | | India (IN) | | | — | | | 100.00 | % | Inabensa Bharat Private Limited/ Instalaciones Inabensa, S.A. | | (*) | | (1) | | — |
IB-PGF-INABEN(JV) GR159 CORE | | India (IN) | | | — | | | 71.00 | % | Inabensa Bharat Private Limited/ Instalaciones Inabensa S.A. | | (*) | | (1) | | — |
Inabensa-Jayton Catral | | Alicante (ES) | | | 10.00 | | | 50.00 | % | Instalaciones Inabensa, S.A. | | | | (1) | | — |
F-160
Table of Contents
Appendices
Appendix III
Temporary Joint Ventures included in the 2014 Consolidation Perimeter
using the proportional integration method (Continuation)
| | | | | | | | | | | | | | | | |
| |
| | Shareholding | |
| |
| |
| |
|
|---|
Company Name | | Registered
Address | | Amount in
thousands
of € | | % of
Nominal
Capital | | Parent Company | | (*) | | Activity
(see Page 2) | | Auditor |
|---|
Inabensa-Jayton La Nucia | | Alicante (ES) | | | 6.00 | | | 50.00 | % | Instalaciones Inabensa, S.A. | | | | (1) | | — |
Inabensa-Jayton Villajoyosa | | Alicante (ES) | | | 3.00 | | | 50.00 | % | Instalaciones Inabensa, S.A. | | | | (1) | | — |
Inabervion | | Vizcaya (ES) | | | 10.00 | | | 50.00 | % | Instalaciones Inabensa, S.A. | | | | (1) | | — |
Inacom | | Madrid (ES) | | | 6.00 | | | 25.00 | % | Instalaciones Inabensa, S.A. | | | | (1) | | — |
Incubadora | | Madrid (ES) | | | 1.80 | | | 30.00 | % | Instalaciones Inabensa, S.A. | | | | (1) | | — |
Inst. Eléctricas Hospital Costa del Sol | | Malaga (ES) | | | 3.00 | | | 50.00 | % | Instalaciones Inabensa, S.A. | | | | (1) | | — |
Instalaciones Hospital VQ | | Seville (ES) | | | 6.00 | | | 60.00 | % | Instalaciones Inabensa, S.A. | | | | (1) | | — |
Instalaciones Plataforma Sur | | Barcelona (ES) | | | 5.00 | | | 50.00 | % | Instalaciones Inabensa, S.A. | | | | (1) | | — |
La Faisanera | | Burgos (ES) | | | 4.00 | | | 30.00 | % | Instalaciones Inabensa, S.A. | | | | (1) | | — |
Lav-Buixalleu | | Barcelona (ES) | | | 3.00 | | | 50.00 | % | Instalaciones Inabensa, S.A. | | | | (1) | | — |
Libia-Líneas | | Seville (ES) | | | — | | | 50.00 | % | Instalaciones Inabensa, S.A. | | | | (1) | | — |
Machupichu | | Seville (ES) | | | 6.00 | | | 100.00 | % | Instalaciones Inabensa, S.A. /Abencor Suministros, S.A. | | | | (1) | | — |
Mataporquera | | Madrid (ES) | | | 3.00 | | | 50.00 | % | Instalaciones Inabensa, S.A. | | | | (1) | | — |
Meisa-Inabensa | | Huelva (ES) | | | 5.00 | | | 50.00 | % | Instalaciones Inabensa, S.A. | | | | (1) | | — |
Metro Ligero de Granada | | Madrid (ES) | | | 6.00 | | | 40.00 | % | Instalaciones Inabensa, S.A. | | | | (1) | | — |
Mnto.Comunic.Metro L9 | | Barcelona (ES) | | | 1.00 | | | 20.00 | % | Instalaciones Inabensa, S.A. | | | | (1) | | — |
Mobiliario La Nucia | | Alicante (ES) | | | 5.00 | | | 45.00 | % | Instalaciones Inabensa, S.A. | | | | (1) | | — |
Nat Electricidad | | Madrid (ES) | | | 4.00 | | | 33.34 | % | Instalaciones Inabensa, S.A. | | | | (1) | | — |
Ontoria | | Vizcaya (ES) | | | 3.00 | | | 50.00 | % | Instalaciones Inabensa, S.A. | | | | (1) | | — |
Pabellón Cubierto La Nucia | | Alicante (ES) | | | 9.00 | | | 45.00 | % | Instalaciones Inabensa, S.A. | | | | (1) | | — |
Parque aeronáutico | | Seville (ES) | | | 2.00 | | | 40.00 | % | Instalaciones Inabensa, S.A. | | | | (1) | | — |
Parque Soland | | Seville (ES) | | | 3.00 | | | 50.00 | % | Instalaciones Inabensa, S.A. | | | | (1) | | — |
Patrimonio | | Seville (ES) | | | 2.00 | | | 35.00 | % | Instalaciones Inabensa, S.A. | | | | (1) | | — |
Peaje Irun (Telvent Inabensa) | | Bilbao (ES) | | | — | | | 20.00 | % | Instalaciones Inabensa, S.A. | | | | (1) | | — |
Pistas Deportivas La Nucia | | Alicante (ES) | | | 1.00 | | | 45.00 | % | Instalaciones Inabensa, S.A. | | | | (1) | | — |
Preufet Juzgados | | Barcelona (ES) | | | 6.00 | | | 50.00 | % | Instalaciones Inabensa, S.A. | | | | (1) | | — |
Primapen III | | Gijón (ES) | | | 6.00 | | | 33.00 | % | Instalaciones Inabensa, S.A. | | | | (1) | | — |
Rap Fenol | | Madrid (ES) | | | 6.00 | | | 33.00 | % | Instalaciones Inabensa, S.A. | | | | (1) | | — |
Rotonda CV-70 | | Alicante (ES) | | | 4.50 | | | 45.00 | % | Instalaciones Inabensa, S.A. | | | | (1) | | — |
S/E Blanes | | Madrid (ES) | | | 6.00 | | | 33.33 | % | Instalaciones Inabensa, S.A. | | | | (1) | | — |
S/E Libia | | Madrid (ES) | | | — | | | 50.00 | % | Instalaciones Inabensa, S.A. | | | | (1) | | — |
S/E Modulares | | Barcelona (ES) | | | 5.00 | | | 50.00 | % | Instalaciones Inabensa, S.A. | | | | (1) | | — |
S/E Sant Adriá | | Madrid (ES) | | | 2.00 | | | 50.00 | % | Instalaciones Inabensa, S.A. | | | | (1) | | — |
Sede Universitaria | | Alicante (ES) | | | 4.50 | | | 45.00 | % | Instalaciones Inabensa, S.A. | | | | (1) | | — |
Seguridad Vial y Tráfico Rodado | | Alicante (ES) | | | 9.00 | | | 90.00 | % | Instalaciones Inabensa, S.A. | | | | (1) | | — |
Semi-Inabensa | | Madrid (ES) | | | 3.00 | | | 50.00 | % | Instalaciones Inabensa, S.A. | | | | (1) | | — |
Sigmacat | | Madrid (ES) | | | 2.00 | | | 33.00 | % | Instalaciones Inabensa, S.A. | | | | (1) | | — |
Silfrasub | | Madrid (ES) | | | 2.00 | | | 40.00 | % | Instalaciones Inabensa, S.A. | | | | (1) | | — |
Silvacat | | Madrid(ES) | | | 30.00 | | | 35.50 | % | Instalaciones Inabensa, S.A. | | | | (1) | | — |
Sisecat | | Madrid (ES) | | | 1.00 | | | 20.95 | % | Instalaciones Inabensa, S.A. | | | | (1) | | — |
Sisecat II | | Madrid (ES) | | | 6.00 | | | 20.95 | % | Instalaciones Inabensa, S.A. | | | | (1) | | — |
Soterramnet 132 Kv | | Barcelona (ES) | | | 2.00 | | | 33.34 | % | Instalaciones Inabensa, S.A. | | | | (1) | | — |
Suburbano Mexico | | Seville (ES) | | | 6.00 | | | 100.00 | % | Instalaciones Inabensa, S.A. /Abeinsa, Ing y Const. Ind., S.A. | | | | (1) | | B |
Tablada | | Seville (ES) | | | 6.00 | | | 50.00 | % | Abengoa Water S.L. | | | | (4) | | — |
Telar Klitten | | Montevideo (UY) | | | 0.88 | | | 100.00 | % | Teyma Uruguay, S.A. | | | | (1) | | — |
Teyma Israel I | | Seville (ES) | | | — | | | 100.00 | % | Abener Energía, S.A./Teyma Gestión de Contratos de Construcción e Ingeniería, S.A. | | | | (1) | | — |
Teyma Israel II | | Seville (ES) | | | — | | | 100.00 | % | Abener Energía, S.A./Teyma Gestión de Contratos de Construcción e Ingeniería, S.A. | | | | (1) | | — |
Teyma Israel III | | Seville (ES) | | | — | | | 100.00 | % | Abener Energía, S.A./Teyma Gestión de Contratos de Construcción e Ingeniería, S.A. | | | | (1) | | — |
Torre | | Bilbao (ES) | | | 6.00 | | | 20.00 | % | Instalaciones Inabensa, S.A. | | | | (1) | | — |
Torre Isla Cartuja | | Seville (ES) | | | 12.00 | | | 20.00 | % | Instalaciones Inabensa, S.A. | | | | (1) | | — |
Tranvía de Jaén | | Seville (ES) | | | 1.00 | | | 15.00 | % | Instalaciones Inabensa, S.A. | | | | (1) | | — |
Túnel Rovira | | Barcelona (ES) | | | 2.00 | | | 33.00 | % | Instalaciones Inabensa, S.A. | | | | (1) | | — |
Usansolo | | Vizcaya (ES) | | | — | | | 50.00 | % | Instalaciones Inabensa, S.A. | | | | (1) | | — |
UTE Abener Teyma Inabensa Atacama I PV | | Seville (ES) | | | — | | | 100.00 | % | Abener Energía, S.A./Instalaciones Inabensa, S.A./Teyma Gestión de Contratos de Construcción e Ingeniería, S.A. | | (*) | | (1) | | — |
F-161
Table of Contents
Appendices
Appendix III
Temporary Joint Ventures included in the 2014 Consolidation Perimeter
using the proportional integration method (Continuation)
| | | | | | | | | | | | | | | | |
| |
| | Shareholding | |
| |
| |
| |
|
|---|
Company Name | | Registered
Address | | Amount in
thousands
of € | | % of
Nominal
Capital | | Parent Company | | (*) | | Activity
(see Page 2) | | Auditor |
|---|
UTE Abener Teyma Inabensa Atacama II PV | | Seville (ES) | | | — | | | 100.00 | % | Abener Energía, S.A./Instalaciones Inabensa, S.A./Teyma Gestión de Contratos de Construcción e Ingeniería, S.A. | | (*) | | (1) | | — |
UTE Alacat | | Madrid (ES) | | | 3.00 | | | 50.00 | % | Instalaciones Inabensa, S.A./ Electrificaciones y Montajes Integrales OHL, S.A. | | (*) | | (1) | | — |
UTE Inabensa-Ansaldo | | Madrid (ES) | | | 10.00 | | | 40.12 | % | Instalaciones Inabensa, S.A./Ansaldo STS España SAU | | (*) | | (1) | | — |
UTE Abeima Teyma Agadir | | Seville (ES) | | | — | | | 100.00 | % | Abeinsa Infraestructuras Medio Ambiente, S.A./Abener Energía, S.A./Teyma Gestión de Contratos de Construcción e Ingeniería, S.A. | | (*) | | (1) | | — |
UTE Abeima Teyma Barka | | Seville (ES) | | | — | | | 100.00 | % | Abeinsa Infraestructuras Medio Ambiente, S.A./Teyma, Gestión de Contratos de Construcción e Ingeniería, S.A. | | | | (1) | | — |
UTE Abeima Teyma Barka II | | Seville (ES) | | | — | | | 100.00 | % | Abeinsa Infraestructuras Medio Ambiente, S.A./Teyma Gestión de Contratos de Const. e Ing., S.A. | | | | (1) | | — |
UTE Abeima Teyma Nungua | | Seville (ES) | | | 7.00 | | | 100.00 | % | Abeinsa Infraestructuras Medio Ambiente, S.A./Teyma, Gestión de Contratos de Construcción e Ingeniería, S.A. | | | | (1) | | — |
UTE Abeima Teyma Zapotillo | | Seville (ES) | | | 7.00 | | | 100.00 | % | Abeinsa Infraestructuras Medio Ambiente, S.A./Teyma, Gestión de Contratos de Construcción e Ingeniería, S.A. | | | | (1) | | — |
UTE Abencor-Inabensa Chilca Montalvo | | Seville (ES) | | | 7.00 | | | 100.00 | % | Instalaciones Inabensa, S.A./Abencor Suministros, S.A. | | | | (1) | | — |
UTE Abener Abengoa Water Sahechores | | Seville (ES) | | | 1.80 | | | 50.00 | % | Abener Energía, S.A./ Abengoa Water, S.L. | | | | (4) | | — |
UTE Abener Befesa Cortés Pallás | | Seville (ES) | | | 4.80 | | | 100.00 | % | Abeinsa Infraestructuras Medio Ambiente, S.A. /'Abener Energía, S.A. | | | | (1) | | — |
UTE Abener Inabensa NP Tabasco II | | Seville (ES) | | | — | | | 100.00 | % | Abener Energía, S.A./Instalaciones Inabensa, S.A. | | (*) | | (1) | | — |
UTE Abener Inabensa Francia | | Seville (ES) | | | — | | | 100.00 | % | Abener Energía, S.A./Instalaciones Inabensa, S.A. | | | | (1) | | — |
UTE Abener Inabensa Germany | | Seville (ES) | | | — | | | 100.00 | % | Abener Energía, S.A./Instalaciones Inabensa, S.A. | | | | (1) | | — |
UTE Abener Inabensa NP Tabasco | | Seville (ES) | | | — | | | 100.00 | % | Abener Energía, S.A./Instalaciones Inabensa, S.A. | | | | (1) | | B |
UTE Abener Inabensa Paises Bajos | | Seville (ES) | | | — | | | 100.00 | % | Abener Energía, S.A./Instalaciones Inabensa, S.A. | | | | (1) | | — |
UTE Abener Teyma Atacama I | | Seville (ES) | | | — | | | 100.00 | % | Abener Energía, S.A./Teyma Gestión de Contratos de Construcción e Ingeniería, S.A. | | (*) | | (1) | | — |
UTE Abener Teyma Atacama II | | Seville (ES) | | | — | | | 100.00 | % | Abener Energía, S.A./Teyma Gestión de Contratos de Construcción e Ingeniería, S.A. | | (*) | | (1) | | — |
UTE Abener Teyma Bélgica | | Seville (ES) | | | — | | | 100.00 | % | Abener Energía, S.A./Teyma Gestión de Contratos de Construcción e Ingeniería, S.A. | | (*) | | (1) | | — |
UTE Abener Teyma Biomasa Salamanca II | | Seville (ES) | | | — | | | 100.00 | % | Abener Energía, S.A./Teyma, Gestión de Contratos de Construcción e Ingeniería, S.A | | | | (1) | | — |
UTE Abener Teyma CRS I | | Seville (ES) | | | — | | | 100.00 | % | Abener Energía, S.A./Teyma, Gestión de Contratos de Construcción e Ingeniería, S.A | | | | (1) | | — |
UTE Abener Teyma CRS II | | Seville (ES) | | | — | | | 100.00 | % | Abener Energía, S.A./Teyma, Gestión de Contratos de Construcción e Ingeniería, S.A | | | | (1) | | — |
UTE Abener Teyma Emirates I | | Seville (ES) | | | — | | | 100.00 | % | Abener Energía, S.A./Teyma, Gestión de Contratos de Construcción e Ingeniería, S.A | | | | (1) | | B |
UTE Abener Teyma Helio Energy I | | Seville (ES) | | | — | | | 100.00 | % | Abener Energía, S.A./Teyma, Gestión de Contratos de Construcción e Ingeniería, S.A | | | | (1) | | — |
UTE Abener Teyma Helio Energy II | | Seville (ES) | | | — | | | 100.00 | % | Abener Energía, S.A./Teyma, Gestión de Contratos de Construcción e Ingeniería, S.A | | | | (1) | | — |
UTE Abener Teyma Helios I | | Seville (ES) | | | — | | | 100.00 | % | Abener Energía, S.A./Teyma, Gestión de Contratos de Construcción e Ingeniería, S.A | | | | (1) | | — |
UTE Abener Teyma Helios II | | Seville (ES) | | | — | | | 100.00 | % | Abener Energía, S.A./Teyma, Gestión de Contratos de Construcción e Ingeniería, S.A | | | | (1) | | — |
UTE Abener Teyma Paulputs | | Seville (ES) | | | — | | | 100.00 | % | Abener Energía, S.A./Teyma, Gestión de Contratos de Construcción e Ingeniería, S.A | | | | (1) | | — |
UTE Abener Teyma Paysandu | | Seville (ES) | | | — | | | 100.00 | % | Abener Energía, S.A./Teyma, Gestión de Contratos de Construcción e Ingeniería, S.A | | | | (1) | | D |
F-162
Table of Contents
Appendices
Appendix III
Temporary Joint Ventures included in the 2014 Consolidation Perimeter
using the proportional integration method (Continuation)
| | | | | | | | | | | | | | | | |
| |
| | Shareholding | |
| |
| |
| |
|
|---|
Company Name | | Registered
Address | | Amount in
thousands
of € | | % of
Nominal
Capital | | Parent Company | | (*) | | Activity
(see Page 2) | | Auditor |
|---|
UTE Abener Teyma Solaben I | | Seville (ES) | | | — | | | 100.00 | % | Abener Energía, S.A./Teyma, Gestión de Contratos de Construcción e Ingeniería, S.A | | | | (1) | | — |
UTE Abener Teyma Solaben II | | Seville (ES) | | | — | | | 100.00 | % | Abener Energía, S.A./Teyma, Gestión de Contratos de Construcción e Ingeniería, S.A | | | | (1) | | — |
UTE Abener Teyma Solaben III | | Seville (ES) | | | — | | | 100.00 | % | Abener Energía, S.A./Teyma, Gestión de Contratos de Construcción e Ingeniería, S.A | | | | (1) | | — |
UTE Abener Teyma Solaben VI | | Seville (ES) | | | — | | | 100.00 | % | Abener Energía, S.A./Teyma, Gestión de Contratos de Construcción e Ingeniería, S.A | | | | (1) | | — |
UTE Abener Teyma Solaben IC | | Seville (ES) | | | — | | | 100.00 | % | Abener Energía, S.A./Teyma, Gestión de Contratos de Construcción e Ingeniería, S.A | | | | (1) | | — |
UTE Abener Teyma Solacor I | | Seville (ES) | | | — | | | 100.00 | % | Abener Energía, S.A./Teyma, Gestión de Contratos de Construcción e Ingeniería, S.A | | | | (1) | | — |
UTE Abener Teyma Solacor II | | Seville (ES) | | | — | | | 100.00 | % | Abener Energía, S.A./Teyma, Gestión de Contratos de Construcción e Ingeniería, S.A | | | | (1) | | — |
UTE Abener Teyma Solar Tabernas | | Seville (ES) | | | — | | | 100.00 | % | Abener Energía, S.A./Teyma, Gestión de Contratos de Construcción e Ingeniería, S.A. / Abengoa Solar New Technologies, S.A | | | | (1) | | — |
UTE Abener Teyma Upington | | Seville (ES) | | | — | | | 100.00 | % | Abener Energía, S.A./Teyma, Gestión de Contratos de Construcción e Ingeniería, S.A. | | | | (1) | | — |
UTE Abener Teyma Xina | | Seville (ES) | | | — | | | 100.00 | % | Abener Energía, S.A./Teyma Gestión de Contratos de Construcción e Ingeniería, S.A. | | | | (1) | | — |
UTE Abensaih Guadalquivir | | Seville (ES) | | | 3.06 | | | 51.00 | % | Abeinsa Infraestructuras Medio Ambiente, S.A. | | | | (1) | | — |
UTE Abensaih Mantenimiento | | Seville (ES) | | | 3.00 | | | 50.00 | % | Abeinsa Infraestructuras Medio Ambiente, S.A. | | | | (1) | | — |
UTE Agua Prieta (EP) | | Agua Prieta (MX) | | | — | | | 100.00 | % | Abener Energía, S.A. | | (*) | | (1) | | B |
UTE Aguas Salobres | | Seville (ES) | | | 3.60 | | | 60.00 | % | Abeinsa Infraestructuras Medio Ambiente, S.A. | | | | (1) | | — |
UTE Alcoy | | Alicante (ES) | | | 3.00 | | | 50.00 | % | Abeinsa Infraestructuras Medio Ambiente, S.A. | | | | (1) | | — |
UTE Amés Brión | | La Coruña (ES) | | | 3.00 | | | 50.00 | % | Abeinsa Infraestructuras Medio Ambiente, S.A. | | | | (1) | | — |
Ute Ashalim Eucomsa-Abeinsa Engineering | | Seville (ES) | | | — | | | 100.00 | % | Europea de Construcc. Metálicas, S.A./Abeinsa Engineering SL | | | | (1) | | — |
UTE Atabal | | Malaga (ES) | | | 3.19 | | | 53.00 | % | Abeinsa Infraestructuras Medio Ambiente, S.A. | | | | (1) | | — |
UTE Avensaih Guadalete—Barbate | | Cadiz (ES) | | | 3.06 | | | 31.00 | % | Abeinsa Infraestructuras Medio Ambiente, S.A. | | | | (1) | | — |
UTE Avinyó | | Cataluña (ES) | | | — | | | 40.00 | % | Construcciones y Depuraciones, S.A. | | | | (1) | | — |
UTE B.Almanzora | | Murcia (ES) | | | 2.40 | | | 40.00 | % | Abeinsa Infraestructuras Medio Ambiente, S.A. | | | | (1) | | — |
UTE Balsa del Rosario | | Seville (ES) | | | 3.12 | | | 52.00 | % | Abeinsa Infraestructuras Medio Ambiente, S.A. | | | | (1) | | — |
UTE Báscara | | Cataluña (ES) | | | — | | | 40.00 | % | Construcciones y Depuraciones, S.A. | | | | (1) | | — |
UTE Boaco | | Nicaragua (NI) | | | 2.21 | | | 73.83 | % | Abeinsa Infraestructuras Medio Ambiente, S.A. | | | | (1) | | — |
CAC Arequipa | | Arequipa (PE) | | | 6.66 | | | 51.00 | % | Abeinsa Infraestructuras Medio Ambiente, S.A. | | | | (1) | | — |
UTE CAC Arequipa | | Arequipa (PE) | | | 3.26 | | | 25.00 | % | Abeinsa Infraestructuras Medio Ambiente, S.A. | | | | (1) | | — |
UTE Cáceres | | Caceres (ES) | | | 3.00 | | | 50.00 | % | Abeinsa Infraestructuras Medio Ambiente, S.A. | | | | (1) | | — |
UTE Campello | | Alicante (ES) | | | 3.00 | | | 50.00 | % | Abeinsa Infraestructuras Medio Ambiente, S.A. | | | | (1) | | — |
UTE Canal Alguerri | | Lleida (ES) | | | 2.00 | | | 33.34 | % | Abeinsa Infraestructuras Medio Ambiente, S.A. | | | | (1) | | — |
UTE Canal de Navarra | | Navarra (ES) | | | 3.60 | | | 20.00 | % | Abeinsa Infraestructuras Medio Ambiente, S.A. | | | | (1) | | — |
UTE Canal Estremera | | Madrid (ES) | | | 6.00 | | | 50.00 | % | Abeinsa Infraestructuras Medio Ambiente, S.A. | | | | (1) | | — |
UTE Carboneras | | Almería (ES) | | | 2.58 | | | 43.00 | % | Abeinsa Infraestructuras Medio Ambiente, S.A. | | | | (1) | | — |
UTE Cartuja | | Seville (ES) | | | — | | | 30.00 | % | Construcciones y Depuraciones, S.A. | | | | (1) | | — |
UTE Centro Morelos | | Seville (ES) | | | — | | | 100.00 | % | Abener Energía, S.A. / Inabensa, S.A. / Serv. Aux. de Administración, S.A. de C.V. | | | | (1) | | — |
UTE Chennai | | India (IN) | | | 6.00 | | | 100.00 | % | Abeinsa Infraestructuras Medio Ambiente, S.A /Construcciones y Depuraciones, S.A. | | | | (1) | | — |
UTE Chennai O&M | | India (IN) | | | 6.00 | | | 100.00 | % | Construcciones y Depuraciones, S.A./ Abengoa Water S.L. | | | | (4) | | — |
UTE Conquero | | Huelva (ES) | | | 3.00 | | | 50.00 | % | Abeinsa Infraestructuras Medio Ambiente, S.A. | | | | (1) | | — |
UTE Cunene | | Angola (AN) | | | 25.00 | | | 50.00 | % | Abeinsa Infraestructuras Medio Ambiente, S.A. | | | | (1) | | — |
Ute Dead Sea | | Seville (ES) | | | — | | | 100.00 | % | Abener Energía, S.A/Abeinsa Engineering SL | | | | (1) | | — |
UTE Deca | | Almeria (ES) | | | 1.94 | | | 32.25 | % | Abeinsa Infraestructuras Medio Ambiente, S.A. | | | | (1) | | — |
UTE Denizli | | Denizli (TR) | | | — | | | 100.00 | % | Abeinsa Infraestructuras Medio Ambiente, S.A./Abener Energía, S.A./ Abengoa Perú S.A. | | (*) | | (1) | | — |
UTE Depurbaix | | Cataluña (ES) | | | 6.00 | | | 50.00 | % | Abeinsa Infraestructuras Medio Ambiente, S.A. | | | | (1) | | — |
UTE Edar Montemayor | | Cordoba (ES) | | | — | | | 50.00 | % | Construcciones y Depuraciones, S.A. | | | | (1) | | — |
UTE El Cerrillo | | Cordoba (ES) | | | 4.80 | | | 80.00 | % | Abeinsa Infraestructuras Medio Ambiente, S.A. | | | | (1) | | — |
UTE Esclusa 42 | | Valladolid (ES) | | | 1.80 | | | 30.00 | % | Abeinsa Infraestructuras Medio Ambiente, S.A. | | | | (1) | | — |
UTE Espluga | | Cataluña (ES) | | | — | | | 40.00 | % | Construcciones y Depuraciones, S.A. | | | | (1) | | — |
F-163
Table of Contents
Appendices
Appendix III
Temporary Joint Ventures included in the 2014 Consolidation Perimeter
using the proportional integration method (Continuation)
| | | | | | | | | | | | | | | | |
| |
| | Shareholding | |
| |
| |
| |
|
|---|
Company Name | | Registered
Address | | Amount in
thousands
of € | | % of
Nominal
Capital | | Parent Company | | (*) | | Activity
(see Page 2) | | Auditor |
|---|
UTE Fontsanta | | Cataluña (ES) | | | 4.80 | | | 40.00 | % | Abeinsa Infraestructuras Medio Ambiente, S.A. | | | | (1) | | — |
UTE Fonz | | Cataluña (ES) | | | 5.40 | | | 90.00 | % | Abeinsa Infraestructuras Medio Ambiente, S.A. | | | | (1) | | — |
UTE Fuente Alamo | | Murcia (ES) | | | 2.97 | | | 33.00 | % | Construcciones y Depuraciones, S.A | | | | (1) | | — |
UTE Guadalajara | | Guadalajara (ES) | | | 3.31 | | | 55.00 | % | Abengoa Water S.L. | | | | (4) | | — |
UTE Guiamets | | Cataluña (ES) | | | 7.20 | | | 60.00 | % | Abeinsa Infraestructuras Medio Ambiente, S.A. | | | | (1) | | — |
UTE Hassi R´Mel Construction | | Seville (ES) | | | — | | | 70.00 | % | Abener Energía, S.A./ Abengoa Solar New Technologies, S.A | | | | (1) | | — |
UTE Hassi R´Mel O&M | | Seville (ES) | | | — | | | 100.00 | % | Abener Energía, S.A./ Abengoa Solar España, S.A | | | | (1) | | D |
UTE Hidrosur | | Malaga (ES) | | | 2.00 | | | 33.33 | % | Abeinsa Infraestructuras Medio Ambiente, S.A. | | | | (1) | | — |
UTE Honaine | | Argelia (AR) | | | 1.50 | | | 50.00 | % | Abengoa Water S.L. | | | | (4) | | — |
UTE Honaine | | Argelia (AR) | | | 1.50 | | | 50.00 | % | Abeinsa Infraestructuras Medio Ambiente, S.A. | | | | (1) | | — |
UTE Huesna | | Seville (ES) | | | 6.01 | | | 33.34 | % | Abeinsa Infraestructuras Medio Ambiente, S.A. | | | | (1) | | — |
UTE Inabensa Teyma Eólica del Tala | | Seville (ES) | | | 60.00 | | | 100.00 | % | Instalaciones Inabensa, S.A. /Teyma Gestión de Contratos de Construcción e Ingeniería, S.A. | | | | (1) | | B |
UTE Inabensa Teyma Peralta | | Seville (ES) | | | 60.00 | | | 100.00 | % | Instalaciones Inabensa, S.A. /Teyma Gestión de Contratos de Construcción e Ingeniería, S.A. | | | | (1) | | B |
UTE Inabensa-Eucomsa-Perú | | Seville (ES) | | | 6.90 | | | 100.00 | % | Instalaciones Inabensa, S.A./Europea de Construcc. Metálicas, S.A. | | | | (1) | | — |
Ute Inst. Clima Hospital Costa del Sol | | Malaga (ES) | | | 3.00 | | | 50.00 | % | Instalaciones Inabensa, S.A. | | | | (1) | | — |
UTE Itoiz II | | Navarra (ES) | | | 3.50 | | | 35.00 | % | Abeinsa Infraestructuras Medio Ambiente, S.A. | | | | (1) | | — |
UTE Júcar Vinalopo | | Valencia (ES) | | | 2.00 | | | 33.34 | % | Abeinsa Infraestructuras Medio Ambiente, S.A. | | | | (1) | | — |
UTE Kurkudi | | Vizcaya (ES) | | | 3.00 | | | 50.00 | % | Abeinsa Infraestructuras Medio Ambiente, S.A. | | | | (1) | | — |
UTE La Codosera | | Caceres (ES) | | | 3.00 | | | 50.00 | % | Abeinsa Infraestructuras Medio Ambiente, S.A. | | | | (1) | | — |
UTE Las Bambas | | Seville (ES) | | | 6.00 | | | 100.00 | % | Instalaciones Inabensa, S.A. /Abencor Suministros, S.A. | | | | (1) | | — |
UTE Lubet Cádiz | | Cadiz (ES) | | | — | | | 75.00 | % | Construcciones y Depuraciones, S.A. | | | | (1) | | — |
UTE Mant. Valdeinfierno | | Murcia (ES) | | | 2.00 | | | 60.00 | % | Abeinsa Infraestructuras Medio Ambiente, S.A /Construcciones y Depuraciones, S.A.(Codesa) | | | | (1) | | — |
UTE Mantenimiento Presas | | Malaga (ES) | | | 2.10 | | | 35.00 | % | Abeinsa Infraestructuras Medio Ambiente, S.A. | | | | (1) | | — |
UTE Marismas Construccion | | Seville (ES) | | | 12.00 | | | 100.00 | % | Abeinsa Infraestructuras Medio Ambiente, S.A /Construcciones y Depuraciones, S.A.(Codesa) | | | | (1) | | — |
UTE Minicentrales | | Madrid (ES) | | | 6.00 | | | 100.00 | % | Abeinsa Infraestructuras Medio Ambiente, S.A /Construcciones y Depuraciones, S.A.(Codesa) | | | | (1) | | — |
UTE Moraira | | Alicante (ES) | | | 2.55 | | | 42.50 | % | Abeinsa Infraestructuras Medio Ambiente, S.A. | | | | (1) | | — |
UTE Ojén Mijas | | Malaga (ES) | | | — | | | 70.00 | % | Construcciones y Depuraciones, S.A. | | | | (1) | | — |
UTE Paneles | | Valladolid (ES) | | | 1.80 | | | 30.00 | % | Abeinsa Infraestructuras Medio Ambiente, S.A. | | | | (1) | | — |
UTE Puerto de Huelva | | Huelva (ES) | | | 3.00 | | | 100.00 | % | Abeinsa Infraestructuras Medio Ambiente, S.A /Construcciones y Depuraciones, S.A.(Codesa) | | | | (1) | | — |
UTE Qingdao | | China (CH) | | | 6.00 | | | 100.00 | % | Abeinsa Infraestructuras Medio Ambiente, S.A /Construcciones y Depuraciones, S.A.(Codesa) | | | | (1) | | — |
UTE Ranilla | | Seville (ES) | | | 1.80 | | | 15.00 | % | Construcciones y Depuraciones, S.A. | | | | (1) | | — |
UTE Retortillo | | Seville (ES) | | | 6.00 | | | 100.00 | % | Abeinsa Infraestructuras Medio Ambiente, S.A /Construcciones y Depuraciones, S.A.(Codesa) | | | | (1) | | — |
UTE Reus | | Cataluña (ES) | | | 3.90 | | | 65.00 | % | Abeinsa Infraestructuras Medio Ambiente, S.A. | | | | (1) | | — |
UTE Ribera | | Valencia (ES) | | | 3.01 | | | 50.00 | % | Abeinsa Infraestructuras Medio Ambiente, S.A. | | | | (1) | | — |
UTE Riegos Marismas | | Seville (ES) | | | 5.94 | | | 99.00 | % | Abeinsa Infraestructuras Medio Ambiente, S.A. | | | | (1) | | — |
UTE Rincón Vict | | Malaga (ES) | | | 3.01 | | | 50.00 | % | Abeinsa Infraestructuras Medio Ambiente, S.A. | | | | (1) | | — |
UTE Sahechores | | Leon (ES) | | | 3.73 | | | 62.00 | % | Abeinsa Infraestructuras Medio Ambiente, S.A. | | | | (1) | | — |
UTE Saih Duero | | Valladolid (ES) | | | 1.80 | | | 30.00 | % | Abeinsa Infraestructuras Medio Ambiente, S.A. | | | | (1) | | — |
UTE Sallent | | Cataluña (ES) | | | 3.00 | | | 50.00 | % | Abeinsa Infraestructuras Medio Ambiente, S.A. | | | | (1) | | — |
UTE San Juan del Sur | | Nicaragua (NI) | | | 2.20 | | | 73.31 | % | Abeinsa Infraestructuras Medio Ambiente, S.A. | | | | (1) | | — |
UTE Sanchonuño | | Valladolid (ES) | | | 3.00 | | | 50.00 | % | Abeinsa Infraestructuras Medio Ambiente, S.A. | | | | (1) | | — |
UTE Sant Celoni | | Cataluña (ES) | | | 6.00 | | | 50.00 | % | Abeinsa Infraestructuras Medio Ambiente, S.A. | | | | (1) | | — |
UTE Segriá Sud | | Cataluña (ES) | | | 3.60 | | | 60.00 | % | Abeinsa Infraestructuras Medio Ambiente, S.A. | | | | (1) | | — |
UTE Skikda | | Argelia (AR) | | | 2.00 | | | 67.00 | % | Abeinsa Infraestructuras Medio Ambiente, S.A /Construcciones y Depuraciones, S.A. | | | | (1) | | — |
UTE Skikda O&M | | Argelia (AR) | | | 2.01 | | | 67.00 | % | Construcciones y Depuraciones, S.A./ Abengoa Water S.L. | | | | (4) | | — |
UTE Sta. Amalia | | Badajoz (ES) | | | 4.80 | | | 80.00 | % | Construcciones y Depuraciones, S.A. | | | | (1) | | — |
UTE Teatinos | | Malaga (ES) | | | 3.00 | | | 50.00 | % | Abeinsa Infraestructuras Medio Ambiente, S.A. | | | | (1) | | — |
UTE Tenés | | Argelia (AR) | | | 6.00 | | | 100.00 | % | Abeinsa Infraestructuras Medio Ambiente, S.A /Construcciones y Depuraciones, S.A. | | | | (1) | | B |
F-164
Table of Contents
Appendices
Appendix III
Temporary Joint Ventures included in the 2014 Consolidation Perimeter
using the proportional integration method (Continuation)
| | | | | | | | | | | | | | | | |
| |
| | Shareholding | |
| |
| |
| |
|
|---|
Company Name | | Registered
Address | | Amount in
thousands
of € | | % of
Nominal
Capital | | Parent Company | | (*) | | Activity
(see Page 2) | | Auditor |
|---|
Ute Tenes O&M | | Argelia (AR) | | | 6.00 | | | 100.00 | % | Abeinsa Infraestructuras Medio Ambiente, S.A./ Abengoa Water S.L. | | (*) | | (4) | | — |
UTE Valdeinfierno | | Murcia (ES) | | | 2.00 | | | 60.00 | % | Abeinsa Infraestructuras Medio Ambiente, S.A /Construcciones y Depuraciones, S.A. | | | | (1) | | — |
UTE Valdelentisco | | Murcia (ES) | | | 4.80 | | | 80.00 | % | Abeinsa Infraestructuras Medio Ambiente, S.A. | | | | (1) | | — |
UTE Vall Baixa | | Cataluña (ES) | | | 6.00 | | | 50.00 | % | Abeinsa Infraestructuras Medio Ambiente, S.A. | | | | (1) | | — |
UTE Vilagarcía | | Pontevedra (ES) | | | 3.00 | | | 50.00 | % | Abeinsa Infraestructuras Medio Ambiente, S.A. | | | | (1) | | — |
UTE Villanueva | | Seville (ES) | | | 3.00 | | | 50.00 | % | Abeinsa Infraestructuras Medio Ambiente, S.A. | | | | (1) | | — |
UTE Xerta-Xenia | | Cataluña (ES) | | | 3.00 | | | 50.00 | % | Abeinsa Infraestructuras Medio Ambiente, S.A. | | | | (1) | | — |
Utrera | | Seville (ES) | | | 3.01 | | | 50.00 | % | Abengoa Water S.L. | | | | (4) | | — |
Winterra.-Inaben.Atraque Puerto de Vigo | | Compostela (ES) | | | — | | | 20.00 | % | Instalaciones Inabensa, S.A. | | | | (1) | | — |
Winterra-Inabensa Monterroso | | Compostela (ES) | | | 6.00 | | | 30.00 | % | Instalaciones Inabensa, S.A. | | | | (1) | | — |
Winterra-Inabensa Sarriá | | Compostela (ES) | | | 2.00 | | | 30.00 | % | Instalaciones Inabensa, S.A. | | | | (1) | | — |
Zonas Deportivas La Nucia | | Alicante (ES) | | | 4.00 | | | 45.00 | % | Instalaciones Inabensa, S.A. | | | | (1) | | — |
Shareholding capital cost is calculated using the current closing year exchange rate
- (*)
- Companies incorporated or acquired and consolidated for the first time in the year.
- (1)
- Operating segment activities area: Engineering and Construction.
- (2)
- Operating segment activities area: Transmission.
- (3)
- Operating segment activities area: Solar.
- (4)
- Operating segment activities area: Water.
- (5)
- Operating segment activities areae: Cogeneration and others.
- (6)
- Operating segment activities area: Bioenergy.
- A
- Audited by PricewaterhouseCoopers Auditores.
- B
- Audited by Deloitte (for legal purposes).
- C
- Audited by Auditoría y Consulta (for legal purposes).
- D
- Audited by others auditors (for legal purposes).
F-165
Table of Contents
Appendices
Appendix IV
Subsidiary companies which during 2014, 2013 and 2012 were no longer included in
the consolidation perimeter
| | | | | | | | |
Company Name | | Year
of Exit | | % Share | | Motive |
|---|
Aleduca, S.L | | | 2014 | | | 100.00 | | Windup of the company |
Befesa Limpiezas Industriales México S.A. de C.V. | | | 2014 | | | 100.00 | | Windup of the company |
Energy & Environmental Constructions, LLC | | | 2014 | | | 100.00 | | Windup of the company |
Hidro Abengoa, S.A. De C.V. | | | 2014 | | | 100.00 | | Windup of the company |
Insolation Sic 4 S.R.L | | | 2014 | | | 100.00 | | Windup of the company |
Insolation Sic 7.R.L | | | 2014 | | | 100.00 | | Windup of the company |
Insolation Sic 8 S.R.L | | | 2014 | | | 100.00 | | Windup of the company |
L.T. Rosarito y Monterrey, S.A. De CV | | | 2014 | | | 100.00 | | Windup of the company |
Las Cabezas Solar, S.L. | | | 2014 | | | 100.00 | | Windup of the company |
Lineas 612 Norte Noroeste, S.A. De C.V. | | | 2014 | | | 100.00 | | Windup of the company |
Qingdao BCTA Desalinataion Co.Ltd. | | | 2014 | | | 92.59 | | Sale of the company |
S.E.T Sureste Peninsular, S.A. De CV | | | 2014 | | | 100.00 | | Windup of the company |
Sol3G | | | 2014 | | | 100.00 | | Merged of the company |
Solaben Electricidad Ocho, S.A. | | | 2014 | | | 100.00 | | Windup of the company |
Abencasa-Abengoa Comer. Y Administraçao, S.A. | | | 2013 | | | 100.00 | | Sale of the company |
Abencs Investments , LLC | | | 2013 | | | 100.00 | | Windup of the company |
Abener Teyma Abeinsa Glendale General Partnership | | | 2013 | | | 100.00 | | Windup of the company |
Abengoa Solar PV, LLC | | | 2013 | | | 100.00 | | Merged of the company |
Abengoa Solar Saudi Arabia Limited Liability Company | | | 2013 | | | 100.00 | | Windup of the company |
Aelsa, Abener El Sauz, S.A. De CV | | | 2013 | | | 100.00 | | Windup of the company |
Alianza Medioambiental, S. L. | | | 2013 | | | 100.00 | | Sale of the company |
Aludisc, Alumninios en Disco S.A. | | | 2013 | | | 100.00 | | Sale of the company |
Aqualdre Zinc ,S.L | | | 2013 | | | 100.00 | | Sale of the company |
Baja California 229, S. A. de C.V. | | | 2013 | | | 100.00 | | Windup of the company |
Bargoa, S.A. | | | 2013 | | | 99.98 | | Sale of the company |
Befesa Aluminio S.L. | | | 2013 | | | 100.00 | | Sale of the company |
Befesa Aluminium Germany GmbH | | | 2013 | | | 100.00 | | Sale of the company |
Befesa Argentina(antes Borg Austral ARP, S.A. | | | 2013 | | | 100.00 | | Sale of the company |
Befesa Escorias Salinas, S.A. | | | 2013 | | | 100.00 | | Sale of the company |
Befesa Gest. Res. Ind, S.L. | | | 2013 | | | 100.00 | | Sale of the company |
Befesa Medio Ambiente, S.L.U. | | | 2013 | | | 100.00 | | Sale of the company |
Befesa PCB | | | 2013 | | | 100.00 | | Sale of the company |
Befesa Perú, S.A. | | | 2013 | | | 100.00 | | Sale of the company |
Befesa Plásticos, S.L. | | | 2013 | | | 97.40 | | Sale of the company |
Befesa Portugal Gestáo de Resíduos Industriais, Bgri, S. A. | | | 2013 | | | 100.00 | | Sale of the company |
Befesa Reciclaje de Residuos de Aluminio, S.L. | | | 2013 | | | 100.00 | | Sale of the company |
Befesa Salt Slag, Ltd | | | 2013 | | | 100.00 | | Sale of the company |
Befesa Salzschlacke GmbH | | | 2013 | | | 100.00 | | Sale of the company |
Befesa Scandust AB | | | 2013 | | | 100.00 | | Sale of the company |
Befesa Servicios Corporativos, S. A. | | | 2013 | | | 100.00 | | Sale of the company |
Befesa Servicios S.A | | | 2013 | | | 51.00 | | Sale of the company |
Befesa Silvermet Adana Celik Tozu Geri Donusum AS | | | 2013 | | | 100.00 | | Sale of the company |
F-166
Table of Contents
Appendices
Appendix IV
Subsidiary companies which during 2014, 2013 and 2012 were no longer included in
the consolidation perimeter (Continuation)
| | | | | | | | |
Company Name | | Year
of Exit | | % Share | | Motive |
|---|
Befesa Silvermet Iskenderun | | | 2013 | | | 100.00 | | Sale of the company |
Befesa Silvermet Izmir Celik Tozu Geri Donusum AS | | | 2013 | | | 100.00 | | Sale of the company |
Befesa Silvermet Turkey, S.L. | | | 2013 | | | 51.00 | | Sale of the company |
Befesa Steel R & D, S.L.U. | | | 2013 | | | 100.00 | | Sale of the company |
Befesa Steel Services GmbH | | | 2013 | | | 100.00 | | Sale of the company |
Befesa Valera, S.A.S. | | | 2013 | | | 100.00 | | Sale of the company |
Befesa Valorización de Azufre, S.L.U. | | | 2013 | | | 100.00 | | Sale of the company |
Befesa Valorización S. L Sociedad Unipersonal | | | 2013 | | | 100.00 | | Sale of the company |
Befesa Zinc Freiberg GmbH & Co KG | | | 2013 | | | 100.00 | | Sale of the company |
Befesa Zinc Aser, S.A. | | | 2013 | | | 100.00 | | Sale of the company |
Befesa Zinc Comercial, S.A. | | | 2013 | | | 100.00 | | Sale of the company |
Befesa Zinc Duisburg GmbH | | | 2013 | | | 100.00 | | Sale of the company |
Befesa Zinc Germany GmbH | | | 2013 | | | 100.00 | | Sale of the company |
Befesa Zinc Gravelines, S.A.S.U. | | | 2013 | | | 100.00 | | Sale of the company |
Befesa Zinc Óxido, S.A.U. | | | 2013 | | | 100.00 | | Sale of the company |
Befesa Zinc Sur, S.L. | | | 2013 | | | 100.00 | | Sale of the company |
Befesa Zinc, S.A.U. | | | 2013 | | | 100.00 | | Sale of the company |
C.D.Puerto San Carlos S.A. De CV | | | 2013 | | | 100.00 | | Windup of the company |
Captasol Fotovoltaica 40 S.L. | | | 2013 | | | 100.00 | | Windup of the company |
Captasol Fotovoltaica 58 S.L. | | | 2013 | | | 99.94 | | Windup of the company |
Captasol Fotovoltaica 72 S.L. | | | 2013 | | | 99.94 | | Windup of the company |
Captasol Fotovoltaica 73 S.L. | | | 2013 | | | 99.94 | | Windup of the company |
Captasol Fotovoltaica 77 S.L. | | | 2013 | | | 99.94 | | Windup of the company |
Complejo Medioambiental Tierra de Campos, S.L | | | 2013 | | | 77.00 | | Sale of the company |
Donsplav | | | 2013 | | | 51.00 | | Sale of the company |
Ecovedras SA | | | 2013 | | | 78.00 | | Sale of the company |
Galdán, S. A | | | 2013 | | | 100.00 | | Sale of the company |
Harper Dry Lake Land Company LLC | | | 2013 | | | 100.00 | | Windup of the company |
Helio Energy Electricidad Siete, S.A. | | | 2013 | | | 100.00 | | Windup of the company |
Helio Energy Electricidad Ocho, S.A. | | | 2013 | | | 100.00 | | Windup of the company |
Helio Energy Electricidad Nueve, S.A. | | | 2013 | | | 100.00 | | Windup of the company |
Helio Energy Electricidad Diez, S.A. | | | 2013 | | | 100.00 | | Windup of the company |
Helio Energy Electricidad Doce, S.A. | | | 2013 | | | 100.00 | | Windup of the company |
Helioenergy Electricidad Veinticinco, S.A | | | 2013 | | | 99.99 | | Windup of the company |
Inabensa Portugal, S.A. | | | 2013 | | | 100.00 | | Windup of the company |
Iniciativas Mediambientales, S.L. | | | 2013 | | | 100.00 | | Sale of the company |
Insolation Sic 5 S.R.L | | | 2013 | | | 100.00 | | Windup of the company |
Insolation Sic 10 S.R.L | | | 2013 | | | 100.00 | | Windup of the company |
Insolation Sic 11 S.R.L | | | 2013 | | | 100.00 | | Windup of the company |
Insolation Sic 12 S.R.L | | | 2013 | | | 100.00 | | Windup of the company |
Insolation Sic 13 S.R.L | | | 2013 | | | 100.00 | | Windup of the company |
Insolation Sic 14 S.R.L | | | 2013 | | | 100.00 | | Windup of the company |
Insolation Sic 15 S.R.L | | | 2013 | | | 100.00 | | Windup of the company |
F-167
Table of Contents
Appendices
Appendix IV
Subsidiary companies which during 2014, 2013 and 2012 were no longer included in
the consolidation perimeter (Continuation)
| | | | | | | | |
Company Name | | Year
of Exit | | % Share | | Motive |
|---|
Italica Solare, S.r.l. | | | 2013 | | | 100.00 | | Windup of the company |
MRH-Residuos Metálicos, S.L. | | | 2013 | | | 100.00 | | Sale of the company |
Mundiland, S.A. | | | 2013 | | | 100.00 | | Windup of the company |
Nicsa Suministros Industriales, S.A. | | | 2013 | | | 100.00 | | Sale of the company |
Pomacocha Power S.A. | | | 2013 | | | 90.00 | | Sale of the company |
Residuos Ind. De la Madera de Córdoba, S.A. | | | 2013 | | | 71.09 | | Sale of the company |
Solaben Electricidad Doce, S.A. | | | 2013 | | | 100.00 | | Windup of the company |
Solaben Electricidad Quince, S.A | | | 2013 | | | 100.00 | | Windup of the company |
Solar Nerva SLU | | | 2013 | | | 100.00 | | Sale of the company |
Solargate Electricidad Uno , S.A. | | | 2013 | | | 100.00 | | Windup of the company |
Solargate Electricidad Dos , S.A. | | | 2013 | | | 100.00 | | Windup of the company |
Soluciones Ambientales del Norte Limitada S.A | | | 2013 | | | 100.00 | | Sale of the company |
Solugas Energía S.A. | | | 2013 | | | 100.00 | | Windup of the company |
Trinacria Spzoo | | | 2013 | | | 95.05 | | Sale of the company |
Valorcam S.L | | | 2013 | | | 80.00 | | Sale of the company |
XiNa Community Trust | | | 2013 | | | 100.00 | | Sale of the company |
Xina Community Trust BEE Holding | | | 2013 | | | 100.00 | | Sale of the company |
Abengoa Bioenergy of SW Kansas, LLC | | | 2012 | | | 100.00 | | Windup of the company |
Almadén Solar, S.A. | | | 2012 | | | 51.00 | | Windup of the company |
Befesa Waterbuilt GP, Inc. | | | 2012 | | | 51.00 | | Merged of the company |
Befesa Zinc Amoreb., S.A. | | | 2012 | | | 100.00 | | Merged of the company |
Bioeléctrica Jienense, S. A. | | | 2012 | | | 100.00 | | Windup of the company |
Captasol Fotovoltaica 41, S.L. | | | 2012 | | | 100.00 | | Windup of the company |
Captasol Fotovoltaica 44, S.L. | | | 2012 | | | 100.00 | | Windup of the company |
Captasol Fotovoltaica 48, S.L. | | | 2012 | | | 100.00 | | Windup of the company |
Captasol Fotovoltaica 49, S.L. | | | 2012 | | | 100.00 | | Windup of the company |
Captasol Fotovoltaica 50, S.L. | | | 2012 | | | 100.00 | | Windup of the company |
Captasol Fotovoltaica 51, S.L. | | | 2012 | | | 100.00 | | Windup of the company |
Captasol Fotovoltaica 53, S.L. | | | 2012 | | | 99.94 | | Windup of the company |
Captasol Fotovoltaica 54, S.L. | | | 2012 | | | 99.94 | | Windup of the company |
Captasol Fotovoltaica 55, S.L. | | | 2012 | | | 99.94 | | Windup of the company |
Captasol Fotovoltaica 56, S.L. | | | 2012 | | | 99.94 | | Windup of the company |
Captasol Fotovoltaica 57, S.L. | | | 2012 | | | 99.94 | | Windup of the company |
Captasol Fotovoltaica 59, S.L. | | | 2012 | | | 99.94 | | Windup of the company |
Captasol Fotovoltaica 60, S.L. | | | 2012 | | | 99.94 | | Windup of the company |
Captasol Fotovoltaica 61, S.L. | | | 2012 | | | 99.94 | | Windup of the company |
Captasol Fotovoltaica 62, S.L. | | | 2012 | | | 99.94 | | Windup of the company |
Captasol Fotovoltaica 63, S.L. | | | 2012 | | | 99.94 | | Windup of the company |
Captasol Fotovoltaica 64, S.L. | | | 2012 | | | 99.94 | | Windup of the company |
Captasol Fotovoltaica 65, S.L. | | | 2012 | | | 99.94 | | Windup of the company |
Captasol Fotovoltaica 66, S.L. | | | 2012 | | | 99.94 | | Windup of the company |
Captasol Fotovoltaica 67, S.L. | | | 2012 | | | 99.94 | | Windup of the company |
Captasol Fotovoltaica 68, S.L. | | | 2012 | | | 99.94 | | Windup of the company |
F-168
Table of Contents
Appendices
Appendix IV
Subsidiary companies which during 2014, 2013 and 2012 were no longer included in
the consolidation perimeter (Continuation)
| | | | | | | | |
Company Name | | Year
of Exit | | % Share | | Motive |
|---|
Captasol Fotovoltaica 69, S.L. | | | 2012 | | | 99.94 | | Windup of the company |
Captasol Fotovoltaica 71, S.L. | | | 2012 | | | 99.94 | | Windup of the company |
Captasol Fotovoltaica 74, S.L. | | | 2012 | | | 99.94 | | Windup of the company |
Captasol Fotovoltaica 75, S.L. | | | 2012 | | | 99.94 | | Windup of the company |
Captasol Fotovoltaica 76, S.L. | | | 2012 | | | 99.94 | | Windup of the company |
Captasol Fotovoltaica 78, S.L. | | | 2012 | | | 99.94 | | Windup of the company |
Captasol Fotovoltaica 79, S.L. | | | 2012 | | | 99.94 | | Windup of the company |
Insolation 1, S.R.L. | | | 2012 | | | 100.00 | | Windup of the company |
Insolation 2, S.R.L. | | | 2012 | | | 100.00 | | Windup of the company |
Insolation 19 S.R.L | | | 2012 | | | 100.00 | | Windup of the company |
Insolation 20 S.R.L | | | 2012 | | | 100.00 | | Windup of the company |
Insolation Sic 16 S.R.L | | | 2012 | | | 100.00 | | Windup of the company |
Proyectos de Inversiones Medioambientales, S.L. | | | 2012 | | | 100.00 | | Merged of the company |
Solaben Electricidad Nueve, S.A. | | | 2012 | | | 100.00 | | Windup of the company |
Solaben Electricidad Once, S.A. | | | 2012 | | | 100.00 | | Windup of the company |
Solúcar Andalucía FV1, S.A | | | 2012 | | | 100.00 | | Windup of the company |
Solúcar Andalucía FV2, S.A | | | 2012 | | | 100.00 | | Windup of the company |
Solúcar Castilla FV1, S. A | | | 2012 | | | 100.00 | | Windup of the company |
Solúcar Castilla FV2, S. A | | | 2012 | | | 100.00 | | Windup of the company |
Telvent Implantación de Sistemas S.L | | | 2012 | | | 100.00 | | Windup of the company |
F-169
Table of Contents
Appendices
Appendix V
Associated companies and Joint Ventures which during 2014, 2013 and 2012 were no longer included in the consolidation perimeter
| | | | | | | | |
Company Name | | Year of Exit | | % Share | | Motive |
|---|
Central Eólica São Tomé Ltda. | | | 2014 | | | 9.00 | | Sale of the company |
Íbice Participações e Consultoria em Energia S.A. | | | 2014 | | | 50.00 | | Windup of the company |
Parque Eólico Cristalândia Ltda. | | | 2014 | | | 20.00 | | Sale of the company |
Abencon, S.A. de C.V. | | | 2013 | | | 50.00 | | Sale of the company |
Abener-Dragados Industrial-México, S.A. De C.V. | | | 2013 | | | 50.00 | | Windup of the company |
Betearte | | | 2013 | | | 33.33 | | Sale of the company |
Carmona & Befesa Limpiezas Industriais, Ltda. (C&B) | | | 2013 | | | 50.00 | | Sale of the company |
Central Eólica Santo Antonio de Pádua S.A. | | | 2013 | | | 100.00 | | Sale of the company |
Central Eólica São Cristóvão S.A. | | | 2013 | | | 100.00 | | Sale of the company |
Central Eólica São Jorge S.A. | | | 2013 | | | 100.00 | | Sale of the company |
Ecología Canaria, S.A. (Ecansa) | | | 2013 | | | 45.00 | | Sale of the company |
Gestión y Valorización Integral del Centro, S.L. | | | 2013 | | | 50.00 | | Sale of the company |
Hankook R&M Co., Ltd. | | | 2013 | | | 25.00 | | Sale of the company |
Recytech SA | | | 2013 | | | 50.00 | | Sale of the company |
Red Eléctrica del Sur, S.A. (Redesur) | | | 2013 | | | 23.75 | | Windup of the company |
Santos Energia Participaçoes S.A | | | 2013 | | | 50.00 | | Sale of the company |
Abengoa Participaçoes Holding | | | 2012 | | | 50.00 | | Sale of the company |
Abenor, S.A. | | | 2012 | | | 20.00 | | Sale of the company |
Araucana de Electricidad, S.A. | | | 2012 | | | 20.00 | | Sale of the company |
ATE II Transmissora de Energia, S.A. | | | 2012 | | | 50.00 | | Sale of the company |
ATE III Transmissora de Energia, S.A. | | | 2012 | | | 50.00 | | Sale of the company |
ATE Transsmisora de Energía, S.A. | | | 2012 | | | 50.00 | | Sale of the company |
Bioener Energía, S.A. | | | 2012 | | | 50.00 | | Windup of the company |
Huepil de Electricidad, S.L. | | | 2012 | | | 20.00 | | Sale of the company |
Inversiones Eléctricas Transam Chile Limitada. | | | 2012 | | | 20.00 | | Sale of the company |
Italgest Abengoa Solar, S.r.l.. | | | 2012 | | | 50.00 | | Windup of the company |
Shams One Company LLC | | | 2012 | | | 20.00 | | Windup of the company |
STE-Sul Transmissora de Energía, Ltda. | | | 2012 | | | 50.00 | | Sale of the company |
F-170
Table of Contents
Appendices
Appendix VI
Temporary Joint Ventures which during 2014, 2013 and 2012 were no longer
included in the consolidation perimeter
| | | | | | | |
Company Name | | Year
of Exit | | % Share | |
|---|
UTE Abener Teyma Biomasa Salamanca | | | 2014 | | | 100.00 | |
UTE Motril | | | 2014 | | | 50.00 | |
Abensaih Construcción | | | 2013 | | | 50.00 | |
China Exhibition Center | | | 2013 | | | 34.50 | |
China Internacional | | | 2013 | | | 34.50 | |
Edar—Motril | | | 2013 | | | 50.00 | |
Elantxobe | | | 2013 | | | 50.00 | |
Energía Palmas Altas | | | 2013 | | | 50.00 | |
Erabil | | | 2013 | | | 20.00 | |
Inabensa—Intel | | | 2013 | | | 50.00 | |
Inelin | | | 2013 | | | 48.50 | |
Itoiz | | | 2013 | | | 34.50 | |
Mundaka | | | 2013 | | | 50.00 | |
Sector Vilablareix | | | 2013 | | | 33.00 | |
Villarreal | | | 2013 | | | 50.00 | |
Abener Inabensa | | | 2012 | | | 70.00 | |
Abener Inabensa Germany | | | 2012 | | | 70.00 | |
Abener Inabensa NP Tabasco | | | 2012 | | | 70.00 | |
Abener Inabensa Paises Bajos | | | 2012 | | | 70.00 | |
Consorcio Abengoa Perú y Cosapi | | | 2012 | | | 50.00 | |
Consorcio Constructor Alto Cayma | | | 2012 | | | 25.00 | |
Hassi R'Mel Construction | | | 2012 | | | 70.00 | |
Hassi´Mel Construcción | | | 2012 | | | 30.00 | |
Inabensa Apca 1 | | | 2012 | | | 50.00 | |
Inabensa Apca 1 | | | 2012 | | | 50.00 | |
Minicentrales | | | 2012 | | | 50.00 | |
Perú | | | 2012 | | | 70.00 | |
Puerto de Huelva | | | 2012 | | | 50.00 | |
Qingdao | | | 2012 | | | 20.00 | |
Retortillo | | | 2012 | | | 30.00 | |
Sahechores | | | 2012 | | | 62.00 | |
Sahechores | | | 2012 | | | 30.00 | |
Skikda | | | 2012 | | | 25.00 | |
Tenés EPC | | | 2012 | | | 20.00 | |
Zonas Deportivas La Nucia | | | 2012 | | | 45.00 | |
Chennai O&M | | | 2012 | | | 20.00 | |
Chennai | | | 2012 | | | 20.00 | |
Honnaine | | | 2012 | | | 50.00 | |
Marismas Construccion | | | 2012 | | | 90.00 | |
Vaideinfierno | | | 2012 | | | 20.00 | |
China Internacional | | | 2012 | | | 34.50 | |
Complejo Espacial | | | 2012 | | | 50.00 | |
F-171
Table of Contents
Appendices
Appendix VI
Temporary Joint Ventures which during 2014, 2013 and 2012 were no longer
included in the consolidation perimeter (Continuation)
| | | | | | | |
Company Name | | Year
of Exit | | % Share | |
|---|
Hospital Aranjuez | | | 2012 | | | 20.00 | |
Intercambiador Mairena | | | 2012 | | | 30.00 | |
Sigmalac | | | 2012 | | | 33.34 | |
Winterra—Inabensa Guardia Civil | | | 2012 | | | 30.00 | |
Winterra—Inabensa E.V. Meixoeiro | | | 2012 | | | 30.00 | |
Ute Selectiva Poniente | | | 2012 | | | 50.00 | |
F-172
Table of Contents
Appendices
Appendix VII
Projects subject to the application of IFRIC 12 interpretation based on the
concession of services
| | | | | | | | | | | | | | | | | | | | | | | | | | | | | | | | | |
Kind of Agreement/Project | | Activity | | Country | | Status
(*) | | % Share | | Years of
Agreement | | Offtaker | | Financial/
Intangible | | Arrangement
Terms | | Description
of the
Arrangement | | Assets/
Investment | | Amort. Acum. | | Revenues
ordinary
operating
activ. | | Operating
Income | |
|---|
Electricity Transmission: | | | | | | | | | | | | | | | | | | | | | | | | | | | | | | | | | |
ATE IV | | Transmission | | Brasil | | (O) | | | 100 | | | 2010-2037 | | Agencia Nacional de Energia Eléctrica (Aneel) | | (I) | | Fixed price indexed by consumer price index and reviewed every 5 years for macroeconomic assumptions | | 30-year Agreement with Aneel | | | 75,480 | | | (8,761 | ) | | 5,887 | | | 1,737 | |
ATE V | | Transmission | | Brasil | | (O) | | | 100 | | | 2009-2036 | | Agencia Nacional de Energia Eléctrica (Aneel) | | (I) | | Fixed price indexed by consumer price index and reviewed every 5 years for macroeconomic assumptions | | 30-year Agreement with Aneel | | | 56,607 | | | (7,334 | ) | | 5,017 | | | 1,417 | |
ATE VI | | Transmission | | Brasil | | (O) | | | 100 | | | 2009-2036 | | Agencia Nacional de Energia Eléctrica (Aneel) | | (I) | | Fixed price indexed by consumer price index and reviewed every 5 years for macroeconomic assumptions | | 30-year Agreement with Aneel | | | 60,173 | | | (8,505 | ) | | 5,598 | | | 2,226 | |
ATE VII | | Transmission | | Brasil | | (O) | | | 100 | | | 2009-2036 | | Agencia Nacional de Energia Eléctrica (Aneel) | | (I) | | Fixed price indexed by consumer price index and reviewed every 5 years for macroeconomic assumptions | | 30-year Agreement with Aneel | | | 37,392 | | | (5,631 | ) | | 3,682 | | | 1,416 | |
ATE VIII | | Transmission | | Brasil | | (O) | | | 50 | | | 2013-2014 | | Agencia Nacional de Energia Eléctrica (Aneel) | | (I) | | Fixed price indexed by consumer price index and reviewed every 5 years for macroeconomic assumptions | | 30-year Agreement with Aneel | | | 14,407 | | | (328 | ) | | — | | | — | |
ATE XVI | | Transmission | | Brasil | | (C) | | | 100 | | | 2013-2043 | | Agencia Nacional de Energia Eléctrica (Aneel) | | (I) | | Fixed price indexed by consumer price index and reviewed every 5 years for macroeconomic assumptions | | 30-year Agreement with Aneel | | | 171,529 | | | — | | | — | | | — | |
ATE XVII | | Transmission | | Brasil | | (C) | | | 100 | | | 2013-2043 | | Agencia Nacional de Energia Eléctrica (Aneel) | | (I) | | Fixed price indexed by consumer price index and reviewed every 5 years for macroeconomic assumptlons | | 30-year Agreement with Aneel | | | 37,859 | | | — | | | — | | | — | |
ATE XVIII | | Transmission | | Brasil | | (c) | | | 100 | | | 2013-2043 | | Agencia Nacional de Energia Eléctrica (Aneel) | | (I) | | Fixed price indexed by consumer price index and reviewed every 5 years for macroeconomic assumptions | | 30-year Agreement with Aneel | | | 49,517 | | | — | | | — | | | — | |
ATE XIX | | Transmission | | Brasil | | (C) | | | 100 | | | 2013-2043 | | Agencia Nacional de Energia Eléctrica (Aneel) | | (I) | | Fixed price indexed by consumer price index and reviewed every 5 years for macroeconomic assumptions | | 30-year Agreement with Aneel | | | 32,461 | | | — | | | — | | | — | |
ATE XX | | Transmission | | Brasil | | (C) | | | 100 | | | 2013-2043 | | Agencia Nacional de Energia Eléctrica (Aneel) | | (I) | | Fixed price indexed by consumer price index and reviewed every 5 years for macroeconomic assumptions | | 30-year Agreement with Aneel | | | 39,570 | | | — | | | — | | | — | |
ATE XXI | | Transmission | | Brasil | | (C) | | | 100 | | | 2013-2043 | | Agencia Nacional de Energia Eléctrica (Aneel) | | (I) | | Fixed price indexed by consumer price index and reviewed every 5 years for macroeconomic assumptons | | 30-year Agreement with Aneel | | | 75,602 | | | — | | | — | | | — | |
F-173
Table of Contents
Appendices
Appendix VII
Projects subject to the application of IFRIC 12 interpretation based on the
concession of services (Continuation)
| | | | | | | | | | | | | | | | | | | | | | | | | | | | | | | | | |
Kind of Agreement/Project | | Activity | | Country | | Status
(*) | | % Share | | Years of
Agreement | | Offtaker | | Financial/
Intangible | | Arrangement
Terms | | Description
of the
Arrangement | | Assets/
Investment | | Amort. Acum. | | Revenues
ordinary
operating
activ. | | Operating
Income | |
|---|
ATE XXII | | Transmission | | Brasil | | (C) | | | 100 | | | 2014-2044 | | Agencia Nacional de Energia Eléctrica (Aneel) | | (I) | | Fixed price indexed by consumer price index and reviewed every 5 years for macroeconomic assumptions | | 30-year Agreement with Aneel | | | 24,227 | | | — | | | — | | | — | |
ATE XXIII | | Transmission | | Brasil | | (C) | | | 100 | | | 2014-2044 | | Agencia Nacional de Energia Eléctrica (Aneel) | | (I) | | Fixed price indexed by consumer price index and reviewed every 5 years for macroeconomic assumptions | | 30-year Agreement with Aneel | | | 8,915 | | | — | | | — | | | — | |
ATE XXIV | | Transmission | | Brasil | | (C) | | | 100 | | | 2014-2044 | | Agencia Nacional de Energia Eléctrica (Aneel) | | (I) | | Fixed price indexed by consumer price index and reviewed every 5 years for macroeconomic assumptions | | 30-year Agreement with Aneel | | | 8,497 | | | — | | | — | | | — | |
Manaus | | Transmission | | Brasil | | (O) | | | 50.5 | | | 2011-2038 | | Agencia Nacional de Energia Eléctrica (Aneel) | | (I) | | Fixed priœ indexed by consumer price index and reviewed every 5 years for macroeconomic assumptions | | 30-year Agreement with Aneel | | | 703,499 | | | (30,287 | ) | | 49,669 | | | 19,945 | |
Norte Brasil | | Transmission | | Brasil | | (O) | | | 51 | | | 2012-2039 | | Agencia Nacional de Energia Eléctrica (Aneel) | | (I) | | Fixed priœ indexed by consumer price index and reviewed every 5 years for macroeconomic assumptions | | 30-year Agreement with Aneel | | | 973,145 | | | (6,264 | ) | | 15,731 | | | 5,979 | |
ATN 1 | | Transmission | | Peru | | (O) | | | 100 | | | 2013-2043 | | Administradora Chungar | | (F) | | Fixed price with annual review by US Finished Goods Less Food and Energy Inflation Index | | 30-year Agreement with the client | | | 57 | | | — | | | 1,042 | | | (101 | ) |
F-174
Table of Contents
Appendices
Appendix VII
Projects subject to the application of IFRIC 12 interpretation based on the
concession of services (Continuation)
| | | | | | | | | | | | | | | | | | | | | | | | | | | | | | | | | |
Kind of Agreement/Project | | Activity | | Country | | Status
(*) | | % Share | | Years of
Agreement | | Offtaker | | Financial/
Intangible | | Arrangement
Terms | | Description
of the
Arrangement | | Assets/
Investment | | Amort. Acum. | | Revenues
ordinary
operating
activ. | | Operating
Income | |
|---|
Electricity Sales: | | | | | | | | | | | | | | | | | | | | | | | | | | | | | | | | | |
Solar Power Plant One | | Solar | | Argelia | | (O) | | | 66 | | | 2011-2035 | | Sonatrach | | (I) | | Fixed price per MWh, update monthly by inflation and exchange rate dinar/euro | | 25 year service contract for the sale of electricity to Sonatrach | | | 299,284 | | | (46,211 | ) | | 43,119 | | | 18,805 | |
F-175
Table of Contents
Appendices
Appendix VII
Projects subject to the application of IFRIC 12 interpretation based on
the concession of services (Continuation)
| | | | | | | | | | | | | | | | | | | | | | | | | | | | | | | | | |
Kind of Agreement/Project | | Activity | | Country | | Status(*) | | % Share | | Years of
Agreement | | Offtaker | | Financial /
Intangible | | Arrangement Terms | | Description of the Arrangement | | Assets/
Investment | | Amort.
Acum. | | Revenues
ordinary
operating
activ. | | Operating
Income | |
|---|
Solnova Electricidad, S.A. | | Solar | | Spain | | (O) | | | 100 | | | 2010-2040 | | Kingdom of Spain | | (I) | | Regulated revenue base | | Regulated revenue established by different laws and rulings in Spain | | | 278,550 | | | (40,275 | ) | | 30,451 | | | 14,612 | |
Solnova Electricidad Tres, S.A. | | Solar | | Spain | | (O) | | | 100 | | | 2010-2040 | | Kingdom of Spain | | (I) | | Regulated revenue base | | Regulated revenue established by different laws and rulings in Spain | | | 260,717 | | | (36,378 | ) | | 29,405 | | | 13,622 | |
Solnova Electricidad Cuatro, S.A. | | Solar | | Spain | | (O) | | | 100 | | | 2010-2040 | | Kingdom of Spain | | (I) | | Regulated revenue base | | Regulated revenue established by different laws and rulings in Spain | | | 243,288 | | | (32,788 | ) | | 30,080 | | | 1,462 | |
Helioenergy Electricidad Uno, S.A. | | Solar | | Spain | | (O) | | | 50 | | | 2011-2041 | | Kingdom of Spain | | (I) | | Regulated revenue base | | Regulated revenue established by different laws and rulings in Spain | | | 135,246 | | | (13,618 | ) | | 14,400 | | | 6,633 | |
Helioenergy Electricidad Dos, S.A. | | Solar | | Spain | | (O) | | | 50 | | | 2012-2042 | | Kingdom of Spain | | (I) | | Regulated revenue base | | Regulated revenue established by different laws and rulings in Spain | | | 135,053 | | | (12,028 | ) | | 14,406 | | | 6,607 | |
F-176
Table of Contents
Appendices
Appendix VII
Projects subject to the application of IFRIC 12 interpretation based on
the concession of services (Continuation)
| | | | | | | | | | | | | | | | | | | | | | | | | | | | | | | | | |
Kind of Agreement/Project | | Activity | | Country | | Status(*) | | % Share | | Years of
Agreement | | Offtaker | | Financial /
Intangible | | Arrangement Terms | | Description of the Arrangement | | Assets/
Investment | | Amort.
Acum. | | Revenues
ordinary
operating
activ. | | Operating
Income | |
|---|
Solaben Electricidad Uno, S.A. | | Solar | | Spain | | (O) | | | 100 | | | 2013-2043 | | Kingdom of Spain | | (I) | | Regulated revenue base | | Regulated revenue established by different laws and rulings in Spain | | | 263,286 | | | (10,024 | ) | | 30,524 | | | 14,501 | |
Solaben Electricidad Seis, S.A. | | Solar | | Spain | | (O) | | | 100 | | | 2013-2043 | | Kingdom of Spain | | (I) | | Regulated revenue base | | Regulated revenue established by different laws and rulings in Spain | | | 260,085 | | | (9,894 | ) | | 30,477 | | | 14,610 | |
Helios I Hyperion Investments, S.L. | | Solar | | Spain | | (O) | | | 100 | | | 2012-2042 | | Kingdom of Spain | | (I) | | Regulated revenue base | | Regulated revenue established by different laws and rulings in Spain | | | 268,224 | | | (48,079 | ) | | 29,297 | | | 12,557 | |
Helios II Hyperion Investments, S.L. | | Solar | | Spain | | (O) | | | 100 | | | 2012-2042 | | Kingdom of Spain | | (I) | | Regulated revenue base | | Regulated revenue established by different laws and rulings in Spain | | | 260,958 | | | (41,666 | ) | | 29,311 | | | 12,689 | |
Kaxu Solar One (Pty) Ltd. | | Solar | | South Africa | | (C) | | | 51 | | | 2015-2035 | | The Department of Energy of South Africa (Offtaker Eskom Holding Soc Limited) | | (I) | | Fixed price in Rands / kWh indexed to annual inflation | | 20 year Implementation Agreement with Department of Energy and 20 year Power Purchase Agreement with Eskom Holding Soc Limited | | | 248,604 | | | (1 | ) | | — | | | –156 | |
Khi Solar One (Pty) Ltd. | | Solar | | South Africa | | (C) | | | 51 | | | 2014-2034 | | The Department of Energy of South Africa (Offtaker Eskom Holding Soc Limited) | | (I) | | Fixed price in Rands / kWh indexed to annual inflation | | 20 year Implementation Agreement with Department of Energy and 20 year Power Purchase Agreement with Eskom Holding Soc Limited | | | 122,265 | | | — | | | — | | | –45 | |
Xina Solar One (Pty) Ltd. | | Solar | | South Africa | | (C) | | | 40 | | | 2017-2037 | | The Department of Energy of South Africa (Offtaker Eskom Holding Soc Limited) | | (I) | | Fixed price in Rands / kWh indexed to annual inflation | | 20 year Implementation Agreement with Department of Energy and 20 year Power Purchase Agreement with Eskom Holding Soc Limited | | | 32,799 | | | — | | | — | | | 336 | |
F-177
Table of Contents
Appendices
Appendix VII
Projects subject to the application of IFRIC 12 interpretation based on
the concession of services (Continuation)
| | | | | | | | | | | | | | | | | | | | | | | | | | | | | | | | | |
Kind of Agreement/Project | | Activity | | Country | | Status(*) | | % Share | | Years of
Agreement | | Offtaker | | Financial /
Intangible | | Arrangement Terms | | Description of the Arrangement | | Assets/
Investment | | Amort.
Acum. | | Revenues
ordinary
operating
activ. | | Operating
Income | |
|---|
Infraestructure Mant.: | | | | | | | | | | | | | | | | | | | | | | | | | | | | | | | | | |
Hospital Costa del Sol | | Construction | | Spain | | (O) | | | 50 | | | 2011-2048 | | Andalucía Government | | (I)/(F) | | Fixed price with annual increases based on inflation and Variable rate base on level of services | | 40-year Concession Agreement with an option to extend for an aditional 20-year period. | | | 10,770 | | | (892 | ) | | 175 | | | (255 | ) |
Hospital del Tajo | | Construction | | Spain | | (O) | | | 20 | | | 2007-2035 | | Madrid Government | | (F) | | Fixed price in fils subject to indexation and adjustment for exchange rate fluctuation | | 30-year Concession Agreement | | | 944 | | | — | | | — | | | — | |
Inapreu | | Construction | | Spain | | (O) | | | 50 | | | 2008-2024 | | Catalunya Government | | (F) | | Fixed price with annual adjustment of 2,5% | | 16-year Concession Agreement | | | 3,118 | | | — | | | 654 | | | (101 | ) |
Concesionaria del Acueducto del Zapotillo, S.A. de C.V. | | Construction | | Mexico | | (C) | | | 100 | | | 2013-2038 | | Mexico Government (Comisión Nacional del Agua) | | (F) | | CPS with fixed price and adjustment for rate fluctuation y Variable rate | | 25-year Concession Agreement with Conagua | | | 203,302 | | | — | | | — | | | — | |
Concecutex | | Construction | | Mexico | | (O) | | | 50 | | | 2012-2031 | | Instituto Mexiquense de Cultura (IMC) | | (F) | | CPS with fixed price and adjustment for rate fluctuation | | 15-year Concession Agreement with IMC | | | 26,167 | | | — | | | 2,464 | | | 31 | |
Zona Norte Engenharia, Manutençao e Gestao De Servicios S.A. Spe. | | Construction | | Brasil | | (C)/(O) | | | 60 | | | 2013-2033 | | Susam | | (I)/(F) | | Fixed price, subject to indexation and annual adjustment by IPCA, IGPM eIAC | | 20-year Concession Agreement with Susam | | | 128,454 | | | (776 | ) | | 12,889 | | | 4,567 | |
Desalt water sales: | | | | | | | | | | | | | | | | | | | | | | | | | | | | | | | | | |
IDAM Cartagena | | Desalation | | Spain | | (O) | | | 38 | | | 2006-2020 | | Ministry of Enviroment | | (F) | | Fixed price to compensate construct ion services and fixed price per m3 produced with indexation mechanism | | 15-year Concession Agreement with Spanish Government | | | 43 | | | (25 | ) | | 1,274 | | | 476 | |
Chennai Water | | Desalation | | India | | (O) | | | 25 | | | 2010-2034 | | Chennai Metropolitan Wate Supply & Sewerage Board | | (I) | | Fixed price per m3 available of the plant and fixed price per m3 produced, with indexation mechanism | | 25-year Concession Agreement from Commercial Operation Date | | | 64,849 | | | (8,863 | ) | | 22,241 | | | 5,163 | |
F-178
Table of Contents
Appendices
Appendix VII
Projects subject to the application of IFRIC 12 interpretation based on
the concession of services (Continuation)
| | | | | | | | | | | | | | | | | | | | | | | | | | | | | | | | | |
Kind of Agreement/Project | | Activity | | Country | | Status(*) | | % Share | | Years of
Agreement | | Offtaker | | Financial /
Intangible | | Arrangement Terms | | Description of the Arrangement | | Assets/
Investment | | Amort.
Acum. | | Revenues
ordinary
operating
activ. | | Operating
Income | |
|---|
Shariket Tenes | | Desalation | | Algeria | | (C) | | | 51 | | | 2015-2039 | | Algerian Energy Company SPA and Algerienne Des Eaux | | (I) | | Fixed price per m3 available of the plant and fixed price per m3 produced, with indexation mechanism | | 25-year Concession Agreement from Commercial Operation Date with state-owned companies | | | 169,621 | | | (97 | ) | | 431 | | | 225 | |
Desalination Developments Ghana | | Desalation | | Ghana | | (C) | | | 56 | | | 2015-2030 | | Ghana Water Company Limited | | (I) | | Fixed price per m3 available of the plant and fixed price per m3 produced, with indexation mechanism | | 25-year Concession Agreement from Commercial Operation Date | | | 90,407 | | | (64 | ) | | — | | | (439 | ) |
Agadir | | Desalation | | Morocco | | (C) | | | 51 | | | 2017-2032 | | Office National de l'Eau Potable et de l'Electricité | | (I) | | Fixed price per m3 available of the plant and fixed price per m3 produced, with indexation mechanism | | 20-year Concession Agreement from Commercial Operation Date with ONEE state-owned company | | | 1,290 | | | (1 | ) | | — | | | (22 | ) |
(*) Operation (O); Construction (C)
F-179
Table of Contents
Appendices
Appendix VIII
Companies not connected with the group but which hold shares equal to
or above 10% of the capital of a subsidiary included in the consolidation
| | | | | | |
Company Shareholding | | Partner | | % Share | |
|---|
Abeima Teyma Barka LLC. | | Sultan Said Abdullah Al Kindi | | | 30.00 | |
Abengoa Bioenergy France, S.A. | | Oceol | | | 25.21 | |
Abengoa Bioenergy Meramec Holding, Inc. | | Cofides | | | 49.00 | |
Abengoa Yield Plc. | | Nasdaq | | | 35.73 | |
Aboadze Desalination Developments, Limited | | Hydrocol Infrastructure | | | 10.00 | |
Advanced Feedstocks of Kansas, LLC | | Pacific Ag Solutions, LLC | | | 49.00 | |
Aguas de Skikda, S.P.A. | | Algerian Energy Company | | | 49.00 | |
Arao Enerxías Eólica, S.L. | | Mustallar Enerxías, S.L. | | | 30.00 | |
ASO Holdings Company, LLC | | Liberty | | | (** | ) |
ATE XI, Manaus Transmissora de Energía | | Chesf/Eletronorte | | | 49.50 | |
ATE XIII, Norte Brasil Transmissora de Energía S.A | | Centrais Elétricas do Norte S.A/ Eletrosul Centrais Elétricas S.A | | | 49.00 | |
ATN 2, S.A. | | Sigma, Fondo de Inversión | | | 60.00 | |
Befesa Desalination Developments Ghana Limited | | Daye Water Investment Ghana Bv. | | | 44.00 | |
Cedisolar, S.A. | | Compañía Española de Industrias Electroquímicas, S.A. (CEDIE) | | | 42.50 | |
Centinela Power Plant S.A.P.I. de C.V. | | Ingeniería Mecánica y Calidad S.A. de C.V. | | | 10.00 | |
Construtora Integração, Ltda. | | Centrais Elétricas Norte Brasil S.A/Eletrosul Centrais Elátricas S.A | | | 49.00 | |
Copero Solar Huerta Uno, S.A. | | Empresa Metropolitana de Abastecimiento de aguas de Sevilla | | | 50.00 | |
Copero Solar Huerta Dos, S.A. | | Empresa Metropolitana de Abastecimiento de aguas de Sevilla | | | 50.00 | |
Copero Solar Huerta Tres, S.A | | Empresa Metropolitana de Abastecimiento de aguas de Sevilla | | | 50.00 | |
Copero Solar Huerta Cuatro, S.A. | | Empresa Metropolitana de Abastecimiento de aguas de Sevilla | | | 50.00 | |
Copero Solar Huerta Cinco, S.A. | | Empresa Metropolitana de Abastecimiento de aguas de Sevilla | | | 50.00 | |
Copero Solar Huerta Seis, S.A. | | Empresa Metropolitana de Abastecimiento de aguas de Sevilla | | | 50.00 | |
Copero Solar Huerta Siete, S.A. | | Empresa Metropolitana de Abastecimiento de aguas de Sevilla | | | 50.00 | |
Copero Solar Huerta Ocho, S.A. | | Empresa Metropolitana de Abastecimiento de aguas de Sevilla | | | 50.00 | |
Copero Solar Huerta Nueve, S.A. | | Empresa Metropolitana de Abastecimiento de aguas de Sevilla | | | 50.00 | |
Copero Solar Huerta Diez, S.A. | | Empresa Metropolitana de Abastecimiento de aguas de Sevilla | | | 50.00 | |
Dalian Xizhong Island Desalination Co., Ltd | | Hitachi Plant Technologies/Dalian Changxong Island Administration | | | 49.00 | |
Fotovoltaica Solar Sevilla, S.A. | | IDAE | | | 20.00 | |
Geida Skikda, S.L. | | Sadyt | | | 33.00 | |
Inabensa, LLC | | Sultan Said Abdullah Al Kindi | | | 30.00 | |
Iniciativas Hidroeléctricas, S.A. | | Suma de Energias/LPV | | | 50.00 | |
Instalaciones Inabensa Contracting, LLC | | Saeed Al Badi | | | 51.00 | |
Kaxu CSP South Africa (Pty) Limited | | Industrial Development Corporation (IDC) | | | 49.00 | |
Khi CSP South Africa (Pty) Limited | | Industrial Development Corporation | | | 49.00 | |
Linha Verde Transmisora de Energia, S.A | | Centrais Elétricas Norte Brasil S.A | | | 49.00 | |
Manaus Constructora, Ltda. | | Centrais Elétricas Norte Brasil S.A/Chesf | | | 49.50 | |
Norventus Atlántico, S.L. | | Mustallar Enerxias | | | 30.00 | |
Procesos Ecológicos, S.A. | | Global Plasma Envioroment | | | 50.00 | |
Rioglass Solar Holding, S.A | | Rioglass Laminar | | | 50.00 | |
Sao Mateus Transmissora de Energía, Ltda. | | Cofides | | | 24.00 | |
Sistemas de Desarrollo Sustentables S.A. De C.V. | | Cofides | | | 35.00 | |
Société d'Eau Déssalée d'Agadir (SEDA) | | InfraMaroc, S.A. | | | 49.06 | |
Solaben Electricidad Dos, S.A. | | I-Solar Investment | | | 30.00 | |
Solaben Electricidad Tres, S.A. | | I-Solar Investment | | | 30.00 | |
Solacor Electricidad Uno, S.A. | | JGC Corporation | | | 26.00 | |
Solacor Electricidad Dos, S.A. | | JGC Corporation | | | 26.00 | |
Solar Power Plant One | | New Energy Algeria (NEAL)/SVH (Sonatrach)/Cofides | | | 49.00 | |
Tenes Lylmyah | | Algerian Energy Company (AEC) | | | 49.00 | |
Transportadora Mar del Plata S.A. | | Tel 3 S.A. | | | 30.00 | |
Unidad Punta de Rieles, S.A. | | Goddard Catering Group Uruguay S.A. | | | 15.00 | |
Zona Norte Engenharia, Manutenção e Gestão De Serviços, S.A. Spe. | | Sh Engenharia/Magi Clean | | | 40.00 | |
- (**)
- Abengoa 100% class B (control), Liberty 100% class A.
F-180
Table of Contents
Appendices
Appendix IX
Companies with projects financed through project debt in 2014
| | | | | | | | | | | |
Project | | Activity | | Country | | Status
(*) | | %
Abengoa | |
|---|
Concession-type Infrastructure | | | | | | | | | | | |
Abengoa Cogeneración Tabasco, S. de R.L. de C.V. | | Cogeneration | | Mexico | | | (O | ) | | 64.27 | |
Abengoa Solar Chile, S.A. | | Solar energy generation | | Chile | | | (C | ) | | 100.00 | |
Abengoa Transmisión Norte, S.A. | | Transmission | | Peru | | | (O | ) | | 64.27 | |
Abengoa Transmisión Sur, S.A. | | Transmission | | Peru | | | (O | ) | | 64.27 | |
Abengoa Vista Ridge, LLC. | | Desalination | | Morocco | | | (C | ) | | 100.00 | |
Abent 3T, S.A.P.I. de C.V. | | Cogeneration | | Mexico | | | (C | ) | | 100.00 | |
ACC 4T, S.A.P.I. de C.V. | | Cogeneration | | Mexico | | | (C | ) | | 100.00 | |
Aguas de Skikda, S.P.A. | | Desalination | | Argelia | | | (O | ) | | 34.17 | |
Arizona Solar One, LLC | | Solar energy generation | | USA | | | (O | ) | | 64.27 | |
ATE VI Campos Novos Transmissora de Energía ,S.A | | Transmission | | Brazil | | | (O | ) | | 100.00 | |
ATE VII Foz do Iguacú Transmissora de Energía, S.A. | | Transmission | | Brazil | | | (O | ) | | 100.00 | |
ATE VIII Transmissora de Energía, S.A. | | Transmission | | Brazil | | | (O | ) | | 50.00 | |
ATE X Abengoa Brasil Administraçao Predial Ltda | | Infraestructure | | Brazil | | | (O | ) | | 100.00 | |
ATE XI, Manaus Transmissora de Energía | | Transmission | | Brazil | | | (O | ) | | 50.50 | |
ATE XIII, Norte Brasil Transmissora de Energía S.A. | | Transmission | | Brazil | | | (O | ) | | 51.00 | |
ATE XVI Transmissora de Energia S.A. | | Transmission | | Brazil | | | (C | ) | | 100.00 | |
ATE XVII Transmissora de Energia S.A. | | Transmission | | Brazil | | | (C | ) | | 100.00 | |
ATE XVIII Transmissora de Energia S.A. | | Transmission | | Brazil | | | (C | ) | | 100.00 | |
ATE XIX Transmissora de Energia S.A. | | Transmission | | Brazil | | | (C | ) | | 100.00 | |
ATE XX Transmissora de Energia S.A. | | Transmission | | Brazil | | | (C | ) | | 100.00 | |
ATE XXI Transmissora de Energia S.A. | | Transmission | | Brazil | | | (C | ) | | 100.00 | |
ATE XXII Transmissora de Energia S.A. | | Transmission | | Brazil | | | (C | ) | | 100.00 | |
ATE XXIII Transmissora de Energia S.A. | | Transmission | | Brazil | | | (C | ) | | 100.00 | |
ATE XXIV Transmissora de Energia S.A. | | Transmission | | Brazil | | | (C | ) | | 100.00 | |
ATN 1, S.A. | | Transmission | | Peru | | | (C | ) | | 99.90 | |
ATN 2, S.A. | | Transmission | | Chile | | | (O | ) | | 39.96 | |
ATN 3, S.A. | | Transmission | | Peru | | | (C | ) | | 99.90 | |
Befesa Desalination Developments Ghana Limited | | Desalination | | Ghana | | | (C | ) | | 56.00 | |
Cadonal, S.A. | | Wind energy generation | | Uruguay | | | (C | ) | | 64.27 | |
Casaquemada Fotovoltaica, S.L. | | Solar energy generation | | Spain | | | (O | ) | | 100.00 | |
Centro Industrial y Logístico Torrecuellar, S.A. | | Infraestructure | | Spain | | | (O | ) | | 100.00 | |
Centro Tecnológico Palmas Altas, S.A. | | Infraestructure | | Spain | | | (O | ) | | 100.00 | |
Chennai Water Desalination Limited | | Desalination | | India | | | (O | ) | | 20.00 | |
CSP Atacama Dos, S.A | | Solar energy generation | | Chile | | | (C | ) | | 100.00 | |
Concecutex, S.A. de C.V. | | Infraestructure | | Mexico | | | (O | ) | | 50.00 | |
Concesionaria Costa del Sol S.A. | | Infraestructure | | Spain | | | (O | ) | | 50.00 | |
Concesionaria del Acueducto el Zapotillo, S.A. de C.V. | | Infraestructure | | Mexico | | | (C | ) | | 100.00 | |
Concesionaria Hospital del Tajo, S.A. | | Infraestructure | | Spain | | | (O | ) | | 20.00 | |
Copero Solar Huerta Uno, S.A. | | Solar energy generation | | Spain | | | (O | ) | | 50.00 | |
Copero Solar Huerta Dos, S.A. | | Solar energy generation | | Spain | | | (O | ) | | 50.00 | |
Copero Solar Huerta Tres, S.A | | Solar energy generation | | Spain | | | (O | ) | | 50.00 | |
Copero Solar Huerta Cuatro, S.A. | | Solar energy generation | | Spain | | | (O | ) | | 50.00 | |
Copero Solar Huerta Cinco, S.A. | | Solar energy generation | | Spain | | | (O | ) | | 50.00 | |
Copero Solar Huerta Seis, S.A. | | Solar energy generation | | Spain | | | (O | ) | | 50.00 | |
Copero Solar Huerta Siete, S.A. | | Solar energy generation | | Spain | | | (O | ) | | 50.00 | |
Copero Solar Huerta Ocho, S.A. | | Solar energy generation | | Spain | | | (O | ) | | 50.00 | |
Copero Solar Huerta Nueve, S.A. | | Solar energy generation | | Spain | | | (O | ) | | 50.00 | |
Copero Solar Huerta Diez, S.A. | | Solar energy generation | | Spain | | | (O | ) | | 50.00 | |
Enernova Ayamonte S.A. | | Cogeneration | | Spain | | | (O | ) | | 91.00 | |
Helioenergy Electricidad Uno, S.A. | | Solar energy generation | | Spain | | | (O | ) | | 50.00 | |
Helioenergy Electricidad Dos, S.A. | | Solar energy generation | | Spain | | | (O | ) | | 50.00 | |
Helios I Hyperion Energy Investments, S.L. | | Solar energy generation | | Spain | | | (O | ) | | 100.00 | |
Helios II Hyperion Energy Investments, S.L. | | Solar energy generation | | Spain | | | (O | ) | | 100.00 | |
Inapreu, S.A. | | Infraestructure | | Spain | | | (O | ) | | 50.00 | |
F-181
Table of Contents
Appendices
Appendix IX
Companies with projects financed through project debt in 2014 (Continuation)
| | | | | | | | | | | |
Project | | Activity | | Country | | Status
(*) | | %
Abengoa | |
|---|
Iniciativas Hidroeléctricas, S.A. | | Wind energy generation | | Spain | | | (O | ) | | 51.00 | |
Kaxu Solar One (Pty) Ltd. | | Solar energy generation | | South Africa | | | (C | ) | | 51.00 | |
Khi Solar One (Pty) Ltd. | | Solar energy generation | | South Africa | | | (C | ) | | 51.00 | |
Las Cabezas Fotovoltaica, S.L. | | Solar energy generation | | Spain | | | (O | ) | | 100.00 | |
Ledincor, S.A. | | Infraestructure | | Uruguay | | | (O | ) | | 49.00 | |
Lidelir, S.A. | | Infraestructure | | Uruguay | | | (O | ) | | 49.00 | |
Linares Fotovoltaica, S.L. | | Solar energy generation | | Spain | | | (O | ) | | 100.00 | |
Linha Verde Transmisora de Energia, S.A | | Transmission | | Brazil | | | (C | ) | | 51.00 | |
Londrina Transmissora De Energía, S.A. | | Transmission | | Brazil | | | (O | ) | | 100.00 | |
Mojave Solar, LLC. | | Solar energy generation | | USA | | | (O | ) | | 64.27 | |
Myah Bahr Honaine, S.P.A. | | Desalination | | Argelia | | | (O | ) | | 25.50 | |
Palmatir, S.A. | | Wind energy generation | | Uruguay | | | (O | ) | | 64.27 | |
Palmucho, S.A. | | Transmission | | Chile | | | (O | ) | | 64.27 | |
PV Atacama Uno, S.A. | | Solar energy generation | | Chile | | | (C | ) | | 100.00 | |
Sanlúcar Solar, S.A. | | Solar energy generation | | Spain | | | (O | ) | | 64.27 | |
Sao Mateus Transmissora de Energía, Ltda. | | Transmission | | Brazil | | | (O | ) | | 76.00 | |
Société d'Eau Déssalée d'Agadir (SEDA) | | Desalination | | Morocco | | | (C | ) | | 50.94 | |
Solaben Electricidad Uno, S.A. | | Solar energy generation | | Spain | | | (O | ) | | 100.00 | |
Solaben Electricidad Dos, S.A. | | Solar energy generation | | Spain | | | (O | ) | | 70.00 | |
Solaben Electricidad Tres, S.A. | | Solar energy generation | | Spain | | | (O | ) | | 70.00 | |
Solaben Electricidad Seis, S.A. | | Solar energy generation | | Spain | | | (O | ) | | 100.00 | |
Solacor Electricidad Uno, S.A. | | Solar energy generation | | Spain | | | (O | ) | | 74.00 | |
Solacor Electricidad Dos, S.A. | | Solar energy generation | | Spain | | | (O | ) | | 74.00 | |
Solar Power Plant One | | Combined cycle generation | | Argelia | | | (O | ) | | 51.00 | |
Solar Processes, S.A. | | Solar energy generation | | Spain | | | (O | ) | | 64.27 | |
Solnova Electricidad, S.A. | | Solar energy generation | | Spain | | | (O | ) | | 100.00 | |
Solnova Electricidad Tres, S.A. | | Solar energy generation | | Spain | | | (O | ) | | 100.00 | |
Solnova Electricidad Cuatro, S.A. | | Solar energy generation | | Spain | | | (O | ) | | 100.00 | |
Solnova Solar Inversiones, S.A | | Solar energy generation | | Spain | | | (O | ) | | 100.00 | |
Tenes Lylmyah | | Desalination | | Argelia | | | (C | ) | | 51.00 | |
Teyma Forestal, S.A. | | Infraestructure | | Uruguay | | | (O | ) | | 100.00 | |
Transmisora Baquedano, S.A. | | Transmission | | Chile | | | (O | ) | | 64.27 | |
Transmisora Mejillones, S.A. | | Transmission | | Chile | | | (O | ) | | 64.27 | |
Zona Norte Engenharia, Manutenção e Gestão De Serviços, S.A. Spe. | | Infraestructure | | Brazil | | | (C | ) | | 60.00 | |
Industrial Production | | | | | | | | | | | |
Abengoa Bioenergía Agroindustria, Ltda. | | Ethanol | | Brazil | | | (O | ) | | 98.05 | |
Abengoa Bioenergy Biomass of Kansas, LLC. | | Ethanol | | USA | | | (O | ) | | 98.05 | |
Abengoa Bioenergy France, S.A. | | Ethanol | | France | | | (O | ) | | 73.33 | |
Abengoa Bioenergy Maple, LLC. | | Ethanol | | USA | | | (O | ) | | 98.05 | |
Abengoa Bioenergy of Illinois, LLC | | Ethanol | | USA | | | (O | ) | | 98.05 | |
Abengoa Bioenergy of Indiana, LLC | | Ethanol | | USA | | | (O | ) | | 98.05 | |
- (*)
- Operative (O), Construction (C)..
F-182
Table of Contents
Appendices
Appendix X
Companies with Electricity Operations included in the 2014 Consolidation Perimeter
| | | | | | | |
Company Name | | Registered
Address | | Activity(*) | | Comments |
|---|
Abengoa Bioenergía Agroindustria, Ltda. | | Sao Paulo (BR) | | | 3 | | Operational |
Abengoa Bioenergy Biomass of Kansas, LLC. | | Kansas (US) | | | 3 | | Operational |
Abengoa Cogeneraçao de Energía II, S.A. | | R. de Janeiro (BR) | | | 9 | | Construction phase |
Abengoa Cogeneración Tabasco, S. de R.L. de C.V. | | Mexico City (MX) | | | 3 | | Operational |
Abengoa Solar Chile, S.A. | | Santiago de Chile (CL) | | | 6 | | Construction phase |
Abengoa Solar Italia, S.R.L. | | Rome (IT) | | | 5 | | Construction phase |
Abengoa Transmisión Norte, S.A. | | Lima (PE) | | | 9 | | Operational |
Abengoa Transmisión Sur, S.A. | | Lima (PE) | | | 9 | | Operational |
Abent 3T, S.A.P.I. de C.V. | | Mexico City (MX) | | | 3 | | Construction phase |
ACC 4T, S.A.P.I. de C.V. | | Mexico City (MX) | | | 3 | | Construction phase |
Aprovechamientos Energéticos Furesa, S.A. | | Murcia (ES) | | | 1 | | Operational |
Arao Enerxías Eólica, S.L. | | A Coruña (ES) | | | 2 | | Construction phase |
Arizona Solar One, LLC | | Colorado (US) | | | 6 | | Operational |
ASI Operations LLC | | Delaware (US) | | | 6 | | Operational |
ATE VI Campos Novos Transmissora de Energía, S.A | | R. de Janeiro (BR) | | | 9 | | Operational |
ATE VII- Foz do Iguacú Transmissora de Energía, S.A. | | R. de Janeiro (BR) | | | 9 | | Operational |
ATE VIII Transmissora de Energía, S.A. | | R. de Janeiro (BR) | | | 9 | | Construction phase |
ATE XI, Manaus Transmissora de Energía | | R. de Janeiro (BR) | | | 9 | | Operational |
ATE XIII, Norte Brasil Transmissora de Energía S.A | | R. de Janeiro (BR) | | | 9 | | Operational |
ATE XVI Transmissora de Energia S.A. | | R. de Janeiro (BR) | | | 9 | | Construction phase |
ATE XVII Transmissora de Energia S.A. | | R. de Janeiro (BR) | | | 9 | | Construction phase |
ATE XVIII Transmissora de Energia S.A. | | R. de Janeiro (BR) | | | 9 | | Construction phase |
ATE XIX Transmissora de Energia S.A. | | R. de Janeiro (BR) | | | 9 | | Construction phase |
ATE XX Transmissora de Energia S.A. | | R. de Janeiro (BR) | | | 9 | | Construction phase |
ATE XXI Transmissora de Energia S.A. | | R. de Janeiro (BR) | | | 9 | | Construction phase |
ATE XXII Transmissora de Energia S.A. | | R. de Janeiro (BR) | | | 9 | | Construction phase |
ATE XXIII Transmissora de Energia S.A. | | R. de Janeiro (BR) | | | 9 | | Construction phase |
ATE XXIV Transmissora de Energia, S.A. | | Rio de Janeiro (BR) | | | 9 | | Construction phase |
ATE XXVI Transmissora de Energia S.A. | | Rio de Janeiro (BR) | | | 9 | | Construction phase |
ATE XXVII Transmissora de Energia, S.A. | | Rio de Janeiro (BR) | | | 9 | | Construction phase |
ATN 1, S.A. | | Lima (PE) | | | 9 | | Operational |
ATN 2, S.A. | | Lima (PE) | | | 9 | | Construction phase |
ATN 3, S.A. | | Lima (PE) | | | 9 | | Construction phase |
Biocarburantes de Castilla y León, S.A. | | Salamanca (ES) | | | 3 | | Operational |
Bioetanol Galicia, S.A. | | A Coruña (ES) | | | 3 | | Operational |
Cadonal, S.A. | | Montevideo (UY) | | | 2 | | Operational |
Captasol Fotovoltaica 1, S.L. | | Seville (ES) | | | 5 | | Operational |
Captasol Fotovoltaica 2, S.L. | | Seville (ES) | | | 5 | | Operational |
Captasol Fotovoltaica 3, S.L. | | Seville (ES) | | | 5 | | Operational |
Captasol Fotovoltaica 4, S.L. | | Seville (ES) | | | 5 | | Operational |
Captasol Fotovoltaica 5, S.L. | | Seville (ES) | | | 5 | | Operational |
Captasol Fotovoltaica 6, S.L. | | Seville (ES) | | | 5 | | Operational |
Captasol Fotovoltaica 7, S.L. | | Seville (ES) | | | 5 | | Operational |
Captasol Fotovoltaica 8, S.L. | | Seville (ES) | | | 5 | | Operational |
Captasol Fotovoltaica 9, S.L. | | Seville (ES) | | | 5 | | Operational |
Captasol Fotovoltaica 10, S.L. | | Seville (ES) | | | 5 | | Operational |
Captasol Fotovoltaica 11, S.L. | | Seville (ES) | | | 5 | | Operational |
Captasol Fotovoltaica 12, S.L. | | Seville (ES) | | | 5 | | Operational |
Captasol Fotovoltaica 13, S.L. | | Seville (ES) | | | 5 | | Operational |
Captasol Fotovoltaica 14, S.L. | | Seville (ES) | | | 5 | | Operational |
Captasol Fotovoltaica 15, S.L. | | Seville (ES) | | | 5 | | Operational |
Captasol Fotovoltaica 16, S.L. | | Seville (ES) | | | 5 | | Operational |
F-183
Table of Contents
Appendices
Appendix X
Companies with Electricity Operations included in the 2014 Consolidation Perimeter (Continuation)
| | | | | | | |
Company Name | | Registered
Address | | Activity(*) | | Comments |
|---|
Captasol Fotovoltaica 17, S.L. | | Seville (ES) | | | 5 | | Operational |
Captasol Fotovoltaica 18, S.L. | | Seville (ES) | | | 5 | | Operational |
Captasol Fotovoltaica 19, S.L. | | Seville (ES) | | | 5 | | Operational |
Captasol Fotovoltaica 20, S.L. | | Seville (ES) | | | 5 | | Operational |
Captasol Fotovoltaica 21, S.L. | | Seville (ES) | | | 5 | | Operational |
Captasol Fotovoltaica 22, S.L. | | Seville (ES) | | | 5 | | Operational |
Captasol Fotovoltaica 23, S.L. | | Seville (ES) | | | 5 | | Operational |
Captasol Fotovoltaica 24, S.L. | | Seville (ES) | | | 5 | | Operational |
Captasol Fotovoltaica 25, S.L. | | Seville (ES) | | | 5 | | Operational |
Captasol Fotovoltaica 26, S.L. | | Seville (ES) | | | 5 | | Operational |
Captasol Fotovoltaica 27, S.L. | | Seville (ES) | | | 5 | | Operational |
Captasol Fotovoltaica 28, S.L. | | Seville (ES) | | | 5 | | Operational |
Captasol Fotovoltaica 29, S.L. | | Seville (ES) | | | 5 | | Operational |
Captasol Fotovoltaica 30, S.L. | | Seville (ES) | | | 5 | | Operational |
Captasol Fotovoltaica 31, S.L. | | Seville (ES) | | | 5 | | Operational |
Captasol Fotovoltaica 32, S.L. | | Seville (ES) | | | 5 | | Operational |
Captasol Fotovoltaica 33, S.L. | | Seville (ES) | | | 5 | | Operational |
Captasol Fotovoltaica 34, S.L. | | Seville (ES) | | | 5 | | Operational |
Captasol Fotovoltaica 35, S.L. | | Seville (ES) | | | 5 | | Operational |
Captasol Fotovoltaica 36, S.L. | | Seville (ES) | | | 5 | | Operational |
Captasol Fotovoltaica 37, S.L. | | Seville (ES) | | | 5 | | Operational |
Captasol Fotovoltaica 38, S.L. | | Seville (ES) | | | 5 | | Operational |
Captasol Fotovoltaica 52 S.L. | | Seville (ES) | | | 5 | | Construction phase |
Cogeneración Motril, S.A. | | Seville (ES) | | | 1 | | Operational |
Cogeneración Villaricos, S.A. | | Seville (ES) | | | 1 | | Operational |
Copero Solar Huerta Uno, S.A. | | Seville (ES) | | | 5 | | Operational |
Copero Solar Huerta Dos, S.A. | | Seville (ES) | | | 5 | | Operational |
Copero Solar Huerta Tres, S.A | | Seville (ES) | | | 5 | | Operational |
Copero Solar Huerta Cuatro, S.A. | | Seville (ES) | | | 5 | | Operational |
Copero Solar Huerta Cinco, S.A. | | Seville (ES) | | | 5 | | Operational |
Copero Solar Huerta Seis, S.A. | | Seville (ES) | | | 5 | | Operational |
Copero Solar Huerta Siete, S.A. | | Seville (ES) | | | 5 | | Operational |
Copero Solar Huerta Ocho, S.A. | | Seville (ES) | | | 5 | | Operational |
Copero Solar Huerta Nueve, S.A. | | Seville (ES) | | | 5 | | Operational |
Copero Solar Huerta Diez, S.A. | | Seville (ES) | | | 5 | | Operational |
CSP Atacama Dos, S.A | | Santiago de Chile (CL) | | | 6 | | Construction phase |
Cycon Solar, LTD | | Nicosia (CY) | | | 6 | | Construction phase |
Ecocarburantes Españoles, S.A. | | Murcia (ES) | | | 3 | | Operational |
Enernova Ayamonte S.A. | | Huelva (ES) | | | 3 | | Operational |
Fotovoltaica Solar Sevilla, S.A. | | Seville (ES) | | | 5 | | Operational |
Helioenergy Electricidad Uno, S.A. | | Seville (ES) | | | 6 | | Operational |
Helioenergy Electricidad Dos, S.A. | | Seville (ES) | | | 6 | | Operational |
Helioenergy Electricidad Tres, S.A. | | Seville (ES) | | | 6 | | Construction phase |
Helioenergy Electricidad Cuatro, S.A. | | Seville (ES) | | | 6 | | Construction phase |
Helioenergy Electricidad Cinco, S.A. | | Seville (ES) | | | 6 | | Construction phase |
Helioenergy Electricidad Once, S.A. | | Seville (ES) | | | 6 | | Construction phase |
Helioenergy Electricidad Trece, S.A. | | Seville (ES) | | | 6 | | Construction phase |
Helioenergy Electricidad Veintiuno, S.A | | Seville (ES) | | | 6 | | Construction phase |
Helioenergy Electricidad Veintidos, S.A | | Seville (ES) | | | 6 | | Construction phase |
Helioenergy Electricidad Veintitres, S.A | | Seville (ES) | | | 6 | | Construction phase |
Helioenergy Electricidad Veinticuatro, S.A | | Seville (ES) | | | 6 | | Construction phase |
Helios I Hyperion Energy Investments, S.L. | | Seville (ES) | | | 6 | | Operational |
F-184
Table of Contents
Appendices
Appendix X
Companies with Electricity Operations included in the 2014 Consolidation Perimeter (Continuation)
| | | | | | | |
Company Name | | Registered
Address | | Activity(*) | | Comments |
|---|
Helios II Hyperion Energy Investments, S.L. | | Madrid (ES) | | | 6 | | Operational |
Inabensa Fotovoltaica, S.L. | | Seville (ES) | | | 5 | | Construction phase |
Iniciativas Hidroeléctricas de Aragón y Cataluña, S.L. | | Huesca (ES) | | | 7 | | Operational |
Iniciativas Hidroeléctricas, S.A. | | Seville (ES) | | | 7 | | Operational |
Insolation Sic 6, S.R.L | | Rome (IT) | | | 5 | | Construction phase |
Insolation Sic 9, S.R.L | | Rome (IT) | | | 5 | | Construction phase |
Insolation 17, S.R.L | | Rome (IT) | | | 5 | | Construction phase |
Insolation 18, S.R.L | | Rome (IT) | | | 5 | | Construction phase |
Instalaciones Fotovoltaicas Torrecuéllar, 1 S.L. | | Seville (ES) | | | 5 | | Construction phase |
Instalaciones Fotovoltaicas Torrecuéllar, 2 S.L. | | Seville (ES) | | | 5 | | Construction phase |
Instalaciones Fotovoltaicas Torrecuéllar, 3 S.L. | | Seville (ES) | | | 5 | | Construction phase |
Kaxu Solar One (Pty) Ltd. | | Gauteng (ZA) | | | 6 | | Construction phase |
Khi Solar One (Pty) Ltd. | | Gauteng (ZA) | | | 6 | | Construction phase |
Linares Fotovoltaica, S.L. | | Seville (ES) | | | 5 | | Operational |
Linha Verde Transmisora de Energia, S.A | | Brasilia (BR) | | | 9 | | Construction phase |
Londrina Transmissora De Energía, S.A. | | R. de Janeiro (BR) | | | 9 | | Operational |
Marismas PV A1, S.L. | | Seville (ES) | | | 5 | | Operational |
Marismas PV A2, S.L. | | Seville (ES) | | | 5 | | Operational |
Marismas PV A3, S.L. | | Seville (ES) | | | 5 | | Operational |
Marismas PV A4, S.L. | | Seville (ES) | | | 5 | | Operational |
Marismas PV A5, S.L. | | Seville (ES) | | | 5 | | Operational |
Marismas PV A6, S.L. | | Seville (ES) | | | 5 | | Operational |
Marismas PV A7, S.L. | | Seville (ES) | | | 5 | | Operational |
Marismas PV A8, S.L. | | Seville (ES) | | | 5 | | Operational |
Marismas PV A9, S.L. | | Seville (ES) | | | 5 | | Operational |
Marismas PV A10, S.L. | | Seville (ES) | | | 5 | | Operational |
Marismas PV A11, S.L. | | Seville (ES) | | | 5 | | Operational |
Marismas PV A12, S.L. | | Seville (ES) | | | 5 | | Operational |
Marismas PV A13, S.L. | | Seville (ES) | | | 5 | | Operational |
Marismas PV A14, S.L. | | Seville (ES) | | | 5 | | Operational |
Marismas PV A15, S.L. | | Seville (ES) | | | 5 | | Operational |
Marismas PV A16, S.L. | | Seville (ES) | | | 5 | | Operational |
Marismas PV A17, S.L. | | Seville (ES) | | | 5 | | Operational |
Marismas PV A18, S.L. | | Seville (ES) | | | 5 | | Operational |
Marismas PV B1, S.L. | | Seville (ES) | | | 5 | | Operational |
Marismas PV B2, S.L. | | Seville (ES) | | | 5 | | Operational |
Marismas PV B3, S.L. | | Seville (ES) | | | 5 | | Operational |
Marismas PV B4, S.L. | | Seville (ES) | | | 5 | | Operational |
Marismas PV B5, S.L. | | Seville (ES) | | | 5 | | Operational |
Marismas PV B6, S.L. | | Seville (ES) | | | 5 | | Operational |
Marismas PV B7, S.L. | | Seville (ES) | | | 5 | | Operational |
Marismas PV B8, S.L. | | Seville (ES) | | | 5 | | Operational |
Marismas PV B9, S.L. | | Seville (ES) | | | 5 | | Operational |
Marismas PV B10, S.L. | | Seville (ES) | | | 5 | | Operational |
Marismas PV B12, S.L. | | Seville (ES) | | | 5 | | Operational |
Marismas PV B13, S.L. | | Seville (ES) | | | 5 | | Operational |
Marismas PV B14, S.L. | | Seville (ES) | | | 5 | | Operational |
Marismas PV B15, S.L. | | Seville (ES) | | | 5 | | Operational |
Marismas PV B16, S.L. | | Seville (ES) | | | 5 | | Operational |
Marismas PV B17, S.L. | | Seville (ES) | | | 5 | | Operational |
Marismas PV B18, S.L. | | Seville (ES) | | | 5 | | Operational |
Marismas PV C1, S.L. | | Seville (ES) | | | 5 | | Operational |
F-185
Table of Contents
Appendices
Appendix X
Companies with Electricity Operations included in the 2014 Consolidation Perimeter (Continuation)
| | | | | | | |
Company Name | | Registered
Address | | Activity(*) | | Comments |
|---|
Marismas PV C2, S.L. | | Seville (ES) | | | 5 | | Operational |
Marismas PV C3, S.L. | | Seville (ES) | | | 5 | | Operational |
Marismas PV C4, S.L. | | Seville (ES) | | | 5 | | Operational |
Marismas PV C5, S.L. | | Seville (ES) | | | 5 | | Operational |
Marismas PV C6, S.L. | | Seville (ES) | | | 5 | | Operational |
Marismas PV C7, S.L. | | Seville (ES) | | | 5 | | Operational |
Marismas PV C8, S.L. | | Seville (ES) | | | 5 | | Operational |
Marismas PV C9, S.L. | | Seville (ES) | | | 5 | | Operational |
Marismas PV C10, S.L. | | Seville (ES) | | | 5 | | Operational |
Marismas PV C11, S.L. | | Seville (ES) | | | 5 | | Operational |
Marismas PV C12, S.L. | | Seville (ES) | | | 5 | | Operational |
Marismas PV C13, S.L. | | Seville (ES) | | | 5 | | Operational |
Marismas PV C14, S.L. | | Seville (ES) | | | 5 | | Operational |
Marismas PV C15, S.L. | | Seville (ES) | | | 5 | | Operational |
Marismas PV C16, S.L. | | Seville (ES) | | | 5 | | Operational |
Marismas PV C17, S.L. | | Seville (ES) | | | 5 | | Operational |
Marismas PV C18, S.L. | | Seville (ES) | | | 5 | | Operational |
Marismas PV E1, S.L. | | Seville (ES) | | | 5 | | Operational |
Marismas PV E2, S.L. | | Seville (ES) | | | 5 | | Operational |
Marismas PV E3, S.L. | | Seville (ES) | | | 5 | | Operational |
Marudhara Akshay Urja Private Limited | | Maharashtra (IN) | | | 6 | | Construction phase |
Marusthal Green Power Private Limited | | Maharashtra (IN) | | | 6 | | Construction phase |
Mojave Solar LLC | | Colorado (US) | | | 6 | | Operational |
Negev Energy—Ashalim Thermo-Solar, Ltd. | | Tel Aviv (IL) | | | 6 | | Construction phase |
Norventus Atlántico, S.L. | | A Coruña (ES) | | | 2 | | Construction phase |
Palmatir, S.A. | | Montevideo (UY) | | | 2 | | Operational |
Palmucho, S.A. | | Santiago de Chile (CL) | | | 9 | | Operational |
Procesos Ecológicos Vilches, S.A. | | Seville (ES) | | | 3 | | Operational |
Puerto Real Cogeneración, S.A. | | Seville (ES) | | | 3 | | Operational |
PV Atacama Uno, S.A. | | Santiago de Chile (CL) | | | 5 | | Construction phase |
PV Atacama Dos, S.A | | Santiago de Chile (CL) | | | 5 | | Construction phase |
Rajasthan Photon Energy Pvt Ltd | | Maharashtra (IN) | | | 6 | | Construction phase |
Sanlúcar Solar, S.A. | | Seville (ES) | | | 6 | | Operational |
Sao Mateus Transmissora de Energía, Ltda. | | R. de Janeiro (BR) | | | 9 | | Operational |
Shams Power Company PJSC | | Abu-Dhabi (AE) | | | 6 | | Operational |
Solaben Electricidad Uno, S.A. | | Caceres (ES) | | | 6 | | Construction phase |
Solaben Electricidad Dos, S.A. | | Caceres (ES) | | | 6 | | Operational |
Solaben Electricidad Tres, S.A. | | Caceres (ES) | | | 6 | | Operational |
Solaben Electricidad Seis, S.A. | | Badajoz (ES) | | | 6 | | Construction phase |
Solaben Electricidad Diez, S.A. | | Caceres (ES) | | | 6 | | Construction phase |
Solacor Electricidad Uno, S.A. | | Seville (ES) | | | 6 | | Operational |
Solacor Electricidad Dos, S.A. | | Seville (ES) | | | 6 | | Operational |
Solar de Receptores de Andalucía, S.A. | | Seville (ES) | | | 5 | | Operational |
Solar Power Plant One | | Argel (DZ) | | | 5 | | Operational |
Solar Processes, S.A. | | Seville (ES) | | | 6 | | Operational |
Solargate Electricidad Tres, S.A. | | Seville (ES) | | | 6 | | Construction phase |
Solargate Electricidad Cuatro, S.A. | | Seville (ES) | | | 6 | | Construction phase |
Solargate Electricidad Cinco, S.A. | | Seville (ES) | | | 6 | | Construction phase |
Solnova Electricidad, S.A. | | Seville (ES) | | | 6 | | Operational |
Solnova Electricidad Dos, S.A. | | Seville (ES) | | | 6 | | Construction phase |
Solnova Electricidad Tres, S.A. | | Seville (ES) | | | 6 | | Operational |
Solnova Electricidad Cuatro, S.A. | | Seville (ES) | | | 6 | | Operational |
F-186
Table of Contents
Appendices
Appendix X
Companies with Electricity Operations included in the 2014 Consolidation Perimeter (Continuation)
| | | | | | | |
Company Name | | Registered
Address | | Activity(*) | | Comments |
|---|
Solnova Electricidad Cinco, S.A. | | Seville (ES) | | | 6 | | Construction phase |
Solnova Electricidad Seis, S.A. | | Seville (ES) | | | 6 | | Construction phase |
Transmisora Baquedano, S.A. | | Santiago de Chile (CL) | | | 9 | | Operational |
Transmisora Mejillones, S.A. | | Santiago de Chile (CL) | | | 9 | | Operational |
Xina Solar One (Rf) (Pty), Ltd. | | Gauteng (ZA) | | | 6 | | Construction phase |
- (*)
- Electricity operations as described in Note 2.29 in accordance with the provisions of Law 54/1997
- (1)
- Production under Special Regime: Cogeneration. Primary energy type: Fuel
- (2)
- Production under Special Regime: Wind. Primary energy type: Wind
- (3)
- Includes production under Special Regime: Cogeneration. Primary energy type: Natural gas
- (4)
- Production under Special Regime: Cogeneration. Primary energy type: Natural gas
- (5)
- Production under Special Regime: Solar Photovoltaic. Primary energy type: Solar light
- (6)
- Production under Special Regime: Solar. Primary energy type: Solar light
- (7)
- Production under Special Regime: Hydraulic. Primary energy type: Water
- (8)
- Production under Special Regime: Other. Primary energy type: Industrial waste (used oils)
- (9)
- Transport
- (10)
- Electricity production: Based on hydrogen. Primary type of energy: Hydrogen
F-187
Table of Contents
Appendices
Appendix XI
Companies taxed under the Special Regime for Company Groups at 12.31.14
| | | | |
| Abengoa Tax Group Number 02/97 |
|---|
Company Name | | Tax Address | | Shareholding |
|---|
Abengoa S.A. | | Seville (ES) | | Sociedad Dominante |
A3T Holdco España, S.A. | | Seville (ES) | | Abener Energía, S.A./ Negocios Industriales y Comerciales, S.A. (Nicsa) |
Abeima Agua Internacional, S.L. | | Seville (ES) | | Abeinsa Infraestructuras Medio Ambiente/Construcciones y Depuraciones, S.A.(Codesa) |
Abeinsa Asset Management, S.L. | | Seville (ES) | | Abener Energía, S.A./Negocios Industriales y Comerciales, S.A. |
Abeinsa Business Development, S.A. | | Seville (ES) | | Abeinsa Ingeniería y Construcción Industrial, S.A./ Negocios Industriales y Comerciales, S.A. |
Abeinsa Engineering, S.L. | | Seville (ES) | | Abener Energía, S.A. |
Abeinsa EPC, S.A. | | Seville (ES) | | Abeinsa Ingeniería y Construcción Industrial S.A./Teyma Gest. Ctos. de Const. e Ing., S.A. |
Abeinsa Infraestructuras Medio Ambiente, S.A. | | Seville (ES) | | Abeinsa, Ingeniería y Construcción Industrial, S.L./Negocios Industriales y Comerciales, S.A |
Abeinsa Inversiones Latam, S.L. | | Seville (ES) | | Asa Iberoamérica, S.L./Abeinsa Ingeniería y Construcción Industrial, S.A. |
Abeinsa Operation and Maintenance, S.A. | | Seville (ES) | | Abeinsa Ing. y Const. Industrial, S.A./Negocios Industriales y de Construcción, S.A. |
Abeinsa, Ingeniería y Construcción Industrial, S.A. | | Seville (ES) | | Abengoa, S.A./Siema |
Abencor Suministros S.A. | | Seville (ES) | | Negocios Industriales y Comerciales, S.A./Abeinsa Ingeniería y Construcción Industrial, S.A. |
Abener Argelia, S.L. | | Seville (ES) | | Abener Energía, S.A./Abeinsa Ingeniería y Construcción Industrial, S.A. |
Abener Energía, S.A. | | Seville (ES) | | Abeinsa, Ing. y Const., S.A./Abeinsa Business Development, S.A./Negocios Ind. y Com., S.A. |
Abengoa Bioenergía Biodiesel, S.A. | | Seville (ES) | | Abengoa Bioenergía Inversiones, S.A./Ecoagrícola, S.A. |
Abengoa Bioenergía Inversiones, S.A. | | Seville (ES) | | Abengoa Bioenergía, S.A./Abengoa Bioenergía Nuevas Tecnologías, S.A. |
Abengoa Bioenergía Nuevas Tecnologías, S.A. | | Seville (ES) | | Abengoa Bioenergía, S.L./Instalaciones Inabensa, S.A. |
Abengoa Bioenergía San Roque, S.A. | | Cadiz (ES) | | Abengoa Bioenergía Inversiones, S.A./Ecoagrícola, S.A. |
Abengoa Bioenergía, S.A. | | Seville (ES) | | Abengoa, S.A./Sociedad Inversora Energía y Medio Ambiente, S.A. |
Abengoa Biotechnology Research, S.A. | | Seville (ES) | | Abengoa Bioenergía Nuevas Tecnologías, S.A./Abengoa Research, S.A. |
Abengoa Concessions, S.L. | | Seville (ES) | | Abengoa, S.A./Siema |
Abengoa Energy Crops, S.A. | | Seville (ES) | | Abengoa, S.A./ Sociedad Inversora en Energía y Medioambiente, S.A. (Siema) |
Abengoa Finance, S.A. | | Seville (ES) | | Abengoa, S.A. |
Abengoa Greenbridge, S.A.U. | | Seville (ES) | | Abengoa, S.A. |
Abengoa Greenfield S.A.U. | | Seville (ES) | | Abengoa, S.A. |
Abengoa Hidrógeno, S.A. | | Seville (ES) | | Abeinsa Ingeniería y Construcción Industrial, S.A./ Instalaciones Inabensa, S.A. |
Abengoa Research, S.L. | | Seville (ES) | | Abeinsa, Ingeniería y Construcción Industrial, S.A./Instalaciones Inabensa, S.A. |
Abengoa SeaPower, S.A. | | Seville (ES) | | Abeinsa Ingeniería y Construcción Industrial, S.A./Instalaciones Inabensa, S.A. |
Abengoa Solar España, S.A. | | Seville (ES) | | Abengoa Solar, S.A./Abengoa Solar New Technologies, S.A. |
Abengoa Solar Extremadura, S.A. | | Caceres (ES) | | Abengoa Solar España, S.A./Abengoa Solar New Technologies, S.A. |
Abengoa Solar Internacional, S.A. | | Seville (ES) | | Abengoa Solar, S.A./ Abengoa Solar España, S.A. |
Abengoa Solar New Technologies, S.A. | | Seville (ES) | | Abengoa Solar, S.A./ Abengoa Solar España, S.A. |
Abengoa Solar Power, S.A. | | Seville (ES) | | Abengoa Solar, S.A./Abengoa Solar España, S.A. |
Abengoa Solar Research, S.A. | | Seville (ES) | | Abengoa Solar New Technologies, S.A./ Abengoa Research, S.L. |
Abengoa Solar Ventures S.A | | Seville (ES) | | Abengoa Solar, S.A./ Abengoa Solar España, S.A. |
Abengoa Solar, S.A. | | Seville (ES) | | Abengoa, S.A./Abengoa Solar España, S.A. |
Abengoa Water Agadir, S.L.U. | | Seville (ES) | | Abengoa Water, S.L. |
Abengoa Water Dalian, S.L.U. | | Seville (ES) | | Abengoa Water, S.L. |
Abengoa Water Internacional, S.L.U. | | Seville (ES) | | Abengoa Water, S.L. |
Abengoa Water Nungua, S.L.U. | | Seville (ES) | | Abengoa Water, S.L.U. |
F-188
Table of Contents
Appendices
Appendix XI
Companies taxed under the Special Regime for Company Groups at 12.31.14 (Continuation)
| | | | |
| Abengoa Tax Group Number 02/97 |
|---|
Company Name | | Tax Address | | Shareholding |
|---|
Abengoa Water Taiwan, S.L.U. | | Seville (ES) | | Abengoa Water, S.L. |
Abengoa Water, S.L. | | Seville (ES) | | Abengoa, S.A./ Sociedad Inversora en Energía y Medioambiente, S.A. (Siema) |
Abentel Telecomunicaciones, S.A. | | Seville (ES) | | Abener Energía, S.A./Abeinsa Ingeniería y Construcción Industrial, S.A. |
Aleduca, S.L | | Madrid (ES) | | Abengoa Solar España, S.A./Abengoa Solar, S.A. |
Aprovechamientos Energéticos Furesa, S.A. | | Murcia (ES) | | Abeinsa Asset Management, S.L. |
Asa Iberoamérica, S.L. | | Seville (ES) | | Soc. Inv. Energía y Medio Ambiente, S.A./Abeinsa Ingeniería y Construcción Industrial, S.A. |
Aznalcóllar Solar, S.A. | | Seville (ES) | | Abengoa Solar España, S.A./Abengoa Solar, S.A. |
Abengoa Water Takoradi, S.L.U. | | Seville (ES) | | Abengoa Water, S.L. |
Befesa Agua Tenes S.L. | | Seville (ES) | | Abengoa Water S.L. |
Befesa CTA Qingdao, S.L.U | | Madrid (ES) | | Abengoa Water, S.L. |
Biocarburantes de Castilla y León, S.A. | | Salamanca (ES) | | Abengoa Bioenergía Inversiones, S.A./Ecoagrícola, S.A. |
Bioetanol Galicia, S.A. | | A Coruña (ES) | | Abengoa Bioenergía Inversiones, S.A./Ecoagrícola, S.A. |
Captación Solar, S.A. | | Seville (ES) | | Abeinsa Asset Management, S.L./Abener Energía, S.A. |
Captasol Fotovoltaica 1, S.L. | | Seville (ES) | | Abengoa Solar España, S.A./Casaquemada Fotovoltaica, S.L. |
Captasol Fotovoltaica 2, S.L. | | Seville (ES) | | Abengoa Solar España, S.A./Casaquemada Fotovoltaica, S.L. |
Captasol Fotovoltaica 3, S.L. | | Seville (ES) | | Abengoa Solar España, S.A./Casaquemada Fotovoltaica, S.L. |
Captasol Fotovoltaica 4, S.L. | | Seville (ES) | | Abengoa Solar España, S.A./Casaquemada Fotovoltaica, S.L. |
Captasol Fotovoltaica 5, S.L. | | Seville (ES) | | Abengoa Solar España, S.A./Casaquemada Fotovoltaica, S.L. |
Captasol Fotovoltaica 6, S.L. | | Seville (ES) | | Abengoa Solar España, S.A./Casaquemada Fotovoltaica, S.L. |
Captasol Fotovoltaica 7, S.L. | | Seville (ES) | | Abengoa Solar España, S.A./Casaquemada Fotovoltaica, S.L. |
Captasol Fotovoltaica 8, S.L. | | Seville (ES) | | Abengoa Solar España, S.A./Casaquemada Fotovoltaica, S.L. |
Captasol Fotovoltaica 9, S.L. | | Seville (ES) | | Abengoa Solar España, S.A./Casaquemada Fotovoltaica, S.L. |
Captasol Fotovoltaica 10, S.L. | | Seville (ES) | | Abengoa Solar España, S.A./Casaquemada Fotovoltaica, S.L. |
Captasol Fotovoltaica 11, S.L. | | Seville (ES) | | Abengoa Solar España, S.A./Casaquemada Fotovoltaica, S.L. |
Captasol Fotovoltaica 12, S.L. | | Seville (ES) | | Abengoa Solar España, S.A./Casaquemada Fotovoltaica, S.L. |
Captasol Fotovoltaica 13, S.L. | | Seville (ES) | | Abengoa Solar España, S.A./Casaquemada Fotovoltaica, S.L. |
Captasol Fotovoltaica 14, S.L. | | Seville (ES) | | Abengoa Solar España, S.A./Casaquemada Fotovoltaica, S.L. |
Captasol Fotovoltaica 15, S.L. | | Seville (ES) | | Abengoa Solar España, S.A./Casaquemada Fotovoltaica, S.L. |
Captasol Fotovoltaica 16, S.L. | | Seville (ES) | | Abengoa Solar España, S.A./Casaquemada Fotovoltaica, S.L. |
Captasol Fotovoltaica 17, S.L. | | Seville (ES) | | Abengoa Solar España, S.A./Casaquemada Fotovoltaica, S.L. |
Captasol Fotovoltaica 18, S.L. | | Seville (ES) | | Abengoa Solar España, S.A./Casaquemada Fotovoltaica, S.L. |
Captasol Fotovoltaica 19, S.L. | | Seville (ES) | | Abengoa Solar España, S.A./Casaquemada Fotovoltaica, S.L. |
Captasol Fotovoltaica 20, S.L. | | Seville (ES) | | Abengoa Solar España, S.A./Linares Fotovoltaica, S.L. |
Captasol Fotovoltaica 21, S.L. | | Seville (ES) | | Abengoa Solar España, S.A./Linares Fotovoltaica, S.L. |
Captasol Fotovoltaica 22, S.L. | | Seville (ES) | | Abengoa Solar España, S.A./Linares Fotovoltaica, S.L. |
Captasol Fotovoltaica 23, S.L. | | Seville (ES) | | Abengoa Solar España, S.A./Linares Fotovoltaica, S.L. |
Captasol Fotovoltaica 24, S.L. | | Seville (ES) | | Abengoa Solar España, S.A./Linares Fotovoltaica, S.L. |
Captasol Fotovoltaica 25, S.L. | | Seville (ES) | | Abengoa Solar España, S.A./Linares Fotovoltaica, S.L. |
Captasol Fotovoltaica 26, S.L. | | Seville (ES) | | Abengoa Solar España, S.A./Linares Fotovoltaica, S.L. |
Captasol Fotovoltaica 27, S.L. | | Seville (ES) | | Abengoa Solar España, S.A./Linares Fotovoltaica, S.L. |
Captasol Fotovoltaica 28, S.L. | | Seville (ES) | | Abengoa Solar España, S.A./Linares Fotovoltaica, S.L. |
Captasol Fotovoltaica 29, S.L. | | Seville (ES) | | Abengoa Solar España, S.A./Linares Fotovoltaica, S.L. |
Captasol Fotovoltaica 30, S.L. | | Seville (ES) | | Abengoa Solar España, S.A./Linares Fotovoltaica, S.L. |
Captasol Fotovoltaica 31, S.L. | | Seville (ES) | | Abengoa Solar España, S.A./Linares Fotovoltaica, S.L. |
Captasol Fotovoltaica 32, S.L. | | Seville (ES) | | Abengoa Solar España, S.A./Linares Fotovoltaica, S.L. |
Captasol Fotovoltaica 33, S.L. | | Seville (ES) | | Abengoa Solar España, S.A./Linares Fotovoltaica, S.L. |
Captasol Fotovoltaica 34, S.L. | | Seville (ES) | | Abengoa Solar España, S.A./Linares Fotovoltaica, S.L. |
Captasol Fotovoltaica 35, S.L. | | Seville (ES) | | Abengoa Solar España, S.A./Linares Fotovoltaica, S.L. |
Captasol Fotovoltaica 36, S.L. | | Seville (ES) | | Abengoa Solar España, S.A./Linares Fotovoltaica, S.L. |
Captasol Fotovoltaica 37, S.L. | | Seville (ES) | | Abengoa Solar España, S.A./Linares Fotovoltaica, S.L. |
Captasol Fotovoltaica 38, S.L. | | Seville (ES) | | Abengoa Solar España, S.A./Linares Fotovoltaica, S.L. |
Captasol Fotovoltaica 40, S.L. | | Seville (ES) | | Abengoa Solar España, S.A./Linares Fotovoltaica, S.L. |
Captasol Fotovoltaica 52 S.L. | | Seville (ES) | | Abengoa Solar, S.A./ Abengoa Solar España, S.A. |
Captasol Fotovoltaica 58, S.L. | | Seville (ES) | | Abengoa Solar España, S.A. |
Captasol Fotovoltaica 72, S.L. | | Seville (ES) | | Abengoa Solar España, S.A. |
Captasol Fotovoltaica 73, S.L. | | Seville (ES) | | Abengoa Solar España, S.A. |
F-189
Table of Contents
Appendices
Appendix XI
Companies taxed under the Special Regime for Company Groups at 12.31.14 (Continuation)
| | | | |
| Abengoa Tax Group Number 02/97 |
|---|
Company Name | | Tax Address | | Shareholding |
|---|
Captasol Fotovoltaica 77, S.L. | | Seville (ES) | | Abengoa Solar España, S.A. |
Casaquemada Fotovoltaica, S.L. | | Seville (ES) | | Abengoa Solar España, S.A./Abengoa Solar, S.A. |
Centro Industrial y Logístico Torrecuellar, S.A. | | Seville (ES) | | Instalaciones Inabensa, S.A./Abeinsa Ingeniería y Construcción Industrial, S.A. |
Centro Tecnológico Palmas Altas, S.A. | | Seville (ES) | | Abengoa, S.A./Abeinsa Ingeniería y Construcción Industrial, S.A. |
Cogeneración Villaricos, S.A. | | Seville (ES) | | Abeinsa Asset Management, S.L. |
Construcciones y Depuraciones, S.A. | | Seville (ES) | | Abeinsa Infraestructuras Medio Ambiente, S.A. |
Ecoagricola, S.A. | | Murcia (ES) | | Abengoa Bioenergía Inversiones, S.A./Ecocarburantes, S.A. |
Ecocarburantes Españoles, S.A. | | Murcia (ES) | | Abengoa Bioenergía Inversiones, S.A. |
Europea de Construcciones Metálicas, S.A. (Eucomsa) | | Seville (ES) | | Abeinsa Ingeniería y Construcción Industrial, S.A./Abengoa Solar, S.A. |
Fotovoltaica Solar Sevilla, S.A. | | Seville (ES) | | Abengoa Solar España, S.A. |
Gestión Integral de Recursos Humanos, S.A. | | Seville (ES) | | Siema Technologies, S.L |
Helioenergy Electricidad Tres, S.A. | | Seville (ES) | | Abengoa Solar España, S.A./Abengoa Solar NT, S.A. |
Helioenergy Electricidad Cuatro, S.A. | | Seville (ES) | | Abengoa Solar España, S.A./Abengoa Solar NT, S.A. |
Helioenergy Electricidad Cinco, S.A. | | Seville (ES) | | Abengoa Solar España, S.A./Abengoa Solar NT, S.A. |
Helioenergy Electricidad Once, S.A. | | Seville (ES) | | Abengoa Solar España, S.A./Abengoa Solar NT, S.A. |
Helioenergy Electricidad Trece, S.A. | | Seville (ES) | | Abengoa Solar España, S.A./Abengoa Solar NT, S.A. |
Helioenergy Electricidad Veintiuno, S.A | | Seville (ES) | | Abengoa Solar España, S.A. /Abengoa Solar New Technologies, S.A. |
Helioenergy Electricidad Veintidos, S.A | | Seville (ES) | | Abengoa Solar España, S.A. /Abengoa Solar New Technologies, S.A. |
Helioenergy Electricidad Veintitres, S.A | | Seville (ES) | | Abengoa Solar España, S.A. /Abengoa Solar New Technologies, S.A. |
Helioenergy Electricidad Veinticuatro, S.A | | Seville (ES) | | Abengoa Solar España, S.A. /Abengoa Solar New Technologies, S.A. |
Helios I Hyperion Energy Investments, S.L. | | Seville (ES) | | Hypesol Energy Holding, S.L./Abengoa Solar New Technologies, S.A. |
Helios II Hyperion Energy Investments, S.L. | | Madrid (ES) | | Hypesol Energy Holding, S.L./Abengoa Solar New Technologies, S.A. |
Hypesol Energy Holding , S.L. | | Seville (ES) | | Abengoa Solar España, S.A./Abengoa Solar New Technologies S.A. |
Inabensa Fotovoltaica, S.L. | | Seville (ES) | | Instalaciones Inabensa, S.A./C.I.L. Torrecuéllar, S.A. |
Iniciativas Hidroeléctricas de Aragón y Cataluña, S.L. | | Huesca (ES) | | Abeinsa Infraestructuras Medio Ambiente, S.A. |
Instalaciones Fotovoltaicas Torrecuéllar, 1 S.L. | | Seville (ES) | | Inabensa Fotovoltaica, S.L./Instalaciones Inabensa, S.A. |
Instalaciones Fotovoltaicas Torrecuéllar, 2 S.L. | | Seville (ES) | | Inabensa Fotovoltaica, S.L./Instalaciones Inabensa, S.A. |
Instalaciones Fotovoltaicas Torrecuéllar, 3 S.L. | | Seville (ES) | | Inabensa Fotovoltaica, S.L./Instalaciones Inabensa, S.A. |
Instalaciones Inabensa, S.A. | | Seville (ES) | | Nicsa/Abener Energía, S.A./Abeinsa Ingeniería y Construcción Industrial, S.A. |
Japan PV Ventures, S.A. | | Seville (ES) | | Abengoa Solar, S.A /Abengoa Solar España, S.A. |
Las Cabezas Fotovoltaica, S.L. | | Seville (ES) | | Abengoa Solar España, S.A./Abengoa Solar, S.A. |
Las Cabezas Solar, S.L. | | Seville (ES) | | Aleduca, S.L. |
Linares Fotovoltaica, S.L. | | Seville (ES) | | Abengoa Solar España, S.A./Abengoa Solar, S.A. |
Logrosán Solar Inversiones Dos, S.L. | | Seville (ES) | | Abengoa Solar España S.A./Abengoa Solar S.A. |
Marismas PV A1, S.L. | | Seville (ES) | | Las Cabezas Fotovoltaica, S.L./Abengoa Solar España, S.A. |
Marismas PV A2, S.L. | | Seville (ES) | | Las Cabezas Fotovoltaica, S.L./Abengoa Solar España, S.A. |
Marismas PV A3, S.L. | | Seville (ES) | | Las Cabezas Fotovoltaica, S.L./Abengoa Solar España, S.A. |
Marismas PV A4, S.L. | | Seville (ES) | | Las Cabezas Fotovoltaica, S.L./Abengoa Solar España, S.A. |
Marismas PV A5, S.L. | | Seville (ES) | | Las Cabezas Fotovoltaica, S.L./Abengoa Solar España, S.A. |
Marismas PV A6, S.L. | | Seville (ES) | | Las Cabezas Fotovoltaica, S.L./Abengoa Solar España, S.A. |
Marismas PV A7, S.L. | | Seville (ES) | | Las Cabezas Fotovoltaica, S.L./Abengoa Solar España, S.A. |
Marismas PV A8, S.L. | | Seville (ES) | | Las Cabezas Fotovoltaica, S.L./Abengoa Solar España, S.A. |
Marismas PV A9, S.L. | | Seville (ES) | | Las Cabezas Fotovoltaica, S.L./Abengoa Solar España, S.A. |
Marismas PV A10, S.L. | | Seville (ES) | | Las Cabezas Fotovoltaica, S.L./Abengoa Solar España, S.A. |
Marismas PV A11, S.L. | | Seville (ES) | | Las Cabezas Fotovoltaica, S.L./Abengoa Solar España, S.A. |
Marismas PV A12, S.L. | | Seville (ES) | | Las Cabezas Fotovoltaica, S.L./Abengoa Solar España, S.A. |
Marismas PV A13, S.L. | | Seville (ES) | | Las Cabezas Fotovoltaica, S.L./Abengoa Solar España, S.A. |
Marismas PV A14, S.L. | | Seville (ES) | | Las Cabezas Fotovoltaica, S.L./Abengoa Solar España, S.A. |
F-190
Table of Contents
Appendices
Appendix XI
Companies taxed under the Special Regime for Company Groups at 12.31.14 (Continuation)
| | | | |
| Abengoa Tax Group Number 02/97 |
|---|
Company Name | | Tax Address | | Shareholding |
|---|
Marismas PV A15, S.L. | | Seville (ES) | | Las Cabezas Fotovoltaica, S.L./Abengoa Solar España, S.A. |
Marismas PV A16, S.L. | | Seville (ES) | | Las Cabezas Fotovoltaica, S.L./Abengoa Solar España, S.A. |
Marismas PV A17, S.L. | | Seville (ES) | | Las Cabezas Fotovoltaica, S.L./Abengoa Solar España, S.A. |
Marismas PV A18, S.L. | | Seville (ES) | | Las Cabezas Fotovoltaica, S.L./Abengoa Solar España, S.A. |
Marismas PV B1, S.L. | | Seville (ES) | | Las Cabezas Fotovoltaica, S.L./Abengoa Solar España, S.A. |
Marismas PV B2, S.L. | | Seville (ES) | | Las Cabezas Fotovoltaica, S.L./Abengoa Solar España, S.A. |
Marismas PV B3, S.L. | | Seville (ES) | | Las Cabezas Fotovoltaica, S.L./Abengoa Solar España, S.A. |
Marismas PV B4, S.L. | | Seville (ES) | | Las Cabezas Fotovoltaica, S.L./Abengoa Solar España, S.A. |
Marismas PV B5, S.L. | | Seville (ES) | | Las Cabezas Fotovoltaica, S.L./Abengoa Solar España, S.A. |
Marismas PV B6, S.L. | | Seville (ES) | | Las Cabezas Fotovoltaica, S.L./Abengoa Solar España, S.A. |
Marismas PV B7, S.L. | | Seville (ES) | | Las Cabezas Fotovoltaica, S.L./Abengoa Solar España, S.A. |
Marismas PV B8, S.L. | | Seville (ES) | | Las Cabezas Fotovoltaica, S.L./Abengoa Solar España, S.A. |
Marismas PV B9, S.L. | | Seville (ES) | | Las Cabezas Fotovoltaica, S.L./Abengoa Solar España, S.A. |
Marismas PV B10, S.L. | | Seville (ES) | | Las Cabezas Fotovoltaica, S.L./Abengoa Solar España, S.A. |
Marismas PV B11, S.L. | | Seville (ES) | | Las Cabezas Fotovoltaica, S.L./Abengoa Solar España, S.A. |
Marismas PV B12, S.L. | | Seville (ES) | | Las Cabezas Fotovoltaica, S.L./Abengoa Solar España, S.A. |
Marismas PV B13, S.L. | | Seville (ES) | | Las Cabezas Fotovoltaica, S.L./Abengoa Solar España, S.A. |
Marismas PV B14, S.L. | | Seville (ES) | | Las Cabezas Fotovoltaica, S.L./Abengoa Solar España, S.A. |
Marismas PV B15, S.L. | | Seville (ES) | | Las Cabezas Fotovoltaica, S.L./Abengoa Solar España, S.A. |
Marismas PV B16, S.L. | | Seville (ES) | | Las Cabezas Fotovoltaica, S.L./Abengoa Solar España, S.A. |
Marismas PV B17, S.L. | | Seville (ES) | | Las Cabezas Fotovoltaica, S.L./Abengoa Solar España, S.A. |
Marismas PV B18, S.L. | | Seville (ES) | | Las Cabezas Fotovoltaica, S.L./Abengoa Solar España, S.A. |
Marismas PV C1, S.L. | | Seville (ES) | | Las Cabezas Fotovoltaica, S.L./Abengoa Solar España, S.A. |
Marismas PV C2, S.L. | | Seville (ES) | | Las Cabezas Fotovoltaica, S.L./Abengoa Solar España, S.A. |
Marismas PV C3, S.L. | | Seville (ES) | | Las Cabezas Fotovoltaica, S.L./Abengoa Solar España, S.A. |
Marismas PV C4, S.L. | | Seville (ES) | | Las Cabezas Fotovoltaica, S.L./Abengoa Solar España, S.A. |
Marismas PV C5, S.L. | | Seville (ES) | | Las Cabezas Fotovoltaica, S.L./Abengoa Solar España, S.A. |
Marismas PV C6, S.L. | | Seville (ES) | | Las Cabezas Fotovoltaica, S.L./Abengoa Solar España, S.A. |
Marismas PV C7, S.L. | | Seville (ES) | | Las Cabezas Fotovoltaica, S.L./Abengoa Solar España, S.A. |
Marismas PV C8, S.L. | | Seville (ES) | | Las Cabezas Fotovoltaica, S.L./Abengoa Solar España, S.A. |
Marismas PV C9, S.L. | | Seville (ES) | | Las Cabezas Fotovoltaica, S.L./Abengoa Solar España, S.A. |
Marismas PV C10, S.L. | | Seville (ES) | | Las Cabezas Fotovoltaica, S.L./Abengoa Solar España, S.A. |
Marismas PV C11, S.L. | | Seville (ES) | | Las Cabezas Fotovoltaica, S.L./Abengoa Solar España, S.A. |
Marismas PV C12, S.L. | | Seville (ES) | | Las Cabezas Fotovoltaica, S.L./Abengoa Solar España, S.A. |
Marismas PV C13, S.L. | | Seville (ES) | | Las Cabezas Fotovoltaica, S.L./Abengoa Solar España, S.A. |
Marismas PV C14, S.L. | | Seville (ES) | | Las Cabezas Fotovoltaica, S.L./Abengoa Solar España, S.A. |
Marismas PV C15, S.L. | | Seville (ES) | | Las Cabezas Fotovoltaica, S.L./Abengoa Solar España, S.A. |
Marismas PV C16, S.L. | | Seville (ES) | | Las Cabezas Fotovoltaica, S.L./Abengoa Solar España, S.A. |
Marismas PV C17, S.L. | | Seville (ES) | | Las Cabezas Fotovoltaica, S.L./Abengoa Solar España, S.A. |
Marismas PV C18, S.L. | | Seville (ES) | | Las Cabezas Fotovoltaica, S.L./Abengoa Solar España, S.A. |
Marismas PV E1, S.L. | | Seville (ES) | | Las Cabezas Fotovoltaica, S.L./Abengoa Solar España, S.A. |
Marismas PV E2, S.L. | | Seville (ES) | | Las Cabezas Fotovoltaica, S.L./Abengoa Solar España, S.A. |
Marismas PV E3, S.L. | | Seville (ES) | | Las Cabezas Fotovoltaica, S.L./Abengoa Solar España, S.A. |
NEA Solar O&M, S.A. | | Seville (ES) | | Abengoa Solar, S.A /Abengoa Solar España, S.A. |
NEA Solar Power, S.A. | | Seville (ES) | | Abengoa Solar, S.A /Abengoa Solar España, S.A. |
Negocios Industriales y Comerciales, S.A. (Nicsa) | | Madrid (ES) | | Abencor, S.A./Abeinsa Ingeniería y Construcción Industrial, S.A. |
Omega Sudamérica, S.L | | Seville (ES) | | Instalaciones Inabensa, S.A./ASA Iberoamérica S.A. |
Power & Railway Solutions, S.L. | | Seville (ES) | | Instalaciones Inabensa, S.A. |
Puerto Real Cogeneración, S.A. | | Seville (ES) | | Abeinsa Asset Management, S.L. |
Siema Investment, S.L.U. | | Madrid (ES) | | Siema Technologies, S.L |
Siema Technologies, S.L. | | Madrid (ES) | | Abengoa, S.A./Siema AG |
Simosa I.T., S.A | | Seville (ES) | | Abengoa, S.A./Simosa, S.A. |
Servicios Integrales de Mantenimiento y Operación, S.A. (Simosa) | | Seville (ES) | | Negocios Industriales y Comerciales, S.A./Abengoa, S.A. |
Sociedad Inversora en Energía y Medioambiente, S.A. (Siema) | | Seville (ES) | | Abengoa, S.A./Negocios Industriales y Comerciales, S.A. |
Sociedad Inversora Lineas de Brasil, S.L. (ETVE) | | Seville (ES) | | Asa Iberoamérica, S.L. |
Sol3G | | Barcelona (ES) | | Abengoa Solar, S.A. |
Solaben Electricidad Ocho, S.A. | | Caceres (ES) | | Abengoa Solar España, S.A./Abengoa Solar New Technologies,S.A. |
F-191
Table of Contents
Appendices
Appendix XI
Companies taxed under the Special Regime for Company Groups at 12.31.14 (Continuation)
| | | | |
| Abengoa Tax Group Number 02/97 |
|---|
Company Name | | Tax Address | | Shareholding |
|---|
Solaben Electricidad Diez, S.A. | | Caceres (ES) | | Abengoa Solar España, S.A./Abengoa Solar NT, S.A. |
Solaben Electricidad Doce, S.A. | | Badajoz (ES) | | Abengoa Solar España, S.A./Abengoa Solar NT, S.A. |
Solaben Electricidad Quince, S.A | | Badajoz (ES) | | Abengoa Solar España, S.A./Abengoa Solar NT, S.A. |
Solar de Receptores de Andalucía, S.A. | | Seville (ES) | | Abengoa Yield Plc./ Abengoa Concessions Infrastructure, S.L. |
Solargate Electricidad Tres, S.A. | | Seville (ES) | | Abengoa Solar España, S.A./Abengoa Solar NT, S.A. |
Solargate Electricidad Cuatro, S.A. | | Seville (ES) | | Abengoa Solar España, S.A./Abengoa Solar NT, S.A. |
Solargate Electricidad Cinco, S.A. | | Seville (ES) | | Abengoa Solar España, S.A./Abengoa Solar NT, S.A. |
Solnova Electricidad, S.A. | | Seville (ES) | | Solnova Solar Inversiones, S.A./Instalaciones Inabensa, S.A. |
Solnova Electricidad Dos, S.A. | | Seville (ES) | | Abengoa Solar España, S.A./Abengoa Solar, S.A. |
Solnova Electricidad Tres, S.A. | | Seville (ES) | | Solnova Solar Inversiones, S.A./Instalaciones Inabensa, S.A. |
Solnova Electricidad Cuatro, S.A. | | Seville (ES) | | Solnova Solar Inversiones, S.A /Instalaciones Inabensa, S.A. |
Solnova Electricidad Cinco, S.A. | | Seville (ES) | | Abengoa Solar España, S.A./Abengoa Solar, S.A. |
Solnova Electricidad Seis, S.A. | | Seville (ES) | | Abengoa Solar España, S.A./Abengoa Solar NT, S.A. |
Solnova Solar Inversiones, S.A | | Seville (ES) | | Abengoa Solar España, S.A./ Abengoa Solar New Technologies, S.A. |
Solúcar Andalucía FV2, S.A | | Seville (ES) | | Abengoa Solar España, S.A./ Abengoa Solar New Technologies, S.A. |
South Africa PV Investments, S.L. | | Seville (ES) | | Abengoa Solar Internacional, S.A./Abengoa Solar Ventures, S.A |
South Africa Solar Investments, S.L. | | Seville (ES) | | Abengoa Solar Internacional, S.A./ Abengoa Solar, S.A. |
South Africa Solar Ventures, S.L. | | Seville (ES) | | Abengoa Solar Internacional, S.A./Abengoa Solar Ventures, S.A |
Teyma, Gestión de Contratos de Construcción e Ingeniería, S.A. | | Seville (ES) | | Abeinsa Ingeniería y Construcción Industrial, S.A. |
Zero Emissions Technologies, S.A. (Zeroemissions) | | Seville (ES) | | Abeinsa Ingeniería y Construcción Industrial, S.A./Abengoa Hidrógeno, S.A. |
Zeroemissions Carbon Trust, S.A | | Seville (ES) | | Zeroemissions Technologies, S.A./Abeinsa Ingeniería y Construcción Industrial, S.A. |
F-192
Table of Contents
Appendices
Appendix XII
Subsidiary companies included in the 2013 consolidation perimeter using
the global integration method
| | | | | | | | | | | | | | | | |
| |
| | Shareholding | |
| |
| |
| |
|
|---|
Company Name | | Registered
Address | | Amount in
thousands
of € | | % of
Nominal
Capital | | Parent Company | | (*) | | Activity
(see
Page 4) | | Auditor |
|---|
AB Bioenergy France, S.A. | | Montardon (FR) | | | 108,353 | | | 74.79 | | Abengoa Bioenergía Inversiones, S.A. | | — | | (6) | | B |
AB Bioenergy Hannover GmbH | | Hannover (DE) | | | 98 | | | 100.00 | | Abengoa Bioenergía, S.A. | | — | | (6) | | — |
Abacus Management LLC | | Phoenix (US) | | | — | | | 100.00 | | Abeinsa, LLC | | — | | (1) | | — |
Abacus Project Management, Inc. | | Phoenix (US) | | | 3,376 | | | 100.00 | | Abeinsa Holding, Inc./Teyma Construction USA, LLC | | — | | (1) | | B |
Abeima, LLC. | | Delaware (US) | | | 1 | | | 100.00 | | Abeinsa Business Development, LLC | | — | | (1) | | — |
Abeima Agua Internacional, S.L. | | Seville (ES) | | | 3 | | | 100.00 | | Abeinsa Infraestructuras Medio Ambiente/Construcciones y Depuraciones, S.A.(Codesa) | | — | | (1) | | — |
Abeima India, Pvt. Ltd. | | Chennai (IN) | | | 7,602 | | | 100.00 | | Abeinsa Infraestructuras Medio Ambiente, S.A. | | — | | (1) | | — |
Abeima Teyma Barka LLC. | | Ruwi (OM) | | | 332 | | | 70.00 | | Abeinsa Infraestructuras Medio Ambiente, S.A./Teyma Gest. Ctos. de Const. e Ing., S.A. | | — | | (1) | | — |
Abeima Teyma Infraestructure Ghana Limited | | Accra (GH) | | | 37 | | | 100.00 | | Abeinsa Infraestructuras Medio Ambiente, S.A./Teyma Gest. Ctos. de Const. e Ing., S.A. | | — | | (1) | | — |
Abeima Teyma Zapotillo SRL de CV | | Mexico City (MX) | | | — | | | 100.00 | | Abeinsa Infraestructuras Medio Ambiente, S.A./Teyma Gest. Ctos. de Const. e Ing., S.A. | | — | | (1) | | — |
Abeinsa Abeima Teyma General Partnership | | Phoenix (US) | | | — | | | 100.00 | | Abeima USA LLC./Teyma Construction USA, LLC/Abeinsa EPC, LLC | | (*) | | (1) | | — |
Abeinsa Abener Teyma General Partnership | | Phoenix (US) | | | 4 | | | 100.00 | | Teyma Construction USA LLC./Abener Eng. Const. Serv., LLC/Abeinsa EPC Inc. | | — | | (1) | | — |
Abeinsa Asset Management, S.L. | | Seville (ES) | | | 22,861 | | | 100.00 | | Abener Energía, S.A./Negocios Industriales y Comerciales, S.A. | | — | | (1) | | — |
Abeinsa BD Asia Pacific Pte. Ltd. | | Singapore (SG) | | | 66 | | | 100.00 | | Abeinsa Business Development, S.A. | | — | | (1) | | — |
Abeinsa Brasil Projetos e Construcoes Ltda | | R. de Janeiro (BR) | | | 170 | | | 100.00 | | Abengoa Brasil, S.A./Inabensa Río Ltda. | | — | | (1) | | — |
Abeinsa Business Development Corp. | | Toronto (CA) | | | — | | | 100.00 | | Abeinsa Business Development, S.A. | | (*) | | (1) | | — |
Abeinsa Business Development Private Limited | | Bombay (IN) | | | 3,261 | | | 100.00 | | Abeinsa Business Development, S.A. /Negocios Industriales y Comerciales, S.A. | | — | | (1) | | — |
Abeinsa Business Development Representaçoes, Energía e Água, Ltda. | | R. de Janeiro (BR) | | | 1 | | | 100.00 | | Abeinsa Business Development, S.A./Negocios Industriales y Comerciales, S.A. | | — | | (1) | | — |
Abeinsa Business Development, LLC | | Chesterfield (US) | | | 71,496 | | | 100.00 | | Abeinsa, Inc. LLC. | | — | | (1) | | — |
Abeinsa Business Development, Ltd. | | Seoul (KR) | | | 75 | | | 100.00 | | Abeinsa Business Development, S.A. | | (*) | | (1) | | — |
Abeinsa Business Development, Pty. Ltd. | | Sydney (AU) | | | — | | | 100.00 | | Abeinsa Business Development, S.A. | | (*) | | (1) | | — |
Abeinsa Business Development, S.A. | | Seville (ES) | | | 501,735 | | | 100.00 | | Abeinsa Ingeniería y Construcción Industrial, S.A./ Negocios Industriales y Comerciales, S.A. | | — | | (1) | | — |
Abeinsa Business Development, S.A.C. | | Lima (PE) | | | — | | | 100.00 | | Abeinsa Business Development, S.A./Negocios Industriales y Comerciales, S.A. | | (*) | | (1) | | — |
Abeinsa Business Development, Sp.z.o.o. | | Gliwice (PL) | | | 1 | | | 100.00 | | Abeinsa Business Development, S.A. | | — | | (1) | | D |
Abeinsa Business Development, Spa. | | Santiago de Chile (CL) | | | — | | | 100.00 | | Abeinsa Business Development, S.A. | | (*) | | (1) | | — |
Abeinsa Business Developmet México, S.A. de C.V. | | Mexico City (MX) | | | 3 | | | 100.00 | | Abeinsa Business Development, S.A./ Negocios Industriales y Comerciales, S.A. | | — | | (1) | | — |
Abeinsa Engineering Private Limited | | Mumbai (IN) | | | 270 | | | 100.00 | | Abeinsa Engineering, S.L./ Abener Energía, S.A. | | — | | (1) | | D |
Abeinsa Engineering S.A. de C.V. | | Mexico City (MX) | | | 3 | | | 100.00 | | Abeinsa Engineering, S.L./Abeinsa Asset Management, S.L. | | — | | (1) | | — |
Abeinsa Engineering, Inc. | | Phoenix (US) | | | 37 | | | 100.00 | | Abeinsa Engineering, S.L. | | — | | (1) | | — |
Abeinsa Engineering, S.L. | | Seville (ES) | | | 5,539 | | | 100.00 | | Abener Energía, S.A. | | — | | (1) | | — |
Abeinsa EPC Kaxu Pty Ltd. | | Johannesburg (ZA) | | | — | | | 92.00 | | Abener Energía, S.A./Teyma Gestión de Contratos de Construcción e Ingeniería, S.A. | | — | | (1) | | — |
Abeinsa EPC Khi Pty Ltd. | | Johannesburg (ZA) | | | — | | | 92.00 | | Abener Energía, S.A./Teyma Gestión de Contratos de Construcción e Ingeniería, S.A. | | — | | (1) | | — |
Abeinsa EPC México, S.A de C.V | | Mexico City (MX) | | | 1 | | | 100.00 | | Abeinsa Ingeniería y Construcción Industrial S.A./ ASA Iberoamérica, S.L. | | — | | (1) | | — |
Abeinsa EPC, LLC. | | Phoenix (US) | | | — | | | 100.00 | | Abeinsa, LLC. | | — | | (1) | | — |
Abeinsa EPC, S.A. | | Seville (ES) | | | 60 | | | 100.00 | | Abeinsa Ingeniería y Construcción Industrial S.A./Teyma Gest. Ctos. de Const. e Ing., S.A. | | — | | (1) | | — |
Abeinsa Holding, Inc. | | Delaware (US) | | | 10,018 | | | 100.00 | | Abengoa US Holding, LLC. | | — | | (1) | | B |
Abeinsa Infraestructuras Medio Ambiente, S.A. | | Seville (ES) | | | 447,151 | | | 100.00 | | Abeinsa, Ingeniería y Construcción Industrial, S.L./Negocios Industriales y Comerciales, S.A | | — | | (1) | | — |
Abeinsa Inversiones Latam, S.L. | | Madrid (ES) | | | 245,333 | | | 100.00 | | Asa Iberoamérica, S.L./Abeinsa Ingeniería y Construcción Industrial, S.A. | | — | | (1) | | — |
Abeinsa Is Gelistirme Limited Sirketi | | Ankara (TR) | | | 5 | | | 100.00 | | Abeinsa Business Development, S.A. | | — | | (1) | | B |
Abeinsa Norte III, S.A. de C. V. | | Mexico City (MX) | | | 3 | | | 100.00 | | Abeinsa, Ingeniería y Construcción Industrial, S.A./Abener México, S.A. de C.V. | | (*) | | (1) | | — |
Abeinsa Operation and Maintenance, S.A. | | Seville (ES) | | | 15 | | | 100.00 | | Abeinsa Ing. y Const. Industrial, S.A./Negocios Industriales y de Construcción, S.A. | | (*) | | (1) | | — |
Abeinsa, Ing y Const. Ind., S.A. | | Seville (ES) | | | 90,642 | | | 100.00 | | Abengoa, S.A./Siema | | — | | (1) | | — |
Abeinsa, LLC | | Delaware (US) | | | 1 | | | 100.00 | | Abengoa US Operations, LLC | | — | | (1) | | — |
Abelec, S.A. | | Santiago de Chile (CL) | | | 2 | | | 99.99 | | Abengoa Chile, S.A. | | — | | (2) | | — |
F-193
Table of Contents
Appendices
Appendix XII
Subsidiary companies included in the 2013 consolidation perimeter using
the global integration method (Continuation)
| | | | | | | | | | | | | | | | |
| |
| | Shareholding | |
| |
| |
| |
|
|---|
Company Name | | Registered
Address | | Amount in
thousands
of € | | % of
Nominal
Capital | | Parent Company | | (*) | | Activity
(see
Page 4) | | Auditor |
|---|
Abema Ltda | | Santiago de Chile (CL) | | | 2 | | | 100.00 | | Abengoa Chile, S.A./Abeinsa Infraestructuras Medio Ambiente, S.A. | | — | | (1) | | — |
Abencor Brasil Ltda. | | R. de Janeiro (BR) | | | — | | | 100.00 | | Abencor Suministros, S.A./Abengoa Construção Brasil Ltda. | | — | | (1) | | — |
Abencor México, S.A. de C.V | | Mexico City (MX) | | | 3 | | | 100.00 | | Abencor Suministros, S.A./Abengoa México, S.A. de C.V. | | — | | (1) | | — |
Abencor Perú | | Lima (PE) | | | 1 | | | 99.99 | | Abencor Suministros S.A. | | — | | (1) | | — |
Abencor South Africa Pty Ltd | | Upington (ZA) | | | — | | | 100.00 | | Abencor Suministros, S.A. | | (*) | | (1) | | — |
Abencor Suministros Chile, S.A. | | Santiago de Chile (CL) | | | 1 | | | 100.00 | | Abengoa Chile S.A./Abencor Suministros, S.A. | | — | | (1) | | — |
Abencor Suministros S.A. | | Seville (ES) | | | 4,133 | | | 100.00 | | Negocios Industriales y Comerciales, S.A./Abeinsa Ingeniería y Construcción Industrial, S.A. | | — | | (1) | | C |
Abencor USA LLC | | Phoenix (US) | | | — | | | 100.00 | | Abeinsa, Inc. LLC. | | — | | (1) | | — |
Abener Argelia | | Seville (ES) | | | 4 | | | 100.00 | | Abener Energía, S.A./Abeinsa Ingeniería y Construcción Industrial, S.A. | | — | | (1) | | — |
Abener Energía, S.A. | | Seville (ES) | | | 454,523 | | | 100.00 | | Abeinsa, Ing. y Const., S.A./Abeinsa Business Development, S.A./Negocios Ind. y Com., S.A. | | — | | (1) | | — |
Abener Energie S.A.R.L. | | Oudja (MA) | | | 3 | | | 100.00 | | Abener Energía, S.A. | | — | | (1) | | A |
Abener Engineering and Construction Services, LLC | | Chesterfield (US) | | | 71,496 | | | 100.00 | | Abeinsa Business Development, LLC | | — | | (1) | | — |
Abener México, S.A. De C.V. | | Mexico City (MX) | | | 4 | | | 100.00 | | Abengoa México, S.A. de C.V./Abeinsa Business Development México, S.A. de C.V. | | — | | (1) | | — |
Abener North America Construction Services, Inc. | | Delaware (US) | | | — | | | 100.00 | | Abener Engineering & Construction Services, LLC. | | (*) | | (1) | | — |
Abener North America Construction Services, L.P. | | Chesterfield (US) | | | 39 | | | 100.00 | | Abener Engineering & Const. Serv., LLC /Abener North America Construction Services, Inc. | | — | | (1) | | — |
Abener Teyma Hugoton General Partnership | | Chesterfield (US) | | | 7 | | | 100.00 | | Teyma Construction USA LLC/Abener Engineering and Construction Services, LLC. | | — | | (1) | | B |
Abener Teyma Mojave General Partnership | | Chesterfield (US) | | | 40 | | | 100.00 | | Teyma Construction USA, LLC/Abener North America Construction Services, L.P. | | — | | (1) | | B |
Abengoa Australia Pty. Ltd. | | Sidney (AU) | | | 3,489 | | | 100.00 | | Instalaciones Inabensa, S.A. | | — | | (1) | | — |
Abengoa Bioenergía Agroindustria Ltda | | Sao Paulo (BR) | | | 294,608 | | | 100.00 | | Abengoa Bioenergía Brasil, S.A./Abengoa Bioenergia Santa Fe, Ltda. | | — | | (6) | | — |
Abengoa Bioenergia Agroindustria Trading US Inc. | | Delaware (US) | | | — | | | 100.00 | | Abengoa Bioenergia Agroindústria Ltda. | | — | | (6) | | — |
Abengoa Bioenergía Biodiesel S.A. | | Seville (ES) | | | 15 | | | 100.00 | | Abengoa Bioenergía Inversiones, S.A./Ecoagrícola, S.A. | | — | | (6) | | — |
Abengoa Bioenergía Brasil, S.A. | | Sao Paulo (BR) | | | 703,636 | | | 99.99 | | Asa Bioenergy Holding AG./Abengoa Bioenergia, S.A. | | — | | (6) | | B |
Abengoa Bioenergia Inovações Ltda. | | Sao Paulo (BR) | | | 307,836 | | | 100.00 | | ASA Bioenergy Holding, AG | | — | | (6) | | — |
Abengoa Bioenergía Inversiones, S.A. | | Seville (ES) | | | 743,069 | | | 100.00 | | Abengoa Bioenergía, S.A./Abengoa Bioenergía Nuevas Tecnologías, S.A. | | — | | (6) | | B |
Abengoa Bioenergía Nuevas Tecnologías, S.A. | | Seville (ES) | | | 386 | | | 100.00 | | Abengoa Bioenergía, S.L./Instalaciones Inabensa, S.A. | | — | | (6) | | B |
Abengoa Bioenergía Outsourcing, LLC | | Chesterfield (US) | | | — | | | 100.00 | | Abengoa Bioenergy Operation, LLC. | | — | | (6) | | — |
Abengoa Bioenergía San Roque, S.A. | | Cadiz (ES) | | | 21,990 | | | 100.00 | | Abengoa Bioenergía Inversiones, S.A./Ecoagrícola, S.A. | | — | | (6) | | B |
Abengoa Bioenergía Santa Fe, Ltda. | | Sao Paulo (BR) | | | 370 | | | 100.00 | | Abengoa Bioenergía Brasil, S.A./Abengoa Bioenergia Trading Brasil Ltda. | | — | | (6) | | — |
Abengoa Bioenergia Trading Brasil Ltda | | Sao Paulo (BR) | | | 50 | | | 100.00 | | Abengoa Bioenergia Brasil, S.A./Abengoa Bioenergia Agroindústria, Ltda. | | — | | (6) | | — |
Abengoa Bioenergía, S.A. | | Seville (ES) | | | 147,093 | | | 98.05 | | Abengoa, S.A./Sociedad Inversora Energía y Medio Ambiente, S.A. | | — | | (6) | | B |
Abengoa Bioenergy Biomass Funding, LLC | | Chesterfield (US) | | | — | | | 100.00 | | Abengoa Bioenergy Technology Holding, LLC. | | (*) | | (6) | | — |
Abengoa Bioenergy Corporation, LLC | | Chesterfield (US) | | | 58,512 | | | 100.00 | | Abengoa Bioenergy Operations, LLC. | | — | | (6) | | B |
Abengoa Bioenergy Developments, LLC | | Missouri (US) | | | 1 | | | 100.00 | | Abengoa Bioenergy US Holding, LLC. | | — | | (6) | | — |
Abengoa Bioenergy Engineering & Construction, LLC | | Chesterfield (US) | | | — | | | 100.00 | | Abengoa Bioenergy Operations, LLC. | | — | | (6) | | — |
Abengoa Bioenergy Funding | | Chesterfield (US) | | | 224,844 | | | 100.00 | | Abengoa Bioenergy Meramec Renewable, LLC. | | — | | (6) | | B |
Abengoa Bioenergy Germany | | Rostock (DE) | | | 11,859 | | | 100.00 | | Abengoa Bioenergía Inversiones, S.A. | | — | | (6) | | — |
Abengoa Bioenergy Holdco, Inc. | | Chesterfield (US) | | | 779,882 | | | 100.00 | | Abengoa US Holding, LLC/ASA Bioenergy Holding, AG | | — | | (6) | | — |
Abengoa Bioenergy Hybrid of Kansas, LLC. | | Chesterfield (US) | | | 330,755 | | | 100.00 | | Abengoa Bioenergy Technology Holding, Inc. | | — | | (6) | | — |
Abengoa Bioenergy Investments , LLC | | Chesterfield (US) | | | — | | | 100.00 | | Abengoa Bioenergy US Holding, LLC. | | — | | (6) | | — |
Abengoa Bioenergy Maple, LLC | | Chesterfield (US) | | | 224,844 | | | 100.00 | | Abengoa Bioenergy Funding LLC. | | — | | (6) | | B |
Abengoa Bioenergy Meramec Renewable, Inc. | | Chesterfield (US) | | | 265,563 | | | 91.00 | | Abengoa Bioenergy Holdco, Inc. | | — | | (6) | | B |
Abengoa Bioenergy Netherlands B.V. | | Rotterdam (NL) | | | 494,710 | | | 100.00 | | Abengoa Bioenergía Inversiones, S.A. | | — | | (6) | | B |
Abengoa Bioenergy New Technologies , LLC. | | Chesterfield (US) | | | 579 | | | 100.00 | | Abengoa Bioenergy Technology Holding, LLC. | | — | | (6) | | B |
F-194
Table of Contents
Appendices
Appendix XII
Subsidiary companies included in the 2013 consolidation perimeter using
the global integration method (Continuation)
| | | | | | | | | | | | | | | | |
| |
| | Shareholding | |
| |
| |
| |
|
|---|
Company Name | | Registered
Address | | Amount in
thousands
of € | | % of
Nominal
Capital | | Parent Company | | (*) | | Activity
(see
Page 4) | | Auditor |
|---|
Abengoa Bioenergy of Illinois, LLC | | Chesterfield (US) | | | 168,227 | | | 100.00 | | Abengoa Bioenergy Maple, LLC | | — | | (6) | | — |
Abengoa Bioenergy of Indiana, LLC | | Chesterfield (US) | | | 140,785 | | | 100.00 | | Abengoa Bioenergy Maple, LLC. | | — | | (6) | | — |
Abengoa Bioenergy of Kansas, LLC | | Chesterfield (US) | | | 176 | | | 100.00 | | Abengoa Bioenergy Operations,LLC | | — | | (6) | | — |
Abengoa Bioenergy Operations , LLC | | Chesterfield (US) | | | 102,497 | | | 100.00 | | Abengoa Bioenergy US Holding, LLC. | | — | | (6) | | B |
Abengoa Bioenergy Renewable Power US,LLC | | Chesterfield (US) | | | 341 | | | 100.00 | | Abengoa Bioenergy Operations, LLC. | | — | | (6) | | — |
Abengoa Bioenergy Technology Holding , LLC | | Chesterfield (US) | | | 330,754 | | | 100.00 | | Abengoa Bioenergy US Holding, LLC. | | — | | (6) | | — |
Abengoa Bioenergy Trading Europe, B.V. | | Rotterdam (NL) | | | 18 | | | 100.00 | | Abengoa Bioenergía Inversiones, S.A. | | — | | (6) | | B |
Abengoa Bioenergy Trading US, LLC | | Chesterfield (US) | | | — | | | 100.00 | | Abengoa Bioenergy Operations, LLC | | — | | (6) | | B |
Abengoa Bioenergy UK Limited | | Cardiff (UK) | | | 14,503 | | | 100.00 | | Abengoa Bioenergía Inversiones, S.A. | | — | | (6) | | — |
Abengoa Bioenergy US Holding, LLC | | Chesterfield (US) | | | 393,262 | | | 100.00 | | Abengoa US, LLC | | — | | (6) | | B |
Abengoa Biotechnology Research, S.A. | | Seville (ES) | | | 60 | | | 100.00 | | Abengoa Bioenergía Nuevas Tecnologías, S.A./Abengoa Research, S.A. | | (*) | | (6) | | — |
Abengoa Chile, S.A. | | Santiago de Chile (CL) | | | 47,409 | | | 100.00 | | Asa Investment, AG/Teyma Abengoa, S.A. | | — | | (1) | | — |
Abengoa Cogeneración de Energía, S.A. | | R. de Janeiro (BR) | | | — | | | 100.00 | | Abengoa Brasil, S.A./Abengoa Concesssoes Brasil Holding, S.A. | | — | | (2) | | — |
Abengoa Cogeneración Tabasco, S. de R.L. de C.V. | | Mexico City (MX) | | | 139,528 | | | 60.00 | | Abener Energía, S.A./Abengoa México, S.A. de C.V. | | — | | (5) | | — |
Abengoa Colombia, S.A.S. | | Bogota (CO) | | | 208 | | | 100.00 | | Abengoa Perú, S.A./Abener Energía, S.A./Abeinsa Infraestructuras Medio Ambiente, S.A. | | — | | (1) | | — |
Abengoa Concessions Investments Ltd. | | Leeds (GB) | | | — | | | 100.00 | | Abengoa Concessions, S.L. | | (*) | | (1) | | — |
Abengoa Concessions Investments, S.à.r.l. | | Luxembourg (LU) | | | 13 | | | 100.00 | | Abengoa Concessions, S.L. | | (*) | | (1) | | — |
Abengoa Concessions, S.L. | | Seville (ES) | | | 3 | | | 100.00 | | Abengoa, S.A./Siema | | (*) | | (1) | | — |
Abengoa Concessões Brasil Holding, S.A. | | R. de Janeiro (BR) | | | 847,514 | | | 100.00 | | Abengoa Brasil, S.A./ Sociedad Inversora de Líneas de Brasil, S.L. | | — | | (2) | | — |
Abengoa Construçao Brasil, Ltda. | | R. de Janeiro (BR) | | | 310,873 | | | 100.00 | | Befesa Brasil, S.A./Sociedad Inversora de Líneas de Brasil, S.L. | | — | | (1) | | — |
Abengoa Energy Crops Uruguay, S.A. | | Buenos Aires (AR) | | | 2 | | | 100.00 | | Teyma Renovables, S.A. | | — | | (1) | | — |
Abengoa Finance | | Seville (ES) | | | 60 | | | 100.00 | | Abengoa, S.A. | | — | | (1) | | B |
Abengoa Hellas Solar Power Systems Limited Liabilities Company | | Atenas (GR) | | | 30 | | | 100.00 | | Abengoa Solar, S.A./Abengoa Solar España, S.A. | | — | | (3) | | B |
Abengoa Hidrógeno, S.A. | | Seville (ES) | | | 912 | | | 100.00 | | Abeinsa Ingeniería y Construcción Industrial, S.A./ Instalaciones Inabensa, S.A. | | — | | (7) | | — |
Abengoa México, S.A. de CV | | Mexico City (MX) | | | 147,448 | | | 97.65 | | Asa Investment, AG | | — | | (1) | | — |
Abengoa Perú, S.A. | | Lima (PE) | | | 126,286 | | | 99.90 | | Asa Investment, AG | | — | | (1) | | B |
Abengoa Puerto Rico, S.E. | | San Juan (PR) | | | 8 | | | 100.00 | | Siema Investment, S.L./Abencor Suministros, S.A. | | — | | (1) | | A |
Abengoa Research, S.L. | | Seville (ES) | | | 9,053 | | | 100.00 | | Abeinsa, Ingeniería y Construcción Industrial, S.A./Instalaciones Inabensa, S.A. | | — | | (1) | | D |
Abengoa SeaPower, S.A. | | Seville (ES) | | | 60 | | | 100.00 | | Abeinsa Ingeniería y Construcción Industrial, S.A./Instalaciones Inabensa, S.A. | | — | | (1) | | — |
Abengoa Servicios Industriales, S.A. de C.V. | | Mexico City (MX) | | | 1,810 | | | 100.00 | | Abengoa México, S.A. de C.V./Asa Iberoamérica, S.L. | | — | | (5) | | — |
Abengoa Servicios S.A. De C.V. | | Mexico City (MX) | | | 158 | | | 100.00 | | Abengoa México, S.A. de C.V./Servicios Aux. de Admon., S.A | | — | | (1) | | — |
Abengoa Solar Power Australia Pty Limited | | Brisbane (AU) | | | 217 | | | 100.00 | | Abengoa Solar Internacional, S.A. | | — | | (3) | | — |
Abengoa Solar Brasil Desenvolvimientos Solares Ltda. | | R. de Janeiro (BR) | | | 962 | | | 100.00 | | Abengoa Solar Internacional, S.A./Abengoa Solar España, S.A. | | (*) | | (7) | | — |
Abengoa Solar Chile, S.A. | | Santiago de Chile (CL) | | | — | | | 100.00 | | Abengoa Solar Internacional S.A./Abengoa Chile, S.A. | | (*) | | (7) | | — |
Abengoa Solar Engeneering (Beijing), Co. Ltd. | | Beijing (CN) | | | 103 | | | 100.00 | | Abengoa Solar, S.A. | | — | | (3) | | — |
Abengoa Solar España, S.A. | | Seville (ES) | | | 34,846 | | | 100.00 | | Abengoa Solar, S.A./Abengoa Solar PV, S.A. | | — | | (7) | | B |
Abengoa Solar Extremadura, S.A. | | Caceres (ES) | | | 60 | | | 100.00 | | Abengoa Solar España, S.A./Abengoa Solar New Technologies, S.A. | | — | | (3) | | — |
Abengoa Solar GmbH | | Berlin (DE) | | | 160 | | | 100.00 | | Abengoa Solar Internacional, S.A. | | — | | (3) | | B |
Abengoa Solar India Private Limited | | Maharashtra (IN) | | | 1,121 | | | 100.00 | | Abengoa Solar China, S.A./Abengoa Solar, S.A. | | — | | (7) | | B |
Abengoa Solar Industrial Systems, LLC | | Colorado (US) | | | 3,977 | | | 100.00 | | Abengoa Solar, LLC. | | — | | (7) | | B |
Abengoa Solar Internacional, S.A. | | Seville (ES) | | | 12,501 | | | 100.00 | | Abengoa Solar, S.A. | | — | | (7) | | B |
Abengoa Solar Italia, S.R.L. | | Rome (IT) | | | 1,666 | | | 100.00 | | Abengoa Solar Internacional, S.A./Abengoa Solar, S.A. | | — | | (7) | | D |
Abengoa Solar México S.A. de C.V. | | Mexico City (MX) | | | 46 | | | 100.00 | | Abengoa Solar Internacional, S.A./Abengoa Solar España, S.A. | | (*) | | (7) | | — |
Abengoa Solar New Technologies, S.A. | | Seville (ES) | | | 3,986 | | | 100.00 | | Abengoa Solar, S.A. | | — | | (7) | | B |
Abengoa Solar Operations LLC | | Delaware (US) | | | 1 | | | 100.00 | | Abengoa Solar, LLC. | | — | | (3) | | — |
Abengoa Solar Power South Africa (Pty) Ltd. | | Gauteng (ZA) | | | 888 | | | 100.00 | | Abengoa Solar Internacional, S.A. | | — | | (3) | | B |
Abengoa Solar Power, S.A. | | Seville (ES) | | | 250 | | | 100.00 | | Abengoa Solar, S.A./Abengoa Solar España, S.A. | | — | | (3) | | — |
Abengoa Solar Research, S.A. | | Seville (ES) | | | 60 | | | 100.00 | | Abengoa Solar New Technologies, S.A./Abengoa Research, S.A. | | (*) | | (7) | | — |
F-195
Table of Contents
Appendices
Appendix XII
Subsidiary companies included in the 2013 consolidation perimeter using
the global integration method (Continuation)
| | | | | | | | | | | | | | | | |
| |
| | Shareholding | |
| |
| |
| |
|
|---|
Company Name | | Registered
Address | | Amount in
thousands
of € | | % of
Nominal
Capital | | Parent Company | | (*) | | Activity
(see
Page 4) | | Auditor |
|---|
Abengoa Solar South Africa (Pty) Ltd. | | Gauteng (ZA) | | | 5,994 | | | 100.00 | | South Africa Solar Investments, S.L. | | — | | (7) | | B |
Abengoa Solar US Holdings Inc. | | Colorado (US) | | | 569,909 | | | 100.00 | | Abengoa US Holding, LLC. | | — | | (7) | | — |
Abengoa Solar Ventures S.A | | Seville (ES) | | | 26,660 | | | 100.00 | | Abengoa Solar, S.A. | | — | | (7) | | B |
Abengoa Solar, LLC. | | New York (US) | | | 385,228 | | | 100.00 | | Abengoa US Operations, LLC | | — | | (7) | | B |
Abengoa Solar, S.A. | | Seville (ES) | | | 12,060 | | | 100.00 | | Abengoa, S.A./Abengoa Solar España, S.A. | | — | | (7) | | B |
Abengoa SP Holdings, LLC | | California (US) | | | 22,845 | | | 100.00 | | Abengoa Solar, LLC. | | (*) | | (7) | | — |
Abengoa Transmisión Norte, S.A. (ATN) | | Lima (PE) | | | 174,756 | | | 100.00 | | Abengoa Perú, S.A./Asa Iberoamérica, S.L. | | — | | (2) | | B |
Abengoa Transmisión Sur, S.A. (ATS) | | Lima (PE) | | | 61,401 | | | 75.00 | | Asa Iberoamérica, S.L./Abengoa Perú, S.A. | | — | | (2) | | B |
Abengoa Transmission & Infrastructure, LLC | | Delaware (US) | | | 725 | | | 100.00 | | Abeinsa, LLC | | — | | (1) | | — |
Abengoa US Holding, LLC | | Washington (US) | | | 1,150,643 | | | 100.00 | | Abengoa Bioenergía, S.A./ Abengoa Solar, S.A./Abeinsa, S.A./Abengoa Water, S.L.U. | | — | | (1) | | — |
Abengoa US Operations, LLC | | Washington (US) | | | 998,350 | | | 100.00 | | Abengoa US, LLC | | — | | (1) | | — |
Abengoa US, LLC | | Washington (US) | | | 568,434 | | | 100.00 | | Abengoa Bioenergy Holdco, Inc./ Abengoa Solar US Holdings, Inc./ Abengoa Water Holding USA, Inc./ Abener Energia, S.A./ Abacus Project Management, Inc./ Abeinsa Holding, Inc. | | — | | (1) | | — |
Abengoa Water Agadir, S.L. | | Seville (ES) | | | 3 | | | 100.00 | | Abengoa Water, S.L.U. | | (*) | | (7) | | — |
Abengoa Water Beijing Co., Ltd | | Beijing (CN) | | | 3 | | | 100.00 | | Abengoa Water, S.L.U. | | — | | (4) | | D |
Abengoa Water Chile, Limitada | | Santiago de Chile (CL) | | | — | | | 100.00 | | Abengoa Water, S.L.U./Abengoa Water International, S.L.U. | | (*) | | (4) | | — |
Abengoa Water Dalian, S.L.U. | | Seville (ES) | | | 33 | | | 100.00 | | Abengoa Water, S.L.U. | | — | | (7) | | — |
Abengoa Water Holding USA, Inc. | | Delaware (US) | | | 5,072 | | | 100.00 | | Abengoa US Holding, LLC | | — | | (4) | | — |
Abengoa Water International, S.L.U. | | Seville (ES) | | | 3 | | | 100.00 | | Abengoa Water, S.L.U. | | (*) | | (7) | | — |
Abengoa Water Investments Ghana BV | | Amsterdam (NL) | | | 3,637 | | | 100.00 | | Abengoa Water Nungua, S.L.U. | | — | | (7) | | — |
Abengoa Water Nungua, S.L.U. | | Seville (ES) | | | 3,399 | | | 100.00 | | Abengoa Water, S.L.U. | | — | | (7) | | — |
Abengoa Water USA, LLC. | | Texas (US) | | | 2,102 | | | 100.00 | | Abengoa US Operations, LLC. | | — | | (7) | | D |
Abengoa Water, S.L.U. | | Seville (ES) | | | 10,860 | | | 100.00 | | Abengoa, S.A./Siema | | — | | (7) | | B |
Abengoa Yield Ltd. | | Leeds (GB) | | | — | | | 100.00 | | Abengoa Concessions Investments Ltd. | | (*) | | (1) | | — |
Abengoa Yield S.à.r.l. | | Luxembourg (LU) | | | 13 | | | 100.00 | | Abengoa Concessions Investments, S.à.r.l. | | (*) | | (1) | | — |
Abent 3T, S de RL de C.V. | | Mexico City (MX) | | | 3 | | | 100.00 | | Abengoa México, S.A. de C.V./ Abener Energía S.A. | | — | | (5) | | — |
Abenta Concessões Brasil | | R. de Janeiro (BR) | | | 3 | | | 95.84 | | Abengoa Concessões Brasil Holding, S.A. | | — | | (2) | | — |
Abenta Construçao Brasil Ltda | | R. de Janeiro (BR) | | | 10,785 | | | 100.00 | | Inabensa Rio, Ltda./Abengoa Brasil Ltda. | | — | | (1) | | — |
Abentel Telecomunicaciones, S.A. | | Seville (ES) | | | 5,530 | | | 100.00 | | Abener Energía, S.A./Abeinsa Ingeniería y Construcción Industrial, S.A. | | — | | (1) | | — |
Abentey Gerenciamiento de Projectos de Engenharia e Construçao, Ltda. | | Pirassununga (BR) | | | — | | | 100.00 | | Abener Energía, S.A./Teyma Internacional,S.A. | | — | | (1) | | — |
Abratey Construção, Ltda. | | R. de Janeiro (BR) | | | — | | | 100.00 | | Abengoa Concessoes Brasil Holding S.A./Teyma Internacional | | — | | (1) | | — |
ACT Holdings, S.A. de C.V. | | Mexico City (MX) | | | — | | | 100.00 | | Abengoa México, S.A. de C.V./Servicios Auxiliares de Administración, S.A. de C.V. | | (*) | | (1) | | — |
Advanced Feedstocks of Kansas, LLC | | Chesterfield (US) | | | 37 | | | 51.00 | | Abengoa Bioenergy Trading US, LLC | | (*) | | (6) | | — |
Aguas de Skikda | | Argel (DZ) | | | 10,811 | | | 51.00 | | Geida Skikda, S.L. | | — | | (4) | | D |
Alantia, Ltd. | | Tel Aviv (IL) | | | — | | | 100.00 | | Rioglass Solar Holding, S.A. | | (*) | | (7) | | — |
Aleduca, S.L | | Madrid (ES) | | | 7,255 | | | 100.00 | | Abengoa Solar España, S.A./Abengoa Solar, S.A. | | — | | (7) | | — |
Aprofursa, Aprovechamientos Energéticos Furesa, S.A. | | Murcia (ES) | | | 2,211 | | | 98.00 | | Abeinsa Asset Management, S.L. | | — | | (5) | | C |
Arao Enerxías Eólica, S.L | | A Coruña (ES) | | | 7 | | | 70.00 | | Instalaciones Inabensa, S.A. | | — | | (5) | | — |
Arizona Solar One, LLC | | Colorado (US) | | | 415,389 | | | 100.00 | | ASO Holdings Company, LLC | | — | | (3) | | B |
Asa Bioenergy Holding, AG | | Zug (SZ) | | | 430,749 | | | 99.98 | | Abengoa Bioenergía, S.A. | | — | | (6) | | B |
Asa Bioenergy of Nebraska, LLC. | | Chesterfield (US) | | | 38,518 | | | 100.00 | | Abengoa Bioenergy Operations, LLC | | — | | (6) | | B |
Asa Desulfuración, S.A. | | Barakaldo (ES) | | | 100,611 | | | 100.00 | | Siema Investment, S.L.U. | | — | | (5) | | — |
Asa E.& E.H., AG | | Zug (SZ) | | | 81 | | | 100.00 | | Sociedad Inversora Energía y Medio Ambiente, S.A. | | — | | (1) | | A |
Asa Iberoamérica, S.L. | | Seville (ES) | | | 48,522 | | | 100.00 | | Soc. Inv. Energía y Medio Ambiente, S.A./Abeinsa Ingeniería y Construcción Industrial, S.A. | | — | | (1) | | D |
Asa Investment AG | | Zug (SZ) | | | 69,950 | | | 100.00 | | Abeinsa Inversiones Latam, S.L. | | — | | (1) | | B |
ASA Investment Brasil Ltda | | R. de Janeiro (BR) | | | 678 | | | 100.00 | | Befesa Brasil/Abengoa Brasil, S.A. | | — | | (1) | | — |
ASO Holdings Company, LLC | | Colorado (US) | | | 197,430 | | | (** | ) | Abengoa Solar US Holdings Inc. | | — | | (7) | | B |
ATE VI Campos Novos Transmissora de Energía, S.A | | R. de Janeiro (BR) | | | 41,056 | | | 100.00 | | Abengoa Concessoes Brasil Holding, S.A./Abengoa Brasil Ltda. | | — | | (2) | | — |
ATE VII- Foz do Iguacú Transmissora de Energía, S.A. | | R. de Janeiro (BR) | | | 25,998 | | | 100.00 | | Abengoa Concessoes Brasil Holding, S.A./Abengoa Brasil Ltda. | | — | | (2) | | — |
ATE IX Transmissora de Energía, S.A. | | R. de Janeiro (BR) | | | — | | | 100.00 | | Abengoa Brasil, S.A./Abengoa Concesssoes Brasil Holding, S.A. | | — | | (2) | | — |
F-196
Table of Contents
Appendices
Appendix XII
Subsidiary companies included in the 2013 consolidation perimeter using
the global integration method (Continuation)
| | | | | | | | | | | | | | | | |
| |
| | Shareholding | |
| |
| |
| |
|
|---|
Company Name | | Registered
Address | | Amount in
thousands
of € | | % of
Nominal
Capital | | Parent Company | | (*) | | Activity
(see
Page 4) | | Auditor |
|---|
ATE X Abengoa Brasil Administraçao Predial Ltda | | R. de Janeiro (BR) | | | — | | | 100.00 | | Abengoa Brasil, S.A./Abengoa Concesssoes Brasil Holding, S.A. | | — | | (1) | | — |
ATE XI, Manaus Transmissora de Energía | | R. de Janeiro (BR) | | | 181,441 | | | 50.50 | | Abengoa Concessoes Brasil Holding, S.A. | | — | | (2) | | — |
ATE XIII, Norte Brasil Transmissora de Energía S.A | | R. de Janeiro (BR) | | | 141,285 | | | 51.00 | | Abengoa Concessoes Brasil Holding, S.A. | | — | | (2) | | — |
ATE XVI Transmissora de Energia S.A. | | R. de Janeiro (BR) | | | 57,776 | | | 100.00 | | Abengoa Concessões Brasil Holding S.A./Abengoa Construção Brasil Ltda. | | — | | (2) | | — |
ATE XVII Transmissora de Energia S.A. | | R. de Janeiro (BR) | | | 11,401 | | | 100.00 | | Abengoa Concessões Brasil Holding S.A./Abengoa Construção Brasil Ltda. | | — | | (2) | | — |
ATE XVIII Transmissora de Energia S.A. | | R. de Janeiro (BR) | | | 31,646 | | | 100.00 | | Abengoa Concessões Brasil Holding S.A./Abengoa Construção Brasil Ltda. | | — | | (2) | | — |
ATE XIX Transmissora de Energia S.A. | | R. de Janeiro (BR) | | | 14,483 | | | 100.00 | | Abengoa Concessões Brasil Holding S.A./Abengoa Construção Brasil Ltda. | | — | | (2) | | — |
ATE XX Transmissora de Energia S.A. | | R. de Janeiro (BR) | | | 19,721 | | | 100.00 | | Abengoa Concessões Brasil Holding, S.A./Abengoa Construção Brasil Ltda. | | (*) | | (2) | | — |
ATE XXI Transmissora de Energia S.A. | | R. de Janeiro (BR) | | | 88,282 | | | 100.00 | | Abengoa Concessões Brasil Holding, S.A./Abengoa Construção Brasil Ltda. | | (*) | | (2) | | — |
ATE XXII Transmissora de Energia S.A. | | R. de Janeiro (BR) | | | — | | | 100.00 | | Abengoa Concessões Brasil Holding, S.A./Abengoa Construção Brasil Ltda. | | (*) | | (2) | | — |
ATE XXIII Transmissora de Energia S.A. | | R. de Janeiro (BR) | | | — | | | 100.00 | | Abengoa Concessões Brasil Holding, S.A./Abengoa Construção Brasil Ltda. | | (*) | | (2) | | — |
ATN 1, Abengoa Trasmisión Sur, S.A. | | Lima (PE) | | | 56 | | | 100.00 | | Abengoa Transmisión Norte, S.A./Abengoa Perú, S.A. | | — | | (2) | | B |
ATN 2, S.A. | | Santiago de Chile (CL) | | | 7,318 | | | 40.00 | | Abengoa Transmisión Norte S.A./Abengoa Perú, S.A. | | — | | (2) | | B |
ATN 3, S.A. | | Lima (PE) | | | 3,672 | | | 100.00 | | Abengoa Perú, S.A./Abengoa Transmisión Norte, S.A. | | (*) | | (2) | | — |
Aurorex, S.A. | | Buenos Aires (AR) | | | 516 | | | 100.00 | | Teyma Renovables, S.A. | | — | | (1) | | — |
Aznalcóllar Solar, S.A. | | Seville (ES) | | | 60 | | | 100.00 | | Abengoa Solar España, S.A./Abengoa Solar, S.A. | | — | | (3) | | — |
Balofix S.A. | | Buenos Aires (AR) | | | — | | | 100.00 | | Teyma Renovables, S.A. | | (*) | | (1) | | — |
Befesa Agua Djerba, S.L. | | Seville (ES) | | | 13 | | | 100.00 | | Abengoa Water, S.L.U. | | — | | (7) | | — |
Befesa Agua Tenes S.L. | | Madrid (ES) | | | 16,143 | | | 100.00 | | Abengoa Water S.L.U. | | — | | (4) | | — |
Befesa Apa, S.R.L | | Bucarest (RO) | | | 10 | | | 100.00 | | Abeima Agua Internacional, S.L. | | — | | (1) | | — |
Befesa Brasil | | R. de Janeiro (BR) | | | 1,304 | | | 100.00 | | Asa Investment, AG/Sociedad Inversora Lineas de Brasil, S.L. (ETVE) | | — | | (5) | | — |
Befesa CTA Qingdao S.L.U | | Madrid (ES) | | | 35,163 | | | 100.00 | | Abengoa Water, S.L.U. | | — | | (4) | | B |
Befesa Desalination Developments Ghana Limited | | Accra (GH) | | | 4 | | | 56.000 | | Abengoa Water Investment Ghana BV | | — | | (4) | | B |
Befesa Limpiezas Industriales México S.A. de C.V. | | Mexico City (MX) | | | 6 | | | 100.00 | | Abengoa Servicios Industriales, S.A../Abengoa México, S.A. d e CV | | — | | (5) | | — |
Beijing Abeinsa Management Consulting Co., Ltd. | | Beijing (CN) | | | 175 | | | 100.00 | | Abeinsa Business Development, S.A. | | (*) | | (1) | | — |
Biocarburantes de Castilla y León, S.A. | | Salamanca (ES) | | | 66,679 | | | 100.00 | | Abengoa Bioenergía Inversiones, S.A./Ecoagrícola, S.A. | | — | | (6) | | B |
Bioetanol Galicia, S.A. | | A Coruña (ES) | | | 7,448 | | | 100.00 | | Abengoa Bioenergía Inversiones, S.A./Ecoagrícola, S.A. | | — | | (6) | | B |
Cadonal, S.A. | | Montevideo (UY) | | | 75 | | | 100.00 | | Holding Energía Eólica, S.A | | — | | (5) | | B |
Captación Solar, S.A. | | Seville (ES) | | | 205 | | | 100.00 | | Abeinsa Asset Management, S.L./Abener Energía, S.A. | | — | | (1) | | — |
Captasol Fotovoltaica 1, S.L. | | Seville (ES) | | | 57 | | | 100.00 | | Abengoa Solar España, S.A./Casaquemada Fotovoltaica, S.L. | | — | | (3) | | — |
Captasol Fotovoltaica 2, S.L. | | Seville (ES) | | | 3 | | | 100.00 | | Abengoa Solar España, S.A./Casaquemada Fotovoltaica, S.L. | | — | | (3) | | — |
Captasol Fotovoltaica 3, S.L. | | Seville (ES) | | | 3 | | | 100.00 | | Abengoa Solar España, S.A./Casaquemada Fotovoltaica, S.L. | | — | | (3) | | — |
Captasol Fotovoltaica 4, S.L. | | Seville (ES) | | | 3 | | | 100.00 | | Abengoa Solar España, S.A./Casaquemada Fotovoltaica, S.L. | | — | | (3) | | — |
Captasol Fotovoltaica 5, S.L. | | Seville (ES) | | | 3 | | | 100.00 | | Abengoa Solar España, S.A./Casaquemada Fotovoltaica, S.L. | | — | | (3) | | — |
Captasol Fotovoltaica 6, S.L. | | Seville (ES) | | | 3 | | | 100.00 | | Abengoa Solar España, S.A./Casaquemada Fotovoltaica, S.L. | | — | | 3) | | — |
Captasol Fotovoltaica 7, S.L. | | Seville (ES) | | | 3 | | | 100.00 | | Abengoa Solar España, S.A./Casaquemada Fotovoltaica, S.L. | | — | | (3) | | — |
Captasol Fotovoltaica 8, S.L. | | Seville (ES) | | | 3 | | | 100.00 | | Abengoa Solar España, S.A./Casaquemada Fotovoltaica, S.L. | | — | | (3) | | — |
Captasol Fotovoltaica 9, S.L. | | Seville (ES) | | | 3 | | | 100.00 | | Abengoa Solar España, S.A./Casaquemada Fotovoltaica, S.L. | | — | | (3) | | — |
Captasol Fotovoltaica 10, S.L. | | Seville (ES) | | | 3 | | | 100.00 | | Abengoa Solar España, S.A./Casaquemada Fotovoltaica, S.L. | | — | | (3) | | — |
F-197
Table of Contents
Appendices
Appendix XII
Subsidiary companies included in the 2013 consolidation perimeter using
the global integration method (Continuation)
| | | | | | | | | | | | | | | | |
| |
| | Shareholding | |
| |
| |
| |
|
|---|
Company Name | | Registered
Address | | Amount in
thousands
of € | | % of
Nominal
Capital | | Parent Company | | (*) | | Activity
(see
Page 4) | | Auditor |
|---|
Captasol Fotovoltaica 11, S.L. | | Seville (ES) | | | 3 | | | 100.00 | | Abengoa Solar España, S.A./Casaquemada Fotovoltaica, S.L. | | — | | (3) | | — |
Captasol Fotovoltaica 12, S.L. | | Seville (ES) | | | 3 | | | 100.00 | | Abengoa Solar España, S.A./Casaquemada Fotovoltaica, S.L. | | — | | (3) | | — |
Captasol Fotovoltaica 13, S.L. | | Seville (ES) | | | 3 | | | 100.00 | | Abengoa Solar España, S.A./Casaquemada Fotovoltaica, S.L. | | — | | (3) | | — |
Captasol Fotovoltaica 14, S.L. | | Seville (ES) | | | 3 | | | 100.00 | | Abengoa Solar España, S.A./Casaquemada Fotovoltaica, S.L. | | — | | (3) | | — |
Captasol Fotovoltaica 15, S.L. | | Seville (ES) | | | 3 | | | 100.00 | | Abengoa Solar España, S.A./Casaquemada Fotovoltaica, S.L. | | — | | (3) | | — |
Captasol Fotovoltaica 16, S.L. | | Seville (ES) | | | 3 | | | 100.00 | | Abengoa Solar España, S.A./Casaquemada Fotovoltaica, S.L. | | — | | (3) | | — |
Captasol Fotovoltaica 17, S.L. | | Seville (ES) | | | 3 | | | 100.00 | | Abengoa Solar España, S.A./Casaquemada Fotovoltaica, S.L. | | — | | (3) | | — |
Captasol Fotovoltaica 18, S.L. | | Seville (ES) | | | 3 | | | 100.00 | | Abengoa Solar España, S.A./Casaquemada Fotovoltaica, S.L. | | — | | (3) | | — |
Captasol Fotovoltaica 19, S.L. | | Seville (ES) | | | 3 | | | 100.00 | | Abengoa Solar España, S.A./Casaquemada Fotovoltaica, S.L. | | — | | (3) | | — |
Captasol Fotovoltaica 20 S.L. | | Seville (ES) | | | 1,144 | | | 100.00 | | Abengoa Solar España, S.A./Linares Fotovoltaica, S.L. | | — | | (3) | | — |
Captasol Fotovoltaica 21 S.L. | | Seville (ES) | | | — | | | 100.00 | | Abengoa Solar España, S.A./Linares Fotovoltaica, S.L. | | — | | (3) | | — |
Captasol Fotovoltaica 22 S.L. | | Seville (ES) | | | — | | | 100.00 | | Abengoa Solar España, S.A./Linares Fotovoltaica, S.L. | | — | | (3) | | — |
Captasol Fotovoltaica 23 S.L. | | Seville (ES) | | | — | | | 100.00 | | Abengoa Solar España, S.A./Linares Fotovoltaica, S.L. | | — | | (3) | | — |
Captasol Fotovoltaica 24 S.L. | | Seville (ES) | | | — | | | 100.00 | | Abengoa Solar España, S.A./Linares Fotovoltaica, S.L. | | — | | (3) | | — |
Captasol Fotovoltaica 25 S.L. | | Seville (ES) | | | — | | | 100.00 | | Abengoa Solar España, S.A./Linares Fotovoltaica, S.L. | | — | | (3) | | — |
Captasol Fotovoltaica 26 S.L. | | Seville (ES) | | | — | | | 100.00 | | Abengoa Solar España, S.A./Linares Fotovoltaica, S.L. | | — | | (3) | | — |
Captasol Fotovoltaica 27 S.L. | | Seville (ES) | | | — | | | 100.00 | | Abengoa Solar España, S.A./Linares Fotovoltaica, S.L. | | — | | (3) | | — |
Captasol Fotovoltaica 28 S.L. | | Seville (ES) | | | — | | | 100.00 | | Abengoa Solar España, S.A./Linares Fotovoltaica, S.L. | | — | | (3) | | — |
Captasol Fotovoltaica 29 S.L. | | Seville (ES) | | | — | | | 100.00 | | Abengoa Solar España, S.A./Linares Fotovoltaica, S.L. | | — | | (3) | | — |
Captasol Fotovoltaica 30 S.L. | | Seville (ES) | | | — | | | 100.00 | | Abengoa Solar España, S.A./Linares Fotovoltaica, S.L. | | — | | (3) | | — |
Captasol Fotovoltaica 31 S.L. | | Seville (ES) | | | — | | | 100.00 | | Abengoa Solar España, S.A./Linares Fotovoltaica, S.L. | | — | | (3) | | — |
Captasol Fotovoltaica 32 S.L. | | Seville (ES) | | | — | | | 100.00 | | Abengoa Solar España, S.A./Linares Fotovoltaica, S.L. | | — | | (3) | | — |
Captasol Fotovoltaica 33 S.L. | | Seville (ES) | | | — | | | 100.00 | | Abengoa Solar España, S.A./Linares Fotovoltaica, S.L. | | — | | (3) | | — |
Captasol Fotovoltaica 34 S.L. | | Seville (ES) | | | — | | | 100.00 | | Abengoa Solar España, S.A./Linares Fotovoltaica, S.L. | | — | | (3) | | — |
Captasol Fotovoltaica 35 S.L. | | Seville (ES) | | | — | | | 100.00 | | Abengoa Solar España, S.A./Linares Fotovoltaica, S.L. | | — | | (3) | | — |
Captasol Fotovoltaica 36 S.L. | | Seville (ES) | | | — | | | 100.00 | | Abengoa Solar España, S.A./Linares Fotovoltaica, S.L. | | — | | (3) | | — |
Captasol Fotovoltaica 37 S.L. | | Seville (ES) | | | — | | | 100.00 | | Abengoa Solar España, S.A./Linares Fotovoltaica, S.L. | | — | | (3) | | — |
Captasol Fotovoltaica 38 S.L. | | Seville (ES) | | | — | | | 100.00 | | Abengoa Solar España, S.A./Linares Fotovoltaica, S.L. | | — | | (3) | | — |
Captasol Fotovoltaica 52 S.L. | | Seville (ES) | | | 3 | | | 100.00 | | Abengoa Solar España, S.A. | | — | | (3) | | — |
Carpio Solar Inversiones, S.A. | | Seville (ES) | | | 130,859 | | | 100.00 | | CSP Equity Investment, S.A.R.L./Abengoa Solar New Technologies S.A. | | — | | (7) | | B |
Casaquemada Fotovoltaica, S.L. | | Seville (ES) | | | 2,936 | | | 100.00 | | Abengoa Solar España, S.A./Abengoa Solar, S.A. | | — | | (3) | | B |
Cedisolar, S.A. | | Ourense (ES) | | | 4,992 | | | 57.50 | | Rioglass Solar Holding, S.A. | | — | | (3) | | — |
Centro Industrial y Logístico Torrecuellar, S.A. | | Seville (ES) | | | 60 | | | 100.00 | | Instalaciones Inabensa, S.A./Abeinsa Ingeniería y Construcción Industrial, S.A. | | — | | (1) | | — |
Centro Morelos 264 S.A. de C.V | | Mexico City (MX) | | | 3 | | | 100.00 | | Abener Energía, S.A./Inst. Inabensa, S.A./Servicios Auxiliares de Administración, S.A. | | — | | (1) | | — |
Centro Tecnológico Palmas Altas, S.A. | | Seville (ES) | | | 12,899 | | | 100.00 | | Abengoa, S.A./Abeinsa Ingeniería y Construcción Industrial, S.A. | | — | | (1) | | B |
Comemsa, Construcc Metalicas Mexicanas, S.A. De CV | | Queretaro (MX) | | | 20,167 | | | 100.00 | | Europea Const. Metálicas, S.A./Abengoa México, S.A. de C.V. | | — | | (1) | | — |
F-198
Table of Contents
Appendices
Appendix XII
Subsidiary companies included in the 2013 consolidation perimeter using
the global integration method (Continuation)
| | | | | | | | | | | | | | | | |
| |
| | Shareholding | |
| |
| |
| |
|
|---|
Company Name | | Registered
Address | | Amount in
thousands
of € | | % of
Nominal
Capital | | Parent Company | | (*) | | Activity
(see
Page 4) | | Auditor |
|---|
Concesionaria del Acueducto el Zapotillo, S.A. de C.V. | | Mexico City (MX) | | | 3 | | | 100.00 | | Abengoa México, S.A.C.V./Abeinsa Infraestructuras MedioAmbiente, S.A./Abeinsa, S.A. | | — | | (4) | | — |
Construcciones y Depuraciones, S.A. | | Seville (ES) | | | 7,771 | | | 100.00 | | Abeinsa Infraestructuras Medio Ambiente, S.A. | | — | | (1) | | — |
Construtora Integração Ltda. | | R. de Janeiro (BR) | | | — | | | 51.00 | | Abengoa Brasil, S.A. | | — | | (1) | | — |
Copero Solar Huerta Uno, S.A. | | Seville (ES) | | | 96 | | | 50.00 | | Abengoa Solar España, S.A. | | — | | (3) | | B |
Copero Solar Huerta Dos, S.A. | | Seville (ES) | | | 92 | | | 50.00 | | Abengoa Solar España, S.A. | | — | | (3) | | B |
Copero Solar Huerta Tres, S. A | | Seville (ES) | | | 94 | | | 50.00 | | Abengoa Solar España, S.A. | | — | | (3) | | B |
Copero Solar Huerta Cuatro, S.A. | | Seville (ES) | | | 88 | | | 50.00 | | Abengoa Solar España, S.A. | | — | | (3) | | B |
Copero Solar Huerta Cinco, S.A. | | Seville (ES) | | | 87 | | | 50.00 | | Abengoa Solar España, S.A. | | — | | (3) | | B |
Copero Solar Huerta Seis, S.A. | | Seville (ES) | | | 83 | | | 50.00 | | Abengoa Solar España, S.A. | | — | | (3) | | B |
Copero Solar Huerta Siete, S.A. | | Seville (ES) | | | 83 | | | 50.00 | | Abengoa Solar España, S.A. | | — | | (3) | | B |
Copero Solar Huerta Ocho, S.A. | | Seville (ES) | | | 81 | | | 50.00 | | Abengoa Solar España, S.A. | | — | | (3) | | B |
Copero Solar Huerta Nueve, S.A. | | Seville (ES) | | | 42 | | | 50.00 | | Abengoa Solar España, S.A. | | — | | (3) | | B |
Copero Solar Huerta Diez, S.A. | | Seville (ES) | | | 32 | | | 50.00 | | Abengoa Solar España, S.A. | | — | | (3) | | B |
Cogeneración Villaricos, S.A. | | Seville (ES) | | | 5,951 | | | 99.22 | | Abeinsa Asset Management, S.L. | | — | | (5) | | D |
CSP Equity Investment S.a.r.l. | | Luxembourg (LU) | | | 342,318 | | | 100.00 | | Abengoa Solar España, S.A. | | — | | (7) | | — |
Cycon Solar, LTD | | Nicosia (CY) | | | 1 | | | 100.00 | | Abengoa Solar Internacional, S.A. | | — | | (3) | | B |
Dalian Xizhong Island Desalination Co., Ltd | | Dalian (CN) | | | — | | | 51.00 | | Abengoa Water Dalian, S.L.U. | | (*) | | (4) | | — |
Desarrolladora de Energía Renovable, S.A.P.I. de C.V | | Mexico City (MX) | | | — | | | 100.00 | | Abengoa México, S.A. de C.V. /Servicios Auxiliares de Administración, S.A. De C.V. | | — | | (1) | | — |
Ecija Solar Inversiones, S. A | | Seville (ES) | | | 85,886 | | | 100.00 | | CSP Equity Investment S.A.R.L./Abengoa Solar, S.A. | | — | | (7) | | B |
Ecoagricola, S.A. | | Murcia (ES) | | | 586 | | | 100.00 | | Abengoa Bioenergía Inversiones, S.A./Ecocarburantes, S.A. | | — | | (6) | | B |
Ecocarburantes Españoles, S.A. | | Murcia (ES) | | | 3,798 | | | 95.10 | | Abengoa Bioenergía Inversiones, S.A. | | — | | (6) | | B |
Energoprojekt-Gliwice S.A. | | Gliwice (PL) | | | 9,895 | | | 100.00 | | Abener Energía, S.A. | | — | | (1) | | D |
Energy & Environmental Constructions, LLC | | Delaware (US) | | | — | | | 100.00 | | Abeinsa, LLC. | | (*) | | (1) | | — |
Enernova Ayamonte S.A. | | Huelva (ES) | | | 2,281 | | | 91.00 | | Abeinsa Asset Management, S.L. | | — | | (5) | | D |
Enicar Chile, SA | | Santiago de Chile (CL) | | | 3 | | | 100.00 | | Abengoa Chile, S.A. | | — | | (2) | | — |
Eucomsa, Europea Const. Metálicas, S.A. | | Seville (ES) | | | 7,124 | | | 100.00 | | Abeinsa Ingeniería y Construcción Industrial, S.A./Abengoa Solar, S.A. | | — | | (1);(7) | | — |
Europa Desenvolvimentos Solares Ltda. | | R. de Janeiro (BR) | | | 3 | | | 100.00 | | Abengoa Solar Brasil Desenv. Solares Ltda./Mallorca Desenvolvimentos Solares, Ltda. | | (*) | | (3) | | — |
Extremadura Equity Investments Sárl. | | Luxembourg (LU) | | | 327,707 | | | 100.00 | | Logrosán Equity Investments Sárl. | | (*) | | (7) | | — |
Faritel, S.A. | | Montevideo (UY) | | | 12 | | | 100.00 | | Teyma Forestal, S.A. | | — | | (1) | | — |
Financiera Soteland, S.A. | | Montevideo (UY) | | | 415 | | | 100.00 | | Asa Investment AG | | — | | (1) | | — |
Fotovoltaica Solar Sevilla, S.A. | | Seville (ES) | | | 800 | | | 80.00 | | Abengoa Solar España, S.A. | | — | | (3) | | B |
Geida Skikda, S.L. | | Madrid (ES) | | | 7,577 | | | 67.00 | | Abengoa Water S.L.U. | | — | | (4) | | — |
GES Investment C.V. | | Amsterdam (NL) | | | — | | | 92.00 | | ASA Investment AG | | — | | (1) | | — |
Gestión Integral de Recursos Humanos, S.A. | | Seville (ES) | | | 462 | | | 100.00 | | Siema Technologies, S.L | | — | | (1) | | B |
Girhmex, S.A. De C.V. | | Mexico City (MX) | | | — | | | 100.00 | | Gestión Integral de Recursos Humanos, S.A./Abengoa México, S.A. de C.V. | | — | | (1) | | — |
Global Engineering Services LLC | | Delaware (US) | | | 2 | | | 100.00 | | GES Investment C.V. | | — | | (1) | | — |
Helioenergy Electricidad Tres, S.A. | | Seville (ES) | | | 4,560 | | | 100.00 | | Abengoa Solar España, S.A./Abengoa Solar NT, S.A. | | — | | (3) | | — |
Helioenergy Electricidad Cuatro, S.A. | | Seville (ES) | | | 60 | | | 100.00 | | Abengoa Solar España, S.A./Abengoa Solar NT, S.A. | | — | | (3) | | — |
Helioenergy Electricidad Cinco, S.A. | | Seville (ES) | | | 60 | | | 100.00 | | Abengoa Solar España, S.A./Abengoa Solar NT, S.A. | | — | | (3) | | — |
Helioenergy Electricidad Once, S.A. | | Seville (ES) | | | 60 | | | 100.00 | | Abengoa Solar España, S.A./Abengoa Solar NT, S.A. | | — | | (3) | | — |
Helioenergy Electricidad Trece, S.A. | | Seville (ES) | | | 60 | | | 100.00 | | Abengoa Solar España, S.A./Abengoa Solar NT, S.A. | | — | | (3) | | — |
Helioenergy Electricidad Veintiuno, S.A | | Seville (ES) | | | 60 | | | 100.00 | | Abengoa Solar España, S.A. /Abengoa Solar New Technologies, S.A. | | — | | (3) | | — |
Helioenergy Electricidad Veintidos, S.A | | Seville (ES) | | | 60 | | | 100.00 | | Abengoa Solar España, S.A. /Abengoa Solar New Technologies, S.A. | | — | | (3) | | — |
Helioenergy Electricidad Veintitres, S.A | | Seville (ES) | | | 60 | | | 100.00 | | Abengoa Solar España, S.A. /Abengoa Solar New Technologies, S.A. | | — | | (3) | | — |
Helioenergy Electricidad Veinticuatro, S.A | | Seville (ES) | | | 60 | | | 100.00 | | Abengoa Solar España, S.A. /Abengoa Solar New Technologies, S.A. | | — | | (3) | | — |
Helios I Hyperion Energy Investments, S.L. | | Seville (ES) | | | 120,739 | | | 100.00 | | Hypesol Energy Holding, S.L./Abengoa Solar New Technologies, S.A. | | — | | (3) | | B |
Helios II Hyperion Energy Investments, S.L. | | Madrid (ES) | | | 113,181 | | | 100.00 | | Hypesol Energy Holding, S.L./Abengoa Solar New Technologies, S.A. | | — | | (3) | | B |
Hidro Abengoa, S.A. De C.V. | | Mexico City (MX) | | | 4 | | | 100.00 | | Abengoa México, S.A. de C.V./Abeinsa Infraestructuras Medio Ambiente, S.A. | | — | | (1) | | — |
Holding de Energía Eólica, S.A. | | Montevideo (UY) | | | 30,642 | | | 100.00 | | Teyma Renovables/Instalaciones Inabensa, S.A | | — | | (1) | | B |
F-199
Table of Contents
Appendices
Appendix XII
Subsidiary companies included in the 2013 consolidation perimeter using
the global integration method (Continuation)
| | | | | | | | | | | | | | | | |
| |
| | Shareholding | |
| |
| |
| |
|
|---|
Company Name | | Registered
Address | | Amount in
thousands
of € | | % of
Nominal
Capital | | Parent Company | | (*) | | Activity
(see
Page 4) | | Auditor |
|---|
Hypesol Energy Holding , S.L. | | Seville (ES) | | | 236,067 | | | 100.00 | | Abengoa Solar España, S.A./Abengoa Solar New Technologies S.A. | | — | | (7) | | B |
Inabensa Bharat Private Limited | | New Delhi (IN) | | | 5,643 | | | 100.00 | | Europea Const. Metálicas, S.A./Instalaciones Inabensa, S.A./Abener Energía, S.A. | | — | | (1) | | A |
Inabensa Electric and Electronic Equipment Manufacturing (Tiajin)Co. Ltda. | | Tianjin (CN) | | | 190 | | | 100.00 | | Instalaciones Inabensa, S.A./Abeinsa Ingeniería y Construcción Industrial, S.A. | | — | | (1) | | D |
Inabensa Fotovoltaica, S.L. | | Seville (ES) | | | 3 | | | 100.00 | | Instalaciones Inabensa, S.A./C.I.L. Torrecuéllar, S.A. | | — | | (1) | | — |
Inabensa France, S.A. | | Pierrelate (FR) | | | 550 | | | 100.00 | | Instalaciones Inabensa, S.A. | | — | | (1) | | B |
Inabensa Limited | | Leeds (GB) | | | — | | | 100.00 | | Instalaciones Inabensa, S.A. | | — | | (1) | | — |
Inabensa Maroc, S.A. | | Tanger (MA) | | | 2,373 | | | 100.00 | | Instalaciones Inabensa, S.A. | | — | | (1) | | A |
Inabensa Pty Ltd | | Johannesburg (ZA) | | | — | | | 100.00 | | Instalaciones Inabensa, S.A. | | — | | (1) | | — |
Inabensa Rio Ltda | | R. de Janeiro (BR) | | | 12,383 | | | 100.00 | | Befesa Brasil, S.A./Abengoa Brasil, S.A. | | — | | (1) | | — |
Inabensa Saudí Arabia, LLC | | Dammam (SA) | | | 93 | | | 100.00 | | Instalaciones Inabensa, S.A./Abeinsa Ingeniería y Construcción Industrial, S.A. | | — | | (1) | | — |
Inabensa USA, LLC | | Phoenix (US) | | | 36 | | | 100.00 | | Abeinsa, Inc. LLC. | | — | | (1) | | — |
Inabensa, LLC | | Ruwi (OM) | | | 366 | | | 70.00 | | Instalaciones Inabensa, S.A. | | — | | (1) | | — |
Iniciativas Hidroeléctricas de Aragón y Cataluña, S.L. | | Huesca (ES) | | | 4,007 | | | 95.00 | | Abeinsa Infraestructuras Medio Ambiente, S.A. | | — | | (5) | | — |
Iniciativas Hidroeléctricas, S.A. | | Seville (ES) | | | 1,227 | | | 50.00 | | Abeinsa Infraestructuras Medio Ambiente, S.A. | | — | | (5) | | — |
Insolation Sic 4 S.R.L | | Rome (IT) | | | — | | | 100.00 | | Abengoa Solar Italia, S.R.L./Abengoa Solar, S.A. | | — | | (3) | | — |
Insolation Sic 6 S.R.L | | Rome (IT) | | | — | | | 100.00 | | Abengoa Solar Italia S.r.l./Abengoa Solar Internacional, S.A. | | — | | (3) | | — |
Insolation Sic 7.R.L | | Palermo (IT) | | | — | | | 100.00 | | Abengoa Solar Italia, S.R.L./Abengoa Solar, S.A. | | — | | (3) | | — |
Insolation Sic 8 S.R.L | | Palermo (IT) | | | — | | | 100.00 | | Abengoa Solar Italia, S.R.L./Abengoa Solar, S.A. | | — | | (3) | | — |
Insolation Sic 9 S.R.L | | Rome (IT) | | | — | | | 100.00 | | Abengoa Solar Italia S.r.l./Abengoa Solar Internacional, S.A. | | — | | (3) | | — |
Insolation 17 S.R.L | | Rome (IT) | | | 9 | | | 100.00 | | Abengoa Solar Italia S.r.l./Abengoa Solar Internacional, S.A. | | — | | (7) | | D |
Insolation 18 S.R.L | | Rome (IT) | | | — | | | 100.00 | | Abengoa Solar Italia S.r.l./Abengoa Solar Internacional, S.A. | | — | | (3) | | — |
Instalaciones Fotovoltaicas Torrecuéllar, 1 S.L. | | Seville (ES) | | | — | | | 100.00 | | Inabensa Fotovoltaica, S.L./Instalaciones Inabensa, S.A. | | — | | (1) | | — |
Instalaciones Fotovoltaicas Torrecuéllar, 2 S.L. | | Seville (ES) | | | — | | | 100.00 | | Inabensa Fotovoltaica, S.L./Instalaciones Inabensa, S.A. | | — | | (1) | | — |
Instalaciones Fotovoltaicas Torrecuéllar, 3 S.L. | | Seville (ES) | | | — | | | 100.00 | | Inabensa Fotovoltaica, S.L./Instalaciones Inabensa, S.A. | | — | | (1) | | — |
Instalaciones Inabensa Insaat Enerji Limited Sirketi | | Ankara (TR) | | | 58 | | | 100.00 | | Instalaciones Inabensa, S.A. | | — | | (1) | | B |
Instalaciones Inabensa, S.A. | | Seville (ES) | | | 17,307 | | | 100.00 | | Nicsa/Abener Energía, S.A./Abeinsa Ingeniería y Construcción Industrial, S.A. | | — | | (1) | | — |
Inversora Enicar S.A. | | Santiago de Chile (CL) | | | 1,868 | | | 100.00 | | Abengoa Chile, S.A. | | — | | (2) | | — |
Junertil S.A. | | Buenos Aires (AR) | | | — | | | 100.00 | | Teyma Renovables, S.A. | | (*) | | (1) | | — |
Kaxu CSP O&M Company (Pty) Limited | | Gauteng (ZA) | | | — | | | 92.00 | | Abengoa Solar Power South Africa (Pty) Ltd. | | — | | (3) | | — |
Kaxu CSP South Africa (Proprietary) Limited | | Gauteng (ZA) | | | 1,232 | | | 51.00 | | Abengoa Solar South Africa (Pty) Ltd. | | — | | (3) | | B |
Khi CSP O&M Company (Pty) Limited | | Gauteng (ZA) | | | — | | | 92.00 | | Abengoa Solar Power South Africa (Pty) Ltd. | | — | | (3) | | — |
Khi CSP South Africa (Proprietary) Limited | | Gauteng (ZA) | | | 739 | | | 51.00 | | Abengoa Solar South Africa (Pty) Ltd. | | — | | (3) | | B |
Klitten, S.A. | | Montevideo (UY) | | | 15 | | | 100.00 | | Teyma Construcciones, S.A. | | — | | (1) | | — |
L.T. Rosarito y Monterrey, S.A. De CV | | Mexico City (MX) | | | 3,084 | | | 100.00 | | Asa Investment AG/Abengoa México S.A. de C.V./Instalaciones Inabensa, S.A. | | — | | (1) | | — |
Las Cabezas Fotovoltaica, S.L. | | Seville (ES) | | | 8,164 | | | 100.00 | | Abengoa Solar España, S.A./Abengoa Solar, S.A. | | — | | (3) | | B |
Las Cabezas Solar, S.L. | | Seville (ES) | | | 3 | | | 100.00 | | Aleduca, S.L. | | — | | (3) | | — |
Linares Fotovoltaica, S.L. | | Seville (ES) | | | 3,271 | | | 100.00 | | Abengoa Solar España, S.A./Abengoa Solar, S.A. | | — | | (3) | | B |
Lineas 612 Norte Noroeste, S.A. De C.V. | | Mexico City (MX) | | | 3 | | | 100.00 | | Abengoa México, S.A. de C.V./Abengoa, S.A. | | — | | (1) | | — |
Linha Verde Transmisora de Energia S.A | | Brasilia (BR) | | | 12,088 | | | 51.00 | | Abengoa Concessoes Brasil Holding S.A. | | — | | (2) | | — |
Logrosán Equity Investments Sárl. | | Luxembourg (LU) | | | 327,707 | | | 100.00 | | Logrosán Solar Inversiones Dos, S.L. | | (*) | | (7) | | — |
Logrosán Solar Inversiones, S.A. | | Extremadura (ES) | | | 125,113 | | | 100.00 | | CSP Equity Investment, S.A.R.L./Abengoa Solar New Technologies S.A. | | — | | (7) | | B |
Logrosán Solar Inversiones Dos, S.L. | | Seville (ES) | | | 327,723 | | | 100.00 | | Abengoa Solar España S.A./Abengoa Solar S.A. | | — | | (7) | | — |
Londrina Transmissora De Energía, S.A. | | R. de Janeiro (BR) | | | 39,663 | | | 100.00 | | Abengoa Concessoes Brasil Holding, S.A./Abengoa Brasil Ltda. | | — | | (2) | | — |
Mallorca Desenvolvimentos Solares Ltda. | | R. de Janeiro (BR) | | | 3 | | | 100.00 | | Abengoa Solar Brasil Desenv. Solares, Ltda./Europa Desenvolvimentos Solares, Ltda. | | (*) | | (3) | | — |
Manaus Constructora Ltda | | R. de Janeiro (BR) | | | — | | | 50.50 | | Abengoa Brasil, Ltda. | | — | | (1) | | — |
Marismas PV A1, S.L. | | Seville (ES) | | | 6,998 | | | 100.00 | | Las Cabezas Fotovoltaica, S.L./Abengoa Solar España, S.A. | | — | | (3) | | — |
Marismas PV A2, S.L. | | Seville (ES) | | | — | | | 100.00 | | Las Cabezas Fotovoltaica, S.L./Abengoa Solar España, S.A. | | — | | (3) | | — |
F-200
Table of Contents
Appendices
Appendix XII
Subsidiary companies included in the 2013 consolidation perimeter using
the global integration method (Continuation)
| | | | | | | | | | | | | | | | |
| |
| | Shareholding | |
| |
| |
| |
|
|---|
Company Name | | Registered
Address | | Amount in
thousands
of € | | % of
Nominal
Capital | | Parent Company | | (*) | | Activity
(see
Page 4) | | Auditor |
|---|
Marismas PV A3, S.L. | | Seville (ES) | | | — | | | 100.00 | | Las Cabezas Fotovoltaica, S.L./Abengoa Solar España, S.A. | | — | | (3) | | — |
Marismas PV A4, S.L. | | Seville (ES) | | | — | | | 100.00 | | Las Cabezas Fotovoltaica, S.L./Abengoa Solar España, S.A. | | — | | (3) | | — |
Marismas PV A5, S.L. | | Seville (ES) | | | — | | | 100.00 | | Las Cabezas Fotovoltaica, S.L./Abengoa Solar España, S.A. | | — | | (3) | | — |
Marismas PV A6, S.L. | | Seville (ES) | | | — | | | 100.00 | | Las Cabezas Fotovoltaica, S.L./Abengoa Solar España, S.A. | | — | | (3) | | — |
Marismas PV A7, S.L. | | Seville (ES) | | | — | | | 100.00 | | Las Cabezas Fotovoltaica, S.L./Abengoa Solar España, S.A. | | — | | (3) | | — |
Marismas PV A8, S.L. | | Seville (ES) | | | — | | | 100.00 | | Las Cabezas Fotovoltaica, S.L./Abengoa Solar España, S.A. | | — | | (3) | | — |
Marismas PV A9, S.L. | | Seville (ES) | | | — | | | 100.00 | | Las Cabezas Fotovoltaica, S.L./Abengoa Solar España, S.A. | | — | | (3) | | — |
Marismas PV A10, S.L. | | Seville (ES) | | | — | | | 100.00 | | Las Cabezas Fotovoltaica, S.L./Abengoa Solar España, S.A. | | — | | (3) | | — |
Marismas PV A11, S.L. | | Seville (ES) | | | — | | | 100.00 | | Las Cabezas Fotovoltaica, S.L./Abengoa Solar España, S.A. | | — | | (3) | | — |
Marismas PV A12, S.L. | | Seville (ES) | | | — | | | 100.00 | | Las Cabezas Fotovoltaica, S.L./Abengoa Solar España, S.A. | | — | | (3) | | — |
Marismas PV A13, S.L. | | Seville (ES) | | | — | | | 100.00 | | Las Cabezas Fotovoltaica, S.L./Abengoa Solar España, S.A. | | — | | (3) | | — |
Marismas PV A14, S.L. | | Seville (ES) | | | — | | | 100.00 | | Las Cabezas Fotovoltaica, S.L./Abengoa Solar España, S.A. | | — | | (3) | | — |
Marismas PV A15, S.L. | | Seville (ES) | | | — | | | 100.00 | | Las Cabezas Fotovoltaica, S.L./Abengoa Solar España, S.A. | | — | | (3) | | — |
Marismas PV A16, S.L. | | Seville (ES) | | | — | | | 100.00 | | Las Cabezas Fotovoltaica, S.L./Abengoa Solar España, S.A. | | — | | (3) | | — |
Marismas PV A17, S.L. | | Seville (ES) | | | — | | | 100.00 | | Las Cabezas Fotovoltaica, S.L./Abengoa Solar España, S.A. | | — | | (3) | | — |
Marismas PV A18, S.L. | | Seville (ES) | | | — | | | 100.00 | | Las Cabezas Fotovoltaica, S.L./Abengoa Solar España, S.A. | | — | | (3) | | — |
Marismas PV B1, S.L. | | Seville (ES) | | | — | | | 100.00 | | Las Cabezas Fotovoltaica, S.L./Abengoa Solar España, S.A. | | — | | (3) | | — |
Marismas PV B2, S.L. | | Seville (ES) | | | — | | | 100.00 | | Las Cabezas Fotovoltaica, S.L./Abengoa Solar España, S.A. | | — | | (3) | | — |
Marismas PV B3, S.L. | | Seville (ES) | | | — | | | 100.00 | | Las Cabezas Fotovoltaica, S.L./Abengoa Solar España, S.A. | | — | | (3) | | — |
Marismas PV B4, S.L. | | Seville (ES) | | | — | | | 100.00 | | Las Cabezas Fotovoltaica, S.L./Abengoa Solar España, S.A. | | — | | (3) | | — |
Marismas PV B5, S.L. | | Seville (ES) | | | — | | | 100.00 | | Las Cabezas Fotovoltaica, S.L./Abengoa Solar España, S.A. | | — | | (3) | | — |
Marismas PV B6, S.L. | | Seville (ES) | | | — | | | 100.00 | | Las Cabezas Fotovoltaica, S.L./Abengoa Solar España, S.A. | | — | | (3) | | — |
Marismas PV B7, S.L. | | Seville (ES) | | | — | | | 100.00 | | Las Cabezas Fotovoltaica, S.L./Abengoa Solar España, S.A. | | — | | (3) | | — |
Marismas PV B8, S.L. | | Seville (ES) | | | — | | | 100.00 | | Las Cabezas Fotovoltaica, S.L./Abengoa Solar España, S.A. | | — | | (3) | | — |
Marismas PV B9, S.L. | | Seville (ES) | | | — | | | 100.00 | | Las Cabezas Fotovoltaica, S.L./Abengoa Solar España, S.A. | | — | | (3) | | — |
Marismas PV B10, S.L. | | Seville (ES) | | | — | | | 100.00 | | Las Cabezas Fotovoltaica, S.L./Abengoa Solar España, S.A. | | — | | (3) | | — |
Marismas PV B11, S.L. | | Seville (ES) | | | — | | | 100.00 | | Las Cabezas Fotovoltaica, S.L./Abengoa Solar España, S.A. | | — | | (3) | | — |
Marismas PV B12, S.L. | | Seville (ES) | | | — | | | 100.00 | | Las Cabezas Fotovoltaica, S.L./Abengoa Solar España, S.A. | | — | | (3) | | — |
Marismas PV B13, S.L. | | Seville (ES) | | | — | | | 100.00 | | Las Cabezas Fotovoltaica, S.L./Abengoa Solar España, S.A. | | — | | (3) | | — |
Marismas PV B14, S.L. | | Seville (ES) | | | — | | | 100.00 | | Las Cabezas Fotovoltaica, S.L./Abengoa Solar España, S.A. | | — | | (3) | | — |
Marismas PV B15, S.L. | | Seville (ES) | | | — | | | 100.00 | | Las Cabezas Fotovoltaica, S.L./Abengoa Solar España, S.A. | | — | | (3) | | — |
Marismas PV B16, S.L. | | Seville (ES) | | | — | | | 100.00 | | Las Cabezas Fotovoltaica, S.L./Abengoa Solar España, S.A. | | — | | (3) | | — |
Marismas PV B17, S.L. | | Seville (ES) | | | — | | | 100.00 | | Las Cabezas Fotovoltaica, S.L./Abengoa Solar España, S.A. | | — | | (3) | | — |
Marismas PV B18, S.L. | | Seville (ES) | | | — | | | 100.00 | | Las Cabezas Fotovoltaica, S.L./Abengoa Solar España, S.A. | | — | | (3) | | — |
Marismas PV C1, S.L. | | Seville (ES) | | | — | | | 100.00 | | Las Cabezas Fotovoltaica, S.L./Abengoa Solar España, S.A. | | — | | (3) | | — |
Marismas PV C2, S.L. | | Seville (ES) | | | — | | | 100.00 | | Las Cabezas Fotovoltaica, S.L./Abengoa Solar España, S.A. | | — | | (3) | | — |
F-201
Table of Contents
Appendices
Appendix XII
Subsidiary companies included in the 2013 consolidation perimeter using
the global integration method (Continuation)
| | | | | | | | | | | | | | | | |
| |
| | Shareholding | |
| |
| |
| |
|
|---|
Company Name | | Registered
Address | | Amount in
thousands
of € | | % of
Nominal
Capital | | Parent Company | | (*) | | Activity
(see
Page 4) | | Auditor |
|---|
Marismas PV C3, S.L. | | Seville (ES) | | | — | | | 100.00 | | Las Cabezas Fotovoltaica, S.L./Abengoa Solar España, S.A. | | — | | (3) | | — |
Marismas PV C4, S.L. | | Seville (ES) | | | — | | | 100.00 | | Las Cabezas Fotovoltaica, S.L./Abengoa Solar España, S.A. | | — | | (3) | | — |
Marismas PV C5, S.L. | | Seville (ES) | | | — | | | 100.00 | | Las Cabezas Fotovoltaica, S.L./Abengoa Solar España, S.A. | | — | | (3) | | — |
Marismas PV C6, S.L. | | Seville (ES) | | | — | | | 100.00 | | Las Cabezas Fotovoltaica, S.L./Abengoa Solar España, S.A. | | — | | (3) | | — |
Marismas PV C7, S.L. | | Seville (ES) | | | — | | | 100.00 | | Las Cabezas Fotovoltaica, S.L./Abengoa Solar España, S.A. | | — | | (3) | | — |
Marismas PV C8, S.L. | | Seville (ES) | | | — | | | 100.00 | | Las Cabezas Fotovoltaica, S.L./Abengoa Solar España, S.A. | | — | | (3) | | — |
Marismas PV C9, S.L. | | Seville (ES) | | | — | | | 100.00 | | Las Cabezas Fotovoltaica, S.L./Abengoa Solar España, S.A. | | — | | (3) | | — |
Marismas PV C10, S.L. | | Seville (ES) | | | — | | | 100.00 | | Las Cabezas Fotovoltaica, S.L./Abengoa Solar España, S.A. | | — | | (3) | | — |
Marismas PV C11, S.L. | | Seville (ES) | | | — | | | 100.00 | | Las Cabezas Fotovoltaica, S.L./Abengoa Solar España, S.A. | | — | | (3) | | — |
Marismas PV C12, S.L. | | Seville (ES) | | | — | | | 100.00 | | Las Cabezas Fotovoltaica, S.L./Abengoa Solar España, S.A. | | — | | (3) | | — |
Marismas PV C13, S.L. | | Seville (ES) | | | — | | | 100.00 | | Las Cabezas Fotovoltaica, S.L./Abengoa Solar España, S.A. | | — | | (3) | | — |
Marismas PV C14, S.L. | | Seville (ES) | | | — | | | 100.00 | | Las Cabezas Fotovoltaica, S.L./Abengoa Solar España, S.A. | | — | | (3) | | — |
Marismas PV C15, S.L. | | Seville (ES) | | | — | | | 100.00 | | Las Cabezas Fotovoltaica, S.L./Abengoa Solar España, S.A. | | — | | (3) | | — |
Marismas PV C16, S.L. | | Seville (ES) | | | — | | | 100.00 | | Las Cabezas Fotovoltaica, S.L./Abengoa Solar España, S.A. | | — | | (3) | | — |
Marismas PV C17, S.L. | | Seville (ES) | | | — | | | 100.00 | | Las Cabezas Fotovoltaica, S.L./Abengoa Solar España, S.A. | | — | | (3) | | — |
Marismas PV C18, S.L. | | Seville (ES) | | | — | | | 100.00 | | Las Cabezas Fotovoltaica, S.L./Abengoa Solar España, S.A. | | — | | (3) | | — |
Marismas PV E1, S.L. | | Seville (ES) | | | — | | | 100.00 | | Las Cabezas Fotovoltaica, S.L./Abengoa Solar España, S.A. | | — | | (3) | | — |
Marismas PV E2, S.L. | | Seville (ES) | | | — | | | 100.00 | | Las Cabezas Fotovoltaica, S.L./Abengoa Solar España, S.A. | | — | | (3) | | — |
Marismas PV E3, S.L. | | Seville (ES) | | | — | | | 100.00 | | Las Cabezas Fotovoltaica, S.L./Abengoa Solar España, S.A. | | — | | (3) | | — |
Marudhara Akshay Urja Private Limited | | Maharashtra (IN) | | | 12 | | | 100.00 | | Abengoa Solar India Private Limited/Abengoa Solar Internacional. S.A. | | — | | (3) | | B |
Marusthal Green Power Private Limited | | Maharashtra (IN) | | | 12 | | | 100.00 | | Abengoa Solar India Private Limited/Abengoa Solar Internacional, S.A. | | — | | (3) | | B |
Mojave Solar Holding, LLC. | | Delaware (US) | | | 246,522 | | | 100.00 | | Abengoa Solar, LLC. | | — | | (7) | | — |
NEA Solar Investments, LLC. | | Delaware (US) | | | 200 | | | 100.00 | | Abengoa Solar LLC. | | (*) | | (7) | | — |
NEA Solar Investments, S.A. | | Seville (ES) | | | 61 | | | 100.00 | | Abengoa Solar Internacional, S.A./Abengoa Solar S.A./Abengoa Solar España, S.A. | | — | | (7) | | — |
NEA Solar O&M, S.A. | | Seville (ES) | | | 61 | | | 100.00 | | Abengoa Solar, S. A /Abengoa Solar España, S.A. | | — | | (7) | | — |
NEA Solar Power, Ltd. | | Ashalim (IL) | | | — | | | 100.00 | | NEA Solar Investments, LLC | | (*) | | (7) | | — |
NEA Solar Power, S.A. | | Seville (ES) | | | 61 | | | 100.00 | | Abengoa Solar, S.A /Abengoa Solar España, S.A. | | — | | (7) | | — |
Nicefield S.A | | Buenos Aires (AR) | | | 13 | | | 100.00 | | Teyma Renovables, S.A./Instalaciones Inabensa, S.A. | | — | | (5) | | — |
Nicsa Asia Pacific Private Limited | | Singapore (SG) | | | — | | | 100.00 | | Negocios Industriales y Comerciales, S.A. | | — | | (1) | | — |
Nicsa Fornecimiento de Materiais Eléctricos, Ltda. | | R. de Janeiro (BR) | | | 5,152 | | | 100.00 | | Abeinsa Ingeniería y Construcción Industrial, S.A./Negocios Industriales y Comerciales, S.A. | | — | | (1) | | — |
Nicsa Industrial Supplies Corporation | | Houston (US) | | | 757 | | | 100.00 | | Abeinsa, Inc. LLC. | | — | | (1) | | — |
Nicsa Industrial Supplies South Africa (Pty) Ltd. | | Upington (ZA) | | | — | | | 100.00 | | Nicsa, Negocios Industriales y Comerciales, S.A. | | (*) | | (1) | | — |
Nicsa Mexico, S.A. de CV | | Mexico City (MX) | | | 4 | | | 100.00 | | Negocios Industriales y Comerciales, S.A./Abengoa México, S.A. de C.V. | | — | | (1) | | — |
Nicsa Middle East, FZE | | Sharjah (AE) | | | 29 | | | 100.00 | | Negocios Industriales y Comerciales, S. A | | — | | (1) | | B |
Nicsa Perú, S.A. | | Lima (PE) | | | 6 | | | 100.00 | | Negocios Industriales y Comerciales, S.A./Abeinsa Ingeniería y Construcción Industrial, S.A. | | — | | (1) | | — |
Nicsa, Negocios Industr. y Comer. S.A. | | Madrid (ES) | | | 1,791 | | | 100.00 | | Abencor, S.A./Abeinsa Ingeniería y Construcción Industrial, S.A. | | — | | (1) | | C |
Norventus Atlántico, S.L | | A Coruña (ES) | | | 7 | | | 70.00 | | Instalaciones Inabensa, S.A. | | — | | (5) | | — |
Omega Chile SpA | | Santiago de Chile (CL) | | | 2 | | | 100.00 | | Omega Sudamérica, S.L. | | (*) | | (1) | | — |
OMEGA Operação de Linhas deTransmissão, S.A. | | R. de Janeiro (BR) | | | 175 | | | 100.00 | | Instalaciones Inabesa S.A./Abengoa Brasil, S.A. | | — | | (1) | | — |
F-202
Table of Contents
Appendices
Appendix XII
Subsidiary companies included in the 2013 consolidation perimeter using
the global integration method (Continuation)
| | | | | | | | | | | | | | | | |
| |
| | Shareholding | |
| |
| |
| |
|
|---|
Company Name | | Registered
Address | | Amount in
thousands
of € | | % of
Nominal
Capital | | Parent Company | | (*) | | Activity
(see
Page 4) | | Auditor |
|---|
Omega Perú Operación y Mantenimiento S.A. | | Lima (PE) | | | — | | | 100.00 | | Omega Sudamérica S.L./Abengoa Perú S.A. | | (*) | | (1) | | — |
Omega Sudamérica, S. L | | Seville (ES) | | | 3 | | | 100.00 | | Instalaciones Inabensa, S.A./ASA Iberoamérica S.A. | | — | | (1) | | — |
Operación y Mantenimiento Uruguay, S.A. | | Montevideo (UY) | | | 2 | | | 100.00 | | Omega Sudamérica S.L. | | — | | (5) | | — |
Palmatir S.A. | | Montevideo (UY) | | | 29,927 | | | 100.00 | | Holding de Energía Eólica, S.A. | | — | | (5) | | B |
Palmucho, S.A. | | Santiago de Chile (CL) | | | 2 | | | 100.00 | | Abengoa Chile, S.A. / Enicar Chile, S.A. | | — | | (2) | | — |
Power Structures Inc. | | Delaware (US) | | | — | | | 100.00 | | Abeinsa, Inc. LLC. | | — | | (1) | | — |
Precosa, Puerto Real Cogeneración, S.A. | | Cadiz (ES) | | | 176 | | | 99.10 | | Abeinsa Asset Management, S.L. | | — | | (5) | | — |
Presentel, S.A. | | Buenos Aires (AR) | | | 3 | | | 100.00 | | Abencor Suministros, S.A. | | (*) | | (1) | | — |
Procesos Ecológicos Carmona 1, S.A. | | Seville (ES) | | | 63 | | | 100.00 | | Abeinsa Infraestructuras Medio Ambiente, S.A./Procesos Ecológicos, S.A. | | — | | (1) | | — |
Procesos Ecológicos Carmona 2, S.A. | | Seville (ES) | | | 90 | | | 100.00 | | Abeinsa Infraestructuras Medio Ambiente, S.A./Procesos Ecológicos, S.A. | | — | | (1) | | — |
Procesos Ecológicos Carmona 3, S.A. | | Seville (ES) | | | 60 | | | 100.00 | | Abeinsa Infraestructuras Medio Ambiente, S.A./Procesos Ecológicos, S.A. | | — | | (1) | | — |
Procesos Ecológicos Lorca 1, S.A. | | Seville (ES) | | | 180 | | | 100.00 | | Abeinsa Infraestructuras Medio Ambiente, S.A./Procesos Ecológicos, S.A. | | — | | (1) | | — |
Procesos Ecológicos Vilches, S.A. | | Seville (ES) | | | 1,299 | | | 100.00 | | Abeinsa Infraestructuras Medio Ambiente, S.A./Procesos Ecológicos, S.A. | | — | | (5) | | — |
Proecsa, Procesos Ecológicos, S.A. | | Seville (ES) | | | 657 | | | 50.00 | | Abeinsa Infraestructuras Medio Ambiente, S.A. | | — | | (1) | | — |
Promotora Serabén de Servicios Corporativos, S.A. de C.V. | | Mexico City (MX) | | | 3 | | | 100.00 | | Abener Mexico S.A. de C.V./Abengoa Mexico S.A. de C.V. | | — | | (1) | | — |
Qingdao BCTA Desalinataion Co.Ltd. | | Qingdao (CH) | | | 37,786 | | | 92.59 | | Befesa CTA Qingdao, S.L. | | — | | (4) | | B |
Qingdao Befesa Agua Co., Ltd (WFOE Qingdao) | | Qingdao (CH) | | | 1,609 | | | 100.00 | | Abeinsa Infraestructuras Medio Ambiente, S.A./Codesa, S.A. | | — | | (1) | | — |
Rajasthan Photon Energy Pvt Ltd | | Maharashtra (IN) | | | 12 | | | 100.00 | | Abengoa Solar India Private Limited/Abengoa Solar Internacional, S.A. | | — | | (3) | | B |
Rioglass Solar 2, S.A. | | Asturias (ES) | | | 60 | | | 100.00 | | Rioglass Solar Holding, S.A. | | — | | (7) | | B |
Rioglass Solar Holding, S.A | | Asturias (ES) | | | 502 | | | 50.00 | | Abengoa Solar, S.A. | | — | | (7) | | B |
Rioglass Solar Inc. | | Delaware (US) | | | 9,391 | | | 100.00 | | Rioglass Solar Holding, S.A. | | — | | (7) | | B |
Rioglass Solar Int. | | Brussels (BE) | | | 62 | | | 100.00 | | Rioglass Solar Holding, S.A./Rioglass Solar, S.A. | | (*) | | (3) | | — |
Rioglass Solar, S.A | | Asturias (ES) | | | 6,906 | | | 100.00 | | Rioglass Solar Holding, S.A. | | — | | (7) | | B |
Rioglass South Africa (Lty) Ltd. | | Upington (ZA) | | | 60 | | | 100.00 | | Rioglass Solar Holding, S.A. | | (*) | | (7) | | — |
Royalla PV Pty Ltd. | | Brisbane (AU) | | | 22 | | | 100.00 | | Abengoa Solar Internacional, S.A. | | — | | (3) | | — |
S.E.T Sureste Peninsular, S.A. De CV | | Mexico City (MX) | | | 1,700 | | | 100.00 | | Abengoa México, S.A. de C.V./Instalaciones Inabensa, S.A. | | — | | (1) | | — |
Sanlúcar Solar, S.A. | | Seville (ES) | | | 8,215 | | | 100.00 | | Abengoa Solar, S.A./Asa Environment | | — | | (3) | | B |
Sao Mateus Transmissora de Energía, Ltda. | | R. de Janeiro (BR) | | | 57,569 | | | 76.00 | | Abengoa Concessoes Brasil Holding, S.A./Abengoa Brasil Ltda. | | — | | (2) | | — |
SAS Abengoa Bioenergia Biomasse France | | Arance (FR) | | | 3 | | | 100.00 | | Abengoa Bioenergía Inversiones, S.A. | | — | | (6) | | — |
Servicios Auxiliares de Administración, S.A. De C.V. | | Mexico City (MX) | | | 3 | | | 99.80 | | Abengoa México, S.A. de C.V./Abengoa, S.A. | | — | | (1) | | — |
Servicios de Ingenieria IMA, S.A. | | Santiago de Chile (CL) | | | 3,268 | | | 94.08 | | Abengoa Chile, S.A. | | — | | (1) | | — |
Shariket Tenes Lilmiyah Spa | | Argel (DZ) | | | 15,630 | | | 51.00 | | Befesa Aguas Tenes, S.L. | | — | | (4) | | D |
Siema AG | | Zug (SZ) | | | 8,757 | | | 100.00 | | Sociedad Inversora Energía y Medio Ambiente, S.A. | | — | | (1) | | — |
Siema Factory Holding, AG | | Zug (SZ) | | | 9,353 | | | 100.00 | | Siema Investment, S.L. | | — | | (1) | | — |
Siema Investment, S.L.U. | | Madrid (ES) | | | 7,000 | | | 100.00 | | Siema Technologies, S.L | | — | | (1) | | — |
Siema Technologies, S.L. | | Madrid (ES) | | | 24,297 | | | 100.00 | | Abengoa, S.A./Siema AG | | — | | (1) | | B |
Simosa I.T., S.A | | Seville (ES) | | | 61 | | | 100.00 | | Abengoa, S.A./Simosa, S.A. | | — | | (1) | | B |
Simosa IT Uruguay S.A. | | Montevideo (UY) | | | 2 | | | 100.00 | | Simosa IT, S.A. | | — | | (1) | | B |
Simosa IT US, LLC | | Chesterfield (US) | | | — | | | 100.00 | | Simosa IT, S.A. | | — | | (1) | | B |
Simosa, Serv. Integ. Manten y Operac., S.A. | | Seville (ES) | | | 1,185 | | | 100.00 | | Negocios Industriales y Comerciales, S.A./Abengoa, S.A. | | — | | (1) | | C |
Sinalan, S.A. | | Montevideo (UY) | | | 3 | | | 100.00 | | Teyma Forestal, S.A. | | — | | (1) | | — |
Sistemas de Desarrollo Sustentables S.A. De C.V. | | Mexico City (MX) | | | 4,458 | | | 65.00 | | Abengoa Servicios Industriales, S.A./Abengoa México, S.A. de CV | | — | | (5) | | — |
Soc. Inver. En Ener. y Medioambiente, S.A. (Siema) | | Seville (ES) | | | 93,008 | | | 100.00 | | Abengoa, S.A./Negocios Industriales y Comerciales, S.A. | | — | | (1) | | B |
Sociedad Inversora Lineas de Brasil, S.L. (ETVE) | | Seville (ES) | | | 12,798 | | | 100.00 | | Asa Iberoamérica, S.L. | | — | | (1) | | B |
Sol3G | | Barcelona (ES) | | | 6,762 | | | 100.00 | | Abengoa Solar, S.A. | | — | | (7) | | D |
Solaben Electricidad Uno | | Caceres (ES) | | | 164,915 | | | 100.00 | | Extremadura Equity Investments Sárl. | | — | | (3) | | B |
Solaben Electricidad Dos | | Caceres (ES) | | | 62,688 | | | 70.00 | | Abengoa Solar España, S.A./ Logrosán Solar Inversiones, S.A. | | — | | (3) | | B |
Solaben Electricidad Tres | | Caceres (ES) | | | 62,401 | | | 70.00 | | Abengoa Solar España, S.A./ Logrosán Solar Inversiones, S.A. | | — | | (3) | | B |
Solaben Electricidad Seis | | Badajoz (ES) | | | 162,793 | | | 100.00 | | Extremadura Equity Investments Sárl. | | — | | (3) | | B |
Solaben Electricidad Ocho, S.A. | | Caceres (ES) | | | 60 | | | 100.00 | | Abengoa Solar España, S.A/Abengoa Solar New Technologies,S.A. | | — | | (3) | | — |
F-203
Table of Contents
Appendices
Appendix XII
Subsidiary companies included in the 2013 consolidation perimeter using
the global integration method (Continuation)
| | | | | | | | | | | | | | | | |
| |
| | Shareholding | |
| |
| |
| |
|
|---|
Company Name | | Registered
Address | | Amount in
thousands
of € | | % of
Nominal
Capital | | Parent Company | | (*) | | Activity
(see
Page 4) | | Auditor |
|---|
Solaben Electricidad Diez, S.A. | | Caceres (ES) | | | 60 | | | 100.00 | | Abengoa Solar España, S.A./Abengoa Solar NT, S.A. | | — | | (3) | | �� |
Solacor Electricidad Uno, S.A. | | Seville (ES) | | | 57,902 | | | 74.00 | | Carpio Solar Inversiones, S.A. | | — | | (3) | | B |
Solacor Electricidad Dos, S.A. | | Seville (ES) | | | 58,477 | | | 74.00 | | Carpio Solar Inversiones, S.A. | | — | | (3) | | B |
Solar de Receptores de Andalucía, S.A. | | Seville (ES) | | | 60 | | | 100.00 | | Abengoa Solar, S.A./Abengoa Solar NT, S.A. | | — | | (3) | | — |
Solar Power Plant One (SPP1) | | Argel (DZ) | | | 42,111 | | | 51.00 | | Abener Energía, S.A. | | — | | (3) | | D |
Solar Power PV South Africa (Pty) Ltd. | | Gauteng (ZA) | | | 173 | | | 100.00 | | Abengoa Solar South Africa (Pty) Ltd. | | — | | (3) | | B |
Solar Processes, S.A. | | Seville (ES) | | | 14,578 | | | 100.00 | | Abengoa Solar España,S.A./ Instalaciones Inabensa, S.A. | | — | | (3) | | B |
Solargate Electricidad Tres, S.A. | | Seville (ES) | | | 60 | | | 100.00 | | Abengoa Solar España, S.A./Abengoa Solar NT, S.A. | | — | | (3) | | — |
Solargate Electricidad Cuatro , S.A. | | Seville (ES) | | | 60 | | | 100.00 | | Abengoa Solar España, S.A./Abengoa Solar NT, S.A. | | — | | (3) | | — |
Solargate Electricidad Cinco , S.A. | | Seville (ES) | | | 60 | | | 100.00 | | Abengoa Solar España, S.A./Abengoa Solar NT, S.A. | | — | | (3) | | — |
Solnova Electricidad, S.A. | | Seville (ES) | | | 30,986 | | | 100.00 | | Solnova Solar Inversiones, S.A./Instalaciones Inabensa, S.A. | | — | | (3) | | B |
Solnova Electricidad Dos, S.A. | | Seville (ES) | | | 4,360 | | | 100.00 | | Abengoa Solar España, S.A./Abengoa Solar, S.A. | | — | | (3) | | — |
Solnova Electricidad Tres, S.A. | | Seville (ES) | | | 30,110 | | | 100.00 | | Solnova Solar Inversiones, S.A./Instalaciones Inabensa, S.A. | | — | | (3) | | B |
Solnova Electricidad Cuatro, S.A. | | Seville (ES) | | | 28,964 | | | 100.00 | | Solnova Solar Inversiones, S.A /Instalaciones Inabensa, S.A. | | — | | (3) | | B |
Solnova Electricidad Cinco, S.A. | | Seville (ES) | | | 3,460 | | | 100.00 | | Abengoa Solar España, S.A./Abengoa Solar, S.A. | | — | | (3) | | — |
Solnova Electricidad Séis , S.A. | | Seville (ES) | | | 60 | | | 100.00 | | Abengoa Solar España, S.A./Abengoa Solar NT, S.A. | | — | | (3) | | — |
Solnova Solar Inversiones, S.A | | Seville (ES) | | | 60 | | | 100.00 | | Abengoa Solar España, S.A. | | — | | (7) | | B |
Son Rivieren (Pty) Limited | | Gauteng (ZA) | | | 549 | | | 100.00 | | South Africa Solar Investment, S.L. | | — | | (7) | | B |
South Africa PV Investments, S.L. | | Seville (ES) | | | 100 | | | 100.00 | | Abengoa Solar Internacional, S.A./Abengoa Solar Ventures, S.A | | (*) | | (7) | | — |
South Africa Solar Investments, S.L. | | Seville (ES) | | | 10,000 | | | 100.00 | | Abengoa Solar Internacional, S.A. | | — | | (7) | | B |
South Africa Solar Ventures, S.L. | | Seville (ES) | | | 50 | | | 100.00 | | Abengoa Solar Internacional, S.A./Abengoa Solar Ventures, S.A | | — | | (7) | | — |
Subestaciones 611 Baja California, S.A. De C.V. | | Mexico City (MX) | | | 3 | | | 100.00 | | Abengoa México, S.A. de C.V./Abengoa, S.A | | — | | (1) | | — |
Tarefix S.A | | Delaware (US) | | | 1 | | | 92.00 | | Asa Investment AG | | — | | (1) | | B |
Teyma Abengoa, S.A. | | Buenos Aires (AR) | | | 49,055 | | | 100.00 | | Asa Investment, AG/Asa Iberoamérica, S.L. | | — | | (1) | | — |
Teyma Construcciones S.A | | Montevideo (UY) | | | 5,094 | | | 97.00 | | Teyma Sociedad de Inversión, S.A. | | — | | (1) | | B |
Teyma Construction USA, LLC. | | Phoenix (US) | | | 1 | | | 100.00 | | Abeinsa, LLC . | | — | | (1) | | — |
Teyma Forestal, S.A. | | Montevideo (UY) | | | 787 | | | 100.00 | | Teyma Renovables | | — | | (7) | | B |
Teyma Gestión Ambiental, S.A. | | Montevideo (UY) | | | 18 | | | 100.00 | | Teyma Medioambiente, S.A. | | — | | (1) | | — |
Teyma India Private Limited | | Mumbai (IN) | | | 1,070 | | | 100.00 | | Teyma Gestión de Contratos de Construcción e Ingeniería, S.A. | | — | | (1) | | B |
Teyma Medio Ambiente, S.A. | | Montevideo (UY) | | | 19 | | | 100.00 | | Teyma Uruguay Holding, S. A . | | — | | (1) | | — |
Teyma Middle East, S.L. | | Seville (ES) | | | 1 | | | 100.00 | | Teyma, S.A. /Teyma Int., S.A. /Ábacus Project Management Inc./Teyma Uruguay, S.A. | | — | | (1) | | B |
Teyma Paraguay, SA. | | Asuncion (PY) | | | — | | | 100.00 | | Teyma Servicios de Ingeniería y Construcción Internacional, S.A. | | — | | (1) | | — |
Teyma Renovables, S.A. | | Montevideo (UY) | | | 3,563 | | | 98.00 | | Teyma Uruguay Holding S.A. | | — | | (1) | | B |
Teyma Servicios de Ingeniería y Construcción Internacional, S.A. | | Montevideo (UY) | | | 19 | | | 100.00 | | Teyma Uruguay Holding, S.A. | | — | | (1) | | B |
Teyma Sociedad de Inversión, S.A. | | Montevideo (UY) | | | 18,220 | | | 92.00 | | Abeinsa Inversiones Latam, S.L. | | — | | (1) | | B |
Teyma South Africa (Pty) Ltd. | | Upington (ZA) | | | 80 | | | 100.00 | | Teyma Gestión de Contratos de Construcción e Ingeniería, S.A. | | (*) | | (1) | | — |
Teyma Uruguay ZF, S.A. | | Montevideo (UY) | | | 23 | | | 100.00 | | Teyma Construcción, S.A. | | — | | (1) | | B |
Teyma USA & Abener Engineering and Construction Services Partnership | | Chesterfield (US) | | | 14,801 | | | 100.00 | | Teyma Construction USA, LLC/Abener Engineering and Construction Services, LLC. | | — | | (1) | | B |
Teyma, Gestión de Contratos de Construcción e Ingeniería, S.A. | | Seville (ES) | | | 55 | | | 92.00 | | Abeinsa Ingeniería y Construcción Industrial, S.A. | | — | | (1) | | — |
Transmisora Baquedano, S.A. | | Santiago de Chile (CL) | | | 8,889 | | | 99.90 | | Abengoa Chile, S.A. | | — | | (2) | | — |
Transmisora Mejillones S.A. | | Santiago de Chile (CL) | | | 7,257 | | | 99.90 | | Abengoa Chile, S.A. | | — | | (2) | | — |
Transportadora Bahía Blanca S.A. | | Buenos Aires (AR) | | | 1 | | | 100.00 | | Abengoa S.A./Teyma Abengoa S.A. | | (*) | | (2) | | — |
Transportadora Cuyana, S.A. | | Buenos Aires (AR) | | | 4 | | | 100.00 | | Teyma Abengoa, S.A./Abengoa, S.A. | | — | | (1) | | — |
Transportadora del Norte, S.A. | | Buenos Aires (AR) | | | — | | | 100.00 | | Abengoa, S.A./Teyma Abengoa, S.A. | | — | | (1) | | — |
Transportadora Río Coronda, S.A. | | Buenos Aires (AR) | | | — | | | 100.00 | | Teyma Abengoa, S.A./Abengoa, S.A. | | — | | (1) | | D |
Transportadora Rio de la Plata, S.A. | | Buenos Aires (AR) | | | — | | | 100.00 | | Teyma Argentina, S.A./Abengoa, S.A. | | — | | (1) | | — |
Turbogenerador Madero 7, S.A. de C.V. | | Mexico City (MX) | | | 1 | | | 100.00 | | Abener Energ., S.A./ Teyma, Gest. Cont. Const. e Ing., S.A./Abengoa México, S.A. de C.V. | | (*) | | (1) | | — |
Waste to Energy Suppliers San Jose, S.A. | | Costa Rica (CR) | | | — | | | 100.00 | | Abeinsa Inf. de Medio Ambiente, S.A./Teyma, Gestión de Contratos e Ingeniería, S.A. | | (*) | | (1) | | — |
F-204
Table of Contents
Appendices
Appendix XII
Subsidiary companies included in the 2013 consolidation perimeter using
the global integration method (Continuation)
| | | | | | | | | | | | | | | | |
| |
| | Shareholding | |
| |
| |
| |
|
|---|
Company Name | | Registered
Address | | Amount in
thousands
of € | | % of
Nominal
Capital | | Parent Company | | (*) | | Activity
(see
Page 4) | | Auditor |
|---|
XiNa CSP South Africa (Pty) Ltd | | Gauteng (ZA) | | | 39 | | | 100.00 | | South Africa Solar Investments, S.L. | | — | | (7) | | B |
Zero Emissions Technologies, S.A. | | Seville (ES) | | | 60 | | | 100.00 | | Abeinsa Ingeniería y Construcción Industrial, S.A./Abengoa Hidrógeno, S.A. | | — | | (7) | | — |
Zeroemissions (Beijing) Technology Consulting Service Co. Ltd | | Beijing (CN) | | | 100 | | | 100.00 | | Zero Emissions Technologies, S.A./Zeroemissions Carbon Trust, S.A. | | — | | (1) | | — |
Zeroemissions Carbon Trust, S.A | | Seville (ES) | | | 125 | | | 100.00 | | Zeroemissions Technologies, S.A./Abeinsa Ingeniería y Construcción Industrial, S.A. | | — | | (7) | | — |
Zeroemissions do Brasil, Ltda | | R. de Janeiro (BR) | | | 2,884 | | | 100.00 | | Zeroemissions Technologies, S.A./Zeroemissions Carbon Trust,S.A. | | — | | (1) | | — |
Zona Norte Engenharia, Manutenção e Gestão De Serviços, S.A. Spe. | | Manaus (BR) | | | 7,210 | | | 60.00 | | Abengoa Concessões Brasil Holding, S.A. | | (*) | | (5) | | — |
Shareholding capital cost is calculated using the current closing year exchange rate
- (*)
- Companies incorporated or acquired and consolidated for the first time in the year.
- (**)
- Abengoa 100% class B (control), Liberty 100% class A.
- (1)
- Operating segment activities area: Engineering and Construction.
- (2)
- Operating segment activities area: Transmission.
- (3)
- Operating segment activities area: Solar.
- (4)
- Operating segment activities area: Water.
- (5)
- Operating segment activities areae: Cogeneration and others.
- (6)
- Operating segment activities area: Bioenergy.
- (7)
- Operating segment activities area: Others.
- A
- Audited by PricewaterhouseCoopers Auditores.
- B
- Audited by Deloitte (for legal purposes).
- C
- Audited by Auditoría y Consulta (for legal purposes).
- D
- Audited by others auditors (for legal purposes).
F-205
Table of Contents
Appendices
Appendix XIII
Associated companies and Joint Ventures included in the 2013 consolidation perimeter using the participation method
| | | | | | | | | | | | | | | | |
| |
| | Shareholding | |
| |
| |
| |
|
|---|
Company Name | | Registered
Address | | Amount in
thousands
of € | | % of
Nominal
Capital | | Parent Company | | (*) | | Activity | | Auditor |
|---|
Abengoa Bioenergy Biomass of Kansas, LLC | | Chesterfield (US) | | | 330,036 | | | 100.00 | | Abengoa Bioenergy Hybrid of Kansas, LLC. | | — | | (6) | | B |
Agua y Gestión de Servicios Ambientales, S.A. | | Seville (ES) | | | 7,124 | | | 41.54 | | Abengoa Water, S.L.U. | | — | | (4) | | — |
Al Osais-Inabensa Co. Ltd | | Dammam (SA) | | | 387 | | | 50.00 | | Inabensa Saudi Arabia, LLC | | — | | (1) | | B |
ATE VIII, Transmissora de Energía, S.A. | | R. de Janeiro (BR) | | | 3,852 | | | 50.00 | | Abengoa Concessoes Brasil Holding, S.A. | | — | | (2) | | B |
Basor México, S.A.P.I. de C.V. | | Mexico City (MX) | | | 180 | | | 50.00 | | Nicsamex, S.A. de C.V. | | (*) | | (1) | | — |
Central Eólica São Tomé Ltda. | | Sao Paulo (BR) | | | 61 | | | 9.00 | | Abengoa Construçao Brasil, Ltda. | | — | | (5) | | — |
Chennai Water Desalination Limited | | Chennai (IN) | | | 7,086 | | | 25.00 | | Abengoa Water, S.L.U. | | — | | (4) | | — |
Coaben, S.A. de C.V. | | Mexico City (MX) | | | 1 | | | 50.00 | | Abengoa México S.A. de C.V./Instalaciones Inabensa, S.A. | | — | | (1) | | B |
Cogeneración Motril, S.A. | | Seville (ES) | | | 1,913 | | | 19.00 | | Abeinsa Asset Management, S.L. | | — | | (5) | | — |
Concecutex, S.A. de C.V. | | Toluca (MX) | | | 6,932 | | | 50.00 | | Abengoa México, S.A. de C.V. | | — | | (5) | | B |
Concesionaria Costa del Sol S.A. | | Malaga (ES) | | | 4,585 | | | 50.00 | | Instalaciones Inabensa, S.A. | | — | | (5) | | B |
Concesionaria Hospital del Tajo, S.A. | | Madrid (ES) | | | 1,727 | | | 20.00 | | Instalaciones Inabensa, S.A. | | — | | (5) | | — |
Consorcio Teyma M y C Ingeniería | | Santiago de Chile (CL) | | | 10 | | | 50.00 | | Abengoa Chile, S.A. | | — | | (1) | | — |
Evacuación Valdecaballeros, S.A. | | Madrid (ES) | | | 8,984 | | | 57.14 | | Solaben Electricidad Uno, Dos, Tres y Seis, S.A. | | — | | (3) | | — |
Evacuación Villanueva del Rey, S. L. | | Seville (ES) | | | 2 | | | 45.13 | | Helioenergy Electricidad Uno, Dos y Tres, S.A. | | — | | (3) | | — |
Explotaciones Varias, S.L. | | Seville (ES) | | | 2,301 | | | 50.00 | | Abengoa, S.A. | | — | | (1) | | — |
Explotadora Hospital del Tajo, S.L. | | Madrid (ES) | | | 1 | | | 20.00 | | Instalaciones Inabensa, S.A. | | — | | (5) | | — |
Geida Tlemcen, S.L. | | Madrid (ES) | | | 13,584 | | | 50.00 | | Abengoa Water, S.L.U. | | — | | (4) | | — |
Ghenova Ingeniería S.L. | | Seville (ES) | | | 1,027 | | | 20.00 | | Abener Energía, S.A. | | — | | (1) | | — |
Green Visión Holding BV | | Arnhem (NL) | | | 3,000 | | | 24.00 | | Abengoa Hidrógeno, S.A. | | — | | (1) | | — |
Helioenergy Electricidad Uno, S.A. | | Seville (ES) | | | 43,600 | | | 50.00 | | Écija Solar Inversiones, S.A. | | — | | (3) | | B |
Helioenergy Electricidad Dos, S.A. | | Seville (ES) | | | 42,718 | | | 50.00 | | Écija Solar Inversiones, S.A. | | — | | (3) | | B |
Íbice Participações e Consultoria em Energia S.A. | | R. de Janeiro (BR) | | | 462 | | | 50.00 | | Abengoa Concessões Brasil Holding, S.A. | | — | | (1) | | — |
Inabensa Green Energy Co., Ltd. | | Japan (JP) | | | 198 | | | 50.00 | | Instalaciones Inabensa S.A. | | (*) | | (1) | | — |
Inapreu, S.A. | | Barcelona (ES) | | | 2,318 | | | 50.00 | | Instalaciones Inabensa, S.A. | | — | | (5) | | B |
Kaxu Solar One (Pty) Ltd. | | Gauteng (ZA) | | | 13,245 | | | 51.00 | | Abengoa Solar South Africa (Pty) Ltd. | | — | | (3) | | B |
Khi Solar One (Pty) Ltd | | Gauteng (ZA) | | | 10,426 | | | 51.00 | | Son Rivieren (Pty) Limited | | — | | (3) | | B |
Ledincor S.A. | | Montevideo (UY) | | | 530 | | | 49.00 | | Teyma Forestal, S.A. | | — | | (1) | | — |
Lidelir S.A. | | Montevideo (UY) | | | 890 | | | 49.00 | | Teyma Forestal, S.A. | | — | | (1) | | — |
Micronet Porous Fibers, S.L. | | Vizcaya (ES) | | | 2,809 | | | 50.00 | | Abengoa Water S.L.U. [K19] 50%; Porous Fiber 50% | | — | | (7) | | — |
Mojave Solar LLC | | Berkeley (US) | | | 246,521 | | | 100.00 | | Mojave Solar Holding, LLC | | — | | (3) | | B |
Myah Bahr Honaine, S.P.A. | | Argel (DZ) | | | 21,600 | | | 51.00 | | Geida Tlemcen, S.L. | | — | | (4) | | D |
Negev Energy—Ashalim Thermo-Solar Ltd. | | Tel Aviv (IL) | | | — | | | 50.00 | | NEA Solar Power, Ltd. | | (*) | | (3) | | — |
Palen Solar Holdings, LLC | | California (US) | | | 22,845 | | | 42.97 | | Abengoa SP Holdings, LLC | | (*) | | (3) | | — |
Parque Eólico Cristalândia Ltda. | | Salvador—Bahía (BR) | | | 1,016 | | | 20.00 | | Instalaciones Inabensa, S.A./Abengoa Concessões Brasil Holding, S.A. | | — | | (5) | | — |
Resurce, Resid. Urbanos de Ceuta, S.L. | | Seville (ES) | | | 2,030 | | | 50.00 | | Abengoa, S.A. | | — | | (1) | | — |
Servicios Culturales Mexiquenses, S.A. de C.V. | | Mexico City (MX) | | | 1 | | | 50.00 | | Abengoa México, S.A. de C.V. | | — | | (1) | | B |
Shams Power Company PJSC | | Abu-Dhabi (AE) | | | 162 | | | 40.00 | | Total Abengoa Solar Emirates Investment Company, BV | | — | | (3) | | — |
SRC Nanomaterials, S.A | | Asturias (ES) | | | 500 | | | 50.00 | | Rioglass Solar, S.A. | | — | | (3) | | — |
Tendogenix (RF) (Pty) Ltd. | | Gauteng (ZA) | | | — | | | 40.00 | | Xina CSP South Africa (Pty) Ltd | | (*) | | (3) | | — |
Total Abengoa Solar Emirates Investment Company, B.V. | | Amsterdam (NL) | | | 24,177 | | | 50.00 | | Abengoa Solar Ventures, S.A | | — | | (7) | | B |
Total Abengoa Solar Emirates O&M Company, B.V. | | Amsterdam (NL) | | | 165 | | | 50.00 | | Abengoa Solar Ventures, S.A. | | — | | (3) | | B |
TSMC Ingeniería y Contrucción, Ltda. | | Santiago de Chile (CL) | | | 12 | | | 33.30 | | Abengoa Chile, S.A. | | — | | (1) | | — |
Shareholding capital cost is calculated using the current closing year exchange rate
- (*)
- Companies incorporated or acquired and consolidated for the first time in the year.
- (1)
- Operating segment activities area: Engineering and Construction.
- (2)
- Operating segment activities area: Transmission.
- (3)
- Operating segment activities area: Solar.
- (4)
- Operating segment activities area: Water.
F-206
Table of Contents
Appendices
Appendix XIII
Associated companies and Joint Ventures included in the 2013 consolidation perimeter using the participation method (Continuation)
- (5)
- Operating segment activities areae: Cogeneration and others.
- (6)
- Operating segment activities area: Bioenergy.
- (7)
- Operating segment activities area: Others.
- A
- Audited by PricewaterhouseCoopers Auditores.
- B
- Audited by Deloitte (for legal purposes).
- C
- Audited by Auditoría y Consulta (for legal purposes).
- D
- Audited by others auditors (for legal purposes)
F-207
Table of Contents
Appendices
Appendix XIV
Temporary Joint Ventures included in the 2013 Consolidation Perimeter using
the proportional integration method
| | | | | | | | | | | | | | | | |
| |
| | Shareholding | |
| |
| |
| |
|
|---|
Company Name | | Registered
Address | | Amount in
thousands
of € | | % of
Nominal
Capital | | Partner Company in Entity | | (*) | | Activity
(see Page 3) | | Auditor |
|---|
Acceso Avda Pais Valencia | | Alicante (ES) | | | 3 | | | 50.00 | | Instalaciones Inabensa, S.A. | | — | | (1) | | — |
Adis Segovia Valdestrilla | | Madrid (ES) | | | — | | | 7.00 | | Instalaciones Inabensa, S.A. | | — | | (1) | | — |
Agencia Andaluza de Energía | | Seville (ES) | | | 6 | | | 35.00 | | Instalaciones Inabensa, S.A. | | — | | (1) | | — |
Albalac | | Madrid (ES) | | | 2 | | | 33.34 | | Instalaciones Inabensa, S.A. | | — | | (1) | | — |
Almanjayar | | Madrid (ES) | | | 2 | | | 25.00 | | Instalaciones Inabensa, S.A. | | — | | (1) | | — |
Almería | | Almeria (ES) | | | 2 | | | 50.00 | | Abengoa Water S.L.U. | | — | | (4) | | — |
Aparcamiento L`Ordana | | Alicante (ES) | | | 5 | | | 90.00 | | Instalaciones Inabensa, S.A. | | — | | (1) | | — |
APCA Inabensa-Abengoa Lote 1 | | Seville (ES) | | | 6 | | | 100.00 | | Instalaciones Inabensa, S.A./Abengoa S.A. | | — | | (1) | | — |
APCA Inabensa-Abengoa Lote 2 | | Seville (ES) | | | 6 | | | 100.00 | | Instalaciones Inabensa, S.A./Abengoa S.A. | | — | | (1) | | — |
Argelia | | Madrid (ES) | | | 3 | | | 50.00 | | Instalaciones Inabensa, S.A. | | — | | (1) | | — |
Armilla | | Seville (ES) | | | 3 | | | 50.00 | | Instalaciones Inabensa, S.A. | | — | | (1) | | — |
Asimel | | Madrid (ES) | | | 1 | | | 25.00 | | Instalaciones Inabensa, S.A. | | — | | (1) | | — |
Badaia | | Vitoria (ES) | | | 3 | | | 30.00 | | Instalaciones Inabensa, S.A. | | — | | (1) | | — |
Baja California | | Seville (ES) | | | — | | | 100.00 | | Inabensa, S.A. /Abener Energía, S.A./Abeinsa Ingeniería y Construcción Industrial, S.A./Serv. Aux. de Administración, S.A. de C.V. | | — | | (1) | | D |
Barras Parada | | Madrid (ES) | | | 3 | | | 50.00 | | Instalaciones Inabensa, S.A. | | — | | (1) | | — |
CARE Córdoba | | Seville (ES) | | | 12 | | | 25.00 | | Instalaciones Inabensa, S.A. | | — | | (1) | | — |
Cartagena | | Murcia (ES) | | | 1 | | | 38.00 | | Abengoa Water S.L.U. | | — | | (4) | | — |
cd | | Madrid (ES) | | | 6 | | | 40.00 | | Instalaciones Inabensa, S.A. | | — | | (1) | | — |
CEI Huesca | | Zaragoza (ES) | | | 1 | | | 20.00 | | Instalaciones Inabensa, S.A. | | (*) | | (1) | | — |
Cercanias Tren (Camas-Salteras) | | Madrid (ES) | | | 1 | | | 35.00 | | Instalaciones Inabensa, S.A. | | — | | (1) | | — |
Circulo Mercantil e Industrial de Sevilla | | Seville (ES) | | | 3 | | | 50.00 | | Instalaciones Inabensa, S.A. | | (*) | | (1) | | — |
Ciudad de la Justicia | | Madrid (ES) | | | 1 | | | 20.00 | | Instalaciones Inabensa, S.A. | | — | | (1) | | — |
Consistorio | | Madrid (ES) | | | 6 | | | 30.00 | | Instalaciones Inabensa, S.A. | | — | | (1) | | — |
Consorcio Abengoa Kipreos Limitada | | Santiago (CL) | | | 8 | | | 50.00 | | Abengoa Chile, S.A. | | (*) | | (1) | | — |
Consorcio Ambiental de la Plata | | Montevideo (UY) | | | 1 | | | 40.00 | | Teyma Uruguay, S.A./Teyma Medioambiente S.A. | | (*) | | (1) | | — |
Consorcio Constructor Alto Cayma | | Lima (PE) | | | — | | | 25.00 | | Abengoa Perú, S.A. | | (*) | | (1) | | — |
Consorcio La Gloria | | Lima (PE) | | | — | | | 50.00 | | Abengoa Perú, S.A. | | — | | (1) | | — |
Consorcio Pachacutec | | Lima (PE) | | | — | | | 50.00 | | Abengoa Perú, S.A. | | — | | (1) | | — |
CPD Solares UTE | | Madrid (ES) | | | 10 | | | 35.00 | | Instalaciones Inabensa, S.A. | | — | | (1) | | — |
Edificio ETEA | | Zaragoza (ES) | | | — | | | 40.00 | | Instalaciones Inabensa, S.A. | | — | | (1) | | — |
Edificio ITA | | Zaragoza (ES) | | | 3 | | | 30.00 | | Instalaciones Inabensa, S.A. | | — | | (1) | | — |
Edificio PICA | | Seville (ES) | | | 5 | | | 50.00 | | Instalaciones Inabensa, S.A. | | — | | (1) | | — |
Electrificación Burgos | | Madrid (ES) | | | 2 | | | 33.34 | | Instalaciones Inabensa, S.A. | | — | | (1) | | — |
Electrificación Granollers | | Madrid (ES) | | | 6 | | | 20.00 | | Instalaciones Inabensa, S.A. | | — | | (1) | | — |
Electrificación L-3 | | Madrid (ES) | | | 1 | | | 50.00 | | Instalaciones Inabensa, S.A. | | — | | (1) | | — |
Emergencia NAT Barcelona | | Barcelona (ES) | | | 9 | | | 33.33 | | Instalaciones Inabensa, S.A. | | — | | (1) | | — |
Emvisesa Palacio Exposiciones | | Seville (ES) | | | 2 | | | 25.00 | | Instalaciones Inabensa, S.A. | | — | | (1) | | — |
Energía Línea 9 | | Barcelona (ES) | | | 1 | | | 20.00 | | Instalaciones Inabensa, S.A. | | — | | (1) | | — |
Energía Noroeste | | Seville (ES) | | | 6 | | | 50.00 | | Instalaciones Inabensa, S.A. | | — | | (1) | | — |
Equipamiento Solar Caballería | | Madrid (ES) | | | 1 | | | 20.00 | | Instalaciones Inabensa, S.A. | | — | | (1) | | — |
Facultades | | Madrid (ES) | | | 1 | | | 15.00 | | Instalaciones Inabensa, S.A. | | — | | (1) | | — |
Ferial Badajoz | | Madrid (ES) | | | — | | | 25.00 | | Instalaciones Inabensa, S.A. | | — | | (1) | | — |
Ferrovial-Agroman Teyma (FAT) | | Montevideo (UY) | | | — | | | 40.00 | | Teyma Uruguay, S.A. | | (*) | | (1) | | — |
Fotovoltaica Expo | | Zaragoza (ES) | | | 7 | | | 70.00 | | Instalaciones Inabensa, S.A. | | — | | (1) | | — |
Gallur Castejon | | Madrid (ES) | | | 2 | | | 33.33 | | Instalaciones Inabensa, S.A. | | — | | (1) | | — |
Guardería La Nucia | | Alicante (ES) | | | 5 | | | 45.00 | | Instalaciones Inabensa, S.A. | | — | | (1) | | — |
H. Campus de la Salud | | Seville (ES) | | | 2 | | | 20.00 | | Instalaciones Inabensa, S.A. | | — | | (1) | | — |
Hospital Costa del Sol | | Malaga (ES) | | | 10 | | | 50.00 | | Instalaciones Inabensa, S.A. | | — | | (1) | | — |
Inabensa-Jayton Catral | | Alicante (ES) | | | 10 | | | 50.00 | | Instalaciones Inabensa, S.A. | | — | | (1) | | — |
Inabensa-Jayton La Nucia | | Alicante (ES) | | | 6 | | | 50.00 | | Instalaciones Inabensa, S.A. | | — | | (1) | | — |
Inabensa-Jayton Villajoyosa | | Alicante (ES) | | | 3 | | | 50.00 | | Instalaciones Inabensa, S.A. | | — | | (1) | | — |
Inabervion | | Vizcaya (ES) | | | 10 | | | 50.00 | | Instalaciones Inabensa, S.A. | | — | | (1) | | — |
Inacom | | Madrid (ES) | | | 6 | | | 25.00 | | Instalaciones Inabensa, S.A. | | — | | (1) | | — |
Incubadora | | Madrid (ES) | | | 2 | | | 30.00 | | Instalaciones Inabensa, S.A. | | — | | (1) | | — |
Inst. Eléctricas Hospital Costa del Sol | | Malaga (ES) | | | 3 | | | 50.00 | | Instalaciones Inabensa, S.A. | | — | | (1) | | — |
Instalaciones Hospital VQ | | Seville (ES) | | | 6 | | | 60.00 | | Instalaciones Inabensa, S.A. | | — | | (1) | | — |
Instalaciones Plataforma Sur | | Barcelona (ES) | | | 5 | | | 50.00 | | Instalaciones Inabensa, S.A. | | — | | (1) | | — |
La Faisanera | | Burgos (ES) | | | 4 | | | 30.00 | | Instalaciones Inabensa, S.A. | | — | | (1) | | — |
Lav-Buixalleu | | Barcelona (ES) | | | 3 | | | 50.00 | | Instalaciones Inabensa, S.A. | | — | | (1) | | — |
Libia-Líneas | | Seville (ES) | | | — | | | 50.00 | | Instalaciones Inabensa, S.A. | | — | | (1) | | — |
F-208
Table of Contents
Appendices
Appendix XIV
Temporary Joint Ventures included in the 2013 Consolidation Perimeter using
the proportional integration method (Continuation)
| | | | | | | | | | | | | | | | |
| |
| | Shareholding | |
| |
| |
| |
|
|---|
Company Name | | Registered
Address | | Amount in
thousands
of € | | % of
Nominal
Capital | | Partner Company in Entity | | (*) | | Activity
(see Page 3) | | Auditor |
|---|
Machupichu | | Seville (ES) | | | 6 | | | 100.00 | | Instalaciones Inabensa, S.A./Abencor Suministros, S.A. | | (*) | | (1) | | — |
Mataporquera | | Madrid (ES) | | | 3 | | | 50.00 | | Instalaciones Inabensa, S.A. | | — | | (1) | | — |
Meisa-Inabensa | | Huelva (ES) | | | 5 | | | 50.00 | | Instalaciones Inabensa, S.A. | | — | | (1) | | — |
Mnto.Comunic.Metro L9 | | Barcelona (ES) | | | 1 | | | 20.00 | | Instalaciones Inabensa, S.A. | | — | | (1) | | — |
Mobiliario La Nucia | | Alicante (ES) | | | 5 | | | 45.00 | | Instalaciones Inabensa, S.A. | | — | | (1) | | — |
Nat Electricidad | | Madrid (ES) | | | 4 | | | 33.34 | | Instalaciones Inabensa, S.A. | | — | | (1) | | — |
O&M Desal. Honaine | | Argelia (DZ) | | | 2 | | | 50.00 | | Abengoa Water S.L.U. | | — | | (4) | | — |
Ontoria | | Vizcaya (ES) | | | 3 | | | 50.00 | | Instalaciones Inabensa, S.A. | | — | | (1) | | — |
Pabellón Cubierto La Nucia | | Alicante (ES) | | | 9 | | | 45.00 | | Instalaciones Inabensa, S.A. | | — | | (1) | | — |
Parque aeronáutico | | Seville (ES) | | | 2 | | | 40.00 | | Instalaciones Inabensa, S.A. | | — | | (1) | | — |
Parque Soland | | Seville (ES) | | | 3 | | | 50.00 | | Instalaciones Inabensa, S.A. | | — | | (1) | | — |
Patrimonio | | Seville (ES) | | | 2 | | | 35.00 | | Instalaciones Inabensa, S.A. | | — | | (1) | | — |
Peaje Irun (Telvent Inabensa) | | Bilbao (ES) | | | — | | | 20.00 | | Instalaciones Inabensa, S.A. | | — | | (1) | | — |
Pistas Deportivas La Nucia | | Alicante (ES) | | | 1 | | | 45.00 | | Instalaciones Inabensa, S.A. | | — | | (1) | | — |
Preufet Juzgados | | Barcelona (ES) | | | 6 | | | 50.00 | | Instalaciones Inabensa, S.A. | | — | | (1) | | — |
Primapen III | | Gijón (ES) | | | 36 | | | 33.00 | | Instalaciones Inabensa, S.A. | | (*) | | (1) | | — |
Rap Fenol | | Madrid (ES) | | | 1 | | | 33.00 | | Instalaciones Inabensa, S.A. | | (*) | | (1) | | — |
Rotonda CV-70 | | Alicante (ES) | | | 5 | | | 45.00 | | Instalaciones Inabensa, S.A. | | — | | (1) | | — |
S/E Blanes | | Madrid (ES) | | | 6 | | | 33.33 | | Instalaciones Inabensa, S.A. | | — | | (1) | | — |
S/E Libia | | Madrid (ES) | | | — | | | 50.00 | | Instalaciones Inabensa, S.A. | | — | | (1) | | — |
S/E Modulares | | Barcelona (ES) | | | 5 | | | 50.00 | | Instalaciones Inabensa, S.A. | | (*) | | (1) | | — |
S/E Sant Adriá | | Madrid (ES) | | | 2 | | | 50.00 | | Instalaciones Inabensa, S.A. | | — | | (1) | | — |
Sede Universitaria | | Alicante (ES) | | | 5 | | | 45.00 | | Instalaciones Inabensa, S.A. | | — | | (1) | | — |
Seguridad Vial y Tráfico Rodado | | Alicante (ES) | | | 9 | | | 90.00 | | Instalaciones Inabensa, S.A. | | — | | (1) | | — |
Semi-Inabensa | | Madrid (ES) | | | 3 | | | 50.00 | | Instalaciones Inabensa, S.A. | | — | | (1) | | — |
Sigmacat | | Madrid (ES) | | | 2 | | | 33.00 | | Instalaciones Inabensa, S.A. | | — | | (1) | | — |
Silfrasub | | Madrid (ES) | | | 2 | | | 40.00 | | Instalaciones Inabensa, S.A. | | — | | (1) | | — |
Silvacat | | Madrid (ES) | | | 30 | | | 35.50 | | Instalaciones Inabensa, S.A. | | — | | (1) | | — |
Sisecat | | Madrid (ES) | | | 1 | | | 20.95 | | Instalaciones Inabensa, S.A. | | — | | (1) | | — |
Sisecat II | | Madrid (ES) | | | 6 | | | 20.95 | | Instalaciones Inabensa, S.A. | | (*) | | (1) | | — |
Soterramnet 132 Kv | | Barcelona (ES) | | | 2 | | | 33.34 | | Instalaciones Inabensa, S.A. | | — | | (1) | | — |
Suburbano Mexico | | Seville (ES) | | | 6 | | | 100.00 | | Instalaciones Inabensa, S.A./Abeinsa Ingeniería y Construcción Industrial, S.A. | | — | | (1) | | D |
Tablada | | Seville (ES) | | | 6 | | | 50.00 | | Abengoa Water S.L.U. | | — | | (4) | | — |
Telar Klitten | | Montevideo (UY) | | | 1 | | | 100.00 | | Teyma Uruguay, S.A. | | (*) | | (1) | | — |
Teyma Israel I | | Seville (ES) | | | — | | | 100.00 | | 'Abener Energía, S.A./Teyma Gestión de Contratos de Construcción e Ingeniería, S.A. | | (*) | | (1) | | — |
Teyma Israel II | | Seville (ES) | | | — | | | 100.00 | | 'Abener Energía, S.A./Teyma Gestión de Contratos de Construcción e Ingeniería, S.A. | | (*) | | (1) | | — |
Teyma Israel III | | Seville (ES) | | | — | | | 100.00 | | 'Abener Energía, S.A./Teyma Gestión de Contratos de Construcción e Ingeniería, S.A. | | (*) | | (1) | | — |
Torre | | Bilbao (ES) | | | 6 | | | 20.00 | | Instalaciones Inabensa, S.A. | | — | | (1) | | — |
Torre Isla Cartuja | | Seville (ES) | | | 12 | | | 20.00 | | Instalaciones Inabensa, S.A. | | — | | (1) | | — |
Tranvía de Jaén | | Seville (ES) | | | 1 | | | 15.00 | | Instalaciones Inabensa, S.A. | | — | | (1) | | — |
Túnel Rovira | | Barcelona (ES) | | | 2 | | | 33.00 | | Instalaciones Inabensa, S.A. | | (*) | | (1) | | — |
Usansolo | | Vizcaya (ES) | | | — | | | 50.00 | | Instalaciones Inabensa, S.A. | | — | | (1) | | — |
UTE Abeima Teyma Barka I | | Seville (ES) | | | — | | | 100.00 | | Abeinsa Infra Medio Ambiente, S.A./Teyma Gest de Contratos de Const e Ing, S.A. | | — | | (4) | | — |
UTE Abeima Teyma Barka II | | Seville (ES) | | | — | | | 100.00 | | Abeinsa Infra Medio Ambiente, S.A./Teyma Gest de Contratos de Const e Ing, S.A. | | (*) | | (1) | | — |
UTE Abeima Teyma Nungua | | Seville (ES) | | | 7 | | | 100.00 | | Abeinsa Infra Medio Ambiente, S.A./Teyma Gest de Contratos de Const e Ing, S.A. | | — | | (1) | | — |
UTE Abeima Teyma Zapotillo | | Seville (ES) | | | 7 | | | 100.00 | | Abeinsa Infra Medio Ambiente, S.A./Teyma Gest de Contratos de Const e Ing, S.A. | | — | | (1) | | — |
UTE Abencor-Inabensa Chilca Montalvo | | Seville (ES) | | | 7 | | | 100.00 | | Instalaciones Inabensa, S.A./Abencor Suministros, S.A. | | — | | (1) | | — |
UTE Abener Befesa Cortés Pallás | | Seville (ES) | | | 5 | | | 100.00 | | Abeinsa Infraestructuras Medio Ambiente, S.A./'Abener Energía, S.A. | | — | | (1) | | — |
UTE Abener Befesa Sahechores | | Seville (ES) | | | — | | | 100.00 | | Abener Energía, S.A./Abeinsa Infraestructura Medio Ambiente/Abengoa Water S.L.U. | | — | | (1) | | — |
UTE Abener Inabensa Francia | | Seville (ES) | | | — | | | 100.00 | | Abener Energía, S.A./Instalaciones Inabensa, S.A. | | — | | (1) | | — |
UTE Abener Inabensa Germany | | Seville (ES) | | | — | | | 100.00 | | Abener Energía, S.A./Instalaciones Inabensa, S.A. | | — | | (1) | | — |
UTE Abener Inabensa NP Tabasco | | Seville (ES) | | | — | | | 100.00 | | Abener Energía, S.A./Instalaciones Inabensa, S.A. | | — | | (1) | | D |
F-209
Table of Contents
Appendices
Appendix XIV
Temporary Joint Ventures included in the 2013 Consolidation Perimeter using
the proportional integration method (Continuation)
| | | | | | | | | | | | | | | | |
| |
| | Shareholding | |
| |
| |
| |
|
|---|
Company Name | | Registered
Address | | Amount in
thousands
of € | | % of
Nominal
Capital | | Partner Company in Entity | | (*) | | Activity
(see Page 3) | | Auditor |
|---|
UTE Abener Inabensa Paises Bajos | | Seville (ES) | | | — | | | 100.00 | | Abener Energía, S.A./Instalaciones Inabensa, S.A. | | — | | (1) | | — |
UTE Abener Teyma Biomasa Salamanca | | Seville (ES) | | | — | | | 100.00 | | Abener Energía, S.A./Teyma Gestión de Contratos de Construcción e Ingeniería, S.A. | | — | | (1) | | — |
UTE Abener Teyma Biomasa Salamanca II | | Seville (ES) | | | — | | | 100.00 | | Abener Energía, S.A./Teyma Gestión de Contratos de Construcción e Ingeniería, S.A. | | — | | (1) | | — |
UTE Abener Teyma CRS I | | Seville (ES) | | | — | | | 100.00 | | Abener Energía, S.A./Teyma Gestión de Contratos de Construcción e Ingeniería, S.A. | | — | | (1) | | — |
UTE Abener Teyma CRS II | | Seville (ES) | | | — | | | 100.00 | | Abener Energía, S.A./Teyma Gestión de Contratos de Construcción e Ingeniería, S.A. | | — | | (1) | | — |
UTE Abener Teyma Emirates I | | Seville (ES) | | | — | | | 100.00 | | Abener Energía, S.A./Teyma Gestión de Contratos de Construcción e Ingeniería, S.A. | | — | | (1) | | D |
UTE Abener Teyma Helio Energy I | | Seville (ES) | | | — | | | 100.00 | | Abener Energía, S.A./Teyma Gestión de Contratos de Construcción e Ingeniería, S.A. | | — | | (1) | | — |
UTE Abener Teyma Helio Energy II | | Seville (ES) | | | — | | | 100.00 | | Abener Energía, S.A./Teyma Gestión de Contratos de Construcción e Ingeniería, S.A. | | — | | (1) | | — |
UTE Abener Teyma Helios I | | Seville (ES) | | | — | | | 100.00 | | Abener Energía, S.A./Teyma Gestión de Contratos de Construcción e Ingeniería, S.A. | | — | | (1) | | — |
UTE Abener Teyma Helios II | | Seville (ES) | | | — | | | 100.00 | | Abener Energía, S.A./Teyma Gestión de Contratos de Construcción e Ingeniería, S.A. | | — | | (1) | | — |
UTE Abener Teyma Paulputs | | Seville (ES) | | | — | | | 100.00 | | Abener Energía, S.A./Teyma Gestión de Contratos de Construcción e Ingeniería, S.A. | | — | | (1) | | — |
UTE Abener Teyma Paysandu | | Seville (ES) | | | — | | | 100.00 | | Abener Energía, S.A./Teyma Gestión de Contratos de Construcción e Ingeniería, S.A. | | — | | (1) | | — |
UTE Abener Teyma Solaben I | | Seville (ES) | | | — | | | 100.00 | | Abener Energía, S.A./Teyma Gestión de Contratos de Construcción e Ingeniería, S.A. | | — | | (1) | | — |
UTE Abener Teyma Solaben IC | | Seville (ES) | | | — | | | 100.00 | | Abener Energía, S.A./Teyma Gestión de Contratos de Construcción e Ingeniería, S.A. | | — | | (1) | | — |
UTE Abener Teyma Solaben II | | Seville (ES) | | | — | | | 100.00 | | Abener Energía, S.A./Teyma Gestión de Contratos de Construcción e Ingeniería, S.A. | | — | | (1) | | — |
UTE Abener Teyma Solaben III | | Seville (ES) | | | — | | | 100.00 | | Abener Energía, S.A./Teyma Gestión de Contratos de Construcción e Ingeniería, S.A. | | — | | (1) | | — |
UTE Abener Teyma Solaben VI | | Seville (ES) | | | — | | | 100.00 | | Abener Energía, S.A./Teyma Gestión de Contratos de Construcción e Ingeniería, S.A. | | — | | (1) | | — |
UTE Abener Teyma Solacor I | | Seville (ES) | | | — | | | 100.00 | | Abener Energía, S.A./Teyma Gestión de Contratos de Construcción e Ingeniería, S.A. | | — | | (1) | | — |
UTE Abener Teyma Solacor II | | Seville (ES) | | | — | | | 100.00 | | Abener Energía, S.A./Teyma Gestión de Contratos de Construcción e Ingeniería, S.A. | | — | | (1) | | — |
UTE Abener Teyma Solar Tabernas | | Seville (ES) | | | — | | | 100.00 | | Abener Energía, S.A./ Teyma, Gestión de Contratos de Construcción e Ingeniería/Abengoa Solar New Technologies | | — | | (1) | | — |
UTE Abener Teyma Upington | | Seville (ES) | | | — | | | 100.00 | | Abener Energía, S.A./Teyma Gestión de Contratos de Construcción e Ingeniería, S.A. | | — | | (1) | | — |
UTE Abener Teyma Xina | | Seville (ES) | | | — | | | 100.00 | | 'Abener Energía, S.A./Teyma Gestión de Contratos de Construcción e Ingeniería, S.A. | | (*) | | (1) | | — |
UTE Abensaih Guadalquivir | | Seville (ES) | | | 3 | | | 51.00 | | Abeinsa Infraestructuras Medio Ambiente, S.A. | | — | | (1) | | — |
UTE Abensaih Mantenimiento | | Seville (ES) | | | 3 | | | 50.00 | | Abeinsa Infraestructuras Medio Ambiente, S.A. | | — | | (1) | | — |
UTE Aguas Salobres | | Seville (ES) | | | 4 | | | 60.00 | | Abeinsa Infraestructuras Medio Ambiente, S.A. | | — | | (1) | | — |
UTE Alcoy | | Alicante (ES) | | | 3 | | | 50.00 | | Abeinsa Infraestructuras Medio Ambiente, S.A. | | — | | (1) | | — |
UTE Amés Brión | | La Coruña (ES) | | | 3 | | | 50.00 | | Abeinsa Infraestructuras Medio Ambiente, S.A. | | — | | (1) | | — |
Ute Ashalim Eucomsa-Abeinsa Engineering | | Seville (ES) | | | — | | | 100.00 | | Europea de Construcc. Metálicas, S.A./Abeinsa Engineering SL | | (*) | | (1) | | — |
UTE Atabal | | Malaga (ES) | | | 3 | | | 53.00 | | Abeinsa Infraestructuras Medio Ambiente, S.A. | | — | | (1) | | — |
UTE Avensaih Guadalete—Barbate | | Cadiz (ES) | | | 3 | | | 31.00 | | Abeinsa Infraestructuras Medio Ambiente, S.A. | | — | | (1) | | — |
UTE Avinyó | | Cataluña (ES) | | | — | | | 40.00 | | Construcciones y Depuraciones, S.A. | | — | | (1) | | — |
UTE B.Almanzora | | Murcia (ES) | | | 2 | | | 40.00 | | Abeinsa Infraestructuras Medio Ambiente, S.A. | | — | | (1) | | — |
UTE Balsa del Rosario | | Seville (ES) | | | 3 | | | 52.00 | | Abeinsa Infraestructuras Medio Ambiente, S.A. | | — | | (1) | | — |
UTE Báscara | | Cataluña (ES) | | | — | | | 40.00 | | Construcciones y Depuraciones, S.A. | | — | | (1) | | — |
UTE Boaco | | Nicaragua (NI) | | | 2 | | | 73.83 | | Abeinsa Infraestructuras Medio Ambiente, S.A. | | — | | (1) | | — |
UTE CAC Arequipa | | Arequipa (PE) | | | 7 | | | 51.00 | | Abeinsa Infraestructuras Medio Ambiente, S.A. | | — | | (1) | | — |
UTE CAC Arequipa | | Arequipa (PE) | | | 3 | | | 25.00 | | Abeinsa Infraestructuras Medio Ambiente, S.A. | | — | | (1) | | — |
UTE Cáceres | | Caceres (ES) | | | 3 | | | 50.00 | | Abeinsa Infraestructuras Medio Ambiente, S.A. | | — | | (1) | | — |
UTE Campello | | Alicante (ES) | | | 3 | | | 50.00 | | Abeinsa Infraestructuras Medio Ambiente, S.A. | | — | | (1) | | — |
F-210
Table of Contents
Appendices
Appendix XIV
Temporary Joint Ventures included in the 2013 Consolidation Perimeter using
the proportional integration method (Continuation)
| | | | | | | | | | | | | | | | |
| |
| | Shareholding | |
| |
| |
| |
|
|---|
Company Name | | Registered
Address | | Amount in
thousands
of € | | % of
Nominal
Capital | | Partner Company in Entity | | (*) | | Activity
(see Page 3) | | Auditor |
|---|
UTE Canal Alguerri | | Lleida (ES) | | | 2 | | | 33.34 | | Abeinsa Infraestructuras Medio Ambiente, S.A. | | — | | (1) | | — |
UTE Canal de Navarra | | Navarra (ES) | | | 4 | | | 20.00 | | Abeinsa Infraestructuras Medio Ambiente, S.A. | | — | | (1) | | — |
UTE Canal Estremera | | Madrid (ES) | | | 6 | | | 50.00 | | Abeinsa Infraestructuras Medio Ambiente, S.A. | | — | | (1) | | — |
UTE Carboneras | | Almeria (ES) | | | 3 | | | 43.00 | | Abeinsa Infraestructuras Medio Ambiente, S.A. | | — | | (1) | | — |
UTE Cartuja | | Seville (ES) | | | — | | | 30.00 | | Construcciones y Depuraciones, S.A. | | — | | (1) | | — |
UTE Centro Morelos | | Seville (ES) | | | — | | | 100.00 | | Abener Energía, S.A./ Inabensa, S.A./ Serv. Aux. de Administración, S.A. de C.V. | | — | | (1) | | — |
UTE Chennai | | India (IN) | | | 6 | | | 100.00 | | Abeinsa Infraestructuras Medio Ambiente, S.A./Construcciones y Depuraciones, S.A. | | — | | (1) | | — |
UTE Chennai O&M | | India (IN) | | | 1 | | | 100.00 | | Construcciones y Depuraciones, S.A./Abengoa Water S.L.U. | | — | | (4) | | — |
UTE Conquero | | Huelva (ES) | | | 3 | | | 50.00 | | Abeinsa Infraestructuras Medio Ambiente, S.A. | | — | | (1) | | — |
UTE Cunene | | Angola (AN) | | | 25 | | | 50.00 | | Abeinsa Infraestructuras Medio Ambiente, S.A. | | — | | (1) | | — |
Ute Dead Sea | | Seville (ES) | | | — | | | 100.00 | | Abener Energía, S.A/Abeinsa Engineering SL | | — | | (1) | | — |
UTE Deca | | Almeria (ES) | | | 2 | | | 32.25 | | Abeinsa Infraestructuras Medio Ambiente, S.A. | | — | | (1) | | — |
UTE Depurbaix | | Cataluña (ES) | | | 6 | | | 50.00 | | Abeinsa Infraestructuras Medio Ambiente, S.A. | | — | | (1) | | — |
UTE Edar Montemayor | | Córdoba (ES) | | | — | | | 50.00 | | Construcciones y Depuraciones, S.A. | | — | | (1) | | — |
UTE El Cerrillo | | Córdoba (ES) | | | 5 | | | 80.00 | | Abeinsa Infraestructuras Medio Ambiente, S.A. | | — | | (1) | | — |
UTE Esclusa 42 | | Valladolid (ES) | | | 2 | | | 30.00 | | Abeinsa Infraestructuras Medio Ambiente, S.A. | | — | | (1) | | — |
UTE Espluga | | Cataluña (ES) | | | — | | | 40.00 | | Construcciones y Depuraciones, S.A. | | — | | (1) | | — |
UTE Fontsanta | | Cataluña (ES) | | | 5 | | | 40.00 | | Abeinsa Infraestructuras Medio Ambiente, S.A. | | — | | (1) | | — |
UTE Fonz | | Cataluña (ES) | | | 5 | | | 90.00 | | Abeinsa Infraestructuras Medio Ambiente, S.A. | | — | | (1) | | — |
UTE Fuente Alamo | | Murcia (ES) | | | 3 | | | 33.00 | | Construcciones y Depuraciones, S.A. | | — | | (1) | | — |
UTE Guadalajara | | Guadalajara (ES) | | | 3 | | | 55.00 | | Abengoa Water S.L.U. | | — | | (4) | | — |
UTE Guiamets | | Cataluña (ES) | | | 7 | | | 60.00 | | Abeinsa Infraestructuras Medio Ambiente, S.A. | | — | | (1) | | — |
UTE Hassi R'Mel Construction | | Seville (ES) | | | — | | | 100.00 | | Abener Energía, S.A., Abengoa Solar New Technologies | | — | | (1) | | — |
UTE Hassi R'Mel O&M | | Seville (ES) | | | — | | | 100.00 | | Abener Energía, S.A./Abengoa Solar España | | — | | (4) | | — |
UTE Hidrosur | | Malaga (ES) | | | 2 | | | 33.33 | | Abeinsa Infraestructuras Medio Ambiente, S.A. | | — | | (1) | | — |
UTE Honaine | | Argelia (AR) | | | 2 | | | 50.00 | | Abeinsa Infraestructuras Medio Ambiente, S.A. | | — | | (1) | | — |
UTE Huesna | | Seville (ES) | | | 6 | | | 33.34 | | Abeinsa Infraestructuras Medio Ambiente, S.A. | | — | | (1) | | — |
UTE Inabensa Teyma Eólica del Tala | | Seville (ES) | | | 60 | | | 100.00 | | Instalaciones Inabensa, S.A./ Teyma Gest de Contratos de Const e Ing, S.A. | | (*) | | (1) | | D |
UTE Inabensa Teyma Peralta | | Seville (ES) | | | 60 | | | 100.00 | | Instalaciones Inabensa, S.A./ Teyma Gest de Contratos de Const e Ing, S.A. | | — | | (1) | | D |
UTE Inabensa-Eucomsa-Perú | | Seville (ES) | | | 7 | | | 100.00 | | Instalaciones Inabensa, S.A./Europea de Construcc. Metálicas, S.A. | | — | | (1) | | — |
Ute Inst. Clima Hospital Costa del Sol | | Malaga (ES) | | | 3 | | | 50.00 | | Instalaciones Inabensa, S.A. | | — | | (1) | | — |
UTE Itoiz II | | Navarra (ES) | | | 4 | | | 35.00 | | Abeinsa Infraestructuras Medio Ambiente, S.A. | | — | | (1) | | — |
UTE Júcar Vinalopo | | Valencia (ES) | | | 2 | | | 33.34 | | Abeinsa Infraestructuras Medio Ambiente, S.A. | | — | | (1) | | — |
UTE Kurkudi | | Vizcaya (ES) | | | 3 | | | 50.00 | | Abeinsa Infraestructuras Medio Ambiente, S.A. | | — | | (1) | | — |
UTE La Codosera | | Caceres (ES) | | | 3 | | | 50.00 | | Abeinsa Infraestructuras Medio Ambiente, S.A. | | — | | (1) | | — |
UTE Las Bambas | | Seville (ES) | | | 6 | | | 100.00 | | Instalaciones Inabensa, S.A. /Abencor Suministros, S.A. | | — | | (2) | | — |
UTE Lubet Cádiz | | Cadiz (ES) | | | — | | | 75.00 | | Construcciones y Depuraciones, S.A. | | — | | (1) | | — |
UTE Mant. Valdeinfierno | | Murcia (ES) | | | 2 | | | 100.00 | | Abeinsa Infraestructuras Medio Ambiente, S.A./Construcciones y Depuraciones, S.A. | | — | | (1) | | — |
UTE Mantenimiento Presas | | Malaga (ES) | | | 2 | | | 35.00 | | Abeinsa Infraestructuras Medio Ambiente, S.A. | | — | | (1) | | — |
UTE Marismas Construccion | | Seville (ES) | | | 12 | | | 100.00 | | Abeinsa Infraestructuras Medio Ambiente, S.A /Construcciones y Depuraciones, S.A. | | — | | (1) | | — |
UTE Minicentrales | | Madrid (ES) | | | 6 | | | 100.00 | | Abeinsa Infraestructuras Medio Ambiente, S.A./Construcciones y Depuraciones, S.A. | | — | | (1) | | — |
UTE Moraira | | Alicante (ES) | | | 3 | | | 42.50 | | Abeinsa Infraestructuras Medio Ambiente, S.A. | | — | | (1) | | — |
UTE Motril | | Granada (ES) | | | 3 | | | 50.00 | | Abeinsa Infraestructuras Medio Ambiente, S.A. | | — | | (1) | | — |
UTE Ojén Mijas | | Malaga (ES) | | | — | | | 70.00 | | Construcciones y Depuraciones, S.A. | | — | | (1) | | — |
UTE Paneles | | Valladolid (ES) | | | 2 | | | 30.00 | | Abeinsa Infraestructuras Medio Ambiente, S.A. | | — | | (1) | | — |
UTE Puerto de Huelva | | Huelva (ES) | | | 3 | | | 100.00 | | Abeinsa Infraestructuras Medio Ambiente, S.A /Construcciones y Depuraciones, S.A. | | — | | (1) | | — |
UTE Qingdao | | China (CN) | | | 6 | | | 100.00 | | Abeinsa Infraestructuras Medio Ambiente, S.A /Construcciones y Depuraciones, S.A. | | — | | (1) | | — |
UTE Ranilla | | Seville (ES) | | | 2 | | | 15.00 | | Construcciones y Depuraciones, S.A. | | — | | (1) | | — |
UTE Retortillo | | Seville (ES) | | | 6 | | | 100.00 | | Abeinsa Infraestructuras Medio Ambiente, S.A./Construcciones y Depuraciones, S.A. | | — | | (1) | | — |
F-211
Table of Contents
Appendices
Appendix XIV
Temporary Joint Ventures included in the 2013 Consolidation Perimeter using
the proportional integration method (Continuation)
| | | | | | | | | | | | | | | | |
| |
| | Shareholding | |
| |
| |
| |
|
|---|
Company Name | | Registered
Address | | Amount in
thousands
of € | | % of
Nominal
Capital | | Partner Company in Entity | | (*) | | Activity
(see Page 3) | | Auditor |
|---|
UTE Reus | | Cataluña (ES) | | | 4 | | | 65.00 | | Abeinsa Infraestructuras Medio Ambiente, S.A. | | — | | (1) | | — |
UTE Ribera | | Valencia (ES) | | | 3 | | | 50.00 | | Abeinsa Infraestructuras Medio Ambiente, S.A. | | — | | (1) | | — |
UTE Riegos Marismas | | Seville (ES) | | | 6 | | | 99.00 | | Abeinsa Infraestructuras Medio Ambiente, S.A. | | — | | (1) | | — |
UTE Rincón Vict | | Malaga (ES) | | | 3 | | | 50.00 | | Abeinsa Infraestructuras Medio Ambiente, S.A. | | — | | (1) | | — |
UTE Sahechores | | León (ES) | | | 4 | | | 62.00 | | Abeinsa Infraestructuras Medio Ambiente, S.A. | | (*) | | (1) | | — |
UTE Saih Duero | | Valladolid (ES) | | | 2 | | | 30.00 | | Abeinsa Infraestructuras Medio Ambiente, S.A. | | — | | (1) | | — |
UTE Sallent | | Cataluña (ES) | | | 3 | | | 50.00 | | Abeinsa Infraestructuras Medio Ambiente, S.A. | | — | | (1) | | — |
UTE San Juan del Sur | | Nicaragua (NI) | | | 2 | | | 73.31 | | Abeinsa Infraestructuras Medio Ambiente, S.A. | | — | | (1) | | — |
UTE Sanchonuño | | Valladolid (ES) | | | 3 | | | 50.00 | | Abeinsa Infraestructuras Medio Ambiente, S.A. | | — | | (1) | | — |
UTE Sant Celoni | | Cataluña (ES) | | | 6 | | | 50.00 | | Abeinsa Infraestructuras Medio Ambiente, S.A. | | — | | (1) | | — |
UTE Segriá Sud | | Cataluña (ES) | | | 4 | | | 60.00 | | Abeinsa Infraestructuras Medio Ambiente, S.A. | | — | | (1) | | — |
UTE Skikda | | Argelia (AR) | | | 2 | | | 67.00 | | Abeinsa Infraestructuras Medio Ambiente, S.A./Construcciones y Depuraciones, S.A. | | — | | (1) | | — |
UTE Skikda O&M | | Argelia (AR) | | | 1 | | | 67.00 | | Construcciones y Depuraciones, S.A./Abengoa Water S.L.U. | | — | | (4) | | — |
UTE Sta. Amalia | | Badajoz (ES) | | | 5 | | | 80.00 | | Construcciones y Depuraciones, S.A. | | — | | (1) | | — |
UTE Teatinos | | Malaga (ES) | | | 3 | | | 50.00 | | Abeinsa Infraestructuras Medio Ambiente, S.A. | | — | | (1) | | — |
UTE Tenés | | Argelia (AR) | | | 6 | | | 100.00 | | Abeinsa Infraestructuras Medio Ambiente, S.A /Construcciones y Depuraciones, S.A. | | — | | (1) | | D |
UTE Valdeinfierno | | Murcia (ES) | | | 2 | | | 60.00 | | Abeinsa Infraestructuras Medio Ambiente, S.A./Construcciones y Depuraciones, S.A. | | — | | (1) | | — |
UTE Valdelentisco | | Murcia (ES) | | | 5 | | | 80.00 | | Abeinsa Infraestructuras Medio Ambiente, S.A. | | — | | (1) | | — |
UTE Vall Baixa | | Cataluña (ES) | | | 6 | | | 50.00 | | Abeinsa Infraestructuras Medio Ambiente, S.A. | | — | | (1) | | — |
UTE Vilagarcía | | Pontevedra (ES) | | | 3 | | | 50.00 | | Abeinsa Infraestructuras Medio Ambiente, S.A. | | — | | (1) | | — |
UTE Villanueva | | Seville (ES) | | | 3 | | | 50.00 | | Abeinsa Infraestructuras Medio Ambiente, S.A. | | — | | (1) | | — |
UTE Xerta-Xenia | | Cataluña (ES) | | | 3 | | | 50.00 | | Abeinsa Infraestructuras Medio Ambiente, S.A. | | — | | (1) | | — |
Utrera | | Seville (ES) | | | 3 | | | 50.00 | | Abengoa Water S.L.U. | | — | | (4) | | — |
Winterra.-Inaben.Atraque Puerto de Vigo | | Compostela (ES) | | | — | | | 20.00 | | Instalaciones Inabensa, S.A. | | — | | (1) | | — |
Winterra-Inabensa Monterroso | | Compostela (ES) | | | 6 | | | 30.00 | | Instalaciones Inabensa, S.A. | | — | | (1) | | — |
Winterra-Inabensa Sarriá | | Compostela (ES) | | | 2 | | | 30.00 | | Instalaciones Inabensa, S.A. | | — | | (1) | | — |
Zonas Deportivas La Nucia | | Alicante (ES) | | | 4 | | | 45.00 | | Instalaciones Inabensa, S.A. | | (*) | | (1) | | — |
Shareholding- capital cost is calculated using the current closing year exchange rate
- (*)
- Companies incorporated or acquired and consolidated for the first time in the year.
- (1)
- Operating segment activities area: Engineering and Construction.
- (2)
- Operating segment activities area: Transmission.
- (3)
- Operating segment activities area: Solar.
- (4)
- Operating segment activities area: Water.
- (5)
- Operating segment activities areae: Cogeneration and others.
- (6)
- Operating segment activities area: Bioenergy.
- (7)
- Operating segment activities area: Others.
- A
- Audited by PricewaterhouseCoopers Auditores.
- B
- Audited by Deloitte (for legal purposes).
- C
- Audited by Auditoría y Consulta (for legal purposes).
- D
- Audited by others auditors (for legal purposes).
F-212
Table of Contents
Appendices
Appendix XV
Companies with Electricity Operations included in the 2013 Consolidation Perimeter
| | | | | | | |
Company Name | | Registered Address | | Activity(*) | | Comments |
|---|
Abengoa Cogeneración Tabasco, S. de R.L. de C.V. | | Mexico City (MX) | | | (3 | ) | Operational |
Abengoa Solar Italia, S.R.L. | | Rome (IT) | | | (5 | ) | Construction phase |
Abengoa Solar Operations LLC | | Delaware (US) | | | (6 | ) | Operational |
Abengoa Transmisión Norte, S.A. (ATN) | | Lima (PE) | | | (9 | ) | Operational |
Abengoa Transmisión Sur, S.A. (ATS) | | Lima (PE) | | | (9 | ) | Construction phase |
Abent 3T, S de RL de C.V. | | Mexico City (MX) | | | (3 | ) | Construction phase |
Aprofursa, Aprovechamientos Energéticos Furesa, S.A. | | Murcia (ES) | | | (1 | ) | Operational |
Arao Enerxías Eólica, S.L | | A Coruña (ES) | | | (2 | ) | Construction phase |
Arizona Solar One, LLC | | Colorado (US) | | | (6 | ) | Construction phase |
ATE VI Campos Novos Transmissora de Energía, S.A | | R. de Janeiro (BR) | | | (9 | ) | Operational |
ATE VII- Foz do Iguacú Transmissora de Energía, S.A. | | R. de Janeiro (BR) | | | (9 | ) | Operational |
ATE VIII, Transmissora de Energía, S.A. | | R. de Janeiro (BR) | | | (9 | ) | Construction phase |
ATE IX Transmissora de Energía, S.A. | | R. de Janeiro (BR) | | | (9 | ) | Construction phase |
ATE XI, Manaus Transmissora de Energía | | R. de Janeiro (BR) | | | (9 | ) | Operational |
ATE XIII, Norte Brasil Transmissora de Energía S.A | | R. de Janeiro (BR) | | | (9 | ) | Construction phase |
ATE XVI Transmissora de Energia S.A. | | R. de Janeiro (BR) | | | (9 | ) | Construction phase |
ATE XVII Transmissora de Energia S.A. | | R. de Janeiro (BR) | | | (9 | ) | Construction phase |
ATE XVIII Transmissora de Energia S.A. | | R. de Janeiro (BR) | | | (9 | ) | Construction phase |
ATE XIX Transmissora de Energia S.A. | | R. de Janeiro (BR) | | | (9 | ) | Construction phase |
ATE XX Transmissora de Energia S.A. | | R. de Janeiro (BR) | | | (9 | ) | Construction phase |
ATE XXI Transmissora de Energia S.A. | | R. de Janeiro (BR) | | | (9 | ) | Construction phase |
ATE XXII Transmissora de Energia S.A. | | R. de Janeiro (BR) | | | (9 | ) | Construction phase |
ATE XXIII Transmissora de Energia S.A. | | R. de Janeiro (BR) | | | (9 | ) | Construction phase |
ATN 1, Abengoa Trasmisión Sur, S.A. | | Lima (PE) | | | (9 | ) | Operational |
ATN 2, S.A. | | Santiago de Chile (CL) | | | (9 | ) | Construction phase |
ATN 3, S.A. | | Lima (PE) | | | (9 | ) | Construction phase |
Biocarburantes de Castilla y León, S.A. | | Salamanca (ES) | | | (3 | ) | Operational |
Bioetanol Galicia, S.A. | | A Coruña (ES) | | | (3 | ) | Operational |
Captasol Fotovoltaica 1, S.L. | | Seville (ES) | | | (5 | ) | Operational |
Captasol Fotovoltaica 2, S.L. | | Seville (ES) | | | (5 | ) | Operational |
Captasol Fotovoltaica 3, S.L. | | Seville (ES) | | | (5 | ) | Operational |
Captasol Fotovoltaica 4, S.L. | | Seville (ES) | | | (5 | ) | Operational |
Captasol Fotovoltaica 5, S.L. | | Seville (ES) | | | (5 | ) | Operational |
Captasol Fotovoltaica 6, S.L. | | Seville (ES) | | | (5 | ) | Operational |
Captasol Fotovoltaica 7, S.L. | | Seville (ES) | | | (5 | ) | Operational |
Captasol Fotovoltaica 8, S.L. | | Seville (ES) | | | (5 | ) | Operational |
Captasol Fotovoltaica 9, S.L. | | Seville (ES) | | | (5 | ) | Operational |
Captasol Fotovoltaica 10, S.L. | | Seville (ES) | | | (5 | ) | Operational |
Captasol Fotovoltaica 11, S.L. | | Seville (ES) | | | (5 | ) | Operational |
Captasol Fotovoltaica 12, S.L. | | Seville (ES) | | | (5 | ) | Operational |
Captasol Fotovoltaica 13, S.L. | | Seville (ES) | | | (5 | ) | Operational |
Captasol Fotovoltaica 14, S.L. | | Seville (ES) | | | (5 | ) | Operational |
Captasol Fotovoltaica 15, S.L. | | Seville (ES) | | | (5 | ) | Operational |
Captasol Fotovoltaica 16, S.L. | | Seville (ES) | | | (5 | ) | Operational |
Captasol Fotovoltaica 17, S.L. | | Seville (ES) | | | (5 | ) | Operational |
Captasol Fotovoltaica 18, S.L. | | Seville (ES) | | | (5 | ) | Operational |
Captasol Fotovoltaica 19, S.L. | | Seville (ES) | | | (5 | ) | Operational |
Captasol Fotovoltaica 20 S.L. | | Seville (ES) | | | (5 | ) | Operational |
Captasol Fotovoltaica 21 S.L. | | Seville (ES) | | | (5 | ) | Operational |
Captasol Fotovoltaica 22 S.L. | | Seville (ES) | | | (5 | ) | Operational |
Captasol Fotovoltaica 23 S.L. | | Seville (ES) | | | (5 | ) | Operational |
F-213
Table of Contents
Appendices
Appendix XV
Companies with Electricity Operations included in the 2013 Consolidation Perimeter (Continuation)
| | | | | | | |
Company Name | | Registered Address | | Activity(*) | | Comments |
|---|
Captasol Fotovoltaica 24 S.L. | | Seville (ES) | | | (5 | ) | Operational |
Captasol Fotovoltaica 25 S.L. | | Seville (ES) | | | (5 | ) | Operational |
Captasol Fotovoltaica 26 S.L. | | Seville (ES) | | | (5 | ) | Operational |
Captasol Fotovoltaica 27 S.L. | | Seville (ES) | | | (5 | ) | Operational |
Captasol Fotovoltaica 28 S.L. | | Seville (ES) | | | (5 | ) | Operational |
Captasol Fotovoltaica 29 S.L. | | Seville (ES) | | | (5 | ) | Operational |
Captasol Fotovoltaica 30 S.L. | | Seville (ES) | | | (5 | ) | Operational |
Captasol Fotovoltaica 31 S.L. | | Seville (ES) | | | (5 | ) | Operational |
Captasol Fotovoltaica 32 S.L. | | Seville (ES) | | | (5 | ) | Operational |
Captasol Fotovoltaica 33 S.L. | | Seville (ES) | | | (5 | ) | Operational |
Captasol Fotovoltaica 34 S.L. | | Seville (ES) | | | (5 | ) | Operational |
Captasol Fotovoltaica 35 S.L. | | Seville (ES) | | | (5 | ) | Operational |
Captasol Fotovoltaica 36 S.L. | | Seville (ES) | | | (5 | ) | Operational |
Captasol Fotovoltaica 37 S.L. | | Seville (ES) | | | (5 | ) | Operational |
Captasol Fotovoltaica 38 S.L. | | Seville (ES) | | | (5 | ) | Operational |
Captasol Fotovoltaica 52 S.L. | | Seville (ES) | | | (5 | ) | Construction phase |
Cogeneración Motril, S.A. | | Seville (ES) | | | (1 | ) | Operational |
Cogeneración Villaricos, S.A. | | Seville (ES) | | | (1 | ) | Operational |
Copero Solar Huerta Uno, S.A. | | Seville (ES) | | | (5 | ) | Operational |
Copero Solar Huerta Dos, S.A. | | Seville (ES) | | | (5 | ) | Operational |
Copero Solar Huerta Tres, S.A | | Seville (ES) | | | (5 | ) | Operational |
Copero Solar Huerta Cuatro, S.A. | | Seville (ES) | | | (5 | ) | Operational |
Copero Solar Huerta Cinco, S.A. | | Seville (ES) | | | (5 | ) | Operational |
Copero Solar Huerta Seis, S.A. | | Seville (ES) | | | (5 | ) | Operational |
Copero Solar Huerta Siete, S.A. | | Seville (ES) | | | (5 | ) | Operational |
Copero Solar Huerta Ocho, S.A. | | Seville (ES) | | | (5 | ) | Operational |
Copero Solar Huerta Nueve, S.A. | | Seville (ES) | | | (5 | ) | Operational |
Copero Solar Huerta Diez, S.A. | | Seville (ES) | | | (5 | ) | Operational |
Cycon Solar, LTD | | Nicosia (CY) | | | (6 | ) | Construction phase |
Ecocarburantes Españoles, S.A. | | Murcia (ES) | | | (3 | ) | Operational |
Enernova Ayamonte S.A. | | Huelva (ES) | | | (3 | ) | Operational |
Fotovoltaica Solar Sevilla, S.A. | | Seville (ES) | | | (5 | ) | Operational |
Helioenergy Electricidad Uno, S.A. | | Seville (ES) | | | (6 | ) | Operational |
Helioenergy Electricidad Dos, S.A. | | Seville (ES) | | | (6 | ) | Operational |
Helioenergy Electricidad Tres, S.A. | | Seville (ES) | | | (6 | ) | Construction phase |
Helioenergy Electricidad Cuatro, S.A. | | Seville (ES) | | | (6 | ) | Construction phase |
Helioenergy Electricidad Cinco, S.A. | | Seville (ES) | | | (6 | ) | Construction phase |
Helioenergy Electricidad Once, S.A. | | Seville (ES) | | | (6 | ) | Construction phase |
Helioenergy Electricidad Trece, S.A. | | Seville (ES) | | | (6 | ) | Construction phase |
Helioenergy Electricidad Veintiuno, S.A | | Seville (ES) | | | (6 | ) | Construction phase |
Helioenergy Electricidad Veintidos, S.A | | Seville (ES) | | | (6 | ) | Construction phase |
Helioenergy Electricidad Veintitres, S.A | | Seville (ES) | | | (6 | ) | Construction phase |
Helioenergy Electricidad Veinticuatro, S.A | | Seville (ES) | | | (6 | ) | Construction phase |
Helios I Hyperion Energy Investments, S.L. | | Seville (ES) | | | (6 | ) | Operational |
Helios II Hyperion Energy Investments, S.L. | | Madrid (ES) | | | (6 | ) | Operational |
Inabensa Fotovoltaica, S.L. | | Seville (ES) | | | (5 | ) | Construction phase |
Iniciativas Hidroeléctricas de Aragón y Cataluña, S.L. | | Huesca (ES) | | | (7 | ) | Operational |
Iniciativas Hidroeléctricas, S.A. | | Seville (ES) | | | (7 | ) | Operational |
Insolation Sic 4 S.R.L | | Rome (IT) | | | (5 | ) | Construction phase |
Insolation Sic 6 S.R.L | | Rome (IT) | | | (5 | ) | Construction phase |
F-214
Table of Contents
Appendices
Appendix XV
Companies with Electricity Operations included in the 2013 Consolidation Perimeter (Continuation)
| | | | | | | |
Company Name | | Registered Address | | Activity(*) | | Comments |
|---|
Insolation Sic 7.R.L | | Palermo (IT) | | | (5 | ) | Construction phase |
Insolation Sic 8 S.R.L | | Palermo (IT) | | | (5 | ) | Construction phase |
Insolation Sic 9 S.R.L | | Rome (IT) | | | (5 | ) | Construction phase |
Insolation 17 S.R.L | | Rome (IT) | | | (5 | ) | Construction phase |
Insolation 18 S.R.L | | Rome (IT) | | | (5 | ) | Construction phase |
Instalaciones Fotovoltaicas Torrecuéllar, 1 S.L. | | Seville (ES) | | | (5 | ) | Construction phase |
Instalaciones Fotovoltaicas Torrecuéllar, 2 S.L. | | Seville (ES) | | | (5 | ) | Construction phase |
Instalaciones Fotovoltaicas Torrecuéllar, 3 S.L. | | Seville (ES) | | | (5 | ) | Construction phase |
Kaxu Solar One (Pty) Ltd. | | Gauteng (ZA) | | | (6 | ) | Construction phase |
Khi Solar One (Pty) Ltd | | Gauteng (ZA) | | | (6 | ) | Construction phase |
Las Cabezas Solar, S.L. | | Seville (ES) | | | (5 | ) | Construction phase |
Linares Fotovoltaica, S.L. | | Seville (ES) | | | (5 | ) | Operational |
Linha Verde Transmisora de Energia S.A | | Brasilia (BR) | | | (9 | ) | Construction phase |
Londrina Transmissora De Energía, S.A. | | R. de Janeiro (BR) | | | (9 | ) | Operational |
Marismas PV A1, S.L. | | Seville (ES) | | | (5 | ) | Operational |
Marismas PV A2, S.L. | | Seville (ES) | | | (5 | ) | Operational |
Marismas PV A3, S.L. | | Seville (ES) | | | (5 | ) | Operational |
Marismas PV A4, S.L. | | Seville (ES) | | | (5 | ) | Operational |
Marismas PV A5, S.L. | | Seville (ES) | | | (5 | ) | Operational |
Marismas PV A6, S.L. | | Seville (ES) | | | (5 | ) | Operational |
Marismas PV A7, S.L. | | Seville (ES) | | | (5 | ) | Operational |
Marismas PV A8, S.L. | | Seville (ES) | | | (5 | ) | Operational |
Marismas PV A9, S.L. | | Seville (ES) | | | (5 | ) | Operational |
Marismas PV A10, S.L. | | Seville (ES) | | | (5 | ) | Operational |
Marismas PV A11, S.L. | | Seville (ES) | | | (5 | ) | Operational |
Marismas PV A12, S.L. | | Seville (ES) | | | (5 | ) | Operational |
Marismas PV A13, S.L. | | Seville (ES) | | | (5 | ) | Operational |
Marismas PV A14, S.L. | | Seville (ES) | | | (5 | ) | Operational |
Marismas PV A15, S.L. | | Seville (ES) | | | (5 | ) | Operational |
Marismas PV A16, S.L. | | Seville (ES) | | | (5 | ) | Operational |
Marismas PV A17, S.L. | | Seville (ES) | | | (5 | ) | Operational |
Marismas PV A18, S.L. | | Seville (ES) | | | (5 | ) | Operational |
Marismas PV B1, S.L. | | Seville (ES) | | | (5 | ) | Operational |
Marismas PV B2, S.L. | | Seville (ES) | | | (5 | ) | Operational |
Marismas PV B3, S.L. | | Seville (ES) | | | (5 | ) | Operational |
Marismas PV B4, S.L. | | Seville (ES) | | | (5 | ) | Operational |
Marismas PV B5, S.L. | | Seville (ES) | | | (5 | ) | Operational |
Marismas PV B6, S.L. | | Seville (ES) | | | (5 | ) | Operational |
Marismas PV B7, S.L. | | Seville (ES) | | | (5 | ) | Operational |
Marismas PV B8, S.L. | | Seville (ES) | | | (5 | ) | Operational |
Marismas PV B9, S.L. | | Seville (ES) | | | (5 | ) | Operational |
Marismas PV B10, S.L. | | Seville (ES) | | | (5 | ) | Operational |
Marismas PV B11, S.L. | | Seville (ES) | | | (5 | ) | Operational |
Marismas PV B12, S.L. | | Seville (ES) | | | (5 | ) | Operational |
Marismas PV B13, S.L. | | Seville (ES) | | | (5 | ) | Operational |
Marismas PV B14, S.L. | | Seville (ES) | | | (5 | ) | Operational |
Marismas PV B15, S.L. | | Seville (ES) | | | (5 | ) | Operational |
Marismas PV B16, S.L. | | Seville (ES) | | | (5 | ) | Operational |
Marismas PV B17, S.L. | | Seville (ES) | | | (5 | ) | Operational |
Marismas PV B18, S.L. | | Seville (ES) | | | (5 | ) | Operational |
F-215
Table of Contents
Appendices
Appendix XV
Companies with Electricity Operations included in the 2013 Consolidation Perimeter (Continuation)
| | | | | | | |
Company Name | | Registered Address | | Activity(*) | | Comments |
|---|
Marismas PV C1, S.L. | | Seville (ES) | | | (5 | ) | Operational |
Marismas PV C2, S.L. | | Seville (ES) | | | (5 | ) | Operational |
Marismas PV C3, S.L. | | Seville (ES) | | | (5 | ) | Operational |
Marismas PV C4, S.L. | | Seville (ES) | | | (5 | ) | Operational |
Marismas PV C5, S.L. | | Seville (ES) | | | (5 | ) | Operational |
Marismas PV C6, S.L. | | Seville (ES) | | | (5 | ) | Operational |
Marismas PV C7, S.L. | | Seville (ES) | | | (5 | ) | Operational |
Marismas PV C8, S.L. | | Seville (ES) | | | (5 | ) | Operational |
Marismas PV C9, S.L. | | Seville (ES) | | | (5 | ) | Operational |
Marismas PV C10, S.L. | | Seville (ES) | | | (5 | ) | Operational |
Marismas PV C11, S.L. | | Seville (ES) | | | (5 | ) | Operational |
Marismas PV C12, S.L. | | Seville (ES) | | | (5 | ) | Operational |
Marismas PV C13, S.L. | | Seville (ES) | | | (5 | ) | Operational |
Marismas PV C14, S.L. | | Seville (ES) | | | (5 | ) | Operational |
Marismas PV C15, S.L. | | Seville (ES) | | | (5 | ) | Operational |
Marismas PV C16, S.L. | | Seville (ES) | | | (5 | ) | Operational |
Marismas PV C17, S.L. | | Seville (ES) | | | (5 | ) | Operational |
Marismas PV C18, S.L. | | Seville (ES) | | | (5 | ) | Operational |
Marismas PV E1, S.L. | | Seville (ES) | | | (5 | ) | Operational |
Marismas PV E2, S.L. | | Seville (ES) | | | (5 | ) | Operational |
Marismas PV E3, S.L. | | Seville (ES) | | | (5 | ) | Operational |
Marudhara Akshay Urja Private Limited | | Maharashtra (IN) | | | (6 | ) | Construction phase |
Marusthal Green Power Private Limited | | Maharashtra (IN) | | | (6 | ) | Construction phase |
Mojave Solar LLC | | Berkeley (US) | | | (6 | ) | Construction phase |
Norventus Atlántico, S.L | | A Coruña (ES) | | | (2 | ) | Construction phase |
Palmatir S.A. | | Montevideo (UY) | | | (2 | ) | Construction phase |
Palmucho, S.A. | | Santiago de Chile (CL) | | | (9 | ) | Operational |
Precosa, Puerto Real Cogeneración, S.A. | | Cadiz (ES) | | | (3 | ) | Operational |
Procesos Ecológicos Vilches, S.A. | | Seville (ES) | | | (3 | ) | Operational |
Rajasthan Photon Energy Pvt Ltd | | Maharashtra (IN) | | | (6 | ) | Construction phase |
Sanlúcar Solar, S.A. | | Seville (ES) | | | (6 | ) | Operational |
Sao Mateus Transmissora de Energía, Ltda. | | R. de Janeiro (BR) | | | (9 | ) | Operational |
Shams Power Company PJSC | | Abu-Dhabi (AE) | | | (6 | ) | Operational |
Solaben Electricidad Uno | | Caceres (ES) | | | (6 | ) | Construction phase |
Solaben Electricidad Dos | | Caceres (ES) | | | (6 | ) | Operational |
Solaben Electricidad Tres | | Caceres (ES) | | | (6 | ) | Operational |
Solaben Electricidad Seis | | Badajoz (ES) | | | (6 | ) | Construction phase |
Solaben Electricidad Ocho, S.A. | | Caceres (ES) | | | (6 | ) | Construction phase |
Solaben Electricidad Diez, S.A. | | Caceres (ES) | | | (6 | ) | Construction phase |
Solacor Electricidad Uno, S.A. | | Seville (ES) | | | (6 | ) | Operational |
Solacor Electricidad Dos, S.A. | | Seville (ES) | | | (6 | ) | Operational |
Solar de Receptores de Andalucía, S.A. | | Seville (ES) | | | (5 | ) | Operational |
Solar Power Plant One (SPP1) | | Argel (DZ) | | | (5 | ) | Operational |
Solar Processes, S.A. | | Seville (ES) | | | (6 | ) | Operational |
Solargate Electricidad Tres, S.A. | | Seville (ES) | | | (6 | ) | Construction phase |
Solargate Electricidad Cuatro, S.A. | | Seville (ES) | | | (6 | ) | Construction phase |
Solargate Electricidad Cinco, S.A. | | Seville (ES) | | | (6 | ) | Construction phase |
Solnova Electricidad, S.A. | | Seville (ES) | | | (6 | ) | Operational |
Solnova Electricidad Dos, S.A. | | Seville (ES) | | | (6 | ) | Construction phase |
Solnova Electricidad Tres, S.A. | | Seville (ES) | | | (6 | ) | Operational |
F-216
Table of Contents
Appendices
Appendix XV
Companies with Electricity Operations included in the 2013 Consolidation Perimeter (Continuation)
| | | | | | | |
Company Name | | Registered Address | | Activity(*) | | Comments |
|---|
Solnova Electricidad Cuatro, S.A. | | Seville (ES) | | | (6 | ) | Operational |
Solnova Electricidad Cinco, S.A. | | Seville (ES) | | | (6 | ) | Construction phase |
Solnova Electricidad Séis, S.A. | | Seville (ES) | | | (6 | ) | Construction phase |
Transmisora Baquedano, S.A. | | Santiago de Chile (CL) | | | (9 | ) | Construction phase |
Transmisora Mejillones S.A. | | Santiago de Chile (CL) | | | (9 | ) | Construction phase |
- (*)
- Electricity operations as described in Note 2.29 in accordance with the provisions of Law 54/1997
- (1)
- Production under Special Regime: Cogeneration. Primary energy type: Fuel
- (2)
- Production under Special Regime: Wind. Primary energy type: Wind
- (3)
- Includes production under Special Regime: Cogeneration. Primary energy type: Natural gas
- (4)
- Production under Special Regime: Cogeneration. Primary energy type: Natural gas
- (5)
- Production under Special Regime: Solar Photovoltaic. Primary energy type: Solar light
- (6)
- Production under Special Regime: Solar Termosolar. Primary energy type: Solar light
- (7)
- Production under Special Regime: Hydraulic. Primary energy type: Water
- (8)
- Production under Special Regime: Other. Primary energy type: Industrial waste (used oils)
- (9)
- Transport.
- (10)
- Electricity production: Based on hydrogen. Primary type of energy: Hydrogen
F-217
Table of Contents
Appendices
Appendix XVI
Companies taxed under the Special Regime for Company Groups at 12.31.13
| | | | |
| Abengoa Tax Group Number 02/97 |
|---|
Company Name | | Tax Address | | Shareholding |
|---|
Abengoa S.A. | | Seville (ES) | | Sociedad Dominante |
Abeima Agua Internacional, S.L. | | Seville (ES) | | Abeinsa Infraestructuras Medio Ambiente/Construcciones y Depuraciones, S.A.(Codesa) |
Abeinsa Asset Management, S.L. | | Seville (ES) | | Abener Energía, S.A./Negocios Industriales y Comerciales, S.A. |
Abeinsa Business Development, S.A. | | Seville (ES) | | Abeinsa Ingeniería y Construcción Industrial, S.A./ Negocios Industriales y Comerciales, S.A. |
Abeinsa Engineering, S.L. | | Seville (ES) | | Abener Energía, S.A. |
Abeinsa EPC, S.A. | | Seville (ES) | | Abeinsa Ingeniería y Construcción Industrial S.A./Teyma Gest. Ctos. de Const. e Ing., S.A. |
Abeinsa Infraestructuras Medio Ambiente, S.A. | | Seville (ES) | | Abeinsa, Ingeniería y Construcción Industrial, S.L./Negocios Industriales y Comerciales, S.A |
Abeinsa, Ing y Const. Ind., S.A. | | Seville (ES) | | Abengoa, S.A./Siema AG |
Abencor Suministros S.A. | | Seville (ES) | | Negocios Industriales y Comerciales, S.A./Abeinsa Ingeniería y Construcción Industrial, S.A. |
Abener Argelia | | Seville (ES) | | Abener Energía, S.A./Abeinsa Ingeniería y Construcción Industrial, S.A. |
Abener Energía, S.A. | | Seville (ES) | | Abeinsa, Ing. y Const., S.A./Abeinsa Business Development, S.A./Negocios Ind. y Com., S.A. |
Abengoa Bioenergía Biodiesel S.A. | | Seville (ES) | | Abengoa Bioenergía Inversiones, S.A./Ecoagrícola, S.A. |
Abengoa Bioenergía Inversiones, S.A. | | Seville (ES) | | Abengoa Bioenergía, S.A./Abengoa Bioenergía Nuevas Tecnologías, S.A. |
Abengoa Bioenergía Nuevas Tecnologías, S.A. | | Seville (ES) | | Abengoa Bioenergía, S.L./Instalaciones Inabensa, S.A. |
Abengoa Bioenergía San Roque, S.A. | | Cadiz (ES) | | Abengoa Bioenergía Inversiones, S.A./Ecoagrícola, S.A. |
Abengoa Bioenergía, S.A. | | Seville (ES) | | Abengoa, S.A./Sociedad Inversora Energía y Medio Ambiente, S.A. |
Abengoa Concessions, S.L. | | Seville (ES) | | Abengoa, S.A./Siema |
Abengoa Finance | | Seville (ES) | | Abengoa, S.A. |
Abengoa Hidrógeno, S.A. | | Seville (ES) | | Abeinsa Ingeniería y Construcción Industrial, S.A./Instalaciones Inabensa, S.A. |
Abengoa Research, S.L. | | Seville (ES) | | Abeinsa, Ingeniería y Construcción Industrial, S.A./Instalaciones Inabensa, S.A. |
Abengoa SeaPower, S.A. | | Seville (ES) | | Abeinsa Ingeniería y Construcción Industrial, S.A./Instalaciones Inabensa, S.A. |
Abengoa Solar España, S.A. | | Seville (ES) | | Abengoa Solar, S.A./Abengoa Solar PV, S.A. |
Abengoa Solar Extremadura, S.A. | | Caceres (ES) | | Abengoa Solar España, S.A./Abengoa Solar New Technologies, S.A. |
Abengoa Solar Internacional, S.A. | | Seville (ES) | | Abengoa Solar, S.A. |
Abengoa Solar New Technologies, S.A. | | Seville (ES) | | Abengoa Solar, S.A. |
Abengoa Solar Power, S.A. | | Seville (ES) | | Abengoa Solar, S.A./Abengoa Solar España, S.A. |
Abengoa Solar Ventures S.A. | | Seville (ES) | | Abengoa Solar, S.A. |
Abengoa Solar, S.A. | | Seville (ES) | | Abengoa, S.A./Abengoa Solar España, S.A. |
Abengoa Water Agadir, S.L. | | Seville (ES) | | Abengoa Water, S.L.U. |
Abengoa Water Dalian, S.L.U. | | Seville (ES) | | Abengoa Water, S.L.U. |
Abengoa Water International, S.L.U. | | Seville (ES) | | Abengoa Water, S.L.U. |
Abengoa Water Nungua, S.L.U. | | Seville (ES) | | Abengoa Water, S.L.U. |
Abengoa Water, S.L.U. | | Seville (ES) | | Abengoa, S.A./Siema |
Abentel Telecomunicaciones, S.A. | | Seville (ES) | | Abener Energía, S.A./Abeinsa Ingeniería y Construcción Industrial, S.A. |
Aleduca, S.L | | Madrid (ES) | | Abengoa Solar España, S.A./Abengoa Solar, S.A. |
Aprofursa, Aprovechamientos Energéticos Furesa, S.A. | | Murcia (ES) | | Abeinsa Asset Management, S.L. |
Asa Iberoamérica, S.L. | | Seville (ES) | | Soc. Inv. Energía y Medio Ambiente, S.A./Abeinsa Ingeniería y Construcción Industrial, S.A. |
Aznalcóllar Solar, S.A. | | Seville (ES) | | Abengoa Solar España, S.A./Abengoa Solar, S.A. |
Befesa Agua Djerba, S.L. | | Seville (ES) | | Abengoa Water, S.L.U. |
Befesa Agua Tenes S.L. | | Madrid (ES) | | Abengoa Water S.L.U. |
Befesa CTA Qingdao S.L.U | | Madrid (ES) | | Abengoa Water, S.L.U. |
Biocarburantes de Castilla y León, S.A. | | Salamanca (ES) | | Abengoa Bioenergía Inversiones, S.A./Ecoagrícola, S.A. |
Bioeléctrica Jienense, S.A. | | Seville (ES) | | Abeinsa Asset Management, S.L. |
F-218
Table of Contents
Appendices
Appendix XVI
Companies taxed under the Special Regime for Company Groups at 12.31.13 (Continuation)
| | | | |
| Abengoa Tax Group Number 02/97 |
|---|
Company Name | | Tax Address | | Shareholding |
|---|
Bioetanol Galicia, S.A. | | A Coruña (ES) | | Abengoa Bioenergía Inversiones, S.A./Ecoagrícola, S.A. |
Captación Solar, S.A. | | Seville (ES) | | Abeinsa Asset Management, S.L./Abener Energía, S.A. |
Captasol Fotovoltaica 1, S.L. | | Seville (ES) | | Abengoa Solar España, S.A./Casaquemada Fotovoltaica, S.L. |
Captasol Fotovoltaica 2, S.L. | | Seville (ES) | | Abengoa Solar España, S.A./Casaquemada Fotovoltaica, S.L. |
Captasol Fotovoltaica 3, S.L. | | Seville (ES) | | Abengoa Solar España, S.A./Casaquemada Fotovoltaica, S.L. |
Captasol Fotovoltaica 4, S.L. | | Seville (ES) | | Abengoa Solar España, S.A./Casaquemada Fotovoltaica, S.L. |
Captasol Fotovoltaica 5, S.L. | | Seville (ES) | | Abengoa Solar España, S.A./Casaquemada Fotovoltaica, S.L. |
Captasol Fotovoltaica 6, S.L. | | Seville (ES) | | Abengoa Solar España, S.A./Casaquemada Fotovoltaica, S.L. |
Captasol Fotovoltaica 7, S.L. | | Seville (ES) | | Abengoa Solar España, S.A./Casaquemada Fotovoltaica, S.L. |
Captasol Fotovoltaica 8, S.L. | | Seville (ES) | | Abengoa Solar España, S.A./Casaquemada Fotovoltaica, S.L. |
Captasol Fotovoltaica 9, S.L. | | Seville (ES) | | Abengoa Solar España, S.A./Casaquemada Fotovoltaica, S.L. |
Captasol Fotovoltaica 10, S.L. | | Seville (ES) | | Abengoa Solar España, S.A./Casaquemada Fotovoltaica, S.L. |
Captasol Fotovoltaica 11, S.L. | | Seville (ES) | | Abengoa Solar España, S.A./Casaquemada Fotovoltaica, S.L. |
Captasol Fotovoltaica 12, S.L. | | Seville (ES) | | Abengoa Solar España, S.A./Casaquemada Fotovoltaica, S.L. |
Captasol Fotovoltaica 13, S.L. | | Seville (ES) | | Abengoa Solar España, S.A./Casaquemada Fotovoltaica, S.L. |
Captasol Fotovoltaica 14, S.L. | | Seville (ES) | | Abengoa Solar España, S.A./Casaquemada Fotovoltaica, S.L. |
Captasol Fotovoltaica 15, S.L. | | Seville (ES) | | Abengoa Solar España, S.A./Casaquemada Fotovoltaica, S.L. |
Captasol Fotovoltaica 16, S.L. | | Seville (ES) | | Abengoa Solar España, S.A./Casaquemada Fotovoltaica, S.L. |
Captasol Fotovoltaica 17, S.L. | | Seville (ES) | | Abengoa Solar España, S.A./Casaquemada Fotovoltaica, S.L. |
Captasol Fotovoltaica 18, S.L. | | Seville (ES) | | Abengoa Solar España, S.A./Casaquemada Fotovoltaica, S.L. |
Captasol Fotovoltaica 19, S.L. | | Seville (ES) | | Abengoa Solar España, S.A./Casaquemada Fotovoltaica, S.L. |
Captasol Fotovoltaica 20 S.L. | | Seville (ES) | | Abengoa Solar España, S.A./Linares Fotovoltaica, S.L. |
Captasol Fotovoltaica 21 S.L. | | Seville (ES) | | Abengoa Solar España, S.A./Linares Fotovoltaica, S.L. |
Captasol Fotovoltaica 22 S.L. | | Seville (ES) | | Abengoa Solar España, S.A./Linares Fotovoltaica, S.L. |
Captasol Fotovoltaica 23 S.L. | | Seville (ES) | | Abengoa Solar España, S.A./Linares Fotovoltaica, S.L. |
Captasol Fotovoltaica 24 S.L. | | Seville (ES) | | Abengoa Solar España, S.A./Linares Fotovoltaica, S.L. |
Captasol Fotovoltaica 25 S.L. | | Seville (ES) | | Abengoa Solar España, S.A./Linares Fotovoltaica, S.L. |
Captasol Fotovoltaica 26 S.L. | | Seville (ES) | | Abengoa Solar España, S.A./Linares Fotovoltaica, S.L. |
Captasol Fotovoltaica 27 S.L. | | Seville (ES) | | Abengoa Solar España, S.A./Linares Fotovoltaica, S.L. |
Captasol Fotovoltaica 28 S.L. | | Seville (ES) | | Abengoa Solar España, S.A./Linares Fotovoltaica, S.L. |
Captasol Fotovoltaica 29 S.L. | | Seville (ES) | | Abengoa Solar España, S.A./Linares Fotovoltaica, S.L. |
Captasol Fotovoltaica 30 S.L. | | Seville (ES) | | Abengoa Solar España, S.A./Linares Fotovoltaica, S.L. |
Captasol Fotovoltaica 31 S.L. | | Seville (ES) | | Abengoa Solar España, S.A./Linares Fotovoltaica, S.L. |
Captasol Fotovoltaica 32 S.L. | | Seville (ES) | | Abengoa Solar España, S.A./Linares Fotovoltaica, S.L. |
Captasol Fotovoltaica 33 S.L. | | Seville (ES) | | Abengoa Solar España, S.A./Linares Fotovoltaica, S.L. |
Captasol Fotovoltaica 34 S.L. | | Seville (ES) | | Abengoa Solar España, S.A./Linares Fotovoltaica, S.L. |
Captasol Fotovoltaica 35 S.L. | | Seville (ES) | | Abengoa Solar España, S.A./Linares Fotovoltaica, S.L. |
Captasol Fotovoltaica 36 S.L. | | Seville (ES) | | Abengoa Solar España, S.A./Linares Fotovoltaica, S.L. |
Captasol Fotovoltaica 37 S.L. | | Seville (ES) | | Abengoa Solar España, S.A./Linares Fotovoltaica, S.L. |
Captasol Fotovoltaica 38 S.L. | | Seville (ES) | | Abengoa Solar España, S.A./Linares Fotovoltaica, S.L. |
Captasol Fotovoltaica 40, S.L. | | Seville (ES) | | Abengoa Solar España, S.A./Linares Fotovoltaica, S.L. |
Captasol Fotovoltaica 48, S.L. | | Seville (ES) | | Abengoa Solar España, S.A./Linares Fotovoltaica, S.L. |
Captasol Fotovoltaica 49, S.L. | | Seville (ES) | | Abengoa Solar España, S.A./Linares Fotovoltaica, S.L. |
Captasol Fotovoltaica 50, S.L. | | Seville (ES) | | Abengoa Solar España, S.A./Linares Fotovoltaica, S.L. |
Captasol Fotovoltaica51 S.L. | | Seville (ES) | | Abengoa Solar España, S.A. |
Captasol Fotovoltaica 52 S.L. | | Seville (ES) | | Abengoa Solar España, S.A. |
Captasol Fotovoltaica 53, S.L. | | Seville (ES) | | Abengoa Solar España, S.A. |
Captasol Fotovoltaica 54, S.L. | | Seville (ES) | | Abengoa Solar España, S.A. |
Captasol Fotovoltaica 55, S.L. | | Seville (ES) | | Abengoa Solar España, S.A. |
Captasol Fotovoltaica 56, S.L. | | Seville (ES) | | Abengoa Solar España, S.A. |
Captasol Fotovoltaica 58, S.L. | | Seville (ES) | | Abengoa Solar España, S.A. |
Captasol Fotovoltaica 66, S.L. | | Seville (ES) | | Abengoa Solar España, S.A. |
Captasol Fotovoltaica 67, S.L. | | Seville (ES) | | Abengoa Solar España, S.A. |
Captasol Fotovoltaica 68, S.L. | | Seville (ES) | | Abengoa Solar España, S.A. |
Captasol Fotovoltaica 72, S.L. | | Seville (ES) | | Abengoa Solar España, S.A. |
Captasol Fotovoltaica 73, S.L. | | Seville (ES) | | Abengoa Solar España, S.A. |
Captasol Fotovoltaica 74, S.L. | | Seville (ES) | | Abengoa Solar España, S.A. |
Captasol Fotovoltaica 77, S.L. | | Seville (ES) | | Abengoa Solar España, S.A. |
Casaquemada Fotovoltaica, S.L. | | Seville (ES) | | Abengoa Solar España, S.A./Abengoa Solar, S.A. |
F-219
Table of Contents
Appendices
Appendix XVI
Companies taxed under the Special Regime for Company Groups at 12.31.13 (Continuation)
| | | | |
| Abengoa Tax Group Number 02/97 |
|---|
Company Name | | Tax Address | | Shareholding |
|---|
Centro Industrial y Logístico Torrecuellar, S.A. | | Seville (ES) | | Instalaciones Inabensa, S.A./Abeinsa Ingeniería y Construcción Industrial, S.A. |
Centro Tecnológico Palmas Altas, S.A. | | Seville (ES) | | Abengoa, S.A./Abeinsa Ingeniería y Construcción Industrial, S.A. |
Construcciones y Depuraciones, S.A. | | Seville (ES) | | Abeinsa Infraestructuras Medio Ambiente, S.A. |
Cogeneración Villaricos, S.A. | | Seville (ES) | | Abeinsa Asset Management, S.L. |
Ecoagricola, S.A. | | Murcia (ES) | | Abengoa Bioenergía Inversiones, S.A./Ecocarburantes, S.A. |
Ecocarburantes Españoles , S.A. | | Murcia (ES) | | Abengoa Bioenergía Inversiones, S.A. |
Eucomsa, Europea Const. Metálicas, S.A. | | Seville (ES) | | Abeinsa Ingeniería y Construcción Industrial, S.A./Abengoa Solar, S.A. |
Fotovoltaica Solar Sevilla, S.A. | | Seville (ES) | | Abengoa Solar España, S.A. |
Gestión Integral de Recursos Humanos, S.A. | | Seville (ES) | | Siema Technologies, S.L |
Helioenergy Electricidad Tres, S.A. | | Seville (ES) | | Abengoa Solar España, S.A./Abengoa Solar NT, S.A. |
Helioenergy Electricidad Cuatro, S.A. | | Seville (ES) | | Abengoa Solar España, S.A./Abengoa Solar NT, S.A. |
Helioenergy Electricidad Cinco, S.A. | | Seville (ES) | | Abengoa Solar España, S.A./Abengoa Solar NT, S.A. |
Helio Energy Electricidad Siete, S.A. | | Seville (ES) | | Abengoa Solar España, S.A./Abengoa Solar NT, S.A. |
Helio Energy Electricidad Ocho, S.A. | | Seville (ES) | | Abengoa Solar España, S.A./Abengoa Solar NT, S.A. |
Helio Energy Electricidad Nueve, S.A. | | Seville (ES) | | Abengoa Solar España, S.A./Abengoa Solar NT, S.A. |
Helio Energy Electricidad DIez, S.A. | | Seville (ES) | | Abengoa Solar España, S.A./Abengoa Solar NT, S.A. |
Helioenergy Electricidad Once, S.A. | | Seville (ES) | | Abengoa Solar España, S.A./Abengoa Solar NT, S.A. |
Helio Energy Electricidad Doce, S.A. | | Seville (ES) | | Abengoa Solar España, S.A./Abengoa Solar NT, S.A. |
Helioenergy Electricidad Trece, S.A. | | Seville (ES) | | Abengoa Solar España, S.A./Abengoa Solar NT, S.A. |
Helioenergy Electricidad Veintiuno, S.A. | | Seville (ES) | | Abengoa Solar España, S.A. /Abengoa Solar New Technologies, S.A. |
Helioenergy Electricidad Veintidos, S.A. | | Seville (ES) | | Abengoa Solar España, S.A. /Abengoa Solar New Technologies, S.A. |
Helioenergy Electricidad Veintitres, S.A. | | Seville (ES) | | Abengoa Solar España, S.A. /Abengoa Solar New Technologies, S.A. |
Helioenergy Electricidad Veinticuatro, S.A | | Seville (ES) | | Abengoa Solar España, S.A. /Abengoa Solar New Technologies, S.A. |
Helioenergy Electricidad Veinticinco, S.A. | | Seville (ES) | | Abengoa Solar España, S.A. |
Helios I Hyperion Energy Investments, S.L. | | Seville (ES) | | Hypesol Energy Holding, S.L./Abengoa Solar New Technologies, S.A. |
Helios II Hyperion Energy Investments, S.L. | | Madrid (ES) | | Hypesol Energy Holding, S.L./Abengoa Solar New Technologies, S.A. |
Hypesol Energy Holding , S.L. | | Seville (ES) | | Abengoa Solar España, S.A./Abengoa Solar New Technologies S.A. |
Inabensa Fotovoltaica, S.L. | | Seville (ES) | | Instalaciones Inabensa, S.A./C.I.L. Torrecuéllar, S.A. |
Iniciativas Hidroeléctricas de Aragón y Cataluña, S.L. | | Huesca (ES) | | Abeinsa Infraestructuras Medio Ambiente, S.A. |
Instalaciones Fotovoltaicas Torrecuéllar, 1 S.L. | | Seville (ES) | | Inabensa Fotovoltaica, S.L./Instalaciones Inabensa, S.A. |
Instalaciones Fotovoltaicas Torrecuéllar, 2 S.L. | | Seville (ES) | | Inabensa Fotovoltaica, S.L./Instalaciones Inabensa, S.A. |
Instalaciones Fotovoltaicas Torrecuéllar, 3 S.L. | | Seville (ES) | | Inabensa Fotovoltaica, S.L./Instalaciones Inabensa, S.A. |
Instalaciones Inabensa, S.A. | | Seville (ES) | | Nicsa/Abener Energía, S.A./Abeinsa Ingeniería y Construcción Industrial, S.A. |
Las Cabezas Fotovoltaica, S.L. | | Seville (ES) | | Abengoa Solar España, S.A./Abengoa Solar, S.A. |
Las Cabezas Solar, S.L. | | Seville (ES) | | Aleduca, S.L. |
Linares Fotovoltaica, S.L. | | Seville (ES) | | Abengoa Solar España, S.A./Abengoa Solar, S.A. |
Logrosán Solar Inversiones Dos, S.L. | | Seville (ES) | | Abengoa Solar España S.A./Abengoa Solar S.A. |
Marismas PV A1, S.L. | | Seville (ES) | | Las Cabezas Fotovoltaica, S.L./Abengoa Solar España, S.A. |
Marismas PV A2, S.L. | | Seville (ES) | | Las Cabezas Fotovoltaica, S.L./Abengoa Solar España, S.A. |
Marismas PV A3, S.L. | | Seville (ES) | | Las Cabezas Fotovoltaica, S.L./Abengoa Solar España, S.A. |
Marismas PV A4, S.L. | | Seville (ES) | | Las Cabezas Fotovoltaica, S.L./Abengoa Solar España, S.A. |
Marismas PV A5, S.L. | | Seville (ES) | | Las Cabezas Fotovoltaica, S.L./Abengoa Solar España, S.A. |
Marismas PV A6, S.L. | | Seville (ES) | | Las Cabezas Fotovoltaica, S.L./Abengoa Solar España, S.A. |
Marismas PV A7, S.L. | | Seville (ES) | | Las Cabezas Fotovoltaica, S.L./Abengoa Solar España, S.A. |
Marismas PV A8, S.L. | | Seville (ES) | | Las Cabezas Fotovoltaica, S.L./Abengoa Solar España, S.A. |
Marismas PV A9, S.L. | | Seville (ES) | | Las Cabezas Fotovoltaica, S.L./Abengoa Solar España, S.A. |
Marismas PV A10, S.L. | | Seville (ES) | | Las Cabezas Fotovoltaica, S.L./Abengoa Solar España, S.A. |
Marismas PV A11, S.L. | | Seville (ES) | | Las Cabezas Fotovoltaica, S.L./Abengoa Solar España, S.A. |
F-220
Table of Contents
Appendices
Appendix XVI
Companies taxed under the Special Regime for Company Groups at 12.31.13 (Continuation)
| | | | |
| Abengoa Tax Group Number 02/97 |
|---|
Company Name | | Tax Address | | Shareholding |
|---|
Marismas PV A12, S.L. | | Seville (ES) | | Las Cabezas Fotovoltaica, S.L./Abengoa Solar España, S.A. |
Marismas PV A13, S.L. | | Seville (ES) | | Las Cabezas Fotovoltaica, S.L./Abengoa Solar España, S.A. |
Marismas PV A14, S.L. | | Seville (ES) | | Las Cabezas Fotovoltaica, S.L./Abengoa Solar España, S.A. |
Marismas PV A15, S.L. | | Seville (ES) | | Las Cabezas Fotovoltaica, S.L./Abengoa Solar España, S.A. |
Marismas PV A16, S.L. | | Seville (ES) | | Las Cabezas Fotovoltaica, S.L./Abengoa Solar España, S.A. |
Marismas PV A17, S.L. | | Seville (ES) | | Las Cabezas Fotovoltaica, S.L./Abengoa Solar España, S.A. |
Marismas PV A18, S.L. | | Seville (ES) | | Las Cabezas Fotovoltaica, S.L./Abengoa Solar España, S.A. |
Marismas PV B1, S.L. | | Seville (ES) | | Las Cabezas Fotovoltaica, S.L./Abengoa Solar España, S.A. |
Marismas PV B2, S.L. | | Seville (ES) | | Las Cabezas Fotovoltaica, S.L./Abengoa Solar España, S.A. |
Marismas PV B3, S.L. | | Seville (ES) | | Las Cabezas Fotovoltaica, S.L./Abengoa Solar España, S.A. |
Marismas PV B4, S.L. | | Seville (ES) | | Las Cabezas Fotovoltaica, S.L./Abengoa Solar España, S.A. |
Marismas PV B5, S.L. | | Seville (ES) | | Las Cabezas Fotovoltaica, S.L./Abengoa Solar España, S.A. |
Marismas PV B6, S.L. | | Seville (ES) | | Las Cabezas Fotovoltaica, S.L./Abengoa Solar España, S.A. |
Marismas PV B7, S.L. | | Seville (ES) | | Las Cabezas Fotovoltaica, S.L./Abengoa Solar España, S.A. |
Marismas PV B8, S.L. | | Seville (ES) | | Las Cabezas Fotovoltaica, S.L./Abengoa Solar España, S.A. |
Marismas PV B9, S.L. | | Seville (ES) | | Las Cabezas Fotovoltaica, S.L./Abengoa Solar España, S.A. |
Marismas PV B10, S.L. | | Seville (ES) | | Las Cabezas Fotovoltaica, S.L./Abengoa Solar España, S.A. |
Marismas PV B11, S.L. | | Seville (ES) | | Las Cabezas Fotovoltaica, S.L./Abengoa Solar España, S.A. |
Marismas PV B12, S.L. | | Seville (ES) | | Las Cabezas Fotovoltaica, S.L./Abengoa Solar España, S.A. |
Marismas PV B13, S.L. | | Seville (ES) | | Las Cabezas Fotovoltaica, S.L./Abengoa Solar España, S.A. |
Marismas PV B14, S.L. | | Seville (ES) | | Las Cabezas Fotovoltaica, S.L./Abengoa Solar España, S.A. |
Marismas PV B15, S.L. | | Seville (ES) | | Las Cabezas Fotovoltaica, S.L./Abengoa Solar España, S.A. |
Marismas PV B16, S.L. | | Seville (ES) | | Las Cabezas Fotovoltaica, S.L./Abengoa Solar España, S.A. |
Marismas PV B17, S.L. | | Seville (ES) | | Las Cabezas Fotovoltaica, S.L./Abengoa Solar España, S.A. |
Marismas PV B18, S.L. | | Seville (ES) | | Las Cabezas Fotovoltaica, S.L./Abengoa Solar España, S.A. |
Marismas PV C1, S.L. | | Seville (ES) | | Las Cabezas Fotovoltaica, S.L./Abengoa Solar España, S.A. |
Marismas PV C2, S.L. | | Seville (ES) | | Las Cabezas Fotovoltaica, S.L./Abengoa Solar España, S.A. |
Marismas PV C3, S.L. | | Seville (ES) | | Las Cabezas Fotovoltaica, S.L./Abengoa Solar España, S.A. |
Marismas PV C4, S.L. | | Seville (ES) | | Las Cabezas Fotovoltaica, S.L./Abengoa Solar España, S.A. |
Marismas PV C5, S.L. | | Seville (ES) | | Las Cabezas Fotovoltaica, S.L./Abengoa Solar España, S.A. |
Marismas PV C6, S.L. | | Seville (ES) | | Las Cabezas Fotovoltaica, S.L./Abengoa Solar España, S.A. |
Marismas PV C7, S.L. | | Seville (ES) | | Las Cabezas Fotovoltaica, S.L./Abengoa Solar España, S.A. |
Marismas PV C8, S.L. | | Seville (ES) | | Las Cabezas Fotovoltaica, S.L./Abengoa Solar España, S.A. |
Marismas PV C9, S.L. | | Seville (ES) | | Las Cabezas Fotovoltaica, S.L./Abengoa Solar España, S.A. |
Marismas PV C10, S.L. | | Seville (ES) | | Las Cabezas Fotovoltaica, S.L./Abengoa Solar España, S.A. |
Marismas PV C11, S.L. | | Seville (ES) | | Las Cabezas Fotovoltaica, S.L./Abengoa Solar España, S.A. |
Marismas PV C12, S.L. | | Seville (ES) | | Las Cabezas Fotovoltaica, S.L./Abengoa Solar España, S.A. |
Marismas PV C13, S.L. | | Seville (ES) | | Las Cabezas Fotovoltaica, S.L./Abengoa Solar España, S.A. |
Marismas PV C14, S.L. | | Seville (ES) | | Las Cabezas Fotovoltaica, S.L./Abengoa Solar España, S.A. |
Marismas PV C15, S.L. | | Seville (ES) | | Las Cabezas Fotovoltaica, S.L./Abengoa Solar España, S.A. |
Marismas PV C16, S.L. | | Seville (ES) | | Las Cabezas Fotovoltaica, S.L./Abengoa Solar España, S.A. |
Marismas PV C17, S.L. | | Seville (ES) | | Las Cabezas Fotovoltaica, S.L./Abengoa Solar España, S.A. |
Marismas PV C18, S.L. | | Seville (ES) | | Las Cabezas Fotovoltaica, S.L./Abengoa Solar España, S.A. |
Marismas PV E1, S.L. | | Seville (ES) | | Las Cabezas Fotovoltaica, S.L./Abengoa Solar España, S.A. |
Marismas PV E2, S.L. | | Seville (ES) | | Las Cabezas Fotovoltaica, S.L./Abengoa Solar España, S.A. |
Marismas PV E3, S.L. | | Seville (ES) | | Las Cabezas Fotovoltaica, S.L./Abengoa Solar España, S.A. |
NEA Solar Investments, S.A. | | Seville (ES) | | Abengoa Solar Internacional, S.A./Abengoa Solar S.A./Abengoa Solar España, S.A. |
NEA Solar O&M, S.A. | | Seville (ES) | | Abengoa Solar, S.A /Abengoa Solar España, S.A. |
NEA Solar Power, S.A. | | Seville (ES) | | Abengoa Solar, S.A /Abengoa Solar España, S.A. |
Nicsa, Negocios Industr. y Comer. S.A. | | Madrid (ES) | | Abencor, S.A./Abeinsa Ingeniería y Construcción Industrial, S.A. |
Omega Sudamérica, S.L | | Seville (ES) | | Instalaciones Inabensa, S.A./ASA Iberoamérica S.A. |
Precosa, Puerto Real Cogeneración, S.A. | | Cadiz (ES) | | Abeinsa Asset Management, S.L. |
Sanlúcar Solar, S.A. | | Seville (ES) | | Abengoa Solar, S.A./Asa Environment |
Siema Investment, S.L.U. | | Madrid (ES) | | Siema Technologies, S.L |
Siema Technologies, S.L. | | Madrid (ES) | | Abengoa, S.A./Siema AG |
Simosa I.T., S.A | | Seville (ES) | | Abengoa, S.A./Simosa, S.A. |
Simosa, Serv. Integ. Manten y Operac., S.A. | | Seville (ES) | | Negocios Industriales y Comerciales, S.A./Abengoa, S.A. |
F-221
Table of Contents
Appendices
Appendix XVI
Companies taxed under the Special Regime for Company Groups at 12.31.13 (Continuation)
| | | | |
| Abengoa Tax Group Number 02/97 |
|---|
Company Name | | Tax Address | | Shareholding |
|---|
Soc. Inver. En Ener. y Medioambiente, S.A. (Siema) | | Seville (ES) | | Abengoa, S.A./Negocios Industriales y Comerciales, S.A. |
Sociedad Inversora Lineas de Brasil, S.L. (ETVE) | | Seville (ES) | | Asa Iberoamérica, S.L. |
Sol3G | | Barcelona (ES) | | Abengoa Solar, S.A. |
Solaben Electricidad Uno | | Caceres (ES) | | Extremadura Equity Investments Sárl. |
Solaben Electricidad Seis | | Badajoz (ES) | | Extremadura Equity Investments Sárl. |
Solaben Electricidad Ocho, S.A. | | Caceres (ES) | | Abengoa Solar España, S.A/Abengoa Solar New Technologies,S.A. |
Solaben Electricidad Nueve, S.A. | | Badajoz (ES) | | Abengoa Solar España, S.A./Abengoa Solar NT, S.A. |
Solaben Electricidad Diez, S.A. | | Caceres (ES) | | Abengoa Solar España, S.A./Abengoa Solar NT, S.A. |
Solaben Electricidad Once, S.A. | | Badajoz (ES) | | Abengoa Solar España, S.A./Abengoa Solar NT, S.A. |
Solaben Electricidad Doce, S.A. | | Badajoz (ES) | | Abengoa Solar España, S.A./Abengoa Solar NT, S.A. |
Solaben Electricidad Quince, S.A | | Badajoz (ES) | | Abengoa Solar España, S.A./Abengoa Solar NT, S.A. |
Solar de Receptores de Andalucía, S.A. | | Seville (ES) | | Abengoa Solar, S.A./Abengoa Solar NT, S.A. |
Solar Processes, S.A. | | Seville (ES) | | Abengoa Solar España,S.A./ Instalaciones Inabensa, S.A. |
Solargate Electricidad Dos , S.A. | | Seville (ES) | | Abengoa Solar España, S.A./Abengoa Solar NT, S.A. |
Solargate Electricidad Tres , S.A. | | Seville (ES) | | Abengoa Solar España, S.A./Abengoa Solar NT, S.A. |
Solargate Electricidad Cuatro , S.A. | | Seville (ES) | | Abengoa Solar España, S.A./Abengoa Solar NT, S.A. |
Solargate Electricidad Cinco , S.A. | | Seville (ES) | | Abengoa Solar España, S.A./Abengoa Solar NT, S.A. |
Solnova Electricidad, S.A. | | Seville (ES) | | Solnova Solar Inversiones, S.A./Instalaciones Inabensa, S.A. |
Solnova Electricidad Dos, S.A. | | Seville (ES) | | Abengoa Solar España, S.A./Abengoa Solar, S.A. |
Solnova Electricidad Tres, S.A. | | Seville (ES) | | Solnova Solar Inversiones, S.A./Instalaciones Inabensa, S.A. |
Solnova Electricidad Cuatro, S.A. | | Seville (ES) | | Solnova Solar Inversiones, S.A. /Instalaciones Inabensa, S.A. |
Solnova Electricidad Cinco, S.A. | | Seville (ES) | | Abengoa Solar España, S.A./Abengoa Solar, S.A. |
Solnova Solar Inversiones, S.A | | Seville (ES) | | Abengoa Solar España, S.A. |
Solúcar Andalucía FV1, S.A | | Seville (ES) | | Abengoa Solar España, S.A./Abengoa Solar NT, S.A. |
Solúcar Andalucía FV2, S.A | | Seville (ES) | | Abengoa Solar España, S.A./Abengoa Solar NT, S.A. |
Solúcar Castilla FV1, S.A | | Seville (ES) | | Abengoa Solar España, S.A./Abengoa Solar NT, S.A. |
Solúcar Castilla FV2, S.A | | Seville (ES) | | Abengoa Solar España, S.A./Abengoa Solar NT, S.A. |
Solugas Energía S.A. | | Seville (ES) | | Abengoa Solar NT, S.A./Abengoa Solar S.A. |
South Africa PV Investments, S.L. | | Seville (ES) | | Abengoa Solar Internacional, S.A./Abengoa Solar
Ventures, S.A |
South Africa Solar Investments, S.L. | | Seville (ES) | | Abengoa Solar Internacional, S.A. |
South Africa Solar Ventures, S.L. | | Seville (ES) | | Abengoa Solar Internacional, S.A./Abengoa Solar
Ventures, S.A |
Telvent Implantación de Sistemas S.L. | | Madrid (ES) | | Simosa I.T., S.A. |
Teyma, Gestión de Contratos de Construcción e Ingeniería, S.A. | | Seville (ES) | | Abeinsa Ingeniería y Construcción Industrial, S.A. |
Zero Emissions Technologies, S.A. | | Seville (ES) | | Abeinsa Ingeniería y Construcción Industrial, S.A./Abengoa Hidrógeno, S.A. |
Zeroemissions Carbon Trust, S.A. | | Seville (ES) | | Zeroemissions Technologies, S.A./Abeinsa Ingeniería y Construcción Industrial, S.A. |
F-222
Table of Contents
Appendices
Appendix XVII
Subsidiary companies included in the 2012 consolidation perimeter using
the global integration method
| | | | | | | | | | | | | | | | |
| |
| | Shareholding | |
| |
| |
| |
|
|---|
Company Name | | Registered
Address | | Amount in
thousands
of € | | % of
Nominal
Capital | | Parent Company | | (*) | | Activity
(see Page 4) | | Auditor |
|---|
AB Bioenergy France, S.A. | | Montardon (FR) | | | 81,953 | | | 69.00 | | Abengoa Bioenergía, S.A. | | — | | (6) | | B |
AB Bioenergy Hannover GmbH | | Hannover (DE) | | | 98 | | | 100.00 | | Abengoa Bioenergía Inversiones, S.A. | | — | | (6) | | — |
Abacus Management, LLC. | | Phoenix (US) | | | — | | | 100.00 | | Abacus Project Management, Inc. | | (*) | | (1) | | — |
Abacus Project Management, Inc. | | Phoenix (US) | | | 3,523 | | | 100.00 | | Teyma USA Inc. | | — | | (1) | | B |
Abeima Enerji ve Insaat Sanayi Ticaret Limited Sirketi | | Ankara (TR) | | | — | | | 100.00 | | Befesa Agua Internacional, S.L. /Abeinsa Ingeniería y Construcción Industrial, S.A. | | (*) | | (1) | | — |
Abeima Teyma Barka, LLC. | | Ruwi (OM) | | | 332 | | | 70.00 | | Abeinsa Infraestructuras Medio Ambiente, S.A./Teyma Gest. Ctos. de Const. e Ing., S.A. | | (*) | | (1) | | — |
Abeima Teyma Infraestructure Ghana Ltd. (Abeima Teyma Ghana) | | Accra (GH) | | | 38 | | | 100.00 | | Abeinsa Infraestructuras Medio Ambiente, S.A./Teyma Gest. Ctos. de Const. e Ing., S.A. | | (*) | | (1) | | B |
Abeima Teyma Zapotillo SRL de C.V. | | Mexico City (MX) | | | — | | | 100.00 | | Abeinsa Infraestructuras Medio Ambiente, S.A./Teyma Gest. Ctos. de Const. e Ing., S.A. | | (*) | | (1) | | B |
Abeima, LLC. | | Delaware (US) | | | — | | | 100.00 | | Abeinsa, Inc. LLC. | | (*) | | (1) | | — |
Abeinsa Abener Teyma General Partnership | | Phoenix (US) | | | — | | | 100.00 | | Teyma USA Inc./Abener Engineering and Construction Services, LLC./Abeinsa EPC Inc. | | (*) | | (1) | | — |
Abeinsa Asset Management, S.L. | | Seville (ES) | | | 22,861 | | | 100.00 | | Abener Energía, S.A./Negocios Industriales y Comerciales, S.A. | | — | | (1) | | — |
Abeinsa BD Asia Pacific Pte. Ltd. | | Singapore (SG) | | | 66 | | | 100.00 | | Abeinsa Infraestructuras Medio Ambiente, S.A. | | (*) | | (1) | | — |
Abeinsa Brasil Projetos e Construcoes Ltda | | R. de Janeiro (BR) | | | 180 | | | 100.00 | | Abengoa Brasil, S.A./Inabensa Río Ltda. | | — | | (1) | | B |
Abeinsa Business Development Private Limited | | Bombay (IN) | | | 3,321 | | | 100.00 | | Abeinsa Asset Management, S.L./Abener Inversiones, S.L. | | — | | (1) | | — |
Abeinsa Business Development, LLC. | | Chesterfield (US) | | | — | | | 100.00 | | Abeinsa, Inc. LLC. | | (*) | | (1) | | — |
Abeinsa Business Development, S.A. | | Seville (ES) | | | — | | | 100.00 | | Abeinsa Ingeniería y Construcción Industrial, S.A./ Negocios Industriales y Comerciales, S.A. | | (*) | | (1) | | — |
Abeinsa Business Development, Sp.z.o.o. | | Gliwice (PL) | | | 1 | | | 100.00 | | Abeinsa Business Development, S.A. | | — | | (1) | | D |
Abeinsa Business Developmet, S.A. de C.V. | | Mexico City (MX) | | | 3 | | | 100.00 | | Abeinsa Business Development, S.A./ Negocios Industriales y Comerciales, S.A. | | (*) | | (1) | | — |
Abeinsa EPC Inc. | | Phoenix (US) | | | — | | | 100.00 | | Abeinsa, Inc. LLC. | | (*) | | (1) | | B |
Abeinsa EPC Kaxu (Pty) Ltd. | | Johannesburg (ZA) | | | — | | | 92.00 | | Abener Energía, S.A./Teyma Gestión de Contratos de Construcción e Ingeniería, S.A. | | (*) | | (1) | | B |
Abeinsa EPC Khi (Pty) Ltd. | | Johannesburg (ZA) | | | — | | | 92.00 | | Abener Energía, S.A./Teyma Gestión de Contratos de Construcción e Ingeniería, S.A. | | (*) | | (1) | | B |
Abeinsa EPC México, S.A de C.V | | Mexico City (MX) | | | 1 | | | 100.00 | | Abeinsa Ingeniería y Construcción Industrial S.A./ ASA Iberoamérica, S.L. | | (*) | | (1) | | B |
Abeinsa EPC, S.A. | | Seville (ES) | | | 60 | | | 100.00 | | Abeinsa Ingeniería y Construcción Industrial S.A./Teyma Gest. Ctos. de Const. e Ing., S.A. | | (*) | | (1) | | B |
Abeinsa Infraestructuras Medio Ambiente, S.A. | | Seville (ES) | | | 447,151 | | | 100.00 | | Abeinsa, Ingeniería y Construcción Industrial, S.L./Negocios Industriales y Comerciales, S.A | | — | | (1) | | B |
Abeinsa Ingenieria y Construccion Industrial, S.A. | | Seville (ES) | | | 90,642 | | | 100.00 | | Abengoa, S.A./Siema AG | | — | | (1) | | B |
Abeinsa Inversiones Latam, S.L. | | Madrid (ES) | | | 283,048 | | | 100.00 | | Abengoa Concessões Brasil Holding, S.A./Abeinsa, Ingeniería y Construcción Industrial, S.A. | | — | | (1) | | — |
Abeinsa, Inc. LLC. | | Delaware (US) | | | 1 | | | 100.00 | | Teyma USA, Inc. | | (*) | | (1) | | — |
Abelec, S.A. | | Santiago (CL) | | | 2 | | | 99.99 | | Abengoa Chile, S.A. | | — | | (2) | | — |
Abema, Ltda. | | Santiago (CL) | | | 2 | | | 100.00 | | Abengoa Chile, S.A./Abeinsa Infraestructuras Medio Ambiente, S.A. | | — | | (1) | | — |
Abencasa-Abengoa Comer. Y Administraçao, S.A. | | R. de Janeiro (BR) | | | 5,334 | | | 100.00 | | Asa Investment AG | | — | | (1) | | — |
Abencor Brasil Ltda. | | R. de Janeiro (BR) | | | — | | | 100.00 | | Abencor Suministros, S.A./Abengoa Construção Brasil Ltda. | | (*) | | (1) | | — |
Abencor México, S.A. de C.V | | Mexico City (MX) | | | — | | | 100.00 | | Abencor Suministros, S.A./Abengoa México, S.A. | | (*) | | (1) | | — |
Abencor Perú | | Lima (PE) | | | 1 | | | 99.99 | | Abencor Suministros S.A. | | — | | (1) | | — |
F-223
Table of Contents
Appendices
Appendix XVII
Subsidiary companies included in the 2012 consolidation perimeter using
the global integration method (Continuation)
| | | | | | | | | | | | | | | | |
| |
| | Shareholding | |
| |
| |
| |
|
|---|
Company Name | | Registered
Address | | Amount in
thousands
of € | | % of
Nominal
Capital | | Parent Company | | (*) | | Activity
(see Page 4) | | Auditor |
|---|
Abencor Suministros Chile, S.A. | | Santiago de Chile (CH) | | | 3 | | | 100.00 | | Abengoa Chile S.A./Abencor Suministros, S.A. | | — | | (1) | | B |
Abencor Suministros S.A. | | Seville (ES) | | | 4,133 | | | 100.00 | | Negocios Industriales y Comerciales, S.A./Abeinsa Ingeniería y Construcción Industrial, S.A. | | — | | (1) | | C |
Abencor USA, LLC. | | Phoenix (US) | | | — | | | 100.00 | | Abeinsa, Inc. LLC. | | (*) | | (1) | | — |
Abencs Investments , LLC. | | Delaware (US) | | | — | | | 100.00 | | Abencs LLC. | | — | | (1) | | — |
Abener Argelia, S.L. | | Seville (ES) | | | 4 | | | 100.00 | | Abener Energía, S.A./Abeinsa Ingeniería y Construcción Industrial, S.A. | | — | | (1) | | — |
Abener Energía Ltda | | R. de Janeiro (BR) | | | 2 | | | 100.00 | | Abener Energía, S.A./Abeinsa Asset Management, S.L. | | (*) | | (1) | | — |
Abener Energía, S.A. | | Seville (ES) | | | 54,523 | | | 100.00 | | Abeinsa Ingeniería y Construcción Industrial, S.A. | | — | | (1) | | B |
Abener Energie S.A.R.L. | | Oudja (MA) | | | 3 | | | 100.00 | | Abener Energía, S.A. | | — | | (1) | | A |
Abener Engineering and Construction Services, LLC. (Abencs) | | Chesterfield (US) | | | 27,539 | | | 100.00 | | Abener, S.A. | | — | | (1) | | B |
Abener Ghenova Engineering Private Limited. | | Mumbai (IN) | | | 151 | | | 100.00 | | Abener Ghenova Ingeniería, S.L./ Abener Energía, S.A. | | (*) | | (1) | | D |
Abener Ghenova Engineering, Inc. | | Phoenix (US) | | | 37 | | | 100.00 | | Abener Ghenova Ingeniería S.L. | | — | | (1) | | B |
Abener Ghenova Ingeniería S.L. | | Seville (ES) | | | 4,470 | | | 90.00 | | Abener Energía, S.A. | | — | | (1) | | B |
Abener México, S.A. De C.V. | | Mexico City (MX) | | | 4 | | | 100.00 | | Abengoa México, S.A. de C.V./Abener Energía, S.A. | | — | | (1) | | B |
Abener North America Construction Services, Inc. | | Chesterfield (US) | | | 40 | | | 100.00 | | Abener Engineering and Construction Services, LLC. | | — | | (1) | | — |
Abener Servicios Auxiliares S.A. de C.V. | | Mexico City (MX) | | | 3 | | | 100.00 | | Abener Mexico, S.A. de C.V./Abengoa Mexico S.A. de C.V. | | (*) | | (1) | | — |
Abener Teyma Abeinsa Glendale General Partnership | | Phoenix (US) | | | — | | | 100.00 | | Teyma USA Inc./Abener Engineering and Construction Services, LLC./Abeinsa EPC Inc. | | (*) | | (1) | | — |
Abener-Ghenova Ingeniería de México, S.A. de C.V. | | Mexico City (MX) | | | 3 | | | 100.00 | | Abener Ghenova Ingeniería, S.L./Abeinsa Asset Management, S.L. | | (*) | | (1) | | B |
Abengoa Australia (Pty) Ltd. | | Sidney (AU) | | | 3,489 | | | 100.00 | | Instalaciones Inabensa, S.A. | | — | | (1) | | B |
Abengoa Bioenergia Agroindustria Trading US Inc. | | Delaware (US) | | | — | | | 100.00 | | Abengoa Bioenergia Agroindústria, Ltda. | | (*) | | (6) | | — |
Abengoa Bioenergía Agroindustria. Ltda. | | Sao Paulo (BR) | | | 47,963 | | | 100.00 | | Abengoa Bioenergía Brasil, S.A./Abengoa Bioenergia Santa Fe, Ltda. | | — | | (6) | | — |
Abengoa Bioenergía Biodiesel S.A. | | Seville (ES) | | | 15 | | | 100.00 | | Abengoa Bioenergía Inversiones, S.A./Ecoagrícola, S.A. | | — | | (6) | | — |
Abengoa Bioenergía Brasil | | Sao Paulo (BR) | | | 888,177 | | | 99.99 | | Asa Bioenergy Holding AG./Abengoa Bioenergia, S.A. | | — | | (6) | | B |
Abengoa Bioenergia Inovações Ltda. | | Sao Paulo (BR) | | | 350 | | | 100.00 | | ASA Bioenergy Holding, AG | | (*) | | (6) | | — |
Abengoa Bioenergía Inversiones, S.A. | | Seville (ES) | | | 627,990 | | | 100.00 | | Abengoa Bioenergía, S.A./Abengoa Bioenergía Nuevas Tecnologías, S.A. | | — | | (6) | | B |
Abengoa Bioenergía Nuevas Tecnologías, S.A. (ABNT) | | Seville (ES) | | | 386 | | | 100.00 | | Abengoa Bioenergía, S.L./Instalaciones Inabensa, S.A. | | — | | (6) | | B |
Abengoa Bioenergía Outsourcing, LLC. | | Chesterfield (US) | | | — | | | 100.00 | | Abengoa Bioenergy Operation, LLC. | | — | | (6) | | — |
Abengoa Bioenergía San Roque, S.A. | | Cadiz (ES) | | | 21,990 | | | 100.00 | | Abengoa Bioenergía Inversiones, S.A./Ecoagrícola, S.A. | | — | | (6) | | B |
Abengoa Bioenergía Santa Fe, Ltda. | | Sao Paulo (BR) | | | 4,136 | | | 100.00 | | Abengoa Bioenergía Brasil, S.A./Abengoa Bioenergia Trading Brasil Ltda. | | — | | (6) | | — |
Abengoa Bioenergia Trading Brasil Ltda | | Sao Paulo (BR) | | | 18 | | | 100.00 | | Abengoa Bioenergia Brasil, S.A./Abengoa Bioenergia Agroindústria, Ltda . | | — | | (6) | | — |
Abengoa Bioenergía, S.A. | | Seville (ES) | | | 145,522 | | | 97.30 | | Abengoa, S.A./Sociedad Inversora Energía y Medio Ambiente, S.A. | | — | | (6) | | B |
Abengoa Bioenergy Corporation, LLC. | | Chesterfield (US) | | | 61,058 | | | 100.00 | | Abengoa Bioenergy Operations, LLC. | | — | | (6) | | B |
Abengoa Bioenergy Developments, LLC. | | Missouri (US) | | | 1 | | | 100.00 | | Abengoa Bioenergy US Holding, LLC. | | (*) | | (6) | | — |
Abengoa Bioenergy Engineering & Construction, LLC. | | Chesterfield (US) | | | — | | | 100.00 | | Abengoa Bioenergy Operations, LLC. | | — | | (6) | | — |
Abengoa Bioenergy Funding | | Chesterfield (US) | | | 234,629 | | | 100.00 | | Abengoa Bioenergy Meramec Renewable, LLC. | | — | | (6) | | B |
Abengoa Bioenergy Germany | | Rostock (DE) | | | 11,859 | | | 100.00 | | Abengoa Bioenergía Inversiones, S.A. | | — | | (6) | | — |
F-224
Table of Contents
Appendices
Appendix XVII
Subsidiary companies included in the 2012 consolidation perimeter using
the global integration method (Continuation)
| | | | | | | | | | | | | | | | |
| |
| | Shareholding | |
| |
| |
| |
|
|---|
Company Name | | Registered
Address | | Amount in
thousands
of € | | % of
Nominal
Capital | | Parent Company | | (*) | | Activity
(see Page 4) | | Auditor |
|---|
Abengoa Bioenergy Holdco, Inc. | | Chesterfield (US) | | | 602,921 | | | 100.00 | | Abengoa US Holding, LLC/ASA Bioenergy Holding, AG | | (*) | | (6) | | — |
Abengoa Bioenergy Hybrid of Kansas, LLC. | | Chesterfield (US) | | | 230,494 | | | 100.00 | | Abengoa Bioenergy Technology Holding, Inc. | | — | | (6) | | — |
Abengoa Bioenergy Investments , LLC. | | Chesterfield (US) | | | — | | | 100.00 | | Abengoa Bioenergy US Holding, LLC. | | — | | (6) | | — |
Abengoa Bioenergy Maple, LLC. | | Chesterfield (US) | | | 234,629 | | | 100.00 | | Abengoa Bioenergy Funding LLC. | | — | | (6) | | B |
Abengoa Bioenergy Meramec Renewable, LLC. | | Chesterfield (US) | | | 277,119 | | | 91.00 | | Abengoa Bioenergy Holdco, Inc. | | — | | (6) | | B |
Abengoa Bioenergy Netherlands B.V. | | Rotterdam (NL) | | | 494,710 | | | 100.00 | | Abengoa Bioenergía Inversiones, S.A. | | — | | (6) | | B |
Abengoa Bioenergy New Technologies , LLC. | | Chesterfield (US) | | | 605 | | | 100.00 | | Abengoa Bioenergy Technology Holding, LLC. | | — | | (6) | | B |
Abengoa Bioenergy of Illinois, LLC. | | Chesterfield (US) | | | 175,548 | | | 100.00 | | Abengoa Bioenergy Maple, LLC | | — | | (6) | | — |
Abengoa Bioenergy of Indiana, LLC. | | Chesterfield (US) | | | 146,911 | | | 100.00 | | Abengoa Bioenergy Maple, LLC. | | — | | (6) | | — |
Abengoa Bioenergy of Kansas, LLC. | | Chesterfield (US) | | | 183 | | | 100.00 | | Abengoa Bioenergy Operations,LLC | | — | | (6) | | — |
Abengoa Bioenergy Operations , LLC. | | Chesterfield (US) | | | 384,075 | | | 100.00 | | Abengoa Bioenergy US Holding, LLC. | | — | | (6) | | B |
Abengoa Bioenergy Renewable Power US, LLC. | | Chesterfield (US) | | | 341 | | | 100.00 | | Abengoa Bioenergy Operations, LLC. | | — | | (6) | | — |
Abengoa Bioenergy Technology Holding , LLC. | | Chesterfield (US) | | | 230,494 | | | 100.00 | | Abengoa Bioenergy US Holding, LLC. | | — | | (6) | | — |
Abengoa Bioenergy Trading Europe, B.V. | | Rotterdam (NL) | | | 18 | | | 100.00 | | Abengoa Bioenergía Inversiones, S.A. | | — | | (6) | | B |
Abengoa Bioenergy Trading US, LLC. | | Chesterfield (US) | | | — | | | 100.00 | | Abengoa Bioenergy Operations, LLC | | — | | (6) | | B |
Abengoa Bioenergy UK Limited | | Cardiff (UK) | | | 14,503 | | | 100.00 | | Abengoa Bioenergía Inversiones, S.A. | | — | | (6) | | — |
Abengoa Bioenergy US Holding, LLC. | | Chesterfield (US) | | | 782,692 | | | 100.00 | | Abengoa Bioenergy Holdco, Inc. | | — | | (6) | | B |
Abengoa Chile, S.A. | | Santiago (CL) | | | 48,167 | | | 100.00 | | Asa Investment, AG/Teyma Abengoa, S.A. | | — | | (1) | | B |
Abengoa Cogeneración Tabasco, S. de R.L. de C.V. | | Mexico City (MX) | | | 74,379 | | | 100.00 | | Abener Energía, S.A/Abengoa México, S.A. de C.V. | | — | | (5) | | B |
Abengoa Colombia, S.A.S. | | Bogota (CO) | | | 42 | | | 100.00 | | Abengoa Perú, S.A./Abener Energía, S.A./Abeinsa Infraestructuras Medio Ambiente, S.A. | | (*) | | (1) | | — |
Abengoa Concessoes Brasil Holding S.A. | | R. de Janeiro (BR) | | | 862,916 | | | 100.00 | | Abengoa Brasil, S.A./ Sociedad Inversora de Líneas de Brasil, S.L. | | — | | (2) | | B |
Abengoa Construçao Brasil, Ltda | | R. de Janeiro (BR) | | | 166,585 | | | 100.00 | | Befesa Brasil, S.A./Sociedad Inversora de Líneas de Brasil, S.L. | | — | | (1) | | B |
Abengoa Finance | | Seville (ES) | | | 60 | | | 100.00 | | Abengoa, S.A. | | — | | (1) | | B |
Abengoa Hellas Solar Power Systems Limited Liabilities Company | | Atenas (GR) | | | 9 | | | 100.00 | | Abengoa Solar, S.A./Abengoa Solar España, S.A. | | — | | (3) | | D |
Abengoa Hidrógeno, S.A | | Seville (ES) | | | 912 | | | 100.00 | | Abeinsa Ingeniería y Construcción Industrial, S.A./ Instalaciones Inabensa, S.A. | | — | | (8) | | B |
Abengoa México, S.A. de C.V. | | Mexico City (MX) | | | 149,806 | | | 97.65 | | Asa Investment, AG | | — | | (1) | | B |
Abengoa Perú, S.A. | | Lima (PE) | | | 128,306 | | | 99.90 | | Asa Investment AG | | — | | (1) | | B |
Abengoa Puerto Rico, S.E. | | San Juan (PR) | | | 8 | | | 100.00 | | Siema Investment, S.L./Abencor Suministros, S.A. | | — | | (1) | | A |
Abengoa Research, S.L. | | Seville (ES) | | | 5,053 | | | 100.00 | | Abeinsa, Ingeniería y Construcción Industrial, S.A. | | — | | (1) | | D |
Abengoa SeaPower, S.A. | | Seville (ES) | | | 60 | | | 100.00 | | Abeinsa Ingeniería y Construcción Industrial, S.A./Instalaciones Inabensa, S.A. | | (*) | | (1) | | — |
Abengoa Servicios S.A. De C.V. | | Mexico City (MX) | | | 166 | | | 100.00 | | Abengoa México, S.A. de C.V./Servicios Aux. de Admon., S.A | | — | | (1) | | B |
Abengoa Solar Power Australia (Pty) Ltd. | | Brisbane (AU) | | | 63 | | | 100.00 | | Abengoa Solar Internacional, S.A. | | — | | (3) | | — |
Abengoa Solar Engeneering (Beijing), Co. Ltd. | | Beijing (CN) | | | 103 | | | 100.00 | | Abengoa Solar, S.A. | | — | | (3) | | D |
Abengoa Solar España, S.A. | | Seville (ES) | | | 13,346 | | | 100.00 | | Abengoa Solar, S.A./Abengoa Solar PV, S.A. | | — | | (8) | | B |
Abengoa Solar Extremadura, S.A. | | Caceres (ES) | | | 60 | | | 100.00 | | Abengoa Solar España, S.A./Abengoa Solar New Technologies, S.A. | | — | | (3) | | — |
Abengoa Solar GmbH | | Berlin (DE) | | | 75 | | | 100.00 | | Abengoa Solar Internacional, S.A. | | (*) | | (3) | | B |
Abengoa Solar India Private Limited | | Maharashtra (IN) | | | 929 | | | 100.00 | | Abengoa Solar China, S.A./Abengoa Solar, S.A. | | — | | (8) | | B |
Abengoa Solar Industrial Systems, LLC. | | Colorado (US) | | | 528 | | | 100.00 | | Abengoa Solar, LLC. | | — | | (8) | | B |
Abengoa Solar Internacional, S.A. | | Seville (ES) | | | 12,501 | | | 100.00 | | Abengoa Solar, S.A. | | — | | (8) | | B |
Abengoa Solar Italia, S.R.L. | | Rome (IT) | | | 501 | | | 100.00 | | Abengoa Solar Internacional, S.A./Abengoa Solar, S.A. | | — | | (8) | | B |
Abengoa Solar New Tecnologies, S.A. | | Seville (ES) | | | 3,986 | | | 100.00 | | Abengoa Solar, S.A. | | — | | (8) | | B |
Abengoa Solar Operations, LLC. | | Delaware (US) | | | 1 | | | 100.00 | | Abengoa Solar, LLC. | | — | | (3) | | — |
Abengoa Solar Power South Africa (Pty) Ltd. | | Gauteng (ZA) | | | 512 | | | 100.00 | | Abengoa Solar Internacional, S.A. | | (*) | | (3) | | B |
Abengoa Solar Power, S.A. | | Seville (ES) | | | 250 | | | 100.00 | | Abengoa Solar, S.A./Abengoa Solar PV, S.A. | | — | | (3) | | — |
F-225
Table of Contents
Appendices
Appendix XVII
Subsidiary companies included in the 2012 consolidation perimeter using
the global integration method (Continuation)
| | | | | | | | | | | | | | | | |
| |
| | Shareholding | |
| |
| |
| |
|
|---|
Company Name | | Registered
Address | | Amount in
thousands
of € | | % of
Nominal
Capital | | Parent Company | | (*) | | Activity
(see Page 4) | | Auditor |
|---|
Abengoa Solar PV, LLC. | | Colorado (US) | | | 8,971 | | | 100.00 | | Abengoa Solar, LLC. | | — | | (8) | | B |
Abengoa Solar S.A. | | Seville (ES) | | | 12,060 | | | 100.00 | | Abengoa, S.A./Abengoa Solar España, S.A. | | — | | (8) | | B |
Abengoa Solar Saudi Arabia Limited Liability Company | | Riyadh (SA) | | | 202 | | | 100.00 | | Abengoa Solar Ventures, S.A./Abengoa Solar Power, S.A. | | (*) | | (8) | | — |
Abengoa Solar South Africa (Pty) Ltd. | | Gauteng (ZA) | | | 5,994 | | | 100.00 | | South Africa Solar Investments, S.L. | | — | | (8) | | B |
Abengoa Solar US Holdings Inc. | | Colorado (US) | | | 8 | | | 100.00 | | Abengoa US Holding, LLC. | | (*) | | (8) | | — |
Abengoa Solar Ventures S.A | | Seville (ES) | | | 26,660 | | | 99.90 | | Abengoa Solar, S.A. | | — | | (8) | | B |
Abengoa Solar, LLC. | | New York (US) | | | 560,938 | | | 100.00 | | Abengoa Solar US Holdings Inc. | | — | | (8) | | B |
Abengoa T&D Corporation | | Delaware (US) | | | 732 | | | 100.00 | | Teyma USA Inc. | | — | | (1) | | B |
Abengoa Transmisión Norte S.A. | | Lima (PE) | | | 175,288 | | | 100.00 | | Abengoa Perú, S.A./Asa Iberoamérica, S.L. | | — | | (2) | | B |
Abengoa Transmisión Sur, S.A. | | Lima (PE) | | | 64,379 | | | 75.00 | | Asa Iberoamérica, S.L./Abengoa Perú, S.A. | | — | | (2) | | B |
Abengoa US Holding, LLC. | | Washington (US) | | | 1,162,868 | | | 100.00 | | Abengoa Bioenergía, S.A./ Abengoa Solar, S.A./Abeinsa, S.A./Abengoa Water, S.L.U. | | (*) | | (1) | | — |
Abengoa US Operations, LLC. | | Washington (US) | | | — | | | 100.00 | | Abengoa US, LLC. | | (*) | | (1) | | — |
Abengoa US, LLC. | | Washington (US) | | | — | | | 100.00 | | Abengoa Bioenergy Holdco, Inc./ Abengoa Solar US Holdings, Inc./ Abengoa Water Holding USA, Inc./ Abener Energia, S.A./ Abacus Project Management, Inc./ Teyma USA Inc. | | (*) | | (1) | | — |
Abengoa Water Beijing Co., Ltd | | Beijing (CN) | | | 3 | | | 100.00 | | Abengoa Water, S.L.U. | | (*) | | (4) | | D |
Abengoa Water Dalian, S.L. | | Seville (ES) | | | 3 | | | 100.00 | | Abengoa Water, S.L.U. | | (*) | | (8) | | — |
Abengoa Water Holding USA, Inc. | | Delaware (US) | | | 1 | | | 100.00 | | Abengoa US Holding, LLC. | | (*) | | (4) | | — |
Abengoa Water Investments Ghana BV | | Amsterdam (NL) | | | 1,348 | | | 100.00 | | Abengoa Water Nungua, S.L.U. | | — | | (8) | | — |
Abengoa Water Nungua, S.L.U | | Seville (ES) | | | 1,315 | | | 100.00 | | Abengoa Water, S.L.U. | | — | | (8) | | — |
Abengoa Water S.L.U. | | Seville (ES) | | | 10,860 | | | 100.00 | | Abengoa, S.A. | | — | | (8) | | B |
Abengoa Water USA, LLC. | | Texas (US) | | | 5,072 | | | 100.00 | | Abengoa Water Holding USA, Inc. | | — | | (8) | | — |
Abent 3T, S de RL de C.V. | | Mexico City (MX) | | | 3 | | | 100.00 | | Abengoa México, S.A. de C.V./ Abener Energía S.A. | | (*) | | (5) | | — |
Abenta Concessões Brasil | | R. de Janeiro (BR) | | | 4 | | | 95.84 | | Abengoa Concessões Brasil Holding, S.A. | | — | | (2) | | — |
Abenta Construçao Brasil Ltda | | R. de Janeiro (BR) | | | — | | | 90.00 | | Abengoa Brasil, Ltda. | | — | | (1) | | B |
Abentel Telecomunicaciones, S.A. | | Seville (ES) | | | 5,530 | | | 100.00 | | Abener Energía, S.A./Abeinsa Ingeniería y Construcción Industrial, S.A. | | — | | (1) | | B |
Abentey Brasil, Ltda. | | Pirassununga (BR) | | | — | | | 100.00 | | Abener Energía, S.A./Teyma Internacional,S.A. | | — | | (1) | | B |
Abentey Hugoton General Partnership | | Chesterfield (US) | | | 8 | | | 100.00 | | Teyma USA Inc./Abener Engineering and Construction Services, LLC. | | — | | (1) | | B |
Abentey Mojave General Partnership | | Chesterfield (US) | | | 42 | | | 100.00 | | Teyma USA Inc./Abencs Construction Services, LP. | | — | | (1) | | B |
Abratey Construção Ltda. | | R. de Janeiro (BR) | | | — | | | 100.00 | | Abengoa Concessoes Brasil Holding, S.A./Abengoa Brasil Ltda. | | — | | (1) | | B |
ACE Abengoa Cogeneración de Energía S.A | | R. de Janeiro (BR) | | | — | | | 100.00 | | Abengoa Brasil, S.A./Abengoa Concesssoes Brasil Holding, S.A. | | — | | (2) | | — |
Aelsa, Abener El Sauz, S.A. De C.V. | | Mexico City (MX) | | | 6 | | | 100.00 | | Abener, S.A./Abengoa, S.A. | | — | | (1) | | B |
Aguas de Skikda | | Argel (DZ) | | | 10,811 | | | 51.00 | | Geida Skikda, S.L. | | — | | (4) | | D |
Aleduca, S.L | | Madrid (ES) | | | 7,255 | | | 100.00 | | Abengoa Solar España, S.A./Abengoa Solar, S.A. | | — | | (8) | | — |
Alianza Medioambiental, S.L. | | Vizcaya (ES) | | | 118,041 | | | 100.00 | | Befesa Medioa Ambiente, S.L.U. | | — | | (7) | | B |
Alumninios en Disco S.A. (Aludisc) | | Huesca (ES) | | | 2,400 | | | 100.00 | | Befesa Aluminio, S.L. | | — | | (7) | | — |
Aprovechamientos Energéticos Furesa, S.A. (Aprofusa) | | Murcia (ES) | | | 2,211 | | | 98.00 | | Abeinsa Asset Management, S.L. | | — | | (5) | | C |
Aqualdre Zinc ,S.L | | San Sebastian (ES) | | | 232 | | | 100.00 | | MRH-Residuos Metálicos, S.L. | | (*) | | (7) | | — |
Arao Enerxías Eólica, S.L | | A Coruña (ES) | | | 7 | | | 70.00 | | Instalaciones Inabensa, S.A. | | — | | (5) | | — |
Asa Bioenergy Holding, AG | | Zug (SZ) | | | 430,749 | | | 99.98 | | Abengoa Bioenergía, S.A. | | — | | (6) | | B |
Asa Bioenergy of Nebraska, LLC. | | Chesterfield (US) | | | 40,195 | | | 100.00 | | Abengoa Bioenergy Operations, LLC | | — | | (6) | | B |
Asa E.& E.H., AG | | Zug (SZ) | | | 214,592 | | | 100.00 | | Sociedad Inversora Energía y Medio Ambiente, S.A. | | — | | (1) | | A |
Asa Iberoamérica, S.L. | | Seville (ES) | | | 48,522 | | | 100.00 | | Soc. Inv. Energía y Medio Ambiente, S.A./Abeinsa Ingeniería y Construcción Industrial, S.A. | | — | | (1) | | D |
Asa Investment AG | | Zug (SZ) | | | 69,950 | | | 100.00 | | Abeinsa Inversiones Latam, S.L. | | — | | (1) | | B |
ASA Investment Brasil Ltda. | | R. de Janeiro (BR) | | | 850 | | | 100.00 | | Befesa Brasil/Abengoa Brasil, S.A. | | — | | (1) | | B |
F-226
Table of Contents
Appendices
Appendix XVII
Subsidiary companies included in the 2012 consolidation perimeter using
the global integration method (Continuation)
| | | | | | | | | | | | | | | | |
| |
| | Shareholding | |
| |
| |
| |
|
|---|
Company Name | | Registered
Address | | Amount in
thousands
of € | | % of
Nominal
Capital | | Parent Company | | (*) | | Activity
(see Page 4) | | Auditor |
|---|
ASO Holdings, LLC. | | Colorado (US) | | | 263,083 | | | 73.52 | | Abengoa Solar, LLC. | | — | | (8) | | B |
ATE IV Sao Mateus Transmissora de Energía | | R. de Janeiro (BR) | | | 69,006 | | | 76.00 | | Abengoa Concessoes Brasil Holding, S.A./Abengoa Brasil Ltda. | | — | | (2) | | B |
ATE IX Transmissora de Energía, S.A. | | R. de Janeiro (BR) | | | — | | | 100.00 | | Abengoa Brasil, S.A./Abengoa Concesssoes Brasil Holding, S.A. | | — | | (2) | | — |
ATE V Londrina Transmissora De Energía S.A | | R. de Janeiro (BR) | | | 47,173 | | | 100.00 | | Abengoa Concessoes Brasil Holding, S.A./Abengoa Brasil Ltda. | | — | | (2) | | B |
ATE VI Campos Novos Transmissora de Energía ,S.A | | R. de Janeiro (BR) | | | 43,672 | | | 100.00 | | Abengoa Concessoes Brasil Holding, S.A./Abengoa Brasil Ltda. | | — | | (2) | | B |
ATE VII Foz do Iguacú Transmissora de Energía, S.A. | | R. de Janeiro (BR) | | | 29,316 | | | 100.00 | | Abengoa Concessoes Brasil Holding, S.A./Abengoa Brasil Ltda. | | — | | (2) | | B |
ATE X Abengoa Brasil Administraçao Predial, Ltda. | | R. de Janeiro (BR) | | | — | | | 100.00 | | Abengoa Brasil, S.A./Abengoa Concesssoes Brasil Holding, S.A. | | — | | (1) | | — |
ATE XI, Manaus Transmissora de Energía, S.A. | | R. de Janeiro (BR) | | | 209,456 | | | 50.50 | | Abengoa Concessoes Brasil Holding, S.A. | | — | | (2) | | B |
ATE XIII, Norte Brasil Transmissora de Energía, S.A | | R. de Janeiro (BR) | | | 145,808 | | | 51.00 | | Abengoa Concessoes Brasil Holding, S.A. | | — | | (2) | | B |
ATE XIX Transmissora de Energia S.A. | | R. de Janeiro (BR) | | | — | | | 100.00 | | Abengoa Concessões Brasil Holding S.A./Abengoa Construção Brasil Ltda. | | (*) | | (2) | | — |
ATE XVI Transmissora de Energia S.A. | | R. de Janeiro (BR) | | | — | | | 100.00 | | Abengoa Concessões Brasil Holding S.A./Abengoa Construção Brasil Ltda. | | (*) | | (2) | | — |
ATE XVII Transmissora de Energia S.A. | | R. de Janeiro (BR) | | | — | | | 100.00 | | Abengoa Concessões Brasil Holding S.A./Abengoa Construção Brasil Ltda. | | (*) | | (2) | | — |
ATE XVIII Transmissora de Energia S.A. | | R. de Janeiro (BR) | | | — | | | 100.00 | | Abengoa Concessões Brasil Holding S.A./Abengoa Construção Brasil Ltda. | | (*) | | (2) | | — |
ATN 1, Abengoa Trasmisión Sur, S.A. | | Lima (PE) | | | 59 | | | 100.00 | | Abengoa Transmisión Norte, S.A./Abengoa Perú, S.A. | | — | | (2) | | B |
ATN 2, S.A. | | Santiago de Chile (CH) | | | 1 | | | 99.98 | | Abengoa Perú, S.A. | | — | | (2) | | B |
Aurorex S.A. | | Montevideo (UY) | | | 108 | | | 100.00 | | Teyma Renovables | | — | | (1) | | — |
Aznalcóllar Solar, S.A. | | Seville (ES) | | | 60 | | | 100.00 | | Abengoa Solar España, S.A./Abengoa Solar, S.A. | | — | | (3) | | — |
Baja California 229, S.A. de C.V. | | Mexico City (MX) | | | 3 | | | 100.00 | | Abener Energía, S.A./Abener Ghenova Ing., S.A./Abener Servicios Auxiliares, S.A. de C.V. | | (*) | | (1) | | B |
Bargoa, S.A. | | R. de Janeiro (BR) | | | 23,854 | | | 99.98 | | Abengoa Comer. y Administraçao, S.A./ Asa Investment AG | | — | | (1) | | A |
Befesa Agua Djerba, S.L. | | Seville (ES) | | | 13 | | | 100.00 | | Abengoa Water, S.L.U. | | — | | (8) | | — |
Befesa Agua Internacional S.L. | | Seville (ES) | | | 3 | | | 100.00 | | Abeinsa Infraestructuras Medio Ambiente/Construcciones y Depuraciones, S.A.(Codesa) | | — | | (1) | | — |
Befesa Agua Tenes S.L. | | Madrid (ES) | | | 10,026 | | | 100.00 | | Abengoa Water S.L.U. | | — | | (4) | | — |
Befesa Aluminio, S.L. | | Vizcaya (ES) | | | 59,109 | | | 100.00 | | Befesa Reciclaje de Residuos de Aluminio, S.L. | | — | | (7) | | B |
Befesa Aluminium Germany GmbH | | Sajonia-Anhalt (DE) | | | 28 | | | 100.00 | | Befesa Salzschlacke GmbH | | (*) | | (7) | | — |
Befesa Apa, S.R.L | | Bucarest (RO) | | | 10 | | | 100.00 | | Abeinsa Infraestructuras Medio Ambiente, S.A. | | — | | (1) | | — |
Befesa Argentina ,S.A. | | Buenos Aires (AR) | | | 6,080 | | | 100.00 | | Alianza Medioambiental, S.L./Befesa Desulfuración, S.A. | | — | | (7) | | B |
Befesa Brasil | | R. de Janeiro (BR) | | | 1,701 | | | 100.00 | | Asa Investment AG /Alianza Medioambiental, S.L. | | — | | (7) | | — |
Befesa CTA Qingdao, S.L.U. | | Madrid (ES) | | | 35,163 | | | 100.00 | | Abengoa Water, S.L.U. | | — | | (4) | | B |
Befesa Desalination Developments Ghana Limited | | Accra (GH) | | | 8 | | | 56.00 | | Abengoa Water Investment Ghana BV | | (*) | | (4) | | — |
Befesa Desulfuración, S.A. | | Barakaldo (ES) | | | 36,510 | | | 90.00 | | Alianza Medioambiental, S.L. | | — | | (7) | | B |
Befesa Escorias Salinas, S.A. | | Valladolid (ES) | | | 6,786 | | | 100.00 | | Befesa Aluminio, S.L. | | — | | (7) | | B |
Befesa Gest. Res. Ind, S.L. (Begri) | | Vizcaya (ES) | | | 79,546 | | | 100.00 | | Alianza Medioambiental, S.L. | | — | | (7) | | B |
Befesa Infraestructure India, Pvt. Ltd. | | Chennai (IN) | | | 7,602 | | | 100.00 | | Abeinsa Infraestructuras Medio Ambiente, S.A. | | — | | (1) | | B |
Befesa Limpiezas Industriales México S.A. de C.V. | | Mexico City (MX) | | | 6 | | | 100.00 | | Befesa México, S.A. De C.V./Abengoa México, S.A. de CV | | — | | (7) | | D |
Befesa Medio Ambiente, S.L.U. | | Vizcaya (ES) | | | 545,736 | | | 100.00 | | Abengoa, S.A. | | — | | (7) | | B |
Befesa México, S.A. De C.V. | | Mexico City (MX) | | | 4,023 | | | 100.00 | | Abengoa México, S.A./Alianza Medioambiental, S.L. | | — | | (7) | | B |
F-227
Table of Contents
Appendices
Appendix XVII
Subsidiary companies included in the 2012 consolidation perimeter using
the global integration method (Continuation)
| | | | | | | | | | | | | | | | |
| |
| | Shareholding | |
| |
| |
| |
|
|---|
Company Name | | Registered
Address | | Amount in
thousands
of € | | % of
Nominal
Capital | | Parent Company | | (*) | | Activity
(see Page 4) | | Auditor |
|---|
Befesa PCB | | Cartagena (ES) | | | 1,358 | | | 100.00 | | Alianza Medioambiental, S.L. | | — | | (7) | | B |
Befesa Perú, S.A. | | Lima (PE) | | | 5,457 | | | 100.00 | | Alianza Mediambiental, S.L. | | — | | (7) | | B |
Befesa Plásticos, S.L. | | Murcia (ES) | | | 5,415 | | | 97.40 | | Alianza Medioambiental, S.L. | | — | | (7) | | B |
Befesa Portugal Gestáo de Resíduos Industriais, S.A. | | Lisboa (PT) | | | 50 | | | 100.00 | | Befesa Gestión de Residuos Industriales, S.L. | | — | | (7) | | — |
Befesa Reciclaje de Residuos de Aluminio S.L. | | Vizcaya (ES) | | | 57,233 | | | 100.00 | | MRH-Residuos Metálicos, S.L. | | — | | (7) | | B |
Befesa Salt Slag, Ltd | | Gales (UK) | | | 21,399 | | | 100.00 | | Befesa Aluminio, S.L./Befesa Escorias Salinas, S.A. | | — | | (7) | | D |
Befesa Salzschlacke GmbH | | Hannover (DE) | | | 6,500 | | | 100.00 | | MRH-Residuos Metálicos, S.L. | | — | | (7) | | B |
Befesa Scandust AB | | Landskrona (SE) | | | 28,044 | | | 100.00 | | Befesa Zinc, S.L. | | — | | (7) | | B |
Befesa Servicios Corporativos, S.A. | | Madrid (ES) | | | 1,126 | | | 100.00 | | Befesa Medioa Ambiente, S.L.U. | | — | | (7) | | — |
Befesa Servicios S.A | | Buenos Aires (AR) | | | 597 | | | 51.00 | | Alianza Medioambiental, S.L./ Befesa Desulfuración | | — | | (7) | | D |
Befesa Silvermet Adana Celik Tozu Geri Donusum AS | | Sarıseki-Iskenderun (TR) | | | 304 | | | 100.00 | | Befesa Silvermet Turkey, S.L. | | — | | (7) | | — |
Befesa Silvermet Iskenderun | | Iskenderun (TU) | | | 8,823 | | | 100.00 | | Befesa Silvermet Turkey, S.L. | | — | | (7) | | B |
Befesa Silvermet Izmir Celik Tozu Geri Donusum AS | | Sarıseki-Iskenderun (TR) | | | 741 | | | 100.00 | | Befesa Silvermet Turkey, S.L. | | — | | (7) | | — |
Befesa Silvermet Turkey, S.L. | | Vizcaya (ES) | | | 6,702 | | | 51.00 | | Befesa Zinc, S.A.U. | | — | | (7) | | — |
Befesa Steel R & D, S.L.U. | | Vizcaya (ES) | | | 3,336 | | | 100.00 | | MRH-Residuos Metálicos, S.L. | | — | | (7) | | — |
Befesa Steel Services GmbH | | Duisburg (DE) | | | 58,878 | | | 100.00 | | Befesa Zinc Germany | | — | | (7) | | B |
Befesa Uruguay | | Montevideo (UY) | | | 12 | | | 100.00 | | Teyma Medioambiente, S.A. | | — | | (1) | | — |
Befesa Valera S.A.S. | | Gravelines (FR) | | | 28,754 | | | 100.00 | | Befesa Zinc, S.A. | | — | | (7) | | B |
Befesa Valorización de Azufre, S.L.U. | | Vizcaya (ES) | | | 46,344 | | | 100.00 | | Alianza Medioambiental, S.L. | | — | | (7) | | B |
Befesa Valorización S.L Sociedad Unipersonal | | Cartagena (ES) | | | 3 | | | 100.00 | | Befesa Gestión de Residuos Industriales, S.L. | | — | | (7) | | — |
Befesa Zinc Freiberg GmbH & Co KG | | Freiberg (DE) | | | 52,521 | | | 100.00 | | Befesa Zinc, S.A.U. | | — | | (7) | | B |
Befesa Zinc Aser, S.A. | | Vizcaya (ES) | | | 18,039 | | | 100.00 | | Befesa Zinc, S.L | | — | | (7) | | B |
Befesa Zinc Comercial, S.A. | | Vizcaya (ES) | | | 60 | | | 100.00 | | Befesa Zinc, S.L. | | — | | (7) | | B |
Befesa Zinc Duisburg GmbH | | Duisburg (DE) | | | 4,953 | | | 100.00 | | Befesa Steel Services GmbH/Befesa Zinc Germany | | — | | (7) | | B |
Befesa Zinc Germany | | Duisburg (DE) | | | 273,190 | | | 100.00 | | Befesa Zinc, S.L. | | — | | (7) | | — |
Befesa Zinc Gravelines, S.A.S.U. | | Gravelines (FR) | | | 8,000 | | | 100.00 | | Befesa Valera, S.A.S. | | — | | (7) | | B |
Befesa Zinc Óxido, S.A.U. | | Vizcaya (ES) | | | 7,436 | | | 100.00 | | Befesa Zinc, S.A.U. | | — | | (7) | | B |
Befesa Zinc Sur, S.L. | | Vizcaya (ES) | | | 5,145 | | | 100.00 | | Befesa Zinc, S.A.U. | | — | | (7) | | — |
Befesa Zinc, S.L. | | Vizcaya (ES) | | | 34,626 | | | 100.00 | | MRH Residuos Metálicos, S.L. | | — | | (7) | | B |
Biocarburantes de Castilla y León, S.A. | | Salamanca (ES) | | | 66,679 | | | 100.00 | | Abengoa Bioenergía Inversiones, S.A./Ecoagrícola, S.A. | | — | | (6) | | B |
Bioetanol Galicia, S.A. | | A Coruña (ES) | | | 7,448 | | | 100.00 | | Abengoa Bioenergía Inversiones, S.A./Ecoagrícola, S.A. | | — | | (6) | | B |
C.D.Puerto San Carlos S.A. De C.V. | | Mexico City (MX) | | | 13,917 | | | 100.00 | | Abener Energía, S.A./Abengoa, S.A./Abengoa México, S.A. de C.V. | | — | | (1) | | B |
Cadonal, S.A. | | Montevideo (UY) | | | 2 | | | 100.00 | | Holding de Energía Eólica, S.A. | | — | | (5) | | B |
Captación Solar, S.A. | | Seville (ES) | | | 205 | | | 100.00 | | Abeinsa Asset Management, S.L./Abener Energía, S.A. | | — | | (1) | | — |
Captasol Fotovoltaica 1, S.L. | | Seville (ES) | | | 57 | | | 100.00 | | Abengoa Solar España, S.A./Casaquemada Fotovoltaica, S.L. | | — | | (3) | | — |
Captasol Fotovoltaica 10, S.L. | | Seville (ES) | | | 3 | | | 100.00 | | Abengoa Solar España, S.A./Casaquemada Fotovoltaica, S.L. | | — | | (3) | | — |
Captasol Fotovoltaica 11, S.L. | | Seville (ES) | | | 3 | | | 100.00 | | Abengoa Solar España, S.A./Casaquemada Fotovoltaica, S.L. | | — | | (3) | | — |
Captasol Fotovoltaica 12, S.L. | | Seville (ES) | | | 3 | | | 100.00 | | Abengoa Solar España, S.A./Casaquemada Fotovoltaica, S.L. | | — | | (3) | | — |
Captasol Fotovoltaica 13, S.L. | | Seville (ES) | | | 3 | | | 100.00 | | Abengoa Solar España, S.A./Casaquemada Fotovoltaica, S.L. | | — | | (3) | | — |
Captasol Fotovoltaica 14, S.L. | | Seville (ES) | | | 3 | | | 100.00 | | Abengoa Solar España, S.A./Casaquemada Fotovoltaica, S.L. | | — | | (3) | | — |
Captasol Fotovoltaica 15, S.L. | | Seville (ES) | | | 3 | | | 100.00 | | Abengoa Solar España, S.A./Casaquemada Fotovoltaica, S.L. | | — | | (3) | | — |
Captasol Fotovoltaica 16, S.L. | | Seville (ES) | | | 3 | | | 100.00 | | Abengoa Solar España, S.A./Casaquemada Fotovoltaica, S.L. | | — | | (3) | | — |
F-228
Table of Contents
Appendices
Appendix XVII
Subsidiary companies included in the 2012 consolidation perimeter using
the global integration method (Continuation)
| | | | | | | | | | | | | | | | |
| |
| | Shareholding | |
| |
| |
| |
|
|---|
Company Name | | Registered
Address | | Amount in
thousands
of € | | % of
Nominal
Capital | | Parent Company | | (*) | | Activity
(see Page 4) | | Auditor |
|---|
Captasol Fotovoltaica 17, S.L. | | Seville (ES) | | | 3 | | | 100.00 | | Abengoa Solar España, S.A./Casaquemada Fotovoltaica, S.L. | | — | | (3) | | — |
Captasol Fotovoltaica 18, S.L. | | Seville (ES) | | | 3 | | | 100.00 | | Abengoa Solar España, S.A./Casaquemada Fotovoltaica, S.L. | | — | | (3) | | — |
Captasol Fotovoltaica 19, S.L. | | Seville (ES) | | | 3 | | | 100.00 | | Abengoa Solar España, S.A./Casaquemada Fotovoltaica, S.L. | | — | | (3) | | — |
Captasol Fotovoltaica 2, S.L. | | Seville (ES) | | | 3 | | | 100.00 | | Abengoa Solar España, S.A./Casaquemada Fotovoltaica, S.L. | | — | | (3) | | — |
Captasol Fotovoltaica 20, S.L. | | Seville (ES) | | | 1,144 | | | 100.00 | | Abengoa Solar España, S.A./Linares Fotovoltaica, S.L. | | — | | (3) | | — |
Captasol Fotovoltaica 21, S.L. | | Seville (ES) | | | 60 | | | 100.00 | | Abengoa Solar España, S.A./Linares Fotovoltaica, S.L. | | — | | (3) | | — |
Captasol Fotovoltaica 22, S.L. | | Seville (ES) | | | 60 | | | 100.00 | | Abengoa Solar España, S.A./Linares Fotovoltaica, S.L. | | — | | (3) | | — |
Captasol Fotovoltaica 23, S.L. | | Seville (ES) | | | 60 | | | 100.00 | | Abengoa Solar España, S.A./Linares Fotovoltaica, S.L. | | — | | (3) | | — |
Captasol Fotovoltaica 24, S.L. | | Seville (ES) | | | 60 | | | 100.00 | | Abengoa Solar España, S.A./Linares Fotovoltaica, S.L. | | — | | (3) | | — |
Captasol Fotovoltaica 25, S.L. | | Seville (ES) | | | 60 | | | 100.00 | | Abengoa Solar España, S.A./Linares Fotovoltaica, S.L. | | — | | (3) | | — |
Captasol Fotovoltaica 26, S.L. | | Seville (ES) | | | 60 | | | 100.00 | | Abengoa Solar España, S.A./Linares Fotovoltaica, S.L. | | — | | (3) | | — |
Captasol Fotovoltaica 27, S.L. | | Seville (ES) | | | 60 | | | 100.00 | | Abengoa Solar España, S.A./Linares Fotovoltaica, S.L. | | — | | (3) | | — |
Captasol Fotovoltaica 28, S.L. | | Seville (ES) | | | 60 | | | 100.00 | | Abengoa Solar España, S.A./Linares Fotovoltaica, S.L. | | — | | (3) | | — |
Captasol Fotovoltaica 29, S.L. | | Seville (ES) | | | 60 | | | 100.00 | | Abengoa Solar España, S.A./Linares Fotovoltaica, S.L. | | — | | (3) | | — |
Captasol Fotovoltaica 3, S.L. | | Seville (ES) | | | 3 | | | 100.00 | | Abengoa Solar España, S.A./Casaquemada Fotovoltaica, S.L. | | — | | (3) | | — |
Captasol Fotovoltaica 30, S.L. | | Seville (ES) | | | 60 | | | 100.00 | | Abengoa Solar España, S.A./Linares Fotovoltaica, S.L. | | — | | (3) | | — |
Captasol Fotovoltaica 31, S.L. | | Seville (ES) | | | 60 | | | 100.00 | | Abengoa Solar España, S.A./Linares Fotovoltaica, S.L. | | — | | (3) | | — |
Captasol Fotovoltaica 32, S.L. | | Seville (ES) | | | 60 | | | 100.00 | | Abengoa Solar España, S.A./Linares Fotovoltaica, S.L. | | — | | (3) | | — |
Captasol Fotovoltaica 33, S.L. | | Seville (ES) | | | 60 | | | 100.00 | | Abengoa Solar España, S.A./Linares Fotovoltaica, S.L. | | — | | (3) | | — |
Captasol Fotovoltaica 34, S.L. | | Seville (ES) | | | 60 | | | 100.00 | | Abengoa Solar España, S.A./Linares Fotovoltaica, S.L. | | — | | (3) | | — |
Captasol Fotovoltaica 35, S.L. | | Seville (ES) | | | 60 | | | 100.00 | | Abengoa Solar España, S.A./Linares Fotovoltaica, S.L. | | — | | (3) | | — |
Captasol Fotovoltaica 36, S.L. | | Seville (ES) | | | 60 | | | 100.00 | | Abengoa Solar España, S.A./Linares Fotovoltaica, S.L. | | — | | (3) | | — |
Captasol Fotovoltaica 37, S.L. | | Seville (ES) | | | 60 | | | 100.00 | | Abengoa Solar España, S.A./Linares Fotovoltaica, S.L. | | — | | (3) | | — |
Captasol Fotovoltaica 38, S.L. | | Seville (ES) | | | 60 | | | 100.00 | | Abengoa Solar España, S.A./Linares Fotovoltaica, S.L. | | — | | (3) | | — |
Captasol Fotovoltaica 4, S.L. | | Seville (ES) | | | 3 | | | 100.00 | | Abengoa Solar España, S.A./Casaquemada Fotovoltaica, S.L. | | — | | (3) | | — |
Captasol Fotovoltaica 40, S.L. | | Seville (ES) | | | 59 | | | 100.00 | | Abengoa Solar España, S.A./Linares Fotovoltaica, S.L. | | — | | (3) | | — |
Captasol Fotovoltaica 5, S.L. | | Seville (ES) | | | 3 | | | 100.00 | | Abengoa Solar España, S.A./Casaquemada Fotovoltaica, S.L. | | — | | (3) | | — |
Captasol Fotovoltaica 52, S.L. | | Seville (ES) | | | 3 | | | 99.94 | | Abengoa Solar España, S.A. | | — | | (3) | | — |
Captasol Fotovoltaica 58, S.L. | | Seville (ES) | | | 3 | | | 99.94 | | Abengoa Solar España, S.A. | | — | | (3) | | — |
Captasol Fotovoltaica 6, S.L. | | Seville (ES) | | | 3 | | | 100.00 | | Abengoa Solar España, S.A./Casaquemada Fotovoltaica, S.L. | | — | | (3) | | — |
Captasol Fotovoltaica 7, S.L. | | Seville (ES) | | | 3 | | | 100.00 | | Abengoa Solar España, S.A./Casaquemada Fotovoltaica, S.L. | | — | | (3) | | — |
Captasol Fotovoltaica 72, S.L. | | Seville (ES) | | | 3 | | | 99.94 | | Abengoa Solar España, S.A. | | — | | (3) | | — |
Captasol Fotovoltaica 73, S.L. | | Seville (ES) | | | 3 | | | 99.94 | | Abengoa Solar España, S.A. | | — | | (3) | | — |
F-229
Table of Contents
Appendices
Appendix XVII
Subsidiary companies included in the 2012 consolidation perimeter using
the global integration method (Continuation)
| | | | | | | | | | | | | | | | |
| |
| | Shareholding | |
| |
| |
| |
|
|---|
Company Name | | Registered
Address | | Amount in
thousands
of € | | % of
Nominal
Capital | | Parent Company | | (*) | | Activity
(see Page 4) | | Auditor |
|---|
Captasol Fotovoltaica 77, S.L. | | Seville (ES) | | | 3 | | | 99.94 | | Abengoa Solar España, S.A. | | — | | (3) | | — |
Captasol Fotovoltaica 8, S.L. | | Seville (ES) | | | 3 | | | 100.00 | | Abengoa Solar España, S.A./Casaquemada Fotovoltaica, S.L. | | — | | (3) | | — |
Captasol Fotovoltaica 9, S.L. | | Seville (ES) | | | 3 | | | 100.00 | | Abengoa Solar España, S.A./Casaquemada Fotovoltaica, S.L. | | — | | (3) | | — |
Carpio Solar Inversiones, S.A. | | Seville (ES) | | | 130,859 | | | 100.00 | | CSP Equity Investment, S.A.R.L./Abengoa Solar New Technologies S.A. | | — | | (8) | | B |
Casaquemada Fotovoltaica, S.L. | | Seville (ES) | | | 2,936 | | | 100.00 | | Abengoa Solar España, S.A./Abengoa Solar, S.A. | | — | | (3) | | B |
Cedisolar | | Ourense (ES) | | | 4,992 | | | 57.50 | | Rioglass Solar Holding, S.A. | | — | | (3) | | — |
Centro Industrial y Logístico Torrecúellar, S.A. | | Seville (ES) | | | 60 | | | 100.00 | | Instalaciones Inabensa, S.A./Abeinsa Ingeniería y Construcción Industrial, S.A. | | — | | (1) | | — |
Centro Morelos 264 S.A. de C.V | | Mexico City (MX) | | | 2 | | | 100.00 | | Abener Energía, S.A./Inst. Inabensa, S.A./Servicios Auxiliares de Administración, S.A. | | (*) | | (1) | | B |
Centro Tecnológico Palmas Altas, S.A. | | Seville (ES) | | | 12,899 | | | 100.00 | | Abengoa, S.A./Abeinsa Ingeniería y Construcción Industrial, S.A. | | — | | (1) | | B |
Cogeneración Villaricos, S.A. (Covisa) | | Seville (ES) | | | 5,951 | | | 99.22 | | Abeinsa Asset Management, S.L. | | — | | (5) | | C |
Comemsa, Construcc Metalicas Mexicanas, S.A. De C.V. | | Queretaro (MX) | | | 21,053 | | | 100.00 | | Europea Const. Metálicas, S.A./Abengoa México, S.A. de C.V. | | — | | (1) | | B |
Complejo Medioambiental Tierra de Campos, S.L | | Palencia (ES) | | | 46 | | | 77.00 | | Befesa Gestión de Residuos Industriales, S.L. | | — | | (7) | | — |
Concesionaria del Acueducto el Zapotillo, S.A. de C.V. | | Mexico City (MX) | | | — | | | 100.00 | | Abengoa México, S.A.C.V./Abeinsa Infraestructuras MedioAmbiente, S.A./Abeinsa, S.A. | | (*) | | (4) | | B |
Construcciones y Depuraciones, S.A. | | Seville (ES) | | | 7,771 | | | 100.00 | | Abeinsa Infraestructuras Medio Ambiente, S.A. | | — | | (1) | | B |
Construtora Integração Ltda. | | R. de Janeiro (BR) | | | — | | | 51.00 | | Abengoa Brasil, S.A. | | — | | (1) | | B |
Copero Solar Huerta Cinco, S.A. | | Seville (ES) | | | 87 | | | 50.00 | | Abengoa Solar España, S.A. | | — | | (3) | | B |
Copero Solar Huerta Cuatro, S.A. | | Seville (ES) | | | 88 | | | 50.00 | | Abengoa Solar España, S.A. | | — | | (3) | | B |
Copero Solar Huerta Diez, S.A. | | Seville (ES) | | | 32 | | | 50.00 | | Abengoa Solar España, S.A. | | — | | (3) | | B |
Copero Solar Huerta Dos, S.A. | | Seville (ES) | | | 92 | | | 50.00 | | Abengoa Solar España, S.A. | | — | | (3) | | B |
Copero Solar Huerta Nueve, S.A. | | Seville (ES) | | | 42 | | | 50.00 | | Abengoa Solar España, S.A. | | — | | (3) | | B |
Copero Solar Huerta Ocho, S.A. | | Seville (ES) | | | 81 | | | 50.00 | | Abengoa Solar España, S.A. | | — | | (3) | | B |
Copero Solar Huerta Seis, S.A. | | Seville (ES) | | | 83 | | | 50.00 | | Abengoa Solar España, S.A. | | — | | (3) | | B |
Copero Solar Huerta Siete, S.A. | | Seville (ES) | | | 83 | | | 50.00 | | Abengoa Solar España, S.A. | | — | | (3) | | B |
Copero Solar Huerta Tres, S.A | | Seville (ES) | | | 94 | | | 50.00 | | Abengoa Solar España, S.A. | | — | | (3) | | B |
Copero Solar Huerta Uno, S.A. | | Seville (ES) | | | 96 | | | 50.00 | | Abengoa Solar España, S.A. | | — | | (3) | | B |
CSP Equity Investment, S.A.R.L. | | Luxembourg (LU) | | | 341,958 | | | 100.00 | | Abengoa Solar España, S.A. | | (*) | | (8) | | — |
Cycon Solar, LTD | | Nicosia (CY) | | | 1 | | | 66.00 | | Abengoa Solar Internacional, S.A. | | — | | (3) | | B |
Donsplav | | Ukraine (UA) | | | 980 | | | 51.00 | | Befesa Aluminio, S.L. | | (*) | | (7) | | — |
Ecija Solar Inversiones, S.A | | Seville (ES) | | | 85,886 | | | 100.00 | | CSP Equity Investment S.A.R.L./Abengoa Solar, S.A. | | — | | (8) | | B |
Ecoagricola, S.A. | | Murcia (ES) | | | 586 | | | 100.00 | | Abengoa Bioenergía Inversiones, S.A./Ecocarburantes, S.A. | | — | | (6) | | B |
Ecocarburantes Españoles , S.A. | | Murcia (ES) | | | 3,798 | | | 95.10 | | Abengoa Bioenergía Inversiones, S.A. | | — | | (6) | | B |
Ecovedras SA | | Torres Vedras (PT) | | | 39 | | | 78.00 | | Alianza Medioambiental, S.L. | | — | | (7) | | — |
Energoprojekt-Gliwice, S.A. | | Gliwice (PL) | | | 6,773 | | | 100.00 | | Abener Energía, S.A. | | — | | (1) | | D |
Enernova Ayamonte S.A. | | Huelva (ES) | | | 2,281 | | | 91.00 | | Abeinsa Asset Management, S.L. | | — | | (5) | | C |
Enicar Chile, S.A. | | Santiago (CL) | | | 3 | | | 100.00 | | Abengoa Chile, S.A. | | — | | (2) | | — |
Epartir, S.A. | | Montevideo (UY) | | | — | | | 100.00 | | Teyma Sociedad de Inversión, S.A. | | (*) | | (5) | | — |
Europea Const. Metálicas, S.A. (Eucomsa) | | Seville (ES) | | | 7,124 | | | 100.00 | | Abeinsa Ingeniería y Construcción Industrial, S.A./Abengoa Solar, S.A. | | — | | (1); (8) | | B |
Evacuación Valdecaballeros | | Madrid (ES) | | | 8,984 | | | 57.12 | | Solaben Electricidad Uno, Dos y Seis S.A. | | — | | (3) | | — |
Faritel, S.A. | | Montevideo (UY) | | | 13 | | | 100.00 | | Teyma Forestal, S.A. | | — | | (1) | | — |
Financiera Soteland, S.A. | | Montevideo (UY) | | | 380 | | | 100.00 | | Asa Investment AG | | — | | (1) | | — |
Fotovoltaica Solar Sevilla, S.A. | | Seville (ES) | | | 800 | | | 80.00 | | Abengoa Solar España, S.A. | | — | | (3) | | B |
Galdán, S.A | | Navarra (ES) | | | 1,485 | | | 100.00 | | Befesa Aluminio, S.L. | | — | | (7) | | — |
Geida Skikda, S.L. | | Madrid (ES) | | | 7,577 | | | 67.00 | | Abengoa Water S.L.U. | | — | | (4) | | — |
GES Investment C.V. | | Amsterdam (NL) | | | — | | | 92.00 | | ASA Investment AG | | (*) | | (1) | | — |
Gestión Integral de Recursos Humanos, S.A. | | Seville (ES) | | | 1,263 | | | 100.00 | | Siema Technologies, S.L | | — | | (1) | | B |
F-230
Table of Contents
Appendices
Appendix XVII
Subsidiary companies included in the 2012 consolidation perimeter using
the global integration method (Continuation)
| | | | | | | | | | | | | | | | |
| |
| | Shareholding | |
| |
| |
| |
|
|---|
Company Name | | Registered
Address | | Amount in
thousands
of € | | % of
Nominal
Capital | | Parent Company | | (*) | | Activity
(see Page 4) | | Auditor |
|---|
Girhmex, S.A. De C.V. | | Mexico City (MX) | | | 3 | | | 100.00 | | Gestión Integral de Recursos Humanos, S.A./Abengoa México, S.A. de C.V. | | (*) | | (1) | | — |
Global Engineering Services LLC. | | Delaware (US) | | | 2 | | | 100.00 | | GES Investment C.V. | | — | | (1) | | — |
Harper Dry Lake Land Company, LLC. | | Delaware (US) | | | 1 | | | 100.00 | | Abengoa Solar, LLC. | | — | | (3) | | — |
Helio Energy Electricidad Cinco, S.A. | | Seville (ES) | | | 60 | | | 100.00 | | Abengoa Solar España, S.A./Abengoa Solar NT, S.A. | | — | | (3) | | — |
Helio Energy Electricidad Cuatro, S.A. | | Seville (ES) | | | 60 | | | 100.00 | | Abengoa Solar España, S.A./Abengoa Solar NT, S.A. | | — | | (3) | | — |
Helio Energy Electricidad DIez, S.A. | | Seville (ES) | | | 60 | | | 100.00 | | Abengoa Solar España, S.A./Abengoa Solar NT, S.A. | | — | | (3) | | — |
Helio Energy Electricidad Doce, S.A. | | Seville (ES) | | | 60 | | | 100.00 | | Abengoa Solar España, S.A./Abengoa Solar NT, S.A. | | — | | (3) | | — |
Helio Energy Electricidad Nueve, S.A. | | Seville (ES) | | | 60 | | | 100.00 | | Abengoa Solar España, S.A./Abengoa Solar NT, S.A. | | — | | (3) | | — |
Helio Energy Electricidad Ocho, S.A. | | Seville (ES) | | | 60 | | | 100.00 | | Abengoa Solar España, S.A./Abengoa Solar NT, S.A. | | — | | (3) | | — |
Helio Energy Electricidad Once, S.A. | | Seville (ES) | | | 60 | | | 100.00 | | Abengoa Solar España, S.A./Abengoa Solar NT, S.A. | | — | | (3) | | — |
Helio Energy Electricidad Siete, S.A. | | Seville (ES) | | | 60 | | | 100.00 | | Abengoa Solar España, S.A./Abengoa Solar NT, S.A. | | — | | (3) | | — |
Helio Energy Electricidad Trece, S.A. | | Seville (ES) | | | 60 | | | 100.00 | | Abengoa Solar España, S.A./Abengoa Solar NT, S.A. | | — | | (3) | | — |
Helio Energy Electricidad Tres, S.A. | | Seville (ES) | | | 4,560 | | | 100.00 | | Abengoa Solar España, S.A./Abengoa Solar NT, S.A. | | — | | (3) | | — |
Helioenergy Electricidad Veinticinco, S.A | | Seville (ES) | | | 60 | | | 99.99 | | Abengoa Solar España, S.A. | | — | | (3) | | — |
Helioenergy Electricidad Veinticuatro, S.A | | Seville (ES) | | | 60 | | | 99.99 | | Abengoa Solar España, S.A. | | — | | (3) | | — |
Helioenergy Electricidad Veintidos, S.A | | Seville (ES) | | | 60 | | | 99.99 | | Abengoa Solar España, S.A. | | — | | (3) | | — |
Helioenergy Electricidad Veintitres, S.A | | Seville (ES) | | | 60 | | | 99.99 | | Abengoa Solar España, S.A. | | — | | (3) | | — |
Helioenergy Electricidad Veintiuno, S.A | | Seville (ES) | | | 60 | | | 99.99 | | Abengoa Solar España, S.A. | | — | | (3) | | — |
Helios I Hyperion Energy Investments, S.L. | | Seville (ES) | | | 120,739 | | | 100.00 | | Hypesol Energy Holding, S.L. | | — | | (3) | | B |
Helios II Hyperion Energy Investments, S.L. | | Madrid (ES) | | | 113,181 | | | 100.00 | | Hypesol Energy Holding, S.L. | | — | | (3) | | B |
Hidro Abengoa, S.A. De C.V. | | Mexico City (MX) | | | 4 | | | 100.00 | | Abengoa México, S.A. de C.V./Abeinsa Infraestructuras Medio Ambiente, S.A. | | — | | (1) | | — |
Holding de Energía Eólica S.A. | | Montevideo (UY) | | | 927 | | | 100.00 | | Teyma Renovables/Instalaciones Inabensa, S.A | | — | | (1) | | B |
Hypesol Energy Holding , S.L. | | Seville (ES) | | | 236,067 | | | 100.00 | | Abengoa Solar España, S.A./Abengoa Solar New Technologies S.A. | | — | | (8) | | B |
Inabensa (Pty) Ltd. | | Johannesburg (ZA) | | | — | | | 100.00 | | Instalaciones Inabensa, S.A. | | (*) | | (1) | | — |
Inabensa Bharat Private Limited | | New Delhi (IN) | | | 4,135 | | | 100.00 | | Europea Const. Metálicas, S.A./Instalaciones Inabensa, S.A./Abener Energía, S.A. | | — | | (1) | | A |
Inabensa Electric and Electronic Equipment Manufacturing (Tiajin) Co. Ltda. | | Tianjin (CN) | | | 190 | | | 100.00 | | Instalaciones Inabensa, S.A./Abeinsa Ingeniería y Construcción Industrial, S.A. | | — | | (1) | | D |
Inabensa Fotovoltaica, S.L. | | Seville (ES) | | | 3 | | | 100.00 | | Instalaciones Inabensa, S.A./C.I.L. Torrecuéllar, S.A. | | — | | (1) | | — |
Inabensa France, S.A. | | Pierrelate (FR) | | | 550 | | | 100.00 | | Instalaciones Inabensa, S.A. | | — | | (1) | | B |
Inabensa Holdings | | London (UK) | | | — | | | 100.00 | | Instalaciones Inabensa, S.A. | | (*) | | (1) | | — |
Inabensa Maroc, S.A. | | Tanger (MA) | | | 2,373 | | | 100.00 | | Instalaciones Inabensa, S.A. | | — | | (1) | | A |
Inabensa Portugal | | Lisboa (PT) | | | 280 | | | 100.00 | | Instalaciones Inabensa, S.A. | | — | | (1) | | B |
Inabensa Rio Ltda. | | R. de Janeiro (BR) | | | — | | | 100.00 | | Befesa Brasil, S.A./Abengoa Brasil, S.A. | | — | | (1) | | B |
Inabensa Saudí Arabia, LLC. | | Dammam (SA) | | | 93 | | | 100.00 | | Instalaciones Inabensa, S.A./Abeinsa Ingeniería y Construcción Industrial, S.A. | | — | | (1) | | B |
Inabensa USA, LLC. | | Phoenix (US) | | | 38 | | | 100.00 | | Abeinsa, Inc. LLC. | | (*) | | (1) | | — |
Inabensa, LLC. | | Ruwi (OM) | | | 366 | | | 70.00 | | Instalaciones Inabensa, S.A. | | (*) | | (1) | | — |
Iniciativas Hidroeléctricas de Aragón y Cataluña, S.L. (IHCAC) | | Huesca (ES) | | | 4,007 | | | 95.00 | | Abeinsa Infraestructuras Medio Ambiente, S.A. | | — | | (5) | | — |
Iniciativas Medioambientales, S.L. | | Seville (ES) | | | 8 | | | 100.00 | | Befesa Gestión de Residuos Industriales, S.L. | | — | | (7) | | — |
Insolation 17 S.R.L | | Rome (IT) | | | 2 | | | 100.00 | | Abengoa Solar Italia, S.R.L./Abengoa Solar, S.A. | | — | | (8) | | — |
Insolation 18 S.R.L | | Rome (IT) | | | — | | | 100.00 | | Abengoa Solar Italia, S.R.L./Abengoa Solar, S.A. | | — | | (3) | | — |
Insolation Sic 10 S.R.L | | Palermo (IT) | | | — | | | 100.00 | | Abengoa Solar Italia, S.R.L./Abengoa Solar, S.A. | | — | | (3) | | — |
F-231
Table of Contents
Appendices
Appendix XVII
Subsidiary companies included in the 2012 consolidation perimeter using
the global integration method (Continuation)
| | | | | | | | | | | | | | | | |
| |
| | Shareholding | |
| |
| |
| |
|
|---|
Company Name | | Registered
Address | | Amount in
thousands
of € | | % of
Nominal
Capital | | Parent Company | | (*) | | Activity
(see Page 4) | | Auditor |
|---|
Insolation Sic 11 S.R.L | | Palermo (IT) | | | — | | | 100.00 | | Abengoa Solar Italia, S.R.L./Abengoa Solar, S.A. | | — | | (3) | | — |
Insolation Sic 12 S.R.L | | Palermo (IT) | | | — | | | 100.00 | | Abengoa Solar Italia, S.R.L./Abengoa Solar, S.A. | | — | | (3) | | — |
Insolation Sic 13 S.R.L | | Palermo (IT) | | | — | | | 100.00 | | Abengoa Solar Italia, S.R.L./Abengoa Solar, S.A. | | — | | (3) | | — |
Insolation Sic 14 S.R.L | | Palermo (IT) | | | — | | | 100.00 | | Abengoa Solar Italia, S.R.L./Abengoa Solar, S.A. | | — | | (3) | | — |
Insolation Sic 15 S.R.L | | Rome (IT) | | | — | | | 100.00 | | Abengoa Solar Italia, S.R.L./Abengoa Solar, S.A. | | — | | (3) | | — |
Insolation Sic 4 S.R.L | | Rome (IT) | | | — | | | 100.00 | | Abengoa Solar Italia, S.R.L./Abengoa Solar, S.A. | | — | | (3) | | — |
Insolation Sic 5 S.R.L | | Palermo (IT) | | | — | | | 100.00 | | Abengoa Solar Italia, S.R.L./Abengoa Solar, S.A. | | — | | (3) | | — |
Insolation Sic 6 S.R.L | | Rome (IT) | | | — | | | 100.00 | | Abengoa Solar Italia, S.R.L./Abengoa Solar, S.A. | | — | | (3) | | — |
Insolation Sic 7.R.L | | Palermo (IT) | | | — | | | 100.00 | | Abengoa Solar Italia, S.R.L./Abengoa Solar, S.A. | | — | | (3) | | — |
Insolation Sic 8 S.R.L | | Palermo (IT) | | | — | | | 100.00 | | Abengoa Solar Italia, S.R.L./Abengoa Solar, S.A. | | — | | (3) | | — |
Insolation Sic 9 S.R.L | | Rome (IT) | | | — | | | 100.00 | | Abengoa Solar Italia, S.R.L./Abengoa Solar, S.A. | | — | | (3) | | — |
Instalaciones Fotovoltaicas Torrecuéllar, 1 S.L. | | Seville (ES) | | | — | | | 100.00 | | Inabensa Fotovoltaica, S.L./Instalaciones Inabensa, S.A. | | — | | (1) | | — |
Instalaciones Fotovoltaicas Torrecuéllar, 2 S.L. | | Seville (ES) | | | — | | | 100.00 | | Inabensa Fotovoltaica, S.L./Instalaciones Inabensa, S.A. | | — | | (1) | | — |
Instalaciones Fotovoltaicas Torrecuéllar, 3 S.L. | | Seville (ES) | | | — | | | 100.00 | | Inabensa Fotovoltaica, S.L./Instalaciones Inabensa, S.A. | | — | | (1) | | — |
Instalaciones Inabensa Insaat Enerji Limited Sirketi | | Ankara (TR) | | | 58 | | | 100.00 | | Instalaciones Inabensa, S.A. | | — | | (1) | | B |
Instalaciones Inabensa, S.A. | | Seville (ES) | | | 17,307 | | | 100.00 | | Nicsa/Abener Energía, S.A./Abeinsa Ingeniería y Construcción Industrial, S.A. | | — | | (1) | | B |
Inversora Enicar, S.A. | | Santiago (CL) | | | 2,140 | | | 100.00 | | Abengoa Chile, S.A. | | — | | (2) | | — |
Italica Solare S.R.L. | | Rome (IT) | | | 15 | | | 100.00 | | Abengoa Solar, S.A. | | — | | (3) | | — |
Kaxu CSP O&M Company (Pty) Ltd. | | Gauteng (ZA) | | | 16,113 | | | 92.00 | | Abengoa Solar Power South Africa (Pty) Ltd. | | (*) | | (3) | | B |
Kaxu CSP South Africa (Pty) Ltd. | | Gauteng (ZA) | | | 1,593 | | | 51.00 | | Abengoa Solar South Africa (Pty) Ltd. | | — | | (3) | | B |
Khi CSP O&M Company (Pty) Ltd. | | Gauteng (ZA) | | | 16,113 | | | 92.00 | | Abengoa Solar Power South Africa (Pty) Ltd. | | (*) | | (3) | | B |
Khi CSP South Africa (Pty) Ltd. | | Gauteng (ZA) | | | 956 | | | 51.00 | | Abengoa Solar South Africa (Pty) Ltd. | | — | | (3) | | B |
Klitten, S.A. | | Montevideo (UY) | | | 17 | | | 100.00 | | Teyma Construcciones, S.A. | | — | | (1) | | — |
L.T. Rosarito y Monterrey, S.A. De C.V. | | Mexico City (MX) | | | 3,024 | | | 100.00 | | Asa Investment AG/Abengoa México S.A. de C.V./Instalaciones Inabensa, S.A. | | — | | (1) | | D |
Las Cabezas Fotovoltaica, S.L. | | Seville (ES) | | | 8,164 | | | 100.00 | | Abengoa Solar España, S.A./Abengoa Solar, S.A. | | — | | (3) | | B |
Las Cabezas Solar S.L. | | Seville (ES) | | | 3 | | | 100.00 | | Aleduca, S.L. | | — | | (3) | | — |
Latifox S.A. | | Montevideo (UY) | | | 2 | | | 100.00 | | Teyma Renovables | | — | | (1) | | — |
Linares Fotovoltaica, S.L. | | Seville (ES) | | | 3,271 | | | 100.00 | | Abengoa Solar España, S.A./Abengoa Solar, S.A. | | — | | (3) | | B |
Lineas 612 Norte Noroeste, S.A. De C.V. | | Mexico City (MX) | | | 4 | | | 100.00 | | Abengoa México, S.A. de C.V./Abengoa, S.A. | | — | | (1) | | — |
Linha Verde Transmisora de Energia, S.A. | | Brasilia (BR) | | | 14,489 | | | 51.00 | | Abengoa Concessoes Brasil Holding S.A. | | — | | (2) | | B |
Logrosán Solar Inversiones Dos, S.A | | Seville (ES) | | | 60 | | | 100.00 | | Abengoa Solar España S.A./Abengoa Solar S.A. | | (*) | | (8) | | — |
Logrosán Solar Inversiones, S.A. | | Extremadura (ES) | | | 125,113 | | | 100.00 | | CSP Equity Investment, S.A.R.L./Abengoa Solar New Technologies S.A. | | — | | (8) | | B |
Manaus Constructora Ltda | | R. de Janeiro (BR) | | | — | | | 50.50 | | Abengoa Concessões Brasil Holding, S.A. | | — | | (1) | | — |
Marismas PV A1, S.L. | | Seville (ES) | | | 6,998 | | | 100.00 | | Las Cabezas Fotovoltaica, S.L./Abengoa Solar España, S.A. | | — | | (3) | | — |
Marismas PV A10, S.L. | | Seville (ES) | | | 123 | | | 100.00 | | Las Cabezas Fotovoltaica, S.L./Abengoa Solar España, S.A. | | — | | (3) | | — |
Marismas PV A11, S.L. | | Seville (ES) | | | 123 | | | 100.00 | | Las Cabezas Fotovoltaica, S.L./Abengoa Solar España, S.A. | | — | | (3) | | — |
Marismas PV A12, S.L. | | Seville (ES) | | | 123 | | | 100.00 | | Las Cabezas Fotovoltaica, S.L./Abengoa Solar España, S.A. | | — | | (3) | | — |
F-232
Table of Contents
Appendices
Appendix XVII
Subsidiary companies included in the 2012 consolidation perimeter using
the global integration method (Continuation)
| | | | | | | | | | | | | | | | |
| |
| | Shareholding | |
| |
| |
| |
|
|---|
Company Name | | Registered
Address | | Amount in
thousands
of € | | % of
Nominal
Capital | | Parent Company | | (*) | | Activity
(see Page 4) | | Auditor |
|---|
Marismas PV A13, S.L. | | Seville (ES) | | | 123 | | | 100.00 | | Las Cabezas Fotovoltaica, S.L./Abengoa Solar España, S.A. | | — | | (3) | | — |
Marismas PV A14, S.L. | | Seville (ES) | | | 123 | | | 100.00 | | Las Cabezas Fotovoltaica, S.L./Abengoa Solar España, S.A. | | — | | (3) | | — |
Marismas PV A15, S.L. | | Seville (ES) | | | 123 | | | 100.00 | | Las Cabezas Fotovoltaica, S.L./Abengoa Solar España, S.A. | | — | | (3) | | — |
Marismas PV A16, S.L. | | Seville (ES) | | | 123 | | | 100.00 | | Las Cabezas Fotovoltaica, S.L./Abengoa Solar España, S.A. | | — | | (3) | | — |
Marismas PV A17, S.L. | | Seville (ES) | | | 123 | | | 100.00 | | Las Cabezas Fotovoltaica, S.L./Abengoa Solar España, S.A. | | — | | (3) | | — |
Marismas PV A18, S.L. | | Seville (ES) | | | 123 | | | 100.00 | | Las Cabezas Fotovoltaica, S.L./Abengoa Solar España, S.A. | | — | | (3) | | — |
Marismas PV A2, S.L. | | Seville (ES) | | | 123 | | | 100.00 | | Las Cabezas Fotovoltaica, S.L./Abengoa Solar España, S.A. | | — | | (3) | | — |
Marismas PV A3, S.L. | | Seville (ES) | | | 123 | | | 100.00 | | Las Cabezas Fotovoltaica, S.L./Abengoa Solar España, S.A. | | — | | (3) | | — |
Marismas PV A4, S.L. | | Seville (ES) | | | 123 | | | 100.00 | | Las Cabezas Fotovoltaica, S.L./Abengoa Solar España, S.A. | | — | | (3) | | — |
Marismas PV A5, S.L. | | Seville (ES) | | | 123 | | | 100.00 | | Las Cabezas Fotovoltaica, S.L./Abengoa Solar España, S.A. | | — | | (3) | | — |
Marismas PV A6, S.L. | | Seville (ES) | | | 123 | | | 100.00 | | Las Cabezas Fotovoltaica, S.L./Abengoa Solar España, S.A. | | — | | (3) | | — |
Marismas PV A7, S.L. | | Seville (ES) | | | 123 | | | 100.00 | | Las Cabezas Fotovoltaica, S.L./Abengoa Solar España, S.A. | | — | | (3) | | — |
Marismas PV A8, S.L. | | Seville (ES) | | | 123 | | | 100.00 | | Las Cabezas Fotovoltaica, S.L./Abengoa Solar España, S.A. | | — | | (3) | | — |
Marismas PV A9, S.L. | | Seville (ES) | | | 123 | | | 100.00 | | Las Cabezas Fotovoltaica, S.L./Abengoa Solar España, S.A. | | — | | (3) | | — |
Marismas PV B1, S.L. | | Seville (ES) | | | 123 | | | 100.00 | | Las Cabezas Fotovoltaica, S.L./Abengoa Solar España, S.A. | | — | | (3) | | — |
Marismas PV B10, S.L. | | Seville (ES) | | | 123 | | | 100.00 | | Las Cabezas Fotovoltaica, S.L./Abengoa Solar España, S.A. | | — | | (3) | | — |
Marismas PV B11, S.L. | | Seville (ES) | | | 123 | | | 100.00 | | Las Cabezas Fotovoltaica, S.L./Abengoa Solar España, S.A. | | — | | (3) | | — |
Marismas PV B12, S.L. | | Seville (ES) | | | 123 | | | 100.00 | | Las Cabezas Fotovoltaica, S.L./Abengoa Solar España, S.A. | | — | | (3) | | — |
Marismas PV B13, S.L. | | Seville (ES) | | | 123 | | | 100.00 | | Las Cabezas Fotovoltaica, S.L./Abengoa Solar España, S.A. | | — | | (3) | | — |
Marismas PV B14, S.L. | | Seville (ES) | | | 123 | | | 100.00 | | Las Cabezas Fotovoltaica, S.L./Abengoa Solar España, S.A. | | — | | (3) | | — |
Marismas PV B15, S.L. | | Seville (ES) | | | 123 | | | 100.00 | | Las Cabezas Fotovoltaica, S.L./Abengoa Solar España, S.A. | | — | | (3) | | — |
Marismas PV B16, S.L. | | Seville (ES) | | | 123 | | | 100.00 | | Las Cabezas Fotovoltaica, S.L./Abengoa Solar España, S.A. | | — | | (3) | | — |
Marismas PV B17, S.L. | | Seville (ES) | | | 123 | | | 100.00 | | Las Cabezas Fotovoltaica, S.L./Abengoa Solar España, S.A. | | — | | (3) | | — |
Marismas PV B18, S.L. | | Seville (ES) | | | 123 | | | 100.00 | | Las Cabezas Fotovoltaica, S.L./Abengoa Solar España, S.A. | | — | | (3) | | — |
Marismas PV B2, S.L. | | Seville (ES) | | | 123 | | | 100.00 | | Las Cabezas Fotovoltaica, S.L./Abengoa Solar España, S.A. | | — | | (3) | | — |
Marismas PV B3, S.L. | | Seville (ES) | | | 123 | | | 100.00 | | Las Cabezas Fotovoltaica, S.L./Abengoa Solar España, S.A. | | — | | (3) | | — |
Marismas PV B4, S.L. | | Seville (ES) | | | 123 | | | 100.00 | | Las Cabezas Fotovoltaica, S.L./Abengoa Solar España, S.A. | | — | | (3) | | — |
Marismas PV B5, S.L. | | Seville (ES) | | | 123 | | | 100.00 | | Las Cabezas Fotovoltaica, S.L./Abengoa Solar España, S.A. | | — | | (3) | | — |
Marismas PV B6, S.L. | | Seville (ES) | | | 123 | | | 100.00 | | Las Cabezas Fotovoltaica, S.L./Abengoa Solar España, S.A. | | — | | (3) | | — |
Marismas PV B7, S.L. | | Seville (ES) | | | 123 | | | 100.00 | | Las Cabezas Fotovoltaica, S.L./Abengoa Solar España, S.A. | | — | | (3) | | — |
Marismas PV B8, S.L. | | Seville (ES) | | | 123 | | | 100.00 | | Las Cabezas Fotovoltaica, S.L./Abengoa Solar España, S.A. | | — | | (3) | | — |
F-233
Table of Contents
Appendices
Appendix XVII
Subsidiary companies included in the 2012 consolidation perimeter using
the global integration method (Continuation)
| | | | | | | | | | | | | | | | |
| |
| | Shareholding | |
| |
| |
| |
|
|---|
Company Name | | Registered
Address | | Amount in
thousands
of € | | % of
Nominal
Capital | | Parent Company | | (*) | | Activity
(see Page 4) | | Auditor |
|---|
Marismas PV B9, S.L. | | Seville (ES) | | | 123 | | | 100.00 | | Las Cabezas Fotovoltaica, S.L./Abengoa Solar España, S.A. | | — | | (3) | | — |
Marismas PV C1, S.L. | | Seville (ES) | | | 123 | | | 100.00 | | Las Cabezas Fotovoltaica, S.L./Abengoa Solar España, S.A. | | — | | (3) | | — |
Marismas PV C10, S.L. | | Seville (ES) | | | 123 | | | 100.00 | | Las Cabezas Fotovoltaica, S.L./Abengoa Solar España, S.A. | | — | | (3) | | — |
Marismas PV C11, S.L. | | Seville (ES) | | | 123 | | | 100.00 | | Las Cabezas Fotovoltaica, S.L./Abengoa Solar España, S.A. | | — | | (3) | | — |
Marismas PV C12, S.L. | | Seville (ES) | | | 123 | | | 100.00 | | Las Cabezas Fotovoltaica, S.L./Abengoa Solar España, S.A. | | — | | (3) | | — |
Marismas PV C13, S.L. | | Seville (ES) | | | 123 | | | 100.00 | | Las Cabezas Fotovoltaica, S.L./Abengoa Solar España, S.A. | | — | | (3) | | — |
Marismas PV C14, S.L. | | Seville (ES) | | | 123 | | | 100.00 | | Las Cabezas Fotovoltaica, S.L./Abengoa Solar España, S.A. | | — | | (3) | | — |
Marismas PV C15, S.L. | | Seville (ES) | | | 123 | | | 100.00 | | Las Cabezas Fotovoltaica, S.L./Abengoa Solar España, S.A. | | — | | (3) | | — |
Marismas PV C16, S.L. | | Seville (ES) | | | 123 | | | 100.00 | | Las Cabezas Fotovoltaica, S.L./Abengoa Solar España, S.A. | | — | | (3) | | — |
Marismas PV C17, S.L. | | Seville (ES) | | | 123 | | | 100.00 | | Las Cabezas Fotovoltaica, S.L./Abengoa Solar España, S.A. | | — | | (3) | | — |
Marismas PV C18, S.L. | | Seville (ES) | | | 123 | | | 100.00 | | Las Cabezas Fotovoltaica, S.L./Abengoa Solar España, S.A. | | — | | (3) | | — |
Marismas PV C2, S.L. | | Seville (ES) | | | 123 | | | 100.00 | | Las Cabezas Fotovoltaica, S.L./Abengoa Solar España, S.A. | | — | | (3) | | — |
Marismas PV C3, S.L. | | Seville (ES) | | | 123 | | | 100.00 | | Las Cabezas Fotovoltaica, S.L./Abengoa Solar España, S.A. | | — | | (3) | | — |
Marismas PV C4, S.L. | | Seville (ES) | | | 123 | | | 100.00 | | Las Cabezas Fotovoltaica, S.L./Abengoa Solar España, S.A. | | — | | (3) | | — |
Marismas PV C5, S.L. | | Seville (ES) | | | 123 | | | 100.00 | | Las Cabezas Fotovoltaica, S.L./Abengoa Solar España, S.A. | | — | | (3) | | — |
Marismas PV C6, S.L. | | Seville (ES) | | | 123 | | | 100.00 | | Las Cabezas Fotovoltaica, S.L./Abengoa Solar España, S.A. | | — | | (3) | | — |
Marismas PV C7, S.L. | | Seville (ES) | | | 123 | | | 100.00 | | Las Cabezas Fotovoltaica, S.L./Abengoa Solar España, S.A. | | — | | (3) | | — |
Marismas PV C8, S.L. | | Seville (ES) | | | 123 | | | 100.00 | | Las Cabezas Fotovoltaica, S.L./Abengoa Solar España, S.A. | | — | | (3) | | — |
Marismas PV C9, S.L. | | Seville (ES) | | | 123 | | | 100.00 | | Las Cabezas Fotovoltaica, S.L./Abengoa Solar España, S.A. | | — | | (3) | | — |
Marismas PV E1, S.L. | | Seville (ES) | | | 123 | | | 100.00 | | Las Cabezas Fotovoltaica, S.L./Abengoa Solar España, S.A. | | — | | (3) | | — |
Marismas PV E2, S.L. | | Seville (ES) | | | 123 | | | 100.00 | | Las Cabezas Fotovoltaica, S.L./Abengoa Solar España, S.A. | | — | | (3) | | — |
Marismas PV E3, S.L. | | Seville (ES) | | | 123 | | | 100.00 | | Las Cabezas Fotovoltaica, S.L./Abengoa Solar España, S.A. | | — | | (3) | | — |
Marudhara Akshay Urja Private Limited | | Maharashtra (IN) | | | 7 | | | 100.00 | | Abengoa Solar India Private Limited/Abengoa Solar Internacional. S.A. | | — | | (3) | | B |
Marusthal Green Power Private Limited | | Maharashtra (IN) | | | 7 | | | 100.00 | | Abengoa Solar India Private Limited/Abengoa Solar Internacional, S.A. | | — | | (3) | | B |
Mojave Solar Holding, LLC. | | Delaware (US) | | | 158,318 | | | 100.00 | | Abengoa Solar, LLC. | | — | | (8) | | — |
MRH-Residuos Metálicos, S.L. | | Vizcaya (ES) | | | 141,363 | | | 100.00 | | Befesa Medioa Ambiente, S.L.U. | | — | | (7) | | — |
Mundiland, S.A. | | Montevideo (UY) | | | 3,006 | | | 100.00 | | Siema Factory Holding AG | | — | | (1) | | — |
NEA Solar Investments, S.A | | Seville (ES) | | | 61 | | | 100.00 | | Abengoa Solar, S.A./Abengoa Solar España, S.A. | | (*) | | (8) | | — |
NEA Solar O&M, S.A. | | Seville (ES) | | | 61 | | | 100.00 | | NEA Solar Investments, S.A /Abengoa Solar España, S.A. | | (*) | | (8) | | — |
NEA Solar Power, S.A. | | Seville (ES) | | | 61 | | | 100.00 | | NEA Solar Investments, S.A /Abengoa Solar España, S.A. | | (*) | | (8) | | — |
Nicefield S.A | | Uruguay (UY) | | | 3 | | | 100.00 | | Holding de Energía Eólica, S.A. | | — | | (5) | | B |
Nicsa Asia Pacific Private Limited | | Singapore (SG) | | | — | | | 100.00 | | Negocios Industriales y Comerciales, S.A. | | (*) | | (1) | | — |
Nicsa Fornecimiento de Materiais Eléctricos Ltda | | R. de Janeiro (BR) | | | 1,503 | | | 100.00 | | Abeinsa Ingeniería y Construcción Industrial, S.A./Negocios Industriales y Comerciales, S.A. | | — | | (1) | | — |
F-234
Table of Contents
Appendices
Appendix XVII
Subsidiary companies included in the 2012 consolidation perimeter using
the global integration method (Continuation)
| | | | | | | | | | | | | | | | |
| |
| | Shareholding | |
| |
| |
| |
|
|---|
Company Name | | Registered
Address | | Amount in
thousands
of € | | % of
Nominal
Capital | | Parent Company | | (*) | | Activity
(see Page 4) | | Auditor |
|---|
Nicsa Industrial Supplies Corporation | | Houston (US) | | | 790 | | | 100.00 | | Abeinsa, Inc. LLC. | | — | | (1) | | B |
Nicsa Mexico, S.A. de C.V. | | Mexico City (MX) | | | 4 | | | 99.80 | | Negocios Industriales y Comerciales, S.A./Abengoa México, S.A. de C.V. | | — | | (1) | | B |
Nicsa Middle East, FZE | | Sharjah (AE) | | | 29 | | | 100.00 | | Negocios Industriales y Comerciales, S. A | | — | | (1) | | B |
Nicsa Perú, S.A. | | Lima (PE) | | | 3 | | | 100.00 | | Negocios Industriales y Comerciales, S.A./Abeinsa Ingeniería y Construcción Industrial, S.A. | | (*) | | (1) | | — |
Nicsa Suministros Industriales, S.A. | | Buenos Aires (AR) | | | — | | | 100.00 | | Befesa Argentina, S.A./Teyma Abengoa, S.A. | | — | | (7) | | D |
Nicsa, Negocios Industr. y Comer. S.A. | | Madrid (ES) | | | 1,791 | | | 100.00 | | Abencor, S.A./Abeinsa Ingeniería y Construcción Industrial, S.A. | | — | | (1) | | C |
Norventus Atlántico, S.L | | A Coruña (ES) | | | 7 | | | 70.00 | | Instalaciones Inabensa, S.A. | | — | | (5) | | — |
OMEGA Operação e Manutenção de Linhas de Transmissão, S.A. | | R. de Janeiro (BR) | | | 175 | | | 100.00 | | Instalaciones Inabesa S.A./Abengoa Brasil, S.A. | | — | | (1) | | B |
Omega Sudamérica, S.L | | Seville (ES) | | | 3 | | | 100.00 | | Instalaciones Inabensa, S.A./ASA Iberoamérica S.A. | | (*) | | (1) | | — |
Palmatir S.A. | | Montevideo (UY) | | | 893 | | | 100.00 | | Holding de Energía Eólica, S.A. | | — | | (5) | | B |
Palmucho, S.A. | | Santiago (CL) | | | 2 | | | 100.00 | | Abengoa Chile, S.A. / Enicar Chile, S.A. | | — | | (2) | | B |
Pomacocha Power S.A. | | Lima (PE) | | | — | | | 90.00 | | Abengoa Perú, S.A. | | — | | (1) | | — |
Power Structures Inc. | | Delaware (US) | | | — | | | 100.00 | | Abeinsa, Inc. LLC. | | — | | (1) | | B |
Procesos Ecológicos Carmona 1, S.A. | | Seville (ES) | | | 63 | | | 100.00 | | Abeinsa Infraestructuras Medio Ambiente, S.A./Procesos Ecológicos, S.A. | | — | | (1) | | — |
Procesos Ecológicos Carmona 2, S.A. | | Seville (ES) | | | 90 | | | 100.00 | | Abeinsa Infraestructuras Medio Ambiente, S.A./Procesos Ecológicos, S.A. | | — | | (1) | | — |
Procesos Ecológicos Carmona 3, S.A. | | Seville (ES) | | | 60 | | | 100.00 | | Abeinsa Infraestructuras Medio Ambiente, S.A./Procesos Ecológicos, S.A. | | — | | (1) | | — |
Procesos Ecológicos Lorca 1, S.A. | | Seville (ES) | | | 180 | | | 100.00 | | Abeinsa Infraestructuras Medio Ambiente, S.A./Procesos Ecológicos, S.A. | | — | | (1) | | — |
Procesos Ecológicos Vilches, S.A. | | Seville (ES) | | | 1,299 | | | 100.00 | | Abeinsa Infraestructuras Medio Ambiente, S.A./Procesos Ecológicos, S.A. | | — | | (7) | | B |
Puerto Real Cogeneración, S.A. (Precosa) | | Cadiz (ES) | | | 176 | | | 99.10 | | Abeinsa Asset Management, S.L. | | — | | (5) | | B |
Qingdao BCTA Desalinataion Co.Ltd. | | Qingdao (CH) | | | 37,786 | | | 92.59 | | Befesa CTA Qingdao, S.L. | | — | | (4) | | B |
Qingdao Befesa Agua Co., Ltd. (WFOE Qingdao) | | Qingdao (CH) | | | 209 | | | 100.00 | | Abeinsa Infraestructuras Medio Ambiente, S.A./Codesa, S.A. | | — | | (1) | | B |
Rajathan Photon Energy | | Maharashtra (IN) | | | 7 | | | 100.00 | | Abengoa Solar India Private Limited/Abengoa Solar Internacional, S.A. | | — | | (3) | | B |
Residuos Ind. De la Madera de Córdoba, S.A. | | Cordoba (ES) | | | 617 | | | 71.09 | | Befesa Gestión de Residuos Industriales, S.L. | | — | | (7) | | — |
Rioglass Solar 2 | | Asturias (ES) | | | 60 | | | 99.99 | | Rioglass Solar Holding, S.A. | | — | | (8) | | B |
Rioglass Solar Holding, S.A. | | Asturias (ES) | | | 502 | | | 50.00 | | Abengoa Solar, S.A. | | — | | (8) | | B |
Rioglass Solar Inc. | | Delaware (US) | | | 9,391 | | | 100.00 | | Rioglass Solar Holding, S.A. | | — | | (8) | | B |
Rioglass Solar, S.A | | Asturias (ES) | | | 6,906 | | | 100.00 | | Rioglass Solar Holding, S.A. | | — | | (8) | | B |
Royalla PV (Pty) Ltd. | | Brisbane (AU) | | | 22 | | | 100.00 | | Abengoa Solar Internacional, S.A. | | (*) | | (3) | | — |
S.E.T Sureste Peninsular, S.A. De C.V. | | Mexico City (MX) | | | 1,615 | | | 100.00 | | Abengoa México, S.A. de C.V./Instalaciones Inabensa, S.A. | | — | | (1) | | — |
Sanlúcar Solar, S.A. | | Seville (ES) | | | 8,225 | | | 100.00 | | Abengoa Solar, S.A./Asa Environment | | — | | (3) | | B |
SAS Abengoa Bioenergia Biomasse France | | Arance (FR) | | | 3 | | | 100.00 | | Abengoa Bioenrgia, S.A. | | — | | (6) | | — |
Scios. Aux. Admon., S.A. De C.V. (Saxsa) | | Mexico City (MX) | | | 3 | | | 99.80 | | Abengoa México, S.A. de C.V./Abengoa, S.A. | | — | | (1) | | B |
Serv. Integ. Manten y Operac., S.A. (Simosa) | | Seville (ES) | | | 1,185 | | | 100.00 | | Negocios Industriales y Comerciales, S.A./Abengoa, S.A. | | — | | (1) | | C |
Servicios de Ingenieria IMASA (SDI -IMA) | | Santiago (CL) | | | 2,832 | | | 60.00 | | Abengoa Chile, S.A. | | — | | (1) | | B |
Shariket Tenes Lilmiyah Spa | | Argel (DZ) | | | 9,871 | | | 51.00 | | Befesa Aguas Tenes, S.L. | | — | | (4) | | D |
Siema Factory Holding, AG | | Zug (SZ) | | | 9,353 | | | 100.00 | | Siema Investment, S.L. | | — | | (1) | | — |
Siema Investment, S.L. | | Madrid (ES) | | | 7,000 | | | 100.00 | | Siema Technologies, S.L | | — | | (1) | | — |
Siema Technologies, S.L. | | Madrid (ES) | | | 24,297 | | | 100.00 | | Abengoa, S.A./Siema AG | | — | | (1) | | B |
Siema, AG | | Zug (SZ) | | | 8,757 | | | 100.00 | | Sociedad Inversora Energía y Medio Ambiente, S.A. | | — | | (1) | | — |
Simosa I.T., S.A | | Seville (ES) | | | 61 | | | 100.00 | | Abengoa, S.A./Simosa, S.A. | | — | | (1) | | B |
Simosa IT Uruguay S.A. | | Montevideo (UY) | | | 2 | | | 100.00 | | Simosa IT, S.A. | | — | | (1) | | B |
Simosa IT US, LLC | | Chesterfield (US) | | | — | | | 100.00 | | Simosa IT, S.A. | | — | | (1) | | B |
Sinalan, S.A. | | Montevideo (UY) | | | 4 | | | 100.00 | | Teyma Forestal, S.A. | | — | | (1) | | — |
F-235
Table of Contents
Appendices
Appendix XVII
Subsidiary companies included in the 2012 consolidation perimeter using
the global integration method (Continuation)
| | | | | | | | | | | | | | | | |
| |
| | Shareholding | |
| |
| |
| |
|
|---|
Company Name | | Registered
Address | | Amount in
thousands
of € | | % of
Nominal
Capital | | Parent Company | | (*) | | Activity
(see Page 4) | | Auditor |
|---|
Sistemas de Desarrollo Sustentables S.A. De C.V. | | Mexico City (MX) | | | 4,678 | | | 65.00 | | Befesa México, S.A. De C.V./Abengoa México, S.A. de CV | | — | | (7) | | B |
Soc. Inver. En Ener. y Medioambiente, S.A. (Siema) | | Seville (ES) | | | 93,008 | | | 100.00 | | Abengoa, S.A./Negocios Industriales y Comerciales, S.A. | | — | | (1) | | B |
Sociedad Inversora Lineas de Brasil, S.L. | | Seville (ES) | | | 12,798 | | | 100.00 | | Asa Iberoamérica, S.L. | | — | | (1) | | — |
Sol3G | | Barcelona (ES) | | | 6,762 | | | 100.00 | | Abengoa Solar, S.A. | | — | | (8) | | D |
Solaben Electricidad Diez, S.A. | | Caceres (ES) | | | 60 | | | 100.00 | | Abengoa Solar España, S.A./Abengoa Solar NT, S.A. | | — | | (3) | | — |
Solaben Electricidad Doce, S.A. | | Caceres (ES) | | | 60 | | | 100.00 | | Abengoa Solar España, S.A./Abengoa Solar NT, S.A. | | — | | (3) | | — |
Solaben Electricidad Dos | | Caceres (ES) | | | 62,688 | | | 70.00 | | Abengoa Solar España, S.A./ Logrosán Solar Inversiones, S.A. | | — | | (3) | | B |
Solaben Electricidad Ocho, S.A. | | Caceres (ES) | | | 60 | | | 100.00 | | Abengoa Solar España, S.A/Abengoa Solar New Technologies,S.A. | | — | | (3) | | — |
Solaben Electricidad Quince, S.A. | | Caceres (ES) | | | 60 | | | 100.00 | | Abengoa Solar España, S.A./Abengoa Solar NT, S.A. | | — | | (3) | | — |
Solaben Electricidad Seis | | Badajoz (ES) | | | 1,310 | | | 100.00 | | Logrosán Solar Inversiones Dos, S.A./Abengoa Solar NT | | — | | (3) | | B |
Solaben Electricidad Tres | | Caceres (ES) | | | 62,401 | | | 70.00 | | Abengoa Solar España, S.A./ Logrosán Solar Inversiones, S.A. | | — | | (3) | | B |
Solaben Electricidad Uno | | Caceres (ES) | | | 1,460 | | | 100.00 | | Logrosán Solar Inversiones Dos, S.A./Abengoa Solar NT | | — | | (3) | | B |
Solacor Electricidad Dos, S.A. | | Seville (ES) | | | 58,477 | | | 74.00 | | Carpio Solar Inversiones, S.A. | | — | | (3) | | B |
Solacor Electricidad Uno, S.A. | | Seville (ES) | | | 57,902 | | | 74.00 | | Carpio Solar Inversiones, S.A. | | — | | (3) | | B |
Solar de Receptores de Andalucía, S.A. | | Seville (ES) | | | 60 | | | 100.00 | | Abengoa Solar, S.A./Abengoa Solar NT, S.A. | | — | | (3) | | — |
Solar Nerva, S.L.U. | | Huelva (ES) | | | 3 | | | 100.00 | | Befesa Gestión de Residuos Industriales, S.L. | | — | | (7) | | — |
Solar Power Plant One (SPP1) | | Argel (DZ) | | | 42,111 | | | 51.00 | | Abener Energía, S.A. | | — | | (3) | | D |
Solar Power PV South Africa (Pty) Ltd. | | Gauteng (ZA) | | | 101 | | | 100.00 | | Abengoa Solar South Africa (Pty) Ltd. | | (*) | | (3) | | B |
Solar Processes, S.A.(PS-20) | | Seville (ES) | | | 14,578 | | | 100.00 | | Abengoa Solar España, S.A. | | — | | (3) | | B |
Solargate Electricidad Cinco , S.A. | | Seville (ES) | | | 60 | | | 100.00 | | Abengoa Solar España, S.A./Abengoa Solar NT, S.A. | | — | | (3) | | — |
Solargate Electricidad Cuatro , S.A. | | Seville (ES) | | | 60 | | | 100.00 | | Abengoa Solar España, S.A./Abengoa Solar NT, S.A. | | — | | (3) | | — |
Solargate Electricidad Dos , S.A. | | Seville (ES) | | | 60 | | | 100.00 | | Abengoa Solar España, S.A./Abengoa Solar NT, S.A. | | — | | (3) | | — |
Solargate Electricidad Tres , S.A. | | Seville (ES) | | | 60 | | | 100.00 | | Abengoa Solar España, S.A./Abengoa Solar NT, S.A. | | — | | (3) | | — |
Solargate Electricidad Uno , S.A. | | Seville (ES) | | | 60 | | | 100.00 | | Abengoa Solar España, S.A./Abengoa Solar NT, S.A. | | — | | (3) | | — |
Solnova Electricidad Cinco, S.A. | | Seville (ES) | | | 3,460 | | | 100.00 | | Abengoa Solar España, S.A./Abengoa Solar, S.A. | | — | | (3) | | — |
Solnova Electricidad Cuatro, S.A. | | Seville (ES) | | | 28,964 | | | 100.00 | | Solnova Solar Inversiones, S.A. | | — | | (3) | | B |
Solnova Electricidad Dos, S.A. | | Seville (ES) | | | 4,360 | | | 100.00 | | Abengoa Solar España, S.A./Abengoa Solar, S.A. | | — | | (3) | | — |
Solnova Electricidad Seis , S.A. | | Seville (ES) | | | 60 | | | 100.00 | | Abengoa Solar España, S.A./Abengoa Solar NT, S.A. | | — | | (3) | | — |
Solnova Electricidad Tres, S.A. | | Seville (ES) | | | 30,110 | | | 100.00 | | Solnova Solar Inversiones, S.A. | | — | | (3) | | B |
Solnova Electricidad, S.A. | | Seville (ES) | | | 30,986 | | | 100.00 | | Solnova Solar Inversiones, S.A. | | — | | (3) | | B |
Solnova Solar Inversiones, S.A | | Seville (ES) | | | 60 | | | 100.00 | | Abengoa Solar España, S.A. | | — | | (8) | | B |
Soluciones Ambientales del Norte Limitada, S.A. | | Santiago (CL) | | | 6,645 | | | 100.00 | | Alianza Medioambiental, S.L. /Befesa Servicios Corporativos, S.A. | | — | | (7) | | B |
Solugas Energía S.A. | | Seville (ES) | | | 60 | | | 100.00 | | Abengoa Solar NT, S.A./Abengoa Solar S.A. | | — | | (3) | | — |
Son Rivieren (Pty) Ltd. | | Gauteng (ZA) | | | 549 | | | 100.00 | | South Africa Solar Investment, S.L. | | — | | (8) | | B |
South Africa Solar Investments, S.L. | | Seville (ES) | | | 10,000 | | | 100.00 | | Abengoa Solar Internacional, S.A. | | — | | (8) | | — |
South Africa Solar Ventures, S.L. | | Seville (ES) | | | 50 | | | 100.00 | | Abengoa Solar Internacional, S.A./Abengoa Solar Ventures, S.A | | (*) | | (8) | | — |
Subestaciones 611 Baja California, S.A. De C.V. | | Mexico City (MX) | | | 4 | | | 100.00 | | Abengoa México, S.A/Abengoa, S.A | | — | | (1) | | D |
Tarefix | | Delaware (US) | | | 1 | | | 92.00 | | Asa Investment AG | | — | | (1) | | B |
F-236
Table of Contents
Appendices
Appendix XVII
Subsidiary companies included in the 2012 consolidation perimeter using
the global integration method (Continuation)
| | | | | | | | | | | | | | | | |
| |
| | Shareholding | |
| |
| |
| |
|
|---|
Company Name | | Registered
Address | | Amount in
thousands
of € | | % of
Nominal
Capital | | Parent Company | | (*) | | Activity
(see Page 4) | | Auditor |
|---|
Teyma Abengoa, S.A. | | Buenos Aires (AR) | | | 49,849 | | | 100.00 | | Asa Investment, AG/Befesa Argentina, S.A. | | — | | (1) | | B |
Teyma Construcción, S.A. | | Montevideo (UY) | | | 5,859 | | | 97.00 | | Teyma Sociedad de Inversión, S.A. | | — | | (1) | | B |
Teyma Forestal, S.A. | | Montevideo (UY) | | | 821 | | | 100.00 | | Teyma Renovables | | — | | (8) | | B |
Teyma Gestión de Contratos de Construcción e Ingeniería, S.A. | | Seville (ES) | | | 55 | | | 92.00 | | Abeinsa Ingeniería y Construcción Industrial, S.A. | | — | | (1) | | B |
Teyma India Private Limited | | Mumbai (IN) | | | 441 | | | 100.00 | | Teyma Gestión de Contratos de Construcción e Ingeniería, S.A. | | — | | (1) | | B |
Teyma Management, LLC. | | Phoenix (US) | | | — | | | 100.00 | | Teyma USA, Inc. | | (*) | | (1) | | — |
Teyma Medioambiente S.A. | | Montevideo (UY) | | | 22 | | | 100.00 | | Teyma Uruguay Holding, S.A. | | — | | (1) | | — |
Teyma Middle East, S.L. | | Seville (ES) | | | 2 | | | 100.00 | | Teyma, S.A. /Teyma Int., S.A. /Ábacus Project Management Inc./Teyma Uruguay, S.A. | | — | | (1) | | — |
Teyma Paraguay, S.A. | | Asuncion (PY) | | | — | | | 100.00 | | Teyma Servicios de Ingeniería y Construcción Internacional, S.A. | | — | | (1) | | — |
Teyma Renovables | | Montevideo (UY) | | | 2,257 | | | 100.00 | | Xina Holding Trust BEE (Pty) Ltd | | — | | (1) | | B |
Teyma Servicios de Ingeniería y Construcción Internacional, S.A. | | Montevideo (UY) | | | 22 | | | 100.00 | | Teyma Uruguay Holding, S.A. | | — | | (1) | | B |
Teyma Sociedad de Inversión, S.A. | | Montevideo (UY) | | | 18,220 | | | 92.00 | | Abeinsa Inversiones Latam, S.L. | | — | | (1) | | B |
Teyma Uruguay ZF, S.A. | | Montevideo (UY) | | | 27 | | | 100.00 | | Teyma Construcción, S.A. | | — | | (1) | | B |
Teyma USA & Abener Engineering and Construction Services Partnership | | Chesterfield (US) | | | 4 | | | 100.00 | | Abener Engineering and Construction Services, LLC/Teyma USA Inc. | | — | | (1) | | B |
Teyma USA, Inc. | | Delaware (US) | | | 10,018 | | | 100.00 | | Abengoa US Holding, LLC. | | — | | (1) | | B |
Transmisora Baquedano, S.A. | | Santiago de Chile (CH) | | | 3,398 | | | 99.90 | | Abengoa Chile, S.A. | | (*) | | (2) | | B |
Transmisora Mejillones S.A. | | Santiago de Chile (CH) | | | 4,200 | | | 99.90 | | Abengoa Chile, S.A. | | (*) | | (2) | | B |
Transportadora Cuyana, S.A. | | Buenos Aires (AR) | | | 1 | | | 100.00 | | Teyma Abengoa, S.A./Abengoa, S.A. | | — | | (1) | | B |
Transportadora del Norte, S.A. | | Buenos Aires (AR) | | | — | | | 100.00 | | Abengoa, S.A./Teyma Abengoa, S.A. | | — | | (1) | | B |
Transportadora Río Coronda, S.A. | | Buenos Aires (AR) | | | — | | | 100.00 | | Teyma Abengoa, S.A./Abengoa, S.A. | | — | | (1) | | D |
Transportadora Rio de la Plata, S.A. | | Buenos Aires (AR) | | | — | | | 100.00 | | Teyma Argentina, S.A./Abengoa, S.A. | | — | | (1) | | D |
Trinacria Spzoo | | Skawina (PL) | | | 4,583 | | | 95.05 | | Befesa Aluminio, S.L. | | — | | (7) | | — |
Valorcam S.L | | Madrid (ES) | | | 2 | | | 80.00 | | Befesa Gestión de Residuos Industriales, S.L. | | — | | (7) | | — |
XiNa Community Trust | | Gauteng (ZA) | | | 9 | | | 100.00 | | Xina Holding Trust BEE (Pty) Ltd | | (*) | | (8) | | — |
Xina Community Trust BEE Holding | | Gauteng (ZA) | | | 89 | | | 100.00 | | South Africa Solar Ventures, S.L. | | (*) | | (8) | | — |
XiNa CSP South Africa (Pty) Ltd. | | Gauteng (ZA) | | | 89 | | | 100.00 | | South Africa Solar Ventures, S.L. | | (*) | | (8) | | — |
Zero Emissions Technologies, S.A. | | Seville (ES) | | | 60 | | | 100.00 | | Abeinsa Ingeniería y Construcción Industrial, S.A./Abengoa Hidrógeno, S.A. | | — | | (8) | | B |
Zeroemissions (Beijing) Technology Consulting Service Co. Ltd. | | Beijing (CN) | | | 100 | | | 100.00 | | Zero Emissions Technologies, S.A./Zeroemissions Carbon Trust, S.A. | | — | | (1) | | — |
Zeroemissions Carbon Trust, S.A | | Seville (ES) | | | 125 | | | 100.00 | | Zeroemissions Technologies, S.A./Abeinsa Ingeniería y Construcción Industrial, S.A. | | — | | (8) | | B |
Zeroemissions do Brasil, Ltda. | | R. de Janeiro (BR) | | | 2,884 | | | 100.00 | | Zeroemissions Technologies, S.A./Zeroemissions Carbon Trust, S.A. | | — | | (1) | | B |
Shareholding capital cost is calculated using the current closing year exchange rate
- (*)
- Companies incorporated or acquired and consolidated for the first time in the year.
- (1)
- Operating segment activities area: Engineering and Construction.
- (2)
- Operating segment activities area: Transmission.
- (3)
- Operating segment activities area: Solar.
- (4)
- Operating segment activities area: Water.
- (5)
- Operating segment activities areae: Cogeneration and others.
- (6)
- Operating segment activities area: Bioenergy.
- (7)
- Operating segment activities area: Recycling.
- (8)
- Operating segment activities area: Others.
- A
- Audited by PricewaterhouseCoopers Auditores.
- B
- Audited by Deloitte (for legal purposes).
- C
- Audited by Auditoría y Consulta (for legal purposes).
- D
- Audited by others auditors (for legal purposes).
F-237
Table of Contents
Appendices
Appendix XVIII
Associated companies and Joint Ventures included in the 2012 consolidation perimeter using
the participation method
| | | | | | | | | | | | | | | | |
| |
| | Shareholding | |
| |
| |
| |
|
|---|
Company Name | | Registered
Address | | Amount in
thousands
of € | | % of
Nominal
Capital | | Parent Company | | (*) | | Activity | | Auditor |
|---|
Abencon, S.A. de C.V. | | Mexico City (MX) | | | 1 | | | 50.00 | | Abengoa México, S.A. | | — | | (1) | | — |
Abener-Dragados Industrial-México, S.A. De C.V. | | Mexico City (MX) | | | — | | | 50.00 | | Abener México, S.A. | | — | | (1) | | — |
Abengoa Bioenergy Biomass of Kansas, LLC. | | Chesterfield (US) | | | 206,287 | | | 100.00 | | Abengoa Bioenergy Hybrid of Kansas, LLC. | | — | | (6) | | B |
Agua y Gestión de Servicios Ambientales, S.A. | | Seville (ES) | | | 7,124 | | | 41.54 | | Abengoa Water, S.L.U. | | — | | (4) | | — |
Al Osais-Inabensa Co. Ltd | | Dammam (SA) | | | 404 | | | 50.00 | | Inabensa Saudi Arabia LLC. | | — | | (1) | | B |
Arizona Solar One, LLC. | | Colorado (US) | | | 357,851 | | | 100.00 | | Abengoa Solar Inc. | | — | | (3) | | B |
ATE VIII Transmissora de Energía S.A. | | R. de Janeiro (BR) | | | — | | | 50.00 | | Abengoa Concessões Brasil Holding, S.A. | | — | | (2) | | B |
Betearte | | Vizcaya (ES) | | | 1,121 | | | 33.33 | | Alianza Medioambiental, S.L. | | — | | (7) | | — |
Carmona & Befesa Limpiezas Industriais, Ltda. (C&B) | | Setúbal (PT) | | | 3 | | | 50.00 | | Befesa Gestión de Residuos Industriales, S.L. | | — | | (7) | | — |
Central Eólica Santo Antonio de Pádua S.A. | | Sao Paulo (BR) | | | 1 | | | 100.00 | | Santos Energia Participaçoes, S.A. | | (*) | | (5) | | — |
Central Eólica São Cristóvão S.A. | | Sao Paulo (BR) | | | 1 | | | 100.00 | | Santos Energia Participaçoes, S.A. | | (*) | | (5) | | — |
Central Eólica São Jorge S.A. | | Sao Paulo (BR) | | | 1 | | | 100.00 | | Santos Energia Participaçoes, S.A. | | (*) | | (5) | | — |
Central Eólica São Tomé Ltda. | | Sao Paulo (BR) | | | — | | | 18.00 | | Instalaciones Inabensa, S.A./Abengoa Construçao Brasil, Ltda | | — | | (5) | | — |
Chennai Water Desalination Limited | | Chennai (IN) | | | 7,086 | | | 25.00 | | Abengoa Water S.L.U. | | — | | (4) | | — |
Coaben SA de C.V. | | Mexico City (MX) | | | 2 | | | 50.00 | | Abengoa México S.A. de CV/Instalaciones Inabensa, S.A. | | — | | (1) | | B |
Cogeneración Motril, S.A. | | Seville (ES) | | | 1,913 | | | 19.00 | | Abeinsa Asset Management, S.L. | | — | | (5) | | — |
Concecutex SA de C.V. | | Toluca (MX) | | | 7,274 | | | 50.00 | | Abengoa México, S.A. de C.V./Abengoa, S.A. | | — | | (5) | | B |
Concesionaria Costa del Sol S.A. | | Malaga (ES) | | | 4,585 | | | 50.00 | | Instalaciones Inabensa, S.A. | | — | | (5) | | B |
Concesionaria Hospital del Tajo, S.A. | | Madrid (ES) | | | 1,727 | | | 20.00 | | Instalaciones Inabensa, S.A. | | — | | (5) | | — |
Consorcio Teyma M&C | | Montevideo (UY) | | | 12 | | | 49.90 | | Abengoa Chile, S.A. | | — | | (1) | | — |
Desarrolladora de Energía Renovable, S.A.P.I. de C.V | | Mexico City (MX) | | | — | | | 50.00 | | Abengoa México, S.A. de C.V. | | (*) | | (1) | | — |
Ecología Canaria, S.A. | | Las Palmas (ES) | | | 68 | | | 45.00 | | Befesa Gestión de Residuos Industriales, S.L. | | — | | (7) | | — |
Evacuación Villanueva del Rey, S.L. | | Seville (ES) | | | 2 | | | 55.24 | | Helioenergy Electricidad Uno, Dos y Tres, S.A. | | — | | (3) | | — |
Explotaciones Varias, S.A. | | Seville (ES) | | | 1,907 | | | 50.00 | | Abengoa, S.A. | | — | | (1) | | — |
Explotadora Hospital del Tajo, S.L. | | Madrid (ES) | | | 1 | | | 20.00 | | Instalaciones Inabensa, S.A. | | — | | (5) | | — |
Geida Tlemcen, S.L. | | Madrid (ES) | | | 13,584 | | | 50.00 | | Abengoa Water S.L.U. | | — | | (4) | | — |
Gestión y Valorización Integral del Centro, S.L. | | Madrid (ES) | | | 2 | | | 50.00 | | Befesa Gestión de Residuos Industriales, S.L. | | (*) | | (7) | | — |
Ghenova Ingeniería S.L. | | Seville (ES) | | | 1,027 | | | 20.00 | | Abener Energía, S.A. | | (*) | | (1) | | — |
Green Visión Holding BV | | Arnhem (NL) | | | 3,000 | | | 24.00 | | Abengoa Hidrógeno, S.A. | | — | | (1) | | — |
Hankook R&M Co., Ltd. | | South Korea (KR) | | | 15,290 | | | 25.00 | | Befesa Zinc Germany | | (*) | | (7) | | — |
Helioenergy Electricidad Dos, S.A. | | Seville (ES) | | | 42,718 | | | 50.00 | | Écija Solar Inversiones, S.A. | | — | | (3) | | B |
Helioenergy Electricidad Uno, S.A. | | Seville (ES) | | | 43,600 | | | 50.00 | | Écija Solar Inversiones, S.A. | | — | | (3) | | B |
Íbice Participações e Consultoria em Energia S.A. | | R. de Janeiro (BR) | | | 554 | | | 50.00 | | Abengoa Concessões Brasil Holding S.A. | | (*) | | (1) | | — |
Inapreu, S.A. | | Barcelona (ES) | | | 2,318 | | | 50.00 | | Instalaciones Inabensa, S.A. | | — | | (5) | | B |
Iniciativas Hidroeléctricas, S.A. (IHSA) | | Seville (ES) | | | 1,227 | | | 50.00 | | Abeinsa Infraestructuras Medio Ambiente, S.A. | | — | | (5) | | B |
Kaxu Solar One (Pty) Ltd. | | Gauteng (ZA) | | | 9,073 | | | 51.00 | | Abengoa Solar South Africa (Pty) Ltd. | | (*) | | (3) | | B |
Khi Solar One (Pty) Ltd. | | Gauteng (ZA) | | | 7,877 | | | 51.00 | | Son Rivieren (Pty) Ltd. | | (*) | | (3) | | B |
Ledincor S.A. | | Montevideo (UY) | | | 553 | | | 49.00 | | Teyma Forestal, S.A. | | (*) | | (1) | | — |
Lidelir S.A. | | Montevideo (UY) | | | 928 | | | 49.00 | | Teyma Forestal, S.A. | | (*) | | (1) | | — |
Micronet Porous Fibers, S.L. | | Vizcaya (ES) | | | 2,209 | | | 50.00 | | Abengoa Water S.L.U. | | — | | (7) | | — |
Mojave Solar, LLC. | | Berkeley (US) | | | 158,317 | | | 100.00 | | Mojave Solar Holding, LLC | | — | | (3) | | B |
Myah Bahr Honaine, S.P.A. | | Argel (DZ) | | | 21,600 | | | 51.00 | | Geida Tlemcen, S.L. | | — | | (4) | | D |
Parque Eólico Cristalândia Ltda. | | Salvador—Bahía (BR) | | | 1,108 | | | 20.00 | | Instalaciones Inabensa, S.A./ Abengoa Concessões Brasil Holding, S.A. | | (*) | | (5) | | — |
Proecsa, Procesos Ecológicos, S.A. | | Seville (ES) | | | 657 | | | 50.00 | | Abeinsa Infraestructuras Medio Ambiente, S.A. | | — | | (1) | | — |
Recytech, S.A. | | Fouquiéres (FR) | | | — | | | 50.00 | | Befesa Steel Services GmbH | | — | | (7) | | — |
Red Eléctrica del Sur, S.A. (Redesur) | | Lima (PE) | | | 3,738 | | | 23.75 | | Abengoa Perú, S.A. | | — | | (2) | | — |
Resid. Urbanos de Ceuta, S.L. (Resurce) | | Seville (ES) | | | 2,030 | | | 50.00 | | Abengoa, S.A. | | — | | (1) | | — |
Santos Energia Participaçoes S.A | | Sao Paulo (BR) | | | 1,298 | | | 50.00 | | Instalaciones Inabensa, S.A./Abengoa Construçao Brasil, Ltda | | (*) | | (5) | | — |
F-238
Table of Contents
Appendices
Appendix XVIII
Associated companies and Joint Ventures included in the 2012 consolidation perimeter using
the participation method (Continuation)
| | | | | | | | | | | | | | | | |
| |
| | Shareholding | |
| |
| |
| |
|
|---|
Company Name | | Registered
Address | | Amount in
thousands
of € | | % of
Nominal
Capital | | Parent Company | | (*) | | Activity | | Auditor |
|---|
Servicios Culturales Mexiquenses, S.A. de C.V. | | Mexico City (MX) | | | 1 | | | 50.00 | | Abengoa México, S.A. de C.V./Instalaciones Inabensa, S.A. | | — | | (1) | | B |
Shams Power Company PJSC | | Abu Dabi (AE) | | | 165 | | | 40.00 | | Total Abengoa Solar Emirates Investment Company B.V. | | — | | (3) | | — |
SRC Nanomaterials, S.A | | Asturias (ES) | | | 500 | | | 50.00 | | Rioglass Solar, S.A | | — | | (3) | | — |
Total Abengoa Solar Emirates Investment Company, B.V. | | Amsterdam (NL) | | | 19,116 | | | 50.00 | | Abengoa Solar Ventures, S.A. | | — | | (8) | | D |
Total Abengoa Solar Emirates O&M Company, B.V. | | Amsterdam (NL) | | | 165 | | | 50.00 | | Abengoa Solar Ventures, S.A. | | — | | (3) | | D |
TSMC Ing. Y Contrucción | | Santiago (CL) | | | 14 | | | 33.30 | | Abengoa Chile, S.A. | | — | | (1) | | — |
Shareholding capital cost is calculated using the current closing year exchange rate
- (*)
- Companies incorporated or acquired and consolidated for the first time in the year.
- (1)
- Operating segment activities area: Engineering and Construction.
- (2)
- Operating segment activities area: Transmission.
- (3)
- Operating segment activities area: Solar.
- (4)
- Operating segment activities area: Water.
- (5)
- Operating segment activities areae: Cogeneration and others.
- (6)
- Operating segment activities area: Bioenergy.
- (7)
- Operating segment activities area: Recycling.
- (8)
- Operating segment activities area: Others.
- A
- Audited by PricewaterhouseCoopers Auditores.
- B
- Audited by Deloitte (for legal purposes).
- C
- Audited by Auditoría y Consulta (for legal purposes).
- D
- Audited by others auditors (for legal purposes).
F-239
Table of Contents
Appendices
Appendix XIX
Temporary Joint Ventures included in the 2012 Consolidation Perimeter
using the proportional integration method
| | | | | | | | | | | | | | | | |
| |
| | Shareholding | |
| |
| |
| |
|
|---|
Company Name | | Registered
Address | | Amount in
thousands
of € | | % of
Nominal
Capital | | Partner Company in Entity | | (*) | | Activity
(see Page 3) | | Auditor |
|---|
Abastecimiento Ribera | | Valencia (ES) | | | 3 | | | 30.00 | | Abeinsa Infraestructuras Medio Ambiente, S.A. | | — | | (1) | | — |
Abener Nuevo Pemex Tabasco I | | Seville (ES) | | | — | | | 100.00 | | Abener Energía, S.A./Instalaciones Inabensa, S.A. | | — | | (1) | | — |
Abener-Inabensa Alemania | | Seville (ES) | | | — | | | 100.00 | | Abener Energía, S.A./Instalaciones Inabensa, S.A. | | — | | (1) | | — |
Abener-Inabensa Francia | | Seville (ES) | | | — | | | 100.00 | | Abener Energía, S.A./Instalaciones Inabensa, S.A. | | — | | (1) | | — |
Abto. Boaco | | Nicaragua (NI) | | | 2 | | | 73.83 | | Abeinsa Infraestructuras Medio Ambiente, S.A. | | — | | (1) | | — |
Acceso Avda. Pais Valencia | | Alicante (ES) | | | 3 | | | 50.00 | | Instalaciones Inabensa, S.A. | | — | | (1) | | — |
Adis Seg.Valdestrilla | | Madrid (ES) | | | — | | | 7.00 | | Instalaciones Inabensa, S.A. | | — | | (1) | | — |
Agencia Andaluza de Energía | | Seville (ES) | | | 6 | | | 35.00 | | Instalaciones Inabensa, S.A. | | — | | (1) | | — |
Albalac | | Madrid (ES) | | | 2 | | | 33.34 | | Instalaciones Inabensa, S.A. | | — | | (1) | | — |
Almanjayar | | Madrid (ES) | | | 2 | | | 25.00 | | Instalaciones Inabensa, S.A. | | — | | (1) | | — |
Aparcamiento L'Ordana | | Alicante (ES) | | | 5 | | | 90.00 | | Instalaciones Inabensa, S.A. | | — | | (1) | | — |
Apca Lote1 Inab-Aben | | Seville (ES) | | | 6 | | | 100.00 | | Abengoa, S.A./Instalaciones Inabensa, S.A. | | — | | (1) | | — |
Apca Lote2 Inab-Abeng | | Seville (ES) | | | 6 | | | 100.00 | | Abengoa, S.A./Instalaciones Inabensa, S.A. | | — | | (1) | | — |
Argelia | | Madrid (ES) | | | 3 | | | 50.00 | | Instalaciones Inabensa, S.A. | | — | | (1) | | — |
Armilla | | Seville (ES) | | | 3 | | | 50.00 | | Instalaciones Inabensa, S.A. | | — | | (1) | | — |
Asimel | | Madrid (ES) | | | 2 | | | 25.00 | | Instalaciones Inabensa, S.A. | | — | | (1) | | — |
Avinyó | | Cataluña (ES) | | | — | | | 40.00 | | Construcciones y Depuraciones, S.A. | | — | | (1) | | — |
Badaia | | Vitoria (ES) | | | 3 | | | 30.00 | | Instalaciones Inabensa, S.A. | | (*) | | (1) | | — |
Balsa Rosario | | Seville (ES) | | | 3 | | | 52.00 | | Abeinsa Infraestructuras Medio Ambiente, S.A. | | — | | (1) | | — |
Barras Parada | | Madrid (ES) | | | 3 | | | 50.00 | | Instalaciones Inabensa, S.A. | | — | | (1) | | — |
Báscara | | Cataluña (ES) | | | — | | | 40.00 | | Construcciones y Depuraciones, S.A. | | — | | (1) | | — |
CAC Arequipa | | Perú (PE) | | | 3 | | | 76.00 | | Abeinsa Infraestructuras Medio Ambiente, S.A./Abengoa Perú, S.A. | | — | | (1) | | — |
Camas-Salteras | | Madrid (ES) | | | 1 | | | 35.00 | | Instalaciones Inabensa, S.A. | | — | | (1) | | — |
Campello | | Alicante (ES) | | | 3 | | | 50.00 | | Abeinsa Infraestructuras Medio Ambiente, S.A. | | — | | (1) | | — |
CARE Córdoba | | Seville (ES) | | | 12 | | | 25.00 | | Instalaciones Inabensa, S.A. | | — | | (1) | | — |
Centro I | | Seville (ES) | | | — | | | 25.00 | | Instalaciones Inabensa, S.A. | | — | | (1) | | — |
Centro Morelos Gen.Electrica 622 MW | | Seville (ES) | | | — | | | 100.00 | | Scios. Aux. Admon., S.A. De CV /Abener Energía, S.A./instalaciones Inabensa, S.A. | | — | | (1) | | — |
Chennai EPC | | India (IN) | | | 6 | | | 100.00 | | Abeinsa Infraestructuras Medio Ambiente, S.A./Construcciones y Depuraciones, S.A. | | — | | (1) | | — |
Chilca- Montalbo Ute | | Seville (ES) | | | 2 | | | 100.00 | | Abencor Suministros S.A./Instalaciones Inabensa, S.A. | | — | | (2) | | — |
China Exhibition Center | | Seville (ES) | | | 6 | | | 34.50 | | Instalaciones Inabensa, S.A. | | — | | (1) | | — |
Ciudad de la Justicia | | Madrid (ES) | | | 1 | | | 20.00 | | Instalaciones Inabensa, S.A. | | — | | (1) | | — |
Climatización Hosp Sol | | Málaga (ES) | | | 3 | | | 50.00 | | Instalaciones Inabensa, S.A. | | — | | (1) | | — |
Colector Puerto Huelva | | Huelva (ES) | | | 6 | | | 100.00 | | Abeinsa Infraestructuras Medio Ambiente, S.A./Construcciones y Depuraciones, S.A. | | — | | (1) | | — |
Colectores Motril | | Granada (ES) | | | 3 | | | 50.00 | | Abeinsa Infraestructuras Medio Ambiente, S.A. | | — | | (1) | | — |
Consistorio | | Madrid (ES) | | | 6 | | | 30.00 | | Instalaciones Inabensa, S.A. | | — | | (1) | | — |
Consorcio La Gloria | | Lima (PE) | | | — | | | 49.00 | | Abengoa Perú, S. A. | | — | | (1) | | — |
Consorcio Norte Pachacutec | | Lima (PE) | | | — | | | 49.00 | | Abengoa Perú, S. A. | | — | | (1) | | — |
Cortes de Pallas | | Valencia (ES) | | | 6 | | | 100.00 | | Abeinsa Infraestructuras Medio Ambiente, S.A./Abener Energía, S. A. | | — | | (1) | | — |
CPD Solares | | Madrid (ES) | | | 10 | | | 35.00 | | Instalaciones Inabensa, S.A. | | — | | (1) | | — |
Cunene | | Angola (AO) | | | 25 | | | 50.00 | | Abeinsa Infraestructuras Medio Ambiente, S.A. | | — | | (1) | | — |
Dead Sea — Israel | | Seville (ES) | | | — | | | 100.00 | | Abener Energía, S.A./Abener Ghenova Ingeniería S.L. | | (*) | | (1) | | — |
Edar Montemayor | | Cordoba (ES) | | | — | | | 60.00 | | Construcciones y Depuraciones, S.A. | | — | | (1) | | — |
Edar Motril | | Granada (ES) | | | 3 | | | 50.00 | | Abeinsa Infraestructuras Medio Ambiente, S.A. | | — | | (1) | | — |
Edificio ETEA | | Zaragoza (ES) | | | — | | | 40.00 | | Instalaciones Inabensa, S.A. | | — | | (1) | | — |
Edificio ITA | | Zaragoza (ES) | | | 3 | | | 30.00 | | Instalaciones Inabensa, S.A. | | — | | (1) | | — |
Edificio PICA | | Seville (ES) | | | 5 | | | 50.00 | | Instalaciones Inabensa, S.A. | | — | | (1) | | — |
El Cerillo-Los Villares | | Cordoba (ES) | | | 5 | | | 80.00 | | Abeinsa Infraestructuras Medio Ambiente, S.A. | | — | | (1) | | — |
El Conquero | | Huelva (ES) | | | 3 | | | 50.00 | | Abeinsa Infraestructuras Medio Ambiente, S.A. | | — | | (1) | | — |
Electricación L-3 | | Barcelona (ES) | | | 1 | | | 50.00 | | Instalaciones Inabensa, S.A. | | — | | (1) | | — |
Electrificación Burgos | | Madrid (ES) | | | 2 | | | 33.34 | | Instalaciones Inabensa, S.A. | | — | | (1) | | — |
Electrificación Granollers | | Madrid (ES) | | | 6 | | | 20.00 | | Instalaciones Inabensa, S.A. | | — | | (1) | | — |
Emergencias Nat | | Barcelona (ES) | | | 9 | | | 33.33 | | Instalaciones Inabensa, S.A. | | — | | (1) | | — |
F-240
Table of Contents
Appendices
Appendix XIX
Temporary Joint Ventures included in the 2012 Consolidation Perimeter
using the proportional integration method (Continuation)
| | | | | | | | | | | | | | | | |
| |
| | Shareholding | |
| |
| |
| |
|
|---|
Company Name | | Registered
Address | | Amount in
thousands
of € | | % of
Nominal
Capital | | Partner Company in Entity | | (*) | | Activity
(see Page 3) | | Auditor |
|---|
Emvisesa Palacio Exposiciones | | Seville (ES) | | | 2 | | | 25.00 | | Instalaciones Inabensa, S.A. | | — | | (1) | | — |
Energía Línea 9 | | Barcelona (ES) | | | 1 | | | 20.00 | | Instalaciones Inabensa, S.A. | | — | | (1) | | — |
Energía Noroeste | | Seville (ES) | | | — | | | 50.00 | | Instalaciones Inabensa, S.A. | | — | | (1) | | — |
Energía Palmas Altas | | Seville (ES) | | | — | | | 50.00 | | Instalaciones Inabensa, S.A. | | — | | (1) | | — |
Equipamiento Solar Caballería | | Madrid (ES) | | | 1 | | | 20.00 | | Instalaciones Inabensa, S.A. | | — | | (1) | | — |
Erabil | | Vizcaya (ES) | | | 6 | | | 20.00 | | Instalaciones Inabensa, S.A. | | — | | (1) | | — |
Explot. Idam Almería | | Almería (ES) | | | 5 | | | 100.00 | | Abeinsa Infraestructuras Medio Ambiente, S.A./Abengoa Water, S.L.U. | | — | | (4) | | — |
Explot.Idam Cartagena | | Murcia (ES) | | | 1 | | | 37.50 | | Construcciones y Depuraciones, S.A./Abengoa Water, S.L.U. | | (*) | | (4) | | — |
Facultades | | Madrid (ES) | | | 1 | | | 15.00 | | Instalaciones Inabensa, S.A. | | — | | (1) | | — |
Ferial Badajoz | | Madrid (ES) | | | — | | | 25.00 | | Instalaciones Inabensa, S.A. | | — | | (1) | | — |
Fotovoltaica Expo | | Huelva (ES) | | | 7 | | | 70.00 | | Instalaciones Inabensa, S.A. | | — | | (1) | | — |
Gallur Castejon | | Madrid (ES) | | | 2 | | | 33.33 | | Instalaciones Inabensa, S.A. | | — | | (1) | | — |
Guardería La Nucia | | Elche (ES) | | | 5 | | | 45.00 | | Instalaciones Inabensa, S.A. | | — | | (1) | | — |
H. Campus de la Salud | | Seville (ES) | | | 2 | | | 20.00 | | Instalaciones Inabensa, S.A. | | — | | (1) | | — |
Hassi R'Mel O&M | | Seville (ES) | | | — | | | 100.00 | | Abener Energía, S.A./Abengoa Solar España S.A. | | — | | (4) | | — |
Helios Campos de San Juan I Ab-Teyma | | Seville (ES) | | | — | | | 100.00 | | Abener Energía, S.A./Teyma Gestión de Contratos de Construcción e Ingeniería | | — | | (1) | | — |
Helios Campos de San Juan II Ab-Teym | | Seville (ES) | | | — | | | 100.00 | | Abener Energía, S.A./Teyma Gestión de Contratos de Construcción e Ingeniería | | — | | (1) | | — |
Honaine | | Argelia (DZ) | | | 2 | | | 50.00 | | Abeinsa Infraestructuras Medio Ambiente, S.A. | | — | | (1) | | — |
Hospital Costa del Sol | | Málaga (ES) | | | 10 | | | 50.00 | | Instalaciones Inabensa, S.A. | | — | | (1) | | — |
Inabensa Eucomsa Carhuamayo Carhuaq | | Seville (ES) | | | 8 | | | 100.00 | | Eucomsa, Europea Const. Metálicas, S.A./Instalaciones Inabensa, S.A. | | — | | (1) | | — |
Inabensa-Intel | | Madrid (ES) | | | 5 | | | 50.00 | | Instalaciones Inabensa, S.A. | | — | | (1) | | — |
Inabensa-Jayton Catral | | Elche (ES) | | | 10 | | | 50.00 | | Instalaciones Inabensa, S.A. | | — | | (1) | | — |
Inabensa-Jayton la Nucia | | Alicante (ES) | | | 6 | | | 50.00 | | Instalaciones Inabensa, S.A. | | — | | (1) | | — |
Inabensa-Jayton Villajoyosa | | Elche (ES) | | | 3 | | | 50.00 | | Instalaciones Inabensa, S.A. | | — | | (1) | | — |
Inabervion | | Vizcaya (ES) | | | 10 | | | 50.00 | | Instalaciones Inabensa, S.A. | | — | | (1) | | — |
Inacom | | Madrid (ES) | | | 6 | | | 25.00 | | Instalaciones Inabensa, S.A. | | — | | (1) | | — |
Incubadora | | Madrid (ES) | | | 2 | | | 30.00 | | Instalaciones Inabensa, S.A. | | — | | (1) | | — |
Inelin | | Madrid (ES) | | | 6 | | | 48.50 | | Instalaciones Inabensa, S.A. | | — | | (1) | | — |
Inst. Hospital Costa del Sol | | Málaga (ES) | | | 3 | | | 50.00 | | Instalaciones Inabensa, S.A. | | — | | (1) | | — |
Instalaciones Hospital VQ | | Seville (ES) | | | 6 | | | 60.00 | | Instalaciones Inabensa, S.A. | | — | | (1) | | — |
Instalaciones Plataformas Sur | | Barcelona (ES) | | | 5 | | | 50.00 | | Instalaciones Inabensa, S.A. | | — | | (1) | | — |
Isla de la Cartuja | | Seville (ES) | | | — | | | 30.00 | | Construcciones y Depuraciones, S.A. | | — | | (1) | | — |
Itoiz II | | Navarra (ES) | | | 4 | | | 35.00 | | Abeinsa Infraestructuras Medio Ambiente, S.A. | | — | | (1) | | — |
Júcar-Vinalopó | | Valencia (ES) | | | 2 | | | 33.34 | | Abeinsa Infraestructuras Medio Ambiente, S.A. | | — | | (1) | | — |
Juzgados | | Barcelona (ES) | | | 6 | | | 50.00 | | Instalaciones Inabensa, S.A. | | — | | (1) | | — |
L`Espluga | | Cataluña (ES) | | | — | | | 40.00 | | Construcciones y Depuraciones, S.A. | | — | | (1) | | — |
La Faisanera | | Burgos (ES) | | | 4 | | | 30.00 | | Instalaciones Inabensa, S.A. | | — | | (1) | | — |
Lav Buixalleu Salt | | Barcelona (ES) | | | 3 | | | 50.00 | | Instalaciones Inabensa, S.A. | | — | | (1) | | — |
Libia-Líneas | | Seville (ES) | | | — | | | 50.00 | | Instalaciones Inabensa, S.A. | | — | | (1) | | — |
Lubet Cádiz | | Cadiz (ES) | | | — | | | 75.00 | | Construcciones y Depuraciones, S.A. | | — | | (1) | | — |
Mantenimiento L-9 | | Barcelona (ES) | | | 1 | | | 20.00 | | Instalaciones Inabensa, S.A. | | — | | (1) | | — |
Mantenimiento Valdeinfierno | | Murcia (ES) | | | 2 | | | 60.00 | | Abeinsa Infraestructuras Medio Ambiente, S.A./Construcciones y Depuraciones, S.A. | | — | | (1) | | — |
Mataporquera | | Madrid (ES) | | | 3 | | | 50.00 | | Instalaciones Inabensa, S.A. | | — | | (1) | | — |
Meisa-Inabensa | | Huelva (ES) | | | 5 | | | 50.00 | | Instalaciones Inabensa, S.A. | | — | | (1) | | — |
Metro Ligero de Granada | | Madrid (ES) | | | 6 | | | 40.00 | | Instalaciones Inabensa, S.A. | | — | | (1) | | — |
Minicentrales, Pedrezuela Valmayor | | Madrid (ES) | | | 6 | | | 100.00 | | Abeinsa Infraestructuras Medio Ambiente, S.A./Construcciones y Depuraciones, S.A. | | — | | (1) | | — |
Mobiliario La Nucia | | Elche (ES) | | | 5 | | | 45.00 | | Instalaciones Inabensa, S.A. | | — | | (1) | | — |
Moraira-Teulada | | Alicante (ES) | | | 3 | | | 42.50 | | Abeinsa Infraestructuras Medio Ambiente, S.A. | | — | | (1) | | — |
Nat Electricidad | | Madrid (ES) | | | 4 | | | 33.33 | | Instalaciones Inabensa, S.A. | | — | | (1) | | — |
O&M Desal. Chennai | | India (IN) | | | 6 | | | 100.00 | | Construcciones y Depuraciones, S.A./Abengoa Water, S.L.U. | | — | | (4) | | — |
O&M Desal. Honaine | | Argelia (DZ) | | | 2 | | | 50.00 | | Abengoa Water, S.L.U. | | — | | (4) | | — |
O&M Desal. Skikda | | Argelia (DZ) | | | 2 | | | 67.00 | | Construcciones y Depuraciones, S.A./Abengoa Water, S.L.U. | | — | | (4) | | — |
F-241
Table of Contents
Appendices
Appendix XIX
Temporary Joint Ventures included in the 2012 Consolidation Perimeter
using the proportional integration method (Continuation)
| | | | | | | | | | | | | | | | |
| |
| | Shareholding | |
| |
| |
| |
|
|---|
Company Name | | Registered
Address | | Amount in
thousands
of € | | % of
Nominal
Capital | | Partner Company in Entity | | (*) | | Activity
(see Page 3) | | Auditor |
|---|
Ojén Mijas | | Málaga (ES) | | | — | | | 70.00 | | Construcciones y Depuraciones, S.A. | | — | | (1) | | — |
Ontoria | | Vizcaya (ES) | | | 3 | | | 50.00 | | Instalaciones Inabensa, S.A. | | — | | (1) | | — |
Pabellón Cubierto La Nucia | | Alicante (ES) | | | 9 | | | 45.00 | | Instalaciones Inabensa, S.A. | | — | | (1) | | — |
Parque Aeronaútico | | Seville (ES) | | | 2 | | | 40.00 | | Instalaciones Inabensa, S.A. | | — | | (1) | | — |
Parque Soland | | Seville (ES) | | | 3 | | | 50.00 | | Instalaciones Inabensa, S.A. | | — | | (1) | | — |
Patrimonio | | Seville (ES) | | | 2 | | | 35.00 | | Instalaciones Inabensa, S.A. | | — | | (1) | | — |
Paysandu (Alur) Abener Teyma | | Seville (ES) | | | — | | | 100.00 | | Abener Energía, S.A./Teyma Gestión de Contratos de Construcción e Ingeniería | | (*) | | (1) | | — |
Peaje Irun (Telvent Inabensa) | | Bilbao (ES) | | | — | | | 20.00 | | Instalaciones Inabensa, S.A. | | — | | (1) | | — |
Pistas Deportivas la Nucia | | Seville (ES) | | | 1 | | | 45.00 | | Instalaciones Inabensa, S.A. | | — | | (1) | | — |
Quingdao | | China (CN) | | | 6 | | | 100.00 | | Abeinsa Infraestructuras Medio Ambiente, S.A./Construcciones y Depuraciones, S.A. | | — | | (1) | | — |
Ranilla | | Seville (ES) | | | 2 | | | 15.00 | | Construcciones y Depuraciones, S.A. | | — | | (1) | | — |
Retortillo | | Seville (ES) | | | 6 | | | 100.00 | | Abeinsa Infraestructuras Medio Ambiente, S.A./Construcciones y Depuraciones, S.A. | | — | | (1) | | — |
Riegos Villareal | | Castellón (ES) | | | 3 | | | 50.00 | | Abeinsa Infraestructuras Medio Ambiente, S.A. | | — | | (1) | | — |
Rotonda CV-70 | | Alicante (ES) | | | 5 | | | 45.00 | | Instalaciones Inabensa, S.A. | | — | | (1) | | — |
San Juan Sur | | Nicaragua (NI) | | | 2 | | | 73.31 | | Abeinsa Infraestructuras Medio Ambiente, S.A. | | — | | (1) | | — |
Sant Adriá S/E | | Madrid (ES) | | | 2 | | | 50.00 | | Instalaciones Inabensa, S.A. | | — | | (1) | | — |
Santa Amalia | | Badajoz (ES) | | | 5 | | | 80.00 | | Construcciones y Depuraciones, S.A. | | — | | (1) | | — |
Sector Vilablareix | | Barcelona (ES) | | | 3 | | | 33.34 | | Instalaciones Inabensa, S.A. | | — | | (1) | | — |
Sede Universitaria | | Elche (ES) | | | 5 | | | 45.00 | | Instalaciones Inabensa, S.A. | | — | | (1) | | — |
Seguridad Vial y Tráfico Rodado | | Alicante (ES) | | | 9 | | | 90.00 | | Instalaciones Inabensa, S.A. | | — | | (1) | | — |
Semi Inabensa | | Madrid (ES) | | | 3 | | | 50.00 | | Instalaciones Inabensa, S.A. | | — | | (1) | | — |
Sigmacat | | Madrid (ES) | | | 2 | | | 33.00 | | Instalaciones Inabensa, S.A. | | — | | (1) | | — |
Silfrasub.Ave Figueras | | Madrid (ES) | | | 2 | | | 40.00 | | Instalaciones Inabensa, S.A. | | — | | (1) | | — |
Silvacat | | Madrid (ES) | | | 11 | | | 35.30 | | Instalaciones Inabensa, S.A. | | — | | (1) | | — |
Sisecat | | Madrid (ES) | | | 1 | | | 20.95 | | Instalaciones Inabensa, S.A. | | — | | (1) | | — |
Skikda | | Argelia (DZ) | | | 2 | | | 67.00 | | Abeinsa Infraestructuras Medio Ambiente, S.A./Construcciones y Depuraciones, S.A. | | — | | (1) | | — |
Solaben Logrosan I Abener — Teyma | | Seville (ES) | | | — | | | 100.00 | | Abener Energía, S.A./Teyma Gestión de Contratos de Construcción e Ingeniería | | — | | (1) | | — |
Solaben Logrosan II Abener — Teyma | | Seville (ES) | | | — | | | 100.00 | | Abener Energía, S.A./Teyma Gestión de Contratos de Construcción e Ingeniería | | — | | (1) | | — |
Solaben Logrosan III Abener — Teyma | | Seville (ES) | | | — | | | 100.00 | | Abener Energía, S.A./Teyma Gestión de Contratos de Construcción e Ingeniería | | — | | (1) | | — |
Solaben Logrosan Infraestr. Comunes | | Seville (ES) | | | — | | | 100.00 | | Abener Energía, S.A./Teyma Gestión de Contratos de Construcción e Ingeniería | | — | | (1) | | — |
Solaben Logrosan VI Abener — Teyma | | Seville (ES) | | | — | | | 100.00 | | Abener Energía, S.A./Teyma Gestión de Contratos de Construcción e Ingeniería | | — | | (1) | | — |
Solacor El Carpio I Abener-Teyma | | Seville (ES) | | | — | | | 100.00 | | Abener Energía, S.A./Teyma Gestión de Contratos de Construcción e Ingeniería | | — | | (1) | | — |
Solacor El Carpio II Abener-Teyma | | Seville (ES) | | | — | | | 100.00 | | Abener Energía, S.A./Teyma Gestión de Contratos de Construcción e Ingeniería | | — | | (1) | | — |
Soterramnet 132 Kv | | Barcelona (ES) | | | 2 | | | 33.34 | | Instalaciones Inabensa, S.A. | | — | | (1) | | — |
Subestación Blanes | | Madrid (ES) | | | 2 | | | 33.33 | | Instalaciones Inabensa, S.A. | | — | | (1) | | — |
Subestacion Libia Lineas | | Madrid (ES) | | | — | | | 50.00 | | Instalaciones Inabensa, S.A. | | — | | (1) | | — |
Suburbano Mexico | | Seville (ES) | | | 12 | | | 100.00 | | Instalaciones Inabensa, S.A./Abeinsa, Ing y Const. Ind., S. A. | | — | | (1) | | — |
Tablada | | Seville (ES) | | | 6 | | | 50.00 | | Abengoa Water, S.L.U. | | — | | (4) | | — |
TEMA Befesa Ferrovial (Saih Duero) | | Valladolid (ES) | | | 2 | | | 30.00 | | Abeinsa Infraestructuras Medio Ambiente, S.A. | | — | | (1) | | — |
Tenes | | Argelia (DZ) | | | 6 | | | 100.00 | | Abeinsa Infraestructuras Medio Ambiente, S.A./Construcciones y Depuraciones, S.A. | | — | | (1) | | — |
Terciario Alcoy | | Alicante (ES) | | | 3 | | | 50.00 | | Abeinsa Infraestructuras Medio Ambiente, S.A. | | — | | (1) | | — |
Torre | | Bilbao (ES) | | | 6 | | | 20.00 | | Instalaciones Inabensa, S.A. | | — | | (1) | | — |
Torre Isla Cartuja | | Seville (ES) | | | 12 | | | 20.00 | | Instalaciones Inabensa, S.A. | | — | | (1) | | — |
Tranvía de Jaén | | Seville (ES) | | | 1 | | | 15.00 | | Instalaciones Inabensa, S.A. | | — | | (1) | | — |
Usansolo | | Vizcaya (ES) | | | — | | | 50.00 | | Instalaciones Inabensa, S.A. | | — | | (1) | | — |
UTE — ABENSAIH GUADALETE BARBATE | | Cadiz (ES) | | | 3 | | | 51.00 | | Abeinsa Infraestructuras Medio Ambiente, S.A. | | — | | (1) | | — |
UTE — ABENSAIH GUADALQUIVIR | | Seville (ES) | | | 3 | | | 51.00 | | Abeinsa Infraestructuras Medio Ambiente, S.A. | | — | | (1) | | — |
UTE Abastecimiento Villanueva | | Cordoba (ES) | | | 3 | | | 50.00 | | Abeinsa Infraestructuras Medio Ambiente, S.A. | | — | | (1) | | — |
UTE Abastecimientos Cáceres | | Extremadura (ES) | | | 3 | | | 50.00 | | Abeinsa Infraestructuras Medio Ambiente, S.A. | | — | | (1) | | — |
F-242
Table of Contents
Appendices
Appendix XIX
Temporary Joint Ventures included in the 2012 Consolidation Perimeter
using the proportional integration method (Continuation)
| | | | | | | | | | | | | | | | |
| |
| | Shareholding | |
| |
| |
| |
|
|---|
Company Name | | Registered
Address | | Amount in
thousands
of € | | % of
Nominal
Capital | | Partner Company in Entity | | (*) | | Activity
(see Page 3) | | Auditor |
|---|
UTE Abeima Teyma Barka | | Seville (ES) | | | — | | | 100.00 | | Abeinsa Infraestructuras Medio Ambiente, S.A./Teyma Gestión de Contratos de Construcción e Ingeniería | | (*) | | (4) | | — |
UTE Abeima Teyma Nungua | | Seville (ES) | | | 7 | | | 100.00 | | Abeinsa Infraestructuras Medio Ambiente, S.A./Teyma Gestión de Contratos de Construcción e Ingeniería | | (*) | | (1) | | — |
UTE Abener Hassi R'Mel | | Seville (ES) | | | — | | | 100.00 | | Abener Energía, S.A./Abengoa Solar España S.A. | | — | | (1) | | — |
UTE Abener Teyma Biomasa Salamanca | | Seville (ES) | | | — | | | 100.00 | | Abener Energía, S.A./Teyma Gestión de Contratos de Construcción e Ingeniería | | — | | (1) | | — |
Ute Abener Teyma biomasa SAlamanca II | | Seville (ES) | | | — | | | 50.00 | | Abener Energía, S.A. | | (*) | | (1) | | — |
UTE Abener Teyma CRS | | Seville (ES) | | | — | | | 100.00 | | Abener Energía, S.A./Teyma Gestión de Contratos de Construcción e Ingeniería | | — | | (1) | | — |
UTE Abener Teyma CRS II | | Seville (ES) | | | — | | | 100.00 | | Abener Energía, S.A./Teyma Gestión de Contratos de Construcción e Ingeniería | | — | | (1) | | — |
UTE Abener Teyma Solar Tabernas | | Seville (ES) | | | — | | | 80.00 | | Abener Energía, S.A./Abengoa Solar S.A./Teyma Gest. de Ctos. de Constr. e Ingeniería | | (*) | | (1) | | — |
UTE Abener-Befesa Agua Sahechores | | León (ES) | | | 6 | | | 80.00 | | Abeinsa Inf. Medio Ambiente, S.A./Abener Energía, S.A./Abengoa Water, S.L.U. | | — | | (1) | | — |
UTE Abener-Inabensa P.Bajos | | Seville (ES) | | | — | | | 100.00 | | Abener Energía, S.A./Instalaciones Inabensa, S.A. | | — | | (1) | | — |
UTE ABENSAIH Construcción | | Seville (ES) | | | 3 | | | 50.00 | | Abeinsa Infraestructuras Medio Ambiente, S.A. | | — | | (1) | | — |
UTE ABENSAIH Mantenimto. | | Seville (ES) | | | 3 | | | 50.00 | | Abeinsa Infraestructuras Medio Ambiente, S.A. | | — | | (1) | | — |
UTE Abtmo. Ames-Brión | | La Coruña (ES) | | | 3 | | | 50.00 | | Abeinsa Infraestructuras Medio Ambiente, S.A. | | — | | (1) | | — |
UTE Agua Prieta (EP) | | México (MX) | | | — | | | 100.00 | | Teyma Gestión de Contratos de Construcción e Ingeniería, S.A. | | (*) | | (1) | | — |
UTE Aguas Salobres Sant Feliú | | Cataluña (ES) | | | 4 | | | 60.00 | | Abeinsa Infraestructuras Medio Ambiente, S.A. | | — | | (1) | | — |
UTE Atabal | | Málaga (ES) | | | 3 | | | 53.00 | | Abeinsa Infraestructuras Medio Ambiente, S.A. | | — | | (1) | | — |
UTE Baix Lobregat | | Cataluña (ES) | | | 6 | | | 50.00 | | Abeinsa Infraestructuras Medio Ambiente, S.A. | | — | | (1) | | — |
Ute Baja California Sur IV | | Seville (ES) | | | — | | | 100.00 | | Saxsa, S.A. De CV /Abener Energía, S.A./Inst. Inabensa, S.A./Abeinsa, Ing y Const. Ind. | | — | | (1) | | — |
UTE Canal Alguerri Balaguer | | Lleida (ES) | | | 2 | | | 33.34 | | Abeinsa Infraestructuras Medio Ambiente, S.A. | | — | | (1) | | — |
UTE Canal Estremera | | Madrid (ES) | | | 6 | | | 50.00 | | Abeinsa Infraestructuras Medio Ambiente, S.A. | | — | | (1) | | — |
UTE CCAC Arequipa | | Perú (PE) | | | 3 | | | 50.00 | | Abeinsa Infraestructuras Medio Ambiente, S.A. | | — | | (1) | | — |
Ute Centro Morelos | | Compostela (ES) | | | — | | | 70.00 | | Instalaciones Inabensa, S.A. | | — | | (1) | | — |
UTE Desaladora Bajo Almanzora | | Murcia (ES) | | | 2 | | | 40.00 | | Abeinsa Infraestructuras Medio Ambiente, S.A. | | — | | (1) | | — |
UTE Edar La Codosera | | Caceres (ES) | | | 3 | | | 50.00 | | Abeinsa Infraestructuras Medio Ambiente, S.A. | | — | | (1) | | — |
UTE Elantxobe | | Vizcaya (ES) | | | 3 | | | 50.00 | | Abeinsa Infraestructuras Medio Ambiente, S.A. | | — | | (1) | | — |
UTE Emirates I — Abener-Teyma | | Seville (ES) | | | — | | | 100.00 | | Abener Energía, S.A./Teyma Gestión de Contratos de Construcción e Ingeniería | | — | | (1) | | — |
Ute Esclusa Duero | | Valladolid (ES) | | | 2 | | | 30.00 | | Abeinsa Infraestructuras Medio Ambiente, S.A. | | — | | (1) | | — |
UTE Fontsanta | | Cataluña (ES) | | | 5 | | | 40.00 | | Abeinsa Infraestructuras Medio Ambiente, S.A. | | — | | (1) | | — |
UTE Fuente Alamo | | Murcia (ES) | | | 3 | | | 33.00 | | Construcciones y Depuraciones, S.A. | | — | | (1) | | — |
UTE Guadalajara | | Guadalajara (ES) | | | 3 | | | 55.00 | | Abengoa Water, S.L.U. | | — | | (4) | | — |
UTE Helioenergy Ecija I Ab-Teyma | | Seville (ES) | | | — | | | 100.00 | | Abener Energía, S.A./Teyma Gestión de Contratos de Construcción e Ingeniería | | — | | (1) | | — |
UTE Helioenergy Ecija II Ab-Teyma | | Seville (ES) | | | — | | | 100.00 | | Abener Energía, S.A./Teyma Gestión de Contratos de Construcción e Ingeniería | | — | | (1) | | — |
UTE Hidrosur | | Málaga (ES) | | | 2 | | | 33.33 | | Abeinsa Infraestructuras Medio Ambiente, S.A. | | — | | (1) | | — |
UTE Huesna | | Seville (ES) | | | 6 | | | 33.34 | | Abeinsa Infraestructuras Medio Ambiente, S.A. | | — | | (1) | | — |
UTE Idam Carboneras | | Almería (ES) | | | 3 | | | 43.00 | | Abeinsa Infraestructuras Medio Ambiente, S.A. | | — | | (1) | | — |
UTE Idam Deca | | Almería (ES) | | | 2 | | | 32.25 | | Abeinsa Infraestructuras Medio Ambiente, S.A. | | — | | (1) | | — |
UTE Inabensa Abencor Las Bambas | | Seville (ES) | | | 6 | | | 100.00 | | Abencor Suministros S.A./Instalaciones Inabensa, S.A. | | (*) | | (2) | | — |
UTE Inabensa Teyma Peralta | | Seville (ES) | | | 60 | | | 100.00 | | Instalaciones Inabensa, S.A./Teyma Gestión de Contratos de Construcción e Ingeniería | | (*) | | (1) | | — |
UTE Itoiz | | Navarra (ES) | | | 4 | | | 35.00 | | Abeinsa Infraestructuras Medio Ambiente, S.A. | | — | | (1) | | — |
UTE Kurkudi | | Vizcaya (ES) | | | 3 | | | 50.00 | | Abeinsa Infraestructuras Medio Ambiente, S.A. | | — | | (1) | | — |
UTE Mantenimiento de Presas | | Málaga (ES) | | | 2 | | | 35.00 | | Abeinsa Infraestructuras Medio Ambiente, S.A. | | — | | (1) | | — |
UTE Marismas Construcción | | Seville (ES) | | | 12 | | | 100.00 | | Abeinsa Infraestructuras Medio Ambiente, S.A./Construcciones y Depuraciones, S.A. | | — | | (1) | | — |
UTE Mundaka | | País Vasco (ES) | | | 3 | | | 50.00 | | Abeinsa Infraestructuras Medio Ambiente, S.A. | | — | | (1) | | — |
F-243
Table of Contents
Appendices
Appendix XIX
Temporary Joint Ventures included in the 2012 Consolidation Perimeter
using the proportional integration method (Continuation)
| | | | | | | | | | | | | | | | |
| |
| | Shareholding | |
| |
| |
| |
|
|---|
Company Name | | Registered
Address | | Amount in
thousands
of € | | % of
Nominal
Capital | | Partner Company in Entity | | (*) | | Activity
(see Page 3) | | Auditor |
|---|
UTE Paneles Informativos | | Valladolid (ES) | | | 2 | | | 30.00 | | Abeinsa Infraestructuras Medio Ambiente, S.A. | | — | | (1) | | — |
UTE Paulputs Abener-Teyma | | Seville (ES) | | | — | | | 100.00 | | Abener Energía, S.A./Teyma Gestión de Contratos de Construcción e Ingeniería | | (*) | | (1) | | — |
Ute Poniente Almeriense | | Gádor (ES) | | | 12 | | | 100.00 | | Befesa Gestión de Residuos Industriales, S.L. | | — | | (7) | | — |
UTE Regadío Guiamets | | Cataluña (ES) | | | 7 | | | 60.00 | | Abeinsa Infraestructuras Medio Ambiente, S.A. | | — | | (1) | | — |
UTE Reus | | Cataluña (ES) | | | 4 | | | 50.00 | | Abeinsa Infraestructuras Medio Ambiente, S.A. | | — | | (1) | | — |
UTE Riegos del Canal de Navarra | | Navarra (ES) | | | 4 | | | 20.00 | | Abeinsa Infraestructuras Medio Ambiente, S.A. | | — | | (1) | | — |
UTE Riegos Marismas | | Seville (ES) | | | 6 | | | 70.00 | | Abeinsa Infraestructuras Medio Ambiente, S.A. | | — | | (1) | | — |
UTE Rincón de la Victoria | | Málaga (ES) | | | 3 | | | 50.00 | | Abeinsa Infraestructuras Medio Ambiente, S.A. | | — | | (1) | | — |
UTE Sallent | | Cataluña (ES) | | | 3 | | | 50.00 | | Abeinsa Infraestructuras Medio Ambiente, S.A. | | — | | (1) | | — |
UTE San Blas de Fonz | | Cataluña (ES) | | | 5 | | | 90.00 | | Abeinsa Infraestructuras Medio Ambiente, S.A. | | — | | (1) | | — |
UTE Sanchonuño | | Valladolid (ES) | | | 3 | | | 50.00 | | Abeinsa Infraestructuras Medio Ambiente, S.A. | | — | | (1) | | — |
UTE Sant Celoni | | Cataluña (ES) | | | 6 | | | 50.00 | | Abeinsa Infraestructuras Medio Ambiente, S.A. | | — | | (1) | | — |
UTE Segria-Sud | | Cataluña (ES) | | | 4 | | | 60.00 | | Abeinsa Infraestructuras Medio Ambiente, S.A. | | — | | (1) | | — |
UTE Teatinos | | Málaga (ES) | | | 3 | | | 50.00 | | Abeinsa Infraestructuras Medio Ambiente, S.A. | | — | | (1) | | — |
UTE Upington Abener-Teyma | | Seville (ES) | | | — | | | 100.00 | | Abener Energía, S.A./Teyma Gestión de Contratos de Construcción e Ingeniería | | (*) | | (1) | | — |
UTE Utrera | | Seville (ES) | | | 3 | | | 80.00 | | Abeinsa Infraestructuras Medio Ambiente, S.A./Abengoa Water, S.L.U. | | — | | (4) | | — |
UTE Valdeinfierno | | Murcia (ES) | | | 2 | | | 60.00 | | Abeinsa Infraestructuras Medio Ambiente, S.A./Construcciones y Depuraciones, S.A. | | — | | (1) | | — |
UTE Valdelentisco | | Murcia (ES) | | | 5 | | | 80.00 | | Abeinsa Infraestructuras Medio Ambiente, S.A. | | — | | (1) | | — |
UTE Vall Baixa | | Cataluña (ES) | | | 6 | | | 50.00 | | Abeinsa Infraestructuras Medio Ambiente, S.A. | | — | | (1) | | — |
Ute Vilagracía | | Pontevedra (ES) | | | 3 | | | 50.00 | | Abeinsa Infraestructuras Medio Ambiente, S.A. | | — | | (1) | | — |
UTE Xerta Xenia | | Cataluña (ES) | | | 3 | | | 50.00 | | Abeinsa Infraestructuras Medio Ambiente, S.A. | | — | | (1) | | — |
UTE Zapotillo — Abeima Teyma | | Seville (ES) | | | 7 | | | 100.00 | | Abeinsa Infraestructuras Medio Ambiente, S.A./Teyma Gestión de Contratos de Construcción e Ingeniería | | (*) | | (1) | | — |
Winterra-Inabensa C.S. San Paio | | Compostela (ES) | | | 2 | | | 30.00 | | Instalaciones Inabensa, S.A. | | — | | (1) | | — |
Winterra-Inabensa Monterroso | | Compostela (ES) | | | 6 | | | 30.00 | | Instalaciones Inabensa, S.A. | | — | | (1) | | — |
Winterra-Inabensa Muelle Trasatl | | Compostela (ES) | | | — | | | 20.00 | | Instalaciones Inabensa, S.A. | | — | | (1) | | — |
Winterra-Inabensa Sarriá | | Compostela (ES) | | | 2 | | | 30.00 | | Instalaciones Inabensa, S.A. | | — | | (1) | | — |
Shareholding capital cost is calculated using the current closing year exchange rate
- (*)
- Companies incorporated or acquired and consolidated for the first time in the year.
- (1)
- Operating segment activities area: Engineering and Construction.
- (2)
- Operating segment activities area: Transmission.
- (3)
- Operating segment activities area: Solar.
- (4)
- Operating segment activities area: Water.
- (5)
- Operating segment activities areae: Cogeneration and others.
- (6)
- Operating segment activities area: Bioenergy.
- (7)
- Operating segment activities area: Recycling.
- (8)
- Operating segment activities area: Others.
- A
- Audited by PricewaterhouseCoopers Auditores.
- B
- Audited by Deloitte (for legal purposes).
- C
- Audited by Auditoría y Consulta (for legal purposes).
- D
- Audited by others auditors (for legal purposes).
F-244
Table of Contents
Appendices
Appendix XX
Companies with Electricity Operations included in the 2012 Consolidation Perimeter
| | | | | | | |
Company Name | | Registered Address | | Activity(*) | | Comments |
|---|
Abengoa Cogeneración Tabasco, S. de R. L. de C.V. | | Mexico City (MX) | | | (3 | ) | Construction phase |
Abengoa Transmisión Norte, S.A. | | Lima (PE) | | | (9 | ) | Operational |
Abengoa Transmisión Sur, S.A. | | Lima (PE) | | | (9 | ) | Construction phase |
Aprofursa, Aprovechamientos Energéticos Furesa, S.A. | | Murcia (ES) | | | (1 | ) | Operational |
Arao Enerxías Eólica, S.L | | A Coruña (ES) | | | (2 | ) | Construction phase |
Arizona Solar One, LLC | | Colorado (US) | | | (6 | ) | Construction phase |
ATE IV Sao Mateus Transmissora de Energía, S.A. | | Rio de Janeiro (BR) | | | (9 | ) | Operational |
ATE IX Transmissora de Energía, S.A. | | Rio de Janeiro (BR) | | | (9 | ) | Construction phase |
ATE V Londrina Transmissora de Energía, S.A. | | Rio de Janeiro (BR) | | | (9 | ) | Operational |
ATE VI Campos Novos Transmissora de Energía, S.A | | Rio de Janeiro (BR) | | | (9 | ) | Operational |
ATE VII- Foz do Iguacú Transmissora de Energía, S.A. | | Rio de Janeiro (BR) | | | (9 | ) | Operational |
ATE VIII Estação Transmissora de Energia S/A | | Rio de Janeiro (BR) | | | (9 | ) | Construction phase |
ATE XI, Manaus Transmissora de Energía | | Rio de Janeiro (BR) | | | (9 | ) | Construction phase |
ATE XIII, Norte Brasil Transmissora de Energía S.A | | Rio de Janeiro (BR) | | | (9 | ) | Construction phase |
ATE XIX Transmissora de Energia S.A. | | Rio de Janeiro (BR) | | | (9 | ) | Construction phase |
ATE XVI Transmissora de Energia S.A. | | Rio de Janeiro (BR) | | | (9 | ) | Construction phase |
ATE XVII Transmissora de Energia S.A. | | Rio de Janeiro (BR) | | | (9 | ) | Construction phase |
ATE XVIII Transmissora de Energia S.A. | | Rio de Janeiro (BR) | | | (9 | ) | Construction phase |
ATN 1, Abengoa Trasmisión Sur, S.A | | Lima (PE) | | | (9 | ) | Operational |
ATN 2, S.A. | | Lima (PE) | | | (9 | ) | Construction phase |
Befesa Plásticos, S.L. | | Murcia (ES) | | | (8 | ) | Operational |
Befesa Valorización de Azufre, SLU | | Zierbena (ES) | | | (8 | ) | Operational |
Biocarburantes de Castilla y León, S.A. | | Salamanca (ES) | | | (3 | ) | Operational |
Bioetanol Galicia, S.A. | | A Coruña (ES) | | | (3 | ) | Operational |
Captasol Fotovoltaica 1, S.L. | | Seville (ES) | | | (5 | ) | Operational |
Captasol Fotovoltaica 10, S.L. | | Seville (ES) | | | (5 | ) | Operational |
Captasol Fotovoltaica 11, S.L. | | Seville (ES) | | | (5 | ) | Operational |
Captasol Fotovoltaica 12, S.L. | | Seville (ES) | | | (5 | ) | Operational |
Captasol Fotovoltaica 13, S.L. | | Seville (ES) | | | (5 | ) | Operational |
Captasol Fotovoltaica 14, S.L. | | Seville (ES) | | | (5 | ) | Operational |
Captasol Fotovoltaica 15,S.L. | | Seville (ES) | | | (5 | ) | Operational |
Captasol Fotovoltaica 16, S.L. | | Seville (ES) | | | (5 | ) | Operational |
Captasol Fotovoltaica 17,S.L. | | Seville (ES) | | | (5 | ) | Operational |
Captasol Fotovoltaica 18, S.L. | | Seville (ES) | | | (5 | ) | Operational |
Captasol Fotovoltaica 19, S.L. | | Seville (ES) | | | (5 | ) | Operational |
Captasol Fotovoltaica 2, S.L. | | Seville (ES) | | | (5 | ) | Operational |
Captasol Fotovoltaica 20, S.L. | | Seville (ES) | | | (5 | ) | Operational |
Captasol Fotovoltaica 21, S.L. | | Seville (ES) | | | (5 | ) | Operational |
Captasol Fotovoltaica 22, S.L. | | Seville (ES) | | | (5 | ) | Operational |
Captasol Fotovoltaica 23, S.L. | | Seville (ES) | | | (5 | ) | Operational |
Captasol Fotovoltaica 24, S.L. | | Seville (ES) | | | (5 | ) | Operational |
Captasol Fotovoltaica 25, S.L. | | Seville (ES) | | | (5 | ) | Operational |
Captasol Fotovoltaica 26, S.L. | | Seville (ES) | | | (5 | ) | Operational |
Captasol Fotovoltaica 27, S.L. | | Seville (ES) | | | (5 | ) | Operational |
Captasol Fotovoltaica 28, S.L. | | Seville (ES) | | | (5 | ) | Operational |
Captasol Fotovoltaica 29, S.L. | | Seville (ES) | | | (5 | ) | Operational |
Captasol Fotovoltaica 3, S.L. | | Seville (ES) | | | (5 | ) | Operational |
Captasol Fotovoltaica 30, S.L. | | Seville (ES) | | | (5 | ) | Operational |
F-245
Table of Contents
Appendices
Appendix XX
Companies with Electricity Operations included in the 2012 Consolidation Perimeter (Continuation)
| | | | | | | |
Company Name | | Registered Address | | Activity(*) | | Comments |
|---|
Captasol Fotovoltaica 31, S.L. | | Seville (ES) | | | (5 | ) | Operational |
Captasol Fotovoltaica 32, S.L. | | Seville (ES) | | | (5 | ) | Operational |
Captasol Fotovoltaica 33, S.L. | | Seville (ES) | | | (5 | ) | Operational |
Captasol Fotovoltaica 34, S.L. | | Seville (ES) | | | (5 | ) | Operational |
Captasol Fotovoltaica 35, S.L. | | Seville (ES) | | | (5 | ) | Operational |
Captasol Fotovoltaica 36, S.L. | | Seville (ES) | | | (5 | ) | Operational |
Captasol Fotovoltaica 37, S.L. | | Seville (ES) | | | (5 | ) | Operational |
Captasol Fotovoltaica 38, S.L. | | Seville (ES) | | | (5 | ) | Operational |
Captasol Fotovoltaica 4, S.L. | | Seville (ES) | | | (5 | ) | Operational |
Captasol Fotovoltaica 40, S.L. | | Seville (ES) | | | (5 | ) | Operational |
Captasol Fotovoltaica 41, S.L. | | Seville (ES) | | | (5 | ) | Operational |
Captasol Fotovoltaica 44, S.L. | | Seville (ES) | | | (5 | ) | Operational |
Captasol Fotovoltaica 48, S.L. | | Seville (ES) | | | (5 | ) | Construction phase |
Captasol Fotovoltaica 49, S.L. | | Seville (ES) | | | (5 | ) | Construction phase |
Captasol Fotovoltaica 5, S.L. | | Seville (ES) | | | (5 | ) | Operational |
Captasol Fotovoltaica 50, S.L. | | Seville (ES) | | | (5 | ) | Construction phase |
Captasol Fotovoltaica 51, S.L. | | Seville (ES) | | | (5 | ) | Construction phase |
Captasol Fotovoltaica 52, S.L. | | Seville (ES) | | | (5 | ) | Construction phase |
Captasol Fotovoltaica 53, S.L. | | Seville (ES) | | | (5 | ) | Construction phase |
Captasol Fotovoltaica 54, S.L. | | Seville (ES) | | | (5 | ) | Construction phase |
Captasol Fotovoltaica 55, S.L. | | Seville (ES) | | | (5 | ) | Construction phase |
Captasol Fotovoltaica 56, S.L. | | Seville (ES) | | | (5 | ) | Construction phase |
Captasol Fotovoltaica 57, S.L. | | Seville (ES) | | | (5 | ) | Construction phase |
Captasol Fotovoltaica 58, S.L. | | Seville (ES) | | | (5 | ) | Construction phase |
Captasol Fotovoltaica 59, S.L. | | Seville (ES) | | | (5 | ) | Construction phase |
Captasol Fotovoltaica 6, S.L. | | Seville (ES) | | | (5 | ) | Operational |
Captasol Fotovoltaica 60, S.L. | | Seville (ES) | | | (5 | ) | Construction phase |
Captasol Fotovoltaica 61, S.L. | | Seville (ES) | | | (5 | ) | Construction phase |
Captasol Fotovoltaica 62, S.L. | | Seville (ES) | | | (5 | ) | Construction phase |
Captasol Fotovoltaica 63, S.L. | | Seville (ES) | | | (5 | ) | Construction phase |
Captasol Fotovoltaica 64, S.L. | | Seville (ES) | | | (5 | ) | Construction phase |
Captasol Fotovoltaica 65, S.L. | | Seville (ES) | | | (5 | ) | Construction phase |
Captasol Fotovoltaica 66, S.L. | | Seville (ES) | | | (5 | ) | Construction phase |
Captasol Fotovoltaica 67, S.L. | | Seville (ES) | | | (5 | ) | Construction phase |
Captasol Fotovoltaica 68, S.L. | | Seville (ES) | | | (5 | ) | Construction phase |
Captasol Fotovoltaica 69, S.L. | | Seville (ES) | | | (5 | ) | Construction phase |
Captasol Fotovoltaica 7, S.L. | | Seville (ES) | | | (5 | ) | Operational |
Captasol Fotovoltaica 71, S.L. | | Seville (ES) | | | (5 | ) | Construction phase |
Captasol Fotovoltaica 72, S.L. | | Seville (ES) | | | (5 | ) | Construction phase |
Captasol Fotovoltaica 73,S.L. | | Seville (ES) | | | (5 | ) | Construction phase |
Captasol Fotovoltaica 74, S.L. | | Seville (ES) | | | (5 | ) | Construction phase |
Captasol Fotovoltaica 75, S.L. | | Seville (ES) | | | (5 | ) | Construction phase |
Captasol Fotovoltaica 76, S.L. | | Seville (ES) | | | (5 | ) | Construction phase |
Captasol Fotovoltaica 77, S.L. | | Seville (ES) | | | (5 | ) | Construction phase |
Captasol Fotovoltaica 78 S.L. | | Seville (ES) | | | (5 | ) | Construction phase |
Captasol Fotovoltaica 79 S.L. | | Seville (ES) | | | (5 | ) | Construction phase |
Captasol Fotovoltaica 8, S.L. | | Seville (ES) | | | (5 | ) | Operational |
Captasol Fotovoltaica 9, S.L. | | Seville (ES) | | | (5 | ) | Operational |
F-246
Table of Contents
Appendices
Appendix XX
Companies with Electricity Operations included in the 2012 Consolidation Perimeter (Continuation)
| | | | | | | |
Company Name | | Registered Address | | Activity(*) | | Comments |
|---|
Cogeneración Motril, S.A. | | Seville (ES) | | | (1 | ) | Operational |
Cogeneración Villaricos, S.A. | | Seville (ES) | | | (1 | ) | Operational |
Copero Solar Huerta Cinco, S.A. | | Seville (ES) | | | (5 | ) | Operational |
Copero Solar Huerta Cuatro, S.A. | | Seville (ES) | | | (5 | ) | Operational |
Copero Solar Huerta Diez, S.A. | | Seville (ES) | | | (5 | ) | Operational |
Copero Solar Huerta Dos, S.A. | | Seville (ES) | | | (5 | ) | Operational |
Copero Solar Huerta Nueve, S.A | | Seville (ES) | | | (5 | ) | Operational |
Copero Solar Huerta Ocho, S.A. | | Seville (ES) | | | (5 | ) | Operational |
Copero Solar Huerta Seis, S.A. | | Seville (ES) | | | (5 | ) | Operational |
Copero Solar Huerta Siete, S.A. | | Seville (ES) | | | (5 | ) | Operational |
Copero Solar Huerta Tres, S.A. | | Seville (ES) | | | (5 | ) | Operational |
Copero Solar Huerta Uno, S.A. | | Seville (ES) | | | (5 | ) | Operational |
Cycon Solar, LTD. | | Cyprus (GR) | | | (6 | ) | Construction phase |
Ecocarburantes Españoles, S.A. | | Murcia (ES) | | | (3 | ) | Operational |
Enernova Ayamonte S.A. | | Huelva (ES) | | | (3 | ) | Operational |
Fotovoltaica Solar Sevilla, S.A. | | Seville (ES) | | | (5 | ) | Operational |
Helio Energy Electricidad Cinco, S.A. | | Seville (ES) | | | (6 | ) | Construction phase |
Helio Energy Electricidad Cuatro, S.A. | | Seville (ES) | | | (6 | ) | Construction phase |
Helio Energy Electricidad Diez, S.A. | | Seville (ES) | | | (6 | ) | Construction phase |
Helio Energy Electricidad Doce, S.A. | | Seville (ES) | | | (6 | ) | Construction phase |
Helio Energy Electricidad Dos, S.A. | | Seville (ES) | | | (6 | ) | Construction phase |
Helio Energy Electricidad Nueve, S.A. | | Seville (ES) | | | (6 | ) | Construction phase |
Helio Energy Electricidad Ocho, S.A. | | Seville (ES) | | | (6 | ) | Construction phase |
Helio Energy Electricidad Once, S.A. | | Seville (ES) | | | (6 | ) | Construction phase |
Helio Energy Electricidad Siete, S.A. | | Seville (ES) | | | (6 | ) | Construction phase |
Helio Energy Electricidad Trece, S.A. | | Seville (ES) | | | (6 | ) | Construction phase |
Helio Energy Electricidad Tres, S.A. | | Seville (ES) | | | (6 | ) | Construction phase |
Helio Energy Electricidad Uno, S.A. | | Seville (ES) | | | (6 | ) | Operational |
Helio energy Electricidad Veinticinco, S.A | | Seville (ES) | | | (6 | ) | Construction phase |
Helio energy Electricidad Veintidos, S.A | | Seville (ES) | | | (6 | ) | Construction phase |
Helio energy Electricidad Veintitres, S.A | | Seville (ES) | | | (6 | ) | Construction phase |
Helio energy Electricidad Veintiuno, S.A | | Seville (ES) | | | (6 | ) | Construction phase |
Helioenergy Electricidad Veinticuatro, S.A | | Seville (ES) | | | (6 | ) | Construction phase |
Helios I Hyperion Energy Investments, S.L. | | Ciudad Real (ES) | | | (6 | ) | Operational |
Helios II Hyperion Energy Investments, S.L. | | Ciudad Real (ES) | | | (6 | ) | Operational |
Inabensa Fotovoltaica, S.L. | | Seville (ES) | | | (5 | ) | Construction phase |
Iniciativas Hidroeléctricas de Aragón y Cataluña S.L. | | Huesca (ES) | | | (7 | ) | Operational |
Iniciativas Hidroeléctricas, SA | | Seville (ES) | | | (7 | ) | Operational |
Insolation 1, S.R.L. | | Rome (IT) | | | (5 | ) | Construction phase |
Insolation 2, S.R.L. | | Rome (IT) | | | (5 | ) | Construction phase |
Insolation 3, S.R.L. | | Rome (IT) | | | (5 | ) | Construction phase |
Insolation Sic 10 S.R.L | | Palermo (IT) | | | (5 | ) | Construction phase |
Insolation Sic 11 S.R.L | | Palermo (IT) | | | (5 | ) | Construction phase |
Insolation Sic 12 S.R.L | | Palermo (IT) | | | (5 | ) | Construction phase |
Insolation Sic 13 S.R.L | | Rome (IT) | | | (5 | ) | Construction phase |
Insolation Sic 14 S.R.L. | | Rome (IT) | | | (5 | ) | Construction phase |
Insolation Sic 15 S.R.L. | | Rome (IT) | | | (5 | ) | Construction phase |
Insolation Sic 16 S.R.L. | | Rome (IT) | | | (5 | ) | Construction phase |
F-247
Table of Contents
Appendices
Appendix XX
Companies with Electricity Operations included in the 2012 Consolidation Perimeter (Continuation)
| | | | | | | |
Company Name | | Registered Address | | Activity(*) | | Comments |
|---|
Insolation Sic 17 S.R.L. | | Rome (IT) | | | (5 | ) | Construction phase |
Insolation Sic 18 S.R.L. | | Rome (IT) | | | (5 | ) | Construction phase |
Insolation Sic 19 S.R.L. | | Rome (IT) | | | (5 | ) | Construction phase |
Insolation Sic 20 S.R.L. | | Rome (IT) | | | (5 | ) | Construction phase |
Insolation Sic 4 S.R.L | | Palermo (IT) | | | (5 | ) | Construction phase |
Insolation Sic 5 S.R.L | | Palermo (IT) | | | (5 | ) | Construction phase |
Insolation Sic 6 S.R.L | | Palermo (IT) | | | (5 | ) | Construction phase |
Insolation Sic 7.R.L | | Palermo (IT) | | | (5 | ) | Construction phase |
Insolation Sic 8 S.R.L | | Palermo (IT) | | | (5 | ) | Construction phase |
Insolation Sic 9 S.R.L | | Palermo (IT) | | | (5 | ) | Construction phase |
Instalaciones Fotovoltaicas Torrecuéllar, 1 S.L. | | Seville (ES) | | | (5 | ) | Construction phase |
Instalaciones Fotovoltaicas Torrecuéllar, 2 S.L. | | Seville (ES) | | | (5 | ) | Construction phase |
Instalaciones Fotovoltaicas Torrecuéllar, 3 S.L. | | Seville (ES) | | | (5 | ) | Construction phase |
Italgest Abengoa Solar, S.r.l | | Rome (IT) | | | (5 | ) | Construction phase |
Kaxu Solar One | | Pofadder (ZA) | | | (6 | ) | Construction phase |
Khi Solar One | | Upington (ZA) | | | (6 | ) | Construction phase |
Las Cabezas Solar S.L. | | Seville (ES) | | | (5 | ) | Construction phase |
Linares Fotovoltaica, S.L. | | Seville (ES) | | | (5 | ) | Operational |
Linha Verde Transmisora de Energia S.A | | Brasilia (BR) | | | (9 | ) | Construction phase |
Marismas PV A1, S.L. | | Seville (ES) | | | (5 | ) | Operational |
Marismas PV A10, S.L. | | Seville (ES) | | | (5 | ) | Operational |
Marismas PV A11, S.L. | | Seville (ES) | | | (5 | ) | Operational |
Marismas PV A12, S.L. | | Seville (ES) | | | (5 | ) | Operational |
Marismas PV A13, S.L. | | Seville (ES) | | | (5 | ) | Operational |
Marismas PV A14, S.L. | | Seville (ES) | | | (5 | ) | Operational |
Marismas PV A15, S.L. | | Seville (ES) | | | (5 | ) | Operational |
Marismas PV A16, S.L. | | Seville (ES) | | | (5 | ) | Operational |
Marismas PV A17, S.L. | | Seville (ES) | | | (5 | ) | Operational |
Marismas PV A18, S.L. | | Seville (ES) | | | (5 | ) | Operational |
Marismas PV A2, S.L. | | Seville (ES) | | | (5 | ) | Operational |
Marismas PV A3, S.L. | | Seville (ES) | | | (5 | ) | Operational |
Marismas PV A4, S.L. | | Seville (ES) | | | (5 | ) | Operational |
Marismas PV A5, S.L. | | Seville (ES) | | | (5 | ) | Operational |
Marismas PV A6, S.L. | | Seville (ES) | | | (5 | ) | Operational |
Marismas PV A7, S.L. | | Seville (ES) | | | (5 | ) | Operational |
Marismas PV A8, S.L. | | Seville (ES) | | | (5 | ) | Operational |
Marismas PV A9, S.L. | | Seville (ES) | | | (5 | ) | Operational |
Marismas PV B1, S.L. | | Seville (ES) | | | (5 | ) | Operational |
Marismas PV B10, S.L. | | Seville (ES) | | | (5 | ) | Operational |
Marismas PV B11, S.L. | | Seville (ES) | | | (5 | ) | Operational |
Marismas PV B12, S.L. | | Seville (ES) | | | (5 | ) | Operational |
Marismas PV B13, S.L. | | Seville (ES) | | | (5 | ) | Operational |
Marismas PV B14, S.L. | | Seville (ES) | | | (5 | ) | Operational |
Marismas PV B15, S.L. | | Seville (ES) | | | (5 | ) | Operational |
Marismas PV B16, S.L. | | Seville (ES) | | | (5 | ) | Operational |
Marismas PV B17, S.L. | | Seville (ES) | | | (5 | ) | Operational |
Marismas PV B18, S.L. | | Seville (ES) | | | (5 | ) | Operational |
Marismas PV B2, S.L. | | Seville (ES) | | | (5 | ) | Operational |
F-248
Table of Contents
Appendices
Appendix XX
Companies with Electricity Operations included in the 2012 Consolidation Perimeter (Continuation)
| | | | | | | |
Company Name | | Registered Address | | Activity(*) | | Comments |
|---|
Marismas PV B3, S.L. | | Seville (ES) | | | (5 | ) | Operational |
Marismas PV B4, S.L. | | Seville (ES) | | | (5 | ) | Operational |
Marismas PV B5, S.L. | | Seville (ES) | | | (5 | ) | Operational |
Marismas PV B6, S.L. | | Seville (ES) | | | (5 | ) | Operational |
Marismas PV B7, S.L. | | Seville (ES) | | | (5 | ) | Operational |
Marismas PV B8, S.L. | | Seville (ES) | | | (5 | ) | Operational |
Marismas PV B9, S.L. | | Seville (ES) | | | (5 | ) | Operational |
Marismas PV C1, S.L. | | Seville (ES) | | | (5 | ) | Operational |
Marismas PV C10, S.L. | | Seville (ES) | | | (5 | ) | Operational |
Marismas PV C11, S.L. | | Seville (ES) | | | (5 | ) | Operational |
Marismas PV C12, S.L. | | Seville (ES) | | | (5 | ) | Operational |
Marismas PV C13, S.L. | | Seville (ES) | | | (5 | ) | Operational |
Marismas PV C14, S.L. | | Seville (ES) | | | (5 | ) | Operational |
Marismas PV C15, S.L. | | Seville (ES) | | | (5 | ) | Operational |
Marismas PV C16, S.L. | | Seville (ES) | | | (5 | ) | Operational |
Marismas PV C17, S.L. | | Seville (ES) | | | (5 | ) | Operational |
Marismas PV C18, S.L. | | Seville (ES) | | | (5 | ) | Operational |
Marismas PV C2, S.L. | | Seville (ES) | | | (5 | ) | Operational |
Marismas PV C3, S.L. | | Seville (ES) | | | (5 | ) | Operational |
Marismas PV C4, S.L. | | Seville (ES) | | | (5 | ) | Operational |
Marismas PV C4, S.L. | | Seville (ES) | | | (5 | ) | Operational |
Marismas PV C5, S.L. | | Seville (ES) | | | (5 | ) | Operational |
Marismas PV C6, S.L. | | Seville (ES) | | | (5 | ) | Operational |
Marismas PV C7, S.L. | | Seville (ES) | | | (5 | ) | Operational |
Marismas PV C8, S.L. | | Seville (ES) | | | (5 | ) | Operational |
Marismas PV C9, S.L. | | Seville (ES) | | | (5 | ) | Operational |
Marismas PV E1, S.L. | | Seville (ES) | | | (5 | ) | Operational |
Marismas PV E2, S.L. | | Seville (ES) | | | (5 | ) | Operational |
Marismas PV E3, S.L. | | Seville (ES) | | | (5 | ) | Operational |
Marudhara Akshay Urja Private Limited | | Maharashtra (IN) | | | (6 | ) | Construction phase |
Marusthal Green Power Private Limited | | Maharashtra (IN) | | | (6 | ) | Construction phase |
Mojave Solar LLC | | Berkeley (US) | | | (6 | ) | Construction phase |
Norventus Atlántico, S.L | | A Coruña (ES) | | | (2 | ) | Construction phase |
Palmatir S.A. | | Montevideo (UY) | | | (2 | ) | Construction phase |
Palmucho, S.A. | | Santiago (CL) | | | (9 | ) | Operational |
Procesos Ecológicos Vilches, S.A. | | Seville (ES) | | | (3 | ) | Operational |
Puerto Real Cogeneración, S.A. | | Seville (ES) | | | (3 | ) | Operational |
Rajathan Photon Energy | | Maharashtra (IN) | | | (6 | ) | Construction phase |
Sanlucar Solar, S.A.(PS-10) | | Seville (ES) | | | (6 | ) | Operational |
Shams Power Company PJSC | | Abu-Dhabi (AE) | | | (6 | ) | Construction phase |
Solaben Electricidad Diez, S.A. | | Badajoz (ES) | | | (6 | ) | Construction phase |
Solaben Electricidad Doce, S.A. | | Badajoz (ES) | | | (6 | ) | Construction phase |
Solaben Electricidad Dos, S.A. | | Badajoz (ES) | | | (6 | ) | Operational |
Solaben Electricidad Nueve S.A. | | Badajoz (ES) | | | (6 | ) | Construction phase |
Solaben Electricidad Ocho S.A. | | Badajoz (ES) | | | (6 | ) | Construction phase |
Solaben Electricidad Once, S.A. | | Badajoz (ES) | | | (6 | ) | Construction phase |
Solaben Electricidad Quince, S.A. | | Badajoz (ES) | | | (6 | ) | Construction phase |
Solaben Electricidad Seis, S.A. | | Badajoz (ES) | | | (6 | ) | Construction phase |
F-249
Table of Contents
Appendices
Appendix XX
Companies with Electricity Operations included in the 2012 Consolidation Perimeter (Continuation)
| | | | | | | |
Company Name | | Registered Address | | Activity(*) | | Comments |
|---|
Solaben Electricidad Tres, S.A. | | Badajoz (ES) | | | (6 | ) | Operational |
Solaben Electricidad Uno, S.A. | | Badajoz (ES) | | | (6 | ) | Construction phase |
Solacor Electricidad Dos, S.A. | | Seville (ES) | | | (6 | ) | Operational |
Solacor Electricidad Uno, S.A. | | Seville (ES) | | | (6 | ) | Operational |
Solar de Receptores de Andalucía S.A. | | Seville (ES) | | | (5 | ) | Operational |
Solar Power Plant One | | Argel (DZ) | | | (5 | ) | Operational |
Solar Processes, S.A.(PS-20) | | Seville (ES) | | | (6 | ) | Operational |
Solargate Electricidad Cinco, S.A. | | Seville (ES) | | | (6 | ) | Construction phase |
Solargate Electricidad Cuatro, S.A. | | Seville (ES) | | | (6 | ) | Construction phase |
Solargate Electricidad Dos, S.A. | | Seville (ES) | | | (6 | ) | Construction phase |
Solargate Electricidad Tres, S.A. | | Seville (ES) | | | (6 | ) | Construction phase |
Solargate Electricidad Uno, S.A. | | Seville (ES) | | | (6 | ) | Construction phase |
Solnova Electricidad Cinco, S.A. | | Seville (ES) | | | (6 | ) | Construction phase |
Solnova Electricidad Cuatro, S.A. | | Seville (ES) | | | (6 | ) | Operational |
Solnova Electricidad Dos, S.A. | | Seville (ES) | | | (6 | ) | Construction phase |
Solnova Electricidad Seis, S.A. | | Seville (ES) | | | (6 | ) | Construction phase |
Solnova Electricidad Tres, S.A. | | Seville (ES) | | | (6 | ) | Operational |
Solnova Electricidad Uno, S.A. | | Seville (ES) | | | (6 | ) | Operational |
Solnova Electricidad, S.A.AZ-50 | | Seville (ES) | | | (6 | ) | Operational |
Transmisora Baquedano, S.A. | | Santiago (CL) | | | (9 | ) | Construction phase |
Transmisora Mejillones, S.A. | | Santiago (CL) | | | (9 | ) | Construction phase |
- (*)
- Electricity operations as described in Note 2.29 in accordance with the provisions of Law 54/1997.
- (1)
- Production under Special Regime: Cogeneration. Primary energy type: Fuel.
- (2)
- Production under Special Regime: Wind. Primary energy type: Wind.
- (3)
- Includes production under Special Regime: Cogeneration. Primary energy type: Natural gas.
- (4)
- Production under Special Regime: Cogeneration. Primary energy type: Natural gas.
- (5)
- Production under Special Regime: Solar Photovoltaic. Primary energy type: Solar light.
- (6)
- Production under Special Regime: Solar. Primary energy type: Solar light.
- (7)
- Production under Special Regime: Hydraulic. Primary energy type: Water.
- (8)
- Production under Special Regime: Other. Primary energy type: Industrial waste (used oils).
- (9)
- Transport.
- (10)
- Electricity production: Based on hydrogen. Primary type of energy: Hydrogen.
F-250
Table of Contents
Appendices
Appendix XXI
Companies taxed under the Special Regime for Company Groups at 12.31.12
| | | | |
| Abengoa Tax Group Number 02/97 |
|---|
Company Name | | Tax Address | | Shareholding |
|---|
Abengoa S.A. | | Seville (ES) | | Parent Company |
Abeinsa Business Development, S.A. | | Seville (ES) | | Abeinsa Ingeniería y Construcción Industrial, S.A./ Negocios Industriales y Comerciales, S.A. |
Abeinsa EPC, S.A. | | Seville (ES) | | Abeinsa Ingeniería y Construcción Industrial S.A./Teyma Gestión de Contratos de Construcción e Ingeniería, S.A. |
Abeinsa Infraestructuras Medio Ambiente, S.A. | | Seville (ES) | | Abeinsa, Ingeniería y Construcción Industrial, S.A./Negocios Industriales y Comerciales, S. A |
Abeinsa Ingenieria y Construccion Industrial, S.A. | | Seville (ES) | | Abengoa, S.A./Siema |
Abencor Suministros S.A. | | Seville (ES) | | Negocios Industriales y Comerciales, S.A./Abeinsa Ingeniería y Construcción Industrial, S.A. |
Abener Argelia, S. L. | | Seville (ES) | | Abener Energía, S.A./Abeinsa Ingeniería y Construcción Industrial, S.A. |
Abener Energía, S.A. | | Seville (ES) | | Abeinsa Ingeniería y Construcción Industrial, S.A. |
Abener Inversiones, S. L. | | Seville (ES) | | Abener Energía, S.A./Negocios Industriales y Comerciales, S.A. |
Abengoa Bioenergía Biodiesel S.A. | | Seville (ES) | | Abengoa Bioenergía, S.A./Ecoagrícola, S.A. |
Abengoa Bioenergía Inversiones, S.A. | | Seville (ES) | | Abengoa Bioenergía, S.A./Abengoa Bioenergía Nuevas Tecnologías, S.A. |
Abengoa Bioenergía Nuevas Tecnologías, S.A. ABNT | | Seville (ES) | | Abengoa Bioenergía, S.L./Instalaciones Inabensa, S.A. |
Abengoa Bioenergía San Roque, S.A. | | Cadiz (ES) | | Ecoagrícola, S.A./Abengoa Bioenergía, S.A. |
Abengoa Bioenergía, S.A. | | Seville (ES) | | Abengoa, S.A./Sociedad Inversora Energía y Medio Ambiente, S.A. |
Abengoa Finance | | Seville (ES) | | Abengoa, S.A. |
Abengoa Hidrógeno, S.A | | Seville (ES) | | Abeinsa Ingeniería y Construcción Industrial, S.A./ Instalaciones Inabensa, S.A. |
Abengoa Research, S. L. | | Seville (ES) | | Abeinsa, Ingeniería y Construcción Industrial, S.A. |
Abengoa SeaPower, S.A. | | Seville (ES) | | Abeinsa Ingeniería y Construcción Industrial, S.A./Instalaciones Inabensa, S.A. |
Abengoa Solar España, S.A. | | Seville (ES) | | Abengoa Solar, S.A./Abengoa Solar PV, S.A. |
Abengoa Solar Extremadura, S.A. | | Seville (ES) | | Abengoa Solar España, S.A./Abengoa Solar New Technologies, S.A. |
Abengoa Solar Internacional, S.A. | | Seville (ES) | | Abengoa Solar, S.A. |
Abengoa Solar New Tecnologies, S.A. | | Seville (ES) | | Abengoa Solar, S.A. |
Abengoa Solar Power, S.A. | | Seville (ES) | | Abengoa Solar, S.A./Abengoa Solar PV, S.A. |
Abengoa Solar S.A. | | Seville (ES) | | Abengoa, S.A./Abengoa Solar España, S.A. |
Abengoa Solar Ventures S. A | | Seville (ES) | | Abengoa Solar, S.A. |
Abentel Telecomunicaciones, S.A. | | Seville (ES) | | Abener Energía, S.A./Abeinsa Ingeniería y Construcción Industrial, S.A. |
Aleduca, S.L | | Madrid (ES) | | Abengoa Solar España, S.A./Abengoa Solar, S.A. |
Aprofursa, Aprovechamientos Energéticos Furesa, S.A. | | Murcia (ES) | | Abeinsa Asset Management, S. L. |
Asa Iberoamérica, S. L. | | Seville (ES) | | Siema/Abeinsa Ingeniería y Construcción Industrial, S.A. |
Aznalcóllar Solar, S.A. | | Seville (ES) | | Abengoa Solar España, S.A./Abengoa Solar, S.A. |
Befesa Agua Internacional S.L. | | Seville (ES) | | Abeinsa Infraestructuras Medio Ambiente/Construcciones y Depuraciones, S.A.(Codesa) |
Biocarburantes de Castilla y León, S.A. | | Salamanca (ES) | | Abengoa Bioenergía, S.A./Ecoagricola, S.A. |
Bioeléctrica Jienense, S.A. | | Seville (ES) | | Abeinsa Asset Management, S.L. |
Bioetanol Galicia, S.A. | | A Coruña (ES) | | Abengoa Bioenergía, S.A. |
Captación Solar, S.A. | | Seville (ES) | | Abeinsa Asset Management, S.L. /Abener Energía, S.A. |
Captasol Fotovoltaica 1, S.L. | | Seville (ES) | | Abengoa Solar España, S.A./Casaquemada Fotovoltaica, S.L. |
Captasol Fotovoltaica 10, S.L. | | Seville (ES) | | Abengoa Solar España, S.A./Casaquemada Fotovoltaica, S.L. |
Captasol Fotovoltaica 11, S.L. | | Seville (ES) | | Abengoa Solar España, S.A./Casaquemada Fotovoltaica, S.L. |
Captasol Fotovoltaica 12, S.L. | | Seville (ES) | | Abengoa Solar España, S.A./Casaquemada Fotovoltaica, S.L. |
Captasol Fotovoltaica 13, S.L. | | Seville (ES) | | Abengoa Solar España, S.A./Casaquemada Fotovoltaica, S.L. |
Captasol Fotovoltaica 14, S.L. | | Seville (ES) | | Abengoa Solar España, S.A./Casaquemada Fotovoltaica, S.L. |
Captasol Fotovoltaica 15, S.L. | | Seville (ES) | | Abengoa Solar España, S.A./Casaquemada Fotovoltaica, S.L. |
Captasol Fotovoltaica 16, S.L. | | Seville (ES) | | Abengoa Solar España, S.A./Casaquemada Fotovoltaica, S.L. |
Captasol Fotovoltaica 17, S.L. | | Seville (ES) | | Abengoa Solar España, S.A./Casaquemada Fotovoltaica, S.L. |
Captasol Fotovoltaica 18, S.L. | | Seville (ES) | | Abengoa Solar España, S.A./Casaquemada Fotovoltaica, S.L. |
Captasol Fotovoltaica 19, S.L. | | Seville (ES) | | Abengoa Solar España, S.A./Casaquemada Fotovoltaica, S.L. |
F-251
Table of Contents
Appendices
Appendix XXI
Companies taxed under the Special Regime for Company Groups at 12.31.12 (Continuation)
| | | | |
| Abengoa Tax Group Number 02/97 |
|---|
Company Name | | Tax Address | | Shareholding |
|---|
Captasol Fotovoltaica 2, S.L. | | Seville (ES) | | Abengoa Solar España, S.A./Casaquemada Fotovoltaica, S.L. |
Captasol Fotovoltaica 20, S.L. | | Seville (ES) | | Abengoa Solar España, S.A./Linares Fotovoltaica, S. L. |
Captasol Fotovoltaica 21, S.L. | | Seville (ES) | | Abengoa Solar España, S.A./Linares Fotovoltaica, S. L. |
Captasol Fotovoltaica 22, S.L. | | Seville (ES) | | Abengoa Solar España, S.A./Linares Fotovoltaica, S. L. |
Captasol Fotovoltaica 23, S.L. | | Seville (ES) | | Abengoa Solar España, S.A./Linares Fotovoltaica, S. L. |
Captasol Fotovoltaica 24, S.L. | | Seville (ES) | | Abengoa Solar España, S.A./Linares Fotovoltaica, S. L. |
Captasol Fotovoltaica 25, S.L. | | Seville (ES) | | Abengoa Solar España, S.A./Linares Fotovoltaica, S. L. |
Captasol Fotovoltaica 26, S.L. | | Seville (ES) | | Abengoa Solar España, S.A./Linares Fotovoltaica, S. L. |
Captasol Fotovoltaica 27, S.L. | | Seville (ES) | | Abengoa Solar España, S.A./Linares Fotovoltaica, S. L. |
Captasol Fotovoltaica 28, S.L. | | Seville (ES) | | Abengoa Solar España, S.A./Linares Fotovoltaica, S. L. |
Captasol Fotovoltaica 29, S.L. | | Seville (ES) | | Abengoa Solar España, S.A./Linares Fotovoltaica, S. L. |
Captasol Fotovoltaica 3, S.L. | | Seville (ES) | | Abengoa Solar España, S.A./Casaquemada Fotovoltaica, S.L. |
Captasol Fotovoltaica 30, S.L. | | Seville (ES) | | Abengoa Solar España, S.A./Linares Fotovoltaica, S. L. |
Captasol Fotovoltaica 31, S.L. | | Seville (ES) | | Abengoa Solar España, S.A./Linares Fotovoltaica, S. L. |
Captasol Fotovoltaica 32, S.L. | | Seville (ES) | | Abengoa Solar España, S.A./Linares Fotovoltaica, S. L. |
Captasol Fotovoltaica 33 S.L. | | Seville (ES) | | Abengoa Solar España, S.A./Linares Fotovoltaica, S. L. |
Captasol Fotovoltaica 34 S.L. | | Seville (ES) | | Abengoa Solar España, S.A./Linares Fotovoltaica, S. L. |
Captasol Fotovoltaica 35, S.L. | | Seville (ES) | | Abengoa Solar España, S.A./Linares Fotovoltaica, S. L. |
Captasol Fotovoltaica 36, S.L. | | Seville (ES) | | Abengoa Solar España, S.A./Linares Fotovoltaica, S. L. |
Captasol Fotovoltaica 37, S.L. | | Seville (ES) | | Abengoa Solar España, S.A./Linares Fotovoltaica, S. L. |
Captasol Fotovoltaica 38, S.L. | | Seville (ES) | | Abengoa Solar España, S.A./Linares Fotovoltaica, S. L. |
Captasol Fotovoltaica 39, S.L. | | Seville (ES) | | Abengoa Solar PV, S.A./Abengoa Solar España, S.A. |
Captasol Fotovoltaica 4, S.L. | | Seville (ES) | | Abengoa Solar España, S.A./Casaquemada Fotovoltaica, S.L. |
Captasol Fotovoltaica 40, S.L. | | Seville (ES) | | Abengoa Solar España, S.A./Linares Fotovoltaica, S. L. |
Captasol Fotovoltaica 41, S.L. | | Seville (ES) | | Abengoa Solar España, S.A./Linares Fotovoltaica, S. L. |
Captasol Fotovoltaica 42, S.L. | | Seville (ES) | | Abengoa Solar PV, S.A./Abengoa Solar España, S.A. |
Captasol Fotovoltaica 43, S.L. | | Seville (ES) | | Abengoa Solar PV, S.A./Abengoa Solar España, S.A. |
Captasol Fotovoltaica 44, S.L. | | Seville (ES) | | Abengoa Solar España, S.A./Linares Fotovoltaica, S. L. |
Captasol Fotovoltaica 45, S.L. | | Seville (ES) | | Abengoa Solar PV, S.A./Abengoa Solar España, S.A. |
Captasol Fotovoltaica 46, S.L. | | Seville (ES) | | Abengoa Solar PV, S.A./ Abengoa Solar España, S.A. |
Captasol Fotovoltaica 47, S.L. | | Seville (ES) | | Abengoa Solar PV, S.A./ Abengoa Solar España, S.A. |
Captasol Fotovoltaica 48, S.L. | | Seville (ES) | | Abengoa Solar España, S.A./Linares Fotovoltaica, S. L. |
Captasol Fotovoltaica 49, S.L. | | Seville (ES) | | Abengoa Solar España, S.A./Linares Fotovoltaica, S. L. |
Captasol Fotovoltaica 5, S.L. | | Seville (ES) | | Abengoa Solar España, S.A./Casaquemada Fotovoltaica, S. L. |
Captasol Fotovoltaica 50, S.L. | | Seville (ES) | | Abengoa Solar España, S.A./Linares Fotovoltaica, S. L. |
Captasol Fotovoltaica 52, S.L. | | Seville (ES) | | Abengoa Solar España, S.A. |
Captasol Fotovoltaica 53, S.L. | | Seville (ES) | | Abengoa Solar España, S.A. |
Captasol Fotovoltaica 54, S.L. | | Seville (ES) | | Abengoa Solar España, S.A. |
Captasol Fotovoltaica 55, S.L. | | Seville (ES) | | Abengoa Solar España, S.A. |
Captasol Fotovoltaica 56, S.L. | | Seville (ES) | | Abengoa Solar España, S.A. |
Captasol Fotovoltaica 57, S.L. | | Seville (ES) | | Abengoa Solar España, S.A. |
Captasol Fotovoltaica 58, S.L. | | Seville (ES) | | Abengoa Solar España, S.A. |
Captasol Fotovoltaica 59, S.L. | | Seville (ES) | | Abengoa Solar España, S.A. |
Captasol Fotovoltaica 6, S.L. | | Seville (ES) | | Abengoa Solar España, S.A./Casaquemada Fotovoltaica, S. L. |
Captasol Fotovoltaica 60, S.L. | | Seville (ES) | | Abengoa Solar España, S.A. |
Captasol Fotovoltaica 61, S.L. | | Seville (ES) | | Abengoa Solar España, S.A. |
Captasol Fotovoltaica 62, S.L. | | Seville (ES) | | Abengoa Solar España, S.A. |
Captasol Fotovoltaica 63, S.L. | | Seville (ES) | | Abengoa Solar España, S.A. |
Captasol Fotovoltaica 64, S.L. | | Seville (ES) | | Abengoa Solar España, S.A. |
Captasol Fotovoltaica 65, S.L. | | Seville (ES) | | Abengoa Solar España, S.A. |
Captasol Fotovoltaica 66, S.L. | | Seville (ES) | | Abengoa Solar España, S.A. |
Captasol Fotovoltaica 67, S.L. | | Seville (ES) | | Abengoa Solar España, S.A. |
Captasol Fotovoltaica 68, S.L. | | Seville (ES) | | Abengoa Solar España, S.A. |
Captasol Fotovoltaica 69, S.L. | | Seville (ES) | | Abengoa Solar España, S.A. |
Captasol Fotovoltaica 7, S.L. | | Seville (ES) | | Abengoa Solar España, S.A./Casaquemada Fotovoltaica, S. L. |
Captasol Fotovoltaica 70, S.L. | | Seville (ES) | | Abengoa Solar España, S.A./Abengoa Solar PV, S.A. |
Captasol Fotovoltaica 71, S.L. | | Seville (ES) | | Abengoa Solar España, S.A. |
Captasol Fotovoltaica 72, S.L. | | Seville (ES) | | Abengoa Solar España, S.A. |
Captasol Fotovoltaica 73, S.L. | | Seville (ES) | | Abengoa Solar España, S.A. |
F-252
Table of Contents
Appendices
Appendix XXI
Companies taxed under the Special Regime for Company Groups at 12.31.12 (Continuation)
| | | | |
| Abengoa Tax Group Number 02/97 |
|---|
Company Name | | Tax Address | | Shareholding |
|---|
Captasol Fotovoltaica 74, S.L. | | Seville (ES) | | Abengoa Solar España, S.A. |
Captasol Fotovoltaica 75, S.L. | | Seville (ES) | | Abengoa Solar España, S.A. |
Captasol Fotovoltaica 76, S.L. | | Seville (ES) | | Abengoa Solar España, S.A. |
Captasol Fotovoltaica 77, S.L. | | Seville (ES) | | Abengoa Solar España, S.A. |
Captasol Fotovoltaica 78, S.L. | | Seville (ES) | | Abengoa Solar España, S.A. |
Captasol Fotovoltaica 79, S.L. | | Seville (ES) | | Abengoa Solar España, S.A. |
Captasol Fotovoltaica 8, S.L. | | Seville (ES) | | Abengoa Solar España, S.A./Casaquemada Fotovoltaica, S. L. |
Captasol Fotovoltaica 9, S.L. | | Seville (ES) | | Abengoa Solar España, S.A./Casaquemada Fotovoltaica, S. L. |
Captasol Fotovoltaica51 S.L. | | Seville (ES) | | Abengoa Solar España, S. A. |
Casaquemada Fotovoltaica, S.L. | | Seville (ES) | | Abengoa Solar España, S.A./Abengoa Solar, S.A. |
Centro Industrial y Logístico Torrecúellar, S.A. | | Seville (ES) | | Instalaciones Inabensa,S.A./Abeinsa Ingeniería y Construcción Industrial, S.A. |
Centro Tecnológico Palmas Altas, S.A. | | Seville (ES) | | Abengoa, S.A./Abeinsa Ingeniería y Construcción Industrial, S.A. |
Construcciones y Depuraciones, S.A. | | Seville (ES) | | Abeinsa Infraestructuras Medio Ambiente, S.A. |
Covisa, Cogeneración Villaricos, S.A. | | Seville (ES) | | Abeinsa Asset Management, S. L. |
Ecoagricola, S.A. | | Murcia (ES) | | Abengoa Bioenergía, S.L./ Ecocarburantes, S.A. |
Ecocarburantes Españoles , S.A. | | Murcia (ES) | | Abengoa Bioenergía, S.A. |
Enernova Ayamonte S.A. | | Huelva (ES) | | Abeinsa Asset Management, S. L. |
Eucomsa, Europea Const. Metálicas, S.A. | | Seville (ES) | | Abeinsa Ingeniería y Construcción Industrial, S.A./Abengoa Solar, S.A. |
Fotovoltaica Solar Sevilla, S.A.(Sevilla PV) | | Seville (ES) | | Abengoa Solar España, S.A. |
Gestión Integral de Recursos Humanos, S. A. | | Seville (ES) | | Siema Technologies, S.L |
Helio Energy Electricidad Cinco, S.A. | | Seville (ES) | | Abengoa Solar España, S.A./Abengoa Solar NT, S.A. |
Helio Energy Electricidad Cuatro, S.A. | | Seville (ES) | | Abengoa Solar España, S.A./Abengoa Solar NT, S.A. |
Helio Energy Electricidad DIez, S.A. | | Seville (ES) | | Abengoa Solar España, S.A./Abengoa Solar NT, S.A. |
Helio Energy Electricidad Doce, S.A. | | Seville (ES) | | Abengoa Solar España, S.A./Abengoa Solar NT, S.A. |
Helio Energy Electricidad Nueve, S.A. | | Seville (ES) | | Abengoa Solar España, S.A./Abengoa Solar NT, S.A. |
Helio Energy Electricidad Ocho, S.A. | | Seville (ES) | | Abengoa Solar España, S.A./Abengoa Solar NT, S.A. |
Helio Energy Electricidad Once, S.A. | | Seville (ES) | | Abengoa Solar España, S.A./Abengoa Solar NT, S.A. |
Helio Energy Electricidad Siete, S.A. | | Seville (ES) | | Abengoa Solar España, S.A./Abengoa Solar NT, S.A. |
Helio Energy Electricidad Trece, S.A. | | Seville (ES) | | Abengoa Solar España, S.A./Abengoa Solar NT, S.A. |
Helio Energy Electricidad Tres, S.A. | | Seville (ES) | | Abengoa Solar España, S.A./Abengoa Solar NT, S.A. |
Helioenergy Electricidad Veinticinco, S. A | | Seville (ES) | | Abengoa Solar España, S.A. |
Helioenergy Electricidad Veinticuatro, S.A | | Seville (ES) | | Abengoa Solar España, S.A. |
Helioenergy Electricidad Veintidos, S.A | | Seville (ES) | | Abengoa Solar España, S.A. |
Helioenergy Electricidad Veintitres, S. A | | Seville (ES) | | Abengoa Solar España, S.A. |
Helioenergy Electricidad Veintiuno, S. A | | Seville (ES) | | Abengoa Solar España, S.A. |
Helios I Hyperion Energy Investments, S.L. | | Seville (ES) | | Hypesol Energy Holding, S. L. |
Helios II Hyperion Energy Investments, S.L. | | Madrid (ES) | | Hypesol Energy Holding, S. L. |
Hypesol Energy Holding , S.L. | | Seville (ES) | | Abengoa Solar España, S. A. |
Inabensa Fotovoltaica, S. L. | | Seville (ES) | | Instalaciones Inabensa, S.A./C.I.L. Torrecuéllar, S.A. |
Iniciativas Hidroeléctricas de Aragón y Cataluña, S. L. (IHCAC) | | Huesca (ES) | | Abeinsa Infraestructuras Medio Ambiente, S.A. |
Instalaciones Fotovoltaicas Torrecuéllar, 1 S.L. | | Seville (ES) | | Inabensa Fotovoltaica, S.L./Instalaciones Inabensa, S.A. |
Instalaciones Fotovoltaicas Torrecuéllar, 2 S.L. | | Seville (ES) | | Inabensa Fotovoltaica, S.L./Instalaciones Inabensa, S.A. |
Instalaciones Fotovoltaicas Torrecuéllar, 3 S.L. | | Seville (ES) | | Inabensa Fotovoltaica, S.L./Instalaciones Inabensa, S.A. |
Instalaciones Inabensa, S.A. | | Seville (ES) | | Negocios Industriales y Comerciales, S.A./Abener Energía, S.A./Abeinsa Ingeniería y Construcción Industrial, S.A. |
Las Cabezas Fotovoltaica, S.L. | | Seville (ES) | | Abengoa Solar España, S.A./Abengoa Solar, S.A. |
Las Cabezas Solar S. L. | | Seville (ES) | | Aleduca, S. L. |
Linares Fotovoltaica, S.L. | | Seville (ES) | | Abengoa Solar España, S.A./Abengoa Solar, S.A. |
Logrosán Solar Inversiones Dos, S.A | | Seville (ES) | | Abengoa Solar España S.A./Abengoa Solar S.A. |
Marismas PV A1, S.L. | | Seville (ES) | | Las Cabezas Fotovoltaica, S. L./Abengoa Solar España, S.A. |
Marismas PV A10, S.L. | | Seville (ES) | | Las Cabezas Fotovoltaica, S.L./Abengoa Solar España, S.A. |
Marismas PV A11, S.L. | | Seville (ES) | | Las Cabezas Fotovoltaica, S.L./Abengoa Solar España, S.A. |
Marismas PV A12, S.L. | | Seville (ES) | | Las Cabezas Fotovoltaica, S.L./Abengoa Solar España, S.A. |
Marismas PV A13, S.L. | | Seville (ES) | | Las Cabezas Fotovoltaica, S.L./Abengoa Solar España, S.A. |
Marismas PV A14, S.L. | | Seville (ES) | | Las Cabezas Fotovoltaica, S.L./Abengoa Solar España, S.A. |
Marismas PV A15, S.L. | | Seville (ES) | | Las Cabezas Fotovoltaica, S.L./Abengoa Solar España, S.A. |
Marismas PV A16, S.L. | | Seville (ES) | | Las Cabezas Fotovoltaica, S.L./Abengoa Solar España, S.A. |
F-253
Table of Contents
Appendices
Appendix XXI
Companies taxed under the Special Regime for Company Groups at 12.31.12 (Continuation)
| | | | |
| Abengoa Tax Group Number 02/97 |
|---|
Company Name | | Tax Address | | Shareholding |
|---|
Marismas PV A17, S.L. | | Seville (ES) | | Las Cabezas Fotovoltaica, S.L./Abengoa Solar España, S.A. |
Marismas PV A18, S.L. | | Seville (ES) | | Las Cabezas Fotovoltaica, S.L./Abengoa Solar España, S.A. |
Marismas PV A2, S.L. | | Seville (ES) | | Las Cabezas Fotovoltaica, S. L./Abengoa Solar España, S.A. |
Marismas PV A3, S.L. | | Seville (ES) | | Las Cabezas Fotovoltaica, S. L./Abengoa Solar España, S.A. |
Marismas PV A4, S.L. | | Seville (ES) | | Las Cabezas Fotovoltaica, S. L./Abengoa Solar España, S.A. |
Marismas PV A5, S.L. | | Seville (ES) | | Las Cabezas Fotovoltaica, S. L./Abengoa Solar España, S.A. |
Marismas PV A6, S.L. | | Seville (ES) | | Las Cabezas Fotovoltaica, S. L./Abengoa Solar España, S.A. |
Marismas PV A7, S.L. | | Seville (ES) | | Las Cabezas Fotovoltaica, S. L./Abengoa Solar España, S.A. |
Marismas PV A8, S.L. | | Seville (ES) | | Las Cabezas Fotovoltaica, S. L./Abengoa Solar España, S.A. |
Marismas PV A9, S.L. | | Seville (ES) | | Las Cabezas Fotovoltaica, S. L./Abengoa Solar España, S.A. |
Marismas PV B1, S. L. | | Seville (ES) | | Las Cabezas Fotovoltaica, S.L./Abengoa Solar España, S.A. |
Marismas PV B10, S. L. | | Seville (ES) | | Las Cabezas Fotovoltaica, S. L./Abengoa Solar España, S.A. |
Marismas PV B11, S. L. | | Seville (ES) | | Las Cabezas Fotovoltaica, S. L./Abengoa Solar España, S.A. |
Marismas PV B12, S. L. | | Seville (ES) | | Las Cabezas Fotovoltaica, S. L./Abengoa Solar España, S.A. |
Marismas PV B13, S. L. | | Seville (ES) | | Las Cabezas Fotovoltaica, S. L./Abengoa Solar España, S.A. |
Marismas PV B14, S. L. | | Seville (ES) | | Las Cabezas Fotovoltaica, S. L./Abengoa Solar España, S.A. |
Marismas PV B15, S. L. | | Seville (ES) | | Las Cabezas Fotovoltaica, S. L./Abengoa Solar España, S.A. |
Marismas PV B16, S. L. | | Seville (ES) | | Las Cabezas Fotovoltaica, S. L./Abengoa Solar España, S.A. |
Marismas PV B17, S. L. | | Seville (ES) | | Las Cabezas Fotovoltaica, S.L./Abengoa Solar España, S.A. |
Marismas PV B18, S. L. | | Seville (ES) | | Las Cabezas Fotovoltaica, S.L./Abengoa Solar España, S.A. |
Marismas PV B2, S. L. | | Seville (ES) | | Las Cabezas Fotovoltaica, S.L./Abengoa Solar España, S.A. |
Marismas PV B3, S. L. | | Seville (ES) | | Las Cabezas Fotovoltaica, S.L./Abengoa Solar España, S.A. |
Marismas PV B4, S. L. | | Seville (ES) | | Las Cabezas Fotovoltaica, S.L./Abengoa Solar España, S.A. |
Marismas PV B5, S. L. | | Seville (ES) | | Las Cabezas Fotovoltaica, S.L./Abengoa Solar España, S.A. |
Marismas PV B6, S. L. | | Seville (ES) | | Las Cabezas Fotovoltaica, S.L./Abengoa Solar España, S.A. |
Marismas PV B7, S. L. | | Seville (ES) | | Las Cabezas Fotovoltaica, S.L./Abengoa Solar España, S.A. |
Marismas PV B8, S. L. | | Seville (ES) | | Las Cabezas Fotovoltaica, S.L./Abengoa Solar España, S.A. |
Marismas PV B9, S. L. | | Seville (ES) | | Las Cabezas Fotovoltaica, S.L./Abengoa Solar España, S.A. |
Marismas PV C1, S.L. | | Seville (ES) | | Las Cabezas Fotovoltaica, S.L./Abengoa Solar España, S.A. |
Marismas PV C10, S.L. | | Seville (ES) | | Las Cabezas Fotovoltaica, S.L./Abengoa Solar España, S.A. |
Marismas PV C11, S.L. | | Seville (ES) | | Las Cabezas Fotovoltaica, S.L./Abengoa Solar España, S.A. |
Marismas PV C12, S.L. | | Seville (ES) | | Las Cabezas Fotovoltaica, S.L./Abengoa Solar España, S.A. |
Marismas PV C13, S.L. | | Seville (ES) | | Las Cabezas Fotovoltaica, S.L./Abengoa Solar España, S.A. |
Marismas PV C14, S.L. | | Seville (ES) | | Las Cabezas Fotovoltaica, S.L./Abengoa Solar España, S.A. |
Marismas PV C15, S.L. | | Seville (ES) | | Las Cabezas Fotovoltaica, S.L./Abengoa Solar España, S.A. |
Marismas PV C16, S.L. | | Seville (ES) | | Las Cabezas Fotovoltaica, S.L./Abengoa Solar España, S.A. |
Marismas PV C17, S.L. | | Seville (ES) | | Las Cabezas Fotovoltaica, S.L./Abengoa Solar España, S.A. |
Marismas PV C18, S.L. | | Seville (ES) | | Las Cabezas Fotovoltaica, S.L./Abengoa Solar España, S.A. |
Marismas PV C2, S.L. | | Seville (ES) | | Las Cabezas Fotovoltaica, S.L./Abengoa Solar España, S.A. |
Marismas PV C3, S.L. | | Seville (ES) | | Las Cabezas Fotovoltaica, S.L./Abengoa Solar España, S.A. |
Marismas PV C4, S.L. | | Seville (ES) | | Las Cabezas Fotovoltaica, S.L./Abengoa Solar España, S.A. |
Marismas PV C5, S.L. | | Seville (ES) | | Las Cabezas Fotovoltaica, S.L./Abengoa Solar España, S.A. |
Marismas PV C6, S.L. | | Seville (ES) | | Las Cabezas Fotovoltaica, S.L./Abengoa Solar España, S.A. |
Marismas PV C7, S.L. | | Seville (ES) | | Las Cabezas Fotovoltaica, S.L./Abengoa Solar España, S.A. |
Marismas PV C8, S.L. | | Seville (ES) | | Las Cabezas Fotovoltaica, S.L./Abengoa Solar España, S.A. |
Marismas PV C9, S.L. | | Seville (ES) | | Las Cabezas Fotovoltaica, S.L./Abengoa Solar España, S.A. |
Marismas PV E1, S. L. | | Seville (ES) | | Las Cabezas Fotovoltaica, S.L./Abengoa Solar España, S.A. |
Marismas PV E2, S. L. | | Seville (ES) | | Las Cabezas Fotovoltaica, S.L./Abengoa Solar España, S.A. |
Marismas PV E3, S. L. | | Seville (ES) | | Las Cabezas Fotovoltaica, S.L./Abengoa Solar España, S.A. |
Nicsa, Negocios Industr. y Comer. S.A. | | Madrid (ES) | | Abencor, S.A./Abeinsa Ingeniería y Construcción Industrial, S.A. |
Omega Sudamérica, S. L | | Seville (ES) | | Instalaciones Inabensa, S.A./ASA Iberoamérica S. A. |
Precosa, Puerto Real Cogeneración, S.A. | | Cadiz (ES) | | Abeinsa Asset Management, S.L. |
Sanlucar Solar, S.A. | | Seville (ES) | | Abengoa Solar, S.A./Asa Environment |
Siema Investment, S. L. | | Madrid (ES) | | Siema Technologies, S.L |
Siema Technologies, S.L. | | Madrid (ES) | | Abengoa, S.A./Siema |
Simosa I.T., S.A | | Seville (ES) | | Abengoa, S.A./Simosa, S.A. |
Simosa, Serv. Integ. Manten y Operac., S.A. | | Seville (ES) | | Negocios Industriales y Comerciales, S.A./Abengoa, S.A. |
Soc. Inver. En Ener. y Medioambiente, S.A. (Siema) | | Seville (ES) | | Abengoa, S.A./Negocios Industriales y Comerciales, S.A. |
Sociedad Inversora Lineas de Brasil, S.L. | | Seville (ES) | | Asa Iberoamérica, S.L. |
F-254
Table of Contents
Appendices
Appendix XXI
Companies taxed under the Special Regime for Company Groups at 12.31.12 (Continuation)
| | | | |
| Abengoa Tax Group Number 02/97 |
|---|
Company Name | | Tax Address | | Shareholding |
|---|
Sol3G | | Barcelona (ES) | | Abengoa Solar, S.A. |
Solaben Electricidad Diez, S.A. | | Badajoz (ES) | | Abengoa Solar España, S.A./Abengoa Solar NT, S.A. |
Solaben Electricidad Doce, S.A. | | Badajoz (ES) | | Abengoa Solar España, S.A./Abengoa Solar NT, S.A. |
Solaben Electricidad Nueve, S.A. | | Badajoz (ES) | | Abengoa Solar España, S.A./Abengoa Solar NT, S.A. |
Solaben Electricidad Ocho, S.A. | | Badajoz (ES) | | Abengoa Solar España, S.A./Abengoa Solar NT, S.A. |
Solaben Electricidad Once, S.A. | | Badajoz (ES) | | Abengoa Solar España, S.A./Abengoa Solar NT, S.A. |
Solaben Electricidad Quince, S.A | | Badajoz (ES) | | Abengoa Solar España, S.A./Abengoa Solar NT, S.A. |
Solaben Electricidad Seis | | Badajoz (ES) | | Abengoa Solar España, S.A./Abengoa Solar NT, S.A. |
Solaben Electricidad Uno | | Badajoz (ES) | | Abengoa Solar España, S.A./Abengoa Solar NT, S.A. |
Solar de Receptores de Andalucía, S.A. | | Seville (ES) | | Abengoa Solar, S.A./Abengoa Solar NT, S.A. |
Solar Processes, S.A.(PS-20) | | Seville (ES) | | Abengoa Solar España, S.A. |
Solargate Electricidad Cinco, S.A. | | Seville (ES) | | Abengoa Solar España, S.A./Abengoa Solar NT, S.A. |
Solargate Electricidad Cuatro, S.A. | | Seville (ES) | | Abengoa Solar España, S.A./Abengoa Solar NT, S.A. |
Solargate Electricidad Dos , S.A. | | Seville (ES) | | Abengoa Solar España, S.A./Abengoa Solar NT, S.A. |
Solargate Electricidad Tres , S.A. | | Seville (ES) | | Abengoa Solar España, S.A./Abengoa Solar NT, S.A. |
Solargate Electricidad Uno , S.A. | | Seville (ES) | | Abengoa Solar España, S.A./Abengoa Solar NT, S.A. |
Solnova Electricidad Cinco, S.A. | | Seville (ES) | | Abengoa Solar España, S.A./Abengoa Solar, S.A. |
Solnova Electricidad Cuatro, S.A. | | Seville (ES) | | Solnova Solar Inversiones, S.A. |
Solnova Electricidad Dos, S.A. | | Seville (ES) | | Abengoa Solar España, S.A./Abengoa Solar, S.A. |
Solnova Electricidad Seis , S.A. | | Seville (ES) | | Abengoa Solar España, S.A./Abengoa Solar NT, S.A. |
Solnova Electricidad Tres, S.A. | | Seville (ES) | | Solnova Solar Inversiones, S.A. |
Solnova Electricidad, S.A. | | Seville (ES) | | Solnova Solar Inversiones, S.A. |
Solnova Solar Inversiones, S. A | | Seville (ES) | | Abengoa Solar España, S.A. |
Solúcar Andalucía FV1, S. A | | Seville (ES) | | Abengoa Solar España, S.A./Abengoa Solar NT, S.A. |
Solúcar Andalucía FV2, S. A | | Seville (ES) | | Abengoa Solar España, S.A./Abengoa Solar NT, S.A. |
Solúcar Castilla FV1, S. A | | Seville (ES) | | Abengoa Solar España, S.A./Abengoa Solar NT, S.A. |
Solúcar Castilla FV2, S. A | | Seville (ES) | | Abengoa Solar España, S.A./Abengoa Solar NT, S.A. |
Solúcar Extremadura FV1, S.A. | | Seville (ES) | | Abengoa Solar PV, S.A./Abengoa Solar NT, S.A. |
Solúcar Extremadura FV2, S.A. | | Seville (ES) | | Abengoa Solar PV, S.A./Abengoa Solar NT, S.A. |
Solugas Energía S.A. | | Seville (ES) | | Abengoa Solar NT, S.A./Abengoa Solar S.A. |
South Africa Solar Investments, S.L. | | Seville (ES) | | Abengoa Solar Internacional, S.A. |
South Africa Solar Ventures, S. L. | | Seville (ES) | | Abengoa Solar Internacional, S.A./Abengoa Solar Ventures, S.A |
Telvent Implantación de Sistemas S.L | | Madrid (ES) | | Simosa I.T., S.A. |
Teyma Gestión de Contratos de Construcción e Ingeniería | | Seville (ES) | | Abeinsa Ingeniería y Construcción Industrial, S.A. |
Zero Emissions Technologies, S.A. | | Seville (ES) | | Abeinsa Ingeniería y Construcción Industrial, S.A./Abengoa Hidrógeno, S.A. |
Zeroemissions Carbon Trust, S. A | | Seville (ES) | | Zeroemissions Technologies, S.A./Abeinsa Ingeniería y Construcción Industrial, S.A. |
| | | | |
| Befesa Tax Group Number 13/05/B |
|---|
Name | | Tax Address | | Shareholding |
|---|
Befesa Medio Ambiente, S. L. | | Vizcaya (ES) | | Sociedad Dominante |
Alianza Medioambiental, S. L. | | Vizcaya (ES) | | Befesa Medio Ambiente, S.L. |
Befesa Aluminio Comercializadora, S.L. | | Vizcaya (ES) | | Befesa Aluminio, S.L. |
Befesa Aluminio, S.L. | | Vizcaya (ES) | | Befesa Reciclaje de Residuos de Aluminio, S. L. |
Befesa Desulfuración, S.A. | | Barakaldo (ES) | | Alianza Medioambiental, S.L. |
Befesa Reciclaje de Residuos de Aluminio, S. L. | | Vizcaya (ES) | | MRH-Residuos Metálicos, S.L. |
Befesa Steel R & D, S.L.U. | | Vizcaya (ES) | | MRH-Residuos Metálicos, S.L. |
Befesa Valorización de Azufre,S.L.U. | | Vizcaya (ES) | | Alianza Medioambiental, S.L. |
Befesa Zinc Aser, S.A. | | Vizcaya (ES) | | Befesa Zinc, S.A. |
Befesa Zinc Comercial, S.A. | | Vizcaya (ES) | | Befesa Zinc, S.A. |
Befesa Zinc Oxido, S.L. | | Vizcaya (ES) | | MRH-Residuos Metálicos, S.L. |
Befesa Zinc, S.A. | | Vizcaya (ES) | | MRH-Residuos Metálicos, S.L. |
MRH-Residuos Metálicos, S. L. | | Vizcaya (ES) | | Befesa Medio Ambiente, S.L. |
F-255
Table of Contents
Appendices
Appendix XXII
Condensed Financial Statement of the parent company
Condensed statements of financial position of Abengoa, S.A.
— Amounts in thousands of euros —
| | | | | | | |
| | 12/13/2014 | | 12/31/2013 | |
|---|
Assets | | | | | | | |
Investment in affiliates | | | 426.280 | | | 370,027 | |
Loans to affiliates | | | 10,913,743 | | | 8,773,808 | |
Trade receivables | | | 5,843 | | | 5,436 | |
Cash and cash equivalents | | | 175,173 | | | 1,030,404 | |
Other assets | | | 230,829 | | | 233,582 | |
| | | | | | | | |
Total assets | | | 11,751,868 | | | 10,413,257 | |
| | | | | | | | |
| | | | | | | | |
| | | | | | | | |
Liabilities and Equity | | | | | | | |
Borrowings | | | 398,565 | | | 1,825,522 | |
Notes and bonds | | | 1,826,092 | | | 1,536,558 | |
Intercompany liabilities | | | 7,601,207 | | | 5,256,534 | |
Other Liabilities | | | 363,532 | | | 437,836 | |
| | | | | | | | |
Total Liabilities | | | 10,189,396 | | | 9,056,450 | |
| | | | | | | | |
| | | | | | | | |
| | | | | | | | |
Common Stock | | | 91,799 | | | 91,857 | |
Accumulated gains (losses)—net | | | 538,147 | | | 312,901 | |
Assets held for sale | | | 830 | | | 808 | |
Cash flow hedges | | | (78,756 | ) | | (62,637 | ) |
Additional paid-in capital | | | 903,377 | | | 903,377 | |
Retained earnings | | | 107,074 | | | 110,501 | |
Total shareholders's equity | | | 1,562,471 | | | 1,356,807 | |
| | | | | | | | |
Total liabilities and equities | | | 11,751,868 | | | 10,413,257 | |
| | | | | | | | |
| | | | | | | | |
| | | | | | | | |
F-256
Table of Contents
Appendices
Appendix XXII
Condensed Financial Statement of the parent company (Continuation)
Condensed income statements of Abengoa, S.A.
— Amounts in thousands of euros —
| | | | | | | | | | |
| | 12/31/2014 | | 12/31/2013 | | 12/31/2012 | |
|---|
Income from | | | | | | | | | | |
Services | | | 1,041,491 | | | 859,969 | | | 664,254 | |
Interest | | | 18,748 | | | 18,978 | | | 15,935 | |
Other revenues | | | 4,262 | | | 3,813 | | | 4,643 | |
Other financial income | | | 1,072,894 | | | 927,898 | | | 334,514 | |
| | | | | | | | | | | |
Total income | | | 2,137,395 | | | 1,810,658 | | | 1,019,346 | |
| | | | | | | | | | | |
| | | | | | | | | | | |
| | | | | | | | | | | |
Expenses | | | | | | | | | | |
Raw materials | | | (11,525 | ) | | (12,649 | ) | | (13,186 | ) |
Employee benefit expenses | | | (31,701 | ) | | (26,153 | ) | | (30,023 | ) |
Other operating expenses | | | (36,928 | ) | | (35,061 | ) | | (28,723 | ) |
Provisions and amortization | | | (721 | ) | | (681 | ) | | (684 | ) |
Interest | | | (882,284 | ) | | (739,868 | ) | | (598,451 | ) |
Other financial expenses | | | (942,097 | ) | | (759,914 | ) | | (232,398 | ) |
| | | | | | | | | | | |
Total expenses | | | (1,905,256 | ) | | (1,574,326 | ) | | (903,465 | ) |
| | | | | | | | | | | |
| | | | | | | | | | | |
| | | | | | | | | | | |
Income before income taxes | | | 232,139 | | | 236,332 | | | 115,881 | |
Income tax benefits (expense) | | | (30,674 | ) | | (42,536 | ) | | (610 | ) |
| | | | | | | | | | | |
Profit for the year | | | 201,465 | | | 193,796 | | | 115,271 | |
| | | | | | | | | | | |
| | | | | | | | | | | |
| | | | | | | | | | | |
F-257
Table of Contents
Appendices
Appendix XXII
Condensed Financial Statement of the parent company (Continuation)
Condensed statements of other comprehensive income of Abengoa, S.A.
— Amounts in thousands of euros —
| | | | | | | | | | |
| | 12/31/2014 | | 12/31/2013 | | 12/31/2012 | |
|---|
Profit for the year | | | 201,465 | | | 193,796 | | | 115,271 | |
Fair Value Cash-Flow Hedges | | | (19,903 | ) | | 38,308 | | | (12,321 | ) |
Tax Effect | | | 5,971 | | | (11,425 | ) | | 3,764 | |
Other Movements | | | — | | | — | | | — | |
Net Income/(Expenses) recognised directly in Equity | | | (13,932 | ) | | 26,883 | | | (8,557 | ) |
Fair Value Cash-Flow Hedges | | | — | | | (1,031 | ) | | (7,695 | ) |
Tax Effect | | | (2,188 | ) | | 309 | | | 2,308 | |
Transfers to Income Statement | | | (2,188 | ) | | (722 | ) | | (5,387 | ) |
Other Comprehensive Income | | | 185,345 | | | 219,957 | | | 101,327 | |
F-258
Table of Contents
Appendices
Appendix XXII
Condensed Financial Statement of the parent company (Continuation)
Condensed cash flow statements of Abengoa, S.A.
— Amounts in thousands of euros —
| | | | | | | | | | |
| | 12/31/2014 | | 12/31/2013 | | 12/31/2012 | |
|---|
Cash Flow from operating activities | | | 260,493 | | | 254,912 | | | 137,111 | |
Cash Flow—investing activities | | | | | | | | | | |
Decrease (increase) in investment and advance to affiliates | �� | | (2,208,209 | ) | | (1,257,363 | ) | | (2,118,333 | ) |
Net decrease (increase) in other assets | | | (26,293 | ) | | 148,113 | | | 25,746 | |
Cash used for investing activities | | | (2,234,502 | ) | | (1,109,250 | ) | | (2,092,587 | ) |
Cash Flow—financing activities | | | | | | | | | | |
Net increases in borrowings and other liabilities | | | 1,161,375 | | | 975,419 | | | 501,194 | |
Dividend paid to shareowner | | | (39,057 | ) | | (37,446 | ) | | (36,632 | ) |
Other | | | (3,540 | ) | | 411,016 | | | (6,075 | ) |
Cash from financing activities | | | 1,118,778 | | | 1,348,989 | | | 458,487 | |
Increase (decrease) in cash and cash equivalents during the | | | | | | | | | | |
year | | | (855,231 | ) | | 494,651 | | | (1,496,989 | ) |
Cash and cash equivalent at the beginning of the year | | | 1,030,404 | | | 535,753 | | | 2,032,742 | |
Cash and cash equivalent at the end of the year | | | 175,173 | | | 1,030,404 | | | 535,753 | |
F-259
Table of Contents
Appendices
Appendix XXII
Condensed Financial Statement of the parent company (Continuation)
Notes to the Condensed Financial Statements
Schedule I has been provided pursuant to the requirements of Rule 12- 04(a) and 5-04-(c) of Regulation SX, of the US Securities and Exchange Commission (SEC) which require condensed financial information as to the financial position, change in financial position, results of operations of a parent company, other comprehensive income statement and cash flow statement as of the same dates and for the same periods for which audited consolidated financial statements have been presented when the restricted net assets of consolidated subsidiaries exceed 25 percent of consolidated net assets as of the end of the most recently completed fiscal year.
Certain information and footnote disclosures normally included in financial statements prepared in accordance with International Financial Reporting Standards have been condensed or omitted. The footnote disclosures contain supplemental information only and, as such, these statements should be read in conjunction with the notes to the accompanying consolidated financial statements.
Basis of Presentation.
- a)
- The presentation of the parent company stands alone condensed financial statement has been prepared using the same accounting policies as set out in the accompanying consolidated financial statements except that, the Company records its investment in subsidiaries under the cost method of accounting and that financial income from credits to companies in the group are recorded under Income from services, given that the company is a holding and this type of service is part of its primary activity. Such investments are presented on the statements of financial position as "Investment in and advances to affiliates" at cost less any identified impairment loss.
- b)
- As of December 31, 2014 and 2013 there were no material contingencies, significant provisions of longterm obligations, mandatory dividend or redemption requirements of redeemable stocks or guarantees of the Company, except for those which have been separately disclosed in the Consolidated Financial Statements, if any.
- c)
- For years ended December 31, 2014, 2013 and 2012, cash dividends of €134,199 thousand, €104,202 thousand and €104,205 thousand were declared to the Company by its consolidated subsidiaries or associates, respectively.
F-260
Table of Contents
Appendices
Appendix XXII
Condensed Financial Statement of the parent company (Continuation)
Reconciliation IFRS—Abengoa
| | | | | | | | | | |
IFRS Profit/(Loss) Reconciliation | | Year Ended
December 31,
2014 | | Year Ended
December 31,
2013 | | Year Ended
December 31,
2012 | |
|---|
Parent only—IFRS (loss) profit for the period | | | 201,465 | | | 193,796 | | | 115,271 | |
Additional profit/(loss) if subsidiaries had been accounted for using the equity method of accounting as opposed to cost method | | | (76,173 | ) | | (92,351 | ) | | (59,901 | ) |
Consolidated IFRS profit/(loss) for the period attributable to the parent company | | | 125,292 | | | 101,445 | | | 55,370 | |
| | | | | | | |
IFRS Equity Reconciliation | | As of
December 31,
2014 | | As of
December 31,
2013 | |
|---|
Parent only—IFRS (loss) shareholders equity | | | 1,562,471 | | | 1,356,807 | |
Additional profit/(loss) if subsidiaries had been accounted for on the equity method of a accounting as opposed to cost method | | | (117,201 | ) | | (35,953 | ) |
Consolidated IFRS shareholders equity attributable to the parent company | | | 1,445,270 | | | 1,320,854 | |
F-261