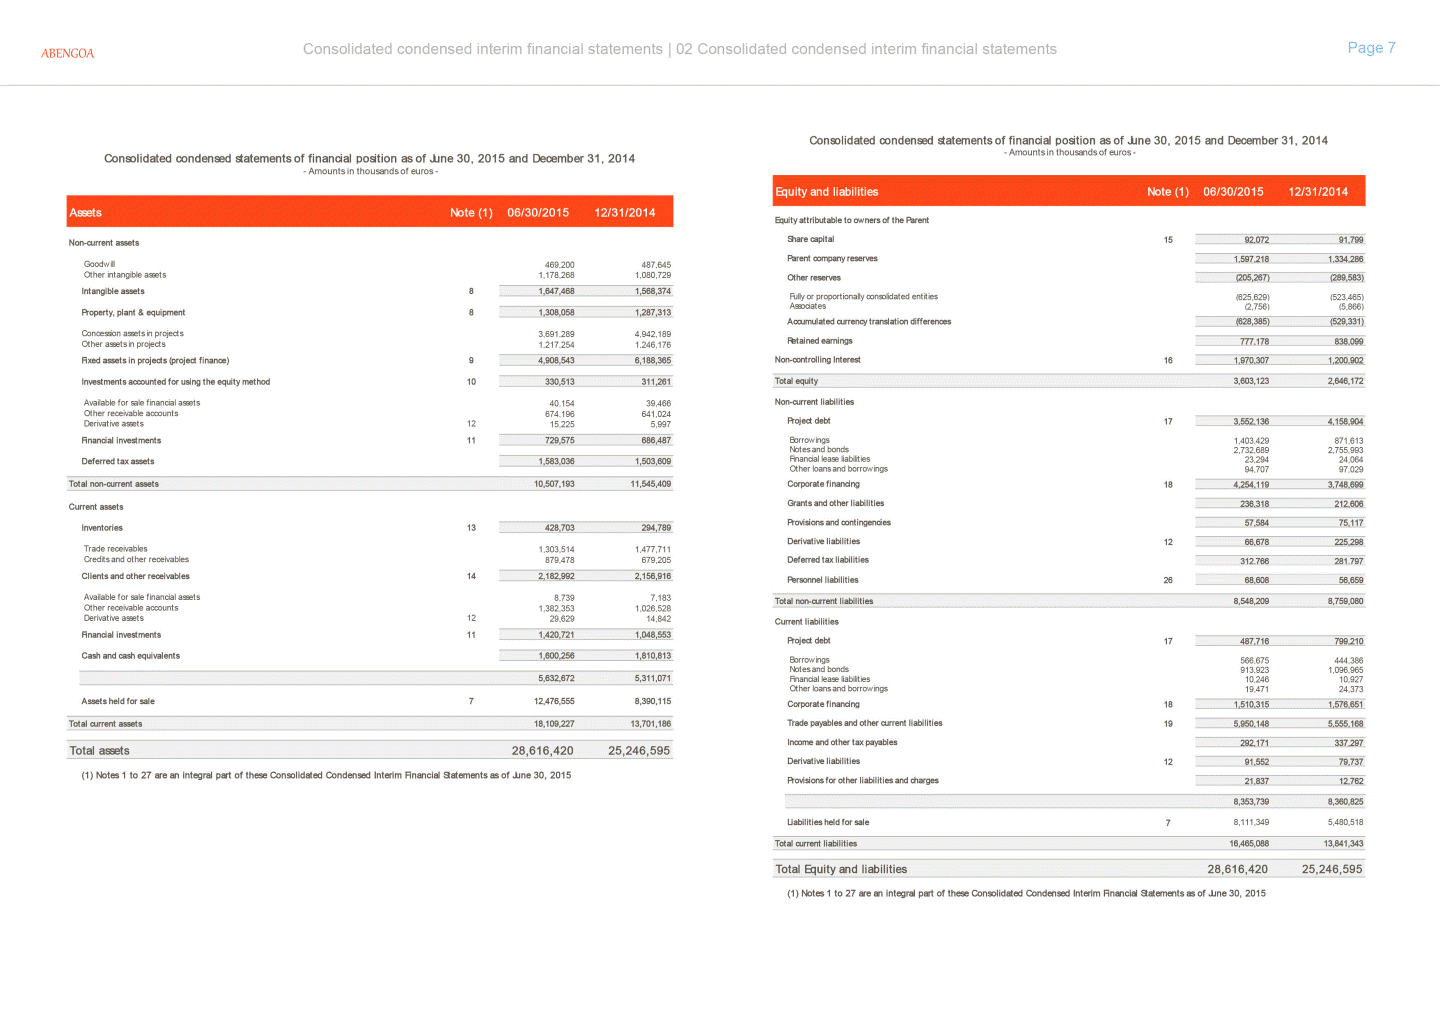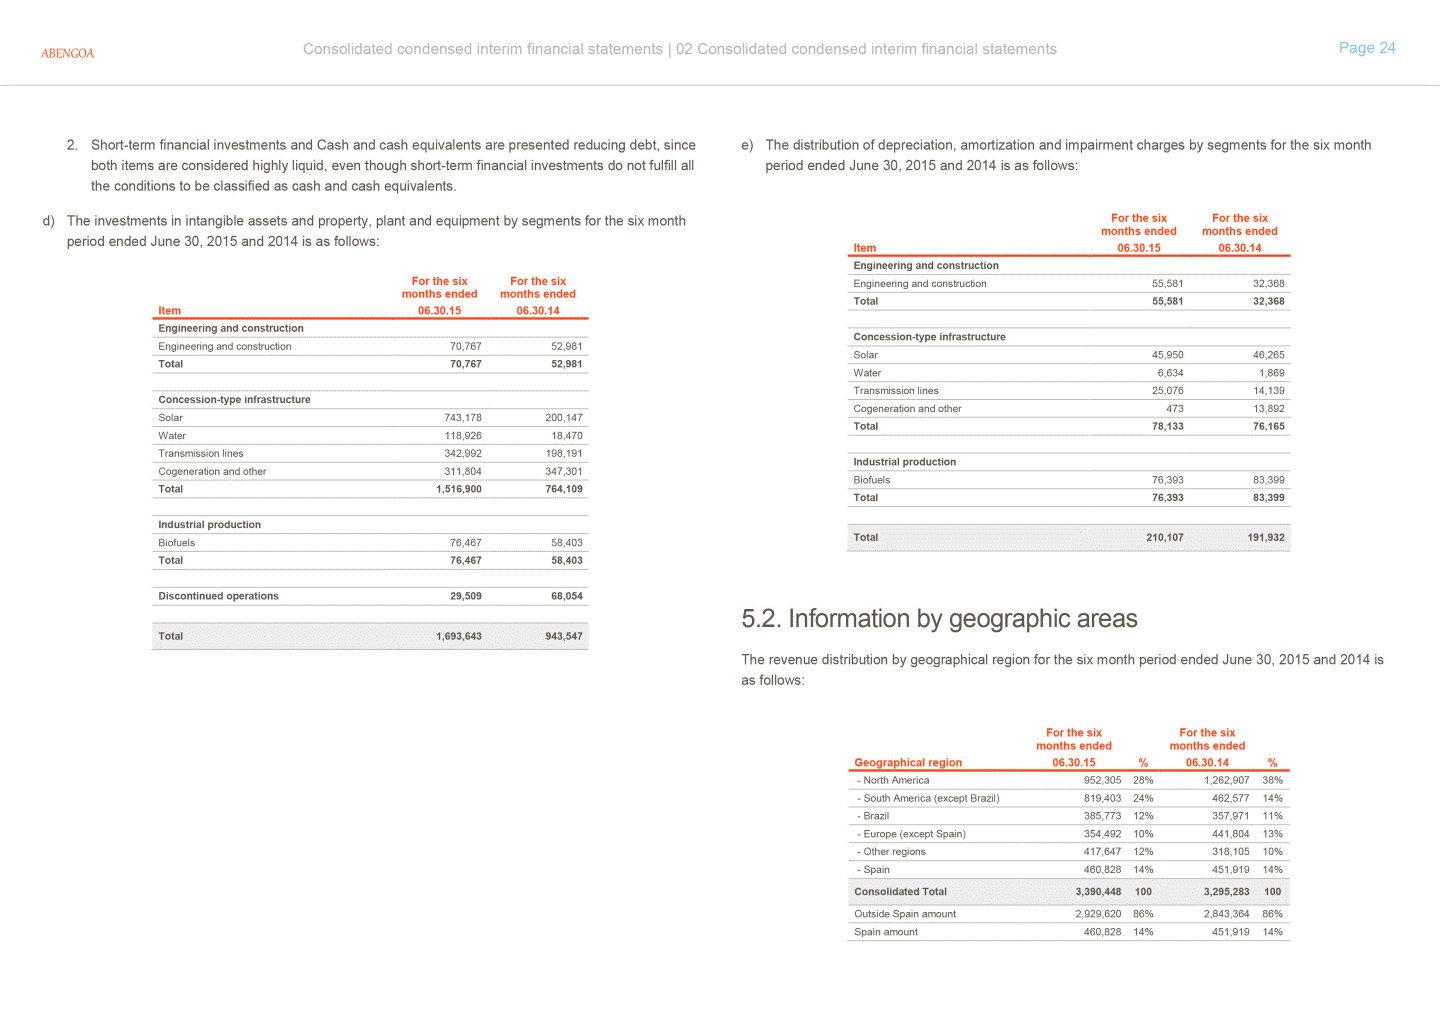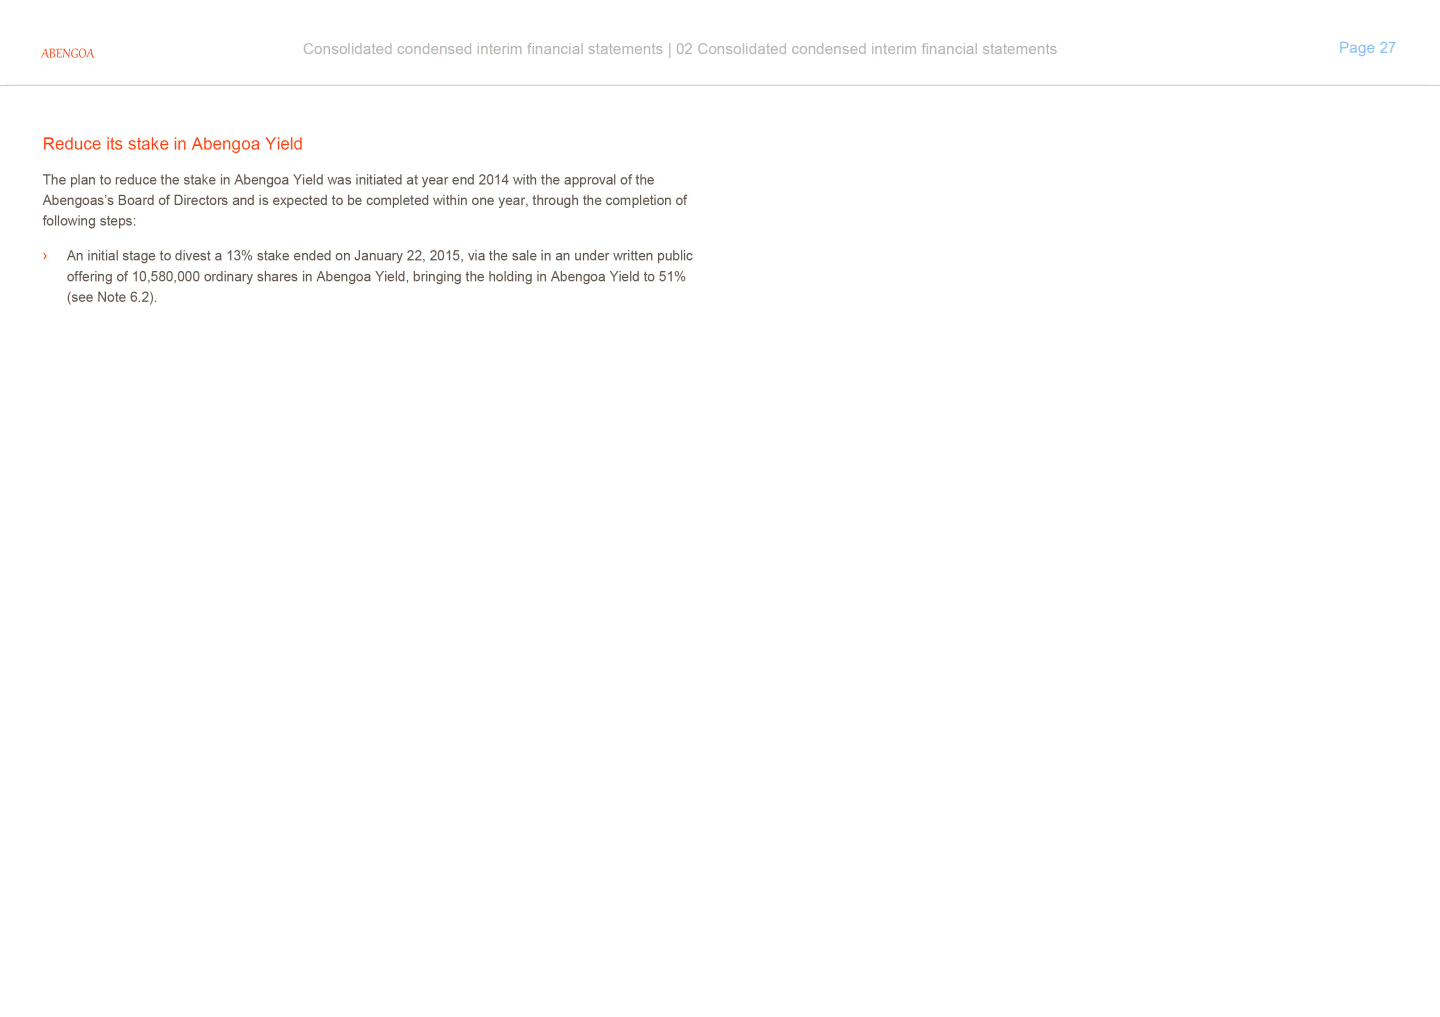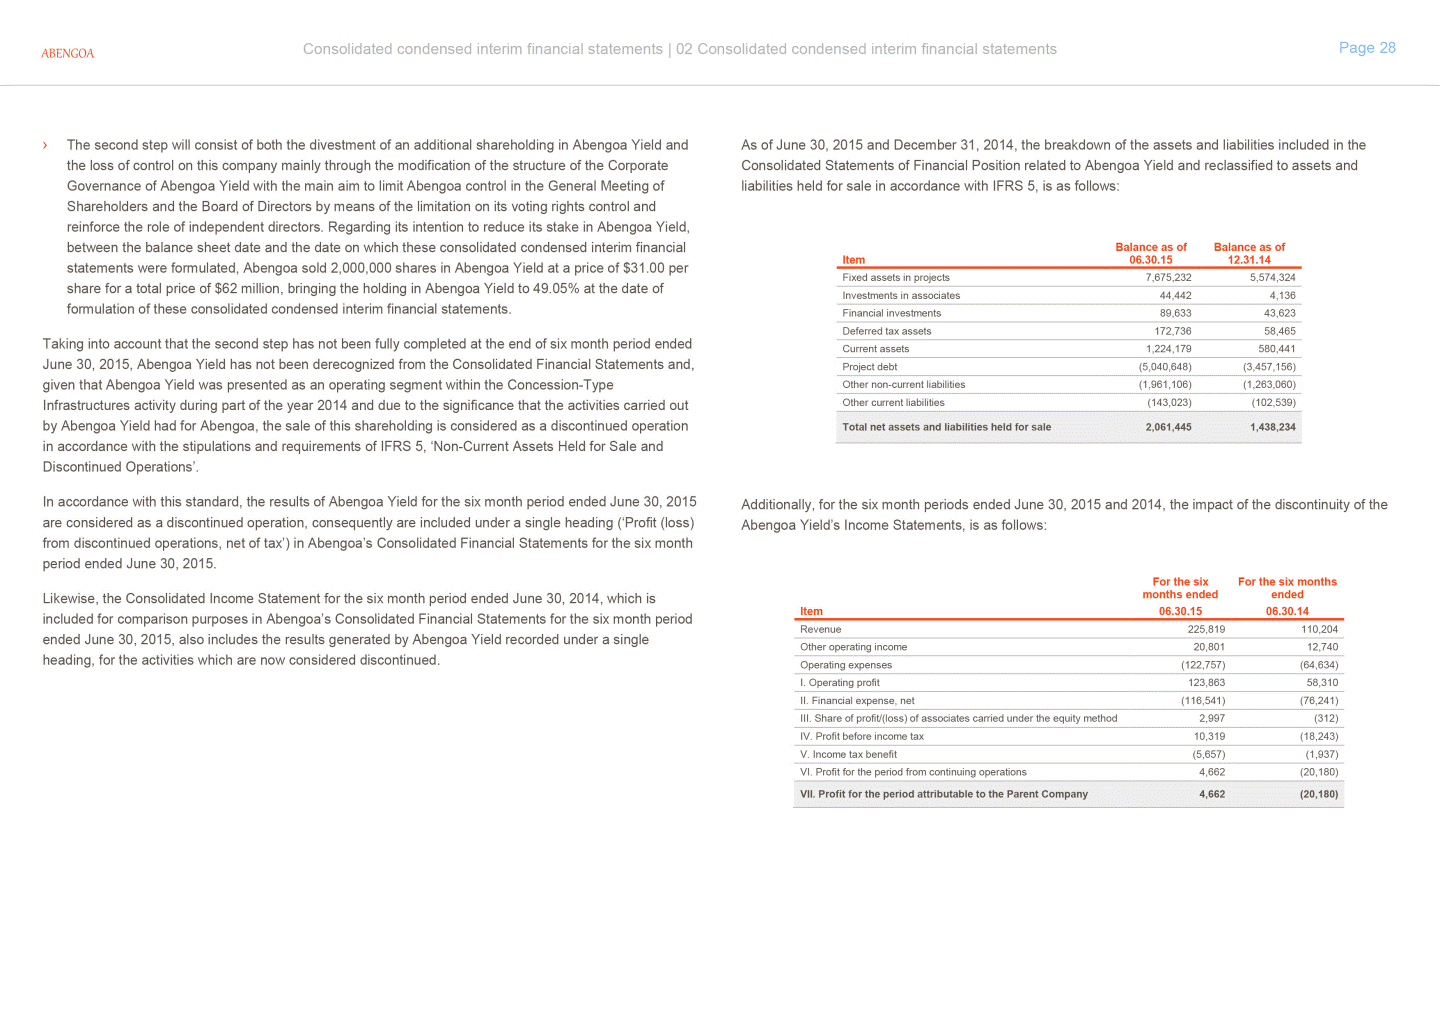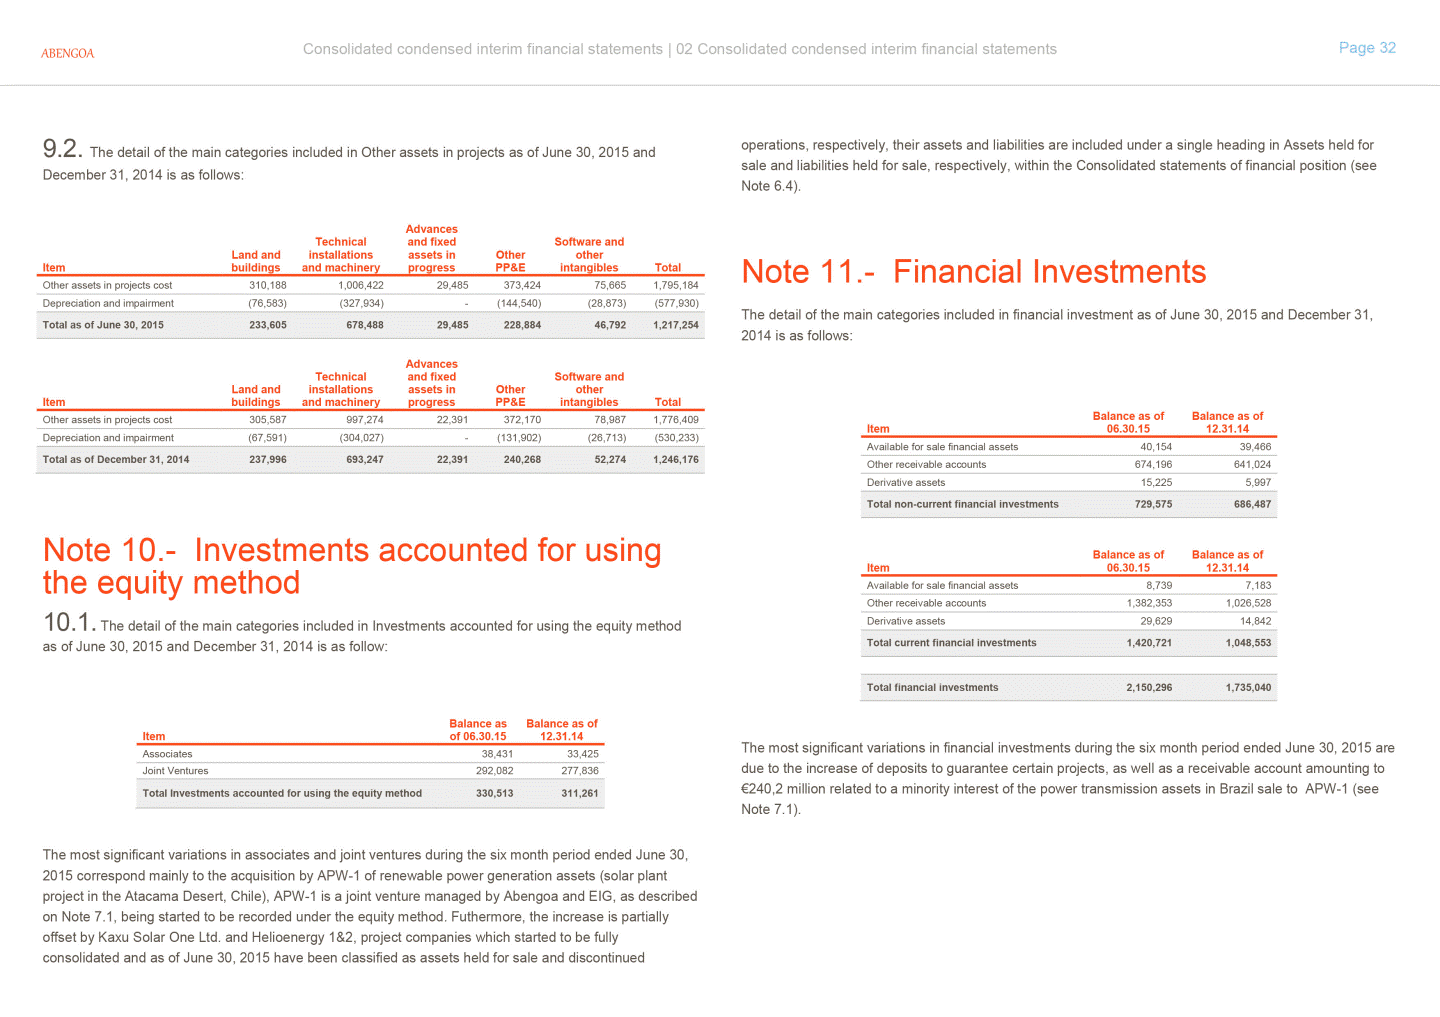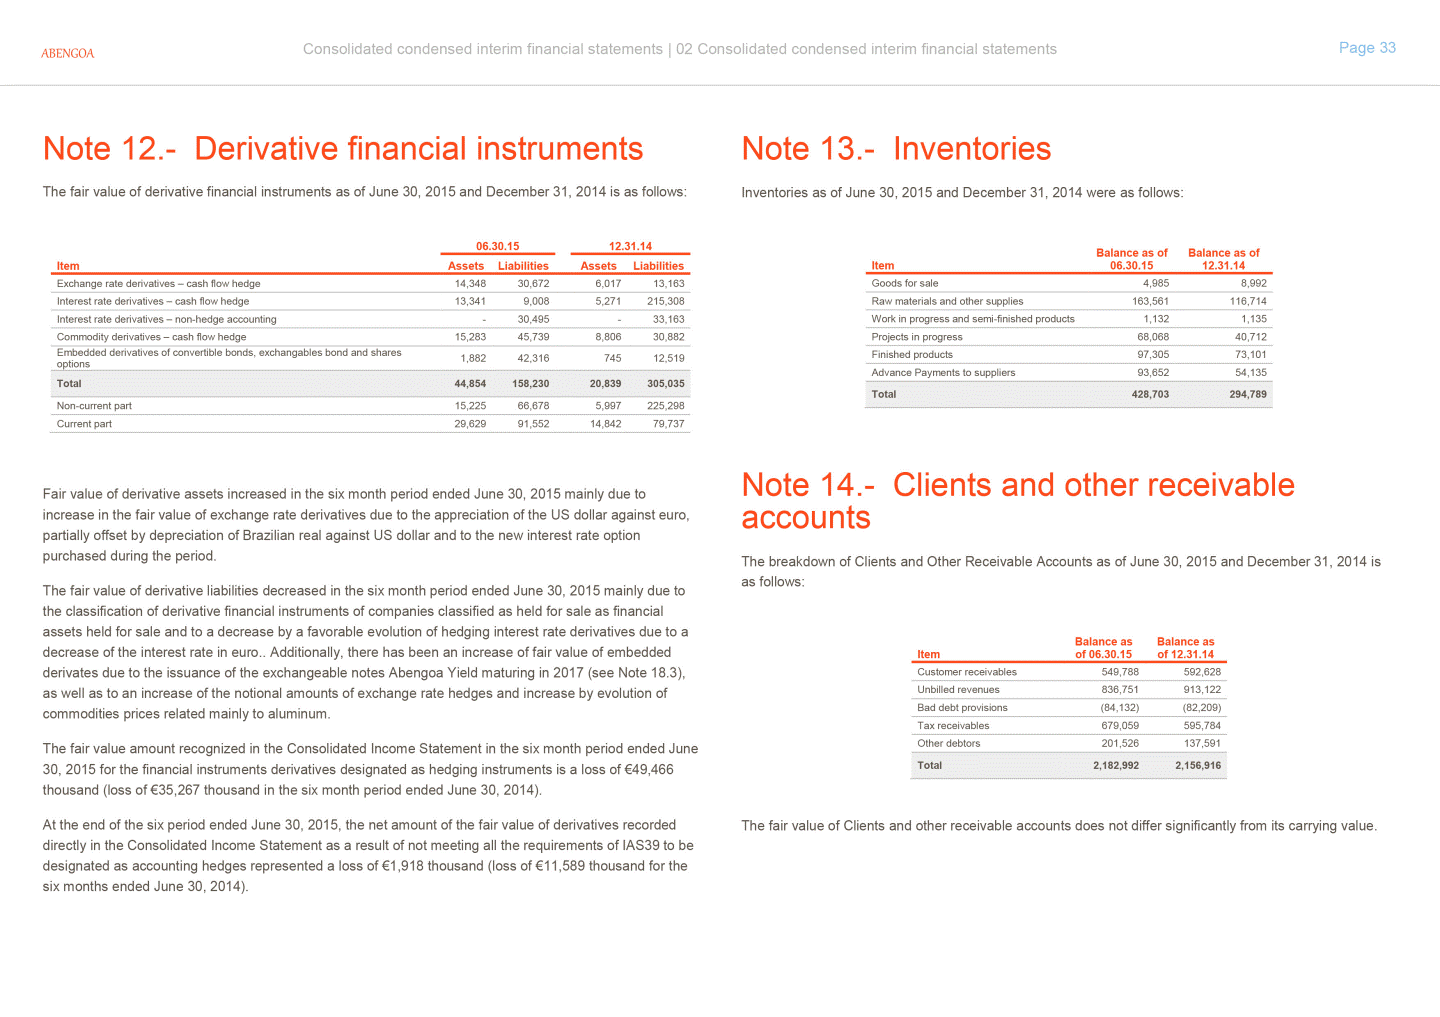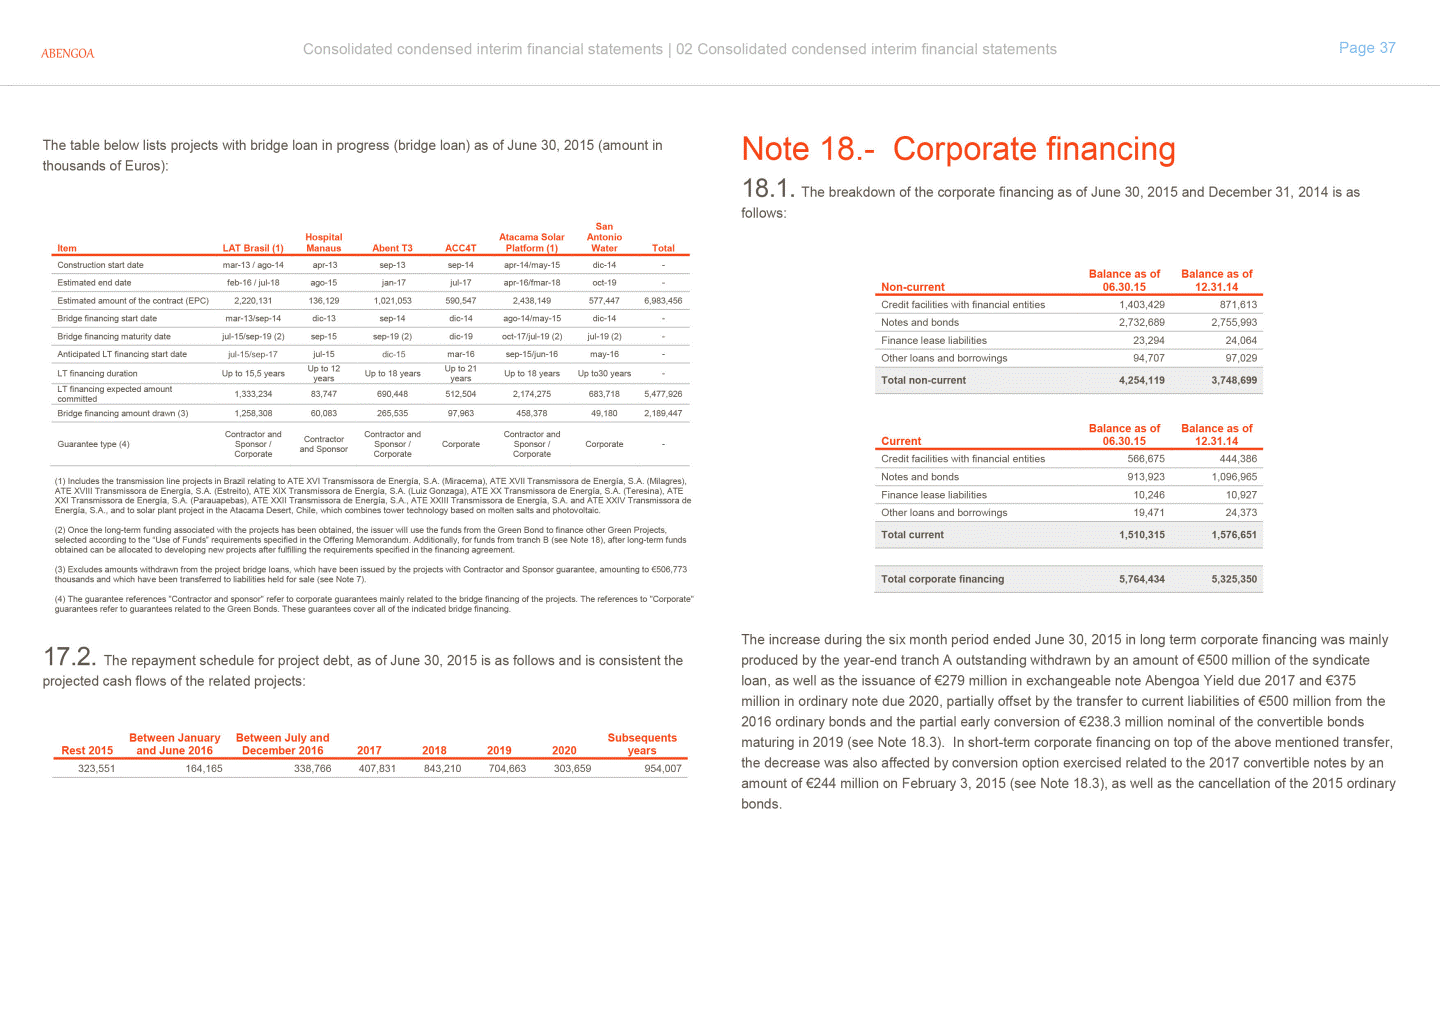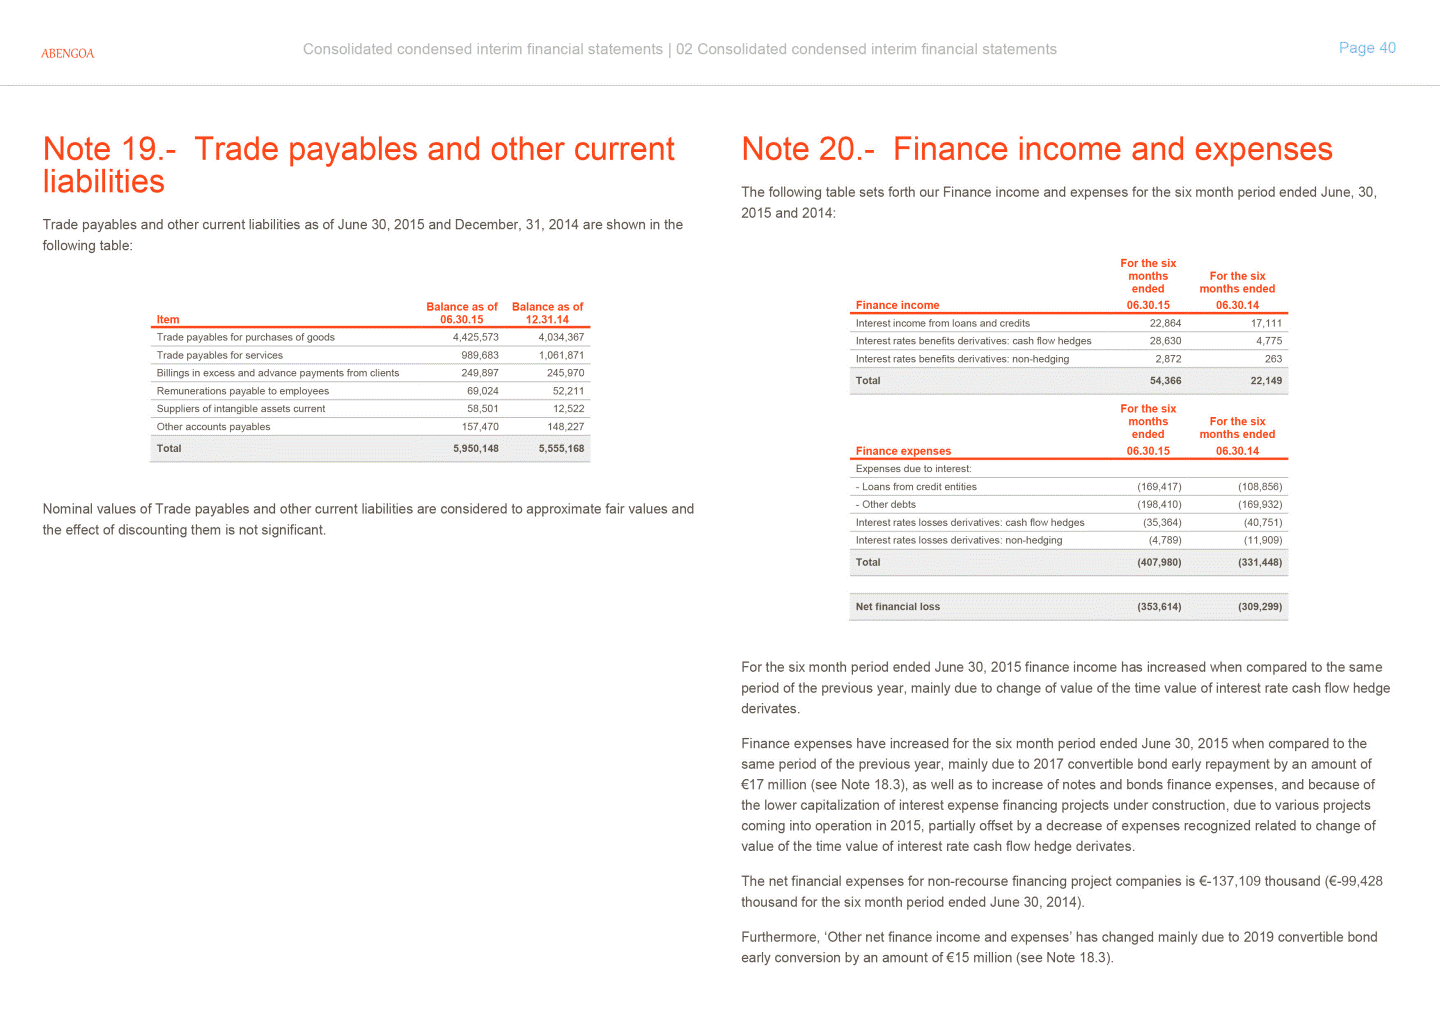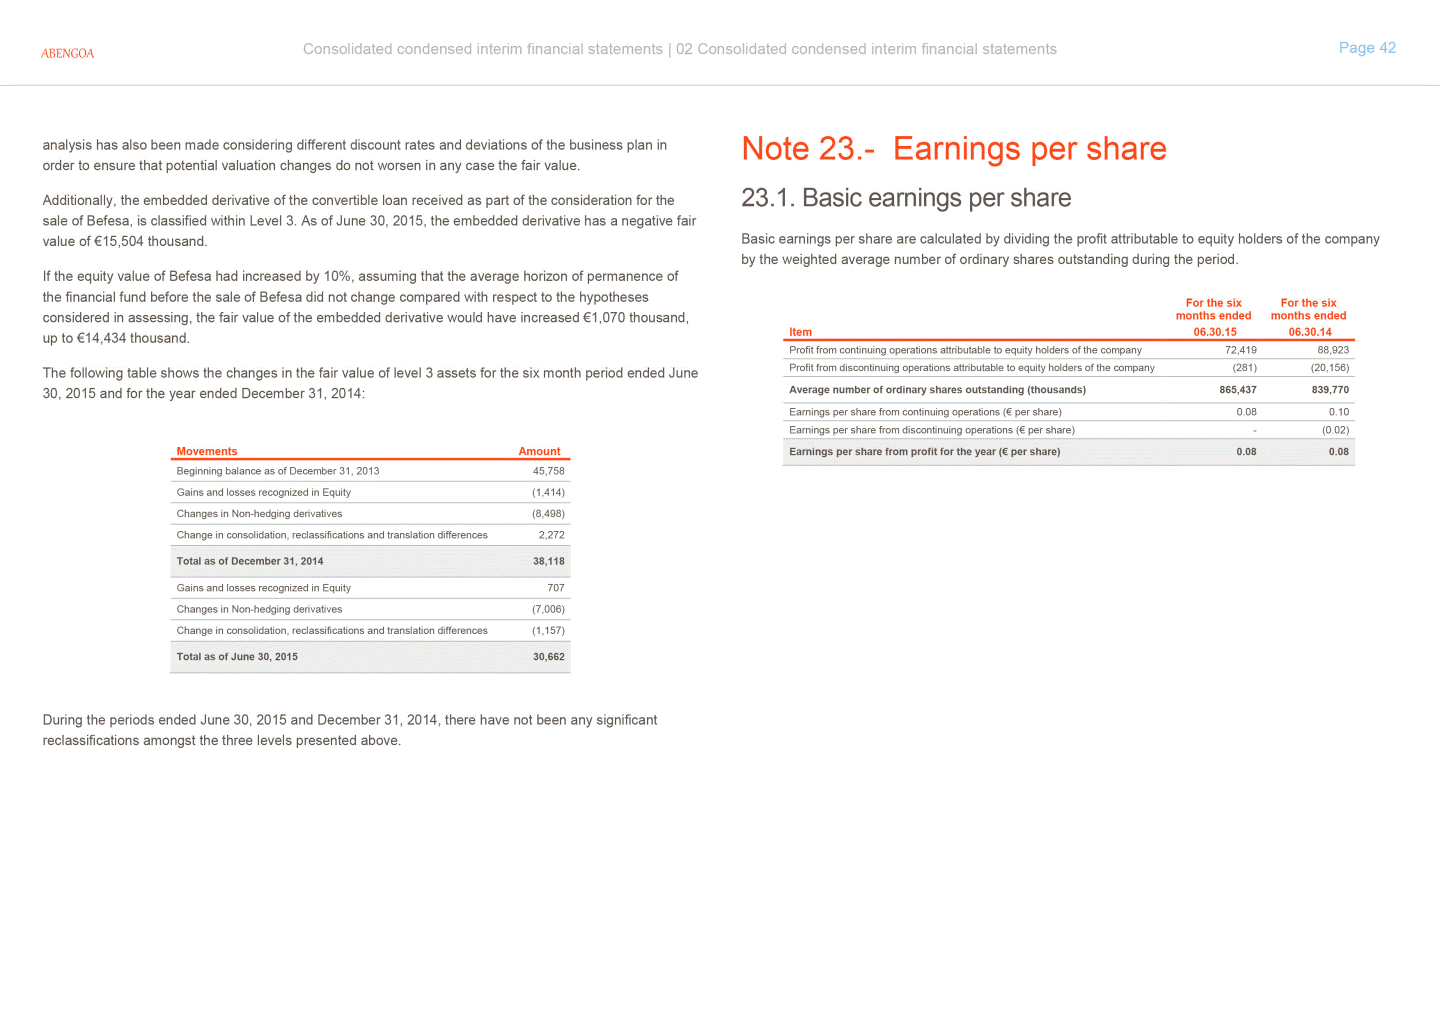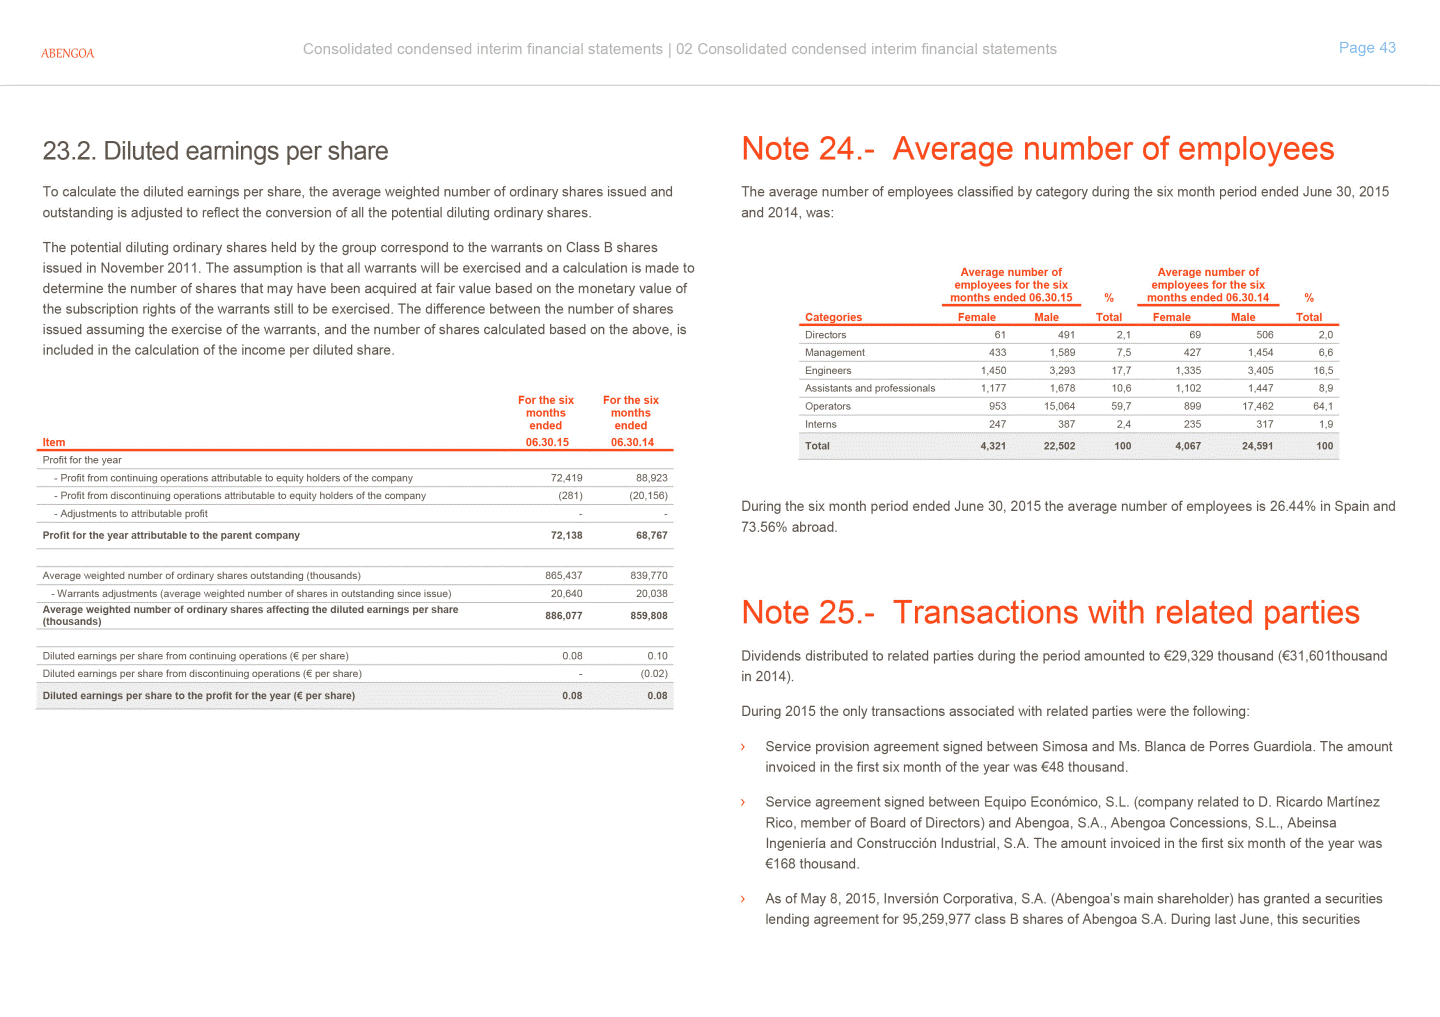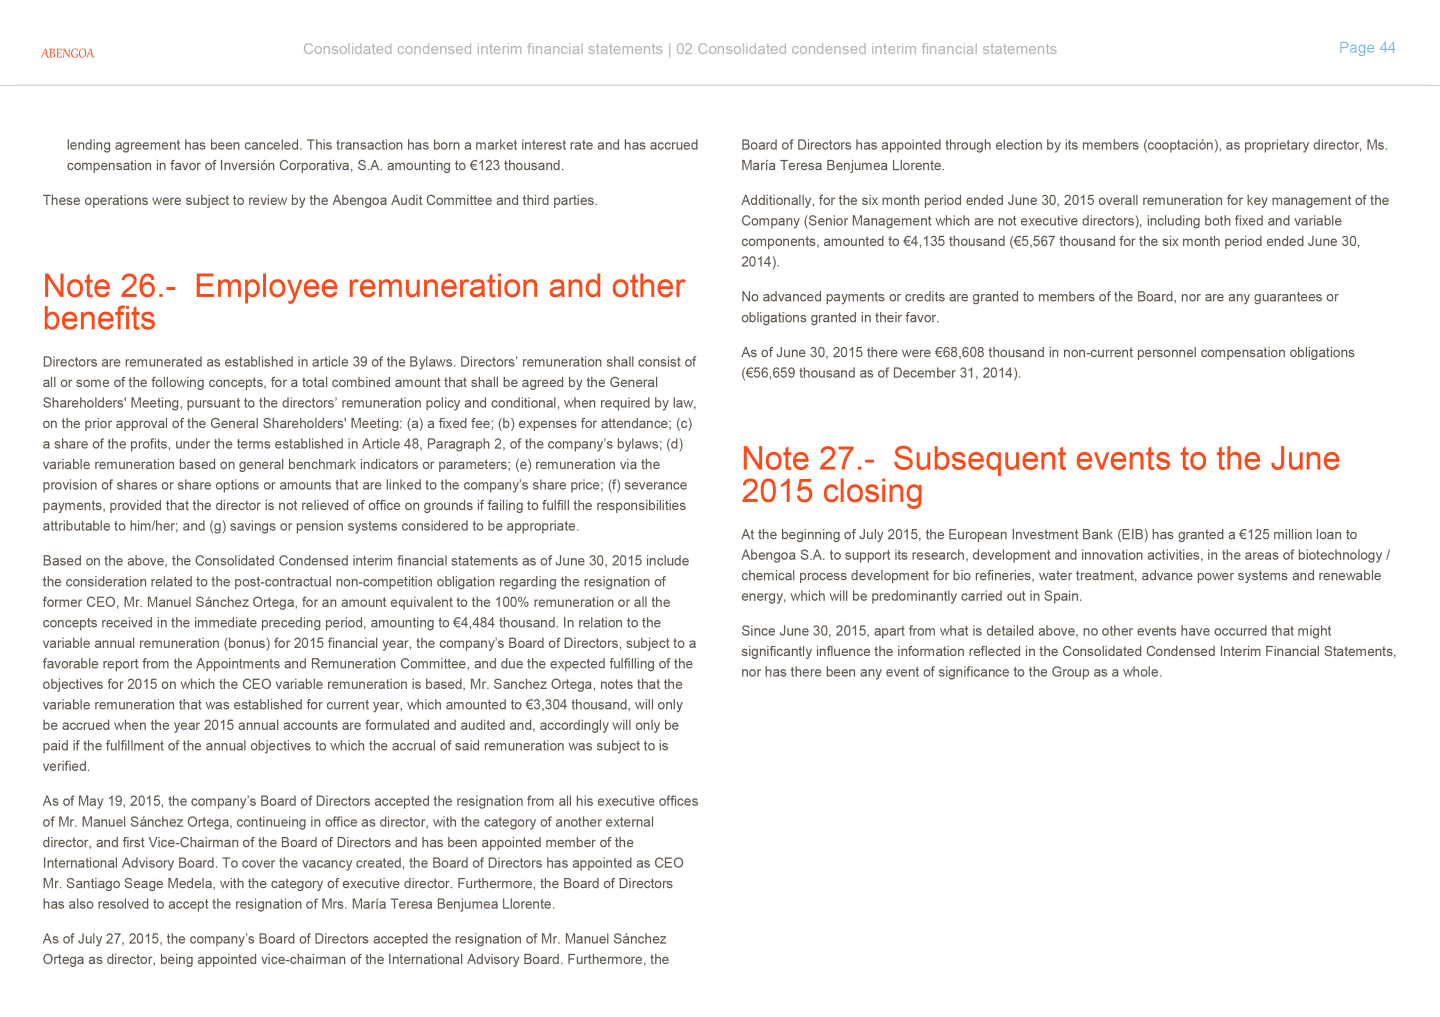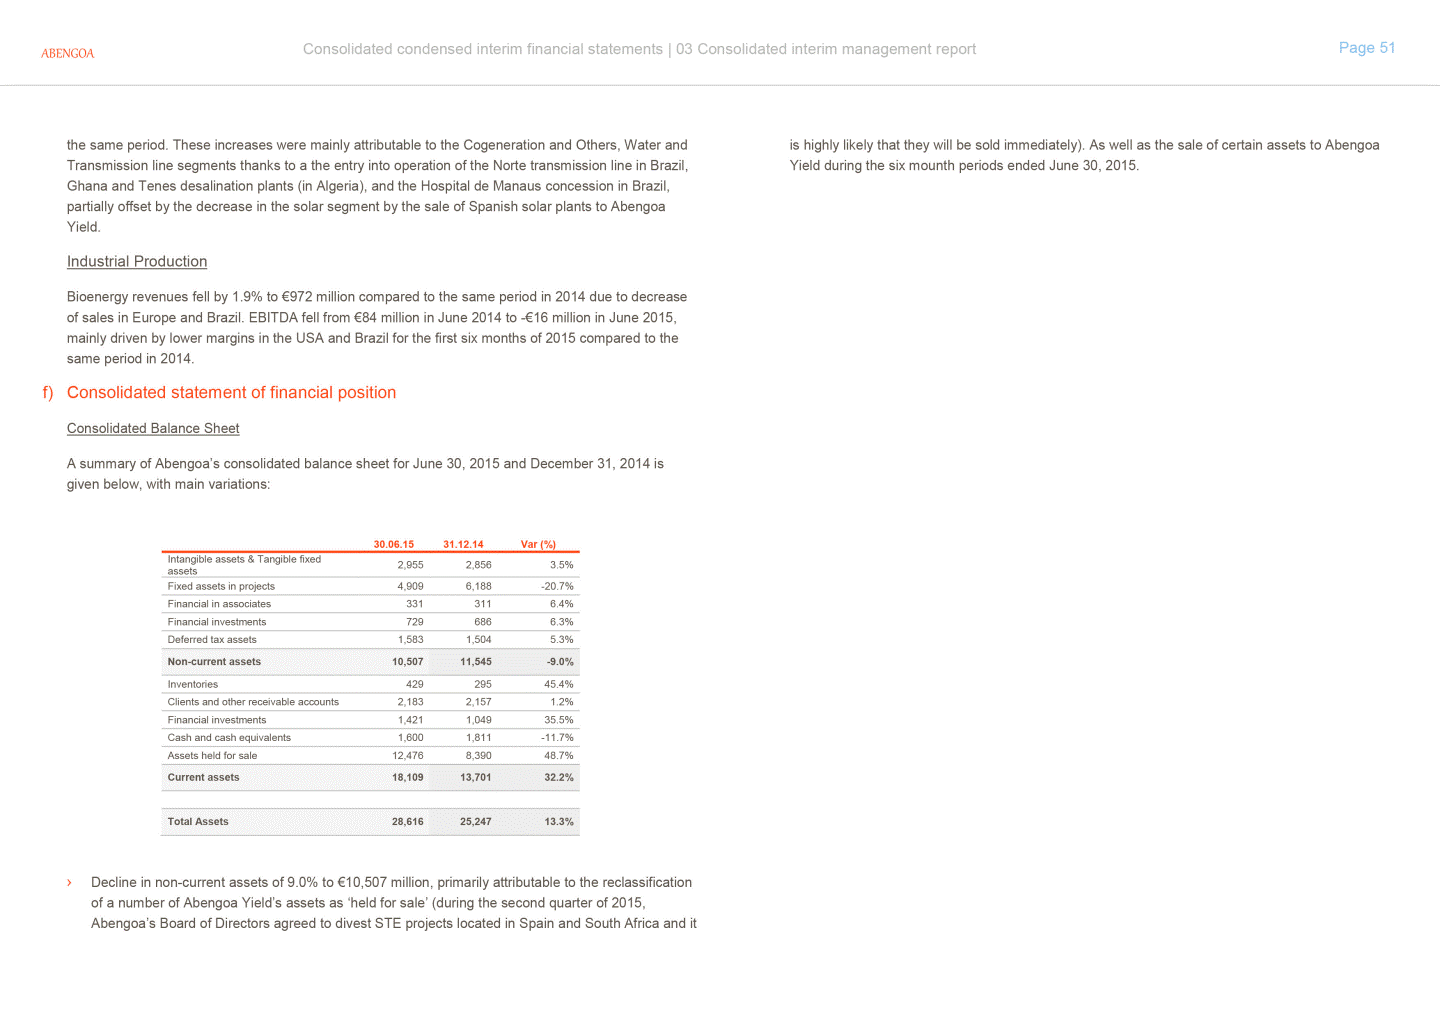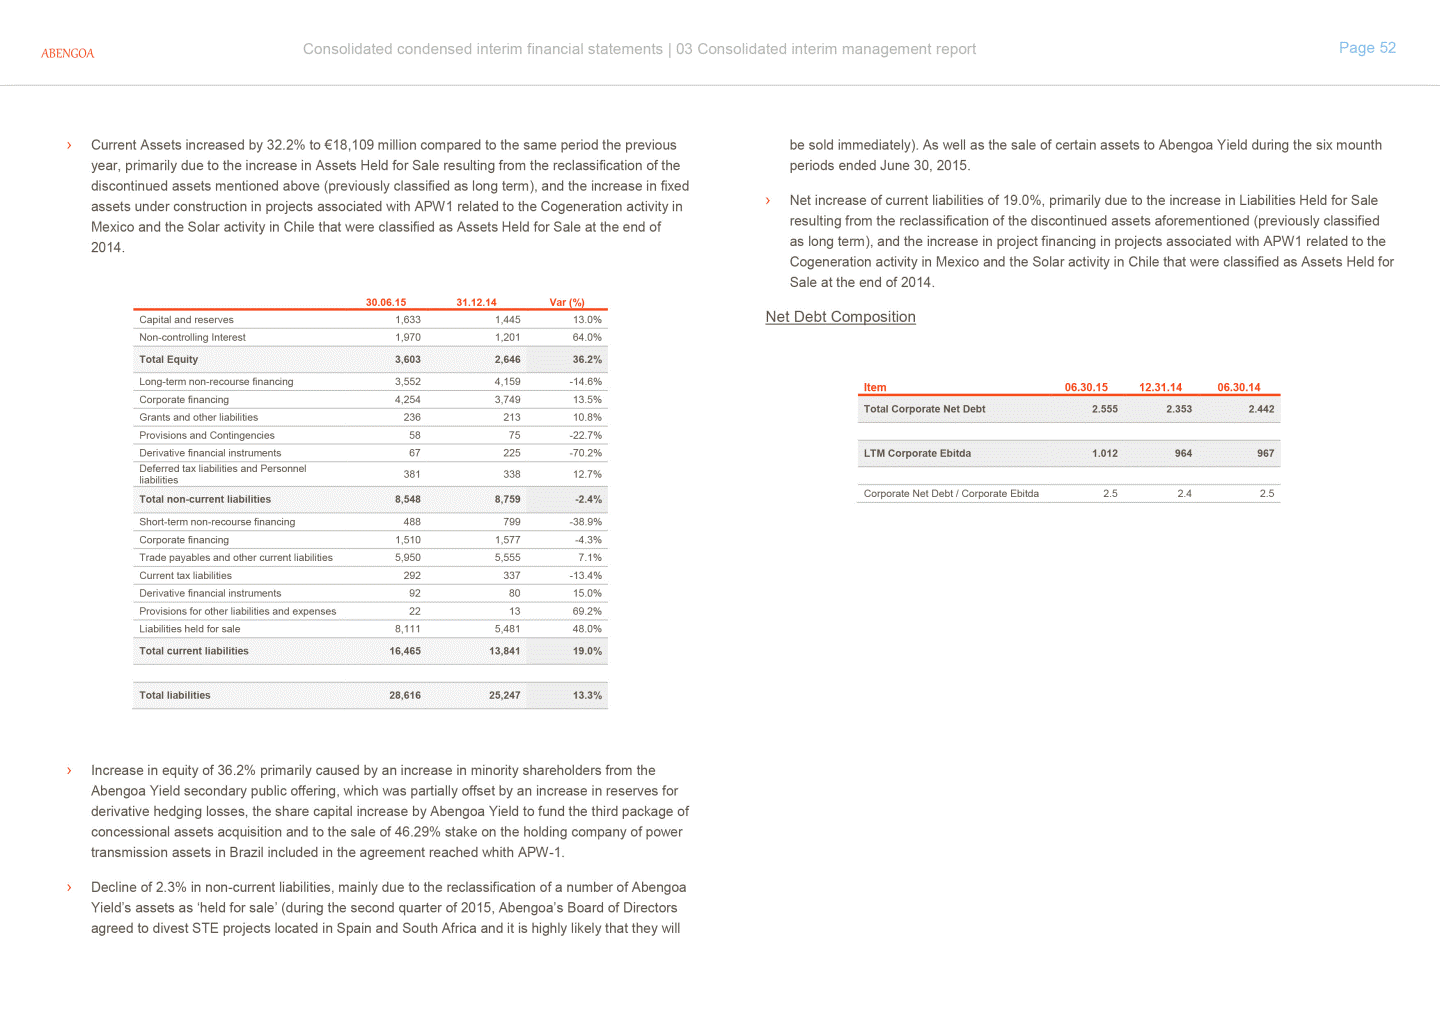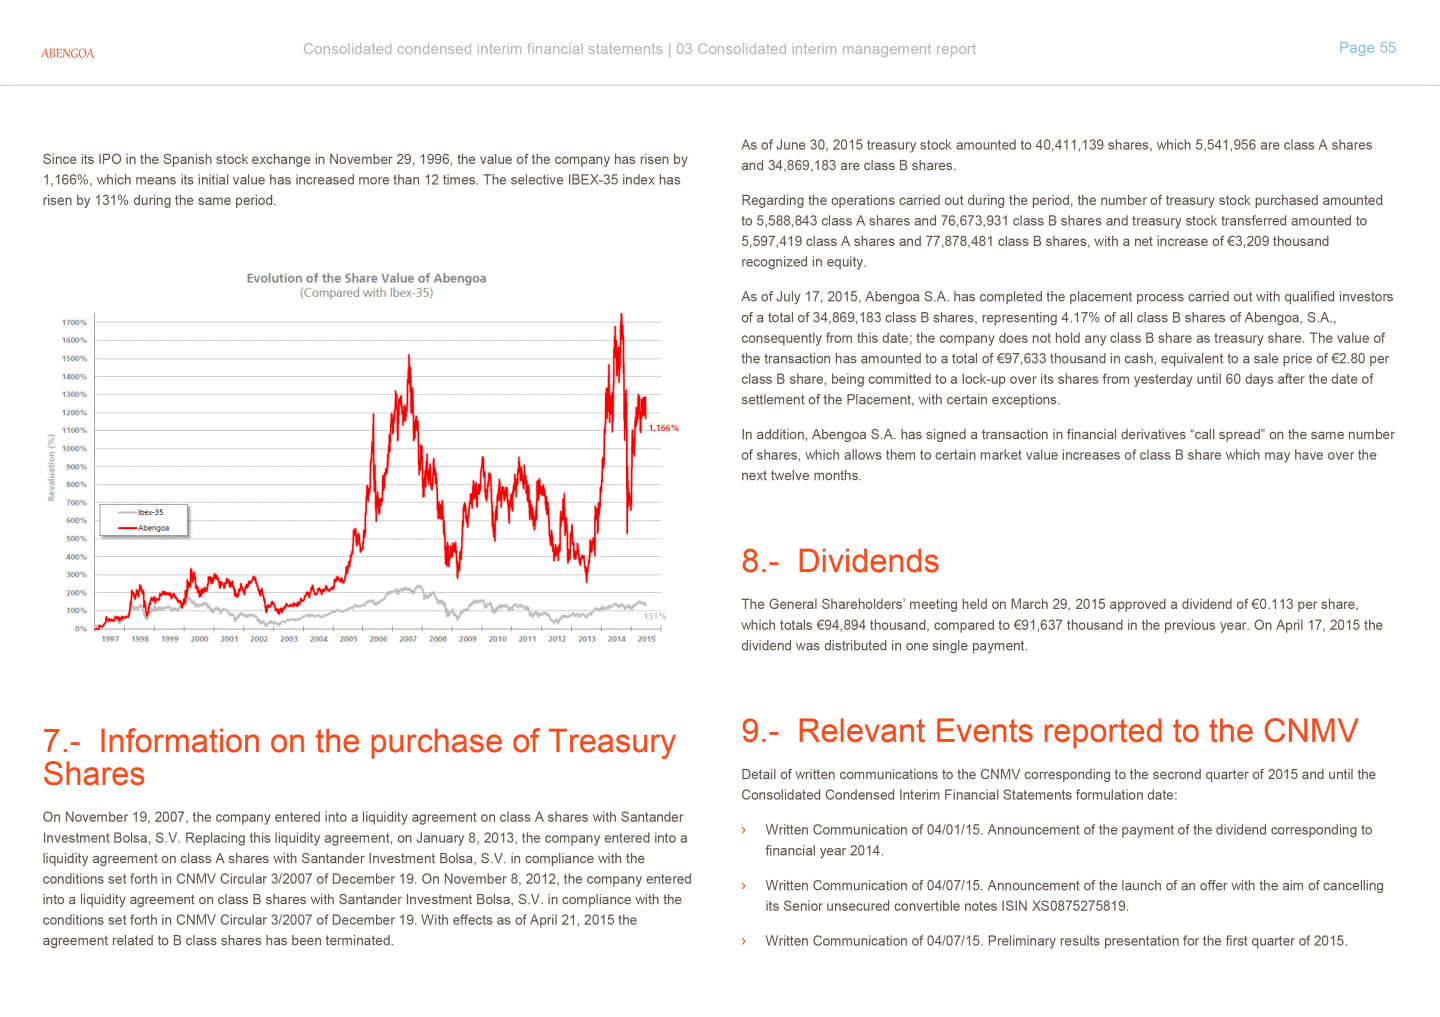
| Consolidated condensed interim financial statements | 02 Consolidated condensed interim financial statements Page 23 ABENGOA The criteria used to obtain the assets and liabilities per segment, are described as follows: Engineering and construction Industrial production Concession-type infrastructure ›With the only objective of presenting liabilities by segment, Net Corporate Debt has been allocated by segments, since its main purpose is to finance investments in projects and in companies needed to expand businesses and lines of activity of the group. Additionally, bridge loans issued at the corporate level has been allocated between different operating segments depending on the projects where funds have been destinated. Cog. and other Balance as of 12.31.14 Item Eng. and const. Solar Water Trans. Biofuels Assets allocated Intangible assets 396,309 276 6,775 - 915 1,164,099 1,568,374 Property plant and equipment 275,952 23,113 4,761 - - 983,487 1,287,313 Fixed assets in projects 2,111,631 484,317 2,273,131 321,102 998,184 6,188,365 c) Net Debt by segment as June 30, 2015 and December 31, 2014 is as follows: Current financial investments 711,312 87,237 9,403 30,694 8,775 201,132 1,048,553 Cash and cash equivalents 498,629 339,434 36,585 119,428 34,143 782,594 1,810,813 Subtotal allocated 1,882,202 2,561,691 541,841 2,423,253 364,935 4,129,496 11,903,418 Unallocated assets Engineering and construction Industrial production Non-current and associated financ. invest. Concession-type infrastructure - - - - - - 997,748 Cog. and other Balance as of 06.30.15 Deferred tax assets - - - - - - 1,503,609 Item Eng. and const. Solar Water Trans. Biofuels Other current assets - - - - - - 2,451,705 Bank debt and current/non-curr. bond 1,547,690 794,432 93,971 318,278 136,611 2,725,734 5,616,716 Assets held for sale - - - - - - 8,390,115 L-T and S-T project debt 8,820 876,537 277,572 1,919,642 513,834 443,447 4,039,852 Subtotal unallocated - - - - - - 13,343,177 Obligat. under curr./non-curr. financial lease 14,535 - - - - 19,005 33,540 Current financial investments (1,142,822) (54,464) (6,442) (20,760) (9,366) (186,867) (1,420,721) Cash and cash equivalents (517,392) (212,224) (25,103) (80,894) (36,494) (728,149) (1,600,256) Engineering and construction Industrial production Concession-type infrastructure Cog. and other Balance as of 12.31.14 Item Eng. and const. Solar Water Trans. Biofuels Engineering and construction Industrial production Concession-type infrastructure Liabilities allocated L-T and S-T corpor. financing 1,351,648 983,267 105,978 362,154 98,904 2,267,006 5,168,957 Cog. and other Balance as of 12.31.14 Item Eng. and const. Solar Water Trans. Biofuels L-T and S-T non rec. financing 6,082 1,722,176 517,975 1,770,138 465,041 476,702 4,958,114 Bank debt and current/non-curr. bond 1,351,648 983,267 105,978 362,154 98,904 2,267,006 5,168,957 L-T and S-T lease liabilities 14,494 - - - - 20,497 34,991 L-T and S-T project debt 6,082 1,722,176 517,975 1,770,138 465,041 476,702 4,958,114 Subtotal allocated 1,372,224 2,705,443 623,953 2,132,292 563,945 2,764,205 10,162,062 Obligat. under curr./non-curr. financial 14,494 - - - - 20,497 34,991 lease Unallocated liabilities Current financial investments (711,312)(87,237)(9,403)(30,694)(8,775)(201,132) (1,048,553) L-T Other loans and borrowings - - - - - - 121,402 Cash and cash equivalents (498,629)(339,434) (36,585) (119,428) (34,143) (782,594) (1,810,813) L-T grants and other liabilities - - - - - - 212,606 - - - - - - Provisions and contingencies 87,879 L-T derivative financial instruments - - - - - - 225,298 Deferred tax liabilities - - - - - - 281,797 L-T personnel liabilities - - - - - - 56,659 In order to obtain Net Debt, by segment: Other current liabilities - - - - - - 5,972,202 Liabilities held for sale - - - - - - 5,480,518 1. With the only objective of presenting liabilities by segment, Net Corporate Debt has been allocated by operating segment, since its main purpose is to finance investments in projects and in companies needed to expand the businesses and lines of activity of the group. Additionally, bridge loans issued at the corporate level has been allocated between different operating segments depending on the projects where funds have been destinated. Subtotal unallocated - - - - - - 12,438,361 Total liabilities - - - - - - 22,600,423 Equity unallocated - - - - - - 2,646,172 Total liabilities and equity unallocated - - - - - - 15,084,533 Total liabilities and equity------25,246,595 Total net debt (cash)162,2832,278,772577,9651,982,170521,0271,780,4797,302,696 Total net debt (cash)(89,169)1,404,281339,9982,136,266604,5852,273,1706,669,131 Total Assets------25,246,595 |
