First Quarter Earnings Call
May 6, 2010
© PPL Corporation 2010
Exhibit 99.2
© PPL Corporation 2010
1
Any statements made in this presentation about future operating
results or other future events are forward-looking statements under
the Safe Harbor Provisions of the Private Securities Litigation Reform
Act of 1995. Actual results may differ materially from such forward-
looking statements. A discussion of factors that could cause actual
results or events to vary is contained in the Appendix to this
presentation and in the Company’s SEC filings.
Cautionary Statements and Factors
That May Affect Future Results
© PPL Corporation 2010
2
J. H. Miller
P. A. Farr
W. H. Spence
Agenda
First Quarter 2010 Earnings and 2010
Earnings Forecast and Outlook
Segment Results and Financial Overview
Operational Review
Q&A
© PPL Corporation 2010
3
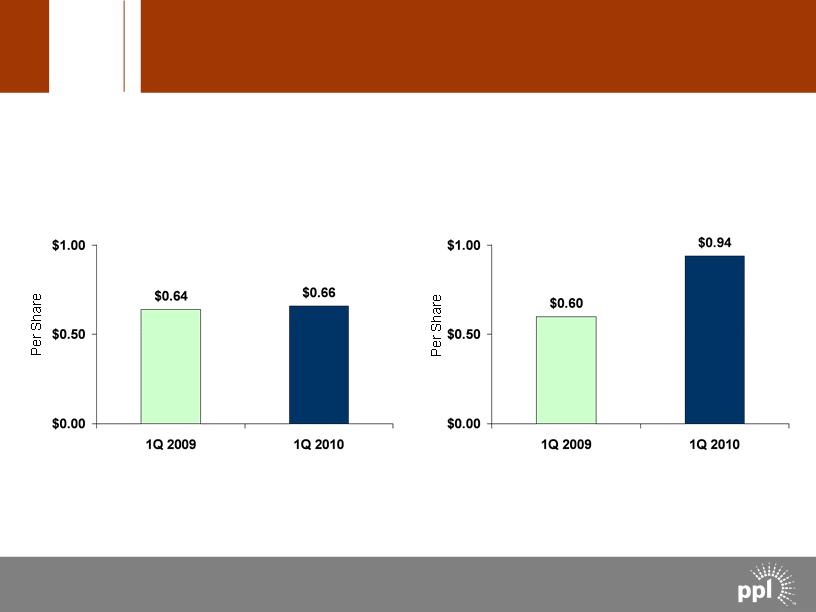
Reported Earnings
Earnings from Ongoing Operations
Note: See Appendix for the reconciliation of earnings from ongoing operations to reported earnings.
Earnings Results
© PPL Corporation 2010
4
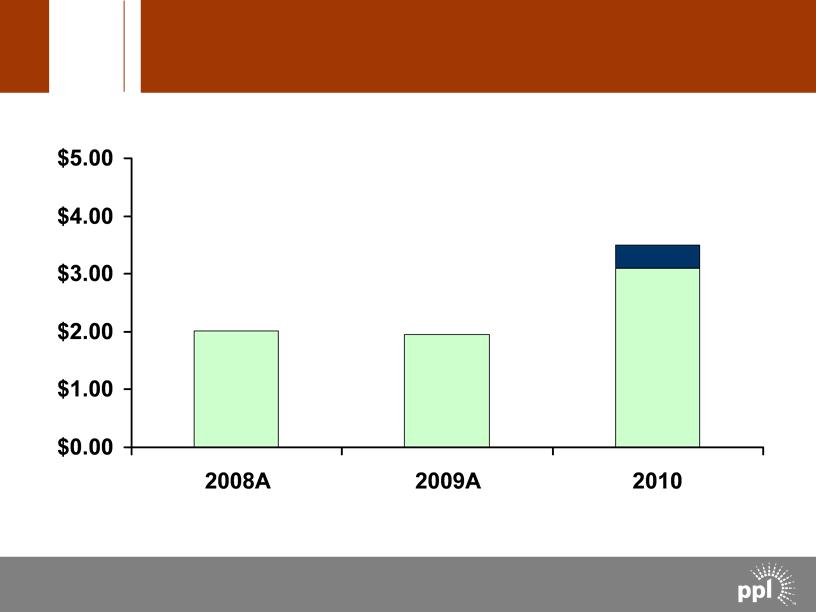
Forecast
$2.02
$3.50
Per Share
$1.95
$3.10
Note: See Appendix for the reconciliation of earnings from ongoing operations to reported earnings.
Strong Expected Earnings Growth
© PPL Corporation 2010
5
$ 0.34
$0.60
$0.94
Total
(0.04)
0.24
0.20
International Delivery
(0.04)
0.14
0.10
Pennsylvania Delivery
$ 0.42
$0.22
$0.64
Supply
Change
Q1
2009
Q1
2010
Note: See Appendix for the reconciliation of earnings from ongoing operations to reported earnings. |
Ongoing Earnings Overview
© PPL Corporation 2010
6
Note: See Appendix for the reconciliation of earnings from ongoing operations to reported earnings. |
| 1st Quarter |
2009 EPS - Ongoing Earnings | | $0.22 |
Margins - East | 0.53 | |
O&M | (0.06) | |
Depreciation | (0.02) | |
Income Taxes & Other | (0.03) | |
Total | | 0.42 |
2010 EPS - Ongoing Earnings | | $0.64 |
Supply Segment
Earnings Drivers
© PPL Corporation 2010
7
Note: See Appendix for the reconciliation of earnings from ongoing operations to reported earnings. |
| 1st Quarter |
2009 EPS - Ongoing Earnings | | $0.14 |
Delivery Margins | (0.02) | |
O&M | (0.02) | |
Total | | (0.04) |
2010 EPS - Ongoing Earnings | | $0.10 |
Pennsylvania Delivery Segment
Earnings Drivers
© PPL Corporation 2010
8
Note: See Appendix for the reconciliation of earnings from ongoing operations to reported earnings. |
| 1st Quarter |
2009 EPS - Ongoing Earnings | | $0.24 |
Utility Revenues | 0.02 | |
O&M | (0.02) | |
Financing Costs | (0.03) | |
Effect of Exchange Rates | 0.02 | |
Income Taxes & Other | (0.03) | |
Total | | (0.04) |
2010 EPS - Ongoing Earnings | | $0.20 |
International Delivery Segment
Earnings Drivers
© PPL Corporation 2010
9
Forecast
Note: See Appendix for the reconciliation of earnings from ongoing operations to reported earnings. |
|
$2.02
$3.50
Per Share
$1.95
$3.10
Strong Expected Earnings Growth
© PPL Corporation 2010
10
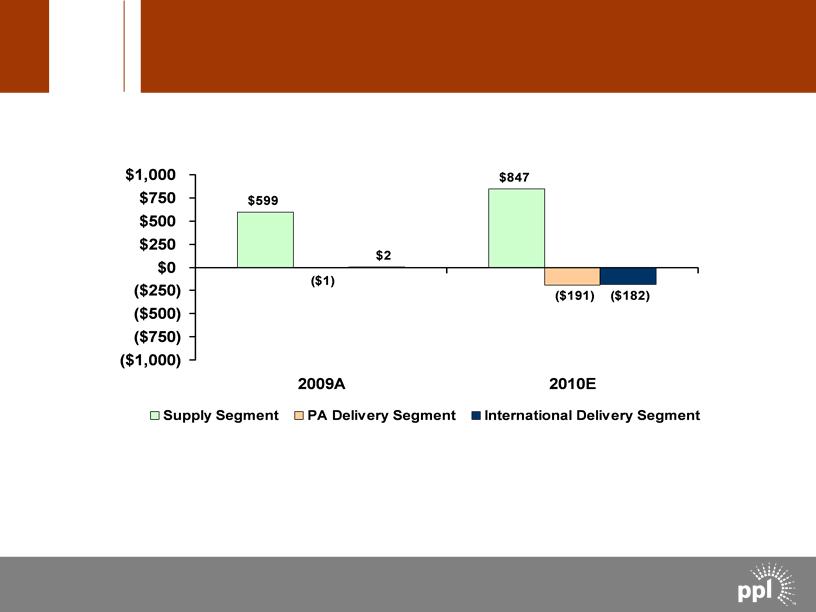
Millions
Note: See Appendix for reconciliation of cash from operations to free cash flow before dividends
Free Cash Flow before Dividends Forecast
© PPL Corporation 2010
11
PA and International Delivery Segment
Operational Update
PA Delivery
§ PPLEU completed 4th solicitation for 2011 to mid-2013 procurement
period
§ PPLEU filed for $114.7 million distribution rate increase
International Delivery
§ WPD agreed to outcome of Distribution Price Control 5 (DPCR5)
• New rates effective April 1
© PPL Corporation 2010
12
PPL Electric Utilities Rate Case Facts
§ Seeking $114.7 million distribution rate increase
• Future test year is 2010
• Requested allowed ROE of 11.75%
• 2010 Common Equity of 48.4%
• 2010 Distribution Rate Base of $2.245 billion
§ 1% change in ROE = $20 million in revenue
§ Docket # R-2010-2161694
© PPL Corporation 2010
13
Supply Segment Operational Update
§ Completed sale of Long Island generation assets
§ Susquehanna nuclear power plant set operational record
§ Susquehanna Unit #1 completed refueling outage and uprate work
© PPL Corporation 2010
14
As of March 31, 2010
*Represents expected sales based on current business plan assumptions
**Represents energy, capacity, congestion and other revenues
| | | 2010 | | 2011 | | 2012 |
Baseload | | | | | | | |
Expected Generation* (Million MWhs) | | | 52.0 | | 52.1 | | 56.1 |
East | | | 43.3 | | 43.8 | | 47.6 |
West | | | 8.7 | | 8.3 | | 8.5 |
| | | | | | | |
Current Hedges (%) | | | 100% | | 96% | | 61% |
East | | | 100% | | 97% | | 58% |
West | | | 100% | | 91% | | 79% |
| | | | | | | |
Average Hedged Price (Energy Only) ($/MWh) | | | $58 | | $57 | | $59 |
East | | | $59 | | $58 | | $60 |
West | | | $49 | | $55 | | $56 |
| | | | | | | |
Expected Average Price (Fully Loaded) ($/MWh) | | | $69 | | $65 | | $66 |
East** | | | $71 | | $67 | | $69 |
West | | | $49 | | $55 | | $56 |
| | | | | | | |
% Hedged Through Swaps/Options Energy Transactions | | | 97% | | 95% | | 61% |
% Hedged Through Load-following Transactions | | | 3% | | 1% | | 0% |
Intermediate/Peaking | | | | | | | |
Expected Generation (Million MWhs) | | | 4.8 | | 5.0 | | 5.1 |
Current Hedges (%) | | | 20% | | 0% | | 0% |
Supply Segment Asset Hedge Positions
© PPL Corporation 2010
15
Note: As of March 31, 2010
(1) Weighted Average $/ton at mine for east wholly owned plants; excludes Keystone & Conemaugh
2010 2011 2012
Uranium 100% 100% 100%
Coal
East 99% 91% 78%
West 100% 100% 91%
Total 99% 93% 81%
| 2010 | 2011 | 2012 |
| Hedge
Level | Price | Hedge
Level | Price | Hedge
Level | Price |
% Fixed Base
Price | 93% | $49 | 29% | $53 | 20% | $65 |
% Collars | 0% | N/A | 68% | $45-
$52 | 80% | $44-
$52 |
% Diesel
Surcharge | 7% | $44 | 4% | $45 | 0% | N/A |
Eastern Coal Contracts (1)
Current Fuel Contracts - Base Prices
© PPL Corporation 2010
A-1
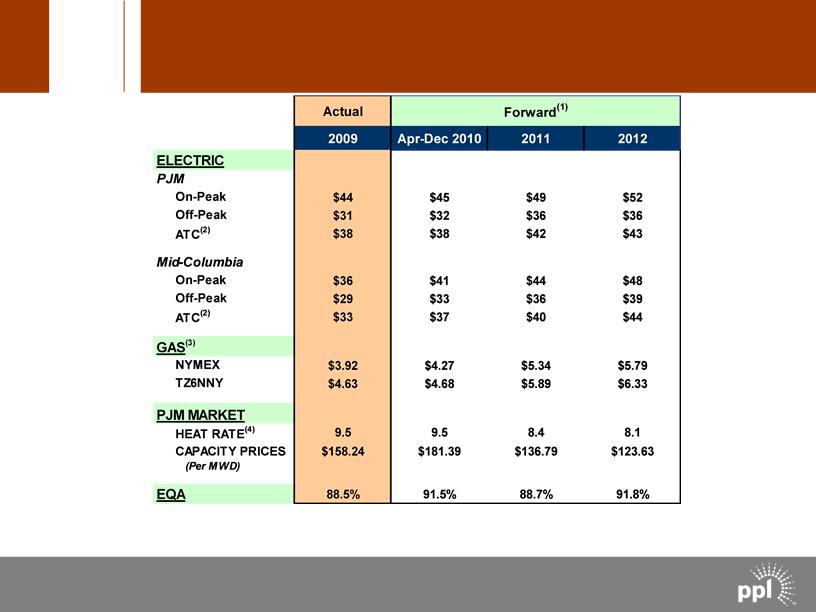
(1) | Market prices based on the average of broker quotes as of 3/31/10 |
(2) | 24-hour average |
(3) | NYMEX and TZ6NNY forward gas prices on 3/31/10 |
(4) | Market Heat Rate = PJM on-peak power price divided by TZ6NNY gas price |
Market Prices
© PPL Corporation 2010
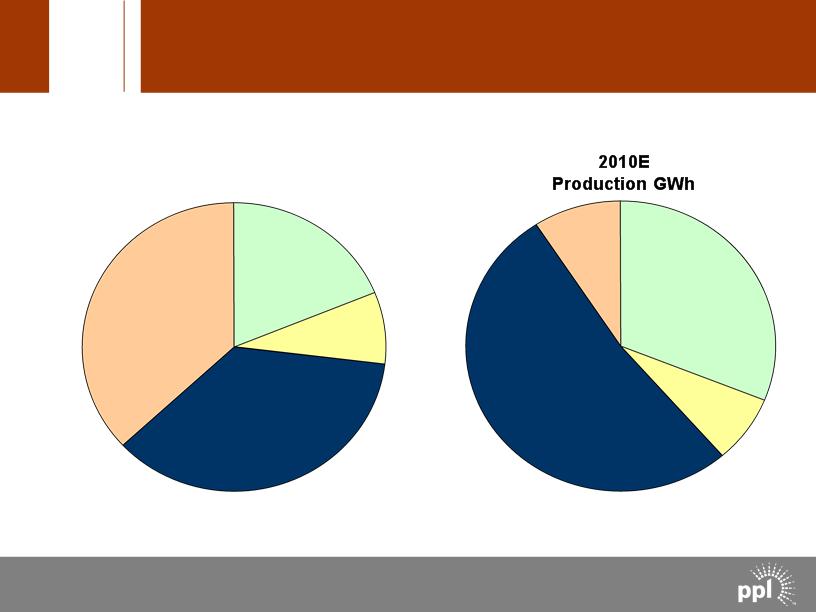
PPL Supply Business Overview
A-2
Gas/Oil
37%
Coal
36%
Nuclear
19%
Hydro
8%
2010E
Installed Capacity MW
Gas/Oil
9%
Coal
52%
Nuclear
31%
Hydro
8%
Note: Includes tolling agreements
© PPL Corporation 2010
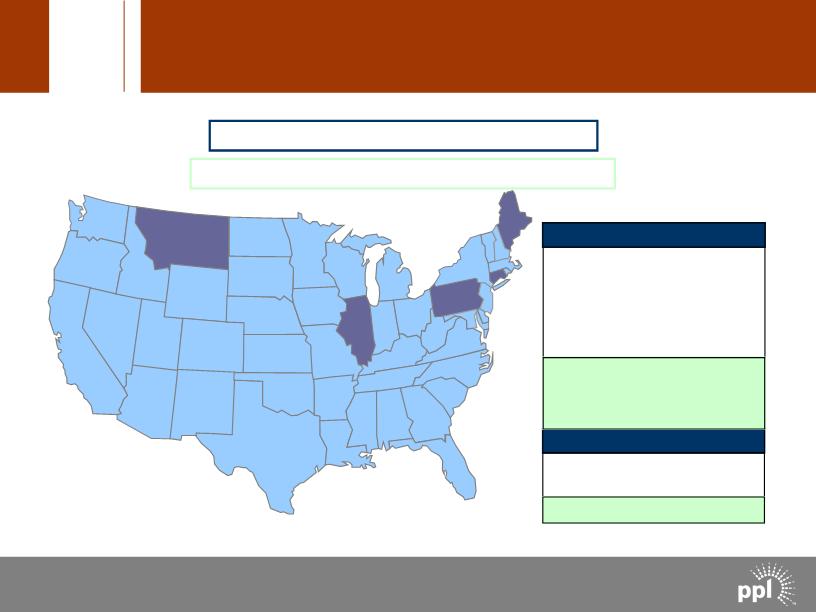
West 1,286 MW
PPL’s Generation Portfolio
Total Domestic Generation: 11,695 MW
Planned Uprate Projects or Additions: 239 MW
Coal 3,497
Nuclear 2,206
Oil 1,672
Gas 2,212
Hydro 324
CTs 465
QFs 33
Coal 682
Hydro 604
Hydro Uprate (2012) 28
Nuclear Uprate (2010-2011) 53
Hydro Uprate (2013) 125
Gas/Oil Uprate (2011) 30
Landfill Gas Uprate (2011) 3
A-3
(1) | Includes tolling agreements, and renewable energy projects |
(2) | Includes 12 MWs associated with the proposed sale of the remaining PPL Maine hydro assets |
(1)
(2)
(1)
Note: As of March 31, 2010
East 10,409 MW
© PPL Corporation 2010
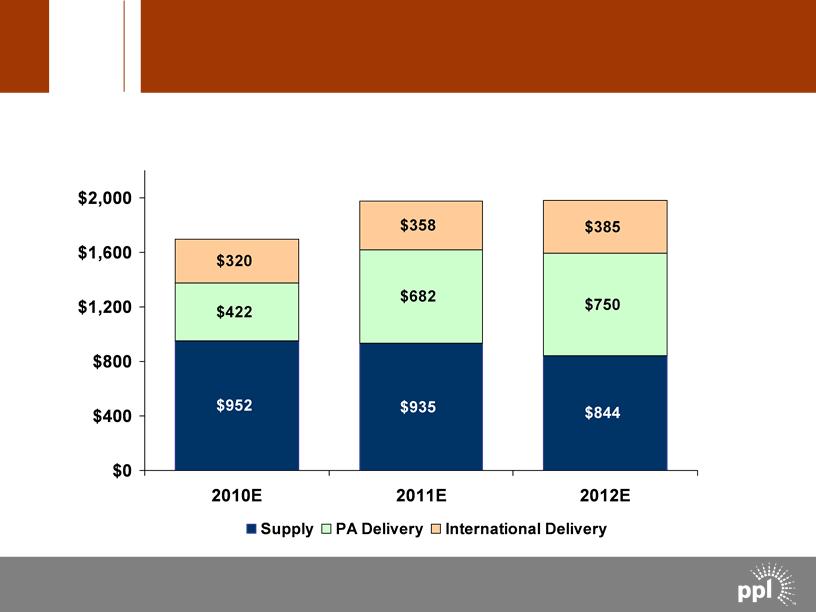
Millions
$1,694
$1,975
$1,979
A-4
Capital Expenditures by Segment
© PPL Corporation 2010
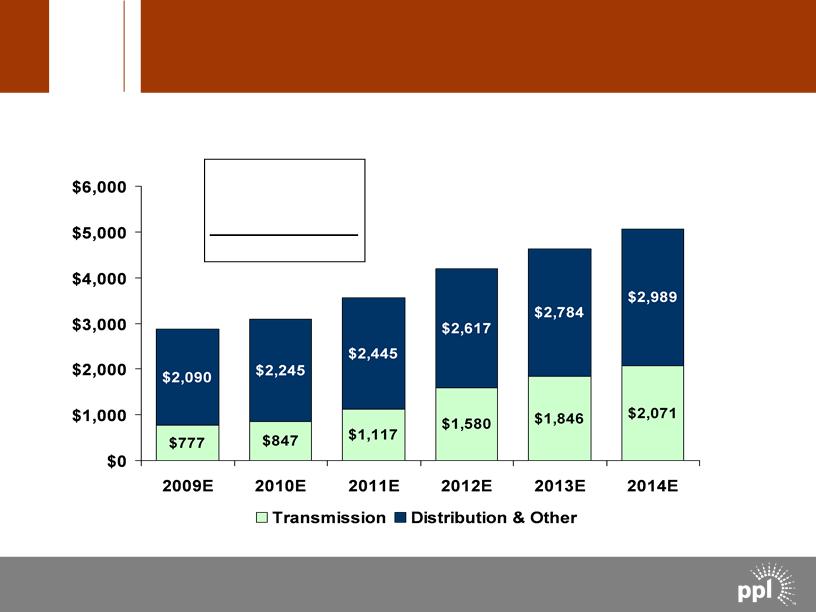
Millions
$3,092
$3,562
$4,197
$4,630
$5,060
$2,867
A-5
CAGR (2009-2014)
Distribution = 7.4%
Transmission = 21.7%
Combined = 12.0%
Pennsylvania Delivery Rate Base
© PPL Corporation 2010
A-6
P
August 11, 2009 July 19, 2011
October 20, 2009 October 18, 2011
January 19, 2010 January 9, 2012
April 20, 2010 April 3, 2012
July 20, 2010 July 17, 2012
October 19, 2010 October 16, 2012
April 18, 2011 January 22, 2013
P
P
Completed
P
P
PPL Electric Utilities 2011 to mid-2013
Procurement Plan Schedule
§ Due dates for bids:
© PPL Corporation 2010
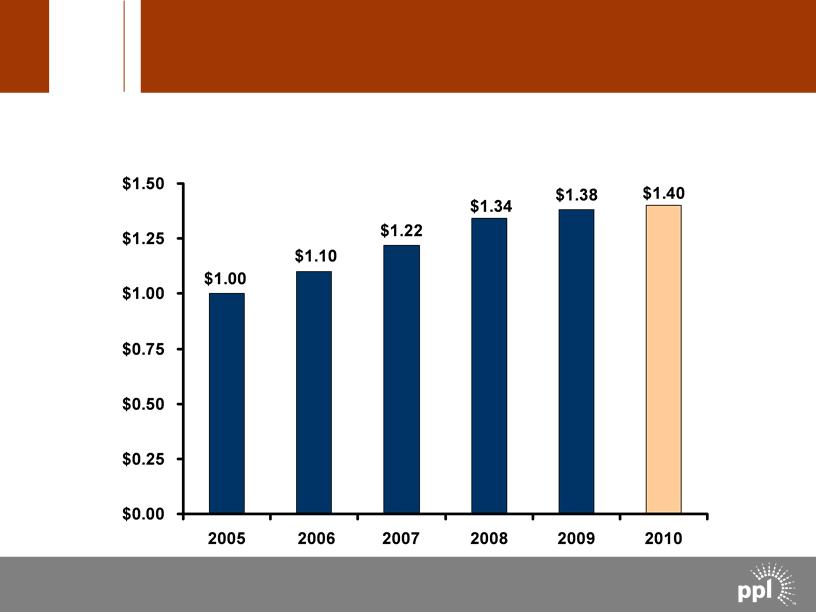
$/Share
Annualized
Dividend Profile
A-7
© PPL Corporation 2010
Note: As of March 31, 2010
(1) Bonds defeased in substance in 2008 by depositing sufficient funds with the trustee
A-8
Debt Maturities
Debt Maturities (Millions) 2010 2011 2012 2013 2014 PPL Energy Supply $0 $500 $0 $737 $300 PPL Capital Funding 0 0 0 0 0 PPL Electric Utilities 0 0 0 400 10 (1) WPD Group 0 0 0 0 0 Total $0 $500 $0 $1,137 $310 Note: As of March 31, 2010 (1) Bonds defeased in substance in 2008 by depositing sufficient funds with the trustee © PPL Corporation 2010 A-8
© PPL Corporation 2010
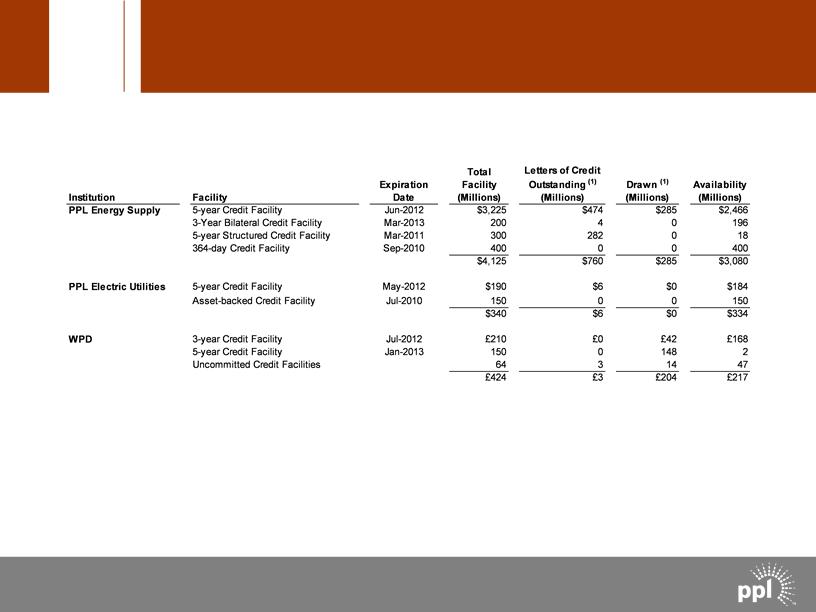
(1) Reported as of March 31, 2010
Domestic facilities consist of a diverse bank group, with no bank and its
affiliates providing an aggregate commitment of more than 15% of the total
committed capacity.
A-9
Liquidity Profile
Liquidity Profile Total Letters of Credit Expiration Facility Outstanding (1) Drawn (1) Availability Institution Facility Date (Millions) (Millions) (Millions) (Millions) PPL Energy Supply 5-year Credit Facility Jun-2012 $3,225 $474 $285 $2,466 3-Year Bilateral Credit Facility Mar-2013 200 4 0 196 5-year Structured Credit Facility Mar-2011 300 282 0 18 364-day Credit Facility Sep-2010 400 0 0 400 $4,125 $760 $285 $3,080 PPL Electric Utilities 5-year Credit Facility May-2012 $190 $6 $0 $184 Asset-backed Credit Facility Jul-2010 150 0 0 150 $340 $6 $0 $334 WPD 3-year Credit Facility Jul-2012 £210 £0 £42 £168 5-year Credit Facility Jan-2013 150 0 148 2 Uncommitted Credit Facilities 64 3 14 47 £424 £3 £ 204 £217 Domestic facilities consist of a diverse bank group, with no bank and its affiliates providing an aggregate commitment of more than 15% of the total committed capacity. (1) Reported as of March 31, 2010 © PPL Corporation 2010 A-9
© PPL Corporation 2010
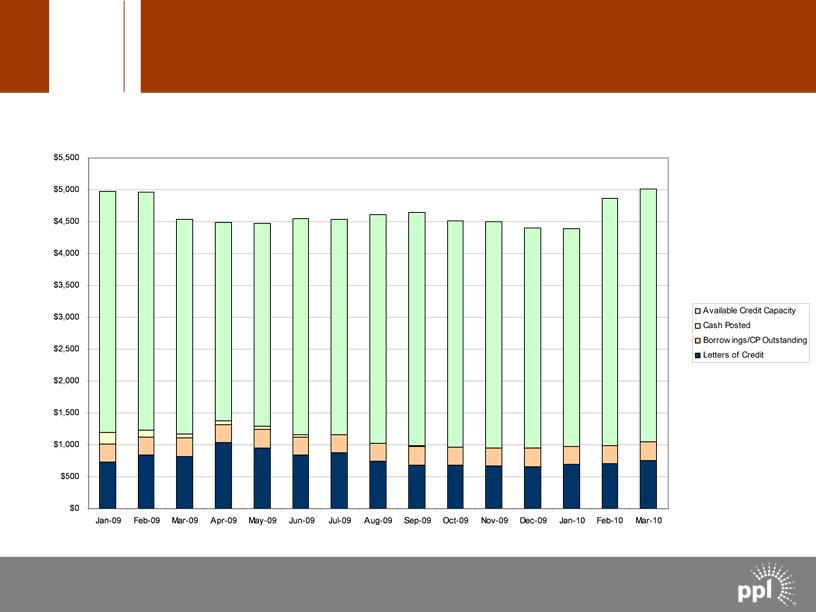
Millions
A-10
PPL Energy Supply Collateral Profile
© PPL Corporation 2010
A-11
| | 2009 | 2010 |
Cash from Operations | | $1,310 | $1,663 |
Increase/(Decrease) in cash due to: | | | |
Capital Expenditures | | (720) | (952) |
Investment in Energy Project | | | |
Asset Sales (1) (2) | | 84 | 151 |
Other Investing Activities-net | | (75) | (15) |
Free Cash Flow before Dividends | | $599 | $847 |
| | | |
(1) 2009 includes sale of Wyman and initial payment for the Maine hydro assets from ArcLight
(2) 2010 includes February 2010 sale of the Long Island generating assets, contingent payment on the pending sale of the
remaining Maine hydro assets from ArcLight, and completion of the pending sale of the remaining Maine hydro assets to the
Penobscot Trust
(Millions)
Actual Projected
Supply Segment Reconciliation of Cash from Operations
to Free Cash Flow before Dividends
© PPL Corporation 2010
A-12
| | 2009 | 2010 |
Cash from Operations | |
$294
| $230 |
Less Transition Bond Repayment | | | |
Increase/(Decrease) in cash due to: | | | |
Capital Expenditures | |
(298)
| (422) |
Asset Sales & Other | |
3
| 1 |
Free Cash Flow before Dividends | |
($1)
| ($191) |
(Millions)
Actual Projected
PA Delivery Segment Reconciliation of Cash from
Operations to Free Cash Flow before Dividends
© PPL Corporation 2010
A-13
| 2009 | 2010 |
Cash from Operations | $248 | $138 |
Increase/(Decrease) in cash due to: | | |
Capital Expenditures Other Investing Activities - Net | (247) 1 | (320) |
Free Cash Flow before Dividends | $2 | ($182) |
| | |
(Millions)
Actual Projected
International Delivery Segment Reconciliation of Cash
from Operations to Free Cash Flow before Dividends
© PPL Corporation 2010
A-14
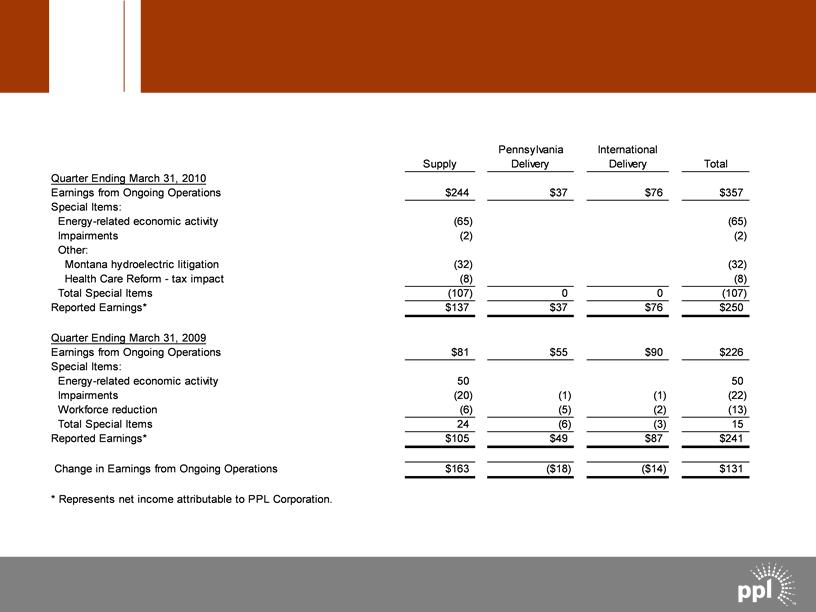
(Millions)
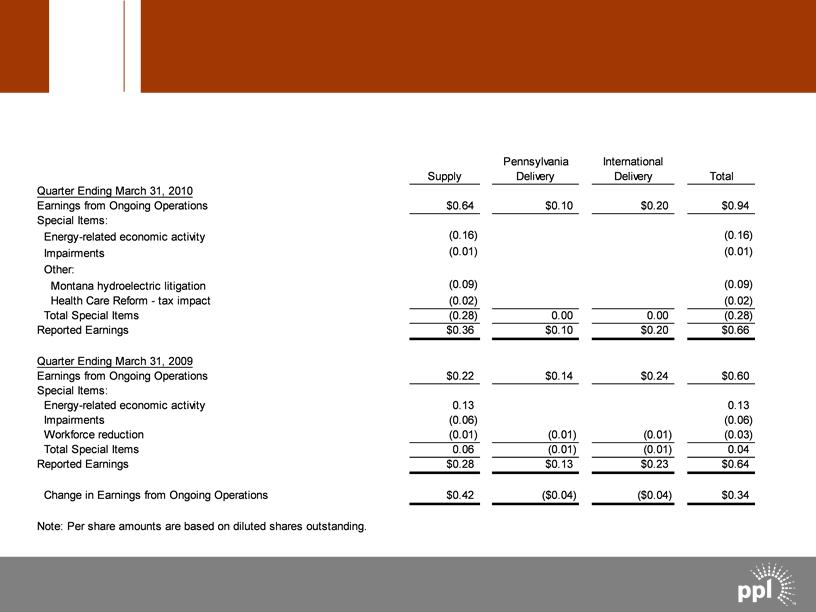
Reconciliation of First Quarter Earnings from Ongoing
Operations to Reported Earnings
Pennsylvania Delivery $37 0 $37 $55 (1) (5) (6) $49 ($18) International Delivery $76 $76 $90 (1) (2) (3) $87 ($14) Total $357 (65) (2) (32) (8) (107) $250 $226 50 (22) (13) 15 $241 $131 © PPL Corporation 2010 A-14
© PPL Corporation 2010
A-15
(Dollars Per Share)
Reconciliation of First Quarter Earnings from Ongoing
Operations to Reported Earnings
Total $0.94 (0.16) (0.01) Montana hydroelectric litigation Health Care Reform - tax impact Total Special Items Reported Earnings (0.09) (0.02) (0.28) $0.36 0.00 $0.10 0.00
$0.20 (0.09) (0.02) (0.28) $0.66 Quarter Ending March 31, 2009 Earnings from Ongoing Operations Special Items: Energy-related economic activity Impairments Workforce reduction Total Special Items Reported Earnings $0.22 0.13 (0.06) (0.01) 0.06 $0.28 $0.14 (0.01) (0.01) $0.13 $0.24 (0.01) (0.01) $0.23 $0.60 0.13 (0.06) (0.03) 0.04 $0.64 Change in Earnings from Ongoing Operations $0.42 ($0.04) ($0.04) $0.34 Note: Per share amounts are based on diluted shares outstanding.& #160; © PPL Corporation 2010 A-15
© PPL Corporation 2010
A-16
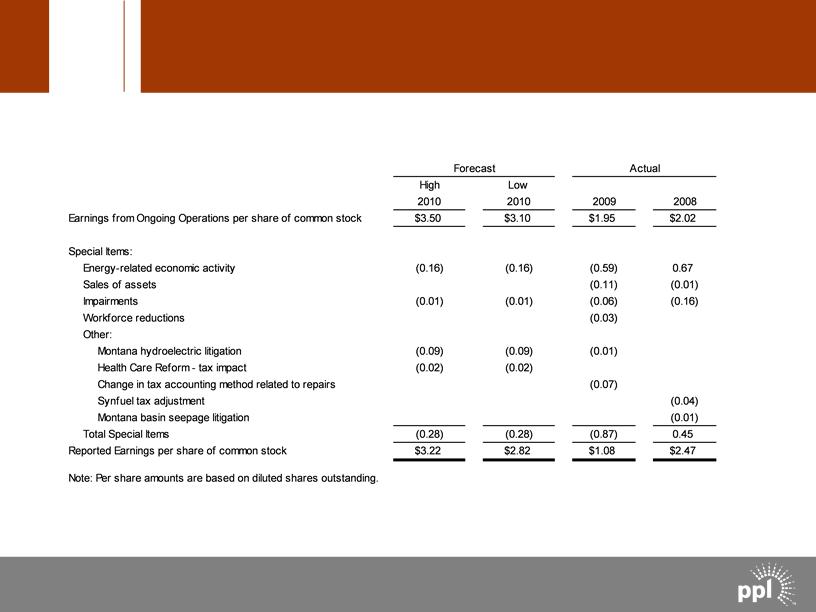
Reconciliation of PPL’s Earnings from
Ongoing Operations to Reported Earnings
econciliation of PPL’s Earnings from Ongoing Operations to Reported Earnings Forecast Actual High Low 2010 2010 2009 2008 Earnings from Ongoing Operations per share of common stock $3.50 $3.10 $1.95 $2.02 Special Items: Energy-related economic activity (0.16) (0.16) (0.59) 0.67 Sales of assets (0.11) (0.01) Impairments (0.01) (0.01) (0.06) (0.16) Workforce reductions (0.03) Other: Montana hydroelectric litigation (0.09) (0.09) (0.01) Health Care Reform - tax impact (0.02) (0.02) Change in tax accounting method related to repairs (0.07) Synfuel tax adjustment (0.04) Montana basin seepage l itigation (0.01) Total Special Items (0.28) (0.28) (0.87) 0.45 Reported Earnings per share of common stock $3.22 $2.82 $1.08 $2.47 Note: Per share amounts are based on diluted shares outstanding. © PPL Corporation 2010 A-16
© PPL Corporation 2010
A-17
(Millions of Dollars)
(a) See additional information on the following slide. |
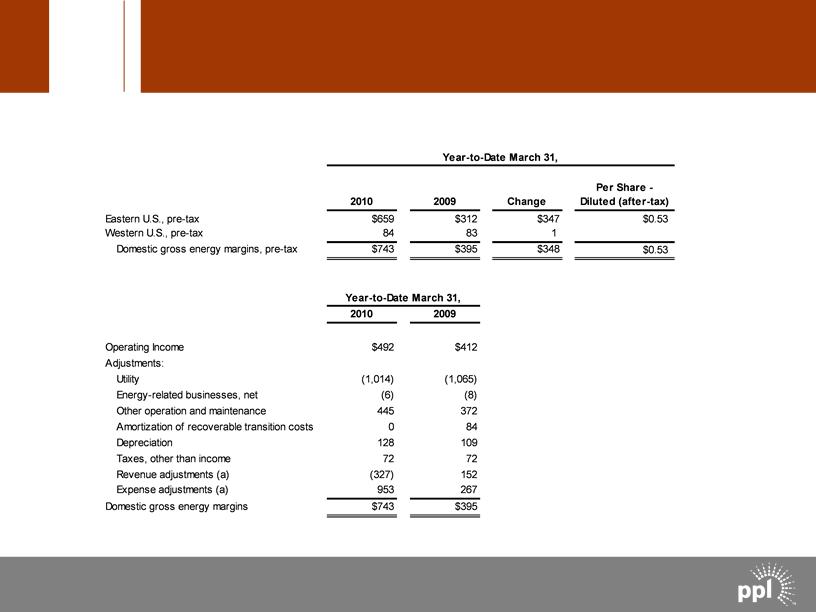
Reconciliation of Year-to-Date
Operating Income and Energy Margins
Reconciliation of Year-to-Date Operating Income and Energy Margins (Millions of Dollars) Year-to-Date March 31, Per Share 2010 2009 Change Diluted (after-tax) Eastern U.S., pre-tax $659 $312 $347 $0.53 Western U.S., pre-tax 84 83 1 Domestic gross energy margins, pre-tax $743 $395 $348 $0.53 Year-to-Date March 31, 2010 2009 Operating Income $492 $412 Adjustments: Utility (1,014) (1,065) Energy-related businesses, net (6) (8) Other operation and maintenance 445 372 Amortization of recoverable transition costs 0 84 Depreciation 128 109 Taxes, other than income 72 72 Revenue adjustments (a) (327) 152 Expense adjustments (a) 953 267 Domestic gross energy margins $743 $395 (a) See additional information on the following slide. © PPL Corporation 2010 A-17
© PPL Corporation 2010
A-18
(Millions of Dollars)
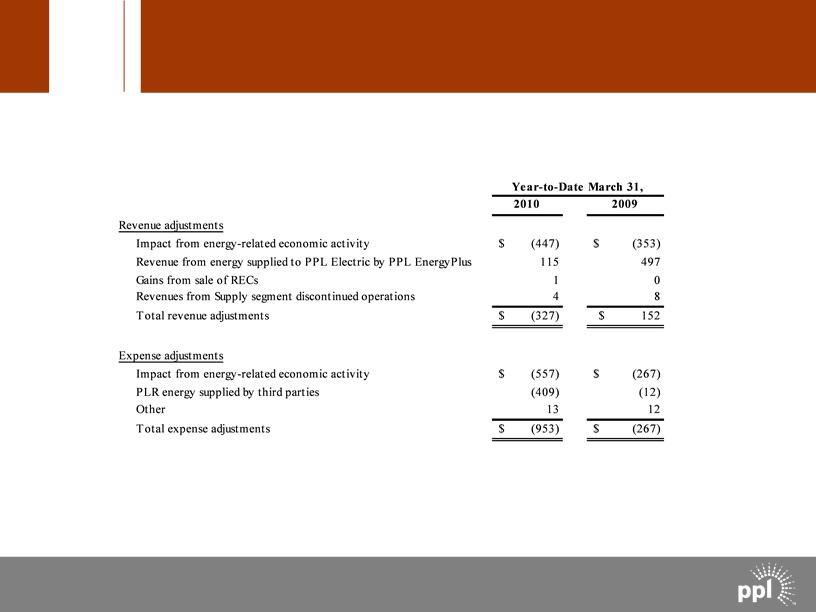
Reconciliation of Year-to-Date
Operating Income and Energy Margins
Reconciliation of Year-to-Date Operating Income and Energy Margins (Millions of Dollars) Year-to-Date March 31, 2010 2009 Revenue adjustments Impact from energy-related economic activity $ (447) $ (353) Revenue from energy supplied to PPL Electric by PPL EnergyPlus 115 497 Gains from sale of RECs 1 0 Revenues from Supply segment discontinued operations 4 8 Total revenue adjustments $ (327) $ 152 Expense adjustments Impact from energy-related economic activity $ (557) $ (267) PLR energy supplied by third parties (409) (12) Other 13 12 Total expense adjustments $ (953) $ (267) © PPL Corporation 2010 A-18
© PPL Corporation 2010
A-19
(Millions of Dollars)
(a) See additional information on the following slide. |
Reconciliation of Year-to-Date
Operating Income and Delivery Margins
Reconciliation of Year-to-Date Operating Income and Delivery (Millions of Dollars) Year-to-Date March 31, Domestic gross delivery margins, pre-tax 2010 $ 221 $ 2009 237 Change $ (16) Per Share Diluted (after-tax) (0.02) $ 2010 2009 Year-to-Date March 31, Operating Income $ 492 $ 412 Adjustments: Unregulated retail electric and gas (104) (42) Wholesale energy marketing (1,810) (1,150) Net energy trading margins (11) 12 Energy-related businesses, net (6) (8) Fuel 233 258 Energy purchases 1,575 946 Other operation and maintenance 445 372 Dep reciation 128 109 Taxes, other than income 72 72 Revenue adjustments (a) (203) (176) Expense adjustments (a) (590) (568) Domestic gross delivery margins (a) See additional information on the following slide. $ 221 $ 237 © PPL Corporation 2010 A-19
© PPL Corporation 2010
A-20
(Millions of Dollars)
Reconciliation of Year-to-Date
Operating Income and Delivery Margins
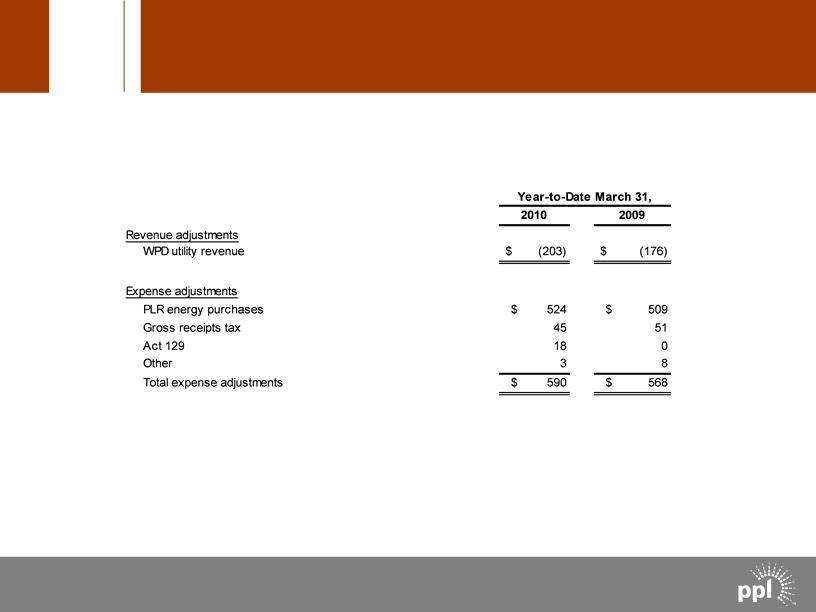
Reconciliation of Year-to-Date Operating Income and Delivery Margins (Millions of Dollars) Year-to-Date March 31, 2010 2009 Revenue adjustments WPD utility revenue $ (203) $ (176) Expense adjustments PLR energy purchases $ 524 $ 509 Gross receipts tax 45 51 Act 129 18 0 Other 3 8 Total expense adjustments $ 590 $ 568 © PPL Corporation 2010 A-20
© PPL Corporation 2010
Credit Ratings
A-21
| Moody’s | Standard & Poor’s | Fitch |
PPL Corporation | | | |
Issuer Rating | Baa2 | BBB | BBB |
Outlook | NEGATIVE | NEGATIVE | STABLE |
| | | |
PPL Energy Supply | | | |
Issuer Rating | | BBB | BBB |
Tax-Exempt Bonds (1) | Aaa | AAA | |
Senior Notes | Baa2 | BBB | BBB |
Outlook | STABLE | NEGATIVE | STABLE |
| | | |
PPL Capital Funding | | | |
Issuer Rating | | | BBB |
Senior Unsecured Debt | Baa2 | BBB- | BBB |
Subordinated Debt | Baa3 | BB+ | BB+ |
Outlook | NEGATIVE | | STABLE |
| | | |
PPL Electric Utilities | | | |
Issuer Rating | Baa1 | A- | BBB |
First Mortgage Bonds | A3 | A- | A- |
Tax-Exempt Bonds (2) | A3/Baa1 | A/A- | |
Senior Secured Debt | A3 | A- | A- |
Commercial Paper | P-2 | A-2 | F-2 |
Preferred Stock | Baa3 | BBB | BBB- |
Preference Stock | Baa3 | BBB | BBB- |
Outlook | NEGATIVE | NEGATIVE | STABLE |
(1) Letter of Credit-Backed Security
(2) Includes both Insured and Non-Insured Securities
© PPL Corporation 2010
Credit Ratings (cont.)
A-22
Commercial Paper
A-
BBB+
Baa1
Senior Unsecured Debt
F2
A-2
P-2
Commercial Paper
POSITIVE
NEGATIVE
STABLE
Outlook
BBB+
BBB+
Baa1
Issuer Rating
A-
BBB+
Baa1
Senior Unsecured Debt
F2
A-2
Commercial Paper
POSITIVE
NEGATIVE
STABLE
Outlook
Western Power Distribution (South West) PLC
BBB+
BBB+
Issuer Rating
Western Power Distribution (South Wales) PLC
POSITIVE
NEGATIVE
STABLE
Outlook
POSITIVE
Outlook
BBB
Issuer Rating
WPD Holdings LLP
BBB-
BBB-
Baa3
Issuer Rating
BBB
BBB-
Baa3
Senior Unsecured Debt
A-3
Commercial Paper
WPD Holdings Limited
BBB
BBB-
Baa3
Pass-Through Certificates
STABLE
STABLE
Outlook
PPL Montana
Fitch
Standard & Poor’s
Moody’s
© PPL Corporation 2010
A-23
Statements contained in this presentation, including statements with respect to future earnings, energy prices, margins and sales,
growth, revenues, expenses, cash flow, acquisitions and dispositions, marketing performance, hedging, financing, exchange rates,
corporate strategy and generating capacity and performance, are “forward-looking statements” within the meaning of the federal
securities laws. Although PPL Corporation believes that the expectations and assumptions reflected in these forward-looking
statements are reasonable, these statements are subject to a number of risks and uncertainties, and actual results may differ materially
from the results discussed in the statements. The following are among the important factors that could cause actual results to differ
materially from the forward-looking statements: market demand and prices for energy, capacity and fuel; weather conditions affecting
customer energy usage and operating costs; competition in power markets; the effect of any business or industry restructuring; the
profitability and liquidity of PPL Corporation and its subsidiaries; new accounting requirements or new interpretations or applications of
existing requirements; operating performance of plants and other facilities; environmental conditions and requirements and the related
costs of compliance, including environmental capital expenditures and emission allowance and other expenses; system conditions and
operating costs; development of new projects, markets and technologies; performance of new ventures; asset acquisitions and
dispositions, including the proposed acquisition of E.ON U.S.; any impact of hurricanes or other severe weather on our business,
including any impact on fuel prices; receipt of necessary government permits, approvals, rate relief and regulatory cost recovery;
capital market conditions and decisions regarding capital structure; the impact of state, federal or foreign investigations applicable to
PPL Corporation and its subsidiaries; the outcome of litigation against PPL Corporation and its subsidiaries; stock price performance;
the market prices of equity securities and the impact on pension income and resultant cash funding requirements for defined benefit
pension plans; the securities and credit ratings of PPL Corporation and its subsidiaries; political, regulatory or economic conditions in
states, regions or countries where PPL Corporation or its subsidiaries conduct business, including any potential effects of threatened or
actual terrorism or war or other hostilities; foreign exchange rates; new state, federal or foreign legislation, including new tax legislation;
and the commitments and liabilities of PPL Corporation and its subsidiaries. Any such forward-looking statements should be
considered in light of such important factors and in conjunction with PPL Corporation’s Form 10-K and other reports on file with the
Securities and Exchange Commission.
Forward-Looking Information Statement
© PPL Corporation 2010
A-24
“Earnings from ongoing operations” should not be considered as an alternative to reported earnings, or net income attributable to PPL, which is
an indicator of operating performance determined in accordance with generally accepted accounting principles (GAAP). PPL believes that
“earnings from ongoing operations,” although a non-GAAP financial measure, is also useful and meaningful to investors because it provides
them with management’s view of PPL’s fundamental earnings performance as another criterion in making their investment decisions. PPL’s
management also uses “earnings from ongoing operations” in measuring certain corporate performance goals. Other companies may use
different measures to present financial performance.
“Earnings from ongoing operations” is adjusted for the impact of special items. Special items include:
• Energy-related economic activity (as discussed below).
• Foreign currency-related economic hedges.
• Sales of assets not in the ordinary course of business.
• Impairment charges (including impairments of securities in the company’s nuclear decommissioning trust funds).
• Workforce reduction and other restructuring impacts.
• Other charges or credits that are, in management’s view, not reflective of the company’s ongoing operations.
Energy-related economic activity includes the changes in fair value of positions used to economically hedge a portion of the economic value of
PPL’s generation assets, load-following and retail activities. This economic value is subject to changes in fair value due to market price volatility
of the input and output commodities (e.g., fuel and power). Also included in this special item is the ineffective portion of qualifying cash flow
hedges and the premium amortization associated with options classified as economic activity. These items are included in ongoing earnings
over the delivery period of the item that was hedged or upon realization. Management believes that adjusting for such amounts provides a
better matching of earnings from ongoing operations to the actual amounts settled for PPL’s underlying hedged assets. Please refer to the
Notes to the Consolidated Financial Statements and MD&A in PPL Corporation’s periodic filings with the Securities and Exchange Commission
for additional information on energy-related economic activity.
“Free cash flow before dividends” is derived by deducting capital expenditures and other investing activities-net, from cash flow from
operations. Free cash flow before dividends should not be considered as an alternative to cash flow from operations, which is determined in
accordance with GAAP. PPL believes that free cash flow before dividends, although a non-GAAP measure, is an important measure to both
management and investors since it is an indicator of the company’s ability to sustain operations and growth without additional outside financing
beyond the requirement to fund maturing debt obligations. Other companies may calculate free cash flow before dividends in a different
manner.
Definitions of Non-GAAP Financial Measures
© PPL Corporation 2010
A-25
"Domestic Gross Energy Margins" and "Domestic Gross Delivery Margins" are not intended to replace "Operating Income," which is
determined in accordance with GAAP, as an indicator of overall operating performance.
•"Domestic Gross Energy Margins" is a single financial performance measure of PPL's domestic energy non-trading and trading
activities. In calculating this measure, the Supply segment's energy revenues are offset by the cost of fuel and energy purchases, and
adjusted for other related items. This performance measure excludes utility revenues and includes revenues from energy sales to PPL
Electric by PPL EnergyPlus. In addition, PPL excludes from "Domestic Gross Energy Margins" energy-related economic activity, which
includes the changes in fair value of positions used to economically hedge a portion of the economic value of PPL's generation assets,
load-following and retail activities. This economic value is subject to changes in fair value due to market price volatility of the input and
output commodities (e.g., fuel and power) prior to the delivery period that was hedged. Also included in this energy-related economic
activity is the ineffective portion of qualifying cash flow hedges and the premium amortization associated with options. This economic
activity is deferred and included in earnings over the delivery period that was hedged. PPL believes that "Domestic Gross Energy
Margins" provides another criterion to make investment decisions. This performance measure is used, in conjunction with other
information, internally by senior management and the Board of Directors to manage its domestic energy non-trading and trading
activities. PPL's management also uses "Domestic Gross Energy Margins" in measuring certain corporate performance goals used in
determining variable compensation. Other companies may use different measures to present the results of their energy non-trading
and trading activities.
•"Domestic Gross Delivery Margins" is a single financial performance measure of PPL's domestic regulated electric delivery operations,
which includes transmission and distribution activities, including PLR energy supply. In calculating this measure, domestic regulated
utility revenues and expenses associated with approved recovery mechanisms, including energy provided as a PLR, are offset. These
mechanisms allow for full cost recovery of certain expenses; therefore certain expenses and revenues offset with minimal impact on
earnings. As a result, this measure represents the net revenues from PPL's domestic regulated electric delivery operations. This
performance measure is used, in conjunction with other information, internally by senior management and the Board of Directors to
manage its domestic regulated electric delivery operations. PPL believes that "Domestic Gross Delivery Margins" provides another
criterion to make investment decisions. Other companies may use different measures to present the results of their regulated electric
delivery operations.
Definitions of Non-GAAP Financial Measures
(continued)