Item 1. Reports to Stockholders.
| Item 7. Financial Statements and Financial Highlights for Open-End Management Investment Companies. |
| | | | |
| Blue Chip Investor Fund | | | |
| | | | |
| Statement of Assets and Liabilities (Unaudited) | | | |
| June 30, 2024 | | | |
| | | | |
| Assets: | | | |
| Investments at Fair Value | $ 39,168,074 | | |
| (Cost - $21,762,890) | | | |
| Cash | 500 | | |
| Dividends Receivable | 18,616 | | |
| Prepaid Expenses | 6,110 | | |
| Receivable for Shareholder Purchases | 15,000 | | |
| Total Assets | 39,208,300 | | |
| Liabilities: | | | |
| Investment Advisory Fee Payable | 19,039 | | |
| Administration Fee Payable | 2,482 | | |
| Other Accrued Expenses | 15,733 | | |
| Total Liabilities | 37,254 | | |
| Net Assets | $ 39,171,046 | | |
| Net Assets Consist of: | | | |
| Paid In Capital | $ 18,777,358 | | |
| Total Distributable Earnings | 20,393,688 | | |
| Net Assets, for 183,522 Shares Outstanding | $ 39,171,046 | | |
| (Unlimited shares authorized, without par value) | | | |
| Net Asset Value, Offering Price and Redemption Price | | | |
| Per Share ($39,171,046/183,522 shares) | $ 213.44 | | |
| | | | |
| Statement of Operations (Unaudited) | | | |
| For the six month period ended June 30, 2024 | | | |
| | | | |
| Investment Income: | | | |
| Dividends (Net of foreign withholding tax of $19,167) | $ 196,324 | | |
| Total Investment Income | 196,324 | | |
| Expenses: | | | |
| Investment Advisory Fees | 190,490 | | |
| Transfer Agent & Accounting Fees | 20,384 | | |
| Administrative Fees | 13,650 | | |
| Registration Fees | 9,828 | | |
| Audit & Tax Fees | 8,976 | | |
| Legal Fees | 8,976 | | |
| Other Fees | 4,914 | | |
| Custody Fees | 4,914 | | |
| Insurance Expense | 3,385 | | |
| Trustee Fees | 1,995 | | |
| Printing and Postage Expense | 998 | | |
| Total Expenses | 268,510 | | |
| Less: Advisory Fee Waiver | (78,020) | | |
| Net Expenses | 190,490 | | |
| Net Investment Income | 5,834 | | |
| | | | |
| Net Realized and Unrealized Gain on Investments: | | | |
| Net Realized Gain on Investments | 2,982,670 | | |
| Net Change in Unrealized Appreciation on Investments | 891,687 | | |
| Net Realized and Unrealized Gain on Investments | 3,874,357 | | |
| | | | |
| Net Increase in Net Assets from Operations | $ 3,880,191 | | |
| | | | |
| | | | |
| | | | |
| The accompanying notes are an integral part of these financial statements. | | | |
| Blue Chip Investor Fund | | | | | | | | | | | |
| | | | | | | | | | | | | | |
| Financial Highlights | | (Unaudited) | | | | | | | | | | | |
| Selected data for a share outstanding | | 1/1/2024 | | 1/1/2023 | | 1/1/2022 | | 1/1/2021 | | 1/1/2020 | | 1/1/2019 | |
| throughout the period: | | to | | to | | to | | to | | to | | to | |
| | | 6/30/2024 | | 12/31/2023 | | 12/31/2022 | | 12/31/2021 | | 12/31/2020 | | 12/31/2019 | |
| Net Asset Value - | | | | | | | | | | | | | |
| Beginning of Period | | $ 192.60 | | $ 169.56 | | $ 206.84 | | $ 162.09 | | $ 172.79 | | $ 144.68 | |
| Net Investment Income (Loss) (a) | | 0.03 | | (0.31) | | (0.29) | | (0.74) | | (0.14) | | 1.83 | |
| Net Gains or (Losses) on Investments | | | | | | | | | | | | | |
| (realized and unrealized) (b) | | 20.81 | | 32.37 | | (34.17) | | 48.15 | | (0.34) | | 28.41 | |
| Total from Investment Operations | | 20.84 | | 32.06 | | (34.46) | | 47.41 | | (0.48) | | 30.24 | |
| | | | | | | | | | | | | | |
| Distributions (From Net Investment Income) | | - | | - | | - | | - | | (0.09) | | (1.91) | |
| Distributions (From Capital Gains) | | - | | (9.02) | | (2.82) | | (2.66) | | (10.13) | | (0.22) | |
| Total Distributions | | - | | (9.02) | | (2.82) | | (2.66) | | (10.22) | | (2.13) | |
| | | | | | | | | | | | | | |
| Net Asset Value - | | | | | | | | | | | | | |
| End of Period | | $ 213.44 | | $ 192.60 | | $ 169.56 | | $ 206.84 | | $ 162.09 | | $ 172.79 | |
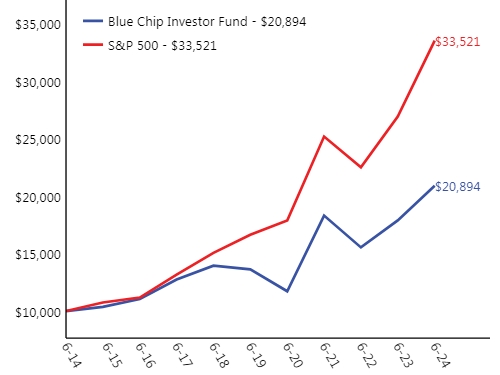
| Total Return (c) | | 10.82% | * | 18.88% | | (16.64)% | | 29.25% | | (0.26)% | | 20.91% | |
| Ratios/Supplemental Data | | | | | | | | | | | | | |
| Net Assets - End of Period (Thousands) | | $ 39,171 | | $ 36,807 | | $ 38,443 | | $ 47,028 | | $ 36,234 | | $ 38,583 | |
| | | | | | | | | | | | | | |
| Before Reimbursement | | | | | | | | | | | | | |
| Ratio of Expenses to Average Net Assets | | 1.41% | ** | 1.39% | | 1.37% | | 1.34% | | 1.44% | | 1.40% | |
| Ratio of Net Investment Income (Loss) to | | | | | | | | | | | | | |
| Average Net Assets | | -0.38% | ** | -0.55% | | -0.52% | | -0.72% | | -0.53% | | 0.73% | |
| After Reimbursement | | | | | | | | | | | | | |
| Ratio of Expenses to Average Net Assets (d) | 1.00% | ** | 1.00% | | 1.01% | | 1.00% | | 1.00% | | 1.00% | |
| Ratio of Net Investment Income (Loss) to | | | | | | | | | | | | | |
| Average Net Assets (d) | | 0.03% | ** | -0.17% | | -0.16% | | -0.38% | | -0.09% | | 1.14% | |
| | | | | | | | | | | | | | |
| Portfolio Turnover Rate | | 4.83% | * | 6.23% | | 2.42% | | 13.33% | | 21.80% | | 14.89% | |
| | | | | | | | | | | | | | |
| | | | | | | | | | | | | | |
| | | | | | | | | | | | | | |
| | | | | | | | | | | | | | |
| | | | | | | | | | | | | | |
| * Not Annualized. | | | | | | | | | | | | | |
| ** Annualized. | | | | | | | | | | | | | |
| (a) Per share amounts calculated using the average shares method. | | | | | | | | | |
| (b) Realized and unrealized gains and losses per share in this caption are balancing amounts necessary to reconcile the | |
| change in net asset value for the period and may not reconcile with the aggregate gains and losses in the Statement of | |
| Operations due to share transactions for the period. | | | | | | | | | | | |
| (c) Total return represents the rate that the investor would have earned or lost on an investment in the Fund assuming reinvestment |
| of all dividends and distributions. | | | | | | | | | | | | | |
| (d) The ratio of expenses to average net assets includes interest expenses. The after reimbursement ratio of expense excluding |
| interest expense was 1.00%, 1.00%, 1.00%, 1.00%, 1.00% and 1.00% for calendar years ended 2019, 2020, 2021, 2022, 2023 |
| and the six month period ended June 30, 2024, respectively. | | | | | | | | | | |
| The after reimbursement ratio of net investment income (loss) excluding interest expense is | | | | | |
| 1.14%, -0.09%, -0.38%, -0.15%, -0.17% and 0.03% for the calendar years ended 2019, 2020, 2021, 2022, 2023 and the six | |
| month period ended June 30, 2024, respectively. | | | | | | | | | | | |
| The accompanying notes are an integral part of these financial statements. | | | | | | | | |
| NOTES TO THE FINANCIAL STATEMENTS |
| BLUE CHIP INVESTOR FUND |
| June 30, 2024 |
| (Unaudited) |
| | | | | | | | | | |
| 1.) ORGANIZATION | | | | | | | | | |
Blue Chip Investor Fund (the “Fund”) is a non-diversified series of the Blue Chip Investor Funds (the “Trust”), formerly Premier Funds. The Trust is an open-end investment company under the Investment Company Act of 1940, as amended (the “1940 Act”). The Trust was organized in Ohio as a business trust on November 1, 2001, and may offer shares of beneficial interest in a number of separate series, each series representing a distinct fund with its own investment objectives and policies. The Fund commenced operations on January 1, 2002. At present, the Fund is the only series authorized by the Trust. The Fund’s investment objective is to seek long-term growth of capital. The Advisor to the Fund is Check Capital Management, Inc. (the “Advisor”).
|
| | | | | | | | | | |
| 2.) SIGNIFICANT ACCOUNTING POLICIES | | | | | | | |
The Fund is an investment company and accordingly follows the investment company accounting and reporting guidance of the Financial Accounting Standards Board (“FASB”) Accounting Standards Codification Topic 946 Financial Services - Investment Companies. The financial statements are prepared in conformity with accounting principles generally accepted in the United States of America (“GAAP”). The Fund follows the significant accounting policies described in this section.
|
| | | | | | | | | | |
| SECURITY VALUATION | | | | | | | | | |
All investments in securities are recorded at their fair value, as described in Note 3.
|
| | | | | | | | | | |
| FEDERAL INCOME TAXES | | | | | | | | | |
The Fund’s policy is to continue to comply with the requirements of the Internal Revenue Code that are applicable to regulated investment companies and to distribute all of its taxable income to shareholders. Therefore, no federal income tax provision is required. It is the Fund’s policy to distribute annually, prior to the end of the calendar year, dividends sufficient to satisfy excise tax requirements of the Internal Revenue Code. This Internal Revenue Code requirement may cause an excess of distributions over the book year-end accumulated income. In addition, it is the Fund’s policy to distribute annually, after the end of the fiscal year, any remaining net investment income and net realized capital gains.
|
| | | | | | | | | | |
The Fund recognizes the tax benefits of certain tax positions only where the position is “more likely than not” to be sustained assuming examination by tax authorities. Management has analyzed the Fund’s tax positions, and has concluded that no liability for unrecognized tax benefits should be recorded related to uncertain tax positions taken on returns filed for open tax years. The Fund identifies its major tax jurisdictions as U.S. Federal tax authorities; however the Fund is not aware of any tax positions for which it is reasonably possible that the total amounts of unrecognized tax benefits will change materially in the next twelve months. The Fund recognizes interest and penalties, if any, related to unrecognized tax benefits as income tax expense in the Statement of Operations. During the six month period ended June 30, 2024, the Fund did not incur any interest or penalties.
|
| | | | | | | | | | |
| SHARE VALUATION | | | | | | | | | |
The net asset value (the “NAV”) is generally calculated as of the close of trading on the New York Stock Exchange (the “Exchange”) (normally 4:00 p.m. Eastern time) every day the Exchange is open. The NAV is calculated by taking the total value of the Fund’s assets, subtracting its liabilities, and then dividing by the total number of shares outstanding, rounded to the nearest cent. The offering price and redemption price per share are equal to the net asset value per share.
|
| | | | | | | | | | |
| DISTRIBUTIONS TO SHAREHOLDERS | | | | | | | |
Distributions to shareholders, which are determined in accordance with income tax regulations, are recorded on the ex-dividend date. The treatment for financial reporting purposes of distributions made to shareholders during the year from net investment income or net realized capital gains may differ from their ultimate treatment for federal income tax purposes. These differences are caused primarily by differences in the timing of the recognition of certain components of income, expenses or realized capital gain for federal income tax purposes. Where such differences are permanent in nature, they are reclassified in the components of the net assets based on their ultimate characterization for federal income tax purposes. Any such reclassifications will have no effect on net assets, results of operations or net asset value per share of the Fund.
|
| | | | | | | | | | |
| USE OF ESTIMATES | | | | | | | | | |
The financial statements are prepared in accordance with GAAP, which requires management to make estimates and assumptions that affect the reported amounts of assets and liabilities and disclosure of contingent assets and liabilities at the date of the financial statements and the reported amounts of increases and decreases in net assets from operations during the reporting period. Actual results could differ from those estimates.
|
| | | | | | | | | | |
| OTHER | | | | | | | | | |
The Fund records security transactions based on trade date. Dividend income is recognized on the ex-dividend date. Non-cash dividends, if any, are recorded at the fair value of the asset received. Interest income and interest expense, if any, are recognized on an accrual basis. The Fund uses the specific identification method in computing gain or loss on sale of investment securities. Withholding taxes on foreign dividends have been provided for in accordance with the Fund’s understanding of the applicable country’s tax rules and regulations.
|
| | | | | | | | | | |
| 3.) SECURITIES VALUATIONS | | | | | | | | | |
The Fund utilizes various methods to measure the fair value of its investments on a recurring basis. GAAP establishes a hierarchy that prioritizes inputs to valuation methods. The three levels of inputs are:
|
| | | | | | | | | | |
Level 1 - Unadjusted quoted prices in active markets for identical assets or liabilities that the Fund has the ability to access.
|
| | | | | | | | | | |
Level 2 - Observable inputs other than quoted prices included in level 1 that are observable for the asset or liability, either directly or indirectly. These inputs may include quoted prices for the identical instrument on an inactive market, prices for similar instruments, interest rates, prepayment speeds, credit risk, yield curves, default rates and similar data.
|
| | | | | | | | | | |
Level 3 - Unobservable inputs for the asset or liability, to the extent relevant observable inputs are not available, representing the Fund’s own assumptions about the assumptions a market participant would use in valuing the asset or liability, and would be based on the best information available.
|
| | | | | | | | | | |
The availability of observable inputs can vary from security to security and is affected by a wide variety of factors, including, for example, the type of security, whether the security is new and not yet established in the marketplace, the liquidity of markets, and other characteristics particular to the security. To the extent that valuation is based on models or inputs that are less observable or unobservable in the market, the determination of fair value requires more judgment. Accordingly, the degree of judgment exercised in determining fair value is greatest for instruments categorized in level 3.
|
| | | | | | | | | | |
The inputs used to measure fair value may fall into different levels of the fair value hierarchy. In such cases, for disclosure purposes, the level in the fair value hierarchy within which the fair value measurement falls in its entirety, is determined based on the lowest level input that is significant to the fair value measurement in its entirety.
|
| | | | | | | | | | |
| FAIR VALUE MEASUREMENTS | | | | | | | | | |
A description of the valuation techniques applied to the Fund’s major categories of assets measured at fair value on a recurring basis follows.
|
| | | | | | | | | | |
Equity securities (common stocks). Equity securities generally are valued by using market quotations, but may be valued on the basis of prices furnished by a pricing service when the Fund believes such prices accurately reflect the fair value of such securities. Securities that are traded on an exchange or on the NASDAQ over-the-counter market are generally valued at the last quoted sale price. Lacking a last sale price, an equity security is generally valued by the pricing service at its last bid price. Generally, if the security is traded in an active market and is valued at the last sale price, the security is categorized as a level 1 security, and if an equity security is valued by the pricing service at its last bid, it is generally categorized as a level 2 security. If market prices are not available or, in the opinion of Fund management including as informed by the Advisor’s opinion, market prices do not reflect fair value, or if events occur after the close of trading (but prior to the time the NAV is calculated) that materially affects fair value, the Fund through the Advisor may value the Fund’s assets at their fair value according to policies approved by the Fund’s Board of Trustees (the “Trustees” or the “Board”). Such securities are categorized in level 2 or level 3, when appropriate.
|
| | | | | | | | | | |
Money market funds. Money market funds are valued at net asset value provided by the fund and are classified in level 1 of the fair value hierarchy.
|
| | | | | | | | | | |
The following table summarizes the inputs used to value the Fund’s assets measured at fair value as of June 30, 2024:
|
| | | | | | | | | | |
| Valuation Inputs of Assets | | Level 1 | | Level 2 | | Level 3 | | Total | |
| Common Stocks | | $ 36,124,939 | | $ - | | $ - | | $ 36,124,939 | |
| Money Market Funds | | 3,043,135 | | - | | - | | 3,043,135 | |
| Total | | $ 39,168,074 | | $ - | | $ - | | $ 39,168,074 | |
| | | | | | | | | | |
The Fund did not hold any level 3 assets during the six month period ended June 30, 2024.
|
| | | | | | | | | | |
| The Fund did not invest in any derivative instruments during the six month period ended June 30, 2024. |
| | | | | | | | | | |
| 4.) INVESTMENT ADVISORY AGREEMENT | | | | | | | |
The Fund has entered into an investment advisory agreement (the “Management Agreement”) with the Advisor, Check Capital Management, Inc. Under the terms of the Management Agreement, the Advisor manages the investment portfolio of the Fund, subject to policies adopted by the Trustees. Under the Management Agreement, the Advisor, at its own expense and without reimbursement from the Trust, furnishes office space and all necessary office facilities, equipment and executive personnel necessary for managing the assets of the Fund. The Advisor also pays the salaries and fees of all of its officers and employees that serve as officers and trustees of the Trust. For its services, the Advisor receives an annual investment management fee from the Fund of 1.00% of the average daily net assets of the Fund which is payable monthly. As a result of the above calculation, for the six month period ended June 30, 2024, the Advisor earned management fees totaling $190,490, before the waiver of fees and/or reimbursement of expenses described below. The Advisor has contractually agreed to waive management fees and reimburse expenses to the extent necessary to maintain total annual operating expenses of the Fund (excluding brokerage fees, commissions, interest and other borrowing expenses, taxes, extraordinary expenses and the indirect costs of investing in acquired funds) at 1.00% of its average daily net assets through April 30, 2025. There are no provisions for recoupment for any of the contractual waivers entered into by the Advisor. The Advisor waived and/or reimbursed expenses of $78,020 for the six month period ended June 30, 2024. At June 30, 2024, the Fund owed the Advisor $19,039.
|
| | | | | | | | | | |
| 5.) RELATED PARTY TRANSACTIONS | | | | | | | |
The Fund has entered into an administration servicing agreement with Premier Fund Solutions, Inc. (the “Administrator”). The Fund pays 0.07% on the first $200 million of assets, 0.05% on the next $500 million of assets and 0.03% on average daily net assets of the Fund thereafter subject to a minimum monthly fee of $2,000. The Fund also pays all out-of-pocket expenses directly attributable to the Fund. Certain officers and a Trustee of the Trust are also officers of Premier Fund Solutions, Inc. (the “Administrator”). For the six month period ended June 30, 2024, the Administrator earned $13,650. At June 30, 2024, the Fund owed the Administrator $2,482.
|
| | | | | | | | | | |
| 6.) PURCHASES AND SALES OF SECURITIES | | | | | | | |
For the six month period ended June 30, 2024, purchases and sales of investment securities other than U.S. Government obligations and short-term investments aggregated $ 1,742,246 and $ 6,063,936, respectively. Purchases and sales of U.S. Government obligations aggregated $0 and $0, respectively.
|
| | | | | | | | | | |
| 7.) CONTROL OWNERSHIP | | | | | | | | | |
The beneficial ownership, either directly or indirectly, of more than 25% of the voting securities of a fund creates a presumption of control of a fund, under Section 2(a)(9) of the 1940 Act. As of June 30, 2024, Charles Schwab & Co. Inc., located at 101 Montgomery Street, San Francisco, California, held for the benefit of others, in aggregate, 56.23% of the Fund, and thus may be deemed to control the Fund. Also, National Financial Services, LLC, located at 200 Liberty Street, New York, New York, held for the benefit of others, in aggregate, 42.92% of the Fund, and thus may be deemed to control the Fund.
|
| | | | | | | | | | |
| 8.) TAX MATTERS | | | | | | | | | |
For Federal income tax purposes, the cost of investments owned at June 30, 2024, was $21,762,890. At June 30, 2024, the composition of unrealized appreciation (the excess of value over tax cost) and depreciation (the excess of tax cost over value) was as follows:
|
| | | | | | | | | | |
| Appreciation | | Depreciation | Net Appreciation/(Depreciation) |
| $17,598,809 | | ($193,625) | | $17,405,184 | |
| | | | | | | | | | |
As of June 30, 2024, there were no differences between book basis and tax basis.
|
| | | | | | | | | | |
The tax character of distributions paid during the six month period ended June 30, 2024, and the fiscal year 2023 was as follows.
|
| | | | | | | | | | |
| | Six Months Ended | | Fiscal Year | | |
| | June 30, 2024 | | Year Ended, 2023 | | |
| Ordinary Income | | $ - | | | | $ - | | | |
| Long-Term Capital Gains | | - | | | | 1,648,691 | | | |
| | | $ - | | | | $ 1,648,691 | | | |
| | | | | | | | | | |
| 9.) LOAN AGREEMENT | | | | | | | | | |
| A loan agreement, subject to certain covenants and restrictions, was in place between the Fund and its prior custodian, U.S. Bank, N.A. The Fund could seek to obtain loans for the purpose of funding redemptions or purchasing securities up to the lesser of $8,500,000 or the maximum amount that the Fund is permitted to borrow under the 1940 Act using the securities in its portfolio as collateral and allowing U.S. Bank, N.A. the right to setoff to those securities. The maximum interest rate of such loans was set at a rate per annum equal to U.S. Bank’s prime–lending rate (which was 8.50% as of the date of loan maturity) less 0.50% . During the six months ended, the Fund had an average loan balance of $0 and incurred no interest. Additionally, the maximum borrowing during the period was $0. No compensating balances were required. The loan matured on February 4, 2024. The loan was not renewed. |
| | | | | | | | | | |
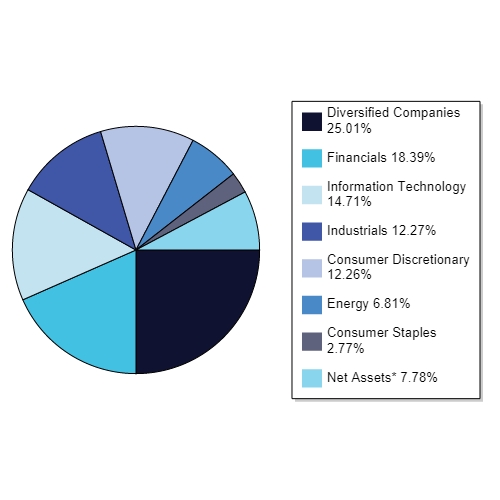
| 10.) CONCENTRATION OF SECTOR RISK | | | | | | | |
If a Fund has significant investments in the securities of issuers in industries within a particular sector, any development affecting that sector will have a greater impact on the value of the net assets of the Fund than would be the case if the Fund did not have significant investments in that sector. In addition, this may increase the risk of loss of an investment in the Fund and increase the volatility of the Fund’s NAV per share. From time to time, circumstances may affect a particular sector and the companies within such sector. For instance, economic or market factors, regulation or deregulation, and technological or other developments may negatively impact all companies in a particular sector and therefore the value of a Fund’s portfolio will be adversely affected. As of June 30, 2024, the Fund had 25.01% of the value of its net assets invested in stocks within the Diversified Companies sector.
|
| | | | | | | | | | |
| 11.) SUBSEQUENT EVENTS | | | | | | | | | |
Subsequent events after the date of the Statement of Assets and Liabilities have been evaluated through the date the financial statements were issued. Management has concluded that there is no impact requiring adjustment to or disclosure in the financial statements.
|