UNITED STATES SECURITIES AND EXCHANGE COMMISSION
Washington, D.C. 20549
Form 10-K
| ý | ANNUAL REPORT PURSUANT TO SECTION 13 OR 15(d) OF THE SECURITIES EXCHANGE ACT OF 1934 | |
| For the fiscal year ended December 31, 2009 | ||
| Or | ||
| o | TRANSITION REPORT PURSUANT TO SECTION 13 OR 15(d) OF THE SECURITIES EXCHANGE ACT OF 1934 | |
For the transition period from __________ to _________ | ||
Commission file number: 0-33347
Ambassadors Group, Inc.
(Exact Name of Registrant as Specified in Its Charter)
| Delaware | 91-1957010 | |
(State or Other Jurisdiction of Incorporation or Organization) | (I.R.S. Employer Identification No.) | |
Dwight D. Eisenhower Building 2001 South Flint Road Spokane, WA | 99224 | |
| (Address of Principal Executive Offices) | (Zip Code) | |
Registrant’s telephone number, including area code: (509) 568-7800 | ||
| Securities registered pursuant to Section 12(b) of the Act: | ||
| Common Stock, $.01 Par Value | The NASDAQ Stock Market | |
| (Title of Class) | (Name of each exchange on which registered) | |
| Securities registered pursuant to Section 12(g) of the Act: | ||
| None | ||
Indicate by check mark if the registrant is a well-known seasoned issuer, as defined in Rule 405 of the Securities Act.
o Yes |
ý No
Indicate by check mark if the registrant is not required to file reports pursuant to Section 13 or Section 15(d) of the Act.
o Yes |
ý No
Indicate by check mark whether the registrant (1) has filed all reports required to be filed by Section 13 or 15(d) of the Securities Exchange Act of 1934 during the preceding 12 months (or for such shorter period that the registrant was required to file such reports), and (2) has been subject to such filing requirements for the past 90 days.
ý Yes |
o No |
Indicate by check mark whether the registrant has submitted electronically and posted on its corporate Web site, if any, every Interactive Data File required to be submitted and posted pursuant to Rule 405 of Regulation S-T (§232.405 of this chapter) during the preceding 12 months (or for such shorter period that the registrant was required to submit and post such files).
| o | Yes | |
| o | No |
Indicate by check mark if disclosure of delinquent filers pursuant to Item 405 of Regulation S-K is not contained herein, and will not be contained, to the best of registrant’s knowledge, in definitive proxy or information statements incorporated by reference in Part III of this Form 10-K or any amendment to this Form 10-K.
| o |
Indicate by check mark whether the registrant is a large accelerated filer, an accelerated filer, a non-accelerated filer, or a smaller reporting company. See definitions of “large accelerated filer,” “accelerated filer,” and “smaller reporting company” in Rule 12b-2 of the Exchange Act. (Check one):
Large accelerated filer o | Accelerated filer x | ||
Non-accelerated filer o (Do not check if a smaller reporting company) | Smaller reporting company o |
Indicate by check mark whether the registrant is a shell company (as defined in Rule 12b-2 of the Exchange Act).
| o | Yes | |||
| ý | No |
The aggregate market value of the voting stock held by non-affiliates of the registrant, based upon the closing sales price of the Common Stock on the NASDAQ Stock Market on June 30, 2009, was $117.9 million. Shares of Common Stock held by each executive officer and director, and by each individual and entity that owns 5% or more of the outstanding Common Stock have been excluded in that such persons may be deemed to be affiliates. This determination of affiliate status is not necessarily a conclusive determination for other purposes.
The number of shares of the registrant’s Common Stock, $0.01 par value, outstanding as of February 18, 2010 was 19,018,865.
DOCUMENTS INCORPORATED BY REFERENCE
Portions of the registrant’s definitive Proxy Statement relating to the 2010 Annual Meeting of Stockholders are incorporated by reference into Part III of this Annual Report on Form 10-K to the extent stated herein.
TABLE OF CONTENTS
| Page | ||
| PART I | ||
| Item 1. | Business | 1 |
| Item 1A. | Risk Factors | 9 |
| Item 1B. | Unresolved Staff Comments | 13 |
| Item 2. | Properties | 14 |
| Item 3. | Legal Proceedings | 14 |
| Item 4. | Reserved | 14 |
| PART II | ||
| Item 5. | Market for the Registrant’s Common Equity, Related Stockholder Matters and Issuer Purchases of Equity Securities | 15 |
| Item 6. | Selected Financial Data | 18 |
| Item 7. | Management’s Discussion and Analysis of Financial Condition and Results of Operation | 19 |
| Item 7A. | Quantitative and Qualitative Disclosures About Market Risk | 31 |
| Item 8. | Financial Statements and Supplementary Data | 31 |
| Item 9. | Changes in and Disagreements With Accountants on Accounting and Financial Disclosure | 31 |
| Item 9A. | Controls and Procedures | 31 |
| Item 9B. | Other Information | 34 |
| PART III | ||
| Item 10. | Directors, Executive Officers and Corporate Governance | 34 |
| Item 11. | Executive Compensation | 34 |
| Item 12. | Security Ownership of Certain Beneficial Owners and Management and Related Stockholder Matters | 34 |
| Item 13. | Certain Relationships and Related Transactions, and Director Independence | 34 |
| Item 14. | Principal Accountant Fees and Services | 34 |
| PART IV | ||
| Item 15. | Exhibits, Financial Statement Schedules | 35 |
| Signatures | II-1 | |
Forward-Looking Statements
Statements contained in this Annual Report on Form 10-K of Ambassadors Group, Inc., which are not historical in nature, are forward-looking statements within the meaning of the Private Securities Litigation Reform Act of 1995, Section 27A of the Securities Act of 1933, as amended (the “Act”) and Section 21E of the Securities Exchange Act of 1934, as amended (the “Exchange Act”). These forward-looking statements include, without limitation, statements that relate to expectations concerning matters that are not historical facts. Words such as “projects,” “believes,” “anticipates,” “plans,” “expects,” “intends,” and similar words and expressions are intended to identify forward-looking statements. These forward-looking statements reflect our beliefs or current expectations with respect to, among other things, trends in the travel and education industry, our business and growth strategies, our use of technology, our ability to integrate acquired businesses, and fluctuations in our results of operations.
Forward-looking statements involve certain risks and uncertainties that could cause actual results to differ materially from anticipated results. These risks and uncertainties include factors affecting the travel and education industry generally, competition, dependence on key personnel and vendor relationships, our ability to successfully integrate the operations of existing or acquired companies, and a variety of factors such as periods of international unrest, the outbreak of disease, changes in the direct-mail environment, protection of intellectual rights, unidentified taxation exposure, recession, weather conditions and concerns for passenger safety that could cause a decline in travel demand, as well as the risk factors set forth in Item 1A and other factors as may be identified from time to time in our filings with the Securities and Exchange Commission (the “SEC”) or in our press releases. All forward-looking statements are expressly qualified in their entirety by these factors and all related cautionary statements. We do not undertake any obligation to update any forward-looking statements.
Ambassadors Group, Inc. (“Ambassadors,” “Company,” “we,” “us” or “our”) is a leading educational company that organizes and promotes worldwide travel programs for students, athletes and professionals, and provides over 8 million pages of online research content through www.BookRags.com. We were founded in 1967, reincorporated in Delaware in 1995, and operated as Ambassadors Education Group, a wholly owned subsidiary of Ambassadors International, Inc. (“International”) until February 2002. Effective February 28, 2002, Ambassadors spun off from International by virtue of a special stock dividend to International’s shareholders of all of the outstanding shares of our Company that International owned (the “Distribution”). Beginning March 1, 2002, we began operating as an independent stand-alone company. Trading of our Common Stock on the NASDAQ Stock Market began on March 1, 2002 under the symbol “EPAX.” Our principal offices are located in Spokane, Washington, USA.
Our travel business consists of several specialized private-label educational travel programs, including (i) the “People to People Student Ambassador Programs” (“Student Ambassador Programs”), which provide opportunities for grade school, middle school and high school students to visit domestic and foreign destinations to learn about the history, government, economy and culture of such countries, (ii) the “People to People Sports Ambassador Programs” (“Sports Ambassador Programs”), which provide opportunities for middle school and high school athletes to participate in international sports challenges, (iii) the “People to People Leadership Summit,” and “World Leadership Forum” (“Leadership Programs”), which provide domestic travel experiences for grade school, middle school and high school students emphasizing leadership, community involvement, and government education, (iv) the “People to People Citizen Ambassador Programs” (“Citizen Ambassador Programs”), which provide foreign travel experiences for professionals, with emphasis on meetings and seminars between delegates and persons in similar professions abroad and (v) “Discovery Student Adventures”, which provide opportunities for grade school, middle school and high school students to visit foreign destinations with an emphasis on adventure and scientific exploration.
Since 1995, we have expanded our travel operations primarily through internal growth and three acquisitions of educational or travel related businesses. Since 1963, we have organized programs for nearly 515,000 students, athletes, and adults. Our educational travel programs feature visits abroad, including, but not limited to, Antarctica, Australia, China, France, Germany, Great Britain, Italy, New Zealand, and South Africa. In 2009, 34,248 delegates, including students from 95 different countries, traveled on our programs to 47 countries on seven continents.
We have the exclusive right from People to People International (“People to People”) to develop and conduct student programs for kindergarten through high school students using the People to People name. We also have the non-exclusive right to develop, market and operate programs for professionals, college students and athletes using the People to People name. At the present time, we are the only entity that has been given this right by People to People. These rights, granted pursuant to agreements with People to People, expire in 2020. People to People is a private, non-profit organization dedicated to the promotion of world peace through cultural exchange. We also have the exclusive right from Discovery Education, Inc. (“Discovery Education”) to develop and conduct international student programs for kindergarten through high school students using the Discovery Education marks and the name “Discovery Student Adventures.” In addition, we have the first right of refusal to develop, market and operate programs for students to domestic destinations. These rights, granted pursuant to agreements with Discovery Education, expire in 2014.
People to People was founded by President Dwight D. Eisenhower in 1956 and was originally administered by the U.S. State Department. Eight U.S. presidents since President Eisenhower have served as the honorary chairman of People to People. Mary Eisenhower, the president and chief executive officer of People to People, also continues her grandfather’s legacy by serving the organization.
We believe that our 43 years of continuous experience, relationships arising from organizing travel programs, and our association with People to People have provided the foundation for our Company. This foundation allows us to develop and maintain strong strategic alliances and a competitive edge in the educational and travel industries at a competitive program cost. This foundation also allows us to provide high-quality and unique educational programs and customer service. We intend to continue to grow our business internally through marketing enhancements, new programs and strategic alliances, and may make selective acquisitions of and/or joint agreements with travel, education, and direct marketing related businesses.
On May 15, 2008, we acquired 100 percent of the stock in the educational website BookRags, Inc. (“BookRags”) (www.BookRags.com). BookRags was founded in 1999. It initially started as a source for online book summaries and notes, and has grown to include a wide variety of content, including lesson plans, film summaries, biographies, and literary criticisms. The BookRags’ demographic is similar in nature to that of Ambassador Programs, Inc.(“Ambassador Programs”) and although it is not travel related, BookRags is a complementary fit to our business model in relation to marketing opportunities, as well as the seasonality of our travel business. The results of BookRags have been consolidated into our results of operations since May 15, 2008.
On January 15, 2009, our subsidiary, World Adventures Unlimited, Inc. (“WAU”) (fka ‘Ambassadors Specialty Group, Inc.’), signed a five year license agreement with Discovery Education. The agreement grants us the exclusive right to license all-inclusive land based group travel packages for students in kindergarten through twelfth grade to destinations outside of North America using the Discovery Education marks and the name “Discovery Student Adventures". Pilot programs were operated in the summer of 2009 in preparation for Discovery Student Adventures’ inaugural 2010 travel season. Costs of operating the pilot programs, as well as general start-up costs, have been consolidated into our results of operations since January 15, 2009.
Student Ambassador Programs
Our Student Ambassador Programs provide an educational opportunity for students in grade school, middle school and high school to travel to one or more foreign countries or domestically, and to learn about the history, government, economy and culture of such countries. We market our Student Ambassador Programs predominantly through a combination of direct mail and local informational meetings primarily from August through February. Our representatives review candidate applications and conduct selection interviews throughout the country. Accepted applicants participate in orientation meetings to prepare for their educational travel programs.
Our Student Ambassador Program delegations depart primarily during the summer months, June through August, and generally travel for approximately fourteen to twenty-three days, during which time each delegation visits one or more countries. Each delegation generally consists of approximately 30 to 40 students and is accompanied by several teachers and local guides in each country who assist the delegations for the duration of each program. Teachers and students composing a delegation generally come from the same locale.
Programs are designed by our staff of international planners and researchers to provide an educational and entertaining travel experience by exposing students to the history, government, economy and culture of the country or countries visited. We have contracts with program coordinators to provide day-to-day coordination and oversight of the programs. In many instances, we also provide students with the opportunity for a brief stay with a host family, which gives students a glimpse of daily life in the visited country.
Eligible students who complete certain written assignments and other projects can receive high school and university credit for their participation in the program. Universities recognizing academic credit include, but are not limited to: Stanford University; Princeton University; Yale University; the University of California, Los Angeles; the University of Washington; MIT (Massachusetts Institute of Technology); Brown University; Johns Hopkins University; Columbia University; Cornell University; Dartmouth College and Georgetown University. In addition, high school students who successfully complete the program may be eligible to receive service-learning credits, which have become a high school graduation requirement in many curricula countrywide.
Sports Ambassador Programs
Our Sports Ambassador Programs provide an opportunity for student athletes in middle school and high school to explore the host country’s culture and most participate in international tournaments with teams from across the world in different sports. We market our Sports Ambassador Programs through a combination of direct mail and local informational meetings. We have also partnered with key organizations to promote our programs at local and national tournaments. Interested athletes apply to the program and are interviewed by our representatives, after which the selected athletes are accepted for the program.
Delegates in the Sports Ambassador Programs depart during the summer months, June through August, and travel for approximately nine to fourteen days. Teams are formed based on gender and age, and most teams comprise athletes from several different states. During a three- to four-day training camp, athletes competing in tournaments participate in an individual skill assessment, after which rosters are formed to ensure balanced and competitive teams. After the formation of rosters, the rest of the training camp focuses on team practice and fundamentals in preparation for the ensuing tournament competition. In each tournament, we have contracts with overseas tournament organizers to provide day-to-day coordination and oversight of the programs. Additionally, athletes participate in sports nutrition, psychology, leadership, physical training and international cultural excursions.
Eligible athletes who complete certain written assignments and projects can receive university credit for their participation in the program. Universities recognizing academic credit include, but are not limited to: Stanford University; Princeton University; Yale University; the University of California, Los Angeles; the University of Washington; MIT (Massachusetts Institute of Technology); Brown University; Johns Hopkins University; Columbia University; Cornell University; Dartmouth College and Georgetown University.
Leadership Programs
Our Leadership Programs provide the opportunity for motivated students with academic promise, leadership potential and a desire to serve their communities to travel domestically and internationally to exchange ideas with renowned speakers, field specific experts, professional educators and their peers. These programs are specifically designed for students in fifth through twelfth grades. In addition to the academic coursework, delegates engage in specially designed leadership study, team-building and leadership-building exercises.
We market the Leadership Programs through direct-mail marketing and online efforts throughout the year. Students travel throughout the year for approximately five to ten days. Leadership Programs include group discussions, workshops, educational meetings and other social and recreational activities. Programs originate from our internal marketing and research staff, who identify academic topics, speakers and facilitators. We organize and operate all activities of most of our Leadership Programs, including speakers, facilitators, events, accommodations and transportation.
Delegates traveling on our Leadership Summit programs, grades nine through twelve, may be eligible to receive transferable high school or university credits as part of the academic program. Universities recognizing academic credit include, but are not limited to: Stanford University; Princeton University; Yale University; the University of California, Los Angeles; the University of Washington; MIT (Massachusetts Institute of Technology); Brown University; Johns Hopkins University; Columbia University; Cornell University; Dartmouth College and Georgetown University. In addition, students who successfully complete the program may be eligible to receive service-learning credits, which have become a high school graduation requirement in many curricula countrywide.
Citizen Ambassador Programs
Our Citizen Ambassador Programs provide professionals with common interests the opportunity to travel abroad to meet and exchange ideas with foreign citizens who have similar backgrounds, interests or professions. Citizen Ambassador Programs are developed and travel throughout the year. Direct-mail invitations are sent to candidate delegates approximately six to eight months prior to the travel period for the delegation. Each program is designed to meet the interests of the individual delegates, and travels for eight to twelve days, with an optional additional cultural exchange following each program. Programs originate from our internal development and research staff, who identify potential delegation topics and leaders. Professional programs have been conducted in such areas as agriculture, economics, education, law, medicine and science. Many of our professional programs provide continuing educational credit for the delegates as part of the program experience. Continuing education credits are granted through alliances with professional and academic institutions, including the Wilderness Medical Society, the University of Pittsburgh, the American Bar Association, many state bar associations and other professional associations and societies.
We believe that our Citizen Ambassador Programs provide delegates with enriching experiences and deeper understandings of foreign cultures and people than visits arranged independently or through travel agencies. Unlike travel programs provided by travel agencies, these professional exchanges are intended largely as working programs, with a significant amount of the participant’s time involved in organized meetings, seminars and round-table discussions with their foreign counterparts; visits to significant foreign facilities and institutions; and informal gatherings with foreign counterparts. Each program is led by a delegation leader based upon his or her recognition in the field and expertise regarding the special focus of the particular program.
Discovery Student Adventures
Discovery Student Adventures provide students age ten through eighteen and their teachers an opportunity to feed their curiosity about the world and experience rare and adventurous activities. As is suited to programs associated with Discovery Education, the trips provide immersive education in the sciences and personal access to researchers and experts in biology, ecology, geology, and other fields.
Trips are seven to sixteen days in length and take place each spring and summer to destinations from the Arctic to South Africa. Invitations are sent throughout the year to kindergarten through twelfth grade educators to lead travel groups and expand their students’ education. Pilot programs were operated in the summer of 2009 in preparation for Discovery Student Adventures’ inaugural 2010 travel season.
Educators leading the trips may be eligible for continuing education credit, and students in grades nine through twelve may choose to earn transferable high school credit as part of the academic program.
BookRags
The BookRags’ website, www.BookRags.com, is an educational website that attracts millions of users and advertisers each month. Students and teachers are able to “research anything” through over 8 million pages of content, including BookRags-created material, licensed material, user-generated content, and other third party content. BookRags provides book summaries, critical essays, as well as online study guides, biographies and references to encyclopedia articles. Due to the nature of this business and the users of the website, most of BookRags’ revenues are earned during the months of September through June.
Segment Information
Historically, our operations were organized into one operating segment, consisting of out-of-classroom educational travel services to students, professionals and athletes through multiple itineraries within various travel program types. The five types of travel programs have been aggregated as a single reporting segment based on the similarity of their economic characteristics and services provided. Beginning May 15, 2008, with the acquisition of BookRags, our operations were organized into two operating segments, which have been determined to be two reporting segments. These two reporting segments are (1) Ambassador Programs and Other, representing our travel programs and (2) BookRags, an internet research site housing content sales and advertising revenue. The acquisition of BookRags aligns with our mission of bridging cultural and political borders through education See Note 15, Segment Reporting, in our consolidated financial statements in this Form 10-K for further segment information.
Academic Accreditation
Since 2004, we have been academically accredited through the Northwest Association of Accredited Schools. We developed the Washington School of World Studies to provide an opportunity for high school students to earn academic credit through their participation in the Student Ambassador Programs, Sports Ambassador Programs, Leadership Programs, or Discovery Student Adventures. The courses offered by the Washington School of World Studies emphasize the total learning experience of the participant while preparing for and participating in the selected program. In addition to elective academic credit, students are eligible to earn service-learning credits on select programs after successfully completing the course requirements. Since inception, the Washington School of World Studies has granted approximately 182,000 academic and service-learning credits.
Since 2007, we have been able to provide teacher leaders with continuing education units from their study and work as leaders through the International Association for Continuing Education and Training (“IACET”). As an authorized IACET provider, we have granted approximately 2,500 continuing education units.
Our delegates and teacher leaders are also able to earn academic credit through Eastern Washington University’s Eisenhower Center (“EWU”). Student Ambassadors in grades nine through twelve may enroll in EWU courses and earn up to 12 credits. In addition, Student Ambassadors in grades seven and eight are eligible to earn one credit per course. Teacher leaders many enroll in EWU courses and earn up to five credits. Between 1980 and 2009, Student Ambassadors transferred more than 42,500 college credits from EWU to universities of their choice. Since 2006, teacher leaders have earned more than 1,950 college credits from EWU.
Strategic Alliances
Alliances with Students on Ice, Inc. and Full On (Europe) Limited provide adventure and quality for our Student and Citizen Ambassador Programs. These agreements prescribe the nature, scope and pricing of the travel services provided to our delegates. An alliance with Safe Passage Travel I, LLC, provides safety awareness to support the education and support of safe travel practices.
We have also entered into alliances with the American College of Medical Quality, the American Bar Association and the University of Pittsburgh to provide continuing education credits for our Citizen Ambassador Programs.
Service and Trademarks
We have registered or applied for a variety of service and trademarks, including, but not limited to, the names “People to People Ambassador Programs,” “People to People Student Ambassador Programs,” “People to People Sports Ambassador Programs,” “People to People Citizen Ambassador Programs,” “People to People Leadership Programs,” “BookRags” and “Society for Global Citizens.” In addition, we have the right, subject to certain exceptions, to use the People to People and Discovery Education name, service mark and logo for use in our marketing. We believe that the strength of our service and trademarks is valuable to our business and intend to continue to protect and promote our marks as appropriate. We believe that our business is not overly dependent upon any one trademark or service mark.
Insurance
We maintain insurance coverage that we believe is adequate for our business, including, but not limited to, professional and general liability insurance. We also maintain insurance coverage on our leased real property and personal property on a replacement cost basis. There is no assurance that the insurance maintained by us will be adequate in the event of a claim, that such insurance will cover a claim or loss, or continue to be available in the future.
Employees
On December 31, 2009, we employed 251 employees, of which 244 were full-time employees. Of our full-time employees, 223 are located in Spokane, Washington, six are located in Seattle, Washington, seven are located in Washington, D.C, and eight are located in various states across the United States to serve as local field representatives. We have 154 full-time employees engaged in selling and marketing and 90 full-time employees in general and administrative positions. We also employ a temporary workforce on a seasonal basis to assist with our direct marketing efforts in recognition of the fact that our travel programs are seasonal in nature. None of our employees are subject to collective bargaining agreements or are represented by a union. We believe that our labor relations are good.
Competition
The travel industry and the educational segment within the travel industry are highly competitive. Our Student Ambassador Programs, Sports Ambassador Programs, Leadership Programs and Discovery Student Adventures compete with similar educational travel programs operated by other individuals and organizations, as well as independent programs organized and sponsored by local teachers with the assistance of local travel agents. Our Sports Ambassador Programs also compete with independent organizations, which coordinate and travel already intact teams for international competition. Citizen Ambassador Programs compete with independent professional associations and educational institutions, which sponsor and organize their own travel programs through the assistance of local travel agents, and other organizations that design travel programs and continuing professional education for adults.
We believe that the principal basis of competition in the educational travel segment of the market is the quality and uniqueness of the educational program offered, customer service, safety, reputation and program cost. We believe that our 43 years of experience organizing student and professional educational programs and established relationships with public officials, organizations and residents in countries where we provide programs, as well as our agreements with People to People and Discovery Education, allow us to provide an educational opportunity that is not easily duplicated by competitors’ programs.
We believe the barriers to entry are relatively low for any future competitors. Certain organizations engaged in the travel business could have substantially greater financial, marketing and sales resources than we do. There can be no assurance that our present or future competitors will not exert significant competitive pressures on us in the future.
In addition to competition we face in the travel industry, we also face significant competition from a wide variety of content and media Web properties with companies throughout the world. Content and advertising on the internet are intensely competitive and have been rapidly evolving with converging technologies. We compete with many larger Web properties that have larger staff dedicated towards selling and advertising and have more traffic to offer potential advertisers. We anticipate that this competition will increase over time as Internet usage continues to grow. We believe that the internet still offers a more attractive and measurable advertising option than traditional off-line media including television, radio, billboard, magazine, and newspaper.
Available Information
We are subject to the informational requirements of the Exchange Act that require us to file reports, proxy and information statements, and other information with the SEC. The public may read and copy our filings at the SEC’s Public Reference Room, 100 F. Street, N.E., Washington, D.C. 20549. The SEC maintains an Internet site that contains reports, proxy and information statements and other information regarding issuers that file electronically with the SEC at www.sec.gov. Similarly, we maintain a website at www.AmbassadorsGroup.com, where we make available our annual report on Form 10-K, quarterly reports on Form 10-Q, current reports on Form 8-K and all amendments to those reports as soon as reasonably practical after, or on the same day as, such material is electronically filed with or furnished to the SEC. We make these available free of charge.
BUSINESS STRATEGY
We believe that high-quality programs and exceptional customer service are and will remain key elements of our success. Our strategy is to maintain our high quality and unique out-of-classroom educational experiences while increasing the volume of business. To grow the business, we intend to (i) introduce new and expand existing marketing channels and to increase volume of current educational travel programs, (ii) introduce new educational travel programs independently and through strategic alliances, (iii) further develop our internet presence, and (iv) pursue acquisition opportunities.
Expand the Marketing and Travel Volume
U.S. Census data projects that there will be more than 42.8 million people in the 10- to 19-year-old age range by 2015, from 41.1 million people in 2010. We believe that a large number of qualified students in this age group are not aware of our youth travel programs. In light of these factors, we intend to further develop our marketing techniques by making greater use of referrals from teachers, parents and past student travelers, targeting strategic partnerships, and expanding and refining our extensive databases of potential customers using more precise business intelligence techniques.
According to U.S. Census data, the number of Americans 45 to 74 years old is expected to grow substantially, increasing to more than 110.4 million people in 2015, from 102.3 million people in 2010. We expect this trend to benefit our program growth, as this population segment historically has been the most likely to participate in one of our professional travel programs. In addition, we believe that American adults interested in traveling abroad will increasingly seek convenient and unique experiences. Consequently, we believe that the opportunity exists to expand the professional educational travel programs by continuing to increase the quality and number of specialty professional programs, including professional education credit opportunities, and by exploring new country destinations. We continue to look for alliances with partners that have strong brand recognition and access to well-defined customer segments.
Introduce New Programs
We continually seek to develop and introduce additional innovative and educational experiences. We intend to maintain our contacts with foreign governmental agencies and officials and utilize these and other foreign contacts to organize opportunities for our program delegates that other travel programs do not currently offer. In addition, we may develop new youth travel programs organized around common extracurricular activities such as science, nature and music.
Expand Website Traffic
According to the U.S. Census, there will be over 48 million people in the United States by 2015 between the ages of 14 and 24. Worldwide, there will be almost 1.4 billion people between the ages of 15 and 24. According to internetworldstats.com, worldwide penetration of the Internet is below 26% at the end of 2009, but is rapidly growing. As we continue to add content, resources, tools and functionality to our websites, we anticipate increasing our appeal to and penetration of these ages as well as other age groups.
Pursue Acquisition Opportunities
We consider the travel and youth education industries encompassed by our business to be large and fragmented, which present attractive acquisition opportunities. We believe acquisitions of businesses that are either compatible with our current business or represent a developing specialty segment may be an opportunity for future growth.
Item 1A. Risk Factors
The following risk factors could materially and adversely affect our future operating results and could cause actual results to differ materially from those predicted in forward-looking statements we make about our business.
A decline in the travel industry could adversely affect our results of operations.
Our results of operations will depend upon factors affecting the travel industry in general. Our enrollments and resulting revenues and earnings are especially sensitive to events that affect domestic and international air travel and the level of hotel reservations. A number of factors, including a rise in fuel prices or other travel costs, excessive inflation, currency fluctuations within the global market, the strength of the dollar, foreign taxation changes, extreme weather conditions and concerns about passenger safety could result in a temporary or longer-term overall decline in demand for our programs. Also, demand for our products and services may be significantly affected by the general level of economic activity and employment levels in the United States and key international markets. Therefore, the economic downturn or a recession in the United States or these other markets could have a material adverse effect on our business, financial condition, cash flows and results of operations. Currently, the United States and other markets are facing these conditions which has impacted the travel industry, the markets in which we operate, our operations and profitability. We expect these conditions will continue to impact our operations and profitability.
Business interruption due to adverse weather conditions or natural disasters, international political climate, armed conflicts, terrorist and threats thereof, and other world events or other incidents affecting the health, safety, security and/or program satisfaction of individuals could have an adverse affect on our profitability.
Demand for our travel programs may be adversely affected by natural occurrences such as hurricanes, earthquakes, epidemics or other disease outbreaks such as influenza, and flooding in geographic regions in which we conduct travel programs. The occurrence of any of the events described above or other unforeseen developments in one or more of these regions would have a material adverse effect on our business, financial condition, cash flows, and results of operations.
Our operations are subject to special risks inherent in doing business internationally, as a substantial portion of our travel programs are conducted outside the United States. Historically, gross program receipts from programs to Europe, the South Pacific (Australia and New Zealand) and China have accounted for a majority of our receipts. Risks inherent in doing business internationally include potential adverse effects on operations from war, U.S. military deployments, international and domestic terrorism, civil disturbances, political instability, foreign currency exchange rates, governmental activities and deprivation of contract rights.
Periods of international and domestic unrest have reduced demand for our travel programs and could have a material adverse effect on our business and results of operations. Examples of such past events include, but are not limited to, war in Iraq in 2003 and various terrorist attacks, such as the attempted airliner terrorist attack on December 25, 2009, the attacks that occurred in India on November 26 through 29, 2008, London on July 7 and 21, 2005, and in the United States on September 11, 2001. A continued U.S. military response and other acts of violence or war have and will affect the travel industry generally, the markets in which we operate, and our operations and profitability. Further terrorist attacks against the United States or U.S. businesses and citizens at home and abroad may occur. The September 11 attacks had a very negative impact on domestic and international air travel and the travel industry in general. The potential long-term effects of these events are uncertain for our customers, the market for our Common Stock, the markets for our services and the U.S. economy. The consequences of any terrorist attacks, or any armed conflicts including war which may result, are unpredictable, and we may not be able to foresee events that could have an adverse effect on our business or operations. Historically, we have experienced increased cancellations for our travel programs during such times.
Our financial results are subject to fluctuations due to the seasonality of our business.
Our business is highly seasonal. The majority of our travel programs are scheduled in June and July of each year, mildly complemented by the majority of content sales which occur during the school year, primarily September to June. We anticipate that this trend will continue for the foreseeable future. We recognize gross program receipts, revenues and program pass-through expenses upon the departure of our program delegates for the majority of our programs. Substantially all of our operating income is generated in the second and third quarters, which historically has offset the operating losses incurred during the rest of the year. Annual results would be adversely affected if our revenues were to be substantially below seasonal norms during the second and third quarters of the year. Furthermore, our operating results may fluctuate as a result of many factors, including the mix among five different travel programs and program destinations offered by us and our competitors, the introduction and acceptance of new programs and program enhancements by us and our competitors, timing of program completions, cancellation rates, competitive conditions in the industry, marketing expenses, extreme weather conditions, international or domestic conflicts, timing of and costs related to acquisitions, changes in relationships with certain travel providers, economic factors and other considerations affecting travel. As a result of the foregoing, annual or quarterly operating results may be below the expectations of public market analysts and investors. In such event, the price of our Common Stock could be materially and adversely affected.
Competition in the travel and education industries could impact our results of operations.
The travel industry in general and the educational segment of the travel industry are highly competitive and have relatively low barriers to entry. We compete with other companies that provide similar educational travel programs for students and athletes, as well as independent programs organized and sponsored by local teachers and coaches with the assistance of local travel agents. People to People, under the terms of its agreement with us, reserves the right to offer programs to college students for studies abroad and to grant to other individuals or entities, the right to use the People to People name in connection with People to People’s professional education and sports programs. In general, our Citizen Ambassador Programs compete with independent professional organizations that sponsor and organize their own travel programs through the assistance of local travel agents, and other organizations that offer travel programs and continuing education credits for adults. Some of our competitors are larger and have greater brand-name recognition and financial resources than we do. In addition to competition we face in the travel industry, we also face significant competition from a wide variety of content and media Web properties with companies throughout the world. Content and advertising on the internet are intensely competitive and have been rapidly evolving with converging technologies. We compete with many larger Web properties that have larger staff and more traffic to offer potential advertisers. There can be no assurance that we will be able to compete successfully, and the failure to compete successfully may have a material adverse effect on our business, financial condition, cash flows and results of operations.
Our inability to use established brands, such as the “People to People” and “Discovery Education” names, could significantly impact our success in attracting future travelers.
Our agreements with People to People give us the exclusive right to develop and conduct programs for kindergarten through high school students using the People to People name, and the non-exclusive right to develop and conduct programs for professionals, college students and athletes using the People to People name. Our agreements with People to People, however, allow People to People to continue to conduct college and professional seminars and internship programs and to develop other sports and professional programs. Our agreements with People to People expire in 2020. Our agreement with Discovery Education gives us the exclusive right to license all-inclusive programs for kindergarten through high school students using the Discovery Education marks and the name “Discovery Student Adventures." We believe that we derive benefit from our ability to market our programs using the People to People and Discovery Education names. If our agreements with People to People and Discovery Education were terminated or if we were unable to use the branded names to market new programs or destinations, this could have a material adverse effect on our business, financial condition, cash flows and results of operations. Similarly, if our relationship with People to People or Discovery Education is disrupted or is adversely impacted because People to People or Discovery Education experiences interruption, delay or ceases operations in the future for any reason, our business could be harmed and our stock price may decline.
Our dependence on travel suppliers could delay the delivery of our products and services, which would impact our reputation and could reduce our profitability.
We are dependent upon travel suppliers for access to their products and services. Travel suppliers include airlines, hotels, bus lines, overseas coordinators and other participants in the travel industry. Consistent with industry practices, we currently have no long-term agreements with travel suppliers that obligate such suppliers to sell services or products through us on an ongoing basis. Therefore, the travel suppliers generally can cancel or modify their agreements with us upon relatively short notice. In addition, any decline in the quality of travel products and services provided by these suppliers, or a perception by our delegates of such a decline, could adversely affect our reputation. The loss of contracts, changes in our pricing agreements, commission schedules or incentive override commission arrangements, more restricted access to travel suppliers’ products and services or less favorable public opinion of certain travel suppliers, resulting in low demand for the products and services of such travel suppliers and loss of deposits with travel suppliers that could go bankrupt could all have a material adverse effect on our business, financial condition, cash flows and results of operations.
We depend on our ability to attract and retain our key personnel.
Our performance is substantially dependent on the continued services and performances of our senior management and certain other key personnel. The loss of the services of any of our executive officers or other key employees could have a material adverse effect on our business, financial condition and results of operations. Our future success also depends on our ability to identify, attract, hire, train, retain and motivate other highly skilled managerial, marketing and customer service personnel. The failure to retain and attract necessary managerial, sales, marketing and customer service personnel could have a material adverse effect on our business, financial condition, cash flows and results of operations.
We depend on the effectiveness of marketing to obtain individuals to travel on our programs and to use our website.
Our performance in our travel programs is substantially dependent on the effectiveness of our direct and indirect marketing efforts, including but not limited to, names sources used to identify potential participants for our programs, direct mail, online presence and local informational meetings. Failure or underperformance of our marketing efforts, including changes in the direct-mail environment and the Company’s reputation with teachers could have a material adverse effect on our business, financial condition, cash flows and results of operations. Such changes in the direct-mail environment could include, but are not limited to, a threat of disease or bioterrorism within the mail environment and new or different regulatory schemes or changes in costs or services by the United States Postal Service. In addition, the performance of our research segment is dependent on advertising rates. Changes affecting advertising fees and reduced traffic could have an impact on operations.
Government regulation and taxation may adversely affect the travel industry and thus increase our operating expenses.
Many travel suppliers, particularly airlines, are subject to extensive regulation by federal, state and foreign governments. In addition, the travel industry is subject to certain seller of travel laws of certain states and special taxes by federal, state, local and foreign governments, including but not limited to hotel bed taxes, car rental taxes, airline excise taxes and airport taxes and fees. New or different regulatory schemes or changes in tax policy could have an adverse impact on the travel industry in general and could have a material adverse effect on our business, financial condition, cash flows and results of operations.
Fluctuations in foreign currency exchange rates could affect our results of operations.
Many of our arrangements with our foreign-based suppliers require payment to be made in foreign currencies. Any decrease in the value of the U.S. dollar in relation to foreign currencies has the effect of increasing the cost of the services to be provided. Since late 1993, we generally have purchased forward contracts and options with less than two years’ maturity to help manage program costs and hedge against foreign currency valuation increases. While the ability to utilize forward contracts for the delivery of foreign currencies can mitigate the effect of increased program costs and foreign currency exchange fluctuations, there can be no assurance that increased program costs relating to such currency fluctuations will not be substantial in future periods. There can also be no assurance our hedging strategy will mitigate longer-term foreign exchange valuation trends. Depending on the strength of the U.S. dollar at the time the forward contracts and options are entered into and its strength throughout the contracted period, we could end up in an over-hedged position, which may result in a gain or loss that must be recognized in our financial statements immediately. Our contract with delegates in our travel programs provides us the option of passing along to delegates any increase in program costs resulting from currency fluctuations. Although we have exercised this option in the past, there can be no assurance that we will be able to increase program prices to offset any such cost increases in the future and any failure to do so could have a material adverse effect on our business, financial condition, cash flows and results of operations.
Litigation may subject us to significant litigation costs, judgments, fines and penalties that may not be covered by or may be in excess of available insurance coverage, and may divert management’s attention and resources from our business.
Due to the nature of our business and being a publicly held company, we may be subject to liability claims arising out of perceived wrong doing related to management’s decisions, securities claims, governmental investigations, business operations, or accidents or disasters causing injury to delegates on our programs, including claims for serious personal injury or death. We believe that we have adequate liability insurance for risks arising in the normal course of our business. Although we have experienced no claims for which we did not have adequate insurance coverage, there can be no assurance that insurance coverage will be sufficient to cover one or more large claims or that the applicable insurer will be solvent at the time of any covered loss. Further, there can be no assurance that we will be able to obtain insurance coverage at acceptable levels and cost in the future. Successful assertion against us of one or a series of large uninsured claims, or of one or a series of claims exceeding any insurance coverage could have a material adverse effect on our business, financial condition, cash flows and results of operations. In addition, liability claims asserted against us may also divert management’s attention and resources from our business to participation in the litigation process and defense of these asserted claims. See Note 10, Commitments and Contingencies, to the consolidated financial statements for a description of the claims that have been made against us.
If we are unable to successfully manage the growth in our business, our prospects may be limited and our future profitability will be decreased.
Our performance is dependent on our ability to grow our business and expand the marketing and volume of our educational travel programs, increase the number of website visitors and unique users, and develop our brands. In addition, our ability to grow is dependent on our ability to find and integrate acquisitions or strategic alliances. Failure to meet growth strategies or any minimum volume requirements pertaining to vendor or strategic alliance agreements could have a material adverse effect on our business, financial condition, cash flows and results of operations.
We are exposed to concentration of credit risk that could affect our results of operations.
Cash, cash equivalents and available-for-sale securities are exposed to concentrations of credit risk. We place our cash and temporary cash investments with high credit quality institutions. At times, such balances may be in excess of the federal depository insurance limit or may be on deposit at institutions which are not covered by this insurance. If such institutions were to become insolvent while holding our cash, cash equivalents or available-for-sale securities in excess of the insurance limit, we could suffer losses or it could be necessary to obtain credit financing to operate our travel programs.
Our short-term investments primarily consist of municipal bonds and our long-term investments consist of auction rate securities ("ARS"). The credit markets are currently experiencing significant uncertainty, however our investments are in high-quality, tax-exempt municipal obligations and our ARS are insignificant compared to our total investment portfolio. See Note 4, Investments and Fair Value Measurements, in our consolidated financial statements in this Form 10-K for further information.
If we are unable to protect our intellectual property, we may lose a competitive advantage or incur substantial litigation costs to protect our rights.
Substantially all of our publications are protected by copyright, held either in our name, in the name of the author of the work, or in the name of the sponsoring professional society. Such copyrights protect our exclusive right to publish the work in the United States and in many countries abroad for specified periods. Our ability to obtain and continue to obtain access to existing and new content, as well as our ability to continue to achieve expected results depends, in part, upon our ability to protect our intellectual property rights. Our results may be adversely affected by lack of legal or technological protections for our intellectual property in some jurisdictions and markets that we operate in.
We depend on our ability to successfully integrate key acquisitions.
One of our growth strategies is to acquire businesses that complement our existing businesses. Target acquisitions may have an impact on costs, revenues, cash flows, and our financial position, such as the acquisition of BookRags, on May 15, 2008. Acquisitions involve risks and uncertainties, including difficulties in integrating acquired operations and in realizing expected opportunities, diversions of management resources and loss of key employees, challenges with respect to operating new businesses, and other unanticipated risks and liabilities.
Our revenues and results of operations may fluctuate unexpectedly from quarter to quarter, which may cause our stock price to decline.
The market price of our Common Stock could be subject to significant fluctuations. Some of the factors that could affect our stock price include:
| • Quarterly variations in operating results; |
| • Changes in revenue or earnings estimates or publication of research reports by analysts; |
| • Speculation in the press or investment community; |
| • Strategic actions by us or our competitors, such as acquisitions or restructurings; |
| • Actions by institutional shareholders; |
| • General market conditions; |
| • Fair value adjustments associated with impairment of investments, goodwill, intangible assets or fixed assets; |
| • Change in key employees; |
| • Domestic or international social and economic factors unrelated to our performance; |
| • Terrorist activities, and |
| • Limited shares of Common Stock available for trading |
The stock markets have experienced extreme volatility that has often been unrelated to the operating performance of particular companies. These broad market fluctuations may adversely affect the trading price of our Common Stock. In particular, we cannot make assurances that our stock will sell at any particular price, or at all.
Item 1B. Unresolved Staff Comments
None.
Item 2. Properties
We own an office building, approximating 132,000 square feet, in which our headquarters are located in Spokane, Washington. Our facilities are well maintained, in good operating condition and provide adequate capacity for our needs. We have the ability to expand our capacity for growth if we should need to in the future. At December 31, 2009, Ambassadors Group, Inc. and its subsidiaries are the occupants of this property.
We also occupy two additional office spaces. One space totals approximately 2,400 square feet in Arlington, Virginia, pursuant to a lease which expires April 30, 2011 and is occupied by Ambassador Programs. The other totals approximately 2,200 square feet in Seattle, Washington, pursuant to a lease which expires on February 28, 2011 and is occupied by both Ambassador Programs and BookRags. Both facilities are well maintained, in good operating condition and provide adequate capacity for our needs.
On July 14, 2009, a securities class action was filed against us and certain of our executive officers on behalf of all persons or entities who purchased our Common Stock between February 8, 2007 and October 23, 2007. The class action was filed in the United States District Court for the Eastern District of Washington by plaintiff Plumbers Union Local No. 12 Pension Fund (“Plumbers Union”). On October 22, 2009, the Court appointed International Brotherhood of Electrical Workers Local 351 (“IBEW 351)” as lead plaintiff. On November 23, 2009, lead plaintiff IBEW 351 filed a motion to withdraw as lead plaintiff and sought appointment of Plumbers Union as substitute lead plaintiff. On January 7, 2010, a hearing was held and the Court appointed Plumbers Union as lead plaintiff and required any amended complaint shall be served and filed on or before January 11, 2010. Plumbers Union filed its amended complaint on January 11, 2010. The amended complaint alleges that the defendants violated federal securities laws by making untrue statements of material fact and/or omitting to state material facts, thereby artificially inflating the price of our Common Stock. We have reviewed the amended complaint and deny the allegations contained therein. We have tendered our defense and indemnity under applicable insurance coverage and defense counsel in Seattle, Washington has been retained to represent us. We believe that the likelihood that our Company will ultimately incur a loss in connection with this litigation is remote. We cannot estimate the possible loss to our Company, if any, at this time. The actual cost to resolve this case will depend upon many factors such as the outcome of mediation, pre-trial motions, trial and any appeals. However, we believe any loss incurred will not have a material adverse effect on our business, financial condition, cash flows or results of operations. We intend to vigorously defend this lawsuit and any alleged claims for damages.
On October 27, 2009, the Company was informed by the SEC that it had issued a formal order of investigation with respect to trading in the Company's securities. The Company believes that the investigation is for the period August through December, 2007. In connection with the investigation, the Company, certain of its officers, directors and employees, as well as other persons, have received subpoenas from the SEC requesting information. The SEC has indicated that the investigation should not be construed as an indication that any violation of law has occurred or as an adverse reflection upon any person, entity or security. The Company intends to cooperate fully with the investigation.
Other than the disclosed, we are not a party to any other material pending legal proceedings other than ordinary routine litigation incidental to our business, the outcome of which we believe will not have a material adverse effect on our business, financial condition, cash flows or results of operations. These matters are subject to inherent uncertainties and management’s view of these matters may change in the future. Adverse outcomes in some or all of the matters described in this section may result in significant monetary damages or injunctive relief against us that would adversely affect our operations.
Not applicable.
PART II
Item 5. Market for the Registrant’s Common Equity, Related Stockholder Matters and Issuer Purchases of Equity Securities |
Market Information
Our Common Stock has been traded on the NASDAQ Stock Market under the symbol “EPAX” since March 1, 2002.
As of February 18, 2010, the last reported sale price of our Common Stock was $11.44. The following table sets forth the high and low sale prices of a share of our Common Stock as reported on the NASDAQ Stock Market on a quarterly basis for our fiscal years ended December 31, 2009 and 2008.
| High | Low | ||||||
| Quarter ended March 31, 2009 | $ | 11.47 | $ | 6.20 | |||
| Quarter ended June 30, 2009 | $ | 14.06 | $ | 7.56 | |||
| Quarter ended September 30, 2009 | $ | 17.29 | $ | 12.01 | |||
| Quarter ended December 31, 2009 | $ | 17.09 | $ | 11.28 | |||
| Quarter ended March 31, 2008 | $ | 20.80 | $ | 16.40 | |||
| Quarter ended June 30, 2008 | $ | 20.42 | $ | 14.90 | |||
| Quarter ended September 30, 2008 | $ | 19.99 | $ | 13.31 | |||
| Quarter ended December 31, 2008 | $ | 16.35 | $ | 7.42 | |||
Performance Graph
The following graph compares our cumulative total shareholder return with the NASDAQ Stock Market Index and the Russell 2000 Index. The graph assumes that $100 was invested on December 31, 2004 in our Common Stock and in each of the indexes mentioned above and that all dividends were reinvested.
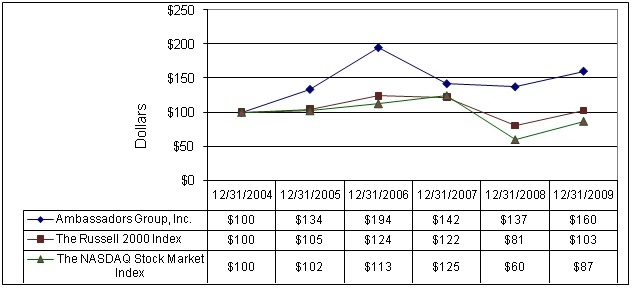
The performance graph is being furnished by us and shall not be deemed “filed” for purposes of Section 18 of the Exchange Act, or otherwise subject to the liabilities of that section, nor shall it be deemed to be incorporated by reference in any filing under the Act, or the Exchange Act.
Holders of Record
As of February 18, 2010, there were approximately 54 holders of record of our Common Stock, according to our registrar. This number does not include beneficial owners holding shares through nominee or street name.
Dividends
In November 2003, the Board of Directors initiated a dividend policy, payable on a quarterly basis. Each quarter, our Board of Directors reviews the dividend payment, assessing the amount, timing and alignment with its strategic direction.
On August 12, 2005, our Board of Directors declared a two-for-one stock split of our Common Stock in the form of a 100-percent common stock dividend, payable on September 15, 2005, to shareholders of record on August 31, 2005.
During 2008 and 2009, and through February 2010, our Board of Directors declared the following dividend payments:
| Declaration Date | Record Date | Payment Date | DividendPer Share | ||
| February 13, 2008 | February 27, 2008 | March 12, 2008 | $ | 0.115 | |
| May 8, 2008 | May 22, 2008 | June 5, 2008 | $ | 0.115 | |
| August 26, 2008 | September 9, 2008 | September 23, 2008 | $ | 0.115 | |
| November 13, 2008 | November 26, 2008 | December 10, 2008 | $ | 0.115 | |
| February 26, 2009 | March 12, 2009 | March 26, 2009 | $ | 0.06 | |
| May 7, 2009 | May 21, 2009 | June 4, 2009 | $ | 0.06 | |
| August 13, 2009 | August 27, 2009 | September 10, 2009 | $ | 0.06 | |
| November 12, 2009 | November 25, 2009 | December 9, 2009 | $ | 0.06 | |
| February 16, 2010 | March 2, 2010 | March 16, 2010 | $ | 0.06 | |
Transfer Agent and Registrar
BNY Mellon Shareowner Services serves as transfer agent and registrar of our Common Stock.
Equity Compensation Plan Information
The following tables provide information as of December 31, 2009 about our Common Stock that may be issued upon the exercise of options, warrants and rights under all of our existing equity compensation plans.
| (a) | (b) | (c) | |||||||||
| Plan category | Number of securities to be issued upon exercise of outstanding options, warrants and rights | Weighted-average exercise price of outstanding options, warrants and rights | Number of securities remaining available for future issuance under equity compensation plans (excluding securities reflected in column (a)) | ||||||||
Equity compensation plans approved by security holders | 2,018,896 | $ | 11.17 | 1,077,675 | |||||||
Equity compensation plans not approved by security holders | N/A | N/A | N/A | ||||||||
| Total | 2,018,896 | $ | 11.17 | 1,077,675 | |||||||
Issuer Purchases of Equity Securities
Between May 2004 and December 2006, our Board of Directors authorized the repurchase of up to $25.0 million of our Common Stock in the open market or through private transactions. On November 8, 2007, our Board of Directors increased the authorized Common Stock repurchase plan amounts to $45.0 million. On November 13, 2008, our Board of Directors, again, increased the authorized Common Stock repurchase plan amounts to $55.0 million. There is no expiration date to repurchase Common Stock. During the quarter ended December 31, 2009, we repurchased 16,337 shares of our Common Stock for $0.2 million. Since inception through December 31, 2009, we have repurchased approximately 1,902,550 shares of our Common Stock, adjusted to reflect the effect of our two-for-one stock split of our Common Stock, for an approximate total of $35.9 million. As of December 31, 2009, approximately $19.1 million remained available for repurchase under the plan. Subsequent to December 31, 2009, no Common Stock has been repurchased. The following is a summary of issuer purchases of equity securities during the quarter ended December 31, 2009:
Period | Total Number of Shares Purchased | Average Price Paid per Share | Total Number of Shares Purchased as Part of Publicly Announced Plans or Programs | Maximum Number (or Approximate Dollar Value) of Shares that May Yet Be Purchased Under the Plans or Program | |||||||||||
| Available for repurchase at September 30, 2009 | $ | 19,297,975 | |||||||||||||
| October 1 – October 31, 2009 | — | — | — | 19,297,975 | |||||||||||
| November 1 – November 30, 2009 | 16,337 | $ | 12.25 | 16,337 | 19,097,847 | ||||||||||
| December 1 – December 31, 2009 | — | — | — | 19,097,847 | |||||||||||
| 16,337 | $ | 12.25 | 16,337 | $ | 19,097,847 | ||||||||||
Independent of this share repurchase plan, during the first quarter of 2007, our Board of Directors approved a single repurchase of 1.2 million shares of common stock for approximately $33.0 million.
Recent Sales of Unregistered Securities
During the fiscal year ended December 31, 2009, we sold no equity securities that were not registered under the Act.
Item 6. Selected Financial Data
This section presents our historical financial data, which should be read carefully with the financial statements included in this Form 10-K, including the notes to the consolidated financial statements and Management’s Discussion and Analysis of Financial Condition and Results of Operations. The statement of operations data for each of the years in the three-year period ended December 31, 2009, and the consolidated balance sheet data as of December 31, 2009 and 2008 have been derived from audited consolidated financial statements included elsewhere in this Form 10-K. The consolidated statement of operations data for the years ended December 31, 2006 and 2005 and the consolidated balance sheet data as of December 31, 2007, 2006 and 2005 have been derived from the audited consolidated financial statements, which are not included in this Form 10-K. Historical results are not necessarily indicative of future results.
| December 31, | ||||||||||||||||||||
| 2009 (C)(D) (E) | 2008 (C) (D) | 2007 | (C) | 2006 | (C) | 2005 | ||||||||||||||
| (in thousands, except per share data) | ||||||||||||||||||||
| Statement of Operations data: | ||||||||||||||||||||
| Net revenue, non-directly delivered programs (A) | $ | 69,279 | $ | 65,656 | $ | 84,512 | $ | 69,554 | $ | 64,321 | ||||||||||
| Gross revenue, directly delivered programs (A) | $ | 26,036 | $ | 30,374 | $ | 30,021 | $ | 19,401 | $ | 4,969 | ||||||||||
| Internet content and advertising revenue | $ | 3,300 | $ | 1,897 | $ | — | $ | — | $ | — | ||||||||||
| Total revenue | $ | 98,615 | $ | 97,927 | $ | 114,533 | $ | 88,955 | $ | 69,290 | ||||||||||
| Cost of sales, directly delivered programs | $ | 14,422 | $ | 18,856 | $ | 18,488 | $ | 11,473 | $ | 2,841 | ||||||||||
| Cost of sales, internet content and advertising | $ | 389 | $ | 192 | $ | — | $ | — | $ | — | ||||||||||
| Gross margin | $ | 83,804 | $ | 78,879 | $ | 96,045 | $ | 77,482 | $ | 66,449 | ||||||||||
| Selling and marketing expenses | $ | 39,021 | $ | 40,842 | $ | 38,943 | $ | 31,638 | $ | 27,574 | ||||||||||
| General and administrative expenses | $ | 14,604 | $ | 12,568 | $ | 15,274 | $ | 11,721 | $ | 8,185 | ||||||||||
| Operating income | $ | 30,179 | $ | 25,469 | $ | 41,828 | $ | 34,123 | $ | 30,690 | ||||||||||
| Operating margin | 36 | % | 32 | % | 44 | % | 44 | % | 46 | % | ||||||||||
| Net income | $ | 20,337 | $ | 18,546 | $ | 31,047 | $ | 26,692 | $ | 22,410 | ||||||||||
| Earnings per share – basic (B) | $ | 1.06 | $ | 0.97 | $ | 1.58 | $ | 1.29 | $ | 1.10 | ||||||||||
| Earnings per share – diluted (B) | $ | 1.05 | $ | 0.95 | $ | 1.53 | $ | 1.24 | $ | 1.05 | ||||||||||
| Balance sheet data: | ||||||||||||||||||||
| Cash, cash equivalents and short-term available-for-sale securities | $ | 81,184 | $ | 74,425 | $ | 84,994 | $ | 133,134 | $ | 116,604 | ||||||||||
| Total assets | $ | 128,095 | $ | 124,277 | $ | 121,704 | $ | 153,953 | $ | 125,046 | ||||||||||
| Total stockholders’ equity | $ | 91,006 | $ | 67,233 | $ | 72,400 | $ | 84,047 | $ | 66,502 | ||||||||||
| Other key financial measures: | ||||||||||||||||||||
| Cash flow from operating activities (C) | $ | 16,138 | $ | 24,732 | $ | 16,436 | $ | 37,207 | $ | 37,792 | ||||||||||
| Cash flow provided by (used in) investing activities | $ | (11,200 | ) | $ | (16,181 | ) | $ | 9,677 | $ | (12,923 | ) | $ | (15,592 | ) | ||||||
| Cash flow used in financing activities (C) | $ | (4,271 | ) | $ | (18,843 | ) | $ | (45,616 | ) | $ | (14,416 | ) | $ | (6,320 | ) | |||||
| Cash dividends declared and paid | $ | (4,581 | ) | $ | (8,801 | ) | $ | (8,940 | ) | $ | (7,655 | ) | $ | (5,729 | ) | |||||
Cash dividends declared and paid, per common share | $ | 0.24 | $ | 0.46 | $ | 0.46 | $ | 0.37 | $ | 0.28 | ||||||||||
| Return on stockholders' equity (F) | 26 | % | 27 | % | 40 | % | 35 | % | 39 | % | ||||||||||
| (A) | Net revenues are a function of gross program receipts from non-directly delivered programs, less program pass-through expenses from non-directly delivered programs. Program pass-through expenses include all direct costs associated with our programs, including, but not limited to, costs related to airfare, hotels, meals, ground transportation, guides, professional exchanges and changes in currency exchange rates. Gross revenues, directly delivered programs are a function of the gross program receipts for those programs we directly organize and operate, including all activities such as speakers, facilitators, events, accommodations and transportation. Gross receipts for both directly delivered programs, non-directly delivered programs and internet content and advertising revenue during the years ended December 31, 2009, 2008, 2007, 2006 and 2005 were $203.7 million, $229.2 million, $277.3 million, $219.5 million, and $180.0 million, respectively. Gross margin as a percent of gross program receipts during the years ended December 31, 2009, 2008, 2007, 2006, and 2005 was 41%, 34%, 35%, 35%, and 37%, respectively. |
| (B) | During September 2005, we implemented a two-for-one stock split in the form of a 100-percent stock dividend. The earnings per share ("EPS") calculations for all periods presented reflect the increase in the number of shares of Common Stock outstanding as a result of the stock split. On January 1, 2009, we adopted a new accounting principle, which requires the inclusion of participating securities in the two class method of computing earnings per share. Participating securities are unvested share-based payment awards that contain nonforfeitable rights to receive dividends or divided equivalents (whether paid or unpaid). Participating securities under this statement include our unvested employee restricted stock awards with time-based vesting and common stock granted in the acquisition of BookRags that will be issued in 2010. As a result of this adoption, all prior period EPS data have been adjusted retrospectively. The effect of this adoption was a decrease in basic EPS of $0.02, $0.02, $0.01 and $0.00 for 2008, 2007, 2006 and 2005, respectively, and a decrease in diluted EPS of $0.02, $0.02, $0.02 and $0.00 for 2008, 2007, 2006, and 2005, respectively. |
| (C) | We adopted accounting principles relating to stock based compensation as of January 1, 2006. During 2009, 2008, 2007, and 2006 stock option expense was $0.9 million, $0.9 million, $1.0 million, and $1.3 million. In addition to stock option expenses we recorded expense related to restricted stock grants in all years presented. Short-fall (excess) tax benefit from stock-based compensation is included in net cash provided by operating activities and net cash used in financing activities of $(0.1) million, $0.1 million, $(2.7) million, and $(2.4) million for 2009, 2008, 2007, and 2006 respectively. |
| (D) | We acquired BookRags on May 15, 2008, therefore our 2008 and 2009 consolidated financial data includes BookRags’ results of operations since this date. |
| (E) | We entered into a license agreement with Discovery Education during the first quarter of 2009. Pilot programs were operated in the summer of 2009, therefore no revenue was generated, and costs associated with those programs and start-up costs are included in the 2009 consolidated financial data. |
| (F) | Calculated as net income divided by average stockholders' equity. |
Item 7. Management’s Discussion and Analysis of Financial Condition and Results of Operations
Management’s Discussion and Analysis of Financial Condition and Results of Operations (“MD&A”) is designed to provide a reader of our consolidated financial statements with a narrative from the perspective of our management on our financial condition, results of operations, liquidity and certain other factors that may affect our future results. Our MD&A is presented in ten sections:
| - | Executive Overview |
| - | Results of Operations |
| - | Results of Operations by Segment |
| - | Key Performance Non-GAAP Financial Indicators |
| - | Liquidity and Capital Resources |
| - | Contractual Obligations |
| - | Off-Balance-Sheet Arrangements |
| - | Market Risk |
| - | Critical Accounting Estimates |
| - | Recent Accounting Pronouncements |
Our MD&A should be read in conjunction with the other sections of this annual report on Form 10-K, including Part I, “Item 1A: Risk Factors”; Part II, “Item 6: Selected Financial Data”; and Part II, “Item 8: Financial Statements and Supplementary Data.” The various sections of this MD&A contain a number of forward-looking statements, all of which are based on our current expectations and could be affected by the uncertainties and risk factors described throughout this filing.
Executive Overview
We are a leading educational company that (1) organizes and promotes worldwide educational travel programs for students, athletes and professionals and (2) provides over 8 million pages of online research content.
Ambassador Programs provides worldwide travel programs for student ambassadors, sports ambassadors, student leaders and professionals and represents the core business which has been established for over forty years. Discovery Student Adventures provides adventure based travel packages for students, kindergarten through twelfth grade, primarily to destinations outside of North America.
The acquisition of BookRags in May of 2008, which aligns with our mission of bridging cultural and political borders through education, was made for the purpose of owning a profitable business that attracts millions of similar customers. BookRags is a thriving young business and is a complementary revenue stream to the seasonal nature of the student travel industry. However, we do not expect this business to perform at the level of our core travel programs.
Our subsidiary World Adventures Unlimited entered into an exclusive agreement with Discovery Education in January of 2009, and provides adventure based travel branded as “Discovery Student Adventures.” This section of our travel offering is in its infancy stages, but we are excited about the future opportunities it brings to offer a premium, adventure based product to a new group of educators.
The key financial indicators that we use in managing our business and in evaluating our financial condition and operating performance are: program operating results; net operating income; net enrollments; financial ratios; free cash flow; deployable cash; leverage as shown on our consolidated balance sheet; various website metrics including monthly page views, website visitors, and unique users; and financial ratios. Net enrollments, free cash flow, and deployable cash are non-GAAP measurements we utilize and are defined and further described in the sections captioned “Key Performance Non-GAAP Financial Indicators” below. The key macro-economic factors and non-financial indicators that affect our financial condition and operating performance are: economic stability; consumer confidence; currency fluctuations; interest rates; political climates; terrorism; and military actions.
Because our operating results depend primarily on income from our travel programs, delegate acquisition and retention costs influence our operating results. Additionally, the level of expenses required to promote and operate our programs will impact our operating results. We incur significant expenses to promote the upcoming travel year (during the current fiscal year). This relationship between expense and associated revenue is pertinent to understanding our financial model.
2009 Overview
Our focus in 2009 has been to scrutinize spending in this challenging economy, optimize contract renegotiations, and invest wisely in positioning our Company for the pending economic recovery. Our methods to achieve this have been to improve margin through effective program cost management; attempt to increase net enrollments for 2009 and 2010 travel programs; enhance marketing and retention strategies; manage operating expenses; maximize utilization of cash; develop our websites; increase efficiency through improved business processes and automation; improve brand recognition; investigate and capitalize on growth opportunities, such as our launch of the Discovery Student Adventures programs. We will continue to seek opportunities to improve our performance and add complementary revenue streams, such as the addition of Discovery Student Adventures during the first quarter of 2009 and the acquisition of BookRags in 2008.
Some of our 2009 key financial measures include the following:
| · | Gross margin increased 6 percent and operating income increased 18 percent despite traveling 18 percent fewer delegates during the year. |
| · | Other income decreased $1.2 million or 53 percent due to lower prevailing interest rates. |
| · | Deployable cash increased 60 percent from $29.9 million to $47.9 million primarily due to the 30 percent decline in participant funds year over year and a 10 percent increase in cash and cash equivalents. |
| · | Free cash flow decreased 48 percent from $19.7 million to $10.3 million. |
| · | BookRags achieved 10 percent revenue growth during the current economic conditions. |
| · | Completed our Discovery Student Adventures pilot programs in the summer of 2009. |
2010 Outlook
In 2010 we will continue to seek the right balance of expense management and the appropriate investment in 2011. Our focus will continue to include: increasing net enrollments for 2010 from current indicatiors and increase enrolled revenue for 2011, optimizing margin, investigating growth opportunities, managing expenses, cultivating new business ventures, increasing efficiency through improved business processes and automation, developing our websites, and improving brand recognition. Please see “2010 Net Enrollments” below for further discussion of our 2010 outlook on delegate registrations.
Some of our 2010 initiatives include the following:
| · | Increase enrollments for 2010 and 2011travel through traditional means in addition to a variety of new avenues, such as offering a job loss insurance called “Peace of Mind”, various pricing tests, and new social media strategies. |
| · | Continued negotiations with program delivery vendors to ensure optimization of margin. |
| · | Continued scrutiny of expenses. |
| · | Improve customer satisfaction ratings utilizing a new approach called Net Promoter, which is both a loyalty metric and a discipline for using customer feedback to fuel profitable growth in our business. |
| · | Outsource our print production processes. |
| · | Integrating key new hires which include a new senior vice president of product management for Ambassador Programs and a new president for BookRags. |
| · | Execute first travel season for Discovery Student Adventures. |
Results of Operations
The following table sets forth the consolidated financial results and change in dollars and percentages for the periods indicated:
Comparison of Year Ended December 31, 2009 to Year Ended December 31, 2008
| Year Ended December 31, | ||||||||||||||||
2009 | 2008 | $ Change | % Change | |||||||||||||
| Total revenue | $ | 98,615 | $ | 97,927 | $ | 688 | 1 | % | ||||||||
| Cost of goods sold | 14,811 | 19,048 | (4,237 | ) | (22 | %) | ||||||||||
| Gross margin | 83,804 | 78,879 | 4,925 | 6 | % | |||||||||||
| Selling and marketing | 39,021 | 40,842 | (1,821 | ) | (4 | %) | ||||||||||
| General and administrative expenses | 14,604 | 12,568 | 2,036 | 16 | % | |||||||||||
| Operating income | 30,179 | 25,469 | 4,710 | 18 | % | |||||||||||
| Other income | 1,051 | 2,246 | (1,195 | ) | (53 | %) | ||||||||||
| Income before tax | 31,230 | 27,715 | 3,515 | 13 | % | |||||||||||
| Income tax provision | 10,893 | 9,169 | 1,724 | 19 | % | |||||||||||
| Net Income | $ | 20,337 | $ | 18,546 | $ | 1,791 | 10 | % | ||||||||
In late 2008, we announced that 2009 results of operations would be down from 2008. Based on a 20 percent decline in net enrollments at that time, travelers for 2009 were projected to be lower than 2008. This reduction was primarily attributable to an uncertain economic outlook across the nation resulting in lower enrollments in our programs. In response to this challenge, we increased our marketing efforts to find new lead sources and increased our delegate retention efforts, which resulted in reducing the year over year gap of estimated 20 percent lower enrollments to 18 percent lower actual travelers.
During 2009, we traveled 34,248 delegates compared to 41,929 delegates in 2008. In 2009, total revenue increased 1 percent to $98.6 million from $97.9 million and gross margin increased 6 percent, to $83.8 million from $78.9 million, respectively. The $0.7 million increase in total revenue and $4.9 million upsurge in gross margin are primarily due to an overall increase in program prices established in 2008, a larger percentage of higher revenue generating Student Ambassadors travelers versus Leadership travelers in 2009 as compared to 2008, and lower program component costs. Specifically, international air costs and land components decreased during the summer of 2009 in comparison to the previous year due to purchase opportunities presented by the downturn in the economy, which significantly increased gross margin. In addition, BookRags’ revenue and gross margin was $3.3 million and $2.9 million in 2009, respectively and $1.9 million and $1.7 million in 2008, respectively. This year-over-period increase in revenue and gross margin is largely due to including a full year of BookRags operations in 2009.
Selling and marketing expenses were $39.0 million and $40.8 million for the years ended December 31, 2009 and 2008, respectively. The $1.8 million decrease is attributable to $1.0 million lower print expense associated with the elimination of less effective marketing pieces and higher utilization of our websites, $1.3 million decrease in personnel expenses primarily related to headcount reductions made in January 2009 and lower incentive payouts in 2009, offset by a $0.7 million increase of expenses as a result of asset retirements related to system replacements performed throughout 2009. As a percent of gross margin, selling and marketing expenses were 47 percent and 52 percent during 2009 and 2008, respectively. The 10 percent improvement is predominantly related to our response to the reduction in expected travelers.
General and administrative expenses increased to $14.6 million for the year ended December 31, 2009 from $12.6 million for the year ended December 31, 2008. The $2.0 million increase is primarily the result of $1.6 million increase in legal and professional fees, and $0.6 million increase in depreciation expense and asset retirement expense related to the new software capitalized in 2009 and 2008. This increase is offset by approximately $0.4 million in personnel savings associated with headcount reductions made in January 2009 and lower incentive payouts in 2009. As a percent of gross margin, general and administrative expenses were consistently 17 percent and 16 percent in 2009 and 2008, respectively.
During the year ended December 31, 2009, our operating income increased to $30.2 million from $25.5 million for the year ended December 31, 2008. Operating income as a percent of gross margin was 36 percent and 32 percent for 2009 and 2008, respectively primarily due to our ability to capitalize on program savings and control our costs.
Other income consisted primarily of interest income generated by our cash, cash equivalents and available-for-sale securities offset by foreign currency losses. We realized interest and dividend income of $2.0 million in the year ended December 31, 2009, compared to $3.1 million in the year ended December 31, 2008. The decrease in interest income is largely attributable to lower prevailing interest rates on our average cash and investment balances. In addition, we realized a $1.0 million foreign currency loss in 2009 compared to a $0.8 million loss in 2008 due to being over-hedged in our foreign currency contracts connected to the 2009 travel year.
We recorded an income tax provision of approximately $10.9 million for the year ended December 31, 2009, in comparison to $9.2 million for the year ended December 31, 2008. The increase is due to higher pre-tax income and an overall increase in our effective tax rate. Our effective tax rate was 34.9 percent and 33.0 percent for the years ended December 31, 2009 and 2008, respectively. The increase is primarily due to the decline in tax exempt interest income year over year.
Comparison of Year Ended December 31, 2008 to Year Ended December 31, 2007
| Year Ended December 31, | |||||||||||||||||
2008 | 2007 | $ Change | % Change | ||||||||||||||
| Total revenue | $ | 97,927 | $ | 114,533 | $ | (16,606 | ) | (14 | %) | ||||||||
| Cost of goods sold | 19,048 | 18,488 | 560 | 3 | % | ||||||||||||
| Gross margin | 78,879 | 96,045 | (17,166 | ) | (18 | %) | |||||||||||
| Selling and marketing | 40,842 | 38,943 | 1,899 | 5 | % | ||||||||||||
| General and administrative expenses | 12,568 | 15,274 | (2,706 | ) | (18 | %) | |||||||||||
| Operating income | 25,469 | 41,828 | (16,359 | ) | (39 | %) | |||||||||||
| Other income | 2,246 | 4,172 | (1,926 | ) | (46 | %) | |||||||||||
| Income before tax | 27,715 | 46,000 | (18,285 | ) | (40 | %) | |||||||||||
| Income tax provision | 9,169 | 14,953 | (5,784 | ) | (39 | %) | |||||||||||
| Net Income | $ | 18,546 | $ | 31,047 | $ | (12,501 | ) | (40 | %) | ||||||||
In late 2007, our Company announced that 2008 results of operations would be down from 2007. Based on a 30 percent decline in net enrollments at that time, travelers for 2008 were projected to be lower than 2007. This reduction was primarily attributable to the underperformance of one name source and an uncertain economic outlook across the nation. In response to these events, we increased our marketing efforts to find new lead sources and increased our delegate retention efforts, which resulted in reducing the year over year gap of 30 percent lower enrollments to 20 percent lower actual travelers.
During 2008, we traveled 41,929 delegates compared to 52,661 delegates in 2007. In 2008, total revenue decreased 14 percent to $97.9 million from $114.5 million and gross margin decreased 18 percent, to $78.9 million from $96.0 million, respectively. The $16.6 million total revenue and $17.2 million gross margin decreases are primarily due to the 20 percent decrease in delegates traveled during the year, which was partially offset by the change in delegate mix of more Student Leaders and fewer Student Ambassadors. Additionally, international air costs increased during the summer of 2008 in comparison to the previous year, which reduced gross margin. Gross receipts and gross margin in 2008 include $1.9 million and $1.7 million from BookRags, respectively, which we acquired in May 2008.
Selling and marketing expenses were $40.8 million and $38.9 million for the years ended December 31, 2008 and 2007, respectively. The $1.9 million increase is primarily the net result of $1.0 million increase of marketing and retention efforts, combined with $0.7 million in additional namelist purchases for 2009 travel programs, $0.9 million increase in personnel expenses related to strategic new hires in product development, sales, and safety, and $0.7 million decrease of operating expenses as a result of expense management measures implemented throughout 2008. As a percent of gross margin, selling and marketing expenses were 52 percent and 41 percent during 2008 and 2007, respectively. The 11 percent increase is predominantly related to our response to the reduction in expected travelers.
General and administrative expenses decreased to $12.6 million for the year ended December 31, 2008 from $15.3 million for the year ended December 31, 2007. The $2.7 million decrease is primarily the result of $1.6 million decrease in personnel incentive pay and reduction of employee headcount, $0.3 million of reduced travel and conference expenses, and $0.8 million of overhead savings as a result of expense management measures implemented throughout 2008. As a percent of gross margin, general and administrative expenses were consistently 16 percent in 2008 and 2007.
During the year ended December 31, 2008, our operating income decreased to $25.5 million from $41.8 million for the year ended December 31, 2007. Operating income as a percent of gross margin was 32 percent and 44 percent for 2008 and 2007, respectively.
Other income consisted primarily of interest income generated by our cash, cash equivalents and available-for-sale securities and foreign currency losses. We realized interest and
dividend income of $3.1 million in the year ended December 31, 2008, compared to $4.4 million in the year ended December 31, 2007. The decrease in interest and dividend income is due to lower interest rates on lower average cash and investment balances, which are primarily the result of Common Stock repurchases approximating $10.2 million, dividends paid to shareholders of $8.8 million and the $9.4 million acquisition of BookRags during 2008. In 2008 and 2007, the average rate of return was 3.3 percent and 3.6 percent, respectively. In addition, we realized a $0.8 million foreign currency loss in 2008 due to being over-hedged in our foreign currency contracts. At the end of every year, it is our policy to be 80 to 100 percent hedged for our forecasted cash flow for the following year. As of December 31, 2008, we were approximately 20 percent over-hedged, primarily in euro, British pound, and Australian dollar on foreign currency contracts, purchased in the spring and summer of 2008 for 2009 travel expenditures. The over-hedged position and the resulting foreign currency loss is due to the decline in net enrollments for 2009 travel programs combined with lower than expected program costs and the strengthening of the U.S. dollar at the end of 2008 in comparison to foreign currency contracted rates.
We recorded an income tax provision of approximately $9.2 million for the year ended December 31, 2008, in comparison to $15.0 million for the year ended December 31, 2007. The decrease is due to lower pre-tax income. Our effective tax rate was 33.0 percent and 32.5 percent for the years ended December 31, 2008 and 2007, respectively. Our effective tax rate was lower than the statutory tax rate due to tax-exempt interest income.
Results of Operations by Segment
With the acquisition of BookRags on May 15, 2008, we changed from having one reporting segment to having two reporting segments, consisting of (1) Ambassador Programs and Other, which provides out-of-classroom educational travel services to students, professionals and athletes through multiple itineraries within five travel program types, and (2) BookRags, an internet research site housing content sales and advertising revenue.
Ambassador Programs and Others’ gross margin is comprised of gross receipts less direct program costs, including accommodation, transportation, speakers, facilitators, and event costs. BookRags’ gross margin is comprised of content, subscription, and advertising revenues via www.BookRags.com, less commissions and amortization of intangible assets directly associated with sales.
Segment results of operations for the year ended December 31, 2009 and 2008 are as follows (in thousands):
| December 31, 2009 | December 31, 2008 | ||||||||||||||||||||||
| Ambassador Programs and Other(1) | BookRags (2) | Consolidated | Ambassador Programs and Other(1) | BookRags (2) | Consolidated | ||||||||||||||||||
| Total revenue | $ | 95,315 | $ | 3,300 | $ | 98,615 | $ | 96,030 | $ | 1,897 | $ | 97,927 | |||||||||||
| Cost of goods sold | 14,422 | 389 | 14,811 | 18,856 | 192 | 19,048 | |||||||||||||||||
| Gross margin | 80,893 | 2,911 | 83,804 | 77,174 | 1,705 | 78,879 | |||||||||||||||||
| Selling and marketing | 38,288 | 733 | 39,021 | 40,404 | 438 | 40,842 | |||||||||||||||||
| General and administrative expenses | 14,269 | 335 | 14,604 | 12,443 | 125 | 12,568 | |||||||||||||||||
| Operating income | 28,336 | 1,843 | 30,179 | 24,327 | 1,142 | 25,469 | |||||||||||||||||
| Other income | 1,048 | 3 | 1,051 | 2,227 | 19 | 2,246 | |||||||||||||||||
| Income before tax | 29,384 | 1,846 | 31,230 | 26,554 | 1,161 | 27,715 | |||||||||||||||||
| Income tax provision | 10,239 | 654 | 10,893 | 8,784 | 385 | 9,169 | |||||||||||||||||
| Net income | $ | 19,145 | $ | 1,192 | $ | 20,337 | $ | 17,770 | $ | 776 | $ | 18,546 | |||||||||||
| 1) | Ambassador Programs and Other include all travel programs offered by Ambassador Programs and World Adventures Unlimited as well as corporate overhead. World Adventures Umlimited had no revenue in 2009, however they did have expenses related to the pilot porgrams that were operated during the summer of 2009 and start -up expenses. |
| (2) | BookRags was acquired on May 15, 2008. Therefore the year ended December 31, 2008 does not represent a full year as it does in 2009 and is not comparable to the year ended December 31, 2009. |
See ‘Results of Operations’ above for a discussion of year over year variances for Ambassador Programs and Other and details regarding the portion that was contributed by BookRags.
Key Performance Non-GAAP Financial Indicators
We analyze our performance on a net income, cash flow and liquidity basis in accordance with generally accepted accounting principles (“GAAP”) as well as on a non-GAAP operating, cash flow and liquidity basis referred to below as “non-GAAP operating results” or “non-GAAP cash flows and liquidity measures.” These measures and related discussions are presented as supplementary information in this analysis to enhance the readers’ understanding of, and highlight trends in, our core financial results. Any non-GAAP financial measure used by us should not be considered in isolation or as a substitute for measures of performance or liquidity prepared in accordance with GAAP.
2010 Net Enrollments
Net enrollments consist of all participants who have enrolled in our programs less those who have already withdrawn. As of February 1, 2010, we had 28,981 net enrolled participants for our 2010 travel programs, compared to 36,534 net enrolled participants as of the same date last year for our 2009 travel programs. The 21 percent decrease in net enrollments for our 2010 programs is likely to negatively impact our 2010 results. We believe the decline is caused primarily by current economic conditions and high unemployment rates. We have taken and will continue to take measures to mitigate these negative impacts, including, but not limited to implementing new enrollment strategies, increasing retention efforts toward 2010 travel through focus on improving the delegate experience, and seeking out new strategic alliances to increase leads. However, there can be no assurances that any of these measures will have any success, and if so, to what extent.
Deployable Cash
Deployable cash is a non-GAAP liquidity measure. Deployable cash is calculated as the sum of cash, cash equivalents, short-term available-for-sale securities and prepaid program costs and expenses less the sum of accounts payable, accrued expenses and other short-term liabilities (excluding deferred taxes), participant deposits and the current portion of long-term capital lease. We believe the deployable cash measurement is useful in understanding cash available to deploy for current and future business opportunities. See the “Liquidity” section below for explanations of cash sources and uses.
| Deployable Cash Reconciliation (in thousands) | ||||||||||||
| December 31, | ||||||||||||
| 2009 | 2008 | 2007 | ||||||||||
| Cash, cash equivalents and short-term available-for-sale securities | $ | 81,184 | $ | 74,425 | $ | 84,994 | ||||||
| Prepaid program cost and expenses | 3,175 | 4,160 | 3,624 | |||||||||
| Less: Participants’ deposits | (31,137 | ) | (44,166 | ) | (42,723 | ) | ||||||
| Less: Accounts payable/accruals/other liabilities | (5,300 | ) | (4,473 | ) | (5,474 | ) | ||||||
| Deployable cash | $ | 47,922 | $ | 29,946 | $ | 40,421 | ||||||
Free Cash Flow
Free cash flow is a non-GAAP cash flow measure. Free cash flow is calculated as cash flow from operations less purchase of property, plant, equipment and intangibles. Management believes this non-GAAP measure is useful to investors in understanding the cash generated within a calendar year for future use in operations.
| Free Cash Flow Reconciliation (in thousands) | |||||||||
| December 31, | |||||||||
| 2009 | 2008 | 2007 | |||||||
| Cash flow from operations as reported | $ | 16,138 | $ | 24,732 | $ | 16,436 | |||
| Purchase of property, plant, equipment and intangibles | (5,883) | (5,042) | (19,271 | ) | |||||
| Free cash flow | $ | 10,255 | $ | 19,690 | $ | (2,835 | ) | ||
Liquidity and Capital Resources
Liquidity
At December 31, 2009, we had approximately $81.2 million of cash, cash equivalents, and short-term available-for-sale securities, which included program participant deposits of approximately $31.1 million. At December 31, 2008, we had approximately $74.4 million of cash and cash equivalents and available-for-sale securities, which included program participant deposits of $44.2 million. In addition to our cash and short-term investments, at December 31, 2009 and 2008, respectively, we had $1.4 million and $2.1 million of ARS which have been classified as long-term investments.
Net cash provided by operations for the years ended December 31, 2009 and 2008 was approximately $16.1 million and $24.7 million, respectively. The $8.6 million decrease in operating cash flows between the years ending December 31, 2009 and 2008 primarily results from a $14.5 million decrease in cash flows for participant deposits year over year, offset by a $1.8 million increase in earnings and a $3.3 million improvement in working capital.
Net cash used in investing was $11.2 million and $16.2 million for the years ended December 31, 2009 and 2008, respectively. This $5.0 million fluctuation was due to $9.4 million of cash used for the acquisition of BookRags during the year ended December 31, 2008 but not in 2009 balanced with a net increase of $3.7 million used to purchase short-term investments and $0.5 million used to purchase intangible assets.
Net cash used in financing activities was $4.3 million in the year ending December 31, 2009 and $18.8 million during the year ending December 31, 2008. The net change in financing activities was a result of a $9.6 million decrease in cash used for the repurchase of our Common Stock; a $4.2 million decrease in cash dividends paid, a $0.2 million increase in tax provision from stock-based compensation, and a $0.4 million increase in proceeds from exercise of stock options. During 2009, we paid $4.6 million in cash dividends and used $0.6 million for stock repurchases.
In light of the current economic conditions, we have taken steps to ensure our liquidity remains a strong aspect of our Company. We continue to aggressively execute our expense management plan, which we began in 2008, and to take advantage of cost savings available during the economic downturn. See ‘Deployable Cash’ and ‘Free Cash Flow’ above for further information on our liquidity.
Capital Resources
Our business is not capital intensive. However, we do retain funds for operating purposes in order to conduct sales and marketing efforts for future programs.
During 2009, we had an unused line of credit in the amount of $20.0 million. The line of credit covenants include a current ratio greater than 1.5, deployable cash greater than zero, tangible net worth greater than $40.0 million and net income after taxes greater than $4.0 million. At December 31, 2009, we were in compliance with all covenants and do not expect to be out of compliance through any additional financial undertakings. Additionally, we have no plans to draw any of these funds in the immediate future.
We continue to consider acquisitions of educational, travel and youth businesses that may require the use of cash and cash equivalents. No such acquisitions are currently pending and no assurance can be given that definitive agreements for any such acquisitions will be entered into, or, if they are entered into, that they will be on terms favorable to us.
We do not have any material capital expenditure commitments for 2010 that were not already presented within our December 31, 2009 consolidated financial statements. We believe that existing cash and cash equivalents and cash flows from operations will be sufficient to fund our anticipated operating needs and capital expenditures through 2010. For a more complete discussion of these and other contractual factors, please refer to our consolidated financial statements and the notes thereto included in this Form 10-K.
Contractual Obligations
We have no long-term debt or purchase obligations as of December 31, 2009.
Off-Balance Sheet Arrangements
As of December 31, 2009, we had no off-balance sheet arrangements, as defined in Item 303(a)(4) of Regulation S-K promulgated by the SEC.
Market Risk
Financial Instruments
We classify our marketable debt investments as available-for-sale securities, which are carried at fair value. Unrealized gains and losses on available-for-sale securities are excluded from operations and reported as accumulated other comprehensive income, net of deferred income taxes. Realized gains and losses on the sale of available-for-sale securities are recognized on a specific identification basis in the statement of operations in the period the investments are sold.
We evaluate investment securities for other-than-temporary declines in fair value on a quarterly basis. If the fair value of investment securities falls below their amortized cost and the decline is deemed to be other-than-temporary, then the amont of other than temporary impariment recognized in the statement of operations depends on whether we intend to sell the investment secutities or more likely than not will be required to sell the investment secutities before recovery of the amortized cost. There were no investment securities that management identified to be other-than-temporarily impaired during the year ended December 31, 2009, because we do not intend and are not required to sell the debt securities before we have recovered the amortized cost basis of the securities. In addition, the amount of the decline is not severe, currently at 15 percent of the assets fair value, nor has it been in an unrealized loss position for a long duration of time. Realized losses could occur in future periods due to a change in our intent to hold the investments until recovery of the amortized cost, a change in our assessment of credit risk, or a change in regulatory or accounting requirements. Significant increases or decreases in the aggregate fair value of our available for-sale securities may affect our liquidity and capital resources, although we believe the credit ratings of the investments held substantiate this risk as low.
In determining whether the current financial crisis will have an impact on the fair value of these investments, we considered the individual ratings of each bond and ARS held. With regards to bonds, we considered the following: the underlying rating of the issuer irrespective of the insurance; the performance of the issuer; the term of the bond; the quality of bond insurance provided by the rating of the bond insurer; and the fair value as of each reporting date. With regards to ARS, we considered the underlying credit quality of student loan portfolios and federal government backing of its collateral as a basis of its valuation. At the reporting dates, and in the future, we recognize that these investments are subject to general credit, liquidity, market and interest rate risks, which have been accentuated by the current global financial crisis. The fair value of these investments accordingly will continue to change, and we will continue to evaluate their carrying values.
See Note 4, Investments and Fair Value Measurements, to the consolidated financial statements in this Form 10-K.
Foreign Currency Exchange Contracts
The majority of our travel programs take place outside of the United States and most foreign suppliers require payment in currency other than the U.S. dollar. Accordingly, we are exposed to foreign currency risk relative to changes in foreign currency exchange rates between those currencies and the U.S. dollar. Our processes include a program to provide a hedge against certain of these foreign currency risks, and we use forward contracts that allow us to acquire the foreign currency at a fixed price for a specified point in time. All of the derivatives are cash flow hedges and qualify for cash flow hedge accounting at December 31, 2009.
We account for these foreign exchange contracts and options in accordance with GAAP which requires that all derivative instruments be recorded on the balance sheet at fair value. Changes in the fair value of derivatives are recorded each period in current earnings or other comprehensive income, depending on whether a derivative is designated as part of a hedge transaction and, if it is, depending on the type of hedge transaction. For qualifying cash-flow hedge transactions in which we are hedging the variability of cash flows related to a forecasted transaction, changes in the fair value of the derivative instrument are reported in other comprehensive income. The gains and losses on the derivative instruments that are reported in other comprehensive income are reclassified as earnings in the periods in which earnings are impacted by the variability of the cash flows of the hedged item. The ineffective portion of all hedged transactions is recognized in current period earnings. Unrealized gains and losses on foreign currency exchange contracts that are not qualifying cash-flow hedges are recorded in the statement of operations.
The table below provides information about our derivative financial instruments that are sensitive to foreign currency exchange rates. For foreign currency forward exchange agreements, the table presents the notional amounts and weighted average exchange rates. All contracts held as of December 31, 2009 mature in 2010. These notional amounts generally are used to calculate the contractual payments to be exchanged under the contract. None of these contracts is entered into for trading purposes.
At December 31, 2009 and 2008, we had outstanding forward contracts as follows (in thousands):
| Notional Amount | U.S. Dollar Average Contractual Exchange Rate | ||||
| December 31, 2009 | |||||
| Forward contracts (pay $U.S./receive foreign currency): | |||||
| Australian dollar | 4,300 | $ | 0.78 | ||
| British pound | 2,000 | $ | 1.70 | ||
| Euro | 6,500 | $ | 1.39 | ||
| Japanese yen | 150,000 | $ | 0.01 | ||
| New Zealand dollar | 500 | $ | 0.63 | ||
| Forward contracts with variable option (pay $U.S./receive foreign currency): | |||||
| Australian dollar | 7,000 | $ | 0.78 | ||
| British pound | 3,000 | $ | 1.70 | ||
| Euro | 13,000 | $ | 1.39 | ||
| New Zealand dollar | 1,400 | $ | 0.63 | ||
| December 31, 2008 | Notional Amount | U.S. Dollar Average Contractual Exchange Rate | |||
| Forward contracts (pay $U.S./receive foreign currency): | |||||
| Australian dollar | 16,650 | $ | 0.85 | ||
| British pound | 6,350 | $ | 1.84 | ||
| Euro | 16,995 | $ | 1.44 | ||
| Japanese yen | 495,000 | $ | 0.01 | ||
| New Zealand dollar | 1,550 | $ | 0.71 | ||
| Forward contracts with variable option (pay $U.S./receive foreign currency): | |||||
| Australian dollar | 10,500 | $ | 0.81 | ||
| British pound | 5,400 | $ | 1.80 | ||
| Euro | 33,300 | $ | 1.45 | ||
| New Zealand dollar | 3,710 | $ | 0.70 | ||
See Note 5, Derivative Financial Instruments, to the consolidated financial statements in this Form 10-K.
Critical Accounting Estimates
Our significant accounting policies are described in Note 2, Summary of Significant Accounting Policies, to the consolidated financial statements in this Form 10-K. As described in Note 2, we are required to make estimates and assumptions that affect the reported disclosures of assets, liabilities, revenue and expenses. Our estimates are based on our experience and our interpretation of economic, political, regulatory, and other factors that affect our business.
We consider that our most critical accounting estimates are related to the valuation of available for sale securities, valuation of goodwill and intangible assets, income taxes, foreign currency, revenue recognition, stock-based compensation and contingencies and litigation as they require us to make assumptions that were highly uncertain at the time the accounting estimates were made and changes in them are reasonably likely to occur from period to period. In addition, there are other items within our consolidated financial statements that require estimation, but are not deemed to be critical. However, changes in estimates used in these and other items could have a material impact on our consolidated financial statements.
Available- for- Sale Securities
Management evaluates available-for-sale securities for other-than-temporary declines in fair value on a quarterly basis. If the fair value of investment securities falls below their amortized cost and the decline is deemed to be other-than-temporary, then a loss could be recorded in the income statement. Key components of this evaluation include knowledge of the underlying investment security and the length of the decline in market price.
Intangible Assets and Goodwill
Goodwill and intangible assets deemed to have an indefinite life are not amortized and are subject to impairment tests, at least annually, which compare the carrying amount of the reporting unit to the fair value of the reporting unit. Intangible assets with definite lives are subject to impairment tests whenever events or changes in circumstances indicate that their carrying amount may not be recoverable. Key components of this valuation include management’s forecast of operating revenues, expense and capital expenditures and industry factors to determine the weighted average cost of capital (“WACC”).
Income Taxes
The asset and liability approach is used to account for income taxes by recognizing deferred tax assets and liabilities for the expected future tax consequences of temporary differences between the carrying amounts and the tax basis of assets and liabilities. We have considered future taxable income and ongoing prudent and feasible tax planning strategies in assessing the need for a valuation allowance.
Foreign Currency
We use foreign currency exchange contracts and options as part of an overall risk-management strategy. Derivative instruments qualifying for hedge accounting are recorded on the balance sheet at fair value. Management must determine the fair value each period end using estimates and assumptions, including current market rates, projected travelers and contractual vendor payment agreements and timelines.
Revenue Recognition
For non-directly delivered programs, we do not actively manage the operations of each program, and our remaining performance obligation for these programs after they convene is perfunctory. Therefore, revenue from these programs is presented as net revenues and recognized as the program convenes. For directly delivered programs, however, we organize and operate all activities including speakers, facilitators, events, accommodations and transportation. As such, we recognize the gross revenue and cost of sales of these directly delivered programs over the period the programs are operated.
We bill travelers in advance of travel, payments of which are recorded as participants’ deposits. We also pay for certain program costs in advance of travel, including, but not limited to, airfare, hotel, rail passes and other program costs, which are recorded as prepaid program costs and expenses. Under our cancellation policy, a program traveler may be entitled to a refund of a portion of his or her payments, less certain fees, depending on the time of cancellation. We recognize cancellation fees concurrent with the revenue recognition from the related programs.
Internet content and advertising revenues are recognized at the point of sale and corresponding to an advertisement being viewed on the BookRags site, respectively. Revenue from annual subscriptions for content access to the website is deferred and recognized monthly over the term of the subscription. Cost of internet content sales include amortization of intangible assets and licensing agreement costs.
Accounting for Stock Options and Restricted Grants
We maintain an Equity Participation Plan under which we have granted non-qualified stock options and restricted stock to employees, non-employee directors and consultants. The fair value of the equity instruments granted are estimated on the date of grant using the Black-Scholes pricing model, utilizing the assumptions as described in Note 11, Stock-Based Compensation, to the consolidated financial statements of this Form 10-K.
Contingencies
We are subject to the possibility of various contingencies including claims, suits and complaints, arising in the ordinary course of business. We consider the likelihood of loss or impairment of an asset or the incurrence of a liability, as well as our ability to reasonably estimate the amount of loss in determining gain or loss contingencies. An estimated contingency is accrued when it is probable that an asset has been impaired or a liability has been incurred and the amount of loss can be reasonably estimated. We regularly evaluate current information available to us to determine whether such accruals should be adjusted and whether new accruals are required.
Recent Accounting Pronouncements
See Note 2, Summary of Significant Accounting Policies, to the consolidated financial statements in this Form 10-K.
Item 7A. Quantitative and Qualitative Disclosures About Market Risk
The information contained in Item 7. “Management’s Discussion and Analysis of Financial Condition and Results of Operations –Market Risk” is incorporated by reference into Item 7A.
Item 8. Financial Statements and Supplementary Data
Reference is made to the Index to consolidated financial statements that appears on page F-1 to this Annual Report. The Report of Independent Registered Public Accounting Firm, the Consolidated Financial Statements and the Notes to the consolidated financial statements listed in the Index to consolidated financial statements, which appear beginning on page F-2 of this Form 10-K, are incorporated by reference into this Item 8.
Item 9. Changes in and Disagreements With Accountants on Accounting and Financial Disclosure
None.
Item 9A. Controls and Procedures
Evaluation of Disclosure Controls and Procedures
As of December 31, 2009, the end of the period covered by this Form 10-K, our chief executive officer and chief financial officer reviewed and evaluated the effectiveness of our disclosure controls and procedures (as defined in Exchange Act Rule 13a-15(e) and 15d-15(e)), which are designed to ensure information required to be disclosed in our Form 10-K filed or submitted under the Exchange Act is recorded, processed, summarized and reported on a timely basis, and have concluded, based on that evaluation, that as of such date, our disclosure controls and procedures were effective to ensure that information required to be disclosed in our reports that we file or submit under the Exchange Act is accumulated and communicated to our chief executive officer and chief financial officer as appropriate to allow timely decisions regarding required disclosure.
Management’s Report on Financial Statements and Practices
Our management is responsible for the preparation and fair presentation of the financial statements included in this Form 10-K. The consolidated financial statements have been prepared in conformity with accounting principles generally accepted in the United States of America and reflect our management’s judgments and estimates concerning effects of events and transactions that are accounted for or disclosed.
Management’s Report on Internal Control over Financial Reporting
We are responsible for establishing and maintaining adequate internal control over financial reporting. Our internal control over financial reporting includes the policies and procedures that pertain to the maintenance of records that in reasonable detail accurately and fairly reflect the transactions and dispositions of the assets of the registrant; to recording transactions as necessary to permit preparation of financial statements in accordance with generally accepted accounting principles; to making receipts and expenditures only in accordance with authorizations of management and directors of our company; and for prevention or timely detection of unauthorized acquisition, use or disposition of our assets that could have a material effect on the financial statements. We recognize that because of its inherent limitation, internal control over financial reporting may not prevent or detect misstatements. Also, projections of any evaluation of effectiveness to future periods are subject to the risk that controls may become inadequate because of changes in conditions, or that the degree of compliance with the policies or procedures may deteriorate. Accordingly, even effective internal control over financial reporting can provide only reasonable assurance with respect to financial statement preparation.
We conducted an evaluation of the effectiveness of our internal control over financial reporting as of December 31, 2009. This evaluation was based on the framework in “Internal Control – Integrated Framework” published by the Committee of Sponsoring Organizations of the Treadway Commission. Based on this evaluation, our management concluded that we maintained effective internal control over financial reporting as of December 31, 2009.
BDO Seidman, LLP, an Independent Registered Public Accounting Firm, has issued an attestation report on the effectiveness of our Company’s internal controls over financial reporting as of December 31, 2009, pursuant to Item 308 of Regulation S-K.
Changes in Internal Control over Financial Reporting
For the quarter ended December 31, 2009, there has been no change in our internal control over financial reporting that has materially affected, or is reasonably likely to materially affect, our internal control over financial reporting.
Report of Independent Registered Public Accounting Firm
Board of Directors and Shareholders
Ambassadors Group, Inc.
Spokane, Washington
We have audited Ambassadors Group Inc.’s internal control over financial reporting as of December 31, 2009, based on criteria established in Internal Control – Integrated Framework issued by the Committee of Sponsoring Organizations of the Treadway Commission (the COSO criteria). Ambassadors Group, Inc.’s management is responsible for maintaining effective internal control over financial reporting and for its assessment of the effectiveness of internal control over financial reporting, included in the accompanying Item 9A, Controls and Procedures. Our responsibility is to express an opinion on the company’s internal control over financial reporting based on our audit.
We conducted our audit in accordance with the standards of the Public Company Accounting Oversight Board (United States). Those standards require that we plan and perform the audit to obtain reasonable assurance about whether effective internal control over financial reporting was maintained in all material respects. Our audit included obtaining an understanding of internal control over financial reporting, assessing the risk that a material weakness exists, and testing and evaluating the design and operating effectiveness of internal control based on the assessed risk. Our audit also included performing such other procedures as we considered necessary in the circumstances. We believe that our audit provides a reasonable basis for our opinion.
A company’s internal control over financial reporting is a process designed to provide reasonable assurance regarding the reliability of financial reporting and the preparation of financial statements for external purposes in accordance with generally accepted accounting principles. A company’s internal control over financial reporting includes those policies and procedures that (1) pertain to the maintenance of records that, in reasonable detail, accurately and fairly reflect the transactions and dispositions of the assets of the company; (2) provide reasonable assurance that transactions are recorded as necessary to permit preparation of financial statements in accordance with generally accepted accounting principles, and that receipts and expenditures of the company are being made only in accordance with authorizations of management and directors of the company; and (3) provide reasonable assurance regarding prevention or timely detection of unauthorized acquisition, use, or disposition of the company’s assets that could have a material effect on the financial statements.
Because of its inherent limitations, internal control over financial reporting may not prevent or detect misstatements. Also, projections of any evaluation of effectiveness to future periods are subject to the risk that controls may become inadequate because of changes in conditions, or that the degree of compliance with the policies or procedures may deteriorate.
In our opinion, Ambassadors Group, Inc. maintained, in all material respects, effective internal control over financial reporting as of December 31, 2009, based on the COSO criteria.
We also have audited, in accordance with the standards of the Public Company Accounting Oversight Board (United States), the consolidated balance sheets of Ambassadors Group, Inc. as of December 31, 2009 and 2008, and the related consolidated statements of operations, comprehensive income, stockholders’ equity, and cash flows for each of the three years in the period ended December 31, 2009 and our report dated March 2, 2010 expressed an unqualified opinion thereon.
BDO Seidman, LLP
Spokane, Washington
March 2, 2010
Item 9B. Other Information
None.
PART III
The information called for by this item is hereby incorporated by reference from our definitive Proxy Statement for the fiscal year ended December 31, 2009, to be filed with the SEC on or about April 13, 2010.
The information called for by this item is hereby incorporated by reference from our definitive Proxy Statement for the fiscal year ended December 31, 2009, to be filed with the SEC on or about April 13, 2010.
| Security Ownership of Certain Beneficial Owners and Management and Related Stockholder Matters |
The information called for by this item is hereby incorporated by reference from our definitive Proxy Statement for the fiscal year ended December 31, 2009, to be filed with the SEC on or about April 13, 2010.
The information called for by this item is hereby incorporated by reference from our definitive Proxy Statement for the fiscal year ended December 31, 2009, to be filed with the SEC on or about April 13, 2010.
The information called for by this item is hereby incorporated by reference from our definitive Proxy Statement for the fiscal year ended December 31, 2009, to be filed with the SEC on or about April 13, 2010.
PART IV
Item 15. Exhibits, Financial Statement Schedules |
(a) The following documents are filed as part of this Annual Report:
(1) Financial Statements. See the accompanying Index to Consolidated Financial Statements, which appears on page F-1 of the Annual Report. The Report of Independent Registered Public Accounting Firm, the consolidated financial statements and the Notes to consolidated financial statements listed in the Index to consolidated financial statements, which appear beginning on page F-2 of this report, are incorporated by reference into Item 8 above.
(2) Financial Statement Schedules. Financial Statement Schedules have been omitted because the information required to be set forth therein is either not applicable or is included in the consolidated financial statements or the notes thereto.
(3) Exhibits. See Item 15(b) below.
(b) Exhibits. The exhibits listed on the accompanying Exhibit Index immediately following the
signature page are filed as part of, or are incorporated by reference into, this Annual Report on Form 10-K.
(c) Financial Statement Schedules. Reference is made to Item 15(a)(2) above.
INDEX TO CONSOLIDATED FINANCIAL STATEMENTS
| Page | ||
| Report of Independent Registered Public Accounting Firm | F-2 | |
| Consolidated Balance Sheets | F-3 | |
| Consolidated Statements of Operations | F-4 | |
| Consolidated Statements of Comprehensive Income | F-5 | |
| Consolidated Statements of Changes in Stockholders’ Equity | F-6 | |
| Consolidated Statements of Cash Flows | F-7 | |
| Notes to Consolidated Financial Statements | F-8 | |
Report of Independent Registered Public Accounting Firm
Board of Directors and Stockholders
Ambassadors Group, Inc.
Spokane, Washington
We have audited the accompanying consolidated balance sheets of Ambassadors Group, Inc. as of December 31, 2009 and 2008 and the related consolidated statements of operations, comprehensive income, stockholders’ equity, and cash flows for each of the three years in the period ended December 31, 2009. These consolidated financial statements are the responsibility of the Company’s management. Our responsibility is to express an opinion on these consolidated financial statements based on our audits.
We conducted our audits in accordance with the standards of the Public Company Accounting Oversight Board (United States). Those standards require that we plan and perform the audit to obtain reasonable assurance about whether the consolidated financial statements are free of material misstatement. An audit includes examining, on a test basis, evidence supporting the amounts and disclosures in the consolidated financial statements, assessing the accounting principles used and significant estimates made by management, as well as evaluating the overall consolidated financial statement presentation. We believe that our audits provide a reasonable basis for our opinion.
In our opinion, the consolidated financial statements referred to above present fairly, in all material respects, the financial position of Ambassadors Group, Inc. at December 31, 2009 and 2008, and the results of its operations and its cash flows for each of the three years in the period ended December 31, 2009, in conformity with accounting principles generally accepted in the United States of America.
As discussed in Note 13 to the consolidated financial statements, the Company changed the manner in which it calculates earnings per share in accordance with ASC 260 Earnings per Share.
We also have audited, in accordance with the standards of the Public Company Accounting Oversight Board (United States), Ambassadors Group, Inc.’s internal control over financial reporting as of December 31, 2009, based on criteria established in Internal Control – Integrated Framework issued by the Committee of Sponsoring Organizations of the Treadway Commission (COSO) and our report dated March 2, 2010 expressed an unqualified opinion thereon.
BDO Seidman, LLP
Spokane, Washington
March 2, 2010
AMBASSADORS GROUP, INC.
| (in thousands, except share and per share data) | December 31, | ||||||
| 2009 | 2008 | ||||||
| Assets | |||||||
| Current assets: | |||||||
| Cash and cash equivalents | $ | 7,656 | $ | 6,989 | |||
| Available-for-sale securities | 73,528 | 67,436 | |||||
| Foreign currency exchange contracts | 1,076 | — | |||||
| Prepaid program cost and expenses | 3,175 | 4,160 | |||||
| Accounts receivable | 2,020 | 1,966 | |||||
| Deferred tax asset | 25 | 2,780 | |||||
| Total current assets | 87,480 | 83,331 | |||||
| Property, plant and equipment, net | 29,376 | 29,148 | |||||
| Available-for-sale securities | 1,397 | 2,100 | |||||
| Deferred tax asset | — | 241 | |||||
| Intangibles | 2,822 | 2,404 | |||||
| Goodwill | 6,911 | 6,935 | |||||
| Other long term assets | 109 | 118 | |||||
| Total assets | $ | 128,095 | $ | 124,277 | |||
| Liabilities | |||||||
| Current liabilities: | |||||||
| Accounts payable and accrued expenses | $ | 5,188 | $ | 4,342 | |||
| Foreign currency exchange contracts | — | 6,641 | |||||
| Participants’ deposits | 31,137 | 44,166 | |||||
| Other liabilities | 112 | 131 | |||||
| Total current liabilities | 36,437 | 55,280 | |||||
| Deferred tax liability | 652 | — | |||||
| Foreign currency exchange contracts | — | 1,764 | |||||
| Total liabilities | 37,089 | 57,044 | |||||
| Commitments and contingencies (notes 3, 5 and 10) | |||||||
| Stockholders' Equity | |||||||
Preferred stock, $.01 par value; 2,000,000 shares authorized; none issued and outstanding | — | — | |||||
| Common stock, $.01 par value; 50,000,000 shares authorized; 19,006,265 and 18,822,563 shares issued and outstanding at December 31, 2009 and 2008, respectively | 188 | 186 | |||||
| Additional paid-in capital | 2,314 | 6 | |||||
| Retained earnings | 87,461 | 71,705 | |||||
| Accumulated other comprehensive income (loss) | 1,043 | (4,664 | ) | ||||
| Stockholders’ equity | 91,006 | 67,233 | |||||
| Total liabilities and stockholders’ equity | $ | 128,095 | $ | 124,277 | |||
The accompanying notes are an integral part of the consolidated financial statements.
CONSOLIDATED STATEMENTS OF OPERATIONS
(in thousands, except per share data)
| Years Ended December 31, | ||||||||||||||
| 2009 | 2008 | 2007 | ||||||||||||
| Net revenue, non-directly delivered programs | $ | 69,279 | $ | 65,656 | $ | 84,512 | ||||||||
| Gross revenue, directly delivered programs | 26,036 | 30,374 | 30,021 | |||||||||||
| Internet content and advertising revenue | 3,300 | 1,897 | — | |||||||||||
| Total revenue | 98,615 | 97,927 | 114,533 | |||||||||||
| Cost of sales, directly delivered programs | 14,422 | 18,856 | 18,488 | |||||||||||
| Cost of sales, internet content and advertising | 389 | 192 | — | |||||||||||
| Gross margin | 83,804 | 78,879 | 96,045 | |||||||||||
| Operating expenses: | ||||||||||||||
| Selling and marketing | 39,021 | 40,842 | 38,943 | |||||||||||
| General and administrative | 14,604 | 12,568 | 15,274 | |||||||||||
| Total operating expenses | 53,625 | 53,410 | 54,217 | |||||||||||
| Operating income | 30,179 | 25,469 | 41,828 | |||||||||||
| Other income (expense): | ||||||||||||||
| Interest and dividend income | 2,012 | 3,057 | 4,355 | |||||||||||
| Foreign currency and other expense | (961 | ) | (811 | ) | (183 | ) | ||||||||
| Total other income | 1,051 | 2,246 | 4,172 | |||||||||||
| Income before income taxes | 31,230 | 27,715 | 46,000 | |||||||||||
| Income tax provision | 10,893 | 9,169 | 14,953 | |||||||||||
| Net income | $ | 20,337 | $ | 18,546 | $ | 31,047 | ||||||||
| Earnings per share — basic and diluted: | ||||||||||||||
| Net income per share – basic | $ | 1.06 | $ | 0.97 | $ | 1.58 | ||||||||
| Weighted-average common shares outstanding — basic | 19,105 | 19,184 | 19,607 | |||||||||||
| Net income per share – diluted | $ | 1.05 | $ | 0.95 | $ | 1.53 | ||||||||
| Weighted-average common shares outstanding — diluted | 19,422 | 19,572 | 20,230 | |||||||||||
The accompanying notes are an integral part of the consolidated financial statements.
AMBASSADORS GROUP, INC.
(in thousands)
| Years Ended December 31, | |||||||||||
| 2009 | 2008 | 2007 | |||||||||
| Net income | $ | 20,337 | $ | 18,546 | $ | 31,047 | |||||
| Unrealized gain (loss) on foreign currency exchange contracts, net of income tax (provision) benefit of ($3,060), $3,887, and ($311) | 5,669 | (7,220 | ) | 579 | |||||||
| Unrealized gain on available-for-sale securities, net of income tax provision of $20, $73, and $109 | 38 | 139 | 202 | ||||||||
| Comprehensive income | $ | 26,044 | $ | 11,465 | $ | 31,828 | |||||
The accompanying notes are an integral part of the consolidated financial statements.
AMBASSADORS GROUP, INC.
(in thousands)
| Accumulated | ||||||||||||||||||||||||
| Additional | Other | |||||||||||||||||||||||
| Common Stock | Paid-In | Retained | Comprehensive | |||||||||||||||||||||
| Shares | Amount | Capital | Earnings | Income (Loss) | Total | |||||||||||||||||||
| Balances, December 31, 2006 | 20, 599 | $ | 205 | $ | 15,619 | $ | 66,587 | $ | 1,636 | $ | 84,047 | |||||||||||||
| Net income | — | — | — | 31,047 | — | 31,047 | ||||||||||||||||||
| Stock options exercised | 289 | 3 | 1,966 | — | — | 1,969 | ||||||||||||||||||
| Stock–based compensation expense | — | — | 1,952 | — | — | 1,952 | ||||||||||||||||||
| Excess tax benefit from stock-based compensation | — | — | 2,707 | — | — | 2,707 | ||||||||||||||||||
| Stock redemptions | (1,598 | ) | (16 | ) | (21,162 | ) | (19,985 | ) | — | (41,163 | ) | |||||||||||||
| Restricted stock grant | 56 | — | — | — | — | — | ||||||||||||||||||
| Dividend to shareholders ($0.46 per share) | — | — | — | (8,940 | ) | — | (8,940 | ) | ||||||||||||||||
| Other comprehensive income, net of income taxes | — | — | — | — | 781 | 781 | ||||||||||||||||||
| Balances, December 31, 2007 | 19,346 | $ | 192 | $ | 1,082 | $ | 68,709 | $ | 2,417 | $ | 72,400 | |||||||||||||
| Net income | — | — | — | 18,546 | — | 18,546 | ||||||||||||||||||
| Stock options exercised | 46 | — | 398 | — | — | 398 | ||||||||||||||||||
| Stock–based compensation expense | — | — | 2,061 | — | — | 2,061 | ||||||||||||||||||
| Shortfall tax benefit from stock-based compensation | — | — | (134 | ) | — | — | (134 | ) | ||||||||||||||||
| Stock redemptions | (645 | ) | (6 | ) | (3,401 | ) | (6,749 | ) | — | (10,156 | ) | |||||||||||||
| Restricted stock grant | 76 | — | — | — | — | — | ||||||||||||||||||
| Dividend to shareholders ($0.46 per share) | — | — | — | (8,801 | ) | — | (8,801 | ) | ||||||||||||||||
| Other comprehensive loss, net of income taxes | — | — | — | — | (7,081 | ) | (7,081 | ) | ||||||||||||||||
| Balances, December 31, 2008 | 18,823 | $ | 186 | $ | 6 | $ | 71,705 | $ | (4,664 | ) | $ | 67,233 | ||||||||||||
| Net income | — | — | — | 20,337 | — | 20,337 | ||||||||||||||||||
| Stock options exercised | 154 | 2 | 836 | — | — | 838 | ||||||||||||||||||
| Stock–based compensation expense | — | — | 1,989 | — | — | 1,989 | ||||||||||||||||||
| Excess tax benefit from stock-based compensation | — | — | 92 | — | — | 92 | ||||||||||||||||||
| Stock redemptions | (73 | ) | — | (609 | ) | — | — | (609 | ) | |||||||||||||||
| Restricted stock grant | 102 | — | — | — | — | — | ||||||||||||||||||
| Dividend to shareholders ($0.24 per share) | — | — | — | (4,581 | ) | — | (4,581 | ) | ||||||||||||||||
| Other comprehensive income, net of income taxes | — | — | — | — | 5,707 | 5,707 | ||||||||||||||||||
| Balances, December 31, 2009 | 19,006 | $ | 188 | $ | 2,314 | $ | 87,461 | $ | 1,043 | $ | 91,006 | |||||||||||||
The accompanying notes are an integral part of the consolidated financial statements.
AMBASSADORS GROUP, INC.
(in thousands)
| Year Ended December 31, | ||||||||||||
| 2009 | 2008 | 2007 | ||||||||||
| Cash flows from operating activities: | ||||||||||||
| Net income | $ | 20,337 | $ | 18,546 | $ | 31,047 | ||||||
| Adjustments to reconcile net income to net cash provided by operating activities: | ||||||||||||
| Depreciation and amortization | 4,364 | 3,426 | 2,532 | |||||||||
| Deferred income tax provision (benefit) | 568 | 1,034 | (71 | ) | ||||||||
| Stock-based compensation expense | 1,989 | 2,061 | 1,952 | |||||||||
| Short-fall (excess) tax benefit from stock-based compensation | (92 | ) | 134 | (2,707 | ) | |||||||
| (Gain) loss on disposal of property and equipment | 428 | (25 | ) | 155 | ||||||||
| Loss on foreign currency contracts | 962 | 759 | — | |||||||||
| Change in assets and liabilities, net of business acquisition: | ||||||||||||
| Accounts receivable and other current assets | (45 | ) | (1,147 | ) | 34 | |||||||
| Prepaid program costs and expenses | 985 | (533 | ) | 162 | ||||||||
| Accounts payable, accrued expenses, and other liabilities | (329 | ) | (966 | ) | 1,260 | |||||||
| Participants’ deposits | (13,029 | ) | 1,443 | (17,928 | ) | |||||||
| Net cash provided by operating activities | 16,138 | 24,732 | 16,436 | |||||||||
| Cash flows from investing activities: | ||||||||||||
| Proceeds from sale of available-for-sale securities | 52,716 | 137,385 | 263,255 | |||||||||
| Purchase of available-for-sale securities | (58,039 | ) | (138,995 | ) | (234,307 | ) | ||||||
| Purchase and construction of property and equipment | (5,138 | ) | (4,991 | ) | (19,271 | ) | ||||||
| Purchase of intangibles | (726 | ) | (207 | ) | — | |||||||
| Adjustments to goodwill | (13 | ) | — | — | ||||||||
| Net cash paid for acquisition | — | (9,373 | ) | — | ||||||||
| Net cash provided by (used in) investing activities | (11,200 | ) | (16,181 | ) | 9,677 | |||||||
| Cash flows from financing activities: | ||||||||||||
| Dividend payment to shareholders | (4,581 | ) | (8,801 | ) | (8,940 | ) | ||||||
| Repurchase of common stock | (609 | ) | (10,156 | ) | (41,163 | ) | ||||||
| Proceeds from exercise of stock options | 838 | 398 | 1,969 | |||||||||
| (Short-fall) excess tax benefit from stock-based compensation | 92 | (134 | ) | 2,707 | ||||||||
| Capital lease payments and other | (11 | ) | (150 | ) | (189 | ) | ||||||
| Net cash used in financing activities | (4,271 | ) | (18,843 | ) | (45,616 | ) | ||||||
| Net increase (decrease) in cash and cash equivalents | 667 | (10,292 | ) | (19,503 | ) | |||||||
| Cash and cash equivalents, beginning of year | 6,989 | 17,281 | 36,784 | |||||||||
| Cash and cash equivalents, end of year | $ | 7,656 | $ | 6,989 | $ | 17,281 | ||||||
See Note 14, Supplemental Disclosures of Consolidated Statements of Cash Flows.
The accompanying notes are an integral part of the consolidated financial statements.
AMBASSADORS GROUP, INC.
| 1. | The Company |
Ambassadors Group, Inc. is a leading educational company that organizes and promotes worldwide educational travel and sports programs for students, athletes and professionals and provides over 8 million pages of online research content through www.BookRags.com. These consolidated financial statements include the accounts of Ambassadors Group, Inc. and our wholly owned subsidiaries, Ambassador Programs, Inc., BookRags, Inc., World Adventures Unlimited, Inc., Ambassadors Unlimited, LLC and Marketing Production Systems, LLC. All significant intercompany accounts and transactions, which are of a normal recurring nature, are eliminated in consolidation.
Our operations are organized in two reporting segments, 1) Ambassador Programs and Other, which provides out-of-classroom educational travel services to students, professionals, and athletes through multiple itineraries within five travel program types, and 2) BookRags, which provides online research capabilities through book summaries, critical essays, online study guides, biographies, and references to encyclopedia articles.
All of our assets are located in the United States. Revenues from our directly delivered travel programs and our internet content and advertising are derived from activity in the United States. Revenue from our non-directly delivered programs is conducted internationally in the following geographic areas for the years ended December 31, 2009, 2008, and 2007:
Years Ended December 31, | ||||||||||||
| 2009 | 2008 | 2007 | ||||||||||
| Europe | 57 | % | 61 | % | 57 | % | ||||||
| South Pacific (primarily Australia and New Zealand) | 19 | % | 16 | % | 24 | % | ||||||
| Asia (primarily China) | 20 | % | 17 | % | 14 | % | ||||||
| Other | 4 | % | 6 | % | 5 | % | ||||||
2. | Summary of Significant Accounting Policies |
Credit Risk
Our financial instruments that are exposed to concentrations of credit risk consist primarily of cash and cash equivalents, available for sale securities and accounts receivable. We place our cash and temporary cash investments in high quality instruments with high credit quality institutions. At times, such balances may be in excess of the federal depository insurance limit or may be on deposit at institutions which are not covered by this insurance. We believe that our primary trade accounts receivable credit risk exposure is limited as delegates are required to pay for their entire program tuition prior to the program departure.
We use foreign currency exchange contracts as part of an overall risk-management strategy. These instruments are used as a means of mitigating exposure to foreign currency risk connected to anticipated travel programs. In entering into these contracts, we have assumed the risk that might arise from the possible inability of counterparties to meet the terms of their contracts, but we do not expect any losses as a result of counterparty defaults, as all contracts are with a high quality institution.
Cash and Cash Equivalents
We invest cash in excess of operating requirements in short-term time deposits, money market instruments, government mutual bond funds and other investments. We consider investments with original maturities at date of purchase of three months or less to be cash equivalents.
F-8
AMBASSADORS GROUP, INC.
NOTES TO CONSOLIDATED FINANCIAL STATEMENTS – (Continued)
Derivative Financial Instruments
We value all derivative instruments on our balance sheet at fair value. Changes in the fair value of derivatives are recorded each period in current earnings or other comprehensive income, depending on whether a derivative is designated as part of a hedge transaction and, if it is, depending on the type of hedge transaction. For qualifying cash flow hedge transactions in which we hedge the variability of cash flows related to a forecasted transaction, changes in the fair value of derivative instruments are reported in accumulated other comprehensive income, net of deferred income taxes. The gains and losses on the derivative instruments that are reported in accumulated other comprehensive income, net of deferred income taxes, are reclassified into earnings in the periods in which the forecasted transaction occurs. The ineffective portion of all hedges is recognized in the statements of operations as other income (expense). Changes in unrealized gains and losses on foreign currency exchange contracts that are not qualifying cash flow hedges are recognized in the statements of operations as other income (expense). At December 31, 2009 all of our outstanding contracts qualified for cash flow hedge accounting, while at December 31, 2008 the majority of our outstanding foreign currency exchange contracts qualified for cash flow hedge accounting.
Available-for-Sale Securities
We classify our marketable debt investments as available-for-sale securities, which are carried at fair value. Unrealized gains and losses on available-for-sale securities are excluded from operations and reported as accumulated other comprehensive income, net of deferred income taxes. Realized gains and losses on the sale of available-for-sale securities are recognized on a specific identification basis in the consolidated statement of operations in the period the investments are sold.
Management evaluates investment securities for other-than-temporary declines in fair value on a quarterly basis. If the fair value of investment securities falls below their amortized cost and the decline is deemed to be other-than-temporary, the securities will be written down to current market value, resulting in a loss recorded in the statement of operations. There were no investment securities that management identified to be other-than-temporarily impaired during the years ended December 31, 2009, 2008 and 2007, because we do not intend and are not required to sell these securities before we have recovered the amortized cost basis, the amount of the decline is not severe, and the unrealized loss position has not existed for a long duration of time. Realized losses could occur in future periods due to a change in management’s intent to hold the investments to maturity, a change in management’s assessment of credit risk, or a change in regulatory or accounting requirements.
At December 31, 2009 and 2008, we held $74.9 million and $69.5 million of short-term and long-term available-for-sale securities consisting primarily of municipal bonds, variable rate municipal demand notes and various ARS. Due to the longer term nature of the next auctions and the continued uncertainty in the financial markets, these ARS holdings totaling $1.4 million have been classified as non-current assets.
Other Investments
Companies in which we own 20% or less are accounted for using the cost method while companies we own at least 20% but less than 50% are accounted for using the equity method. Companies in which we own greater than 50% are consolidated into our financial statements and are listed in Note 1, The Company, to the Consolidated Financial Statements in this Form 10-K.
In 2003, we purchased a minority interest in a company, Full-On (Europe) Ltd. This company provides a one-day development activity for our delegates traveling in Europe and Australia. This investment is reported using the equity method. Additionally, during August 2005, we made an investment in a safety awareness firm to support the education of and support of safe travel practices, Safe Passage Travel I, LLC. This investment is reported using the cost method. These investments are included in other long-term assets on the consolidated balance sheets.
AMBASSADORS GROUP, INC.
NOTES TO CONSOLIDATED FINANCIAL STATEMENTS – (Continued)
Property, Plant and Equipment
Property, plant and equipment are stated at cost less accumulated depreciation. Cost of maintenance and repairs that do not improve or extend the lives of the respective assets are expensed currently. Major additions and betterments are capitalized. Depreciation and amortization are provided over the lesser of the estimated useful lives of the respective assets or the lease term (excluding extensions), using the straight-line method, generally three to seven years for office furniture and computer equipment, and thirty-nine years for the building.
We perform reviews for the impairment of property, plant and equipment whenever events or changes in circumstances indicate that the carrying amount of an asset may not be recoverable. When property, plant and equipment are sold or retired, the related cost and accumulated depreciation are removed from the accounts and any gain or loss is recognized in the consolidated statement of operations.
Intangible Assets and Goodwill
Intangible assets include goodwill, trademark, contract license agreements, content copyrights, plagiarism software, non-compete agreements, and advertising relationships. The majority of these assets were recorded in conjunction with the acquisition of BookRags in May 2008. Intangible assets other than trademark are amortized on a straight-line basis over a weighted average life of 12 years. Goodwill and intangible assets deemed to have an indefinite life are not subject to amortization but are subject to impairment tests, at least annually, which compare the carrying amount of the reporting unit to the fair value of the reporting unit. Intangible assets with definite lives are also subject to impairment tests whenever events or changes in circumstances indicate that their carrying amount may not be recoverable. An impairment loss is recognized if the carrying amount of the goodwill or intangible asset is not recoverable and exceeds its fair value. The impairment tests performed in 2009 and 2008 substantiated the carrying value of goodwill and intangible assets, and as such, no write-downs in the carrying value were recorded.
Revenue Recognition
For non-directly delivered programs, we do not actively manage the operations of each program, and our remaining performance obligation for these programs after they convene is perfunctory. Therefore, revenue and anticipated costs from these programs is recognized when the program convenes. For directly delivered programs, however, we organize and operate all activities including speakers, facilitators, events, accommodations and transportation. As such, we recognize the gross revenue and cost of sales of these directly delivered programs over the period the programs are operating.
We invoice delegates in advance of travel, payments of which are recorded as participants’ deposits. We also pay for certain direct program costs in advance of travel, including but not limited to airfare, hotel, rail passes and other program costs, which are recorded as prepaid program costs and expenses. Under our withdrawal policy, a delegate may be entitled to a refund of a portion of his or her deposit, less certain fees, depending on the time of withdrawal. We recognize withdrawal fees concurrent with the revenue recognition from the related programs.
Internet content and advertising revenues are recognized at the point of sale and corresponding to an advertisement being viewed on the BookRags site, respectively. Revenue from annual subscriptions for content access to the website is deferred and recognized monthly over the term of the subscription. Cost of internet content sales include amortization of intangible assets and licensing agreement costs.
Selling and Marketing Expenses
We expense all selling and marketing expenses as incurred.
AMBASSADORS GROUP, INC.
NOTES TO CONSOLIDATED FINANCIAL STATEMENTS – (Continued)
Income Taxes
The asset and liability approach is used to account for income taxes by recognizing deferred tax assets and liabilities for the expected future tax consequences of temporary differences between the carrying amounts and the tax basis of assets and liabilities.
Earnings Per Share
Earnings per share — basic is computed using the two-class method by dividing net income by the weighted-average number of common shares, including participating securities, outstanding during the period. Earnings per share — diluted is computed by increasing the weighted-average number of common shares outstanding by the additional common shares that would have been outstanding if the potentially dilutive common shares had been issued. Participating securities include our unvested employee restricted stock awards with time-based vesting and common stock granted in the acquisition of BookRags that will be issued in 2010 when escrow conditions are known. These participating securities receive nonforfeitable dividend payments.
Comprehensive Income
Other comprehensive income refers to revenues, expenses, gains and losses that under accounting principles generally accepted in the United States are included in comprehensive income, but are excluded from net income as these amounts are recorded directly as an adjustment to stockholders’ equity, net of tax. Our other comprehensive income is composed of unrealized gains and losses on foreign currency exchange contracts and available-for-sale securities. At December 31, 2009, accumulated other comprehensive income comprised $0.7 million unrealized gain from foreign currency contracts and $0.3 million unrealized gain from available-for -sale securities. At December 31, 2008, accumulated other comprehensive loss comprised $5.0 million unrealized loss from foreign currency contracts and $0.3 million unrealized gain from available-for -sale securities.
Accounting for Stock Options and Restricted Grants
We maintain an Equity Participation Plan under which we have granted non-qualified stock options and restricted stock to employees, non-employee directors and consultants. The fair value of the equity instruments granted are estimated on the date of grant using the Black-Scholes pricing model, utilizing assumptions as described in Note 11, Stock-Based Compensation.
Estimates
The preparation of consolidated financial statements requires us to make estimates and judgments that affect the reported amounts of assets, liabilities, revenue and expenses, and related disclosure of contingent assets and liabilities. On an on-going basis, we evaluate our estimates and judgments, including those associated with investments, intangible assets, income taxes, foreign currency exchange contracts, revenue recognition, stock based compensation, and contingencies and litigation.
We base our estimates on historical experience and on various other assumptions that are believed to be reasonable under the circumstances, the results of which form the basis for making judgments about the carrying values of assets and liabilities that are not readily apparent from other sources. Actual results may differ from these estimates under different assumptions or conditions.
Contingencies
We are subject to the possibility of various contingencies including claims, suits and complaints, arising in the ordinary course of business. We consider the likelihood of loss or impairment of an asset or the incurrence of a liability, as well as our ability to reasonably estimate the amount of loss in determining gain or loss contingencies. An estimated contingency is accrued when it is probable that an asset has been impaired or a liability has been incurred and the amount of loss can be reasonably estimated. We regularly evaluate current information available to us to determine whether such accruals should be adjusted and whether new accruals are required.
AMBASSADORS GROUP, INC.
NOTES TO CONSOLIDATED FINANCIAL STATEMENTS – (Continued)
Reclassifications
Certain reclassifications from 2007 and 2008 amounts have been made to conform to the year ended December 31, 2009 financial statement presentation with no effect on previously reported net income, retained earnings, or cash flow from operations.
Recent Accounting Pronouncements
In December 2007, the Financial Accounting Standards Board (“FASB”) issued a new accounting principle which changed the accounting for business combinations. The new accounting principle requires an acquiring entity to recognize all the assets acquired and liabilities assumed in a transaction at the acquisition-date fair value with limited exceptions. It also changed the accounting treatment for certain specific items. Acquisition costs are generally expensed as incurred, noncontrolling interests are valued at fair value at the acquisition date, acquired contingent liabilities are recorded at fair value at the acquisition date and subsequently measured at either the higher of such amount or the amount determined under existing guidance for non-acquired contingencies, in-process research and development are recorded at fair value as an indefinite-lived intangible asset at the acquisition date, restructuring costs associated with a business combination are generally expensed subsequent to the acquisition date, and changes in deferred tax asset valuation allowances and income tax uncertainties after the acquisition date generally affect income tax expense. The new principle also includes a substantial number of new disclosure requirements and applies prospectively to business combinations for which the acquisition date is on or after the beginning of the first annual reporting period beginning on or after December 15, 2008, or our first quarter of 2009. The adoption of this principle had no effect on our consolidated financial statements. Business acquisitions are not in our normal course of business and, as necessary, we will comply with this standard.
In March 2008, the FASB issued a new accounting principle which requires entities to provide qualitative disclosures about the objectives and strategies for using derivatives, quantitative data about the fair value of and gains and losses on derivative contracts, and details of credit-risk-related contingent features in their hedged positions. The new principle also requires entities to disclose more information about the location and amounts of derivative instruments in financial statements; how derivatives and related hedges are accounted for; and how the hedges affect the entity's financial position, financial performance, and cash flows. The adoption of this new principle on January 1, 2009 has been incorporated into the notes to our consolidated financial statements.
In April 2008, the FASB issued a new accounting principle regarding the factors an entity should consider in developing renewal or extension assumptions used to determine the useful life of a recognized intangible asset. The new principle applies to intangible assets that are acquired individually or with a group of assets and intangible assets acquired in both business combinations and asset acquisitions. It removes an existing provision, requiring an entity to consider whether a contractual renewal or extension clause can be accomplished without substantial cost or material modifications of the existing terms and conditions associated with the asset. Instead, the new principle requires that an entity consider its own experience in renewing similar arrangements. An entity would consider market participant assumptions regarding renewal if no such relevant experience exists. The adoption of this new principle on January 1, 2009 did not impact our consolidated financial statements.
In June 2008, the FASB issued a new accounting principle which establishes that unvested share-based payment awards that contain rights to receive nonforfeitable dividends or dividend equivalents are participating securities, and thus, should be included in the two-class method of computing EPS. It also requires that all prior-period EPS data be adjusted retrospectively. We adopted this new principle on January 1, 2009. See Note 13, Earnings Per Share, to the consolidated financial statements in this Form 10-K for further discussion of this adoption.
AMBASSADORS GROUP, INC.
NOTES TO CONSOLIDATED FINANCIAL STATEMENTS – (Continued)
In April 2009, the FASB issued a new accounting principle that requires disclosure about the fair value of financial instruments for interim reporting periods of publicly traded companies as well as in annual financial statements. The new principle also requires those disclosures in summarized financial information at interim reporting periods and is effective for interim periods ending after June 15, 2009, or our second quarter of 2009. The adoption of this new guidance on April 1, 2009 has been incorporated into the notes to our consolidated financial statements.
In April 2009, the FASB amended the other-than-temporary impairment guidance in the U.S. GAAP for debt securities to make the guidance more operational and to improve the presentation and disclosure of other-than-temporary impairments on debt and equity securities in the financial statements. It does not amend existing recognition and measurement guidance related to other-than-temporary impairments of equity securities. The amendment is effective for interim and annual reporting periods ending after June 15, 2009, or our second quarter of 2009. The adoption of this amendment on April 1, 2009 has been incorporated into the notes to our consolidated financial statements.
In April 2009, the FASB issued a new accounting principle that provides guidance for estimating fair value when the volume and level of activity for an asset or liability have significantly decreased and identifying circumstances indicating that a transaction is not an orderly one. The new principle is effective for interim and fiscal periods ending after June 15, 2009, or our second quarter of 2009. The adoption of this new principle on April 1, 2009 has been incorporated into our consolidated financial statements.
In May 2009, the FASB issued a new accounting principle that establishes general standards of accounting for and disclosure of events that occur after the balance sheet date but before financial statements are issued. This new principle is effective for interim and annual periods ending after June 15, 2009, or our second quarter of 2009 and has been incorporated into the notes to our consolidated financial statements.
In January 2010, the FASB issued a new accounting principle that requires new disclosures and clarifies existing disclosures about fair value measurements. The new principle is effective for interim and annual periods beginning after December 15, 2009, except for the disclosures about purchases, sales, issuances and settlements in the rollforward of activity in Level 3 fair value measurements, which will be effective for the fiscal year beginning after December 15, 2010 and for the interim periods within those fiscal years. The adoption of this new principle on January 1, 2010 will not have a material impact our consolidated financial statements.
In Februay 2010, the FASB amended the subsequent events guidance issued in May 2009 to remove the requirement for SEC filers to disclose a date through which subsequent events have been evaluated in both issued and revised financial statements. The amendment is effective upon issuance and has been incorporated into the notes of our consolidated financial statements.
On May 15, 2008, we acquired 100 percent of the outstanding common shares of BookRags. BookRags is an educational website providing book summaries, critical essays, online study guides, biographies and references to encyclopedia articles. BookRags operates in an adjacent space to student travel and education. BookRags’ core audiences of students, parents and teachers overlaps with our key demographic and will enable us to expand our reach into new media and online channels where this target audience continues to spend more and more time. These reasons were considered in determining the purchase price which resulted in goodwill being recorded for the acquisition.
AMBASSADORS GROUP, INC.
NOTES TO CONSOLIDATED FINANCIAL STATEMENTS – (Continued)
The aggregate purchase price for BookRags is expected to be approximately $16.9 million, of which $9.4 million has been paid, including $8.5 million of cash to the prior owners at inception, $0.6 million in tax payments made on the seller’s behalf, and $0.3 million of acquisition expenses. The remaining estimated purchase price comprised common stock valued at $4.5 million and future earn-out provisions of up to $3.0 million. The $4.5 million value of the common stock issued was determined based on a ten day average closing price of our common stock prior to the date of the acquisition for the issuance of 233,584 shares and is subject to change if escrow conditions are not met. In 2010, the escrow conditions will be known and the actual number of shares to be issued will be determined. Since the acquisition was made prior to the adoption of FASB Accounting Standards Codification (“ASC”) Topic 805, Business Combinations, the estimated value of these contingent shares was not made at the time of acquisition. When escrow conditions are met in 2010 the actual number of common shares issued will be recorded at their fair value as an addition to goodwill.. Therefore, the ultimate value of these shares may be higher or lower than $4.5 million. These shares have been excluded from outstanding stock Originally, the future payments pursuant to the earn-out agreements were up to $5.0 million in 2009 and 2010. The earnings threshold for 2009 was not met, therefore the remaining potential earn-out is up to $3.0 million in 2010. Any future payments will be added to goodwill when and if required earning thresholds are met.
BookRags’ results of operations in 2007 and prior to May 15, 2008 were immaterial in comparison to our results of operations as reported; therefore pro forma financial information is not disclosed. BookRags’ results of operations since May 15, 2008 are included in our consolidated financial statements.
The following table summarizes the estimated fair values of the assets acquired and liabilities assumed (in thousands):
| Assets | |||
| Current assets | $ | 209 | |
| Intangible assets | 2,359 | ||
| Goodwill | 6,841 | ||
| Total assets acquired | 9,409 | ||
| Liabilities and net assets acquired | |||
| Current liabilities | 163 | ||
| Total liabilities assumed | 163 | ||
| Net assets acquired | $ | 9,246 | |
The difference between the total purchase price and the fair value of tangible and intangible assets and liabilities was recorded as goodwill.
4. Investments and Fair Value Measurements
Fair value is defined as the price that would be received from selling an asset or paid to transfer a liability in an orderly transaction between market participants at the measurement date. When determining fair value, we consider the principal or most advantageous market in which we would transact, and we consider assumptions that market participants would use when pricing the asset or liability, such as inherent risk, transfer restrictions, and risk of non-performance.
Our financial instruments are measured and recorded at fair value. Our non-financial assets, (including: property, plant and equipment; intangible assets; and goodwill), are measured at fair value when there is an indicator of impairment and recorded at fair value only when an impairment charge is recognized.
Fair value is determined for assets and liabilities using a three-tiered value hierarchy into which these assets and liabilities must be grouped, based upon significant levels of inputs as follows:
| - | Level 1 – Quoted prices in active markets for identical assets or liabilities. |
| - | Level 2 – Observable inputs, other than Level 1 prices, such as quoted prices in active markets for similar assets and liabilities, quoted prices for identical or similar assets and liabilities in markets that are not active, or other inputs that are observable or can be corroborated by observable market data. |
F - -14
AMBASSADORS GROUP, INC.
NOTES TO CONSOLIDATED FINANCIAL STATEMENTS – (Continued)
| - | Level 3 – Unobservable inputs that are supported by little or no market activity and that are significant to the fair value of the assets or liabilities. This includes certain pricing models, discounted cash flow methodologies and similar techniques that use significant unobservable inputs. |
Te The following tables summarize the composition of our investments at December 31, 2009 and 2008 (in thousands):
| Classification on Balance Sheet | |||||||||||||||||||||||||||
December 31, 2009 | Amortized Cost | Unrealized Gains | Unrealized Losses (less than 12 months) | Aggregate Fair Value | Cash and cash equivalents | Short-term available-for-sale securities | Long-term available-for-sale securities | ||||||||||||||||||||
| Auction rate securities (ARS) | $ | 1,600 | $ | — | $ | 203 | $ | 1,397 | $ | — | $ | — | $ | 1,397 | |||||||||||||
| Money market funds | 5,703 | — | — | 5,703 | 5,703 | — | — | ||||||||||||||||||||
| Municipal securities | 72,789 | 739 | — | 73,528 | — | 73,528 | — | ||||||||||||||||||||
| $ | 80,092 | $ | 739 | $ | 203 | $ | 80,628 | $ | 5,703 | $ | 73,528 | $ | 1,397 | ||||||||||||||
| Classification on Balance Sheet | |||||||||||||||||||||||||||
December 31, 2008 | Amortized Cost | Unrealized Gains | Unrealized Losses | Aggregate Fair Value | Cash and cash equivalents | Short-term available-for-sale securities | Long-term available-for-sale securities | ||||||||||||||||||||
| Auction rate securities (ARS) | $ | 2,100 | $ | — | $ | — | $ | 2,100 | $ | — | $ | — | $ | 2,100 | |||||||||||||
| Money market funds | 4,375 | — | — | 4,375 | 4,375 | — | — | ||||||||||||||||||||
| Municipal securities | 68,199 | 473 | — | 68,672 | 1,236 | 67,436 | — | ||||||||||||||||||||
| $ | 74,674 | $ | 473 | $ | — | $ | 75,147 | $ | 5,611 | $ | 67,436 | $ | 2,100 | ||||||||||||||
Th
The amortized cost and fair value of the available-for-sale securities at December 31, 2009, by contractual maturity were as follows (in thousands):
we
Amortized Cost | Fair Value | ||||||
| Auction rate securities (ARS) | $ | 1,600 | $ | 1,397 | |||
| One year or less | 3,431 | 3,441 | |||||
| After one year through three years | 68,084 | 68,754 | |||||
| After three years through five years | 1,274 | 1,333 | |||||
| $ | 74,389 | $ | 74,925 | ||||
Expected maturities may differ from contractual maturities because issuers may have the right to call or prepay obligations with or without call or prepayment penalties.
AMBASSADORS GROUP, INC.
NOTES TO CONSOLIDATED FINANCIAL STATEMENTS – (Continued)
The following table details the fair value measurements of assets and liabilities within the three levels of the fair value hierarchy at December 31, 2009 and 2008 (in thousands):
| Fair Value Measurements at Reporting Date Using | |||||||||||||
| December 31, 2009 | Quoted Prices in Active Markets for Identical Assets (Level 1) | Significant Other Observable Inputs (Level 2) | Significant Other Unobservable Inputs (Level 3) | ||||||||||
| Assets: | |||||||||||||
| Auction rate securities (ARS) | $ | 1,397 | $ | — | $ | — | $ | 1,397 | |||||
| Money market funds | 5,703 | 5,703 | — | — | |||||||||
| Municipal securities | 73,528 | 73,528 | — | — | |||||||||
| Foreign currency exchange contracts | 1,076 | — | 1,076 | — | |||||||||
| Total financial assets | $ | 81,704 | $ | 79,231 | $ | 1,076 | $ | 1,397 | |||||
| Fair Value Measurements at Reporting Date Using | |||||||||||||
| December 31, 2008 | Quoted Prices in Active Markets for Identical Assets (Level 1) | Significant Other Observable Inputs (Level 2) | Significant Other Unobservable Inputs (Level 3) | ||||||||||
| Assets/(liabilities): | |||||||||||||
| Auction rate securities (ARS) | $ | 2,100 | $ | — | $ | — | $ | 2,100 | |||||
| Money market funds | 4,375 | 4,375 | — | ||||||||||
| Municipal securities | 68,672 | 68,672 | — | — | |||||||||
| Foreign currency exchange contracts | (8,405) | — | (8,405) | — | |||||||||
| Total financial assets, net | $ | 66,742 | $ | 73,047 | $ | (8,405) | $ | 2,100 | |||||
At December 31, 2009, we classified money market funds and municipal securities as Level 1 assets because market prices are readily available for these investments. Level 2 financial assets represent the fair value of our foreign currency exchange contracts that were valued using pricing models that take into account the contract terms as well as multiple inputs where applicable, such as equity prices, interest rate yield curve, option volatility and currency rates. Level 3 financial assets represent the fair value of our ARS, which were valued using a pricing model that takes into account the average life of the underlying collateral, the rate of return, and the spread used for similar issuances.
The following table presents a reconciliation for the year ended December 31, 2009, of assets and liabilities measured at fair value on a recurring basis using Level 3 inputs (in thousands):
Auction Rate Securities | ||||
| December 31, 2008 | $ | 2,100 | ||
| Total realized / unrealized gains (losses): | ||||
| Included in earnings | — | |||
| Included in other comprehensive income (loss) | (203 | ) | ||
| Purchases, sales, issuances, and settlements, net | (500 | ) | ||
| Transfers into Level 3, net | — | |||
| December 31, 2009 | $ | 1,397 | ||
AMBASSADORS GROUP, INC.
NOTES TO CONSOLIDATED FINANCIAL STATEMENTS – (Continued)
The following table presents a reconciliation for the year ended December 31, 2008, of assets and liabilities measured at fair value on a recurring basis using Level 3 inputs (in thousands):
Auction Rate Securities | |||
| December 31, 2007 | $ | — | |
| Total realized / unrealized gains (losses): | |||
| Included in earnings | — | ||
| Included in other comprehensive income (loss) | — | ||
| Purchases, sales, issuances, and settlements, net | — | ||
| Transfers into Level 3, net | 2,100 | ||
| December 31, 2008 | $ | 2,100 | |
The credit markets are experiencing significant uncertainty, and some of this uncertainty has impacted and may continue to impact the markets where our ARS would be offered. During 2008 and the first quarter of 2009, we experienced two failed ARS auctions, representing principal of $1.6 million. However, in the second quarter of 2009 we successfully re-offered our third ARS at par of $0.5 million. Due to the longer term nature of the next auctions and the continued uncertainty in the financial markets, these two remaining ARS values have been classified as non-current assets. We have determined that there is no other-than-temporary impairment on these securities, since we do not intend and are not required to sell these securities before we have recovered the amortized cost basis, the amount of the decline is not severe, currently at 15 percent of the assets’ fair value, the unrealized loss position has not existed for a long duration of time, the credit quality of the issuer and we continue to receive interest at the coupon rate. We will continue to reassess the liquidity in future reporting periods based on several factors, including the success or failure of future auctions, possible failure of the investment to be redeemed, deterioration of the credit rating of the investment, market risk and other factors.
| 5. | Derivative Financial Instruments |
The majority of our travel programs take place outside of the United States and most foreign suppliers require payment in currency other than the U.S. dollar. Accordingly, we are exposed to foreign currency risk relative to changes in foreign currency exchange rates between those currencies and the U.S. dollar for our non-directly delivered programs. Our processes include a program to provide a hedge against certain of these foreign currency risks, and we use forward contracts that allow us to acquire the foreign currency at a fixed price for a specified point in time. All of the derivatives are cash flow hedges and at December 31, 2009 all of the contracts qualified for cash flow hedge accounting.
For derivative instruments that are designated and qualify as a cash flow hedge, the effective portion of the gain or loss on the derivative is reported as a component of other comprehensive income and reclassified into earnings in the same period during which the hedged transaction is recognized in earnings, which is typically during the second and third quarters of the year when our student and sports travel programs occur. Gains or losses representing either hedge ineffectiveness or hedge components excluded from the assessment of effectiveness are recognized in current earnings.
At December 31, 2009, the following forward contracts were outstanding (in thousands):
Notional Amount | Matures | |||
| Forward contracts: | ||||
| Australian dollar | 4,300 | May 2010 | ||
| British pound | 2,000 | June 2010 | ||
| Euro | 6,500 | May 2010 – June 2010 | ||
| Japanese Yen | 150,000 | April 2010 | ||
| New Zealand dollar | 500 | June 2010 | ||
| Forward contracts with variable option: | ||||
| Australian dollar | 7,000 | April 2010 | ||
| British pound | 3,000 | May 2010 | ||
| Euro | 13,000 | April 2010 – June 2010 | ||
| New Zealand dollar | 1,400 | April 2010 – May 2010 | ||
The fair values of derivatives are as follows (in thousands):
| December 31, 2009 | |||||||||||||||||||
Derivates Designated as Hedging Instruments | Derivates Not Designated as Hedging Instruments | Total (Net) | |||||||||||||||||
| Assets | Liabilities | Assets | Liabilities | Assets | |||||||||||||||
| Forward contracts | $ | 864 | $ | 172 | $ | — | $ | — | 692 | ||||||||||
| Forward contracts with variable option | 595 | 211 | — | — | 384 | ||||||||||||||
| Total | $ | 1,459 | $ | 383 | $ | — | $ | — | $ | 1,076 | |||||||||
The net asset derivative is reported in the balance sheet as “foreign currency exchange contracts”.
Following is an analysis of the changes in the net gain or loss on cash flow hedges included in accumulated other comprehensive income (loss) (in thousands):
| Balance, January 1, 2009 | $ | (4,970 | ) | |
| Net gain for the period | 9,515 | |||
| Effective portion loss transferred to earnings | (3,847 | ) | ||
| Ineffective portion gain/(loss) transferred to earnings | — | |||
| Balance, December 31, 2009 | $ | 698 |
Unrealized gains on forward contracts recorded in accumulated other comprehensive income at December 31, 2009, which are expected to be reclassified to net revenue during the next twelve months is approximately $0.7 million.
AMBASSADORS GROUP, INC.
NOTES TO CONSOLIDATED FINANCIAL STATEMENTS – (Continued)
For the year ended December 31, 2009, the amount of gains or losses recognized in the income statement for derivatives designated as hedging instruments (and their locations) are as follows (in thousands):
Derivates Designated as Hedging Instruments | Location of Gain or (Loss) Recognized in Income on Derivative | Amount of Gain or (Loss) Reclassified from AOCI into Income (Effective Portion) | |||
| Forward contracts | Net revenue, non-directly delivered programs | $ | (2,789 | ) | |
| Forward contracts with variable options | Net revenue, non-directly delivered programs | (1,058 | ) | ||
| Total | $ | (3,847 | ) | ||
For the year ended December 31, 2009, the amount of gains or losses recognized in the income statement for derivatives not designated as hedging instruments (and their locations) are as follows (in thousands):
Derivates Designated as Hedging Instruments | Location of Gain or (Loss) Recognized in Income on Derivative | Amount of Gain or (Loss) | |||
| Forward contracts | Foreign currency and other expense | $ | (631 | ) | |
| Forward contracts with variable options | Foreign currency and other expense | (331 | ) | ||
| Total | $ | (962 | ) | ||
We do not typically enter into derivatives that are not designated as hedging instruments. Our policy is to be 80 to 100 percent hedged for our forecasted cash flow for the following year. At December 31, 2008, we were approximately 20 percent over-hedged, primarily in euro, British pound, and Australian dollar on foreign currency contracts purchased in the spring and summer of 2008 for 2009 travel expenditures. The over-hedged position was due to the decline in net enrollments for 2009 travel programs combined with lower than expected program costs and the strengthening of the U.S. dollar at the end of 2008 in comparison to foreign currency contracted rates. As a result, a $1.0 million and $0.8 million foreign currency loss was recognized for the years ended December 31, 2009 and December 31, 2008, respectively. Also, the majority of the contracts at December 31, 2008 qualified for cash flow hedge accounting, while all contracts at December 31, 2009 qualified for cash flow hedge accounting.
6. Property, Plant and Equipment
Property, plant and equipment and the changes therein consist of the following (in thousands):
| December 31, | |||||||
| 2009 | 2008 | ||||||
| Land | $ | 1,817 | $ | 1,817 | |||
| Building | 16,198 | 16,198 | |||||
| Office furniture, fixtures and equipment | 8,889 | 8,925 | |||||
| Computer equipment and software | 14,559 | 12,384 | |||||
| Construction in progress | 1,689 | 103 | |||||
| 43,152 | 39,427 | ||||||
| Less accumulated depreciation | (13,776 | ) | (10,279 | ) | |||
| $ | 29,376 | $ | 29,148 | ||||
F-19
AMBASSADORS GROUP, INC.
NOTES TO CONSOLIDATED FINANCIAL STATEMENTS – (Continued)
The remaining cost of completion for construction in process is approximately $0.9 million at December 31, 2009.
Depreciation and amortization expense on property and equipment of approximately $4.1 million, $3.3 million, and $2.5 million for the years ended December 31, 2009, 2008, and 2007, respectively, was included in the determination of net income. During 2009, approximately $1.1 million in property, plant and equipment was written off or sold for a net loss of $0.4 million. During 2008, approximately $0.5 million in property, plant and equipment was written off or sold for a net gain of $0.03 million. During 2007, approximately $3.1 million in property, plant and equipment was written off for a net loss of $0.2 million.
| 7. Intangible Assets |
Identified intangible assets other than goodwill and the changes therein consist of the following (in thousands):
| December 31, | ||||||||
| 2009 | 2008 | |||||||
| Content license agreements | $ | 838 | $ | 838 | ||||
| Content copyrights | 1,295 | 569 | ||||||
| Advertising Relationship | 512 | 512 | ||||||
| Other | 130 | 130 | ||||||
| Trademark | 517 | 517 | ||||||
| 3,292 | 2,566 | |||||||
| Less accumulated amortization | (470 | ) | (162 | ) | ||||
| $ | 2,822 | $ | 2,404 | |||||
Amortization expense on intangible assets of approximately $0.3 million and $0.2 million for the years ended December 31, 2009 and 2008, respectively, was included in the determination of net income.
Estimated annual amortization expense for each of the next five years is as follows (in thousands):
Years Ended December 31, | ||
| 2010 | $ | 352 |
| 2011 | $ | 324 |
| 2012 | $ | 223 |
| 2013 | $ | 179 |
| 2014 | $ | 179 |
| 8. | Line of Credit |
On May 30, 2008, we entered into a $20.0 million unsecured revolving line of credit (the “Revolving Credit Agreement”) with Wells Fargo Bank, National Association (“Wells Fargo”). This Revolving Credit Agreement expires on May 21, 2011. In addition, the Revolving Credit Agreement provides for the issue of letters of credit not to exceed $2.5 million. Monthly interest only payments, if applicable, are paid based on a pricing grid under which the interest rate decreases or increases based on our ratio of funded debt to earnings before interest, taxes, depreciation and amortization. We can elect to borrow utilizing the offshore London Inter-Bank Offering Rate (“LIBOR”) plus an applicable spread or the prime rate. The credit agreement contains certain quarterly financial covenants, including current ratio greater than 1.50, deployable cash greater than zero at all times, tangible net worth greater than $40.0 million, and net income after taxes greater than $4.0 million for the trailing four quarters. At December 31, 2009, we were in compliance with all of the financial covenants of the credit agreement.
AMBASSADORS GROUP, INC.
NOTES TO CONSOLIDATED FINANCIAL STATEMENTS – (Continued)
At December 31, 2009 and 2008, we had no amounts outstanding on the revolving line of credit. At December 31, 2009 and 2008, the availability under the line of credit was $18.6 million, with $1.4 million of the line of credit issued in the form of letters of credits to several airline companies.
| 9. | Income Taxes |
The provision for income taxes consisted of the following (in thousands):
| Years Ended December 31, | ||||||||||||
| 2009 | 2008 | 2007 | ||||||||||
| Current: | 1 | |||||||||||
| Federal | $ | 9,302 | $ | 8,077 | $ | 14,929 | ||||||
| State | 1,023 | 58 | 95 | |||||||||
| Deferred | 568 | 1,034 | (71 | ) | ||||||||
Total income tax provision | $ | 10,893 | $ | 9,169 | $ | 14,953 | ||||||
Components of the net deferred tax assets and liabilities are as follows (in thousands):
| December 31, 2009 | ||||||||||||
| Assets | Liabilities | Total | ||||||||||
| Amortization of goodwill and other intangibles | $ | 753 | $ | — | $ | 753 | ||||||
| Accrued vacation and compensation | 182 | — | 182 | |||||||||
| Unrealized gain on foreign currency exchange contracts | — | (383 | ) | (383 | ) | |||||||
| Unrealized gain on available-for-sale securities | — | (191 | ) | (191 | ) | |||||||
| Depreciation | — | (2,912 | ) | (2,912 | ) | |||||||
| Stock options | 1,388 | — | 1,388 | |||||||||
| Restricted stock grants | 498 | — | 498 | |||||||||
| State tax deduction | 258 | — | 258 | |||||||||
| Non-compete agreements | — | (251 | ) | (251 | ) | |||||||
| Other | 31 | — | 31 | |||||||||
| Total deferred tax assets (liabilities) | $ | 3,110 | $ | (3,737 | ) | $ | (627 | ) | ||||
| December 31, 2008 | ||||||||||||
| Assets | Liabilities | Total | ||||||||||
| Amortization of goodwill and non-compete agreement | $ | 833 | $ | — | $ | 833 | ||||||
| Accrued vacation and compensation | 213 | — | 213 | |||||||||
| Unrealized loss on foreign currency exchange contracts | 2,676 | — | 2,676 | |||||||||
| Unrealized gain on available-for-sale securities | — | (166 | ) | (166 | ) | |||||||
| Depreciation | — | (2,165 | ) | (2,165 | ) | |||||||
| Stock options | 1,032 | — | 1,032 | |||||||||
| Restricted stock grants | 605 | — | 605 | |||||||||
| Other | — | (7 | ) | (7 | ) | |||||||
| Total deferred tax assets (liabilities) | $ | 5,359 | $ | (2,338 | ) | $ | 3,021 | |||||
AMBASSADORS GROUP, INC.
NOTES TO CONSOLIDATED FINANCIAL STATEMENTS – (Continued)
The income tax provision differs from that computed using the federal statutory rate applied to income before income taxes as follows (in thousands):
| Years Ended December 31, | ||||||||||||||||||||||||
2009 Amount | % | 2008 Amount | % | 2007 Amount | % | |||||||||||||||||||
| Provision at the federal statutory rate | $ | 10,931 | 35.0 | % | $ | 9,700 | 35.0 | % | $ | 16,100 | 35.0 | % | ||||||||||||
| Tax-exempt interest | (723 | ) | (2.3 | ) | (1,024 | ) | (3.7 | ) | (1,385 | ) | (3.0 | ) | ||||||||||||
| State income tax, net of federal benefit | 669 | 2.1 | 38 | 0.1 | 95 | 0.2 | ||||||||||||||||||
| Other | 16 | 0.1 | 455 | 1.6 | 143 | 0.3 | ||||||||||||||||||
| Total income tax provision | $ | 10,893 | 34.9 | % | $ | 9,169 | 33.0 | % | $ | 14,953 | 32.5 | % | ||||||||||||
As of December 31, 2009, we have $573,000 of unrecognized tax benefits that have been recorded as “accounts payable and accrued expenses” in our balance sheet, which also would affect the annual effective tax rate if recognized. Our policy is to account for interest and penalties related to uncertain tax positions as part of income tax expense. During the year ended December 31, 2009, we recognized $163,000 of income tax expense in our statement of operations.
The following summarizes the unrecognized tax benefits activity during 2009 and 2008 (in thousands).
| 2009 | 2008 | |||||||
| Gross unrecognized tax benefit as of January 1, | $ | — | $ | 14 | ||||
| Increases in uncertain tax benefits as a result of tax positions taken during the prior period | 573 | 26 | ||||||
| Settlements with tax authorities | — | (40 | ) | |||||
| Gross unrecognized tax benefits as of December 31, | $ | 573 | $ | — | ||||
It is reasonably possible that our unrecognized tax benefits will decrease between $250,000 and $573,000 pending the outcome of discussions with certain tax jurisdictions regarding our activities in their jurisdictions.
We file tax returns in the U.S. federal jurisdiction and various state jurisdictions. We may be subject to examination by the Internal Revenue Service for the years after 2005. We may also be subject to examination by various state jurisdictions for the years after 2004.
| 10. | Commitments and Contingencies |
On July 14, 2009, a securities class action was filed against us and certain of our executive officers on behalf of all persons or entities who purchased our Common Stock between February 8, 2007 and October 23, 2007. The class action was filed in the United States District Court for the Eastern District of Washington by plaintiff Plumbers Union Local No. 12 Pension Fund (“Plumbers Union”). On October 22, 2009, the Court appointed International Brotherhood of Electrical Workers Local 351 (“IBEW 351)” as lead plaintiff. On November 23, 2009, lead plaintiff IBEW 351 filed a motion to withdraw as lead plaintiff and sought appointment of Plumbers Union as substitute lead plaintiff. On January 7, 2010, a hearing was held and the Court appointed Plumbers Union as lead plaintiff and required any amended complaint shall be served and filed on or before January 11, 2010. Plumbers Union filed its amended complaint on January 11, 2010. The amended complaint alleges that the defendants violated federal securities laws by making untrue statements of material fact and/or omitting to state material facts, thereby artificially inflating the price of our Common Stock. We have reviewed the amended complaint and deny the allegations contained therein. We have tendered our defense and indemnity under applicable insurance coverage and defense counsel in Seattle, Washington has been retained to represent us. We believe that the likelihood that our Company will ultimately incur a loss in connection with this litigation is remote. We cannot estimate the possible loss to our Company, if any, at this time. The actual cost to resolve this case will depend upon many factors such as the outcome of mediation, pre-trial motions, trial and any appeals. However, we believe any loss incurred will not have a material adverse effect on our business, financial condition, cash flows or results of operations. We intend to vigorously defend this lawsuit and any alleged claims for damages.
AMBASSADORS GROUP, INC.
NOTES TO CONSOLIDATED FINANCIAL STATEMENTS – (Continued)
On October 27, 2009, the Company was informed by the SEC that it had issued a formal order of investigation with respect to trading in the Company's securities. The Company believes that the investigation is for the period August through December, 2007. In connection with the investigation, the Company, certain of its officers, directors and employees, as well as other persons, have received subpoenas from the SEC requesting information. The SEC has indicated that the investigation should not be construed as an indication that any violation of law has occurred or as an adverse reflection upon any person, entity or security. The Company intends to cooperate fully with the investigation.
Other than the disclosed, we are not a party to any other material pending legal proceedings other than ordinary routine litigation incidental to our business, the outcome of which we believe will not have a material adverse effect on our business, financial condition, cash flows or results of operations. These matters are subject to inherent uncertainties and management’s view of these matters may change in the future. Adverse outcomes in some or all of the matters described in this section may result in significant monetary damages or injunctive relief against us that would adversely affect our operations.
We are subject to the possibility of various loss contingencies including claims, suits and complaints, arising in the ordinary course of business. We consider the likelihood of loss or impairment of an asset or the incurrence of a liability, as well as our ability to reasonably estimate the amount of loss in determining loss contingencies. An estimated loss contingency is accrued when it is probable that an asset has been impaired or a liability has been incurred and the amount of loss can be reasonably estimated. We regularly evaluate current information available to us to determine whether such accruals should be adjusted and whether new accruals are required. In the opinion of management and its legal counsel, all matters are adequately covered by insurance or, if not covered, are without merit or are of such nature, or involve such amounts as would not have a material effect on our financial position, cash flows or results of operations.
Under our Bylaws, our directors and officers have certain rights to indemnification by us against certain liabilities that may arise by reason of their status or service as directors or officers. We maintain director and officer insurance, which may cover certain liabilities arising from our obligation to indemnify our directors and officers and former directors in certain circumstances. No material indemnification liabilities were accrued at December 31, 2009.
11. Stock-Based Compensation
In May 2009, our shareholders approved our 2009 Equity Participation Plan (the “2009 Plan”). The 2009 Plan replaces our 2001 Equity Participation Plan (the “Prior Plan”). Under the 2009 Plan, we may grant stock-based incentive compensation awards to eligible employees (including officers), non-employee directors and consultants in the form of distribution equivalent rights, incentive stock options, non-qualified stock options, performance share awards, performance unit awards, restricted stock awards, restricted stock units awards, stock appreciation rights, tandem stock appreciation rights, unrestricted stock awards or any combination of the foregoing, as may be best suited to the circumstances of the particular employee, director or consultant. The maximum aggregate number of shares of Common Stock of the Company, par value $0.01 (“Common Stock”), that may be issued under the 2009 Plan is 1,200,000 shares, plus any shares that were available for issuance under the Prior Plan, which totaled 204,458 shares as of May 7, 2009.
Under the terms of the 2009 Plan, options to purchase shares of our Common Stock are granted at a price set by the Compensation Committee of the Board of Directors (the “Compensation Committee”), not to be less than the par value of a share of Common Stock, and if granted as performance-based compensation or as incentive stock options, not to be less than the fair market value of the stock on the date of grant. The Compensation Committee establishes the vesting period of the awards, which is generally set at 25 percent per year for four years. Options may be exercised any time after they vest for a period up to 10 years from the grant date.
AMBASSADORS GROUP, INC.
NOTES TO CONSOLIDATED FINANCIAL STATEMENTS – (Continued)
Under the terms of the 2009 Plan, restricted stock awards are granted at a price set by the Compensation Committee on the same terms as options. The Compensation Committee also establishes the vesting period of the awards, which is generally set at 100 percent at the conclusion of one to four years. Our key employees who have been awarded stock and are full time employees are subject to a four year vesting period, while our Board of Directors who have been awarded stock are subject to a one year vesting period.
The fair value of each stock option granted is estimated on the date of grant using the Black-Scholes option-pricing model. The Black-Scholes option-pricing model was developed for use in estimating the fair value of options. Option valuation models require the input of highly subjective assumptions, particularly for the expected term and stock price volatility. The assumptions used to calculate the fair value of options granted are evaluated and revised, as necessary, to reflect market conditions and our experience. Our employee stock options do not trade on a secondary exchange; therefore, employees do not derive a benefit from holding stock options unless there is an appreciation in the market price of our stock above the grant price. Such an increase in stock price would benefit all shareholders commensurately.
The fair value of each option grant is estimated on the date of grant using the Black-Scholes option-pricing model with the following weighted-average assumptions used for grants in the years ended December 31, 2009, 2008, and 2007.
| Years Ended December 31, | |||||||||||
| 2009 | 2008 | 2007 | |||||||||
| Expected dividend yield | 2.15 | % | 2.66 | % | 1.41 | % | |||||
| Expected stock price volatility | 54.45 | % | 49.48 | % | 43.40 | % | |||||
| Risk-free interest rate | 2.24 | % | 2.48 | % | 3.93 | % | |||||
| Expected term of options | 5.00 | years | 4.51 | years | 4.45 | years | |||||
The weighted-average fair value of options granted during 2009, 2008 and 2007 was $4.70, $3.51, and $7.02, respectively.
The dividend yield is based on expected quarterly cash dividends paid to our shareholders. Expected stock price volatility is based on historical volatility of our stock. The risk-free interest rate is based on the implied yield available on U.S. Treasury zero-coupon issues with an equivalent remaining term. The expected term of the options represents the estimated period of time until exercise and is based on historical experience of similar awards, giving consideration to the contractual terms, vesting schedules and expectations of future employee behavior. Additionally, an annualized forfeiture rate of 8.49 percent is used as a best estimate of future forfeitures based on our historical forfeiture experience. The stock-based compensation expense will be adjusted in later periods if the actual forfeiture rate is different from the estimate.
Total stock-based compensation expense recognized in the consolidated statement of operations for the years ended 2009, 2008, and 2007 was $2.0 million, $2.1 million, $2.0 million, respectively, before income taxes. Of the total stock-based compensation expense during 2009, stock option expense was $0.9 million and restricted stock grant expense was $1.1 million. Of the total stock-based compensation expense during 2008, stock option expense was $0.9 million and restricted stock grant expense was $1.2 million. Of the total stock-based compensation expense during 2007, stock option expense was $1.0 million and restricted stock grant expense was $0.9 million.
AMBASSADORS GROUP, INC.
NOTES TO CONSOLIDATED FINANCIAL STATEMENTS – (Continued)
The following table presents information about the common stock options and restricted grants as of December 31, 2009:
| Options and Restricted Stock Outstanding | Options Exercisable | ||||||||||||||||||||
Range of Exercise Prices | Shares | Weighted- Average Remaining Contractual Life (years) | Weighted - Average Exercise Price | Shares | Weighted- Average Exercise Price | ||||||||||||||||
| Restricted Stock Grants | |||||||||||||||||||||
| $ | 0.00 | 252,959 | 2.79 | $ | N/A | N/A | N/A | ||||||||||||||
| Stock Options | |||||||||||||||||||||
| $ | 3.47 -6.93 | 542,346 | 2.07 | $ | 5.89 | 542,346 | $ | 5.89 | |||||||||||||
| 6.94 - 10.39 | 323,255 | 6.86 | 9.05 | 159,678 | 9.42 | ||||||||||||||||
| 10.40 - 13.86 | 292,166 | 9.30 | 11.92 | 22,475 | 11.61 | ||||||||||||||||
| 13.87 - 17.32 | 317,570 | 6.29 | 16.86 | 234,381 | 16.81 | ||||||||||||||||
| 17.33 - 20.79 | 12,824 | 8.35 | 18.41 | 3,206 | 18.41 | ||||||||||||||||
| 20.80 - 24.25 | 48,000 | 1.94 | 21.09 | 48,000 | 21.09 | ||||||||||||||||
| 24.26 - 27.72 | 204,508 | 6.11 | 27.11 | 181,383 | 27.06 | ||||||||||||||||
| 27.73 - 31.18 | 12,609 | 6.15 | 29.20 | 8,394 | 29.04 | ||||||||||||||||
| 31.19 - 34.65 | 12,659 | 7.34 | 34.65 | 6,326 | 34.65 | ||||||||||||||||
| Total Stock Options | 1,765,937 | 5.48 | $ | 12.77 | 1,206,189 | $ | 12.72 | ||||||||||||||
| Combined | 2,018,896 | 5.14 | $ | 11.17 | 1,206,189 | $ | 12.72 | ||||||||||||||
At December 31, 2008, there were 1,183,288 exercisable stock options at the weighted-average exercise price of $10.89 per share.
At December 31, 2009, the aggregate intrinsic value of outstanding stock options and restricted stock was $9.1 million and exercisable stock options and restricted stock was $4.6 million, before applicable income taxes, based on our $13.26 closing stock price at December 31, 2009. This intrinsic value would have been received by the optionees had all restricted stock been vested and all stock options been exercised on that date. The weighted-average remaining contractual life of stock options and restricted grants outstanding was 5.1 years and exercisable was 3.8 years. As of December 31, 2009, total unrecognized stock-based compensation expense related to non-vested stock options and restricted stock awards was approximately $4.6 million, which is expected to be recognized over approximately 3.9 years. During the year ended December 31, 2009, the total intrinsic value of stock options exercised was $1.0 million and the total fair value of options which vested was $1.2 million while the total fair value of restricted stock awards which vested was $1.4 million.
At December 31, 2008, the aggregate intrinsic value of outstanding stock options and restricted stock was $4.3 million and exercisable stock options and restricted stock was $2.4 million, before applicable income taxes, based on our $9.20 closing stock price at December 31, 2008. This intrinsic value would have been received by the optionees had all restricted stock been vested and all stock options been exercised on that date. The weighted-average remaining contractual life of stock options and restricted grants outstanding was 5.2 years and exercisable was 4.2 years. As of December 31, 2008, total unrecognized stock-based compensation expense related to non-vested stock options and restricted stock grants was approximately $4.2 million, which is expected to be recognized over a period of approximately 3.9 years. During the year ended December 31, 2008, the total intrinsic value of stock options exercised was $0.8 million, and the total fair value of options vested was $1.5 million while the total fair value of restricted stock awards which vested was $0.2 million.
AMBASSADORS GROUP, INC.
NOTES TO CONSOLIDATED FINANCIAL STATEMENTS – (Continued)
At December 31, 2007, the aggregate intrinsic value of outstanding stock options and restricted stock was $14.8 million and exercisable stock options and restricted stock was $10.3 million, before applicable income taxes, based on our $18.31 closing stock price at December 31, 2007. This intrinsic value would have been received by the optionees had all restricted stock been vested and all stock options been exercised on that date. The weighted average remaining contractual life of stock options and restricted grants outstanding was 5.4 years and exercisable was 4.8 years. As of December 31, 2007, total unrecognized stock-based compensation expense related to non-vested stock options and restricted stock grants was approximately $4.6 million, which is expected to be recognized over a period of approximately 3.9 years. During the year ended December 31, 2007, the total intrinsic value of stock options exercised was $8.0 million, and the total fair value of options vested was $1.3 million while the total fair value of restricted stock awards which vested was $0.1 million.
Stock option and restricted stock grant transactions during 2009 were as follows:
| Restricted | Weighted- | Weighted- | |||||||
| Stock | Average Grant | Stock | Average | ||||||
| Grants | Date Fair Value | Options | Exercise Price | ||||||
| Balance at December 31, 2008 | 205,585 | $ | 18.33 | 1,639,874 | $ | 12.34 | |||
| Granted | 111,696 | 11.52 | 309,081 | 11.32 | |||||
| Forfeited | (9,374) | 12.71 | (28,529) | 11.17 | |||||
| Vested | (54,948) | 24.69 | N/A | N/A | |||||
| Exercised | N/A | N/A | (154,489) | 5.41 | |||||
| Balance December 31, 2009 | 252,959 | $ | 14.15 | 1,765,937 | $ | 12.77 | |||
| 12. | Employee Benefit Plan |
Effective March 2002, we established a 401(k) Profit Sharing Plan (the “Sharing Plan”) for our employees. Employees are eligible to participate in the Sharing Plan upon six months of service and 18 years of age. Employees may contribute up to 92 percent of their salary, subject to the maximum contribution allowed by the Internal Revenue Service. Our matching contribution is discretionary based upon approval by management. Employees are 100 percent vested in their contributions and vest in our matching contributions after their initial four years of employment. During the years ended December 31, 2009, 2008, and 2007, we contributed approximately $0.02 million, $0.2 million, and $0.2 million to the Sharing Plan, respectively.
F-26
| 13. | Earnings Per Share |
The following table presents a reconciliation of basic and diluted EPS computations (in thousands, except per share data):
| Year ended December 31, | |||||||||||
| 2009 | 2008 | 2007 | |||||||||
| Numerator: | |||||||||||
| Net income | $ | 20,337 | $ | 18,546 | $ | 31,047 | |||||
| Denominator: | |||||||||||
| Weighted-average shares outstanding | 18,618 | 18,745 | 19,385 | ||||||||
Effect of unvested restricted stock awards considered participating securities | 487 | 439 | 222 | ||||||||
| Weighted-average shares outstanding – basic | 19,105 | 19,184 | 19,607 | ||||||||
| Effect of dilutive common stock options | 317 | 388 | 623 | ||||||||
| Weighted average shares outstanding – diluted | 19,422 | 19,572 | 20,230 | ||||||||
| Earnings per share – basic and diluted: | |||||||||||
| Net income per share – basic | $ | 1.06 | $ | 0.97 | $ | 1.58 | |||||
| Net income per share – diluted | $ | 1.05 | $ | 0.95 | $ | 1.53 | |||||
| Cash dividends declared per share | $ | 0.24 | $ | 0.46 | $ | 0.46 | |||||
| Antidilutive options not included in diluted EPS | 608,770 | 609,192 | 12,659 | ||||||||
On January 1, 2009, we adopted a new accounting principle, which clarified that unvested share-based payment awards that contain nonforfeitable rights to receive dividends or dividend equivalents (whether paid or unpaid) are participating securities, and thus, should be included in the two-class method of computing “EPS”. Participating securities under this statement include our unvested employee restricted stock awards with time-based vesting and common stock granted in the acquisition of BookRags that will be issued in 2010 when escrow conditions are known, which receive nonforfeitable dividend payments. As a result of this new provision, all prior period EPS data have been adjusted retrospectively. The effect of adopting this new accounting provision was a decrease in basic and diluted EPS of $0.02 for both the years ending December 31, 2008 and 2007.
| 14. | Supplemental Disclosures of Consolidated Statements of Cash Flows |
We paid cash for taxes during 2009, 2008, and 2007 of approximately $9.9 million, $8.5 million, and $13.3 million, respectively.
Our non-cash investing and financing activities during the years ended December 31, 2009, 2008, and 2007, are as follows (in thousands):
| 2009 | 2008 | 2007 | ||||||||||
| Unrealized gain (loss) on foreign currency exchange contracts | $ | (8,729 | ) | $ | (11,107 | ) | $ | 890 | ||||
| Unrealized gain on available-for-sale securities | 58 | 213 | 311 | |||||||||
| Property, plant and equipment | 426 | 22 | 1,397 | |||||||||
| Capital lease | — | 37 | — | |||||||||
| Purchase price allocation for goodwill | 24 | — | — | |||||||||
AMBASSADORS GROUP, INC.
NOTES TO CONSOLIDATED FINANCIAL STATEMENTS – (Continued)
| 15. | Segment Reporting |
Our operations are organized into two reporting segments, consisting of (1) Ambassador Programs and Other, which provides out-of-classroom educational travel services to students, professionals and athletes through multiple itineraries within five travel program types, and (2) BookRags, an internet research site housing content sales and advertising revenue.
Ambassador Programs and Others’ gross margin is comprised of gross receipts less direct program costs, including accommodations, transportation, speakers, facilitators, and event costs. BookRags’ gross margin is comprised of content and subscription and advertising revenues via www.BookRags.com, less commissions and amortization of intangible assets directly associated with sales.
Prior to May 15, 2008, we only had one segment. Segment information as of and for the years ended December 31, 2009 and 2008 are as follows (in thousands):
| Year ended December 31, 2009 | Year ended December 31, 2008 | ||||||||||||||||||||||
| Ambassador Programs and Other (1) | BookRags (2) | Consolidated | Ambassador Programs and Other (1) | BookRags (2) | Consolidated | ||||||||||||||||||
| Total revenue | $ | 95,315 | $ | 3,300 | $ | 98,615 | $ | 96,030 | $ | 1,897 | $ | 97,927 | |||||||||||
| Gross margin | $ | 80,893 | $ | 2,911 | $ | 83,804 | $ | 77,174 | $ | 1,705 | $ | 78,879 | |||||||||||
| Depreciation and amortization | $ | 4,052 | $ | 312 | $ | 4,364 | $ | 3,264 | $ | 162 | $ | 3,426 | |||||||||||
| Operating income | $ | 28,336 | $ | 1,843 | $ | 30,179 | $ | 24,327 | $ | 1,142 | $ | 25,469 | |||||||||||
| Income tax provision | $ | 10,239 | $ | 654 | $ | 10,893 | $ | 8,784 | $ | 385 | $ | 9,169 | |||||||||||
| Net income | $ | 19,145 | $ | 1,192 | $ | 20,337 | $ | 17,770 | $ | 776 | $ | 18,546 | |||||||||||
| Total additions to property, plant, and equipment | $ | 5,078 | $ | 79 | $ | 5,157 | $ | 5,042 | $ | — | $ | 5,042 | |||||||||||
| Total additions to goodwill and intangible assets | $ | — | $ | 726 | $ | 726 | $ | — | $ | 9,431 | $ | 9,431 | |||||||||||
| Intangible assets, excluding goodwill | $ | — | $ | 2,822 | $ | 2,822 | $ | — | $ | 2,404 | $ | 2,404 | |||||||||||
| Total goodwill | $ | 70 | $ | 6,841 | $ | 6,911 | $ | 70 | $ | 6,865 | $ | 6,935 | |||||||||||
| Total assets | $ | 116,334 | $ | 11,751 | $ | 128,095 | $ | 113,713 | $ | 10,564 | $ | 124,277 | |||||||||||
| (1) | Ambassador Programs and Other include all travel programs offered by Ambassador Programs and World Adventures Unlimited as well as corporate overhead. World Adventures Unlimited had no revenue in 2009, however they did have expenses related to the pilot programs that were operated during the summer of 2009 and start-up expenses. |
| (2) | BookRags was acquired on May 15, 2008. Therefore, the year ended December 31, 2008 does not represent a full year as it does in 2009 and is not comparable to the year ended December 31, 2009. |
Any intercompany sales or services provided that exist are eliminated. Intercompany expenses paid for by Ambassador Programs and Other on behalf of BookRags are recorded as intercompany receivables and payables and eliminated upon consolidation. On October 1, 2008, an operating agreement was entered into by Ambassador Programs and BookRags. The operating agreement outlines the agreed upon charges for services provided by Ambassador Programs to BookRags for accounting, human resources, and technology support. In addition, it defines the terms in which the two companies can perform lead generation for marketing purposes.
AMBASSADORS GROUP, INC.
NOTES TO CONSOLIDATED FINANCIAL STATEMENTS – (Continued)
| 16. | Quarterly Financial Data (unaudited) |
Summarized quarterly financial data for 2009, 2008, and 2007 is as follows (unaudited, and in thousands except per share data). All adjustments necessary to fairly present the interim results have been recorded:
| Quarters Ended | |||||||||||||||
| March 31 | June 30 | September 30 | December 31 | ||||||||||||
| 2009 | |||||||||||||||
| Total revenue | $ | 10,006 | $ | 46,176 | $ | 36,407 | $ | 6,026 | |||||||
| Gross margin | 5,281 | 40,292 | 33,201 | 5,030 | |||||||||||
| Selling and marketing expense | 8,872 | 9,258 | 11,281 | 9,610 | |||||||||||
| General and administrative expense | 3,369 | 3,303 | 3,252 | 4,680 | |||||||||||
| Income (loss) before income taxes | (7,407 | ) | 28,305 | 19,169 | (8,837 | ) | |||||||||
| Net income (loss) | (5,254 | ) | 19,179 | 12,505 | (6,093 | ) | |||||||||
| Earnings (loss) per share-basic | (0.28 | ) | 1.01 | 0.66 | (0.32 | ) | |||||||||
| Earnings (loss) per share-diluted | (0.28 | ) | 0.99 | 0.64 | (0.32 | ) | |||||||||
Gross program receipts reflect total amounts charged for our goods and services. Gross program receipts totaled $10.4 million, $99.3 million, $82.8 million and $11.2 million for the quarters ended March 31, June 30, September 30, and December 31, 2009, respectively.
Quarters Ended | ||||||||||||||||
| March 31 | June 30 | September 30 | December 31 | |||||||||||||
| 2008 | ||||||||||||||||
| Total revenue | $ | 7,880 | $ | 42,286 | $ | 40,119 | $ | 7,642 | ||||||||
| Gross margin | 3,470 | 36,717 | 33,018 | 5,674 | ||||||||||||
| Selling and marketing expense | 9,364 | 8,875 | 11,272 | 11,331 | ||||||||||||
| General and administrative expense | 3,018 | 3,168 | 2,822 | 3,560 | ||||||||||||
| Income (loss) before income taxes | (8,009 | ) | 25,579 | 19,591 | (9,446 | ) | ||||||||||
| Net income (loss) | (5,474 | ) | 17,184 | 13,298 | (6,462 | ) | ||||||||||
| Earnings (loss) per share-basic | (0.29 | ) | 0.89 | 0.70 | (0.34 | ) | ||||||||||
| Earnings (loss) per share-diluted | (0.29 | ) | 0.87 | 0.68 | (0.34 | ) | ||||||||||
Gross program receipts totaled $8.9 million, $104.0 million, $101.2 million and $15.1 million for the quarters ended March 31, June 30, September 30, and December 31, 2008, respectively.
F-29
Pursuant to the requirements of Section 13 or 15(d) of the Securities Exchange Act of 1934, the registrant has caused this report to be signed on its behalf by the undersigned, thereunto duly authorized.
| AMBASSADORS GROUP, INC. | ||||
| By: | /s/ JEFFREY D. THOMAS | |||
| Jeffrey D. Thomas, | ||||
| President and Chief Executive Officer | ||||
Date: March 1, 2010
Pursuant to the requirements of the Securities Exchange Act of 1934, this report has been signed below by the following persons on behalf of the registrant and in the capacities and on the dates indicated.
| Signature | Title | Date | ||
| /s/ JEFFREY D. THOMAS | President, Chief Executive Officer and Director (Principal Executive Officer) | March 2, 2010 | ||
| Jeffrey D. Thomas | ||||
| /s/ JOHN A. UEBERROTH | Chairman of the Board of Directors | March 2, 2010 | ||
| John A. Ueberroth | ||||
| /s/ KRISTI J. GRAVELLE | Chief Financial Officer and Secretary | March 2, 2010 | ||
| Kristi J. Gravelle | (Principal Financial and Accounting Officer) | |||
/s/ BRIGITTE M. BREN | Director | March 2, 2010 | ||
| Brigitte M. Bren | ||||
| /s/ DANIEL G. BYRNE | Director | March 2, 2010 | ||
| Daniel G. Byrne | ||||
| /s/ RAFER L. JOHNSON | Director | March 2, 2010 | ||
| Rafer L. Johnson | ||||
| /s/ JAMES M. KALUSTIAN | Director | March 2, 2010 | ||
| James M. Kalustian | ||||
| /s/ JOSEPH J. UEBERROTH | Director | March 2, 2010 | ||
| Joseph J. Ueberroth |
| /s/ RICARDO L. VALENCIA | Director | March 2, 2010 | ||
Ricardo L. Valencia | ||||
| /s/ RICHARD D. C. WHILDEN | Director | March 2, 2010 | ||
Richard D. C. Whilden |
INDEX TO EXHIBITS
Exhibit Number | Description | |
| 3.1 | Amended and Restated Certificate of Incorporation of the registrant incorporated by reference to the registrant’s Registration Statement on Form 10 filed on November 15, 2001. | |
| 3.2 | Certificate of Amendment to Amended and Restated Certificate of Incorporation of the registrant incorporated by reference to the registrant’s Form 8-K filed on May 17, 2005. | |
| 3.3 | Bylaws of the registrant incorporated by reference to the registrant’s Registration Statement on Form 10 filed on November 15, 2001. | |
| 4.1 | Form of Common Stock Certificate of the registrant incorporated by reference to the registrant’s Form 10-K filed on March 9, 2007. | |
| 10.1 | 2001 Equity Participation Plan incorporated by reference to the registrant’s Registration Statement on Form 10 filed on January 7, 2002. | |
| 10.2 | Form of 2001 Equity Participation Plan Agreement incorporated by reference to the registrant’s Registration Statement on Form 10 filed on November 15, 2001. | |
| 10.3 | Form of Indemnification Agreement between the registrant and each of its executive officers and directors incorporated by reference to the registrant’s Registration Statement on Form 10 filed on January 25, 2002. | |
| 10.4 | Commercial Lease Agreement by and between Portolese & Sample Investments and the registrant incorporated by reference to the registrant’s Form 8-K filed on January 4, 2005. | |
| 10.5 | AIA Document A101, Standard Form of Agreement between Owner and Contractor by and between the registrant and Graham Construction and Management, Inc. incorporated by reference to registrant’s Form 8-K filed on September 29, 2006. | |
| 10.6 | Employment Agreement by and between the registrant and Jeffrey D. Thomas, incorporated by reference to the registrant’s Form 8-K filed on October 3, 2006. | |
| 10.7 | Stock Purchase Agreement by and between the registrant and Invemed Catalyst Fund, L.P. incorporated by reference to the registrant’s Form 8-K filed on January 31, 2007. | |
| 10.8 | Stock Purchase Agreement incorporated by reference to the registrant’s Form 8-K filed on May 21, 2008. | |
| 10.9 | Credit Agreement by and between the registrant and Wells Fargo Bank, N.A. incorporated by reference to the registrant’s Form 8-K file on May 30, 2008. | |
| 10.10 | Revolving Line of Credit Note incorporated by reference to the registrant’s Form 8-K filed May 30, 2008. | |
| 10.11 | 2009 Equity Participation Plan Agreement incorporated by reference to the registrant’s Definitive Proxy Statement on Form 14A filed on April 6, 2009. | |
| 14.1 | Code of Ethics incorporated by reference from our definitive Proxy Statement for the fiscal year ended December 31, 2009, to be filed with the SEC on or about April 13, 2010. |
| 21.1 | List of subsidiaries of the registrant as of December 31, 2009.* | |
| 23.1 | Consent of BDO Seidman, LLP, Independent Registered Public Accounting Firm.* | |
| 31.1 | Certification by Chief Executive Officer required by Rule 13a-14(a) or Rule 15(d)-14(a).* | |
| 31.2 | Certification by Chief Financial Officer required by Rule 13a-14(a) or Rule 15(d)-14(a).* | |
| 32.1 | Certification by the Chief Executive Officer and Chief Financial Officer as required by Rule 13a-14(b) or 15(d)-14(b) and Section 1350 of Chapter 63 of Title 13 of the United States Code (18 U.S.C. §1350).* |
* Filed herewith
II - 3