Washington, D.C. 20549
Form 10-K
(Mark One)
| ý | ANNUAL REPORT PURSUANT TO SECTION 13 OR 15(d) OF THE SECURITIES EXCHANGE ACT OF 1934 | |
| For the fiscal year ended December 31, 2011 | ||
| Or | ||
| o | TRANSITION REPORT PURSUANT TO SECTION 13 OR 15(d) OF THE SECURITIES EXCHANGE ACT OF 1934 | |
For the transition period from ________ to ________ | ||
Commission file number: 0-33347
Ambassadors Group, Inc.
(Exact Name of Registrant as Specified in Its Charter)
| Delaware | 91-1957010 | |
(State or Other Jurisdiction of Incorporation or Organization) | (I.R.S. Employer Identification No.) | |
Dwight D. Eisenhower Building 2001 South Flint Road Spokane, WA | 99224 | |
| (Address of Principal Executive Offices) | (Zip Code) | |
Registrant’s telephone number, including area code: (509) 568-7800 | ||
| Securities registered pursuant to Section 12(b) of the Act: | ||
| Common Stock, $0.01 Par Value | The NASDAQ Stock Market | |
| (Title of Class) | (Name of each exchange on which registered) | |
| Securities registered pursuant to Section 12(g) of the Act: | ||
| None | ||
Indicate by check mark if the registrant is a well-known seasoned issuer, as defined in Rule 405 of the Securities Act.
o Yes ý No
Indicate by check mark if the registrant is not required to file reports pursuant to Section 13 or Section 15(d) of the Act.
o Yes ý No
Indicate by check mark whether the registrant (1) has filed all reports required to be filed by Section 13 or 15(d) of the Securities Exchange Act of 1934 during the preceding 12 months (or for such shorter period that the registrant was required to file such reports), and (2) has been subject to such filing requirements for the past 90 days.
ý Yes o No
Indicate by check mark whether the registrant has submitted electronically and posted on its corporate Web site, if any, every Interactive Data File required to be submitted and posted pursuant to Rule 405 of Regulation S-T (§232.405 of this chapter) during the preceding 12 months (or for such shorter period that the registrant was required to submit and post such files).
ý Yes o No
Indicate by check mark if disclosure of delinquent filers pursuant to Item 405 of Regulation S-K (§229.405 of this chapter) is not contained herein, and will not be contained, to the best of registrant’s knowledge, in definitive proxy or information statements incorporated by reference in Part III of this Form 10-K or any amendment to this Form 10-K.
| o |
Indicate by check mark whether the registrant is a large accelerated filer, an accelerated filer, a non-accelerated filer, or a smaller reporting company. See definitions of “large accelerated filer,” “accelerated filer,” and “smaller reporting company” in Rule 12b-2 of the Exchange Act. (Check one):
Large accelerated filer o | Accelerated filer ý | ||
Non-accelerated filer o (Do not check if a smaller reporting company) | Smaller reporting company o |
Indicate by check mark whether the registrant is a shell company (as defined in Rule 12b-2 of the Exchange Act).
o Yes ý No |
The aggregate market value of the voting stock held by non-affiliates of the registrant, based upon the closing sales price of the Common Stock on the NASDAQ Stock Market on June 30, 2011, was $76.2 million. Shares of Common Stock held by each executive officer and director, and by each individual and entity that owns 5% or more of the outstanding Common Stock have been excluded in that such persons may be deemed to be affiliates. This determination of affiliate status is not necessarily a conclusive determination for other purposes.
The number of shares of the registrant’s Common Stock, $0.01 par value, outstanding as of February 28, 2012, was 17,590,300.
DOCUMENTS INCORPORATED BY REFERENCE
Portions of the registrant’s definitive Proxy Statement relating to the 2012 Annual Meeting of Stockholders are incorporated by reference into Part III of this Annual Report on Form 10-K to the extent stated herein.
TABLE OF CONTENTS
| Page | ||
| PART I | ||
| Item 1. | Business | 1 |
| Item 1A. | Risk Factors | 7 |
| Item 1B. | Unresolved Staff Comments | 13 |
| Item 2. | Properties | 13 |
| Item 3. | Legal Proceedings | 13 |
Item 4. | Mine Safety Disclosures | 13 |
| PART II | ||
| Item 5. | Market for the Registrant’s Common Equity, Related Stockholder Matters and Issuer Purchases of Equity Securities | 14 |
| Item 6. | Selected Financial Data | 17 |
| Item 7. | Management’s Discussion and Analysis of Financial Condition and Results of Operations | 19 |
| Item 7A. | Quantitative and Qualitative Disclosures About Market Risk | 29 |
| Item 8. | Financial Statements and Supplementary Data | 29 |
| Item 9. | Changes in and Disagreements With Accountants on Accounting and Financial Disclosure | 30 |
| Item 9A. | Controls and Procedures | 30 |
| Item 9B. | Other Information | 32 |
| PART III | ||
| Item 10. | Directors, Executive Officers and Corporate Governance | 32 |
| Item 11. | Executive Compensation | 32 |
| Item 12. | Security Ownership of Certain Beneficial Owners and Management and Related Stockholder Matters | 32 |
| Item 13. | Certain Relationships and Related Transactions, and Director Independence | 32 |
| Item 14. | Principal Accountant Fees and Services | 32 |
| PART IV | ||
| Item 15. | Exhibits, Financial Statement Schedules | 33 |
| Signatures | II-1 | |
Statements contained in this Annual Report on Form 10-K of Ambassadors Group, Inc., which are not historical in nature, are forward-looking statements within the meaning of the Private Securities Litigation Reform Act of 1995, Section 27A of the Securities Act of 1933, as amended (the “Act”) and Section 21E of the Securities Exchange Act of 1934, as amended (the “Exchange Act”). These forward-looking statements include, without limitation, statements that relate to expectations concerning matters that are not historical facts. Words such as “projects,” “believes,” “anticipates,” “plans,” “expects,” “intends,” and similar words and expressions are intended to identify forward-looking statements. These forward-looking statements reflect our beliefs or current expectations with respect to, among other things, trends in the travel and education industry, our business and growth strategies, our use of technology, our ability to integrate acquired businesses, and fluctuations in our results of operations.
Forward-looking statements involve certain risks and uncertainties that could cause actual results to differ materially from anticipated results. These risks and uncertainties include factors generally affecting the travel and education industry, competition, dependence on key personnel and vendor relationships, our ability to successfully integrate the operations of existing or acquired companies, and a variety of other factors such as periods of international unrest, the outbreak of disease, changes in the direct-mail environment, protection of intellectual rights, unidentified taxation exposure, recession, weather conditions and concerns for passenger safety that could cause a decline in travel demand, as well as the risk factors set forth in Item 1A and other factors as may be identified from time to time in our filings with the Securities and Exchange Commission (“SEC”) or in our press releases. All forward-looking statements are expressly qualified in their entirety by these factors and all related cautionary statements. We do not undertake any obligation to update any forward-looking statements.
PART I
Company Background
Ambassadors Group, Inc. (“Ambassadors,” “Company,” “we,” “us” or “our”) is a socially conscious educational company primarily engaged in organizing and promoting differentiated worldwide travel programs for students and professionals. In addition, we operate BookRags, an education oriented research website, which provides study guides, lesson plans and other educational resources to students and teachers.
We were founded in 1967 and reincorporated in Delaware in 1995. We operated as Ambassadors Education Group, a wholly owned subsidiary of Ambassadors International, Inc. (“International”) until February 2002. Effective February 28, 2002, Ambassadors spun off from International through a special stock dividend to International’s shareholders (the “Distribution”). Beginning March 1, 2002, we began operating as an independent stand-alone company. Since that time we have traded our common stock on the NASDAQ Stock Market under the symbol “EPAX.” Our principal offices are located in Spokane, Washington, USA.
Our operations are organized in two reporting segments: 1) “Ambassador Programs and Other,” which provides educational travel services through multiple itineraries within four travel program types and corporate overhead; and 2) “BookRags.” See Note 13, “Segment Reporting,” in our consolidated financial statements in this Form 10-K for further segment information.
Business Organization
Ambassador Programs, Inc.
Ambassadors and its predecessor companies have organized programs for more than 500,000 students and adults. Our educational travel programs offer both domestic and international travel destinations, including, but not limited to, Europe, Australia, China, Japan, South Africa, India, Rwanda, Costa Rica, the Galapagos Islands and Antarctica. This direct to consumer travel business consists of four specialized private-label educational travel programs that seek to educate, inspire intellectual exchange, and develop the cultural and global intelligence of our participants. In 2011, 23,928 delegates, including students from 61 different countries, traveled on our programs to 39 countries on all seven continents.
We operate these programs using the People to People brand which we believe possesses strong awareness in the student travel industry and in turn, provides a high level of credibility for our programs. People to People International (“People to People”) is a private, non-profit organization dedicated to the promotion of world peace through cultural exchange. We license from them the exclusive right to develop and conduct programs for kindergarten through high school students using the People to People name. We also have the non-exclusive right to develop, market and operate programs for professionals, college students and athletes using the People to People name. Our current agreements with People to People expire in 2020 with potential for renewal.
Student Ambassador Programs
Our flagship program, Student Ambassador Programs, provides educational opportunities for students in grade school, middle school and high school to visit one or more foreign destinations to learn about its history, government, economy and culture. We market our Student Ambassador Programs predominantly through a combination of direct mail and local informational meetings held between August and February. Our representatives review candidate applications and conduct local selection interviews to identify applicants for acceptance into our programs. Upon acceptance, students then participate in a series of orientation meetings to prepare for their upcoming travel experience.
Student Ambassador Program delegations generally travel for approximately 14 to 23 days during the summer months. Each delegation typically consists of 30 to 40 students and several teachers usually from the same geographical area, and is accompanied by local guides in each country to assist for the duration of each program.
Programs are designed by a staff of international planners and researchers to provide both an educational and entertaining travel experience, including what we refer to as People to People moments. These moments may include such experiences as access to a government leader, a hands-on cultural experience or opportunity to complete a service-related project in an effort to encourage global citizenship, and in many instances, students have the opportunity to stay for a few days with a host family an experience which provide students a glimpse of daily life in the visited country. As a part of our distinguished safety program, we have contracts with program coordinators to provide day-to-day coordination and oversight of the programs. Many of these travel program components are exclusive to our programs.
Leadership Programs
We provide domestic travel experiences to motivated grade school, middle school and high school students through our “People to People Leadership Summit” and “World Leadership Forum” (“Leadership Programs”), which emphasize leadership, community involvement, and government education. Our Leadership Programs have provided students from over 60 countries with academic promise, leadership potential and a desire to serve their communities, to travel to various U.S. destinations to exchange ideas with renowned speakers, field specific experts, professional educators and their peers. On these five to ten day programs, typically delivered throughout the year, delegates also engage in specially designed leadership study, team-building and leadership-building exercises, which include group discussions, workshops, educational meetings and other social and recreational activities. We market our Leadership Programs predominantly through direct mail. We directly organize and operate all aspects of these domestic programs, including the arrangement of speakers, facilitators, events, accommodations and transportation, which is different than our international program offerings.
Citizen Ambassador Programs
Our Citizen Ambassador Programs provide professionals with common interests the opportunity to travel abroad to meet and exchange ideas with foreign citizens who have similar backgrounds, interests or professions. Citizen Ambassador Programs travel throughout the year on eight to twelve day programs and have the option of adding other cultural exchange activities prior to or following each program. Citizen Ambassador Programs have been conducted in such areas as agriculture, economics, education, law, medicine and science. We market our Citizen Ambassador Programs predominantly through a combination of direct mail and professional association relationships.
As a part of many of our professional programs, continuing education credits are offered through alliances with the American Bar Association and various State Bar Associations for CLE credits for lawyers; the Wilderness Medical Society for the provision of CME credits for physicians; the University of Pittsburgh School of Nursing for CNE credits for nurses; and through credit hours individually approved through associations such as the National Association of Social Workers, American Counseling Association, American Occupational Therapy Association, and the Society for Human Resource Management.
Discovery Student Adventures
In 2009, we began a teacher recruited student travel program, Discovery Student Adventures (“DSA”), which operates under our subsidiary World Adventures Unlimited, Inc. DSA provides opportunities for grade school, middle school and high school students to visit destinations with an emphasis on adventure and scientific exploration, and provides us with a foothold into the existing teacher recruitment market. As is suited to programs associated with Discovery Education, the trips provide immersive education in the sciences and personal access to researchers and experts in biology, ecology, geology, and other fields. Trips are seven to sixteen days in length and take place each spring and summer to destinations from the Grand Canyon to South Africa. We completed our first full travel season for DSA in 2010 and saw growth in delegates and the teacher leader base in 2011, however, this program remains in an early stage of development.
We operate this business under an exclusive license from Discovery Education, Inc. (“Discovery Education”), which expires in 2016 but with an option for potential renewal. Under this agreement, we develop and conduct international and domestic student programs for elementary through high school students using the Discovery Education trademark. We market our Discovery Student Adventure programs to prospective students and parents through our network of teachers using a combination of local information meetings arranged by a teacher who is affiliated with us, our website, and email.
BookRags
In May 2008, we acquired 100 percent of the stock in the educational website www.bookrags.com (“BookRags”). Founded in 1999, BookRags originally began as a source for online book summaries and notes that has grown to include a wide variety of additional content including book summaries, critical essays, study guides, lesson plans, film summaries, biographies, literary criticisms, and references to encyclopedia articles. The site attracts students and teachers each month to its millions of pages of content, which includes internally developed material, licensed material, user-generated content, and other third party content. The website currently sees approximately 4.2 million unique visitors per month. The BookRags’ demographic is similar in nature to that of our educational travel programs. As a result, we believe it serves as a complementary marketing channel and offsets some of the seasonality of our travel businesses, as most of BookRags’ revenues are earned during the traditional school year, or the months of September through June.
Academic Accreditation
Since 2004, we have operated our Washington School of World Studies (“WSWS”), a program academically accredited through the Northwest Accreditation Commission (“NWAC”). WSWS provides an opportunity for high school students to earn academic credit through their participation in our travel programs. The courses we offer emphasize the total learning experience of the participant while preparing for and participating in their selected travel program. In addition to elective academic credit, students are eligible to earn service-learning credits on select programs after successfully completing the course requirements. Since inception, the WSWS has granted approximately 207,500 academic and service-learning credits.
Since 2007, we have been able to provide teacher leaders with continuing education units from their study and work as leaders through the International Association for Continuing Education and Training (“IACET”). As an authorized IACET provider, we have granted approximately 5,600 continuing education units.
Our delegates and teacher leaders are also able to earn academic credit at a reduced rate through Eastern Washington University’s Eisenhower Center (“EWU”). Student Ambassadors in high school may enroll in EWU courses and earn up to 12 college credits. In addition, Student Ambassadors in grades seven and eight are eligible to earn one college credit per course. Teacher leaders many enroll in EWU courses and earn up to five credits. Between 1980 and 2010, Student Ambassadors transferred more than 43,000 college credits from EWU to universities of their choice. Since 2006, teacher leaders have earned more than 2,000 college credits from EWU.
BUSINESS STRATEGY
We believe that our 45 years of experience organizing student and professional educational programs and establishing relationships with public officials, organizations and residents in countries where we provide programs, as well as our agreements with People to People and Discovery Education, allows us to provide an educational opportunity that is not readily duplicated by competitors’ programs. We believe that the high-quality, differentiated nature of our programs, industry-leading safety profile and relationship based customer service model are and will remain key elements to our success. Our customer satisfaction is high as evidenced by our top-quality Net Promoter scores which we believe underline the value of the educational experiences we offer. We have developed solid relationships with our worldwide partners and suppliers, and continue to grow strategic alliances with organizations that closely align to our education-based corporate mission.
Our strategy is to maintain our high quality and unique out-of-classroom educational experiences while increasing the volume of business. To grow the business, we intend to (i) introduce new and expand existing marketing channels, (ii) build and preserve high quality customer relationships (iii) introduce new educational travel programs and experiences independently and through strategic alliances and (iv) pursue acquisition opportunities.
Introduce New and Expand Existing Marketing Channels
We continue to pursue organic growth opportunities through enhancement of our existing marketing efforts and exploring new marketing channels which align strategically with our goals. We are placing a large majority of our focus and resources on growing our core product offering, Student Ambassador Programs. We believe a vast, accessible youth market exists as U.S. Census data projects that there will be more than 41.3 million people in the 10- to 19-year-old age range by 2016. To secure market share, we intend to further develop our marketing techniques by integrating digital tools throughout our process, make greater use of referrals from teachers, parents and past student travelers, target strategic partnerships and expand and refine our access to extensive databases of potential customers using precise business intelligence techniques. We are particularly focused on enhancing our digital marketing efforts to further leverage social media and other online channels which can both complement and augment our direct marketing campaigns. While few of our competitors have a significant digital presence beyond program web sites, we believe a more focused marketing effort in this area will both enhance the productivity of our existing campaigns, and develop new sales paths. We believe this presence is important to maintain and improve our market position. The number of youth using the internet and social media as their primary means of communication and information sharing is high and as this trend proliferates, we believe it is important to seamlessly incorporate these tools into our communication processes. We plan to continue to add engaging content, pertinent resources, interactive tools and increased functionality to our websites, which we believe will increase our footprint in other social media platforms to broaden our appeal among our target audiences. We also continue to look for alliances with partners that have strong brand recognition and access to well-defined customer segments which can assist in marketing the uniqueness and exclusive nature of the travel experience we provide.
Build and Preserve High Quality Customer Relationships
Because we provide students, as young as 10 years old, a two to three week international travel experience, a high degree of parental trust in our brand and our ability to deliver our programs safely is required. We believe a key factor to fostering this trust and awareness of our robust safety programs is through building a strong relationship with these families from the start. We incorporate a high touch customer service model throughout the marketing process as well as the pre- and post-travel experience with our delegates and their families. We also believe it is valuable to continue this relationship beyond a family’s initial travel experience. These alumni are an important part of our marketing strategies and we have many families who have the same student or siblings who will travel with us multiple times. We also believe continuing to foster this relationship beyond travel is an important part of building and maintaining positive brand awareness.
Introduce New Educational Travel Programs and Experiences
We continually seek to develop and introduce additional innovative and educational experiences. We intend to maintain our contacts with foreign governmental agencies and officials and utilize these and other foreign and domestic contacts to organize opportunities for our program participants that other travel programs do not currently offer. In addition, we may develop new youth travel programs organized around common extracurricular activities that are not currently offered.
In addition to our commitment of continual improvement and evolution of unique and culturally relevant program content, we utilize strategic partnerships and licensing agreements with People to People and Discovery Education. We currently have and actively seek various strategic alliances with other organizations that enhance our creditability to consumers, provide access to unique program elements and activities and can make introductions to or provide access to individuals who may be interested in our products. For example, we are a sponsor of the National Teacher of the Year Program, a project of the Council of Chief State School Officers, which allows us to support the most recognized teachers in the United States as part of our education leadership platform. We have also entered into a strategic partnership with Scholastic related to their children’s book series The 39 Clues that aligns well with our target demographic and provides an opportunity to offer innovative educational experiences in the future.
Pursue Acquisition Opportunities
We consider the travel and youth education industries to be large and fragmented, which present attractive acquisition opportunities. We believe acquisitions that create synergies with our current travel and internet educational businesses, provide alternative distribution channels, and/or serve to offset the inherent seasonality of our core travel business may be an opportunity for future growth.
Employees
On December 31, 2011, we employed 240 employees, of which 225 were full-time. Of these, 202 are located in Spokane, Washington, 11 are located in Seattle, Washington, five are located in Washington, D.C, and seven are located in various states across the United States to serve as local field representatives or remote employees. We also employ a temporary workforce throughout the year to assist with the seasonal needs of our business, which has been as high as 33 individuals during the last year. None of our employees are subject to collective bargaining agreements or are represented by a union. We believe that our labor relations are good.
Available Information
We are subject to the informational requirements of the Exchange Act that require us to file reports, proxy and information statements, and other information with the SEC. The public may read and copy our filings at the SEC’s Public Reference Room, 100 F. Street, N.E., Washington, D.C. 20549. The SEC maintains an Internet site that contains reports, proxy and information statements and other information regarding issuers that file electronically with the SEC at www.sec.gov. Similarly, we maintain a website at www.AmbassadorsGroup.com, where we make available our annual report on Form 10-K, quarterly reports on Form 10-Q, current reports on Form 8-K and all amendments to those reports as soon as reasonably practical after, or on the same day as, such material is electronically filed with or furnished to the SEC. We make these available free of charge.
Item 1A. Risk Factors
The following risk factors could materially and adversely affect our future operating results and could cause actual results to differ materially from those predicted in forward-looking statements we make about our business.
Deterioration of and extreme volatility in general economic conditions and consumer spending conditions could result in a decline in the number of people willing to purchase our premium travel products.
Demand for our products and services may be significantly affected by the general level of economic activity, level of discretionary spending and employment levels in the United States and key international markets. Therefore, global economic downturns or a recession could have a material adverse effect on our business, impact cash flows and our results of operations. Currently, the United States and other markets are facing these conditions which have impacted demand in the travel industry, the markets in which we operate and our profitability. We expect these conditions will continue to impact our operations and profitability for the foreseeable future.
A decline in the travel industry could adversely affect our results of operations.
Our results of operations depend upon factors affecting the travel industry in general. Our earnings are especially sensitive to events that affect domestic and international air travel and availability of lodging and transportation. A number of factors, including a rise in fuel prices or other travel costs, which if passed along later in the year could decrease our ability to pass these costs onto our participants, reduction of airline capacity causing prices to increase, excessive inflation, currency fluctuations within the global market, the strength of the dollar, foreign taxation changes, extreme weather conditions and concerns about passenger safety could result in a temporary or longer-term overall decline in demand for our programs.
If we are ineffective in our marketing efforts or are unable to obtain quality leads or prospects, our future growth and profitability could be impacted.
Performance in our travel programs is substantially reliant on our ability to attract and retain travelers through our direct and indirect marketing efforts. The effectiveness of marketing efforts is highly dependent on our ability to identify and obtain productive lead sources, execute direct mail strategies, secure attendance and conversion at our local informational meetings, increase our digital presence, including the number of website visitors and unique users, and develop our brands. Failure or underperformance of our marketing efforts, including changes in the direct-mail environment and the Company’s reputation with teachers and potential participants could have a material adverse effect on our business, financial condition, cash flows and results of operations. Such changes in the direct-mail environment could include, but are not limited to, new or different regulatory schemes or changes in costs or services by the United States Postal Service.
Business interruption due to natural occurrences, international political or terrorist activities and threats thereof, and other world events or incidents affecting the health, safety, security and/or program satisfaction of individuals without adequate insurance coverage or preparedness could have an adverse effect on our profitability.
Our operations are subject to unique risks inherent in doing business internationally, as most of our travel programs are conducted outside of the United States. Demand for our travel programs may be adversely affected by natural occurrences such as hurricanes, tsunamis, earthquakes, extreme flooding, and epidemics or other disease outbreaks such as influenza in geographic regions in which we conduct travel programs. In the event potential risks, such as war, U.S. military deployments, international and domestic terrorism, civil disturbances, political instability, governmental activities and deprivation of contract rights occur, they may impact our customers willingness to travel to these destinations or our ability to deliver planned programs.
The consequences of these types of events are unpredictable and the occurrence of any of the events described above, or other unforeseen developments in one or more of the regions in which we travel, could have a material adverse effect on our ability to acquire, retain, and/or travel enrollments, which would substantially impact profitability, cash flows, and results of operations. Historically, we have experienced increased cancellations for our travel programs during such times and if these business interruptions occur during the peak travel season, the impact can be magnified.
If we are unable to use our established brands such as the “People to People” name, or if the value of our name, image or brand diminishes, our ability in attracting future travelers could be significantly impacted and our business would be harmed.
Our brand names and trademarks are integral to our marketing efforts. We have registered or applied for a variety of service and trademarks including, but not limited to, the names “People to People Ambassador Programs,” “People to People Student Ambassador Programs,” “People to People Sports Ambassador Programs,” “People to People Citizen Ambassador Programs,” “People to People Leadership Programs,” “BookRags” and “Society for Global Citizens.” In addition, we have the right, subject to certain exceptions, to use the “People to People” and “Discovery Education” service, trademarks and logos for use in our marketing.
Our agreements with People to People International, currently scheduled to expire in 2020, give us the exclusive right to develop and conduct programs for kindergarten through high school students using the People to People name, and the non-exclusive right to develop and conduct programs for professionals, college students and athletes using the People to People name. If our agreement with People to People International were terminated or if we were unable to use the branded name to market new programs or destinations, this could have a material adverse effect on our ability to acquire participants for our programs and consequently affect our results of operations. Similarly, if our relationship with People to People International is disrupted or is adversely impacted because People to People International experiences interruption, delay or ceases operations in the future for any reason, our business could be harmed.
In addition, our ability to attract and enroll new delegates to travel with us is dependent on the value of the brands we associate with and our reputation with potential customers. If negative news coverage or other negative public relation matters occur in the student travel industry or specifically related to our company, our business could experience adverse effects impacting our volume and profitability.
Our dependence on travel suppliers could delay the delivery of our products and services, which would impact our reputation and could reduce our profitability.
We are dependent upon travel suppliers for access to their products and services. Travel suppliers include airlines, hotels, bus lines, overseas coordinators and other participants in the travel industry. Consistent with industry practices, we currently have no long-term agreements with travel suppliers that obligate such suppliers to sell services or products through us on an ongoing basis. Therefore, the travel suppliers generally can cancel or modify their agreements with us upon relatively short notice. In addition, any decline in the quality of travel products and services provided by these suppliers, or a perception by our participants of such a decline, could adversely affect our reputation and profitability. In addition, the loss of contracts, changes in our pricing agreements or commission arrangements, more restricted access to travel suppliers’ products and services, less favorable public opinion of certain travel suppliers, or loss of deposits with travel suppliers that could go bankrupt, could all have a material adverse effect on our business, financial condition, cash flows and results of operations.
Fluctuations in foreign currency exchange rates affect the amount we pay for services received from foreign vendors and could positively or negatively affect our gross margin results.
Over 90 percent of our travel is internationally based and many of our arrangements with our foreign-based suppliers require payment to be made in foreign currencies. Increases and decreases in the value of the U.S. dollar in relation to foreign currencies have the effect of impacting the cost of the services to be provided. Since late 1993, we generally have entered into forward contracts and other financial instruments with less than two years' maturity to help manage program costs and hedge against foreign currency valuation changes. While the ability to utilize forward contracts for the delivery of foreign currencies can mitigate the effect on program costs and foreign currency exchange fluctuations, there can be no assurance that program costs will not be significantly impacted in future periods. There can also be no assurance our hedging strategy will mitigate longer-term foreign exchange valuation trends. Depending on the strength of the U.S. dollar at the time the forward contracts and options are entered into, its strength throughout the contracted period, and the accuracy of our projected enrollment volume, we could experience over-hedged positions, which may result in a gain or loss that must be recognized immediately in our consolidated financial statements.
Significant fluctuations in financial results from quarter to quarter related to the seasonality of our business and the timing differences of marketing expenses as compared to corresponding revenue could impact investor confidence and cause potential share price volatility.
Our business is highly seasonal and we anticipate that this trend will continue for the foreseeable future. The majority of our travel programs and the associated revenues are delivered in June and July of each year. A small number of travel programs are delivered throughout the rest of the year as well as the majority of our internet research and advertising sales that occur primarily during the traditional school year. Sales and marketing costs are highest in the third and fourth quarters and typically occur nine to twelve months in advance of the associated revenue, mostly recognized during the second and third quarters. Although historically revenue recognized has offset the operating losses incurred during the rest of the year, the long lead time for this revenue, creates a situation where individual quarter or annual operating results may not match expectations of public market analysts and investors. Depending on their understanding of this aspect of our business, history with our company, and confidence in forthcoming business plans, our share price could be materially and adversely affected.
The market price of our Common Stock could also be subject to significant fluctuations due to specific market changes such as speculation in the press or investment community, actions by institutional shareholders, general market conditions, limited shares of Common Stock available for trading.
We are exposed to impairment risk of goodwill, intangibles and other long-lived assets.
Financial and credit market volatility directly impacts fair value measurement through our Company’s estimated weighted average cost of capital used to determine discount rate, and through our Common Stock price that is used to determine market capitalization. During times of volatility, significant judgment must be applied to determine whether credit or stock price changes are a short-term swing or a longer-term trend.
The assessment for possible impairment requires us to make judgments including estimating future cash flows that are dependent upon internal forecasts, estimating the long-term rate of growth for our business, and estimating the useful life over which our cash flows will occur. While we have not previously recorded any impairment losses for goodwill or intangible assets, continued adverse market conditions could impact the fair value of our reporting units that could result in impairments of goodwill, intangible and other long-lived assets. Changes in our estimates and assumptions as they relate to valuation of goodwill, intangibles and other long-lived assets could affect, potentially materially, our financial condition or results of operations in the future.
The travel industry and specifically the educational segment within the travel industry are highly competitive. If we are unable to compete effectively in these markets, our financial condition and results of operations could be affected.
The travel industry in general and the educational segment of the travel industry are highly competitive and have relatively low barriers to entry. We compete with other companies that provide similar educational travel programs, professional travel and adult continuing education programs, activity camps and summer camps, as well as independent programs organized and sponsored by local teachers with the assistance of local travel agents.
People to People, under the terms of its agreement with us, reserves the right to offer programs to college students for studies abroad and to grant to other individuals or entities the right to use the People to People name in connection with People to People’s professional education and sports programs.
Certain organizations engaged in the travel business could have substantially greater brand-name recognition and financial, marketing and sales resources than we do, and may offer an educational travel experience at a lower price. There can be no assurance that our present or future competitors will not exert significant competitive pressures on us in the future.
The online research and advertising market is intensely competitive and changes rapidly. If we are unable to project trends and develop new sales opportunities to effectively compete in this space, our ability to maintain historical growth trends could be impacted.
We face significant competition from a wide variety of content and media Web properties with companies throughout the world. Content and advertising on the internet are intensely competitive and have been rapidly evolving with converging technologies. We compete with many larger Web properties that have larger staff dedicated towards selling and advertising and have more traffic to offer potential advertisers. We believe that the internet offers a more attractive and measurable advertising option than traditional off-line media including television, radio, billboard, magazine, and newspaper, and anticipate that this competition will increase over time as online usage continues to grow. There can be no assurance that we will be able to compete successfully, and the failure to compete successfully may have a significant adverse effect on our ability for future growth as well as on our results of operations and future cash flows.
Litigation or other claims of liability may subject us to significant costs, judgments, fines and penalties that may not be covered by or may be in excess of available insurance coverage, may divert management’s attention and resources from our business, and may result in adverse publicity.
Due to the nature of our business and being a publicly held company, we may be subject to liability claims arising out of perceived wrong doing related to management’s decisions, securities claims, governmental investigations, business operations, accidents or disasters causing injury to delegates on our programs, including claims for serious personal injury or death. We maintain adequate liability insurance coverage for risks arising from the normal course of our business, including, but not limited to, professional and general liability insurance. There is no assurance that the insurance maintained by us will be sufficient to cover one or more large claims, that such insurance will cover a claim or loss, continue to be available in the future, or that the applicable insurer will be solvent at the time of any covered loss. Further, there can be no assurance that we will be able to obtain insurance coverage at acceptable levels and cost in the future. Successful assertion against us of one or a series of large uninsured claims, or of one or a series of claims exceeding any insurance coverage could have a material adverse effect on our business, financial condition, and cash flows. In addition to impact on profitability, liability claims asserted against us can also divert management’s attention and company resources to participation in the litigation process and defense of these asserted claims. Lastly, claims asserted against us could adversely affect the public’s perception of us. See Note 9, “Commitments and Contingencies,” to the consolidated financial statements in this Form 10-K for a description of the recent claims that have been made against us.
We depend on our ability to attract and retain our key personnel with industry specific knowledge.
Our performance is dependent on the continued services and performance of our senior management and certain other key personnel that have experience pertinent to success in the educational travel industry. The loss of the services of any of our executive officers or other key employees could have an adverse effect on our business operations, along with our ability to grow our business, generate innovative ideas, remain strategic, and recruit and maintain highly functional teams. Our future success also depends on our ability to identify, attract, hire, train, retain and motivate other highly skilled managerial, sales, marketing and customer service personnel. Our inability to do so could have an adverse effect on our business, cash flows and results of operations.
Government regulation and taxation may adversely affect our business or the travel industry and thus increase our operating expenses.
Many travel suppliers, particularly airlines, are subject to extensive regulation by federal, state and foreign governments. In addition, the travel industry is subject to certain seller of travel laws and special taxes by federal, state, local and foreign governments, including but not limited to hotel bed taxes, car rental taxes, airline excise taxes, airport taxes and fees and income and business taxes. New or different regulatory schemes, increasing regulatory scrutiny on third party marketing and licensing arrangements, more rigorous privacy laws, or changes in tax policy could have an adverse impact on key parts of our business or the travel industry in general and could have a material adverse effect on our business and results of operations.
If we are unable to protect our intellectual property, we may lose a competitive advantage or incur substantial litigation costs to protect our rights.
Substantially all of our publications in the BookRags segment are protected by copyright, held either in our name, in the name of the author of the work, or in the name of the sponsoring professional society. Such copyrights protect our exclusive right to publish the work in the United States and in many countries abroad for specified periods. Our ability to obtain and continue to obtain access to existing and new content, as well as our ability to continue to achieve expected results depends, in part, upon our ability to protect our intellectual property rights. Our results may be adversely affected by lack of adequate legal or technological protections for our intellectual property in some jurisdictions and markets that we operate in.
We are exposed to concentration of credit risk that could affect our results of operations.
A larger percentage of our balance sheet consists of cash, cash equivalents and available-for-sale securities which are exposed to concentrations of credit risk. Although we place our cash and temporary cash investments with high credit quality institutions, at times, such balances may be in excess of the federal depository insurance limit or may be on deposit at institutions which are not covered by this insurance. If such institutions were to become insolvent while holding our cash, cash equivalents or available-for-sale securities in excess of the insurance limit, we could suffer losses or it could be necessary to obtain credit financing to operate our travel programs. There is no assurance that we could respond timely enough to avoid losses and a swift, material change in these markets could have an adverse effect on our cash flow.
We cannot assure you that we will be able to continue paying dividends at the current rate.
Based on current circumstances, we plan to continue our current dividend practices. However, you should be aware that these practices are subject to change due to a variety of factors, including the following: (i) we may not have enough cash to pay such dividends due to changes in our cash requirements, capital spending plans, cash flows or financial position; (ii) decisions on whether, when and in which amounts to make any future distributions will remain at all times entirely at the discretion of our Board of Directors, which reserves the right to change our dividend practices at any time and for any reason; (iii) the effects of changes to laws or regulations which impact our ability to pay dividends; (iv) the amount of dividends that we may distribute to our stockholders may be limited by the terms of any future indebtedness that we may incur; and (v) the effects of downturns in the domestic and global economies. Our stockholders should be aware that they have no contractual or other legal right to dividends. If we do not pay dividends, our Common Stock may be less valuable because a return on an investment in our Common Stock will only occur if our stock price appreciates.
Failure to comply with the applicable rules and regulatory standards or maintain the security of internal or customer data, including Payment Card Industry (PCI) Data, could adversely affect our reputation and subject us to substantial fines and penalties.
Our businesses require collection and retention of large volumes of internal and customer data, including credit card numbers and other personally identifiable information of our customers, that are processed, summarized and reported by our various information systems and those of our service providers. We also maintain personally identifiable information about our employees. The integrity and protection of all customer, employee, and company data is critical to us. We devote substantial time and incur additional costs to ensure proper compliance and safe guarding of such data. Our customers and employees expect that we will adequately protect their personal information, and comply with the regulatory environment surrounding information security and privacy which is increasingly demanding. A theft, loss or fraudulent use of customer personal or credit card information, employee, or company data could adversely impact our reputation and could result in significant remedial and other costs, fines and litigation.
We could be negatively impacted by a security breach, through cyber-attack, cyber intrusion or otherwise.
We face the risk of a security breach, whether through cyber-attack or cyber intrusion over the Internet, malware, computer viruses, attachments to e-mails, persons inside our organization or persons with access to systems inside our organization, or other significant disruption of our IT networks and related systems. The risk of a security breach or disruption, particularly through cyber-attack or cyber intrusion, including by computer hackers and cyber terrorists, has increased as the number, intensity and sophistication of attempted attacks and intrusions from around the world have increased. We face a heightened risk of a security breach or disruption from threats to gain unauthorized access to our and our customers' proprietary or classified information on our IT networks and related systems. Although we make significant efforts to maintain the security and integrity of these types of information and IT networks and related systems, and we have implemented various measures to manage the risk of a security breach or disruption, there can be no assurance that our security efforts and measures will be effective or that attempted security breaches or disruptions would not be successful or damaging. Even the most well protected information, networks, systems and facilities remain potentially vulnerable because attempted security breaches, particularly cyber-attacks and intrusions, or disruptions will occur in the future, and because the techniques used in such attempts are constantly evolving and generally are not recognized until launched against a target, and in some cases are designed not be detected and, in fact, may not be detected. Accordingly, we may be unable to anticipate these techniques or to implement adequate security barriers or other preventative measures, and thus it is virtually impossible for us to entirely mitigate this risk. A security breach or other significant disruption involving our IT networks and related systems could: disrupt the proper functioning of these networks and systems and therefore our operations; result in the unauthorized access to, and destruction, loss, theft, misappropriation or release of proprietary, confidential, sensitive or otherwise valuable information, which others could use to compete against us; require significant management attention and resources to remedy the damages that result; subject us to claims for contract breach and damages; or damage our reputation, any or all of which could have a negative impact on our results of operations, financial condition and cash flows.
Item 1B. Unresolved Staff Comments
None.
We own an office building, approximating 132,000 square feet, in which our headquarters are located in Spokane, Washington. Our facilities are well maintained, in good operating condition and provide adequate capacity for our needs. We have the ability to expand our capacity for growth if we should need to in the future. At December 31, 2011, Ambassadors Group, Inc. and its subsidiaries are the only occupants of this property.
We also occupy three additional office spaces in Arlington, Virginia, Seattle, Washington, and Beijing, China under leases which expire on December 31, 2015, September 30, 2016, and January 9, 2013, respectively. Additionally, an office space under lease in Portland, Oregon was vacated in 2011. Subsequent to the end of the year, we have executed an early termination option that became effective in February 2012. All facilities are well maintained, in good operating condition and provide adequate capacity for our needs.
We maintain insurance coverage that we believe is adequate for our business, including general liability insurance and leased property and personal property insurance on a replacement cost basis.
Item 3. Legal Proceedings
The information contained in Note 9, “Commitments and Contingencies,” to our consolidated financial statements is incorporated by reference.
Not applicable
PART II
Item 5. Market for the Registrant’s Common Equity, Related Stockholder Matters and Issuer |
| Purchases of Equity Securities |
Market Information
Our Common Stock has been traded on the NASDAQ Stock Market under the symbol “EPAX” since March 1, 2002.
As of February 28, 2012, the last reported sale price of our Common Stock was $5.35. The following table sets forth the high and low sale prices of a share of our Common Stock as reported on the NASDAQ Stock Market on a quarterly basis for our fiscal years ended December 31, 2011 and 2010.
| High | Low | ||||||
| Quarter ended March 31, 2011 | $ | 11.94 | $ | 9.74 | |||
| Quarter ended June 30, 2011 | $ | 11.06 | $ | 8.55 | |||
| Quarter ended September 30, 2011 | $ | 9.15 | $ | 5.48 | |||
| Quarter ended December 31, 2011 | $ | 6.46 | $ | 3.88 | |||
| Quarter ended March 31, 2010 | $ | 13.76 | $ | 10.48 | |||
| Quarter ended June 30, 2010 | $ | 12.65 | $ | 10.18 | |||
| Quarter ended September 30, 2010 | $ | 12.09 | $ | 10.32 | |||
| Quarter ended December 31, 2010 | $ | 12.29 | $ | 10.30 |
Performance Graph
The following graph compares our cumulative total shareholder return with the NASDAQ Stock Market Index and the Russell 2000 Index. The graph assumes that $100 was invested on December 31, 2006 in our Common Stock and in each of the indexes mentioned above and that all dividends were reinvested.
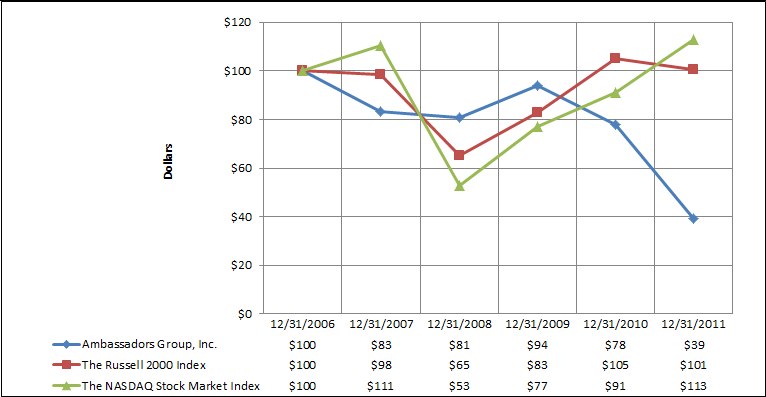
The performance graph is being furnished by us and shall not be deemed “filed” for purposes of Section 18 of the Exchange Act, or otherwise subject to the liabilities of that section, nor shall it be deemed to be incorporated by reference in any filing under the Act, or the Exchange Act.
Holders of Record
As of February 28, 2012, there were approximately 46 holders of record of our Common Stock, according to our registrar. This number does not include beneficial owners holding shares through nominee or street name.
Dividends
We have an established dividend policy, and each quarter, our Board of Directors reviews the dividend payment to ensure the amount is in alignment with our strategic direction, capital requirements, financial position and other conditions, which may affect the Board of Director’s decision or our ability to pay dividends in the future.
On August 12, 2005, our Board of Directors declared a two-for-one stock split of our Common Stock in the form of a 100-percent common stock dividend, payable on September 15, 2005, to shareholders of record on August 31, 2005.
During 2010 and 2011, and through February 2012, our Board of Directors declared the following dividend payments:
| Declaration Date | Record Date | Payment Date | Dividend Per Share | ||
| February 16, 2010 | March 2, 2010 | March 16, 2010 | $0.06 | ||
| May 13, 2010 | May 27, 2010 | June 10, 2010 | $0.06 | ||
| August 12, 2010 | August 26, 2010 | September 9, 2010 | $0.06 | ||
| November 10, 2010 | November 24, 2010 | December 8, 2010 | $0.06 | ||
| February 15, 2011 | March 1, 2011 | March 15, 2011 | $0.06 | ||
| May 12, 2011 | May 26, 2011 | June 9, 2011 | $0.06 | ||
| August 11, 2011 | August 25, 2011 | September 8, 2011 | $0.06 | ||
| November 9, 2011 | November 23, 2011 | December 7, 2011 | $0.06 | ||
| February 16, 2012 | March 01, 2012 | March 15, 2012 | $0.06 | ||
Transfer Agent and Registrar
BNY Mellon Shareowner Services serves as transfer agent and registrar of our Common Stock.
Equity Compensation Plan Information
The following tables provide information as of December 31, 2011 about our Common Stock that may be issued upon the exercise of options, warrants and rights under all of our existing equity compensation plans.
| (a) | (b) | (c) | ||||||||||
| Plan category | Number of securities to be issued upon exercise of outstanding options, warrants and rights | Weighted-average exercise price of outstanding options, warrants and rights | Number of securities remaining available for future issuance under equity compensation plans (excluding securities reflected in column (a)) | |||||||||
Equity compensation plans approved by security holders | 2,337,278 | 11.56 | 513,898 | |||||||||
Equity compensation plans not approved by security holders | N/A | N/A | N/A | |||||||||
| Total | 2,337,278 | 11.56 | 513,898 | |||||||||
Issuer Purchases of Equity Securities
On various dates between May 2004 and February 2011, our Board of Directors authorized the repurchase of up to an aggregate of $70.0 million of our Common Stock in the open market or through private transactions (the “Repurchase Plan”). The Repurchase Plan does not expire as of any particular date. During the year ended December 31, 2011, we repurchased 776,374 shares of our Common Stock for $7.6 million. Since inception through December 31, 2011, we have repurchased approximately 3,840,121 shares of our Common Stock, adjusted to reflect the effect of our two-for-one stock split of our Common Stock in 2005, for an approximate total of $56.5 million. As of December 31, 2011, approximately $13.5 million remained available for repurchase under the Repurchase Plan.
Independent of the Repurchase Plan, during the first quarter of 2007, our Board of Directors approved a single repurchase of 1.2 million shares of Common Stock for approximately $33.0 million.
Recent Sales of Unregistered Securities
During the fiscal year ended December 31, 2011, we did not sell any equity securities that were not registered under the Act.
Item 6. Selected Financial Data
This section presents our historical financial data, which should be read carefully with the financial statements included in this Form 10-K, including the notes to the consolidated financial statements and Management’s Discussion and Analysis of Financial Condition and Results of Operations. The statement of operations data for each of the years in the three-year period ended December 31, 2011, and the consolidated balance sheet data as of December 31, 2011 and 2010 have been derived from audonsolidated financial statements included elsewhere in this Form 10-K. The consolidated statement of operations data for the years ended December 31, 2008 and 2007 and the consolidated balance sheet data as of December 31, 2009, 2008 and 2007 have been derived from the audited consolidated financial statements, which are not included in this Form 10-K. Historical results are not necessarily indicative of future results.
| December 31, | |||||||||||
| 2011 (C) | 2010 (C) | 2009 (C)(D) | 2008 (C) | 2007 | |||||||
| (in thousands, except per share data) | |||||||||||
| Statement of Operations data: | |||||||||||
| Net revenue, non-directly delivered programs (A) | 51,966 | 56,618 | 69,279 | 65,656 | 84,512 | ||||||
| Gross revenue, directly delivered programs (A) | 10,426 | 16,423 | 26,036 | 30,374 | 30,021 | ||||||
| Internet content and advertising revenue | 4,046 | 3,105 | 3,300 | 1,897 | 0 | ||||||
| Total revenue | 66,438 | 76,146 | 98,615 | 97,927 | 114,533 | ||||||
| Cost of sales, directly delivered programs | 6,822 | 9,591 | 14,422 | 18,856 | 18,488 | ||||||
| Cost of sales, internet content and advertising | 575 | 454 | 389 | 192 | 0 | ||||||
| Gross margin | 59,041 | 66,101 | 83,804 | 78,879 | 96,045 | ||||||
| Selling and marketing expenses | 40,367 | 41,880 | 39,021 | 40,842 | 38,943 | ||||||
| General and administrative expenses | 16,564 | 14,125 | 14,604 | 12,568 | 15,274 | ||||||
| Operating income | 2,110 | 10,096 | 30,179 | 25,469 | 41,828 | ||||||
| Operating margin | 4% | 15% | 36% | 32% | 44% | ||||||
| Net income | 2,956 | 8,116 | 20,337 | 18,546 | 31,047 | ||||||
| Earnings per share - basic (B) | 0.17 | 0.43 | 1.06 | 0.97 | 1.58 | ||||||
| Earnings per share - diluted (B) | 0.17 | 0.42 | 1.05 | 0.95 | 1.53 | ||||||
| Balance sheet data: | |||||||||||
| Cash, cash equivalents and short-term available-for-sale securities | 58,647 | 79,378 | 81,184 | 74,425 | 84,994 | ||||||
| Total assets | 114,100 | 128,556 | 128,095 | 124,277 | 121,704 | ||||||
| Total stockholders' equity | 76,957 | 86,038 | 91,006 | 67,233 | 72,400 | ||||||
| Other key financial measures: | |||||||||||
| Cash flow provided by (used in) operating activities (C) | (6,655) | 21,639 | 16,138 | 24,732 | 16,436 | ||||||
| Cash flow provided by (used in) investing activities | 30,797 | (4,716) | (11,200) | (16,181) | 9,677 | ||||||
| Cash flow used in financing activities (C) | (11,461) | (17,741) | (4,271) | (18,843) | (45,616) | ||||||
| Cash dividends declared and paid | (4,258) | (4,594) | (4,581) | (8,801) | (8,940) | ||||||
| Cash dividends declared and paid, per common share | 0.24 | 0.24 | 0.24 | 0.46 | 0.46 | ||||||
| Return on stockholders' equity (E) | 4% | 9% | 26% | 27% | 40% | ||||||
| (A) | Net revenues are a function of gross program receipts from non-directly delivered programs, less program pass-through expenses from non-directly delivered programs. Program pass-through expenses include all direct costs associated with our programs, including, but not limited to, costs related to airfare, hotels, meals, ground transportation, guides, professional exchanges and changes in currency exchange rates. Gross revenues, directly delivered programs are a function of the gross program receipts for those programs we directly organize and operate, including all activities such as speakers, facilitators, events, accommodations and transportation. Gross revenue for both directly delivered programs, non-directly delivered programs and internet content and advertising revenue during the years ended December 31, 2011, 2010, 2009, 2008 and 2007 were $155.1 million, $162.0 million, $203.7 million, $229.2 million, and $277.3 million, respectively. Gross margin as a percent of gross program receipts during the years ended December 31, 2011, 2010, 2009, 2008, and 2007 was 38%, 41%, 41%, 34%, and 35%, respectively. |
| (B) | On January 1, 2009, we adopted a new accounting principle, which requires the inclusion of participating securities in the two class method of computing earnings per share. Participating securities are unvested share-based payment awards that contain non-forfeitable rights to receive dividends or divided equivalents (whether paid or unpaid). Participating securities under this statement include our unvested employee restricted stock awards with time-based vesting. As a result of this adoption, all prior period EPS data have been adjusted retrospectively. The effect of this adoption was a decrease in basic EPS of $0.02 and $0.02 for 2008 and 2007, respectively, and a decrease in diluted EPS of $0.02 and $0.02 for 2008 and 2007, respectively. |
| (C) | We acquired BookRags on May 15, 2008; therefore our 2008, 2009, 2010 and 2011 consolidated financial data includes BookRags’ results of operations since this date. |
| (D) | We entered into a license agreement with Discovery Education during the first quarter of 2009. Pilot programs were operated in the summer of 2009; therefore no revenue was generated or included in consolidated financial results. On the other hand, costs associated with those pilot programs and start-up costs are included in the 2009 consolidated financial data. |
| (E) | Calculated as net income divided by average stockholders’ equity. |
Item 7. Management’s Discussion and Analysis of Financial Condition and Results of Operations
Management’s Discussion and Analysis of Financial Condition and Results of Operations (“MD&A”) is designed to provide a reader of our consolidated financial statements with a narrative perspective from our management on our financial condition, results of operations, liquidity and certain other factors that may affect our future results. Our MD&A should be read in conjunction with the other sections of this annual report on Form 10-K, including Part I, “Item 1A: Risk Factors”; Part II, “Item 6: Selected Financial Data”; and Part II, “Item 8: Financial Statements and Supplementary Data.”
Executive Overview
Ambassadors Group, Inc. is a socially conscious education company primarily engaged in organizing and promoting worldwide travel programs for students through a direct to consumer revenue model. Our corporate mission is to bridge cultural and political borders through education and exchange, making the world a better place for future generations while maximizing value to our stockholders. We operate our differentiated and premium student travel programs primarily using the People to People brand under a long-term exclusive license agreement. We believe that our association with that brand and our own 45 years of experience in the student travel industry give us both a strong awareness in the market and a high level of credibility.
Our core program offering is an international destination trip for U.S. students in the 11 to 17 year old age group (“Student Ambassadors Program”). We also offer domestic destination travel programs for U.S. students and international students from over 60 countries focused on leadership and education (“Student Leadership Program”). We recently began to expand our in-bound travel draw by establishing a Beijing office traveling Chinese students on U.S. destination trips (“People to People – China”).
In addition to our People to People student programs, we operate professional travel programs for adults under the People to People brand “(Citizen Ambassadors Program”) and a start-up student travel operation under the Discovery Student Adventures brand (“DSA”). That program is associated with Discovery Student Education and operates through a teacher recruited revenue model. Lastly, we operate BookRags (www.bookrags.com), an education oriented research website which provides study guides, lesson plans and other educational resources to students and teachers. The site attracts students and teachers each month to its millions of pages of content, which includes internally developed material, licensed material, and user-generated content.
As further discussed below, our operating results depend on the number of travelers that attend our programs (“travelers” or “delegates”), the fees we are able to charge for each traveler (“gross revenue”), and the direct costs associated with the traveler’s itinerary including air fare, hotel charges, meal costs, event and location fees, chaperone costs, tour manager fees, and the cost of in country travel (“cost of sales”). In aggregate, the revenues we are able to charge less the direct cost of sales for those itineraries is referred to as gross margin. Additional costs including the cost to market our programs, design and deliver the itineraries, and support the travelers while on program are included in operating costs along with all administrative and operating support costs, which is true of all of our travel programs.
Revenues from content sales and advertising revenue through our BookRags operation and the corresponding cost of sales are separately identified in the financial statements. The operating costs for BookRags and the general and administrative costs for the corporation are also included in operating expenses.
There are two unique and important things to note about the presentation of our operating results. First, on our international program, we contract with various vendors (“worldwide partners”) to manage our travelers while in country and provide logistics, event access, and other services. Revenue from these programs is referred to as non-directly delivered and under generally accepted accounting principles (“GAAP”) is reported in our financial statements net of the directly related cost of sales as net revenue. On our domestic destination programs we directly contract all services and these revenues are reported separately as gross revenue, directly delivered programs with a corresponding cost of sales.
Second, the relationship between certain of our operating expenses and their associated revenues create a distinct challenge. selling and marketing and general and administrative expenses related to promoting and planning our travel programs are recognized as incurred under GAAP. Those expenses are predominantly incurred during the third and fourth quarters of the year, but the vast majority of the expenses relate to travel to occur six to nine months later. Most of our travel is done during the second and third quarters, and the related gross revenue and costs of sales are recognized at that time. For example, we will not recognize the majority of the revenue generated by our 2011 sales and marketing efforts until the second and third quarters of 2012.
Looking at our results for 2011 overall, under our core Student Ambassadors Program, we traveled 19,179 delegates, up 4.2% from 2010. In aggregate however, we traveled 23,928 individuals overall or down 10% from 2010. The decrease was due to declines in our Student Leadership and Citizen Ambassadors programs. Delegate counts in our non-core programs are expected to continue to be less significant as our business focuses more resources on our core product, Student Ambassador Programs. We are re-working our marketing strategy related to Student Leadership Programs and we believe delegate counts will begin to grow again in 2013, although there can be no assurance of that growth. We believe that the diminished Citizens Ambassadors Program counts will be a long-term trend and we are scaling back the operation of this program.
Overall, we saw a decline in total gross revenue from our travel programs related to the volume of travelers. On a per traveler basis, our gross revenue for travel programs is up 5.9% related to the mix of products and destinations offered. Looking forward to our 2012 travel season, we anticipate declines in revenue compared to 2011. Enrolled revenue from Student Ambassador Programs at February 5, 2012 was down 9.6% compared to the same point in time in 2011 and overall enrolled revenue is down 10.5%. While these are point in time references as of the date of our last public release, we believe they are indicative of expectations for 2012 travel program trends and delegate counts.
Our gross margin as a percentage of gross revenues was 38.1% in 2011 compared to 40.8% in 2010. This resulted in a gross margin of $59.0 million compared to $66.1 million in 2010, or 10.6% lower. Our gross margin percentage in 2011 was impacted primarily by rising air fares and fuel surcharges and the overall resulting gross margin decrease was driven by the lower traveler volumes. While we cannot make assurances, we have taken action to stabilize the gross margin percentage and expect to stay in range of 36% to 38%.
Operating expenses for 2011 were $56.9 million compared to $56.0 million in 2010 and were maintained at these levels in anticipation of growth in 2011 and 2012 traveler counts. Given the current expectation of lower delegate counts in 2012, we are reducing planned operating expenses by $4.5 million to $5.5 million related to personnel costs, selling and marketing expenses on our non-core programs, and administrative and support costs in an effort to better match the level of traveler activity in the market.
As we look forward and plan for the long term success of our business, we believe that continuing to innovate and invest in new distribution and conversion channels is critical. We need to maintain our successful direct mail sources, but also draw from digital and other non-mail marketing sources for revenue. Customer relationships are the primary focus of everything we do, and we will continue to refine our high touch customer service model that prioritizes communication, fosters trust, and communicates the true value of our travel programs and the People to People experience we provide.
Our strategy in 2012 is to make our upfront fixed marketing costs more effective with intent to travel a greater number of delegates that will improve the profitability of our travel business as a whole. We are also significantly focusing on other lead and revenue channels including in the digital and social media space. We believe a more focused marketing effort will improve the productivity of our campaigns, ultimately improving our cost to acquire travelers as student travel industry volumes recover. In the meantime, we are focused on aligning our corporate operating budget expenses with our anticipated 2012 revenue level.
Results of Operations
Comparison of Year Ended December 31, 2011 to Year Ended December 31, 2010
The following table sets forth the consolidated financial results and change in dollars and percentages for the periods indicated:
| Year Ended December 31, | ||||||||||||||||
| 2011 | 2010 | $ Change | % Change | |||||||||||||
| Total revenue | $ | 66,438 | $ | 76,146 | $ | (9,708 | ) | -13 | % | |||||||
| Cost of goods sold | 7,397 | 10,045 | (2,648 | ) | -26 | % | ||||||||||
| Gross margin | 59,041 | 66,101 | (7,060 | ) | -11 | % | ||||||||||
Selling and marketing expenses | 40,367 | 41,880 | (1,513 | ) | -4 | % | ||||||||||
| General and administrative expenses | 16,564 | 14,125 | 2,439 | 17 | % | |||||||||||
| Operating income | 2,110 | 10,096 | (7,986 | ) | -79 | % | ||||||||||
| Other income | 1,495 | 1,501 | (6 | ) | 0 | % | ||||||||||
| Income before income tax provision | 3,605 | 11,597 | (7,992 | ) | -69 | % | ||||||||||
| Income tax provision | (649 | ) | (3,481 | ) | 2,832 | -81 | % | |||||||||
| Net income | $ | 2,956 | $ | 8,116 | $ | (5,160 | ) | -64 | % | |||||||
During the year ended December 31, 2011, we traveled 23,928 delegates compared to 26,657 delegates in 2010. We experienced modest growth in the number of delegates traveled on our core Student Ambassadors program offering, but we suffered significant declines in two of our non-core programs, Student Leadership and Citizens as the market demand for these programs shifted. The decline in total revenue is mainly due to the decrease in delegates traveled, but based on the fact that we report our international travel programs on a net revenue basis, increased costs associated with base airfare, fuel surcharges, departure taxes, and foreign currency exchange rates also contributed to this decline. The decrease in revenues from the travel business is partially offset by an increase in BookRag’s internet content and advertising revenue. Refer to the results of operations by segment for a breakdown of these revenues.
Selling and marketing costs were in line with 2010 on a comparable year over year basis. The decline noted above was caused by asset impairments or loss on sale of equipment associated with outsourcing our print and production facilities during 2010. In the year ended December 31, 2011 as compared to the same period in 2010, general and administrative expenses increased mainly due to legal and professional expenses. In fiscal year 2010, a benefit was recorded for favorable insurance recoveries for legal expenses incurred in 2009. In 2011, we continued to sustain significant legal and professional expenses that are outside the normal course of business associated with the securities class action lawsuit and the SEC investigation.
For the year ended December 31, 2011 and 2010, the income tax provision recorded resulted in an 18 percent and 30 percent annual effective income tax rate applied to pre-tax income, respectively, in relation to our current federal statutory tax rate of 34 percent. The difference from our effective tax rate on a year over year basis is primarily due to increased weight of our tax exempt interest earned during the period as a percent of our lower pre-tax net income.
Comparison of Year Ended December 31, 2010 to Year Ended December 31, 2009
| Year Ended December 31, | ||||||||||||||||
| 2010 | 2009 | $ Change | % Change | |||||||||||||
| Total revenue | $ | 76,146 | $ | 98,615 | $ | (22,469 | ) | -23 | % | |||||||
| Cost of goods sold | 10,045 | 14,811 | (4,766 | ) | -32 | % | ||||||||||
| Gross margin | 66,101 | 83,804 | (17,703 | ) | -21 | % | ||||||||||
| Selling and marketing expenses | 41,880 | 39,021 | 2,859 | 7 | % | |||||||||||
| General and administrative expenses | 14,125 | 14,604 | (479 | ) | -3 | % | ||||||||||
| Operating income | 10,096 | 30,179 | (20,083 | ) | -67 | % | ||||||||||
| Other income | 1,501 | 1,051 | 450 | 43 | % | |||||||||||
| Income before income tax provision | 11,597 | 31,230 | (19,633 | ) | -63 | % | ||||||||||
| Income tax provision | (3,481 | ) | (10,893 | ) | 7,412 | -68 | % | |||||||||
| Net income | $ | 8,116 | $ | 20,337 | $ | (12,221 | ) | -60 | % | |||||||
In late 2009, we announced a 24 percent decline in net enrollments, which was largely driven by an uncertain economic outlook across the nation impacting discretionary spending and resulting in lower enrollments in our programs. In response to this challenge, we increased our marketing efforts to find new lead sources as well as our delegate retention efforts such as increasing the number of customer touch points through personal call outs and offering job loss insurance. During 2010, we traveled 26,657 delegates compared to 34,248 delegates in 2009.
The percentage declines in total revenue and gross margin closely correspond to the decline in delegates traveled year over year. Gross margin held stronger than total revenue due to strict negotiations and favorable purchasing strategies utilized with our air and land vendors related to our travel programs.
Selling and marketing expenses increased primarily due to targeted sales and marketing initiatives aimed at increasing the number of leads, utilization of these leads, and ultimately, our enrolled delegates for future travel. Built into our 2010 results are approximately $1.8 million of expenses that are outside the normal course of business. These expenses include $0.3 million in separation payments and $1.5 million in asset impairments or loss of sale of print equipment associated with outsourcing of our print and production facilities. General and administrative expenses decreased due to insurance recovery recorded related to legal expense claims.
Other income consisted primarily of interest income generated by our cash, cash equivalents and available-for-sale securities offset by foreign currency losses and other expenses. The increase in other income is a result of lower investment return rates offset by a $1.0 million foreign currency loss in 2009 that did not reoccur in 2010.
The decrease in income tax provision is due to lower pre-tax income and an overall decrease in our effective tax rate. Our effective tax rate was 30.0 percent and 34.9 percent for the years ended December 31, 2010 and 2009, respectively. The decrease is primarily due to greater leverage of tax exempt interest in relation to lower pre-tax income.
Results of Operations by Segment
Our operations are organized in two reporting segments, 1) “Ambassador Programs and Other,” which provides educational travel services to students, and professionals through multiple itineraries within four travel program types and corporate overhead, and 2) “BookRags,” which provides online research capabilities through book summaries, critical essays, online study guides, lesson plans, biographies, and references to encyclopedia articles.
Ambassador Programs and Others’ gross margin is comprised of gross receipts less direct program costs, including air, accommodation, transportation, speakers, facilitators, and event costs. BookRags’ gross margin is comprised of content, subscription, and advertising revenues via www.bookrags.com, less commissions and amortization of intangible assets directly associated with sales.
Segment results of operations for the year ended December 31, 2011 and 2010 are as follows (in thousands):
| Year ended December 31, 2011 | Year ended December 31, 2010 | |||||||||||||||||||||||
| Ambassador Programs and Other (1) | BookRags | Consolidated | Ambassador Programs and Other (1) | BookRags | Consolidated | |||||||||||||||||||
| Total revenue | $ | 62,392 | $ | 4,046 | $ | 66,438 | $ | 73,041 | $ | 3,105 | $ | 76,146 | ||||||||||||
| Cost of goods sold | 6,822 | 575 | 7,397 | 9,591 | 454 | 10,045 | ||||||||||||||||||
| Gross margin | 55,570 | 3,471 | 59,041 | 63,450 | 2,651 | 66,101 | ||||||||||||||||||
| Selling and marketing expenses | 38,912 | 1,455 | 40,367 | 40,912 | 968 | 41,880 | ||||||||||||||||||
| General and administrative expenses | 15,724 | 840 | 16,564 | 13,364 | 761 | 14,125 | ||||||||||||||||||
| Operating income | 934 | 1,176 | 2,110 | 9,174 | 922 | 10,096 | ||||||||||||||||||
| Other income | 1,452 | 43 | 1,495 | 1,499 | 2 | 1,501 | ||||||||||||||||||
| Income before income tax provision | 2,386 | 1,219 | 3,605 | 10,673 | 924 | 11,597 | ||||||||||||||||||
| Income tax provision | (232 | ) | (417 | ) | (649 | ) | (3,156 | ) | (325 | ) | (3,481 | ) | ||||||||||||
| Net income | $ | 2,154 | $ | 802 | $ | 2,956 | $ | 7,517 | $ | 599 | $ | 8,116 | ||||||||||||
| (1) | Ambassador Programs and Other include all travel programs offered by Ambassador Programs and World Adventures Unlimited as well as corporate overhead. |
See ‘Results of Operations’ above for a discussion of year over year variances for Ambassador Programs and Other, as it represents the largest portion of our operating results. BookRags total revenue and gross margin increased during the fiscal year 2011 as compared to the same period in 2010. The improvement achieved year over year can be attributed to growth from both our content sales and direct advertising channels.
Key Performance Non-GAAP Financial Indicators
We analyze our performance on a net income, cash flow and liquidity basis in accordance with generally accepted accounting principles (“GAAP”) as well as on a non-GAAP operating, cash flow and liquidity basis referred to below as “non-GAAP operating results” or “non-GAAP cash flows and liquidity measures.” These measures and related discussions are presented as supplementary information in this analysis to enhance the readers’ understanding of, and highlight trends in, our core financial results. Any non-GAAP financial measure used by us should not be considered in isolation or as a substitute for measures of performance or liquidity prepared in accordance with GAAP.
2012 Net Enrollments
Net enrollments on a forward looking basis consist of all active participants, which we define as those who have enrolled in our programs less those who have already withdrawn for the travel year referenced. This is a point in time measurement that we use to estimate future revenues. Enrolled revenue consists of estimated gross receipts to be recognized, in the future, upon travel of an enrolled participant and may not result in the actual gross receipts eventually recognized due both to withdrawals from our programs and expected future enrollments. We believe the decline in enrolled revenue will translate to lower gross revenue for 2012 for our travel programs. Our core Student Ambassador Programs offering is down less than the travel programs as a whole, which supports our belief that this program is more forceful against the economic headwinds which the student travel industry is battling. We will continue to work to improve retention of our delegates and reduce this gap, but there can be no guarantee that we will be successful in closing this gap. This non-GAAP measure relates to our travel programs only and does not include anticipated revenue for BookRags.
| As of February 5, | |||||||
| Delegates | |||||||
| Enrollment detail for travel year | 2012 | 2011 | Change | % Change | |||
| Student Ambassadors | 21,548 | 24,003 | (2,455) | -10.2% | |||
| Total, all programs | 24,966 | 28,172 | (3,206) | -11.4% | |||
Deployable Cash
We use deployable cash as a liquidity measure and it is calculated as the sum of cash, cash equivalents, short-term available-for-sale securities and prepaid program costs and expenses less the sum of accounts payable, accrued expenses and other short-term liabilities (excluding deferred taxes) and participant deposits. We believe the deployable cash measurement is useful in understanding cash available to deploy for current and future business opportunities, as it represents an estimate of excess cash available for strategic actions such as acquisitions. This non-GAAP measure is based on conservative assumptions, such as all participant' deposits being forfeited and should not be construed as the maximum amount of cash sources available to run the business. See the ‘Liquidity’ section below for explanations of cash sources and uses.
Deployable Cash Reconciliation (in thousands) |
| December 31, | ||||||||||||
| 2011 | 2010 | 2009 | ||||||||||
| Cash, cash equivalents and short-term available-for-sale securities | $ | 58,647 | $ | 79,378 | $ | 81,184 | ||||||
| Prepaid program cost and expenses | 13,299 | 3,230 | 3,175 | |||||||||
| Less: Participants’ deposits | (27,396 | ) | (34,436 | ) | (31,137 | ) | ||||||
| Less: Accounts payable / accruals / other liabilities | (5,970 | ) | (6,061 | ) | (5,300 | ) | ||||||
| Deployable cash | $ | 38,580 | $ | 42,111 | $ | 47,922 | ||||||
Free Cash Flow
Free cash flow is calculated as cash flow from operations less purchase of property, equipment and intangible assets. Management believes this non-GAAP measure is useful to investors in understanding the cash generated or distributed within the current period for future use in operations. See the ‘Liquidity’ section below for explanations of cash sources and uses.
Free Cash Flow Reconciliation (in thousands)
| December 31, | |||||||||||
| 2011 | 2010 | 2009 | |||||||||
| Cash flow (used in) provided by operations | $ | (6,655 | ) | $ | 21,639 | $ | 16,138 | ||||
| Purchase of property, equipment and intangibles | (3,594 | ) | (5,402 | ) | (5,883 | ) | |||||
| Free cash flow | $ | (10,249 | ) | $ | 16,237 | $ | 10,255 | ||||
Liquidity and Capital Resources
Liquidity
Total assets at December 31, 2011 were $114.1 million, of which 51 percent, or $58.6 million, were cash, cash equivalents and short-term available-for-sale securities. At that date, we also had long-lived assets totaling $39.4 million, primarily related to our office building, technology hardware and systems used to deliver our services, and goodwill and intangible assets almost exclusively related to our BookRags segment. Our total liabilities at December 31, 2011 were $37.1 million, including $27.4 million in participant deposits for future travel and we had no debt outstanding in 2010 or 2011.
Cash used in operations during 2011 was $6.7 million during the year ended December 31, 2011, whereas cash provided by operations was $21.6 million during the same period in 2010. The year over year decrease is primarily due to an increase in prepaid program costs, a decline in participant funds and lower current period earnings. The increase in prepaid expenses represents an accelerated use of cash associated with airline deposits targeted to secure pricing for our 2012 travel programs. The decline in participant funds is primarily attributable to a lower number of enrollments combined with timing differences in payment plans resulting in a less mature payment cycle at December 31, 2011 than at December 31, 2010.
Cash provided by investing activities was $30.8 million during the year ended December 31, 2011, whereas cash used in investing activities was $4.7 million during the year ended December 31, 2010. This $35.5 million difference was primarily due to a net increase in cash provided by the sale of available-for-sale securities as we prepared to transfer a portion of our investment portfolio in 2012 to new account managers in an attempt to further diversify our holdings.
Cash used in financing activities was $11.5 million and $17.7 million during the year ended December 31, 2011 and 2010, respectively. The net change in financing activities was a result of a $5.8 million decrease in cash used for the repurchase of our Common Stock coupled with a $0.3 million decrease in cash paid out in the form of dividends due to a smaller number of shares outstanding on a year over year basis. We make cash utilization decisions that support our strategic plans. We have historically and plan to continue to take steps to ensure liquidity remains a strong aspect of our Company. See ‘Deployable Cash’ above for further information about our liquidity.
Capital Resources
As discussed in our current report on Form 8-K filed on June 1, 2011, we renewed our unsecured revolving line of credit (the “Revolving Credit Agreement”) with Wells Fargo Bank, National Association (“Wells Fargo”). During 2011, we had an unused line of credit in the amount of $20.0 million. In order to utilize this line of credit, we must comply with certain covenants, which include deployable cash greater than zero, tangible net worth greater than $50.0 million and net income after taxes for the current and previous three quarters of greater than $4.0 million. At December 31, 2011, we were in compliance with all covenants except net income of greater than $4.0 million. On February 2, 2012, we received a waiver from Wells Fargo waiving their default rights to the contract for 2011 which results in our continued ability to utilize the line of credit if deemed necessary. There can be no assurance that we will be able to comply with all of the covenants in the future. For additional information regarding our line of credit, see Note 7, “Line of Credit,” to the consolidated financial statements in this Form 10-K.
On February 23, 2012, one of our stockholders publicly announced that it will seek to have its own slate of three director candidates elected to our Board of Directors at our 2012 annual meeting of stockholders. In the customary sequence of our corporate governance process, the Board of Directors and its nominating committee will consider these candidates, along with existing board members that may decide to run for election or other potential candidates. A proxy contest may well ensue, which may require the Company to incur additional expenses including legal and professional fees. We are unable to determine the impact of those potential costs on our earnings or our capital resources.
We continue to consider acquisitions of educational and travel businesses. An acquisition may require the use of cash and cash equivalents. Currently, there are no pending acquisitions and no assurance can be given that definitive agreements for any such acquisitions will be entered into, or, if they are entered into, that they will be on terms favorable to us.
We do not have any material capital expenditure commitments for 2012. Our business is not capital intensive and we believe that existing cash and cash equivalents and cash flows from operations will be sufficient to fund our anticipated operating needs and capital expenditures through 2012. For a more complete discussion of these and other contractual factors, please refer to our consolidated financial statements and the notes thereto included in this Form 10-K.
Contractual Obligations
We have no long-term debt or purchase obligations as of December 31, 2011 other than the following.
In 2009 we entered into an agreement with Discovery Education. Within the terms of the contract, the following minimum payments are due regardless of total sales (in thousands):
| Years Ended December 31, | |||
| 2012 | $ | 200 | |
| 2013 | $ | 400 | |
| 2014 | $ | 400 | |
| 2015 | $ | 750 | |
Off-Balance Sheet Arrangements
As of December 31, 2011, we had no off-balance sheet arrangements, as defined in Item 303(a)(4) of Regulation S-K promulgated by the SEC.
Market Risk
Financial Instruments
We classify our marketable debt investments as available-for-sale securities, which are carried at fair value. Unrealized gains and losses on available-for-sale securities are excluded from operations and reported as accumulated other comprehensive income, net of deferred income taxes. Realized gains and losses on the sale of available-for-sale securities are recognized on a specific identification basis in the consolidated statement of operations in the period the investments are sold.
We evaluate investment securities for other-than-temporary declines in fair value on a quarterly basis. If the fair value of investment securities falls below their amortized cost and the decline is deemed to be other-than-temporary, then the amount of other-than-temporary impairment recognized in the consolidated statement of operations depends on whether we intend to or will be required to sell the investment securities before recovery of the amortized cost and whether there has been any further deterioration of the credit rating of the investments. There were no investment securities that management identified to be other-than-temporarily impaired during the year ended December 31, 2011. We do not intend and are not required to sell the debt securities before we have recovered the amortized cost basis of the securities, we expect to recover the entire amortized cost basis of the securities and we continue to receive interest at the coupon rate. Realized losses could occur in future periods due to a change in our intent to hold the investments until recovery of the amortized cost, a change in our assessment of credit risk, or a change in regulatory or accounting requirements. Significant increases or decreases in the aggregate fair value of our available for-sale securities may affect our liquidity and capital resources, although we believe the credit ratings of the investments held substantiate this risk as low.
In determining whether the current financial environment will have an impact on the fair value of these investments, we considered the following for each bond and ARS held: the individual ratings of the investment, the underlying rating of the issuer irrespective of the insurance; the performance of the issuer; the term of the bond; the quality of bond insurance provided by the rating of the bond insurer; and the fair value as of each reporting date. At the reporting dates and in the future, we recognize that these investments are subject to general credit, liquidity, market and interest rate risks. The fair value of these investments accordingly will continue to change, and we will continue to evaluate their carrying values.
For additional information regarding our investments, see Note 3, “Investments and Fair Value Measurement,” to the consolidated financial statements in this Form 10-K.
Foreign Currency Exchange Contracts
The majority of our travel programs take place outside of the United States and most foreign suppliers require payment in currency other than the U.S. dollar. Accordingly, we are exposed to foreign currency risk relative to changes in foreign currency exchange rates between those currencies and the U.S. dollar. Our processes include a program to provide a hedge against certain of these foreign currency risks, and we typically use forward contracts that allow us to acquire the foreign currency at a fixed price for a specified point in time. All of the derivatives are cash flow hedges and qualify for cash flow hedge accounting at December 31, 2011.
We account for these foreign exchange contracts and options in accordance with GAAP, which requires that all derivative instruments be recorded on the balance sheet at fair value. Changes in the fair value of derivatives are recorded each period in current earnings or other comprehensive income, depending on whether a derivative is designated as part of a hedge transaction and, if it is, depending on the type of hedge transaction. For qualifying cash-flow hedge transactions, changes in the fair value of the derivative instrument are reported in other comprehensive income. The gains and losses on the derivative instruments that are reported in other comprehensive income are reclassified into earnings in the periods in which earnings are impacted by the variability of the cash flows of the hedged item. Any ineffective portion of hedged transactions is recognized in current period earnings. Unrealized gains and losses on foreign currency exchange contracts that are not qualifying cash-flow hedges are recorded in the statement of operations.
For additional information regarding our foreign currency exchange contracts, see Note 4, “Derivative Financial Instruments,” to the consolidated financial statements in this Form 10-K.
Critical Accounting Estimates
Our significant accounting policies are described in Note 2, “Summary of Significant Accounting Policies,” to the consolidated financial statements in this Form 10-K. As described in Note 2, we are required to make estimates and assumptions that affect the reported disclosures of assets, liabilities, revenue and expenses. Our estimates are based on our experience and our interpretation of economic, political, regulatory, and other factors that affect our business.
We consider that our most critical accounting estimates are related to the valuation of available-for-sale securities, valuation of goodwill and intangible assets, foreign currency exchange contracts, revenue recognition, and contingencies and litigation as they require us to make assumptions that may be highly uncertain at the time the accounting estimates were made and changes in them are reasonably likely to occur from period to period. There are other items within our consolidated financial statements that require estimation, but are not deemed to be critical. Changes in estimates used in these and other items could have a material impact on our consolidated financial statements.
Available-for-Sale Securities
Management evaluates available-for-sale securities for other-than-temporary declines in fair value on a quarterly basis. If the fair value of investment securities falls below their amortized cost and the decline is deemed to be other-than-temporary, then a loss would be recorded in the income statement. Key components of this evaluation include knowledge of the underlying investment security and the length of the decline in market price.
Intangible Assets and Goodwill
Goodwill and intangible assets deemed to have an indefinite life are not amortized and are subject to impairment tests, at least annually, which compare the carrying amount of the reporting unit to the fair value of the reporting unit. Intangible assets with definite lives are subject to impairment tests whenever events or changes in circumstances indicate that their carrying amount may not be recoverable. Key components of these valuations include management’s forecast of operating revenues, expense, future cash flows and capital expenditures and industry factors to determine the weighted-average cost of capital (“WACC”).
Foreign Currency
We use foreign currency exchange contracts and options in our cash flow hedging program we implement as part of an overall risk-management strategy. Derivative instruments qualifying for hedge accounting are recorded on the balance sheet at fair value. Management determines the fair value each period end using estimates and assumptions, including current market rates, contractual vendor payment agreements impacted by projected number of travelers, and timelines for payments due in conjunction with contracts held.
Revenue Recognition
Within our Ambassador Programs and Other segment, revenue is categorized as non-directly and directly delivered. For non-directly delivered programs, we do not actively manage the operations of each program, and our remaining performance obligation for these programs after they convene is perfunctory. Therefore, revenue from these programs is presented on a net basis and recognized as programs convene. For directly delivered programs, however, we organize and operate all program activities. As such, we recognize the gross revenue and cost of sales of these directly delivered programs over the period the programs are operated.
We invoice travelers in advance of travel, payments received against these invoices are recorded as participants’ deposits. In addition, we pay for certain program costs in advance of travel, including, but not limited to international vendor deposits, airfare, hotel and other program costs, which are recorded as prepaid program costs and expenses. Under our cancellation policy, a program traveler may be entitled to a refund of a portion of his or her payments, less certain fees, which are variable depending on the time of cancellation. We recognize all cancellation fees concurrent with the revenue associated with the related programs.
Internet content revenue is recognized at the point of sale and advertising revenue as corresponding advertisements are viewed on the BookRags site. Revenue from annual subscriptions for access to the website content is deferred and recognized on a monthly basis pro-rata over the term of the subscription. Cost of internet content sales include amortization of intangible assets and licensing agreement costs.
Contingencies
We are subject to the possibility of various contingencies including claims, suits and complaints, arising in the ordinary course of business. We consider the likelihood of loss or impairment of an asset or the incurrence of a liability, as well as our ability to reasonably estimate the amount of loss in determining gain or loss contingencies. An estimated contingency is accrued when it is probable that an asset has been impaired or a liability has been incurred and the amount of loss can be reasonably estimated. We regularly evaluate current information available to us to determine whether such accruals should be adjusted and whether new accruals are required. For additional information regarding our contingencies, see Note 9, “Commitments & Contingencies,” to the consolidated financial statements in this Form 10-K.
Recent Accounting Pronouncements
See Note 2, “Summary of Significant Accounting Policies,” to the consolidated financial statements in this Form 10-K.
Item 7A. Quantitative and Qualitative Disclosures About Market Risk
The information contained in Item 7. “Management’s Discussion and Analysis of Financial Condition and Results of Operations –Market Risk” is incorporated by reference into Item 7A.
Item 8. Financial Statements and Supplementary Data
Reference is made to the Index to consolidated financial statements that appears on page F-1 to this Annual Report. The Report of Independent Registered Public Accounting Firm, the Consolidated Financial Statements and the Notes to the consolidated financial statements listed in the Index to consolidated financial statements, which appear beginning on page F-2 of this Form 10-K, are incorporated by reference into this Item 8.
Item 9. Changes in and Disagreements With Accountants on Accounting and Financial Disclosure
None.
Evaluation of Disclosure Controls and Procedures
As of December 31, 2011, the end of the period covered by this Form 10-K, our chief executive officer and chief financial officer reviewed, evaluated and concluded that our disclosure controls and procedures (as defined in Exchange Act Rule 13a-15(e) and 15d-15(e)) were effective. These controls and procedures are designed to ensure information required to be disclosed in our Form 10-K filed or submitted under the Exchange Act is recorded, processed, summarized and reported on a timely basis, and has been accumulated and communicated to our chief executive officer and chief financial officer as appropriate to allow timely decisions regarding required disclosure.
Management’s Report on Financial Statements and Practices
Our management is responsible for the preparation and fair presentation of the consolidated financial statements included in this Form 10-K. The consolidated financial statements have been prepared in conformity with accounting principles generally accepted in the United States of America and reflect our management’s judgments and estimates concerning effects of events and transactions that are accounted for or disclosed.
Management’s Report on Internal Control over Financial Reporting
We are responsible for establishing and maintaining adequate internal control over financial reporting. Our internal control over financial reporting includes the policies and procedures that pertain to the maintenance of records that in reasonable detail accurately and fairly reflect the transactions and dispositions of the assets of the registrant; to recording transactions as necessary to permit preparation of consolidated financial statements in accordance with generally accepted accounting principles; to making receipts and expenditures only in accordance with authorizations of management and directors of our company; and for prevention or timely detection of unauthorized acquisition, use or disposition of our assets that could have a material effect on the financial statements. We recognize that because of its inherent limitation, internal control over financial reporting may not prevent or detect misstatements. Also, projections of any evaluation of effectiveness to future periods are subject to the risk that controls may become inadequate because of changes in conditions, or that the degree of compliance with the policies or procedures may deteriorate. Accordingly, even effective internal control over financial reporting can provide only reasonable assurance with respect to financial statement preparation.
We conducted an evaluation of the effectiveness of our internal control over financial reporting as of December 31, 2011. This evaluation was based on the framework in “Internal Control – Integrated Framework” published by the Committee of Sponsoring Organizations of the Treadway Commission. Based on this evaluation, our management concluded that we maintained effective internal control over financial reporting as of December 31, 2011.
BDO USA, LLP, an Independent Registered Public Accounting Firm, has issued an attestation report on the effectiveness of our Company’s internal controls over financial reporting as of December 31, 2011, pursuant to Item 308 of Regulation S-K.
Changes in Internal Control over Financial Reporting
For the quarter ended December 31, 2011, there has been no change in our internal control over financial reporting that has materially affected, or is reasonably likely to materially affect, our internal control over financial reporting.
Report of Independent Registered Public Accounting Firm
Board of Directors and Stockholders
Ambassadors Group, Inc.
Spokane, Washington
We have audited Ambassadors Group Inc.’s internal control over financial reporting as of December 31, 2011, based on criteria established in Internal Control – Integrated Framework issued by the Committee of Sponsoring Organizations of the Treadway Commission (the COSO criteria). Ambassadors Group Inc.’s management is responsible for maintaining effective internal control over financial reporting and for its assessment of the effectiveness of internal control over financial reporting, included in the accompanying “Item 9A, Controls and Procedures”. Our responsibility is to express an opinion on the company’s internal control over financial reporting based on our audit.
We conducted our audit in accordance with the standards of the Public Company Accounting Oversight Board (United States). Those standards require that we plan and perform the audit to obtain reasonable assurance about whether effective internal control over financial reporting was maintained in all material respects. Our audit included obtaining an understanding of internal control over financial reporting, assessing the risk that a material weakness exists, and testing and evaluating the design and operating effectiveness of internal control based on the assessed risk. Our audit also included performing such other procedures as we considered necessary in the circumstances. We believe that our audit provides a reasonable basis for our opinion.
A company’s internal control over financial reporting is a process designed to provide reasonable assurance regarding the reliability of financial reporting and the preparation of financial statements for external purposes in accordance with generally accepted accounting principles. A company’s internal control over financial reporting includes those policies and procedures that (1) pertain to the maintenance of records that, in reasonable detail, accurately and fairly reflect the transactions and dispositions of the assets of the company; (2) provide reasonable assurance that transactions are recorded as necessary to permit preparation of financial statements in accordance with generally accepted accounting principles, and that receipts and expenditures of the company are being made only in accordance with authorizations of management and directors of the company; and (3) provide reasonable assurance regarding prevention or timely detection of unauthorized acquisition, use, or disposition of the company’s assets that could have a material effect on the financial statements.
Because of its inherent limitations, internal control over financial reporting may not prevent or detect misstatements. Also, projections of any evaluation of effectiveness to future periods are subject to the risk that controls may become inadequate because of changes in conditions, or that the degree of compliance with the policies or procedures may deteriorate.
In our opinion, Ambassadors Group Inc. maintained, in all material respects, effective internal control over financial reporting as of December 31, 2011, based on the COSO criteria.
We also have audited, in accordance with the standards of the Public Company Accounting Oversight Board (United States), the consolidated balance sheets of Ambassadors Group Inc. as of December 31, 2011 and 2010, and the related consolidated statements of operations and comprehensive income, stockholders’ equity, and cash flows for each of the three years in the period ended December 31, 2011 and our report dated March 12, 2012 expressed an unqualified opinion thereon.
BDO USA, LLP
Spokane, Washington
March 12, 2012
Item 9B. Other Information
None.
The information called for by this item is hereby incorporated by reference from our definitive Proxy Statement for the fiscal year ended December 31, 2011, to be filed with the SEC on or about April 10, 2012.
The information called for by this item is hereby incorporated by reference from our definitive Proxy Statement for the fiscal year ended December 31, 2011, to be filed with the SEC on or about April 10, 2012.
| Security Ownership of Certain Beneficial Owners and Management and Related Stockholder Matters |
The information called for by this item is hereby incorporated by reference from our definitive Proxy Statement for the fiscal year ended December 31, 2011, to be filed with the SEC on or about April 10, 2012.
The information called for by this item is hereby incorporated by reference from our definitive Proxy Statement for the fiscal year ended December 31, 2011, to be filed with the SEC on or about April 10, 2012.
The information called for by this item is hereby incorporated by reference from our definitive Proxy Statement for the fiscal year ended December 31, 2011, to be filed with the SEC on or about April 10, 2012.
PART IV
Item 15. Exhibits, Financial Statement Schedules |
(a) The following documents are filed as part of this Annual Report:
(1) Financial Statements. See the accompanying Index to Consolidated Financial Statements, which appears on page F-1 of the Annual Report. The Report of Independent Registered Public Accounting Firm, the consolidated financial statements and the Notes to consolidated financial statements listed in the Index to consolidated financial statements, which appear beginning on page F-2 of this report, are incorporated by reference into Item 8 above.
(2) Financial Statement Schedules. Financial Statement Schedules have been omitted because the information required to be set forth therein is either not applicable or is included in the consolidated financial statements or the notes thereto.
(3) Exhibits. See Item 15(b) below.
(b) Exhibits. The exhibits listed on the accompanying Exhibit Index immediately following the
signature page are filed as part of, or are incorporated by reference into, this Annual Report on Form 10-K.
(c) Financial Statement Schedules. Reference is made to Item 15(a)(2) above.
AMBASSADORS GROUP, INC.
INDEX TO CONSOLIDATED FINANCIAL STATEMENTS
| Page | |||
| Report of Independent Registered Public Accounting Firm | F-2 | ||
| Consolidated Balance Sheets | F-3 | ||
| Consolidated Statements of Operations | F-4 | ||
| Consolidated Statements of Comprehensive Income | F-5 | ||
| Consolidated Statements of Changes in Stockholders’ Equity | F-6 | ||
| Consolidated Statements of Cash Flows | F-7 | ||
| Notes to Consolidated Financial Statements | F-8 | ||
Report of Independent Registered Public Accounting Firm
Board of Directors and Stockholders
Ambassadors Group, Inc.
Spokane, Washington
We have audited the accompanying consolidated balance sheets of Ambassadors Group, Inc. as of December 31, 2011 and 2010 and the related consolidated statements of operations and comprehensive income, stockholders’ equity, and cash flows for each of the three years in the period ended December 31, 2011. These financial statements are the responsibility of the Company’s management. Our responsibility is to express an opinion on these financial statements based on our audits.
We conducted our audits in accordance with the standards of the Public Company Accounting Oversight Board (United States). Those standards require that we plan and perform the audit to obtain reasonable assurance about whether the financial statements are free of material misstatement. An audit includes examining, on a test basis, evidence supporting the amounts and disclosures in the financial statements, assessing the accounting principles used and significant estimates made by management, as well as evaluating the overall financial statement presentation. We believe that our audits provide a reasonable basis for our opinion.
In our opinion, the consolidated financial statements referred to above present fairly, in all material respects, the financial position of Ambassadors Group, Inc. at December 31, 2011 and 2010, and the results of its operations and its cash flows for each of the three years in the period ended December 31, 2011, in conformity with accounting principles generally accepted in the United States of America.
We also have audited, in accordance with the standards of the Public Company Accounting Oversight Board (United States), Ambassadors Group, Inc.’s internal control over financial reporting as of December 31, 2011, based on criteria established in Internal Control – Integrated Framework issued by the Committee of Sponsoring Organizations of the Treadway Commission (COSO) and our report dated March 12, 2012 expressed an unqualified opinion thereon.
BDO USA, LLP
Spokane, Washington
March 12, 2012
AMBASSADORS GROUP, INC.
(in thousands, except share and per share data)
| December 31, | ||||||||
| 2011 | 2010 | |||||||
| ASSETS | ||||||||
| Current assets: | ||||||||
| Cash and cash equivalents | $ | 19,519 | $ | 6,838 | ||||
| Available-for-sale securities and other | 39,128 | 72,540 | ||||||
| Foreign currency exchange contracts | - | 1,864 | ||||||
| Prepaid program costs and expenses | 13,299 | 3,230 | ||||||
| Accounts receivable | 1,395 | 1,976 | ||||||
| Deferred tax assets | 668 | - | ||||||
| Total current assets | 74,009 | 86,448 | ||||||
| Property and equipment, net | 26,104 | 27,625 | ||||||
| Available-for-sale securities | 700 | 1,250 | ||||||
| Intangibles | 3,421 | 3,367 | ||||||
| Goodwill | 9,781 | 9,781 | ||||||
| Other long-term assets | 85 | 85 | ||||||
| Total assets | $ | 114,100 | $ | 128,556 | ||||
| LIABILITIES | ||||||||
| Current liabilities: | ||||||||
| Accounts payable and accrued expenses | $ | 5,858 | $ | 5,954 | ||||
| Participants’ deposits | 27,396 | 34,436 | ||||||
| Foreign currency exchange contracts | 1,671 | - | ||||||
| Deferred tax liability | - | 668 | ||||||
| Other liabilities | 112 | 107 | ||||||
| Total current liabilities | 35,037 | 41,165 | ||||||
| Foreign currency exchange contracts | 102 | - | ||||||
| Deferred tax liability | 2,004 | 1,353 | ||||||
| Total liabilities | 37,143 | 42,518 | ||||||
| Commitments and Contingencies (Note 9) | ||||||||
| STOCKHOLDERS’ EQUITY | ||||||||
| Preferred stock, $.01 par value; 2,000,000 shares authorized; none issued and outstanding | - | - | ||||||
| Common stock, $.01 par value; 50,000,000 shares authorized; 17,588,088 and 18,255,557 shares issued and outstanding, respectively | 172 | 180 | ||||||
| Additional paid-in capital | 314 | - | ||||||
| Retained earnings | 77,489 | 84,825 | ||||||
| Accumulated other comprehensive income (loss) | (1,018 | ) | 1,033 | |||||
| Stockholders’ equity | 76,957 | 86,038 | ||||||
| Total liabilities and stockholders’ equity | $ | 114,100 | $ | 128,556 | ||||
The accompanying notes are an integral part of the consolidated financial statements.
CONSOLIDATED STATEMENTS OF OPERATIONS
(in thousands, except per share data)
| Years Ended December 31, | ||||||||||||
| 2011 | 2010 | 2009 | ||||||||||
| Net revenue, non-directly delivered programs | $ | 51,966 | $ | 56,618 | $ | 69,279 | ||||||
| Gross revenue, directly delivered programs | 10,426 | 16,423 | 26,036 | |||||||||
| Gross revenue, internet and advertising | 4,046 | 3,105 | 3,300 | |||||||||
| Total revenue | 66,438 | 76,146 | 98,615 | |||||||||
| Cost of sales, directly delivered programs | 6,822 | 9,591 | 14,422 | |||||||||
| Cost of sales, internet and advertising | 575 | 454 | 389 | |||||||||
| Gross margin | 59,041 | 66,101 | 83,804 | |||||||||
| Operating expenses: | ||||||||||||
| Selling and marketing | 40,367 | 41,880 | 39,021 | |||||||||
| General and administrative | 16,564 | 14,125 | 14,604 | |||||||||
| Total operating expenses | 56,931 | 56,005 | 53,625 | |||||||||
| Operating income | 2,110 | 10,096 | 30,179 | |||||||||
| Other income (expense): | ||||||||||||
| Interest and dividend income | 1,340 | 1,501 | 2,012 | |||||||||
| Foreign currency and other income (expense) | 155 | - | (961 | ) | ||||||||
| Total other income | 1,495 | 1,501 | 1,051 | |||||||||
| Income before income tax provision | 3,605 | 11,597 | 31,230 | |||||||||
| Income tax provision | (649 | ) | (3,481 | ) | (10,893 | ) | ||||||
| Net income | $ | 2,956 | $ | 8,116 | $ | 20,337 | ||||||
| Weighted-average common shares outstanding - basic | 17,746 | 19,085 | 19,105 | |||||||||
| Weighted-average common shares outstanding - diluted | 17,869 | 19,303 | 19,422 | |||||||||
| Net income per share - basic | $ | 0.17 | $ | 0.43 | $ | 1.06 | ||||||
| Net income per share - diluted | $ | 0.17 | $ | 0.42 | $ | 1.05 | ||||||
The accompanying notes are an integral part of the consolidated financial statements.
AMBASSADORS GROUP, INC.
(in thousands)
| Year ended December 31, | |||||||||||
| 2011 | 2010 | 2009 | |||||||||
| Net income | $ | 2,956 | $ | 8,116 | $ | 20,337 | |||||
| Unrealized gain (loss) on foreign currency exchange contracts, net of income tax benefit (provision) of $1,273, ($276), and ($3,060) | (2,364 | ) | 512 | 5,669 | |||||||
| Unrealized gain (loss) on available-for-sale securities, net of income tax benefit (provision) of ($168), $281, and ($20) | 313 | (522 | ) | 38 | |||||||
| Comprehensive income | $ | 905 | $ | 8,106 | $ | 26,044 | |||||
The accompanying notes are an integral part of the consolidated financial statements.
AMBASSADORS GROUP, INC.
(in thousands)
Accumulated Other Comprehensive Income (Loss) | |||||||||||||||||||||||||||
| Common Stock | |||||||||||||||||||||||||||
| Shares | Amount | Additional Paid-In Capital | Retained Earnings | Available-for-sale securities | Foreign currency exchange contracts | Total | |||||||||||||||||||||
| Balances, December 31, 2008 | 18,823 | $ | 186 | $ | 6 | $ | 71,705 | $ | (4,970 | ) | $ | 306 | $ | 67,233 | |||||||||||||
| Net income | - | - | - | 20,337 | - | - | 20,337 | ||||||||||||||||||||
| Stock options exercised | 154 | 2 | 836 | - | - | - | 838 | ||||||||||||||||||||
| Stock-based compensation expense | - | - | 1,989 | - | - | - | 1,989 | ||||||||||||||||||||
| Excess tax benefit from stock-based compensation | - | - | 92 | - | - | - | 92 | ||||||||||||||||||||
| Stock redemptions | (73 | ) | - | (609 | ) | - | - | - | (609 | ) | |||||||||||||||||
| Restricted stock grant | 102 | - | - | - | - | - | - | ||||||||||||||||||||
| Dividend to shareholders (0.24 per share) | - | - | - | (4,581 | ) | - | - | (4,581 | ) | ||||||||||||||||||
| Other comprehensive income, net of income taxes | - | - | - | - | 5,668 | 39 | 5,707 | ||||||||||||||||||||
| Balances, December 31, 2009 | 19,006 | $ | 188 | $ | 2,314 | $ | 87,461 | $ | 698 | $ | 345 | $ | 91,006 | ||||||||||||||
| Net income | - | - | - | 8,116 | - | - | 8,116 | ||||||||||||||||||||
| Stock options exercised | 114 | 2 | 698 | - | - | - | 700 | ||||||||||||||||||||
| Stock-based compensation expense | - | - | 2,022 | - | - | - | 2,022 | ||||||||||||||||||||
| Shortfall tax shortfall from stock-based compensation | - | - | (119 | ) | (322 | ) | - | - | (441 | ) | |||||||||||||||||
| Stock redemptions | (1,224 | ) | (12 | ) | (7,783 | ) | (5,836 | ) | - | - | (13,631 | ) | |||||||||||||||
| Consideration paid for acquisition | 234 | 2 | 2,868 | - | - | - | 2,870 | ||||||||||||||||||||
| Restricted stock grant | 126 | - | - | - | - | - | - | ||||||||||||||||||||
| Dividend to shareholders (0.24 per share) | - | - | - | (4,594 | ) | - | - | (4,594 | ) | ||||||||||||||||||
| Other comprehensive loss, net of income taxes | - | - | - | - | 512 | (522 | ) | (10 | ) | ||||||||||||||||||
| Balances, December 31, 2010 | 18,256 | $ | 180 | $ | - | $ | 84,825 | $ | 1,210 | $ | (177 | ) | $ | 86,038 | |||||||||||||
| Net income | - | - | - | 2,956 | - | - | 2,956 | ||||||||||||||||||||
| Stock options exercised | 37 | - | 227 | - | - | - | 227 | ||||||||||||||||||||
| Stock-based compensation expense | - | - | 1,475 | - | - | - | 1,475 | ||||||||||||||||||||
| Excess tax benefit from stock-based compensation | - | - | 160 | - | - | - | 160 | ||||||||||||||||||||
| Stock redemptions | (776 | ) | (8 | ) | (1,548 | ) | (6,034 | ) | - | - | (7,590 | ) | |||||||||||||||
| Restricted stock grant | 72 | - | - | - | - | - | - | ||||||||||||||||||||
| Dividend to shareholders (0.24 per share) | - | - | - | (4,258 | ) | - | - | (4,258 | ) | ||||||||||||||||||
| Other comprehensive loss, net of income taxes | - | - | - | - | (2,363 | ) | 312 | (2,051 | ) | ||||||||||||||||||
| Balances, December 31, 2011 | 17,589 | $ | 172 | $ | 314 | $ | 77,489 | $ | (1,153 | ) | $ | 135 | $ | 76,957 | |||||||||||||
The accompanying notes are an integral part of the consolidated financial statements.
AMBASSADORS GROUP, INC.
(in thousands)
| Year Ended December 31, | |||||||||||
| 2011 | 2010 | 2009 | |||||||||
| Cash flows from operating activities: | |||||||||||
| Net income | $ | 2,956 | $ | 8,116 | $ | 20,337 | |||||
| Adjustments to reconcile net income to net cash provided by (used in) operating activities: | |||||||||||
| Depreciation and amortization | 4,742 | 4,646 | 4,364 | ||||||||
| Stock-based compensation | 1,475 | 2,022 | 1,989 | ||||||||
| Deferred income taxes | 420 | 1,399 | 568 | ||||||||
| Loss on foreign currency exchange contracts | - | - | 962 | ||||||||
| Loss on disposition and impairment of property and equipment | 246 | 1,480 | 428 | ||||||||
| Excess tax (benefit) shortfall from stock-based compensation | (160 | ) | 441 | (92 | ) | ||||||
| Change in assets and liabilities: | |||||||||||
| Accounts receivable and other assets | 581 | 68 | (45 | ) | |||||||
| Prepaid program costs and expenses | (10,069 | ) | (55 | ) | 985 | ||||||
| Accounts payable, accrued expenses, and other current liabilities | 194 | 223 | (329 | ) | |||||||
| Participants’ deposits | (7,040 | ) | 3,299 | (13,029 | ) | ||||||
| Net cash provided by (used in) operating activities | (6,655 | ) | 21,639 | 16,138 | |||||||
| Cash flows from investing activities: | |||||||||||
| Purchase of available for sale securities | (48,693 | ) | (59,331 | ) | (58,039 | ) | |||||
| Proceeds from sale of available-for-sale securities | 83,035 | 59,764 | 52,716 | ||||||||
| Purchase and construction of property and equipment | (3,101 | ) | (4,461 | ) | (5,157 | ) | |||||
| Proceeds from sale of property and equipment | 49 | 253 | 19 | ||||||||
| Purchase of intangibles | (493 | ) | (941 | ) | (726 | ) | |||||
| Adjustments to goodwill | - | - | (13 | ) | |||||||
| Net cash provided by (used in) investing activities | 30,797 | (4,716 | ) | (11,200 | ) | ||||||
| Cash flows from financing activities: | |||||||||||
| Repurchase of Common Stock | (7,590 | ) | (13,406 | ) | (609 | ) | |||||
| Dividend payment to shareholders | (4,258 | ) | (4,594 | ) | (4,581 | ) | |||||
| Proceeds from exercise of stock options | 227 | 700 | 838 | ||||||||
| Excess tax benefit (shortfall) from stock-based compensation | 160 | (441 | ) | 92 | |||||||
| Capital lease payments and other | - | - | (11 | ) | |||||||
| Net cash used in financing activities | (11,461 | ) | (17,741 | ) | (4,271 | ) | |||||
| Net increase (decrease in) cash and cash equivalents | 12,681 | (818 | ) | 667 | |||||||
| Cash and cash equivalents, beginning of period | 6,838 | 7,656 | 6,989 | ||||||||
| Cash and cash equivalents, end of period | $ | 19,519 | $ | 6,838 | $ | 7,656 | |||||
See Note 15, “Supplemental Disclosures of Consolidated Statements of Cash Flows.”
The accompanying notes are an integral part of the consolidated financial statements.
AMBASSADORS GROUP, INC.
| 1. | The Company |
Ambassadors Group, Inc. is a socially conscious educational company primarily engaged in organizing and promoting differentiated worldwide travel programs for students and professionals. In addition, we operate an education oriented research website called BookRags that provides study guides, lesson plans and other educational resources to students and teachers. These consolidated financial statements include the accounts of Ambassadors Group, Inc., and our wholly owned subsidiaries, Ambassador Programs, Inc., BookRags, Inc., World Adventures Unlimited, Inc., Ambassadors Unlimited, LLC, AGI Hong Kong Limited, Beijing People to People Education Consultation Co., Ltd, and Marketing Production Systems, LLC. All significant intercompany accounts and transactions, which are of a normal recurring nature, are eliminated in consolidation.
Our operations are organized in two reporting segments, 1) “Ambassador Programs and Other,” which provides educational travel services to students, professionals, and athletes through multiple itineraries within four travel program types and corporate overhead, and 2) “BookRags,” which provides online research capabilities through book summaries, critical essays, online study guides, lesson plans, biographies, and references to encyclopedia articles.
The large majority of our assets are located in the United States. We maintain a sufficient amount of cash held in foreign bank accounts which is utilized for operating expenses of our China operations. Revenues from our directly delivered travel programs and our internet content and advertising are derived primarily from activity in the United States. Revenue from our non-directly delivered programs is derived internationally in the following geographic areas for the years ended December 31, 2011, 2010, and 2009:
| Years Ended December 31, | ||||||||||||
| 2011 | 2010 | 2009 | ||||||||||
| Europe | 67 | % | 55 | % | 57 | % | ||||||
| South Pacific (primarily Australia and New Zealand) | 23 | % | 24 | % | 19 | % | ||||||
| Asia (primarily China) | 4 | % | 14 | % | 20 | % | ||||||
| Other | 6 | % | 7 | % | 4 | % | ||||||
2. | Summary of Significant Accounting Policies |
Cash, Cash Equivalents, and Available-for-Sale Securities
We invest cash in excess of operating requirements in high quality short-term money market instruments, government and municipal bonds, and other investments at high credit quality institutions. At times, such balances may be in excess of the federal depository insurance limit or may be on deposit at institutions which are not covered by this insurance.
We consider investments with original maturities at date of purchase of three months or less to be cash equivalents. We classify our marketable debt investments as available-for-sale securities, which are carried at fair value and they can be exposed to concentrations of credit risk. Unrealized gains and losses on available-for-sale securities are excluded from operations and reported as accumulated other comprehensive income, net of deferred income taxes. Realized gains and losses on the sale of available-for-sale securities are recognized on a specific identification basis in the consolidated statement of operations in the period the investments are sold.
Management evaluates investment securities for other-than-temporary declines in fair value on a quarterly basis. If the fair value of investment securities falls below their amortized cost and the decline is deemed to be other-than-temporary, the securities will be written down to current market value, resulting in a loss recorded in the statement of operations. Realized losses could occur in future periods due to a change in management’s intent to hold the investments to maturity, a change in management’s assessment of credit risk, or a change in regulatory or accounting requirements.
Derivative Financial Instruments
We use foreign currency exchange contracts as a means of mitigating exposure to foreign currency risk connected to anticipated travel programs. In entering into these contracts, we have assumed the risk that might arise from the possible inability of counterparties to meet the terms of their contracts. However, as all contracts are with a high quality institution, we do not expect any losses as a result of counterparty defaults.
We value all derivative instruments on our balance sheet at fair value. Changes in the fair value of derivatives are recorded each period in current earnings or accumulated other comprehensive income, depending on whether a derivative is designated as part of a hedge transaction and, if it is, depending on the type of hedge transaction. For qualifying cash flow hedge transactions in which we hedge the variability of cash flows related to a forecasted transaction, changes in the fair value of derivative instruments are reported in accumulated other comprehensive income, net of deferred income taxes. The gains and losses on the derivative instruments that are reported in accumulated other comprehensive income, net of deferred income taxes, are reclassified into earnings in the periods in which the forecasted transaction occurs. The ineffective portion of hedges is recognized in the consolidated statements of operations as other income (expense). Changes in unrealized gains and losses on foreign currency exchange contracts that are not qualifying cash flow hedges are recognized in the consolidated statements of operations as other income (expense).
Other Investments
Companies in which we own 20% or less are accounted for using the cost method, while companies we own at least 20% but less than 50% are accounted for using the equity method. Companies in which we own greater than 50% are consolidated into our financial statements and are listed in Note 1, “The Company,” to the consolidated financial statements.
In 2003, we purchased a minority interest in a company, Full On (Europe) Ltd. This company provides a one-day development activity for our delegates traveling in Europe and Australia, and is accounted for using the equity method. Additionally, during August 2005, we made an investment in a safety awareness firm to support the education of and support of safe travel practices, Safe Passage Travel I, LLC. This investment is accounted for using the cost method. Both investments are included in other long-term assets on the consolidated balance sheets.
Property and Equipment
Property and equipment are stated at acquisition cost less accumulated depreciation. Major additions and increases in functionality are capitalized, whereas cost of maintenance and repairs that do not improve or extend the lives of the respective assets are expensed as incurred. Depreciation and amortization are recorded using the straight-line method over the estimated useful lives of the respective assets, generally three to seven years for office furniture and computer equipment, and thirty-nine years for the building.
We perform reviews for the impairment of property and equipment at least annually or whenever events or changes in circumstances indicate that the carrying amount of an asset may not be recoverable. When property and equipment are sold or retired, the related cost and accumulated depreciation are removed from the accounts and any gain or loss is recognized in the consolidated statement of operations.
Intangible Assets and Goodwill
Our intangible assets include goodwill, trade name, contract license agreements, content copyrights, plagiarism software, and advertising relationships. The majority of these assets were recorded in conjunction with the acquisition of BookRags in May 2008. Intangible assets with definite lives are amortized on a straight-line basis over a weighted-average life of 12 years. Goodwill and intangible assets deemed to have an indefinite life, specifically our trade name, are not amortized but are subject to impairment tests, at least annually, which compare the carrying amount of the reporting unit to the fair value of the reporting unit. Intangible assets with definite lives are also subject to impairment tests whenever events or changes in circumstances indicate that their carrying amount may not be recoverable. An impairment loss is recognized if the carrying amount of the goodwill or intangible asset is not recoverable and exceeds its fair value.
Prepaid Program Costs and Expenses
Our prepaid expenses consist primarily of prepaid program costs for airline deposits, program delivery vendor deposits, hotel deposits and other miscellaneous costs associated with delivering our programs. Additionally, we have prepaid costs associated with merchandise used on our programs and operating expenses, such as insurance.
Revenue Recognition
For non-directly delivered programs, we do not actively manage the operations of each program, and therefore, recognize revenue and anticipated costs from these programs on a net basis when the program convenes. For directly delivered programs in which we organize and operate all activities, we recognize the gross revenue and cost of sales of these directly delivered programs over the period the programs operate.
We charge administrative fees under our withdrawal policy for any delegate who enrolls on our programs but does not ultimately travel. The amount of the administrative fee will vary depending on when the withdrawal occurs. We recognize withdrawal fees concurrent with the revenue recognition from the related programs.
Internet content is recognized at the point of sale while advertising revenues are recognized in conjunction with an advertisement being viewed on the BookRags site. Revenue from annual subscriptions for content access to the website is deferred and recognized monthly over the term of the subscription. Cost of internet content sales include amortization of intangible assets and licensing agreement costs.
Income Taxes
The asset and liability approach is used to account for income taxes by recognizing deferred tax assets and liabilities for the expected future tax consequences of temporary differences between the carrying amounts and the tax basis of assets and liabilities.
Earnings Per Share
Earnings per share — basic is computed using the two-class method by dividing net income by the weighted-average number of common shares, including participating securities, outstanding during the period. Earnings per share — diluted is computed by increasing the weighted-average number of common shares outstanding by the additional common shares that would have been outstanding if the potentially dilutive common shares had been issued. Participating securities include our unvested employee restricted stock awards with time-based vesting, which receive non-forfeitable dividend payments.
Other Comprehensive Income
Other comprehensive income refers to revenues, expenses, gains and losses that under accounting principles generally accepted in the United States are included in comprehensive income, but are excluded from net income as these amounts are recorded directly as an adjustment to stockholders’ equity, net of tax. Our other comprehensive income is composed of unrealized gains and losses on foreign currency exchange contracts and available-for-sale securities.
Accounting for Stock Options and Restricted Grants
We maintain an Equity Participation Plan under which we have granted non-qualified stock options and restricted stock to employees, non-employee directors and consultants. The fair value of the equity instruments granted are estimated on the date of grant using the Black-Scholes pricing model, utilizing assumptions as described in Note 10, “Stock-Based Compensation,” to the consolidated financial statements.
Estimates
The preparation of consolidated financial statements requires us to make estimates and judgments that affect the reported amounts of assets, liabilities, revenue and expenses, and related disclosure of contingent assets and liabilities. On an on-going basis, we evaluate our estimates and judgments, including those associated with available-for-sale securities, valuation of goodwill and intangible assets, income taxes, foreign currency exchange contracts, revenue recognition, stock-based compensation, and contingencies.
We base our estimates on historical experience and on various other assumptions that are believed to be reasonable under the circumstances, the results of which form the basis for making judgments about the carrying values of assets and liabilities that are not readily apparent from other sources. Actual results may differ from these estimates under different assumptions or conditions.
Reclassifications
Certain reclassifications from 2009 and 2010 amounts have been made to conform to the year ended December 31, 2011 financial statement presentation with no effect on previously reported net income, retained earnings, or cash flow from operations.
Recent Accounting Policies
In May 2011, the FASB issued new accounting guidance that provides a consistent definition of fair value and common requirements of and disclosure about fair value between GAAP and International Financial Reporting Standards (“IFRS”). The guidance states the concepts of highest and best use and valuation premise are only relevant when measuring the fair value of nonfinancial assets. Enhanced disclosure requirements will require companies to disclose quantitative information about unobservable inputs used, a description of the valuation processes used, and a qualitative discussion about the sensitivity of the measurements for recurring Level 3 fair value measurements. For assets and liabilities not recorded at fair value but where fair value is disclosed, companies must report the level in the fair value hierarchy of assets and liabilities. This new guidance is effective for interim and annual periods beginning January 1, 2012, and we do not anticipate a material impact on our consolidated financial statements.
In June 2011, the Financial Accounting Standards Board (FASB) issued Accounting Standards Update (ASU) No. 2011-05, “Comprehensive Income (Topic 220): Presentation of Comprehensive Income.” This update, effective for interim and annual reporting periods beginning after December 15, 2011, requires that the total of comprehensive income, the components of net income, and the components of other comprehensive income be presented in either a single continuous statement of comprehensive income or in two separate but consecutive statements. This update does not change what items are reported in other comprehensive income or the requirement to report reclassification of items from other comprehensive income to net income. Effective December 2011, the FASB issued ASU No. 2011-12, “Deferral of the Effective Date for Amendments to Presentation Reclassifications of Items Out of Accumulated Other Comprehensive Income in Accounting Standards Update No. 2011-05,” which deferred the requirement to present separate line items on the income statement for reclassification adjustments of items out of accumulated other comprehensive income into net income. This deferral is temporary until the FASB reconsiders the operational concerns and needs of financial statement users. We will adopt the new guidance in the first quarter of 2012, but since we already present two separate but consecutive statements for income and comprehensive income, the adoption of the ASU will not have a material effect on our consolidated financial statements.
In September 2011, the FASB issued new accounting guidance regarding the performance of the two-step quantitative impairment testing of goodwill. Under the guidance, companies would be allowed to assess on a qualitative basis whether it is more likely than not that the fair value of the reporting unit is less than its carrying amount before performing quantitative tests. If after performing appropriate qualitative assessments the company determines the reporting unit’s fair value is more likely than not to exceed its carrying value, then no further quantitative testing will need to be performed. This new guidance is effective for annual and interim periods after December 15, 2011, and we do not anticipate a material impact on our consolidated financial statements.
3. Investments and Fair Value Measurements
Fair value is defined as the price that would be received from selling an asset or paid to transfer a liability in an orderly transaction between market participants at the measurement date. When determining fair value, we consider the principal or most advantageous market, and we consider assumptions that market participants would use when pricing the asset or liability, such as inherent risk, transfer restrictions, and risk of non-performance.
Our financial instruments are measured and recorded at fair value. Our non-financial assets, (including: property and equipment; intangible assets; and goodwill), are measured at fair value upon acquisition, reviewed annually, and are fully assessed if there is an indicator of impairment. An adjustment would be made to record non-financial assets at fair value only when an impairment charge is recognized.
Fair value is determined for assets and liabilities using a three-tiered hierarchy, based upon significant levels of inputs as follows:
| - | Level 1 – Quoted prices in active markets for identical assets or liabilities. |
| - | Level 2 – Observable inputs, other than Level 1 prices, such as quoted prices in active markets for similar assets and liabilities, quoted prices for identical or similar assets and liabilities in markets that are not active, or other inputs that are observable or can be corroborated by observable market data. |
| - | Level 3 – Unobservable inputs that are supported by little or no market activity and that are significant to the fair value of the assets or liabilities. This includes certain pricing models, discounted cash flow methodologies and similar techniques that use significant unobservable inputs. |
The following tables summarize the composition of our investments at December 31, 2011 and 2010 (in thousands):
[
| Classification on Balance Sheet | |||||||||||||||||||||||
| December 31, 2011 | Amortized Cost | Unrealized Gains (Losses) | Aggregate Fair Value | Cash and cash equivalents | Short-term available-for- sale securities | Long-term available-for sale securities | |||||||||||||||||
| Auction rate securities (“ARS”), greater than one year | $ | 1,000 | $ | (300 | ) | $ | 700 | $ | - | $ | - | $ | 700 | ||||||||||
| Money market funds, ninety days or less | 14,503 | - | 14,503 | 14,503 | - | - | |||||||||||||||||
Municipal securities1 | |||||||||||||||||||||||
| One year or less | 3,639 | (1 | ) | 3,638 | - | 3,638 | - | ||||||||||||||||
| After one year through three years | 16,679 | 118 | 16,797 | - | 16,797 | - | |||||||||||||||||
| Greater than three years through five years | 18,295 | 398 | 18,693 | - | 18,693 | - | |||||||||||||||||
| Total | $ | 54,116 | $ | 215 | $ | 54,331 | $ | 14,503 | $ | 39,128 | $ | 700 | |||||||||||
| Classification on Balance Sheet | |||||||||||||||||||||||
| December 31, 2010 | Amortized Cost | Unrealized Gains (Losses) | Aggregate Fair Value | Cash and cash equivalents | Short-term available-for -sale securities | Long-term available -for-sale securities | |||||||||||||||||
| ARS, greater than one year | $ | 1,600 | $ | (350 | ) | $ | 1,250 | $ | - | $ | - | $ | 1,250 | ||||||||||
| Money market funds, ninety days or less | 2,076 | - | 2,076 | 2,076 | - | - | |||||||||||||||||
Municipal securities1 | |||||||||||||||||||||||
| One year or less | 17,081 | (19 | ) | 17,062 | - | 17,062 | - | ||||||||||||||||
| After one year through three years | 53,334 | 59 | 53,393 | - | 53,393 | - | |||||||||||||||||
| Greater than three years through five years | 2,041 | 44 | 2,085 | - | 2,085 | - | |||||||||||||||||
| Total | $ | 76,132 | $ | (266 | ) | $ | 75,866 | $ | 2,076 | $ | 72,540 | $ | 1,250 | ||||||||||
1 Expected maturities may differ from contractual maturities because issuers may have the right to call or prepay obligations with or without call or prepayment penalties.
The following table details the fair value measurements of assets and liabilities within the three levels of the fair value hierarchy at December 31, 2011 and 2010 (in thousands):
| Fair Value Measurements at Reporting Date Using | |||||||||||||||
| December 31, 2011 | Fair Market Value | Quoted Prices in Active Markets for Identical Assets (Level 1) | Significant Other Observable Inputs (Level 2) | Significant Other Unobservable Inputs (Level 3) | Losses on Impairment | ||||||||||
| Financial assets: | |||||||||||||||
| ARS | $ | 700 | $ | - | $ | - | $ | 700 | $ | - | |||||
| Money market funds | 14,503 | 14,503 | - | - | - | ||||||||||
Municipal securities1 | 39,128 | 39,128 | - | - | - | ||||||||||
| Foreign currency exchange contracts | 115 | - | 115 | - | - | ||||||||||
| Total financial assets | $ | 54,446 | $ | 53,631 | $ | 115 | $ | 700 | $ | - | |||||
| Financial liabilities: | |||||||||||||||
| Foreign currency exchange contracts | 1,888 | - | 1,888 | - | - | ||||||||||
| Total financial liabilities | $ | 1,888 | $ | - | $ | 1,888 | $ | - | $ | - | |||||
| Fair Value Measurements at Reporting Date Using | |||||||||||||||
| December 31, 2010 | Fair Market Value | Quoted Prices in Active Markets for Identical Assets (Level 1) | Significan Other Observable Inputs (Level 2) | Significant Other Unobservable Inputs (Level 3) | Losses on Impairment | ||||||||||
| Financial assets: | |||||||||||||||
| ARS | $ | 1,250 | $ | - | $ | - | $ | 1,250 | $ | - | |||||
| Money market funds | 2,076 | 2,076 | - | - | - | ||||||||||
Municipal securities1 | 72,540 | 72,540 | - | - | - | ||||||||||
| Foreign currency exchange contracts | 1,974 | - | 1,974 | - | - | ||||||||||
| Total financial assets | $ | 77,840 | $ | 74,616 | $ | 1,974 | $ | 1,250 | $ | - | |||||
| Financial liabilities: | |||||||||||||||
| Foreign currency exchange contracts | 110 | - | 110 | - | - | ||||||||||
| Total financial liabilities | $ | 110 | $ | - | $ | 110 | $ | - | $ | - | |||||
| Non-financial assets: | |||||||||||||||
| Property and equipment | 165 | - | 165 | - | 0.8 | ||||||||||
| Total non-financial assets | $ | 165 | $ | - | $ | 165 | $ | - | $ | 0.8 | |||||
1 At December 31, 2011, municipal securities consisted of an 83/17 split between municipal revenue bonds and municipal general obligation bonds, respectively. At December 31, 2010, municipal securities consisted of a 72/28 split between municipal revenue bonds and municipal general obligation bonds, respectively. In addition, the underlying credit rating of the municipal securities at December 31, 2011 and 2010 were A+, A1 or better as defined by S&P 500 and Moody’s.
Money market funds and municipal securities are classified as Level 1 assets because market prices are readily available for these investments. Level 2 financial assets and liabilities represent the fair value of our foreign currency exchange contracts that were valued using pricing models that take into account the contract terms as well as multiple inputs where applicable, such as equity prices, interest rate yield curve, option volatility and currency rates. Level 2 non-financial assets represent the fair value of property and equipment, which are valued based on quoted prices and sales of identical assets in an inactive market. Level 3 financial assets represent the fair value of our ARS, which were valued using a pricing model that takes into account the average life of the underlying collateral, the rate of return, and the spread used for similar issuances.
Fair value measurements on a recurring basis using Level 3 inputs only consist of available-for-sale ARS. The following table presents a reconciliation for the year ended December 31, 2011 and 2010 of available for sale ARS measured at fair value on a recurring basis using Level 3 inputs (in thousands):
| December 31, | ||||||||
| 2011 | 2010 | |||||||
| Beginning balance | $ | 1,250 | $ | 1,397 | ||||
| Total realized / unrealized losses: | ||||||||
| Included in earnings | 69 | - | ||||||
| Included in OCI | (19 | ) | (147 | ) | ||||
| Sales and settlements | (600 | ) | - | |||||
| Ending balance | $ | 700 | $ | 1,250 | ||||
In determining the fair value of bond and ARS investments, we consider the individual ratings of each holding. With regard to bonds, we consider the following: the underlying rating of the issuer irrespective of the insurance; the performance of the issuer; the term of the bond; and the quality of bond insurance provided by the rating of the bond insurer. With regard to ARS, we consider the underlying credit quality of student loan portfolios and federal government backing of its collateral as a basis of its valuation. At the reporting dates and in the future, we recognize that this investment is subject to general credit, liquidity, market and interest rate risks, which have been exacerbated by the current global financial environment. The fair value of this investment accordingly will continue to change, and we will continue to evaluate its carrying value.
| 4. | Derivative Financial Instruments |
The majority of our travel programs take place outside of the United States and most foreign suppliers require payment in currency other than the U.S. dollar. Accordingly, we are exposed to foreign currency risk relative to changes in foreign currency exchange rates between those currencies and the U.S. dollar for our non-directly delivered programs. Our processes include a program to provide a hedge against certain of these foreign currency risks, and we use forward contracts that allow us to acquire the foreign currency at a fixed price for a specified point in time. All of the derivatives are cash flow hedges and at December 31, 2011. All contracts qualified for cash flow hedge accounting.
For derivative instruments that are designated and qualify as a cash flow hedge, the effective portion of the gain or loss on the derivative is reported as a component of other comprehensive income and reclassified into earnings in the same period during which the hedged transaction is recognized in earnings, which is primarily during the second and third quarters of the year when our student travel programs occur. Gains or losses representing either hedge ineffectiveness or hedge components excluded from the assessment of effectiveness are recognized in current earnings.
At December 31, 2011, the following forward contracts were outstanding (in thousands):
| Notional Amount | Matures | ||||
| Forward contracts: | |||||
| Australian dollar | 5,450 | Jan 2012 - July 2013 | |||
| British pound | 4,350 | Jan 2012 - July 2013 | |||
| Euro | 24,850 | Jan 2012 - July 2013 | |||
| New Zealand dollar | 400 | Mar 2012 - May 2012 | |||
| Canadian dollar | 1,541 | Feb 2012 - Jun 2012 |
The fair values of derivatives are as follows (in thousands):
| December 31, 2011 | ||||||||||||||
Derivatives designated as hedging instruments | Derivatives not designated as hedging instruments | Total Net | ||||||||||||
| Assets | Liabilities | Assets | Liabilities | Liabilities | ||||||||||
| Forward contracts | $ | 115 | $ | 1,888 | $ | - | $ | - | $ | 1,773 | ||||
| December 31, 2010 | ||||||||||||||
Derivatives designated as hedging instruments | Derivatives not designated as hedging instruments | Total Net | ||||||||||||
| Assets | Liabilities | Assets | Liabilities | Assets | ||||||||||
| Forward contracts | $ | 1,974 | $ | 110 | $ | - | $ | - | $ | 1,864 | ||||
The net liabilities and asset derivatives at December 31, 2011 and 2010 are reported in the consolidated balance sheet as current and long-term ‘foreign currency exchange contracts’.
The following table summarizes the gain (loss) recognized in other comprehensive income (“OCI”) and the gain (loss) reclassified from AOCI into the income statement for derivatives designated as hedging instruments (and their locations) (in thousands):
| Gain (loss) recognized in OCI (effective portion) | Location of gain (loss) reclassed from AOCI (effective portion) | Gain (loss) reclassed from AOCI (effective portion) | |||||||||||||||||
| Year ended December 31, | Year ended December 31, | ||||||||||||||||||
| 2011 | 2010 | 2011 | 2010 | ||||||||||||||||
| Forward contracts | $ | (2,364 | ) | $ | 512 | Net revenue, non-directly delivered programs | $ | 2,595 | $ | (351 | ) | ||||||||
Unrealized losses on forward contracts recorded in AOCI at December 31, 2011, which are expected to be realized in net revenue during the next 12 months, is approximately $1.1 million as reflected in the Consolidated Statement of Changes in Stockholders’ Equity. This amount was computed using the fair value of the cash flow hedges at December 31, 2011, and will change before actual reclassification from AOCI.
For the years ended December 31, 2011 and 2010, the amount of gains or losses recognized in the income statement for derivatives not designated as hedging instruments are as follows (in thousands):
| Amount of Gain | ||||||||
Derivative not designated as hedging instruments | Location of Gain Recognized in Income on Derivative | Year ended December 31, 2011 | Year ended December 31, 2010 | |||||
| Forward contracts | Foreign currency and other expense | $ | 183 | $ | - | |||
During 2011, we recognized a gain of $0.2 million as a result of the de-designation of our Japanese yen forward contracts associated with vendor payments planned for 2011 summer travel. Due to the catastrophic events that occurred in spring of 2011, management suspended all 2011 travel programs to Japan and re-routed a majority of these delegates to other destinations throughout the world.
We do not typically enter into derivatives that are not designated as hedging instruments. Our policy is to be 80 to 100 percent hedged at the end of each year in regards to our forecasted cash flow for the following year.
5. Property and equipment
Property and equipment and the changes therein consist of the following (in thousands):
| December 31, | |||||||||
| 2011 | 2010 | ||||||||
| Land | $ | 1,817 | $ | 1,817 | |||||
| Building | 16,207 | 16,198 | |||||||
| Office furniture, fixtures and equipment | 2,596 | 2,948 | |||||||
| Computer equipment and software | 19,117 | 18,551 | |||||||
| Construction in progress | 1,462 | 720 | |||||||
| Total property and equipment, gross | 41,199 | 40,234 | |||||||
| Less accumulated depreciation | (15,095 | ) | (12,609 | ) | |||||
| Total property and equipment, net | $ | 26,104 | $ | 27,625 | |||||
During 2011, approximately $2.2 million in property and equipment was sold, written off or impaired for a net loss of $0.2 million. These assets included $1.4 million of fully depreciated assets no longer utilized in our operations and $0.8 million of assets associated with the final stages of outsourcing of our print and production facility. During 2010, approximately $1.7 million in property and equipment was sold, written off or impaired for a net loss of $1.5 million, primarily related to the outsourcing of our print and production facilities. The net loss of $1.5 million consists of $0.7 million loss on sale of assets and $0.8 million loss on impaired assets, both of which are reported in the consolidated statement of operations as ‘selling and marketing’ expense. In accordance with the guidance for the impairment of long-lived assets, assets with a carrying amount of $1.0 million were adjusted to their fair value of $0.2 million. See Note 3, “Investments and Fair Value Measurements”, for a discussion regarding fair value calculations for property and equipment that were impaired in 2010. During 2009, approximately $1.1 million in property and equipment was written off or sold for a net loss of $0.4 million, of which $0.3 million is reported as ‘selling and marketing’ expense and $0.1 million is reported as ‘general and administrative’ expense in the consolidated statement of operations.
6. Goodwill and Intangible Assets
Identified goodwill and the changes therein consist of the following (in thousands):
| Year ended December 31, 2011 | Year ended December 31, 2010 | ||||||||||||||||
| Ambassador Programs and Other | BookRags | Consolidated | Ambassador Programs and Other | BookRags | Consolidated | ||||||||||||
| Balance, January 1 | $ | 70 | $ | 9,711 | $ | 9,781 | $ | 70 | $ | 6,841 | $ | 6,911 | |||||
| Purchase price allocation | - | - | - | - | 2,870 | 2,870 | |||||||||||
| Balance, December 31 | $ | 70 | $ | 9,711 | $ | 9,781 | $ | 70 | $ | 9,711 | $ | 9,781 | |||||
Identified intangible assets other than goodwill and the changes therein consist of the following (in thousands):
| December 31, | ||||||||
| 2011 | 2010 | |||||||
| Content license agreements | $ | 838 | $ | 838 | ||||
| Content copyrights | 2,730 | 2,237 | ||||||
| Advertising relationship | 512 | 512 | ||||||
| Other | 130 | 130 | ||||||
| Trademark | 517 | 517 | ||||||
| Total intangible assets, gross | 4,727 | 4,234 | ||||||
| Less accumulated amortization | ||||||||
| Content license agreements | (152 | ) | (110 | ) | ||||
| Content copyrights | (556 | ) | (304 | ) | ||||
| Advertising relationship | (469 | ) | (339 | ) | ||||
| Other | (129 | ) | (114 | ) | ||||
| Total intangible assets, net | $ | 3,421 | $ | 3,367 | ||||
Amortization expense on intangible assets of approximately $0.4 million, $0.4 million and $0.3 million for the years ended December 31, 2011, 2010 and 2009, respectively, was included in the determination of net income.
Estimated annual amortization expense for each of the next five years is as follows (in thousands):
| Years Ended December 31, | |||
| 2012 | $ | 375 | |
| 2013 | $ | 331 | |
| 2014 | $ | 331 | |
| 2015 | $ | 331 | |
| 2016 | $ | 331 | |
We completed our annual impairment test of goodwill and other indefinite lived intangible assets as of December 1, 2011. As noted above, the majority of our goodwill and intangible assets are held by our BookRags segment. We engaged a third party valuation specialist to complete a schedules only analysis for the BookRags segment using the income method, which concluded that no impairment of goodwill existed at this time. The review of goodwill requires the use of several estimates including management assumptions for future cash flows, weighted average cost of capital, discount rates, and equity multiples, all which involve a large degree of judgment. We believe estimates utilized in our analysis are likely to occur, but there can be no assurance that these estimates will materialize as projected.
| 7. | Line of Credit |
On May 31, 2011, we renewed the $20.0 million Revolving Credit Agreement with Wells Fargo. This Revolving Credit Agreement expires on June 1, 2014. In addition, the Revolving Credit Agreement provides for the issue of letters of credit not to exceed $2.5 million. Monthly interest only payments, if applicable, are paid based on a pricing grid under which the interest rate decreases or increases based on our ratio of funded debt to earnings before interest, taxes, depreciation and amortization. We can elect to borrow utilizing the London Inter-Bank Offering Rate (“LIBOR”) plus an applicable spread or the prime rate. The credit agreement contains certain quarterly financial covenants, including, deployable cash greater than zero at all times, tangible net worth greater than $50.0 million, and net income after taxes greater than $4.0 million for the trailing four quarters. As of December 31, 2011, we were not in compliance with the restrictive covenant which calls for a minimum net income of $4.0 million. On February 2, 2012 we received a waiver for this violation from Wells Fargo and there are no restrictions on our borrowings.
At December 31, 2011 and 2010, we had no amounts outstanding on the revolving line of credit, and the availability under the total line of credit was $18.6 million, as we have utilized $1.4 million of the line in the form of letters of credit to several airline companies.
| 8. | Income Taxes |
The provision for income taxes consisted of the following (in thousands):
| Years Ended December 31, | |||||||||||
| 2011 | 2010 | 2009 | |||||||||
| Current tax expense (benefit) | |||||||||||
| Federal | $ | 322 | $ | 2,332 | $ | 9,302 | |||||
| State | (93 | ) | (250 | ) | 1,023 | ||||||
| Deferred tax expense | |||||||||||
| Federal | 350 | 1,260 | 568 | ||||||||
| State | 70 | 139 | - | ||||||||
| Total income tax provision | $ | 649 | $ | 3,481 | $ | 10,893 | |||||
Components of the net deferred tax assets and liabilities are as follows (in thousands):
| December 31, 2011 | |||||||||||
| Assets | Liabilities | Total | |||||||||
| Amortization of goodwill and other intangibles | $ | 586 | $ | (752 | ) | $ | (166 | ) | |||
| Accrued vacation and compensation | 166 | - | 166 | ||||||||
| Unrealized loss on foreign currency exchange contracts | 616 | - | 616 | ||||||||
| Unrealized gain on available-for-sale securities | - | (180 | ) | (180 | ) | ||||||
| Unrealized loss on auction rate securities | 105 | - | 105 | ||||||||
| Depreciation | (4,105 | ) | (4,105 | ) | |||||||
| Stock options | 1,653 | - | 1,653 | ||||||||
| Restricted stock grants | 459 | - | 459 | ||||||||
| State tax deduction | 121 | - | 121 | ||||||||
| Other | 181 | (186 | ) | (5 | ) | ||||||
| Total deferred tax assets (liabilities) | $ | 3,887 | $ | (5,223 | ) | $ | (1,336 | ) | |||
| December 31, 2010 | ||||||||||||
| Assets | Liabilities | Total | ||||||||||
| Amortization of goodwill and other intangibles | $ | 631 | $ | (455 | ) | $ | 176 | |||||
| Accrued vacation and compensation | 165 | - | 165 | |||||||||
| Unrealized gain on foreign currency exchange contracts | - | (660 | ) | (660 | ) | |||||||
| Unrealized gain on available-for-sale securities | - | (31 | ) | (31 | ) | |||||||
| Unrealized loss on auction rate securities | 126 | - | 126 | |||||||||
| Depreciation | - | (3,969 | ) | (3,969 | ) | |||||||
| Stock options | 1,466 | - | 1,466 | |||||||||
| Restricted stock grants | 495 | - | 495 | |||||||||
| State tax deduction | 165 | - | 165 | |||||||||
| Other | 46 | - | 46 | |||||||||
| Total deferred tax assets (liabilities) | $ | 3,094 | $ | (5,115 | ) | $ | (2,021 | ) | ||||
The income tax provision differs from that computed using the federal statutory rate applied to income before income taxes as follows (in thousands):
| Years Ended December 31, | |||||||||||||||||||||||||||||
2011 Amount | % | 2010 Amount | % | 2009 Amount | % | ||||||||||||||||||||||||
| Provision at the federal statutory rate | $ | 1,226 | 34.0 | % | $ | 4,059 | 35.0 | % | $ | 10,931 | 35.0 | % | |||||||||||||||||
| Tax-exempt interest | (417 | ) | (11.6 | ) | (521 | ) | (4.5 | ) | (723 | ) | (2.3 | ) | |||||||||||||||||
| Tax rate change to deferreds - federal | (62 | ) | (1.7 | ) | - | - | - | - | |||||||||||||||||||||
| State income tax, net of federal benefit | (24 | ) | (0.7 | ) | (110 | ) | (0.9 | ) | 669 | 2.1 | |||||||||||||||||||
| Other | (74 | ) | (2.0 | ) | 53 | 0.4 | 16 | 0.1 | |||||||||||||||||||||
| Total income tax provision | $ | 649 | 18.0 | % | $ | 3,481 | 30.0 | % | $ | 10,893 | 34.9 | % | |||||||||||||||||
As of December 31, 2011, $328 thousand of unrecognized tax benefits are recorded as ‘accounts payable and accrued expenses’ in the consolidated balance sheet. If recognized, $217 thousand would affect the annual effective tax rate. Our policy is to account for interest and penalties related to uncertain tax positions as part of income tax expense. During the year ended December 31, 2011, we recognized $25 thousand of income tax benefit in the consolidated statement of operations and $28 thousand in the consolidated balance sheet associated with interest on uncertain tax positions.
The following summarizes the unrecognized tax benefits activity during 2011 and 2010 (in thousands):
| 2011 | 2010 | |||||||
| Gross unrecognized tax benefit as of January 1, | $ | 423 | $ | 573 | ||||
| Increases in uncertain tax benefits as a result of tax positions taken during the prior period | - | 112 | ||||||
| Increases in uncertain tax benefits as a result of tax positions taken during the current period | 30 | 49 | ||||||
| Settlements with tax authorities | - | (176 | ) | |||||
| Lapse of statute of limitations | (125 | ) | (135 | ) | ||||
| Gross unrecognized tax benefits as of December 31, | $ | 328 | $ | 423 | ||||
We file tax returns in the U.S. federal jurisdiction and various state jurisdictions. We may be subject to examination by the Internal Revenue Service for the years after 2007. We may also be subject to examination by various state jurisdictions for the years after 2006.
| 9. | Commitments and Contingencies |
In 2009, we entered into an agreement with Discovery Education, which was renegotiated during 2011. Within the terms of the renegotiated contract, the following minimum payments are due regardless of total sales (in thousands):
| Years Ended December 31, | |||
| 2012 | $ | 200 | |
| 2013 | $ | 400 | |
| 2014 | $ | 400 | |
| 2015 | $ | 750 | |
On October 27, 2009, we were informed by the Securities and Exchange Commission (“SEC”) that it had issued a formal order of investigation with respect to trading in the Company’s securities. We believe that the investigation is for the period August through December 2007. In connection with the investigation, the Company, certain of its officers, directors and employees, as well as other persons, have received subpoenas from the SEC requesting information. The SEC has indicated that the investigation should not be construed as an indication that any violation of law has occurred or as an adverse reflection upon any person, entity or security. The U.S. Department of Justice is involved in the investigation and has served subpoenas upon various employees to appear before the federal grand jury to which the matter has been assigned. The Company will continue to cooperate fully with the investigation.
Other than as disclosed herein, we are not a party to any other material pending legal proceedings other than ordinary routine litigation incidental to our business; the outcome of which we believe will not have a material adverse effect on our business, financial condition, cash flows or results of operations. These matters are subject to inherent uncertainties and management’s view of these matters may change in the future. Adverse outcomes in some or all of the matters described in this section may result in significant monetary damages or injunctive relief against us that would adversely affect our results of operations.
We are subject to the possibility of various loss contingencies, including claims, suits and complaints, arising in the ordinary course of business. We consider the likelihood of loss or impairment of an asset or the incurrence of a liability, as well as our ability to reasonably estimate the amount of loss, in determining loss contingencies. An estimated loss contingency is accrued when it is probable that an asset has been impaired or a liability has been incurred and the amount of loss can be reasonably estimated. We regularly evaluate current information available to us to determine whether such accruals should be adjusted and whether new accruals are required.
Under our Bylaws, our directors and officers have certain rights to indemnification by us against certain liabilities that may arise by reason of their status or service as directors or officers. We maintain director and officer insurance, which covers certain liabilities arising from our obligation to indemnify our directors and officers and former directors in certain circumstances. No material indemnification liabilities were accrued at December 31, 2011.
10. Stock-Based Compensation
Under the Equity Participation Plan (the “Plan”), we may grant stock-based incentive compensation awards to eligible employees (including officers), non-employee directors and consultants in the form of distribution equivalent rights, incentive stock options, non-qualified stock options, performance share awards, performance unit awards, restricted stock awards, restricted stock units awards, stock appreciation rights, tandem stock appreciation rights, unrestricted stock awards or any combination of the foregoing, as may be best suited to the circumstances of the particular employee, director or consultant.
Under the terms of the Plan, options to purchase shares of our Common Stock are granted at a price set by the Compensation Committee of the Board of Directors (the “Compensation Committee”), not to be less than the par value of a share of Common Stock, and if granted as performance-based compensation or as incentive stock options, not to be less than the fair market value of the stock on the date of grant. The Compensation Committee establishes the vesting period of the awards, which is generally set at 25 percent per year for four years. Options may be exercised any time after they vest for a period up to 10 years from the grant date.
Under the terms of the Plan, restricted stock awards are granted by the Compensation Committee on the same terms as options. The Compensation Committee also establishes the vesting period of the awards, which is generally set at 100 percent at the conclusion of one to four years. Our key employees and consultants who have been awarded stock are typically subject to a four year vesting period, while our Board of Directors who have been awarded stock are subject to a one year vesting period.
The fair value of each stock option granted is estimated on the date of grant using the Black-Scholes option-pricing model. The Black-Scholes option-pricing model was developed for use in estimating the fair value of options. Option valuation models require the input of highly subjective assumptions, particularly for the expected term and stock price volatility. The assumptions used to calculate the fair value of options granted are evaluated and revised, as necessary, to reflect market conditions and our experience. Our employee stock options do not trade on a secondary exchange; therefore, employees do not derive a benefit from holding stock options unless there is an appreciation in the market price of our stock above the grant price. Such an increase in stock price would benefit all shareholders commensurately.
The fair value of each option grant is estimated on the date of grant using the Black-Scholes option-pricing model with the following weighted-average assumptions used for grants in the years ended December 31, 2011, 2010, and 2009.
| Year Ended | |||||||||||||
| 2011 | 2010 | 2009 | |||||||||||
| Expected dividend yield | 4.78 | % | 2.03 | % | 2.15 | % | |||||||
| Expected stock price volatility | 62.58 | % | 63.83 | % | 54.45 | % | |||||||
| Risk-free interest rate | 1.95 | % | 1.41 | % | 2.24 | % | |||||||
| Expected life of options | 4.63 | Years | 4.94 | Years | 5.00 | Years | |||||||
| Estimated fair value per option granted | $2.07 | $5.16 | $4.70 | ||||||||||
The dividend yield is based on expected quarterly cash dividends paid to our shareholders. Expected stock price volatility is based on historical volatility of our stock. The risk-free interest rate is based on the implied yield available on U.S. Treasury zero-coupon issues with an equivalent remaining term. The expected term of the options represents the estimated period of time until exercise and is based on historical experience of similar awards, giving consideration to the contractual terms, vesting schedules and expectations of future employee behavior. Additionally, an annualized forfeiture rate of 11.5 percent is used as a best estimate of future forfeitures based on our historical forfeiture experience. The stock-based compensation expense will be adjusted in later periods if the actual forfeiture rate is different from the estimate.
Total stock-based compensation expense recognized in the consolidated statement of operations for the years ended 2011, 2010, and 2009 was $1.8 million, $2.0 million, $2.0 million, respectively, before income taxes. Of the total stock-based compensation expense during 2011, stock option expense was $1.0 million and restricted stock grant expense was $0.8 million. Of the total stock-based compensation expense during 2010, stock option expense was $1.1 million and restricted stock grant expense was $0.9 million. Of the total stock-based compensation expense during 2009, stock option expense was $0.9 million and restricted stock grant expense was $1.1 million.
The following table presents information about the common stock options and restricted grants as of December 31, 2011:
| Options and Awards Outstanding | Options Exercisable | ||||||||||||
| Range of Exercise Prices | Shares | Weighted -Average Remaining Contractual Life (years) | Weighted- Average Exercise Price | Shares | Weighted- Average Exercise Price | ||||||||
| Restricted Stock Awards | |||||||||||||
| $ | 0.00 | 374,957 | 2.56 | N/A | N/A | N/A | |||||||
| Stock Options | |||||||||||||
| $ | 3.47 - 6.93 | 670,060 | 3.97 | $ | 5.42 | 408,138 | $ | 6.00 | |||||
| 6.94 - 10.39 | 304,489 | 5.53 | 9.09 | 218,929 | 9.23 | ||||||||
| 10.40 - 13.86 | 477,801 | 8.16 | 11.51 | 183,700 | 11.66 | ||||||||
| 13.87 - 17.32 | 287,022 | 4.43 | 16.90 | 287,022 | 16.90 | ||||||||
| 17.33 - 20.79 | 8,702 | 5.35 | 18.41 | 6,870 | 18.41 | ||||||||
| 20.80 - 24.25 | 16,000 | 3.62 | 21.09 | 16,000 | 21.09 | ||||||||
| 24.26 - 27.72 | 184,146 | 4.30 | 27.08 | 184,146 | 27.08 | ||||||||
| 27.73 - 31.18 | 7,916 | 4.21 | 29.28 | 7,916 | 29.28 | ||||||||
| 31.19 - 34.65 | 6,185 | 4.71 | 34.65 | 6,185 | 34.65 | ||||||||
| Total Stock Options | 1,962,321 | 5.34 | $ | 11.56 | 1,318,906 | $ | 13.17 | ||||||
| Combined | 2,337,278 | 4.89 | $ | 11.56 | 1,318,906 | $ | 13.17 | ||||||
At December 31, 2010, there were 1,202,848 exercisable stock options at the weighted-average exercise price of $13.25 per share.
At December 31, 2011, the aggregate intrinsic value of outstanding stock options and restricted stock was $1.7 million and exercisable stock options and restricted stock was zero, before applicable income taxes, based on our $4.51 closing stock price at December 31, 2011. This intrinsic value would have been received by the optionees had all restricted stock been vested and all stock options been exercised on that date. The weighted-average remaining contractual life of stock options and restricted grants outstanding was 5.9 years and exercisable was 3.6 years. As of December 31, 2011, total unrecognized stock-based compensation expense related to non-vested stock options and restricted stock awards was approximately $4.3 million, which is expected to be recognized over approximately 3.6 years. During the year ended December 31, 2011, the total intrinsic value of stock options exercised was $0.1 million and the total fair value of options which vested was $1.0 million while the total fair value of restricted stock awards which vested was $0.9 million.
At December 31, 2010, the aggregate intrinsic value of outstanding stock options and restricted stock was $7.2 million and exercisable stock options and restricted stock was $2.9 million, before applicable income taxes, based on our $11.50 closing stock price at December 31, 2010. This intrinsic value would have been received by the optionees had all restricted stock been vested and all stock options been exercised on that date. The weighted-average remaining contractual life of stock options and restricted grants outstanding was 6.1 years and exercisable was 3.9 years. As of December 31, 2010, total unrecognized stock-based compensation expense related to non-vested stock options and restricted stock grants was approximately $5.5 million, which is expected to be recognized over a period of approximately 3.9 years. During the year ended December 31, 2010, the total intrinsic value of stock options exercised was $0.6 million, and the total fair value of options vested was $1.0 million while the total fair value of restricted stock awards which vested was $1.0 million.
At December 31, 2009, the aggregate intrinsic value of outstanding stock options and restricted stock was $9.1 million and exercisable stock options and restricted stock was $4.6 million, before applicable income taxes, based on our $13.26 closing stock price at December 31, 2009. This intrinsic value would have been received by the optionees had all restricted stock been vested and all stock options been exercised on that date. The weighted-average remaining contractual life of stock options and restricted grants outstanding was 5.1 years and exercisable was 3.8 years. As of December 31, 2009, total unrecognized stock-based compensation expense related to non-vested stock options and restricted stock grants was approximately $4.6 million, which is expected to be recognized over a period of approximately 3.9 years. During the year ended December 31, 2009, the total intrinsic value of stock options exercised was $1.0 million, and the total fair value of options vested was $1.2 million while the total fair value of restricted stock awards which vested was $1.4 million.
Stock option and restricted stock grant transactions during 2011 were as follows:
Restricted Stock Awarded | Weighted- Average Grant Date Fair Value | Stock Options | Weighted- Average Exercise Price | ||||||
| Balance at December 31, 2010 | 337,918 | $ | 11.83 | 1,851,851 | $ | 12.64 | |||
| Granted | 141,402 | 5.39 | 315,619 | 5.32 | |||||
| Forfeited | (50,855) | 11.31 | (168,595) | 12.90 | |||||
| Vested | (53,508) | 16.44 | N/A | N/A | |||||
| Exercised | N/A | N/A | (36,554) | 6.21 | |||||
| Balance at December 31, 2011 | 374,957 | $ | 8.82 | 1,962,321 | $ | 11.56 | |||
| 11. | Employee Benefit Plan |
Effective March 2002, we established a 401(k) Profit Sharing Plan (the “Sharing Plan”) for our employees. Employees are eligible to participate in the Sharing Plan upon six months of service and 18 years of age, and may contribute up to 92 percent of their salary, subject to the maximum contribution allowed by the Internal Revenue Service. Our matching contribution is discretionary based upon approval by management. Employees are 100 percent vested in their contributions and vest in our matching contributions after their initial four years of employment. During the years ended December 31, 2011, 2010, and 2009, we contributed approximately $0.1 million, $0.1 million, and $0.02 million to the Sharing Plan, respectively.
| 12. | Earnings Per Share |
The following table presents a reconciliation of basic and diluted EPS computations (in thousands, except per share data and anti-dilutive stock option counts):
| Year Ended December 31, | |||||||||||
| 2011 | 2010 | 2009 | |||||||||
| Numerator: | |||||||||||
| Net income | $ | 2,956 | $ | 8,116 | $ | 20,337 | |||||
| Denominator: | |||||||||||
| Weighted-average shares outstanding | 17,371 | 18,747 | 18,618 | ||||||||
Effect of unvested restricted stock awards considered participating securities | 375 | 338 | 487 | ||||||||
| Weighted-average shares outstanding – basic | 17,746 | 19,085 | 19,105 | ||||||||
| Effect of dilutive common stock options | 123 | 218 | 317 | ||||||||
| Weighted-average shares outstanding – diluted | 17,869 | 19,303 | 19,422 | ||||||||
| Net income per share – basic | $ | 0.17 | $ | 0.43 | $ | 1.06 | |||||
| Net income per share – diluted | $ | 0.17 | $ | 0.42 | $ | 1.05 | |||||
| Cash dividends declared per share | $ | 0.24 | $ | 0.24 | $ | 0.24 | |||||
| Stock options excluded from the calculation of diluted earnings per share because their effect would have been anti-dilutive | 1,316,895 | 816,649 | 608,770 | ||||||||
| 13. | Segment Reporting |
Our operations are organized in two reporting segments, 1) “Ambassador Programs and Other,” which provides educational travel services to students and professionals through multiple itineraries within four travel program types and corporate overhead, and 2) “BookRags,” which provides online research capabilities through book summaries, critical essays, online study guides, lesson plans, biographies, and references to encyclopedia articles.
Ambassador Programs and Others’ gross margin is comprised of gross receipts less direct program costs, including accommodations, transportation, speakers, facilitators, and event costs. BookRags’ gross margin is comprised of content and subscription and advertising revenues via www.bookrags.com, less commissions and amortization of intangible assets directly associated with sales.
Segment information for the years ended December 31, 2011 and 2010 are as follows (in thousands):
| Year ended December 31, 2011 | Year ended December 31, 2010 | ||||||||||||||||||||||
| Ambassador Programs and Other (1) | Ambassador Programs and Other (1) | ||||||||||||||||||||||
| BookRags | Consolidated | BookRags | Consolidated | ||||||||||||||||||||
| Total revenue | $ | 62,392 | $ | 4,046 | $ | 66,438 | $ | 73,041 | $ | 3,105 | $ | 76,146 | |||||||||||
| Gross margin | $ | 55,570 | $ | 3,471 | $ | 59,041 | $ | 63,450 | $ | 2,651 | $ | 66,101 | |||||||||||
| Depreciation and amortization | $ | 4,243 | $ | 499 | $ | 4,742 | $ | 4,222 | $ | 424 | $ | 4,646 | |||||||||||
| Operating income | $ | 934 | $ | 1,176 | $ | 2,110 | $ | 9,174 | $ | 922 | $ | 10,096 | |||||||||||
| Income tax provision | $ | 232 | $ | 417 | $ | 649 | $ | 3,156 | $ | 325 | $ | 3,481 | |||||||||||
| Net income | $ | 2,154 | $ | 802 | $ | 2,956 | $ | 7,517 | $ | 599 | $ | 8,116 | |||||||||||
| Total additions to property, plant, and equipment | $ | 2,746 | $ | 230 | $ | 2,976 | $ | 4,461 | $ | - | $ | 4,461 | |||||||||||
| Total additions to goodwill and intangible assets | $ | - | $ | 493 | $ | 493 | $ | - | $ | 3,811 | $ | 3,811 | |||||||||||
| Intangible assets, excluding goodwill | $ | - | $ | 3,421 | $ | 3,421 | $ | - | $ | 3,367 | $ | 3,367 | |||||||||||
| Total goodwill | $ | 70 | $ | 9,711 | $ | 9,781 | $ | 70 | $ | 9,711 | $ | 9,781 | |||||||||||
| Total assets | $ | 97,161 | $ | 16,939 | $ | 114,100 | $ | 113,256 | $ | 15,300 | $ | 128,556 | |||||||||||
| (1) | Ambassador Programs and Other include all travel programs offered by Ambassador Programs and World Adventures Unlimited as well as corporate overhead. |
Any intercompany sales or services provided are eliminated upon consolidation.
| 14. | Quarterly Financial Data (unaudited) |
Summarized quarterly financial data for 2011 and 2010 is as follows (unaudited, and in thousands except per share data). All adjustments necessary to fairly present the interim results have been recorded:
| Quarters Ended | |||||||||||||||||
| March 31 | June 30 | September 30 | December 31 | ||||||||||||||
| 2011 | |||||||||||||||||
| Total revenue | $ | 1,662 | $ | 36,056 | $ | 26,742 | $ | 1,978 | |||||||||
| Gross margin | 1,043 | 32,848 | 23,251 | 1,899 | |||||||||||||
| Selling and marketing expense | 10,095 | 9,439 | 11,872 | 8,961 | |||||||||||||
| General and administrative expense | 4,383 | 4,120 | 3,924 | 4,137 | |||||||||||||
| Income (loss) before income taxes | (12,919 | ) | 19,695 | 7,779 | (10,950 | ) | |||||||||||
| Net income (loss) | (8,729 | ) | 13,431 | 6,052 | (7,798 | ) | |||||||||||
| Earnings (loss) per share-basic | (0.48 | ) | 0.76 | 0.34 | (0.45 | ) | |||||||||||
| Earnings (loss) per share-diluted | (0.48 | ) | 0.75 | 0.34 | (0.45 | ) | |||||||||||
Gross revenue reflects total amounts charged for all our goods and services. Gross revenue totaled $1.8 million, $87.2 million, $61.3 million and $4.9 million for the quarters ended March 31, June 30, September 30, and December 31, 2011, respectively. |
| Quarters Ended | |||||||||||||||||
| March 31 | June 30 | September 30 | December 31 | ||||||||||||||
| 2010 | |||||||||||||||||
| Total revenue | $ | 2,736 | $ | 38,664 | $ | 29,936 | $ | 4,810 | |||||||||
| Gross margin | 1,593 | 34,509 | 25,635 | 4,364 | |||||||||||||
| Selling and marketing expense | 9,402 | 8,981 | 11,811 | 11,686 | |||||||||||||
| General and administrative expense | 3,694 | 3,412 | 3,871 | 3,148 | |||||||||||||
| Income (loss) before income taxes | (11,106 | ) | 22,579 | 10,330 | (10,206 | ) | |||||||||||
| Net income (loss) | (7,489 | ) | 15,183 | 7,142 | (6,720 | ) | |||||||||||
| Earnings (loss) per share-basic | (0.39 | ) | 0.79 | 0.38 | (0.36 | ) | |||||||||||
| Earnings (loss) per share-diluted | (0.39 | ) | 0.78 | 0.37 | (0.36 | ) | |||||||||||
Gross revenue totaled $3.1 million, $83.1 million, $65.7 million and $10.0 million for the quarters ended March 31, June 30, September 30, and December 31, 2010, respectively.
| Quarters Ended | |||||||||||||||||
| March 31 | June 30 | September 30 | December 31 | ||||||||||||||
| 2009 | |||||||||||||||||
| Total revenue | $ | 10,006 | $ | 46,176 | $ | 36,407 | $ | 6,026 | |||||||||
| Gross margin | 5,281 | 40,292 | 33,201 | 5,030 | |||||||||||||
| Selling and marketing expense | 8,749 | 9,140 | 11,154 | 9,487 | |||||||||||||
| General and administrative expense | 3,492 | 3,421 | 3,379 | 4,803 | |||||||||||||
| Income (loss) before income taxes | (7,407 | ) | 28,305 | 19,169 | (8,837 | ) | |||||||||||
| Net income (loss) | (5,254 | ) | 19,179 | 12,505 | (6,093 | ) | |||||||||||
| Earnings (loss) per share-basic | (0.28 | ) | 1.01 | 0.66 | (0.32 | ) | |||||||||||
| Earnings (loss) per share-diluted | (0.28 | ) | 0.99 | 0.64 | (0.32 | ) | |||||||||||
Gross revenue totaled $10.4 million, $99.3 million, $82.8 million and $11.2 million for the quarters ended March 31, June 30, September 30, and December 31, 2009, respectively.
| 15. | Supplemental Disclosures of Consolidated Statements of Cash Flows |
We paid cash for taxes during 2011, 2010, and 2009 of approximately $0.3 million, $2.6 million, and $9.9 million, respectively.
Our non-cash investing and financing activities during the years ended December 31, 2011, 2010, and 2009, are as follows (in thousands):
| 2011 | 2010 | 2009 | ||||||||||
| Unrealized gain (loss) on foreign currency exchange contracts | $ | (3,637 | ) | $ | 788 | (8,729 | ) | |||||
| Unrealized gain (loss) on available-for-sale securities | $ | 481 | $ | (803 | ) | 58 | ||||||
| Property and equipment | $ | (24 | ) | $ | (229 | ) | 426 | |||||
| Purchase price allocation for goodwill | $ | - | $ | 2,870 | (24 | ) | ||||||
| Repurchase of common stock | $ | - | $ | 225 | - | |||||||
SIGNATURES
Pursuant to the requirements of Section 13 or 15(d) of the Securities Exchange Act of 1934, the registrant has caused this report to be signed on its behalf by the undersigned, thereunto duly authorized.
| By: | /s/ JEFFREY D. THOMAS | ||||
| Jeffrey D. Thomas, | |||||
| President and Chief Executive Officer | |||||
Date: March 12, 2012
Pursuant to the requirements of the Securities Exchange Act of 1934, this report has been signed below by the following persons on behalf of the registrant and in the capacities and on the dates indicated.
| Signature | Title | Date | |||
| /s/ JEFFREY D. THOMAS | President, Chief Executive Officer and Director (Principal Executive Officer) | March 12, 2012 | |||
| Jeffrey D. Thomas | |||||
| /s/ JOHN A. UEBERROTH | Chairman of the Board of Directors | March 12, 2012 | |||
| John A. Ueberroth | |||||
/s/ ANTHONY F. DOMBROWIK | Senior Vice President, Chief Financial Officer | March 12, 2012 | |||
| Anthony F. Dombrowik | (Principal Financial Officer) | ||||
| /s/ KRISTI J. GRAVELLE | Vice President, Finance & Accounting | March 12, 2012 | |||
| Kristi J. Gravelle | (Principal Accounting Officer) | ||||
/s/ DANIEL G. BYRNE | Director | March 12, 2012 | |||
| Daniel G. Byrne | |||||
| /s/ RAFER L. JOHNSON | �� | Director | March 12, 2012 | ||
| Rafer L. Johnson | |||||
| /s/ JAMES M. KALUSTIAN | Director | March 12, 2012 | |||
| James M. Kalustian | |||||
| /s/ NILOFER MERCHANT | Director | March 12, 2012 | |||
| Nilofer Merchant | |||||
/s/ THOMAS J. RUSIN | Director | March 12, 2012 | |||
Thomas Rusin | |||||
| /s/ RICARDO L. VALENCIA | Director | March 12, 2012 | |||
Ricardo L. Valencia | |||||
| /s/ TIMOTHY M. WALSH | Director | March 12, 2012 | |||
Timothy M. Walsh |
INDEX TO EXHIBITS
Exhibit Number | Description | |
| 3.1 | Amended and Restated Certificate of Incorporation of the registrant incorporated by reference to the registrant’s Registration Statement on Form 10 filed on November 15, 2001. | |
| 3.2 | Certificate of Amendment to Amended and Restated Certificate of Incorporation of the registrant incorporated by reference to the registrant’s Form 8-K filed on May 17, 2005. | |
| 3.3 | Bylaws of the registrant incorporated by reference to the registrant’s Registration Statement on Form 10 filed on November 15, 2001. | |
| 4.1 | Form of Common Stock Certificate of the registrant incorporated by reference to the registrant’s Form 10-K filed on March 9, 2007. | |
| 10.1 | 2001 Equity Participation Plan incorporated by reference to the registrant’s Registration Statement on Form 10 filed on January 7, 2002. | |
| 10.2 | Form of 2001 Equity Participation Plan Agreement incorporated by reference to the registrant’s Registration Statement on Form 10 filed on November 15, 2001. | |
| 10.3 | Form of Indemnification Agreement between the registrant and each of its executive officers and directors incorporated by reference to the registrant’s Registration Statement on Form 10 filed on January 25, 2002. | |
| 10.4 | Commercial Lease Agreement by and between Portolese & Sample Investments and the registrant incorporated by reference to the registrant’s Form 8-K filed on January 4, 2005. | |
| 10.5 | AIA Document A101, Standard Form of Agreement between Owner and Contractor by and between the registrant and Graham Construction and Management, Inc. incorporated by reference to registrant’s Form 8-K filed on September 29, 2006. | |
| 10.6 | Employment Agreement by and between the registrant and Jeffrey D. Thomas, incorporated by reference to the registrant’s Form 8-K filed on October 3, 2006. | |
10.7 10.8 10.9 10.10 | Stock Purchase Agreement by and between the registrant and Invemed Catalyst Fund, L.P. incorporated by reference to the registrant’s Form 8-K filed on January 31, 2007. Stock Purchase Agreement incorporated by reference to the registrant’s Form 8-K filed on May 21, 2008. Credit Agreement by and between the registrant and Wells Fargo Bank, N.A. incorporated by reference to the registrant’s Form 8-K filed on May 30, 2008. Revolving Line of Credit Note incorporated by reference to the registrant’s Form 8-K filed May 30, 2008. | |
| 10.11 | 2009 Equity Participation Plan incorporated by reference to the registrant’s Definitive Proxy Statement on Form 14A filed on April 6, 2009. | |
| 10.12 | Severance Agreement by and between the registrant and Margaret M. Thomas incorporated by reference to the registrant’s Form 10-K filed March 11, 2011. | |
| 10.13 | Severance Agreement by and between the registrant and Anthony F. Dombrowik incorporated by reference to the registrant’s Form 10-K filed March 11, 2011. |
| 14.1 | Code of Ethics incorporated by reference to the registrant’s Definitive Proxy Statement on Form 14A filed on April 13, 2010. | |
| 21.1 | List of subsidiaries of the registrant as of December 31, 2011.* | |
| 23.1 | Consent of BDO USA, LLP, Independent Registered Public Accounting Firm.* | |
| 31.1 | Certification by Chief Executive Officer required by Rule 13a-14(a) or Rule 15(d)-14(a).* | |
| 31.2 | Certification by Chief Financial Officer required by Rule 13a-14(a) or Rule 15(d)-14(a).* | |
| 32.1 | Certification by the Chief Executive Officer and Chief Financial Officer as required by Rule 13a-14(b) or 15(d)-14(b) and Section 1350 of Chapter 63 of Title 13 of the United States Code (18 U.S.C. §1350).* |
* Filed herewith.
II - 3