
Wonder Auto Technology, Inc.
(NASDAQ: WATG)
November 2008

2
Safe Harbor Statement
CAUTIONARY STATEMENT REGARDING FORWARD-LOOKING STATEMENTS
This presentation includes or incorporates by reference statements that constitute forward-
looking statements within the meaning of Section 27A of the Securities Act of 1933, as
amended, and Section 21E of the Securities Exchange Act of 1934, as amended. These
statements relate to future events or to our future financial performance, and involve known
and unknown risks, uncertainties and other factors that may cause our actual results, levels
of activity, performance, or achievements to be materially different from any future results,
levels of activity, performance or achievements expressed or implied by these forward-
looking statements. These statements include, but are not limited to, information or
assumptions about revenues, gross profit, expenses, income, capital and other expenditures,
financing plans, capital structure, cash flow, liquidity, management’s plans, goals and
objectives for future operations and growth. In some cases, you can identify forward-looking
statements by the use of words such as “may,” “could,” “expect,” “intend,” “plan,” “seek,”
“anticipate,” “believe,” “estimate,” “predict,” “potential,” “continue,” or the negative of these
terms or other comparable terminology. You should not place undue reliance on forward-
looking statements since they involve known and unknown risks, uncertainties and other
factors which are, in some cases, beyond our control and which could materially affect actual
results, levels of activity, performance or
achievements.
We do not intend or assume any obligation to update any of these forward-looking
statements, except as required by law.
3
Company Overview

4
Diversifying Products Mix
Alternator
Starter
Rods & Shafts
Valve Tappets
Engine Valve
5
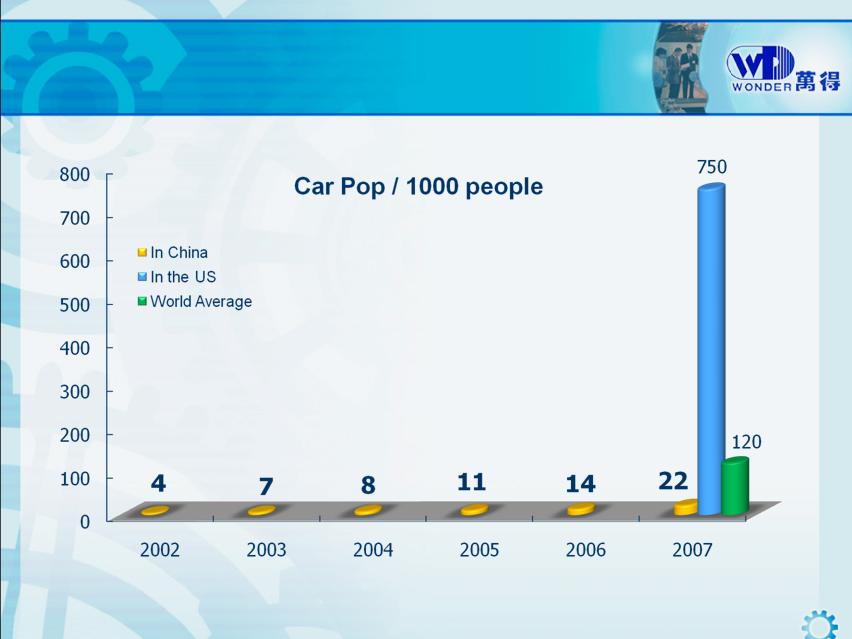
Market Dynamics in China
Source: National Bureau of Statistics of China
http://www.chinadaily.com.cn/bizchina/2008-10/20/content_7122408.htm
(Units)
6
Source: http://auto.sohu.com/s2007/fxgn/
(In Millions)
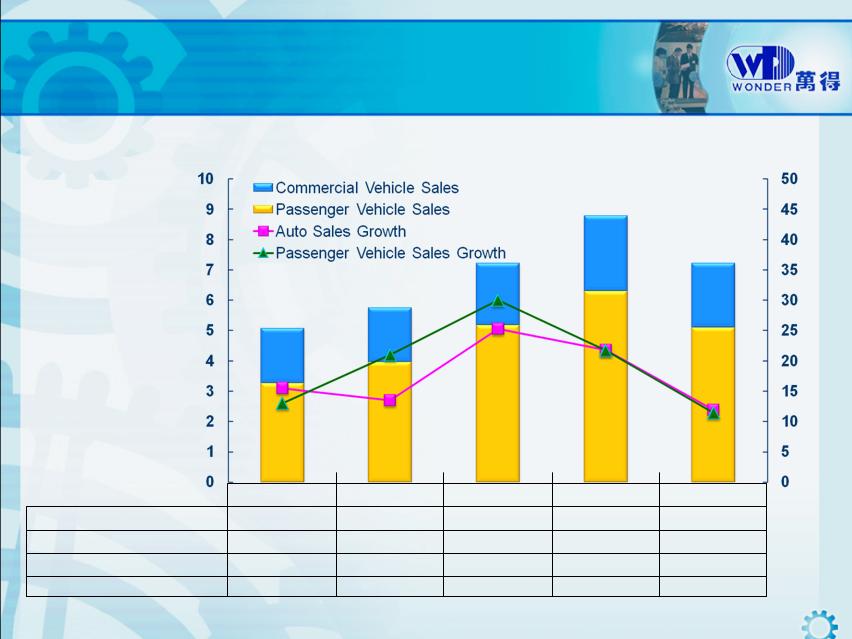
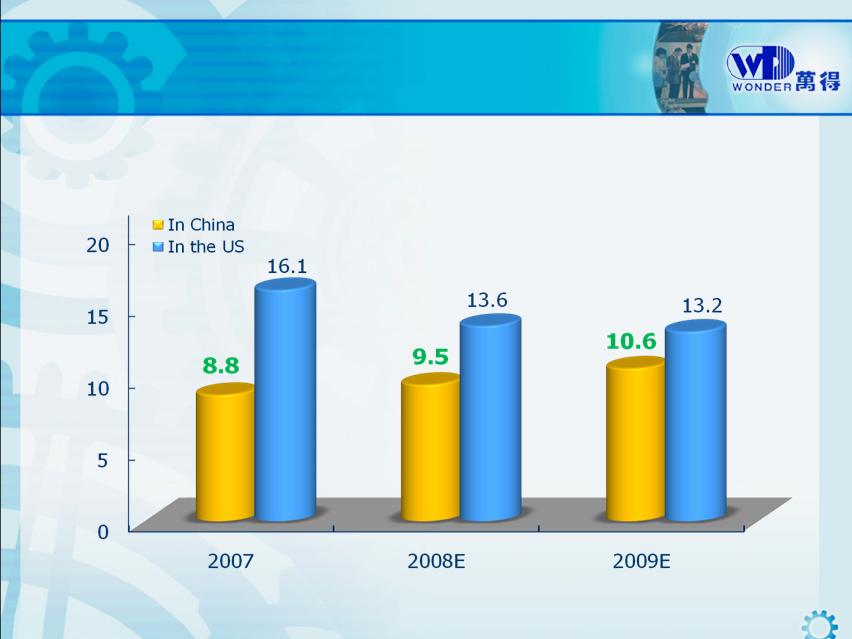
Market Dynamics in China (continue)
2004
2005
2006
2007
1-9 2008
Auto Sales
5.0
5.8
7.2
8.8
7.2
Auto Growth
15.5%
13.5%
25.3%
21.8%
11.9%
Passenger Vehicle Sales
3.2
4.0
5.1
6.3
5.1
Passenger Vehicle Growth
13.0%
21.0%
30.0%
21.7%
11.4%
(%)
Auto Sales Growth Analysis
7
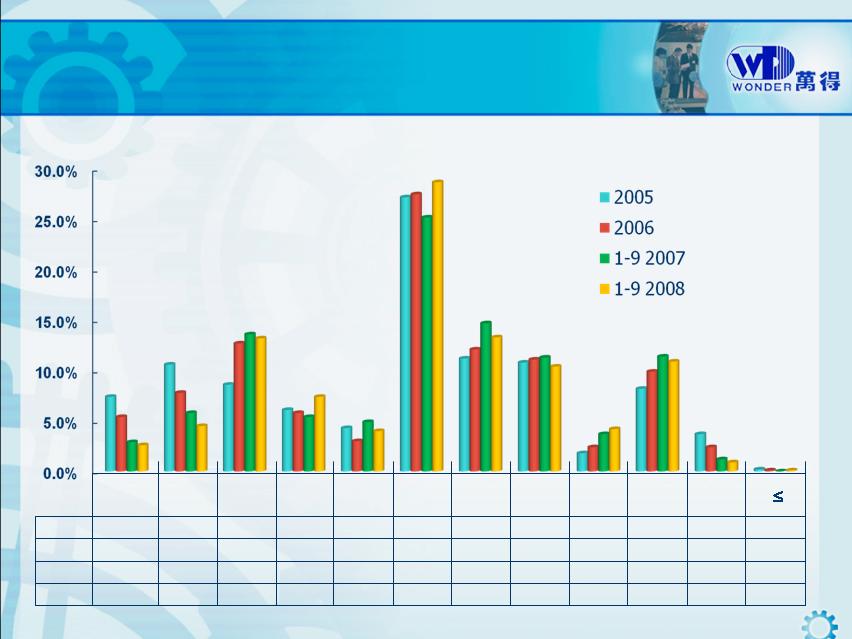
Market Dynamics in China (continue)
0.8-0.9
1.0-1.1
1.3-1.4
1.5L
1.6-AO
1.6-A
1.8L
2.0L
1.8T-
2.0T
2.3-2.5
2.5-3
3L =
2005
7.4%
10.6%
8.6%
6.1%
4.3%
27.2%
11.2%
10.8%
1.8%
8.2%
3.7%
0.2%
2006
5.4%
7.8%
12.7%
5.8%
3.0%
27.5%
12.1%
11.1%
2.4%
9.9%
2.4%
0.1%
1-9 2007
2.9%
5.8%
13.6%
5.4%
4.9%
25.2%
14.7%
11.3%
3.7%
11.4%
1.2%
0.0%
1-9 2008
2.6%
4.5%
13.2%
7.4%
4.0%
28.7%
13.3%
10.4%
4.2%
10.9%
0.9%
0.1%
Source: http://auto.sohu.com/s2007/fxgn/
Passenger Vehicle Market Shares By Engine Size
Market Trend Comparison
8
(In Millions)
Source: http://biz.jrj.com.cn/2008/10/1207282260900.shtml
http://finance.sina.com.cn/money/future/20081030/08245448057.shtml
Auto Sales Volume Comparison

9
Leading Market Position
Mission Statement
Same Performance with the Lower Price
Same Price with the Better Performance
10+ years expericence, well
recognized brand name,
eastablished customer base
Larger scale of capacity and
order volumes
Stronger R&D capabilities
Advantages over Local
Competitors
Developed low-cost supplier
network
Competitive manufacturing
cost & operating overheads
China-based R&D efforts,
closer to the end market
Advantages over Foreign
Competitors
10
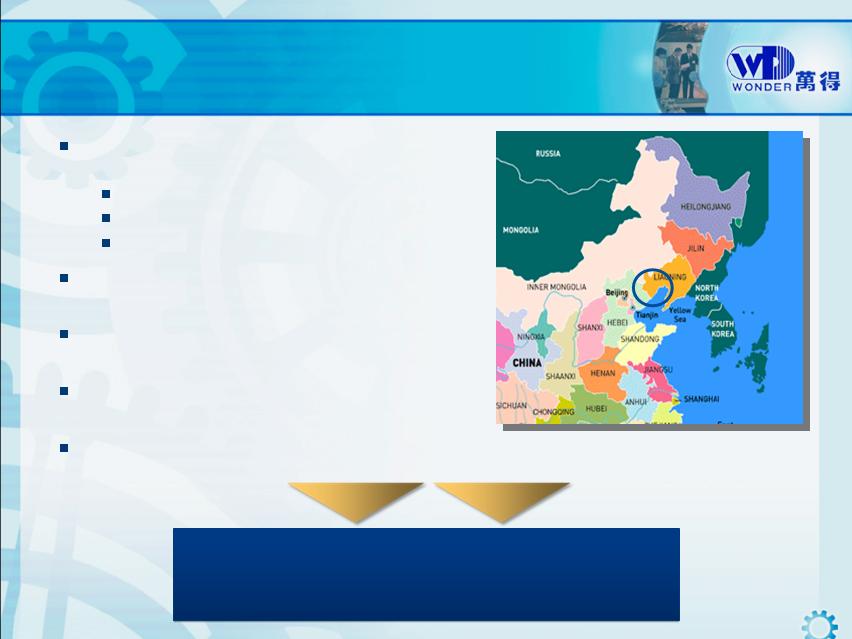
Low-cost Supplier Network
The majority of our suppliers is located
within 300 km of our manufacturing facilities
Shorter lead time
Lower delivery costs
Easier quality control and monitoring
Long-term relationships and exclusive
arrangements with key suppliers
Meeting rigorous quality assurance
standards and delivery schedules
Multiple sources for most raw materials and
components
Vertical integration to control key suppliers
Sourcing Stability
Lower sourcing cost
11
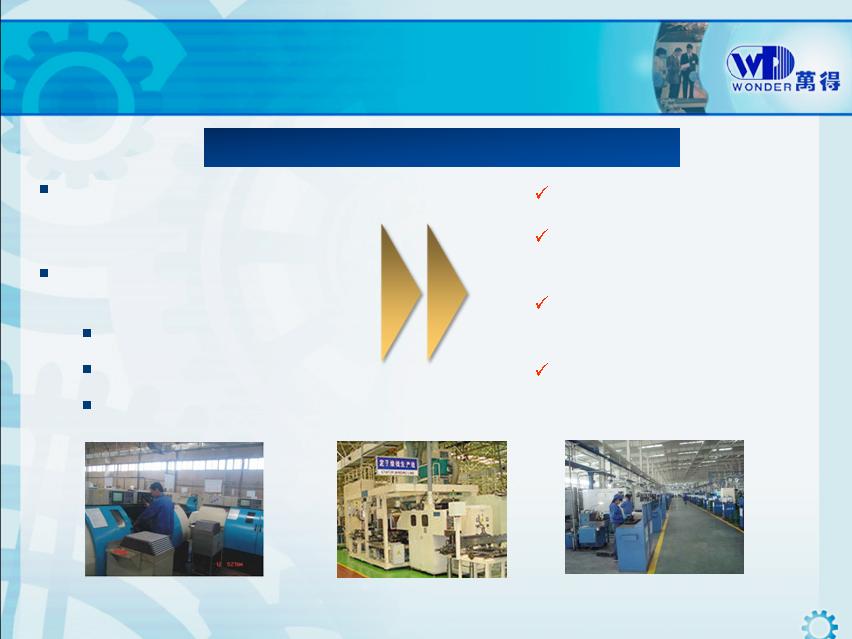
Manufacturing capabilities
accumulated over the past 10+
years
Customized assembly lines
and equipments providing:
Manufacturing flexibility
Process optimization
Quality assurance
Proprietary Manufacturing Processes
Short lead time
Reduced overhead and
equipment downtime
Reduced material
wastage
Ability to handle frequent
product change-over
Competitive Manufacturing Cost
12
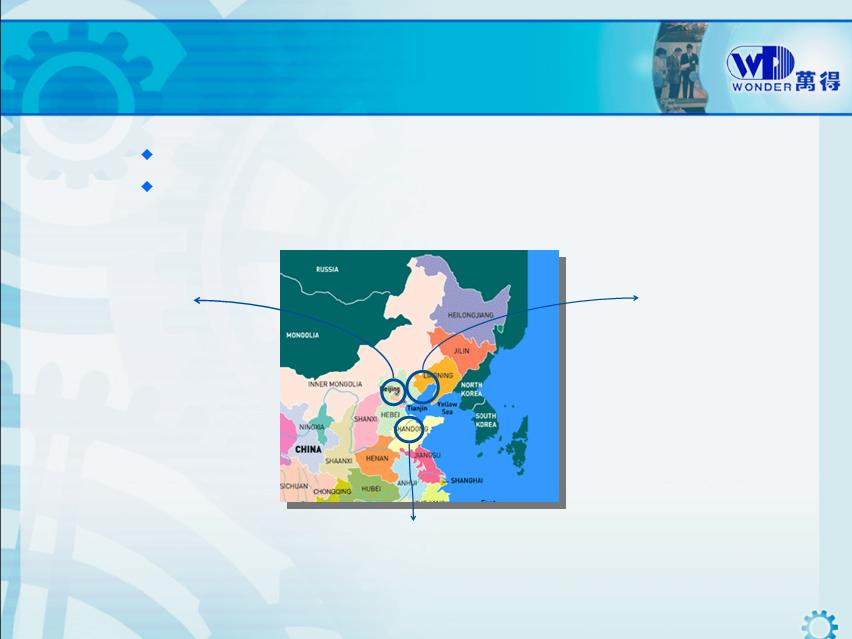
Strong R&D Capabilities
Jinzhou
Update existing
products and test new
products.
Beijing
Research and design
new technologies
and products ..
163 professionals including 14 foreign experts
Early access to customers’ new product designs,
28 joint programs from Jan. to Sep. 2008.
Jinan
Research and develop technology and
products of engine valve and valve tappet.
13
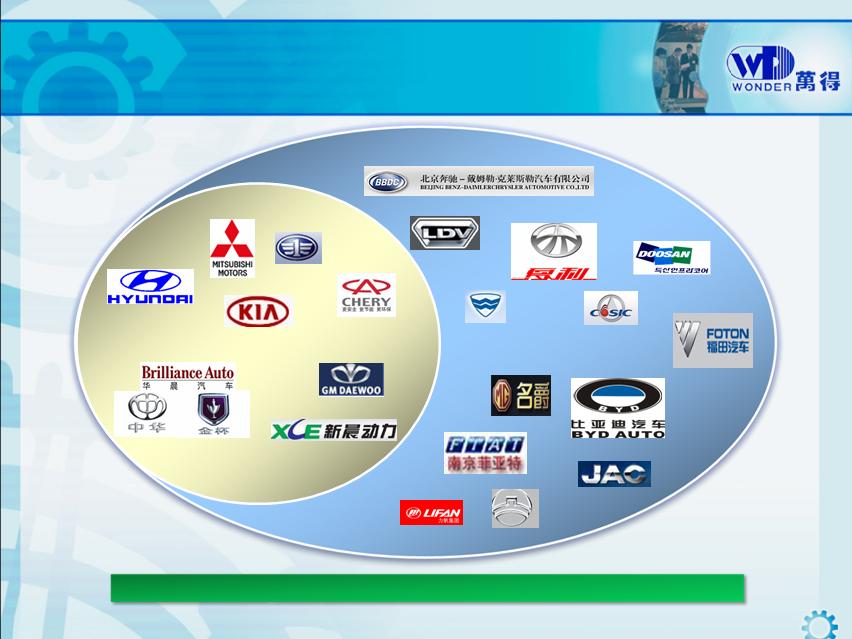
Expanding Customer Base
Expanding Customers
Core Customers
Number of Customers
30
2001
65
3Q 2008

Expanding Customer Base (continue)
14
Dongan Group
Xingguang Brilliance
Chaoyang Diesel Eng.
Dalian Diesel Engine
Weifang Disel Engine
Wuxi Diesel Engine
Shanghai Diesel Eng.
Chongqing Cummins
Yuchai Group
Liuzhou Wuling Motor
FAW
Beijing Jeep
Shanghai VW
Foton Motor
Tianjing FAW Toyota
Chery Auto
Nanjing FIAT
DF Peugeot Citroen
DF Motor
Geely Auto
Customers of JWAA (Jinan Worldwide Auto Accessory Co.)
15
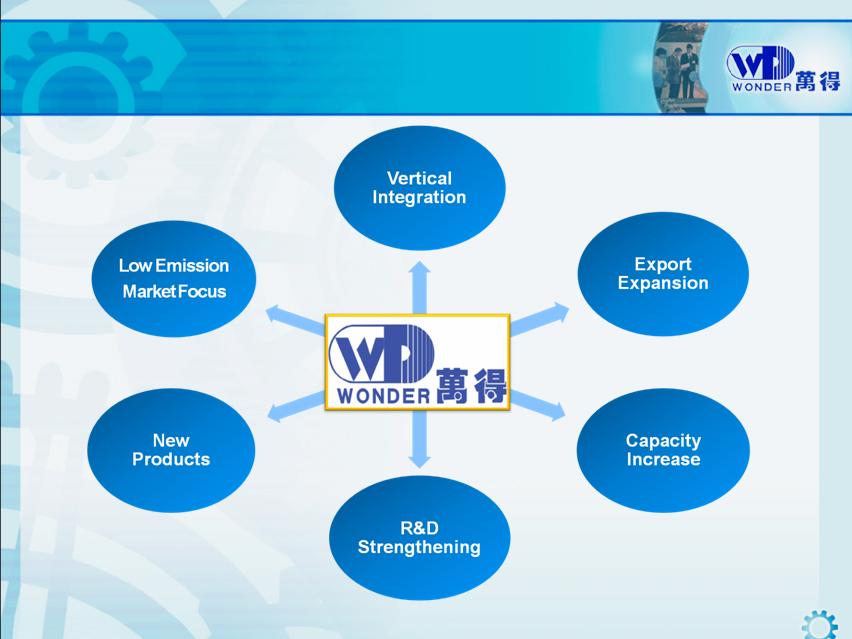
Growth Strategies

16
Experienced Management Team
Name
Title
Age
With Wonder
(years)
Industry
Experience
(years)
Qingjie Zhao
Chairman & CEO
51
12
28
Meirong Yuan
CFO
37
7
15
Yuncong Ma
COO
61
12
26
Seuk Jun Kim
Vice R&D President
52
12
25
17
Financial Overview
18
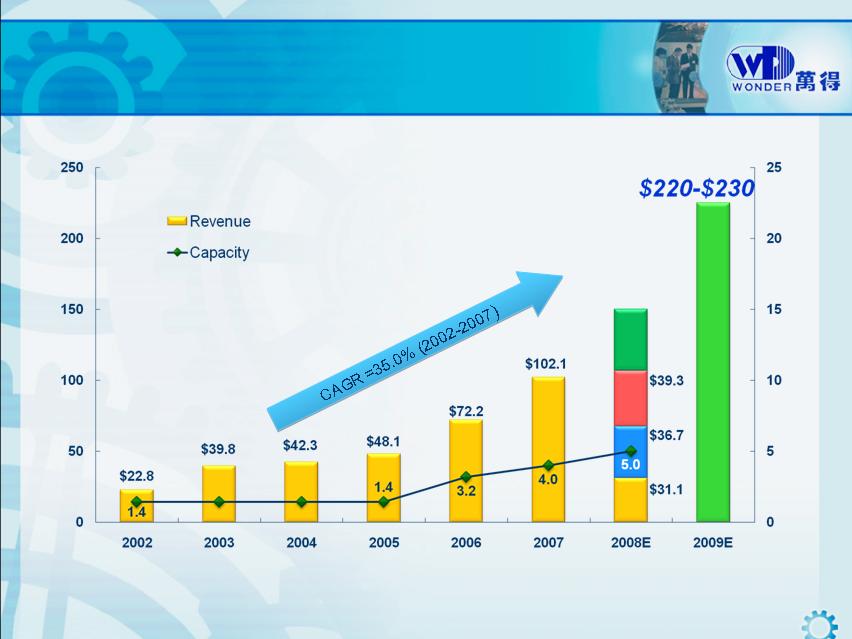
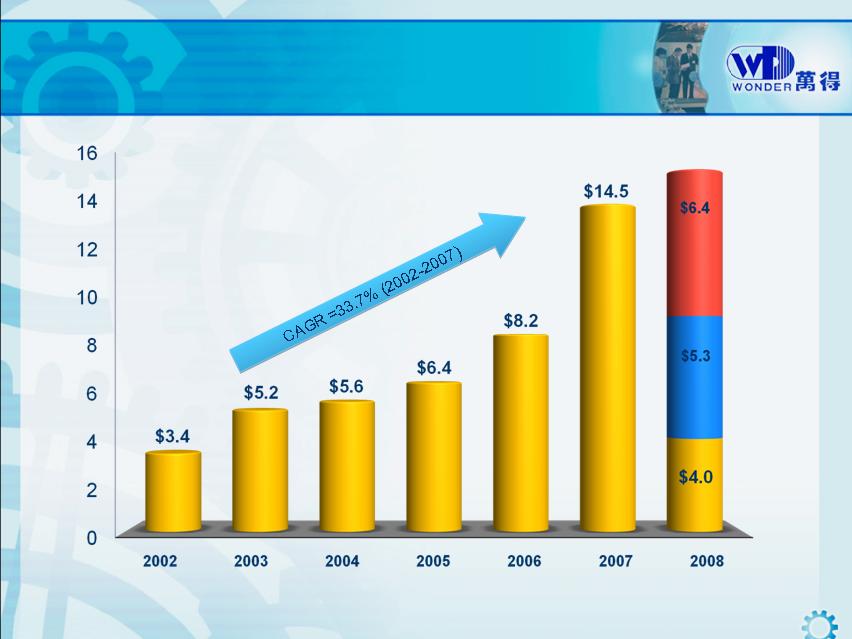
Top Line & Capacity Growth
($ In Millions)
(Million Units)
3Q
2Q
4Q
1Q
$150
19
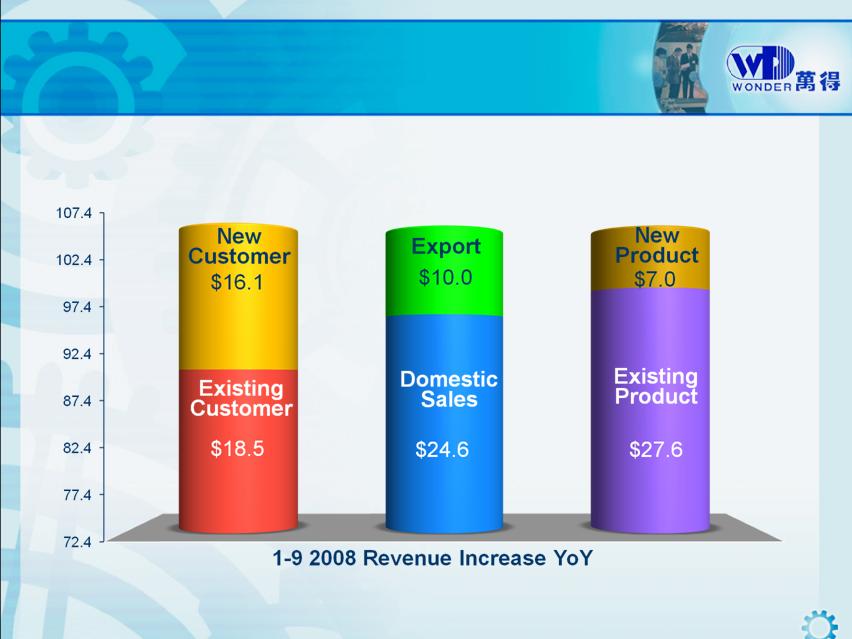
Analysis on Revenue Increase
(1-9 2007 Revenue)
($ in Millions)
$107 .0(1-9 2008 Revenue)
20
Strong Net Income Generation
($ in Millions)
3Q
2Q
1Q
$15.6
21
Healthy Balance Sheet
Key Items
30-Sept-2008
Un-audited
31-Dec-2007
Audited
Current Assets
111.2
99.3
Cash and Restricted Cash
19.9
34.7
Non-Current Assets
67.4
43.1
Total Assets
178.6
142.4
Current Liabilities
55.4
43.1
Secured Short-Term Debt
19.3
10.3
Secured Long-term Debt
18.0
17.6
Total Liabilities
73.4
64.0
Shareholders’ Equity
98.0
78.4
Total Liabilities and Equity
178.6
142.4
$ in Millions
Key Valuation Ratios
22
Source: http://finance.yahoo.com/q/ks?s=WATG
Ratios
As of 31 Oct, 2008
Trailing P/E (TTM, intraday)
5.94
Diluted EPS (TTM)
0.67
Total Debt / Equity (MRQ)
0.45
Operating Margin (TTM)
18.13%
Return on Assets (TTM)
10.11%
Return on Equity (TTM)
25.10%
23
Wall Street Analysts Coverage
Research Firm
Analyst
Rating (Date)
Piper Jaffray
Mr. Michael Cox
Buy (10/22/2008)
Roth Capital
Mr. John Ma
Buy (08/07/2008)
Susquehanna Financial
Ms. Adele Mao
Positive (09/11/2008)
CRT Capital Group
Ms. Julie Chen
Buy (08/08/2008)
Brean Murray
Mr. Chenyi Lu
Buy (08/07/2008)
Merriman Curhan Ford
Mr. Dave Duley
Buy (08/07/2008)
Global Hunters
Ms. Ping Luo
Buy (10/14/2008)
24
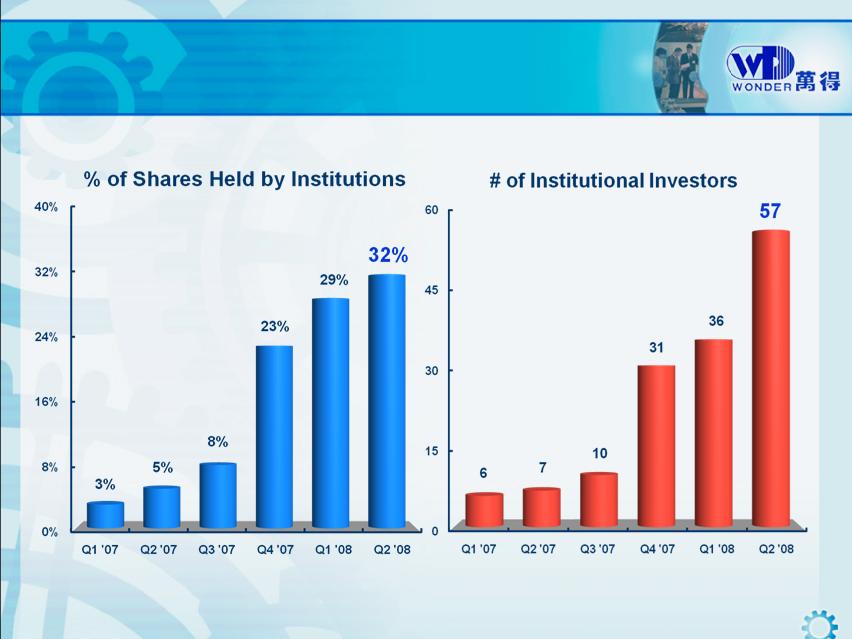
Institutional Holders
Source: http://www.aol.com

25
Key Investment Highlights
Leading Market Position
Strong Collaborative Relationships with Customers
Proven Track Record of Growth and Profitability
Experienced Management Team
Large and Growing China’s Auto Market Opportunities
#1
#2
#3
#4
#5

Questions?
Yechon Xie
+86 416 266 1186
ycxie@watg.cn
Investor Contact:
Lydia Zhao
+86 10 8478 5339
lydiaz@watg.cn