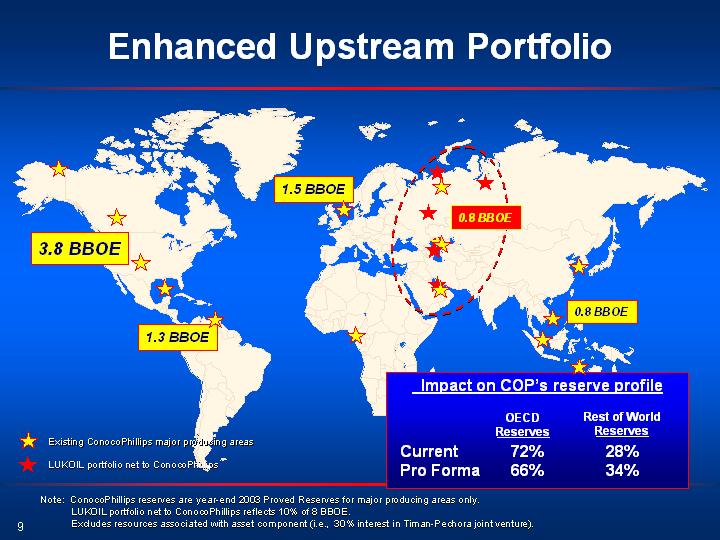
Free signup for more
- Track your favorite companies
- Receive email alerts for new filings
- Personalized dashboard of news and more
- Access all data and search results
Filing tables
Filing exhibits
COP similar filings
- 3 Dec 04 Other Events
- 27 Oct 04 Results of Operations and Financial Condition
- 5 Oct 04 Results of Operations and Financial Condition
- 30 Sep 04 Regulation FD Disclosure
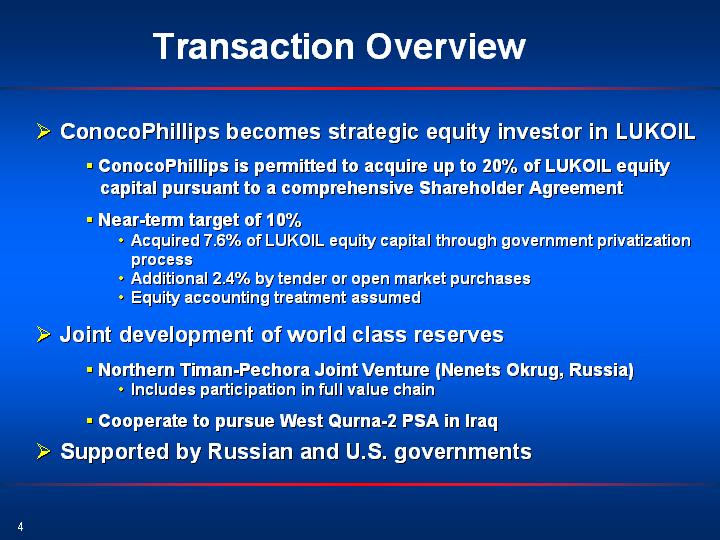
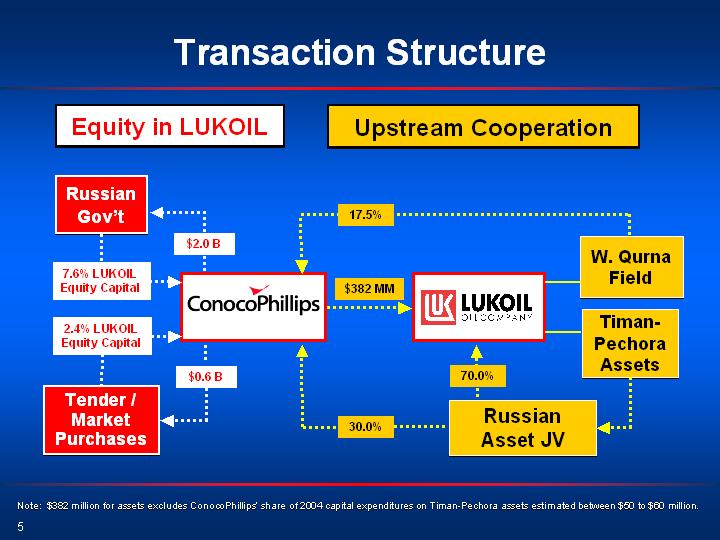
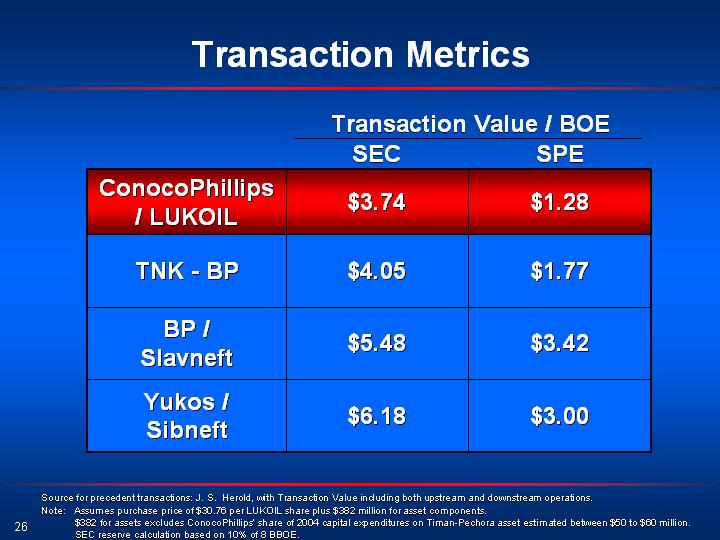
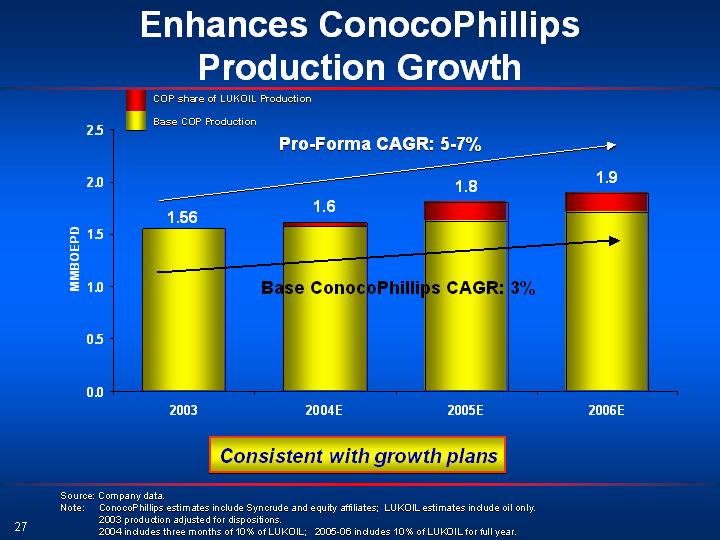
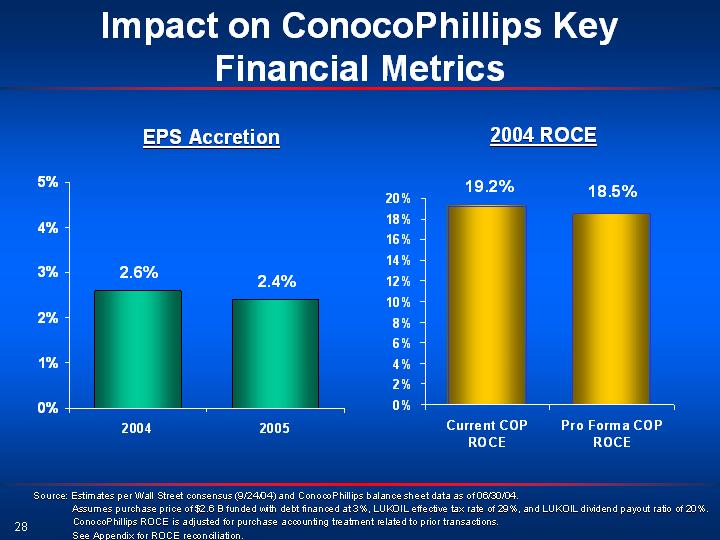
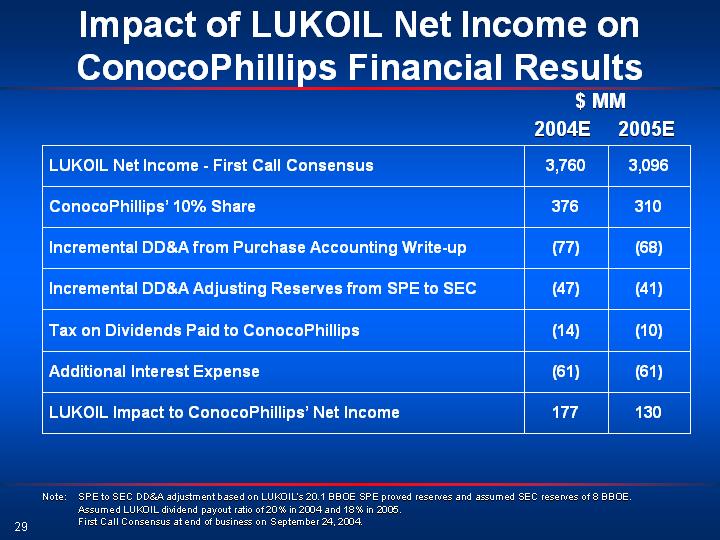
- 29 Sep 04 ConocoPhillips and LUKOIL Form Strategic Alliance; ConocoPhillips to Become Equity Investor in LUKOIL
- 22 Sep 04 Entry into a Material Definitive Agreement
- 28 Jul 04 Financial statements and exhibits
Filing view
External links