Third Quarter 2022 Earnings Call October 28, 2022 David Burritt President and Chief Executive Officer Jessica Graziano SVP and Chief Financial Officer Rich Fruehauf SVP, Chief Strategy and Sustainability Officer Kevin Lewis VP, Investor Relations and Corporate FP&A

Legal disclaimers 2 2 These slides are being provided to assist readers in understanding the results of operations, financial condition and cash flows of United States Steel Corporation as of and for the third quarter 2022. Financial results as of and for the periods ended September 30, 2022 provided herein are preliminary unaudited results based on current information available to management. They should be read in conjunction with the consolidated financial statements and Notes to the Consolidated Financial Statements contained in our Annual Report on Form 10-K and Quarterly Reports on Form 10-Q filed with the Securities and Exchange Commission. This release contains information that may constitute “forward-looking statements” within the meaning of Section 27A of the Securities Act of 1933, as amended, and Section 21E of the Securities Exchange Act of 1934, as amended. We intend the forward-looking statements to be covered by the safe harbor provisions for forward-looking statements in those sections. Generally, we have identified such forward-looking statements by using the words “believe,” “expect,” “intend,” “estimate,” “anticipate,” “project,” “target,” “forecast,” “aim,” “should,” “plan,” “goal,” “future,” “will,” “may,” and similar expressions or by using future dates in connection with any discussion of, among other things, financial performance, the construction or operation of new and existing facilities or operating capabilities, the timing, size and form of share repurchase transactions, operating performance, trends, events or developments that we expect or anticipate will occur in the future, statements relating to volume changes, share of sales and earnings per share changes, anticipated cost savings, potential capital and operational cash improvements, changes in global supply and demand conditions and prices for our products, international trade duties and other aspects of international trade policy, statements regarding our future strategies, products and innovations, statements regarding our greenhouse gas emissions reduction goals and statements expressing general views about future operating results. However, the absence of these words or similar expressions does not mean that a statement is not forward-looking. Forward-looking statements are not historical facts, but instead represent only the Company’s beliefs regarding future events, many of which, by their nature, are inherently uncertain and outside of the Company’s control. It is possible that the Company’s actual results and financial condition may differ, possibly materially, from the anticipated results and financial condition indicated in these forward-looking statements. Management believes that these forward- looking statements are reasonable as of the time made. However, caution should be taken not to place undue reliance on any such forward-looking statements because such statements speak only as of the date when made. Our Company undertakes no obligation to publicly update or revise any forward-looking statements, whether as a result of new information, future events or otherwise, except as required by law. In addition, forward-looking statements are subject to certain risks and uncertainties that could cause actual results to differ materially from our Company's historical experience and our present expectations or projections. These risks and uncertainties include, but are not limited to, the risks and uncertainties described in “Item 1A. Risk Factors” in our Annual report on Form 10-K for the year ended December 31, 2021 and those described from time to time in our future reports filed with the Securities and Exchange Commission. The investment in direct reduced-grade (DR) pellets and expected timeline described herein are subject to state and local support and receipt of regulatory permitting. References to “U. S. Steel,” “the Company,” “we,” “us,” and “our” refer to United States Steel Corporation and its consolidated subsidiaries, and references to “Big River Steel” refer to Big River Steel Holdings LLC and its direct and indirect subsidiaries unless otherwise indicated by the context.

Explanation of use of non-GAAP measures 3 3 We present earnings before interest, income taxes, depreciation and amortization (EBITDA) and adjusted EBITDA, which are non-GAAP measures, as additional measurements to enhance the understanding of our operating performance. We believe that EBITDA, considered along with net earnings, is a relevant indicator of trends relating to our operating performance and provides management and investors with additional information for comparison of our operating results to the operating results of other companies. Adjusted EBITDA is a non-GAAP measure that excludes the effects of items that include: restructuring and other charges and other charges, net (Adjustment Items). We present adjusted EBITDA to enhance the understanding of our ongoing operating performance and established trends affecting our core operations by excluding the effects of events that can obscure underlying trends. U. S. Steel's management considers adjusted EBITDA as alternative measures of operating performance and not alternative measures of the Company's liquidity. U. S. Steel’s management considers adjusted EBITDA useful to investors by facilitating a comparison of our operating performance to the operating performance of our competitors. Additionally, the presentation adjusted EBITDA provides insight into management’s view and assessment of the Company’s ongoing operating performance because management does not consider the Adjustment Items when evaluating the Company’s financial performance. Adjusted EBITDA should not be considered a substitute for net earnings or other financial measures as computed in accordance with U.S. GAAP and is not necessarily comparable to similarly titled measures used by other companies. We also present free cash flow, a non-GAAP measure of cash generated from operations, after any investing activity and dividends paid to stockholders. We believe that free cash flow provides further insight into the Company's overall utilization of cash.

Advancing towards our Best for All® future 4 4 CURRENT LANDSCAPE CHALLENGES SOLUTION PATH FORWARD Bullish on U. S. Steel’s future Delivering on Best for All Transitioning to a less capital- and carbon- intensive business model while becoming the best steel competitor Balanced capital allocation framework Expanding competitive advantages Confident in our ability to execute our Best for All future, SAFELY Maintaining strong trade enforcement

5 5 Today’s highlights RETURNING CAPITAL TO STOCKHOLDERS OPERATING FROM A POSITION OF STRENGTH SAFELY NAVIGATING CURRENT HEADWINDS

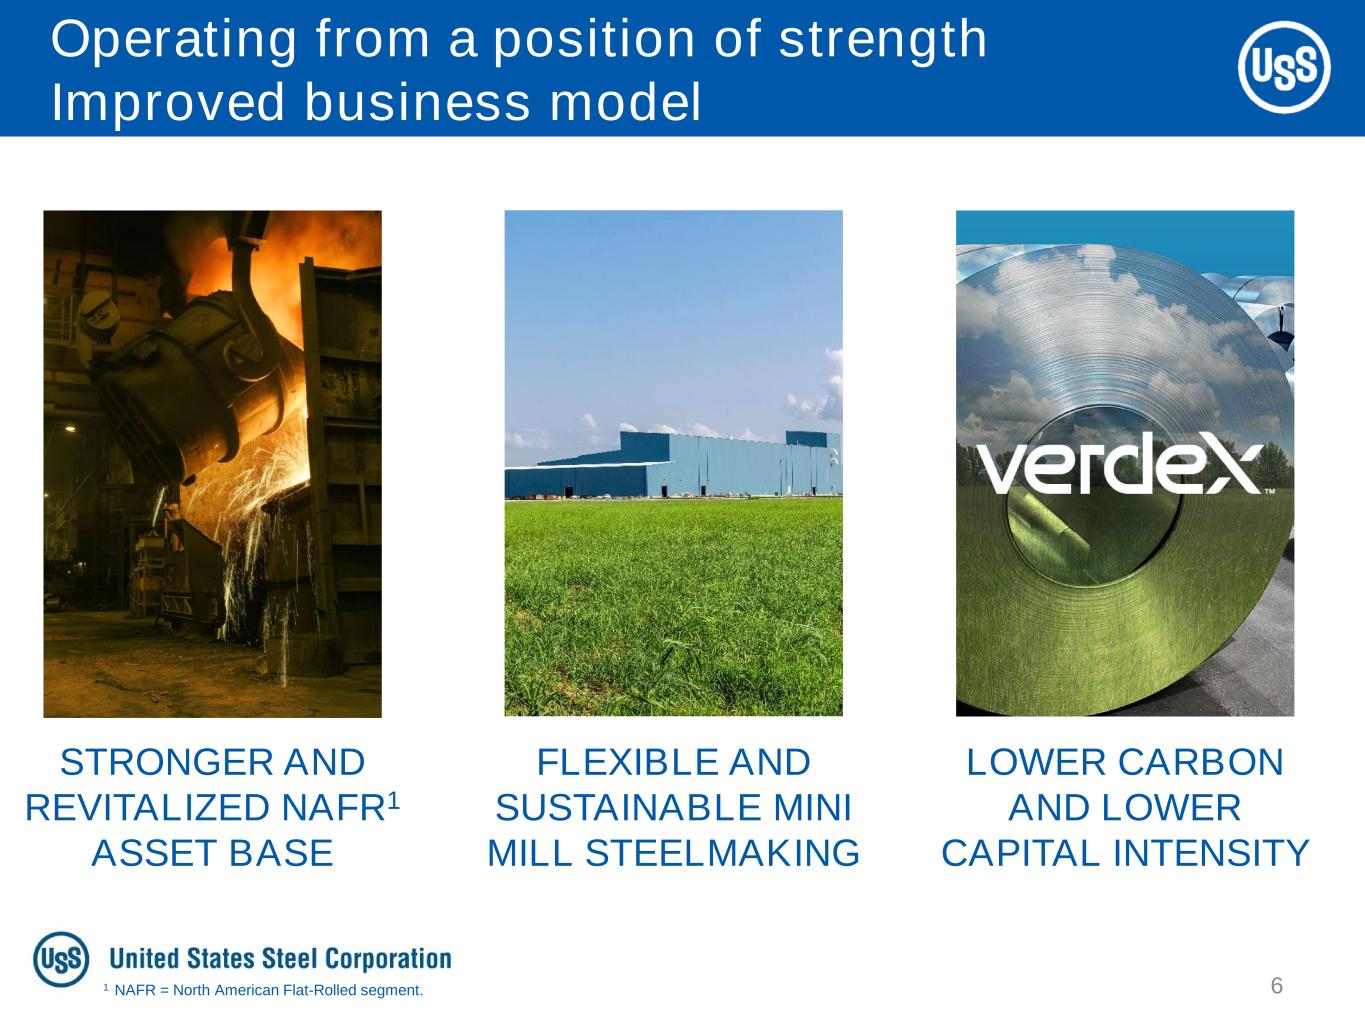
6 6 Operating from a position of strength Improved business model STRONGER AND REVITALIZED NAFR1 ASSET BASE LOWER CARBON AND LOWER CAPITAL INTENSITY FLEXIBLE AND SUSTAINABLE MINI MILL STEELMAKING 1 NAFR = North American Flat-Rolled segment.

7 7 Operating from a position of strength Transformed balance sheet $0.0B 20292022 20252023 $0.0B 20282024 2026 2027 $0.1B 20332030 2031 $0.0B 2032 2034 2035+ $0.0B$0.0B $1.8B $0.1B $0.1B $0.0B $0.5B $0.0B $1.2B $0.0B U. S. Steel Big River Steel Debt maturity profile, in billions, as of 9/30/2022 Strategic investment horizon Record cash and record liquidity Of total debt due in 2029 and beyond Over-funded pension and OPEB plans ~80%

8 8 Operating from a position of strength Pre-funded investments Record cash & liquidity support strategic capex, as of 9/30/2022 1 Strategic capex includes Gary pig iron machine, Big River 2 (BR2), BRS non-grain oriented (NGO) electrical steel line, BRS coating line, and Keetac DR-grade pellet upgrades. $5.8B $3.9B Record Cash / Liquidity 3Q 2022 Strategic Capex ~40% Completed strategic capex expected by year-end 2023 Total capex forecast; $1.7B on strategic investments On-time & on-budget strategic projects $1.4B 2021 – 2022E $2.5B 2023E – 2024E $3.4B Cash & Cash Equivalents $2.4B Available Liquidity $2.5B

9 9 NA Flat-rolled Mini Mill U. S. Steel Europe Tubular Safely navigating current headwinds Business update Market Conditions Management Actions Demand soft; cautious buying continues Steel prices stabilizing above historical norms Adjusted integrated steelmaking footprint Leveraging diverse end-market exposure Prolonged effects of Ukraine war pressuring steel prices / demand Raw materials costs remain elevated; energy costs surging Pulled ahead a planned 60-day outage on BF#2 to better align supply with demand Conducted voluntary workforce reduction Higher seamless OCTG prices contributing to EBITDA performance Running at higher utilization, based on customer specifications Invested in the downturn; EAF providing rounds substrate creating cost advantage; $100 million annual savings

10 10 Returning capital to stockholders Balanced capital allocation approach PRIORITIES CONSIDERATIONS OBJECTIVES 1 Balance sheet strength Through-cycle adjusted debt to EBITDA range 3.0x – 3.5x range 2 Announced Best for All investments Cash to NTM1 capex and cash of no less than $1.5B 1:1 ≥ $1.5B cash 3 Capability capex Expands iron ore, mini mill or finishing competitive advantages 15%+ IRR & advances Best for All 4 $0.05/share measured & opportunistic SBB Direct returns Maintain quarterly dividend Return excess cash w/ buybacks On-track Executing on current $500M buyback authorization On-track On-track STATUS 1 NTM = Next twelve months

11 11 Advancing towards our Best for All future 3Q 2022 results In the third quarter 2022: Adjusted EBITDA $848M Supporting 16% enterprise EBITDA Adjusted EPS $1.95 Top end of our guidance range Free cash flow $599M Contributing to record cash and record liquidity

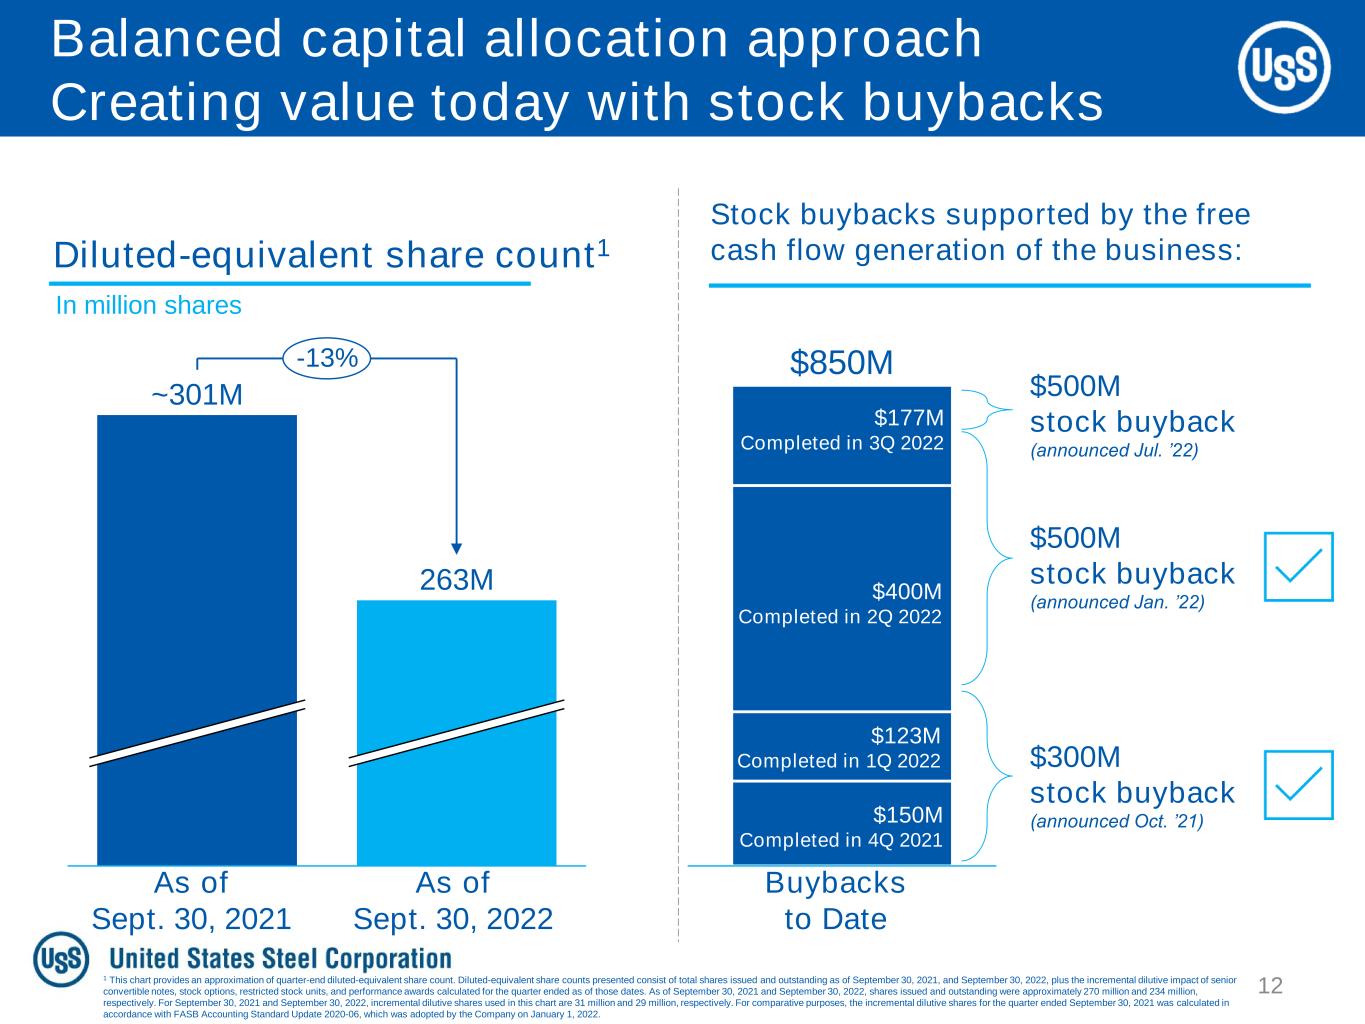
12 12 Balanced capital allocation approach Creating value today with stock buybacks ~301M 263M -13% Diluted-equivalent share count1 In million shares As of Sept. 30, 2021 As of Sept. 30, 2022 $850M $300M stock buyback (announced Oct. ’21) $500M stock buyback (announced Jan. ’22) $150M Completed in 4Q 2021 $123M Completed in 1Q 2022 Stock buybacks supported by the free cash flow generation of the business: $400M Completed in 2Q 2022 $177M Completed in 3Q 2022 $500M stock buyback (announced Jul. ’22) Buybacks to Date 1 This chart provides an approximation of quarter-end diluted-equivalent share count. Diluted-equivalent share counts presented consist of total shares issued and outstanding as of September 30, 2021, and September 30, 2022, plus the incremental dilutive impact of senior convertible notes, stock options, restricted stock units, and performance awards calculated for the quarter ended as of those dates. As of September 30, 2021 and September 30, 2022, shares issued and outstanding were approximately 270 million and 234 million, respectively. For September 30, 2021 and September 30, 2022, incremental dilutive shares used in this chart are 31 million and 29 million, respectively. For comparative purposes, the incremental dilutive shares for the quarter ended September 30, 2021 was calculated in accordance with FASB Accounting Standard Update 2020-06, which was adopted by the Company on January 1, 2022.

$1,110M 2024E2021 $800M $1,710M 2023E2022E $320M Expected strategic CAPEX: Best-in-class finishing Mini mill steelmaking Low-cost iron ore ~$250M ~$650M ~$1,350M ~$750M ~$385M ~$235M ~$40M ~$75M ~$125M ~$10M Advancing towards our Best for All future Investing in competitive advantages ~$70M 2022 total capex is expected to be ≤ $2.0 billion 2023 total capex is expected to be ~$2.5 billion 13 13

14 14 Advancing towards our Best for All future OPERATING FROM A POSITION OF STRENGTH SAFELY NAVIGATING CURRENT HEADWINDS RETURNING CAPITAL TO STOCKHOLDERS

Q&A Big River 2 construction

Closing Remarks

Flat-rolled ($ millions) 3Q 2022 Segment (loss) earnings before interest and income taxes $505 Depreciation 126 Flat-rolled Segment EBITDA $631 U. S. Steel Europe ($ millions) 3Q 2022 Segment (loss) earnings before interest and income taxes ($32) Depreciation 22 U. S. Steel Europe Segment EBITDA ($12) Tubular ($ millions) 3Q 2022 Segment (loss) earnings before interest and income taxes $155 Depreciation 12 Tubular Segment EBITDA $167 Other ($ millions) 3Q 2022 Segment (loss) earnings before interest and income taxes $21 Depreciation 1 Other Segment EBITDA $22 Reconciliation of segment EBITDA Mini Mill ($ millions) 3Q 2022 Segment (loss) earnings before interest and income taxes $1 Depreciation 39 Mini Mill Segment EBITDA $40 17

Reconciliation of adjusted EBITDA 18 ($ millions) 3Q 2022 Reported net earnings attributable to U. S. Steel $490 Income tax provision (benefit) 154 Net interest and other financial costs (30) Reported earnings before interest and income taxes $614 Depreciation, depletion and amortization expense 198 EBITDA $812 Restructuring and other charges 23 Other charges, net 13 Adjusted EBITDA $848

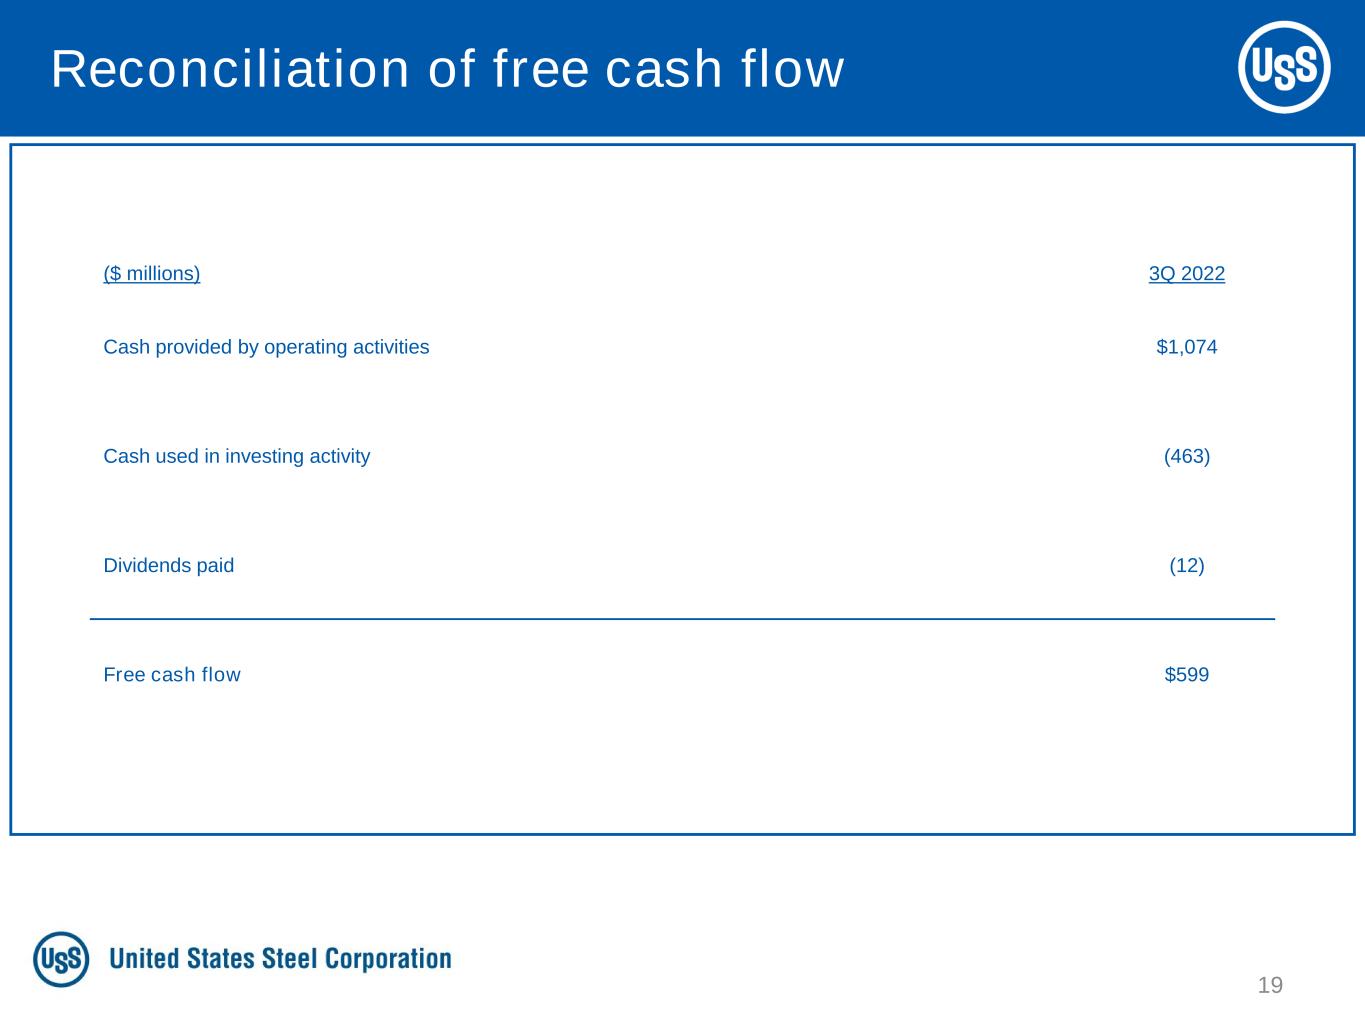
Reconciliation of free cash flow 19 ($ millions) 3Q 2022 Cash provided by operating activities $1,074 Cash used in investing activity (463) Dividends paid (12) Free cash flow $599

INVESTOR RELATIONS Kevin Lewis Vice President 412-433-6935 klewis@uss.com Eric Linn Director 412-433-2385 eplinn@uss.com www.ussteel.com @USS_Investors