
| INVESTOR PRESENTATION 4th Quarter, 2007 |
| Forward Looking Statements & Safe Harbor This presentation contains certain statements, estimates and forecasts with respect to future performance and events. These statements, estimates and forecasts are "forward-looking statements". In some cases, forward-looking statements can be identified by the use of forward- looking terminology such as "may," "might," "will," "should," "expect," "plan," "intend," "estimate," "anticipate," "believe," "predict," "potential" or "continue" or the negatives thereof or variations thereon or similar terminology. All statements other than statements of historical fact included in this presentation are forward-looking statements and are based on various underlying assumptions and expectations and are subject to known and unknown risks, uncertainties and assumptions, may include projections of our future financial performance based on our growth strategies and anticipated trends in our business. These statements are only predictions based on our current expectations and projections about future events. There are important factors that could cause our actual results, level of activity performance or achievements to differ materially from the results, level of activity, performance or achievements expressed or implied in the forward-looking statements. As a result, there can be no assurance that the forward-looking statements included in this presentation will prove to be accurate or correct. In light of these risks, uncertainties and assumptions, the future performance or events described in the forward- looking statements in this presentation might not occur. Accordingly, you should not rely upon forward-looking statements as a prediction of actual results and we do not assume any responsibility for the accuracy or completeness of any of these forward-looking statements that may be made from time to time. We are under no obligation (and expressly disclaim any such obligation) to update or revise any forward-looking statements, whether as a result of new information, future developments or otherwise. |
| Agenda Executive Summary Financial Review Appendix |
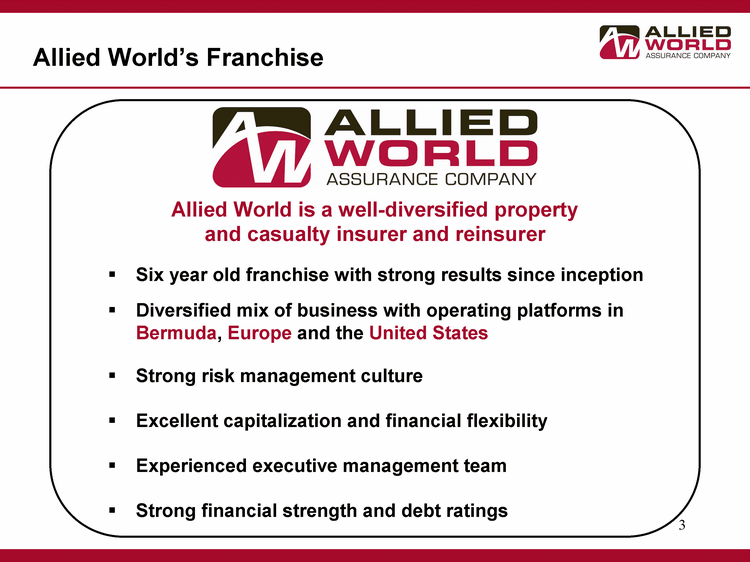
| Allied World's Franchise Six year old franchise with strong results since inception Diversified mix of business with operating platforms in Bermuda, Europe and the United States Strong risk management culture Excellent capitalization and financial flexibility Experienced executive management team Strong financial strength and debt ratings Allied World is a well-diversified property and casualty insurer and reinsurer |
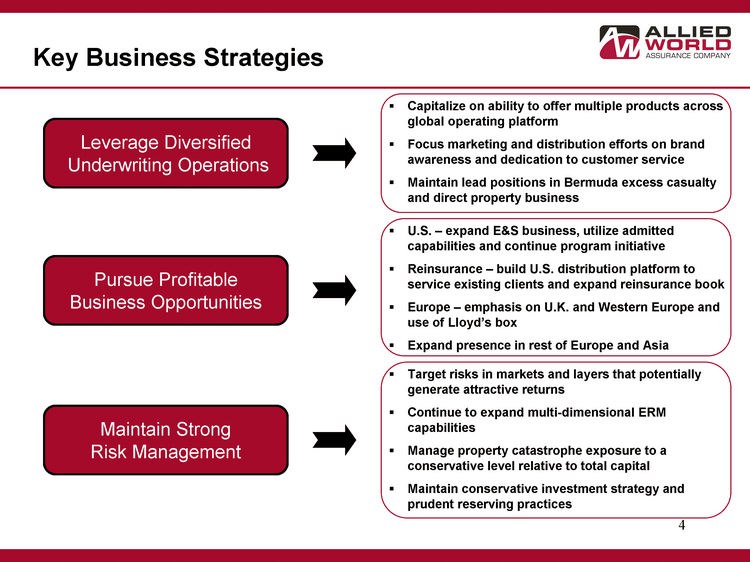
| Key Business Strategies Leverage Diversified Underwriting Operations Pursue Profitable Business Opportunities Capitalize on ability to offer multiple products across global operating platform Focus marketing and distribution efforts on brand awareness and dedication to customer service Maintain lead positions in Bermuda excess casualty and direct property business U.S. - expand E&S business, utilize admitted capabilities and continue program initiative Reinsurance - build U.S. distribution platform to service existing clients and expand reinsurance book Europe - emphasis on U.K. and Western Europe and use of Lloyd's box Expand presence in rest of Europe and Asia Maintain Strong Risk Management Target risks in markets and layers that potentially generate attractive returns Continue to expand multi-dimensional ERM capabilities Manage property catastrophe exposure to a conservative level relative to total capital Maintain conservative investment strategy and prudent reserving practices |
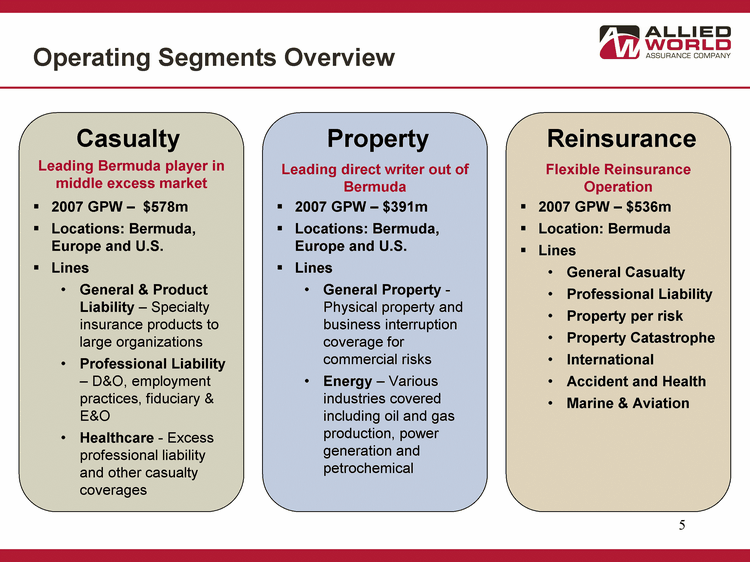
| Operating Segments Overview 2007 GPW - $578m Locations: Bermuda, Europe and U.S. Lines General & Product Liability - Specialty insurance products to large organizations Professional Liability - - D&O, employment practices, fiduciary & E&O Healthcare - Excess professional liability and other casualty coverages Leading Bermuda player in middle excess market Casualty Property Leading direct writer out of Bermuda 2007 GPW - $391m Locations: Bermuda, Europe and U.S. Lines General Property - Physical property and business interruption coverage for commercial risks Energy - Various industries covered including oil and gas production, power generation and petrochemical Reinsurance Flexible Reinsurance Operation 2007 GPW - $536m Location: Bermuda Lines General Casualty Professional Liability Property per risk Property Catastrophe International Accident and Health Marine & Aviation |
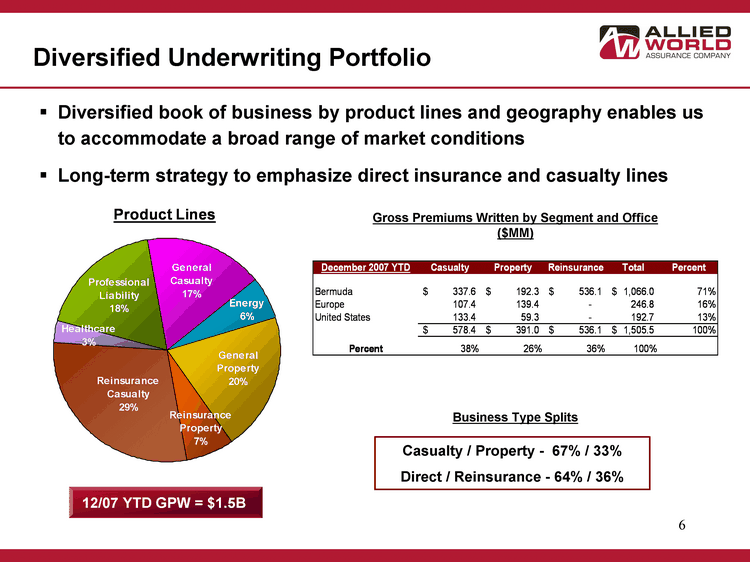
| Diversified book of business by product lines and geography enables us to accommodate a broad range of market conditions Long-term strategy to emphasize direct insurance and casualty lines Diversified Underwriting Portfolio Reinsurance Casualty Healthcare Professional Liability General Casualty Energy General Property Reinsurance Property East 0.29 0.03 0.18 0.17 0.06 0.2 0.07 12/07 YTD GPW = $1.5B Casualty / Property - 67% / 33% Direct / Reinsurance - 64% / 36% Gross Premiums Written by Segment and Office ($MM) Business Type Splits |
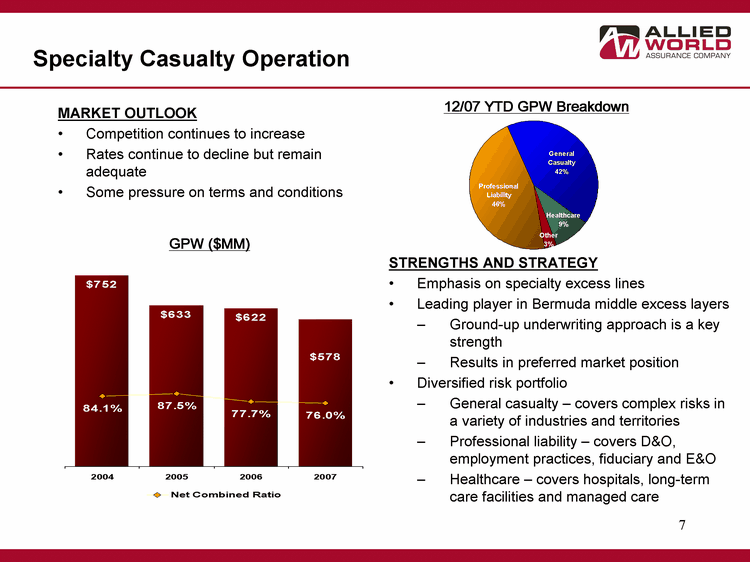
| Professional Liability General Casualty Healthcare Other East 0.46 0.416 0.091 0.03 Allied World Net Combined Ratio 2004 752 0.841 2005 633 0.875 2006 622.3 0.777 2007 578 0.76 Specialty Casualty Operation 12/07 YTD GPW Breakdown GPW ($MM) STRENGTHS AND STRATEGY Emphasis on specialty excess lines Leading player in Bermuda middle excess layers Ground-up underwriting approach is a key strength Results in preferred market position Diversified risk portfolio General casualty - covers complex risks in a variety of industries and territories Professional liability - covers D&O, employment practices, fiduciary and E&O Healthcare - covers hospitals, long-term care facilities and managed care MARKET OUTLOOK Competition continues to increase Rates continue to decline but remain adequate Some pressure on terms and conditions |
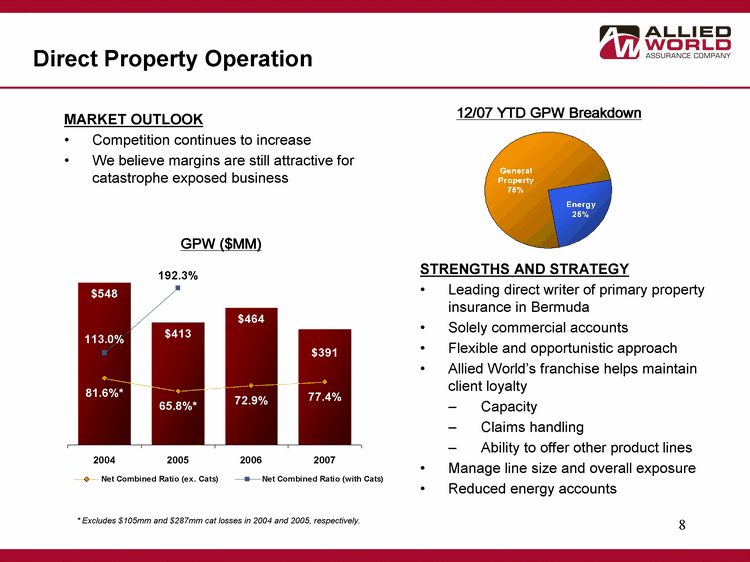
| STRENGTHS AND STRATEGY Leading direct writer of primary property insurance in Bermuda Solely commercial accounts Flexible and opportunistic approach Allied World's franchise helps maintain client loyalty Capacity Claims handling Ability to offer other product lines Manage line size and overall exposure Reduced energy accounts General Property Energy East 0.75 0.25 Direct Property Operation 12/07 YTD GPW Breakdown MARKET OUTLOOK Competition continues to increase We believe margins are still attractive for catastrophe exposed business GPW ($MM) Allied World Net Combined Ratio (ex. Cats) Net Combined Ratio (with Cats) 2004 548 0.816 1.13 2005 413 0.658 1.923 2006 464 0.729 2007 391 0.774 * Excludes $105mm and $287mm cat losses in 2004 and 2005, respectively. |
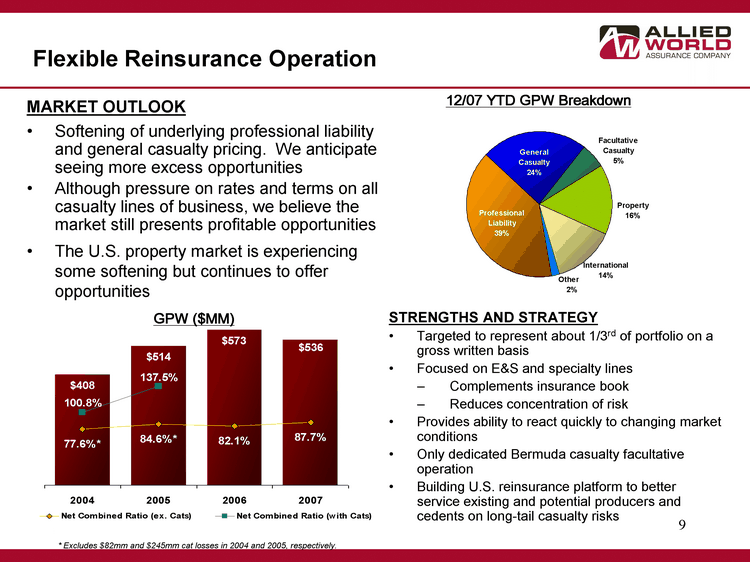
| Allied World Upward Premium Adjustments Net Combined Ratio (ex. Cats) Net Combined Ratio (with Cats) 2004 408 0.776 1.008 2005 514 0.846 1.375 2006 573 0.821 2007 536 0.877 Professional Liability General Casualty Facultative Casualty Property International Other East 0.393 0.236 0.053 0.156 0.1378 0.016 Flexible Reinsurance Operation 12/07 YTD GPW Breakdown * Excludes $82mm and $245mm cat losses in 2004 and 2005, respectively. GPW ($MM) STRENGTHS AND STRATEGY Targeted to represent about 1/3rd of portfolio on a gross written basis Focused on E&S and specialty lines Complements insurance book Reduces concentration of risk Provides ability to react quickly to changing market conditions Only dedicated Bermuda casualty facultative operation Building U.S. reinsurance platform to better service existing and potential producers and cedents on long-tail casualty risks MARKET OUTLOOK Softening of underlying professional liability and general casualty pricing. We anticipate seeing more excess opportunities Although pressure on rates and terms on all casualty lines of business, we believe the market still presents profitable opportunities The U.S. property market is experiencing some softening but continues to offer opportunities |
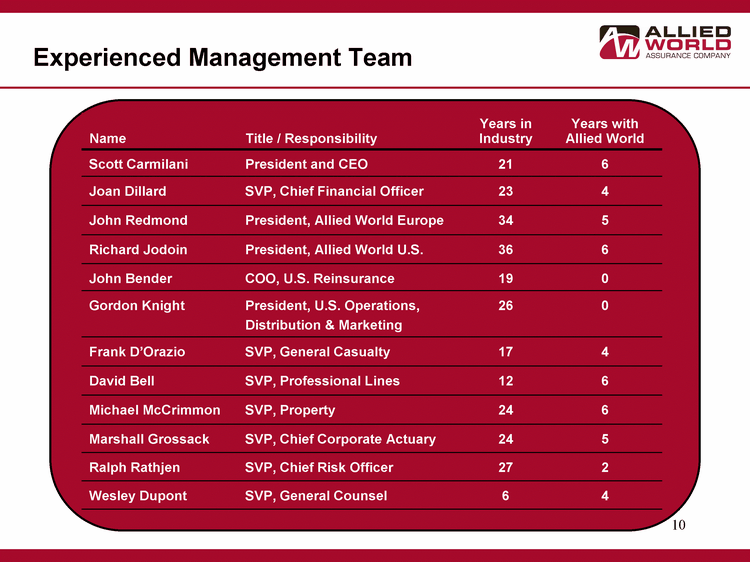
| Name Title / Responsibility Years in Industry Years with Allied World Scott Carmilani President and CEO 21 6 Joan Dillard SVP, Chief Financial Officer 23 4 John Redmond President, Allied World Europe 34 5 Richard Jodoin President, Allied World U.S. 36 6 John Bender COO, U.S. Reinsurance 19 0 Gordon Knight President, U.S. Operations, Distribution & Marketing 26 0 Frank D'Orazio SVP, General Casualty 17 4 David Bell SVP, Professional Lines 12 6 Michael McCrimmon SVP, Property 24 6 Marshall Grossack SVP, Chief Corporate Actuary 24 5 Ralph Rathjen SVP, Chief Risk Officer 27 2 Wesley Dupont SVP, General Counsel 6 4 Experienced Management Team |
| Agenda Executive Summary Financial Review Appendix |
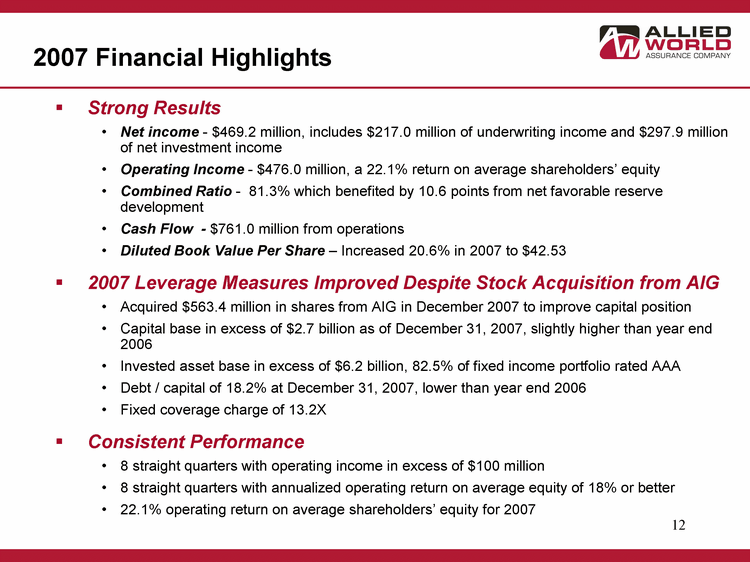
| 2007 Financial Highlights Strong Results Net income - $469.2 million, includes $217.0 million of underwriting income and $297.9 million of net investment income Operating Income - $476.0 million, a 22.1% return on average shareholders' equity Combined Ratio - 81.3% which benefited by 10.6 points from net favorable reserve development Cash Flow - $761.0 million from operations Diluted Book Value Per Share - Increased 20.6% in 2007 to $42.53 2007 Leverage Measures Improved Despite Stock Acquisition from AIG Acquired $563.4 million in shares from AIG in December 2007 to improve capital position Capital base in excess of $2.7 billion as of December 31, 2007, slightly higher than year end 2006 Invested asset base in excess of $6.2 billion, 82.5% of fixed income portfolio rated AAA Debt / capital of 18.2% at December 31, 2007, lower than year end 2006 Fixed coverage charge of 13.2X Consistent Performance 8 straight quarters with operating income in excess of $100 million 8 straight quarters with annualized operating return on average equity of 18% or better 22.1% operating return on average shareholders' equity for 2007 |
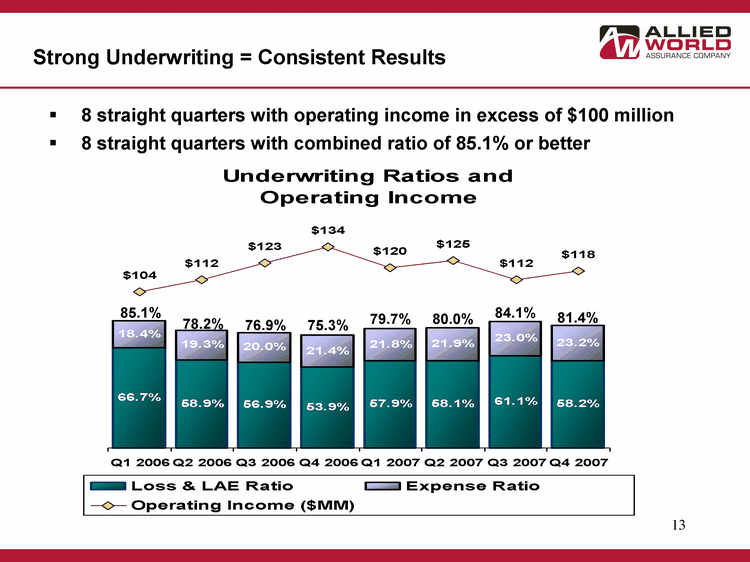
| 8 straight quarters with operating income in excess of $100 million 8 straight quarters with combined ratio of 85.1% or better Loss & LAE Ratio Expense Ratio Operating Income ($MM) Q1 2006 0.667 0.184 104 Q2 2006 0.589 0.193 112 Q3 2006 0.569 0.2 123 Q4 2006 0.539 0.214 134 Q1 2007 0.579 0.218 120 Q2 2007 0.581 0.219 125 Q3 2007 0.611 0.23 112 Q4 2007 0.582 0.232 118 Strong Underwriting = Consistent Results 85.1% 78.2% 76.9% 75.3% 79.7% 80.0% 84.1% 81.4% |
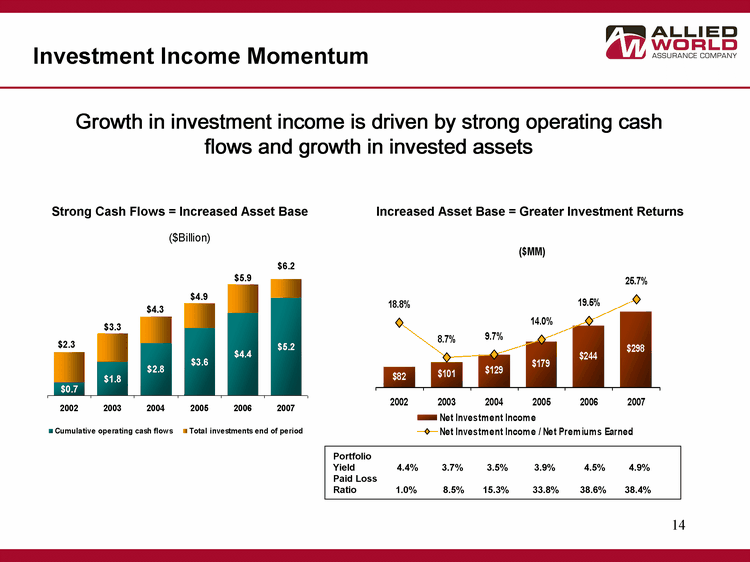
| Investment Income Momentum Cummulative operating cash flows Total investments end of period Combined Ratio (ex. Cats) Combined Ratio (with Cats) 2002 0.7 1.6 82 2003 1.8 1.5 101 2004 2.8 1.4 129 113 2005 3.6 1.3 179 192.3 2006 4.4 1.5 240 2007 5.2 1 265.6 Net Investment Income Net Investment Income / Net Premiums Earned 2002 81.6 0.188 2003 101 0.087 2004 129 0.097 2005 179 0.14 2006 244 0.195 2007 297.9 0.257 Growth in investment income is driven by strong operating cash flows and growth in invested assets Strong Cash Flows = Increased Asset Base Increased Asset Base = Greater Investment Returns Portfolio Yield 4.4% 3.7% 3.5% 3.9% 4.5% 4.9% Paid Loss Ratio 1.0% 8.5% 15.3% 33.8% 38.6% 38.4% |
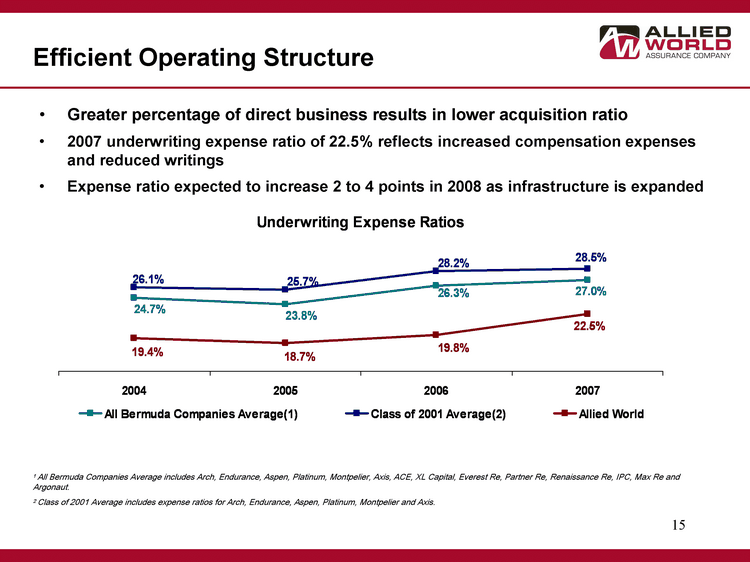
| Efficient Operating Structure 2004 2005 2006 2007 All Bermuda Companies Average(1) 0.247 0.238 0.263 0.27 Class of 2001 Average(2) 0.260833333 0.257166667 0.282 0.285 Allied World 0.194 0.187 0.198 0.225 1 All Bermuda Companies Average includes Arch, Endurance, Aspen, Platinum, Montpelier, Axis, ACE, XL Capital, Everest Re, Partner Re, Renaissance Re, IPC, Max Re and Argonaut. 2 Class of 2001 Average includes expense ratios for Arch, Endurance, Aspen, Platinum, Montpelier and Axis. Greater percentage of direct business results in lower acquisition ratio 2007 underwriting expense ratio of 22.5% reflects increased compensation expenses and reduced writings Expense ratio expected to increase 2 to 4 points in 2008 as infrastructure is expanded |
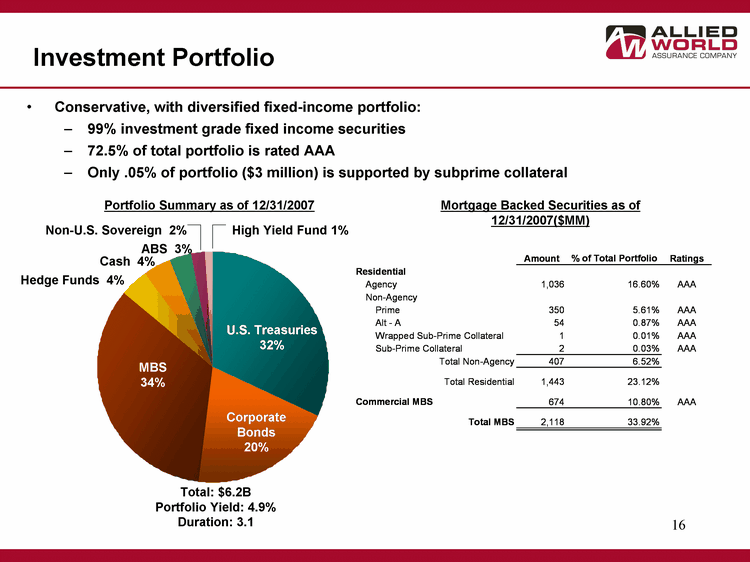
| Conservative, with diversified fixed-income portfolio: 99% investment grade fixed income securities 72.5% of total portfolio is rated AAA Only .05% of portfolio ($3 million) is supported by subprime collateral Portfolio Summary as of 12/31/2007 US Treasuries 0.32 Corporate Bonds 0.2 MBS 0.34 Hedge Funds 0.04 Cash 0.04 ABS 0.03 Non-US Sovereign 0.02 High Yield Funds 0.01 U.S. Treasuries 32% Corporate Bonds 20% MBS 34% Hedge Funds 4% Cash 4% ABS 3% Non-U.S. Sovereign 2% High Yield Fund 1% Total: $6.2B Portfolio Yield: 4.9% Duration: 3.1 Investment Portfolio Mortgage Backed Securities as of 12/31/2007($MM) |
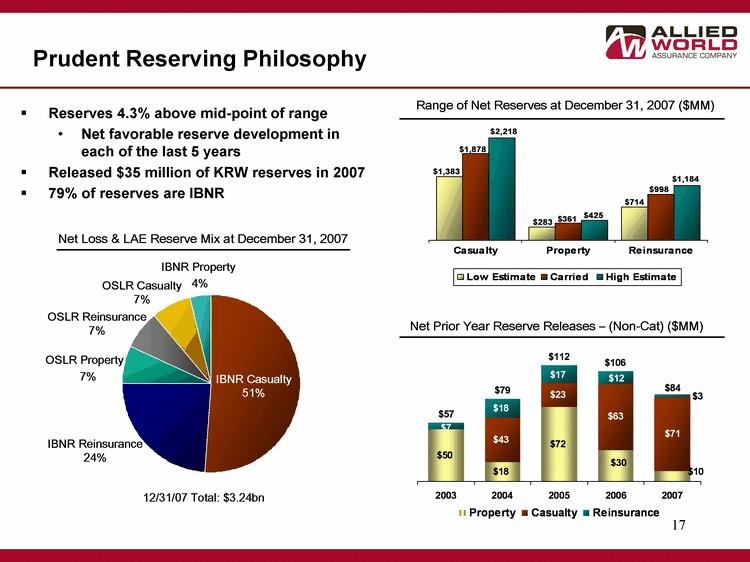
| Casualty Property Reinsurance Low Estimate 1383 283 714 Carried 1878 361 998 High Estimate 2218 425 1184 Reserves 4.3% above mid-point of range Net favorable reserve development in each of the last 5 years Released $35 million of KRW reserves in 2007 79% of reserves are IBNR 2003 2004 2005 2006 2007 Property 50.2 18.4 71.8 30.3 10 Casualty 0 43.4 22.7 63.4 71 Reinsurance 6.6 17.8 17 12.4 3 Total 15 15 15 15 15 Net Loss & LAE Reserve Mix at December 31, 2007 3/31/2006 IBNR Casualty 51 IBNR Reins 24 OSLR Property 7 OSLR Reins 7 OSLR Casualty 7 IBNR Prop 4 OSLR Property 7% IBNR Casualty 51% OSLR Casualty 7% IBNR Reinsurance 24% OSLR Reinsurance 7% IBNR Property 4% 12/31/07 Total: $3.24bn Net Prior Year Reserve Releases - (Non-Cat) ($MM) Range of Net Reserves at December 31, 2007 ($MM) Prudent Reserving Philosophy |
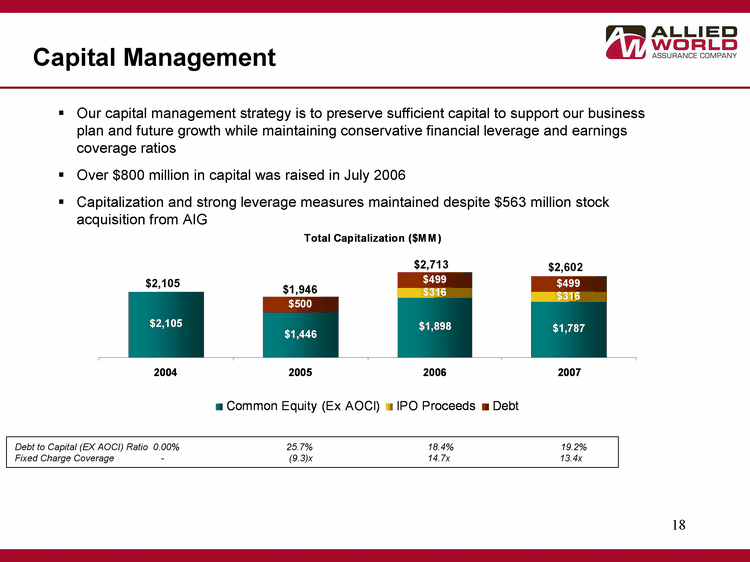
| Capital Management Our capital management strategy is to preserve sufficient capital to support our business plan and future growth while maintaining conservative financial leverage and earnings coverage ratios Over $800 million in capital was raised in July 2006 Capitalization and strong leverage measures maintained despite $563 million stock acquisition from AIG Debt to Capital (EX AOCI) Ratio 0.00% 25.7% 18.4% 19.2% Fixed Charge Coverage - (9.3)x 14.7x 13.4x $1,946 $2,713 $2,602 $2,105 |
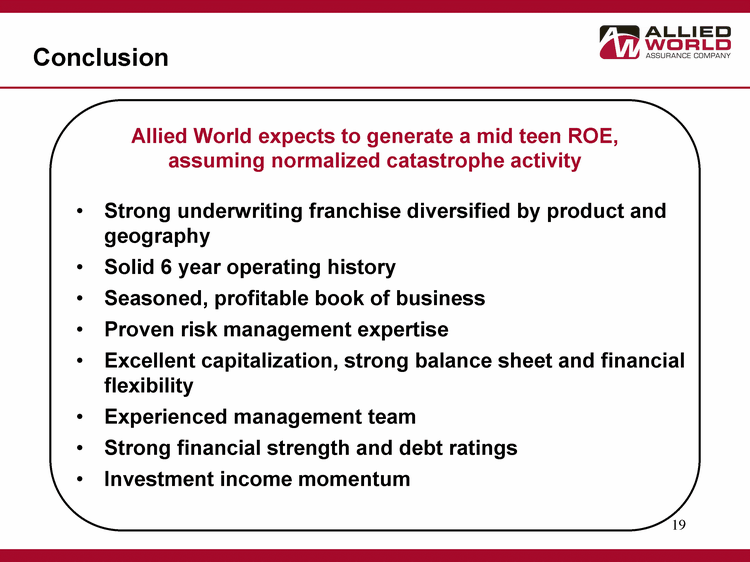
| Conclusion Allied World expects to generate a mid teen ROE, assuming normalized catastrophe activity Strong underwriting franchise diversified by product and geography Solid 6 year operating history Seasoned, profitable book of business Proven risk management expertise Excellent capitalization, strong balance sheet and financial flexibility Experienced management team Strong financial strength and debt ratings Investment income momentum |

| Agenda Executive Summary Financial Review Appendix |
Segment Results — 2007 & 2006
| | | | | | | | | | | | | | | | | |
| Year Ended December 31, 2007 | | Property | | | Casualty | | | Reinsurance | | | Total | |
| |
| Gross premiums written | | $ | 391,017 | | | $ | 578,433 | | | $ | 536,059 | | | $ | 1,505,509 | |
| Net premiums written | | | 176,420 | | | | 440,802 | | | | 535,888 | | | | 1,153,110 | |
| Net premiums earned | | | 180,458 | | | | 475,523 | | | | 503,961 | | | | 1,159,942 | |
| Net losses and loss expenses | | | (105,662 | ) | | | (275,815 | ) | | | (300,863 | ) | | | (682,340 | ) |
| Acquisition costs | | | 114 | | | | (17,269 | ) | | | (101,804 | ) | | | (118,959 | ) |
| General and administrative expenses | | | (34,185 | ) | | | (68,333 | ) | | | (39,123 | ) | | | (141,641 | ) |
| | | |
| Underwriting income | | | 40,725 | | | | 114,106 | | | | 62,171 | | | | 217,002 | |
| Net investment income | | | | | | | | | | | | | | | 297,932 | |
| Net realized investment losses | | | | | | | | | | | | | | | (7,617 | ) |
| Interest expense | | | | | | | | | | | | | | | (37,848 | ) |
| Foreign exchange gain | | | | | | | | | | | | | | | 817 | |
| | | | | | | | | | | | | | | | |
| Income before income taxes | | | | | | | | | | | | | | $ | 470,286 | |
| | | | | | | | | | | | | | | | |
| | | | | | | | | | | | | | | | | |
GAAP Ratios: | | | | | | | | | | | | | | | | |
| Loss and loss expense ratio | | | 58.6 | % | | | 58.0 | % | | | 59.7 | % | | | 58.8 | % |
| Acquisition cost ratio | | | (0.1 | %) | | | 3.6 | % | | | 20.2 | % | | | 10.3 | % |
| General and administrative expense ratio | | | 18.9 | % | | | 14.4 | % | | | 7.8 | % | | | 12.2 | % |
| | | |
| Combined ratio | | | 77.4 | % | | | 76.0 | % | | | 87.7 | % | | | 81.3 | % |
| | | |
| | | | | | | | | | | | | | | | | |
| Year Ended December 31, 2006 | | Property | | | Casualty | | | Reinsurance | | | Total | |
| |
| Gross premiums written | | $ | 463,903 | | | $ | 622,387 | | | $ | 572,735 | | | $ | 1,659,025 | |
| Net premiums written | | | 193,655 | | | | 540,980 | | | | 571,961 | | | | 1,306,596 | |
| Net premiums earned | | | 190,784 | | | | 534,294 | | | | 526,932 | | | | 1,252,010 | |
| Net losses and loss expenses | | | (114,994 | ) | | | (331,759 | ) | | | (292,380 | ) | | | (739,133 | ) |
| Acquisition costs | | | 2,247 | | | | (30,396 | ) | | | (113,339 | ) | | | (141,488 | ) |
| General and administrative expenses | | | (26,294 | ) | | | (52,809 | ) | | | (26,972 | ) | | | (106,075 | ) |
| | | |
| Underwriting income | | | 51,743 | | | | 119,330 | | | | 94,241 | | | | 265,314 | |
| Net investment income | | | | | | | | | | | | | | | 244,360 | |
| Net realized investment losses | | | | | | | | | | | | | | | (28,678 | ) |
| Interest expense | | | | | | | | | | | | | | | (32,566 | ) |
| Foreign exchange loss | | | | | | | | | | | | | | | (601 | ) |
| | | | | | | | | | | | | | | | |
| Income before income taxes | | | | | | | | | | | | | | $ | 447,829 | |
| | | | | | | | | | | | | | | | |
| | | | | | | | | | | | | | | | | |
GAAP Ratios: | | | | | | | | | | | | | | | | |
| Loss and loss expense ratio | | | 60.3 | % | | | 62.1 | % | | | 55.5 | % | | | 59.0 | % |
| Acquisition cost ratio | | | (1.2 | %) | | | 5.7 | % | | | 21.5 | % | | | 11.3 | % |
| General and administrative expense ratio | | | 13.8 | % | | | 9.9 | % | | | 5.1 | % | | | 8.5 | % |
| | | |
| Combined ratio | | | 72.9 | % | | | 77.7 | % | | | 82.1 | % | | | 78.8 | % |
| | | |
21
| Non-GAAP Financial Measures In presenting the company's results, management has included and discussed in this press release certain non-GAAP financial measures within the meaning of Regulation G as promulgated by the U.S. Securities and Exchange Commission. Management believes that these non-GAAP measures, which may be defined differently by other companies, better explain the company's results of operations in a manner that allows for a more complete understanding of the underlying trends in the company's business. However, these measures should not be viewed as a substitute for those determined in accordance with GAAP. "Operating income" is an internal performance measure used by the company in the management of its operations and represents after-tax operational results excluding, as applicable, net realized investment gains or losses and foreign exchange gains or losses. The company excludes net realized investment gains or losses and net foreign exchange gains or losses from its calculation of operating income because the amount of these gains or losses is heavily influenced by, and fluctuates in part according to, the availability of market opportunities. The company believes these amounts are largely independent of its business and underwriting process and including them distorts the analysis of trends in its operations. In addition to presenting net income determined in accordance with GAAP, the company believes that showing operating income enables investors, analysts, rating agencies and other users of its financial information to more easily analyze the company's results of operations in a manner similar to how management analyzes the company's underlying business performance. Operating income should not be viewed as a substitute for GAAP net income. The company has included "diluted book value per share" because it takes into account the effect of dilutive securities; therefore, the company believes it is a better measure of calculating shareholder returns than book value per share. "Annualized return on average equity" ("ROAE") is calculated using average equity, excluding the average after tax unrealized gains or losses on investments. Unrealized gains (losses) on investments are primarily the result of interest rate movements and the resultant impact on fixed income securities. Such gains (losses) are not related to management actions or operational performance, nor are they likely to be realized. Therefore, the company believes that excluding these unrealized gains (losses) provides a more consistent and useful measurement of operating performance, which supplements GAAP information. In calculating ROAE, the net income (loss) available to shareholders for the period is multiplied by the number of such periods in a calendar year in order to arrive at annualized net income (loss) available to shareholders. The company presents ROAE as a measure that is commonly recognized as a standard of performance by investors, analysts, rating agencies and other users of its financial information. "Annualized operating return on average equity" is calculated using operating income (as defined above and annualized in the manner described for net income (loss) available to shareholders under ROAE above), and average equity, excluding the average after tax unrealized gains (losses) on investments. Unrealized gains (losses) are excluded from equity for the reasons outlined in the annualized return on average equity explanation above. See slides 23 - 25 for a reconciliation of non-GAAP measures used in this presentation to their most directly comparable GAAP measures. |
Non-GAAP Financial Measures - Reconciliations
ALLIED WORLD ASSURANCE COMPANY HOLDINGS, LTD
UNAUDITED ANNUALIZED RETURN ON SHAREHOLDERS’ EQUITY RECONCILIATION
(Expressed in thousands of United States dollars, except for percentage information)
| | | | | | | | | | | | | | | | | | | | | | |
| | | Quarter Ended December 31, | | | | | | | Year Ended December 31, |
| | | 2007 | | 2006 | | | | | | | 2007 | | 2006 |
| Opening shareholders’ equity | | $ | 2,612,775 | | | $ | 2,094,872 | | | | | | | | $ | 2,220,084 | | | $ | 1,420,266 | |
| Deduct/add: accumulated other comprehensive (income)/loss | | | (62,917 | ) | | | (3,447 | ) | | | | | | | | (6,464 | ) | | | 25,508 | |
| | | | | | | | | | |
| Adjusted opening shareholders’ equity | | | 2,549,858 | | | | 2,091,425 | | | | | | | | | 2,213,620 | | | | 1,445,774 | |
| | | | | | | | | | | | | | | | | | | | | | |
| Closing shareholders’ equity | | | 2,239,842 | | | | 2,220,084 | | | | | | | | | 2,239,842 | | | | 2,220,084 | |
| Deduct: accumulated other comprehensive income | | | (136,214 | ) | | | (6,464 | ) | | | | | | | | (136,214 | ) | | | (6,464 | ) |
| | | | | | | | | | |
| Adjusted closing shareholders’ equity | | | 2,103,628 | | | | 2,213,620 | | | | | | | | | 2,103,628 | | | | 2,213,620 | |
| | | | | | | | | | | | | | | | | | | | | | |
| Average shareholders’ equity | | $ | 2,326,743 | | | $ | 2,152,523 | | | | | | | | $ | 2,158,624 | | | $ | 1,829,697 | |
| | | | | | | | | | |
| Net income available to shareholders | | $ | 123,015 | | | $ | 128,362 | | | | | | | | $ | 469,182 | | | $ | 442,838 | |
| Annualized net income available to shareholders | | | 492,060 | | | | 513,448 | | | | | | | | | 469,182 | | | | 442,838 | |
| Annualized return on average shareholders’ equity — net income available to shareholders | | | 21.1 | % | | | 23.9 | % | | | | | | | | 21.7 | % | | | 24.2 | % |
| | | | | | | | | | |
| Operating income available to shareholders | | $ | 118,066 | | | $ | 133,644 | | | | | | | | $ | 475,982 | | | $ | 472,117 | |
| Annualized operating income available to shareholders | | | 472,264 | | | | 534,576 | | | | | | | | | 475,982 | | | | 472,117 | |
| Annualized return on average shareholders’ equity — operating income available to shareholders | | | 20.3 | % | | | 24.8 | % | | | | | | | | 22.1 | % | | | 25.8 | % |
| | | | | | | | | | |
| | | |
| | |  |
| Non-GAAP Financial Measures - Reconciliations |
ALLIED WORLD ASSURANCE COMPANY HOLDINGS, LTD
UNAUDITED OPERATING INCOME RECONCILIATION
(Expressed in thousands of United States dollars, except share and per share amounts)
| | | | | | | | | | | | | | | | | | | | | |
| | | Quarter Ended December 31, | | | | | Year Ended December 31, | |
| | | 2007 | | | 2006 | | | | | 2007 | | | 2006 | |
| | | | | | | |
| Net income | | $ | 123,015 | | | $ | 128,362 | | | | | $ | 469,182 | | | $ | 442,838 | |
| Net realized investment (gain) losses | | | (4,544 | ) | | | 4,190 | | | | | | 7,617 | | | | 28,678 | |
| Foreign exchange (gain) loss | | | (405 | ) | | | 1,092 | | | | | | (817 | ) | | | 601 | |
| | | | | | | |
| Operating income | | $ | 118,066 | | | $ | 133,644 | | | | | $ | 475,982 | | | $ | 472,117 | |
| | | | | | | |
| | | | | | | | | | | | | | | | | | | |
Weighted average common shares outstanding: | | | | | | | | | | | | | | | | | | |
| Basic | | | 58,247,755 | | | | 60,284,459 | | | | | | 59,846,987 | | | | 54,746,613 | |
| Diluted | | | 61,133,206 | | | | 62,963,243 | | | | | | 62,331,165 | | | | 57,115,172 | |
| | | | | | | | | | | | | | | | | | | |
Basic per share data: | | | | | | | | | | | | | | | | | | |
| Net income | | $ | 2.11 | | | $ | 2.13 | | | | | $ | 7.84 | | | $ | 8.09 | |
| Net realized investment (gain) losses | | | (0.07 | ) | | | 0.07 | | | | | | 0.12 | | | | 0.52 | |
| Foreign exchange (gain) loss | | | (0.01 | ) | | | 0.02 | | | | | | (0.01 | ) | | | 0.01 | |
| | | | | | | |
| Operating income | | $ | 2.03 | | | $ | 2.22 | | | | | $ | 7.95 | | | $ | 8.62 | |
| | | | | | | |
| | | | | | | | | | | | | | | | | | | |
Diluted per share data | | | | | | | | | | | | | | | | | | |
| Net income | | $ | 2.01 | | | $ | 2.04 | | | | | $ | 7.53 | | | $ | 7.75 | |
| Net realized investment (gain) losses | | | (0.07 | ) | | | 0.06 | | | | | | 0.12 | | | | 0.51 | |
| Foreign exchange (gain) loss | | | (0.01 | ) | | | 0.02 | | | | | | (0.01 | ) | | | 0.01 | |
| | | | | | | |
| Operating income | | $ | 1.93 | | | $ | 2.12 | | | | | $ | 7.64 | | | $ | 8.27 | |
| | | | | | | |
Non-GAAP Financial Measures - Reconciliations
ALLIED WORLD ASSURANCE COMPANY HOLDINGS, LTD
UNAUDITED DILUTED BOOK VALUE PER SHARE RECONCILIATION
(Expressed in thousands of United States dollars, except share and per share amounts)
| | | | | | | | | |
| | | As of | | As of |
| | | December 31, | | December 31, |
| | | 2007 | | 2006 |
| Price per share at period end | | $ | 50.17 | | | $ | 43.63 | |
| | | | | | | | | |
| Total shareholders’ equity | | | 2,239,842 | | | | 2,220,084 | |
| | | | | | | | | |
| Basic common shares outstanding | | | 48,741,927 | | | | 60,287,696 | |
| | | | | | | | | |
| Add: unvested restricted share units | | | 820,890 | | | | 704,372 | |
| | | | | | | | | |
| Add: performance based equity awards | | | 886,251 | | | | 342,501 | |
| | | | | | | | | |
| Add: dilutive options/warrants outstanding | | | 6,723,875 | | | | 6,695,990 | |
| Weighted average exercise price per share | | $ | 33.62 | | | $ | 33.02 | |
| Deduct: options bought back via treasury method | | | (4,506,182 | ) | | | (5,067,534 | ) |
| | | | | | | | | |
| Common shares and common share equivalents outstanding | | | 52,666,761 | | | | 62,963,025 | |
| | | | | | | | | |
| Basic book value per common share | | $ | 45.95 | | | $ | 36.82 | |
| Diluted book value per common share | | $ | 42.53 | | | $ | 35.26 | |


