INVESTOR PRESENTATION 1st Quarter, 2009 |
1 Forward Looking Statements & Safe Harbor This presentation contains certain statements, estimates and forecasts with respect to future performance and events. These statements, estimates and forecasts are "forward-looking statements". In some cases, forward-looking statements can be identified by the use of forward- looking terminology such as "may," "might," "will," "should," "expect," "plan," "intend," "estimate," "anticipate," "believe," "predict," "potential" or "continue" or the negatives thereof or variations thereon or similar terminology. All statements other than statements of historical fact included in this presentation are forward-looking statements and are based on various underlying assumptions and expectations and are subject to known and unknown risks, uncertainties and assumptions, may include projections of our future financial performance based on our growth strategies and anticipated trends in our business. These statements are only predictions based on our current expectations and projections about future events. There are important factors that could cause our actual results, level of activity performance or achievements to differ materially from the results, level of activity, performance or achievements expressed or implied in the forward-looking statements. As a result, there can be no assurance that the forward-looking statements included in this presentation will prove to be accurate or correct. In light of these risks, uncertainties and assumptions, the future performance or events described in the forward- looking statements in this presentation might not occur. Accordingly, you should not rely upon forward-looking statements as a prediction of actual results and we do not assume any responsibility for the accuracy or completeness of any of these forward-looking statements that may be made from time to time. We are under no obligation (and expressly disclaim any such obligation) to update or revise any forward-looking statements, whether as a result of new information, future developments or otherwise. |
2 Executive Summary Direct Insurance Opportunities in U.S. Operations Financial Results and Strength Peer Comparison / Conclusion Appendix Agenda |
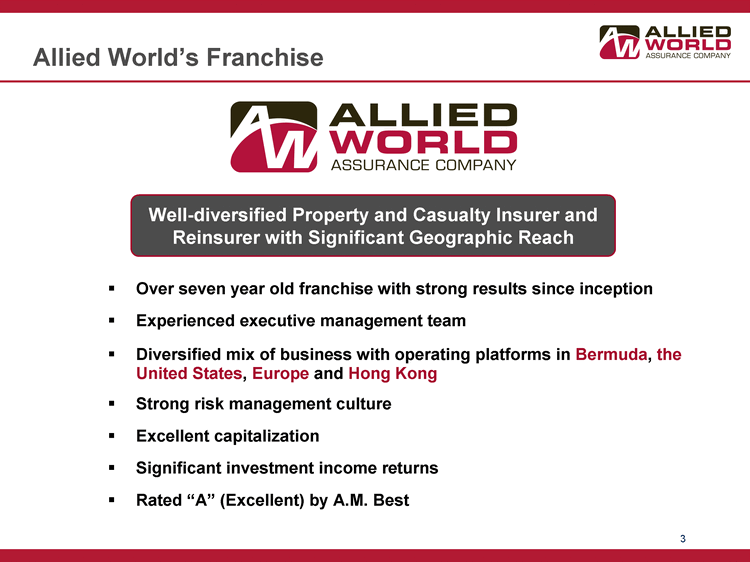
3 Allied World's Franchise Over seven year old franchise with strong results since inception Experienced executive management team Diversified mix of business with operating platforms in Bermuda, the United States, Europe and Hong Kong Strong risk management culture Excellent capitalization Significant investment income returns Rated "A" (Excellent) by A.M. Best Well-diversified Property and Casualty Insurer and Reinsurer with Significant Geographic Reach |
Leverage Diversified Underwriting Operations Pursue Profitable Business Opportunities Capitalize on ability to offer multiple products across global operating platform Focus marketing and distribution efforts on brand awareness and dedication to customer service Recognized market leader in targeted sectors U.S. - expand specialty business, utilize primary and admitted capabilities Europe - emphasis on U.K. and Western Europe and use of Lloyd's box Expand presence in rest of Europe and Asia Reinsurance - capitalize on U.S. and International distribution platforms to expand reinsurance book Maintain Strong Risk Management Target risks in markets and layers that potentially generate attractive returns Continue to expand multi-dimensional ERM capabilities Manage property catastrophe exposure to a conservative level relative to total capital Maintain conservative investment strategy and prudent reserving practices Our Key Business Strategies |
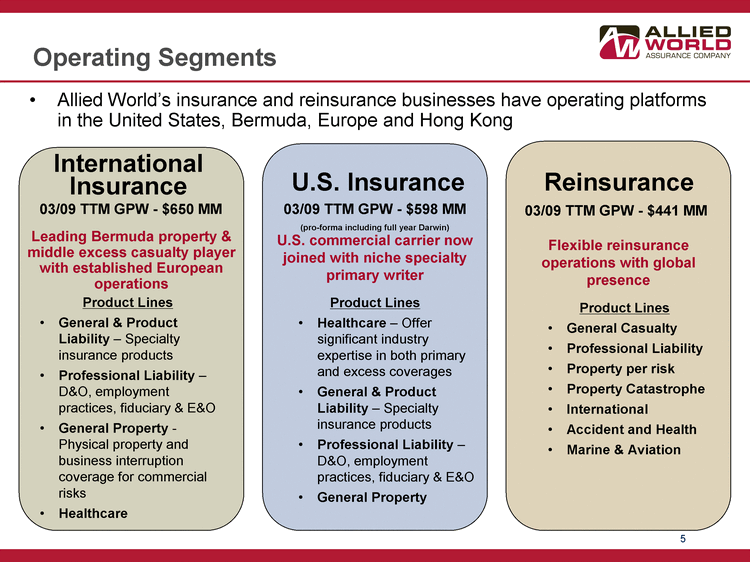
5 Operating Segments Product Lines General & Product Liability - Specialty insurance products Professional Liability - D&O, employment practices, fiduciary & E&O General Property - Physical property and business interruption coverage for commercial risks Healthcare International Insurance U.S. Insurance U.S. commercial carrier now joined with niche specialty primary writer Product Lines Healthcare - Offer significant industry expertise in both primary and excess coverages General & Product Liability - Specialty insurance products Professional Liability - D&O, employment practices, fiduciary & E&O General Property Reinsurance Flexible reinsurance operations with global presence Product Lines General Casualty Professional Liability Property per risk Property Catastrophe International Accident and Health Marine & Aviation Leading Bermuda property & middle excess casualty player with established European operations Allied World's insurance and reinsurance businesses have operating platforms in the United States, Bermuda, Europe and Hong Kong 03/09 TTM GPW - $650 MM 03/09 TTM GPW - $441 MM 03/09 TTM GPW - $598 MM (pro-forma including full year Darwin) |
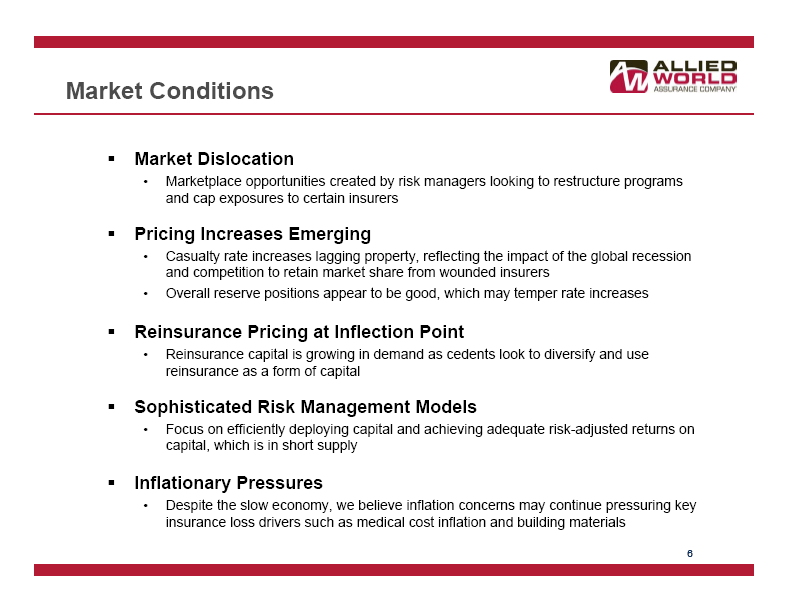
Market ConditionsMarket Dislocation · Marketplace opportunities created by risk managers looking to restructure programs and cap exposures to certain insurersPricing Increases Emerging · Casualty rate increases lagging property, reflecting the impact of the global recession and competition to retain market share from wounded insurers · Overall reserve positions appear to be good, which may temper rate increasesReinsurance Pricing at Inflection Point · Reinsurance capital is growing in demand as cedents look to diversify and use reinsurance as a form of capitalSophisticated Risk Management Models · Focus on efficiently deploying capital and achieving adequate risk-adjusted returns on capital, which is in short supplyInflationary Pressures · Despite the slow economy, we believe inflation concerns may continue pressuring key insurance loss drivers such as medical cost inflation and building materials 6 |
Our Reinsurance Operating Platforms - - Flexibility to take advantage of opportunities in the marketplace BERMUDA / INTERNATIONAL Allied World Bermuda has been writing reinsurance since 2002Location: Bermuda HeadquartersBusiness Focus — Property catastrophe - North America and International catastrophe risks and select ILW opportunities — Property Treaty - Per risk and quota share treaties which protect insurers of residential, commercial and industrial accounts on worldwide basis — Specialty — Excess of loss and quota share treaties for accident and health, aviation and workers’ compensation catastrophe UNITED STATES Allied World Reinsurance Company began writing business in April 2008Location: New York CityRated Business A (Excellent) Focus by A.M. BestChubb — General Re began Casualty operations - Proportional in 1998 and and developed working, a profitable intermediate book andof higher business layer which excess was acquired of loss structures. and expanded Principally by Harbor covering Point general in 2005 liability, umbrella,Acquired excess renewal casualty, rights autofrom liability Chubb and Re of diversified some workers’ book compensation of short-tail and long — -Professional tail business Lines - Broad range ofManagement lines covered, team including with track directors record and of generating officers, superior errors and results omissions andStrong medical risk management malpractice cultureExcellent — Property capitalization — Some property and strong per risk, financial inland flexibility marine, ocean marine, crop & regional non-aggregating cat · Swiss branch office opened in September 2008 to expand geographic presence 17 |
8 $3.0 billion capital base at March 31, 2009 2008 operating results Operating income of $455 million Almost 8% increase in book value per share during 2008 despite turbulent year Operating cash flow remains strong at $657 million $280 million prior year favorable reserve development Hurricanes Gustav and Ike losses only $113 million; less than 4% of June 2008 capital Manageable investment losses despite financial crisis Realized investment losses of $273 million for 2008 with change in unrealized losses of $4 million Net investment income of $309 million Allied World expanded the breadth of its operations and increased its capital position in 2008 and through first quarter 2009 despite the financial crisis and catastrophe events Ability to Capitalize in a Changing Marketplace |
9 Executive Summary Direct Insurance Opportunities in U.S. Operations Financial Results and Strength Peer Comparison / Conclusion Appendix Agenda |
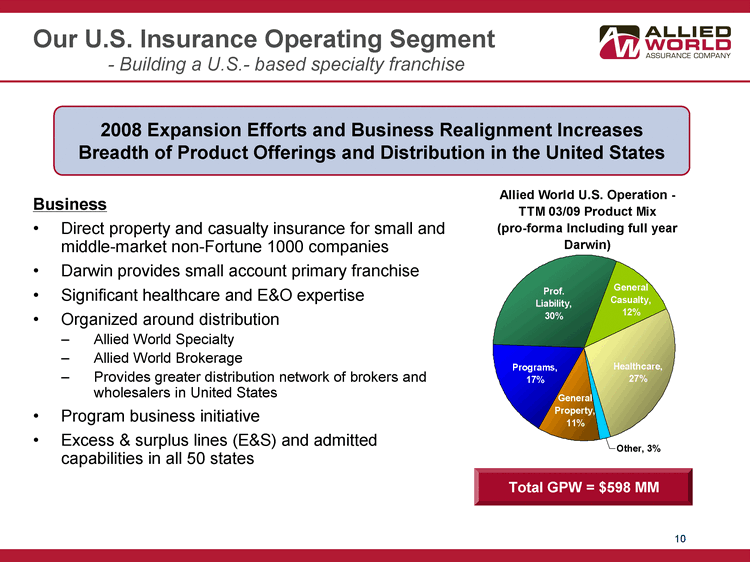
10 Our U.S. Insurance Operating Segment - Building a U.S.- based specialty franchise Business Direct property and casualty insurance for small and middle-market non-Fortune 1000 companies Darwin provides small account primary franchise Significant healthcare and E&O expertise Organized around distribution Allied World Specialty Allied World Brokerage Provides greater distribution network of brokers and wholesalers in United States Program business initiative Excess & surplus lines (E&S) and admitted capabilities in all 50 states Total GPW = $598 MM 2008 Expansion Efforts and Business Realignment Increases Breadth of Product Offerings and Distribution in the United States Allied World U.S. Operation - TTM 03/09 Product Mix (pro-forma Including full year Darwin) Other, 3% Healthcare, 27% Programs, 17% Prof. Liability, 30% General Property, 11% General Casualty, 12% |
11 Expanding U.S. Operating Platform Significant infrastructure investments made throughout 2008 Office locations throughout the U.S. 368 staff count, 62% of Allied World group Dedicated U.S. management team with significant industry experience Enhancements implemented to Allied World's IT platform Darwin Increases Allied World's Presence in U.S. and Significantly Enhances its Domestic Operations 0 100 200 300 400 March 2008 March 2009 Allied World U.S. Staff Count AW New AW Darwin |
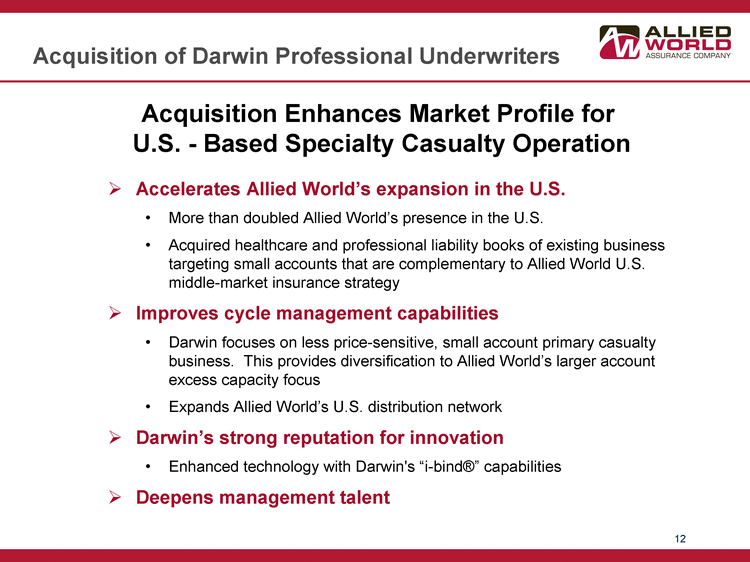
12 Acquisition of Darwin Professional Underwriters Accelerates Allied World's expansion in the U.S. More than doubled Allied World's presence in the U.S. Acquired healthcare and professional liability books of existing business targeting small accounts that are complementary to Allied World U.S. middle-market insurance strategy Improves cycle management capabilities Darwin focuses on less price-sensitive, small account primary casualty business. This provides diversification to Allied World's larger account excess capacity focus Expands Allied World's U.S. distribution network Darwin's strong reputation for innovation Enhanced technology with Darwin's "i-bind(r)" capabilities Deepens management talent Acquisition Enhances Market Profile for U.S. - Based Specialty Casualty Operation |
13 Overview of Darwin Over five year old U.S. based insurer with demonstrated healthcare expertise Strong market identity across three major business lines: Errors and Omissions Medical Malpractice Directors and Officers Proven risk management capabilities Strong reputation for innovative approach to underwriting Advanced technology platform that enhances distribution Proven management and underwriting team Profitable growth since inception Strong balance sheet / conservative reserving philosophy Darwin is a Well Established Specialty Insurer Focused on Professional Liability Coverages |
14 2008 PRO-FORMA 2008 Combined GPW: $ 1,677mm % Insurance / Reinsurance: 74% / 26% % Property / Casualty: 26% / 74% 2008 GPW: $ 1,376mm % Insurance / Reinsurance: 69% / 31% % Property / Casualty: 35% / 65% Darwin Greatly Increases Allied World's Access to Attractive U.S. Healthcare Market Diversified and Expanded Business Mix Excluding Darwin Including full year Darwin Prog 2% HC 5% Prop. 24% Prof. Liab. 22% Gen. Cas. 17% Prop. Reins. 6% Cas. Reins. 24% Cas. Reins. 21% Prop. Reins. 5% Gen. Casualty 13% Prof. Liab. 23% Prop. 20% HC 15% Prog 2% Other 1% |
15 Executive Summary Direct Insurance Opportunities in U.S. Operations Financial Results and Strength Peer Comparison / Conclusion Appendix Agenda |
16 International Insurance Operating Segment GPW = $650 MM Bermuda Underwrites direct property and casualty risks primarily to Fortune 1000 North American domiciled accounts Strong diversity of industries covered including manufacturing, financial institutions, energy, chemicals, transportation, real estate, consumer products, medical and healthcare products and construction Europe Focus predominantly on mid-sized to large non- North American domiciled accounts Diversification initiative to attract more middle- market non-North American domiciled accounts produced in Europe Offers full range of casualty & property insurance products for multi-national corporations worldwide Allied World International TTM 03/09 Product Mix Gen Cas., 24% Energy, 7% Prof Liab., 33% Gen Prop., 28% HC, 8% |
17 Rated A (Excellent) by A.M. Best Chubb Re began operations in 1998 and developed a profitable book of business which was acquired and expanded by Harbor Point in 2005 Acquired renewal rights from Chubb Re of diversified book of short-tail and long-tail business Management team with track record of generating superior results Strong risk management culture Excellent capitalization and strong financial flexibility Our Reinsurance Operating Platforms - Flexibility to take advantage of opportunities in the marketplace Location: Bermuda Headquarters Business Focus Property catastrophe - North America and International catastrophe risks and select ILW opportunities Property Treaty - Per risk and quota share treaties which protect insurers of residential, commercial and industrial accounts on worldwide basis Specialty - Excess of loss and quota share treaties for accident and health, aviation and workers’ compensation catastrophe Allied World Bermuda has been writing reinsurance since 2002 BERMUDA UNITED STATES Allied World Reinsurance Company began writing business in April 2008 Location: New York City Business Focus General Casualty - Proportional and working, intermediate and higher layer excess of loss structures. Principally covering general liability, umbrella, excess casualty, auto liability and some workers’ compensation Professional Lines - Broad range of lines covered, including directors and officers, errors and omissions and medical malpractice Property - Some property per risk, inland marine, ocean marine, crop & regional non-aggregating cat Swiss office opened in September 2008 to expand geographic presence |
18 Reinsurance Operating Segment Renewing Casualty Accounts in U.S. Move closer to "decision makers" on year round basis and provide greater access to information Pursue New U.S. Business Opportunities Certain lines that do not typically find their way to Bermuda marketplace, including U.S. regional company multi-line business, super regional, middle- market business and stand alone casualty clash business Broaden product selection when market conditions improve Capture additional E&S business Sustain Targeted Bermuda Business Property catastrophe, property per risk, workers' compensation catastrophe, accident & health, specialty casualty and international Total GPW = $441 MM Allied World Reinsurance - TTM 03/09 Product Mix Property Treaty, 25% Prof Liab., 29% Casualty, 41% Other, 5% |
19 Executive Summary Direct Insurance Opportunities in U.S. Operations Financial Results and Strength Peer Comparison / Conclusion Appendix Agenda |
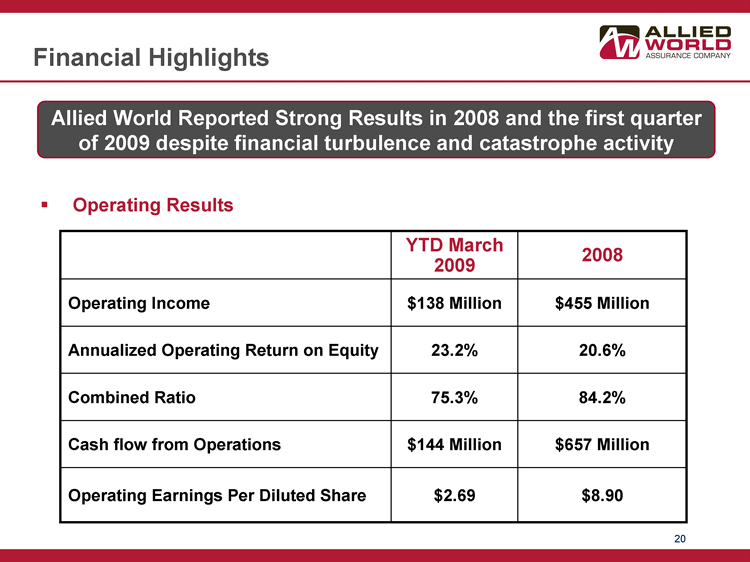
20 Operating Results Allied World Reported Strong Results in 2008 and the first quarter of 2009 despite financial turbulence and catastrophe activity Financial Highlights YTD March 2009 2008 Operating Income $138 Million $455 Million Annualized Operating Return on Equity 23.2% 20.6% Combined Ratio 75.3% 84.2% Cash flow from Operations $144 Million $657 Million Operating Earnings Per Diluted Share $2.69 $8.90 |
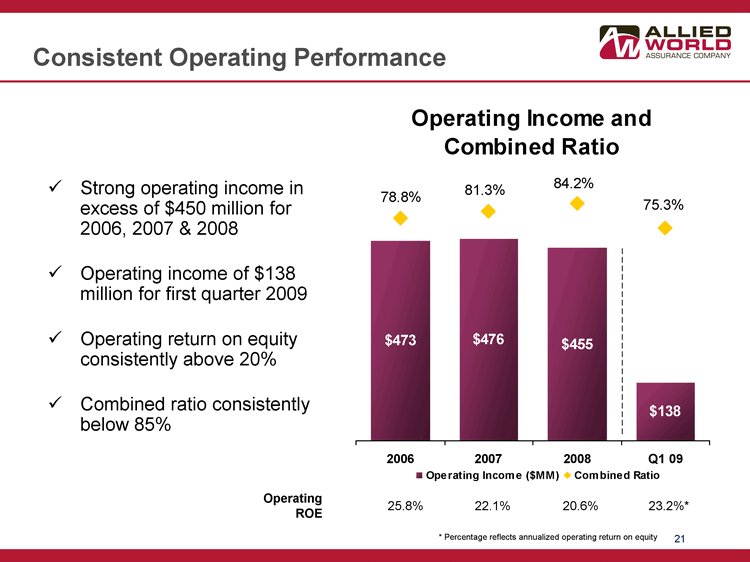
21 Consistent Operating Performance Operating ROE 25.8% 22.1% 20.6% 23.2%* Strong operating income in excess of $450 million for 2006, 2007 & 2008 Operating income of $138 million for first quarter 2009 Operating return on equity consistently above 20% Combined ratio consistently below 85% * Percentage reflects annualized operating return on equity Operating Income and Combined Ratio $473 $476 $455 $138 78.8% 81.3% 84.2% 75.3% 2006 2007 2008 Q1 09 Operating Income ($MM) Combined Ratio |
22 Strong Underwriting Results Underwriting performance has been strong since our inception Historical Loss Ratios through December 31, 2008 ($000's) * Includes net favorable reserve development from Darwin AY 2002 2003 2004 2005 2006 2007 2008 CY Total CY Original Loss Ratio 70.1% 65.3% 76.5% 105.7% 59.0% 58.8% 57.4% Prior Year Development 0.0% 4.9% 6.0% 3.9% 8.8% 10.6% 25.1% AY Original Loss Ratio 70.1% 70.2% 82.5% 109.6% 67.8% 69.4% 82.5% 2002 2003 (56,817) (56,817) 2004 (26,748) (52,687) (79,435) 2005 (8,436) (45,970) 5,321 (49,085) 2006 (16,474) (42,714) (43,346) (8,184) (110,718) 2007 6,185 (32,677) (71,222) (5,306) (20,057) (123,077) 2008 (8,923) (87,061) (93,705) (69,595) 4,663 (25,474) * (280,095) Subsequent Development (111,213) (261,109) (202,952) (83,085) (15,394) (25,474) (699,227) Loss Ratio Points - -25.6% - -22.4% - -15.3% - -6.5% - -1.2% - -2.2% 0.0% AY Developed 44.5% 47.8% 67.2% 103.1% 66.6% 67.2% 82.5% Cat Losses 0.0% 0.0% 18.1% 31.5% 0.0% 0.0% 13.3% AY Developed EX Cat Losses 44.5% 47.8% 49.1% 71.6% 66.6% 67.2% 69.2% Case Incurred through 12/08 36.5% 35.1% 42.3% 65.0% 26.9% 17.8% 28.9% Remaining IBNR / EP Ratio @ 12/08 8.0% 12.7% 24.9% 38.1% 39.7% 49.4% 53.6% |
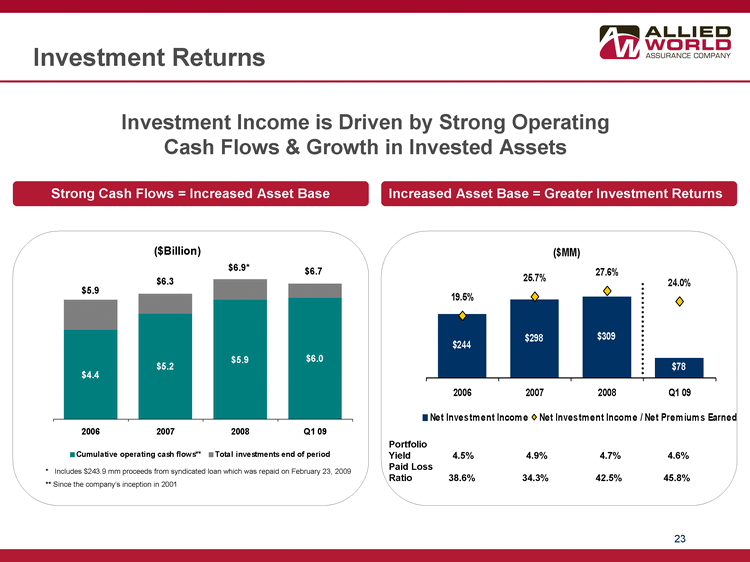
23 Investment Returns Investment Income is Driven by Strong Operating Cash Flows & Growth in Invested Assets Portfolio Yield 4.5% 4.9% 4.7% 4.6% Paid Loss Ratio 38.6% 34.3% 42.5% 45.8% Increased Asset Base = Greater Investment Returns Strong Cash Flows = Increased Asset Base * Includes $243.9 mm proceeds from syndicated loan which was repaid on February 23, 2009 ** Since the company's inception in 2001 ($Billion) $4.4 $5.2 $5.9 $6.0 $6.7 $6.9* $6.3 $5.9 2006 2007 2008 Q1 09 Cumulative operating cash flows** Total investments end of period ($MM) $244 $298 $309 $78 25.7% 27.6% 24.0% 19.5% 2006 2007 2008 Q1 09 Net Investment Income Net Investment Income / Net Premiums Earned |
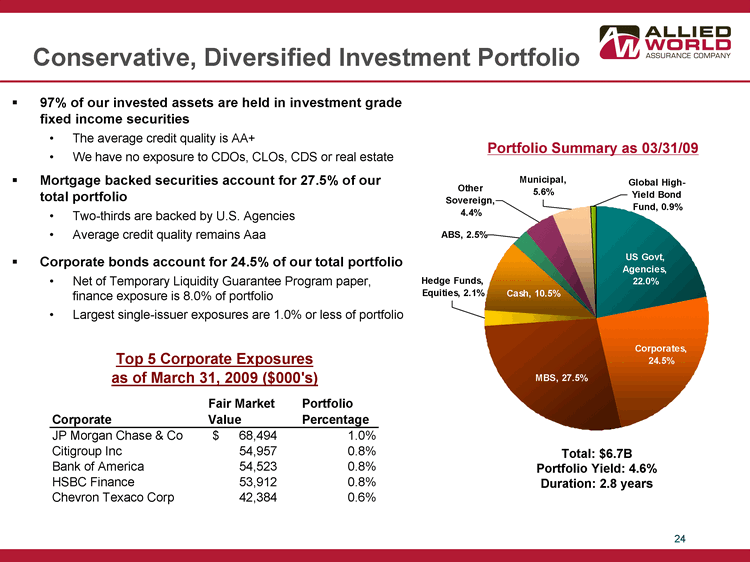
24 97% of our invested assets are held in investment grade fixed income securities The average credit quality is AA+ We have no exposure to CDOs, CLOs, CDS or real estate Mortgage backed securities account for 27.5% of our total portfolio Two-thirds are backed by U.S. Agencies Average credit quality remains Aaa Corporate bonds account for 24.5% of our total portfolio Net of Temporary Liquidity Guarantee Program paper, finance exposure is 8.0% of portfolio Largest single-issuer exposures are 1.0% or less of portfolio Portfolio Summary as 03/31/09 Total: $6.7B Portfolio Yield: 4.6% Duration: 2.8 years Conservative, Diversified Investment Portfolio Global High- Yield Bond Fund, 0.9% ABS, 2.5% Municipal, 5.6% Other Sovereign, 4.4% Cash, 10.5% Hedge Funds, Equities, 2.1% MBS, 27.5% Corporates, 24.5% US Govt, Agencies, 22.0% Corporate Fair Market Value Portfolio Percentage JP Morgan Chase & Co 68,494 $ 1.0% Citigroup Inc 54,957 0.8% Bank of America 54,523 0.8% HSBC Finance 53,912 0.8% Chevron Texaco Corp 42,384 0.6% Top 5 Corporate Exposures as of March 31, 2009 ($000's) |
25 Reserves 4.9% above mid-point of range at March 31, 2009 Net favorable reserve development in each of the last 6 years 79% of reserves are IBNR Net Loss & LAE Reserve Mix at March 31, 2009 3/31/2009 IBNR U.S. Insurance 0.179 IBNR International Insurance 0.383 OSLR U.S. Insurance 0.044 OSLR Reins 0.069 OSLR International Insurance 0.104 IBNR Reinsurance 0.221 OSLR U.S. Insurance 4% IBNR International Insurance 38% OSLR International Insurance 11% IBNR Reinsurance 23% OSLR Reinsurance 6% IBNR U.S. Insurance 18% Q1 2009 Total: $3.7bn Net Prior Year Reserve Releases - (Non-Cat) ($MM) Range of Net Reserves at March 31, 2009 ($MM) Prudent Reserving Philosophy $640 $847 $972 $1,398 $1,787 $2,018 $783 $1,089 $1,288 U.S. Insurance International Insurance Reinsurance Low Estimate Carried High Estimate $60 $247 $84 $57 $79 $106 $112 2003 2004 2005 2006 2007 2008 Q1 09 |
26 Growth in Shareholders' Equity Grew shareholders' equity by 3.1% in Q1 2009 Our capital management strategy is to preserve sufficient capital to support our business plan and future growth while maintaining conservative financial leverage and earnings coverage ratios Capitalization and strong leverage measures maintained after acquisition of AIG shares in 2007 Debt to Capital Ratio 0.0% 26.0% 18.4% 18.2% 17.1% 16.7% Fixed Charge Coverage - (9.3)x 14.7x 13.4x 5.5x 14.6x * Excludes $243.8 million syndicated loan which was repaid on February 23, 2009 $2,139 $1,420 $2,240 $2,492 $500 $499 $499 $499 $499 $2,220 $2,417 $2,991 $2,916 $2,739 $2,719 $1,920 $2,139 2004 2005 2006 2007 2008* Q1 2009 Debt Common Equity |
27 Executive Summary Direct Insurance Opportunities in U.S. Operations Financial Results and Strength Peer Comparison / Conclusion Appendix Agenda |
28 Peer Comparisons - Operating Income ROE Annualized operating return on shareholders equity is calculated by dividing operating income (net income available to common shareholders' excluding net realized investment gains or losses and net foreign exchange gains or losses) by average adjusted shareholders' common equity (shareholders' common equity excluding the average after tax unrealized gains or losses on investments). 3 - Year Average Allied World 22.8% Berkley 21.5% Arch 20.6% Axis 19.5% Endurance 19.5% RLI 18.5% HCC 16.4% Markel 16.5% Aspen 15.9% Navigators 14.5% 2008 Operating ROE 7.1% 8.4% 8.8% 10.2% 13.3% 13.4% 15.7% 16.9% 19.0% 20.6% $0 $0 $0 Aspen Axis Endurance Arch HCC Navigators Markel RLI Berkley Allied World |
29 Peer Comparisons - Leverage Operating leverage calculated by adding Net premium leverage (NPW / total shareholders' equity) and net reserve leverage (net loss reserves / total shareholders' equity). * Leverage amounts are calculated on a pro-forma basis including full year Darwin. ** Excludes $243.8 million syndicated loan which was repaid on February 23, 2009. Low leverage offers us more capacity for growth within existing capital structure 2.55 1.66 1.71 2.01 1.67 2.91 2.41 1.87 2.06 4.28 Net Operating & Financial Leverage @ 12/08 (Based on Shareholders' Equity) 0.53 0.82 0.66 0.60 1.32 0.81 0.78 0.90 0.96 0.73 1.53 1.73 1.00 2.96 1.20 0.89 2.01 1.45 1.14 1.11 18.9% 22.1% 11.6% 24.0% 15.3% 12.4% 17.1% ** 25.2% 23.8% 18.5% Allied World * Arch Aspen Axis Berkley Endurance HCC Markel Navigators RLI 0% 0% 0% Net Premium Leverage Net Reserve Leverage Debt & Preferred / Adjusted Capital |
30 ROE Target for Current Capital Base Premium Leverage Investment Leverage 90% - 95%Combined Ratio(2) Current TTM (pro-forma including full year Darwin) .54x 2.69x 12.5% -15.0% Targets .75x - 1.0% - 2.0% Targets - 3.25x 1.75% Illustrative ROE 15.25% - 18.75% Premium leverage defined as NPW / shareholders' equity. Investment leverage defined as invested assets / equity Assumes 7.5% current tax rate Based on current investment yield of 4.6% (1) (1) (3) |
31 Conclusion Allied World Expects to Generate a Mid-teen ROE, Assuming Normalized Catastrophe Activity Strong underwriting franchise diversified by product and geography Experienced executive management team in place Excellent capitalization, strong balance sheet and financial flexibility Significant infrastructure investments made during 2008 Addition of Darwin, strengthens U.S. specialty franchise Well positioned to capitalize on market dislocation Current valuation inconsistent with history of strong returns |
32 Executive Summary Direct Insurance Opportunities in U.S. Operations Financial Results and Strength Peer Comparison / Conclusion Appendix Agenda |
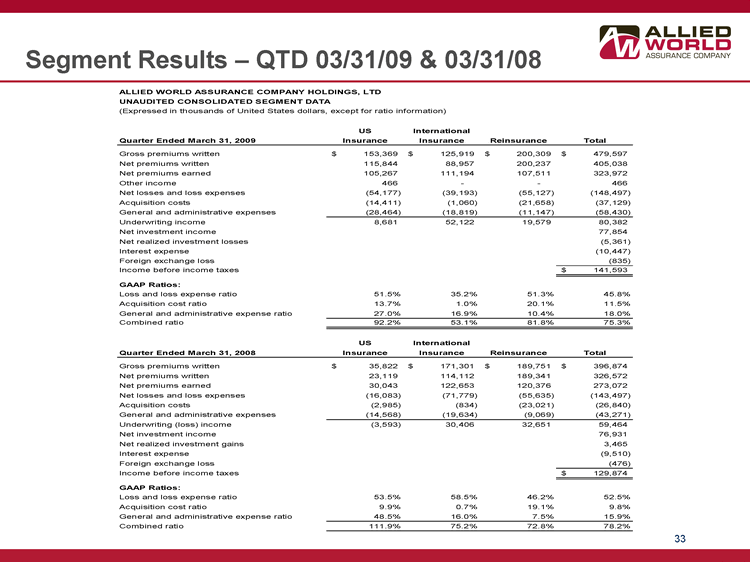
33 Segment Results - QTD 03/31/09 & 03/31/08 ALLIED WORLD ASSURANCE COMPANY HOLDINGS, LTD UNAUDITED CONSOLIDATED SEGMENT DATA (Expressed in thousands of United States dollars, except for ratio information) US International Insurance Insurance Reinsurance Total Gross premiums written 153,369 $ 125,919 $ 200,309 $ 479,597 $ Net premiums written 115,844 88,957 200,237 405,038 Net premiums earned 105,267 111,194 107,511 323,972 Other income 466 - - - - 466 Net losses and loss expenses (54,177) (39,193) (55,127) (148,497) Acquisition costs (14,411) (1,060) (21,658) (37,129) General and administrative expenses (28,464) (18,819) (11,147) (58,430) Underwriting income 8,681 52,122 19,579 80,382 Net investment income 77,854 Net realized investment losses (5,361) Interest expense (10,447) Foreign exchange loss (835) Income before income taxes 141,593 $ GAAP Ratios: Loss and loss expense ratio 51.5% 35.2% 51.3% 45.8% Acquisition cost ratio 13.7% 1.0% 20.1% 11.5% General and administrative expense ratio 27.0% 16.9% 10.4% 18.0% Combined ratio 92.2% 53.1% 81.8% 75.3% US International Insurance Insurance Reinsurance Total Gross premiums written 35,822 $ 171,301 $ 189,751 $ 396,874 $ Net premiums written 23,119 114,112 189,341 326,572 Net premiums earned 30,043 122,653 120,376 273,072 Net losses and loss expenses (16,083) (71,779) (55,635) (143,497) Acquisition costs (2,985) (834) (23,021) (26,840) General and administrative expenses (14,568) (19,634) (9,069) (43,271) Underwriting (loss) income (3,593) 30,406 32,651 59,464 Net investment income 76,931 Net realized investment gains 3,465 Interest expense (9,510) Foreign exchange loss (476) Income before income taxes 129,874 $ GAAP Ratios: Loss and loss expense ratio 53.5% 58.5% 46.2% 52.5% Acquisition cost ratio 9.9% 0.7% 19.1% 9.8% General and administrative expense ratio 48.5% 16.0% 7.5% 15.9% Combined ratio 111.9% 75.2% 72.8% 78.2% Quarter Ended March 31, 2009 Quarter Ended March 31, 2008 |
34 Consolidated Balance Sheets ($MM) 2006 2007 2008 Q109 Cash 505 $ 270 $ 706 $ 705 $ Bonds 5,178 5,707 6,032 5,808 Other investments 263 322 125 197 Securities lending collateral 305 147 171 - - Insurance balances receivable 304 305 348 418 Prepaid reinsurance 160 164 193 177 Reinsurance recoverable 689 683 888 880 Accrued investment income 51 56 51 51 DAC 100 108 136 141 Goodwill 4 4 268 268 Intangibles - - - - 71 70 Other assets 62 133 83 177 Total Assets 7,621 $ 7,899 $ 9,072 $ 8,892 $ Loss reserves, gross 3,637 $ 3,920 $ 4,577 $ 4,603 $ Unearned premiums 814 811 930 996 Ceding commissions 24 29 50 48 Securities lending payable 305 147 177 - - Debt 499 499 743 499 Other 122 253 178 254 Total Liabilities 5,401 $ 5,659 $ 6,655 $ 6,400 $ Shareholders Equity 2,220 $ 2,240 $ 2,417 $ 2,492 $ Total Liabilities & S/H Equity 7,621 $ 7,899 $ 9,072 $ 8,892 $ |
35 Historical Operating Results ($MM) 2002 2003 2004 2005 2006 2007 2008 Q109 Gross premiums written 923 $ 1,574 $ 1,708 $ 1,560 $ 1,659 $ 1,506 $ 1,446 $ 480 $ Net premiums written 846 1,347 1,373 1,222 1,307 1,153 1,107 405 Net premiums earned 434 1,167 1,326 1,272 1,252 1,160 1,117 324 Net losses and loss expenses 304 762 1,013 1,345 739 682 641 148 Acquisition costs 58 163 171 143 141 119 113 37 General and administrative expenses 32 67 86 94 106 142 187 58 Underwriting income 40 176 55 (311) 265 217 176 81 Net investment income 82 101 129 179 244 298 309 78 Net realized investment (losses) gains 7 13 11 (10) (29) (8) (273) (5) Interest expense - - - - - - (16) (33) (38) (39) (10) Foreign exchange gains/losses & income taxes (1) (2) 3 (2) (6) - - 10 (13) Net income (loss) 128 $ 288 $ 197 $ (160) $ 443 $ 469 $ 183 $ 131 $ GAAP Ratios: Loss and loss expense ratio 70.0% 65.3% 76.5% 105.7% 59.0% 58.8% 57.4% 45.8% Acquisition ratio 13.4% 13.9% 13.0% 11.3% 11.3% 10.3% 10.1% 11.5% General and administrative expense ratio 7.3% 5.7% 6.5% 7.4% 8.5% 12.2% 16.7% 18.0% Combined ratio 90.7% 84.9% 96.0% 124.4% 78.8% 81.3% 84.2% 75.3% |
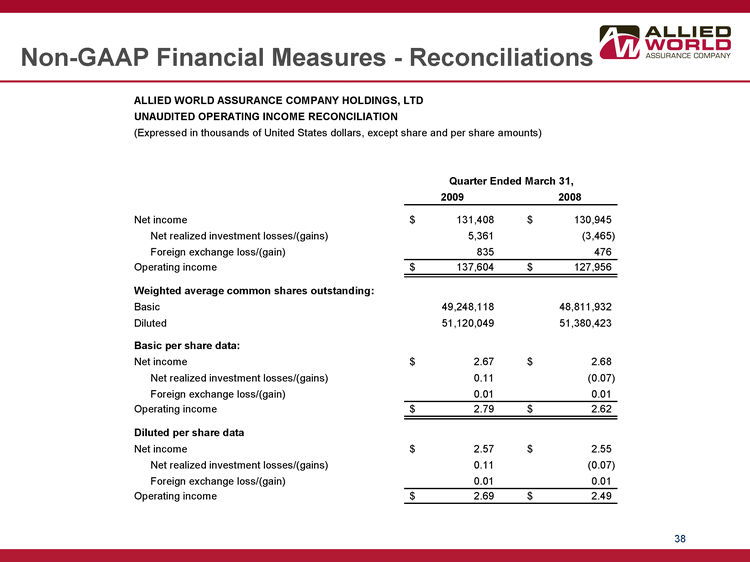
36 Non-GAAP Financial Measures In presenting the company's results, management has included and discussed in this press release certain non-GAAP financial measures within the meaning of Regulation G as promulgated by the U.S. Securities and Exchange Commission. Management believes that these non-GAAP measures, which may be defined differently by other companies, better explain the company's results of operations in a manner that allows for a more complete understanding of the underlying trends in the company's business. However, these measures should not be viewed as a substitute for those determined in accordance with GAAP. "Operating Income" is an internal performance measure used by the company in the management of its operations and represents after-tax operational results excluding, as applicable, net realized investment gains or losses and foreign exchange gains or losses. The company excludes net realized investment gains or losses and net foreign exchange gains or losses from its calculation of operating income because the amount of these gains or losses is heavily influenced by, and fluctuates in part according to, the availability of market opportunities. The company believes these amounts are largely independent of its business and underwriting process and including them distorts the analysis of trends in its operations. In addition to presenting net income determined in accordance with GAAP, the company believes that showing operating income enables investors, analysts, rating agencies and other users of its financial information to more easily analyze the company's results of operations in a manner similar to how management analyzes the company's underlying business performance. Operating income should not be viewed as a substitute for GAAP net income. The company has included "diluted book value per share" because it takes into account the effect of dilutive securities; therefore, the company believes it is a better measure of calculating shareholder returns than book value per share. "Annualized Return on Shareholders' Average Equity" ("ROAE") is calculated using average equity, excluding the average after tax unrealized gains or losses on investments. Unrealized gains (losses) on investments are primarily the result of interest rate movements and the resultant impact on fixed income securities. Such gains (losses) are not related to management actions or operational performance, nor are they likely to be realized. Therefore, the company believes that excluding these unrealized gains (losses) provides a more consistent and useful measurement of operating performance, which supplements GAAP information. In calculating ROAE, the net income (loss) available to shareholders for the period is multiplied by the number of such periods in a calendar year in order to arrive at annualized net income (loss) available to shareholders. The company presents ROAE as a measure that is commonly recognized as a standard of performance by investors, analysts, rating agencies and other users of its financial information. "Annualized operating return on average shareholders' equity" is calculated using operating income (as defined above and annualized in the manner described for net income (loss) available to shareholders under ROAE above), and average equity, excluding the average after tax unrealized gains (losses) on investments. Unrealized gains (losses) are excluded from equity for the reasons outlined in the annualized return on average equity explanation above. See slides 37 - 39 for a reconciliation of non-GAAP measures used in this presentation to their most directly comparable GAAP measures. |
37 Non-GAAP Financial Measures - Reconciliations ALLIED WORLD ASSURANCE COMPANY HOLDINGS, LTD UNAUDITED ANNUALIZED RETURN ON SHAREHOLDERS' EQUITY RECONCILIATION (Expressed in thousands of United States dollars, except for percentage information) 2009 2008 Opening shareholders' equity 2,416,862 $ 2,239,842 $ Deduct: accumulated other comprehensive income (105,632) (136,214) Adjusted opening shareholders' equity 2,311,230 2,103,628 - - - - Closing shareholders' equity 2,491,860 $ 2,394,620 $ Deduct: accumulated other comprehensive income (48,204) (135,626) Adjusted closing shareholders' equity 2,443,656 2,258,994 Average shareholders' equity 2,377,443 $ 2,181,311 $ Net income available to shareholders 131,408 $ 130,945 $ Annualized net income available to shareholders 525,632 523,780 Annualized return on average shareholders' equity - net income available to shareholders 22.1% 24.0% Operating income available to shareholders 137,604 $ 127,956 $ Annualized operating income available to shareholders 550,416 511,824 Annualized return on average shareholders' equity - operating income available to shareholders 23.2% 23.5% Quarter Ended March 31, |
38 Non-GAAP Financial Measures - Reconciliations ALLIED WORLD ASSURANCE COMPANY HOLDINGS, LTD UNAUDITED OPERATING INCOME RECONCILIATION (Expressed in thousands of United States dollars, except share and per share amounts) 2009 2008 Net income 131,408 $ 130,945 $ Net realized investment losses/(gains) 5,361 (3,465) Foreign exchange loss/(gain) 835 476 Operating income 137,604 $ 127,956 $ Weighted average common shares outstanding: Basic 49,248,118 48,811,932 Diluted 51,120,049 51,380,423 Basic per share data: Net income 2.67 $ 2.68 $ Net realized investment losses/(gains) 0.11 (0.07) Foreign exchange loss/(gain) 0.01 0.01 Operating income 2.79 $ 2.62 $ Diluted per share data Net income 2.57 $ 2.55 $ Net realized investment losses/(gains) 0.11 (0.07) Foreign exchange loss/(gain) 0.01 0.01 Operating income 2.69 $ 2.49 $ Quarter Ended March 31, |
39 Non-GAAP Financial Measures - Reconciliations ALLIED WORLD ASSURANCE COMPANY HOLDINGS, LTD UNAUDITED DILUTED BOOK VALUE PER SHARE RECONCILIATION (Expressed in thousands of United States dollars, except share and per share amounts) As of As of March 31, December 31, 2009 2008 Price per share at period end 38.03 $ 40.60 $ Total shareholders' equity 2,491,860 2,416,862 Basic common shares outstanding 49,522,766 49,036,159 Add: unvested restricted share units 954,292 971,907 Add: Performance based equity awards 1,332,161 1,345,903 Add: dilutive options/warrants outstanding 6,268,818 6,371,151 Weighted average exercise price per share 33.42 33.38 Deduct: options bought back via treasury method (5,509,056) (5,237,965) Common shares and common share equivalents outstanding 52,568,981 52,487,155 Basic book value per common share 50.32 $ 49.29 $ Diluted book value per common share 47.40 $ 46.05 $ |