 Industry Leader in Value Creation 4 th Quarter 2011 Investor Presentation Exhibit 99.1 |
 Forward-Looking Statements & Safe Harbor 2 This presentation contains certain statements, estimates and forecasts with respect to future performance and events. These statements, estimates and forecasts are "forward-looking statements". In some cases, forward-looking statements can be identified by the use of forward-looking terminology such as "may," “might,” “will," “should,” "expect," “plan,” "intend," "estimate," "anticipate," "believe,” “predict,” “potential” or "continue" or the negatives thereof or variations thereon or similar terminology. All statements other than statements of historical fact included in this presentation are forward-looking statements and are based on various underlying assumptions and expectations and are subject to known and unknown risks, uncertainties and assumptions, may include projections of our future financial performance based on our growth strategies and anticipated trends in our business. These statements are only predictions based on our current expectations and projections about future events. There are important factors that could cause our actual results, level of activity, performance or achievements to differ materially from the results, level of activity, performance or achievements expressed or implied in the forward-looking statements. As a result, there can be no assurance that the forward-looking statements included in this presentation will prove to be accurate or correct. In light of these risks, uncertainties and assumptions, the future performance or events described in the forward-looking statements in this presentation might not occur. Accordingly, you should not rely upon forward-looking statements as a prediction of actual results and we do not assume any responsibility for the accuracy or completeness of any of these forward-looking statements that may be made from time to time. We are under no obligation (and expressly disclaim any such obligation) to update or revise any forward-looking statements, whether as a result of new information, future developments or otherwise. |
 Agenda Executive Summary Executive Summary U.S. Insurance U.S. Insurance International Insurance International Insurance Reinsurance Reinsurance Financial Highlights Financial Highlights Peer Comparison Peer Comparison /Conclusion /Conclusion Appendix Appendix 3 |
 Allied World’s Franchise Industry leading results and value creation Experienced executive management team Diversified mix of business with global operations Strong risk management culture Excellent capitalization / active capital management Highly Rated - “A” (Strong) by S&P, “A” (Excellent) by A.M. Best and “A2” (Good) by Moody’s 4 Well-diversified Property and Casualty Insurer and Reinsurer with Significant Geographic Reach |
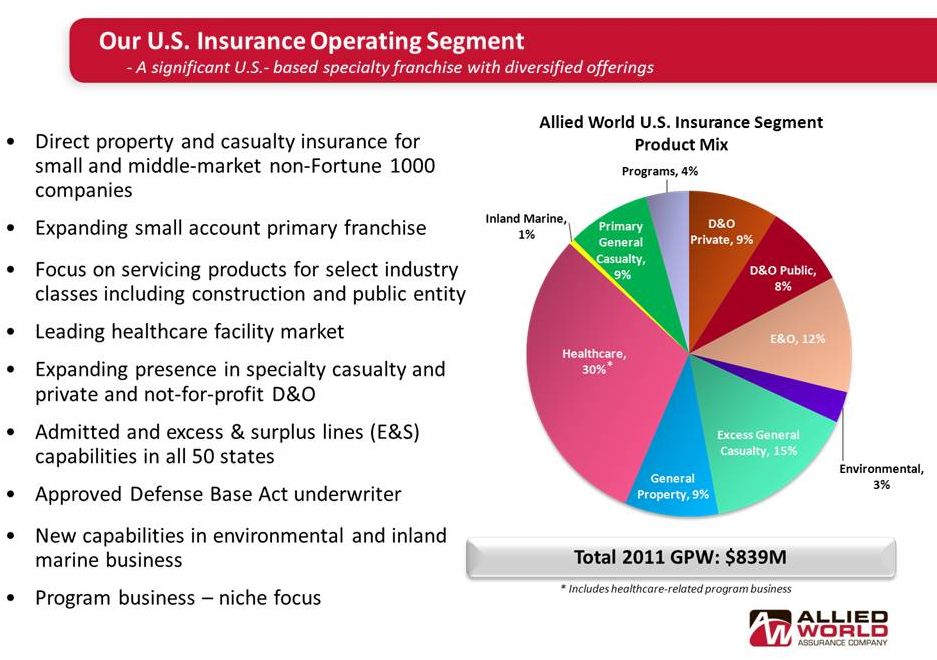
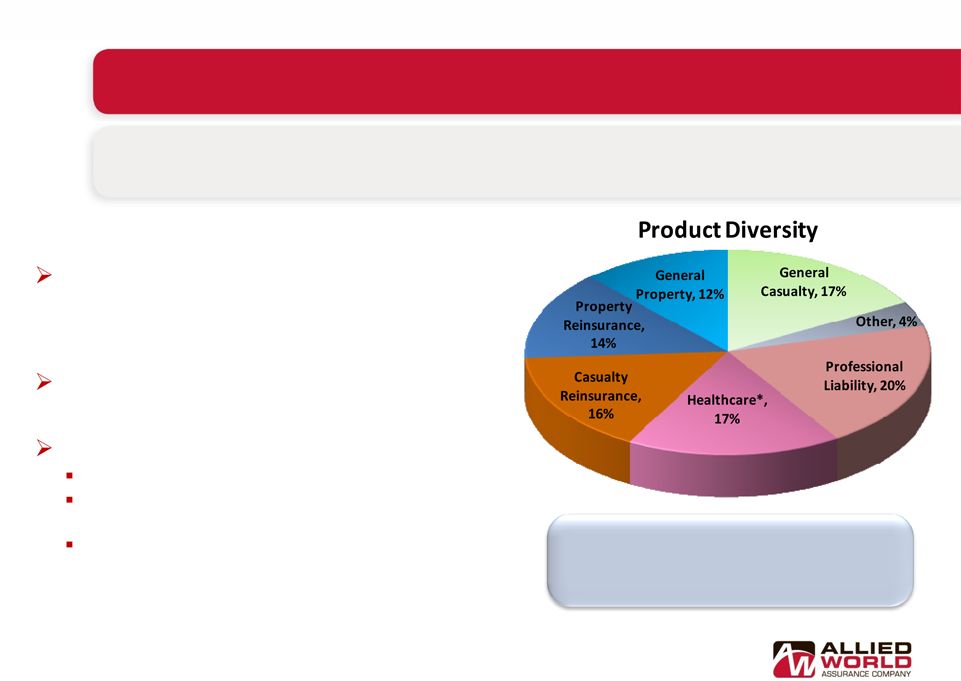 Allied World’s Key Business Strategies Leading specialty insurance company with broad range of product offerings, global capabilities and significant U.S. focus 5 * Includes healthcare-related program business 2011 GPW: $ 1,940M 70% Insurance / 30% Reinsurance 74% Casualty / 26% Property Diversified insurance and reinsurance products offered across global platform with operations in the U.S., Bermuda, Lloyd’s, Europe, Hong Kong and Singapore Insurance and casualty emphasis with strong reinsurance and property capabilities Customer focus Moving closer to clients in markets Demonstrated expertise in markets in which we underwrite A “go to” market for targeted lines and classes of business such as healthcare and construction |
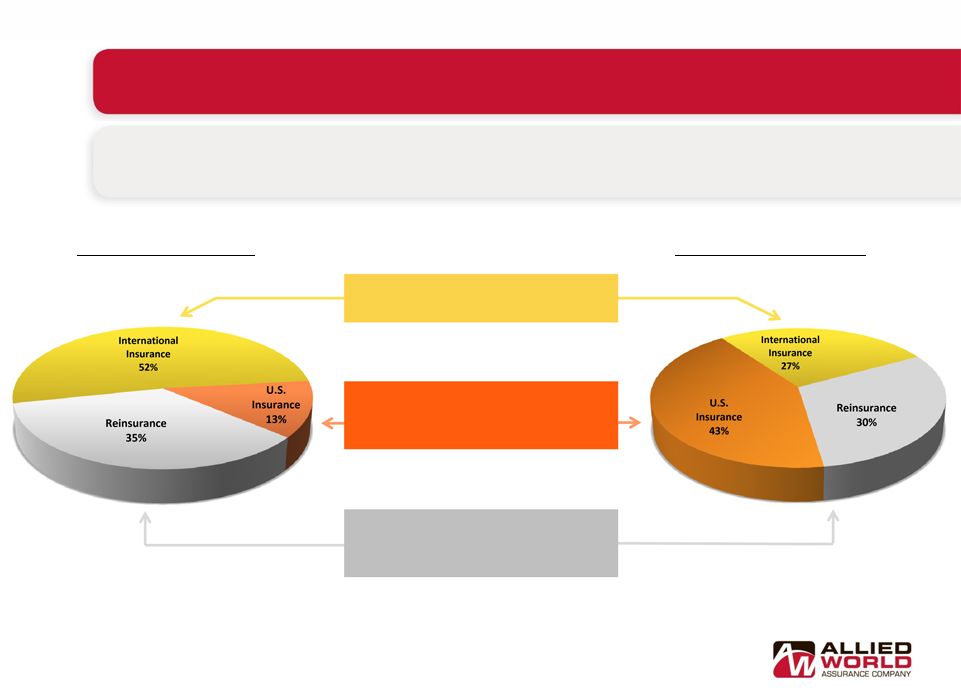 Actively Shifted Business in Response to Market Changes 6 2007 GPW: $1,506M In response to the changing macro economic environment, Allied World has transformed itself since its formation in 2001 2011 GPW: $1,940M Allied World 2007 Allied World Today Reduced dependence on Bermuda large account excess business U.S. segment has increased significantly with focus on small account primary and specialty business Reinsurance segment now with strong U.S. presence and growing internationally |
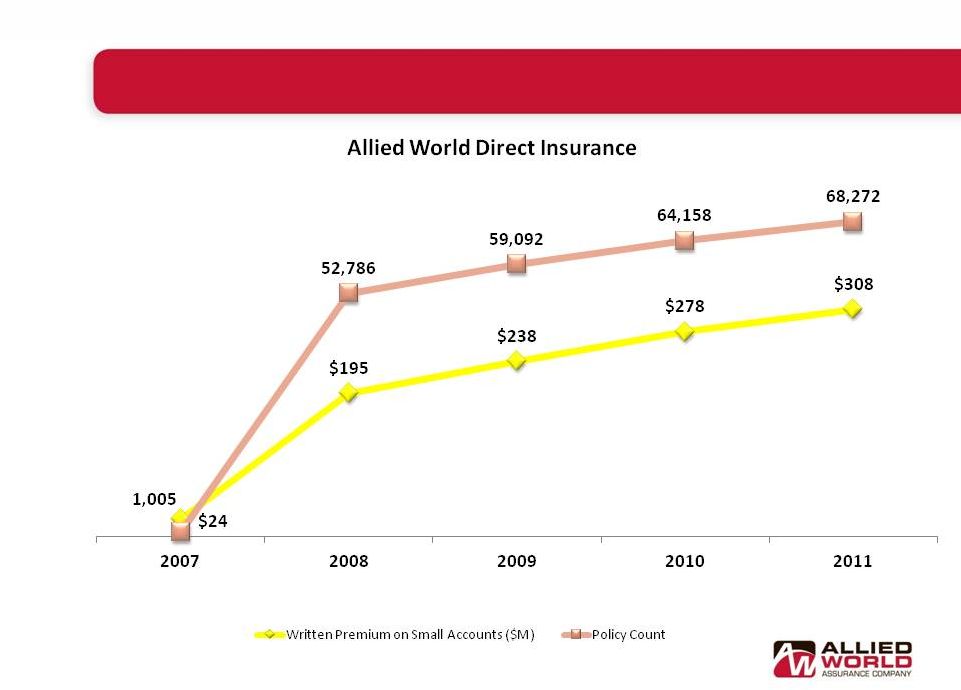 Growth in Small Accounts = Increased Importance 7 % of Total Premium 2% 13% 14% 16% 16% Small accounts based on policy limits of less than $3M. |
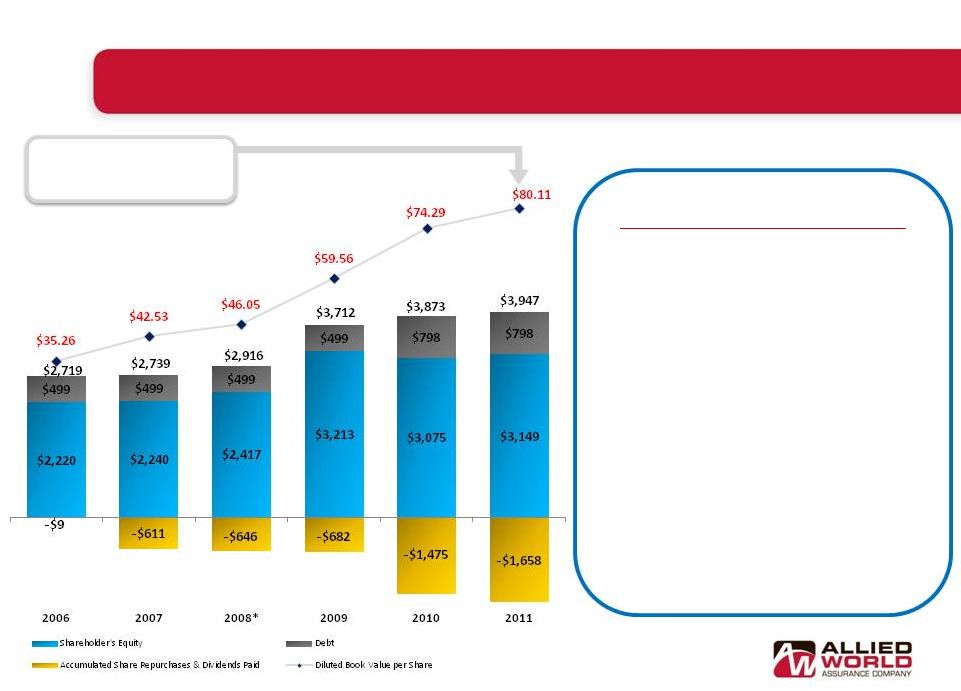 Active Capital Management Improves Shareholder Value * Excludes $243.8 million syndicated loan which was repaid on February 23, 2009 8 Diluted book value per share has more than doubled since 2006 Capital Management History o $210 million of common dividends paid since going public in 2006 o $563 million of shares repurchased from AIG in December 2007 o $500 million share repurchase program • $174 million remaining capacity at December 2011 o $505 million of shares and warrants repurchased from founders in 2010 o $300 million in ten-year senior notes issued in November 2010 o $53.6 million warrant repurchased from founder in first quarter 2011 (In millions, except for per share amounts) |
 Consistently Strong Operating Performance Strong Operating Income – Operating return on equity averaged 15.9% over last five years, 6% in 2011 despite impact from catastrophic events ($292 million) Favorable Reserve Development – Every year since our inception, $254 million in 2011 Solid Investment Returns - $160 million, 2.0%, total net investment return 1 in 2011, $469 million, 6.1%, in 2010 Operating Cash Flows – $1.7 billion over last three years, $548 million in 2011 Diluted Book Value Growth – Diluted book value per share has increased 2 ½ times since the company went public in 2006 (after adjusting for dividends) Maintained Strong Capital Position - Total capital base of $3.95 billion at December 2011, with conservative financial leverage 2 of 20.2% and operating leverage 3 of 1.83x 9 Management has demonstrated superior execution in a challenging marketplace 1 Total net investment return includes net investment income, net realized gains, net change in unrealized gains and net impairment charges recognized in earnings. The percentage return is calculated by taking the total net investment return for the year divided by the average aggregate invested assets for the year. 2 Financial leverage calculated by dividing debt by total capital at 12/11. 3 Operating leverage calculated by taking sum of 2011 net premiums written and 12/11 net loss reserves divided by 12/11 shareholders’ equity. |
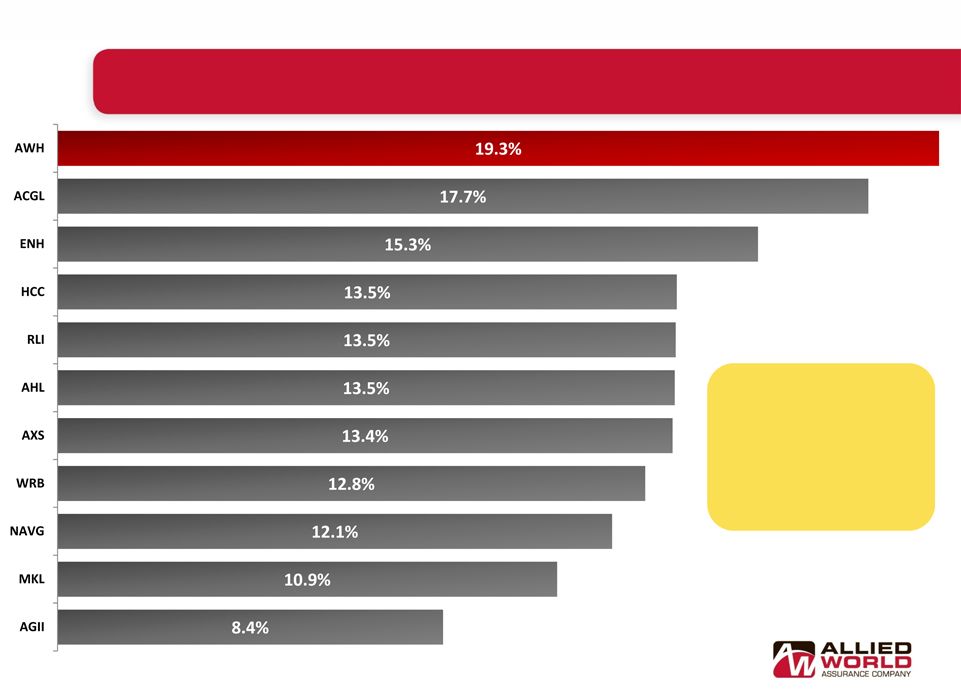 Superior Value Creation Since 2006 IPO Compound annual growth in diluted book value per share calculated by taking change in diluted book value per share from September 2006 through December 2011 adjusted for common dividends declared or paid. 10 Compound Annual Growth in Diluted Book Value per Share through December 2011 |
 Agenda Executive Summary Executive Summary U.S. Insurance U.S. Insurance International Insurance International Insurance Reinsurance Reinsurance Financial Highlights Financial Highlights Peer Comparison/ Peer Comparison/ Conclusion Conclusion 11 Appendix Appendix |
 12 |
 We continue to expand our brand in target markets and geographies Ten branch office locations throughout country Increased access to attractive small account primary business including: o Healthcare organizations o Specialty casualty o Not-for-profit D&O Industry verticals – focused on servicing products for select industry classes including: o Healthcare o Private / Non-Profit o Public entity / Construction New specialty product capabilities o Defense Base Act approved underwriter o Environmental o Inland marine Expanded distribution partners o Since 2007 4X increase in number of producers 13 Strong Competitive Position – U.S. Insurance |
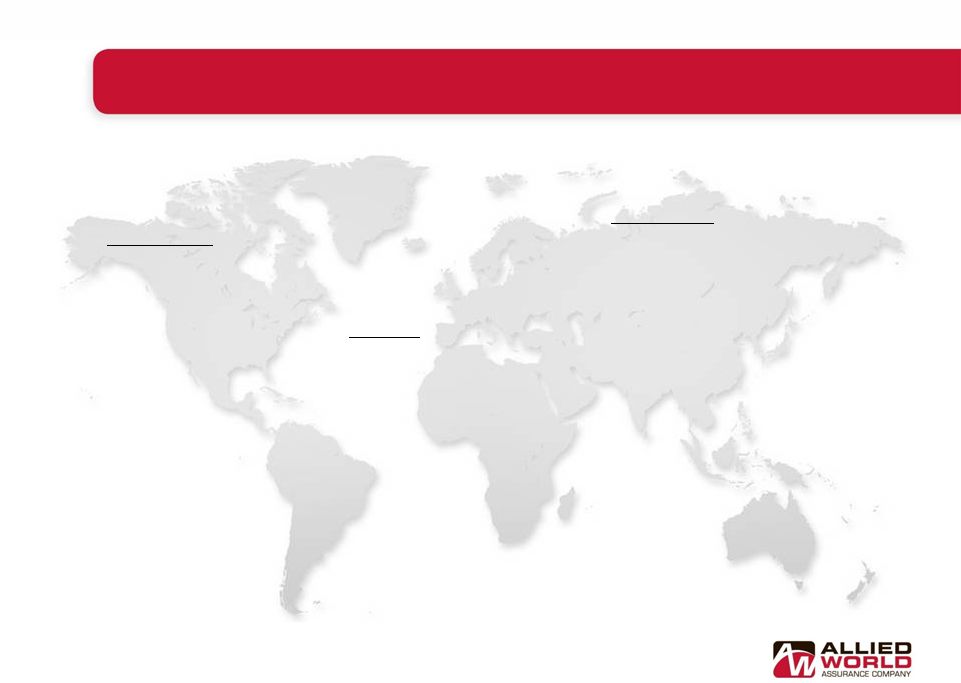
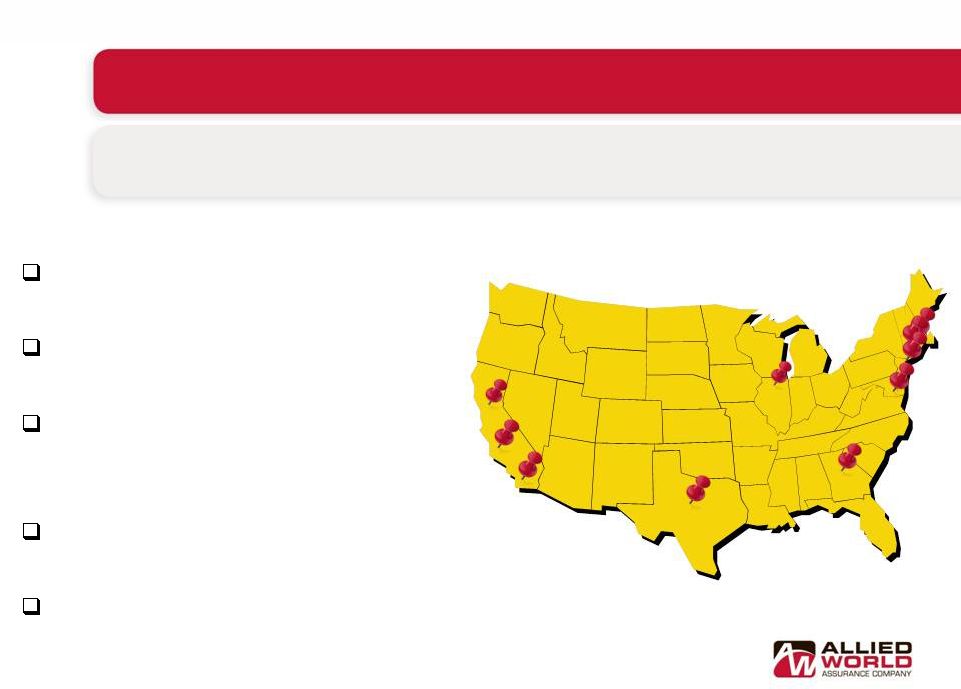 Expanding U.S. Direct Operating Platform Branch offices in strategic locations throughout the U.S. Dedicated U.S. management team with significant industry experience Significantly increased submission activity throughout the country • Up over 50% in all regions since 2008 435 staff count, 62% of Allied World group at December 2011 Significant IT infrastructure in place Allied World’s expanded presence in U.S. has significantly Allied World’s expanded presence in U.S. has significantly enhanced the market profile of our domestic operations enhanced the market profile of our domestic operations San Francisco San Francisco Los Angeles Los Angeles Costa Mesa Costa Mesa Dallas Dallas Chicago Chicago Atlanta Atlanta Boston Boston Farmington Farmington New York New York 14 Philadelphia Philadelphia |
 Agenda Executive Summary Executive Summary U.S. Insurance U.S. Insurance International Insurance International Insurance Reinsurance Reinsurance Financial Highlights Financial Highlights Peer Comparison/ Peer Comparison/ Conclusion Conclusion 15 Appendix Appendix |
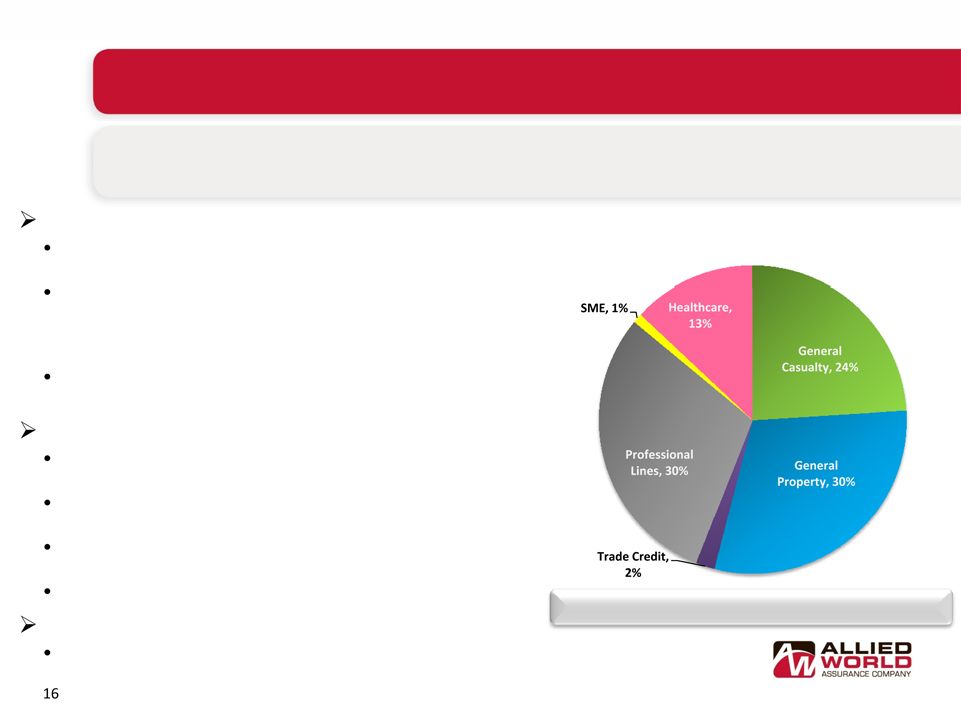 International Insurance Segment - Overview Bermuda (2011 GPW: $361M) A leading direct writer of Fortune 1000 North American domiciled property and casualty risks Strong diversity of industries covered including manufacturing, chemicals, transportation, real estate, consumer products, medical and healthcare products and construction Recently began writing trade credit and political risk products Europe (2011 GPW: $153M) Focus predominantly on mid-sized to large non-North American domiciled accounts Offers broad range of casualty & property insurance products for multi-national corporations worldwide Lloyd’s Syndicate expands insurance product capabilities in Latin America and the Asia Pacific region Recently launched SME and healthcare initiatives Asia (2011 GPW: $16M) Offers professional lines, healthcare and general casualty business Allied World International Insurance Operating Segment Product Mix Global Diversification and Expansion Global Diversification and Expansion Total 2011 GPW: $530M |
 Offices in Bermuda, London, Dublin, Switzerland, Hong Kong and Singapore position the company to meet developing opportunities Lloyd’s Syndicate 2232 o Association with Lloyd’s enhances Allied World’s brand recognition o Increases access to Latin America and Asia-Pacific region o Offers treaty and individual risk products Redomestication to Switzerland provides a more efficient structure and greater flexibility to manage our business New product capabilities: o Trade credit and political risk o European healthcare o Small-to-medium enterprises (SME Professional) 17 Strong Competitive Position – International Insurance We continue to expand our brand in target markets and geographies |
 Launched SME Platform in the U.K. in February 2010 Continuing development of Asia Platform Established Lloyd’s Syndicate 2232 effective mid-2010 Launched Trade Credit/Political Risk capability in October 2010 via MGA relationship with Latin American Underwriters Expanding Healthcare Platform internationally (Asia & Europe) Business development personnel now in London, Scotland and Singapore MGA and program business initiated in targeted areas International Insurance – Recent Initiatives 18 |
 Executive Summary Executive Summary U.S. Insurance U.S. Insurance International Insurance International Insurance Reinsurance Reinsurance Financial Highlights Financial Highlights Peer Comparison/ Peer Comparison/ Conclusion Conclusion 19 Appendix Appendix Agenda |
 Reinsurance Operating Platforms and Major Product Lines 20 Bermuda Bermuda • Property Catastrophe • Property Treaty • Specialty • Facultative • PA / WC Catastrophe United States United States • General Casualty • Professional Lines • Property • Global Marine and Crop International International • Property Catastrophe • Property Per Risk • Commercial Auto • General Liability • Employers’ Liability • Professional Lines |
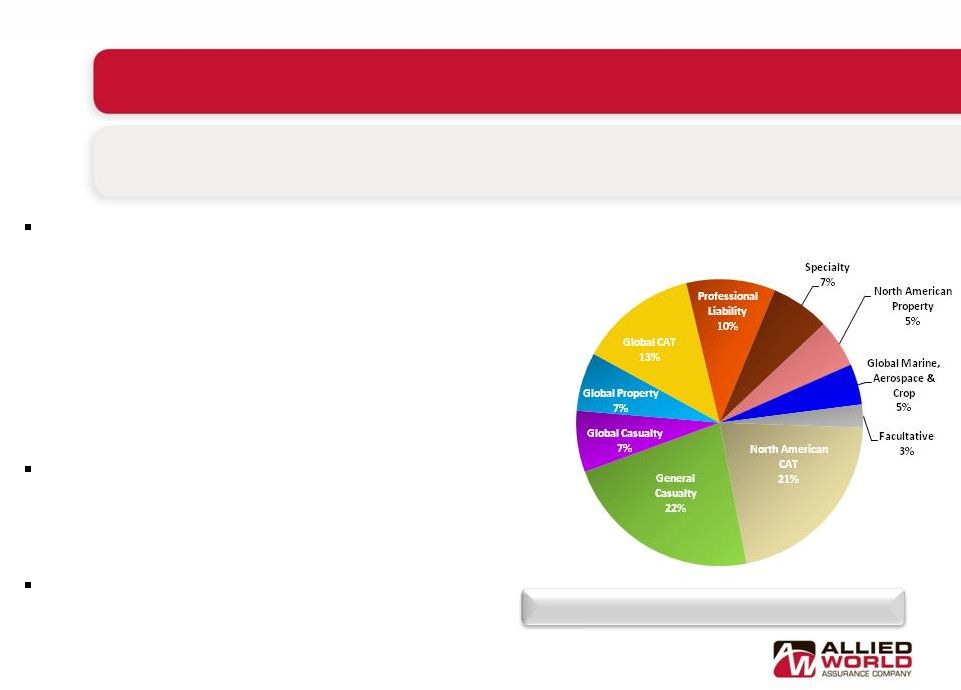 Reinsurance Operating Segment Allied World Reinsurance Segment Product Mix 21 Flexibility to take advantage of reinsurance opportunities in the global Flexibility to take advantage of reinsurance opportunities in the global marketplace marketplace Casualty Presence Established in U.S. • Underwriting teams closer to “decision makers” which provides greater access to information • Accessing clients and lines that do not typically access the Bermuda marketplace, including U.S. regional company multi-line business, super regional, middle- market business and stand-alone casualty-clash business • Broaden product selection when market conditions improve Strategic Bermuda Platform • Property catastrophe, property per risk, workers’ compensation catastrophe, accident & health and specialty casualty Expanded Global Presence • Swiss and Singapore offices • Lloyd’s Syndicate established in June 2010 Total 2011 GPW: $571M |
 U.S. operation has improved access to U.S. regional business and strengthened local relationships o In 2009, added property reinsurance that focuses on small and medium account regional carriers o In late 2010, launched Global Marine and Specialty unit that offers marine and aerospace coverages as well as crop and hail business Swiss and Singapore offices and Lloyd’s Syndicate 2232 increases global reach o Swiss office opened in 2008 offers property, general casualty and professional liability products throughout Europe o Singapore office opened in 2009 as Allied World's hub for all classes of treaty business in Asia Pacific, Middle East and Africa o Established Lloyd's Syndicate 2232 in June 2010, which significantly expanded reinsurance products throughout Europe, Latin American and the Asia Pacific region 22 Strong Competitive Position – Reinsurance We continue to expand our brand in target markets and geographies |
 Agenda Executive Summary Executive Summary U.S. Insurance U.S. Insurance International Insurance International Insurance Reinsurance Reinsurance Financial Highlights Financial Highlights Peer Comparison/ Peer Comparison/ Conclusion Conclusion Appendix Appendix 23 |
 Financial Highlights Operating Results Operating Results 2011 2011 2010 2010 2009 2009 2008 2008 2007 2007 Net Income $275M $665M $607M $184M $469M Operating Income $184M $398M $538M $455M $476M Annualized Net Income Return on Average Equity 8.9% 21.9% 22.6% 8.3% 21.7% Annualized Operating Return on Average Equity 6.0% 13.1% 20.0% 20.6% 22.1% Combined Ratio 95.9% 84.9% 76.1% 84.1% 81.3% Cash flow from Operations $548M $451M $668M $657M $761M Operating Earnings Per Diluted Share $4.63 $7.97 $10.34 $8.90 $7.64 Ending Diluted Book Value per Share $80.11 $74.29 $59.56 $46.05 $42.53 Growth in Diluted Book Value Per Share 8% 25% 29% 8% 21% Allied World has reported very strong results despite competitive landscape, financial turbulence and catastrophe activity 24 |
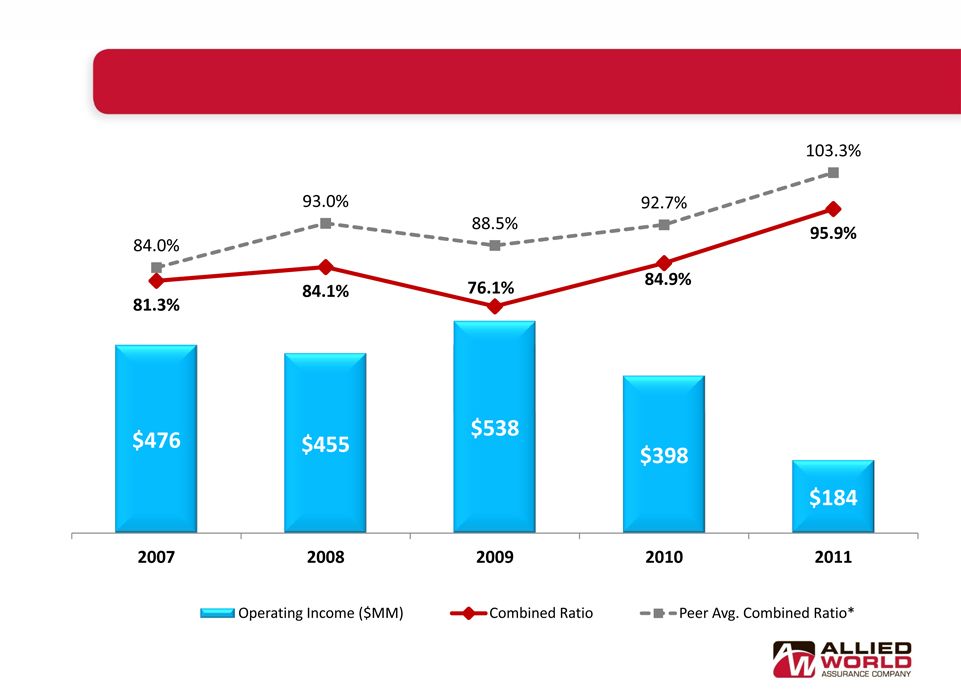 Annualized Operating ROE 22.1% 20.6% 20.0% 13.1% 6.0% 25 * Peer average include ACGL, AGII, AHL, AXS, ENH, HCC, MKL, RLI, THG, NAVG and WRB. Source: SNL Financial Operating Income and Combined Ratio Strong Operating Performance |
 AY 2002 2003 2004 2005 2006 2007 2008 2009 2010 2011 CY Total CY Original Loss Ratio 70.1% 65.3% 75.9% 103.1% 59.6% 58.4% 55.6% 45.9% 52.1% 65.8% Prior Year Development 0.0% -4.9% -5.8% -3.6% -8.2% -10.2% -24.2% -18.8% -23.1% -17.4% AY Original Loss Ratio 70.1% 70.1% 81.7% 106.7% 67.7% 68.6% 79.8% 64.7% 75.1% 83.2% 2002 2003 (57) (57) 2004 (27) (53) (79) 2005 (8) (46) 6 (49) 2006 (16) (43) (45) (8) (113) 2007 6 (34) (77) (6) (26) (137) 2008 (9) (88) (100) (74) (8) (34) (313) 2009 (17) (57) (118) (103) 12 2 32 (248) 2010 4 (11) (57) (147) (54) (25) (23) (1) (313) 2011 (0) (1) (22) (90) (42) (69) (22) (28) 20 (254) Subsequent Development (123) (333) (414) (427) (119) (125) (12) (29) 20 (1,562) Loss Ratio Points -28.4% -28.4% -30.2% -31.5% -8.6% -9.3% -0.9% -2.2% 1.5% AY Developed 41.6% 41.7% 51.5% 75.2% 59.1% 59.2% 78.9% 62.5% 76.6% 83.2% Cat Losses 16.4% 28.0% 9.6% 6.3% 20.1% AY Developed EX Cat Losses 41.6% 41.7% 35.1% 47.2% 59.1% 59.2% 69.2% 62.5% 70.3% 63.2% Case Incurred through 2011 Q4 39.3% 34.0% 45.1% 59.6% 39.2% 38.6% 46.7% 23.4% 39.2% 29.3% Remaining IBNR / EP Ratio @ 2011 Q4 2.3% 7.8% 6.4% 15.7% 19.9% 20.7% 32.2% 39.1% 37.4% 54.0% Strong Underwriting Results Underwriting performance has been strong since our inception 26 Historical Loss Ratios Through December 31, 2011 ($MM) 1 2 (1) Pro-forma including Darwin development since inception (2) Case incurred ratios by year are not directly comparable to our financial statements as reinsurance case incurred losses shown above are on a treaty year basis |
 • Net reserves about 4.5% above mid-point of range at December 31, 2011 • $1.6 billion net favorable reserve development since inception (including Darwin development) • 72% of reserves are IBNR Net Loss & LAE Reserve Mix at December 31, 2011 Case U.S. Insurance, 7% IBNR International Insurance 30% Case International Insurance, 10% IBNR Reinsurance 20% Case Reinsurance, 11% IBNR U.S. Insurance 22% December 31, 2011 Total: $4.2B Net Prior Year Reserve Releases* ($MM) Range of Net Reserves at December 31, 2011 ($MM) Prudent Reserving Philosophy 27 * Pro-forma including Darwin development since inception |
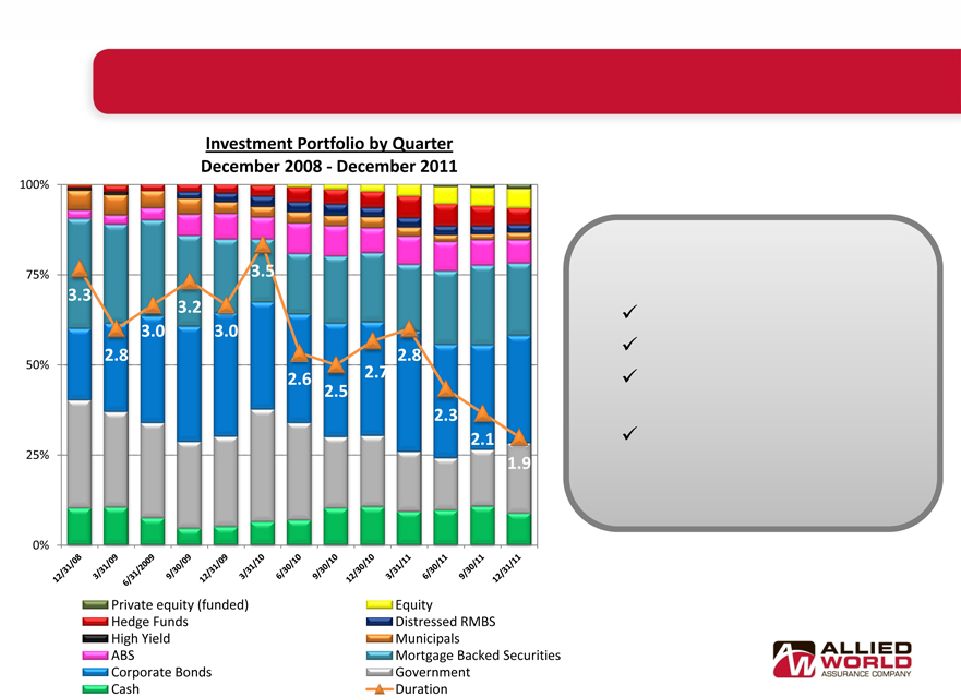 Investment Track Record: Where We’ve Been 28 We have actively managed the portfolio exposures, including: Exposure to rates Exposure to spread assets Exposure to non-fixed income assets Always within stated risk appetite |
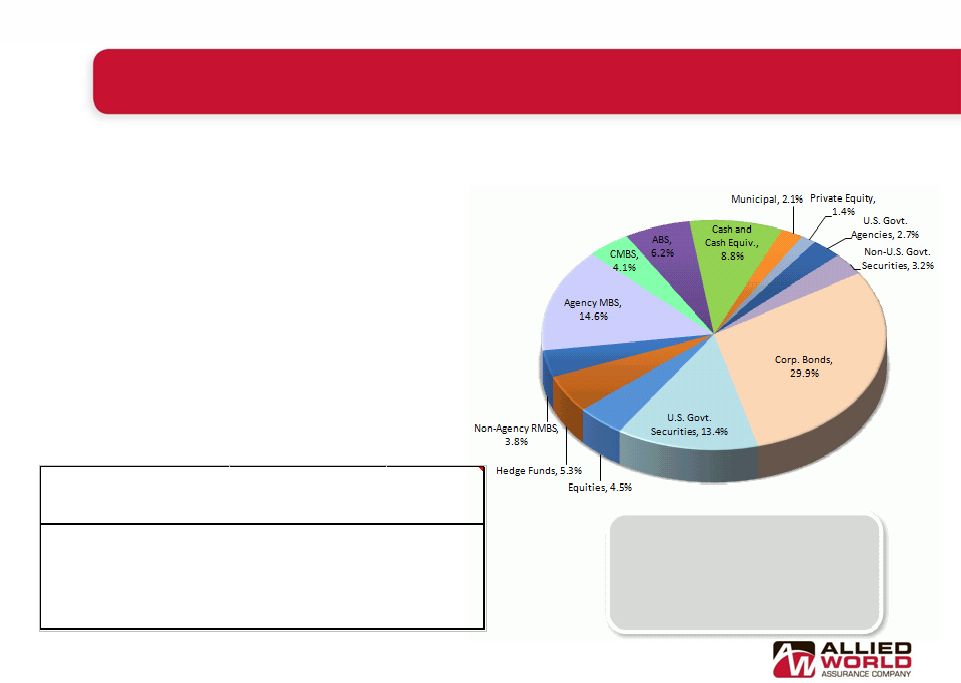  • U.S. Treasury yields declined modestly during 4Q11 and spreads tightened, creating positive core fixed income returns • Relative value and significant market volatility remains in favor of a diversified portfolio Portfolio Summary - December 31, 2011 Investment Portfolio: Where we are Today 29 Name Market Value ($) % Portfolio JPMorgan Chase & Co 67,776,188 0.8% Bank of America Corp 55,093,335 0.7% Wells Fargo & Co 52,784,154 0.7% Sparebank 1 Boligkreditt AS 51,696,377 0.6% Citigroup Inc 49,700,624 0.6% Top 5 Corporate Exposures Total: $8.1 B Portfolio Yield: 2.5% Duration: 1.9 years 2011 Total Portfolio Return: 2.0% Average Credit Quality is AA- |
 Agenda Executive Summary Executive Summary U.S. Insurance U.S. Insurance International Insurance International Insurance Reinsurance Reinsurance Financial Highlights Financial Highlights Peer Comparison/ Peer Comparison/ Conclusion Conclusion 30 Appendix Appendix |
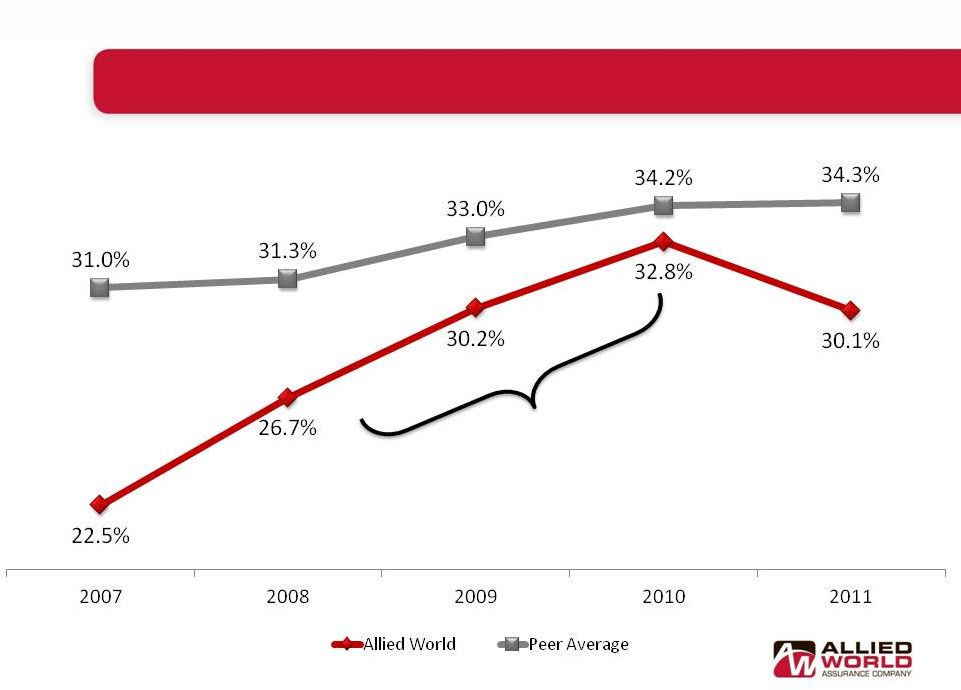 31 Expense Ratio Declining as we Build Scale Note: GAAP expense ratio Peer average includes ACGL, AGII, AHL, AXS, ENH, HCC, MKL, RLI, THG, NAVG and WRB. Source: SNL Financial Allied World expanded global operations, including: the acquisition of Darwin, establishment of a U.S. reinsurance company and the opening of Lloyd's Syndicate 2232 |
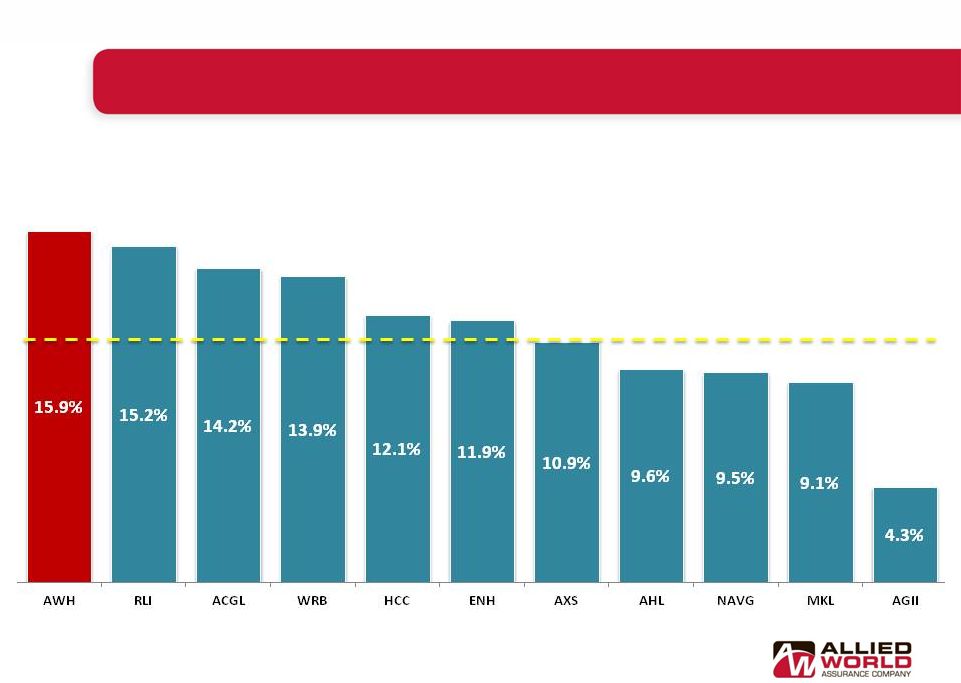 Peer Comparisons – Operating Income ROE Source: SNL Financial 32 Five Year Average Operating ROE 2007 - 2011 Peer Average = 11.1% |
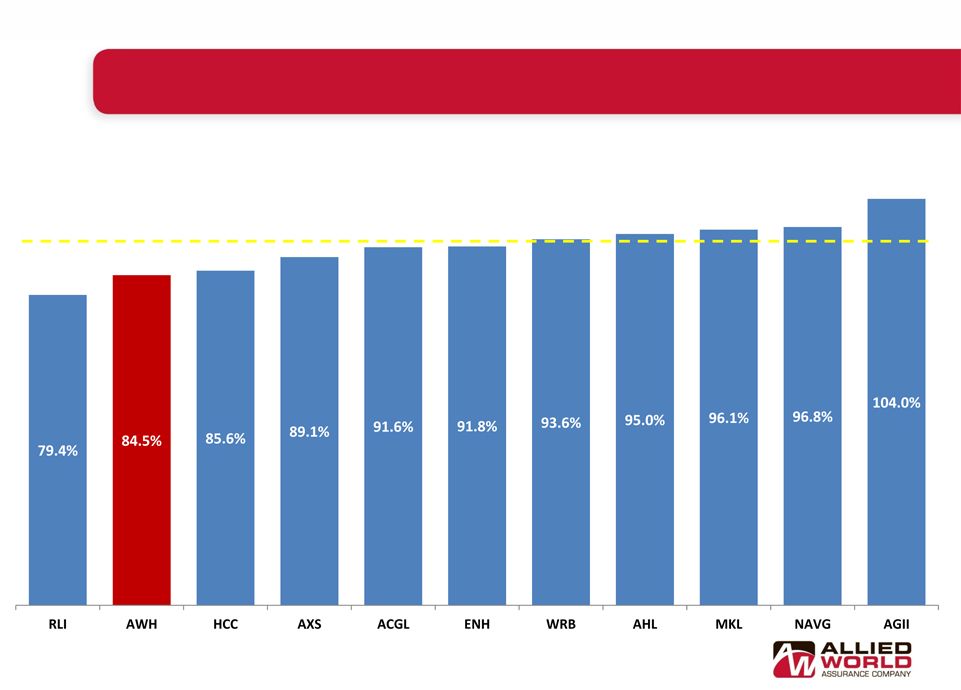 Peer Comparisons - Combined Ratio Source: SNL Financial 33 Five Year Average Combined Ratio 2007 - 2011 Peer Average = 92.3% |
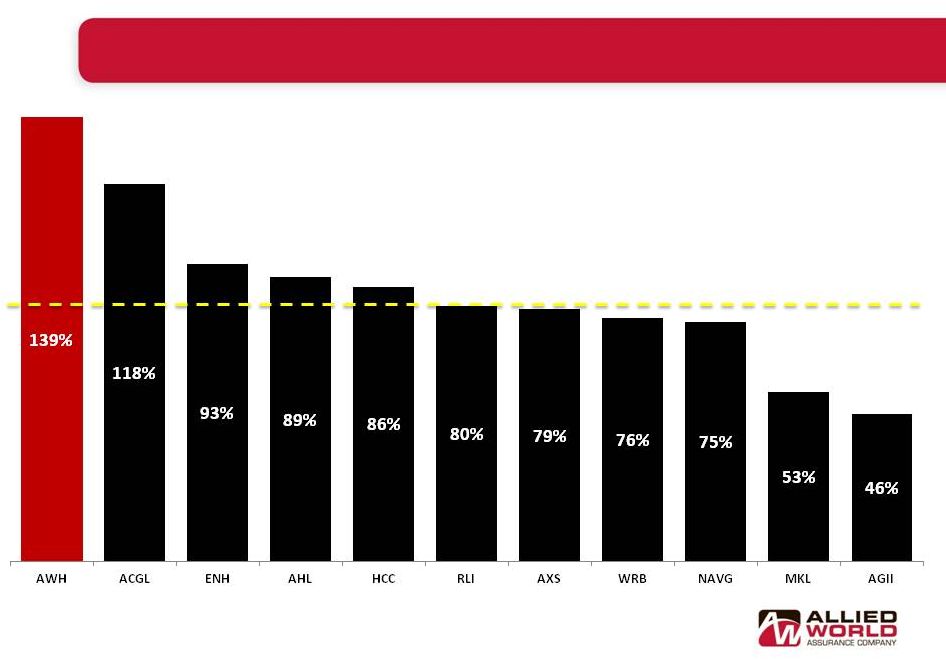 Superior Book Value Growth Versus Peers Growth in book value per share calculated by taking change in diluted book value per share from December 2006 through December 2011 adjusted for dividends paid or declared. 34 Peer Average = 80% Five Year Growth in Diluted Book Value per Share 2007 - 2011 |
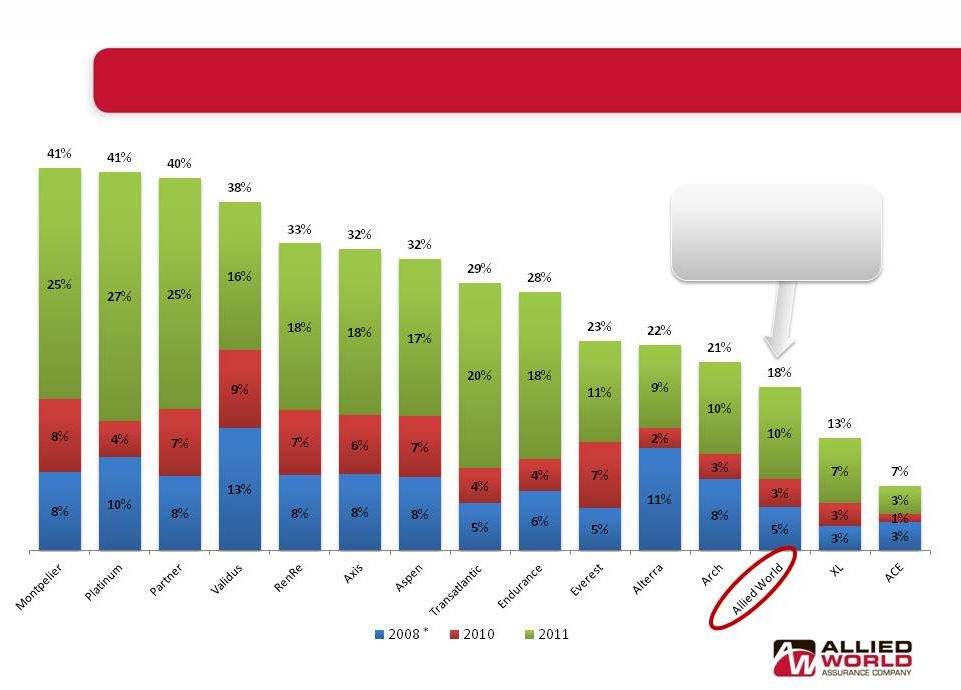 35 Catastrophe Losses at Low End of Competitors Catastrophe Losses as a % of Prior Year Shareholders’ Equity Catastrophe losses in line with our risk appetite * Hurricanes Ike and Gustav Percentages represent pre tax catastrophe losses divided by prior year-end shareholders equity. Source: SNL Financial and company filings |
 Conclusion Allied World Expects to Generate a Mid-teen ROE Over the Cycle, Allied World Expects to Generate a Mid-teen ROE Over the Cycle, Assuming Normalized Catastrophe Activity Assuming Normalized Catastrophe Activity Strong underwriting franchise diversified by product and geography Experienced executive management team in place Excellent capitalization, strong balance sheet and financial flexibility Enhanced by recent capital management initiatives Significant infrastructure investments made since 2008 Strengthened U.S. specialty franchise and global capabilities Well positioned to capitalize on market opportunities Current valuation inconsistent with history of strong returns 36 |
 Agenda Executive Summary Executive Summary U.S. Insurance U.S. Insurance International Insurance International Insurance Reinsurance Reinsurance Financial Highlights Financial Highlights Peer Comparison/ Peer Comparison/ Conclusion Conclusion Appendix Appendix 37 |
 Non-GAAP Financial Measures 38 In presenting the company's results, management has included and discussed in this presentation certain non generally accepted accounting principles ("non-GAAP") financial measures within the meaning of Regulation G as promulgated by the U.S. Securities and Exchange Commission. Management believes that these non-GAAP measures, which may be defined differently by other companies, better explain the company's results of operations in a manner that allows for a more complete understanding of the underlying trends in the company's business. However, these measures should not be viewed as a substitute for those determined in accordance with generally accepted accounting principles ("U.S. GAAP"). "Operating income" is an internal performance measure used by the company in the management of its operations and represents after-tax operational results excluding, as applicable, net realized investment gains or losses, net impairment charges recognized in earnings, net foreign exchange gain or loss, impairment of intangible assets and other non-recurring items. The company excludes net realized investment gains or losses, net impairment charges recognized in earnings, net foreign exchange gain or loss and other non-recurring items from its calculation of operating income because these amounts are heavily influenced by and fluctuate in part according to the availability of market opportunities and other factors. The company excludes impairment of intangible assets as these are non-recurring charges. In addition to presenting net income determined in accordance with GAAP, the company believes that showing operating income enables investors, analysts, rating agencies and other users of its financial information to more easily analyze the company’s results of operations and the company’s underlying business performance. Operating income should not be viewed as a substitute for GAAP net income. The company has included "diluted book value per share" because it takes into account the effect of dilutive securities; therefore, the company believes it is an important measure of calculating shareholder returns. "Annualized return on average shareholders' equity" ("ROAE") is calculated using average equity, excluding the average after tax unrealized gains or losses on investments. Unrealized gains (losses) on investments are primarily the result of interest rate and risk premium movements and the resultant impact on fixed income securities. Such gains (losses) are not related to management actions or operational performance, nor are they likely to be realized. Therefore, the company believes that excluding these unrealized gains (losses) provides a more consistent and useful measurement of operating performance, which supplements GAAP information. In calculating ROAE, the net income (loss) available to shareholders for the period is multiplied by the number of such periods in a calendar year in order to arrive at annualized net income (loss) available to shareholders. The company presents ROAE as a measure that is commonly recognized as a standard of performance by investors, analysts, rating agencies and other users of its financial information. "Annualized operating return on average shareholders' equity" is calculated using operating income (as defined above and annualized in the manner described for net income (loss) available to shareholders under ROAE above), and average shareholders' equity, excluding the average after tax unrealized gains (losses) on investments. Unrealized gains (losses) are excluded from equity for the reasons outlined in the annualized return on average shareholders' equity explanation above. See slides 39 - 41 for a reconciliation of non-GAAP measures used in this presentation to their most directly comparable GAAP measures. |
 Non-GAAP Financial Measures - Reconciliations 39 ALLIED WORLD ASSURANCE COMPANY HOLDINGS, AG UNAUDITED ANNUALIZED RETURN ON SHAREHOLDERS' EQUITY RECONCILIATION (Expressed in thousands of United States dollars, except for percentage information) 2011 2010 2011 2010 Opening shareholders' equity 3,003,074 $ 3,341,314 $ 3,075,820 $ 3,213,295 $ Deduct: accumulated other comprehensive income (17,796) (111,760) (57,135) (149,849) Adjusted opening shareholders' equity 2,985,278 3,229,554 3,018,685 3,063,446 Closing shareholders' equity 3,149,022 $ 3,075,820 $ 3,149,022 $ 3,075,820 $ Deduct: accumulated other comprehensive income (14,484) (57,135) (14,484) (57,135) Adjusted closing shareholders' equity 3,134,538 3,018,685 3,134,538 3,018,685 Average shareholders' equity 3,059,908 $ 3,124,120 $ 3,076,612 $ 3,041,066 $ Net income available to shareholders 183,100 $ 92,786 $ 274,548 $ 665,005 $ Annualized net income available to shareholders 732,400 371,144 274,548 665,005 Annualized return on average shareholders' equity - net income available to shareholders 23.9% 11.9% 8.9% 21.9% Operating income available to shareholders 94,681 $ 97,288 $ 183,686 $ 397,831 $ Annualized operating income available to shareholders 378,724 389,152 183,686 397,831 Annualized return on average shareholders' equity - operating income available to shareholders 12.4% 12.5% 6.0% 13.1% Quarter Ended December 31, Year Ended December 31, |
  Non-GAAP Financial Measures - Reconciliations 40 ALLIED WORLD ASSURANCE COMPANY HOLDINGS, AG UNAUDITED OPERATING INCOME RECONCILIATION (Expressed in thousands of United States dollars, except share and per share amounts) 2011 2010 2011 2010 Net income 183,100 $ 92,786 $ 274,548 $ 665,005 $ Add after tax affect of: Net realized investment (gains) losses (26,332) 4,306 (213) (267,727) Net impairment charges recognized in earnings - - - 109 Other Income - termination fee (61,538) - (93,808) - Foreign exchange (gain) / loss (549) 196 3,159 444 Operating income 94,681 $ 97,288 $ 183,686 $ 397,831 $ Weighted average common shares outstanding: Basic 38,138,558 40,291,620 38,093,351 46,491,279 Diluted 39,524,273 43,501,068 39,667,905 49,913,317 Basic per share data: Net income 4.80 $ 2.30 $ 7.21 $ 14.30 $ Add after tax affect of: Net realized investment (gains) losses (0.69) 0.11 (0.01) (5.75) Net impairment charges recognized in earnings - - - - Other Income - termination fee (1.62) - (2.46) - Foreign exchange (gain) / loss (0.01) - 0.08 0.01 Operating income 2.48 $ 2.41 $ 4.82 $ 8.56 $ Diluted per share data Net income 4.63 $ 2.13 $ 6.92 $ 13.32 $ Add after tax affect of: Net realized investment (gains) losses (0.67) 0.10 (0.01) (5.36) Net impairment charges recognized in earnings - - - - Other Income - termination fee (1.56) - (2.36) - Foreign exchange (gain) / loss - 0.01 0.08 0.01 Operating income 2.40 $ 2.24 $ 4.63 $ 7.97 $ Quarter Ended December 31, Year Ended December 31, |
  Non-GAAP Financial Measures - Reconciliations 41 ALLIED WORLD ASSURANCE COMPANY HOLDINGS, AG UNAUDITED DILUTED BOOK VALUE PER SHARE RECONCILIATION (Expressed in thousands of United States dollars, except share and per share amounts) As of As of December 31, December 31, 2011 2010 Price per share at period end 62.93 $ 59.44 $ Total shareholders' equity 3,149,022 $ 3,075,820 $ Basic common shares outstanding 37,742,131 38,089,226 Add: unvested restricted share units 249,251 571,178 Add: Performance based equity awards 889,939 1,440,017 Add: employee share purchase plan 11,053 10,576 Add: dilutive options/warrants outstanding 1,525,853 3,272,739 Weighted average exercise price per share 45.72 $ 35.98 $ Deduct: options bought back via treasury method (1,108,615) (1,980,884) Common shares and common share equivalents outstanding 39,309,612 41,402,852 Basic book value per common share 83.44 $ 80.75 $ Diluted book value per common share 80.11 $ 74.29 $ |