 Industry Leader in Value Creation 1 st Quarter 2012 Investor Presentation Exhibit 99.1 |
 Forward-Looking Statements & Safe Harbor 2 This presentation contains certain statements, estimates and forecasts with respect to future performance and events. These statements, estimates and forecasts are "forward-looking statements". In some cases, forward- looking statements can be identified by the use of forward-looking terminology such as "may," “might,” “will," “should,” "expect," “plan,” "intend," "estimate," "anticipate," "believe,” “predict,” “potential” or "continue" or the negatives thereof or variations thereon or similar terminology. All statements other than statements of historical fact included in this presentation are forward-looking statements and are based on various underlying assumptions and expectations and are subject to known and unknown risks, uncertainties and assumptions, may include projections of our future financial performance based on our growth strategies and anticipated trends in our business. These statements are only predictions based on our current expectations and projections about future events. There are important factors that could cause our actual results, level of activity, performance or achievements to differ materially from the results, level of activity, performance or achievements expressed or implied in the forward-looking statements. As a result, there can be no assurance that the forward-looking statements included in this presentation will prove to be accurate or correct. In light of these risks, uncertainties and assumptions, the future performance or events described in the forward- looking statements in this presentation might not occur. Accordingly, you should not rely upon forward-looking statements as a prediction of actual results and we do not assume any responsibility for the accuracy or completeness of any of these forward-looking statements that may be made from time to time. We are under no obligation (and expressly disclaim any such obligation) to update or revise any forward-looking statements, whether as a result of new information, future developments or otherwise. |
 Agenda Executive Summary Executive Summary Operating Segments Operating Segments U.S. Insurance U.S. Insurance International Insurance International Insurance Reinsurance Reinsurance Financial Highlights Financial Highlights Conclusion Conclusion Appendix Appendix 3 |
 Allied World’s Franchise Well-diversified property and casualty insurer and reinsurer with significant geographic reach Experienced executive management team with strong risk management culture Excellent capitalization with active capital management Highly Rated – “A” (Strong) by S&P, “A” (Excellent) by A.M. Best and “A2” (Good) by Moody’s Industry leading results and value creation 4 |
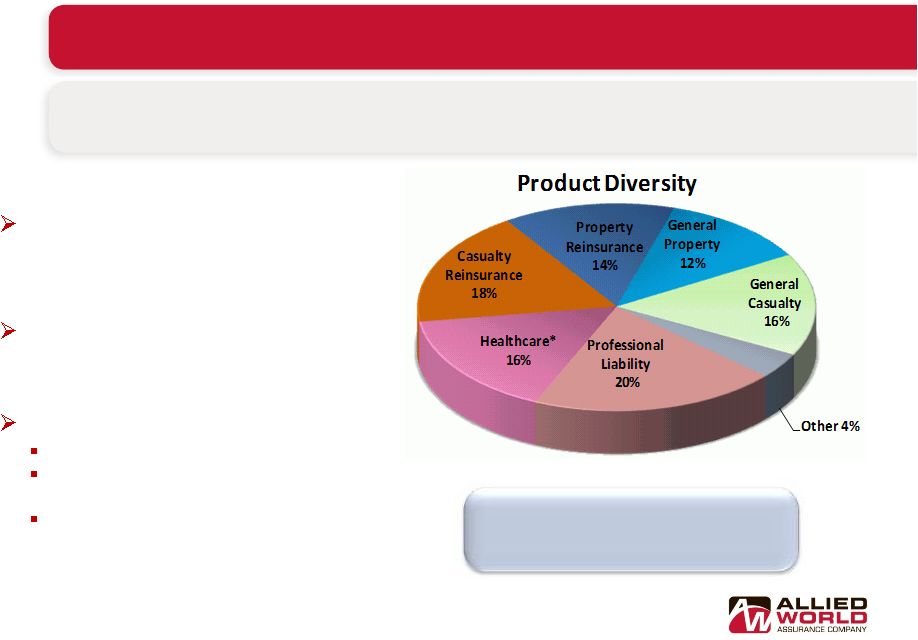 Diversified insurance and reinsurance products offered across global platform with operations in the U.S., Bermuda, Lloyd’s, Europe, Hong Kong and Singapore Emphasis on insurance and casualty lines with strong reinsurance and property capabilities Customer focus Moving closer to clients in markets Demonstrated expertise in markets in which we underwrite A “go to” market for targeted lines and classes of business such as healthcare and construction Allied World – A Diversified mix Leading specialty insurance company with broad range of product offerings, global capabilities and significant U.S. focus 5 * Includes healthcare-related program business Total TTM March 2012 GPW: $ 2,060M 68% Insurance / 32% Reinsurance 74% Casualty / 26% Property |
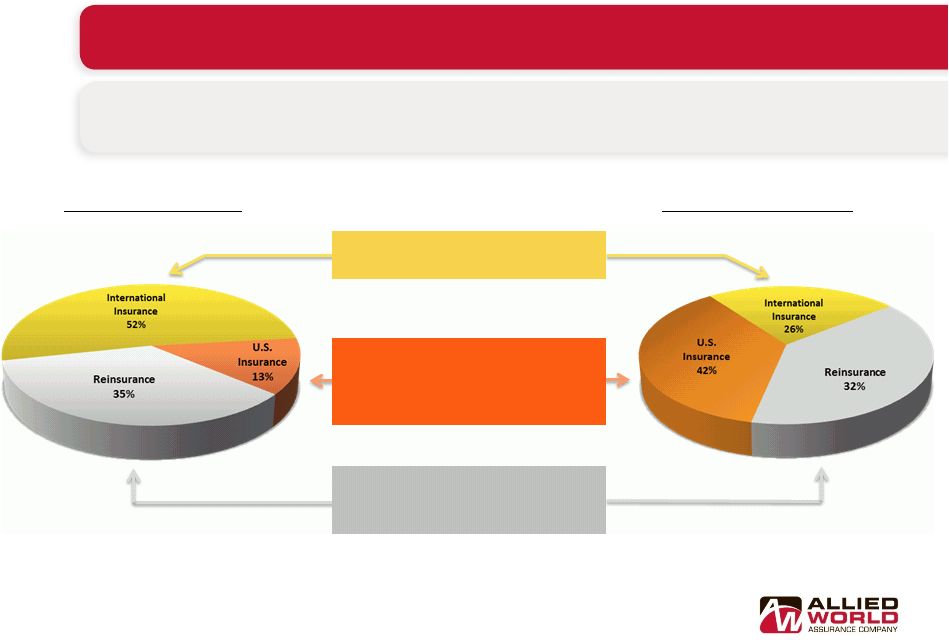 Experienced Management: Shifting the Business Focus 6 2007 GPW: $1,506M In response to the changing macro economic environment, Allied World has transformed itself since 2007 TTM March 2012 GPW: $2,060M Allied World 2007 Allied World Today Reduced dependence on Bermuda large account excess business U.S. segment has increased significantly with focus on small and middle market account primary and specialty business Reinsurance segment now with strong U.S. presence and growing internationally |
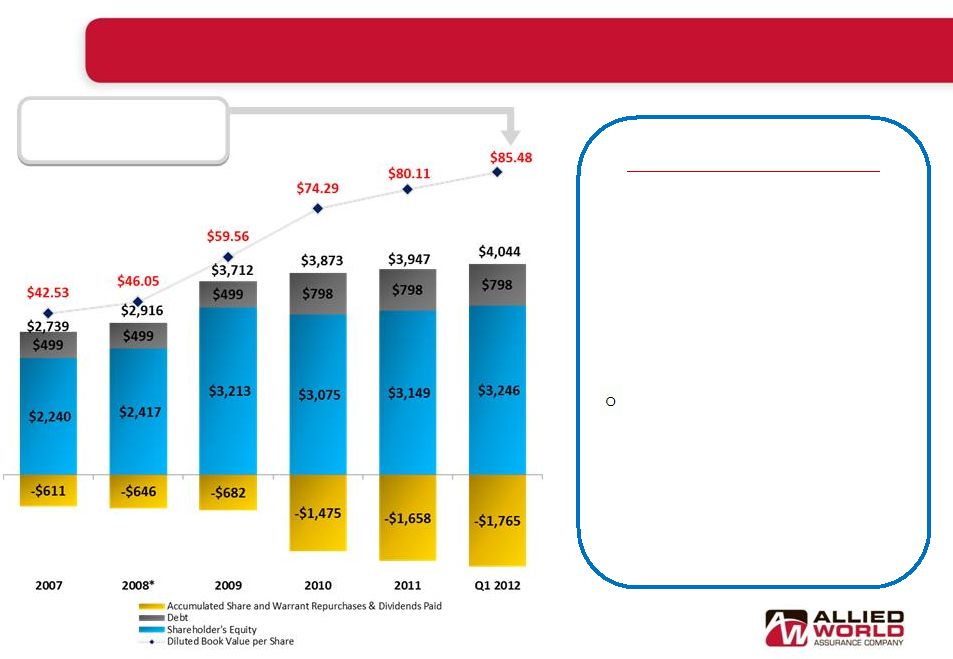 Active Capital Management Improves Shareholder Value * Excludes $243.8 million syndicated loan which was repaid on February 23, 2009 7 Diluted book value per share has more than doubled since 2007 Capital Management History o Share Repurchases • Shareholders approved new $500 million share repurchase program in May 2012 • $1.5 billion of shares and warrants repurchased between December 2007 and March 2012 • $81 million remaining capacity in original share repurchase program as of March 2012 • $214 million of common dividends paid since 2007; current quarterly dividend of $0.375 per share o Conservative Capital Position: • $300 million in ten-year senior notes issued in November 2010; financial leverage of 19.7% at March 2012 (In millions, except for per share amounts) Dividends: |
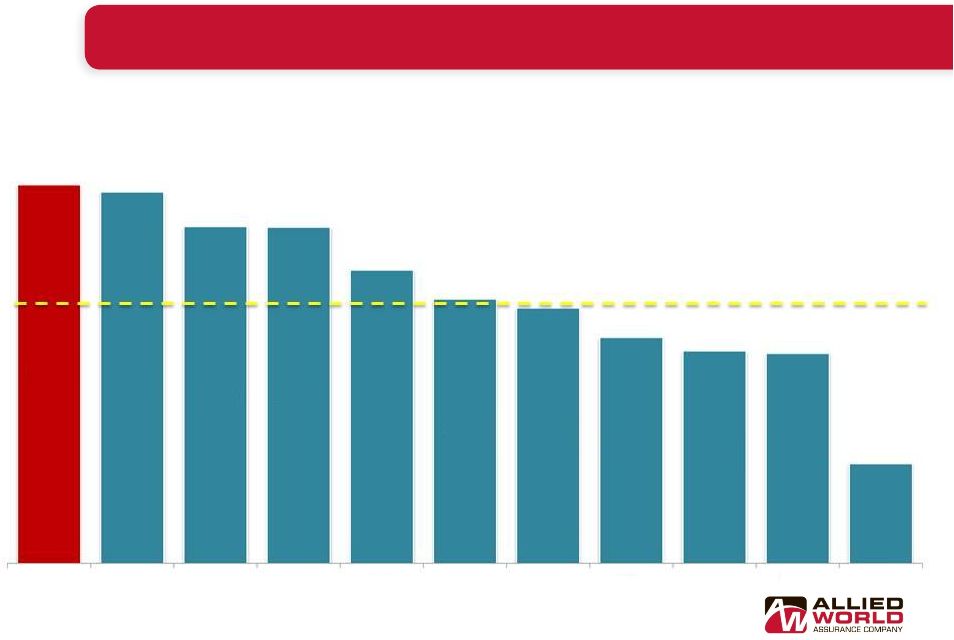
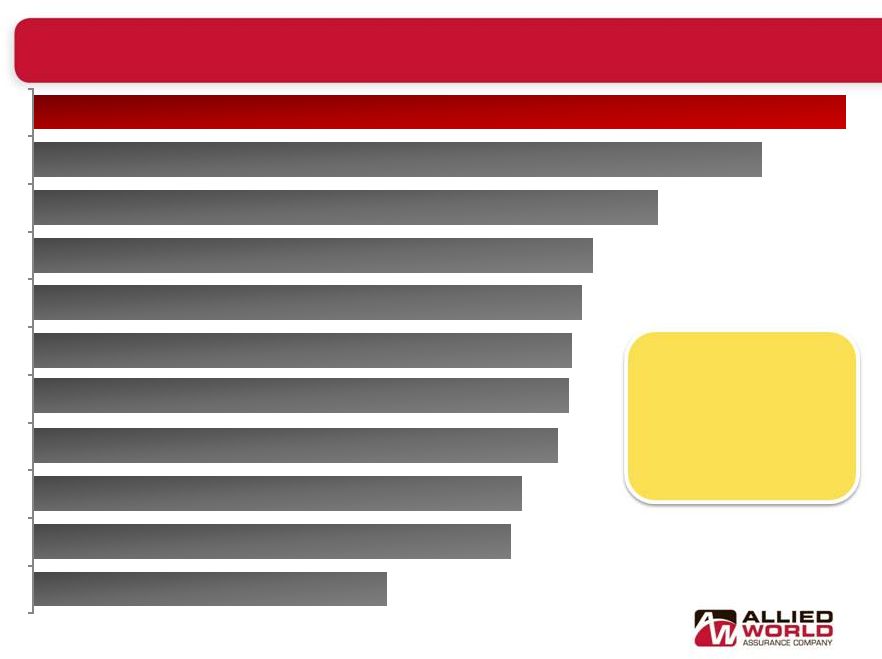 Superior Value Creation Since 2006 IPO Compound annual growth in diluted book value per share calculated by taking change in diluted book value per share from September 2006 through March 2012 adjusted for common dividends declared or paid. 8 Compound Annual Growth in Diluted Book Value per Share through March 2012 19.7% 17.7% 15.2% 13.6% 13.3% 13.1% 13.0% 12.7% 11.9% 11.6% 8.6% Allied World Arch Endurance Axis HCC RLI Aspen Berkley Navigators Markel Argo |
 Agenda Executive Summary Executive Summary Operating Segments Operating Segments U.S. Insurance U.S. Insurance International Insurance International Insurance Reinsurance Reinsurance Financial Highlights Financial Highlights Conclusion Conclusion Appendix Appendix 9 |
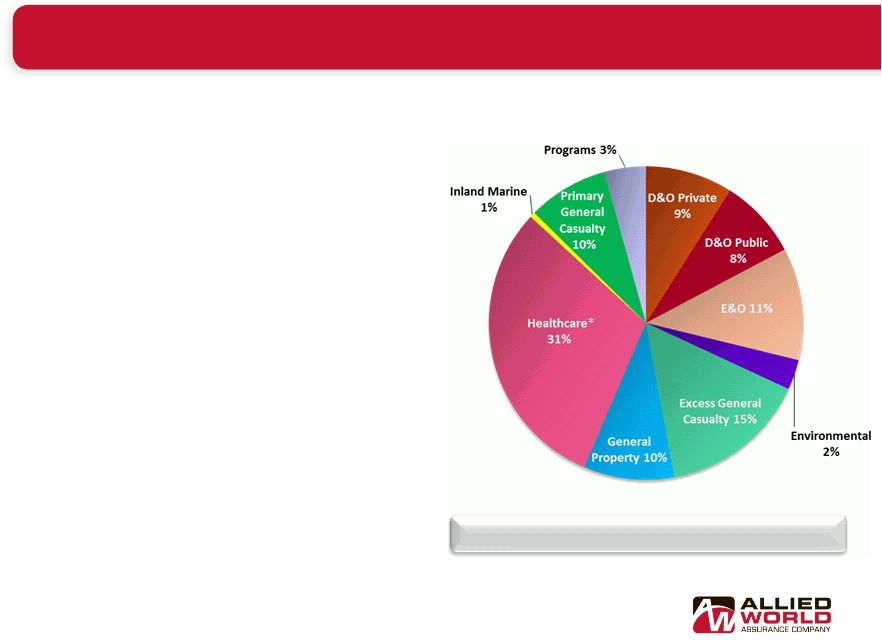 Our U.S. Insurance Operating Segment - A significant U.S.- based specialty franchise with diversified offerings • Direct property and casualty insurance for small and middle-market non-Fortune 1000 companies • Ten branch offices in strategic locations throughout the U.S. • Admitted and excess & surplus lines (E&S) capabilities in all 50 states • Increased access to attractive small account primary business • Industry verticals strategy • New specialty products o Defense Base Act approved underwriter, environmental, inland marine and M&A capabilities * Includes healthcare-related program business Allied World U.S. Insurance Operating Segment Product Mix 10 Total TTM March 2012 GPW: $860M * o Focused on servicing products in select industry classes, including healthcare, private / non-profit, and public entity / construction |
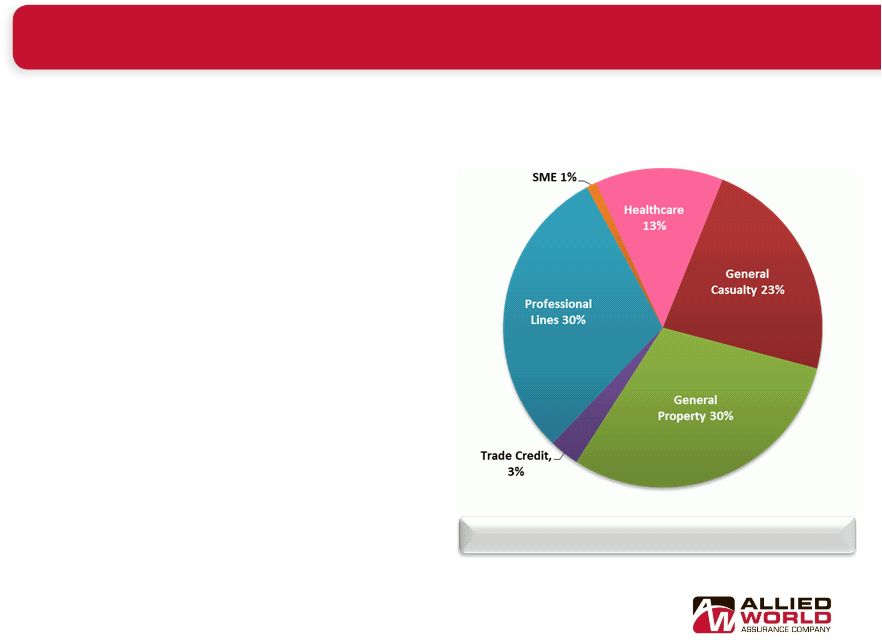 Allied World International Insurance Operating Segment Product Mix 11 Our International Insurance Operating Segment - Global Diversification and Expansion • Offices in Bermuda, Dublin, Hong Kong, London, Singapore and Zug position the company to meet developing opportunities • Lloyd’s Syndicate 2232 • New product capabilities: • MGA and program business initiated in targeted areas Total TTM March 2012 GPW: $533M o Association with Lloyd’s enhances Allied World’s brand recognition o Increases access to Latin America and Asia- Pacific region o Offers treaty and individual risk products o Trade credit and political risk o European healthcare o Small-to-medium enterprises (SME Professional) |
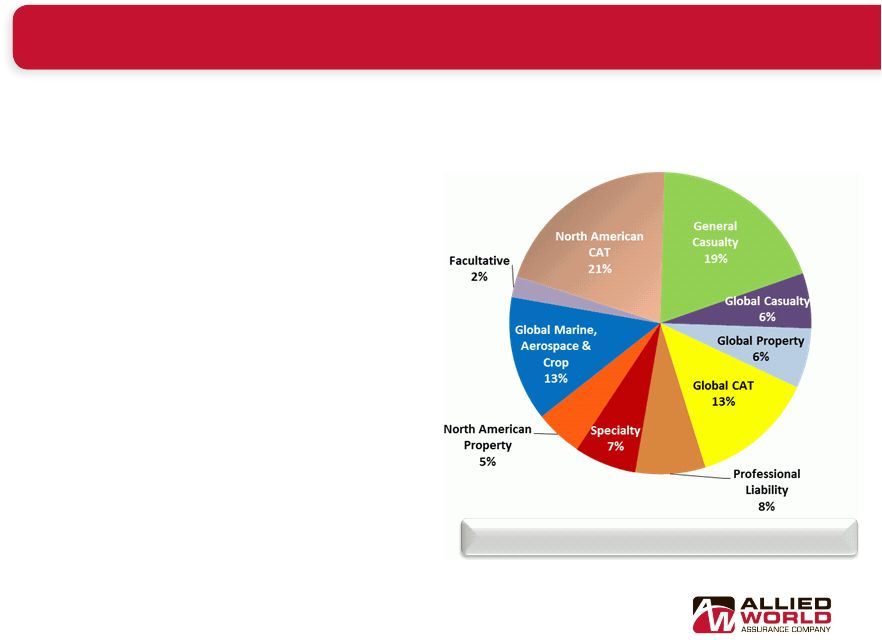 Allied World Reinsurance Operating Segment Product Mix 12 • U.S. operation has improved access to U.S. regional business and strengthened local relationships • Strategic Bermuda Platform • Swiss and Singapore offices and Lloyd’s Syndicate 2232 increases global reach Our Reinsurance Operating Segment - Flexibility to take advantage of reinsurance opportunities in the global marketplace Total TTM March 2012 GPW: $667M o Property reinsurance capabilities that focus on small and medium account regional carriers o In late 2010, launched Global Marine and Specialty Unit that offers marine and aerospace coverages as well as crop and hail business o Property catastrophe, property per risk, workers’ compensation catastrophe, accident & health and specialty casualty o Significantly expanded reinsurance capabilities throughout Europe, Latin American, Middle East, Africa and the Asia Pacific region |
 Quarterly Highlights – First Quarter 2012 Investments in operations are paying off with increased production and strong underwriting results across all of our operating segments 13 • Record quarter for the company with gross premiums written of $680 million, up over 21% from prior period • Combined ratio of 85.2% for the quarter reflecting benign catastrophe activity; expense ratio lowered to 29.2%, down 2.5 points from prior period • Reinsurance Segment • U.S. Insurance Segment • International Insurance Segment o Crop and marine business increased to $80 million, up 4.5 times from the prior year reflecting added expertise and capabilities in this area o Asia platform premiums increased to $29 million in the first quarter of 2012, almost doubling from prior period o Premium increased $21 million, or 11.4% from prior period with growth across most product lines including general property and specialty casualty classes o Premiums increased for fourth straight quarter reflecting the continued build out of specialty classes of business |
 Agenda Executive Summary Executive Summary Operating Segments Operating Segments U.S. Insurance U.S. Insurance International Insurance International Insurance Reinsurance Reinsurance Financial Highlights Financial Highlights Conclusion Conclusion Appendix Appendix 14 |
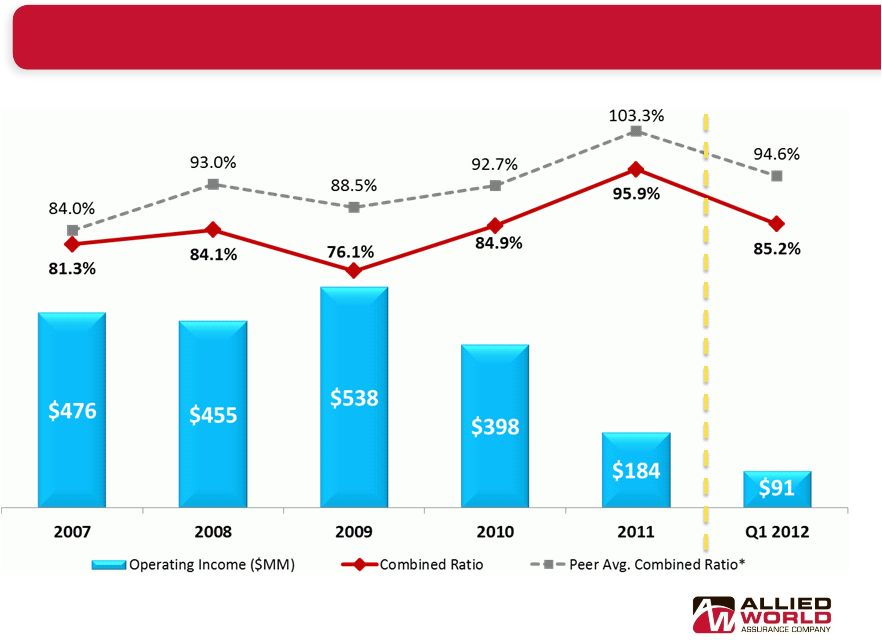 15 * Peer average include ACGL, AGII, AHL, AXS, ENH, HCC, MKL, RLI, THG, NAVG and WRB. Source: SNL Financial Operating Income and Combined Ratio Strong Operating Performance |
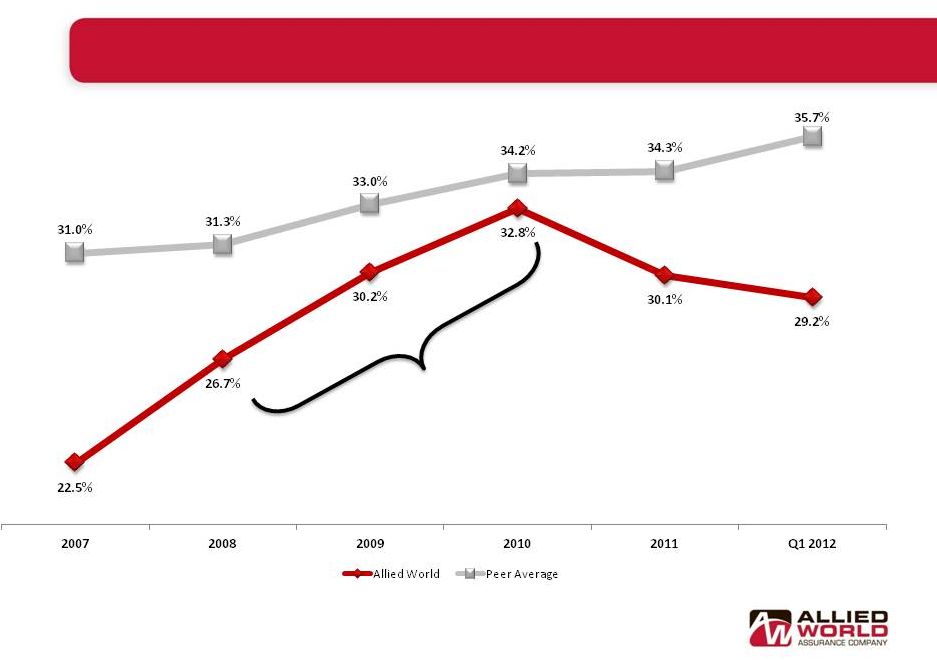 16 Expense Ratio Declining as We Build Scale Note: GAAP expense ratio Peer average includes ACGL, AGII, AHL, AXS, ENH, HCC, MKL, NAVG, RLI, THG and WRB. Source: SNL Financial Allied World expanded global operations, including: the build-out of the U.S. platform, the acquisition of Darwin, the establishment of a U.S. reinsurance company and the opening of Lloyd's Syndicate 2232 |
 AY 2002 2003 2004 2005 2006 2007 2008 2009 2010 2011 2012 CY Total CY Original Loss Ratio 70.1% 65.3% 75.9% 103.1% 59.6% 58.4% 55.6% 45.9% 52.1% 65.8% 56.0% Prior Year Development 0.0% -4.9% -5.8% -3.6% -8.2% -10.2% -24.2% -18.8% -23.1% -17.4% -9.8% AY Original Loss Ratio 70.1% 70.1% 81.7% 106.7% 67.7% 68.6% 79.8% 64.7% 75.1% 83.2% 65.9% 2002 2003 (56.8) (56.8) 2004 (26.7) (52.7) (79.4) 2005 (8.4) (45.7) 5.6 (48.5) 2006 (16.5) (43.1) (45.3) (8.2) (113.0) 2007 6.2 (33.8) (76.9) (6.2) (26.1) (136.9) 2008 (8.9) (87.9) (100.3) (73.8) (7.8) (33.9) (312.6) 2009 (16.5) (57.2) (118.1) (102.5) 11.6 2.4 32.2 (248.0) 2010 4.4 (10.9) (57.0) (146.7) (54.4) (24.8) (22.6) (1.2) (313.4) 2011 (0.0) (1.3) (22.1) (89.5) (42.3) (68.7) (21.7) (27.9) 20.1 (253.5) 2012 (1.2) (1.8) (1.3) (13.9) (25.6) (25.2) (2.9) (2.3) 2.7 32.0 (39.5) Subsequent Development (124.6) (334.3) (415.3) (440.9) (144.7) (150.2) (15.0) (31.4) 22.8 32.0 (1,601.6) Loss Ratio Points -28.7% -28.5% -30.3% -32.5% -10.4% -11.2% -1.2% -2.4% 1.7% 2.2% AY Developed 41.3% 41.6% 51.4% 74.2% 57.3% 57.4% 78.6% 62.3% 76.8% 85.4% 65.9% Cat Losses 16.4% 28.1% 9.8% 6.2% 20.8% AY Developed EX Cat Losses 41.3% 41.6% 35.0% 46.1% 57.3% 57.4% 68.9% 62.3% 70.6% 64.6% 65.9% Case Incurred through 2012 Q1 39.2% 33.8% 45.4% 59.7% 39.4% 39.0% 48.1% 24.4% 41.6% 35.2% 6.8% Remaining IBNR / EP Ratio @ 2012 Q1 2.1% 7.8% 6.0% 14.5% 17.8% 18.3% 30.6% 37.9% 35.2% 50.2% 59.1% Strong Underwriting Results Underwriting performance has been strong since our inception 17 Historical Loss Ratios Through March 31, 2012 ($MM) 1 2 (1) Pro-forma including Darwin development since inception (2) Case incurred ratios by year are not directly comparable to our financial statements as reinsurance case incurred losses shown above are on a treaty year basis |
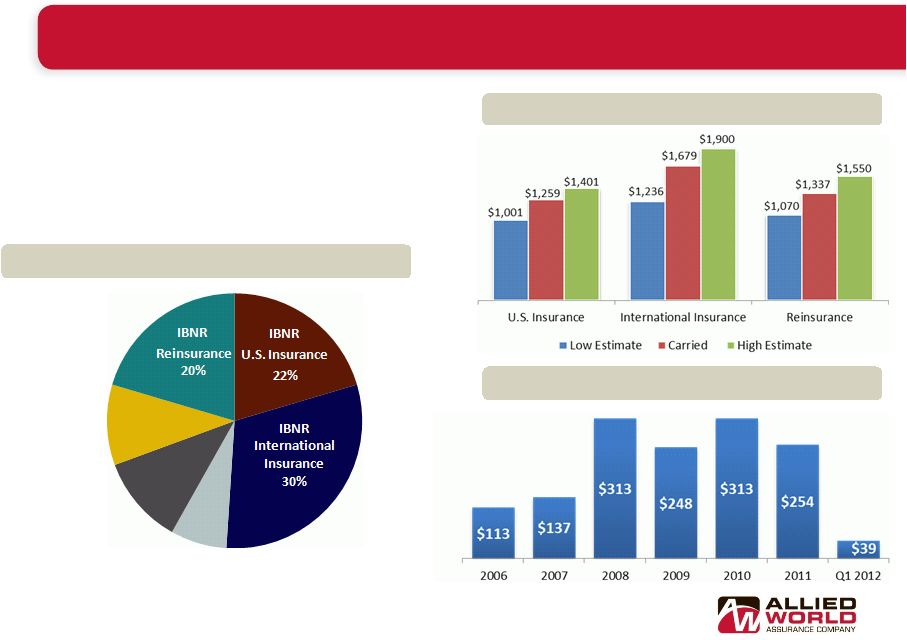 March 31, 2012 Total: $4.3B • Net reserves about 4.8% above mid-point of range at March 31, 2012 • $1.6 billion net favorable reserve development since inception (including Darwin development) • 72% of reserves are IBNR Net Loss & LAE Reserve Mix at March 31, 2012 Net Prior Year Reserve Releases* ($MM) Range of Net Reserves at March 31, 2012 ($MM) Prudent Reserving Philosophy 18 * Pro-forma including Darwin development since inception Case U.S. Insurance 8% Case International Insurance 9% Case Reinsurance 11% |
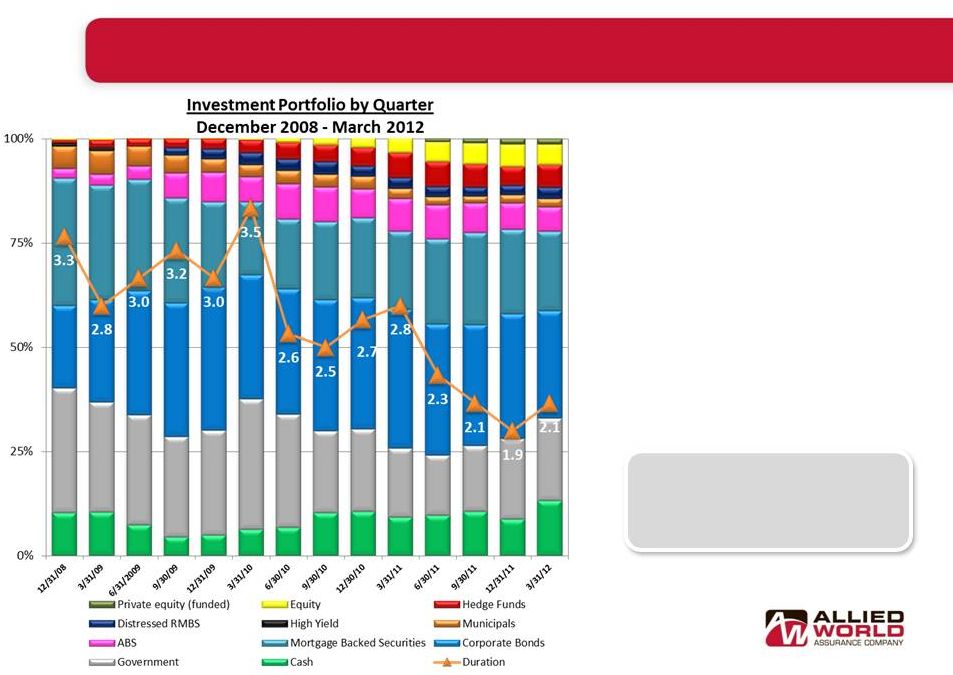 Investment Portfolio Highlights 19 • We maintain a short duration/overweight credit position in core fixed-income • We will continue to build out non-core portfolio in 2012. Relative value and significant market volatility remains in favor of a diversified portfolio, by asset class as well as by issuer Total Cash and Investments: $8.4 B Portfolio Yield: 2.4% Q1 2012 Total Portfolio Return: 2.0% Average Credit Quality (S&P): AA- |
 Financial Highlights Operating Results Operating Results Q1 2012 Q1 2012 2011 2011 2010 2010 2009 2009 2008 2008 Net Income $218M $275M $665M $607M $184M Operating Income $91M $184M $398M $538M $455M Annualized Net Income Return on Average Equity 27.4% 8.9% 21.9% 22.6% 8.3% Annualized Operating Return on Average Equity 11.5% 6.0% 13.1% 20.0% 20.6% Combined Ratio 85.2% 95.9% 84.9% 76.1% 84.1% Cash flow from Operations $143M $548M $451M $668M $657M Total Investment Portfolio Return 2.0% 2.0% 6.1% 7.9% 0.5% Ending Diluted Book Value per Share $85.48 $80.11 $74.29 $59.56 $46.05 Growth in Diluted Book Value Per Share 7% 8% 25% 29% 8% Allied World has reported very strong results despite competitive landscape, financial turbulence and catastrophe activity 20 |
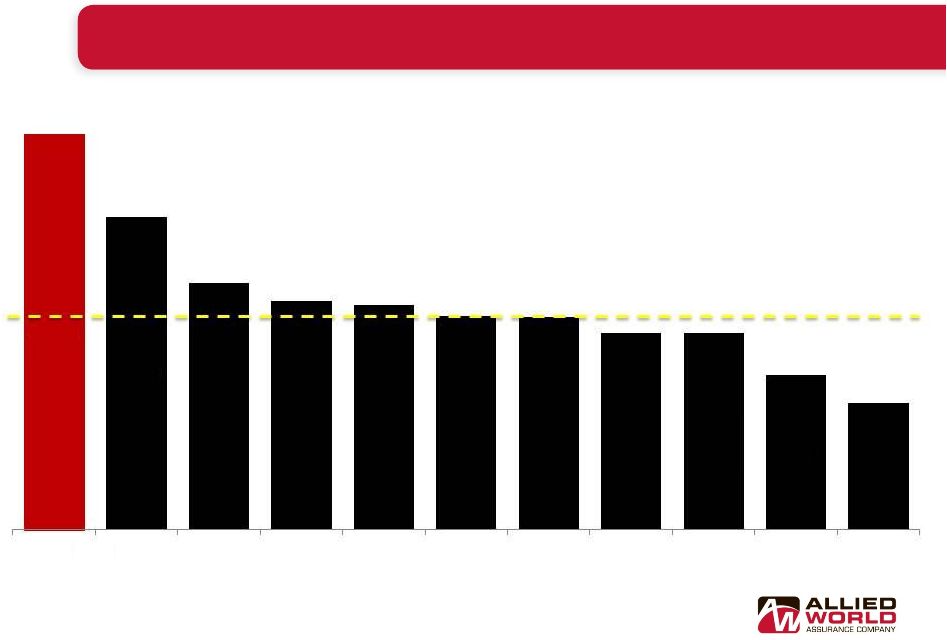
 Peer Comparisons – Operating Income ROE Source: SNL Financial 21 Five Year Average Quarterly Annualized Operating ROE April 2007 – March 2012 Peer Average = 10.4% 15.1% 14.8% 13.5% 13.4% 11.7% 10.6% 10.2% 9.0% 8.5% 8.4% 4.0% AWH RLI ACGL WRB HCC ENH AXS AHL MKL NAVG Argo |
 22 Catastrophe Losses at Low End of Competitors Catastrophe Losses as a % of Prior Year Shareholders’ Equity 2007 shareholders’ equity includes Max Capital and Harbor Point Hurricanes Ike and Gustav Percentages represent pre tax catastrophe losses divided by prior year-end shareholders equity. Source: SNL Financial and company filings 1 2 Catastrophe losses in line with our risk appetite |
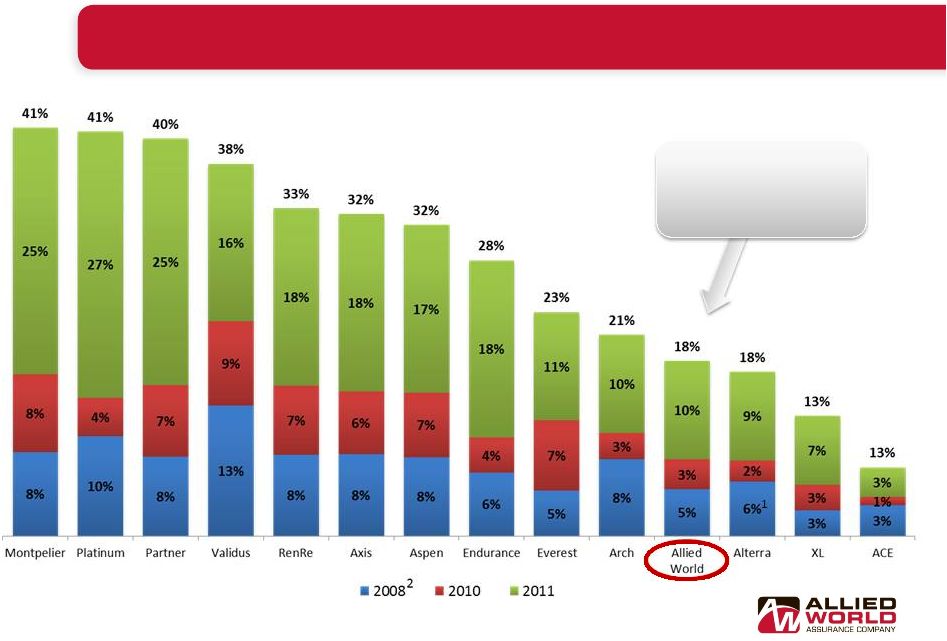
 Growth in book value per share calculated by taking change in book value per share from March 31, 2007 through March 31, 2012 adjusted for dividends paid or declared. Diluted book value per share used when available 23 Peer Average = 77% Five Year Growth in Book Value per Share April 2007 – March 2012 Superior Book Value Growth Versus Peers 143% 113% 89% 83% 81% 77% 77% 71% 71% 56% 46% AWH ACGL ENH HCC AHL AXS RLI WRB NAVG MKL AGII |
 Agenda Executive Summary Executive Summary Operating Segments Operating Segments U.S. Insurance U.S. Insurance International Insurance International Insurance Reinsurance Reinsurance Financial Highlights Financial Highlights Conclusion Conclusion Appendix Appendix 24 |
 Conclusion 25 Despite recent gains, current valuation is still inconsistent with company’s historical performance and strong position to capitalize on market opportunities Well-diversified property and casualty insurer and reinsurer with significant geographic reach Experienced executive management team with strong risk management culture Excellent capitalization with active capital management Highly Rated – “A” (Strong) by S&P, “A” (Excellent) by A.M. Best and “A2” (Good) by Moody’s Industry leading results and value creation |
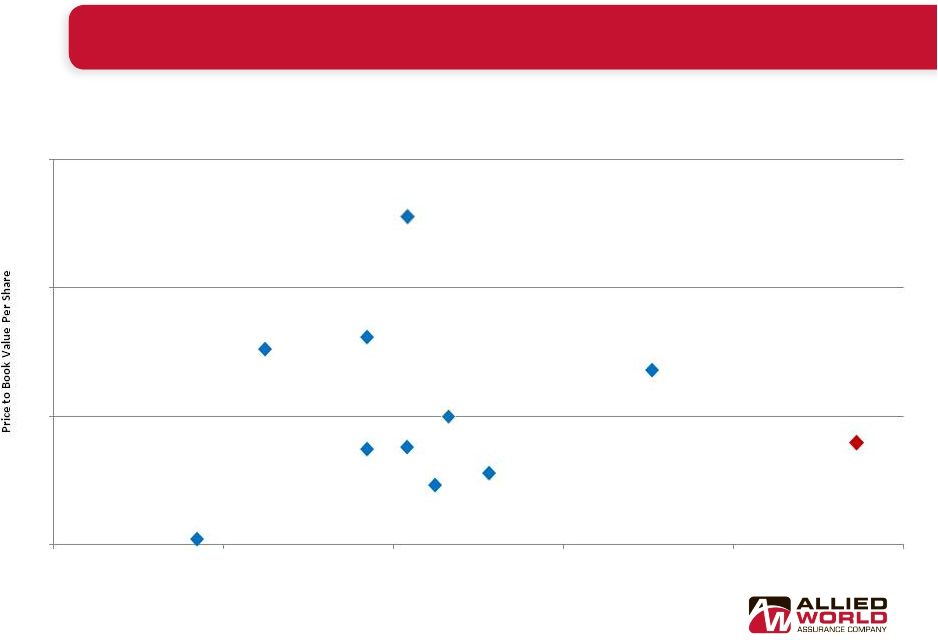 26 Five Year Growth in Book Value per Share vs. Price to Book Value Conclusion - Allied World is attractively valued given its historical performance 0.50 1.00 1.50 2.00 25% 50% 75% 100% 125% 150% Five Year Growth in Book Value Per Share AWH ACGL AGII AHL AXS ENH HCC MKL NAVG RLI WRB Growth in book value per share calculated by taking change in book value per share from March 31, 2007 through March 31, 2012 adjusted for dividends paid or declared. Price to book as of May 10, 2012. Diluted book value per share used when available |
 Agenda Executive Summary Executive Summary Operating Segments Operating Segments U.S. Insurance U.S. Insurance International Insurance International Insurance Reinsurance Reinsurance Financial Highlights Financial Highlights Conclusion Conclusion Appendix Appendix 27 |
 Non-GAAP Financial Measures 28 In presenting the company's results, management has included and discussed in this presentation certain non generally accepted accounting principles ("non- GAAP") financial measures within the meaning of Regulation G as promulgated by the U.S. Securities and Exchange Commission. Management believes that these non-GAAP measures, which may be defined differently by other companies, better explain the company's results of operations in a manner that allows for a more complete understanding of the underlying trends in the company's business. However, these measures should not be viewed as a substitute for those determined in accordance with generally accepted accounting principles ("U.S. GAAP"). "Operating income" is an internal performance measure used by the company in the management of its operations and represents after-tax operational results excluding, as applicable, net realized investment gains or losses, net impairment charges recognized in earnings, net foreign exchange gain or loss, impairment of intangible assets and other non-recurring items. The company excludes net realized investment gains or losses, net impairment charges recognized in earnings, net foreign exchange gain or loss and other non-recurring items from its calculation of operating income because these amounts are heavily influenced by and fluctuate in part according to the availability of market opportunities and other factors. The company excludes impairment of intangible assets as these are non-recurring charges. In addition to presenting net income determined in accordance with GAAP, the company believes that showing operating income enables investors, analysts, rating agencies and other users of its financial information to more easily analyze the company’s results of operations and the company’s underlying business performance. Operating income should not be viewed as a substitute for GAAP net income. The company has included "diluted book value per share" because it takes into account the effect of dilutive securities; therefore, the company believes it is an important measure of calculating shareholder returns. "Annualized return on average shareholders' equity" ("ROAE") is calculated using average equity, excluding the average after tax unrealized gains or losses on investments. Unrealized gains (losses) on investments are primarily the result of interest rate and risk premium movements and the resultant impact on fixed income securities. Such gains (losses) are not related to management actions or operational performance, nor are they likely to be realized. Therefore, the company believes that excluding these unrealized gains (losses) provides a more consistent and useful measurement of operating performance, which supplements GAAP information. In calculating ROAE, the net income (loss) available to shareholders for the period is multiplied by the number of such periods in a calendar year in order to arrive at annualized net income (loss) available to shareholders. The company presents ROAE as a measure that is commonly recognized as a standard of performance by investors, analysts, rating agencies and other users of its financial information. "Annualized operating return on average shareholders' equity" is calculated using operating income (as defined above and annualized in the manner described for net income (loss) available to shareholders under ROAE above), and average shareholders' equity, excluding the average after tax unrealized gains (losses) on investments. Unrealized gains (losses) are excluded from equity for the reasons outlined in the annualized return on average shareholders' equity explanation above. See slides 29 - 31 for a reconciliation of non-GAAP measures used in this presentation to their most directly comparable GAAP measures. |
  Non-GAAP Financial Measures - Reconciliations 29 ALLIED WORLD ASSURANCE COMPANY HOLDINGS, AG UNAUDITED ANNUALIZED RETURN ON SHAREHOLDERS' EQUITY RECONCILIATION (Expressed in thousands of United States dollars, except for percentage information) 2012 2011 Opening shareholders' equity 3,149,022 $ 3,075,820 $ Deduct: accumulated other comprehensive income (14,484) (57,135) Adjusted opening shareholders' equity 3,134,538 3,018,685 Closing shareholders' equity 3,245,821 $ 2,950,953 $ Deduct: accumulated other comprehensive income (2,325) (32,963) Adjusted closing shareholders' equity 3,243,496 2,917,990 Average shareholders' equity 3,189,017 $ 2,968,338 $ Net income available to shareholders 218,156 $ 8,620 $ Annualized net income available to shareholders 872,624 34,480 Annualized return on average shareholders' equity - net income available to shareholders 27.4% 1.2% Operating income (loss) available to shareholders 91,505 $ (41,348) $ Annualized operating income (loss) available to shareholders 366,020 (165,392) Annualized return on average shareholders' equity - operating income (loss) available to shareholders 11.5% (5.6%) Quarter Ended March 31, |
 Non-GAAP Financial Measures - Reconciliations 30 ALLIED WORLD ASSURANCE COMPANY HOLDINGS, AG UNAUDITED OPERATING INCOME RECONCILIATION (Expressed in thousands of United States dollars, except share and per share amounts) 2012 2011 Net income 218,156 $ 8,620 $ Add after tax affect of: Net realized investment gains (126,570) (49,526) Foreign exchange gain (81) (442) Operating income (loss) 91,505 $ (41,348) $ Weighted average common shares outstanding: Basic 37,205,166 38,199,867 Diluted 38,284,635 40,383,523 Basic per share data: Net income 5.86 $ 0.23 $ Add after tax affect of: Net realized investment gains (3.40) (1.30) Foreign exchange gain - (0.01) Operating income (loss) 2.46 $ (1.08) $ Diluted per share data: Net income 5.70 $ 0.21 $ Add after tax affect of: Net realized investment gains (3.31) (1.22) Foreign exchange gain - (0.01) Operating income (loss) 2.39 $ (1.02) $ Quarter Ended March 31, |
 Non-GAAP Financial Measures - Reconciliations 31 ALLIED WORLD ASSURANCE COMPANY HOLDINGS, AG UNAUDITED DILUTED BOOK VALUE PER SHARE RECONCILIATION (Expressed in thousands of United States dollars, except share and per share amounts) As of As of As of March 31, December 31, March 31, 2012 2011 2011 Price per share at period end 68.67 $ 62.93 $ 62.69 $ Total shareholders' equity 3,245,821 $ 3,149,022 $ 2,950,953 $ Basic common shares outstanding 36,786,067 37,742,131 37,899,699 Add: unvested restricted share units 187,623 249,251 475,679 Add: performance based equity awards 524,888 889,939 920,164 Add: employee share purchase plan - 11,053 - Add: dilutive options/warrants outstanding 1,429,333 1,525,853 1,674,993 Weighted average exercise price per share 45.98 $ 45.72 $ 45.47 $ Deduct: options bought back via treasury method (957,064) (1,108,615) (1,215,020) Common shares and common share equivalents outstanding 37,970,847 39,309,612 39,755,515 Basic book value per common share 88.24 $ 83.44 $ 77.86 $ Diluted book value per common share 85.48 $ 80.11 $ 74.23 $ |