Exhibit 99.1

ALLIED WORLD
ASSURANCE COMPANY
Investor Presentation
3rd Quarter 2012
BERMUDA
EUROPE
HONG KONG
SINGAPORE
USA
Forward-Looking Statements & Safe Harbor
This presentation contains certain statements, estimates and forecasts with respect to future performance and events. These statements, estimates and forecasts are “forward-looking statements”. In some cases, forward-looking statements can be identified by the use of forward-looking terminology such as “may,” “might,” “will,” “should,” “expect,” “plan,” “intend,” “estimate,” “anticipate,” “believe,” “predict,” “potential” or “continue” or the negatives thereof or variations thereon or similar terminology. All statements other than statements of historical fact included in this presentation are forward-looking statements and are based on various underlying assumptions and expectations and are subject to known and unknown risks, uncertainties and assumptions, may include projections of our future financial performance based on our growth strategies and anticipated trends in our business. These statements are only predictions based on our current expectations and projections about future events. There are important factors that could cause our actual results, level of activity, performance or achievements to differ materially from the results, level of activity, performance or achievements expressed or implied in the forward-looking statements. As a result, there can be no assurance that the forward-looking statements included in this presentation will prove to be accurate or correct. In light of these risks, uncertainties and assumptions, the future performance or events described in the forward-looking statements in this presentation might not occur. Accordingly, you should not rely upon forward-looking statements as a prediction of actual results and we do not assume any responsibility for the accuracy or completeness of any of these forward-looking statements that may be made from time to time. We are under no obligation (and expressly disclaim any such obligation) to update or revise any forward-looking statements, whether as a result of new information, future developments or otherwise.
2
ALLIED WORLD
ASSURANCE COMPANY

Agenda
Executive Summary
Operating Segments
U.S. Insurance
International Insurance
Reinsurance
Financial Highlights
Conclusion
Appendix
3
ALLIED WORLD
ASSURANCE COMPANY
Allied World’s Franchise
Well-diversified property and casualty insurer and reinsurer with significant geographic reach
Experienced executive management team with strong risk management culture
Excellent capitalization with active capital management
Highly Rated - “A” (Excellent) by A.M. Best, “A” (Strong) by S&P, “A2” (Good) by Moody’s and “A+” (Good) by Fitch
Industry leading results and value creation
4
ALLIED WORLD
ASSURANCE COMPANY
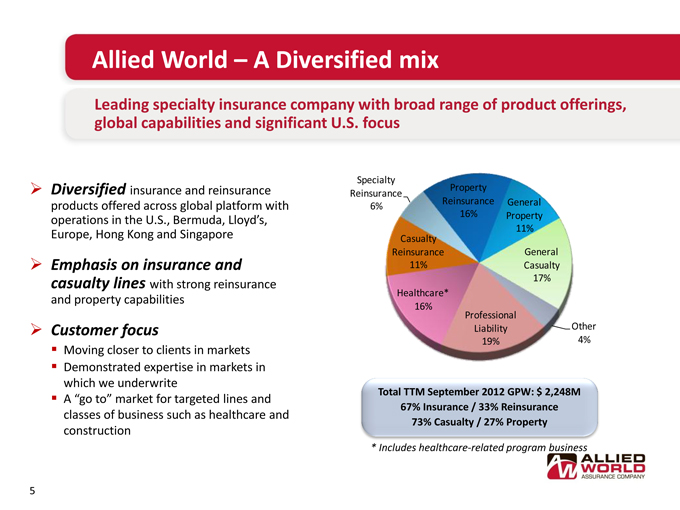
Leading specialty insurance company with broad range of product offerings, global capabilities and significant U.S. focus
Diversified insurance and reinsurance products offered across global platform with operations in the U.S., Bermuda, Lloyd’s,
Europe, Hong Kong and Singapore
Emphasis on insurance and
casualty lines with strong reinsurance and property capabilities
Customer focus
Moving closer to clients in markets ?Demonstrated expertise in markets in which we underwrite
A “go to” market for targeted lines and classes of business such as healthcare and construction
Specialty Reinsurance 6%
Casualty Reinsurance 11%
Healthcare* 16%
Professional Liability 19%
Other
4%
General Casualty 17%
General Property 11%
Property Reinsurance 16%
Total TTM September 2012 GPW: $ 2,248M 67% Insurance / 33% Reinsurance 73% Casualty / 27% Property
* Includes healthcare-related program business
Experienced Management: Shifting the Business Focus
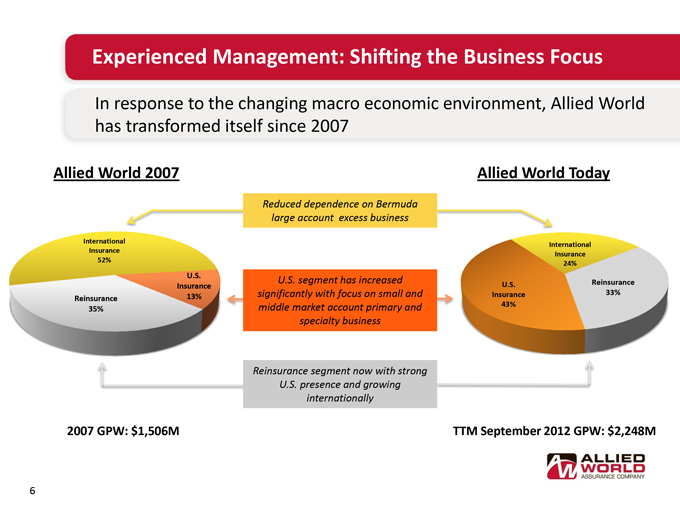
In response to the changing macro economic environment, Allied World has transformed itself since 2007
Allied World 2007
International Insurance 52%
U.S. Insurance 13%
Reinsurance 35%
Reduced dependence on Bermuda large account excess business
U.S. segment has increased significantly with focus on small and middle market account primary and specialty business
Reinsurance segment now with strong U.S. presence and growing internationally
Allied World Today
International Insurance 24%
U.S. Insurance 43%
Reinsurance 33%
2007 GPW: $1,506M
TTM September 2012 GPW: $2,248M
6
ALLIED WORLD
ASSURANCE COMPANY
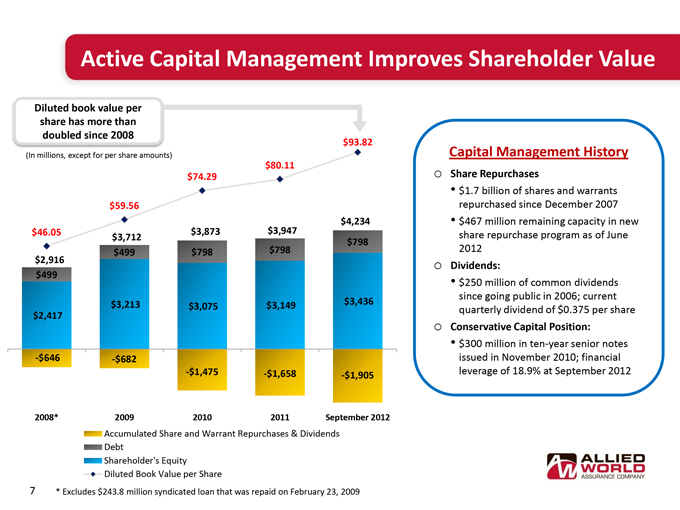
Active Capital Management Improves Shareholder Value
Diluted book value per share has more than doubled since 2008
(In millions, except for per share amounts)
$46.05 $59.56 $74.29 $80.11 $93.82
$2,916 $3,712 $3,873 $3,947 $4,234
$499 $499 $798 $798 $798
$2,417 $3,213 $3,075 $3,149 $3,436
-$646 -$682 -$1,475 -$1,658 -$1,905
2008* 2009 2010 2011 September 2012
Shareholder’s Equity
Debt
Accumulated Share and Warrant Repurchases & Dividends
Diluted Book Value per Share
* Excludes $243.8 million syndicated loan that was repaid on February 23, 2009
Capital Management History
Share Repurchases
$1.7 billion of shares and warrants repurchased since December 2007
$467 million remaining capacity in new share repurchase program as of June 2012
Dividends:
$250 million of common dividends since going public in 2006; current quarterly dividend of $0.375 per share
Conservative Capital Position:
$300 million in ten-year senior notes issued in November 2010; financial leverage of 18.9% at September 2012
7
ALLIED WORLD
ASSURANCE COMPANY
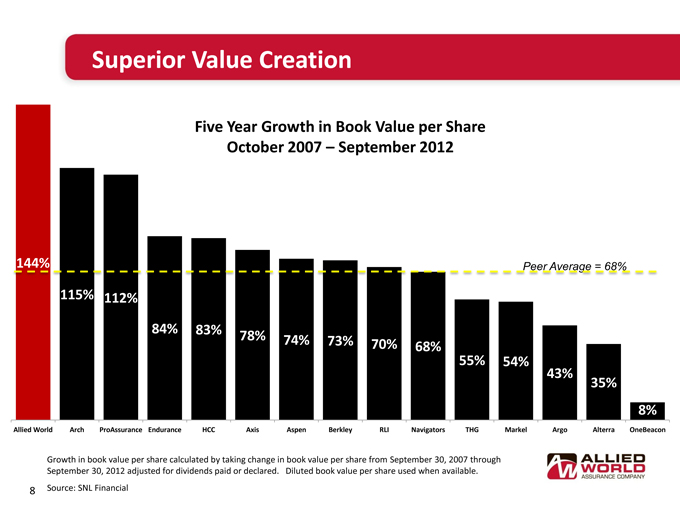
Superior Value Creation
Five Year Growth in Book Value per Share October 2007 – September 2012
Peer Average = 68%
144% 115% 112%
84% 83% 78% 74%
73% 70% 68%
55% 54%
43% 35%
8%
Allied World Arch ProAssurance Endurance HCC Axis Aspen Berkley RLI Navigators THG Markel Argo Alterra OneBeacon
Growth in book value per share calculated by taking change in book value per share from September 30, 2007 through September 30, 2012 adjusted for dividends paid or declared. Diluted book value per share used when available.
Source: SNL Financial

Agenda
Executive Summary
Operating Segments
U.S. Insurance
International Insurance
Reinsurance
Financial Highlights
Conclusion
Appendix
9
ALLIED WORLD
ASSURANCE COMPANY
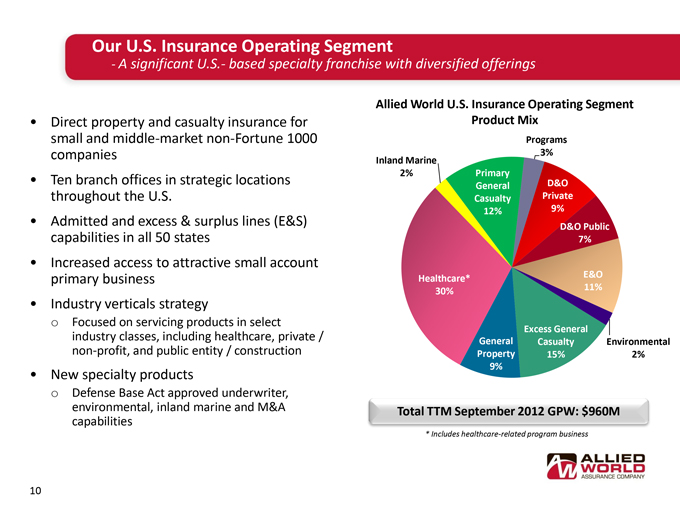
Our U.S. Insurance Operating Segment
- A significant U.S.- based specialty franchise with diversified offerings
Direct property and casualty insurance for small and middle-market non-Fortune 1000 companies
Ten branch offices in strategic locations throughout the U.S.
Admitted and excess & surplus lines (E&S) capabilities in all 50 states
Increased access to attractive small account primary business
Industry verticals strategy
Focused on servicing products in select industry classes, including healthcare, private / non-profit, and public entity / construction
New specialty products
Defense Base Act approved underwriter, environmental, inland marine and M&A capabilities
Allied World U.S. Insurance Operating Segment Product Mix
Programs 3%
Inland Marine 2%
Primary General Casualty 12%
D&O Private 9%
D&O Public 7%
Healthcare* 30%
E&O 11%
Excess General Casualty 15%
General Property 9%
Environmental 2%
Total TTM September 2012 GPW: $960M
* Includes healthcare-related program business
10
ALLIED WORLD
ASSURANCE COMPANY
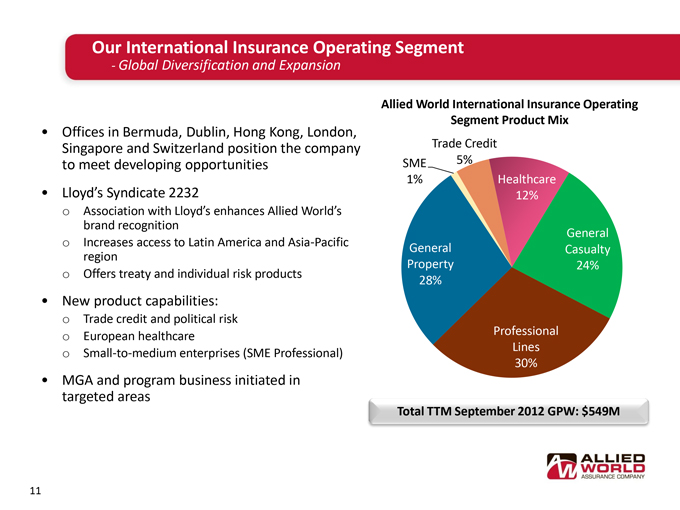
Our International Insurance Operating Segment
- Global Diversification and Expansion
Offices in Bermuda, Dublin, Hong Kong, London, Singapore and Switzerland position the company to meet developing opportunities
Lloyd’s Syndicate 2232
Association with Lloyd’s enhances Allied World’s brand recognition
Increases access to Latin America and Asia-Pacific region
Offers treaty and individual risk products
New product capabilities:
Trade credit and political risk
European healthcare
Small-to-medium enterprises (SME Professional)
MGA and program business initiated in targeted areas
Allied World International Insurance Operating Segment Product Mix
Trade Credit 5%
SME 1%
Healthcare 12%
General Casualty 24%
General Property 28%
Professional Lines 30%
Total TTM September 2012 GPW: $549M
11
ALLIED WORLD
ASSURANCE COMPANY
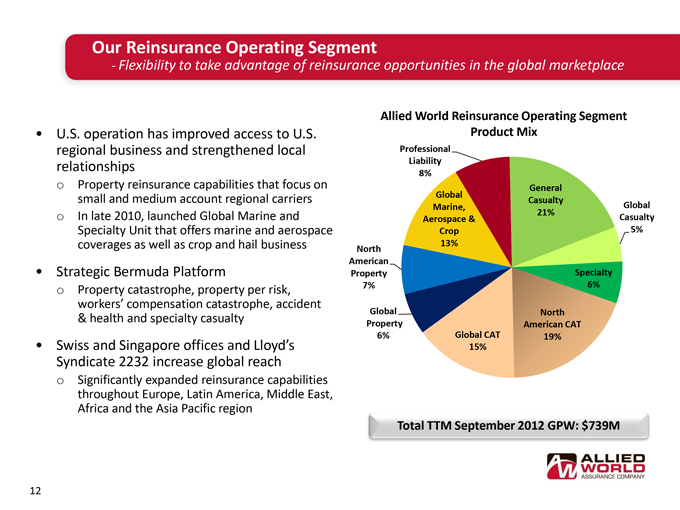
Our Reinsurance Operating Segment
- Flexibility to take advantage of reinsurance opportunities in the global marketplace
U.S. operation has improved access to U.S. regional business and strengthened local relationships
Property reinsurance capabilities that focus on small and medium account regional carriers
In late 2010, launched Global Marine and Specialty Unit that offers marine and aerospace coverages as well as crop and hail business
Strategic Bermuda Platform
Property catastrophe, property per risk, workers’ compensation catastrophe, accident & health and specialty casualty
Swiss and Singapore offices and Lloyd’s Syndicate 2232 increase global reach
Significantly expanded reinsurance capabilities throughout Europe, Latin America, Middle East, Africa and the Asia Pacific region
Allied World Reinsurance Operating Segment Product Mix
Professional Liability 8%
General Casualty 21%
Global Marine, Aerospace & Crop 13%
Global Casualty 5%
North American Property 7%
Specialty 6%
Global Property 6%
North American CAT 19%
Global CAT 15%
Total TTM September 2012 GPW: $739M
12
ALLIED WORLD
ASSURANCE COMPANY
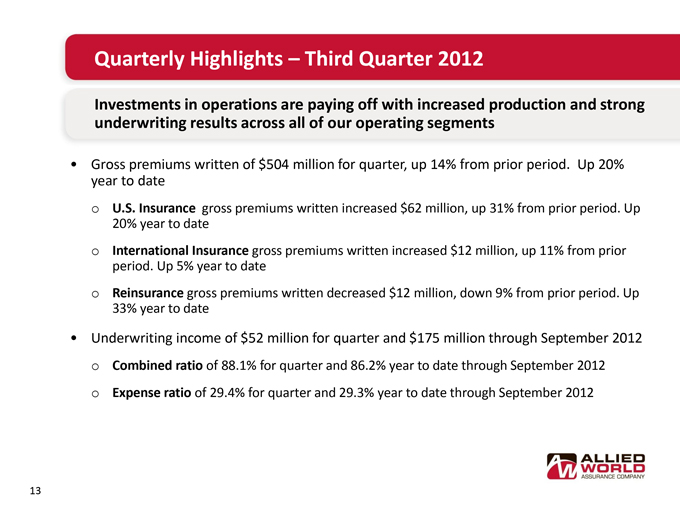
Quarterly Highlights - Third Quarter 2012
Investments in operations are paying off with increased production and strong underwriting results across all of our operating segments
Gross premiums written of $504 million for quarter, up 14% from prior period. Up 20% year to date
U.S. Insurance gross premiums written increased $62 million, up 31% from prior period. Up 20% year to date
International Insurance gross premiums written increased $12 million, up 11% from prior period. Up 5% year to date
Reinsurance gross premiums written decreased $12 million, down 9% from prior period. Up 33% year to date
Underwriting income of $52 million for quarter and $175 million through September 2012
Combined ratio of 88.1% for quarter and 86.2% year to date through September 2012
Expense ratio of 29.4% for quarter and 29.3% year to date through September 2012
13
ALLIED WORLD
ASSURANCE COMPANY
Quarterly Highlights – Allied World Financial Services Company
Allied World Financial Services Company’s goals:
Optimize expenses
Increase our knowledge and expertise by partnering with experts
Participate in the economic returns of these business relationships
Announced signings of first two transactions:
Cunningham Lindsey
Global TPA
One of the largest providers of claims administration globally
Purchasing company in participation with private equity firm CVC Capital, Stonepoint Capital, Fairfax Financial and the Cunningham Lindsey management team
Will be a strategic partner as we continue to expand our global insurance reach
MatlinPatterson Asset Management
Well known distressed business that has broadened its platform, including multiple liquid credit strategies ??Will manage $500 million of our portfolio, over time, across multiple strategies

Agenda
Executive Summary
Operating Segments
U.S. Insurance
International Insurance
Reinsurance
Financial Highlights
Conclusion
Appendix
15
ALLIED WORLD
ASSURANCE COMPANY
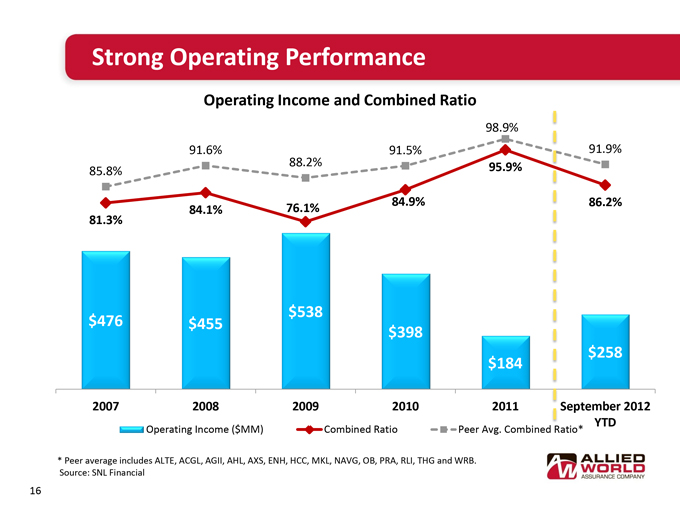
Strong Operating Performance
Operating Income and Combined Ratio
85.8% 91.6% 88.2% 91.5% 98.9% 91.9%
81.3% 84.1% 76.1% 84.9% 95.9% 86.2%
$476 $455 $538 $398 $184 $258
2007 2008 2009 2010 2011 September 2012 YTD
Operating Income ($MM) Combined Ratio Peer Avg. Combined Ratio*
* Peer average includes ALTE, ACGL, AGII, AHL, AXS, ENH, HCC, MKL, NAVG, OB, PRA, RLI, THG and WRB.
Source: SNL Financial
16
ALLIED
WORLD
ASSURANCE COMPANY
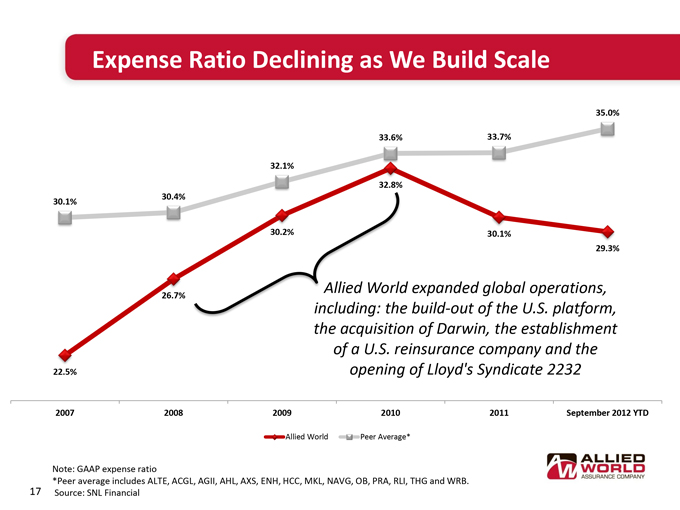
Expense Ratio Declining as We Build Scale
30.1% 30.4% 32.1% 33.6% 33.7% 35.0%
22.5% 26.7% 30.2% 32.8% 30.1% 29.3%
Allied World expanded global operations, including: the build-out of the U.S. platform, the acquisition of Darwin, the establishment of a U.S. reinsurance company and the opening of Lloyd’s Syndicate 2232
2007 2008 2009 2010 2011 September 2012 YTD
Allied World
Peer Average*
Note: GAAP expense ratio
*Peer average includes ALTE, ACGL, AGII, AHL, AXS, ENH, HCC, MKL, NAVG, OB, PRA, RLI, THG and WRB.
Source: SNL Financial
17
ALLIED
WORLD
ASSURANCE COMPANY
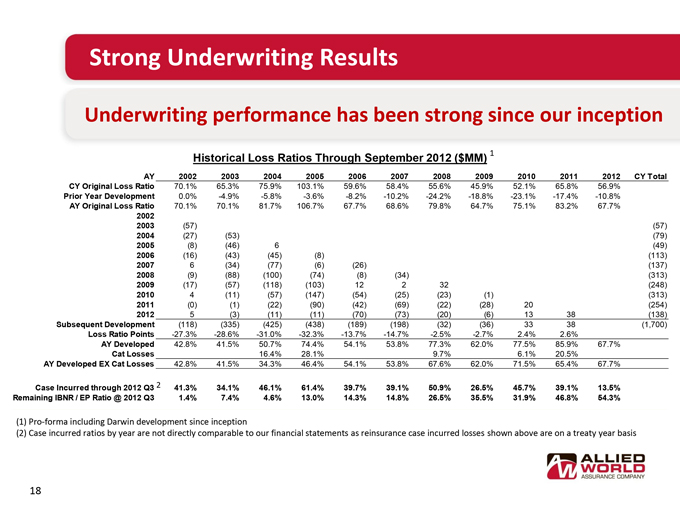
Strong Underwriting Results
Underwriting performance has been strong since our inception
Historical Loss Ratios Through September 2012 ($MM) 1
AY 2002 2003 2004 2005 2006 2007 2008 2009 2010 2011 2012 CY Total
CY Original Loss Ratio 70.1% 65.3% 75.9% 103.1% 59.6% 58.4% 55.6% 45.9% 52.1% 65.8% 56.9%
Prior Year Development 0.0% -4.9% -5.8% -3.6% -8.2% -10.2% -24.2% -18.8% -23.1% -17.4% -10.8%
AY Original Loss Ratio 70.1% 70.1% 81.7% 106.7% 67.7% 68.6% 79.8% 64.7% 75.1% 83.2% 67.7%
2002
2003 (57) (57)
2004 (27) (53) (79)
2005 (8) (46) 6 (49)
2006 (16) (43) (45) (8) (113)
2007 6 (34) (77) (6) (26) (137)
2008 (9) (88) (100) (74) (8) (34) (313)
2009 (17) (57) (118) (103) 12 2 32 (248)
2010 4 (11) (57) (147) (54) (25) (23) (1) (313)
2011 (0) (1) (22) (90) (42) (69) (22) (28) 20 (254)
2012 5 (3) (11) (11) (70) (73) (20) (6) 13 38 (138)
Subsequent Development (118) (335) (425) (438) (189) (198) (32) (36) 33 38 (1,700)
Loss Ratio Points -27.3% -28.6% -31.0% -32.3% -13.7% -14.7% -2.5% -2.7% 2.4% 2.6%
AY Developed 42.8% 41.5% 50.7% 74.4% 54.1% 53.8% 77.3% 62.0% 77.5% 85.9% 67.7%
Cat Losses 16.4% 28.1% 9.7% 6.1% 20.5%
AY Developed EX Cat Losses 42.8% 41.5% 34.3% 46.4% 54.1% 53.8% 67.6% 62.0% 71.5% 65.4% 67.7%
Case Incurred through 2012 Q3 2 41.3% 34.1% 46.1% 61.4% 39.7% 39.1% 50.9% 26.5% 45.7% 39.1% 13.5%
Remaining IBNR / EP Ratio @ 2012 Q3 1.4% 7.4% 4.6% 13.0% 14.3% 14.8% 26.5% 35.5% 31.9% 46.8% 54.3%
(1) Pro-forma including Darwin development since inception
(2) Case incurred ratios by year are not directly comparable to our financial statements as reinsurance case incurred losses shown above are on a treaty year basis
18
ALLIED
WORLD
ASSURANCE COMPANY
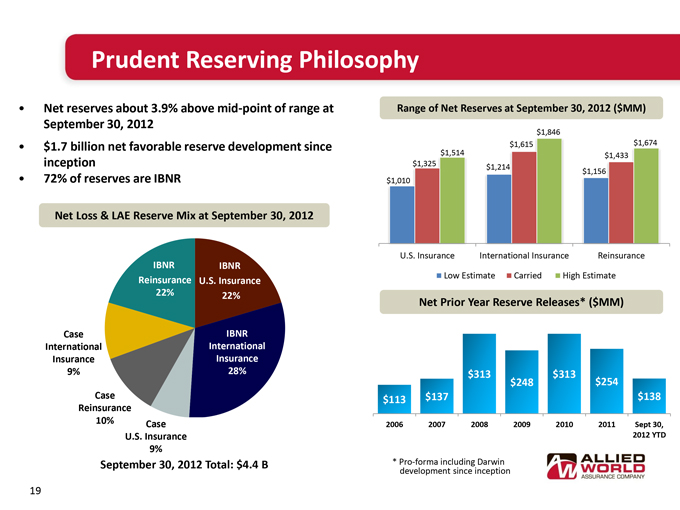
Prudent Reserving Philosophy
Net reserves about 3.9% above mid-point of range at September 30, 2012
$1.7 billion net favorable reserve development since inception
72% of reserves are IBNR
Net Loss & LAE Reserve Mix at September 30, 2012
IBNR Reinsurance 22%
IBNR U.S. Insurance 22%
IBNR International Insurance 28%
Case International Insurance 9%
Case Reinsurance 10%
Case U.S. Insurance 9%
September 30, 2012 Total: $4.4 B
Range of Net Reserves at September 30, 2012 ($MM)
$1,010 $1,325 $1,514 $1,214 $1,615 $1,846 $1,156 $1,433 $1,674
U.S. Insurance International Insurance Reinsurance
Low Estimate Carried High Estimate
Net Prior Year Reserve Releases* ($MM)
$113 $137 $313 $248 $313 $254 $138
2006 2007 2008 2009 2010 2011 Sept 30,
2012 YTD
* Pro-forma including Darwin development since inception
19
ALLIED
WORLD
ASSURANCE COMPANY
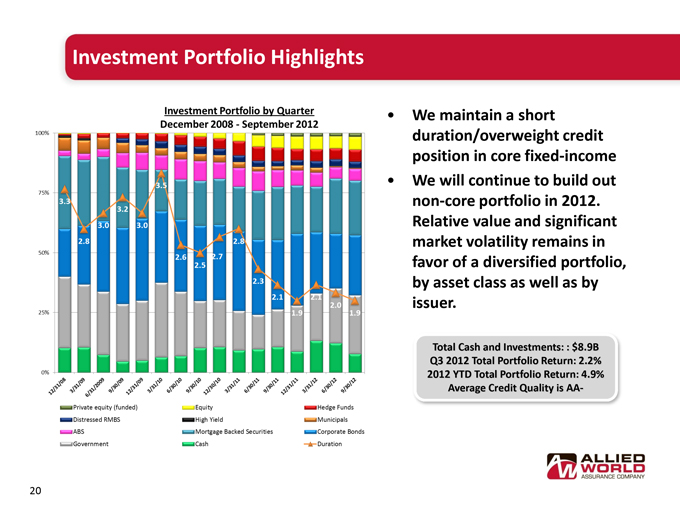
Investment Portfolio Highlights
Investment Portfolio by Quarter
December 2008 - September 2012
100% 75% 50% 25% 0%
3.3 2.8 3.0 3.2 3.0 3.5 2.6 2.5 2.7 2.8 2.3 2.1 1.9 2.1 2.0 1.9
12/31/08 3/31/09 6/31/2009 9/30/09 12/31/09 3/31/10 6/30/10 9/30/10 12/30/10 3/31/11 6/30/11 9/30/11 12/31/11 3/31/12 6/30/12 9/30/12
Private equity (funded) Equity Hedge Funds
Distressed RMBS High Yield Municipals
ABS Mortgage Backed Securities Corporate Bonds
Government Cash Duration
We maintain a short duration/overweight credit position in core fixed-income
We will continue to build out non-core portfolio in 2012.
Relative value and significant market volatility remains in favor of a diversified portfolio, by asset class as well as by issuer.
Total Cash and Investments: : $8.9B Q3 2012 Total Portfolio Return: 2.2% 2012 YTD Total Portfolio Return: 4. 9%
Average Credit Quality is AA-
20
ALLIED
WORLD
ASSURANCE COMPANY
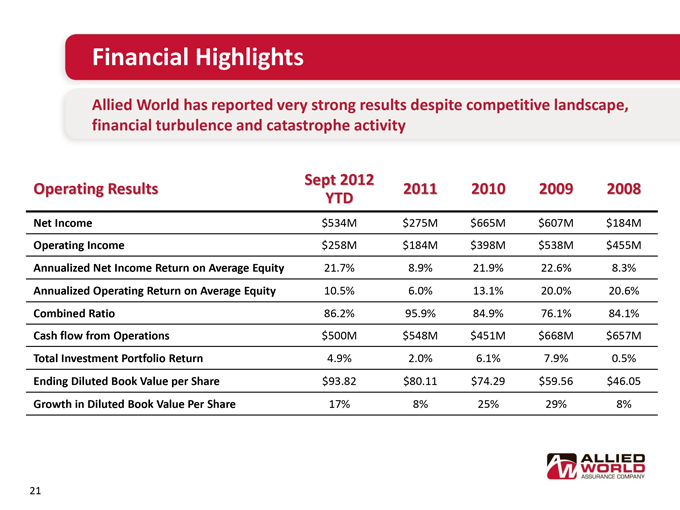
Financial Highlights
Allied World has reported very strong results despite competitive landscape, financial turbulence and catastrophe activity
Operating Results Sept 2012 YTD 2011 2010 2009 2008
Net Income $534M $275M $665M $607M $184M
Operating Income $258M $184M $398M $538M $455M
Annualized Net Income Return on Average Equity 21.7% 8.9% 21.9% 22.6% 8.3%
Annualized Operating Return on Average Equity 10.5% 6.0% 13.1% 20.0% 20.6%
Combined Ratio 86.2% 95.9% 84.9% 76.1% 84.1%
Cash flow from Operations $500M $548M $451M $668M $657M
Total Investment Portfolio Return 4.9% 2.0% 6.1% 7.9% 0.5%
Ending Diluted Book Value per Share $93.82 $80.11 $74.29 $59.56 $46.05
Growth in Diluted Book Value Per Share 17% 8% 25% 29% 8%
21
ALLIED
WORLD
ASSURANCE COMPANY
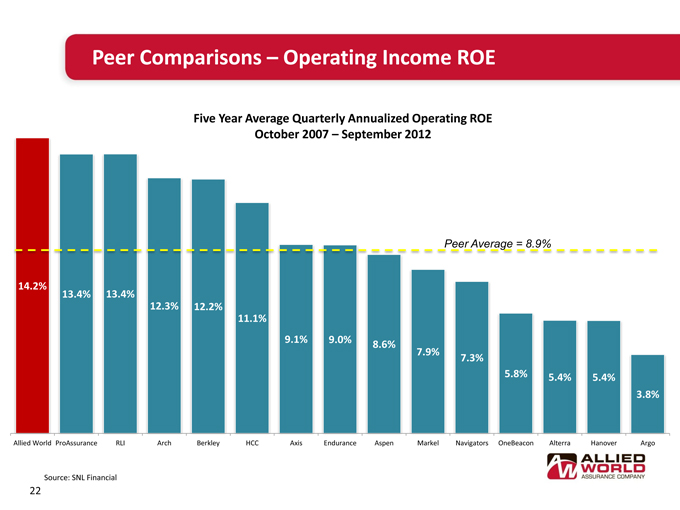
Peer Comparisons – Operating Income ROE
Five Year Average Quarterly Annualized Operating ROE October 2007 – September 2012
Peer Average = 8.9%
14.2%
13.4% 13.4%
12.3% 12.2%
11.1%
9.1% 9.0%
8.6%
7.9%
7.3%
5.8% 5.4% 5.4%
3.8%
Allied World ProAssurance RLI Arch Berkley HCC Axis Endurance Aspen Markel Navigators OneBeacon Alterra Hanover Argo
Source: SNL Financial
22
Agenda
Executive Summary
Operating Segments
U.S. Insurance
International Insurance
Reinsurance
Financial Highlights
Conclusion
Appendix
23
ALLIED
WORLD
ASSURANCE COMPANY
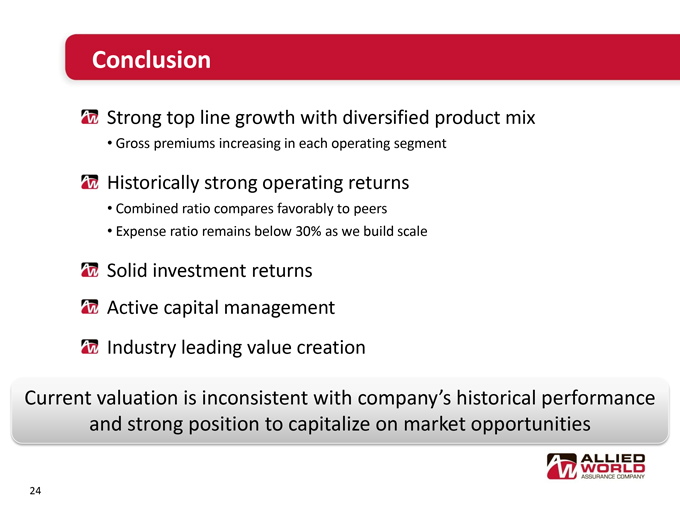
Conclusion
Strong top line growth with diversified product mix
Gross premiums increasing in each operating segment
Historically strong operating returns
Combined ratio compares favorably to peers
Expense ratio remains below 30% as we build scale
Solid investment returns Active capital management Industry leading value creation
Current valuation is inconsistent with company’s historical performance and strong position to capitalize on market opportunities
24
ALLIED
WORLD
ASSURANCE COMPANY
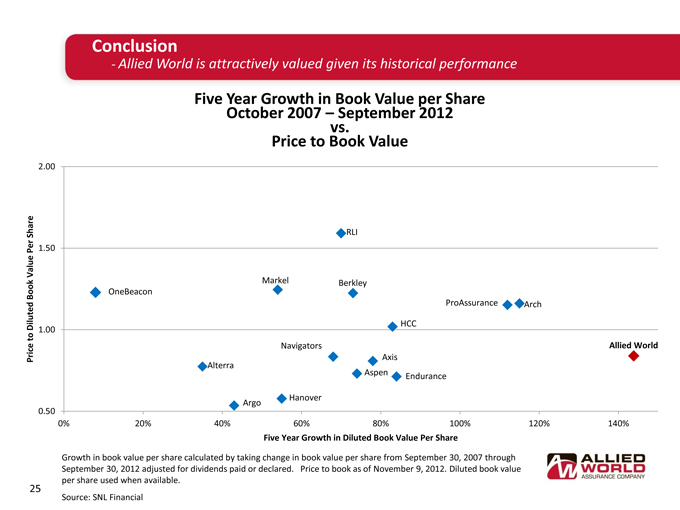
Conclusion
Allied World is attractively valued given its historical performance
Five Year Growth in Book Value per Share October 2007 – September 2012 vs.
Price to Book Value
Price to Diluted Book Value Per Share
2.00
1.50
1.00
0.50
OneBeacon
RLI
Markel
Berkley
ProAssurance
Arch
HCC
Alterra
Navigators
Axis
Allied World
Argo
Hanover
Aspen
Endurance
0% 20% 40% 60% 80% 100% 120% 140%
Five Year Growth in Diluted Book Value Per Share
Growth in book value per share calculated by taking change in book value per share from September 30, 2007 through September 30, 2012 adjusted for dividends paid or declared. Price to book as of November 9, 2012. Diluted book value per share used when available.
Source: SNL Financial
25
Agenda
Executive Summary
Operating Segments
U.S. Insurance
International Insurance
Reinsurance
Financial Highlights
Conclusion Appendix
26
ALLIED
WORLD
ASSURANCE COMPANY
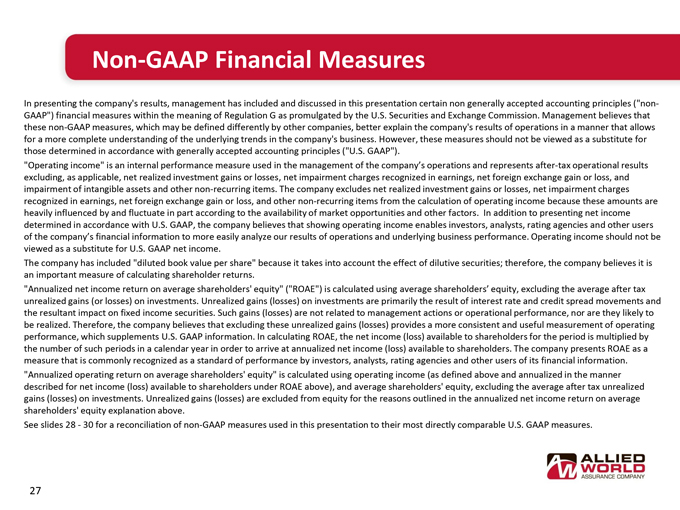
Non-GAAP Financial Measures
In presenting the company’s results, management has included and discussed in this presentation certain non generally accepted accounting principles (“non-GAAP”) financial measures within the meaning of Regulation G as promulgated by the U.S. Securities and Exchange Commission. Management believes that these non-GAAP measures, which may be defined differently by other companies, better explain the company’s results of operations in a manner that allows for a more complete understanding of the underlying trends in the company’s business. However, these measures should not be viewed as a substitute for those determined in accordance with generally accepted accounting principles (“U.S. GAAP”).
“Operating income” is an internal performance measure used in the management of the company’s operations and represents after-tax operational results excluding, as applicable, net realized investment gains or losses, net impairment charges recognized in earnings, net foreign exchange gain or loss, and impairment of intangible assets and other non-recurring items. The company excludes net realized investment gains or losses, net impairment charges recognized in earnings, net foreign exchange gain or loss, and other non-recurring items from the calculation of operating income because these amounts are heavily influenced by and fluctuate in part according to the availability of market opportunities and other factors. In addition to presenting net income determined in accordance with U.S. GAAP, the company believes that showing operating income enables investors, analysts, rating agencies and other users of the company’s financial information to more easily analyze our results of operations and underlying business performance. Operating income should not be viewed as a substitute for U.S. GAAP net income.
The company has included “diluted book value per share” because it takes into account the effect of dilutive securities; therefore, the company believes it is an important measure of calculating shareholder returns.
“Annualized net income return on average shareholders’ equity” (“ROAE”) is calculated using average shareholders’ equity, excluding the average after tax unrealized gains (or losses) on investments. Unrealized gains (losses) on investments are primarily the result of interest rate and credit spread movements and the resultant impact on fixed income securities. Such gains (losses) are not related to management actions or operational performance, nor are they likely to be realized. Therefore, the company believes that excluding these unrealized gains (losses) provides a more consistent and useful measurement of operating performance, which supplements U.S. GAAP information. In calculating ROAE, the net income (loss) available to shareholders for the period is multiplied by the number of such periods in a calendar year in order to arrive at annualized net income (loss) available to shareholders. The company presents ROAE as a measure that is commonly recognized as a standard of performance by investors, analysts, rating agencies and other users of its financial information. “Annualized operating return on average shareholders’ equity” is calculated using operating income (as defined above and annualized in the manner described for net income (loss) available to shareholders under ROAE above), and average shareholders’ equity, excluding the average after tax unrealized gains (losses) on investments. Unrealized gains (losses) are excluded from equity for the reasons outlined in the annualized net income return on average shareholders’ equity explanation above.
See slides 28 - 30 for a reconciliation of non-GAAP measures used in this presentation to their most directly comparable U.S. GAAP measures.
27
ALLIED
WORLD
ASSURANCE COMPANY
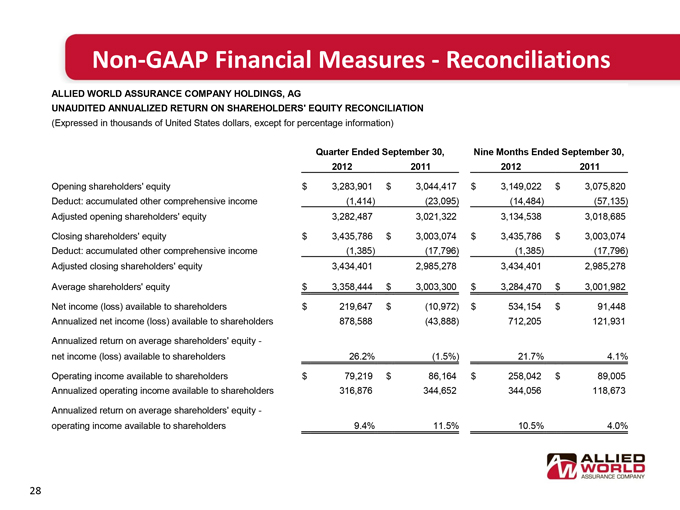
Non-GAAP Financial Measures - Reconciliations
ALLIED WORLD ASSURANCE COMPANY HOLDINGS, AG
UNAUDITED ANNUALIZED RETURN ON SHAREHOLDERS’ EQUITY RECONCILIATION
(Expressed in thousands of United States dollars, except for percentage information)
Quarter Ended September 30, Nine Months Ended September 30,
2012 2011 2012 2011
Opening shareholders’ equity $ 3,283,901 $ 3,044,417 $ 3,149,022 $ 3,075,820
Deduct: accumulated other comprehensive income (1,414) (23,095) (14,484) (57,135)
Adjusted opening shareholders’ equity 3,282,487 3,021,322 3,134,538 3,018,685
Closing shareholders’ equity $ 3,435,786 $ 3,003,074 $ 3,435,786 $ 3,003,074
Deduct: accumulated other comprehensive income (1,385) (17,796) (1,385) (17,796)
Adjusted closing shareholders’ equity 3,434,401 2,985,278 3,434,401 2,985,278
Average shareholders’ equity $ 3,358,444 $ 3,003,300 $ 3,284,470 $ 3,001,982
Net income (loss) available to shareholders $ 219,647 $ (10,972) $ 534,154 $ 91,448
Annualized net income (loss) available to shareholders 878,588 (43,888) 712,205 121,931
Annualized return on average shareholders’ equity - net income (loss) available to shareholders 26.2% (1.5%) 21.7% 4.1%
Operating income available to shareholders $ 79,219 $ 86,164 $ 258,042 $ 89,005
Annualized operating income available to shareholders 316,876 344,652 344,056 118,673
Annualized return on average shareholders’ equity - operating income available to shareholders 9.4% 11.5% 10.5% 4.0%
28
ALLIED
WORLD
ASSURANCE COMPANY
Non-GAAP Financial Measures - Reconciliations
ALLIED WORLD ASSURANCE COMPANY HOLDINGS, AG
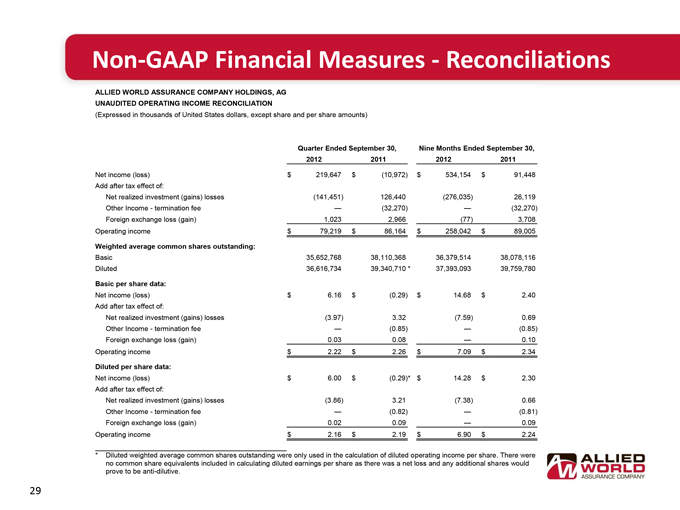
UNAUDITED OPERATING INCOME RECONCILIATION
(Expressed in thousands of United States dollars, except share and per share amounts)
Quarter Ended September 30, Nine Months Ended September 30,
2012 2011 2012 2011
Net income (loss) $ 219,647 $ (10,972) $ 534,154 $ 91,448
Add after tax effect of:
Net realized investment (gains) losses (141,451) 126,440 (276,035) 26,119
Other Income - termination fee - (32,270) - (32,270)
Foreign exchange loss (gain) 1,023 2,966 (77) 3,708
Operating income $ 79,219 $ 86,164 $ 258,042 $ 89,005
Weighted average common shares outstanding:
Basic 35,652,768 38,110,368 36,379,514 38,078,116
Diluted 36,616,734 39,340,710 * 37,393,093 39,759,780
Basic per share data:
Net income (loss) $ 6.16 $ (0.29) $ 14.68 $ 2.40
Add after tax effect of:
Net realized investment (gains) losses (3.97) 3.32 (7.59) 0.69
Other Income - termination fee - (0.85) - (0.85)
Foreign exchange loss (gain) 0.03 0.08 - 0.10
Operating income $ 2.22 $ 2.26 $ 7.09 $ 2.34
Diluted per share data:
Net income (loss) $ 6.00 $ (0.29)* $ 14.28 $ 2.30
Add after tax effect of:
Net realized investment (gains) losses (3.86) 3.21 (7.38) 0.66
Other Income - termination fee - (0.82) - (0.81)
Foreign exchange loss (gain) 0.02 0.09 - 0.09
Operating income $ 2.16 $ 2.19 $ 6.90 $ 2.24
* Diluted weighted average common shares outstanding were only used in the calculation of diluted operating income per share. There were no common share equivalents included in calculating diluted earnings per share as there was a net loss and any additional shares would prove to be anti-dilutive.
29
ALLIED WORLD
ASSURANCE COMPANY
Non-GAAP Financial Measures - Reconciliations
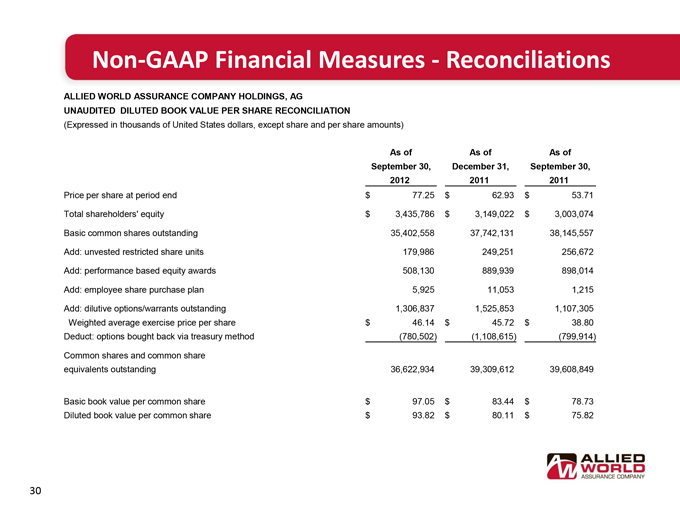
ALLIED WORLD ASSURANCE COMPANY HOLDINGS, AG
UNAUDITED DILUTED BOOK VALUE PER SHARE RECONCILIATION
(Expressed in thousands of United States dollars, except share and per share amounts)
As of As of As of
September 30, December 31, September 30,
2012 2011 2011
Price per share at period end $ 77.25 $ 62.93 $ 53.71
Total shareholders’ equity $ 3,435,786 $ 3,149,022 $ 3,003,074
Basic common shares outstanding 35,402,558 37,742,131 38,145,557
Add: unvested restricted share units 179,986 249,251 256,672
Add: performance based equity awards 508,130 889,939 898,014
Add: employee share purchase plan 5,925 11,053 1,215
Add: dilutive options/warrants outstanding 1,306,837 1,525,853 1,107,305
Weighted average exercise price per share $ 46.14 $ 45.72 $ 38.80
Deduct: options bought back via treasury method (780,502) (1,108,615) (799,914)
Common shares and common share equivalents outstanding 36,622,934 39,309,612 39,608,849
Basic book value per common share $ 97.05 $ 83.44 $ 78.73
Diluted book value per common share $ 93.82 $ 80.11 $ 75.82
30
ALLIED
WORLD
ASSURANCE COMPANY