![]() Investor Presentation 4 Quarter 2012 Exhibit 99.1 th |
![]() Forward-Looking Statements & Safe Harbor This presentation contains certain statements, estimates and forecasts with respect to future performance and events. These statements, estimates and forecasts are “forward-looking statements”. In some cases, forward-looking statements can be identified by the use of forward-looking terminology such as “may,” “might,” “will,” “should,” “expect,” “plan,” “intend,” “estimate,” “anticipate,” “believe,” “predict,” “potential” or "continue" or the negatives thereof or variations thereon or similar terminology. All statements other than statements of historical fact included in this presentation are forward-looking statements and are based on various underlying assumptions and expectations and are subject to known and unknown risks, uncertainties and assumptions, may include projections of our future financial performance based on our growth strategies and anticipated trends in our business. These statements are only predictions based on our current expectations and projections about future events. There are important factors that could cause our actual results, level of activity, performance or achievements to differ materially from the results, level of activity, performance or achievements expressed or implied in the forward-looking statements. As a result, there can be no assurance that the forward-looking statements included in this presentation will prove to be accurate or correct. In light of these risks, uncertainties and assumptions, the future performance or events described in the forward-looking statements in this presentation might not occur. Accordingly, you should not rely upon forward- looking statements as a prediction of actual results and we do not assume any responsibility for the accuracy or completeness of any of these forward-looking statements that may be made from time to time. We are under no obligation (and expressly disclaim any such obligation) to update or revise any forward-looking statements, whether as a result of new information, future developments or otherwise. 2 |
![]() Agenda Executive Summary Executive Summary Operating Segments Operating Segments U.S. Insurance U.S. Insurance International Insurance International Insurance Reinsurance Reinsurance Financial Highlights Financial Highlights Conclusion Conclusion Appendix Appendix 3 |
![]() Allied World’s Franchise Well-diversified property and casualty insurer and reinsurer with significant geographic reach Experienced executive management team with strong risk management culture Excellent capitalization with active capital management Progressive investment philosophy Highly Rated – “A” (Excellent) by A.M. Best, “A” (Strong) by S&P, “A2” (Good) by Moody’s and “A+” (Good) by Fitch Industry leading results and value creation 4 |
![]() Diversified insurance and reinsurance products offered across global platform with operations in the U.S., Bermuda, Lloyd’s, Europe, Hong Kong and Singapore Emphasis on insurance and casualty lines with strong reinsurance and property capabilities Customer focus Moving closer to clients in markets Demonstrated expertise in markets in which we underwrite A “go to” market for targeted lines and classes of business such as healthcare and construction Allied World – A Diversified mix Leading specialty insurance company with broad range of product offerings, global capabilities and significant U.S. focus 5 * Includes healthcare-related program business |
![]() Experienced Management: Shifting the Business Focus 6 2007 GPW: $1,506M In response to the changing macro economic environment, Allied World has transformed itself since 2007 2012 GPW: $2,329M Allied World 2007 Allied World Today |
![]() Active Capital Management Improves Shareholder Value 7 * Excludes $243.8 million syndicated loan that was repaid on February 23, 2009 |
![]() Growth in book value per share calculated by taking change in book value per share from December 31, 2007 through December 31, 2012 adjusted for dividends paid or declared. Diluted book value per share used when available. Source: SNL Financial 8 Superior Value Creation |
![]() Growth in book value per share calculated by taking change in book value per share from December 31, 2007 through December 31, 2012 adjusted for dividends paid or declared. Diluted book value per share used when available. Source: SNL Financial Five Year Value Creation Book Value Growth (through 12/31/12) Vs. Total Return (through 2/20/13) 9 Superior Value Creation |
![]() Agenda Executive Summary Executive Summary Operating Segments Operating Segments U.S. Insurance U.S. Insurance International Insurance International Insurance Reinsurance Reinsurance Financial Highlights Financial Highlights Conclusion Conclusion Appendix Appendix 10 |
![]() Our U.S. Insurance Operating Segment - A significant U.S.- based specialty franchise with diversified offerings * Includes healthcare-related program business Allied World U.S. Insurance Operating Segment Product Mix 11 |
![]() Allied World International Insurance Operating Segment Product Mix 12 Our International Insurance Operating Segment - Global Diversification and Expansion • Offices in Bermuda, Dublin, Hong Kong, London, Singapore and Switzerland position the company to meet developing opportunities • Lloyd’s Syndicate 2232 • Specialty product capabilities: • MGA business initiated in targeted areas o Association with Lloyd’s enhances Allied World’s brand recognition o Increases access to Latin America and Asia- Pacific region o Offers individual risk products o Trade credit and political risk o International healthcare o Small-to-medium enterprises (SME Professional) |
![]() Allied World Reinsurance Operating Segment Product Mix 13 • U.S. operation has improved access to U.S. regional business and strengthened local relationships • Strategic Bermuda Platform • Swiss and Singapore offices and Lloyd’s Syndicate 2232 increase global reach Our Reinsurance Operating Segment - Flexibility to take advantage of reinsurance opportunities in the global marketplace o Property reinsurance capabilities that focus on small and medium account regional carriers o Global Marine and Specialty Unit offers marine and aerospace coverages as well as crop and hail business o Property catastrophe, property per risk, workers’ compensation catastrophe, accident & health and specialty casualty o Reinsurance capabilities in Europe, Latin America, Middle East, Africa and the Asia Pacific region |
![]() Quarterly Highlights – Fourth Quarter 2012 Investments in operations are paying off with increased production and strong underwriting results across all of our operating segments 14 |
![]() Quarterly Highlights – Allied World Financial Services 15 Allied World Financial Services was established in September 2012 with the following objectives: • Optimize expenses by getting the best value for the fees we pay • Increase our knowledge and expertise by partnering with experts • Participate in the economic returns of these business relationships Completed $127.6 million of transactions, including: Cunningham Lindsey (Global TPA) MatlinPatterson Asset Management (Asset Manager) Aeolus Capital Management (Collateralized Reinsurer) Crescent Capital Group (Asset Manager) |
![]() Agenda Executive Summary Executive Summary Operating Segments Operating Segments U.S. Insurance U.S. Insurance International Insurance International Insurance Reinsurance Reinsurance Financial Highlights Financial Highlights Conclusion Conclusion Appendix Appendix 16 |
![]() Financial Highlights Operating Results Operating Results 2012 2012 2011 2011 2010 2010 2009 2009 2008 2008 Net Income $493M $275M $665M $607M $184M Operating Income $203M $184M $398M $538M $455M Net Income Return on Average Equity 15.3% 8.9% 21.9% 22.6% 8.3% Operating Return on Average Equity 6.3% 6.0% 13.1% 20.0% 20.6% Combined Ratio 94.5% 95.9% 84.9% 76.1% 84.1% Cash flow from Operations $629M $548M $451M $668M $657M Total Financial Statement Portfolio Return 5.5% 2.0% 6.1% 7.9% 0.5% Ending Diluted Book Value per Share $92.59 $80.11 $74.29 $59.56 $46.05 Growth in Diluted Book Value Per Share 15.6% 7.8% 24.7% 29.3% 8.3% Allied World has reported very strong results despite competitive landscape, financial turbulence and catastrophe activity 17 |
![]() 18 Expense Ratio Declining as We Build Scale Note: GAAP expense ratio *Peer average includes ALTE, ACGL, AGII, AHL, AXS, ENH, HCC, MKL, NAVG, OB, PRA, RLI, THG and WRB. Source: SNL Financial |
![]() Case Incurred through 2012 Q4 41.4% 34.1% 46.0% 62.3% 40.0% 39.0% 51.9% 29.5% 47.9% 41.1% 23.9% Remaining IBNR / EP Ratio @ 2012 Q4 1.3% 7.3% 4.8% 12.1% 13.2% 13.5% 24.3% 32.4% 29.5% 45.8% 50.9% Strong Underwriting Results Underwriting performance has been strong since our inception (1) Pro-forma including Darwin development since inception (2) Case incurred ratios by year are not directly comparable to our financial statements as reinsurance case incurred losses shown above are on a treaty year basis 19 Historical Loss Ratios Through December 2012 ($MM) 1 2 AY 2002 2003 2004 2005 2006 2007 2008 2009 2010 2011 2012 CY Total CY Original Loss Ratio 70.1% 65.3% 75.9% 103.1% 59.6% 58.4% 55.6% 45.9% 52.1% 65.8% 65.1% Prior Year Development 0.0% -4.9% -5.8% -3.6% -8.2% -10.2% -24.2% -18.8% -23.1% -17.4% -9.7% AY Original Loss Ratio 70.1% 70.1% 81.7% 106.7% 67.7% 68.6% 79.8% 64.7% 75.1% 83.2% 74.9% 2002 2003 (57) (57) 2004 (27) (53) (79) 2005 (8) (46) 6 (49) 2006 (16) (43) (45) (8) (113) 2007 6 (34) (77) (6) (26) (137) 2008 (9) (88) (100) (74) (8) (34) (313) 2009 (17) (57) (118) (103) 12 2 32 (248) 2010 4 (11) (57) (147) (54) (25) (23) (1) (313) 2011 (0) (1) (22) (90) (42) (69) (22) (28) 20 (254) 2012 4 (4) (9) (11) (82) (91) (35) (8) 11 53 (170) Subsequent Development (119) (336) (423) (438) (201) (216) (47) (37) 31 53 (1,732) Loss Ratio Points -27.4% -28.7% -30.9% -32.3% -14.5% -16.1% -3.6% -2.8% 2.3% 3.7% AY Developed 42.6% 41.4% 50.8% 74.4% 53.2% 52.5% 76.2% 61.9% 77.4% 86.9% 74.9% Cat Losses 16.4% 28.1% 9.7% 6.1% 20.3% 10.3% AY Developed EX Cat Losses 42.6% 41.4% 34.4% 46.3% 53.2% 52.5% 66.5% 61.9% 71.3% 66.6% 64.6% |
![]() December 31, 2012 Total: $4.5 B • Net reserves about 4.5% above mid-point of range at December 31, 2012 • Over $1.7 billion net favorable reserve development since inception • 71% of net reserves are IBNR Net Loss & LAE Reserve Mix at December 31, 2012 Case U.S. Insurance 9% IBNR International Insurance 27% Case International Insurance 9% IBNR Reinsurance 22% Case Reinsurance 11% IBNR U.S. Insurance 22% Net Prior Year Reserve Releases* ($MM) Range of Net Reserves at December 31, 2012 ($MM) Prudent Reserving Philosophy 20 * Pro-forma including Darwin development since inception |
![]() 21 • We maintain a short duration/overweight credit position in core fixed-income • We will continue to build out non-core portfolio in 2013 • Relative value and significant market volatility remains in favor of a diversified portfolio, by asset class as well as by issuer. Investment Portfolio Highlights |
![]() Peer Comparisons – Operating Income ROE Source: SNL Financial 22 |
![]() Agenda Executive Summary Executive Summary Operating Segments Operating Segments U.S. Insurance U.S. Insurance International Insurance International Insurance Reinsurance Reinsurance Financial Highlights Financial Highlights Conclusion Conclusion Appendix Appendix 23 |
![]() Conclusion 24 Strong top line growth with diversified product mix • Gross premiums increasing in each operating segment Historically strong operating returns • Combined ratio compares favorably to peers • Expense ratio remains below 30% as we build scale Solid investment returns Active capital management Industry leading value creation Current valuation is inconsistent with company’s historical performance and strong position to capitalize on market opportunities |
![]() Growth in book value per share calculated by taking change in book value per share from December 31, 2007 through December 31, 2012 adjusted for dividends paid or declared. Price to book as of February 20, 2013. Diluted book value per share used when available. Five Year Growth in Book Value per Share (through December 2012) vs. Price to Book Value @ February 20, 2013 25 Conclusion - Allied World is attractively valued given its historical performance |
![]() Agenda Executive Summary Executive Summary Operating Segments Operating Segments U.S. Insurance U.S. Insurance International Insurance International Insurance Reinsurance Reinsurance Financial Highlights Financial Highlights Conclusion Conclusion Appendix Appendix 26 |
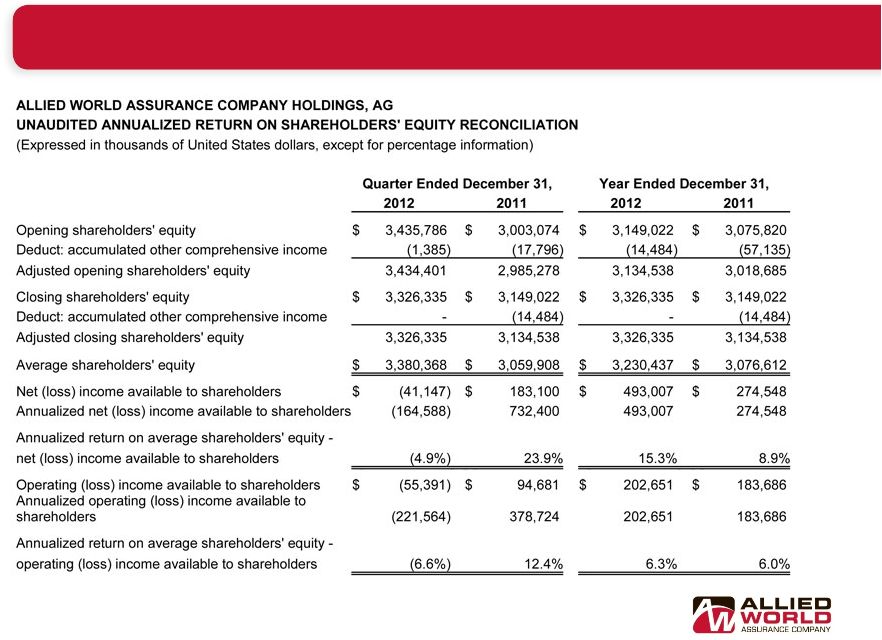
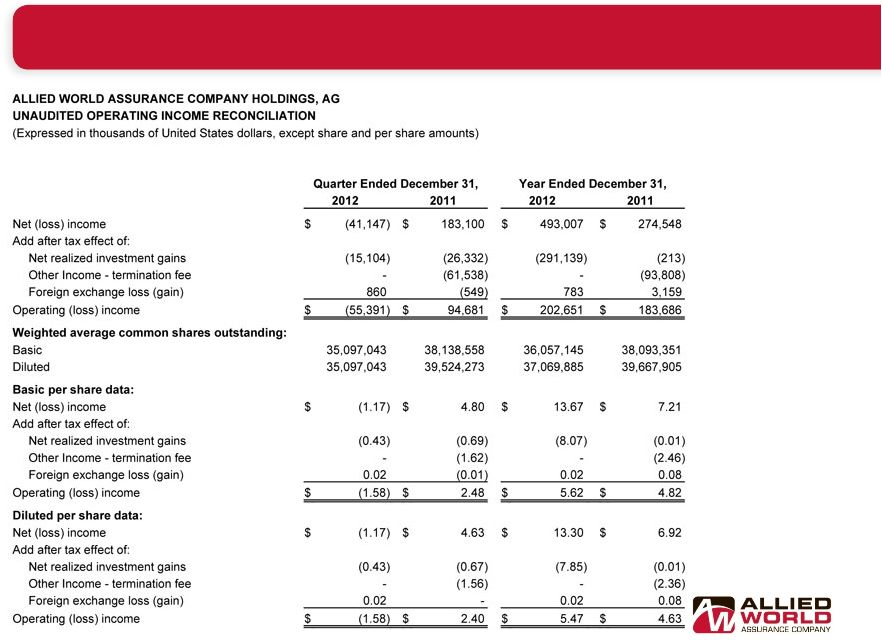
![]() Non-GAAP Financial Measures In presenting the company's results, management has included and discussed in this presentation certain non generally accepted accounting principles ("non-GAAP") financial measures within the meaning of Regulation G as promulgated by the U.S. Securities and Exchange Commission. Management believes that these non-GAAP measures, which may be defined differently by other companies, better explain the company's results of operations in a manner that allows for a more complete understanding of the underlying trends in the company's business. However, these measures should not be viewed as a substitute for those determined in accordance with generally accepted accounting principles ("U.S. GAAP"). "Operating income" is an internal performance measure used in the management of the company’s operations and represents after-tax operational results excluding, as applicable, net realized investment gains or losses, net impairment charges recognized in earnings, net foreign exchange gain or loss and other non-recurring items. The company excludes net realized investment gains or losses, net impairment charges recognized in earnings, net foreign exchange gain or loss, and other non- recurring items from the calculation of operating income because these amounts are heavily influenced by and fluctuate in part according to the availability of market opportunities and other factors. The company has excluded from operating income the termination fee received from Transatlantic Holdings, Inc. in 2011 as this is a non-recurring item. In addition to presenting net income determined in accordance with U.S. GAAP, the company believes that showing operating income enables investors, analysts, rating agencies and other users of the company’s financial information to more easily analyze our results of operations and underlying business performance. Operating income should not be viewed as a substitute for U.S. GAAP net income. The company has included "diluted book value per share" because it takes into account the effect of dilutive securities; therefore, the company believes it is an important measure of calculating shareholder returns. "Annualized net income return on average shareholders' equity" ("ROAE") is calculated using average shareholders’ equity, excluding the average after tax unrealized gains (or losses) on investments. Unrealized gains (losses) on investments are primarily the result of interest rate and credit spread movements and the resultant impact on fixed income securities. Such gains (losses) are not related to management actions or operational performance, nor are they likely to be realized. Therefore, the company believes that excluding these unrealized gains (losses) provides a more consistent and useful measurement of operating performance, which supplements U.S. GAAP information. In calculating ROAE, the net income (loss) available to shareholders for the period is multiplied by the number of such periods in a calendar year in order to arrive at annualized net income (loss) available to shareholders. The company presents ROAE as a measure that is commonly recognized as a standard of performance by investors, analysts, rating agencies and other users of its financial information. "Annualized operating return on average shareholders' equity" is calculated using operating income (as defined above and annualized in the manner described for net income (loss) available to shareholders under ROAE above), and average shareholders' equity, excluding the average after tax unrealized gains (losses) on investments. Unrealized gains (losses) are excluded from equity for the reasons outlined in the annualized net income return on average shareholders' equity explanation above. See slides 28 - 30 for a reconciliation of non-GAAP measures used in this presentation to their most directly comparable U.S. GAAP measures. 27 |
![]() Non-GAAP Financial Measures - Reconciliations 28 |
![]() 29 Non-GAAP Financial Measures - Reconciliations |
![]() Non-GAAP Financial Measures - Reconciliations 30 |