Exhibit 99.1
Investor Presentation
4th Quarter 2013
Forward-Looking Statements & Safe Harbor
This presentation contains certain statements, estimates and forecasts with respect to future performance and events. These statements, estimates and forecasts are "forward-looking statements". In some cases, forward-looking statements can be identified by the use of forward-looking terminology such as "may," “might,” “will," “should,” "expect," “plan,” "intend," "estimate," "anticipate," "believe,” “predict,” “potential” or "continue" or the negatives thereof or variations thereon or similar terminology. All statements other than statements of historical fact included in this presentation are forward-looking statements and are based on various underlying assumptions and expectations and are subject to known and unknown risks, and may include projections of our future financial performance based on our growth strategies and anticipated trends in our business. These statements are only predictions based on our current expectations and projections about future events. There are important factors that could cause our actual results, level of activity, performance or achievements to differ materially from the results, level of activity, performance or achievements expressed or implied in the forward-looking statements. As a result, there can be no assurance that the forward-looking statements included in this presentation will prove to be accurate or correct. In light of these risks, uncertainties and assumptions, the future performance or events described in the forward-looking statements in this presentation might not occur. Accordingly, you should not rely upon forward-looking statements as a prediction of actual results and we do not assume any responsibility for the accuracy or completeness of any of these forward-looking statements that may be made from time to time. We are under no obligation (and expressly disclaim any such obligation) to update or revise any forward-looking statements, whether as a result of new information, future developments or otherwise.
??Executive Summary ??Operating Segments
§?U.S. Insurance
Agenda §?International Insurance§?Reinsurance
??Financial Highlights ??Conclusion ??Appendix
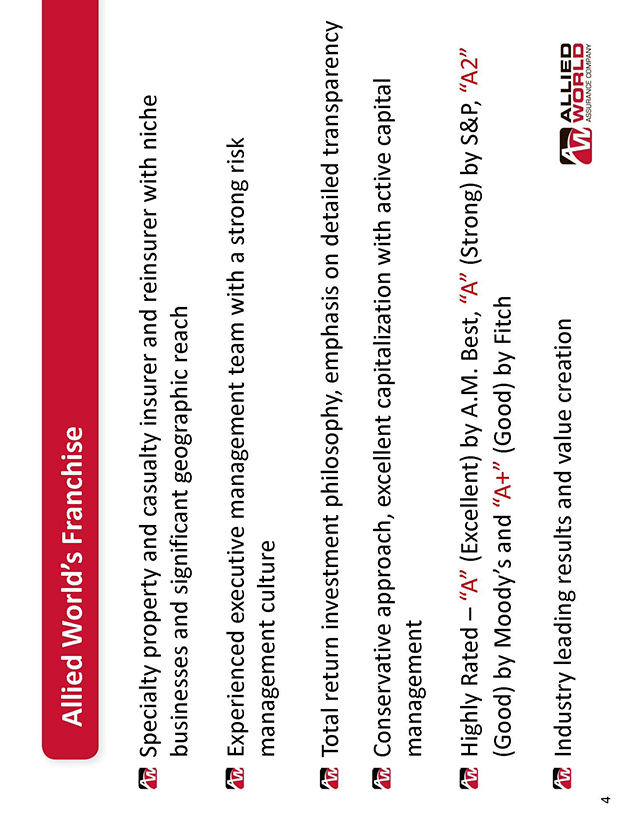
Allied World’s Franchise
Specialty property and casualty insurer and reinsurer with niche businesses and significant geographic reach
Experienced executive management team with a strong risk management culture
Total return investment philosophy, emphasis on detailed transparency Conservative approach, excellent capitalization with active capital management
Highly Rated _ “A” (Excellent) by A.M. Best, “A” (Strong) by S&P, “A2” (Good) by Moody’s and “A+” (Good) by Fitch
Industry leading results and value creation
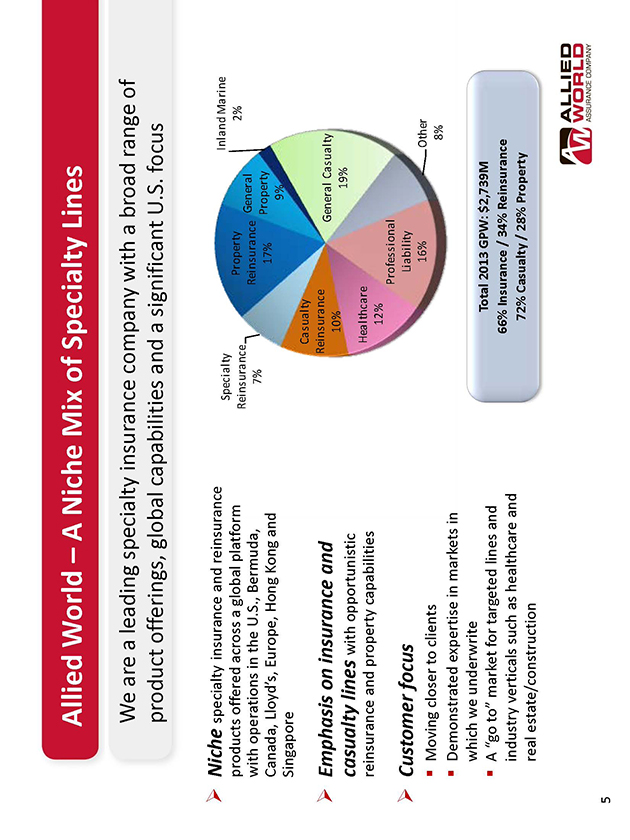
Allied World - A Niche Mix of Specialty Lines
We are a leading specialty insurance company with a broad range of product offerings, global capabilities and a significant U.S. focus
??Niche specialty insurance and reinsurance Inland Marine
products offered across a global platform Reinsurance Property General 2% with operations in the U.S., Bermuda, 7% Reinsurance Property Canada, Lloyd’s, Europe, Hong Kong and 17% 9% Singapore
Casualty Reinsurance
??Emphasis on insurance and General Casualty
10%
casualty lines with opportunistic 19% reinsurance and property capabilities Healthcare
12% Professional
??Customer focus Liability
16% Other
§?Moving closer to clients
8%
§?Demonstrated expertise in markets i which we underwrite
§?A “go to” market for targeted lines and Total 2013 GPW: $2,739M
66% Insurance / 34% Reinsurance
industry verticals such as healthcare and
72% Casualty / 28% Property
real estate/construction
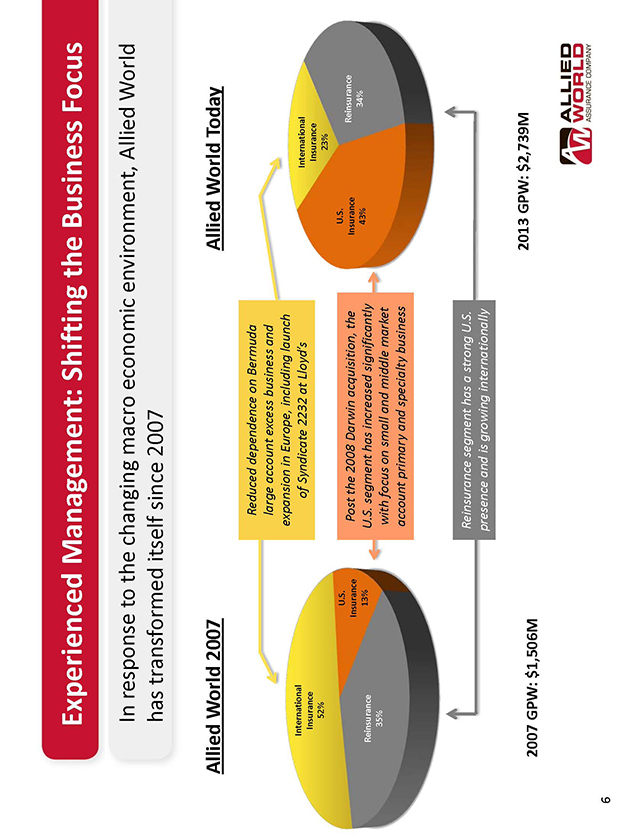
Experienced Management: Shifting the Business Focus
In response to the changing macro economic environment, Allied World has transformed itself since 2007
Allied World 2007 Allied World Today
Reduced dependence on Bermuda large account excess business and expansion in Europe, including launch
International of Syndicate 2232 at Lloyd’s International
Insurance Insurance 52% 23% U.S. U.S.
Post the 2008 Darwin acquisition, the Insurance Reinsurance
Insurance
43% 34%
Reinsurance 13% U.S. segment has increased significantly 35% with focus on small and middle market account primary and specialty business
Reinsurance segment has a strong U.S. presence and is growing internationally
2013 GPW: $2,739M 2007 GPW: $1,506M
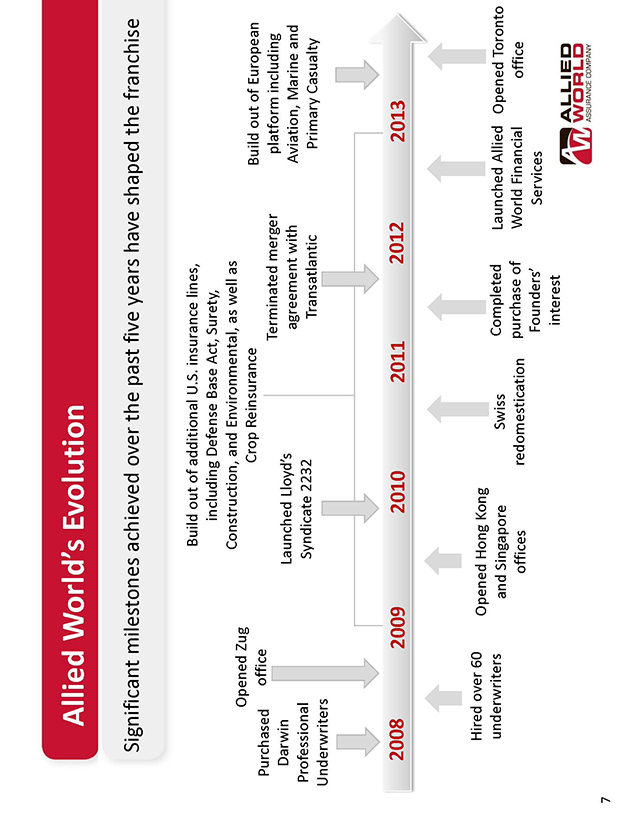
Allied World’s Evolution
Significant milestones achieved over the past five years have shaped the franchise
Build out of additional U.S. insurance lines, including Defense Base Act, Surety, Construction, and Environmental, as well as Opened Zug
Crop Reinsurance Build out of European Purchased office Terminated merger platform including Darwin Launched Lloyd’s agreement with Aviation, Marine and Professional Syndicate 2232 Transatlantic Primary Casualty Underwriters
2008 2009 2010 2011 2012 2013
Hired over 60 Opened Hong Kong underwriters and Singapore Swiss Completed Launched Allied Opened Toronto offices redomestication purchase of World Financial office Founders’ Services interest
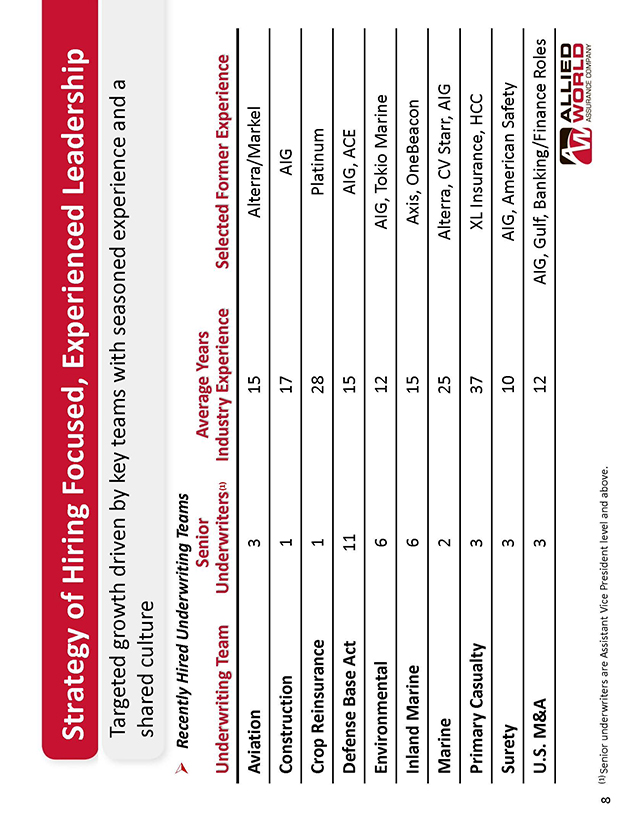
Strategy of Hiring Focused, Experienced Leadership
Targeted growth driven by key teams with seasoned experience and a shared culture
??Recently Hired Underwriting Teams
Senior Average Years
Underwriting Team Underwriters (1) Industry ExperienceSelected Former Experience
Aviation 3 15 Alterra/Markel
Construction 1 17 AIG Crop Reinsurance 1 28 Platinum Defense Base Act 11 15 AIG, ACE
Environmental 6 12 AIG, Tokio Marine Inland Marine 6 15 Axis, OneBeacon Marine 2 25 Alterra, CV Starr, AIG Primary Casualty 3 37 XL Insurance, HCC Surety 3 10 AIG, American Safety U.S. M&A 3 12 AIG, Gulf, Banking/Finance Roles
8 | | (1) Senior underwriters 8 are Assistant Vice President level and above. Proprietary and Confidential |
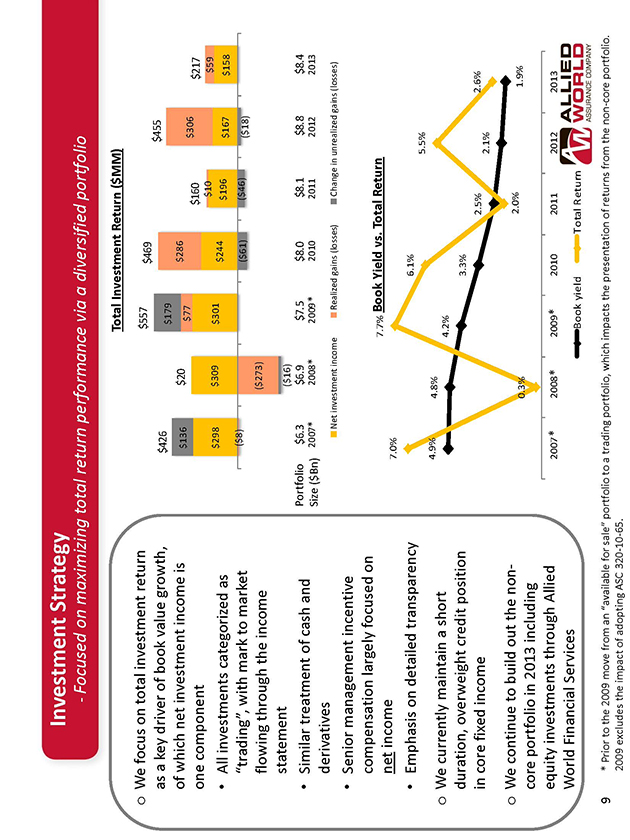
Investment Strategy
- Focused on maximizing total return performance via a diversified portfolio
Total Investment Return ($MM)
o We focus on total investment return $557
$469
as a key driver of book value growth, $426 $179 $455 of which net investment income is $136 $20 $286
$77 $306
one component $160 $217
$10 $59 $298 $309 $301 $244
" All investments categorized as $196 $167 $158 “trading”, with mark to market ($8) ($61) ($46)
($18)
flowing through the income ($273) statement ($16)
" Similar treatment of cash and Portfolio $6.3 $6.9 $7.5 $8.0 $8.1 $8.8 $8.4
Size ($Bn) 2007* *2008 2009* 2010 2011 2012 2013
derivatives
" Senior management incentive Net investment income Realized gains (losses) Change in unrealized gains (losses)
compensation largely focused on
7.7% Book Yield vs. Total Return
net income 7.0%
" Emphasis on detailed transparency 6.1%
5.5%
o We currently maintain a short 4.9% 4.8%
4.2%
duration, overweight credit position 3.3% in core fixed income 2.5% 2.6%
2.1%
o We continue to build out the non- 2.0%
0.3% 1.9%
core portfolio in 2013 including equity investments through Allied 2007* 2008* 2009* 2010 2011 2012 2013 World Financial Services
Book yield Total Return
9 * Prior to the 2009 move from an “available for sale” portfolio to a trading portfolio, which impacts the presentation of returns from the non-core portfolio.
2009 excludes the impact of adopting ASC 320-10-65.
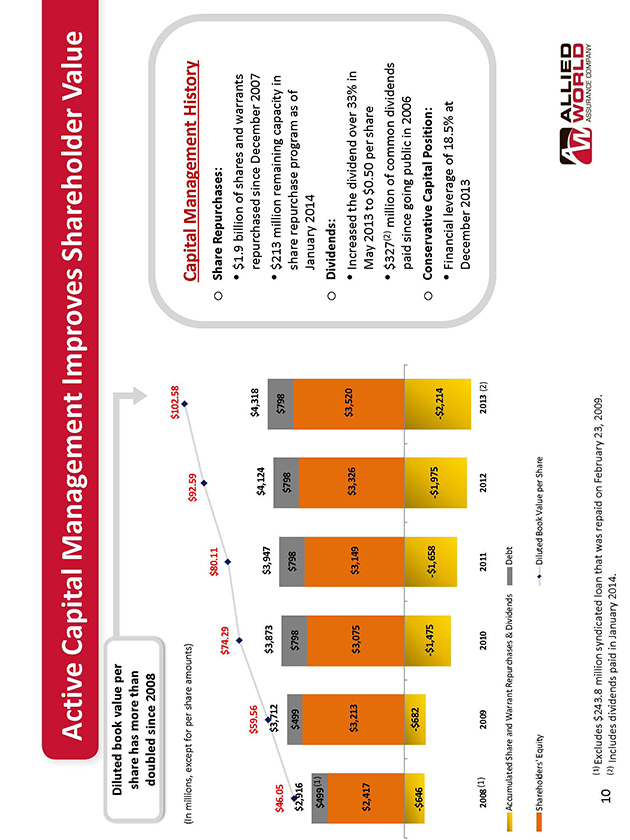
Active Capital Management Improves Shareholder Value
Diluted book value per share has more than doubled since 2008
$102.58
(In millions, except for per share amounts) $92.59 Capital Management History
$80.11 o Share Repurchases:
$74.29
" $1.9 billion of shares and warrants $59.56 $4,318 repurchased since December 2007
$4,124 $3,873 $3,947
$3,712 " $213 million remaining capacity in
$46.05 $798 $798
$499 $798 $798 share repurchase program as of
$2,916
January 2014
$499(1)
o Dividends: $3,213 $3,326 $3,520 " Increased the dividend over 33% in
$3,075 $3,149
$2,417 May 2013 to $0.50 per share " $327(2) million of common dividends paid since going public in 2006
-$646 -$682 Conservative Capital Position:
-$1,475 -$1,658 o -$1,975 -$2,214
" Financial leverage of 18.5% at December 2013
2008 (1) 2009 2010 2011 2012 2013 (2)
Accumulated Share and Warrant Repurchases & Dividends Debt
Shareholders' Equity Diluted Book Value per Share
(1) | | Excludes $243.8 million syndicated loan that was repaid on February 23, 2009. |
10
(2) | | Includes dividends paid in January 2014. |
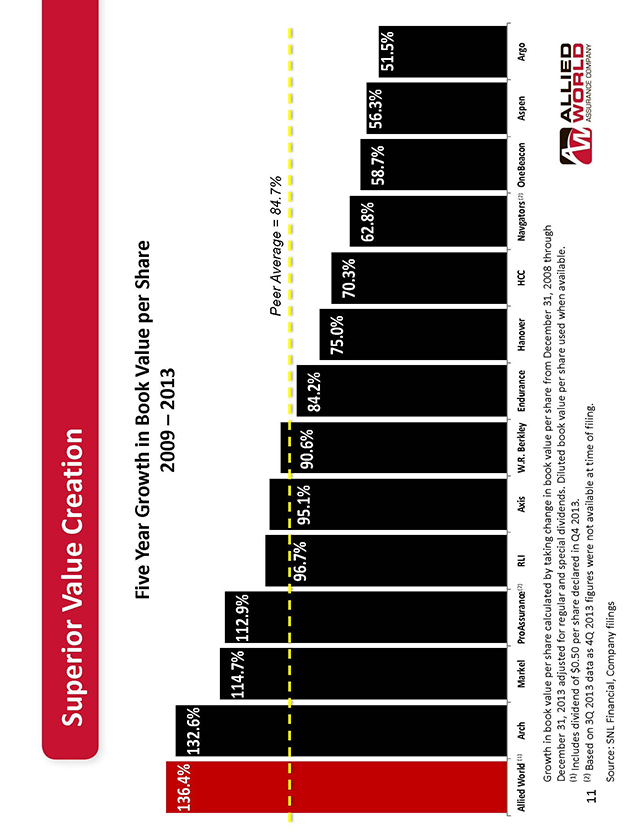
Superior Value Creation
Five Year Growth in Book Value per Share 2009 - 2013
136.4% 132.6%
114.7% 112.9%
Peer Average = 84.7%
96.7% 95.1% 90.6% 84.2% 75.0%
70.3% 62.8%
58.7% 56.3%
51.5%
Allied World (1) Arch Markel ProAssurance(2) RLI Axis W.R. Berkley Endurance Hanover HCC Navgators (2) OneBeacon Aspen Argo
Growth in book value per share calculated by taking change in book value per share from December 31, 2008 through December 31, 2013 adjusted for regular and special dividends. Diluted book value per share used when available. (1) Includes dividend of $0.50 per share declared in Q4 2013.
11 (2) Based on 3Q 2013 data as 4Q 2013 figures were not available at time of filing.
Source: SNL Financial, Company filings
ü?Executive Summary ??Operating Segments
§?U.S. Insurance
Agenda §?International Insurance §?Reinsurance
??Financial Highlights ??Conclusion ??Appendix
12
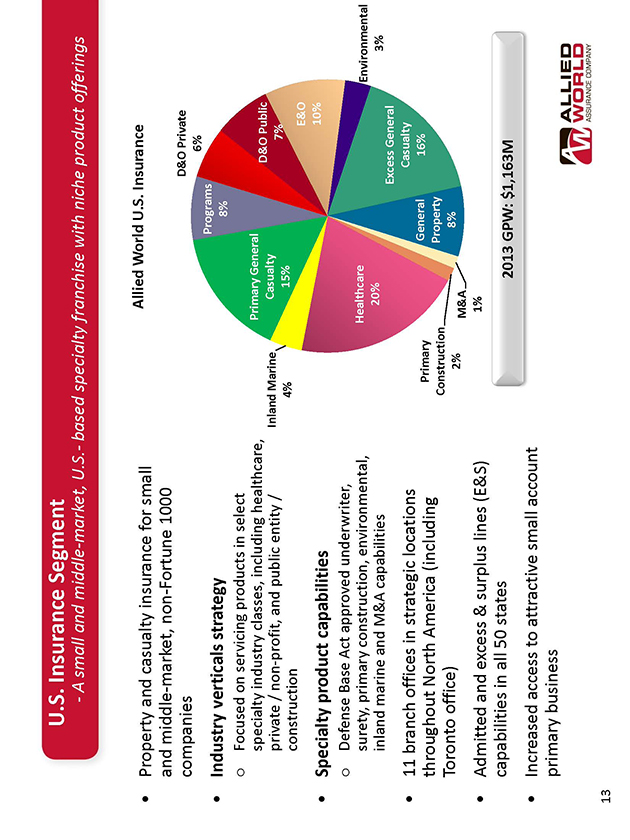
U.S. Insurance Segment
- A small and middle-market, U.S.- based specialty franchise with niche product offerings
" Property and casualty insurance for small Allied World U.S. Insurance and middle-market, non-Fortune 1000
companies D&O Private
6% Programs
" Industry verticals strategy 8% o Focused on servicing products in select specialty industry classes, including healthcare, Primary General
D&O Public
private / non-profit, and public entity / Inland Marine Casualty
7%
construction 4% 15%
E&O 10%
" Specialty product capabilities * o Defense Base Act approved underwriter, surety, primary construction, environmental, Healthcare Environmental inland marine and M&A capabilities 20% 3%
Excess General
" 11 branch offices in strategic locations Casualty throughout North America (including Primary General 16%
Construction Property
Toronto office) 2% 8%
M&A
" Admitted and excess & surplus lines (E&S) 1% capabilities in all 50 states 2013 GPW: $1,163M
" Increased access to attractive small account primary business
13
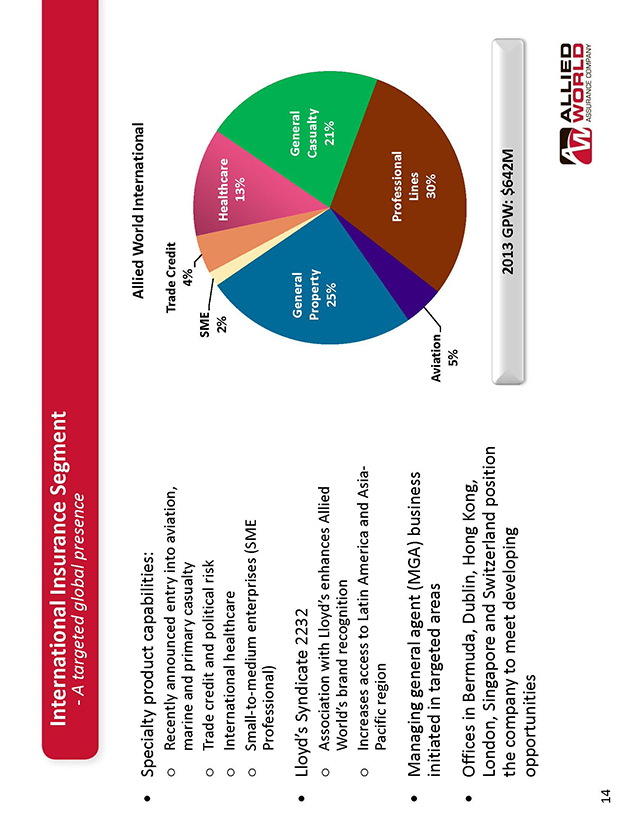
International - A targeted global presence Insurance Segment
Allied World International
" Specialty product capabilities: o Recently announced entry into aviation, Trade Credit marine and primary casualty 4% o Trade credit and political risk SME o International healthcare 2% Healthcare
13%
o Small-to-medium enterprises (SME Professional)
" Lloyd’s Syndicate 2232 General General
Property Casualty
o Association with Lloyd’s enhances Allied 25% 21% World’s brand recognition o Increases access to Latin America and Asia-Pacific region
Professional
" Managing general agent (MGA) business Lines initiated in targeted areas Aviation 30%
5%
" Offices in Bermuda, Dublin, Hong Kong, London, Singapore and Switzerland position the company to meet developing 2013 GPW: $642M opportunities
14
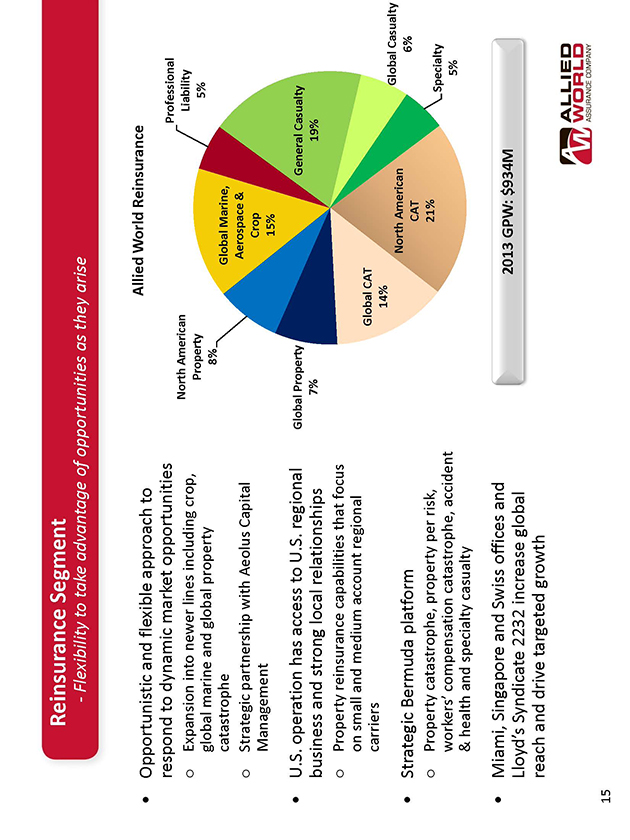
Reinsurance Segment
- Flexibility to take advantage of opportunities as they arise
" Opportunistic and flexible approach to Allied World Reinsurance respond to dynamic market opportunities Professional o Expansion into newer lines including crop, North American Liability
Property 5%
global marine and global property 8%
catastrophe Global Marine,
o Strategic partnership with Aeolus Capital Aerospace & Management Crop
15%
" U.S. operation has access to U.S. regional Global Property General Casualty business and strong local relationships 7% 19% o Property reinsurance capabilities that focus on small and medium account regional
carriers Global CAT 14%
Global Casualty North American
" Strategic Bermuda platform 6%
CAT
o Property catastrophe, property per risk, 21%
Specialty
Workers’ compensation catastrophe, accident 5%
& health and specialty casualty
" Miami, Singapore and Swiss offices and
2013 GPW: $934M
Lloyd’s Syndicate 2232 increase global reach and drive targeted growth
15
ü?Executive Summary ü?Operating Segments
§?U.S. Insurance
Agenda §?International Insurance §?Reinsurance
??Financial Highlights ??Conclusion ??Appendix
16
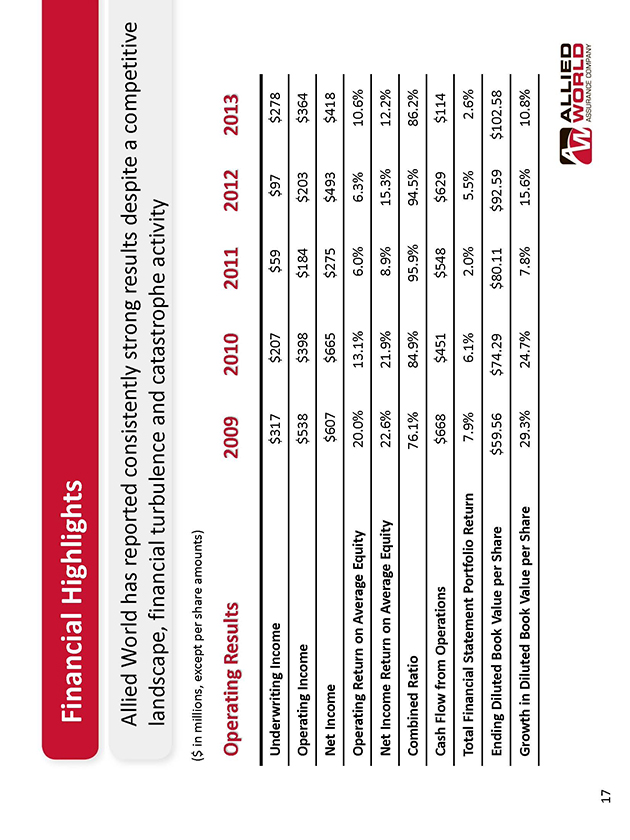
Financial Highlights
Allied World has reported consistently strong results despite a competitive landscape, financial turbulence and catastrophe activity
($ in millions, except per share amounts)
Operating Results 2009 2010 2011 2012 2013
Underwriting Income $317 $207 $59 $97 $278
Operating Income $538 $398 $184 $203 $364 Net Income $607 $665 $275 $493 $418
Operating Return on Average Equity 20.0% 13.1% 6.0% 6.3% 10.6% Net Income Return on Average Equity 22.6% 21.9% 8.9% 15.3% 12.2%
Combined Ratio 76.1% 84.9% 95.9% 94.5% 86.2%
Cash Flow from Operations $668 $451 $548 $629 $114 Total Financial Statement Portfolio Return 7.9% 6.1% 2.0% 5.5% 2.6% Ending Diluted Book Value per Share $59.56 $74.29 $80.11 $92.59 $102.58 Growth in Diluted Book Value per Share 29.3% 24.7% 7.8% 15.6% 10.8%
17
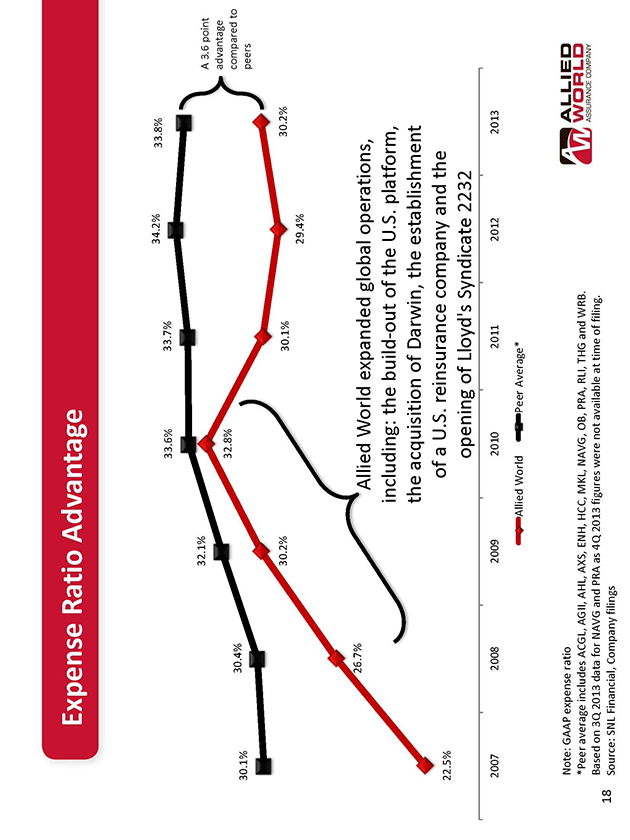
Expense Ratio Advantage
33.7% 34.2% 33.8% 33.6%
32.1% A 3.6 point advantage 32.8% compared to
30.4%
30.1% peers
30.2% 30.1% 30.2% 29.4%
26.7% Allied World expanded global operations, including: the build-out of the U.S. platform, the acquisition of Darwin, the establishment 22.5% of a U.S. reinsurance company and the opening of Lloyd's Syndicate 2232
2007 2008 2009 2010 2011 2012 2013 Allied World Peer Average*
Note: GAAP expense ratio
*Peer average includes ACGL, AGII, AHL, AXS, ENH, HCC, MKL, NAVG, OB, PRA, RLI, THG and WRB. Based on 3Q 2013 data for NAVG and PRA as 4Q 2013 figures were not available at time of filing.
18 Source: SNL Financial, Company filings
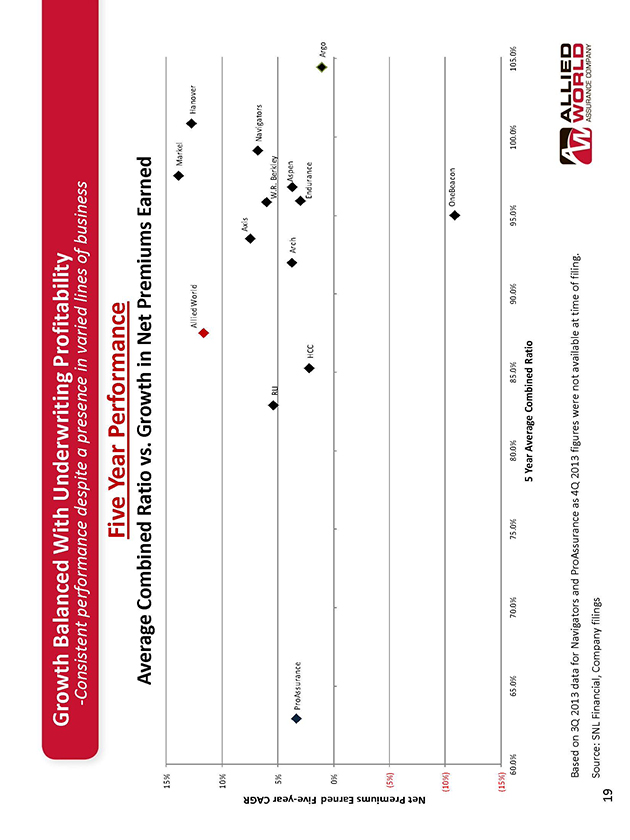
Growth Balanced -Consistent performance despite With Underwriting a presence in Profitability varied lines of business
Five Year Performance
Average Combined Ratio vs. Growth in Net Premiums Earned
15%
Markel
Allied World Hanover
10%
Axis
CAGR
Navigators RLI W.R. Berkley 5% Arch Aspen ProAssurance Five-year HCC Endurance
Earned Argo
0%
Premiums
(5%)
Net
(10%)
OneBeacon
(15%)
60.0% 65.0% 70.0% 75.0% 80.0% 85.0% 90.0% 95.0% 100.0% 105.0%
5 | | Year Average Combined Ratio |
Based on 3Q 2013 data for Navigators and ProAssurance as 4Q 2013 figures were not available at time of filing. Source: SNL Financial, Company filings
19
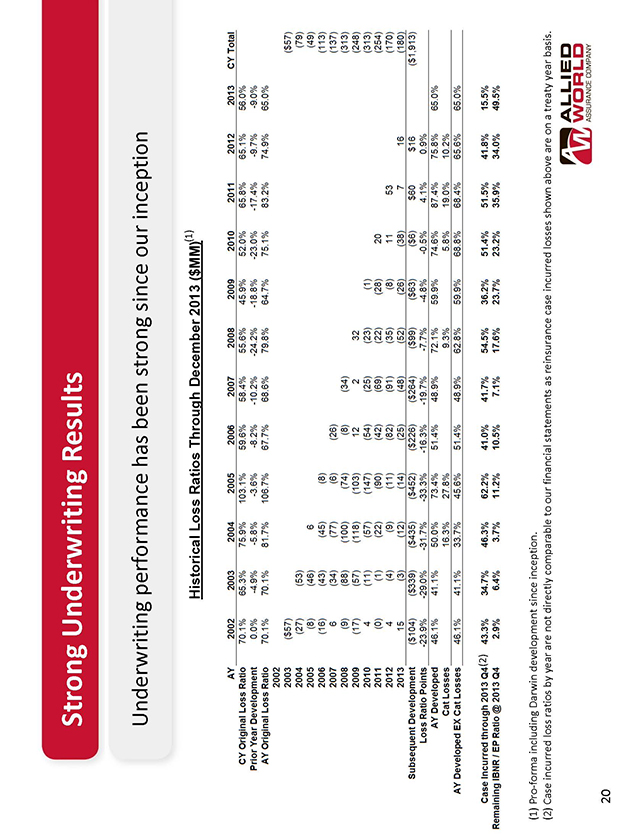
Strong Underwriting Results
Underwriting performance has been strong since our inception
Historical Loss Ratios Through December 2013 ($MM)(1)
(1) | | Pro-forma including Darwin development since inception. |
(2) Case incurred loss ratios by year are not directly comparable to our financial statements as reinsurance case incurred losses shown above are on a treaty year basis.
20
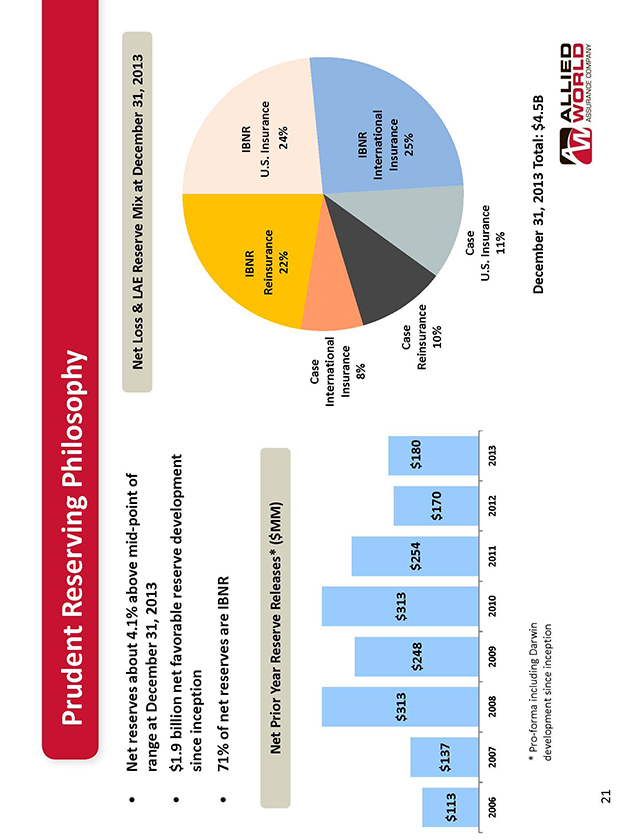
Prudent Reserving Philosophy
" Net reserves about 4.1% above mid-point of Net Loss & LAE Reserve Mix at December 31, 2013 range at December 31, 2013 " $1.9 billion net favorable reserve development since inception
" 71% of net reserves are IBNR
IBNR IBNR Reinsurance U.S. Insurance
Net Prior Year Reserve Releases* ($MM)
22% 24%
Case International Insurance
8% IBNR
International Insurance $313 $313 Case
25% $248 $254 $180 Reinsurance $170 10% $113 $137
Case U.S. Insurance
2006 2007 2008 2009 2010 2011 2012 2013
11%
* | | Pro-forma including Darwin December 31, 2013 Total: $4.5B |
development since inception
21
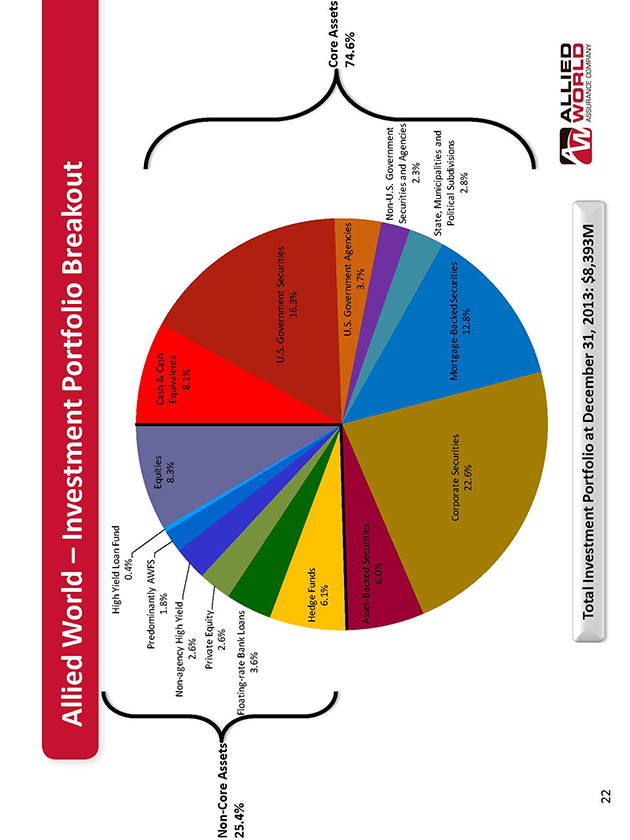
Allied World - Investment Portfolio Breakout
High Yield Loan Fund 0.4% Predominantly AWFS
Equities Cash & Cash 1.8% 8.3% Equivalents Non-agency High Yield 8.1% 2.6% Private Equity
Non-Core Assets 2.6%
25.4% Floating-rate Bank Loans 3.6%
U.S. Government Securities 16.3% Hedge Funds 6.1%
Core Assets
U.S. Government Agencies 74.6% 3.7% Asset-Backed Securities 6.0% Non-U.S. Government Securities and Agencies 2.3% State, Municipalities and Corporate Securities Mortgage-Backed Securities Political Subdivisions 22.6% 12.8% 2.8%
Total Investment Portfolio at December 31, 2013: $8,393M
22
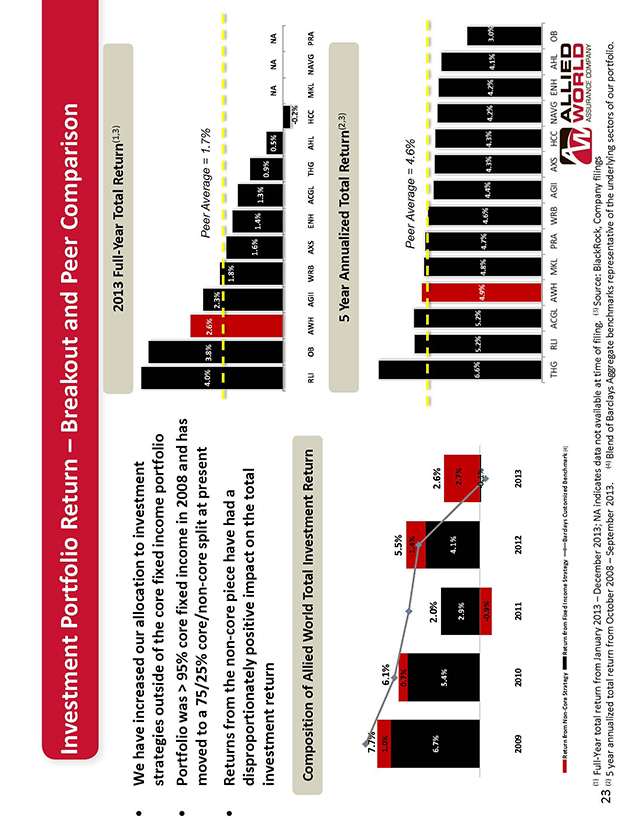
Investment Portfolio Return - Breakout and Peer Comparison
2013 Full-Year Total Return(1,3)
" We have increased our allocation to investment strategies outside of the core fixed income portfolio
" Portfolio was > 95% core fixed income in 2008 and has moved to a 75/25% core/non-core split at present 4.0%
3.8% 2.6% 2.3%
" Returns from the non-core piece have had a disproportionately positive impact on the total 1.6%
1.4% 1.3%
investment return 0.9%
0.5% NA NA NA
Composition of Allied World Total Investment Return -0.2%
RLI OB AWH AGII WRB AXS ENH ACGL THG AHL HCC MKL NAVG PRA
5 | | Year Annualized Total Return(2,3) |
7.7%
1.0% 6.1%
5.5%
0.7% 1.4%
6.7% 2.0% 2.6%
5.4%
4.1%
2.9% 2.7% -0.1% -0.9%
2009 2010 2011 2012 2013
Return from Non-Core Strategy Return from Fixed Income Strategy Barclays Customized Benchmark (4)
(1) Full-Year total return from January 2013 - December 2013; NA indicates data not available at time of filing. (3) Source: BlackRock, Company filings
23 (2) 5 year annualized total return from October 2008 _ September 2013. (4) Blend of Barclays Aggregate benchmarks representative of the underlying sectors of our portfolio.
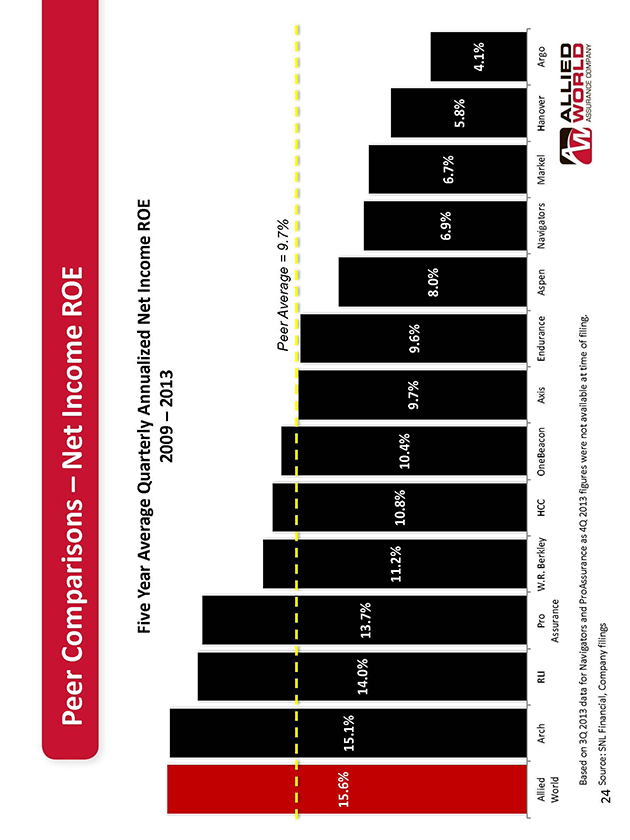
Peer Comparisons _ Net Income ROE
Five Year Average Quarterly Annualized Net Income ROE 2009 _ 2013
15.6% 15.1%
14.0% 13.7%
11.2% 10.8%
10.4%
9.7% 9.6%
8.0%
6.9% 6.7%
5.8%
4.1%
Allied Arch RLI Pro W.R. Berkley HCC OneBeacon Axis Endurance Aspen Navigators Markel Hanover Argo World Assurance
Based on 3Q 2013 data for Navigators and ProAssurance as 4Q 2013 figures were not available at time of filing.
24 Source: SNL Financial, Company filings
[Graphic Appears Here]
ü?Executive Summary ü?Operating Segments
§?U.S. Insurance
Agenda §?International Insurance §?Reinsurance
ü?Financial Highlights ??Conclusion ??Appendix
25
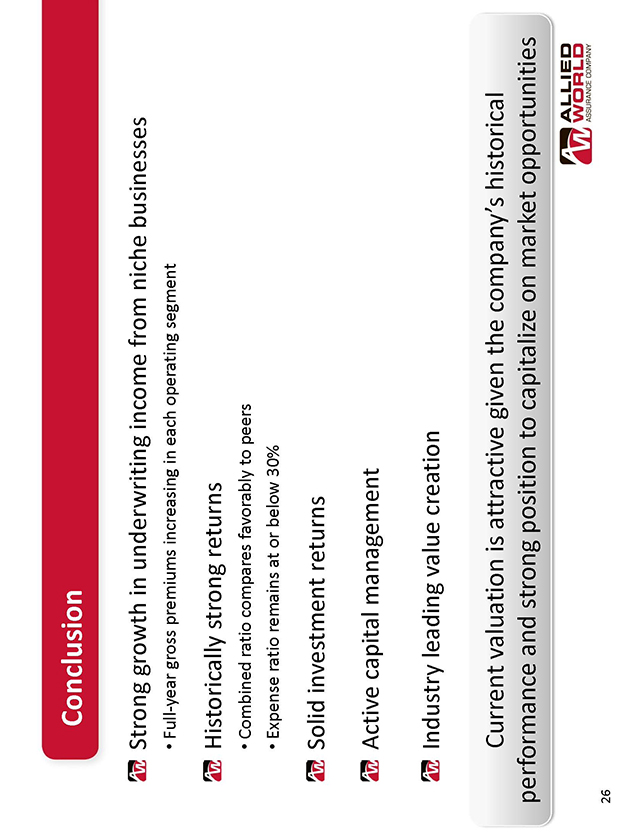
Conclusion
Strong growth in underwriting income from niche businesses
" Full-year gross premiums increasing in each operating segment
Historically strong returns
" Combined ratio compares favorably to peers
" Expense ratio remains at or below 30%
Solid investment returns Active capital management
Industry leading value creation
Current valuation is attractive given the company_s historical performance and strong position to capitalize on market opportunities
26
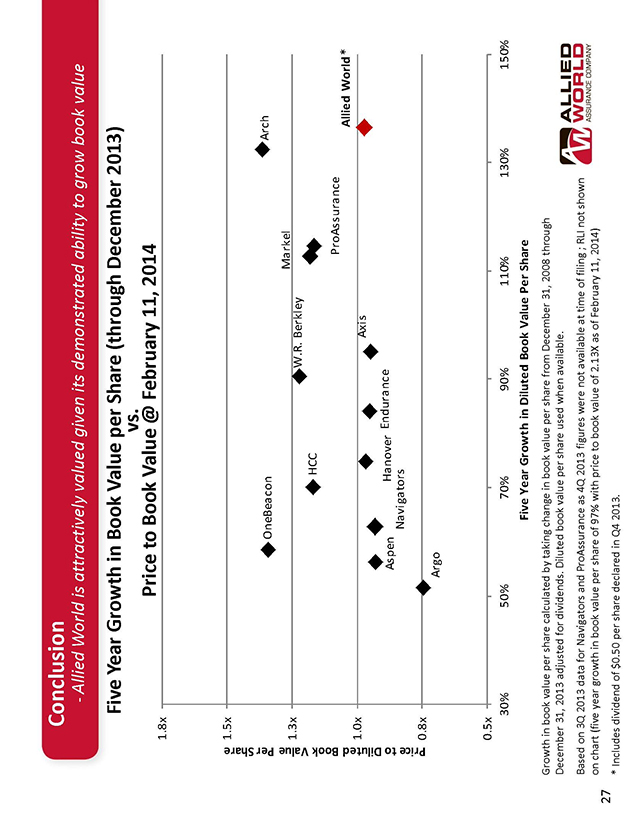
Conclusion
- Allied World is attractively valued given its demonstrated ability to grow book value
Five Year Growth in Book Value per Share (through December 2013) vs.
Price to Book Value @ February 11, 2014
1.8x
Share 1.5x
Arch OneBeacon Markel 1.3x W.R. Berkley HCC
Book Value Per ProAssurance
Diluted Allied World*
1.0x Axis to Aspen Hanover Endurance Price Navigators 0.8x Argo
0.5x
30% 50% 70% 90% 110% 130% 150%
Five Year Growth in Diluted Book Value Per Share
Growth in book value per share calculated by taking change in book value per share from December 31, 2008 through December 31, 2013 adjusted for dividends. Diluted book value per share used when available.
Based on 3Q 2013 data for Navigators and ProAssurance as 4Q 2013 figures were not available at time of filing ; RLI not shown on chart (five year growth in book value per share of 97% with price to book value of 2.13X as of February 11, 2014)
27
* | | Includes dividend of $0.50 per share declared in Q4 2013. |

ü?Executive Summary ü?Operating Segments
§?U.S. Insurance
Agenda §?International Insurance §?Reinsurance
ü?Financial Highlights ü?Conclusion ??Appendix
28
Non-GAAP Financial Measures
In presenting the company's results, management has included and discussed in this presentation certain non generally accepted accounting principles ("non-GAAP") financial measures within the meaning of Regulation G as promulgated by the U.S. Securities and Exchange Commission. Management believes that these non-GAAP measures, which may be defined differently by other companies, better explain the company's results of operations in a manner that allows for a more complete understanding of the underlying trends in the company's business. However, these measures should not be viewed as a substitute for those determined in accordance with generally accepted accounting principles ("U.S. GAAP"). "Operating income" is an internal performance measure used in the management of the company_s operations and represents after-tax operational results excluding, as applicable, net realized investment gains or losses, net impairment charges recognized in earnings, net foreign exchange gain or loss and other non-recurring items. The company excludes net realized investment gains or losses, net impairment charges recognized in earnings, net foreign exchange gain or loss, and other non-recurring items from the calculation of operating income because these amounts are heavily influenced by and fluctuate in part according to the availability of market opportunities and other factors. The company has excluded from operating income the termination fee received from Transatlantic Holdings, Inc. in 2011 as this is a non-recurring item. In addition to presenting net income determined in accordance with U.S. GAAP, the company believes that showing operating income enables investors, analysts, rating agencies and other users of the company_s financial information to more easily analyze our results of operations and underlying business performance. Operating income should not be viewed as a substitute for U.S. GAAP net income.
The company has included "diluted book value per share" because it takes into account the effect of dilutive securities; therefore, the company believes it is an important measure of calculating shareholder returns. "Annualized net income return on average shareholders' equity" ("ROAE") is calculated using average shareholders_ equity, excluding the average after tax unrealized gains (or losses) on investments. Unrealized gains (losses) on investments are primarily the result of interest rate and credit spread movements and the resultant impact on fixed income securities. Such gains (losses) are not related to management actions or operational performance, nor are they likely to be realized. Therefore, the company believes that excluding these unrealized gains (losses) provides a more consistent and useful measurement of operating performance, which supplements U.S. GAAP information. In calculating ROAE, the net income (loss) available to shareholders for the period is multiplied by the number of such periods in a calendar year in order to arrive at annualized net income (loss) available to shareholders. The company presents ROAE as a measure that is commonly recognized as a standard of performance by investors, analysts, rating agencies and other users of its financial information. "Annualized operating return on average shareholders' equity" is calculated using operating income (as defined above and annualized in the manner described for net income (loss) available to shareholders under ROAE above), and average shareholders' equity, excluding the average after tax unrealized gains (losses) on investments. Unrealized gains (losses) are excluded from equity for the reasons outlined in the annualized net income return on average shareholders' equity explanation above.
See slides 30 _ 32 for a reconciliation of non-GAAP measures used in this presentation to their most directly comparable U.S. GAAP measures.
29
Non-GAAP Financial Measures - Reconciliations
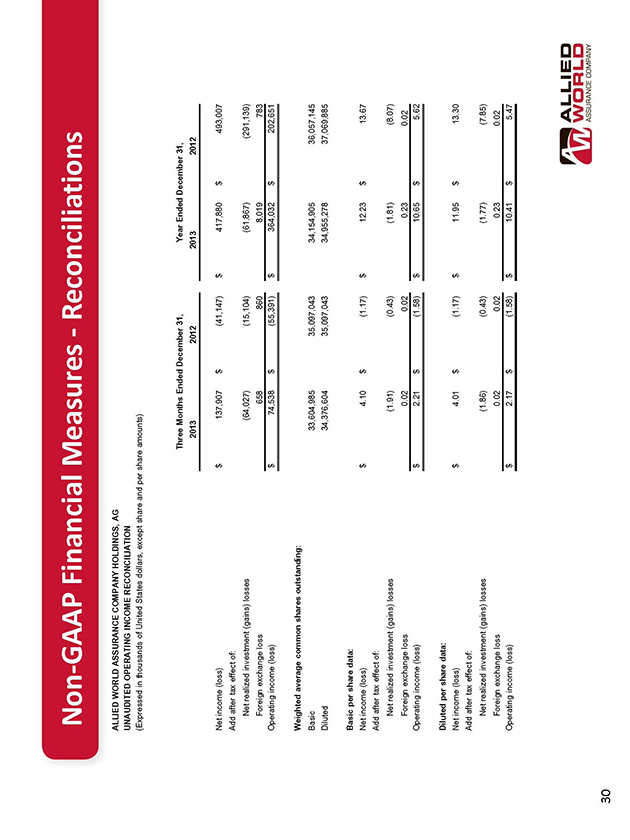
ALLIED WORLD ASSURANCE COMPANY HOLDINGS, AG UNAUDITED OPERATING INCOME RECONCILIATION
(Expressed in thousands of United States dollars, except share and per share amounts)
Three Months Ended December 31, Year Ended December 31, 2013 2012 2013 2012
Net income (loss) $ 137,907 $ (41,147) $ 417,880 $ 493,007 Add after tax effect of: Net realized investment (gains) losses (64,027) (15,104) (61,867) (291,139) Foreign exchange loss 658 860 8,019 783 Operating income (loss) $ 74,538 $ (55,391) $ 364,032 $ 202,651
Weighted average common shares outstanding:
Basic 33,604,985 35,097,043 34,154,905 36,057,145 Diluted 34,376,604 35,097,043 34,955,278 37,069,885
Basic per share data:
Net income (loss) $ 4.10 $ (1.17) $ 12.23 $ 13.67 Add after tax effect of: Net realized investment (gains) losses (1.91) (0.43) (1.81) (8.07) Foreign exchange loss 0.02 0.02 0.23 0.02 Operating income (loss) $ 2.21 $ (1.58) $ 10.65 $ 5.62
Diluted per share data:
Net income (loss) $ 4.01 $ (1.17) $ 11.95 $ 13.30 Add after tax effect of: Net realized investment (gains) losses (1.86) (0.43) (1.77) (7.85) Foreign exchange loss 0.02 0.02 0.23 0.02 Operating income (loss) $ 2.17 $ (1.58) $ 10.41 $ 5.47
30
Non-GAAP Financial Measures - Reconciliations
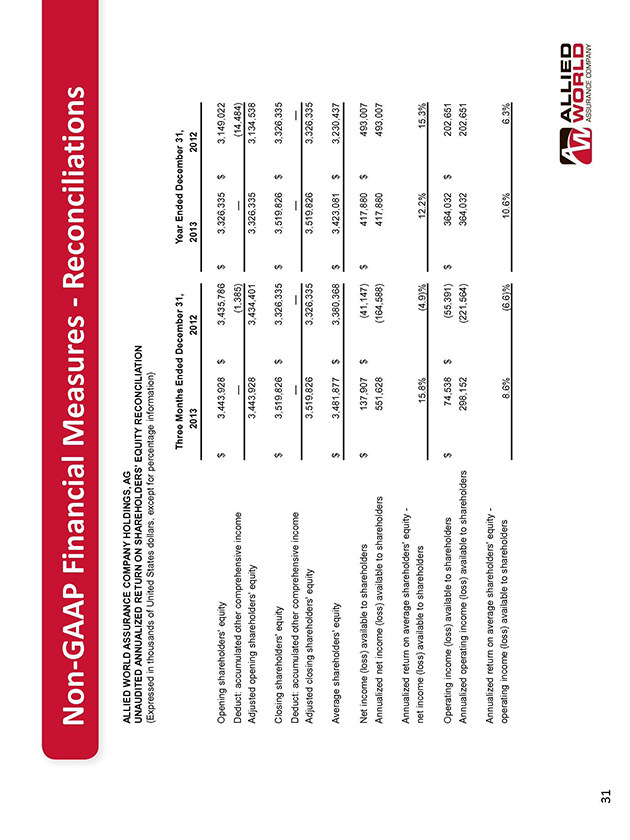
ALLIED WORLD ASSURANCE COMPANY HOLDINGS, AG
UNAUDITED ANNUALIZED RETURN ON SHAREHOLDERS' EQUITY RECONCILIATION
(Expressed in thousands of United States dollars, except for percentage information)
Three Months Ended December 31, Year Ended December 31, 2013 2012 2013 2012
Opening shareholders' equity $ 3,443,928 $ 3,435,786 $ 3,326,335 $ 3,149,022 Deduct: accumulated other comprehensive income (1,385) (14,484) Adjusted opening shareholders' equity 3,443,928 3,434,401 3,326,335 3,134,538
Closing shareholders' equity $ 3,519,826 $ 3,326,335 $ 3,519,826 $ 3,326,335 Deduct: accumulated other comprehensive income Adjusted closing shareholders' equity 3,519,826 3,326,335 3,519,826 3,326,335
Average shareholders' equity $ 3,481,877 $ 3,380,368 $ 3,423,081 $ 3,230,437
Net income (loss) available to shareholders $ 137,907 $ (41,147) $ 417,880 $ 493,007 Annualized net income (loss) available to shareholders 551,628 (164,588) 417,880 493,007
Annualized return on average shareholders' equity - net income (loss) available to shareholders 15.8% (4.9)% 12.2% 15.3%
Operating income (loss) available to shareholders $ 74,538 $ (55,391) $ 364,032 $ 202,651 Annualized operating income (loss) available to shareholders 298,152 (221,564) 364,032 202,651
Annualized return on average shareholders' equity - operating income (loss) available to shareholders 8.6% (6.6)% 10.6% 6.3%
31
Non-GAAP Financial Measures - Reconciliations
ALLIED WORLD ASSURANCE COMPANY HOLDINGS, AG
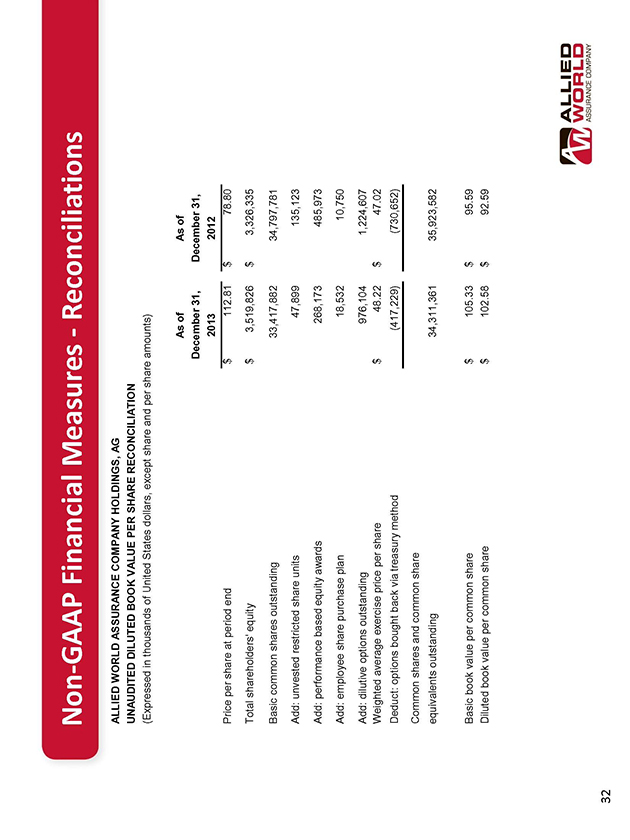
UNAUDITED DILUTED BOOK VALUE PER SHARE RECONCILIATION
(Expressed in thousands of United States dollars, except share and per share amounts)
As of As of December 31, December 31, 2013 2012
Price per share at period end $ 112.81 $ 78.80 Total shareholders' equity $ 3,519,826 $ 3,326,335 Basic common shares outstanding 33,417,882 34,797,781 Add: unvested restricted share units 47,899 135,123 Add: performance based equity awards 268,173 485,973 Add: employee share purchase plan 18,532 10,750 Add: dilutive options outstanding 976,104 1,224,607 Weighted average exercise price per share $ 48.22 $ 47.02 Deduct: options bought back via treasury method (417,229) (730,652) Common shares and common share equivalents outstanding 34,311,361 35,923,582
Basic book value per common share $ 105.33 $ 95.59 Diluted book value per common share $ 102.58 $ 92.59
32