Joe Schierhorn, Chief Financial Officer (907) 261-3308
EXHIBIT 99.1
NEWS RELEASE
Northrim BanCorp Earns $1.9 Million, or $0.29 Per Share, in 2Q09
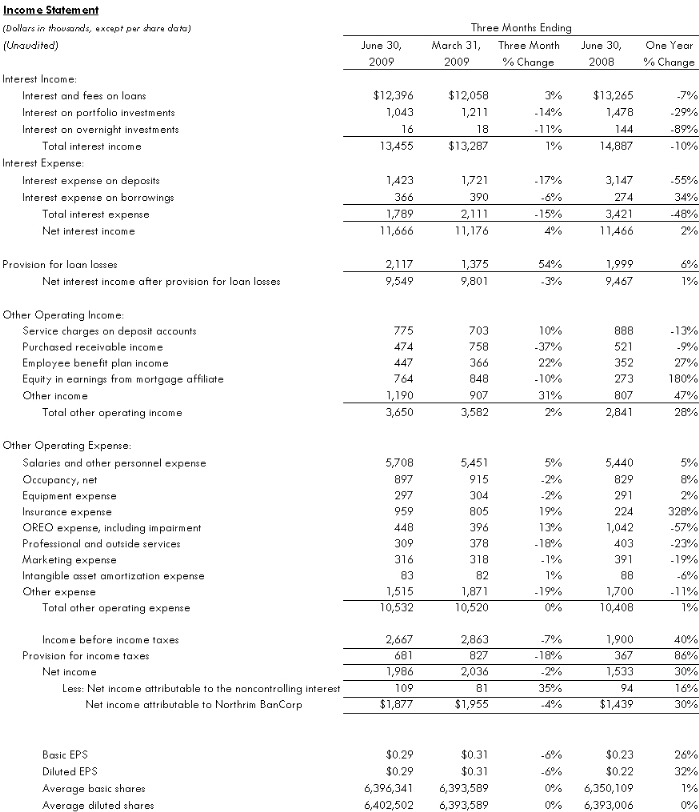
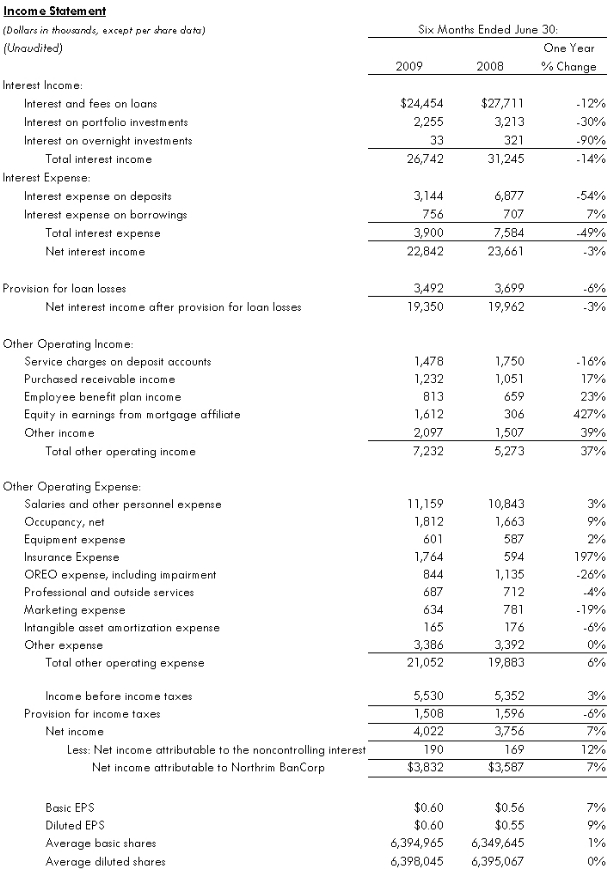
ANCHORAGE, AK—July 22, 2009—Northrim BanCorp, Inc. (NASDAQ: NRIM) today reported second quarter 2009 profits were $1.9 million, or $0.29 per diluted share, compared to $2.0 million, or $0.31 per diluted share, in the first quarter of 2009, and up 30% from $1.4 million, or $0.22 per diluted share, in the second quarter of 2008. For the first half of 2009, profits grew 7% to $3.8 million, or $0.60 per diluted share, compared to $3.6 million, or $0.55 per diluted share, in the first six months of 2008.
Financial Highlights (at or for the quarters ended June 30, 2009, compared to March 31, 2009, and June 30, 2008)
•
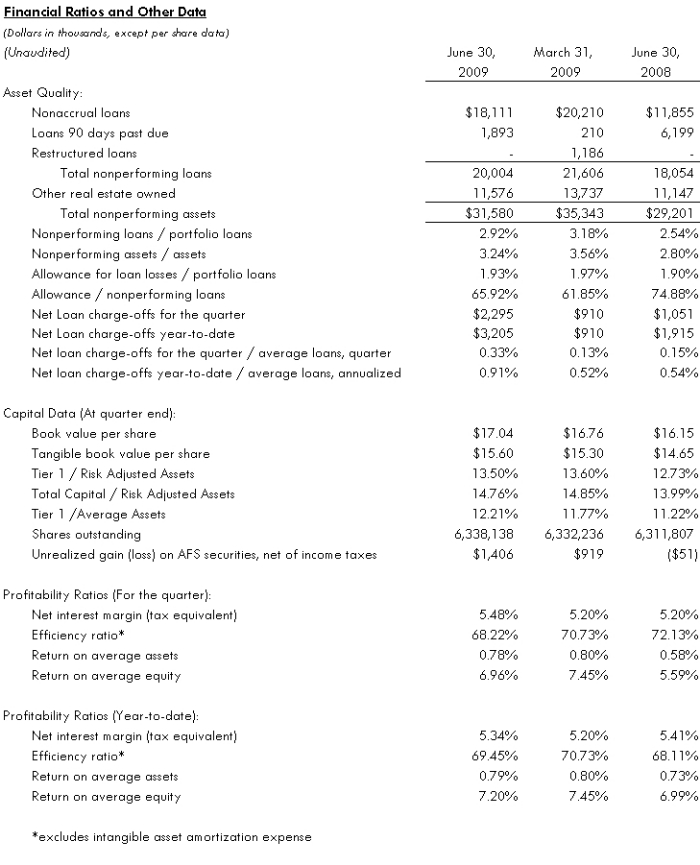
Northrim remains well capitalized with Tier 1 Capital/risk adjusted assets of 13.50% as compared to 13.60% in the immediate prior quarter and 12.73% a year ago.
•
The net interest margin improved to 5.48% for the second quarter of 2009, up from 5.20% in both the immediate prior quarter and the second quarter of 2008.
•
Book value per share was $17.04 and tangible book value was $15.60 per share, up from book value of $16.76 per share and tangible book value per share of $15.30 at March 31, 2009.
•
Contributions from financial services affiliates helped generate a 28% year-over-year increase in other operating income.
•
Nonperforming assets were $31.6 million, or 3.24% of total assets at quarter end, compared to $35.3 million, or 3.56% of total assets last quarter and $29.2 million, or 2.80% of assets a year ago.
•
The allowance for loan losses totaled 1.93% of gross loans at June 30, 2009, as compared to 1.97% at March 31, 2009 and 1.90% a year ago.
•
Residential construction loans declined to $79.5 million, or 12% of portfolio loans, down from $83.5 million, or 12% of portfolio loans at March 31, 2009 and $115.6 million, or 16% of portfolio loans a year ago.
•
Northrim Bancorp was added to the Russell 2000 index of small-cap companies at the end of June 2009.
Capital Adequacy and Liquidity
“Our capital and liquidity positions remain healthy, reflecting the bank’s solid balance sheet and the continuing relative strength in the Alaska economy,” said Marc Langland, Chairman, President, and CEO. Northrim’s ratio of total capital to risk based assets was 14.76% at June 30, 2009, well above the national average of 13.31% for all commercial banks based upon statistics compiled by the FDIC for March 31, 2009. “Our capital ratios continue to be in excess of our peers without the benefit of any government assistance.”
Liquidity also remains at an elevated level with cash and investments totaling more than 20% of total assets. “In addition to our balance sheet liquidity, we maintain access to several sources of secondary liquidity,” said Joe Schierhorn, Chief Financial Officer.
Alaska Economic Update
“While the growth in the Alaska economy has slowed, we continue to generate stronger economic performance relative to other areas of the country,” said Chris Knudson, Chief Operating Officer. “Investments in the energy sector provide high-paying jobs in the Alaska economy. The Alaska economy continues to be dominated by natural resources with the exploration and production of oil and natural gas at its foundation. The announcement last quarter that Exxon (NYSE: XOM) will be investing more than $70 million and doubling the total commitment with Trans Canada on the Natural Gas Pipeline is just one high profile example of the activity in our market area.”
According to the State of Alaska Department of Labor, employment in Alaska grew by 0.4% for the first six months of 2009, compared to the first six months of 2008. However, statewide employment declined by 0.3% in June of 2009, as compared to June of last year. The State of Alaska Department of Labor continues to forecast a slight decline of 700 jobs or 0.2% in 2009. In addition, according to state and national news sources, the tourism industry is reporting a 10% to 20% decline in visitors to the state in 2009 as compared to 2008.
Single family residential permits for two or less units decreased 16% in Anchorage for the first six months of 2009, compared to the same period in 2008 according to the Anchorage Multiple Listing Service (MLS). Active listings and the number of units sold have declined during this same period by 8% and 19%, respectively in our primary market area of Anchorage, which has led to a 6.3 months supply of single family housing available for sale and a decline of 1.3% in housing prices in the first six months of 2009 according to MLS statistics.
For more information on the Alaska economy, visitwww.northrim.com and click on the “About Alaska” tab.
Asset Quality and Balance Sheet Review
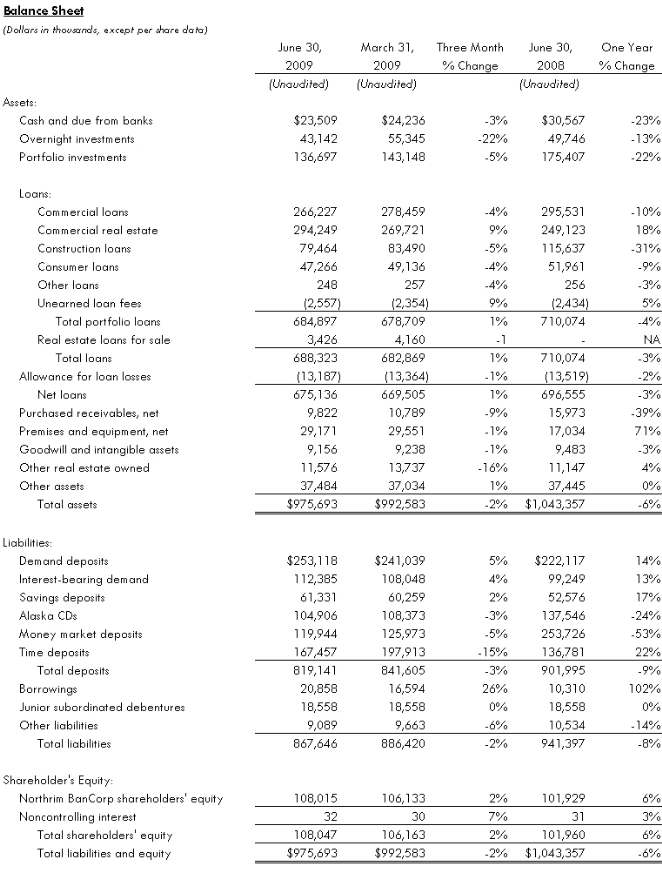
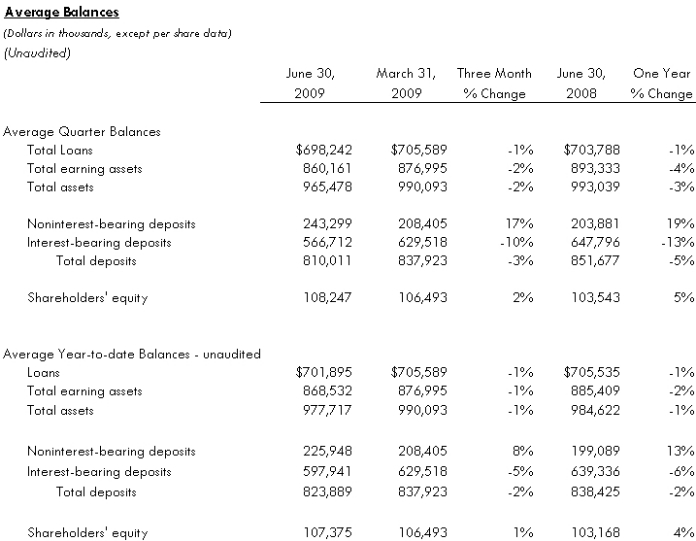
Northrim’s total assets declined to $976 million at June 30, 2009, from $993 million at March 31, 2009, and $1.04 billion at June 30, 2008, primarily due to the $36 million decline in construction loans. The loan portfolio contracted 4% in the second quarter of 2009 to $685 million from $710 million a year ago, with a decline in construction and commercial loans partially offset by growth in commercial real estate loans. The geographic distribution of the loan portfolio at June 30, 2009, continues to show about 85% of the portfolio made to customers located in the greater Anchorage area and 15% in the Fairbanks area.
The loan portfolio remains diversified with commercial loans accounting for 39% of the portfolio and commercial real estate accounting for 43% of the portfolio at June 30, 2009. Construction and land development loans, which account for 12% of the loan portfolio at June 30, are down 31% to $79.5 million from $115.6 million a year ago, reflecting the maturing of projects funded in past years and the reduction in new projects starts in the past two years.
Overall asset quality continued to improve and the risk profile of the portfolio improved based on a number of factors. “The decline in the residential construction portfolio reflects the ongoing success of our local builders in completing and marketing their inventory, which is mirrored in our own Other Real Estate Owned (OREO) portfolio,” said Joe Beedle, Chief Lending Officer. “Second quarter sales of OREO properties totaled $2.7 million and generated a $116,000 gain, supporting our belief that real estate values in the greater Anchorage market continue to show resilience and stability. We have substantially completed construction on all of our OREO properties, which will allow us to actively market them. The majority of these properties are in a price range with the highest amount of sales activity.”
At the end of the second quarter of 2009, nonperforming loans totaled $20.0 million, or 2.92% of total portfolio loans, compared to $21.6 million, or 3.18% of total portfolio loans at March 31, 2009, and $18.1 million, or 2.54% of total portfolio loans a year ago.
Nonperforming assets consist of nonaccrual loans, accruing loans 90 days or more past due, restructured loans, and OREO. Total nonperforming assets were $31.6 million, or 3.24% of total assets at June 30, 2009, compared to $35.3 million, or 3.56% of total assets at March 31, 2009, and $29.2 million, or 2.80% of total assets a year ago. Approximately 55% of the nonperforming assets at June 30, 2009 were for construction and land development projects, 26% were for commercial loans and the remainder were for commercial real estate loans.
The allowance for loan losses was $13.2 million, or 1.93% of total loans at the end of the second quarter of 2009, compared to $13.4 million, or 1.97% of total loans at March 31, 2009, and $13.5 million, or 1.90% of total loans a year ago. Net charge-offs (NCOs) in the second quarter of 2009 were $2.3 million, or 0.33% of average loans, annualized, compared to $1.1 million, or 0.15% of average loans in the second quarter of 2008. Year-to-date NCOs totaled $3.2 million or 0.91% of average loans, compared to $1.9 million or 0.54% of average loans in the first half of 2008. “Two large business loans, a commercial real estate loan, and a land development loan accounted for a majority of the net charge-offs in the second quarter of 2009,” said Beedle.
Investment securities totaled $136.7 million at the end of the second quarter of 2009, down from $175.4 million a year ago. At June 30, 2009, the portfolio was comprised of 67% U.S. Agency securities, 19% securities of Alaskan municipalities, utilities, or state agencies, 13% corporate bonds, and 1%, or $2 million of stock in the Federal Home Loan Bank of Seattle. “Our investment securities portfolio continues to be managed to provide maximum liquidity with high quality, short term income producing investments,” said Knudson.`
Total deposits decreased to $819.1 million at June 30, 2009, compared to $902.0 million a year earlier. Noninterest- bearing demand deposits at June 30, 2009, increased 14% and interest bearing demand deposits grew 13% year-over-year reflecting the continuing success of the High Performance Checking program. At June 30, 2009, time deposit balances increased 22% and savings account balances increased 17% compared to a year ago while the Alaska CD (a flexible certificate of deposit program) and money market balances fell 24% and 53% respectively over the same period. The increase in time deposits continues to reflect the movement of customers from lower yielding accounts to higher yielding certificates of deposit. The decrease in the money market balances was due primarily to customers moving to demand deposit accounts as well as the decrease in deposit balances for one large commercial depositor. At the end of the second quarter of 2009, demand deposits accounted for 31% of total deposits, money market balances accounted for 15%, the Alaska CD accounted for 13%, interest-bearing demand accounts were 14%, savings deposits were 7%, and time certificates were 20% of total deposits. “Transaction accounts are the primary source of our deposits. They contribute to our strong liquidity and provide an affordable source of funding,” said Knudson.
Shareholders’ equity increased 6% to $108.0 million, or $17.04 per share, at June 30, 2009, compared to $101.9 million, or $16.15 per share, at June 30, 2008. Tangible book value per share was $15.60 at June 30, 2009, compared to $14.65 a year earlier. Northrim remains well capitalized with Tier 1 Capital to Risk Adjusted Assets of 13.50% at June 30, 2009.
Review of Operations
Reflecting strong contributions from affiliates and an increase in net interest income, revenue (net interest income plus other operating income) grew 7% year-over-year and 4% from the preceding quarter to $15.3 million in the second quarter of 2009, compared to $14.8 million in the preceding quarter and $14.3 million in the second quarter a year ago. Year-to-date revenue grew 4% to $30.1 million from $28.9 million in the first half of 2008.
Second quarter 2009 net interest income, before the provision for loan losses, grew 2% year-over-year to $11.7 million from $11.5 million in the second quarter of 2008, and increased 4% from $11.2 million in the preceding quarter. In the first half of 2009, net interest income before provision for loan losses was down 3% to $22.8 million from $23.7 million in the first half of 2008.
Northrim’s net interest margin (net interest income as a percentage of average earning assets on a tax equivalent basis) was 5.48% in the second quarter of 2009, compared to 5.20% in both the first quarter of 2009 and the second quarter a year ago. For the first six months of 2009, Northrim’s net interest margin was 5.34% compared to 5.41% in the like period a year ago. “Second quarter net interest margin improved due to a number of factors including recoveries of interest for two large nonperforming loans, when one loan was sold and the other loan was brought current by the borrower. Improved pricing on loans and the run-off of higher priced time deposits also contributed to margin expansion in the second quarter of 2009,” said Schierhorn. Net recoveries of interest on nonperforming assets contributed 6 basis points to the net interest margin in the second quarter of 2009, compared to net reversals of interest that reduced the net interest margin in the second quarter of 2008 by 6 basis points. Net reversals of interest on nonperforming assets reduced the net interest margin for the six month period ending June 30, 2009 by 1 basis point, compared to an 8 basis point reduction for the six month period ending June 30, 2008.
The loan loss provision in the second quarter of 2009 totaled $2.1 million, compared to $2.0 million in the second quarter a year ago. Year-to-date, the provision for loan losses totaled $3.5 million compared to $3.7 million in the first half of 2008. In the second quarter of 2009, net interest income, after the provision for loan losses, was $9.5 million compared to $9.8 million in the prior quarter and $9.5 million a year ago. For the first six months of 2009, net interest income after provision for loan losses was $19.4 million compared to $20.0 million in the like period a year ago.
Total other operating income increased 28% for the second quarter of 2009 and 37% year-to-date as compared to the same periods a year ago due to strong contributions from affiliated financial services offerings, particularly from earnings of Northrim’s mortgage affiliate. Other operating income grew to $3.7 million, in the second quarter of 2009 compared to $3.6 million in the first quarter of 2009 and $2.8 million in the second quarter of 2008. For the first six months of 2009, other operating income grew to $7.2 million from $5.3 million for the first six months of 2008. Deposit account service charge income was down 13% at $775,000 in the second quarter of 2009 compared to $888,000 for the second quarter a year ago due to fewer overdraft transactions. For the first six months of the year, service charges on deposit accounts were down 16% to $1.5 million from $1.8 million in the first half of 2008.
Purchased receivable income fell 9% to $474,000 in the second quarter of 2009 from $521,000 in the second quarter a year ago. These balances decreased primarily because one purchased receivable customer sold a portion of its business which allowed it to pay off its purchased receivable balance at the end of the first quarter of 2009. Employee benefit plan income grew to $447,000 for the second quarter of 2009 compared to $352,000 for the second quarter of 2008 due to the addition of more customers to this product line.
Income from Northrim’s mortgage affiliate increased significantly in the second quarter of 2009 to $764,000 from $273,000 in the second quarter a year ago, reflecting the strong refinance activity resulting from lower mortgage rates. “Demand for mortgage refinancing continues to be strong due to the low mortgage rates and the stable real estate market that continues to provide many of our customers with adequate equity to refinance their homes, although we expect this activity to slow in future quarters,” said Langland.
Operating expenses increased 1% for the second quarter of 2009 and increased 6% year-over-year. Overhead expenses increased slightly in the second quarter ended June 30, 2009 compared to the quarter ended March 31, 2009 due to higher FDIC insurance costs which was the largest cause of the increase in overhead on a year-over-year basis. In addition to boosting its regular insurance fees, the FDIC levied a special assessment on all banks to bolster its insurance fund. Including the $420,000 special FDIC assessment levied in the second quarter, FDIC insurance premiums increased by $748,000 to $923,000 for the second quarter of 2009 from $175,000 paid in the second quarter a year ago. Noninterest expense in the second quarter of 2009 was $21.0 million compared to $19.9 million in the second quarter a year ago.
The efficiency ratio during the second quarter of 2009 was 68.22%, compared to 70.73% in the first quarter of 2009 and 72.13% in the second quarter a year ago. The efficiency ratio, calculated by dividing noninterest expense, excluding intangible asset amortization expense, by net interest income and noninterest income, measures overhead costs as a percentage of total revenues.
About Northrim BanCorp
Northrim BanCorp, Inc. is the parent company of Northrim Bank, a commercial bank that provides personal and business banking services through locations in Anchorage, Eagle River, Wasilla, and Fairbanks, Alaska, and an asset based lending division in Washington. The bank differentiates itself with a “Customer First Service” philosophy. Affiliated companies include Elliott Cove Capital Management, LLC; Residential Mortgage, LLC; Northrim Benefits Group, LLC; and Pacific Wealth Advisors, LLC. In June 2009, Northrim Bancorp was added to the Russell 2000 Index, a subset of the Russell 3000 Index. Both indices are widely used by professional money managers as benchmarks for investment strategies.
www.northrim.com
Sources include thehttp://www.iser.uaa.alaska.edu/presentations/LookingAheadAKEconomy.pdf and the State of Alaska Department of Labor.
This release may contain “forward-looking statements” that are subject to risks and uncertainties. Readers should not place undue reliance on forward-looking statements, which reflect management’s views only as of the date hereof. All statements, other than statements of historical fact, regarding our financial position, business strategy and management’s plans and objectives for future operations are forward-looking statements. When used in this report, the words “anticipate,” “believe,” “estimate,” “expect,” and “intend” and words or phrases of similar meaning, as they relate to Northrim or management, are intended to help identify forward-looking statements within the meaning of the Private Securities Litigation Reform Act of 1995. Although we believe that management’s expectations as reflected in forward-looking statements are reasonable, we cannot assure readers that those expectations will prove to be correct. Forward-looking statements are subject to various risks and uncertainties that may cause our actual results to differ materially and adversely from our expectations as indicated in the forward-looking statements. These risks and uncertainties include our ability to maintain or expand our market share or net interest margins, and to implement our marketing and growth strategies. Further, actual results may be affected by our ability to compete on price and other factors with other financial institutions; customer acceptance of new products and services; the regulatory environment in which we operate; and general trends in the local, regional and national banking industry and economy as those factors relate to our cost of funds and return on assets. In addition, there are risks inherent in the banking industry relating to collectibility of loans and changes in interest rates. Many of these risks, as well as other risks that may have a material adverse impact on our operations and business, are identified in our other filings with the SEC. However, you should be aware that these factors are not an exhaustive list, and you should not assume these are the only factors that may cause our actual results to differ from our expectations.
-0-
We use cookies on this site to provide a more responsive and personalized service. Continuing to browse, clicking I Agree, or closing this banner indicates agreement. See our Cookie Policy for more information.