EXHIBIT 99.1
| Northrim BanCorp, Inc. | ||
Contact: | Joe Schierhorn, Chief Financial Officer (907) 261-3308 | |
NEWS RELEASE
Northrim BanCorp Earnings Per Share Up 25% to $0.30 in 3Q09 from $0.24 in 3Q08
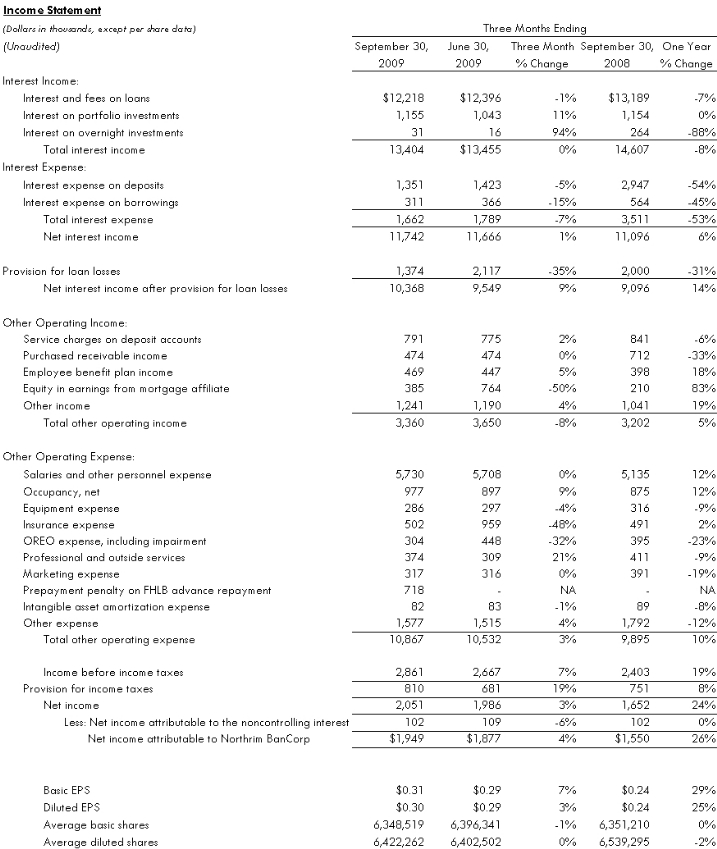
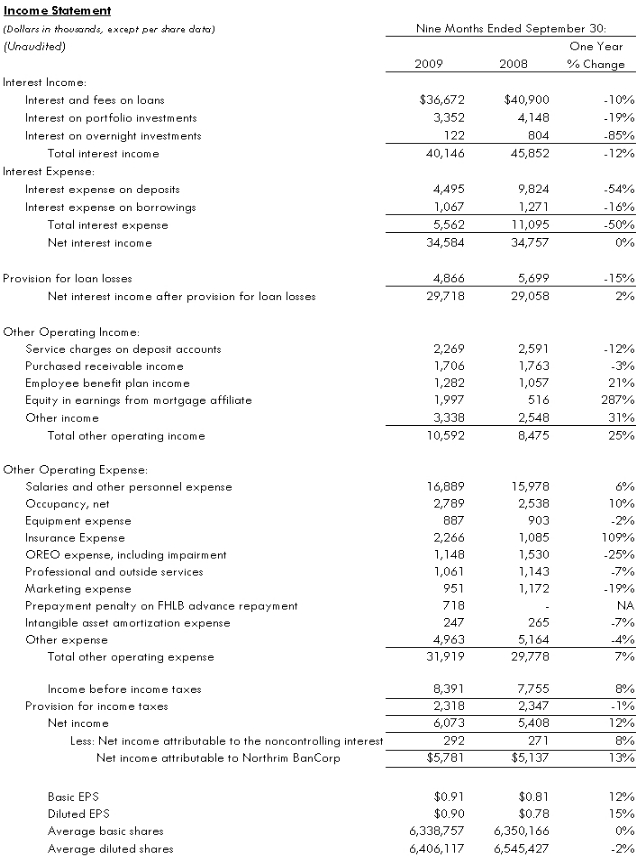
ANCHORAGE, AK—October 21, 2009—Northrim BanCorp, Inc. (NASDAQ: NRIM) today reported that growth in its net interest margin, lower provisions for loan losses, and larger contributions from affiliates contributed to a 26% increase in profits for the third quarter of 2009 as compared to the third quarter a year ago. Net income attributable to Northrim BanCorp in the quarter ended September 30, 2009, increased to $1.9 million, or $0.30 per diluted share, from $1.6 million, or $0.24 per diluted share, in the third quarter of 2008. Year-to-date, profits grew 13% to $5.8 million, or $0.90 per diluted share, compared to $5.1 million, or $0.78 per diluted share, in the first nine months of 2008.
Financial Highlights(at or for the periods ended September 30, 2009, compared to September 30, 2008)
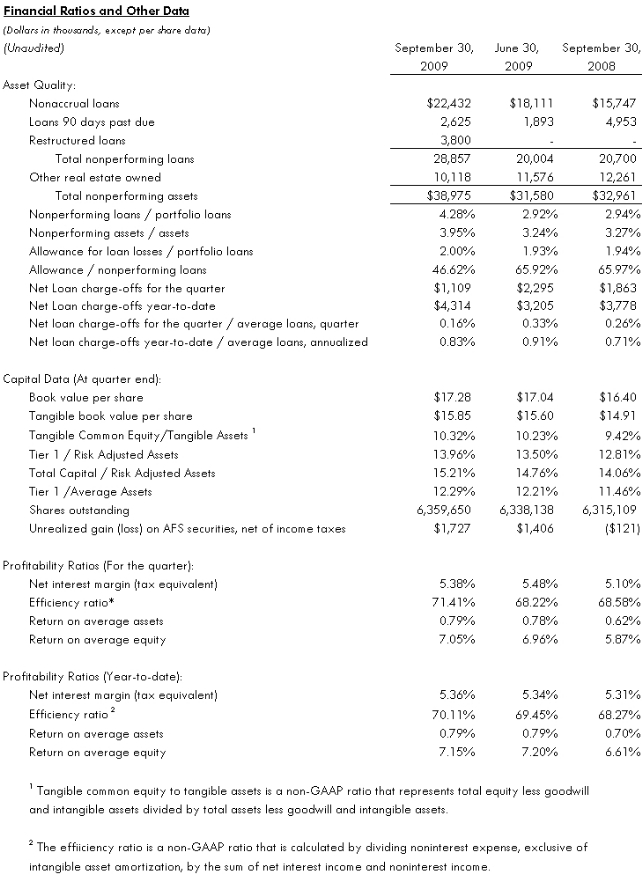
| • | Northrim remains well-capitalized with Tier 1 Capital/risk adjusted assets 13.96% at September 30, 2009, up from 13.50% in the immediate prior quarter and 12.81% a year ago. Northrim’s total tangible common equity to total tangible assets at September 30, 2009, was 10.32%, up from 9.42% a year ago. These ratios do not reflect any government investment in Northrim as the company elected not to participate in the Capital Purchase Program sponsored by the U. S. Treasury in 2008. |
| • | The $154 million investment portfolio, consisting primarily of high quality, short term income producing investments, is managed to provide a balance of yield and liquidity. |
| • | The net interest margin (NIM) for the third quarter improved to 5.38% up from 5.10% a year ago. Year-to-date, NIM expanded to 5.36% from 5.31% for the first nine months of 2008. |
| • | Book value per share grew 5% to $17.28 and tangible book value grew 6% to $15.85 per share. |
| • | Contributions from affiliates boosted other operating income for the first nine months of 2009 by 25% compared to a year ago. |
| • | Nonperforming assets were $39.0 million, or 3.95% of total assets at September 30, 2009, compared to $31.6 million, or 3.24% of total assets at June 30, 2009, and $33.0 million, or 3.27% of assets a year ago. |
| • | The allowance for loan losses totaled 2.00% of gross loans at September 30, 2009, compared to 1.93% at June 30, 2009 and 1.94% a year ago. |
| • | High cost long term borrowings were reduced by more than half as Northrim prepaid $9.9 million of Federal Home Loan Bank (FHLB) advances with an average remaining life of over 8 years during the quarter ended September 30, 2009. The resulting $718,000 prepayment penalty reduced 3Q09 earnings per share by $0.07 and is expected to save as much as $0.05 per share in 2010 and additional amounts in future years. |
Capital Adequacy and Liquidity
“We continue to build tangible common equity through profitable operations,” said Marc Langland, Chairman, President and CEO of Northrim BanCorp, Inc. “Our capital ratios exceed the regulatory requirements for well-capitalized institutions, and we are happy to be able to meet these requirements without any investments from the federal government. We continue to maintain high levels of liquidity with 23% of our assets in liquid investments.”
Alaska Economic Update
Alaska’s economy continues to be healthier than the nation as a whole in the areas of employment, housing and state revenues. Alaska employment fell slightly in September, according to the State of Alaska Department of Labor, dropping 0.6% or 2,000 jobs to an estimated 335,000, primarily due to a typical seasonal decline in seafood processing employment. Based on statistics released by the State of Alaska Department of Labor, employment in construction, accommodations, retail trade, and restaurants are all down from the September 2008 levels, with job losses in these industries partially offset by over-the-year gains in health care and government jobs. On a year-to-date basis through September of 2009, Alaska’s total employment level remains unchanged as compared to the same period in 2008.
According to studies conducted by the University of Alaska Institute of Social and Economic Research, natural resources, and oil and gas in particular, continue to provide the majority of Alaska state revenues and indirectly generate more than one-third of the jobs in the state. The state has current reserves of $12 billion and a Permanent Fund of $34 billion based upon information provided by the State of Alaska. The Permanent Fund distributed a dividend of $1,305 to every eligible Alaskan this month, which totaled approximately $850 million and provides a source of added liquidity to the state. These yearly dividends contribute to the overall strong household income in the state.
“Our housing markets also continue to perform better than the rest of the country with stable values and strong affordability,” noted Chris Knudson, Chief Operating Officer. For more information on the Alaska economy, visitwww.northrim.com and click on the “About Alaska” tab.
Asset Quality and Balance Sheet Review
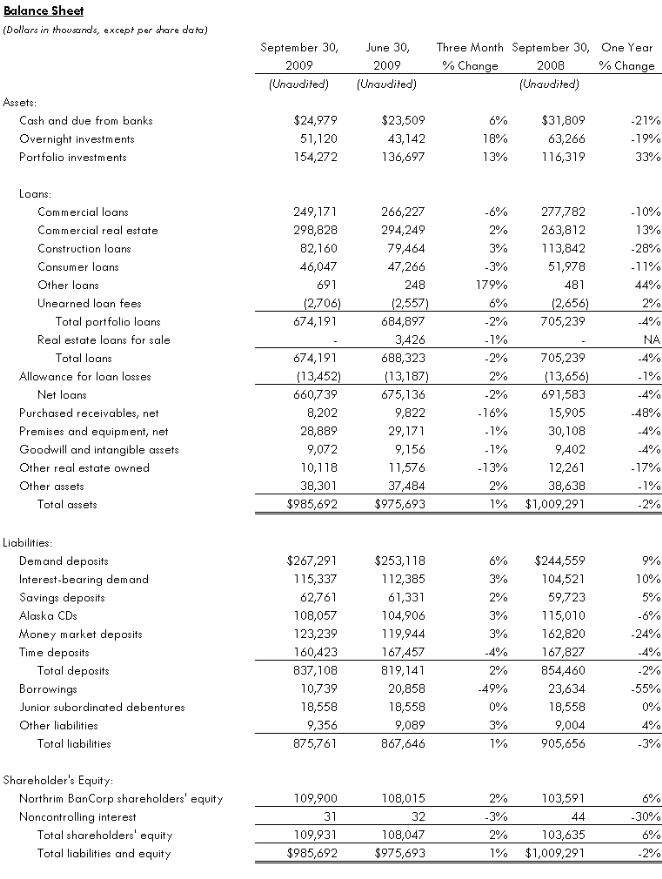
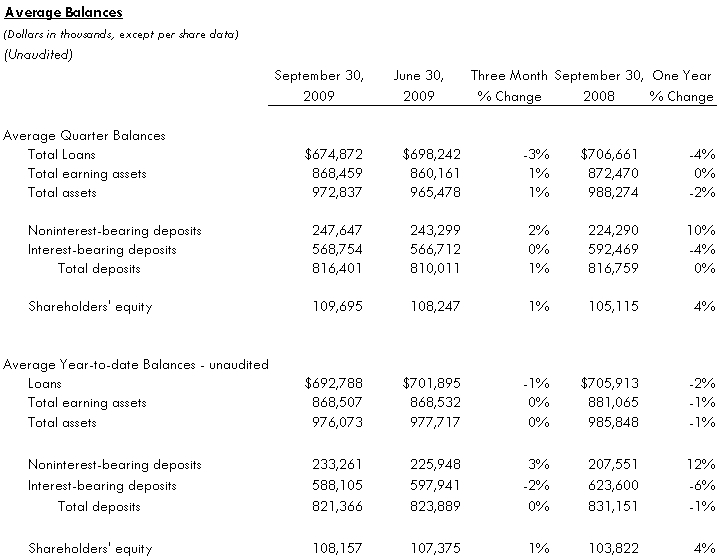
Northrim’s total assets increased to $985.7 million at September 30, 2009, from $975.7 million at June 30, 2009. Total assets at the end of the third quarter of 2009 decreased from $1.01 billion a year ago, primarily due to a $32 million decline in construction loans.
The loan portfolio contracted 4% to $674.2 million at the end of September 2009 from $705.2 million a year ago, with a continued decline in construction and commercial loans partially offset by growth in commercial real estate loans. The geographic distribution of the loan portfolio continues to show about 85% of the portfolio consists of loans made to customers located in the greater Anchorage area and 15% in the Fairbanks area.
The loan portfolio remains diversified with commercial loans accounting for 37% of the portfolio and commercial real estate accounting for 44% of the portfolio at September 30, 2009. Construction and land development loans, which account for 12% of the loan portfolio at September 30, 2009, are down 28% to $82.2 million from $113.8 million a year ago, reflecting the maturing of projects funded in past years and the reduction in new projects starts in the past two years.
While nonperforming assets at September 30, 2009, increased by $6 million year-over-year and $7.4 million from the prior quarter, the risk profile of the portfolio improved as a result of the following developments:
| • | The projects in the construction and development category, both loans to builders and foreclosed developments in other real estate owned (OREO), are complete and on the market. |
| • | Sales of OREO continued during the quarter ending September 30, 2009, with 15 properties sold for $2.6 million, generating a $200,000 gain over current book value. Year-to-date through September 30, 2009, 40 OREO properties sold for $7.5 million and generated a $424,000 gain. |
| • | The increase in nonaccrual loans during the third quarter ending September 30, 2009, reflects the addition of a $9.0 million condominium conversion project in Anchorage. Of the 68 original units, 15 condos have been sold and 48 are rented, providing cash flow for the project. |
| • | Restructured loans of $3.8 million represent the balance of a troubled debt restructuring of a $4.6 million loan. The borrower is current with payments and the loan is at current market rates. |
| • | Net charge-offs in the third quarter ending September 30, 2009 totaled $1.1 million, or 0.16% of average loans, down from $2.3 million, or 0.33% of average loans in the second quarter ending June 30, 2009 and $1.9 million, or 0.26% of average loans in the third quarter a year ago. |
| • | Loans measured for impairment decreased to $52.6 million at September 30, 2009, compared to $67.1 million at June 30, 2009 and $87 million in the third quarter a year ago. |
“We continue to move impaired loans through the collections process, and we are confident this proactive approach of our team is working to reduce the costs and risks in this portfolio,” said Joe Beedle, President of Northrim Bank. “Gains from the OREO portfolio continue to support the valuation of our total loan portfolio, and the level of write downs and net charge-offs in the portfolio is moving in the right direction.”
At the end of the third quarter of 2009, nonperforming loans totaled $28.9 million, or 4.28% of total portfolio loans, compared to $20.0 million, or 2.92% of total portfolio loans at June 30, 2009, and $20.7 million, or 2.94% of total portfolio loans a year ago. “The increase in nonperforming loans in the third quarter of this year reflects management’s decision to deal with its problem assets by taking steps to acquire the underlying collateral of loans when borrowers fail to perform,” said Beedle.
Nonperforming assets consist of nonaccrual loans, accruing loans 90 days or more past due, restructured loans, and OREO. Total nonperforming assets were $39.0 million, or 3.95% of total assets at September 30, 2009, compared to $31.6 million, or 3.24% of total assets at June 30, 2009, and $33.0 million, or 3.27% of total assets a year ago. Approximately 63% of the nonperforming assets at September 30, 2009, were for construction and land development projects, 26% were for commercial loans and the remainder was for commercial real estate loans.
The allowance for loan losses was $13.5 million, or 2.00% of total loans at the end of the third quarter of 2009, compared to $13.7 million, or 1.94% of total loans a year ago. Net charge-offs (NCOs) in the third quarter of 2009 were $1.1 million, or 0.16% of average loans, compared to $1.9 million, or 0.26% of average loans in the third quarter of 2008. Year-to-date NCOs totaled $4.3 million or 0.83% of average loans annualized, compared to $3.8 million or 0.71% of average loans annualized in the first nine months of 2008.
Investment securities totaled $154.3 million at the end of the third quarter of 2009, up from $116.3 million a year ago. At September 30, 2009, the portfolio was comprised of 70% U.S. Agency securities, 17% securities of Alaskan municipalities, utilities, or state agencies, 12% corporate bonds, and 1%, or $2 million of stock in the Federal Home Loan Bank of Seattle. “Our investment securities portfolio consists of high-quality, short-term income-producing investments, which support our liquidity requirements,” said Joe Schierhorn, Chief Financial Officer.
Total deposits increased to $837.1 million at September 30, 2009, compared to $819.1 million from the immediate prior quarter and decreased from $854.5 million at September 30, 2008. Noninterest-bearing demand deposits at September 30, 2009, increased 9% and account for 32% of total deposits. Interest bearing demand deposits at September 30, 2009 grew 10% year-over-year reflecting customer preferences for flexibility of demand accounts over both the Alaska CD and money market accounts. The Alaska CD (a flexible certificate of deposit program) and money market balances fell 6% and 24% respectively, from year ago levels. Time deposit balances at September 30, 2009 fell 4% and savings account balances increased 5% compared to a year ago. At the end of the third quarter of 2009, demand deposits accounted for 32% of total deposits, interest-bearing demand accounts were 14%, savings deposits were 7%, money market balances accounted for 15%, the Alaska CD accounted for 13% and time certificates were 19% of total deposits. “With no brokered deposits or ‘hot money’ our deposit base provides a very stable and cost effective funding source,” said Beedle.
Shareholders’ equity increased 6% to $110.0 million, or $17.28 per share, at September 30, 2009, compared to $103.6 million, or $16.40 per share, at September 30, 2008. Tangible book value per share was $15.85 at September 30, 2009, compared to $14.91 a year earlier. Northrim remains well-capitalized with Tier 1 Capital to Risk Adjusted Assets of 13.96% at September 30, 2009.
Review of Operations
Reflecting growth in contributions from affiliates and an increase in net interest income, revenue (net interest income plus other operating income) grew 6% year-over-year to $15.1 million in the third quarter of 2009, compared to $14.3 million in the third quarter a year ago. Year-to-date revenue grew 4% to $45.2 million from $43.2 million in the first nine months of 2008.
Third quarter 2009 net interest income, before the provision for loan losses, grew 6% year-over-year to $11.7 million from $11.1 million in the third quarter of 2008. In the first nine months of 2009, net interest income before provision for loan losses was down slightly to $34.6 million from $34.8 million in the first nine months of 2008.
Northrim’s net interest margin (net interest income as a percentage of average earning assets on a tax equivalent basis) was 5.38% in the third quarter of 2009, compared to 5.10% in the third quarter a year ago. For the first nine months of 2009, Northrim’s net interest margin was 5.36% compared to 5.31% in the like period a year ago. “Our net interest margin continues to be one of the highest in the country, because of our strong core deposit base and solid demand for loans from our business community,” said Beedle. Net recoveries of interest on nonperforming assets contributed 1 basis point to the net interest margin in the third quarter of 2009, compared to net reversals of interest that reduced the net interest margin in the third quarter of 2008 by 7 basis points. Net reversals of interest on nonperforming assets reduced the net interest margin for the nine month period ending September 30, 2009 by 1 basis point, compared to a 7 basis point reduction for the nine month period ending September 30, 2008.
The loan loss provision in the third quarter of 2009 totaled $1.4 million, compared to $2.0 million in the third quarter a year ago. Year-to-date, the provision for loan losses totaled $4.9 million compared to $5.7 million in the first nine months of 2008.
Total other operating income increased 5% for the third quarter of 2009 and 25% year-to-date compared to the same periods a year ago due to contributions from affiliated financial services offerings, particularly from earnings of Northrim’s mortgage and employee benefits affiliates. “We have consciously built a suite of complementary financial services to better serve our customers and attract new business to the bank,” said Langland. “We offer employee benefit insurance products, factoring, mortgage loans and wealth management through a division of the bank and several affiliated businesses in which we have an ownership position. We believe this business model is scalable and contributes nicely to the profitability of our core operations.”
Other operating income grew to $3.4 million in the third quarter of 2009 compared to $3.2 million in the third quarter a year ago. Year-to-date, other operating income grew to $10.6 million from $8.5 million for the first nine months of 2008. Deposit account service charge income was down 6% at $791,000 in the third quarter of 2009 compared to $841,000 for the third quarter a year ago due to fewer overdraft transactions. For the first nine months of the year, service charges on deposit accounts were down 12% to $2.3 million from $2.6 million in the first nine months of 2008.
Purchased receivable income fell 33% to $474,000 in the third quarter of 2009 from $712,000 in the third quarter a year ago. These balances decreased primarily because two purchased receivable customers restructured their businesses which allowed them to pay off their purchased receivable balances at the end of the first quarter and during the third quarter of 2009. Employee benefit plan income grew to $469,000 for the third quarter of 2009 compared to $398,000 for the third quarter of 2008 due to the additional customers utilizing this product line.
Income from Northrim’s mortgage affiliate was $385,000 during the third quarter ending September 30, 2009, a decline from income of $764,000 in the second quarter of this year and up from $210,000 in the third quarter a year ago. While income from Northrim’s mortgage affiliate increased on a year-over-year basis due to continuing refinance demand, this income was down in the third quarter of 2009 as compared to the second quarter due to lower refinance volume on a linked quarter basis.
Operating expenses in the third quarter of 2009 increased 3% on a linked quarter basis and 10% year-over-year. Reflecting the one-time $718,000 prepayment penalty on FHLB advances, third quarter 2009 overhead expenses increased to $10.9 million compared to $10.5 million in the second quarter and $9.9 million in the third quarter a year ago. Year–to-date, noninterest expenses increased 7% to $31.9 million from $29.8 million in the first nine months of 2008.
The efficiency ratio during the third quarter of 2009 was 71.41%, compared to 68.22% in the preceding quarter and 68.58% in the third quarter a year ago. The efficiency ratio, calculated by dividing noninterest expense, excluding intangible asset amortization expense, by net interest income and noninterest income, measures overhead costs as a percentage of total revenues.
About Northrim BanCorp
Northrim BanCorp, Inc. is the parent company of Northrim Bank, a commercial bank that provides personal and business banking services through locations in Anchorage, Eagle River, Wasilla, and Fairbanks, Alaska, and an asset based lending division in Washington. The bank differentiates itself with a “Customer First Service” philosophy. Affiliated companies include Elliott Cove Capital Management, LLC; Residential Mortgage, LLC; Northrim Benefits Group, LLC; and Pacific Wealth Advisors, LLC. In June 2009, Northrim Bancorp was added to the Russell 2000 Index, a subset of the Russell 3000 Index. Both indices are widely used by professional money managers as benchmarks for investment strategies.
www.northrim.com
Sources include thehttp://www.iser.uaa.alaska.edu/presentations/LookingAheadAKEconomy.pdf and the State of Alaska Department of Labor.
This release may contain “forward-looking statements” that are subject to risks and uncertainties. Readers should not place undue reliance on forward-looking statements, which reflect management’s views only as of the date hereof. All statements, other than statements of historical fact, regarding our financial position, business strategy and management’s plans and objectives for future operations are forward-looking statements. When used in this report, the words “anticipate,” “believe,” “estimate,” “expect,” and “intend” and words or phrases of similar meaning, as they relate to Northrim or management, are intended to help identify forward-looking statements within the meaning of the Private Securities Litigation Reform Act of 1995. Although we believe that management’s expectations as reflected in forward-looking statements are reasonable, we cannot assure readers that those expectations will prove to be correct. Forward-looking statements are subject to various risks and uncertainties that may cause our actual results to differ materially and adversely from our expectations as indicated in the forward-looking statements. These risks and uncertainties include our ability to maintain or expand our market share or net interest margins, and to implement our marketing and growth strategies. Further, actual results may be affected by our ability to compete on price and other factors with other financial institutions; customer acceptance of new products and services; the regulatory environment in which we operate; and general trends in the local, regional and national banking industry and economy as those factors relate to our cost of funds and return on assets. In addition, there are risks inherent in the banking industry relating to collectibility of loans and changes in interest rates. Many of these risks, as well as other risks that may have a material adverse impact on our operations and business, are identified in our other filings with the SEC. However, you should be aware that these factors are not an exhaustive list, and you should not assume these are the only factors that may cause our actual results to differ from our expectations.