October 29, 2012
Ms. Suzanne Hayes
Assistant Director
Division of Corporation Finance
U.S. Securities and Exchange Commission
100 F Street, N.E.
Washington, D.C. 20549
U.S.A.
Re: | Nomura Holdings, Inc. | |||
| Form 20-F for Fiscal Year Ended March 31, 2012 | ||||
| Filed June 27, 2012 and Amended June 28, 2012 | ||||
File No. 001-15270 |
Dear Ms. Hayes:
We refer to the comment letter from the staff (the “Staff”) of the Securities and Exchange Commission (the “SEC”), dated September 28, 2012 (the “Letter”) with respect to the annual report on Form 20-F of Nomura Holdings, Inc. (“Nomura”) for the year ended March 31, 2012 filed with the SEC on June 27, 2012. Our responses to the Staff’s comments in the Letter are set forth below. For your convenience, we have included the text of the Staff’s comments below and have keyed our responses accordingly.
Form 20-F for Fiscal Year Ended March 31, 2012
General
| 1. | We note that your Form 20-F and website discuss business operations in the Middle East and that one of your subsidiaries is Nomura Investment Banking (Middle East). Iran, Syria and Sudan, countries generally understood to be included in references to the Middle East, are identified by the U.S. Department of State as state sponsors of terrorism and are subject to U.S. economic sanctions and export controls. Please describe to us the nature and extent of your past, current, and anticipated contacts with Iran, Syria and Sudan, whether through subsidiaries, affiliates, or other direct or indirect arrangements. In this regard, we note 2012 news articles reporting that you partnered with Man Group to establish the Nomura Man Systemic Fixed Income Fund, and that Man Truck and Bus Middle East, a unit of the Man Group, operates a network of dealers and importers in countries including Iran and Syria. Your response should describe any services, transactions or products you have provided into Iran, Syria or Sudan, and any agreements, commercial arrangements, or other contacts you have had with the governments of those countries or entities controlled by those governments. |
1
Response:
Our business operations in Europe, the Middle East and Africa include the operations conducted by our subsidiary in Bahrain, Nomura Investment Banking (Middle East) B.S.C. (c) and certain other subsidiaries and branches. We do not have any subsidiaries or branches located in countries that are identified by the U.S. Department of State as state sponsors of terrorism, including Iran, Syria and Sudan.
Further, in August 2009, we codified our internal policy to refrain from engaging in any business with governments of or clients residing in countries designated by certain authorities including the U.S. Department of State as state sponsors of terrorism and to comply with all laws, rules and regulations designed to combat money laundering and the financing of terrorism. Under such policy, we have put in place a process to screen all incoming and outgoing wire payments to ensure that funds are not released to or received from individuals, entities or jurisdictions which are subject to financial sanctions by certain authorities, including the Office of Foreign Assets Control of the U.S. Department of Treasury, Her Majesty’s Treasury of the United Kingdom, European Union, and United Nations Security Council. In addition, when establishing new relationships with clients, we conduct a review process to ensure that any new client, including its branches and subsidiaries, are not subject to such sanctions. Our review process also includes identifying and screening the shareholders, beneficial owners and directors of new clients for entities subject to the relevant sanctions. We conduct continuing reviews on a regular basis thereafter for our existing accounts.
We currently do not have, and do not anticipate in entering into, any arrangements with governments of or clients residing in countries designated as state sponsors of terrorism. We are aware that the governments of, or entities controlled by the governments of, Iran, Syria or Sudan holds a small percentage of the outstanding shares of certain supra-national entities such as regional development banks who are our current or potential counterparties in certain business activities we conduct outside such countries. These supra-national entities are not currently included in the international sanctions lists, including the list of Specifically Designated Nationals maintained by the U.S. Office of Foreign Assets Control. Prior to establishing relationship with such entities, we obtain external legal advice from leading international law firms to ensure that such transactions would not be considered equivalent to engaging in dealings with the underlying shareholders. We have also established an escalation process, pursuant to which an internal transactional committee reviews and approves such transactions prior to entering into the transactions. Our transactions with these entities are in ordinary course of business and we believe such transactions do not promote money laundering or financing of terrorism.
With respect to our past operations, we are aware that an account for the Central Bank of Iran was opened with our subsidiary, Nomura International plc, in 1999, but no trades have been executed for the account, and we subsequently closed the account and ceased all dealings with the Central Bank of Iran from March 2010.
As indicated in your letter, we have established Nomura Man Systemic Fixed Income Fund partnering with Man Group plc, which is one of the world’s largest alternative investment managers based in the United Kingdom. We respectfully advise the Staff that Man Truck and Bus Middle East, the company referenced in your letter that operates a network of dealers and importers in countries including Iran and Syria, is not a unit of Man Group plc and belongs to a separate corporate group that is unaffiliated with Man Group plc.
2
Other than as described above, we have no current and anticipated contacts with Iran, Syria and Sudan, whether through subsidiaries, affiliates or other direct or indirect arrangements. In addition, other than as described above, we do not provide any services, transactions or products into Iran, Syria or Sudan and do not have any agreements, commercial arrangements, or other contacts with the governments of those countries or entities controlled by those governments.
| 2. | Please discuss the materiality of your contacts with Iran, Syria and Sudan described in response to the foregoing comment and whether those contacts constitute a material investment risk for your security holders. You should address materiality in quantitative terms, including the approximate dollar amounts of any associated revenues, assets, and liabilities for the last three fiscal years and the subsequent interim period. Also, address materiality in terms of qualitative factors that a reasonable investor would deem important in making an investment decision, including the potential impact of corporate activities upon a company’s reputation and share value. Various state and municipal governments, universities, and other investors have proposed or adopted divestment or similar initiatives regarding investment in companies that do business with U.S. – designated state sponsors of terrorism. Your materiality analysis should address the potential impact of the investor sentiment evidenced by such actions directed toward companies that have operations associated with Iran, Syria and Sudan. |
Response:
Other than as stated in our response to comment 1, we have not provided any services or products to, or entered into any financial or commercial arrangements with, counterparties in Iran, Syria or Sudan or the governments of those countries in the last three fiscal years and in the subsequent interim period. As we do not have or anticipate having operations associated with these countries, we do not believe that our contacts with these countries currently represent a material investment risk or would have a material impact on investor sentiment.
Item 3. Key Information, page 2
D. Risk Factors, page 5
| 3. | Please revise your risk factor disclosure in future filings to clarify how, or the extent to which, the risk presented has adversely impacted your business and operations. In revising your disclosure, please ensure that you address the following: |
| • | On page 5, under “Our investment banking revenues may decline,” please quantify the extent to which your investment banking revenues have declined. |
3
Response:
Beginning with our annual report on Form 20-F for the fiscal year ending March 31, 2013, we will revise the relevant risk factor by including quantitative disclosure of the results of investment banking substantially in the following form, as revised to appropriately reflect the facts and circumstances at the time of filing:
Our investment banking revenues may decline
Changes in financial or economic conditions would likely affect the number and size of transactions for which we provide securities underwriting, financial advisory and other investment banking services. Our investment banking revenues, which include fees from these services, are directly related to the number and size of the transactions in which we participate and would therefore decrease if there are financial and market changes unfavorable to our investment banking business and our clients.For example, due in part to the slowdown in financing activities resulting primarily from the worsened and prolonged impact of the European sovereign debt crisis in 2011, our Investment Banking net revenue for the year ended March 31, 2012 decreased by 15% from the previous year.
| • | On page 6, under “We may incur significant losses from our trading and investment activities,” please quantify the additional collateral requirements that would be triggered by a one and two notch downgrade in your credit ratings. |
Response:
Beginning with our annual report on Form 20-F for the fiscal year ending March 31, 2013, we will revise our risk factor by inserting quantitative disclosure of the additional collateral requirements that would be triggered by a one-notch and two-notch downgrade in our credit ratings, absent other changes, substantially in the form as follows:
Assuming a one-notch and two-notch downgrade of our long-term credit ratings occurred on March 31, 2013, absent other changes, we estimate that the aggregate fair value of assets that would have been required to be posted as additional collateral in connection with our derivative contracts would have been approximately ¥ [X] billion and ¥ [X] billion, respectively.
| • | On page 6, under “Holding large and concentrated positions of securities and other assets…,” please quantify the “substantial amounts of capital” that you have committed and indicate whether your holdings are concentrated in particular industries, countries, or regions. |
Response:
Beginning with our annual report on Form 20-F for the fiscal year ending March 31, 2013, we will revise our risk factor by enhancing the discussion of where our risk may be concentrated, substantially in the form as follows. We cannot reasonably quantify the substantial amount of capital we have committed in our businesses of market-making, block trading, underwriting, asset securitization and acquiring newly-issued convertible bonds through third-party allotment. However, we impose limits to outstanding amounts and control our positions in these businesses to mitigate excessive concentration of risks.
4
Holding large and concentrated positions of securities and other assets may expose us to large losses
Holding a large amount of securities concentrated in specific assets can increase our risks and expose us to large losses in our businesses such as market-making, block trading, underwriting, asset securitization and acquiring newly-issued convertible bonds through third-party allotment. These businesses often require us to take large positions in the securities of a particular issuer or issuers in a particular industry, country or region.We generally have higher exposure to those issuers engaged in financial services businesses, including commercial banks, broker-dealers, clearing houses, exchanges and investment companies. There may also be cases where we hold relatively large amounts of securities by issuers in particular countries or regions due to the business we conduct with our clients or our counterparties.In addition, we may incur substantial losses due to market fluctuations on asset-backed securities such as residential and commercial mortgage-backed securities.
| • | On page 8, under “Lowering of our credit ratings could increase our borrowing costs,” please disclose the March 2012 downgrade of your long-term debt ratings by Moody’s Investors Service and clarify the extent to which credit ratings downgrades have adversely impacted your profitability, borrowing costs, or ability to access the capital markets. |
Response:
Beginning with our annual report on Form 20-F for the fiscal year ending March 31, 2013, we will revise the relevant risk factor by including disclosure regarding the downgrade of our long-term debt ratings substantially in the following form as follows:
Our borrowing costs and our access to the debt capital markets depend significantly on our credit ratings. Rating agencies may reduce or withdraw their ratings or place us on “credit watch” with negative implications.For example, on March 15, 2012, Moody’s Investors Service downgraded our senior debt rating from Baa2 to Baa3. Although the impact of this downgrade has been limited, future downgrades could increase our borrowing costs and limit our access to the capital markets. This, in turn, could reduce our earnings and adversely affect our liquidity.Further, other factors which are not specific to us may increase our funding costs, such as negative market perception of Japan’s fiscal soundness.
5
| • | On page 13, under “Misconduct or fraud by an employee, director or officer…,” please revise to address the recent business improvement order issued by the Financial Services Agency against Nomura Securities Co., Ltd. |
Response:
We will revise the relevant risk factor, beginning with our annual report on Form 20-F for the fiscal year ending March 31, 2013, to address the business improvement order issued by the Financial Services Agency of Japan against Nomura Securities Co., Ltd. substantially in the following manner:
Misconduct or fraud by an employee, director or officer, or any third party, could occur, and our reputation in the market and our relationships with clients could be harmed
We face the risk that misconduct by an employee, director or officer, or any third party, could occur which may adversely affect our business. Misconduct by an employee, director or officer can include, for example, entering into transactions in excess of authorized limits, acceptance of risks that exceed our limits, or concealment of unauthorized or unsuccessful activities. The misconduct could also involve, for example, the improper use or disclosure of our or our clients’ confidential information, such as insider trading, which could result in regulatory sanctions, legal liability and serious reputational or financial damage to us.
In July 2012, Japan’s Securities and Exchange Surveillance Commission (“SESC”) issued a recommendation to the Prime Minister of Japan and the Commissioner of the Financial Services Agency of Japan (“FSA”) to bring administrative action against Nomura Securities Co., Ltd. (“NSC”), based on the finding that NSC had failed to take necessary and appropriate measures in its business operations to prevent illegal trading with regard to the management of non-public, corporate-related information in connection with public offerings of new shares. In accordance with the SESC’s recommendation, in August 2012, the FSA issued a business improvement order to NSC. In response to the order, NSC has implemented a series of measures designed to address the issues identified and is working across its entire operations to prevent similar incidents from occurring in the future.
Although we have precautions in place to detect and prevent misconductand have recently taken steps to enhance such precautions, the measures we implement may not be effective in all cases, and we may not always be able to detect or deter misconduct by an employee, director or officer. If any administrative or judicial sanction is issued against us as a result of such misconduct, we may lose business opportunities for a period of time, even after the sanction is lifted, if and to the extent that our clients, especially public institutions, decide not to engage us for their financial transactions.
6
We are a holding company and depend on payments from our subsidiaries, page 14
| 4. | Please expand your risk factor to disclose the nature and extent of the legal or economic restrictions on your broker-dealer and other subsidiaries’ ability to transfer funds to you. |
Response:
Beginning with our annual report on Form 20-F for the fiscal year ending March 31, 2013, we propose to further expand the relevant disclosure by specifying that the applicable restrictions include those under the Companies Act of Japan and in addition that certain subsidiaries, including our broker-dealer subsidiaries, are subject to regulatory capital requirements that may restrict their ability to transfer funds to us.
We are a holding company and depend on payments from our subsidiaries
We depend on dividends, distributions and other payments from our subsidiaries to fund dividend payments and to fund all payments on our obligations, including debt obligations. Regulatory and other legal restrictions, such as those under the Companies Act of Japan, may limit our ability to transfer funds freely, either to or from our subsidiaries. In particular, many of our subsidiaries, including our broker-dealer subsidiaries, are subject to laws and regulations, including regulatory capital requirements, that authorize regulatory bodies to block or reduce the flow of funds to the parent holding company, or that prohibit such transfers altogether in certain circumstances.For example, Nomura Securities Co., Ltd., Nomura Securities International, Inc., Nomura International plc and Nomura International (Hong Kong) Limited, our main broker-dealer subsidiaries, are subject to regulatory capital requirements that could limit the transfer of funds to us. These laws and regulations may hinder our ability to access funds that we may need to make payments on our obligations.
Results of Operations, page 33
Overview, page 33
| 5. | You disclose that the Other non-interest revenues of ¥563,186 million for the year ended March 31, 2012 was primarily due to the conversion of Nomura Land and Building Co., Ltd (NLB) into a subsidiary of Nomura Holdings, Inc. To enhance the transparency of your disclosure and to give the reader an idea of the continuity of such revenue streams, please expand your disclosure in future filings to clearly quantify the amount related to the conversion transaction itself and how such amount was derived. Quantify the amount of operating revenues generated by NLB that are included here, and discuss the extent to which you expect these revenue streams to be recurring. Provide similar disclosure addressing their related expenses as well. |
Response:
In respect of the total amount of ¥563,186 million reported inNon-interest revenue – Other for the year ended March 31, 2012, ¥510,556 million relates to revenues recognized in connection with the acquisition of NLB during the year. This amount includes ¥24,299 million recognized in connection with the acquisition transaction and ¥486,257 million of operating revenues of NLB consolidated into Nomura’s results post-acquisition. Similarly, of the total amount of ¥1,450,902 million reported inNon-interest expensesfor the year ended March 31, 2012, ¥467,816 million was recognized as operating expenses of NLB consolidated into Nomura’s results post-acquisition.
7
We will enhance our disclosure in future filings, beginning with our annual report on Form 20-F for the fiscal year ending March 31, 2013, underResults of Operations – Overview, to more clearly disclose the revenue and expense amounts arising from the acquisition of NLB. Using the year ended March 31, 2012 as an example, our disclosure will be revised as follows:
Net revenue increased by 36% from ¥1,130,698 million for the year ended March 31, 2011 to ¥1,535,859 million for the year ended March 31, 2012. Commissions decreased by 14%, due primarily to a decrease in commissions for the distribution of investment trusts, reflecting the turmoil in the global financial markets which was mainly caused by the European sovereign debt crisis. Fees from investment banking decreased by 44%, due primarily to a decrease in transaction volume in equity finance for Japanese companies. Net gain on trading was ¥272,557 million for the year ended March 31, 2012, due primarily to downturn in financial markets mainly caused by the European sovereign debt crisis. Gain on private equity investments was ¥25,098 million for the year ended March 31, 2012 due primarily to realized gains on equity securities of certain investee companies. Other was ¥563,186 million for the year ended March 31, 2012,including ¥510,556 million relating to the conversion of Nomura Land and Building Co., Ltd into a subsidiary of Nomura Holdings, Inc.Of this amount, ¥24,299 million was recognized at the time of the acquisition and is therefore expected to be non-recurring in nature and the remaining ¥486,257 million relates to operating revenues of NLB which were consolidated into Nomura’s group revenue from acquisition date.
Non-interest expenses increased by 40% from ¥1,037,443 million for the year ended March 31, 2011 to ¥1,450,902 million for the year ended March 31, 2012. The increase in non-interest expenses was caused by an increase in other expenses by 296% from ¥125,448 million for the year ended March 31, 2011 to ¥496,227 million for the year ended March 31, 2012, including¥382,044 million relating to the conversion of Nomura Land and Building Co., Ltd. into a subsidiary of Nomura Holdings, Inc.This amount relates to operating expenses of NLB which were consolidated into Nomura’s group expenses from acquisition date.
| 6. | Your disclosure on page 42 notes that the combined gains on financial liabilities and derivatives due to changes in your own creditworthiness amounted to ¥27.1 billion, which is slightly more than your net income for 2012. In light of the significance of the gains recognized due to changes in your own creditworthiness in relation to your net income, please revise your Overview to quantify the impact of these gains. |
8
Response:
We will enhance our disclosures in future filings, beginning with our annual report on Form 20-F for the fiscal year ending March 31, 2013, underResults of Operations – Overview, to quantify the total amount of gains or losses recognized due to changes in our own creditworthiness where these gains or losses are significant as follows:
Net gain on trading also includes total [gains] of ¥ [X] million attributable to changes in Nomura’s own creditworthiness with respect to derivative liabilities and financial liabilities for which the fair value option has been elected. This net [gain] was due primarily to the [widening] of Nomura’s credit spreads during the period.
Results by Business Segment, page 35
Wholesale, page 39
Operating Results of Wholesale, page 39
| 7. | We note that net revenue decreased by 12% from ¥630,536 million for the year ended March 31, 2011 to ¥555,882 million for the year ended March 31, 2012. We also note that it decreased by 20% from ¥789,531 million for the year ended March 31, 2010 to ¥630,536 million for the year ended March 31, 2011. You primarily attribute the decline in net revenues to the volatile economical and financial market conditions in Europe. In future filings, please more specifically identify how the economic environment in Europe affected the net revenues of your wholesale business segment. |
Response:
We will enhance our disclosures in future filings, beginning with our annual report on Form 20-F for the fiscal year ending March 31, 2013, underResults by Business Segment – Wholesale – Operating Results of Wholesale, to more specifically identify how the economic environment in Europe has affected the net revenues of our Wholesale business segment. Using the year ending March 31, 2012 as an example, our disclosure will be revised as follows:
The operating results of Wholesale comprise the combined results of our Fixed Income, Equities and Investment Banking businesses.
Net revenue decreased by 12% from ¥630,536 million for the year ended March 31, 2011 to ¥555,882 million for the year ended March 31, 2012, due primarily to the volatile economical and financial market conditions in Europe.Specifically, these conditions contributed to low client activity, which among other factors caused a decrease in revenues in Equities, and lower equity capital markets and M&A activity, which negatively impacted revenues in Investment Banking.
Assets and Liabilities Associated with Investment and Financial Services Business, page 46
Securitization Products, page 46
9
| 8. | We note that your tabular presentation disclosed at the beginning of page 47 excludes securitization products for which you transferred financial assets to securitization vehicles where such transfers were accounted for as secured financings rather than sales under ASC 860, and in which you have no continuing economic exposures. In future filings, please disclose the amount of such products, and explain why you no longer have an economic exposure relating to these financial assets. |
Response:
We have no continuing economic exposure after the transfer of such financial assets where the beneficial interests of the securitization vehicles have been sold to third parties. We will enhance our disclosure in future filings, beginning with our annual report on Form 20-F for the fiscal year ending March 31, 2013, in footnote 1 of the table, to specifically disclose the amount of such products and explain why we no longer have an economic exposure relating to the transferred financial assets as follows:
| (1) | The balances shown excludecertain CMBS of ¥ [X] million which we transferred to securitization vehicles where such transfers were accounted for as secured financings rather than sales under ASC 860, “Transfers and Servicing” (“ASC 860”), and in which we have no continuing economic exposurebecause the beneficial interests in the vehicles have been sold to third parties. |
| 9. | In addition, you state in footnote 3 of the tabular presentation on page 47 that the RMBS balance for Americas excludes mortgage pass-through securities and U.S. government guaranteed collateralized mortgage obligations (“CMOs”) because their credit risks are considered minimal. In future filings, please disclose the amount of such securities. |
Response:
We will enhance our disclosure in future filings, beginning with our annual report on Form 20-F for the fiscal year ending March 31, 2013, in footnote 3 of the table, to specifically disclose the amount of such securities as follows:
| (3) | The RMBS balance for Americas excludes U.S. Government guaranteed and U.S. Agency mortgage pass-through securities and collateralized mortgage obligations (CMO)of ¥ [X] million because their credit risks are considered minimal. |
B – Liquidity and Capital Resources, page 51
Funding and Liquidity Management, page 51
4 – Implementation of Liquidity Stress Tests, page 55
| 10. | We note you perform stress tests to verify that sufficient funding capacity is accessible under multiple stress scenarios. Please expand your disclosure in future filings to discuss the time horizon that the stress scenarios measure. Additionally, expand this disclosure to discuss whether the results of these tests indicated that you had sufficient liquidity under each of the stress scenarios performed. |
10
Response:
We will enhance our disclosure in future filings, beginning with our annual report on Form 20-F for the fiscal year ending March 31, 2013, as follows:
We assess liquidity requirements of the Nomura group under various stress scenarios with differing levels of severity over multiple time horizons. We evaluate these requirements under Nomura-specific and broad market-wide events, including potential credit rating downgrades at our parent company and subsidiary levels that may impact us by loss of access to unsecured capital markets, additional collateral posting requirements, limited or no access to secured funding markets and other events. We call this risk analysis our “Maximum Cumulative Outflow” (“MCO”) framework.
The MCO framework is designed to incorporate the primary liquidity risks for Nomura and models the relevant cash flows in the following two primary scenarios:
| • | Stressed scenario –To maintain adequate liquidity during a severe market-wide liquidity event without raising additional funds through unsecured financing or the liquidation of assets for a year; and |
| • | Acute stress scenario – To maintain adequate liquidity during a severe market-wide liquidity event coupled with credit concerns regarding Nomura’s liquidity position, without raising additional funds through unsecured funding or the liquidation of assets for one month. |
We assume that Nomura will not be able to liquidate assets or adjust its business model during the time horizons used in each of these scenarios. The MCO framework therefore defines the amount of liquidity required to be held in order to meet our expected liquidity needs in a stress event to a level we believe appropriate based on our liquidity risk appetite.
As of March 31, 2012, our liquidity portfolio exceeded the net cash outflows under the stress scenarios described above.
| 11. | We note your disclosure of the value of your liquid assets as of March 31, 2012 and 2011. Given the importance of liquidity to your operations, and the potential volatility of liquid assets on a daily basis, in addition to disclosing the amount of liquid assets as of the balance sheet dates, please also disclose the weighted average amounts of liquid assets during the period. Additionally, please consider disaggregating and quantifying the components included in liquid assets, at both period-end and on an average basis during the period. |
11
Response:
We will enhance our disclosure in future filings, beginning with our annual report on Form 20-F for the fiscal year ending March 31, 2013, to disclose the average amount of liquid assets by component as follows:
The following table presents a breakdown of our liquidity portfolio by type of financial asset as of March 31, 2012 and 2013 and average balances maintained during the period. Average balances are calculated using monthly amounts.
| Billions of yen | ||||||||||||||||
| Average for year ended March 31, 2012 | As of March 31, 2012 | Average for year ended March 31, 2013 | As of March 31, 2013 | |||||||||||||
Cash, Cash Equivalent and Time Deposits | X | 1,137.3 | ¥ | X | ¥ | X | ||||||||||
Government Securities | X | 3,877.4 | X | X | ||||||||||||
Others(1) | X | 413.0 | X | X | ||||||||||||
|
|
|
|
|
|
|
| |||||||||
Total Liquidity Portfolio | ¥ | X | ¥ | 5,427.7 | ¥ | X | ¥ | X | ||||||||
|
|
|
|
|
|
|
| |||||||||
| (1) | Others include other highly liquid financial assets such as money market funds and U.S. agency securities. |
The following table presents a breakdown of our liquidity portfolio by currency as of March 31, 2012 and 2013 and the average balances maintained during the year. Average balances are calculated using monthly amounts.
| Billions of yen | ||||||||||||||||
| Average for year ended March 31, 2012 | As of March 31, 2012 | Average for year ended March 31, 2013 | As of March 31, 2013 | |||||||||||||
Japanese Yen | X | X | ¥ | X | ¥ | X | ||||||||||
US Dollar | X | X | X | X | ||||||||||||
Euro | X | X | X | X | ||||||||||||
Others | X | X | X | X | ||||||||||||
|
|
|
|
|
|
|
| |||||||||
Total Liquidity Portfolio | ¥ | X | ¥ | X | ¥ | X | ¥ | X | ||||||||
|
|
|
|
|
|
|
| |||||||||
12
| 12. | In your future filings, please revise to more clearly discuss whether you maintain the liquidity portfolio at the parent company level or at a lower level, such as individual subsidiary, country, or business unit level. Consider providing further granular data about these different liquidity portfolios. Briefly discuss how you manage the portfolio amounts between these levels, and any regulatory requirements for which you may have to maintain minimum amounts at various levels. |
Response:
We will enhance our disclosure in future filings, beginning with our annual report on Form 20-F for the fiscal year ending March 31, 2013, to provide more clarity as to levels at which we maintain our liquidity portfolios as shown below. Disclosure regarding regulatory requirements including regulatory capital requirements that may impact our ability to freely transfer liquidity across different entities in the Nomura Group is included in Note 20 “Regulatory requirements” to our consolidated financial statements. For users’ convenience, we will also add a reference to this note in future filings.
We assess our liquidity portfolio requirements globally as well as by each major operating entity in the group. We primarily maintain our liquidity portfolio at Nomura Holdings, Inc. (“NHI”), Nomura Securities Co. Ltd (“NSC”), our other major broker-dealer subsidiaries and our bank subsidiaries. In determining the amounts and entities which hold this portfolio, we consider legal, regulatory and tax restrictions which may impact our ability to freely transfer liquidity across different entities in the Nomura Group. For more information regarding regulatory restrictions, see Note XX“Regulatory requirements” to our consolidated financial statements.
The following table presents a breakdown of our liquidity portfolio by entity as of March 31, 2012 and 2013:
| Billions of yen | ||||||||
| March 31 | ||||||||
| 2012 | 2013 | |||||||
NHI and NSC(1) | ¥ | 1,535.6 | ¥ | X | ||||
Major broker dealer subsidiaries | 2,724.7 | X | ||||||
Bank subsidiaries | 921.8 | X | ||||||
Other group entities | 245.6 | X | ||||||
|
|
|
| |||||
Total | ¥ | 5,427.7 | ¥ | X | ||||
|
|
|
| |||||
| (1) | NSC, a broker dealer located in Japan, holds an account with the Bank of Japan and has a direct access to the Bank of Japan Lombard facility through which same day funding is available for our securities pool. Liquidity surplus at NHI is lent to NSC via short-term intercompany loans, which can be unwound immediately when needed. |
Balance Sheet and Financial Leverage, page 57
| 13. | It appears that your presentation of adjusted assets and adjusted leverage ratio meets the definition of a non-GAAP measure. Please revise your future filings to address the disclosure requirements within Item 10(e) of Regulation S-K, including reconciliation to the actual GAAP measure. Refer to General Instruction C(e) of Form 20-F. |
13
Response:
We respectfully believe our current disclosure complies with the disclosure requirements for non-GAAP measures provided by Item 10(e) of Regulation S-K. However, we will enhance our disclosure in future filings, beginning with our annual report on Form 20-F for the fiscal year ending March 31, 2013, to state that our Adjusted leverage ratio is a non-GAAP measure and to more clearly show a quantitative reconciliation between “Adjusted assets” and “Total assets” as follows:
As leverage ratios are commonly used by other financial institutions similar to us, we voluntarily provide a Leverage ratio and Adjusted leverage ratio primarily for benchmarking purposes so that users of our annual report can compare our leverage against other financial institutions.Adjusted leverage ratio is a non-GAAP financial measure that Nomura considers to be a useful supplemental measure of leverage.There are currently no regulatory or statutory reporting requirements which require us to disclose leverage ratios.
The following table sets forth NHI shareholders’ equity, total assets, adjusted assets and leverage ratios:
| Billions of yen, except ratios | ||||||||
| March 31 | ||||||||
| 2012 | 2013 | |||||||
NHI shareholders’ equity | ¥ | 2,107.2 | ¥ | X | ||||
Total assets(1) | 35,697.3 | X | ||||||
Adjusted assets(2) | 21,954.7 | X | ||||||
Leverage ratio(3) | 16.9x | X | ||||||
Adjusted leverage ratio(4) | 10.4x | X | ||||||
| (1) | Reconciles to the total assets amount disclosed on the face of our consolidated balance sheets and therefore excludes the fair value of securities transferred to counterparties under repo-to-maturity and certain Japanese securities lending transactions which are accounted for as sales rather than collateralized financing arrangements. The fair value of securities derecognized under these agreements has not had a significant impact on our reported Leverage and Adjusted leverage ratios as of March 2012 and 2013. |
| (2) | Represents total assets lessSecurities purchased under agreements to resell andSecurities borrowed.Adjusted assets is a non-GAAP financial measure and is calculated as follows: |
14
| Billions of yen, except ratios | ||||||||
| March 31 | ||||||||
| 2012 | 2013 | |||||||
Total assets | ¥ | 35,697.3 | ¥ | X | ||||
Less: | ||||||||
Securities purchased under agreements to resell | 7,662.7 | X | ||||||
Securities borrowed | 6,079.9 | X | ||||||
|
|
|
| |||||
Adjusted assets | 21,954.7 | X | ||||||
|
|
|
| |||||
| (3) | Equals total assets divided by NHI shareholders’ equity. |
| (4) | Equals adjusted assets divided by NHI shareholders’ equity. |
Item 11. Quantitative and Qualitative Disclosures about Market Risk, page 103
Risk Management Organizations, page 105
| 14. | We note your disclosure regarding various committees to whom the board of directors has delegated the responsibility of risk management oversight on its behalf. Please expand your disclosure to explain in greater detail the committees’ roles and how risk related information is communicated to senior level executives and to the board. In expanding your disclosure, please address the following. |
| • | Please clarify what matters the Executive Management Board delegates to the Group Integrated Risk Management Committee (GIRMC). |
| • | We note that you indicate on page 105 that the “core bodies tasked with risk management” are involved with the management of market risk, credit risk, operational risk and “other.” Please explain what you mean by “other” and clarify whether all risk categories presented on page 106 correspond with a core risk management entity (e.g., what group has primary responsibility for managing country risk, system risk and business risk). |
| • | Please clarify the relationship between the GIRMC and the Global Risk Management Committee and describe how different credit risk management issues are delegated between these two entities. |
| • | Please disclose how frequently, and under what circumstances, the Risk Management Departments report to Executive/Senior Managing Directors and to the GIRMC. Please also disclose under what circumstances risk management issues are reported to the Board of Directors. |
15
Response:
We will enhance our disclosure in future filings, beginning with our annual report on Form 20-F for the fiscal year ending March 31, 2013, to specifically provide the information requested by the Staff as follows:
Risk Management Organizations
The organizational structure and core bodies tasked with risk management in the Nomura Group are shown in the following chart.
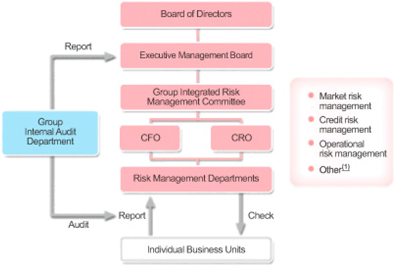
| (1) | Other includes other risks such as Country Risk, System Risk, Liquidity Risk and Business Risk. Prudent risk controls involve identifying, evaluating and appropriately managing risks at each of our business units, risk management departments and internal audit departments within the Nomura Group. Any issues that could potentially cause a significant impact on the management of the Nomura Group will be reported to senior management and the GIRMC by the relevant risk management units in charge of monitoring the relevant risk. |
Executive Management Board
The EMB deliberates on and determines management strategy, allocation of management resources and important management matters of Nomura Group by promoting the effective use of management resources and execution of business with the unified intent of contributing to the increase of shareholder value.Key responsibilities of the EMB are as follows:
| • | Resource Allocation– At the beginning of each financial year, the EMB determines the allocation of management resources and financial resources such as economic capital and unsecured funding to the business units and establishes usage limits which are monitored on a daily basis; |
| • | Business Plan– At the beginning of each financial year, the EMB approves the business plan and budget of the Nomura Group. Introduction of significant new businesses, changes to business plans, the budget and the allocation of management resources during the year are also discussed by the EMB; and |
16
| • | Reporting – The EMB reports to the Board of Directors on the status of discussions at the EMB on a quarterly basis. |
Group Integrated Risk Management Committee
Upon delegation by the EMB, the GIRMC deliberates on and determines important matters concerning integrated risk management of the Nomura Group to ensure the sound and effective management of our business.The key responsibilities of the GIRMC are as follows:
| • | Risk Appetite– The GIRMC establishes the risk appetite of the Nomura Group and provides a framework for integrated risk management in accordance with this risk appetite. |
| • | Oversight– The GIRMC supervises risk management in the Nomura Group by establishing and operating group-wide risk control processes. These processes consist of identification of specific risks, evaluation and monitoring of these risks and implementation of appropriate risk management measures and reporting; and |
| • | Reporting – The GIRMC reports the status of key risk management issues to the Board of Directors and the EMB on a quarterly basis. |
Chief Risk Officer
The Chief Risk Officer (“CRO”) is responsible for supervising the Risk Management Department and maintaining the effectiveness of the risk management framework independently from the business units within the Nomura Group. The CRO not only regularly reports on the status of the Nomura Group’s risk management to the GIRMC, but also reports to and seeks the approval of the GIRMC on measures required for risk management.
Chief Financial Officer
The Chief Financial Officer (“CFO”) has the operational authority and responsibility over our liquidity management. Liquidity risk management policy is based on risk appetite which the GIRMC formulates. Our primary objective for liquidity risk management is to ensure continuous liquidity across market cycles and periods of stress, and to ensure that all funding requirements and unsecured debt obligations that fall due within one year can be met without additional unsecured funding or forced liquidation of trading assets.
17
Risk Management Departments
The Risk Management Departments are defined collectively as the Group Risk Management Department and departments or units in charge of risk management established independently from the business units of Nomura entities. The Risk Management Departments are responsible for establishing and operating of risk management processes, establishing and enforcing risk management policies and regulations, verifying the effectiveness of risk management methods, gathering reports from Nomura Group entities, reporting to Executive/Senior Managing Directors and the GIRMC and others and also reporting to regulatory bodies and handling of regulatory applications concerning risk management methods and other items.Important risk management issues are closely communicated between members of the Risk Management Departments and the CRO. The CRO or Deputy CRO regularly attend the EMB and GIRMC meetings to report specific risk issues.
In addition to the above, insertion will be made to our disclosure on “Credit Risk Management Framework” as follows:
Credit Risk Management Framework
Under the credit risk management framework, the GIRMC, upon delegation by the EMB, deliberates on and determines important matters concerning integrated risk management of the Nomura Group and accordingly has established important principles concerning credit risk management as described in the Credit Risk Management Policy and other documents. Also, the Global Risk Management Committee(“GRMC”), upon delegation by the GIRMC, deliberates on and determines important matters concerning credit risk management of the Nomura Group based on strategic risk allocation and risk appetite of Nomura Group as determined by the GIRMC.Subject matters for the GRMC include discussion of significant transactions that require consideration for its risk management framework.
The Nomura Group has established an organizational structure with an appropriate system of check-and-balances under the CRO. The Credit Planning Unit is responsible for planning or implementation of amending, revising or abolishing Internal Rating Systems, including development, oversight and continuous revising of the Internal Rating Model.
The Credit Department, which is independent from the business units, conducts credit analysis, internal rating assignment, monitoring of credit risk profiles including credit concentration risk and others. Also, the Credit Risk Control Unit (the “CRCU”), also independent from the business units and Credit Department, is responsible for monitoring operations, validation and others items for the Internal Rating System. Additionally, the Internal Audit Department, independently from these departments, audits the adequacy of credit risk management.
Value at Risk, page 107
| 15. | We note that you are committed to continuous review and enhancement of VaR methodologies and assumptions in order to capture evolving risks associated with changes in market structure and dynamics. Please respond to the following and expand your disclosure in future filings as appropriate: |
| • | Tell us the number of different VaR models that are used to determine your total trading VaR, and discuss the drivers regarding the need to use multiple different models. |
18
Response:
Nomura uses a single VaR model which is implemented globally in order to determine the total trading VaR for the Nomura group.
| • | Tell us how all of the different VaR models used are aggregated to arrive at your total trading VaR as well as the individual market risk categories disclosed. For example, clarify whether you simply aggregate the outputs from the different models or whether adjustments are made, and if so, how the adjustments are determined. |
Response:
As discussed above, Nomura uses a single VaR model and therefore no aggregation of the results of individual models is required.
| • | Tell us whether the VaR models used for regulatory capital purposes are the same as the VaR models used for your market risk disclosures. To the extent that certain of the models used for both purposes differ, please tell us the drivers behind those differences. |
Response:
The market risk disclosure we provide in our annual report on Form 20-F is based on the VaR model we use for internal risk management purposes and is the same model we use for reporting our consolidated VaR to the Financial Services Agency of Japan (“FSA”) for regulatory capital purposes. As currently described on page 107 of our annual report on Form 20-F for the year ending March 31, 2012, the only significant difference between these models is that we use a 1 day time horizon for internal risk management and market risk disclosure purposes whereas we use a 10 day time horizon for regulatory reporting to the FSA.
| • | Discuss the process and validation procedures in place prior to implementing significant model and assumption changes. For example, discuss the approval process required, back-testing procedures performed, and periods of parallel model runs before implementation. |
Response:
We have documented policies in place approved by the GIRMC which define the process and validation procedures required in order to implement changes to our VaR and other risk models. The Global Risk Methodology Group (“GRMG”) within our Risk Management Division has primary responsibility for the ongoing refinement and improvement of our risk models and methodologies. All model changes are communicated to the Global Model Validation Group (“MVG”) and certain significant changes proposed by the GRMG are initially independently reviewed and validated by the MVG before being implemented.
19
The nature of the processes required to be performed by GRMG to support a model change and the level of validation required by MVG depends on the significance of the model change. For certain significant changes, back-testing of the new model, parallel running of both models and stress-testing of the new model are required prior to implementation.
Under delegated authority from the GRMC, model changes are also formally approved by the Global Risk Analytics Committee (“GRAC”) if certain materiality thresholds defined by the Nomura group are met. The GRAC is formed of senior risk managers within Nomura, including the CRO and the CFO, and has delegated authority from the GRMC to approve such changes.
Details of all significant model changes are reported to the GRMC on a quarterly basis or more frequently, if required.
| • | To the extent that all or some of your VaR models used for your market risk disclosures are different than those used to calculate regulatory capital, please tell us whether the model review process and model oversight processes are the same for both. As part of your response, please clarify when approval is required from any of your regulators regarding VaR model changes. |
Response:
As described above, we use the same VaR model for our market risk disclosures and for regulatory reporting to the FSA. The model review and oversight processes, including the process for significant changes discussed above, are the same in both cases.
We are required to formally report significant changes in our VaR and other models to the FSA. A significant change is defined internally as any change resulting in a change of more than 10% of Nomura’s consolidated group regulatory capital. Insignificant changes are also informally communicated to the FSA on a regular basis.
| • | Given that your VaR models are evolving over time, tell us how you consider when disclosure is required under Item 11(a)(4) of Form 20-F regarding model, assumptions and parameter changes. |
Response:
As described above, we have detailed internal policies regarding the process and validation procedures for any changes to our VaR or other risk models. If a change is significant, independent review and validation by the MVG is required, together with additional approval by the GRAC if certain materiality thresholds of the Nomura group are met. We consider whether any significant change requiring approval by the GRAC requires disclosure in our annual report on Form 20-F under Item 11(a)(4).
20
We will enhance our disclosures in future filings, beginning with our annual report on Form 20-F for the fiscal year ending March 31, 2013, underMarket Risk – Value at Risk, to incorporate certain of the above responses as follows:
VaR Methodology Assumptions
Nomura uses a single VaR model which is implemented globally in order to determine the total trading VaR for the Nomura Group.
Nomura’s VaR methodology uses historical simulation to estimate potential profit or loss. Historical market moves are repeatedly applied to the Firm’s current exposure, forming a distribution of simulated portfolio returns. From this distribution the required potential losses can be estimated at required confidence levels (probabilities).
Nomura uses the same VaR model for both internal risk management purposes and for regulatory reporting of our consolidated VaR to the Financial Services Agency of Japan. For internal risk management purposes,VaR is calculated at a 99% confidence level and using a 1-day time horizon.For regulatory reporting purposes, we use the same confidence level but a 10-day time horizon, calculated using actual 10-day historical market moves.
For internal information purposes, Nomura also calculates a ‘1% VaR’ which represents the potential profits from the same distribution. Differences between 99% and 1% measures can be used to demonstrate that markets do not always follow a simple statistical probability model. Additionally, Nomura calculates other measures used to complement VaR under recent regulation known as ‘Basel 2.5’. One of these, Stressed-VaR (SVaR) is calibrated on a one-year window from a period of financial stress. All VaR and SVaR numbers are calculated within the same system using equivalent assumptions.
* * *
Changes in VaR Models and Assumptions
Nomura is committed to continuous improvement of our risk modeling and to maintaining risk modeling that is in line with best practices in our industry.
We have documented policies in place approved by the GIRMC which define the process and validation procedures required in order to implement changes to our VaR and other risk models. The Global Risk Methodology Group (“GRMG”) within our Risk Management Division has primary responsibility for the ongoing refinement and improvement of our risk models and methodologies. All model changes are communicated by the GRMG to the Global Model Validation Group (“MVG”) and any significant changes are initially independently reviewed and validated by MVG before being implemented.
The nature of the processes required to be performed by GRMG to support a model change and the level of validation required by MVG depends on the significance of the model change. For certain significant changes, back-testing of the new model, parallel running of both models and stress-testing of the new model are required prior to implementation.
21
Under delegated authority from the GRMC, model changes are also formally approved by the Global Risk Analytics Committee (“GRAC”) if certain materiality thresholds defined by the Nomura Group are met. The GRAC is formed of senior risk managers within Nomura including the CRO and the CFO and has delegated authority from the GRMC to approve such changes.
Details of all significant model changes are reported to the GRMC on a quarterly basis or more frequently, if required.
We are required to formally report significant changes in our VaR and other models to the FSA. A significant change is defined internally as any change resulting in a change of more than 10% of Nomura’s consolidated group regulatory capital. Insignificant changes are also informally communicated to the FSA on a regular basis.
Credit Risk, page 110
Integrated Management, page 112
| 16. | Please explain under what circumstances you evaluate credit risk “by obligor groups” and also explain how you compile the groups. |
Response:
We evaluate credit risk by “obligor groups” (i.e., by counterparty groups) when significant legal or economic relationships exist between or among counterparties which mitigates or increases our credit risk exposure when compared to these individual counterparties if considered separately. Such relationships may exist through one counterparty owning a controlling financial interest in another, significant financing relationships existing between or among counterparties or if there are other indicators of significant financial interdependence between or among counterparties.
Credit Risk to counterparties to derivatives transaction, page 112
| 17. | Footnote (2) to your tabular disclosure notes that the row labeled “Other” does not necessarily indicate that the counterparties’ credit rating is below investment grade. Please revise your future filings to more clearly explain what the Other classification does mean here and to quantify the amounts within the Other row that are below investment grade or of similar credit quality. |
22
Response:
We will enhance our disclosure in future filings, beginning with our annual report on Form 20-F for the fiscal year ending March 31, 2013, to more clearly quantify amounts which are below investment grade or of similar quality and to clarify the nature of any amounts still reported in “Other” as follows:
| Billions of yen | ||||||||||||||||||||||||||||||||||||
| Years to Maturity | Cross-Maturity Netting(1) | Total Fair Value | Collateral Obtained | Replacement Cost | ||||||||||||||||||||||||||||||||
Credit Rating | Less than 1 Year | 1 to 3 Years | 3 to 5 Years | 5 to 7 Years | More than 7 Years | |||||||||||||||||||||||||||||||
| (a) | (b) | (a)-(b) | ||||||||||||||||||||||||||||||||||
AAA | ¥ | X | ¥ | X | ¥ | X | ¥ | X | ¥ | X | ¥ | (X | ) | ¥ | X | ¥ | X | ¥ | X | |||||||||||||||||
AA | X | X | X | X | X | (X | ) | X | X | X | ||||||||||||||||||||||||||
A | X | X | X | X | X | (X | ) | X | X | X | ||||||||||||||||||||||||||
BBB | X | X | X | X | X | (X | ) | X | X | X | ||||||||||||||||||||||||||
BBand lower | X | X | X | X | X | (X | ) | X | X | X | ||||||||||||||||||||||||||
Other(2) | X | X | X | X | X | (X | ) | X | X | X | ||||||||||||||||||||||||||
|
|
|
|
|
|
|
|
|
|
|
|
|
|
|
|
|
| |||||||||||||||||||
Sub-total | X | X | X | X | X | (X | ) | X | X | X | ||||||||||||||||||||||||||
Listed | X | X | X | X | X | (X | ) | X | X | X | ||||||||||||||||||||||||||
|
|
|
|
|
|
|
|
|
|
|
|
|
|
|
|
|
| |||||||||||||||||||
Total | ¥ | X | ¥ | X | ¥ | X | ¥ | X | ¥ | X | ¥ | (X | ) | ¥ | X | ¥ | X | ¥ | X | |||||||||||||||||
|
|
|
|
|
|
|
|
|
|
|
|
|
|
|
|
|
| |||||||||||||||||||
| (1) | This item represents netting of payable balances with receivable balances for the same counterparty across maturity band categories. Receivable and payable balances with the same counterparty in the same maturity category, however, are net within the maturity category. Cash collateral netting against net derivatives in accordance with ASC 210-20 “Balance Sheet–Offsetting” are included. |
| (2) | “Other” comprises unrated counterparties and certain portfolio level valuation adjustments not allocated to specific counterparties. |
Exposure to certain European peripheral countries, page 113
| 18. | On January 6, 2012, the Division of Corporation Finance issued disclosure guidance CF Disclosure Guidance: Topic 4, European Sovereign Debt Exposures relating to registrants’ exposures to European countries. In accordance with such guidance, please revise your future filings, as appropriate, to provide disclosure regarding your sovereign and non-sovereign exposures, to address the following: |
| • | Revise your tabular presentation to include your unfunded exposure located in these countries. Your total gross exposure should include the effect of both your gross funded exposure and total unfunded exposure. |
23
| • | When presenting your unfunded exposure, please disaggregate such exposure by type of counterparty and by country. In addition, please disclose the key terms and any potential limitations of the counterparty being able to draw down on the facilities. |
| • | Your presentation appears to include derivatives in three separate columns. Revise your presentation to clearly indentify how you have separated your derivatives held between the three columns. For the amounts quantified in footnote (1), clarify whether these amounts relate only to the credit derivatives presented in the inventory positions column or also include amounts shown in the other columns. Consider providing a separate table of your credit defaults swaps that quantifies the notional and fair value of protection sold from protection purchased by country (separated between sovereign and non-sovereign). |
| • | Disclose the effects of credit default protection purchased separately by counterparty and country, the nature of payout or trigger events under the purchased credit protection contracts, the types of counterparties that the credit protection was purchased from and an indication of the counterparty’s credit quality. Discuss whether credit protection purchased has a shorter maturity date than the bonds or other exposure against which the protection was purchased. If so, provide clarifying disclosure about this fact and the risks presented by the mismatch of maturities. |
| • | Discuss how you monitor and/or mitigate the effects of indirect exposure from countries that you have identified. Your disclosure should explain how you identify indirect exposures, examples of the identified indirect exposures, along with the level of the indirect exposures. To the extent possible, please also provide quantitative information regarding the level of indirect exposures identified and factored into your stress analysis. |
| • | In notes 2 and 3 to the tabular presentation, you state that derivatives and securities financing transactions are shown net by counterparty after deduction of collateral received. Please disclose the type and amount of collateral offsetting such instruments. |
24
Response:
We will enhance our disclosure in future filings, beginning with our annual report on Form 20-F for the fiscal year ending March 31, 2013, to specifically provide the information requested by the Staff as follows:
Exposure to certain European peripheral countries
During 2012 and continuing into 2013, the creditworthiness of several peripheral countries within the Eurozone such as Greece, Italy, Ireland, Portugal and Spain (the “GIIPS” countries) has declined to economic and fiscal weaknesses.
The worsening of financial, economic and structural issues in the GIIPS countries have adversely influenced major global financial markets. A sustained market/economic downturn can adversely affect our business and can result in substantial losses.
The table below presents information regarding this exposure as at March 31, 2013 as measured in accordance with our internal risk management policies. Country risk exposure under these policies is reported based on the location of the counterparty, issuer or underlier’s assets.
| Millions of yen | ||||||||||||||||||||||||||||||||||||||||||||
| March 31, 2013 | ||||||||||||||||||||||||||||||||||||||||||||
| Net inventory exposures | Net counterparty exposures | |||||||||||||||||||||||||||||||||||||||||||
| Debt securities(1) | Equity securities(2) | Equity and credit derivatives referencing GIIPs underlyings(3) | Loans(4) | Derivative contracts with GIIPS counterparties(5) | Securities financing transactions(6) | Total gross funded exposure | Unfunded exposure(7) | Total gross exposure | Less: Hedges(8) | Total net exposure | ||||||||||||||||||||||||||||||||||
[Country] | ¥ | X | ¥ | X | ¥ | X | ¥ | X | ¥ | X | ¥ | X | ¥ | X | ¥ | X | ¥ | X | ¥ | (X | ) | ¥ | X | |||||||||||||||||||||
Sovereign | X | X | X | X | X | X | X | X | X | (X | ) | X | ||||||||||||||||||||||||||||||||
Non-sovereign(9) | X | X | X | X | X | X | X | X | X | (X | ) | X | ||||||||||||||||||||||||||||||||
| (1) | Fair value amounts of long and short debt securities by GIIPS issuers and alsoincludes GIIPS collateral with a fair value of ¥[X] million used in open repo-to-maturity transactions. |
| (2) | Fair value amounts of long and short equity securities by GIIPS issuers. |
| (3) | Net derivatives entered into for market-making and trading purposes which reference GIIPS underlyings and includes both single-name credit default swaps (CDS) and other credit derivatives referencing baskets of reference assets, indices or other multiple underlyings.Amounts disclosed are calculated based on notional amounts of the derivatives assuming zero recovery as adjusted for fair value movements. |
| (4) | Fair value amounts of loans to GIIPS counterparties. |
| (5) | Derivatives with GIIPS counterparties which are shown net by counterparty and after deduction of cash collateral received of ¥ [X] billion |
| (6) | Fair value amounts of repurchase agreements and securities borrowing and lending transactions when are shown net by counterparty and after deduction ofsecurities collateral andcash margin receivedof ¥ [X] billion. |
| (7) | Notional amount of unfunded loan commitments with GIIPS borrowers. These commitments are generally extended either for relationship purposes or as part of our leverage and acquisition finance activities and will expire by [Final maturity date]. The borrowers are typically not permitted to draw down on the facilities if a default event such as insolvency or failure to pay occurs or if material misrepresentations have been made to Nomura. |
| (8) | Hedges consist primarily ofsingle-name CDS contractswhere Nomura has purchased net protection against GIIPS net counterparty credit exposures. Amounts disclosed are calculated based on notional amounts of the contracts assuming zero recovery as adjusted for fair value movements. The counterparties to these transactions are non-GIIPS counterparties which are rated as investment grade using Nomura’s internal credit rating methodology. Nomura will attempt to match the reference assets and maturity of the CDS hedges to the underlying exposure against which they are hedging. In certain situations, however, hedges of equivalent duration may not be available in the market and therefore a maturity mismatch may exist. These mismatches are actively monitored and managed by Nomura. |
| (9) | Non-sovereign counterparties are primarily financial institutions located in these countries. |
25
Amounts reported in net inventory exposures and hedges include single-name CDS contracts where Nomura has either purchased or sold credit protection on a single name GIIPS underlying. The following table presents the gross notional value and fair value of these contracts by relevant GIIPS country and by type of underlying.
| Billions of yen March 31, 2013 | ||||||||||||||||
| Purchased protection | Sold protection | |||||||||||||||
| Notional value | Fair value | Notional value | Fair value | |||||||||||||
[Country] | ||||||||||||||||
Sovereign | ¥ | X | ¥ | X | ¥ | X | ¥ | X | ||||||||
Non-sovereign | X | X | X | X | ||||||||||||
|
|
|
|
|
|
|
| |||||||||
Total | ¥ | X | ¥ | X | ¥ | X | ¥ | X | ||||||||
|
|
|
|
|
|
|
| |||||||||
These notional and fair value amounts are not representative of Nomura’s overall exposure as they exclude the impact of master netting agreements and collateralization arrangements in place with the counterparties to these transactions. See Note 3“Derivative instruments and hedging activities” to our consolidated financial statements included within this annual report for more information around the nature of Nomura’s credit derivative activities,including the nature of payout or trigger events under these contracts.
In addition to the above direct exposures to these countries, Nomura also has indirect exposures to these countries as follows:
| • | We have exposure to other European sovereign and non-sovereign counterparties such as entities in France, Germany and the UK who themselves may have significant exposures to these countries. We consider this indirect exposure to GIIPS as part of our usual credit risk management monitoring procedures for these exposures; |
| • | We have exposure to redenomination risk if the Euro is no longer used as the currency unit in one or more GIIPS or other Eurozone countries. Redenomination risk arises when obligations of that country are redenominated from the Euro into a local currency, the local currency devalues against the Euro and other major global currencies which impacts upon other securities, contracts we have and the wider markets. Nomura monitors and manages redenomination risk through scenario analyses which quantify the potential impact on our GIIPS exposures; and |
| • | We have additional exposure to replacement risk arising from financial instruments entered into with GIIPS counterparties. Replacement risk arises if a GIIPS counterparty defaults and we are required to replace the transaction at additional cost to Nomura. Such replacement costs may arise if exposures to hedges are large or on illiquid financial instruments. We manage and mitigate replacement risk relating to GIIPS counterparties by monitoring exposures on selected counterparties that we believe represent the greatest risk, identifying any significant concentration of risks in order to reduce exposures when possible and being prepared to put in place a preemptive plan of action if such an event occurs. |
26
| 19. | Furthermore, we note that your tabular presentation disaggregates financial instruments into two columns. The first column presents your inventory positions, which includes long and short-term debt and equity securities, loans, equity derivatives and credit derivatives, while second column presents the total of derivative contracts, securities financing transactions and others. To enhance the transparency of your disclosure, please revise future filings to further disaggregate these columns by financial instrument type and by country to arrive at total gross funded exposure in your tabular presentation. |
Response:
As shown in the draft disclosure provided as part of our response to comment 18 above, we will enhance our disclosure in future filings, beginning with our annual report on Form 20-F for the fiscal year ending March 31, 2013, to include our gross funded exposures by type of financial instrument.
| 20. | In note 1 of the tabular presentation, you state that inventory positions are “generally” carried at fair value on a recurring basis in your consolidated balance sheets. Your disclosure suggests that you may have some inventory positions that are being presented on a basis other than fair value. If so, please clarify which financial instruments are being presented on a basis other than fair value. To the extent such instruments are presented on an amortized cost basis, please present the gross amount prior to the deduction of impairment and the net amount after impairment. |
Response:
All instruments currently reported within inventory are carried at fair value. As shown in the draft disclosure provided as part of our response to comment 18 above, we will enhance our disclosure in future filings, beginning with our annual report on Form 20-F for the fiscal year ending March 31, 2013, to clarify that all positions in inventory are at fair value. To the extent we identify any exposures outside of inventory carried on a basis other than fair value, we will show the gross amount and net amount after impairment.
27
| 21. | We note your disclosure of the gross notional values of single-name credit default swaps purchased and written, along with the fair value amounts. Tell us whether you have any (a) credit default swaps that reference any of these sovereign entities as part of a basket or (b) tranched purchased or sold credit protection covering a portfolio of multiple underlyings. If so, please tell us how those contracts are reflected in your table and considered in your quantification of notional amounts below the table. |
Response:
The notional amounts disclosed for purchased and sold credit protection within footnote 1 of the table only represent amounts arising from single name credit default swaps. We also have credit default contracts where we have purchased or sold protection on a basket of reference assets, indices and other multiple underlyings. All of these exposures are included within our inventory exposures quantified in the table. Where exposures cover more than one GIIPS country or both sovereign and non-sovereign underlyings, exposures are disaggregated into their constituent single names for reporting in the table.
Consolidated Statements of Income, page F-7
| 22. | Based upon your footnote disclosure on page F-80, we note that Revenue – Other of ¥563,186 primarily consists of revenue of ¥488,536 million, which includes real estate sales of ¥251,377 million, generated by NLB and other companies acquired in the Share Exchange Agreement. Given that revenue generated by NLB and other companies presents approximately 35% of total revenue, please advise us how your presentation of such revenue complies with Rule 5-03(b) of Regulation S-X. |
Response:
We considered the requirements of Regulation S-X Rule 5-03(b) in connection with the post-acquisition revenue streams generated by NLB and specifically considered whether any of these different streams was significant enough to warrant separate disclosure on the face of our income statement. We identified real estate sales by NLB as being more than 10% of our total revenue for the year but did not change the face of our income statement since it was uncertain to us whether this particular revenue stream would continue to represent more than 10% of total revenue in subsequent years. Consequently, we decided to disclose such amount (together with the amount of cost of real estate sales) in Note 11 to our financial statements to provide transparency regarding the significance of this revenue type, and NLB revenues in general.
Assuming real estate sales continue to represent more than 10% of total revenue, we will enhance future filings to separately disclose this revenue type and cost of real estate sales on the face of our income statement.
Notes to the Consolidated Financial Statements, page F-13
Note 1 – Summary of accounting policies, page F-13
28
Collateralized agreements and collateralized financing, page F-15
| 23. | We note your policy on page F-16 regarding repurchase and resale agreements, securities lending and borrowing and other secured financing transactions. We also note your prior correspondence letter with the staff dated April 15, 2010 where you indicated that “Gensaki” transactions are accounted for as sales. In order to increase the transparency of this disclosure, in future filings, please describe the key terms and nature of these transactions, and quantify the amount of these transactions entered into during the periods presented. |
Response:
Nomura no longer uses traditional “Gensaki” transactions which were historically accounted for as sales under ASC 860-10. These transactions have now been replaced with “Gensaki Repo” transactions which are accounted for as secured borrowing transactions. The final Gensaki transaction reported as a sale matured in March 2010, which is prior to the periods to be covered by our financial statements included in future filings. In light of this, we do not believe any enhancement of our disclosures in future filings is required.
| 24. | You disclose on pages F-16 and F-25 that you prospectively adopted Accounting Standard Update (ASU) 2011-03 on January 1, 2012. Please address the following regarding your adoption of ASU 2011-03: |
| • | For certain securities lending transactions, you indicate that, as a result of your adoption of ASU 2011-03, you ceased accounting for these transactions as sales and began treating them as secured borrowings. Please provide us with a detailed description of these transactions and an analysis of how you determined that this new guidance prohibited sale treatment for these transactions. Revise your future filings to more clearly address the nature of these transactions and key features that led to the change in accounting. |
Response:
Consistent with our correspondence letter with the Staff dated April 15, 2010, we historically accounted for certain Japanese securities lending transactions undertaken prior to our adoption of ASU 2011-03 as sales in accordance with ASC 860-10.
The agreements governing these transactions include varying margining requirements, but the amount of cash we borrow from our counterparties is typically less than the fair value of securities we lend. The amount of the “haircut” is set by percentages agreed between the two parties. We concluded that we did not maintain effective control over the transferred financial assets and therefore the criterion for derecognition prescribed by ASC 860-10-40-5c was met. We arrived at this conclusion by specific consideration of the condition within ASC 860-10-40-24b that the transferred financial assets were not returned to us on substantially agreed terms, even in the event of default by the transferee. Although the haircuts we set in agreement with counterparties are commonly applied in the Japanese market, the collateral arrangements were outside the over collateralization guidelines previously defined by ASC 860-10-55-37.
29
The amendments to ASC 860 introduced by ASU 2011-03 removed this condition and consequently, the levels of cash collateral, haircuts and ongoing margining received by the transferor in a repurchase or other similar agreement are now irrelevant in determining if such a transaction should be accounted for as a sale. However, since the amendments were to be applied prospectively, any outstanding transactions as of our adoption date continued to be reported as sales until maturity. As of September 30, 2012, we no longer have any outstanding Japanese securities lending transactions accounted for as sales.
We will enhance our disclosure in future filings, beginning with our annual report on Form 20-F for the fiscal year ending March 31, 2013, to more specifically discuss the key features of these transactions which resulted in such transactions no longer being accounted for as sales following adoption of ASU 2011-03 as follows:
Nomura adopted Accounting Standard Update (“ASU”) No. 2011-03“Reconsideration of Effective Control for Repurchase Agreements”(“ASU 2011-03”) from January 1, 2012 and certain Japanese securities lending transactions undertaken after adoption date are accounted for as secured borrowings rather than sales in these consolidated financial statements as the criteria for derecognition of the transferred financial assets under ASC 860 are no longer be met.The agreements governing these transactions include varying margining requirements, but the amount of cash Nomura borrows from its counterparties is typically less than the fair value of securities Nomura lends. The amount of the “haircut” is set by percentages agreed between the two parties. Following adoption of ASU 2011-03, the levels of cash collateral, haircuts and ongoing margining received by Nomura in these transactions are now irrelevant in determining whether these should be accounted for as sales or secured borrowings.
However, since the amendments were to be applied prospectively, any outstanding transactions as of adoption date continued to be reported as sales through until maturity.
The amounts of securities derecognized from the consolidated balance sheets under this type of securities lending transaction as of March 31, 2012and March 31, 2013 were ¥1,930 million and ¥nil, respectively.
| • | From your disclosures it appears that after your adoption of ASU 2011-03, you continued to use sale accounting for certain resale and repurchase transactions and/or certain securities lending transactions. Revise your future filings to more clearly address the nature of such transactions along with your basis for determining that ASU 2011-03 did not prohibit sale treatment of such transactions. Provide us with a detailed analysis that addresses the nature and application of ASU 2011-03 to each type of transaction for which you still believe sale accounting is appropriate. |
30
Response:
Following adoption of ASU 2011-03 from January 1, 2012, we continued to apply sale accounting to those historical Japanese securities lending transactions discussed above and separately for repo-to-maturity transactions.
Repo-to-maturity transactions continue to be accounted for as sales following adoption of ASU 2011-03 since Nomura does not maintain effective control over the transferred assets through an agreement that both entitles and obligates Nomura to repurchase or redeem them before their maturity. This condition to qualify for sales accounting was not amended by ASU 2011-03 and therefore the criterion for derecognition prescribed by ASC 860-10-40-5c is satisfied for repo-to-maturity transactions.
We respectfully believe our existing disclosures regarding repo-to-maturity transactions on page F-16 are appropriate and no further enhancement of these disclosures in future filings is required.
| • | As part of your response, please specifically address your Gensaki transactions. In your letter dated April 15, 2010, you indicated that you did not have effective control over “Gensaki” transactions based upon the guidance in ASC 860-10-40-24b. You indicated this was because you are not able to repurchase or redeem the transferred financial assets on substantially agreed terms, even in the event of default by the transferee, as in the Gensaki agreement there are no margin requirements. Therefore, during the contract term you may not have obtained cash or other collateral sufficient to fund substantially all of the cost of purchasing replacement assets from others. Explain to us how you considered the guidance in ASU 2011-03, which removes such provisions in determining whether you have effective control, when concluding that such transactions should continue to be accounted for as sales. |
Response:
Consistent with our response to comment 23 above, no new Gensaki transactions have been entered into following adoption of ASU 2011-03, and consequently, none have been accounted for as sales.
Notes to the Consolidated Financial Statements, page F-13
Note 2 – Fair value of financial instruments, page F-28
Valuation technique by major class of financial instrument, page F-33
| 25. | In several instances, we note that the description of the valuation technique and inputs used for your Level 2 financial instruments appears to be vague and/or unclear. For example, you state in valuing corporate debt securities that you primarily use internal models. Your disclosure appears to be vague in describing the specific valuation method used in valuing such securities. In addition while you disclose that significant inputs are observable in determining the fair value of CMBS and RMBS classified as Level 2, it continues to remain unclear what specific inputs are used in valuing these securities. In future filings, please describe the specific valuation method and significant inputs used in valuing your financial instruments classified as Level 2 pursuant to ASC 820-10-50-2bbb. |
31
Response:
We will enhance our disclosures in future filings, beginning with our annual report on Form 20-F for the fiscal year ending March 31, 2013, to more clearly describe the specific valuation methods and significant inputs used for Level 2 corporate debt securities, CMBS and RMBS as follows:
Corporate debt securities–The fair value of corporate debt securities is primarily determined using DCF valuation techniques but also using quoted market prices and recent market transactions of identical or similar debt securities, if available. The significant valuation inputs used for DCF valuations are yield curves, asset swap spreads and credit spreads of the issuer. Corporate debt securities are generally classified in Level 2 because these valuation inputs are usually observable. Certain corporate debt securities will be classified as Level 3 because they are traded infrequently and there is insufficient information from comparable securities to classify them as Level 2, or because credit spreads of the issuer used in DCF valuations are unobservable.
Commercial mortgage-backed securities (“CMBS”) and Residential mortgage-backed securities (“RMBS”)–The fair value of CMBS and RMBS is primarily determined using DCF valuation techniques but also using quoted market prices and recent market transactions of identical or similar securities, if available. The significant valuation inputs used for DCF valuations include yields, prepayment rates, default probabilities and loss severities. CMBS and RMBS are generally classified in Level 2 because these valuation inputs are observable. Certain CMBS and RMBS positions will be classified as Level 3 because they are traded infrequently and there is insufficient information from comparable securities to classify them as Level 2, or because one or more of the valuation inputs used in DCF valuations are unobservable.
| 26. | We also note you may use brokers or pricing services to assist you in determining fair values. In your future filings, consider explaining the extent to which, and how, the information is obtained and used in developing the fair value measurements in the consolidated financial statements. The nature and form of this information may vary depending on the facts and circumstances, but may include the following: |
| • | The number of quotes or prices you generally obtained per instrument, and if you obtained multiple quotes or prices, how you determined the ultimate value you used in your financial statements; |
| • | Whether, and if so, how and why, you adjusted quotes or prices you obtained from brokers and pricing services; |
32
| • | The extent to which the brokers or pricing services are gathering observable market information as opposed to using unobservable inputs and/or proprietary models in making valuation judgments and determinations; |
| • | Whether the broker quotes are binding or non-binding; and |
| • | How the pricing information obtained is reviewed and validated under your governance framework discussed on page F-36. |
Response:
We will consider enhancing our disclosures in future filings, beginning with our annual report on Form 20-F for the fiscal year ending March 31, 2013, to address each of these points, depending on relevant facts and circumstances.
| 27. | We note that the values of listed equities traded in inactive markets and derivatives may have been adjusted for a variety of factors including liquidity. Tell us the amount of such adjustments, your basis for the adjustment, and how you considered guidance in ASC 820-10-35-36B with respect to these adjustments. |
Response:
As of March 31, 2012, the amount of such adjustments made to listed equity securities traded in inactive markets was ¥nil. We may adjust the quoted exchange price of a listed equity security traded in an inactive market if we do not believe the exchange price represents an appropriate fair value measurement. While rare in practice, we may apply a discount or liquidity adjustment to the exchange price if we feel the exchange price is stale or has been artificially inflated. The nature of this adjustment is to ensure the fair value measurement we apply is consistent with the characteristics of the position and would represent a fair value measurement that would be used by market participants upon a sale of the equity securities at our measurement date. Consistent with ASC 820-10-35-36B, this adjustment is determined by individual security (being its unit of account) but is not determined nor influenced by the size of our holding in the security.
We will enhance our disclosures in future filings, beginning with our annual report on Form 20-F for the fiscal year ending March 31, 2013, to more clearly explain the nature of these adjustments and to state that these adjustments are rare in practice.
| 28. | You state on page F-36 that the fair value of your structured notes includes an adjustment to reflect Nomura’s own creditworthiness. Please disclose in future filings the amount of the adjustment to reflect the company’s own credit risk and how such adjustment was determined. In addition, please explain to us your basis to support your conclusion that such notes should be classified as Level 2 as oppose to Level 3 in your fair value hierarchy. |
33
Response:
We classify structured notes in the fair value hierarchy based on the lowest level of input that is significant to the fair value measurement of the financial instrument. We determine significance of valuation inputs from a balance sheet perspective by defining a significant valuation input as one which may result in a significant change in the fair value measurement of the structured note in its entirety, generally demonstrated by a sensitivity analysis for a reasonable range of possible outcomes. If more than one unobservable input is identified, significance is analyzed based on the aggregate effect of all the unobservable inputs.
As of March 31, 2012, we determined that our own creditworthiness as a valuation input applied to structured notes was an observable (i.e., Level 2) valuation input since the adjustment was derived from credit spreads observed on recent secondary market transactions and executable broker quotes involving Nomura debt instruments in the same market as where the structured notes are issued.
We will enhance our disclosure in future filings, beginning with our annual report on Form 20-F for the fiscal year ending March 31, 2013, to specifically disclose the amount of the valuation adjustment related to our own creditworthiness that is applied to structured notes and how such adjustment is determined as follows:
Short-term and long-term borrowings (“Structured notes”) – Structured notes are debt securities issued by Nomura which contain embedded features that alter the return to the investor from simply receiving a fixed or floating rate of interest to a return that depends upon some other variables, such as an equity or equity index, commodity price, foreign exchange rate, credit rating of a third party or a more complex interest rate. The fair value of structured notes is estimated using a quoted price in an active market for the identical liability if available, and where not available, using a mixture of valuation techniques that use the quoted price of the identical liability when traded as an asset, quoted prices for similar liabilities, similar liabilities when traded as assets, and also the amount at the measurement date that Nomura would pay to transfer the identical liability or would receive if the identical liability is entered at the measurement date.As of March 31, 2013, the fair value of structured notes includes an adjustment of ¥ [X] million to reflect Nomura’s own creditworthiness. This adjustment is determined based on recent observable secondary market transactions and executable broker quotes involving Nomura debt instruments and is therefore typically treated as a Level 2 valuation input. Structured notes are generally classified in Level 2 of the fair value hierarchy as unobservable inputs are not significant. Where the unobservable inputs are significant, they will be classified in Level 3.
Quantitative information regarding significant unobservable inputs and observations, page F-38
| 29. | You disclose on pages F-38 – F-40 the range of significant unobservable inputs for each major category of assets and liabilities measured at fair value on a recurring basis with a significant Level 3 balance, as well as qualitative information on the sensitivity of the fair value measurements to changes in the significant unobservable inputs. Given the wide range of assumptions for several of the categories, please consider revising your disclosure in future filings to also provide a weighted average of the significant unobservable inputs reported, similar to the illustration provided in ASC 820-10-55-103, and state your basis for calculating the weighted average (e.g., weighted average by notional, principal, etc.). |
34
Response:
In preparing this tabular presentation in our Form 20-F, we not only considered the requirements of ASC 820-10-50-2bbb and illustrative examples suggested by ASC 820-10-55-103, but also the more general requirements of ASC 820-10-50-1A. We respectfully believe that the existing quantitative range information currently provided in our table on page F-38 complies with the requirements of ASC 820-10-50-2bbb and provides sufficient quantitative information for users of our financial statements to evaluate the significant unobservable inputs used in our Level 3 financial instruments. We have not provided weighted averages in this table as we do not believe this would provide users of our financial statements with additional meaningful, useful information.
Note 3 – Derivative instruments and hedging activities, page F-54
| 30. | Your table on page F-56 separates your derivatives between derivatives used for trading purposes and derivatives designated as hedging instruments (for accounting purposes). Footnote (3) to the table notes that the category titled “derivatives used for trading purposes” includes derivatives used for non-trading purposes which are not designated as hedges for accounting purposes. In future filings, please separate the amounts reported as derivatives used for trading purposes between two categories: derivatives used for economic hedging purposes that do not qualify for hedges under accounting guidance and derivatives used for trading purposes. Similarly, separate the table of gains and losses on page F-57 into these two categories as well. |
Response:
We have historically not separately disclosed derivatives used for non-trading purposes which are not designated as hedges for accounting purposes as such amounts have not been significant. As of March 31, 2012 the total notional and fair value amounts of derivative assets used for this purpose were only ¥5 billion and ¥2 billion, respectively. Similarly, the total notional and fair value amounts of derivative liabilities used for this purpose were only ¥11 billion and ¥0 billion, respectively. Changes in fair value of these derivatives reported through earnings for the year ended March 31, 2012 were only a loss of ¥4 billion.
If such amounts continue not to be significant, we will enhance our disclosure in future filings, beginning with our annual report on Form 20-F for the fiscal year ending March 31, 2013, to expand the existing footnotes to the tables to state that such amounts are not significant. Conversely, if such amounts become significant, we will separately disclose notional and fair value amounts and gains and losses for derivatives used for this purpose as follows:
35
Derivative activities
The following tables quantify the volume of Nomura’s derivative activity through a disclosure of notional amounts, in comparison with the fair value of those derivatives. All amounts are disclosed on a gross basis, prior to counterparty netting of derivative assets and liabilities and cash collateral netting against net derivatives.
| Billions of yen | ||||||||||||||||
| March 31, 2012 | ||||||||||||||||
| Derivative assets | Derivative liabilities | |||||||||||||||
| Notional | Fair value | Notional(1) | Fair value(1) | |||||||||||||
Derivatives used for trading purposes(2)(3): | ||||||||||||||||
Equity contracts | ¥ | 16,079 | ¥ | 1,603 | ¥ | 14,497 | ¥ | 1,687 | ||||||||
Interest rate contracts | 636,833 | 18,843 | 592,413 | 18,597 | ||||||||||||
Credit contracts | 37,067 | 1,864 | 41,785 | 1,952 | ||||||||||||
Foreign exchange contracts | 59,296 | 1,356 | 62,999 | 1,407 | ||||||||||||
Commodity contracts | 50 | 4 | 45 | 5 | ||||||||||||
|
|
|
|
|
|
|
| |||||||||
Total | ¥ | 749,325 | ¥ | 23,670 | ¥ | 711,739 | ¥ | 23,648 | ||||||||
|
|
|
|
|
|
|
| |||||||||
Derivatives designated as hedging instruments: | ||||||||||||||||
Interest rate contracts | ¥ | 1,855 | ¥ | 78 | ¥ | — | ¥ | — | ||||||||
Foreign exchange contracts | 190 | 4 | 97 | 1 | ||||||||||||
|
|
|
|
|
|
|
| |||||||||
Total | ¥ | 2,045 | ¥ | 82 | ¥ | 97 | ¥ | 1 | ||||||||
|
|
|
|
|
|
|
| |||||||||
Total derivatives | ¥ | 751,370 | ¥ | 23,752 | ¥ | 711,836 | ¥ | 23,649 | ||||||||
|
|
|
|
|
|
|
| |||||||||
| Billions of yen | ||||||||||||||||
| March 31, 2013 | ||||||||||||||||
| Derivative assets | Derivative liabilities | |||||||||||||||
| Notional | Fair value | Notional(1) | Fair value(1) | |||||||||||||
Derivatives used for trading purposes(2): | ||||||||||||||||
Equity contracts | ¥ | X | ¥ | X | ¥ | X | ¥ | X | ||||||||
Interest rate contracts | X | X | X | X | ||||||||||||
Credit contracts | X | X | X | X | ||||||||||||
Foreign exchange contracts | X | X | X | X | ||||||||||||
Commodity contracts | X | X | X | X | ||||||||||||
|
|
|
|
|
|
|
| |||||||||
Total | ¥ | X | ¥ | X | ¥ | X | ¥ | X | ||||||||
|
|
|
|
|
|
|
| |||||||||
Derivatives used for non-trading purposes: | ||||||||||||||||
Equity contracts | ¥ | X | ¥ | X | ¥ | X | ¥ | X | ||||||||
|
|
|
|
|
|
|
| |||||||||
Total | ¥ | X | ¥ | X | ¥ | X | ¥ | X | ||||||||
|
|
|
|
|
|
|
| |||||||||
Derivatives designated as hedging instruments: | ||||||||||||||||
Interest rate contracts | ¥ | X | ¥ | X | ¥ | X | ¥ | X | ||||||||
Foreign exchange contracts | X | X | X | X | ||||||||||||
|
|
|
|
|
|
|
| |||||||||
Total | ¥ | X | ¥ | X | ¥ | X | ¥ | X | ||||||||
|
|
|
|
|
|
|
| |||||||||
Total derivatives | ¥ | X | ¥ | X | ¥ | X | ¥ | X | ||||||||
|
|
|
|
|
|
|
| |||||||||
36
| (1) | Includes the amount of embedded derivatives bifurcated in accordance with ASC 815. |
| (2) | Each derivative classification includes derivatives referencing multiple risk components. For example, interest rates contracts include complex derivatives referencing interest rate risk as well as foreign exchange risk or other factors such as prepayment rates. Credit contracts include credit default swaps as well as derivatives referencing corporate and government securities. |
| (3) | As of March 31, 2012, the amounts reported include derivatives used for non-trading purposes which are not designated as fair value hedges or net investment hedges.These amounts have not been separately presented since such amounts were not significant. |
Changes in fair value are recognized either through earnings or other comprehensive income depending on the purpose for which the derivatives are used.
Derivatives used for trading purposes
Derivative financial instruments used for trading, including bifurcated embedded derivatives, are carried at fair value with changes in fair value recognized through the consolidated statements of income within Revenue—Net gain on trading.
The following table presents amounts included in the consolidated statements of income related to derivatives used for tradingand non-trading purposes by type of underlying derivative contract.
| Billions of yen | ||||||||||||
| Year ended March 31 | ||||||||||||
| 2011 | 2012 | 2013 | ||||||||||
Derivatives used for tradingand non-tradingpurposes(1)(2): | ||||||||||||
Equity contracts | ¥ | 206 | ¥ | (137 | ) | ¥ | X | |||||
Interest rate contracts | 132 | 42 | X | |||||||||
Credit contracts | 88 | (73 | ) | X | ||||||||
Foreign exchange contracts | (171 | ) | (67 | ) | X | |||||||
Commodity contracts | (10 | ) | (4 | ) | X | |||||||
|
|
|
|
|
| |||||||
Total | ¥ | 245 | ¥ | (239 | ) | ¥ | X | |||||
|
|
|
|
|
| |||||||
| (1) | Each derivative classification includes derivatives referencing multiple risk components. For example, interest rates contracts include complex derivatives referencing interest rate risk as well as foreign exchange risk or other factors such as prepayment rates. Credit contracts include credit default swaps as well as derivatives referencing corporate and government securities. |
| (2) | Includes net gain (loss) on derivatives used for non-trading purposes which are not designated as fair value or net investment hedges. For the years ended March 31, 2011 and 2012, these amounts have not been separately presented as net gains (losses) for these non-trading derivatives were not significant. For the year ended March 31, 2013, the amounts reported include [gains/(losses)] of ¥ [X] billion for [equity] contracts used for non-trading purposes. |
37
Note 9 – Financing receivables, page F-71
| 31. | You disclose that your Loans at banks include secured and unsecured loans extended by licensed banks within Nomura. Please revise this footnote or your Business section to more clearly identify the customer base and underwriting standards for your Loans at banks and how it differs from that of your Corporate loans. It is not clear how you are differentiating these two loan classes. |
Response:
We differentiate Loans at banks from Corporate loans because of the nature of the Nomura entity extending the loans, the different regulatory regime under which our banking and non-banking subsidiaries operate and the fact that Loans at banks includes loans to retail borrowers which are collectively rather than individually assessed for impairment.
We will enhance our disclosure in future filings, beginning with our annual report on Form 20-F for the fiscal year ending March 31, 2013, to clarify the differences between Loans at banks and Corporate loans as follows:
Loans at banks includesboth retail and commercial secured and unsecured loans extended by licensed banking entities within Nomurasuch as The Nomura Trust & Banking Co., Ltd and Nomura Bank International plc. Forboth retail and commercial loans secured by real estate or securities, Nomura is exposed to the risk of a decline in the value of the underlying collateral.Loans at banks also includes unsecured commercial loans provided to investment banking clients for relationship purposes. Nomura is exposed to risk of default of the counterparty, although these counterparties usually have high credit ratings. Where loans are secured by guarantees, Nomura is also exposed to the risk of default by the guarantor.
Corporate loans are primarily commercial loans to corporate clientsextended by non-licensed banking entities within Nomura. Corporate loans include loans secured by real estate or securities, as well as unsecuredcommercial loans provided to investment banking clients for relationship purposes. The risk to Nomura of making these loans is similar to those risks arising fromcommercial loans reported in Loans at banks.
38
| 32. | Please revise the table on page F-73 to address the following: |
| • | Revise this table to be consistent with the five loan classes presented in your allowance table on page F-75. Separately breakout your advances to affiliates from the four categories presented on page F-73. |
| • | Revise the table on page F-73 to separately quantify the amount of loans held at fair value from the amount of loans held at amortized cost for each of the five classes of loans presented. |
Response:
Revised tables which are consistent with the five loan classes presented on page F-75 and which separately quantify amounts carried at amortized cost and fair value as of March 31, 2012 and 2013 are shown below. Advances to affiliated companies were not included in the existing four categories of loans receivable provided in F-73 because advances to affiliated companies are presented in a different line item than loans receivable on the face of the balance sheet. Accordingly, advances to affiliated companies are presented as a separate category below. We will enhance our disclosure in future filings, beginning with our annual report on Form 20-F for the fiscal year ending March 31, 2013 to reflect this revised presentation as follows:
| Millions of yen | ||||||||||||
| As of March 31, 2012 | ||||||||||||
| Carried at amortized cost | Carried at fair value(1) | Total | ||||||||||
Loans receivable | ||||||||||||
Loans at banks | ¥ | 235,407 | ¥ | 50,109 | ¥ | 285,516 | ||||||
Short-term secured margin loans | 165,246 | — | 165,246 | |||||||||
Inter-bank money market loans | 95,461 | — | 95,461 | |||||||||
Corporate loans | 338,906 | 408,243 | 747,149 | |||||||||
|
|
|
|
|
| |||||||
Total loans receivable | ¥ | 835,020 | ¥ | 458,352 | ¥ | 1,293,372 | ||||||
|
|
|
|
|
| |||||||
Advances to affiliated companies | ¥ | 10,649 | ¥ | — | ¥ | 10,649 | ||||||
|
|
|
|
|
| |||||||
Total | ¥ | 845,669 | ¥ | 458,352 | ¥ | 1,304,021 | ||||||
|
|
|
|
|
| |||||||
| Millions of yen | ||||||||||||
| As of March 31, 2013 | ||||||||||||
| Carried at amortized cost | Carried at fair value(1) | Total | ||||||||||
Loans receivable | ||||||||||||
Loans at banks | ¥ | X | ¥ | X | ¥ | X | ||||||
Short-term secured margin loans | X | X | X | |||||||||
Inter-bank money market loans | X | X | X | |||||||||
Corporate loans | X | X | X | |||||||||
|
|
|
|
|
| |||||||
Total loans receivable | ¥ | X | ¥ | X | ¥ | X | ||||||
|
|
|
|
|
| |||||||
Advances to affiliated companies | ¥ | X | ¥ | X | ¥ | X | ||||||
|
|
|
|
|
| |||||||
Total | ¥ | X | ¥ | X | ¥ | X | ||||||
|
|
|
|
|
| |||||||
| (1) | Carried at fair value through election of the fair value option. |
39
* * * * *
Nomura acknowledges that:
| • | Nomura is responsible for the adequacy and accuracy of the disclosure in the filing; |
| • | Staff comments or changes to disclosure in response to Staff comments do not foreclose the SEC from taking any action with respect to the filing; and |
| • | Nomura may not assert Staff comments as a defense in any proceeding initiated by the SEC or any person under the federal securities laws of the United States. |
If you have any questions about this response letter, please contact the undersigned by fax at 81-3-3274-4496.
| Very truly yours, |
/s/ Junko Nakagawa |
| Junko Nakagawa |
| Chief Financial Officer |
| cc: | Yolanda Trotter |
Kevin W. Vaughn
Eric Envall
Celia Soehner
(Division of Corporation Finance,
U.S. Securities and Exchange Commission)
Izumi Akai
(Sullivan & Cromwell LLP)
Tadayuki Matsushige
(Ernst & Young ShinNihon LLC)
40