Table of Contents
FORM6-K
U.S. SECURITIES AND EXCHANGE COMMISSION
Washington, D.C. 20549
Report of Foreign Private Issuer
Pursuant to Rule13a-16 or15d-16 of
the Securities Exchange Act of 1934
Commission File Number:1-15270
For the month of May 2019
NOMURA HOLDINGS, INC.
(Translation of registrant’s name into English)
9-1, Nihonbashi1-chome
Chuo-ku, Tokyo103-8645
Japan
(Address of principal executive offices)
Indicate by check mark whether the registrant files or will file annual reports under cover Form20-F or Form40-F.
Form20-F X Form40-F
Indicate by check mark if the registrant is submitting the Form6-K in paper as permitted by RegulationS-T Rule 101(b)(1):
Indicate by check mark if the registrant is submitting the Form6-K in paper as permitted by RegulationS-T Rule 101(b)(7):
Table of Contents
Information furnished on this form:
Exhibit Number
| 1. | Consolidated Results of Operations (US GAAP), Fourth quarter and fiscal year ended March 2019 |
Table of Contents
SIGNATURES
Pursuant to the requirements of the Securities Exchange Act of 1934, the registrant has duly caused this report to be signed on its behalf by the undersigned, thereunto duly authorized.
| NOMURA HOLDINGS, INC. | ||||
| Date: May 10, 2019 | By: | /s/ Go Sugiyama | ||
| Go Sugiyama | ||||
| Senior Managing Director | ||||
Table of Contents
|
|
Connecting Markets East & West Consolidated Results of Operations Fourth quarter, year ended March 2019 (US GAAP) Nomura Holdings, Inc. April 2019 © Nomura
Table of Contents
 |
Outline Presentation Executive summary (p. 2-4) Overview of results (p. 5) Business segment results (p. 6) Retail (p. 7-8) Asset Management (p. 9-10) Wholesale (p. 11-13) Non-interest expenses (p. 14) Robust financial position (p. 15) Funding and liquidity (p. 16) Financial Supplement Consolidated balance sheet (p. 18) Value at risk (p. 19) Consolidated financial highlights (p. 20) Consolidated income (p. 21) Main revenue items (p. 22) Consolidated results: Income (loss) before income taxes by segment and region (p. 23) Segment “Other” (p. 24) Retail related data (p. 25-28) Asset Management related data (p. 29-30) Wholesale related data (p. 31) Number of employees (p. 32)
Table of Contents
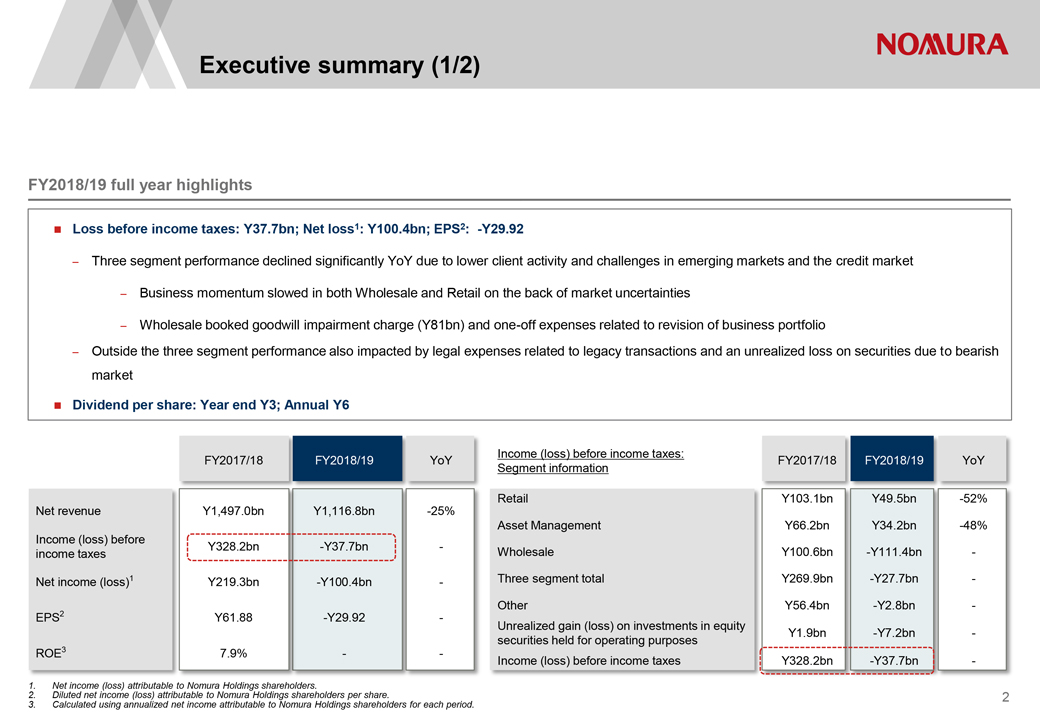 |
Executive summary (1/2) FY2018/19 full year highlights Loss before income taxes: Y37.7bn; Net loss1: Y100.4bn; EPS2: -Y29.92 Three segment performance declined significantly YoY due to lower client activity and challenges in emerging markets and the credit market Business momentum slowed in both Wholesale and Retail on the back of market uncertainties Wholesale booked goodwill impairment charge (Y81bn) and one-off expenses related to revision of business portfolio Outside the three segment performance also impacted by legal expenses related to legacy transactions and an unrealized loss on securities due to bearish market Dividend per share: Year end Y3; Annual Y6 FY2017/18 FY2018/19 YoY Net revenue Y1,497.0bn Y1,116.8bn -25% Income (loss) before income taxes Y328.2bn -Y37.7bn—Net income (loss)1 Y219.3bn -Y100.4bn—EPS2 Y61.88 -Y29.92—ROE3 7.9% — Income (loss) before income taxes: FY2017/18 FY2018/19 YoY Segment information Retail Y103.1bn Y49.5bn -52% Asset Management Y66.2bn Y34.2bn -48% Wholesale Y100.6bn -Y111.4bn—Three segment total Y269.9bn -Y27.7bn—Other Y56.4bn -Y2.8bn—Unrealized gain (loss) on investments in equity Y1.9bn -Y7.2bn—securities held for operating purposes Income (loss) before income taxes Y328.2bn -Y37.7bn— 1. Net income (loss) attributable to Nomura Holdings shareholders. 2. Diluted net income (loss) attributable to Nomura Holdings shareholders per share. 3. Calculated using annualized net income attributable to Nomura Holdings shareholders for each period. 2
Table of Contents
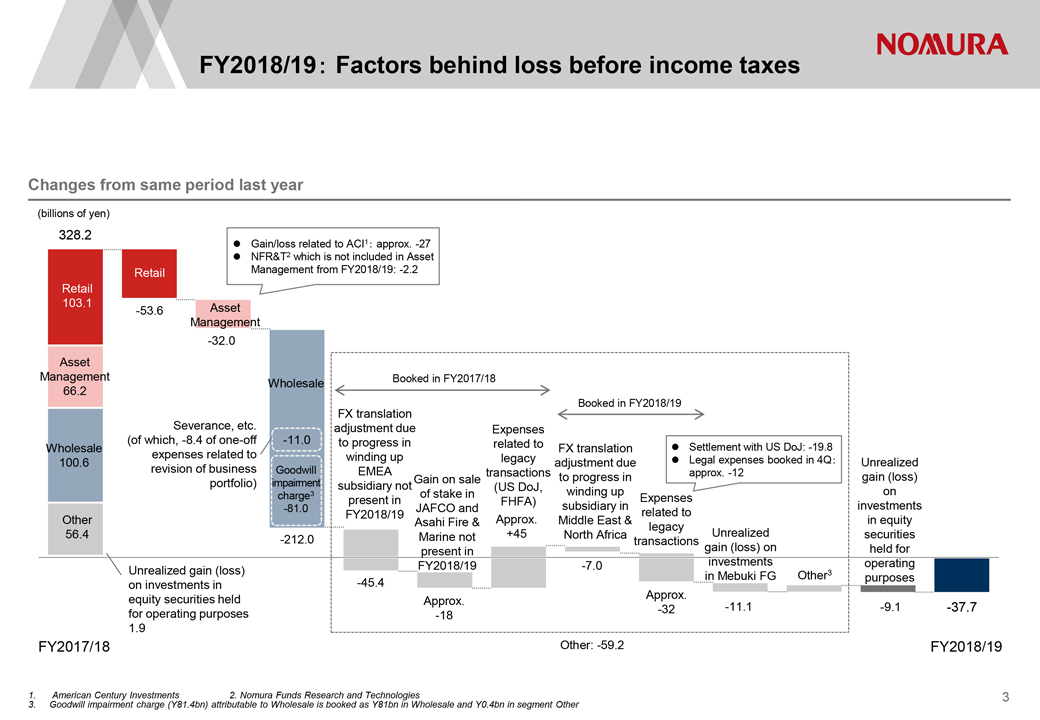 |
FY2018/19 Factors behind loss before income taxes Changes from same period last year (billions of yen) 328.2 Gain/loss related to ACI1 approx. -27 NFR&T2 which is not included in Asset Retail Management from FY2018/19: -2.2 Retail 103.1 Asset -53.6 Management -32.0 Asset Management Booked in FY2017/18 Wholesale 66.2 FX translation Booked in FY2018/19 Severance, etc. adjustment due Expenses (of which, -8.4 of one-off -11.0 to progress in related to Wholesale FX translation Settlement with US DoJ: -19.8 expenses related to winding up legacy 100.6 adjustment due Legal expenses booked in 4Q Unrealized revision of business Goodwill EMEA transactions approx. -12 Gain on sale to progress in gain (loss) portfolio) impairment subsidiary not (US DoJ, charge3 of stake in winding up on present in FHFA) Expenses -81.0 JAFCO and subsidiary in investments FY2018/19 related to Other Asahi Fire & Approx. Middle East & in equity legacy 56.4 Marine not +45 North Africa Unrealized securities -212.0 transactions present in gain (loss) on held for FY2018/19 -7.0 investments operating Unrealized gain (loss) Other3 in Mebuki FG purposes on investments in -45.4 equity securities held Approx. Approx. -32 -11.1 -9.1 -37.7 for operating purposes -18 1.9 FY2017/18 Other: -59.2 FY2018/19 1. American Century Investments 2. Nomura Funds Research and Technologies 3. Goodwill impairment charge (Y81.4bn) attributable to Wholesale is booked as Y81bn in Wholesale and Y0.4bn in segment Other 3
Table of Contents
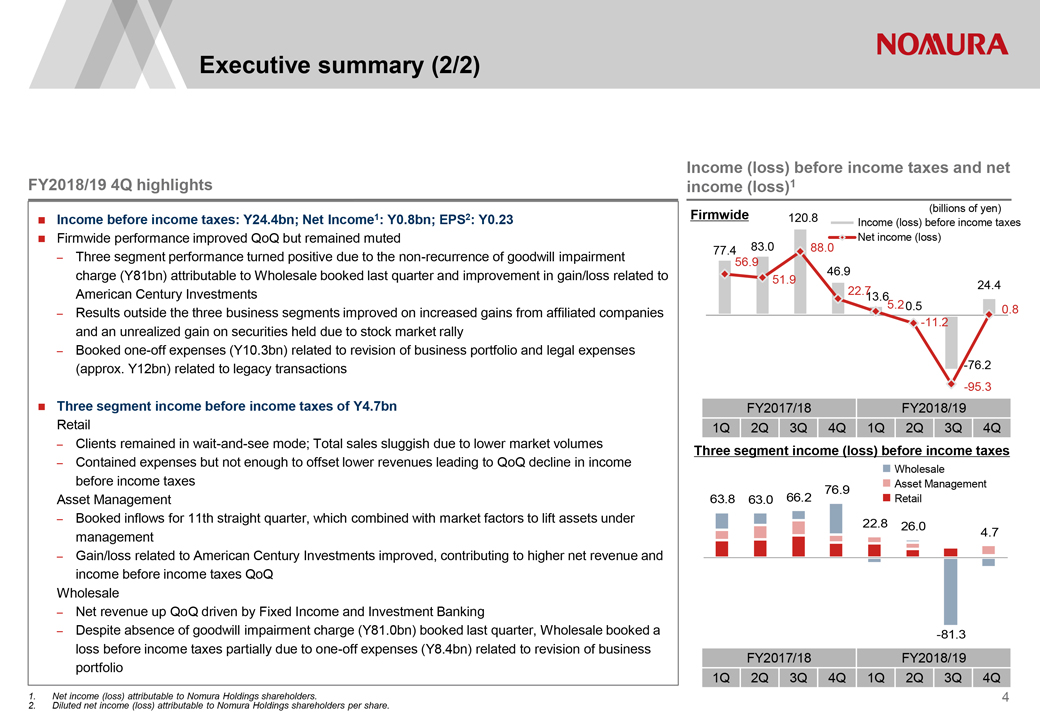 |
Executive summary (2/2) FY2018/19 4Q highlights Income before income taxes: Y24.4bn; Net Income1: Y0.8bn; EPS2: Y0.23 Firmwide performance improved QoQ but remained muted Three segment performance turned positive due to the non-recurrence of goodwill impairment charge (Y81bn) attributable to Wholesale booked last quarter and improvement in gain/loss related to American Century Investments Results outside the three business segments improved on increased gains from affiliated companies and an unrealized gain on securities held due to stock market rally Booked one-off expenses (Y10.3bn) related to revision of business portfolio and legal expenses (approx. Y12bn) related to legacy transactions Three segment income before income taxes of Y4.7bn Retail Clients remained in wait-and-see mode; Total sales sluggish due to lower market volumes Contained expenses but not enough to offset lower revenues leading to QoQ decline in income before income taxes Asset Management Booked inflows for 11th straight quarter, which combined with market factors to lift assets under management Gain/loss related to American Century Investments improved, contributing to higher net revenue and income before income taxes QoQ Wholesale Net revenue up QoQ driven by Fixed Income and Investment Banking Despite absence of goodwill impairment charge (Y81.0bn) booked last quarter, Wholesale booked a loss before income taxes partially due to one-off expenses (Y8.4bn) related to revision of business portfolio Income (loss) before income taxes and net income (loss)1 (billions of yen) Firmwide 120.8 Income (loss) before income taxes Net income (loss) 77.4 83.0 88.0 56.9 46.9 51.9 24.4 22.7 13.6 5.2 0.5 0.8 -11.2 -76.2 -95.3 FY2017/18 FY2018/19 1Q 2Q 3Q 4Q 1Q 2Q 3Q 4Q Three segment income (loss) before income taxes Wholesale 76.9 Asset Management 63.8 63.0 66.2 Retail 22.8 26.0 4.7 -81.3 FY2017/18 FY2018/19 1Q 2Q 3Q 4Q 1Q 2Q 3Q 4Q 1. Net income (loss) attributable to Nomura Holdings shareholders. 2. Diluted net income (loss) attributable to Nomura Holdings shareholders per share. 4
Table of Contents
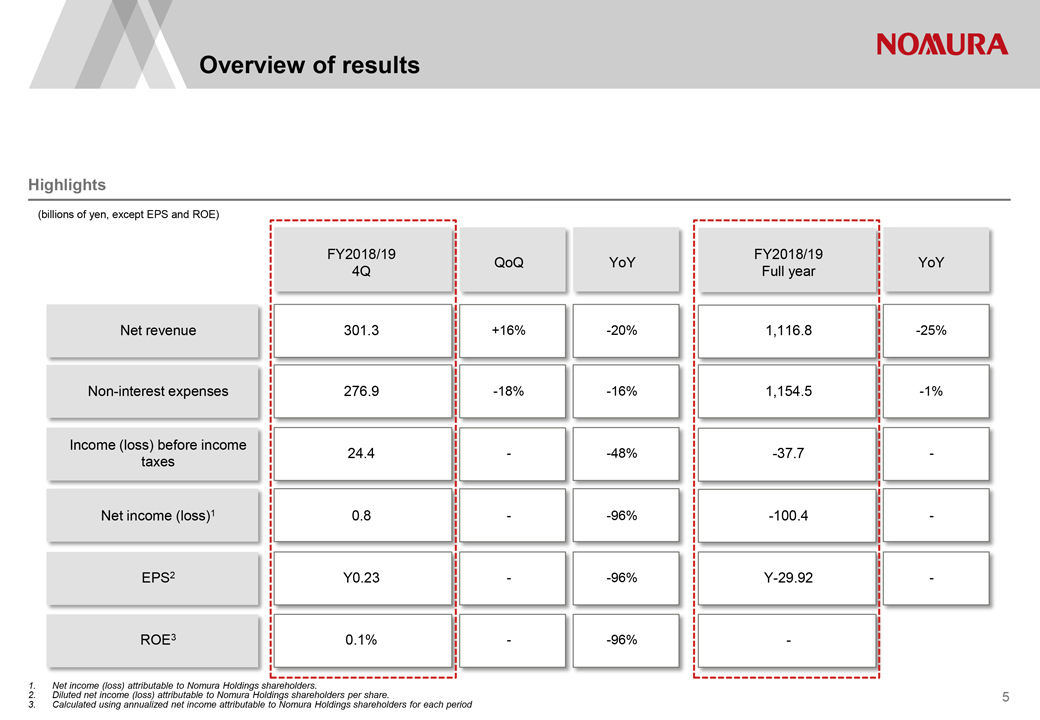 |
Overview of results Highlights (billions of yen, except EPS and ROE) FY2018/19 FY2018/19 QoQ YoY YoY 4Q Full year Net revenue 301.3 +16% -20% 1,116.8 -25% Non-interest expenses 276.9 -18% -16% 1,154.5 -1% Income (loss) before income 24.4 —48% -37.7—taxes Net income (loss)1 0.8 —96% -100.4—EPS2 Y0.23 —96% Y-29.92—ROE3 0.1% —96%— 1. Net income (loss) attributable to Nomura Holdings shareholders. 2. Diluted net income (loss) attributable to Nomura Holdings shareholders per share. 3. Calculated using annualized net income attributable to Nomura Holdings shareholders for each period 5
Table of Contents
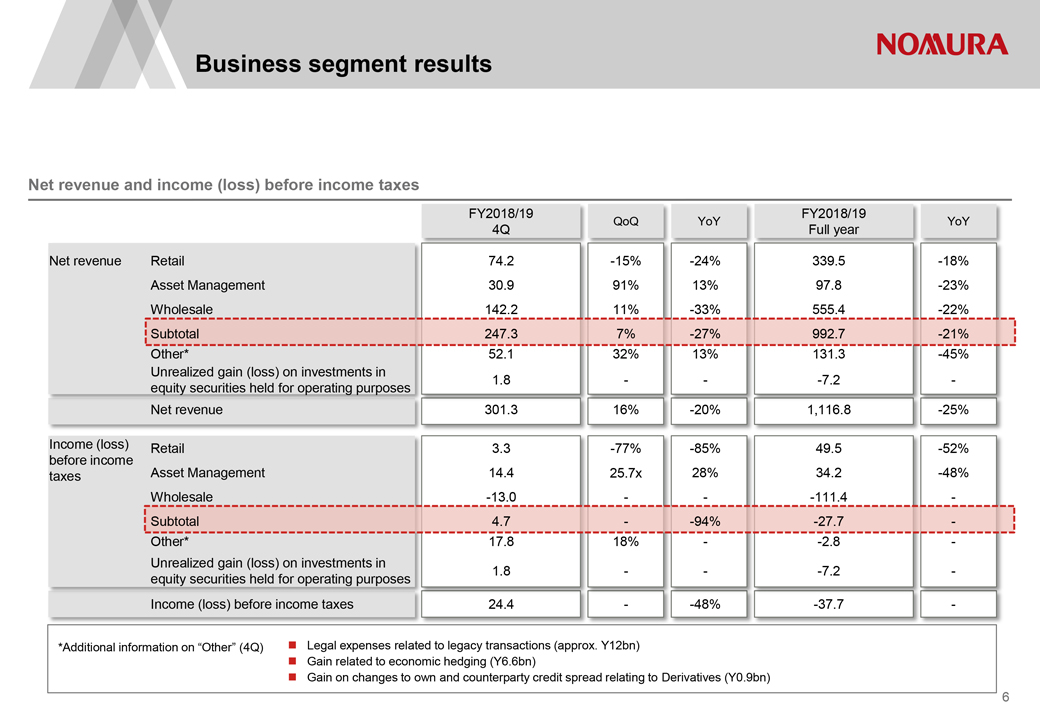 |
Business segment results Net revenue and income (loss) before income taxes FY2018/19 FY2018/19 QoQ YoY YoY 4Q Full year Net revenue Retail 74.2 -15% -24% 339.5 -18% Asset Management 30.9 91% 13% 97.8 -23% Wholesale 142.2 11% -33% 555.4 -22% Subtotal 247.3 7% -27% 992.7 -21% Other* 52.1 32% 13% 131.3 -45% Unrealized gain (loss) on investments in equity securities held for operating purposes 1.8 — -7.2— Net revenue 301.3 16% -20% 1,116.8 -25% Income (loss) Retail 3.3 -77% -85% 49.5 -52% before income taxes Asset Management 14.4 25.7x 28% 34.2 -48% Wholesale -13.0 — -111.4— Subtotal 4.7 —94% -27.7— Other* 17.8 18% —2.8— Unrealized gain (loss) on investments in 1.8 — -7.2— equity securities held for operating purposes Income (loss) before income taxes 24.4 —48% -37.7— *Additional information on ?Other? (4Q) Legal expenses related to legacy transactions (approx. Y12bn) Gain related to economic hedging (Y6.6bn) Gain on changes to own and counterparty credit spread relating to Derivatives (Y0.9bn) 6
Table of Contents
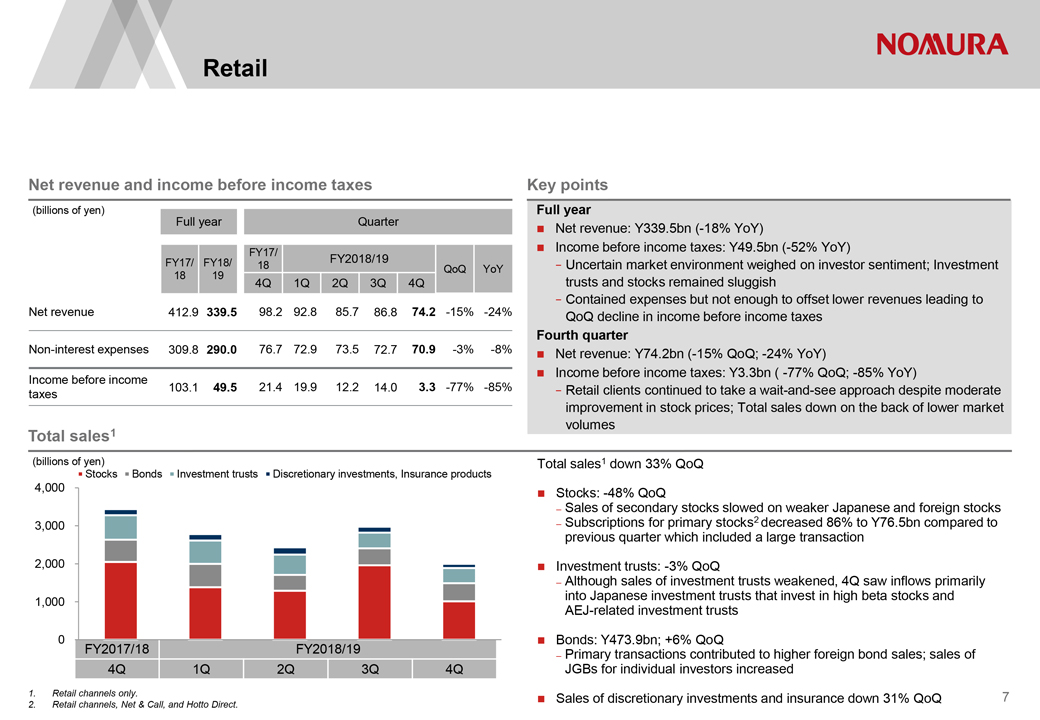 |
Retail Net revenue and income before income taxes (billions of yen) Full year Quarter FY17/ FY17/ FY18/ FY2018/19 18 QoQ YoY 18 19 4Q 1Q 2Q 3Q 4Q Net revenue 412.9 339.5 98.2 92.8 85.7 86.8 74.2 -15% -24% Non-interest expenses 309.8 290.0 76.7 72.9 73.5 72.7 70.9 -3% -8% Income before income 103.1 49.5 21.4 19.9 12.2 14.0 3.3 -77% -85% taxes Key points Full year Net revenue: Y339.5bn (-18% YoY) Income before income taxes: Y49.5bn (-52% YoY) Uncertain market environment weighed on investor sentiment; Investment trusts and stocks remained sluggish Contained expenses but not enough to offset lower revenues leading to QoQ decline in income before income taxes Fourth quarter Net revenue: Y74.2bn (-15% QoQ; -24% YoY) Income before income taxes: Y3.3bn ( -77% QoQ; -85% YoY) Retail clients continued to take a wait-and-see approach despite moderate improvement in stock prices; Total sales down on the back of lower market volumes Total sales1 (billions of yen) Stocks Bonds Investment trusts Discretionary investments, Insurance products 4,000 3,000 2,000 1,000 0 FY2017/18 FY2018/19 4Q 1Q 2Q 3Q 4Q 1. Retail channels only. 2. Retail channels, Net & Call, and Hotto Direct. Total sales1 down 33% QoQ Stocks: -48% QoQ Sales of secondary stocks slowed on weaker Japanese and foreign stocks Subscriptions for primary stocks2 decreased 86% to Y76.5bn compared to previous quarter which included a large transaction Investment trusts: -3% QoQ Although sales of investment trusts weakened, 4Q saw inflows primarily into Japanese investment trusts that invest in high beta stocks and AEJ-related investment trusts Bonds: Y473.9bn; +6% QoQ Primary transactions contributed to higher foreign bond sales; sales of JGBs for individual investors increased Sales of discretionary investments and insurance down 31% QoQ 7
Table of Contents
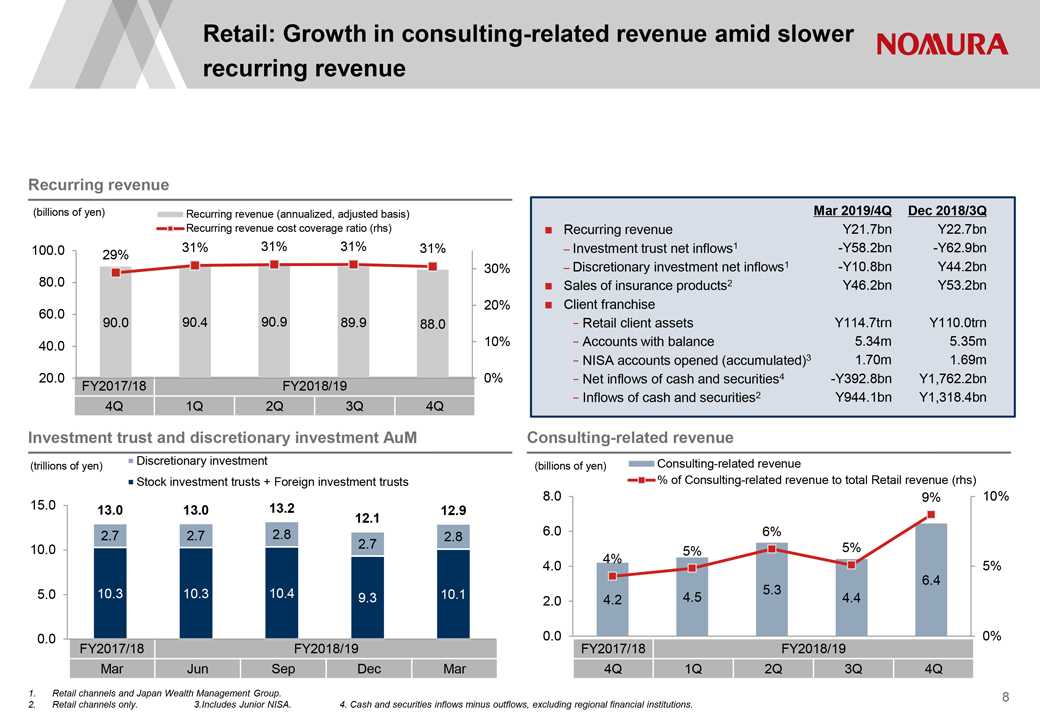 |
Retail: Growth in consulting-related revenue amid slower recurring revenue Recurring revenue (billions of yen) Recurring revenue (annualized, adjusted basis) Recurring revenue cost coverage ratio (rhs) 100.0 31% 31% 31% 31% 29% 30% 80.0 20% 60.0 90.0 90.4 90.9 89.9 88.0 40.0 10% 20.0 0% FY2017/18 FY2018/19 4Q 1Q 2Q 3Q 4Q Mar 2019/4Q Dec 2018/3Q Recurring revenue Y21.7bn Y22.7bn Investment trust net inflows1 -Y58.2bn -Y62.9bn Discretionary investment net inflows1 -Y10.8bn Y44.2bn Sales of insurance products2 Y46.2bn Y53.2bn ? Client franchise Retail client assets Y114.7trn Y110.0trn Accounts with balance 5.34m 5.35m NISA accounts opened (accumulated)3 1.70m 1.69m Net inflows of cash and securities4 -Y392.8bn Y1,762.2bn Inflows of cash and securities2 Y944.1bn Y1,318.4bn Investment trust and discretionary investment AuM Consulting-related revenue Discretionary investment Consulting-related revenue (trillions of yen) (billions of yen) Stock investment trusts + Foreign investment trusts % of Consulting-related revenue to total Retail revenue (rhs) 8.0 9% 10% 15.0 13.0 13.0 13.2 12.9 12.1 2.7 2.7 2.8 6.0 6% 2.8 10.0 2.7 5% 5% 4% 4.0 5% 6.4 5.0 10.3 10.3 10.4 10.1 5.3 9.3 2.0 4.2 4.5 4.4 0.0 0.0 0% FY2017/18 FY2018/19 FY2017/18 FY2018/19 Mar Jun Sep Dec Mar 4Q 1Q 2Q 3Q 4Q 1. Retail channels and Japan Wealth Management Group. 2. Retail channels only. 3.Includes Junior NISA. 4. Cash and securities inflows minus outflows, excluding regional financial institutions. 8
Table of Contents
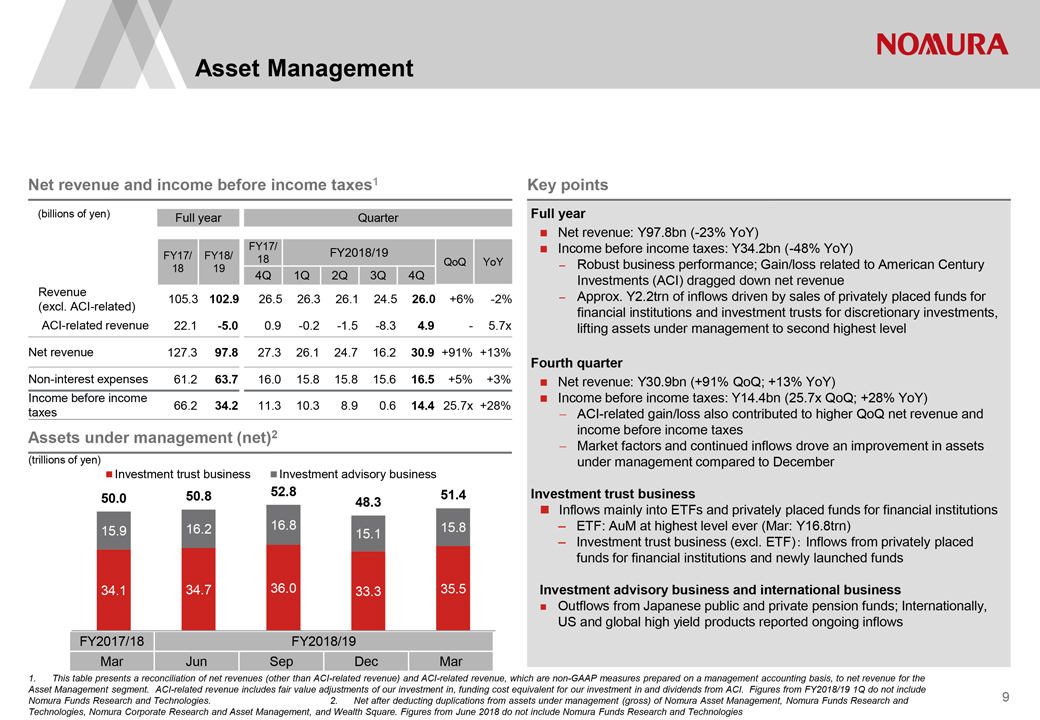 |
Asset Management Net revenue and income before income taxes1 Key points (billions of yen) Full year Quarter Full year Net revenue: Y97.8bn (-23% YoY) FY17/ Income before income taxes: Y34.2bn (-48% YoY) FY17/ FY18/ FY2018/19 18 QoQ YoY 18 19 4Q 1Q 2Q 3Q 4Q ? Robust business performance; Gain/loss related to American Century Revenue Investments (ACI) dragged down net revenue 105.3 102.9 26.5 26.3 26.1 24.5 26.0 +6% -2% ? Approx. Y2.2trn of inflows driven by sales of privately placed funds for (excl. ACI-related) financial institutions and investment trusts for discretionary investments, ACI-related revenue 22.1 -5.0 0.9 -0.2 -1.5 -8.3 4.9—5.7x lifting assets under management to second highest level Net revenue 127.3 97.8 27.3 26.1 24.7 16.2 30.9 +91% +13% Fourth quarter Non-interest expenses 61.2 63.7 16.0 15.8 15.8 15.6 16.5 +5% +3%? Net revenue: Y30.9bn (+91% QoQ; +13% YoY) Income before income Income before income taxes: Y14.4bn (25.7x QoQ; +28% YoY) 66.2 34.2 11.3 10.3 8.9 0.6 14.4 25.7x +28% taxes —ACI-related gain/loss also contributed to higher QoQ net revenue and 2 income before income taxes Assets under management (net)—Market factors and continued inflows drove an improvement in assets (trillions of yen) under management compared to December Investment trust business Investment advisory business 50.8 52.8 51.4 Investment trust business 50.0 48.3 Inflows mainly into ETFs and privately placed funds for financial institutions 15.9 16.2 16.8 15.8 ? ETF: AuM at highest level ever (Mar: Y16.8trn) 15.1 Investment trust business (excl. ETF) Inflows from privately placed funds for financial institutions and newly launched funds 34.1 34.7 36.0 33.3 35.5 Investment advisory business and international business Outflows from Japanese public and private pension funds; Internationally, US and global high yield products reported ongoing inflows FY2017/18 FY2018/19 Mar Jun Sep Dec Mar 1. This table presents a reconciliation of net revenues (other than ACI-related revenue) and ACI-related revenue, which are non-GAAP measures prepared on a management accounting basis, to net revenue for the Asset Management segment. ACI-related revenue includes fair value adjustments of our investment in, funding cost equivalent for our investment in and dividends from ACI. Figures from FY2018/19 1Q do not include Nomura Funds Research and Technologies. 2. Net after deducting duplications from assets under management (gross) of Nomura Asset Management, Nomura Funds Research and Technologies, Nomura Corporate Research and Asset Management, and Wealth Square. Figures from June 2018 do not include Nomura Funds Research and Technologies 9
Table of Contents
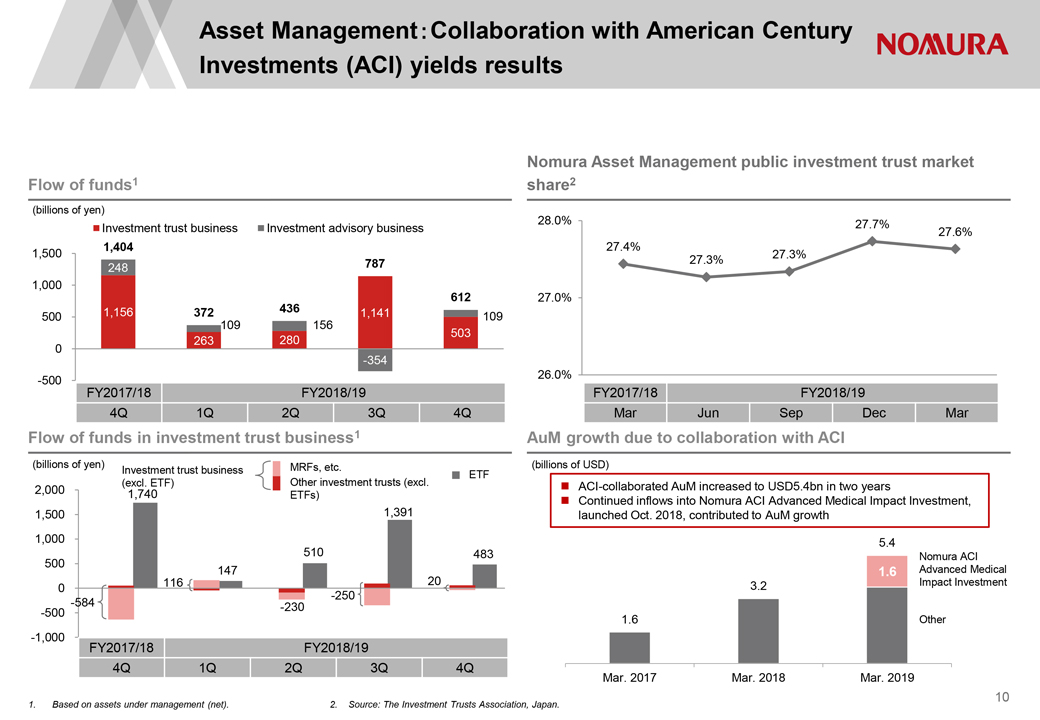 |
Asset Management Collaboration with American Century Investments (ACI) yields results Nomura Asset Management public investment trust market Flow of funds1 share2 (billions of yen) 28.0% Investment trust business Investment advisory business 27.7% 27.6% 1,404 27.4% 1,500 27.3% 787 27.3% 248 1,000 612 27.0% 1,156 372 436 1,141 500 109 109 156 503 263 280 0 -354 26.0% -500 FY2017/18 FY2018/19 FY2017/18 FY2018/19 4Q 1Q 2Q 3Q 4Q Mar Jun Sep Dec Mar Flow of funds in investment trust business1 AuM growth due to collaboration with ACI (billions of yen) MRFs, etc. (billions of USD) Investment trust business ETF (excl. ETF) Other investment trusts (excl. ACI-collaborated AuM increased to USD5.4bn in two years 2,000 1,740 ETFs) Continued inflows into Nomura ACI Advanced Medical Impact Investment, 1,500 1,391 launched Oct. 2018, contributed to AuM growth 1,000 5.4 510 483 Nomura ACI 500 147 1.6 Advanced Medical 116 20 3.2 Impact Investment 0 -250 -500 -584 -230 1.6 Other -1,000 FY2017/18 FY2018/19 4Q 1Q 2Q 3Q 4Q Mar. 2017 Mar. 2018 Mar. 2019 10 1. Based on assets under management (net). 2. Source: The Investment Trusts Association, Japan. 10
Table of Contents
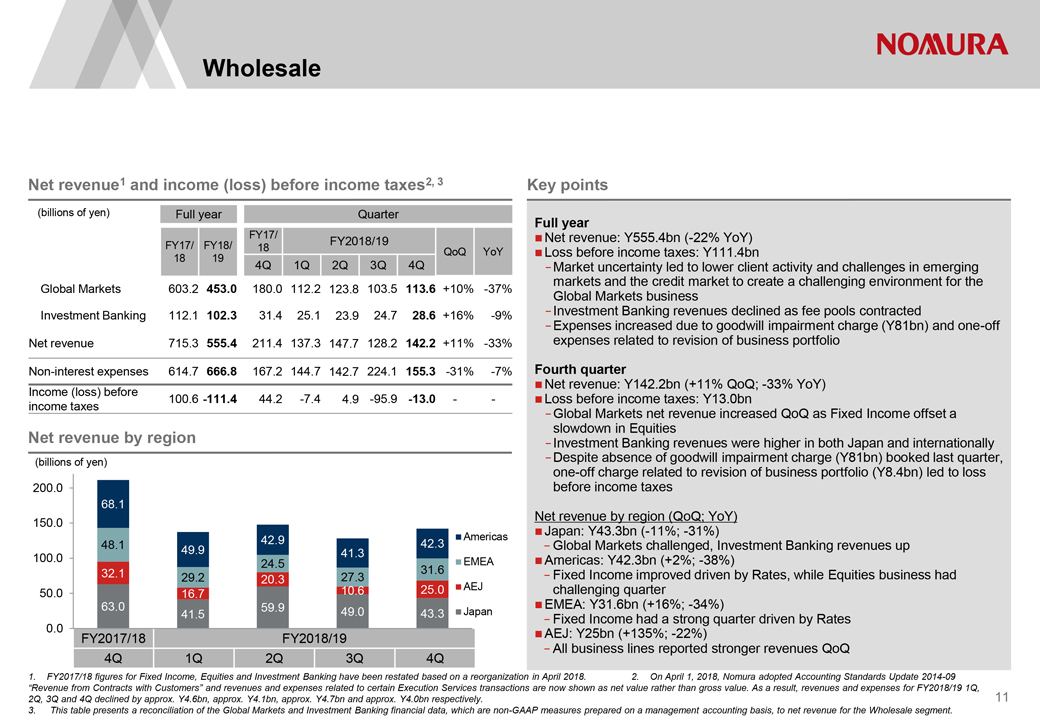 |
Wholesale Net revenue1 and income (loss) before income taxes2, 3 Key points (billions of yen) Full year Quarter Full year FY17/ Net revenue: Y555.4bn (-22% YoY) FY17/ FY18/ FY2018/19 18 QoQ YoY Loss before income taxes: Y111.4bn 18 19 4Q 1Q 2Q 3Q 4Q—Market uncertainty led to lower client activity and challenges in emerging markets and the credit market to create a challenging environment for the Global Markets 603.2 453.0 180.0 112.2 123.8 103.5 113.6 +10% -37% Global Markets business Investment Banking 112.1 102.3 31.4 25.1 23.9 24.7 28.6 +16% -9%—Investment Banking revenues declined as fee pools contracted —Expenses increased due to goodwill impairment charge (Y81bn) and one-off Net revenue 715.3 555.4 211.4 137.3 147.7 128.2 142.2 +11% -33% expenses related to revision of business portfolio Non-interest expenses 614.7 666.8 167.2 144.7 142.7 224.1 155.3 -31% -7% Fourth quarter revenue: Y142.2bn (+11% QoQ; -33% Net YoY) Income (loss) before 100.6 -111.4 44.2 -7.4 4.9 -95.9 -13.0 — Loss before income taxes: Y13.0bn income taxes —Global Markets net revenue increased QoQ as Fixed Income offset a slowdown in Equities Net revenue by region —Investment Banking revenues were higher in both Japan and internationally (billions of yen)—Despite absence of goodwill impairment charge (Y81bn) booked last quarter, one-off charge related to revision of business portfolio (Y8.4bn) led to loss 200.0 before income taxes 68.1 Net revenue by region (QoQ; YoY) 150.0 Japan: Y43.3bn (-11%; -31%) 42.9 Americas 48.1 42.3—Global Markets challenged, Investment Banking revenues up 49.9 41.3 100.0 EMEA Americas: Y42.3bn (+2%; -38%) 24.5 32.1 31.6 had 29.2 20.3 27.3—Fixed Income improved driven by Rates, while Equities business 10.6 25.0 AEJ challenging quarter 50.0 16.7 EMEA: -34%) 63.0 59.9 Y31.6bn (+16%; 41.5 49.0 43.3 Japan—Fixed Income had a strong quarter driven by Rates 0.0 AEJ: Y25bn (+135%; -22%) FY2017/18 FY2018/19—All business lines reported stronger revenues QoQ 4Q 1Q 2Q 3Q 4Q 1. FY2017/18 figures for Fixed Income, Equities and Investment Banking have been restated based on a reorganization in April 2018. 2. On April 1, 2018, Nomura adopted Accounting Standards Update 2014-09 ?Revenue from Contracts with Customers? and revenues and expenses related to certain Execution Services transactions are now shown as net value rather than gross value. As a result, revenues and expenses for FY2018/19 1Q, 2Q, 3Q and 4Q declined by approx. Y4.6bn, approx. Y4.1bn, approx. Y4.7bn and approx. Y4.0bn respectively. 3. This table presents a reconciliation of the Global Markets and Investment Banking financial data, which are non-GAAP measures prepared on a management accounting basis, to net revenue for the Wholesale segment. 11
Table of Contents
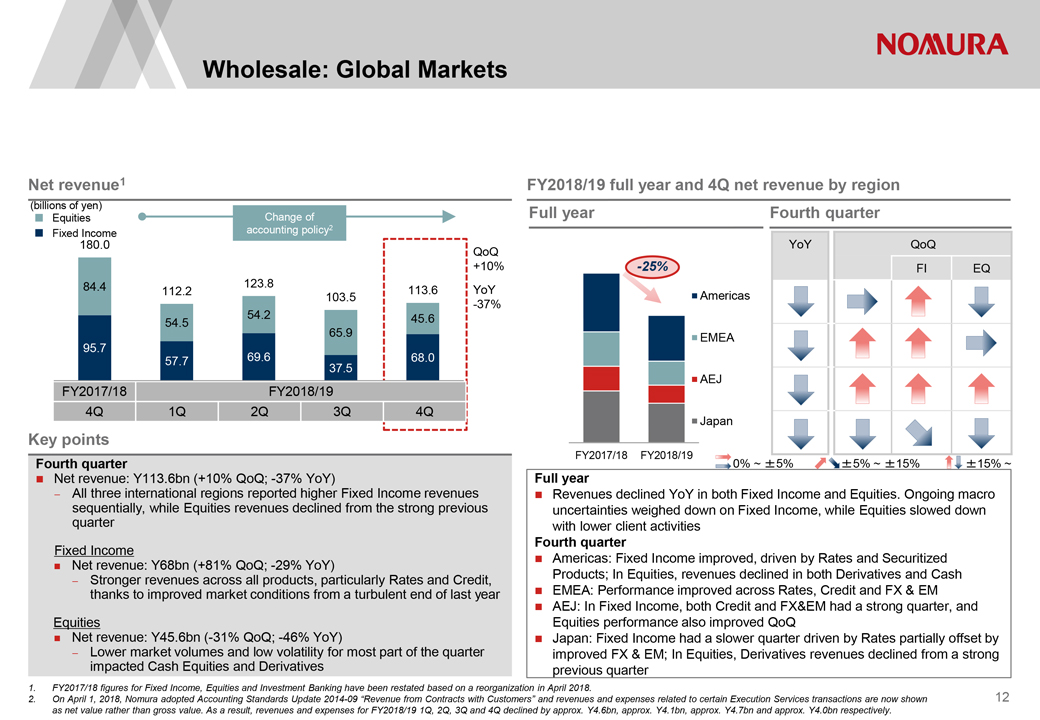 |
Wholesale: Global Markets Net revenue1 FY2018/19 full year and 4Q net revenue by region (billions of yen) Full year Fourth quarter Equities Change of accounting policy2 Fixed Income 180.0 YoY QoQ QoQ +10% -25% FI EQ 84.4 123.8 112.2 113.6 YoY 103.5 Americas 54.2 -37% 54.5 45.6 65.9 EMEA 95.7 57.7 69.6 37.5 68.0 AEJ FY2017/18 FY2018/19 4Q 1Q 2Q 3Q 4Q Japan Key points FY2017/18 FY2018/19 Fourth quarter 0% ~ ?5% ?5% ~ ?15% ?15% ~ Net revenue: Y113.6bn (+10% QoQ; -37% YoY) Full year —All three international regions reported higher Fixed Income revenues ? Revenues declined YoY in both Fixed Income and Equities. Ongoing macro sequentially, while Equities revenues declined from the strong previous uncertainties weighed down on Fixed Income, while Equities slowed down quarter with lower client activities Fourth quarter Fixed Income Americas: Fixed Income improved, driven by Rates and Securitized Net revenue: Y68bn (+81% QoQ; -29% YoY) Stronger Products; In Equities, revenues declined in both Derivatives and Cash—revenues across all products, particularly Rates and Credit, thanks to improved market conditions from a turbulent end of last year EMEA: Performance improved across Rates, Credit and FX & EM AEJ: In Fixed Income, both Credit and FX&EM had a strong quarter, and Equities Equities performance also improved QoQ Net revenue: Y45.6bn (-31% QoQ; -46% YoY) Japan: Fixed Income had a slower quarter driven by Rates partially offset by—Lower market volumes and low volatility for most part of the quarter improved FX & EM; In Equities, Derivatives revenues declined from a strong impacted Cash Equities and Derivatives previous quarter 1. FY2017/18 figures for Fixed Income, Equities and Investment Banking have been restated based on a reorganization in April 2018. 2. On April 1, 2018, Nomura adopted Accounting Standards Update 2014-09 ?Revenue from Contracts with Customers? and revenues and expenses related to certain Execution Services transactions are now shown 12 as net value rather than gross value. As a result, revenues and expenses for FY2018/19 1Q, 2Q, 3Q and 4Q declined by approx. Y4.6bn, approx. Y4.1bn, approx. Y4.7bn and approx. Y4.0bn respectively. 12
Table of Contents
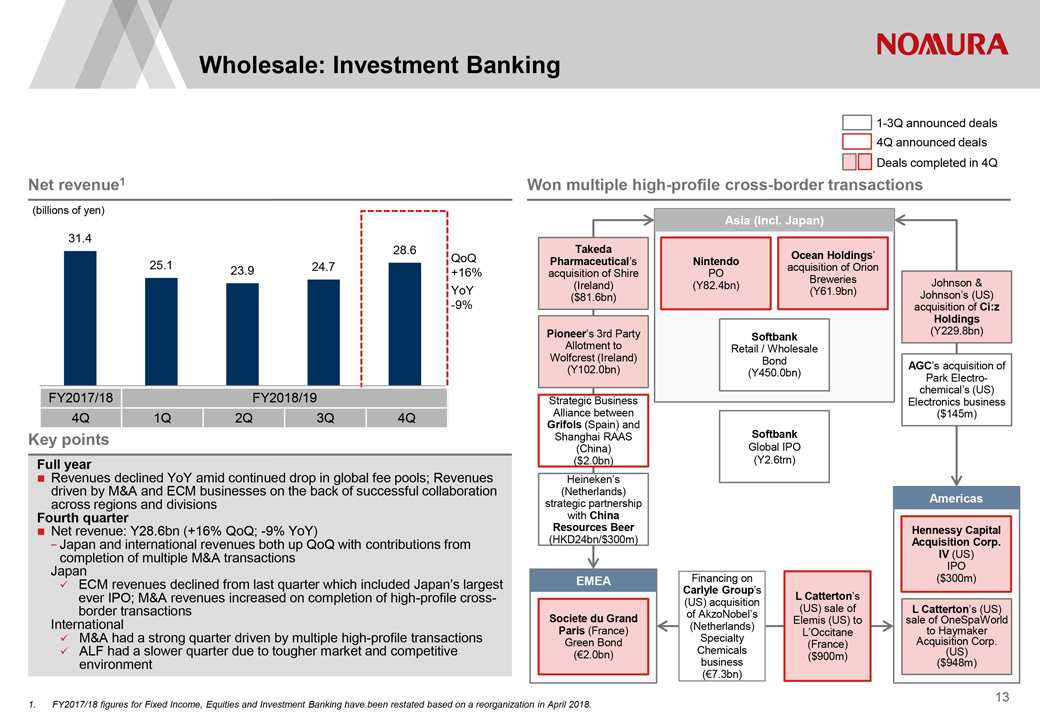 |
Wholesale: Investment Banking 1-3Q announced deals 4Q announced deals Deals completed in 4Q Net revenue1 Won multiple high-profile cross-border transactions (billions of yen) Asia (Incl. Japan) 31.4 28.6 Takeda QoQ Ocean Holdings? 25.1 Pharmaceutical?s Nintendo 23.9 24.7 +16% acquisition of Orion acquisition of Shire PO Breweries Johnson & YoY (Ireland) (Y82.4bn) (Y61.9bn) Johnson?s (US) ($81.6bn) -9% acquisition of Ci:z Holdings Pioneer?s 3rd Party (Y229.8bn) Allotment to Softbank Wolfcrest (Ireland) Retail / Wholesale Bond (Y102.0bn) AGC?s acquisition of (Y450.0bn) Park Electrochemical?s (US) FY2017/18 FY2018/19 Strategic Business Electronics business 4Q 1Q 2Q 3Q 4Q Alliance between ($145m) Grifols (Spain) and Softbank Key points Shanghai RAAS (China) Global IPO Full year ($2.0bn) (Y2.6trn) Revenues declined YoY amid continued drop in global fee pools; Revenues Heineken?s driven by M&A and ECM businesses on the back of successful collaboration (Netherlands) across regions and divisions strategic partnership Americas Fourth quarter with China Net revenue: Y28.6bn (+16% QoQ; -9% YoY) Resources Beer Hennessy Capital Japan and international both up QoQ contributions from (HKD24bn/$300m) Acquisition Corp. —revenues with IV (US) completion of multiple M&A transactions Japan IPO EMEA Financing on ($300m) ECM revenues declined from last quarter which included Japan?s largest Carlyle Group?s ever IPO; M&A revenues increased on completion of high-profile cross- L Catterton?s (US) acquisition border transactions (US) sale of L Catterton?s (US) Societe du Grand of AkzoNobel?s International Elemis (US) to sale of OneSpaWorld Paris (France) (Netherlands) to Haymaker L?Occitane M&A had a strong quarter driven by multiple high-profile transactions Green Bond Specialty Acquisition Corp. (France) ALF had a slower quarter due to tougher market and competitive (2.0bn) Chemicals (US) ($900m) environment business ($948m) (7.3bn) 1. FY2017/18 figures for Fixed Income, Equities and Investment Banking have been restated based on a reorganization in April 2018. 13
Table of Contents
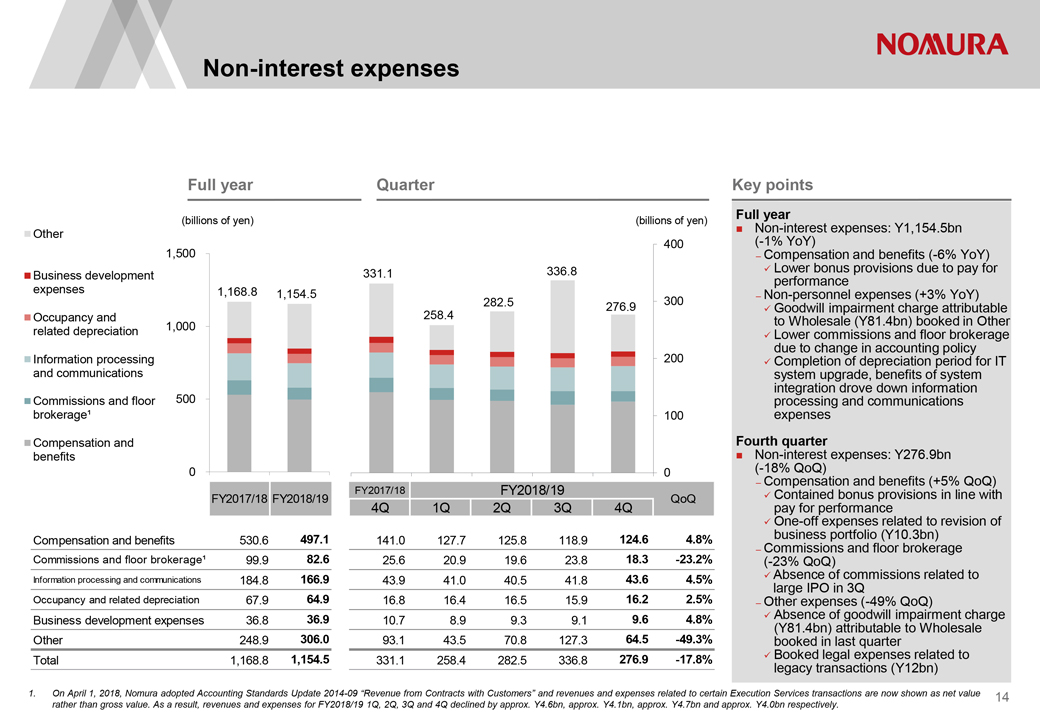 |
Non-interest expenses Full year Quarter Key points Full year (billions of yen) (billions of yen) Non-interest expenses: Y1,154.5bn Other 400 (-1% YoY) 1,500 ? Compensation and benefits (-6% YoY) 331.1 336.8 Lower bonus provisions due to pay for Business development performance expenses 1,168.8 1,154.5 300 ? Non-personnel expenses (+3% YoY) 282.5 276.9 Goodwill impairment charge attributable Occupancy and 258.4 1,000 to Wholesale (Y81.4bn) booked in Other related depreciation Lower commissions and floor brokerage Information processing 200 due to change in accounting policy Completion of depreciation period for IT and communications system upgrade, benefits of system 500 integration drove down information Commissions and floor processing and communications brokerage? 100 expenses Compensation and Fourth quarter benefits Non-interest expenses: Y276.9bn 0 0 (-18% QoQ) ? Compensation and benefits (+5% QoQ) FY2017/18 FY2018/19 FY2017/18 FY2018/19 QoQ Contained bonus provisions in line with 4Q 1Q 2Q 3Q 4Q pay for performance One-off expenses related to revision of 497.1 124.6 4.8% business portfolio (Y10.3bn) Compensation and benefits 530.6 141.0 127.7 125.8 118.9 ? Commissions and floor brokerage Commissions and floor brokerage? 99.9 82.6 25.6 20.9 19.6 23.8 18.3 -23.2% (-23% QoQ) Information processing and communications 166.9 43.6 4.5% Absence of commissions related to 184.8 43.9 41.0 40.5 41.8 64.9 16.2 2.5% large IPO in 3Q Occupancy and related depreciation 67.9 16.8 16.4 16.5 15.9 ? Other expenses (-49% QoQ) 36.9 9.6 4.8% Absence of goodwill impairment charge Business development expenses 36.8 10.7 8.9 9.3 9.1 306.0 64.5 -49.3% (Y81.4bn) attributable to Wholesale Other 248.9 93.1 43.5 70.8 127.3 booked in last quarter Total 1,168.8 1,154.5 331.1 258.4 282.5 336.8 276.9 -17.8% Booked legal expenses related to legacy transactions (Y12bn) 1. On April 1, 2018, Nomura adopted Accounting Standards Update 2014-09 ?Revenue from Contracts with Customers? and revenues and expenses related to certain Execution Services transactions are now shown as net value 14 rather than gross value. As a result, revenues and expenses for FY2018/19 1Q, 2Q, 3Q and 4Q declined by approx. Y4.6bn, approx. Y4.1bn, approx. Y4.7bn and approx. Y4.0bn respectively. 14
Table of Contents
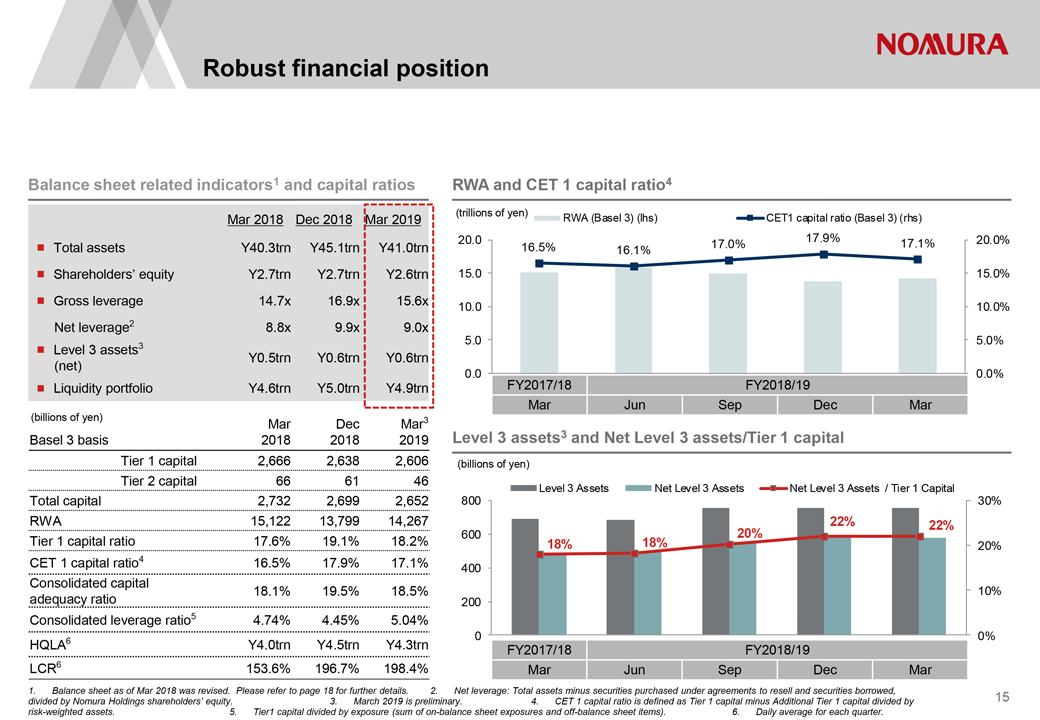 |
Robust financial position Balance sheet related indicators1 and capital ratios RWA and CET 1 capital ratio4 (trillions of yen) Mar 2018 Dec 2018 Mar 2019 RWA (Basel 3) (lhs) CET1 capital ratio (Basel 3) (rhs) 20.0 17.9% 20.0% Total assets Y40.3trn Y45.1trn Y41.0trn 16.5% 17.0% 17.1% 16.1% Shareholders? equity Y2.7trn Y2.7trn Y2.6trn 15.0 15.0% Gross leverage 14.7x 16.9x 15.6x 10.0 10.0% Net leverage2 8.8x 9.9x 9.0x 5.0 5.0% Level 3 assets3 Y0.5trn Y0.6trn Y0.6trn (net) 0.0 0.0% Liquidity portfolio Y4.6trn Y5.0trn Y4.9trn FY2017/18 FY2018/19 Mar Jun Sep Dec Mar (billions of yen) 3 Mar Dec Mar 3 Basel 3 basis 2018 2018 2019 Level 3 assets and Net Level 3 assets/Tier 1 capital Tier 1 capital 2,666 2,638 2,606 (billions of yen) Tier 2 capital 66 61 46 Level 3 Assets Net Level 3 Assets Net Level 3 Assets / Tier 1 Capital Total capital 2,732 2,699 2,652 800 30% RWA 15,122 13,799 14,267 22% 22% 600 20% Tier 1 capital ratio 17.6% 19.1% 18.2% 18% 18% 20% CET 1 capital ratio4 16.5% 17.9% 17.1% 400 Consolidated capital 18.1% 19.5% 18.5% 10% adequacy ratio 200 Consolidated leverage ratio5 4.74% 4.45% 5.04% 0 0% HQLA6 Y4.0trn Y4.5trn Y4.3trn FY2017/18 FY2018/19 LCR6 153.6% 196.7% 198.4% Mar Jun Sep Dec Mar 1. Balance sheet as of Mar 2018 was revised. Please refer to page 18 for further details. 2. Net leverage: Total assets minus securities purchased under agreements to resell and securities borrowed, divided by Nomura Holdings shareholders? equity. 3. March 2019 is preliminary. 4. CET 1 capital ratio is defined as Tier 1 capital minus Additional Tier 1 capital divided by 15 risk-weighted assets. 5. Tier1 capital divided by exposure (sum of on-balance sheet exposures and off-balance sheet items). 6. Daily average for each quarter. 15
Table of Contents
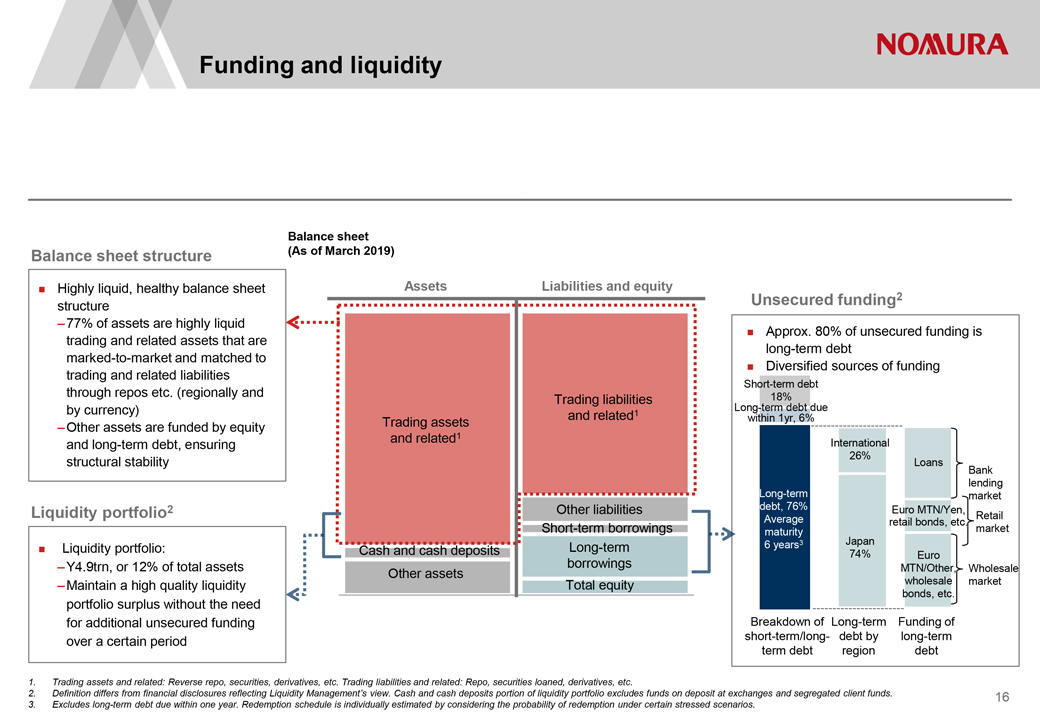 |
Funding and liquidity Balance sheet Balance sheet structure (As of March 2019) Highly liquid, healthy balance sheet Assets Liabilities and equity Unsecured funding2 structure ? 77% of assets are highly liquid Approx. 80% of unsecured funding is trading and related assets that are long-term debt marked-to-market and matched to ? Diversified sources of funding trading and related liabilities Short-term debt through repos etc. (regionally and 18% Trading liabilities by currency) Long-term debt due and related1 Trading assets within 1yr, 6% ? Other assets are funded by equity and related1 and long-term debt, ensuring International 26% structural stability Loans Bank lending Long-term market Liquidity portfolio2 Other liabilities debt, 76% Euro MTN/Yen, Retail Average retail bonds, etc. Short-term borrowings market maturity Japan 6 years3 Liquidity portfolio: Cash and cash deposits Long-term 74% Euro ? Y4.9trn, or 12% of total assets borrowings Other assets MTN/Other, Wholesale ? Maintain a high quality liquidity Total equity wholesale market portfolio surplus without the need bonds, etc. for additional unsecured funding Breakdown of Long-term Funding of over a certain period short-term/long- debt by long-term term debt region debt 1. Trading assets and related: Reverse repo, securities, derivatives, etc. Trading liabilities and related: Repo, securities loaned, derivatives, etc. 2. Definition differs from financial disclosures reflecting Liquidity Management?s view. Cash and cash deposits portion of liquidity portfolio excludes funds on deposit at exchanges and segregated client funds. 16 3. Excludes long-term debt due within one year. Redemption schedule is individually estimated by considering the probability of redemption under certain stressed scenarios. 16
Table of Contents
 |
Financial Supplement
Table of Contents
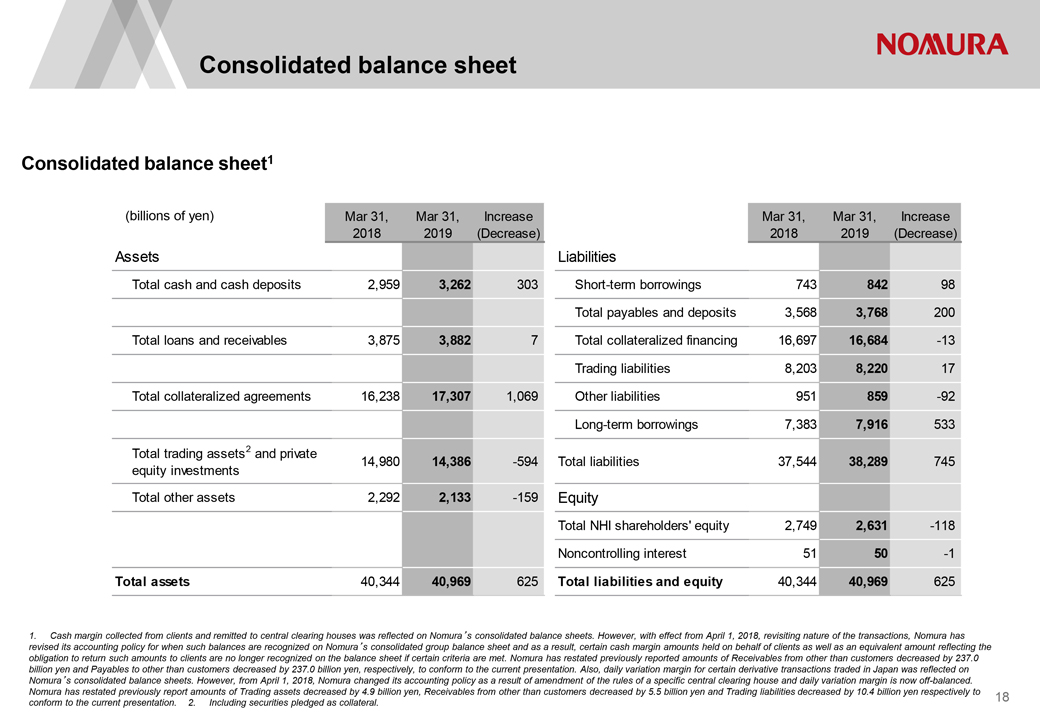 |
Consolidated balance sheet Consolidated balance sheet1 (billions of yen) Mar 31, Mar 31, Increase Mar 31, Mar 31, Increase 2018 2019 (Decrease) 2018 2019 (Decrease) Assets Liabilities Total cash and cash deposits 2,959 3,262 303 Short-term borrowings 743 842 98 Total payables and deposits 3,568 3,768 200 Total loans and receivables 3,875 3,882 7 Total collateralized financing 16,697 16,684 -13 Trading liabilities 8,203 8,220 17 Total collateralized agreements 16,238 17,307 1,069 Other liabilities 951 859 -92 Long-term borrowings 7,383 7,916 533 Total trading assets2 and private 14,980 14,386 -594 Total liabilities 37,544 38,289 745 equity investments Total other assets 2,292 2,133 -159 Equity Total NHI shareholders’ equity 2,749 2,631 -118 Noncontrolling interest 51 50 -1 Total assets 40,344 40,969 625 Total liabilities and equity 40,344 40,969 625 1. Cash margin collected from clients and remitted to central clearing houses was reflected on Nomura?s consolidated balance sheets. However, with effect from April 1, 2018, revisiting nature of the transactions, Nomura has revised its accounting policy for when such balances are recognized on Nomura?s consolidated group balance sheet and as a result, certain cash margin amounts held on behalf of clients as well as an equivalent amount reflecting the obligation to return such amounts to clients are no longer recognized on the balance sheet if certain criteria are met. Nomura has restated previously reported amounts of Receivables from other than customers decreased by 237.0 billion yen and Payables to other than customers decreased by 237.0 billion yen, respectively, to conform to the current presentation. Also, daily variation margin for certain derivative transactions traded in Japan was reflected on Nomura?s consolidated balance sheets. However, from April 1, 2018, Nomura changed its accounting policy as a result of amendment of the rules of a specific central clearing house and daily variation margin is now off-balanced. Nomura has restated previously report amounts of Trading assets decreased by 4.9 billion yen, Receivables from other than customers decreased by 5.5 billion yen and Trading liabilities decreased by 10.4 billion yen respectively to conform to the current presentation. 2. Including securities pledged as collateral. 18
Table of Contents
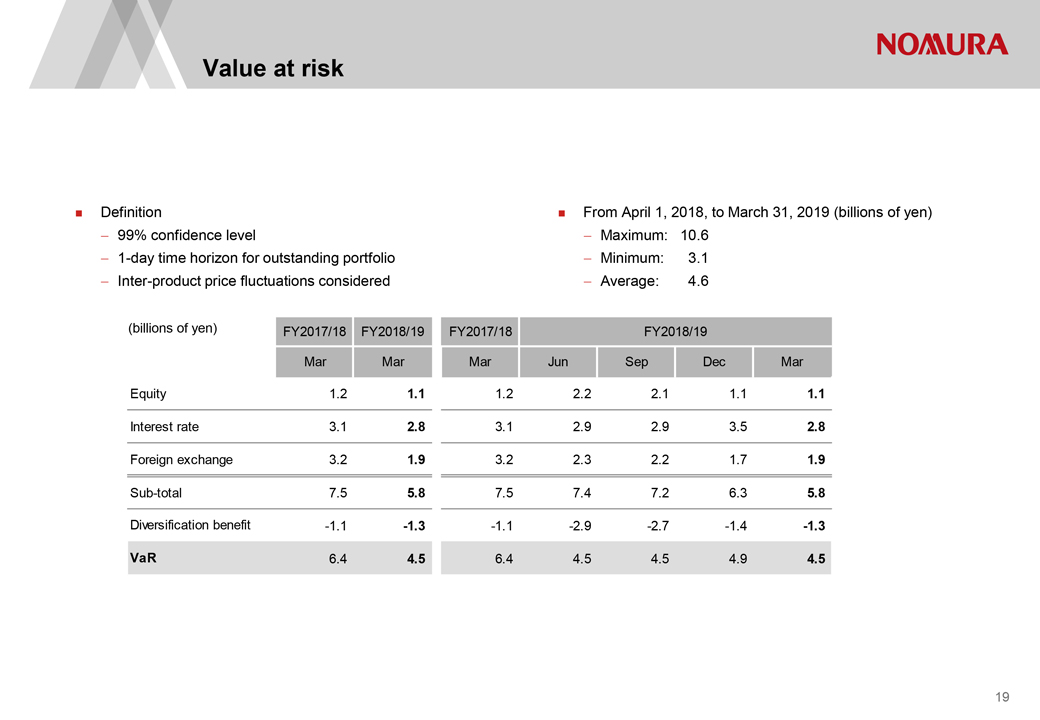 |
Value at risk Definition From April 1, 2018, to March 31, 2019 (billions of yen)—99% confidence level—Maximum: 10.6—1-day time horizon for outstanding portfolio—Minimum: 3.1—Inter-product price fluctuations considered—Average: 4.6 (billions of yen) FY2017/18 FY2018/19 FY2017/18 FY2018/19 Mar Mar Mar Jun Sep Dec Mar Equity 1.2 1.1 1.2 2.2 2.1 1.1 1.1 Interest rate 3.1 2.8 3.1 2.9 2.9 3.5 2.8 Foreign exchange 3.2 1.9 3.2 2.3 2.2 1.7 1.9 Sub-total 7.5 5.8 7.5 7.4 7.2 6.3 5.8 Diversification benefit -1.1 -1.3 -1.1 -2.9 -2.7 -1.4 -1.3 VaR 6.4 4.5 6.4 4.5 4.5 4.9 4.5 19
Table of Contents
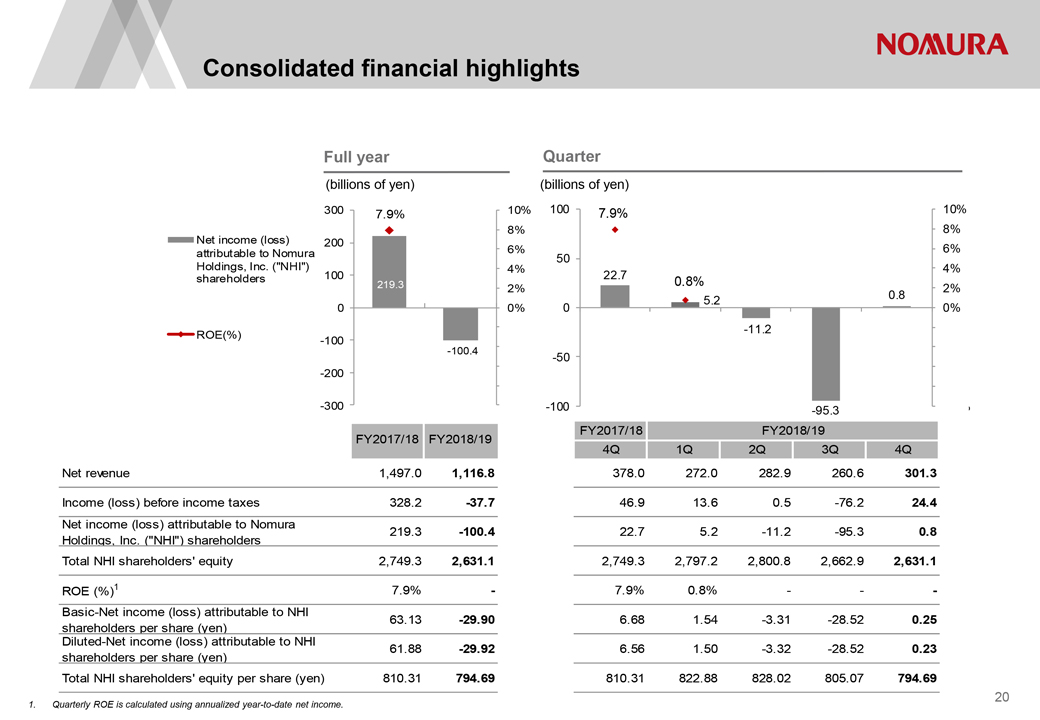 |
Consolidated financial highlights Full year Quarter (billions of yen) (billions of yen) 300 7.9% 10% 100 7.9% 10% 8% 8% Net income (loss) 200 attributable to Nomura 6% 50 6% Holdings, Inc. (“NHI”) 4% 4% shareholders 100 22.7 219.3 0.8% 2% 2% 0.8 5.2 0 0% 0 0% -11.2 ROE(%) -100 -100.4 -50 -200 -300 -100 -95.3 FY2017/18 FY2018/19 FY2017/18 FY2018/19 4Q 1Q 2Q 3Q 4Q Net revenue 1,497.0 1,116.8 378.0 272.0 282.9 260.6 301.3 Income (loss) before income taxes 328.2 -37.7 46.9 13.6 0.5 -76.2 24.4 Net income (loss) attributable to Nomura 219.3 -100.4 22.7 5.2 -11.2 -95.3 0.8 Holdings, Inc. (“NHI”) shareholders Total NHI shareholders’ equity 2,749.3 2,631.1 2,749.3 2,797.2 2,800.8 2,662.9 2,631.1 ROE (%)1 7.9%—7.9% 0.8% — -Basic-Net income (loss) attributable to NHI 63.13 -29.90 6.68 1.54 -3.31 -28.52 0.25 shareholders per share (yen) Diluted-Net income (loss) attributable to NHI 61.88 -29.92 6.56 1.50 -3.32 -28.52 0.23 shareholders per share (yen) Total NHI shareholders’ equity per share (yen) 810.31 794.69 810.31 822.88 828.02 805.07 794.69 1. Quarterly ROE is calculated using annualized year-to-date net income. 20
Table of Contents
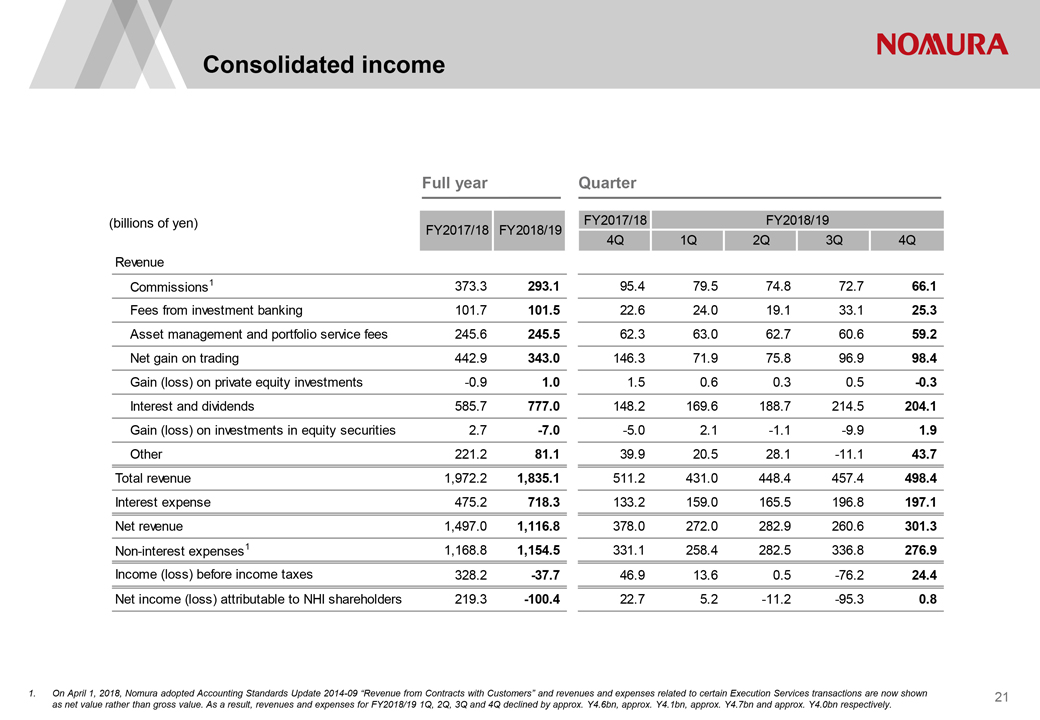 |
Consolidated income Full year Quarter (billions of yen) FY2017/18 FY2018/19 FY2017/18 FY2018/19 4Q 1Q 2Q 3Q 4Q Revenue Commissions1 373.3 293.1 95.4 79.5 74.8 72.7 66.1 Fees from investment banking 101.7 101.5 22.6 24.0 19.1 33.1 25.3 Asset management and portfolio service fees 245.6 245.5 62.3 63.0 62.7 60.6 59.2 Net gain on trading 442.9 343.0 146.3 71.9 75.8 96.9 98.4 Gain (loss) on private equity investments -0.9 1.0 1.5 0.6 0.3 0.5 -0.3 Interest and dividends 585.7 777.0 148.2 169.6 188.7 214.5 204.1 Gain (loss) on investments in equity securities 2.7 -7.0 -5.0 2.1 -1.1 -9.9 1.9 Other 221.2 81.1 39.9 20.5 28.1 -11.1 43.7 Total revenue 1,972.2 1,835.1 511.2 431.0 448.4 457.4 498.4 Interest expense 475.2 718.3 133.2 159.0 165.5 196.8 197.1 Net revenue 1,497.0 1,116.8 378.0 272.0 282.9 260.6 301.3 Non-interest expenses1 1,168.8 1,154.5 331.1 258.4 282.5 336.8 276.9 Income (loss) before income taxes 328.2 -37.7 46.9 13.6 0.5 -76.2 24.4 Net income (loss) attributable to NHI shareholders 219.3 -100.4 22.7 5.2 -11.2 -95.3 0.8 1. On April 1, 2018, Nomura adopted Accounting Standards Update 2014-09 ?Revenue from Contracts with Customers? and revenues and expenses related to certain Execution Services transactions are now shown as net value rather than gross value. As a result, revenues and expenses for FY2018/19 1Q, 2Q, 3Q and 4Q declined by approx. Y4.6bn, approx. Y4.1bn, approx. Y4.7bn and approx. Y4.0bn respectively. 21
Table of Contents
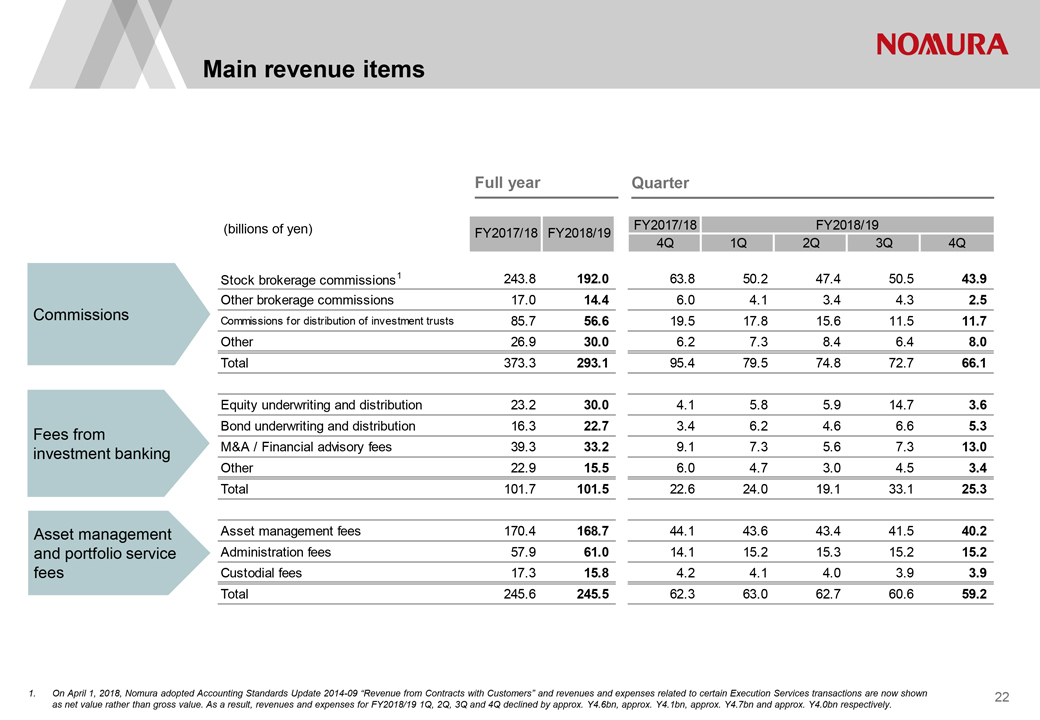 |
Main revenue items Full year Quarter (billions of yen) FY2017/18 FY2018/19 FY2017/18 FY2018/19 4Q 1Q 2Q 3Q 4Q Stock brokerage commissions1 243.8 192.0 63.8 50.2 47.4 50.5 43.9 Other brokerage commissions 17.0 14.4 6.0 4.1 3.4 4.3 2.5 Commissions Commissions for distribution of investment trusts 85.7 56.6 19.5 17.8 15.6 11.5 11.7 Other 26.9 30.0 6.2 7.3 8.4 6.4 8.0 Total 373.3 293.1 95.4 79.5 74.8 72.7 66.1 Equity underwriting and distribution 23.2 30.0 4.1 5.8 5.9 14.7 3.6 Bond underwriting and distribution 16.3 22.7 3.4 6.2 4.6 6.6 5.3 Fees from M&A / Financial advisory fees 39.3 33.2 9.1 7.3 5.6 7.3 13.0 investment banking Other 22.9 15.5 6.0 4.7 3.0 4.5 3.4 Total 101.7 101.5 22.6 24.0 19.1 33.1 25.3 Asset management Asset management fees 170.4 168.7 44.1 43.6 43.4 41.5 40.2 and portfolio service Administration fees 57.9 61.0 14.1 15.2 15.3 15.2 15.2 fees Custodial fees 17.3 15.8 4.2 4.1 4.0 3.9 3.9 Total 245.6 245.5 62.3 63.0 62.7 60.6 59.2 1. On April 1, 2018, Nomura adopted Accounting Standards Update 2014-09 ?Revenue from Contracts with Customers? and revenues and expenses related to certain Execution Services transactions are now shown as net value rather than gross value. As a result, revenues and expenses for FY2018/19 1Q, 2Q, 3Q and 4Q declined by approx. Y4.6bn, approx. Y4.1bn, approx. Y4.7bn and approx. Y4.0bn respectively. 22
Table of Contents
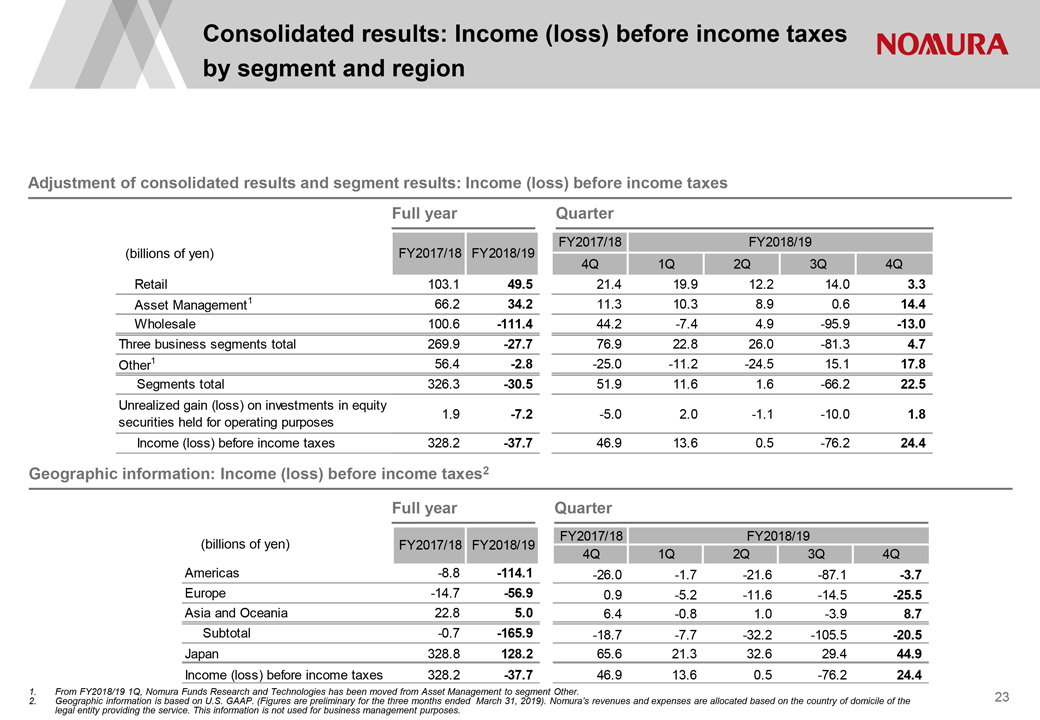 |
Consolidated results: Income (loss) before income taxes by segment and region Adjustment of consolidated results and segment results: Income (loss) before income taxes Full year Quarter (billions of yen) FY2017/18 FY2018/19 FY2017/18 FY2018/19 4Q 1Q 2Q 3Q 4Q Retail 103.1 49.5 21.4 19.9 12.2 14.0 3.3 Asset Management1 66.2 34.2 11.3 10.3 8.9 0.6 14.4 Wholesale 100.6 -111.4 44.2 -7.4 4.9 -95.9 -13.0 Three business segments total 269.9 -27.7 76.9 22.8 26.0 -81.3 4.7 Other1 56.4 -2.8 -25.0 -11.2 -24.5 15.1 17.8 Segments total 326.3 -30.5 51.9 11.6 1.6 -66.2 22.5 Unrealized gain (loss) on investments in equity 1.9 -7.2 -5.0 2.0 -1.1 -10.0 1.8 securities held for operating purposes Income (loss) before income taxes 328.2 -37.7 46.9 13.6 0.5 -76.2 24.4 Geographic information: Income (loss) before income taxes2 Full year Quarter FY2017/18 FY2018/19 (billions of yen) FY2017/18 FY2018/19 4Q 1Q 2Q 3Q 4Q Americas -8.8 -114.1 -26.0 -1.7 -21.6 -87.1 -3.7 Europe -14.7 -56.9 0.9 -5.2 -11.6 -14.5 -25.5 Asia and Oceania 22.8 5.0 6.4 -0.8 1.0 -3.9 8.7 Subtotal -0.7 -165.9 -18.7 -7.7 -32.2 -105.5 -20.5 Japan 328.8 128.2 65.6 21.3 32.6 29.4 44.9 Income (loss) before income taxes 328.2 -37.7 46.9 13.6 0.5 -76.2 24.4 1. From FY2018/19 1Q, Nomura Funds Research and Technologies has been moved from Asset Management to segment Other. 2. Geographic information is based on U.S. GAAP. (Figures are preliminary for the three months ended March 31, 2019). Nomura?s revenues and expenses are allocated based on the country of domicile of the legal entity providing the service. This information is not used for business management purposes. 23
Table of Contents
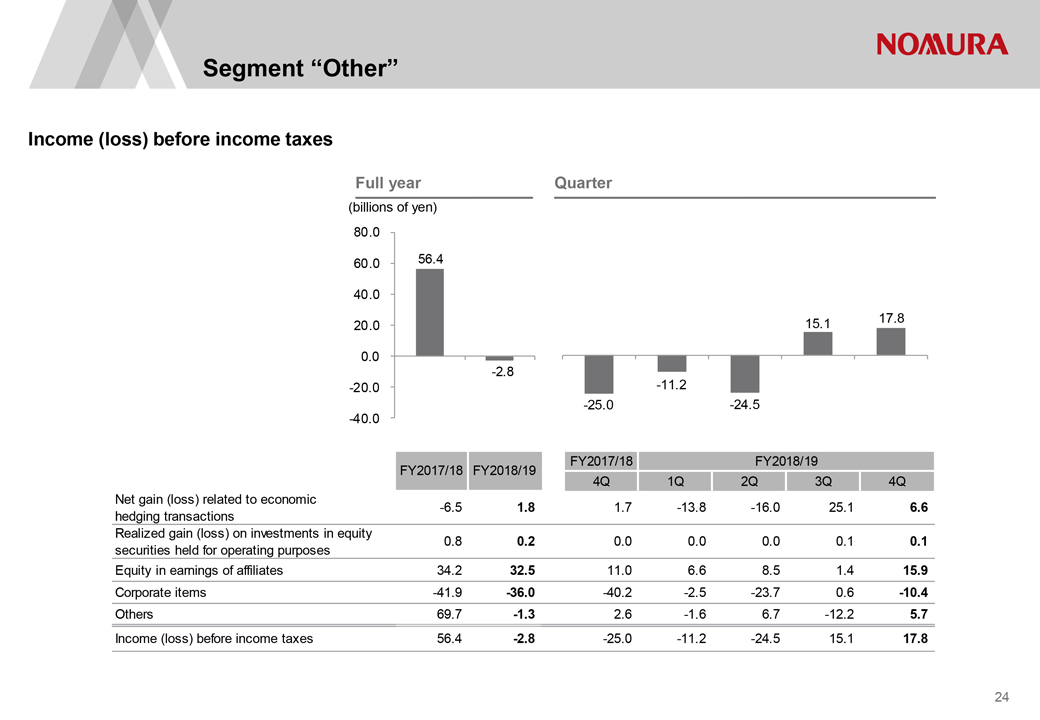 |
Segment “Other” Income (loss) before income taxes Full year Quarter (billions of yen) 80.0 60.0 56.4 40.0 17.8 20.0 15.1 0.0 -2.8 -20.0 -11.2 -25.0 -24.5 -40.0 1 2 1 2 3 4 5 FY2017/18 FY2018/19 FY2017/18 FY2018/19 4Q 1Q 2Q 3Q 4Q Net gain (loss) related to economic -6.5 1.8 1.7 -13.8 -16.0 25.1 6.6 hedging transactions Realized gain (loss) on investments in equity 0.8 0.2 0.0 0.0 0.0 0.1 0.1 securities held for operating purposes Equity in earnings of affiliates 34.2 32.5 11.0 6.6 8.5 1.4 15.9 Corporate items -41.9 -36.0 -40.2 -2.5 -23.7 0.6 -10.4 Others 69.7 -1.3 2.6 -1.6 6.7 -12.2 5.7 Income (loss) before income taxes 56.4 -2.8 -25.0 -11.2 -24.5 15.1 17.8 24
Table of Contents
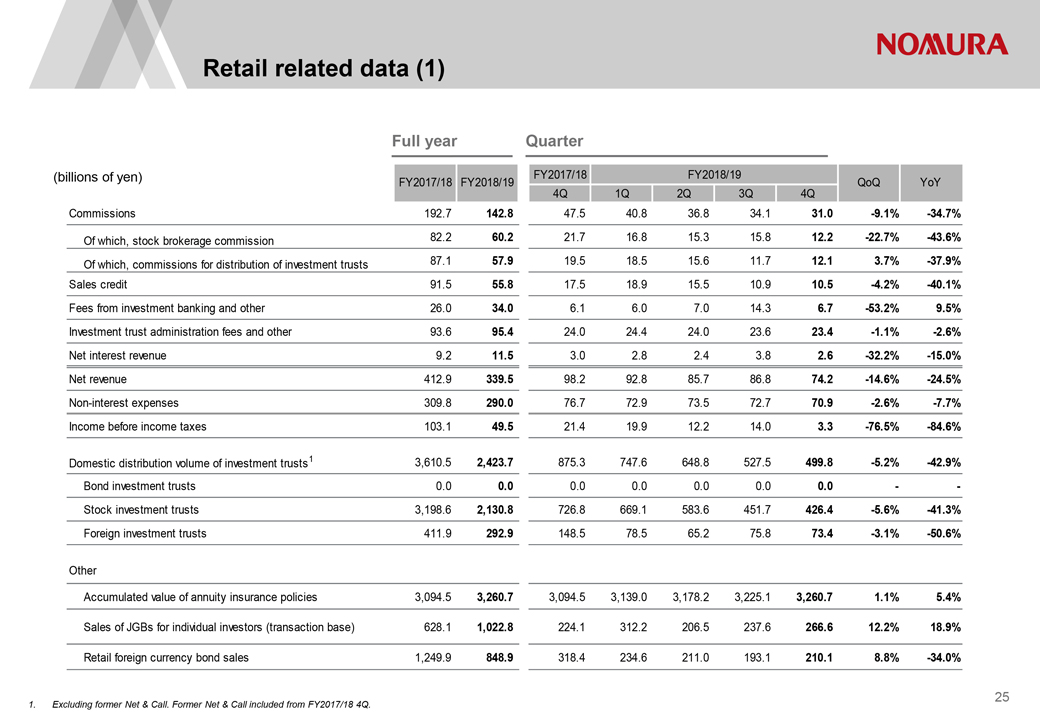 |
Retail related data (1) Full year Quarter (billions of yen) FY2017/18 FY2018/19 FY2017/18 FY2018/19 4Q 1Q 2Q 3Q 4Q QoQ YoY Commissions 192.7 142.8 47.5 40.8 36.8 34.1 31.0 -9.1% -34.7% Of which, stock brokerage commission 82.2 60.2 21.7 16.8 15.3 15.8 12.2 -22.7% -43.6% Of which, commissions for distribution of investment trusts 87.1 57.9 19.5 18.5 15.6 11.7 12.1 3.7% -37.9% Sales credit 91.5 55.8 17.5 18.9 15.5 10.9 10.5 -4.2% -40.1% Fees from investment banking and other 26.0 34.0 6.1 6.0 7.0 14.3 6.7 -53.2% 9.5% Investment trust administration fees and other 93.6 95.4 24.0 24.4 24.0 23.6 23.4 -1.1% -2.6% Net interest revenue 9.2 11.5 3.0 2.8 2.4 3.8 2.6 -32.2% -15.0% Net revenue 412.9 339.5 98.2 92.8 85.7 86.8 74.2 -14.6% -24.5% Non-interest expenses 309.8 290.0 76.7 72.9 73.5 72.7 70.9 -2.6% -7.7% Income before income taxes 103.1 49.5 21.4 19.9 12.2 14.0 3.3 -76.5% -84.6% Domestic distribution volume of investment trusts1 3,610.5 2,423.7 875.3 747.6 648.8 527.5 499.8 -5.2% -42.9% Bond investment trusts 0.0 0.0 0.0 0.0 0.0 0.0 0.0 —Stock investment trusts 3,198.6 2,130.8 726.8 669.1 583.6 451.7 426.4 -5.6% -41.3% Foreign investment trusts 411.9 292.9 148.5 78.5 65.2 75.8 73.4 -3.1% -50.6% Other Accumulated value of annuity insurance policies 3,094.5 3,260.7 3,094.5 3,139.0 3,178.2 3,225.1 3,260.7 1.1% 5.4% Sales of JGBs for individual investors (transaction base) 628.1 1,022.8 224.1 312.2 206.5 237.6 266.6 12.2% 18.9% Retail foreign currency bond sales 1,249.9 848.9 318.4 234.6 211.0 193.1 210.1 8.8% -34.0% 1. Excluding former Net & Call. Former Net & Call included from FY2017/18 4Q. 25
Table of Contents
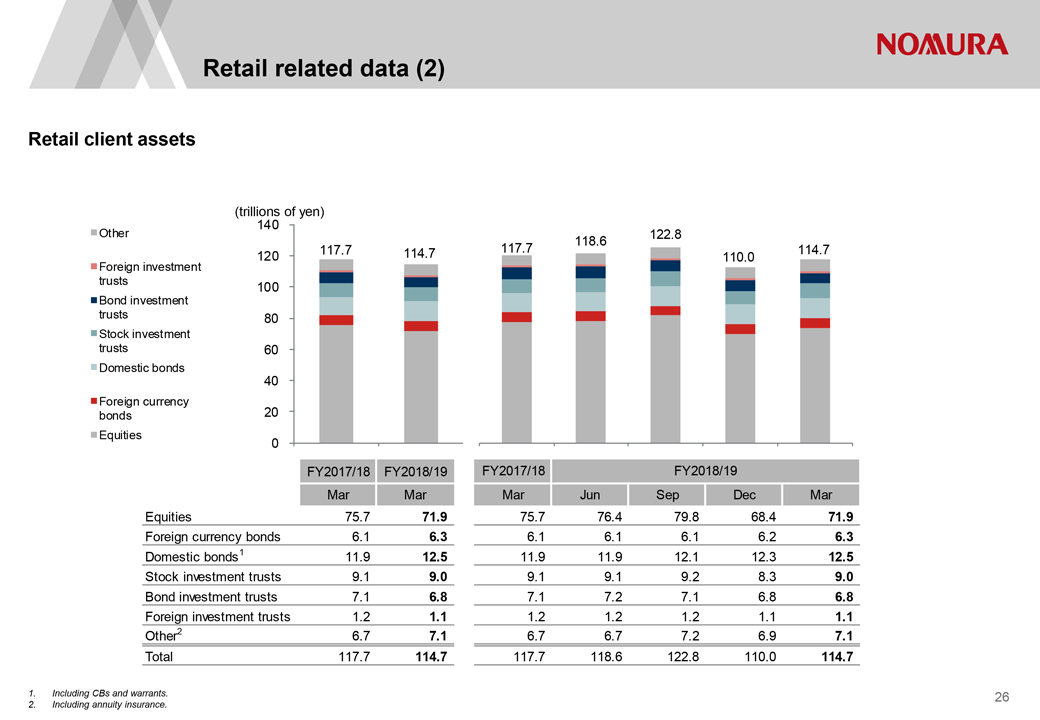 |
Retail related data (2) Retail client assets (trillions of yen) 140 Other 122.8 118.6 117.7 114.7 117.7 114.7 Foreign investment 120 110.0 trusts 100 Bond investment trusts 80 Stock investment trusts 60 Domestic bonds 40 Foreign currency 20 bonds Equities 0 FY2017/18 FY2018/19 FY2017/18 FY2018/19 Mar Mar Mar Jun Sep Dec Mar Equities 75.7 71.9 75.7 76.4 79.8 68.4 71.9 Foreign currency bonds 6.1 6.3 6.1 6.1 6.1 6.2 6.3 Domestic bonds1 11.9 12.5 11.9 11.9 12.1 12.3 12.5 Stock investment trusts 9.1 9.0 9.1 9.1 9.2 8.3 9.0 Bond investment trusts 7.1 6.8 7.1 7.2 7.1 6.8 6.8 Foreign investment trusts 1.2 1.1 1.2 1.2 1.2 1.1 1.1 Other2 6.7 7.1 6.7 6.7 7.2 6.9 7.1 Total 117.7 114.7 117.7 118.6 122.8 110.0 114.7 1. Including CBs and warrants. 2. Including annuity insurance. 26
Table of Contents
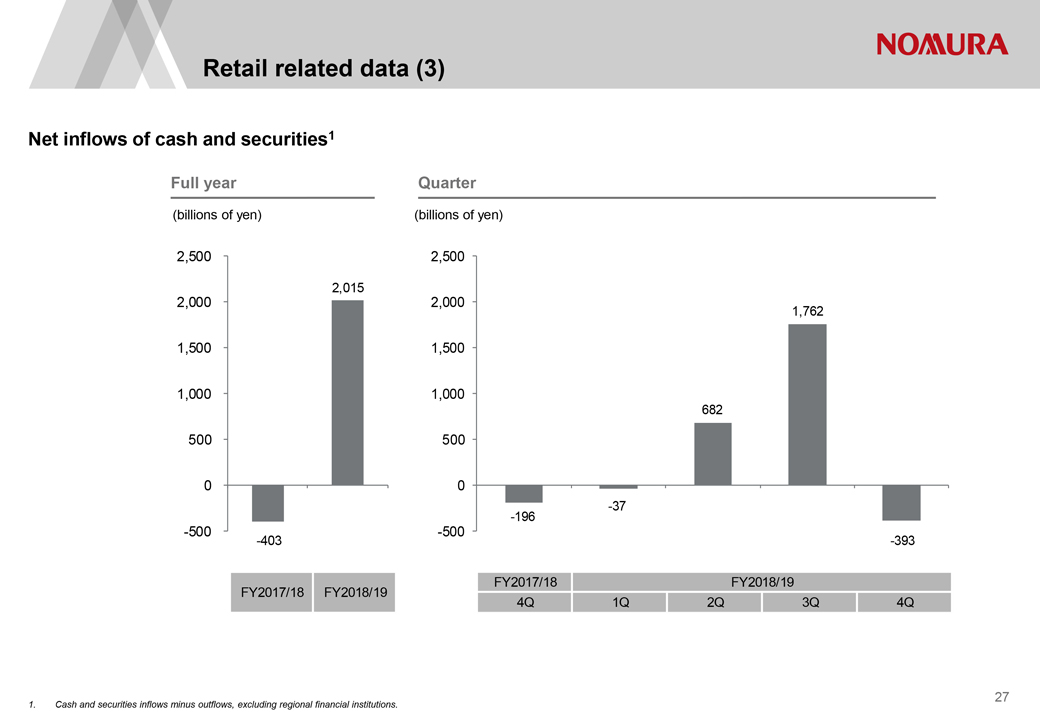 |
Retail related data (3) Net inflows of cash and securities1 Full year Quarter (billions of yen) (billions of yen) 2,500 2,500 2,015 2,000 2,000 1,762 1,500 1,500 1,000 1,000 682 500 500 0 0 -196 -37 -500 -500 -403 -393 FY2017/18 FY2018/19 FY2017/18 FY2018/19 4Q 1Q 2Q 3Q 4Q 1. Cash and securities inflows minus outflows, excluding regional financial institutions. 27
Table of Contents
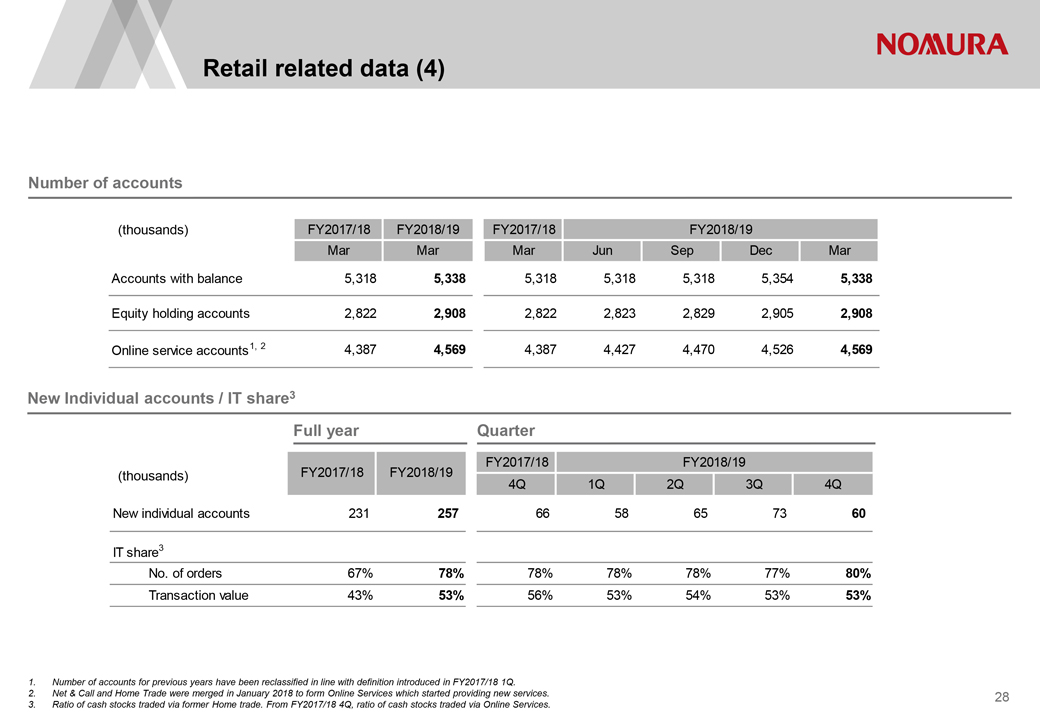 |
Retail related data (4) Number of accounts (thousands) FY2017/18 FY2018/19 FY2017/18 FY2018/19 Mar Mar Mar Jun Sep Dec Mar Accounts with balance 5,318 5,338 5,318 5,318 5,318 5,354 5,338 Equity holding accounts 2,822 2,908 2,822 2,823 2,829 2,905 2,908 Online service accounts1, 2 4,387 4,569 4,387 4,427 4,470 4,526 4,569 New Individual accounts / IT share3 Full year Quarter FY2017/18 FY2018/19 (thousands) FY2017/18 FY2018/19 4Q 1Q 2Q 3Q 4Q New individual accounts 231 257 66 58 65 73 60 IT share3 No. of orders 67% 78% 78% 78% 78% 77% 80% Transaction value 43% 53% 56% 53% 54% 53% 53% 1. Number of accounts for previous years have been reclassified in line with definition introduced in FY2017/18 1Q. 2. Net & Call and Home Trade were merged in January 2018 to form Online Services which started providing new services. 3. Ratio of cash stocks traded via former Home trade. From FY2017/18 4Q, ratio of cash stocks traded via Online Services. 28
Table of Contents
 |
Asset Management related data (1) Full year1 Quarter1 (billions of yen) FY2017/18 FY2018/19 FY2017/18 FY2018/19 QoQ YoY 4Q 1Q 2Q 3Q 4Q Revenue (excl. ACI-related) 105.3 102.9 26.5 26.3 26.1 24.5 26.0 6.3% -1.7% ACI-related revenue 22.1 -5.0 0.9 -0.2 -1.5 -8.3 4.9—5.7x Net revenue 127.3 97.8 27.3 26.1 24.7 16.2 30.9 91.0% 13.1% Non-interest expenses 61.2 63.7 16.0 15.8 15.8 15.6 16.5 5.5% 2.8% Income before income taxes 66.2 34.2 11.3 10.3 8.9 0.6 14.4 25.7x 27.7% Assets under management by company FY2017/18 FY2018/19 FY2017/18 FY2018/19 (trillions of yen) Mar Mar Mar Jun Sep Dec Mar Nomura Asset Management 52.4 53.4 52.4 53.1 55.1 50.2 53.4 Nomura Funds Research and Technologies 2.8—2.8 — —Nomura Corporate Research and Asset Management 2.7 3.0 2.7 2.8 2.9 2.6 3.0 Assets under management (gross) 2 57.8 56.4 57.8 55.9 58.0 52.9 56.4 Group company overlap 7.8 5.0 7.8 5.1 5.2 4.5 5.0 Assets under management (net) 3 50.0 51.4 50.0 50.8 52.8 48.3 51.4 1. This table presents a reconciliation of net revenues (other than ACI-related revenue) and ACI-related revenue, which are non-GAAP measures prepared on a management accounting basis, to net revenue for the Asset Management segment. ACI-related revenue includes fair value adjustments of our investment in, funding cost equivalent for our investment in and dividends from ACI. Figures from FY2018/19 1Q onwards do not include Nomura Fund Research and Technologies. 2. Total assets under management for Nomura Asset Management, Nomura Funds Research and Technologies, Nomura Corporate Research and Asset Management, and Wealth Square. Figures from June 2018 do not include Nomura Fund Research and Technologies. 3. Net after deducting duplications from assets under management (gross). 29
Table of Contents
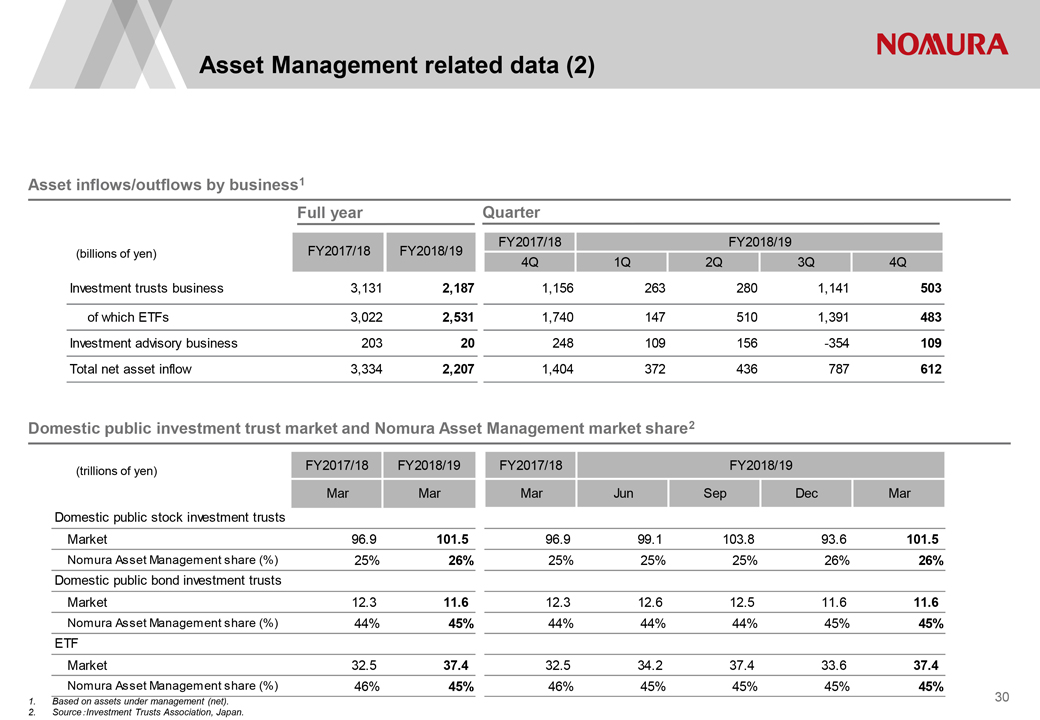 |
Asset Management related data (2) Asset inflows/outflows by business1 Full year Quarter FY2017/18 FY2018/19 (billions of yen) FY2017/18 FY2018/19 4Q 1Q 2Q 3Q 4Q Investment trusts business 3,131 2,187 1,156 263 280 1,141 503 of which ETFs 3,022 2,531 1,740 147 510 1,391 483 Investment advisory business 203 20 248 109 156 -354 109 Total net asset inflow 3,334 2,207 1,404 372 436 787 612 Domestic public investment trust market and Nomura Asset Management market share2 (trillions of yen) FY2017/18 FY2018/19 FY2017/18 FY2018/19 Mar Mar Mar Jun Sep Dec Mar Domestic public stock investment trusts Market 96.9 101.5 96.9 99.1 103.8 93.6 101.5 Nomura Asset Management share (%) 25% 26% 25% 25% 25% 26% 26% Domestic public bond investment trusts Market 12.3 11.6 12.3 12.6 12.5 11.6 11.6 Nomura Asset Management share (%) 44% 45% 44% 44% 44% 45% 45% ETF Market 32.5 37.4 32.5 34.2 37.4 33.6 37.4 Nomura Asset Management share (%) 46% 45% 46% 45% 45% 45% 45% 1. Based on assets under management (net). 2. Source Investment Trusts Association, Japan. 30
Table of Contents
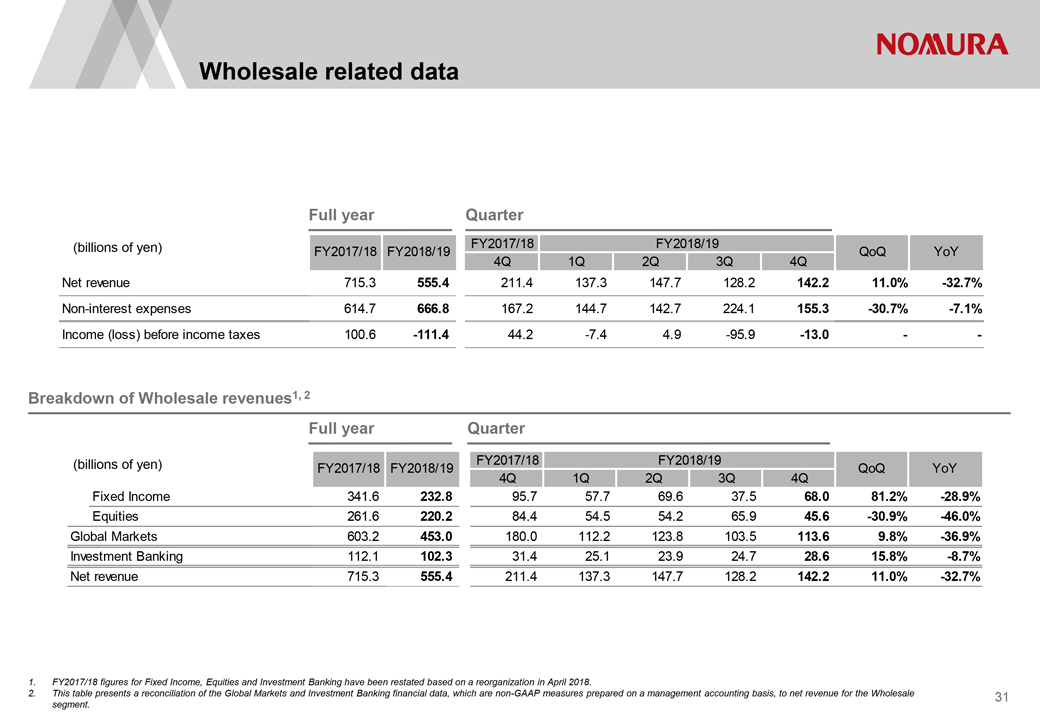 |
Wholesale related data Full year Quarter (billions of yen) FY2017/18 FY2018/19 FY2017/18 FY2018/19 QoQ YoY 4Q 1Q 2Q 3Q 4Q Net revenue 715.3 555.4 211.4 137.3 147.7 128.2 142.2 11.0% -32.7% Non-interest expenses 614.7 666.8 167.2 144.7 142.7 224.1 155.3 -30.7% -7.1% Income (loss) before income taxes 100.6 -111.4 44.2 -7.4 4.9 -95.9 -13.0 — Breakdown of Wholesale revenues1, 2 Full year Quarter (billions of yen) FY2017/18 FY2018/19 FY2017/18 FY2018/19 QoQ YoY 4Q 1Q 2Q 3Q 4Q Fixed Income 341.6 232.8 95.7 57.7 69.6 37.5 68.0 81.2% -28.9% Equities 261.6 220.2 84.4 54.5 54.2 65.9 45.6 -30.9% -46.0% Global Markets 603.2 453.0 180.0 112.2 123.8 103.5 113.6 9.8% -36.9% Investment Banking 112.1 102.3 31.4 25.1 23.9 24.7 28.6 15.8% -8.7% Net revenue 715.3 555.4 211.4 137.3 147.7 128.2 142.2 11.0% -32.7% 1. FY2017/18 figures for Fixed Income, Equities and Investment Banking have been restated based on a reorganization in April 2018. 2. This table presents a reconciliation of the Global Markets and Investment Banking financial data, which are non-GAAP measures prepared on a management accounting basis, to net revenue for the Wholesale segment. 31
Table of Contents
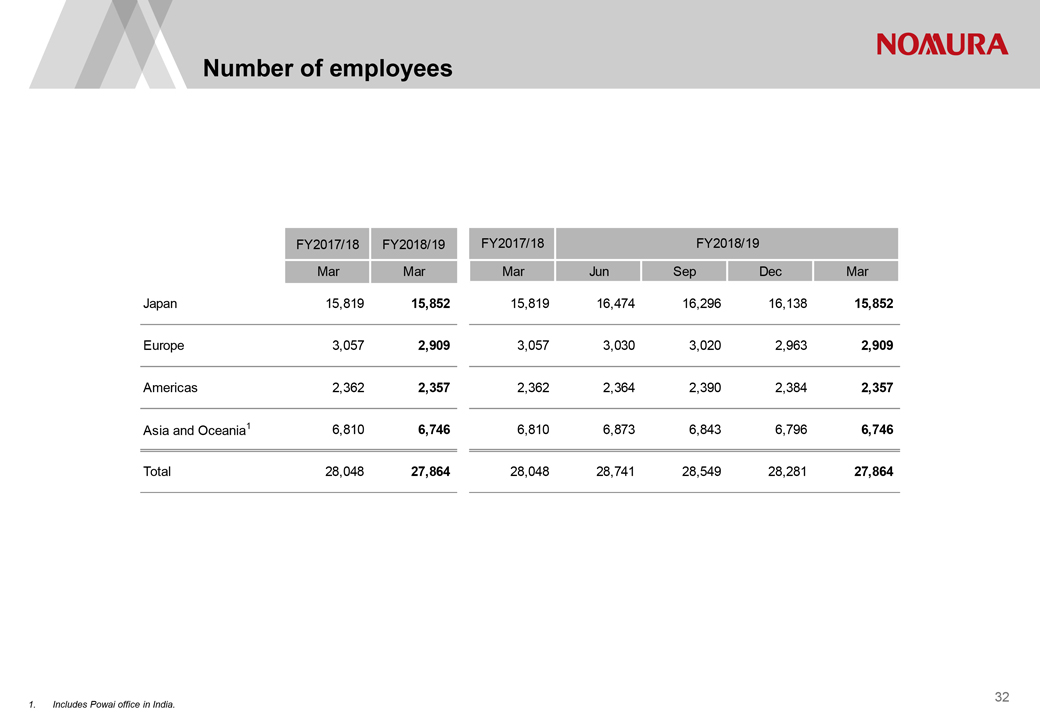 |
Number of employees FY2017/18 FY2018/19 FY2017/18 FY2018/19 Mar Mar Mar Jun Sep Dec Mar Japan 15,819 15,852 15,819 16,474 16,296 16,138 15,852 Europe 3,057 2,909 3,057 3,030 3,020 2,963 2,909 Americas 2,362 2,357 2,362 2,364 2,390 2,384 2,357 Asia and Oceania1 6,810 6,746 6,810 6,873 6,843 6,796 6,746 Total 28,048 27,864 28,048 28,741 28,549 28,281 27,864 1. Includes Powai office in India. 32
Table of Contents
 |
Disclaimer This document is produced by Nomura Holdings, Inc. (?Nomura?). Nothing in this document shall be considered as an offer to sell or solicitation of an offer to buy any security, commodity or other instrument, including securities issued by Nomura or any affiliate thereof. Offers to sell, sales, solicitations to buy, or purchases of any securities issued by Nomura or any affiliate thereof may only be made or entered into pursuant to appropriate offering materials or a prospectus prepared and distributed according to the laws, regulations, rules and market practices of the jurisdictions in which such offers or sales may be made. The information and opinions contained in this document have been obtained from sources believed to be reliable, but no representations or warranty, express or implied, are made that such information is accurate or complete and no responsibility or liability can be accepted by Nomura for errors or omissions or for any losses arising from the use of this information. All rights regarding this document are reserved by Nomura unless otherwise indicated. No part of this document shall be reproduced, stored in a retrieval system or transmitted in any form or by any means, electronic, mechanical, photocopying, recording or otherwise, without the prior written permission of Nomura. This document contains statements that may constitute, and from time to time our management may make ?forward-looking statements? within the meaning of the safe harbor provisions of The Private Securities Litigation Reform Act of 1995. Any such statements must be read in the context of the offering materials pursuant to which any securities may be offered or sold in the United States. These forward-looking statements are not historical facts but instead represent only our belief regarding future events, many of which, by their nature, are inherently uncertain and outside our control. Actual results and financial condition may differ, possibly materially, from what is indicated in those forward-looking statements. You should not place undue reliance on any forward-looking statement and should consider all of the following uncertainties and risk factors, as well as those more fully discussed under Nomura?s most recent Annual Report on Form 20-F and other reports filed with the U.S. Securities and Exchange Commission (?SEC?) that are available on Nomura?s website (http://www.nomura.com) and on the SEC?s website (http://www.sec.gov); Important risk factors that could cause actual results to differ from those in specific forward-looking statements include, without limitation, economic and market conditions, political events and investor sentiments, liquidity of secondary markets, level and volatility of interest rates, currency exchange rates, security valuations, competitive conditions and size, and the number and timing of transactions. Forward-looking statements speak only as of the date they are made, and Nomura undertakes no obligation to update any forward-looking statement to reflect the impact of circumstances or events that arise after the date the forward-looking statement was made. The consolidated financial information in this document is unaudited.
Table of Contents
 |
Nomura Holdings, Inc. www.nomura.com