Table of Contents
FORM 6-K
U.S. SECURITIES AND EXCHANGE COMMISSION
Washington, D.C. 20549
Report of Foreign Private Issuer
Pursuant to Rule 13a-16 or 15d-16 of
the Securities Exchange Act of 1934
Commission File Number: 1-15270
For the month of November 2020
NOMURA HOLDINGS, INC.
(Translation of registrant’s name into English)
13-1, Nihonbashi 1-chome
Chuo-ku, Tokyo 103-8645
Japan
(Address of principal executive offices)
Indicate by check mark whether the registrant files or will file annual reports under cover Form 20-F or Form 40-F.
Form 20-F X Form 40-F
Indicate by check mark if the registrant is submitting the Form 6-K in paper as permitted by Regulation S-T Rule 101(b)(1):
Indicate by check mark if the registrant is submitting the Form 6-K in paper as permitted by Regulation S-T Rule 101(b)(7):
Table of Contents
Information furnished on this form:
Exhibit Number
| 1. | Consolidated Results of Operations (US GAAP), Second quarter, year ending March 2021 |
Table of Contents
SIGNATURES
Pursuant to the requirements of the Securities Exchange Act of 1934, the registrant has duly caused this report to be signed on its behalf by the undersigned, thereunto duly authorized.
| NOMURA HOLDINGS, INC. | ||||||
| Date: November 5, 2020 | By: | /s/ Go Sugiyama | ||||
| Go Sugiyama | ||||||
| Senior Managing Director | ||||||
Table of Contents
|
Connecting Markets East & WestConsolidated Results of OperationsSecond quarter, year ending March 2021(US GAAP)Nomura Holdings, Inc.October 2020
Table of Contents
|
OutlinePresentationExecutive summary (P2-4) Overview of results (P5) Business segment results (P6) Retail (P7-8) Asset Management (P9-10) Wholesale (P11-13) Non-interest expenses (P14) Robust financial position (P15) Funding and liquidity (P16)Financial SupplementConsolidated balance sheet (P18) Value at risk (P19) Consolidated financial highlights (P20) Consolidated income (P21) Main revenue items (P22)Consolidated results: Income (loss) before income taxes by segment and region (P23)Segment “Other” (P24)Retail related data (P25-28)Asset Management related data (P29-30) Wholesale related data (P31) Number of employees (P32)1
Table of Contents
|
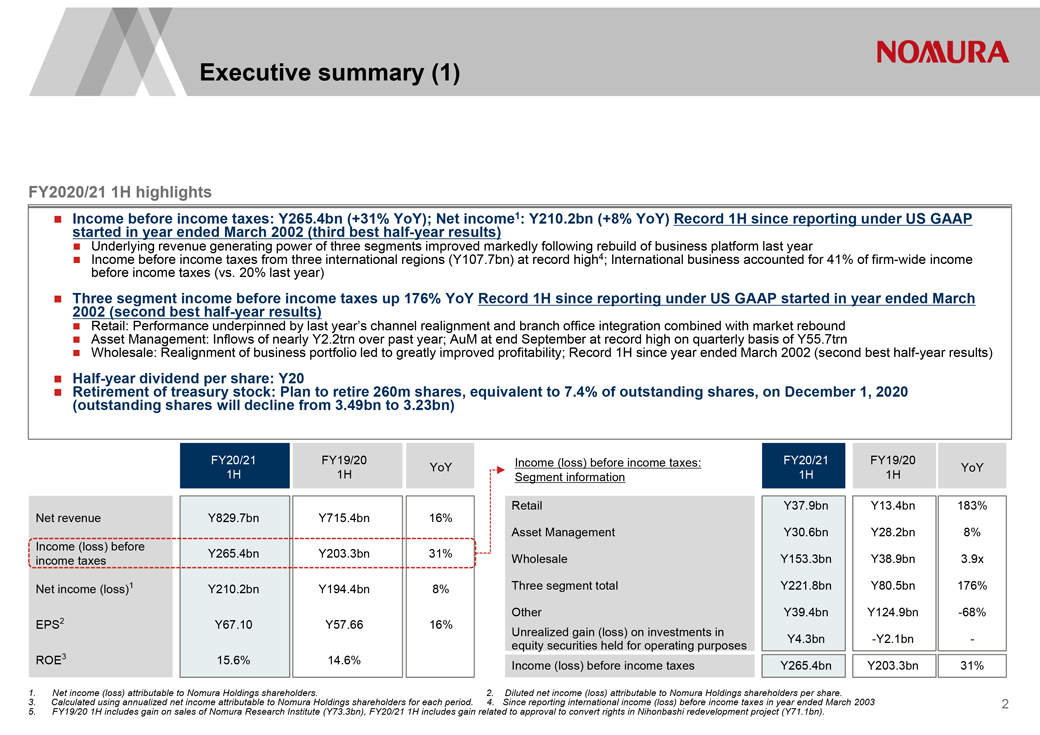
Executive summary (1)FY2020/21 1H highlightsï® Income before income taxes: Y265.4bn (+31% YoY); Net income1: Y210.2bn (+8% YoY) Record 1H since reporting under US GAAP started in year ended March 2002 (third best half-year results)ï® Underlying revenue generating power of three segments improved markedly following rebuild of business platform last yearï® Income before income taxes from three international regions (Y107.7bn) at record high4; International business accounted for 41% of firm-wide income before income taxes (vs. 20% last year)ï® Three 2002 (second segment best income half- year before results) income taxes up 176% YoY Record 1H since reporting under US GAAP started in year ended Marchï® Retail: Performance underpinned by last year’s channel realignment and branch office integration combined with market reboundï® Asset Management: Inflows of nearly Y2.2trn over past year; AuM at end September at record high on quarterly basis of Y55.7trn ï® Wholesale: Realignment of business portfolio led to greatly improved profitability; Record 1H since year ended March 2002 (second best half-year results)ï® Half-year dividend per share: Y20ï® Retirement (outstanding of shares treasury will stock: decline Plan from to retire 3.49bn 260m to 3.23bn) shares, equivalent to 7.4% of outstanding shares, on December 1, 2020FY20/21 FY19/20YoY1H 1HNet revenue Y829.7bn Y715.4bn 16%Income (loss) beforeY265.4bn Y203.3bn 31% income taxesNet income (loss)1 Y210.2bn Y194.4bn 8% EPS2 Y67.10 Y57.66 16% ROE3 15.6% 14.6%Income (loss) before income taxes: FY20/21 FY19/20 YoY Segment information 1H 1HRetail Y37.9bn Y13.4bn 183% Asset Management Y30.6bn Y28.2bn 8% Wholesale Y153.3bn Y38.9bn 3.9x Three segment total Y221.8bn Y80.5bn 176%Other Y39.4bn Y124.9bn -68% Unrealized gain (loss) on investments in Y4.3bn -Y2.1bn -equity securities held for operating purposes Income (loss) before income taxes Y265.4bn Y203.3bn 31%1. Net income (loss) attributable to Nomura Holdings shareholders. 2. Diluted net income (loss) attributable to Nomura Holdings shareholders per share.3. Calculated using annualized net income attributable to Nomura Holdings shareholders for each period. 4. Since reporting international income (loss) before income taxes in year ended March 20035. FY19/20 1H includes gain on sales of Nomura Research Institute (Y73.3bn), FY20/21 1H includes gain related to approval to convert rights in Nihonbashi redevelopment project (Y71.1bn).2
Table of Contents
|
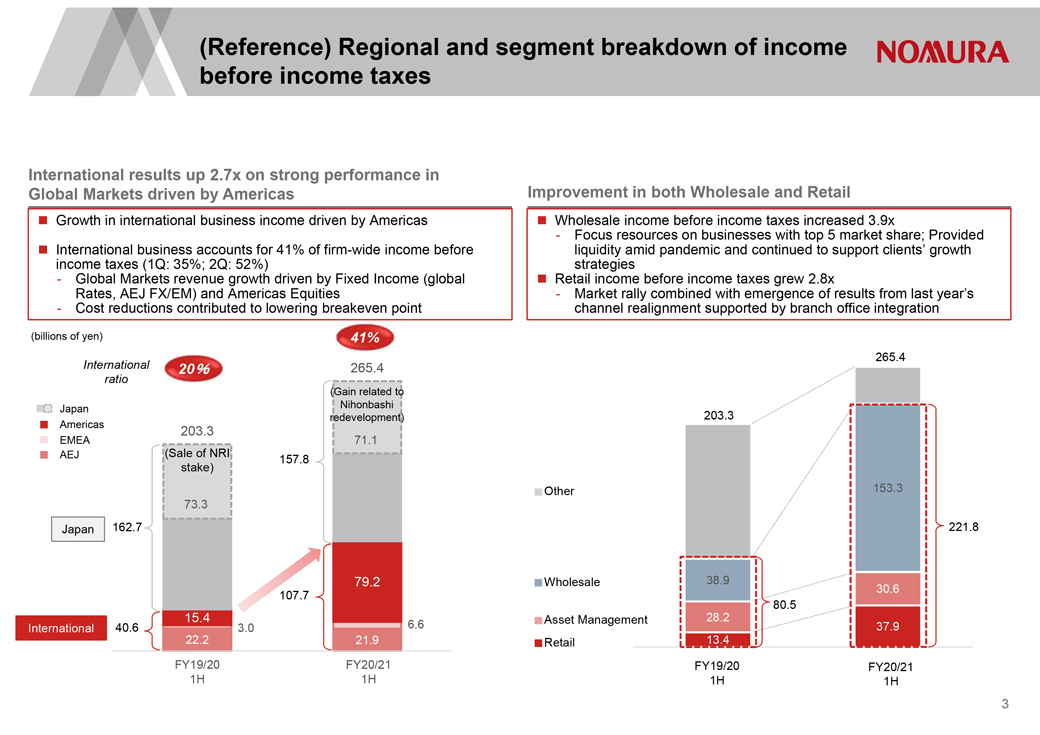
(Reference) Regional and segment breakdown of income before income taxes International results up 2.7x on strong performance in Global Markets driven by Americas Improvement in both Wholesale and Retail ® Growth in international business income driven by Americas ï® Wholesale income before income taxes increased 3.9x - Focus resources on businesses with top 5 market share; Provided ï® International business accounts for 41% of firm-wide income before liquidity amid pandemic and continued to support clients’ growth income taxes (1Q: 35%; 2Q: 52%) strategies - Global Markets revenue growth driven by Fixed Income (global ï® Retail income before income taxes grew 2.8x Rates, AEJ FX/EM) and Americas Equities - Market rally combined with emergence of results from last year’s - Cost reductions contributed to lowering breakeven point channel realignment supported by branch office integration 3
Table of Contents
|
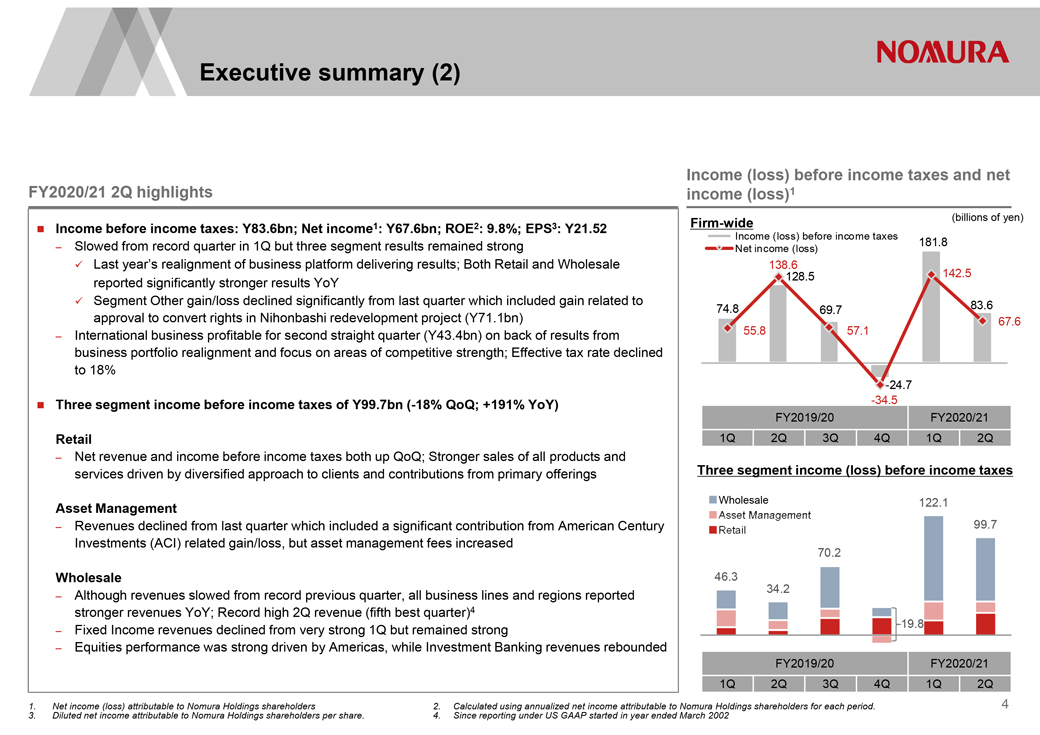
Executive summary (2) FY2020/21 2Q highlights Income before income taxes: Y83.6bn; Net income1: Y67.6bn; ROE2: 9.8%; EPS3: Y21.52 – Slowed from record quarter in 1Q but three segment results remained strong Last year’s realignment of business platform delivering results; Both Retail and Wholesale reported significantly stronger results YoY Segment Other gain/loss declined significantly from last quarter which included gain related to approval to convert rights in Nihonbashi redevelopment project (Y71.1bn) – International business profitable for second straight quarter (Y43.4bn) on back of results from business portfolio realignment and focus on areas of competitive strength; Effective tax rate declined to 18% Three segment income before income taxes of Y99.7bn (-18% QoQ; +191% YoY) Retail – Net revenue and income before income taxes both up QoQ; Stronger sales of all products and services driven by diversified approach to clients and contributions from primary offerings Asset Management – Revenues declined from last quarter which included a significant contribution from American Century Investments (ACI) related gain/loss, but asset management fees increased Wholesale – Although revenues slowed from record previous quarter, all business lines and regions reported stronger revenues YoY; Record high 2Q revenue (fifth best quarter)4 – Fixed Income revenues declined from very strong 1Q but remained strong – Equities performance was strong driven by Americas, while Investment Banking revenues rebounded Income (loss) before income taxes and net income (loss)1 Firm-wide (billions of yen) Income (loss) before income taxes 181.8 Net income (loss) 138.6 128.5 142.5 74.8 69.7 83.6 67.6 55.8 57.1 -24.7 -34.5 FY2019/20 FY2020/21 1Q 2Q 3Q 4Q 1Q 2Q Three segment income (loss) before income taxes Wholesale 122.1 Asset Management 99.7 70.2 46.3 34.2 19.8 FY2019/20 FY2020/21 1Q 2Q 3Q 4Q 1Q 2Q (billions of yen) 41% International 20 265.4 ratio (Gain related to Japan Nihonbashi redevelopment) Americas 203.3 EMEA 71.1 AEJ (Sale of NRI 157.8 stake) 73.3 Japan 162.7 79.2 15.4 International 40.6 3.0 6.6 22.2 21.9 FY19/20 FY20/21 1H 1H 265.4 203.3 Other 153.3 221.8 Wholesale 38.9 30.6 80.5 Asset Management 28.2 37.9 Retail 13.4 FY19/20 FY20/21 1H 1H 1. Net income (loss) attributable to Nomura Holdings shareholders 2. Calculated using annualized net income attributable to Nomura Holdings shareholders for each period. 3. Diluted net income attributable to Nomura Holdings shareholders per share. 4. Since reporting under US GAAP started in year ended March 2002 4
Table of Contents
|
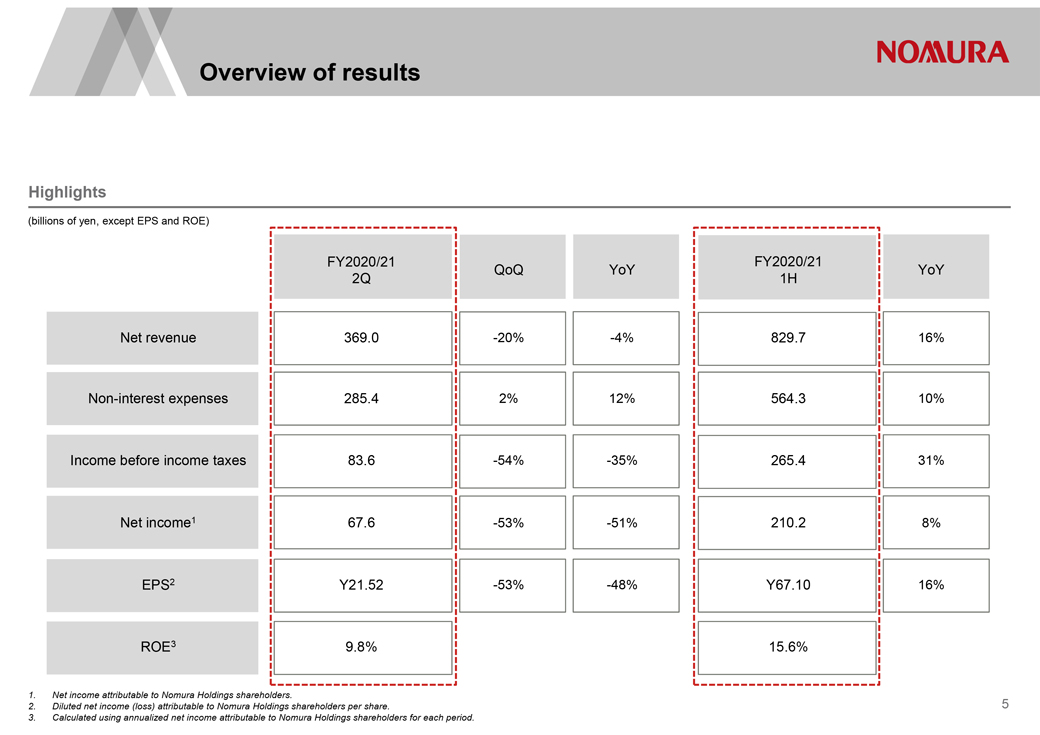
Overview of resultsHighlights (billions of yen, except EPS and ROE)FY2020/21FY2020/21QoQ YoYYoY 2Q1HNet revenue369.0-20%-4% 829.7 16% Non-interest expenses2 85.4 2% 12% 564.3 10%Income before income taxes 83.6 -54% -35% 265.4 31% Net income167.6 -53% -51% 210.2 8% EPS2Y21.52 -53% -48% Y67.1016% ROE 39.8% 15.6% 1. Net income attributable to Nomura Holdings shareholders. 2. Diluted net income (loss) attributable to Nomura Holdings shareholders per share. 3. Calculated using annualized net income attributable to Nomura Holdings shareholders for each period. 5
Table of Contents
|
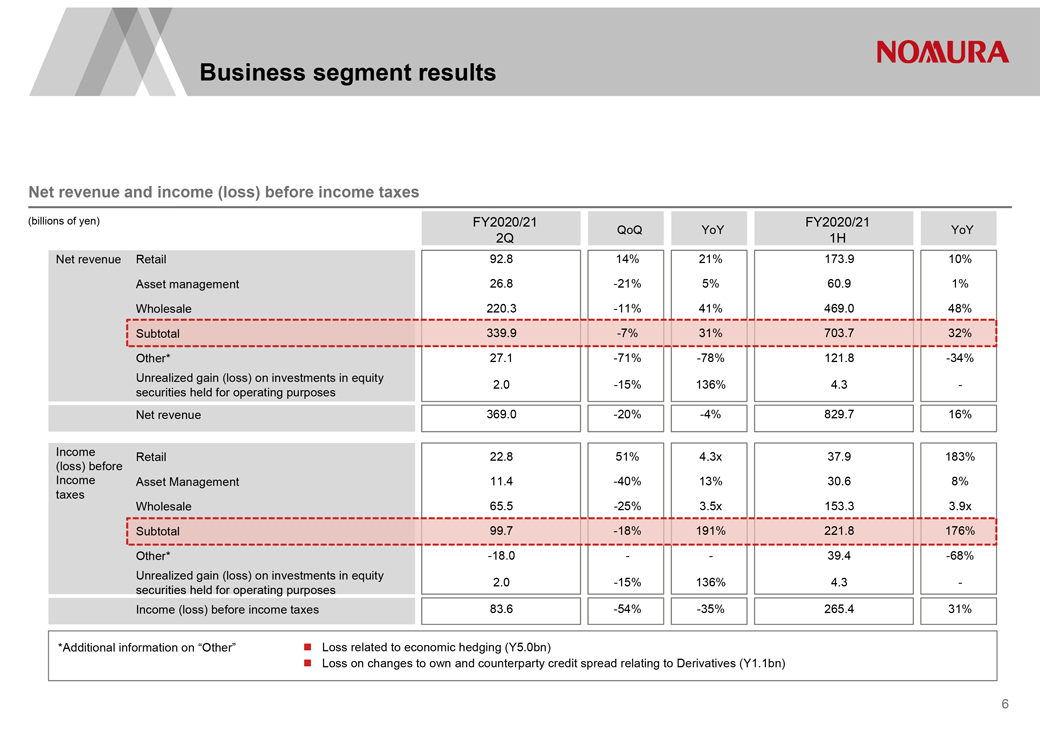
Business segment resultsNet revenue and income (loss) before income taxes (billions of yen)FY2020/21FY2020/21QoQ YoYYoY 2Q1H Net revenueRetail 92.8 14% 21% 173.9 10%Asset management 26.8 -21% 5% 60.91% Wholesale 220.3 -11% 41% 469.048% Subtotal 339.9 -7%31%703.732%Other*27.1 -71% -78%121.8 -34%Unrealized gain (loss) on investments in equity2.0 -15% 136 %4.3 -securities held for operating purposes Net revenue 369.0 -20% -4% 829.7 16% Income Retail 22.851%4.3x37.9183%(loss) beforeIncome Asset Management11.4-40%13%30.68%taxesWholesale65.5-25%3.5x153.33.9x Subtotal 99.7 -18% 191% 221.81 76% Other* -18.0--39.4 -68%Unrealized gain (loss) on investments in equity2.0-15%136%4.3-securities held for operating purposesIncome (loss) before income taxes 83.6 -54% -35% 265.431%*Additional information on “Other”ï® Loss related to economic hedging (Y5.0bn)ï® Loss on changes to own and counterparty credit spread relating to Derivatives (Y1.1bn)6
Table of Contents
|
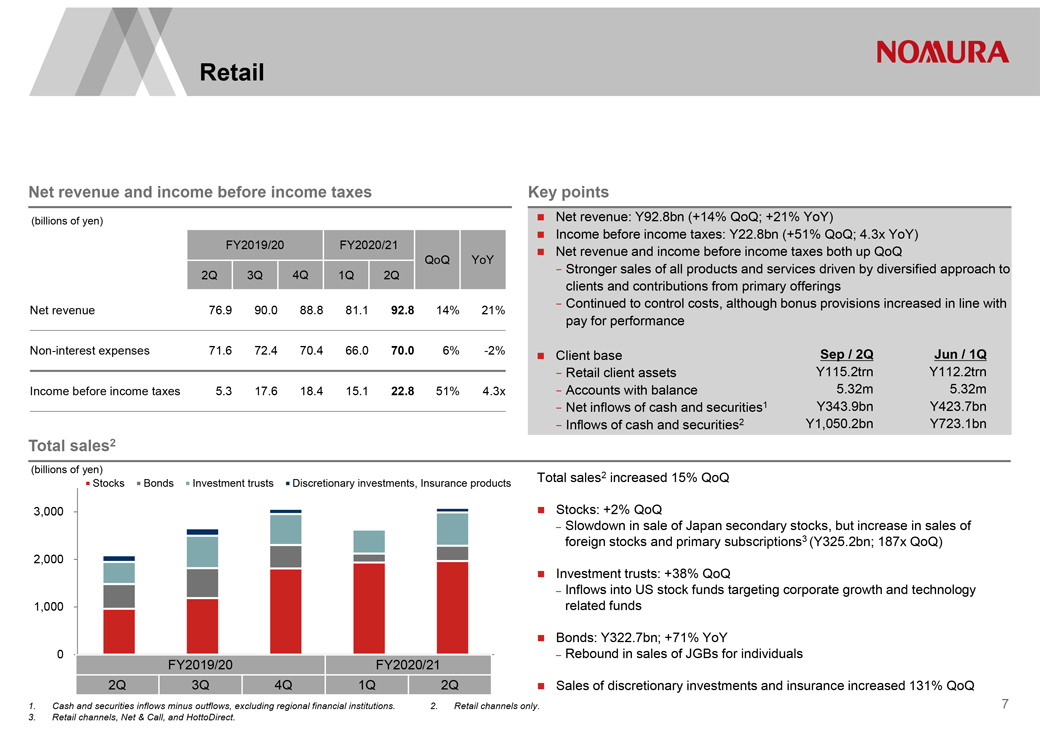
RetailNet revenue and income before income taxes (billions of yen)FY2019/20FY2020/21QoQ YoY2Q3Q4Q1Q2QNet revenue 76.9 90.0 88.8 81.1 92.8 14% 21% Non-interest expenses 71.6 72.4 70.4 66.0 70.0 6% -2% Income before income taxes 5.3 17.6 18.4 15.1 22.8 51% 4.3x Total sales 2(billions of yen)Stocks BondsInvestment trustsDiscretionary investments, Insurance products 3,000 2,000 1,0000 FY2019/20 FY2020/212Q3Q4Q1Q2QKey points Net revenue: Y92.8bn (+14% QoQ; +21% YoY) Income before income taxes: Y22.8bn (+51% QoQ; 4.3x YoY) Net revenue and income before income taxes both up QoQ- Stronger sales of all products and services driven by diversified approach to clients and contributions from primary offerings—Continued to control costs, although bonus provisions increased in line with pay for performance Client base Sep / 2Q Jun / 1Q- Retail client assets Y115.2trn Y112.2trn—Accounts with balance 5.32m 5.32m—Net inflows of cash and securities1 Y343.9bn Y423.7bn—Inflows of cash and securities2 Y1,050.2bn Y723.1bnTotal sales2 increased 15% QoQ Stocks: +2% QoQ– Slowdown in sale of Japan secondary stocks, but increase in sales of foreign stocks and primary subscriptions3 (Y325.2bn; 187x QoQ) Investment trusts: +38% QoQ– Inflows into US stock funds targeting corporate growth and technology related funds Bonds: Y322.7bn; +71% YoY – Rebound in sales of JGBs for individuals Sales of discretionary investments and insurance increased 131% QoQ1. Cash and securities inflows minus outflows, excluding regional financial institutions. 2. Retail channels only.3. Retail channels, Net & Call, and HottoDirect.7
Table of Contents
|
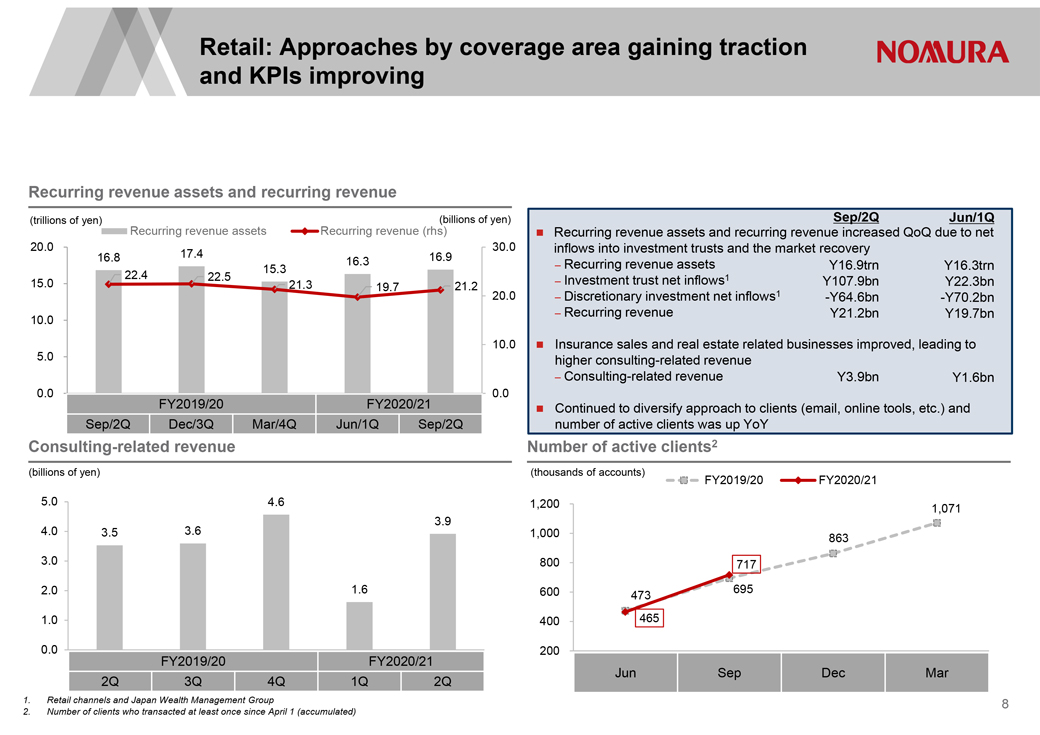
Retail: Approaches by coverage area gaining traction and KPIs improvingRecurring revenue assets and recurring revenue (trillions of yen) (billions of yen)Recurring revenue assetsRecurring revenue (rhs)20.0 30.0 16.8 17.4 16.3 16.9 22.4 22.5 15.3 15.0 21.3 19.7 21.2 20.0 10.0 10.0 5.0 0.00.0 FY2019/20 FY2020/21 Sep/2Q Dec/3Q Mar/4Q Jun/1Q Sep/2Q Consulting-related revenue(billions of yen)5.0 4.6 3.9 4.0 3.5 3.6 3.0 2.0 1.6 1.0 0.0FY2019/20FY2020/212Q3Q4Q1Q2Q1.Retail channels and Japan Wealth Management Group 2. Number of clients who transacted at least once since April 1 (accumulated) Sep/2QJun/1Qï® Recurring revenue assets and recurring revenue increased QoQ due to net inflows into investment trusts and the market recovery– Recurring revenue assetsY16.9trnY16.3trn– Investment trust net inflows1Y107.9bnY22.3bn– Discretionary investment net inflows1-Y64.6bn-Y70.2bn– Recurring revenueY21.2bnY19.7bn Insurance sales and real estate related businesses improved, leading tohigher consulting-related revenue– Consulting-related revenueY3.9bnY1.6bn Continued to diversify approach to clients (email, online tools, etc.) andnumber of active clients was up YoYNumber of active clients2(thousands of accounts) FY2019/20 FY2020/21 1,200 1,071 1,000 863 800 717 600 473 695 400 465 200 Jun Sep Dec Mar8
Table of Contents
|
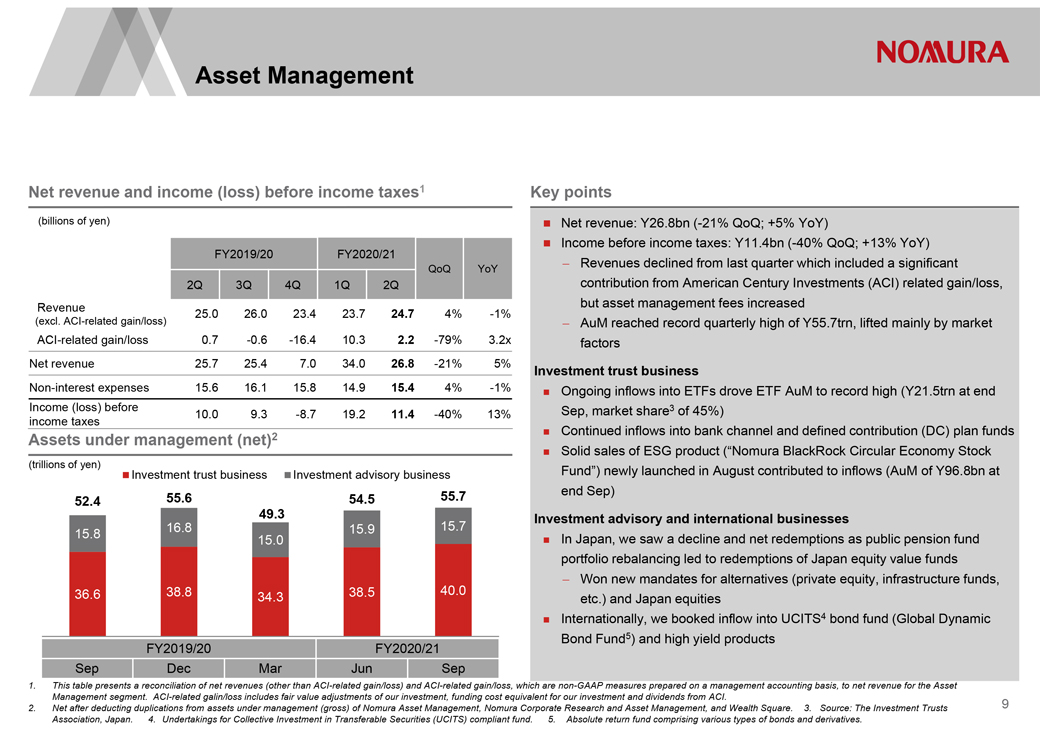
Net revenue and income (loss) before income taxes1 (billions of yen) FY2019/20 FY2020/21QoQ YoY 2Q 3Q 4Q 1Q 2Q Revenue 25.0 26.0 23.4 23.7 24.7 4% -1% (excl. ACI-related gain/loss)ACI-related gain/loss0.7 -0.6 -16.4 10.3 2.2 -79% 3.2xNet revenue25.725.47.034.026.8-21%5%Non-interest expenses15.616.115.814.915.44%-1%Income (loss) before10.09.3-8.719.211.4-40%13%income taxesAssets under management (net)2(trillions of yen)Investment trust businessInvestment advisory business 52.4 55.6 54.5 55.7 49.3 15.8 16.8 15.91 5.7 15.0 36.6 38.8 34.3 38.5 40.0 FY2019/20 FY2020/21 Sep Dec Mar Jun Sep Key points Net revenue: Y26.8bn (-21% QoQ; +5% YoY) Income before income taxes: Y11.4bn (-40% QoQ; +13% YoY)- Revenues declined from last quarter which included a significant contribution from American Century Investments (ACI) related gain/loss, but asset management fees increased- AuM reached record quarterly high of Y55.7trn, lifted mainly by market factorsInvestment trust business Ongoing inflows into ETFs drove ETF AuM to record high (Y21.5trn at end Sep, market share3 of 45%) Continued inflows into bank channel and defined contribution (DC) plan funds Solid sales of ESG product (“Nomura BlackRock Circular Economy Stock Fund”) newly launched in August contributed to inflows (AuM of Y96.8bn at end Sep)Investment advisory and international businesses In Japan, we saw a decline and net redemptions as public pension fund portfolio rebalancing led to redemptions of Japan equity value funds- Won new mandates for alternatives (private equity, infrastructure funds, etc.) and Japan equities Internationally, we booked inflow into UCITS4 bond fund (Global Dynamic Bond Fund5) and high yield products1. This table presents a reconciliation of net revenues (other than ACI-related gain/loss) and ACI-related gain/loss, which are non-GAAP measures prepared on a management accounting basis, to net revenue for the Asset Management segment. ACI-related galin/loss includes fair value adjustments of our investment, funding cost equivalent for our investment and dividends from ACI.2. Net after deducting duplications from assets under management (gross) of Nomura Asset Management, Nomura Corporate Research and Asset Management, and Wealth Square. 3. Source: The Investment Trusts Association, Japan. 4. Undertakings for Collective Investment in Transferable Securities (UCITS) compliant fund. 5. Absolute return fund comprising various types of bonds and derivatives.9
Table of Contents
|
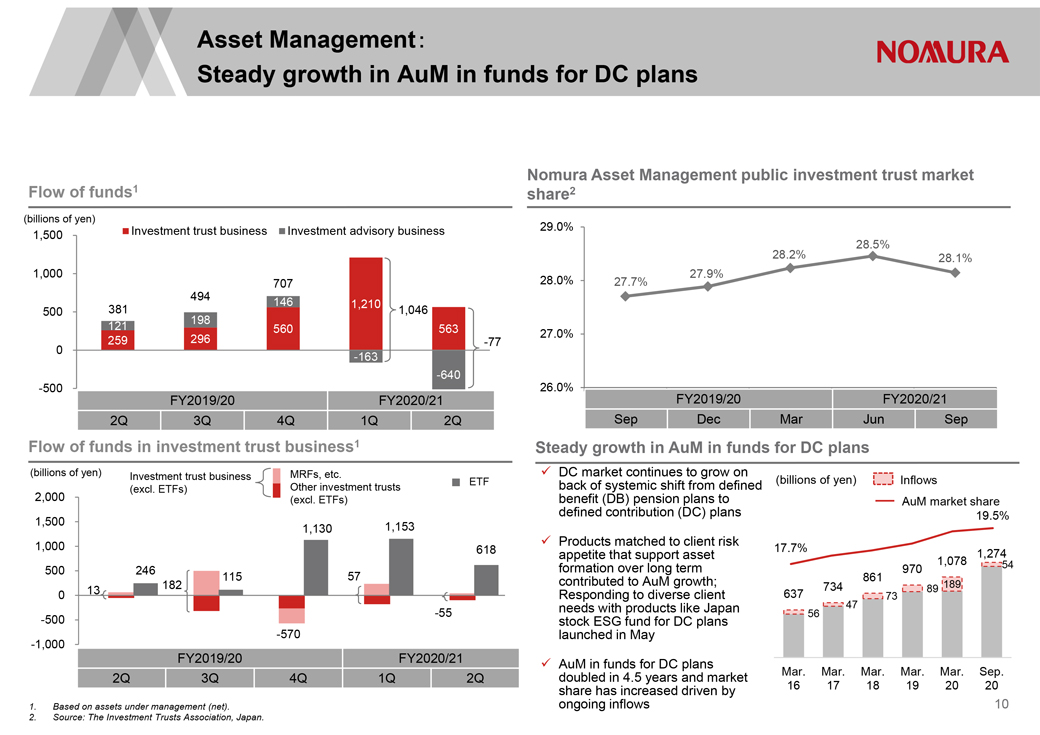
Asset Management Steady growth in AuM in funds for DC plansFlow of funds1 (billions of yen) 1,500 Investment trust businessInvestment advisory business 1,000 707 494 146 1,210 500 3 811,046 198 121 560 563 259 296 -770 -163 -640-500FY2019/20 FY2020/21 2Q 3Q 4Q 1Q 2Q Flow of funds in investment trust business1(billions of yen)Investment trust businessMRFs, etc.(excl. ETFs) Other investment trusts ETF2,000(excl. ETFs)1,5001,1301,1531,000618500246115571820 13 -500 -55-570 -1,000 FY2019/20 FY2020/21 2Q 3Q 4Q 1Q 2Q Nomura Asset Management public investment trust marketshare 229.0% 28.5% 28.2% 28.1% 28.0% 27.7% 27.9% 27.0% 26.0% FY2019/20 FY2020/21 Sep Dec Mar Jun Sep Steady growth in AuM in funds for DC plans DC market continues to grow onback of systemic shift from defined(billions of yen)Inflowsbenefit (DB) pension plans toAuM market share defined contribution (DC) plans19.5%Products matched to client risk17.7%appetite that support asset1,274 formation over long term 9701,078 54 contributed to AuM growth; 73486189 189 Responding to diverse client63773needs with products like Japan56 47stock ESG fund for DC planslaunched in MayAuM in funds for DC plans doubled in 4.5 years and marketMar. Mar. Mar. Mar. Mar. Sep.share has increased driven by16 1718 1920 20 ongoing inflows 1010
Table of Contents
|
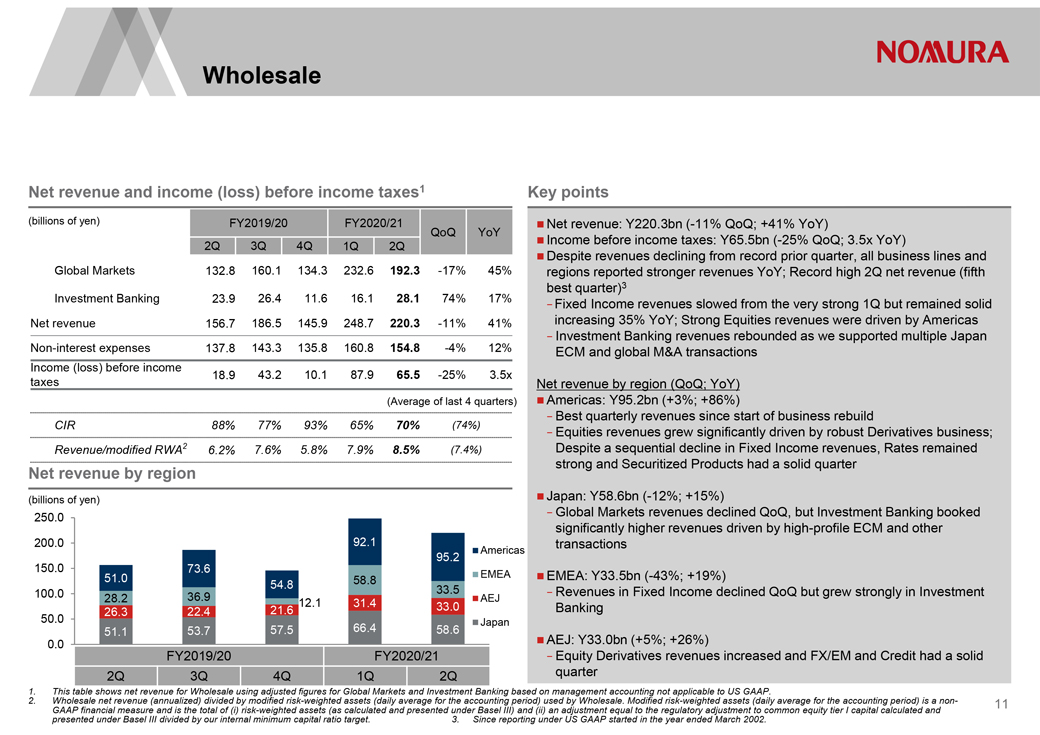
WholesaleNet revenue and income (loss) before income taxes1 (billions of yen)FY2019/20FY2020/21QoQ YoY 2Q3Q4Q1Q2QGlobal Markets132.8160.1134.3232.6192.3-17%45%Investment Banking23.926.411.616.128.174%17%Net revenue156.7186.5145.9248.7220.3-11%41%Non-interest expenses137.8143.3135.8160.8154.8-4%12%Income (loss) before incometaxes18.943.210.187.965.5-25%3.5x(Average of last 4 quarters)CIR88%77%93%65%70%(74%)Revenue/modified RWA26.2%7.6%5.8%7.9%8.5%(7.4%)Net revenue by region(billions of yen)250.0200.092.195.2Americas150.073.651.054.858.8EMEA100.028.236.933.5AEJ26.322.421.6 12.131.433.050.0Japan51.153.757.566.458.60.0FY2019/20FY2020/212Q3Q4Q1Q2QKey pointsï®Net revenue: Y220.3bn (-11% QoQ; +41% YoY)ï®Income before income taxes: Y65.5bn (-25% QoQ; 3.5x YoY)ï®Despite revenues declining from record prior quarter, all business lines and regions reported stronger revenues YoY; Record high 2Q net revenue (fifth best quarter)3 -Fixed Income revenues slowed from the very strong 1Q but remained solid increasing 35% YoY; Strong Equities revenues were driven by Americas—Investment Banking revenues rebounded as we supported multiple Japan ECM and global M&A transactionsNet revenue by region (QoQ; YoY)ï®Americas: Y95.2bn (+3%; +86%)- Best quarterly revenues since start of business rebuild- Equities revenues grew significantly driven by robust Derivatives business; Despite a sequential decline in Fixed Income revenues, Rates remained strong and Securitized Products had a solid quarterï®Japan: Y58.6bn (-12%; +15%)- Global Markets revenues declined QoQ, but Investment Banking booked significantly higher revenues driven by high-profile ECM and other transactionsï®EMEA: Y33.5bn (-43%; +19%)- Revenues in Fixed Income declined QoQ but grew strongly in Investment Bankingï®AEJ: Y33.0bn (+5%; +26%)- Equity Derivatives revenues increased and FX/EM and Credit had a solid quarter1. This table shows net revenue for Wholesale using adjusted figures for Global Markets and Investment Banking based on management accounting not applicable to US GAAP. 2. Wholesale net revenue (annualized) divided by modified risk-weighted assets (daily average for the accounting period) used by Wholesale. Modified risk-weighted assets (daily average for the accounting period) is a non-GAAP financial measure and is the total of (i) risk-weighted assets (as calculated and presented under Basel III) and (ii) an adjustment equal to the regulatory adjustment to common equity tier I capital calculated and presented under Basel III divided by our internal minimum capital ratio target. 3. Since reporting under US GAAP started in the year ended March 2002.11
Table of Contents
|
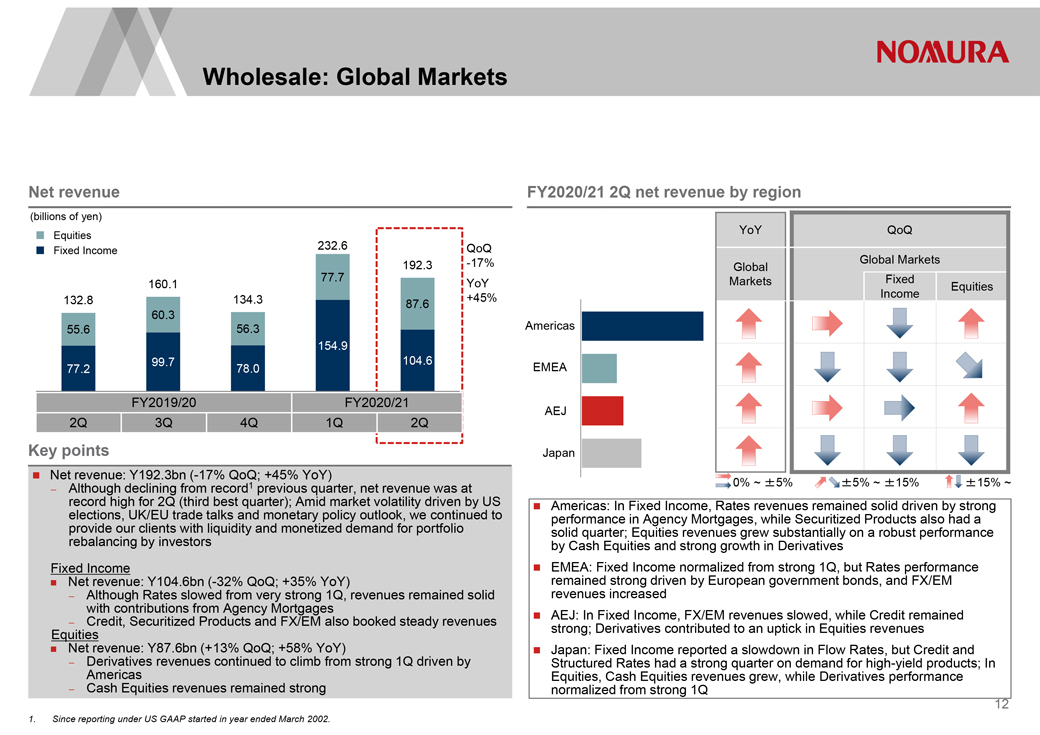
Wholesale: Global MarketsNet revenue (billions of yen)EquitiesFixed Income232.6QoQ 192.3-17%77.7160.1YoY132.8134.387.6+45%60.355.656.3154.999.7104.677.278.0FY2019/20FY2020/212Q3Q4Q1Q2QFY2020/21 2Q net revenue by regionYoYQoQ GlobalGlobal Markets Markets FixedEquitiesIncomeAmericasEMEAAEJJapan0% ~ ±5%±5% ~ ±15%±15% ~Key pointsï® Net revenue: Y192.3bn (-17% QoQ; +45% YoY)- Although declining from record1 previous quarter, net revenue was at record high for 2Q (third best quarter); Amid market volatility driven by US elections, UK/EU trade talks and monetary policy outlook, we continued to provide our clients with liquidity and monetized demand for portfolio rebalancing by investors Fixed Incomeï® Net revenue: Y104.6bn (-32% QoQ; +35% YoY)- Although Rates slowed from very strong 1Q, revenues remained solid with contributions from Agency Mortgages- Credit, Securitized Products and FX/EM also booked steady revenues Equitiesï�� Net revenue: Y87.6bn (+13% QoQ; +58% YoY)- Derivatives revenues continued to climb from strong 1Q driven by Americas- Cash Equities revenues remained strong1. Since reporting under US GAAP started in year ended March 2002.ï® Americas: In Fixed Income, Rates revenues remained solid driven by strong performance in Agency Mortgages, while Securitized Products also had a solid quarter; Equities revenues grew substantially on a robust performance by Cash Equities and strong growth in Derivativesï® EMEA: Fixed Income normalized from strong 1Q, but Rates performance remained strong driven by European government bonds, and FX/EM revenues increasedï® AEJ: In Fixed Income, FX/EM revenues slowed, while Credit remained strong; Derivatives contributed to an uptick in Equities revenuesï® Japan: Fixed Income reported a slowdown in Flow Rates, but Credit and Structured Rates had a strong quarter on demand for high-yield products; In Equities, Cash Equities revenues grew, while Derivatives performance normalized from strong 1Q12
Table of Contents
|
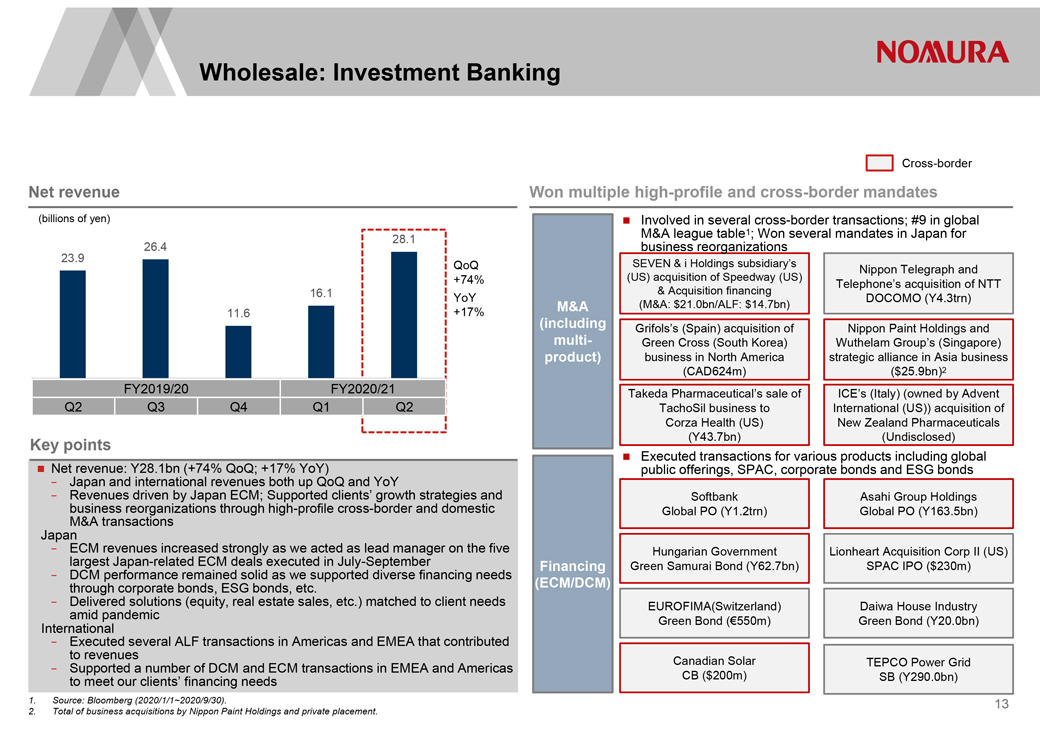
Wholesale: Investment BankingNet revenue (billions of yen)26.428.123.9QoQ +74%16.1YoY11.6+17%FY2019/20FY2020/21Q2Q3Q4Q1Q2Key pointsï® Net revenue: Y28.1bn (+74% QoQ; +17% YoY)- Japan and international revenues both up QoQ and YoY- Revenues driven by Japan ECM; Supported clients’ growth strategies and business reorganizations through high-profile cross-border and domestic M&A transactions Japan- ECM revenues increased strongly as we acted as lead manager on the five largest Japan-related ECM deals executed in July-September—DCM performance remained solid as we supported diverse financing needs through corporate bonds, ESG bonds, etc.- Delivered solutions (equity, real estate sales, etc.) matched to client needs amid pandemic International- Executed several ALF transactions in Americas and EMEA that contributed to revenues- Supported a number of DCM and ECM transactions in EMEA and Americas to meet our clients’ financing needsCross-borderWon multiple high-profile and cross-border mandatesï® Involved in several cross-border transactions; #9 in global M&A league table1; Won several mandates in Japan for business reorganizationsSEVEN & i Holdings subsidiary’s Nippon Telegraph and(US) acquisition of Speedway (US) Telephone’s acquisition of NTT & Acquisition financingDOCOMO (Y4.3trn)M&A (M&A: $21.0bn/ALF: $14.7bn)(including Grifols’s (Spain) acquisition of Nippon Paint Holdings and multi- Green Cross (South Korea) Wuthelam Group’s (Singapore) product) business in North America strategic alliance in Asia business (CAD624m) ($25.9bn)2 Takeda Pharmaceutical’s sale of ICE’s (Italy) (owned by Advent TachoSil business to International (US)) acquisition of Corza Health (US) New Zealand Pharmaceuticals (Y43.7bn) (Undisclosed)ï® Executed transactions for various products including global public offerings, SPAC, corporate bonds and ESG bondsSoftbank Asahi Group Holdings Global PO (Y1.2trn) Global PO (Y163.5bn)Hungarian Government Lionheart Acquisition Corp II (US) Financing Green Samurai Bond (Y62.7bn) SPAC IPO ($230m)(ECM/DCM)EUROFIMA(Switzerland) Daiwa House Industry Green Bond (€550m) Green Bond (Y20.0bn)Canadian Solar TEPCO Power Grid CB ($200m) SB (Y290.0bn)1. Source: Bloomberg (2020/1/1~2020/9/30). 2. Total of business acquisitions by Nippon Paint Holdings and private placement.13
Table of Contents
|
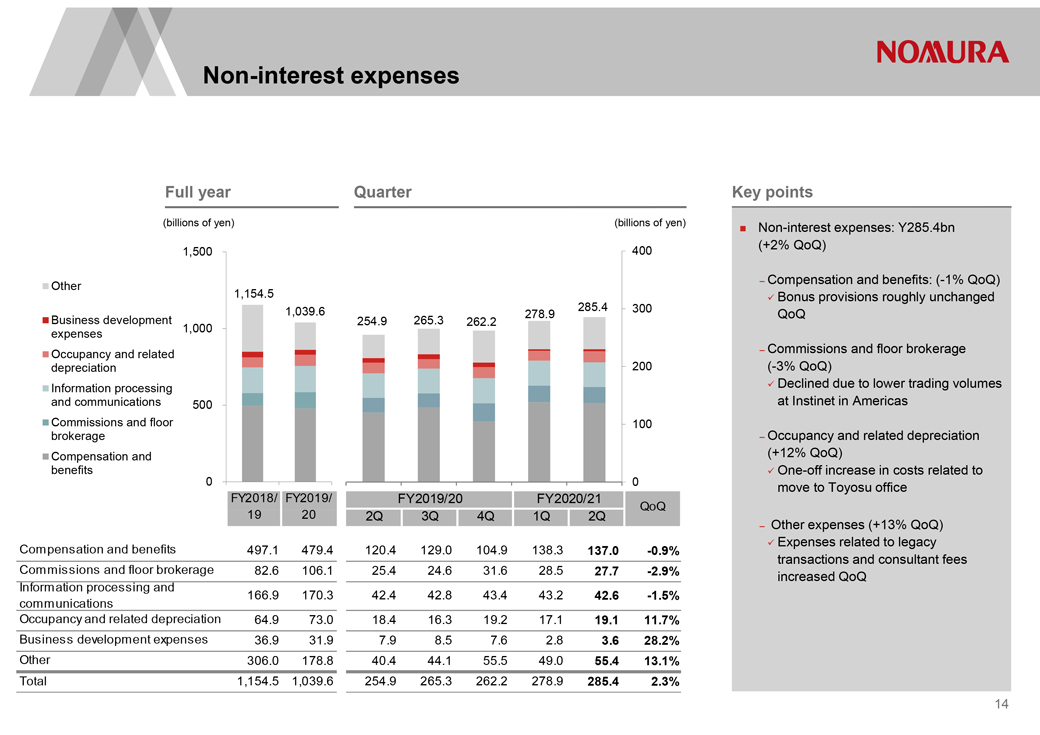
Non-interest expensesFull year Quarter(billions of yen)(billions of yen) 1,500 400 Other 1,154.51,039.6278.9285.4300Business development254.9265.3262.2expenses1,000Occupancy and relateddepreciation200Information processingand communications500Commissions and floor100brokerageCompensation andbenefits00FY2018/ FY2019/FY2019/20FY2020/21QoQ 19202Q3Q4Q1Q2QCompensation and benefits497.1479.4120.4129.0104.9138.3137.0-0.9%Commissions and floor brokerage82.6106.125.424.631.628.527.7-2.9%Information processing andcommunications166.9170.342.442.843.443.242.6-1.5%Occupancy and related depreciation64.973.018.416.319.217.119.111.7%Business development expenses36.931.97.98.57.62.83.628.2%Other306.0178.840.444.155.549.055.413.1%Total1,154.51,039.6254.9265.3262.2278.9285.42.3%Key pointsï® Non-interest expenses: Y285.4bn (+2% QoQ)– Compensation and benefits: (-1% QoQ) Bonus provisions roughly unchanged QoQ– Commissions and floor brokerage (-3% QoQ) Declined due to lower trading volumes at Instinet in Americas– Occupancy and related depreciation (+12% QoQ) One-off increase in costs related to move to Toyosu office– Other expenses (+13% QoQ) Expenses related to legacy transactions and consultant fees increased QoQ14
Table of Contents
|
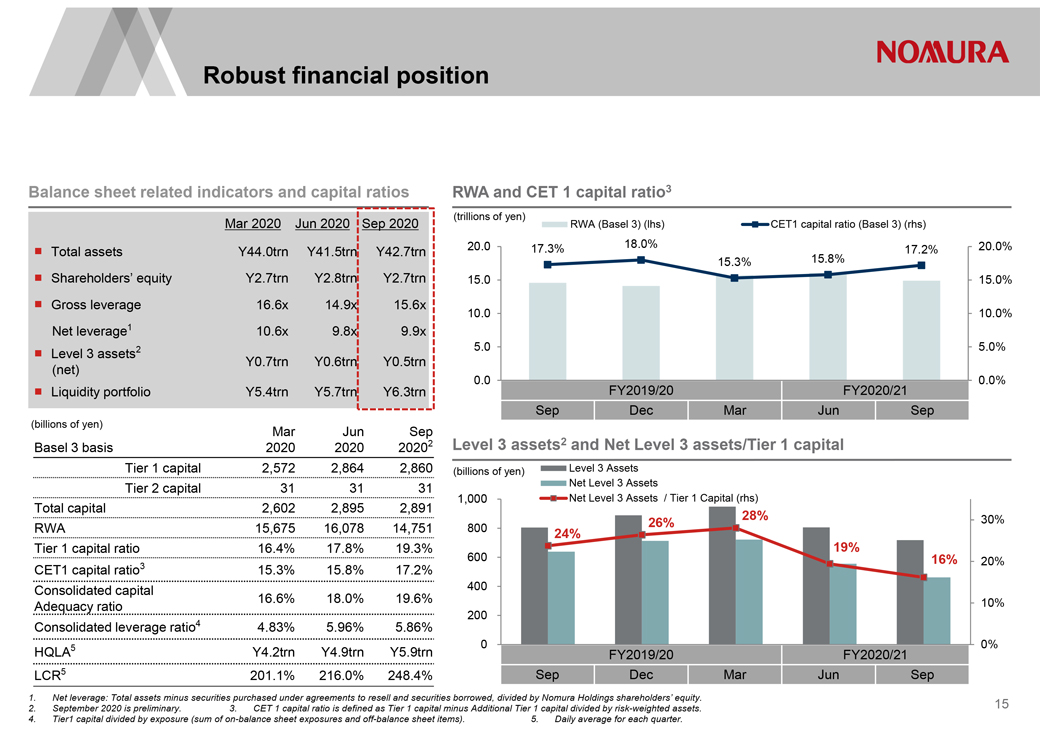
Robust financial positionBalance sheet related indicators and capital ratios Mar 2020Jun 2020 Sep 2020ï® Total assetsY44.0trnY41.5trnY42.7trnï® Shareholders’ equityY2.7trnY2.8trnY2.7trnï® Gross leverage16.6x14.9x15.6xNet leverage110.6x9.8x9.9xï® Level 3 assets2(net)Y0.7trnY0.6trnY0.5trnï® Liquidity portfolioY5.4trnY5.7trnY6.3trn(billions of yen)MarJunSepBasel 3 basis 2020202020202Tier 1 capital2,5722,8642,860Tier 2 capital313131Total capital2,6022,8952,891RWA15,67516,07814,751Tier 1 capital ratio16.4%17.8%19.3%CET1 capital ratio315.3%15.8%17.2%Consolidated capital16.6%18.0%19.6%Adequacy ratioConsolidated leverage ratio44.83%5.96%5.86%HQLA5Y4.2trnY4.9trnY5.9trnLCR5201.1%216.0%248.4%RWA and CET 1 capital ratio3(trillions of yen)RWA (Basel 3) (lhs)CET1 capital ratio (Basel 3) (rhs) 20.017.3%18.0%17.2%20.0%15.3%15.8%15.015.0%10.010.0%5.05.0%0.00.0%FY2019/20FY2020/21SepDecMarJunSepLevel 3 assets2 and Net Level 3 assets/Tier 1 capital(billions of yen)Level 3 AssetsNet Level 3 Assets1,000Net Level 3 Assets / Tier 1 Capital (rhs) 26%28%30%80024%19%60016%20%40010%20000%FY2019/20FY2020/21SepDecMarJunSep1. Net leverage: Total assets minus securities purchased under agreements to resell and securities borrowed, divided by Nomura Holdings shareholders’ equity.2. September 2020 is preliminary. 3. CET 1 capital ratio is defined as Tier 1 capital minus Additional Tier 1 capital divided by risk-weighted assets.4. Tier1 capital divided by exposure (sum of on-balance sheet exposures and off-balance sheet items). 5. Daily average for each quarter.15
Table of Contents
|
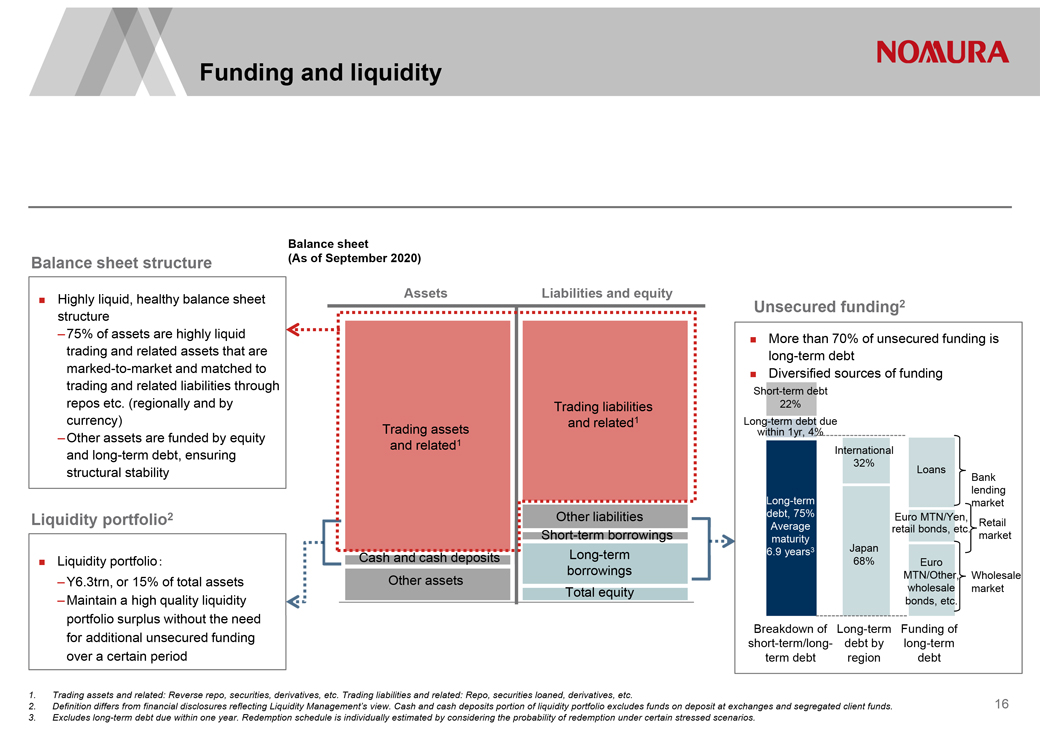
Funding and liquidityBalance sheet structureï® Highly liquid, healthy balance sheet structure –75% of assets are highly liquid trading and related assets that are marked-to-market and matched to trading and related liabilities through repos etc. (regionally and by currency) –Other assets are funded by equity and long-term debt, ensuring structural stabilityLiquidity portfolio2ï® Liquidity portfolio –Y6.3trn, or 15% of total assets –Maintain a high quality liquidity portfolio surplus without the need for additional unsecured funding over a certain periodBalance sheet (As of September 2020)Assets Liabilities and equityTrading liabilities and related1 Trading assets and related1Other liabilities Short-term borrowings Cash and cash deposits Long-term borrowings Other assets Total equityUnsecured funding2ï® More than 70% of unsecured funding is long-term debt ï® Diversified sources of funding Short-term debt 22% Long-term debt due within 1yr, 4% International 32% Loans Bank lending Long-term market debt, 75% Euro MTN/Yen, Retail Average retail bonds, etc. market maturity Japan 6.9 years3 68% Euro MTN/Other, Wholesale wholesale market bonds, etc. Breakdown of Long-term Funding of short-term/long- debt by long-term term debt region debt 1. Trading assets and related: Reverse repo, securities, derivatives, etc. Trading liabilities and related: Repo, securities loaned, derivatives, etc. 2. Definition differs from financial disclosures reflecting Liquidity Management’s view. Cash and cash deposits portion of liquidity portfolio excludes funds on deposit at exchanges and segregated client funds. 3. Excludes long-term debt due within one year. Redemption schedule is individually estimated by considering the probability of redemption under certain stressed scenarios. 16
Table of Contents
|

Financial Supplement17
Table of Contents
|
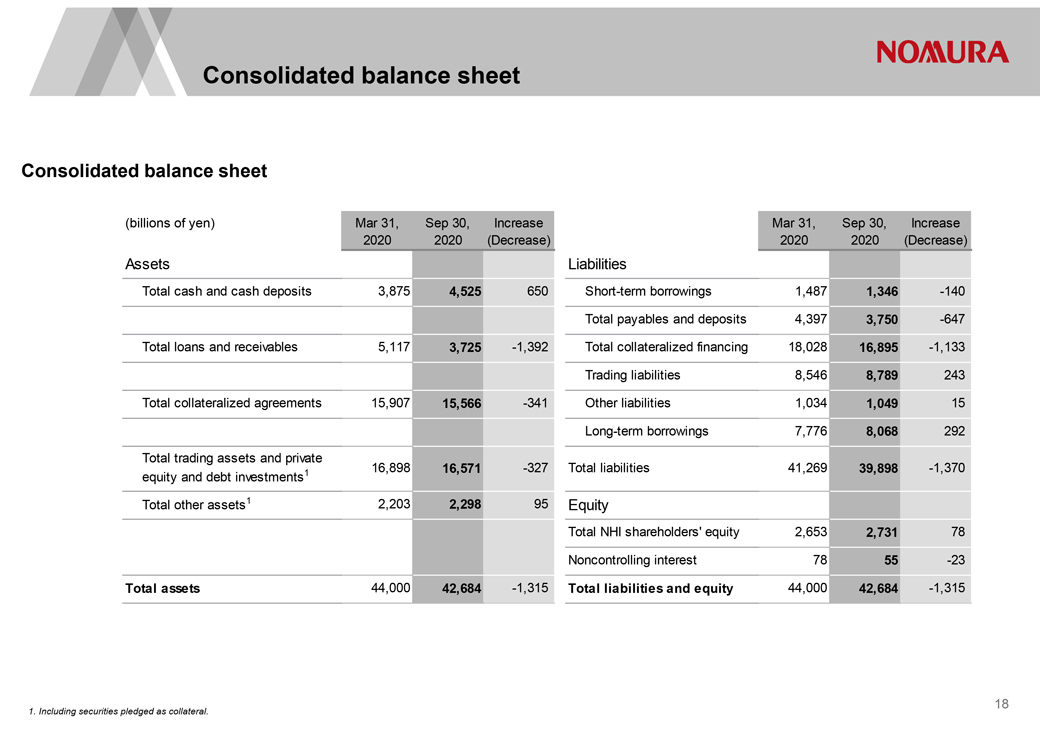
Consolidated balance sheetConsolidated balance sheet (billions of yen)Mar 31,Sep 30,IncreaseMar 31,Sep 30,Increase20202020(Decrease)20202020(Decrease)AssetsLiabilitiesTotal cash and cash deposits3,8754,525650Short-term borrowings1,4871,346-140Total payables and deposits4,3973,750-647Total loans and receivables5,1173,725-1,392Total collateralized financing18,02816,895-1,133Trading liabilities8,5468,789243Total collateralized agreements15,90715,566-341Other liabilities1,0341,04915Long-term borrowings7,7768,068292Total trading assets and privateequity and debt investments116,89816,571-327Total liabilities41,26939,898-1,370Total other assets12,2032,29895EquityTotal NHI shareholders’ equity2,6532,73178Noncontrolling interest 7855-23Total assets44,00042,684-1,315Total liabilities and equity44,00042,684-1,315 1. Including securities pledged as collateral.18
Table of Contents
|
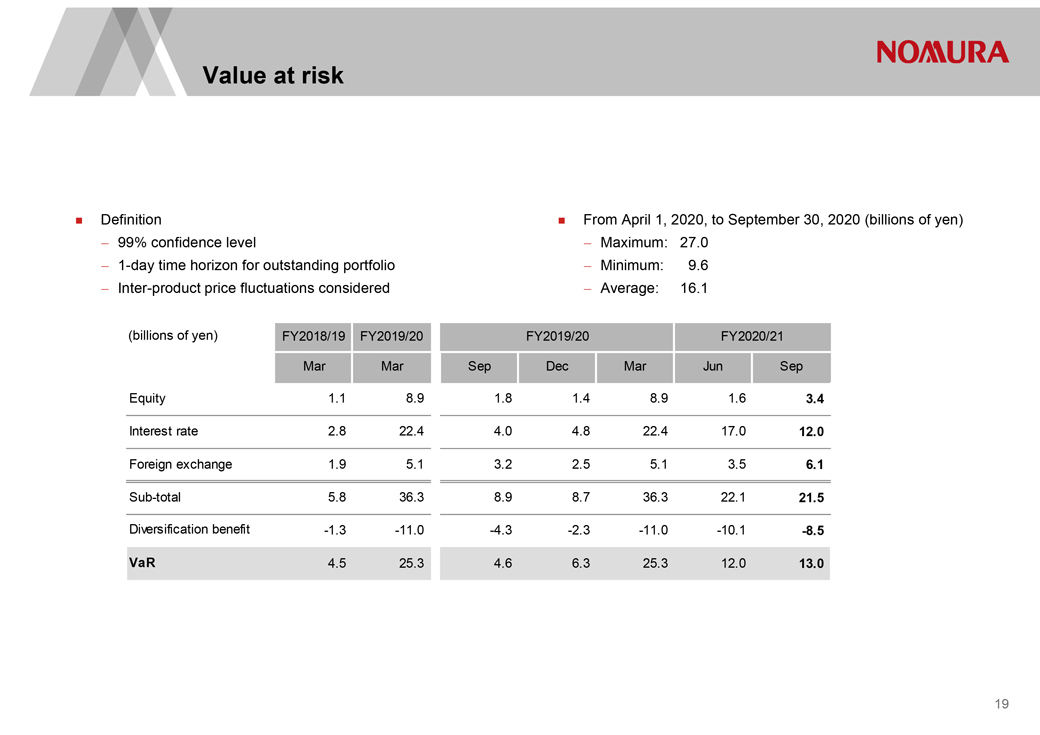
ï® Definition ï® From April 1, 2020, to September 30, 2020 (billions of yen)- 99% confidence level-Maximum:27.0-1-day time horizon for outstanding portfolio-Minimum:9.6-Inter-product price fluctuations considered-Average:16.1(billions of yen)FY2018/19 FY2019/20FY2019/20FY2020/21MarMar SepDecMarJunSepEquity1.18.91.81.48.91.63.4Interest rate2.822.44.04.822.417.012.0Foreign exchange1.95.13.22.55.13.56.1Sub-total5.836.38.98.736.322.121.5Diversification benefit-1.3-11.0-4.3-2.3-11.0-10.1-8.5VaR 4.525.34.66.325.312.013.019
Table of Contents
|
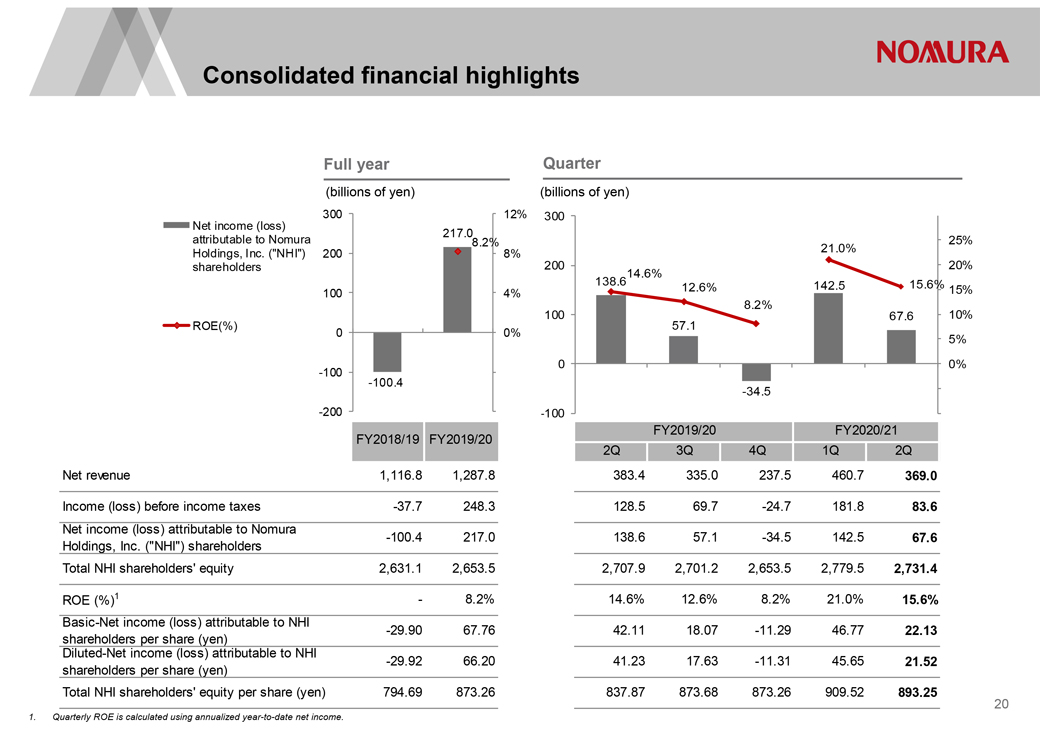
Consolidated financial highlights Full year(billions of yen)30012%Net income (loss)217.0attributable to Nomura8.2%Holdings, Inc. (“NHI”)2008%shareholders1004%ROE(%)00%-100-100.4-200FY2018/19 FY2019/20Net revenue1,116.81,287.8Income (loss) before income taxes-37.7248.3Net income (loss) attributable to Nomura-100.4217.0Holdings, Inc. (“NHI”) shareholdersTotal NHI shareholders’ equity2,631.12,653.5ROE (%)1-8.2%Basic-Net income (loss) attributable to NHI-29.9067.76shareholders per share (yen)Diluted-Net income (loss) attributable to NHI-29.9266.20shareholders per share (yen)Total NHI shareholders’ equity per share (yen)794.69873.261.Quarterly ROE is calculated using annualized year-to-date net income. Quarter (billions of yen)30021.0%25%20020%138.6 14.6%15.6%12.6%142.515%8.2%10067.610%57.15%00%-34.5-100FY2019/20FY2020/212Q3Q4Q1Q2Q383.4335.0237.5460.7369.0128.569.7-24.7181.883.6138.657.1-34.5142.567.62,707.92,701.22,653.52,779.52,731.414.6%12.6%8.2%21.0%15.6%42.1118.07-11.2946.7722.1341.2317.63-11.3145.6521.52837.87873.68873.26909.52893.2520
Table of Contents
|
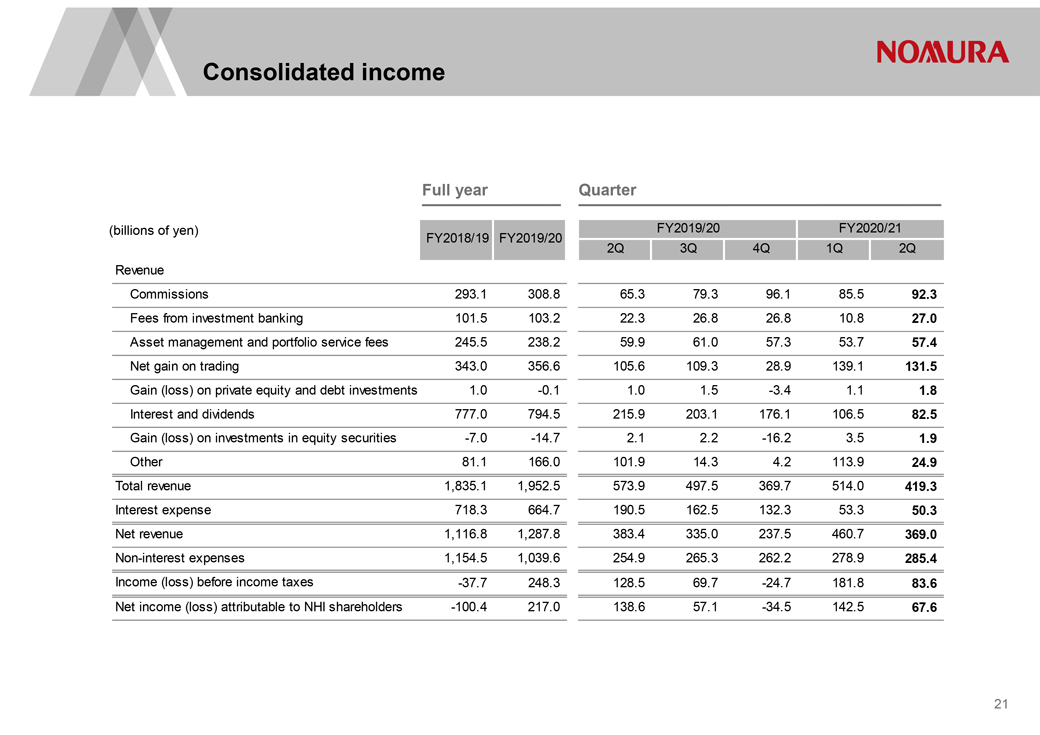
Consolidated income Full year Quarter(billions of yen)FY2019/20FY2020/21FY2018/19 FY2019/202Q3Q4Q1Q2QRevenueCommissions293.1308.865.379.396.185.592.3Fees from investment banking101.5103.222.326.826.810.827.0Asset management and portfolio service fees245.5238.259.961.057.353.757.4Net gain on trading343.0356.6105.6109.328.9139.1131.5Gain (loss) on private equity and debt investments1.0-0.11.01.5-3.41.11.8Interest and dividends777.0794.5215.9203.1176.1106.582.5Gain (loss) on investments in equity securities-7.0-14.72.12.2-16.23.51.9Other81.1166.0101.914.34.2113.924.9Total revenue1,835.11,952.5573.9497.5369.7514.0419.3Interest expense718.3664.7190.5162.5132.353.350.3Net revenue1,116.81,287.8383.4335.0237.5460.7369.0Non-interest expenses1,154.51,039.6254.9265.3262.2278.9285.4Income (loss) before income taxes-37.7248.3128.569.7-24.7181.883.6Net income (loss) attributable to NHI shareholders-100.4217.0138.657.1-34.5142.567.621
Table of Contents
|
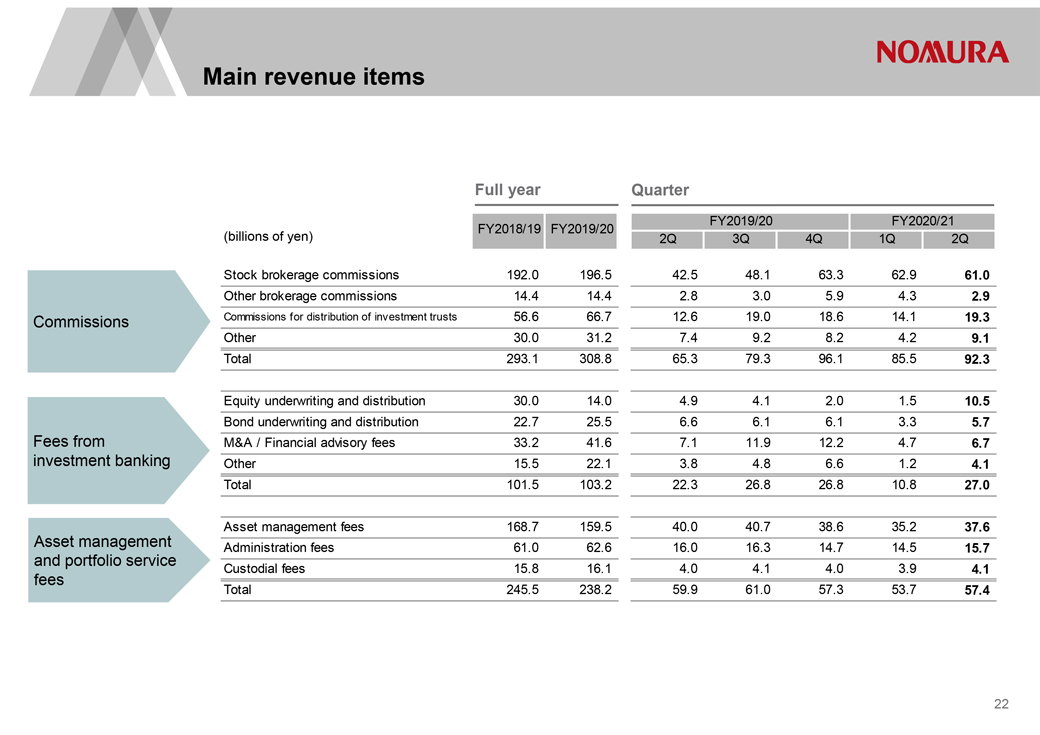
Main revenue items Full yearQuarterFY2018/19 FY2019/20FY2019/20FY2020/21(billions of yen)2Q3Q4Q1Q2QStock brokerage commissions192.0196.542.548.163.362.961.0Other brokerage commissions14.414.42.83.05.94.32.9CommissionsCommissions for distribution of investment trusts56.666.712.619.018.614.119.3Other30.031.27.49.28.24.29.1Total293.1308.865.379.396.185.592.3Equity underwriting and distribution30.014.04.94.12.01.510.5Bond underwriting and distribution22.725.56.66.16.13.35.7Fees fromM&A / Financial advisory fees33.241.67.111.912.24.76.7investment bankingOther15.522.13.84.86.61.24.1Total101.5103.222.326.826.810.827.0Asset management fees168.7159.540.040.738.635.237.6Asset managementAdministration fees61.062.616.016.314.714.515.7and portfolio serviceCustodial fees15.816.14.04.14.03.94.1feesTotal245.5238.259.961.057.353.757.422
Table of Contents
|
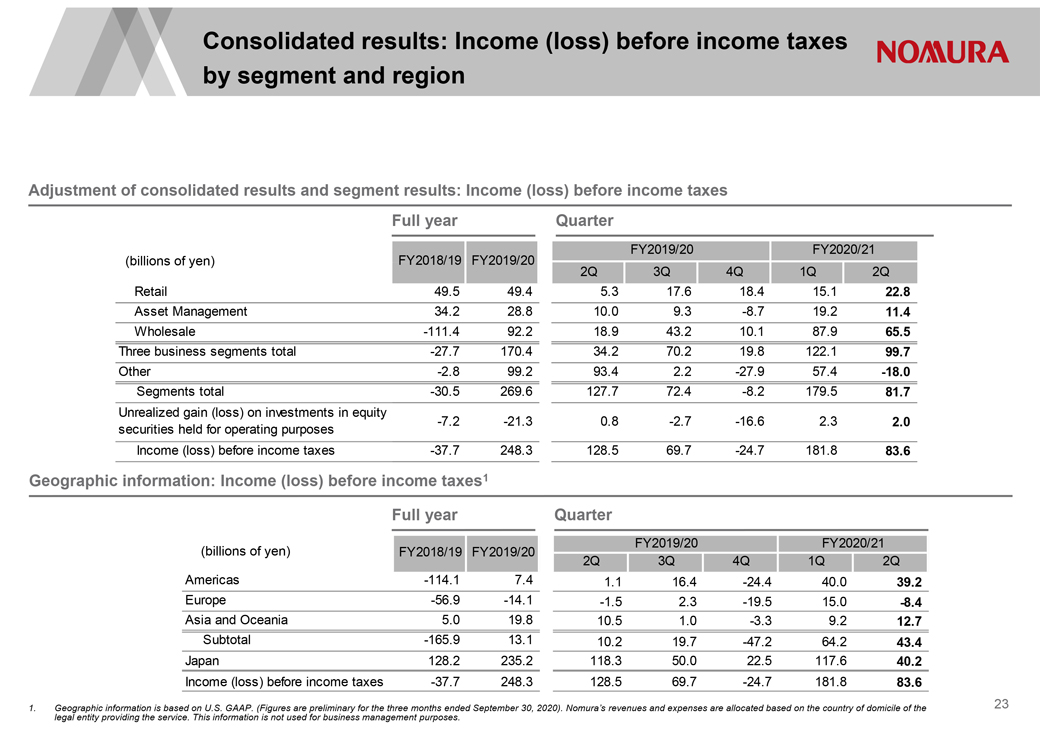
Consolidated results: Income (loss) before income taxes by segment and regionAdjustment of consolidated results and segment results: Income (loss) before income taxes Full yearQuarterFY2019/20FY2020/21(billions of yen)FY2018/19FY2019/202Q3Q4Q1Q2QRetail49.549.45.317.618.415.122.8Asset Management34.228.810.09.3-8.719.211.4Wholesale-111.492.218.943.210.187.965.5Three business segments total-27.7170.434.270.219.8122.199.7Other-2.899.293.42.2-27.957.4-18.0Segments total-30.5269.6127.772.4-8.2179.581.7Unrealized gain (loss) on investments in equitysecurities held for operating purposes-7.2-21.30.8-2.7-16.62.32.0Income (loss) before income taxes-37.7248.3128.569.7-24.7181.883.6Geographic information: Income (loss) before income taxes1Full yearQuarter(billions of yen)FY2018/19 FY2019/20FY2019/20FY2020/212Q3Q4Q1Q2QAmericas-114.17.41.116.4-24.440.039.2Europe-56.9-14.1-1.52.3-19.515.0-8.4Asia and Oceania5.019.810.51.0-3.39.212.7Subtotal-165.913.110.219.7-47.264.243.4Japan128.2235.2118.350.022.5117.640.2Income (loss) before income taxes-37.7248.3128.569.7-24.7181.883.61. Geographic information is based on U.S. GAAP. (Figures are preliminary for the three months ended September 30, 2020). Nomura’s revenues and expenses are allocated based on the country of domicile of thelegal entity providing the service. This information is not used for business management purposes. 23
Table of Contents
|
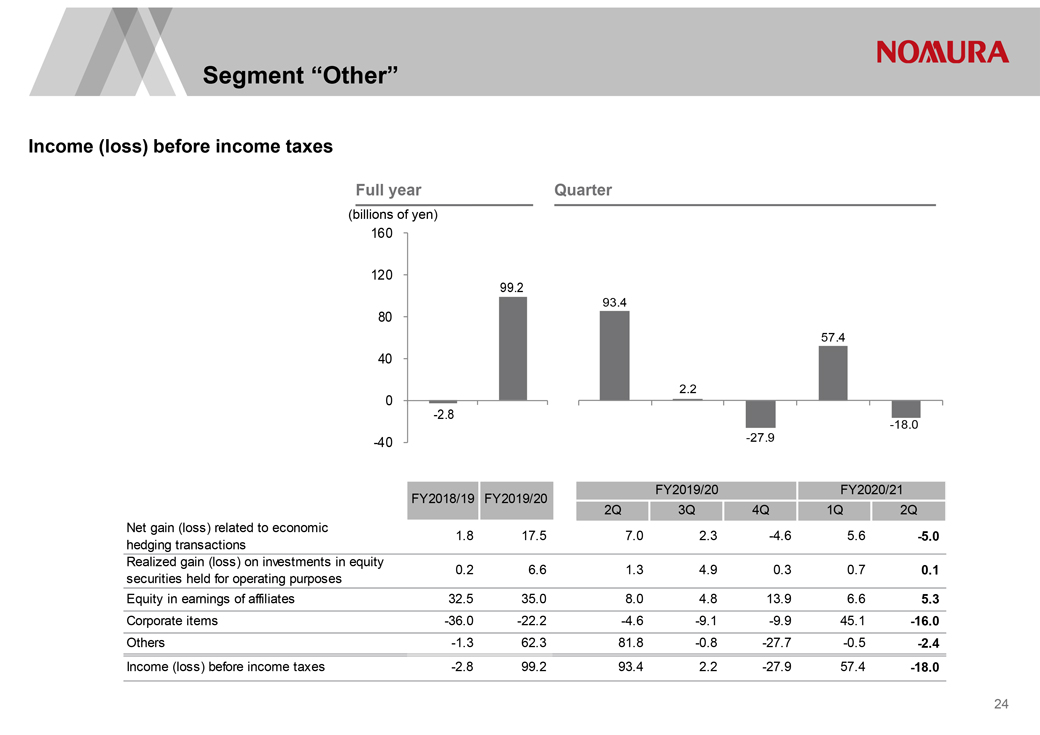
Segment “Other”Income (loss) before income taxes Full yearQuarter(billions of yen)16012099.293.48057.4402.20-2.8-18.0-40-27.91212345FY2019/20FY2020/21FY2018/19 FY2019/202Q3Q4Q1Q2QNet gain (loss) related to economic1.817.57.02.3-4.65.6-5.0hedging transactionsRealized gain (loss) on investments in equity0.26.61.34.90.30.70.1securities held for operating purposesEquity in earnings of affiliates32.535.08.04.813.96.65.3Corporate items-36.0-22.2-4.6-9.1-9.945.1-16.0Others-1.362.381.8-0.8-27.7-0.5-2.4Income (loss) before income taxes-2.899.293.42.2-27.957.4-18.024
Table of Contents
|
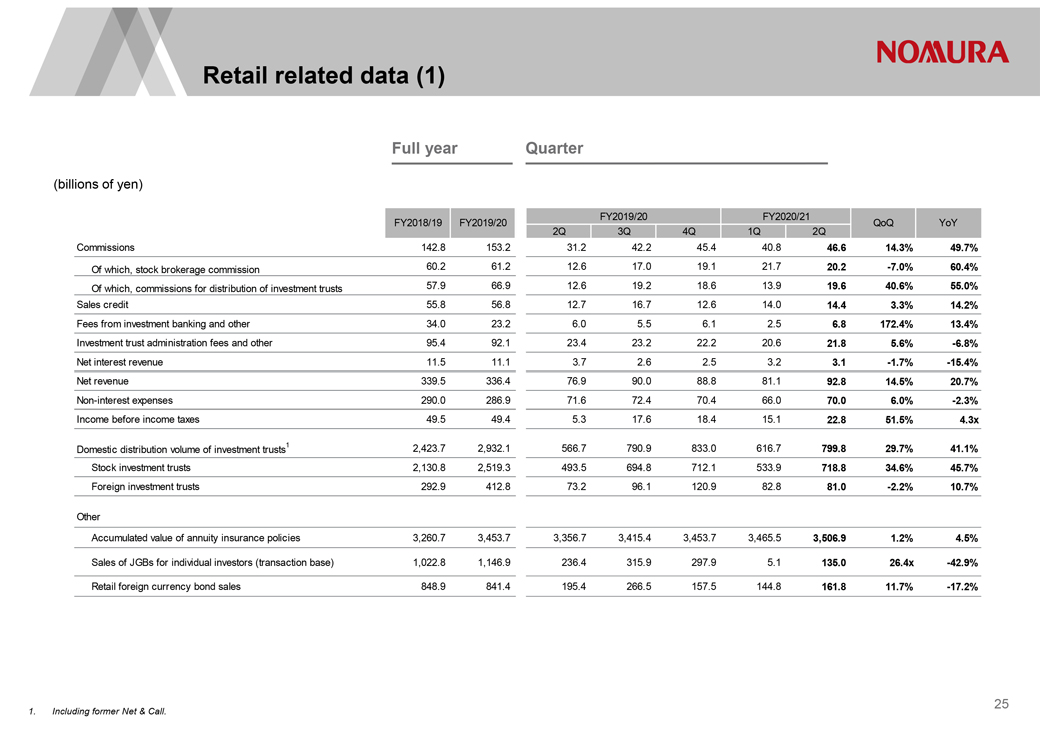
Retail related data (1) Full yearQuarter(billions of yen)FY2019/20FY2020/21FY2018/19 FY2019/20QoQ YoY2Q3Q4Q1Q2QCommissions142.8153.231.242.245.440.846.614.3%49.7%Of which, stock brokerage commission60.261.212.617.019.121.720.2-7.0%60.4%Of which, commissions for distribution of investment trusts57.966.912.619.218.613.919.640.6%55.0%Sales credit55.856.812.716.712.614.014.43.3%14.2%Fees from investment banking and other34.023.26.05.56.12.56.8172.4%13.4%Investment trust administration fees and other95.492.123.423.222.220.621.85.6%-6.8%Net interest revenue11.511.13.72.62.53.23.1-1.7%-15.4%Net revenue339.5336.476.990.088.881.192.814.5%20.7%Non-interest expenses290.0286.971.672.470.466.070.06.0%-2.3%Income before income taxes49.549.45.317.618.415.122.851.5%4.3xDomestic distribution volume of investment trusts12,423.72,932.1566.7790.9833.0616.7799.829.7%41.1%Stock investment trusts2,130.82,519.3493.5694.8712.1533.9718.834.6%45.7%Foreign investment trusts292.9412.873.296.1120.982.881.0-2.2%10.7%OtherAccumulated value of annuity insurance policies3,260.73,453.73,356.73,415.43,453.73,465.53,506.91.2%4.5%Sales of JGBs for individual investors (transaction base)1,022.81,146.9236.4315.9297.95.1135.026.4x-42.9%Retail foreign currency bond sales848.9841.4195.4266.5157.5144.8161.811.7%-17.2%1. Including former Net & Call.25
Table of Contents
|
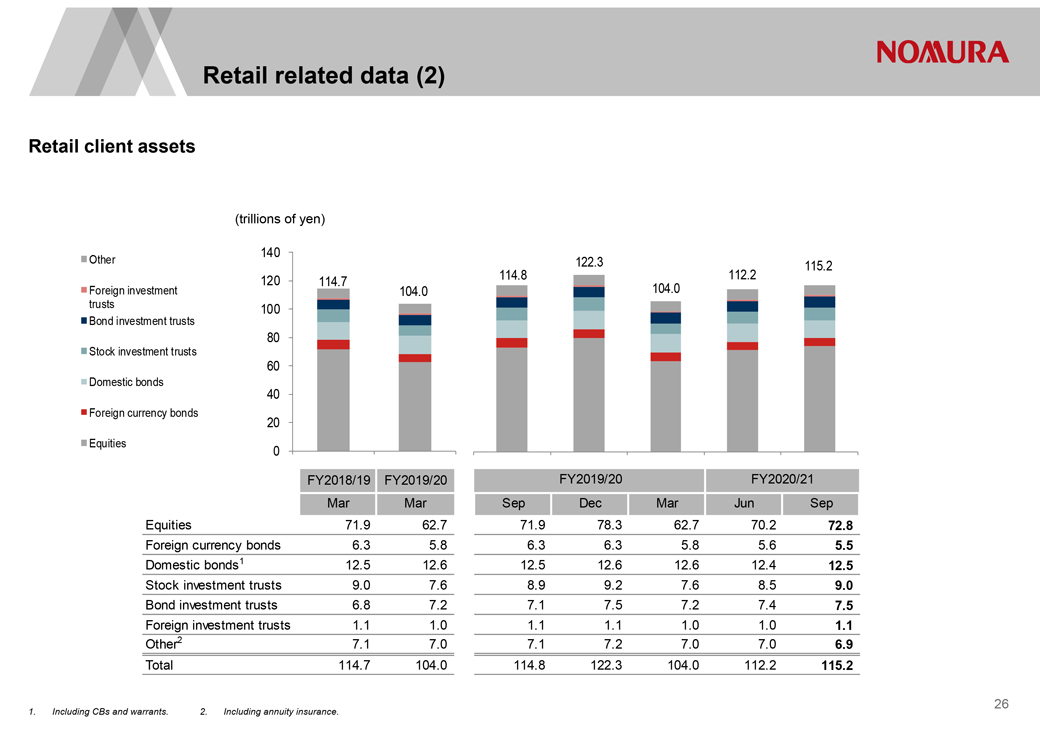
Retail related data (2) Retail client assets(trillions of yen)140Other122.3115.2120114.7114.8112.2Foreign investment104.0104.0trusts100Bond investment trusts80Stock investment trusts60Domestic bonds40Foreign currency bonds20Equities0FY2018/19FY2019/20FY2019/20FY2020/21MarMar SepDecMarJunSepEquities 71.962.771.978.362.770.272.8Foreign currency bonds6.35.86.36.35.85.65.5Domestic bonds112.512.612.512.612.612.412.5Stock investment trusts9.07.68.99.27.68.59.0Bond investment trusts6.87.27.17.57.27.47.5Foreign investment trusts1.11.01.11.11.01.01.1Other27.17.07.17.27.07.06.9Total114.7104.0114.8122.3104.0112.2115.21. Including CBs and warrants. 2. Including annuity insurance.26
Table of Contents
|
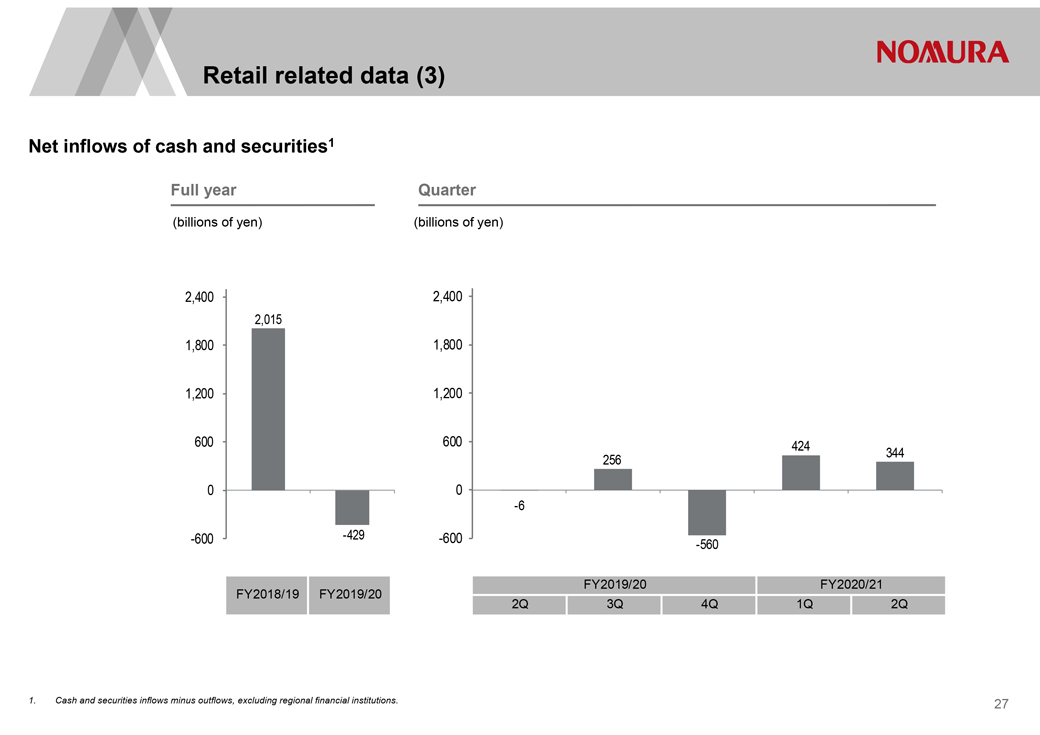
Retail related data (3)Net inflows of cash and securities1 Full yearQuarter(billions of yen)(billions of yen)2,4002,4002,0151,8001,8001,2001,20060060042434425600-6-600-429-600-560FY2019/20FY2020/21FY2018/19FY2019/202Q3Q4Q1Q2Q1. Cash and securities inflows minus outflows, excluding regional financial institutions.27
Table of Contents
|
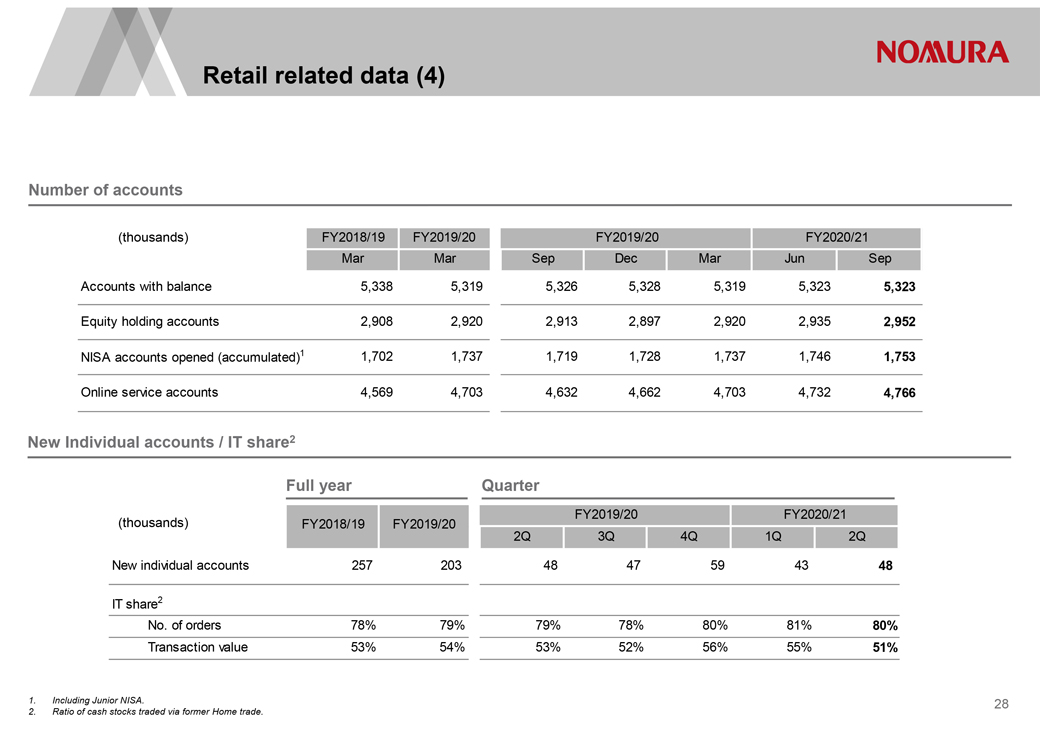
Retail related data (4) Number of accounts(thousands)FY2018/19FY2019/20FY2019/20FY2020/21MarMar SepDecMarJunSepAccounts with balance 5,3385,3195,3265,3285,3195,3235,323Equity holding accounts2,9082,9202,9132,8972,9202,9352,952NISA accounts opened (accumulated)11,7021,7371,7191,7281,7371,7461,753Online service accounts4,5694,7034,6324,6624,7034,7324,766New Individual accounts / IT share2Full yearQuarter(thousands)FY2018/19 FY2019/20FY2019/20FY2020/212Q3Q4Q1Q2QNew individual accounts2572034847594348IT share2No. of orders78%79%79%78%80%81%80%Transaction value53%54%53%52%56%55%51%1. Including Junior NISA. 2. Ratio of cash stocks traded via former Home trade.28
Table of Contents
|
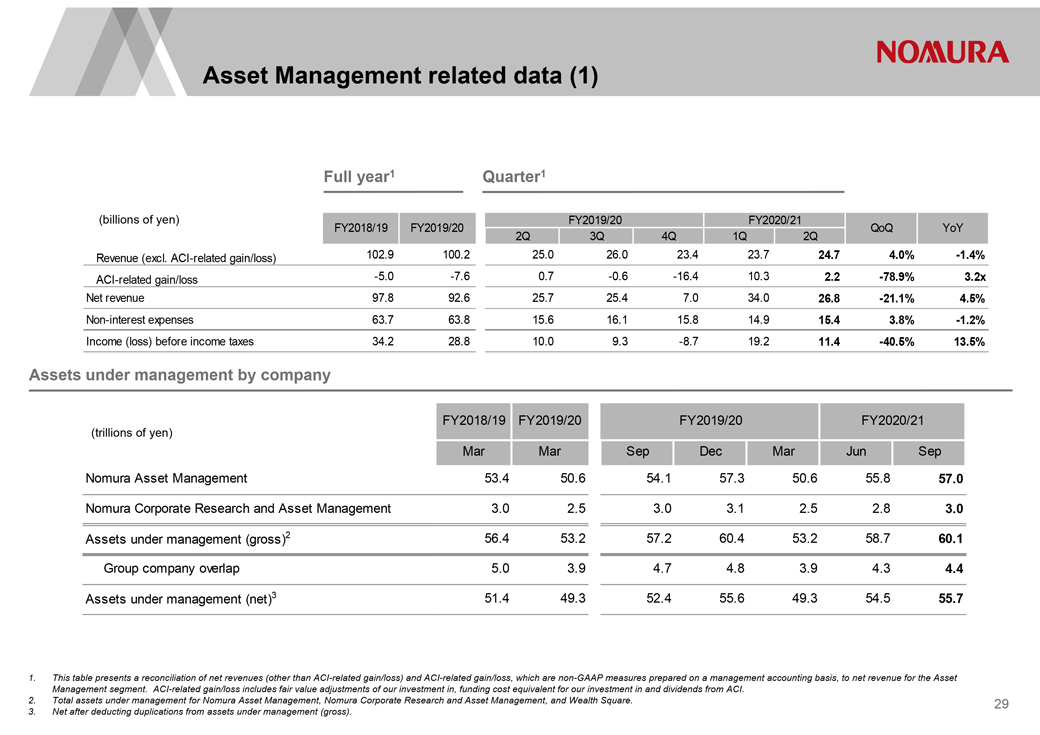
Asset Management related data (1) Full year1 Quarter1(billions of yen)FY2019/20FY2020/21FY2018/19 FY2019/20QoQ YoY2Q3Q4Q1Q2QRevenue (excl. ACI-related gain/loss)102.9100.225.026.023.423.724.74.0%-1.4%ACI-related gain/loss-5.0-7.60.7-0.6-16.410.32.2-78.9%3.2xNet revenue97.892.625.725.47.034.026.8-21.1%4.5%Non-interest expenses63.763.815.616.115.814.915.43.8%-1.2%Income (loss) before income taxes34.228.810.09.3-8.719.211.4-40.5%13.5%Assets under management by companyFY2018/19 FY2019/20FY2019/20FY2020/21(trillions of yen)MarMar SepDecMarJunSepNomura Asset Management 53.450.654.157.350.655.857.0Nomura Corporate Research and Asset Management3.02.53.03.12.52.83.0Assets under management (gross)256.453.257.260.453.258.760.1 Group company overlap5.03.94.74.83.94.34.4Assets under management (net)351.449.352.455.649.354.555.71. This table presents a reconciliation of net revenues (other than ACI-related gain/loss) and ACI-related gain/loss, which are non-GAAP measures prepared on a management accounting basis, to net revenue for the Asset Management segment. ACI-related gain/loss includes fair value adjustments of our investment in, funding cost equivalent for our investment in and dividends from ACI. 2. Total assets under management for Nomura Asset Management, Nomura Corporate Research and Asset Management, and Wealth Square. 3. Net after deducting duplications from assets under management (gross).29
Table of Contents
|
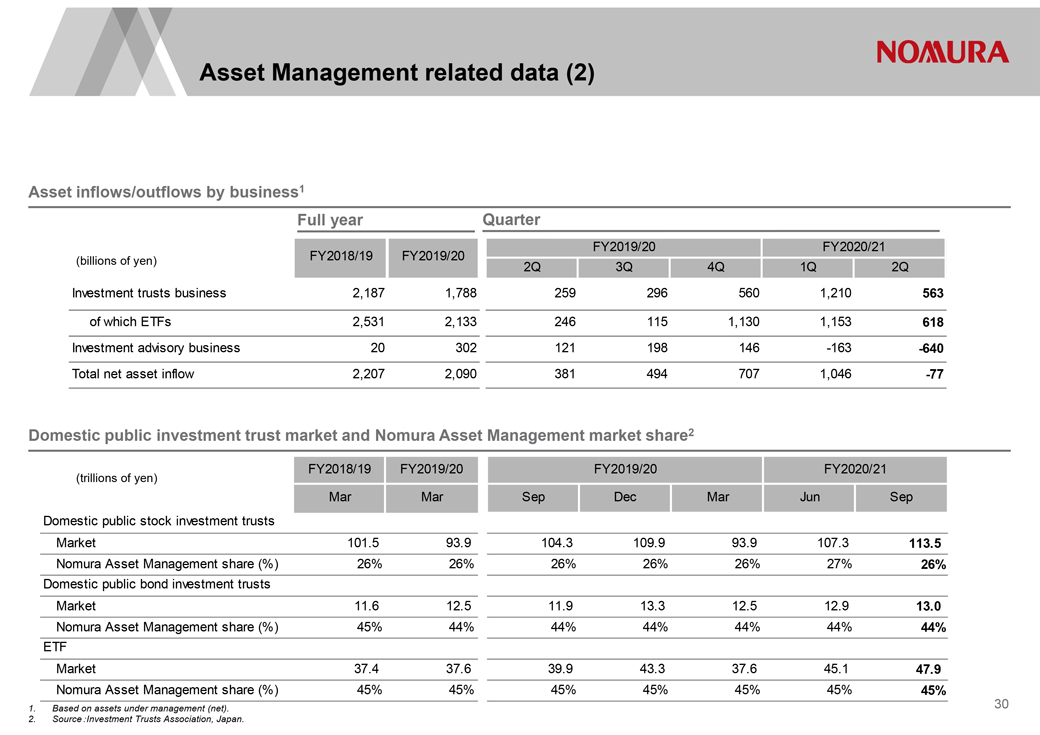
Asset Management related data (2)Asset inflows/outflows by business1 Full yearQuarterFY2019/20FY2020/21(billions of yen)FY2018/19FY2019/202Q3Q4Q1Q2QInvestment trusts business2,1871,7882592965601,210563 of which ETFs2,5312,1332461151,1301,153618Investment advisory business20302121198146-163-640Total net asset inflow2,2072,0903814947071,046-77Domestic public investment trust market and Nomura Asset Management market share2FY2018/19FY2019/20FY2019/20FY2020/21(trillions of yen)MarMar SepDecMarJunSepDomestic public stock investment trusts Market101.593.9104.3109.993.9107.3113.5Nomura Asset Management share (%)26%26%26%26%26%27%26%Domestic public bond investment trustsMarket11.612.511.913.312.512.913.0Nomura Asset Management share (%)45%44%44%44%44%44%44%ETFMarket37.437.639.943.337.645.147.9Nomura Asset Management share (%)45%45%45%45%45%45%45%1. Based on assets under management (net). 2. Source Investment Trusts Association, Japan. 30
Table of Contents
|
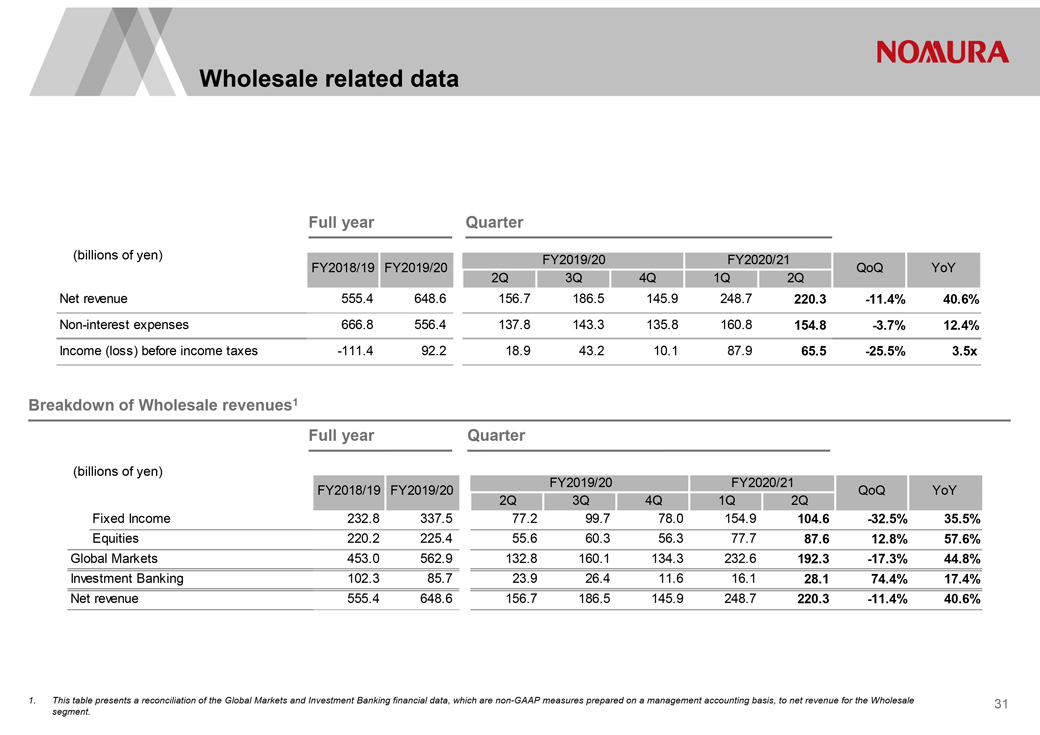
Wholesale related data Full year Quarter(billions of yen)FY2019/20FY2020/21FY2018/19 FY2019/20QoQ YoY2Q3Q4Q1Q2QNet revenue555.4648.6156.7186.5145.9248.7220.3-11.4%40.6%Non-interest expenses666.8556.4137.8143.3135.8160.8154.8-3.7%12.4%Income (loss) before income taxes-111.492.218.943.210.187.965.5-25.5%3.5xBreakdown of Wholesale revenues1Full yearQuarter(billions of yen)FY2019/20FY2020/21FY2018/19 FY2019/20QoQ YoY2Q3Q4Q1Q2QFixed Income232.8337.577.299.778.0154.9104.6-32.5%35.5%Equities220.2225.455.660.356.377.787.612.8%57.6%Global Markets453.0562.9132.8160.1134.3232.6192.3-17.3%44.8%Investment Banking102.385.723.926.411.616.128.174.4%17.4%Net revenue555.4648.6156.7186.5145.9248.7220.3-11.4%40.6%1. This table presents a reconciliation of the Global Markets and Investment Banking financial data, which are non-GAAP measures prepared on a management accounting basis, to net revenue for the Wholesale segment.31
Table of Contents
|
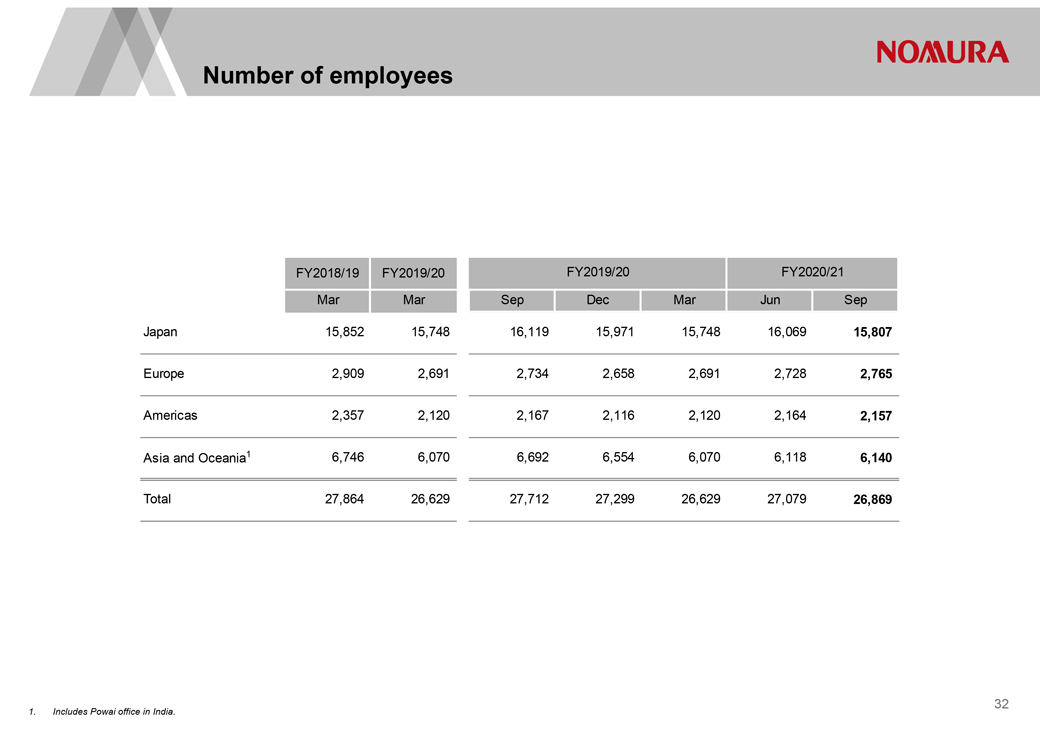
Number of employees FY2018/19 FY2019/20FY2019/20FY2020/21MarMar SepDecMarJunSepJapan 15,85215,74816,11915,97115,74816,06915,807Europe2,9092,6912,7342,6582,6912,7282,765Americas2,3572,1202,1672,1162,1202,1642,157Asia and Oceania16,7466,0706,6926,5546,0706,1186,140Total27,86426,62927,71227,29926,62927,07926,86932
Table of Contents
|
DisclaimerThis document is produced by Nomura Holdings, Inc. (“Nomura”).Nothing in this document shall be considered as an offer to sell or solicitation of an offer to buy any security, commodity or other instrument, including securities issued by Nomura or any affiliate thereof. Offers to sell, sales, solicitations to buy, or purchases of any securities issued by Nomura or any affiliate thereof may only be made or entered into pursuant to appropriate offering materials or a prospectus prepared and distributed according to the laws, regulations, rules and market practices of the jurisdictions in which such offers or sales may be made.The information and opinions contained in this document have been obtained from sources believed to be reliable, but no representations or warranty, express or implied, are made that such information is accurate or complete and no responsibility or liability can be accepted by Nomura for errors or omissions or for any losses arising from the use of this information.All rights regarding this document are reserved by Nomura unless otherwise indicated. No part of this document shall be reproduced, stored in a retrieval system or transmitted in any form or by any means, electronic, mechanical, photocopying, recording or otherwise, without the prior written permission of Nomura.This document contains statements that may constitute, and from time to time our management may make “forward-looking statements” within the meaning of the safe harbor provisions of The Private Securities Litigation Reform Act of 1995. Any such statements must be read in the context of the offering materials pursuant to which any securities may be offered or sold in the United States. These forward-looking statements are not historicalfacts but instead represent only our belief regarding future events, many of which, by their nature, are inherently uncertain and outside our control. Actual results and financial condition may differ, possibly materially, from what is indicated in those forward-looking statements. You should not place undue reliance on any forward-looking statement and should consider all of the following uncertainties and risk factors, as well as those more fully discussed under Nomura’s most recent Annual Report on Form 20-F and other reports filed with the U.S. Securities and Exchange Commission (“SEC”) that are available on Nomura’s website (http://www.nomura.com) and on the SEC‘s website (http://www.sec.gov); Important risk factors that could cause actual results to differ from those in specific forward-looking statements include, without limitation, economic and market conditions, political events and investor sentiments, liquidity of secondary markets, level and volatility of interest rates, currency exchange rates, security valuations, competitive conditions and size, and the number and timing of transactions.Forward-looking statements speak only as of the date they are made, and Nomura undertakes no obligation to update any forward-looking statement to reflect the impact of circumstances or events that arise after the date the forward-looking statement was made.The consolidated financial information in this document is unaudited.33
Table of Contents
|

Nomura Holdings, Inc.www.nomura.com34